A Cipher text B Cryptography C Plain Text D Symmetric Marks ...
Upload
khangminh22Category
view
0download
0
Maria
H
ele
ne P
ale
sa Jaeger G
en
etic
Stu
die
s o
n B
lack an
d W
hit
e C
attle
MARIA HELENE PALESA JAEGER
Phenotypic, Quantitative Genetic and
Genomic Characterization of the
German Black and White Dual-Purpose
Cattle Breed
VVB LAUFERSWEILER VERLAGSTAUFENBERGRING 15D-35396 GIESSEN
Tel: 0641-5599888 Fax: [email protected]
VVB LAUFERSWEILER VERLAGédition scientifique
9 7 8 3 8 3 5 9 6 7 5 4 0
ISBN: 978-3-8359-6754-0
VVBVERLAG
Photo cover: ©
VVB
VVB LAUFERSWEILER VERLAGédition scientifique
INAUGURAL-DISSERTATION
zur Erlangung des Doktorgrades eines Doctor agriculturae (Dr. agr.)
durch den Fachbereich Agrarwissenschaften, Ökotrophologie und
Umweltmanagement der Justus-Liebig-Universität Gießen
Aus dem Institut für Tierzucht und Haustiergenetik
Professur für Tierzüchtung
der Justus-Liebig-Universität Gießen
__________________________________________________________________
Phenotypic, Quantitative Genetic and Genomic
Characterization of the German Black and White Dual-
Purpose Cattle Breed
INAUGURAL-DISSERTATION
zur Erlangung des Doktorgrades (Dr. agr.)
im Fachbereich Agrarwissenschaften, Ökotrophologie und
Umweltmanagement der Justus-Liebig-Universität Gießen
vorgelegt von
MARIA HELENE PALESA JAEGER
aus Roma, Lesotho
Gießen, 5. Oktober 2018
Mit Genehmigung des Fachbereiches Agrarwissenschaften,
Ökotrophologie und Umweltmanagement der
Justus-Liebig-Universität Gießen
Dekan: Prof. Dr. Klaus Eder
Prüfungskommission 1. GUTACHTER: Prof. Dr. Sven König 2. GUTACHTER: Prof. Dr. Dirk Hinrichs Prüfer: Prof. Dr. Andreas Gattinger Prüfer: Prof. Dr. Horst Brandt Vorsitzender: Prof. Dr. Rod Snowdon
Tag der Disputation 13. Dezember 2018

The key is a man’s power of accumulative selection: nature gives successive variations;
man adds them up in certain directions useful to him.
Charles Darwin

Meiner Familie
I
Table of Contents
LIST OF TABLES ......................................................................................................... IV
LIST OF FIGURES ........................................................................................................ VI
LIST OF ABBREVIATIONS ...................................................................................... VIII
SUMMARY ..................................................................................................................... 1
ZUSAMMENFASSUNG ................................................................................................. 8
CHAPTER 1 ................................................................................................................... 16
GENERAL INTRODUCTION ........................................................................................... 16
Changes in the dairy sector ..................................................................................... 17
Grassland systems and organic dairy production .................................................... 18
Situation of endangered native dual-purpose cattle breeds in Germany ................. 20
References ............................................................................................................... 25
CHAPTER 2 ................................................................................................................... 29
INBREEDING AND GENETIC RELATIONSHIPS OF THE ENDANGERED DUAL-PURPOSE
BLACK AND WHITE CATTLE BREED BASED ON OWN GENETIC BREED PERCENTAGE
CALCULATIONS ........................................................................................................... 29
Einleitung ................................................................................................................ 30
Material und Methoden ........................................................................................... 32
Ergebnisse ............................................................................................................... 37
Diskussion ............................................................................................................... 42
Schlussfolgerung ..................................................................................................... 47
Literatur ................................................................................................................... 49
CHAPTER 3 ................................................................................................................... 52
ASSOCIATIONS BETWEEN PRECISION SENSOR DATA WITH SUBJECTIVELY SCORED
CATTLE WELFARE INDICATORS, TEST-DAY PRODUCTION-, HEALTH- AND
II
FERTILITY TRAITS IN NATIVE BLACK AND WHITE DUAL-PURPOSE CATTLE KEPT IN
PASTURE-BASED PRODUCTION SYSTEMS ................................................................... 52
Introduction ............................................................................................................. 53
Materials and Methods ............................................................................................ 57
Results ..................................................................................................................... 60
Discussion ............................................................................................................... 64
Conclusion ............................................................................................................... 70
References ............................................................................................................... 71
CHAPTER 4 ................................................................................................................... 74
MULTI-BREED GWAS FOR ELECTRONICALLY RECORDED CATTLE BEHAVIOUR
TRAITS ......................................................................................................................... 74
Introduction ............................................................................................................. 75
Materials and Methods ............................................................................................ 77
Results ..................................................................................................................... 84
Discussion ............................................................................................................... 95
Conclusion ............................................................................................................. 106
References ............................................................................................................. 108
CHAPTER 5 ................................................................................................................. 117
VARIANCE HETEROGENEITY AND GENOTYPE BY ENVIRONMENT INTERACTIONS IN
NATIVE BLACK AND WHITE DUAL-PURPOSE CATTLE FOR DIFFERENT HERD
ALLOCATION SCHEMES ............................................................................................ 117
Introduction ........................................................................................................... 118
Materials and Methods .......................................................................................... 120
Results ................................................................................................................... 124
Discussion ............................................................................................................. 134
Conclusion ............................................................................................................. 139
References ............................................................................................................. 140
III
CHAPTER 6 ................................................................................................................. 144
SIMULATION AND ECONOMIC EVALUATION OF BLACK AND WHITE DUAL-PURPOSE
CATTLE BREEDING PROGRAMS ................................................................................ 144
Introduction ........................................................................................................... 145
Materials and Methods .......................................................................................... 147
Results ................................................................................................................... 152
Discussion ............................................................................................................. 158
Conclusion ............................................................................................................. 163
References ............................................................................................................. 165
CHAPTER 7 ................................................................................................................. 169
GENERAL DISCUSSION .............................................................................................. 169
GENETIC ASSOCIATIONS BETWEEN PRODUCTIVITY AND COW BEHAVIOUR .......... 171
Introduction ........................................................................................................... 171
Materials and Methods .......................................................................................... 173
Results and Discussion .......................................................................................... 175
Conclusion ............................................................................................................. 181
FUTURE PERSPECTIVES ............................................................................................. 183
Maintaining genetic diversity and mitigating inbreeding in small dual-purpose cattle
populations ............................................................................................................ 183
Applying innovative phenotypic behaviour trait recording in dual-purpose cattle 185
Associating significant genomic variants with candidate genes ........................... 186
The effect of GxE interaction in DSN cattle breeding .......................................... 190
Including functional traits in the economic evaluation of breeding programs for small
dual-purpose cattle populations ............................................................................. 191
Conclusion ............................................................................................................. 193
References ............................................................................................................. 195
ACKNOWLEDGEMENT ............................................................................................... 204
FORMAL DECLARATION ............................................................................................ 206
IV
List of Tables
Table 1: Rasseanteile innerhalb der Rassecode-Zuordnungen ...................................... 35
Table 2: Deskriptive Statistik der Leistungsmerkmale Milch-kg, Fett-kg und log-
transformierte Zellzahl für DSN_90 % und HF_90 %. .................................................. 36
Table 3: Literature overview of sensor studies with regard to the tested traits: feeding,
rumination, active, high active, lying, ear temperature. ................................................. 56
Table 4: Pearson correlation of subjectively scored welfare assessment traits and
temperament traits. ......................................................................................................... 60
Table 5: Phenotype data of cattle breeds included in multi-breed GWAS and genetic
parameter estimation....................................................................................................... 78
Table 6: Composed index of phenotyped animals with >30 days of sensor recordings
based on the welfare quality assessment protocol® ....................................................... 80
Table 7: Composed index-classes of phenotyped animals with >30 days of sensor
recordings based on the welfare quality assessment protocol® ..................................... 80
Table 8: Genotype data of five cattle breeds included in PCA, WIDDE and multi-breed
GWAS. ........................................................................................................................... 81
Table 9: Descriptive statistics of phenotypes of sensor and production traits. .............. 87
Table 10: Variance components for sensor traits. ......................................................... 87
Table 11: SNPs associated with behaviour traits ........................................................... 88
Table 12: Potential candidate genes associated with animal behaviour traits. .............. 93
Table 13: Descriptive statistics for milk yield, SCS and fat-to-protein ratio .............. 121
Table 14: Applied herd and geographical descriptors and respective thresholds for the
classification of herds into herd group 1 or herd group 2 ............................................. 121
Table 15: Number of cows within herds groups 1 or 2 for the different herd descriptors
and genetic lines ........................................................................................................... 122
Table 16: Mean values for herd descriptors for clusters 1, 2 and 3. ............................ 123
Table 17: Variance components and heritabilities for milk yield................................ 126
Table 18: Variance components and heritabilities for somatic cell score. ................. 126
Table 19: Variance components and heritabilities for fat-to-protein ratio .................. 127
Table 20: Genetic correlations between the same traits for milk yield, somatic cell score
and fat-to-protein ratio .................................................................................................. 130
V
Table 21: Genetic correlations between the same trait for milk yield, somatic cell score
and fat-to-protein ratio between clusters from the Mixed breed analyses .................... 131
Table 22: Phenotypic standard deviation, heritabilities, genetic and phenotypic
correlations between traits. ........................................................................................... 148
Table 23: Population parameters of a conventional and an organic breeding program for
the DSN cattle population applied in ZPLAN+. .......................................................... 150
Table 24: Different scenarios within the combined breeding program ....................... 151
Table 25: Average variable breeding cost components for a conventional and an organic
breeding program .......................................................................................................... 151
Table 26: Annual monetary genetic gain, discounted return, discounted costs, and
discounted profits for different breeding program simulations .................................... 157
Table 27: Observation and number of animals per breed included in the estimation of
genetic (co)variance components. ................................................................................ 174
Table 28: Genetic and phenotypic correlations within sensor traits ............................ 177
Table 29: Phenotypic correlations between sensor and production traits.................... 179
Table 30: Genetic correlations between sensor and production traits ......................... 181
VI
List of Figures
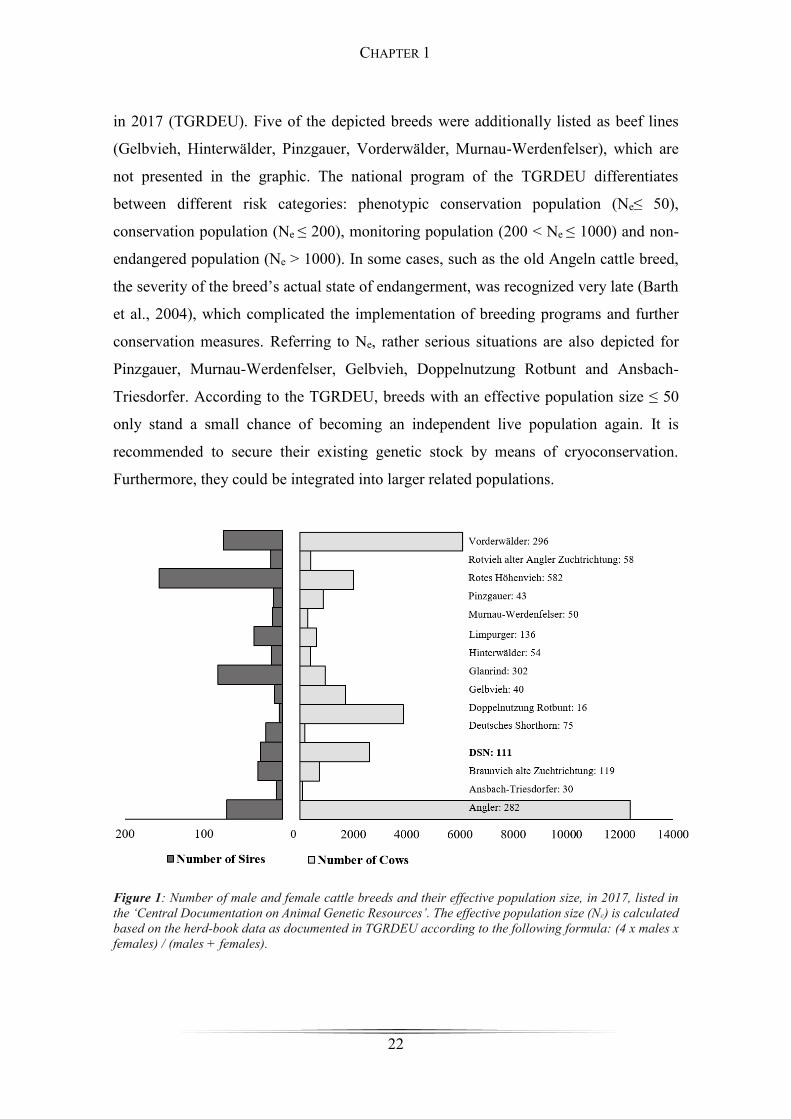
Figure 1: Number of male and female cattle breeds and effective population size ...... 22
Figure 2: Flowchartdiagramm des Algorithmus zur Berechnung der Rasseanteile ...... 33
Figure 3: Einflussreiche DSN-Bullen mit Geburtsjahr ................................................. 38
Figure 4: Durchschnittlicher Verwandtschaftskoeffizient von aktiven DSN-Kühen .... 38
Figure 5: Generationsintervalle für DSN und für HF .................................................... 39
Figure 6: Durchschnittlicher Inzuchtkoeffizient für DSN-Kühe und Bullen ................ 40
Figure 7: Least Square Means für Milch-kg in Abhängigkeit der Inzuchtkoeffizienten
........................................................................................................................................ 41
Figure 8: Least Square Means für Fett-kg in Abhängigkeit der Inzuchtkoeffizienten .. 41
Figure 9: Least Square Means für somatische Zellzahl in Abhängigkeit der
Inzuchtkoeffizienten ....................................................................................................... 41
Figure 10: Least square means of milk yield of dairy cattle grouped into different sensor
classes ............................................................................................................................. 61
Figure 11: Least square means of the sensor traits daily rumination and feeding ........ 62
Figure 12: Least square means of sensor traits of daily rumination and feeding grouped
into somatic cell count classes ........................................................................................ 63
Figure 13: Least square means body condition score .................................................... 64
Figure 14: First three principal components .................................................................. 85
Figure 15: Ancestry composition of European genotyped animals .............................. 86
Figure 16: Manhattan plot of the production trait fat percent ....................................... 89
Figure 17: Manhattan plots of the sensor trait Not Active ............................................ 89
Figure 18: Manhattan plots of the sensor trait Rumination ........................................... 90
Figure 19: Manhattan plots of the sensor trait Feeding ................................................. 90
Figure 20: Manhattan plots of the sensor trait Activity ................................................. 90
Figure 21: Manhattan plots of the sensor trait High Active .......................................... 91
Figure 22: Manhattan plots of the sensor Ear Temperature .......................................... 91
Figure 23: Manhattan plots of the combined sensor trait Index .................................... 91
Figure 24: Manhattan plots of the combined sensor trait Index Class .......................... 92
Figure 25: Average coefficient of relationship and inbreeding coefficient ................. 132
Figure 26: Average coefficient of relationship between groups ................................. 134
VII
Figure 27: Combination of the conventional and organic breeding program ............. 150
Figure 28: Responses to selection for the conventional and the organic breeding program
...................................................................................................................................... 153
Figure 29: GxE_BP: Responses to selection across different correlations within traits
...................................................................................................................................... 153
Figure 30: MSG_BP: Responses to selection across changing percentages of AI- and NS-
sire implementation ...................................................................................................... 154
Figure 31: FSG_BP: Responses to selection across changing percentages of AI- and NS-
sire implementation ...................................................................................................... 155
Figure 32: MFSG_BP: Responses to selection across changing percentages of AI- and
NS-sire implementation ................................................................................................ 155
VIII
List of Abbreviations
ABL Alte Bundesländer ACT Daily activity behaviour (sensor trait) AGG Aggressiveness AI Artificial insemination AMGG Annual monetary genetic gain ASD Allele sharing distance AvgBW Average body weight BCS Body condition score BLUP Best linear unbiased prediction BP Breeding program BTA Bos taurus (chromosome) C_BP Conventional breeding program CH_OBS Original Brown Swiss from Switzerland CH_Si Simmental from Switzerland CLA Conjugated linoleic acid CM Clinical mastitis CN Casein d Day DC Discounted costs DE_DN Red and White dual-purpose cattle from Germany DE_DSN Black and White dual-purpose cattle from Germany DIM Days in milk DMI Dry matter intake DO Days open DR Discounted return DRP De-regressed proof DSN Deutsches Schwarzbuntes Niederungsrind (Black and White dual-
purpose cattle) DSN_90 % Cows with ≥ 90 % of DSN breed percentage (based on own
algorithm) EBV Estimated breeding value ET Ear temperature F Inzuchtkoeffizient, Inbreeding coefficient F-ALTITUDE Farm altitude FDR False discovery rate FEED Daily feeding behaviour (sensor trait) Fkg Fat kilogram F-LATITUDE Farm latitude Fat % Fat percent
IX
FPR Fat-to-protein ratio FSG_BP Combined BP, changing percent. of AI, NSS in female selection
group GT General temperament GUI Genotyp-Umwelt-Interaktion GWAS Genome wide association study GxE Genotype by environment (interaction) GxE_BP Conventional breeding program with GxE interaction h2 Heritability HA Daily high active behaviour (sensor trait) H-CA Average herd calving age H-DSN % Average herd DSN percentage HF Holstein Friesian cattle HF_90 % Cows with ≥ 90 % of HF breed percentage (based on own algorithm) H-MPL Average herd milk production level H-NSS Average herd natural service sire implementation H-SCC Average herd somatic cell count H-SIZE Average herd size I Index (sensor trait) IC Index class (sensor trait) IHRO Intra herd rank order kb Kilo bases KB Künstliche Besamung L Longevity LD Linkage disequilibrium LG Lactoglobulin LHS Leg hygiene score LS Locomotion score MACE Multiple-trait across country evaluation MAF Minor allele frequency MFSG_BP Combined breeding program with changing percentage of AI and
NSS in both male and female selection groups Mkg Milk kilogram mL Millilitre MSG_BP Combined BP, changing percent. of AI and NSS in male selection
group MTAM Multiple-trait animal model MY Milk yield NA Daily sleeping (not active) behaviour (sensor trait) NBL Neue Bundesländer NDF Natural detergent fibre Ne Effective population size
X
NSB Natursprungbulle NSS Natural service sire O_BP Organic breeding program OGC Optimum genetic contribution (theory) PCA Principal component analysis PDF Precision dairy farming PL_BS Brown Swiss cow from Poland PL_HF Holstein Friesian cow from Poland Pro % Protein percent QTL Quantitative trait loci R Average relationship r2 Reliability of estimated breeding value RA Rasseanteil RBB Rinderzuchtverband Berlin-Brandenburg eG RC Rasse Code RFI Residual feed intake rg Genetic correlation rp Phenotypic correlation RUM Daily rumination behaviour (sensor trait) SCC Somatic cell count SCS Somatic cell score Sl_BS Brown Swiss cow from Slovenia Sl_HF Holstein Friesian cow from Slovenia Sl_Si Simmental from cow Slovenia SMR Schwarzbuntes Milchrind SNP Single nucleotide polymorphism THI Temperature humidity index UHS Udder hygiene score VEF-DSN Verein zur Erhaltung und Förderung des alten schwarzbunten
Niederungsrindes VIT Vereinigte Informationssysteme Tierhaltung e.V. WAT Welfare assessment traits
1
SUMMARY
The objective of this study was an in-depth evaluation of novel functional traits in
endangered dual-purpose cattle, kept in organic pasture-based production systems, on a
quantitative genetic, as well as a genomic level, including the effect of environmental
influences. The preliminary work constituted a comprehensive pedigree analysis within
the endangered black and white dual-purpose (DSN) cattle breed, along with a detailed
examination of the population structure (inbreeding, genetic relationships, effective
population size), to better characterize the German DSN population. Against this
background, a simulation of breeding programs and economic evaluations of production
and functional traits of the DSN breed was conducted, based on deterministic equations
and population parameters. Different aspects of DSN breeding are divided into five
scientific studies (chapters 2, 3, 4, 5 and 6), which address the previously mentioned
research areas: 1) Characterization of the German DSN population, based on pedigree
analyses; 2) Examination of relations between novel functional traits and productivity,
health and welfare indicator traits in native DSN cattle, under grazing conditions; 3)
Multi-breed genome wide association studies (GWAS) of novel functional traits in DSN
and other European dual-purpose cattle; 4) Variance heterogeneity and genotype by
environment (GxE) interaction analysis in DSN for different herd allocation schemes; 5)
Comparison of disparate breeding scenarios for the German DSN population. In chapter
7, further aspects of quantitative-genetic and genomic studies are presented and discussed
against the background of DSN breeding program improvements. Finally, genetic
correlations between novel functional and production traits are estimated and an outlook
regarding future challenges and trends in German DSN breeding is given.
As the last in-depth genetic population evaluation of the endangered German DSN breed
was conducted more than 15 years ago, gaining an up-to-date status quo of this situation
was essential, before addressing all subsequent research questions. Thus, in the first study
(chapter 2), an own algorithm was developed, in order to identify DSN and Holstein
Friesian (HF) cows, according to their genetic percentages. These newly calculated breed
percentages were the basis for further investigations on German HF and DSN population
genetics (relationship within and between defined groups, inbreeding coefficients,
effective population size, generation intervals, and possible inbreeding depressions). The
2
newly developed algorithm revealed pronounced differences between animal allocations
to breeds, based on their genetic percentage, compared to allocations, based on the
officially assigned breed codes. Considering genetic breed percentages and strict
thresholds of 90 % breed percentage, 46 % of cows were wrongly ascribed to DSN
(compared to their official breed code). Moreover, there was a distinct difference between
wrongly allocated DSN in eastern and western Germany. Only minor erroneous
allocations in former East Germany (only 5 %) were detected, while more severe
erroneous breed assignments in the federal states of former West Germany (91 %) were
noted. Ascribing DSN, according to their genetic breed percentage, a rather low
inbreeding coefficient of 2 % in recent birth years was discovered. Based on the average
increase of inbreeding (0.1 %), the effective population size consisted of 85 animals,
confirming the status of German DSN as an endangered cattle population. The
relationship between HF and DSN (R= 0.02 %) was negligible. Furthermore, inbreeding
depression in production traits was noted for DSN in the first and second lactation. From
the extensive DSN pedigree studies, it could be concluded, that there were, and still are,
specific breeding strategies in East and West Germany. In East Germany, pure breeding
of DSN in large farms was predominant, while in West Germany rather small-scale farms
were identified, which often cross bred their DSN with HF, while pure DSN breeding
farms were rather scarce. Regarding the inbreeding coefficient and the DSN’s endangered
state, a monitoring of the breed is strongly recommended as well as the implementation
of mating designs, that pay certain attention to inbreeding development.
The second study (chapter 3) investigated the usage of innovative trait recording via
electronic sensor ear tags, implemented in dual-purpose cattle in pasture-based
production systems. Until now, statistical analysis on longitudinal electronic behaviour
data has not yet been put into relationship with conventional production or welfare
assessment traits (WAT) of dual-purpose cattle, in alternative production systems. The
study evaluated interrelations between WAT (body condition score, locomotion score,
leg hygiene score, udder hygiene score), temperament traits (general temperament during
milking, aggressiveness against other herd members, rank of a cow within herd),
longitudinal electronically recorded sensor behaviour traits (rumination, feeding, activity,
resting, high activity) and production data (milk yield, fat percent, protein percent) of
local DSN on a phenotypic level. Associations, based on phenotypic correlations and
SUMMARY
3
mixed model applications, were used to derive practical management recommendations
for farmers, who keep their cows in pasture-based production systems. Regarding
subjective WAT and temperament scoring, correlations between the level of
aggressiveness towards other herd mates and the intra herd rank order (0.36) were
significant, indicating, that cows with a higher intra-herd rank showed increased
aggressive behaviour. Mixed model analyses revealed that DSN cows, which spend more
time lying down, had reduced daily milk and fat yields. Oppositely, high yielding DSN
depicted intensive feeding and rumination behaviour. For the first time, a substantial
decrease in rumination and feeding time was observed for cows with elevated somatic
cells (>700,000 cells/mL) in pasture systems, suggesting the utilisation of sensor
behaviour, as a reliable indicator for udder health. This research has shown, how sensor
behaviour patterns were closely related to the production potential of individual cows.
Especially, in harsh and extensive environments the subjective scoring of health and
welfare traits remains a challenge. Automatically recorded longitudinal behaviour data
can be a useful alternative for cow phenotyping in extensive grassland systems. The
behavioural observations of this study contributed to a better understanding of dual-
purpose cattle physiology. Thus, the gap of understanding cow behaviour in grazing
systems could be closed, when combining electronic sensor behaviour, milk production
and WAT data. Body condition scoring (BCS) provided sufficiently accurate information
regarding the animal’s energy reserves. Combined with real time behaviour data,
developed models allow the prediction of future BCS, performance levels and contribute
to management decisions. Consequently, automatically recorded longitudinal behaviour
data is a proper alternative for cow phenotyping, especially to supervise udder health in
extensive grassland systems. Another interesting aspect of automated longitudinal cattle
behaviour recording is its potential use for the estimation of novel breeding values and
genetic parameters. In this regard, cows with favourable behaviour attributes, that are
linked to good production and high animal welfare states, can be selected.
The third scientific study (chapter 4) based on genomic marker data (i.e. single
nucleotide polymorphism: SNP), in order to study functional biodiversity, to conduct a
breed assignment of European dual-purpose and dairy cattle breeds and to apply multiple
breed GWAS. In the breed diversity sub-study allele-sharing distances (ASD) between
individual genotypes were calculated, allowing the prediction of ancestry impact on the
SUMMARY
4
current population structure. The breeds included were Brown Swiss (Sl_BS), Holstein
Friesian (Sl_HF) and Simmental (Sl_Si) cattle from Slovenia, Holstein Friesian (PL_HF)
and Brown Swiss (PL_BS) cattle from Poland, original dual-purpose Brown Swiss
(CH_OBS) and Simmental (CH_Si) cattle from Switzerland and DSN (DE_DSN) and red
(DE_DN) cattle from Germany. A principal component analysis (PCA) on the genotype
data revealed a clear clustering, depending on the geographic origin of breeds,
differentiating between Simmental, Holstein Friesian and Brown Swiss. These three
clusters underlined the footprints of artificial selection and the ‘genetic isolation’ from
one another very well. The results of the breed assignment were quite interesting,
revealing at least 57.83 % of genetic relations to European cattle breeds, such as Holstein,
Hereford, French Red Pied Lowland, Norwegian Red, Red Angus, Bretonne Black Pied,
Parthenais, Tarine, Abondance, Charolais, Montbeliarde and French Brown Swiss,
affirming a European line of descent. However, exotic ancestral proportions, such as
Sheko, Zebu Bororo, Gir or Arabic Zebu were identified within the European genotypes
as well. These displayed footprints of exotic breeds are one indication for the evolutionary
formative events, that took place during the Neolithic age. They illustrate the migration
routes very well, on which breeders spread from the Fertile Crescent towards North-West
Europe.
The genetic parameters for behaviour traits were estimated, based on pedigree and
genomic relationship matrices. The estimation of genetic parameters (via a combination
of genomic relationship matrix and pedigree, as well as only based on pedigree) showed
no difference in the outcome of results, ensuring the results’ reliability of both
methodologies. Genetic parameters for sensor behaviour traits were low to moderate
heritable and both variance components, additive-genetic and residuals, were quite high,
indicating a potential for selection on dual-purpose cow behaviour. In spite of the small
sample size, the standard errors of heritabilities remained acceptable (<0.06), which can
be attributed to the plethora of records and the longitudinal data structure of every
individual. The highest heritabilities were found for daily high activity (0.19-0.20) and
daily feeding (0.19-0.20) behaviour. Sleeping behaviour (0.16-0.18) was under moderate
genetic control, while rumination (0.02) and active (0.06-0.08) behaviour as well as ear
temperature (0.07) were lowly heritable. The heritability estimations emphasized the
opportunity and value for breeders and breeding organizations to select for cows with
SUMMARY
5
desired phenotypic behaviour expressions, that contribute to the animal’s wellbeing and
physiological sound production levels, as discussed in chapter 3.
Furthermore, the potential of a multi-breed GWAS was investigated, in order to detect
significant genomic variants, associated with electronically recorded sensor behaviour
data. Genotype and phenotype (sensor behaviour) data from the “2-Org-Cows” project
partners (Germany, Poland, Slovenia, Switzerland) was combined to identify significant
SNPs, associated with bovine rumination, feeding, active, high active, sleeping behaviour
and ear temperature. In spite of the small sample size plausible results were generated. At
first, a multi-breed GWAS was conducted on the production trait fat percent. The
identification of significant SNPs on chromosome 14, within the region of the DGAT1
gene, confirmed the reliability of the multi-breed approach. Furthermore, significant
SNPs for the traits rumination, activity and feeding were detected on chromosomes 11,
13, 17, 23, 27 and 29. Applying the gene-based test in GCTA, 22 potential candidate
genes were discovered and associated with bovine behaviour traits.
In the fourth scientific study (chapter 5), quantitative genetic analyses for milk
production and novel traits of dual-purpose and HF populations were conducted.
Applying a multi-trait animal model (MTAM) allowed the estimation of genetic
parameters and correlations within the same trait, to investigate the matter of GxE
interactions. In total, eight discrete herd descriptors were chosen, to divide the herd data
base into two groups. The chosen herd descriptors for herd grouping considered classical
management factors (average herd size, average herd calving age), production
characteristics (average herd milk production level, average herd somatic cell count
level), genetic descriptors (average percentage of DSN cows within herds, average
percentage of natural service sires within herds) and environmental descriptors (altitude
and latitude of farm). The study considered 3,659 DSN and 2,324 HF cows from parities
one to three. The 46 herds always kept DSN cows, but in most cases, herds were mixed
herds (Mixed), including both genetic lines, HF and DSN. Traits were records from the
first official test-day after calving for milk yield (Mkg), somatic cell score (SCS) and fat-
to-protein ratio (FPR). Genetic parameters were estimated in bivariate runs (separate runs
for the three genetic lines Mixed, HF and DSN), defining the same trait from different
herd groups or clusters as different traits. For all genetic lines, heritabilities were generally
SUMMARY
6
higher for Mkg, compared to the low heritability traits SCS and FPR. Additive-genetic
variances and heritabilities were higher in herd groups indicating superior herd
management. This was especially the case for the descriptors: large herds, low calving
age, high herd production level and low intra-herd somatic cell count. Herd descriptor
group differences in additive-genetic variances for Mkg were most obvious in the HF
line, but less pronounced for Mkg in Mixed and DSN. Similar variance components and
heritabilities across groups and genetic lines were found for the geographical descriptors
altitude and latitude. The residual variances for Mkg were also greater in those herd
groups, implying a superior herd management. Permanent environmental variances were
close to zero for all traits in all herd groups, due to repeated measurements from different
lactations. From 72 bivariate runs, 29 genetic correlations were exactly 1.00 (mostly for
Mkg). Somatic cell score was the trait with the lowest genetic correlation, especially for
DSN analyses and when stratifying herds according to genetic line compositions (rg=
0.11) or according to the percentage of natural service sires (rg= 0.08). Genetic
correlations were higher than 0.80 for all traits, when grouping herds according to
geographical descriptors. In cluster analyses, genetic correlations were lower than 0.80
for SCS, but close to 1 for Mkg and FPR. The impact of genetic connectedness between
herd groups on genetic correlation estimates was assessed as well. However, only a slight
trend for larger genetic relationships between groups with increasing rg estimates was
identified.
In chapter 6, a relatively new approach was chosen with the deterministic modelling of
an organic breeding program design, that accounts for possible GxE interactions.
Simulating different breeding plans over a period of 20 years, they were compared, based
on calculated annual monetary genetic gain (AMGG), total discounted return (DR) and
total discounted costs (DC). The objective was to examine the genetic and economic
efficiency as well as implications of specific breeding strategies for a small dual-purpose
cattle population, including functional, fertility and production traits. From an economical
point of view the organic breeding plan, characterized by natural service sire
implementation (NSS), presented a favourable breeding strategy for a small cattle
population, emphasizing on functional traits (e.g. body weight) and minimizing costs.
Regarding the economic evaluation criteria, the conventional breeding program (usage of
test and waiting bull system with artificial insemination: AI), has proven to be the least
SUMMARY
7
suitable approach for a small cattle population. The most desirable economic results,
regarding DR, were generated applying the combined breeding plan. The selection
scenarios, considering 80-90 % AI and 20-10 % NSS mating in the combined breeding
programs, provided a great opportunity, to significantly improve functional traits, such as
a reduction in clinical mastitis and an increase in longevity. The essential factors, which
affected the economic parameters of breeding programs, were the generation interval,
genetic correlations among traits, selection pressure on functional traits, the number of
daughters per sire and possible GxE interactions.
In chapter 7, a general discussion evaluates the results presented in this study.
Furthermore, genetic correlation estimates between production and sensor behaviour
traits are investigated. It was shown, that phenotypic and genetic correlations of sensor
behaviour and production traits often differed from each other. Mostly, the phenotypic
correlations diverged from the genetic correlations between the same traits. The
phenotypic correlations between sensor behaviour and production traits remained in a low
range (≤ 0.14) with acceptable standard errors. The highest phenotypic correlations were
estimated between Mkg and the sensor traits feeding (0.14), high active and sleeping (-
0.22) as well as between fat-kg (Fkg) and sleeping (0.13) and Fkg and ear temperature (-
0.11). Small correlations were observed between Mkg and rumination (0.07). The
estimation of genetic correlations between sensor behaviour and production traits, of
different dual-purpose breeds, ranged from low to high values (≥ -0.75 to ≤ 0.65) with
rather high standard errors. These can be explained with the rather small sample size and
issues of pedigree incompleteness. The phenotypic correlations between sensor and
production traits depicted similar trends as the results, generated by the mixed model
analyses, which were conducted in chapter 3. It was concluded, that phenotypic
correlations among sensor behaviour and between sensor behaviour and production traits
were plausible, while the estimation of genetic correlations most likely requires a more
extensive data base (greater sample size) as well as a more profound pedigree.
SUMMARY
8
ZUSAMMENFASSUNG
Ziel der Studie war es, eine ausführliche Analyse von innovativen Merkmalen sowie
Milchleistungsdaten und damit verbundene Einflüsse von Umweltdeskriptoren auf
phänotypischer, quantitativ genetischer und genomischer Ebene am Beispiel des
Deutschen Schwarzbunten Niederungsrindes (DSN) in Weideproduktionssystemen
durchzuführen. Da bis heute die Zucht von Zweinutzungsrindern auf Daten der
konventionellen Leistungsprüfung zurückgreift, können innovative neue Merkmale
sowie mittels technischer Automatisierung erfasste Tierwohlindikatoren eine Alternative
für moderne züchterische Impulse darstellen. Diese Arbeit beleuchtet das Potential
innovative Tierwohl- und Gesundheitsmerkmale als mögliches zukünftiges züchterisches
Instrument zur Formulierung neuer Zuchtziele von Zweinutzungsrinderrassen zu nutzen.
Die Erfassung von Tiergesundheits- und Tierverhaltensmerkmalen kann künftig dazu
beitragen Besonderheiten von lokal angepassten und oftmals vom Aussterben bedrohten
Rassen zu identifizieren. Mögliche Besonderheiten bezüglich Robustheit, Fitness,
Langlebigkeit und Produktqualität können somit den Erhalt dieser Rassen, im Sinne einer
ökologisch ausgerichteten Tierzucht, fördern.
Elektronische Sensoren ermöglichten eine longitudinale Messung tierindividueller
Verhaltensparameter (Wiederkäuen, Fressen, Schlafen, Aktivität, gesteigerte Aktivität,
Ohrtemperatur) über einen Zeitraum von mehreren Monaten. Neben einer umfangreichen
Analyse der Pedigreestrukturen innerhalb der deutschen DSN-Population und
Auswertungen zu Populationskennzahlen (Inzucht, effektive Populationsgröße,
Verwandtschaft, Inzuchtdepressionen) erfolgten Schätzungen von genetischen
Parametern für Produktionsmerkmale unter Berücksichtigung von Genotyp-Umwelt-
Interaktionen (GUI). Des Weiteren wurden ökonomische Zuchtplanungssimulationen zur
Rentabilitätsbeurteilung verschiedener Zuchtprogramme für Zweinutzungsrassen
untersucht. In der vorliegenden Arbeit wurden auf Grundlage unterschiedlicher
Datensätze fünf verschiedene wissenschaftliche Studien durchgeführt (siehe Kapitel 2,
3, 4, 5 und 6). Die Kapitel behandeln somit unterschiedliche Fragestellungen zur DSN-
Rindrinderrasse: 1) Studien zur Inzucht und Verwandtschaft auf Basis eigens berechneter
Rasseanteile, 2) Assoziationen zwischen elektronisch erfassten Sensordaten zum
Tierverhalten, Milchleistungsdaten und eigens erfassten Gesundheits- und
9
Tierwohlindikatoren bei DSN-Kühen in Weidehaltung, 3) „Multi-Breed“ genomweite
Assoziationsstudie europäischer Rinderrassen zur Identifizierung von Kandidatengenen
für bovine Verhaltensweisen, 4) Stratifizierung von Herden nach Umweltdeskriptoren
zum Nachweis von Genotyp-Umwelt-Interaktionen, 5) Simulation und ökonomische
Bewertung von Zuchtprogrammen unter Berücksichtigung von Produktions- und
funktionalen Merkmalen. Abschließend dient Kapitel 7 der Diskussion der generierten
Ergebnisse vor dem Hintergrund der aktuellen züchterischen Entwicklung und gibt einen
Ausblick bezüglich zukünftiger Herausforderungen, Trends und
Entwicklungsmöglichkeiten in der deutschen DSN-Zucht. Zusätzlich wurden genetische
Korrelationen zwischen elektronischen Verhaltens- und Produktionsmerkmalen
geschätzt.
In Kapitel 2 wurde eine intensive populationsgenetische Untersuchung der deutschen
DSN-Rasse, auf Basis eigens berechneter DSN-Genanteile, durchgeführt, da die letzten
Berechnungen hierzu mehr als ein Jahrzehnt zurückliegen. Unter Berücksichtigung der
genetischen Rasseanteile und der offiziellen Auslegung des Fremdgenanteils für DSN
wurden in den Kalbejahren von 2005 bis 2016 insgesamt 46 % der Kühe fälschlicherweise
der DSN-Rasse zugewiesen. Besonders in den alten Bundesländern waren die
Falschzuordnungen mit 91 % sehr hoch und unterschieden sich deutlich von den neuen
Bundesländern (5 % Falschzuweisungen). Diese Ergebnisse deuten auf unterschiedliche
Zuchtstrategien in Ost- und Westdeutschland hin. So gab es in Westdeutschland wenig
„reine“ DSN-Zuchtbetriebe, wobei Anpaarungen von HF-Bullen mit DSN-Kühen sehr
häufig waren. Die untersuchten Betriebe in den neuen Bundesländern hingegen
verfolgten strikte DSN-Reinzucht und vermieden Kreuzungen zwischen HF und DSN.
Basierend auf diesen Erkenntnissen wurden weitere Analysen zur Verwandtschaft,
Inzucht, effektiven Populationsgröße, Generationsintervall und Inzuchtdepression,
basierend auf der neuen Rassezuordnung, durchgeführt. Generell war der
durchschnittliche Inzuchtkoeffizient für den jüngsten Geburtsjahrgang, sowohl bei DSN-
Kühen als auch bei DSN-Bullen, mit ca. 2 % niedrig. Ein Inzuchtzuwachs von 0,1 % pro
Jahr implizierte eine effektive Populationsgröße von 85 Tieren und hob den
Gefährdungsstatus der DSN, als bedrohte Rasse, besonders hervor. Die aktuelle
verwandtschaftliche Beziehung zwischen HF und DSN ist mit R= 0,02 % sehr gering.
ZUSAMMENFASSUNG
10
Inzuchtdepressionen wurden für die Merkmale Milch-kg (Mkg) und Fett-kg (Fkg) in den
ersten beiden Laktationen beobachtet.
Trotz der relativ geringen Inzuchtsteigerung pro Jahr sollte sie zukünftig kritisch
beobachtet werden. Darüber hinaus ist ein Monitoring der Rasse sowie der Einsatz von
Anpaarungsprogrammen, unter Berücksichtigung der Entwicklung von Inzucht und
Verwandtschaft, dringend erforderlich.
In Kapitel 3 wurden Assoziationen zwischen elektronischen Sensordaten zur
Tierverhaltensmessung (tägliches Wiederkäuen, Fressen, Schlafen, Aktivitätsverhalten,
gesteigertes Aktivitätsverhalten und Ohrtemperatur), phänotypischen
Tierwohlindikatoren und Milchleistungsmerkmalen von DSN, aus Weidesystemen,
untersucht. Zu den Tierwohlindikatoren gehörten Körperkonditionsbeurteilung,
Lahmheitsbefundung, Euterverschmutzung, Beinverschmutzung, allgemeines
Temperament während des Melkens, Aggressivität gegenüber anderen
Herdengefährtinnen und Rang der Kuh innerhalb der Herde. Korrelationen zwischen den
Merkmalen zeigten, dass sich ranghöhere Kühe allgemein aggressiver gegenüber ihren
Herdengefährtinnen verhielten (0,36), während rangniedere Tiere in der Regel vermehrte
Verschmutzungen an Euter (-0,20) und Hinterbeinen (-0,25) aufwiesen. Mittels linearer
gemischter Modelle wurden Zusammenhänge zwischen konventionell erfassten
Milchkontroll- und Sensordaten herausgestellt. Kühe mit einem geringeren
Milchleistungsniveau verbrachten allgemein mehr Zeit am Tag mit Schlafen, als Kühe
mit höherer Milchleistung, die sich durch längere tägliche Futteraufnahme- und
Wiederkäuzeiten auszeichneten. Darüber hinaus zeigten Kühe mit gesteigerten
somatischen Zellgehalten in der Milch (> 350.000 Zellen/mL) reduzierte tägliche
Futteraufnahmezeiten. Basierend auf diesen Ergebnissen konnte der Einsatz des
Sensorsystems zur Tierverhaltensmessung bei Zweinutzungsrinderrassen als wertvolles
Instrument zur Früherkennung von Euterentzündungen identifiziert werden. Zusätzlich
ermöglicht dieser umfangreiche Datenfundus zukünftige rassespezifische
Zuchtwertschätzungen für Verhaltensmerkmale. Auf diese Weise können Züchter gezielt
Bullen einsetzen, die das Tierverhalten und die Tiergesundheit der Herde verbessern.
Dies könnte sich wiederum positiv auf die Betriebsökonomie, in Form von reduzierten
Krankheitsinzidenzen (e.g. Mastitis), auswirken. Untersuchungen zum Sensorsystem
zeigten, dass praxisrelevante Managementempfehlungen, bezüglich des physiologischen
ZUSAMMENFASSUNG
11
Verhaltens von Zweinutzungsrassen in Weidesystemen, zuverlässig abgeleitet werden
konnten.
Die in Kapitel 4 aufgeführten genomischen Analysen basierten ebenfalls auf den
elektronisch erfassten Sensordaten zum Tierverhalten. Hier sollten mögliche
Besonderheiten auf dem bovinen Genom untersucht werden, die mit Verhaltensweisen
assoziiert werden könnten. In Form einer „multi-breed“ GWAS wurden Sensordaten von
fünf europäischen Rinderrassen aus vier Ländern analysiert. Die Datengrundlage bildeten
Genotyp- und Phänotypdaten der Projektpartner des „2-Org-Cows“-Projekts und
umfassten Brown Swiss (Sl_BS), Holstein Friesian (Sl_HF) und Simmental (Sl_Si) aus
Slowenien, Holstein Friesian (PL_HF) und Brown Swiss (PL_BS) aus Polen, original
Brown Swiss (CH_OBS) und Simmental (CH_Si) aus der Schweiz sowie DSN
(DE_DSN) und Doppelnutzung Rotvieh (DE_DN) -Kühe aus Deutschland. Zusätzlich
diente eine Hauptkomponentenanalyse zur Populationsstratifizierung und ein „Breed
Assignment“, basierend auf gemeinsamen Allelen (ASD), zur Untersuchung von
Verwandtschaften einzelner Genotypen zu anderen Rinderrassen. Zuletzt wurden
genetische Parameter für die elektronisch erfassten Verhaltensmerkmale (Wiederkäuen,
Fressen, Aktivität, Schlafen, gesteigerte Aktivität und Ohrtemperatur) auf Basis der
genomischen Verwandtschaftsmatrix, in Kombination mit Pedigree sowie nur auf dem
Pedigree basierend, geschätzt. Hohe genetische Verwandtschaften (57,83 %) zwischen
den genotypisierten Rassen bestanden zu anderen europäischen Rinderrassen, wie
Holstein, Hereford, French Red Pied Lowland, Norwegisches Rotvieh, Red Angus,
Bretonne Black Pied, Parthenais, Tarine, Abondance, Charolais, Montbeliarde und
französisches Brown Swiss. Darüber hinaus zeigten die berechneten ASD auch, dass
heutzutage immer noch genetische „Fußabdrücke“ anderer, exotischer Rinderrassen, wie
dem Zebu, im Genom der Zweinutzungsrassen zu finden sind. Die
Hauptkomponentenanalyse zeigte drei wesentliche Rassecluster, die sich in Holstein,
Simmental und Brown Swiss aufteilten. Diese Ergebnisse reflektieren die geografischen
Zuchtgebiete der Holsteinlinien, welche überwiegend in Mittel- und Norddeutschland
sowie in Polen eingesetzt werden. Im Gegensatz dazu werden in Südeuropa Brown Swiss
und Simmental bevorzugt.
Die geschätzten Parameter für Verhaltensmerkmale fielen für beide Schätzmethoden
(Pedigree + genomische Verwandtschaftsmatrix, nur Pedigree) sehr ähnlich aus. Die
ZUSAMMENFASSUNG
12
Verhaltensmerkmale waren gering bis moderat erblich und lagen meist im Bereich bereits
geschätzter Erblichkeiten aus anderen Studien. Trotz der geringen Stichprobe waren die
Standardfehler mit < 0,06 akzeptabel, was auf das große Datenvolumen und die Vielzahl
wiederholter Beobachtungen am Einzeltier zurückgeführt wird. Die höchste Heritabilität
wurde für gesteigertes tägliches Aktivitätsverhalten (0,19-0,20) geschätzt. Das
Schlafverhalten war moderat erblich (0,16-0,18), wohingegen Wiederkäuen (0,02) und
Aktivität (0,06-0,08) sowie Ohrtemperatur (0,07) im niedrigen Erblichkeitsbereich lagen.
Anhand der moderaten Erblichkeiten und der z.T. hohen additive-genetischen Varianzen
kann man ableiten, dass die elektronisch gemessenen Verhaltensmerkmale durchaus
genetisch beeinflusst werden und eine zukünftige Selektion auf besonders vorteilhafte
Verhaltensmuster, wie in Kapitel 3 diskutiert, möglich ist.
Zuletzt wurde eine multi-breed GWAS anhand der oben genannten Genotypen, basierend
auf den elektronisch aufgezeichneten Verhaltensdaten aus den Ländern Polen, Slowenien,
Schweiz und Deutschland, durchgeführt. Aufgrund der geringen Stichprobe wurde die
Funktionalität der multi-breed GWAS zunächst für das Produktionsmerkmal Fettprozent,
basierend auf konventionellen Testtagsdaten, geprüft. Hier wurden signifikante SNPs auf
Chromosom 14 im Bereich des DGAT1-Gens identifiziert, was für eine erfolgreiche
Anwendung des multi-breed Ansatzes spricht. Die Ergebnisse der multi-breed GWAS
zeigten signifikante SNPs auf den Chromosomen 11, 13, 17, 23, 27 und 29, für die
Sensormerkmale Wiederkäuen, Aktivität und Futteraufnahme. Nach Anwendung des
„gene-based test“ in GCTA wurden insgesamt 22 potenzielle Kandidatengene mit den
Verhaltensmerkmalen assoziiert. Es konnte gezeigt werden, dass verlässliche
Selektionssignaturen für funktionale innovative Merkmale, trotz geringer Stichprobe
(246 Tiere), detektiert wurden.
In der vierten Studie, in Kapitel 5, wurde eine quantitativ genetische Analyse (Schätzung
genetischer Kovarianzen) für neue und bereits bestehende Merkmale innerhalb von DSN
und HF durchgeführt. Aktuell besteht nur bedingt Kenntnis über den Einfluss von
Herdendeskriptoren und Umweltfaktoren von Weidesystemen auf die Ausprägung von
Produktions- und funktionalen Merkmalen von DSN-Zweinutzungsrindern auf
quantitativ genetische (Ko)Varianzkomponenten. Ziel der Untersuchung war daher, das
Phänomen von GUI unter Berücksichtigung des „Multiple-Trait Herd Cluster Models“
von Weigel und Rekaya (2000) aufzuklären. Hintergrund dieses „borderless clustering“
ZUSAMMENFASSUNG

13
ist die Implementierung einer Zuchtwertschätzung über Ländergrenzen hinweg, die nach
Charakteristika von Produktionssystemen (Umweltdeskriptoren), anstelle von
Ländergrenzen, ausgerichtet ist. Hierbei werden Herden u.a. auf Grund von
Managementfaktoren (durchschnittliche Herdengröße, durchschnittliches Kalbealter),
geografischer Lage (Breitengrad und Höhenlage des Betriebs), Herdenleistungsniveau
(durchschnittliche Milchleistung, durchschnittliche somatische Zellzahl) und genetischen
Faktoren (genetischer DSN-Anteil, Anteil Deckbullen im Betrieb) in bestimmte Gruppen
(Herdenparameter) eingeteilt. Generell lagen die additiv-genetischen Varianzen,
Restvarianzen und Heritabilitäten für Mkg, Log-transformierte Zellzahl (SCS) und Fett-
Eiweiß-Quotient für Tiere aus DSN-Betrieben in der von HF-Studien bekannten
Bandbreite. Dennoch ergaben sich für die beiden Gruppen innerhalb definierter
Herdenparameter teilweise ausgeprägte Differenzen (z.B. Herdengröße). Genetische
Unterschiede wurden in größeren Betrieben besser deutlich. Dies wurde auf den Einsatz
modernster Managementbedingungen zurückgeführt, die eine bessere Differenzierung
des genetischen Potenzials der Tiere bedingten. Zudem waren Erblichkeiten für die
Produktionsmerkmale (Mkg= 0,16-0,19) höher als für das Indikatormerkmal der
Eutergesundheit (SCS= 0,05-0,12) und den Fett-Eiweiß-Quotienten (0,17-0,09). Die
genetischen Korrelationen im gleichen Merkmal zwischen Gruppe 1 und Gruppe 2,
innerhalb eines Herdenparameters, lagen im Bereich von 0,08 bis 1,00. Die meisten
genetischen Korrelationen übertrafen somit den von Robertson (1959) definierten
Richtwert (0,80), welcher als Indikator für eine GUI angesehen wird. Die niedrigsten
genetischen Korrelationen ergaben sich für das funktionale Merkmal SCS, insbesondere
für die Gruppenbildung nach genetischem DSN-Anteil (0,11) und den Einsatz von
Deckbullen in der Herde (0,08). Hohe genetische Korrelationen für Mkg und Fkg
deuteten darauf hin, dass auch bei Zweinutzungsrassen in Weidesystemen
Leistungsmerkmale mit hoher Heritabilität weniger den Umwelteinflüssen ausgesetzt
sind, als Gesundheitsmerkmale mit niedriger Erblichkeit. Verwandtschaftsberechnungen
zwischen den Herdenparametergruppen konnten die Hypothese, dass genetische
Korrelationen durch Verwandtschaften beeinflusst werden, nicht bestätigen. Obwohl
durchaus Indikatoren für GUI nachgewiesen wurden, wird von einer getrennten
Zuchtwertschätzung in der DSN-Zucht für unterschiedliche Umwelten abgeraten.
Innerhalb Deutschlands werden die Umweltdeskriptoren sich nicht derartig
ZUSAMMENFASSUNG
14
unterscheiden, als dass ein „Re-Ranking“ der DSN-Zuchtbullen, gemäß
unterschiedlichen Umweltbedingungen, notwendig wäre.
In Kapitel 6 konnte anhand von Zuchtplanungsrechnungen gezeigt werden, dass
zielgerichtete Zuchtarbeit bei bedrohten Rassen, die in Weidehaltungssystemen gehalten
werden, zu einer Verbesserung funktionaler- und Gesundheitsmerkmale beiträgt. Vor
diesem Hintergrund wurde eine eingehende Bewertung von neuen funktionalen
Merkmalen in Abhängigkeit von relevanten Umweltdeskriptoren angestrebt. Die
ökonomische Bewertung und der züchterische Erfolg wurde an Hand von
deterministischen Simulationen unterschiedlicher Zuchtszenarien für eine DSN-
Population von 3.000 Tieren verglichen. Vier verschiedene Zuchtprogramme wurden
über eine Investitionsdauer von 20 Jahren mit einem Sollzinssatz von 6 % und einem
Habenzinssatz von 4 % evaluiert. Das erste Szenario beschrieb ein konventionelles
Zuchtprogramm mit Test- und Wartebulleneinsatz, bei 100 % künstlicher Besamung
(KB) und Drei-Stufen-Selektion der männlichen Nachzucht. Im zweiten Szenario wurden
GUI, basierend auf dem konventionellen Zuchtprogramm, modelliert, indem die
genetischen und phänotypischen Korrelationen im selben Merkmal von 0,1 bis 0,9
variierten und auf diese Weise Leistungen von Töchtern in unterschiedlichen
Produktionssystemen reflektierten. Das dritte Szenario simulierte ein ökologisches
Zuchtprogramm, welches ausschließlich den Einsatz von Natursprungbullen (NSB) und
eine Zwei-Stufen-Selektion der männlichen Nachzucht vorsah. Das letzte
Zuchtprogramm stellte eine Kombination aus konventionellem und ökologischem
Szenario dar, wobei sich der Anteil der männlichen und weiblichen Selektionsgruppen
im Bullenpfad änderte. Hier variierte der Anteil der KB und der NSB stetig um 10 %, von
90 % bis auf 10 %, innerhalb des männlichen, des weiblichen, oder in beiden,
Selektionspfaden, wobei alle anderen Parameter konstant blieben. Aus ökonomischer
Sicht eignete sich besonders das ökologische Zuchtprogramm für kleine Populationen,
wie DSN, unter Einbeziehung funktionaler Merkmale. Im Gegensatz zum
konventionellen Ansatz fiel der diskontierte Gewinn pro genetische Standardabweichung
in den Merkmalen Milchleistung und durchschnittliches Körpergewicht höher aus.
Zusätzlich waren die diskontierten Kosten pro Tier im ökologischen Szenario sehr viel
geringer (Differenz: 60,43 Euro) im Vergleich zum konventionellen Programm. Dies
wurde hauptsächlich auf den Verzicht der Wartebullenhaltung zurückgeführt. Die
ZUSAMMENFASSUNG
15
Simulation von GUI im konventionellen Zuchtprogramm zeigte, dass sich mit sinkenden
genetischen und phänotypischen Korrelationen, im selben Merkmal, der diskontierte
Gewinn sowie der jährliche monetäre Zuchtfortschritt reduzierte. Anhand dieser
Simulationen konnte gezeigt werden, dass zielgerichtete Zuchtarbeit bei bedrohten
Rassen in Weidehaltungssystemen zu einer Verbesserung funktionaler und
Gesundheitsmerkmale beitragen kann.
Kapitel 7 fasst in einem allgemeinen Diskussionsteil die wichtigsten Erkenntnisse sowie
forschungsrelevante Ergebnisse vor dem Hintergrund der aktuellen Situation der
deutschen DSN-Zucht zusammen. Darüber hinaus wird ein Ausblick bezüglich
zukünftiger Herausforderungen an- und Trends in der Rinderzucht gegeben. Zusätzlich
wurden genetische Korrelationen zwischen Produktions- und Sensormerkmalen
geschätzt. Häufig stimmten die phänotypischen und genetischen Korrelationen nicht
überein. Die phänotypischen Korrelationen zwischen Sensor- und
Produktionsmerkmalen fielen sehr gering aus (≤ 0.14), wobei die höchsten Werte
zwischen Mkg und Futteraufnahme (0.14), hoher Aktivität und Schlafen (-0.22) sowie für
Fkg und Schlafen (0.13) und Fkg und Ohrtemperatur (-0.11) berechnet wurden. Eine
geringere Korrelation wurde zwischen Mkg und Wiederkäuen (0.07) beobachtet. Die
geschätzten genetischen Korrelationen zwischen Sensor- und Milchleistungsmerkmalen
variierten mit hohen Standardfehlern sehr stark voneinander (≥ -0.75 bis ≤ 0.65). Dies
wurde auf die geringe Stichprobenzahl und Pedigreeunvollständigkeit zurückgeführt.
Folglich ergaben sich sehr plausible Werte für die phänotypischen Korrelationen,
wohingegen die genetischen Korrelationen kritisch zu betrachten sind.
ZUSAMMENFASSUNG
16
CHAPTER 1
General Introduction
17
Changes in the dairy sector
Over the last decades, the European dairy sector has undergone several structural changes
as a result of dynamic adaptation processes along with altering ways of production
(Huettel and Jongeneel, 2008). One of these trends is the increasing momentum of
(organic) pasture-based milk production (Rosati and Aumaitre, 2004). Organic dairy
production is the fastest growing organic food segment in the United States (DuPuis et
al., 2000). Correspondingly, the EU organic dairy production has nearly doubled since
2006 and stands at 3.8 million metric tons, representing more than 2.6 % of the EU’s milk
production in 2014. While the organic farm land in Germany constituted of 6.3 % of the
total land share in 2014 (IFOAM, EU and FiBL 2016). Driven by ethical and moral values
(e.g. commitment to locality, ecological sustainability and animal stewardship
considerations), consumer requests for safer and more sustainably produced food are
growing (Thongplew et al., 2016; Conner et al., 2008). As a consequence, companies,
such as Danone and FrieslandCampina, engaged in organic food provision, due to
profitable market opportunities and the aspect of corporate social responsibility (Maloni
and Brown, 2006; Thongplew et al., 2014).
In this regard, Hambrusch et al. (2011) discussed the challenge of the German
dairy industry, to increase the added value of their products and thusly assuring long term
business success. Their analysis about the consumer’s willingness-to-pay revealed, that
there is a potential market for pasture-based dairy products and a common desire for food
to be ‘re-embedded’ in nature. However, legally binding guidelines for dairy products,
generated from pasture-based production systems, do not exist (Hambrusch et al., 2012).
Attributes, such as health, animal welfare and environmental issues, which are highly
valued by the consumer, are associated with pasture-based dairy production (Hambrusch
et al., 2012). For that matter, a widely discussed aspect is the beneficial effect of higher
concentrations of conjugated linoleic acid and unsaturated fatty acids in the milk, which
result from pasture-grazed cows (Croissant et al., 2007). Next to the ‘natural image’ of
pasture-based production and the putative health effects, that are presumed to come with
it, the system offers environmental benefits compared to row crop production.
Accordingly, a reduction of sediment erosion, phosphorus runoff and improved carbon
sequestration only constitute a few ecological benefits (Conner et al., 2007).
CHAPTER 1
18
Nonetheless, literature has shown, that the organic production strategy does not
automatically meet the demands for animal health and welfare, as these attributes conflict
with high productivity and low costs (Sundrum, 2001). Decreasing the feed intake level
in high genetic merit milking cows could entail negative effects on health and
reproduction (Sehested et al., 2003). Concerning this matter, the question of which dairy
cow breed is best suited for the special challenges of pasture-based production will be
closer examined.
Grassland systems and organic dairy production
Since the late 1960’s the awareness, that highly specialized breeds gain more profit than
a single breed, selected for various different traits, strongly influenced dairy cattle
breeding. This contributed to the so called ‘holsteinization’ phenomenon and a consistent
implementation of North American bull sires worldwide (VanRaven, 2004; Harris and
Kolver, 2001, Philipsson and Lindhé, 2003). Relating to this, the selection for tall, high
yielding dairy cows was favoured, as bigger heifers and cows generated higher sales
prices on the market. At this point in the past, little attention was paid to health and fitness
traits as well as to the steady fertility decline in dairy cattle. Furthermore, the aspect of
increasing feed requirements of bigger cows was often unnoted (VanRaven, 2004).
However, the issue of feed costs should not be handled inadvertently, as they present a
fundamental economic part of animal production (Rauw et al., 1998).
As a consequence of fluctuating milk prices and increasing labour, machinery,
housing and feeding costs, a resurgence of interest in pastoral dairy farming was observed
in New Zealand, Australia and parts of western Europe (Macdonal et al., 2008). Although
conventional dairy farming depicted higher production levels than pasture-based systems,
White et al. (2002) reported lower operating expenses and higher net incomes per cow in
pasture systems. Including grains and concentrates into the diet of dairy cattle in New
Zealand has shown to be 6 to 12 times as expensive as grazing. This has caused New
Zealand farmers to adopt low-cost production technologies, such as year-round grazing
and strict seasonal calving, which is especially suitable in temperate regions (Rinehart,
2009). As a corollary and due to the homogenous structure of the New Zealand milk
producing system, certain breeding goals have been pursued over 50 years, which focus
on functional traits (e.g. claw health, disease resistance), high fertility, longevity/
robustness and efficient production of milk solids (Barth et al., 2004). In other words, the
CHAPTER 1
19
New Zealand merit index favours resilient, lightweight, long living and efficient milk
producing pasture converters (Mertens et al., 2011). The strong selection for these
breeding characteristics in New Zealand resulted into dairy cattle with increased
longevity (6-7 years) and parities (4.6 lactations), reduced average calving intervals (368
days), low lameness and mastitis incidences and a ‘digestion type’, that efficiently covers
its energy demand solely by feeding on roughage (Barth et al., 2004). When Harris and
Kolver (2001) compared the performance between North American Holsteins and New
Zealand Holstein cattle, the lighter New Zealand Holsteins revealed lower milk yields
with higher concentrations of fat and protein. Moreover, the New Zealand line expressed
a high level of fertility and robustness, while the American Holstein cows depicted low
fertility rates. Overall, the analysis revealed an average advantage of $NZ 4,950 per farm
per year in favour of New Zealand cows, which corresponded to approximately 12 %
difference in economic farm surplus (Harris and Kolver, 2001).
The example of pastoral dairy production in New Zealand has demonstrated the variety
of dairy cattle farming. Although many breeding programs are global, farmers and
breeders can benefit from implementing and selecting unconventional breeds, which
match local markets or are better adapted to certain environments and purposes
(VanRaden, 2004). As described earlier, the rejuvenated interest in organic farming
constitutes a classic example. Similar to year-round pasture production, organic dairy
farming has to meet different management needs than conventional production does and
is affected by environmental influences more severely (Rosati and Aumaitre, 2004).
Consequently, the choice of which breeds to implement and which breeding goals to focus
on is fundamental. The principle of organic farming obliges the adaptation of an animal
towards the local and natural production system, rather than the adaption of the
environment towards the requirements of high-yielding breeds. Apart from that, European
organic production standards strictly limit the prophylactic use of antibiotics, which
prevents dairy farmers from routinely treating their cows with antibiotics, to reduce the
risk of mastitis infections. Aside from medication restrictions, forage-based feeding (60
% of daily dry matter intake) and primarily home-grown diets, along with restrained
supplement feeding are stipulated. These factors greatly affect the physiology of milking
cows. Due to less energy enriched feeds cows are expected to have lower milk yields,
CHAPTER 1
20
while breeds of high genetic merit are at increased risk to suffer from energy deficiency,
resulting into metabolic disorders and poor fertility (Hovi et al., 2003).
A Swedish survey revealed, that organic farmers desired a higher genetic gain of their
herds in disease resistance (mastitis and parasites), rather than in milk production
(Ahlman et al., 2014). Ahlman et al. (2014) have shown, that the farm management type
(organic vs. conventional) was the most important criteria, influencing the dairy farmer’s
preference of traits. Hence, functional traits (e.g. reproduction, health, longevity) were of
greater importance for organic dairy farmers than for conventional milk producers. On
the other side, conventional dairy producers valued milk production more than organic
farmers (Ahlman et al., 2014). This suggests, that due to different breeding goal
preferences, organic farmers might favour the implementation of alternative cow
genetics, which are better suited for extensive systems. In this regard, Sundberg et al.
(2009) pointed out, that crossbreeding and local breeds, such as Swedish Red, were more
common in Sweden in organic production compared to conventional farming. This
concurs with the results of Dillon et al. (2003), who compared French dual-purpose cows
(Montbeliarde) to North American Holsteins in a seasonal grass-based system. They
pointed out the Montbeliardes’ outstanding potential for preferable milk composition
(especially omega-3 fatty acids and conjugated linoleic acids), higher meat merit (highly
marbled meat) and increased pregnancy rates. Additionally, they recorded greater
herbage-concentrate substitution rates and higher herbage dry matter intake per kg live
weight, which emphasized their ability to produce milk from herbage alone (Dillon et al.,
2003).
Therefore, it is hypothesized, that local dual-purpose breeds, that adapted to harsh
environments over the course of many years, are better suited for organic milk production
than high producing cattle breeds, which are predominantly kept in conventional indoor
systems.
Situation of endangered native dual-purpose cattle breeds in Germany
Aside the adaptation of indigenous breeds to specific habitats, there are other substantial
reasons for implementing and maintaining local landraces in extensive production
systems. These breeds, which are often specialized to live in one certain environment and
display a high degree of resilience, represent unique genetic resources, which might be
valuable in the future. As these traits have co-evolved with a particular environment or
CHAPTER 1
21
husbandry system, they cannot simply be re-established. The Food and Agricultural
Organization (FAO) described the maintenance of genetic diversity as an insurance
package against adverse future conditions (Brem et al., 1989). Moreover, indigenous
breeds are considered a genetic reservoir, in case effective and utilizable genetic variation
in the predominant population decreases. Additionally, the value of cultural heritage of
local domestic breeds has to be considered. In certain regions, these breeds contribute to
local colour, recreational value and play a significant role in tourism (Brem et al., 1989).
Medugorac et al. (2009) emphasized the importance of conserving genetic diversity by
preserving (endangered) native cattle breeds.
Of the 1,478 officially world-wide recorded cattle breeds, 254 have already become
extinct (Taberlet et al., 2008; Medugorac et al., 2009). To this effect, it is fundamental to
encourage the implementation and maintenance of local endangered breeds in
extensively/organically managed farms or for landscape conservation purposes, through
state subsidy, in the form of research projects, pilot and demonstration projects, zoos or
cryopreservation (Barth et al., 2004). Unfortunately, there are no legal means, which
prevent a further depletion of genetic diversity (Barth et al., 2004). So far, only the EU
regulations 1804/1999 regarding organic animal production stipulated, that “in the choice
of breeds, account must be taken of the capacity of animals to adapt to local conditions
[…] Preference is to be given to indigenous breeds and strains.” Nonetheless, Barth et al.
(2004) concluded, that endangered cattle breeds were often kept together with
conventional breeds in organic farms. In many cases, farmers did not entirely renounce
of high merit dairy cows, as they accounted for the economic basis of these farms, due to
their higher production level.
In 2003, the ministry of Food and Agriculture and Consumer Protection appointed a
National Committee on Animal Genetic Resources to monitor the state of German farm
animals and release early warnings (red list) for breeds at risk (TGRDEU). The basis for
categorizing the (endangerment) state of a population is the effective population size,
which is calculated on herd-book numbers. According to the red list, there are 27
indigenous cattle breeds in Germany, of which 20 are at risk of becoming extinct
(TGRDEU). Figure 1 gives an overview about endangered indigenous cattle breeds, the
number of males and females and their effective population size (Ne), which were listed
in the database of the ‘Central Documentation on Animal Genetic Resources in Germany’
CHAPTER 1
22
in 2017 (TGRDEU). Five of the depicted breeds were additionally listed as beef lines
(Gelbvieh, Hinterwälder, Pinzgauer, Vorderwälder, Murnau-Werdenfelser), which are
not presented in the graphic. The national program of the TGRDEU differentiates
between different risk categories: phenotypic conservation population (Ne≤ 50),
conservation population (Ne ≤ 200), monitoring population (200 < Ne ≤ 1000) and non-
endangered population (Ne > 1000). In some cases, such as the old Angeln cattle breed,
the severity of the breed’s actual state of endangerment, was recognized very late (Barth
et al., 2004), which complicated the implementation of breeding programs and further
conservation measures. Referring to Ne, rather serious situations are also depicted for
Pinzgauer, Murnau-Werdenfelser, Gelbvieh, Doppelnutzung Rotbunt and Ansbach-
Triesdorfer. According to the TGRDEU, breeds with an effective population size ≤ 50
only stand a small chance of becoming an independent live population again. It is
recommended to secure their existing genetic stock by means of cryoconservation.
Furthermore, they could be integrated into larger related populations.
Figure 1: Number of male and female cattle breeds and their effective population size, in 2017, listed in the ‘Central Documentation on Animal Genetic Resources’. The effective population size (Ne) is calculated based on the herd-book data as documented in TGRDEU according to the following formula: (4 x males x females) / (males + females).
CHAPTER 1
23
In order to engage in breeding activities, a certain population size and genetic variability
is required as a basis for selection, while maintaining a minimum inbreeding level.
Particularly, in regard to preserving fitness and genetic adaptability, Soulé (1980)
recommended an Ne of 500. Shaffer (1981) reasoned, that a minimum viable population
is not one, that can maintain itself under average conditions, but one, that is of sufficient
size to endure the calamities of various perturbations (e.g. diseases, environmental
catastrophes). In the case of the old Angeln breed, at least 13 sires and 184 dams were
considered necessary to maintain the population without high inbreeding rates (Barth et
al., 2004). For this reason, the DSN population was chosen for further investigation, as a
sufficient genetic diversity and (effective) population size was given.
In this regard, within the course of the ‘2-Org-Cows’ project, the study examines the
suitability of dual-purpose DSN cows, kept in pasture-based production systems, based
on innovative trait comparisons on a phenotypic, genetic and genomic level. Aside from
milk production data, health trait and welfare indicators were recorded in the German
black and white dual-purpose breed, in order to assess their robustness and identify
potential candidate genes, that might support a better adaptation towards harsh
environments. Moreover, economic evaluations, based on deterministic simulations, were
applied, to find the optimum breeding approach for a small local dual-purpose breed. All
these aspects are addressed in separate chapters, that recursively interdepend on each
other.
The 2nd chapter outlines the actual situation of DSN breeding in Germany, conducting a
thorough analysis of population parameters (inbreeding coefficient, average relationship,
effective population size, influential sires). An own algorithm is programmed to assure
the genetic breed percentage of DSN. Based on these newly calculated breed percentages,
a linear mixed model is applied, using official DSN test-day data, to check for potential
inbreeding depressions.
The 3rd chapter investigates the implementation of a new herd management tool in a
pasture-based production system. So far, the electronic sensor technology was only used
in indoor housing systems and predominantly applied in milking breeds. Phenotypic
correlations and linear mixed model applications are used to study the relations between
the electronically recorded data with subjectively scored health and welfare traits as well
as milk production records and to derive possible management recommendations.
CHAPTER 1
24
Chapter 4 explores the electronically recorded sensor traits on a quantitative genetic and
genomic level. A PCA is conducted for population stratification purposes, while ASD are
calculated to assess genetic relationships between DSN and other European cattle breeds.
Furthermore, genetic parameters are estimated as well as genomic significant variants are
studied, applying a multi-breed GWAS.
The 5th chapter investigates whether German DSN herds are under the influence of GxE
interactions. Consequently, herds are grouped according to distinct environmental
descriptors, following the approach of Weigel and Rekaya (2000). Implementing a multi-
trait animal model, genetic parameters of test-day data are estimated separately within the
same trait (Weigel and Rekaya, 2000). Due to the different farm management situations
in East and West Germany (see chapter 2), exploring the matter of GxE interactions is
important, to clarify whether implementing separate breeding value estimation for DSN
or re-ranking breeding sires is required.
The 6th chapter compares different deterministic breeding plan simulations for a small
DSN population, including functional traits in the breeding goals and considering GxE
interactions. Several schemes of conventional (based on AI), organic (based on NSS) and
combined breeding of DSN cattle are compared, to optimize annual monetary genetic
gain, discounted return while minimizing discounted costs.
In chapter 7, most important results of the previous chapters are discussed against the
background of current and future challenges of dairy cattle breeding. In this regard genetic
correlations are estimated between production and sensor traits, exploring the relations
between economically important traits and animal behaviour on a quantitative genetic
scale. Based on relevant findings, recommendations for organic breeders and farmers are
given, using the example of DSN, to address the more than ever pressing and actual topic
of the future direction sustainable (dual-purpose) cattle breeding should take.
CHAPTER 1
25
References
Ahlman, T., M. Ljung, L. Rydhmer, H. Röcklinsberg, E. Strandberg, and A. Wallenbeck.
2014. Differences in preferences for breeding traits between organic and conventional
dairy producers in Sweden. Livestock Science 162:5–14.
https://doi.org/10.1016/j.livsci.2013.12.014.
Auldist, M.J., Pyman, M.F.S., Grainger, C., Macmillan, K.L., 2007. Comparative
reproductive performance and early lactation productivity of Jersey x Holstein cows
in predominantly Holstein herds in a pasture-based dairying system. Journal of Dairy
Science 90:4856–4862. https://doi.org/10.3168/jds.2006-869.
Barth, Bilz, M., Brauner, R., Clausen, J., Dross, M., Heineke, C., Idel, A., Isele, J.,
Kohlschütter, N., Mathes, M., Meyer, A., Petschow, U., Walter, S., Vögel, R., Wissen,
M., Wolff, F., Wunderlich, U. 2004. Agrobiodiversität entwickeln!
Handlungsstrategien für eine nachhaltige Tier- und Pflanzenzucht. Kapitel 10:
Fallstudie Rind. Institut für ökologische Wirtschaftsforschung, Öko-Institut e.V.,
Schweisfurth-Stiftung, Freie Universität Berlin, Landesanstalt für Großschutzgebiete
(Hrsg.). Berlin. Accessed 26.09.2018: www.agrobiodiversitaet.net .
Brem, G., Brenig, B., Müller, M., Springmann, K. 1989. Ex situ cryoconservation of
genomes and genes of endangered cattle breeds by means of modern biotechnological
methods. FAO Animal Production and Health Paper 76. Accessed 26.09.2018:
http://www.fao.org/docrep/004/T0094E/T0094E00.htm#TOC .
Conner, D.S., Campbell-Arvai, V. and Hamm, M.W. 2008. Value in the values: pasture-
raised livestock products offer opportunities for reconnecting producers and
consumers. Renewable Agriculture and Food Systems 23:62–69.
https://doi.org/10.1017/S1742170507002086.
Croissant, A.E., Washburn, S.P., Dean, L.L. and Drake, M.A. 2007. Chemical properties
and consumer perception of fluid milk from conventional and pasture-based
production systems. Journal of Dairy Science 90 :4942–4953.
https://doi.org/10.3168/jds.2007-0456.
Dillon, P., F. Buckley, P. O’Connor, D. Hegarty, and M. Rath. 2003. A comparison of
different dairy cow breeds on a seasonal grass-based system of milk production.
Livestock Production Science 83:21–33. https://doi.org/10.1016/S0301-
6226(03)00041-1.
CHAPTER 1
26
DuPuis, M. E. 2000. Not in my body: BGH and the rise of organic milk. Agriculture and
Human Values 17:285–295.
EU regulations 1804/1999. Origin of the animals. Chapter 3. Accessed 26.09.2018:
https://publications.europa.eu/en/publication-detail/-/publication/d839b766-276a-
4a46-b26d-7feca84b1876/language-en.
Hambrusch, J., Hoffmann, C., Kantelhardt, J., Oedl-Wieser, T. and Groetze, M. 2012.
Diversifizierung versus Spezialisierung in der Agrar- und Ernährungswirtschaft:
Beiträge der 21. ÖGA-Jahrestagung an der Europäischen Akademie Bozen (EURAC)
vom 4. bis 6. Oktober 2011. 1. Aufl. Jahrbuch der Österreichischen Gesellschaft für
Agrarökonomie 21.2011, Heft 1. Facultas, Wien.
Harris, B.L. and Kolver, E.S. 2001. Review of Holsteinization on Intensive Pastoral Dairy
Farming in New Zealand. Journal of dairy science 84: E56-E61.
https://doi.org/10.3168/jds.S0022-0302(01)70197-X.
Hovi, M., A. Sundrum, and S.M. Thamsborg. 2003. Animal health and welfare in organic
livestock production in Europe: current state and future challenges. Livestock
Production Science 80:41–53. https://doi.org/10.1016/S0301-6226(02)00320-2.
Huettel, S., and R. Jongeneel. 2008. Structural Change in the Dairy Sectors of Germany
and the Netherlands - A Markov Chain Analysis. p. 1–17. In D. A. Edwards, and M.
J. Syphers (eds.). An introduction to the physics of high energy accelerators. Wiley,
Weinheim.
IFOAM. 2016. Organic in Europe, Prospects and Developments 2016. Accessed
24.09.2018: www.ifoam-eu.org.
Maloni, M. J., and M. E. Brown. 2006. Corporate Social Responsibility in the Supply
Chain: An Application in the Food Industry. Journal of Business Ethics 68:35–52.
https://doi.org/10.1007/s10551-006-9038-0.
Macdonald, K.A., Penno, J.W., Lancaster, J.A.S. and Roche, J.R. 2008. Effect of stocking
rate on pasture production, milk production, and reproduction of dairy cows in pasture-
based systems. Journal of Dairy Science 91:2151–2163.
https://doi.org/10.3168/jds.2007-0630.
Medugorac, I., A. Medugorac, I. Russ, C. E. Veit-Kensch, P. Taberlet, B. Luntz, H. M.
Mix, and M. Förster. 2009. Genetic diversity of European cattle breeds highlights the
conservation value of traditional unselected breeds with high effective population size.
CHAPTER 1
27
Molecular Ecology 18:3394–3410. https://doi.org/10.1111/j.1365-
294X.2009.04286.x.
Mertens, J., Klemm, R. and Fischer, R. LfULG-Schriftenreihe Heft 13/2011 -
Kreuzungszucht beim Milchrind - ökonomische Bewertung. LfULG 2011:1–39.
Philipsson, J. and B. Lindhé. 2003. Experiences of including reproduction and health
traits in Scandinavian dairy cattle breeding programmes. Livestock Production
Science 83:99–112. https://doi.org/10.1016/S0301-6226(03)00047-2.
Rauw, W.M., Kanis, E., Noordhuizen-Stassen, E.N. and Grommers, F.J. 1998.
Undesirable side effects of selection for high production efficiency in farm animals: a
review. Livestock Production Science 56:15–33. https://doi.org/10.1016/S0301-
6226(98)00147-X.
Rinehart, L. 2009. Dairy Production on Pasture: An Introduction to Grass-Based and
Seasonal Dairying. In National Sustainable Agriculture Information Service:1–15.
https://doi.org/10.1142/9789814293273_0001.
Rosati, A., and A. Aumaitre. 2004. Organic dairy farming in Europe. Livestock
Production Science 90:41–51. https://doi.org/10.1016/j.livprodsci.2004.07.005.
Sehested, J., Kristensen, T.and Søegaard, K. 2003. Effect of concentrate supplementation
level on production, health and efficiency in an organic dairy herd. Livestock
Production Science 80:153–165. https://doi.org/10.1016/S0301-6226(02)00317-2.
Shaffer, M.L. 1981. Minimum Population Sizes for Species Conservation. BioScience
31:131–134.
Soulé, M.E. 1980. Thresholds for survival: maintaining fitness and evolutionary potential.
In: M.E. Soulé, B.A. Wilcox (Eds.), Conservation biology. An evolutionary-ecological
perspective, Sinauer Associates, Sunderland, MA:151-170.
Sundberg, T., B. Berglund, L. Rydhmer, and E. Strandberg. 2009. Fertility, somatic cell
count and milk production in Swedish organic and conventional dairy herds. Livestock
Science 126:176–182. https://doi.org/10.1016/j.livsci.2009.06.022.
Sundrum, A., 2001. Organic livestock farming. A critical review. Livestock Production
Science 67: 207–215. https://doi.org/10.1016/S0301-6226(00)00188-3.
Taberlet, P., A. Valentini, H. R. Rezaei, S. Naderi, F. Pompanon, R. Negrini, and P.
Ajmone-Marsan. 2008. Are cattle, sheep, and goats endangered species? Molecular
Ecology 17:275–284. https://doi.org/10.1111/j.1365-294X.2007.03475.x.
CHAPTER 1
28
TGRDEU. Zentrale Dokumentation Tiergenetischer Ressourcen in Deutschland
Bundesanstalt für Landwirtschaft und Ernährung. Accessed 20.09.2018:
https://tgrdeu.genres.de/index/index.
Thongplew, N., C.S.A. van Koppen, and G. Spaargaren. 2014. Companies contributing
to the greening of consumption: findings from the dairy and appliance industries in
Thailand. Journal of cleaner Production 75:96–105.
https://doi.org/10.1016/j.jclepro.2014.03.076.
Thongplew, N., C.S.A. van Koppen, and G. Spaargaren. 2016. Transformation of the
dairy industry toward sustainability: The case of the organic dairy industries in the
Netherlands and Thailand. Environmental Development 17:6–20.
https://doi.org/10.1016/j.envdev.2015.11.005.
VanRaden, P.M. 2004. Invited Review: Selection on Net Merit to Improve Lifetime
Profit. Journal of Dairy Science 87:3125–3131. https://doi.org/10.3168/jds.S0022-
0302(04)73447-5.
Weigel, K. A., and R. Rekaya. 2000. A Multiple-Trait Herd Cluster Model for
International Dairy Sire Evaluation. Journal of Dairy Science 83:815–821.
https://doi.org/10.3168/jds.S0022-0302(00)74944-7.
White, S.L., Benson, G.A., Washburn, S.P. and Green, J.T. 2002. Milk Production and
Economic Measures in Confinement or Pasture Systems Using Seasonally Calved
Holstein and Jersey Cows. Journal of Dairy Science 85:95–104.
https://doi.org/10.3168/jds.S0022-0302(02)74057-5.
CHAPTER 1
29
CHAPTER 2
Inbreeding and Genetic Relationships of the Endangered Dual-
Purpose Black and White Cattle Breed Based on Own Genetic Breed
Percentage Calculations
M. Jaeger, C. Scheper, S. König, K. Brügemann
Published 2018 in Züchtungskunde
30
Einleitung
Das „alte“ Deutsche Schwarzbunte Niederungsrind (DSN) hat seinen züchterischen
Ursprung in den Marsch- und Niederungsgebieten im Nordsee-Raum. Wegen seiner
Anpassungsfähigkeit, fruchtbaren und futterdankbaren Eigenschaften bei gleichzeitig
hoher Dauerleistung an fettreicher Milch und guter Mastfähigkeit, wurden und werden
DSN-Rinder vielseitig in Deutschland und den Niederlanden eingesetzt (Gassan, 2017;
Brade und Brade, 2013). Die Zuchtgeschichte der DSN wurde intensiv von Mügge et al.
(1999) betrachtet. Dazu gehören insbesondere im Kontext der Rasseentwicklung die
unterschiedlichen züchterischen Strategien unter verschiedenen Haltungsbedingungen
seit Anfang der 60iger Jahre im Ost- und im Westteil Deutschlands. In Ostdeutschland
wurden DSN mit Jerseys und Holstein Friesian (HF) gekreuzt, was zur systematischen
Konsolidierung der neuen synthetischen Rasse „Schwarzbuntes Milchrind“ (SMR)
führte. Zeitgleich wurden Ende der 60iger Jahre sieben Stammzuchtzentren für DSN
eingerichtet, unter anderem Gut Kölsa im Bezirk Cottbus, Lebusa und Gräfendorf. Der
Bestand verfügte insgesamt über 4.000 schwarzbunte Kühe, 100.000 eingelagerte
Spermaportionen und jährlich 15 bis 20 zur Zucht aufgestellte Jungbullen. In
Westdeutschland führte die Verdrängungskreuzung mit HF zu grundlegenden
Änderungen des Rassecharakters der Schwarzbuntpopulation. Als Reaktion auf die
fortlaufende Dezimierung der DSN-Bestände gründete sich 1989 der „Verein zur
Erhaltung und Förderung des alten schwarzbunten Niederungsrindes“ (VEF-DSN), der
in Westdeutschland Aufgaben der Zuchtorganisation und Herdbuchführung übernimmt.
Zusätzlich wurde in Mariensee eine Genreserve mit Embryonen und Sperma angelegt.
Nach der Wiedervereinigung wurde die Zuchtarbeit der DSN-Rasse in den neuen
Bundesländern durch den Rinderzuchtverband Berlin-Brandenburg eG organisiert
(RBB). Von der Landesregierung gewährte Fördermittel ermöglichten die fortbestehende
Erhaltung der kulturhistorischen Genreserve. In den alten Bundesländern ist weiterhin der
VEF-DSN aktiv, um einen deutlichen Beitrag zur Konsolidierung der Rasse als auch zu
deren züchterische Weiterentwicklung zu leisten. Erst im Jahre 1997 erfolgte eine strikte
Trennung von DSN und HF durch die Vergabe getrennter Rassecodes (RC; DHV, 2017).
Die DSN erhielten RC= 10 und HF der Farbrichtung Schwarzbunt wurde RC= 01
zugewiesen.
CHAPTER 2
31
Trotz der Aktivitäten des RBB und des VEF-DSN werden DSN-Bullen heutzutage nur
eingeschränkt und meist in Betrieben mit hohem Grundfutteranteil in der Fütterung
eingesetzt, da sie aufgrund geringerer Milchmengenzuchtwerte nicht mit
Hochleistungsrassen konkurrieren können. Biedermann (2003) berichtete, dass 47 % der
DSN-Tiere in ökologisch wirtschaftenden Betrieben gehalten werden. Das Potenzial der
Rasse DSN liegt in diesem Zusammenhang in ihrer langen Nutzungsdauer und
Gesundheit sowie Anpassungsfähigkeit an extensivere Haltungsbedingungen, wie sie
beispielsweise in der stark weidebasierten Milchproduktion anzutreffen sind
(Biedermann, 2003).
Trotz dieser Vorzüge für DSN handelt es sich um eine gegenwärtig kleine Population mit
nur 2.847 (Stand 2016) Herdbuchkühen (TGRDEU). Inzuchtmanagement und die
Erhaltung genetischer Eigenständigkeit bzw. Diversität stellen die Kernelemente eines
Erhaltungszuchtprogrammes in kleinen lokalen Rassen dar (Hartwig und Bennewitz,
2014). Die Erhaltung des robusten Rassecharakters der DSN bzw. die Realisierung von
Zuchtfortschritt, insbesondere in den niedrig erblichen funktionalen Merkmalen, stellt
eine große Herausforderung dar, da für Fitnessmerkmale Inzuchtdepressionen zu
erwarten sind (DeRose und Roff, 1999). Biedermann et al. (2005) berechneten einen
Inzuchtkoeffizienten von 2,5 % mit einer Inzuchtsteigerung von 1,4 % pro Generation in
2003 für die DSN-Gesamtpopulation unter Einbeziehung der fünf zurückliegenden
Generationen, ohne konkret die weiteren Auswirkungen von Inzucht zu analysieren.
Ziel dieses Beitrages ist es, nach nun mehr als 15 Jahren eine umfassende
populationsgenetische Analyse innerhalb der DSN-Rasse durchzuführen. Da vorherige
DSN-Studien zeigten, dass genetische Rasseanteile von DSN-Tieren nicht zwangsläufig
den eingetragenen Rassecode widerspiegeln (Biedermann et al. 2005; Ehling et al. 1999),
wurde ein eigener Algorithmus entwickelt, um DSN-Genanteile zu berechnen. Sämtliche
Auswertungen zur Inzucht, Verwandtschaft, weiteren Determinanten des
Zuchtfortschritts als auch zu etwaigen Inzuchtdepressionen basieren somit auf den
eigenständig berechneten Genanteilen bzw. daran anschließenden Rasseeinteilungen.
CHAPTER 2
32
Material und Methoden
Datenmaterial
Die vom VIT (Vereinigte Informationssysteme Tierhaltung e.V., Verden) bereitgestellte
Abstammungsdatei für DSN-Tiere und Herdengefährtinnen anderer Rassen beinhaltete
insgesamt 82.538 Tiere. Die Zuordnung der Tiere zu DSN bzw. HF basierte auf den
Ergebnissen des eigens entwickelten Algorithmus. Für die Zuordnung eines Tieres zu
DSN wurden mindestens 90 % DSN-Genanteile verlangt (DSN_90 %) und
dementsprechend für die Zuordnung eines Tieres zu HF 90 % HF-Genanteile vorgegeben
(HF_90 %).
Die Verwandtschaftsberechnungen zwischen aktiven DSN_90 %-Kühen mit definierten
Subgruppen nach Leistungsniveaus oder geographischer Zuordnung sowie zu
einflussreichen Vätern basierten auf der Datengrundlage des Kalbejahres 2015 und 46
Betrieben (davon 44 Betriebe der alten Bundesländer mit mindestens fünf aktiven DSN
Kühen). Dabei wurden Untersuchungen nur innerhalb der ersten Laktation durchgeführt
(238 DSN_90 % Kühe) als auch unter gemeinsamer Berücksichtigung von Kühen der
ersten bis dritten Laktation (573 DSN_90 % Kühe). Zur Berechnung von
verwandtschaftlichen Beziehungen zwischen DSN-Kühen und HF-Kühen wurde die
Restriktion für den DSN-Anteil in den Herden außen vorgelassen und somit 928 DSN-
Kühe und 1.190 HF-Kühe des Kalbejahres 2015 und den Laktationen eins bis drei in die
Analysen inkludiert. Für die Untersuchungen zu der Auswirkung von Inzucht in der
DSN_90 %-Kuhpopulation und der HF_90 %-Kuhpopulation wurden die Kalbejahre
2005 bis 2017 berücksichtigt. Das Interesse lag dabei auf dem Studium der Effekte von
Inzucht in der Frühlaktation. Somit wurden die Merkmale Milch-kg (Mkg), Fett-kg (Fkg)
und log-transformierte Zellzahl (SCS= log 2 (Zellzahl/100.000) + 3) vom ersten
offiziellen Testtag einbezogen.
Algorithmus zur Berechnung von DSN-Rasseanteilen
Die Berechnung der tierindividuellen Rasseanteile (RA) erfolgte iterativ ausgehend von
den Gründertieren (Generation 0 ohne bekannte Vorfahren) über alle Generationen
hinweg im gesamten Pedigree (Abbildung 2).
CHAPTER 2
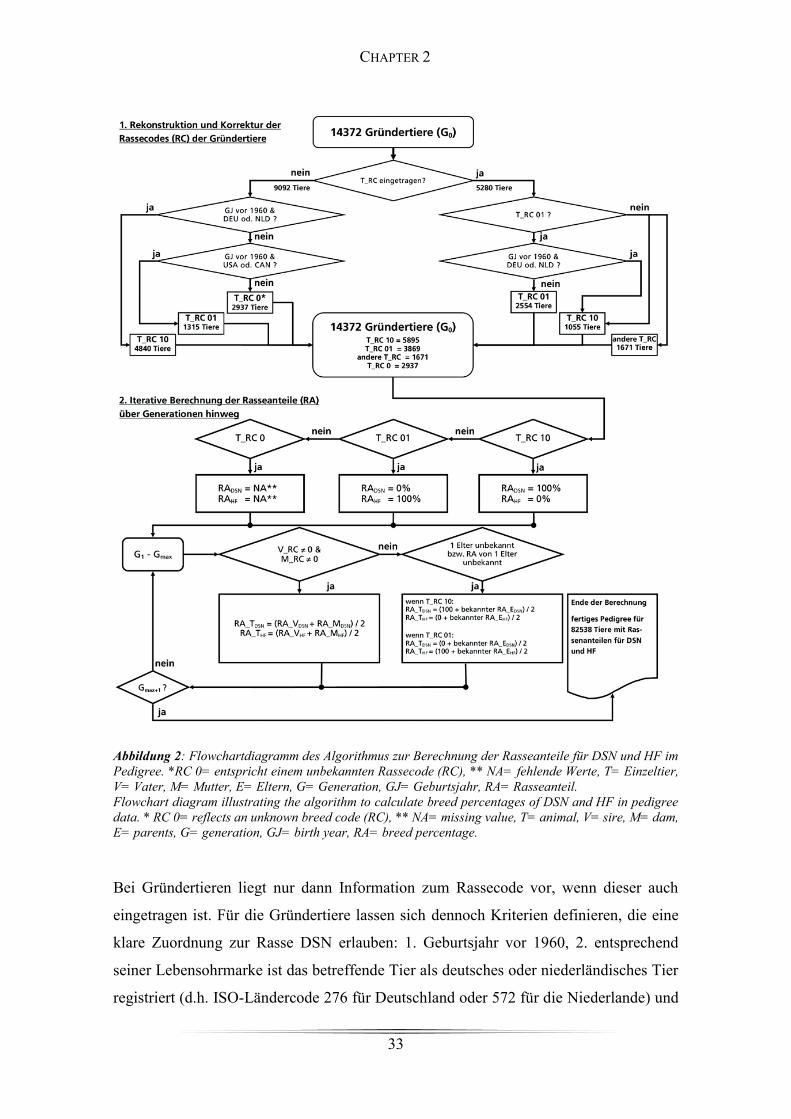
33
Abbildung 2: Flowchartdiagramm des Algorithmus zur Berechnung der Rasseanteile für DSN und HF im Pedigree. *RC 0= entspricht einem unbekannten Rassecode (RC), ** NA= fehlende Werte, T= Einzeltier, V= Vater, M= Mutter, E= Eltern, G= Generation, GJ= Geburtsjahr, RA= Rasseanteil. Flowchart diagram illustrating the algorithm to calculate breed percentages of DSN and HF in pedigree data. * RC 0= reflects an unknown breed code (RC), ** NA= missing value, T= animal, V= sire, M= dam, E= parents, G= generation, GJ= birth year, RA= breed percentage.
Bei Gründertieren liegt nur dann Information zum Rassecode vor, wenn dieser auch
eingetragen ist. Für die Gründertiere lassen sich dennoch Kriterien definieren, die eine
klare Zuordnung zur Rasse DSN erlauben: 1. Geburtsjahr vor 1960, 2. entsprechend
seiner Lebensohrmarke ist das betreffende Tier als deutsches oder niederländisches Tier
registriert (d.h. ISO-Ländercode 276 für Deutschland oder 572 für die Niederlande) und
CHAPTER 2
34
3. das betreffende Tier hat entsprechend der ISO-Ländercodes ausschließlich deutsche
Nachkommen. Von 9.092 Gründertieren ohne eingetragenen Rassecode konnten auf
diesem Weg 4.840 Tiere eindeutig der Rasse DSN zugeordnet werden. Darüber hinaus
wurden, basierend auf den genannten Kriterien, 536 als HF mit RC= 01 registrierte
Gründertiere, als eindeutige DSN Tiere identifiziert. Deren Rassecodes wurden
entsprechend zu RC= 10 umcodiert.
Die initiale Berechnung der Rasseanteile für DSN und HF bei den Gründertieren erfolgte
im ersten Schritt auf Basis der wie zuvor beschrieben rekonstruierten oder korrigierten
Rassecodes. So wurde dementsprechend Gründertieren mit RC= 10 ein DSN-Anteil von
100 % zugewiesen. Analog erhielten Tiere mit RC= 01 oder RC= 02 (HF-Farbrichtung
Rotbunt) einen HF-Anteil von 100 %. Für Gründertiere, deren Rassecode auch nach der
oben beschriebenen Prüfung unbekannt war, wurden keine Anteile berechnet. Die
Berechnung der Rasseanteile in Prozent ab Generation 1 erfolgte für den Fall, dass beide
Elterntiere bekannt waren, mit folgender Formel:
RANachkomme = (RAVater+RAMutter) / 2 .
War eines der Elterntiere unbekannt (d.h. eine vorherige Berechnung der Rasseanteile für
das unbekannte Elterntier, wie oben beschrieben, war nicht möglich), so wurde der
registrierte RC des Nachkommen als Referenz verwendet. Dies impliziert für ein Tier mit
RC = 10, dass der DSN-Rasseanteil wie folgt berechnet wurde:
DSN-RANachkomme = (100+DSN-RAbekannter Elternteil)/ 2 .
Analog wurde für HF vorgegangen. Der iterative Algorithmus, inklusive der Ableitung
und Korrektur, der Rassecodes der Gründertiere wurde im Software-Paket R (R Core
Team, 2017) eigenständig programmiert. Die Berechnung der tierindividuellen
Generationenzahl (die maximale Generationenzahl für Einzeltiere betrug 25
Generationen) erfolgte mit dem R-Paket „pedigree V1.4“ (Coster, 2012) vor der
Berechnung der Rasseanteile.
Tabelle 1 zeigt die Zuordnung der Kühe nach berechneten Rasseanteilen innerhalb der
alten und neuen Bundesländer. Die Berechnungen der Rasseanteile ergaben in den
Kalbejahren von 2005 bis 2016 für insgesamt 46 % der DSN-Tiere und für 22 % der HF-
Tiere Zuordnungen, die nicht mit der ursprünglichen Rassecodierung in Einklang waren.
CHAPTER 2
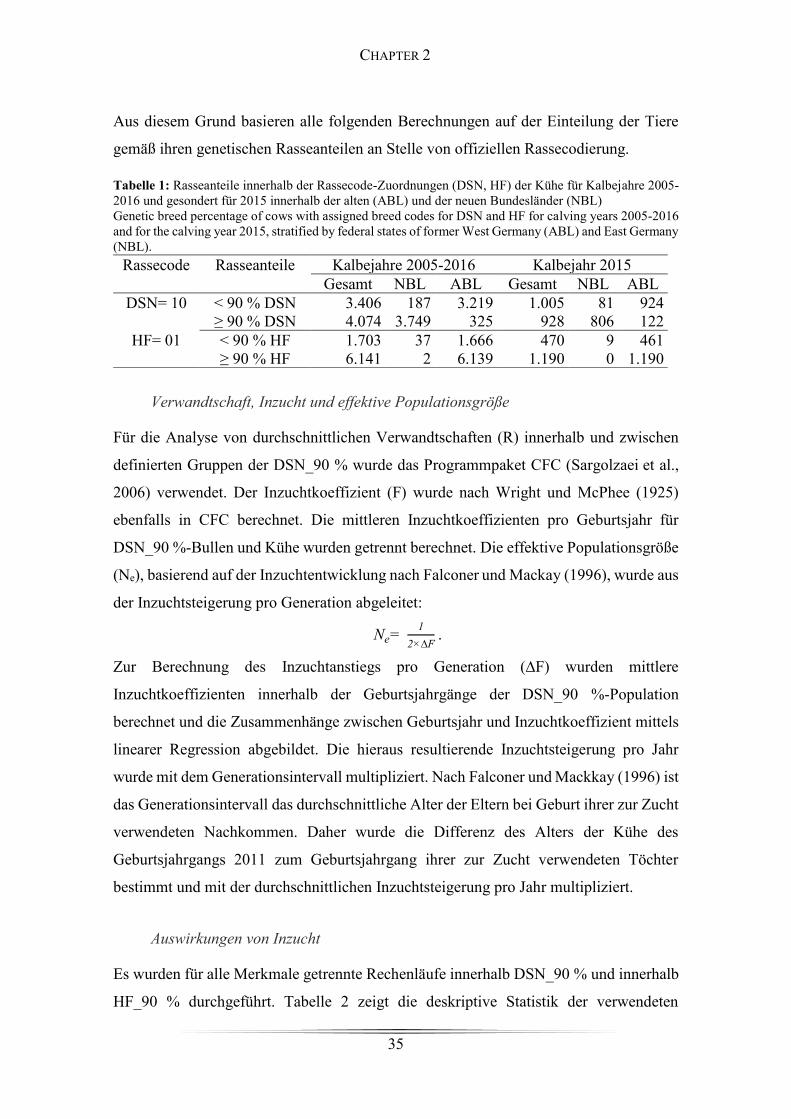
35
Aus diesem Grund basieren alle folgenden Berechnungen auf der Einteilung der Tiere
gemäß ihren genetischen Rasseanteilen an Stelle von offiziellen Rassecodierung.
Tabelle 1: Rasseanteile innerhalb der Rassecode-Zuordnungen (DSN, HF) der Kühe für Kalbejahre 2005-2016 und gesondert für 2015 innerhalb der alten (ABL) und der neuen Bundesländer (NBL) Genetic breed percentage of cows with assigned breed codes for DSN and HF for calving years 2005-2016 and for the calving year 2015, stratified by federal states of former West Germany (ABL) and East Germany (NBL).
Verwandtschaft, Inzucht und effektive Populationsgröße
Für die Analyse von durchschnittlichen Verwandtschaften (R) innerhalb und zwischen
definierten Gruppen der DSN_90 % wurde das Programmpaket CFC (Sargolzaei et al.,
2006) verwendet. Der Inzuchtkoeffizient (F) wurde nach Wright und McPhee (1925)
ebenfalls in CFC berechnet. Die mittleren Inzuchtkoeffizienten pro Geburtsjahr für
DSN_90 %-Bullen und Kühe wurden getrennt berechnet. Die effektive Populationsgröße
(Ne), basierend auf der Inzuchtentwicklung nach Falconer und Mackay (1996), wurde aus
der Inzuchtsteigerung pro Generation abgeleitet:
Ne= 12×∆F
.
Zur Berechnung des Inzuchtanstiegs pro Generation (∆F) wurden mittlere
Inzuchtkoeffizienten innerhalb der Geburtsjahrgänge der DSN_90 %-Population
berechnet und die Zusammenhänge zwischen Geburtsjahr und Inzuchtkoeffizient mittels
linearer Regression abgebildet. Die hieraus resultierende Inzuchtsteigerung pro Jahr
wurde mit dem Generationsintervall multipliziert. Nach Falconer und Mackkay (1996) ist
das Generationsintervall das durchschnittliche Alter der Eltern bei Geburt ihrer zur Zucht
verwendeten Nachkommen. Daher wurde die Differenz des Alters der Kühe des
Geburtsjahrgangs 2011 zum Geburtsjahrgang ihrer zur Zucht verwendeten Töchter
bestimmt und mit der durchschnittlichen Inzuchtsteigerung pro Jahr multipliziert.
Auswirkungen von Inzucht
Es wurden für alle Merkmale getrennte Rechenläufe innerhalb DSN_90 % und innerhalb
HF_90 % durchgeführt. Tabelle 2 zeigt die deskriptive Statistik der verwendeten
Rassecode Rasseanteile Kalbejahre 2005-2016 Kalbejahr 2015 Gesamt NBL ABL Gesamt NBL ABL
DSN= 10 < 90 % DSN 3.406 187 3.219 1.005 81 924 ≥ 90 % DSN 4.074 3.749 325 928 806 122
HF= 01 < 90 % HF 1.703 37 1.666 470 9 461 ≥ 90 % HF 6.141 2 6.139 1.190 0 1.190
CHAPTER 2
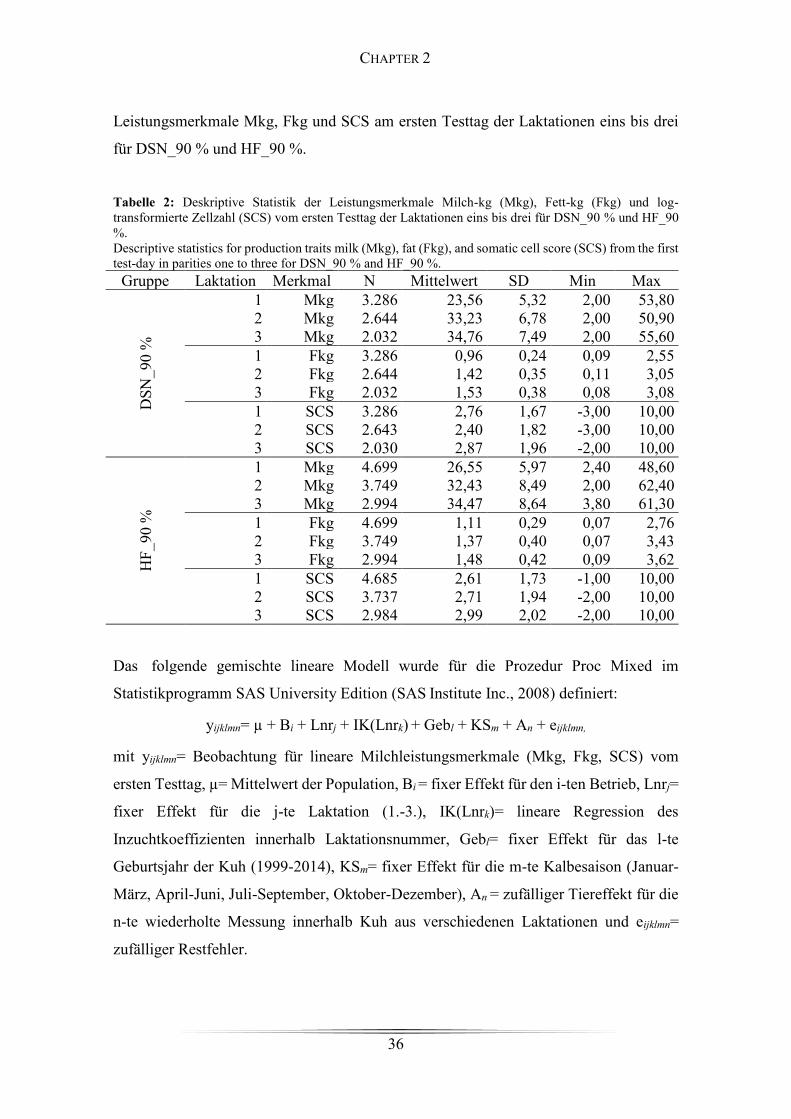
36
Leistungsmerkmale Mkg, Fkg und SCS am ersten Testtag der Laktationen eins bis drei
für DSN_90 % und HF_90 %.
Tabelle 2: Deskriptive Statistik der Leistungsmerkmale Milch-kg (Mkg), Fett-kg (Fkg) und log-transformierte Zellzahl (SCS) vom ersten Testtag der Laktationen eins bis drei für DSN_90 % und HF_90 %. Descriptive statistics for production traits milk (Mkg), fat (Fkg), and somatic cell score (SCS) from the first test-day in parities one to three for DSN_90 % and HF_90 %.
Gruppe Laktation Merkmal N Mittelwert SD Min Max
DSN
_90
%
1 Mkg 3.286 23,56 5,32 2,00 53,80 2 Mkg 2.644 33,23 6,78 2,00 50,90 3 Mkg 2.032 34,76 7,49 2,00 55,60 1 Fkg 3.286 0,96 0,24 0,09 2,55 2 Fkg 2.644 1,42 0,35 0,11 3,05 3 Fkg 2.032 1,53 0,38 0,08 3,08 1 SCS 3.286 2,76 1,67 -3,00 10,00 2 SCS 2.643 2,40 1,82 -3,00 10,00 3 SCS 2.030 2,87 1,96 -2,00 10,00
HF_
90 %
1 Mkg 4.699 26,55 5,97 2,40 48,60 2 Mkg 3.749 32,43 8,49 2,00 62,40 3 Mkg 2.994 34,47 8,64 3,80 61,30 1 Fkg 4.699 1,11 0,29 0,07 2,76 2 Fkg 3.749 1,37 0,40 0,07 3,43 3 Fkg 2.994 1,48 0,42 0,09 3,62 1 SCS 4.685 2,61 1,73 -1,00 10,00 2 SCS 3.737 2,71 1,94 -2,00 10,00 3 SCS 2.984 2,99 2,02 -2,00 10,00
Das folgende gemischte lineare Modell wurde für die Prozedur Proc Mixed im
Statistikprogramm SAS University Edition (SAS Institute Inc., 2008) definiert:
yijklmn= µ + Bi + Lnrj + IK(Lnrk) + Gebl + KSm + An + eijklmn,
mit yijklmn= Beobachtung für lineare Milchleistungsmerkmale (Mkg, Fkg, SCS) vom
ersten Testtag, µ= Mittelwert der Population, Bi = fixer Effekt für den i-ten Betrieb, Lnrj=
fixer Effekt für die j-te Laktation (1.-3.), IK(Lnrk)= lineare Regression des
Inzuchtkoeffizienten innerhalb Laktationsnummer, Gebl= fixer Effekt für das l-te
Geburtsjahr der Kuh (1999-2014), KSm= fixer Effekt für die m-te Kalbesaison (Januar-
März, April-Juni, Juli-September, Oktober-Dezember), An = zufälliger Tiereffekt für die
n-te wiederholte Messung innerhalb Kuh aus verschiedenen Laktationen und eijklmn=
zufälliger Restfehler.
CHAPTER 2
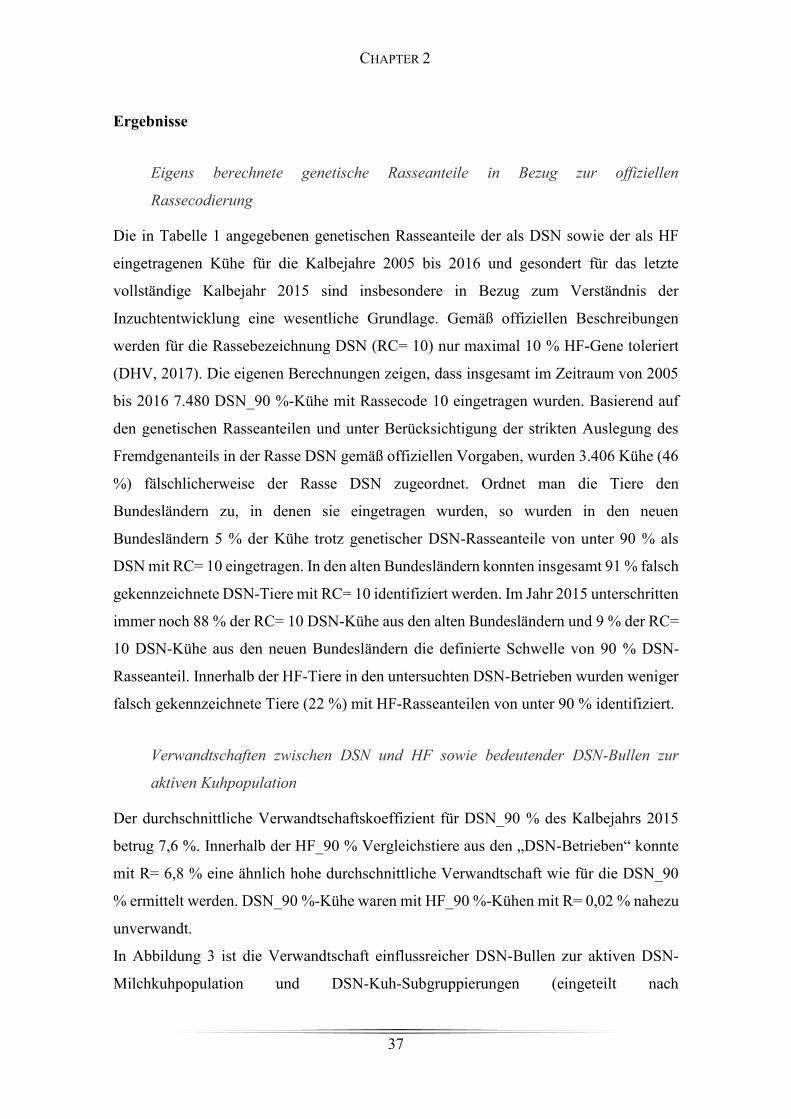
37
Ergebnisse
Eigens berechnete genetische Rasseanteile in Bezug zur offiziellen
Rassecodierung
Die in Tabelle 1 angegebenen genetischen Rasseanteile der als DSN sowie der als HF
eingetragenen Kühe für die Kalbejahre 2005 bis 2016 und gesondert für das letzte
vollständige Kalbejahr 2015 sind insbesondere in Bezug zum Verständnis der
Inzuchtentwicklung eine wesentliche Grundlage. Gemäß offiziellen Beschreibungen
werden für die Rassebezeichnung DSN (RC= 10) nur maximal 10 % HF-Gene toleriert
(DHV, 2017). Die eigenen Berechnungen zeigen, dass insgesamt im Zeitraum von 2005
bis 2016 7.480 DSN_90 %-Kühe mit Rassecode 10 eingetragen wurden. Basierend auf
den genetischen Rasseanteilen und unter Berücksichtigung der strikten Auslegung des
Fremdgenanteils in der Rasse DSN gemäß offiziellen Vorgaben, wurden 3.406 Kühe (46
%) fälschlicherweise der Rasse DSN zugeordnet. Ordnet man die Tiere den
Bundesländern zu, in denen sie eingetragen wurden, so wurden in den neuen
Bundesländern 5 % der Kühe trotz genetischer DSN-Rasseanteile von unter 90 % als
DSN mit RC= 10 eingetragen. In den alten Bundesländern konnten insgesamt 91 % falsch
gekennzeichnete DSN-Tiere mit RC= 10 identifiziert werden. Im Jahr 2015 unterschritten
immer noch 88 % der RC= 10 DSN-Kühe aus den alten Bundesländern und 9 % der RC=
10 DSN-Kühe aus den neuen Bundesländern die definierte Schwelle von 90 % DSN-
Rasseanteil. Innerhalb der HF-Tiere in den untersuchten DSN-Betrieben wurden weniger
falsch gekennzeichnete Tiere (22 %) mit HF-Rasseanteilen von unter 90 % identifiziert.
Verwandtschaften zwischen DSN und HF sowie bedeutender DSN-Bullen zur
aktiven Kuhpopulation
Der durchschnittliche Verwandtschaftskoeffizient für DSN_90 % des Kalbejahrs 2015
betrug 7,6 %. Innerhalb der HF_90 % Vergleichstiere aus den „DSN-Betrieben“ konnte
mit R= 6,8 % eine ähnlich hohe durchschnittliche Verwandtschaft wie für die DSN_90
% ermittelt werden. DSN_90 %-Kühe waren mit HF_90 %-Kühen mit R= 0,02 % nahezu
unverwandt.
In Abbildung 3 ist die Verwandtschaft einflussreicher DSN-Bullen zur aktiven DSN-
Milchkuhpopulation und DSN-Kuh-Subgruppierungen (eingeteilt nach
CHAPTER 2
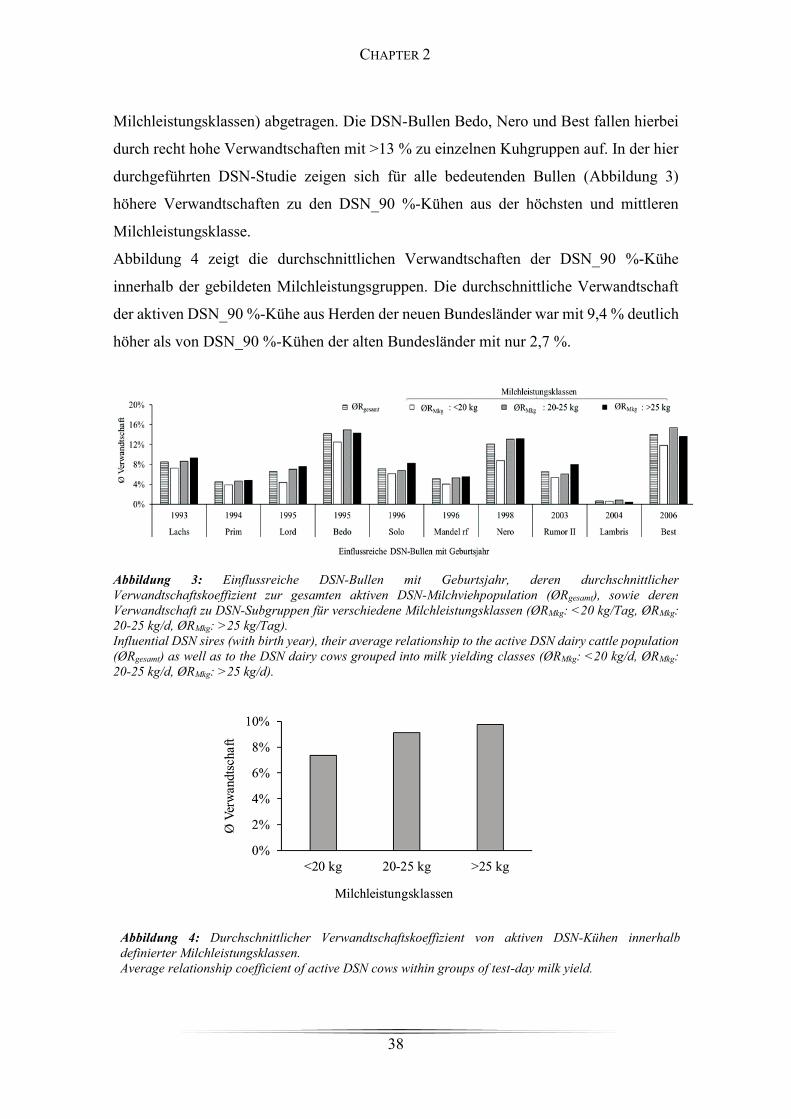
38
Milchleistungsklassen) abgetragen. Die DSN-Bullen Bedo, Nero und Best fallen hierbei
durch recht hohe Verwandtschaften mit >13 % zu einzelnen Kuhgruppen auf. In der hier
durchgeführten DSN-Studie zeigen sich für alle bedeutenden Bullen (Abbildung 3)
höhere Verwandtschaften zu den DSN_90 %-Kühen aus der höchsten und mittleren
Milchleistungsklasse.
Abbildung 4 zeigt die durchschnittlichen Verwandtschaften der DSN_90 %-Kühe
innerhalb der gebildeten Milchleistungsgruppen. Die durchschnittliche Verwandtschaft
der aktiven DSN_90 %-Kühe aus Herden der neuen Bundesländer war mit 9,4 % deutlich
höher als von DSN_90 %-Kühen der alten Bundesländer mit nur 2,7 %.
Abbildung 3: Einflussreiche DSN-Bullen mit Geburtsjahr, deren durchschnittlicher Verwandtschaftskoeffizient zur gesamten aktiven DSN-Milchviehpopulation (ØRgesamt), sowie deren Verwandtschaft zu DSN-Subgruppen für verschiedene Milchleistungsklassen (ØRMkg: <20 kg/Tag, ØRMkg: 20-25 kg/d, ØRMkg: >25 kg/Tag). Influential DSN sires (with birth year), their average relationship to the active DSN dairy cattle population (ØRgesamt) as well as to the DSN dairy cows grouped into milk yielding classes (ØRMkg: <20 kg/d, ØRMkg: 20-25 kg/d, ØRMkg: >25 kg/d).
Abbildung 4: Durchschnittlicher Verwandtschaftskoeffizient von aktiven DSN-Kühen innerhalb definierter Milchleistungsklassen. Average relationship coefficient of active DSN cows within groups of test-day milk yield.
CHAPTER 2
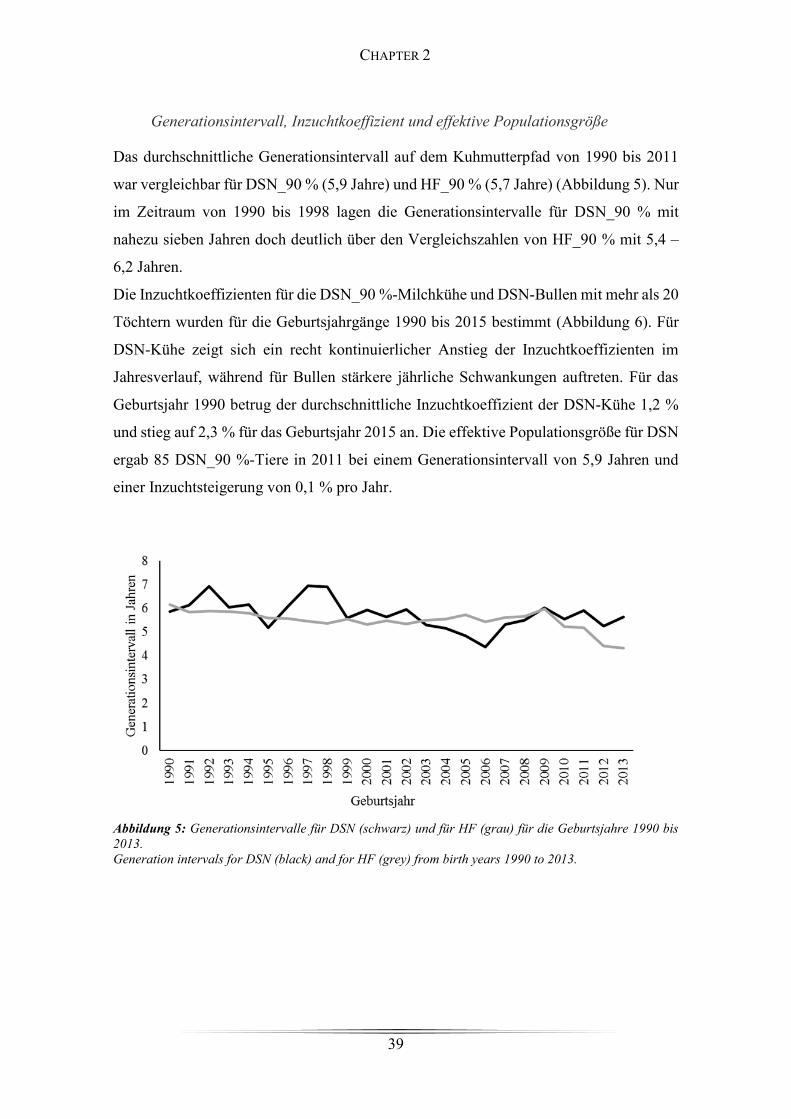
39
Generationsintervall, Inzuchtkoeffizient und effektive Populationsgröße
Das durchschnittliche Generationsintervall auf dem Kuhmutterpfad von 1990 bis 2011
war vergleichbar für DSN_90 % (5,9 Jahre) und HF_90 % (5,7 Jahre) (Abbildung 5). Nur
im Zeitraum von 1990 bis 1998 lagen die Generationsintervalle für DSN_90 % mit
nahezu sieben Jahren doch deutlich über den Vergleichszahlen von HF_90 % mit 5,4 –
6,2 Jahren.
Die Inzuchtkoeffizienten für die DSN_90 %-Milchkühe und DSN-Bullen mit mehr als 20
Töchtern wurden für die Geburtsjahrgänge 1990 bis 2015 bestimmt (Abbildung 6). Für
DSN-Kühe zeigt sich ein recht kontinuierlicher Anstieg der Inzuchtkoeffizienten im
Jahresverlauf, während für Bullen stärkere jährliche Schwankungen auftreten. Für das
Geburtsjahr 1990 betrug der durchschnittliche Inzuchtkoeffizient der DSN-Kühe 1,2 %
und stieg auf 2,3 % für das Geburtsjahr 2015 an. Die effektive Populationsgröße für DSN
ergab 85 DSN_90 %-Tiere in 2011 bei einem Generationsintervall von 5,9 Jahren und
einer Inzuchtsteigerung von 0,1 % pro Jahr.
Abbildung 5: Generationsintervalle für DSN (schwarz) und für HF (grau) für die Geburtsjahre 1990 bis 2013. Generation intervals for DSN (black) and for HF (grey) from birth years 1990 to 2013.
CHAPTER 2
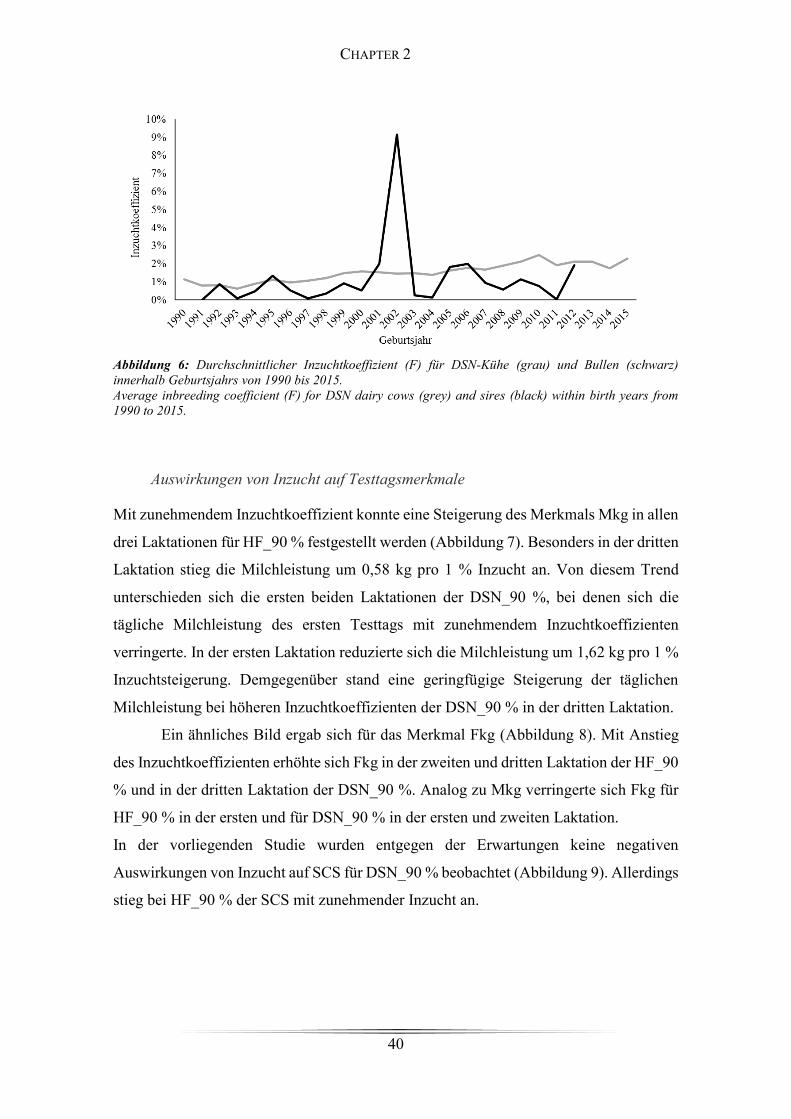
40
Abbildung 6: Durchschnittlicher Inzuchtkoeffizient (F) für DSN-Kühe (grau) und Bullen (schwarz) innerhalb Geburtsjahrs von 1990 bis 2015. Average inbreeding coefficient (F) for DSN dairy cows (grey) and sires (black) within birth years from 1990 to 2015.
Auswirkungen von Inzucht auf Testtagsmerkmale
Mit zunehmendem Inzuchtkoeffizient konnte eine Steigerung des Merkmals Mkg in allen
drei Laktationen für HF_90 % festgestellt werden (Abbildung 7). Besonders in der dritten
Laktation stieg die Milchleistung um 0,58 kg pro 1 % Inzucht an. Von diesem Trend
unterschieden sich die ersten beiden Laktationen der DSN_90 %, bei denen sich die
tägliche Milchleistung des ersten Testtags mit zunehmendem Inzuchtkoeffizienten
verringerte. In der ersten Laktation reduzierte sich die Milchleistung um 1,62 kg pro 1 %
Inzuchtsteigerung. Demgegenüber stand eine geringfügige Steigerung der täglichen
Milchleistung bei höheren Inzuchtkoeffizienten der DSN_90 % in der dritten Laktation.
Ein ähnliches Bild ergab sich für das Merkmal Fkg (Abbildung 8). Mit Anstieg
des Inzuchtkoeffizienten erhöhte sich Fkg in der zweiten und dritten Laktation der HF_90
% und in der dritten Laktation der DSN_90 %. Analog zu Mkg verringerte sich Fkg für
HF_90 % in der ersten und für DSN_90 % in der ersten und zweiten Laktation.
In der vorliegenden Studie wurden entgegen der Erwartungen keine negativen
Auswirkungen von Inzucht auf SCS für DSN_90 % beobachtet (Abbildung 9). Allerdings
stieg bei HF_90 % der SCS mit zunehmender Inzucht an.
CHAPTER 2
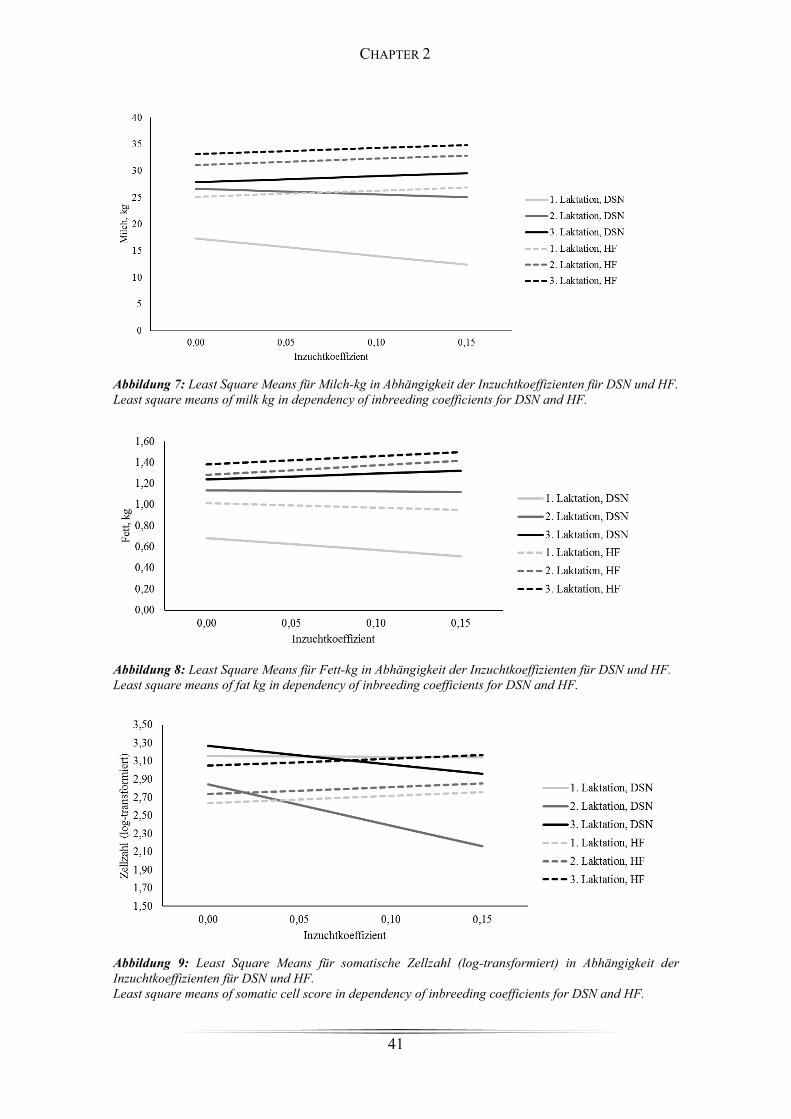
41
Abbildung 7: Least Square Means für Milch-kg in Abhängigkeit der Inzuchtkoeffizienten für DSN und HF. Least square means of milk kg in dependency of inbreeding coefficients for DSN and HF.
Abbildung 8: Least Square Means für Fett-kg in Abhängigkeit der Inzuchtkoeffizienten für DSN und HF. Least square means of fat kg in dependency of inbreeding coefficients for DSN and HF.
Abbildung 9: Least Square Means für somatische Zellzahl (log-transformiert) in Abhängigkeit der Inzuchtkoeffizienten für DSN und HF. Least square means of somatic cell score in dependency of inbreeding coefficients for DSN and HF.
CHAPTER 2
42
Diskussion
Rasseanteile in Bezug zur offiziellen Rassecodierung
Die Berechnungen genetischer Rasseanteile aus Tabelle 1 zeigen, dass in den Jahren von
2005 bis 2016, 46 % der DSN-Kühe und 22 % der HF-Kühe falsch gekennzeichnet
wurden. Dies bedeutet, dass 3.406 Kühe den DSN und 1.703 Kühe der Rasse HF
zugeordnet wurden, obwohl ihr genetischer Fremdgenanteil über 10 % lag. Selbst wenn
der zulässige HF-Fremdgenanteil für DSN von 10 % auf 30 % gemäß Biedermann et al.
(2005) hochgesetzt würde, wären noch immer 52 % der Tiere aus den alten
Bundesländern, aber 0 % der Tiere aus den neuen Bundesländern, falsch gekennzeichnet.
Mögliche Gründe für die unterschiedlich strikten Rassekennzeichnungen zwischen alten
und neuen Bundesländern sind wohl die zentrale Organisation der DSN-Zucht durch den
RBB und die Konzentration des DSN-Hauptbestands auf nur zwei Großbetriebe, wobei
in den alten Bundesländern keine vergleichbaren intensiv organisierten Zuchtstrukturen
und Zuchtprogramme für DSN vorliegen. Zudem werden die Züchter in den alten
Bundesländern dazu ermutigt, Anpaarungen von DSN-Kühen mit HF-Bullen
durchzuführen, da Nachkommen aus diesen „Kreuzungen“ als deutsche Holsteins im
Herdbuch eingetragen werden dürfen (DHV, 2017). Biedermann et al. (2005)
recherchierten nach den Ursachen für variierende genetische Rasseanteile in den DSN.
Dabei identifizierten sie Züchter, die nur über einen sehr kurzen Zeitraum HF-Bullen
einsetzen, oder solche, die über eine Verdrängungszucht erneut Herden des alten Typs
aufbauen wollen.
Verwandtschaften
Der ermittelte Verwandtschaftskoeffizient der DSN_90 % (Kalbejahr 2015) (7,6 %) liegt
sehr viel höher, als der damals von Biedermann et al. (2005) ermittelte Wert (4,6 %) für
423 aktive DSN-Kühe und 140 aktive DSN-Bullen. Eine Ursache für die höhere
Verwandtschaft in der aktuellen DSN-Studie ist wohl darauf zurückzuführen, dass
Biedermann et al. (2005) 30 % Fremdgenanteil zu ließen.
Auch in Bezug zu anderen bedrohten Rassen wie dem Vorderwälder Rind mit R= 3,5 %
(Biedermann et al., 2004) sind die DSN untereinander enger miteinander verwandt.
Allerdings muss bei derartigen Vergleichen immer bedacht werden, dass die Tiefe der
CHAPTER 2
43
berücksichtigten Abstammungsdateien in verschiedenen Studien variierte und somit der
Inzuchtzuwachs eine bessere Maßzahl für neutrale Populations- oder Rassevergleiche
wäre. In einer intensiv vorselektierten kleineren Subpopulation von HF-Bullenmüttern
und HF-Bullenvätern mit ähnlicher Populationsgröße, analog zur DSN-Population,
fanden König und Simianer (2006) mit R= 5,9 % ähnliche Verwandtschaften wie in der
aktuellen DSN-Population. Aber auch innerhalb von großen Holsteinpopulationen unter
Berücksichtigung kommerzieller Produktionskühe wurden schon vor ca. 20 Jahren
vergleichbare Verwandtschaftskoeffizienten berechnet (u.a. R= 10,2 % in der
amerikanischen Holsteinpopulation (Young und Seykora, 1996). Im genomischen
Zeitalter ist innerhalb HF ein weiterer deutlicher Anstieg der
Verwandtschaftskoeffizienten zu beobachten (König et al., 2018).
Auffallend hohe Verwandtschaften (R> 13 %) der DSN-Bullen Bedo, Nero und
Best zu einzelnen Kuhgruppen können zum einen durch deren große Töchterzahlen
bedingt sein, zum anderen aber auch durch den starken Einsatz ihrer eigenen Väter und
Söhne über künstliche Besamung erklärt werden. So ist Bedo der Vater zweier
einflussreicher DSN-Bullen wie Berko und Best. Darüber hinaus hat Nero mit Nestor und
Nimbus zwei bedeutende Söhne. Nero prägte als Muttersvater auch die Linie von Larus
und Sony. Bereits Biedermann et al. (2005) hoben die Bedeutung der Bullen Solist und
Renegat hervor, für welche durchschnittliche Verwandtschaften zur DSN-Kuhpopulation
von 2,8 % und 4,7 % berechnet wurden. Da auch Semper, Hermes und Nimbus (nicht
abgebildet) von einflussreichen Vätern wie Solo, Hanno und Nero abstammen, waren
höhere Verwandtschaftskoeffizienten für diese Bullen bzw. Blutlinien zu erwarten. Auch
bewusst herbeigeführte Inzucht im Falle sehr leistungsfähiger Vaterlinien zur
Konsolidierung besonders wünschenswerter Anlagen ist eine Begründung für höhere
Verwandtschaften bestimmter Bullen zur Kuhpopulation. Dies trifft beispielsweise für
den DSN-Vererber Renegat zu. Renegats Vater ist Reaktor (Geburtsjahr 1979), dessen
Vater wiederum Remus ist. Mütterlicherseits ist Remus ebenfalls als Muttersvater in
Renegats Vorfahren enthalten.
König und Simianer (2006) berechneten Verwandtschaften zwischen
einflussreichen HF-Bullen zu Kuhgruppen mit hohen oder niedrigen Zuchtwerten für
verschiedene Relativzuchtwerte. Somit konnten in der HF-Studie Rückschlüsse gezogen
werden, welche Vererber oder Blutlinien zur Verbesserung, aber auch Verschlechterung,
einzelner Merkmalskomplexe beigetragen haben. Es wurden vergleichsweise hohe
CHAPTER 2
44
Verwandtschaftskoeffizienten bedeutender Bullen zu DSN-Kühen aus der höchsten und
mittleren Milchleistungsklasse berechnet, wohingegen die Verwandtschaftskoeffizienten
zwischen diesen Bullen und den DSN_90 %-Kühen der niedrigsten Milchleistungsklasse
geringer waren. Der Grund für diese geringeren Verwandtschaften ist eine weniger starke
Selektion auf Milchleistung, aber womöglich auch der verstärkte Einsatz von ungeprüften
Deckbullen.
Die durchschnittlichen Verwandtschaften innerhalb Leistungsgruppen
reflektieren auch auf der Ebene der Kuhpopulation den Selektionseffekt bzw. den Fokus
auf bestimmte Bullen und Bullenmütter (Abbildung 4). Mit zunehmendem
Leistungsniveau wurden höhere Verwandtschaften innerhalb der Tiergruppen
festgestellt. Insbesondere der Verwandtschaftskoeffizient von fast 10 % in der Kuhgruppe
mit dem höchsten Milchleistungsniveau ist durch die intensive Nutzung von wenigen sehr
guten Leistungsvererbern begründet. Pirchner et al. (2002) argumentierten ähnlich und
nannten eine verstärkte Selektion auf Milchleistung als Grund für höhere Inzuchtraten
beim Tiroler Grauvieh, was dementsprechend eine höhere mittlere Verwandtschaft
widerspiegelte.
Deutliche Unterschiede zwischen Verwandtschaften der aktiven DSN_90 %-
Kühe aus Herden der neuen Bundesländer verglichen mit aktiven DSN_90 %-Kühen der
alten Bundesländer lassen sich auf die Nutzung künstlicher Besamung, besonders in
Ostdeutschland, zurückführen. Insbesondere strikte Reinzucht und Minimierung des
Fremdgenanteils innerhalb der Ostbetriebe könnten Begründungen für diese
vergleichsweise hohe Verwandtschaft sein.
Generationsintervall, Inzuchtkoeffizient und effektive Populationsgröße
Die Generationsintervalle der DSN_90 % (5,9 Jahre) und HF_90 % (5,7 Jahre) auf dem
Kuhmutterpfad sind vergleichbar mit Werten für andere vom Aussterben bedrohte Rassen
wie dem Tiroler Grauvieh (5,7 %), aber auch größeren Populationen wie den Dänischen
Holsteins (4,6 %-5,0 %), den Dänischen Jerseys (4,7 %-5,2 %) und dem Dänischen
Rotvieh (4,8 % - 5,0 %) (Mészáros et al., 2015; Sørensen et al., 2005). Für kleine sowie
große Milchkuhpopulationen gelten somit auf dem Kuhmutterpfad der Selektion ähnliche
Selektionsstrategien und es ist auch fraglich, ob das Werkzeug der genomischen Selektion
diesbezüglich innerbetriebliche Veränderungen bewirken wird (König et al., 2018). Ein
überraschend geringes Generationsintervall von nur 4,9 Jahren ermittelten Ehling et al.
CHAPTER 2
45
(1999) für den DSN-Bestand in Mariensee. Im Rahmen eines Erhaltungszuchtprogramms
werden eher lange Generationsintervalle angestrebt, um den durchschnittlichen
Inzuchtzuwachs pro Jahr zu minimieren (Kehr et al., 2009).
Der kontinuierliche Anstieg der Inzuchtkoeffizienten im Jahresverlauf der DSN-Kühe
unterscheidet sich gravierend vom Inzuchtverlauf der DSN-Bullen. So ist der Peak im
Inzuchtkoeffizient für Bullen für das Geburtsjahr 2002 auf den starken Einsatz des DSN-
Vererbers Jochem zurückzuführen. Der hohe Inzuchtwert des Bullen Jochem (25,8 %),
welcher sich durch seine ingezüchteten Vorfahren begründet, stellt nur ein Beispiel des
von Biedermann et al. (2004) beschriebenen Flaschenhalseffektes auf paternaler Seite
dar. Weitere Bullen, die substanziell zur Inzuchtentwicklung innerhalb der DSN
beigetragen haben, waren Semper (1,7 %), Hermes (2,5 %) und Nimbus (3,4 %). Neben
Jochem fiel auch Renegat mit einem recht hohen Inzuchtkoeffizienten von 5 % auf. Auch
VanRaden und Smith (1999) berechneten Inzuchtkoeffizienten für einzelne HF-Bullen,
mit Maximalwerten von 7,9 % für To-Mar Blackstar und 7,7 % für R.O.R.A. Elevation.
Moderate Steigerungen der durchschnittlichen Inzuchtkoeffizienten der DSN-
Kühe der Geburtsjahre 1990 (1,2 %) bis 2015 (2,3 %) sind vergleichbar mit Werten für
DSN aus älteren Studien. So schätzten Ehling et al. (1999) für die DSN-Kühe in
Mariensee einen Inzuchtkoeffizienten von 1,27 % in 1995, welcher mit dem
Inzuchtkoeffizienten aller DSN_90 %-Kühe des Geburtsjahres 1995 (1,1 %) in Einklang
ist. Studien für amerikanische Holsteins zeigten einen vergleichbaren
Inzuchtkoeffizienten mit dem der DSN-Kühe für das Geburtsjahr 1999, aber wiesen ein
sehr viel höheres Inzuchtniveau für 2015 auf (CDCB, 2017). Dies könnten schon
Auswirkungen der genomischen Selektion, mit einer Fokussierung auf weitestgehend
identische HF-Genetik weltweit, sein.
Basierend auf der Inzuchtentwicklung fiel die effektive Populationsgröße der
DSN_90 % in 2011 mit 85 Tieren gering aus. König und Simianer (2006) berechneten in
1999 eine effektive Populationsgröße von 52 Tieren basierend auf der
Inzuchtentwicklung deutscher Holstein-Kühe. Medugorac et al. (2009) bewerteten die
effektive Populationsgröße von 142 Tieren bei Murnau-Werdenfelsern als kritisch, und
identifizierten als Gründe den Einsatz von nur drei Vaterlinien, umfassende künstliche
Besamung und wenig diversifizierte Zuchtprogramme. Hartwig und Bennewitz (2014)
hingegen beurteilten eine effektive Populationsgröße zwischen 50 und 100 Tieren
(basierend auf der Inzuchtentwicklung) als ausreichend genetisch divers. Laut der
CHAPTER 2
46
Bundesanstalt für Landwirtschaft und Ernährung (TGRDEU, 2018) ist eine Population
mit Ne< 200 Tieren (Ne-Berechnung basierend auf der Anzahl männlicher und weiblicher
Tiere) als stark existenzgefährdet einzustufen. Aktuelle Bestandszahlen der TGRDEU aus
2016 verzeichneten 71 DSN-Bullen und 2.847 DSN-Kühe (Ne= 277, basierend auf der
Anzahl männlicher und weiblicher Tiere). Es muss an dieser Stelle erwähnt werden, dass
effektive Populationskennzahlen, welche auf verschiedener Rechenmethodik basieren
(Inzuchtanstieg oder Geschlechterverhältnis), nicht unmittelbar miteinander vergleichbar
sind.
Auswirkungen von Inzucht auf Testtagsmerkmale
Heterogene Ergebnisse für den Einfluss der Inzuchtkoeffizienten auf die
Produktionsmerkmale Mkg und Fkg in den Rassen DSN_90 % und HF_90 % bedürfen
weiterer Studien. Jedoch fanden auch Smith et al. (1998) unterschiedliche
Inzuchtauswirkungen für verschiedene Produktions- und Exterieurmerkmale. Negative
Auswirkungen von Inzucht auf Mkg und Fkg in den ersten beiden Laktationen der
DSN_90 % sind in Einklang mit Ergebnissen von Croquet et al. (2006) für belgische
Holsteins. Am Beispiel amerikanischer Jerseys, die in etwa das Milchleistungsniveau der
DSN reflektieren, zeigten Thompson et al. (2000) und Cassell et al. (2002) ebenfalls
negative Inzuchteinflüsse auf Milchleistungsmerkmale.
Für das funktionale und niedrig erbliche Merkmal SCS fanden Thompson et al.
(2000) jedoch keinerlei Inzuchtdepressionen, was in der vorliegenden Studie durch die
Ergebnisse der DSN_90 % bestätigt wurde. Allerdings wurde ein Anstieg des SCS mit
zunehmender Inzucht bei HF_90 % beobachtet. Auch Miglior et al. (1995) berichteten
von erhöhten SCS von HF-Kühen mit hohen Inzuchtkoeffizienten. Sørensen et al. (2006)
begründeten höhere SCS-Werte durch geringere Mastitis-Resistenzen von stärker
ingezüchteten HF-Kühen. Die unterschiedlichen Auswirkungen von Inzucht beim
Vergleich HF_90 % mit DSN_90 % kann insbesondere beim Merkmal Zellzahl durch
unterschiedliche Selektionsstrategien begründet sein. Innerhalb der DSN-Rasse gibt es
nur wenige Vererber für hohe Zellzahlzuchtwerte, die gleichzeitig umfangreich eingesetzt
wurden. Insgesamt konnten nur wenig DSN_90 %-Kühe mit hohem Inzuchtniveau (≥ 10
%) identifiziert werden. Bei niedrigem Ausgangsniveau der Inzucht sind auch generell
weniger Inzuchtdepressionen zu erwarten. Dies ist vor dem Hintergrund zukünftiger
CHAPTER 2
47
Inzuchtentwicklungen und der Weiterentwicklung züchterischer Strategien für DSN als
überausaus positiv zu bewerten.
Schlussfolgerung
Eigene Berechnungen zu genetischen Rasseanteilen der DSN und HF zeigten, dass
überwiegend DSN-Tiere (Rassecode= 10) aus den alten Bundesländern über mehr als den
erlaubten HF-Fremdgenanteil von 10 % verfügten. So wurden in den Kalbejahren von
2005 bis 2016 insgesamt 46 % der Kühe fälschlicherweise der DSN-Rasse zugewiesen.
Dieses Ergebnis lässt deutliche Rückschlüsse auf unterschiedliche Zuchtstrategien in Ost-
und Westdeutschland zu, mit nur wenigen „reinen“ DSN-Zuchtbetrieben im Westen. Hier
überwogen Anpaarungen von HF-Bullen mit DSN-Kühen, wohingegen die untersuchten
Betriebe in den neuen Bundesländern strikte DSN-Reinzucht verfolgten. Bezüglich der
Verwandtschaftsstrukturen zeigten insbesondere höher leistende DSN-Milchkühe engere
Verwandtschaften zu bedeutenden DSN-Bullenlinien. Dies legt den Schluss nahe, dass
geprüfte und bekannte Milchmengenvererber über künstliche Besamung intensiv genutzt
wurden und niedrig leistende Herden doch verstärkt Natursprungbullen genutzt haben.
Obwohl die Inzuchtsteigerung für DSN_90 % von 2006 bis 2011 bei lediglich 0,1 % pro
Jahr lag, sollte sie zukünftig kritisch beobachtet werden. Eine aus dieser
Inzuchtsteigerung resultierende effektive Populationsgröße von nur 85 Tieren
unterstreicht die Notwendigkeit eines Monitorings der Rasse DSN oder weiterführend
den Einsatz von Anpaarungsprogrammen unter Berücksichtigung der Entwicklung von
Inzucht und Verwandtschaft. Für Milchleistungsmerkmale in der Frühlaktation konnten
keine ausgeprägten Inzuchtdepressionen, weder für DSN_90 % noch für HF_90 %,
nachgewiesen werden. Allgemein gingen höhere Inzuchtkoeffizienten mit einer
Steigerung der Milch- und Fettleistung in allen drei Laktationen für HF_90 % einher. Von
diesem Trend unterschieden sich die ersten beiden Laktationen der DSN_90 %, wo sich
die tägliche Milchleistung des ersten Testtags mit zunehmenden Inzuchtkoeffizienten
reduzierte. Demgegenüber stand ein geringfügiger Anstieg der täglichen Milchleistung
bei höheren Inzuchtkoeffizienten der DSN_90 % in der dritten Laktation. Steigende
Inzuchtkoeffizienten führten sogar zu verringerten somatischen Zellzahlen für DSN_90
% in der zweiten und dritten Laktation. Diese Ergebnisse widersprachen den
Entwicklungen der HF_90 %, wo mit steigender Inzucht erhöhte Zellzahlen in der
zweiten und dritten Laktation beobachtet wurden. An dieser Stelle bedarf es
CHAPTER 2
48
weiterführender vertiefender Analysen, um die unterschiedlichen Reaktionen zwischen
HF und DSN auf Inzucht genau erklären zu können. Es sind doch deutlich verschiedene
Rassen, da der Verwandtschaftskoeffizient zwischen HF und DSN nur 0,02 % beträgt.
CHAPTER 2
49
Literatur
Biedermann, G. 2003. Zuchtplanung für die Erhaltung des Alten Schwarzbunten
Niederungsrindes. Bundesprogramm ökologischer Landbau und andere Formen
nachhaltiger Landwirtschaft. Accessed 03.07.2017:
https://service.ble.de/ptdb/index2.php?detail_id=84928&site_key=141&stichw=sch
wrzbuntes+Niederungsrind&zeilenzahl_zaehler=3#newContent.
Biedermann, G., Ott, B., Rübesam, K. und Maus, F. 2004. Genetische Analyse der
Population des Vorderwälder Rindes. Archiv für Tierzucht, Dummersdorf 47: 141-
153.
Biedermann, G., Poppinga, O. und Weitmeyer, I. 2005. Die genetische Struktur der
Population des Schwarzbunten Niederungsrindes. Züchtungskunde 77: 3-14.
Brade, W. und Brade, E. 2013. Zuchtgeschichte der Deutschen Holsteinrinder. Zeitschrift
für Agrarpolitik und Landwirtschaft 91: 1-40.
Cassell, B.G., Adamec, V. und Pearson, R.E. 2002. Effect of incomplete pedigrees on
estimates of inbreeding and inbreeding depression for days to first service and summit
milk yield in Holsteins and Jerseys. Journal of Dairy Science 86: 2967-2976.
CDCB. 2017. Council on Dairy Cattle Breeding. Accessed 05.01. 2018:
https://queries.uscdcb.com/eval/summary/inbrd.cfm?R_Menu=HO#StartBody.
Coster, A. 2012. pedigree: Pedigree functions. R package version 1.4. https://CRAN.R-
project.org/package=pedigree.
Croquet, C., Mayeres, P., Gillon, A., Vanderick, S. und Gengler, N. 2006. Inbreeding
depression for global and partial economic indexes, Production type, and functional
traits. Journal of Dairy Science 89: 2257-67.
DeRose, M.A. and Roff, D.A. 1999. A comparison of inbreeding depression in life-
history and morphological traits in animals. Evolution; International Journal of
Organic Evolution. 53:1288–1292.
DHV. 2017. Mitgliederversammlung- Hinweise/ Regelungen zur Herdbucharbeit der
Rasse DSN. RBB.
Ehling, C., Schmidt, T. und Niemann, H. 1999. Untersuchungen zur genetischen Struktur
und Diversität der Genreserve Deutscher Schwarzbunter Rinder Alter Zuchtrichtung
in Niedersachsen. Züchtungskunde 71: 130–146.
Falconer, D.S. und Mackay, T.F.C. 1996. Introduction to Quantitative Genetics, 4th ed.
Longman Harlow, New York, NY.
CHAPTER 2
50
Gassan, M. 2017. RBB Rinderproduktion Berlin-Brandenburg GmbH. Accessed:
05.05.2017. http://www.rinderzucht-bb.de/de/zucht/dsn-genreserve/ .
Hartwig, S. und Bennewitz, J. 2014. Züchterische Aspekte zur Konsolidierung und
Weiterentwicklung lokaler Rinderpopulationen. Züchtungskunde 86: 19-24.
König, S. und Simianer, H. 2006. Approaches to the management of inbreeding and
relationship in the German Holstein dairy cattle population. Livestock Science 103:
40-53.
König, S., Klein, S. und Brügemann, K. 2018. Genomische Selektion: Internationale
Aktivitäten und internationaler Wettbewerb. 8. Rinder-Workshop Uelzen, DGfZ
Schriftenreihe 75: 132-141.
Kehr, C., Klunker, M. und Fischer, R. 2009. Monitoring genetischer Diversität-
Schriftenreihe des Landesamtes für Umwelt, Landwirtschaft und Geologie 1: 85-91.
Medugorac, I., Medugorac, A., Russ, I., Veit-Kensch, C., Taberlet, P., Luntz, B., Mix, H.
und Förster, M. 2009. Genetic diversity of european cattle breeds highlights the
conservation value of traditional unselected breeds with high effective population
size. Molecular Ecology 18: 3394-3410.
Mészáros, G., Boison, S., Pérez O’Brien, A.M., Ferenčaković, M., Curik, I., Barbosa Da
Silva, M., Utsunomiya, Y., Garcia J. und Sölkner, J. 2015. Genomic analysis for
managing small and endangered populations: a case study in Tyrol Grey cattle.
Frontiers in Genetics 6: 1-12.
Miglior, F., Burnside, E. und Dekkers, J.C.M. 1995. Nonadditive Genetic Effects and
Inbreeding Depression for Somatic Cell Counts of Holstein Cattle. Journal of Dairy
Science 78: 1168-1173.
Mügge, B., Lutz, W.E., Südbeck, H. und Zelfel, S. 1999. Deutsche Holsteins. Die
Geschichte einer Zucht. Verlag Eugen Ulmer.
Pirchner, F. 2002. Schätzung inzuchtwirksamer (effektiver) Populationsgrößen aus
Genfrequenzschwankungen bei Bayerischem Fleckvieh und Tiroler Grauvieh. Archiv
für Tierzucht, Dummerstorf 45: 331-339.
R Core Team. 2017. R: A language and environment for statistical computing. R
Foundation for Statistical Computing, Vienna, Austria. URL https://www.R-
project.org/.
CHAPTER 2
51
Sargolzaei, M., Iwaisaki, H. und Colleau, J.J. 2006. CFC - A Software Package for
Pedigree Analysis and Monitoring Genetic Diversity. User’s Manual. Release 1.0.
SAS Institute Inc. 2008. The Cluster Procedure. User’s Guide, 9.2, 1230.
Smith, L.A., Cassell, B.G. und Pearson, R.E. 1998. The effects of inbreeding on the
lifetime performance of dairy cattle. Journal of Dairy Science 81: 2729-37.
Sørensen, A.C., Sørensen, M.K. und Berg, P. 2005. Inbreeding in Danish dairy cattle
breeds. Journal of Dairy Science 88: 1865-72.
Sørensen, A.C., Madsen, P., Sørensen, M.K. und Berg, P. 2006. Udder Health Shows
Inbreeding Depression in Danish Holsteins. Journal of Dairy Science 89: 4077-82.
TGRDEU. 2018. Zentrale Dokumentation Tiergenetischer Ressourcen in Deutschland,
Bundesanstalt für Landwirtschaft und Ernährung. Accessed 08.01.2018:
https://tgrdeu.genres.de/.
Thompson, J.R., Everett, R.W. und Wolfe, C.W. 2000. Effects of inbreeding on
production and survival in Jerseys. Journal of Dairy Science 83: 2131-2138.
VanRaden, P.M. und Smith, L.A. 1999. Selection and mating considering expected
inbreeding of future progeny. Journal of Dairy Science 82: 2771–2778.
Wright, S. und McPhee, H.C. 1925. An approximate method of calculating coefficients
of inbreeding and relationship. Journal of Agricultural Research 31: 377–383.
Young, C.W. und Seykora, A.J. 1996. Estimates of inbreeding and relationship among
registered Holstein females in the United States. Journal of Dairy Science 79: 502-
505.
CHAPTER 2
52
CHAPTER 3
Associations between Precision Sensor Data with Subjectively Scored
Cattle Welfare Indicators, Test-Day Production, Health and Fertility
Traits in Native Black and White Dual-Purpose Cattle Kept in
Pasture-Based Production Systems
53
Introduction
With the abolition of the European Union milk quota system in April 2015 rose the
opportunity for dairy farms to expand, causing substantial structural changes in the dairy
sector (Klootwijk et al., 2016). Together with co-drivers such as technical change and
altering macroeconomic conditions, a steady herd-size evolution led to increasing dairy
cow numbers per herd (Huettel and Jongeneel, 2011). In Germany 2013, the average herd
size comprised 54 cows, but increased up to 64 cows per herd in 2017 (©DIALOG-
MILCH, 2018). As labour expenses are one major contributor to milk production costs in
industrialized countries, mechanization and precision management have been
progressively implemented, changing the daily work routine of farmers. However, due to
mass handling of large dairy cattle groups, only limited time is available for individual
animal welfare supervision.
From such a perspective, an alternative solution for subjective dairy cattle observation is
the establishment of precision dairy monitoring and managing techniques. Nowadays,
automatically assessing feeding, ruminating, activity, heat and calving behaviour, as well
as ruminal pH, reticular contraction, acoustics, progesterone, vaginal mucus electrical
resistance, surface temperature, respiration rate, heart rate measurement is possible. Next
to animal welfare aspects, dairy farmers have to meet extensive consumer demands,
which can be fulfilled by the usage of precision dairy farming (PDF): Continuous quality
control, natural pathogen-free food, prevention of zoonotic disease transmission and
minimizing medical treatment (Bewley et al., 2010). Additionally, data generated by PDF
can be used for future genetic evaluations for functional traits, in order to improve animal
health and thus longevity (Bewley et al., 2010). With increasing incidences of health
disorders and mortality rates from 2 to 3.5 % within the last 10 years, early identification
of distressed animals can improve animal welfare and helps to minimize costs (Thomsen
et al., 2004). In many cases, it is too late and very costly to take actions, by the time the
animal exhibits clinical signs of distress, as obvious clinical symptoms are usually the
consequence of preceding physiological disruptions, that are difficult to detect (e.g.
change in temperature, heart rate). Hence, with the recording of on-farm real time
behaviour/ health data, physiological changes may be noticed right at the beginning,
enabling an early intervention and thus, improving treatment efficiency (Bewley et al.,
2010).
CHAPTER 3
54
Ample evidence from experimental studies emphasizes the importance of modern farm
technology implementation. Quimby et al. (2001) showed, that measuring feeding time
at the feed bunk via radiofrequency technology contributed to the detection of morbid
beef cattle 4 days earlier than only visually monitoring animals by experienced farm staff.
Additionally, Dutta et al. (2015) described the possibilities of machine-learning
techniques, as collar systems (3-axis accelerometer) and magnetometers, accurately infer
and classify physical cow behaviour (ruminating, grazing, walking, searching, chewing
scratching/ grooming).
Especially daily behaviour such as rumination, eating and activity patterns are commonly
respected indicators, relating well to animal health (Bikker et al., 2014). Thus, automated
behaviour observation may provide a useful tool to monitor cattle, especially before the
time of calving, as various behavioural parameters (e.g. eating, ruminating) change within
the days prior to parturition (Rutten, 2017). The electronic behaviour ‘CowManager
SensOor system’ (Agis Automatisering BV, Harmelen, the Netherlands) promises real-
time quantification of (multi-point) ear temperature, ruminating and feeding behaviour,
as well as activity of milking cows. A literature overview, addressing validations of the
CowManager SensOor system, is given in Table 3. Sensors may be capable to detect
gradual changes in feeding, ruminating and activity, and they give early ‘health’ alerts.
Up to this point, various studies have been conducted on the subject of PDF in Holstein
Friesian (HF) herds. However, other cattle breeds, especially dual-purpose cattle, vary in
dry matter intake (DMI), milk production and composition, live weight, body
conformation and breed typical behaviour patterns from HF (Palladino et al., 2010).
Consequently, resilient dual-purpose cattle might react differently on environmental
stimuli. Typical breed behaviour patterns interacting with environmental influences
suggest a broad validation of sensor technology, i.e. additionally relating sensor data to
novel health and welfare indicator traits under grazing conditions.
To our knowledge, behaviour data recorded by sensor, has not yet been statistically
evaluated and put into relationship with conventional production or welfare assessment
traits, especially against the background of dual-purpose cattle kept in alternative outdoor
or grazing systems. Hence, the present study aims at identifying associations between
longitudinal sensor data recording for feeding, rumination, activity and sleeping/lying
behaviour as well as ear temperature with own subjective scores for welfare indicator
CHAPTER 3

55
traits. As a further challenge, novel trait recording under grazing conditions in local black
and white dual-purpose cattle (DSN) was conducted. Correlations between sensor traits
with productivity and novel welfare assessment traits are imperative when i) enhancing
DSN breeding goals via longitudinal sensor data, and ii) aiming on the optimisation of
preventive DSN health management in grazing systems.
CHAPTER 3
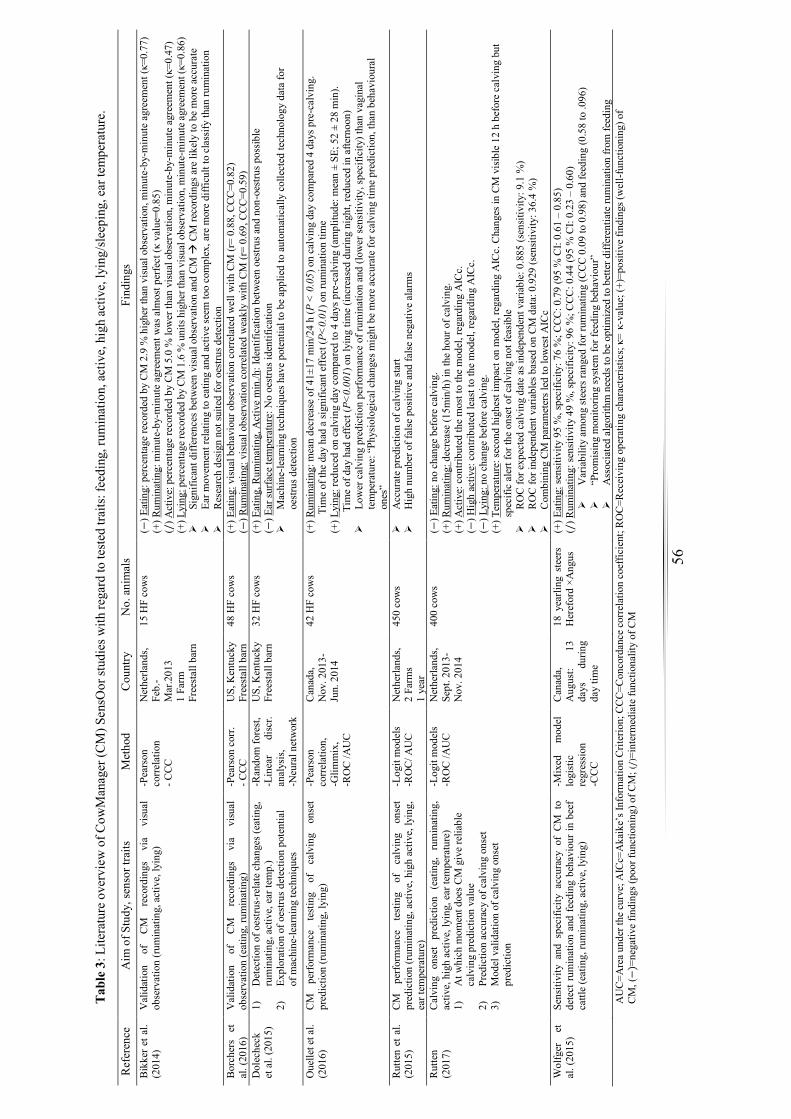
56
T
able
3: L
itera
ture
ove
rvie
w o
f Cow
Man
ager
(CM
) Sen
sOor
stud
ies w
ith re
gard
to te
sted
trai
ts: f
eedi
ng, r
umin
atio
n, a
ctiv
e, h
igh
activ
e, ly
ing/
slee
ping
, ear
tem
pera
ture
.
AU
C=A
rea
unde
r the
cur
ve; A
ICc=
Aka
ike’
s Inf
orm
atio
n C
riter
ion;
CC
C=C
onco
rdan
ce c
orre
latio
n co
effic
ient
; RO
C=R
ecei
ving
ope
ratin
g ch
arac
teris
tics;
κ= κ-
valu
e; (+
)=po
sitiv
e fin
ding
s (w
ell-f
unct
ioni
ng) o
f C
M, (
−)=
nega
tive
findi
ngs (
poor
func
tioni
ng) o
f CM
; (/
)=in
term
edia
te fu
nctio
nalit
y of
CM
Ref
eren
ce
Aim
of S
tudy
, sen
sor t
raits
M
etho
d C
ount
ry
No.
ani
mal
s Fi
ndin
gs
Bik
ker e
t al.
(201
4)
Val
idat
ion
of
CM
reco
rdin
gs
via
visu
al
obse
rvat
ion
(rum
inat
ing,
act
ive,
lyin
g)
-Pea
rson
co
rrela
tion
- CCC
Net
herla
nds,
Feb.
-M
ar.2
013
1 Fa
rm
Free
stal
l bar
n
15 H
F co
ws
(−
) Eat
ing:
per
cent
age
reco
rded
by
CM 2
.9 %
hig
her t
han
visu
al o
bser
vatio
n, m
inut
e-by
-min
ute
agre
emen
t (κ=
0.77
) (+
) Rum
inat
ing:
min
ute-
by-m
inut
e ag
reem
ent w
as a
lmos
t per
fect
(κ v
alue
=0.8
5)
(/) A
ctiv
e: p
erce
ntag
e re
cord
ed b
y C
M 5
.0 %
low
er th
an v
isual
obs
erva
tion,
min
ute-
by-m
inut
e ag
reem
ent (
κ=0.
47)
(+) L
ying
: per
cent
age r
ecor
ded
by C
M 1
.6 %
uni
ts hi
gher
than
visu
al o
bser
vatio
n, m
inut
e-m
inut
e agr
eem
ent (
κ=0.
86)
➢
Sign
ifica
nt d
iffer
ence
s bet
wee
n vi
sual
obs
erva
tion
and
CM →
CM
reco
rdin
gs a
re li
kely
to b
e m
ore
accu
rate
➢
Ea
r mov
emen
t rel
atin
g to
eat
ing
and
activ
e se
em to
o co
mpl
ex, a
re m
ore
diffi
cult
to c
lass
ify th
an ru
min
atio
n ➢
R
esea
rch
desi
gn n
ot su
ited
for o
estru
s det
ectio
n B
orch
ers
et
al. (
2016
) V
alid
atio
n of
CM
re
cord
ings
vi
a vi
sual
ob
serv
atio
n (e
atin
g, ru
min
atin
g)
-Pea
rson
cor
r. - C
CC
US,
Ken
tuck
y Fr
eest
all b
arn
48 H
F co
ws
(+) E
atin
g: v
isua
l beh
avio
ur o
bser
vatio
n co
rrela
ted
wel
l with
CM
(r=
0.88
, CCC
=0.8
2)
(−) R
umin
atin
g: v
isual
obs
erva
tion
corre
late
d w
eakl
y w
ith C
M (r
= 0.
69, C
CC=
0.59
) D
olec
heck
et
al.
(201
5)
1)
Det
ectio
n of
oes
trus-
rela
te c
hang
es (e
atin
g,
rum
inat
ing,
act
ive,
ear
tem
p.)
2)
Expl
orat
ion
of o
estru
s det
ectio
n po
tent
ial
of m
achi
ne-le
arni
ng te
chni
ques
-Ran
dom
fore
st,
-Lin
ear
disc
r. an
alys
is,
-Neu
ral n
etw
ork
US,
Ken
tuck
y Fr
eest
all b
arn
32 H
F co
ws
(+
) Eat
ing,
Rum
inat
ing,
Act
ive
min
./h: I
dent
ifica
tion
betw
een
oest
rus a
nd n
on-o
estru
s pos
sible
(−
) Ear
surfa
ce te
mpe
ratu
re: N
o oe
stru
s ide
ntifi
catio
n
➢
Mac
hine
-lear
ning
tech
niqu
es h
ave
pote
ntia
l to
be a
pplie
d to
aut
omat
ical
ly c
olle
cted
tech
nolo
gy d
ata
for
oest
rus d
etec
tion
Oue
llet e
t al.
(201
6)
CM
pe
rform
ance
te
stin
g of
ca
lvin
g on
set
pred
ictio
n (ru
min
atin
g, ly
ing)
-P
ears
on
corre
latio
n,
-Glim
mix
, -R
OC
/AU
C
Can
ada,
N
ov. 2
013-
Ju
n. 2
014
42 H
F co
ws
(+
) Rum
inat
ing:
mea
n de
crea
se o
f 41±
17 m
in/2
4 h
(P <
0.0
5) o
n ca
lvin
g da
y co
mpa
red
4 da
ys p
re-c
alvi
ng.
T
ime
of th
e da
y ha
d a
sign
ifica
nt e
ffec
t (P<
0.01
) on
rum
inat
ion
time
(+
) Lyi
ng: r
educ
ed o
n ca
lvin
g da
y co
mpa
red
to 4
day
s pre
-cal
ving
(am
plitu
de: m
ean
± SE
; 52
± 28
min
).
T
ime
of d
ay h
ad e
ffect
(P<0
.001
) on
lyin
g tim
e (in
crea
sed
durin
g ni
ght,
redu
ced
in a
ftern
oon)
➢
Lo
wer
cal
ving
pre
dict
ion
perfo
rman
ce o
f rum
inat
ion
and
(low
er s
ensi
tivity
, spe
cific
ity) t
han
vagi
nal
tem
pera
ture
: “Ph
ysio
logi
cal c
hang
es m
ight
be
mor
e ac
cura
te fo
r cal
ving
tim
e pr
edic
tion,
than
beh
avio
ural
on
es”
R
utte
n et
al.
(201
5)
CM
pe
rform
ance
te
stin
g of
ca
lvin
g on
set
pred
ictio
n (ru
min
atin
g, a
ctiv
e, h
igh
activ
e, ly
ing,
ea
r tem
pera
ture
)
-Log
it m
odel
s -R
OC
/ AU
C
Net
herla
nds,
2
Farm
s 1
year
450
cow
s ➢
A
ccur
ate
pred
ictio
n of
cal
ving
star
t ➢
H
igh
num
ber o
f fal
se p
ositi
ve a
nd fa
lse n
egat
ive
alar
ms
Rut
ten
(201
7)
Cal
ving
on
set
pred
ictio
n (e
atin
g,
rum
inat
ing,
ac
tive,
hig
h ac
tive,
lyin
g, e
ar te
mpe
ratu
re)
1)
At w
hich
mom
ent d
oes C
M g
ive
relia
ble
calv
ing
pred
ictio
n va
lue
2)
Pred
ictio
n ac
cura
cy o
f cal
ving
ons
et
3)
Mod
el v
alid
atio
n of
cal
ving
ons
et
pred
ictio
n
-Log
it m
odel
s -R
OC
/AU
C
Net
herla
nds,
Sept
. 201
3-
Nov
. 201
4
400
cow
s (−
) Eat
ing:
no
chan
ge b
efor
e ca
lvin
g.
(+) R
umin
atin
g: d
ecre
ase
(15m
in/h
) in
the
hour
of c
alvi
ng.
(+) A
ctiv
e: c
ontri
bute
d th
e m
ost t
o th
e m
odel
, reg
ardi
ng A
ICc.
(−
) Hig
h ac
tive:
con
tribu
ted
leas
t to
the
mod
el, r
egar
ding
AIC
c.
(−) L
ying
: no
chan
ge b
efor
e ca
lvin
g.
(+) T
empe
ratu
re: s
econ
d hi
ghes
t im
pact
on
mod
el, r
egar
ding
AIC
c. C
hang
es in
CM
vis
ible
12
h be
fore
cal
ving
but
sp
ecifi
c al
ert f
or th
e on
set o
f cal
ving
not
feas
ible
➢
R
OC
for e
xpec
ted
calv
ing
date
as i
ndep
ende
nt v
aria
ble:
0.8
85 (s
ensit
ivity
: 9.1
%)
➢
RO
C fo
r ind
epen
dent
var
iabl
es b
ased
on
CM d
ata:
0.9
29 (s
ensit
ivity
: 36.
4 %
) ➢
C
ombi
ning
CM
par
amet
ers l
ed to
low
est A
ICc
W
olfg
er
et
al. (
2015
) Se
nsiti
vity
and
spe
cific
ity a
ccur
acy
of C
M t
o de
tect
rum
inat
ion
and
feed
ing
beha
viou
r in
beef
ca
ttle
(eat
ing,
rum
inat
ing,
act
ive,
lyin
g)
-Mix
ed
mod
el
logi
stic
re
gres
sion
-C
CC
Can
ada,
A
ugus
t: 13
da
ys
durin
g da
y tim
e
18 y
earli
ng s
teer
s H
eref
ord
×Ang
us
(+) E
atin
g: se
nsiti
vity
95
%, s
peci
ficity
: 76
%; C
CC: 0
.79
(95
% C
I: 0.
61 –
0.8
5)
(/) R
umin
atin
g: se
nsiti
vity
49
%, s
peci
ficity
: 96
%; C
CC: 0
.44
(95
% C
I: 0.
23 –
0.6
0)
➢
Var
iabi
lity
amon
g st
eers
rang
ed fo
r rum
inat
ing
(CCC
0.0
9 to
0.9
8) a
nd fe
edin
g (0
.58
to .0
96)
➢
“Pro
mis
ing
mon
itorin
g sy
stem
for f
eedi
ng b
ehav
iour
” ➢
A
ssoc
iate
d al
gorit
hm n
eeds
to b
e op
timiz
ed to
bet
ter d
iffer
entia
te ru
min
atio
n fro
m fe
edin
g
57
Materials and Methods
Welfare assessment and temperament trait recording
The study included 118 DSN cows from parities one to four, kept on an organic research
farm in Hessen, Germany. The grazing season ranged from the beginning of April until
the end of November, with a daily pasture access of 6 hours. A weather station, belonging
to the research farm, recorded daily temperature and humidity on an hourly basis.
Subjective recording of welfare assessment traits (WAT) included body condition score
(BCS: scale 1= emaciated to 5= obese) (Spengler Neff et al., 2015), locomotion score
(LS: scale 1= normal to 5= severely lame) (Zinpro Corporation, 2018), and hygiene scores
for the udder (UHS: scale 1= clean to 5= manure encrusted) and for legs (LHS: scale 1=
clean to 5= manure encrusted) (Reneau et al., 2005). The same trained observer recorded
all traits five times, beginning in April 2016 until May 2017. In total, 451 observations
were available for data processing. A trained person recorded temperament traits
according to Juga (1996) of 67 DSN cows twice (July 2016 and May 2017). In this regard,
general temperament (GT) during milking (scale: 1= nervous to 5= calm), aggressiveness
(AGG) towards herd mates (scale: 1= aggressive; 0= untroubled) and intra herd rank order
(IHRO) (scale: 1= submissive; 2= medium rank; 3= dominant) were recorded. In the
following, GT, AGG and IHRO are defined as temperament traits.
Sensor trait recording
The automated CowManager technology (by Agis Automatisering BV) was chosen due
to its practicability and broad pattern of longitudinal trait recording (Bikker et al., 2002).
Previous sensor studies stated the device’s high value and contribution to research (Table
3). In order to generate a longitudinal data structure of electronically recorded behaviour
traits, 49 DSN cows were equipped with sensors. The sensor was implemented at least 2
days prior to the expected calving date. Once implemented into the cow’s left ear, the
sensor system uses a 3-dimentional accelerometer (attached to radio frequency
identification tag) to match records of every minute to five behaviour categories
(rumination= RUM, feeding= FEED, sleeping/lying/ not active= NA, moderate activity=
ACT, high activity= HA). Besides behaviour recordings, the sensor uses a digital surface
temperature monitor to measure the mean hourly ear surface temperature (ET). While the
CHAPTER 3
58
system detects RUM based on the typical repetitive ear movements caused by the
animal’s chewing and regurgitation, FEED relates to the cow’s food intake expressed
through masticatory movement. The activity parameters are subcategorized into basic
ACT, HA and no activity NA. The state of ACT describes any kind of moderate ear
movements resulting from walking, head shaking etc., that cannot be associated with the
repetitive ear movements during rumination or feeding. High activity implies increased
ACT, which in most cases is elevated prior to parturition or during oestrus, including
mounting behaviour. No activity refers to a minimum or no ear movement while the cow
sleeps or rests (usually when lying down). The hourly percentage for all sensor traits is
transmitted through a wireless connection to a router within the stable. Consequently,
whenever the sensor records a certain behaviour such as RUM, it does not assign this time
to another behaviour trait (e.g. NA), implying collinearity for the sensor traits.
Data processing and statistical analysis
Outlier removal for sensor traits included daily mean values that were smaller than 5 %
or larger than 90 %, applying the UNIVARIATE procedure of JMP (SAS Institute Inc.,
2008). For ET, reasonable records ranged between > 5 °C and < 40 °C. Daily temperature
and humidity records from the on-farm weather station were merged with daily sensor
records. In a second step, the daily mean of each sensor trait was merged with test-day
traits for milk yield (Mkg), fat yield (Fkg), somatic cell score (SCS) and somatic cell
count (SCC), and with the WAT from the same date. Pearson correlation coefficients
were calculated among sensor traits, and between WAT and temperament traits, applying
the CORR procedure of SAS. Furthermore, mixed model analysis (as implemented in the
SAS MIXED procedure) was applied to infer associations between sensor, test-day traits
and WAT.
The first mixed model (1) was defined to analyse the influence of sensor traits on
production traits (i.e., the sensor trait was the explanatory categorical fixed effect). Model
(1) was chosen, because our intention was to test if sensor trait behaviour thresholds can
explain variation in cow productivity.
1) yijklmn = µ + CSi + Lnoj + DIMk + Al + ET*Tempm + Sn + eijklmn
CHAPTER 3

59
The second model (2) was a recursive model in analogy to model (1), i.e., analysing the
influence of production traits on sensor traits (i.e., the production trait category was the
explanatory categorical fixed effect). The reason behind this modelling was to get deeper
insight into behaviour patterns, depending on production levels. Norring et al. (2012)
identified a strong impact of milk yield on lying and feeding behaviour in Ayrshire cows.
Hence, model (2) was defined to study those associations in dual-purpose cows under
grazing conditions. Model (2) was:
2) yijklm = µ + Lnoi + DIMj + Ak + ET*Templ + Pm + eijklm
In the third model (3), the influence of sensor traits on WAT (i.e., the sensor trait was the
explanatory categorical fixed effect) was investigated. It was hypothesised that certain
sensor behaviours may directly be linked to the body condition, hygiene or locomotion
of cows. Knowledge of such associations is imperative when using sensor traits as
possible indicators for energy efficiency (e.g. BCS), health (e.g. locomotion) or welfare
traits (e.g. hygiene scores) in selection index calculations when defining overall breeding
goals. Model (3) was:
3) yijkl = µ + Lnoi + DIMj + Ak + Sl + eijkl
where, yijklmn was the observation for production traits (Mkg, Fkg) of test-day records;
yijklm was the observation for sensor traits (RUM, FEED, ACT, HA, NA, ET); yijkl was
the observation for WAT (LS, BCS, UHS, LHS); CSi was the fixed effect for calving
season (April-November, December-March); Lnoj and Lnoi were the fixed effects for
parity classes (1-4), DIMj and DIMk were the fixed effects of days in milk classes (9
classes: 1-50 d, 50-100 d, until 250-300 d, 300-400 d, 400-500 d, >500 d); DIMj in model
(3) was the fixed effect of days in milk at the WAT recording date (3 classes: 0-50 d, 50-
150 d, >150 d); Al and Ak were random cow effects; ET*Tempm and ET*Templ were
combined fixed effects of ET and the outside temperature; Sn and Sl were the fixed effects
for the daily mean of sensor traits (NA in %/d: <22, 22-28, >28 or FEED in %/d: <17,
17-23, >23 or RUM in %/d: <37, 37-41, >41; ACT in %/d: <6, 6-8, >8; HA in %/d: <6,
6-8, >8); Pm was the fixed effect of production trait classes (Mkg: <15, 15-17, 17-20, 20-
25, 25-30, >30, or SCC*1000: <50 , 50-100, 100-150, 150-200, 200-250, 250-300, 300-
350, 350-450, 450-550, 550-700, >700); eijklmn, eijklm and eijkl were the random residual
effects. When modelling the impact of production traits on sensor traits, of sensor traits
CHAPTER 3
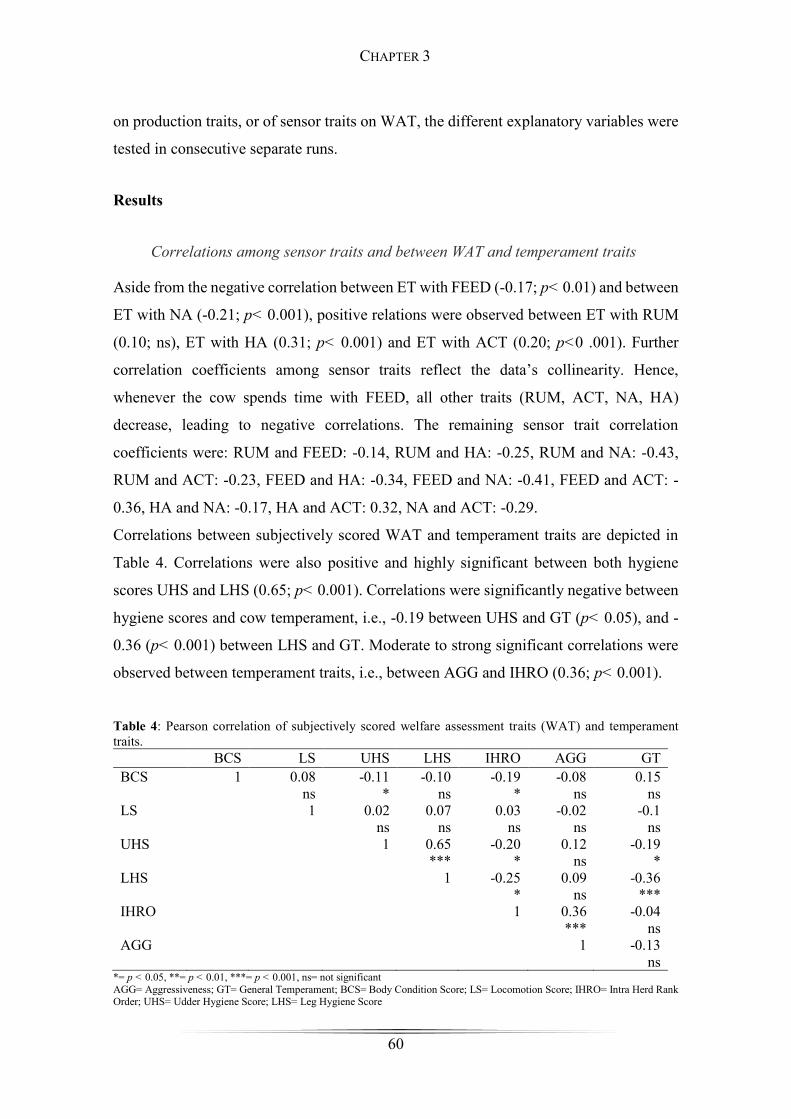
60
on production traits, or of sensor traits on WAT, the different explanatory variables were
tested in consecutive separate runs.
Results
Correlations among sensor traits and between WAT and temperament traits
Aside from the negative correlation between ET with FEED (-0.17; p< 0.01) and between
ET with NA (-0.21; p< 0.001), positive relations were observed between ET with RUM
(0.10; ns), ET with HA (0.31; p< 0.001) and ET with ACT (0.20; p<0 .001). Further
correlation coefficients among sensor traits reflect the data’s collinearity. Hence,
whenever the cow spends time with FEED, all other traits (RUM, ACT, NA, HA)
decrease, leading to negative correlations. The remaining sensor trait correlation
coefficients were: RUM and FEED: -0.14, RUM and HA: -0.25, RUM and NA: -0.43,
RUM and ACT: -0.23, FEED and HA: -0.34, FEED and NA: -0.41, FEED and ACT: -
0.36, HA and NA: -0.17, HA and ACT: 0.32, NA and ACT: -0.29.
Correlations between subjectively scored WAT and temperament traits are depicted in
Table 4. Correlations were also positive and highly significant between both hygiene
scores UHS and LHS (0.65; p< 0.001). Correlations were significantly negative between
hygiene scores and cow temperament, i.e., -0.19 between UHS and GT (p< 0.05), and -
0.36 (p< 0.001) between LHS and GT. Moderate to strong significant correlations were
observed between temperament traits, i.e., between AGG and IHRO (0.36; p< 0.001).
Table 4: Pearson correlation of subjectively scored welfare assessment traits (WAT) and temperament traits.
BCS LS UHS LHS IHRO AGG GT BCS 1 0.08
ns -0.11
* -0.10
ns -0.19
* -0.08
ns 0.15
ns LS
1 0.02
ns 0.07
ns 0.03
ns -0.02
ns -0.1
ns UHS
1 0.65
*** -0.20
* 0.12
ns -0.19
* LHS
1 -0.25
* 0.09
ns -0.36
*** IHRO
1 0.36
*** -0.04
ns AGG
1 -0.13
ns *= p < 0.05, **= p < 0.01, ***= p < 0.001, ns= not significant AGG= Aggressiveness; GT= General Temperament; BCS= Body Condition Score; LS= Locomotion Score; IHRO= Intra Herd Rank Order; UHS= Udder Hygiene Score; LHS= Leg Hygiene Score
CHAPTER 3
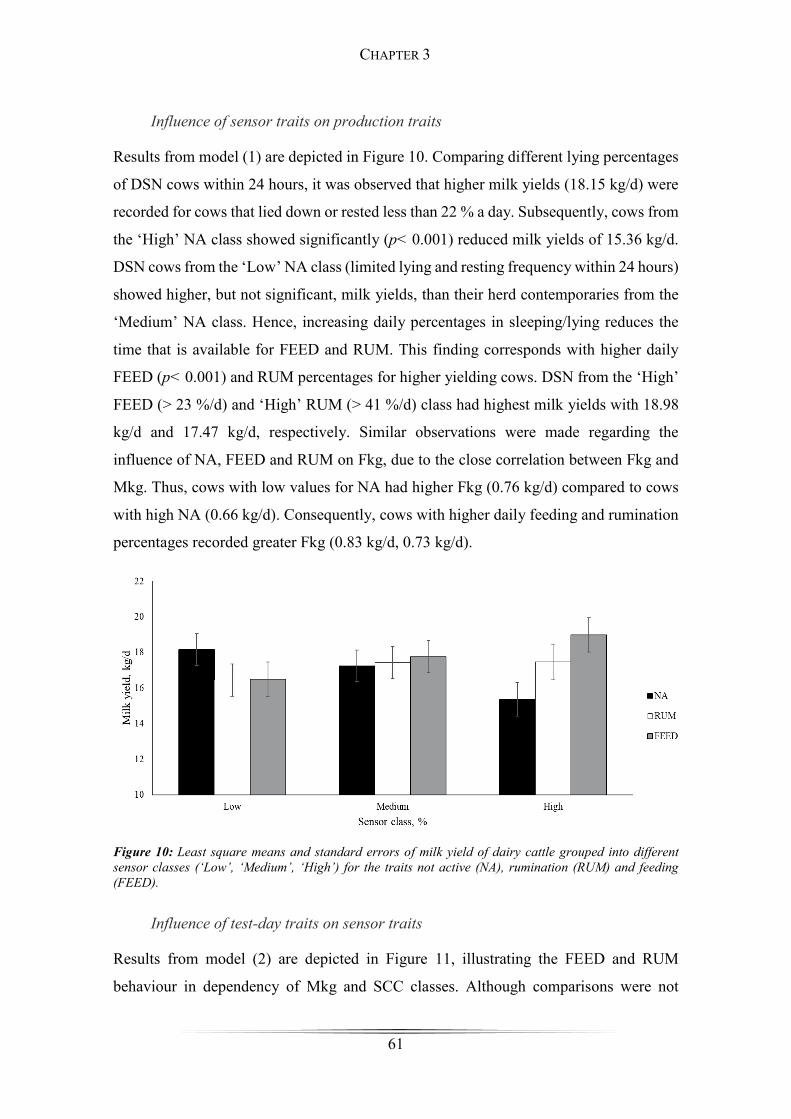
61
Influence of sensor traits on production traits
Results from model (1) are depicted in Figure 10. Comparing different lying percentages
of DSN cows within 24 hours, it was observed that higher milk yields (18.15 kg/d) were
recorded for cows that lied down or rested less than 22 % a day. Subsequently, cows from
the ‘High’ NA class showed significantly (p< 0.001) reduced milk yields of 15.36 kg/d.
DSN cows from the ‘Low’ NA class (limited lying and resting frequency within 24 hours)
showed higher, but not significant, milk yields, than their herd contemporaries from the
‘Medium’ NA class. Hence, increasing daily percentages in sleeping/lying reduces the
time that is available for FEED and RUM. This finding corresponds with higher daily
FEED (p< 0.001) and RUM percentages for higher yielding cows. DSN from the ‘High’
FEED (> 23 %/d) and ‘High’ RUM (> 41 %/d) class had highest milk yields with 18.98
kg/d and 17.47 kg/d, respectively. Similar observations were made regarding the
influence of NA, FEED and RUM on Fkg, due to the close correlation between Fkg and
Mkg. Thus, cows with low values for NA had higher Fkg (0.76 kg/d) compared to cows
with high NA (0.66 kg/d). Consequently, cows with higher daily feeding and rumination
percentages recorded greater Fkg (0.83 kg/d, 0.73 kg/d).
Figure 10: Least square means and standard errors of milk yield of dairy cattle grouped into different sensor classes (‘Low’, ‘Medium’, ‘High’) for the traits not active (NA), rumination (RUM) and feeding (FEED).
Influence of test-day traits on sensor traits
Results from model (2) are depicted in Figure 11, illustrating the FEED and RUM
behaviour in dependency of Mkg and SCC classes. Although comparisons were not
CHAPTER 3
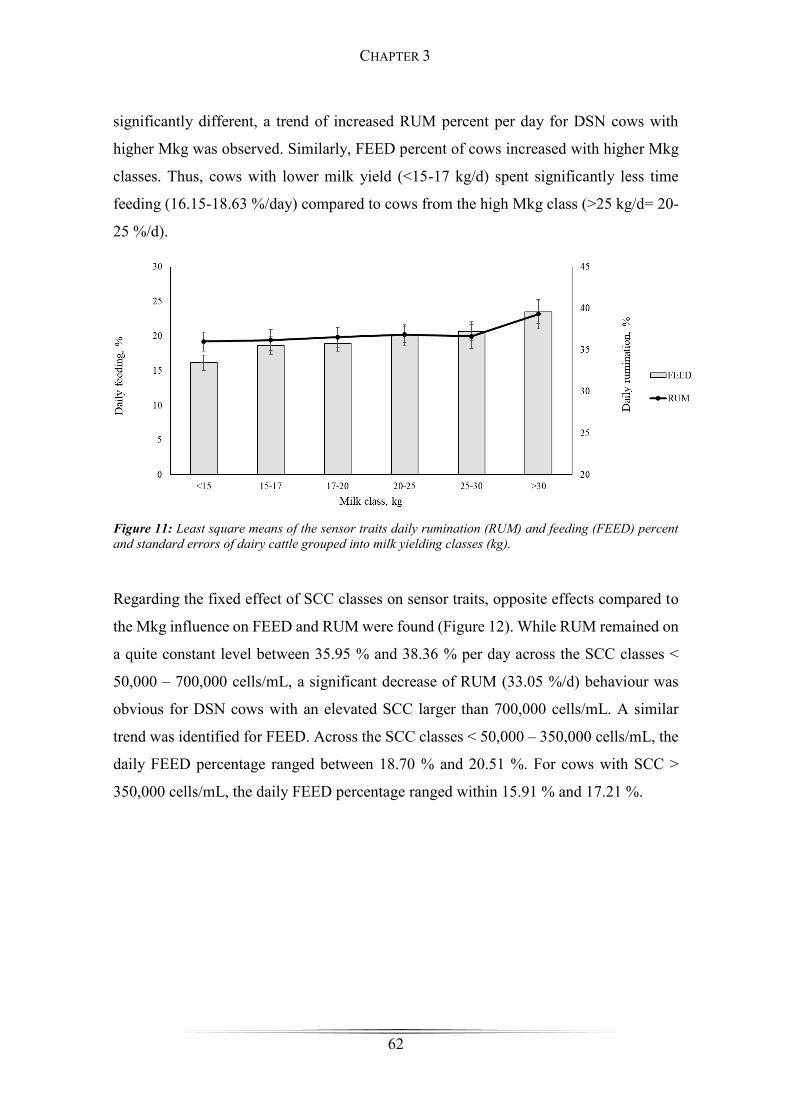
62
significantly different, a trend of increased RUM percent per day for DSN cows with
higher Mkg was observed. Similarly, FEED percent of cows increased with higher Mkg
classes. Thus, cows with lower milk yield (<15-17 kg/d) spent significantly less time
feeding (16.15-18.63 %/day) compared to cows from the high Mkg class (>25 kg/d= 20-
25 %/d).
Figure 11: Least square means of the sensor traits daily rumination (RUM) and feeding (FEED) percent and standard errors of dairy cattle grouped into milk yielding classes (kg).
Regarding the fixed effect of SCC classes on sensor traits, opposite effects compared to
the Mkg influence on FEED and RUM were found (Figure 12). While RUM remained on
a quite constant level between 35.95 % and 38.36 % per day across the SCC classes <
50,000 – 700,000 cells/mL, a significant decrease of RUM (33.05 %/d) behaviour was
obvious for DSN cows with an elevated SCC larger than 700,000 cells/mL. A similar
trend was identified for FEED. Across the SCC classes < 50,000 – 350,000 cells/mL, the
daily FEED percentage ranged between 18.70 % and 20.51 %. For cows with SCC >
350,000 cells/mL, the daily FEED percentage ranged within 15.91 % and 17.21 %.
CHAPTER 3
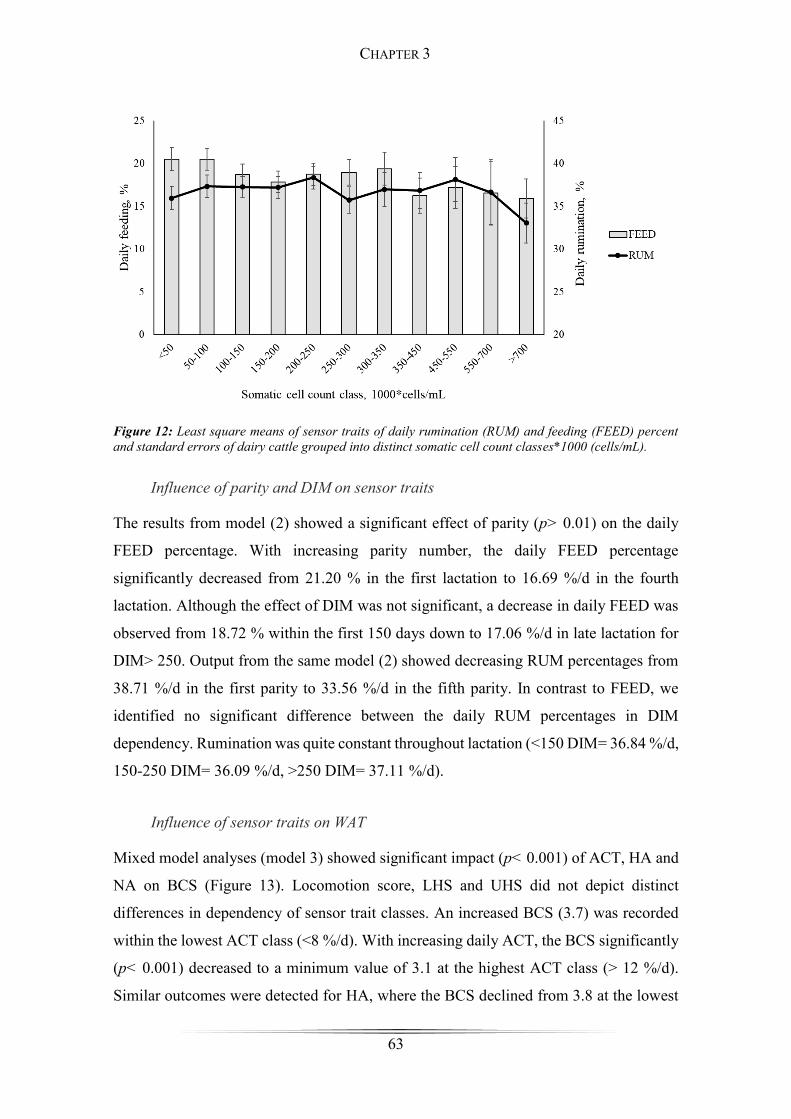
63
Figure 12: Least square means of sensor traits of daily rumination (RUM) and feeding (FEED) percent and standard errors of dairy cattle grouped into distinct somatic cell count classes*1000 (cells/mL).
Influence of parity and DIM on sensor traits
The results from model (2) showed a significant effect of parity (p> 0.01) on the daily
FEED percentage. With increasing parity number, the daily FEED percentage
significantly decreased from 21.20 % in the first lactation to 16.69 %/d in the fourth
lactation. Although the effect of DIM was not significant, a decrease in daily FEED was
observed from 18.72 % within the first 150 days down to 17.06 %/d in late lactation for
DIM> 250. Output from the same model (2) showed decreasing RUM percentages from
38.71 %/d in the first parity to 33.56 %/d in the fifth parity. In contrast to FEED, we
identified no significant difference between the daily RUM percentages in DIM
dependency. Rumination was quite constant throughout lactation (<150 DIM= 36.84 %/d,
150-250 DIM= 36.09 %/d, >250 DIM= 37.11 %/d).
Influence of sensor traits on WAT
Mixed model analyses (model 3) showed significant impact (p< 0.001) of ACT, HA and
NA on BCS (Figure 13). Locomotion score, LHS and UHS did not depict distinct
differences in dependency of sensor trait classes. An increased BCS (3.7) was recorded
within the lowest ACT class (<8 %/d). With increasing daily ACT, the BCS significantly
(p< 0.001) decreased to a minimum value of 3.1 at the highest ACT class (> 12 %/d).
Similar outcomes were detected for HA, where the BCS declined from 3.8 at the lowest
CHAPTER 3
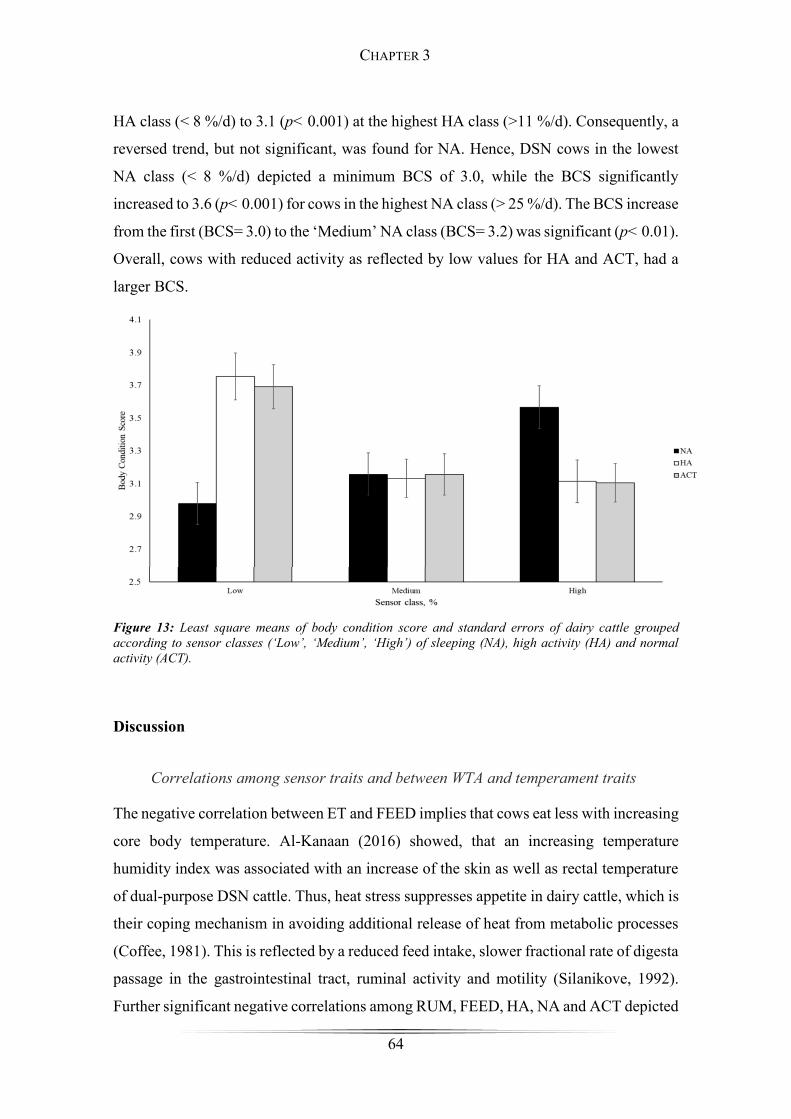
64
HA class (< 8 %/d) to 3.1 (p< 0.001) at the highest HA class (>11 %/d). Consequently, a
reversed trend, but not significant, was found for NA. Hence, DSN cows in the lowest
NA class (< 8 %/d) depicted a minimum BCS of 3.0, while the BCS significantly
increased to 3.6 (p< 0.001) for cows in the highest NA class (> 25 %/d). The BCS increase
from the first (BCS= 3.0) to the ‘Medium’ NA class (BCS= 3.2) was significant (p< 0.01).
Overall, cows with reduced activity as reflected by low values for HA and ACT, had a
larger BCS.
Figure 13: Least square means of body condition score and standard errors of dairy cattle grouped according to sensor classes (‘Low’, ‘Medium’, ‘High’) of sleeping (NA), high activity (HA) and normal activity (ACT).
Discussion
Correlations among sensor traits and between WTA and temperament traits
The negative correlation between ET and FEED implies that cows eat less with increasing
core body temperature. Al-Kanaan (2016) showed, that an increasing temperature
humidity index was associated with an increase of the skin as well as rectal temperature
of dual-purpose DSN cattle. Thus, heat stress suppresses appetite in dairy cattle, which is
their coping mechanism in avoiding additional release of heat from metabolic processes
(Coffee, 1981). This is reflected by a reduced feed intake, slower fractional rate of digesta
passage in the gastrointestinal tract, ruminal activity and motility (Silanikove, 1992).
Further significant negative correlations among RUM, FEED, HA, NA and ACT depicted
CHAPTER 3
65
the associations of behaviour traits among each other, due to the recording mechanism of
the sensor. As the system only assigns one activity at a time, the percentage of the
remaining four activities decreases (auto-correlated effect).
Noteworthy, significant correlations between LHS and UHS corroborated well with
significant associations between udder and lower leg hygiene as described by Reneau et
al. (2005). Moreover, moderate negative correlations between UHS with IHRO (-0.20;
p< 0.05), and between LHS with IHRO (-0.25; p< 0.05) indicate that dominant cows are
less dirty around legs and udder than submissive cows from the same herd. One possible
explanation could be that lower ranking cows are left to use the least desirable places in
the barn, which often show faecal contamination. In comparison, dominant cows occupy
cleaner lying areas within the barn (Friend and Polan, 1974). Additionally, it was shown
that submissive cows spent more time looking for bunk space during feeding and rested
less, as they were chased away by dominant cows more often (Lamb, 1975). Prolonged
time spent in the alleyways might contribute to increased udder and leg contamination of
submissive cows as well. A moderate positive significant correlation between AGG and
IHRO appeared reasonable, as particularly aggressive behaviour of dairy cattle
determines the social rank in a herd (Lamb, 1975). Moderate negative correlations
between UHS with GT, and between LHS with GT, indicate that calmer cows were less
contaminated than nervous cattle. It can be argued that nervous animals were possibly
hypersensitive to stress, leading to rapid movement through the barn, causing splashes
which contaminate their udder and legs. Bartussek et al. (2002) linked cleanliness of the
barn and of the cows directly to cow welfare, as it reflects the extent with which the
stockman meets his responsibility for providing a well-managed housing environment
and preventing damage and stress to the animals.
Influence of sensor traits on production traits
The different percentages DSN cows spend resting within 24 hours indicated that long
resting periods reduce the time that is available for FEED and RUM, which in turn affects
milk yield. Dual-purpose cows with large daily FEED and RUM percentages showed
highest levels of milk and fat yields (p< 0.001). In support of our findings, Soriani et al.
(2013) described positive relations between rumination time and milk yield as well.
Moallem et al. (2010) observed, that a depression of rumination time led to a reduction
CHAPTER 3
66
of DMI, followed by a decline in milk yield. Azizi et al. (2009) pointed out the importance
of feed intake of dairy cows in order to maintain a high milk production level and recorded
significant differences in DMI (meal sizes) between milking groups. Cows with high milk
yield ate approximately 1.2 kg dry matter per meal more than cows in low production
classes, while the feeding rate of multiparous cows exceeded the feeding rate of
primiparous cows by 30 g DM/min. The results clearly state differences between sensor
behaviour regarding FEED and RUM, that allow predicting a cow’s production level.
Moreover, changes in FEED and RUM behaviour can be used to identify distressed and
sick cows more easily. The clear relation between a dual-purpose cow’s production level
and her daily behaviour pattern, suggests utilisation of the sensor system as a suitable
early alert system for detecting physiological changes.
Influence of Mkg on sensor traits
The effect of production level on sensor traits (Figure 11) revealed, that DSN cattle in the
highest milk yielding class (> 30 kg/d) recorded maximum RUM percentages (39.31
%/d). Stone et al. (2017) also corroborated positive associations between milk yield and
rumination time in Holstein, Jersey and crossbreds (Holstein x Jersey). They argued that
with increasing milk production, higher feed intake is required, implying increasing
rumination times. In the present study, DSN cows with milk yields < 15 kg/d showed a
minimum daily RUM of 35.99 %. While RUM remained steady between 36.17-36.83
%/d, it rapidly increased, once DSN cows passed the threshold of milking 30 kg/d (RUM=
39.31 %). In dairy breeds, a broad range for rumination duration per day has been
reported. Braun et al. (2015) described daily rumination times of 368 ± 54 minutes
(~25.52 %/d) for Brown Swiss cattle with a daily milk yield of 28.4 ± 2.9 kg at 4.4 years
of age and 12.5 weeks postpartum. In contrast to this grazing-system research, it was a
study conducted in an indoor system. In the indoor system, hay was available ad libitum
during the day; corn silage was fed several times during the day and concentrate rations
depended on the level of production. DeVries et al. (2009) reported an average rumination
time of 555 min/d (~38.5 % RUM) in mid-lactating HF cows fed a 60:40
forage:concentrate ratio at a milk production level between 34-40 kg/d. Hence, HF
demonstrated a much higher production level, but rumination times were similar in
comparison to DSN. Apart from physiological breed differences, these discrepancies may
be due to varying feeding regimes (DSN: grazing, HF: indoor system). Dado and Allen
CHAPTER 3
67
(1996) found that a 10 % increase of natural detergent fibre prolonged rumination by 130
min/d. The DSN cows from our study were fed roughage and grass silage without
receiving concentrates. The higher percentage of roughage and natural detergent fibre in
the ratio might explain the increased daily RUM percentages in DSN. The slight increase
in RUM beyond 250 DIM from 36.48 % to 37.6 % is in agreement with results by Miguel-
Pacheco et al. (2014).
A similar trend to RUM was delineated for FEED in relation to different milk yield classes
(Figure 11). Daily FEED significantly differed (p< 0.001) between the lowest and the
highest milk yield class, confirming increasing feed intake with increasing milk
production (Stone et al., 2017). In general, the feeding percentage for DSN was slightly
lower than for HF. For example, DeVries et al. (2009) assigned 395 min of daily feeding
time (~27.4 %) for Holstein cattle. In contrast, Braun et al. (2015) recorded similar ranges
of feeding times for HF (206-207 min/d; ~14.3 %-21.3 %), Brown Swiss (262-338 min/d;
~ 18.7-23.43 %) and Swiss Fleckvieh (207-309 min/d; 14.4-21.4 %). As a corollary, it
can be stated that the sensor system detected small differences in the daily FEED and
RUM behaviour of dual-purpose cows, kept in pasture-based production systems,
compared to indoor managed Holstein cattle. These distinctions are most likely due to
differences in the physiology of dual-purpose and high yielding breeds regarding their
metabolism and energy requirements, as well as due to variation in feeding and
management.
Influence of SCC on sensor traits
Figure 12 illustrates the physiological impact of the udder health indicator SCC on DSN
FEED and RUM behaviour. A significant difference (p< 0.05) in FEED and RUM
behaviour was found between DSN cows with 200,000-250,000 cells/mL and cows with
>700,000 cells/mL. In the study by Soriani et al. (2012), a five percent drop in daily
rumination was due to fever caused by (sub-) clinical mastitis. Soriani et al. (2012)
determined reduced rumen contractions as typical signs of clinical mastitis in dairy cattle.
Chapinal et al. (2014) used rumination behaviour as an on-farm management tool for
mastitis treatment efficacy monitoring. Also, for DSN kept in the grazing system, we
found associations between SCC levels and daily FEED time (Figure 12). Feeding varied
between 20.51 %/d and 17.85 %/d for SCC levels up to 350,000 cells/mL. A substantial
CHAPTER 3
68
drop in daily FEED down to 16.24 %/d at 350,000-450,000 cells/mL might explain the
physiological (sub-) clinical mastitis response. Significant differences (p< 0.05) for
FEED between the SCC classes (<50,000 cells/mL and 150,000-200,000 cells/mL,
<50,000 cells/mL and >700,000 cells/mL, 50,000-100,000 cells/mL and 150,000-200,000
cells/mL, <50,000-100,000 cells/mL and >700,000 cells/mL) underline the assumption
of changing physiological behaviour. Noteworthy physiological changes in RUM and
FEED were identified for elevated SCC levels at 350,000-550,000 cells/ mL. A relatively
late physiological response of RUM to higher SCC might be due to the relation between
immune competence and immunoregulators (Wellnitz et al., 2010). Wellnitz et al. (2010)
concluded, that also very low SCC impaired the immune competence of udder quarters.
Distinct relationships between the udder indicator trait SCC and daily behaviour were
observed, i.e., a clear endogenous defence reaction towards a disease was reflected by
sensor traits. A significant decrease in FEED was detected at a SCC threshold of 350,000
cells/ mL. For RUM, the reaction to increased SCC required a higher threshold, implying
that FEED is more sensitive to diseases as RUM. Distressed DSN cows decrease their
feed intake earlier than showing an obvious RUM response. Especially the sensor trait
FEED might be a suitable indicator trait that can be considered as an early warning alert
for mastitis under grazing conditions.
Influence of parity and DIM on sensor traits
Daily RUM percentages decreased with increasing parity number. RUM decreased from
38.71 %/d in the first parity to 33.56 %/d in the fifth parity. Similarly, FEED decreased
from 21.2 %/d in the first parity to16.69 %/d in the fourth parity. One possible explanation
could be that cows in higher lactations feed more efficiently, which means they realize a
higher DMI in less time. In this regard, Azizi et al. (2009) described the “adaptation”
potential of cows to increase DMI while reducing their overall feeding time. Dado and
Allen (1996) related varying feeding rates to differences in body weight, energy demand
for lactation and increased rumen fill of primiparous cows. In contrast to our results,
Soriani et al. (2012) identified increasing rumination with increasing parities. Generally,
pluriparous Holstein dairy cattle show higher levels of daily rumination than primiparous
cows. Opposite results in our study might be due to breed differences or due to the specific
grazing environment.
CHAPTER 3
69
A significant FEED difference (p< 0.05) was observed between DIM. The highest FEED
(18.91 %/d) during 150-250 DIM decreased to 17.06 %/d with DIM >250. The FEED
decrease by DIM can be explained with the basic physiological processes underlying the
lactation curve. For example, Norring et al. (2012) related changes in feeding behaviour
to decreasing energy requirements due the milk yield decline. Applying the sensor
technology allows further cow management optimisations, concerning the impact of
parity and lactation stage on dual-purpose FEED and RUM behaviour. Such sensor
information supports the farmer to individually adjust the management and feeding
regime to lactating cows. Thus, also the sensor trait variations suggest grouping DSN
cows according to their lactation number, production level or lactation stage, to better
meet their energy requirements.
Influence of sensor traits on WAT
Sensor traits were weakly related with UHS, LHS and LS. An increase of LS, reflecting
lame cows, did not result in significantly decreased ACT, HA or increased NA. This
implies, that claw diseases in dual-purpose DSN are unlikely to be detected by sensor at
an early stage. This might be a particularity of the cow friendly grazing environment.
Also, from the background of a grazing environment, increased daily activity or lying
periods did not significantly affect the leg or udder cleanliness of DSN cows. High BCS
were recorded for cows with reduced daily ACT and ‘High’ NA (Figure 13).
Subsequently, these cows spent more time resting, than with FEED or RUM. We showed
that high-yielding cows spent more time feeding and ruminating than being inactive. In
consequence, these cows had a lower BCS, due to their extensive fat mobilization to
maintain enough energy for a higher milk production. In contrast, low yielding cows do
not spend as much time feeding and ruminating, but resting, revealing a higher BCS. This
leads to the classification of two general cow types within the research herd: One group
spends more time feeding, ruminating and being active with a generally lower BCS, and
a second group with increased BCS but reduced activity, feeding, rumination and lower
milk yield. Roche et al. (2009) corroborated these findings, implying that body condition
loss correlated positively with cow activity and peak milk yield. Garnsworthy and Topps
(1982) analysed the effect of disparate calving BCS on milk production, feed intake and
early lactation BCS change. They identified a negative effect of calving BCS on milk
yield, with leaner cows producing more milk, because of a larger DMI. Reduced feeding
CHAPTER 3
70
activity could also be a consequence of over conditioning (Garnsworthy and Topps,
1982). Hence, the sensor trait ACT can be associated with BCS.
Conclusion
The behavioural observations via visual observation as well as via innovative sensor
technology contributed to a better understanding of dual-purpose cow behaviour under
grazing conditions. Hence, automatically recorded longitudinal sensor traits can be used
to improve grazing cow management and preventive health management. In this regard,
cows with increased daily feed intake and rumination showed lower SCC. Moreover, it
was demonstrated that feeding could be used as an indicator trait for early mastitis
detection as a decrease of daily feeding percent was already noticeable at 350,000
cells/mL. Changes in rumination were also detected in case of mastitis, however here a
much higher SCC threshold of 700,000 cells/mL was required, making this trait less
sensitive to mastitis infection than feeding. Furthermore, an increase in daily resting
indicated a lower milk yield production while high daily rumination and feeding
percentages were associated with a high milk production potential in DSN. The sensor
behaviour data also offered valuable insights to energy requirements in dual-purpose
cows within different parity and lactation stages. Although net energy lactation in dual-
purpose cows may not be as high as for Holstein Friesian cows, significant differences in
feeding time per day were found for high milk yielding DSN cows. For the welfare
assessment traits, a relation between BCS and the DSN daily activity was observed, while
no distinct interrelations were found between sensor traits and hygiene scores or
locomotion.
CHAPTER 3
71
References
Al-Kanaan, J. 2016. Heat stress response for physiological traits in dairy and dual-
purpose cattle populations on phenotypic and genetic scales. Dissertation,
Witzenhausen.https://www.researchgate.net/publication/295931900_Heat_stress_res
ponse_for_physiological_traits_in_dairy_and_dual_purpose_cattle_populations_on_
phenotypic_and_genetic_scales
Azizi, O., Kaufmann, O. and Hasselmann, L. 2009. Relationship between feeding
behaviour and feed intake of dairy cows depending on their parity and milk yield.
Livestock Science 122:156–161. https://doi.org/10.1016/j.livsci.2008.08.009.
Bewley, J. M., Boyce, R.E., Hockin, J., Munksgaard, L., Eicher, S.D., Einstein, M.E. and
Schutz, M.M. 2010. Influence of milk yield, stage of lactation, and body condition on
dairy cattle lying behaviour measured using an automated activity monitoring sensor.
The Journal of Dairy Research 77:1–6. https://doi.org/10.1017/S0022029909990227.
Bikker, J.P., van Laar, H., Rump, P., Doorenbos, J., van Meurs, K., Griffioen, G.M. and
Dijkstra, J. 2014. Technical note: Evaluation of an ear-attached movement sensor to
record cow feeding behavior and activity. Journal of Dairy Science 97:2974–2979.
https://doi.org/10.3168/jds.2013-7560.
Braun, U., Zürcher, S. and Hässig, M. 2015. Eating and rumination activity in 10 cows
over 10 days. Research in Veterinary Science 101:196–198.
https://doi.org/10.1016/j.rvsc.2015.05.001.
Chapinal, N., Fitzpatrick, C.E., Leslie, K.E. and Wagner, S.A. 2014. Short
Communication: Automated assessment of the effect of flunixin meglumine on
rumination in dairy cows with endotoxin-induced mastitis. Canadian Journal of
Animal Science 94:21–25. https://doi.org/10.4141/cjas2013-071.
Coffee, L. 1981. Effect of environment on nutrient requirements of domestic animals.
National Academy Press, Washington D.C.
DeVries, T.J., Beauchemin, K.A., Dohme, F. and Schwartzkopf-Genswein, K.S. 2009.
Repeated ruminal acidosis challenges in lactating dairy cows at high and low risk for
developing acidosis: feeding, ruminating, and lying behavior. Journal of Dairy Science
92 :5067–5078. https://doi.org/10.3168/jds.2009-2102.
DIALOG-MILCH. 2018. Auch 2017 verringert sich die Zahl der Milchviehbetriebe in
Deutschland. Accessed in 20.06.2018: https://www.dialog-milch.de/auch-2017-
verringert-sich-die-zahl-der-milchviehbetriebe-in-deutschland/.
CHAPTER 3
72
Dutta, R., Smith, D., Rawnsley, R., Bishop-Hurley, G., Hills, J., Timms, G. and Henry,
D. 2015. Dynamic cattle behavioural classification using supervised ensemble
classifiers. Computers and Electronics in Agriculture 111:18–28.
https://doi.org/10.1016/j.compag.2014.12.002.
Friend, T.H., and Polan, C.E. 1974. Social Rank, Feeding Behavior, and Free Stall
Utilization by Dairy Cattle. Journal of Dairy Science 57:1214–1220.
https://doi.org/10.3168/jds.S0022-0302(74)85040-X.
Huettel, S. and Jongeneel, R. 2011. How has the EU milk quota affected patterns of herd-
size change? European Review of Agricultural Economics 38:497–527.
https://doi.org/10.1093/erae/jbq050.
Juga, J. 1996. Evaluation methods of subjectively scored functional traits in Finland.
Interbull Bull. 14: 155–160.
Klootwijk, C.W., van Middelaar, C.E., Berentsen, P.B.M. and de Boer, I.J.M. 2016.
Dutch dairy farms after milk quota abolition: Economic and environmental
consequences of a new manure policy. Journal of Dairy Science 99:8384–8396.
https://doi.org/10.3168/jds.2015-10781.
Lamb, R.C. 1975. Relationship Between Cow Behavior Patterns and Management
Systems to Reduce Stress. Journal of Dairy Science 59: 1630-1636.
https://doi.org/10.3168/jds.S0022-0302(76)84416-5
Miguel-Pacheco, G.G., Kaler, J., Remnant, J., Cheyne, L., Abbott, C., French, A.P.,
Pridmore, T.P. and Huxley, J.N. 2014. Behavioural changes in dairy cows with
lameness in an automatic milking system. Applied Animal Behaviour Science 150:1–
8. https://doi.org/10.1016/j.applanim.2013.11.003.
Norring, M., Valros, A. and Munksgaard, L. 2012. Milk yield affects time budget of dairy
cows in tie-stalls. Journal of Dairy Science 95:102–108.
https://doi.org/10.3168/jds.2010-3458.
Quimby, W.F., Sowell, B.F., Bowman, J.G.P., Branine, M.E., Hubbert, M.E. and
Sherwood, H.W. 2001. Application of feeding behaviour to predict morbidity of newly
received calves in a commercial feedlot. Canadian Journal of Animal Science 81:315–
320. https://doi.org/10.4141/A00-098.
Reneau, J.K., Seykora, A.J., Heins, B.J., Endres, M.I., Farnsworth, R.J. and Bey, R.F.
2005. Association between hygiene scores and somatic cell scores in dairy cattle.
CHAPTER 3
73
Journal of the American Veterinary Medical Association 227:1297–1301.
https://doi.org/10.2460/javma.2005.227.1297.
Roche, J.R., Friggens, N.C., Kay, J.K., Fisher, M.W., Stafford, K.J. and Berry, D.P. 2009.
Invited review: Body condition score and its association with dairy cow productivity,
health, and welfare. Journal of Dairy Science 92:5769–5801.
https://doi.org/10.3168/jds.2009-2431.
Rutten, C.J. 2017. Sensor data on cow activity, rumination, and ear temperature improve
prediction of the start of calving in dairy cows. Computers and Electronics in
Agriculture 132:108–118. https://doi.org/10.1016/j.compag.2016.11.009.
Silanikove, N. 1992. Effects of water scarcity and hot environment on appetite and
digestion in ruminants: A review. Livestock Production Science 30:175–194.
https://doi.org/10.1016/0301-6226(92)90068-F.
Soriani, N., Panella, G. and Calamari, L. 2013. Rumination time during the summer
season and its relationships with metabolic conditions and milk production. Journal of
Dairy Science 96:5082–5094. https://doi.org/10.3168/jds.2013-6620.
Soriani, N., Trevisi, E. and Calamari, L. 2012. Relationships between rumination time,
metabolic conditions, and health status in dairy cows during the transition period.
Journal of Animal Science 90:4544–4554. https://doi.org/10.2527/jas.2011-5064.
Spengler Neff, A., Notz, C., Ivemeyer, S. and Walkenhorst, M. 2015. FiBL: Body
Condition Scoring. Accessed in 03.04.2017: https://shop.fibl.org/CHde/1650-
bsc.html?ref=1.
Stone, A.E., Jones, B.W., Becker, C.A. and Bewley, J.M. 2017. Influence of breed, milk
yield, and temperature-humidity index on dairy cow lying time, neck activity,
reticulorumen temperature, and rumination behavior. Journal of Dairy Science
100:2395–2403. https://doi.org/10.3168/jds.2016-11607.
Thomsen, P.T., Kjeldsen, A.M., Sørensen, J.T. and Houe, H. 2004. Mortality (including
euthanasia) among Danish dairy cows (1990-2001). Preventive veterinary medicine
62:19–33. https://doi.org/10.1016/j.prevetmed.2003.09.002.
Wellnitz, O., Baumert, A., Saudenowa, M. and Bruckmaier, R.M. 2010. Immune
response of bovine milk somatic cells to endotoxin in healthy quarters with normal
and very low cell counts. The Journal of Dairy Research 77:452–459.
https://doi.org/10.1017/S0022029910000348.
Zinpro Corporation. Accessed in 20.06.2018.: http://www.zinpro.com/lameness/dairy.
CHAPTER 3
74
CHAPTER 4
Multi-Breed GWAS for Electronically Recorded Cattle Behaviour
Traits
75
Introduction
The fundamental interest of dairy farmers and breeders lies within understanding the role
genetics play in the expression of animal behaviour and how it affects their productivity.
Behaviour can be described as an essential part of biological regulations and as an integral
effect influencing animal production and welfare. A better understanding of genetic
animal behaviour mechanisms allows selection of dual-purpose cattle, which are well
adapted to current and future production systems or which show an improved feeding
behaviour (e.g. higher dry matter intake). Furthermore, welfare aspects can be derived
from cattle behaviour. Hohenboken (1986) listed traits of cattle, which are known to be
partly under genetic control, such as feeding, reproduction, social interaction and
temperament. Additional findings about ruminants revealed, that a proportion of variation
in foraging behaviour is genetically inherited (Launchbaugh et al., 1999; Snowder et al.,
2001). This enables a selection for behavioural attributes, associated with feed intake.
Next to feeding, rumination time and number of rumination intervals are considered novel
traits, which are associated with milk yield and butterfat production.
Schutz and Pajor (2001) discovered substantial variation in behavioural traits, which in
many cases, were favourably correlated with production traits. Although a better
knowledge about how traits influence dairy cattle habits may be of high economic value,
little is known about the genetic control of their expression (Schutz and Pajor, 2001). In
general, cattle behaviour traits are considered low to moderate inheritable, with
heritabilities ranging from 0.01 to 0.44 (Løvendahl and Munksgaard, 2016; Byskov et al.,
2017). Furthermore, quantifiable phenotype data and single nucleotide polymorphism
(SNP) marker information is required, to implement genome-wide association studies
(GWAS) and to unravel genetic architecture of complex traits, that are involved in cattle
behaviour.
Currently, the status of cattle breeding on a molecular level, regarding behaviour traits, is
at its very beginning. So far, no candidate genes were significantly associated with cattle
behaviour traits. This emphasizes the complex underlying genetic as well as molecular
basis of quantitative traits, the importance of environmental effects and the need for broad
phenotypic data recording, characterizing the behaviour (Schutz and Pajor, 2001).
Although, understanding the genetic background of cattle is desirable, in order to improve
CHAPTER 4
76
animal wellbeing and production, published studies suggesting genes, that affect cattle
temperament, feeding and reproductive behaviour are scarce (Adamczyk et al., 2013).
Alam et al. (2012) proposed, the polymorphism of bovine neuropeptide Y5 receptor gene
(NPY5R) might potentially modify the action of neuropeptide Y and affect the regulation
of appetite and feeding behaviour in beef cattle. Results generated from Korean Hanwoo
cattle corroborated similar findings on the polymorphism of the melanocortin 4 receptor
gene (MC4R), affecting feed intake capacity and feeding behaviour (Seong et al., 2012).
Since the beginning of animal husbandry, the influence of domestication and
implementation of breeding programs led to extensive linkage disequilibrium (LD) within
the bovine genome (e.g. LD> 0.3 at 250 kb). Consequently, confidence intervals of the
significant SNP are long, indicating the difficulty of precisely mapping potential
candidate genes (Raven et al., 2014). Raven et al. (2014) hypothesized, that less LD across
bovine breeds and thus, a multi-breed GWAS could more accurately pinpoint the location
of well-described mutations. By including different breeds, LD over short distances (5-
10 kb for Bos taurus) rather than long-range LD could be conserved (De Roos et al., 2008;
Raven et al., 2014). In other words, the SNP would have to be located in close proximity
to the quantitative trait loci (QTL), in order to have an effect across multiple breeds. This
way, effects, associated with SNPs, are less likely to derive from relationship within a
breed and are rather due to LD with the QTL (Habier et al., 2010; Roos et al., 2008). This
phenomenon is well exploited in refining QTL regions in dogs to a range of ~100 kb,
which only contain limited candidate genes (Sutter, 2004). First, a dog breed with
extensive LD is used to identify QTL, in a second step, multiple dog breeds and dense
SNP typing are used to precisely map causal variants (Raven et al., 2014; Sutter, 2004).
De Roos et al. (2008) requested, that around 300,000 SNPs should be included to keep
the persistence of LD between divergent breeds, such as Angus and Jersey. Hence, for
QTL, that segregate in multiple breeds, multi-breed GWAS could result in more precise
mapping, while within breed analysis contributes to a better detection power of identified
QTL (Raven et al., 2014). In addition to a higher GWAS resolution, a multi-breed GWAS
is likely to identify older, conserved mutations, but may fail to effectively detect recently
diverged mutations (Raven et al., 2014). As the aim of this study is, to investigate the
CHAPTER 4
77
cause of genetics in basic bovine habits, a multi-breed GWAS seems to be the appropriate
method to pursue.
The current study is based on multiple-breed genomic SNP data from four countries
(Germany, Poland, Slovenia, Switzerland), including five different dual-purpose cattle
breeds. This is the first study conducting a multi-breed GWAS on continuously recorded
24 h behaviour data of loose-housed dual-purpose cattle. The overall assumption is, that
intensively recorded longitudinal electronically data of basic cow behaviour (feeding,
ruminating, resting, activity, high activity) and ear temperature across different herds
might reveal associated makers within the bovine genome. Thus, it is hypothesized, that
it is very much likely, that dual-purpose breeds share ancestral mutations and
recombination events can be used to map QTL to a smaller genomic interval and to
identify significant SNPs. In this regard, Gutiérrez-Gil et al. (2015) have shown, that in
many cases selection signatures are also shared by breeds with different production
characteristics. These may be regions of interest in relation to metabolic homeostasis, or
other general traits, such as disease resistance and behaviour (Gutiérrez-Gil et al., 2015).
The objectives of this study were i) to identify the ancestry via allele sharing distances
and to cluster European dual-purpose and dairy cattle breeds into groups; ii) to estimate
genetic parameters for behaviour traits, based on pedigree and genomic information; and
iii) to detect associated SNPs and potential candidate genes, underlying general cattle
behaviour across different European dual-purpose breeds.
Materials and Methods
Phenotypes
Phenotypic records of five dual-purpose cattle breeds from Germany (DE_DSN= black
and white dual-purpose cattle), Poland (PL_BS= Brown Swiss, PL_HF= Holstein
Friesian), Slovenia (Sl_BS= Brown Swiss, Sl_Si= Simmental) and Switzerland
(CH_OBS= dual-purpose original Brown Swiss, CH_Si= Simmental) were combined, in
order to perform a multi-breed GWAS (Table 5). In Germany and Poland animals
originated only from one research farm. The Slovenian data was recorded at three farms
and in Switzerland, animals came from one original Brown Swiss herd and from one
Simmental herd, located at another research farm. All farms can be characterized as
CHAPTER 4
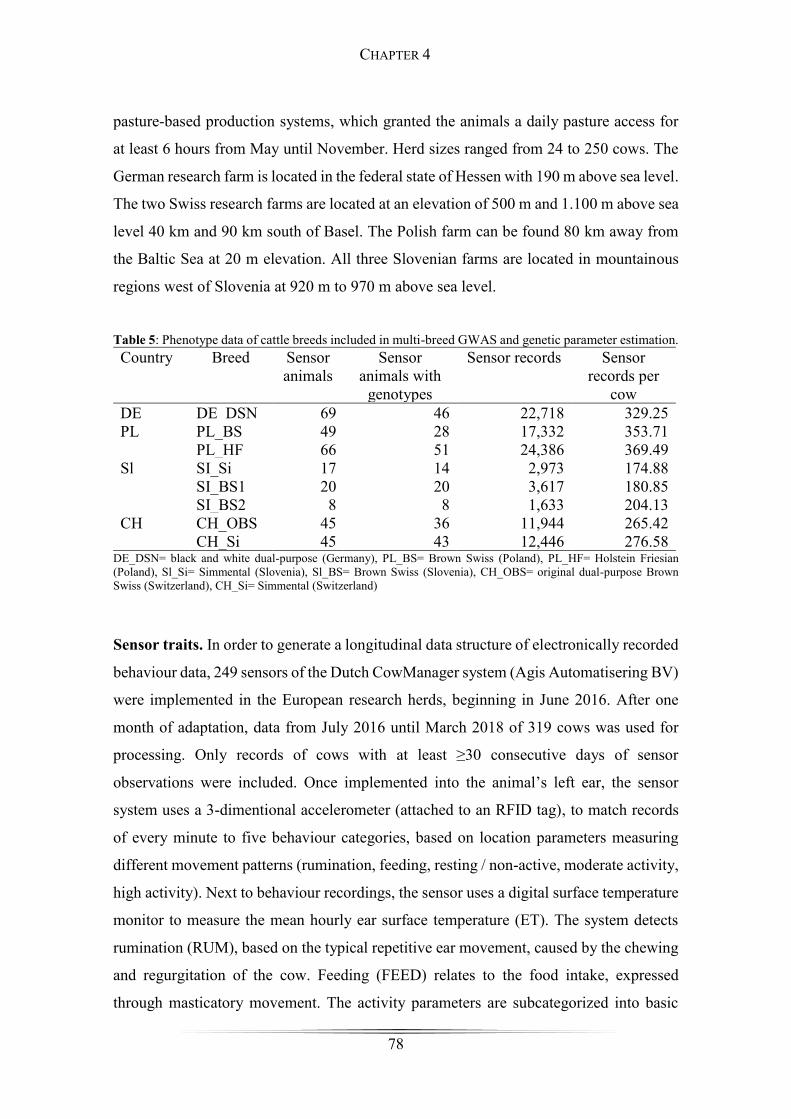
78
pasture-based production systems, which granted the animals a daily pasture access for
at least 6 hours from May until November. Herd sizes ranged from 24 to 250 cows. The
German research farm is located in the federal state of Hessen with 190 m above sea level.
The two Swiss research farms are located at an elevation of 500 m and 1.100 m above sea
level 40 km and 90 km south of Basel. The Polish farm can be found 80 km away from
the Baltic Sea at 20 m elevation. All three Slovenian farms are located in mountainous
regions west of Slovenia at 920 m to 970 m above sea level.
Table 5: Phenotype data of cattle breeds included in multi-breed GWAS and genetic parameter estimation. Country Breed Sensor
animals Sensor
animals with genotypes
Sensor records Sensor records per
cow DE DE_DSN 69 46 22,718 329.25 PL PL_BS 49 28 17,332 353.71
PL_HF 66 51 24,386 369.49 Sl SI_Si 17 14 2,973 174.88
SI_BS1 20 20 3,617 180.85 SI_BS2 8 8 1,633 204.13
CH CH_OBS 45 36 11,944 265.42 CH_Si 45 43 12,446 276.58
DE_DSN= black and white dual-purpose (Germany), PL_BS= Brown Swiss (Poland), PL_HF= Holstein Friesian (Poland), Sl_Si= Simmental (Slovenia), Sl_BS= Brown Swiss (Slovenia), CH_OBS= original dual-purpose Brown Swiss (Switzerland), CH_Si= Simmental (Switzerland)
Sensor traits. In order to generate a longitudinal data structure of electronically recorded
behaviour data, 249 sensors of the Dutch CowManager system (Agis Automatisering BV)
were implemented in the European research herds, beginning in June 2016. After one
month of adaptation, data from July 2016 until March 2018 of 319 cows was used for
processing. Only records of cows with at least ≥30 consecutive days of sensor
observations were included. Once implemented into the animal’s left ear, the sensor
system uses a 3-dimentional accelerometer (attached to an RFID tag), to match records
of every minute to five behaviour categories, based on location parameters measuring
different movement patterns (rumination, feeding, resting / non-active, moderate activity,
high activity). Next to behaviour recordings, the sensor uses a digital surface temperature
monitor to measure the mean hourly ear surface temperature (ET). The system detects
rumination (RUM), based on the typical repetitive ear movement, caused by the chewing
and regurgitation of the cow. Feeding (FEED) relates to the food intake, expressed
through masticatory movement. The activity parameters are subcategorized into basic
CHAPTER 4
79
activity (ACT), high activity (HA) and no activity (NA). The state of ACT describes any
kind of moderate ear movement resulting from walking, head shaking or other, that cannot
be associated with the repetitive ear movement during RUM or FED. High activity (HA)
results from increased ACT, that in most instances is elevated prior to parturition or
during oestrus, including mounting behaviour. No activity refers to a minimum or no ear
movement, while the cow sleeps or rests. The hourly percentage of time spent for every
behaviour is transmitted through a wireless connection to a router within the stable and at
the end the hourly percentages were further transformed to daily time percentages.
Whenever the sensor records a certain behaviour such as RUM, it does not assign this
time to another behaviour trait (e.g. NA) (Agis Automatisering BV, Harmelen, the
Netherlands). Additionally, to evaluate the five sensor behaviour categories, two more
were formed: index (I) and index class (IC). The index was formed according to the
welfare quality assessment protocol® (2009) (Table 6). Physiological thresholds of every
sensor behaviour were assigned with a grade from 0 to 2 and summed up. The IC
consisted of I, grouped into classes with additional conditions depicted in Table 7.
Production traits. Test-day records included the varied lactations (from 1 to 12) within
the calving years of summer 2015 until winter 2018. Test-day milk yield (Mkg), fat
percentage (Fat %), protein percentage (Pro %) and the log-transformed somatic cell
count (somatic cell score= SCS) were available for 329 cows from Germany, Poland and
Switzerland.
CHAPTER 4
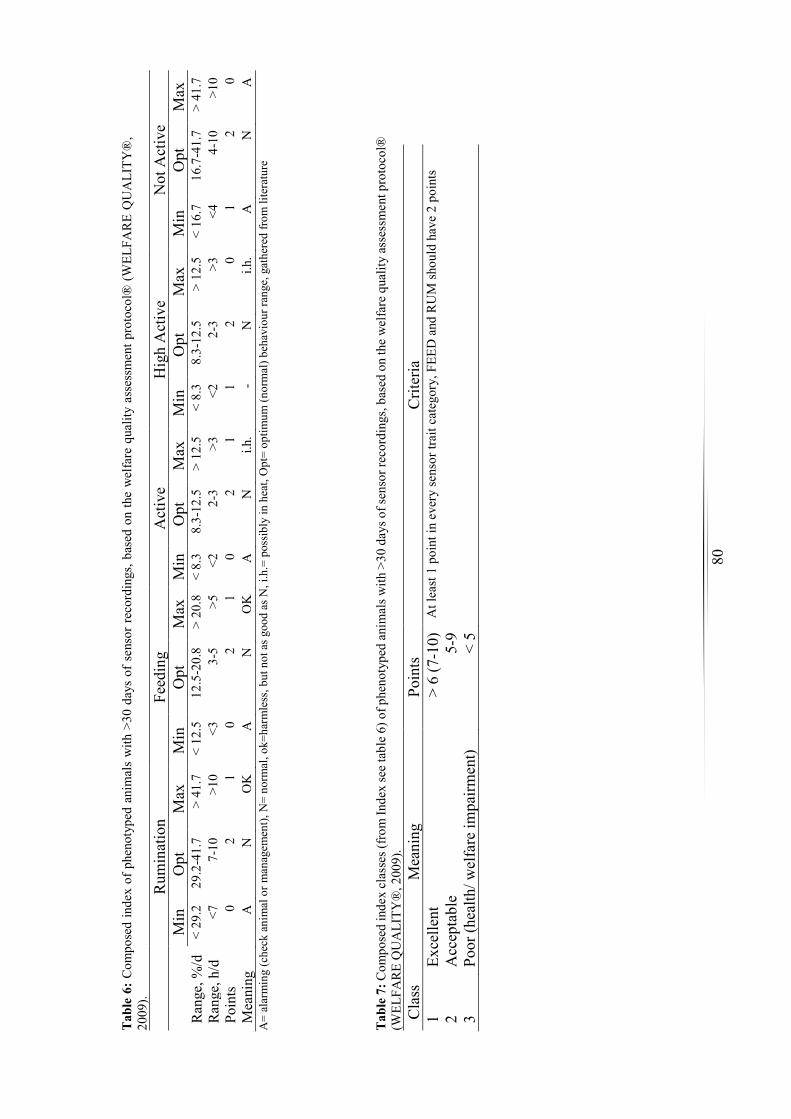
80
Tab
le 6
: Com
pose
d in
dex
of p
heno
type
d an
imal
s w
ith >
30 d
ays
of s
enso
r rec
ordi
ngs,
base
d on
the
wel
fare
qua
lity
asse
ssm
ent p
roto
col®
(WEL
FAR
E Q
UA
LITY
®,
2009
).
Rum
inat
ion
Feed
ing
Act
ive
Hig
h A
ctiv
e N
ot A
ctiv
e
Min
O
pt
Max
M
in
Opt
M
ax
Min
O
pt
Max
M
in
Opt
M
ax
Min
O
pt
Max
R
ange
, %/d
<
29.2
29
.2-4
1.7
> 41
.7
< 12
.5
12.5
-20.
8 >
20.8
<
8.3
8.3-
12.5
>
12.5
<
8.3
8.3-
12.5
>
12.5
<
16.7
16
.7-4
1.7
> 41
.7
Ran
ge, h
/d
<7
7-10
>1
0 <3
3-
5 >5
<2
2-
3 >3
<2
2-
3 >3
<4
4-
10
>10
Poin
ts 0
2 1
0 2
1 0
2 1
1 2
0 1
2 0
Mea
ning
A
N
O
K
A
N
OK
A
N
i.h
. -
N
i.h.
A
N
A
A=
alar
min
g (c
heck
ani
mal
or m
anag
emen
t), N
= no
rmal
, ok=
harm
less
, but
not
as g
ood
as N
, i.h
.= p
ossi
bly
in h
eat,
Opt
= op
timum
(nor
mal
) beh
avio
ur ra
nge,
gat
here
d fro
m li
tera
ture
Tab
le 7
: Com
pose
d in
dex
clas
ses (
from
Inde
x se
e ta
ble
6) o
f phe
noty
ped
anim
als w
ith >
30 d
ays o
f sen
sor r
ecor
ding
s, ba
sed
on th
e w
elfa
re q
ualit
y as
sess
men
t pro
toco
l®
(WEL
FAR
E Q
UA
LITY
®, 2
009)
. C
lass
M
eani
ng
Poin
ts
Crit
eria
1
Exce
llent
>
6 (7
-10)
A
t lea
st 1
poi
nt in
eve
ry se
nsor
trai
t cat
egor
y, F
EED
and
RU
M sh
ould
hav
e 2
poin
ts
2 A
ccep
tabl
e 5-
9
3 Po
or (h
ealth
/ wel
fare
impa
irmen
t) <
5
81
Genotypes
The five breeds, mentioned above, and two additional breeds from Germany (DE_DN=
dual-purpose Red and White; DE_HF= German Holstein) were genotyped with the
Illumina BovineSNP 50 k Bead chip (v2 and v3), according to the Illumina Infinium assay
protocol (Illumina Inc., San Diego, CA, USA). The quality control of the genotypic data
was conducted applying the software PLINK (Purcell et al., 2007), defining a minor allele
frequency (MAF) below 0.01 and a Hardy–Weinberg equilibrium of p< 0.00001. All
SNPs had a call rate larger than 85 %, while excluding SNPs located on sex chromosomes.
Cows with a call rate less than 80 % for all loci were also excluded. Whenever the relation
between two animals was higher than 0.95, the animals were deleted. After SNP data
editing, a total of 35,826 SNPs were available of 615 cows (Table 8). Sporadic missing
SNP were imputed by the software BEAGLE version 3.3.2 (Browning and Browning,
2007).
Table 8: Genotype data of five cattle breeds included in PCA, WIDDE and multi-breed GWAS. Country Breed No of animals No of animals after quality control DE DE_DSN 266 266
DE_DN 20 20 DE_HF 50 50
PL PL_BS 34 34 PL_HF 59 59
Sl Sl_Si 46 44 Sl_BS 36 36 Sl_HF 14 14
CH CH_OBS 48 46 CH_Si 48 46
DE_DSN= black and white dual-purpose (Germany), DE_DN= red and white dual-purpose (Germany), DE_HF= Holstein Friesian (Germany), PL_BS= Brown Swiss (Poland), PL_HF= Holstein Friesian (Poland), Sl_Si= Simmental (Slovenia), Sl_BS= Brown Swiss (Slovenia), Sl_HF= Holstein Friesian (Slovenia), CH_OBS= original dual-purpose Brown Swiss (Switzerland), CH_Si= Simmental (Switzerland).
Population structure and breed assignment
In order to account for potential population stratification and to explore the genetic
diversity of the dataset, due to relatedness among the sampled individuals, a principal
component analysis (PCA) was conducted prior to the GWAS. The PCA based on the
genomic relationship matrix generated in GCTA (Yang et al., 2011). In a second step, a
breed assignment analysis was conducted using the WIDDE program (Web-Interfaced
Next Generation Database) (Sempéré et al., 2015). The WIDDE cattle data base contained
CHAPTER 4
82
750,000 SNPs and 2,827 publicly available individuals, which belong to 129 different
populations (Sempéré et al., 2015). The broad variety of local cattle populations are
supposed to represent the bovine genetic diversity and cover the three main cattle groups,
i.e., European and African taurine (Bos taurus) as well as zebus (Bos indicus) (Sempéré
et al., 2015). The allele proximity between the own genotyped populations and the
populations represented in the world reference dataset in WIDDE were estimated, based
on supervised clustering (Sempéré et al., 2015). A stopping criterion of 0.01 was set in
WIDDE, as a smaller value of criterion enhances the accuracy of estimated parameters
(Sempéré et al., 2015). For each genotyped individual, the percentage of ancestry
proportions between the individual and the 129 populations from the WIDDE world
reference dataset was listed.
Statistical model for genetic parameter estimation
For the estimation of genetic parameters, a combination of genomic relationship matrix
and pedigree (PGMIX procedure in DMU) (Madsen and Jensen, 2018), as well as only
pedigree in a separate run, were included. The pedigree consisted of 8,798 animals and
was traced back as far as possible. Variance components of sensor traits were estimated
from univariate animal models using the AIREML procedure, as implemented in the
DMU software package (Madsen and Jensen, 2018):
(1)
where y was the observation vector for sensor traits and indices (RUM, FEED, NA, ACT,
HA, ET, I and IC); b was the vector of fixed effects, including breed-farm and measuring
year-month, and age of the sensor cows is a fixed regression; a was the vector for additive
genetic effects; p was the vector for permanent environmental effects; e was the vector of
random residual effects, and X, Z1, and Z2 were incidence matrices for b, a, and p,
respectively. It was assumed, that the variance-covariance structure of a ~ N (0, Kσa2),
where σu2 was the genetic variance, K was the either genomic relationship matrix (G) or
combined relationship matrix (H), when blending the pedigree-based relationship matrix
(A) and weighted genomic relationship matrix (Gw) (Legarra et al., 2009; Christensen et
al., 2012). Gw was calculated as follows:
CHAPTER 4
83
where A22 is the sub-matrix of the pedigree-based relationship matrix for genotyped
animals. Estimated breeding values (EBV) from model 1, based on A matrix were de-
regressed to produce de-regressed proofs (DRP) according to Garrick et al. (2009). Only
animals with a DRP weight larger than 0.2 were kept in GWAS. Another repeatability
model, using only A matrix, was applied on test-day production traits and SCS,
respectively, to obtain the EBV and consequently to calculate the DRP. The classification
fixed effects contained breed-farm and calving-year-season. The lactation curve, using
Legendre polynomial three, on days-in-milk was also included in the model because test-
day in varied lactations were included in the data. The three random effects in the model
were the additive genetic effect, the permanent environmental effect and the residual
effect.
Multi-breed GWAS
Single-trait multi-breed GWAS was performed, applying the software package GCTA
(Yang et al., 2011) with the leave-one-chromosome-out (loco) option, using the mean of
repeated sensor traits (MEAN) and DRP, calculated before as phenotypes. Testing single-
locus SNP effects, the following statistical model was included:
(2)
where y was the vector of DRP or MEAN for RUM, FEED, NA, ACT, HA, ET, I, and
IC); b was the overall mean, when using DRP as phenotypes, and breed-farm was
included as a classification fixed effect, when MEAN were the phenotypes; g was the
additive fixed effect of SNPs, tested for association; u was a vector of polygenic effects
calculated based on all SNP, except those on the chromosome, where the candidate SNP
was located; and e was the vector of random residual effects; X, W, and Z were incidence
matrices for b, g, and u, respectively. In order to test the reliability of GWAS, based on
small population size, DRP of test-day production traits and SCS were also analysed in
model 2. The Bonferroni threshold was pBonf = 0.05/35,826 = 4.47 x 10⁻⁷. Next to the
Bonferroni correction, the false discovery rate (FDR), introduced by Benjamini and
Hochberg (1995), was applied as another significance threshold for genome-wide
analysis. The FDR was set to 20 %, in order to detect candidate SNPs for behaviour traits.
CHAPTER 4
84
Candidate gene annotation
The associated candidate genes were identified via the gene-based test in GCTA applying
the fastBAT option. The database (version UMD3.1), including gene locations, start
positions and end sites for every bovine gene was downloaded from Ensembl (Zerbino et
al., 2018). Although, 24,616 gene ID entries were originally available in the data base,
only 17,545 genes on chromosome 1 to 29 were included in further analyses, due to valid
evidence in the gene ontology (Ashburner et al., 2000; Gene Ontology Consortium,
2017). At first, SNPs exploited in GWAS were mapped to the genes, applying a window
of 50 kb upstream and 50 kb downstream from the genes. Subsequently, the output from
annotations and SNP p-values from GWAS were used simultaneously, to detect genes,
that were associated with sensor and production traits. Finally, the p-values of genes were
adjusted according to FDR (Benjamini and Hochberg, 1995). For further understanding,
physiological functions and positions of candidate genes were examined in the Ensembl
(Zerbino et al., 2018), NCBI (Geer et al., 2010), UniProt (Chen et al., 2017) data bases.
Results
Population structure and breed assignment
PCA. When plotting the first and the second principal components (explaining 4.71 %
and 3.05 % of variance), the PCA revealed two distinctly diverged clusters of genetic
origin (Figure 14a). The Holstein lines showed obvious genetic differentiation from the
other breeds (Sl_Si, Sl_BS, PL_BS, CH_OBS, and CH_Si). Depicting the first and third
(explaining a variance of 2.38 %) principal components, three clusters were formed in a
triangle-like 2-dimensional form (Figure 14b). Each cluster was positioned at the three
apexes of the triangle, with the admixed populations of Sl_Si in a rather intermediate
position. Three disparate groups were formed with DE_HF, DE_DSN, DE_DN, Sl_HF,
and PL_HF on the left. A second cluster of PL_BS, Sl_BS and CH_OBS was located in
the bottom right corner, and a third group in the top right corner, consisting of CH_Si
and, slightly distanced Sl_Si. Illustrating the second and third principal components
(Figure 14c), the three clusters mentioned above can also be seen according to the third
principal component. However, the second principal component revealed the diversity
within the Holstein breeds.
CHAPTER 4
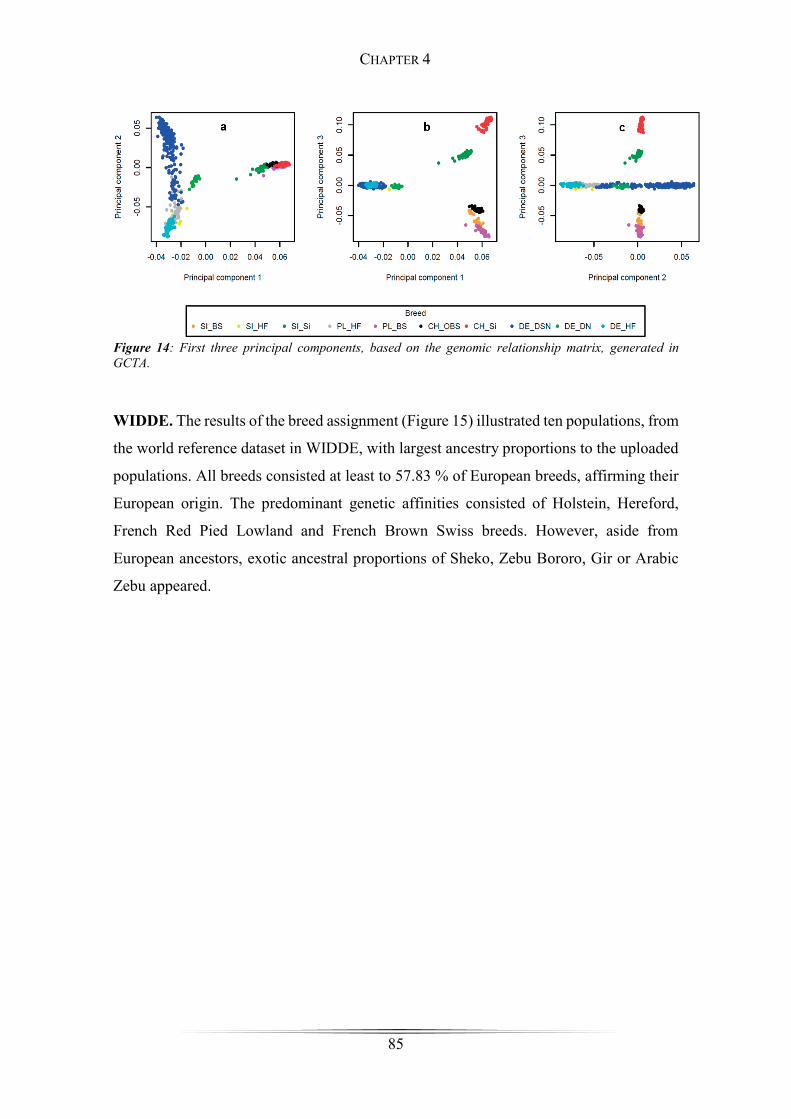
85
Figure 14: First three principal components, based on the genomic relationship matrix, generated in GCTA.
WIDDE. The results of the breed assignment (Figure 15) illustrated ten populations, from
the world reference dataset in WIDDE, with largest ancestry proportions to the uploaded
populations. All breeds consisted at least to 57.83 % of European breeds, affirming their
European origin. The predominant genetic affinities consisted of Holstein, Hereford,
French Red Pied Lowland and French Brown Swiss breeds. However, aside from
European ancestors, exotic ancestral proportions of Sheko, Zebu Bororo, Gir or Arabic
Zebu appeared.
CHAPTER 4
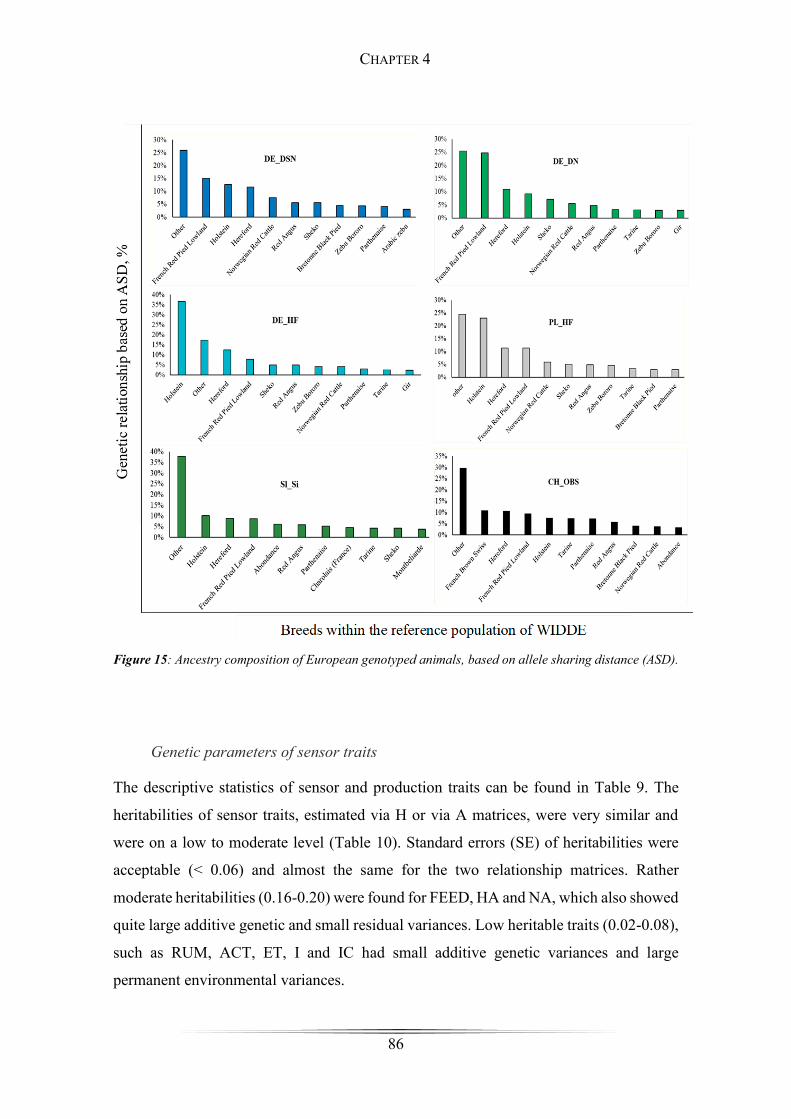
86
Figure 15: Ancestry composition of European genotyped animals, based on allele sharing distance (ASD).
Genetic parameters of sensor traits
The descriptive statistics of sensor and production traits can be found in Table 9. The
heritabilities of sensor traits, estimated via H or via A matrices, were very similar and
were on a low to moderate level (Table 10). Standard errors (SE) of heritabilities were
acceptable (< 0.06) and almost the same for the two relationship matrices. Rather
moderate heritabilities (0.16-0.20) were found for FEED, HA and NA, which also showed
quite large additive genetic and small residual variances. Low heritable traits (0.02-0.08),
such as RUM, ACT, ET, I and IC had small additive genetic variances and large
permanent environmental variances.
CHAPTER 4
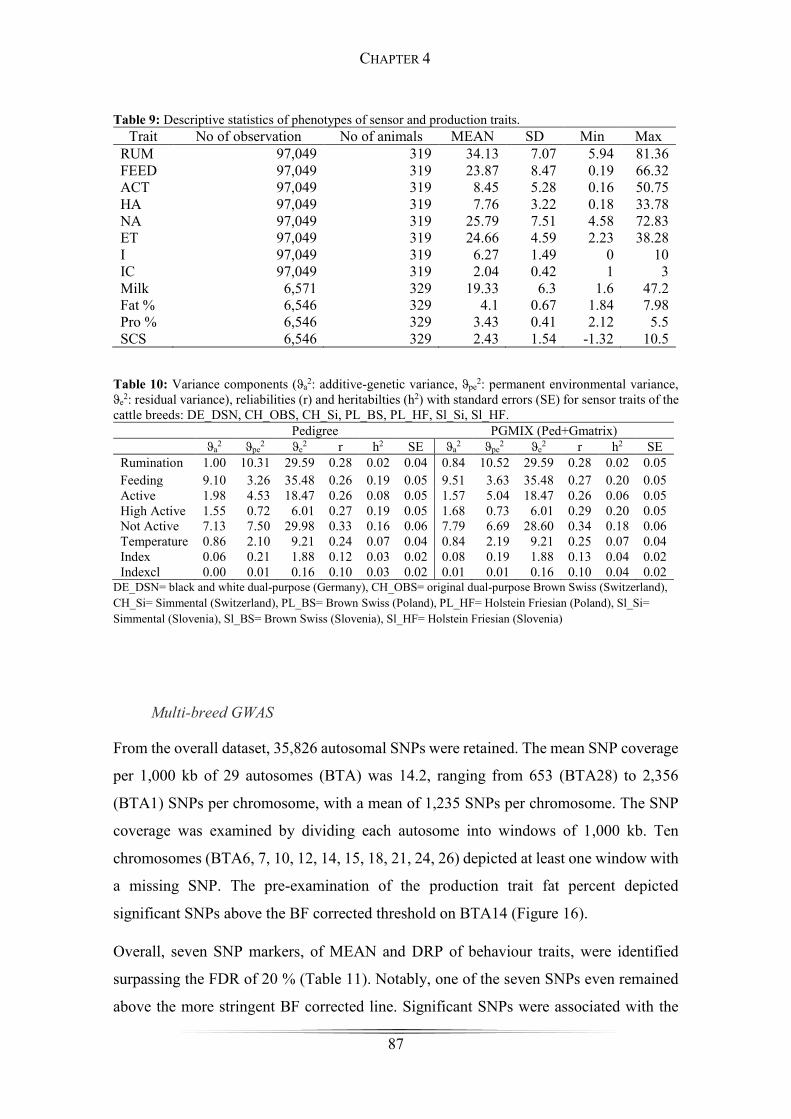
87
Table 9: Descriptive statistics of phenotypes of sensor and production traits. Trait No of observation No of animals MEAN SD Min Max
RUM 97,049 319 34.13 7.07 5.94 81.36 FEED 97,049 319 23.87 8.47 0.19 66.32 ACT 97,049 319 8.45 5.28 0.16 50.75 HA 97,049 319 7.76 3.22 0.18 33.78 NA 97,049 319 25.79 7.51 4.58 72.83 ET 97,049 319 24.66 4.59 2.23 38.28 I 97,049 319 6.27 1.49 0 10 IC 97,049 319 2.04 0.42 1 3 Milk 6,571 329 19.33 6.3 1.6 47.2 Fat % 6,546 329 4.1 0.67 1.84 7.98 Pro % 6,546 329 3.43 0.41 2.12 5.5 SCS 6,546 329 2.43 1.54 -1.32 10.5
Table 10: Variance components (ϑa2: additive-genetic variance, ϑpe
2: permanent environmental variance, ϑe
2: residual variance), reliabilities (r) and heritabilties (h2) with standard errors (SE) for sensor traits of the cattle breeds: DE_DSN, CH_OBS, CH_Si, PL_BS, PL_HF, Sl_Si, Sl_HF.
Pedigree PGMIX (Ped+Gmatrix) ϑa
2 ϑpe2 ϑe
2 r h2 SE ϑa2 ϑpe
2 ϑe2 r h2 SE
Rumination 1.00 10.31 29.59 0.28 0.02 0.04 0.84 10.52 29.59 0.28 0.02 0.05 Feeding 9.10 3.26 35.48 0.26 0.19 0.05 9.51 3.63 35.48 0.27 0.20 0.05 Active 1.98 4.53 18.47 0.26 0.08 0.05 1.57 5.04 18.47 0.26 0.06 0.05 High Active 1.55 0.72 6.01 0.27 0.19 0.05 1.68 0.73 6.01 0.29 0.20 0.05 Not Active 7.13 7.50 29.98 0.33 0.16 0.06 7.79 6.69 28.60 0.34 0.18 0.06 Temperature 0.86 2.10 9.21 0.24 0.07 0.04 0.84 2.19 9.21 0.25 0.07 0.04 Index 0.06 0.21 1.88 0.12 0.03 0.02 0.08 0.19 1.88 0.13 0.04 0.02 Indexcl 0.00 0.01 0.16 0.10 0.03 0.02 0.01 0.01 0.16 0.10 0.04 0.02
DE_DSN= black and white dual-purpose (Germany), CH_OBS= original dual-purpose Brown Swiss (Switzerland), CH_Si= Simmental (Switzerland), PL_BS= Brown Swiss (Poland), PL_HF= Holstein Friesian (Poland), Sl_Si= Simmental (Slovenia), Sl_BS= Brown Swiss (Slovenia), Sl_HF= Holstein Friesian (Slovenia)
Multi-breed GWAS
From the overall dataset, 35,826 autosomal SNPs were retained. The mean SNP coverage
per 1,000 kb of 29 autosomes (BTA) was 14.2, ranging from 653 (BTA28) to 2,356
(BTA1) SNPs per chromosome, with a mean of 1,235 SNPs per chromosome. The SNP
coverage was examined by dividing each autosome into windows of 1,000 kb. Ten
chromosomes (BTA6, 7, 10, 12, 14, 15, 18, 21, 24, 26) depicted at least one window with
a missing SNP. The pre-examination of the production trait fat percent depicted
significant SNPs above the BF corrected threshold on BTA14 (Figure 16).
Overall, seven SNP markers, of MEAN and DRP of behaviour traits, were identified
surpassing the FDR of 20 % (Table 11). Notably, one of the seven SNPs even remained
above the more stringent BF corrected line. Significant SNPs were associated with the
CHAPTER 4
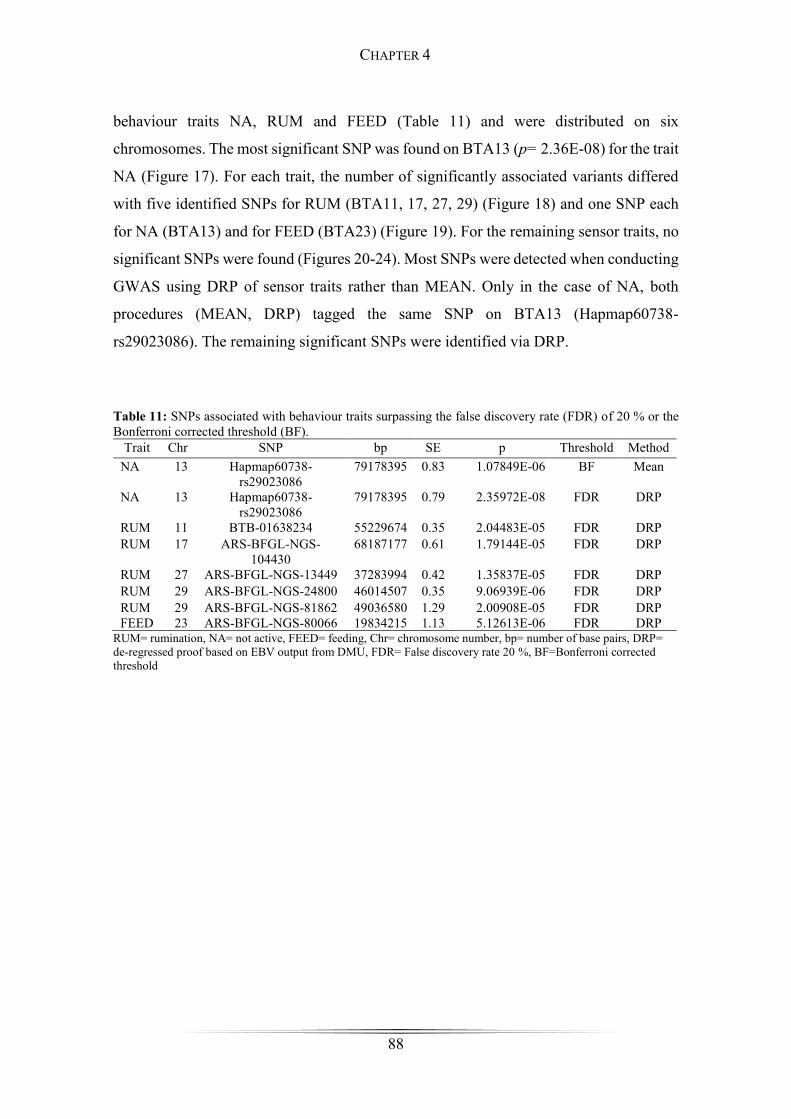
88
behaviour traits NA, RUM and FEED (Table 11) and were distributed on six
chromosomes. The most significant SNP was found on BTA13 (p= 2.36E-08) for the trait
NA (Figure 17). For each trait, the number of significantly associated variants differed
with five identified SNPs for RUM (BTA11, 17, 27, 29) (Figure 18) and one SNP each
for NA (BTA13) and for FEED (BTA23) (Figure 19). For the remaining sensor traits, no
significant SNPs were found (Figures 20-24). Most SNPs were detected when conducting
GWAS using DRP of sensor traits rather than MEAN. Only in the case of NA, both
procedures (MEAN, DRP) tagged the same SNP on BTA13 (Hapmap60738-
rs29023086). The remaining significant SNPs were identified via DRP.
Table 11: SNPs associated with behaviour traits surpassing the false discovery rate (FDR) of 20 % or the Bonferroni corrected threshold (BF).
Trait Chr SNP bp SE p Threshold Method NA 13 Hapmap60738-
rs29023086 79178395 0.83 1.07849E-06 BF Mean
NA 13 Hapmap60738-rs29023086
79178395 0.79 2.35972E-08 FDR DRP
RUM 11 BTB-01638234 55229674 0.35 2.04483E-05 FDR DRP RUM 17 ARS-BFGL-NGS-
104430 68187177 0.61 1.79144E-05 FDR DRP
RUM 27 ARS-BFGL-NGS-13449 37283994 0.42 1.35837E-05 FDR DRP RUM 29 ARS-BFGL-NGS-24800 46014507 0.35 9.06939E-06 FDR DRP RUM 29 ARS-BFGL-NGS-81862 49036580 1.29 2.00908E-05 FDR DRP FEED 23 ARS-BFGL-NGS-80066 19834215 1.13 5.12613E-06 FDR DRP
RUM= rumination, NA= not active, FEED= feeding, Chr= chromosome number, bp= number of base pairs, DRP= de-regressed proof based on EBV output from DMU, FDR= False discovery rate 20 %, BF=Bonferroni corrected threshold
CHAPTER 4
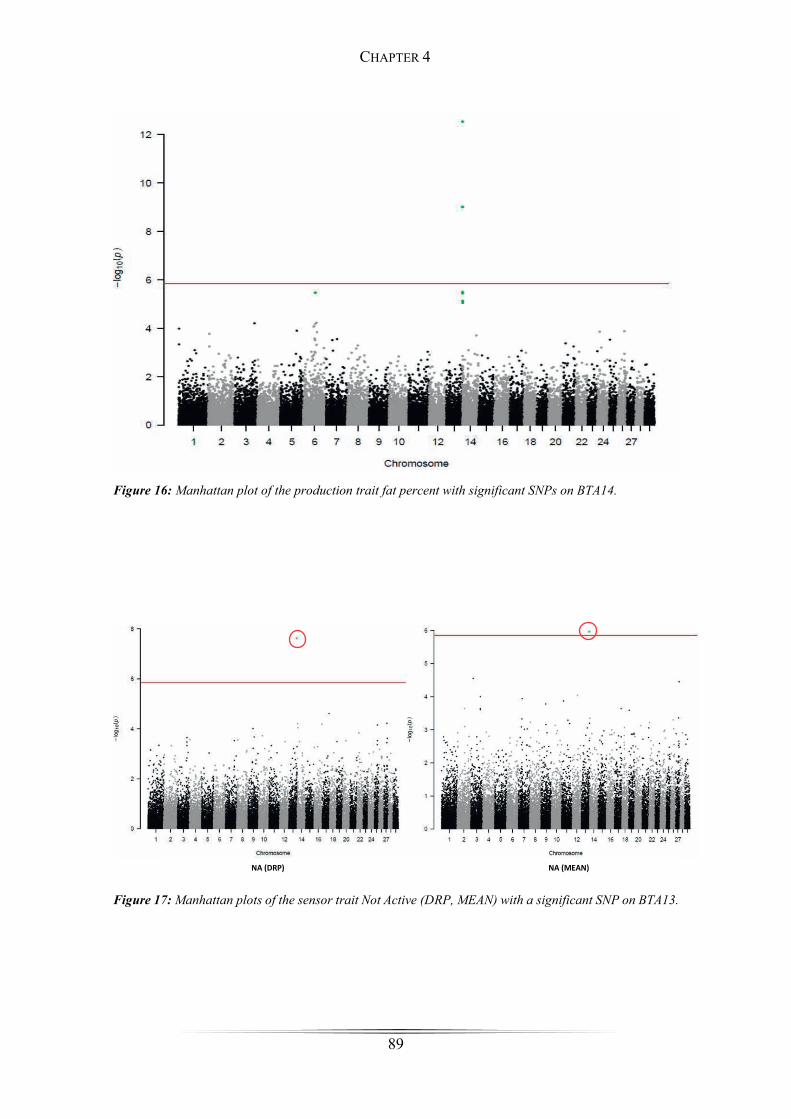
89
Figure 16: Manhattan plot of the production trait fat percent with significant SNPs on BTA14.
Figure 17: Manhattan plots of the sensor trait Not Active (DRP, MEAN) with a significant SNP on BTA13.
NA (DRP) NA (MEAN)
CHAPTER 4
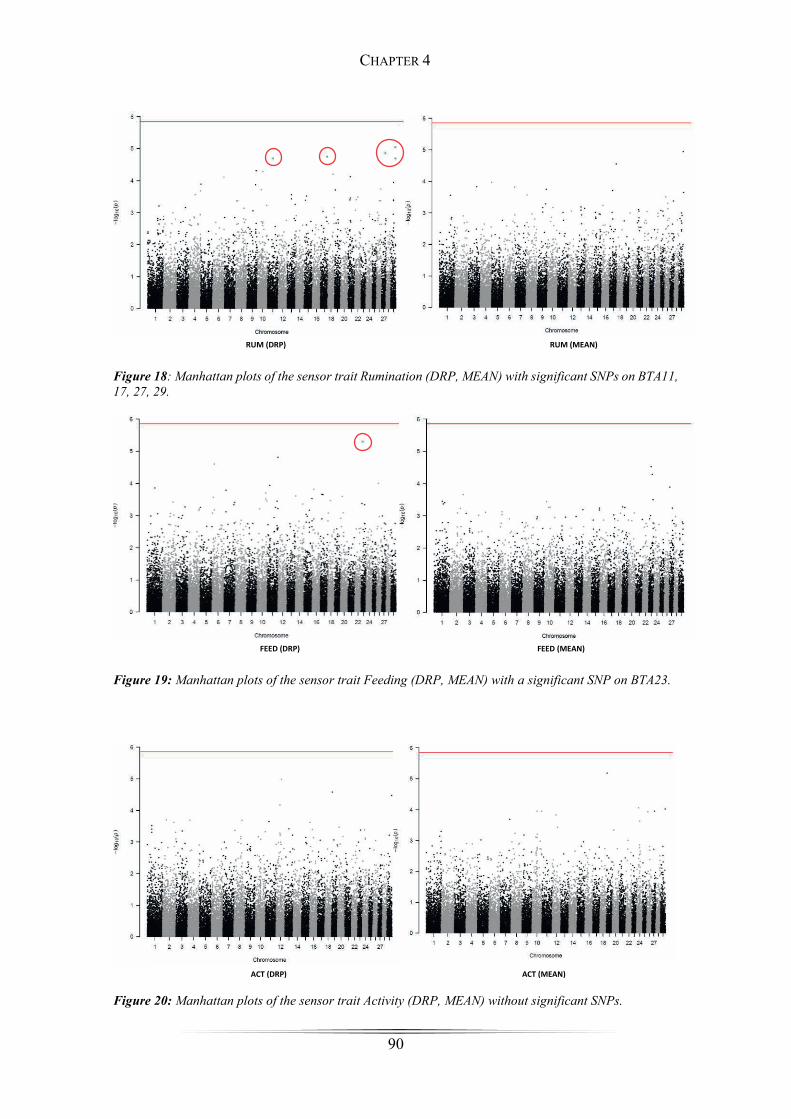
90
Figure 18: Manhattan plots of the sensor trait Rumination (DRP, MEAN) with significant SNPs on BTA11, 17, 27, 29.
Figure 19: Manhattan plots of the sensor trait Feeding (DRP, MEAN) with a significant SNP on BTA23.
Figure 20: Manhattan plots of the sensor trait Activity (DRP, MEAN) without significant SNPs.
RUM (DRP) RUM (MEAN)
FEED (DRP) FEED (MEAN)
ACT (DRP) ACT (MEAN)
CHAPTER 4
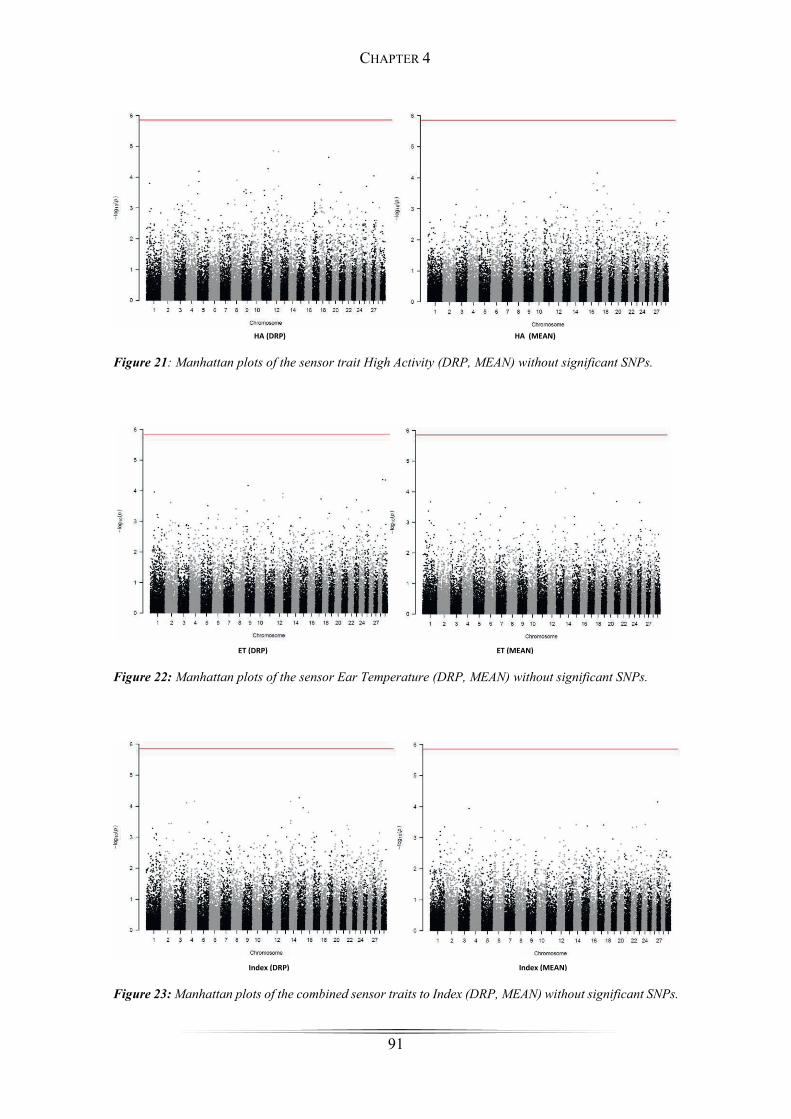
91
Figure 21: Manhattan plots of the sensor trait High Activity (DRP, MEAN) without significant SNPs.
Figure 22: Manhattan plots of the sensor Ear Temperature (DRP, MEAN) without significant SNPs.
Figure 23: Manhattan plots of the combined sensor traits to Index (DRP, MEAN) without significant SNPs.
HA (DRP) HA (MEAN)
ET (DRP) ET (MEAN)
Index (DRP) Index (MEAN)
CHAPTER 4
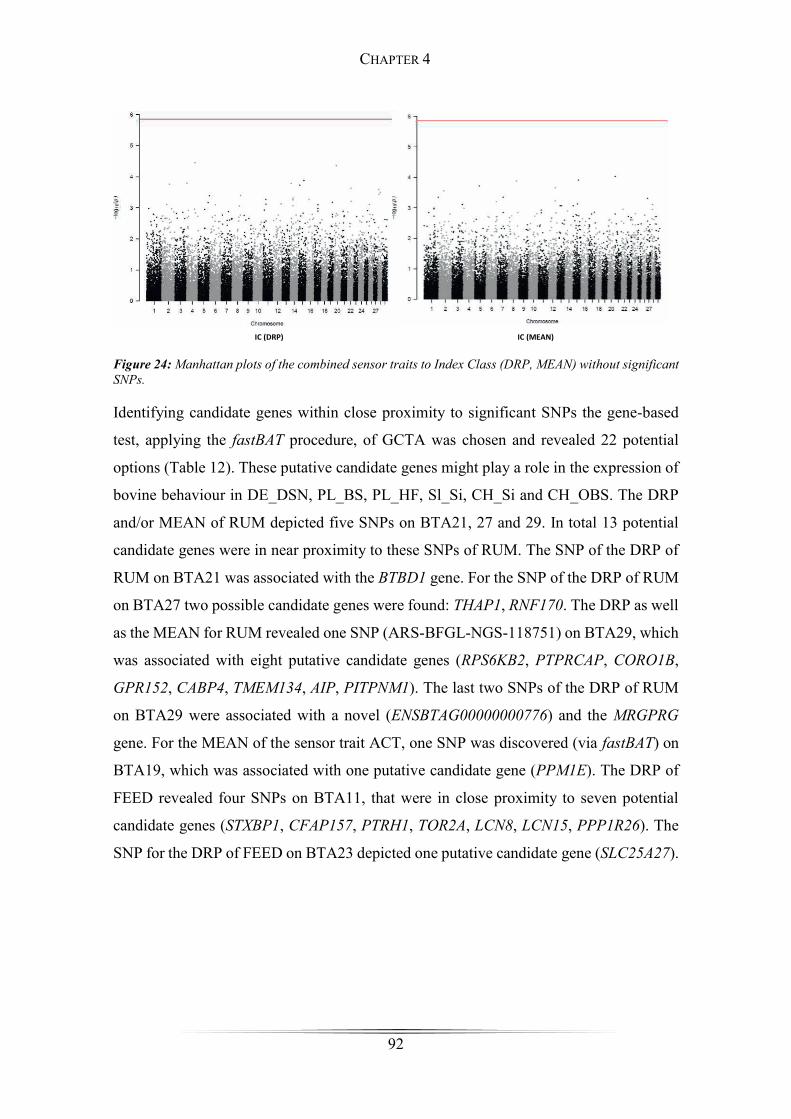
92
Figure 24: Manhattan plots of the combined sensor traits to Index Class (DRP, MEAN) without significant SNPs.
Identifying candidate genes within close proximity to significant SNPs the gene-based
test, applying the fastBAT procedure, of GCTA was chosen and revealed 22 potential
options (Table 12). These putative candidate genes might play a role in the expression of
bovine behaviour in DE_DSN, PL_BS, PL_HF, Sl_Si, CH_Si and CH_OBS. The DRP
and/or MEAN of RUM depicted five SNPs on BTA21, 27 and 29. In total 13 potential
candidate genes were in near proximity to these SNPs of RUM. The SNP of the DRP of
RUM on BTA21 was associated with the BTBD1 gene. For the SNP of the DRP of RUM
on BTA27 two possible candidate genes were found: THAP1, RNF170. The DRP as well
as the MEAN for RUM revealed one SNP (ARS-BFGL-NGS-118751) on BTA29, which
was associated with eight putative candidate genes (RPS6KB2, PTPRCAP, CORO1B,
GPR152, CABP4, TMEM134, AIP, PITPNM1). The last two SNPs of the DRP of RUM
on BTA29 were associated with a novel (ENSBTAG00000000776) and the MRGPRG
gene. For the MEAN of the sensor trait ACT, one SNP was discovered (via fastBAT) on
BTA19, which was associated with one putative candidate gene (PPM1E). The DRP of
FEED revealed four SNPs on BTA11, that were in close proximity to seven potential
candidate genes (STXBP1, CFAP157, PTRH1, TOR2A, LCN8, LCN15, PPP1R26). The
SNP for the DRP of FEED on BTA23 depicted one putative candidate gene (SLC25A27).
IC (DRP) IC (MEAN)
CHAPTER 4
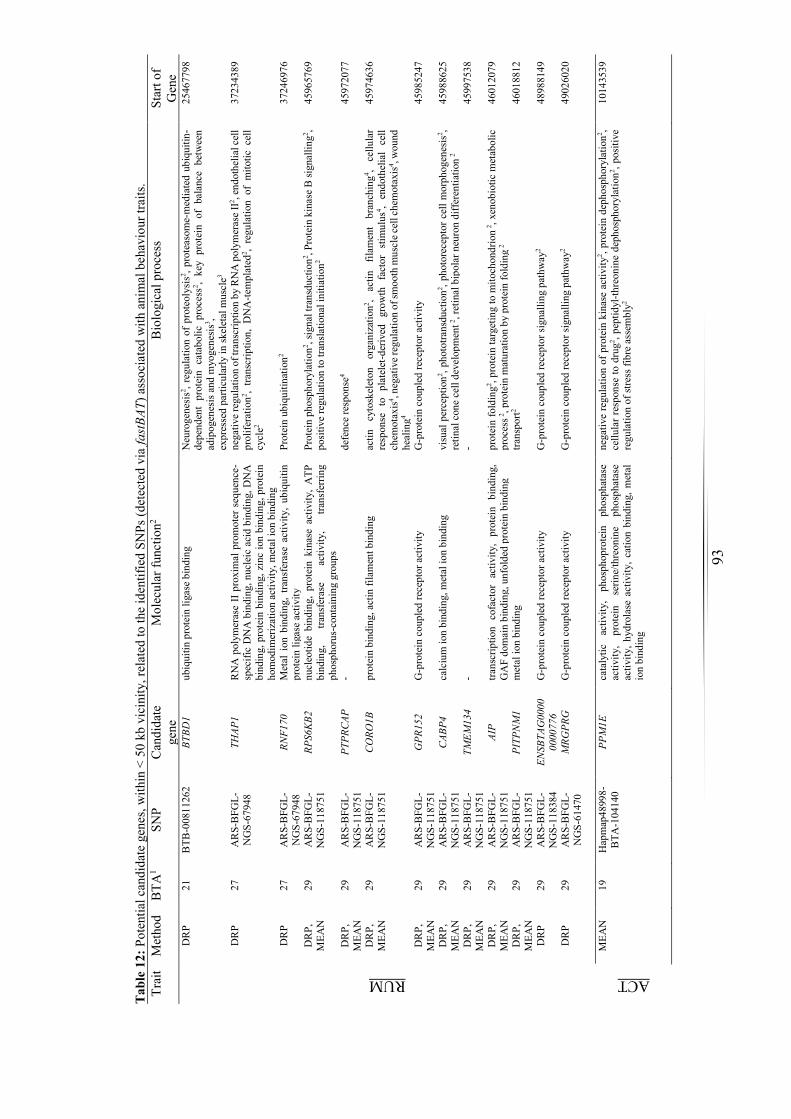
93
T
able
12:
Pot
entia
l can
dida
te g
enes
, with
in <
50
kb v
icin
ity, r
elat
ed to
the
iden
tifie
d SN
Ps (d
etec
ted
via
fast
BAT)
ass
ocia
ted
with
ani
mal
beh
avio
ur tr
aits
.
Trai
t M
etho
d B
TA1
SNP
Can
dida
te
gene
M
olec
ular
func
tion2
Bio
logi
cal p
roce
ss
Star
t of
Gen
e
RUM
DR
P 21
B
TB-0
0811
262
BTBD
1 ub
iqui
tin p
rote
in li
gase
bin
ding
N
euro
gene
sis2 , r
egul
atio
n of
pro
teol
ysis
2 , pro
teas
ome-
med
iate
d ub
iqui
tin-
depe
nden
t pr
otei
n ca
tabo
lic p
roce
ss2 ,
key
prot
ein
of b
alan
ce b
etw
een
adip
ogen
esis
and
myo
gene
sis3 ,
expr
esse
d pa
rticu
larly
in sk
elet
al m
uscl
e3
2546
7798
DR
P 27
A
RS-
BFG
L-N
GS-
6794
8 TH
AP1
RN
A p
olym
eras
e II
prox
imal
pro
mot
er s
eque
nce-
spec
ific
DN
A b
indi
ng, n
ucle
ic a
cid
bind
ing,
DN
A
bind
ing,
pro
tein
bin
ding
, zin
c io
n bi
ndin
g, p
rote
in
hom
odim
eriz
atio
n ac
tivity
, met
al io
n bi
ndin
g
nega
tive r
egul
atio
n of
tran
scrip
tion
by R
NA
pol
ymer
ase
II2 , e
ndot
helia
l cel
l pr
olife
ratio
n2 , tra
nscr
iptio
n, D
NA
-tem
plat
ed2 ,
regu
latio
n of
mito
tic c
ell
cycl
e2
3723
4389
DR
P 27
A
RS-
BFG
L-N
GS-
6794
8 RN
F170
M
etal
ion
bin
ding
, tra
nsfe
rase
act
ivity
, ub
iqui
tin
prot
ein
ligas
e ac
tivity
Pr
otei
n ub
iqui
tinat
ion2
3724
6976
DR
P,
MEA
N
29
AR
S-B
FGL-
NG
S-11
8751
RP
S6KB
2 nu
cleo
tide
bind
ing,
pro
tein
kin
ase
activ
ity,
ATP
bi
ndin
g,
trans
fera
se
activ
ity,
trans
ferri
ng
phos
phor
us-c
onta
inin
g gr
oups
Prot
ein
phos
phor
ylat
ion2 , s
igna
l tra
nsdu
ctio
n2 , Pro
tein
kin
ase
B si
gnal
ling2 ,
posi
tive
regu
latio
n to
tran
slatio
nal i
nitia
tion2
4596
5769
DR
P,
MEA
N
29
AR
S-B
FGL-
NG
S-11
8751
PT
PRCA
P -
defe
nce
resp
onse
4 45
9720
77
DR
P,
MEA
N
29
AR
S-B
FGL-
NG
S-11
8751
C
ORO
1B
prot
ein
bind
ing,
act
in fi
lam
ent b
indi
ng
actin
cy
tosk
elet
on
orga
niza
tion2 ,
actin
fil
amen
t br
anch
ing4 ,
cellu
lar
resp
onse
to
plat
elet
-der
ived
gro
wth
fac
tor
stim
ulus
4 , en
doth
elia
l ce
ll ch
emot
axis
4 , neg
ativ
e reg
ulat
ion
of sm
ooth
mus
cle c
ell c
hem
otax
is4 , w
ound
he
alin
g4
4597
4636
DR
P,
MEA
N
29
AR
S-B
FGL-
NG
S-11
8751
G
PR15
2 G
-pro
tein
cou
pled
rece
ptor
act
ivity
G
-pro
tein
cou
pled
rece
ptor
act
ivity
45
9852
47
DR
P,
MEA
N
29
AR
S-B
FGL-
NG
S-11
8751
C
ABP4
ca
lciu
m io
n bi
ndin
g, m
etal
ion
bind
ing
visu
al p
erce
ptio
n2 , pho
totra
nsdu
ctio
n2 , pho
tore
cept
or c
ell m
orph
ogen
esis
2 , re
tinal
con
e ce
ll de
velo
pmen
t 2, r
etin
al b
ipol
ar n
euro
n di
ffere
ntia
tion 2
45
9886
25
DR
P,
MEA
N
29
AR
S-B
FGL-
NG
S-11
8751
TM
EM13
4 -
- 45
9975
38
DR
P,
MEA
N
29
AR
S-B
FGL-
NG
S-11
8751
AI
P tra
nscr
iptio
n co
fact
or a
ctiv
ity,
prot
ein
bind
ing,
G
AF
dom
ain
bind
ing,
unf
olde
d pr
otei
n bi
ndin
g pr
otei
n fo
ldin
g2 , pro
tein
targ
etin
g to
mito
chon
drio
n 2, x
enob
iotic
met
abol
ic
proc
ess 2
, pro
tein
mat
urat
ion
by p
rote
in fo
ldin
g 2
4601
2079
DR
P,
MEA
N
29
AR
S-B
FGL-
NG
S-11
8751
PI
TPN
M1
met
al io
n bi
ndin
g tra
nspo
rt2
4601
8812
DR
P 29
A
RS-
BFG
L-N
GS-
1183
84
ENSB
TAG
0000
00
0077
6 G
-pro
tein
cou
pled
rece
ptor
act
ivity
G
-pro
tein
cou
pled
rece
ptor
sign
allin
g pa
thw
ay2
4898
8149
DR
P 29
A
RS-
BFG
L-N
GS-
6147
0
MRG
PRG
G
-pro
tein
cou
pled
rece
ptor
act
ivity
G
-pro
tein
cou
pled
rece
ptor
sign
allin
g pa
thw
ay2
4902
6020
ACT
MEA
N
19
Hap
map
4899
8-B
TA-1
0414
0 PP
M1E
ca
taly
tic
activ
ity,
phos
phop
rote
in
phos
phat
ase
activ
ity,
prot
ein
serin
e/th
reon
ine
phos
phat
ase
activ
ity, h
ydro
lase
act
ivity
, cat
ion
bind
ing,
met
al
ion
bind
ing
nega
tive
regu
latio
n of
pro
tein
kin
ase
activ
ity2 , p
rote
in d
epho
spho
ryla
tion2 ,
cellu
lar r
espo
nse
to d
rug2 , p
eptid
yl-th
reon
ine
deph
osph
oryl
atio
n2 , pos
itive
re
gula
tion
of st
ress
fibr
e as
sem
bly2
1014
3539
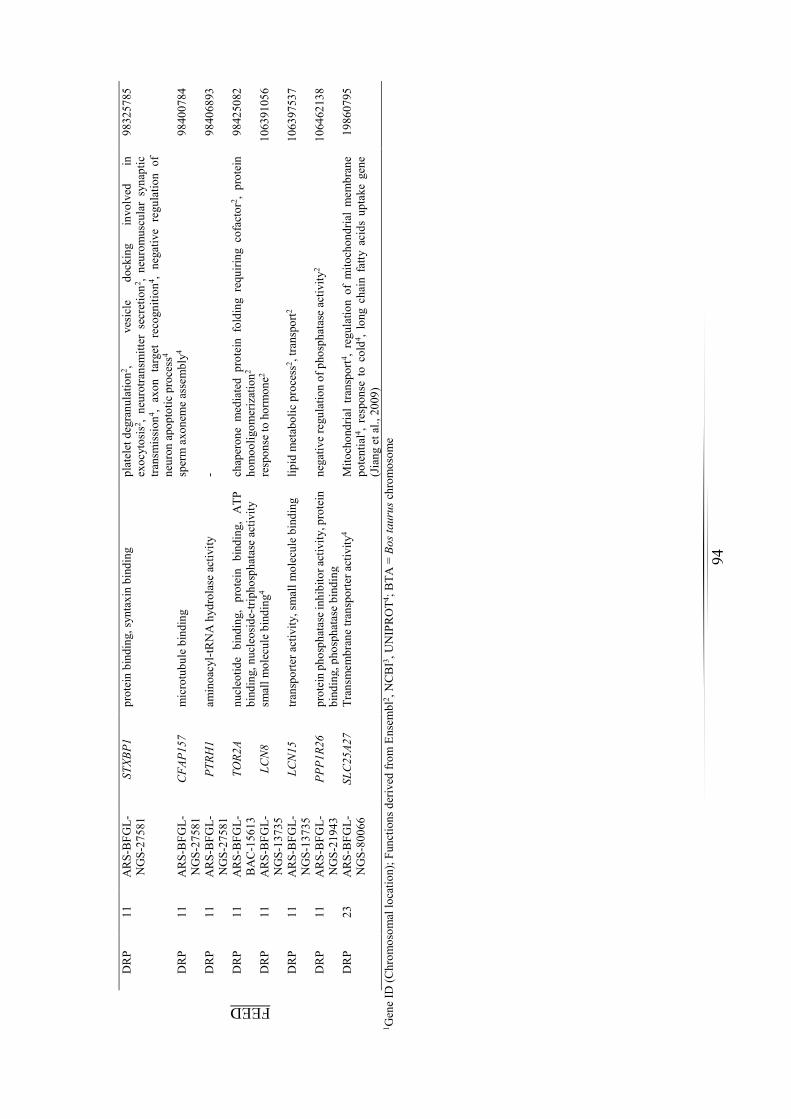
94
FEED
D
RP
11
AR
S-B
FGL-
NG
S-27
581
STXB
P1
prot
ein
bind
ing,
synt
axin
bin
ding
pl
atel
et d
egra
nula
tion2 ,
ve
sicl
e do
ckin
g in
volv
ed
in
exoc
ytos
is2 ,
neur
otra
nsm
itter
sec
retio
n2 , ne
urom
uscu
lar
syna
ptic
tra
nsm
issi
on4 ,
axon
tar
get
reco
gniti
on4 ,
nega
tive
regu
latio
n of
ne
uron
apo
ptot
ic p
roce
ss4
9832
5785
DR
P 11
A
RS-
BFG
L-N
GS-
2758
1 C
FAP1
57
mic
rotu
bule
bin
ding
sp
erm
axo
nem
e as
sem
bly4
9840
0784
DR
P 11
A
RS-
BFG
L-N
GS-
2758
1 PT
RH1
amin
oacy
l-tR
NA
hyd
rola
se a
ctiv
ity
- 98
4068
93
DR
P 11
A
RS-
BFG
L-B
AC
-156
13
TOR2
A nu
cleo
tide
bind
ing,
pro
tein
bin
ding
, A
TP
bind
ing,
nuc
leos
ide-
triph
osph
atas
e ac
tivity
ch
aper
one
med
iate
d pr
otei
n fo
ldin
g re
quiri
ng c
ofac
tor2 ,
prot
ein
hom
oolig
omer
izat
ion2
9842
5082
DR
P 11
A
RS-
BFG
L-N
GS-
1373
5 LC
N8
smal
l mol
ecul
e bi
ndin
g4 re
spon
se to
hor
mon
e2 10
6391
056
DR
P 11
A
RS-
BFG
L-N
GS-
1373
5 LC
N15
tra
nspo
rter a
ctiv
ity, s
mal
l mol
ecul
e bi
ndin
g lip
id m
etab
olic
pro
cess
2 , tra
nspo
rt2 10
6397
537
DR
P 11
A
RS-
BFG
L-N
GS-
2194
3 PP
P1R2
6 pr
otei
n ph
osph
atas
e inh
ibito
r act
ivity
, pro
tein
bi
ndin
g, p
hosp
hata
se b
indi
ng
nega
tive
regu
latio
n of
pho
spha
tase
act
ivity
2 10
6462
138
DR
P 23
A
RS-
BFG
L-N
GS-
8006
6 SL
C25
A27
Tran
smem
bran
e tra
nspo
rter a
ctiv
ity4
Mito
chon
dria
l tra
nspo
rt4 , re
gula
tion
of m
itoch
ondr
ial
mem
bran
e po
tent
ial4 ,
resp
onse
to
cold
4 , lo
ng c
hain
fat
ty a
cids
upt
ake
gene
(J
iang
et a
l., 2
009)
1986
0795
1 Gen
e ID
(Chr
omos
omal
loca
tion)
; Fun
ctio
ns d
eriv
ed fr
om E
nsem
bl2 ,
NC
BI3 ,
UN
IPR
OT4 ;
BTA
= B
os ta
urus
chr
omos
ome
95
Discussion
Characterization of genetic diversity via principal component analysis and WIDDE
breed assignment
The two to three clusters, resulting from the PCA, reflected the geographical origin of the
European cattle breeds. Figure 14a clearly differentiated between the Holstein lines from
northern Europe (Germany, Poland) and the Simmental and Brown Swiss breeds from
the south of Europe (Flori et al., 2009), implying that alleles were not common in all
breeds. It has to be kept in mind however, that the PCA does not necessarily include
geographical information, as the optimization criterion lies within the maximization of
genetic variance (Gautier et al., 2011). Gautier et al. (2011) argued, that spatial structuring
will not be accounted for, if it is not associated with the most pronounced differentiation.
This can be seen with the close ascribing of Sl_HF and DE_HF in one cluster (Figure
14a, b, c), due to their high genetic relationships, in spite of their geographic distance. In
this regard, Wiener et al. (2004) reported relationships, based on 30 microsatellites,
between breeds, that do not primarily cluster according to geographical origin. They
declared, that Scottish breeds (e.g. Highland, Galloway) were not closely related with
other breeds from the British Isles (e.g. Dexter, Hereford), regardless of their close
geographic distribution. On the contrary, they found surprisingly close genetic
connections between the British Friesian, imported from continental breeds and the
Scottish Ayrshire. Wiener et al. (2004) justified this relationship with crossbreeding of
Ayrshire and Dutch-Flemish cattle for productivity improvement during the 18th century,
while Friesians were imported from the same area in the 19th century.
The second distinct cluster represented cattle breeds from the south of Europe
(Switzerland), due to the similar genetics of CH_OBS, PL_BS, CH_Si and Sl_Si.
Although, in this case geographic effects certainly have contributed to the cluster
formation, different breeding goals within each breed were expected to intensify the
differentiation as well. As Simmental and CH_OBS are dual-purpose breeds, they are
expected to differ from high milk yielding Holstein lines (Chen et al., 2016). Figure 14b
and 14c differentiated between the breeds Simmental, Holstein Friesian and Brown
Swiss, underlining the footprints of artificial selection more clearly. Although the
DE_DN and DE_DSN are considered dual-purpose breeds, they constituted the ancestors
CHAPTER 4
96
of Holstein Friesian cattle, explaining their close affinities. As a corollary, the PCA
recapitulated the geographic origins and endogamous breeding units of Holstein, Brown
Swiss and Simmental cattle, emphasizing a ‘genetic isolation’ (Figure 14b) by the
absence of admixture.
The results of the breed assignment were most relevant, in order to comprehend the
patterns of genetic diversity and the historical evolutionary processes, helping to uncover
the composition of bovine populations. All breeds depicted at least 57.83 % of genetic
relations to European cattle breeds, such as Holstein, Hereford, French Red Pied
Lowland, Norwegian Red, Red Angus, Bretonne Black Pied, Parthenais, Tarine,
Abondance, Charolais, Montbeliarde and French Brown Swiss, affirming their European
line of descent. On the other side, exotic ancestral proportions, such as Sheko, Zebu
Bororo, Gir or Arabic Zebu were identified within the European genotypes. Despite the
fact, that cattle are ascribed to two major geographic types, taurine (humpless- European,
African, Asian) and indicine (humped- South Asian, East African), > 250,000 years ago
they diverged from common ancestors (Gibbs et al., 2009). Gibbs et al. (2009) confirmed
the persistency of the same haplotypes among taurine and within indicine breeds, while
the same haplotypes between those two groups were scarce. Ancient genetic ties to a
common ancestor as well as interbreeding events explain a relationship of up to 7.09 %
between Sheko and Holstein (DE_DSN, DE_DN, DE_HF, PL_HF) and Simmental
(Sl_Si) lines. Furthermore, Gibbs at al. (2009) corroborated the descent of European
breeds from indicine and taurine crosses, such as Beefmaster, Santa Gertrudis and Sheko.
In the present study, low genetic proportions of these taurine crosses were identified
within the European genotypes as well.
Payne and Hodges et al. (1997) illustrated, how breeders spread from the Fertile Crescent
towards North-West Europe, following two migration routes. One route led to the north
along the Balkans’ rivers (Danubian route) towards Germany and the Netherlands, while
the second route (Mediterranean route) led through western Europe across the
Mediterranean Sea towards Italy, Spain and France. During these migration waves,
potential interbreeding between wild European aurochs and already domesticated stocks
explain the displayed footprints of exotic breeds within the European bovine genome
(Gautier et al., 2011). These findings also confirmed the known recent shared ancestry of
Holstein and Norwegian Red (Gibbs et al., 2009). In all Holstein lines (DE_DSN,
CHAPTER 4
97
DE_DN, DE_HF, PL_HF) genetic relations of Norwegian red cattle were detected.
Additionally, Gautier et al. (2011) affirmed the Northern European origin of Angus, Red
Angus, French and American Holstein, French Red Pied Lowland and Norwegian Red
cattle, via Reynolds genetic distances (computed via allele frequencies at 44,706 SNPs),
accounting for the depicted genetic kinships in Figure 15. Close genetic proximities
between French Red Pied Lowland to Holstein can be explained by the Red Pied
Lowland’s recent derivation from red Holstein and Meuse-Rhin-Yssel breeds from
Germany (Gautier et al., 2011). Relatively high average genetic relationships (8.87-12.39
%) between Hereford and Simmental and Brown Swiss and Holstein in the current study
concur with the results of Gautier et al. (2011), where Hereford, Holstein and Brown
Swiss were ascribed to one major cluster. Gamarra et al. (2017) explained the historical
genetic influence of Hereford on Holstein, Simmental and Brown Swiss by interbreeding
events, that occurred before the establishment of the Hereford herd in 1846 (Heath-
Agnew, 1983).
As exemplified in the present study, PCA as well as the breed assignment supported the
European origin of these breeds (HF, DSN, DN, Si, BS, OBS) and implied distinct
geographically variable selective forces (influenced by economic purposes). These
evolutionary formative events resulted into different genetic variants in cattle breeds of
disparate regions. Moreover, they influenced the differentiation of allele frequencies
among populations and the relation between phenotypes and genotypes. Furthermore, it
was affirmed that, based on allele-sharing distances between individuals, the extent of
ancestry can be predicted rather accurately without pedigree information. Hence, the
WIDDE breed assignment can be of great use for the management of endangered bovine
populations, whenever pedigree information is missing.
Genetic parameters of sensor traits
Estimating genetic parameters via PGMIX as well as solely on pedigree basis did not
significantly affect the outcome of results, ensuring the results’ reliability of both
methodologies. Basic dairy cattle habits (e.g. sleeping, feeding) underlay moderate
genetic control, while RUM, ACT, ET, I and IC resulted into minor heritabilities, which
will be more difficult to select for. Index and IC seem to be more of a management tool,
that can be applied on farm, in order to reach conclusive insights about an animal’s
CHAPTER 4
98
welfare status but fail to function as indicator traits. Especially the heritability of FEED
behaviour concurs well with results from literature. Løvendahl and Munksgaard (2016)
derived a moderate heritability of 0.20 in Holstein dairy cattle, while Robinson and Oddy
(2004) reported a heritability of 0.36 for time spent feeding in feedlot-finished beef cattle.
However, the question remains, of how feeding behaviour ought to be evaluated from a
breeder’s point of view. Whether long feeding times represent a desirable breeding goal,
as opposed to shorter feeding times, one always has to bear in mind the trade-off between
feeding and rumination time (Løvendahl and Munksgaard, 2016). Therewith, when
breeding for increased milk production in dairy cattle, physiological coping mechanisms,
reflected by reduced feeding and resting times of cows, in order to uphold their production
level, should be monitored. Especially high yielding cows might compensate for shorter
feeding periods by faster food intake or increased rumination efficiency, in order to satisfy
their energy requirements. This aspect has been addressed by Løvendahl and Munksgaard
(2016), who emphasized the effects of time constraints on dairy cow behaviour.
The estimated heritability for RUM does not comply with the results from literature.
Byskov et al. (2017) reported heritabilities of rumination time (microphone-based
rumination monitoring) ranging between 0.14-0.44 in primiparous Holstein herds. A
reason for the low heritability in the current study may be the high rest variance (29.59)
with a comparably low additive genetic variance (0.84-1.00). Moreover, negative
individual level correlations were found between rumination time and DMI (rg= -0.24 to
0.09), and between rumination time and residual feed intake (rg= -0.34 to -0.03) (Byskov
et al., 2017). Then again, other findings in literature described positive relationships
between rumination time and intake of forage natural detergent fibre (NDF) (Nørgaard et
al., 2010), physical effective fibre (Mertens, 1997), or long-particle alfalfa silage (Krause
et al., 2002). Byskov et al. (2017) suspected weak genetic associations between high feed
efficiency and increased rumination time. Their line of argument assumed, that high
rumination time implied a thorough mastication of feed particles, which facilitates further
breakdown of the feed, leading to increased utilization. Thus, high daily RUM percentage
could still be a useful selection criterion and function as an indicator trait for feed
efficiency. Corresponding to this hypothesis are findings of Gregorini et al. (2015). They
observed longer rumination periods in dairy cows with high feed efficiency, compared to
cows with low feed efficiency. Overall, RUM behaviour in cattle can be considered as a
CHAPTER 4
99
functional trait with economic impact on feed costs. As feed costs make up half of the
operating costs of European dairy herds (European Commission, 2015), selecting for high
feed efficiency in dairy cows is crucial for profitable milk production (Veerkamp, 1998).
The low heritability estimates of ET implied some genetic control of temperature
regulation mechanisms, next to the strong effects of environment and production level
(Dikmen et al., 2012). Findings from literature revealed heritabilities for rectal
temperature to be of moderate strength (0.15-0.17) (Dikmen et al., 2012; Seath, 1947),
which do not concur with the range of the current estimations. One reason for the
discrepancy between heritabilities could be the difference of measurement procedure (ear
surface vs. rectal temperature). Additionally, the surface ET trait in this study has shown
to be greatly affected by the environmental temperature and may differ distinctly from
rectal and core body temperature. In this regard, the correlation of surface ET and core
body temperature should be evaluated, in order to assess, whether ET reflects temperature
regulation of dairy cattle in the same way as core body temperature or rectal temperature
do. A moderate heritability of body temperature is considered a particularly interesting
functional trait in breeding dairy cattle in tropical and subtropical regions for heat
tolerance. Olson et al. (2012) generated evidence, supporting the existence of a major
gene, that is responsible for producing a very short, sleek hair coat, which allows the cow
to maintain a lower rectal temperature. This gene was predominantly found in Senepol
cattle and criollo breeds from Central and South America and Carora cows from
Venezuela. Even Carora x Holstein F1 crossbred cows showed improved thermotolerance
due to inherited slick-haired coats.
Heritabilities for daily ACT (0.06-0.08) confirmed estimates from literature, based on
accelerometer recordings of activity monitoring (0.03-0.12) (Ismael et al., 2015; Schöpke
and Weigel, 2014). However, the implementation of different measuring devices
(accelerometer vs. sensor), the recording lengths and number of animals differed between
studies. Schöpke and Weigel (2014) considered a period of > 100 days of accelerometer
measurements of 1,171 HF cows and focused on the detection of oestrus, which has not
been the case in this study. Nonetheless, their results on genetic parameters support the
current findings. They concluded, that normal everyday cattle activity needs to be
considered a different trait than the increased activity, which is expressed during oestrus.
CHAPTER 4
100
This was reflected in slightly different heritability estimates of activity during non-oestrus
periods (0.03-0.05) and activity during oestrus (0.12) (Schöpke and Weigel, 2014).
The moderate genetic parameters of NA (0.15-0.17) do not coincide with the heritability
estimate of dairy cattle lying/sleeping behaviour (0.01) of Løvendahl and Munksgaard
(2016). They suspected differences in milk merit to be the driving force behind lying
behaviour and eventual trade-offs between lying and eating time. However, the
significantly associated SNP markers of NA present compelling reasons, as do the
estimated heritabilities, that NA is under some genetic control.
SNP-based heritabilities
In future studies, heritabilities of sensor traits should be estimated based on SNPs (hSNP2 ).
Yang et al. (2017) suspected potential biases in pedigree based heritabilities (h2), due to
confounding factors, such as common environmental effects shared between close
relatives. Moreover, hSNP2 is unlikely to be contaminated with contributions from non-
additive genetic effects, as the correlation between additive and non-additive genetic
relationships is small compared to h2. Speed et al. (2012) claimed, that hSNP2 from
genotyped unrelated individuals offers advantages over the pedigree-based approach.
Accordingly, dense genotype data allows the exploitation of small differences in the
proportions of the genome, that is shared among unrelated individuals. These short
genomic regions, inherited from a remote common ancestor, generate LD. Consequently,
hSNP2 based on unrelated individuals relate only to causal-variant heritability tagged by
SNPs (Speed et al., 2012; Yang et al., 2010). Another aspect is the application of multiple
trait analyses based on SNPs, where genetic correlations between complex traits,
measured on different samples, can be estimated. This is particularly useful when
estimating genetic correlations between multiple diseases, which are often unlikely to co-
segregate in sufficiently large pedigrees. Such a case would make it impossible to apply
the traditional pedigree-based approach. Hence, estimating a genetic correlation, based
on hSNP2 , between any two diseases, using independent case-control data, is possible
(Visscher et al., 2014).
Generally, hSNP2 remain smaller than pedigree-based h2. Yang et al. (2017) reasoned, that
not all causal variants, especially those with low frequency, are perfectly tagged by SNPs
CHAPTER 4
101
used in GWAS. Most of the heritability is not ‘missing’ but cannot be detected, because
the individual effects are too small, to pass stringent significance tests. They proved, that
the remaining estimated heritability was due to incomplete LD between causal variants
and genotyped SNPs. This is aggravated by causal variants, that have a lower MAF than
the genotyped SNPs (Yang et al., 2010). In other words, SNPs do not fully explain
estimated heritabilities, because the SNPs on the arrays are not in complete LD with the
causal variants. The potential of SNPs to explain phenotypic variation, due to causal
variants, depends on the LD between all causal variants and all SNPs (Yang et al., 2010).
In order to avoid large biases due to LD, overestimating regions of strong LD and
underestimating regions of low LD, different methodologies are suggested. Yang et al.
(2010) recommended a transformation, including uniformly scaling the usual SNP-based
kinship coefficients, while Speed et al. (2012) suggested a weighting of SNPs, depending
on how well they are tagged by their neighbours.
In order to estimate hSNP2 however, rather large sample sizes are required, as the
information comes from very small coefficients of genetic relationship for pairs of
individuals (n > 10,000) (Yang et al., 2017). Thus, the aforementioned small samples size
of the current study presents an obstacle in this regard.
Multi-breed GWAS
The identification of the DGAT1 gene on BTA14 favoured the a priori conclusion that,
despite the small sample size, the multi-breed GWAS was able to identify putative
causative variants and candidate genes. The gene-based test and fastBAT procedure led to
the detection of 7 SNPs, which were in close proximity (50 kb) to 22 putative candidate
genes, that may affect cattle behaviour such as RUM, ACT and FEED. With an FDR of
20 %, the detection power was increased, compared to applying the stricter BF correction.
However, the risk of detecting false positive SNPs was raised as well.
This is the first study, where large data volume of repeated measurements of dual-purpose
cows from pasture-systems was condensed to one value per cow, using two different
approaches (MEAN, DRP). Hence, it is complicated to assess the value of each approach
and to decide, which methodology will proof best in the future. Possibly, there is an even
better procedure for processing this kind of data in an appropriate manner for GCTA.
However, it can be assumed, that the DRP better captures and sums up the daily behaviour
CHAPTER 4
102
expression in one value than the MEAN does. The reason behind this hypothesis is, that
the statistical model, for estimating the breeding values of sensor traits, already corrected
for fixed and random effects (breed-farm, year-month of measurement, age of cow,
permanent environment, additive genetic effect), which influenced bovine behaviour. In
this regard, Speed et al. (2012) explained, the estimation of random effects (‘breeding
values’) is of primary importance, because these values reflect a ‘true’ phenotype adjusted
for environmental effects or measurement error. On the other hand, when using the
MEAN in GCTA, the data was only corrected for the ‘breed-farm’ effect. Consequently,
it is most likely, that the MEAN of sensor behaviour traits, does not correctly reflect the
genetic variance of bovine behaviour, due to confounding environmental effects. Thus, a
more precise picture of the true phenotype might be gained via DRP, by pre-correcting
for fixed and random effects in the DMU model, when calculating the EBVs. The multi-
breed GWAS results supported this assumption, as only one significant SNP was detected
via the MEAN approach and seven significant SNPs were discovered using DRP.
It is the polygenic nature of most complex traits and diseases, that the effect size of
individual variants is too small, in order to be detected, despite large sample sizes (Bakshi
et al., 2016). Ample evidence even suggested, that complex trait-associated genetic
variants, discovered via GWAS, are enriched in genic regions (Yang et al, 2011a; Schork
et al., 2013) and in many cases, there are multiple associated variants at a single locus
(Yang et al., 2012; Wood et al., 2014). Due to this phenomenon, Bakshi et al. (2016)
reasoned, that for the discovery of complex trait genes, it is more powerful to test the
accumulated effect of a set of SNPs, applying set-based association. According to this
hypothesis, the a priori conclusion was formulated, that the issue of a ‘polygenic’
architecture would also affect bovine behaviour traits, marking the gene-based test in
GCTA (fastBAT option) the best methodology to pursue. Applying fastBAT, Bakshi et al.
(2016) discovered six novel gene loci for height, two for body mass index and three for
schizophrenia. They argued, that the detection power of fastBAT was increased, due to
multiple small independent association signals at these loci and pfastBAT was smaller than
pGWAS. Nonetheless, if there is only one causal variant at a locus, pfastBAT was expected to
be larger than pGWAS of the top associated SNP (Bakshi et al., 2016). The current results
have shown, that next to the identified significant SNPs from Table 11, other SNPs were
discovered (via gene-based test and fastBAT) and associated with potential candidate
CHAPTER 4
103
genes (Table 12). The only SNP, that was detected in GWAS and in the gene-based test
was ARS-BFGL-NGS-80066 (BTA23, FEED). These results support the assumption,
that there could be more independent association signals (variants) at certain loci, which
are simply not tagged by GWAS, due to their small effect size, but which are discovered
via fastBAT.
The innovative character and the small sample size of this study, make it difficult to
clearly associate the identified candidate genes directly to bovine behaviour, such as
RUM, ACT or FEED. However, some of the discovered potential candidate genes were
already linked to traits or diseases in cattle, humans, pigs or mice.
Rumination. The putative candidate gene RPS6KB2 was associated with innate immune
response in indigenous and crossbred cattle (Thapakar, Vrindavani) (Chauhan et al.,
2015). Moreover, Chen et al. (2011) discovered the gene to be differentially expressed in
the liver transcriptome of Angus cattle, that were genetically selected for low and high
residual feed intake. Meade et al. (2007) identified the gene to be differently expressed in
bovine tuberculosis- infected and control cattle. The real time quantitative PCR confirmed
a trend of innate immune gene repression for RPS6KB2. Other findings from literature
implied an association of RPS6KB2, as a TGF-β gene, with pre-implantation embryonic
development in cattle (Li et al., 2012).
Another potential candidate gene, which was associated with RUM behaviour was the
PTPRCAP gene. The gene was suggested to be involved in the defence response in
humans (Zerbino et al., 2018) as a key regulator of lymphocyte activation, while Fuka et
al. (2011) found it to be repressed by the Leukemia-Specific Fusion Gene ETV6/RUNX1.
The putative candidate gene CaBP4, coding for a neuronal Ca2+-binding protein, was
described to be expressed in photoreceptors in mice, where it is localized to synaptic
terminals (Haeseleer et al., 2004). Haeseleer et al. (2004) further concluded, that the
phenotype of Cabp4−/− mice shared similarities with patients of incomplete congenital
stationary night blindness (CSNB2). Generally, CaBP4 is suggested to play an important
role in normal synaptic function (Haeseleer et al., 2004).
A rather interesting association was found between the potential candidate gene
TMEM134 and obesity as well as atherosclerosis in adults (Keustermans et al., 2017).
Furthermore, Literature implied, that TMEM134 was involved in the prototypical
inflammatory nuclear factor-κB (NF-κB) signalling pathway (Keustermans et al., 2017).
CHAPTER 4
104
The modulation of downstream NF-κB signalling was reasoned to be one of the hallmarks
of innate immune programming in chronic inflammation (Morris et al., 2014). However,
whether the downregulation of the TMEM134 has a distinct effect on cattle remains to be
elucidated. The identified PITPNM1 gene was associated with retinal degeneration and
hypopyon in human; amongst its related pathways were metabolism and
glycerophospholipid biosynthesis (Stelzer et al., 2016).
Activity. The potential PPM1E candidate gene was linked with ACT behaviour in dual-
purpose cattle. Inter alia, the dephosphorylation gene was associated with feeding
behaviour in Danish Duroc boars (Do et al., 2013). Do et al. (2013) assumed, that PPM1E
is mediated by 5’AMP-activated protein kinase (AMPK), which is well documented to
play key roles in controlling energy balance. It was assumed, that AMPK is involved in
hypothalamic glucose and nutrient sensing. There is some basis for argumentation, that
PPM1E can be related to activity and feeding behaviour. The previous study in chapter 3
revealed an indistinct relationship between ACT behaviour and BCS. Dual-purpose cows,
that expressed low levels of daily ACT showed significantly higher BCS, as cows, that
were more active. It was argued, that cows, which spend more time feeding, ruminating
and being active, had a generally lower BCS, due to higher milk yield. On the other hand,
cows with increased BCS, but reduced activity, feeding and rumination behaviour had
lower milk yields. This trend was confirmed by Roche et al. (2009), who concluded, that
body condition loss correlated positively with cow activity and peak milk yield. As a
corollary, it can be stated that, in spite of an association with PPM1E and pig feeding
behaviour, bovine activity may also be associated with PPM1E, as phenotypic relations
between feeding and activity were assumed.
A straighter forward aspect of the PPM1E gene was depicted in the study of
Detmer et al. (2008). They demonstrated hindlimb gait defects, due to decreased hindlimb
muscle mass and reduced number of motor axons, in transgenic mice. Notably, the
transgene was integrated into chromosome 11 between the Rad51c and PPM1E genes
(Detmer et al., 2008). Due to these findings, it can be assumed, because of the PPM1E’s
proximity to the transgene, that PPM1E is involved in the locomotor system and the
distribution of axonal mitochondria in motor neurons as well.
CHAPTER 4
105
Feeding. The potential LCN15 candidate gene was associated with FEED in dual-purpose
cattle. Notably, existing studies indicated the gene’s involvement in transport of glucose
and other sugars, bile salts and organic acids, metal ions and amine compounds as well
as transport of vitamins and nucleosides (Stelzer et al., 2016). As a member of the
lipocalin gene family, of which LCN2 is assumed to be involved in obesity and diabetes
in human (Boztepe and Gulec, 2018), it can be hypothesized, that LCN15 plays a role in
feeding behaviour in dual-purpose cattle. Boztepe and Gulec (2018) have shown, that
elevated glucose dosages distinctly induced levels of LCN15 transcription. Furthermore,
it was proposed, that LCN15 physiologically interacted with high glucose levels in
enterocytes. Hence, the intestinal absorption of glucose may, among other genes, be
controlled by LCN15 (Boztepe and Gulec, 2018).
The potential candidate gene SLC25A27 was also associated with FEED. Jiang et al.
(2009) identified the gene to be part of a novel genetic network, associated with
economically important traits in Wagyu x Limousin cattle (Jiang et al., 2009).
The multi-breed GWAS study revealed various interesting aspects and novel approaches,
which is why further research in this field is strongly recommended. Especially, because
of the complexity of traits, it would be desirable to increase the sample size as well as the
SNP density to imputed full-sequence genotypes, as the SNP coverage was insufficient
for some regions within the genome. McClure et al. (2012) also mentioned different SNP
densities, which possibly affected the results. Moreover, Sanchez et al. (2017) described,
that in their multi-breed GWAS, significant differences between markers (50 K, HD SNP,
or sequence) led to variations of peaks within the Manhattan plots. While there were
several peaks identified for whole-genome sequences, only one peak was observed for 50
K SNP density.
Although the reliable detection of the DGAT1 gene assured the workability of the multi-
breed GWAS approach on a small sample size, Raven et al. (2014) clearly stressed the
effect of sample size on detection power. They combined data of Holstein bulls and cows,
instead of analysing them separately. McClure et al. (2012) reached similar conclusions
when conducting within and across breed GWAS on beef breeds (Angus, Hereford,
Simmental, Charolais, Limousin). They reasoned, that the within breed analyses were
underpowered to detect segregating loci, due to smaller sample sizes.
CHAPTER 4
106
When increasing the sample size, the conduction of a within breed GWAS is
recommended. This way, significantly detected SNPs within single breeds can be
compared and it becomes clearer, whether there are differences in proportion of
significant variants between breeds. Another aspect is the detection of private alleles or
breed-specific QTLs, which would require within-breed GWAS. Also, the number of
significant variants, detected per trait, may increase when using within-breed analyses, as
Sanchez et al. (2017) reported for their within-breed analyses.
Conclusion
This study provided evidence of a clear clustering of the genetic relatedness between
European dual-purpose cattle. The heritability estimates for behaviour traits were similar
for pedigree-based and single-step GBLUP. As expected, the genetic parameters of the
electronically recorded bovine behaviour traits, such as rumination, feeding, activity, high
activity, sleeping and ear temperature remained within a rather low range and showed
acceptable standard errors. In spite of the small sample size, reliable heritability estimates
were generated, due to multiple repeated measurements per animal. A combination of
sensor traits into one indicator trait, such as index and index class, did not reveal sufficient
heritability and should rather be used as a reference value for management decisions.
Despite the low sample size, it is worth noting, that the multi-breed GWAS reliably
detected the region within the genome, containing genes, known to be related to fat
production, such as DGAT1. The limited number of individuals analysed and the complex
nature of behaviour traits examined, which are influenced by environmental factors, may
have a negative influence on the power of this analysis. Moreover, the SNP coverage was
not evenly distributed across the 29 autosomes. However, significant SNPs for
rumination, activity and feeding were detected. Applying the gene-based test and the
fastBAT procedure, allowed an identification of plausible candidate genes, which could
harbour mutations, affecting bovine behaviour. In the future, using sequence data rather
than SNP array genotypes combined with a multi-breed analysis and increased records of
phenotypes and genotypes, could result into direct identification of causative mutations
in natural cattle behaviour. A discovery of potential causative mutations may have
immediate applications for improvements in selecting dual-purpose cows, that are better
adjusted for current and future production systems in terms of behaviour. Continuing
research in the field of multi-breed GWAS, with regard to behaviour traits, seems most
CHAPTER 4
107
promising. Only a combination between genetic, genotypic and phenotypic measures of
complex traits will complement the physiological characterisation of cattle. This aspect
is particularly important, in the case of endangered dual-purpose breeds, as it can
contribute to conservation and genetic resource management decisions.
CHAPTER 4
108
References
Adamczyk, K., Pokorska, J., Makulska, J., Earley, B. and Mazurek, M. 2013. Genetic
analysis and evaluation of behavioural traits in cattle. Livestock Science 154:1–12.
https://doi.org/10.1016/j.livsci.2013.01.016.
Alam, T., Bahar, B., Waters, S.M., McGee, M. and Sweeney, T. 2012. Analysis of
multiple polymorphisms in the bovine neuropeptide Y5 receptor gene and structural
modelling of the encoded protein. Molecular Biology Reports 39:4411–4421.
https://doi.org/10.1007/s11033-011-1229-9.
Ashburner, M., Ball, C.A., Blake, J.A., Botstein, D., Butler, H., Cherry, J.M., et al.
2000. Gene ontology: Tool for the unification of biology. The Gene Ontology
Consortium. Nature Genetics 25:25–29.
Bakshi, A., Zhu, Z., Vinkhuyzen, A.A.E., Hill, W.D., McRae, A.F., Visscher, P.M. and
Yang, J. 2016. Fast set-based association analysis using summary data from GWAS
identifies novel gene loci for human complex traits. Scientific Reports 6:32894.
https://doi.org/10.1038/srep32894.
Benjamini, Y. and Hochberg, Y. 1995. Controlling the False Discovery Rate: A
Practical and Powerful Approach to Multiple Testing. Journal of Royal Statistical
Society 57:289–300.
Boztepe, T. and S. Gulec. 2018. Investigation of the influence of high glucose on
molecular and genetic responses: an in vitro study using a human intestine model.
Genes & Nutrition 13:11. https://doi.org/10.1186/s12263-018-0602-x.
Browning, S.R. and Browning, B.L. 2007. Rapid and accurate haplotype phasing and
missing-data inference for whole-genome association studies by use of localized
haplotype clustering. American Journal of Human Genetics 81:1084–1097.
https://doi.org/10.1086/521987.
Byskov, M.V., Fogh, A. and Løvendahl, P. 2017. Genetic parameters of rumination
time and feed efficiency traits in primiparous Holstein cows under research and
commercial conditions. Journal of Dairy Science 100 :9635–9642.
https://doi.org/10.3168/jds.2016-12511.
Chauhan, A., Maurya, S., Yadav, A.S., Sonwane, A., Shukla, S.K., Prakash, C. 2015.
Differential expression profile of innate immune response genes between indigenous
CHAPTER 4
109
and crossbred cattle. Journal of Pure and Applied Microbiology 9: 2913+.
Academic OneFile
Chen, Y., Gondro, C., Quinn, K., Herd, R.M., Parnell, P.F. and Vanselow, B. 2011.
Global gene expression profiling reveals genes expressed differentially in cattle with
high and low residual feed intake. Animal Genetics 42:475–490.
https://doi.org/10.1111/j.1365-2052.2011.02182.x.
Chen, M., Pan, D., Ren, H., Fu, J., Li, J., Su, G., Wang, A., Jiang, L., Zhang, Q. and
Liu, J.F. 2016. Identification of selective sweeps reveals divergent selection between
Chinese Holstein and Simmental cattle populations. Genetics, Selection, Evolution
48:76. https://doi.org/10.1186/s12711-016-0254-5.
Chen, C., Huang, H., Wu, C. 2017. Protein Bioinformatics Databases and Resources.
Methods Molecular Biology 1558: 3-39. https://doi.org/10.1007/978-1-4939-6783-
4_1.
Christensen, O.F., Madsen, P., Nielsen, B., Ostersen, T. and Su, G. 2012. Single‐step
methods for genomic evaluation in pigs. Animal 6:1565–1571.
https://doi.org/10.1017/S1751731112000742.
Cody, R. An Introduction to SAS® University Edition. Accessed Jun 25, 2018.
https://www.google.com/search?client=firefox-b
ab&ei=LaswW6elMYOxsAG_wpCoAg&q=university+edition+sas+user+guide&
oq=university+edition+sas+users+&gs_l=psyab.1.0.33i22i29i30k1.4169.4169.0.59
46.1.1.0.0.0.0.81.81.1.1.0…0…1.1.64.psy-ab.0.1.81…0._FHPDQUmXw0.
DeRoos, A.P.W., Hayes, B.J., Spelman, R.J. and Goddard, M.E. 2008. Linkage
disequilibrium and persistence of phase in Holstein-Friesian, Jersey and Angus
cattle. Genetics 179:1503–1512. https://doi.org/10.1534/genetics.107.084301.
Detmer, S.A., Velde, C.V., Cleveland, D.W. and Chan, D.C. 2008. Hindlimb gait
defects due to motor axon loss and reduced distal muscles in a transgenic mouse
model of Charcot-Marie-Tooth type 2A. Human Molecular Genetics 17:367–375.
https://doi.org/10.1093/hmg/ddm314.
Dikmen, S., Cole, J.B., Null, D. J. and Hansen, P.J. 2012. Heritability of rectal
temperature and genetic correlations with production and reproduction traits in dairy
cattle. Journal of Dairy Science 95:3401–3405. https://doi.org/10.3168/jds.2011-
4306.
CHAPTER 4
110
Do, D.N., Strathe, A.B, Ostersen, T., Jensen, J., Mark, T., and Kadarmideen, H.N.
2013. Genome-wide association study reveals genetic architecture of eating
behaviour in pigs and its implications for humans obesity by comparative mapping.
PloS one 8:e71509. https://doi.org/10.1371/journal.pone.0071509.
European Commission. 2015. An overview of estimates of costs of production and
gross margins of milk production in the EU: EU Agricultural and Farm Economics
Briefs.Accessed23.08.2018:ec.europa.eu/agriculture/rica/pdf/Milk_margin_estimat
e_2015.pdf
Flori, L., Fritz, S., Jaffrézic, F., Boussaha, M., Gut, I., Heath, S., Foulley, J.L. and
Gautier, M. 2009. The genome response to artificial selection: a case study in dairy
cattle. PloS one 4: e6595. https://doi.org/10.1371/journal.pone.0006595.
Fuka, G., Kauer, M., Kofler, R., Haas, O.A. and Panzer-Grümayer, R. 2011. The
leukemia-specific fusion gene ETV6/RUNX1 perturbs distinct key biological
functions primarily by gene repression. PloS one 6:e26348.
https://doi.org/10.1371/journal.pone.0026348.
Gamarra, D., Lopez-Oceja, A. and de Pancorbo, M.M. 2017. Genetic characterization
and founder effect analysis of recently introduced Salers cattle breed population.
Animal an international journal of animal bioscience 11:24–32.
https://doi.org/10.1017/S1751731116001063.
Garrick, D. J., Taylor, J.F. and Fernando, R.L. 2009. Deregressing estimated breeding
values and weighting information for genomic regression analyses. Genetics,
Selection, Evolution 41:55. https://doi.org/10.1186/1297-9686-41-55.
Gautier, M., Laloë, D. and Moazami-Goudarzi, K. 2011. Correction: Insights into the
Genetic History of French Cattle from Dense SNP Data on 47 Worldwide Breeds.
PloS one 6. https://doi.org/10.1371/annotation/84c8c4fa-031d-4a7a-8c09-
2619627fc387.
Gene Ontology Consortium. 2017. Expansion of the Gene Ontology knowledgebase
and resources. Nucleic Acids Research 45: D331-D338.
https://doi.org/10.1093/nar/gku1179.
Geer, L.Y., Marchler-Bauer, A., Geer, R.C., Han, L., He, J., He, S., Liu, C., Shi, W.,
Bryant SH. 2010. The NCBI BioSystems database. Nucleic Acids Research
38:D492-6.
CHAPTER 4
111
Gibbs, R.A., Taylor, J. F., van Tassell, C.P., Barendse, W., Eversole, K.A., Gill,
C.A., Green, R.D., Hamernik, D.L., Kappes, S.M., Lien, S., Matukumalli, L.K.,
McEwan, J.C., Nazareth, L.V., Schnabel, R.D., Weinstock, G.M., Wheeler, D.A. et
al. 2009. Genome-wide survey of SNP variation uncovers the genetic structure of
cattle breeds. Science (New York, N.Y.) 324: 528–532.
https://doi.org/10.1126/science.1167936.
Gregorini, P., Waghorn, G.C., Kuhn-Sherlock, B., Romera, A.J. and Macdonald, K.A.
2015. Short communication: grazing pattern of dairy cows that were selected for
divergent residual feed intake as calves. Journal of Dairy Science 98:6486–6491.
https://doi.org/10.3168/jds.2015-9614.
Gutiérrez-Gil, B., Arranz, J.J. and Wiener, P. 2015. An interpretive review of selective
sweep studies in Bos taurus cattle populations: identification of unique and shared
selection signals across breeds. Frontiers in genetics 6:167.
https://doi.org/10.3389/fgene.2015.00167.
Habier, D., Tetens, J., Seefried, F.R., Lichtner, P. and Thaller, G. 2010. The impact of
genetic relationship information on genomic breeding values in German Holstein
cattle. Genetics, Selection, Evolution 42:5. https://doi.org/10.1186/1297-9686-42-5.
Haeseleer, F., Imanishi, Y., Maeda, T., Possin, D.E., Maeda, A., Lee, A., Rieke, F. and
Palczewski, K. 2004. Essential role of Ca2+ -binding protein 4, a Cav 1.4 channel
regulator, in photoreceptor synaptic function. Nature Neuroscience 7:1079–1087.
Heath-Agnew, E. 1983. History of Hereford Cattle. Gerald Duckworth & Co Ltd,
London.
Hohenboken, W.D. 1986. Inheritance of behavioral chracteristics in livestock. A
review. Anim. Breed. Abstr. 54:623–639.
Ismael, A., Strandberg, E., Kargo, M, Fogh, A. and Løvendahl, P. 2015. Estrus traits
derived from activity measurements are heritable and closely related to the time from
calving to first insemination. Journal of Dairy Science 98:3470–3477.
https://doi.org/10.3168/jds.2014-8940.
Jiang, Z., Michal, J.J., Chen, J., Daniels, T.F., Kunej, T., Garcia, M.D., Gaskins, C.T.,
Busboom, J.R., Alexander, L.J., Wright Jr., R.W. and MacNeil, M.D. 2009.
Discovery of novel genetic networks associated with 19 economically important
CHAPTER 4
112
traits in beef cattle. International Journal of Biological Sciences: 528–542.
https://doi.org/10.7150/ijbs.5.528.
Keustermans, G.C., Kofink, D., Eikendal, A., de Jager, W., Meerding, J., Nuboer, R.,
Waltenberger, J., Kraaijeveld, A.O., Jukema, J.W., Sels, J.W., Garssen, J., Prakken,
B.J., Asselbergs, F.W., Kalkhoven, E., Hoefer, I.E., Pasterkamp, G. and Schipper,
H.S. 2017. Monocyte gene expression in childhood obesity is associated with
obesity and complexity of atherosclerosis in adults. Scientific reports 7:16826.
https://doi.org/10.1038/s41598-017-17195-3.
Krause, K.M., Combs, D.K. and Beauchemin, K.A. 2002. Effects of Forage Particle
Size and Grain Fermentability in Midlactation Cows. II. Ruminal pH and Chewing
Activity. Journal of Dairy Science 85:1947–1957.
https://doi.org/10.3168/jds.S0022-0302(02)74271-9.
Launchbaugh, K.L., Walker, J.W. and Taylor, C.A. 1999. Foraging behavior:
experience or inheritance: Grazing behavior of livestock and wildlife. 70th ed.
Moscow, ID, USA: University of Idaho.
Li, G., Khateeb, K., Schaeffer, E., Zhang, B. and H. Khatib. 2012. Genes of the
transforming growth factor-beta signalling pathway are associated with pre-
implantation embryonic development in cattle. The Journal of Dairy Research
79:310–317. https://doi.org/10.1017/S0022029912000210.
Legarra, A., Aguilar, I. and Misztal, I. 2009. A relationship matrix including full
pedigree and genomic information. Journal of Dairy Science 92: 4656–63.
https://doi.org/10.3168/jds.2009-2061.
Løvendahl, P., and L. Munksgaard. 2016. An investigation into genetic and phenotypic
variation in time budgets and yield of dairy cows. Journal of Dairy Science 99:408–
417. https://doi.org/10.3168/jds.2015-9838.
Madsen, P. and Jensen, J. 2018. A user's guide to DMU: A package for analysing
multivariate mixed models. Accessed Jun 26, 2018:
https://www.researchgate.net/publication/291444592_A_user
%27s_guide_to_DMU.
McClure. 2012. Genome-wide association analysis for quantitative trait loci
influencing Warner–Bratzler shear force in five taurine cattle breeds. Animal
Genetics 43: 662–673. https://doi10.1111/j.1365-2052.2012.02323.x
CHAPTER 4
113
Meade, K.G., Gormley, E., Doyle, M.B., Fitzsimons, T., O'Farrelly, C., Costello, E.,
Keane, J., Zhao, Y. and MacHugh, D.E. 2007. Innate gene repression associated
with Mycobacterium bovis infection in cattle: toward a gene signature of disease.
BMC genomics 8:400. https://doi.org/10.1186/1471-2164-8-400.
Mertens, D. R. 1997. Creating a System for Meeting the Fiber Requirements of Dairy
Cows. Journal of Dairy Science 80:1463–1481. https://doi.org/10.3168/jds.S0022-
0302(97)76075-2.
Morris, M.C., Gilliam, E.A. and Li, L. 2014. Innate immune programming by
endotoxin and its pathological consequences. Frontiers in Immunology 5: 680.
https://doi.org/10.3389/fimmu.2014.00680.
Nørgaard, P., Nadeau, E. and Randby, Å.T. 2010. A new Nordic evaluation system for
diets fed to dairy cows: A meta analysis: in: Modelling Nutrient Digestion and
Utilisation in Farm Animals pages: 112–120. ed. Wageningen Academic Publishers,
Wageningen, the Netherlands.
Olson, T.A., Lucena, C., Chase Jr., C.C. and Hammond, A.C. 2012. Evidence of a
major gene influencing hair length and heat tolerance in Bos taurus cattle.
Payne, W.J.A. and Hodges, J. 1997. Tropical cattle: origins, breeds and breeding
policies. Blackwell Science Ltd, Oxford, UK.
Purcell, S., Neale, B., Todd-Brown, K., Thomas, L., Ferreira, M.A.R., Bender, D.,
Maller, J. Sklar, P., de Bakker, I. W., Daly, M.J. and Sham, P.C. 2007. PLINK: a
tool set for whole-genome association and population-based linkage analyses.
American journal of human genetics 81:559–575. https://doi.org/10.1086/519795.
R Core Team. 2013. A language and environment for statistical computing. Vienna,
Austria. https://cran.r-project.org/doc/manuals/fullrefman.pdf
Raven, L.A., Cocks, B.G. and Hayes, B.J. 2014. Multibreed genome wide association
can improve precision of mapping causative variants underlying milk production in
dairy cattle. BMC genomics 15:62. https://doi.org/10.1186/1471-2164-15-62.
Robinson, D.L. and Oddy, V.H. 2004. Genetic parameters for feed efficiency, fatness,
muscle area and feeding behaviour of feedlot finished beef cattle. Livestock
Production Science 90:255–270. https://doi.org/10.1016/j.livprodsci.2004.06.011.
Roche, J.R., Friggens, N.C., Kay, J.K., Fisher, M.W., Stafford, K.J. and Berry, D.P.
2009. Invited review: Body condition score and its association with dairy cow
CHAPTER 4
114
productivity, health, and welfare. Journal of Dairy Science 92:5769–5801.
https://doi.org/10.3168/jds.2009-2431.
Sanchez, M.P., Govignon-Gion, A., Croiseau, P., Fritz, S., Hozé, C., Miranda, G.,
Martin, P. Barbat-Leterrier, A., Letaïef, R., Rocha, D., Brochard, M., Boussaha, M.
and Boichard, D. 2017. Within-breed and multi-breed GWAS on imputed whole-
genome sequence variants reveal candidate mutations affecting milk protein
composition in dairy cattle. Genetics, Selection, Evolution 49:68.
https://doi.org/10.1186/s12711-017-0344-z.
Schöpke, K., Weigel, K.A. 2014. Use of Accelerometer Data for Genetic Evaluation in
Dairy Cattle. Interbull Bulletin 48:68–72.
Schork, A.J., Thompson, W.K., Pham, P., Torkamani, A., Roddey, J.C., Sullivan, P.F.,
Kelsoe, J.R., O'Donovan, M.C., Furberg, H., Schork, N.J., Andreassen, O.A. and
Dale, A.M. 2013. All SNPs are not created equal: genome-wide association studies
reveal a consistent pattern of enrichment among functionally annotated SNPs. PLoS
genetics 9:e1003449. https://doi.org/10.1371/journal.pgen.1003449.
Schutz, M.M. and Pajor, E.A. 2001. Genetic Control of Dairy Cattle Behavior. Journal
of Dairy Science 84:31-38. https://doi.org/10.3168/jds.S0022-0302(01)70194-4.
Seath, D.M. 1947. Heritability of Heat Tolerance in Dairy Cattle.
https://doi.org/10.3168/jds.S0022-0302(47)92331-X
Sempéré, G., Moazami-Goudarzi, K., Eggen, A., Laloë, D., Gautier, M. and Flori, L.
2015. WIDDE: a Web-Interfaced next generation database for genetic diversity
exploration, with a first application in cattle. BMC genomics 16:940.
https://doi.org/10.1186/s12864-015-2181-1.
Seong, J., Suh, D.S., Park, K.D., Lee, H.K. and Kong, H.S. 2012. Identification and
analysis of MC4R polymorphisms and their association with economic traits of
Korean cattle (Hanwoo). Molecular biology reports 39:3597–3601.
https://doi.org/10.1007/s11033-011-1133-3.
Snowder, G.D., Walker, J.W., Launchbaugh, K.L. and van Vleck, L.D. 2001. Genetic
and phenotypic parameters for dietary selection of mountain big sagebrush
(Artemisia tridentata Nutt. ssp. vaseyana. Journal of Animal Science 79:486.
https://doi.org/10.2527/2001.792486x.
CHAPTER 4
115
Speed, D., Hemani, G., Johnson, M.R. and Balding, D.J. 2012. Improved heritability
estimation from genome-wide SNPs. American journal of human genetics 91:1011–
1021. https://doi.org/10.1016/j.ajhg.2012.10.010.
Stelzer, G., Rosen, R., Plaschkes, I., Zimmerman, S., Twik, M., Fishilevich, S., Iny
Stein, T., Nudel, R., Lieder, I., Mazor, Y., Kaplan, S., Dahary, D., Warshawsky, D.,
Guan – Golan, Y., Kohn, A., Rappaport, N., Safran, M. and Lancet, D. 2016. The
GeneCards Suite: From Gene Data Mining to Disease Genome Sequence Analysis,
Current Protocols in Bioinformatics, 54:1.30.1 - 1.30.33. https://doi:10.1002/cpbi.5.
Su, G. and Madsen, P. User's Guide for Gmatrix Ver2. A program for computing
Genomic relationship matrix. Department of Genetics and Biotechnology, Aarhus
University. Accessed 23.05.2018:
dmu.agrsci.dk/Gmatrix/Doc/Current/GmatrixV2-User-Guide.pdf
Sutter, N.B., Eberle, M.A., Parker, H.G., Pullar, B.J., Kirkness, E.F., Kruglyak, L. and
Ostrander, E.A. 2004. Extensive and breed-specific linkage disequilibrium in Canis
familiaris. Genome Research 14:2388-2396.
http://www.genome.org/cgi/doi/10.1101/.
Veerkamp, R.F. 1998. Selection for Economic Efficiency of Dairy Cattle Using
Information on Live Weight and Feed Intake: A Review. Journal of Dairy Science
81:1109–1119. https://doi.org/10.3168/jds.S0022-0302(98)75673-5.
Visscher, P.M., Hemani, G., Vinkhuyzen, A.A.E., Chen, G.B., Lee, S.H., Wray, N.R.,
Goddard, M.E. and Yang, J. 2014. Statistical Power to Detect Genetic (Co)Variance
of Complex Traits Using SNP Data in Unrelated Samples. Plos genetics 10:
e1004269 https://doi.org/10.1371/journal.pgen.1004269
Welfare assessment protocol. 2009. Welfare Quality® Assessment protocol for cattle.
ASG Veehouderij BV, Lelystad, The Netherlands. Accessed 23.05.2018.
www.welfarequality.net/media/1017/cattle_protocol_without_veal.PDF.
Wiener, P., Burton, D. and Williams, J.L. 2004. Breed relationships and definition in
British cattle: a genetic analysis. Heredity 93:597–602.
https://doi.org/10.1038/sj.hdy.6800566.
Wood, A.R., Esko, T., Yang, J., Vedantam, S., Pers, T.H., Gustafsson, S.A., Chu, Y.,
Estrada, K., Luan, J.'a., Kutalik, Z., Amin, N., Buchkovich, M.L., Croteau-Chonka,
D.C., Day, F.R. et al. 2014. Defining the role of common variation in the genomic
CHAPTER 4
116
and biological architecture of adult human height. Nature genetics 46:1173–1186.
https://doi.org/10.1038/ng.3097.
Yang, J., Benyamin, B., McEvoy, B.P., Gordon, S., Henders, A.K., Nyholt, D.R.,
Madden, P.A., Heath, A.C., Martin, N.G., Montgomery, G.W., Goddard, M.E. and
Visscher, P.M. 2010. Common SNPs explain a large proportion of the heritability
for human height. Nature Genetics 42: 565–569. https://doi.org/10.1038/ng.608.
Yang, J., Ferreira, T., Morris, A.P., Medland, S.E., Madden, P.A.F., Heath, A.C.,
Martin, N.G., Montgomery, G.W., Weedon, M.N., Loos, R.J., Frayling, T.M.,
McCarthy, M.I., Hirschhorn, J.N., Goddard, M.E. and Visscher, P.M. 2012.
Conditional and joint multiple-SNP analysis of GWAS summary statistics identifies
additional variants influencing complex traits. Nature genetics 44:369-75, S1-3.
https://doi.org/10.1038/ng.2213.
Yang, J., Lee, S.H., Goddard, M.E. and Visscher, P.M. 2011. GCTA: a tool for genome-
wide complex trait analysis. American journal of human genetics 88:76–82.
https://doi.org/10.1016/j.ajhg.2010.11.011.
Yang, J., Manolio, T.A., Pasquale, L.R., Boerwinkle, E., Caporaso, N., Cunningham,
J.M., de Andrade, M., Feenstra, B., Feingold, E., Hayes, M.G., Hill, W.G., Landi,
M.T., Alonso, A., Lettre, G., Lin, P., Ling, H., Lowe, W., Mathias, R.A., Melbye,
M., Pugh, E., Cornelis, M.C., Weir, B.S., Goddard, M.E. and Visscher, P.M. 2011a.
Genome partitioning of genetic variation for complex traits using common SNPs.
Nature genetics 43:519–525. https://doi.org/10.1038/ng.823.
Yang, J., Zeng, J., Goddard, M.E, Wray, N.R. and Visscher, P.M.2017. Concepts,
estimation and interpretation of SNP-based heritability. Nature Genetics 49: 1304–
1310. https://doi.org/10.1038/ng.3941.
Zerbino, D.R., Premanand, A., Wasiu, A., Amode, M.R., Barrell, D., Bhai, J., Billis,
K., Cummins, C., Gall, A., Girón, C.G., Gil, L., Gordon, L., Haggerty, L., Haskell,
E., Hourlier, T., Izuogu, O.G., Janacek, S.H., Juettemann, T., To, J.K., Laird, M.R.,
Lavidas, I., Liu, Z., Loveland, J.E., Maurel, T., McLaren, W., Moore, B., Mudge,
J., Murphy, D.N., Newman, V., Nuhn, M., Ogeh, D., Ong, C.K., Parker, A.,
Patricio, M., Riat, H.S., Schuilenburg, H., Sheppard, D., Sparrow, H., Taylor, K.,
Thormann, A., Vullo, A., Walts, B., et al. 2018. Ensembl. PubMed PMID.
https://doi:10.1093/nar/gkx1098.
CHAPTER 4
117
CHAPTER 5
Variance Heterogeneity and Genotype by Environment Interactions in
Native Black and White Dual-Purpose Cattle for Different Herd
Allocation Schemes
M. Jaeger, H. Brandt, K. Brügemann, S. Naderi, S. König
Published 2019 in ANIMAL
118
Introduction
Daughter records of influential artificial insemination (AI) sires are available in different
environments, allowing i) estimations and comparisons of genetic correlations between
same traits across country borders and ii) ranking of the same bulls on different national
scales according to environmental classifications (Hammami et al., 2009). For bull
comparisons across country borders, Schaeffer (1994) developed the multiple-trait across
country evaluation (MACE) methodology. Instead of country borders, Weigel and
Rekaya (2000) suggested a ‘borderless clustering’ approach for genetic evaluation of
sires, where herds were allocated into different clusters, based on their management
practices, climatic conditions, or genetic herd architectures. The idea behind this approach
being, that herds located in different countries may be more similar regarding
management, climate and genetic compositions, than herds from the same country.
Against this background, various studies considered the aspect of genotype by
environment interactions (GxE), defining different environments (Weigel and Rekaya,
2000), feeding systems (Kolver et al., 2002), herd protein production levels (Kolmodin et
al., 2002) or management and housing characteristics (Fatehi et al., 2003) within and
across countries. Instead of a multiple-trait animal model (MTAM) application,
Kolmodin et al. (2002) studied phenotypic and genetic variations for protein yield on a
continuous herd scale via reaction norm models. In this regard, most of the GxE studies
were conducted in large dairy cattle populations, especially in Holstein Friesian (HF).
Byrant et al. (2006) studied productivity for a range of different feeding levels.
“Environmental sensitivity” was more obvious in high yielding North American HF,
compared to New Zealand HF or Jerseys. In consequence, Byrant et al. (2006) described
North American HF strains as specialists (high production output in superior feeding level
environments), and New Zealand HF and Jersey breeds as generalists, tolerating
environmental changes. Such a genetic line characterisation supports the hypothesis of
generalists evolving in heterogeneous, and of specialists (e.g. HF) in homogeneous
environments (Byrant et al., 2006). Kolmodin et al. (2002) confirmed this hypothesis.
They detected significant variations between sires regarding daughter sensitivity in
different farm environments. Sires with a high genetic merit for production traits reacted
more sensitive to changes in herd environments than sires with low a genetic merit.
CHAPTER 5
119
Changes on the European milk market with decreasing prices and increasing fodder costs
force dairy farmers to switch from conventional to alternative dairy production systems,
i.e. changing from high-input indoor to low-input pasture-based production. However,
there are certain requirements for dairy cows kept in grazing systems, regarding metabolic
stability, robustness and fertility (Dillon et al., 2003). The shift in feeding and thus,
reduced energy intake, especially affects high producing breeds having been selected for
indoor systems for decades, such as HF (Dillon et al., 2003).
Due to their long process of adaptation to grassland or ecological systems, it can be
hypothesized, that so-called indigenous dual-purpose cattle are more robust to challenges
in harsh environments, such as low fodder quality, heat stress or disease infections. In
such context, the definition of robustness also implies quite homogeneous genetic values
and genetic (co)variance components with environmental alterations (König, 2017). The
black and white dual-purpose cattle (DSN) have the ability to efficiently convert pasture
into milk, without feeding concentrates in small-scale grassland or organic family farms
(Jürgens et al., 2015; Gassan, 2017). Belonging to the lowland breeds, DSN cattle
originated from the coastal grassland regions of northern Germany and the Netherlands.
Black and white cattle populations from the Netherlands and Poland are descendants from
common German founders, and considered as a robust breed for similar grassland
production systems (Nauta et al., 2006; Gassan, 2017; Biedermann, 2003). Hence, in
order to provide optimal genetic material for specific European environments, a
borderless estimation of breeding values might be an alternative for strict national genetic
evaluations for DSN.
Nevertheless, the quality of across country genetic evaluations or borderless clustering
approaches via MTAM strongly depends on genetic connectedness among clusters or
herd strata. In such context, König et al. (2002) hypothesized impact on genetic
relationships on genetic (co)variance component estimates. Clément et al. (2001) stated,
that also an AI program might contribute to poor genetic connectedness, i.e., when only
operating within specific regions - as being the case for endangered breeds. In regional
breeds of dairy goats, Analla et al. (1995) pointed out, that poor genetic connectedness
and sparse pedigree information were main causes for biased breeding values with low
prediction accuracies.
CHAPTER 5
120
So far, there is only limited research addressing the impact of heterogenic environmental
effects and of genetic connectedness on genetic (co)variance estimates in endangered
native dual-purpose cattle breeds. In consequence, this study aimed at defining
environmental and herd descriptors, in order to follow the ‘multiple-trait herd cluster’
approach (Weigel and Rekaya, 2000) for the DSN breed. Specifically, the objectives of
this study were i) to estimate genetic (co)variance components in discrete herd
environments via MTAM applications, and ii) to study genetic correlation estimates
against the background of genetic connectedness of DSN sub-populations. Results for
DSN were compared with genetic parameter estimates from HF and “mixed” breed
analyses, using the same herd data base and same strategies for data stratification
according to environmental and herd descriptors.
Materials and Methods
DSN herds and traits
The majority of farms was located in the northwest grassland region in East Friesland and
around Hannover and Bremen. Three major geographic regions were determined: 1.
intensive grazing systems on coastal marshlands, 2. large-scale farms in one region of
former East Germany, and 3. small-scale family farms in the middle and the south of
Germany. Apart from the eastern German region, farms predominantly reflected pasture-
based low-input production systems.
The study included 3,659 DSN and 2,324 HF cows from parities one to three, kept in 46
different herds. Herds always kept DSN cows, but in most cases, herds were ‘mixed’
herds (Mixed) including both genetic lines (HF and DSN). In calving years 2014 and
2015, herd sizes ranged from 11 to 1,712 cows, with an average of 130 cows per herd.
With a focus on the naturally negative energy balance during the early lactation period,
traits of interest were test-day records from the first official test-day after calving for a
production trait (milk yield: Mkg), an indicator trait for udder health (somatic cell score:
SCS) and a trait, reflecting metabolic stability (fat-to-protein ratio: FPR). Cow test-day
traits represented the first three lactations from calving years 2010 to 2015. Descriptive
statistics for the test-day traits are given in Table 13.
CHAPTER 5
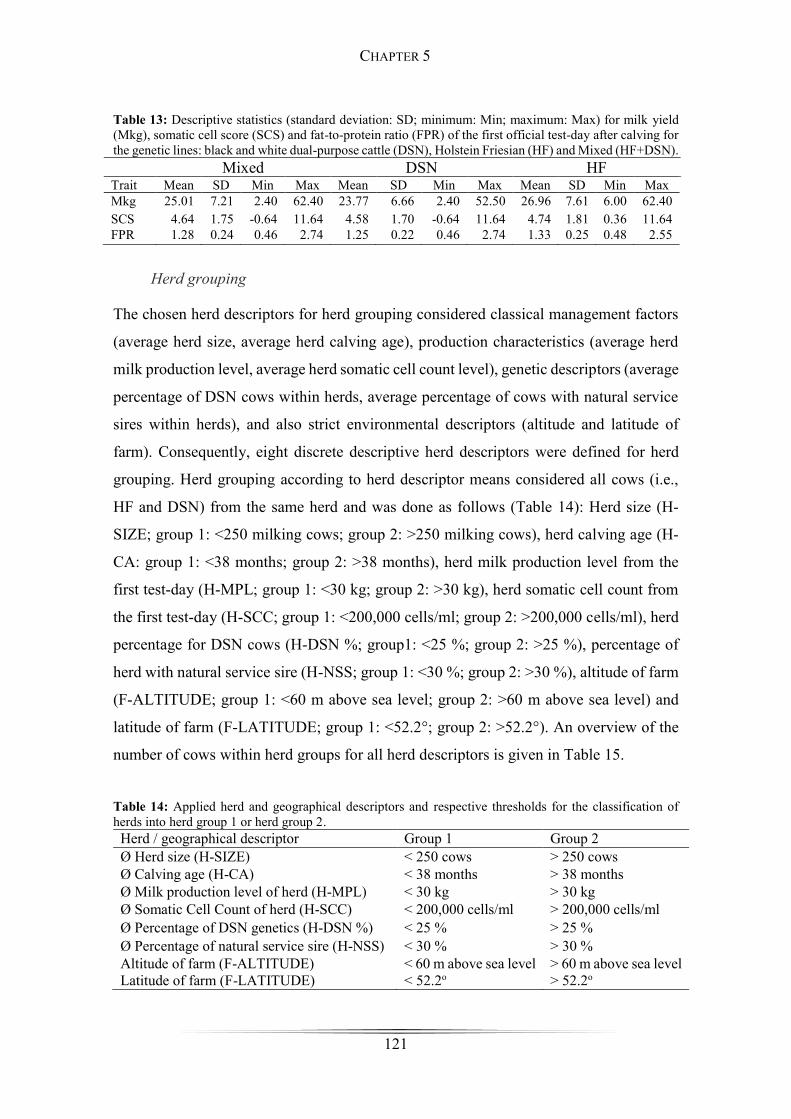
121
Table 13: Descriptive statistics (standard deviation: SD; minimum: Min; maximum: Max) for milk yield (Mkg), somatic cell score (SCS) and fat-to-protein ratio (FPR) of the first official test-day after calving for the genetic lines: black and white dual-purpose cattle (DSN), Holstein Friesian (HF) and Mixed (HF+DSN).
Mixed DSN HF Trait Mean SD Min Max Mean SD Min Max Mean SD Min Max Mkg 25.01 7.21 2.40 62.40 23.77 6.66 2.40 52.50 26.96 7.61 6.00 62.40 SCS 4.64 1.75 -0.64 11.64 4.58 1.70 -0.64 11.64 4.74 1.81 0.36 11.64 FPR 1.28 0.24 0.46 2.74 1.25 0.22 0.46 2.74 1.33 0.25 0.48 2.55
Herd grouping
The chosen herd descriptors for herd grouping considered classical management factors
(average herd size, average herd calving age), production characteristics (average herd
milk production level, average herd somatic cell count level), genetic descriptors (average
percentage of DSN cows within herds, average percentage of cows with natural service
sires within herds), and also strict environmental descriptors (altitude and latitude of
farm). Consequently, eight discrete descriptive herd descriptors were defined for herd
grouping. Herd grouping according to herd descriptor means considered all cows (i.e.,
HF and DSN) from the same herd and was done as follows (Table 14): Herd size (H-
SIZE; group 1: <250 milking cows; group 2: >250 milking cows), herd calving age (H-
CA: group 1: <38 months; group 2: >38 months), herd milk production level from the
first test-day (H-MPL; group 1: <30 kg; group 2: >30 kg), herd somatic cell count from
the first test-day (H-SCC; group 1: <200,000 cells/ml; group 2: >200,000 cells/ml), herd
percentage for DSN cows (H-DSN %; group1: <25 %; group 2: >25 %), percentage of
herd with natural service sire (H-NSS; group 1: <30 %; group 2: >30 %), altitude of farm
(F-ALTITUDE; group 1: <60 m above sea level; group 2: >60 m above sea level) and
latitude of farm (F-LATITUDE; group 1: <52.2°; group 2: >52.2°). An overview of the
number of cows within herd groups for all herd descriptors is given in Table 15.
Table 14: Applied herd and geographical descriptors and respective thresholds for the classification of herds into herd group 1 or herd group 2. Herd / geographical descriptor Group 1 Group 2 Ø Herd size (H-SIZE) < 250 cows > 250 cows Ø Calving age (H-CA) < 38 months > 38 months Ø Milk production level of herd (H-MPL) < 30 kg > 30 kg Ø Somatic Cell Count of herd (H-SCC) < 200,000 cells/ml > 200,000 cells/ml Ø Percentage of DSN genetics (H-DSN %) < 25 % > 25 % Ø Percentage of natural service sire (H-NSS) < 30 % > 30 % Altitude of farm (F-ALTITUDE) < 60 m above sea level > 60 m above sea level Latitude of farm (F-LATITUDE) < 52.2o > 52.2o
CHAPTER 5
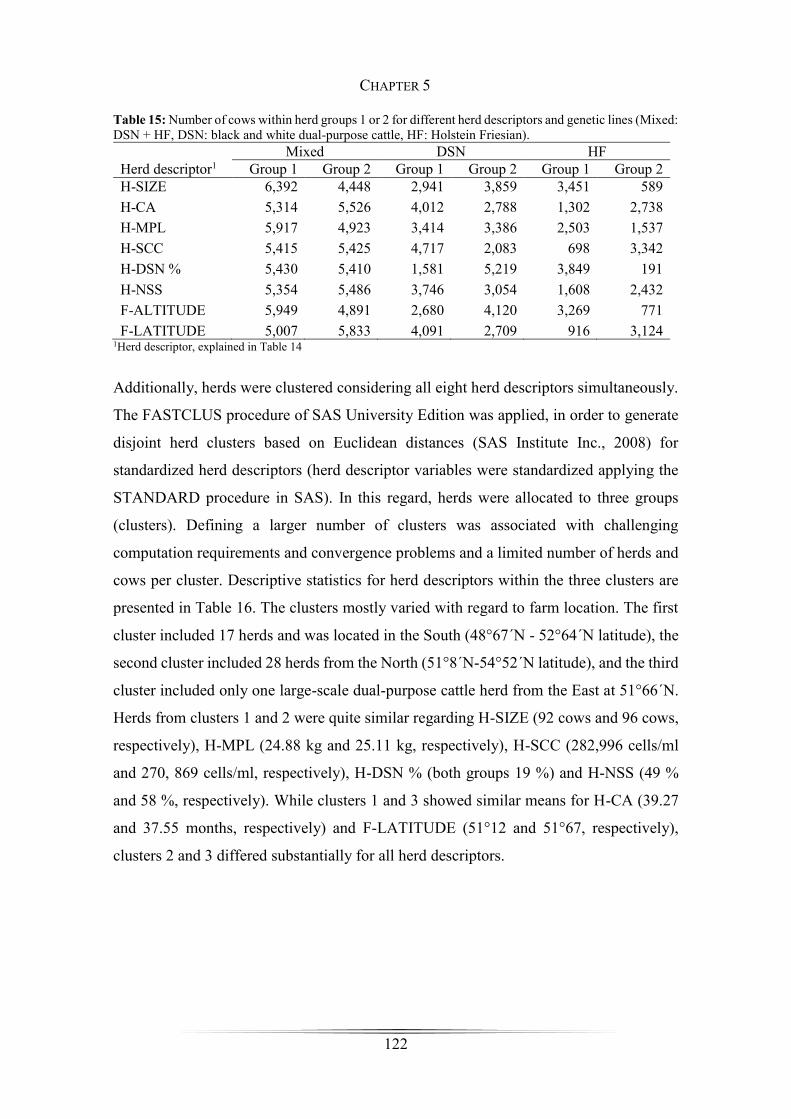
122
Table 15: Number of cows within herd groups 1 or 2 for different herd descriptors and genetic lines (Mixed: DSN + HF, DSN: black and white dual-purpose cattle, HF: Holstein Friesian).
Mixed DSN HF Herd descriptor1 Group 1 Group 2 Group 1 Group 2 Group 1 Group 2 H-SIZE 6,392 4,448 2,941 3,859 3,451 589 H-CA 5,314 5,526 4,012 2,788 1,302 2,738 H-MPL 5,917 4,923 3,414 3,386 2,503 1,537 H-SCC 5,415 5,425 4,717 2,083 698 3,342 H-DSN % 5,430 5,410 1,581 5,219 3,849 191 H-NSS 5,354 5,486 3,746 3,054 1,608 2,432 F-ALTITUDE 5,949 4,891 2,680 4,120 3,269 771 F-LATITUDE 5,007 5,833 4,091 2,709 916 3,124
1Herd descriptor, explained in Table 14
Additionally, herds were clustered considering all eight herd descriptors simultaneously.
The FASTCLUS procedure of SAS University Edition was applied, in order to generate
disjoint herd clusters based on Euclidean distances (SAS Institute Inc., 2008) for
standardized herd descriptors (herd descriptor variables were standardized applying the
STANDARD procedure in SAS). In this regard, herds were allocated to three groups
(clusters). Defining a larger number of clusters was associated with challenging
computation requirements and convergence problems and a limited number of herds and
cows per cluster. Descriptive statistics for herd descriptors within the three clusters are
presented in Table 16. The clusters mostly varied with regard to farm location. The first
cluster included 17 herds and was located in the South (48°67´N - 52°64´N latitude), the
second cluster included 28 herds from the North (51°8´N-54°52´N latitude), and the third
cluster included only one large-scale dual-purpose cattle herd from the East at 51°66´N.
Herds from clusters 1 and 2 were quite similar regarding H-SIZE (92 cows and 96 cows,
respectively), H-MPL (24.88 kg and 25.11 kg, respectively), H-SCC (282,996 cells/ml
and 270, 869 cells/ml, respectively), H-DSN % (both groups 19 %) and H-NSS (49 %
and 58 %, respectively). While clusters 1 and 3 showed similar means for H-CA (39.27
and 37.55 months, respectively) and F-LATITUDE (51°12 and 51°67, respectively),
clusters 2 and 3 differed substantially for all herd descriptors.
CHAPTER 5
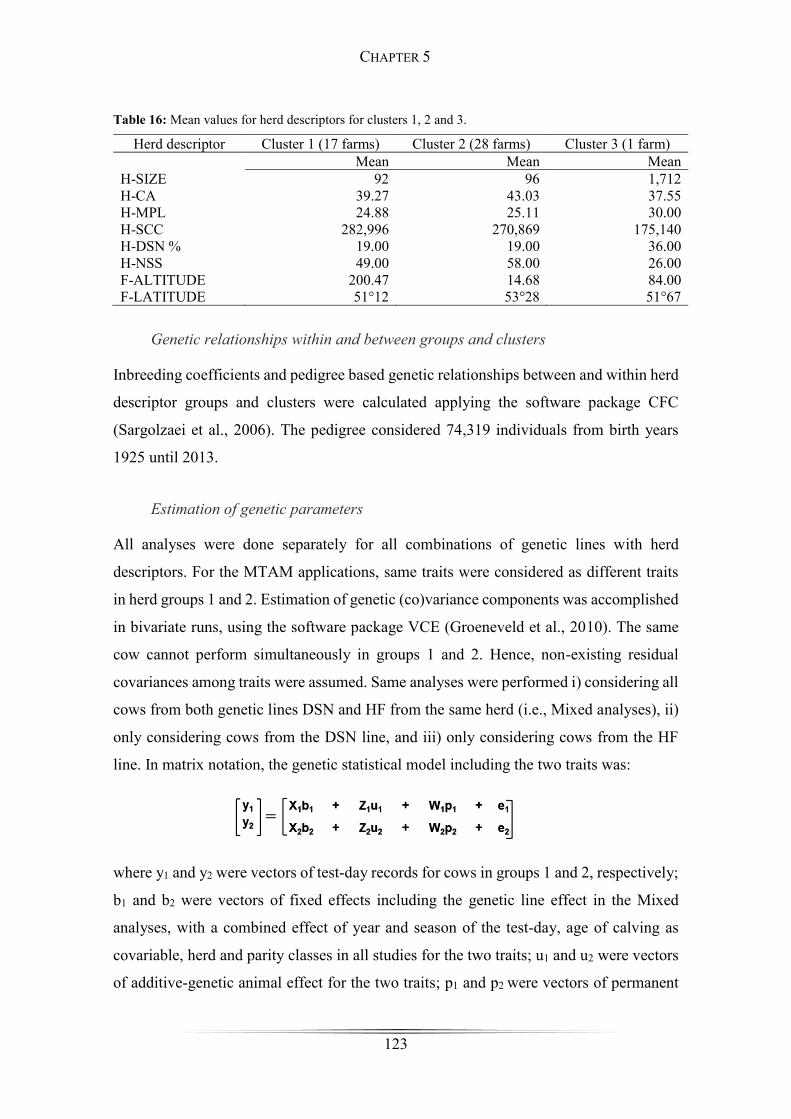
123
Table 16: Mean values for herd descriptors for clusters 1, 2 and 3.
Herd descriptor Cluster 1 (17 farms) Cluster 2 (28 farms) Cluster 3 (1 farm) Mean Mean Mean
H-SIZE 92 96 1,712 H-CA 39.27 43.03 37.55 H-MPL 24.88 25.11 30.00 H-SCC 282,996 270,869 175,140 H-DSN % 19.00 19.00 36.00 H-NSS 49.00 58.00 26.00 F-ALTITUDE 200.47 14.68 84.00 F-LATITUDE 51°12 53°28 51°67
Genetic relationships within and between groups and clusters
Inbreeding coefficients and pedigree based genetic relationships between and within herd
descriptor groups and clusters were calculated applying the software package CFC
(Sargolzaei et al., 2006). The pedigree considered 74,319 individuals from birth years
1925 until 2013.
Estimation of genetic parameters
All analyses were done separately for all combinations of genetic lines with herd
descriptors. For the MTAM applications, same traits were considered as different traits
in herd groups 1 and 2. Estimation of genetic (co)variance components was accomplished
in bivariate runs, using the software package VCE (Groeneveld et al., 2010). The same
cow cannot perform simultaneously in groups 1 and 2. Hence, non-existing residual
covariances among traits were assumed. Same analyses were performed i) considering all
cows from both genetic lines DSN and HF from the same herd (i.e., Mixed analyses), ii)
only considering cows from the DSN line, and iii) only considering cows from the HF
line. In matrix notation, the genetic statistical model including the two traits was:
where y1 and y2 were vectors of test-day records for cows in groups 1 and 2, respectively;
b1 and b2 were vectors of fixed effects including the genetic line effect in the Mixed
analyses, with a combined effect of year and season of the test-day, age of calving as
covariable, herd and parity classes in all studies for the two traits; u1 and u2 were vectors
of additive-genetic animal effect for the two traits; p1 and p2 were vectors of permanent
CHAPTER 5
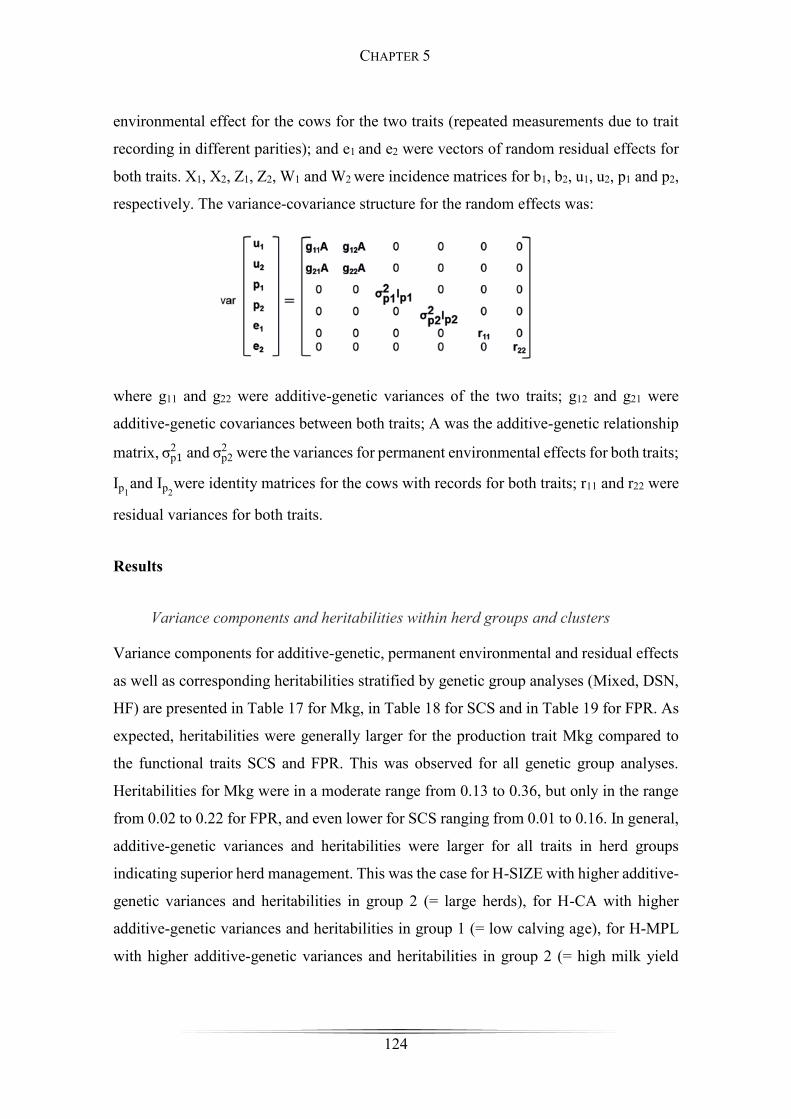
124
environmental effect for the cows for the two traits (repeated measurements due to trait
recording in different parities); and e1 and e2 were vectors of random residual effects for
both traits. X1, X2, Z1, Z2, W1 and W2 were incidence matrices for b1, b2, u1, u2, p1 and p2,
respectively. The variance-covariance structure for the random effects was:
where g11 and g22 were additive-genetic variances of the two traits; g12 and g21 were
additive-genetic covariances between both traits; A was the additive-genetic relationship
matrix, σp12 and σp2
2 were the variances for permanent environmental effects for both traits;
Ip1and Ip2
were identity matrices for the cows with records for both traits; r11 and r22 were
residual variances for both traits.
Results
Variance components and heritabilities within herd groups and clusters
Variance components for additive-genetic, permanent environmental and residual effects
as well as corresponding heritabilities stratified by genetic group analyses (Mixed, DSN,
HF) are presented in Table 17 for Mkg, in Table 18 for SCS and in Table 19 for FPR. As
expected, heritabilities were generally larger for the production trait Mkg compared to
the functional traits SCS and FPR. This was observed for all genetic group analyses.
Heritabilities for Mkg were in a moderate range from 0.13 to 0.36, but only in the range
from 0.02 to 0.22 for FPR, and even lower for SCS ranging from 0.01 to 0.16. In general,
additive-genetic variances and heritabilities were larger for all traits in herd groups
indicating superior herd management. This was the case for H-SIZE with higher additive-
genetic variances and heritabilities in group 2 (= large herds), for H-CA with higher
additive-genetic variances and heritabilities in group 1 (= low calving age), for H-MPL
with higher additive-genetic variances and heritabilities in group 2 (= high milk yield
CHAPTER 5
125
production level), and for H-SCC with higher additive-genetic variances and heritabilities
in group 1 (= low somatic cell count level).
CHAPTER 5
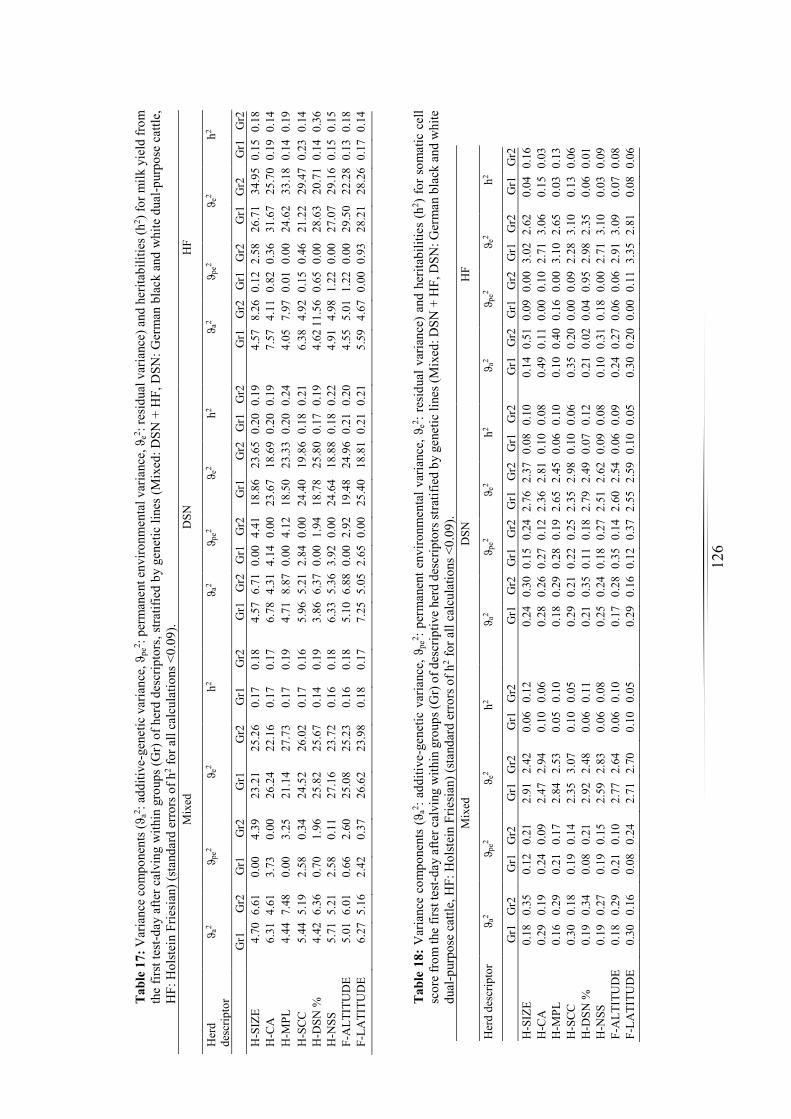
12
6 T
able
17:
Var
ianc
e co
mpo
nent
s (ϑ a
2 : ad
ditiv
e-ge
netic
var
ianc
e, ϑ
pe2 :
perm
anen
t env
ironm
enta
l var
ianc
e, ϑ
e2 : re
sidu
al v
aria
nce)
and
her
itabi
litie
s (h2 )
for m
ilk y
ield
from
th
e fir
st te
st-d
ay a
fter c
alvi
ng w
ithin
gro
ups (
Gr)
of h
erd
desc
ripto
rs, s
tratif
ied
by g
enet
ic li
nes (
Mix
ed: D
SN +
HF,
DSN
: Ger
man
bla
ck a
nd w
hite
dua
l-pur
pose
cat
tle,
HF:
Hol
stei
n Fr
iesi
an) (
stan
dard
err
ors o
f h2 f
or a
ll ca
lcul
atio
ns <
0.09
).
Mix
ed
DSN
H
F
Her
d de
scrip
tor
ϑ a2
ϑ pe2
ϑ e2
h2
ϑ
a2
ϑpe
2
ϑe2
h2
ϑa2
ϑ pe2
ϑ e
2
h2
G
r1
Gr2
G
r1
Gr2
G
r1
Gr2
G
r1
Gr2
G
r1
Gr2
G
r1
Gr2
G
r1
Gr2
G
r1
Gr2
G
r1
Gr2
G
r1
Gr2
G
r1
Gr2
G
r1
Gr2
H
-SIZ
E 4.
70 6
.61
0.00
4.
39
23.2
1 25
.26
0.17
0.
18
4.57
6.7
1 0.
00 4
.41
18.8
6 23
.65
0.20
0.1
9 4.
57
8.26
0.1
2 2.
58
26.7
1 34
.95
0.15
0.1
8 H
-CA
6.
31 4
.61
3.73
0.
00
26.2
4 22
.16
0.17
0.
17
6.78
4.3
1 4.
14 0
.00
23.6
7 18
.69
0.20
0.1
9 7.
57
4.11
0.8
2 0.
36
31.6
7 25
.70
0.19
0.1
4 H
-MPL
4.
44 7
.48
0.00
3.
25
21.1
4 27
.73
0.17
0.
19
4.71
8.8
7 0.
00 4
.12
18.5
0 23
.33
0.20
0.2
4 4.
05
7.97
0.0
1 0.
00
24.6
2 33
.18
0.14
0.1
9 H
-SC
C
5.44
5.1
9 2.
58
0.34
24
.52
26.0
2 0.
17
0.16
5.
96 5
.21
2.84
0.0
0 24
.40
19.8
6 0.
18 0
.21
6.38
4.
92 0
.15
0.46
21
.22
29.4
7 0.
23 0
.14
H-D
SN %
4.
42 6
.36
0.70
1.
96
25.8
2 25
.67
0.14
0.
19
3.86
6.3
7 0.
00 1
.94
18.7
8 25
.80
0.17
0.1
9 4.
62 1
1.56
0.6
5 0.
00
28.6
3 20
.71
0.14
0.3
6 H
-NSS
5.
71 5
.21
2.58
0.
11
27.1
6 23
.72
0.16
0.
18
6.33
5.3
6 3.
92 0
.00
24.6
4 18
.88
0.18
0.2
2 4.
91
4.98
1.2
2 0.
00
27.0
7 29
.16
0.15
0.1
5 F-
ALT
ITU
DE
5.01
6.0
1 0.
66
2.60
25
.08
25.2
3 0.
16
0.18
5.
10 6
.88
0.00
2.9
2 19
.48
24.9
6 0.
21 0
.20
4.55
5.
01 1
.22
0.00
29
.50
22.2
8 0.
13 0
.18
F-LA
TITU
DE
6.27
5.1
6 2.
42
0.37
26
.62
23.9
8 0.
18
0.17
7.
25 5
.05
2.65
0.0
0 25
.40
18.8
1 0.
21 0
.21
5.59
4.
67 0
.00
0.93
28
.21
28.2
6 0.
17 0
.14
Tab
le 1
8: V
aria
nce
com
pone
nts
(ϑa2 :
addi
tive-
gene
tic v
aria
nce,
ϑpe
2 : pe
rman
ent e
nviro
nmen
tal v
aria
nce,
ϑe2 :
resi
dual
var
ianc
e) a
nd h
erita
bilit
ies
(h2 )
for s
omat
ic c
ell
scor
e fr
om th
e fir
st te
st-d
ay a
fter c
alvi
ng w
ithin
gro
ups (
Gr)
of d
escr
iptiv
e he
rd d
escr
ipto
rs st
ratif
ied
by g
enet
ic li
nes (
Mix
ed: D
SN +
HF,
DSN
: Ger
man
bla
ck a
nd w
hite
du
al-p
urpo
se c
attle
, HF:
Hol
stei
n Fr
iesi
an) (
stan
dard
err
ors o
f h2 f
or a
ll ca
lcul
atio
ns <
0.09
).
Mix
ed
DSN
H
F
Her
d de
scrip
tor
ϑ a2
ϑ pe2
ϑ e2
h2 ϑ a
2 ϑ p
e2 ϑ e
2 h2
ϑ a2
ϑ pe2
ϑ e2
h2
Gr1
G
r2
Gr1
G
r2
Gr1
G
r2
Gr1
G
r2
Gr1
G
r2
Gr1
G
r2
Gr1
G
r2
Gr1
G
r2
Gr1
G
r2
Gr1
G
r2
Gr1
G
r2
Gr1
G
r2
H-S
IZE
0.18
0.
35
0.12
0.
21
2.91
2.
42
0.06
0.
12
0.24
0.
30 0
.15
0.24
2.7
6 2.
37 0
.08
0.10
0.
14 0
.51
0.09
0.0
0 3.
02 2
.62
0.04
0.1
6 H
-CA
0.
29
0.19
0.
24
0.09
2.
47
2.94
0.
10
0.06
0.
28
0.26
0.2
7 0.
12 2
.36
2.81
0.1
0 0.
08
0.49
0.1
1 0.
00 0
.10
2.71
3.0
6 0.
15 0
.03
H-M
PL
0.16
0.
29
0.21
0.
17
2.84
2.
53
0.05
0.
10
0.18
0.
29 0
.28
0.19
2.6
5 2.
45 0
.06
0.10
0.
10 0
.40
0.16
0.0
0 3.
10 2
.65
0.03
0.1
3 H
-SC
C
0.30
0.
18
0.19
0.
14
2.35
3.
07
0.10
0.
05
0.29
0.
21 0
.22
0.25
2.3
5 2.
98 0
.10
0.06
0.
35 0
.20
0.00
0.0
9 2.
28 3
.10
0.13
0.0
6 H
-DSN
%
0.19
0.
34
0.08
0.
21
2.92
2.
48
0.06
0.
11
0.21
0.
35 0
.11
0.18
2.7
9 2.
49 0
.07
0.12
0.
21 0
.02
0.04
0.9
5 2.
98 2
.35
0.06
0.0
1 H
-NSS
0.
19
0.27
0.
19
0.15
2.
59
2.83
0.
06
0.08
0.
25
0.24
0.1
8 0.
27 2
.51
2.62
0.0
9 0.
08
0.10
0.3
1 0.
18 0
.00
2.71
3.1
0 0.
03 0
.09
F-A
LTIT
UD
E 0.
18
0.29
0.
21
0.10
2.
77
2.64
0.
06
0.10
0.
17
0.28
0.3
5 0.
14 2
.60
2.54
0.0
6 0.
09
0.24
0.2
7 0.
06 0
.06
2.91
3.0
9 0.
07 0
.08
F-LA
TITU
DE
0.30
0.
16
0.08
0.
24
2.71
2.
70
0.10
0.
05
0.29
0.
16 0
.12
0.37
2.5
5 2.
59 0
.10
0.05
0.
30 0
.20
0.00
0.1
1 3.
35 2
.81
0.08
0.0
6
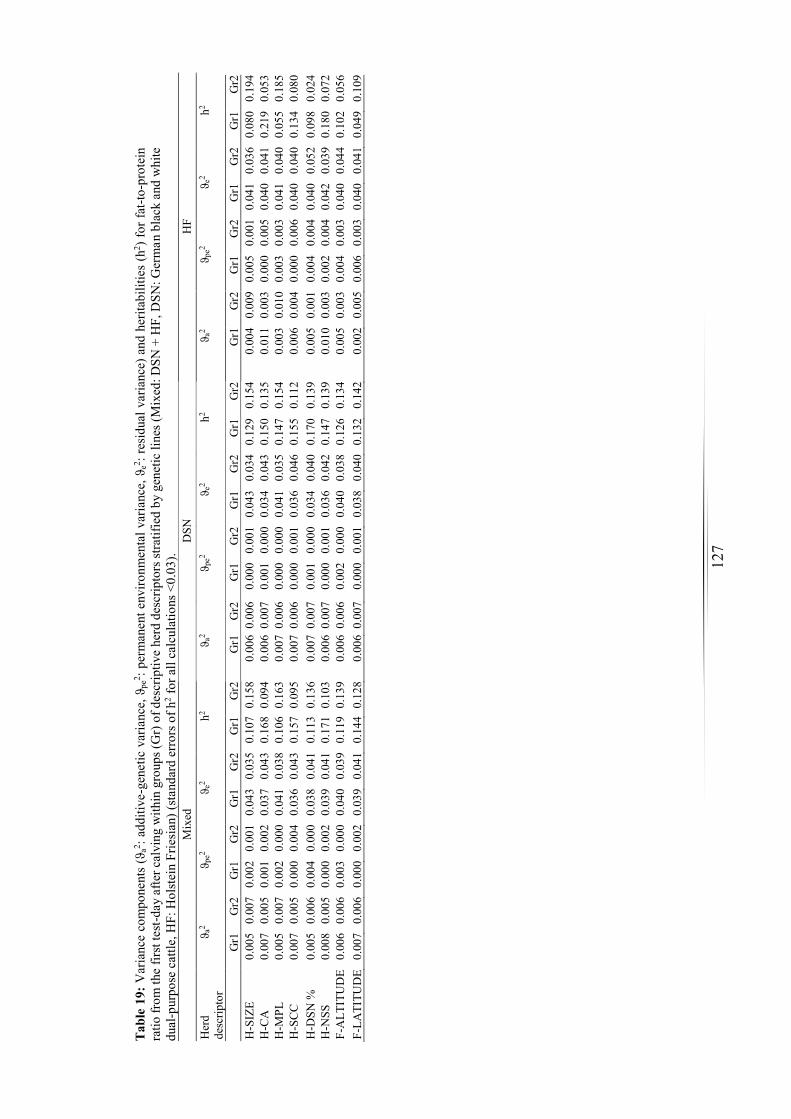
12
7
Tab
le 1
9: V
aria
nce
com
pone
nts
(ϑa2 :
addi
tive-
gene
tic v
aria
nce,
ϑpe
2 : pe
rman
ent e
nviro
nmen
tal v
aria
nce,
ϑe2 :
resi
dual
var
ianc
e) a
nd h
erita
bilit
ies
(h2 )
for f
at-to
-pro
tein
ra
tio fr
om th
e fir
st te
st-d
ay a
fter c
alvi
ng w
ithin
gro
ups (
Gr)
of d
escr
iptiv
e he
rd d
escr
ipto
rs st
ratif
ied
by g
enet
ic li
nes (
Mix
ed: D
SN +
HF,
DSN
: Ger
man
bla
ck a
nd w
hite
du
al-p
urpo
se c
attle
, HF:
Hol
stei
n Fr
iesi
an) (
stan
dard
err
ors o
f h2 f
or a
ll ca
lcul
atio
ns <
0.03
).
Mix
ed
DSN
H
F H
erd
desc
ripto
r ϑ a
2 ϑ p
e2 ϑ e
2 h2
ϑ a2
ϑ pe2
ϑ e2
h2 ϑ a
2 ϑ p
e2 ϑ e
2 h2
G
r1
G
r2
Gr1
G
r2
Gr1
G
r2
Gr1
G
r2
Gr1
Gr2
G
r1
Gr2
G
r1
Gr2
G
r1
Gr2
G
r1
G
r2
Gr1
G
r2
Gr1
G
r2
Gr1
G
r2
H-S
IZE
0.00
5 0.
007
0.00
2 0.
001
0.04
3 0.
035
0.10
7 0.
158
0.00
6 0.
006
0.00
0 0.
001
0.04
3 0.
034
0.12
9 0.
154
0.00
4 0.
009
0.00
5 0.
001
0.04
1 0.
036
0.08
0 0.
194
H-C
A
0.00
7 0.
005
0.00
1 0.
002
0.03
7 0.
043
0.16
8 0.
094
0.00
6 0.
007
0.00
1 0.
000
0.03
4 0.
043
0.15
0 0.
135
0.01
1 0.
003
0.00
0 0.
005
0.04
0 0.
041
0.21
9 0.
053
H-M
PL
0.00
5 0.
007
0.00
2 0.
000
0.04
1 0.
038
0.10
6 0.
163
0.00
7 0.
006
0.00
0 0.
000
0.04
1 0.
035
0.14
7 0.
154
0.00
3 0.
010
0.00
3 0.
003
0.04
1 0.
040
0.05
5 0.
185
H-S
CC
0.
007
0.00
5 0.
000
0.00
4 0.
036
0.04
3 0.
157
0.09
5 0.
007
0.00
6 0.
000
0.00
1 0.
036
0.04
6 0.
155
0.11
2 0.
006
0.00
4 0.
000
0.00
6 0.
040
0.04
0 0.
134
0.08
0 H
-DSN
%
0.00
5 0.
006
0.00
4 0.
000
0.03
8 0.
041
0.11
3 0.
136
0.00
7 0.
007
0.00
1 0.
000
0.03
4 0.
040
0.17
0 0.
139
0.00
5 0.
001
0.00
4 0.
004
0.04
0 0.
052
0.09
8 0.
024
H-N
SS
0.00
8 0.
005
0.00
0 0.
002
0.03
9 0.
041
0.17
1 0.
103
0.00
6 0.
007
0.00
0 0.
001
0.03
6 0.
042
0.14
7 0.
139
0.01
0 0.
003
0.00
2 0.
004
0.04
2 0.
039
0.18
0 0.
072
F-A
LTIT
UD
E 0.
006
0.00
6 0.
003
0.00
0 0.
040
0.03
9 0.
119
0.13
9 0.
006
0.00
6 0.
002
0.00
0 0.
040
0.03
8 0.
126
0.13
4 0.
005
0.00
3 0.
004
0.00
3 0.
040
0.04
4 0.
102
0.05
6 F-
LATI
TUD
E 0.
007
0.00
6 0.
000
0.00
2 0.
039
0.04
1 0.
144
0.12
8 0.
006
0.00
7 0.
000
0.00
1 0.
038
0.04
0 0.
132
0.14
2 0.
002
0.00
5 0.
006
0.00
3 0.
040
0.04
1 0.
049
0.10
9
128
Especially for Mkg for all genetic line analyses (Table 17), heritabilities and additive-
genetic variances were substantially larger in high productivity herds (group 2 for H-
MPL). In addition, a higher percentage of DSN cows within herds (H-DSN % group 2)
was associated with larger additive-genetic variances and heritabilities for Mkg. For
Mixed, additive-genetic Mkg variances were 4.42 kg2 in H-DSN % group 1, but 6.63 kg2
in group 2 (Table 17). Corresponding values were 3.86 kg2 in group 1 and 6.37 kg2 in
group 2 from the separate DSN analysis, and 4.62 kg2 in group 1 and even 11.56 kg2 in
group 2 from the separate HF analysis. With regard to herd stratifications according to H-
NSS, and according to classical environmental (geographical) descriptors F-ALTITUDE
and F-LATITUDE, additive-genetic variances and heritabilities for Mkg were quite
constant in groups 1 and 2 for all genetic line analyses. In HF, heritabilities and additive-
genetic variances for Mkg were substantially higher in H-SCC group 1 (low SCC), but
these estimates were almost identical in groups 1 and 2 for Mixed and for DSN.
Permanent environmental variance components for Mkg mostly followed the pattern of
additive-genetic variances in groups 1 and 2 (Table 17): herd groups indicating a superior
environment or herd management (larger herds, lower calving age, lower herd level for
SCC, higher herd production level) not only had higher additive-genetic variances for
Mkg, but also greater permanent environmental variances. In herd groups indicating
suboptimal herd management, permanent environmental variances were smaller in the
DSN and Mixed populations compared to corresponding estimates in HF. Estimates for
permanent environmental variances for Mkg in DSN and Mixed were zero in group 1 for
H-SIZE, in group 2 for H-CA and in group 1 for H-MPL, but were slightly higher in HF
with 0.12 kg2, 0.36 kg2 and 0.01 kg2, respectively. Apart from H-SCC, also residual
variances for Mkg were larger in herd groups indicating a superior herd management
(Table 17).
For test-day SCS, all genetic lines showed a similar trend for heritabilities and additive-
genetic variances regarding herd descriptors H-SIZE, H-CA, H-MPL, H-SCC, F-
ALTITUDE and F-LATITUDE (Table 18). Again, heritabilities and additive-genetic
variances were higher in herd groups indicating a superior herd management, i.e., in larger
herds allocated to group 2, in herds with a lower calving age allocated to group 1, in herds
with a higher milk yield production level allocated to group 2, and in herds with a lower
somatic cell count level allocated to group 1. Additive-genetic variances and heritabilities
CHAPTER 5
129
for SCS within superior herd groups were larger for HF compared to corresponding
groups in the DSN or Mixed analyses. The highest additive-genetic variance for SCS was
0.51, and the highest heritability was 0.16, both in HF for H-SIZE group 2. However,
there were only minor heritability differences when comparing the three genetic lines,
due to larger residual variances in HF. In contrast to Mkg, residual variances for SCS
from all genetic line analyses were smaller in the superior herd groups compared to the
respective suboptimal herd groups for H-SIZE, H-CA, H-MPL and H-SCC. Residual SCS
variances for all genetic lines were larger for the groups with a lower SCS heritability,
apart from the genetic herd descriptor H-NSS and the geographical descriptors F-
ALTITUDE and F-LATITUDE. When grouping herds according to H-DSN %, quite
small SCS heritabilities were estimated for both groups in the HF population (0.06 in
group 1 and 0.01 in group 2), but in Mixed and DSN groups 2, additive-genetic variances
(Mixed: 0.34, DSN: 0.35) and heritabilities (Mixed: 0.11, DSN: 0.12) were substantially
higher than in HF.
For SCS, there was no obvious association between group estimates for the permanent
environmental and for the additive-genetic variance component. In some scenarios,
highest permanent environmental variances were identified in groups with largest
additive-genetic variances, but also opposite relationships were found.
For test-day FPR (Table 19), in all groups and for all herd descriptors, additive-genetic
variances were almost identical, especially for Mixed and DSN in a quite narrow range
from 0.005 to 0.007. Hence, minor alterations in heritabilities for FPR were due to
variations in the residual variance component. Again, also heritabilities for FPR were
higher in the superior herd management groups for H-SIZE (group 2), for H-CA (group
1), for H-MPL (group 2) and for H-SCC (group 1). This was the case for all genetic line
analyses. Quite similar variance components and heritabilities for FPR across groups and
genetic lines were identified for the geographical descriptors F-ALTITUDE and F-
LATITUDE, especially when comparing within-group estimates from the Mixed and
DSN analyses. Interestingly, only for the HF analysis, the FPR heritability was
substantially lower (0.02) in herds with a greater percentage of DSN cows (H-DSN %
group 2), compared to the heritability in group 1 for H-DSN % (0.10). Such heritability
differences for FPR between H-DSN % groups 1 and 2 were not observed for Mixed and
DSN. Similarly, herd grouping according to H-NSS was associated with greater
CHAPTER 5
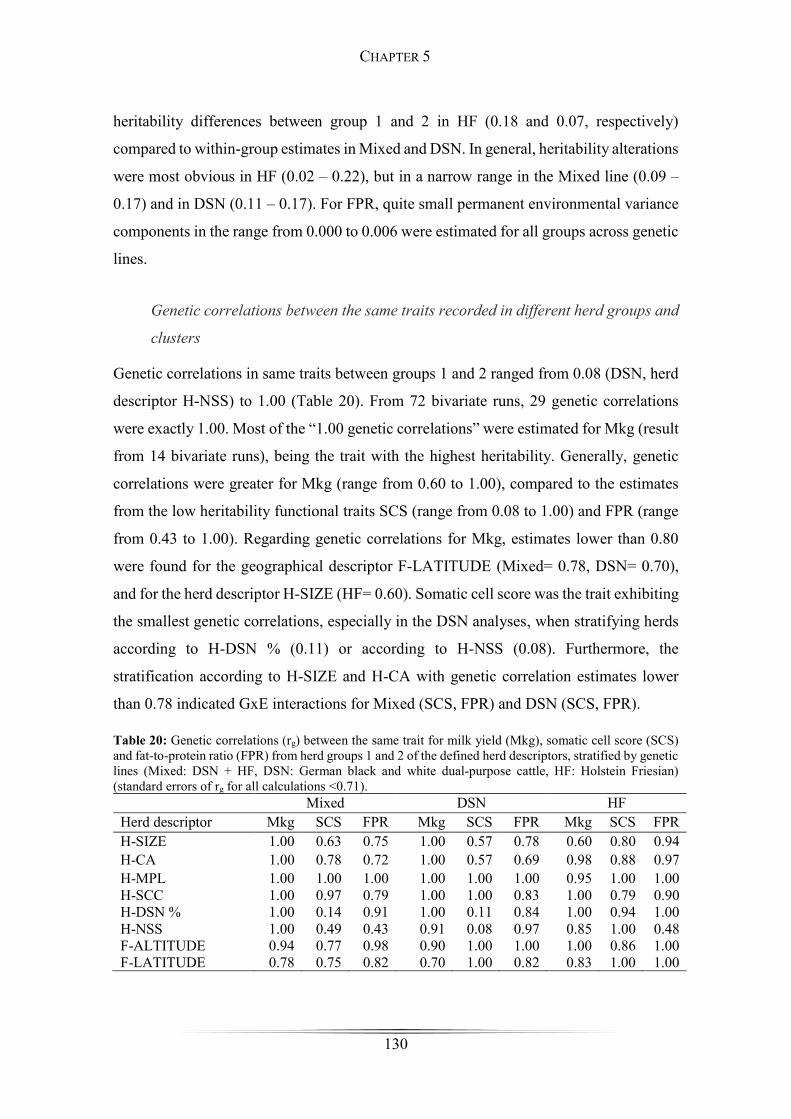
130
heritability differences between group 1 and 2 in HF (0.18 and 0.07, respectively)
compared to within-group estimates in Mixed and DSN. In general, heritability alterations
were most obvious in HF (0.02 – 0.22), but in a narrow range in the Mixed line (0.09 –
0.17) and in DSN (0.11 – 0.17). For FPR, quite small permanent environmental variance
components in the range from 0.000 to 0.006 were estimated for all groups across genetic
lines.
Genetic correlations between the same traits recorded in different herd groups and
clusters
Genetic correlations in same traits between groups 1 and 2 ranged from 0.08 (DSN, herd
descriptor H-NSS) to 1.00 (Table 20). From 72 bivariate runs, 29 genetic correlations
were exactly 1.00. Most of the “1.00 genetic correlations” were estimated for Mkg (result
from 14 bivariate runs), being the trait with the highest heritability. Generally, genetic
correlations were greater for Mkg (range from 0.60 to 1.00), compared to the estimates
from the low heritability functional traits SCS (range from 0.08 to 1.00) and FPR (range
from 0.43 to 1.00). Regarding genetic correlations for Mkg, estimates lower than 0.80
were found for the geographical descriptor F-LATITUDE (Mixed= 0.78, DSN= 0.70),
and for the herd descriptor H-SIZE (HF= 0.60). Somatic cell score was the trait exhibiting
the smallest genetic correlations, especially in the DSN analyses, when stratifying herds
according to H-DSN % (0.11) or according to H-NSS (0.08). Furthermore, the
stratification according to H-SIZE and H-CA with genetic correlation estimates lower
than 0.78 indicated GxE interactions for Mixed (SCS, FPR) and DSN (SCS, FPR).
Table 20: Genetic correlations (rg) between the same trait for milk yield (Mkg), somatic cell score (SCS) and fat-to-protein ratio (FPR) from herd groups 1 and 2 of the defined herd descriptors, stratified by genetic lines (Mixed: DSN + HF, DSN: German black and white dual-purpose cattle, HF: Holstein Friesian) (standard errors of rg for all calculations <0.71). Mixed DSN HF Herd descriptor Mkg SCS FPR Mkg SCS FPR Mkg SCS FPR H-SIZE 1.00 0.63 0.75 1.00 0.57 0.78 0.60 0.80 0.94 H-CA 1.00 0.78 0.72 1.00 0.57 0.69 0.98 0.88 0.97 H-MPL 1.00 1.00 1.00 1.00 1.00 1.00 0.95 1.00 1.00 H-SCC 1.00 0.97 0.79 1.00 1.00 0.83 1.00 0.79 0.90 H-DSN % 1.00 0.14 0.91 1.00 0.11 0.84 1.00 0.94 1.00 H-NSS 1.00 0.49 0.43 0.91 0.08 0.97 0.85 1.00 0.48 F-ALTITUDE 0.94 0.77 0.98 0.90 1.00 1.00 1.00 0.86 1.00 F-LATITUDE 0.78 0.75 0.82 0.70 1.00 0.82 0.83 1.00 1.00
CHAPTER 5
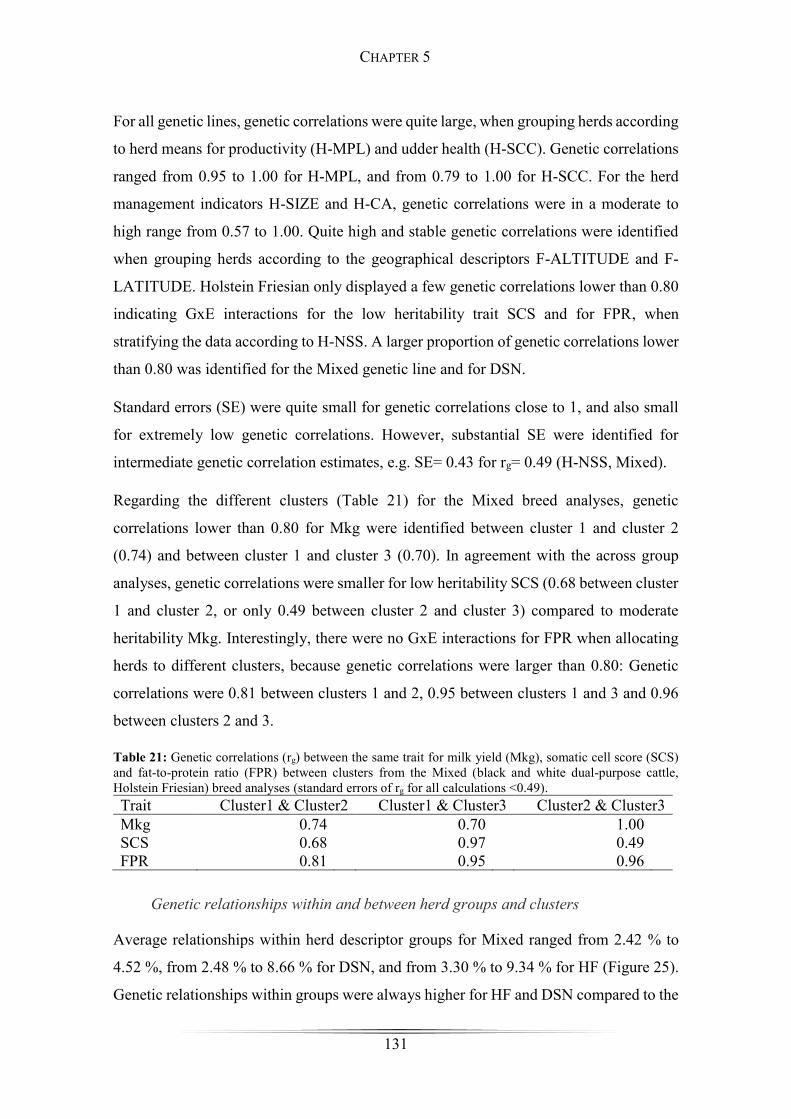
131
For all genetic lines, genetic correlations were quite large, when grouping herds according
to herd means for productivity (H-MPL) and udder health (H-SCC). Genetic correlations
ranged from 0.95 to 1.00 for H-MPL, and from 0.79 to 1.00 for H-SCC. For the herd
management indicators H-SIZE and H-CA, genetic correlations were in a moderate to
high range from 0.57 to 1.00. Quite high and stable genetic correlations were identified
when grouping herds according to the geographical descriptors F-ALTITUDE and F-
LATITUDE. Holstein Friesian only displayed a few genetic correlations lower than 0.80
indicating GxE interactions for the low heritability trait SCS and for FPR, when
stratifying the data according to H-NSS. A larger proportion of genetic correlations lower
than 0.80 was identified for the Mixed genetic line and for DSN.
Standard errors (SE) were quite small for genetic correlations close to 1, and also small
for extremely low genetic correlations. However, substantial SE were identified for
intermediate genetic correlation estimates, e.g. SE= 0.43 for rg= 0.49 (H-NSS, Mixed).
Regarding the different clusters (Table 21) for the Mixed breed analyses, genetic
correlations lower than 0.80 for Mkg were identified between cluster 1 and cluster 2
(0.74) and between cluster 1 and cluster 3 (0.70). In agreement with the across group
analyses, genetic correlations were smaller for low heritability SCS (0.68 between cluster
1 and cluster 2, or only 0.49 between cluster 2 and cluster 3) compared to moderate
heritability Mkg. Interestingly, there were no GxE interactions for FPR when allocating
herds to different clusters, because genetic correlations were larger than 0.80: Genetic
correlations were 0.81 between clusters 1 and 2, 0.95 between clusters 1 and 3 and 0.96
between clusters 2 and 3.
Table 21: Genetic correlations (rg) between the same trait for milk yield (Mkg), somatic cell score (SCS) and fat-to-protein ratio (FPR) between clusters from the Mixed (black and white dual-purpose cattle, Holstein Friesian) breed analyses (standard errors of rg for all calculations <0.49). Trait Cluster1 & Cluster2 Cluster1 & Cluster3 Cluster2 & Cluster3 Mkg 0.74 0.70 1.00 SCS 0.68 0.97 0.49 FPR 0.81 0.95 0.96
Genetic relationships within and between herd groups and clusters
Average relationships within herd descriptor groups for Mixed ranged from 2.42 % to
4.52 %, from 2.48 % to 8.66 % for DSN, and from 3.30 % to 9.34 % for HF (Figure 25).
Genetic relationships within groups were always higher for HF and DSN compared to the
CHAPTER 5
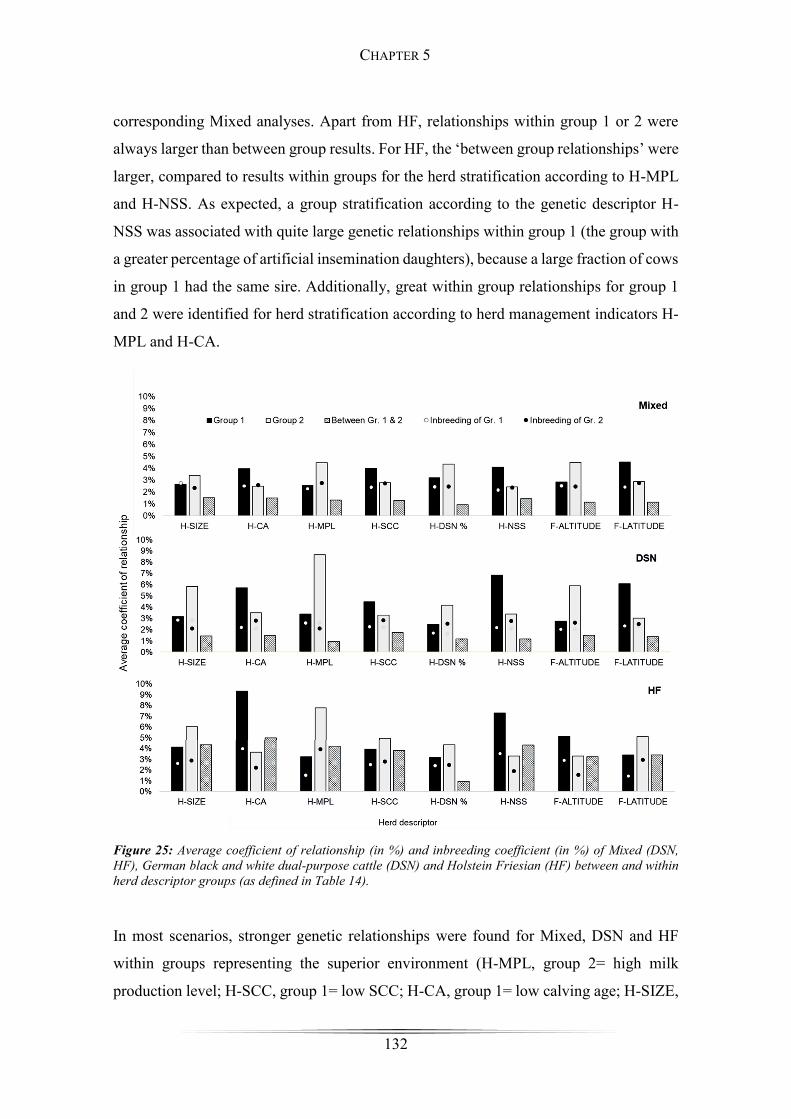
132
corresponding Mixed analyses. Apart from HF, relationships within group 1 or 2 were
always larger than between group results. For HF, the ‘between group relationships’ were
larger, compared to results within groups for the herd stratification according to H-MPL
and H-NSS. As expected, a group stratification according to the genetic descriptor H-
NSS was associated with quite large genetic relationships within group 1 (the group with
a greater percentage of artificial insemination daughters), because a large fraction of cows
in group 1 had the same sire. Additionally, great within group relationships for group 1
and 2 were identified for herd stratification according to herd management indicators H-
MPL and H-CA.
Figure 25: Average coefficient of relationship (in %) and inbreeding coefficient (in %) of Mixed (DSN, HF), German black and white dual-purpose cattle (DSN) and Holstein Friesian (HF) between and within herd descriptor groups (as defined in Table 14).
In most scenarios, stronger genetic relationships were found for Mixed, DSN and HF
within groups representing the superior environment (H-MPL, group 2= high milk
production level; H-SCC, group 1= low SCC; H-CA, group 1= low calving age; H-SIZE,
CHAPTER 5
133
group 2= large herds). For Mixed, high genetic relationships were also observed for herds
located 60 m above sea level (F-ALTITUDE, group 2= 4.48 %), and for herds located
below a latitude of 52.2° (F-LATITUDE, group 1= 4.52 %). These two groups coincided
with each other, as altitudes greater than 60 m above sea level mostly represented regions
in the middle and the South of Germany, reflecting latitudes <52.2°.
Average relationships within clusters depicted a similar trend for all genetic lines (not
shown). Highest coefficients of relationships within clusters were found for cluster 3
(Mixed= 8.70 %; DSN= 8.85 %; HF= 29.87 %), which only represented one large-scale
farm from East Germany. As identified for the single herd descriptors, genetic
relationships between clusters were lower than within clusters. The between-cluster
relationships were largest between cluster 1 and 2 (Mixed= 2.60 %; DSN= 3.35 %; HF=
4.36 %).
Associations between genetic correlations and relationship coefficients
Figure 26 displays average coefficients of relationship between groups, based on a
‘genetic correlation estimates’ categorization. For same rg-categories, coefficients of
relationships were always largest for HF, but substantially lower and on a similar level
for DSN and Mixed. Categorization of bivariate runs according to the rg-categories ‘rg <
0.80’, ‘rg 0.80 – 0.90’ and ‘rg > 0.90’ gave almost identical average coefficients of
relationship between the groups for the same genetic lines. Hence, only a slight trend for
larger additive-genetic relationships between groups with increasing rg-estimates was
identified, neglecting the hypothesis, that genetic connectedness between groups has an
impact on rg-estimates in MTAM.
Correlations between rg-results with genetic relationships from the respective groups 1
and 2 were mostly close to zero. For the moderate heritability trait Mkg, correlations were
not significantly different from zero (p> 0.05), and were 0.39 for Mixed, -0.02 for DSN,
and -0.31 for HF. There was only a trend of stronger associations between rg and group
relationships for the low heritability trait SCS in the genetic line Mixed with a correlation
coefficient of 0.55. For SCS, correlation coefficients were 0.37 in DSN, and 0.07 in HF.
In addition, for the herd clustering approach, associations between rg-results and
“between-cluster relationships” were non-significant.
CHAPTER 5
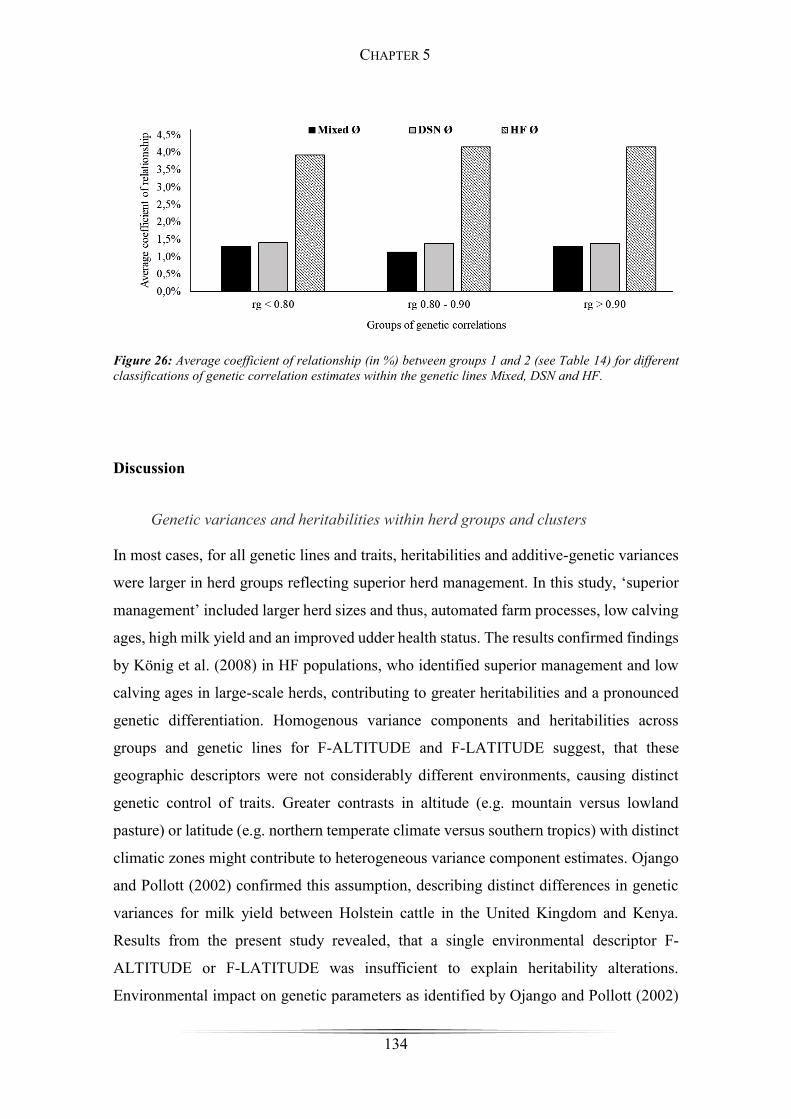
134
Figure 26: Average coefficient of relationship (in %) between groups 1 and 2 (see Table 14) for different classifications of genetic correlation estimates within the genetic lines Mixed, DSN and HF.
Discussion
Genetic variances and heritabilities within herd groups and clusters
In most cases, for all genetic lines and traits, heritabilities and additive-genetic variances
were larger in herd groups reflecting superior herd management. In this study, ‘superior
management’ included larger herd sizes and thus, automated farm processes, low calving
ages, high milk yield and an improved udder health status. The results confirmed findings
by König et al. (2008) in HF populations, who identified superior management and low
calving ages in large-scale herds, contributing to greater heritabilities and a pronounced
genetic differentiation. Homogenous variance components and heritabilities across
groups and genetic lines for F-ALTITUDE and F-LATITUDE suggest, that these
geographic descriptors were not considerably different environments, causing distinct
genetic control of traits. Greater contrasts in altitude (e.g. mountain versus lowland
pasture) or latitude (e.g. northern temperate climate versus southern tropics) with distinct
climatic zones might contribute to heterogeneous variance component estimates. Ojango
and Pollott (2002) confirmed this assumption, describing distinct differences in genetic
variances for milk yield between Holstein cattle in the United Kingdom and Kenya.
Results from the present study revealed, that a single environmental descriptor F-
ALTITUDE or F-LATITUDE was insufficient to explain heritability alterations.
Environmental impact on genetic parameters as identified by Ojango and Pollott (2002)
CHAPTER 5
135
was due to the combined effect of climate and geography. Fikse et al. (2003) identified
genetic parameter variations when considering at least three environmental descriptors
(within-herd standard deviation, peak milk yield, herd size) out of a set of fifteen possible
herd descriptors. In this study, the impact of environmental descriptors on variance
components partly differed for Mkg and SCS. Results from structural equation models
suggested to consider trait specific environmental descriptors, in order to describe
heterogeneity of variances depending on the trait of interest (Fikse et al., 2003).
In the DSN herds, that mostly reflect low-input or grassland production systems,
heritabilities for a production trait (Mkg) were greater than for a health (SCS) or
metabolic stress indicator (FPR) across all genetic lines. Nauta et al. (2006) described a
similar trend for Holstein cows in organic and pasture-based production systems. In the
present study, additive-genetic variances and heritabilities increased with increasing
intra-herd DSN percentages (group 2 for H-DSN %). Herds only keeping DSN, or herds
with a large percentage of DSN cows, traditionally breed black and white cows in
grassland systems (Jaeger et al., 2018). In contrast, most of the herds with a small
percentage of DSN cows recently converted from indoor to grazing systems. Against this
background, one explanation could be an improved adaptability of cows from pure DSN
herds to grassland systems, contributing to the full phenotypic expression of their true
genetic potential. These findings are in line with observations by Hoffmann and Merilä
(1999), who stated, that trait heritability estimates depend on adaptive selection strategies,
being specific for specific environments. In herds with a larger percentage of HF cows
(group 1 for H-DSN %), intensive selection on production traits was a major breeding
strategy for decades (König et al., 2007). Following the theoretical principles of animal
breeding, intensive selection decreases levels of additive-genetic variances of quantitative
traits. Falconer and Mackay (1996) referred to genetic architectures of quantitative traits
and mentioned the reduction of additive-genetic variance being proportional to the
increase of inbreeding coefficients. Koenig and Simianer (2006) described a rapid
increase of inbreeding in commercial cow herds with a large proportion of HF cows,
which was accelerated due to genomic selection in HF herds in recent years.
Quite constant additive-genetic variances and heritabilities within group 1 and 2 for H-
NSS, F-ALTITUDE and F-LATITUDE imply, that these chosen environments or herd
descriptors did not contrast enough, in order to initiate different genetic mechanisms for
CHAPTER 5
136
Mkg with environmental alterations. Hammami et al. (2009) stated, that minor
environmental differences mainly contribute to scaling effects, implying quite constant
variance ratios in different environments. Holstein Friesian cows showed a reduced
genetic variation for Mkg in harsh or “challenging” environments (i.e., high intra-herd
SCC in group 2), but a considerable larger heritability and additive-genetic variance for
Mkg in H-SCC of group 1. Such results indicate environmental sensitivity for HF.
Regarding SCS, larger heritabilities within superior herd groups were not only due to
larger additive-genetic variances, but also due to the smaller residual components. For
SCS, environmental sensitivity (i.e., alterations of genetic variances with environmental
alterations) was more pronounced in HF, compared to DSN or Mixed. Calus et al. (2006)
made similar observations for high yielding HF at the first test-day early in lactation.
They concluded, that the lower resistance against major pathogens of high yielding cows,
early in lactation, increased mastitis incidences, contributing to increased variance
components for SCS. On the other hand, small and quite constant SCS variance
components, early in lactation for DSN, might be due to better adaptive mechanisms.
Such genetic line differences with regard to endoparasite infections, and further impact
on genetic parameter estimates were identified by May et al. (2017).
Regarding FPR and all genetic lines, extremely small permanent environmental variances
within all groups were identified, suggesting limited within-cow variation across
lactations due to specific environmental effects. Consequently, Buttchereit et al. (2011)
focused on genetic variance components within lactation for high yielding HF and
identified heritability alterations within lactation, due to biological processes with
different genetic background in different lactation stages. In the present study, major
impact on variations of heritability estimates across herd groups was due to alterations of
the residual component.
Genetic correlations between herd groups, clusters and GxE interactions
Robertson (1959) suggested, that a genetic correlation equal or lower than 0.80 indicated
possible GxE interactions. Genetic correlations between the same trait in group 1 and 2
for the same environmental or herd descriptor were between 0.08 and 1.00. Genetic
correlations from the clustering approach ranged between 0.49 and 1.00. Genetic
correlations for Mkg mostly exceeded 0.80 for all genetic lines and herd descriptors,
CHAPTER 5
137
except for H-SIZE and F-LATITUDE. Correspondingly, Zwald et al. (2003) reported
genetic correlations above the ‘0.80-threshold’ for moderate heritability production traits.
Hammami et al. (2009) stated, that differences in genetic (co)variance components for
production traits were mostly due to scaling effects. They deduced, that small
environmental differences within European countries do not justify separate breeding
schemes in different environments. When stratifying the data via cluster analysis, genetic
correlations for Mkg in the Mixed line were 0.74 between the first and second cluster,
even lower between the first and the third cluster (0.70) and highest between the first and
third cluster (1.00). Hence, as suggested by Fikse et al. (2003), considering several herd
parameters simultaneously contributed to production characteristics, that are more
diverse.
For low heritability SCS in all three genetic lines, the impact of environmental changes
on genetic covariances and genetic correlations was more pronounced than for Mkg.
These results are in agreement with findings of Calus et al. (2006), who identified genetic
correlations in a broad range from 0.43 to 0.89 for SCS. Similar observations were made
for low to moderate heritability FPR, with genetic correlations lower than 0.80 for
different combinations of genetic lines and herd descriptors. For FPR, and in contrast to
Mkg, genetic correlations between clusters were larger, compared to genetic correlation
estimates from single herd descriptor analyses, encouraging deeper analyses in this
regard.
Best herd descriptors for environmental sensitivity (i.e., small genetic correlations) for all
genetic lines and traits were H-SIZE, H-CA and H-NSS. Accordingly, Osorio-Avalos et
al. (2015) stated, that herd management systems and herd size were most efficient criteria
for herd clustering. Particularly small genetic correlations for SCS and FPR for H-SIZE,
H-CA, H-DSN % and H-NSS stratifications underline this assumption. Intra-herd first
calving age also had a major impact on genetic covariances of test-day traits from HF
cows in large-scale contract herds (Gernand et al., 2007). Opposite results reported Zwald
et al. (2003), because they estimated large genetic correlations, when grouping herds
according to age at first calving.
Most of the genetic correlations lower than 0.80 where detected for Mixed. In most cases,
herd descriptor x trait-combinations, causing low genetic correlations, differed between
DSN and HF. Differences in genetic correlation estimates suggested, that different herd
CHAPTER 5
138
descriptors have different importance in different genetic lines of black and white dairy
cattle. Regarding genetic correlations, one specific genetic line and trait combination (HF
x Mkg) was more affected by a herd management descriptor (H-SIZE), while another
genetic line-trait combination (DSN x SCS) was stronger affected by genetic herd
descriptors (H-DSN % and H-NSS). Zwald et al. (2003) considered both, herd size and
the percentage of North American HF genes as important herd descriptors for HF cows.
These findings coincide with the estimates from the present study, with small genetic
correlations, especially for classifications according to H-SIZE and H-DSN %.
Impact of genetic relationships on genetic correlations
Average relationship coefficients for DSN within different geographical regions were
quite large for the region of East Germany (8.81 %), and for small-scale family farms
located in the South of Germany (6.71 %). Relationship coefficients were substantially
lower for DSN herds from intensive grassland systems in the North of Germany (3.04 %),
probably due to the less intensive use of artificial insemination in this region. Especially,
high DSN relationships within the eastern part of Germany, but low relationships between
East Germany and northern (0.73 %) or southern Germany (1.40 %) reflected the impact
of 41 years of separate DSN breeding in the former German democratic republic.
Stronger genetic relationships within herd descriptor groups and clusters than between
group relationships depict the impact of management or environmental classifications on
genetic herd compositions (Yin and König, 2018). Quite high within-group relationships
for H-MPL group 2 for DSN and HF are due to intensive selection on milk yield in both
genetic lines, leading to decreased genetic variability and strong genetic connectedness.
Correspondingly, Koenig and Simianer (2006) identified strong associations between
relationship coefficients and breeding values of production traits.
Results from the present study rejected the hypothesis, that group relationships have an
impact on genetic correlation estimates. This was also an assumption phrased by König
et al. (2002), because genetic correlations in protein yield between two regions were
larger when basing the calculations on proven bulls with a large number of daughters
instead of young bulls. Recently, Yin and König (2018) used genomic marker data, and
they found changes in genetic correlations when stratifying groups according to genomic
CHAPTER 5
139
intra-herd inbreeding coefficients. Such contradictive findings suggest ongoing studies in
this regard.
Conclusion
In general, larger heritabilities and additive-genetic variances for all genetic lines (DSN,
HF and Mixed) were detected within “superior” herd environments with higher average
milk production level (> 30 kg/day), lower average calving age (< 38 months), larger herd
sizes (> 250 dairy cows) and low average somatic cell count (< 200,000 cells/ml). For all
genetic lines, heritabilities and additive-genetic variances were larger for Mkg, compared
to the functional health indicators SCS and FPR.
Differences in additive-genetic variances and heritabilities in groups 1 and 2 for the same
herd descriptor were stronger for HF compared to Mixed or DSN. In all genetic lines,
permanent environmental variances were small, especially for SCS and FPR. Alterations
in FPR heritabilities were mainly due to changes of residual variance components in herd
groups 1 and 2. For Mkg, genetic correlations mostly exceeded the critical threshold of
0.80. Quite low genetic correlations for SCS and FPR were identified, when grouping
herds according to H-SIZE and H-CA. For the geographical descriptors F-ALTITUDE
and F-LATITUDE most of the genetic correlations were larger than 0.80. Genetic
relationships differed between groups and clusters, but were not associated with genetic
correlation estimates.
CHAPTER 5
140
References
Analla, M., Sanchez-Palma, A., Muñoz-Serrano, A. and Serradilla, J.M. 1995. Simulation
analysis with BLUP methodology of different data structures in goat selection schemes
in Spain. Small Ruminant Research 17: 51–55.
Biedermann, G. 2003. Zuchtplanung für die Erhaltung des Alten Schwarzbunten
Niederungsrindes. Bundesprogramm ökologischer Landbau und andere Formen
nachhaltiger Landwirtschaft. Accessed 03.04.2018:
http://https://service.ble.de/ptdb/index2.php?detail_id=84928&site_key=141&stichw
=schwrzbuntes+Niederungsrind&zeilenzahl_zaehler=3#newContent.
Buttchereit, N., Stamer, E., Junge, W. and Thaller, G. 2011. Genetic parameters for
energy balance, fat /protein ratio, body condition score and disease traits in German
Holstein cows. Journal of Animal Breeding and Genetics 129: 280–288.
Byrant, J.R., López-Villalobos, N., Pryce, J.E., Holmes, C.W., Johnson, D.L. and Carrick,
D.J. 2006. Environmental Sensitivity in New Zealand Dairy Cattle. Journal of Dairy
Science 90: 1538–1547.
Calus, M.P.L., Janss, L.L.G. and Veerkamp, R.F. 2006. Genotype by environment
Interaction for somatic cell score across bulk milk somatic cell count and days in milk.
Journal of Dairy Science 89: 4846–4857.
Clément, V., Bibé, B., Verrier, É., Elsen, J.M., Manfredi, E., Bouix, J. and Hanocq, É.
2001. Simulation analysis to test the influence of model adequacy and data structure
on the estimation of genetic parameters for traits with direct and maternal effects.
Genetics Selection Evolution 33: 369–395.
Dillon, P., Buckley, F., O’Connor, P., Hegarty, D. and Rath, M. 2003. A comparison of
different dairy cow breeds on a seasonal grass-based system of milk production.
Livestock Production Science 83: 21–33.
Falconer, D.S. and Mackay, T.F.C. 1996. Introduction to Quantitative Genetics, 4.
Pearson Education Limited, Harlow, England.
Fatehi, J., Stella, A., Shannon, J.J. and Boettcher, P.J. 2003. Genetic Parameters for Feet
and Leg Traits Evaluated in Different Environments. Journal of Dairy Science 86:
661–666.
CHAPTER 5
141
Fikse, W.F., Rekaya, R. and Weigel, K.A. 2003. Assessment of environmental descriptors
for studying genotype by environment interaction. Livestock Production Science 82:
223–231.
Gassan, M. 2017. RBB Rinderproduktion Berlin-Brandenburg GmbH. Accessed in
03.04.2018: http://www.rinderzucht-bb.de/de/zucht/dsn-genreserve/.
Gernand, E., Waßmuth, R., von Borstel U. and König, S. 2007. Heterogeneity of variance
components for production traits in large-scale dairy farms. Livestock Science 112:
78–89.
Groeneveld, E., Kovac, M. and Mielenz, M. 2010. VCE User’s Guide and Reference
Manual Version 6.0, Institute of Farm Animal Genetics Friedrich Loeffler Institute
(FLI), Neustadt, Germany.
Hammami, H. 2009. Genotype by environment interaction in dairy cattle. Biotechnology,
Agronomy, Society and Environment 13: 155–164.
Hoffmann, A.A. and Merilä, J. 1999. Heritable variation and evolution under favourable
and unfavourable conditions. Trends Ecology Evolution 14: 96–101.
Jaeger, M., Scheper, C., König, S. and Brügemann, K. 2018. Inbreeding and genetic
relationships of the endangered dual-purpose Black and White cattle breed (DNS)
based on own genetic breed percentage calculations. Züchtungskunde, 90: 262-279.
Jürgens, K., Poppinga, O. and Sperling, U. 2015. Es geht auch ohne: Wirtschaftlichkeit
einer kraftfutterfreien Milchviehhaltung in Deutschland - erste Zwischenbilanz eines
neuen Forschungsprojekts. Der kritische Agrarbericht, 149–153.
Koenig, S. and Simianer, H. 2006. Approaches to the management of inbreeding and
relationship in the German Holstein dairy cattle population. Livestock Science 103:
40–53.
Kolmodin, R., Strandberg, E., Madsen, P., Jensen, J. and Jorjani, H. 2002. Genotype by
Environment Interaction in Nordic Dairy Cattle Studied Using Reaction Norms. Acta
Agriculturae Scandinavica 52: 11–24.
Kolver, E.S., Rocher, J.R., De Veth, M.J., Thorne, P.L. and Napper, A.R. 2002. Total
mixed rations versus pasture diets: Evidence for a genotype x diet interaction in dairy
cow performance. Proceedings of the New Zealand Society of Animal Production 62:
246–251.
König, S., Simianer, H. and Swalve, H.H. 2002. Genetic relationships between dairy
performance under large-scale farm and family farm conditions estimated from
CHAPTER 5
142
different groups of common sires. In Proceedings of the 7th World Congress on
Genetics Applied to Livestock Production, Montpellier, France.
König, S., Lessner, S. and Simianer, H. 2007. Application of controlling instruments for
improvements in cow sire selection. Journal of Dairy Science 90: 1967–1980.
König, S., Brügemann, K., Simianer, H. and Swalve, H.H. 2008. Testherden in
Zuchtprogrammen für Milchrinder 2. Mitteilung: Strategien zur Findung von
Testherden. Züchtungskunde 80: 114–126.
König, S. 2017. Genetic background of resistance, tolerance and resilience traits in dairy
cattle. In Proceedings of the 68th annual EAAP Meeting, 28 August -1 September
2017, Tallinn, Estonia, pp. 461.
May, K., Brügemann, K., Yin, T., Scheper, C., Strube, C. and König, S. 2017. Genetic
line comparisons and genetic parameters for endoparasite infections and test-day milk
production traits. Journal of Dairy Science 100: 7330–7344.
Nauta, W.J., Veerkamp, R.F., Brascamp, E.W. and Bovenhuis, H. 2006. Genotype by
Environment Interaction for Milk Production Traits between Organic and
Conventional Dairy Cattle Production in the Netherlands. Journal of Dairy Science 89:
2729–2737.
Ojango, J.M.K. and Pollott, G.E. 2002. The relationship between Holstein bull breeding
values for milk yield derived in both the UK and Kenya. Livestock Production Science
74: 1–12.
Osorio-Avalos, J., Menéndez-Buxadera, A., Serradilla, J.M. and Molina, A. 2015. Use of
descriptors to define clusters of herds under similar environmental conditions to
improve the level of connection among contemporary groups of mutton type merino
sheep under an extensive production system. Livestock Science 176: 54–60.
Robertson, A. 1959. The sampling variance of the genetic correlation coefficient.
Biometrics 15: 469–485.
Sargolzaei, M., Iwaisaki, H. and Colleau, J.J. 2006. CFC - A Software Package for
Pedigree Analysis and Monitoring Genetic Diversity. User’s Manual. Release 1.0.
SAS Institute Inc. 2008. The Cluster Procedure. User’s Guide 9.2, 1230.
Schaeffer, L.R. 1994. Multiple-Country Comparison of Dairy Sires. Journal of Dairy
Science 77: 2671–2678.
Weigel, K.A. and Rekaya, R. 2000. A Multiple-Trait Herd Cluster Model for International
Dairy Sire Evaluation. Journal of Dairy Science 83: 815–821.
CHAPTER 5
143
Yin, T. and König, S. 2018. Heritabilities and genetic correlations in the same traits across
different strata of herds created according to continuous genomic, genetic and
phenotypic descriptors. Journal of Dairy Science 101: 2171–2186.
Zwald, N.R., Weigel, K.A., Fikse, W.F. and Rekaya, R. 2003. Identification of Factors
That Cause Genotype by Environment Interaction between Herds of Holstein Cattle in
Seventeen Countries. Journal of Dairy Science 86: 1009–1018.
CHAPTER 5
144
CHAPTER 6
Simulation and Economic Evaluation of Black and White Dual-
Purpose Cattle Breeding Programs
145
Introduction
The robust German dual-purpose black and white cattle (DSN) have their origin in
northern Germany and the Netherlands (Brade and Brade, 2013). Increasing selection and
the import of American Holstein Friesian (HF) semen as well as artificial insemination
(AI) during the 1960’ies resulted into an overall reduction of genetic diversity of the
global DSN population. In 2016, the TGRDEU announced the breed to be endangered-
maintained with a population number of 2,847 registered animals in Germany
(TGRDEU). The DSN cattle are predestined for low input pasture-based milk production.
These characteristics are reflected in their breeding goals, as they are expected to be of
good health, robustness, good fertility and an adequate development potential with high
forage and dry matter intake capacity. Due to these qualities, around 47 % of German
DSN cattle are nowadays kept in organic pasture-based production systems (Biedermann,
2003). The organically managed herds usually implement natural service sires (NSS), as
a decrease of AI is desired (Harder et al., 2004), whereas in conventional managed DSN
herds (predominantly found in East Germany) AI is applied (Jaeger et al., 2018). The
situation is very different in conventional HF dairy cattle breeding, where AI
predominates. The federal statistical office reported, that in 2016 of all German dairy
cows, only 4.1 % were kept in organic farms (Destatis, 2018). As opposed to a rather
small dual-purpose population, that is managed organically to a significant extend,
breeding programs and institutions of high yielding modern dairy breeds are organized
on a large and international scale. König et al. (2009) simulated a conventional progeny
testing breeding program for German Holstein cattle with 100 % AI, which consisted of
a population size of 100,000 cows and a usage of 50 young bulls per year.
A breeding program can be simulated either via a stochastic approach or follow the
deterministic methodology. An advantage of the straightforward stochastic approach is
the possibility of imitating the actual breeding program more precisely by simulating
individual animals. However, compared to deterministic simulations little insight is
gained, while time and computer power requirements are high and thus, unsuited for
comparisons between alternative breeding schemes (Haile et al., 2011). The deterministic
approach is based on deterministic equations and population parameters, in order to
predict genetic gain and inbreeding, rather than mimicking a breeding program on an
individual animal level. Reduced computation time and detailed information about
CHAPTER 6
146
genetic gain, inbreeding and economic efficiency characterize this approach as a
convenient tool for comparing and evaluating complex breeding scenarios (Haile et al.,
2011).
In this study, the software package ZPLAN+ (Täubert et al., 2011) was introduced to
model genetic gain for different breeding scenarios, selection responses for single traits
and the return on investment adjusted for costs of 3,000 cows. ZPLAN+ covers a wide
range of functions (e.g. implementing genomic information, applying multiple stage
selection, optimization of side effects) compared to alternative software packages (e.g.
SelAction), that consider only single fragments of breeding programs (i.e. selection
index) (Rutten et al., 2002). A graphic user interface, a platform-independent software
and a database driven web-application contribute to its user-friendly handling (Täubert et
al., 2011). However, it is of major importance to treat absolute output values of ZPLAN+
with caution, as all described input parameters are supposed to reflect the future, which
is difficult to predict. With 20 years’ worth of planning horizon, uncertainties and
deviations will remain (Steininger, 2011). However, simulating alternating breeding
scenarios with similar input parameters in ZPLAN+ will generate reliable results, which
can function as a basis for comparison and decision-making.
As this study aims at evaluating breeding plans and their economic efficiency of a small
dual-purpose dairy cattle breed, the breeding goal does not solely consider production,
but functional and health traits as well. With regard to the difficulty of predicting future
consumer trends and demands and the breeders’ habit of thinking in generations,
emphasizing functional and health traits in breeding goals, to reduce production costs, has
proven to be a wise long-term decision (Willam et al., 2002). Harder et al. (2004) shared
this opinion as well, stating, that emphasizing functional traits within a breeding goal is a
reasonable alternative and may present a possibility to reduce costs. Since the 1960ies,
Scandinavian countries demonstrated, that the recording and adoption of reproduction
and health traits into HF selection schemes led to improved functional efficiency of cows
along with an increase in production (Philipsson and Lindhé, 2003). Including functional
and reproduction traits in turn, will affect the genetic gain as well as the economic
outcome of breeding programs, due to low heritabilities and unfavourable negative
correlations between functional, reproduction and production traits (Willam et al., 2002).
Willam et al. (2002) predicted a change in the design of dual-purpose Simmental progeny
CHAPTER 6
147
testing schemes in dairy cattle. They concluded, that the inclusion of low heritable
functional traits in the total merit index required more daughter records per sire in terms
of breeding value accuracy. However, they demonstrated, that emphasizing functional
traits in the breeding goal led to reduced negative genetic gains and a higher monetary
genetic gain.
For this reason, several schemes of conventional (based on AI), organic (based on NSS)
and combined breeding of the DSN cattle population were compared to optimize annual
monetary genetic gain and discounted return while minimizing discounted costs. Ceteris
paribus, varying genetic correlations with regard to genotype by environment interactions
(GxE) and changes in AI percentage in different runs were investigated. The objective of
the study was to evaluate the genetic and the economic efficiency as well as implications
of four different breeding strategies for a small dual-purpose cattle population including
functional, fertility and production traits.
Materials and Methods
Genetic parameters
In order to run ZPLAN+ a matrix with genetic correlations, heritabilities, phenotypic
standard deviations and phenotypic correlations is required. The depicted information in
Table 22 was identified via an extensive literature research including production (milk
yield: MY, average body weight: AvgBW), fertility (days open: DO) and functional traits
(clinical mastitis: CM, longevity: L) (Frevert et al., 2014; Berry et al., 2003; Kern et al.,
2015) (Shabalina et al., 2018). Lower heritabilities were found for functional, health and
fertility traits (L, CM, DO). Often unfavourable correlations between production and
fertility or health traits were recorded. Whenever information about correlations between
traits was missing from literature, correlations were assumed to be zero. Economic values
were calculated by using 1 divided by the respective genetic standard deviation, to meet
the assumption of equal economic weight for every trait in the overall breeding goal.
CHAPTER 6
148
Table 22: Phenotypic standard deviation (SD), heritabilities (diagonal), genetic (above diagonal) and phenotypic (below diagonal) correlations between traits. Economic values (EV) were calculated based on equal economic weights for the traits.
Trait MY DO CM AvgBW L EV Milk yield (MY) 0.34 0.93 0.04 -0.011 0.237 0.60 Days open (DO) 0.12 0.03 -0.18 - -0.446 -0.10 Clinical mastitis (CM) 0.01 0.02 0.10 - -0.535 -1.66 Av. body weight (AvgBW) 0.141 - - 0.601 -0.312 0.021 Longevity (L) 0.057 - 0.084 -0.042 0.097 0.01 SD phenotype 2.88 60.57 1.91 473 487.494
(Frevert et al., 2014); 1= (Berry et al., 2003); 2= (Kern et al., 2015); 3= (Søndergaard et al., 2002); 4= Shablina et al., 2018; 5= (Roxström and Strandberg, 2002); 6= (Zavadilová and Zink, 2013); 7= (Jenko et al., 2015); - = not available from literature
Breeding strategies
For DSN, a population size of 3,000 dairy cows was assumed. Depending on the breeding
program (BP), the number of test bulls per year and average number of daughter records
for breeding programs changed, while keeping the dairy population constant. With regard
to different BPs, selection groups with different selection intensities were formed.
Conventional breeding scheme. The first scenario reflected a conventional progeny
testing approach (C_BP), described by Täubert et al. (2011) with 100 % AI and a waiting
bull system with planned mating and a three-step selection of male offspring. The average
number of daughter records for AI sires was 50. The C_BP consisted of four selection
groups (bull calves/ young bulls, test bulls, AI proven sires, AI elite sires) for the selection
of breeding bulls. As the DSN breed has a rather small population size, only a small
number of sires was selected for progeny testing. The proportion of test bull candidates,
selected for progeny testing per year was 0.38. From test bulls, 33 % became AI proven
sires, based on their daughter performance records and another 40 % of the AI proven
sires were chosen for AI elite sires. Population parameters of the C_BP are depicted in
Table 23.
Conventional breeding scheme with GxE interactions. The second breeding strategy
evaluated GxE interactions (GxE_BP), applying the C_BP assuming daughters of AI
proven and elite sires were kept in different production systems (e.g. organic vs.
conventional). Genotype by environment interactions were accounted for by varying
phenotypic and genetic correlations between the same traits (e.g. Milk yield 1 and Milk
yield 2) from 0.1 to 1.0 stepwise by 0.1 in separate scenarios.
CHAPTER 6
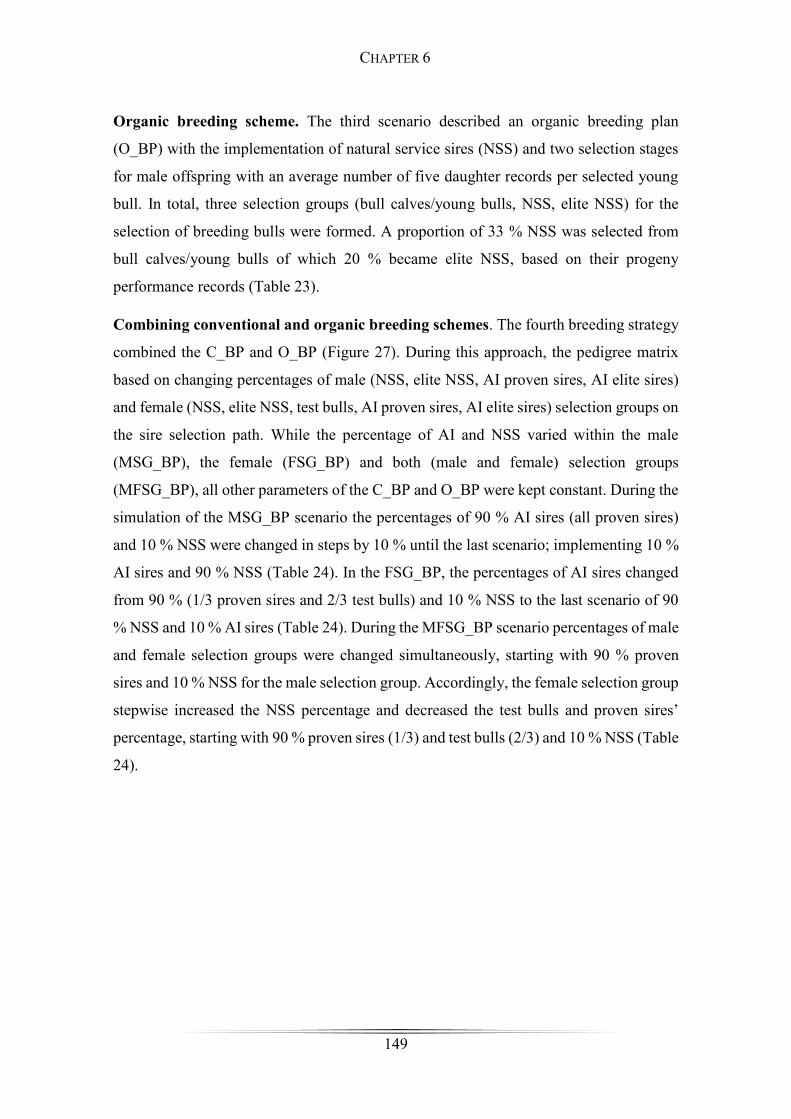
149
Organic breeding scheme. The third scenario described an organic breeding plan
(O_BP) with the implementation of natural service sires (NSS) and two selection stages
for male offspring with an average number of five daughter records per selected young
bull. In total, three selection groups (bull calves/young bulls, NSS, elite NSS) for the
selection of breeding bulls were formed. A proportion of 33 % NSS was selected from
bull calves/young bulls of which 20 % became elite NSS, based on their progeny
performance records (Table 23).
Combining conventional and organic breeding schemes. The fourth breeding strategy
combined the C_BP and O_BP (Figure 27). During this approach, the pedigree matrix
based on changing percentages of male (NSS, elite NSS, AI proven sires, AI elite sires)
and female (NSS, elite NSS, test bulls, AI proven sires, AI elite sires) selection groups on
the sire selection path. While the percentage of AI and NSS varied within the male
(MSG_BP), the female (FSG_BP) and both (male and female) selection groups
(MFSG_BP), all other parameters of the C_BP and O_BP were kept constant. During the
simulation of the MSG_BP scenario the percentages of 90 % AI sires (all proven sires)
and 10 % NSS were changed in steps by 10 % until the last scenario; implementing 10 %
AI sires and 90 % NSS (Table 24). In the FSG_BP, the percentages of AI sires changed
from 90 % (1/3 proven sires and 2/3 test bulls) and 10 % NSS to the last scenario of 90
% NSS and 10 % AI sires (Table 24). During the MFSG_BP scenario percentages of male
and female selection groups were changed simultaneously, starting with 90 % proven
sires and 10 % NSS for the male selection group. Accordingly, the female selection group
stepwise increased the NSS percentage and decreased the test bulls and proven sires’
percentage, starting with 90 % proven sires (1/3) and test bulls (2/3) and 10 % NSS (Table
24).
CHAPTER 6
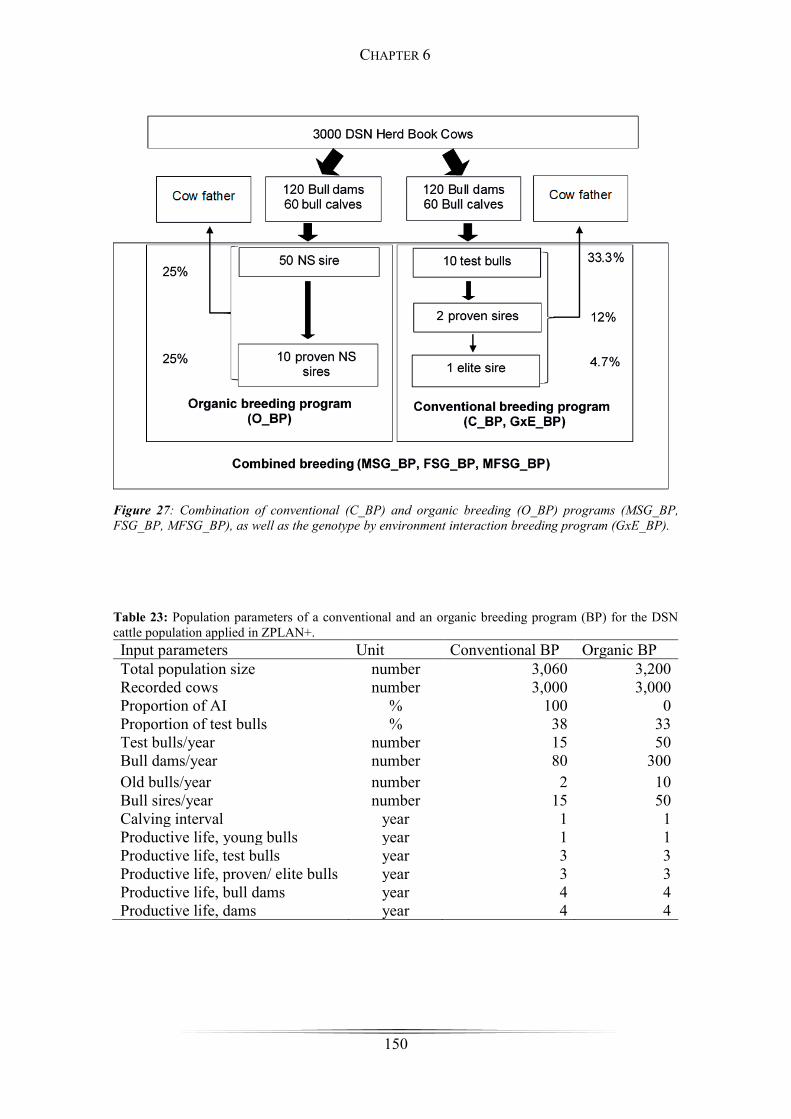
150
Figure 27: Combination of conventional (C_BP) and organic breeding (O_BP) programs (MSG_BP, FSG_BP, MFSG_BP), as well as the genotype by environment interaction breeding program (GxE_BP).
Table 23: Population parameters of a conventional and an organic breeding program (BP) for the DSN cattle population applied in ZPLAN+. Input parameters Unit Conventional BP Organic BP Total population size number 3,060 3,200 Recorded cows number 3,000 3,000 Proportion of AI % 100 0 Proportion of test bulls % 38 33 Test bulls/year number 15 50 Bull dams/year number 80 300 Old bulls/year number 2 10 Bull sires/year number 15 50 Calving interval year 1 1 Productive life, young bulls year 1 1 Productive life, test bulls year 3 3 Productive life, proven/ elite bulls year 3 3 Productive life, bull dams year 4 4 Productive life, dams year 4 4
CHAPTER 6
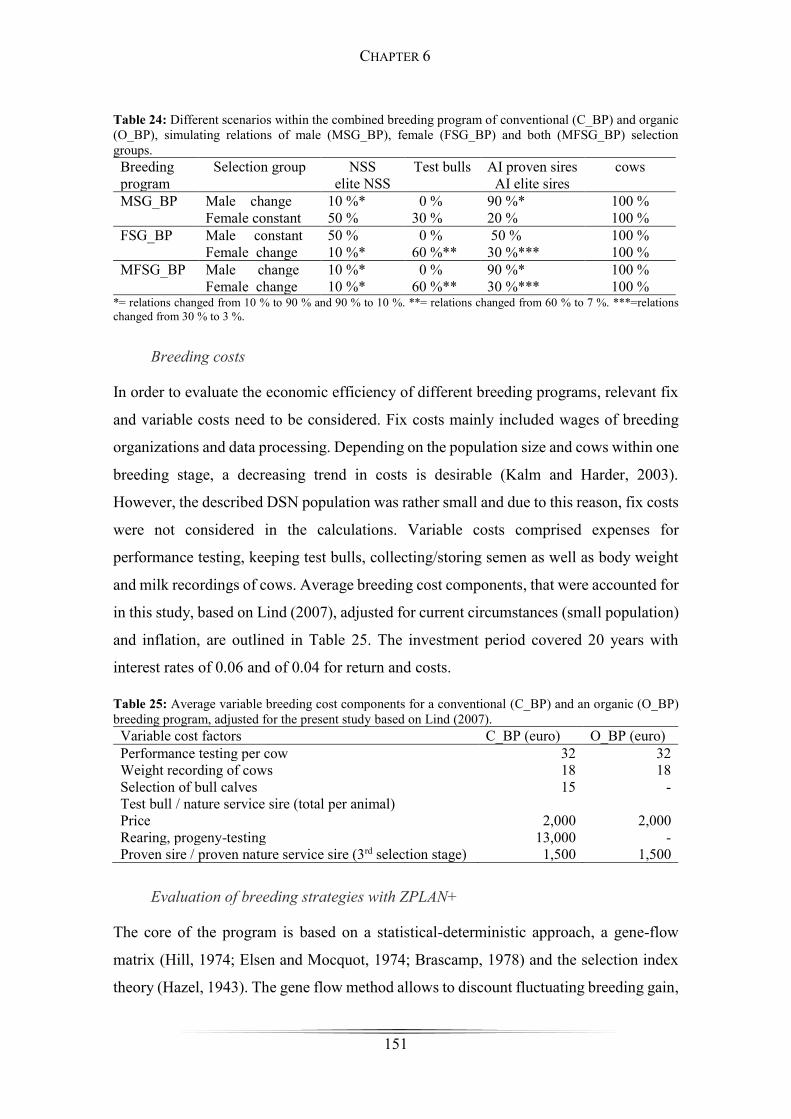
151
Table 24: Different scenarios within the combined breeding program of conventional (C_BP) and organic (O_BP), simulating relations of male (MSG_BP), female (FSG_BP) and both (MFSG_BP) selection groups. Breeding program
Selection group NSS elite NSS
Test bulls AI proven sires AI elite sires
cows
MSG_BP Male change 10 %* 0 % 90 %* 100 % Female constant 50 % 30 % 20 % 100 %
FSG_BP Male constant 50 % 0 % 50 % 100 % Female change 10 %* 60 %** 30 %*** 100 %
MFSG_BP Male change 10 %* 0 % 90 %* 100 % Female change 10 %* 60 %** 30 %*** 100 %
*= relations changed from 10 % to 90 % and 90 % to 10 %. **= relations changed from 60 % to 7 %. ***=relations changed from 30 % to 3 %.
Breeding costs
In order to evaluate the economic efficiency of different breeding programs, relevant fix
and variable costs need to be considered. Fix costs mainly included wages of breeding
organizations and data processing. Depending on the population size and cows within one
breeding stage, a decreasing trend in costs is desirable (Kalm and Harder, 2003).
However, the described DSN population was rather small and due to this reason, fix costs
were not considered in the calculations. Variable costs comprised expenses for
performance testing, keeping test bulls, collecting/storing semen as well as body weight
and milk recordings of cows. Average breeding cost components, that were accounted for
in this study, based on Lind (2007), adjusted for current circumstances (small population)
and inflation, are outlined in Table 25. The investment period covered 20 years with
interest rates of 0.06 and of 0.04 for return and costs.
Table 25: Average variable breeding cost components for a conventional (C_BP) and an organic (O_BP) breeding program, adjusted for the present study based on Lind (2007). Variable cost factors C_BP (euro) O_BP (euro) Performance testing per cow 32 32 Weight recording of cows 18 18 Selection of bull calves 15 - Test bull / nature service sire (total per animal) Price Rearing, progeny-testing
2,000
13,000
2,000
- Proven sire / proven nature service sire (3rd selection stage) 1,500 1,500
Evaluation of breeding strategies with ZPLAN+
The core of the program is based on a statistical-deterministic approach, a gene-flow
matrix (Hill, 1974; Elsen and Mocquot, 1974; Brascamp, 1978) and the selection index
theory (Hazel, 1943). The gene flow method allows to discount fluctuating breeding gain,
CHAPTER 6
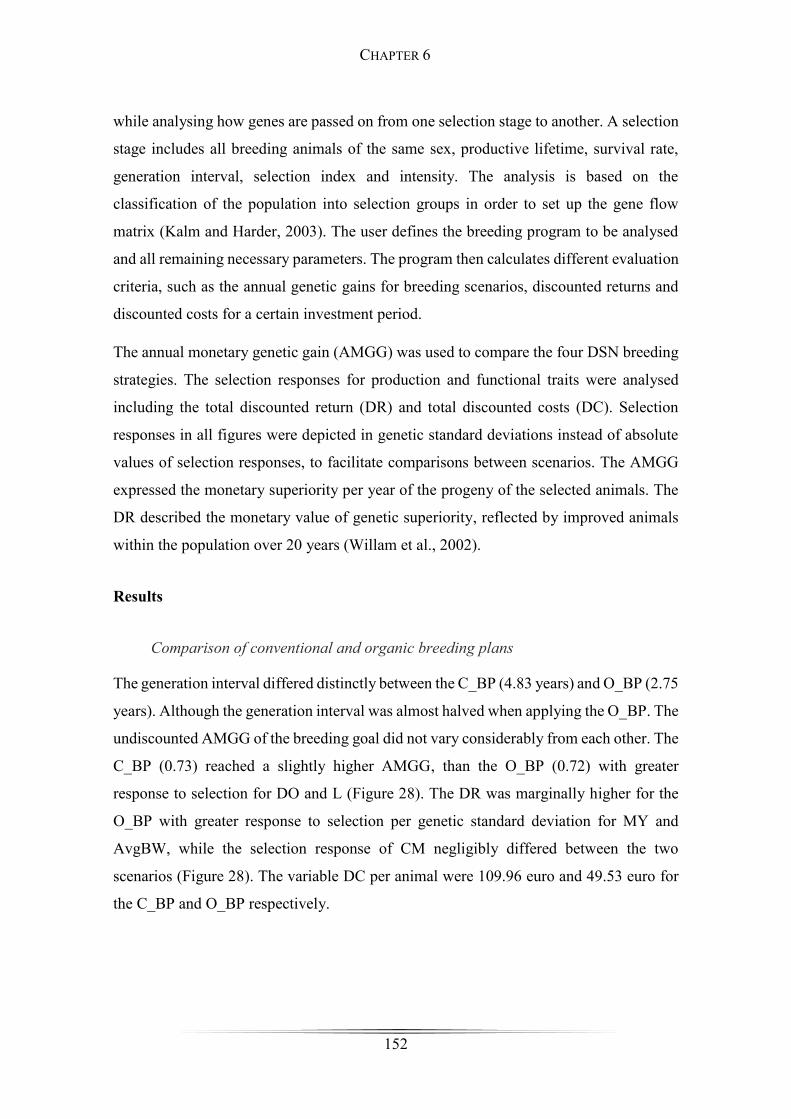
152
while analysing how genes are passed on from one selection stage to another. A selection
stage includes all breeding animals of the same sex, productive lifetime, survival rate,
generation interval, selection index and intensity. The analysis is based on the
classification of the population into selection groups in order to set up the gene flow
matrix (Kalm and Harder, 2003). The user defines the breeding program to be analysed
and all remaining necessary parameters. The program then calculates different evaluation
criteria, such as the annual genetic gains for breeding scenarios, discounted returns and
discounted costs for a certain investment period.
The annual monetary genetic gain (AMGG) was used to compare the four DSN breeding
strategies. The selection responses for production and functional traits were analysed
including the total discounted return (DR) and total discounted costs (DC). Selection
responses in all figures were depicted in genetic standard deviations instead of absolute
values of selection responses, to facilitate comparisons between scenarios. The AMGG
expressed the monetary superiority per year of the progeny of the selected animals. The
DR described the monetary value of genetic superiority, reflected by improved animals
within the population over 20 years (Willam et al., 2002).
Results
Comparison of conventional and organic breeding plans
The generation interval differed distinctly between the C_BP (4.83 years) and O_BP (2.75
years). Although the generation interval was almost halved when applying the O_BP. The
undiscounted AMGG of the breeding goal did not vary considerably from each other. The
C_BP (0.73) reached a slightly higher AMGG, than the O_BP (0.72) with greater
response to selection for DO and L (Figure 28). The DR was marginally higher for the
O_BP with greater response to selection per genetic standard deviation for MY and
AvgBW, while the selection response of CM negligibly differed between the two
scenarios (Figure 28). The variable DC per animal were 109.96 euro and 49.53 euro for
the C_BP and O_BP respectively.
CHAPTER 6
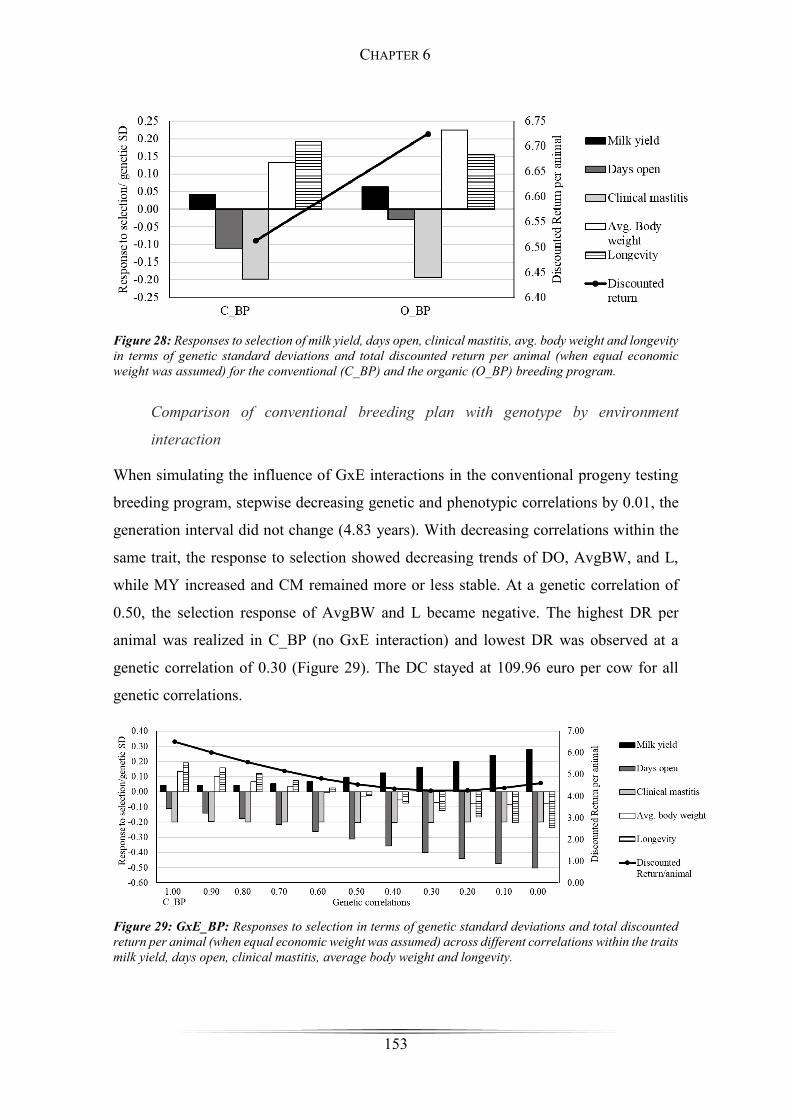
153
Figure 28: Responses to selection of milk yield, days open, clinical mastitis, avg. body weight and longevity in terms of genetic standard deviations and total discounted return per animal (when equal economic weight was assumed) for the conventional (C_BP) and the organic (O_BP) breeding program.
Comparison of conventional breeding plan with genotype by environment
interaction
When simulating the influence of GxE interactions in the conventional progeny testing
breeding program, stepwise decreasing genetic and phenotypic correlations by 0.01, the
generation interval did not change (4.83 years). With decreasing correlations within the
same trait, the response to selection showed decreasing trends of DO, AvgBW, and L,
while MY increased and CM remained more or less stable. At a genetic correlation of
0.50, the selection response of AvgBW and L became negative. The highest DR per
animal was realized in C_BP (no GxE interaction) and lowest DR was observed at a
genetic correlation of 0.30 (Figure 29). The DC stayed at 109.96 euro per cow for all
genetic correlations.
Figure 29: GxE_BP: Responses to selection in terms of genetic standard deviations and total discounted return per animal (when equal economic weight was assumed) across different correlations within the traits milk yield, days open, clinical mastitis, average body weight and longevity.
CHAPTER 6
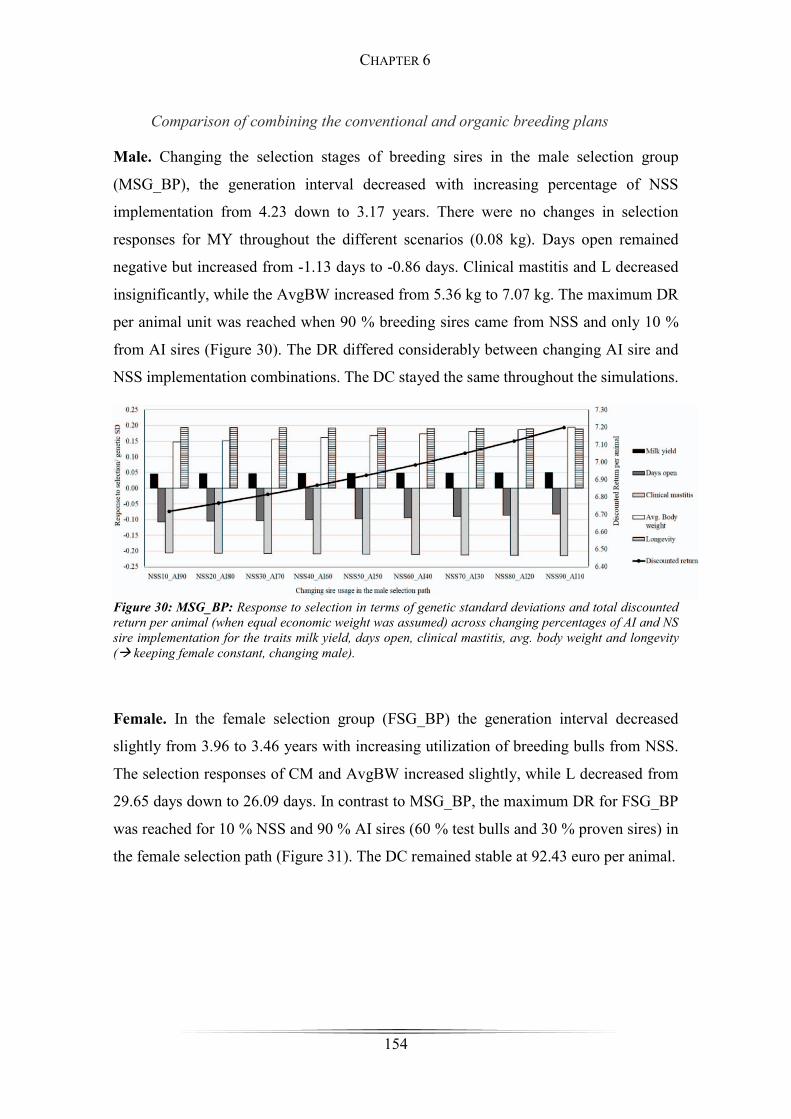
154
Comparison of combining the conventional and organic breeding plans
Male. Changing the selection stages of breeding sires in the male selection group
(MSG_BP), the generation interval decreased with increasing percentage of NSS
implementation from 4.23 down to 3.17 years. There were no changes in selection
responses for MY throughout the different scenarios (0.08 kg). Days open remained
negative but increased from -1.13 days to -0.86 days. Clinical mastitis and L decreased
insignificantly, while the AvgBW increased from 5.36 kg to 7.07 kg. The maximum DR
per animal unit was reached when 90 % breeding sires came from NSS and only 10 %
from AI sires (Figure 30). The DR differed considerably between changing AI sire and
NSS implementation combinations. The DC stayed the same throughout the simulations.
Figure 30: MSG_BP: Response to selection in terms of genetic standard deviations and total discounted return per animal (when equal economic weight was assumed) across changing percentages of AI and NS sire implementation for the traits milk yield, days open, clinical mastitis, avg. body weight and longevity (→ keeping female constant, changing male).
Female. In the female selection group (FSG_BP) the generation interval decreased
slightly from 3.96 to 3.46 years with increasing utilization of breeding bulls from NSS.
The selection responses of CM and AvgBW increased slightly, while L decreased from
29.65 days down to 26.09 days. In contrast to MSG_BP, the maximum DR for FSG_BP
was reached for 10 % NSS and 90 % AI sires (60 % test bulls and 30 % proven sires) in
the female selection path (Figure 31). The DC remained stable at 92.43 euro per animal.
CHAPTER 6
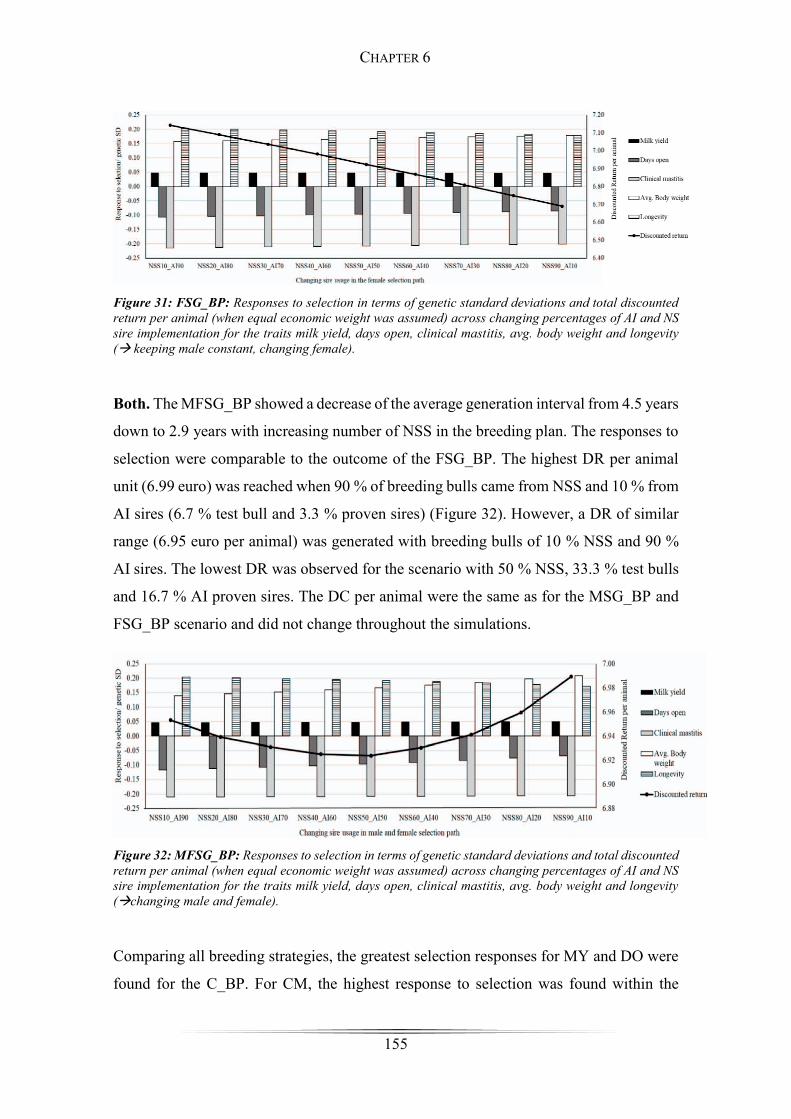
155
Figure 31: FSG_BP: Responses to selection in terms of genetic standard deviations and total discounted return per animal (when equal economic weight was assumed) across changing percentages of AI and NS sire implementation for the traits milk yield, days open, clinical mastitis, avg. body weight and longevity (→ keeping male constant, changing female).
Both. The MFSG_BP showed a decrease of the average generation interval from 4.5 years
down to 2.9 years with increasing number of NSS in the breeding plan. The responses to
selection were comparable to the outcome of the FSG_BP. The highest DR per animal
unit (6.99 euro) was reached when 90 % of breeding bulls came from NSS and 10 % from
AI sires (6.7 % test bull and 3.3 % proven sires) (Figure 32). However, a DR of similar
range (6.95 euro per animal) was generated with breeding bulls of 10 % NSS and 90 %
AI sires. The lowest DR was observed for the scenario with 50 % NSS, 33.3 % test bulls
and 16.7 % AI proven sires. The DC per animal were the same as for the MSG_BP and
FSG_BP scenario and did not change throughout the simulations.
Figure 32: MFSG_BP: Responses to selection in terms of genetic standard deviations and total discounted return per animal (when equal economic weight was assumed) across changing percentages of AI and NS sire implementation for the traits milk yield, days open, clinical mastitis, avg. body weight and longevity (→changing male and female).
Comparing all breeding strategies, the greatest selection responses for MY and DO were
found for the C_BP. For CM, the highest response to selection was found within the
CHAPTER 6
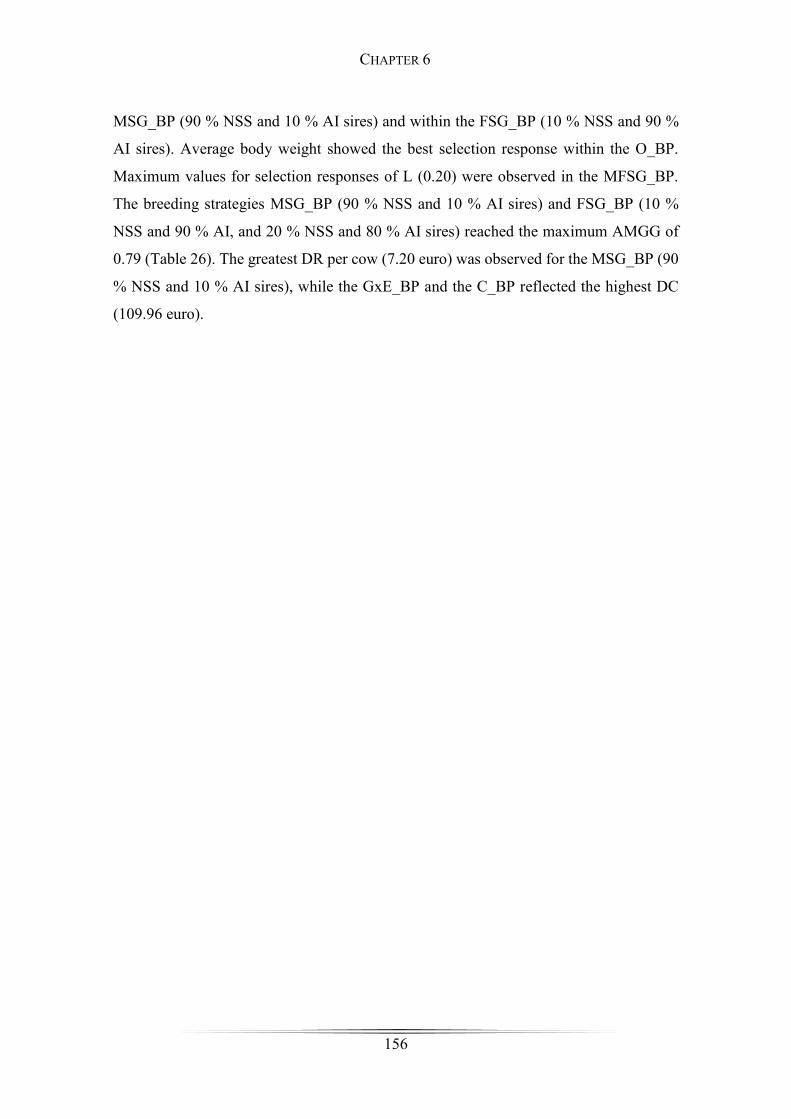
156
MSG_BP (90 % NSS and 10 % AI sires) and within the FSG_BP (10 % NSS and 90 %
AI sires). Average body weight showed the best selection response within the O_BP.
Maximum values for selection responses of L (0.20) were observed in the MFSG_BP.
The breeding strategies MSG_BP (90 % NSS and 10 % AI sires) and FSG_BP (10 %
NSS and 90 % AI, and 20 % NSS and 80 % AI sires) reached the maximum AMGG of
0.79 (Table 26). The greatest DR per cow (7.20 euro) was observed for the MSG_BP (90
% NSS and 10 % AI sires), while the GxE_BP and the C_BP reflected the highest DC
(109.96 euro).
CHAPTER 6
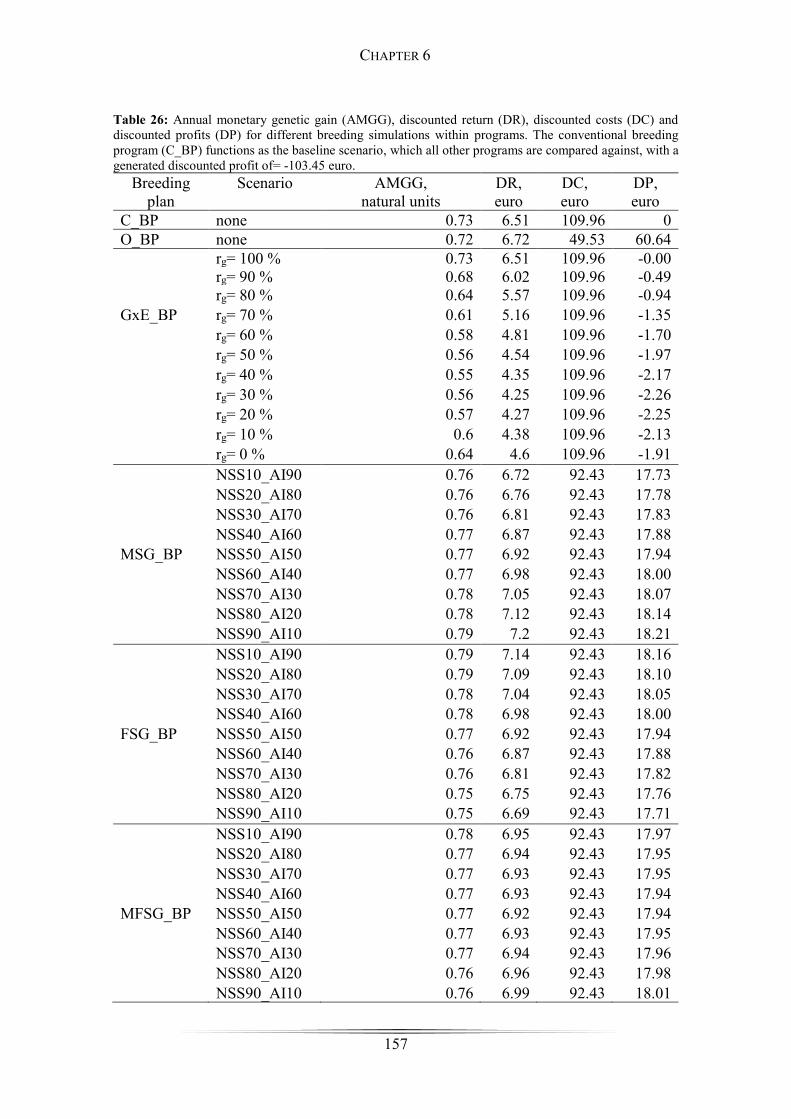
157
Table 26: Annual monetary genetic gain (AMGG), discounted return (DR), discounted costs (DC) and discounted profits (DP) for different breeding simulations within programs. The conventional breeding program (C_BP) functions as the baseline scenario, which all other programs are compared against, with a generated discounted profit of= -103.45 euro.
Breeding plan
Scenario AMGG, natural units
DR, euro
DC, euro
DP, euro
C_BP none 0.73 6.51 109.96 0 O_BP none 0.72 6.72 49.53 60.64
rg= 100 % 0.73 6.51 109.96 -0.00 rg= 90 % 0.68 6.02 109.96 -0.49 rg= 80 % 0.64 5.57 109.96 -0.94
GxE_BP rg= 70 % 0.61 5.16 109.96 -1.35 rg= 60 % 0.58 4.81 109.96 -1.70 rg= 50 % 0.56 4.54 109.96 -1.97 rg= 40 % 0.55 4.35 109.96 -2.17 rg= 30 % 0.56 4.25 109.96 -2.26 rg= 20 % 0.57 4.27 109.96 -2.25 rg= 10 % 0.6 4.38 109.96 -2.13 rg= 0 % 0.64 4.6 109.96 -1.91 NSS10_AI90 0.76 6.72 92.43 17.73 NSS20_AI80 0.76 6.76 92.43 17.78 NSS30_AI70 0.76 6.81 92.43 17.83 NSS40_AI60 0.77 6.87 92.43 17.88
MSG_BP NSS50_AI50 0.77 6.92 92.43 17.94 NSS60_AI40 0.77 6.98 92.43 18.00 NSS70_AI30 0.78 7.05 92.43 18.07 NSS80_AI20 0.78 7.12 92.43 18.14 NSS90_AI10 0.79 7.2 92.43 18.21 NSS10_AI90 0.79 7.14 92.43 18.16 NSS20_AI80 0.79 7.09 92.43 18.10 NSS30_AI70 0.78 7.04 92.43 18.05 NSS40_AI60 0.78 6.98 92.43 18.00
FSG_BP NSS50_AI50 0.77 6.92 92.43 17.94 NSS60_AI40 0.76 6.87 92.43 17.88 NSS70_AI30 0.76 6.81 92.43 17.82 NSS80_AI20 0.75 6.75 92.43 17.76 NSS90_AI10 0.75 6.69 92.43 17.71 NSS10_AI90 0.78 6.95 92.43 17.97 NSS20_AI80 0.77 6.94 92.43 17.95 NSS30_AI70 0.77 6.93 92.43 17.95 NSS40_AI60 0.77 6.93 92.43 17.94
MFSG_BP NSS50_AI50 0.77 6.92 92.43 17.94 NSS60_AI40 0.77 6.93 92.43 17.95 NSS70_AI30 0.77 6.94 92.43 17.96 NSS80_AI20 0.76 6.96 92.43 17.98 NSS90_AI10 0.76 6.99 92.43 18.01
CHAPTER 6
158
Discussion
In the light of the present results, the important criteria determining the economic value
(AMGG, DR and DC) of the described breeding strategies were a low generation interval,
genetic correlations between traits, strong selection responses of functional traits (not
production traits!) such as CM, AvgBW as well as L and in this context, a high number
of daughter records per sire. Additionally, for a breeding program to succeed, the
prevention of GxE interaction was considered fundamental as well as the overall
population size.
Effect of generation interval on genetic gain and economic factors
The lowest average generation interval of all scenarios, found in the O_BP, can be
explained with the missing selection stage of sires on testing stations. Natural service sires
are implemented at the age of 12 months and are usually replaced when they are on
average 3 years old, whereas proven and elite AI sires are between 5 and 10 years before
being replaced by their offspring. With an investment duration of 20 years, 7.30
generations were realized for the O_BP, but only a maximum of 6.31 generations were
reached conducting alternative strategies (MSG_BP with 90 % NSS and 10 AI). In this
context, the superiority of the O_BP opposed to conventional progeny testing (C_BP)
must be mentioned. The O_BP realized 3.13 more generations for selection than the C_BP
along with reduced DC and a similar AMGG. Paying special regards to DC in terms of
breeding program selection is essential. There are distinct warnings in literature against a
large increase of costs in the breeding program, as this can be a significant barrier to the
adoption of beneficial technology in breeding (Kahi et al., 2003). Although greater
selection intensity with more selection stages was obtained in the C_BP, the AMGG
might have been compromised by longer generation intervals. In the case of the present
study, reduced selection intensity in the O_BP seemed to be compensated by almost
doubling the generations for selection due to short generation intervals. Consequently,
decreasing generation intervals in the O_BP appear to have a comparable effect on genetic
responses for MY, CM and L as the enhanced selection of sires, i.e., realizing genetic
superiority of AI sires in the C_BP.
The decline of generation interval could also be observed in the MSG_BP, the FSG_BP
and the MFSG_BP along with decreasing implementation of AI sires, while extending
CHAPTER 6
159
the use of NSS. Naturally, a stronger utilization of breeding bulls from NSS and elite NSS
in the male and female selection group led to a reduced generation interval for sires.
Harder et al. (2004) corroborated these findings explaining, that a higher proportion of
NSS led to a decrease in generation interval. The reduced generation interval in the
MSG_BP with the use of 90 % NSS and only 10 % AI sires can be one explanation for
the obtained superior AMGG, DR and the high selection responses in CM, AvgBW and
L. Kahi and Hirooka (2005) also expected faster genetic gains for carcass traits when
decreasing the generation interval. Accordingly, other findings from literature accounted
decreasing generation intervals for a higher discounted profit, due to minimizing costs for
housing and feeding of waiting bulls, as well (Thomasen et al., 2014; Karras et al., 2011).
However, the decreasing generation intervals did not seem to affect the AMGG of the
FSG_BP positively. In this particular case, the AMGG declined with decreasing
generation interval. Possible reasons may be, that in the male selection path AI and NSS
remained constant at 50 % and the generation interval only decreased roughly one year
from 4.23 to 3.17 years. In contrast to the MSG_BP, the FSG_BP reached the maximum
AMGG with an 80-90 % implementation of AI sires. With regard to AMGG and DR, the
MSG_BP constitutes a possible breeding strategy for DSN cattle and high NSS
implementation.
Effect of number of daughter records and genetic correlations on genetic gain and
economic factors in breeding programs
The number of daughter records per sire as well as genetic correlations are potential
causes for varying selection pressure on functional traits in the presented breeding
strategies. Compared to the O_BP, greater selection responses for DO, CM and L were
observed in the MSG_BP and MFSG_BP. In turn, the O_BP realized a slightly higher
selection response than the MSG_BP, FSG_BP and FMSG_BP in the production trait
MY. The moderate higher genetic responses to selection for DO and L with increased AI
sire implementation in the MSG_BP and the MFSG_BP could be due to the fact, that low
heritable functional traits exhibit improved reliabilities of EBV in large scale progeny
testing schemes, as opposed to elite NSS with limited daughter records. For the same
reason the AMGG seemed to be higher in the FSG_BP, when implementing 90 % AI
sires on the female selection path, leading to decreased DO and CM while increasing L.
A similar effect was observed in the C_BP compared to the O_BP, where greater
CHAPTER 6
160
responses to selection were observed for DO, CM and L in the C_BP (Figure 28).
Moreover, it was confirmed that, with greater daughter size, higher genetic gain was
generated for functional traits, while only low genetic gain was achieved for milk
production (Sorensen et al., 1999; Harder et al., 2004). Harder et al. (2004) reasoned, that
the optimum number of daughter records per test bull depended on the objective to be
optimized. Although, the increase of their (Harder et al., 2004) number of daughter
records up to 100 had only little effect on the monetary genetic gain of all traits, the
composition of the monetary genetic gain was changed favouring the functional traits.
Hence, they recommended around 100 or even more daughters per test bull for an organic
breeding program (Harder et al., 2004). Regarding this aspect, Kahi and Hirooka (2005)
stated, that the optimal test capacity and selection intensity depended on the breeding
scheme and thus, with the level of recording. Optimal test capacity was high with low
levels of recording and in case when young bulls were selected, based on their own
performance alone. While including additional information from relatives of young bulls
during first-stage selection process markedly decreased the optimal test capacity (Kahi
and Hirooka, 2005). Willam et al. (2002) proposed an optimum number of daughters per
test bull of around 100, while a further increase of number of daughters per test bull would
only have little impact on the AMGG.
Moreover, the FSG_BP reflected the importance of sire selection. The implementation of
90-80 % AI sires, which possessed information from relatives, generated a superior
AMGG and DR compared to all alternative breeding strategies except for the MSG_BP.
Only minor differences were obtained between the economic outcome of the MSG_BP
(90 % NSS, 10 % AI sire) and the FSG_BP (10 % NSS and 90 % AI sires). The AMGG
and DC remain the same, while the DR is 0.06 euro less for the FSG_BP. The MSG_BP
favours the implementation of NSS on the male selection path over AI sires, while the
FSG_BP succeeds with a predominately AI sire implementation on the female selection
path. Causes for this may be the low heritability of functional traits (DO: 0.03 h2, CM:
0.10 h2, L: 0.09 h2) as well as their difference in positive genetic gain in the two breeding
plans. While both breeding plans (MSG_BP: 90 % NSS and 10 % AI; and FSG_BP: 90
% AI and 10 % NSS) show a slightly positive genetic gain in CM (here decrease of CM),
the MSG_BP has a lower generation interval as well as higher genetic gain for AvgBW
(90 % NSS and 10 % AI). However, on the other side the FSG_BP (90 % AI and 10 %
CHAPTER 6
161
NSS) has a superior genetic gain in DO and L while decreasing AvgBW. Thus, both
breeding plans have their advantages and disadvantages in terms of positive genetic gain
of functional traits and generation interval. However, they depicted opposite reactions
(increase or decrease) of genetic gain in functional traits, due to unfavourable genetic
correlations between the functional traits itself (DO & CM -0.18; DO & L -0.44; CM &
L -0.53; AvgBW & L -0.31). This explains why the MSG_BP (90 % NSS and 10 % AI)
and FSG_BP (90 % AI and 10 % NSS) reach similar AMGG but slightly different DR,
as the genetic gain in functional traits differs as well as the generation interval. Kahi and
Hirooka (2005) concluded, that focusing on sire selection led to the highest genetic
response, rather than concentrating on cow selection to breed dams. Thus, a high
percentage of AI sire implementation (90 %) on the female selection path in the FSG_BP
and MFSG_BP improved the genetic gain of functional traits more than the genetic gain
of the production trait MY.
One reason for reduced selection response in MY in all breeding programs, except the
GxE_BP (for genetic correlations ≥ 0.50), could be unfavourable genetic correlations
between production and functional traits (MY & DO 0.93; MY & CM 0.04; MY &
AvgBW -0.01). In this context, Baumung et al. (2001) offered an explanation arguing,
that the calculated expected selection responses for single traits were distinctly affected
by their correlations. They concluded, that the lower selection response of milk traits in
their study was nearly compensated by higher response of functional traits (Baumung et
al., 2001). Kahi and Hirooka (2005) corroborated this argument stating that, the inclusion
of some traits in a breeding goal may cause undesirable correlated changes in other sets
of traits.
The effect of GxE interaction on genetic gain and economic factors
The AMGG and DR seemed to be affected by the presence of GxE interaction, as apart
from the GxE_BP, all breeding strategies generated an AMGG > 0.72 and a DR > 6.51
euro. With decreasing correlations within the same trait, the AMGG and DR declined.
The highest DR was generated when there were no GxE interactions present, which
accorded to the simple progeny testing scheme of the C_BP. Especially, the functional
traits (AvgBW and L) showed negative genetic responses to selection with decreasing
genetic correlations, which apparently influenced the AMGG quite distinctly. Fuerst-
CHAPTER 6
162
Waltl et al. (2002) explained a negative AMGG for the fertility trait DO with its limited
heritability. They stated slightly negative AMGG for functional traits, such as paternal
calving ease (-0.039) as well (Fuerst-Waltl et al., 2002). Concomitantly, Harder et al.
(2004) described the importance of functional traits (somatic cell score and longevity)
and their contribution to a sufficient AMGG. Accordingly, Willam et al. (2002)
confirmed the relevance of functional longevity (as the economically most important
functional trait) in the total merit index of Brown Swiss. Thus, declining AMGG and DR
along with decreasing genetic correlations may come from the failure of cows expressing
their genetic potential in a suboptimal environment. Whenever GxE interactions exist,
individuals, that may be genetic superior in one environment, show average or even
reduced performances in a different production system, resulting into decreased economic
efficiency (Charagu and Peterson, 1998). Interestingly, the presence of GxE interaction
(rg= 0.00) caused high responses to selection for MY and DO, as higher economic values
were assigned for MY, DO and CM. Possibly, diluting effects to unfavourable genetic
correlations were another reason for high responses to selection for MY and DO. As the
heritability for CM is smaller than for MY, the selection response remains smaller as well.
However, a positive genetic gain of those traits did contribute neither to a satisfying
AMGG (0.64) nor to a desirable DR (4.60 euro).
The effect of population size on genetic gain and economic factors
Due to the small population size of DSN cattle, DC per cow remained quite high (49.53
euro to 109.96 euro). Willam et al. (2002) showed the impact of population size on DP,
comparing the Brown Swiss against the much greater Simmental population, leading to a
14–25 % lower DP for Brown Swiss. As mentioned at the beginning, no fix costs were
included. The considerable difference of DC per animal between the O_BP and the
remaining strategies resulted from the variable cost factors of rearing and progeny testing
of waiting bulls (13,000 euro per waiting bull). Under different circumstances, i.e., greater
population size, the combined breeding scenarios including AI (MSG_BP and FSG_BP)
might be the better option with regard to AMGG, DR and DC. Harder et al. (2004)
described controversial results as well, reporting a distinct superiority of a conventional
as opposed to an organic breeding program. This was mainly due to a larger population
size within the conventional breeding program, caused by improved selection of bull
sires. They even suggested developing an organic breeding program throughout
CHAPTER 6
163
Germany, to get an adequate population size of at least 50,000 cows (Harder et al., 2004).
However, in a small population like DSN, the O_BP may be the best choice due low DC
as well as generation intervals and satisfying AMGG at the same time.
König et al. (2009) considered a population of 100,000 Holstein cows, applying a
conventional progeny testing program for 50 young bulls with 100 daughter records per
year. They concluded, that in large dairy populations, too, the reduction of generation
intervals due to genomic selection breeding programs and abdication of conventional
progeny testing led to tremendous cost diminution and increased genetic gain (König et
al., 2009). Consequently, greater population size will increase the benefits of economies
of scale, reducing costs of progeny waiting bulls.
At this point however, the important matter of inbreeding must be considered as well.
Even in big populations, findings from other studies warned against increasing selection
intensity and decreasing generation intervals, regardless their impact on inbreeding
(König et al., 2009; Hayes et al., 2009). Karras et al. (2011) reported increasing
inbreeding in the sire selection path in combination with genomic selection and decreased
generation intervals. Especially, in a small population with low generation intervals,
increased inbreeding presents a major obstacle, particularly in the sire selection path.
Therefore, regarding inbreeding, keeping more sires and implementing limited selection
(i.e., O_BP) should be a feasible alternative for the small DSN population.
Conclusion
The lowest DC was realized in the O_BP, which together with the low generation interval
resulted into a satisfying DR. From an economical point of view, the O_BP presented a
favourable breeding strategy for a small cattle population emphasizing on functional traits
as body weight while minimizing costs. As the C_BP represented a certain scenario of
the GxE_BP (with a genetic correlation= 1), the GxE_BP (and thus the C_BP) was the
least suitable breeding plan for a small dual-purpose cattle population with regard to
economic measures. The selection scenarios of an 80-90 % AI sire and 20-10 % NSS
implementation in the FSG_BP and a 10 % AI sire and 90 % NSS implementation in the
MSG_BP provided a great opportunity, to significantly improve functional traits such as
CM and L, while generating most desirable economic results regarding DR. Essential
parameters affecting the economic parameters of the breeding programs were a reduced
CHAPTER 6
164
generation interval, antagonistic genetic correlations between traits, strong selection
responses of functional traits and high number of daughter records per sire while the
absence of GxE interactions was considerable.
CHAPTER 6
165
References
Baumung, R., Sölkner, J., Gierzinger, E. and Willam, A. 2001. Ecological total merit
index for an Austrian dual-purpose cattle breed. Archiv für Tierzucht. 44:5–14.
https://doi.org/10.5194/aab-44-5-2001.
Berry, D.P., Buckley, F., Dillon, P., Evans, R.D., Rath, M. and Veerkamp, R.F. 2003.
Genetic Relationships among Body Condition Score, Body Weight, Milk Yield, and
Fertility in Dairy Cows. Journal of Dairy Science. 86:2193–2204.
https://doi.org/10.3168/jds.S0022-0302(03)73809-0.
Biedermann, G. 2003. Zuchtplanung für die Erhaltung des Alten Schwarzbunten
Niederungsrindes.: Bundesprogramm ökologischer Landbau und andere Formen
nachhaltiger Landwirtschaft. Accessed in 30.08.2018:
https://service.ble.de/ptdb/index2.php?detail_id=84928&site_key=141.
Brade, W. and Brade, E. 2013. Zuchtgeschichte der Deutschen Holsteinrinder. Zeitschrift
für Agrarpolitik und Landwirtschaft 91: 1–41.
Brascamp, E. W. 1978. Methods on economic optimization of animal breeding plans.
Rapport B-134, Wageningen.
Charagu, P. and Peterson, R. 1998. Estimates of GxE Effects for Economic Efficiency
among Daughters of Canadian and New Zealand Sires in Canadian and New Zealand
Dairy Herds. University of British Columbia:105–109.
Destatis. 2018. Viehhaltung der Betriebe, Agrarstrukturerhebung. Accessed in
30.08.2018:https://www.destatis.de/DE/Publikationen/Thematisch/LandForstwirtsch
aft/ViehbestandTierischeErzeugung/FleischuntersuchungHj.html.
Elsen, J.M. and Mocquot, J.C. 1974. Méthode de prévision de l’évolution du niveau
génétique d’une population soumise à une opération de sélection et dont les
générations se chevauchent. Bull. Tech. Dépt. Génét. Anim, INRA 17: 30–54.
Frevert, H., Yin, T., Simianer, H. and König, S. 2014. Comparison of traditional and
genomic breeding programs for organic and low input dairy cattle accounting for traits
relevant in different macro-climatic zones. organic Eprints.
orgprints.org/26639/1/Frevert-etal-2014-paper-lowinputbreeds-dairy-cattle.pdf
Fuerst-Waltl, B., Willam, A. and Sölkner, J. 2002. Optimization of a specialized beef
breeding program with a crossbreeding component. Archiv für Tierzucht: 433–442.
CHAPTER 6
166
Haile, A., Wurzinger, M., Mueller, J., Mirkena, T., Duguma, G., Mwai, O., Sölkner, J.
and B. Rischkowsky. 2011. Guidelines for Setting up Community-based Sheep
Breeding Programs in Ethiopia, Aleppo, Syria.
Harder, B., Junge, W., Bennewitz, J. and Kalm, E. 2004. Investigations on breeding plans
for organic dairy cattle. Archiv für Tierzucht 47: 129–139.
Hayes, B.J., Bowman, P.J., Chamberlain, A.J. and Goddard, M.E. 2009. Invited review:
Genomic selection in dairy cattle: progress and challenges. Journal of Dairy Science
92: 433–443. https://doi.org/10.3168/jds.2008-1646.
Hazel, L.N. 1943. The Genetic Basis for Constructing Selection Indexes. Genetics (28):
476–490.
Hill, W.G. 1974. Prediction and evaluation of response to selection with overlapping
generations. Animal Production 18: 117–139.
Jaeger, M., Scheper, C., König, S. and Brügemann, K. 2018. Studien zur Inzucht und
Verwandtschaft beim „Deutschen Schwarzbunten Niederungsrind“ (DSN) auf Basis
eigens berechneter Rasseanteile. Züchtungskunde 90: 262–279.
Jenko, J., Perpar, T. and Kovač, M. 2015. Genetic relationship between the lifetime milk
production, longevity and first lactation milk yield in Slovenian Brown cattle breed.
Mljekarstvo 65: 111–120.
Kahi, A.K., Barwick, S.A. and Graser, H.U. 2003. Economic evaluation of Hereford
cattle breeding schemes incorporating direct and indirect measures of feed intake.
Austrian Journal of Agricultural Research 54: 1039–1055.
Kahi, A.K. and Hirooka, H. 2005. Genetic and economic evaluation of Japanese Black
(Wagyu) cattle breeding schemes. Journal of Animal Science 83: 2021–2032.
https://doi.org/10.2527/2005.8392021x.
Kalm, E. and Harder, B. 2003. Ökologische Tierzucht: Status Quo, Möglichkeiten und
Erfordernisse in der Rinder- und Schweinezucht. Abschlussbericht, Kiel.
Karras, K., Herold, P., Hamman, H., Weidele, A. and Zárate, A. 2011. Genomische
Selektion beim Braunvieh: Auswirkungen auf Zuchtfortschritt und Züchtungsgewinn.
Züchtungskunde 83:333-349.
Kern, E.L., Cobuci, J.A., Costa, C.N., McManus, C.M. and Braccini Neto J. 2015.
Genetic association between longevity and linear type traits of Holstein cows. Scientia
Agricola (Piracicaba, Braz.) 72: 203–209. https://doi.org/10.1590/0103-9016-2014-
0007.
CHAPTER 6
167
König, S., Simianer, H. and Willam, A. 2009. Economic evaluation of genomic breeding
programs. Journal of Dairy Science 92: 382–391. https://doi.org/10.3168/jds.2008-
1310.
Lind, B. 2007. Ableitung der Wirtschaftlichkeitskoeffizienten und optimalen
Indexgewichte des Gesamtzuchtwertes für die deutschen Milch- und
Zweinutzungsrassen unter Berücksichtigung aktueller und erwarteter zukünftiger
Rahmenbedingungen. Dissertation, Göttingen. https://ediss.uni-
goettingen.de/bitstream/handle/11858/00-1735-0000-0006-B003
F/lind.pdf?sequence=1
Philipsson, J. and Lindhé, B. 2003. Experiences of including reproduction and health
traits in Scandinavian dairy cattle breeding programmes. Livestock Production
Science 83: 99–112. https://doi.org/10.1016/S0301-6226(03)00047-2.
Roxström, A. and Strandberg, E. 2002. Genetic analysis of functional, fertility-, mastitis-
, and production-determined length of productive life in Swedish dairy cattle.
Livestock Production Science 74: 125–135. https://doi.org/10.1016/S0301-
6226(01)00300-1.
Rutten, M.J.M., Bijma, P., Woolliams, J.A. and Arendonk, J.A.M. 2002. SelAction:
Software to Predict Seletion Response and Rate of Inbreeding in Livestock Breeding
Programs. Journal of Heredity 93:456–458.
Shabalina, T., Yin, T., König, S. 2018. Survival analysis for health traits in German
Holstein dairy cows. 69th Annual Meeting of the European Federation of Animal
Science. Dubrovnik, Croatia, 27th to 31st August.
Søndergaard, E., Sørensen, M.K., Mao, I.L. and Jensen, J. 2002. Genetic parameters of
production, feed intake, body weight, body composition, and udder health in lactating
dairy cows. Livestock Production Science 77: 23–34. https://doi.org/10.1016/S0301-
6226(02)00023-4.
Sorensen, M.K., Berg, P., Jensen, J. and Christensen, L.G. 1999. Stochastic simulation of
breeding schemes for dairy cattle: In: van Arendonk, (Ed.), Book of Abstracts No. 5,
Zürich, Wageningen.
Steininger, F. 2011. Analyse der Rinder-Zuchtprogramme Fleckvieh AUSTRIA und
Braunvieh AUSTRIA. Dissertation, Wien. http://docplayer.org/57593454-Analyse-
der-rinder-zuchtprogramme-fleckvieh-austria-und-braunvieh-austria.html
CHAPTER 6
168
Täubert, H., Rensing, S. and Reinhardt, F. 2011. Zuchtplanung mit ZPLAN+ am Beispiel
genomischer Zuchtprogramme bei Holsteins. Züchtungskunde 83: 315–332.
TGRDEU. 2018. Zentrale Dokumentation Tiergenetischer Ressourcen in Deutschland:
Rassebeschreibung: Deutsches Schwarzbuntes Niederungsrind. Accessed in
20.08.2018:https://tgrdeu.genres.de/default/hausundnutztiere/detailansicht/detail/63E
5D466-B9E4-FD58-E040-A8C0286E751D.
Thomasen, J.R., Egger-Danner, C., Willam, A., Guldbrandtsen, B., Lund, M.S. and
Sørensen, A.C. 2014. Genomic selection strategies in a small dairy cattle population
evaluated for genetic gain and profit. Journal of Dairy Science 97: 458–470.
https://doi.org/10.3168/jds.2013-6599.
Willam, A., Egger-Danner, C., Sölkner, J. and Gierzinger, E. 2002. Optimization of
progeny testing schemes when functional traits play an important role in the total merit
index. Livestock Production Science 77:217–225. https://doi.org/10.1016/S0301-
6226(02)00041-6.
Zavadilová, L. and Zink, V. 2013. Genetic relationship of functional longevity with
female fertility and milk production traits in Czech Holsteins. Czech Journal of Animal
Science 58: 554–565.
CHAPTER 6
169
CHAPTER 7
General Discussion
170
The development of a new merit index, or just the inclusion of new traits into an already
existing breeding program, requires an extensive knowledge of genetic correlations
between all traits. Otherwise, economic losses may be the consequence, due to
unfavourable correlations among production and fertility or health traits (Philipsson et
al., 1994). Hence, the aim of this chapter is the estimation of genetic correlations between
production and sensor traits, exploring the relations between economically important
traits and animal behaviour on a quantitative genetic scale. Furthermore, as the
requirements of the dairy industry are many-sided, especially with regard to climate
change, previously generated results and conclusions will be discussed in the context of
future demands of cattle breeding. In the second part of this chapter, a more general focus
will address environmental challenges, societal demands, and practical implementations
of dairy farming, that require a minimization of its environmental footprint. As an
example, the whole production system needs to reduce its overall water consumption,
while feeding needs to be reconsidered, utilizing fodder that mitigates methane
production (Augustin et al., 2013). In this regard, recommendations for breeders and
farmers are given, using the example of DSN, to address the more than ever pressing and
actual topic of the future direction, sustainable (dual-purpose) cattle breeding should take.
Including innovative technology, such as herd management tools and future marker-
assisted selection, the issue of organic livestock production ‘how to improve animal
husbandry and livestock health status’, can be tackled. Thus, the potential of welfare and
health trait indicators, as a breeding tool for defining new breeding goals, will be
addressed.
Especially, which opportunities in breeding of dual-purpose cattle can be of good use and
how to proceed from here onwards, will determine the focus of discussion with respect
to the previously addressed chapters: 2) Maintaining genetic diversity and mitigating
inbreeding in dual-purpose populations, 3) Applying innovative phenotypic behaviour
trait recording in dual-purpose cattle, 4) Associating significant genomic variants with
candidate genes of bovine behaviour, 5) Analysing GxE interactions in DSN cattle
breeding, 6) Including functional traits in the economic evaluation of breeding programs
for small dual-purpose cattle populations.
CHAPTER 7

171
Genetic Associations between Productivity and Cow Behaviour
Introduction
One of the greatest challenges in farm animal breeding is the ability of breeders, to
distinguish between traits, that are only temporarily favoured by the market and
consumers, and those traits, which will be of long-term interest. In this regard, Lush
(1960) concluded, “one would like to select today in accordance with the economic
values, which will prevail 10 to 20 years from now”. Planning ahead is particularly
important, as the genetic choices, breeders make today, will affect the profit in future
generations (VanRaden, 2004). Via breeding, the genetic merit of animals in future
generations is changed, so they will produce the desired products more efficiently
(compared to present generation) under future economic, natural and social conditions
(Groen et al., 1997). In 1971, the first economic index was formed in the US, to include
traits, that affected dairy cattle profit, while the national index of Sweden already
consisted of 12 traits (milk production, growth rate, female fertility, stillbirth, ease of
milking, temperament, six conformation traits) in 1975 (Philipsson et al., 1994;
Philipsson and Lindhé, 2003). During the 1970ies and 1980ies, the American
predominant selection focus lay on milk, fat, protein as well as cheese yield (Norman and
Dickinson, 1971). Philipsson et al. (1994) reported, that the only national breeding index,
incorporating health traits before 1994, were found in Scandinavia. One explanation for
the overall lack of health and functional traits in breeding programs was the problem of
accurate recording and genetic evaluation for low heritable traits (VanRaden, 2004).
Nowadays, breeding for functional traits, in order to reduce expenses, is nearly as relevant
as increasing income. Due to this reason, the USDA’s net merit index was changed in
2003, to include genetic evaluations for calving ease and cow fertility (Philipsson and
Lindhé, 2003).
With the rapid development of PDF and new herd management technologies, to
track cow activity (e.g. pedometer, electronic ear tag sensors, electronic collars/halters),
it became feasible to record large data volume of individual cattle behaviour and estimate
genetic parameters of these traits (chapter 3). Whether sensor traits will be included into
the total merit index of DSN breeding programs remains to be seen. Nonetheless, in order
to develop a total merit index for cattle breeding, it is essential to be aware of the genetic
correlations between all traits, that are included.
CHAPTER 7
172
There are various theories, that aim to explain the occurrence and biological reason of
negative genetic correlations. Rendel (1936) reasoned, that the cause of genetic
correlations was due to traits sharing resources for their development. Hence, a limitation
in resources would cause a negative correlation between those traits. Consequently,
selecting one trait affected the total amount of available resources as well as their
distribution (Rendel, 1936). On this basis, Goddard and Beilharz (1977) developed the
‘Resource Allocation Theory’, where resources (e.g. feed intake, body tissue), used for
one biological process (maintenance, reproduction, reaction to pathogens and stressors),
cannot be allocated to another process. Farm animals in particular are confronted with the
issue of limited resources. Due to artificial selection, the residual feed intake (feed intake
that is not required for maintenance and reproduction) is disproportionally used to the
maximum development of one trait, leaving the animal little resources to adequately
respond to unexpected environmental stressors (Dunnington, 1990). Rauw et al. (1998)
argued, that a growing imbalance between fitness and production traits will result in
increasing negative correlations and challenge the homeostatic balance within an animal.
Thus, genetic selection for production traits alters the physiological system, consuming
endogenous resources, that are needed to strengthen the animal’s disease resistance,
reproduction and metabolism.
In order to construct multiple-trait selection indices heritabilities, phenotypic and genetic
correlations are needed, to maximize accuracy (Hazel, 1943; VanRaden, 2004). The
relative efficiency of selection depends on the number of traits selected, relative economic
values of traits, heritabilities, phenotypic and genetic correlations between traits (Young,
1961). Accordingly, negative correlations among favourable traits will reduce the genetic
progress (Lin, 1978). Moreover, as genetic and environmental correlations may differ in
magnitude and sign, the apparent phenotypic correlation does not necessarily give any
inference about the magnitude and sign of the genetic correlation (Rauw et al., 1998).
VanRaden (2004) explained, how health and fitness traits received less attention in the
past, because accurate genetic evaluations were not available for low heritable traits. As
a consequence, one-sided selection for yield and type traits led to a decline in fertility
traits, due to unfavourable correlations with yield traits. To name only a few impacts of
genetic selection, that affected the homeostatic balance of animals, Wall et al. (2003)
emphasized the unfavourable genetic response of BCS when selecting for milk yield.
CHAPTER 7
173
They implied, that sires with higher EBV had daughters with lower body condition, due
to greater negative energy balance. A reduced negative energy balance in turn caused
reduced fertility and health (Wall et al., 2003). Moreover, Shanks et al. (1978) reported
increased joint and leg injuries in daughters of sires, that were predicted to have high
average milk yield, compared to a control group of cows, that were randomly bred.
Axiomatically, the problem of undesirable side-effects, that come along with one-sided
selection, can be observed in other species as well. Breeding for high body weight in
turkeys correlated with higher mortality rates, negative immune performances, such as
lower antibody responses, as well as heart and circulation problems (Rauw et al., 1998).
In Swedish pigs (Landrace, Yorkshire), selected for high leanness and growth rate, greater
leg weakness and osteochondrosis scores were observed, confirming unfavourable
genetic correlations between constitution and growth rate as well as between constitution
and lean percentage (Lundeheim, 1987).
The previous chapters already emphasized the economic importance of functional
traits and their integration into total merit indices, in order to reduce production costs.
Especially, against the background of long-term selection decisions, that affect the course
of breeding for several generations, it its crucial, to be aware of all correlations among
traits, whether they are favourable or not. Hence, the aim of this study is the estimation
of genetic as well as phenotypic correlations between sensor and production traits. This
is the first study, in which phenotypic and genetic correlations of electronically recorded
behaviour traits of different dual-purpose cattle breeds, kept in extensive grazing systems
in different countries, were estimated. The innovative approach intends to contribute to a
better understanding, of how correlations will affect future dual-purpose cattle breeding.
Anticipating the expression of production and functional traits in future generations, will
help to prevent undesirable responses of selection.
Materials and Methods
Test-day production and sensor records were available for dual-purpose cattle from
Germany (DE_DSN= black and white dual-purpose cattle), Poland (PL_BS= Brown
Swiss, PL_HF= Holstein Friesian), and Switzerland (CH_OBS= dual-purpose original
Brown Swiss, CH_Si= Simmental) (Table 27). The data set was the same as for the
estimation of genetic parameters of sensor traits, described in chapter 4, except for the
Slovenian records. Test-day records included milk yield (Mkg), fat percentage (Fat%),
CHAPTER 7
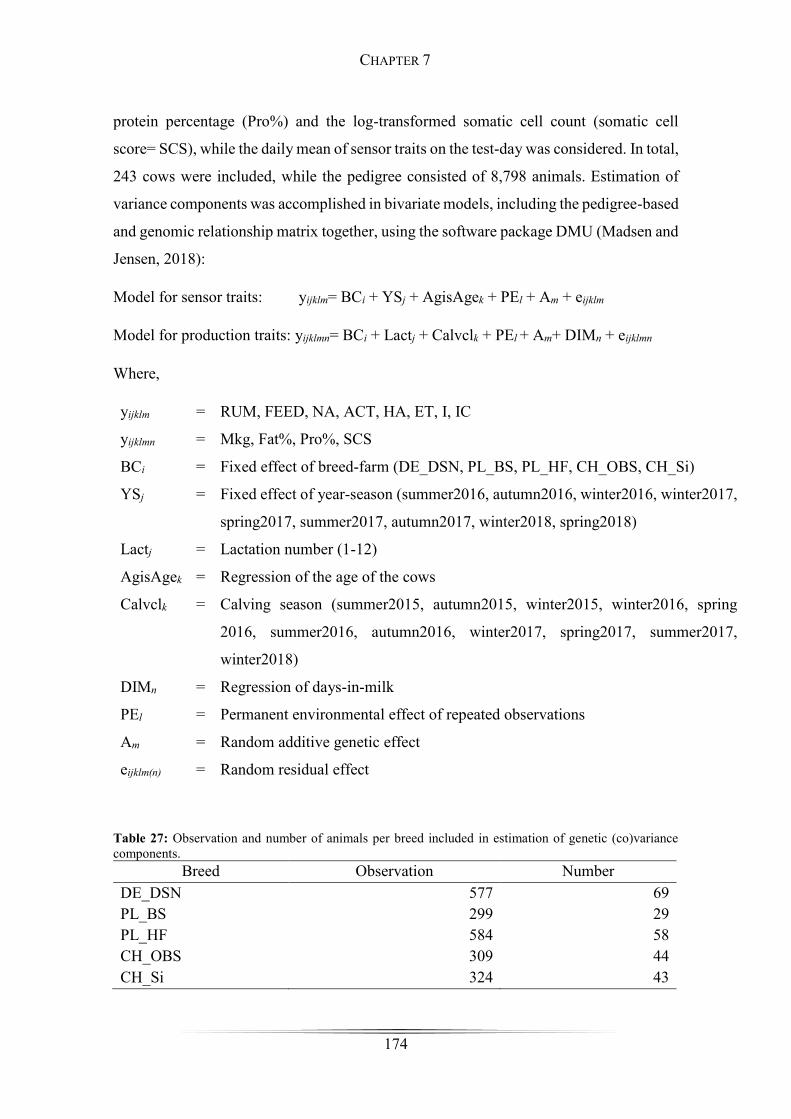
174
protein percentage (Pro%) and the log-transformed somatic cell count (somatic cell
score= SCS), while the daily mean of sensor traits on the test-day was considered. In total,
243 cows were included, while the pedigree consisted of 8,798 animals. Estimation of
variance components was accomplished in bivariate models, including the pedigree-based
and genomic relationship matrix together, using the software package DMU (Madsen and
Jensen, 2018):
Model for sensor traits: yijklm= BCi + YSj + AgisAgek + PEl + Am + eijklm
Model for production traits: yijklmn= BCi + Lactj + Calvclk + PEl + Am+ DIMn + eijklmn
Where,
yijklm = RUM, FEED, NA, ACT, HA, ET, I, IC
yijklmn = Mkg, Fat%, Pro%, SCS
BCi = Fixed effect of breed-farm (DE_DSN, PL_BS, PL_HF, CH_OBS, CH_Si)
YSj = Fixed effect of year-season (summer2016, autumn2016, winter2016, winter2017,
spring2017, summer2017, autumn2017, winter2018, spring2018)
Lactj = Lactation number (1-12)
AgisAgek = Regression of the age of the cows
Calvclk = Calving season (summer2015, autumn2015, winter2015, winter2016, spring
2016, summer2016, autumn2016, winter2017, spring2017, summer2017,
winter2018)
DIMn = Regression of days-in-milk
PEl = Permanent environmental effect of repeated observations
Am = Random additive genetic effect
eijklm(n) = Random residual effect
Table 27: Observation and number of animals per breed included in estimation of genetic (co)variance components.
Breed Observation Number DE_DSN 577 69 PL_BS 299 29 PL_HF 584 58 CH_OBS 309 44 CH_Si 324 43
CHAPTER 7
175
Phenotypic correlations were not calculated based on the raw data, but based on the
variances generated via the bivariate repeatability models in DMU. Applying the
following formula, the phenotypic correlations were calculated:
Va1 and Va2 are the genetic variances for trait 1 and 2, cov(a1, a2) are the additive genetic
covariances between trait 1 and trait 2, Vpe1 and Vpe2 are the permanent environmental
variances, cov(pe1, pe2) are the permanent environmental covariances between trait 1
and 2, Ve1 and Ve2 are the rest variances and cov(e1, e2) are the rest covariances between
trait 1 and trait 2. Applying the ‘delta’ method in R, including first-order Taylor
approximation (Gold et al., 2018), the standard errors of the phenotypic correlations were
calculated.
Results and Discussion
Sensor traits
Estimations of phenotypic and genetic correlations among sensor traits and between
sensor and production traits are depicted in Tables 28-30. Most phenotypic correlations
were similar to the ones from chapter 3, despite the differences between the two data sets
(e.g. records per animal, number of dual-purpose cattle, breed, country) (Table 28).
Phenotypic correlations, within the same range of chapter 3 and the present estimations,
were found between the traits ET and FEED (rp-chapter3= -0.17, rp= -0.16), RUM and FEED
(rp-chapter3= -0.14, rp=-0.13), RUM and HA (rp-chapter3= -0.25, rp= -0.28), RUM and NA (rp-
chapter3= -0.43, rp= -0.33), FEED and ACT (rp-chapter3= -0.36, rp= -0.40), HA and NA (rp-
chapter3= -0.17, rp= -0.22) and HA and ACT (rp-chapter3= 0.32, rp= 0.18). One reason for
similar correlations in two different data sets may be, the sensor data’s collinearity, as
already pointed out in chapter 3. Once, the animal showed enhanced sensor behaviour of
one trait, all other behaviour traits decreased, except from ACT and HA as well as RUM
and FEED. Whenever ACT increased, HA inclined as did RUM and FEED. Due to the
collinear data structure of the sensor data, discussions about correlations of behaviour
traits are to be considered with caution, as the way of data measuring does not allow the
recording of several activities, which may potentially be expressed at the same time
CHAPTER 7
176
(described in chapter 3 and 4). This does not apply for the recording of ET, however,
which was measured parallel to sensor behaviour.
Aside from the data’s collinearity, it can also be assumed that, common physiological
processes play a role, leading to the similarity of phenotypic correlations between the two
data sets. Referring to this, Grant and Albright (2001) described, how dairy cows
generally spend roughly 3 to 5 h/d feeding, ruminate 7 to 10 h/d and require another 10
h/d of lying and/or resting time. Fregonesi et al. (2007) formulated, that lying times in
lactating dairy cattle followed a diurnal pattern, inverse to that of feeding behaviour.
Regardless of farm, breed or country effect, negative correlations were depicted between
RUM and FEED or between NA and RUM for the data set of chapter 3 (only German
DSN cows), as well as for the dual-purpose breeds from Germany, Switzerland and
Poland (Table 27). These findings indicated, that dual-purpose cow FEED, RUM and NA
behaviour cannot be conducted simultaneously. Schirmann et al. (2012) depicted, that
periods where Holstein dairy cows spent more time ruminating, were associated with
lower feeding times and lower DMI (rp= -0.71 and rp= -0.72, respectively). Consequently,
on a daily basis one might expect a positive relationship between rumination and feeding,
because greater feed intakes may require more rumination time to process. However,
direct negative correlations between FEED and RUM can be explained because cows
cannot ruminate and eat at the same time. Additionally, the influence of management
processes as milking, time of feed delivery and feed push-up should not be
underestimated in affecting animal behaviour rhythms of when they feed, ruminate or rest
(Schirmann et al., 2012).
Correlations (phenotypic and genetic) between sensor and I or IC did not always
converge. This is not peculiar, as I and IC comprised of the sum of all sensor behaviour
traits together. At this point I and IC shall not be of further interest.
CHAPTER 7
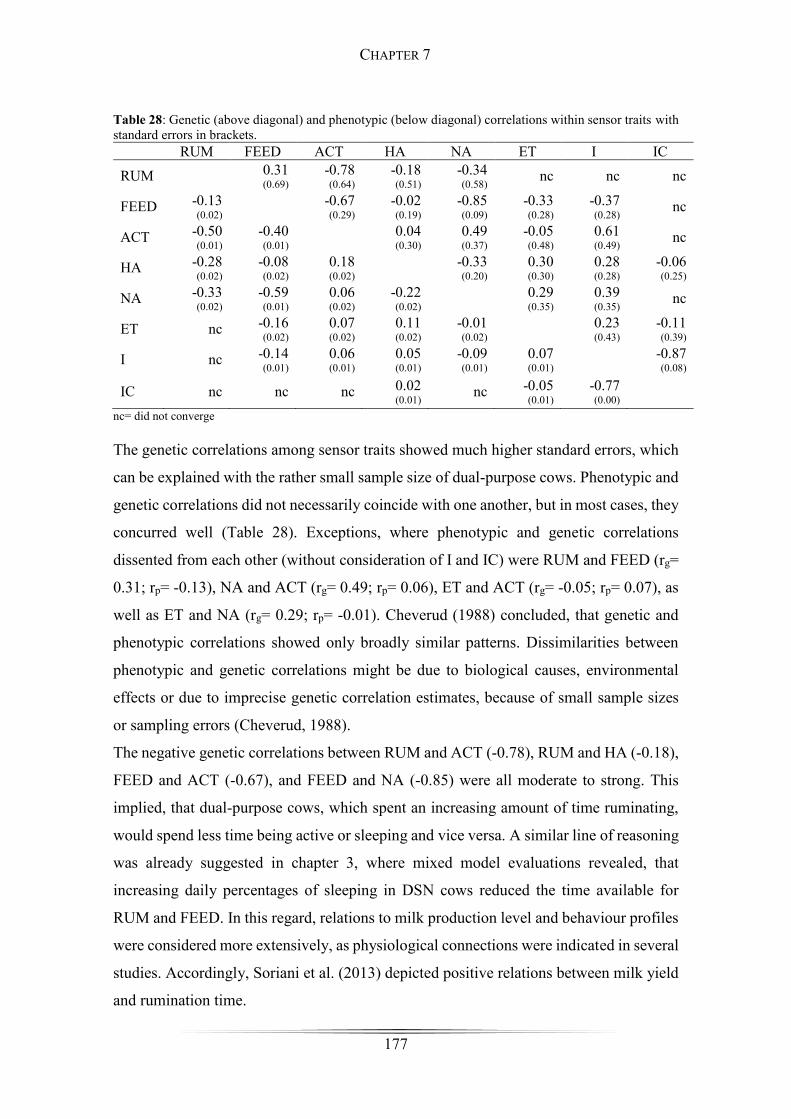
177
Table 28: Genetic (above diagonal) and phenotypic (below diagonal) correlations within sensor traits with standard errors in brackets.
RUM FEED ACT HA NA ET I IC
RUM
0.31 (0.69)
-0.78 (0.64)
-0.18 (0.51)
-0.34 (0.58) nc nc nc
FEED -0.13 (0.02)
-0.67 (0.29)
-0.02 (0.19)
-0.85 (0.09)
-0.33 (0.28)
-0.37 (0.28) nc
ACT -0.50 (0.01)
-0.40 (0.01)
0.04 (0.30)
0.49 (0.37)
-0.05 (0.48)
0.61 (0.49) nc
HA -0.28 (0.02)
-0.08 (0.02)
0.18 (0.02)
-0.33 (0.20)
0.30 (0.30)
0.28 (0.28)
-0.06 (0.25)
NA -0.33 (0.02)
-0.59 (0.01)
0.06 (0.02)
-0.22 (0.02)
0.29 (0.35)
0.39 (0.35) nc
ET nc -0.16 (0.02)
0.07 (0.02)
0.11 (0.02)
-0.01 (0.02)
0.23 (0.43)
-0.11 (0.39)
I nc -0.14 (0.01)
0.06 (0.01)
0.05 (0.01)
-0.09 (0.01)
0.07 (0.01)
-0.87 (0.08)
IC nc nc nc 0.02 (0.01) nc -0.05
(0.01) -0.77 (0.00)
nc= did not converge
The genetic correlations among sensor traits showed much higher standard errors, which
can be explained with the rather small sample size of dual-purpose cows. Phenotypic and
genetic correlations did not necessarily coincide with one another, but in most cases, they
concurred well (Table 28). Exceptions, where phenotypic and genetic correlations
dissented from each other (without consideration of I and IC) were RUM and FEED (rg=
0.31; rp= -0.13), NA and ACT (rg= 0.49; rp= 0.06), ET and ACT (rg= -0.05; rp= 0.07), as
well as ET and NA (rg= 0.29; rp= -0.01). Cheverud (1988) concluded, that genetic and
phenotypic correlations showed only broadly similar patterns. Dissimilarities between
phenotypic and genetic correlations might be due to biological causes, environmental
effects or due to imprecise genetic correlation estimates, because of small sample sizes
or sampling errors (Cheverud, 1988).
The negative genetic correlations between RUM and ACT (-0.78), RUM and HA (-0.18),
FEED and ACT (-0.67), and FEED and NA (-0.85) were all moderate to strong. This
implied, that dual-purpose cows, which spent an increasing amount of time ruminating,
would spend less time being active or sleeping and vice versa. A similar line of reasoning
was already suggested in chapter 3, where mixed model evaluations revealed, that
increasing daily percentages of sleeping in DSN cows reduced the time available for
RUM and FEED. In this regard, relations to milk production level and behaviour profiles
were considered more extensively, as physiological connections were indicated in several
studies. Accordingly, Soriani et al. (2013) depicted positive relations between milk yield
and rumination time.
CHAPTER 7
178
While dual-purpose cows expressed enhanced ACT, they also seemed to be sleeping (NA)
more (0.49). Once they were highly active (HA), they showed reduced sleeping periods
(-0.33). These results imply, that normal daily ACT behaviour of dual-purpose cows also
requires enhanced sleeping behaviour. However, during oestrus or parturition (when
enhanced HA is usually recorded), cows express excessive walking, mounting and overall
restlessness behaviour, while the usual resting habits decrease (Walker et al., 2008).
Regarding the genetic correlations between ET and the behaviour traits FEED, ACT, HA
and NA, physiological relations can be suspected. With increasing ET, the FEED
behaviour decreased. West (2003) explained the physiological processes behind high
outside temperatures, increasing body temperature and declined feed intake by the
example of dairy cows in the south eastern United States. Especially lactating dairy cows
create large quantities of metabolic heat, which leads to increasing core body
temperatures. In order to prevent heat accumulation through metabolic heat production,
the feed intake decreases. As physical activity increases heat production by skeletal
muscles and body tissues, a positive correlation between sleeping/resting (NA) and
increasing ET (0.29) is understandable (West, 2003). In order to avoid more endogenous
heat production, cows reduce their activity behaviour by lying down, in order to dissipate
heat. Additionally, lying down on concrete floors enhances physical means of cooling
mechanisms (conduction) as well (West, 2003).
A positive correlation between ET and HA (0.30) can be explained with the afore
mentioned increase of body temperature during physical activity (West, 2003). Increasing
restlessness and movement of cows is usually observed shortly before parturition or
oestrus, leading to increased ET. Moreover, Piccioni et al. (2003) observed an elevation
of 1.3 °C every 21 days on the day of oestrus in adult cows. Consequently, there may be
several physiological reasons for a positive correlation between ET and HA. For once,
the body temperature of cows during oestrus is already increased and second, they exhibit
restlessness and increased movement, that contributes to further heat accumulation.
Sensor and production traits
The phenotypic correlations between sensor and production traits remained in a low range
(≤ 0.14) with acceptable standard errors (Table 29). The highest phenotypic correlations
were estimated between Mkg and the sensor traits FEED, HA and NA as well as between
CHAPTER 7
179
Fat% and NA, and Fat% and ET. Small correlations between Mkg and RUM (0.07), and
Mkg and FEED (0.14) comply with the trend of the least square means of the mixed
model analyses from chapter 3. In chapter 3, DSN cows with higher daily FEED or RUM
percentages depicted greater milk yields. The current multi-breed sensor data set (Table
27) derived a low positive relation between rumination, feed intake and milk yield output
as well. Harrison et al. (1990) found a close correlation (rp= 0.88) between milk
production and DMI.
The trend of a negative relation between HA and Mkg (-0.11) can be explained by
physiological processes, that occur during oestrus, the period when enhanced HA is
mainly recorded. Lopez et al. (2004) related a decreased milk production to increasing
oestradiol concentrations (rp= -0.57; p< 0.001) during this time. Extensive restlessness
(HA) may contribute to reduced Mkg, as usual diurnal behaviour, such as RUM was
observed to decrease during increased HA (-0.28) as well, and milk production depends
on rumination activity (Soriani et al., 2013). Decreasing Mkg was also observed when
diurnal NA increased (-0.12). In this case, the same argumentation, as already discussed
for DSN in chapter 3, can be invoked. Dual-purpose cows, that spend increased diurnal
time with resting, would spend less time with feeding or rumination. Accordingly,
Moallem et al. (2010) observed, that a depression of rumination time lead to a reduction
of DMI followed by a decline in milk yield.
Increasing resting periods (NA) were related to positive Fat% (0.13). This outcome was
not observed in the DSN analysis of chapter 3. Further research is required, to elucidate,
whether a physiological relation between resting periods and Fat% exists in dual-purpose
cattle. Phenotypic correlations between Fat% and FEED (0.00), RUM (nc) and NA (0.13)
of this study, did not coincide with the previous findings from chapter 3. A low negative
relation between Fat% and ET (-0.11) and between Pro% and ET (-0.09) was observed.
Several studies investigated negative effects of heat stress on lactating cows and their
milk composition. Knapp and Grummer (1990) concluded, that heat stress decreased
DMI, milk yield and fat kg per day.
The remaining phenotypic correlations were rather low, or did not converge (nc), which
is, why they are of no further interest. Phenotypic and genetic correlation almost never
coincided with each other in magnitude. Strong environmental influences as well as a
small sample sizes may be reasons for these dissimilarities (Cheverud, 1988). Table 29: Phenotypic correlations between sensor and production traits with standard errors in brackets.
CHAPTER 7
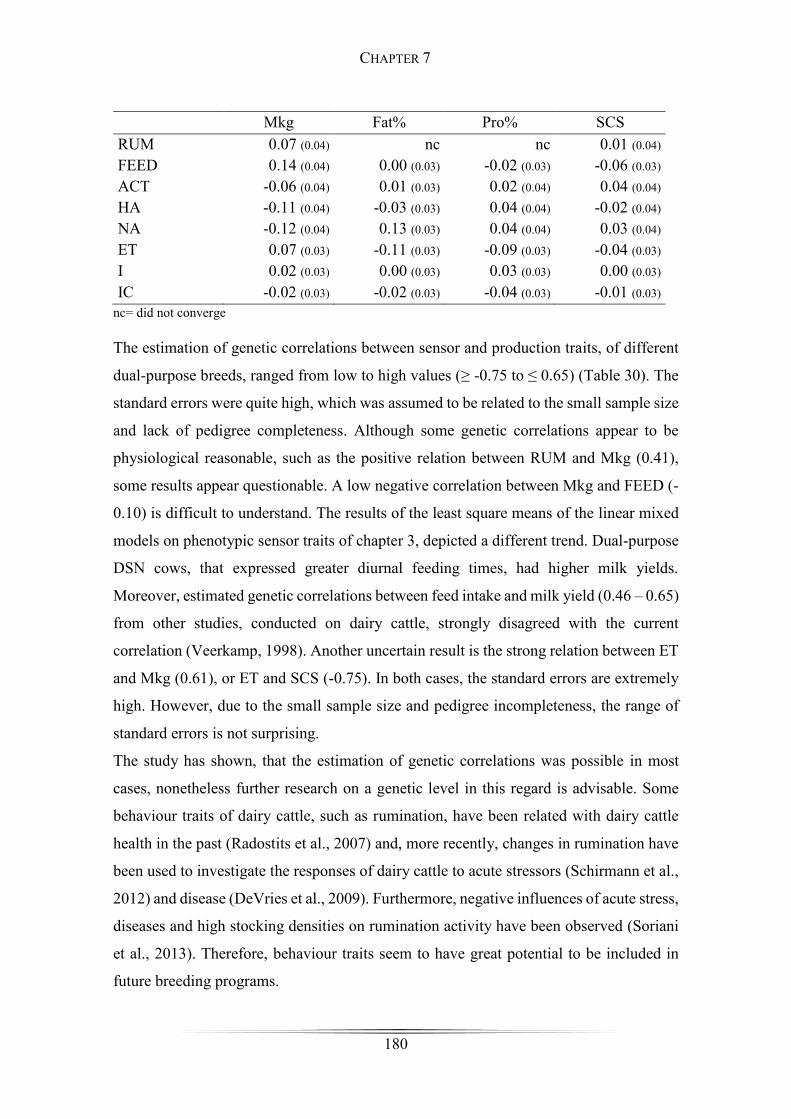
180
Mkg Fat% Pro% SCS RUM 0.07 (0.04) nc nc 0.01 (0.04) FEED 0.14 (0.04) 0.00 (0.03) -0.02 (0.03) -0.06 (0.03) ACT -0.06 (0.04) 0.01 (0.03) 0.02 (0.04) 0.04 (0.04) HA -0.11 (0.04) -0.03 (0.03) 0.04 (0.04) -0.02 (0.04) NA -0.12 (0.04) 0.13 (0.03) 0.04 (0.04) 0.03 (0.04) ET 0.07 (0.03) -0.11 (0.03) -0.09 (0.03) -0.04 (0.03) I 0.02 (0.03) 0.00 (0.03) 0.03 (0.03) 0.00 (0.03) IC -0.02 (0.03) -0.02 (0.03) -0.04 (0.03) -0.01 (0.03)
nc= did not converge
The estimation of genetic correlations between sensor and production traits, of different
dual-purpose breeds, ranged from low to high values (≥ -0.75 to ≤ 0.65) (Table 30). The
standard errors were quite high, which was assumed to be related to the small sample size
and lack of pedigree completeness. Although some genetic correlations appear to be
physiological reasonable, such as the positive relation between RUM and Mkg (0.41),
some results appear questionable. A low negative correlation between Mkg and FEED (-
0.10) is difficult to understand. The results of the least square means of the linear mixed
models on phenotypic sensor traits of chapter 3, depicted a different trend. Dual-purpose
DSN cows, that expressed greater diurnal feeding times, had higher milk yields.
Moreover, estimated genetic correlations between feed intake and milk yield (0.46 – 0.65)
from other studies, conducted on dairy cattle, strongly disagreed with the current
correlation (Veerkamp, 1998). Another uncertain result is the strong relation between ET
and Mkg (0.61), or ET and SCS (-0.75). In both cases, the standard errors are extremely
high. However, due to the small sample size and pedigree incompleteness, the range of
standard errors is not surprising.
The study has shown, that the estimation of genetic correlations was possible in most
cases, nonetheless further research on a genetic level in this regard is advisable. Some
behaviour traits of dairy cattle, such as rumination, have been related with dairy cattle
health in the past (Radostits et al., 2007) and, more recently, changes in rumination have
been used to investigate the responses of dairy cattle to acute stressors (Schirmann et al.,
2012) and disease (DeVries et al., 2009). Furthermore, negative influences of acute stress,
diseases and high stocking densities on rumination activity have been observed (Soriani
et al., 2013). Therefore, behaviour traits seem to have great potential to be included in
future breeding programs.
CHAPTER 7
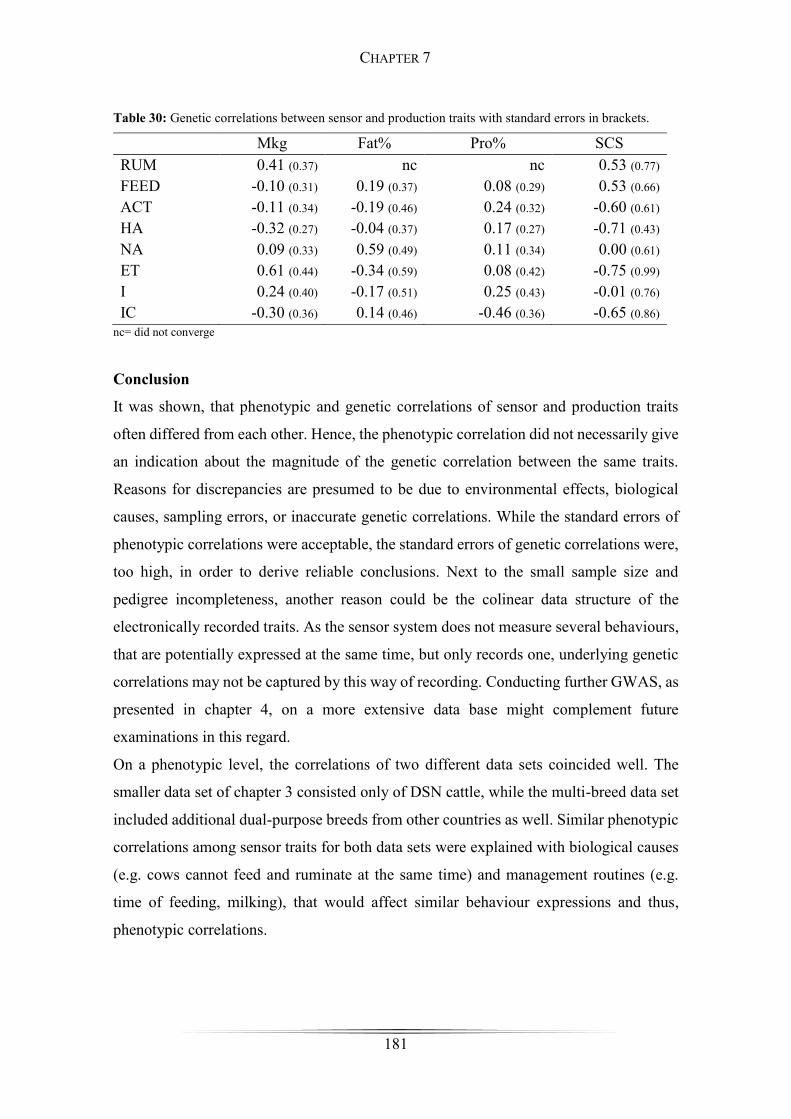
181
Table 30: Genetic correlations between sensor and production traits with standard errors in brackets. Mkg Fat% Pro% SCS RUM 0.41 (0.37) nc nc 0.53 (0.77) FEED -0.10 (0.31) 0.19 (0.37) 0.08 (0.29) 0.53 (0.66) ACT -0.11 (0.34) -0.19 (0.46) 0.24 (0.32) -0.60 (0.61) HA -0.32 (0.27) -0.04 (0.37) 0.17 (0.27) -0.71 (0.43) NA 0.09 (0.33) 0.59 (0.49) 0.11 (0.34) 0.00 (0.61) ET 0.61 (0.44) -0.34 (0.59) 0.08 (0.42) -0.75 (0.99) I 0.24 (0.40) -0.17 (0.51) 0.25 (0.43) -0.01 (0.76) IC -0.30 (0.36) 0.14 (0.46) -0.46 (0.36) -0.65 (0.86)
nc= did not converge
Conclusion
It was shown, that phenotypic and genetic correlations of sensor and production traits
often differed from each other. Hence, the phenotypic correlation did not necessarily give
an indication about the magnitude of the genetic correlation between the same traits.
Reasons for discrepancies are presumed to be due to environmental effects, biological
causes, sampling errors, or inaccurate genetic correlations. While the standard errors of
phenotypic correlations were acceptable, the standard errors of genetic correlations were,
too high, in order to derive reliable conclusions. Next to the small sample size and
pedigree incompleteness, another reason could be the colinear data structure of the
electronically recorded traits. As the sensor system does not measure several behaviours,
that are potentially expressed at the same time, but only records one, underlying genetic
correlations may not be captured by this way of recording. Conducting further GWAS, as
presented in chapter 4, on a more extensive data base might complement future
examinations in this regard.
On a phenotypic level, the correlations of two different data sets coincided well. The
smaller data set of chapter 3 consisted only of DSN cattle, while the multi-breed data set
included additional dual-purpose breeds from other countries as well. Similar phenotypic
correlations among sensor traits for both data sets were explained with biological causes
(e.g. cows cannot feed and ruminate at the same time) and management routines (e.g.
time of feeding, milking), that would affect similar behaviour expressions and thus,
phenotypic correlations.
CHAPTER 7
182
Phenotypic correlations between sensor and production traits depicted similar trends to
the results of mixed model analyses, that were conducted in chapter 3. From this study, it
can be concluded, that phenotypic correlations among sensor and between sensor and
production traits showed encouraging results, while the estimation of genetic correlations,
most likely requires a more extensive data base (greater sample size) as well as a more
profound pedigree.
CHAPTER 7
183
Future Perspectives
Maintaining genetic diversity and mitigating inbreeding in small dual-purpose cattle
populations
Despite the rather low inbreeding coefficient of 2 % and average increase of inbreeding
(0.1 % per year) for DSN, inbreeding depression is of minor importance. However, in a
small population, with limited numbers of herd book cows and breeding sires, the rate of
inbreeding should be monitored carefully. The Food and Agricultural Organization
guidelines strictly recommend to avoid an inbreeding rate of >1 % per generation, to
ensure fitness in a breed (FAO, 1998). Accordingly, Falconer (1989) emphasized the
negative consequences of loss in genetic variability. He pointed out the increased risks of
individuals inheriting detrimental or even lethal recessive genes, due to the homozygous
state and furthermore, the effect of inbreeding depression, leading to decreases in
performance of production, fertility and health. The effective DSN population size (85
animals) was lower, than for the German red and white dual-purpose cattle (Addo et al.,
2017), which emphasized the urgency to monitor this breed. Although, the effective
population sizes of Irish Hereford (64), Simmental (127), and Holstein Friesian (75) are
within the same range as German DSN (Mc Parland et al., 2007), it needs to be
considered, that DSN only consisted of about 2,722 herd book cows in 2013 (GEH, 2018).
Moreover, the high average relationship (chapter 2) between breeding sires, with high
genetic milk merit (Bedo, Nero, Best) and high yielding cows, implied a rather distinct
breeding focus on production. Mc Parland et al. (2007), observed a similar phenomenon
in Irish Holstein Friesian and Charolais cattle. Within those breeds, some ancestors
accounted for a large proportion of the population, while the rest was related to many
others (Mc Parland et al., 2007).
In the future, countermeasures should be taken, to attenuate this trend in DSN
breeding, e.g. apply alternative breeding strategies, in order to maintain long-term genetic
diversity. This could be realized by focusing on other breeding goals, aside from
production, and the implementation of broader selection indices. Thus, alternative DSN
family lines may be explored, which particularly exceed in desirable functional traits
(fertility, health traits, sensor behaviour traits). Another way would be a more frequent
exchange of sires (natural service sires or semen) between East and West German
breeding organisations. As pointed out in chapter 2, the different DSN breeding
CHAPTER 7
184
approaches between East and West Germany were one reason for the generally low
relationship between eastern and western herds (0.73 %) (chapter 5).
Another possibility to restrict further increase in relationship and inbreeding,
while increasing genetic gain, would be the use of optimum genetic selection (Koenig
and Simianer, 2006). The underlying objective of the Optimum Genetic Contribution
theory (OGC) is the maximization of genetic gain, while restraining the rate of inbreeding
and coancestry among selection candidates to a predefined value (Wooliams and
Meuwissen, 1993). Meuwissen (1997) reported genetic gains to be 21 % to 60 % greater
than selecting via BLUP-EBV at equal rates of inbreeding. Especially in small
populations, optimum genetic selection showed advantages over BLUP selection.
However, that advantage decreases with increasing population size (Meuwissen and
Sonesson, 1998). Meuwissen and Sonesson (1998) recommended a population of 1,700
nucleus animals, in order for optimal contribution selection to be useful in practice. This
marks OGC a suitable tool, to apply for such a small population as DSN.
A more global approach, to increase genetic diversity and mitigate inbreeding,
would be the inclusion of Dutch, Polish or British Friesian sires in DSN mating programs,
as black and white cattle share a common genetic background (Brade and Brade, 2013;
Mügge et al., 1999). The developed algorithm, to calculate DSN breed percentages
(chapter 2), already accounted for Dutch ancestors in the DSN pedigree, highlighting
some genetic influence from the Netherlands. Furthermore, there has been exchanges of
Dutch and German breeding animals until the 19th century, expressed by similar
phenotypic and genotypic traits. At one point in history, the Dutch cattle population was
almost entirely repopulated by German black and white cattle mass imports from the
Holstein region, due to cattle plague epidemics in the 18th century (Brade and Brade,
2013). In addition, the PCA (chapter 4) confirmed close genetic relations between HF
breeds, emphasizing their common origin in northern Germany and the Netherlands
(North Sea region, East Friesland) (Lush et al., 1936). Thus, old genetic ties between
European black and white cattle lines still exist and can be detected on a genomic level
as well as traced via pedigree analyses. These genetic relations of black and white dual-
purpose cattle across European countries could be a potential basis for a transnational
breeding program. Hinrichs et al. (2017) described, how the red dairy breeds are
organized in transnational breeding programs. Such a European cooperation among black
and white dual-purpose cattle breeders would allow a more frequent exchange of sires
CHAPTER 7
185
and herd book cows between the Netherlands, Germany, Britain and Poland. This way,
the future genetic diversity within the DSN population could be assured and the rate of
inbreeding restricted, while still maintaining breed specific phenotypic characteristics.
Applying innovative phenotypic behaviour trait recording in dual-purpose cattle
The implementation of the sensor system has not only proven to deliver reliable behaviour
data, but also allowed to derive management recommendations. This enabled herd
managers to react to unusual animal behaviour, in case of distress, at an early stage.
Hence, this system provides a valuable tool, to characterize dual-purpose cattle behaviour
and to assess the animal’s health and welfare state. Additionally, high data volume and
repeated measurements per cow provided the basis for quantitative genetic estimations,
also for a small number of cows with phenotypes. The results of chapter 3 were beneficial,
as they support the system’s functionality in dual-purpose cattle, kept in extensive grazing
systems.
However, test runs of the system have shown, that updates were necessary to
adjust the sensor technology to pasture conditions. Grodkowski et al. (2017) described
rather poor correlations between visual observation and sensor recordings, on pasture
during summer. They explained, that cattle expressed increasing head shaking and ear
flapping, due to flies, which falsified sensor measures. When this was communicated to
the company, an update of the system was developed, that, after installation, ensured high
correlations between visual observation and electronic recording (e.g. rumination, rp=
0.97, not active, rp= 0.90) (Grodkowski et al., 2017). This points out, that environmental
descriptors are not to be underestimated in studies, diverging from conventional frame of
references. In other words, new herd management technology always needs to be
validated, especially when applied in harsh environments outside the barn. After critical
investigations, implementing a novel herd management tool in pasture systems has
proven to be as helpful as in conventional systems.
Chapter 3 illustrated, how decreasing production was observed in dual-purpose cows, that
were in distress, and depicted increased SCC levels due to (sub-) clinical mastitis.
Hinrichs (2005) estimated a high genetic correlation (0.84) between SCS and mastitis
susceptibility. This correlation points out the reliable detection of potentially sickened
cows, with increased SCS/ SCC, by recording decreasing feeding and rumination times
CHAPTER 7
186
via sensor. Especially in organic production systems, modern herd management
technologies, that precisely monitor cow behaviour, are helpful in detecting diseases at
an early stage. This is particularly essential, as organic farmers are limited in medication
use (Vaarst and Bennedsgaard, 2001). Vaarst and Bennedsgaard (2001) explained, that
the reduced need for disease treatment reflects animal health and welfare and that
restrictions on medication in organic farming aim to encourage disease prevention. In
Denmark, the shorter duration of antibiotic mastitis treatment in organic herds relates to
restrictions and prohibitions to use follow up treatments with antibiotics (Vaarst and
Bennedsgaard, 2001).
Learning more about the relation between genetic production potential and bovine
behaviour will improve the understanding, of how dual-purpose cows adapt to a more
extensive environment, cope with external stressors and how their behaviour affects the
production output. Moreover, comparisons between the phenotypic sensor behaviour of
dual-purpose cattle, in extensive systems, and high yielding dairy cows, in conventional
farming, might offer insights to physiological (metabolic) processes, that function
differently in high merit production and dual-purpose breeds.
Associating significant genomic variants with candidate genes
Detecting candidate genes of complex behaviour traits would allow breeders, to precisely
select individuals early in life for genetic variants, that express desirable phenotypic
behaviour in cows. The multi-breed GWAS identified significant SNPs for the MEAN
and DRP of the sensor traits RUM, FEED and NA. Especially FEED has shown to be an
interesting indicator for the estimation of milk production level in DSN (chapter 3), as
cows with higher daily feeding times depicted greater milk yields. Applying marker
assisted selection and genomic estimation of breeding values in the future is particularly
tempting for traits, that are complicated to assess or are only observable late in live, which
often applies for functional traits (e.g. longevity, robustness) (Goddard et al., 2010).
Sensor traits revealed moderate heritabilities and additive genetic variances,
demonstrating sufficient genetic control, that underlined cattle behaviour (chapter 4).
Therefore, selection of these novel functional traits, based on phenotypic records and
pedigree, is possible. Although, the identification of causative SNPs and candidate genes
has proven to be complicated, there are some promising findings in literature regarding
CHAPTER 7

187
significant associations between SNPs and functional (body temperature, feed intake) as
well as production (milk quality) traits.
Liu et al. (2011) identified cows, that were genetically superior in body temperature
regulation by virtue of inheriting a specific ATP1A1 allele. They observed, that Holstein
cows with genotype CC at the novel SNP of ATP1A1 expressed a significantly higher
heat resistance, than those of genotype CA. Extreme examples about dairy cows adapted
to heat stress support the existence of genomic variants, that underlie the expression of
temperature regulating traits in cattle. In order to detect significant SNP marker, the multi-
breed GWAS should be extended to other dairy cattle populations with increased genetic
diversity and cattle known for their heat tolerance, which are kept in tropical
environments. This way SNPs, that are associated with temperature regulating genes,
might be discovered.
Xi et al. (2015) associated the PRKCI gene with the hormonal regulation of residual feed
intake (RFI) in Holstein cattle. Evidence of this study suggested, that genes regulating the
adipocytokine signalling pathways and insulin pathway (e.g. PRKCI) were differentially
expressed in the low RFI and the high RFI cow group. Furthermore, they explained, how
insulin played a major role in the glucose metabolism, energy storage in insulin-sensitive
tissues (muscle, adipose tissue) and its effect on RFI. Xi et al. (2015) concluded, that RFI
was associated with the insulin signalling pathway and related it to the regulation of leptin
and lipid metabolism. Corresponding to these findings, it could be hypothesized, that
dual-purpose cows with a favourable expression of the PRKCI gene might show a more
favourable feeding behaviour (3-5h per day, chapters 3 and 4) as well as RFI.
Accordingly, Nkrumah et al. (2004) discovered a SNP in the bovine leptin gene
(obese gene), that was associated with feed intake, feed efficiency, feeding behaviour and
body composition in Angus, Hereford, Limousin, Gelbvieh and Charolais cattle. They
observed, that Angus and Hereford carried higher frequencies of the thymine (mutant)
allele, while the beef lines, descending from continental breeds, depicted higher
frequencies of the cytosine (normal) allele. The thymine allele was significantly
associated with higher backfat gain (measured via ultrasound), poorer yield grades and
lower lean meat yields, compared to the cytosine allele. Additionally, a trend of greater
feed intake and feed efficiency was expressed in animals with the thymine allele
CHAPTER 7
188
(Nkrumah et al., 2004). Further research, based on the sensor trait FEED, seems
particularly interesting for DSN, as a dual-purpose breed. Findings suggest, that potential
mutations in the obese gene may also be found in DSN, as they were once bred for beef
as well (Mügge et al., 1999). This hypothesis is further supported by the estimated genetic
relationships, based on ASD (chapter 4) between DSN and Hereford as well as between
DSN and Angus. Thus, DSN might also have inherited the mutant thymine allele.
A study by Do et al. (2013) has shown, that SNPs in pigs existed within regions, where
QTLs have been identified to be involved in feeding behaviour and/ or intake traits. They
reported, that synapse genes, dephosphorylation genes and positive regulation of peptide
secretion genes were significantly associated with feeding behaviour traits in pigs (Do et
al., 2013). Identifying significant SNPs in the swine genome, that are potentially related
to feeding behaviour, gives cause to believe, that similar SNPs potentially exist in the
bovine genome as well.
Even in the area of milk composition and quality, information about genes and
physiological pathways, that harbour genetic mutations affecting milk volume and
composition is limited (Raven et al., 2016). Once again, the difficulty lies in narrowing
regions to single gene candidates, due to the low level but long-range LD within cattle
breeds and small sample sizes (de Roos et al., 2008). Furthermore, Dickson et al. (2010)
discussed the challenge in identifying rare variants at high significant thresholds, which
are required to avoid high false discovery rates. Raven et al. (2016) detected associations
between SNP or indel in or close to BTRC, MGST1, SLC37A1, STAT5A, STAT5B, PAEP,
VDR, CSF2RB, MUC1, NCF4, GHDC and milk production traits, and EPGN for both
milk production and calving interval in Holstein and Jersey cattle.
The study of Poulsen et al. (2013) identified genetic variants of caseins, that were
associated with bovine milk coagulation in Danish Holstein, Danish Jersey and Swedish
Red cows. They observed a positive effect of CSN1S1 C, CSN2 B, and CSN3 B on milk
coagulation, whereas CSN2 A2 had a particularly negative effect. Although, superior milk
coagulation was observed in Danish Jersey compared to Danish Holstein cows, further
research in the coagulation potential of DSN is auspicious. Especially, against the
background of organic milk production, the coagulation capacity of DSN should be
further examined, as substantial variation among individual cows has been reported.
Differences in coagulation quality influence cheese processing (e.g. curd firmness) and
CHAPTER 7
189
often, if insufficient, requires the addition of unwanted additives. As milk coagulation is
a trait influenced by additive genetic variation, Poulsen et al. (2013) recommended the
monitoring of unfavourable variants, in order to prevent inadvertent selection of cows,
producing milk of impaired coagulation characteristics.
Moreover, the protein variants of cows and their effect on human nutrition
presents another interesting field of research. Most milk proteins are potential allergens,
while the release of peptides with biological functions from milk proteins is assumed to
affect human health (Caroli et al., 2009). Rando et al. (1998) identified the bovine
CSN1S1*G to be associated with reduced expression of the specific allergenic protein.
Bio active peptides (specific protein fragments) on the other hand, are suspected to
negatively affect the nutritional value, such as increasing diabetes and heart disease
(CSN2*A1, CSN2*B and CSN2*C) (Lorenzini et al., 2007; Caroli et al. 2009). Caroli et
al. (2009) concluded, that milk produced from cows carrying certain genotypes are more
suitable for human nutrition in specific pathology situations, than milk of other genotypes.
Aside from the nutritional or cheese making value, milk protein varieties are also of high
commercial interest. Thus, selecting for DSN with milk proteins of beneficial effects for
the human diet presents a promising marketing option.
Goddard et al. (2010) suggested, that many SNPs have small effects on quantitative traits.
Accordingly, the challenge lies within the correct identification of causal polymorphisms
affecting complex traits. Furthermore, they argued, a small effective population size (Ne)
implies, that the effective number of chromosome segments is small and the accuracy of
estimating their effects is high. In other words, Ne affects the extent of linkage
disequilibrium in a population (Wientjes et al., 2013). Consequently, cattle breeds with
reduced Ne (~100) depict a large variation in relationship, that can be sufficiently
estimated by 50,000 SNPs. Correspondingly, the genetic variance explained by the SNPs
is close to the full genetic variance (VanRaden et al., 2009). Due to the small effective
population size of DSN, further GWAS analyses, based on a greater sample size of
genotypes and phenotypic sensor records, should be pursued. This way, the accuracy of
chromosome segment effects can be increased and contribute to further refine causal
variants of behaviour traits.
Another approach is to conduct a GWAS across dual-purpose breeds, which are
closely related to one another, such as DSN, British, Dutch and Polish Friesian. Saatchi
CHAPTER 7
190
et al. (2014) concluded, that the detection of false positive associations from GWAS
mainly derived from stochastic noise. Additionally, patterns of correlation among loci
and factors, responsible for trait variation, create indirect associations between markers
and traits, where no causal relationship exists (due to population structure). Hence, they
suggested to address the problem of false positives by increasing the sample size and thus,
the statistical power. Solving the issue of false associations due to population structure
can be achieved by validating identified QTL in an independent, but demographic similar
population. Consequently, whenever the same marker is highly associated across different
populations, it is likely to be in strong LD with the causal variant (Saatchi et al., 2014).
Following this approach, Saatchi et al. (2014) discovered several important across-breed
and breed-specific large-effect pleiotropic or closely linked QTL in Simmental, Angus,
Hereford, Limousin, Red Angus, Gelbvieh, Brangus, Maine-Anjou, Shorthorn and
Charolais (Saatchi et al., 2014). Including similar demographic breeds to DSN might
contribute to the discovery of DSN-specific QTL as well.
The effect of GxE interaction in DSN cattle breeding
The results of chapter 5 have shown, that despite the indications for GxE interactions,
which affected DSN dual-purpose cows in Germany, a re-ranking of breeding sires or a
separate evaluation of breeding values, according to different environments, is not
necessary. As Germany is a rather small country, the chosen environmental descriptors
were not as much distinct from one another. According to Weigel and Rekaya (2000),
herds from small, neighbouring countries may be much more similar with regard to
management, climate, and genetic background, than herds far away from each other, but
within the same large country (Weigel and Rekaya, 2000).
Nonetheless, the phenomenon of GxE interactions in dual-purpose cows in
Germany should be considered more relevant than ever. Against the afore mentioned
background of climate change, there are environmental stressors, that might affect strains
of Holstein cows (DSN, HF) differently. The study of Al-Kanaan et al. (2016) described
how, even in temperate zones of middle Europe, heat stress is a serious issue. The study
revealed slightly stronger abnormal physiological reactions (increase in rectal
temperature and skin surface temperature) in HF cows, than in dual-purpose DSN,
towards increasing temperature humidity indices (THI). A higher average rectal
temperature of HF was related to greater metabolic heat production of high yielding cattle
CHAPTER 7
191
with larger body size (Al-Kanaan, 2016). Thus, GxE interactions for THI measurements
in Germany could be identified and implied, that dual-purpose DSN cattle have a
physiological advantage under heat stress, compared to high yielding HF.
Another potential GxE interaction, that affects cattle in pasture systems, is the disease
pressure resulting from parasites. May et al. (2017) calculated heritabilities in different
HF lines for gastrointestinal nematodes (0.05–0.06), liver fluke (0.33) and lungworm
(0.05). They concluded, that the lowest infections were identified for New Zealand
Holstein lines, that were specifically selected for pasture-based milk production (May et
al., 2017). In this regard, low to moderate heritable resistance against parasites could be
included in long-term DSN breeding goals, as it has proven successful in New Zealand
HF.
Consequently, environmental stressors need to be considered in extensive farming
systems, as they cause GxE interactions, affecting DSN dual-purpose cattle. Despite little
GxE interactions in DSN on production traits, it was shown from literature and own
research (chapter 5), that functional traits (rectal temperature, skin surface temperature,
parasite resistance, SCS, fat-to-protein ratio) were affected by changing environmental
descriptors, while some Holstein lines (New Zealand HF, DSN) expressed better coping
mechanism towards external stress than others.
Including functional traits in the economic evaluation of breeding programs for
small dual-purpose cattle populations
Economic evaluations of breeding programs (chapter 6) have shown, that for a small
native breed, the organic breeding plan, based on natural service sire implementation, was
promising. The combined breeding scenarios of conventional and organic (MSG_BP/
MFSG_BP: 80-90 % natural service sire, 20-10 % artificial insemination) were feasible
as well, although they involved higher DC.
Including functional traits, such as fertility, robustness, fitness, parasite resistance, heat
stress resistance, and behaviour, into selection schemes of dual-purpose cattle, kept in
pasture systems, is indispensable. It is widely recognized, that despite low heritabilities,
selecting health traits has proven to be beneficial in farm management and helps to reduce
production costs (Philipsson and Lindhé, 2003). Nordic countries have demonstrated,
how the incorporation of fertility and health traits in the total merit index, improved
CHAPTER 7
192
maintaining functional efficiency of cows and simultaneously increased production
(Philipsson and Lindhé, 2003).
Aside a further adoption of the ‘Scandinavian’ philosophy in dual-purpose cattle
breeding, another category of characteristics should be considered. Often, in organic milk
production, a “healthier” fatty acid profile of milk from pasture fed cows is promoted.
Several studies have pointed out increased contents of the beneficial cis-9, trans-11
conjugated linoleic acids (CLA) in milk from cows, that are extensively fed on pasture
(Auldist et al., 2002; Kay et al., 2005). These milk fat contents have not only shown
anticarcinogenic effects in animal models, but are considered to have other health benefits
as well (Corl et al., 2003). A plethora of data demonstrates actions of CLA to reduce
atherosclerosis, onset of diabetes, and body fat mass (Belury, 2002). These positive milk
characteristics, that come with pasture-based feeding, are potential market niches, which
can be used, to market milk products from DSN in grazing systems.
A more breeding related, rather than management related, marketing opportunity for DSN
breeders would be the selection of dual-purpose cows, which express the BB variant of
the β-lactoglobulin (LG) and κ-casein (CN) phenotype. Corresponding to literature, milk
from cows of the BB variant of β-LG is superior for the manufacture of cheese (Aleandri
et al., 1990; Schaar et al., 1985). Accordingly, greater concentrations of protein and casein
in milk from cows of the BB variant of κ-CN, compared with milk from cows of the AA
variant of the κ-CN phenotype, was observed (McLean et al., 1984; Aleandri et al., 1990).
Including functional traits in dual-purpose breeding does not only improve the
cows’ fitness, but also offers new possibilities, to market dairy products of dual-purpose
cattle, from extensive systems, distinctly from conventional systems. Different incentives
were proposed, which could help DSN farmers to take advantages of market niches via
management (feeding, pasture access) or breeding (functional traits, milk composition
traits). Also, sensor traits (rumination, feeding, active, sleeping, high active, ear
temperature) could be included in the breeding goal as desirable fitness characteristics.
Chapter 4 has proven sufficient genetic variance and heritability of sensor traits, allowing
selection. However, the sensor system may be too expensive in acquisition, discouraging
farmers from implementing it. This makes it difficult, to take behaviour traits into account
in breeding programs, as long as on farm-based longitudinal standardized recording is
lacking.
CHAPTER 7
193
Conclusion
The results of this study have shown, that there is great potential for dual-purpose DSN
breeding with regard to the adoption of new breeding goals and selection for novel
functional traits. The breed is well organized by its breeding organizations RBB and VEF-
DSN. The simulations of breeding plans have shown, that under the given economic and
political framework, DSN breeding has the capability to react and adapt to new trends
and challenges in the dairy sector by successfully increasing genetic gain in production
as well as functional traits. As DSN are considered robust and well adapted to extensive
pasture systems and organic dairy farming, they have great potential to satisfy consumer
demands for increasing animal welfare standards and organic milk products. This may
benefit the overall image of dairy farming as well. Hence, in the future the implementation
of a standardized estimation of breeding values for innovative traits, such as behaviour,
is conceivable. The results of the multi-breed GWAS lay the basis for more profound
investigations, regarding the genetic expression underlining bovine behaviour, which in
the future might offer the opportunity to understand, anticipate and prevent negative side
effects of selection.
The major results from this study are:
• Pronounced differences regarding animal allocations to breeds, based on either
breed percentage or on officially assigned breed codes, were detected. A small
number of influential sires depicted large genetic relationships to high-yielding
DSN cows. The average inbreeding coefficient of DSN was quite low (2 %) in
recent birth years. No inbreeding depression for DSN was observed.
• Phenotypic relations between bovine behaviour traits, recorded via sensors, exist
and can be used to derive management decisions and have potential as an early
warning system.
• On the basis of sensor records from multiple dual-purpose cattle breeds across
country borders, genomic regions of interest and potential candidate genes for
behaviour and welfare traits were identified. Sophisticated studies on genetic
diversity in dual-purpose cattle breeds revealed a clear separation of those breeds.
Genetic similarities were identified and explained in the context of the breed
history.
• Genetic parameter estimates of sensor traits revealed low to moderate additive
genetic variance and heritabilities.
CHAPTER 7
194
• Multiple-trait herd cluster models have been developed, in order to study GxE
interactions for DSN, HF and Mixed (HF+DSN) cattle across distinct production
systems and environments (herd size, calving age, latitude of farm, milk production
level, somatic cell count level, genetic DSN percentage, percentage of artificial
insemination and percentage of natural service sires). For some functional traits
(somatic cell score, fat to protein ratio) genetic correlations were lower than 0.80,
indicating GxE.
• The simulation and economic evaluation of breeding programs for small dual-
purpose cattle revealed satisfying genetic gains, discounted returns and the lowest
discounted cost for an organic breeding plan.
CHAPTER 7
195
References
Addo, S., Schäler, J., Hinrichs, D. and Thaller, G. 2017. Genetic Diversity and
Ancestral History of the German Angler and the Red-and-White Dual-Purpose
Cattle Breeds Assessed through Pedigree Analysis. Agricultural Sciences 8:1033-
1047. http://www.scirp.org/journal/as.
Aleandri, R., Buttazzoni, L.G., Schneider, J.C., Caroli, A. and Davoli, R. 1990. The
Effects of Milk Protein Polymorphisms on Milk Components and Cheese-
Producing Ability. Journal of Dairy Science 73:241–255.
https://doi.org/10.3168/jds.S0022-0302(90)78667-5
Al-Kanaan, J. 2016. Heat stress response for physiological traits in dairy and dual-
purpose cattle populations on phenotypic and genetic scales. Dissertation,
Witzenhausen.https://www.researchgate.net/publication/295931900_Heat_stress_r
esponse_for_physiological_traits_in_dairy_and_dual_purpose_cattle_populations
_on_phenotypic_and_genetic_scales
Augustin, M.A., Udabage, P., Juliano, P. and Clarke, P.T. 2013. Towards a more
sustainable dairy industry: Integration across the farm–factory interface and the
dairy factory of the future. International Dairy Journal 31:2–11.
https://doi.org/10.1016/j.idairyj.2012.03.009.
Auldist, M.J., Kay, J.K., Thomson, N.A., Napper, A.R. and Kolver, E.S. 2002.
Concentrations of conjugated linoleic acid in milk from cows grazing pasture or fed
a total mixed ration for an entire lactation. Proceedings of the New Zealand Society
of Animal Production 62:240–241.
Belury, M.A. 2002. Dietary conjugated linoleic acid in health: physiological effects and
mechanisms of action. Annual review of nutrition 22:505–531.
https://doi.org/10.1146/annurev.nutr.22.021302.121842.
Brade, W., and Brade, E. 2013. Berichte über Landwirtschaft: Zuchtgeschichte der
Deutschen Holsteinrinder. Zeitschrift für Agrarpolitik und Landwirtschaft 91:1-40.
http://dx.doi.org/10.12767/buel.v91i2.25.g70
Bristow, D.J. and Holmes, D.S. 2007. Cortisol levels and anxiety-related behaviors in
cattle. Physiology and Behavior 90:626–628.
https://doi.org/10.1016/j.physbeh.2006.11.015.
CHAPTER 7
196
Caroli, A.M., Chessa, S. and Erhardt, G.J. 2009. Invited review: milk protein
polymorphisms in cattle: effect on animal breeding and human nutrition. Journal of
Dairy Science 92:5335–5352. https://doi. org/10.3168/jds.2009-2461.
Cheverud, J.M. 1988. A Comparison of Genetic and Phenotypic Correlations.
Evolution 42:958-968. https://doi.org/10.1111/j.1558-5646.1988.tb02514.x.
Corl, B.A., Barbano, D.M., Bauman, D.E. and Ip, C. 2003. cis-9, trans-11 CLA derived
endogenously from trans-11 18:1 reduces cancer risk in rats. The Journal of
Nutrition 133:2893–2900.
De Roos, A.P.W., Hayes, B.J., Spelman, R.J., Goddard, M.E. 2008. Linkage
disequilibrium and persistence of phase in Holstein-Friesian, Jersey and Angus
cattle. Genetics 179:1503–1512. https://doi.org/10.1534/genetics.107.084301 .
DeVries, T.J., Beauchemin, K.A., Dohme, F. and Schwartzkopf-Genswein, K.S. 2009.
Repeated ruminal acidosis challenges in lactating dairy cows at high and low risk
for developing acidosis: Feeding, ruminating, and lying behavior. Journal of Dairy
Science 92:5067–5078. https://doi.org/10.3168/jds.2009-2102.
Dickson, S.P., Wang, K., Krantz, I., Hakonarson, H. and Goldstein, D.B. 2010. Rare
variants create synthetic genome-wide associations. PLoS Biol 8: e1000294.
https://doi.org/10.1371/journal.pbio.1000294.
Do, D.N., Strathe, A.B., Ostersen, T., Jensen, J., Mark, T. and Kadarmideen, H.N.
2013. Genome-wide association study reveals genetic architecture of eating
behavior in pigs and its implications for humans obesity by comparative mapping.
PloS one 8:e71509. https://doi.org/10.1371/journal.pone.0071509.
Dunnington, E.A., 1990. Selection and homeostasis. Proc. 4th World Congr. Gen.
Appl. Livest. Prod., Edinburgh, UK (XVI), pp. 5–12.
Falconer, D.S., 1989. Introduction to Quantitative Genetics. John Wiley & Sons, Inc.,
New York, NY.
Food and Agriculture Organisation (FAO). 1998. Secondary guidelines for
development of national farm animal genetic resources management plans. Page 63
in Management of Small Populations at Risk. Accessed Aug 20, 2018. fao.org/3/a-
w9361e.pdf
CHAPTER 7
197
Fregonesi, J.A., Tucker, C.B. and Weary, D.M. 2007. Overstocking reduces lying time
in dairy cows. Journal of Dairy Science 90:3349–3354.
https://doi.org/10.3168/jds.2006-794.
GEH, 2018. The Society for the Conservation of Old and Endangered Livestock Breeds
- Deutsches Schwarzbuntes Niederungsrind. Accessed Aug 20, 2018. http://www.g-
e-h.de/rassebeschreibungen/34-rassekurzbeschreibungen-rinder/70-deutsches-
schwarbuntes-niederungsrind
Goddard, M.E., Hayes, B.J. and Meuwissen, T.H.E. 2010. Genomic selection in
livestock populations. Genetics research 92:413–421.
https://doi.org/10.1017/S0016672310000613.
Goddard, M.E. and Beilharz, R.G., 1977. Natural selection and animal breeding. Proc.
3rd Int. Congr. S.A.B.R.A.O., Animal Breeding Papers 4.19 to 4.21.
Gold, A., Olin, N. and Wang, A. 2018: What is the Delta Method. https://cran.r-
project.org/web/packages/modmarg/vignettes/delta-method.html
Accessed:12.11.2018.
Grant, R.J. and Albright, J.L. 2001. Effect of Animal Grouping on Feeding Behavior
and Intake of Dairy Cattle. Journal of Dairy Science 84:156-163.
https://doi.org/10.3168/jds.S0022-0302(01)70210-X.
Grodkowski, G., Sakowski, T., Puppel, K., Baars, T. and van Meurs, K. 2017.
Validation of an electronic herd control system for grazing dairy cows. 68th Annual
meeting of the European Association for Animal Production, Tallinn, Estonia, 28.
Aug. - 1. Sept. 2017
Groen, A.F., Steine, T., Colleau, J.J., Pedersen, J., Pribyl, J., and Reinsch, N. 1997.
Economic values in dairy cattle breeding, with special reference to functional traits.
Report of an EAAP-working group. Livestock Production Science 49:1-21.
https://doi.org/10.1016/S0301-6226(97)00041-9.
Harrison, R.O., Ford, S.P., Young, J.W., Conley, A.J. and Freeman, A.E., 1990.
Increased milk production versus reproductive and energy status of high producing
dairy cows. Journal of Dairy Science 73:2749–2758.
https://doi.org/10.3168/jds.S0022-0302(90)78960-6.
CHAPTER 7
198
Hayes, B. and Goddard, M.E. 2001. The distribution of the effects of genes affecting
quantitative traits in livestock. Genetics, Selection, Evolution 33:209–229.
https://doi.org/10.1051/gse:2001117.
Hazel, L.N. 1943. The genetic basis for constructing selection indexes. Genetics
28:476.
Hinrichs, D. 2005. Genetic analysis of health traits in German Holstein dairy cattle.
Züchtungskunde 77:234-238.
https://www.zuechtungskunde.de/Artikel.dll/12_MTE5MTUxMg.PDF.
Hinrichs, D., Calus, M., De Koning, D.J., Bennewitz, J., Meuwissen, T., Thaller, G.,
Szyda, J., Tetens, J., Juskiene, V. and Guldbrandtsen, B. 2017. Biodiversity within
and between European Red dairy breeds – conservation through utilization. 68th
annual EAAP conference, Tallinn, 23, 82, ISBN: 978-90-8686-312-9
Hovi, M., Sundrum, A. and Thamsborg, S.M. 2003. Animal health and welfare in
organic livestock production in Europe: current state and future challenges.
Livestock Production Science 80:41–53. https://doi.org/10.1016/S0301-
6226(02)00320-2.
Kay, J.K., Roche, J.R., Kolver, E.S., Thomson, N.A. and Baumgard, L.H. 2005. A
comparison between feeding systems (pasture and TMR) and the effect of vitamin
E supplementation on plasma and milk fatty acid profiles in dairy cows. The Journal
of Dairy Research 72:322–332. https://doi.org/10.1017/S0022029905000944.
Knapp, D.M., Grummer, R.R. 1990. Response of Lactating Dairy Cows to Fat
Supplementation During Heat Stress. Journal of Dairy Science 74:2573-2579.
https://doi.org/10.3168/jds.S0022-0302(91)78435-X.
Koenig, S. and Simianer, H. 2006. Approaches to the management of inbreeding and
relationship in the German Holstein dairy cattle population. Livestock Science
103:40–53. https://doi.org/10.1016/j.livsci.2005.12.009.
Lin, C.Y. 1978. Index Selection for genetic Improvement of Quantitative Characters.
Theoretical and Applied Genetics 52:49–56.https://doi.org/10.1007/BF00281316.
Liu, Y., Li, D., Li, H., Zhou, X. and Wang, G. 2011. A novel SNP of the ATP1A1 gene
is associated with heat tolerance traits in dairy cows. Molecular biology reports
38:83–88. https://doi.org/10.1007/s11033-010-0080-8.
CHAPTER 7
199
Lopez, H., Satter, L.D. and Wiltbank, M.C. 2004. Relationship between level of milk
production and estrous behavior of lactating dairy cows. Animal Reproduction
Science 81:209–223. https://doi.org/10.1016/j.anireprosci.2003.10.009.
Lorenzini, E., Chessa, S., Chiatti, F., Caroli, A. and Pagnacco, G. 2007. Peptidi bioattivi
di latte e derivati. Sci. Tecn. Latt. Cas. 58:113– 156.
Lundeheim, N. 1987. Genetic analysis of osteochondrosis and leg weakness in the
Swedish pig progeny testing scheme. Acta Agriculturae Scandinavica. 37:159–173.
https://doi.org/10.1080/00015128709436552.
Lush, J.L. 1960. Improving dairy cattle by breeding: Current status and outlook. Journal
of Dairy Science 43:702–706.https://doi.org/10.3168/jds.S0022-0302(60)90222-8.
Lush, J.L., Holbert, J.C. and Willham, O.S. 1936. Genetic History of the Holstein
Freisian Cattle in the United States. Journal of Heredity 27:61–72.
https://doi.org/10.1093/oxfordjournals.jhered.a104174
Madsen, P., Jensen, J. (2018) A user's guide to DMU. A package for analysing
multivariate mixed models. Accessed Jan 20, 2018.
https://www.researchgate.net/publication/291444592_A_user
%27s_guide_to_DMU.
May, K., Brügemann, K., Yin, T., Scheper, C., Strube, C. and König, S. 2017. Genetic
line comparisons and genetic parameters for endoparasite infections and test-day
milk production traits. Journal of Dairy Science 100:7330–7344.
https://doi.org/10.3168/jds.2017-12901
Mc Parland, S., Kearney, J.F, Rath, M. and Berry, D.P. 2007. Inbreeding trends and
pedigree analysis of Irish dairy and beef cattle populations. Journal of Animal
Science 85:322–331. https://doi.org/10.2527/jas.2006-367.
McLean, D.M., Graham, E.R.B., Ponzoni, R.W. and McKenzie, H.A. 1984. Effects of
milk protein genetic variants on milk yield and composition. Journal of Dairy
Research 51:531–546.
Meuwissen, T.H.E and Sonesson, A.K. 1998. Maximizing the response of selection
with a predefined rate of inbreeding: Overlapping generations. Journal of Animal
Science 76: 2575-2583.
CHAPTER 7
200
Meuwissen, T.H.E. 1997. Maximizing the Response of Selection with a predefined
Rate of Inbreeding. Journal of Animal Science 75:934–940.
https://doi.org/10.2527/1997.754934x.
Mügge, B., Lutz, W.E., Südbeck, H. and Zelfel, S. 1999. Deutsche Holsteins. Die
Geschichte einer Zucht. Verlag Eugen Ulmer.
Nkrumah, J.D., Li, C., Basarab, J.B., Guercio, S., Meng, Y., Murdoch, B., Hansen, C.
and Moore, S.S. 2004. Association of a single nucleotide polymorphism in the
bovine leptin gene with feed intake, feed efficiency, growth, feeding behaviour,
carcass quality and body composition. Canadian Journal of Animal Science
84:211–219. https://doi.org/10.4141/A03-033.
Norman, H.D. and Dickinson, F.N. 1971. An economic index for determining the
relative value of milk and fat in predicted differences of bulls and cow index values
of cows. ARS-44-223. DHI. Lett. 47:1–34.
Philipsson, J. and Lindhé, B. 2003. Experiences of including reproduction and health
traits in Scandinavian dairy cattle breeding programmes. Livestock Production
Science 83:99–112. https://doi.org/10.1016/S0301-6226(03)00047-2
Philipsson, J., Banos, G. and Arnason, T. 1994. Present and future uses of selection
index methodology in dairy cattle. Journal of Dairy Science 77:3252–3261.
https://doi.org/10.3168/jds.S0022-0302(94)77266-0.
Piccione, G., Caola, G., and Refinetti, R. 2003. Daily and estrous rhythmicity of body
temperature in domestic cattle. BMC Physiology 3:1-8.
https://doi.org/10.1186/1472-6793-3-7.
Poulsen, N.A., Bertelsen, H.P., Jensen, H.B., Gustavsson, F., Glantz, M., Månsson,
H.L., Andrén, A., Paulsson, M., Bendixen, C., Buitenhuis, A.J. and Larsen, L.B.
2013. The occurrence of noncoagulating milk and the association of bovine milk
coagulation properties with genetic variants of the caseins in 3 Scandinavian dairy
breeds. Journal of Dairy Science 96:4830–4842. https://doi.org/10.3168/jds.2012-
6422.
Radostits, O.M., Gay, C.C., Hinchcliff, K.W. and Constable, P.D. 2007. in Veterinary
Medicine: A Textbook of the Diseases of Cattle, Horses, Sheep, Pigs and Goats.
10th ed. Saunders Ltd., Philadelphia: 268
CHAPTER 7
201
Rando, A., Di Gregorio, P., Ramunno, L., Mariani, P., Fiorella, A., Senese, C.,
Marletta, D. and Masina, P. 1998. Characterization of the CSN1AG allele of the
bovine αs1-casein locus by the insertion of a relict of a long interspersed element.
Journal of Dairy Science 81:1735–1742. https://doi.org/10.3168/jds.S0022-
0302(98)75741-8.
Rauw, W.M., Kanis, E., Noordhuizen-Stassen, E.N. and Grommers, F.J. 1998.
Undesirable side effects of selection for high production efficiency in farm animals:
a review. Livestock Production Science 56:15–33. https://doi.org/10.1016/S0301-
6226(98)00147-X.
Raven, L.A., Cocks, B.G., Kemper, K.E., Chamberlain, A.J., Vander Jagt, C.J.,
Goddard, M.E. and Hayes, B.J. 2016. Targeted imputation of sequence variants and
gene expression profiling identifies twelve candidate genes associated with
lactation volume, composition and calving interval in dairy cattle. Mammalian
genome official journal of the International Mammalian Genome Society 27:81–
97. https://doi.org/10.1007/s00335-015-9613-8.
Rendel, J.M. 1963. Correlation between the number of scutellar and abdominal bristles
in drosophila melanogaster. Genetics 48:391–408.
Saatchi, M., Schnabel, R.D., Taylor, J.F. and Garrick, D.J. 2014. Large-effect
pleiotropic or closely linked QTL segregate within and across ten US cattle breeds.
BMC genomics 15:442. https://doi.org/10.1186/1471-2164-15-442.
Schaar, J., Hansson, B. and Petterson, H.E. 1985. Effects of genetic variants of κ-casein
and β-lactoglobulin on cheesemaking. Journal of Dairy Research 52:429–437.
Schirmann, K., Chapinal, N., Weary, D.M., Heuwieser, W. and von Keyserlingk,
M.A.G. 2012. Rumination and its relationship to feeding and lying behavior in
Holstein dairy cows. Journal of Dairy Science 95: 3212-3217.
https://doi.org/10.3168/jds.2011-4741.
Shanks, R.D., Freeman, A.E., Berger, P.J. and Kelley, D.H., 1978. Effect of selection
for milk production on reproductive and general health of the dairy cow. Journal of
Dairy Science 61:1765–1772. https://doi.org/10.3168/jds.S0022-0302(78)83800-4.
Soriani, N., Panella, G. and Calamari, L. 2013. Rumination time during the summer
season and its relationships with metabolic conditions and milk production. Journal
of Dairy Science 96:5082–5094. https://doi.org/10.3168/jds.2013-6620.
CHAPTER 7
202
Vaarst, M. and Bennedsgaard, T.W. 2001. Reduced Medication in Organic Farming
with Emphasis on Organic Dairy Production. Acta Veterinaria Scandinavica 95:51–
57.
VanRaden, P.M. 2004. Invited Review: Selection on Net Merit to Improve Lifetime
Profit. Journal of Dairy Science 87:3125–3131. https://doi.org/10.3168/jds.S0022-
0302(04)73447-5.
VanRaden, P.M., van Tassell, C.P., Wiggans, G.R., Sonstegard, T.S., Schnabel, R.D.,
Taylor, J.F. and Schenkel, F.S. 2009. Invited review: reliability of genomic
predictions for North American Holstein bulls. Journal of Dairy Science 92:16–24.
https://doi.org/10.3168/jds.2008-1514
Veerkamp, R.F. 1998. Selection for economic efficiency of dairy cattle using
information on live weight and feed intake: A Review. Journal of Dairy Science
81:1109-1119. https://doi.org/10.3168/jds.S0022-0302(98)75673-5.
Walker, S.L., Smith, R.F., Routly, J.E., Jones, D.N., Morris, M.J. and Dobson, H. 2008.
Lameness, activity time-budgets, and estrus expression in dairy cattle. Journal of
Dairy Science 91:4552–4559. https://doi.org/10.3168/jds.2008-1048.
Wall, E., Brotherstone, S., Woolliams, J.A., Banos, G. and Coffey, M.P. 2003. Genetic
Evaluation of Fertility Using Direct and Correlated Traits. Journal of Dairy Science
86:4093–4102. https://doi.org/10.3168/jds.S0022-0302(03)74023-5.
Weigel, K.A. and Rekaya, R. 2000. A Multiple-Trait Herd Cluster Model for
International Dairy Sire Evaluation. Journal of Dairy Science 83:815–821.
https://doi.org/10.3168/jds.S0022-0302(00)74944-7.
West, J.W. 2003. Effects of Heat-Stress on Production in Dairy Cattle. Journal of Dairy
Science 86:2131–2144.https://doi.org/10.3168/jds.S0022-0302(03)73803-X.
Wientjes, Y.C. J., Veerkamp, R.F. and Calus, M.P.L. 2013. The effect of linkage
disequilibrium and family relationships on the reliability of genomic prediction.
Genetics 193:621–631.
Wooliams, J.A. and Meuwissen, T.H.E., 1993. Decision rules and variance of response
in breeding schemes. Animal Production 56:179.
https://doi.org/10.1017/S0003356100021231.
Xi, Y.M., Yang, Z., Wu, F., Han, Z.Y. and Wang, G.L. 2015. Gene expression profiling
of hormonal regulation related to the residual feed intake of Holstein cattle.
CHAPTER 7
203
Biochemical and biophysical research communications 465:19–25.
https://doi.org/10.1016/j.bbrc.2015.07.092.
Young, S.S.Y. 1961. A further examination of the relative efficiency of three methods
of selection for genetic gains under less-restricted conditions. Genetics research
2:106–121. https://doi.org/10.1017/S0016672300000598.
CHAPTER 7
204
Acknowledgement
Die vorliegende Arbeit wurde am Institut für Tierzucht und Haustiergenetik der Justus-
Liebig-Universität angefertigt. Im Laufe meiner Promotionszeit haben viele Personen auf
ihre Weise zum Gelingen dieser Arbeit beigetragen, denen ich herzlich danken möchte.
Mein besonderer Dank gilt Prof. Dr. Sven König für die Überlassung des Themas, die
sehr lehrreiche Zusammenarbeit sowie die Möglichkeit und das in mich gesetzte
Vertrauen, meine Ergebnisse auf Konferenzen und Tagungen im In- und Ausland
vorstellen zu dürfen. Durch das angenehme und äußerst kollegiale Arbeitsklima in seiner
Abteilung werde ich auch in Zukunft gerne an die Zeit in Witzenhausen und Gießen
zurückdenken.
Ausdrücklich bedanken möchte ich mich bei Herrn Prof. Dr. Hinrichs von der Universität
Kassel für die Begutachtung der Arbeit als Zweitprüfer.
Auch bei den Projektpartnern des CoreOrganic ‚2-Org-Cows‘-Projekts möchte ich mich
herzlich für die immer gute Zusammenarbeit bedanken. Insbesondere den Projektpartnern
aus der Schweiz mit Beat Bapst, aus Polen mit Prof. Dr. Tomasz Sakowski und Grzegorz
Grodkowski sowie Prof. Dr. Marija Klopčič aus Slowenien gilt mein besonderer Dank
für die Bereitstellung der Daten.
Ebenso bin ich den Mitarbeitern, insbesondere der Herdenmanagerin Frau Kerstin Vienna
und Herrn Dr. Christian Krutzinna, des Versuchsguts Domäne Frankenhausen für Ihren
Einsatz und Ihre Unterstützung während der Datenerfassung zu Dank verpflichtet. An
dieser Stelle möchte ich mich auch bei Karin Rübesam und Boris Kulig von der
Universität Kassel für die Unterstützung bei der Nutzung der
Herdenmanagementsoftware bedanken.
Bei der Bundesanstalt für Landwirtschaft und Ernährung (BLE) und dem
Bundesministerium für Ernährung, Landwirtschaft und Verbraucherschutz (BMELV)
möchte ich mich für die Projektbetreuung und die finanzielle Unterstützung bedanken.
Die Kollegen an den Instituten in Witzenhausen und Gießen haben das Ihrige für eine
wunderbare Promotionszeit beigetragen. Bei Dr. Kerstin Brügemann, Prof. Dr. Horst
Brandt, Carsten Scheper und Dr. Tong Yin möchte ich mich ausdrücklich für die fachliche
205
Unterstützung, ihr Engagement, die ständige Diskussionsbereitschaft und besonders für
ihre Geduld bedanken.
Sarah, Dr. Christina Weimann und Diana danke ich für die stets positive
Arbeitsatmosphäre im Büro, für ihre aufmunternden Worte und fachlichen Ratschläge.
Weiterhin bedanke ich mich bei der Arbeitsgruppe Tierzucht und der Arbeitsgruppe
Haustier- und Pathogenetik für die erquicklichen Gespräche und oft fachfremden
Diskussionen während der Frühstücks- und Mittagspausen.
Moni, Thomas, Omi und den Kumpfis gebührt mein Dank für die herzliche Unterstützung
und langjährige Freundschaft.
Oma und Opa, ich weiß ihr wärt stolz auf diese Arbeit, ich habe euch lieb und halte meine
Erinnerungen an euch in Ehren.
Falk und Antje, ich bin euch sehr dankbar für die schönen Erinnerungen an gemeinsame
Zeiten und eure willkommene und herzliche Art. Antje, du wirst immer einen Platz in
meinem Herzen haben, warst du doch ein ganz besonderer Mensch. Falk, vielen Dank für
deine Ratschläge, Unterstützung und die vielen Gespräche schon mein Leben lang.
Max, ich möchte dir für die 576 Stunden danken, die du die vergangenen zwei Jahre für
mich im Zug verbracht hast, um nach Gießen zu pendeln. Vielen Dank für deine Liebe
und deine Hilfsbereitschaft. Ich hoffe, deine Freundschaft und Lebensfreude werden mich
mein Leben lang begleiten.
Als letztes bleibt mir nur noch den größten Dank meinen Eltern und meiner Schwester
auszusprechen. Neben der unendlichen Liebe und Unterstützung, im Beruflichen wie im
Privaten, haben sie mir gezeigt, wo mein Zuhause ist. Danke Andrea, dass du mir stets
bedingungslos zur Seite stehst und immer für mich da bist. Meinen Eltern danke ich, dass
sie mir diese Ausbildung ermöglicht haben. Ich hoffe, ich kann euch mit dieser Arbeit
einen Teil eures Vertrauens zurückgeben.
ACKNOWLEDGEMENT
206
Formal Declaration
Erklärung gemäß der Promotionsordnung des Fachbereichs 09 vom 07. Juli 2004 §
17 (2)
„Ich erkläre: Ich habe die vorgelegte Dissertation selbständig und ohne unerlaubte
fremde Hilfe und nur mit den Hilfen angefertigt, die ich in der Dissertation angegeben
habe. Alle Textstellen, die wörtlich oder sinngemäß aus veröffentlichten Schriften
entnommen sind, und alle Angaben, die auf mündlichen Auskünften beruhen, sind als
solche kenntlich gemacht.
Bei den von mir durchgeführten und in der Dissertation erwähnten Untersuchungen habe
ich die Grundsätze guter wissenschaftlicher Praxis, wie sie in der „Satzung der Justus-
Liebig-Universität Gießen zur Sicherung guter wissenschaftlicher Praxis“ niedergelegt
sind, eingehalten.“
Gießen, den 05. Oktober 2018
____________________________
Maria Helene Palesa Jaeger

207
Lebenslauf
Der Inhalt wurde aus Datenschutzgründen entfernt.

Maria
H
ele
ne P
ale
sa Jaeger G
en
etic
Stu
die
s o
n B
lack an
d W
hit
e C
attle
MARIA HELENE PALESA JAEGER
Phenotypic, Quantitative Genetic and
Genomic Characterization of the
German Black and White Dual-Purpose
Cattle Breed
VVB LAUFERSWEILER VERLAGSTAUFENBERGRING 15D-35396 GIESSEN
Tel: 0641-5599888 Fax: [email protected]
VVB LAUFERSWEILER VERLAGédition scientifique
9 7 8 3 8 3 5 9 6 7 5 4 0
ISBN: 978-3-8359-6754-0
VVBVERLAG
Photo cover: ©
VVB
VVB LAUFERSWEILER VERLAGédition scientifique
INAUGURAL-DISSERTATION
zur Erlangung des Doktorgrades eines Doctor agriculturae (Dr. agr.)
durch den Fachbereich Agrarwissenschaften, Ökotrophologie und
Umweltmanagement der Justus-Liebig-Universität Gießen
Copyright © 2022 FDOKUMEN