Volunteering, Human Capital and Well-Being: The Racial Implications of Differential Access to and...
23
1 Volunteering, Human Capital and Well-Being: The Racial Implications of Differential Access to and Happiness Gains from Volunteering Rosa Ammon-Ciaglo (Barnard College ’14) Abstract This paper uses cross-sectional data from the 2012 US General Social Survey (GSS) to examine the relationship between differential access to and happiness gains from volunteer work, especially as indicated by race and class. This study contradicts the existing literature on the topic, mostly performed 15 years prior, with the finding that blacks volunteer in higher percentages but experience less happiness associated with volunteering than whites, while they continue to suffer from gaps in human capital attributes (education and socioeconomic status). The paper concludes that as volunteer activity becomes increasingly acceptable as a substitute for paid work experience, the human capital, social capital and status attributes that are disproportionately distributed to whites may be a source of access to categories of volunteer activity that enable growth and application of professional skills, in addition to related psychological/financial benefits. Volunteer activity is therefore framed as a possible variable contributing to systemic disparities in economic success and happiness along racial lines in the United States. Introduction When it comes to examining the relationship between work and happiness, one will find that studies performed on this topic focus primarily on job satisfaction, compensation and work environment, referring to particular features of paid work that affect psychological well-being. Alongside paid work and career trajectories, however, a considerable portion of societal well- being depends on volunteer activity and community service organizations. In the mid-1800s, Alexis de Tocqueville (French political thinker and author of Democracy in America) pointed out the tendency of Americans to engage in civic service, creating or joining voluntary organizations in massive numbers (Thoits & Hewitt, 2001). Today, the role of volunteer activity in American society has remained very relevant to social and economic life: the Bureau of Labor Statistics reported that in 2013, 25.4% of the US population had engaged in volunteer activity. Now more than ever, employers look for volunteer engagement as a positive attribute in job
Transcript of Volunteering, Human Capital and Well-Being: The Racial Implications of Differential Access to and...

1
Volunteering, Human Capital and Well-Being: The Racial Implications of Differential Access to and Happiness Gains from Volunteering
Rosa Ammon-Ciaglo (Barnard College ’14)
Abstract This paper uses cross-sectional data from the 2012 US General Social Survey (GSS) to examine the relationship between differential access to and happiness gains from volunteer work, especially as indicated by race and class. This study contradicts the existing literature on the topic, mostly performed 15 years prior, with the finding that blacks volunteer in higher percentages but experience less happiness associated with volunteering than whites, while they continue to suffer from gaps in human capital attributes (education and socioeconomic status). The paper concludes that as volunteer activity becomes increasingly acceptable as a substitute for paid work experience, the human capital, social capital and status attributes that are disproportionately distributed to whites may be a source of access to categories of volunteer activity that enable growth and application of professional skills, in addition to related psychological/financial benefits. Volunteer activity is therefore framed as a possible variable contributing to systemic disparities in economic success and happiness along racial lines in the United States. Introduction
When it comes to examining the relationship between work and happiness, one will find
that studies performed on this topic focus primarily on job satisfaction, compensation and work
environment, referring to particular features of paid work that affect psychological well-being.
Alongside paid work and career trajectories, however, a considerable portion of societal well-
being depends on volunteer activity and community service organizations. In the mid-1800s,
Alexis de Tocqueville (French political thinker and author of Democracy in America) pointed
out the tendency of Americans to engage in civic service, creating or joining voluntary
organizations in massive numbers (Thoits & Hewitt, 2001). Today, the role of volunteer activity
in American society has remained very relevant to social and economic life: the Bureau of Labor
Statistics reported that in 2013, 25.4% of the US population had engaged in volunteer activity.
Now more than ever, employers look for volunteer engagement as a positive attribute in job

2
candidates, and corporations engage their workforce in volunteer service to promote corporate
social responsibility. Given volunteering’s significant role in society, the purpose of this paper is
to examine how volunteer work impacts individual well-being, how its benefits are distributed
demographically, and what motivates individuals to volunteer.
Literature Review Psychological Well-Being
In past studies, social scientists have observed positive impacts of volunteering on
numerous aspects of psychological and physical health. Generally, their results show that
increased hours of volunteering are correlated with higher reported happiness and life
satisfaction, lower levels of stress and depression and reduced mortality (Thoits & Hewitt, 2001),
among other things. Volunteering, defined by Musick as “unremunerated time and effort devoted
to helping others” (Wilson & Musick, pp. 800), is best understood as other-oriented, social and
voluntary (lacking coercion or obligation). This particular feature of volunteering has been
argued to make it a significant source of eudaimonic well-being, which is measured in terms of
noble purpose and self-realization (Piliavin & Siegl, 2007). This is in contrast to hedonic well-
being, which is gained from self gratification, or an increase in pleasure vis-à-vis pain.
Studies have indeed shown that volunteering is correlated with higher levels of self-
esteem and sense of “mattering” (Piliavin & Siegl, 2007), because the perception that one’s
voluntary activities are important for the greater good contributes to a feeling of purpose and
meaning in life. Thoits (2012) further attributes these effects to volunteering’s contribution to a
stronger sense of “self” gained from occupying multiple roles in society. Her study suggests that
the extent to which volunteers identify with their volunteer work as a defining role is positively

3
correlated with various psychological health factors, including general happiness, life
satisfaction, self-esteem, and the sense of one’s life as purposeful and meaningful.
Causal Relationships
Thoits & Hewitt (2001) explore a hypothesized reciprocal relationship between
volunteering and well-being. They find greater volunteer hours among individuals with personal
characteristics such as self-control, self-efficacy, confidence and high self-worth, all of which are
tied to higher well-being. These individuals are thought more likely to seek out volunteer work
and to be chosen for it, and to be more socially integrated through membership in various
religious and secular organizations that provide a network of opportunities for volunteer work.
Further, a positive feedback loop may occur between these positive characteristics and
volunteering, where the personal gratification gained from volunteer work in turn feeds into
greater coping resources and high senses of mastery over life, in addition to the numerous
indicators of positive mental health mentioned above (Thoits & Hewitt, 2001).
The Role of Capital
Beyond personal characteristics, three categories of capital influence an individual’s
decision to volunteer and his or her access to volunteer opportunities: social, cultural and human
capital. Social capital is a relational resource that includes social networks, organization
membership and church attendance. Volunteering is very much a collective activity, which
strengthens the role of social capital in volunteer opportunity. In fact, a 2000 study of a US panel
survey found that volunteers who were asked to volunteer contributed 20 more hours in a year
than those who volunteered on their own (Musick et al, 2000). Cultural capital, on the other
hand, is made up of individual beliefs about the importance of civic participation and charitable
4
responsibility. For example, Musick, Wilson & Bynum (2000) suggest that people who volunteer
more hours per week are more likely to be individuals who believe social problems are to be
solved on an individual basis. Alternatively, groups who believe it is the government’s duty to
provide social support to its citizens may volunteer less.
Lastly, according to Wilson & Musick (1997), individuals with more human capital
(education, income) are more likely to seek out volunteer opportunities applying their skills or
knowledge, are more qualified and attractive to those seeking volunteer work, and are more
likely to leverage volunteer work as a source of labor market experience. Following
encouragement from the US Civil Service Commission, many firms accept experience gained
from volunteer activities in lieu of paid employment experience (Day & Devlin, 1998), defining
volunteering as a source of human capital investment. Volunteering is therefore a way for an
individual to apply and develop his or her skills in a role outside their primary employment, and
to signal desirable character traits (such as those mentioned in the previous section) to future
employers. The result is the development of a category of high-skill volunteer experience that
both selects for and builds high levels of human capital, and that is more likely to provide the
type of role-defining volunteer activity that enhances one’s sense of mattering and purpose
(Thoits, 2012).
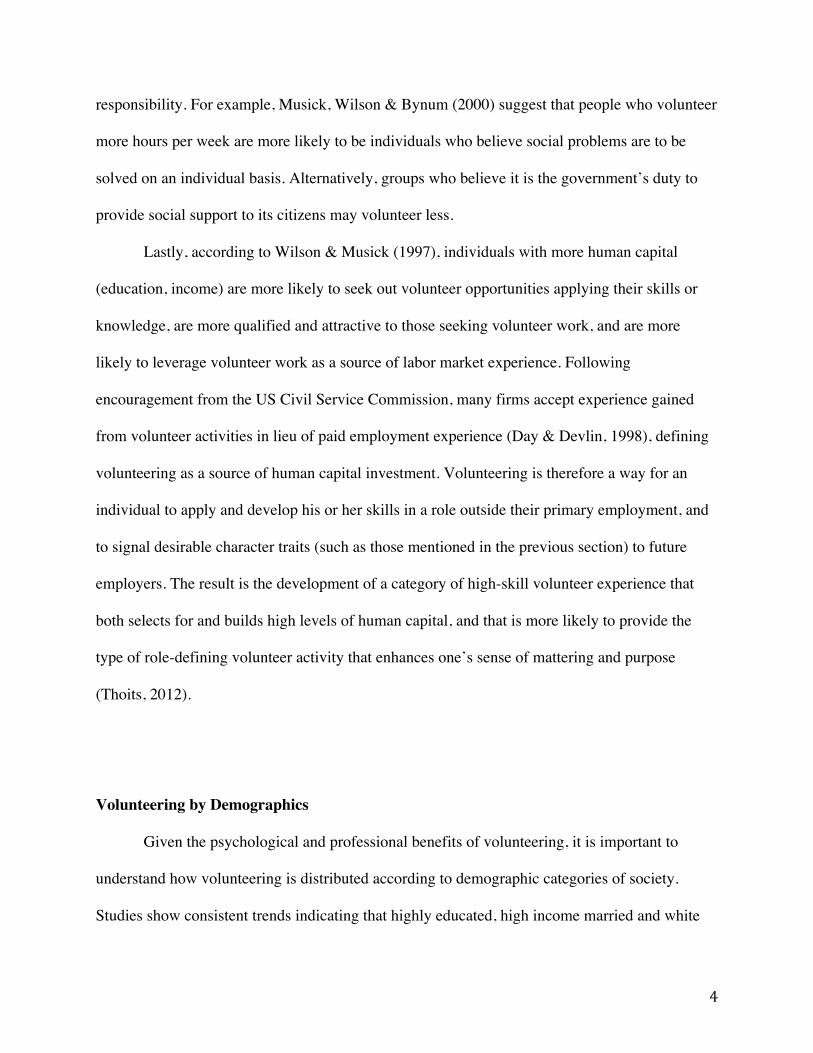
Volunteering by Demographics
Given the psychological and professional benefits of volunteering, it is important to
understand how volunteering is distributed according to demographic categories of society.
Studies show consistent trends indicating that highly educated, high income married and white

5
individuals are more likely to participate in volunteer work, as are married women who have
children at home (Thoits & Hewitt, 2001). In a close study by Musick and co-authors (2000) of
racial disparities in volunteer involvement, blacks lag in a series of human capital and social
attributes that are correlated with higher volunteer rates: they are more likely to have less
education, lower incomes, poorer functional health, more likely to be single parents and less
likely to be asked to volunteer. However, earlier data from Wilson and Musick (1997) shows that
while blacks lag in education level, increased education positively impacts volunteer hours only
amongst whites, with no apparent impact on black volunteer participation.
In his 2000 study, Musick takes a close look at disparities between black and white
volunteer rates, finding that whites volunteer more than blacks. He asserts the importance of
social capital in determining black volunteer rates on one hand, and the importance of human
capital in determining that of whites, on the other. In his study, blacks’ church attendance as a
form of social capital was a key context within which blacks would volunteer. However, based
on his finding that whites volunteer more, he concludes that human capital is a more powerful
enabling factor for volunteers, because it allows for more influential networks of volunteer
opportunities and higher desirability to volunteer recruiters. Finally, he cites data suggesting that
racial discrimination explains part of why blacks are less likely to be asked to volunteer, as
blacks are asked less frequently than whites even when controlling for socioeconomic and social
capital attributes (Musick et al, 2000).
Purpose
In light of the literature exploring the causal factors of volunteering on one hand and the
correlation of volunteer work to well-being on the other, the primary purpose of this paper is to

6
examine the relationship between differential access to and happiness gains from volunteering,
especially as indicated by race and class.
• Hypothesis 1: I expect that volunteering will be positively correlated with happiness,
beyond what can be explained by demographic and human capital variables.
• Hypothesis 2: Higher volunteer rates should exist among those who are more educated, of
higher class, more trusting and more religiously active. I expect lower volunteer rates
among blacks and those who believe the government should be more involved in social
welfare.
• Hypothesis 3: I expect to find higher general happiness from volunteering among groups
whose higher human capital characteristics allow them to benefit more broadly from the
social integration and skill development of volunteer work (higher class and education,
whites).
Analytical Strategy Data
This study uses cross-sectional data from the 2012 US General Social Survey (GSS).
Variables
The data analysis assesses both the effect of volunteering on general happiness and
different levels of volunteer activity according to demographic, human capital and social capital
indicators. Happiness measure used is general happiness on a 3-point scale. The three measures
of volunteer activity assess whether or not a respondent has volunteered in the past year, the past
month, and how frequently she/he volunteers for charity. Volunteering in the past year is used
most here, due to consistency of results.

7
Demographic variables explicitly examined are race and gender; age serves as a control
variable. Human capital is measured in terms of education and subjective class identification;
income serves as a control variable. Social capital is measured by frequency of religious activity.
The cited literature measures social capital more specifically through church attendance,
organization membership and social interaction; however, limits of this dataset do not allow for
these measures. Finally, measures of cultural capital are opinion of government having too much
or too little involvement in social support and level of trust in others. See table 1 for description
of variables.
Main Regressions
• Regression series 1: The effects of education, class, sex and religious activity on volactyr
and volmonth, respectively, regressed within racial subgroups (black and white). Control
= age. The purpose was to compare the effects of human and social capital on
volunteering between races.
• Regression series 2: Regression of volactyr on general happiness, controlling for
education, race, class and sex first individually and then combined.
• Regression series 3: Regression of volactyr on happiness by subgroups white, black,
female, male, religious activity and class, controlling for age, education, race and sex.
Table 1: Description of Variables
Happy2 General happiness on scale of 1 – 3. 1 = not too happy 2 = pretty happy 3 = very happy
Volactyr Answer Yes or No to question, “have you volunteered in the past year?”

8
Volmonth Answer Yes or No to question, “have you volunteered in the past month?”
Volchrty How often does respondent volunteer for charity: Never, once a year, at least 2 – 3 times a year, once a month, at least once a week.
Educ2 Years of education indicating: High school dropout, high school degree, some college, college degree, post-graduate degree
Class Subjective class identification: lower class, working class, middle class, upper class
Sexd Female = 1, Male = 0 Race White, black, other. White omitted in
regressions relactiv How often does respondent engage in religious
activity: never, 2 times/year or less, several times/year, 1 – 3 times monthly, approximately weekly, several times weekly, every day
Trust Can people generally be trusted? Yes, no, depends.
Helpnot Should the government do more or less to help people? 1 = does not do enough, 3 = neutral, 5 = government does too much
Results Distribution of volunteer activity
The percentage distribution of respondents who volunteered in the past year by various
categories is shown in Table 2 (Appendix). In general, volunteer rates were higher with higher
class and education level, greater frequency of religious activity trust in others and with belief
that the government provides too much social support. A higher percentage of black respondents
than white had volunteered in the past year, although a small majority of both groups had not
volunteered, and a higher percentage of females than males had volunteered.
Volunteer predictors by race

9
Results from regression series 1 (Table 3) showed that among whites, education, class
and frequency of religious activity (in other words, indicators of both social and human capital),
were positively correlated with volunteering in the past year and past month. The effect on
volunteering of education and religious activity was particularly strong in regressions of both
volunteer variables (volactyr and volmonth), whereas the effect was weaker by increases in class.
Among blacks, increased religious activity was highly correlated with high volunteer
rates in the past month, with a less consistent effect on volunteering in the past year. Black
females were more likely to have volunteered in the past month and year vis-à-vis black males.
However, neither education nor class showed any statistically significant effect on volunteering,
except among black respondents with post-graduate degrees.
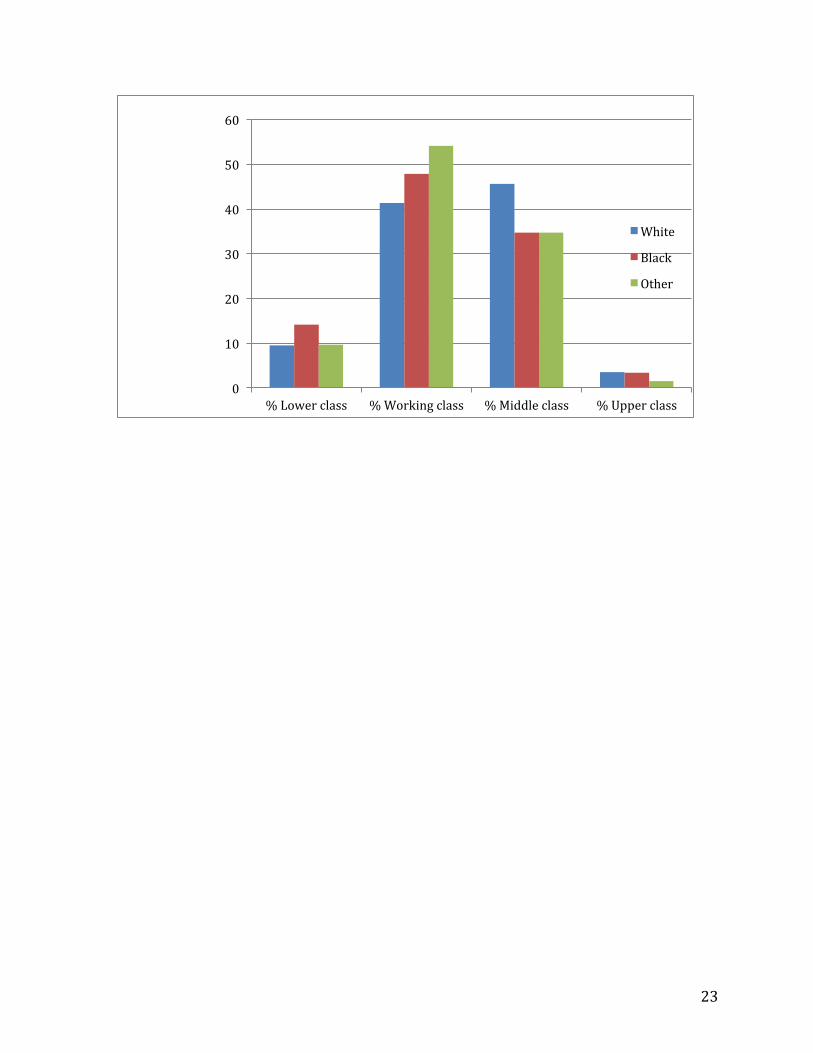
Racial distribution of human and social capital
The racial composition of this dataset was 75% white, 15% black and 10% other race. A higher
percentage of blacks than whites were both high school and college dropouts, while a higher
percentage of whites than blacks held college or post-graduate degrees (Figure 1, Appendix).
Higher proportions of blacks than whites self-identified as lower and working class, while higher
proportions of whites than blacks reported being middle and upper class (Figure 2, Appendix).
Happiness and volunteer activity
Regressions of the three measures of volunteer activity (volactyr, volmonth, volchrty) on
general happiness showed that in general, frequency of volunteering is associated with higher
happiness levels (Table 4, Appendix). When controlling individually and then collectively for

10
education, race, class and sex, the effect of volunteering in the past year on happiness remained
positive and statistically significant (Table 5). The positive coefficients diminished slightly when
controlling for education and class, respectively, while the impact of education and class on
happiness remained statistically significant in the presence of volunteering as a control.
Table 6 shows regressions for the effect of volunteering in the past year on happiness by
subgroups according to race, sex, class and religious activity. Controlling for education, age,
race, income and gender, the only groups within which volunteering had a statistically significant
positive correlation with happiness were whites, females, members of the working class and
those who never participated in religious activity. Coefficients among blacks and males were
positive, however. Notably, all frequencies of religious activity above zero were not significant
(Table 6), despite being very strong indicators of higher rates of volunteering (Table 3).
Similarly, while higher class was positively correlated with volunteering (Table 3), higher
classes showed no significant correlation between volunteering and happiness (Table 6). No
significant effect of volunteering on happiness was shown within groups with different beliefs
about the government’s supportive role.
Table 3 Dependent Variables: Has respondent volunteered in the past year (volactyr) or past month (volmonth). Statistically insignificant coefficients have not been reported. Volactyr: White
Respondents Volmonth: White Respondents
Volactyr: Black Respondents
Volmonth: Black Respondents
Education High School Omitted Omitted Omitted Omitted

11
dropout High School Diploma
-- 0.101 (.049)*
-- --
Some college 0.235 (.050)***
0.127 (.050)*
-- --
College Degree 0.337 (.056)***
0.346 (.055)***
-- --
Post-Graduate 0.395 (.055)***
0.370 (.056)***
0.266 (.127)*
--
Class Lower class Omitted Omitted Omitted Omitted Working class -- -- -- -- Middle class 0.156
(.052)** 0.127 (.058)*
-- --
Upper class 0.252 (.093)**
-- -- --
Sex Male Omitted Omitted Omitted Omitted Female -- -- 0.155
(.072)* 0.135
(.070)* Religious Activity Never Omitted Omitted Omitted Omitted Less than 1X/year -- -- -- -- 1 to 2 times/year 0.197
(.047)*** 0.201 (.044)***
-- 0.242 (.103)*
Several times/Year 0.335 (.051)***
0.301 (.051)***
0.395 (.125)**
0.348 (.120)**
Once a month 0.385 (.067)***
0.370 (.062)***
-- 0.323 (.103)**
2 to 4 times monthly
0.439 (.053)***
0.456 (.052)***
0.519 (.096)***
0.617 (.102)***
Every week 0.446 (.056)***
0.525 (.057)***
0.423 (.115)***
0.619 (.102)***
Several times weekly
0.547 (.153)***
0.482 (.147)**
0.474 (.195)*
0.887 (.224)***
Control Age Age Age Age *p < .05 **p < .01 ***p < .001
Table 5 Dependent Variable: Happiness on a scale from 1 (not too happy) to 3 (very happy) Variable (1)
Volactyr (2) Volactyr + Education
(3) Volactyr + Race
(4) Volactyr + Class
(5) Volactyr + Sex
(6) Volactyr + All
Have volunteered in past year
0.127 (.035)***
0.098 (.036)**
0.131 (.035)***
0.105 (.035)**
0.126 (0.035)***
0.098 (.036)**

12
Education High school degree
0.068 (.054)
0.045 (.054)
Some college 0.117 (.055)*
0.086 (.055)
College graduate
0.198 (.064)**
0.107 (.065)
Postgraduate 0.137 (.063)*
0.044 (.065)
Race Black (comp. to white)
-0.141 (.048)**
-0.121 (.048)*
Class Working class
0.160 (.057)**
0.143 (.057)*
Middle class 0.262 (.057)***
0.237 (.059)***
Upper class 0.521 (.057)***
0.499 (.109)***
Sex Female 0.016
(.034) 0.029 (.034)
Observations 1292 1292 1292 1292 1292 1292 R2 0.0099 0.018 0.017 0.036 0.010 0.046 *p < .05 **p < .01 ***p < .001 Discussion
This paper, in the first set of data analysis, has sought to establish links between
volunteering and particular demographic, capital and personal attributes in comparison with the
literature on volunteering. As the series of literature cited earlier dates around fifteen years
previous to this study, noting reinforced or changed trends in volunteering is important for
ongoing research on the role of volunteering in both psychological well-being and professional
development. The second portion of the data analysis focused on the correlation between
volunteering and general happiness. The intent was to compare any connections between human
and social capital indicators of volunteering and the happiness associated with it, focusing
specifically on these patterns between the black and white populations of this dataset.

13
Table 6 Dependent variable: Happiness on a scale from 1 (not too happy) to 3 (very happy) White Black Female Male Religious
Activity: Never
Working Class
volactyr 0.111 (.042)**
0.103 (.091)
0.125 (.049)*
0.088 (.054)
0.134 (.063)*
0.172 (.055)**
Control: Age
Yes Yes Yes Yes Yes Yes
Control: Education
Yes Yes Yes Yes Yes Yes
Control: Income
Yes Yes Yes Yes Yes No
Control: Race
No No Yes Yes Yes Yes
Control: Sex
Yes Yes No No Yes Yes
R2 0.053 0.089 0.056 0.062 0.093 0.048 *p < .05 **p < .01 ***p < .001
Volunteering was found to be higher among the more educated and higher-class
respondents, matching results in the literature. This seems to confirm the hypothesis that those
with more human capital have both the means and a broader network of access to volunteer
opportunities. Results showing a correlation between frequent religious activity and volunteering
also matched the literature and hypothesis 2. In a reflection of the literature, religious activity
was used here to assess the effects of social capital on volunteering; however, being able to
measure for community organization membership and other social integration indicators would
have provided more accurate results for social capital. Hypothesis 2 was further confirmed by the
positive effect of trust (used to indicate an open, other-oriented attitude) on volunteering, and by
a higher number of volunteers among respondents who believed the government provides too
much social support.
In terms of race, data showed that among whites, education, class and religious activity
all had positive effects on volunteering. In contrast, among blacks only religious activity and

14
gender (being female) impacted volunteering. Musick’s (2000) study suggests that blacks have
lower human capital than social capital enabling them to volunteer, and he finds that blacks
volunteer less than whites. However, results from the data analysis here partially contradict
Musick’s finding, showing that the percentage of blacks indicating having volunteered in the past
year was in fact greater than that of whites (Table 2, Appendix). What has brought about this
trend change over time, be it due to increased volunteer opportunities or changing attitudes in the
black community, would be best determined by a longitudinal study.
Another difference in results is that while the literature indicated that volunteering was
highest in the middle class (Musick et al, 2000), GSS data shows highest volunteer rates in the
upper class, both overall and among whites alone. On the other hand, there are relatively few
upper class respondents, and no clear effect of class on volunteering was observed among blacks.
Because no clear patterns indicate that higher class blacks volunteer more than lower class
blacks, it is possible that the types of volunteer activity and organizations participated in are
different between the two racial groups. Perhaps the type of volunteer work requiring high
financial means is more prevalent among whites than blacks. For example, upper and middle
class whites may be more likely to volunteer on nonprofit boards or manage and fund
community programs. This could be in part explained by racial differences in beliefs about
government involvement in social support. Musick (2000) suggests that blacks are more likely to
believe in the government’s role in solving social problems. If this were assumed to be the case,
whites with higher status and financial means would be more likely to apply their own solutions
to community need than blacks with similar attributes.
Alternatively, there could be fewer cultural differences by class among blacks as opposed
to among whites. This data uses a subjective measure of class, and income distribution within

15
each subjective class is fairly widespread. This suggests that class highlights more cultural and
status differences than financial means. In fact, Musick (2000) addressed his similar finding, that
education and income (human capital and financial means) were correlated with volunteering
among whites but not blacks, by asserting that blacks of different classes were more likely to
identify with each other, attend the same churches and participate in the same community events
than whites of different classes.
An important distinction that this study’s dataset was unable to provide is that between
different types of volunteer activity. Motivations to volunteer include: a) to gain or apply and
develop knowledge and skills b) volunteering out of belief in a cause and c) volunteering as a
community activity, either with group of friends or through religious organization. These
different motivations will lead individuals into volunteer contexts that vary in skill level – for
example, motivations A and B above are more likely to be associated with higher skill
application and resume-building potential than motivation C. As results have shown (both here
and according to Musick, 2000) that higher human capital attributes are more likely to be an
indicator of volunteering among whites than among blacks, it is very possible that high-skill
volunteer work is unevenly distributed to whites. On the other hand, community volunteer
activities motivated by social capital such as church attendance, the main volunteer indicator
among blacks, are very likely to be low-skill.
Moving to the second set of data, results reporting a persistent positive correlation
between volunteering and happiness (Tables 4 & 5) confirm hypothesis 1 and reinforce results in
the literature. Specifically, among controls for the effects of race, gender, education and class on
happiness, volunteers remain on average happier than non-volunteers. The causal implications of

16
these results, as in the literature, are ambiguous: they could mean that volunteers volunteer
because they are happy, or that they become happier as a result of having volunteered.
Although the data analysis demonstrates generally higher well-being among volunteers
than non-volunteers, the results in Table 6 show that this trend is not equal among races: whites
who volunteer are generally happier than those who do not, whereas blacks who volunteer are
not significantly happier. These results occur in the presence of controls for age, education,
income and gender to limit the extent to which socioeconomic status could explain these
differences. This in part confirms hypothesis 3, but it is initially surprising, as the hypotheses
assumed that differences in human capital would explain differential benefits from volunteering
between blacks and whites. One possible interpretation could be that whites are particularly more
likely to volunteer if they are generally happier, have higher self-esteem or possess other positive
attributes that Thoits and Hewitt (2001) show to be causal factors in the choice to volunteer.
Unfortunately, the single measure of general happiness in this dataset does not allow any
understanding of how the numerous measures of well-being and positive personal characteristics
used in the literature (Thoits, 2012; Thoits & Hewitt, 2001) correlate with volunteering
depending on race, class, education, etc. In addition, neither the literature nor this paper’s data
analysis has been able to reveal whether the context of volunteer work changes the effect of
volunteering on general well-being or any other positive traits such as self-esteem, mattering,
and mastery. For example, being able to analyze happiness gains from volunteering based on the
skill-level would be key to revealing the true implications of demographic trends in volunteering.
This disparity could also be drawn from the differing motivators of volunteer activity
between blacks and whites. Results discussed earlier showed that blacks appeared to be more
likely to volunteer according to religious activity than any other indicator, whereas white

17
volunteer rates were also correlated with class and education. Data shown in Table 6 reveals that
the only category of religious activity within which volunteers showed significantly higher
happiness levels than non-volunteers was the subgroup in which individuals were never
religiously active. In this context it is evident why no significant positive correlation between
volunteering and happiness would result among blacks.
A second implication of these findings concerns the causal relationship between
volunteering and happiness. Note that religious activity is positively correlated with both general
happiness and volunteer activity in this dataset (Table 3). The lower general happiness of non-
religious individuals results in a contrast between non-religious non-volunteers and those who
are motivated by higher well-being to volunteer. If we assume that religiously active individuals
are both happier and more likely to volunteer, this could suggest that general happiness is a
causal factor in the decision to volunteer, which provides evidence for the positive feedback loop
of causality between numerous factors of well-being and volunteering posed by Thoits & Hewitt
(2001).
Another surprising result from the data is the fact that the working class is the only class
group within which happiness was significantly correlated with volunteering. The most
straightforward explanation could be that the motivations to volunteer are different between
classes. Members of the working class may be overall less generally happy than middle or upper
class individuals, and therefore only relatively happier or more socially integrated persons within
the working class will make the choice to volunteer. In contrast, higher classes obtain additional
well-being from sources outside human capital attributes, such as status. This is reinforced by
results from regression series 2, in which class remains a strong indicator of general happiness in
the presence of controls for volunteering, education, race, and gender. It is instead possible that

18
higher-class individuals are motivated to volunteer based more on a desire to apply their skills or
to enhance their professional experience.
In fact, many academic institutions and public and private enterprises work to encourage
volunteering by having it as a prerequisite for admission or for employment at higher-level
positions (Meier & Stutzer, 2004). People who are educated and of higher status are more likely
to work in contexts where volunteering is more relevant to their employment experience, so they
may be likely to volunteer out of this type of obligation or by calculation of volunteering’s
professional benefits. They may therefore be less motivated by general happiness and less likely
to receive the same kinds of psychological benefits from volunteering in less skill-based settings.
Perhaps boosts in sense of efficacy, sense of mastery and self-esteem are more specific gains of
advanced professional volunteer activities, as opposed to a general sense of well-being that may
be associated with other types. Once again, any further analysis would require data that
distinguished between categories of volunteering and the types of psychological benefits
associated with them.
Concluding Remarks
This study shows that there is a clear correlation between volunteer activity and general
happiness, although the direction of the causal relationship is not established. Levels of
volunteering and the correlation between general happiness and volunteering are higher
according to certain racial, socioeconomic and cultural categories. Notably, human capital and
religious activity are strong indicators of volunteering, and blacks volunteer more but experience
less additional happiness associated with volunteering than whites. Further studies to enhance
our understanding of the causal relationships between volunteering and happiness would require

19
comprehensive longitudinal data and more than one measure of well-being. A closer look at
categories of volunteer activity distinguished by skill-level and consequential well-being factors
would serve to clarify the social implications of demographic trends in volunteering.
While social capital and human capital can be important causal factors of volunteering, it
is also possible to observe volunteering as a human capital and social capital acquisition. When
volunteering becomes a substitute for paid experience, and when it can be used as a way of
pursuing social change through activism or volunteer organization around a particular social
cause, access to volunteer experience can be recognized as important for both professional and
personal development. A broader understanding of the roles human capital, social capital and
status play in providing access to these kinds of volunteer activity is required to determine
whether or not volunteering is yet another variable contributing to systemic disparities in success
and happiness along racial lines. To paraphrase Wilson and Musick (1998), social capital
requires knowledge, organizational skill, self-assurance, literacy, discretionary income and some
“standing” in a community to be used most effectively. Gaps in education and class between
blacks and whites may be sources of difficulty in converting high social capital (Musick et al,
2000) into access to the types of volunteer activities that are socially influential and contribute to
professional success.
References
US General Social Survey (GSS) 2012 Day, Kathleen M., and Rose Anne Devlin. "The Payoff to Work without Pay: Volunteer Work as
an Investment in Human Capital." The Canadian Journal of Economics 31.5 (1998): 1179-191. JSTOR. Web. 22 Apr. 2014.
Meier, Stephan, and Alois Stutzer. "Is Volunteering Rewarding in Itself? Evidence from a
Natural Experiment." Center for Research in Economics, Management and the Arts,

20
Working Paper 2004 (2004): n. pag. Web. 20 Apr. 2014. Musick, Mark A., John Wilson, and William B. Bynum. "Race and Formal Volunteering: The
Differential Effects of Class and Religion." Social Forces (2000): 1539-570. Web. 3 Apr. 2014.
Piliavin, Jane A., and Erica Siegl. "Health Benefits of Volunteering in the Wisconsin
Longitudinal Study." Journal of Health and Social Behavior 48 (2007): 450-62. Web. 11 Apr. 2014.
Thoits, Peggy A., and Lyndi N. Hewitt. "Volunteer Work and Well-Being." Journal of Health
and Social Behavior 42.2 (2001): 115-31. JSTOR. Web. 11 Apr. 2014. Thoits, Peggy A. "Role-Identity Salience, Purpose and Meaning in Life, and Well-Being among
Volunteers." Social Psychology Quarterly (2012): 360-81. Web. 11 Apr. 2014. "Volunteering in the United States, 2013." U.S. Bureau of Labor Statistics. U.S. Bureau of Labor
Statistics, 25 Feb. 2014. Web. 04 May 2014. <http://www.bls.gov/news.release/volun.nr0.htm>.
Wilson, John. "The Contribution of Social Resources to Volunteering." Social Science Quarterly 79.4 (1998): 799-814. Web. 20 Apr. 2014. Appendix
Table 2 Responses to Question: Have you engaged in volunteer activity in the past year? Subgroups Volunteer:
Yes (%) Volunteer: No (%)
Education High School dropout 21 79 High School Diploma
30 70
Some college 45 55

21
College Degree 53 47 Post-Graduate degree
56 44
Race White 40 60 Black 44 56 Other 31 69 Class Lower class 31 69 Working class 37 63 Middle class 45 55 Upper class 53 47 Gender Male 39 61 Female 41 59 Religious Activity Never 24 76 Less than 1X/year 35 64 1 to 2 times/year 49 60 Several times/Year 56 44 Once a month 58 42 2 to 4 times monthly 67 33 Every week 65 35 Several times weekly
69 31
Trust Yes 52 48 No 34 66 Depends 39 61 Should Govt. Help Not enough 36 64 Not quite enough 39 61 Neutral 35 65 A little too much 49 51 Does too much 49 51
Table 4 Dependent variable: general happiness on a scale from 1 (not too happy) to 3 (very happy) Independent Variable Volactyr Volmonth volchrty Have volunteered in past year (dummy)
0.127 (.035)***
Have volunteered in past month (dummy)
0.075 (.037)*
Volunteered for charity Once a year 0.013

22
(.057) At least 2 – 3 times/year
0.146 (.047)**
Once a month 0.063 (.061)
At least once a week 0.141 (.062)*
Observations 1292 1289 1964 R2 0.0099 0.0031 0.0071 *p < .05 **p < .01 ***p < .001
Figure 1
Education Level by Race
Figure 2
Class Distribution by Race (Percent of Respondents)
0
5
10
15
20
25
30
35
Percent of white respondents
Percent of black respondents
23
0
10
20
30
40
50
60
% Lower class % Working class % Middle class % Upper class
White
Black
Other