Volume 5, Issue 4 (XX) - Advance and Innovative Research
129
Volume 5, Issue 4 (XX) ISSN 2394 - 7780 October - December 2018 UGC University Grants Commission Journal No.: 63571 International Journal of Advance and Innovative Research Indian Academicians and Researchers Association www.iaraedu.com
-
Upload
khangminh22 -
Category
Documents
-
view
3 -
download
0
Transcript of Volume 5, Issue 4 (XX) - Advance and Innovative Research

Volume 5, Issue 4 (XX) ISSN 2394 - 7780 October - December 2018
UGC University Grants Commission
Journal No.: 63571
International Journal of
Advance and Innovative Research
Indian Academicians and Researchers Association www.iaraedu.com
International Journal of Advance and Innovative Research Volume 5, Issue 4 ( XX ): October - December 2018
Editor- In-Chief Dr. Tazyn Rahman
Members of Editorial Advisory Board
Mr. Nakibur Rahman Ex. General Manager ( Project ) Bongaigoan Refinery, IOC Ltd, Assam
Dr. Mukesh Saxena Pro Vice Chancellor, University of Technology and Management, Shillong
Dr. Alka Agarwal Director, Mewar Institute of Management, Ghaziabad
Dr. Archana A. Ghatule Director, SKN Sinhgad Business School, Pandharpur
Prof. (Dr.) Sudhansu Ranjan Mohapatra Dean, Faculty of Law, Sambalpur University, Sambalpur
Prof. (Dr.) Monoj Kumar Chowdhury Professor, Department of Business Administration, Guahati University, Guwahati
Dr. P. Malyadri Principal, Government Degree College, Hyderabad
Prof. (Dr.) Baljeet Singh Hothi Professor, Gitarattan International Business School, Delhi
Prof.(Dr.) Shareef Hoque Professor, North South University, Bangladesh
Prof. (Dr.) Badiuddin Ahmed Professor & Head, Department of Commerce, Maulana Azad Nationl Urdu University, Hyderabad
Prof.(Dr.) Michael J. Riordan Professor, Sanda University, Jiashan, China
Dr. Anindita Sharma Dean & Associate Professor, Jaipuria School of Business, Indirapuram, Ghaziabad
Prof.(Dr.) James Steve Professor, Fresno Pacific University, California, USA
Prof. (Dr.) Jose Vargas Hernandez Research Professor, University of Guadalajara,Jalisco, México
Prof.(Dr.) Chris Wilson Professor, Curtin University, Singapore
Prof. (Dr.) P. Madhu Sudana Rao Professor, Mekelle University, Mekelle, Ethiopia
Prof. (Dr.) Amer A. Taqa Professor, DBS Department, University of Mosul, Iraq
Prof. (Dr.) Himanshu Pandey Professor, Department of Mathematics and Statistics Gorakhpur University, Gorakhpur
Dr. Nurul Fadly Habidin Faculty of Management and Economics, Universiti Pendidikan Sultan Idris, Malaysia
Prof. (Dr.) Agbo Johnson Madaki Faculty, Faculty of Law, Catholic University of Eastern Africa, Nairobi, Kenya
Dr. Neetu Singh HOD, Department of Biotechnology, Mewar Institute, Vasundhara, Ghaziabad
Prof. (Dr.) D. Durga Bhavani Professor, CVR College of Engineering, Hyderabad, Telangana

Prof. (Dr.) Shashi Singhal Professor, Amity University, Jaipur
Prof. (Dr.) Aradhna Yadav Professor, Krupanidhi School of Management, Bengaluru
Prof. (Dr.) Alireza Heidari Professor, Faculty of Chemistry, California South University, California, USA
Prof.(Dr.) Robert Allen Professor Carnegie Mellon University, Australia
Prof. (Dr.) A. Mahadevan Professor S. G. School of Business Management, Salem
Prof. (Dr.) S. Nallusamy Professor & Dean, Dr. M.G.R. Educational & Research Institute,Chennai
Prof. (Dr.) Hemant Sharma Professor, Amity University, Haryana
Prof. (Dr.) Ravi Kumar Bommisetti Professor, Amrita Sai Institute of Science & Technology, Paritala
Dr. C. Shalini Kumar Principal, Vidhya Sagar Women’s College, Chengalpet
Dr. Syed Mehartaj Begum Professor, Hamdard University, New Delhi
Prof. (Dr.) Badar Alam Iqbal Adjunct Professor, Monarch University, Switzerland
Dr. Darshana Narayanan Head of Research, Pymetrics, New York, USA
Prof.(Dr.) D. Madan Mohan Professor, Indur PG College of MBA, Bodhan, Nizamabad
Dr. Rosemary Ekechukwu Associate Dean, University of Port Harcourt, Nigeria
Dr. Sandeep Kumar Sahratia Professor Sreyas Institute of Engineering & Technology
Dr. P.V. Praveen Sundar Director, Shanmuga Industries Arts and Science College
Dr. S. Balamurugan Director - Research & Development, Mindnotix Technologies, Coimbatore
Dr. Manoj P. K. Associate Professor, Cochin University of Science and Technology
Dr. Dhananjay Prabhakar Awasarikar Associate Professor, Suryadutta Institute, Pune
Dr. Indu Santosh Associate Professor, Dr. C. V.Raman University, Chhattisgath
Dr. Mohammad Younis Associate Professor, King Abdullah University, Saudi Arabia
Dr. Pranjal Sharma Associate Professor, Department of Management Mile Stone Institute of Higher Management, Ghaziabad
Dr. Kavita Gidwani Associate Professor, Chanakya Technical Campus, Jaipur
Dr. Lalata K Pani Reader, Bhadrak Autonomous College, Bhadrak, Odisha
Dr. Vijit Chaturvedi Associate Professor, Amity University, Noida
Dr. Pradeepta Kishore Sahoo Associate Professor, B.S.A, Institute of Law, Faridabad
Dr. Marwan Mustafa Shammot Associate Professor, King Saud University, Saudi Arabia
Dr. R. Navaneeth Krishnan Associate Professor, Bharathiyan College of Engg & Tech, Puducherry

Dr. Mahendra Daiya Associate Professor, JIET Group of Institutions, Jodhpur
Dr. G. Valarmathi Associate Professor, Vidhya Sagar Women's College, Chengalpet
Dr. Parbin Sultana Associate Professor, University of Science & Technology Meghalaya
Dr. M. I. Qadir Assistant Professor, Bahauddin Zakariya University, Pakistan
Dr. Kalpesh T. Patel Principal (In-charge) Shree G. N. Patel Commerce College, Nanikadi
Dr. Brijesh H. Joshi Principal (In-charge) B. L. Parikh College of BBA, Palanpur
Dr. Juhab Hussain Assistant Professor, King Abdulaziz University, Saudi Arabia
Dr. Namita Dixit Assistant Professor, ITS Institute of Management, Ghaziabad
Dr. V. Tulasi Das Assistant Professor, Acharya Nagarjuna University, Guntur, A.P.
Dr. Nidhi Agrawal Assistant Professor, Institute of Technology & Science, Ghaziabad
Dr. Urmila Yadav Assistant Professor, Sharda University, Greater Noida
Dr. Ashutosh Pandey Assistant Professor, Lovely Professional University, Punjab
Dr. M. Kanagarathinam Head, Department of Commerce Nehru Arts and Science College, Coimbatore
Dr. Subha Ganguly Scientist (Food Microbiology) West Bengal University of A. & F Sciences, Kolkata
Dr. V. Ananthaswamy Assistant Professor The Madura College (Autonomous), Madurai
Dr. R. Suresh Assistant Professor, Department of Management Mahatma Gandhi University
Dr. S. R. Boselin Prabhu Assistant Professor, SVS College of Engineering, Coimbatore
Dr. V. Subba Reddy Assistant Professor, RGM Group of Institutions, Kadapa
Dr. A. Anbu Assistant Professor, Achariya College of Education, Puducherry
Dr. R. Jayanthi Assistant Professor, Vidhya Sagar Women's College, Chengalpattu
Dr. C. Sankar Assistant Professor, VLB Janakiammal College of Arts and Science
Dr. Manisha Gupta Assistant Professor, Jagannath International Management School
Copyright @ 2018 Indian Academicians and Researchers Association, Guwahati All rights reserved. No part of this publication may be reproduced or transmitted in any form or by any means, or stored in any retrieval system of any nature without prior written permission. Application for permission for other use of copyright material including permission to reproduce extracts in other published works shall be made to the publishers. Full acknowledgment of author, publishers and source must be given. The views expressed in the articles are those of the contributors and not necessarily of the Editorial Board or the IARA. Although every care has been taken to avoid errors or omissions, this publication is being published on the condition and understanding that information given in this journal is merely for reference and must not be taken as having authority of or binding in any way on the authors, editors and publishers, who do not owe any responsibility for any damage or loss to any person, for the result of any action taken on the basis of this work. All disputes are subject to Guwahati jurisdiction only.


International Journal of Advance and Innovative Research Volume 5, Issue 4 ( XX ) : October – December 2018
CONTENTS
Research Papers
OPTIMIZATION OF REACTION CONDITIONS FOR GRAFTING OF SODIUM SALT OF PARTIALLY CARBOXYMETHYLATED SODIUM ALGINATE WITH ETHYL METHACRYLATE
J. H. Trivedi and M. K. Prajapati
1 – 10
COMPUTER BASED INSTRUCTION IN SECOND LANGUAGE LEARNING: FACTS AND GAPS
Areeba Shabbir
11 – 16
SYNTHESIS AND CHARACTERIZATION OF SILVER NANOPARTICLES USING DILLENIA PENTAGYNA ROXB. EXTRACT AT ROOM TEMPERATURE AND THEIR ANTIMICROBIAL STUDIES
Nishikant Shiwankar, Pradnya Anasane, Alka Chatuevedi
17 – 22
IMPACT OF EFFICIENT FUNCTIONAL CLONE SELECTION FROM REPOSITORIES DURING CODE REUSABILITY
K. Vidhya and A. Brunda
23 – 25
LEVERAGING THE SPIRITUALITY IN MARKETING
Dr. Sunil Kumari
26 – 27
STUDY OF CONSUMER BUYING BEHAVIOUR TOWARDS HOME LOAN
Dr. Ravindra Deshmukh
28 – 36
ALGORITHM FOR THE DEVELOPMENT OF REKHA DEUL OF SAPTA RATHA TEMPLES
Dr. Rinku Parashar and Ayush Agrawal
37 – 41
EXPLORING THE ROLE OF CURCUMIN ON GEMCITABINE-INDUCED LIPID PEROXIDATION
Sarbani Dey Ray
42 – 45
CLUSTERED GRAPH BASED RELIABLE ROUTING PROTOCOL FOR VANET USING VEHICLES VELOCITY
Dr. A. Noble Mary Juliet and Dr. N. Suba Rani
46 – 51
STUDY ON DEVELOPMENT AND QUALITY OF WHEY BASE FRUIT BEVERAGE USING TOMATO PUREE
Mane K. A and Pawar V. N.
52 – 58
MATHEMATICAL MODELING OF NON-HOMOGENEOUS STEADY STATE HEAT CONDUCTION PROBLEM IN A THIN CIRCULAR PLATE WITH UNIFORM HEAT SOURCE
Kishor R. Gaikwad
59 – 64
PHARMACOGNOSTICAL AND PHYTOCHEMICAL EVALUATION OF UNANI FORMULATION MAJOON NAJAH AND HPTLC FINGER PRINTING OF ITS EXTRACT
Zeba Afrin, Aisha Siddiqui, M. A. Jafri, Divya Vohora, M. Asif and Mohd Hafizur Rehman Ansari
65 – 73

A THEORETICAL APPROACH TO FORENSIC ACCOUNTING
Amala Siby and Sivakumar S.
74 – 80
EFFECTS OF MOBILE PHONE RADIATION ON HUMAN BIOLOGICAL PERSONALITY
Kusum Sajwan Negi and Sunita Godiyal
81 – 86
PALM HAND VEIN DETECTION USING ICP ALGORITHM FOR PERSON IDENTIFICATION
A Jeyakalyani, Dr. N. Suguna , Dr. S. Arivalagan
87 – 89
A CRITICAL ANALYSIS: SELECTED SERVICE INDUSTRIES
Dr. Mehal Pandya
90 – 97
ORIENTATIONS VS CONSUMER BEHAVIOUR: AN EMERGING MULTIDISCIPLINARY APPROACH TO CONSUMER PSYCHOLOGY
Dr. Vishal Soodan and Dr. Akhilesh Chandra Pandey
98 – 101
Ce(IV)-ION INITIATED GRAFT COPOLYMERIZATION OF METHACRYLATES ONTO SODIUM SALT OF PARTIALLY CARBOXYMETHYLATED SODIUM ALGINATE: CHARACTERIZATION AND COMPARISON OF RELATIVE REACTIVITY
J. H. Trivedi and M. K. Prajapati
102 – 111
IMPLICATIONS IN THE BANKING & FINANCIAL REFORMS IN SOUTH ASIAN COUNTRIES: WITH SPECIAL REFERENCE TO INDIA
Aanchal Nigam and Abhishek Pal
112 - 119

International Journal of Advance and Innovative Research Volume 5, Issue 4 (XX): October - December, 2018
1
ISSN 2394 - 7780
OPTIMIZATION OF REACTION CONDITIONS FOR GRAFTING OF SODIUM SALT OF PARTIALLY CARBOXYMETHYLATED SODIUM ALGINATE WITH ETHYL METHACRYLATE
J. H. Trivedi1 and M. K. Prajapati2 1Department of Chemistry, Sardar Patel University, Vallabh Vidyanagar
2Gujarat Industrial Research and Development Agency, Vadodara
ABSTRACT Graft copolymerization of ethyl methacylate (EMA) onto sodium salt of partially carboxymethylated sodium alginate (Na-PCMSA, DS = 0.605) was studied with ceric ammonium nitrate (CAN) as a redox initiator in an aqueous medium. The reaction conditions were optimized by varying concentrations of CAN, nitric acid and EMA as well as time, temperature and amount of substrate. The resulting copolymer (Na-PCMSA-g-PEMA) was characterized by a Fourier transform infrared (FTIR) spectroscopy. The FTIR spectrum of the product showed absorption due to the presence of ester bonds as a proof of grafting. The influence of the reaction conditions on the grafting yields has been studied. A suitable mechanism to explain initiation, propagation and termination of graft copolymerization has also been proposed. The kinetics of the graft copolymerization of EMA onto Na-PCMSA( DS = 0.605) has also been studied.
Keywords: Ethyl methacrylate, Free radical initiator, Graft copolymer, Kinetics and Mechanism, Optimal reaction conditions, Sodium salt of partially carboxymethylated sodium alginate
INTRODUCTION Graft copolymerization is a useful technique for modifying the properties of the natural polymers. Among natural polymers, sodium alginate (SA) is an industrially important marine polysaccharide product extracted from brown seaweeds. Alginates are unbranched copolymers of (14) linked -D-mannuronic acid (M) and -L-guluronic acid [G] residue (Cottrell and Kovacs, 1980). Salts of alginates, due to its excellent physical and chemical properties, are used in a wide range of applications like food, leather, pharmaceutical and industrial. Even though SA enjoys a number of applications, however, like other biopolymers, it also suffers from the drawback of being susceptible of microbial attack. In order to overcome with this drawback, the modification of SA may be carried out by grafting of different vinyl monomers onto it, using chemical as well as radiation methods (Shah, Patel and Trivedi, 1994; Shah, Patel and Trivedi, 1994; Shah, Patel and Trivedi, 1994; Shah, Patel and Trivedi, 1996; Liu et al., 2005; Liu et al., 2005; Sand et al., 2010).
In the present investigation, we have modified SA by carrying out carboxymethylation of it, as the introduction of carboxymethyl groups in the SA molecule will enhance the behavior of SA towards grafting. Literature survey reveals that the reports on the modification of sodium salt of partially carboxymethylated sodium alginate (Na-PCMSA) through grafting are scantly available (Patel, Patel and Trivedi, 1999; Lin et al. 2010). As a part of our research program, therefore, we have modified Na-PCMSA ( DS = 0.605) through grafting of different vinyl monomers onto it using chemical method (Trivedi and Prajapati, 2016; Trivedi and Prajapati, 2015; Trivedi and Prajapati, 2018). This has been done not only to develop specialty polymeric materials but also to elucidate the grafting reaction mechanism studied in the present work.
EXPERIMENTAL Materials Sodium alginate (SA) was kindly supplied by Loba Chemie Pvt. Ltd., Mumbai. Ethyl methacrylate (Fluka, Switzerland) was purified by treating it with alkali solution in the usual manner. CAN (Qualigens, India) was used as received. Analar grade nitric acid was used. Fresh solutions of the initiator prepared by dissolving the required amount of CAN in nitric acid were used. All other reagents and solvents used were of reagent grade. Purified nitrogen gas and low conductivity water were used for carrying out graft copolymerization reactions. The preparation and purification of the sample of sodium salt of partially carboxymethylated sodium alginate was done as per the procedure described in our earlier communication (Trivedi and Prajapati, 2015). The average degree of substitution, DS , of the sample of Na-PCMSA was determined by following the acid-wash method (Eyler, Klug and Diephuis, 1947) and the value of the DS of Na-PCMSA sample was found to be 0.605.

International Journal of Advance and Innovative Research Volume 5, Issue 4 (XX): October - December, 2018
2
ISSN 2394 - 7780
Procedure for Grafting The grafting of EMA onto Na-PCMSA ( DS = 0.605) using CAN as a redox initiator was carried out as per the procedure described earlier (Trivedi and Prajapati, 2016). However, the reaction conditions which where varied are: Weight of Na-PCMSA ( DS = 0.605) = 0.5 to 3.0 g (dry basis); [CAN] = 10.0 x 10⁻³ M to 80.0 x 10⁻³ M; [HNO3] = Nil to 1.0 M; [MMA] = 0.051 to 0.506 M; Reaction time = 0.5 to 10h; Temperature = 15oC to 55oC and Total volume = 150 mL.
After completion of the reaction, the reaction mixture was immediately poured in the excess of methanol to coagulate the polymer. The crude copolymer product was filtered, repeatedly washed with nitric acid as well as with 90% methanol and finally washed with pure methanol. The crude copolymer thus obtained was dried under vacuum at 40oC.
The crude copolymer then was extracted with absolute ethyl alcohol to remove the homopolymer (PEMA) for 48h. After the complete removal of PEMA, the pure graft copolymer was dried at 40oC under vacuum to a constant weight.
The grafting yields (%G, %GE and %Hp) as well as the rates of grafting (Rg) and polymerization (Rp) were calculated as follows:
210 r homopolyme of Weight
graftedPolymer ofWeight (%G) Grafting Percentage (i)
210
r homopolyme of Weight graftedPolymer ofWeight
graftedPolymer ofWeight (%GE) Efficiency Grafting Percentage (ii)
%GE100 )p(%Hr Homopolyme % (iii)
Isolation of grafted chains The grafted chains (PEMA) were isolated from the graft copolymer sample of Na-PCMSA containing PEMA by carrying out hydrolysis of the graft copolymer sample following the Brockway and Seaberg method (Brockway and Seaberg, 1967).
Fourier Transform Infrared measurements Fourier transform infrared spectra of Na-PCMSA, Na-PCMSA-g-PEMA and PEMA were taken in the wavelength region between 400 and 4000 cm-1 at the ambient temperature, using Nicolet Impact 400D Fourier Transform Infra Red Spectrophotometer with KBr discs.
RESULTS AND DISCUSSION Synthesis of the graft copolymer, Na-PCMSA-g-PEMA
In the present work of Ce(IV)- initiated graft copolymerization of EMA onto Na-PCMSA ( DS = 0.605), the oxidation reaction of Ce(IV) with Na-PCMSA will occur preferably at the C2-C3 position and to a lesser
)1- .s1-L (mol. )(R
tion Polymeriza of Rate (iv)
p
310x
(mL) mix.reaction theof Volume
(sec) time
Reactionmonomer
of Wt.Mol.r homopolyme of Weight graftedPolymer ofWeight
)1- .s1-L (mol. )(R
zation CopolymeriGraft of Rate (v)
g
310x
(mL) mix.reaction theof Volume
(sec) time
Reactionmonomer
of Wt.Mol. graftedPolymer ofWeight
(1)
(2)
(3)
(4)
(5)
)1- .s1-L (mol. )(R
rization Homopolyme of Rate (vi)
h
310x
(mL) mix.reaction theof Volume
(sec) time
Reactionmonomer
of Wt.Mol.r homopolyme ofWeight
(6)

International Journal of Advance and Innovative Research Volume 5, Issue 4 (XX): October - December, 2018
3
ISSN 2394 - 7780
extent at the C6 primary hydroxyl as a result of one electron process. The Ce(IV) ion initially forms a complex which is then reduced to Ce(III) ion with the formation of free radicals at either C2 or C3 position on the backbone as shown in Fig.1, which represents the mechanistic pathway for the synthesis of Na-PCMSA-g-PEMA. A monomer is also known to form a complex with Ce(IV) ions that dissociates to give a monomer radical, which further propagates to give polymeric chains. These growing polymeric chains attack to the active sites on Na-PCMSA ( DS = 0.605) to produce the graft copolymer (Na-PCMSA-g-PEMA) or terminate to give the homopolymer (PEMA).
OCOOR
OH OHO
OOHO
O O
COOR
COOC2H5COOC2H5
n
Termination :
XMn + 1 + XMn + 1
Na-PCMSA-g-PEMA
CH3CH3
Fig. – 1: The mechanistic pathway for the synthesis of Na-PCMSA-g-PEMA

International Journal of Advance and Innovative Research Volume 5, Issue 4 (XX): October - December, 2018
4
ISSN 2394 - 7780
Determination of Optimum Reaction Conditions The reaction conditions were optimized by varying the concentrations of backbone, initiator, nitric acid, monomer along with reaction time and temperature and their effect on grafting yields (%G and %GE) has also been studied.
Effect of amount of Na-PCMSA The effect of the amount of Na-PCMSA on %G and %GE was studied by varying the amount of Na-PCMSA (0.5-3.0g) keeping other reaction variables constant. Fig.2 (a) shows that both the values %G and %GE, increased initially up to 1.0 g of Na-PCMSA, beyond which they decreased with further increase in the amount of Na-PCMSA. The initial increase may be due to the fact that the reactive sites increase with increase in the amount of Na-PCMSA. The decrease beyond the amount of 1.0g may be attributed to the destruction of radical activity on the backbone soon after it is formed due to the termination between backbone-backbone and backbone-primary radicals. Fig. 2(b) represents the relationship between the value of rate of copolymerization (Rg) and the amount of Na-PCMSA. As is evident, the value of Rg increases up to Na-PCMSA = 1.0 g but beyond the optimum concentration of Na-PCMSA, the value of Rg tends to level off indicating the similar behavior with regard to the value of %G [cf. Fig. 2(a)].
Fig. – 2: (a) Effect of amount of Na-PCMSA on (●) - %G; or (▲) - % GE and (b) Relationship
between (■) - Rg x 106 and the amount of NA-PCMSA.
Effect of Initiator concentration The effect of variation in CAN concentration on %G and %GE is shown in Fig. 3(a). CAN concentration was increased from 10 x 10-3 to 80 x 10-3 mol/L, at constant concentrations of nitric acid (0.10 mol/L) and monomer (0.203 mol/L) at a reaction temperature of 35oC. It is evident from the Fig. 3(a) that with increasing ceric-ion concentration, the values of %G and %GE are found to be increased and reached the maximum values of %G = 305.73% and %GE = 96.87% at [Ce4+] = 0.03 mol/L. However, the values of %G and %GE are found to be decreased with further increase in [CAN] beyond the optimal value of initiator concentration (0.03mol/L).
Thus, the observed increase in the grafting yields within the concentration range of 0.01-0.03 mol/L with EMA [cf. Fig. 3(a)] may be explained on the basis of the fact that, within this concentration range, the formation of sufficient numbers of ceric(IV) ions in the reaction mixture takes place which are ultimately consumed in the formation of active sites on the Na-PCMSA backbone to facilitate graft copolymerization of EMA onto it. The observed decrease in %G and %GE beyond the optimum concentration (0.03 mol/L) of ceric(IV) ions [at constant concentration of nitric acid (0.10 mol/L)] may be attributed to the decrease in ratio of nitric acid to CAN leading to the production of hydrated form of ceric (IV) ions which are unable to produce active sites onto the Na-PCMSA backbone. However, the hydrated ceric (IV) ions would participate preferably in the formation of homopolymer (PEMA) than in formation of graft copolymer.

International Journal of Advance and Innovative Research Volume 5, Issue 4 (XX): October - December, 2018
5
ISSN 2394 - 7780
Fig.- 3: Influence of (a) ceric ammonium nitrate (CAN) concentration; (b) nitric acid concentration; and (c) ethyl
methacrylate (EMA) concentration and (d) reaction temperature on: () - %G; or (▲) - %GE.
Effect of Nitric Acid Concentration The concentration of nitric acid was varied from nil to 1.0M keeping the concentrations of all other reagents, as well as time and temperature constant. The effect of acid concentration on %G and %GE is shown in Fig. 3(b). It becomes evident from this figure that %G increases with an increase of acid concentration up to 0.3 mol/L beyond which it decreases. Thus, in the present case the optimum concentration of nitric acid is 0.3 mol/L which affords maximum values of %G (238.82%) and %GE (96.10%).
The observed increase in %G with increasing HNO3 concentration is attributed to the fact that the concentration of Ce4+ increases with an increasing concentration of acid, which forms a complex with Na-PCMSA and hence facilitates grafting. However, at higher concentration of HNO3 i.e. beyond the optimal concentration (0.3 mol/L) of HNO3, [Ce4+] is known to accelerate the termination of growing polymeric grafting chains, resulting the decrease in %G. The value of %GE also varied in similar manner with the concentration of HNO3 [cf. Fig. 3(b)]. The observed decrease in %GE beyond the optimum acid concentration could be attributed to the reduction in ceric-Na-PCMSA complex formation as well as increase in polymer termination rates.
Effect of Monomer Concentration The results reported in Fig. 3(c) show that there is rapid increase in %G with the increase concentration up to 0.203 mol/L beyond which %G shows a tendency to level off at higher monomer concentration. However, %GE also increases in the beginning very slowly and thereafter it decreases. The observed initial increase in the grafting yields is attributed to increasing supply of monomer (EMA) to Na-PCMSA macroradicals, however, the decline in %GE at higher concentration of EMA could be ascribed to the chain transfer to excess of monomer molecules in the vicinity of growing ends of grafted chains (Gao et al., 1994). The leveling off the grafting after saturation could be attributed to the depletion of grafting sites on the Na-PCMSA molecule. Consequently, the ungrafted EMA tends to form homopolymer (PEMA).
Effect of Temperature The grafting reactions were carried out at different temperatures (15-55oC) keeping other variables constant. The effect of temperature on %G and %GE is shown in Fig. 3(d). Results show that maximum %G obtained at 30oC and its value decreases with a further increase in temperature. The dependence of %G on temperature can be ascribed to the enhancement of the rate of diffusion of monomer. With an increase in temperature beyond 30oC, graft copolymerization occurs with poor selectivity and various hydrogen abstraction and chain transfer reactions also might be accelerated at higher temperature leading to the decrease of the grafting yields.
Effect of Reaction Time The influence of reaction time on grafting yields has also been studied by varying the polymerization reaction time from 0.5 to 10h keeping all other reaction parameters constant and the results are shown in Fig. 4(a). It can be seen from this figure that the value of %G increases gradually with increase in time up to 4h, after which it tends to level off. However, the values of %GE also increases slowly in the beginning and decreases beyond the optimum value of 4h. The maximum values of the grafting yields achieved at 4h are %G = 220.01 and % GE = 95.12. The

International Journal of Advance and Innovative Research Volume 5, Issue 4 (XX): October - December, 2018
6
ISSN 2394 - 7780
Fig. – 4: Effect of Reaction Time on (a) (●) - %G; or (▲) - % GE; (b) (●) - Rp x 106; and (c) (■) -Rg x106;
or (▲) - Rh x 106.
observed increase in %G is due to the increase in the number of grafting sites in the initial stage of the reaction but after 4h of the reaction time, their number remains more or less constant. Also, as time progresses, the grafted chains may act as diffusion barriers which impede the diffusion of monomer into the backbone. As a result of which the formation of homopolymer (PEMA) is favored thereby reducing % GE.
The influence of reaction time on Rp, Rg and Rh in the case of grafting of EMA onto ( DS = 0.605) is represented in Figs. 4(b) and 4(c). It is evident from Fig. 4(b) that the value of the rate of polymerization (Rp) decreases with increasing time which may be due to the fact that the relative increment in the total yield is very much less when compared to that of time, and in the expression for Rp, the numerator becomes almost constant and when the time for the reaction is raised, the denominator becomes larger and Rp will reduce accordingly [cf. Fig. 4(b)]. Since Rg and Rh are related to Rp, the relative decrease of Rg and Rh with time can be understood [Fig.4(c)]. Further, the observed decrease in the values of Rp, Rg and Rh may also be due to the depletion of initiator and monomer concentrations with time.
Thus, from the above discussion, the optimized reaction conditions obtained for grafting of EMA onto Na-PCMSA ( DS = 0.605) were: Na-PCMSA ( DS = 0.605) = 1.0 g (dry basis); [CAN] = 0.03 mol.L-1; [HNO3] = 0.30 mol.L-1; [EMA] = 0.203 mol.L-1; Time = 3 h; Temperature = 30oC and Total Volume = 150 mL. The highest percentage of grafting (290.45%), percentage of grafting efficiency (95.99%) and the lowest homopolymer content (4.21%) were achieved under the above referred optimized reaction conditions.
KINETICS OF GRAFT COPOLYMERIZATION The mechanism of free radical graft copolymerization of ethyl methacrylate ( DS = 0.605) is expected to proceed as per the kinetic scheme suggested earlier by us (Trivedi et al., 2005). In light of the said proposed scheme we have also suggested the expressions for the values of the rates of polymerization (Rp), graft copolymerization (Rg) and homopolymerization (Rh).
Fig. – 5: (a) Plot of (●) - Rg x106 versus [CAN]0.5 and (b) Plot of (●) – Rp x 106 versus [M]2 & (▲) - Rp x 106
versus 1/[Ce+4]
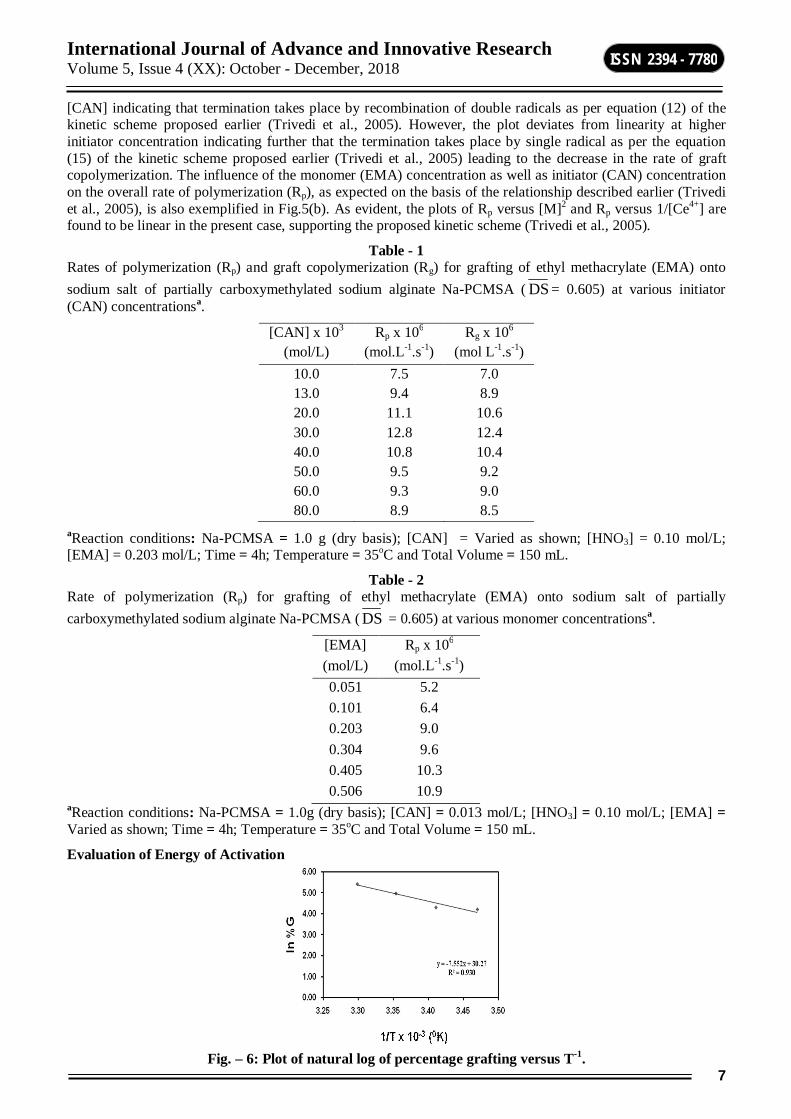
The experimental results of the present investigation, as represented in Tables 1 and 2, have been analyzed in terms of the proposed kinetic scheme (Trivedi et al., 2005) and accordingly the plot of Rg versus [CAN]0.5 should be linear at lower [CAN]. Such type of typical plot obtained in the present case is shown in Fig.5(a). As shown in the figure, the plot is found to be linear at lower
International Journal of Advance and Innovative Research Volume 5, Issue 4 (XX): October - December, 2018
7
ISSN 2394 - 7780
[CAN] indicating that termination takes place by recombination of double radicals as per equation (12) of the kinetic scheme proposed earlier (Trivedi et al., 2005). However, the plot deviates from linearity at higher initiator concentration indicating further that the termination takes place by single radical as per the equation (15) of the kinetic scheme proposed earlier (Trivedi et al., 2005) leading to the decrease in the rate of graft copolymerization. The influence of the monomer (EMA) concentration as well as initiator (CAN) concentration on the overall rate of polymerization (Rp), as expected on the basis of the relationship described earlier (Trivedi et al., 2005), is also exemplified in Fig.5(b). As evident, the plots of Rp versus [M]2 and Rp versus 1/[Ce4+] are found to be linear in the present case, supporting the proposed kinetic scheme (Trivedi et al., 2005).
Table - 1 Rates of polymerization (Rp) and graft copolymerization (Rg) for grafting of ethyl methacrylate (EMA) onto sodium salt of partially carboxymethylated sodium alginate Na-PCMSA ( DS = 0.605) at various initiator (CAN) concentrationsa.
[CAN] x 103 (mol/L)
Rp x 106 (mol.L-1.s-1)
Rg x 106 (mol L-1.s-1)
10.0 7.5 7.0 13.0 9.4 8.9 20.0 11.1 10.6 30.0 12.8 12.4 40.0 10.8 10.4 50.0 9.5 9.2 60.0 9.3 9.0 80.0 8.9 8.5
aReaction conditions: Na-PCMSA = 1.0 g (dry basis); [CAN] = Varied as shown; [HNO3] = 0.10 mol/L; [EMA] = 0.203 mol/L; Time = 4h; Temperature = 35oC and Total Volume = 150 mL.
Table - 2 Rate of polymerization (Rp) for grafting of ethyl methacrylate (EMA) onto sodium salt of partially carboxymethylated sodium alginate Na-PCMSA ( DS = 0.605) at various monomer concentrationsa.
[EMA] (mol/L)
Rp x 106 (mol.L-1.s-1)
0.051 5.2 0.101 6.4 0.203 9.0 0.304 9.6 0.405 10.3 0.506 10.9
aReaction conditions: Na-PCMSA = 1.0g (dry basis); [CAN] = 0.013 mol/L; [HNO3] = 0.10 mol/L; [EMA] = Varied as shown; Time = 4h; Temperature = 35oC and Total Volume = 150 mL.
Evaluation of Energy of Activation
Fig. – 6: Plot of natural log of percentage grafting versus T-1.

International Journal of Advance and Innovative Research Volume 5, Issue 4 (XX): October - December, 2018
8
ISSN 2394 - 7780
The natural log of %grafting (ln%G) versus 1/T was plotted for the initial portion of the curve i.e. 15o-30oC [cf. Fig. 3(d)], as shown in Fig.6. and these values are found to fall on a straight line with a good correlation coefficient value. The least square value of the overall activation energy of grafting (Eg) was calculated and was found to be 62.78 kJ/mol
Evidence of Grafting FTIR Spectra Fig. 7(a), 7(b) and 7(c) represent the IR spectra of Na-PCMSA ( DS = 0.605), Na-PCMSA-g-PEMA (%G = 290.45%),) and PEMA respectively. It is evident from Fig. 7(a) that the absorption peak appeared at 1745 cm-
1 is a strong one and is assigned to C=O stretching, suggesting the
presence of moiety in the Na-PCMSA. The presence of –COO moiety present in in Na-PCMSA is also evident from the absorption bands appeared at 1620cm-1 and 1420 cm-1 [cf. Fig. 7(a)].
The IR spectrum of the graft copolymer, Na-PCMSA-g-PEMA [Fig. 7(b)] shows absorption bands of the Na-PCMSA as well as an additional strong absorption band at 1734cm-1 assigned to C=O stretching of ester group (-COOCH3), characteristic of the methacrylates.
Fig. – 7: IR spectra of (a) Na-PCMSA ( DS = 0.605), (b) Na-PCMSA-g-PEMA (%G = 290.45) and (c)
PEMA samples.
The IR spectrum of PEMA [Fig. 7(c)] indicates the presence of C=O stretching at 1734cm-1. This may be attributed to the fact that the hydrolysis of the graft copolymer, Na-PCMSA-g-PEMA, gives back ethyl methacrylate. Thus, the results of Figs. 7(a) to 7(c) provide a substantial evidence of grafting of EMA onto Na-PCMSA ( DS = 0.605).
CONCLUSIONS Polyethyl methacrylate (PEMA) was successfully grafted onto Na-PCMSA ( DS = 0.605) under inert atmosphere via graft copolymerization of ethyl methacrylate (EMA) using a ceric-saccharide redox initiating system. The variation in the amount of grafting changes versus the reaction variables was investigated to optimize the graft copolymerization. The optimum conditions were found to be as follows: Na-PCMSA = 1.0 g
C O
O CH2 C O
O

International Journal of Advance and Innovative Research Volume 5, Issue 4 (XX): October - December, 2018
9
ISSN 2394 - 7780
(dry basis); [CAN] = 0.03 mol.L-1; [HNO3] = 0.30 mol.L-1; [EMA] = 0.203 mol.L-1; Time = 3 h; Temperature = 30oC and Total Volume = 150 mL. The maximum %G and %GE obtained under these conditions were 290.45% and 95.79% respectively. Minimum homopolymer content was 4.21% under the optimal conditions. The characterization of graft copolymer was carried out by using Fourier Transform Infrared Spectroscopy (FTIR). Characteristics signal of carboxyl group was observed at 1734 cm-1 which belongs to the poly(ethyl methacylate) segments in the graft copolymer.
ACKNOWLEDGMENTS The authors gratefully acknowledge the financial support provided by the Ministry of Earth Sciences (MoES), New Delhi, India through Project No. 11-MRDF/1/40/P/07, dtd. 21/2/2008.
REFERENCES Cottrell, I.W. and Kovacs, P. (1980). In Hand Book of Water Soluble Gums and Resins: Davidson, R. L.,
Ed., Mc Graw Hill Inc: New York, Chapter 2.
Shah, S.B., Patel, C.P. and Trivedi, H.C. (1994). Kinetics and reaction mechanism of fenton’s-reagent-initiated graft copolymerization of acrylonitrile onto sodium alginate. Journal of Applied Polymer Science, 52(7): 857-860.
Shah, S.B., Patel, C.P. and Trivedi, H.C. (1994). Ceric-induced grafting of ethyl-acrylate onto sodium alginate. Die Angewandte Makromolekulare Chemie, 214(1): 75-89.
Shah, S.B., Patel, C.P. and Trivedi, H.C. (1994). Ceric-induced grafting of acrylate monomers onto sodium alginate. Carbohydrate Polymers, 26(1): 61-67.
Shah, S.B., Patel, C.P. and Trivedi, H.C. (1996). Thermal behaviour of graft copolymers of sodium alginate. Die Angewandte Makromolekulare Chemie, 235(1): 1-13.
Liu, Y., Li, Y., Yang, l., Liu, Y. and Bai, L. (2005). Graft Copolymerization of Methyl Acrylate on to Sodium Alginate Initiated by Potassium Diperiodatocuprate. Iranian Polymer Journal. 14(5): 457-463.
Liu, Y, Yang, L., Li, J. and Shi, Z. (2005). Grafting of methyl methacrylate onto sodium alginate initiated by potassium ditelluratoargentate(III). Journal of Applied Polymer Science, 97(4): 1688-1694.
Sand, A., Yadav, M., Mishra, D. K. and Behari, K. (2010). Modification of alginate by grafting of N-vinyl-2-pyrrolidone and studies of physicochemical properties in terms of swelling capacity, metal-ion uptake and flocculation. Carbohydrate Polymers, 80(4): 1147-1154.
Patel, G.M., Patel, C.P. and Trivedi H.C. (1999). Ceric-induced grafting of methyl acrylate onto sodium salt of partially carboxymethylated sodium alginate. European Polymer Journal, 35(2): 201-208.
Lin H., Zhou J., Yingde C. and Gunasekaran S. (2010). Synthesis and characterization of pH-and salt-responsive hydrogels based on etherificated sodium alginate. Journal of Applied Polymer Science, 115(6): 3161-3167.
Trivedi, J. H and Prajapati, M. K. (2016). Optimization of ceric ammonium nitrate initiated graft copolymerization of acrylonitrile onto sodium salt of partially Carboxymethylated sodium alginate. International Journal of Research in Engineering and Applied Sciences, 6(10): 57-74.
Trivedi, J. H and Prajapati, M. K. (2015). Graft copolymerization of Ethyl acrylate onto sodium salt of partially carboxymethylated sodium alginate: Optimal reaction variables and characterization. International Journal of Research in Engineering and Applied Sciences, 5(5): 107-117.
Trivedi, J. H and Prajapati, M. K. (2018). Synthesis, Characterization and Swelling behavior of superabsorbent hydrogel, H-Na-PCMSA-g-PAN. In Polymer Research: Communicating Current Advances, Contributions, Applications and Educational Aspects, Polymer Science Book Series No. 2, Ed., Vilas A. M., Formatex Research Centre, Spain, p. 62-75.
Trivedi, J.H. and Prajapati M.K. (2015). Carboxymethyl Sodium alginate: Synthesis and Characterization. Prajna- Journal of Pure and Applied Sciences, 22 & 23: 24-28.
Eyler, H.W., Klug, E.D. and Diephuis, F. (1947). Determination of Degree of Substitution of Sodium Carboxymethylcellulose. Analytical Chemistry, 19(1): 24-27.

International Journal of Advance and Innovative Research Volume 5, Issue 4 (XX): October - December, 2018
10
ISSN 2394 - 7780
Brockway, C. E. and Seaberg, P.A. (1967). Grafting of polyacrylonitrile to granular corn starch, Journal of Polymer Science Part A-1: Polymer Chemistry, 5(6): 1313-1326.
Gao J., Tian, R., Yu, J. and Duan, M. (1994). Graft copolymers of methyl methacrylate onto canna starch using magnetic pyrophosphate as an initiator. Journal of Applied Polymer Science, 53(8): 1091-1102
Trivedi, J. H., Kalia, K., Patel, N. K. and Trivedi, H. C. (2005), Ceric-induced grafting of acrylonitrile onto sodium salt of partially carboxymethylated guar gum, Carbohydrate Polymers, 60(1): 117-125.

International Journal of Advance and Innovative Research Volume 5, Issue 4 (XX): October - December, 2018
11
ISSN 2394 - 7780
COMPUTER BASED INSTRUCTION IN SECOND LANGUAGE LEARNING: FACTS AND GAPS
Areeba Shabbir Research Scholar, Department of ELT, Aligarh Muslim University Aligarh
ABSTRACT As the expansion of technology advances, it has become feasible to integrate computer instruction into the language classroom. There is a strong tradition of Computer Assisted Language Learning (CALL), Information and Communication Technology (ICT) and Technology Enhanced Learning (TEL) addressing materials and software packages that aid and promote cognitive development and linguistic performance. A number of agencies like Bravia, NCERT, BBC, Longman and Macmillan have come with useful audio and video materials for teachers and learners of English. The purpose of introducing technology is to provide students with resources and experiences that facilitate practice in listening, speaking, reading and writing. However, there are problems which arise leading to inability to integrate Computer Based Instruction in language classroom. Many of the teachers and learners are not aware of the importance of using technology in language classroom. At times, equipment may not be placed in easily accessible locations. Hardware and software often pose problems for teachers in the classroom and in just time technical support may be unavailable. Thus, this leads to the lack of upgrades, maintenance and ongoing professional development. This paper aims to provide a comprehensive view with special reference to facts and gaps of Computer Based Instruction into the English language classroom. It also explores the view of students and teachers about the English Language Class, experience using technology, access to technological infrastructure, support available, obstacles to the use of technology in learning and teaching, skills and attitudes to technology.
Keywords: Assisted Language Learning, Communication technology, Computer Based Instruction, English Language Teaching and, Technology Enhanced Learning.
INTRODUCTION In teaching and learning of English, the Computer based technologies such as Computer Assisted Language Learning, Multimedia, Technology Enhanced Language Learning, Information and Communication Technology plays a crucial role. Next to its commercial importance, it is seen as the pedagogical tool for independent research and practice in academics. The last two decades have encountered a revolutionary change due to the onset of the latest invention of software, multimedia and the way teaching and learning is done. The rapid pace in the development of IT sector has offered a better technique and methodology to explore the new teaching framework.
Computer technology is an important component for English language learning which gives learners the true picture of language as it is realized by native men and women in real life and it also make them experience the proper use of language in the appropriate context.
As the expansion of technology advances, it has become more practical to incorporate technologies directly into the English language classrooms into the language teaching. There is a strong tradition of Computer Assisted Language Learning (CALL), Information and Computer Technology (ICT) and Technology Enhanced Learning (TEL) addressing materials, software packages and technologies that aid and promote cognitive development and linguistic performance through contextualized learning. It emphasizes that language educators and learners, both, should give attention to technologies embedded in larger social and cultural contexts.
The purpose of introducing computer based technology is to provide students with resources and experiences that will facilitate practice in listening, speaking, reading and writing. However, there are some problems which arise leading to the inability to integrate technology in the classroom. Regardless of the various tools available, teacher trainees prefer to use the traditional method in their classroom teaching. They are contented with just using the conventional ways of teaching methods. At times, equipments may not be placed in accessible locations. Hardware and software often pose problems for teachers in the classroom, and in just time technical support may be unavailable. Teachers and students may lack the time and the motivation to learn technologically skills. Infrastructure and computer software are not affordable for every student. Further professional development activities may not provide ongoing, hands- on training for teachers or practical strategies for implementing technology into lesson plans. Initial technology funding may not be sustained. Thus, this leads to the lack of upgrade, maintenance and ongoing professional development.

International Journal of Advance and Innovative Research Volume 5, Issue 4 (XX): October - December, 2018
12
ISSN 2394 - 7780
REVIEW OF LITERATURE I) Egbert, et al. (1991) pointed out that access and exposure to authentic materials in the target language are essential for successful language learning. However, for many learners such access is often limited. Hence, educators have looked ICT and CALL as solutions to the problem.
II) Shea (2000) in his research compared the time students needed to complete their language tasks using captioned video versus Interactive Video Disc and concluded that the students using Interactive Video Disc completed the task faster (p<0.05).
III) Al- Seghar (2001) compared ESL students’ vocabulary learning in different annotation conditions and found that video clip in combination with a text definition is more effective in teaching unknown vocabulary than a picture in combination with a text definition. The variety of modality cues can reinforce each other and are linked together in meaningful ways to provide in depth experience.
IV) Holland (1991) tested the effectiveness of a virtual conversation program in Arabic at the Defense Language Institute. The program enabled the students to interview virtual native speaking characters orally with speech recognition technology. After with these virtual characters for at least hours per day for four days, the participants speaking and reading skills increased ‘significantly’ while their listening skill increased ‘convincingly’.
V) Nagata (1992), summarized from her research findings that traditional feedback may be as good as the intelligent feedback for helping learners to correct word- level errors while computer feedback may be more helpful for understanding and correcting sentence level errors.
RESEARCH QUESTIONS ii) What are the efficient technologies that English Language Teachers use to support their classroom?
iii) Do students and teachers have access to technological infrastructure?
iv) What are the attitudes of teachers and learners towards the use of technology in EFL/ESL classroom?
RESEARCH DESIGN The research utilized a quantitative and qualitative research methodology. The data was collected through a questionnaire. A set of questionnaire was developed for students specifically for the purpose containing different types of questions such as likert scale open ended and Yes/No questions. The questionnaire was piloted to a group of 5 students in order to assess its validity before distributing it to the 25 students of M.A. ELT Fourth and Second Semester. They were guided with brief explanation of how to complete the questionnaire. Answering the questionnaire had taken not more than 10 minutes.
The data was analysed manually as well as by using Microft Excel 2013.
TEACHERS’ INTERVIEW The interview was conducted with ten teachers of the Department of English at Aligarh Muslim University. The interview south information about the teachers’ knowledge on their computer skills, computer facilities and courses provided by university, obstacles to the use of multimedia technology in teaching, reasons for using multimedia/technology and attitudes to technology .
SIGNIFICANCE OF THE STUDY There are some important elements of this study for the incorporation of multimedia into classroom teaching. These are follows.
1) EFL/ESL teachers have to accept the fact that teaching is no longer confined to four walls of their classrooms or even in resource centers such as library and media rooms. They are facing a reality that the education field has gone beyond their imagination whereby they can get the information only at their fingertips. Thus, the technology that has changed the world is also essential to our education system so that it allows limitless learning.
2) Besides that incorporation of multimedia technology into the EFL/ESL classroom can increase awareness among teachers and students benefitting the use of technology. It also caters to students’ learning preferences as it incorporates five elements of multimedia into teaching: text, audio, graphic, animation as well as video.
ANALYSIS OF QUESTIONNAIRE Q1) Which of the following systems you own? (You can choose more than one answer)
1-A laptop? 2- A desktop computer? 3- A smart phone?

International Journal of Advance and Innovative Research Volume 5, Issue 4 (XX): October - December, 2018
13
ISSN 2394 - 7780
1 2 3 Total 2nd Semester 11 10 18 39 4th Semester 15 4 23 42 Total 26 14 41 81
1) Owing computer/tablet/laptop help (s) in my studies:
1- Agree 2- Strongly Agree 3- Disagree 4- Cannot say
1 2 3 4 Total 2nd Semester 15 10 0 0 25 4th Semester 9 16 0 0 25 Total 24 26 0 0 50
2) How frequently do you use laptop/ computer/tablet in your English Language Classroom?
1- Sometimes 2) Usually 3) Always
1 2 3 Total 2nd Semester 21 4 0 25 4th Semester 23 2 0 25 Total 44 6 0 50
3) Language teachers should encourage the use of computer in their classrooms
1- Agree 2- Strongly Agree 3- Disagree 4- Cannot Say
1 2 3 4 Total 2nd Semester 22 3 0 0 25 4th Semester 14 10 1 0 25 Total 36 13 1 0 50
4) Does your language laboratory sufficiently equipped for your needs
1- Yes 2- No
1 2 Total 2nd Semester 22 3 25 4th Semester 2 23 25 Total 24 26 50
5) For what purpose do you use computer in English language classroom?
1- Taking notes 2- Following along with the instructor 3- Web surfing 4- Playing Games
1 2 3 4 Total 2nd semester 21 6 6 6 39 4th Semester 21 9 6 6 42 Total 42 15 12 12 81
6) Indicate top three Computer based technologies that you like teacher to use in English Language Classroom?
1- Power point 2- Images and pictures 3- Guest Lectures 4- Pod casts of class session
5- Audio clips and video recordings 6- Blog that students and teachers contribute to
1 2 3 4 5 6 Total 2nd semester 20 15 5 5 17 20 62 4th Semester 19 16 5 7 13 17 60 Total 39 31 10 12 30 37 122

International Journal of Advance and Innovative Research Volume 5, Issue 4 (XX): October - December, 2018
14
ISSN 2394 - 7780
1) Computer Based technologies consumes lot of time
1) Strongly Agree 2) Agree 3) Disagree 4) Cannot Say
1 2 3 4 Total 2nd Semester 15 6 4 0 25 4th Semester 8 5 12 0 25 Total 16 11 23 0 50
7) I would be a better learner if I knew how to use Computer based technologies properly
1) Strongly Agree 2) Agree 3) Disagree 4) Cannot Say
1 2 3 4 Total 2nd Semester 4 5 4 2 25 4th Semester 7 11 7 2 25 Total 19 16 11 4 50
10- Computer technology is not necessary for learning languages-
1) Strongly Agree 2) Agree 3) Disagree 4) Cannot Say
1 2 3 4 Total 2nd Semester 22 0 1 2 25 4th Semester 6 0 16 3 25 Total 28 0 17 5 50
FINDINGS OF THE STUDY After analyzing the qualitative data collected from the interview, it is crystal clear that formal learning of computer did not directly affect to teachers’ use of computer in the classroom. Surprisingly, many teachers had professional courses on multimedia learning, yet most instructors had years of informal learning and were self- taught. It can be entailed that motivation, attributes and attitudes were the major factors to bring the use of technology in syllabus and curriculum. The data also reveals that majority of the instructors talked about need of infrastructural support to establish technology based classroom. They also mentioned that barrier to the use of computer based instructions in classroom was unavailability of updated computers, recent programs, and awareness on how to operate technology in classroom. Many language teachers claimed that were insufficient resources to remain updated and also related to organizational factors like timings, class size and inclusion of laboratory activities in lesson plan.
Moreover, if language educators believe in conventional method of teaching and have the tendency to resist innovative paradigms in pedagogical transformations, then encouraging technological driven change will be a colossal challenge. Further it appears that the amount of time they have assumed, to functionally integrate computer based instructions has been underestimated. It seems that majority of them thought that offering a few programs/courses on ‘how to’ would be enough to adopt technology instructions in English language classroom.
As far as the quantitative analysis is concerned, one of the prominent attributes for English language classrooms in Aligarh Muslim University were the distinctive levels of involvement and learning, diverse educated capacities, diverse capacities and qualities, diverse language capability in both native language and second language, and changing information of advancements. Since the levels of students in a class are extraordinary, the capacity of a few learners was high and that of others was low, utilizing intelligent and individualized computer based direction, including electronic mail, Computer conferencing, or other comparable media communications permits ESL/EFL learners to discover more noteworthy chance to take an interest and feel more good participating in the class communications.
They feel equity and opportunity in online collaborative learnings. With more opportunity to figure inquiries and explanations, learners with constrained language aptitudes could consider their answers and respond to them appropriately and confidently. Moreover, at the lower levels, the ESL/EFL learners can discover varieties of online activities that are appropriate for them to work on tuning in, talking, perusing, and composing at their own pace.
International Journal of Advance and Innovative Research Volume 5, Issue 4 (XX): October - December, 2018
15
ISSN 2394 - 7780
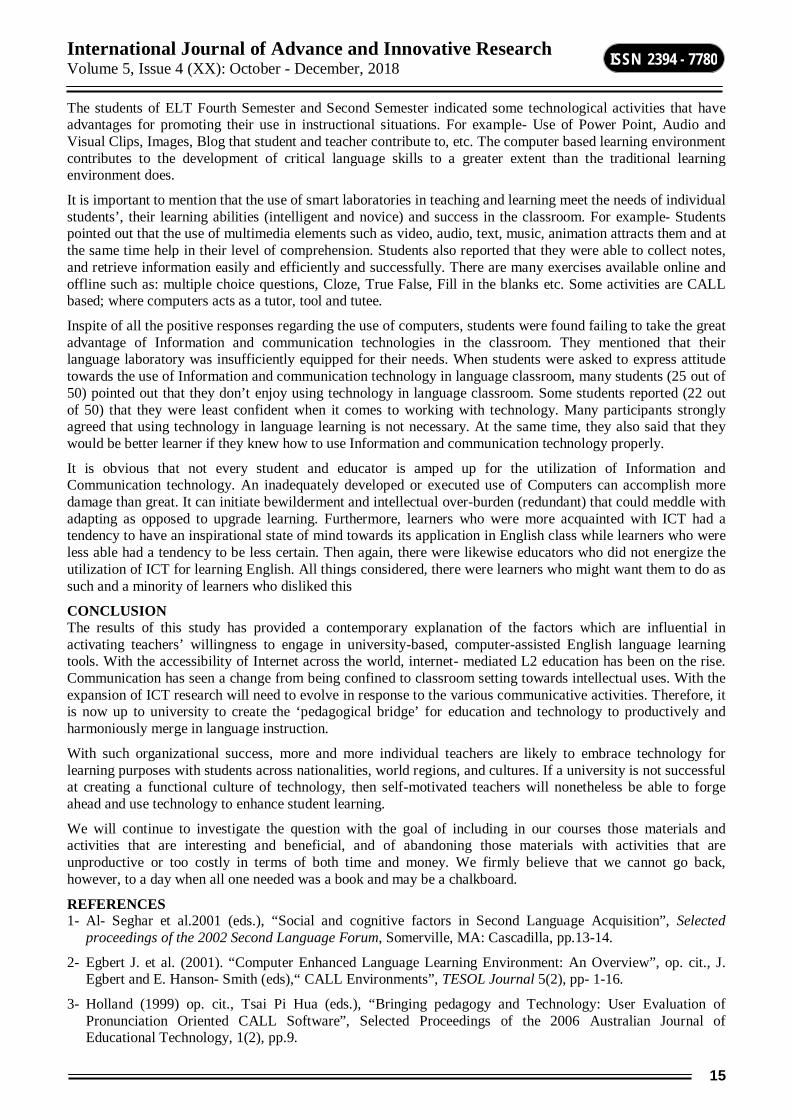
The students of ELT Fourth Semester and Second Semester indicated some technological activities that have advantages for promoting their use in instructional situations. For example- Use of Power Point, Audio and Visual Clips, Images, Blog that student and teacher contribute to, etc. The computer based learning environment contributes to the development of critical language skills to a greater extent than the traditional learning environment does.
It is important to mention that the use of smart laboratories in teaching and learning meet the needs of individual students’, their learning abilities (intelligent and novice) and success in the classroom. For example- Students pointed out that the use of multimedia elements such as video, audio, text, music, animation attracts them and at the same time help in their level of comprehension. Students also reported that they were able to collect notes, and retrieve information easily and efficiently and successfully. There are many exercises available online and offline such as: multiple choice questions, Cloze, True False, Fill in the blanks etc. Some activities are CALL based; where computers acts as a tutor, tool and tutee.
Inspite of all the positive responses regarding the use of computers, students were found failing to take the great advantage of Information and communication technologies in the classroom. They mentioned that their language laboratory was insufficiently equipped for their needs. When students were asked to express attitude towards the use of Information and communication technology in language classroom, many students (25 out of 50) pointed out that they don’t enjoy using technology in language classroom. Some students reported (22 out of 50) that they were least confident when it comes to working with technology. Many participants strongly agreed that using technology in language learning is not necessary. At the same time, they also said that they would be better learner if they knew how to use Information and communication technology properly.
It is obvious that not every student and educator is amped up for the utilization of Information and Communication technology. An inadequately developed or executed use of Computers can accomplish more damage than great. It can initiate bewilderment and intellectual over-burden (redundant) that could meddle with adapting as opposed to upgrade learning. Furthermore, learners who were more acquainted with ICT had a tendency to have an inspirational state of mind towards its application in English class while learners who were less able had a tendency to be less certain. Then again, there were likewise educators who did not energize the utilization of ICT for learning English. All things considered, there were learners who might want them to do as such and a minority of learners who disliked this
CONCLUSION The results of this study has provided a contemporary explanation of the factors which are influential in activating teachers’ willingness to engage in university-based, computer-assisted English language learning tools. With the accessibility of Internet across the world, internet- mediated L2 education has been on the rise. Communication has seen a change from being confined to classroom setting towards intellectual uses. With the expansion of ICT research will need to evolve in response to the various communicative activities. Therefore, it is now up to university to create the ‘pedagogical bridge’ for education and technology to productively and harmoniously merge in language instruction.
With such organizational success, more and more individual teachers are likely to embrace technology for learning purposes with students across nationalities, world regions, and cultures. If a university is not successful at creating a functional culture of technology, then self-motivated teachers will nonetheless be able to forge ahead and use technology to enhance student learning.
We will continue to investigate the question with the goal of including in our courses those materials and activities that are interesting and beneficial, and of abandoning those materials with activities that are unproductive or too costly in terms of both time and money. We firmly believe that we cannot go back, however, to a day when all one needed was a book and may be a chalkboard.
REFERENCES 1- Al- Seghar et al.2001 (eds.), “Social and cognitive factors in Second Language Acquisition”, Selected
proceedings of the 2002 Second Language Forum, Somerville, MA: Cascadilla, pp.13-14.
2- Egbert J. et al. (2001). “Computer Enhanced Language Learning Environment: An Overview”, op. cit., J. Egbert and E. Hanson- Smith (eds),“ CALL Environments”, TESOL Journal 5(2), pp- 1-16.
3- Holland (1999) op. cit., Tsai Pi Hua (eds.), “Bringing pedagogy and Technology: User Evaluation of Pronunciation Oriented CALL Software”, Selected Proceedings of the 2006 Australian Journal of Educational Technology, 1(2), pp.9.

International Journal of Advance and Innovative Research Volume 5, Issue 4 (XX): October - December, 2018
16
ISSN 2394 - 7780
4- Shea (1991). “Recent Developments in Technology & Language Learning: A Literature Review and Meta-analysis’’, CALICO Journal, 21(1), pp.7-27.
5- Sherrington (1986). “Applying Instructional Technologies: Foreign Language Annals”, CALICO Journal, 23(5),pp402
6- Nagata N. 1993. “ The Effectiveness of Computer Assisted Metalinguistic Instruction : A Case Study of Japanese’’, CALICO Journal, 24(3), pp 550-552.

International Journal of Advance and Innovative Research Volume 5, Issue 4 (XX): October - December, 2018
17
ISSN 2394 - 7780
SYNTHESIS AND CHARACTERIZATION OF SILVER NANOPARTICLES USING DILLENIA PENTAGYNA ROXB. EXTRACT AT ROOM TEMPERATURE AND THEIR ANTIMICROBIAL
STUDIES
Nishikant Shiwankar1, Pradnya Anasane2, Alka Chatuevedi3 Research Scholar1, 2 and Professor3, Department of Botany, RTM Nagpur University Campus, Nagpur
ABSTRACT Silver nanoparticles widely used by humans in medicine, targeted drug delivery, agricultural industry, food industry, environment, electronics and energy etc. Silver nanoparticles were synthesized by using green chemistry approach. This method is a hopeful alternative to the conventional reduction routes to avoid usage of toxic chemicals. Dillenia pentagyna bark powder extract was used as a reducing agent in the present study. Conformation and characterization of silver nanoparticles was done by visual observation and using UV-Visible spectrum, SEM and FTIR. Aqueous silver ions when exposed to bark powder extract were reduced and resulted silver nanoparticles were of average size of 17 nm. Antibacterial assay of different concentration of silver nanoparticles was compared to crude extract to know the inhibitory potential against Escherichia coli, Pseudomonas aeruginosa, Salmonella typhi, Proteus mirabilis, Klebsiella pneumoniae and Staphylococcus areus. The particle produced in nano dimensions were effective alike to antibiotics and other drugs used in biomedical applications. The use of nanoparticles in biomedical application has potential source of cures for severe problems.
Keywords: Antibacterial applications, Bark powder, Dillenia pentagyna, Green synthesis, Silver nanoparticles
I. INTRODUCTION Plants derived phytochemicals are always use as a potential source of cures against several pathogens. In rural area tribes use different plants for medicinal purpose in daily routine. Synthesis of silver nanoparticles by using green chemistry approach is a best substitute to the conventional chemicals methods of reduction by which toxic effect can be minimized. Finally, it seeks applications of nanoscience that maximize societal benefit while minimizing impact on the ecosystem (Dahl et al, 2007). Nano-science is based on the manipulation of individual atoms and/or molecules to produce materials from them for functioning well below the sub-microscopic level. Now it is emerging as one of the most active areas of research in modern science. The nanoparticles exhibit completely new or improved properties based on specific characteristics such as size, distribution and morphology (Ahmed et al, 2005, Kesarla et al, 2012).
Silver nanoparticles among various metal nanoparticles have established major consideration because they are successful antimicrobial agent/s that exhibits low toxicity and have various in vitro and in vivo applications (Krishnaraj et al, 2010). Use of plants for the fabrication of nanoparticles has drawn attention, since of its rapid, economical, eco-friendly protocol and it provides a single step technique for the biosynthesis process. From last few years biological approach is special area of research in nanoparticle synthesis as it is best substitute for the conventional chemical reduction routs. A plant mediated biosynthesis approach is best to reduce the impact of overexploitation on medicinal flora.
In the recent few year lot of literature comes up with Gold and Silver nanoparticles till date. AgNPs synthesized using Terminalia arjuna leaves with particle size between 3 to 50 nm were found effective against Gram-negative and Gram-positive bacteria (Ahmed et al, 2005). AgNPs synthesized by Terminalia chebula fruit powder shows hydrolysable tannins serve both as reducing and capping agent (Kesarla et al, 2012). Rapid synthesis of AgNp within 30 min. was observed when leaf extract of Acalypha indica were used (Krishnaraj et al, 2010). Leaves extract from Abutulon indicum synthesis of 7-17 nm spherical AgNPs observed (Padalia et al, 2014). AgNPs synthesized using Solanum tricobatum, Syzygium cumini, Centella asiatica and Citrus sinensis extracts and the AFM image suggests that the particles are irregular in shape. FTIR study suggests that the proteins play an important role in the stabilization of silver nanoparticles (Logeswari et al 2014). AgNPs from Tribulus terrestris with size 16-28 nm were achieved using this extract with antibacterial property (Gopinatha et al 2014).
2. MATERIAL AND METHODS 2.1. Collection of plant material The collection of the plant material of interest was done from the Bhandara and Gondia district of Maharashtra and species was identified as Dillenia pentagyna Roxb. (Family: Dilleniaceae). Bark material was washed with tap water followed with deionized distilled water to remove microbial flora and dust particles.

International Journal of Advance and Innovative Research Volume 5, Issue 4 (XX): October - December, 2018
18
ISSN 2394 - 7780
2.2. Preparation of extract 10 g of finely grinded and meshed bark powder of Dillenia pentagyna was mixed with 100 ml of deionized distilled water and heated at 90̊ C on temperature controlled water bath for 1 h and cooled, centrifuged at 3000 rpm for 5 min & supernatant passed through Whatmann filter paper was finally collected for further use.
2.3. Preparation of silver ion solution The silver nitrate, A.R., used in this study was obtained from Himedia Laboratories Pvt. Ltd., Mumbai, India. AgNO3 (mol. wt. 169.87) was dissolve in deionized distilled water.
2.4. Synthesis of silver nanoparticles 10 ml well prepared plant extract was taken and treated with 10 ml of aqueous 1-3 M AgNO3 solution and kept at room temperature. Color changed was recorded with respect to time.
2.5. CHARACTERIZATION OF SILVER NANOPARTICLES 2.5.1. Visual observations Initiation of AgNp synthesis start with addition of plant extract to 10-3M aqueous AgNO3 solution. Different proportions were evaluated based on color intensity to meet favorable concentration and then same concentration was used for further investigation.
2.5.2. UV–visible spectroscopy The initial characterization of formation and completion of silver nanoparticles was carried out by UV-visible spectroscopy using a Double beam spectrophotometer (SHIMANDZU, UV-1800). The reduction of the silver ions by the supernatant of the plant extracts in the solutions and formation of silver nanoparticles were characterized by UV visible spectroscopy monitored by sampling the extract (1ml) after 10-fold diluting the sample with deionized water against deionized water as blank and measuring the UV–VIS spectrum of solutions. The reduction of silver ions was monitored by UV-VIS spectra of the solution between 300 nm to 600 nm.
2.5.3. SEM analysis Solution containing synthesized AgNPs were centrifuged at 3000 rpm for 10 min and the pellets were discarded and the supernatants were again centrifuged at 12,000 rpm for 25 min. Then supernatants were discarded and the final pellets were collected and dried in oven for 20 to 30 min at 60˚C. Then finely crushed powder was used during scanning electron microscopy (SEM) analysis. The images of AgNps were obtained by a scanning electron microscope (ZEISS, EVO-18).
2.5.4. FTIR analysis Purified AgNPs in the form of powder were analyzed using FT-IR spectral measurements. The measurements were carried out on an instrument (BRUKER) in the diffuse reflectance mode at a resolution of 4 cm−1 in KBr pellets. For comparison, sample powder in the form of pellets was used as control.
2.5.5. Assessment of antibacterial activities Pure culture of all test micro-organism Escherichia coli, Pseudomonas aeruginosa, Salmonella typhi, Proteus mirabilis, Klebsiella pneumoniae and Staphylococcus areus were used.
Figure - 1. Biosynthesis of silver nanoparticles and characterization
International Journal of Advance and Innovative Research Volume 5, Issue 4 (XX): October - December, 2018
19
ISSN 2394 - 7780
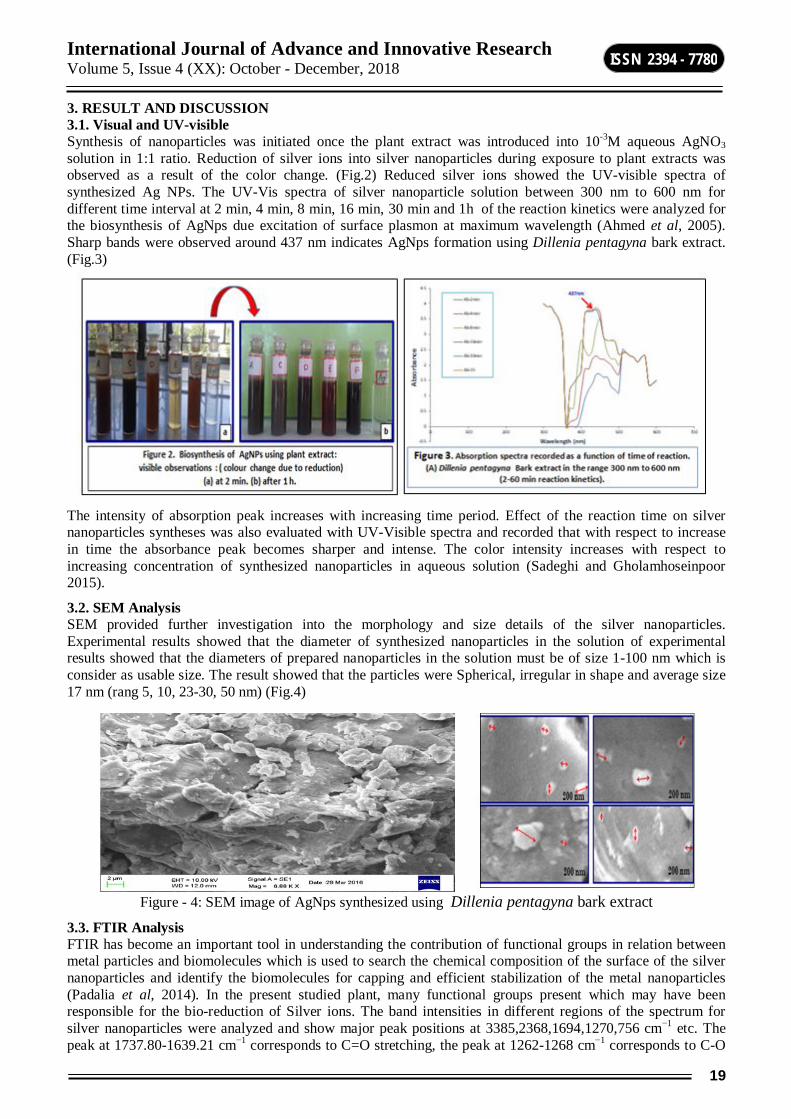
3. RESULT AND DISCUSSION 3.1. Visual and UV-visible Synthesis of nanoparticles was initiated once the plant extract was introduced into 10-3M aqueous AgNO3 solution in 1:1 ratio. Reduction of silver ions into silver nanoparticles during exposure to plant extracts was observed as a result of the color change. (Fig.2) Reduced silver ions showed the UV-visible spectra of synthesized Ag NPs. The UV-Vis spectra of silver nanoparticle solution between 300 nm to 600 nm for different time interval at 2 min, 4 min, 8 min, 16 min, 30 min and 1h of the reaction kinetics were analyzed for the biosynthesis of AgNps due excitation of surface plasmon at maximum wavelength (Ahmed et al, 2005). Sharp bands were observed around 437 nm indicates AgNps formation using Dillenia pentagyna bark extract. (Fig.3)
The intensity of absorption peak increases with increasing time period. Effect of the reaction time on silver nanoparticles syntheses was also evaluated with UV-Visible spectra and recorded that with respect to increase in time the absorbance peak becomes sharper and intense. The color intensity increases with respect to increasing concentration of synthesized nanoparticles in aqueous solution (Sadeghi and Gholamhoseinpoor 2015).
3.2. SEM Analysis SEM provided further investigation into the morphology and size details of the silver nanoparticles. Experimental results showed that the diameter of synthesized nanoparticles in the solution of experimental results showed that the diameters of prepared nanoparticles in the solution must be of size 1-100 nm which is consider as usable size. The result showed that the particles were Spherical, irregular in shape and average size 17 nm (rang 5, 10, 23-30, 50 nm) (Fig.4)
Figure - 4: SEM image of AgNps synthesized using Dillenia pentagyna bark extract
3.3. FTIR Analysis FTIR has become an important tool in understanding the contribution of functional groups in relation between metal particles and biomolecules which is used to search the chemical composition of the surface of the silver nanoparticles and identify the biomolecules for capping and efficient stabilization of the metal nanoparticles (Padalia et al, 2014). In the present studied plant, many functional groups present which may have been responsible for the bio-reduction of Silver ions. The band intensities in different regions of the spectrum for silver nanoparticles were analyzed and show major peak positions at 3385,2368,1694,1270,756 cm−1 etc. The peak at 1737.80-1639.21 cm−1 corresponds to C=O stretching, the peak at 1262-1268 cm−1 corresponds to C-O

International Journal of Advance and Innovative Research Volume 5, Issue 4 (XX): October - December, 2018
20
ISSN 2394 - 7780
stretching. The bands appeared at 3741.97 cm−1 is due to CH stretching for highly in symmetrical ether, the peak at 1800-1600 cm−1 is due to enol and compound may be flavanol or its derivative .Peaks at 3300-3800 cm−1, it is due to more –OH groups. Overtone combination region at 2000-2800 cm−1 is due to aromatic rings and compound may be of dihydroflavanol type. The Functional groups present above may have been responsible for the bio-reduction of Ag+ ion
3.4. Antibacterial Study Antimicrobial activity of AgNPs synthesized by Dillenia petagyna bark powders which was investigated against various pathogenic bacteria, such as Salmonella typhi, Staphylococcus aureus, Klebsiella pneumonia, Escherchia coli, Protease mirabilis, Pseudomonas aerugionsa using the well diffusion method. The diameter of inhibition zones (mm) against P. aeruginosa was found to be 16 mm which is highest and lowest against S. aureus (9 mm lesser) while against K. pneumonia was found to be 10 mm, P. mirabilis 10 mm, E.coli (12 mm).
Figure – 6: Susceptibility test following human pathogen by (Well diffusion method)
(1) S. typhi, (2) P. mirabilis, (3) P.aeruginosa, (4) K.pneumonia, (5) E.coli, (6) S.aureus

International Journal of Advance and Innovative Research Volume 5, Issue 4 (XX): October - December, 2018
21
ISSN 2394 - 7780
Figure - 7: Zone of inhibition of following human pathogen:
(1) S. typhi, (2) P. mirabilis, (3) P.aeruginosa, (4) K.pneumonia, (5) E.coli, (6) S.aureus
IV. CONCLUSION Spherical and irregular shape of Silver nanoparticles were observed in average 17nm (5, 10, 23, 30nm). The synthesized silver nanoparticles were characterized by UV-Vis, SEM and by FTIR. It was concluded that plant mediated synthesis of silver nanoparticles possess potential antibacterial applications. This method is a potential alternative to the traditional reduction routes to avoid usage of toxic chemicals. The particle produced in nanodimentions were effective similar to antibiotics and other drugs used in biomedical applications. The use of nanoparticles in biomedical application could be used as a impending source of cures for severe problems.
REFERENCES 1. Gopinatha V, Ali MD, Priyadarshini S, Meera Priyadharsshini N, Thajuddinb N, Velusamy P. Biosynthesis
of silver nanoparticles from Tribulus terrestris and its antimicrobial activity: a novel biological approach. Colloid Surf B: Biointerface 2012; 96: 69–74.
2. Ingole, A.R. S.R.T., N.T. Khati, Atul V. Wankhade, D. K. Burghate "Green synthesis of selenium nanoparticles under ambient condition". Chalcogenide Letters 2010; 7: 485-489.
3. Iravani S, Korbekandi H, Mirmohammadi SV, Zolfaghari B. Synthesis of silver nanoparticles: chemical, physical and biological methods. Res Pharm Sci 2014; 9: 385–406.
4. Jennifer A. Dahl, Bettye L. S. Maddux, and James E. Hutchison, Toward Greener Nanosynthesis; Chem. Rev. 2007; 107, 2228-2269.
5. Kesarla Mohan Kumara, Madhulika Sinhaa, Badal Kumar Mandala, Green synthesis of silver nanoparticles using Terminalia chebula extract at room temperature and their antimicrobial studies. Spectrochimica Acta Part A. 2012; 91: 228– 233
6. Korbekandi H, Iravani S. Silver nanoparticles, the delivery of nanoparticles. In: Hashim Abbass A. InTech 2012 978-953- 51-0615-9,
7. Krishnaraj C, Jagan EG, Rajasekar S, Selvakumar P, Kalaichelvan PT, et al. Synthesis of silver nanoparticles using Acalypha indica leaf extracts and its antibacterial activity against water borne pathogens. Colloids Surf Biointer. 2010; 76: 50-56.
8. Logeswari P, Silambarasan S, Abraham J; Ecofriendly synthesis of silver nanoparticles from commercially available plant powder and their antibacterial properties. Scientia Iranica F. 2013, 20: 1049-1054.
9. Kolte N, Tumane P,Wasnik D, Extracellular biosynthesis and characterization of silver nanoparticles by using Bacillus cereus gad 20 and their antibacterial potential against E.coli and S.aureus. Int. J Cur Res.2017; 9: 61849-61856.
10. Padalia H, Moteriya P, Chanda S, Green synthesis of silver nanoparticles from marigold flowers and its synergistic antibacterial potential. Arab J Chem. 2015; 5: 732-741.

International Journal of Advance and Innovative Research Volume 5, Issue 4 (XX): October - December, 2018
22
ISSN 2394 - 7780
11. Ramya M, Subapriya MS, Green synthesis of silver nanoparticles. Int J Pharm Med Biol Sci 2012; 1: 54–61.
12. Sadeghi B, Gholamhoseinpoor F, A study on the stability and green synthesis of silver nanoparticles using Ziziphora tenuior (Zt) extract at room temperature. Spectrochim Acta Part A: Mol Biomol Spectrosc. 2015; 134: 310-315
13. Shakeel A, and Saiqa I, Silver Nanoparticles: One Pot Green Synthesis Using Terminalia arjuna Extract for Biological Application; J Nanomed Nanotechnol. 2015; 6: 72/215-7439.
14. Thombre R, Parekh F, Patil N. Green synthesis of silver nanoparticles using seed extract of Argyreia nervosa. International Journal of Pharm Biol Sci. 2014; 5: 114–119.
15. Veeraputhiran V, Bio-catalytic synthesis of silver nanoparticles. Int J Chem Tech Res 2013; 5: 255–2562
16. Wang Y, H. N, "Nanometer-sized semiconductor clusters: materials synthesis, quantum size effects, and photophysical properties.". J Phys Chem. 1991; 95: 525-532.
17. Zargar M, Hamid A, Bakar FA, Shamsudin MN, Shameli K, Jahanshiri F, Green synthesis and antibacterial effect of silver nanoparticles using Vitex negundo L. Molecules. 2011; 16: 6667–6676.

International Journal of Advance and Innovative Research Volume 5, Issue 4 (XX): October - December, 2018
23
ISSN 2394 - 7780
IMPACT OF EFFICIENT FUNCTIONAL CLONE SELECTION FROM REPOSITORIES DURING CODE REUSABILITY
K. Vidhya and A. Brunda Assistant Professor, CSE, Dr. MCET, Pollachi
ABSTRACT Code clone repositories maintained in software development companies will intensify the code reusability .It reduces the utilization of resources and man hours which in turn lessen the cost and time of the project. After successful deployment of any project, its source code is split into modules and stored in code repositories. Programming language wise repositories will be more advantageous than general one. Modules which are copied (reused) in other projects are called as code clones. Code clones play a major role in code reusability. There may exist n number of functional clones for the same purpose implemented in different ways. Selection of the clone/module for reuse will also have an impact on the efficiency of the project where it is being employed. So code clones selected should be efficient among the existing. Analysis (time and space complexity) of the source code is done and considered as an important metric for clone selection. Additionally test cases are written and number of test cases passed is also considered as a metric in code clone selection.
Keywords: Code Repository, Code Reuse, Functional clones, selection of efficient code clone
I. INTRODUCTION Software code Clones are segments of code that are similar to each other[5].They may be called as clones even if they follow the similar structure to implement a solution for similar problem. Two code fragments can be similar based on the similarity of their program text or they can be similar in their functionalities without being textually similar. The former is called structural and the later is called functional clone [5].
Software development companies spend huge resources and the quality of the source code depends on organization’s time and resource constraint. Need for the quality also increases the time and cost of the software being developed [4]. The primary objective of using software clones is to increase the percentage of reusability of the organization’s own source code so that it can save time and cost.
II. CODE REPOSITORIES Code repositories are the databases where the software codes developed by the company are stored. Code repositories maintained in each company plays a vital role in software reuse. Sometimes the company may get similar type of project and in that case already coded module or file can be reused in the new project which reduced the project development time and increased the productivity[11] [12].
Code repositories may be maintained programming language wise. Once the project is completed, the modules of the project are taken and named by the functionality it does and stored in the particular language repository. This should be done appropriately by the project manager; Project manager has the complete thorough knowledge about the project. These code repositories have several advantages like code reusability and code may be taken even if the project manager is migrated [12].
III. MODULE SELECTION SYSTEM First challenge here in this system is identifying the right module from the repositories. The success of this system depends on the appropriateness of the storage and the searching system. The manager of the new project has to decide on the modules to be developed for the project. Then he/she has to search in the code repositories. Searching should be done in all the language repositories. The searching system should search for the files based on the given functionality name, since files are named based on function what it does. It should also consider the synonyms of the file name to make the searching more accurate [12].
The searching system will retrieve the modules which match with requirement. There may exist more than one module for the same purpose (from the same programming language repository or from different repositories). This happens because a problem could be solved in several ways, so more than one solution may be available (implemented in different manner). Second challenge is selecting the suitable module from the list returned by the search system. One more feature called module selection is added to the system discussed in [12].Module selection system selects one efficient code block from n blocks. The system employs the following metrics for module selection. Complexity of the system Number of test cases satisfied

International Journal of Advance and Innovative Research Volume 5, Issue 4 (XX): October - December, 2018
24
ISSN 2394 - 7780
The preparatory work is done while storing modules in the repositories. Each module is stored with additional piece of information. First information is complexity of the module which includes time complexity and the second one is the number of test cases it passes with total number of test cases given. Figure 1 and 2 depicts the storage of module to the repository with the above said additional information.
Figure – 1: Add module to repository option is selected
Figure – 2: Description about the module is given and module stored in the repository
Searching system plays an important role and its efficiency determines the success of this system. The searching system first searches all the modules which match with the requirement. Then among the retrieved code blocks, it identifies the efficient one based on the additional data that are stored along with the code module. It also compares with the complexity and the percentage of test cases passed by the module. Analysis is made by the system based on the comparison results and the best suitable code clone is suggested for reusability
IV. CONCLUSION This system selects the efficient code clone among the code blocks that exist in the code repositories. It helps to build the efficient software by incorporating the advantages of software reuse. The system increases the efficiency, productivity and reduces the usage of resources in terms of cost and time.
REFERENCES 1. Alan MacCormack, John Rusnak, Carliss Baldwin(2007), ‘The Impact of Component Modularity on
Design Evolution: Evidence from the Software Industry’, http://ssrn.com/abstract=1071720 .
2. Gennari J.H., Tu S.W., Rothenfluh T.E., Musen M.,(1994), ‘Mapping Domains to Methods in Support of Reuse’. International Journal of Human-Computer Studies. 41: 399-424.

International Journal of Advance and Innovative Research Volume 5, Issue 4 (XX): October - December, 2018
25
ISSN 2394 - 7780
3. Jalender B,Dr Govardhan A, Dr Premchand P,)2012), ‘Designing Code Level Reusable Software Components’ , International Journal of Software Engineering & Applications (IJSEA), Vol.3, No.1:219-229.
4. Kavitha Esther Rajakumari1 ,Dr.S.Srinivasan,(2015), ‘Role of Functional Clones in Software Development’,Proceedings of International Conference on Future Computational Technologies:41-47.
5. Kodhai.E, Perumal.A, and Kanmani.S,(2010), ‘Clone Detection using Textual and Metric Analysis to figure out all Types of Clones’ , International Journal of Computer Communication and Information System ( IJCCIS), Vol2. No1:99-103.
6. Manuel Sojer, Joachim Henkel,(2010), ‘Code Reuse in Open Source Software Development: Quantitative Evidence, Drivers, and Impediments’, Journal of the Association for Information Systems,Vol.11:868-901.
7. Martin Molina, Jose L. Sierra, Jose Cuena, (1999) , ‘Reusable Knowledge-based Components for Building Software Applications: A Knowledge Modelling Approach’, International Journal of Software Engineering and Knowledge Engineering, Vol. 9 No. 3 :297-317 .
8. Shireesha, Sharma,(2010), Building Reusable Software Component For Optimization Check in ABAP Coding, International Journal of Software Engineering & Applications (IJSEA), Vol.1, No.3:38-49.
9. Christopher Pohl, Carlos Paiz, and Mario Porrmannv,(2009), ‘MAGIC—Automatic Code Generation for VHDL’ , International Journal of Reconfigurable Computing Volume, Article ID 205149.
10. Vidhya k, Thirukumar K, (2013), ‘Identifying Functional Clones Between Java Directories Using Metric Based System’, International Journal of Advanced Research in Computer Science and Engineering, Vol. 3,Issue 8:1255-1261.
11. Vidhya k, Brunda A, (2016), ‘Deployment of Modularity to Enhance the Software Code Reusability by Maintaining Code Repositories for Multiple Programming Language’, International Journal of Advanced Research in Computer Science and Engineering, Vol.6,Issue 6 :151-154.
12. Vidhya k, Brunda A,(2017), ‘ Automatic Code Generation and Code Reusability through Software Clone Repositories’ , International Journal of Advanced Research in Computer Science and Engineering, Vol.7,Issue 6: 532-536.

International Journal of Advance and Innovative Research Volume 5, Issue 4 (XX): October - December, 2018
26
ISSN 2394 - 7780
LEVERAGING THE SPIRITUALITY IN MARKETING
Dr. Sunil Kumari Assistant Professor, Govt. College Meham, Haryana
ABSTRACT In modern era where logical and rational thinking is taking its height but simultaneously spirituality is also regaining its worth to the society. In this scenario, marketer needs to change his marketing strategy according thereto. Present study focuses on determining the relationship between spirituality and marketing environment. On the basis of survey analysis of 212 people, it has found that marketing is significantly affected by spirituality level of buyers. Consequently, marketers are required to incorporate the spirituality concept in product features.
Keywords: Spirituality, Marketing, Consumers, Buying Decision.
INTRODUCTION Spirituality refers to truth (Satya). The phrase “Satyamev Jayate” which means truth always wins has been well heard to everyone. In the world of commercialization spirituality had been supposed to be lost somewhere but ignorance of truth cannot run in long run. Thus this is the time when entire world seems to return to its original roots. As level of education is increasing people seems to be free from institutional religions and seek for truth. The 21st century will be spiritual or won’t be at all (Malraux). Spirituality is a integral part of our human body which represent the existence of human in entirety. This is the inner state of human being which is responsible for all physical acts of a person. All physical activities of a person are backboned by spiritual aspect which is the processed output of unconscious and sub-conscious sheaths of body. What the consumer would purchase is determined by one’s internal stimuli. If a marketer is able to connect his products’ utility to target customers’ spirituality can raise much more demand in market. This is the new age of spirituality which is being taken a big business where new age of spiritualism witnesses truth-seeking buyers who believes in experiments instead of religious obscurantism and hierarchy (Van Der Veer, 2009). Such individualism has forced the marketers to rethink upon their marketing philosophy and designing it accordingly. Transformation of consumers’ realism to idealism or spiritualism has considerable value to marketers in present scenario. Marketer needs to incorporate the spiritual content in product features to make it high profitable. Human organisms consists of four sheaths – physical, subtle, causal and absolute.
LITERATURE REVIEW Emre Basci (2015) gave a holistic marketing review by combining the 4Ps of marketing with 1C (customer). Under it four types of spiritualities i.e. anti-capitalist, reformist, consumerist and capitalist, have been studied with their distinctive features. Study found the inner state of world is changing due to political and social factors where marketers need to make marketing strategy accordingly. Liberalized economic policies led to put the spiritual content in the product to make more salable.
Vinod Kumar & Ankit Jain (2016) this paper talks about marketing through spirituality through the case study and success story of Patanjali Yogpeeth. The research uses a qualitative approach to collect data from various officials of Patanjali Yogpeeth through unstructured face-to-face interviews. The study revealed that yoga and pranayam are very effective tools in marketing through spirituality and influence the consumption behavior of masses. Patanjali Yogpeeth is best suited example to study the present topic.
RESEARCH METHODOLOGY Present research studies the cognition of the buyer in terms of spirituality. Spirituality is an internal stimulus that directs the consumer behavior. However it is very difficult to define the parameters of spirituality but study prescribes the certain measures i.e. religion, nationalism, cognition and subtle sheath of an individual. Study proceeded with a sample size of 212 people through a structured questionnaire as well as personal interviews.
RESULTS & DISCUSSIONS Majority of the respondents said that they connect their spiritual aspect to the buying decision. Majority (67%) of the rural but minority (33%) of the urban was found connected with nationalism concept like swadeshi, in their buying decision. Religion has been found an eminent concept, majority (71%) of the people don’t compromise with their religious view. They always keep priority of their religious view over economic view. In India, sometimes it is named superstition but it is Indian scenario where majority (82%) of the people firmly believe in their traditions and customs without any logic or reasoning. They strongly believe in succeeding their ancient culture. Most of the people surrender and sacrifice a lot of money or things to pay the tribute to their
International Journal of Advance and Innovative Research Volume 5, Issue 4 (XX): October - December, 2018
27
ISSN 2394 - 7780
God. A significant number of people were found very rigid to their culture. Marketers could be able to sell their product more and more by connecting their products’ features with the religious view of the customers. Consumers’ cognition is another major factor affecting the purchase decision. Cognition is the inner concept of a person that derives from his own thinking and view point. It is a self concept that also determines the consumer behavior. It is supposed that intelligent people are found more rational and intellectual. They have their own technical view to interpret the things. It is a strong stimuli to behave in righteous manner. Study found the cognition least affected by the external forces like peers, groups and society. Generally it moves genetically from one generation to another generation. In present study majority (%%%) of the people accepted that they use their own sense in buying decision. So marketers should frame such strategy that associate the product with the cognition of the consumers. They should make surveys to know the cognition value of the buyers. The last aspect of the spirituality is subtle sheath of the person. Subtle represents the unconscious sheath of human body. There are so many things which continuously run in unconscious mind of the human body, which is micro in nature but gets activated when certain kinds of external forces interact with them. It is very difficult to measure this subtle aspect of consumer, so there is lot of chances to mismatch the products features to subtle sheath of the buyer. It is a psychological concept that needs a keen and close observation of the behavior of the person. But with the help of past data and behavior, marketers can be able to understand such casual and subtle part of buyer. Majority (61%) of the respondents stated that they don’t make deliberate efforts to bring out their subtle sense to use it in their decisions. It works automatically but it becomes important to understand to marketers being its impact on buyer behavior.
CONCLUSION Present study aims at measuring the impact of spirituality on marketing strategy. Present market scenario is changing where logical attitude as well as rationality is stimulating the people to analyze the things economically but simultaneously, it can not be denied that people’ spiritual roots are getting stronger day by day. It can be said that personal, societal, spiritual and economic all aspects move together. With the changing time spirituality may arise in different color but it can not get finished because it is an integral part of a human being. Consequently Giants of corporate world have started to make the studies on how to connect the product’s characteristics to the spirituality aspect of target customers. On the basis of data analysis in descriptive manner, study explores that there is a significant relationship between spirituality and buying decision of the people. Hence present study adds value to the existing literature.
REFERENCES 1. Vinod Kumar, Ankit Jain, Zillur Rahman et al (2014). Marketing through spirituality: A case of Patanjali
Yogpeeth. Procedia - Social and Behavioral Science, Volume 236, Pages 1-384 (14 December 2016), International Conference on Communication in Multicultural Society, CMSC 2015, 6-8 December 2015, Moscow, Russian Federation. Retrieved from http://dx.doi.org/10.1016/j.sbspro.2014.04.215
2. Vinod Kumar & Ankit Jain (2014), Marketing through Spirituality: A Case of Patanjali Yogpeeth, Procedia - Social and Behavioral Sciences 133 ( 2014 ) 481 – 490
3. Emre Basci (2015). 4P‟s and 1C of New Age Spirituality: A Holistic Marketing Review. International Journal of Social Science and Humanity, Vol. 5, No. 5, May 2015, pp 446-450
4. Sudhir Kale (2016),"Consumer Spirituality and Marketing", in AP - Asia-Pacific Advances in Consumer Research Volume 7, eds. Margaret Craig Lees, Teresa Davis, and Gary Gregory, Sydney, Australia : Association for Consumer Research, Pages: 108-110, available at http://www.acrwebsite.org/ volumes/13027/volumes/ap07/AP-07

International Journal of Advance and Innovative Research Volume 5, Issue 4 (XX): October - December, 2018
28
ISSN 2394 - 7780
STUDY OF CONSUMER BUYING BEHAVIOUR TOWARDS HOME LOAN
Dr. Ravindra Deshmukh Associate Professor, Ahmednagar College, Ahmednagar
ABSTRACT House is a basic necessity. Every one, rich or poor, whether in rural or urban areas, needs a house to protect his life and property and also to promote his well-being. In Indian a person assumed to be settling when he owns his house. To construct or purchase a house, everybody is in need of loan. Number of banks and financial institute is ready to give home loans. For banks it is profitable to give home loans for two reasons- bank gets considerable interest and also it is very safe. Naturally the customer has a wide choice to select from. Many banks and financial institute provides easy loan that are processed in a day time. The customers also gets income tax rebate on the interest paid for housing loan. In this research paper the researcher tried to find it out the purpose of home loan, factors which is consider by customers for selecting bank or financial institute, and also which factor influence them to select so.
Keywords: Marketing, Customer Buying Behavior, Housing Finance Corporation, Considering Factors
INTRODUCTION Every person, irrespective of his religion, caste, creed, income, age etc. wants to purchase his/her own home. For purchasing a home one requires financial assistance. In last few years, the home loan market in India has grown at a rapid rate of over 40%. The most important sources offering home finance are housing finance companies, commercial banks, cooperative banks and other non banking financial companies. As per the reports, there are about twenty registered Housing Financial Corporations and over two hundred unregistered Housing Finance Corporations in the country offering home loans. These HFC are trying to attract consumers by differentiating themselves through various schemes. The customers are considering various factors before approaching an HFC.
FACTORS TO BE CONSIDER WHILE TAKING HOME LOAN Customers have become aware about the various options/plans of home loans offered by the various banks. Which factor is most important varies person to person. But there are certain factors which every customer is suppose to consider before going for a home loan. These factors can be stated as under: Rate of Interest
Repayment Period
Types of interest rate: fixed or floating
Procedure for disbursement of loan amount
Ratio of Loan amount to the property amount
The percentage amount which has to be pay by the customer
Require time for processing the loan
Processing fee
Number of guarantors requirement
Type of hypothecation
Prepayment penalty
Late payment penalty
Foreclosure penalty
Reputation of Bank
Insurance
Hidden charges
Staff

International Journal of Advance and Innovative Research Volume 5, Issue 4 (XX): October - December, 2018
29
ISSN 2394 - 7780
OBJECTIVES OF THE RESEARCH The main objectives of the present study are: 1. To understand the demographic characteristics of home loan customers in Ahmednagar city.
2. To study for what purpose the customers are taking home loan.
3. To understand which is preferable duration of home loan customers.
4. To aware the various sources from which the customers gets the information about home loan.
5. To study the factors which are considered by costumers while selecting the Financial Institute.
4. To understand the factors this influenced the customers while selecting HFC.
5. To study which interest rate is preferred by the consumers regarding home loan
HYPOTHESIS OF THE STUDY The main hypotheses of the study are 1. The customers for home loan are mainly male customers having good income.
2. The salaried persons are the main customers of home loan.
3. Most of the home loan customers prefer to have a home loan for 10-15 years of duration.
4. Rate of interest is the most important factor which is considered by home loan customers.
5. Customer of home loan prefers floating rate of interest than fixed rate of interest.
RESEARCH METHODOLOGY Data Collection: For the present study primary and secondary data was used. The primary data was collected through questionnaire from 200 home loan customers. 20% of the respondents were interviewed. The secondary data was also used. The secondary data was collected from website, newspaper and magazines. Collected data was tabulated & analyzed by using appropriate statistical techniques.
Sample Size & Method: For the present study the sample size was 200 home loan customers out of those 20% customers were interviewed. The Random Sampling Method was used to select the sample.
Scope of the Study: The scope of the study is: 1. The scope of the present study is confined to the geographical and corporation limits of Ahmednagar city.
2. A period of five years is selected i.e. 2012 to 2017 for conducting the research.
3. The researcher has selected a sample of 200 home loan customers.
4. The researcher selected the sample by convenience sampling method.
5. The findings of the study are based on the primary data as well as secondary data. The primary data was collected through questionnaire and interviews.
6. This research study is confined to only understanding how customers take their decision regarding home loan.
REVIEW OF LITERATURE Dr N. Shani & Ms. P. Sopna1 (2011) conducted a research on the topic ‘A Study on Customer Satisfaction Towards Housing Loan in Banking Sector with reference to Corporation Bank’. Sample size was 150 customers of Corporation Bank. The data was collected through structured questionnaire and interview. The objectives of the research were 1. to find out the satisfaction level of the customers, 2. to understand operating and processing system of housing loan in banking sector, 3. to suggest the method for improving customer satisfaction.
The main findings of the study were 1 majority of the customers has accounts with corporation bank, 2 the customer gathering information about the housing loans from the banks and also having good opinion about the customer service provided by the bank. This bank takes 3-4 weeks to process the loan. Because of monthly installment scheme the customer felt easy to repay the loan amount. The customers’ opinions about demand of any securities availing for housing loan, majority of respondents were satisfied with bank dealings.
Murugan, M. Sakthivel, Jansirani2, (2017) conducted a research on the topic of, ‘Consumer Perception towards Home Loan. The data was collected from 500 respondents from Chennai with the help of structured questionnaire supported by interviews. The main objectives of the study were, 1. analyzing the customer’s

International Journal of Advance and Innovative Research Volume 5, Issue 4 (XX): October - December, 2018
30
ISSN 2394 - 7780
perception on home loans offered by banks, 2. to study the socio-economic profile of the respondents, 3 to study the housing loan borrowers for availing of such loan from public and private sector banks, 4 to study the corporate culture about the home loan and 5 to analyze public & private home loan market and its growing trends. The findings of the study were, housing finance witnessed phenomenal growth and real boom during the last two decades. Banks are now the major players in the field. Housing finance has emerged as an important segment of the credit portfolio of the banks. This phenomenal growth has also brought in fundamental changes in the housing finance system and housing market in India. It has become very competitive and the increasing competition has benefited the customers significantly. However, its rapid rate of growth in the recent years has become “the cause for potential worry” to the regulator RBI.
Vijaykumar, M. & Subburaj B.3, (2012) conducted a research on the topic of, ‘Housing Loan Purchase Decision of Consumers’. In this study, random sampling technique has been used to draw adequate samples. The sample size was 531 borrowers from Namakkal District. The main objectives of the study were- to assess the socio-economic characteristics of the consumers of the housing loans in schedule commercial banks, to find out the factors influencing the purchase decision of consumers, to analyse the purchase behaviour of the consumers.
The main findings of the study were nearly 87 % of the respondents are going for house construction before they attain 50 years, salaried and educated persons are the major segments for the housing loan, perception on product and price are the major determinant for the loan in all the banks, among several sources of awareness, TV & magazine advertisement, previous borrowers of housing loans, bank officials are found as the prominent sources of information, spouse is the major source of influence for the purchase of home loans as 86.8 per cent of them opined so, regarding the various attributes influencing the selection of the bank, the attributes such as, flexibility, the processing fee, the interest rate, and the processing time are found prominent.
Bhalla, G.S. & Manureet, Rair4 (2016) conducted an enquiry on the topic of, ‘Customers Perception towards Home loan, A Study Conducted at Punjab’. The sample was collected from 1000 respondents of Punjab State. The data was analyzed with the help of various statistical tools. The main objective of the study was To study the factors motivating the customers for choosing a bank for the purpose of home loan.
The finding of the study was the factors that motivated customers in choosing a particular bank for the purpose of home loan through descriptive statistics. It is observed that respondents were slightly agree with the statement that option to design amount and frequency of installment. On the other hand, respondents are slightly neutral with the statement that highly reputable bank.
Mahabir Singh Narwal, Sushma Rani & Radhika5, (2013) conducted a study on the topic of ‘Customers Preferences of Home Loan’. In the present study, a sample of 200 respondents (100 each from Kurukshetra & Ambala District of Haryana has been taken into consideration, using convenience sampling method. The data has been collected through survey – questionnaire method. The data was analysed with the help of various statistical tools. The objectives of the present study were to study the customer preferences for home loans and to study the differences among customer preferences for home loan on the basis of occupation and income.
The findings of the present study reveal that there are five factors which affect the customer preferences while deciding home loans. The customers prefer those banks which provide them “friendly environment”. The courtesy of employees, simple process/procedure and comfortable/ convenience in the bank influence the customers most. The second most important factor in the study is “processing and disbursing”. Here customers are looking for least disbursement time, and least miscellaneous & hidden charges. Customers are also expecting that conditions for guarantor should not be stringent.“Rate of interest” appeared the third most important factor affecting customer preferences.
Here customers prefer the home loan which offers flexibility, least/no prepayment penalty, and less down payments. Customer preferences for home loan is least influenced by “freebies offered and other considerations”, may be because it is negligible in huge amount of home loan.
Research Gap: Number of researches has been carried out by the researchers to understand which financial institute is better in respect to lending the loan. Very few researches have been carried out to find out the factors which are influenced the customers and the factors which are considered by customers before taking a home loan. The researches which are carried out were mainly in metros. The researcher could not find any research in comparatively undeveloped city. Therefore the researcher felt a need to conduct a research on the topic, ‘Study of Consumer Buying Behaviour towards Home Loan’, and the researcher has selected the sample from Ahmadnagar City which is a developing city.

International Journal of Advance and Innovative Research Volume 5, Issue 4 (XX): October - December, 2018
31
ISSN 2394 - 7780
ANALYSIS & INTERPRETATION OF THE DATA The researcher has collected the information from 200 house loan customer with the help of structured questionnaire. The responses received from the respondents are presented as below.
1. DEMOGRAPHIC CHARACTERISTICS OF THE RESPONDENTS The researcher wants to understand the demographic characteristics of the home loan customers. The responses are summarized in the following table.
Table No – 1: Demographic Characteristics of the Respondents Demographic Characteristic Category Frequency Percentage
Age
<30 30 15 30-40 78 39 40-50 62 31 50-60 26 13 >60 04 02
Gender
Male 174 87 Female 26 13
Education
Up to HSC 28 14 Graduation 102 51
Postgraduate 48 24 Professional 22 11
Income
<30000 32 16 30000-50000 47 23.5 50000-70000 87 43.5
70000-100000 23 11.5 >100000 11 5.5
Occupation
Govt. & semi - Govt employees
91
45.5
Private employees 47 23.5 Businessman 39 19.5 Professional 23 11.5
Farmers 0 0
1. Age: From the above table it is observed that, 70% of the respondents were from the age group of 30 yrs. to 50 yrs. It is a common practice in India that most of the people start to earn at the age of 25 yrs., get married in thirties and want to own a house after 30yrs. The table also shows that 13% of the respondents were from the age group of 50 to 60 yrs. While interviewing the respondents, the researcher found that most of the respondents from this group belong to those people who want to purchase a second home to take the advantage of tax relief.
2. Gender: Out of 200 respondents 174 (87%) were male 26(13%) were female. This data clearly reveals that the main customer of home loan was male. Very few females found asking for home loan. These women are either single or asking a loan jointly with their husband.
3. Education: The above table shows that 14% respondents studied up to H.Sc, 51% did their graduation, and 24% completed their post graduation whereas 11% respondents were having professional degrees. Conclude that 86% of respondents were at least completed their graduation.
4. Income: The above table shows that 84% of the respondents were earning more than Rs.30,000 monthly. Out of this, 12.5% of the respondents were getting more than Rs 30,000 up to Rs50,000, 43.5% of the respondents were from the income group of Rs 50,000to Rs70,000, 11.5% of the respondents were from Rs70,000 to Rs 1,00,000 and 5.5 respondents were getting more than Rs 1,00,000 monthly. While interviewing the respondents, the researcher came to know that the respondents (83%) who’s earning were in the group of Rs 30,000 up to Rs 70,000 monthly were the genuine customers; they were going for their first home. Most of the respondents who were earning more than Rs. 70,000 (17%) were basically from the

International Journal of Advance and Innovative Research Volume 5, Issue 4 (XX): October - December, 2018
32
ISSN 2394 - 7780
age group of 50 yrs and above, having their first home and for getting the benefit in Income Tax, they were either purchasing the second home or doing extension to their existing home.
5. Occupation of the respondents The above table is indicative of the occupation of the respondents. 69% of the respondents were salaried;
they were working either in Govt & semi-govt offices or in private firms. 19.5% of the respondents were businessman and 11.5% were professionals. The researcher did not found any farmer as home loan customer. The farmers generally do not have either a salary slip or IT return to take home loan. Secondly the farmers are more interested to purchase agricultural land and gold than a home in urban area.
2. ABOUT HOME LOAN The researcher wants to know the exact purpose of home loan and wants to know the duration of it. The researcher was also eager to know from which sources the respondents got the information about the home loan scheme. Therefore the researcher enquired about these points. The responses are presented in the following table.
Table No - 2: About Home Loan Variables Category Frequency Percentage
Purpose of Home Loan
Purchasing Home Construction of Home Enovation/ Modification of Home Extension of Home Purchase of a Plot Balance of Transfer Bridge Loan
69 49 44 17 19 02 -
34.5 24.5 22
08.5 09.5 01 -
Duration of Home Loan
< 5 Yrs 5 Yrs -10 Yrs 10 Yrs -15 Yrs 15 Yrs-20 Yrs
17 55 90 38
8.5 27.5 45 19
Source of Information
Friends T. V. News Paper Internet Banks Housing Finance corporation
37 12 09 24 65 53
18.5 06
04.5 12
32 .5 26.5
1. Purpose of Home Loan : The above table shows that 34.5% of the respondents were taken home loan for purchasing home, 24.5% for construction of home, 22 for improvement of home, 8.5% for purchase of plot, 9.5% for extension of home and only 1% for balance transfer. The researcher has not come across any respondent who had taken loan as a bridge loan. The above data suggest that 59% of the respondents were taken loan for constructing or purchasing new home and 30.5 % of the respondents were going for extension or improvement of existing home.
2. Duration of Home Loan: The above table shows the duration of home loan taken by the respondents. Out of 8.5% respondents had taken a home loan for below 5 years period, 27.5% respondents had taken home loan for the period of 5 years to 10 years, 45% respondents had taken home loan for the period of 10 years to 15 years and 19 respondents had taken home loan for more than 20 years period.
The above data clearly indicates that nearly half of the respondents were taken loan for the period of 10 years to 15 years. The respondents who were gone for the period of below 5 years, the loan amount of such respondents were very less as compared to their income. Most of the respondents who prefer 5 years to 10 years period were taken loan for the period of more than 8 years. The loan amount is highest who had taken a loan for the period of 15 years to 20 years as compared to their income.
The above data shows that nearly three fourth of the respondents were taken loan for the period of 5 years to 15 years. The HFC should formulate their policies by considering the need of such group.

International Journal of Advance and Innovative Research Volume 5, Issue 4 (XX): October - December, 2018
33
ISSN 2394 - 7780
4. Source of Information: Out of 32.5% respondents got the information about home loan scheme from banks, 26.5% respondents from Housing Finance Corporation, 18.5% respondents got the information from friends, 12.5% from Internet and 6% and 4.5% respondents received the information from T.V. and News Paper respectively. From the above data it was clear that three fifth respondents go directly to the HFC when they wish to have the home loan. Only 10.5% of the respondents take the help of advertisement media to aware about home loan.
3. FACTORS CONSIDERED BY THE RESPONDENTS WHILE SELECTING HFC The main object of the present study is to know which factors home loan customers considered before selecting HFC. The researcher asked the customer to give their preferences. The responses of the respondents are presented in the following table.
Table No – 3: Factors Considered by the Respondents While Selecting HFC Variables Category Pre 1 Pre2 Pre 3 Pre 4 Pre 5 Pre 6
F % F % F % F % F % F % Factors Considered
Rate of Interest 30 15 152 76 - - 18 09 - - - - Less Documentation 164 82 - - 30 15 06 03 - - - - Incentives in Fees - - - - - - - - 08 04 14 7 Fast Disposal of Loan
- 18 09 12 06 34 17 70 35 24 12
Service Charges - -- 26 13 86 43 14 07 Behavior of the Staff - - - - - - - 10 05 32 16 Repayment Period - - 82 41 28 14 12 06 Hidden Terms & conditions
01 0.5 12 06 26 13 12 06 88 44
Flexibility - - - - Prepayment penalty 05 2.5 06 03 12 06 Down payment - - 10 05 18 09 16 08 72 36 Reputation of Bank - - 08 04 Insurance facility - - - - 08 04 Guarantors - - - - 18 09
The above table shows the preferences given by the respondents about the factors which they felt important when they selected the HFC. 82 percent of the respondents ranked 'Less Documentation' as their first preference, 15 percent considered ‘Rate of Interest’, 2.5 percent respondent considered ‘Prepayment Penalty’ and 0.5 percent considered ‘Hidden Terms & Conditions’. It means that most of the respondents have given first preference to the factor of minimum documentation.
While giving second preference 76 percent of the respondent rated 'Rate of interest’ as most important factor which have to be consider before taking a home loan. Followed by 9 percent to ‘Fast Disposal of Loan’, 6 percent to ‘Hidden Terms & Conditions’,5 percent to ‘Down Payment’, & 4 percent to ‘Reputation of Bank’.
The other studied found that rate of interest is more important than the documentation. The researcher asked this question to the customer. The customer feel that when they are taking a home loan either from commercial bank or a housing finance corporation, the rate of interest is generally same. The commercial banks generally asked for more documentation as compared to Finance Corporation.
41 percent respondent rated ‘Repayment Period’ as third most important factor which has to be considered before taking home loan. Generally all HFC’s are offering loans in between five year to fifteen year of period. Considering this the researcher asked the respondents about the reason of giving much importance to the repayment period. The researcher found that these group were mainly required a loan for more than fifteen years of period. Followed to this 15 percent respondent given importance for ‘Less Documentation’, 13 percent each to ‘Service Charges’ and ‘Hidden Terms & Conditions’, 09 percent to ‘Down Payment’ and 06 percent to ‘Prepayment Penalty’.
While deciding the importance of the factors which has to be consider before taking home loan, 43 percent respondents rated ‘Service Charges’ as the fourth most important factor. Followed by 17 percent rated ‘Fast

International Journal of Advance and Innovative Research Volume 5, Issue 4 (XX): October - December, 2018
34
ISSN 2394 - 7780
Disposal of Loan’, 14 percent to ‘Repayment Period’, 9 percent to ‘Rate of Interest’, 8 percent to ‘Down Payment’, 6 percent to ‘Hidden Terms & Conditions’ and 3 percent to ‘Less Documentation’.
While giving fifth preference 44 percent respondents rated ‘Hidden Terms & Conditions’, 35 percent to ‘Fast Disposal of Loan’, 6 percent to ‘Prepayment Penalty’,5 percent to ‘Behavior of the Staff’, and 4 percent each to ‘Insurance Facility’ and ‘Incentives in Fees’. The respondent has given sixth preference mainly to ‘Down Payment’ (36%) and ‘Behavior of the Staff’ (16%).
The researcher has collected the primary data from 200 respondents to understand which factors are to be consider before taking a home loan. The responses are presented in above table and the researcher has analyzed the data also. After analyzing the data, conclude that the most important factors are 1. Less Documentation, 2. Rate of Interest, 3. Prepayment Period, 4. Service charges, 5. Hidden Terms & Conditions, 6.Fast Disposal of Loan, & 7. Down Payment. The researcher also found that Flexibility, Reputation of Bank, Insurance Facility, Requirement of Guarantors, Incentives in Fees and Prepayment Penalty are the least important factors.
The above data suggest that the HFC should consider Less Documentation as one of the important factor and reformulate their strategies & policies according to that.
4. FACTORS INFLUENCING THE DECISION OF SELECTION OF HFC One of the important objectives of the present study is to find out the factor which influences the decision of the customer while selecting the HFC. The researcher posed a question that which factor influenced you more in selecting proper home loan? The responses are presented in the following table
Table No – 4: Factors Influenced While Selecting HFC Variable Category Frequency Percentage
Factors Influenced
Study of HFC Advertisement Suggestions of Friends Parents / Spouse Colleagues Trade Associations Children
41 17 57 28 39 04 14
20.5 8.5
28.5 14
19.5 2 7
The above table shows the factors which influences the decision of customer while selecting the HFC. 28.5 percent of respondents selected the HFC on the basis of suggestions of friends. These respondents understand what the experience of their friends regarding the HFC is. These friends include those people who had recently taken a home loan or they may be professionals like CA. These respondents took the help from their friends to choose HFC and get the home loan sanctioned.
20.5 percent of the respondents selected the HFC after studying the various HFC carefully. These respondents considered various factors which are mentioned in the above table, they prepare a comparative analysis and on that basis they selected the HFC. 19.5 percent of the respondents agreed that their decision of selecting HFC was influenced by their colleagues. Further they stated that they also compared the various factors which are important, and then they consider the colleagues opinion also. 14 percent of the respondents stated that they have not thought much about the selection of HFC. They categorically stated that this decision are taken by either their spouse or by parents. These people mainly include the professionals and the female customers; like that 7 percent respondents claimed that their decision regarding selection of HFC were taken by their children after carefully examining the various factors.
8.5 percent of the respondents selected HFC on the basis of advertisement. According to them various ads contains comparative information about various HFC. Above table shows that nearly half (48%) respondents has taken the help of either their friend or colleague for selecting the HFC. A Considerable number (29%) of respondents stated that they have studied the HFC carefully either by various documents or with the help of comparing advertisements. Whereas 21 percent of the respondents agreed that, the decision of selecting HFC is taken either by their parents, spouse or children.
5. RATE OF INTEREST The rate of Interest of housing loan changes frequently. Therefore it is essential to know whether the HFC used to intimate the changes to the customers or not. Every HFC is charging the interest by two method i.e. floating rate and fixed rate of interest. The customer has to decide the method of interest. Deciding the method of

International Journal of Advance and Innovative Research Volume 5, Issue 4 (XX): October - December, 2018
35
ISSN 2394 - 7780
interest is an important decision for customer. Therefore, the researcher tried to know about it. The responses are presented in the following table
Table No – 5: Rate of Interest Variables Category Frequency Percentage
Intimation of change in ROI
Intimation Given Intimation not Given
84 116
42 58
Preferences of ROI Method
Floating Rate of Interest Fixed Rate of Interest
164 36
82 18
Intimation of Changes in ROI: 58 percent respondents stated that their HFC does not intimate the changes in rate of interest regularly to them whereas 42 percent respondents agreed that their HFC is intimating about changes in rate of interest regularly.
Preferences for ROI Method: 82percent of the respondents preferred floating rate of interest, whereas only 18 percent of the respondents preferred fixed rate of interest. From the above table it is clear that floating rate of interest is very popular method of interest for housing loan.
CONCLUSIONS The important conclusions of the present study are summarized as under. 1. Most (70 percent) of the respondents are from the age group of 30 years to 50 years. In India it is a
common practice to purchase a house as soon as one gets settled. Indian youth are generally settled near about 30 years of age. Generally the customers prefer to have fifteen years home loan period.
2. Majority (87 percent) of the respondents were male. It shows the dominance of male in the home loan market. In India girls’ average marriage age is 23- 25 years. When a girl gets married it is assumed that it’s a duty of a boy to purchase a home and get settled the life.
3. Most of the respondents (86percent) were at least completed their graduation.
4. Most of the respondents (67 percent) getting the monthly income in between Rs 30,000 to Rs 70,000.
5. Most of the respondents (69 percent) were salaried. Earlier studies found that majority of the home loan customers are salary earners. Because salary earners have all the documents ready which HFC required and these people want to invest in property whereas the non salaried person generally does not show their proper income and secondly they want to invest their funds in their businesses. But the home loan customers of Ahmednagar city do not have the same trend.
6. Most of the respondents (59percent) were taken home loan for either constructing or purchasing a new home. A sizable number of respondents (30.5 percent) were availed the loan for Enovation/ Modification or extension of existing home.
7. Nearly three fourth of the customers (72.5 percent) of home loan in Ahmednagar City were taken loan for the period of 5 years to 15 years. The customers who had taken the loan less than 5 years, the loan amount of such customers were very less as compared to their income and taken mainly for renovation purpose.
8. Most of the respondents who prefer 5 years to 10 years period are taken loan for the period of more than 8 years. The loan amount is highest who had taken a loan for the period of 15 years to 20 years as compared to their income.
9. Near about three fifth (59 percent) customers of home loan got the information directly from HFC, 18.5 percent got the information from friends whereas only 10.5 percent received the information through Advertisement.
10. The most important factor considered by the customers of Ahmednagar City were 1. Less Documentation, 2. Rate of Interest, 3. Prepayment Period, 4. Service charges, 5. Hidden Terms & Conditions, 6.Fast Disposal of Loan, & 7. Down Payment.
11. Flexibility, Reputation of Bank, Insurance Facility, Requirement of Guarantors, Incentives in Fees and Prepayment Penalty were the least important factors.
12. A nearly half (48%) respondent has taken the help of either their friend or colleague for selecting the HFC. A Considerable number (29%) of respondents stated that they have studied the HFC carefully either by

International Journal of Advance and Innovative Research Volume 5, Issue 4 (XX): October - December, 2018
36
ISSN 2394 - 7780
various documents or with the help of comparing advertisements. Whereas 21 percent of the respondents agreed that, the decision of selecting HFC is taken either by their parents, spouse or children.
13. 58 percent of home loan customers from Ahmednagar city claimed that their HFC does not intimate the changes in rate of interest regularly to them whereas only 42 percent customers agreed that their HFC was intimating them about changes in rate of interest regularly.
14. More than Four Fifth customers of home loan of Ahmednagar City preferred Floating Rate of Interest as a method of home loan.
SUGGESTIONS 1. 70 percent of the home loan customers of Ahmednagar City were up to the age of 50years. These people are
purchasing their first home. Very first time they are taking a loan. This age & situation requires the moral support from family members & financers. The HFC should train their staff in such a manner that they will support the customers & also create a confidence in the mind of customers.
2. The researcher does not come across any farmer as a home loan customer. The basic reason is that they do not have a salary slip or I.T. Return. Therefore even though they want to purchase or construct a home, the HFC do not sanction home loan to them. The HFC should change their policy & sanction the home loan application of farmers by hypothecating their land.
3. Most of the customers are the genuine customers. They are purchasing or constructing their first home. The HFC should give concession in rate of interest to these people. The HFC should charge more interest who are purchasing their second home, because these people are taking home loan for taking the benefit of Income Tax.
4. Only few HFC use to provide loan for purchasing Plot. HFC should change their policy and do sanction loan also for purchasing home loan.
5. 71percent of the customers get the information about home loan schemes directly from HFC & Internet. Most of the HFC offices in Ahmednagar City do not have a separate person to give the information about home loan schemes .Currently the person who haves other assignments used to give information in his free time. Therefore every HFC in Ahmednagar City should appoint a separate person for giving the information about various schemes.
6. 'Less Documentation' & 'Rate of Interest' are the two most important factors which are considered by customers while selecting HFC. Therefore every HFC should give more weightage on these factors while preparing the policies and developing their strategies.
7. 58% of the customers of Ahmednagar City said that their HFC does not intimate them the changes in Rate of Interest. Naturally the customers do not have a faith on HFC. This situation should be changed. Every HFC should see whether the proper intimation is given or not.
REFERENCES 1. Shani, N. Sopna, P., A Study of Customer Satisfaction Towards Housing Loan in Banking Sector With
Reference to Corporation Bank, International Journal of Sales & Marketing Management & Research (IJSMMRD), Vol. 1, Issue 2,Dec. 2011, pp. 28-35.
2. Murugan,M. Sakthivel, Jansirani, ‘Consumer Perception Towards Home Loan’, Special Issue Published in International Journal of Trend in Research and Development (IJTRD), ISSN: 2394-9333, www.ijtrd.com, pp-1-5
3. Vijaykumar, M. & Subburaj B., ‘Housing Loan Purchase Decision of Consumers’ International Journal of Engineering & Management Science, I.J.E.M.S., VOL.3 (2) 2012, pp184- 195.
4. Bhalla, G.S. & Manureet, Rair, ‘Customers Perception towards Home loan, A Study Conducted at Punjab’, IOSR Journal of Business and Management (IOSR-JBM), e-ISSN: 2278-487X, p-ISSN: 2319-7668. Volume 18, Issue 7 .Ver. IV (July 2016), pp 09-14
5. Mahabir Singh Narwal, Sushma Rani & Radhika, ‘Customers Preferences of Home Loan’, International Journal of Banking, Risk and Insurance, Volume 1, Issue 1, March 2013, pp 46-55.

International Journal of Advance and Innovative Research Volume 5, Issue 4 (XX): October - December, 2018
37
ISSN 2394 - 7780
ALGORITHM FOR THE DEVELOPMENT OF REKHA DEUL OF SAPTA RATHA TEMPLES
Dr. Rinku Parashar1 and Ayush Agrawal2 Faculty1, NIT Raipur, Raipur
Student2, BIT, Durg
ABSTRACT India is known for her traditional culture, an outcome of her sublime artistic and religious belief systems. Typical characteristics of early Indian architecture were nothing but an expression of its spiritual content, through temple architecture in a tangible form. The first Hindu temples were built from rock cut caves, which were later converted into free standing structures, at the advent of Gupta architecture around 4th and 5th century A. D. Various researches have been carried out on Hindu Temple Architecture, but still many aspects are left unexposed. Out of the various styles of temple architecture existing in India, Kalinga style is reflected in the temples of Odisha. The temples found here show homogeneous characteristics, with continuity from 6th to 16th century A D. and are of “Rekha” order. The evolution can be seen through four distinct phases. In these four different phases, different types of temples, belonging to the Kalinga style, were found to exist. The differentiation of the temples was based on the offsets, found in the walls of the “Rekha Deul” of the temples. The Mature Phase that is the third phase is characterized by “Sapta-ratha" temples, with walls of “Rekha Deul” having seven offsets. In the present paper an investigative approach has been applied, to the find out the hidden grid geometry of the Bakreshvara temple and Chitrakarini temple which are examples of “Sapta-ratha" type and an attempt is made to develop the algorithm for the generation of the plan of “Rekha Deul” of the same.
Keywords: Algorithm, Grid geometry, Hindu Temples, Kalinga Architecture, Plan form
INTRODUCTION The practices and traditions of the temples are continuing from history to the present time, influencing the socio-cultural life of the people thus giving continuity to the traditional Indian values. The first Hindu temples were built from rock cut caves, which were later converted into free standing structures, at the advent of Gupta architecture around 4th and 5th century.This temple architecture is known to extend up till the construction of Kashi Visvanatha Temple, rebuilt by Rani Ahilyabai of Indore in 1776 A.D. The Indian temple architecture depicts clearly their evolution, following the original ancient models which were derived from religious considerations and this practice is further being followed, since many centuries. Though there exists a variety of temples in India, the basic nature of the temple remains same with, a womb chamber housing the deity commonly known as the sanctum or the “Garbha Griha”. A “Mandapa” or the hall of gathering was usually attached to the “Garbha Griha” through an “Antarala”. Apart from this, other elements were also added to the “Mandapa” as per the need.
TYPOLOGY OF HINDU TEMPLES The Samaranganasutradhara (Hardy, 2009) talks about two broad classification of Hindu temples, the “Nagara” style (North Indian Temples) and the “Dravida” style (South Indian Temples). As per Garnayak (2007), the North Indian temples are known as Prasada, whereas the South Indian temples are known as Vimana, occasionally as Prasada. A third style known as “Vesera”, which is said to be the combination of both the styles is also found (Saraswati, 1989). Apart from these three styles, the inscriptions in Amriteshvara temple at Holal (Karnataka) dated 1235 A.D., mentions a fourth style as the “Kalinga” style of temple architecture (Das, 1994) along with the other regional styles, that are found to exist. The Kalinga architecture forms the sub style of Indo Aryan or “Nagara”, temple architecture. The temples belonging to this type of style, is found in the state of Odisha. Different aspects of Odishan temples have been unravelled by different scholars and historians, through their studies since last two centuries, having either a descriptive approach or an analytical approach, many even documented different aspects related to the temples. From the documentations and scripts, it becomes clear that when the temples were constructed, they followed some rule or geometry in the ancient period using some measurement techniques, which were basically anthropometric in nature like, “Angula” (finger) or “Hasta” (hand) as the measurement unit for the temples.
ODISHA Odisha is one of the 29 states of India, located in the Eastern coast, along the Bay of Bengal, carved out of Bihar in 1936. The name of the state changed from Orissa to Odisha in 2011. Modern day Odisha, coincides with the ancient kingdom of Kalinga, which was invaded by the Mauryan emperor Ashoka, in 261.This modern state of Odisha, was established on 1st of April 1936 and the region is also known as “Utkala” (CDP, 2006)BCE.

International Journal of Advance and Innovative Research Volume 5, Issue 4 (XX): October - December, 2018
38
ISSN 2394 - 7780
Figure - 1: Map of Odisha showing location of Bhubaneswar
Source: https://www.mapsofindia.com/india/where-is-bhubaneswar.html
BHUBANESWAR Bhubaneswar, the capital city of Odisha, is supposed to be the centre of economic and religious importance in Eastern India. It was established in 1948 and show some of the finest examples of “Kalinga architecture”. This is the largest city in Odisha and also a tourist destination of national and international importance. Several places belonging both, from the new era to the old era, include ancient temples. A proud possessor of glorious sculpture and magnificent architectural heritage, the city is one of the most visited destinations in East India. With the growth of Saiva Pasupatha sect, after the decline of Buddhism and Jainism, 2nd Century B.C. saw Brahmanism as the dominant religion under the successive dynasties that ruled Odisha. Many temples were constructed in and around the city and the temple buildings reached its zenith around 12th -13th Century A.D., when many temples in sandstone were erected around the city.
EVOLUTION OF ODISHAN TEMPLES The evolution of temple architecture of Odisha can be witnessed through four distinctive phases as shown in Figure 2, namely: i) Formative phase (8th to 9th CenturyA.D.)
ii) Transitional phase (9th to 11th Century A.D.)
iii) Mature phase (11th to 13th Century A.D.)
iv) Phase of decadence (13th to 16th Century A.D.)
Figure 2: Different Phases of Evolution of Temples in Odisha
Source: Drawn by author
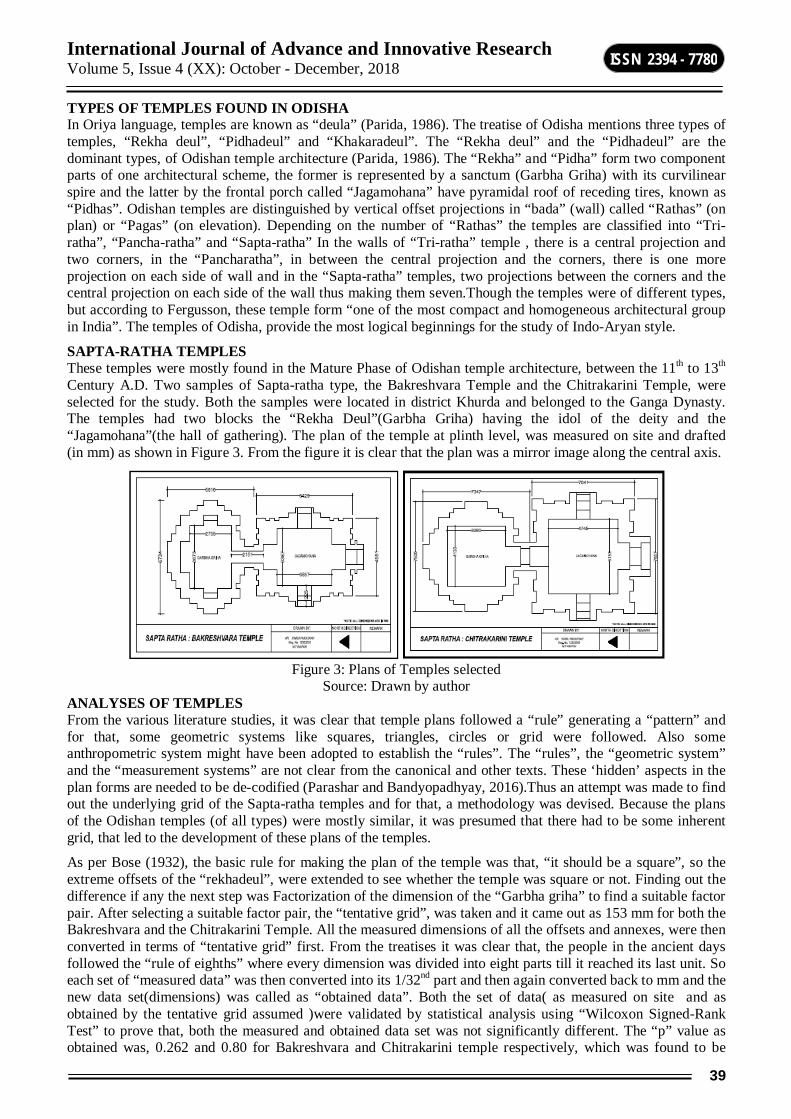
International Journal of Advance and Innovative Research Volume 5, Issue 4 (XX): October - December, 2018
39
ISSN 2394 - 7780
TYPES OF TEMPLES FOUND IN ODISHA In Oriya language, temples are known as “deula” (Parida, 1986). The treatise of Odisha mentions three types of temples, “Rekha deul”, “Pidhadeul” and “Khakaradeul”. The “Rekha deul” and the “Pidhadeul” are the dominant types, of Odishan temple architecture (Parida, 1986). The “Rekha” and “Pidha” form two component parts of one architectural scheme, the former is represented by a sanctum (Garbha Griha) with its curvilinear spire and the latter by the frontal porch called “Jagamohana” have pyramidal roof of receding tires, known as “Pidhas”. Odishan temples are distinguished by vertical offset projections in “bada” (wall) called “Rathas” (on plan) or “Pagas” (on elevation). Depending on the number of “Rathas” the temples are classified into “Tri-ratha”, “Pancha-ratha” and “Sapta-ratha” In the walls of “Tri-ratha” temple , there is a central projection and two corners, in the “Pancharatha”, in between the central projection and the corners, there is one more projection on each side of wall and in the “Sapta-ratha” temples, two projections between the corners and the central projection on each side of the wall thus making them seven.Though the temples were of different types, but according to Fergusson, these temple form “one of the most compact and homogeneous architectural group in India”. The temples of Odisha, provide the most logical beginnings for the study of Indo-Aryan style.
SAPTA-RATHA TEMPLES These temples were mostly found in the Mature Phase of Odishan temple architecture, between the 11th to 13th Century A.D. Two samples of Sapta-ratha type, the Bakreshvara Temple and the Chitrakarini Temple, were selected for the study. Both the samples were located in district Khurda and belonged to the Ganga Dynasty. The temples had two blocks the “Rekha Deul”(Garbha Griha) having the idol of the deity and the “Jagamohana”(the hall of gathering). The plan of the temple at plinth level, was measured on site and drafted (in mm) as shown in Figure 3. From the figure it is clear that the plan was a mirror image along the central axis.
Figure 3: Plans of Temples selected
Source: Drawn by author ANALYSES OF TEMPLES From the various literature studies, it was clear that temple plans followed a “rule” generating a “pattern” and for that, some geometric systems like squares, triangles, circles or grid were followed. Also some anthropometric system might have been adopted to establish the “rules”. The “rules”, the “geometric system” and the “measurement systems” are not clear from the canonical and other texts. These ‘hidden’ aspects in the plan forms are needed to be de-codified (Parashar and Bandyopadhyay, 2016).Thus an attempt was made to find out the underlying grid of the Sapta-ratha temples and for that, a methodology was devised. Because the plans of the Odishan temples (of all types) were mostly similar, it was presumed that there had to be some inherent grid, that led to the development of these plans of the temples.
As per Bose (1932), the basic rule for making the plan of the temple was that, “it should be a square”, so the extreme offsets of the “rekhadeul”, were extended to see whether the temple was square or not. Finding out the difference if any the next step was Factorization of the dimension of the “Garbha griha” to find a suitable factor pair. After selecting a suitable factor pair, the “tentative grid”, was taken and it came out as 153 mm for both the Bakreshvara and the Chitrakarini Temple. All the measured dimensions of all the offsets and annexes, were then converted in terms of “tentative grid” first. From the treatises it was clear that, the people in the ancient days followed the “rule of eighths” where every dimension was divided into eight parts till it reached its last unit. So each set of “measured data” was then converted into its 1/32nd part and then again converted back to mm and the new data set(dimensions) was called as “obtained data”. Both the set of data( as measured on site and as obtained by the tentative grid assumed )were validated by statistical analysis using “Wilcoxon Signed-Rank Test” to prove that, both the measured and obtained data set was not significantly different. The “p” value as obtained was, 0.262 and 0.80 for Bakreshvara and Chitrakarini temple respectively, which was found to be

International Journal of Advance and Innovative Research Volume 5, Issue 4 (XX): October - December, 2018
40
ISSN 2394 - 7780
greater than 0.05, at 95% significant level which indicated that the measured and the obtained data sets were not found to be significantly different and the “tentative grid” size taken as 153mm is correct and might have been the grid size used, at the time when both the temples were constructed.
ALGORITHM FOR THE DEVELOPMENT OF “REKHA DEUL” OF “SAPTARATHA” TEMPLES Further a program was developed in Python-Anaconda, based on the above explained “grid system”, for the development of the “rekhadeul” of the Sapta-ratha temples, using co-ordinate geometry and mirror command. A starting point was taken and each offset (dimension of sides) was plotted as per its co-ordinates. Thus in this manner the upper part of the plan of the “rekha deul” was generated and then mirrored along the central axis. Both the existing plan of the temple and the one generated by the programming did not show any noticeable variation. The steps for the generation of the rekhadeul as shown in Figure - 4
The First step of the generation process asks for the size of the grid, where 153mm was put as the grid size.
Then in the next step, the command window asks for the type of the temple for which the plan is to be generated, so Sapta-ratha was selected.
After Sapta-ratha is entered, the program uses co ordinate geometry and mirror command, for drafting the plan. The boxes in Step3 show numbers like 3,5,2..etc., which indicate the size of the offset in multiples of the assumed grid size like twice or thrice etc. of 153mm(the grid size).
Figure - 4: Steps as per the program to develop the “Rekha Deul”
The Step 4 shows the generated plan of the “rekha deul” of the temple. The following image shows a clip of programming done for the generation of the plan.
This program can be further developed for the generation of the entire plan of any temple.
International Journal of Advance and Innovative Research Volume 5, Issue 4 (XX): October - December, 2018
41
ISSN 2394 - 7780
CONCLUSION Thus the programme that is developed would help in generating plan of any type of Odishan temple (i.e. Tri ratha ,Pancharatha, or Saptaratha) and of any grid size required. Also, it will help in preventing any deviation in the planform, from the original ancient model. Moreover it can be concluded that, the temple plan of any type of temple, can be generated using this program if the grid size is known. It can help to generate the plans of the temples that are not existing as well as those, which are in dilapidated condition today, thus providing a sympathetic approach towards their conservation.
REFERENCES Acharya, P.K. (1993), Architecture of Mansara: Illustrations of Architectural and Scuptural Objects.
London: Oxford University Press.
Behera, K.S. (1993). Temples of Orissa. Bhubaneswar: Orissa Sahitya Academy.
Brown, P. (1940). Indian Architecture: Buddhist and Hindu periods. Delhi: Kiran Book Agency.
Bose, N. K. (1932). Canons of Orissan Architecture. Calcutta: R. Chatterji
Das, R. P. (1994). Terminology of Orissan Temple Architecture. National Seminar, Lalit Kala Akademi, New Delhi.
Fergusson, J. (1876). History of Indian and Eastern Architecture. London: Dodd, Mead & Company.
Garnayak, D. B. (2007). Evolution of Temple Architecture in Orissa. Orissa Review, LXIV (4), 55-59.
Ganguly, M. M., & Dasgupta, K. K. (1987). Orissa and Her Remains. New Delhi: Eastern Book House.
Gandotra, A. (2011). Indian Temple Architecture: Analysis of Plans, Elevations and Roof Forms. Gurgaon; Shubhi Publications
Hardy, A. (2009). Drāvida Temples in the Samarānganasūtradhāra. South Asian Studies, 25(1), 41-62. doi:10.1080/02666030.2009.9628698
Khan, S. (2017). History of Indian Architecture: Buddhist, Jain and Hindu period. New Delhi: CBS & Distributors.
Kramrisch, S. (1946). The Hindu Temple, Vol. I. Calcutta: University of Calcutta
Panda, B. P. (2016). Temples of Orissa. Global Journal of Indian History and Culture, 1(1), 1-11. Delhi: Global Vision Publishing House
Parida, A. N. (1986). Early Temples of Orissa (from the Sixth Century A.D. to the End of Somvansi Rule) (Unpublished Doctoral thesis). Bhubaneswar: Utkal University.
Parashar, R. and Bandyopadhyay, A. (2016). Temples of Odisha- the Geometry of Plan Form, International Journal for Innovative Research in Science & Technology. 2(10). 117-121.
Panigrahi, K. C. (1981). History of Orissa. Cuttack: Kitab Mahal.
Saraswati. (1989). Architecture, the Struggle for Empire Vol. V. Bombay: Bharatiya Vidya Bhavan.

International Journal of Advance and Innovative Research Volume 5, Issue 4 (XX): October - December, 2018
42
ISSN 2394 - 7780
EXPLORING THE ROLE OF CURCUMIN ON GEMCITABINE-INDUCED LIPID PEROXIDATION
Sarbani Dey Ray Department of Pharmaceutical Sciences, Assam University, Silchar
ABSTRACT The present work explores the free radical scavenging property of curcumin on gemcitabine-induced lipid peroxidation. The work was carried out in vitro and goat liver was used as model lipid source. Two common laboratory markers such as malondialdehyde and reduced glutathione were used for the model. The results showed that gemcitabine has the ability to induce lipid peroxidation to a significant extent and it was also found that curcumin has the ability to suppress the gemcitabine-induced toxicity.
Keywords: Gemcitabine, curcumin, lipid peroxidation, malondialdehyde, reduced glutathione
INTRODUCTION Gemcitabine is a pyrimidine nucleoside prodrug. Mainly it is used in breast cancer, ovarian cancer, non-small cell lung cancer, pancreatic cancer and bladder cancer. However along with its desired effect it produces several side effects such as pale skin, diarrhea, headache, skin rash etc to mention a few (Zhang et al., 2017).
Lipid peroxidation is oxidative deterioration of poly unsaturated fatty acid and producing some toxic end products like malondialdehyde (MDA), 4-hydroxy-2-nonenal (4-HNE) etc (Esterbauer et al., 1998). Measurement of these end products may act as marker of lipid peroxidation. As free radical is involved in lipid peroxidation, free radical scavengers may be helpful to arrest drug induced lipid peroxidation. Combined use of cisplatin along with resveratrol reduces the tumor growth in pancreatic cancer (Vendrely et al., 2017).
In view of the above finding and the ongoing search of the present author for antioxidant that may reduce drug induced lipid peroxidation (Ray and Dey Ray, 2016) the present work has been carried out in vitro to evaluate the antiperoxidative potential of curcumin on gemcitabine-induced lipid peroxidation.
MATERIALS Thiobarbituric acid (TBA) and trichloroacetic acid (TCA) were purchased from Ranbaxy Fine Chemicals Ltd., New Delhi. 1,1,3,3, tetraethoxypropane and reduced glutathione were from Sigma chemicals Co. St. Louis, MO, USA. 5, 5’ dithiobis(2-nitrobenzoic acid) was from SRL Pvt. LTd., Mumbai. Curcumin was from Himedia Bioscience, Mumbai. Pure sample of gemcitabine used in present study was obtained from Parchem, New Rochelle, New York, USA. All other reagents were of analytical grade. Goat liver was used as the lipid source.
METHODS Preparation of tissue homogenate Goat liver was collected from Silchar Municipal Corporation approved outlet. Goat liver was selected because of its easy availability and close similarity with human liver in its lipid profile (Hilditch and Williams, 1964). Goat liver perfused with normal saline through hepatic portal vein was harvested and its lobes were briefly dried between filter papers to remove excess blood and thin cut with a heavy-duty blade. The small pieces were then transferred in a sterile vessel containing phosphate buffer (pH 7.4) solution. After draining the buffer solution as completely as possible, the liver was immediately grinded to make a tissue homogenate (1 g/ml) using freshly prepared phosphate buffer (pH 7.4). The homogenate was divided into four equal parts, which were then treated differently as mentioned below.
Group I: One equal part of the homogenate was kept as control (C).
Group II: Second equal part was treated with the gemcitabine (D) at a concentration of 1.2mg/g tissue homogenate.
Group III: Third equal part was treated with both gemcitabine at a concentration 1.2mg/g tissue homogenate and curcumin at a concentration of 0.1666 mg / g homogenate (DA).
Group IV: Fourth portion was treated only with curcumin at a concentration of 0.1666 mg / g tissue homogenate (A).
After drug and / or antioxidant treatment tissue homogenates of various groups were shaken for two hours and the malondialdehyde and reduced glutathione content of various portions were determined. For each parameter (MDA/GSH) three animal sets were used.

International Journal of Advance and Innovative Research Volume 5, Issue 4 (XX): October - December, 2018
43
ISSN 2394 - 7780
ESTIMATION OF MALONDIALDEHYDE (MDA) LEVEL FROM TISSUE HOMOGENATE The MDA was determined as per thiobarbuturic acid (TBA) method (Ohkawa et al., 1979). In each case three samples of 2.5 ml of incubation mixture were treated with 2.5 ml of 10% (w/v) trichloroacetic acid (TCA) and centrifuged at room temperature at 3000 rpm for 30 minutes to precipitate protein. Then 2.5 ml of the supernatant was treated with 5 ml of 0.002 (M) TBA solutions and then volume was made up to 10 ml with distilled water. The mixture was heated on a boiling water bath for 30 minutes. Then tubes were cooled to a room temperature and the absorbance was measured at 530 nm against a TBA blank (prepared from 5 ml of TBA solution and 5 ml of distilled water). The concentrations of MDA were determined from standard curve. The best-fit equation is A=0.006776 M + 0.003467, where M= nanomoles of MDA, A= absorbance, r = 0.996, SEE= 0.0037, F=1068.76 (df=1,8).
ESTIMATION OF REDUCED GLUTATHIONE (GSH) LEVEL FROM TISSUE HOMOGENATE The GSH was measured as per Ellman’s method (George, 1959). In each case three samples of 1 ml of incubation mixture were treated with 1 ml of 5% (w/v) TCA in 1 mM EDTA centrifuged at 2000 g for 10 minutes. After that 1 ml of the filtrate was mixed with 5 ml of 0.1M phosphate buffer (pH 8.0) and 0.4 ml of 5, 5’-dithiobis(2-nitrobenzoic acid in 0.01% in phosphate buffer pH 8.0) (DTNB) was added to it. The absorbances of the solutions were measured at 412 nm against blank (prepared from 6.0 ml of phosphate buffer and 0.4 ml of DTNB) (0.01% in phosphate buffer). The concentrations of reduced glutathione were determined from standard curve. The best-fit equation is A=0.001536 M - 0.00695, where M= nanomoles of GSH, A= absorbance, r = 0.995, SEE= 0.0067, F=1638.83 (df=1,8).
STATISTICAL ANALYSIS Analysis of variance (ANOVA) and multiple comparison analysis using least significant different procedure (Snedecor and Cochran, 1967; Bolton, 2000) were also performed on the percent changes data of various groups such as gemcitabine-treated (D), gemcitabine and curcumin (DA) and only curcumin-treated (A) with respect to control group of corresponding time.
RESULTS & DISCUSSION Tissue homogenate treated with gemcitabine showed an increase in MDA level (7.01%) with respect to corresponding control (Figure 1). This suggests lipid peroxidation potential of gemcitabine. MDA is three-carbon dialdehyde produced as a byproduct of polyunsaturated fatty acid peroxidation and arachidonic acid metabolism and it is highly reactive (Yahya et al., 1996). However when tissue homogenate treated with gemcitabine and curcumin, the MDA content is reduced (-3.04%) in comparison to both control and gemcitabine treated groups. Again the tissue homogenates were treated only with curcumin, the MDA (-1.01%) level were reduced in comparison to both groups. This decrease may be due to the antioxidant property of curcumin.
It was also evident from Figure 2 that tissue homogenates treated with gemcitabine showed a decrease in GSH (-10.24%) content in samples with respect to control to a significant extent. The observations suggest that gemcitabine could significantly induce the lipid peroxidation process. Glutathione plays a vital role in the defence mechanism for tissue against the reactive oxygen species (Wilkinson, 2001). However when tissue homogenates were treated both with gemcitabine and curcumin, the GSH level was increased (4.55%) in comparison to control and gemcitabine-treated groups. Again the tissue homogenates was treated only with curcumin then the GSH level was increased (2.15%) in comparison to the control and the gemcitabine treated group. This increase may be explained by the free radical scavenging property of the curcumin.
From Table 1, it is observed that there is significant differences among various groups (F1) such as gemcitabine-treated, gemcitabine and curcumin-treated and only curcumin-treated. But within a particular group, differences (F2) are insignificant which shows that there is no statistical difference in animals in a particular group. The Table 1 also indicates that for MDA / GSH content, all three groups i.e. gemcitabine –treated, gemcitabine and curcumin-treated and only curcumin-treated groups are statistically significantly different from each other.
CONCLUSION The generated data from the work indicate the lipid peroxidation induction potential of gemcitabine. The side effects of the drug may be due to lipid peroxidation. The results also suggest the antiperoxidative effects of curcumin and demonstrate its potential to reduce gemcitabine induced toxic effects.
REFERENCES Bolton, S. (2000), “Remington: The Science and Practice of Pharmacy”, Lippincott Williams & Wilkins,
Philadelphia.

International Journal of Advance and Innovative Research Volume 5, Issue 4 (XX): October - December, 2018
44
ISSN 2394 - 7780
Esterbauer, H., Zollner, H., Schauer, R.J., (1998), ‘Hydroalkenals: Cytotoxic products of lipid peroxidation’, Biochemistry and Molecular Biology, 1: 311-319.
George, E. L., (1959), ‘Tissue Sulfhydryl Groups’, Archives of Biochemistry and Biophysics, 82: 70-77.
Hilditch, T.P., Williams, P.N. (1964) “The Chemical Constituents of Fats”, Chapman & Hall, London.
Zhang, X.W., Ma, Y.X., Sun, Y., Cao, Y.B., Li, Q., Xu, C.A., (2017), ‘Gemcitabine in Combination with a Second Cytotoxic Agent in the First-Line Treatment of Locally Advanced or Metastatic Pancreatic Cancer: a Systematic Review and Meta-Analysis’, Target Oncology, 12: 309-321.
Ohkawa, H., Ohishi, N., Yagi, K., (1979), ‘Assay of lipid peroxidation in animal tissue by thiobarbituric acid reaction’, Analytical Biochemistry, 95: 351-358.
Ray, S., Dey Ray, S., (2016), ‘Paclitaxel-induced lipid peroxidation: Role of water extract of Spirulina platensis’, Journal of Pharmaceutical and Scientific Innovation, 5: 38-41.
Snedecor, G.W., Cochran, W.G. (1967), “Statistical Methods”, Oxford & IBH Publishing Co Pvt Ltd, New Delhi.
Vendrely, V., Peuchant, E., Buscail, E., Moranvillier, I., Rousseau, B., Bedel, A., Brillac, A., de Verneuil, H., Moreau-Gaudry, F., Dabernat, S., (2017) ‘Resveratrol and capsaicin used together as food complements reduce tumor growth and rescue full efficiency of low dose gemcitabine in a pancreatic cancer model’, Cancer Letters, 390: 390-391.
Wilkinson, G.R. (2001), “Goodman & Gilman’s The Pharmacological Basis of Therapeutics”, Mc Graw- Hill, New York.
Yahya, M.D., Pinnsa, J.L., Meinke, G.C., Lung, C.C., (1996), ‘Antibodies against malondialdehyde (MDA) in MLR / lpr / lpr Mice: Evidence for an autoimmune mechanism involving lipid peroxidation’, Journal of Autoimmunity, 9: 3-9.
Figure 1: Effects of curcumin on gemcitabine-induced changes in MDA content (n=3); D, DA & A indicate only gemcitabine-treated, gemcitabine & curcumin-treated and only curcumin–treated samples
Figure 2: Effects of curcumin on gemcitabine-induced changes in GSH content (n=3); D, DA & A indicate
only gemcitabine-treated, gemcitabine & curcumin-treated and only curcumin–treated samples

International Journal of Advance and Innovative Research Volume 5, Issue 4 (XX): October - December, 2018
45
ISSN 2394 - 7780
Table - 1: Analysis of variance & multiple comparisons
Theoretical values of F: p=0.05 level F1=4.46 [df=(2,8)], F2=3.84 [df=(4,8)]; P=0.01 level F1=8.65 [df=(2,8)], F2=7.01 [df=(4,8)]. F1 and F2 corresponding to variance ratio between groups and within groups respectively. D, DA, A indicate gemcitabine-treated, gemcitabine and curcumin-treated, curcumin-treated respectively. df= degree of freedom; * Error mean square, # Critical difference according to least significant procedure8 ** Two means not included within same parenthesis are statistically significantly different at p=0.05 level
Name of marker
Analysis of variance & multiple comparisons
MDA F1=3489.21 [df=(2,4)], F2=0.608 [df=(2, 4)] Pooled variance (S2)* =0.0243 Critical difference,(p=0.05)# LSD =0.293 Ranked means**
(D) (DA) (A) GSH F1=463.15 [df=(2,4)], F2=0.033 [df=(2, 4)]
Pooled variance (S2)* =0.1839 Critical difference,(p=0.05)# LSD =0.81 Ranked means**
(D) (DA) (A)

International Journal of Advance and Innovative Research Volume 5, Issue 4 (XX): October - December, 2018
46
ISSN 2394 - 7780
CLUSTERED GRAPH BASED RELIABLE ROUTING PROTOCOL FOR VANET USING VEHICLES VELOCITY
Dr. A. Noble Mary Juliet1 and Dr. N. Suba Rani2
Associate Professor1 and Assistant Professor2, Dr. Mahalingam College of Engineering & Technolocy, Pollachi
ABSTRACT VANET is formed by allowing vehicles to communicate directly to each other without infrastructure. Interest on VANET has been increased in order to improve safety and traffic efficiency. VANET is more dynamic in nature, so the routing protocol proposed for MANET should be modified and used in VANET. The routing protocol proposed for VANET can be improved by considering route reliability and variable velocity of vehicles. In this paper, we use clustered graph based reliable routing(CGR) scheme to find the reliable route for those vehicles that are moving in the variable velocity vehicles. This paper group the vehicles based on the vehicles velocity. Each group can be treated as temporary stable. This group is called cluster. Then propose graph based reliable routing protocol to make communication between the clusters and within the cluster.
Keywords: VANET, MANET, CGR, Route Reliability, Cluster
I. INTRODUCTION VANET is autonomous and self organizing wireless communication network, where nodes in VANET involve themselves as servers and/or clients for exchanging and sharing information. VANET allow communication among vehicles on roads. It is developed to improve road safety and transportation efficiency. These two are interrelated. For example, reducing the number of accident can lead to less traffic jam. The increasing problems of accident and traffic jam need the concept of VANET [Blum 2004]. It provides both vehicle to vehicle communication and vehicle to roadside unit communication. Each vehicle includes a GPS device to find the position of each vehicle in vehicular network . The GPS information is used for VANET communication to identify the location of other vehicles and send the information.
A vehicular network is high dynamic in nature as compared to MANET. One of the critical issues consists of the design of scalable routing algorithms that are robust to frequent path disruptions caused by vehicles mobility. Existing routing protocols, traditionally designed for MANET, do not make use of the unique characteristics of VANETs and are not suitable for Vehicle-to-Vehicle (V2V) communications over VANETs. Many interesting improvements can be obtained by adjusting these routing protocols to reflect the dynamically changing topology of VANETs while taking into account vehicles’ movement information such as position, direction, speed, and digital mapping of roads. There are some advantages over the MANET. In VANET, vehicles movement always constrained by roads, road users and RSU. Another advantage is, there is no power saving issue in the VANET.
In VANET, the routing protocols are classified into five categories: Topology based routing protocol, Position based routing protocol, Cluster based routing protocol, Geocast routing protocol and Broadcast routing protocol. Topology based routing protocols use links information that exists in the network to perform packet forwarding. Position based routing share the property of using geographic positioning information in order to select the next forwarding hops. Cluster based routing is preferred in clusters. A group of nodes identifies themselves to be a part of cluster and a node is designated as cluster controller will broadcast the packet to cluster. Good scalability can be provided for large networks but overhead is incurred when forming clusters in highly mobile VANET. Geo cast routing is basically a location based multicast routing. Its objective is to deliver the packet from source node to all other nodes within a specified geographical region. Broadcast routing is frequently used in VANET for sharing, traffic, weather and emergency, road conditions among vehicles and delivering advertisements and announcements.
The characteristic of highly dynamic topology makes the design of efficient routing protocol for VANET is challenging. To deal with the high mobility, here graph based reliable routing model is used where the vehicles can be modeled as a vertices and their communication link can be modeled as an edges in a graph [Mahmoud Hashem Eiza 2013]. It uses the topological properties of the VANET and form the communication graph. It choose most reliable route from source to destination. It considers the link reliability metric. But this graph based routing give good result for vehicles that are moving in the constant velocity. This method alone, lead to frequent route failure when vehicles move at variable velocity. The basic idea behind the paper is to use the vehicles velocity information to avoid route failure. Vehicles are grouped into number of sets according to their velocity. The group is not a stable one. During communication, vehicles may change their velocity and belongs

International Journal of Advance and Innovative Research Volume 5, Issue 4 (XX): October - December, 2018
47
ISSN 2394 - 7780
to a different group. Communication between vehicles in the cluster and communication between clusters is done by using the graph based routing method.
The rest of this paper is organized as follows: Section II overviews the related work in this field. Section III presents CGR protocol. Section IV shows the simulation environments and performance metrics to be evaluated. Finally, Section V concludes this paper.
II. RELATED WORK Routing has always been a challenge in VANET since the position of the nodes chance more frequently with time [Abdalla GMT 2006]. Routing algorithm in VANET using the positioning information provided by the GPS. Proactive based and reactive based routing are two strategies of data forwarding commonly used for wireless network. Proactive routing means that the routing information such as next forwarding hop is maintained in the background irrespective of communication request. Reactive routing opens the route only when it is necessary for a node to communicate with other.
The authors in [Nie 2006] introduced the link reliability model for VANET. Link reliability is a probability that persist for a certain time interval to describe the future status of a wireless link. Link reliability is based on road density, average speed and traffic flow of vehicles. A link reliability model is provided by capture the probability density function of link lifetime and calculating the link reliability through integration or discrete sum.
In [Monteiro.J 2006] the evolving graph concept is explained. Evolving graph was proposed to capture the dynamic behavior of the wireless network. The objective of graph theory is the construction of efficient routing in realistic scenarios. Here, three metric has been formalized such as foremost, shortest and fastest journey.
In [Kuklinski.S 2009], density based clustering algorithm for VANET. It forms the stable, long living clusters for reliable communication. Clustering is based on the density of connection graph, link quality and traffic condition.
The authors in [Taleb.T 2006] proposed a vehicle heading based routing protocol for VANET. This paper argues the use of information on vehicle headings to predict a possible link failure prior to its occurrence. Vehicles are grouped into a number of sets according to their moving directions. Communication paths are maintained between vehicles belonging to the same group. If an intermediate routing node changes its direction and belongs to a different group, a link failure will occur. To avoid that, a more stable route is selected that includes only nodes from the same group.
In summary, no direct work has been done to integrate the clustering technique with the graph based reliable routing in order to deal with the vehicles that are move at variable velocity on highways, which is the subject of this paper.
3. CGR PROTOCOL 3.1 Clustering Model On highway, each vehicles move at different speed. Traditionally graph based routing protocol is designed for the constant velocity vehicles. During route discovery, path can be changed very often due to frequent change of vehicle’s speed, which lead to additional time and overhead in the entire network in order to discover the new routes. So the graph based routing protocol alone do not totally appropriate for time critical applications[Jeng.A 2009]. Due to these reasons, grouping is performed based on the vehicle’s velocity before using graph based routing protocol. This type of cluster based routing is also suitable for networks with a large number of vehicles.
To deal with this, we will use a kind of clustering model and the main principle behind this is to group the vehicle according to their velocity. While clustering can be implemented on any routing protocol, in this paper we choose graph based reliable routing protocol.
Cluster Controller Selection During cluster controller selection, each node calculates load based on its residual power and midpoint. The load is given by the following equation
load = l1 × P – l2 × M
where
2
1
1i
il and 0 <l2 < l1 , ‘P’ is the residual power of sensor node and ‘M’ is the midpoint of that node.
Midpoint is calculated as follows. Let (a,b) be the location of a vehicle node ‘ vi ’ where 1 ≤ i ≤ n. Let (am,bm) be the mid point of the cluster in which ‘vi’ is located. Then

International Journal of Advance and Innovative Research Volume 5, Issue 4 (XX): October - December, 2018
48
ISSN 2394 - 7780
BBAAM MM The main objective of using midpoint in calculation of load is to select a node as a cluster controller that is located either at the center or close to center of the cluster, and has higher residual power. After calculating load for all nodes, a node with the highest load is selected as a cluster controller. Supplementary Cluster Controller Selection Once the cluster-controller is selected, next step is to select the supplementary cluster-controller selection. The node with the second highest load is chosen as an supplementary cluster-controller for that cluster. The supplementary cluster-controller acts as a normal cluster member as long as the cluster-controller is active. When the supplementary cluster controller receives a leave message from the cluster-controller or does not receive any communication from the cluster controller for a specified time, it takes over the responsibility and announces itself as the controller of that cluster.
Cross-Cluster Communication After forming cluster, communication between the vehicles within the cluster is taken place using graph based reliable routing protocol. Always routing is performed through the cluster controller. During communication before the message reach to the destination, if a destination node or a node involved in the path may change their velocity and move to another cluster, the path formation will be destroyed. This path failure should be informed to the cluster controller immediately. Then the cluster controller send the request to the corresponding cluster controller where the node is presented. The new cluster controller will start the data transfer by using graph based routing protocol.
3.2 Graph based reliable routing Link Reliability We propose the graph model to address the evolving properties of the VANET communication graph and consider the reliability of communications links among vehicles.
A link reliability model is a probabilistic function that can predict the future status of a wireless link. To calculate the link reliability, we utilize the vehicle’s velocity parameter. It is assumed that the velocity of vehicles has a normal distribution. Let g(T) be the probability density function of the communication duration T, then
v
v
v
TR
eT
RTg
22
2)2(
12
4)( 2
for T ≥ 0 (1)
where μΔv and σ2Δv denote the mean value and the variance of vehicle’s relative velocity Δv, respectively. Lab is
defined as the continuous availability of a specific link l between two vehicles a and b. It can be determined as
ba
baba
ab
abab vv
xxyyR
vDRL
22 )()(
(2) where R denotes the radio communication range, Dab is the Euclidean space between vehicles a and b, and vab is the relative velocity between vehicles a and b. Take integration of g(T) from t to t + Lab to obtain the probability that, at time t, the link will be available for a duration Lab. Thus, the link reliability value lr(e) at time t is calculated as follows:
0,)()(
ab
Lt
tt ifLdTTgelr
ab
(3) In the graph based model, we put the following 2-tuple (t, lr(e)) in each edge, where t denotes the current time. The communication link between two vehicles is not available if its reliability value lr(e) is equal to zero. Let e = {A,B} be a link in the graph, where V is the set of vertices and E is the set of links. Let Use(e) be a function that determines whether this link e can be used or not, i.e., Use(e) = True, if 0 < lr(e) ≤ 1 False, lr(e) = 0. Reliable route formation In VANETs, multiple potential routes could exist between the source vehicle sr and the destination vehicle de, where each route is a set of links between the source and the destination. Calculate the route reliability value for each route. The route reliability is defined as the multiplicative product of reliability values across the formed links of this route. The route reliability for a route P, which is denoted by R(P(sr, de)), is defined as follows:

International Journal of Advance and Innovative Research Volume 5, Issue 4 (XX): October - December, 2018
49
ISSN 2394 - 7780
)()),((1
w
k
wter lrdsPR
(4)
where ),( erw dsPl . If multiple routes are available, then we choose the most reliable route. If M(sr, de) = {P1, P2, . . . , Pz} is the set of all those possible routes, then the Most Reliable Journey(MRJ) will be chosen at the source node based on the following criteria:
Arg maxP∈ M(sr,de) R(P)
After finding reliable route, source vehicle create a routing request message (RREQ) and assign the hops of the MRJ as extensions to this RREQ. At each vehicle along the route, when an RREQ is received, the information about from which vehicle it heard is recorded. By utilizing the extension information in the RREQ, intermediate nodes are able to forward the routing request to the next hop without broadcasting. When the RREQ arrives at the destination vehicle, an RREP will be sent back to the source vehicle to start data transfer.
IV. PERFORMANCE EVALUATION The main objective of this performance evaluation is to identify the impact of the high dynamic
topology on the routing process performance. The simulation results are compared between AODV, graph based routing protocol, and Clustered graph based routing protocol. We perform he simulation by changing the average velocity of vehicles from 60 to 120 km/h. The data packet size is 1500 bytes. The transmission data rate is 128 kb/s.
Performance Metrics Four performance metrics will be used for the simulation process.
1) Packet delivery ratio (PDR): It represents the average ratio of all successfully received data packets at the destination node over all data packets generated by the application layer at the source node.
2) Link failures: It represents the average number of link failures during the routing process. This metric shows the efficiency of the routing protocol in avoiding link failures.
3) Route lifetime: It represents the average lifetime of the discovered route. A longer lifetime means a more stable and more reliable route.
4) Average end-to-end (E2E) delay: It represents the average time between the sending and receiving times for packets received.
Simulation Result The aim of this experiment is to investigate the impact of different velocities on the routing performance. In this experiment, we also compare AODV protocol and existing graph based protocol with a proposed Clustered graph based protocol.
As shown in Fig. 1, the average packet delivery ratio reduces for all routing protocols when the average velocity increases from 60 to 110 km/h. This reduction comes from the fact that the routing topology becomes more dynamic and unstable when velocity increases. The decrease of the packet delivery ratio of AODV is much more rapid than that of graph based protocol and our proposed clustered graph based protocol. To keep the routing tables updated in AODV, topology control messages are sent to exchange information about the current

International Journal of Advance and Innovative Research Volume 5, Issue 4 (XX): October - December, 2018
50
ISSN 2394 - 7780
vehicular status. It is clear that AODV is not suitable for highly dynamic networks such as VANETs. The graph based protocol performs the best for the constant velocity vehicles. In Clustered graph based protocol, choosing the most reliable route for variable velocity vehicles helps reduce the possibility of a link breakage and keeps the highest deliver ratio among the three schemes.
In Fig. 2, Clustered graph based protocol and graph based protocol show lower E2E delay values than AODV. The average E2E delay values of graph based protocol and Clustered graph based protocol are again the lowest and are not affected by the network topology changes. AODV cause much higher E2E delay values when the velocity increases.
As shown in Fig. 3, Clustered graph based protocol obtains the lowest average number of link failures among all the considered routing protocols. The number of link failures of AODV increases when the velocity increases. The shortest route selection algorithm in AODV is highly prone to link breakages when the velocity of vehicles increases.
In Fig. 4, we show the average route lifetime obtained by AODV, graph based protocol and Clustered graph based routing protocols. Clustered graph based routing protocols achieved a longer route lifetime than both AODV and graph based protocol because it uses the most reliable route in the network, where AODV gets the lowest route lifetime value among the three schemes.
VI. CONCLUSION In this paper, we have included the clustering concept with the extended evolving graph theory and proposed our clustered graph based model. A new clustering model is introduced to group the vehicles according to the vehicles velocity and direction. Then routing is performed within the group using extended evolving graph model. The performance of clustered graph based model has been compared with AODV and conventional graph based routing protocols using extensive simulations with different vehicular velocities. The results showed that clustered graph based protocol achieves the highest packet delivery ratio among all the tested routing protocols. As it chooses the most reliable route to the destination, it achieves the lowest number of link failures, the highest route lifetime, and the lowest average E2E delay values.
V. REFERENCES Abdalla G. M. T, Abu-Rgheff M. A., and. Senouci S. M.(2007). “Current trends in vehicular ad hoc
networks,” In Proceedings of the IEEE Global Information Infrastructure Symposium, (2007), 1--7.
Abdalla, G.M.T., Abu-Rgheff, M.A. and Senouci, S.M. Current trends in vehicular ad-hoc networks. [2] Blum J.J, Eskandarian A, and Hoffman.L.J.(2004). “Challenges of inter vehicle ad hoc networks,” IEEE Trans. Intelligent Transport System, vol. 5, no. 4, pp. 347–351, Dec. 2004.
Jeng A.A.K. Rong-Hong Jan, Chien Chen, Tsun-Chieh Chiang.(2009). “Efficient Broadcast Mechanism for Cooperative Collision Avoidance Using Power Control,” 2009 10th International Symposium on Pervasive Systems, Algorithms, and Networks (ISPAN), pp. 266-271, 2009.
Kuklinski.S and Wolny.G. (2009). “Density based clustering algorithm for VANETs,” International Journal of Internet Protocol Technology (IJIPT), Vol. 4, No. 3, 2009

International Journal of Advance and Innovative Research Volume 5, Issue 4 (XX): October - December, 2018
51
ISSN 2394 - 7780
Mahmoud Hashem Eiza and Qiang Ni.(2013). “An Evolving Graph-Based Reliable Routing Scheme for VANETs” in IEEE transactions on vehicular technology, vol. 62, no. 4, May 2013.
Mao.G and Anderson.B.O.D.(2009). “Graph theoretic models and tools for the analysis of dynamic wireless multihop networks,” in in Proceedings of IEEE International Conference on Wireless and Mobile Computing, Networking and Communications 2009, pp. 1–6.
Monteiro.J, Goldman.A, and Ferreira.A.(2006). “Performance evaluation of dynamic networks using an evolving graph combinatorial model ,”in Proceedings of IEEE International Conference on Wireless and Mobile Computing, Networking and Communications 2009, pp. 173–180.
Z. Niu, W. Yao, Q. Ni, and Y. Song, “Link reliability model for vehicle ad hoc networks,” in Proceedings of. London Communication Symposium., London, 2006, pp. 1–4.
Taleb.T, Ochi.M, Jamalipour.A, Kato.N, and Nemoto.Y.(2006)., “An efficient vehicle-heading based routing protocol for VANET networks,” in Proc. IEEE Wireless Commun. Network Conference 2006, pp. 2199–2204.

International Journal of Advance and Innovative Research Volume 5, Issue 4 (XX): October - December, 2018
52
ISSN 2394 - 7780
STUDY ON DEVELOPMENT AND QUALITY OF WHEY BASE FRUIT BEVERAGE USING TOMATO PUREE
Mane K. A and Pawar V. N. MIT College of Food Technology, Rajbaug Educational Complex, Loni Kalbhor, Taluka Haveli, Dist. Pune
ABSTRACT Whey is a valuable by product from dairy industry obtained during processing of coagulated milk products. Though nutritious it is discarded as a waste and its disposal creates major pollution problems besides the loss of valuable nutrients. In present investigation, dairy waste from paneer and cheese processing was utilized for development of value added beverage using fruit juice and tomato puree which is a rich source of lycopene, a major antioxidant carotenoid. Whey fruit juice beverages were formulated by blending tomato puree with varying concentrations of fruit juice and evaluated for organoleptic properties by sensory evaluation using 9 point hedonic scale and physico-chemical properties (TSS, acidity, ash content, total solids, reducing, non-reducing and total sugars) by standard procedures.
The study revealed progressive increase in score of sensorial quality attributes such as taste, flavour, mouthfeel and overall acceptability with increase in fruit juice level in whey base fruit juice beverages using tomato puree. This indicated that the fruit juice has successfully masked the unpleasant taste and flavour of whey with these fruit concentrations in beverage. A reducing trend was observed in TSS, acidity, total solids, reducing, non-reducing and total sugars of beverages with increase in fruit juice level. Whereas increasing trend was observed in pH and ash content of beverages with increase in fruit juice level. Blending of fruit juice and tomato puree for preparation of whey base beverages could be a convenient way of utilization to have value added product considering the health benefits of whey and tomato puree.
Keywords: Beverage, Fruit juice, Lycopene, Sensory Quality, Tomato puree, Whey
INTRODUCTION Whey is a water base dairy industry by-product delivered during processing of coagulated milk products like paneer, channa, chakka and cheese as a result of effective coagulation of milk constituents (Sirohi, 2002, Darade and Ghodake, 2012 and Singh and Singh, 2012). It is a source of valuable nutrients like lactose, proteins, minerals and vitamins etc. (Revathi and Singh, 2014). Whey proteins being a source of α-lactalbumin, β-lactoglobulin, bovine serum albumin, caseinomacropeptides, immunoglobulins, lactoferrin, and lysozyme are associated with many health benefits such as enhanced immunity, anticancer properties, antiadhesive effect against pathogenic properties, as well as antiviral, antimicrobial and antihypertensive properties (Chavan et al., 2015).
Whey has cumulative protective and curative efficacy against different diseases such as jaundice, infected skin, arthritis, anaemia, liver complaints, anti-carcinogenic activity and HIV infection (Darade and Ghodake, 2012). Annually about 100 million kg of whey is produced as a by-product in India (Gupta et al., 2017) and despite of nutritional importance and significant health benefits this valuable by product is discarded every year as a waste (Kulkarni et al., 2017). Although a neglected product in human diet with research and technology base developments associated with nutritional and functional importance of whey proteins, whey and whey components are gaining importance now a day and are viewed as precious ingredients in food product development (Yonis, Nagib and Abo Nishouk, 2014).The nutritional and functional properties of whey protein can be explored in manufacturing beverages to deliver high protein products to consumers. Being neutral in taste whey can be used to prepare beverages by utilizing different fruits and vegetables (Chauhan et al., 2011)or to produce nutritional drinks serving numerous purposes from refreshment to dietary supplements (Kulkarni et al., 2017).
Tomato is a versatile fruit, consumed all around the world and 80% of the tomatoes are being processed (Trivedi and Patel, 2015). The red tint characterized tomatoes are a predominant source of lycopene against other fruits and vegetables. In general, tomato and tomato base food products provide around 85% of dietary lycopene against 15% contributory share of watermelon, pink grapefruit, guava, and papaya (Levy and Sharoni, 2004 and Alda et al., 2009). Lycopene being highly effective natural antioxidant has attracted substantial interest among scientists and nutritionists due to its ability to act as a free radical scavenger (Fadupin, Osadola and Atinmo, 2012). However inability of human body to vivo synthesize lycopene, its requirement is fulfilled exclusively from dietary sources (Ishiwu et al., 2014). Nutrient bioavailability of tomato lycopene is affected predominantly by processing technology (Trivedi and Patel, 2015). Lycopene from processed tomato products

International Journal of Advance and Innovative Research Volume 5, Issue 4 (XX): October - December, 2018
53
ISSN 2394 - 7780
appears to be more bioavailable than raw tomatoes (Agarwal and Rao, 2010). Heating tomatoes disrupts the cells and facilitates lycopene release process, rendering it more readily available for absorption in the intestine (Cox, 2001).
Now a day there is increasing trend towards utilization of food processing by product as a source of functional component to develop value added food products. Whey, a by-product of cheese and paneer manufacturing is considered as waste product. The recognition as functional food along with nutritional importance has diverted the whey to be utilized in development of functional food. In view of the documented importance of whey proteins and tomato lycopene in human health and nutrition, the present investigation was undertaken to develop whey base fruit juice beverage using tomato puree with process standardization and quality evaluation.
METHODOLOGY PREPARATION OF MILK WHEY The buffalo milk (Fat 6.4%) was heated to 82°C and acidified by adding 2% citric acid solution with stirring till the completion of coagulation; which resulted in the coagulation of milk protein. The clear liquid (whey) was separated by filtration using muslin cloth. The whey obtained was stored at 5-70C till use (Sakhale, Pawar and Ranveer, 2012).
PREPARATION OF TOMATO PUREE Fully ripened, deep red coloured and freshly harvested tomatoes (Var. Meghdut) were procured from local market and primary processing operations were undertaken under controlled conditions. The cut pieces of tomatoes were subjected to tissue maceration using screw type juice extractor to obtain liquefied mass of tomato devoid of large size peel flakes. The sieving process facilitated through 100 mesh sieve (0.15mm particle size) resulted in fine tomato puree which was subjected to a heat treatment of 900C temperature for 1h by using water bath.
EXTRACTION OF FRUIT JUICE The fresh fully ripened good quality pineapple and mango fruits were procured from the local market and washed with clean water under controlled conditions. The fruit juice was extracted by standard method (Lal, Siddappa and Tandon, 1967) and stored at refrigerated temperature (5-70C) until use.
FORMULATION OF WHEY FRUIT JUICE BEVERAGE RECIPE The whey fruit juice beverages were formulated by blending whey with fruit juice in varying proportions ( Pineapple juice beverages- 83.61:0, 81.11:2.5, 78.61:5, 76.11:7.5 and 73.61:10 and Mango juice beverages- 84.59:0, 82.09:2.5, 79.59:5, 77.59:7.5 and 74.59:10) and tomato puree as a rich source of lycopene (0.42mg/100g) as shown in Table 1. The ingredients like sugar, stabilizer (Guar gum), preservative (Sodium Benzoate) and citric acid were dissolved in whey by heating to 60ºC and then filtered through muslin cloth (Figure 1). The fruit juice and tomato puree were added to whey and uniform blending was carried out for homogenized mixture. Thus prepared beverages were then pasteurized at 80ºC for 15min (Bhat and Singh, 2014), cooled to room temperature and stored at 5-7°C.
Table - 1: Formulation of whey base tomato beverage using pineapple fruit juice Ingredient Whey fruit juice beverage
formulations using pineapple fruit juice
Whey fruit juice beverage formulations using mango fruit juice
PT0 PT1 PT2 PT3 PT4 MT0 MT1 MT2 MT3 MT4
Whey (%) 83.61 81.11 78.61 76.11 73.61 84.59 82.09 79.59 77.09 74.59
Fruit juice (%) 0 2.5 5 7.5 10 0 2.5 5 7.5 10
Sugar (%) 6 6 6 6 6 5 5 5 5 5
Preservative (%) 0.01 0.01 0.01 0.01 0.01 0.01 0.01 0.01 0.01 0.01
Stabilizer (%) 0.3 0.3 0.3 0.3 0.3 0.3 0.3 0.3 0.3 0.3
Citric acid (%) 0.08 0.08 0.08 0.08 0.08 0.1 0.1 0.1 0.1 0.1
Tomato puree (% ) 10 10 10 10 10 10 10 10 10 10

International Journal of Advance and Innovative Research Volume 5, Issue 4 (XX): October - December, 2018
54
ISSN 2394 - 7780
Figure - 1: Process flow chart for the preparation of lycopene enriched whey fruit juice beverage
SENSORY EVALUATION OF WHEY FRUIT JUICE BEVERAGE USING TOMATO PUREE The freshly prepared tomato puree enriched beverage samples with varying levels of fruit juice and whey were served chilled for sensory evaluation by a panel of semi trained judges, using nine point hedonic scale (Anon, 1971).
PHYSICOCHEMICAL CHARACTERISTICS OF WHEY FRUIT JUICE BEVERAGE USING TOMATO PUREE The physico-chemical analysis of whey fruit juice beverages were carried for different parameters. The total soluble solids (TSS), ash content, titrable acidity, pH, total and reducing sugars and lycopene content were estimated by the standard methods (Ranganna, 2007).
RESULTS AND DISCUSSION In present investigation, sincere efforts are executed to formulate whey fruit juice beverage using tomato puree as rich source of lycopene (0.42mg/100g) in coordination with optimization of fruit juice quantity and quality analysis (Sensory and physico-chemical) to justify its status as techno-economic functional beverage.
SENSORY EVALUATION OF WHEY FRUIT BEVERAGE USING TOMATO PUREE The whey base beverage samples formulated by blending of whey with different proportions of fruit juice and tomato puree were analyzed for various sensorial attributes for their acceptance by using 9 point hedonic scale. The data on organoleptic characteristics specified by different formulations of whey fruit juice beverages presented by graphics (Figure 2 and 3) reflects on effect of fruit juice quantity on average sensory scores with respect to colour and appearance, flavour, taste, mouthfeel and overall acceptability
COLOUR AND APPEARANCE The linear increase in pineapple fruit juice concentration (0 to 10%) resulted in decrease in average colour and appearance score (7.0 to 6.6) of whey fruit juice beverage (Figure 2). This indicates that higher level of pineapple juice is responsible for modulating the physical appearance that affects the colour and appearance score of beverage.
However it can be seen very clearly from Figure 3 that there is progressive increase in the average colour and appearance score of whey fruit juice beverages with mango juice (6.2 to 8.0) with linear increase in fruit juice quantity (0 to 10ml). The results revealed that there is marked effect of fruit juice proportion on colour and appearance score of beverage samples. The results leading to increase in colour and appearance score with increase in fruit juice level appears to be analogous to results reported by Alane et al. (2017).

International Journal of Advance and Innovative Research Volume 5, Issue 4 (XX): October - December, 2018
55
ISSN 2394 - 7780
Taste The data on average sensory score of whey fruit juice beverages presented in Figure 2 and 3 revealed that the taste of whey fruit juice beverage was affected by fruit juice concentration resulting in increased average taste score with linear increase in fruit juice concentration for both the types of beverages (Pineapple and Mango). It is very clearly seen from Table 3 that the higher level of fruit juice in the beverage increases the taste score. The results are in accordance with the results reported by Alane et al. (2017) and Devi, Singh, and Chandra (2017) and revealed that increase in fruit juice concentration improves the taste for both (Pineapple and mango) types of beverages.
Flavour The data presented in Figure 2 and 3 revealed that the flavour of whey base tomato beverage was influenced by fruit juice concentration. The beverage with 73.61:10 proportion of whey: fruit juice maintained the highest average flavour score (8.0) followed by beverage with 76.11:7.5 proportion (7.5) among pineapple beverage samples. The similar trend was observed with mango juice beverages. The mango fruit juice beverage with 74.59:10 proportion of whey: mango juice scored higher (7.2) followed by beverage with 77.09:7.5 proportion (6.8). The results revealed increase in average flavour score with increase in fruit juice level in beverage formulations and are in accordance with the results reported by Sakhale, Pawar and Ranveer (2012) and Devi, Singh, and Chandra (2017).
Mouthfeel Mouthfeel of whey tomato beverage was found to be improved with increase in fruit juice level (Figure 2 and 3). The higher average mouthfeel score (7.9) was observed in beverage with 73.61:10 proportion of whey: fruit juice among pineapple beverage samples. The similar trend was observed for mango juice beverages with the higher mouthfeel score (7.0) in beverage with 74.59:10 proportion of whey: mango juice.
Overall acceptability Data on overall acceptability of whey fruit juice beverages depicted in Figure 2 and 3 revealed that the linear increase in fruit juice level increases overall acceptability of whey fruit juice beverage. The beverage prepared with 10% of fruit juice was most preferred by sensory panel members as compared to the other combinations. The data on sensory evaluation of beverages leading to increased overall acceptability score based on effect of fruit juice level from this investigation appeared to be analogous to the data reported by (Devi, Singh, and Chandra, 2017 and Sakhale, Pawar and Ranveer, 2012)
Figure - 2: Effect of pineapple juice concentration on sensory attributes of whey fruit juice beverage
using tomato puree
Figure - 3: Effect of mango juice concentration on sensory attributes of whey fruit juice beverage using
tomato puree

International Journal of Advance and Innovative Research Volume 5, Issue 4 (XX): October - December, 2018
56
ISSN 2394 - 7780
PHYSICO CHEMICAL PROPERTIES OF WHEY FRUIT JUICE BEVERAGE USING TOMATO PUREE Total Soluble Solids The data on total soluble solids (TSS) of whey fruit juice beverages depicted in Table 2 reflects on effect of fruit juice level on TSS of beverages. The observed increase in TSS of whey pineapple juice beverage (12.5 to 14.50
Brix) and whey mango juice beverage (12.0 to 14.00 Brix) recorded positive effect of increase fruit juice level (2.5 to 10%) in beverage formulations. These results are in accordance with the results reported by Bhavsagar et al. (2010) and revealed increase in TSS with increase in fruit juice level in beverage formulations.
Titrable acidity Data on acidity of whey fruit juice beverages tabulated in Table 2 indicates the increase in acidity of beverage samples with increase in the fruit juice level. Whey pineapple fruit juice beverage with 73.61:10 proportion of whey: fruit juice exhibited higher acidity values (0.31%) followed by 76.11:7.5 proportion (0.29%). The lowest acidity value (0.26%) was observed with control sample. Similar trend was observed in whey mango fruit juice beverages with the highest acidity (0.29%) in beverage using 74.59:10 proportion of whey: mango juice followed by 77.09:7.5 proportion (0.28%) and the least (0.26%) in 82.09:2.5 proportion and control sample. The results obtained are in conformity with the results obtained by Bhavsagar et al. (2010) and Siriki (2004) and justifies positive effect of fruit juice level on acidity of whey fruit juice beverages.
pH Data on pH of whey fruit juice beverages depicted in Table 2 indicated no significant difference in pH of whey fruit juice beverages. It was found in the range from 4.6 to 4.8
Total solids The data on total solids content of whey fruit juice beverage depicted in Table 2 reflects on effect of fruit juice level on total solid contents of beverage. The total solids content in whey pineapple fruit juice beverage was observed to be increased with increase in fruit juice level. The higher (14.0%) total solid contents were found in beverage with 73.61:10 proportion of whey: pineapple juice followed by 76.11:7.5 proportion (13.6%) as compared to other treatments. The similar trend of total solids content was observed in whey mango juice beverages. It was found more (13.6%) in beverage with 74.59:10 proportion of whey: mango juice followed by 77.09:7.5 proportion (13.2%). The results are in conformity with results reported by Bhavsagar et al. (2010) and revealed positive relationship between the total solids content and fruit juice concentration in lycopene enriched whey fruit beverages of both types (Pineapple fruit and mango fruit).
Ash content The data on ash content depicted in Table 2 revealed that decrease in ash content with increase in fruit juice level of whey fruit juice beverage. The ash content was higher (0.42%) for control sample followed by whey fruit juice beverage with 81.11:2.5 proportion of whey: fruit juice (0.39%) among all pineapple fruit juice beverages. The least ash content (0.33%) was found in the beverage with 73.61:10 proportion of fruit juice to tomato puree. The similar trend of ash content was found in whey mango juice beverages. It was found more (0.51%) in control sample followed by 82.09:2.5 proportion of whey: fruit juice (0.48%) among all mango fruit juice beverages. The least ash content (0.38%) was found with 74.59:10 proportion of mango juice to tomato puree.
Total sugar A critical look on total sugar data tabulated in Table 2 revealed that total sugar in whey pineapple fruit juice beverage was found to be increased with increase in fruit juice level. It was found more (9.85%) in beverage with 73.61:10 proportion of whey: pineapple juice followed by 76.11:7.5 proportion (9.67%). The least total sugar content (9.28%) was found in the control sample without pineapple fruit juice. The similar trend was observed in whey mango juice beverages. It was found more (9.24%) in beverage with 74.59:10 proportion of whey: mango juice followed by 77.09:7.5 proportion (9.06%). However the least total sugar content (8.61%) was found in the control sample without mango fruit juice. These results are in conformity with the results reported by Siriki (2004).
Reducing sugar The data depicted in Table 2 reported that reducing sugar was found higher i.e. 3.47% in whey pineapple fruit juice beverage with 73.61:10 proportion of whey: pineapple juice followed by 76.11:7.5 proportion (3.41%). The same trend was found in whey mango fruit juice beverages with more reducing sugar (3.76%) in beverage with 74.59:10 proportion of whey: mango juice followed by 77.09:7.5 proportion (3.67%). The results revealed that reducing sugar of whey base tomato beverage was increased with increase in fruit juice concentration. Almost similar findings were reported by Siriki (2004).

International Journal of Advance and Innovative Research Volume 5, Issue 4 (XX): October - December, 2018
57
ISSN 2394 - 7780
Table - 2: Effect of fruit juice proportion on physico-chemical characteristics of whey base beverage using tomato puree
CONCLUSION Whey can be successfully utilized for development of whey base fruit juice beverage using lycopene rich tomato puree with optimum sensory characteristics. The beverage with 10% fruit juice was liked most by sensory panel members followed by 7.5% fruit juice level as compared to other combinations This indicated that the fruit juice has successfully masked the unpleasant taste and flavour of whey with these fruit concentrations in beverage. Blending of fruit juice and tomato puree for preparation of whey base beverages could be a convenient way of utilization to have value added product considering the health benefits of whey and tomato puree. The results of the study showed that dairy by product in the form of whey could be successfully incorporated in formulation of lycopene enriched functional beverage using tomato puree.
REFERENCES Agarwal, S. and Rao A. V. (2000). Tomato Lycopene and Its Role in Human Health and Chronic Diseases.
Can. Med. Asso. J. 163(6): 739–744
Alane, D., Raut, N., Kamble, D. B. and Bhotmange, M. (2017). Studies on Preparation and Storage Stability of Whey Based Mango Herbal Beverage. Int. J. Chem. Studies, 5(3): 237-241
Alda, L. M., Gogoaşa, I., Bordean, D. M., Alda, G. S., Moldovan, C., Niţa, L. (2009). Lycopene content of tomatoes and tomato products. J Agro. Alimentary Proc. and Technol., 15 (4): 540-542
Anon (1971). Sensory Evaluation. IS6373-1971. Indian Standard Institution
Bhavsagar, M. S., Awaz, H. B. and Patange, U. L. (2010). Manufacture of Pineapple Flavoured Beverage from Chhana Whey. J. Dairying, Foods & H.S., 29(2):110 - 113
Bhat, F. M. and Singh, R. (2014). Preparation, Quality Evaluation and Shelf Life Studies of Whey-Guava Beverage. World J. Agri. Sci., 10(3): 141-145
Chavan, G. M. (2015). Studies on Preparation of Blended Pineapple (Ananas Comosus L.) Mango (Mangifera Indica L.) Crush. M.Sc. Thesis, Faculty of Post-Harvest Management, Dr. Balasaheb Sawant Konkan Krishi Vidyapeeth, Dapoli
Chauhan, K., Sharma S., Agarwal N. and Chauhan B. (2011). Lycopene of Tomato Fame: It’s Role In Health and Disease. Int. J. of Pharma. Sci. Rev. and Res. 10(1):99-115
Chavan, R. S., Nalawade T. and A. Kumar (2015). Studies on the Development of Whey Based Mango Beverage Research & Reviews. J. of Food and Dairy Technol. 3(2)
Cox, S. E. (2001). Lycopene Analysis and Horticultural Attributes of Tomatoes. Master of Science Thesis, Colorado State University Fort Collins, Colorado Spring PP. 31
Sample Code
TSS (0Brix)
Titrable acidity
(%) pH
Total solids (%)
Ash content
(%)
Total sugar (%)
Reducing sugar (%)
PT0 12.5 0.26 4.8 12.8 0.42 9.28 3.27
PT1 13.0 0.27 4.8 12.9 0.39 9.39 3.32
PT2 13.5 0.28 4.7 13.2 0.38 9.5 3.36
PT3 14.0 0.29 4.7 13.6 0.36 9.67 3.41
PT4 14.5 0.31 4.6 14.0 0.33 9.85 3.47
MT0 12.0 0.26 4.8 12.3 0.51 8.61 3.42
MT1 12.5 0.26 4.8 12.7 0.48 8.73 3.45
MT2 13.0 0.27 4.7 13.0 0.44 8.91 3.59
MT3 13.5 0.28 4.7 13.2 0.42 9.06 3.67
MT4 14.0 0.29 4.6 13.6 0.38 9.24 3.76

International Journal of Advance and Innovative Research Volume 5, Issue 4 (XX): October - December, 2018
58
ISSN 2394 - 7780
Darade, R. V. and Ghodake, S. S., (2012). An Overview of Whey Beverages Res. J. Animal Hus and Dairy Sci., 3(1): 41-44
Devi, L. S., Singh, and Chandra, R. (2017). Development, Chemical Analysis and Sensory Evaluation of Whey based Pineapple Juice Beverages International J. Food Sci. and Nutr., 2(5):102-105
Fadupin, G. T., Osadola, O.T. and Atinmo, T. (2012). Lycopene Content of Selected Tomato Based Products, Fruits and Vegetables Consumed In South Western Nigeria. Afr. J. Biomed. Res., 15:187 - 191
Gupta, M., Yadav M. P. S., Chauhan A. S. and Verma R. (2017). Physico-Chemical Qualities of Papaya Pulp Based Whey Beverage. Int. J. Pure App. Biosci. 5 (4): 341-345
Ishiwu, C. N., Iwouno, J. O., Obiegbuna, J. E., Ezike, T. C., (2014). Effect of Thermal Processing on Lycopene, Beta-Carotene and Vitamin C Content of Tomato [Var.UC82B]. J. Food Nutri. Sci., 2 (3):87-92
Kulkarni, N., Pawar P., Pachori R. and Sadar P. (2017). Studies on the Development of Fermented Whey Beverage. Int. J. of Innov. Res. and Ad. Stud. 4 (8)
Lal, G., Siddappa G. S, Tandon G. L. (1967). Preservation of fruits and vegetables. Indian council of agriculture research (ICAR), New Delhi. 294-297
Levy, J. and Y. Sharoni (2004). The Functions of Tomato Lycopene and Its Role in Human Health, J. Am. Bot. Council62 : 49-56
Madalageri, D. M., Bharati, P. and Kage, U. (2017). Physicochemical Properties, Nutritional and Antinutritional Composition of Pulp and Peel of Three Mango Varieties. Int. J. Edu. Sci. Res., 7(3):2249-6947
Maia, G. A., Fernandes, A. G., Santos, G. M., Silva, D. S., De Sousa, P. H. M., Brasil, I. M. and Fonseca, A. V. V. (2007). Effect of the Processing on Some Chemical Components of Pineapple Tropical Juice. Bio Eng. Campinas., 1(1):14-22
Ranganna, S. (2007). Handbook of Analysis and Quality Control for Fruits and Vegetables Products. Tata Mcgraw Hill Publication, PP1-45.
Sakhale, B. K., Pawar V. N. and Ranveer R.C. (2012). Studies on the Development and Storage of Whey based RTS Beverage from Mango cv. Kesar. J. Food Process Technol. 3:3
Singh, A. K. and Singh K. (2012). Utilization of Whey for the Production of Instant Energy Beverage by Using Response Surface Methodology Advance. J. Food Sci. and Technol. 4(2): 103-111
Siriki, H. B. (2004). Formulation of Whey Based Ready-To-Serve fruit Beverages. Thesis for Master of Science in Food Science and Technology, Acharya N. G. Ranga Agricultural University Rajendranagar, Hyderabad
Trivedi, T. K. and Patel V. H. (2015). To Study the Effect of Raw and Processed Tomato Supplementation on Plasma Total Antioxidant Capacity. J. Med. and Heal. Sci.4 (4): 38-43
Revathi, S. and Singh A. (2014). Chemical analysis of whey based pineapple. International J. Home Sci. Ext. and Comm. Management 1(1): 32-34
Sirohi, D. (2002). Technological Studies on Production of Whey Based Mango-Herbal Beverages. M. Tech. (Agril. Engg.) Thesis, Department of Agricultural Processing and Food Engineering Faculty of Agricultural Engineering, Indira Gandhi Agricultural University Raipur (C.G.)
Yonis, A. A. M., Nagib R. M. and AboNishouk Beverages L. A. (2014). Utilization Sweet Whey in Production of Whey Guava. J. Food and Dairy Sci. 5 (10): 731 – 739

International Journal of Advance and Innovative Research Volume 5, Issue 4 (XX): October - December, 2018
59
ISSN 2394 - 7780
MATHEMATICAL MODELING OF NON-HOMOGENEOUS STEADY STATE HEAT CONDUCTION PROBLEM IN A THIN CIRCULAR PLATE WITH UNIFORM HEAT SOURCE
Kishor R. Gaikwad P. G. Department of Mathematics, NES, Science College, Nanded
I. INTRODUCTION During the second half of the 20th century, non-isothermal problems of the theory of elasticity became increasingly important. This is mainly due to their many applications in widely diverse fields. First, the high velocities of modern aircraft give rise to aerodynamic heating, which produces intense thermal stresses, reducing the strength of the aircraft structure. Second, in the nuclear field, the extremely high temperatures and temperature gradients originating inside nuclear reactors influence their design and operations [1].
Nowacki [2] determined steady-state thermal stresses in a circular plate subjected to an axisymmetric temperature distribution on the upper surface. The lower face is kept at zero temperature and the fixed circular edge is thermally insulated. The direct problem of normal deflection of an axisymmetrically heated circular plate in the case of fixed and simply supported edges have been considered by Boley and Weiner [3]. Further, Roy Choudhury [4] discussed the normal thermal deflection of a thin clamped circular plate due to ramp type heating of a concentric circular region of the upper face and lower face of the plate is kept at zero temperature, while the circular edge is thermally insulated. Ootao et al. [5] studied three-dimensional transient thermal stress analysis of a non-homogeneous hollow circular cylinder. Ishihara at al. [6] discussed the transient thermo elastoplastic bending problems of circular plate making use of the strain increment theorem. Some contribution of this theory are given in [7–18]
In this work, the two-dimensional steady-state heat conduction thermoelastic problem for a thin circular plate with the uniform heat source is considered. The fixed circular edge is a function of thickness, with the two ends maintained at zero temperature and with uniform heat source The finite Fourier transform technique is used. The analytical solution in the transform domain is obtained by using a direct approach. The temperature, displacement, and stress are obtained. Numerical computations are carried out and represented graphically. The results presented here will be useful in engineering problems, particularly in aerospace engineering for stations of a missile body not influenced by nose tapering. The missile skill material is assumed to have physical properties independent of temperature, so that the temperature is a function of radius and thickness only.
II. FORMULATION OF THE PROBLEM Consider a thin circular plate of radius r and thickness h occupying space under a steady-state temperature distribution, with uniform heat source The fixed circular edge is kept at temperature while the upper and lower surfaces are maintained at zero temperature. Under these realistic prescribed conditions, the thermoelasticity of a thin circular plate with uniform heat source are required to be determined. The steady-state temperature of the plate satisfies the following model:
2 20
2 2
1 0gT T T
r r kr z
in (1)
with the boundary conditions,
0Tr
at (symmetry) (2)
at (3)
at and (4)
where is the thermal conductivity of the material of the circular plate.
Following Roy Choudhary [4], we assume that a circular plate of small thickness is in a plane state of stress. In fact “the smaller the thickness of the circular plate compared to its diameter, the nearer to a plane state of stress is the actual state”. Then the displacements equations of thermoelasticity have the form
, , ,1 12 . .1 1i kk i t iU e a T
, ;k ke U , 1,2,k i

International Journal of Advance and Innovative Research Volume 5, Issue 4 (XX): October - December, 2018
60
ISSN 2394 - 7780
where iU is the displacements component, e is the dilatation, T is the temperature and and ta are respectively, the Poisson ratio and linear coefficients thermal expansions of the circular plate material. Introducing , ( 1,2)i iU i , we have
21 (1 ) ,ta T
where 2 2
21 2 2
1 2x x
The stress i j is given by
, ,2 ( ) , , 1, 2 i j i j i j k k i j k
where is Lam ’s constant and ij is the well-known Kronecker symbol.
In the axisymmetric case,
( , )r z ( , )T T r z
and the differential equation governing the displacements function ( , )r z is given by 2
2
1 (1 ) ta Tr rr
(5)
The stress components r r and of the circular plate are given by
2r r r r
(6)
2
22r
(7)
with 0r rT at ,
Also, in the planar state of stress within the circular plate, 0r z zz z . (8)
Equations (1) to (8) constitute the mathematical formulation of the problem under consideration. III. SOLUTION OF HEAT CONDUCTION EQUATION We first reduce Poisson’s Eq. 1 to the Laplace equation by defining a new dependent variable as described below.
( , ) ( , ) ( )T r z r z z (9)
where ( , )r z will take the homogeneous form of the PDE and ( )z will take the non-homogeneous ODE, containing the heat source term. The formulation of the non-homogeneous ( )z problem becomes
20
2 0gdkdz
in (10)
with the boundary condition, 0 at and (11)
The solution of Eq. 10 Becomes 22
0( ) 2
g h z zzk h h
(12)
The formulation of the homogeneous PDE ( , )r z problem becomes

International Journal of Advance and Innovative Research Volume 5, Issue 4 (XX): October - December, 2018
61
ISSN 2394 - 7780
2 2
2 2
1 0r r r z
in (13)
with the boundary conditions,
0r
at (symmetry) (14)
( ) ( ) ( )f z z g z at (15)
0 at and (16)
To obtain the expressions for temperature ( , )r z , Assume
01
( , ) ( )sin( )m m mm
r z C I r z
(17)
where 1 2 3, , ,... are the positive roots of the transcendental equation
sin( ) 0mh 1,2,...m
and 0 ( )mI r denotes the modified Bessel’s function of the first order zero and mC is constant. The constant
mC can be found from the nature of temperature on the outer curved surface. From the boundary condition 15, we have
01
( ) ( )sin( )m m mm
g z C I a z
in (18)
Now, We introduced the finite Fourier sine transform over the variable in the range and its inverse transformed defined in Sneddon [20] as
0
2( ) ( )sin( )h
mz
g z g z z dzh
(19)
where is called the finite Fourier sine transform of an arbitrary function The Fourier sine inversion is defined as
0
( ) ( )sin( )h
mz
g z g z z dz
(20)
The constant are determined as
20
0
( )2
( ) sin ( )m h
m mz
h g zCI a z dz
Substituting Eqs. 12 and 17 into Eq. 9, one obtains the expression of the temperature distribution function as 22
00
1
( , ) ( )sin( )2m m m
m
g h z zT r z C I r zk h h
(21)
IV. DISPLACEMENT POTENTIAL AND THERMAL STRESSES Using Eq. 21 in Eq. 5, one obtains
2
2
220
01
1 (1 )
( )sin
( )2
t
m m mm
ar r r
g h z zC I r zk h h
(22)
Solving Eq. 22, by using the result, 2
20 02
1 ( ) ( )m m mI r I rr r r

International Journal of Advance and Innovative Research Volume 5, Issue 4 (XX): October - December, 2018
62
ISSN 2394 - 7780
ones obtains 22 2
0 02
1
( ) sin( )8
mm m
m m
I r g h r z zC zX k h h
(23)
Using Eq. 23 in Eqs. 6 and 7, one obtains the expressions of thermal stresses as 22
1 0
1
( )1 sin( )4
mrrm m
m m
I r g h z zC zY r k h h
(24)
10
1
( )( ) sin( )m
m m mm m
I rC I r zY r
220
4g h z z
k h h
(25)
where and are the constants and set for convenience, as (1 ) tX a 2(1 ) tY a
IV. NUMERICAL CALCULATIONS Setting
(26) Apply the finite Fourier transform to the Eq. 26, one obtains
(27)
The pure aluminum material was chosen for purposes of numerical evaluations. The constant of the problem are thus given by . Thermal diffusivity , thermal conductivity , density , specific heat capacity , Poisson’s ratio , Lam ’s constant,
, coefficients of linear thermal expansion , Young’s modulus elasticity of the material of the plate , heat source is a constant heat source of strength . The first five positive root of the transcendental equation as defined in Ozisik [19] are = 3.14, = 6.28, = 9.42, = 12.56, = 15.70. The numerical expressions for temperature, displacement and stress components are obtained by Eqs. 21 and 23 to 25. In order to examine the influence of steady state temperature field on the thin circular plate, one performed the numerical calculations in radial directions are shown in the figures with the help of PTC Mathcad Prime 3.1.
Fig.-1: Temperature distribution.
Fig. – 2: Displacement distribution.

International Journal of Advance and Innovative Research Volume 5, Issue 4 (XX): October - December, 2018
63
ISSN 2394 - 7780
Fig.- 3: Radial stress distribution.
Fig. – 4: Angular stress distribution.
V. CONCLUSIONS In this paper, we analyzed the two-dimensional steady-state thermoelastic problem in a thin circular plate with a uniform heat source at a constant rate is considered. The present method is based on the direct method, using the finite Fourier transform and using their inversion. As a special case, a mathematical model is constructed for and examined the thermoelastic behaviors in the steady-state field for temperature, displacement, thermal stresses in the radial direction. The temperature profile in Figure-1, reveals interesting trends that are rooted in the physics of the boundary condition and presence of internal energy generation. Near the centerline , the temperature is minimum and increasing towards the outer edge in the radial direction. Figure-2, represents the displacement profiles along the radial direction. It is seen that, due to the internal heat source at a constant rate of a thin circular plate, the displacement is minimum at the center and increasing toward the outer circular edge. The displacement is proportional to the temperature. In Figure-3, represents the radial stress profiles along the radial direction. It can be observed that, near the centerline radial stress is zero and increases non-uniformly towards the outer edge in the radial direction. In Figure -4, represents the axial stress profiles along the radial direction. It is seen that, the axial stress decreases within the region and increasing within the region . We conclude that the displacement and the stress components occur near heat region. Due to the uniform heat source of a thin circular plate at a constant rate, the radial stress and axial stress develops the tensile stresses in the radial direction. In the plane state of stress the stress components are zero. Also, any particular case of special interest can be derived by assigning suitable values to the parameters and functions in the expressions 21–25.
ACKNOWLEDGMENT The authors are thankful to University Grant Commission, New Delhi, India, to provide the partial financial assistance under Minor Research Project Scheme.
REFERENCES [1] J. L. Nowinski: Theory of Thermoelasticity with Application, Sijthof Noordhoff, Alphen Aan Den Rijn,
The Netherlands, 407, 1978.
[2] W. Nowacki, The state of stresses in a thick circular plate due to temperature field, Bull. Acad. Polon. Sci., Ser. Scl. Tech. 5(1957) 227.
[3] B. A. Boley, J.H. Weiner, Theory of Thermal Stresses, John Wiley and Sons, Inc., New York,1960.

International Journal of Advance and Innovative Research Volume 5, Issue 4 (XX): October - December, 2018
64
ISSN 2394 - 7780
[4] S.K. Roy Choudhary, A note on quasi-static thermal deflection of a thin clamped circular plate due to ramp-type heating of a concentric circular region of the upper face, Journal of the Franklin Institute. Volume-296, Issue-3, PP. 213–219, 1973.
[5] Y. Ootao, T. Akai, Y. Tanigawa, Three dimentional transient thermal stress analysis of a nonhomogeneous hollow circular cylinder due to a moving heat source in the axial direction, Journal of Thermal Stresses, 18(5)(1995) 497–512.
[6] M. Ishihara, Y. Tanigawa, R. Kawamura, N. Noda, Theoretical analysis of ther moelastoplastic deformation of a circular plate due to a partially distributed heat supply, Journal of Thermal Stresses, vol. 20, pp. 203–225, 1997.
[7] K. R. Gaikwad and K. P. Ghadle, An inverse quasi-static thermal stresses in a thick annular disc, International Journal of Applied Mathematics and Statistics, 19, No-D10 (2010), 50–62.
[8] K. R. Gaikwad and K. P. Ghadle, Quasi-static thermoelastic problem of an infinitely long circular cylinder, Journal of Korean Society for Industrial and Applied Mathematics, 14, No. 3 (2010), 141-149.
[9] K. R. Gaikwad and K. P. Ghadle, An Inverse Heat Conduction Problem in a Thick Annular Disc, International Journal of Applied Mathematics and Mechanics. Vol. 7(16), pp-27-41, 2011.
[10] K. R. Gaikwad and K. P. Ghadle, An Inverse Quasi-Static Thermoelastic Problem in a Thick Circular Plate, Southern Journal of Pure and Applied Mathematics, Volume-5, 13-25, 2011.
[11] K. R. Gaikwad and K. P. Ghadle, An Inverse Problem for the Quasi-Static Thermoelastic System in a Thin Clamped Circular Plate, Advances in Applied Mathematical Analysis, Vol. 6, No. 1, pp. 43-54, 2011.
[12] K. R. Gaikwad and K. P. Ghadle, On a certain thermoelastic problem of temperature and thermal stresses in a thick circular plate, Australian Journal of Basic and Applied Sciences, 6, No. 2 (2012), 34-48.
[13] K. R. Gaikwad and K. P. Ghadle, Nonhomogeneous heat conduction problem and its thermal deflection due to internal heat generation in a thin hollow circular disk, Journal of Thermal Stresses, 35, No. 6 (2012), 485–498. http://dx.doi.org/10.1080/01495739.2012.671744
[14] K. R. Gaikwad, Analysis of thermoelastic deformation of a thin hollow circular disk due to partially distributed heat supply, Journal of Thermal Stresses, 36, No. 3 (2013), 207–224. http://dx.doi.org/ 10.1080/01495739.2013.765168
[15] K. R. Gaikwad, Mathematical modelling and its simulation of a quasi-static thermoelastic problem in a semi-infinite hollow circular disk due to internal heat generation, Journal of Korean Society for Industrial and Applied Mathematics, Vol.19, No.1, pp. 69-81, 2015.
[16] K. R. Gaikwad, Mathematical modelling of thermoelastic problem in a circular sector disk subject to heat generation, Int. J. Adv. Appl. Math. and Mech. Vol. 2(3), pp. 183–195, 2015.
[17] K. R. Gaikwad, Two-dimensional steady-state temperature distribution of a thin circular plate due to uniform internal energy generation, Cogent Mathematics, Taylor and Francis Group, 3 No. 1 (2016), 1–10. http://dx.doi.org/10.1080/23311835.2015.1135720
[18] K. R. Gaikwad, Steady-state heat conduction problem in a thick circular plate and its thermal stresses, International Journal of Pure and Applied Mathematics, 115(2)(2017) 301–310. http://dx.doi: 10.12732/ijpam.v115i2.8
[19] N.M. Ozisik, Boundary Value Problem of Heat Conduction, International Textbook Company, Scranton, Pennsylvania, (1968) 84–101.
[20] Sneddon I. N. (1972) The use of Integral Transform, McGraw Hill, New York, 235–238.

International Journal of Advance and Innovative Research Volume 5, Issue 4 (XX): October - December, 2018
65
ISSN 2394 - 7780
PHARMACOGNOSTICAL AND PHYTOCHEMICAL EVALUATION OF UNANI FORMULATION MAJOON NAJAH AND HPTLC FINGER PRINTING OF ITS EXTRACT
Zeba Afrin1, Aisha Siddiqui2, M. A. Jafri3, Divya Vohora4, M. Asif2 and Mohd Hafizur Rehman Ansari5 Research Associate1, Central Council for Research in Unani Medicine Headquarters, Janakpuri, New Delhi
Assistant Professor2 and Professor3, School of Unani Medical Education & Research, Jamia Hamdard, New Delhi Professor4 and Head, School of Pharmaceutical Education and Research, Jamia Hamdard, New Delhi Research Scholar5, Department of Pharmacognosy and Phytochemistry, Jamia Hamdard, New Delhi
ABSTRACT Majoon Najah (MN) is an age old, time tested Unani pharmacopoeial formulation containing 8 ingredients Post-e-halela kabli (Terminalia chebula Retz), Post-e-Balela (Terminalia bellerica Roxb), Amla (Emblica officinalis Gaertn.), Halela Siyah (Terminalia chebula Retz), Turbud (Operculina turpethum Linn), Bisfaij (Polypodium vulgare Linn), Aftimoon (Cuscuta reflexa Roxb.) and Ustukhuddus (Lavandula stoechas Mill.) widely used for the treatment of epilepsy (Sara) and other neurological disorders. The objective of the present investigation was the development of quality standards and phytochemical analysis of Majoon Najah (MN). MN was subjected to determination of various physicochemical standardization parameters as per the method described in WHO guidelines This included organoleptic properties, pH of 5% and 10% aqueous solution, ash values, extractive values, successive extractive values, moisture content and HPTLC finger printing profile. The hydroalcoholic extract of Majoon Najah was subjected to preliminary phytochemical screening for detection of various chemical constituents viz. Phenols, tannins, sterols/terpenes, alkaloids, flavonoids, saponins and resins. The results of this study might be useful to supplement information in regard to its identification parameters.
Keywords: Majoon Najah, phytochemical, HPTLC, phenols
INTRODUCTION According to a survey WHO appraises that 80% of the world population reckon on medicines of plant origin for their primary healthcare (Kamboj, 2000). It has been approximated that in developed countries such as United States, plant drugs constitute 25% of the total drugs, whereas the contribution is as much as 80% in fast developing countries such as China and India. Hence, the economic importance of medicinal plants is much more to countries such as India than to rest of the world. The herbal products today signify safety in contrast to the synthetics that are regarded as unsafe to human and environment. Herbal medicines are frequently regarded to be a gentle and safe alternative to synthetic drugs. Over half of the medically important pharmaceutical drugs are either natural products or derivatives of natural products (Marjan et al., 2007).
Although herbal products have become increasingly prevalent throughout the world, one of the impediments in its acceptance is the lack of standard quality control profile. The quality of herbal medicine that is, the profile of the constituents in the final product has implications in efficacy and safety. However, due to the complex nature and inherent variability of the constituents of plant-based drugs, it is difficult to establish quality control parameter though modern analytical technique are expected to help in circumventing this problem. Furthermore, the constituents responsible for the claimed therapeutic effects are frequently unknown or only partly explained. This is further complicated by the use of combination of herbal ingredients in compound formulations as being used in traditional practice. It is common to have as many as five different herbal ingredients in one product. Thus batch to batch variation starts from the collection of raw material itself in the absence of any reference standard for identification. These variations multiply during storage and further processing. Hence for herbal drugs and products, standardization should include the entire field of study from cultivation of medicinal plant to its clinical application (Kunle, 2012).
With the mounting use of herbal medicines globally and the brisk extension of the universal market for these products, the safety and quality of medicinal plant materials and finished herbal medicinal products have become a major apprehension for health authorities, pharmaceutical industries and the public. In order to diminish the threat of adverse events attributable to unsafe and poor-quality herbal medicines, WHO has devoted to developing a sequence of new technical guidelines relating to the safety and quality assurance of herbal medicines, and to updating existing technical documents in this field. These actions execute parts of the WHO Traditional Medicine Strategy: 2002–2005. Within the overall framework of quality control of herbal medicines, WHO has also developed general global guidelines for assessing the safety of potentially hazardous substances in herbal medicines, with particular reference to biological, chemical, and radioactive contaminants, and pesticide residues.

International Journal of Advance and Innovative Research Volume 5, Issue 4 (XX): October - December, 2018
66
ISSN 2394 - 7780
Presently, there is substantial disparity from country to country in the quality control of such materials and products and this disparity not only impacts on public health, as contaminants in herbal medicines may correspond to preventable risks for patients and consumers, but also has effects on international trade. Hence, execution of testing for contaminants in the national and/or regional quality control of herbal medicines is extremely recommended. (Anonymous, 2007)
MN is beneficial for the treatment of Malikholia (melancholia), Sara (epilepsy), Ikhtenaqur raham (hysteria), (insanity), Qolanj (colitis), Junoon (schizophrenia), Juzam (leprosy), waja-ul-mafasil (arthritis) etc. It is much more effective for the treatment of mental diseases which are caused due to excess of sauda (black bile). It also purifies blood from thick black bile and acts as a tranquillizer, cephalic tonic and Mushile Sauda wa Balgham ghaliz (purgative of black bile and viscid phlegm). (Anonymous, 2006; Anonymous, 1986; Kabiruddin, 1938) Keeping in view the importance of Majoon Najah the present investigation was carried out to establish pharmacognostical and physicochemical standards which would help in authentication as well as in checking adulteration, if any; further the study will greatly help in quality assurance of this formulation.
MATERIAL AND METHODS Procurement and authentication of raw drugs All the required ingredients of Majoon Najah were procured from the raw drug dealers in Khari Baoli market, Old Delhi under the supervision of Guide. All the raw drugs were identified and authenticated by the expert from Dept. of Botany, School of Chemical & Life Sciences, Jamia Hamdard, New Delhi.
Preparation of Majoon Najah Majoon Najah was prepared as per the procedure mentioned in the pharmacopeia ‘National Formulary of Unani Medicine (NFUM) Part II, Vol. I. The ingredients of Majoon Najah are as follows:
Table 5: Ingredients of Majoon Najah
S. No. Unani Name Botanical Name Parts Used Quantity 1. Post-e-halela kabli Terminalia chebula Retz Fruit 40g 2. Post-e-Balela Terminalia bellerica Roxb Fruit 40g 3. Aamla Emblica officinalis Gaertn. Fruit 40g 4. Halela Siyah Terminalia chebula Retz Fruit 40g 5. Turbud Operculina turpethum Linn Root 40g 6. Bisfayej Polypodium vulgare Linn Root 20g 7. Aftimoon Cuscuta reflexa Roxb. Whole plant 20g 8. Ustukhuddus Lavandula stoechas Mill. Flowers 20g 9. Qand safaid (Sugar) 750g
Preparation of Hydroalcoholic extract of MN (HEMN) All the crude ingredients of MN were kept in a drying oven at 40oC for about 30min to evaporate moisture and powdered in an electrical grinder. The powder obtained was rubbed with Raughan-e-Badam and then extracted in soxhlet’s extractor with hydroalcoholic solvent (ethanol and distilled water in ratio 80:20) for about 6 hours at the fixed temperature of 80oC. The liquid extract cooled and filtered by Whatmann filter paper No.40. Then the filtrate was concentrated over steam bath till it dried completely. The resultant residue was collected and stored for further use.
Standardization of Majoon Najah The Physico-Chemical and Phytochemical studies were carried out on Majoon Najah in the laboratory of Dept of Ilmul Advia, Jamia Hamdard, New Delhi. The Physico-Chemical and phytochemical assessment parameters are as follows which were studies according to the WHO and pharmacopoeial guidelines. (Thomas S et al., 2008; Prabhu K et al., 2009; Anonymous, 1998; Evans WC, 2002)
Physico-Chemical Parameters Organoleptic properties
Appearance
Color
Smell

International Journal of Advance and Innovative Research Volume 5, Issue 4 (XX): October - December, 2018
67
ISSN 2394 - 7780
Taste Alcohol soluble matter Water soluble matter Successive extractives
Pet. Ether Chloroform Ethyl alcohol Water
pH pH of 1% aqueous solution pH of 10% aqueous solution
Loss in wt. on drying at 105oC Ash value
Total ash
Acid insoluble ash
Water soluble ash
Density
Bulk density
Phytochemical parameters
Total alkaloids Glycosides Tannins Total phenolics Oils
Volatile oils Fixed oils
Sugar Reducing sugar
TLC HPTLC
DETERMINATION OF TOTAL PHENOLIC CONTENT BY UV SPECTROPHOTOMETER Phenolic compounds are the class of antioxidants agents, which act as free radical scavengers. (Shahidi and Wanasundara, 1992)
Reagents and sample preparations 10% Folin Ciocalteu (F.C.) reagent in distilled water Na2CO3 (1 M) Standard (Gallic Acid) 1.0 mg/mL solution in methanol was prepared. Different dilutions of standard gallic acid (25-300 µg/mL) were made in methanol. Different samples were prepared as 1.0 mg/mL in methanol. Procedure: Took 1.0 mL of each standard and sample solution in separate test tube. To this added 5.0 mL F. C. reagent and 4.0 mL of Na2CO3 solution then absorbance was taken at 765 nm after 15 min. (McDonald et al., 2001)
Blank Solutions: 1.0 mL of methanol + 5.0 mL F.C reagent and 4.0 mL of Na2CO3solution.
International Journal of Advance and Innovative Research Volume 5, Issue 4 (XX): October - December, 2018
68
ISSN 2394 - 7780
DETERMINATION OF TOTAL FLAVANOID CONTENT BY UV SPECTROPHOTOMETER The mechanism of action of flavonoids is through scavenging or chelating process. The total flavonoid content in a sample was determined by the reported method (Pourmorad et al., 2006).
Reagent and sample preparation Aluminium chloride (AlCl3 0.1 gm/mL) and sodium acetate, 1M were prepared in methanol. The stock solution of gallic acid (standard) was prepared as 1.0 mg/mL and further dilutions were prepared as 10 mg/ mL in methanol.
Procedure: 0.5 mL of each solution was taken in separate test tube and added 1.5 mL in methanol. To this added 0.1 ML of AlCl3 and 0.1 ML of CH3COONa reagents and added 2.8 ML distilled water and kept for 30 min, then absorbance was taken at 415 nm with UV spectrophotometer.
Blank Solutions: 0.5 mL of methanol + 0.1 mL of AlCl3 + 0.1 mL of CH3COONa reagents and then added 2.8 ML (Pourmorad et. al., 2006).
DEVELOPMENT OF CHROMATOGRAPHIC FINGERPRINT PROFILE OF HYDROALCOHOLIC EXTRACT BY HPTLC Preparation of samples of MN for TLC and HPTLC In 10g of MN, 70ml water and 2ml HCl were added and boiled for 30 minute. The extract was filtered and fractioned with 70ml of chloroform and then with 30ml. The obtained fraction was dried on water bath. The dried fraction was then dissolved in methanol 2ml and filtered through 0.45 /u membrane filter.
THIN LAYER CHROMATOGRAPHY (TLC): (ANONYMOUS, 1986) Thin layer chromatography was carried out on TLC pre coated aluminium plates, silica gel 60 F 254 (layer thickness 0.25mm) for hydroalcoholic extract of the test drug MN in various mobile phases, later sprayed by different spraying reagents to visualise the spots. The Rf values of the spots were calculated by the following formula:
Rf Value = distance travelled by spot
distance travelled by solvent
Application of the sample- For applying test samples on TLC plate, glass capillaries were used. Various extracts (alcoholic, hydroalcoholic) were subjected to TLC analysis. The spots were applied with the help of a translucent template, keeping a minimum distance of 1cm between the two adjacent spots.
Chromatographic chamber, Conditions of saturation and Development of TLC plates- Chromatographic rectangular glass chamber (16.5 x 19.5 cm) was used in the experiment. The chamber was allowed to saturate for 24 hours before use. The experiments were carried out at room temperature in diffused day light.
Developing solvent system- A number of developing solvent systems were tried for each residue, but the satisfactory resolution was obtained in the solvent systems mentioned in respective tables. TLC results obtained in these systems are given in tables.
Spraying equipment- Compressed air sprayer with a fine nozzle was used to detect the different constituents present on TLC plates. The sprayer was filled with about 50ml of 8 % H2SO4 and then used.
HIGH PERFORMANCE THIN LAYER CHROMATOGRAPHY (HPTLC) The dried hydroalcoholic extract of ingredients of Majoon Najah were reconstituted using methanol (HPLC grade) and prepared 10 mg/mL concentration of the extracts. The samples were spotted with a CAMAG microlitre syringe on pre-coated HPTLC silica gel aluminum plates (60F254; 5 × 10 cm, Merck KGaA, Germany) using a CAMAG Linomat V (Muttenz, Switzerland) and were controlled by WinCATS software (CAMAG). A constant application rate of 5µL/s was employed. The slit dimension was maintained at 5.0 × 0.3 mm, and 20 mm/s scanning speed was employed. The solvent system of hydroalcoholic extract of MN consisted of chloroform: methanol: Formic acid 10%, (8:2:1.5, v/v/v). Linear ascending development was carried out in a 20 × 10 cm twin trough glass chamber, saturated with the solvent system. The optimized chamber saturation time for the solvent system was 15 min at room temperature. The length of chromatogram run was 80 mm. Subsequent to development, HPTLC plates were dried in an oven at 60°C for five min. Densitometric scanning was performed on a CAMAG TLC scanner IV with WinCATS (at 254 & 366nm) software after spraying the developed plate with anisaldehyde-sulphuric acid reagent and heating it on a hot air oven at 110°C for five min.

International Journal of Advance and Innovative Research Volume 5, Issue 4 (XX): October - December, 2018
69
ISSN 2394 - 7780
RESULTS
Table - 6: Organoleptic characters of Majoon Najah (MN) S. No. Properties Observation
1 Appearance Semi-solid 2 Colour Dark brown 3 Smell Pleasant 4 Taste Sweetish and acrid
Table - 7: Physicochemical observations of Majoon Najah S. No. Parameters Mean + SEM
1. Solubility Alcohol soluble matter 64.66+0.169gm% Water soluble matter 62.46+0.115gm%
2. Successive extractive values Petroleum ether 1.25+0.082% Chloroform 0.64+0.029% Methanol 0.065%+6.82 Water 5.19+0.052%
3. pH pH of 1% solution 5.34+0.092 pH of 10% solution 5.47+0.192
4. Ash value Total ash 1.34+0.11% Acid insoluble ash 0.55+0.026% Water soluble ash 1.25+0.03%
5. Loss on drying 10.43+0.24% 6. Bulk density 1.39+0.132
Table - 19: Phytochemical screening of individual extracts of MN S.No. Phtochemical tests Petroleum ether Chloroform Methanolic Aqueous
1 Alkaloids + + + - 2 Glycosides - + + - 3 Tannins - - + + 4 Volatile oils + + - - 5 Fixed oils + + - + 6 Flavanoids + + + + 7 Reducing sugar + + + - 8 Saponins + - + -
Determination of total phenolic content
Table - 25: Concentration and absorbance of reference compound (gallic acid) for phenolic content S. No. Concentration of standard solution (µg/mL) Absorbance at 415 nm
1 5 0.045 2 10 0.117 3 15 0.229 4 20 0.337 5 25 0.487 6 30 0.645

International Journal of Advance and Innovative Research Volume 5, Issue 4 (XX): October - December, 2018
70
ISSN 2394 - 7780
Figure - 4: Calibration curve for total phenolic content
Table - 26: Total phenolic content of hydroalcoholic extract of Majoon Najah S. No. Absorbance Total phenolic
content ((µg/mL)) Total phenolic content
(mg/gm of extract) (% w/w)
1 0.882 41.23 4.123 0.04123
2 0.892 41.33 4.133 0.04133
3 0.895 41.36 4.136 0.04136
Mean+SEM 4.130+0.0039
Determination of total flavanoid content
Table - 27: Concentration and absorbance of reference compound for flavanoid content S. No. Concentration of standard solution (µg/mL) Absorbance at 415 nm
1 5 0.098 2 10 0.178 3 15 0.278 4 20 0.384 5 25 0.487 6 30 0.647
Figure - 5: Calibration curve for total flavanoid content
Table - 28: Total flavanoid content of hydroalcoholic extract of Majoon Najah S. No. Absorbance Total flavanoid
content ((µg/mL)) Total flavanoid content
(mg/gm of extract) (% w/w)
1 2.280 107.06 10.706 1.0706 2 2.279 107.059 10.705 1.0705 3 2.278 107.058 10.705 1.0705
Mean+SEM 10.7053+0.000333

International Journal of Advance and Innovative Research Volume 5, Issue 4 (XX): October - December, 2018
71
ISSN 2394 - 7780
Table - 29: Observation of Rf value and % area of the chromatogram of hydroalcoholic extract of Majoon Najah
UV 366nm UV 254nm
S.No. Rf % area Rf % area
1 0.01 0.07 0.02 1.17
2 0.06 7.38 0.09 6.82
3 0.10 23.35 0.19 21.65
4 0.12 4.86 0.22 10.13 5 0.19 22.17 0.29 2.83 6 0.26 6.94 0.33 6.83 7 0.33 21.57 0.45 8.93
8 0.43 4.01 0.63 32.10
9 0.53 4.38 0.72 7.97 10 0.58 2.12 0.85 1.51 11 0.62 2.77 0.93 0.15 12 0.69 0.22 13 0.81 0.14
a) Scanned HPTLC plate at 366nm b) Scanned HPTLC plate at 254nm
(after derivatization with anisaldehyde sulphuric acid) Figure - 6: Photograph of HPTLC plate of Hydroalcoholic extract of Majoon Najah
Figure - 7: HPTLC chromatogram of hydroalcoholic extract of Majoon Najah at 366nm

International Journal of Advance and Innovative Research Volume 5, Issue 4 (XX): October - December, 2018
72
ISSN 2394 - 7780
Figure - 8: HPTLC chromatogram of hydroalcoholic extract of Majoon Najah at 254nm
DISCUSSION The quality control of herbal medicines has a direct impact on their safety and efficacy. The physicochemical evaluation of the drugs is an important parameter for detecting identification, authentication and adulteration of the crude drugs and formulations. The test formulation Majoon Najah was subjected to determination of various physicochemical standardization parameters as per the method described in WHO guidelines.
Organoleptic properties like appearance, colour, smell and taste was found to be semi-solid, dark brown, pleasant, sweetish and acrid respectively. The alcohol and water soluble matter of MN was determined. The percentage of alcohol and water soluble matter was found to be 64.66+0.169 and 62.46+0.115 respectively. The extractive value of the drugs is a valuable test to check the quality of drugs. The extractive values in various organic solvents are based on the quantity of the solvents. Any variation in the chemical constituents may cause a change in the extractive values. The extractive values of the drugs are determined by soxhlet’s apparatus with different solvents like petroleum ether, chloroform, methanol and water. Successive extraction of petroleum ether extract, chloroform extract, methanol extract and water extract of MN was carried out. The mean percentage values of petroleum ether extract, chloroform extract, methanol extract and water extract were found to be 1.25+0.082, 0.64+0.029, 6.82+0.065 and 5.19+0.052 respectively. The pH value of the drug gives an idea about the acidity or alkalinity of the drug. The pH value of Majoon Najah of 1% and 10% solutions are 5.34+0.092 and 5.47+0.192 respectively. Acidic pH of MN may be attributed to phenolic content of MN. The moisture content of the drug is not too high, thus it could discourage growth of bacteria, fungi or yeast, as the general requirement for moisture content is not more than 14% (w/w) (Anonymous, 1986). The amount water present in plant material determines its deterioration time. The plant can easily be deteriorated due to fungal contamination if the water content is high. The moisture content value of Majoon Najah was found to be 10.43+0.24. Ash value constraint can be used for the determination of inorganic materials such as carbonates, silicates, oxalate and phosphates. Ash value is an important characteristic of a drug and with the help of this parameter we can detect the extent of adulteration as well as establish the quality and purity of the drug. The acid insoluble ash consists mainly of silica and high acid insoluble ash thereby indicating the contamination with earthly materials. The water soluble ash is used to estimate the amount of inorganic materials. Total ash, acid insoluble ash and water soluble ash values were found to be 1.34+0.11, 0.55+0.026 and 1.25+0.03 respectively.
Various extracts (petroleum ether, chloroform, methanol and water) were subjected to preliminary chemical tests to detect the presence and absence of various phytoconstituents.
TLC of hydroalcoholic extract of Majoon Najah was performed. The extract was subjected to generate HPTLC fingerprinting profile represented as chromatogram. The solvent system (Chloroform: methanol: Formic acid 10% at a ration of 8:2:1.5, v/v/v) used in the investigation was found to give compact spots for Majoon Najah at different Rf values and there was no overlap with any other component in the analyzed samples. A total 11 peaks were observed at Rf 0.02, 0.09, 0.19, 0.22, 0.29, 0.33, 0.45, 0.63, 0.72, 0.85, 0.93 when scanned at 254 nm. A total of 13 peaks were observed at Rf 0.01, 0.06, 0.10, 0.12, 0.19, 0.26, 0.33, 0.43, 0.53, 0.58, 0.62, 0.69, 0.81 when scanned at 366nm after derivatization with anisaldehyde sulphuric acid.
The therapeutic properties of medicinal plants or formulations are due to the presence of various secondary metabolites. Thus the preliminary screening tests may be useful in the detection of bioactive principles. HPTLC

International Journal of Advance and Innovative Research Volume 5, Issue 4 (XX): October - December, 2018
73
ISSN 2394 - 7780
results indicate the number of constituents and further facilitate their quantitative estimation and qualitative separation of pharmacologically active chemical compounds. Phytochemical study was also useful to isolate the pharmacologically active principles present in the drug. More phytochemical research work is required for isolation, purification and characterization of biologically compounds.
CONCLUSION Present study concludes that physicochemical parameters, qualitative, quantitative analysis and HPTLC profile together may be used for quality control parameters of Majoon Najah to obtain genuine and standard drug for therapeutic purpose.
REFERENCES 1. Kamboj V. (2000). Herbal medicine. Current Science; 78(1): 35-39.
2. Marjan N.-A., Schwann S.-R., & Soltani F. Z. (2007) Anticonvulsant effects of aerial parts of Passiflora incarnata extract in mice: involvement of benzodiazepine and opoid receptors. BMC complementary and Alternative Medicine; 7(26): 1-6.
3. Kunle O. F., Henry E. O., & Peter O. (2012) Standardization of herbal medicines - A review. International Journal of Biodiversity and Conservation; 4(3): 101-112.
4. Anonymous. (2007). WHO guidelines for assessing quality of herbal medicines with reference to contaminants and residues. WHO Library Cataloguing: pp.1,3.
5. Anonymous. (2006) National Formulary of Unani Medicine, Part I. New Delhi: Ministry of Health & Family Welfare (Department of AYUSH), Govt. of India; pp.138.
6. Anonymous. (1986) Qarabadeen-e-Majeedi. New Delhi: All India Unani Tibbi Conference; pp.397.
7. Kabiruddin HM. (1938) Bayaze Kabir (5th ed., Vol. 2). Hyderabad: Hikmat Book Depot.
8. Thomas S, Patil DA, Patil AG, Chandra N. (2008) Journal of Herbal Medicine and Toxicology l(2): 51-54
9. Prabhu K, Karar PK, Ponnudurai K, Hemalatha S. (2009). J Pharm Sci & Res 1: 43
10. Anonymous. (1998). Quality control methods for medicinal plant materials: WHO.
11. Evans W. (2001). Trease & Evans Pharmacognosy (15th ed.).Elsevier. pp.137-138.
12. Pourmorad F., Hosseinimehr S. J.,Shahabimajd N. (2006).Antioxidant activity, phenol and flavanoid contents of some selected Iranian medicinal plants. African Journal of Biotechnology 5(11): 1142-1145.
13. Anonymous. (1986). Physicochemical standards of Unani Formulations, Part I. New Delhi: CCRUM, Dept. of AYUSH, Ministry of Health & Family Welfare, Govt. of India pp. 202,203,213-215,228,229,232-234,240-245.
14. Anonymous. (1986). The Useful plants of India. New Delhi: Publications & Information Directorate, CSIR; pp. 152,319,320,409.

International Journal of Advance and Innovative Research Volume 5, Issue 4 (XX): October - December, 2018
74
ISSN 2394 - 7780
A THEORETICAL APPROACH TO FORENSIC ACCOUNTING
Amala Siby1 and Sivakumar S.2 M. Com Research Scholar1 and Associate Professor2, Christ (Deemed to be University), Bengaluru
ABSTRACT Forensic accounting are specialized accounting which is an expansion to the traditional accounting and auditing profession. This study is aimed at understanding the concept, history, working as well as the various challenges faced by forensic accounting as an emerging profession with wider scopes which are not still clearly differentiated from traditional accounting and auditing procedures. This paper has taken a descriptive approach to forensic accounting by review of former available articles in this genre and has given suggestions which can be incorporated to strengthen the position of forensic accounting as a medium to establish and estimate factual and truthful information in the eyes of law.
Keywords: Forensic Accounting, Auditing, Fraud detection, Book keeping, Law
JEL CLASSIFICATION: M40, M410, M420
I. INTRODUCTION First coined in the year 1946 by Maurice E. Peloubet, the term ‘forensic accounting’ has been an intergral part of accounting. Peloubet was one of the partners in an accounting firm based in Europe. He had emphasized the use of accounting in courtrooms as testimony. He also acknowledged the growing scope of investigation into the accounts by the accountants all over the world due to the increased number of government agencies who regulated the practice. (Crumbly, 2001; Joshi, 2003)
It was in the year 1953, that Max Lourie, a lawyer in New York came up with the claim that it is him who invented the term ‘Forensic Accounting’. Though Piloubet mentioned about it first, it was Lourie who brought about the need for training in forensic accounting.(Chakrabarti, 2014) Splitting and understanding the terms ‘Forensic’ and ‘Accounting’ helps us in getting an insight into what the term exactly is. In Webster’s Dictionary, the term ‘Forensic’ is defined as “belonging to used in or suitable to judicature or to public discussion and debate”. The definition for ‘Accounting’ is as “a system of recording and summarizing business and financial transactions and analysing, verifying and recording the results.”
The definition developed by AICPA’s Forensic Litigation Services Committee, describes “forensic accounting may involve the application of special skills in accounting, auditing, finance, quantitative methods, the law and research. It may also require investigative skills in accounting to collect, analyse and evaluate financial evidence as well as the ability to interpret and communicate the findings” (S.P. Jain, 2017).
The supervisory form of management structure, cut-throat corporate competition and performance and result based evaluation system has added to the corporate frauds. (W.S Albrecht, 2004; Raymond A K Cox, 2002). The frauds thus become very common in this era. The detection of fraud can be a tedious work which sometimes can happen accidentally too. (Seidman, 1939) However the forensic accounting shouldn’t be merely limited to the fraud detection mechanism. It is the activity which utilises skills of law, accounting, audit and assessment to deal with the issues relating to damages, illegal encroachments, maintenance of value and value addition to legal purposes.(Renzhou, 2011)
(G.J Bologna, 1995) has described forensic accounting as a technique where the application of financial skills, investigative mentality to unresolved issues are conducted within the framework of evidence rules.
The publisher of the ‘Journal of Forensic Accounting’, gives a broad definition than the cliché age narrowing of forensic accountants into fraud examiners. He says that “forensic accountants are employed to seek, interpret and communicate transactional and reporting event evidence in an objective, legally sustainable fashion, not only in situations in which there are specific allegations of wrongdoing, but also in situations in which interested parties judge that the risk of loss from wrongdoing is such that proper prudence requires legally sustainable evidence to support the conclusion that no wrongdoing is occurring.”
Hence, the action or process of recording, classifying, identifying, sorting, extracting and reporting the financial data or any other accounting or non- accounting transactions with the purpose of creating evidence or for finding solutions to present or prospective legal disputes.(Cali, 2013).The ultimate result that is expected from every forensic accountant is to use their forensic skills and to draft a written report which helps in analysis and judgement for a judge in the court of law.

International Journal of Advance and Innovative Research Volume 5, Issue 4 (XX): October - December, 2018
75
ISSN 2394 - 7780
II. OBJECTIVE This study is conducted with the aim of developing a general understanding about forensic accounting and to identify the various tools used in Forensic accounting so as to find out the various aspects that need to be looked into by the accounting stakeholders all around the world in order to encourage the use of forensic accounting.
III. METHODOLOGY The methodology adopted was detailed review of literature that are collected from different secondary sources of journal articles which throw light on the clarity of the topic forensic accounting.
IV. REVIEW OF LITERATURE 1. Inception of Forensic Accounting The earliest roots of forensic accounting can be identified back to 200 years. (Indrani Ghosh, 2011) says that the first evidences of forensic accounting was found in the year 1824 in an advertising circular by an accountants in Glasgow, Scotland. They gave testimony in courts and in other proceedings of arbitration. In Egyptian times ranging between 3300 BC- 3500 BC, the commercial transactions used to be recorded on tablets made of clay. These tablets were then sealed and and kept. Later, if these tablets are found missing or interloped, proper enquiries and inquisitions were conducted which if found to be a crime from the part of any employee, penance will have to be paid by employees in the form of fine or in extreme cases even mutilation or death penalty will also be given. There were several instances that was quoted in the history regarding the particularity that was shown by the Roman Empire where the royal courts of justice was taking care of the audit as well as control of financial matters as well as the administrative as well as the accounting functions of the empire. The world renowned detective character Sherlock Holmes by the writer Sir Arthur Conan Doyle was adorned by readers all around the world for his mastery logical reasoning, observation and the most important forensic science. It was in 1887 that Sherlock Holmes first appeared in print through ‘A Study in Scarlet’. The traces of forensic accounting and forensic science can be traced back in that era which made Sir Arthur Conan Doyle even be called as the pioneer of forensic accounting. The Indian roots of Forensic Accounting can be traced back to the Kautilya’s Arthashasthra who in his book wrote about famous forty ways of embezzlement. He can also be called as the aboriginal economist who openly gave recognition to the need of forensic accountant. Birbal, one among the Navaratnas in the court of Akbar the Great ,who was the famous Mughal emperor who reigned from 1556 to 1605 have given various methods in which fraud can be determined and examined. (Bhasin, 2007)
It was after the great recession of 1980’s (July 1981- November 1982) the business’ suffered huge losses which lead to the increased demand for services rendered by forensic accountants. Gradually the need for forensic accounting as well as its extended scope to the present era was well understood and established which eventually paved way to the founding of two institutions that concreted the spread of forensic accounting as an essential part of accounting which raised its standards from mere record keeping to overall management of accounting as well as financial information. In 1988, The Association of Certified Fraud Examiners (ACFE) was established in Texas, USA and in 1992, The American College of Forensic Examiners was founded. Both these institutions aimed at providing information and professional training for fraud examination and prevention. The Forensic accounting trend swept US and UK in the twentieth century. The Internal Revenue Service (IRS) of USA was one of the pioneering institutions to use the services of investigative accountants in their system of administration. The increasing white-collar scams during the 1990’s (Carter, 1997; Kay C. Karnes, 2001) gave further expansion in scope for the growth of forensic accounting as a profession separate from traditional accounting or a status above the normal accounting procedures. The increasing financial frauds as well as corporate and political scams emphasises the need for forensic accounting profession.
2. Forensic Accounting – Scope The forensic accounting has got a wide scope with regard to the detection and prevention of fraud. (GJ Bologna, 1995). The broad scope of forensic accounting is the various activities performed by using the forensic accounting.(DiGabriele, 2015). Forensic accounting techniques are applied in order to seek truth and bring out their results in an unbiased objective manner.(Bhasin, 2007)
1. Employee Fraud Detection The forensic accountant tries to find out if any assets are created by the employees using the fund embezzlements in the organisation. They investigate deeply into the accounts to find out the misappropriations.
2. Investigation into criminal cases The civil as well as criminal cases are charged against the conductors of fraud based on the investigation done by the forensic accountant. Forensic Accounting not only examines what is shown but also analyses what is withheld from being disclosed.

International Journal of Advance and Innovative Research Volume 5, Issue 4 (XX): October - December, 2018
76
ISSN 2394 - 7780
3. Professional negligence The mistakes that are happened due to the professional negligence are also dealt using the investigative accounting. It may include non- compliance with GAAP, Accounting and Auditing Standards as well as violation of professional or ethical code of conduct.
4. Mediation services Alternate Dispute Resolution (ADR) is a formal way of dispute settlement that is outside the court between individuals and organisations. One of the methods of dispute settlement in ADR is Arbitration whereby it is a more legally binding form of ADR. The role played by forensic Accountants comes because they are perfectly equipped to take a courteous decision based on all the different heads of losses and the various methods to reduce the data conflicts. (Deloitte, 2016)
5. Insurance Claim Settlement In the insurance field, there is a contract between the insurer and the insured. When a claimant is filing a request for obtaining his claim, should be verified before sanctioning them. A forensic accountant with the help of his expertise will verify all the claims filed along with the supporting evidences and decide the claim amount to be allowed.
6. Matrimonial dispute settlement The discovering, identifying and asset examination are done with the help of forensic accounting which are helpful for legal purposes.
3. FORENSIC ACCOUNTING- SERVICES, SKILLS AND OPPORTUNITIES The broad classification of services done by forensic accountant can be classified under 3 heads; (Gulsman, 2007; D’aunno, 2009)
Table - 1 SERVICES Consultancy- an expert retained by a party and is not expected to be
called as a witness at trial Dispute resolution Reporting manipulations in corporate filing Bankruptcy Insolvency Reorganisation Consumer protection Arbitration Valuation Family disputes
Non- Scientific testimony- identification of party as potential witness Fact finding Collection of evidences for criminal investigation
Investigative Services- developing a knowledge or skill through education and experience in any particular domain so that his opinions can assist the fact finder. Manipulating accounts Ascertainment of damages Employee ignorance and corrupted management
SKILLS Auditing Accounting Statistics Information technology Legal Knowledge of human-behaviour and skills

International Journal of Advance and Innovative Research Volume 5, Issue 4 (XX): October - December, 2018
77
ISSN 2394 - 7780
PROSPECTIVE CLIENTS
Lawyers Police department Insurance firms Government departments Banks Courts Corporates Investors
Source: (Reshma Kumari Tiwari, 2017)
4. TOOLS USED IN FORENSIC ACCOUNTING Detection of frauds is one of the major arena in which forensic accounting is applied. (Sulaiman Qureshia, 2015). This doesn’t mean that it is only meant for fraud detection. (Kahan, 2006) Forensic accountants employ several traditional as well as modern methods to perform the functions.(Bassey, 2018)
1. Theory of Relative Size Factor (Nigrini, 2011) When large number of subsets are given, RSF is used to test anomalities in the given data
RSF=
The ratio of the highest and lowest values is taken and is interpreted as higher the ratio higher the chances of error.
2. Benford’s Law (Nigrini, 2000) Benford’s law works in the form of pattern prediction of the digits in numbers such as in the case of fictitious return on investments in tabular data. The use of Benford’s law in the field of forensic accounting is explained as follows in the book Benford’s Law: Applications for forensic Accounting, Auditing and fraud detection. Explores primary, associated, and advanced tests, all described with data sets that include corporate
payments data and election data. Includes ten fraud studies for fraud detection, which is inclusive of vendor fraud, payroll fraud, due diligence
in purchasing a business and tax evasion. Covers financial statement fraud, using available data from Enron, AIG, and companies that were the target
of hedge fund short sales Identifies how to detect Ponzi schemes, including data on Madoff, Waxenberg etc. Examines many other applications, from the Clinton tax returns and the charitable gifts of Lehman
Brothers to tax evasion and number invention” Benford's Law has 250 figures also they have included 50 authentic and fraudulent real-world data sets to elucidate on both theory and practice.
3. Digital Investigation Manager This tracker software is used in investigations that are digital in nature and helps in digital evidence process support majorly in computer forensic and incident response operations. The digital investigation manager allows users to catalogue the information’s in the process of gathering information. Reports are made from these catalogs of information which can be used for analysis purposes during investigation.
4. Encase This software contains different tools that help in various digital forensic process such as acquisition, analysis and reporting. “The unique features of Encase software are the breadth of operating system and file system are separate, but they have a deep relationship on how information is stored and how the host operating system operates system that exists, there are number of different file system which the host operating system could utilize and the ability to deeply analyse a broad range of operating system and file system is a critical component of an enterprise investigation.”
5. Computer Aided Audit Tools (CAAT) These are automated software’s that helps in performing the process of auditing. These software’s extract data, analyse data and also check for exceptions that relate to fund. CAAT tools include ACL Audit, IDEA Analysis,

International Journal of Advance and Innovative Research Volume 5, Issue 4 (XX): October - December, 2018
78
ISSN 2394 - 7780
Wiz Rule etc. which makes them more advantageous over the manual auditing and error detection methods. (Dhami, 2015)
6. Data Mining Techniques(Anuj Sharma, 2012) This technique is majorly used to find out the purchase frauds that are associated with business. The data mining software with the help of algorithms create different models such as predictive model, exploration model, classification model etc. These models are then used to associate with vendors and the transactions which are the roots through which frauds may occur. Clustering, Prediction, Outlier detection, Regression etc are applied as tools in the process of analysing the financial statements. Then the software detects patterns in particular transaction behaviour and find out the anomalities and trends to give a prediction to future events associated with that transaction. The various other techniques applied as part of forensic accounting also comes under data mining. They are;
i. Neural networks ii. Nearest neighbour method
iii. Bayesian belief network iv. Decision tress v. Fuzzy logic and genetic algorithm
7. Genogram and Timeline analysis (Warshavsky, 2010) Genogram is a graphical representation of all the material and relevant facts that have been detected during the investigation of cases by the forensic accountant. The phases such as research, interview, inspection of documents and the analysis phases are all visually described using this tool.
The timeline analysis is useful in giving a logical and chronological order of their occurrence. Since forensic accounting is a profession which require a lot of on-site inspections, the timelines become very important. Since the role forensic accounting plays as evidence in courtrooms is high, the dates and time becomes highly significant.
5. CHALLENGES OF FORENSIC ACCOUNTING The major issues faced by the forensic Accounting profession are due to the larger scope that it covers. Despite the expanded scope of forensic accounting there is still no formal training given in particular to the forensic Accounting as given for professional courses.;(Chakrabarti, 2014) Recent studies have pointed out various issues concerning to forensic accounting and the certification. The major contribution by forensic accounting in in the court of law. But there are cases where the forensic
accountants face stiff challenges in collecting adequate data due to the restrictions of law. Many corporates and others are unwilling to disclose the financial and other evidencing documents that help the forensic accountant.
Most companies appoint forensic accountants in addition to the auditor. This will result in professional competition among individuals. Auditors may not necessarily be providing adequate records for investigation.
There are no specific set of guidelines that are acting upon the forensic accountants. The failure in implementing a code of The lack of such guidelines and professional body to cover the activities separate from that of traditional accountants and other professionals such as CA, CMA, ACCA or CMA subsume the credibility with which the forensic accountants work.
V. SUGGESTIONS AND CONCLUSIONS In many of the developing countries like India, Australia, Ireland, Canada etc. the services of forensic accounting are performed by professional accounting bodies such as CA or CMA. (Reshma Kumari Tiwari, 2017). Also most of the time forensic accounting is considered similar or used interchangeable to forensic audit. In order to bring unity and general acceptability still need to be developed as a separate discipline independent of traditional accounting, auditing and forensic auditing. (Mike Seda, 2014). The lack of adequate accounting bodies to certify forensic accounting has resulted in many accountants abstaining certification from unauthorised bodies. This scenario should be changed. On the context of forensic accounting becoming exclusive and technologically driven, the need for digital education and the need to make forensic accountants familiar with such software’s have become the need of the hour. Not only because of the transparency and speed that are being brought in by technological advancement but also the speed and accuracy in bringing out the relevant results from accounting information which will eventually become a reliable evidence in the eyes of law.

International Journal of Advance and Innovative Research Volume 5, Issue 4 (XX): October - December, 2018
79
ISSN 2394 - 7780
The solutions to these problems include actions by corporations willingly disclosing the required reports to forensic accountants. This will happen only when there is some legality governing the disclosure of relevant information to forensic accountants come into force. Government level legislations are the only way to bring about the changes to the issues faced by forensic accounting profession. (Huber, 2012). The forensic accounting education has not yet been brought forward to the main stream of accounting studies. A change in this has to be made so that the unfamiliarity to this newer concept of accounting could be eliminated making it popular.
REFERENCES Anuj Sharma, P. K. (2012). A Review of Financial Accounting Fraud Detection. International Journal of
Computer Applications .
Annual report, Deloitte, 2016
Bassey, B. E. (2018). Effect of Forensic Accounting On the Management of Fraud In. IOSR Journal of Economics and Finance , 79-89.
Bhasin, M. (2007). Forensic Accounting: A New Paradigm for Niche Consulting. The Chartered Accountant Journal , 1000-1010.
Cali, J. (2013). forensic accounting. encyclopedia of forensic sciences , 423-431.
Carter, T. (1997). Accounting gumshoes: lawyers increasingly rely on specialists to uncover fiscal fraud. ABA journal , 36-37.
Chakrabarti, D. (2014). Problems and Prospects of forensic accounting profession in India. International Journal of Informative & Futuristic Research , 1-9.
Crumbley, D. L. (2001). Forensic Accounting Older Than You Think. Journal of forensic Accounting .
Dhami, P. (2015). Forensic Accounting: Signaling Practicing Accountants To. GLOBAL JOURNAL FOR RESEARCH ANALYSIS , 63-66.
DiGabriele, J. A. (2015). topics and methods in forensic accounting research. Accounting research journal .
G.J Bologna, R. L. (1995). Fraud auditing and forensic accounting: new tools and techniques. NewYork: wiley.
GJ Bologna, R. L. (1995). Fraud auditing and forensic accounting: new tools and techniques. New York: Wiley.
Glusman, D. H. (2007). Why Use A Forensic Accountant? Who to hire? What will it cost? How to supervise? Who. American Bar Association , 20-23.
Huber, D. (2012). Should the forensic accounting profession be regulated? Research in Accounting Regulation , 123-132.
Indrani Ghosh, K. K. (2011). Forensic Accounting- Another feather in the hat of Accounting. chartered Accountant, ICAI .
Kay C. Carnes, N. J. (2001). Forensic accounting skills: will supply finally catch up to demand? Managerial Auditing Journal , 378-382.
Mike Seda, B. P. (2014). An Examination of the Availability An examination of the aailability and Composition of Forensic Accounting Education in the United States and Other Countries. jornal of forensic & investigative accounting .
Nigrini, M. J. (2000). Benford's Law: Applications for Forensic Accounting, Auditing, and Fraud Detection. wiley corporate F&A.
Nigrini, M. J. (2011). Forensic Analytics: Methods and Techniques for Forensic Accounting Investigations. Wiley Corporate F&A.
Raymond A K Cox, T. R. (2002). The Stock Market Reaction to Fraudulent Financial Reporting. Managerial Auditing Journal , 374-382.
Renzhou, D. (2011). Research on legal procedural functions of forensic accounting. Energy procedia .

International Journal of Advance and Innovative Research Volume 5, Issue 4 (XX): October - December, 2018
80
ISSN 2394 - 7780
Reshma Kumari Tiwari, J. D. (2017). Forensic accounting: a blend of knowledge. Journal of Financial Regulation and compliance , 73-85.
S.P. Jain, K. N. (2017). Advanced Accountancy (Volume - II) (Corporate Accounting). Kalyani Publishers.
Seidman, J. S. (1939). Catching up with employee frauds. The Accounting Review , 415-424.
Sulaiman Qureshia, M. D. (2015). Forensic Accounting Tools in Detecting & Investigating Fraud in Malaysia. International Conference on Business, Accounting, Finance, and Economics (BAFE 2015). malaysia: Universiti Tunku Abdul Rahman.
W.S. Albrecht, C. A. (2004). Fraud and corporate executives: Agency, stewardship and broken trust. Journal of Forensic Accounting, , 109-130.
Warshavsky, M. S. (2010, march). Deploying Genogram and Timeline Analysis. Litigation Forensics Board of NACVA .
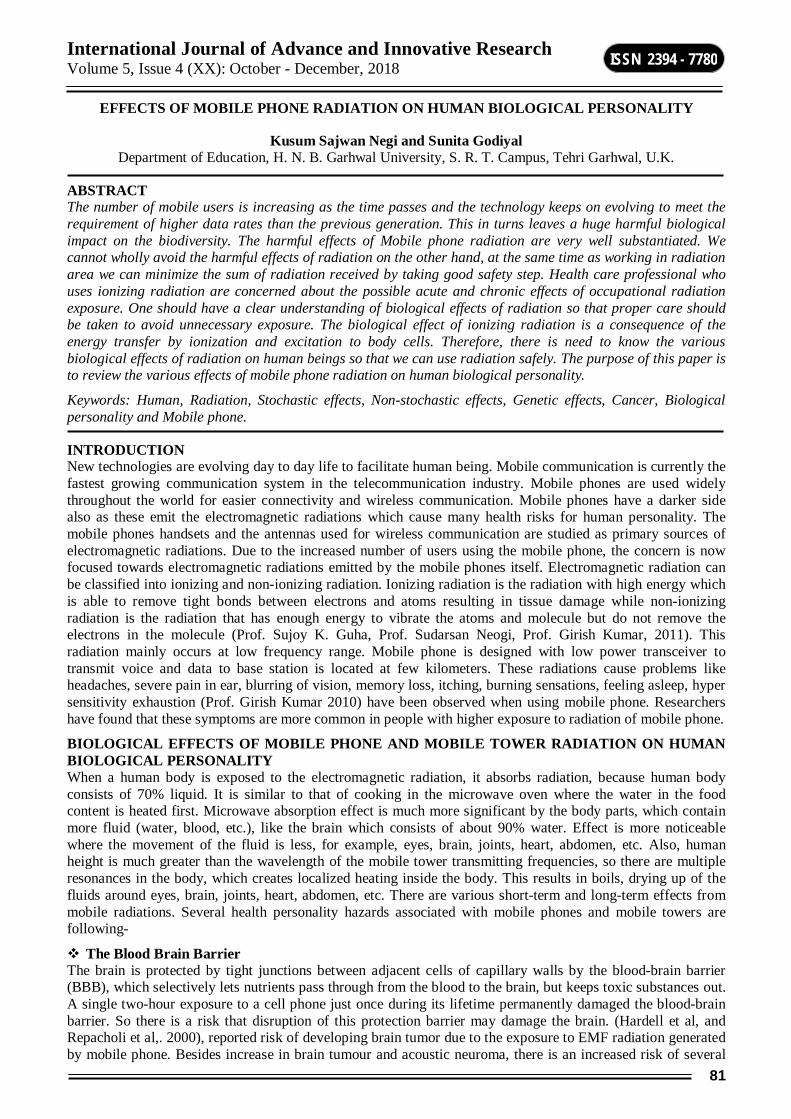
International Journal of Advance and Innovative Research Volume 5, Issue 4 (XX): October - December, 2018
81
ISSN 2394 - 7780
EFFECTS OF MOBILE PHONE RADIATION ON HUMAN BIOLOGICAL PERSONALITY
Kusum Sajwan Negi and Sunita Godiyal Department of Education, H. N. B. Garhwal University, S. R. T. Campus, Tehri Garhwal, U.K.
ABSTRACT The number of mobile users is increasing as the time passes and the technology keeps on evolving to meet the requirement of higher data rates than the previous generation. This in turns leaves a huge harmful biological impact on the biodiversity. The harmful effects of Mobile phone radiation are very well substantiated. We cannot wholly avoid the harmful effects of radiation on the other hand, at the same time as working in radiation area we can minimize the sum of radiation received by taking good safety step. Health care professional who uses ionizing radiation are concerned about the possible acute and chronic effects of occupational radiation exposure. One should have a clear understanding of biological effects of radiation so that proper care should be taken to avoid unnecessary exposure. The biological effect of ionizing radiation is a consequence of the energy transfer by ionization and excitation to body cells. Therefore, there is need to know the various biological effects of radiation on human beings so that we can use radiation safely. The purpose of this paper is to review the various effects of mobile phone radiation on human biological personality.
Keywords: Human, Radiation, Stochastic effects, Non-stochastic effects, Genetic effects, Cancer, Biological personality and Mobile phone.
INTRODUCTION New technologies are evolving day to day life to facilitate human being. Mobile communication is currently the fastest growing communication system in the telecommunication industry. Mobile phones are used widely throughout the world for easier connectivity and wireless communication. Mobile phones have a darker side also as these emit the electromagnetic radiations which cause many health risks for human personality. The mobile phones handsets and the antennas used for wireless communication are studied as primary sources of electromagnetic radiations. Due to the increased number of users using the mobile phone, the concern is now focused towards electromagnetic radiations emitted by the mobile phones itself. Electromagnetic radiation can be classified into ionizing and non-ionizing radiation. Ionizing radiation is the radiation with high energy which is able to remove tight bonds between electrons and atoms resulting in tissue damage while non-ionizing radiation is the radiation that has enough energy to vibrate the atoms and molecule but do not remove the electrons in the molecule (Prof. Sujoy K. Guha, Prof. Sudarsan Neogi, Prof. Girish Kumar, 2011). This radiation mainly occurs at low frequency range. Mobile phone is designed with low power transceiver to transmit voice and data to base station is located at few kilometers. These radiations cause problems like headaches, severe pain in ear, blurring of vision, memory loss, itching, burning sensations, feeling asleep, hyper sensitivity exhaustion (Prof. Girish Kumar 2010) have been observed when using mobile phone. Researchers have found that these symptoms are more common in people with higher exposure to radiation of mobile phone.
BIOLOGICAL EFFECTS OF MOBILE PHONE AND MOBILE TOWER RADIATION ON HUMAN BIOLOGICAL PERSONALITY When a human body is exposed to the electromagnetic radiation, it absorbs radiation, because human body consists of 70% liquid. It is similar to that of cooking in the microwave oven where the water in the food content is heated first. Microwave absorption effect is much more significant by the body parts, which contain more fluid (water, blood, etc.), like the brain which consists of about 90% water. Effect is more noticeable where the movement of the fluid is less, for example, eyes, brain, joints, heart, abdomen, etc. Also, human height is much greater than the wavelength of the mobile tower transmitting frequencies, so there are multiple resonances in the body, which creates localized heating inside the body. This results in boils, drying up of the fluids around eyes, brain, joints, heart, abdomen, etc. There are various short-term and long-term effects from mobile radiations. Several health personality hazards associated with mobile phones and mobile towers are following-
The Blood Brain Barrier The brain is protected by tight junctions between adjacent cells of capillary walls by the blood-brain barrier (BBB), which selectively lets nutrients pass through from the blood to the brain, but keeps toxic substances out. A single two-hour exposure to a cell phone just once during its lifetime permanently damaged the blood-brain barrier. So there is a risk that disruption of this protection barrier may damage the brain. (Hardell et al, and Repacholi et al,. 2000), reported risk of developing brain tumor due to the exposure to EMF radiation generated by mobile phone. Besides increase in brain tumour and acoustic neuroma, there is an increased risk of several

International Journal of Advance and Innovative Research Volume 5, Issue 4 (XX): October - December, 2018
82
ISSN 2394 - 7780
other types of cancers following prolonged exposure to mobile phone/tower radiation, such as, salivary gland tumors, uveal melanoma, lymphoma, facial nerve tumors, skin, blood, testicular and breast cancer. Inter phone study in May 2010 has also found a significantly increased risk of some brain tumors for heavy users of mobile phones (> 20 minutes per day) for a period of 10 years or more. This is later substantiated by International Agency for Research in Cancer (IARC), part of WHO (World Health Organization) in May 2011.
Risk to Pregnant Women A pregnant woman and the fetus both are vulnerable because of the fact that these RF radiations continuously react with the developing embryo and increasing cells. Microwave radiation can damage the placental barrier; the membrane which prevents the passage of some materials between the maternal and fetal blood, protecting the fetus, implying that pregnant woman should avoid exposure to mobile phone and tower radiation.
Risk of Children Children are more vulnerable to mobile phone radiation as they Absorb more energy than adults from the same phone owing to their smaller head and brain size, thinner cranial bones and skin, thinner, more elastic ears, lower blood cell volume, as well as greater conductivity of nerve cells and the energy penetrates more deeply. Children’s cells reproduce more quickly than adults which make cancers more deadly. (Tracy Lightfoot et al., 2000) found memory errors, cognitive function and mental health problems due to exposure to EMF. (Ching et al., 2006) has confirmed decreases in skin resistance.
Irreversible Infertility In 2006, the American Society for Reproductive Medicine reported that use of mobile phones by men is associated with decrease in semen quality, sperm count, motility, viability and normal morphology and is related to the duration of mobile phone use. Studies have found 30% sperm decrease in intensive mobile phone users, in addition to damage of sperms. Radiation from mobile phone can also produce DNA breaks in sperm cells that can mutate and cause cancer. Damage to sperm DNA increases the risk further and can pass on the genetic changes to subsequent generations. Cellular telephone frequencies can lead to damaged DNA. Studies show that microwave exposure at levels below the current FCC exposure standard, produces single and double strand breaks in DNA. Microwave radiation can also interfere with the natural processes involved in DNA replication and repair. Another possibility of DNA damage is via free radical formation inside cells. Free radicals kill cells by damaging macromolecules, such as DNA, protein and membrane and are shown to be carcinogenic (Lalrinthara Pachuau1, Zaithanzauva Pachuau 2014). Damage to DNA is a central mechanism for developing tumors and cancer. When the rate of damage to DNA exceeds the rate at which DNA can be repaired, there is the possibility of retaining mutations and initiating cancer. DNA damage in brain cells can affect neurological functions and also possibly lead to neurodegenerative diseases. (Phillips et al.1995), reported DNA damage due to exposure to EMF radiation. (Hardell et al., 2000 and Muscat et al., 2000) found that exposures cause DNA damage and induce chromosome breaks. The study present the results of two case-control studies on benign brain tumors diagnosed during 1997-2003 including answers from 1,254 cases and 2,162 controls.
Risk to Patients Carrying Pace Makers The RF Exposure can adversely affect the heart: Pace Maker, Implantable Cardiovascular Defibrillators (ICDs) and Impulse Generators and become arrhythmic. These radiations produced by mobile phone can interfere with the implanted pacemakers and stop to delivering pulses in a regular way or may generate some kind of external controlling pulse putting the patient to death.
Effect on Skin Radiation from mobile towers and mobile phones affects human skin. The radiation degrades the immune system and stimulates various allergic and inflammatory responses. The effect of Non-ionizing high radiation are Rashes /sores, redness of skin, crawling, biting and stinging sensations, and granules, threads or black speck-like materials on or beneath the skin.
Tinnitus and Ear Damage The radiation emitted by mobile phones may damage the delicate workings of the inner ear, and long-term and intensive mobile phone use for more than four years and for longer periods than 30 minutes in a day are at a higher risk of developing hearing loss, which cannot be reversed. Today, more and more young people between 18 and 25 years of age are suffering from hearing loss, which doctors say is due to excessive use of mobile phones and other gadgets. Anyone who spends two to three hours on the mobile phone every day runs the risk of partial deafness over three to five years. The problem starts with a pain in the ear that gradually develops into tinnitus or a ringing sensation which finally leads to hearing loss and ear tumour.

International Journal of Advance and Innovative Research Volume 5, Issue 4 (XX): October - December, 2018
83
ISSN 2394 - 7780
Effect on Eye / Uveal Melanoma Frequent use of mobile phones can also damage the visual system in many ways and cause uveal melanoma i.e. tumor of the eye. Increase in temperature close to the eye lens (as low as 30C) can result in lens opacities and increase the risk of developing cataracts in humans, a condition characterized by clouding in the natural lens of the eye and lens opacities. Prolonged exposure to microwave radiation can lead to both macroscopic and microscopic damage to the lens and part of this damage seems to accumulate over time and does not heal.
Electromagnetic fields Electromagnetic fields have been shown to affect the brain physiology of human personality. Use of the cell phones before bed, delays and reduces sleep, and causes headaches, confusion and depression. The findings are especially alarming for children and teenagers as they use cell phones at night and also keep the phone next to their head; which may lead to mood and personality changes, depression, lack of concentration and poor academic performance. The percentage increase in sleep disturbance is proportional to the exposure dose. It has been reported that even at radiation density of 10 μW/m2, disturbance in the sleep is of the order of 35%. When the transmitter was turned off, the symptoms resumed gradually. Various studies are conducted in India on health hazards of EMR radiations on human body (Siriwitpreecha1 et. 2011, Lalrinthara Pachuau1 and Zaithanzauva Pachuau 2014, Singh K, etc. 2016). Majority of the subjects who were residing near the mobile base station complained of sleep disturbances, headache, dizziness, irritability, concentration difficulties, and hypertension.
VARIOUS FACTORS ON WHICH RADIATIONS EMITTED FROM A MOBILE PHONE AFFECTS A HUMAN BIOLOGICAL PERSONALITY Distance of mobile phone from human body If a mobile phone move even an inch from the body, it can greatly reduce radiation exposure. Strength of the signals decreases as the square of the distance from the source. This means that if we double the distance from the source, which is like mobile phone to our head, the signal strength would be four times less, as square of two is four. If we increase 10 times the distance between the mobile phone and our head, the signal strength will be 100 times less, and similarly at 100 times the distance, signal strength becomes10000 times less.
Distance from the cell phone tower Different Cell sites emits different amount of radiation. With the help of a suitable meter we can measure how much radiation is received at a particular spot. Around a single tower, radiation may not be uniform. The energy from a cellular phone tower antenna, like that of other telecommunication antennas, is directed toward horizon (parallel to the ground), with some downward scatter. Mobile phones communicate with nearby mobile tower mainly through radiofrequency (RF) waves, a form of energy in the electromagnetic spectrum between FM radio waves and microwaves. Like FM radio waves, microwaves, visible light, and heat, they are forms of non-ionizing radiation. This means they cannot cause cancer by directly damaging DNA. When a person makes a mobile phone call, a signal is sent from the phone’s antenna to the nearest base station antenna. The base station responds to this signal by assigning it an available radiofrequency channel. RF waves transfer the voice information to the base station. The voice signals are then sent to a switching center, which transfers the call to its destination. Voice signals are then relayed back and forth during the call, so effects human brain.
SAR (Specific Absorption Rate) S.A.R. is the measurement of rate by which a body absorbs energy when the body is exposed to radio frequency electromagnetic field. We can also say that it is a measure of absorption of EM wave energy by tissues. It defined as power absorbed per mass of tissue and has unit’s watts/ kilogram. Absorption rate is observed either for whole body or for a small sample volume of tissues ([ICNIRP] International Commission on Non-Ionizing Radiation Protection. 1998). According to ICNIRP guidelines. For limiting exposure to time varying electric, magnetic and electromagnetic fields, the maximum SAR value for mobile phones has been set at 2 Watts/Kg localised for the head and the trunk (of a human) in the frequency range of 10MHz to 10GHz These guidelines have been developed in collaboration with Environment Health Division of the World Health Organisation (WHO). In India, the FCC limit for public exposure is 1.6 W/kg for 1 gram volume averaged SAR (http://www.icnirp.de/documents /emfgdl.pdf).
Extent of conversation It has also a large impact on human brain, it is proved that if a person talks more than 50 minutes on mobile phone, they found a 7 percent increase in brain metabolism in the region closest to cellphone antenna when the phone was on, as a result of it temperature of body increases.

International Journal of Advance and Innovative Research Volume 5, Issue 4 (XX): October - December, 2018
84
ISSN 2394 - 7780
Age of the person As compare to adults, children have large effect on their brain while talking on the mobile phone because children are growing more rapidly, they are more cell dividing capability, so that radiations disrupts more no. of cells. Also, children have thinner skull as compare to adults so they have larger impact (World Health Organization [WHO]). It is also proved that fetuses are higher sensitive to radiations than others.
SAFETY GUIDELINES FOR SOME PRECAUTIONS EMR exposure at the highest frequencies is a source of serious biological damage. However, everyone should be aware that exposure to such radiation may not be completely safe at certain power levels and frequencies. It is always a good idea to avoid unnecessary radiation exposure whenever possible (Hirata, 2006). Health effects from exposure to this form of radiation vary from no effect at all to death, and can cause diseases such as leukemia or bone, breast, and lung cancer. To protect ourselves, we just ensure to take some precautions:
Human beings should spend less time on the mobile phones.
Mobile phones with a lower specific absorption rate (SAR) should be used.
Use of mobile phones should be limited in case if children below 10 years.
It should be avoided to make calls with a low signal and low battery as the mobile phone will generate more radiation in an effort to compensate for it.
For talking, keep your mobile phone away from body. Use some hands-free device such as earphones or Bluetooth while communicating. Use more of landline phones as they use analog signals.
Either keep your calls short or send a text message (SMS) instead. This advice applies especially to children, adolescents and pregnant women.
People having active medical implants should keep their mobile phone at least 30 cm away from the implant.
CONCLUSION This paper reviewed long-term and short-term effects of mobile phones on human biological personality. Long-term usage of mobile phones cause health personality hazards such as cancer, high blood pressure, miscarriages, DNA damage, hormonal imbalance etc. while their short term uses can cause conditions like insomnia, depression, headaches, sleep disorders, etc. To minimize the health of personality issues related to the exposure of radiations the safety guidelines provided by various organizations such as ICNIRP should be followed. Some simple mobile phone usage habits such as the time distance between the mobile and body, etc. can prevent the various health hazards from the radiations of the mobile phones.
The microwave mobile communication systems include the TV, FM and AM broadcasting station which use large amount of power to transmit the signals at a greater amount of distance. WiFi and WiMAX are used in most of the developed parts of the world where there is a need of greater data rates. Both of these communication technologies have operating frequencies of some multiples of GHz which is the higher end of the microwave frequency band. The microwave frequencies used in the cellular communication causes the thermal and non-thermal effects. There are a lot of damages that is done by the non-thermal effects as compared to the thermal effects.
Out of all the mobile phone towers in metropolitan cities, almost 45% of them are illegal. They did not follow the norms that are set for the purpose and ignorantly put the lives of people at risk of cancer and other disastrous ailments. It is always recommended to avoid the unnecessary exposure to EM fields whenever possible. Though technology makes our life very comfortable but at the expense of our health, it is our first duty to save our life. Need to develop health based precautionary guidelines in the Country.
REFERENCES [1]. Dr. Girish Kumar (2010), “Report on Cell Tower Radiation”, Submitted to Secretary, DOT, Delhi,
[Online] Available: http://www.indiaenvironmentportal.org.in/files/file/Kumar-Cell-Tower-Radiation-Report sent-to-DOTDepartment-of- Telecommunications.pdf
[2]. Prof. Sujoy K. Guha, Prof. Sudarsan Neogi, Prof. Girish Kumar (October, 2011), “Report on Cell Phone Towers Radiation Hazards,” Submitted to West Bengal Environment Minister (Dr. Sudarsan Ghosh).
[3]. [ICNIRP] (1998) International Commission on Non-Ionizing Radiation Protection. 1998.
International Journal of Advance and Innovative Research Volume 5, Issue 4 (XX): October - December, 2018
85
ISSN 2394 - 7780
[4]. Guidelines for limiting exposure to time-varying electric, magnetic, and electromagnetic fields (2000), (up to 300 GHz). Health Physics [Internet]; 74(4): 494-522. Available from: http://www.icnirp.de/documents/emfgdl.pdf.
[5]. [WHO] (2010) World Health Organization. EMF World Wide Standards Database [Internet]. Available from:http://www.who.int/docstore/peh-emf/EMFStandards/who-0102/Worldmap5.htm
[6]. [FCC] Federal Communication Commission (1997). Guidelines for the environmental effects of radiofrequency radiation [Internet]. ET Docket 93-62. Available from: http://www.fcc.gov/oet/ dockets/et93-62/pdf.
[7]. “Information paper On Effects of Electromagnetic Field Radiation from Mobile Towers and Handsets” (2000) by Telecom Regulatory authority of India.
[8]. Inskip PD (2001), Tarone RE, Hatch EE, “Cellular telephone use and brain tumors,” N. Engl J Med, 344:79-86.
[9]. Hirata (2006), “ Peak spatial-average SAR and temperature increase due to antennas attached to human trunk,” Journal of the American College of Cardiology, Volume 48 , Issue 1 , Pages 185 – 186.
[10]. Anderson V, Joyner KH(1995), “Specific absorption rate levels measured in a phantom head exposed to radio frequency transmissions from analog hand-held mobile phones,” Bioelectromagnetics, 16:60-69.
[11]. "Standard for Safety Level with Respect to Human Exposure to Radio Frequency Electromagnetic Fields (Oct 2005), 3 KHz to 300GHz". IEEE STD (IEEE) C95.1.
[12]. Tracy Lightfoot et al., (2000), International Commission on Non-Ionizing Radiation Protection, “Guidelines for limiting exposure to time- varying electric, magnetic, and electromagnetic fields (up to 300 GHz)”, Health Physics 74 (4), April 1998.
[13]. Preece AW (2000), “Mobile phones and human heads,” Neuro Report, Vol 11 No 2.
[14]. Chang Nam Ki, Sung Woo Kim (2006), “Effects of RF exposure of teenagers and adults by CDMA cellular phones, Bio electromagnetics Volume 27 Issue 7, Pages 509 – 514.
[15]. Ashraf Aly and Frank Barnes (2008), “Effects of 900-MHz Radio Frequencies on the Chemo taxis of Human Neutrophils-in-Vitro,” IEEE Transactions On biomedical Engineering, VOL. 55, NO. 2.
[16]. Muscat JE (2000),”Handheld Cellular Telephone use and Risk of Brain Cancer,” JAMA;the journal of the American Medical Association 284.23:3001-7.
[17]. World Health Organisation (WHO) (2011), Media centre, electromagnetic fields and public health: Mobile phones.
[18]. Chia, S. E., Chia, H. P., & Tan, J. S (2000). “Prevalence of headache among handheld cellular telephone users in Singapore”: A community study. Environmental Health Perspectives, 108(11), 1059-1062.
[19]. Siriwitpreecha1, A., Wessapan,T. and Rattanadecho, P. (October, 2011) “Computational Analysis of SAR and Temperature Distributions in Human Body Exposed to Microwave”:The Second TSME International Conference on Mechanical Engineering 19-21, Krabi.
[20]. Lalrinthara Pachuau1, Zaithanzauva Pachuau (2014),” Study of Cell Tower Radiation and its Health Hazards on human body”.
[21]. World Health Organization (June 2011), “Electromagnetic Fields and public health-Mobile phones: Fact sheet”, No.193.
[22]. Environmental Working Group (2009), “Cell phone Radiation- Science Review on Cancer Risks and Children’s Health: Do cell phones cause cancer or other illnesses”,1, 8-10
[23]. Sara Thomee, Annika Harenstam and Mats Hagberg (2011), “Mobile phone use and stress, sleep disturbances and symptoms of depression among young adults-a prospective cohort study” BioMed Central Public Health, 11:66.1-11.
[24]. Harell L, Carlberg M, Hansson Mild K, (2000) “Pooled analysis of two case-control studies on the use of cellular and cordless telephones and the risk of benign”.

International Journal of Advance and Innovative Research Volume 5, Issue 4 (XX): October - December, 2018
86
ISSN 2394 - 7780
[25]. Neha Kumar, Dr. Girish Kumar (2009), “Biological Effects of Cell Tower Radiation on Human Body”, ISMOT 2009, Dec. 16- 19, New Delhi, India.
[26]. Graham C, Cook MR, Gerkovich MM, Sastre A (2001), “Examination of the melatonin hypothesis in women exposed at night to EMR or bright light”, Environ Health Prospect, Dec; 109, (supply): 911-933.
[27]. “Health impact of electromagnetic radiation from telecommunication towers located in close proximity to residential areas” (June 22, 2008), Office of the Auditor General of Canada, Petition No. 255, Environmental Petition to the Auditor General, Submitted.
[28]. Alleyne, R. (2012), “Mobile phones can cause brain tumors, court rules. The Telegraph”, http://www.telegraph.co.uk/health/9619514/Mobilephones can cause brain tumors’ court-rules. Html.
[29]. Blackman, C. (2009, August). “Cell phone radiation: Evidence from ELF and RF studies supporting more inclusive risk identification and assessment”, Path physiology, 16(2/3), 205-216.
[30]. Blackman CF, Benane SG, House DE (2001).” The influence of 1.2 microT, 60 Hz magnetic fields on melatonin- and tamoxifen-induced inhibition of MCF-7 cell growth”, Bioelectromagnetics; 22:122-8.
[31]. IARC (International Agency for Research on Cancer). “Non-Ionizing Radiation, Part 1: Static and extremely low-frequency (ELF) electric and magnetic fields”. IARC Monographs on the Evaluation of carcinogenic Risks to Humans: Volume 80. Lyon: IARC Press; 2002.
[32]. Braune S, Wrocklage C, Raczek J, Gailus T, Lucking C (1998). “Resting blood pressure increased during exposure to a radio-frequency electromagnetic field”, Lancet; 351:1857-1858.
[33]. Singh K, Nagaraj A, Yousuf A, Ganta S, Pareek S, Vishnani P.(2016) J. Int Soc Prev Community Dent “Effect of electromagnetic radiations from mobile phone base stations on general health and salivary function” 6:54-59, http://www.ncbi.nlm.nih.gov/pubmed /term=27011934.

International Journal of Advance and Innovative Research Volume 5, Issue 4 (XX): October - December, 2018
87
ISSN 2394 - 7780
PALM HAND VEIN DETECTION USING ICP ALGORITHM FOR PERSON IDENTIFICATION
A Jeyakalyani, Dr. N. Suguna , Dr. S. Arivalagan Computer and Information Science, Annamalai University, Chidambaram
ABSTRACT The palm hand vein recognition technique is a unique biometric technology; it is an efficient personal authentication and identification technique. The first step is Acquisition of the image the stored database, and second step is preprocessing and Region of Interest, Image segmentation, Pattern Thinning and Matching. Vein recognition is a biometric technique, which is recently used for the purpose of authentication in several applications. The different techniques which were discovered and used for developing this system are being discussed here. Basically it is the technology equipped with science for measuring and analyzing the Biological Data. Palm hand vein recognition is used to increase the accuracy of palm hand vein authentication.
Keywords : Biometrics, Palm hand Vein, Adaptive Histogram Equalization, Image Segmentation, Pattern Thinning, Matching.
1. INTRODUCTION In the recent days, automatically identifying a person has not been uncommon. Automatic personal identification using biometric plays an important in all applications for public security, access control, banking and goes on. The three major points of vein images of hand that are very strong. The first and the foremost one is, it has got no physical contact; hence it does not make the content displeasure. Naturally, it becomes better than a fingerprint and iris scanning. Secondly, it possesses a forceful universality and uniqueness. For adults, less change following the growth of age and the vein patterns are different. It is not similar from individual to individual. Above all it’s very hard to forge, not similar and better than a fingerprint.
Authors Pattern Extraction Feature extraction Matching Hassan et t al[1] SIFT Linear Vector Quantization Zhou and Kumar [2] Histogram
Equalization Hessian Phase Neighborhood Matching Random
Transform Ladou et al[3] Gaussian low –pass
51x51 Filter SIFT Euclidean distance between SIFT
description Zhang et al [4] Gaussian shaped
Filter Using AND , OR operator to
measure the distance between two palm vein feature.
2. PROPOSED IDENTIFICATION SYSTEM The database consist of 4 images , each for 100 different people . Two different phases are considered , training phase and testing phase. Training phase consists of 3 images, each of 100 different people and other testing phase consist of 1 image each of respective 100 people. Figure 1. is shown a diagram of Identification system . The Palm hand vein image is captured through CCD Camera . The Captured images show in the RGB format. Then,using algorithm to change grayscale image. The next step is the extraction of ROI. Then Edge Detection , Pattern Thinning, matching the ICP(Iterative Closest point) algorithm are used for identification of persons.
Fig.- 1: Proposed System for Identification of Person

International Journal of Advance and Innovative Research Volume 5, Issue 4 (XX): October - December, 2018
88
ISSN 2394 - 7780
Many papers are reported good Recognition result, their result are not reproducible as none of them allow open access to their database. It contains suitable standard Palm hand vein images database available on the internet. In this research paper is using Bosphorus database http://bosphorus.ee.boun.edu.tr/.
2.1. ROI EXTRACTION The input image is an infrared image acquired by NIR Camera. The NIR illumination is absorbed more by hemoglobin in the vein by the surrounding tissue and thus highlights the vein patterns. Accurate recognition using vein pattern images requires to process the input image by extraction appropriate ROI as well as an effective pre-processing technique and then by double click on that square it shows only cropped portion of an image. Figure 1 shows the extracted ROI image. The ROI approach from the given image by discarding background as well as outer region.
Figure – 2: (a) Original image and (b) ROI image
3.2 ADAPTIVE HISTOGRAM EQUALIZATION Adaptive Histogram Equalization depends on the contrast enhancement method. Histogram Equalization is used to operate on the full image, but AHE performs in small areas in the image called ‘tiles’ . Each tile’s contrast is improved and then the neighbouring tiles are linked to eliminate Partificially included boundaries.
3.3 IMAGE SEGMENTATION The Palm vein region is separated from the background using segmentation process. It is used three processes, namely:
i. Edge Detection
ii. Edge Smoothing.
iii. Palm Region filling.
i. Edge Detection Edge detection is one of the most important phenomenon in image processing. In this paper Canny Edge detection technique is used for extracting structural information to be processed. Canny Edge detection is a reliable detection of veins. The distance between one detected point and the true edge point should be the minimum.
ii. Edge smoothing Gaussian function is used for removing noise for edge smoothing. It is mainly used in graphics software and also used for reducing noise from blur image.
iii. Palm Region Filling Begin with point p inside the boundary and then fill the entire region with 1’s.
All non-boundary (background) points are labeled 0 The value 1 is assigned to p to begin... Then Region is filled up under the procedure with 1’s,
XK = (XK-1 ⊕ B) ∩ AC, k= 1, 2, 3 . . . Where X0= p, and the symmetric structuring element is B.
The Morphological region filling algorithm algorithm is used to terminate at iteration step k if XK = XK-1
The set union of XK and A consist of the filled set and contain its boundary.

International Journal of Advance and Innovative Research Volume 5, Issue 4 (XX): October - December, 2018
89
ISSN 2394 - 7780
3.4 Pattern Thinning The Thinning algorithm is used to extract the image undergoes thinning. The Identification is using the thinned image . When the thinning is done , the geometric value to decrease in the image. The resulting image shows below.
Figure – 2: Thinned Pattern
3.5 Matching Vein matching is described the verify of the person or identity. Iterative Closest Point algorithm is used to perform the matching . An ICP algorithm is used to compare between user’s input scanned pattern with the database storing pattern for identification either the person denied or granted access,
4. EXPERIMENTAL RESULT The database consist of 4 images, each of 100 different people . Two different phases are considered training phase and testing phase. Training phase consists of 3 images, each of 100 different people and other testing phase consist of 1 image each of respective 100 people. The vein patterns are unique to each individual. Apart from size, pattern does not change over time. This pattern makes it suitable for one to many matching, for which hand geometry and face recognition may not be suitable. In the MATLAB is implementing the proposed algorithm . All the images are taken from BOSPHORUS Database. In this research paper the False Rejection Rate of 0.01% and the False Acceptance rate of 0.0001% in this vein identification. It’s acceptable for high security applications.
5. CONCLUSION This research paper is used to consider the accuracy of result and processing time. This paper describes a phase of the art biometric vein of the hand, It improves the verification performance too. It is globally recognized as secured and integrated with “aliveness” detection. Using these information authenticating person and identification is processed.
REFERENCES [1] Hassan Soliman, Abdelnasser Saber Mohamed and Ahmed Atwan, Feature Level Fusion of Palm Veins
and Signature Biometrics , International Journal of Video & Image Processing and Network Security IJVIPNS-IJENS Vol: 12 No: 01, pp.28-39, 2012.
[2] Yingbo Zhou and Ajay Kumar, Human Identification Using Palm-Vein Images , IEEE transactions on information forensics and security, vol. 6, no. 4,pp.1259-1247, December 2011.
[3] Pierre-Olivier Ladoux, Christophe Rosenberger and Bernadette Dorizzi , Palm Vein Verification System based on SIFT matching Third International Conference on Advances in Biometrics, pp. 1290-1298, June 2009.
[4] David Zhang, Zhenhua Guo, Guangming Lu, Lei Zhang, Yahui Liu, Wangmeng Zuo, Online joint palmprint and palmvein verification , Expert Systems with Applications, No.11, pp. 2621-2631 , 2010.
[5] S. Prabhakar, S. Pankanti, and A. K. Jain. Biometric Recognition: Security and Privacy Concerns, IEEE Security and Privacy, Vol.1, No. 2, pp. 33-42, 2003.
[6] Shigeru Sasaki, and Akira Wakabayashi, Business Expansion of Palm Vein Pattern Authentication Technology, Fujitsu Sci. Tech. J., 41, 3, pp. 341-347, 2005.
[7] Hao luo,Fa-Xin Yu,Jeng-Shyang Pan,Shu-Chuan Chu and Pei-Wei Tsai, A Survey of Vein Recognition Techniques ,information technology Journal,vol.9,no 6,pp.1142-1149,2010.
[8] D. Zhang, Z. Guo, G. Lu, L. Zhang, and W. Zuo, An online system of multispectral palmprint verification, IEEE Trans. Instrum. Meas., vol. 59, no. 2, pp. 480–490, Feb. 2010.

International Journal of Advance and Innovative Research Volume 5, Issue 4 (XX): October - December, 2018
90
ISSN 2394 - 7780
A CRITICAL ANALYSIS: SELECTED SERVICE INDUSTRIES
Dr. Mehal Pandya Associate Professor, B. K. School of Professional and Management Studies, Gujarat University, Ahmedabad
ABSTRACT Researcher has reviewed 19 research paper related to the service industries. Further researcher has done in depth critical analysis of these research papers. Methodology adopted is secondary. The findings from this paper are that every firm is aware about the importance of the service quality and accordingly put their efforts.
INTRODUCTION Service Sector is the tertiary sector after primary sector (raw material) and secondary sector (manufacturing). Services are intangible and play major role in the India economic growth. According to latest update of ibef, service sector contributed around 53.8 per cent of its Gross Value Added in 2016-17 and employed 28.6 per cent of the total population. Net services exports from India reached US$ 67.5 billion in 2016-17 while the sector attracted 60.7 per cent of India’s total FDI inflows. India's score in the Nikkei/IHS Markit Services Purchasing Managers Index reached an eight month high of 53.1 in June, 2017, supported by the rise in new business orders, and heavy growth in the private sector output. The Central Statistics Office’s (CSO) provisional estimates of Gross Value Added (GVA) in FY 2016-17 (PE) indicate that the service sector grew 7.74 per cent year-on-year to Rs 21.43 trillion (US$ 332.74 billion).
OBJECTIVE To study importance given to the service quality by the service firm
To study different perspective of the firm for the service quality

International Journal of Advance and Innovative Research Volume 5, Issue 4 (XX): October - December, 2018
91
ISSN 2394 - 7780

International Journal of Advance and Innovative Research Volume 5, Issue 4 (XX): October - December, 2018
92
ISSN 2394 - 7780

International Journal of Advance and Innovative Research Volume 5, Issue 4 (XX): October - December, 2018
93
ISSN 2394 - 7780

International Journal of Advance and Innovative Research Volume 5, Issue 4 (XX): October - December, 2018
94
ISSN 2394 - 7780

International Journal of Advance and Innovative Research Volume 5, Issue 4 (XX): October - December, 2018
95
ISSN 2394 - 7780

International Journal of Advance and Innovative Research Volume 5, Issue 4 (XX): October - December, 2018
96
ISSN 2394 - 7780
FINDINGS Bank 1. Bank gives more importance to reliability, responsiveness and assurance.
2. SERVQUAL have positive and significant impact on customer satisfaction
3. Assurance and core services are found to be the same in all the three groups (Public, Private, Foreign Bank)
4. Service Quality is the basic and also important factor that influences the overall customer satisfaction.
Airlines 1. Service Quality is a useful methods of reviewing and improving strategies development plans and
performance evaluations.
2. Importance is given to the service quality which determines the passengers choice of repeat patronage
3. Service quality decrease with low price
4. Domestic customers are not satisfied with the customer services offered by the companies in India. Promotional activities are exaggerated.
Hotel Industry 1. In order to provide superior quality of the service the training is to be provided to the employee.
2. Focus should be there on the three core part Service Concept, Service Content, Service Style.
3. Organisation can achieve strong service quality reputation if they meet the customer expectation.
Fast Food Restaurant 1. Customer makes their judgment of the service quality on the basis of a series of factors.
2. Quality of the service based on the level of satisfaction with physical environment and process of service delivery.
3. MC Donald should focus on the service quality to increase the customer satisfaction and to reach at the customer expectation.
4. Improving service quality will not only strengthen customer loyalty, but also improve the restaurants reputation, and result in more sales and greater revenue in the long term.
5. Focus should be on four factors of service quality Physical, design, product quality and price.
Telecom 1. Firm should satisfy the customer through provision of good service and network coverage.
General Papers on Service Sector 1 For Survival and Sustenance-Strategies should be evolved.
2 The success of the service relies on the success of the communication between service provider and customers.
CONCLUSION From this study it is concluded that service firms give huge importance to the service quality. They believe that if service quality is good than only the firm can build a repo, trust with the customer. Further they put emphasis in providing training to the employees, maintain proper ambiance, product quality and price etc.
BIBLIOGRAPHY W.Rajendrasingh, J.Brijeshkumar (2014), “Service Marketing Quality and Problems in Public Sector and
Private Sector Banks of Indore City”, Abhinav National Monthly Refereed Journal of Research in Commerce and Management,Vol:3(11)
A.Ibrahim,S.Bokkasam (2016), “Bank Customers Perception of Service Quality and Customer Satisfaction in Saudi Arabia”, European journal of Business and Social Sciences,Vol:4(11)
B.Ismail,G.Anjali (2012), “ A Study on Customers Perception on Services Provided by Banks in the City of Ahmedabad ”, Pacific Business Review International,Vol:5(5)
N.Ragavan, R.Mageh (2013), “A Study on Service Quality Perspectives and Customer Satisfaction in New Private Sector Banks” , Journal of Business and Management,Vol:7(2)

International Journal of Advance and Innovative Research Volume 5, Issue 4 (XX): October - December, 2018
97
ISSN 2394 - 7780
A.N.Festus, A.J.Anyadighibe (2014), “An Appraisal of Strategies and Challenges of Services Marketing in a Globalized Business Environment”,International Journal of Managerial Studies and Research,Vol:2(9)
K.Sanjeev , K.Mishra (2014), “Marketing of Services :Challenges & Opportunities in Today Global Competitive Business Environment” , International Journal on Recent and Innovation Trends in Computing and Communication,Vol:2(11)
C.Yuan-Ho,T.Ming-lang,L.Ru-Jen,(2011), “Evaluating the customer perceptions on in-flight service quality,African Journal of Business Management,Vol:5(7)
G.Okeudo, U.C.David (2013), “Effects of airline service quality on airline image and passengers loyalty: Findings from Arik Air Nigeria passengers”, Journal of Hospitality and Management Tourism,Vol:4(2)
A.B.David Mv (2013), “Service Quality and Customer Satisfaction in the Airline Industry: A Comparison between legacy Airlines and Low-cost Airlines”, American Journal of Tourism Research,Vol:2(1)
G.David,W.Robin W.C.(2003), “Passenger expectations and airlines services: a Hongkong base study, Science Direct(Tourism Management),Vol:24
P.Malydari,P Satyanarayan (2014), “Service Quality Perception of Domestic Airline Consumers in India-An Empirical Study”, International Journal of Economics and Management Sciences,Vol:3(3)
G.Umesh (2014), “Relationship between Service Quality and Customer Satisfaction in Srilankan Hotel Industry”, International Journal of Scientific and Research Publication,Vol:4(11)
K.Harit, S.Priyanka (2015), “ A Study of Hospitality Marketing Mix with Reference to Indian Hotel Industry”, Intercontinental Journal of Marketing research rEview,Vol:3(12)
D.Sathya, D.Sabyasachi (2015), “Customer Perception to Service Quality Towards Luxury Hotels in Odisha using Servqual Model”,Vol:2(9)
Wu. Hung-Che (2015), “Assessment of Service Quality in the Fast-Food Restaurant”, Journal of Foodservice Business Research,Vol:18
D.Jelena, R. Sanja, M.Suzana (2011), “What are the key dimensions of restaurant service quality? An Empirical study in the city restaurant settings”, Sustainable Tourism: Socio-Cultural,pp-235-249
Hilly,R.Nimiya,S.Shikha,T Monica (2015), “Service Quality of McDonald’s”, Global Journal of Enterprise Information System,Vol:7(3)
R.Prabha (2012), “Perceived Service Quality in Restaurant Services: Evidence from Mauritius”, International Journal of Management and Marketing Research,Vol:5(3)
S.Raja, I.Muhammad, A.Naeem, P.Muhammad,R Asad (2014), “Customer Satisfaction in the Restaurant Industry; Examining the Model in Local Industry Perspective”, Journal of Asian Business Strategy.
A.Jawwad, H.Mazhar, R.Amer, “Customer Loyalty Framework of Telecommunication Service Market, International Journal of Managing Value and Supply Chain,Vol:6(1)
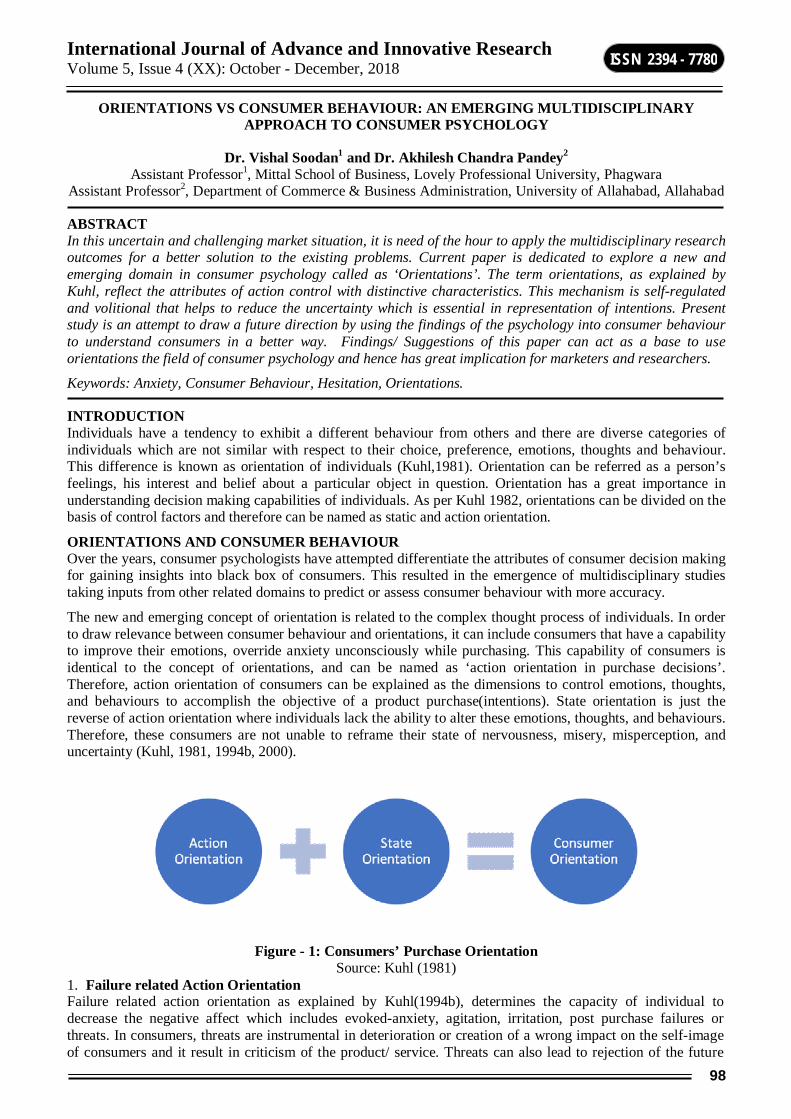
International Journal of Advance and Innovative Research Volume 5, Issue 4 (XX): October - December, 2018
98
ISSN 2394 - 7780
ORIENTATIONS VS CONSUMER BEHAVIOUR: AN EMERGING MULTIDISCIPLINARY APPROACH TO CONSUMER PSYCHOLOGY
Dr. Vishal Soodan1 and Dr. Akhilesh Chandra Pandey2
Assistant Professor1, Mittal School of Business, Lovely Professional University, Phagwara Assistant Professor2, Department of Commerce & Business Administration, University of Allahabad, Allahabad
ABSTRACT In this uncertain and challenging market situation, it is need of the hour to apply the multidisciplinary research outcomes for a better solution to the existing problems. Current paper is dedicated to explore a new and emerging domain in consumer psychology called as ‘Orientations’. The term orientations, as explained by Kuhl, reflect the attributes of action control with distinctive characteristics. This mechanism is self-regulated and volitional that helps to reduce the uncertainty which is essential in representation of intentions. Present study is an attempt to draw a future direction by using the findings of the psychology into consumer behaviour to understand consumers in a better way. Findings/ Suggestions of this paper can act as a base to use orientations the field of consumer psychology and hence has great implication for marketers and researchers.
Keywords: Anxiety, Consumer Behaviour, Hesitation, Orientations.
INTRODUCTION Individuals have a tendency to exhibit a different behaviour from others and there are diverse categories of individuals which are not similar with respect to their choice, preference, emotions, thoughts and behaviour. This difference is known as orientation of individuals (Kuhl,1981). Orientation can be referred as a person’s feelings, his interest and belief about a particular object in question. Orientation has a great importance in understanding decision making capabilities of individuals. As per Kuhl 1982, orientations can be divided on the basis of control factors and therefore can be named as static and action orientation.
ORIENTATIONS AND CONSUMER BEHAVIOUR Over the years, consumer psychologists have attempted differentiate the attributes of consumer decision making for gaining insights into black box of consumers. This resulted in the emergence of multidisciplinary studies taking inputs from other related domains to predict or assess consumer behaviour with more accuracy.
The new and emerging concept of orientation is related to the complex thought process of individuals. In order to draw relevance between consumer behaviour and orientations, it can include consumers that have a capability to improve their emotions, override anxiety unconsciously while purchasing. This capability of consumers is identical to the concept of orientations, and can be named as ‘action orientation in purchase decisions’. Therefore, action orientation of consumers can be explained as the dimensions to control emotions, thoughts, and behaviours to accomplish the objective of a product purchase(intentions). State orientation is just the reverse of action orientation where individuals lack the ability to alter these emotions, thoughts, and behaviours. Therefore, these consumers are not unable to reframe their state of nervousness, misery, misperception, and uncertainty (Kuhl, 1981, 1994b, 2000).
Figure - 1: Consumers’ Purchase Orientation
Source: Kuhl (1981) 1. Failure related Action Orientation Failure related action orientation as explained by Kuhl(1994b), determines the capacity of individual to decrease the negative affect which includes evoked-anxiety, agitation, irritation, post purchase failures or threats. In consumers, threats are instrumental in deterioration or creation of a wrong impact on the self-image of consumers and it result in criticism of the product/ service. Threats can also lead to rejection of the future

International Journal of Advance and Innovative Research Volume 5, Issue 4 (XX): October - December, 2018
99
ISSN 2394 - 7780
purchase or it could also lead to exclusion of the potential product /service from the consumers’ mind. This type of orientation also helps to remove the sense of risk/ potential danger emerging out of the purchase. Furthermore, consumers showcasing this orientation also have a propensity to decrease the negative effect associated with their purchases which tend to lower down the impact of criticism of the purchase experience and try to memorise the best part of purchase experience. Consumers reflecting this form of action orientation have a better tendency to discontinue from this sense of threat and negativism related to a purchase with ease, hence this tendency is called disengagement.
2. Failure related State Orientation There are some consumers who are not so active but demonstrate a different kind of orientation called as failure related state orientation. Consumers of this orientation feel already occupied with the threats related to a purchase and this tendency is known as preoccupation. Preoccupation of consumers can be related to the previous experience, word of mouth or through social influence. Thus, consumers with state of failure related action orientation always remain preoccupied in their mind regarding threats associated with the purchase because of already developed psychological state in their mind which prevents them to take further action on purchase.
3. Decision related Action Orientation It is the capacity of consumers to enhance the positive affect that is needed to initiate a purchase. This type of orientation includes confidence, enthusiasm and excitement to carry out the intentions linked with a purchase. It entails nature of purchase intentions including unforeseen events like price increase, inconsistent and non-personalized experience and hurdles in addition to conflicting goals and tasks that reduce the confidence and decrease positive affect of individuals related to purchase. Individuals with this type of action orientation have a tendency to increase their positive affect and can improve self-confidence and improve their self-image. The individuals the category can initiate or execute their purchase intentions despite the underlined problems. This capacity therefore, is sometimes regarded as initiative.
4. Decision related State Orientation Consumers with a decision state orientation tend to hesitate in taking purchase decisions and generally decide to delay when it comes to execution of their intentions. Individuals of this category have very less tendency to overcome the hesitation. This tendency is thus called hesitation.
Figure – 2: Types of Orientations (Kuhl 1994)
Although these two dimensions are distinguished and can be reported in a different way, researches indicate that preoccupation of consumers and their hesitation both are moderately and highly correlated in different cases. There are some studies which have reported a moderate correlation between preoccupation and hesitation whereas other research studies have reported higher correlations.
Further, several scholarly studies pointed out that individuals reporting failure related action orientation reflect a tendency to alter their feelings (affective state). According to Koole & Coenen (2007) such kind of orientation exhibit that consumer can easily access its sense of self in response to approaching threat (factors affecting purchase). This leads to minimum response time and therefore consumers can activate several psychological traits in order to counter the effect of the state of mind. Hence, consumers with failure related action orientation

International Journal of Advance and Innovative Research Volume 5, Issue 4 (XX): October - December, 2018
100
ISSN 2394 - 7780
has a capacity to change their feelings towards the risk or conflict related to purchases. Therefore, they can activate their personal values which they have from persons affecting their behaviour. Consumers with a state of disengagement try to curb the negative effect by setting their priorities or changing them accordingly. Consumers also tend to dilute their attention from the negative effect of purchase related intentions and tend to incline towards their preferences. There is another mechanism to develop negative effect by consumers is that they try to perceive the thing in their way. It has been seen that the capacity to access the sense of self capacity develops because during the childhood stage the consumers might have been offered a sense of choice during threatening, conflicting or stressful conditions. This led them to associate such related situations with the same logic of choice with their values and favouring proclivities with conflicting situations.
Measuring Orientations The orientations can be measured by using a tool ACS90, validated by Kuhl (1994) and has found its relevance in range of studies too(Jostmann et al. 2005). The ACS90 contains two subscales namely: failure-related and decision-related-comprise 12 items. The two subscales were combined in few studies to develop an inclusive measure of action versus state orientation, called volitional control (Jostmann et.al, 2006).
Therefore, about purchase orientation it can be said that the both static and action orientation hold respective characteristics which provide gainful insights to complex psychology of consumer purchases. As consumers become more action oriented, the intentions of consumers are steered more by attitudes than subjective norms. But when they become more state oriented, then intentions try to find a base upon subjective norms and less on attitudes. (Bagozzi, Baumgartner &Yi, 1992).
Implications and Conclusion Present paper is an attempt to uncover the role of consumers’ orientations in the field of marketing. Orientations hold the ability to predict the action of individuals. Hence, study of consumers’ orientation can be helpful to gauge the purchase behaviour of consumers related to :New Technology Adoption, Green Products Purchase etc. A model can be developed by taking orientations as moderators in various market settings. Hence by determining the orientations, one can easily depict their role in persuading or deterring the consumer to purchase. Therefore, it can be stated that like other psychological aspects of consumers, orientations are equally responsible in generation of favourable/ unfavourable decision related to a purchase. A future study can be taken to access the orientations of consumers about a specific topic of concern by utilizing ACS90 as a scale. The study results could give a remarkable result and will ultimately serve to discover a new domain of knowledge which is yet to be explored.
REFERENCES 1. Bagozzi, R. P., Baumgartner, H., & Yi, Y. (1992). State versus action orientation and the theory of reasoned
action: An application to coupon usage. Journal of Consumer Research, 18(4), 505-518. 2. Bagozzi, Richard P. (1981), Attitudes, Intentions, and Behaviors: A Test of Some Key Hypotheses,Journal
of Personality and Social Psychology, 41, 607-627. 3. Beckmann, J., & Kuhl, J. (1984). Altering information to gain action control: Functional aspects of human
information processing in decision making. Journal of Research in Personality, 18, 224-237. 4. Jostmann, N. B., & Koole, S. L. (2006). On the waxing and waning of working memory: Action orientation
moderates the impact of demanding relationship primes on working memory capacity. Personality and Social Psychology Bulletin, 32, 1716-1728.
5. Jostmann, N. B., Koole, S. L., van der Wulp, N., & Fockenberg, D. A. (2005). Subliminal affect regulation: The moderating role of action vs. state orientation. European Psychologist, 10, 209-217.
6. Kuhl, J. (1982), “Action vs. State Orientation as a Mediator between Motivation and Action,” in W. Hacker et al., Cognitive and Motivational Aspects of Action. North-Holland: Amsterdam, 67–85.
7. Kuhl, J. (1994b). Action and state orientation: Psychometric properties of the action control scales (ACS-90). In J. Kuhl & J. Beckmann (Eds.), Volition and personality: Action vs. state orientation (pp. 47-59). Gottingen: Hogrefe.
8. Kuhl, J., & Helle, P. (1994). Motivational and volitional determinants of depression: The degenerated-intention hypothesis. In J. Kuhl & J Beckmann (Eds.), Volition and personality: Action vs state orientation (pp. 283-296). Seattle: Hogrefe & Huber.
9. Kuhl, J., & Helle, P. (1994). Motivational and volitional determinants of depression: The degenerated-intention hypothesis. In J. Kuhl & J Beckmann (Eds.), Volition and personality: Action vs state orientation (pp. 283-296). Seattle: Hogrefe & Huber.

International Journal of Advance and Innovative Research Volume 5, Issue 4 (XX): October - December, 2018
101
ISSN 2394 - 7780
10. Kuhl, J., & Koole, S.L. (2004). Workings of the will: A functional approach. In J. Greenberg, S.L. Koole, & T. Pyszczynski (Eds.), Handbook of experimental existential psychology (pp. 411-430). New York: Guilford.
11. Moss, Simon (2016). Action versus state orientation. Accessed from https://www.sicotests.com/ psyarticle.asp?id=208.

International Journal of Advance and Innovative Research Volume 5, Issue 4 (XX): October - December, 2018
102
ISSN 2394 - 7780
Ce(IV)-ION INITIATED GRAFT COPOLYMERIZATION OF METHACRYLATES ONTO SODIUM SALT OF PARTIALLY CARBOXYMETHYLATED SODIUM ALGINATE: CHARACTERIZATION
AND COMPARISON OF RELATIVE REACTIVITY
J. H. Trivedi1 and M. K. Prajapati2 1Department of Chemistry, Sardar Patel University, Vallabh Vidyanagar
2Gujarat Industrial Research and Development Agency, Vadodara
ABSTRACT The graft copolymers of sodium salt of partially carboxymethylated sodium alginate (Na-PCMSA, = 0.605) with methyl acrylate (MA), methyl methacrylate (MMA) and ethyl methacrylate (EMA) were synthesized by ceric ion induced initiation using earlier established optimal reaction conditions. The synthesized different graft copolymers viz. Na-PCMSA-g-PMA, Na-PCMSA-g-PMMA and Na-PCMSA-g-PEMA were then characterized by various instrumental techniques like FTIR, thermal and SEM studies. The reactivity of different methacrylates has been found to be varied to towards grafting and the reactivity pattern for the higher homologous series is found to be MA > MMA > EMA. The comparison of the value of the overall activation energy of grafting (Eg) has also interestingly shown the same reactivity pattern.
Key words: Free Radical Initiator, Graft Copolymers, Relative Reactivity of Methacrylates, Sodium Salt of Partially Carboxymethylated Sodium Alginate, Scanning Electron Microscopy, Thermal Analysis
INTRODUCTION The modification of natural polymers, mainly polysaccharides, is a promising method for the preparation of new materials. Among various methods, graft copolymerization is most attractive because it is useful technique for modifying the chemical and physical properties of polysaccharides (Bhattacharya and Mishra, 2004). Among such polysaccharides, alginates and its salts are used in a wide range of food, leather, pharmaceutical and industrial applications. They are important hydrocolloids that are capable of both thickening and gelling water (Lu et al., 2005). However, they are prone to enzymatic degradation and suffer from limitations in fabrication; which limits its applications. In our laboratory, to overcome this problem, efforts have been made to develop chemically modified matrices by grafting. For this purpose, graft copolymerization of different vinyl monomers onto sodium alginate (Shah, Patel and Trivedi, 1992; Shah, Patel and Trivedi, 1994a; Shah, Patel & Trivedi, 1994b; Shah, Patel & Trivedi, 1994c; Shah et al., 1994; Shah, Patel and Trivedi, 1994d, Shah, Patel and Trivedi, 1995 and Shah, Patel and Trivedi, 1996) as well as sodium salt of partially carboxymethylated sodium alginate (Na-PCMSA, DS = 0.605) (Patel, Patel and Trivedi, 1999, Trivedi and Prajapati, 2018a; Trivedi and Prajapati, 2016; Trivedi & Prajapati, 2015a) has been successfully carried out using ceric ammonium nitrate (CAN) as an initiator.
In the previous study, as a part of our research programme we have grafted MA (Trivedi and Prajapati, 2018b), MMA (Trivedi and Prajapati, 2018c) and EMA (Trivedi and Prajapati, 2018d) onto Na-PCMSA
0.605)DS( using CAN as a redox initiator and the optimal reaction conditions for affording maximum percentage of grafting were evaluated and thereby the factors affecting the graft copolymerization were studied in details.
In this study, the graft copolymers of Na-PCMSA containing PMA, PMMA and PEMA i.e. Na-PCMSA-g-PMA, Na-PCMSA-g-PMMA and Na-PCMSA-g-PEMA were synthesized using earlier established optimal reaction conditions (Trivedi and Prajapati, 2018b; Trivedi and Prajapati, 2018c and Trivedi and Prajapati, 2018d) and the respective graft copolymers were characterized by FTIR, TGA and SEM techniques. The reactivity of different methacrylates towards grafting was also studied.
EXPERIMENTAL Materials and Methods Sodium alginate (SA) used in the present work was kindly supplied by Loba Chemie, Mumbai, India. Methyl acrylate, Methyl methacrylate and Ethyl methacrylate (all fluka make) were purified by treating them with alkali solution in the usual manner. CAN (Qualigens, Glaxo, India) was used as received. Analar grade nitric acid was used. All other reagents and solvents used were of reagent grade. The methods of preparation, purification and measurement of degree of substitution of the sodium salt of partially carboxymethylated sodium alginate (Na-PCMSA) were followed in the similar manner as discussed earlier (Trivedi and Prajapati, 2015b). The DS of Na-PCMSA was found to be 0.605.

International Journal of Advance and Innovative Research Volume 5, Issue 4 (XX): October - December, 2018
103
ISSN 2394 - 7780
Synthesis of Graft copolymers The methods followed for the preparation and purification of the different graft copolymers viz. Na-PCMSA-g-PMA (%G = 364.94, %GE = 94.76), Na-PCMSA-g-PMMA (%G = 352.37, %GE = 95.61) and Na-PCMSA-g-PEMA (%G = 290.45, %GE = 95.79) were the same as reported earlier (Trivedi and Prajapati, 2018b; Trivedi and Prajapati, 2018c and Trivedi and Prajapati, 2018d). However, the samples of these three different graft copolymers were prepared using the following optimal reaction conditions: MA: Na-PCMSA ( DS = 0.605) = 1.5 g (dry basis); [CAN] = 0.05 mol.L-1; [HNO3] = 0.30 mol.L-1; [MA] =
0.304 mol.L-1; Time = 2 h, Temperature = 40oC and Total Volume = 150 mL;
MMA: Na-PCMSA ( DS = 0.605) = 1.0 g (dry basis); [CAN] = 0.03 mol.L-1; [HNO3] = 0.30 mol.L-1; [MMA] = 0.203 mol.L-1; Time = 3 h; Temperature = 30oC and Total Volume = 150 mL; and
EMA: Na-PCMSA ( DS = 0.605) = 1.0 g (dry basis); [CAN] = 0.03 mol.L-1; [HNO3] = 0.30 mol.L-1; [EMA] = 0.203 mol.L-1; Time = 3 h; Temperature = 30oC and Total Volume = 150 mL
as established earlier by us (Trivedi and Prajapati, 2018b; Trivedi and Prajapati, 2018c and Trivedi and Prajapati, 2018d).
The values of the grafting yields (%G and %GE) were calculated by using the expressions as reported in the literature (Trivedi et al. 2005a).
Isolation of grafted chains The different graft copolymers of Na-PCMSA ( DS = 0.605) containing PMA, PMMA and PEMA were hydrolyzed by refluxing them for 12 h in 1N HCl ( Brockway and Seaberg, 1967).
Characterization IR analysis The IR spectra of ungrafted and grafted samples have been recorded with Nicolet Impact 400D Fourier Transform Infra Red Spectrophotometer (FTIR) in the range of 400-4000 cm-1 to provide the proof of grafting.
TGA analysis The thermal behavior of the ungrafted and grafted samples has been examined by a study of their primary thermograms in an inert atmosphere at a heating rate of 10oC/min on the Metler Toledo make (model TGA 851e) thermogravimetric analyzer.
Scanning Electron Microscopy (SEM) Model ESEM TMP + EDAX, Philips make was used to obtain the micrographs of Na-PCMSA ( DS = 0.605) and its graft copolymers viz. Na-PCMSA-g-PMA (%G = 364.94, %GE = 94.76), Na-PCMSA-g-PMMA (%G = 352.37, %GE = 95.61) and Na-PCMSA-g-PEMA (%G = 290.45, %GE = 95.79).
RESULTS AND DISCUSSION Reactivity of methacrylates towards grafting Recently, we have evaluated the optimal reaction conditions in the case of grafting of MA (Trivedi and Prajapati, 2018b), MMA (Trivedi and Prajapati, 2018c) and EMA (Trivedi and Prajapati, 2018d) onto Na-PCMSA ( DS = 0.605) and the maximum values of the grafting yields obtained are tabulated in Table 1.
The structures of the repeating units of the graft copolymers viz. Na-PCMSA-g-PMA (%G = 364.94, %GE = 94.76), Na-PCMSA-g-PMMA (%G = 352.37, %GE = 95.61) and Na-PCMSA-g-PEMA (%G = 290.45, %GE = 95.79) are depicted in Figs. 1(a) to 1(c).
The results of the Table 1 show that under optimum reaction conditions, following is the reactivity pattern for the higher members of methacrylate homologous series:
MA > MMA > EMA
Thus, it is evident that all monomers are not equally reactive towards graft copolymerization. However, the difference in monomer reactivity might depend on solubility, polarity, molecular size, chemical nature etc.

International Journal of Advance and Innovative Research Volume 5, Issue 4 (XX): October - December, 2018
104
ISSN 2394 - 7780
Fig. – 1: Repeating units of (a) Na-PCMSA-g-PMA (%G = 364.94, %GE = 94.76); (b) Na-PCMSA-g-
PMMA (%G = 352.37, %GE = 95.61) and (c) Na-PCMSA-g-PEMA (%G = 290.45, %GE = 95.79).
TABLE - 1 The values of the maximum grafting yields (%G and %GE) obtained in the case of grafting of MA, MMA and EMA onto Sodium salt of Partially Carboxymetylated Sodium alginate (Na-PCMSA, DS = 0.605) under optimum reaction conditions.a-c
Monomer %Grafting (%G)
%Grafting Efficiency (%GE)
Reference
MAa 364.94 94.76 15 MMAb 352.37 95.61 16 EMAc 290.45 95.79 17
aNa-PCMSA ( DS = 0.605) = 1.5 g (dry basis); [CAN] = 0.05 mol.L-1; [HNO3] = 0.30 mol.L-1; [MA] = 0.304 mol.L-1; Time = 2 h, Temperature = 40oC and Total Volume = 150 mL;
bNa-PCMSA ( DS = 0.605) = 1.0 g (dry basis); [CAN] = 0.03 mol.L-1; [HNO3] = 0.30 mol.L-1; [MMA] = 0.203 mol.L-1; Time = 3 h; Temperature = 30oC and Total Volume = 150 mL;
cNa-PCMSA ( DS = 0.605) = 1.0 g (dry basis); [CAN] = 0.03 mol.L-1; [HNO3] = 0.30 mol.L-1; [EMA] = 0.203 mol.L-1; Time = 3 h; Temperature = 30oC and Total Volume = 150 mL.
With MAA, there is an additional –CH3 group on vinylic carbon position which offer some more steric hindrance than MA. This is why MMA is less reactive than MA (cf. Table 1). It can be further seen from the table that EMA is less reactive than MMA towards grafting. This can be attributed to the fact that the reactivity of the methacyrlates (MMA and EMA) decreases with the increase in the alkyl group length, can be understood from their structures. Thus, EMA being highly crowded monomer forms complex with Ce4+ ions less readily and accordingly affords less %G in comparison with MMA.
TABLE - 2 The values of the overall activation energy of grafting (Eg) in the case of grafting of MA, MMA and EMA onto Na-PCMSA ( DS = 0.605).
athe values are reported under evaluated optimal reaction conditions.
Earlier we have calculated, the values of the overall activation energy of grafting (Eg)from the plots of natural log of percentage grafting versus T-1 in the case of grafting of MA, MMA and EMA at Na-PCMSA ( DS = 0.605) (Trivedi and Prajapati, 2018b; Trivedi and Prajapati, 2018c and Trivedi and Prajapati, 2018d) and the results obtained are summarized in Table 2. It is very interesting to note from the results of Table 2 that upon comparing the values of Eg also the same reactivity pattern of methacylates towards grafting is observed. The
Monomer %Graftinga (%G)
Eg (kJ/mole)
Reference
MA 364.94 22.85 15 MMA 352.37 32.79 16 EMA 290.45 62.78 17

International Journal of Advance and Innovative Research Volume 5, Issue 4 (XX): October - December, 2018
105
ISSN 2394 - 7780
lowest value of Eg (22.85 kJ/mole) obtained in the case of MA, compared to that of MMA (32.79 kJ/mole) and EMA (62.78 kJ/mole) indicates the case of occurrence of grafting reaction as a result of which higher value of the %G is observed in MA (%G = 364.94) compared to MMA (%G = 352.37) and EMA (%G = 290.45). Similar observations have also been reported in the literature (Trivedi, Bhatt and Trivedi, 2014 and Liu et al., 2003, Patel, Patel and Trivedi, 1993 and Trivedi, et. al., 2005b).
Effect of Liquor ratio The results regarding the influence of liquor ratio on percent grafting in the case of MA (Trivedi and Prajapati,
2018b), MMA (Trivedi and Prajapati, 2018c) and EMA (Trivedi and Prajapati, 2018d) onto Na-PCMSA ( DS = 0.605) are summarized in Table 3. It can be observed from the results that even at lower value of liquor ratio i.e. at 50 mL solution per g. Na-PCMSA, the higher value of %G = 126.20%, 131.50% and 78.87% has been found in the case of MA, MMA and EMA respectively. This observed higher value of %G in the case of all these three monomers can be attributed to the fact that at this higher ratio value the ionization of carboxyl groups on the backbone results in an attraction of ceric ions to the backbone thereby creating more active sites onto it. Secondly, the relative concentration of monomer (MA or MMA or EMA) is higher at this liquor ratio value and therefore the chances of monomer molecules to contact the active Na-PCMSA sites and to initiate grafting are also more and therefore %G is usually found to be higher.
It can also become evident from the results of Table 3 that there is a continuous increase in %G from 126.20% to 221.34% in the case of MA and from 131.50% to 211.66% in the case of MMA with the increase in the liquor ratio from 50 to 300 mL soln. per gm Na-PCMSA. This observation can be explained on the basis of the fact that as the value of liquor ratio decreases, the viscosity of the medium increases, which in turn, hinders the movement of free radicals, thereby decreasing %G.
On the other hand, the value %G increases from 78.87% to 220.01% in the case of EMA with the increase in the liquor ratio from 50 to 150 ml soln. per gram Na-PCMSA (cf. Table 3). However, beyond the value of this liquor ratio i.e. 150 ml soln. per gram Na-PCMSA, the value of %G decreases with further increase in liquor ratio in the case of the monomer, EMA.
The observed decrease in %grafting beyond the optimum values of the liquor ratio (i.e. 150 ml soln. per gram Na-PCMSA) can also be attributed to the dilution of the monomer (EMA) with increasing the liquor ratio as a result of which the chances for the monomer molecules to remain in contact with Na-PCMSA active sites to initiate grafting will be lessen. Similar results are also reported in the literature (Trivedi, et. al. 2005c and Mostafa, Samerkandy and El- Sanabary, 2011)
TABLE - 3 Effect of Liquor ratio (mL.soln./g. Na-PCMSA) in the grafting of various vinyl monomers onto Sodium salt of Partially Carboxymethylated Sodium Alginate (Na-PCMSA, DS = 0.605)a-c.
amL. soln./g. Na-PCMSA = Varied as shown (dry basis); [CAN] = 0.013 mol/L; [HNO3] = 0.10 mol/L; [MA] = 0.203 mol/L; Time = 4h; Temperature = 35oC and Total Volume = 150 mL bmL. soln./g. Na-PCMSA = Varied as shown (dry basis); [CAN] = 0.013 mol/L; [HNO3] = 0.10 mol/L; [MMA] = 0.203 mol/L; Time = 4h; Temperature = 35oC and Total Volume = 150 mL and cmL. soln./g. Na-PCMSA = Varied as shown (dry basis); [CAN] = 0.013 mol/L; [HNO3] = 0.10 mol/L; [EMA] = 0.203 mol/L; Time = 4h; Temperature = 35oC and Total Volume = 150 mL
Liquor ratio mL soln./ g. Na-PCMSA
% Grafting (%G) MAa MMAb EMAc
300:1 221.34 211.66 202.40 150:1 204.22 186.63 220.01 100:1 156.74 170.54 144.65 75:1 138.31 158.91 105.55 60:1 131.41 141.53 91.12 50:1 126.20 131.50 78.87

International Journal of Advance and Innovative Research Volume 5, Issue 4 (XX): October - December, 2018
106
ISSN 2394 - 7780
SPECTRAL, THERMAL AND MORPHOLOGICAL CHARACTERIZATION The FTIR spectra of Na-PCMSA ( DS = 0.605) and its graft copolymers of Na-PCMSA-g-PMA (%G = 364.94, %GE = 94.76), Na-PCMSA-g-PMMA (%G = 352.37, %GE = 95.61) and Na-PCMSA-g-PEMA (%G = 290.45, %GE = 95.79) are shown in Figs. 2 (a) to 2(f). Upon comparing the IR spectra of the grafted samples with ungrafted sample it has been observed that the grafted samples showed the absorption bands of Na-PCMSA as well as an additional strong absorption band at 1731-1744 cm-1 assigned to C=O stretching of ester group (-COOCH3), characteristic of the methacylates.
Fig. 3 shows the primary thermograms observed at a scan rate of 10oC/min for Na-PCMSA ( DS = 0.605), Na-PCMSA-g-PMA (%G = 364.94) and PMA in an inert atmosphere. It can be observed from this figure that Na-PCMSA sample involves two steps of degradation. The first step of degradation encompasses the temperature range from 70oC to 550oC, amounting to a loss of about 62.5 percent weight, exhibiting maximum rate of weight loss at 245oC. The second step of degradation exhibits the temperature range 550o to 650oC involving about 16% weight loss with a
Fig. – 2: IR spectra of (a) Na-PCMSA ( DS = 0.605); (b) Na-PCMSA-g-PMA (%G = 364.94, %GE = 94.76); (c) Na-PCMSA-g-PMMA (%G = 352.37, %GE = 95.61); and (d) Na-PCMSA-g-PEMA (%G =
290.45, %GE = 95.79).
Fig. - 3: TG thermograms for () Na-PCMSA ( DS = 0.605); (- - -) Na-PCMSA-g-PMA (% G = 364.94)
and (- - -) PMA at 10oC/min.

International Journal of Advance and Innovative Research Volume 5, Issue 4 (XX): October - December, 2018
107
ISSN 2394 - 7780
maximum weight of loss occurs at 605oC. The sample leaves about 17% weight residue. The overall thermal degradation of Na-PCMSA-g-PMA involves only single step which commences from 100oC, followed by a slow decrease in weight up to 300oC. Beyond 300oC there is a steep weight loss up to 380oC, involving about 61% weight loss with a maximum rate of weight loss at 350oC. A char yield of only 16% is obtained. In case of PMA, the decomposition begins at 135oC and proceeds very slowly up to 300oC involving about 10% weight loss. Beyond 300oC, the sample degrades very rapidly up to 425oC involving about 90% weight loss. The maximum weight loss occurs at 380oC. The sample degrades completely leaving behind no residue.
Fig. 4. shows the primary thermograms obtained at a scan rate of 10oC/min Na-PCMSA ( DS = 0.605), Na-PCMSA-g-PMMA (%G = 352.37) and PMMA in an inert atmosphere. The overall thermal degradation of Na-PCMSA-g-PMMA involves only single step of degradation. The degradation begins at 125oC and proceeds gradually up to 300oC. Beyond this temperature, there is a rapid weight loss up to 400oC involving about 37.5% weight loss and the rate of weight loss reaching a maximum at 360oC. The final residue amounts to about 25.5% only. In case of PMMA, the overall degradation involves only single step. This step of degradation encompasses the temperature range from 210oC to 805oC, amounting a loss of about 37.5% weight, exhibiting maximum rate of weight loss at 375oC. The overall degradation leaves about 62.5% residue.
Fig.- 4: TG thermograms for () Na-PCMSA ( DS = 0.605); (- - -) Na-PCMSA-g- PMMA (% G =
352.37) and (- - -) PMMA at 10oC/min
The primary thermograms obtained for Na-PCMSA ( DS = 0.605), Na-PCMSA-g-PEMA (%G = 290.45) and PEMA at the scan rate of 10oC/min in an inert atmosphere are represented in Fig. 5. In the case of Na-PCMSA-g-PEMA, the overall degradation involves only single step which commences from 85oC, followed by a very slow degree up to 275oC. Beyond 275oC, there is a steep weight loss up to 350oC involving about 75.5% weight loss with a maximum rate of weight loss at 310oC. A char yield of 7.5% is obtained at the end of the decomposition. In the case of PEMA the overall thermal degradation also involves only a single step which commences from 205oC and proceeds slowly up to 285oC, the sample degrades very rapidly up to 500oC involving about 97% weight loss. The maximum weight loss occurs at 325oC. The degradation is observed to be completed at about 450oC leaving about 3% residual weight.
Table 4 represents the temperature characteristics of Na-PCMSA ( DS = 0.605) and its graft copolymer of Na-PCMSA-g-PMA (%G = 364.94), Na-PCMSA-g-PMMA (%G = 352.37) and Na-PCMSA-g-PEMA (%G = 290.45) as well as corresponding homopolymers (PMA or PMMA or PEMA). The values of the temperature characteristics viz. initial decomposition temperature (IDT or Ti), temperature for 10% weight loss (T10), temperature for maximum rate of decomposition (Tmax) and temperature for 50% weight loss (T50) derived from the corresponding thermograms (Figs. 3 to 5) are presented in Table 4.

International Journal of Advance and Innovative Research Volume 5, Issue 4 (XX): October - December, 2018
108
ISSN 2394 - 7780
Fig. – 5: TG thermograms for () Na-PCMSA ( DS = 0.605); (- - -) Na-PCMSA-g-PEMA (% G = 290.45)
and (- - -) PEMA at 10oC/min.
TABLE - 4 Thermogravimetric analysis of Sodium salt of Partially Carboxymethylated Sodium Alginate (Na-PCMSA, DS = 0.605) and its different graft copolymers as well as the corresponding homopolymers.
Sample %Grafting (% G)
Ti oC (IDT)
Tf oC
(FDT)
Tmax ( oC) T10
(oC)
T50
(oC)
Step 1 Step 2
Na-PCMSA - 70 810 240 620 170 325 Na-PCMSA-g-PMA 364.94 100 380 360 - 240 360 Na-PCMSA-g-PMMA 352.37 125 405 310 - 200 350 Na-PCMSA-g-PEMA 290.45 100 320 240 435 250 310 PMA - 135 425 375 - 245 380 PMMA - 210 690 325 - 360 - PEMA - 200 475 245 375 285 325
The values of the decomposition temperature (TD) for Na-PCMSA ( DS = 0.605) and their different graft copolymers along with their corresponding homopolymers, at every 10% weight loss, are also tabulated in Table 5.
Fig. 6(a) to 6(d) represent scanning electron micrographs obtained for of Na-PCMSA ( DS = 0.605) and its graft copolymers of Na-PCMSA-g-PMA (%G = 364.94, %GE = 94.76), Na-PCMSA-g-PMMA (%G = 352.37, %GE = 95.61) and Na-PCMSA-g-PEMA (%G = 290.45, %GE = 95.79) samples respectively. Upon comparing the morphology of the grafted samples [Figs. 6(b) to 6(d)] with ungrafted material [Na-PCMSA, Fig. 6(a)] it becomes clearly evident that the grafted chains have changed drastically the topology of the samples. Depending upon the nature of the individual monomer used for grafting onto Na-PCMSA ( DS = 0.605), the topology is dictated by them. The scanning electron micrographs of the graft copolymer further reveal additional surface deposits in all the cases, indicating that grafting has taken place.
TABLE - 5 Decomposition temperature, TD, for Sodium salt of Partially Carboxymethylated Sodium Alginate (Na-PCMSA, DS = 0.605) and its different graft copolymers as well as the corresponding homopolymers at different weight losses.
Sample %Grafting (% G)
TD (oC) at percentage weight loss of
10% 20% 30% 40% 50% 60% 70% 80% 90%
Na-PCMSA - 170 230 245 260 325 500 620

International Journal of Advance and Innovative Research Volume 5, Issue 4 (XX): October - December, 2018
109
ISSN 2394 - 7780
Na-PCMSA-g-PMA 364.94 240 285 330 350 360 365 370 375 Na-PCMSA-g-PMMA 352.37 200 240 270 320 350 375 Na-PCMSA-g-PEMA 290.45 250 290 300 305 310 315 320 325 335 PMA - 300 345 360 370 380 390 400 400 400 PMMA - 360 375 415 PEMA - 285 295 305 315 325 335 350 365 380
Fig. – 6: Scanning Electron Micrograph of (a) Sodium salt of Partially Carboxymethylated Sodium
Alginate (Na-PCMSA , DS = 0.605); (b) Na-PCMSA-g-PMA (%G = 364.94); (c) Na-PCMSA-g-PMMA (%G = 352.37) and (d) Na-PCMSA-g-PEMA (%G = 290.45) (500X).
CONCLUSIONS In the present work the three different graft copolymer samples viz. Na-PCMSA-g-PMA, Na-PCMSA-g-PMMA and Na-PCMGS-g-PEMA have been synthesized using the established optimum reaction conditions earlier. Under the established respective optimum reaction conditions, the reactivity of methacrylates towards grafting has been compared and observed the following reactivity order:
MA > MMA > EMA
The plausible explanation has been furnished for the observed reactivity order of methacrylates towards grafting. The values of the overall activation energy (Eg) have also been evaluated in the case of these methacrylates and the following reactivity pattern for the higher members of methacrylate homologous series has been suggested:
MA > MMA > EMA
The influence of liquor ratio on %G in the case of grafting of MA, MMA and EMA onto Na-PCMSA ( DS = 0.605) has been studied and the results have been discussed. All the synthesized graft copolymers have been characterized by using FTIR, TGA and SEM techniques. Study of FTIR spectra provided a strong proof of grafting. TGA results showed different thermal decomposition patterns for the base polysaccharide and the corresponding graft copolymers. Morphological variation of graft copolymers and Na-PCMSA ( DS = 0.605) also supported the above conclusion of the occurrence of grafting.

International Journal of Advance and Innovative Research Volume 5, Issue 4 (XX): October - December, 2018
110
ISSN 2394 - 7780
ACKNOWLEDGMENTS The authors gratefully acknowledge the financial support provided by the Ministry of Earth Sciences (MoES), New Delhi, India through Project No. 11-MRDF/1/40/P/07, dtd. 21/2/2008.
REFERENCES Bhattacharya, A. and Mishra, B.N. (2004). Grafting a versatile means to modify polymers: Techniques,
factors and applications. Progress in Polymer Science, 29(8): 767-814.
Liu, Y, Yang, L., Li, J. and Shi, Z. (2005). Grafting of methyl methacrylate onto sodium alginate initiated by potassium ditelluratoargentate(III). Journal of Applied Polymer Science, 97(4): 1688-1694.
Shah, S.B., Patel, C.P. and Trivedi, H.C. (1992). Ceric-induced Grafting of Acrylonitrile onto Sodium Alginate. High Performance Polymers, 4(3): 151-159.
Shah, S.B., Patel, C.P. and Trivedi, H.C. (1994a). Ceric-induced grafting of acrylonitrile onto sodium alginate: kinetics and mechanism and effects of the reaction medium. High Performance Polymers, 6(3): 193-200.
Shah, S.B., Patel, C.P. and Trivedi, H.C. (1994b). “Fenton’s reagent-initiated graft copolymerization of acrylonitrile onto sodium alginate, Journal of Applied Polymer Science, 51(8): 1421-1426.
Shah, S.B., Patel, C.P. and Trivedi, H.C. (1994c). Kinetics and reaction mechanism of fenton’s-reagent-initiated graft copolymerization of acrylonitrile onto sodium alginate. Journal of Applied Polymer Science, 52(7): 857-860.
Shah, S.B., Ray, R., Patel, C.P. and Trivedi, H.C. (1994). Studies on Biodegradability of Sodium Alginate-graft-Polyacrylonitrile. Journal of Polymer Materials, 11: 85-88.
Shah, S.B., Patel, C.P. and Trivedi, H.C. (1994d). Ceric-induced grafting of ethyl-acrylate onto sodium alginate. Die Angewandte Makromolekulare Chemie, 214(1): 75-89.
Shah, S.B., Patel, C.P. and Trivedi, H.C. (1995). Ceric-induced grafting of acrylate monomers onto sodium alginate. Carbohydrate Polymers, 26(1): 61-67.
Shah, S.B., Patel, C.P. and Trivedi, H.C. (1996). Thermal behaviour of graft copolymers of sodium alginate. Die Angewandte Makromolekulare Chemie, 235(1): 1-13.
Patel, G.M., Patel, C.P. and Trivedi H.C. (1999). Ceric-induced grafting of methyl acrylate onto sodium salt of partially carboxymethylated sodium alginate. European Polymer Journal, 35(2): 201-208.
Trivedi, J.H and Prajapati, M.K. (2018a). Synthesis, Characterization and Swelling behavior of superabsorbent hydrogel, H-Na-PCMSA-g-PAN. In Polymer Research: Communicating Current Advances, Contributions, Applications and Educational Aspects, Polymer Science Book Series No. 2, Ed., Vilas A. M., Formatex Research Centre, Spain, p. 62-75.
Trivedi, J.H and Prajapati, M.K. (2016). Optimization of ceric ammonium nitrate initiated graft copolymerization of acrylonitrile onto sodium salt of partially Carboxymethylated sodium alginate. International Journal of Research in Engineering and Applied Sciences, 6(10): 57-74.
Trivedi, J.H and Prajapati, M.K. (2015a). Graft Copolymerization of Ethyl Acrylate onto Sodium Salt of Partially Carboxymethylated Sodium Alginate: Optimal Reaction Variables and Characterization. International Journal of Research in Engineering and Applied Sciences, 5(5): 107-117.
Trivedi, J.H. and Prajapati, M.K. (2018b). Graft Copolymerization of Methyl Acrylate onto Sodium Salt of Partially Carboxymethylated Sodium Alginate using Redox System: Synthesis, Kinetics and Mechanism. International Journal of Research and Analytical Reviews, 5(4): 301-309.
Trivedi, J.H. and Prajapati, M.K. (2018c). Synthesis and Characterization of Sodium salt of Partially Carboxymethylated Sodium Alginate-modified poly(methyl metahcrylate), Journal of Applied Science and Computations, 5(11): 2122-2130.
Trivedi, J.H. and Prajapati, M.K. (2018d). Optimization of Reaction Conditions for Grafting of Sodium salt of Partially Carboxymethylated Sodium Alginate with Ethyl Methacrylate. International Journal of Advance & Innovative Research, Communicated.

International Journal of Advance and Innovative Research Volume 5, Issue 4 (XX): October - December, 2018
111
ISSN 2394 - 7780
Trivedi, J.H. and Prajapati M.K. (2015b). Carboxymethyl Sodium alginate: Synthesis and Characterization. Prajna- Journal of Pure and Applied Sciences, 22 & 23: 24-28.
Trivedi, J.H., Kalia, K., Patel, N.K. and Trivedi, H.C. (2005a), Ceric-induced grafting of acrylonitrile onto sodium salt of partially carboxymethylated guar gum, Carbohydrate Polymers, 60(1): 117-125.
Brockway, C. E. and Seaberg, P.A. (1967). Grafting of polyacrylonitrile to granular corn starch, Journal of Polymer Science Part A-1: Polymer Chemistry, 5(6): 1313-1326.
Trivedi, J.H., Bhatt, T.A. and Trivedi, H.C. (2014). Synthesis and Characterization of Poly(butyl methacrylate) grafted Sodium salt of Partially Carboxymethylated Guar Gum, 48(5-6): 503-514.
Liu, Y., Liu, X., Deng, K., Liu, Z. and Yang, L. (2003). Graft Copolymerization of Methyl Acrylate onto Poly(Vinyl Alcohol) Initiated by Potassium Diperiodatocuprate(III). Journal of Macromolecular Science, Part A: Pure and Applied Chemistry, 40(2), 211-223.
Trivedi, J.H., Kalia, K., Patel, N.K. and Trivedi, H.C. (2005b). Grafting of Vinyl monomers onto Sodium salt of Partially Carboxymethylated Guar Gum : Comparison of their Reactivity, Polymer - Plastics Technology and Engineering, 44(3): 407-425.
Patel, B.K., Patel, C.P. and Trivedi, H.C. (1993). Grafting of different vinyl monomers onto sodium salt of partially carboxymethylated amylase. Die Angewandte Makromolekulare Chemie, 210(1): 1-5.
Trivedi, J.H., Kalia, K., Patel, N.K. and Trivedi, H.C. (2005c). Ceric-induced Grafting of Vinyl monomers onto Sodium salt of Partially Carboxymethylated Guar Gum : Effects of Substrate structure and Liquor Ratio. Journal of Pure & Applied Sciences – “PRAJNA”, 13: 44-55.
Mostafa, Kh.M., Samerkandy A.R. and El- Sanabary, A.A. (2011). Grafting onto Carbohydrate Polymer Using Novel Potassium Persulphate/Tetramethylethylene Diamine Redox System for Initiating Grafting. Advances in Polymer Technology, 30(2): 138–149.

International Journal of Advance and Innovative Research Volume 5, Issue 4 (XX): October - December, 2018
112
ISSN 2394 - 7780
IMPLICATIONS IN THE BANKING & FINANCIAL REFORMS IN SOUTH ASIAN COUNTRIES: WITH SPECIAL REFERENCE TO INDIA
Aanchal Nigam and Abhishek Pal Assistant Professor, School of Management Sciences, Lucknow
ABSTRACT South Asian Countries began to initiate reforming for financial restructuring in their aligned economics in the early 1980s. These reforms helped South Asian economies to raise domestic savings, attract foreign capital & raise economic growth rates, Financial reforms had also been supporting for huge economic integration growth in South Asia is forecast to pick up to 6.9% in 2018, mainly showing casing India emerging from its slow down and has successfully become a growth promoter of the world during the recent past as a result of financial reforms in the 1990s. South Asia should fix its position as the fastest growing region & even expand its lead over East Asia & the Pacific by improving the implicating factors in the way to achieve perfection.
This research paper included the pinpoints related to financial & banking structure positioning and significance in South Asian Countries. This data is based on case study of methodologies for structuring banks and type of research is descriptive in nature. This paper is special reference with India as a promoter for growth in economy. The discussion proceeded further with the channels for the processing of implementing the reforms and restructuring the economy in India.
Keywords: Banking, Financial Reforms, South Asian Countries.
INTRODUCTION South Asian countries started initiating far attaining reforms to the financial sector in their respective economies in the early 1980s. It varied in different countries in terms of variety and advancement. These reforms including promotional competition in the financial sector, covered numerous streams, especially banking sector, fortifying regulations: meliorating disclosure requirements and auditing accounting standards, developing payment and settlement systems and strengthening the legal framework.
In South Asia, after independence from the British in 1947, both India and Pakistan adopted a Soviet-type model, which was featured by import-substitution policy framework and an influencing public sector thereby placing many restrictions on the private sector. These policies led to high tariff system and various varieties of licensing to control entry into industries. As a result of it, ‘license raj’ in both the countries created inefficiencies, promoted public sector corruption and constrained the rate of economic growth. The smaller South Asian countries like Bhutan, Maldives, Nepal followed rage and adopted a similar development strategy.
The reforms took on thus helped SAC economies to significantly nurturing domestic savings, pull in foreign capital, and raise economy’s growth rates. In Asia, the instance for strengthening the financial schemes came to the forefront following the East Asian Crisis, leading to a further round of reforms in the 1990s. There are following points of objectives about the study-
To explore the overall impact of financial reforms on economic growth of India as compared to other South Asian countries.
To find the relationship among economic growth, banking and financial reforms and current issues with innovative activities to be undertaken to improve the financial scenario.
LITERATURE REVIEW According to Tressel and Detragiache (2008) “a positive impact of the banking reforms on economic growth, especially in those countries where institutional environment was conducive”. For the sake of economical restructuring processes Qauyyam, Khan,and Ahmad (2005) examined structural constancy of financial intensification in the presence of financial sector reforms which were integral part of liberalization process of economy. They demonstrated that financial depth and real interest have a positive effect on economic growth in the long. On the basis of their findings, they ascertained and then anticipated that financial development has a vital and positive impact on the economic growth of a country. Another brilliant work has been done by Saez (2001) who studied financial reforms in India and China. Due to their synchronised pattern of economy and growth, these South Asian countries were selected. In his view point, he presented after banking sector reforms India was able to overcome the problems of bad debts by allowing new entrant in the market. On the other hand China as on the other side as a powerful and developing country in the ace of space tried to restore its state owned banks by way of asset management institutions. According to Galbis (1995) who examined financial

International Journal of Advance and Innovative Research Volume 5, Issue 4 (XX): October - December, 2018
113
ISSN 2394 - 7780
sector reforms in eight developing countries, where financial sector reforms were implemented along with other structural reforms. Throughout the banking and reforming sections, all the countries had shown different aspects efficiently. The main objective of these reforms was to improve monetary control and provide healthy and sound financial system. Galbis further urged and tried to prove that all countries should continue with policies to improve monetary policy and should strengthen prudential regulation and supervision, privatize and restructure the financial institutions.
Research on the macro level efficiency of the banks has gained some attentions, but most of the researchers preferred European region, hence ignoring the south Asian region (Brown and Skully, 2003).
For the proper understanding about the policy movements, Shafique (2007) properly analyzed impact of banking sector reforms on economic growth of Pakistan and explored positive relationship between banking reforms and economic growth.
In a press release of World Bank Group (2015) ‘the economic growth which has been led by India, South Asian Countries are expected to be stable its lead in position as the fastest developing region in the world, and the economic growth has been forecasted to accelerate from 7% in 2015 to 7.4% in 2016’. Limited exposure to the finance turmoil and an improved external position has given most South Asian Countries important policy space.
India has its weightage in the whole region, its performance greatly influences the projections for South Asia as a whole. Improved investor sentiment and resilience to external shocks are expected to increase India’s growth rate to 7.5% in fiscal year 2015 to 7.8% in FY 2016. A lot of South Asian Countries were proved their potential for accelerated growth in the short to medium term. However, the transition in Afghanistan, the Earthquakes in Nepal, and repetitions to national accounts in Sri Lanka, had resulted in all three countries experiencing slower growth than previously expected.
OBJECTIVES OF FINANCIAL SECTOR REFORM The main objectives in Indian financial sector reforms in the early 1990s are- Dispatch Financial Repression that existed from the beginning
Implementing an effective, productive and beneficial financial sector industry
Enabling price breakthrough, specifically, by the market fixation of rates of interest rates that gives assistance in efficient allocation of resources.
Provide operational and functional autonomy to institutions
To develop the financial system for increasing international competition
To open external sector in a calibrated rage.
Promote the maintenance of financial stability even in the face of domestic and external scenario.

International Journal of Advance and Innovative Research Volume 5, Issue 4 (XX): October - December, 2018
114
ISSN 2394 - 7780
From the above South Asian Countries statistical data table, it can be shown that India is one of the most developing economies with a growing rate of percentile of economic growth. India’s economic development in fiscal year 2018 might be the dullest in the previous four years at 6.75%, before it recoiling between 7% and 7.5% in the upcoming financial, this is based on the reports released by the Government in a survey. There are three ‘Transformation’ services that are provided by the financial intermediaries are as follows-
Transforming and allocating risk through diversification for association with investors to reduce savers known as transformation of risk.
Movement of funds and facilitating borrowers with long term loans for synchronizing between investments and generated cash flows known as transformation of maturity.
On the basis of numerous tiny deposits, the mobilisation of funds and its distribution is done which is known as transformation of liability-asset and size.
HIERARCHY OF BANKING & FINANCIAL REFORMS
a) Banking Regulation Act, 1949: This Act came into force on 16 March, 1949. It provides safety in interest
of depositors and prevents misuse of powers by managers of banks.
b) State Bank of India Act, 1955: SBI Act came into force to perform as principal bank of other nationalized bank. In 1959, SBI (Subsidiary Banks) Act provide for the formation of certain Government and Government Associated Banks as subsidiary of the SBI.
c) Banking Laws (Miscellaneous Provisions) Act, 1963
d) The Banking Companies (Aquisition and Transfer of Undertakings) Act, 1970
e) Regional Rural Banks Act, 1976

International Journal of Advance and Innovative Research Volume 5, Issue 4 (XX): October - December, 2018
115
ISSN 2394 - 7780
f) Sarfaesi Act, 2002: The full form of Sarfaesi Act is Securitisation and Reconstruction of Financial Assets and Enforcement of Security Interest Act, 2002. Bank utilizes this act as an effective instrument for bad debts (Non-Performing Assets) recovery.
g) RBI Amendment Act, 2006: In 2006 Government amended the RBI Act, 1974 and the Banking regulation act. Under this act the Government removed the floor and CAR on Cash Reserve Ratio and floor on statutory liquidity ratio to the RBI to manage liquidity.
h) The Banking Laws (Amendment) Bill, 2011: To enable banking companies to issue preference shares subject to regulatory guidelines by the RBI.
INNOVATIVE PROCESSES
REFORMS STREAMLINE FOR BANKING & FINANCIAL SECTOR REFORMS IN INDIA
Regulators: The Finance ministry invariably formulated major strategies in the stream of financial sector of
the country. The Government acknowledged the specific role of regulators. SEBI and IRDA became important institutions. Some viewpoints are also there that there should be a super regulator for the financial services sector instead of multiplicity of regulators.
International Journal of Advance and Innovative Research Volume 5, Issue 4 (XX): October - December, 2018
116
ISSN 2394 - 7780
Financial Reforms: The basic motive of banking sector reforms was to uphold a diversified, efficient and competitive financial system with the goal of rectifying the allocated efficiency of resources through operational flexibility, improved financial stability and organizational solidification.
Capital Market Reform: The reforms of Capital market works as a processor in the financial market that works as a channel for demand and supply of debt and equity capital. It channels the money provided by savers and depository institutions (banks, credit unions, insurance companies, etc.) to borrowers and investors through a variety of financial instruments (bonds, notes, shares) called securities.
Mutual Funds: Under the SEBI (Mutual Funds) Regulations, 1996 reforming and restructuring is based. Through these rules, the industrial framework were both for Indian and foreign firms. The growth period for the securities markets and tax advantages allowances to the investment in organization’s units with Rs.70000/- Crores. The international Asset management companies are ideal to set new standards in financial scenario.
Insurance Sector- With the commencement of IRDA Act ,1999 ,the liberalizing bases for banking system encouraged the trio participants’ viz. private sector banks, public sector banks and companies and foreign banks.
CURRENT ISSUES IN FINANCIAL SECTOR REFORMS 1. Status of Financial Sector Reforms As per the KPGM-CII report, India’s banking sector is expanding rapidly and has potential to become the 5th
largest banking industry in the world by 2020 and 3rd largest by 2025.
The Indian banking system consists of 26 public sector banks, 20 private sector banks, 43 foreign banks, 56 regional rural banks, 1589 urban cooperative banks and 93550 rural cooperative banks.
The Indian banking sector’s assets reached $1.8 trillion in 2014-15 from $1.3 trillion in 2010-11, with 70% of it being accounted by public sector.
Total lending and deposits increased at a compound annual growth rate (CAGR) of 20.7% and 19.7% respectively between 2007 and 2014 and are further poised for growth, backed by demand for housing and personal finance.
Indian Banks have successfully adopted the Basel-II norms of international banking supervision and as per the RBI majority of the banks have already met Basel-III capital norms prior to its deadline of 31st March, 2019.
2. Non Performing Assets- These are those bad debts which comes in default due to non-payment on t6he scheduled date and time. The maximum time limit is mentioned for a period upto 90 days.
3. Monetary Transmission- This is basically a mechanism that can be seen after the implementation of monetary policy in the economy as an immediate effect. Change in cash reserve ratio status automatically affects the flexi-liquid positioning.
4. Corruption- Corruption in terms of policy implementation or approval and systematic flow of policy framework projected techniques.
5. Crisis in Management- Crisis management is technically a blow horn for the turbulent and unforeseen difficulties that can be seen on a sudden basis in the organization. Since 1980, it had played a vital role in the process of public relations. The surprise element, an unusual threat and short term decision making limitation of the organization are the basic elements in this methodology.
REMEDIAL MEASURES BY GOVERNMENT & BANKING SECTOR Ministry of finance in its Economic Survey 2015-16 suggested 4R’s- Recognition, Recapitalization,
Resolution & Reforms to address problem of NPAs.
Infusion of Rs.70000 Cr. in next few years by the Union Government, but Public Sector Unit banks would need at least Rs.1.8 Lakh Crore by 2019-20.
Requirement for greater synchronisation and consistency between economic policies and the regulatory framework for financial system constancy.
There is a full necessity for further strengthening the banking sector by allowing mergers and acquisitions.

International Journal of Advance and Innovative Research Volume 5, Issue 4 (XX): October - December, 2018
117
ISSN 2394 - 7780
Keeping in light the irrregulated shadow banking system along with the significant build-up of off-balance sheet leverage under the scrutiny of the prevailing regulatory regime.
Need for developing capital markets to grow long-term funds and share the risk of raising capital.
Promoting long-term funding sources and derivative/futures markets.
Fortifying the regulatory and supervisory framework and better cooperation between regulators.
Accumulated and effective supervision to limit regulatory arbitrage that can arise from fragmented supervision.
The requirement for strengthening disclosure requirements and monitoring compliance with standards.
Maintaining a regional alliance to facilitate intra-trade, excess fund investments by banks, and investments in sovereign bonds raised by regional economies.
LIMITATIONS A very small number of respondents’ data collected and analyzed on the basis of questionnaire and interview
with financial discussions due to shortage of time.
Lack of numerical framework due to some limits of the objectivity of paper.
Lack of elaborated work as it can include more statistical tools through different financial tests and measurement techniques.
More detailed study can be done on the basis of each south asian country’s economic and taxation structures and reforms.
FINDINGS & RECOMMENDATION
We have collected the responses on different arenas of financial reforming and restructuring regarding market-based economic system, narrow banking, international collaboration, emergence of economic policies, monetary policies and industrial policies. This questionnaire has some close-ended system which was given to financial experts and finance background academicians. They know better about the terms and facts related to finance.
70% of the responses are positive with the requirement and implementation of different policies in India and also in South Asian countries. Whereas 20% of the responses are negatively responded towards the need of reforms and restructuring in India and other countries. In an interview and group discussion with financial experts and academicians along with students organized at college level, they argued in favour and against about the different aspects of financial activities and market participants. Private and public sector risk management control also affects the financial scenario in an economy.
There were utmost 10% of the responses who were not aware about the captivity of the financial reforming and restructuring not only in South Asian Countries but also in India as the whole study is theoretically based over the referential economic status of India. The biasness of these viewers was overwhelming towards only the taxation structure and other policies but not on those reforms that are provided by the Government in any of the countries of South Asia whether it is Sri Lanka, Bhutan, Nepal, Bangladesh, Pakistan or China.

International Journal of Advance and Innovative Research Volume 5, Issue 4 (XX): October - December, 2018
118
ISSN 2394 - 7780
Therefore, it can be recommended from the above findings and observational survey that there are certain aspects that are required to be considered for the overall development of Financial background so as to giving power to the economic conditions of a country or to strengthen the public policies by clarifying public fundamentals.
CONCLUSION Financial growth and development can initiate new avenues and opportunities for firms, but, simultaneously, can portray risk to the overall heath of the financial system. The results of this paper reaffirm the importance of bank monitoring in order to reduce excessive risk-taking of the banks. Conclusively, financial development will remain crucially important for the development of the economy and, specifically for those firms that are implementing their activities in developing countries, and proper synchronisation due to financial development on financial excitability remains important to banking and reform restructuring research not only in developed countries but also in South Asian developing countries.
The current issues related to financial scenario are on the way to be solved by innovative activities of banking structure and are giving a new initiation towards the phase of development among the South Asian Countries. India, among all these South Asian countries, is developing on a pace rate and giving highest growth towards the economic scenario.
The collected respondent’s data analyzed and it showed that narrow banking and international collaboration is very much essential for the better efficiency of financial restructuring. Therefore, economic, monetary and industrial policies are giving base support to the economic conditions of any country. The financial experts recommended that restructuring with innovative activities along with attractive policies for public investors benefits.
REFERENCES 1. Ang, B.J. and McKibbin, J.W. (2005).Financial Liberalisation, Financial Sector Development and Growth:
Evidence from Malaysia, Brookings Discussion Papers.
2. Bonaccorsi, P.E. and Hardy, C. (2003). The Effect of Banking System Reforms, IMF Working paper, Washington D.C.
3. Brown, K. And Skully, M. (2003). International studies on comparative banking: A survey of Recent Developments, SSRN Working Paper No.365920.
4. Galbis, V. (1995). Financial Sector Reforms in Eight Countries: Issues and Results IMF Working Paper No.95/141.
5. Saez, L. (2001). Financial reform in India and China International Journal of Finance & Economics Vol.6, 3, pp. 235-244.
6. Rana B., (2012) "Reform strategies in South Asian countries: a comparative analysis", South Asian Journal of Global Business Research, 1, pp.96-107
7. Fernandez, R. And D. Rodrik (1991), “Resistance to reform: Status Quo Bias in the Presence of Individual-Specific Uncertainty”, American Economic Review, 81(5), pp. 1146-1155.
8. Fidrmuc, J. and A.G. Noury (2002), Interest Groups, Stakeholders and the Distribution of benefits and Costs of Reform, mimeo, prepared for the GDN Global Research Project on `Understanding Reform.
9. Fishow, Albert (1990), “Some Reflections on Comparative Latin American Performance and Policy” in T. Banuni (ed.) Economic Liberalisation: No Panacea – the experience of Latin America and Asia, Oxford, Clarendon Press.
10. Fraja, De, G. (1993), “Productive Efficiency in Public and Private Firms”, Journal of Public Economics, Vol. 30, pp. 15-30.
11. Ghuman, B. S (2001), “New Public Management: Theory and Practice”, Indian Journal of Public Administration, Vol. XLVII, (4) pp.769-779.
12. Madhav ,Godbole (2000), “Electricity Regulatory Commissions: Empowerment of Consumers”, Economic and Political Weekly, vol.34 (4), pp.1-3.
13. Hellman, J.S. (1998), “Winners Take All: The Politics of Partial Reform in Post-Communist Transitions”, World Politics, 50 (January), pp. 203-234.

International Journal of Advance and Innovative Research Volume 5, Issue 4 (XX): October - December, 2018
119
ISSN 2394 - 7780
14. Herring, Ronald. (1983), Land to the Tiller: The Political Economy of Agrarian Reform in South Asia, Yale University Press, New Haven.
15. Hussain, Atlas Syed (1990), Corruption, its nature, causes and functions, Gower Publishing Company, New Delhi.
16. Dang V., Bhaumik, S.K. and Kutan A. 2011. “Implications of Bank Ownership for the Credit Channel of Monetary Policy Transmission: Evidence from India.” Journal of Banking and Finance 35(9): 2418-2426.
17. Celasun O. And Agca S. 2012. “Banking Sector Reforms and Corporate Borrowing Costs in Emerging Markets.” Emerging Markets Finance and Trade 48(4): 71-95.
18. September, 2009, Basel Committee on Banking Supervision, Report and recommendations of the cross-border bank resolution group.
19. M Drehmann and R Alfaro, “Macro stress tests and crises: What can we learn?”, BIS Quarterly Review, December 2009, pp 29-41.
20. Casu, B., Ferrari, A. & Zhao, T. (2010). The impact of regulatory reforms on cost structure, ownership and competition in Indian banking, Journal of Banking & Finance, 34(1), pp-246-254.

MANUSCRIPT SUBMISSION
GUIDELINES FOR CONTRIBUTORS 1. Manuscripts should be submitted preferably through email and the research article / paper
should preferably not exceed 8 – 10 pages in all.
2. Book review must contain the name of the author and the book reviewed, the place of publication and publisher, date of publication, number of pages and price.
3. Manuscripts should be typed in 12 font-size, Times New Roman, single spaced with 1” margin on a standard A4 size paper. Manuscripts should be organized in the following order: title, name(s) of author(s) and his/her (their) complete affiliation(s) including zip code(s), Abstract (not exceeding 350 words), Introduction, Main body of paper, Conclusion and References.
4. The title of the paper should be in capital letters, bold, size 16” and centered at the top of the first page. The author(s) and affiliations(s) should be centered, bold, size 14” and single-spaced, beginning from the second line below the title.
First Author Name1, Second Author Name2, Third Author Name3 1Author Designation, Department, Organization, City, email id 2Author Designation, Department, Organization, City, email id 3Author Designation, Department, Organization, City, email id
5. The abstract should summarize the context, content and conclusions of the paper in less than 350 words in 12 points italic Times New Roman. The abstract should have about five key words in alphabetical order separated by comma of 12 points italic Times New Roman.
6. Figures and tables should be centered, separately numbered, self explained. Please note that table titles must be above the table and sources of data should be mentioned below the table. The authors should ensure that tables and figures are referred to from the main text.
EXAMPLES OF REFERENCES All references must be arranged first alphabetically and then it may be further sorted chronologically also.
Single author journal article: Fox, S. (1984). Empowerment as a catalyst for change: an example for the food industry. Supply Chain Management, 2(3), 29–33.
Bateson, C. D.,(2006), ‘Doing Business after the Fall: The Virtue of Moral Hypocrisy’, Journal of Business Ethics, 66: 321 – 335
Multiple author journal article: Khan, M. R., Islam, A. F. M. M., & Das, D. (1886). A Factor Analytic Study on the Validity of a Union Commitment Scale. Journal of Applied Psychology, 12(1), 129-136.
Liu, W.B, Wongcha A, & Peng, K.C. (2012), “Adopting Super-Efficiency And Tobit Model On Analyzing the Efficiency of Teacher’s Colleges In Thailand”, International Journal on New Trends In Education and Their Implications, Vol.3.3, 108 – 114.

Text Book: Simchi-Levi, D., Kaminsky, P., & Simchi-Levi, E. (2007). Designing and Managing the Supply Chain: Concepts, Strategies and Case Studies (3rd ed.). New York: McGraw-Hill.
S. Neelamegham," Marketing in India, Cases and Reading, Vikas Publishing House Pvt. Ltd, III Edition, 2000.
Edited book having one editor: Raine, A. (Ed.). (2006). Crime and schizophrenia: Causes and cures. New York: Nova Science.
Edited book having more than one editor: Greenspan, E. L., & Rosenberg, M. (Eds.). (2009). Martin’s annual criminal code:Student edition 2010. Aurora, ON: Canada Law Book.
Chapter in edited book having one editor: Bessley, M., & Wilson, P. (1984). Public policy and small firms in Britain. In Levicki, C. (Ed.), Small Business Theory and Policy (pp. 111–126). London: Croom Helm.
Chapter in edited book having more than one editor: Young, M. E., & Wasserman, E. A. (2005). Theories of learning. In K. Lamberts, & R. L. Goldstone (Eds.), Handbook of cognition (pp. 161-182). Thousand Oaks, CA: Sage.
Electronic sources should include the URL of the website at which they may be found, as shown:
Sillick, T. J., & Schutte, N. S. (2006). Emotional intelligence and self-esteem mediate between perceived early parental love and adult happiness. E-Journal of Applied Psychology, 2(2), 38-48. Retrieved from http://ojs.lib.swin.edu.au/index.php/ejap
Unpublished dissertation/ paper: Uddin, K. (2000). A Study of Corporate Governance in a Developing Country: A Case of Bangladesh (Unpublished Dissertation). Lingnan University, Hong Kong.
Article in newspaper: Yunus, M. (2005, March 23). Micro Credit and Poverty Alleviation in Bangladesh. The Bangladesh Observer, p. 9.
Article in magazine: Holloway, M. (2005, August 6). When extinct isn't. Scientific American, 293, 22-23.
Website of any institution: Central Bank of India (2005). Income Recognition Norms Definition of NPA. Retrieved August 10, 2005, from http://www.centralbankofindia.co.in/ home/index1.htm, viewed on 7. The submission implies that the work has not been published earlier elsewhere and is not
under consideration to be published anywhere else if selected for publication in the journal of Indian Academicians and Researchers Association.
8. Decision of the Editorial Board regarding selection/rejection of the articles will be final.