Volume 44 Number 4 December 2019
136
Volume 44 Number 4 December 2019 Volume 44 Number 4 December 2019 BANGLADESH JOURNAL OF AGRICULTURAL RESEARCH Please visit our website : www.bari.gov.bd ISSN 0258 - 7122 (Print) 2408 - 8293 (Online)
-
Upload
khangminh22 -
Category
Documents
-
view
1 -
download
0
Transcript of Volume 44 Number 4 December 2019

Volume 44 Number 4December 2019
Volum
e 44 Num
ber 4D
ecember 2019
BA
NG
LAD
ESH JO
UR
NA
L OF A
GR
ICU
LTUR
AL R
ESEAR
CH
Please visit our website : www.bari.gov.bd
ISSN 0258 - 7122 (Print)2408 - 8293 (Online)


Bangladesh
Journal of
AGRICULTURAL
RESEARCH Volume 44 Number 4
December 2019

BANGLADESH JOURNAL OF AGRICULTURAL RESEARCH
Editorial Board
Editor-in Chief Abul Kalam Azad, Ph. D.
Associate Editors
Md. Abdul Wohab, Ph. D.
Babu Lal Nag, Ph.D.
Md. Miaruddin, Ph.D.
M. Habibur Rahman Sheikh
M. Zinnatul Alam, Ph. D.
M. Mofazzal Hossain, Ph. D.
Hamizuddin Ahmed, Ph. D.
M. Matiur Rahman, Ph. D.
B. A. A. Mustafi, Ph. D.
M. A. Quayyum, Ph. D.
A. J. M. Sirajul Karim, Ph. D.
Editor (Technical) Md. Hasan Hafizur Rahman
B. S. S. (Hons.), M. S. S. (Mass Com.)
Address for Correspondence
Editor (Technical)
Editorial and Publication Section
Bangladesh Agricultural Research Institute
Joydebpur, Gazipur 1701
Bangladesh
Phone : 88-02-49270038
E-mail : [email protected]
Rate of Subscription Taka 100.00 per copy (home)
US $ 10.00 per copy (abroad)
Cheque, Money Orders, Drafts or Coupons, etc.
should be issued in favour of the Director General,
Bangladesh Agricultural Research Institute
Bangladesh Agricultural Research Institute (BARI) Joydebpur, Gazipur 1701
Bangladesh

BANGLADESH JOURNAL OF AGRICULTURAL RESEARCH
Vol. 44 December 2019 No. 4
C O N T E N T S
M. Moniruzzaman, R. Khatoon, M. Moniruzzaman, and A. K. M.
Qamruzzaman − Influence of plant growth regulators on vegetative
growth, sex expression and yield of summer bottle gourd
577
M. A. K. Mian, A. A. Begum and R. R. Saha − Requirement of different
nutrients for yield maximization of Bt Brinjal
591
M. A. Quddus, M. A. Hossain, H. M. Naser and S. Aktar − Effects of
potassium application on yield attributes, yield and grain quality of lentil
in terrace soil of Joydebpur
599
M. A. Hoque − Physical and engineering properties of BARI released
three groundnut varieties
609
M. Afroz, M. R. Amin, M. R. U. Miah and M. M. Hossain − Incidence of
major insect pests on sweet gourd germplasm
621
M. R. Ali, M. M. Rahman, M. Asaduzzaman, M. A. H. Khan and J.
Rahman − Moisture level and storage container effects on seed quality of
soybean genotypes under ambient condition
631
Bandita Deo, Bikram Keshari and Bikram Pradhan − In vitro propagation
of popular banana cultivar (Musa spp. Cv. Patakpura)
641
K. S. Rahman, M. K. Hasan and M. Hasan − Determinants of household
food security in rural Bangladesh: an imperial analysis of farm level data
649
M. S. Islam, M. Zakaria, M. M. Hossain, M. A. B. Mia and A. J. M. S.
Karim − Effect of potassium on yield, quality and shelf life of tomato
659
M. H. Rahman, M. R. Islam, F. M. Aminuzzaman, A. Latif and S. Nahar
− Evaluation of plant extracts, fungicides, bio-agent and soil amendments
against foot and root rot disease of betelvine caused by Sclerotium rolfsii
under field condition
669
M. M. Rahman and M. N. Jahan − Species diversity and richness of ant
(hymenoptera, formicidae) in Bhawal National Park of Bangladesh
679

Short Communication
A. Singh and R. S. Meena − Effect of foliar spray of bioregulators and
irrigation on dry matter accumulation of mustard (Brassica juncea L.)
689
M. Khatun and M. S. Rahman − Farmer’s knowledge, attitude and
practices on safety, quality and post harvest management of brinjal and
tomato in some selected areas of Bangladesh
695

ISSN 0258-7122 (Print), 2408-8293 (Online)
Bangladesh J. Agril. Res. 44(4): 577-590, December 2019
INFLUENCE OF PLANT GROWTH REGULATORS ON VEGETATIVE
GROWTH, SEX EXPRESSION AND YIELD OF
SUMMER BOTTLE GOURD
M. MONIRUZZAMAN1, R. KHATOON2, M. MONIRUZZAMAN3
AND A. K. M. QAMRUZZAMAN4
Abstract
Field experiments on bottle gourd variety ‘BARI Lau -4’ were conducted at
the Plant Physiology field of Horticulture Research Center, Bangladesh
Agricultural Research Institute, Gazipur during two consecutive summer
seasons of 2015 and 2016 to investigate the effect of plant growth regulators on
growth, sex expression, yield and yield components of the crop. The experiment
consisted of different concentrations of Gibberellic acid (GA3), Naphthalene
acetic acid (NAA), Maleic hydrazide (MH) and single concentration of cycocel
(CCC) viz., GA3 @ 10 ppm, GA3 @ 30 ppm, NAA @100 ppm, NAA @ 150
ppm, MH @ 50 ppm, MH @ 150 ppm and CCC @ 500 ppm along with
distilled water considered as control. All growth regulators were sprayed to the
seedlings at two-leaf stage and 4 days after the first spray. Growth regulator
treatments had significant effect on primary branches/plant, node number of 1st
male and female flower appearance, number of days to 1st male and female
flower appearance, number of male and female flowers, sex ratio (male:female
flower) number of fruits/plant, individual fruit weight and fruit yield. Spraying
of MH @ 150 ppm gave the highest primary branches/plant (17.0 and 18.0 in
first and 2nd year, respectively) and induced maximum female flowers (37.3 and
40.0 in first and 2nd year, respectively) at lower nodes followed by CCC @ 500
ppm (36.3) in the first year and MH @ 50 ppm (40.0) in the 2nd year.
Application of MH @ 150 ppm caused early appearance of female flowers on
the nearest node (from bottom). Application of MH @ 150 ppm gave the lower
number of male flowers (81.7 and 96.0 in first and 2nd year, respectively) and the
highest number of female flowers/plant, thereby producing lower male:female
sex ratio (2.2 and 2.5 in first and 2nd year, respectively) and the maximum
number of fruits/plant (12.0 and 14.0 in first and 2nd year, respectively). The
maximum fruit weight/plant was obtained from the application of MH @ 150
ppm (29.3 and 35.8 in first and 2nd year, respectively) followed by CCC @ 500
ppm (26.0 in the 1st year and 29.0 in 2nd year). The highest fruit yield per hectare
was recorded significantly with the application of MH @ 150 ppm (97.6 t/ha
and 89.6 t/ha in first and 2nd year, respectively) closely followed by CCC @ 500
ppm (88.5 t/ha in 2015) and GA3 @ 30 ppm (75.3 t/ha in 2016), as compared to
1Principal Scientific Officer, Plant Physiology Section, Horticulture Research Centre
(HRC), Bangladesh Agricultural Research Institute (BARI), Gazipur, 2&3Scientific
Officer, Plant Physiology Section, Horticulture Research Centre (HRC), BARI, Gazipur, 4Principal Scientific Officer, Olericulture Division, Horticulture Research Centre (HRC),
BARI, Gazipur, Bangladesh.
DOI: http://-

578 MONIRUZZAMAN et al.
other treatments. The highest mean yield over the years was also recorded at
MH @ 150 ppm (93.6 t/ha) followed by CCC @ 150 ppm (80.6 t/ha) and GA3
30 (74.1). Application of MH @ 150 ppm gave the maximum gross return and
net return with the highest BCR of 5.24 followed by CCC 500 ppm (4.15) and
GA3 30 ppm (3.86).
Keywords: Growth regulators, sex expression, fruit yield, summer bottle gourd.
Introduction
Bottle gourd [Lagenaria siceraria (Molina) Standle] locally known as ‘Lau’ or
‘Kadu’, is one of the important and popular vegetables of the family Cucurbitaceae, extensively grown throughout Bangladesh. Fruits at tender stage
are used as a cooked vegetable and for preparation of sweets (e.g. kheer, petha, burfi and halwa), pickles and rayta. Hard shells of mature fruits are used as water
jugs, domestic utensils, floats for fishing nets and making musical instruments, etc.
As a vegetable it is easily digestible. It has cooling effect and has diuretic and having cardio-tonic properties. Fruit pulp is used as an antidote against certain
poisons and is good for controlling constipation, night blindness and cough. It is especially recommended in the diet of patients suffering from high blood pressure.
The composition of immature fruits of bottle gourd per 100 g of fresh edible portion consists of water 93.9 g, energy 88 kJ (21 kcal), protein 0.5 g, fat 0.1 g,
carbohydrate 5.2 g, fiber 0.6 g, Ca 44 mg, P 34 mg, Fe 2.4 mg, β-carotene 25 μg, thiamin 0.03 mg, niacin 1.2 mg, ascorbic acid 10 mg (Leghari et al., 2014).
The growth and yield of cultivated crop plants is mainly influenced by genetic and crop management factors; first factor involves in various breeding techniques while second factor involves cultural operation, plant protection and other agronomic practices, both these factors have been fully exploited by researchers. In recent years, scientists have given attention to the idea of regulating plant growth as third most important factor in improving growth and yield. It helps in efficient utilization of metabolites in certain physiological processes going in plant system (Krisnamurthy, 2011).
Bangladesh Agricultural Research Institute (BARI) has developed five bottle gourd varieties for cultivation in both winter and summer seasons. The variety ‘BARI Lau-4’ is recommended for cultivation in both winter and summer season. In summer season, the yield of bottle gourd is low. Besides many other reasons for low yield of bottle gourd, there is one acute problem of fewer female flowers and high sex ratio (male:female) during summer. In cucurbitaceous plants, sex expression is determined by gene as well as the environment. Huyskens et al. (1992) reported that significantly more male flowers were produced during summer, under long days and high temperature, than in winter, under short days and low temperature condition. Plant growth regulators (PGRs) such as Gibberellic acid (GA3), Naphthalene acetic acid (NAA), Maleic hydrazide (MH), Cycocel (CCC), etc. are found beneficial for induction of female flowers and reduction of male flowers in summer bottle gourd and sex expression can also be

INFLUENCE OF PLANT GROWTH REGULATORS ON VEGETATIVE 579
controlled by using different growth regulators (Kooner et al., 2000; Rahman and Karim, 1997; Hidayatullah et al., 2012; Gaurav et al., 2008 and Kumar et al., 2000). Very little information is available on the effect of growth regulators on sex expression and yield of bottle gourd in Bangladesh. Therefore, this investigation was carried out to assess the effect of PGRs (GA3, NAA, MH and CCC) on vegetative growth and to narrow the sex ratio by increasing female flowers side by side, decreasing male flowers per plant for yield improvement of bottle gourd in summer.
Materials and Methods
The experiment was conducted at the Plant Physiology field of HRC, BARI, Gazipur during two consecutive summer seasons of 2015 and 2016.The variety ‘BARI Lau-4’ was used in this experiment. The experiment consisted of eight treatments viz., T0 = control (distilled water), T1 = GA3 @ 10 ppm, T2 = GA3 @ 30 ppm, T3 = NAA @ 100 ppm , T4 = NAA @ 150 ppm, T5 = MH @ 50 ppm, T6 = MH @ 150 ppm and T7 = CCC @ 500 ppm. The sources of GA3 and CCC were Isha, Chemical Pvt. Ltd. (India), and those of MH and NAA were BDH Chemicals Ltd. (England) and SD Fine Chemicals Ltd. (Mumbai, India), respectively. All chemicals were Laboratory Grade.
250 mg of gibberellic acid was accurately weighed out using sensitive electronic balance and dissolved in a few ml of alcohol (95%). The solution thus prepared was transferred to 250 ml volumetric flask containing distilled water. The volume of the solution was made upto 250 ml to get the 1000 ppm stock solution. NAA stock solution (1000 ppm) was prepared by dissolving 500 mg NAA powder in 500 ml of distilled water. 500 mg NAA powder was accurately weighed out and dissolved by keeping it in a 500 ml volumetric flask and by adding 1 N NaOH solution drop by drop till the powder was completely dissolved. The volume was adjusted to 500 ml with distilled water in a volumetric flask. Thus the stock solution was prepared. 500 mg MH was accurately weighed out using sensitive electronic balance and dissolved in a few ml of 1 N NaOH. 100 ml of distilled water was added in a 500 ml volumetric flask. The solution was then adjusted to 500 ml by adding distilled water. This gives 1000 ppm stock solution. 2 ml (50% ai) of CCC was taken by 10 ml pipette ans dissolved in distilled water by adding-shaking method. The volume was adjusted to 1000 ml with distilled water in a volumetric flask to obtain a stock solution of 1000 ppm. Finally, the required lower concentrations of GA3 (10 and 30 ppm), NAA (100 and 150 ppm), MH (50 and 150 ppm) and CCC (500 ppm) were prepared from their stock solutions by using the formula: V1 x S1 = V2 x S2; where. S1: concentration of stock solution (1000 ppm) of the desired chemical (GA3, NAA, MH or CCC), V1 = volume of stock solution of desired chemical (what we have to calculate), S2: concentration of desired chemical and V2: amount of solution required for spray treatment-wise. Then calculated amount (V1) of desired chemical was taken from stock solution and poured into a pot of known volume and then required amount

580 MONIRUZZAMAN et al.
of water was added into this pot. Hand sprayer was used for spray of the chemicals.
The experiment was laid out in a randomized complete block design (RCBD) with three replications. For raising seedlings sandy loam soil and well
decomposed cowdung were thoroughly mixed in 1:1 ratio and then plastic pots were filled with this mixture. Seeds were placed in plastic pots on 01 March,
2015 and 11 February, 2016. Seeds were soaked in distilled water for 24 hours to facilitate germination. After final land preparation, pits were prepared by spade
and size of each pit was 30 cm x 30 cm x 30 cm. One pit was made in the middle
of each plot and one seedling was planted in that pit . Plot size was 2.0 m x 1.5 m and 2.0 m x 2.0 m in 2015 and 2016, respectively. Manure and fertilizers were
applied as cow dung, N, P, K, S, B and Zn @ 10000, 80, 45, 88, 25, 1.8 and 4.5 kg/ha, respectively (Quamruzzaman et al., 2015). Half of cow dung; full doses of
S, Zn and B, and P and K @ 30 kg/ha each were applied during final land preparation. The rest half of cow dung and P and K @ 15 kg/ha was applied as
basal in pit. Rest of N and K was applied in 4 equal installments at 20 days interval starting from 20 days after transplanting. Seventeen day- old seedlings
were transplanted on 19 March 2015 and 01 March 2016. First spraying of plant growth regulators (PGRs) were done at the 2 true leaf stage on March 23, 2015
and 03 March, 2016. Second spraying of PGRs was done after 4 days of first spray. Control plants were sprayed with distilled water. Trellises made of
bamboos and iron nets were used for the support of each plant individually. Plants were allowed to be grown individually and not be allowed to intermingle
with other plants grown beside. Weeding and irrigation were done as required. When 1st flower was seen, it was tagged and each male and female flower was
tagged separately throughout the growing period, and the number of male and
female flowers was counted.
Data were recorded on main vine length, number of primary branches/plant,
number of leaves/plant, CCI (Chlorophyll Content Index), Fv/Fm (efficiency of photosystem II), days to first male and female flowers, node order of first and
female flowers (from the bottom), number of male and female flowers/plant, number of fruits/plant, individual fruit weight, fruit length, fruit circumference
and yield/plot. Then plot yield was converted to per hectare yield. Data on CCI (Chlorophyll Content Index) was taken by Chlorophyll Content Meter (Model:
CCM-200, Opti-sciences, USA). The leaf discs were previously adapted to the dark for 20 minutes. The fluorescence data (Fv/Fm) were collected at 70 days
after sowing within 10.00 am to 12.00 pm. In the first year (2015), the fruit harvest started from 21 May and ended in 18 June; while, in the 2nd year (2016),
fruit harvest started from 09 May and ended in 29 June. Each fruit was harvested after twelve days of anthesis. Thus every fruit was harvested by sharp knife 12
days after anthesis. A total of 7 and 8 harvests were required in 2015 and 2016, respectively. Recorded data were statistically analyzed by MSTAT-C and mean
separation was done by Tukey’s W test at 5% level of probability.

INFLUENCE OF PLANT GROWTH REGULATORS ON VEGETATIVE 581
Results and Discussion
Vegetative growth of bottle gourd plants
Plant growth regulators had significant effect on number of primary branches/plant in both the years. The number of leaves/plant was significantly influenced by growth regulators in 2015 but insignificant effect on length of main vine in both years (Table 1). The maximum number of primary branches/plant was recorded in the plants treated with MH @ 150 ppm (17.0 and 18.0 in 2015 and 2016, respectively; mean 17.5) closely followed by CCC @ 500 ppm (15.0 in both 2015 and 2016; mean 15.0) and MH @ 50 ppm (13.0 in 2015 and 15.0 in 2016, mean 14.00) and GA3 @ 30 ppm (12.0 in 2015 and 16.0 in 2016, mean 14.0) and its minimum number from control in both years (6.0 in 2015 and 8.0 in 2016; mean 7.0). Ansari and Choudhury (2014) obtained significantly higher number of branches in bottle gourd by the application of GA3 (50-100 ppm) and MH @ 50 ppm. Sadiq et al. (1990) reported to have the highest number of branches per plant in cucumber while spraying with CCC @ 500 ppm at 4 leaf stage. In the first year, spraying of MH @ 150 ppm gave the maximum number of leaves/plant (343.0) which was identical with MH @ 50 ppm (337.0) and CCC @ 500 ppm (341.0). Number of leaves/plant did not vary significantly with PGR treatments in the 2nd year, but numerically the PGR treated plants produced more leaves than control. The highest mean number of leaves/plant (325.0) was recorded at both MH @ 150 ppm and CCC @ 500 ppm. The control treatment gave the minimum number of leaves/plant in both the years.
Table 1. Effect of plant growth regulators on vegetative growth of summer bottle
gourd
Treatment
Main vine length
(m)
Primary branches/plant
(no.) Leaves/plant (no.)
2015 2016 Mean 2015 2016 Mean 2015 2016 Mean
T0 12.2 12.0 12.1 6.0 e 8.0c 7.0 277 d 298 288.
T1 12.2 12.1 12.1 11.0 cd 10.0c 10.5 304cd 310 307
T2 12.1 13.2 12.6 12.0 bcd 16.0a 14.0 309 bcd 318 314
T3 12.3 12.4 12.4 9.0 de 11.0bc 10.0 285d 300 294
T4 11.9 13.2 12.6 9.0 de 10.0c 9.5 298 d 308 303
T5 12.4 12.6 12.5 13.0 abc 15.0ab 14.0 337 abc 309 323
T6 13.0 11.8 12.4 17.0 a 18.0a 17.5 343 a 307 325
T7 13.00 11.8 12.4 15.0 ab 15.0ab 15.0 341 ab 309 325
CV(%) 3.94 10.37 - 10.97 10.73 - 3.62 5.31 -
Means showing dissimilar letters in a column are significantly different at 5% level by
Tukey’s W test.
T0 = Control (distilled water), T1 = GA3 @10 ppm, T2 = GA3 @ 30 ppm, T3 = NAA @
100 ppm, T4 = NAA @ 150 ppm, T5 = MH @ 50 ppm, T6 = MH @ 150 ppm, T7 = CCC
@ 500 ppm.

582 MONIRUZZAMAN et al.
Effect of PGRs on CCI and Fv/Fm values
In both the years all growth regulator treated plants produced identical chlorophyll content index (CCI) and Fv/Fm with control (Table 2). All the
treatments gave Fv/Fm values close to 0.80 indicating photosystem II of the plants were not affected by the application of PGRs. The Fv/Fm values close to
0.800 revealed that all the plants under treatment were in healthier condition.
Table 2. Effect of plant growth regulators on chlorophyll content and quantum
yield (Fv/fm values) of summer bottle at 70 days after sowing
Treatment CCI value Fv/Fm value
2015 2016 Mean 2015 2016 Mean
T0 20.2 21.3 20.7 0.80 0.81 0.81
T1 20.3 21.5 20.9 0.80 0.81 0.81
T2 21.4 22.3 21.9 0.80 0.82 0.81
T3 20.5 20.2 20.4 0.81 0.81 0.81
T4 20.6 21.2 20.9 0.81 0.81 0.81
T5 20.7 20.1 20.4 0.80 0.80 0.80
T6 20.7 20.8 20.8 0.80 0.82 0.80
T7 20.4 21.3 20.9 0.80 0.80 0.80
CV (%) 5.20 4.88 5.13 3.08 4.60 3.52
T0 = Control (distilled water), T1 = GA3 @10 ppm, T2 = GA3 @ 30 ppm, T3 = NAA @
100 ppm, T4 = NAA @ 150 ppm, T5 = MH @ 50 ppm, T6 = MH @ 150 ppm, T7 = CCC
@ 500 ppm.
Node number and number of days to first male and female flowers
Number of node and days required for the appearance of the first male flower were significantly lowered by all PGRs treatments except control (Table 3). The first male flower appeared at the lowest node (18.0 in 2015 and 16.3 in 2016; mean 17.15) on the plants treated with MH @ 150 ppm. The node numbers required for the first male flower were identical in NAA @ 100 ppm, NAA @ 150 ppm, MH @ 50 ppm, MH @ 150 ppm and CCC @ 500 ppm in the 1st year whereas, in 2nd year, node numbers were identical in all treatments except control. The plants treated with MH @ 150 ppm produced the first male flower in the least number of days in both years (59.0 in 2015, 63.0 in 2016 with a mean value 61.0. MH @ 150 ppm was statistically similar to GA3 @ 30 ppm, and CCC @ 500 ppm with regard to number of days to first male flower appearance in 2nd year. All the PGR treatments significantly lowered the number of nodes and days required for the appearance of the first female flower than control in 2015 but, in 2016, application of MH both at 50 and 150 ppm significantly reduced node number at which female flower appeared and all the PGR treatments significantly lowered number of days required for the appearance of first female flower as compared to control (Table 3). The first

INFLUENCE OF PLANT GROWTH REGULATORS ON VEGETATIVE 583
female flower appeared at the lowest node (21.0 in 2015 and 20.0 in 2016; mean 20.5) in the plants treated with MH @ 150 ppm, closely followed by CCC @ 500 ppm, MH @ 50 ppm and NAA @ 150 ppm during 2015, but in 2016, there was no significant differences among PGR treatments in respect of node number of female flower except control. Heslop–Harrison (1957) reported that the sexual differentiation is controlled by endogenous level of auxin content, which favours the formation of female flowers. Browning et al. (1992) explained that paclobutrazol induced a large, but transient increase in IAA (natural auxin) concentration within two days after treatment of the plants. These seem to be a reasonable explanation for the early appearance of female flowers at lower node. Similar findings have been reported with CCC by Sharma et al. (1988) and with MH by Singh and Choudhury (1988), Patel (1992) and Pandya and Dixit (1997) in bottle gourd. The plants treated with MH @ 150 ppm were able to produce the first female flower in least number of days in both the years (70.0 in 2015, 74.3 in 2016 and mean value 72.15. MH at 50 & 150 ppm and GA3 @ 30 ppm gave identical number of days to 1st female flower in 2015 whereas, in 2016, MH @ 150 ppm was statistically similar to GA3 @ 30 ppm with regard to number of days to first female flower appearance.
Male and female flowers
Spraying of CCC @ 500 ppm gave the highest number of male flowers (143.3 in 2015) followed by control treatment (123.0 in 2015) but in 2016, this treatment produced lower male flower than control (Table 3). The lowest male flowers/plant (81.7 in 2015, 96.0 in 2016 and mean 88.8) was recorded at MH @ 150 ppm, which was identical with NAA @ 100 and MH @ 50 ppm in 2015; but in 2016, it was identical with NAA @ 100 and 150 @ ppm. In 2015, all treatments significantly produced the maximum female flowers/plant while in 2016, except NAA @ 150 ppm all other treatments significantly increased number of female flowers/plant as compared to control. In the first year, the maximum number of female flowers/plant was found in MH @ 150 ppm (37.3 in 2016, 40 in 2016; mean 38.7) closely followed by CCC @ 500 ppm (36.3 in 2015, 38.0 in 2016; mean 38.0) and GA3 @ 30 ppm (34.0 in 2016).
The CCC has been reported to cause reduction in respiration rate and accumulation of photosynthates, an effect similar to low temperature and short days (Choudhury, 1996) which might promote female flower production in cucurbits. Desai et al. (2011) obtained male flowers ranging from 86.27 -151 (CCC @ 250 ppm); 111.43 by control treatment and female flowers with a range of 29.7 (control) to 51.1 (PBZ @ 25 ppm); 40.5 by CCC. The present experimental result corroborates the rfindings of Hidayatullah et al. (2012). Pandey and Singh (1976) reported that spraying of NAA @ 100 and 150 @ ppm and GA3 @ 10 ppm increased the female flowers and decreased the male flowers per plant in sponge gourd compared to control. The present experimental results were also in agreement with the results of Pandey and Singh (1976) and Arora et al. (1982).

584 MONIRUZZAMAN et al.
Ta
ble
3.
Eff
ect
of
pla
nt
gro
wth
reg
ula
tors
on
sex
exp
ress
ion
of
sum
mer
bo
ttle
go
urd
Tre
atm
ent
No
de
at w
hic
h t
he
1st m
ale
flo
wer
ap
pea
red
N
um
ber
of
days
to 1
st m
ale
flo
wer
N
od
e at
whic
h t
he
1st f
em
ale
flo
wer
ap
pea
red
N
um
ber
of
days
to 1
st f
em
ale
flo
wer
20
15
20
16
Mea
n
20
15
20
16
Mea
n
20
15
20
16
Mea
n
20
15
20
16
Mea
n
T0
25
.3a
21
.3a
23
.3
67
.0a
69
.7a
68
.3
28
.3a
27
.0a
27
.7
78
.3a
81
.7a
80
.0
T1
23
.0b
19
.3ab
2
1.2
6
2.3
b
65
.7b
c 6
4.0
2
6.3
b
24
.3ab
2
5.3
7
5.7
b
78
.7b
77
.2
T2
22
.3c
17
.0b
c 1
9.7
6
0.3
cd
63
.3cd
6
1.8
2
3.0
de
21
.0ab
2
2.0
7
1.0
0cd
7
4.7
d
72
.8
T3
21
.3cd
1
8.0
bc
19
.7
61
.0b
c 6
6.7
b
63
.8
25
.3b
c 2
3.0
ab
23
.2
76
.0b
79
.00b
77
.5
T4
21
.0cd
1
8.0
bc
19
.5
61
.3b
c 6
7.3
ab
64
.3
24
.3cd
2
3.0
ab
23
.7
76
.3b
79
.3b
77
.8
T5
20
.3d
17
.0b
c 1
8.7
6
0.3
cd
65
.7b
c 6
3.0
2
2.3
ef
20
.3b
2
1.3
7
2.0
cd
76
.7c
74
.3
T6
18
.0e
16
.3c
17
.2
59
.0e
63
.0d
61
.0
21
.0f
20
.0b
2
0.5
7
0.0
d
74
.3d
72
.2
T7
21
.0cd
1
7.0
bc
19
.0
60
.0cd
6
5.0
bcd
6
2.5
2
2.0
ef
21
.3ab
2
1.7
7
2.7
c 7
6.7
c 7
4.7
CV
(%
) 4
.87
5
.35
- 4
.30
2.2
6
- 4
.02
3.9
6
- 4
.12
3.7
6
-
Ta
ble
3.
con
t’d
.
Tre
atm
ent
Mal
e fl
ow
er (
no
.)
Fem
ale
flo
wer
(no
.)
S
ex r
atio
(m
ale
: fe
male
)
20
15
20
16
Mea
n
20
15
20
16
Mea
n
20
15
20
16
Mea
n
T0
12
3.0
b
13
1.3
a 1
27
.2
15
.7 c
1
8.3
d
17
.0
7.9
a
7.2
a 7
.5
T1
10
3.7
c
11
5.3
bc
10
9.5
2
4.0
b
27
.3b
c 2
5.7
4
.3 b
c 4
.3b
4.3
T2
10
3.2
c
11
8.3
b
10
7.8
2
3.0
b
34
.0ab
2
8.5
4
.5 b
c 3
.5b
c 4
.0
T3
82
.0 d
e 9
8.3
de
90
.2
25
.3 b
2
8.3
bc
26
.8
3.2
c
3.4
bc
3.4
T4
94
.7 d
1
04
.0e
99
.3
23
.3 b
2
5.0
cd
24
.2
4.1
bc
4.2
b
4.1
T5
9
3.0
cd
e 1
07
.3cd
1
00
.2
24
.3 b
2
9.0
bc
26
.7
3.8
bc
3.8
b
3.8
T6
8
1.7
e 9
6.0
e 8
8.8
3
7.3
a
40
.0a
38
.7
2.2
c
2.5
d
2.3
T7
14
3.3
a
12
0.3
b
13
1.8
3
6.3
a
38
.0a
37
.2
3.9
bc
3.2
cd
3.6
CV
(%)
4.1
8
4.8
7
- 5
.74
8.2
6
- 9
.14
11
.14
-
Mea
ns
sho
win
g d
issi
mil
ar l
ette
rs i
n a
co
lum
n a
re s
ignif
icantl
y d
iffe
ren
t at
5%
lev
el b
y T
ukey’s
W t
est.
T0 =
C
ontr
ol
(dis
till
ed w
ater
), T
1 =
GA
3 @
10
pp
m,
T2 =
GA
3 @
30
pp
m,
T3 =
NA
A @
10
0 p
pm
, T
4 =
NA
A @
15
0 p
pm
, T
5 =
MH
@ 5
0
pp
m,
T6 =
MH
@ 1
50
pp
m,
T7 =
C
CC
@ 5
00
pp
m.

INFLUENCE OF PLANT GROWTH REGULATORS ON VEGETATIVE 585
Ta
ble
4.
Eff
ect
of
pla
nt
gro
wth
reg
ula
tors
on
yie
ld c
om
po
nen
ts a
nd
fru
it y
ield
of
sum
mer
bo
ttle
g
ou
rd
Tre
atm
ent
Fru
its/
pla
nt
(no
.)
Fru
it l
eng
th (
cm
) F
ruit
cir
cum
fere
nce
(cm
)
20
15
20
16
Mea
n
20
15
20
16
Mea
n
20
15
20
16
Mea
n
T0
4.7
c
6.7
f 5
.7
46
.7
47
.3
47
.0
37
.9
37
.6
37
.8
T1
7.7
b
9.7
cde
8.7
4
7.5
4
7.7
4
7.6
3
8.3
3
9.9
3
9.1
T2
8.7
b
12
.0ab
1
0.4
4
9.6
4
9.5
4
9.5
3
9.8
4
0.2
4
0.0
T3
6.7
bc
7.7
ef
7.2
4
8.9
4
9.2
4
9.1
3
9.1
3
9.9
3
9.5
T4
7.0
b
9.0
de
8.0
4
7.7
4
7.7
4
7.7
4
1.3
4
0.2
4
0.8
T5
8.0
b
10
.7b
cd
9.3
4
6.8
4
7.9
4
7.4
3
8.1
4
0.3
3
9.2
T6
12
.0 a
1
4.0
a 1
3.0
4
7.2
4
8.1
4
7.7
3
8.7
3
9.6
3
9.2
T7
11
.3 a
1
1.7
bc
11
.5
47
.2
48
.2
47
.7
35
.8
38
.6
27
.2
CV
(%
) 9
.76
7.8
7
- 5
.61
6.5
6
- 1
0.5
9
8.1
3
-
Ta
ble
4.
con
t’d
.
Tre
at-
men
t
Ind
ivid
ual
fru
it w
eight
(kg)
Fru
it w
eig
ht/
pla
nt
(kg)
Fru
it y
ield
(t/
ha)
Mea
n y
ield
incr
ease
over
contr
ol
(%)
20
15
20
16
Mea
n
20
15
20
16
Mea
n
20
15
2
01
6
Mea
n
T0
2.4
2
.5
2.5
1
1.5
e 1
6.1
e 1
3.8
3
8.5
e
40
.4e
39
.4
-
T1
2.4
2
.5
2.4
1
8.3
cd
20
.8d
19
.6
61
.1 c
d
52
.0d
56
.5
30
.2
T2
2.7
2
.6
2.6
2
1.8
bc
30
.1b
26
.0
72
.8 b
c 7
5.3
b
74
.1
46
.7
T3
2.4
2
.6
2.5
1
6.2
de
2
0.1
d
18
.2
53
.5 d
e 5
0.4
de
52
.0
24
.1
T4
2.8
2
.6
2.7
1
8.6
cd
22
.8cd
2
0.7
6
2.0
cd
56
.9d
59
.4
33
.7
T5
2.7
2
.6
2.6
2
1.1
c
26
.5b
c 2
3.8
7
0.4
c
66
.2c
68
.3
42
.3
T6
2.6
2
.7
2.6
2
9.3
a 3
5.8
a 3
2.6
9
7.6
a
89
.6a
93
.6
54
.2
T7
2.5
2
.6
2.6
2
6.6
ab
29
.1b
27
.8
88
.5 a
b
72
.7b
80
.6
51
.1
CV
(%
) 6
.18
1
0.3
4
- 8
.33
6.1
3
- 8
.27
6.1
0
8.5
9
-
Mea
ns
sho
win
g d
issi
mil
ar l
ette
rs i
n a
co
lum
n a
re s
ignif
icantl
y d
iffe
ren
t at
5%
lev
el b
y T
ukey’s
W t
est.
T0 =
C
ontr
ol
(dis
till
ed w
ater
), T
1 =
GA
3 @
10
pp
m,
T2 =
GA
3 @
30
pp
m,
T3 =
NA
A @
10
0 p
pm
, T
4 =
NA
A @
15
0 p
pm
, T
5 =
MH
@ 5
0
pp
m,
T6 =
MH
@ 1
50
pp
m,
T7 =
C
CC
@ 5
00
pp
m.

586 MONIRUZZAMAN et al.
Sex ratio of male and female flower
All the treatments resulted in narrowing down of male-female sex ratio over control in both years (Table 3).The lowest sex ratio (male:female) was recorded
at MH @150 ppm in both the years (2.2 in 2015 and 2.5 in 2016; mean 2.30 ). In 2015, all the treatments except control produced identical values of sex ratio,
but in 2016, MH @ 150 and CCC @ 500 were identical with regard to sex ratio. Again, in 2016, there was no significant difference among GA3 @10 (T1), GA3 @
30 (T2), NAA @100 (T3), NAA @ 150 (T4) and MH @ 150 (T5) ppm in respect of sex ratio. Although CCC @ 500 ppm produced the maximum male flowers
compared to control in 2015, it gave lower sex ratio (3.9) than control (7.9) because of producing higher female flowers.
The marked suppression of male flowers and induction of female flowers by all
concentrations of GA3, NAA, MH and CCC @ 500 ppm was noticed. Induction of female flowers by all concentrations of PGRs was the evidence of lowered sex
ratio. The sex ratio recorded in this investigation was comparable to the results reported by Hidayatullah et al. (2012) with GA3, Sharma et al. (1988) as well as
Pandya and Dixit (1997) with CCC and Ingle et al. (2000) as well as Arora et al. (1982) with MH in bottle gourd.
Yield attributes and yield of bottle gourd
Growth regulator treatments had significant effect on yield components and yield
of bottle gourd except fruit length, fruit circumference and individual fruit weigh in both the years (Table 4). The maximum number of fruits/plant was found in
MH @ 150 ppm in both the years (12.0 in 2015 and 14.0 in 2016; mean 13.0). In the first year, MH @ 150 ppm gave identical fruit number with CCC @ 500
ppm (11.3), but in the 2nd year, number of fruits produced by the plants treated with MH 150 ppm was statistically similar to those of GA3 @ 30 ppm (12.0).
The lowest number of fruits was obtained from control in both the years (4.7 in 2015 and 6.7 in 2016; mean 5.7). The maximum fruit weight/plant was recorded
at MH @ 150 ppm in both the years (29.3 kg and 35.8 kg in 2015 and 2016,
respectively). In 2015, MH @ 150 ppm was identical with CCC @ 500 ppm in producing fruit weight/plant. In the 2nd year, the second highest fruit weight/plant
was obtained from the application of GA3 @ 30 ppm (30.1 kg) which was statistically similar to CCC @ 500 ppm (29.1 kg). The mean values over two
years indicated the highest fruit weight/plant (32.6 kg) was recorded from MH @ 150 ppm followed by CCC @ 500 ppm (27.8 kg) and GA3 @ 30 ppm (26.0 kg).
The lowest fruit weight/plant was found from the control (11.5 kg in 2015 and 16.1 kg in 2016; mean 13.8 kg) in both the years.
Fruit yield per hectare followed the same trend of fruit weight/plant. MH 150 ppm gave the highest fruit yield (97.6 t/ha in 2016, 89.6 t/ha in 2016 and mean
93.6 t/ha). In 2015, CCC @ 500 produced the identical yield (88.5 t/ha) of MH @ 150 ppm. In 2016, application of GA3 @ 30 ppm gave the 2nd highest yield

INFLUENCE OF PLANT GROWTH REGULATORS ON VEGETATIVE 587
(74.1 t/ha) which was statistically similar to CCC @ 500 ppm (72.7 t/ha). It was
observed from the mean values that the maximum fruit yield (93.6 t/ha) was recorded from MH @ 150 ppm followed by CCC @ 500 ppm (80.6 t/ha) and
GA3 @ 30 ppm (74.1 t/ha). The control treatment gave the lowest yield (38.5 t/ha and 40.4 t/ha in 2015 and 2016, respectively; mean 39.4) (Table 4). MH (50-150
ppm) produced yields in the range of 70.4 -97.6 t/ha in 2015 and 66.2-89.6 t/ha in 2016. Higher concentration of MH (150 ppm) produced higher yield than MH @
50 ppm in both the years. On the other hand, GA3 (10-30 ppm) gave the yields ranged from 61.1 -72.8 t/ha in 15 and 52.0-75.3 t/ha in 2016 and GA3 @ 30 ppm
produced the highest yield in both the years. NAA (100-150 ppm) produced fruit yield ranged from 53.5-62.0 t/ha in the first year and from 50.4-56.9 t/ha in the
2nd year and NAA @ 150 ppm gave the highest fruit yield in both the years. In
mean values over two years, plants of bottle gourd treated with 150 pm MH, 500 ppm CCC and 30 ppm GA3 gave 54.16%, 51.06% and 46.74 % higher yield,
respectively than control. An increase in yield could be attributed to earliness and increased number of female flowers as well as narrowed male:female sex ratio.
Arora et al. (1982) reported that MH @ 50 ppm was most effective in producing the maximum fruit weight/plant and ultimately the yield. Foliar spray of MH (50-
150 ppm) increased the yield in most of the cucurbits (Sonkar, 2003; Jatoi et al., 2010). Plants sprayed with MH @ 50 ppm at 2-leaf stage produced the best yield
(Baruah and Das, 1997). Saimbhi and Thakur (2006) reported that single spray of CCC @ 500 ppm increased number of fruits per plant and yield in squash
melon (Citrullus vulgaris). Sadiq et al. (1990) obtained maximum number of fruits/plant and yield/vine from application of CCC 5@ 00 in cucumber.
Hidayatullah et al. (2012) obtained maximum fruit weight/plant and yield in bottle gourd from the spraying of plants with GA3 30 ppm. Desai et al. (2011)
obtained the maximum yield of bottle gourd from spraying with paclobutrazol @ 25 ppm followed by CCC @ 200 ppm, CCC @ 500 ppm and MH @ 200 ppm.
Partial Economic Analysis
The present study (Table 5) revealed that the maximum gross return (Tk. 11,70,000.00) was found from the plants sprayed with MH @ 150 ppm followed
by CCC @ 500 ppm (Tk. 10,07,380.00) and GA3 @ 30 ppm (Tk. 9,25,750.00) and the minimum gross return was recorded from control (Tk. 4,93,000.00). Net
return showed marked difference among the treatments and followed the same trend of gross return. Net return was the highest (Tk. 9,82,600.00) in MH @ 150
ppm followed by CCC @ 500 ppm (Tk. 8,15,580.00) and GA3 @ 30 ppm (Tk. 7,35,200.00) while the lowest (Tk. 3,06,200.00) in control. The maximum benefit
cost ratio (BCR) was obtained from MH @150 ppm (5.24) followed by CCC @ 500 ppm (4.25) and GA3 @ 30 ppm (3.86); while the minimum from control
(1.64). The cost and return analysis revealed that spraying of MH @ 150 ppm was superior to CCC @ 500 and GA3 @ 30 ppm in terms of net income and
BCR.

588 MONIRUZZAMAN et al.
Table 5. Partial cost benefit analysis of summer bottle gourd production by using
plant growth regulators
Treatment
Mean
fruit yield (t/ha)
Gross
return
(‘000 Tk./ha)
Cost of
treatment
(‘000 Tk./ha)
Cost of
cultivation
(‘000 Tk./ha)
Net return
(‘000 Tk./ha)
Benefit-
cost ratio (BCR)
T0 39.44 493.00 0.00 186.80 306.20 1.64
T1 56.54 706.75 1.25 188.05 518.70 2.76
T2 74.06 925.75 3.75 190.55 735.20 3.86
T3 51.98 649.75 0.55 187.35 462.40 2.47
T4 59.44 743.00 0.83 187.63 555.38 2.96
T5 68.31 853.87 0.20 187.00 666.87 3.57
T6 93.60 1170.00 0.60 187.40 982.60 5.24
T7 80.59 1007.38 5.00 191.80 815.58 4.25
T0 = Control (distilled water), T1 = GA3 @10 ppm, T2 = GA3 @ 30 ppm, T3 = NAA @
100 ppm, T4 = NAA @ 150 ppm, T5 = MH @ 50 ppm, T6 = MH @ 150 ppm, T7 = CCC
@ 500 ppm.
Basic cost of cultivation: 186800 Tk./ha.
Cost of PGRs:
1. Gibberellic acid (GA3): Tk. 500.00/g
2. Naphthalelene Acetic Acid (NAA): Tk. 2200.00/100 g
3. Maleic hydrazide : Tk. 1500.00/100g
4. Cycocel (CCC) : Tk. 2000.00/100ml (50% ai)
Treatment Dose/ha
GA3 @ 10 ppm (T1) 2.5 g
GA3 @ 30 ppm (T2) 7.5 g
NAA @ 100 ppm (T3) 25.0 g
NAA @ 150 ppm (T4) 37.5 g
MH @ 50 ppm (T5) 13.33 g
MH @ 150 ppm (T6) 40.0 g
CCC @ 500 ppm (T7) 500 ml
Market selling price of bottle gourd fruits: Tk. 12.50/kg (Tk 12500.00/ton)
Conclusion
The experimental result revealed that PGR played a significant role in regulating number of branches/plant, male and female flowering, narrowing sex ratio and
ultimately increasing number of fruits and yield. Treatments of MH @ 150 ppm, CCC @ 500 ppm and GA3 @ 30 ppm were superior to the rest of the treatments
for the earliness of female flower appearance, narrowing down sex-ratio and

INFLUENCE OF PLANT GROWTH REGULATORS ON VEGETATIVE 589
finally increasing yield. These three treatments also registered higher gross
return, net return and BCR. Therefore, it can be concluded that spraying MH @150 ppm or CCC @ 500 ppm or GA3 @ 30 ppm to the seedlings of bottle
gourd at two-leaf stage and 2nd spraying after four days of 1st spray should be done in summer to get higher yield with higher return.
References
Ansari, A. M. and B. M. Choudhury. 2014. Effects of boron and plant growth regulators
on vegetative, physiological and fruit characters of bottle gourd (Lagenaria siceraria
(Molina) Standle). Progressive Res. 9 (conf. suppl.): 974-978.
Arora, S. K., M. L. Pandita and A. S. Sidhu. 1982. Effect of maleic hydrazide on
vegetative growth, flowering and fruiting of bottle gourd. Scientia Horticulturae.
17(3): 211-215.
Baruah, G. K. S and R. K. Das. 1997. Effect of plant growth regulators on growth,
flowering and yield of bottle gourd at different sowing dates. Ann. of Agril. Res.
18(3): 371-374.
Browning, G., Z. Singh, A. Kuden and P. Blake. 1992. Effect of paclobutrazol on
endogenous indol-3-acetic acid in shoot apices of pear cv. Doyenne do Comice.
Hort. Sci. 67: 129-135.
Choudhury, B. 1966. Modification of sex by plant regulators spraying on cucurbits under
high temperature and long day conditions. Proc. 17th Int. Hort. Cong. Md. L. Abstr.
191.
Desai. K. D., S. N. Saravaiya, , B. N. Patel and N. B. Patel. 2011. Response of growth
retardants on sex expression and fruit yield of bottle gourd [Lagenaria siceraria
(Mol.) Standl.] cv. Pusa Naveen under South Gujrat conditions. The Asian J. Hort.
6(1): 22-25.
Gaurav, S. S., S. P. S. Sirohi, R. Yadov and P. Sirohi. 2008. Effect of plant growth
regulators on growth, yield and sex expression on bottle gourd (Lagenaria siceraria).
J. Plant Archives. 8 (2): 1029-1031.
Heslop-Harrison, J. 1957. The experimental modification of sex expression in flowering
plants. Bio. Rev. 32: 38-90.
Hidayatullah, T., M. Mahmood, M. Farooq, M. A. Khokhar and S. I. Hossain. 2012. Plant
growth regulators affecting sex expression of bottle gourd ( Lagenaria siceraria
Molina) plants. Pakistan J. Agric. Res. 25 (1): 50-54.
Huyskens, S., S. Mendlinger, A. Benzioni and M. Ventura. 1992. Optimization of
agrotechniques for cultivating Momordica charantia (Karela). J. Hort. Sci. 67: 259-
264.
Ingle, V. G., B. J. Jadhao and P. S. Joshi. 2000. Effect of plant growth regulators on
growth, sex ratio and yield of bottle gourd. J. Soils Crops. 10 (1): 101-104.
Jatoi, S. A., A. Kikuchi, D. Ahmad and K. N. Watanabe. 2010. Characterization of the
genetic structure of mango ginger (Curcuma amada Roxb.) from Myanmar in farm
and gene bank collection by the natural and functional genomic markers. Electronic

590 MONIRUZZAMAN et al.
J. Biotechnol. 13:6. [Available from http://www.ejbiotechnology.info accessed on
12.11.2017].
Kooner, K. S., S. Jaskaran, and M. S. Saimbhi. 2000. Effect of plant growth substances
on growth, sex expression and fruit yield in bottle gourd cv. Punjab Komal. Haryana
J. Hort. Sci. 29: (3/4):268-269.
Krishnamurthy, H. N. 2011. Plant Growth Substances. Tata McGraw-Hill Pub. Com. Ltd.
New Delhi.
Kumar, S., S. K. Dixit and H. R. Mishra. 2000. Effect of plant growth regulatiors on yield
and yield contributing characters of bottle gourd (Lagenaria siceraria Molina).
Advances in Plant Sci. 19 (2): 419-421.
Leghari, M. H., A. A. Mugheri, S. A. Sheikh, N. A. Wahocho. 2014. Response of
nitrogen levels on the growth and yield of bottle gourd varieties. Int. J. of Agron. and
Agril. Res. (IJAAR). 5 (6): 86-92.
Pandey, R. P. and K. Singh. 1976. Effect of plant growth regulators on sex expression,
fruit set and yield of sponge gourd (Luffa cylindrica Poem.). Hort. Abstract.
499(11): 733.
Pandya, M. B. and C. K. Dixit. 1997. Effect of plant growth regulators and chemicals on
the growth, sex behavior and yield of bottle gourd [[Lagenaria siceraria (Mollina)
Stand]. Cv. Pusa Summer Prolific Long. J. Applied Hort. 3(1&2): 105-111.
Patel, A. K. 1992. Assessment of the effectiveness of MH and NAA on growth, sex
expression and yield of bottle gourd [Lagenaria siceraria (Mollina) Stand) cv.
Pattiwali. M.Sc (Ag.) Thesis, GAU, Sardarkrushinagar, Gujrat, India.
Quamruzzaman, A. K. M., L. Akter, M. H. Rahman and M. T. Rahman. 2015.
Preliminary yield trial of bottle gourd lines for summer season. Research Report on
Horticultural Crops 2014-2015. Olericulture Division, Horticulture Research centre,
Bangladesh Agricultural Research Institute, Gazipur. pp. 90-92.
Rahman, M. A. and M. R. Karim. 1997. Effect of foliar treatment of NAA, TIBA and
GA3 on vegetative growth, NPK concentration, sex expression and yield of bottle
gourd (Lagenaria siceraria). Chittagong University Studies. Science. 21(1): 9-13.
Sadiq, W. M., H. Inatullah and A. Wahdud. 1990. Effect of different doses of cycocel
(CCC) on growth and yield of cucumber. Sarhad J. Agric. 6(1): 61-65.
Saimbhi, M. S. and M. R. Thakur. 2006. Growth, sex expression and yield of squash
melon (Citrullus vulgaris var. fistulosus) as influenced by 2 (Chloroethyl) trimethyl-
ammonium chloride. Physiologia Plantarum. 28(3): 383-387.
Sharma, N. K., S. K. Arora and B. S. Dhankhar. 1988. Effect of plant growth substances
on growth, flowering, sex expression and fruit yield in bottle gourd [Lagenaria
siceraria (Mollina) Stand]. Haryana Agric. Univ. J. Res. 18(4): 291-297.
Singh, R. K. and B. Choudhury. 1988. Differential response of chemicals on sex
modifications of three genera of cucurbits. Indian J. Hort. 45(1-2): 88-99.
Sonkar, S. K. 2003. Effect of plant growth regulators on sex expression and yield of
pumkin (Cucurbita moschata Dutch. Ex. Poir). M.Sc. Thesis, VBS Poorvanchal
University, Jaunpur, India.

ISSN 0258-7122 (Print), 2408-8293 (Online)
Bangladesh J. Agril. Res. 44(4): 591-598, December 2019
REQUIREMENT OF DIFFERENT NUTRIENTS FOR YIELD
MAXIMIZATION OF BT BRINJAL
M. A. K. MIAN1, A. A. BEGUM2 AND R. R. SAHA3
Abstract
The experiment was conducted at Agronomy field of Bangladesh Agricultural
Research Institute, Gazipur during 2016-2017 and 2017-2018 to determine the
nutrient requirement for yield maximization of Bt brinjal (var. BARI Bt Begun-
2). The treatments were T1= STB (soil test base) recommendation (120-36-90-
15-2-1 kg/ha N-P-K-S-Zn-B+ 3 t/ha poultry manure), T2 = T1 + 25% of N-P-K-
S-Zn-B (150-45-112-18-2.5-1.25 kg/ha N-P-K-S-Zn-B +3 t/ha poultry manure),
T3= T1 + 50% of N-P-K-S-Zn-B (180-54-135-22-3-1.50 kg/ha N-P-K-S-Zn-B +3
t/ha poultry manure), T4= T1 + 25% of N-P-K-S-Zn-B + 3 t/ha poultry manure
(150-45-112-18-2.5-1.25 kg/ha N-P-K-S-Zn-B+6 t/ha poultry manure), T5= T1 +
3 t/ha poultry manure (120-36-90-15-2-1 kg/ha N-P-K-S-Zn-B + 6 t/ha poultry
manure). Nutrient uptake, yield components and yield of Bt brinjal varied
significantly due to variation of nutrients in the tested years. The highest plant
height (98-116 cm), canopy coverage (1.21-1.26 m2/plant), number of
fruits/plant (57.69-59.23) and individual fruit weight (83-86 g) were obtained
from 180-54-135-22-3-1.50 kg/ha N-P-K-S-Zn-B +3 t/ha poultry manure (T3)
treatment where days to flowering showed the lowest values (109-110 days).
The highest pooled yield (58.46 t/ha) of Bt brinjal was observed from the
treatment 180-54-135-22-3-1.50 kg/ha N-P-K-S-Zn-B +3 t/ha poultry
manure(T3) and the lowest (23.39 t/ha) from 120-36-90-15-2-1 kg/ha N-P-K-S-
Zn-B+ 3 t/ha poultry manure) (T1). The highest nutrient uptake (214-43-208-60-
0.38-0.213-49 kg/ha N-P-K-S-B-Ca) was also observed from the same treatment
(T3). Fruit yield showed a strong (r=0.97) linear relationship with applied
nutrients. Effect of nutrient application on fruit yield of Bt brinjal was estimated
about 86%. The highest gross return (Tk. 587900/ha), gross margin (Tk.
417660/ha) and benefit cost ratio (3.45) were obtained by applying 180-54-135-
22-3-1.50 kg/ha N-P-K-S-Zn-B+3 t/ha poultry manure. Results revealed that
application of 180-54-135-22-3-1.50 kg/ha N-P-K-S-Zn-B along with 3 t/ha
poultry manure would be economically optimum for achieving higher yield of
Bt brinjal grown under Grey Terrace soil (Aeric Albaquept) of Gazipur.
Keyword: Nutrient requirement, nutrient uptake, yield and Bt brinjal
Introduction
Brinjal (Solanum melongena) is the third most important vegetable in terms of both yield and production area in Bangladesh. Recently Bangladesh Agricultural
1Principal Scientific Officer, 2Senior Scientific Officer, 3Chief Scientific Officer,
Agronomy Division, Bangladesh Agricultural Research Institute (BARI), Gazipur-1701,
Bangladesh.
DOI: http://-

592 MIAN et al.
Research Institute has developed four Bt brinjal varieties. It has high potentiality to boost up the yield and brinjal production of the country. Bt brinjal needs additional fertilizer than the recommended dose for proper growth and yield (Mian, 2017). Optimum nutrient dose exerts proper growth and development of crop plant contributing to better yield components and yield (Morgan and Connolly, 2013). Nutrient involves in many important metabolic processes in the plant system and influences the growth and development of crop plant. Recommended fertilizer dose for non Bt brinjal is generally used in Bt brinjal because of no fertilizer recommendation for Bt brinjal yet in Bangladesh (FRG, 2018). Bt brinjal produced lower yield when recommended fertilizer dose for non Bt brinjal is used in Bt brinjal (BARI, 2017). Previous field experience and observation indicated that Bt brinjal has profused bearing than non Bt brinjal. Hence, higher fertilizer dose may require for full exploitation of yield potentiality of Bt brinjal. Most of the flowering buds of Bt Brinjal are active for fruiting. Bt gene is resistance to brinjal shoot and fruit borer of Bt brinjal. Probably Bt gene is also tolerance to fungal disease development on flowering buds of Bt brinjal. Consequently, more active flowering buds produce more fruits/plant and higher yield of Bt brinjal. Higher fruit yield of Bt brinjal may require high nutrient dose as compared to recommended nutrient dose for non Bt Brinjal because of high nutrient uptake by Bt Brinjal from the soil. There is a positive relationship between yield and nutrient uptake of a crop (Masni and Wasli, 2019). On the other hand, one of the major causes of low yield of brinjal might be due to low organic matter content as well as low nutrient status of soils those has been declined over time (Mian, 2008). Application of higher dose of nutrients than at present nutrient recommendation for non Bt brinjal may improve the yield of Bt brinjal. Moreover, optimum application of nutrient provides better agronomic and economic benefits to brinjal growers. Very little information is available regarding fertilizer management in Bt brinjal. As such, there is a need to recommend the fertilizer requirement for Bt brinjal. Therefore, the experiment was undertaken to find out economic fertilizer dose for achieving high yield of Bt brinjal.
Materials and Methods
The experiment was conducted at Agronomy field of Bangladesh Agricultural Research Institute, Gazipur during 2016-2017 and 2017-2018. The soil of the experimental field is clay loam under Chhiata series. Soil samples were collected from a depth of 0-20 cm prior to application of fertilizer in both the years. Results of soil analysis are presented in Table 1. Organic matter content and total N were very low. Exchangeable K and available P, S, Zn and B were found to be below the critical level. Five treatments consist of T1=120-36-90-15-2-1 kg/ha of N-P-K-S-Zn-B+ 3 t/ha poultry manure based on STB (FRG, 2012), T2 = T1 + 25% of N-P-K-S-Zn-B (150-45-112-18-2.5-1.25 kg/ha of N-P-K-S-Zn-B +3 t/ha poultry manure), T3= T1 + 50% of N-P-K-S-Zn-B (180-54-135-22-3-1.50 kg/ha of N-P-K-S-Zn-B +3 t/ha poultry manure), T4= T1 + 25% of N-P-K-S-Zn-B + 3 t/ha poultry manure (150-45-112-18-2.5-1.25 kg/ha of N-P-K-S-Zn-B+6 t/ha

REQUIREMENT OF DIFFERENT NUTRIENTS FOR YIELD 593
poultry manure), T5= T1+ 3 t/ha poultry manure (120-36-90-15-2-1 kg/ha of N-P-K-S-Zn-B + 6 t/ha poultry manure). The experiment was conducted in a randomized complete block (RCB) design with three replications. Unit plot size was 6.4 m ×5.4 m. All of poultry manure, phosphorus, sulphur, zinc and boron fertilizers were applied at the time of final land preparation. Nitrogen and potassium fertilizers were applied in four equal splits at 20, 40, 60 and 80 DAT (days after transplanting) around the plant roots and mixed thoroughly with the soil. The brinjal var. BARI Bt Begun-2 was used as test crop. Thirty days old seedling was transplanted on 11 November 2016 and 16 November 2017 at a spacing of 90 cm ×80 cm. Intercultural operations such as weeding, mulching, irrigation etc. were done as per requirement. The crop was harvested from 8-12 February to 1-5 April in 2017 and 2018. Frequent rainfall (66-107 mm in February to April) at later stage affected the crop (Fig.2) and drastically reduced fruit yield. Nutrient concentration in fruit and plant tissues of Bt brinjal was analyzed following the standard laboratory procedures. Nutrient uptake was computed on the basis of dry matter accumulation of Bt Brinjal and nutrient concentration in the tissues (both fruit and plant). Correlation of yield with nutrient uptake and nutrient uptake with applied nutrients were done. Functional relationship between total applied nutrient and fruit yield of Bt brinjal were established. Nutrient from poultry manure were calculated and considered in total applied nutrient (FRG, 2012). Data on yield and other associated characters were recorded. Canopy coverage was measured by meter-stick method (Armbust, 2009). Vertical projection area of the outer most perimeter of the natural spread of foliage of plants was measured. Soil surface coverage (D=diameter of coverage of the plant) was measured at four positions of spreading margin of the plant canopy (perimeter) perpendicular to the soil surface. Randomly selected 5 plant’s canopy coverage (D=diameter) was measured from each plot. Then mean value was calculated using the following formula. This measurement (A= π r2
where, D=2r) was done at first harvesting time of fruits. Data on yield and other associated characters were recorded. Collected data was subjected to analysis of variance. Least significant difference (LSD) value was used for mean separation and treatments means were compared by LSD (0.05) (Gomez and Gomez, 1984). Cost benefit analysis was also evaluated.
Table 1. Chemical properties of the experimental soil (average of two years)
Properties pH OM(%)
Total N
(%)
Exchangeable
K
(meq/100g
soil)
P
(ppm)
S
(ppm)
Zn
(ppm)
B
(ppm)
Nutrient Status
6.25 1.73 0.079 0.16 8.09 9.88 0.47 0.18
Critical limit - C:N=10:1 0.12 0.12 10 10 0.60 0.20
Interpretation Acidic VL VL L L L L L
VL=Very low, L=Low

594 MIAN et al.
Ta
ble
2.
To
tal
nu
trie
nt
up
tak
e (k
g/h
a)
by
Bt
Bri
nja
l fr
uit
an
d p
lan
t a
s in
flu
ence
d b
y n
utr
ien
t le
vel
(A
ver
ag
e of
201
6-2
01
7 a
nd
20
17-2
01
8)
Tre
atm
ent
N
P
K
S
Zn
B
C
a
T1
85
17
65
25
0.1
14
0.0
72
19
T2
13
4
28
13
2
32
0.2
31
0.1
32
32
T3
21
4
43
20
8
60
0.3
80
0.2
13
49
T4
16
2
35
15
6
41
0.2
88
0.1
58
34
T5
12
7
30
77
38
0.2
13
0.1
16
29
SE
(±)
6.9
1
3.0
9
7.6
6
3.6
3
0.0
10
0.0
07
3
Ta
ble
3.
Yie
ld a
ttri
bu
tes
an
d y
ield
of
Bt
bri
nja
l a
s in
flu
ence
d b
y n
utr
ien
t le
vel
in
20
1-2
01
7 a
nd
20
17
-20
18
Tre
atm
ent
Pla
nt
hei
ght
(cm
)
Can
op
y
cover
age
(m2)/
pla
nt
Days
to
flo
wer
ing (
day)
Fru
its/
pla
nt
(no
.)
Ind
ivid
ual
fruit
wei
ght
(g)
Fru
its
yie
ld (
t/ha)
20
16
-
20
17
20
17
-
20
18
20
16
-
20
17
20
17
-
20
18
20
16
-
20
17
20
17
-
20
18
20
16
-
20
17
20
17
-
20
18
20
16
-
20
17
20
17
-
20
18
20
16
-
20
17
20
17
-
20
18
Po
ole
d
T1
52
66
0.8
9
1.0
1
11
4
11
2
24
.45
22
.32
7
2
61
24
.45
22
.32
23
.39
T2
76
93
1.0
5
1.0
6
11
3
11
1
46
.77
42
.03
7
8
76
46
.77
42
.03
44
.40
T3
98
11
6
1.2
6
1.2
1
11
0
10
9
59
.23
57
.69
8
3
86
59
.23
57
.69
58
.46
T4
84
10
3
1.1
7
1.0
9
11
3
11
1
48
.28
46
.81
7
9
79
48
.28
46
.81
47
.55
T5
65
81
0.8
9
1.0
3
11
3
11
0
34
.35
33
.37
7
5
70
34
.35
33
.37
33
.86
LS
D (
0.0
5)
4.2
2
8.9
3
0.3
2
0.1
8
NS
N
S
4.0
1
3.6
8
2.3
2
.1
4.0
1
3.6
8
3.3
5
CV
(%
) 4
.92
5.2
7
7.8
5
4.5
8
5.3
7
4.3
3
5.0
7
5.6
7
3.1
1
3.0
2
5.0
7
5.6
7
5.3
7
T1=
12
0-3
6-9
0-1
5-2
-1 k
g/h
a N
-P-K
-S-Z
n-B
+ 3
t/h
a p
oult
ry m
anu
re
T2 =
150
-45
-11
2-1
8-2
.5-1
.25
kg/h
a N
-P-K
-S-Z
n-B
+3
t/h
a p
oult
ry m
an
ure
T3=
18
0-5
4-1
35
-22
-3-1
.50
kg/h
a N
-P-K
-S-Z
n-B
+3
t/h
a p
ou
ltry
man
ure
T4=
15
0-4
5-1
12
-18
-2.5
-1.2
5 k
g/h
a N
-P-K
-S-Z
n-B
+6
t/h
a p
oult
ry m
anure
T5=
12
0-3
6-9
0-1
5-2
-1 k
g/h
a N
-P-K
-S-Z
n-B
+ 6
t/h
a po
ult
ry m
an
ure

REQUIREMENT OF DIFFERENT NUTRIENTS FOR YIELD 595
Results and Discussion
Nutrient uptake:
Uptake of N, P, K, S, Zn, B and Ca by whole plant (stem+leaves+fruit) of Bt
brinjal differed among the treatments (Table 2). N uptake by both shoot and fruit varied from 85 to 214 kg/ha. The highest N uptake by whole plant occurred in the
180-54-135-22-3-1.5 kg/ha N-P-K-S-Zn-B + 3 t/ha poultry manure (T3) treatment. Higher nutrient application into soil enhanced crop growth as well as
total dry matter resulting the highest nutrient uptake from soil. Similar results were also reported by Ghosh et al. (2014). The uptake of N was the lowest in the
treatment 120-36-90-15-2-1 kg/ha N-P-K-S-Zn-B+ 3 t/ha poultry manure (T1) possibly due to lower availability of N coupled with lower dry matter. P, K, S,
Zn, B and Ca uptake by whole plant of Bt brinjal also followed a similar pattern
to that obtained for N uptake (Table 2).
Plant height and yield attributes:
Plant height and canopy coverage/plant showed significant variation among the nutrient level in both the years (Table 3). Plant height was found maximum in T3
treatment followed by T4 treatment and the lowest from T1. Similar trend was also observed in the case of canopy coverage/plant. Higher nutrient level
increased plant height and canopy coverage indicated better crop growth. Similar results were reported by Khanum et.al. (2017) in Bt Brinjal. Days to flowering
did not differ significantly among the treatments in both the years. Days to flowering ranged from 109-114 days being the lowest value from T3 treatment
(Table 3). The results indicated that higher nutrient level enhanced early flowering (Ahmad et al., 2011; Sajid and Amin, 2014). The highest number of
fruits/plant was found in T3 treatment and it was significantly different from all other treatments. The lowest number of fruits/plant was obtained from T1
treatment. The result indicated that higher nutrient level enhanced crop growth resulting higher fruits/plant. Similar results were reported by Sharma and Guru
(2016) in brinjal. Individual fruit weight varied considerably and increased
significantly in different treatments as compared to T1. The highest fruit weight was recorded in T3 treatment and it was significantly superior to all other
treatments in both the years. Treatment T1 produced the lowest individual fruit weight.
Fruit yield:
Application of different nutrients (higher nutrients) increased fruit yield from
24.45 to 59.23 t/ha in 2016-2017 and 22.32 to 57.69 t/ha in 2017-2018 (Table 3). The highest fruit yields (59.23 t/ha in 2016-2017 and 57.69 t/ha in 2017-2018)
were obtained from T3 treatment and it was significantly different from all other treatments. The result indicates that Bt brinjal produced higher fruit yield at
higher nutrient level as it was required for exploitation of it’s high yield

596 MIAN et al.
potentiality. The results are in agreement with the findings of Anonymous (2017)
and Mian (2017). The yield advantage was achieved through greater nutrient uptake by Bt brinjal resulting increased fruits/plant and individual fruit weight
which eventually increased fruit yield of Bt brinjal. Recommended nutrient level for brinjal produced lower yield of Bt brinjal in both the years. Fruit yield was
significantly correlated with applied nutrients (r=0.97). Correlation of yield with nutrient uptake and nutrient uptake with applied nutrients were positive and
significant (Table 4). Functional relationship between applied nutrient and fruit yield of Bt brinjal suggests that variation in yield can be attributed to the
differences in applied nutrients. The result shows that higher nutrients gave higher fruit yield of Bt brinjal (Fig.1). Cost and return analysis of different
treatments are presented in Table 5. Gross return (Tk. 587900/ha), gross margin
(Tk. 417660/ha) and BCR (3.45) were found the highest in T3 treatment followed by T4 treatment and T2 treatment. The results indicated that higher nutrient dose
gave higher economic advantage.
Table 4. Correlation of yield with nutrient uptake and nutrient uptake with applied
nutrients (average of 2016-2017 and 2017-2018)
Nutrient Correlation of yield with
nutrient uptake (r)
Correlation of nutrient uptake
with applied nutrient (r)
N 0.98** 0.86**
P 0.95** 0.73**
K 0.98** 0.79**
S 0.89** 0.85**
Zn 0.99** 0.91**
B 0.99** 0.93**
Ca 0.97** 0.86**
** Significant at 1% level of probability
Table 5. Cost and return analysis of Bt brinjal as influenced by nutrient level
(average of 2016-2017and 2017-2018)
Treatment Gross return
(Tk./ha) Cost of cultivation
(Tk./ha)
Gross margin
(Tk./ha) BCR
T1 223200 121600 101600 1.84
T2 420300 145920 274380 2.88
T3 587900 170240 417660 3.45
T4 468100 152000 316100 3.08
T5 333700 127680 206020 2.61
Price (Tk./kg)
Urea:16.00, TSP:22.00, MOP:15.00, Gypsum:10.00, Zinc sulphate :170.00, Boric acid:200.00
Bt brinjal fruit: 9.50-10.00, Labour wage: Tk.400.00/day
T1= 120-36-90-15-2-1 kg/ha N-P-K-S-Zn-B+ 3 t/ha poultry manure
T2 = 150-45-112-18-2.5-1.25 kg/ha N-P-K-S-Zn-B +3 t/ha poultry manure
T3= 180-54-135-22-3-1.50 kg/ha N-P-K-S-Zn-B +3 t/ha poultry manure
T4= 150-45-112-18-2.5-1.25 kg/ha N-P-K-S-Zn-B+6 t/ha poultry manure
T5= 120-36-90-15-2-1 kg/ha N-P-K-S-Zn-B + 6 t/ha poultry manure

REQUIREMENT OF DIFFERENT NUTRIENTS FOR YIELD 597
Y = - 53.281+ 0.216x
R2 = 0.86
0
10
20
30
40
50
60
70
300 350 400 450 500 550
Total applied nutrient (Kg/ha)
Fru
it y
ield
(t/
ha)
Fig. 1. Functional relationship between applied nutrient and fruit yield of Bt Brinjal
(average of 2016- 2017 and 2017-2018).
Fig.2. Rainfall distribution during growing period of Bt brinjal (2016-2017 and 2017-2018)
Conclusion
The results of two years’ study revealed that application of 180-54-135-22-3-
1.50 kg/ha N-P-K-S-Zn-B along with 3 t/ha poultry manure was the suitable combination of nutrients for raising maximum fruit yield and also economically
profitable for brinjal production in Chhiata series of the Grey Terrace soil of Gazipur.
598 MIAN et al.
References
Armbust 2009: www.webpages.uidaho.edu/range357/notes/cover.pdf (Visited on 4 July
2018).
Ahmad, M., A. Asif, A. Amjad and S. Ahmadturk. 2011. J. Agric For. 35:641-648
(TÜBİTAKdoi:10.3906/tar-1005-995).
Anonymous.2017. Effect of different fertilizer treatment on eggplant production in
Hainan. Intl. Plant nutrition (china.ipni.net/article/CNP-3119) (Visited 02.7.2017).
BARI (Bangladesh Argil. Res. Inst.). 2014. New technology of developing variety and
production of Bt brinjal in Bangladesh (Bangladeshey Adunik Projuktir Bt beguner
jat udvabhon o’ utpadon projukti: In Bangla. BARI. Gazipur. 1701. pp.1-3.
BARI (Bangladesh Argil. Res. Inst.). 2017. On farm trial of BARI released Bt Brinjal
varieties. In: Annual Res. Report (2016-2017). On Farm Res. Div. BARI. Gazipur.
1701. pp.505-510.
FRG (Fertilizer recommendation guide). 2012. BARC (Bangladesh Argil. Res. Council).
Farm gate, Dhaka. 1215. pp.118-248.
FRG (Fertilizer recommendation guide). 2018. BARC (Bangladesh Argil. Res. Council).
Farm gate, Dhaka. 1215. pp.102-103.
Gomez K.A. and A.A. Gomez. 1984. Statistical procedures for Agriculture Research.
Intl. Rice Res. Inst. Philippines. pp. 87-411.
Ghosh, K., M. A. H. Chowdhury, M. H. Rahman and S. Bhattacherjee. 2014. Effect of
integrated nutrient management on nutrient uptake and economics of fertilizer use in
rice cv. NERICA 10. J. Bangladesh Agril. Univ., Mymensingh. 12(2): 273–277.
Khanum, M., M.M. Bazzaz and M.A.K. Mian. 2017. Effect of fertilizer management on
fruit yield of Bt Brinjal at Dinajpur. In: Annual Res. Report (2016-2017). Agron.
Div. BARI. Gazipur 1701. pp.36-37.
Masni Z. and M. E. Wasli. 2019. Yield performance and nutrient uptake of red rice
variety (MRM 16) at different NPK fertilizer rates. Intl. J. Agron. p.6. (Malaysia).
(https://doi.org/10.1155/2019/5134358) (Visited on 24 October 2019).
Mian, M.A.K. 2008. Performance of maize oriented cropping under different nutrient
management. Ph.D. Dissertation. Department of Agronomy. Bangladesh Agril. Univ.
Mymensingh. pp. 1-2.
Mian M.A.K. 2017. Development of production package and adaptation of Bt Brinjal in
different agro-ecological zone as changing climate of Bangladesh. J. Sci. and
Techno. Res., Ministry of Sci. and Techno. Bangladesh. pp.37-42.
Morgan, J. B. and Connolly, E. L. 2013. Plant-soil interactions: Nutrient uptake. Nature
Education Knowledge. 4(8):2-5.
Sajid, M. and N. Amin. 2014. Effect of various combinations of nitrogen, phosphorus and
potash on enhancing the flowering time in Chrysanthemum (Chrysanthemum
morifolium). Int. J. Biosci. 4(10): 99-108.
Sharma, S.N and Guru, N C. 2016. Requirement of N P K for brinjal in silty loam soil at
Haryana. Physiology J. 2(2): 321-324. (Visited 02.7.2017 physoc. online library.
wiley. com/ hub/ journal /10.1111/(ISSN) 1469-7793/).

ISSN 0258-7122 (Print), 2408-8293 (Online)
Bangladesh J. Agril. Res. 44(4): 599-607, December 2019
EFFECTS OF POTASSIUM APPLICATION ON YIELD ATTRIBUTES,
YIELD AND GRAIN QUALITY OF LENTIL IN TERRACE SOIL
OF JOYDEBPUR
M. A. QUDDUS1, M. A. HOSSAIN2, H. M. NASER3 AND S. AKTAR4
Abstract
An experiment was conducted in the research field of Pulses Research Sub-Station,
BARI, Gazipur during two consecutive years of 2015-16 and 2016-17 to determine the suitable dose of potassium for achieving higher yield attributes, nodulation, nutrient
concentration and yield maximization of lentil. There were 5 treatments viz. T1 = Control, T2 = 30 kg K ha-1, T3= 40 kg K ha-1, T4= 50 kg K ha-1 and T5= 60 kg K ha-1 along with the
blanket dose of fertilizers of N, P, S, Zn and B @ 15, 20, 10, 2 and 1.5 kg ha-1,
respectively for all treatments. The experiment was laid out in randomized complete block design (RCBD) with three replications. Results revealed that the highest seed yield (1092 kg
ha-1) of lentil (mean of two years) was found in T4 followed by T5 treatment and the lowest (736 kg ha-1) was noted in K control (T1) treatment. The highest % yield increase
over control (48.3%) was recorded from T4 treatment. The maximum nodulation was found in T5 followed by T4 treatment. The highest protein (26.9%), N, P, K, S, Zn and B
concentrations of lentil seed were recorded in T4 treatment. Therefore, the results suggest that the appliction of 50 kg K ha-1
along with N15P20S10Zn2B1.5 kg ha-1 are optimum for
achieving higher yield potential of lentil in terrace soils of Bangladesh.
Keywords: Potassium, lentil yield, nodulation, nutrient content, terrace soil
Introduction
Improved variety and intensive cropping followed by imbalanced use of
fertilizers make the soils deficient in nutrients and thus the crops grown on such
soils show mineral deficiencies. Deficiency of several major and minor nutrients
such as K, S, Ca, Zn, Fe and B are increasing with time (Kurhade et al., 2015;
Rao and Vittal, 2007). Lentil (Lens culinaris Medic) is an edible and popular
pulse crop that belongs to the family Fabaceae. Lentil seed contains 25% protein,
1.1% fat, 59% carbohydrate, and is also rich in important vitamins, minerals, and
soluble and insoluble dietary fiber (Islam et al., 2018). It helps to improve the
soil fertility through biological nitrogen fixation (Quddus et al., 2014). The
average yield of lentil in Bangladesh is low (752 kg ha-1) due to non-judicious
use of manures and fertilizers (Zahan et al., 2009).
Potassium (K), as a plant nutrient, is becoming increasingly important in
Bangladesh and shows a good response to pulse crop. Potassium improves
1Senior Scientific Officer, Soil and Water Management Section, HRC, Bangladesh
Agricultural Research Institute (BARI), Gazipur, 2Chief Scientific Officer, Soil Science
Division, BARI, Gazipur, 3Principal Scientific Officer, Soil Science Division, BARI,
Gazipur, 4Scientific Officer, Pulses Research Sub-Station, BARI, Gazipur, Bangladesh.
DOI: http://-

600 QUDDUS et al.
plant water relationship and improves shoot growth of pulse crop (Kabir et al.,
2004). It maintains turgor pressure of cell which is necessary for cell
expansion. It helps in osmo-regulation of plant cell, assists in opening and
closing of stomata (Yang et al., 2004). Potassium nutrition is associated with
the nodulation and grain quality and protein content (Srinivasarao et al., 2003).
It also helps improve disease resistance, drought stress, tolerance to water
stress, winter hardiness, tolerance to plant pests and uptake efficiency of other
nutrients (Gupta et al., 2013). Considering its nutritional value; it is necessary
to uplift the production level and nutritional quality of lentil. Therefore, the
present study was undertaken to find out the suitable dose of K for yield
maximization of lentil.
Materials and Methods
Field experiment was conducted in Rabi season of 2015-16 and 2016-17 in the
research field of Pulses Research Sub-Station, Bangladesh Agricultural Research
Institute (BARI), Gazipur (24° 0′ 13″ N latitude and 90° 25′ 0″ E longitude).
Gazipur is medium high land with fine-textured (clay loam) terrace soils. It
belongs to Chhiata series (Soil taxonomy: Udic Rhodustalf) under the
agroecological zone - Madhupur Tract (AEZ-28). The Gazipur area received
average rainfall from 1.40 to 118 mm during October to March. The mean
minimum and maximum air temperatures during October to March of the
experiment were 12.2 & 33.1°C during 2015-16 and 13.6 & 33.1°C, respectively
during 2016-17. The average minimum and maximum humidity (%) were 51 and
88 during October to March (Table 1). Before starting the experiment, initial soil
(0-15 cm) sample was analyzed as outlined by Page et al. (1982) and standard
method. The chemical properties are shown in Table 2.
Table 1. Weather data during the experimental period at Gazipur
Months
Avg. Temperature (°C) Avg. Humidity (%) Rainfall (mm)
2015-16 2016-17 2015-16 2016-17 2015-16 2016-17
Min. Max. Min. Max. Min. Max. Min. Max. - -
October 24.0 33.1 24.8 33.1 76 83 67 79 14 13.7
November 18.2 30.7 19.4 30.1 84 88 61 72 0 1.40
December 16.5 26.2 15.5 28.2 74 82 53 80 0 0
January 12.2 25.2 13.6 27.0 67 80 51 81 0 0
February 17.0 29.6 16.3 30.4 57 74 46 73 0 0
March 19.9 33.1 19.4 30.9 53 73 56 75 118 8.02
Source: Weather centre, BARI, Gazipur, Bangladesh

EFFECTS OF POTASSIUM APPLICATION ON YIELD ATTRIBUTES, YIELD 601
Table 2. Fertility status of initial soil sample of the experimental field at Gazipur
Location pH OM
(%)
Total
N
(%)
Ca K P S Zn B
meq. 100 g-1 mg kg-1
Gazipur
(result) 6.2 1.30 0.061 6.55 0.11 13 13.5 0.65 0.16
Critical level - - 0.12 2.0 0.12 7 10 0.60 0.20
Interpretation* acidic low very
low high low medium medium low low
*FRG, (2012)
The land was firstly opened by a tractor operated chisel plough and then prepared
thoroughly by ploughing with a power tillerfollowed by laddering and leveling.
There were 5 treatments consisting of different levels of potassium (0, 30, 40, 50
& 60 kg K ha-1) including control such as T1 = Control, T2 = 30 kg K ha-1, T3= 40
kg K ha-1, T4= 50 kg K ha-1, T5= 60 kg K ha-1 along with the blanket dose of other
nutrients N, P, S, Zn and B @ 15, 20, 10, 2 and 1.5 kg ha-1, respectively.The
experiment was laid out in randomized complete block design (RCBD) with three
replications. The unit plot size was 12 m2 (4 m x 3 m). Nutrients N, P, K, S, Zn and B
were applied as urea, TSP, MoP, gypsum, zinc sulphate and boric acid, respectively
during final plot preparation. Seeds of lentil (cv. BARI Masur-7) were treated
using the fungicide Provex 200 (at 2.5 g kg-1 seeds) before sowing for controlling
of root rot disease. Treated seeds (@ 30 kg ha-1) were sown on 09 November,
2015 and 16 November, 2016. Seeds were sown continuously in rows (10
rows/plot) maintaining row to row spacing of 30 cm. Hand weeding as well as
thining of seedlings were done at 25 days after sowing (DAS) maintaining the
distance of plant to plant 05 cm by making a total of 800 plants per plot (12 m2).
Again, hand weeding was done at 50 DAS. Three sprays were done with
fungicide of Rovral starting from 55 DAS to control Stemphylium disease and
two times insecticide (Karate @ 2 ml L-1 of water) sprayed at 10 days interval
starting from 60 DAS to overcome insect infestation. The crop was harvested at
maturity. Data on seed yield (kg ha-1) at around 10% moisture basis were
recorded from the whole plot technique. For stover yield (kg ha-1), mature plants
were collected from two 1m2 quadrates in each plot at harvest time. The yield
contributing characters namely: plant height and number of pods plant-1 were
recorded from ten plants selected randomly from each unit plot. Pods were
detached from every plant and the number of pods per plant was counted and
averaged. Thousand seed weight (g) was determined by the counting of 500
seeds randomly from each plot and weighing through electronic balance and
converting it into 1000-seed weight. For nodule counting per plant, 5 plants from
each plot were selected randomly at seedling, vegetative, flowering and podding

602 QUDDUS et al.
stages. Plants were smoothly uprooted and the soil from roots was removed
carefully using tap water. Separated nodules were sliced into two pieces to
observe the inside color for nodules activity. The light-pink or red coloured
nodules were considered as active.
Stover and seed samples were digested with di-acid mixture (HNO3-HClO4) (5:
1) as described by Piper (1966) for determination of P (spectrophotometer
method), K (atomic absorption spectrophotometer method), S (turbidity method
using BaCl2 by spectrophotometer), Zn (atomic absorption spectrophotometer
method, VARIAN SpectrAA 55B, Australia) and B (spectrophotometer
following azomethine-H method) concentration. The N concentration was
determined by Micro-Kjeldahl method. Protein content was calculated
multiplying the N value by 6.25 (Hiller et al., 1948).
Data on yield attributes, number of nodules per plant, protein content and N, P,
K, S, Zn, B content were computed on average of two study years. Data of all
parameters were statistically analysed by ANOVA procedure. Then, multiple
comparisons were done by LSD at 5% level (Statistix 10., 1985).
Results and Discussion
Effects of K application on yield attributes of lentil
The yield attributes of lentil such as plant height, pods per plant and seed weight
responded significantly to application of different rates of potassium (Table 3). In
the present experiment, plant height varied from 27.2 to 30.7 cm. The tallest
plant (30.7 cm) was recorded from the treatment T5 which was statistically
identical with T4 and T3 treatments. The dwarf plant (27.2 cm) was noted for K
control (T1) treatment. The result is in agreement with the findings of Sahay et al.
(2013) who observed the maximum plant height of lentil (43.5 cm) due to
application of 90 kg K2O ha-1. Optimum dose of K can increase flowering, pod
formation, grain set and early physiological maturity (Hasanuzzaman et al.,
2018). Different levels of K showed significant effect on the number of pods per
plant (Table 3). The maximum number of pods per plant (48.4) was found in the
treatment T4 followed by T5 treatment and the minimum number of pods per
plant (30.0) was observed in K control (T1) treatment (Table 3). Ali et al. (2007)
reported on chickpea that application of 150 kg K2O ha-1 produced significantly
maximum number of pods plant-1 (61.9). The K application contributed
significantly to the seed weight of lentil. The 1000- seed weight varied from 17.2
to 19.9 g, the highest seed weight being recorded for treatment T5 which was
significantly higher than the other treatments. The lowest 1000- seed weight was
recorded in K control treatment (Table 3). Higher K levels resulted in higher seed
weight probably due to role of potash in translocation of photosynthates and its

EFFECTS OF POTASSIUM APPLICATION ON YIELD ATTRIBUTES, YIELD 603
ability to develop bold seeds (Ali et al., 2007). Islam and Muttaleb (2016)
reported that the higher amount of K helps transfer food material to develop
grains.
Table 3. Effects of different levels of K on yield attributes of lentil (pooled data of
two years)
Treatment Plant height (cm) No. of pods plant-1 1000- seed wt. (g)
T1 (Control) 27.2 30.0 17.2
T2 (30 kg K ha-1) 29.0 38.4 18.6
T3 (40 kg K ha-1) 29.5 39.7 19.0
T4 (50 kg K ha-1) 29.6 48.4 19.2
T5 (60 kg K ha-1) 30.7 44.7 19.9
CV (%) 2.84 3.14 1.71
LSD (0.05) 1.56 2.38 0.60
Effects of K application on yield of lentil
The seed yield of lentil responded significantly to the application of potassium
(Table 4). Potassium involves increasing the utilization of carbohydrates,
enhances the dry matter accumulation and ultimately increases the yields of
crop (Cheema et al., 2012). The highest seed yield of 1015 kg ha-1 in the 1st
year was recorded from T4 which was significantly higher than other treatments
except T5 treatment (994 kg ha-1). The lowest seed yield value (722 kg ha-1)
being noted in the K control (T1) treatment. Smilarly in the 2nd year, the
significantly highest seed yield (1168 kg ha-1) was recorded in T4 treatment.
The lowest seed yield was observed in K control treatment (Table 4).
Potassium might have regulated the biosynthesis, conversion, and allocation of
metabolites that ultimately increased the yield. Many research works support
the idea that K is directly or indirectly responsible for higher yield of crops
(Hasanuzzaman et al., 2018). Sahay et al. (2013) reported that grain yield of
lentil increased with increase in K level up to 90 kg K2O ha-1. Regarding stover
yield of lentil, the trend was similar to that of seed yield. The mean stover yield
(average of two years) of lentil varied from 1669 to 2542 kg ha -1. The percent
seed yield increase over control varied from 20.8 to 48.3%. The highest seed
yield increase noted from T4 treatment was followed by T5 treatment and the
lowest from T2 treatment (Table 4). Jahan et al. (2009) reported that 34.2%
grain yield increase of lentil over control was obtained by the application of 42
kg K2O ha-1.

604 QUDDUS et al.
Table 4. Effects of different levels of K on seed and stover yield of lentil
Treatment
Seed yield ( kg ha-1) % yield
increase over
control
Stover yield ( kg ha-1)
1st Yr. 2nd Yr. mean 1st Yr. 2nd Yr. Mean
T1 (Control) 722 750 736 - 1793 1544 1669
T2 (30 kg K ha-1) 879 899 889 20.8 2233 1809 2021
T3 (40 kg K ha-1) 949 932 941 27.9 2538 1871 2205
T4 (50 kg K ha-1) 1015 1168 1092 48.3 2816 2267 2542
T5 (60 kg K ha-1) 994 1022 1008 36.9 2628 2073 2351
CV (%) 2.03 4.74 - - 2.25 2.81 -
LSD (0.05) 34.9 85.0 - - 102 101 -
Effects of K application on nodulation and protein content of lentil
Adequate K supply enhances the biological nitrogen (N) fixation (Srinivasarao et
al., 2003). Table 5 shows that the number of nodules per plant increased from 32
days after sowing (DAS) to 62 DAS, and then it decreased. Nodulation was
influenced significantly due to application of of potassium. At 32 days after
sowing, the number of nodules per plant varied from 6.30 to 9.33, at 47 DAS it
ranged from 15.4 to 26.7, at 62 DAS it was from 15.7 to 27.3 and at 77 DAS, this
range varied from 11.1 to 16.9 (Table 5). The maximum number of nodules per
plant was recorded from the treatment T5 in all the dates of nodule collection
followed by T4 treatment except the collection date 47 (DAS) it was highest in T4
treatment followed by T5 treatment. The lowest number of nodules was found in
the K control treatment (Table 5). The experimental results show that the
maximum nodule formation occured during early to mid flowering. After
flowering, nodule efficiency was reduced. The result of this study indicates that
the different rates of K application contributed for higher seed protein content in
lentil (Table 5). The maximum seed protein (26.9%) of lentil was found in T4
treatment followed by T5, T3 and T2 treatments. The lowest amount (24.3%) was
found in K control (T1) treatment (Table 5). Similar result was observed by
Sahay et al. (2013) who noted that the highest protein content (22.01%) in lentil
grain was obtained by fertilization of 90 kg K2O ha-1.
Table 5. Effects of different levels of K application on number of nodules per plant
and on protein concentration of lentil seed (pooled data of two years)
Treatment No. of nodules
32 DAS No. of nodules
47 DAS No. of nodules
62 DAS No. of nodules
77 DAS Protein (%)
T1 (Control) 6.30 15.4 15.7 11.1 24.3
T2 (30 kg K ha-1) 7.98 23.3 23.7 15.4 26.2
T3 (40 kg K ha-1) 8.43 24.1 24.4 15.5 26.6
T4 (50 kg K ha-1) 8.83 26.7 25.8 15.3 26.9
T5 (60 kg K ha-1) 9.33 25.6 27.3 16.9 26.8
CV (%) 1.62 2.90 3.35 5.28 3.09
LSD (0.05) 0.25 1.26 1.47 1.48 1.53

EFFECTS OF POTASSIUM APPLICATION ON YIELD ATTRIBUTES, YIELD 605
Effects of K application on nutrient concentration of lentil seed
Potassium plays a significant regulatory role in numerous plants’ physiological
processes- seed germination and emergence, protein synthesis, nutrient content
and nutrient balance (Marschner, 2012). The N, P, K, S, Zn, and B concentration
of lentil (seed) was markedly influenced by the K application (Tables 6). The
highest N concentration in lentil seed (4.31%) was found in the T4 treatment,
which was statistically identical to T5, T3 and T2 treatments. The lowest seed N
concentration (3.88%) was noted from the K control (T1) treatment. In case of P
concentration, the highest P content in seed (0.45%) was recorded in T5 treatment
followed by T4 treatment. The lowest P concentration (0.31%) in seed was found
in K control treatment (Table 6). The highest K concentration in lentil seed
(0.66%) was recorded from the T4 treatment, which was statistically similar to T5,
T3 and T2 treatments. The lowest seed K concentration (0.57%) was found in
control (T1) treatment (Table 6). Regarding S concentration, the highest S
concentration in lentil seed (0.37%) was recorded in T5 treatment followed by T4
treatment. The lowest S concentration in seed was found in control (T1) treatment
(Table 6). The highest Zn concentration in lentil seed (75.7 ppm) was noted from
the T4 treatment. The lowest seed Zn concentration was noted in the control (T1)
treatment. The highest B concentration (46.4 ppm) in lentil seed was observed in
the T4 treatment, which was statistically similar to T5 treatment. The lowest seed
B concentration was estimated from K control (T1) treatment (Table 6). Similar
results were reported earlier that the K application influenced the uptake of N, P,
K, S, Zn, and B (Kurhade et al., 2015; Chaudhari et al., 2018).
Table 6. Effects of different levels of K on nutrient concentration of lentil seed
(Pooled data of two years)
Treatment N (%) P (%) K (%) S (%) Zn (ppm) B (ppm)
T1 (Control) 3.88 0.31 0.57 0.28 74.1 40.2
T2 (30 kg K ha-1) 4.20 0.38 0.62 0.31 74.5 42.0
T3 (40 kg K ha-1) 4.26 0.40 0.63 0.33 74.8 44.3
T4 (50 kg K ha-1) 4.31 0.44 0.66 0.36 75.7 46.4
T5 (60 kg K ha-1) 4.28 0.45 0.64 0.37 74.9 46.2
CV (%) 3.04 4.72 4.18 3.03 1.34 2.08
LSD (0.05) 0.24 0.04 0.05 0.02 ns 1.72
Conclusion
Application 50 kg K ha-1 gave the highest seed yield of lentil. The K application
contributed to pod setting, which finally increased the seed yield. The same K
rate also showed the highest nutrient and protein content in lentil. Application of
50 kg K ha-1 along with N15P20S10Zn2B1.5 kg ha-1 can be recommended for lentil
cultivation in terrace soils of Bangladesh.

606 QUDDUS et al.
References
Ali, A., M. Ather Nadeem, A.Tanveer, M. Tahir and M. Hussain. 2007. Effect of
different potash levels on the growth, yield and protein contents of chickpea (Cicer
arietinum L.). Pak. J. Bot., 39(2): 523-527.
Chaudhari, A.V., S.S. Mane and B.R. Chadar. 2018. Effect of graded levels of potassium
on growth, yield and quality of black gram. Int. J. Curr. Microbiol .App. Sci.,
Special Issue-6:1607-1612.
Gupta, K., A. Dey and B. Gupta. 2013. Plant polyamines in abiotic stress responses. Acta
Physiologiae Plantarum, 35: 2015-2036.
Hasanuzzaman, M., M. H. M. Borhannuddin Bhuyan, , Kamrun Nahar, Md. Shahadat
Hossain, Jubayer Al Mahmud, Md. Shahadat Hossen, Abdul Awal Chowdhury
Masud, Moumita and Masayuki Fujita. 2018. Potassium: a vital regulator of plant
responses and tolerance to abiotic stresses. Agronomy,
doi:10.3390/agronomy8030031
Hiller, A., J. Plazin and D.D.Vanslyke. 1948. A study of conditions of Kjeldhal
determination of nitrogen in proteins. J. Biol. Chem., 176(3):1401-1420.
Islam, A. and A. Muttaleb. 2016. Effect of potassium fertilization on yield and potassium
nutrition of Boro rice in a wetland ecosystem of Bangladesh. Arch. Agron. Soil Sci.,
62: 1530-1540.
Islam, M.M., M.R. Karim, M.M.H. Oliver, T.A. Urmi, M.A. Hossain, and M.M. Moynul
Haque. 2018. Impacts of Trace Element Addition on Lentil (Lens culinaris L.)
Agronomy. Agronomy, 8(7): 100; https://doi.org/10.3390/agronomy8070100
Kabir , M. E., M.A. Karim and M.A.K. Azad. 2004. Effect of Potassium on Salinity
Tolerance of Mungbean (Vigana radiata L. Wilczek). Journal of Biological
Sciences, 4:103-110. DOI: 10.3923/jbs.2004.103.110
Kurhade, P.P., H.N. Sethi and R.S. Zadode. 2015. Effect of different levels of potassium
on yield, quality, available nutrient and uptake of blackgram. Internat. J. agric. Sci.,
11 (1): 175-178. DOI: 10.15740/HAS/IJAS/11.1/175-178
Marschner, H. 2012. Marschner’s Mineral Nutrition of Higher Plants, 3rd ed.;
Academic Press: London, UK, pp. 178–189.
Page, A.L., R.H. Miller, and D.R. Keeney (Eds.). 1982. Agronomy Series 9 ASA, SSSA.
Methods of Soil Analysis (Part 2, 2nd ed., pp. 403-427). Am. Soc. Agron., Madison,
USA.
Piper, C.S. 1966. Soil and Plant Analysis. Adelaide University Press, Australia
Quddus, M.A., H.M. Naser, M.A. Hossain and M. Abul Hossain. 2014. Effect of zinc and
boron on yield and yield contributing characters of lentil in low Ganges river
floodplain soil at madaripur, bangladesh. Bangladesh Journal of Agricultural
Research, 39(4): 591-603.
Rao, Ch. Srinivasa and K.P.R. Vittal. 2007. Emerging nutrient deficiencies in different
soil types under rainfed production systems of India. Indian J. Fertilizer, 3: 37-46.
Sahay, N., S.P. Singh and V. K. Sharma. 2013. Effect of cobalt and potassium application
on growth, yield and nutrient uptake in lentil ( Lens culinaris L.). Legume Res., 36
(3): 259-262.

EFFECTS OF POTASSIUM APPLICATION ON YIELD ATTRIBUTES, YIELD 607
Srinivasarao, C., Masood Ali, A.N. Ganeshamurthy, and K.K. Singh. 2003. Potassium
Requirements of Pulse Crops. Better Crops International, 17 (1): 8-11.
Statistix 10. 1985. An Analytical Software, Po Box 12185, Tallahassee, FL 32317, Copy
right © 1985-2013
Yang, X.E., W.M. Wang and He Zi. 2004. Physiological and genetic characteristics of
nutrient efficiency of plants in acid soils. p. 78-83.
Zahan, S. A., M. A. Alim, M.M. Hasan, U.K. Kabiraj and M.B. Hossain. 2009. Effect of
potassium levels on the growth, yield and yield attributes of lentil. Int. J. Sustain.
Crop Prod. 4(6):1-6.

608 QUDDUS et al.

ISSN 0258-7122 (Print), 2408-8293 (Online)
Bangladesh J. Agril. Res. 44(4): 609-620, December 2019
PHYSICAL AND ENGINEERING PROPERTIES OF BARI RELEASED
THREE GROUNDNUT VARIETIES
M. A. HOQUE1
Abstract
The knowledge of the physical characteristics of particles is essential for the
designer of agricultural machines. The study was aimed to determine physical
and engineering properties of three selected varieties of groundnuts cultivated in
Bangladesh such as Dhaka-1, BARI Badam-8 and BARI Badam-9 at safe
storage moisture content of 7.5%. One hundred groundnut pods and kernels
were randomly selected and the length, width and thickness were measured
using a vernier caliper. The geometric mean diameter, sphericity, aspect ratio
was calculated using standard formula and measured values. Bulk density, true
density, mass and porosity were found through direct weighing and water
displacement. Angle of repose of pods and kernels was also measured on wood,
glass and mild steel sheet surfaces. BARI Badam-9 had the highest pod
geometric mean diameter and BARI Badam-8 had the highest kernel geometric
mean diameter. Sphericity of groundnut pod was the highest for Dhaka-1.
Surface area of pod and aspect ratio of both pod and kernel were the highest in
BARI Badam-9. Porosity of the pod was the least for BARI Badam-8. Angle of
repose of kernel varied on wood and glass. But it was similar for kernel on MS
sheet for the varieties. This result will be useful to design and develop groundnut
processing equipment for different varietal variability.
Keywords: Groundnut, Engineering properties, geometric dimensions, BARI
Introduction
Groundnut (Arachis hypogaea L.) is one of the important oilseed crops in the
world. It is rich in protein and has a high energy value. Groundnut is grown on
26.4 million ha worldwide with a total production of 37.1 million metric tons
(Mt) and an average productivity of 1.4 Mt/ha (GOI, 2008). Groundnut is one of
the oilseed crop in Bangladesh on the basis of both in area and production
(Biswas et al., 2000). Production area and amount of groundnut in Bangladesh is
36842 ha and 66000 metric tons, respectively (BBS, 2017). All parts of
groundnut are consumed such as kernels and oil for human and hay for livestock
feeds. It is also processed into cake or further processed into confectionary
products or snack food. Groundnut oils used in make-up, medicines, textile
materials, cosmetics, nitroglycerin, plastics, dyes and paints as well as many
other uses (Firouzi et al., 2009). Groundnut production and marketing play a
1Senior Scientific Officer, FMP Engineering Division, Bangladesh Agricultural Research
Institute (BARI), Gazipur-1701, Bangladesh.
DOI: http://-

610 HOQUE
significant role in the agricultural economies as the most important sources of
employment and income (Ntare et al., 2008).
The knowledge of the engineering and other physical properties of groundnut
is very fundamental because they expedite the design and development of
equipment for harvesting, handling, separation, oil extraction and other forms
of processing agricultural materials (Singh and Goswami, 1996; Chukwu and
Sunmonu, 2010). Some studies had been done on properties of groundnut
kernels (Olajide and Igbeka, 2003; Aydin, 2007; Davies, 2009, Firouzi et al.,
2009, Atasie et al., 2009, Jean-Baptiste, et al., 2012, Fashina et al., 2014).
Hossain and Haque (1999) evaluated geometric properties of four
Bangladeshi groundnut varieties namely Basanti, Maischar, Jhinga and
Tridana. But, there is no study on such properties for BARI developed latest
groundnut varieties.
In developing country like Bangladesh, the equipment used in the processing of
groundnut has been generally designed without taken into consideration of the
physical properties of the seeds. Most of the agricultural processing equipment
designed for planting, harvesting, threshing, handling, processing and storage of
agricultural materials are largely seen to be of low efficiency in terms of the
quality of their output and the economy of using which is largely due to non-
availability of data and other engineering properties such as size, mass, density
and sphericity of the materials to design such machines. Akanni et al., (2005)
reported that inadequate engineering data of groundnuts have greatly influenced
the development of processing machinery. The study of these parameters has
become necessary to develop an effective groundnut processing equipment
resulting in a low breakage of pods and kernels. Therefore, this study was
investigated to obtain some engineering properties of pods and kernels of the
three selected groundnut varieties.
Materials and Methods
The experiment was conducted at Farm Machinery and Postharvest Process
Engineering (FMPE) Division, Bangladesh Agricultural Research Institute
(BARI), Gazipur, Bangladesh during 2015-16. Three varieties of groundnut
commonly cultivated in Bangladesh were identified, selected and collected from
Oilseed Research Centre, Bangladesh Agricultural Research Institute (BARI),
Gazipur. These were Dhaka-1, BARI Badam-8 and BARI Badam-9 (Table-1).
These varieties were selected on the basis that BARI Badam-8 and BARI Badam-
9 are trying to replace local and old varieties for better yield and reduce insect
and pest susceptibility (BARI, 2017). Samples were collected at maturity from
the field and harvesting was done manually. The pods were cleaned to remove all
foreign materials (Table-1).
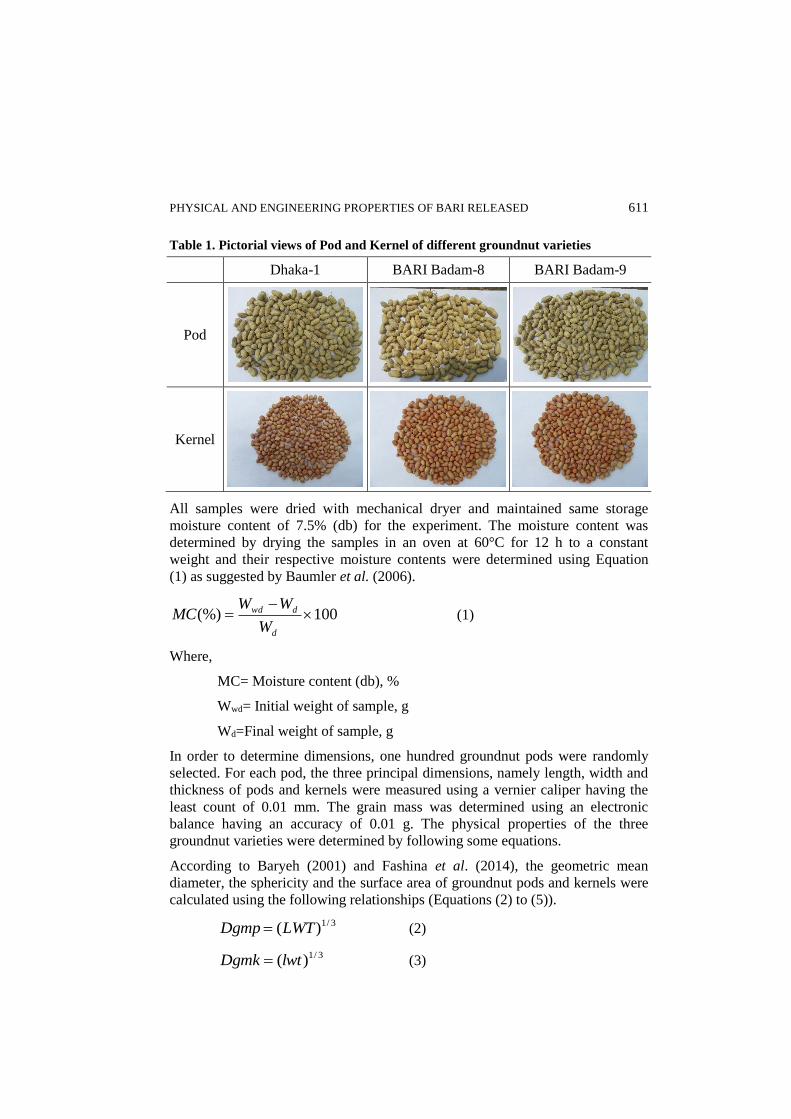
PHYSICAL AND ENGINEERING PROPERTIES OF BARI RELEASED 611
Table 1. Pictorial views of Pod and Kernel of different groundnut varieties
Dhaka-1 BARI Badam-8 BARI Badam-9
Pod
Kernel
All samples were dried with mechanical dryer and maintained same storage
moisture content of 7.5% (db) for the experiment. The moisture content was
determined by drying the samples in an oven at 60°C for 12 h to a constant
weight and their respective moisture contents were determined using Equation
(1) as suggested by Baumler et al. (2006).
100(%)
d
dwd
W
WWMC (1)
Where,
MC= Moisture content (db), %
Wwd= Initial weight of sample, g
Wd=Final weight of sample, g
In order to determine dimensions, one hundred groundnut pods were randomly
selected. For each pod, the three principal dimensions, namely length, width and
thickness of pods and kernels were measured using a vernier caliper having the
least count of 0.01 mm. The grain mass was determined using an electronic
balance having an accuracy of 0.01 g. The physical properties of the three
groundnut varieties were determined by following some equations.
According to Baryeh (2001) and Fashina et al. (2014), the geometric mean
diameter, the sphericity and the surface area of groundnut pods and kernels were
calculated using the following relationships (Equations (2) to (5)).
3/1)(LWTDgmp (2)
3/1)(lwtDgmk (3)

612 HOQUE
L
Dgmpp (4)
l
Dgmkk (5)
Where,
L= pod length, mm
W= pod width, mm
T= pod thickness, mm
l= kernel length, mm
w= kernel width, mm
t= kernel thickness, mm
Dgmp= geometric mean diameter of pod, mm
Dgmk= geometric mean diameter of kernel, mm
φp= pod sphericity, %
φk= kernel sphericity, %
The surface areas S (cm2) of groundnut pods and kernels were calculated using
Equations (6) and (7) stated below (Moshenin, 1986 and Jean-Baptiste et al.,
2012):
2
gmpap DS (6)
2
gmkak DS (7)
Where:
Sap = surface area of the pod, mm2
Sak = surface area of the kernel, mm2
The aspect ratio (R) is the ratio of the width of the pod or the kernel to its
respective length which was calculated by applying the following relationships
according to Maduako and Faborode (1990):
Rap = L
W × 100 (8)
Rak = L
W × 100 (9)
Where:
Rap = Aspect ratio of the pod
Rak = Aspect ratio of the kernel

PHYSICAL AND ENGINEERING PROPERTIES OF BARI RELEASED 613
The bulk density (ρb), which is defined as the ratio of the mass sample of the
grains to its total volume, was determined according to Singh and Goswami
(1996):
V
Mb (10)
where b = Bulk density, kg/m3
M=Mass of seeds or kernels, kg
V =Volume occupied, m3
The volumes of randomly selected 100 groundnut pods from each of the three
selected varieties were determined by displacement method (Olajide and Ade-
Omowaye, 1999). Water was poured in a 1000 cm³ capacity measuring cylinder.
The initial level was recorded. Three groundnut pods were immersed in the water
at a time while noting the new level to which the water rose. Since groundnut
pods float in water, a small metal bob was used as a sinker. Its rise in water level
was also noted such that it was deducted from the final water level when tied
with the groundnut pods. The volume of the groundnut pod was computed by
subtracting the volume of the bob from the difference. The experiment was
replicated ten times for each variety. The weights of 100 randomly selected
groundnut pods and kernels from the three selected varieties were determined by
digital electronic weighing balance (2 kg capacity with 0.01 accuracy) as
suggested by Milani et al. (2007); Mohsenin (1986). The true density was
determined using the unit values of unit volume and unit mass of individual pod
and kernel and calculated using the following relationship:
d
tV
M (11)
where t = True density, kg/m3
M=Mass of seeds or kernels, kg
Vd =Volume of water displaced, m3
The porosity value (ε) which is defined as the fraction of space in the bulk grain,
not occupied by the grain, was calculated from the following relationship
(Mohsenin, 1986):
100*)1((%)t
b
(12)
Thousand grain weight (g) was determined by weighing 100 seeds and kernels in
an electronic balance to an accuracy of 0.01 g and then multiplying by 10 to get

614 HOQUE
the mass of 1,000 grains. The angle of repose (θ) of pods or kernels was
measured by the emptying method in bottomless cylinder (diameter, 5 cm;
height, 8.5 cm). The cylinder filled with groundnut seeds or kernels was placed
on a wooden table, glass sheet and Mild Steel (MS) sheet separately and raised
slowly until it forms a heap. The diameter (D) and height (H) of the heap were
recorded (Malik and Saini, 2016). Using the following equation, θ was
determined.
D
H2tan 1 (13)
Results and discussion
Moisture content (MC) of collected samples was maintained at 7.5% (db) over
the experimentation by mechanical drying. Physical properties of groundnut
pod and kernel are genetically controlled but the application of these values in
practical field is affected by the environmental factors in particular moisture
content (Baumler et al., 2006; Yalcin, 2007; Firouzi et al., 2009). Thus, the
engineering properties of three selected groundnut varieties of Bangladesh were
measured at 7.5% MC for both pods and kernels. Frequency distribution of
length of pod and kernel of selected three varieties is shown in Fig. 1. Length
of pod and kernel of BARI Badam-9 was the highest where pod ranged from 22
to 34 mm and kernel ranged from 8 to 16 mm (Fig. 1). Width of kernel ranged
from 4 to 10 mm irrespective of variety and pod width ranged least (10 to 14
mm) as shown in Fig. 2. Thickness of kernel also ranged from 4 to 10 mm
irrespective of variety (Fig. 3). Pod width of BARI Badam-8 and BARI Badam-
9 ranged from 10 to 14 mm whereas that of Dhaka-1 ranged within 8 to 16 mm
range (Fig. 2).
(a) Kernel (b) Pod
Fig. 1. Frequency distribution of length of pod and kernel of selected three varieties.

PHYSICAL AND ENGINEERING PROPERTIES OF BARI RELEASED 615
(a) Kernel (b) Pod
Fig. 2. Frequency distribution of width of pod and kernel of selected three varieties.
(a) Kernel (b) Pod
Fig. 3. Frequency distribution of thickness of pod and kernel of selected three varieties.
Physical dimensions (length, width and thickness) are important parameters
which are useful in determining aperture size in grain handling machinery. The
average values for the length, width, thickness, geometric mean diameter,
sphericity, surface area, aspect ratio, bulk density, true density, porosity,
thousand grain weight and angle of repose of the three selected groundnut
varieties were measured at moisture content of 7.5% (db). The determined
engineering properties of the groundnut pods are presented in Table 2 while their
corresponding values for the kernels were exposed in Table 3. The highest mean
length, width and thickness were recorded for BARI Badam-9. It was exposed
from the geometric dimensions of these varieties that BARI Badam-9 had the
highest pod geometric mean diameter (12.08 mm) and BARI Badam-8 had the
highest kernel geometric mean diameter (9.74 mm) (Table 2). The lowest pod
and kernel geometric mean diameter were for Dhaka-1. The average dimension
of the pods in length, width and thickness of Dhaka-1 were 20.99, 11.20, and
10.46 mm, respectively. Thus, it has been recognized that substantial differences
among the three selected groundnut varieties cultivated in Bangladesh were

616 HOQUE
found in terms of their geometric dimensions. This is in agreement with the
variability for the engineering properties among varieties reported by Fashina et
al. (2014); Jean-Baptiste et al. (2012); Firouzi et al. (2009); Olajide and Igbeka
(2003).
The ability of the grain to roll or slide depends on its aspect ratio and sphericity.
Sphericity of both the groundnut pods and the kernels are dynamic parameter of
processing. Sphericity affects how easily grains can be processed by the food
industry (Kabas et al., 2001). It also indicates the relative nearness of the product
shape to spherical shape. Sphericity of groundnut pod was the highest for Dhaka-
1 (65%) though that of kernel was statistically similar for Dhaka-1 and BARI
Badam-8. The average kernel sphericity was lower than that reported by Olajide
and Igbeka (2003) corresponding to the value of 76% but higher than the values
of 51.6% to 57.1% obtained by Aydin (2007).
Geometric surface is dependent on length, breadth and thickness which is
importantly useful in determination of heat and mass transfer (Adebowale et al.,
2011). Surface area of pod was found the highest in BARI Badam-9 (778 mm2)
but for kernel, it was the highest in BARI Badam-8 (301 mm2).
The aspect ratio of a product is an indicator which expresses its tendency towards
an oblong shape. The study found the aspect ratio of the groundnut pods for
Dhaka-1, BARI Badam-8 and BARI Badam-9 varieties to be 54.06, 50.58 and
44.23, respectively. The corresponding aspect ratio values for the kernels were
found to be 71.63, 65.08 and 59.70. Significantly lowest aspect ratio of pod and
kernel was found in BARI Badam-9.
Bulk density of BARI Badam-8 was the highest for both pod (342.51 kg/m3) and
kernel (658.56 kg/m3). The value of kernel agrees with Davies (2009) who found
the average density of 753 kg/m³. Porosity of the pod was the least for BARI
Badam-8 (64.06%) but that of kernel was similar for all varieties.
Seed weight is an important attribute that determines the consumer preference in
groundnut cultivars. Kernel weight had positive and significant correlations with
geometric surface, degree of sphericity and porosity of the seeds (Jean-Baptiste et
al., 2012).
Research findings indicate positive correlation between weight and oil content of
groundnut kernels (Dwivedi et al.,1990). Thousand grain weight of BARI
Badam-8 was the highest (886.67 g) among the selected varieties but for kernel,
it was statistically similar between BARI Badam-9 (497.33 g) and BARI Badam-
8 (373.33 g). Relatively lighter pod and kernel were obtained from Dhaka-1
variety.

PHYSICAL AND ENGINEERING PROPERTIES OF BARI RELEASED 617
Table 2. Some physical and engineering properties of the pods of the selected
groundnut varieties at 7.5 % MC (db)
Dhaka-1 BARI Badam-8 BARI Badam-9 CV HSD
Length, mm 20.99±2.72c 23.98± 3.20b 27.09±2.35a 10.43 1.19
Width, mm 11.20±1.24b 11.88± 1.09a 11.90±0.72a 8.23 0.46
Thickness, mm 10.46±0.99b 12.44± 1.20a 12.08±1.05a 8.06 0.45
Geometric mean
diameter, mm
13.46±1.19c 15.20± 1.25b 15.71±0.87a 6.24 0.44
Sphericity, % 64.72±6.05a 64.08± 6.17b 58.24±3.97b 8.63 0.03
Surface area, mm2 574.18±100.28c 731.17±116.26b 777.84±85.95a 12.29 40.61
Aspect ratio 54.06±8.28a 50.58±9.37a 44.23±4.51b 14.91 3.52
Bulk density, kg/m3 303.87±5.52b 342.51±11.05a 311.60±3.03b 2.01 11.58
True density, kg/m3 908.14±30.35b 968.43±12.94a 970.69±13.11a 1.95 53.81
Porosity, % 66.51±1.51a 64.06±0.77b 67.93±0.40a 1.12 2.15
1000 grain wt, g 593.33 ±23.09c 813.33±11.55b 886.67±30.55a 2.05 45.52
Angle of repose (degree) on
Wood 29.28±0.43 26.24 ±0.70 28.66±2.81 6.60 ns
Glass 28.51±0.47 24.94±2.18 26.22±1.76 7.47 ns
MS Sheet 28.76 ±2.00 25.03±2.63 26.97 ±1.78 5.70 ns
Foot notes: Value is for Mean± sd; Similar letter in same rows did not significantly
varied
The angle of repose of a granular material is the steepest angle of descent or dip
of the slope relative to the horizontal plane when material on the slope face is on
the edge of sliding. Angle of repose of groundnut pod on wood, glass and MS
sheet did not vary for the selected varieties. Again, angle of repose of kernel was
statistically similar for BARI Badam-8 and BARI Badam-9 but significantly
higher than that found for Dhaka-1 on wood and glass. But angle of repose did
not vary for kernel on MS sheet for the varieties. This might be due to the
relative smoothness of the surface of the kernels. Results found from this
experiment were similar to that of Davies (2009) who noted the angle of repose
as 28° for pod at moisture content of 7.6% (db).
The angle of repose was higher for pod than kernel on all surfaces as evaluated.
This is because groundnut pods are more cohesive than kernels. Eventually more
cohesive surface of the tested grain will have higher angle of repose which were
also reported on sunflower (Santalla and Mascheroni, 2003) and Canavalia
(Niveditha et al., 2013).

618 HOQUE
Table 3. Some physical and engineering properties of the kernels of the selected
groundnut varieties at 7.5 % MC (db)
Dhaka-1 BARI Badam-8 BARI Badam-9 CV HSD
Length, mm 11.24 ± 1.13b 13.27±1.55a 13.16±1.63a 11.64 0.70
Width, mm 8.02 ±1.09b 8.59±1.02a 7.84±1.61ab 15.39 0.60
Thickness, mm 7.12±0.83b 8.18±0.99a 7.75±1.23a 12.73 0.47
Geometric mean
diameter, mm
8.61±0.89c 9.74±0.93a 9.24±1.29b 10.84 0.47
Sphericity, % 76.83±5.55a 73.81±6.24a 70.41±8.27b 9.35 0.03
Surface area, mm2 235.57±47.16c 300.94±54.80a 273.14±67.84b 20.31 26.09
Aspect ratio 71.63±8.71a 65.08±7.43b 59.70±12.16c 15.17 4.73
Bulk
density,kg/m3
630.94±6.05c 658.56±7.20a 647.51±4.62b 0.89 10.37
True
density,kg/m3
930.31±41.55 983.33±28.87 994.67±23.44 4.00 ns
Porosity, % 31.99±3.63 32.55±1.54 34.99±1.56 8.78 ns
1000 grain wt, g 241.33±8.08c 373.33±11.55a 497.33±11.72a 3.21 34.69
Angle of repose (degree) on
Wood 17.76±0.66b 20.05±0.80a 20.67±0.21a 3.00 1.70
Glass 16.77±2.18b 19.55±1.41a 19.27±1.39ab 4.73 2.55
MS Sheet 17.67±1.57 19.87±2.38 19.65±1.85 10.71 ns
Foot notes: Value is for Mean± sd; Similar letter in same rows did not significantly
varied
Conclusions
BARI Badam-9 had the highest pod geometric mean diameter and BARI
Badam-8 had the highest kernel geometric mean diameter at moisture content
of 7.5% (d.b). The lowest pod and kernel geometric mean diameters were for
Dhaka-1. Sphericity of groundnut pod was the highest for Dhaka-1. Surface
area of pod was the highest in BARI Badam-9. Aspect ratio of pod and kernel
was the lowest in BARI Badam-9. Porosity of the pod was the least for BARI
Badam-8. Angle of repose of kernel was statistically similar for BARI Badam-8
and BARI Badam-9 on wood and glass. But angle of repose did not vary for
kernel on MS sheet for the varieties. The results thus help the designers to
design an efficient groundnut processing machines for groundnut varieties in
Bangladesh.

PHYSICAL AND ENGINEERING PROPERTIES OF BARI RELEASED 619
Acknowledgement
The author acknowledge the authority of Bangladesh Agricultural Research
Institute, Gazipur to allow fund and facilities for this research.
References
Adebowale, A.A., S.A. Sanni, and O.A. Falore. 2011. Varietal differences in the physical
properties and proximate composition of elite sesame seeds. World J. of Agric. Sci.
7(1): 42-46.
Akanni, M.S., A.S. Adekunle and E.A. Oluyemi. 2005. Physico-chemical properties of
some non-conventional oil seeds. J. of Food Tech. 3: 177-181.
Atasie, V.N., T.F. Akinhanmi and C.C. Ojiodu. 2009. Proximate Analysis and Physico-
Chemical Properties of Groundnut (Arachis hypogaea L.). Pakistan J. of Nutri. 8:
194-197.
Aydin, C. 2007. Some engineering properties of peanut and kernel. J. of Food Eng. 79:
810-816.
Baryeh, E.A. 2001. Physical properties of Bambara groundnuts. J. of Food Eng. 47(4):
321-326.
Baumler, E., H. Cuniberti, S.M. Nolasso and I.C. Riccobene. 2006. Moisture dependent
physical and compression properties of safflower seed. J. of Food Eng. 72(2): 134-140.
Biswas, G.C., S. Begum and M.Y. Mian. 2000. Leaf infestation and yield loss caused by
thrips and jassids in groundnut. J. of Asiatic Society Bangladesh Sci. 26(2): 253-258.
BBS. 2017. Bangladesh Bureau of Statistics. Statistical Pocket Book. Ministry of
planning, Government of the People’s Republic of Bangladesh, Dhaka.
BARI. 2017. Bangladesh Agricultural Research Institute Krishi Projukti Hat Boi,
Gazipur.
Chukwu, O. and M.O. Sunmonu. 2010. Determination of Selected Engineering Properties
of Cowpea (Vigna unguiculata) Related to Design of Processing Machines. Int. J. of
Eng. and Tech. 2(6): 373-378.
Davies, R.M. 2009. Some Physical Properties of Groundnut Grains Research. J. of
Applied Sci. Eng. and Tech. 1(2): 10 – 13.
Dwivedi, S.L., R. Jambunathan, and S.N. Nigam. 1990. Relationship of seed mass to oil
andprotein contents in peanut (Arachis hypogaea L.). Peanut Sci. 17(2): 48-52.
Fashina, A.B., A. Saleh and F.B. Akande. 2014. Some engineering properties of three
selected groundnut (Arachishypogaea L.) varieties cultivated in Nigeria. Agric Eng
Int: CIGR J. 16(4), 268-277. Open access at http://www.cigrjournal.org
Firouzi, S., M.N.S. Vishgaei and B. Kaviani. 2009. Some physical properties of
groundnut (Arachishypogaea L.) Kernel cv. NC2 as a function of moisture content.
American-Eurasian J. of Agri. and Env. Sci. 6(6): 675-679
GOI. 2008. Economic Survey of India (2008), Government of India, New Delhi.
Hossain M.A. and M.A. Haque. 1999. Geometric properties of groundnut kernels.
Tropical Agri. Res. and Ext. 2(2): 107-110.

620 HOQUE
Jean-Baptiste, N.T., G. Souina, N.Y. Nicolas, N.M. Richard and Z.Z. Arlette. 2012.
Genetic variability and heritability estimates of some properties of groundnut
(ArachishypogaeaL.) kernels. Int. J. of Biosci. 2(1): 25-35.
Kabas, O., E. Yilmaz, A. Ozmerzi and I. Akinci. 2007. Some physical and nutritional
properties of cowpea seed (Vigna sinensis L.). J. of Food Eng. 79: 1406-1409.
Maduako, J.N. and M.O. Faborode. 1990. Some physical properties of cocoa pods in
relation to primary processing. J. of Tech. 2: 1-7.
Malik, M.A. and C.S. Saini. 2016. Engineering properties of sunflower seed: Effect of
dehulling and moisture content. Cogent Food and Agri. 2: 1145783
http://dx.doi.org/10.1080/23311932.2016.1145783
Milani, E., M. Seyed, A. Razavi, A. Koocheki, V. Nikzadeh, N. Vahedi, M. Moein Fard,
and G. H. A. Pour. 2007. Moisture dependent physical properties of cucurbit seeds.
Int. Agrophysics 21(2): 157- 168.
Mohsenin, N. N. 1986. Physical Properties of Plant and Animal Materials. Seconded.
Gordon and Breach, Science Publishers Inc., One Park Avenue, New York 10016. 58
– 76.
Niveditha, V. R., K. R. Sridhar, and D. Balasubramanian. 2013. Physical and mechanical
properties of seeds and kernels of Canavalia of coastal sand dunes. Int. Food Res. J.
20: 1547–1554.
Ntare, B.R, A.T. Diallo, J. Ndjeunga and F. Waliyar. 2008. Groundnut Seed Production
Manual. Patancheru 502 324, Andhra Pradesh, India: Int. Crops Res. Inst. for the
Semi-Arid Tropics (ICRISAT). 20 pp.
Olajide, J.O. and B.I.O. Ade-Omowaye. 1999. Some Physical Properties of Locust Bean
Seed. J. of Agri. Eng. Res. 74(2): 213-215.
https://doi.org/10.1006/jaer.1997.0243
Olajide, J.O. and J.C. Igbeka. 2003. Some physical properties of groundnut kernels. J. of
Food Eng. 58(2): 201-204.
Santalla, E. M. and R. H. Mascheroni 2003. Note: Physical properties of high oleic
sunflower seeds. Food Sci. and Tech. Int. 9: 435–442.
http://dx.doi.org/10.1177/1082013203040756
Singh, K. K. and T. K. Goswami. 1996. Physical properties of cumin seed. J. of Agri. and
Eng. Res. 64(2): 93-98.
Yalcin, I., C. Ozarslan, and T. Akbas. 2007. Physical properties of pea (Pisum sativum)
seed. Jo. of Food Eng. 79(2): 375-384.

ISSN 0258-7122 (Print), 2408-8293 (Online)
Bangladesh J. Agril. Res. 44(4): 621-630, December 2019
INCIDENCE OF MAJOR INSECT PESTS ON SWEET GOURD
GERMPLASM
M. AFROZ1, M. R. AMIN2, M. R. U. MIAH3 AND M. M. HOSSAIN4
Abstract
Abundance of the major insect pests viz., red pumpkin beetle, epilachna beetle
and fruit fly on twelve sweet gourd germplasms namely BD 264, BD 265, BD
266, BD 268, BD 269, BD 274, BD 275, BD 277, BARI Mistikumra 1, BARI
Mistikumra 2, Gazipur Local Line and China line was studied in the
experimental field of the Department of Entomology, Bangabandhu Sheikh
Mujibur Rahman Agricultural University, Gazipur, Bangladesh during July 2018
to June 2019. The mean number of red pumpkin was the highest (2.3 adults/ 3
leaves) during 4th week of December and the lowest (0.7 adults/ 3 leaves) during
4th week of March. The mean number of grub (6.5 grubs/3 leaves) and adult (2.3
adults/ 3 leaves) of epilachna beetle were the highest during 2nd week of March
and 4th week of February, respectively. The mean number of fruit fly was found
the lowest (1.0 adults plant-1) during 5th week of January and the highest (2.5
adults plant-1) during 4th week of February. BARI Mistikumra 1, BARI
Mistikumra 2 and China Line provided the lowest yield ranged from 4.8 ± 5.3 to
7.4 ± 0.5 t ha-1 and the remaining germplasms showed statistically similar yield.
Keywords: Cucurbita moschata, germplasms, red pumpkin beetle, epilachna
beetle, fruit fly.
Introduction
Sweet gourd, Cucurbita moschata Duch, a nutritive vegetable belongs to the
family Cucurbitaceae grows in Bangladesh and around the world. Cucurbitaceae is one of the largest families having 118 genera and 825 species (Rai and Kumar,
2008). In Bangladesh, a total of 28.5 thousand hectares of land were occupied for sweet gourd cultivation with an annual production of 294.5 thousand tons in the
year of 2016-17, and the average yield of sweet gourd was 9.22 t ha-1 and 11.0 t ha-1 in summer and winter, respectively (BBS, 2017).
The red pumpkin beetle, epilachna beetle, cucurbit fruit fly, thrips, cutworm, aphid and whitefly are the major constraints of cucurbit production due to their
constant attacks which lead to severe yield loss. Among the harmful insects, red pumpkin beetle Aulacophora foveicollis Lucas (Coleoptera: Chrysomelidae),
epilachna beetle Epilachna dodecatigma Wied., E. vigintioctopunctata Fab. (Coleoptera: Coccinellidae) and cucurbit fruit fly Bactrocera cucurbitae
1,2,3Department of Entomology, Bangabandhu Sheikh Mujibur Rahman Agricultural
University (BSMRAU), Gazipur, 4Department of Horticulture, BSMRAU, Gazipur,
Bangladesh.
DOI: http://-

622 AFROZ et al.
Coquillett, B. dorsalis Hendel (Diptera: Tephritidae) showed higher abundance
and caused serious damage on sweet gourd (Ali et al., 2015; Nancy et al., 2018).
Red pumpkin beetle attacks young plants, leaves and flowers and feed on both
surface of leaves and produce a characteristic, circular ring like injury and cause 30 to 100% yield loss (Aslam et al., 2017). Both adult and grub of epilachna
beetle infest throughout the growth stages of crop and the grubs scrap the epidermis while the adults make semicircular cuts in rows on the epidermis of
leaves thus cause up to 80% infestation of the host plant (Ghule et al., 2014). Female fruit fly deposits eggs below the skin of the fruit and the maggots
developed inside the fruit feed on the inner pulp and they cause up to 71.5% fruit infestation on sweet gourd in Bangladesh (Amin et al., 2011a).
Seasonal variations of the weather factors play a vital role in multiplication,
growth, development and distribution of insects, and influence on their population dynamics (Namni et al., 2017). Fruit flies showed fluctuations in their
abundance on sweet gourd and caused higher infestation in summer than winter (Amin et al., 2019). Plant species and their varieties, cultivars and germplasms
varied in their morphological traits and biochemical contents and affect the growth, development, reproduction and abundance herbivore insects (Amin et
al., 2011b; Amin et al., 2015a; Amin et al., 2017).
Information on population fluctuations and infestation of the major insect pests is
important in forecasting and warning system and to find out resistant germplasm through screening is very useful in pest management program. With this point in
view, the study was conducted to know the abundance of red pumpkin beetle, epilachna beetle and fruit fly on twelve germplasms of sweet gourd.
Materials and Methods
Study site and condition
The study was conducted during July 2018 to June 2019in the field and laboratory of the Department of Entomology, Bangabandhu Sheikh Mujibur
Rahman Agricultural University (BSMRAU), Gazipur, Bangladesh. The site is
located at 25°25′ North latitude and 89°5′ East longitude having annual mean maximum and minimum temperatures, relative humidity and rainfall 36.0 and
12.7 oC, 65.8% and 237.6 cm, respectively (Amin et al., 2015b).
Experimental materials and raising of seedling
Twelve sweet gourd germplasm, namely BARI Mistikumra-1, BARI Mistikumra-2, BD 264, BD 265, BD 266, BD 268, BD 269, BD 274, BD 275,
BD 277, Gazipur Local Line and China Line were used in this study. The seeds were collected from Bangladesh Agricultural Research Institute, local market of
Gazipur and Department of Entomology, BSMRAU, and the seeds were sown in polybags on 14 November to raise seedling.

INCIDENCE OF MAJOR INSECT PESTS ON SWEET GOURD GERMPLASM 623
Experimental design and cultivation of the germplasms
The germplasms were cultivated in 4.0 m × 3.0 m plots following randomized complete block design with three replications. The spacing between block to
block and plot to plot was 1.0 m and 1.0 m, respectively. Three weeks aged seedlings were transplanted to the field on December 4, 2018. All the
intercultural operations except insect pest management were done whenever necessary and fertilizers were applied according to Fertilizer Recommendation
Guide (FRG, 2018).
Observation of plant growth and morphological traits
Weekly observations were done to collect data on initiation of branch, flower and fruit, fruit elongation, maturity of fruit for market and seed production.
Observation of insect abundance
Systemic sampling at weekly interval was employed to collect data on the abundance of red pumpkin beetle, epilachna beetle and fruit fly. Five plants for
each germplasm were selected and the abundance (number/ 3 leaves) of adult red pumpkin beetle, and grub and adult epilachna beetle on top, middle and bottom
leaves of a plant was noted. The number of adult fly sitting on the fruits of a plant was considered to know its abundance and the observations were replicated for
five times.
Quantifying yield
The mature fruits of each plot were harvested and weighed using a digital balance (CANRY, China) and the data were converted to ton ha-1.
Data analysis
One way analysis of variance (ANOVA) followed by Tukey’s HSD posthoc test
was employed for analyzing the data. All the analyses were performed using IBM SPSS 21.0.
Results and Discussion
The abundance of adult red pumpkin beetle on sweet gourd germplasms showed
fluctuations throughout the study period (Figure 1). The incidence of red
pumpkin beetle was found from 2nd week of December to 4th week of March. Red pumpkin beetle population showed a sudden decrease in 3rd week of December
having the mean abundance 1.0 adult/3 leaves. This might happen due to sudden winter rainfall during that period. Khan et al. (2015) found that rainfall had
negative impact on red pumpkin beetle population. Red pumpkin beetle population sharply increased and reached to the peak with mean abundance 2.3
adults/3 leaves during 4th week of December. This finding was different from that

624 AFROZ et al.
of Khan et al. (2015) who found the peak abundance of red pumpkin beetle
during February to April. The variation might happen due to the variation of crop growing period. They conducted the experiment during summer whereas the
present study was conducted during winter. With the advent of plant growth, the population of beetle declined. As the beetles prefer young plants, their population
was the maximum during early growing season. Shrikrushna (2012) reported that the adult and grub of the insect caused the most serious damage to seedlings due
to their attractive greenness and palatability. During the next few months, red pumpkin beetle showed a little change in its population. The beetle population
increased slightly with mean abundance 1.4 adults/3 leaves during 2nd week of March and finally decreased at the very end of growing season during 4th week of
March (0.7 adult/3 leaves).
Fig. 1. Abundance of red pumpkin beetle on twelve sweet gourd germplasm during
December 2018 to March 2019.
In the present study, the grub of epilachna beetle was first observed during 2nd
week of January and was persistent until harvesting of the crop (Figure 2). The presence of grub was more or less constant throughout the growing period and
the lowest abundance of grub was recorded in 2nd week of January with mean abundance 2.5 grubs/3 leaves. The population of grub reached its peak (6.5
grubs/3 leaves) in 2nd week of March. Ghule et al. (2014) found that the population of epilachna beetle remained active during March to May. Uikey et al.
(2016) observed that the population of epilachna beetle on bottle gourd remained active during the warmer part of the crop growing season and found a maximum
of 8.4 grubs plant-1 during the 4th week of March.

INCIDENCE OF MAJOR INSECT PESTS ON SWEET GOURD GERMPLASM 625
Fig. 2. Abundance of grubs of epilachna beetle on twelve sweet gourd germplasm
during December 2018 to March 2019.
The adult epilachna beetle was first observed in 2nd week of January and was continuously present till 4th week of March (Figure 3). The mean abundance of
the adult was the lowest (1.4 adults/ 3 leaves) during 1st week of February. Then
the number of adult epilachna beetle showed an increasing trend and reached the peak during 4th week of February with the mean abundance 2.3 adults/3 leaves.
After that, the abundance was gradually decreasing till 4th week of March, the period of final harvesting. Bhowmik and Saha (2017) reported epilachna beetle
as a serious pest of bottle gourd found its infestation from early September.
Fig. 3. Abundance of adult epilachna beetle on twelve sweet gourd germplasm
during December 2018 to March 2019.

626 AFROZ et al.
The population of adult fruit fly started to appear in 5th week of January which
coincided with the period of fruit initiation and remained in the field till harvesting (Figure 4). The lowest mean number of fruit fly (1.0 plant-1) was
found during 5th week of January. The peak abundance of adult fruit fly was recorded during 4th week of February with mean abundance 2.5 plant-1. Then the
population declined and a little number of fruit flies was recorded at the end of growing season. The present finding showed agreement with Amin et al. (2019)
who reported that the B. cucurbitae increased in their abundance from the second week of January, increasing before reaching peak abundance in the fourth week
of February.
Fig. 4. Abundance of adult fruit fly on twelve sweet gourd germplasm during
December 2018 to March 2019.
Different germplasms of sweet gourd vary in their durations of growth and
development. The study revealed that there was significant variation in the durations of different developmental phenomena such as branch initiation (F11,48
= 5.3, p ˂ 0.001), flower initiation (F11,48 = 10.5, p ˂ 0.001), fruit initiation (F11,48
= 3.2, p ˂ 0.01), fruit elongation (F11,48 = 2.8, p ˂ 0.01), marketable maturity of
fruit (F11,48 = 5.3, p ˂ 0.001) and seed production maturity of fruit (F11,48 = 3.4, p ˂ 0.01) among twelve sweet gourd germplasms (Table 1). Results showed that
the duration of branch initiation was the highest and statistically similar in BD 264, BD 274 and BARI Mistikumra 1 having mean duration 26.8 ± 1.1, 26.8 ±
0.8 and 26.6 ± 0.7 days after transplanting (DAT), respectively. BD 266 took the shortest period for initiating branch with mean duration 20.2 ± 0.4 DAT. In case
of flower initiation, Gazipur Local Line took the highest time (46.0 ± 0.7 DAT). BD 274 and BD 275 showed statistically similar results and took the lowest

INCIDENCE OF MAJOR INSECT PESTS ON SWEET GOURD GERMPLASM 627
Ta
ble
1.
Va
ria
tio
n i
n t
he
du
rati
on
s (m
ean
± S
E d
ay
s a
fter
tra
nsp
lan
tin
g)
of
dif
feren
t d
evel
op
men
tal
ph
eno
men
a a
mo
ng
tw
elv
e
swee
t g
ou
rd g
erm
pla
sm d
uri
ng
Dec
em
ber
20
18
to M
arc
h 2
01
9
Ger
mp
lasm
s
Dev
elo
pm
enta
l ti
me
at d
iffe
rent
DA
T
Bra
nch
init
iati
on
F
low
er i
nit
iati
on
F
ruit
init
iati
on
F
ruit
elo
ngat
ion
M
arket
able
mat
uri
ty o
f fr
uit
See
d p
rod
uct
ion
mat
uri
ty o
f fr
uit
BD
26
4
26
.8 ±
1.1
a
42
.0 ±
1.0
bf
56
.8 ±
0.8
ac
61
.0 ±
0.8
ab
9
8.4
± 1
.2 a
d
10
6.6
± 0
.9 a
b
BD
26
5
25
.0 ±
0.6
ac
43
.2 ±
0.8
ae
56
.4 ±
1.1
ac
60
.4 ±
1.0
ab
95
.6 ±
0.9
cd
1
04
.4 ±
0.5
b
BD
26
6
20
.2 ±
0.4
c
40
.4 ±
0.8
df
55
.2 ±
0.9
ac
60
.4 ±
1.6
ab
9
3.8
± 1
.3 d
1
05
.6 ±
0.5
ab
BD
26
8
26
.4 ±
1.0
ab
4
1.6
± 1
.0 c
f 5
5.6
± 0
.7 a
c 5
9.8
± 0
.7 a
b
96
.0 ±
1.2
bd
1
03
.8 ±
1.2
b
BD
26
9
21
.4 ±
1.3
bc
44
.0 ±
0.7
ad
5
8.8
± 1
.0 a
c 6
2.8
± 0
.9 a
b
10
1.4
± 0
.9 a
c 1
09
.0 ±
1.3
ab
BD
27
4
26
.8 ±
0.8
a
39
.4 ±
1.3
f
54
.8 ±
2.2
bc
58
.8 ±
2.3
b
98
.6 ±
1.9
ad
1
05
.0 ±
2.1
ab
BD
27
5
22
.8 ±
0.4
ac
38
.8 ±
0.4
f
53
.0 ±
0.9
c
57
.6 ±
1.0
b
96
.4 ±
1.0
bd
1
04
.6 ±
1.3
b
BD
27
7
25
.0 ±
2.0
ac
40
.0 ±
0.4
ef
57
.6 ±
1.3
ac
62
.0 ±
1.4
ab
1
01
.8 ±
1.3
ab
1
09
.2 ±
1.2
ab
BA
RI
Mis
tiku
mra
1
26
.6 ±
0.7
a
43
.8 ±
0.6
ad
5
7.8
± 1
.1 a
c 6
2.2
± 1
.2 a
b
99
.2 ±
1.6
ad
1
06
.8 ±
1.5
ab
BA
RI
Mis
tiku
mra
2
22
.4 ±
0.7
ac
45
.0 ±
0.7
ac
59
.4 ±
1.5
ac
63
.4 ±
1.4
ab
1
00
.4 ±
0.9
ac
10
8.8
± 0
.7 a
b
Gaz
ipur
Lo
cal
Lin
e
25
.4 ±
0.9
ab
4
6.0
± 0
.7 a
6
1.4
± 0
.8 a
6
5.6
± 0
.9 a
1
03
.4 ±
0.8
a
11
0.8
± 0
.9 a
Chin
a L
ine
21
.4 ±
1.4
bc
45
.6 ±
0.8
ab
6
0.2
± 2
.6 a
b
63
.8 ±
2.0
ab
1
00
.6 ±
0.7
ac
10
9.2
± 1
.9 a
b
Mea
ns
wit
hin
a c
olu
mn f
oll
ow
ed b
y s
am
e le
tter
(s)
are
no
t si
gnif
ican
tly d
iffe
rent
by T
ukey’s
HS
D p
ost
ho
c st
atis
tic
at <
0.0
5.

628 AFROZ et al.
period for flower initiation (39.4 ± 1.3 and 38.8 ± 0.4 DAT, respectively).
Gazipur Local Line took the highest duration and BD 275 took the shortest duration for fruit initiation (61.4 ± 0.8 and 53.0 ± 0.9 DAT, respectively).
Gazipur Local Line took the maximum period for fruit elongation (65.6 ± 0.9 DAT). BD 274 and BD 275 had identical as well as lower duration for fruit
elongation (58.8 ± 2.3 and 57.6 ± 1.0 DAT, respectively). Gazipur Local Line took the maximum period for attaining the fruit of marketable maturity and seed
production maturity (103.4 ± 0.8 and 110.8 ± 0.9 DAT, respectively). BD 266 showed the shortest duration for producing marketable matured fruit (93.8 ± 1.3
days). BD 265, BD 268 and BD 275 had the minimum duration for attaining marketable maturity and seed production maturity of fruit (104.4 ± 0.5, 103.8 ±
1.2 and 104.6 ± 1.3 DAT, respectively). So, the total developmental period of
tested germplasms during the study ranged from 103.8 ± 1.2 to 110.8 ± 0.9 DAT. The results were in accordance with the findings of Ahamed et al. (2011) who
reported that genotypes of sweet gourd took 104 to 123 days for total development.
Fig. 5. Comparison of yield (mean ± SE) among twelve sweet gourd germplasm.
The yield of the tested germplasms is presented in figure 5. The yield of BD 264,
BD 265, BD 266, BD 268, BD 269, BD 274, BD 275, BD 277 and Gazipur Local
Line was statistically similar and comparatively higher ranged from 10.5 ± 2.1 to 19.9 ± 3.6 t ha-1. BARI Mistikumra 1, BARI Mistikumra 2 and China line had the
lowest and statistically similar yield ranged from 4.8 ± 5.3 to 7.4 ± 0.5 t ha-1.
The abundance of red pumpkin beetle, epilachna beetle and fruit fly on sweet
gourd germplasms showed fluctuations during the study period. The insect infested plants showed a great variation in case of duration for development,
morphological traits and yield. The results of this study provide information for

INCIDENCE OF MAJOR INSECT PESTS ON SWEET GOURD GERMPLASM 629
forecasting regarding the incidence of the major insect pests of sweet gourd and
find out variations among the germplasms that could be helpful to develop resistant variety.
References
Ahamed, K. U., B. Akhter, M. R. Islam, N. Ara and M. R. Humauan. 2011. An
assessment of morphology and yield characteristics of pumpkin (Cucurbita
moschata) genotypes in northern Bangladesh. Trop. Agril. Res. Ext. 14: 5-10.
Ali, M. A., M. S. Islam, M. N. I. Sarker and A. M. Bari. 2015. Study on biology of red
pumpkin beetle in sweet gourd plants. Intl. J. Appl. Res. 2: 1-4.
Amin, M. R., D. A. Tithi and Y. J. Kwon. 2011b. Characteristics of three cotton varieties
and their impact on feeding and growth of cotton armyworm. Ent. Res. 41: 151-156.
Amin, M. R., R. Afrin, M. Z. Alam, M. M. Hossain and Y. J. Kwon. 2017. Effect of leaf
trichomes and meteorological parameters on population dynamics of aphid and jassid
in cotton. Bangladesh J. Agril. Res. 42: 13-25.
Amin, M. R., S. Namni, M. R. U. Miah, M. G. Miah, M. Zakaria, S. J. Suh and Y. J.
Kwon. 2015b. Insect inventories in a mango-based agroforestry area in Bangladesh:
foraging behavior and performance of pollinators on fruit set. Ent. Res. 45: 217-224.
Amin, M. R., T. Sarkar and I. J Chun. 2011a. Comparison of host plants infestation level
and life history of fruit fly (Bactrocera cucurbitae Coquillett) on cucurbitaceous
crops. Hort. Environ. Biotech. 52: 541.
Amin, M. R., M. C. Roy, M. M. Rahman, M. G. Miah, Y. J. Kwon and S. J. Suh. 2015a.
Foraging and growth responses of the cotton armyworm (Spodoptera litura) to the
biophysical characteristics of five cotton varieties. Ent. Res. 45: 286-293.
Amin, M. R., N. P. Nancy, M. R. U. Miah, M. G. Miah, O. Kwon and S. J. Suh. 2019.
Fluctuations in fruit fly abundance and infestation in sweet gourd fields in relation to
varied meteorological factors. Ent. Res. 49: 223-228.
Aslam, M. R., K. Javed, H. Javed, T. Ahmad and A. K. Kassi. 2017. Varietal resistance
of pumpkin (Cucurbita pepo L.) germplasms against red pumpkin beetle
(Aulacophora foveicollis) L. in Pothwar region. J. Ent. Zool. Stud. 5: 7-12.
BBS. 2017. Yearbook of Agricultural Statistics. Bangladesh Bureau of Statistics.
Statistics and Informatics Division (SID), Ministry of Planning, Government of the
People’s Republic of Bangladesh. pp. 250-300.
Bhowmik, S. and S. Saha. 2017. Study on the pest complex of bottle gourd in the
gangetic plains of West Bengal. J. Ent. Zool. Stud. 5: 725-727.
FRG. 2018. Fertilizer Recommendation Guide. Bangladesh Agricultural Research
Council, Farm Gate, Dhaka.
Ghule, T. M., L. L. Devi and S. Jha. 2014. Seasonal incidence of epilachna beetle
(Henosepilachna septima Dieke) in relation to weather parameters on pointed gourd
(Tricosanthes dioica Roxb.). J. Crop and Weed. 10: 430-432.
Khan, L., M. Shah and A. Usman. 2015. Host preference of red pumpkin beetle
(Aulacophora faveicollis) Lucas (Chrysomelidae: Coleoptera) among different
Cucurbits. J. Ent. Zool. Stud. 3: 100-104.

630 AFROZ et al.
Namni, S., M. R. Amin, M. R. U. Miah, M. F. Rahman and S. J. Suh. 2017. Role of
weather parameters on seasonal abundance of insects in a mango-based agroforestry
in Bangladesh, with particular reference to mango hopper. Bangladesh J. Agril. Res.
42: 197-205.
Nancy, N. P., M. R. Amin, M. R. U. Mia and M. G. Miah. 2018. Diversity of insects in
sweet gourd field of Bangladesh. Indian J. Ecol. 45: 854-857.
Rai, M. P. S. and S. Kumar. 2008. Cucurbit research in India: A retrospect Cucurbitaceae.
In: Cucurbitaceae Pitrat, M. (ed.). Proceedings of the IX Eucarpia Meeting on
Genetics and Breeding of Cucurbitaceae, Inra, Avignon, France.
Shrikrushna, D. S. 2012. Studies on insect pest complex and screening of improved
varieties of bottle gourd (Lagenaria siceraria). MS Thesis. Department of
Entomology, Jawaharlal Nehru KrishiVishwaVidyalaya, Jabalpur.
Uikey, B. L., B. Kumar, T. M. Ghule, S. Jha and R. K, Kekti. 2016. Incidence pattern and
biology of epilachna beetle (Henosepilachna septima Dieke) on bottle gourd in
gangetic new alluvial zone of West Bengal. J. Insect Sci. 29: 63-66.

ISSN 0258-7122 (Print), 2408-8293 (Online)
Bangladesh J. Agril. Res. 44(4): 631-640, December 2019
MOISTURE LEVEL AND STORAGE CONTAINER EFFECTS ON SEED
QUALITY OF SOYBEAN GENOTYPES UNDER AMBIENT
CONDITION
M. R. ALI1, M. M. RAHMAN2, M. ASADUZZAMAN3
M. A. H. KHAN4 AND J. RAHMAN5
Abstract
The experiment was conducted at the Seed Laboratory, Regional Agricultural
Research Station, Bangladesh Agricultural Research Institute, Jamalpur in 2013
to study the effect of seed moisture content and storage containers on seed
quality of soybean genotypes. Three genotypes of soybean (AGS 191, ASET 93
and Shohag), four initial seed moisture content (6, 8, 10 and 12%) and two types
of storage containers (polythene bag and glass jar) were included in the
experimental treatment. Seeds of soybean genotypes was stored at ambient
condition were temperature ranged from 15.97 to 29.37 0C, relative humidity
ranged from 75.21 to 86.23% and rainfall ranged from 0.00 to 425mm during
the whole storage period. Seed moisture content (%), germination (%) and
vigour index were recorded at 50, 100, 150 and 200 days after storage (DAS).
Result showed that final seed moisture content increased with the increase of
initial seed moisture content. Genotype AGS 191 showed the highest
germination (%) and vigour index. Seeds stored in polythene bag or glass jar
showed similar performance for germination (%) and vigour index. Highest seed
moisture content significantly reduced the germination and vigour index
errespective of containers. The results indicate that soybean seed can be stored
safely for at least 200 days maintaining >80% germination and high vigour
when stored in polythene bag or glass jar with 6-8% initial moisture content at
ambient room temperature and relative humidity.
Keywords: Soybean, seed moisture, storage container, vigour
Introduction
Soybean (Glycine max [L.] Merrill) is the world’s most important grain legume
crop in terms of total production and international trade. Soybean seed contains 36-47% protein and 15-25% oil, 20-26% carbohydrate (Rahman, 2001). It is a
high and available source of calcium, phosphorus, iron, thiamine including vitamins A, B, C and D. The common people of Bangladesh can not afford
animal protein like egg, milk, meat and fish in their daily diet because of their
high cost. The demand of soybean is increasing for making different food
1Principal Scientific Officer, RARS, Jamalpur, 2Professor, Department of Agronomy,
Bangladesh Agricultural University (BAU), Mymensingh, 3Senior Scientific Officer,
RARS, Jamalpur, 4Senior Scientific Officer, OFRD, Mymensingh, 5Scientific Officer,
RARS, Jamalpur, Bangladesh.
DOI: http://-

632 ALI et al.
products for human consumption as well as feed for poultry and fish in
Bangladesh. The soil and climatic condition of Bangladesh is congenial for soybean production. The lack of supply of quality seed to the farmers render
major problem in the expansion of area under soybean cultivation. It has been reported that soybean seed is short lived and loses its viability in very short
period of storage even with good nonporous storage container. Arunnandhy and Senanayaka (1991) reported that the soybean seeds can be kept with high
germination and vigour for more than one year when stored in sealed containers. Storage containers or packaging materials are considered as one of the most
important factors influencing longevity of seeds in storage. Storage container had significant effect on moisture content of wheat seed at different observation date
of storing (Rahman et al., 2010). When seed could be packaged in moisture proof
containers, the relative humidity of the air around the seed remains low, then the seed equilibrium moisture remains low and the seed maintains its viability and
vigour for a longer time (Poonam et al., 2001; Agha et al., 2004). Storage container influences seed quality and initial adjustment of seed moisture played a
vital role in the preservation and longevity of seeds. The physical properties and storage potential of seed were influenced to a very large extent by moisture
content and the relative humidity of the atmosphere surrounding the seed (Kong et al., 2008). Reports are also available that polythene bags can be used as
moisture proof container (Alam and Rahman, 2005). Soybean seeds stored in moisture proof containers retain high viability than those in moisture permeable
containers (Tatipata, 2009). Depending on initial condition, seed deteriorates less rapidly in impermeable then permeable containers. Use of proper storage
container to maintain the quality of farmer-saved seed in storage and preserving its viability should be an important consideration to reduce seed loss and increase
crop yield. In view of the above facts, the present study was undertaken to develop appropriate storage techniques to maintain desired viability and vigour
of soybean seeds.
Materials and Methods
The experiment was conducted at Seed Laboratory of Regional Agricultural
Research Station, BARI, Jamalpur during May to December 2013. Daily temperature (maximum, minimum and mean), total monthly rainfall and
monthly relative humidity were collected from records of the Regional Agricultural Research Station, Jamalpur. The average monthly maximum and
minimum temperature, relative humidity and total rainfall that prevailed during the experimental period have been presented in Table 1. The maximum and
minimum temperatures were found in the month of April and January, Heavy rainfall was observed during the month of April to October whereas it was
scanty during the month of November to March. There was no rainfall in the month of December. Monthly average relative humidity ranged from 75.21 to
86.23%.

MOISTURE LEVEL AND STORAGE CONTAINER EFFECTS ON SEED QUALITY 633
Table 1. Monthly record of air temperature, rainfall and relative humidity the
experimentation period at Bangladesh Agricultural Research Station,,
Jamalpur from January to December 2013
Month Air temperature Relative humidity
(%)
Rain fall
(mm) Maximum Minimum Average
January 21.77 10.17 15.97 83.65 Trace
February 26.67 15.49 21.08 75.21 27.10
March 27.95 18.11 23.03 75.39 114.00
April 31.63 22.25 26.94 80.07 96.20
May 32.03 23.33 27.68 81.13 265.00
June 30.57 25.68 28.13 86.23 425.30
July 31.81 26.89 29.35 85.00 212.90
August 31.36 26.42 28.89 85.00 192.40
September 32.22 25.95 29.09 84.23 330.90
October 31.29 22.89 27.09 84.77 105.80
November 28.79 18.54 23.67 82.53 83.10
December 25.32 14.40 19.86 84.06 00.00
Source: Regional Agricultural Research Station, Jamalpur.
Three soybean genotypes (AGS 191, ASET 93 and Shohag), two storage
container (polythene bag and glass jar) and four level of initial seed moisture content (6, 8, 10 and 12%) were used as treatment variables. The experiment was
laid out in a Completely Randomized Design with three replications. The crop was grown at Regional Agricultural Research Station Farm, Jamalpur with
proper agronomic management. The crop was harvested at full maturity and after
proper processing, cleaning and drying the seed was stored in polythene bags until used for experimentation. The seed was dried in the sun on a tripale set on
the cemented floor to about 6% initial seed moisture content (SMC). Just before final storage the seed was re-hydrated at 70% relative humidity (RH) for required
period of time to obtain targeted moisture contents were achieved. Each container was completely filled with seed as per experimental specification and then made
air tight. The seed was tested for different quality parameters at 50, 100, 150 and 200 days after storage (DAS). The containers were kept in the laboratory under
ambient room condition (23-32oC temperature and 78.64% relative humidity). The quality parameters tested were seed moisture content, germination
percentage and vigour index.
Seed moisture content was measured using high constant temperature oven dry
method following ISTA rules (2003). About 5-8g of seeds were taken in the

634 ALI et al.
alluminium dish and dried in the oven at 130 oC for 2 hours (until constant
weight reached). Germination test was done in sand culture method. Two third of
a plastic dish (20 cm diameter and 15 cm deep) was filled with sterilized sand
having 60% water holding capacity. Randomly collected 100 seeds from each
container were placed into the sand for the germination test. The germination
dishes were placed in the germination cabinet and seedling evaluation was done
at 8 days after placing the test. The number of normal seedlings per dish was
regarded as the germination percentage. Germination index of seed was
estimated from the seed set in the germination test by calculating the vigour
index formula. The seedling emerged each day having radical length of 2 cm or
more was considered as germinated. At the end of the storage period, randomly
selected 100 seeds from each seed lot in three replications were sown in the well
prepared field. The number of seedlings emerged each day were counted up to
15 days after sowing.
Data analysis was done following the analysis of variance (ANOVA) technique
and mean differences were adjusted by Duncan’s New Multiple Range Test at
5% level of significance with a computer package programme MSTAT-C.
Results and Discussion
Seed moisture content (SMC)
The effect of storage container, initial seed moisture content and genotypes on
seed moisture content and germination performance was evaluated in terms of
germination, germination index and field performance. The interaction effect of
storage container, initial seed moisture content and genotypes on moisture
content of soybean seed was statistically significant at each of the observation
dates during the storage period in 2013. The moisture content of ASET 93 stored
in glass jar with 6% initial MC were 6.90, 7.23, 8.09 and 8.70%, respectively at
50, 100, 150 and 200 DAS and it was statistically at par to those of AGS 191 or
ASET 93 or Shohag in polythene bag or glass jar with 6% initial MC with,
respectively (Table 1). The moisture content of Shohag stored in polythene bag
at 12% initial MC were 12.40, 12.70, 13.40 and 13.93%, respectively at 50,
100, 150 and 200 DAS and it was statistically at par to those of AGS 191 and
ASET 93 stored in glass jar or polythene bag with 12% initial MC (Table 2).
When seed could be packaged in moisture proof containers, the relative humidity
of the air around the seed remains low, then the seed equilibrium moisture
remains low (Poonam et al., 2001; Agha et al., 2004, Kong et al., 2008). Similar
genetic variations in moisture content of soybean seed have also been reported by
Tatic et al., 2012. These results are in good agreement with those reported by
Tatipata (2009).

MOISTURE LEVEL AND STORAGE CONTAINER EFFECTS ON SEED QUALITY 635
Table 2. Interaction effect of storage container, genotype and initial seed moisture
content onmoisture content of soybean seed at different days after storage
Container×genotype
× initial SMC
Seed moisture content (%) at different days after storage
50 100 150 200
C1V1M1 7.14e 7.60e 8.40def 8.95ef
C1V1M2 8.36d 8.90c 9.50cb 10.03d
C1V1M3 10.47c 11.04b 11.60b 12.13b
C1V1M4 12.35a 12.60a 13.25a 13.64a
C1V2M1 7.07e 7.55e 8.32ef 8.96ef
C1V2M2 8.50d 8.90c 9.21c-f 10.10d
C1V2M3 10.28c 10.80b 11.40b 11.93bc
C1V2M4 12.40a 12.70a 13.04a 13.32a
C1V3M1 7.08e 7.80de 8.50c-f 9.02ef
C1V3M2 8.38d 8.96c 9.53c 10.16d
C1V3M3 10.39c 10.80b 11.43b 11.85bc
C1V3M4 12.40a 12.70a 13.40a 13.93a
C2V1M1 7.01e 7.48e 8.21f 8.86ef
C2V1M2 8.44d 8.90c 9.33cd 9.87d
C2V1M3 11.02b 11.30b 11.65b 11.87bc
C2V1M4 12.30a 12.70a 13.20a 13.49a
C2V2M1 6.90e 7.29e 8.09f 8.70f
C2V2M2 8.43d 8.70c 9.15c-f 9.49de
C2V2M3 10.21c 10.60b 11.02b 11.36c
C2V2M4 12.31a 12.60a 13.02a 13.30a
C2V3M1 7.00e 7.40e 8.10f 8.73f
C2V3M2 8.22d 8.60cd 9.10c-f 9.50de
C2V3M3 10.20c 10.60b 11.00b 11.40c
C2V3M4 12.20a 12.70a 13.19a 13.53a
CV (%) 4.28 6.29 5.34 7.21
CV= Coefficient of variation, C1= Polythene bag, C2=, Glass jar, V1= AGS-191, V2=
ASET-93, V3= Shohag, SMC= Seed moisture content, M1= 6% SMC, M2= 8% SMC,
M3= 10% SMC, M4= 12% SMC, In a column, figures having similar letter(s) do not
differ significantly by DMRT.

636 ALI et al.
Germination percentage
The interaction of effect of storage container, genotypes and initial seed moisture
content on germination percentage was statistically significant at each of the
observation dates during the storage period in 2013. The germination percentage
of AGS 191 stored in glass jar with 6% MC were 96.66, 94.00, 93.33 and
92.00%, respectively at 50, 100, 150 and 200 DAS and it was statistically at par
to those of AGS 191 or ASET 93 or Shohag stored in glass jar or polythene bag
with at 6% and 8% initial SMC. Those values for Shohag in polythene bag with
12% initial SMC were 74.00, 62.00, 24.00 and 6.33%, respectively (Table 3).
These results are conformity of those reported by Balesevic-Tubic et al., 2005.
Storage containers or packaging materials are considered as one of the most
important factors influencing longevity of seeds in storage. Storage container had
significant effect on moisture content of wheat seed at different observation date
of storing (Rahman et al., 2010 and Ali et al., 2018).
Field emergence performance
Field emergence performance was evaluated in terms of field emergence and
mean germination time in field. Soybean genotype, storage container and initial
seed moisture content had significant effect on field emergence of soybean seed
at 200 DAS (Table 3). The field emergence percentage of AGS 191 seed stored
in polythene bag were 88.66, 88.00, 36.00 and 8.00% at 6, 8, 10 and 12% initial
SMC while those stored in glass jar were 90.00, 88.00, 54.00 and 16.00%,
respectively (Table 3). The field emergence of ASET 93 seed stored in polythene
bag were 86.30, 83.33, 42.66 and 6.00% at 6, 8, 10 and 12% initial SMC while
those stored in glass jar were 86.00, 84.00, 40.00 and 18.00%, respectively
(Table 3). The field emergence of Shohag seed stored in polythene bag were
80.00, 80.00, 16.33 and 3.33% at 6, 8, 10 and 12% initial SMC while those
stored in glass jar were 80.00, 80.00, 36.00and 12.00%, respectively (Table 3).
Though the field emergence (%) among the genotype was statistically identical
but AGS 191 showed the best performance followed by ASET 93 and Shohag.
Upto 8% SMC, more than 80% field emergence was observed. After that the
same was drastically declined irrespective of container. Poonam et al. (2001) also
reported that seeds of soybean cv. PK-327 at moisture content of 7-8% stored in
single and double polyethylene bags could be stored for up to 8 months under
ambient conditions.

MOISTURE LEVEL AND STORAGE CONTAINER EFFECTS ON SEED QUALITY 637
Table 3. Interaction effect of storage container, genotype and initial seed moisture
content on germination and field emergence of soybean seed
Container×genotype×
initial SMC
Germination (%) at different days after storage Field emergence
at 200 days after storage 50 100 150 200
C1V1M1 96.33a 94.00a 92.00a 91.66a 88.66a
C1V1M2 96.00a 93.33ab 90.92ab 90.00a 88.00a
C1V1M3 89.33c-f 83.33de 62.00e 40.00ef 36.00c
C1V1M4 80.00gh 60.00g 30.00hi 8.66i 8.00def
C1V2M1 94.00ab 92.33abc 88.66abc 87.33abc 86.3a
C1V2M2 94.00abc 92.00a-d 88.00abc 85.33abc 83.33a
C1V2M3 84.33efg 72.00fg 64.00e 46.66e 42.66bc
C1V2M4 78.00gh 60.00g 33.00ghi 10.00i 6.00ef
C1V3M1 92.00a-d 86.00b-e 84.00bc 82.00bc 80.00a
C1V3M2 92.00a-d 84.00cde 82.00cd 80.00c 80.00a
C1V3M3 89.33c-f 72.00g 43.33fg 21.33h 16.33d
C1V3M4 74.00h 62.00g 24.00i 6.33i 3.33f
C2V1M1 96.66a 94.00a 93.33a 92.00a 90.00a
C2V1M2 96.00ab 93.66ab 92.33a 91.33a 90.00a
C2V1M3 90.00c-f 84.00cde 74.00d 62.00d 54.00b
C2V1M4 82.00fgh 62.00g 42.00fg 27.00gh 16.00d
C2V2M1 94.00abc 92.00abc 90.00ab 88.00ab 86.00a
C2V2M2 94.00abc 92.00ab 90.00ab 87.00abc 84.00a
C2V2M3 90.00b-e 82.00ef 62.00e 48.00e 40.00c
C2V2M4 80.00gh 70.00g 40.00fg 26.00gh 18.00d
C2V3M1 92.00a-e 86.00b-e 84.00bc 82.00bc 80.00a
C2V3M2 92.00a-d 86.00b-e 84.00bc 82.00bc 80.00a
C2V3M3 89.33c-f 67.00g 48.66f 34.00fg 36.00c
C2V3M4 85.33d-g 60.00g 34.66gh 21.33h 12.00de
CV (%) 4.95 6.69 7.23 8.20 7.32
CV= Coefficient of variation, C1= Polythene bag, C2=, Glass jar, V1= AGS-191, V2=
ASET-93.
V3= Shohag, SMC= Seed moisture content, M1= 6% SMC, M2= 8% SMC, M3= 10%
SMC, M4= 12% SMC.
In a column, figures having similar letter(s) do not differ significantly.

638 ALI et al.
Table 4. Interaction of storage container, genotype and seed moisture content on
germination index of soybean seed at different days after storage
Container×genotype
× initial SMC
Germination index at different days after storage
50 100 150 200
C1V1M1 38.00ab 34.00a 28.00ab 24.33abc
C1V1M2 38.00ab 35.00a 27.00ab 23.66abc
C1V1M3 34.00a-e 26.00def 18.00de 12.00de
C1V1M4 34.00a-e 19.33h 9.0gh 1.00h
C1V2M1 38.00ab 32.00abc 27.00ab 24.33abc
C1V2M2 37.00abc 30.00a-d 26.00ab 24.33abc
C1V2M3 32.00c-f 25.00d-g 18.00de 11.00def
C1V2M4 30.00ef 20.00gh 7.00gh 1.37h
C1V3M1 31.00def 27.00cde 24.00abc 20.66bc
C1V3M2 30.00ef 27.00cde 23.00bcd 20.33c
C1V3M3 24.00gh 18.00hi 11.00fg 8.00efg
C1V3M4 20.00h 12.00j 5.00h 1.00h
C2V1M1 39.00a 35.00a 30.00a 26.33a
C2V1M2 39.00a 34.00a 28.00ab 25.55ab
C2V1M3 36.00a-d 30.00a-d 24.00abc 14.33d
C2V1M4 34.00a-e 22.00e-h 15.00ef 4.40gh
C2V2M1 38.00ab 33.00ab 29.00ab 25.66ab
C2V2M2 38.00ab 32.00abc 28.00ab 26.00a
C2V2M3 33.00b-e 26.00def 20.00cde 15.00d
C2V2M4 31.00def 21.00fgh 10.00fgh 5.10gh
C2V3M1 32.00c-f 28.00bcd 25.00abc 22.33abc
C2V3M2 32.00c-f 27.00cde 24.00abc 21.66abc
C2V3M3 28.00fg 22.00e-h 15.00ef 7.00fg
C2V3M4 22.00h 14.00ij 8.00gh 3.66gh
CV (%) 8.41 6.48 5.75 7.32
CV= Coefficient of variation, C1= Polythene bag, C2=, Glass jar, V1= AGS-191.
V2= ASET-93, V3= Shohag, SMC= Seed moisture content, M1= 6% SMC, M2= 8%
SMC, M3= 10% SMC, M4= 12% SMCIn a column, figures having similar letter(s) do not
differ significantly.

MOISTURE LEVEL AND STORAGE CONTAINER EFFECTS ON SEED QUALITY 639
Germination index
The interaction of storage container, genotypes and initial seed moisture content on germination index was statistically significant at each of the observation dates
during the storage period in 2013. The highest germination index for AGS 191 in glass jar with 6% initial MC were 39.00, 35.00, 30.00 and 26.33,
respectively at 50, 100, 150 and 200 DAS and it was statistically at par to those of AGS 191 in glass jar with 8% initial MC, ASET 93 in polythene bag with at
6% and 8% SMC, Shohag in glass jar with 6 or 8% initial MC. Those values for Shohag in polythene bag with 12% initial MC were 20.00, 12.00, 5.00 and 1.00
and it was statistically identical to Shohag in glass jar with 12% initial MC, respectively (Table 4). These results are conformity of those reported by
Balesevic-Tubic et al., 2005. Agha et al., 2004 reported that when seed could be
packaged in moisture proof containers, the relative humidity of the air around the seed remains low, then the seed equilibrium moisture remains low and the seed
maintains its viability and vigour for a longer time.
Conclusion
The study conclude that seeds of AGS 191, ASET 93 and Shohag could be stored in polythene bag or glass jar at 6 to 8% initial seed moisture content safely for
maintaining high seed quality. However, seed with high moisture content should never be stored in air tight container.
References
Agha, S. K., Z. H. Malik, M. Hatam and G. H. Jamro. 2004. Emergence of healthy
seedlings of soybeans as influenced by seed storage containers. Pakistan J. Biol. Sci.
7(1): 42-44.
Ali, M. R., M. M. Rahman, M. A. wadud, A. H. F.Fahim and M. S. Nahar. 2018. Effect of
seed moisture content and storage container on seed viability and vigor soybean.
Bangladesh Agron. J. 21(1):131-141.
Alam, M. M. and M. M. Rahman. 2005. Effect of seed moisture content and thickness of
polythene bag on germination and vigour on soybean seed. Bangladesh Seed Sci.
Technol. 9(1&2): 33-38.
Arunnandhy, V. and Senanayaka, Y.D.A. 1991. Changes in viability, vigour and
chemical composition of soybean seeds stored under the humid tropical conditions.
Legume Research. 14(3):135-140.
Balesevic-Tubic, M. Tatic, V. DorDevic, Z. Nikolic, J. Subic and V. Dukic. 2011.
Changes in soybean seeds as affected by accelerated and natural ageing. Romanian
Biotechnological Letters. 16(6):6740-6747.
Balesevic-Tubic, M. Tatic, V. DorDevic, Z. Nikolic, J. Subic and V. Dukic. 2011.
Changes in soybean seeds as affected by accelerated and natural ageing. Romanian
Biotechnological Letters. 16(6):6740-6747.

640 ALI et al.
Kong, F., S. K. C. Chang, Z. Liu and L. A. Wilson. 2008. Change of soybean quality
during storage as related to soyamilk and tofu making. J. Food Sci. 73(3): 134-144.
Poonam S., N. Tewari, P. K. Katiyar, T. Das and C.P. Vaish. 2001. Storability of soybean
(Glycine max Merr.) seeds in different containers under ambient conditions. Progres.
Agric. 1(1): 90-93.
Rahman, M. M., B. Hagidok, M. M. Masood and M. N. Islam. 2010. Effect of storage
container and relative humidity on the quality of wheat seed. Bangladesh J. Seed Sci.
Technol. 14(1&2): 89-94.
Rahman, L. 2001. Soybean: Production Food Uses Technology (in Bangla). BAU-USDA
Soybean Project, Dept. Genetics and Plant Breeding. Bangladesh Agril. Univ.,
Mymensingh, pp. 1-24.
Tatic M, S. Balesevic-Tubic, V. Dordevic, V. Miklic, M. Vujakovic and V. Dukic. 2012.
Vigor of sunflower and soybean ageing seed. Helia. 25(56):119-126.
Tatipata, A. 2009. Effect of seed moisture content packaging and storage period on
microchondria inner membrane of soybean seed. J. Agric. Technol. 5(1): 51-54.

ISSN 0258-7122 (Print), 2408-8293 (Online)
Bangladesh J. Agril. Res. 44(4): 641-648, December 2019
IN VITRO PROPAGATION OF POPULAR BANANA CULTIVAR
(Musa spp. cv. Patakpura)
BANDITA DEO1, BIKRAM KESHARI2 AND BIKRAM PRADHAN3
Abstract
The present experiment was conducted to optimize protocols for in vitro
propagation of banana (Musa sp.) cv. ‘Patakpura’ (AAB), supplemented with
different growth regulators. Shoot tips obtained from sword suckers were
cultured aseptically on MS medium supplemented with different concentrations
of cytokinins like 6-Benzylaminopurine (BAP) and Kinetin (KN) for
multiplication of shootsand auxins such as indole acetic acid (IAA) and
naphthalene acetic acid (NAA) for induction of roots. The best result from the
initial culture was obtained from MS medium supplimented with 4 mg/l BAP +
0.5 mg/l IAA. The highest shoot fresh weight, shoot length and number of
shoots per explant were recorded from MS medium supplemented with 4 mg/l
BAP + 0.5 mg/l IAA + 0.25 mg/l NAA. Therefore, the MS medium
supplemented with 4 mg/l BAP + 0.5 mg/l IAA + 0.25 mg/l NAA was found to
be most effective and productive combination for shoot multiplication and
proliferation of the culture in vitro. IAA at a concentration of 1 mg/l was found
to be most suitable for rooting of the shoots.
Keywords: Musa; in vitro; micro propagation; MS medium; phytohormones.
Introduction
Cultivated banana is derived from two diploid species of genus Musa acuminata
X Musa balbisiana. Banana and plantain approximately account for 21-22 % of
the fresh fruit production of the world and is one of the major economic crops. It is world’s second largest fruit crop and fourth most important global food crop
which is produced over 100 million metric tons per year (Banana Market Review and Banana Statistics 2012-2013, FAO, 2014). India, the largest banana producer
in the world, has been rapidly increasing cultivated area and volumes of production over the past decade. Although India currently produces
predominantly for the domestic market, it also supplies bananas to other countries. The ‘Patakpura’ variety of Odisha belongs to Musa pradisiaca (Musa
pradisiaca = hybrid between Musa acuminata and Musa balbisiana) having the genotype of AAB and is among one of the most popular local banana cultivars of
Odisha which have a very high demand in the markets of many states of India.
Researchers have found that fruits of banana contain various antioxidants such as
vitamin C, vitamin E and β-carotene (Kanazawa and Sakakibara, 2000). It has
1,2,3Plant Physiology and Biochemistry Division, Regional Plant Resource Centre,
Bhubaneswar, Odisha, India.
DOI: http://-

642 DEO et al.
been reported that the fruit has been used as anti-scorbutic, aphrodisiac and
diuretic (Salawu et al., 2010). It also contains dopamine, a powerful antioxidant, and all the B group vitamins present in the plant kingdom [Banana inter
professional association (AIB), 2014]. Thus bananas contribute to the proper functioning of energy metabolism and the nervous system and to maintain of
good digestive transit in human (Aprifel, 2015).
Banana species are normally propagated through vegetative parts (suckers)
because all the cultivated banana varieties are triploid and have sterile seeds (Muhammad et al., 2013). Conventional vegetative means of banana propagation
was noted to have several negative impacts which include diseases transmission, low production, very slow rate of multiplication of suckers and poor preservation
of original plant genetic material (Hussein, 2012).The cultivation of ‘Patakpura’
is mostly restricted to the coastal areas of Odisha. Mainly it is affected with diseases like panama wilt and banana streak disease. In conventional method
adequate numbers of suckers are not available. Transfer of diseases through suckers is also one of its major drawbacks. The disadvantages arising from
conventional propagation can be terminated by propagating banana through in vitro propagation (tissue culture) which offers clean planting material by mass
propagation (Ali et al., 2011).
Previously many researchers reported rapid regeneration of Musa sp. through in
vitro propagation (Nauyen & Kozai, 2001; Krishnamoorthy et al., 2001; Roels et al., 2005). Cytokinins and auxins play key role in in vitro culture as the later are
concerned with root formation, the former is mainly required for shoot formation and growth of buds. Cytokinins such as benzyl aminopurine (BAP) and kinetin
are known to reduce the apical meristem dominance and induce both auxiliary and adventitious shoot formation from meristematic explants in banana (Khalid,
2011).
The presences of BAP inhigher concentrations inhibit elongation of adventitious
meristems and developmentinto complete plants (Buising, 1994). Auxins and
other growth regulators such as gibberellins play important roles in the growth and differentiation of cultured cells and tissues (Alexandrova, 1996). The present
study was undertaken for optimization of protocols for rapid multiplication of ‘Patakpura’ banana on using Murashige and Skoog medium supplimented with
different plant growth regulators.
Materials and Methods
The present study was conducted in Banana Tissue Culture laboratory, Regional Plant Resource Centre, Bhubaneswar, Odisha, India. Sword suckers with an average height of 30-45 cm and with of 3 cm of selected plants from eastern coasts of Odisha was collected and the rhizomes were selected as explant. Suckers for initial tissue culture were collected in the month of July, 2017 and it took 8 months for completion of in vitro propagation of Patakpura. Explants were

IN VITRO PROPAGATION OF POPULAR BANANA CULTIVAR 643
processed by cutting the corm portion of the suckers into cylindrical shape of 4-5 cm in height and 2 cm in diameter. Then the explants were washed with detergent (Labolene) and treated with Bavistin for 45 mins. Surface sterilization with 0.5% Sodium hypochloride for 30 mins was done followed bywashing thrice in sterile distilled water in aseptic condition (under Laminar Air flow). The explants were inoculated aseptically in MS Medium (Murashige and Skoog, 1962).
The growth regulators used for shoot culture studies were Benzyl Amino Purine (BAP), Kinetin (KN), Indole-3-acetic acid (IAA) and Naphtalene acetic acid (NAA). For the initial culture the concentration and combination of plant growth regulators used with MS medium were as follows: 2 mg/l BAP + 0.5 mg/l IAA (P1), 4 mg/l BAP + 0.5 mg/l IAA (P2), 8 mg/l BAP + 0.5 mg/l IAA (P3), 5 mg/l KN + 0.5 mg/l IAA (P4) and 10 mg/l KN + 0.5 mg/l IAA (P5). Different concentrations of growth regulators supplemented in MS medium during multiplication culture of Musa spp. cv. ‘Patakpura’ explants were as follows: 2 mg/l BAP + 0.5 mg/l IAA (T1), 4 mg/l BAP + 0.5 mg/l IAA (T2), 2 mg/l BAP + 0.5 mg/l IAA + 0.25 mg/l NAA (T3), 4 mg/l BAP + 0.5 mg/l IAA + 0.25 mg/l NAA (T4), 2 mg/l KN + 0.5 mg/l IAA + 0.25 mg/l NAA (T5), 4 mg/l KN + 0.5 mg/l IAA + 0.25 mg/l NAA (T6), 1 mg/l BAP + 1 mg/l KN + 0.5 mg/l IAA + 0.25 mg/l NAA (T7) and 2 mg/l BAP + 2 mg/l KN + 0.5 mg/l IAA + 0.25 mg/l NAA (T8). MS media supplimented with three concentration of IAA such as 0.5 mg/L (R1), 1.0 mg/L (R2) and 2.0 mg/L (R3) were used for root development.
At first the explants were grown on initial culture medium for 15 days. Then the initial culture were transferred to multiplication culture stage. During multiplication stage the explants were cultured up to six sub-cultures and in each sub-culture the explants were grown on MS media for 21 days. After formation of individual shoots the explants were the culture in rooting medium for root development. All of the explants were cultured on MS media solidified with agar (6.5 gm/L). After preparation of MS media the pH was adjusted to 5.75-5.8 by using 1% NaOH or 1% HCl, which is suitable for the growth of cultured plantlets during in vitro culture before autoclaving the media for 15-20 mins at 121ºC and 15 PSI. The culture bottles containing the explants were kept in culture rack. For each treatment twenty explants were taken into consideration.
The culture room was maintained at 22ᵒC to 25ᵒC, 16 hr photo period of 35-50μEm-2s-1 intensity provided by cool white fluorescent tubes. After the root formation the banana plantlets were transferred to green house for primary hardening. The plantlets were planted in soilrite inside the primary hardening chamber and watered regularly. After primary hardening for 2-3 weeks the plantlets were transferred to polybags in secondary hardening containing soil, sand and FYM in the ratio 1:1:1.
The experiment was repeated thrice for confirmation of findings. The data collected at different stages of the experiment were analysed in MS Excel to find
mean and standard error.

644 DEO et al.
Results and Discussion
The explants were inoculated on MS medium with different concentration and combination of plant growth regulators (Auxins and Cytokinins). During the initial stage the rate of contamination remained high (10 %) because the suckers were obtained directly from soil. After 20-30 minutes of inoculation secretion of phenolic compound was observed on the whitish portion of the explant as it turned into light brown in colour. After 1 week of cultureall explants in initial mediums became enlarged and changed to greenish in colour.
Figure 1: Growth of Musa cv. ‘Patakpura’ explants during initial culture after 2
weeks of inoculation.
Fig. 2. a- Musa cv. ‘Patakpura’ explant on initial culture medium and b- Growth after
15 days of inoculation, c- ‘Patakpura’ explants cultured on medium containing
with 2 mg/l KN + 0.5 mg/l IAA + 0.25 mg/l NAA, d-Explants cultured on
medium containing with 4 mg/l BAP + 0.5 mg/l IAA + 0.25 mg/l NAA.
a b
d c

IN VITRO PROPAGATION OF POPULAR BANANA CULTIVAR 645
Best response from the initial cultures was obtained on medium supplimented
with 4 mg/L BAP where explants showed better growth and proliferations in
comparison to other media. Cytokinins like benzylaminopurine (BAP) and
kinetin play significant role to reduce the apical meristem dominance and induce
both auxiliary and adventitious shoot formation from meristematic explants in
banana (Khalid, 2011). Highest final fresh weight (4.3 ± 0.18 gm)was observed
fromexplants in 4 mg/L BAP + 0.5 mg/L IAA medium (P2). Poor response was
observed in explants grown on medium with high Kinetin content (10 mg/L),
producing least final fresh weight (2.6 ± 0.18 gm) among all the explants
cultured on other media.Explants exhibited vigorous proliferation in lower
concentration of BAP in comparison to Kinetin. Venkatachalam et al., 2007 and
Farahani et al., 2008 reported the importance of BAP than other cytokinins in
inducing growth of shoot tip cultures in different cultivars of bananas. Rahman et
al., 2006 and Dhed’a et al., 1991 reported that BAP has a remarkable effect in
inducing the growth of axillary and adventitious buds and foliar development of
shoot tip cultures.During Multiplication stage growth and proliferation of
explants were seen after 6-7 days after inoculation in all the 8 different media
compositions.
Table 1. Effect of plant growth regulators on shoot proliferation of ‘Patakpura’.
Medium Code Avg. Fresh Weight
(gm)
Avg. Shoot Length
(cm)
Avg. Number of
shoot
T1 5.29 2.9 6.9
T2 6.15 3.75 7.1
T3 6.81 3.17 9.37
T4 8.53 3.61 13.57
T5 4.78 2.89 5.8
T6 5.38 2.35 6.57
T7 5.77 3.1 8.7
T8 5.21 3.31 11.9
The lowest shoot buds number as well as percentage of response (50 %) was
marked in culture medium supplied with 2 mg/L KN. Media containing only
BAP and IAA were marked by inducing shoot proliferation. Better results
were obtained when explants cultured on medium containing BAP along with
IAA and NAA. The highest number of shoot (13) was observed in explants
cultured on medium supplied with 4 mg/l BAP + 0.5 mg/l IAA + 0.25 mg/l
NAA (T4).

646 DEO et al.
Table 2. Effect of plant growth regulators on root induction of ‘Patakpura’.
Parameters Medium Code
R1 R2 R3
Average no. of roots per shoot 4 6 6
Average root length (cm) 4 5 3
Average shoot length (cm) 5 4 4
Average no. of leaves per shoot 3 4 4
Robert et al., (2013) reported that the highest multiple shoot induction was found
in MS + 5 mg/l BAP while MS + 1 mg/l NAA + 0.2 mg/l BAP gave the longest regenerated shoots after 45 days of incubation. The developed shoots were
cultured in MS medium with different auxin concentrations for root induction and growth. Previously Wong (1986) stated that by increasing the concentration
of BAP the production of shoots per explants was also increased. Devendrakumar et al., 2013 studied that use of BAP at 20 µM/L showed better results in
comparison to its low and high concentrations for shoot induction and proliferation.
Fig. 3. a- Root induction of ‘Patakpura’ shoots supplimented with IAA (1
mg/l); b- Tissue cultured ‘Patakpura’ plants in RPRC nursery.
The best response for root induction was observed in MS medium containing 1 mg/l IAA. In an average of 6 ± 0.95 roots per shoot was observed in 1 mg/L IAA
medium within 8 days of culture, and the average length of roots was 5 ± 1.61 cm. Auxins such as Indole -3-acetic acid (IAA) and Naphtalene acetic acid
(NAA) have been reported to promote plant rooting in vitro (Vuylsteke, 1989). Auxins also play vital roles in the growth and differentiation of cultured cells and
tissues (Bohidar et al., 2008; Ngomuo et al., 2014).
b a

IN VITRO PROPAGATION OF POPULAR BANANA CULTIVAR 647
Conclusion
From the present study it was observed that the response of ‘Patakpura’ banana explants was better when cultured in medium containing BAP in comparison to
Kinetin during initial as well as in the multiplication stages. It was observed that auxins like IAA and NAA also play a vital role in shoot formation during
proliferation stages. The uses of auxins are very much essential during in vitro culture of banana as they are involved in root formation and proliferation. The
optimum concentrations of growth regulators for initial and shoot multiplication during in vitro culture of ‘Patakpura’ banana were 4 mg/l BAP + 0.5 mg/l IAA
and 4 mg/l BAP + 0.5 mg/l IAA + 0.25 mg/l NAA respectively.
Acknowledgement
Authors are thankful to Government of Odisha, Department of Forest and
Environment for funding and Regional Plant Resource Centre for providing facilities to carry out the research studies.
Reference
Alexandrova, K., P., Denchev and B., Conger. 1996. Micropropagation of Switchgrass by Node Culture. Crop Science. 36:1709-1711.
Ali, A., A., Sajid, N.H., Naveed, A., Majid, A., Saleem, U.A., Khan, F.I. Jafery and S., Naz. 2011. Initiation, Proliferation and Development of Micro-Propagation System for Mass Scale Production of Banana through Meristem Culture. African Journal of Biotechnology.10:15731-15738.
Aprifel. 2015 : http://www.aprifel.com/fiche-nutri-produit-allegations-banane,24.html
Banana interprofessional association (AIB). 2014. «Fiche 1: La bananeenchiffres», Recueil de fiches de qualité de la banane. CIRAD, France.
Bohidar, S., M. Thirunavoukkarasu and T. Rao. 2008. Effect of Plant Growth Regulators On In Vitro Micropropagation of ‘Garden Rue’ (Ruta graveolens L.). International Journal of Integrative Biology. 3:36-43.
Buising, C.M., R.C., Shoemaker and R.M., Benbow. 1994. Early Events of Multiple Bud Formation and Shoot Development in Soybean Embryonic Axes Treated with the Cytokinin, 6-Benzylaminopurine. American Journal of Botany. 81:1435-1448.
Dhed’a, D., F., Dumortier, B., Panis, D., Vuylsteke and E., De Langhe. 1991. Plant regeneration in cell suspension cultures of cooking banana “Bluggoe’ cultivar (Musa spp. ABB group). Fruits. 46: 125-135.
FAO. 2014. Food and Agricultural Organization of the United Nations.Banana Market Review and Banana Statistics 2012-2013.
Farahani F., H., Aminpoor, M., Sheidai,Z., Noormohammadi, M.H., Mazinani. 2008. An Improved System for in vitro Propagation of Banana (Musa acuminate L.) Cultivars. Asian J. Plant Sci. 7(1):116 –118.
Hussein, N. 2012. Effects of Nutrient Media Constituents on Growth and Development of Banana (Musa spp.) Shoot Tips Cultured in Vitro. African Journal of Biotechnology.11:9001-9006.

648 DEO et al.
Kanazawa, K. and H., Sakakibara. 2000. High content of dopamine, a strong antioxidant,
in Cavendish banana. J. Agric. Food Chem. 48(3): 844-848.
Khalid, N. 2011. Effect of Benzylaminopurine (BAP) Pulsing on in Vitro Shoot
Multiplication of Musa acuminata (Banana) cv. Berangan. African Journal of
Biotechnology. 10:2446-2450
Krishnamoorthy, V., N., Kumar, K., Sooriananthasundaram. 2001. In vitro propagation of
the popular desert cv. Poovan (AAB). First post graduate seminar. TNAU,
Coimbatore. 46.
Muhammad M.I., A., Muhammad, I., Hussain, H., Bilal. 2013. "Optimization of In Vitro
Micropropagation Protocol for Banana (Musa Sapientum L.) Under Different
Hormonal Concentrations and Growth Media". IJAIR. 2(1): 23-27.
Murashige, T. and F., Skoog. 1962. A revised medium for rapid growth and bioassays
with tobacco tissue culture. Physiol Plant., 15: 473 – 497.
Nauyen, O. T., and T., Kozai. 2001. Growth of in vitro banana (Musa sp.).Shoots under
photomixotrophic and photoautotrophic conditions. In-vitro cell. Dev. Bio. Plants.
37: 824-829.
Ngomuo, M., E., Mneney, P.A., Ndakidemi. 2014. The in Vitro Propagation Techniques
for Producing Banana Using Shoot Tip Cultures. American Journal of Plant
Sciences. 5: 1614-1622.
Rahman , M.Z., M.G. Sharoar, M.N. Matin , M.H. Rahman, M.M. Rahman and M.R.
Islam. 2006. High frequency plant regeneration of a dessert banana cv. Mehersagar
for commercial exploitation. Biotechnology. 5: 296-300.
Robert, L., H., Vanlaldiki and W. I., Meitei. 2013. In vitro shoot tip culture of banana
cultivar meiteihei. The Bioscan. 8(3): 839-844.
Roels, S., M., EScalona, I., Cejas, C., Noceda, R., Rodriguez, M. J., Canal and D.,
Sandoval. 2005. Optimization of plantain (Musa AAB) micropropagation by
temporary immersion system. Plant Cell Tissue Organ Cult. 82: 57-66.
Salawu, L., R. A., Bolarinwa, A. B., Adegunloye and H. A., Moraine. 2010. HBs Ag,
anti-HCV, anti-HIV and VDRL in blood donors: Prevalence and trends in the last
three and a half years in a tertiary health care facility in Ile-Ife, Nigeria. Int. J. Med.
Sci. 2(11): 335-341.
Venkatachalam, L., R. V., Sreedhar and N., Bhagyalakshmi. 2007. “Micro Propagation in
Banana Using High Levels Does Not Involve Any Genetic Change as Revealed by
RAPD and ISSR Markers”. Plant Growth Regulation. 51(3):192-205.
Vuylsteke, D. R. 1989. Shoot-Tip Culture for the Propagation, Conservation and
Exchange of Musa germplasm.
Wong, W.C. 1986. In vito propagation of banana (Musa spp.): Initiation, Proliferation
and Development of Shoot – tip cultures on defined media. Plant Cell, Tissue and
Organ Culture. 6:159 – 166.

ISSN 0258-7122 (Print), 2408-8293 (Online)
Bangladesh J. Agril. Res. 44(4): 649-658, December 2019
DETERMINANTS OF HOUSEHOLD FOOD SECURITY IN RURAL
BANGLADESH: AN EMPIRICAL ANALYSIS OF FARM LEVEL DATA
K. S. RAHMAN1, M. K. HASAN2 AND M. HASAN
Abstract
The study endeavors to estimate the food security status and identify the
determinants of food security among households in Hakimpur Upazila in
Dinajpur district, Bangladesh. it was found that households of Hakimpur upazila
in Dinajpur district were food insecure during the period of the survey. Number
of dependents, income of household head, age of household head and level of
education were found to significantly influence household head food security in
the study area positively. It is recommended that social security measures must
ensure that the benefits of public efforts to improve food security and nutrition
are universal. Human rights based practices are preferable.
Introduction
Now a day’s food security issue is getting more attention in the world. The
stability means both the availability and accessibility of food in various
dimensions of food. Food security comprised of four components such as food
availability, accessibility, utilization and stability. Bangladesh is an over
populated country having a population density of 1104 per square kilometer.
Agriculture is the most important sector for the economy of Bangladesh
contributing 14.74% to the GDP. The huge population of the country depends on
agriculture sector for their foods and calories.
The population growth rate of Bangladesh is 1.03%. According to this rate, the
total population will become 233.2 million within 2050. In Bangladesh, about
0.08 million of arable land are going out of production every year (Mondal,
2010). However, the country faces a tremendous challenge for providing food
security to the increasing population. Therefore, it is important to increase food
production in order to meet the growing demand for food emanating from
population growth. Although there are significant achievements in food grain
production but, food insecurity both in national and household level remains a
matter of major concern in Bangladesh. Like many other developing countries,
food security in Bangladesh is also threatened by the global economic crisis
and soaring price of essentials. Food security is viewed as the “number one”
priority of the government. Poverty is the major factor effecting food security in
1Scientific Officer, 2Chief Scientific Officer, Agricultural Statistics & ICT, Bangladesh
Agricultural Research Institute (BARI), Gazipur, 3Scientific Officer, Farm Machinery
and Post-harvest Process Engineering Division, BARI, Gazipur, Bangladesh.
DOI: http://-

650 RAHMAN et al.
Bangladesh. According to World food Summit, 1996 food security is defined as
“when all people all the times access to sufficient, safe, nutritious food to
maintain a healthy and active life.” Commonly, the food security is defined as
including both physical and economic access to food that meets people’s dietary
needs as well as their food preferences. Food security is built on three pillars
namely, Food availability, Food access and Food use. People are considered food
secure when they have availability and adequate access at all times to sufficient,
safe, nutritious food to maintain a healthy and active life. Food security analysts
look at the combination of the following three main elements such as food
availability, food accessibility and food utilization.
Rice is the staple food and its production plays an important role in the economy
of the country. In Bangladesh, rice alone constitutes 92 percent of the total food
grain production annually. It provides about 80 percent of the people’s energy
intake (Tetens et al. 2003), the majority of their protein intake, and a
considerable proportion of several micronutrients in their average daily diet (Hels
et al. 2003). Food availability of a country may depend on some other factor also.
Among them, different socio-economic and demographic variables like
population, total food production, imports of the food items, per capita income,
adult literacy rate, female attending school, male attending school, infant
mortality rate, employed labour force are remarkable. Therefore it is our
particular interest to investigate the determinants of food security of Bangladesh
using econometric time series approach. In this view points a number of studies
which have been conducted to investigate such determinants are reviewed are
noted bellow.
Gebre (2012) applied logistic regression model to examined the determinants of
food insecurity among urban households in Addis Ababa city and pointed out six
important factors out of ten factors. The identified significant factors are
household size, age of household head, education of the household head, and
access to credit, household asset possession, and access to employment. Sultana
and Kiani (2011) studied to examine the determinants of household’s food
security in Pakistan using micro data for the year of 2007-08 and found that
place of residence has a significant and negative effect on household’s food
security status. They also identified that the dependency ratio has a significant
impact on food security and has expected sign negative. Educational attainment
level of household’s head beyond intermediate level has also significant and
positive impact on food security status of household. Whereas social capital and
employment do not effect household’s food security significantly. They advised
different policies and programs that should be needed to address for the
wellbeing of their people. Some other remarkable research have been cited in the
literature [Iram and Butt (2004), Hazarika and Khasnobis (2005); Omotesho et.
al., (2010); Arene and Anyaeji (2010); Sisay and Edriss, (2012); Bogale and

DETERMINANTS OF HOUSEHOLD FOOD SECURITY IN RURAL BANGLADESH: 651
Shimelis (2009) and Mitiku et. al., (2012)] to investigate and idetified some
important factors through their research in food security area.
Faridi and Wadood (2010) studied to investigate the determinants of household
food security situation in Bangladesh applying the logistic regression. They
found different household characteristics which are strongly correlated with food
security indicator. They also show that food security indicator is also highly
sensitive to rice price changes. Most of the studies have been introduced
regression technique. As therefore, it is our particular interest to investigate the
determinants of food security of Bangladesh using household level data. Most of
the studies have been introduced regression techniques having without or partial
involvement of econometric tests may questionable on their application. As
therefore, it is our particular interest to investigate the determinants of food
security of Bangladesh using Logistic Regression Analysis approach which could
be able to meet the existing research gap. Therefore the study is very important to
have an idea about the factors affecting food security might help in making
decision by the policymakers for policy making in future.
The Specific Objectives of the study are:
(i) To explore the present status of food security in Bangladesh on the basis
of availability, accessibility and utilization of food.
(ii) To identify the factors influencing food security/ insecurity in
Bangladesh.
(iii) To establish an econometric time series model to forecast the future food
security status.
(iv) To formulate policy guidelines/suggestions
Materials and Method
The study was conducted in Hakimpur (Hili) Upazila in Dinajpur district in
Bangladesh. Hakimpur (Hili) is located at the North-Western part of the country
and considered as the center of northwestern Bangladesh. Hakimpur (Hili) is an
emerging urban center and magnification rate of the urban population has been
incrementing at an expeditious rate and commercialization active have been on
the incrimination placing most of the inhabitants who are mostly farmers, civil
servants, handicrafts worker and traders under economic stress.
Selection of the Study area and Sample Size
Purposive Simple random sampling techniques were adopted for selecting
reasonable numbers of sample from farmers, traders/merchants, handicrafts
worker and civil/public servants. At the first stage of Sampling, one districts was
selected from 10 most poor districts (Kurigram, Dinajpur, Magura, Bandarban,

652 RAHMAN et al.
Khagrachari, Shariatpur, Lalmonirhat, Gaibandha, Nilphamari and Thakurgaon)
for the study. At the second stage of sampling, one Upazila, Hakimpur was
selected purposively for the study. Then sample farmers, traders/merchants,
handicrafts worker and Civil/public servants were randomly selected for primary
data collection. The population of the study was purposively drawn from
respondents who are mainly farmers. Traders/merchants, handicrafts, worker and
civil/public servants. A total of 56 respondents were arbitrarily drawn from the
Hakimpur (Hili) Upazila in Dinajpur district.
Data/information and Analytical Technique
Both primary and secondary data and information were used for the study.
Primary data were collected from field level through questionnaire survey from
the aforesaid locations. Secondary data and information relating to different
statistics were gathered from various published Sources like BBS, FAOStat,
research reports etc.
Data were analyzed applying descriptive statistics and logistic regression
analysis. Firstly, a set of brief descriptive coefficients that summarizes a given
data set. Which can either be a representation of the entire population or a
sample. The measures used to describe the data set are measures of central
tendency and measures of variability or dispersion. Measures of central tendency
include the Mean, Median and Mode while measures of variability include the
Standard Deviation (or variance), the minimum and maximum variables,
Kurtosis and Skewness. Food security status was quantified setting a binary value
of one or zero. Where one represents food secure and zero represents food
insecure. The logistic regression then provides a model of observing the
probability of a household becoming food secure or food insecure.
The logistic model is designated explicitly as:
Y= b0 + b1 X1 + b2 X2 + b3 X3 + b4 X4 + b5 X5 + b6 X6
Where Y=Food security status (1, if household is food secure; 0,if household is
food insecure)
X1 =Sex of household head (Male=1; female=0)
X2 =Household size (Member of dependents)
X3 =Manthly Income of household (TK)
X4 =Age of household head (Year)
X5 =Level of education of household head (Year of schooling)
X6 =ePemixtC xm np f ymhnnamPatPpaC rePm

DETERMINANTS OF HOUSEHOLD FOOD SECURITY IN RURAL BANGLADESH: 653
Results and Discussion
Socioeconomic characteristics of the respondents:
Age of the respondents
It was found that the highest percentage (46.42%) of the respondents was in the
age group of 46-60 years followed by 31-45 years (44.67%) and age group up to
30 years (5.36%) and age group above 60 years has the lowest percentage
(3.58%) (Table 1)
Education level of the respondents
On an average, 10.71% respondents were illiterate and others having variable
levels of academic background. Among the educated respondents 21.43% had
primary level of education, 33.92% had S S C level of education, 19.65% had H
S C level of education, 14.29% had education at above H.S.C.(Table 1)
Table 1. Socioeconomic characteristics of the respondents
Items
Age : No. of the respondents % of the respondents
Up to 30 years 3 5.36%
31-45 years 25 44.64%
46-60 years 26 46.42%
Above 60 years 2 3.58%
Education :
Illiterate 6 10.71
Primary 12 21.43
SSC 19 33.92
HSC 11 19.65
Above HSC 8 14.29
Descriptive Statistics
Descriptive Statistics provide a useful summary of security returns when
performing empirical and analytical analysis, as they provide a historical account
behavior. Although past information is useful in any analysis, one should always
consider the expectations of future events. There are 48 male and 8 female
among 56 respondents.

654 RAHMAN et al.
Table 2. Descriptive Statistics on the selected variable
Variables Maximum Minimum Average
Number of Dependents 10 1 3.694
Income of Household head (Tk./Month)
75000 3500 24022
Age of Household Head 65 28 46.34
Per Capita monthly food expenditure
9000 1200 3313
Level of Education 15 0 8.304
Source Field Survey 2019
Table 2 shows the descriptive statistics. The variable number of dependents
means value is 3.694, and the maximum and the minimum value are 10 and 01 respectively. Consequently, the average income, the maximum income and the
minimum income of household head are respectively Tk. 75000, Tk. 3500. Similarly, the respondents average age, maximum age and are respectively 46, 65
and 28. Per Capita monthly food expenditure, the maximum food expenditure and the minimum food expenditure of the household are respectively Tk. 3313,
Tk. 9000 and Tk.1200.
Food Security index
This analysis evaluates the food security status of respondents using per capta
expenditure on food (Table 3).
Table 3. Food Security line for the respondents
Respondents MPCFE
(Tk.)
Stats Respondents MPCFE
(Tk.)
Stats
01 2600 High 31 3000 High
02 2500 High 32 3500 High
03 3900 High 33 2500 High
04 4000 High 34 2500 High
05 4000 High 35 2500 High
06 5000 High 36 8000 High
07 3000 High 37 2500 High
08 3000 High 38 2000 Low
09 4500 High 39 2000 Low

DETERMINANTS OF HOUSEHOLD FOOD SECURITY IN RURAL BANGLADESH: 655
Respondents MPCFE
(Tk.)
Stats Respondents MPCFE
(Tk.)
Stats
10 2500 High 40 1500 Low
11 5000 High 41 2000 Low
12 2400 High 42 3000 High
13 2000 Low 43 2500 High
14 2100 Low 44 1500 Low
15 1595 Low 45 1500 Low
16 3000 High 46 1800 Low
17 2500 High 47 1800 Low
18 1900 Low 48 1950 Low
19 2000 Low 49 3500 High
20 2800 High 50 1950 Low
21 1900 Low 51 2000 Low
22 3600 High 52 2000 Low
23 7500 High 53 9000 High
24 6900 High 54 3500 High
25 7500 High 55 1200 Low
26 2200 Low 56 1950 Low
27 4500 High Total 185545
28 7500 High Mean MPCFE 3313.304
29 7500 High 2/3MPCFE 2208.869
30 5000 High Source: field Survey, 2019
Note: Mean per Capita Food Expenditure = MPCFE in TK
The analysis ascertained that more than the respondents (37.5%) are food
insecure since their monthly per capita food expenditure falls below two-third (2/3) of the mean monthly per capita food expenditure.
Logistic Regression Analysis Result
The logistic regression analysis identified the factors affecting the ability of the
households to secure available food supplies .the result of analysis is demonstrated in Table 4.

656 RAHMAN et al.
Table 4. Logistic Regression Result for the Determinants of food Security status
Explanatory variable Coefficients Standard Z-Statistics Pr(>z)
Sex of household head 0.06138 1.181 0.520 0.60332
Number of dependents or household size
-1.227 0.4598 -2.669** 0.00761
Income of household head 0.000175 0.0000643 2.732** 0.00630
Age -0.1229 0.05911 -2.078* 0.03768
Level of education -0.1557 0.1332 -1.168* 0.04261
Per capita monthly food
expenditure
-0.0005415 .0003338 1.622 0.10474
Constant 6.825 3.829 1.782 0.07472
chi-square 39.182
R2 67.22
*Significant at 5 % level of probability,**Significant at 1 % level of probability
Source: field survey, 2019
Four Variables are important in explaining the food security status of the
household . They are number of dependents, income of household head, age of
household head and level of education. The other variables demonstrate not to be
important. Sex of household head has a negative impact on food security status
because more dependents want more food with in the household with a fixed
income of household head. Income of household has positive effect on food
security status suggesting that the more gainfully employed a household head is,
the greater his or her chances of being food secure. The level of education has
positive effects on food security status point toward that higher of level education
has a greater chance to get a better job, which indirectly helps to earn higher
income. Higher income also has positive effects on food security status
In brief, it is yielded that number of dependents, income of household head, age
of household head and level of education of the households are the determinants
of food security status among the responds of Hakimpur Upazila in Dinajpur
District. The coefficient of determination, R2 is 67.22 percent inferring that the
variation in food security status is due to the stated socio-economic
characteristics of Hakimpur Upazila in Dinajpur District households. The result
further showed that the overall logistic model was significant based on the chi-
square. Thus representing that the explanatory variables are relevant in
determining the household food security status.

DETERMINANTS OF HOUSEHOLD FOOD SECURITY IN RURAL BANGLADESH: 657
Conclusion
The study has found that households of Hakimpur Upazila in Dinajpur District were food insecure during the period of the survey. Number of dependents,
income of household head, age of household head and level of education were found to significantly influence household head food security in the study area
positively. However, sex of household head, Per Capita monthly food expenditure was found to influence food security negatively at the household
level.
Based on the results, It is recommended that social security measures must
ensure that the benefits of public efforts to improve food security and nutrition are universal. Human rights based practices are preferable. Extremely versatile,
tolerant and nutrient-sensitive, it is vital to grow agriculture.
References
Arene, C.J. and R. C. Anyaeji, (2010): Determinants of Food Security among Households
in Nsukka Metropolis of Enugu State, Nigeria. Pakistan Journal of Social Sciences
30(1):9
Bogale A., and A.Shimelis, (2009); Household level determinants of food insecurity in
rural areas of Dire Dawa, Eastern Ethiopia, African Journal of food, agriculture
nutrition and development. 9(9):1915-1926.
Faridi. R.and S. N. Wadood. 2010. An Econometric Assessment of Household Food
Security in Bangladesh. The Bangladesh Development Studies 33(3):97-111.
Gebre, G. G. 2012. Determinants of food insecurity among households in Addis Ababa
city, Ethiopia. Interdisciplinary Description of Complex Systems 10(2):159-173.
Hazarika, G. and B. Khasnobis. 2005. Women's status and children's food security in
Pakistan. Department of Business Administration, University of Texas.
Hels, O., N.Hassan, I. Tetens, and S. H. Thilsted. 2003. Food consumption, energy and
nutrient intake and nutritional status in rural Bangladesh: Changes from 1981-82 to
1995-96. Eur. J. Clin.Nutr. 57: 586-594.
Iram, U., and M.S. Butt. 2004. Determinants of household food security: an imperial
analysis for Pakistan. International Journal of Social Economics. 31(8):753-766.
Mitiku, A., B. Fufa, and B. Tadese. 2012. Empirical analysis of the determinants of rural
households food security in Southern Ethiopia: The case of Shashemene District.
Basic Research Journal of Agricultural Science and Review. 1(6):132-138
Mondal, M H. 2010. Crop agriculture of Bangladesh: Challenges and opportunities.
Bangladesh J. Agril. Res. 35(2): 235-245.
Omotesho O. A; M.O. Adewumi and K.S. Fadimula. 2010. Food Security and Poverty of
the Rural Households in Kwara State, Nigeria. Libyan Agriculture Research Center
Journal International 1(1): 56-59
Sisay, E. and , A. K. Edriss. 2012. Determinants of Food Insecurity in Addis Ababa City,
Ethiopia. Journal of Economics and Sustainable Development 3(3):2222-2855

658 RAHMAN et al.
Sultana A. and A. Kiani. 2011. Determinants of food security at household level in
Pakistan, African Journal of Business Management 5(34):12972-12979.
Tetens I, O Hels, NL Khan, SH Thilsted, N Hassan. 2003. Rice-based diets in rural
Bangladesh: How do different age and sex groups adapt to seasonal changes in
energy intake? Am. J. Clin. Nutr. 78: 406-413.
ISSN 0258-7122 (Print), 2408-8293 (Online)
Bangladesh J. Agril. Res. 44(4): 659-668, December 2019
EFFECT OF POTASSIUM ON YIELD, QUALITY AND SHELF
LIFE OF TOMATO
M. S. ISLAM1, M. ZAKARIA2, M. M. HOSSAIN3
M. A. B. MIA4 AND A. J. M. S. KARIM5
Abstract
The experiment was conducted at the experimental field of the Department of
Horticulture, Bangabandhu Sheikh Mujibur Rahman Agricultural University
(BSMRAU), Salna, Gazipur, to study the effect of potassium on yield, quality
and shelf life of tomato under ambient condition during 15 October 2015 to 30
June 2016. Six levels of K viz., 0, 35, 70, 105, 140 and 175 kg/ha consisted of
the treatments of the experiment. The tomato plant treated with K105 produced
maximum plant height (128.50 cm), number of fruits plant-1 (26.49), fruit
diameter (5.71 cm), fruit length (5.83 cm), weight of fruits plant-1 (1.72 kg), fruit
yield ha-1(71.96 ton), dry matter (7.56 %), firmness (1.22 N), shelf life (15
days), TSS (10.30 %), β carotene (0.090 mg/100 g), ascorbic acid (26.49 mg/100
g) and total sugar (5.05 %). Contents of iron (123.20 ppm), calcium (0.42%) and
potassium (0.71%) were recorded maximum in K140, K35 and K175 respectively.
Iron and potassium content increased with the increasing level of potassium but
reverse effect was found in case of calcium. The regression equation for applied
K were Y=-3.339x2 + 636.5x + 42606. Based on this equation, the optimum dose
of K for tomato was 95.31 kg ha-1 in salna series of shallow red brown terrace
soil and its corresponding yield is 71.96 t ha-1.
Keywords: Potassium, yield, quality and shelf life, tomato.
Introduction
Tomato (Solanum lycopersicum) is one of the most important vegetable crops grown throughout the world under field and green house conditions (Kaloo,
1986). In terms of human health, tomato is a major component in the daily diet in many countries and constitutes an important source of minerals, vitamins, and
antioxidants (Grierson and Kader, 1986). The global production area for tomato was estimated at 44,12,757 ha with world production quantity estimated at
15,16,99,405 metric tons and global yield was estimated 34.38 t/ha (FAO, 2010).
The area of tomato in Bangladesh is 26,316 ha and production is 2,50,947 metric tons. While the yield is 9.54 t/ha (BBS, 2013) which is relatively very low in
Bangladesh as compared to other tomato producing countries (Vanitha et al., 2013).
1Deputy Secretary, Ministry of Industries, 2&3Department of Horticulture, 4Department of
Crop Botany, 5Department of Soil Science, Bangabandhu Sheikh Mujibur Rahman
Agricultural University (BSMRAU), Salna, Gazipur- 1706, Bangladesh.
DOI: http://-

660 ISLAM et al.
Tomato is a highly perishable vegetable with limited shelf life and can be kept
very short period in room temperature. The post harvest loss reported upto 32.90% in tomato (Hassan et al., 2010). Moreover, it grows in Bangladesh
mainly in winter period which lead to market glut in season. Adequate supply of nutrient can increase the yield, fruit quality, fruit size, keeping quality, colour and
taste of tomato (Shukla and Naik, 1993). Concerning plant nutrition, potassium plays an important role in the improvement of post harvest quality traits in
tomato (Cakmak, 2005). Adequate K nutrition has also been associated with increased yield, fruit size, increased soluble solids and ascorbic acid
concentrations, improved fruit colour, increased shelf life and shipping quality of many horticultural crops (Lester et al., 2007). Potassium act like a spark-plug for
activation of more than 60 enzymes which needs improvement of yield and
quality of plant (Malvi, 2011). So application of proper doses of potassium is of great importance.
But little specific work has been carried out in Bangladesh condition to investigate the effect of potassium on yield, quality and self life improvement of
tomato. Considering the above facts, the present study was undertaken to find out the optimum dose of potassium for yield, quality and shelf life improvement of
tomato.
Materials and Methods
The experiment was conducted at the experimental field of Horticulture and at
the laboratory of Horticulture and Soil Science Department of Bangabandhu
Sheikh Mujibur Rahman Agricultural University (BSMRAU), Salna, Gazipur,
Bangladesh during October 2015 to June 2016. Six levels of potassium viz. T0=
K0(0 kg MoP ha-1), T1=K35(70 kg MoP ha-1), T2=K70(140 kg MoP ha-
1),T3=K105(210 kg MoP ha-1) ,T4=K140(280 kg MoP ha-1) and T5=K175(350 kg
MoP ha-1) consisted of the treatments of the experiment. The treatments were
selected on the basis of initial soil test value. The soil contained 1.06 % organic
matter, 0.114% total nitrogen, 3.70 µg/g available phosphorus, 0.11 meq/100g
exchangeable potassium, 12.00 ppm sulphur, 1.30 µg/g zinc and 0.20 ppm
available boron. The experiment was laid out in a Randomized Complete Block
Design (RCBD) with four replications. The dimension of each plot was 1.8 × 2
m. The unit plots and blocks were separated by 0.50 m and 1.0, m respectively.
The selected land was prepared in October 2015 by tractor drawn plough
followed by harrowing and laddering. The plots were prepared, drains were made
around each plot and the excavated soil was used for raising the plots about 10
cm high from the soil surface. Other fertilizers were applied @10000-126-64-12-
2-1 kgha-1 of Cowdung-N-P-S-Zn-B. Doses of fertilizer were calculated
according to Fertilizer Recommendation Guide (FRG, 2012). Full doses of well
decomposed cowdung, P, S, Zn, B, 50% potassium were applied as basal dose
and were incorporated into the prepared plots a few days before planting.

EFFECT OF POTASSIUM ON YIELD, QUALITY AND SHELF LIFE OF TOMATO 661
Remaining 50% potassium and full dose of urea were applied in two splits after
20 and 40 days of transplanting. Seeds of tomato variety BARI Tomato-14 were
collected from the Horticulture Research Centre of BARI, Gazipur. Seeds were
sown in plastic trays on 26 October, 2015 in 2-3 cm deep furrows at 10 cm apart
rows. Seedlings emerged between 3-4 days after sowing. After 5 days of
germination, seedlings were transferred into poly bags. Twenty days old
seedlings were transplanted in the experimental field on 20 November, 2015 at
60 cm row to row and 40 cm plant to plant distance.
Necessary intercultural operations such as weeding, staking, pruning, irrigation
and mulching were done as and when necessary during the crop growing period.
Admire 20 SL @ 0.5 ml/l, dithane M-45 @ 2.5 g/l of water was applied to
control insect pest and fungus diseases. Tomato was harvested at breaker stage
from randomly selected 10 plants of each plot. Data on plant height, number of
fruit per plant, fruit diameter and length, weight of fruit per plant were recorded
in the field at last harvest and yield per hectare were estimated from plot yield.
The following chemical and nutritive components were recorded after harvesting.
Determination of shelf life (days)
Days required from harvest to ripening (marketable condition) under ambient condition.
Weight loss (%)
Loss of weight were estimated by the following formula
Percent weight loss = weightInital
weightFinal- weightInitial× 100
Determination of moisture percent (%)
Moisture percent was calculated according to the following formula:
Moisture percent = ht Fresh weig
Dry weight-htFresh weig× 100
Dry matter (%)
Dry matter percent of tomato was calculated according to the following formula:
Dry matter percent = pulp ofht Fresh weig
pulp of Dry weight× 100
Total soluble solids (%)
Total soluble solids were determined by an ATAGO NT hand refractometer and expressed in percentage.

662 ISLAM et al.
Firmness (N)
Firmness was determined by using Fruit Texture Analyzer (Guss, Model No. GS25, SA) supported by FTA win software. Results were expressed in Newton (N).
Nutrient content analysis
Ascorbic acid was determined as per Pleshkov (1976), β - carotene was
calculated according to Nagata et al., (1992), total sugar was estimated according to bertrand method and mineral elements viz. iron, calcium, potassium as
described by Piper (1966)
Statistical analysis
The recorded data were statistically analyzed by using MSTAT-C software and mean were compared by DMRT at 5% or 1% level of probability.
Results and Discussion
Plant height
Different doses of potassium had no significant effect on plant height (Table
1).The tallest plant was found in K105 (128.50 cm) and it was followed by K70 (128.00 cm) K35 (127.50 cm) and K140 (127.30 cm). The shortest plant height was
found in K175 (125.50 cm). Similar opinion was also express by Bhagat et al. (2014) who found the tallest tomato plant in 100 kg K ha-1.
Number of fruits per plant
Different doses of potassium had significant effect on number of fruit per plant
(Table 1). The highest number of fruit per plant was observed in K105 (26.49) which was statistically alike to K70 (26.01). On the other hand, the plants under
control (K0) gave the lowest number of fruit (17.60) per plant. Similar result was also reported by Bhagat et al., (2014) who found the highest number of tomato
per plant with 100 kg K ha-1.
Fruit diameter
Significant variation in fruit diameter (cm) was found due to the effect of potassium (Table 1). The highest fruit diameter (5.71 cm) was found in K105
which was statistically similar to K70 (5.63 cm) and it was minimum (4.68 cm) in
K0. The results were in line with the report of Mazed et al., (2015) who found maximum diameter of fruit from 140 kg K ha-1 and minimum from control (K0).
Fruit length
Highest fruit length was recorded in K105 (5.83 cm) and it was statistically similar
to K70 (5.71 cm), K35 (5.50) and K140 (5.51 cm). On the contrary, the fruit length

EFFECT OF POTASSIUM ON YIELD, QUALITY AND SHELF LIFE OF TOMATO 663
was the minimum (5.05 cm) in K175. Optimum potassium influenced nutrient
absorption capacity of plant that encouraged cell division, hormonal and enzymatic activities resulting higher fruit length.
Fruit yield per plant
Significant variation of yield per plant was found due to the influence of
potassium (Table 1). The maximum yield was observed in K105 (1.72 kg) which was statistically alike to K70 (1.68 kg) and it was minimum in K0 (0.99 kg).
Fruit yield per hectare
The highest yield was recorded in treatment K105 (71.96) which was statistically
similar to K 70 (70.34). The lowest yield was recorded in K0 (41.25) (Table 1). Bhagat et al., (2014) also reported that 100 kg K/ha gave the highest yield in
tomato. Usherwood (1985) reported that adequate K fertilizer involved in
photophosphorylation, transportation of photoassimilates from source tissues via the phloem to sink tissues, enzymes activation, turgor maintenance and stress
tolerance resulting in higher yield.
Table 1. Yield and physical characteristics of tomato in response of potassium
Level of K
Plant
height
(cm)
No. of fruit/plant
Fruit
diameter (cm)
Fruit
length (cm)
Fruit
yield
(kg
plant-1)
Fruit
yield
(t ha-1)
Dry
matter
(%)
Firmness
(N)
Weight loss (%)
K0 126.17c 17.60e 4.68 c 5.31 b 0.99e 41.25e 5.41c 0.90c 12.24 a
K35 127.50b 23.63c 5.21b 5.50 ab 1.49c 62.39c 6.13b 1.10ab 10.76b
K70 128.00ab 26.01ab 5.63 ab 5.71 ab 1.68a 70.34a 7.29a 1.17ab 9.36 bc
K105 128.50a 26.49a 5.71 a 5.83 a 1.72a 71.96a 7.56a 1.22a 8.36 c
K140 127.30b 25.08b 5.42 b 5.51 ab 1.59b 66.33b 7.47a 1.07b 10.05bc
K175 125.50c 21.46d 4.78 c 5.05 c 1.24d 51.91d 6.27b 0.92c 10.76 b
Level of significance
** ** ** ** ** ** ** ** **
CV (%) 4.49 3.43 3.02 3.75 3.69 3.63 4.84 7.91 3.12
Means bearing same letter (s) do not differ significantly at 1% level of probability by
DMRT.
** 1% level of probability.
Dry matter
Dry matter content of tomato varied significantly at different doses of potassium
(Table 1). The highest dry matter was recorded in K105 (7.56%) which was statistically similar to K140 (7.47%) and K70 (7.29%). The lowest dry matter was

664 ISLAM et al.
found in K0 (5.41%). This might be due to optimum supply of potassium that
increased photosynthesis and translocation of photosynthetic from source to sink.
Firmness
Firmness varied significantly with the different levels of potassium (Table1). The highest firmness (1.22 N) was found in K105 which was statistically similar to K70
(1.17 N) and K35 (1.10 N) While K0 showed the lowest firmness (0.90 N). Potassium may helped in increase fibre and lignin formation that resulted in more
compactness of fruit.
Weight loss
Significant variation of weight loss (%) was found due to different doses of potassium at ambient condition (Table 1). However, maximum weight loss
(12.24%) was found in K0. The minimum weight loss was found in K105 (8.36 %)
which was statistically identical with K70 (9.36%) and K140 (10.05%).
Shelf life
Shelf life of tomato varied significantly with the different rate of potassium (Fig 1.). The highest shelf life (15 days) was found in K105. On the contrary, the lowest
shelf life was found in K0 (9 days). With optimum K nutrition, fruit is generally higher in total solids, sugars, acid, carotene and lycopene content and has a better
keeping quality (Munson, 1985). Optimum dose of K may promote the development of thicker outer wall by producing lignin in the epidermal cells to
prevent disease attack and increase shelf life.
Fig. 1. Influence of potassium on shelf life (days) of tomato.
(Means bearing same letter (s) do not differ significantly at 0.05 level by DMRT).
Total soluble solids
Potassium had significant influence on total soluble solids (Table 2). The highest
TSS (10.30%) was found in K105 which was statistically similar with K70.
whereas the lowest was found in K0 (9.17%). These results are in line with Cakmak (2005). He reported increasing trend of sugar contents as well as TSS in
tomato with K fertilizer application.

EFFECT OF POTASSIUM ON YIELD, QUALITY AND SHELF LIFE OF TOMATO 665
Table 2. Nutritive quality of tomato in response of potassium
Level of K TSS
(%)
β carotene
(mg/100 g)
Ascorbic
acid
(mg/100 g)
Total
sugar (%)
Iron
(ppm)
Calcium
(%)
Potassium
(%)
K0 9.17c 0.050d 14.30e 3.62d 23.75d 0.40ab 0.33c
K35 9.82b 0.057c 19.76c 4.45c 51.03c 0.42a 0.35c
K70 10.05ab 0.072b 22.68a 4.94ab 62.28b 0.40ab 0.39cb
K105 10.30a 0.090a 26.49a 5.05a 70.77b 0.38b 0.52b
K140 9.97b 0.070b 18.77cd 4.71bc 123.20a 0.37b 0.68a
K175 9.18c 0.057c 16.48de 3.63d 116.00a 0.32c 0.71a
Level of
significance
** ** ** ** ** ** **
CV (%) 1.80 11.56 7.97 4.78 9.39 21.48 8.74
Means bearing same letter (s) do not differ significantly at 1 % level of probability by
DMRT.
** 1% level of probability.
β carotene
β carotene content of tomato had significantly varied due to the influence of
different levels of potassium (Table 2). The maximum β carotene (0.090 mg/100 g) was found in K105 and it was followed by K70 (0.072 mg/100 g) while the
lowest β carotene content was found in K0 (0.050 mg/100 g).
Ascorbic acid
Significant variation was observed of the content of ascorbic acid in tomato due
to the effect of different levels of potassium (Table 2). The maximum ascorbic acid (26.49 mg/100 g) was found in K105 which was statistically similar with K70
(22.68 mg/100 g) While it was minimum (14.30mg/100 g) in of K0. The reason of increased content of ascorbic acid might be that K played a key role in proper
carbohydrates metabolism and formation of ascorbic acid (Majumdar et al., 2000).
Total sugar
The percentage of total sugar significantly varied due to the effect of potassium (Table .2). The highest content of total sugar (5.05%) was found in K105 which
was statistically similar with P70 (4.94%). On the other hand, the lowest total sugar content was found in K0 (3.62%). This might happen due to the fact that
potassium played a key role in carbohydrate metabolism and photosynthesis and as a consequence, an optimum potassium supply determine better sugar content
into sink organs (Marschner, 1995).

666 ISLAM et al.
Iron
Significant variation of iron content of tomato was found due to the effect of K (Table 2). The highest content of iron (123.20 ppm) was found in K140 which was
statistically alike with K175 (116.00 ppm) and it was followed by T105 (70.77 ppm) while it was the lowest in K0 (23.75 ppm). It was observed that iron content
of tomato increased with the increase of potassium upto K140.
Calcium
Calcium had significant influence on calcium content of tomato (Table 2). The maximum calcium (0.42%) was found in K35 which was statistically similar with
K0 (0.40%) and K70 (0.40%). However, K105 (0.38%) and K140 (0.37%) showed the intermediate Ca content and it was lowest in K175 (0.32%). The result also
indicated that increase of potassium rate decreased the Ca content. It might be
due to the negative interaction between Ca and K in tomato. Malvi (2011) reported that Ca and K ions are quite similar in size and charge. So, high K
reduces plants ability to absorb Ca due to their antagonistic nature.
Potassium
The highest content of potassium (0.71%) was found in K175 follower by K140
(0.68%), K105 (0.52%) and K70 (0.39%) while it was lowest in K0 (0.33%). It was
observed that increased the rate of K increased the K content of tomato. Kaviani et al., (2004) reported that increasing the K level increased the K uptake in plant.
Response equation
Regression analysis was done to quantify the relationship of applied potassium
with yield (kg ha-1) of tomato. A quardratic relationship between yield and K was observed (Fig. 2). The estimated relationship reveal that fruit yield would be
increased with the application of K up to 95.31 kg per hectare and beyond that dose, the yield may be declined. From the regression equation (y = -3.339x2 +
636.5x + 42606 for K) the optimum doses of K was 95.31 kg ha-1 and its corresponding yield was 71.96 t ha-1.
Fig. 2. Response of yield of tomato to potassium fertilizer.
Optimum Dose:95.31
kg K ha-1

EFFECT OF POTASSIUM ON YIELD, QUALITY AND SHELF LIFE OF TOMATO 667
Conclusion
The tomato plant treated with potassium @ 105 kg ha-1 produce maximum plant
height, number of fruits plant-1, fruit diameter, fruit length, weight of fruit plant-1,
fruit yield ha-1, dry matter, firmness, shelf life, TSS, β carotene, ascorbic acid and
total sugar. On the other hand, maximum weight loss was found in K0. Iron
content increased upto 140 kg ha-1 and potassium content increased with the
increasing level of potassium but reverse effect was found in case of calcium.
Based on regression equation, the optimum doses of K for tomato production was
95.31 kg ha-1 in salna series of shallow red brown terrace soil.
References
BBS (Bangladesh Bureau of Statistics). 2013. Year book of agricultural statistics of
Bangladesh. Statistics Division, Ministry of Planning, Govt. of the People’s Republic
of Bangladesh.pp.128-142.
Bhagat S. K., M. S. Islam, A. Ullah, M. H. Akand and A. F. M. J. Uddin. 2014.
Consequence of potassium levels on growth and yield of BARI Tomato-14. J. Expt.
Biosci. 5(2):7-10.
Cakmak, I. 2005. The role of potassium in alleviating detrimental effects of abiotic
stresses in plants. J. Plant Nutr. Soil Sci. 168:521–530.
FAO. 2010. The state of food insecurity in the world: Addressing food insecurity in the
protracted crises. Food and Agriculture Organisation of the United Nations, Rome,
Italy, pp: 120-140.
FRG. 2012. Fertilizer Recommendation Guide. Bangladesh Agricultural Research
Council, Soils Pub.No. 41, pp.113-120.
Grierson, D. and A. A. Kader. 1986. Fruit ripening and quality. The tomato crop.
Chapman and Hall, London. pp 240-280.
Hassan, H. K., B. L. D. Chowdhury and N. Akter. 2010. Final report on Post harvest Loss
Assessment: A study to formulate policy for loss reduction of fruits and vegetable
and socio-economic uplift of the stakeholders. With the support of NFPCSP and
USAID, Bangldesh Agriculturl University, Mymensingh, pp. 30-188.
Kaloo, G., 1986. Tomato (Lycopersicon esculentum Miller). Allied Publishers Pvt. Ltd.,
New Dehli. pp. 203-220.
Kaviani, I., M. Basiral, and M. J. Malakouti. 2004. A comparison between the effect of
fertilization and soil application of potassium chloride and Soluble sop on the yield
and quality of tomato in Borasian Region of Bonshehv. IPI regional workshop on
potassium and fertilization development in west Asia and North Africa. Rabat,
Moroceo, Nov. 24-28.
Lester, G. E., J. I. Jifon and W. M. Stewart. 2007. Better Crops. 91:(1)24-25.
Malvi, U. R. 2011. Interaction of micronutrients with major nutrients with special
reference to potassium. Karnataka J. Agric. Sci. 24 (1): 106-109.

668 ISLAM et al.
Marschner, H. 1995. Functions of mineral nutrients: macronutirents, In: H. Marschner
(ed). Mineral nutrition of higher plants 2nd Edition. Academic Press,. N.Y. p.
299-312.
Majumdar, S. P., R. L. Meena, and G. D. S. Baghel. 2000. Effect of levels of compaction
and potassium on yield and quality of tomato and chilli crops grown on highly
permeable soils. J. Indian Soc. Soil Sci. 48(2): 215-220.
Mazed H. E. M. K., M. H. Akand , M. N. Haque , M.. A. I. Pulok and S. G. Partho.
2015. Yield and Economic Analysis of Tomato (Lycopersicon Esculentum Mill.) as
Influenced by Potassium and Stem Pruning. International Journal of Scientific and
Research Publications, 5(1): 1-5.
Munson, R. D. 1985. Potassium in Agriculture, ASA – CSSA – SSSA, Madison, Wiscon
sin, USA.
Nagata, M., K. Dar and D.I. Yamashita. 1992. Simple method for simultaneous
determination of Chlorophyll and Arytenoids in tomato. J. Japan Soc. Hort. Sci.
61(2):686-687. (Supplementary issue).
Piper, C. S. 1966. Soil and plant analysis, Hans Publishers, Bombay (Reprint): pp. 368-
392.
Pleshkov, B.P. 1976. Practical Work on plant Biochemistry. Mosco. Kolos, Pp:236-238.
Shukla, V. and L. B. Naik. 1993. Agro-lechniques for Solanaceous Vegetables. In:
Vegetable Crops: Part-I, Advances in Horticulture, Vol. 5, Eds: K. L. Chadha and G.
Kalloo, Malhotra Publishing House, New Delhi, India. p.37I
Usherwood, N. R. 1985. The role of potassium in crop quality. In: Munson R.D. (ed.)
Potassium in Agriculture. Am. Soc. of Agron, Madison, USA. Pp 489-513.
Vanitha, S.M., S.N.S. Chaurasia, P.M. Singh and P.S. Naik. 2013. Vegetable statistics,
Technical Bulletin No, 51, HVR, Varanasi, pp, 250. (Published by P.S. Naik, Indian
Institute of Vegetables Research, Varanasi, Uttar pradesh).

ISSN 0258-7122 (Print), 2408-8293 (Online)
Bangladesh J. Agril. Res. 44(4): 669-677, December 2019
EVALUATION OF PLANT EXTRACTS, FUNGICIDES, BIO-AGENT
AND SOIL AMENDMENTS AGAINST FOOT AND ROOT ROT
DISEASE OF BETELVINE CAUSED BY SCLEROTIUM ROLFSII
UNDER FIELD CONDITION
M. H. RAHMAN1, M. R. ISLAM2, F. M. AMINUZZAMAN3
A. LATIF4 AND S. NAHAR5
Abstract
The studies were carried out on the management of foot and root rot disease
caused by Sclerotium rolfsii Sacc. of betelvine (Piper betle L.) during April,
2017 to April, 2018 in a betelvine orchard (baroj) in the experimental farm of
Sher-e-Bangla Agricultural University, Dhaka. There were 10 treatments,
namely Provax 200, Tilt 250 EC, Score 250 EC, Pencozeb 80 WP, Garlic clove
extract, Allamanda leaf extract, Poultry waste, Vermi-compost, Trichoderma
harzianum and Control. The in-vivo evatuation, plant was inoculated by S. rolfsii
after six month of plantation. The evaluation revealed that the lowest disease
incidence of 8.33% was found in Provax 200 whereas the highest disease
incidence of 91.67 was recorded under the untreated control treatment. The
maximum of 90.91% reduction in disease incidence over control was found
under Provax 200, which was significantly higher compared to all other
treatments. Among the treatments, Provax 200 was noted as the most effective
fungicide followed by Score 250 EC. The highest yield (7.57 t/ha) at 120 days
after inoculation was found in case of Provax 200 which was 330.1% increased
over untreated control. Stem and soil treated with Provax 200 including spraying
at 3 days after inoculation, then sprayed at 7 days’ intervals minimized disease
incidence and increased yield. Among the eco-friendly approach, Garlic clove
extract, Trichoderma harzianum and soil amended with Vermi-compost also
showed better performance in controlling foot and root rot disease of betelvine
as compared to control.
Keywords: Betelvine, disease management, foot and root rot, Sclerotium rolfsii.
Introduction
Betelvine (Piper betle L.), vernacularly known as ‘Pan’, is a kind of dioecious
perennial creeper vine belonging to the family Piperaceae. It is cultivated largely
for its leaves. It is an important cash crop of Bangladesh. Betel leaves have a
strong pungent aromatic flavor and are widely used as masticatory. Mature leaves
are used for chewing with smeared hydrated lime and catechu, arecanut,
1Regional Agricultural Research Station, Bangladesh Agricultural Research Institute
(BARI), Cumilla, 2&3Department of Plant Pathology, Sher-e-Bangla Agricultural
University, Dhaka, 4Department of Entomology, Sher-e-Bangla Agricultural University,
Dhaka, 5Senior Assistant Director, NATA, Bangladesh.
DOI: http://-

670 RAHMAN et al.
cardamom, clove, etc. Betelvine leaf chewing is considered as a good and cheap
source of dietary calcium. Usually the people of South-Asia, South-east Asia,
Gulf States and Pacific Islands chew betel leaves. All classes of people of
Bangladesh chew not only as a habit but also as an item of rituals, etiquette and
manners. There are about 100 varieties/cultivars of betelvine in the world (Guha
and Jain, 1997). Among the cultivars, Desi Bangla, Bangla, Kali Bangla, Jhali,
Sanchi, Goyeshi, Bhabna, Mitha, Geso, Bonhoogly, etc., are found to be widely
grown in Bangladesh. Total cultivated area under the crop in Bangladesh in
2016-17 was about 23,803.20 hectares and the total annual production was about
2,14,252 metric tons. The average yield per hectare is 9.0 metric tons (BBS,
2018). Pan leaf is usually plucked throughout the year but maximum production
obtained in the months of July to October.
The acreage of betelvine is decreasing gradually due to infestation of disease and
pest (Islam, 2005) and the extent of losses varies from 5-90 percent (Dasgupta
and Sen, 1999; Dasgupta et al., 2005). Among the diseases of betelvine foot and
root rot caused by Sclerotium rolfsii is the most overwhelming disease which
decreases the production of betel leaf to a great extent (Islam, 2005). Humid and
moist shaded conditions are favorable for betelvine growth which also favor a
variety of root and foliage disease development (Goswami et al., 2002). The
fungus can overwinter as mycelium in infected tissues or plant debris or as
sclerotia near soil surface or buried in soil which serve as a major source of
primary infection by germinating in response to alcohols and other volatile
compounds released from decomposing plant material (Punja, 1985).
At present diseases are mainly managed by the use of chemicals such as
fungicides. However, the indiscriminate use of chemicals not only hazardous to
living being but also break the natural ecological balance by killing the beneficial
and/or antagonist microorganisms. On the other hand, Botanical extracts, Plant
growth promoting fungi (PGPF) and soil amended materials etc. suppress the
pathogen and protect the plants that is environmentally safe, durable and cost
effective alternative to chemicals (Mukhopadhyay, 1994) and avoid the
development of resistant strains of the pathogen.
Hence, efforts have to be made to retain pathogen activity below economic
threshold level by choosing different alternative methods. So, the present
experiment was conducted to evaluate the efficacy of four fungicides [Provax
200 (Carboxin 17.5%+ Thiram 17.5%), Tilt 250 EC (25% Propiconazole), Score
250 EC (25% Difenconazole) and Pencozeb 80 WP (80 % Mancozeb)], two
botanicals [Garlic clove extract (allicin), Allamanda leaf extract (allamandin)],
two soil amendments [Poultry waste, Vermi-compost] and one bio-agent
(Trichoderma harzianum) for controlling foot and root rot disease of betelvine
caused by S. rolfsii in field condition.

EVALUATION OF PLANT EXTRACTS, FUNGICIDES, BIO-AGENT 671
Materials and Methods
The experiment was conducted in a betelvine orchard (baroj) in the experimental farm of Sher-e-Bangla Agricultural University (SAU), Dhaka during April, 2017
to April, 2018. The experiment was laid out in RCBD with 4 replications maintaining plot size (0.30 x 0.60) m2 and plant to plant spacing 20 cm. One hill
with three plants were used for each treatments. Altogether 10 treatments comprising fungicides, botanicals, bio-agent and soil amendments were tested in
the experiment. The treatments were T1 = Provax 200 @ 0.25%, T2 = Tilt-250 EC @ 0.1%, T3 = Score 250 EC @ 0.05%, T4 = Pencozeb 80 WP @ 0.45%, T5 =
Garlic clove extract @ 15%, T6 = Allamanda leaf extract @ 15%, T7 = Vermi-compost @ 30g/plant, T8 = Poultry manure @ 30g/plant, T9 = Trichoderma
harzianum @ 5g/plant and T10 = Control.
(a) Growing of betelvine cuttings
A piece of medium high land with well drainage system was selected and deep
ploughing was done during early summer at the end of April month in 2017. After ploughing, upper soil is left exposed in the sun for two months. During the
first week of June, three times ploughing was done for well pulverized good tilth condition of soil. Weeds and stubbles were removed manually. Drainage trenches
of 90 cm width by 15 cm depth were dugged in between two adjacent beds. A suseptible betelvine cultivar Misti pan cutting was collected from 3-5 years old
betelvine orchared in Rajshahi. Forty centimeter long cuttings with three to five nodes were cut from the vine. For each treatment, twelve betelvine cuttings were
treated deeply into suspension of fungicides, plant extracts and bioagent separately for 20 minutes. The cuttings were then drained off, air dried and
planted in the field. For control treatment the cuttings were treated with plain water.
Treated vine cuttings were planted in the experimental field under partially shaded and humid environment in the betelvine baroj. Planting was done with the
help of khurpi (a hand operated implement). For planting, a hole was made with
khurpi, so that the internodes below the bud point is dipped in soil, but rest part of cutting must be touching with surface soil. The cuttings were planted in the
furrows at 8-10 cm deep. The hole was compacked with the help of thumb finger. The planted cuttings were watered twice a day until the vines were established.
Sticking of vines, irrigation and fertilization/manuring were done as per requirement of the orchard. Weeding was done regularly to ensure weed free
clean cultivation.
(b) Inoculum preparation and inoculation of S. rolfsii
The isolate of S. rolfsii isolated from foot and root rot infected betelvine following tissue planting method (Mian, 1995) and multiplied on barley grains
(Gupta and Kolte, 1982). Fresh barley grains were pre-soaked in 2% sucrose

672 RAHMAN et al.
solution overnight, drained off excess solution and boiled in fresh water for 30
minutes and drained off again. These were transferred into 250 ml conical flasks @ 80 g and autoclaved at 121.60C temperature, under 1.1 kg/cm2 pressure for 20
minutes. The conical flasks were allowed to cool at room temperature and were inoculated with 5 mm discs of 3 to 4 days old culture of S. rolfsii grown on PDA.
Seven discs per flask were added and flasks were incubated for three weeks at 25±20C.
After six months of plantation of betelvine the isolate of causal pathogen (S. rolfsii) were inoculated. The plants were prepared for inoculation by removing
top soil around 5 cm of the stem to a depth of 2 cm. A table spoon (5 g) of inoculum was placed in direct contact of entire circumference of the exposed
stem. Finally, the inoculum was lightly covered with top soil for infection.
(c) Collection and preparation of plant extracts
The plant leaf extracts were prepared by using the method of Ashrafuzzaman and
Hossain (1992). For preparation of extracts, collected leaves were weighted in an electric balance and then washed in tap water and then in distilled water. After
washing the big leaves were cut into small pieces. For getting extract, weighted plant parts were blended in an electric blender and then distilled water was added
into the jug of the blender. For getting 1:1 (w/v) ratio 100 ml of distilled water was added with 100g plant parts. The pulverized mass was squeezed through 3
folds of fine cotton cloth. The extract was used as stock solution for the study. To prepare 15 % concentrations of plant extract, 15 ml of stock solution was mixed
with 85 ml of sterilized water. The 15% concentrations of plant extract was used for application.
(d) Preparation of bio-agent
The fungal antagonist bio-agents, Trichoderma harzianum collected from the
laboratory of Plant Pathology Division, Bangladesh Agricultural Research Institute (BARI) and cultured on PDA. Inoculum of the bio-agent, T. harzianum
was prepared using the method as described by Gupta and Kolte (1982). Fresh
barley grains were pre-soaked in 2% sucrose solution overnight, drained off excess solution and boiled in fresh water for 30 minutes and drained off again.
These were transferred into 250 ml conical flasks @ 80 g and autoclaved at 121.60C temperature, under 1.1 kg/cm2 pressure for 20 minutes. The conical
flasks were allowed to cool at room temperature and were inoculated with 5 mm discs of 3 to 4 days old culture of T. harzianum grown on PDA. The inoculated
flasks were incubated at 25±20C for three weeks.
(e) Spraying of fungicides and plant extracts
Fungicides (Provax 200 @ 0.25%, Tilt-250 EC @ 0.1%, Score 250 EC @ 0.05%, Pencozeb 80 WP @ 0.45%) and plant extracts solutions were prepared

EVALUATION OF PLANT EXTRACTS, FUNGICIDES, BIO-AGENT 673
separately. The selected plant extracts and fungicides were sprayed at 3 days
after inoculation at the base of the plant and plant base soil. Then sprayed at 7 days’ intervals for three times by hand sprayer. Precautions were taken to avoid
drifting of spray materials to neighboring plants.
(f) Application of bio-agent, poultry manure and vermi-compost
A table spoon (5 g) of cultured T. harzianum on barley grains were applied at the base and root zone of the plants before 10 days of S. rolfsii inoculation.
Similarly, poultry manure 30g and vermi-compost 30g per plant were applied seperately on different plant at the base and root zone before 10 days of S. rolfsii
inoculation. Precautions were taken to avoid drifting of application materials to the neighboring plants.
(g) Data collection
The data on days required for appearance of disease symptom, disease incidence and yield of betel leaf were recorded.
The incidence of the disease was computed based on the following formula:
% Disease incidence= plant inspected ofNumber
covered area in theplant infected ofNumber × 100
The yield increase was calculated using the following formula:
% yield increase over control = y
y-x × 100
Where x = Mean under treatments (Tn, n = 1 - 9) and y = Mean under control (T10)
(h) Statistical analysis
The data were statistically analyzed by using computer package program (Statistix 10). The significant differences of the treatment means were compared
by Duncan’s Multiple Range Test (DMRT) at 1% level of significance.
Results and discussion
(A) Days required for appearance of disease symptom
Appearance of foot and root rot disease in inoculated betelvine varied from 10 to
95 days among the treatments (Table 1). Disease symptom appeared at 10 days in the control treatment while it ranged from 29 to 95 days among the treated plots.
The result indicated that the appearance of foot and root rot disease could be
deferred or delayed by the application of different treatment with fungicides, botanicals, bio-agent and soil amendments.

674 RAHMAN et al.
(B) Disease incidence
The highest disease incidence ranging from 58.33 to 91.67% was observed in control treatment at 30 through 120 DAI (Table 1). The disease incidence
increased gradually with the progress of duration after inoculation showing the maximum of 91.67% at 105 and 120 DAI. Application of different treatments
significantly reduced the disease incidence over control.
No visible symptoms of foot and root rot of betelvine appeared at 30 DAI, in case
of fungicides, botanicals, bio-agents and soil amendments. Though poultry
manure and control treated plot showed the disease incidence 16.67% and
58.33%, respectively.
At 45 DAI, the minimum of 16.67% disease incidence was recorded in case of
treatment T7 followed by T8. At 60 DAI, the disease incidence was absent under
T1, T2, T3, T5, T6 and T9. No disease incidence was observed at 75 DAI in T1, T2,
T3, T5 and T9. At that stage the lowest incidence of 16.16.67% was recorded from
T6 which was statistically similar to T4 but significantly higher as compared to T7
and T8. At 90 DAI, only T1 and T5 showed no incidence of disease. At that stage
the disease incidence under T2, T4, T7 and T8 were statistically similar but
significantly higher as compared to T6 and T9 (Table 1). At 105 DAI, minimum
of 8.33% foot and root rot incidence of betevine was found under T1, which were
statistically similar to T3 and T9.
At 120 DAI, the lowest disease incidence of 8.33% was recorded from T1, which
was statistically similar to only T3 (16.67%) but significantly higher as compared
to other treatments. The disease incidence was 33.33% in the treatments T2, T5
and T9, 49.99% under T6, 58.32% in T7 and 66.66% in T4 and T8 (Table 1).
At 120 days after inoculation (DAI), the maximum of 90.91% reduction in
disease incidence over control was found under T1, which was statistically
similar to only T3 (81.82%) but significantly higher as compared to all other
treatments (Fig. 1). The lowest reduction was found under T4 (18.95%) followed
by T8, T6 and T7. The disease incidence was 63.64 under treatments T2, T5 and T9
which were significantly higher as compared to T4, T6, T7 and T8. Among the
treatments, T1 i.e. Provax 200 was noted as the most effective fungicide followed
by T3 i.e. Score 250 EC in controlling foot and root rot disease of betelvine.
(C) Yield
The per hectare yield of betel leaf at 120 days after inoculation was 7.57, 7.24,
7.16, 7.14 and 6.59 tons under the treatments of Provax 200 (T1), Score 250 EC
(T3), T. harzianum (T9), Garlic clove extract (T5) and Tilt-250 EC (T2),
respectively (Table 2). The lowest yield of 1.76 t/ha was found under control
(T10) followed by Poultry manure (T8), Allamanda leaf extract (T6).

EVALUATION OF PLANT EXTRACTS, FUNGICIDES, BIO-AGENT 675
Application of Provax 200, Tilt-250 EC, Score 250 EC, Garlic clove extract and
Trichoderma harzianum, produced increased yield over control ranged from 274.4 to 330.1%. These five treatments were noted as effective treatments to
control the disease.
The results of the present investigation were in agreement with findings of many
other researchers. Carboxin (Provax 200/ Vitavax 200) reported to be effective in controlling collar rot of Sunflower and Sunhemp caused by S. rolfsii (Pal and
Choudhary, 1983). Others reported that Garlic clove extract found effective both in-vitro and in-vivo in controlling foot and root rot of betelvine (Yasmin, 2016;
Shahiduzzaman, 2015). As a bio-agent T. harzianum and T. viride were also proved to be highly promising against soil borne pathogen, S. rolfsii (Rekha et
al., 2012; Parvin et al., 2016).
Table 1. Effect of fungicides, plant extracts, bio-agent and soil amendments on the
incidence of foot and root disease of betelvine under field condition
Treatments DDI
Percent disease incidence (PDI) at different days after inoculation
(DAI)
30 DAI 45 DAI 60 DAI 75 DAI 90 DAI 105 DAI 120 DAI
T1 = Provax 200 95 0.00 c
(0.083)
0.00 d
(0.083)
0.00 c
(0.083)
0.00 d
(0.083)
0.00 e
(0.083)
8.33 e
(8.57)
8.33 e
(8.57)
T2 = Tilt- 250 EC 76 0.00 c
(0.083)
0.00 d
(0.083)
0.00 c
(0.083)
0.00 d
(1.59)
33.33 bc
(34.02)
33.33bcd
(34.02)
33.33 cd
(34.17)
T3 = Score 250 EC 86 0.00 c
(0.083)
0.00 d
(0.083)
0.00 c
(0.083)
0.00 d
(0.083)
16.66 d
(17.05)
16.67 de
(17.05)
16.67 de
(17.05)
T4 = Pencozeb 80
WP
47 0.00 c
(0.083)
0.00 d
(0.083)
8.33 c
(9.70)
24.99 bc
(25.53)
33.33 bc
(34.02)
58.33 b
(48.10)
66.66 b
(52.80)
T5 = Garlic clove
extract
91 0.00 c
(0.083)
0.00 d
(0.083)
0.00 c
(0.083)
0.00 d
(0.083)
0.00 e
(0.083)
24.99 cd
(25.53)
33.33 cd
(34.01)
T6 = Allamunda
extract
70 0.00 c
(0.083)
0.00 d
(0.083)
0.00 c
(0.083)
16.67 cd
(17.05)
24.99 cd
(25.53)
41.66 bc
(38.71)
49.99 bc
(43.41)
T7 = Vermi-compost 44 0.00 c
(0.083)
16.67 c
(17.05)
33.33 b
(34.02)
41.66 b
(38.71)
49.99 b
(43.41)
58.33 b
(48.10)
58.32 bc
(48.10)
T8 = Poultry manure 29 16.67 b
(17.05)
33.33 b
(34.02)
41.66 b
(38.71)
49.99 b
(43.41)
49.99 b
(43.41)
66.66 b
(52.80)
66.66 b
(52.80)
T9 = T. harzianum 87 0.00 c
(0.083)
0.00 d
(0.083)
0.00 c
(0.083)
0.00 d
(0.083)
16.66 d
(17.05)
16.67 de
(17.05)
33.33 cd
(30.22)
T10 = Control 10 58.33 a
(51.91)
66.66 a
(56.60)
74.99 a
(65.11)
74.99 a
(65.11)
83.33 a
(69.81)
91.67 a
(78.32)
91.67 a
(78.31)
LSD - 14.48 13.67 15.69 18.45 16.57 18.95 18.04
Figures within same column having common letter(s) do not differ significantly at 1.00% level of significance.
Data within parenthesis are arc-sine transformed values. DDI: Days to disease initiation.

676 RAHMAN et al.
Figure 01. Percent reduction of incidence of foot and root rot disease of betel vine
due to different treatments over control at 120 days after inoculation.
[T1 = Provax 200, T2 = Tilt- 250 EC, T3 = Score 250 EC, T4 = Pencozeb 80 WP, T5 = Garlic
clove extract, T6 = Allamanda leaf extract, T7 = Vermi-compost, T8 = Poultry manure, T9 =
Tricoderma harzianum and T10 = Control (No chemicals, plant extract, bio-agents and soil
amendments].
Table 2. Effect of fungicides, plant extracts, bio-agents and soil amendments on
yield of beteleaf under field condition
Treatments Yield (t/ha)
at 120 days
Yield increase (%)
over control£
T1 = Provax 200 7.57 a 330.1
T2 = Tilt- 250 EC 6.59 abc 274.4
T3 = Score 250 EC 7.24 a 311.4
T4 = Pencozeb 80 WP 5.94 bcd 237.6
T5 = Garlic clove extract 7.14 ab 300.5
T6 = Allamanda extract 5.59 cde 218.0
T7 = Vermi-compost 5.29 de 201.0
T8 = Poultry manure 4.48 e 154.5
T9 = T. harzianum 7.16 a 306.8
T10 = Control 1.76 f -
Conclusion
Foot and root rot caused by Sclerotium rolfsii, the most devastating disease of
betelvine in Bangladesh, reduced the yield and quality of betel leaves every year. Based on results of the in-vivo evaluation, Garlic clove extract, Provax-200 &
Score 250 EC fungicides, T. harzianum and soil amendments with Vermi-

EVALUATION OF PLANT EXTRACTS, FUNGICIDES, BIO-AGENT 677
compost were found to be most effective against S. rolfsii which could be used as
IPM components for increasing the yield of betel leaf under baroj conditions.
References
Ashrafuzzaman, H. and I. Hossain. 1992. Antifungal activity of crude extracts of plants against Rhizoctonia solani and Bipolaris sorokiniana. Proc, BAU. Res. Prog., 6: 188- 192.
BBS. 2018. Year Book of Agricultural Statistics of Bangladesh-2017, 29th Series. Bangladesh Bureau of Statistics, Statistics and Informatics Division, Ministry of Planning, Government of the Peoples’ Republic of Bangladesh. 197 pp.
Dasgupta, B. and C. Sen. 1999. Assessment of Phytophthora root rot of betelvine and its management using chemicals. Indian J. Mycol. Pl. Pathol. 29: 91-95.
Dasgupta, B., P. K. Dutta, D. Padmanabhan and Satyabrata. 2005. Management of foot rot of betelvine. Indian J. Mycol. Plant Pathol., 33: 375-377.
Goswami, B.K., K.A. Kader, M.L. Rahman, M.R. Islam and P.K. Malaker. 2002. Development of leaf spot of betelvine caused by Colletotrichum capsici. Bangladesh J. Plant Pathol. 18(1&2): 39-42.
Guha, P. and R.K. Jain. 1997. Status Report on Production, Processing and Marketing of Betel leaf (Piper betle L.). Agricultural and Food Engineering Department, IIT, Kharagpur, India, pp. 15-22.
Gupta, S.C and S.J. Kolte. 1982. A comparative study of isolates Macrophomina phaseolina from leaf and root of groundnut. Indian Phytopathol. 35: 619-623.
Islam, M.R. 2005. An integrated approach for the management of phomosis blight and fruit rot of eggplant. PhD. Thesis. Department of Plant Pathology, BAU, Mymensingh, Bangladesh. pp. 45-46.
Mian, I. H. (1995). Methods in Plant Pathology. IPSA-JICA Project Publication, 24, 100p.
Mukhopadhyay, A.N. 1994. Biocontrol of soil-borne plant pathogens current status, future prospects and potential limitations. Indian Phytopathol. 47(2): 199-126.
Pal, A.K. and K.C.B. Chowdhary. (1983). Control of some root diseases of sunhemp. Pesticides. 17: 9-10.
Parvin, R., M.R. Islam, M.S. Islam, N. Hasan, K. Begum and M.Z.K. Roni. 2016. Comparative efficacy of different fungicides against foot and root rot disease of betelvine caused by Sclerotium rolfsii. Bangladesh Res. Pub. J. 12(1): 09-15.
Punja, Z.K. 1985. The biology, ecology and control of Sclerotium rolfsii. Ann. Rev. Phytopath. 23: 97-118.
Rekha, D., M.B. Patil, P.S. Shetty, K.M. Swamy and R.B. Gamanagatti. 2012. In-vitro screening of native Trichoderma isolates against Sclerotium rolfsii causing collar rot of groundnut. Int. J. Sci. Nat. 3(1): 117-120.
Shahiduzzaman, M. 2015. Efficacy of fungicides and botanicals in controlling foot and root rot of lentil. Bangladesh J. Agril. Res. 40(4): 711-715
Yasmin, S. 2016. In-vitro evaluation of botanical extracts against some soil and seed borne fungi of economic importance. J. Agri. Ecolo. Res. Int. 8(2): 1-11.

678 RAHMAN et al.

ISSN 0258-7122 (Print), 2408-8293 (Online)
Bangladesh J. Agril. Res. 44(4): 679-688, December 2019
SPECIES DIVERSITY AND RICHNESS OF ANT (Hymenoptera,
formicidae) IN BHAWAL NATIONAL PARK OF BANGLADESH
M. M. RAHMAN1 AND M. N. JAHAN2
Abstract
Ant community serves as an bioindicator on the assumption that the extent of
ant diversity reflects broader ecosystem change. Bangladesh with varied agro
ecosystem providing broad ecological niche of diversified ant community. The
study of ant community is a way to measure the recent transformation of agro
ecosystems in Bangladesh to provide information about management and
conservation of agricultural landscape. The present study was conducted in
Bhawal National Park to delve deeper into the diversity and richness of ants as
they work as ecological indicators of an ecosystem. Being a conservation site
with natural resources, Bhawal National Park can serve as study site with
species diversity due to having sites with similar vegetation and soil type, but
different ecological parameters. The objective of the study was to identify local
ant fauna in forest agroecosystem to understand the impact on human
disturbance to ant communities of the study area. Total 399 individuals were
identified from 42 species of 17 genera belonging to 6 subfamilies. Sampling
was performed using Time unit sampling (TUS) and pitfall trap in two different
areas, viz, area 1 and 2. The most dominant subfamily of the study area was
Myrmicinae. The highest number of species were found from the genus
Camponotus. The Shannon-Wiener's Diversity Index showed that area 1 had
higher species diversity due to favorable living conditions with less animal
intervention and higher density of vegetation playing key role. However, the
species dissimilarity in different study areas were relatively low due to similar
vegetation and soil type. The study provided an inventory of Bangladesh as well
as identification system of ants. This is the first comprehensive list of ants from
forest ecosystem of Bangladesh.
Keywords: Ant diversity, Bhawal National Park, bioindicator, forest ecosystem
Introduction
Ant is a eusocial species that plays a crucial role in ecological systems as soil engineers, competitors, predators, scavengers, mutualists, gardeners, and biological agents of insect pests in agriculture (Pal, 2006). In tropical regions, 10-15% animal biomass in different biotopes constitute of ants making them one of the most abundant insect groups (Agosti et al., 2000). From top of the tall trees to the soil and litters of forests, in almost all territory-based ecosystems, a broad range of 15,000 ants can be found (Andrade et al., 2007). Ants participate in
1Associate Professor, Department of Entomology, Bangabandhu Sheikh Mujibur Rahman
Agricultural University (BSMRAU), 2MS Student, Department of Entomology,
BSMRAU, Bangladesh.
DOI: http://-

680 RAHMAN AND JAHAN
various natural cycles that help to reduce climate change hence, considered to be bio-indicators of the quality of forests (Nguyen and Nguyen, 2016). Ant species have been used as soil indicators of mine site rehabilitation (Andersen et al., 2003). They also contribute to modify the physical and chemical properties of soil increasing its drainage and aeration (Dostál et al., 2005) and responsible for altering temperature and other micro climatic variables (Jenkins et al., 2011). High diversity in taxonomy and association with specific settlements make ants a good object in monitoring studies. Thus, ants are usually chosen to compare species diversity at different habitats.
Numerous researches have been conducted recently (Szewczyk and McCain, 2016, Arnan et al., 2017, Belskaya et al. 2017) on ant diversity and functions for ecosystem management. However the association of ant community with agroecosystems needs more detailed study in the tropics.
In Bangladesh, no research was conducted to monitor ant diversity as a tools of bio-indicator in the natural system due to lack of taxonomic information and method for measuring human disturbance. Therefore, the present study was conducted to analyze the diversity of local ant fauna, understand the prevalent ecosystem by correlating it with the presence of ants found in the study area and shed light on the differences in the various ecosystems with the interfering effects in the study area and how it impacts the ant biomass.
Methodology
Study Area
The study was conducted in Bhawal National Park (24o01’N, 90o20’E) during June 2015 to November 2015. The park is situated about 40 km north of Dhaka, the capital city of Bangladesh, at the heart of Gazipur city. Along with the forest, the park covers 5,000 ha area (Kabir and Ahmed, 2005). Its coverage of this huge area contributes to its biological diversity in both flora and fauna.
Habitat Characterization
The forest area of the park is a mix of different habitats dominated by Sal forests and rice fields. The topology is classified as low hills that raise 3.0-4.5 m above the surrounding paddy fields (Kabir and Ahmed 2005). The tree that dominates the forest is Sal (Shorea robusta) covering 90% of the area. A total of 221 species consisting of 27 grass species, 24 climber species, 3 palm species 105 herb species, 19 shrubs species, and 43 tree species have been identified here. Plants include Careyaa rborea, Dillenia pentagyna, Terminalia belerica, Milius avelutura etc. Among vegetation, Lantala, Melostoma, etc. are commonly found here. Few mammals including Vulpes bengalensis, Canis aureus, Viverricula indica etc. can be seen (Kabir and Ahmed, 2005).
Although it was a reserve forest, the forest have several ecological properties. Some part of this forest is open with foraging fields where people and cattle

SPECIES DIVERSITY AND RICHNESS OF ANT 681
move frequently. This area is bounded by lakes and some aquatic feature as well.
Paddy fields are observed in the periphery of this area. The other side is occupied by deep vegetation and relatively undisturbed areas. No such lakes or aquatic
environment are observed. For this study, for measuring the diversity and functions of ants, we categorized the two areas as Area 1 and Area 2, respectively
based on the type of vegetation and management approaches. The perimeter of both the areas were about 372 m. The two areas are: Open Forest containing
foraging fields and lakes that has been mentioned as Area 1 and Deep Forest containing higher vegetation and limited intervention, termed as Area 2 in this
paper.
Sampling
Sampling of ants were done using Time-Unit Sampling (Ogata, 2001) and by
setting pitfall trap. In Time-Unit Sampling method, the whole operation was divided into four time-units. Each unit lasted for 15 minutes at stretch. Two
persons conducted the operation in 30+ minutes ( signifies the gap between
two time-units). Ants were searched on the ground, in/under shelters, on lower
vegetations and collected using forceps. The key idea in this method is to collect as many ants as possible within a single 15-minute time unit. Each of the time
unit samples is independent, so the samples were preserved in their own vials
with their own serial code. These vials were prepared beforehand using 70% ethanol.For pitfall trap method, small containers were placed on the ground with
their tops on the surface level. The containers were filled with ethylene glycol. Ants that fell into the trap while roaming around were collected from the
containers afterwards for further processing.
Cleaning and Sorting
Collected specimens were cleaned using brush dipped in water to remove any dirt or other materials. After cleaning, the samples were washed in alcohol and sorted
into similar groups. Each group were put in separate vial and labeled accordingly.
Dry Preservation
The collected specimens were preserved on a dry basis using card points and card mounts. Small triangular pieces of white cardboard, points were made using
scissors. Each point was mounted on a macro-pin inserted near the base of the triangle. Using water-soluble glue, the samples were glued to the tip of the point.
Multiple ants from same group were placed on one macro-pin.
Identification and Labeling
Samples were inspected under electronic microscope and identified with their
taxonomic keys (Bolton, 1994). The identified ants were properly labeled and

682 RAHMAN AND JAHAN
preserved in the museum of Department of Entomology of Bangabandhu Sheikh
Mujibur Rahman Agricultural University for future references.
Statistical Analysis
For measuring the diversity of ants, few renowned methodology were followed:
1, Shannon-Wiener Diversity Index:
Shannon-Wiener Diversity Index (H) (Krebs, 1999) was calculated to determine
the species diversity in each study area. It measures the amount of order (or
disorder) contained in a system (Margalef, 1958). The value is given by:
H =
s
i
ii pInp1
)(
where,
s= Number of Species
pi= Proportion of the Total Sample Belonging to the -th Species
2. The Evenness Index:
The Evenness Index (J) (Krebs 1999) was calculated to determine the equal
abundance of ants in each study area. The value is given by:
J = maxH
H
where,
H = Observed Index of Species Diversity
Hmax = Maximum Possible Index of Diversity
3. Effective Number of Species:
Effective Number of Species (ENS) (Jost, 2006) was calculated using the
Shannon-Wiener Diversity Index (H) to find the true diversity of the areas in
question. This helped us to find an actual measure to compare and contrast the
two study areas. The value is given by:
ENS = eH
where,
H= Observed Index of Species Diversity

SPECIES DIVERSITY AND RICHNESS OF ANT 683
4. Bray-Curtis Dissimilarity:
Bray-Curtis Dissimilarity ( ) (Bray and Curtis 1957) was calculated to
quantify the compositional dissimilarity between two areas. The result is often multiplied by 100 and treated as percentage. The value is given by:
BC = 1‒ YX
YX
2
where,
ǀX ∩ Yǀ = Number of species common in both areas
ǀXǀ = Total number of species in area 1
ǀYǀ = Total number of species in area 2
5. Statistica Package:
Statistica Package R was used for generating the graph on species diversity in
two areas.
Results and Discussion
A total of 399 individuals of 42 species in 17 genera distributed among 6 subfamilies were collected from two areas using time-unit sampling and pitfall
traps. The detailed checklist can be found in Table 1. Among the subfamilies, Myrmicinae thrives having 215 samples from 8 genera consisting of 20 different
species followed by Ponerinae and Dorylinae, respectively. The highest number of ants were identified from Pheidole followed by Camponotus and
Dolichoderus. Both the areas were dominated by 6 different species from the the genus Camponotus.
The most dominant species in both the areas of Bhawal National Park is D. affinisoccupying 7.27% of the identified samples, followed by P. binghamiiand
M. brunnea (Table 2). Area 2 was found more diverse with species richness than that of Area 1. Thirty Four species of ants in 16 genera were found in Area 2,
while, 27 species of ants in 14 genera were identified in Area 1. This can be
attributed to diverged vegetation pattern incorporated with the lack of human intervention and no foraging activity in Area 2. Bhawal National Park is
dominated by deciduous Sal tree. The leaves of these trees fall off every year. Fallen leaves are decomposed by microorganisms resulting in higher nutrient
content. This is why ants seek refuge in places with high vegetation. Moreover, limited human access and lack of foraging activities facilitate free movement of
ants. This has made the place an ant sanctuary. On the contrary, Area 1 is facilitated with lakes and crop fields that allow intervention of cattle and human
along with some aquatic insectivores. These make the area less suitable for ants.

684 RAHMAN AND JAHAN
Table 1. Species diversity of different ant fauna in Bhawal National Park
Subfamily Genera Number of Species Total Individuals
Dolichoderinae Dolichoderus 2 41
Dorylinae Camponotus 6 55
Cerapachys 1 5
Formicinae Oecophylla 1 21
Myrmicinae
Crematogaster 3 35
Meranoplus 2 29
Myrmica 2 11
Myrmicaria 2 32
Pheidole 5 65
Solenopsis 1 14
Tetramorium 2 13
Trichomyrmex 3 16
Ponerinae
Anochetus 2 8
Diacamma 3 22
Leptogenys 3 9
Odontoponera 1 4
Pseudomyrmecinae Tetraponera 3 19
Total 42 399
Table 2. Relative abundance of listed ant species in two areas
Genus Species Area 1 Area 2 Total Occurrence (%)
Dolichoderus D. affinis 9 20 29 7.27%
D. taprobanae 0 12 12 3.01%
Camponotus
C. angusticollis 4 2 6 1.50%
C. festinus 7 11 18 4.51%
C. fulvopilosus 4 3 7 1.75%
C. oblongus 3 5 8 2.01%
C. rufoglaucus 0 6 6 1.50%
C. siemsseni 0 10 10 2.51%
Cerapachys C. sulcinodis 0 5 5 1.25%
Oecophylla O. smaragdina 11 10 21 5.26%

SPECIES DIVERSITY AND RICHNESS OF ANT 685
Genus Species Area 1 Area 2 Total Occurrence (%)
Crematogaster
C. abdominalis 9 5 14 3.51%
C. binghamii 4 8 12 3.01%
C. rufa 3 6 9 2.26%
Meranoplus M. laeviventris 7 0 7 1.75%
M. rothneyi 0 22 22 5.51%
Myrmica M. indica 4 4 8 2.01%
M. rugosa 0 3 3 0.75%
Myrmicaria M. brunnea 0 22 22 5.51%
M. fodiens 0 10 10 2.51%
Pheidole
P. binghamii 0 25 25 6.27%
P. feae 13 3 16 4.01%
P. indica 8 0 8 2.01%
P. roberti 0 7 7 1.75%
P. noda 4 5 9 2.26%
Solenopsis S. geminata 0 14 14 3.51%
Tetramorium T. belgaense 3 0 3 0.75%
T. indicum 4 6 10 2.51%
Trichomyrmex
T. criniceps 3 4 7 1.75%
T. destructor 0 7 7 1.75%
T. mayri 2 0 2 0.50%
Anochetus A. cryptus 0 3 3 0.75%
A. rufus 4 1 5 1.25%
Diacamma
D. assamense 4 0 4 1.00%
D. ceylonense 0 6 6 1.50%
D. indicum 7 5 12 3.01%
Leptogenys
L. assamensis 0 4 4 1.00%
L. falcigera 3 0 3 0.75%
L. roberti 1 1 2 0.50%
Odontoponera O. denticulata 4 0 4 1.00%
Tetraponera
T. binghami 3 7 10 2.51%
T. nigra 3 2 5 1.25%
T. rufonigra 4 0 4 1.00%
Between the two areas, Area 2 scores higher Shannon-Wiener Diversity Index compared to Area 1. This result is shown in Table 3. These findings support
previous phenomenon of higher abundance of species in Area 2. The evenness index of both areas are close to 1, denoting that in both areas the number of

686 RAHMAN AND JAHAN
species are close to each other. Evenness index works better when the number of
sample is higher. However, it fails to capture the intricate difference between evenness of species for smaller sample sizes as shown in this case. For this
reason, the effective number of species were calculated. It shows us the degree of unevenness or dominance of species in the area. It emphasizes the result of
Shannon-Wiener Diversity Index as it weighs each species exactly according to its frequency. Even though there were 34 species found Area 2, the effective
number of species is far lesser denoting the huge difference between the contribution of each species in the biomass of the area. The Bray-Curtis
Dissimilarity between Area 1 and Area 2 is 0.377. That means the two areas have 37.7% dissimilarity between them. The reasoning behind this can be the
similarity in vegetation of the two areas.
Table 3: Shannon-Wiener Diversity, Evenness Index and Effective Number of
Species of the two areas
Area Number of Species Number of Samples J' H' ENS
1 27 135 0.96 3.15 23
2 34 264 0.92 3.26 26
8 species from 7 genera were exclusive to area 1 whereas 15 species from 12 genera were exclusive to area 2, however, 11 species were common in both areas
(Fig. 1).
Fig. 1. Relative distribution of ant species in the two areas.

SPECIES DIVERSITY AND RICHNESS OF ANT 687
Conclusion
The diversity and richness of ants in Bhawal National Park was highlighted in this study. A total of 42 species from 17 genera distributed among 6 subfamilies were
identified. The difference in species composition found can be attributed to the difference in the habitats of the study area. Higher density in vegetation and lack
of animal intervention resulted higher diversity index. However, similarity in regions were found due to homogenous vegetation pattern. As ants are using to
measure and monitor biodiversity in different agroecosystem, therefore, the findings of this study will be useful to evaluate recent biodiversity and the effects
of agricultural intensification. This study of the ant community of Bhawal national park will be a way to measure the transformation of agroecosystemsand
can provide information about management and conservation of agricultural
landscape by studying the impacts of disturbance on ant communities in agroecosystem of Bangladesh.
Acknowledgement
The authors are thankful to Dr. Nguyen Van Thinh, Research fellow, Institute of
Tropical Agriculture, Kyushu University, Japan for his generous support of processing the data of identified ant samples for this study.
Conflict of interest
The authors declare that there is no conflict of interest regarding the publication
of this paper.
References
Agosti. D, J. D. Majer, L. E. Alonso and T. R. Schultz. 2000. Ants: Standard Methods for
Measuring and Monitoring Biodiversity. Smithsonian Inst. Press, Washington.
Andersen, A. N., B. D. Hoffmann and J. Somes. 2003. Ants as indicators of minesite
restoration: community recovery at one of eight rehabilitation sites in central
Queensland. Ecological Management & Restoration 4. pp. S12-19.
Andrade, T, G. D. Marques and K. Del-Claro. 2007. Diversity of ground dwelling ants in
cerrado: an analysis of temporal variations and distinctive physiognomies of
vegetation (Hymenoptera: Formicidae). Sociobiology. 50(1): 121-34.
Arnan, X, X. Cerdá and J. Retana. 2017. Relationships among taxonomic, functional, and
phylogenetic ant diversity across the biogeographic regions of Europe. Ecography.
40(3): 448-57.
Bolton, B. 1994. Identification guide to the ant genera of the world. Harvard University
Press.
Bray, J. R. and J. T. Curtis. 1957. An ordination of upland forest communities of southern
Wisconsin. Ecological Monographs. 27: 325-349.
Dostál, P., M. Březnová, V. Kozlíčková, T. Herben and P. Kovář. 2005. Ant induced soil
modification and its effect on plant below-ground biomass. Pedobiologia 49: 2:127-137.

688 RAHMAN AND JAHAN
Jenkins, C.N., N. J. Sanders, A. N. Andersen, X. Arnan, C. A. Brühl, X. Cerda, A. M.
Ellison, B. L. Fisher, M. C. Fitzpatrick, N. J. Gotelli and A. D. Gove. 2011. Global
diversity in light of climate change: the case of ants. Diversity and Distributions 17:
4:652-662.
Jost, L. 2006. Entropy and diversity. Oikos. 113(2): 363-75.
Kabir, D. S. and A. Z. Ahmed. 2005. Wildlife biodiversity in Bhawal National Park:
Management techniques and drawbacks of wildlife management and nature
conservation. Our Nature. 3(1): 83-90. doi: https://doi.org/10.3126/on.v3i1.340
Krebs, C. J. 1999. Ecological Methodology. Addison Wesley Longman, Menlo Park, CA.
Margalef, R. 1958. Information Theory in biology. General Systems Yearbook. 3: 36-71.
Nguyen, D. D. and L. T. Nguyen. 2016. Diversity and abundance of ants (Hymenoptera:
Formicidae) in Phu Luong, Thai Nguyen province, Vietnam.
Ogata, K. 2001. Time Unit Sampling: a Protocol. ANeT Newsletter. No. 3: 18-19.
Pal, K. K. and B. M. Gardener. 2006. Biological control of plant pathogens. The Plant
Health Instructor.
Szewczyk, T. and C. M. McCain. 2016. A systematic review of global drivers of ant
elevational diversity. PLoSOne. 11(5): e0155404.

ISSN 0258-7122 (Print), 2408-8293 (Online)
Bangladesh J. Agril. Res. 44(4): 689-693, December 2019 Short Communication
EFFECT OF FOLIAR SPRAY OF BIOREGULATORS AND
IRRIGATION ON DRY MATTER ACCUMULATION OF
MUSTARD (Brassica juncea L.)
A. SINGH1 AND R. S. MEENA2
Rapeseed and mustard is generally, affect by irrigation water. The rapeseed-
mustard is the crop that has fewer requirements of the water (Aujla et al., 2005).To alleviate the harmful effect of drought stress, bioregulators may be used
to change the different metabolic and physiological activities of the plant for increasing the yield of mustard crop (Meena et al., 2013). Thiourea containing
one SH group and it’s is a sulphydryl compound. The SH group has been implicated in photosynthetic translocation in plants (Giaquinta, 1976). It is
simply concerned in light activation of photosynthetic enzymes (Salisbury and Ross, 1986). The exogenous application of Salicylic acid (SA) has been reduced
the negative effect of water stress (Khan et al., 2015) and spray of SA improve the growth of the plant (Hayat et al., 2010). Glycinebetainean important
ammonium compound, it considered to be one of the most pre-dominant and effective osmoprotectants. The exogenous application of glycinebetaine
improved the drought tolerance in plants (Mahmood et al., 2009; Meena et al., 2018). Hence, the study was conducted to see the effect of bioregulators on dry
matter accumulation of Indian mustard under different levels of irrigation.
The experiment was conducted during the rabi (winter) seasons of 2014-15 and
2015-16 at Agricultural Research Farm, Department of Agronomy, Institute of
Agricultural Sciences, Banaras Hindu University, Varanasi, India. The
experimental field has clay loam soil. The soil have pH 7.58, 7.60, organic
carbon 0.44%, 0.46%, available nitrogen 217.3, 224.1 kg/ha, available
phosphorus 20.28, 22.85 kg/ha, available potassium 219.2, 226.4 kg/ha and
available sulphur 20.90, 21.85 mg/kg/ha during both the years, respectively. The
field experiment was laid out in split plot design, where, main plot treatment:
three irrigation levels (zero irrigation, one irrigation (at pre-flowering stage) and
two irrigation (at pre-flowering and pod formation stage) and Sub-plots
treatment: seven foliar spray of bioregulators (control, thiourea@1000ppm,
thiourea@ 500ppm, salicylic acid @ 100ppm, salicylic acid @ 50ppm,
glycinebetaine@ 100ppm and glycinebetaine @ 50ppm)and irrigation was
applied@ 6 cm by V-notch method. Foliar spray was done at 50 per cent flower
initiation and 50 per cent pod formation stage. Furrows were opened at a spacing
of 45 cm ×15 cm for the sowing of Indian mustard variety ‘Ashirwad’ with seed
rate of 5kg/ha. The sowing was done on 13th November 2014 in 2014-15 and 23rd
1&2Department of Agronomy, Institute of Agricultural Sciences, Banaras Hindu
University, Varanasi-221005 Uttar Pradesh, India.
DOI: http://-

690 SINGH AND SWAROOPMEENA
November 2015 in 2015-16. The N, P, K and S were applied as 100, 50,50 and
40 kg/haby basal application. Nitrogen and phosphorus were applied through
diammonium phosphate and urea, potash and sulphur through murate of potash
and elemental sulphur, respectively. The ½ dose of N and full dose of P, K and S
were applied at sowing and ½ dose of Ngiven at the time of first irrigation as
basal dressing but full dose of NPKS was applied at the time of sowing in zero
irrigation treatment. The data were analyzed as per the standard procedure for
“Analysis of Variance” (ANOVA) (Gomez and Gomez, 1976).
The pooled analysis showed that the Interaction effect of levels of irrigation and
foliar spray of bioregulators were observed significant on dry matter
accumulation (Table 1). The result indicated that the two irrigation was produce
maximum dry matter accumulation (DMA) at 80, 100 DAS (days after sowing)
and at harvest with the foliar spray of thiourea@1000ppm which was statistically
at par with two irrigation with foliar spray of thiourea @ 500ppm. Therefore, the
application of two irrigation with foliar spray of salicylic acid @ 100 ppm gave
more dry matter than two irrigation withfoliar spray of salicylic acid @ 50ppm.
However, the application of two irrigation with foliar spray of glycinebetaine @
100ppmwas recorded higher dry matter over two irrigation with foliar spray of
glycinebetaine @ 50ppm. The minimum dry matter accumulation at 80, 100 DAS
and at harvest was recorded in zero irrigation + water spray, respectively. The
maximum dry matter accumulation was recorded with the application of two
irrigation (at pre flowering and pod formation stage). This might be due to the
adequate soil moisture increase the availability of the nutrient in the soil for the
plant to increase in growth parameters by cell elongation and cell division this
ascribed due to higher activity of auxin in plant tissues and photosynthesis
activity of plant so they produced more food (Mandal et al., 2006; Meenaet al.,
2019). The higher value of DMA was recorded with the foliar spray of thiourea
@1000ppm which was found statistically at par with the application of thiourea
@500 ppm. This may be ascribed due to the foliar application of thiourea
motivating the photosynthetic carbon fixation mechanism that enhanced the
canopy of the plant (Mehta and Sumeria; 2001, Meena et al., 2020).Moreover,
the favorable effect of foliar application of salicylic acid on dry matter
accumulation might be due to increased photosynthetic efficiency by increased
chlorophyll content, number of branches and leaf area index, which ultimately
resulted in increased dry matter accumulation (Hassanein et al.,2012; Meenaet
al., 2017).
The significant improvement in Dry matter accumulation of Indian mustard could
be achieved by application of two irrigation +foliar spray of thiourea @1000ppm
followed by two irrigation + foliar application of thiourea @500ppm.

EFFECT OF FOLIAR SPRAY OF BIOREGULATORS AND IRRIGATION 691
Ta
ble
1.
Inte
ract
ion
eff
ect
of
foli
ar
spra
y o
f b
iore
gu
lato
rs a
nd
irr
iga
tio
n l
evel
s o
n D
MA
(g
/pla
nt)
at
dif
feren
t d
ay
s a
fter
sow
ing
(DA
S)
of
Ind
ian
mu
sta
rd (
po
ole
d)
Tre
atm
en
t
DM
A (
g/p
lan
t) a
t 8
0 D
AS
D
MA
(g
/pla
nt)
at
10
0 D
AS
D
MA
(g/p
lan
t)
at
ha
rves
t
Zero
irrig
ati
on
On
e
irri
ga
tio
n
Tw
o
irri
ga
tio
n
Zero
irri
ga
tio
n
On
e
irri
ga
tio
n
Tw
o
irri
ga
tio
n
Zero
irri
ga
tio
n
On
e
irri
ga
tio
n
Tw
o
irri
ga
tio
n
Co
ntr
ol
(wate
r sp
ray)
23
.83
31
.41
3
3.0
0
25
.32
34
.31
36
.20
26
.86
36
.23
37
.79
Thio
ure
a @
50
0 p
pm
33
.72
38
.36
3
9.7
6
37
.05
42
.56
44
.22
39
.03
44
.81
46
.72
Thio
ure
a @
10
00
pp
m
33
.93
38
.51
3
9.8
8
37
.30
42
.73
44
.36
39
.32
45
.01
46
.88
Sal
icyli
c ac
id @
50
pp
m
31
.88
36
.60
3
8.0
4
34
.87
40
.47
42
.19
36
.73
42
.50
44
.48
Sal
icyli
c ac
id @
10
0 p
pm
3
2.6
2
37
.46
3
8.8
4
35
.74
41
.49
43
.13
37
.74
43
.68
45
.57
Gly
cineb
etai
ne
@ 5
0 p
pm
2
9.9
7
34
.79
3
5.8
8
32
.60
38
.33
39
.62
34
.67
40
.03
41
.52
Gly
cineb
etai
ne
@ 1
00 p
pm
3
0.8
7
35
.72
3
7.1
7
33
.67
39
.43
41
.15
35
.72
41
.30
43
.29
SE
m±
0
.16
0.2
0
0.2
4
CD
(p
=0
.05
) 0
.46
0.5
5
0.6
6

692 SINGH AND SWAROOPMEENA
References Aujla, M. S., H. S. Thind and G. S. Buttar. 2005. Cotton yield and water use efficiency at
various levels of water and N through drip irrigation under two methods of planting.
Agricultural Water Management.71:167-179.
Giaquinta, R. T. 1976. Evidence of phloem loading from the apoplast: Chemical
modification of membrane sulphydryl group. Plant Physiology.58:872-875.
Gomez, K. A. and A. A. Gomez. 1976. Statistical Procedures for Agricultural Research,
2ndedn. John Willey and Sons Inc. New York, USA. Pp-97-101.
Hassanein, R.A., A. F. Abdelkader, H. Ali, A. A. E. Amin and E. M. Rashad. 2012. Grain
primary and foliar pretreatment enhanced stress defense in wheat (Triticumaestivum
var. Gimaza) plants cultivated in drought land.Australian Journal of Crop Science.6:
121-129.
Hayat, Q., S. Hayat, M. Ifran and A. Ahmad. 2010. Effect of exogenous salicylic acid
under changing environment: a review. Environmental and Experimental Botany.
68:14-25.
Khan, M. I. R., M. Fatma, T. S. Per, N. A. Anjum and N. A. Khan. 2015. Salicylic acid
on photosynthetic pigments and antioxidative enzymes of soybean plant. Frontier of
Plant Science. 6:1-17.
Mahmood, T., M. Asraf and M. Shahbaz. 2009. Does exogenous application of glycine
betaine as a pre-sowing seed treatment improve growth and regulate some key
physiological attributes in wheat plants grown under water deficit condition.
Pakistan Journal of Botany. 41(3):1291-1302.
Mandal, K. G., K. M. Hati, A. K. Misra and K. K. Bandyopadhyay. 2006. Assessment of
irrigation and nutrient effects on growth, yield and water use efficiency of Indian
mustard (Brassica juncea) in central India. Agricultural Water Management.
85(3):279-286.
Meena, R. K., D. D. Sharma, G. S. Chouhan, K. B. Shukla, H. K. Sumeriya and N. K.
Padiwal. 2013. Growth and productivity of mustard [Brassica juncea (L.)
Czern&Coss] as influenced by irrigation levels and agrochemicals. Annals of Agri-
Bio Research. 18(3):312-317.
Meena, R. S., S. Kumar, J. S. Bohra, R. Lal, G. S. Singh and A. Pandey. 2019. Response
of alley cropping grown sesame to lime and sulphur on yield and available nutrient
status in an acidic soil of Eastern India. Energy, Ecology and Environment.
4(2): 65–74.
Meena, R. S., R. Lal and G. S. Yadav. 2020. Long-term impacts of topsoil depth and
amendments on soil physical and hydrological properties of an Alfisol in Central
Ohio, USA, Geoderma, Accepted.
Meena, R. S., V. Kumar, G. S. Yadav and T. Mitran. 2018. Response and interaction
of Bradyrhizobiumjaponicum and Arbuscularmycorrhizal fungi in the soybean
rhizosphere: A review. Plant Growth Regulation. 84:207–223.

EFFECT OF FOLIAR SPRAY OF BIOREGULATORS AND IRRIGATION 693
Meena, R. S., P. D. Meena, G. S. Yadav and S. S. Yadav. 2017. Phosphate Solubilizing
Microorganisms, Principles and Application of Microphos Technology. Journal of
CleanerProduction. 145: 157-158.
Mehta, Y. K. and H. K. Sumeria. 2001. Effect of plant growth regulators sulphuric acid
on dry matter partitioning of pea cultivars. Haryana journal of Agronomy.17:173-
174.
Salisbury, F. B. and C. W. Ross. 1986. Plant Physiology. Wads Worth Publishing
Company, USA, 206-207.

694 SINGH AND SWAROOPMEENA

ISSN 0258-7122 (Print), 2408-8293 (Online)
Bangladesh J. Agril. Res. 44(4): 695-702, December 2019 Short Communication
FARMER’S KNOWLEDGE, ATTITUDE AND PRACTICES ON SAFETY,
QUALITY AND POST HARVEST MANAGEMENT OF BRINJAL AND
TOMATO IN SOME SELECTED AREAS OF BANGLADESH
M. KHATUN1 AND M. S. RAHMAN2
Post harvest management is very important for horticultural crops. The safety and
quality of horticultural crops specially vegetables largely depends on its post harvest management. Due to improper management farmers have to bear
significant post harvest losses. Post harvest losses of fruits and vegetables are estimated at 5-20% in developed countries and 20-50% in developing countries
(Mashav, 2010). In Bangladesh, post-harvest losses of fruits and vegetables amount to 16.73-43.5% which accounts for an annual loss of Tk. 34420 million (Hasan et
al., 2010; Kaysar et al., 2016). The country like Bangladesh suffer much of the postharvest losses due to a number of factors such as lack of adequate knowledge
and information, the unavailability of appropriate practices under funded research and development (Hasan et al. 2010 and Azad et al., 2014). The quality and
nutritional value of fresh vegetables are also affected by postharvest handling and storage condition (Sablani et al., 2006). In order to reduce post harvest losses and
to arrest higher profit vegetable producers in the tropics and subtropics relies heavily on chemicals such as fertilizers, pesticides and crop preservatives. Pesticide
comes with a specific environmental concern due to their toxicity and persistence
in the environment (Lamberth et al., 2013). So, it not only advantages for crop yield but it also have a significant negative impacts.
Farmers directly involved in the handling of pesticides and insecticides and are at a high risk of exposure to these through contact with pesticide residues on treated
crops, unsafe handling, storage and disposal practices (Koureas et al., 2014; Manyilizu et al., 2017). They are using a large number of insecticides during the
entire period of growth of vegetables, even at fruiting stage. Sometimes they also ignored the recommended waiting period between the harvest and last spray.
Improve post harvest practices reduce food losses, increase food quality, food safety and also higher profit for the grower and marketers. So, improve post
harvest management is a very important component in reducing production loss of vegetables. Knowledge, attitude and practice (KAP) survey is an essential tool
to know the existing post harvest management and farmers views on safety and quality of vegetables.
KAP are the components of human behavior which is responsible for any action in dealing everyday life. These three components are somewhat pre-requisite in
1Assistant Professor, Department of Agricultural Finance, Bangladesh Agricultural
University (BAU), Mymensingh-2202, 2Scientific Officer, Agricultural Economics
Division, Bangladesh Agricultural Research Institute (BARI), Gazipur-1701, Bangladesh.
DOI: http://-

696 KHATUN AND RAHMAN
adopting new knowledge on safe and quality vegetable production. Knowledge is the result of some activity such as generation, storage, dissemination and utilization of something that entails either information or data. It is usually based on learning, thinking, and proper understanding of the problem area (Azad, 2013). Attitude is defined by Ajzen and Fishbein (1980) as a person’s degree of evaluative affect toward a target behavior. An individual may have multiple attitudes about an object, accessing different ones at different points in time (Wilson, 1998). Attitudes are relatively stable and once adopted, can provide a long-term effect (Olgyaiova et al., 2005). Through changing attitude of farmers, it is possible to improve their performance in adoption and commercialization of horticultural products (Meena et. al., 2009).
A good number of researches on knowledge, attitude and practice of the farmers on different issues of crop production were carried out (Yuantari et. al., 2015; Azad et. al., 2014; Assis and Ismail, 2011; Muhammad et. al., 2012; Abbassy, 2017; Amponsah, et. al., 2018; Baksh et al. 2015; Adesuyi et. al., 2018; Mohamed et. al., 2018; Meena et. al., 2009) but unfortunately there is lack of information on KAP on safety, quality and post-harvest management of vegetables. Due to limited knowledge and information on these areas the present study was designed to demonstrate the status of tomato and brinjal grower’s knowledge, attitude and current practices regarding safety, quality and post harvest management in some selected areas of Bangladesh. The study was conducted with a structured interview schedule in two Upazila from Jamalpur and Rangpur district of Bangladesh. They were selected based on intensive growing of tomato and brinjal. Total number of respondents was 100 taking 50 from each district.
Safety, quality and post-harvest management of tomato and brinjal cultivation
Farmers’ knowledge
All the respondents under this study were using chemical fertilizers, insecticides, fungicides and pesticides. At the same time some farmers were using herbicides along with the chemical components as all they believe that these are mandatory for higher yield. These findings are similar to Zawiyah et al., 2007 who indicated that insecticides were used by 98% of the farmers, followed by bactericides (79%), nematicides (24%), and herbicides (5%) and Mohamed et al., 2018 who indicated that pesticides were indispensable for high crop yield (80%). Farmers were asked about the harmfulness of the chemical components used in brinjal and tomato cultivation. Among them 84.9% knew that these are very harmful The study also found that 2.7% of the respondents still have no idea on the harmful effect of chemical components used in brinjal and tomato cultivation.
The knowledge level of brinjal and tomato farmer on safety, quality and post harvest management was shown by the following Table 1. It shows the number of respondents who answered the 18 statements as whether they know (Yes) means that they gave the correct answer or don’t know (No) means that they gave

FARMER’S KNOWLEDGE, ATTITUDE AND PRACTICES (KAP) ON SAFETY 697
the false answer as previously done by Baksh et.al., (2015) and Yuantari et.al., (2015). It is evident from the mean frequencies that 74.61% of the sample farmers have sufficient knowledge on the safety, quality and post-harvest management of brinjal and tomato cultivation whereas the rest (25.39%) still unaware of this issue. Farmers had highest knowledge in response to “Good management increases vegetables quality (100%)”, “The level of vegetables loss is more prominent for delay harvesting (98%)”, “Morning is the appropriate time for vegetable harvesting (98%)” and “The level of vegetable loss is more prominent at storage stage (96%)”. Lowest knowledge was with respect to “Idea on proper storage technique (32%)” and “It is very important to follow pre harvest interval rules (13%)”.
Table 1. Farmers Knowledge on safety, quality and post harvest management of
tomato and brinjal cultivation
Sl. No.
Statements
Extent of knowledge (% of respondents)
Yes No
1. Good management increases quality 100 0
2. The level of loss is more prominent for delay harvesting
98 2
3. Morning is the appropriate time for harvesting 98 2
4. The level of loss is more prominent at storage stage
96 4
5. Should collect after natural maturity 95 5
6. Variety influences the post-harvest loss 93 7
7. Should be free from disease 92 8
8. Should be free from harmful insecticide and pesticide
85 15
9. Good processing and packaging increases net revenue
79 21
10. Large volume transport at a time increases post-harvest loss
76 24
11. Idea on safety issues for human consumption 73 27
12. Knowledge on sorting and grading 72 28
13. Idea on optimum maturity 71 29
14. Knowledge on pre and post-harvest handling 59 41
15. Idea on proper transportation technique 58 42
16. Should be washed after harvesting 53 47
17. Idea on proper storage technique 32 68
18. It is very important to follow pre harvest interval rules
13 87
Summary (mean) knowledge 74.61 25.39
Source: Field survey, 2018.

698 KHATUN AND RAHMAN
Farmers Attitude
In order to measure farmers’ attitude Table 2 enumerates ten statements on which
farmers showed their opinions on two scales- agree and disagree as done by
Yuantari et al. (2015). Majority of the respondents (82.78%) attitude was positive
to the statement whereas 17.22% have negative attitude towards the statements
means that they disagreed with the statement. Farmers agreed mostly with the
statement, “Necessary to circulate more awareness building materials at the
farmer level (100%)”, “Ensuring the quality of insecticide and pesticide
(100%)”, “Should maintain proper management technique (96.8)” and “Use of
pheromone trap and light trap (95.7)”. Farmer were disagreed mostly with the
statements “Use of bio pesticide and bio insecticide (50.7%)”, “Pre harvest
interval rules should follow (40.7%)” and “Clean the collected vegetables with
hygienic water (37.5%)”. It indicates that farmers have a strong believe on using
chemical component to reduce insects and pests rather depend on bio pesticide
and insecticide.
Table 2. Farmer’s attitude towards safety, quality and post harvest management of
brinjal and tomato cultivation
Sl. No. Statements Agree (%) Disagree (%)
1. Necessary to circulate more awareness
building materials at the farmer level
100 0
2. Ensuring the quality of insecticide and
pesticide
100 0
3. Should maintain proper management
technique
96.8 3.2
4. Use of pheromone trap and light trap to
reduce insecticide and pesticide application
95.7 4.3
5. Optimum use of chemical fertilizers 93.2 6.8
6. Sources of pesticides and insecticides should
be taken under strong monitoring
92.6 7.4
7. Educate farmers on the optimum application
of insecticide and pesticide
78.4 21.6
8. Clean the collected vegetables with hygienic
water
62.5 37.5
9. Pre harvest interval rules should follow 59.3 40.7
10. Use of bio pesticide and bio insecticide 49.3 50.7
Summary (mean) attitude 82.78 17.22
Source: Field survey, 2018

FARMER’S KNOWLEDGE, ATTITUDE AND PRACTICES (KAP) ON SAFETY 699
Farmers Practices
Farmers practices has enumerated through Table 3. It shows seven practice
statements of the study and farmers responses (%) as always, rarely and never as
done by Yuantari et al. (2015). Majority (43.93%) of the respondents stated that
they always practice these statements whereas a significant portion of the
respondents (38.40%) opined that they never follow this statement in the
cultivation of brinjal and tomato. Among the respondents 88.7% told that they
timely apply quality pesticide and insecticide. But at the same time, 66.3% of the
respondents always apply unnecessary insecticide and pesticide. This might be
due to the knowledge gap of the farmers and their traditional attitude regarding
safety and quality issues of brinjal and tomato cultivation.
Table 3. Farmer practices on safety, quality and post harvest management of brinjal
and tomato cultivation
Sl.
No. Statements
Always
(%)
Rarely
(%)
Never
(%)
1. Farmer thinks about the safety and quality
issue
10.8 22.6 66.6
2. Farmer applies unnecessary insecticide
and pesticide
66.3 8.5 25.2
3. Farmer applies bio fertilizer and bio
medicine
19.8 37.3 42.9
4. Farmer uses pheromone trap, light trap
and some other technology to destroy the
harmful insect
53.4 28.7 17.9
5. Farmer follows pre harvest interval rules 8.7 10.6 80.7
6. Farmer timely applies quality insecticide
and pesticide
88.7 2.3 9.0
7. Farmer depends on natural maturity 59.8 13.7 26.5
Summary (Mean) practices 43.93 17.67 38.40
Source: Filed survey, 2018
Attitude and perceptions towards safe and hygienic brinjal and tomato
Farmer attitude
Enumerates nine statements on farmers’ attitude towards safe and hygienic
tomato and brinjal. In each of the statements farmers showed their views as agree
and disagree. Majority of the respondents (75.2%) showed positive attitude on
the statements in Table 7. Farmers agreed mostly on “Quality seed (100%)”,
“Variety should be high yielding (96.7)” and “Proper management of the crop

700 KHATUN AND RAHMAN
field (92.3%)”. Farmer showed disagreed on “Collected vegetables should be
sun dried (65.4%)” and “Clean with fresh water (60.1%)”.
Farmer perception
Farmers’ perception towards safe and hygienic brinjal and tomato cultivation has
enumerated in Table 4 where they answer in three different scales - always
practice, rarely practice and never practice as done by Yuantari et.al. (2015).
Most of the respondents were against the statements as maximum 40.93% never
practiced during the cultivation of brinjal and tomato. Again 38.49% of the
respondents had always practiced following by 20.58% as rarely practice in
brinjal and tomato growing.
Table 4. Perception of brinjal and tomato farmers on safe and hygienic brinjal and
tomato cultivation
Sl. No. Statement Always
(%)
Rarely
(%)
Never
(%)
1. Think about this issue 54.3 23.8 21.9
2. Collect and sell quickly 86.0 14.0 0.0
3. Cultivate high yielding variety 57.3 21.1 21.6
4. Use bio fertilizer, insecticide and
pesticide
12.2 21.7 66.1
5. Follow pre harvest interval rules 15.9 31.4 52.7
6. Make proper management of the crop
field
89.4 8.6 2.0
7. Clean with fresh water 14.5 15.7 69.8
8. Clean with fresh piece of cloth 21.3 15.6 63.1
9. Keep the collected tomato and brinjal in
open sunlight
0.0 5.00 95.00
10. Keep the collected tomato and brinjal in
bare soil
34.0 48.9 17.1
Summary (mean) perceptions 38.49 20.58 40.93
Source: Field survey, 2018
Tomato and brinjal farmers are practicing a good number of post harvest
management. They had good level of knowledge and positive attitude towards
safety and quality issues of tomato and brinjal. A significant number of tomato
and brinjal growers were habituated with right practices regarding point of
harvesting, packaging, transportation, grading, sorting and storing. They were
well informed about the harmfulness of applying insecticide and pesticide in
brinjal and tomato cultivation. Though they had enough knowledge on safety and

FARMER’S KNOWLEDGE, ATTITUDE AND PRACTICES (KAP) ON SAFETY 701
quality issues of tomato and brinjal but less than half of the farmers were
practicing at farm level. So, still there is floor to improve their practices. In order
to bridge the gap between knowledge and practice, new and update technology
and information to improve their production performances should disseminate at
farm level. Beside motivation training should follow up by the research
institution and agricultural extension. This will be helpful for the farmer to come
out of their normal trend of cultivation and enable them to use their knowledge
without hesitation.
References
Abbassy, M. M. S. 2017. Farmer’s knowledge, attitudes and practices, and their exposure to pesticide residues after application on the vegetable and fruit crops. case study: north of delta, Egypt. Journal of Environmental and Analytical Toxicology, 7(5):1-6.
Adesuyi, A. A., V. C. Nnodu, K. L. Njoku and A. Jolaoso. 2015. Nitrate and Phosphate Pollution in Surface Water of Nwaja Creek, Port Harcourt, Niger Delta, Nigeria. International Journal of Geology, Agriculture and Environmental Sciences, 3(5):14-20.
Ajzen, I. and M. Fishbein. 1980. Understanding attitudes and predicting social behavior. Englewood Cliffs, N. J, Prentice Hall.
Amponsah, S. K., A. Addo, K. Dzisi, B. Asante, and D. Afona. 2018. Assessment of rice farmers’ knowledge and perception of harvest and postharvest losses in Ghana. Cogent Food & Agriculture 4, pp. 1-14.
Assis, K. and H. A. Mohd Ismail. 2011. Knowledge, attitude and practices of farmers towards organic farming. Int. J. Eco. Res. 2(3):1-6.
Azad, M. J. 2013. Farmers’ knowledge on postharvest practices of vegetables. Master of Science Thesis, Department of Agricultural Extension & Information System, Sher-e-Bangla Agricultural University, Dhaka-1207
Azad, M. J., M. S. Ali and M. R. Islam. 2014. Knowledge on postharvest practices of vegetables. Int. J. Expt. Agric. 4(3):7-11.
Baksh, K., W. Ganpat, and L. Narine. 2015. Farmers’ knowledge, attitudes and perceptions of occupational health and safety hazards in Trinidad, West Indies and implications for the agriculture sector. Journal of Agricultural Extension and Rural Development. 7(7):221-228
Hasan, M. K., B. L. D. Chowdhury and N. Akter. 2010. Postharvest loss assessment: a study to formulate policy for loss reduction of fruits and vegetables and socioeconomic uplift of the stakeholders, National Food Policy Capacity Strengthening Programme, FAO, Rome, Italy.
Kaysar, M. I., M. S. Mia, M. S. Islam and A. K. M. G. Kausar. 2016. Postharvest loss assessment of brinjal in some selected areas of Bangladesh. International Journal of Business, Management and Social Research, 2(2):118-124.
Koureas, M., A. Tsakalof, M. Tzatzarakis, E. Vakonaki, A. Tsatsakis and C. Hadjichristodoulou. 2014. Biomonitoring of organophosphate exposure of pesticide sprayers and comparison of exposure levels with other population groups in Thessaly (Greece). Occup. Environ. Med 71, pp. 126–133.

702 KHATUN AND RAHMAN
Lamberth, C., S. Jeanmart, T. Luksch, A. Plant. 2013. Current Challenges and Trends in
the Discovery of Agrochemicals. Science, 341(6147):742–746.
Manyilizu, W. B., R. H. Mdegela, A. Helleve, E. Skjerve, R. Kazwala, H. Nonga, M. H.
B. Muller, E. Lie, and J. Lyche. 2017. Self-Reported Symptoms and Pesticide Use
among Farm Workers in Arusha, Northern Tanzania: A Cross Sectional Study.
Toxics, 5:24-37.
Mashav. 2010. Postharvest losses of fruits and vegetables. Available at:
http//www.mashav.mfa. gov.il/ mfm/web/main/document.asp?document ID=42327
viewed March, 2019.
Meena, M. S., A. Kumar, K. M. Singh and H. R. Meena. 2009. Farmers’ attitude
towards post-harvest issues of horticultural crops. Indian Res. J. Ext. Edu, 9
(3):15-19.
Mohamed, A. O., A. A. Mater, A. M.A. Hammad, A. E. S.A. A. M. Eldein, E. M.
Eltayeb, A. A. Dahab, A. A. Gader, and A. Abdelbagi. 2018. Knowledge, attitudes
and practices of farmers towards pesticides use and handling in greenhouse farms,
Sudan. International Journal of Research – Granthaalayah, 6(9):520-534.
https://doi.org/10.5281/zenodo.1465024.
Muhammad, R.H., G.C. Hionu and F.F. Olayemi. 2012. Assessment of the post harvest
knowledge of fruits and vegetable farmers in Garun Mallam L.G.A of Kano, Nigeria.
International Journal of Development and Sustainability, 1(2):510–515.
Olgyaiova, K., E. Pongrácz, T. Mikkola, R. Radoslav Skapa and R. L. Keiski. 2005.
Attitudes toward waste minimization in Finland and Czech Republic - Barriers and
drivers. In: Proceedings of the RESOPT closing seminar ‘waste minimization and
utilization in Oulu region: Drivers and constraints’ Edited By Eva Pongrácz. Oulu
University Press, Oulu, pp. 85 -109.
Sablani, S. S., L. U. Opara, and K. Al-Ballushi. 2006. Influence of bruising and storage
temperature on vitamin C content of tomato. J. Food Agric. Environ, 4(1): 54-56.
Yuantari M. G. C., C. A. M. Van Gestel, N. M. Van Straalen, B. Widianarko, H. R.
Sunoko and M. N. Shobib. 2015. Knowledge, attitude, and practice of Indonesian
farmers regarding the use of personal protective equipment against pesticide
exposure. Environ Monit Assess, pp. 187: 142.
Zawiyah, S., Y. B. Che Man, H. Nazimah, C. K. Chin, I. Tsukamoto, A. H. Hamanyza,
and I. Norhaizan. 2007. Determination of Organochlorine and Pyrethroid
Pesticides in Fruit and Vegetables Using Sax/Psa Clean-Up Column. Food Chem.,
102, pp. 98-103.

Guidelines for Contributors
Bangladesh Journal of Agricultural Research (BJAR) is a quarterly Journal highlighting
original contributions on all disciplines of crop agricultural research conducted in any part of the globe. The full text of the Journal is visible in www.banglajol.info and
www.bari.gov.bd websites. Contributors are requested to note the following points while
preparing paper for the Journal.
Paper submitted for publication must contain original unpublished material.
Papers in the Journal are published on the entire responsibility of the contributors.
Paper must be in English and type-written in Times New Roman (font size 12) with double space on one side of A4 size 80g paper.
Margin should be 2.50 cm (1 inch) in all sides.
Manuscript should be submitted in duplicate along with a soft copy.
The manuscript should contain the following sub-titles in sequence: Title,
Abstract, Key words, Introduction, Materials and Methods, Results and Discussion, Conclusion, Acknowledgements (if any) and References. In case of
‘Short Communication’ no sub-titles are necessary except Abstract and References.
Title: It should be brief and specific and typed in capital letters. The manuscript will have a separate title page giving title of the paper, author(s) name and address.
Abstract: It should not exceed 150 words containing the highlights of the study, but in case of short communication if should not exceed 70 words.
Key words: Should not exceed 6 words and it should be below the Abstract.
Text: The text of the article should be clear and precise. Introduction should be precise and relevant to the study. Methods already published should be indicated
by references. In case of modification of a method it needs explicit description. Results should be stated concisely and presented referring to Tables and Figures.
Data of Tables and Figures should not be repeated in the text. Each result should be followed by discussion or interpretation with appropriate reference(s).
Tables and Figures: Number of Tables and Figures should be minimum. The figures and graphs should be properly drawn with bold and solid lines. The photographs should be submitted on glossy paper or in JPG format. Black and
white and colored photographs are acceptable.
All quantitative data must be in metric units.
Abbreviations should be as per style “Manual for Biological Editors”.

References: The references and scientific names are important. The authors must
be sure about the correctness of citations and spellings. In the text, references should be cited within brackets quoting author’s surname and the year of
publication in the appropriate place e.g. (Bhuiyan, 1964), Khan and Rahman (1970). Two or more references when put within the same bracket should be
separated by a semicolon.
For more than two authors the reference should be cited with the surname of the first
author and then et al. (year), for example Ahmed et al. (1999).
References should be arranged alphabetically according to author’s surname, to be
followed by year of publication and full title of the paper. Name of the Journal and Book should be in italics, to be followed by volume, number and page range.
Ahmed, F. and M. Z. Alam. 1993. Mango leaf consumption by Cricula trifenestrata
Heifer (Lepidoptera: Saturnide) larvae under field conditions. Bangladesh J. Entomol. 31: 9-17.
Cano, H., N. Gabas and J. P. Canselier. 2001. Experimental study on the ibuprofen crystal growth morphology in solution. J. Crystal Growth 224: 335.
De Beer, G. R.1940. Embryology and Taxonomy. In: The New Systematics. (Ed. Huxely, J.). Oxford Univ. Press, London. pp. 365-393.
Dockery, D. J. and C. A. Pope, 1994. Acute respiratory effects of particulate air pollution. Ann. Rev. Public Health 15: 107-110.
Edmonds, J. and K. M. Karp. 1997. Theoretical improvements in Algorithmic Efficiency for network flow problems. J. Assoc. Comput. Mach. 19: 248-264.
A full paper exceeding 12 typed pages and a short communication exceeding six typed pages will not be entertained.
Principal author should take consent of the co-author(s) while including the name(s) in the article.
The article prepared from M.S/Ph.D. thesis should be mentioned in the foot note of the article.
Authors get no complimentary copy of the Journal. Twenty copies of reprints are
supplied free of cost to the author(s).
FOR SUBMISSION OR CONTACT
Editor (Technical)
Bangladesh Journal of Agricultural Research
Bangladesh Agricultural Research Institute (BARI)
Joydebpur, Gazipur-1701
Phone: 02-49270038
E-mail: [email protected]

Short CommunicationA. Singh and R. S. Meena − Effect of foliar spray of bioregulators and irrigation on dry matter accumulation of mustard (Brassica juncea L.)M. Khatun and M. S. Rahman − Farmer’s knowledge, attitude and practices on safety, quality and post harvest management of brinjal and tomato in some selected areas of Bangladesh
689
695
C O N T E N T S

M. Moniruzzaman, R. Khatoon, M. Moniruzzaman, and A. K. M. Qamruzzaman − Influence of plant growth regulators on vegetative growth, sex expression and yield of summer bottle gourd
M. A. K. Mian, A. A. Begum and R. R. Saha − Requirement of different nutrients for yield maximization of Bt Brinjal
M. A. Quddus, M. A. Hossain, H. M. Naser and S. Aktar − Effects of potassium application on yield attributes, yield and grain quality of lentil in terrace soil of Joydebpur
M. A. Hoque − Physical and engineering properties of BARI released three groundnut varieties
M. Afroz, M. R. Amin, M. R. U. Miah and M. M. Hossain − Incidence of major insect pests on sweet gourd germplasm
M. R. Ali, M. M. Rahman, M. Asaduzzaman, M. A. H. Khan and J. Rahman − Moisture level and storage container effects on seed quality of soybean genotypes under ambient condition
Bandita Deo, Bikram Keshari and Bikram Pradhan − In vitro propagation of popular banana cultivar (Musa spp. Cv. Patakpura)
K. S. Rahman, M. K. Hasan and M. Hasan − Determinants of household food security in rural Bangladesh: an imperial analysis of farm level data
M. S. Islam, M. Zakaria, M. M. Hossain, M. A. B. Mia and A. J. M. S. Karim − Effect of potassium on yield, quality and shelf life of tomato
M. H. Rahman, M. R. Islam, F. M. Aminuzzaman, A. Latif and S. Nahar − Evaluation of plant extracts, fungicides, bio-agent and soil amendments against foot and root rot disease of betelvine caused by Sclerotium rolfsii under field condition
M. M. Rahman and M. N. Jahan − Species diversity and richness of ant (hymenoptera, formicidae) in Bhawal National Park of Bangladesh
(Cont’d. inner back cover)
BANGLADESH JOURNAL OF AGRICULTURAL RESEARCH
Vol. 44 December 2019 No. 4
577
591
599
609
621
631
641
649
659
669
679
Published by the Director General, Bangladesh Agricultural Research Institute (BARI), Gazipur 1701, Bangladesh. Printed at Jharna Art Press, 48/3/C, R. K. Mission Road, Dhaka 1203, Phone: 9555556.