Volume 2 - Прикарпатський національний університет імені...
122
-
Upload
khangminh22 -
Category
Documents
-
view
0 -
download
0
Transcript of Volume 2 - Прикарпатський національний університет імені...


ACADEMY OF TECHNICAL SCIENCES OF UKRAINE INSTITUTE OF EDUCATION CONTENT MODERNIZATION
VASYL STEFANYK PRECARPATHIAN NATIONAL UNIVERSITY IVANO-FRANKIVSK NATIONAL TECHNICAL UNIVERSITY OF OIL AND GAS
KING DANYLO UNIVERSITY UKRAINIAN STATE UNIVERSITY OF RAILWAY TRANSPORT
UKRAINIAN NATIONAL FORESTRY UNIVERSITY
CONNECTIVE TECHNOLOGIES LTD (GREAT BRITAIN)
APPLIED SCIENTIFIC AND TECHNICAL RESEARCH
ПРИКЛАДНІ НАУКОВО-ТЕХНІЧНІ ДОСЛІДЖЕННЯ
Proceedings of the IV International Scientific and Practical Conference
(April 1–3, 2020, Ivano-Frankivsk)
In Two Volumes Volume 2
Conference Partner:
Ivano-Frankivsk Vasyl Stefanyk Precarpathian National University
2020
EIF “Tempo” http://tempo-temp.com.ua/

УДК 60 ББК 30 П75
APPLIED SCIENTIFIC AND TECHNICAL RESEARCH Proceedings of the IV International Scientific and Practical Conference
ORGANIZING COMMITTEE:
Head of the Organizing Committee: Kuz M. – Doctor of Technical Sciences, President of the Academy of Technical Sciences of Ukraine, Professor of the Department of Information Technologies of Vasyl Stefanyk Precarpathian National University, Ivano-Frankivsk. Members of the Organizing Committee: Arkhypova L. – Doctor of Technical Sciences, Academician of the Academy of Technical Sciences of Ukraine, Head of the Department of Tourism of the Ivano-Frankivsk National Technical University of Oil and Gas, Ivano-Frankivsk; Novak V. – Director at Connective Technologies LTD, London, the United Kingdom of Great Britain and Northern Ireland; Vashchyshak S. – PhD in Technical Sciences, Corresponding Member of the Academy of Technical Sciences of Ukraine, Associate Professor of the Depar-tment of Information Technologies of King Danylo University, Ivano-Frankivsk; Lomotko D. – Doctor of Technical Sciences, Academician of the Academy of Technical Sciences of Ukraine, Head of the Department of Transport Systems and Logistics of the Ukrainian State University of Railway Transport, Kharkiv; Bakay B. – PhD in Technical Sciences, Corresponding Member of the Aca-demy of Technical Sciences of Ukraine, Associate Professor of the Department of Forest Engineering and Forest Roads of the Ukrainian National Forestry University, Lviv.
Applied Scientific and Technical Research : Proceedings of the IV International Scientific and Practical Conference, April 1–3, 2020, Ivano-Frankivsk / Academy of Technical Sciences of Ukraine. Ivano-Frankivsk : Vasyl Stefanyk Precarpathian National University, 2020. V. 2. 120 p. ISBN 978-966-640-484-1
The collection includes the proceedings of the IV International Scientific and Practical
Conference «Applied Scientific and Technical Research». The collection is intended for students, postgraduates, teachers of higher educational
institutions and scientific organizations. УДК 60 ББК 30
ISBN 978-966-640-484-1 © Authoring Team, 2020
© Vasyl Stefanyk Precarpathian National University, 2020
П75
3 Natural sciences
УДК 551.508.53/54 INDUCTION ANEMORUMBOMETER
Ph.D. Martinenko S.A., Ph.D. Artemenko D.Yu., Central Ukrainian National Technical University, Kropyvnytskyi, Ukraine
Introduction. A step forward in the study of meteorological processes is considerably determined by the quality and perfection of meteorological devices. It is impossible to detect and evaluate the physical processes taking place in the atmosphere and to carry out scientific research at the current level without such devices. One of the important parameters in the study of meteorological processes is the wind speed and direction.
In order to measure the mentioned parameters, there are used either separate devices - anemometers and weathervanes, or combined devices - anemorumbometers. The well-known remote anemorumbometer which consists of an impeller with a weathervane, speed and direction transducer in the form of a seal switch and a pulse generator [1]. It requires power that means that it is not autonomous. The remote anemorumbometer does not possess such a disadvantage since it does not require power [2]. On the axis of the impeller of the remote anemorumbometer is mounted a driving gear connected with driven gear on which is attached a U-shaped magnet connected in its turn with a weathervane and under the magnet, all round, are installed induction coils in accordance with the wind directions. But design complexity, due to the availability of the gear drive and mounting of the driven gear on the weathervane, which adds load to the it and increases its resistance to rotation and thus reduces the sensitivity of the device to changes in wind direction.
In order to simplify the design and improve the quality of measurements, we have proposed a design that, in our opinion, does not possess such disadvantages.
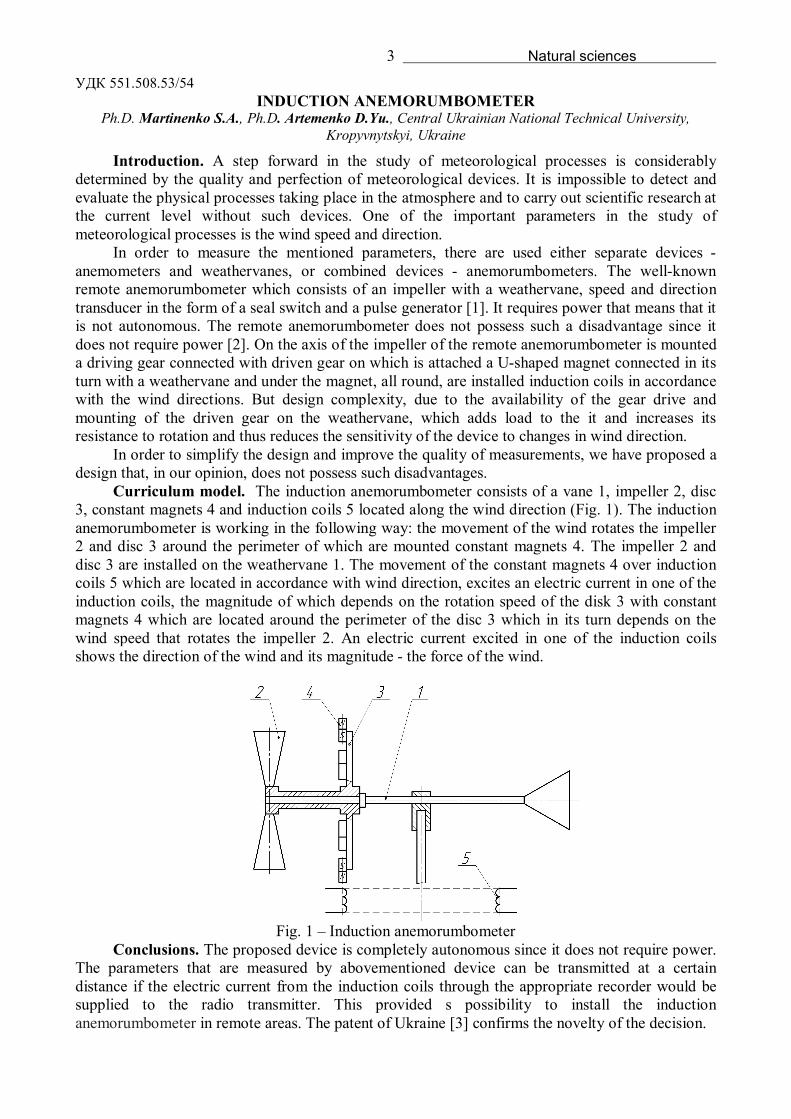
Curriculum model. The induction anemorumbometer consists of a vane 1, impeller 2, disc 3, constant magnets 4 and induction coils 5 located along the wind direction (Fig. 1). The induction anemorumbometer is working in the following way: the movement of the wind rotates the impeller 2 and disc 3 around the perimeter of which are mounted constant magnets 4. The impeller 2 and disc 3 are installed on the weathervane 1. The movement of the constant magnets 4 over induction coils 5 which are located in accordance with wind direction, excites an electric current in one of the induction coils, the magnitude of which depends on the rotation speed of the disk 3 with constant magnets 4 which are located around the perimeter of the disc 3 which in its turn depends on the wind speed that rotates the impeller 2. An electric current excited in one of the induction coils shows the direction of the wind and its magnitude - the force of the wind.
Fig. 1 – Induction anemorumbometer
Conclusions. The proposed device is completely autonomous since it does not require power. The parameters that are measured by abovementioned device can be transmitted at a certain distance if the electric current from the induction coils through the appropriate recorder would be supplied to the radio transmitter. This provided s possibility to install the induction anemorumbometer in remote areas. The patent of Ukraine [3] confirms the novelty of the decision.
4 Natural sciences
References. 1. А.S. USSR №970224, 1982. 2. The Patent of Ukraine for utility model «Remote anemorumbometer» №125455, published May 10, 2018., bul. №9. 3. The Patent of Ukraine for utility model «Induction anemorumbometer» №132901, published March 11, 2019., bul. №5. УДК 669.162.267.6:669.721
COMPLEX CAST IRON CRAFTING BEFORE OXYGEN-CONVERTER SMELTING Pushkarenko M.V., Doct. Tarakanov A.K., National Metallurgical Academy of Ukraine, Dnipro, Ukraine
Introduction. Cast iron is the main charging component in basic oxygen steelmaking process. That’s why melted steel quality and metal products competitive ability considerably depend on chemical composition of charging component and its temperature at the moment of metal pouring into converter.
Presentation of the material. According to manufacture conditions and final metal rolling requirements the structure of manufacture technological path of iron-carbon melt changed during last decades. In primary variant the element of «complex refining of cast iron» technological path contained elements of silicon, sulphur and phosphorus removal in Japanese manufactures conditions [1,2,3].The main disadvantage of such technologies is their multi-stage process and considerable decrease of cast iron temperature (150 °C and more). Earlier ladle energy-saving technology of cast-iron refining with simultaneous silicon and sulphur removal was proposed and worked out in laboratory conditions. This removing process proceeded with the help of synthetic slag, that was created in consequence of dolomitic lime and aluminium pour in oxygen stream injection . Achieved perfomance of sulphur and silicon removal drafted 58,1 – 82,7 % and 64,3 – 90,1 % respectively. However, in spite of indisputable advantages (one-stage and allotermical process) proposed technology has a number of disadvantages, that limit its using in manufacture conditions:
– using expensive aluminium pour in composition; – risks of fire and burst during injection of aluminium composition in oxygen stream. Conclusion. In this research work it is proposed to replace aluminium pour by aluminium
bars or wire. This decision will help to decline equipment expenditure and increase manufacture safety. The point of improved variant of cast iron crafting with silicon and sulphur simultaneous removal consists in next points:
- primary handling of liquid conversion cast iron is produced with providing necessary concentration of dissolved aluminium in the melt.;
- then the injection of lime pour to the liquid cast iron in oxygen stream, surrounded by protecting ring nitrogen envelope with the help of type «tube in tube» nozzles.
In the limits of reactionary zone, which is created during synergy between oxygen-pour stream and the melt, reactions of silicon and aluminium oxidation with liquid-moving system CaO - SiO2- Al2O3 slag forming get progression. The drops of this slug take part in removing sulphur from the metal in the limits of reaction zone, which forms across the shaft of plunged tyere.
References. 1. Voskoboinikov V.G. Cast iron treatment out of blast furnace abroad. Preparation of raw materials to metallurgical remaking and cast iron manufacture / V.G. Voskoboinikov, I.M.Perkazov, V.A.Zavidonskij and others// Moscow «Chermetinformacia»,1986–№ 2–32p. 2. Ogava Y. Progress of hot metal treatment technology and future outlook / Y. Ogava, N. Maruoka // Tetsu-to-hagane «Journal of the Iron and Steel Institute of Japan». – 2014. –v.100. – №4. – P. 434–444. 3. Shevchenko A.F. Removing sulphur from cast iron in ladles out of blast furnace. Technology, research, analysis, development/ A.F. Shevchenko, I.A. Manachin, A.S. Vergun and others// Dnipro – VAL, 2017. – 252 p.
5 Natural sciences
УДК 004.9:620.92 ASSESSMENT OF SURFACE WATER RESOURCES FOR THE LOCATION OF THE
RESORT IN THE CARPATHIANS Doct. Arkhypova L.N., Ivano-Frankivsk National Technical University of Oil and Gas, Ivano-Frankivsk,
Ukraine
Introduction. The Carpathian region in Ukraine is unique in terms of opportunities to restore the spiritual and physical strength of man, and therefore the development of recreation and tourism. Let's try to understand the part of the quantitative resource potential of surface waters to ensure the planned activity of the ski resort Svidovets. The announcement of the intention of such construction appeared in official sources almost two years ago.
Outline of the material. The territory of the planned Svidovets resort is located in the most water-flooded area of the Carpathians with the highest river runoff modules both in the average water year (up to 30 l/s km2) and in the minimum water year in comparison with other mountainous regions of the Ukrainian Carpathians.
For each bed-place of the resort should be calculated from 120 to 300 litres of pure water for water supply per day (according to DBN.V.2.5-64: 2012, depending on the stars of the hotel). For 18,000 beds the volume of water consumption will be 2500-5800 m³ per day. Therefore, the maximum volume of water supply is 5800 m3/day, which is equal to 0.067 m3/s. To produce snow for the slopes, up to 1 million m³ of reservoir water is required.
Drinking groundwater resources in the study area are insignificant and amount to 50-100 m3/day. There is no centralized water intake system in the mountain settlements of Yasinya (9200 inhabitants) and Cherna Tysa (3000 inhabitants). In this regard, mountain streams in forested areas outside settlements are promising for the centralized provision of quality water of the planned tourist complex.
Within the location of the resort there is a hydrological post of the Cherna Tysa River - village Yasinya; for comparison and justification of calculations the data of two posts of the same river Tisza downstream were used: the river Cherna Tysa River - village Bilin and Tysa River – town Rakhiv. The observation period ranges from 40 to 70 years, baseline annual runoff values are significant with relative standard errors not exceeding + 4,5%.
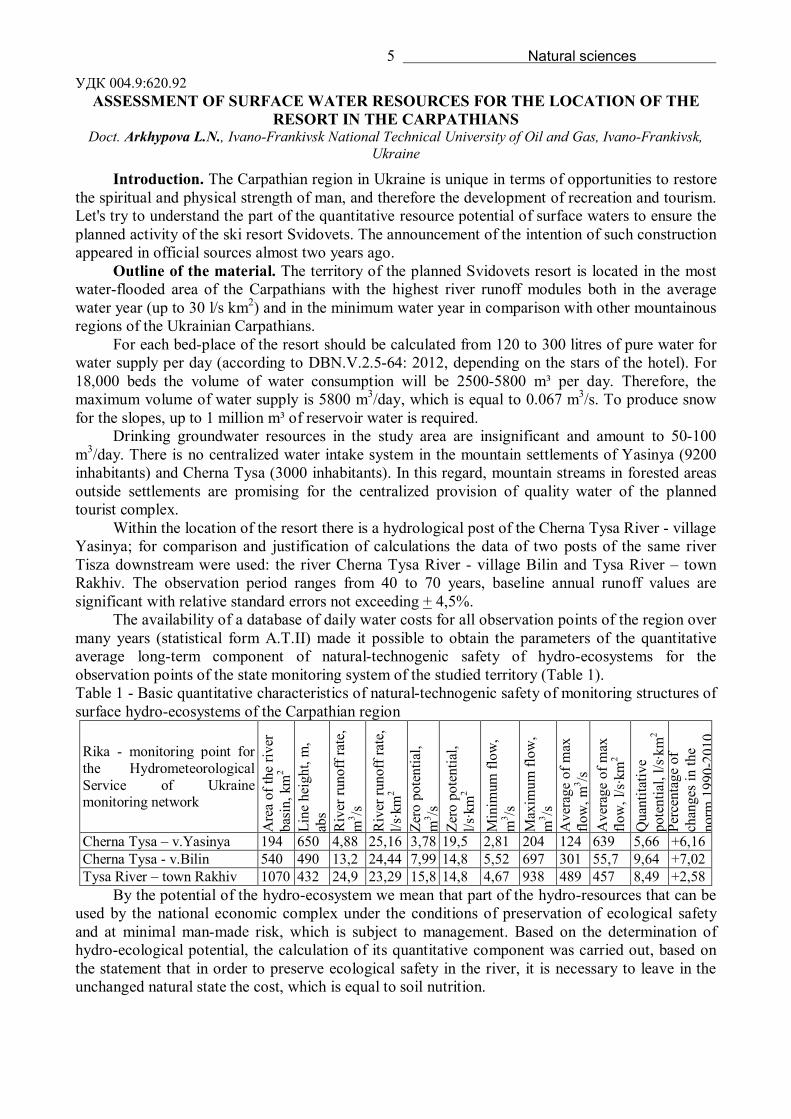
The availability of a database of daily water costs for all observation points of the region over many years (statistical form A.T.II) made it possible to obtain the parameters of the quantitative average long-term component of natural-technogenic safety of hydro-ecosystems for the observation points of the state monitoring system of the studied territory (Table 1). Table 1 - Basic quantitative characteristics of natural-technogenic safety of monitoring structures of surface hydro-ecosystems of the Carpathian region
Rika - monitoring point for the Hydrometeorological Service of Ukraine monitoring network
Are
a of
the
river
ba
sin,
km
2 Li
ne h
eigh
t, m
, ab
s R
iver
runo
ff ra
te,
m3 /s
R
iver
runo
ff ra
te,
l/s·k
m2
Zero
pot
entia
l, m
3 /s
Zero
pot
entia
l, l/s
·km
2 M
inim
um fl
ow,
m3 /s
M
axim
um fl
ow,
m3 /s
A
vera
ge o
f max
flo
w, m
3 /s
Ave
rage
of m
ax
flow
, l/s
·km
2 Q
uant
itativ
e po
tent
ial,
l/s·k
m2
Perc
enta
ge o
f ch
ange
s in
the
norm
199
0-20
10
Cherna Tysa – v.Yasinya 194 650 4,88 25,16 3,78 19,5 2,81 204 124 639 5,66 +6,16 Cherna Tysa - v.Bilin 540 490 13,2 24,44 7,99 14,8 5,52 697 301 55,7 9,64 +7,02 Tysa River – town Rakhiv 1070 432 24,9 23,29 15,8 14,8 4,67 938 489 457 8,49 +2,58
By the potential of the hydro-ecosystem we mean that part of the hydro-resources that can be used by the national economic complex under the conditions of preservation of ecological safety and at minimal man-made risk, which is subject to management. Based on the determination of hydro-ecological potential, the calculation of its quantitative component was carried out, based on the statement that in order to preserve ecological safety in the river, it is necessary to leave in the unchanged natural state the cost, which is equal to soil nutrition.
6 Natural sciences
Conclusions. Therefore, according to our calculations, 1.1 m3/s can be used in the regoin of Yasinya without damaging the hydro-ecosystem. The resort Svidovets needs 0.067 m3/s, which is 6.1%. УДК 630*375.12
SKYLINE YARDING SYSTEMS – GUARANTEE OF ENVIRONMENTALLY SOUND TECHNOLOGIES FOR MOUNTAIN FOREST MANAGEMENT
Boratynskyy O. W., Ph.D. Mahura B. O., Ph.D. Karatnyk I. R., Ukrainian National Forestry University, Lviv, Ukraine
Introduction. Protection of environment requires continuous improvement of the work organization and also improvement of machineries and equipment which are used. This is especially important during the development of mountain forests, where the ecological balance is fragile and extremely sensitive to anthropogenic impact, the degree of which increases annually. It should be noted that one of the important factors, that is today confirmed by a large number of diverse studies by scientists from different countries, of natural phenomena in mountainous areas (windthrows, floods, landslides, etc.) is destructive logging and deforestation.
Statement of main material. Forest is a natural complex with domination of trees. Regardless of the supposed simplicity of forest area calculations, all current assessments are rather relative and approximate for a number of reasons [1]: 1) lack of perfect inventory methods; 2) political and economic motives created by national governments; 3) different classifications and inevitable boundaries for the distribution of basic formations; 4) lack of sufficient funds to carry out inventory works.
The main reason for such wide variation of assessments is the significant differences in the definition of “forest” (data from different sources differ significantly). Basically, they are in the range of 34.0-50.6 million km2 [2]. According to the report of the United Nations Food and Agriculture Organization (FAO), the world's forests cover an area of 40.3 million km2 [3]. These FAO estimates are based on the definition: forests are all ecological systems with a closed wood cover of at least 10 %. In recent decades, there has been a steady decrease in forest area, with the ratio of reforestation areas to stand canopy density 1: 1000 and even 1: 1000 (in some countries of the southern Earth hemisphere) [4]. During the mankind existence, the afforestation of land has decreased from 75 to 28 % [5].
Timber harvesting can be presented as the removal of timber for economic purposes. The rational use of harvested wood can be discussed, since just over half of its volume goes to fuel (firewood for heating homes and cooking use about 2.5 billion people on the Earth [6]). The other part (much smaller) in the form of a roundwood is mainly used for the production of various products: lumber, particle boards, pulp for paper production [7].
Mountain forests of the Ukrainian Carpathians are a source of valuable wood (there is a large number of coniferous and deciduous species) to provide a variety of economic needs, as well as one of the main ecosystems conservation factors that have been formed over many centuries.
Forests in mountainous regions stabilize the processes of degradation and destruction of particular components of ecological systems (flora and fauna, water regime, soil erosion, etc.), determine the conditions of dynamic equilibrium of the environment. Therefore, considerable attention should be paid to their conservation and restoration. Preservation of undergrowth in the mountainous conditions can significantly reduce the duration of forest growth – on 20-30 years and increase the productivity of stands [8].
It should be noted, that during the development and justification of logging technologies in mountain conditions the requirements of nature conservation and ecological balance as a fundamental factors are not always observed. Among the main reasons: the productivity of machines on logging in mountain conditions is at 2-3 times lower than the performance of similar machines on flat terrains; engineering design and development of machines systems for mountain conditions are not intensive enough.
7 Natural sciences
The Carpathian mountain slopes characterized by sufficiently long slopes and increased damage rate of a soil cover. In addition, successful reforestation in mountain forests and the conservation of their useful functions depends to a large extent on the harvesting technique and technology, that are used. The most effective technique is the one that simultaneously provides successful reforestation, and in the mountain conditions the most appropriate is the natural reforestation, as well as high productivity of mechanized work. The results studies of undergrowth damage by different transport types most fully presented in the works of prof. Gorshenin M. M., according to which the use of skyline systems for timber transportation allows to save the soil cover and forest undergrowth – twice as much, than it is in a case of skidders usage. Studies of A. Poliakov also confirm the least negative impact, from the point of view of the various erosion phenomena formation, on the conservation of soil coverings of the suspended-type of yarding by cable skyline systems.
Existing contradictions between the necessity to conserve mountain ecosystems and the demand for timber can be solved by the widespread implementation on logging operations of overhead skyline systems.
Skyline yarding systems are widely recognized and implemented into logging industry as the basis of ecologically sound and energy saving technologies in many countries of the world with mountain forests. In Western Europe, annually from 50 to 200 skyline systems of various design and load capacity have been developed. Cable aerial transport is being developed intensively to solve the problems of primary transportation of timber in various environmental and terrain conditions in the USA, Canada, Japan, Australia. However, the existing cable systems are designed for the specific conditions of the countries that operate them, and therefore they can be inefficient for the conditions of the Ukrainian Carpathians. In addition, the cost and service factor must be taken into account, as well as the need to train skilled workers for their operating.
Conclusions. The solution of the problem of mountain forests development through the more intensive logging operations and reaching the highest productivity with preservation and multiplication of all protective functions, is possible only with a rational combination of progressive harvesting methods with optimal means of primary transport mechanization, namely skyline yarding systems and logging operations adapted to the ecology of mountain forests, which at the same time meet the restoration regularity and high level of industrial timber harvesting.
References. 1. Бочарников В.Н. Биоразнообразие: оценка и сохранение на базе ГИС-технологий. – Владивосток: Дальнаука, 1998.– 288 с. 2. http://www.treeland.ru/article/garden/oaky/leca_mira.htm. 3. State of the World’s Forests. Rome: Food and Agriculture Organization of the United Nations, 2011. 164 p. 4. World Resources. 1990–1991. N.Y., Oxford: Basic Book Inc. 1990. Vol. XII. 383 p. 5. Семенова–Тян-Шанская А.М. Мир растений и люди. – Л.: Наука, 1986. – 174с. 6. Говорушко С.М. Энергия биомассы: направления использования и экологические проблемы /С.М. Говорушко//Альтернативная энергетика и экология. – 2011. – №3. – С. 48-51. 7. Горшков С.П. Концептуальные основы геоэкологии. – Москва: Желдориздат, 2001. – 592 с. 8. Боратинський О.В. Лісотранспортні підвісні канатні установки – основа збереження та стабільності гірських лісових екосистем / О.В. Боратинський // Лісове господарство, лісова, паперова і деревообробна промисловість. – 2011. – Вип. 37.1. – С. 234-238. УДК 630*22
ORGANIZATION OF CLOSE TO NATURE SILVICULTURE OBJECT “MIZHHIRIA” Ph.D. Vytseha R. R., Ukrainian National Forestry University, Lviv
Introduction. Close to nature silviculture object MIZHHIRIA is located in Bohorodchany rayon of Ivano-Frankivsk region in the Mizhhiria area at the slope, which borders right bank of Lukva river, which is right tributary to Dnister river. Mizhhiria village is located nearby. Forest

8 Natural sciences
stands of the object area are represented by mixed (2-3 and more species) spruce (35%), fir (25.8%), and beech (25.6%) forest stands. Besides main forest species here are pine, larch, oak, sycamore maple, hornbeam, birch and alder. Typical feature of forests in this region is its intensive use, both in the past and in present times. According to descriptions and maps of the end of 19th – beginning of 20th century, area around Mizhhiria village was covered with mixed coniferous and broadleaf forests. However, as a result of intensive harvesting of forest resources at the end of 30s years of previous century, and especially in second half of 40s until the end of 60s, share of broadleaf species, particularly beech, has increased in the composition of the forests. Valuable tree species were cut in order to satisfy needs of local people in construction materials, household products and for firewood. Significant amount of timber was used by at that time operating extracting and processing industries.
Forest management was done according to the age classes method, which was based on establishment of management units formed by forests stands, homogenous by composition and productivity, united by the same age and type of harvesting. Initial accounting unit is taxation subcompartment, and initial planning unit – management section. All calculations are done based on results of area and growing stock of management sections by age classes. Method of age classes foresees clear cutting. At the clear cut areas single specie stands were established, mainly of fast growing spruce of non-local origin. Areas after the last cut of gradual cuts and after clear cuts, which were left for the natural regeneration, were reforested mainly by even-age natural regeneration with significant part of pioneer species. Particularly spruce and softwood – birch and aspen, regenerated intensively. That is why, as a result of such management system, currently in forest area we have significant part of secondary, dominantly one-layer, evenage and single specie stands. Taking into account natural climatic conditions, wide variety of species in the stands, its biological features, perfect capability for successful regeneration in natural way, there is practical need in use of close to nature silviculture at this area.
Presentation of the material. Forest areas of the object are related to marginal low-hill terrains of subregion of Outer Carpathians, forest vegetation area of beech-fir mountain forests of northern megaslope of marginal ridges. Locality, where the educational plot is situated, belongs to the nature protection fund of Ukraine.
In previous audit period inventory of the forests of educational sample plot was done using method of age classes and forest management there was carried out based on clear cut system. Taking into account natural protection status and condition of the forests of educational sample plot, forest inventory, in the period from 1978 and until 2013, didn’t prescribe any forest management activities, except support to natural regeneration and cleaning from litter. Forest management activities, which were carried out during last 30 years, besides the improvement of the sanitary conditon of forests, resulted in significant decrease of number of European spruce in the composition of the stand. Such situation in the stands creates wide possibilities for introduction of different approaches and methods of stand conversion and creation of forest stands, which would have features of natural forest.
With the goal to increase ecological stability of stands and strengthening of their functions, it is important to reform current model on forest regeneration and nursing methods towards close to nature silviculture approaches. When designing and implementation of forest management operations it is important to base on principles of close to nature silviculture, which will ensure formation of high productive mixed, rich by specie compositions and complicated by structure forest stands. Principles of close to nature silviculture in forest stand of educational object should be based on selective, group-selective, and gradual types of cuts, use of mainly gradual shelterwood cuts with repetition in 2-3 stages. Taking into account uneven horizontal and vertical structure of the stand it is important to use in different parts of the subcompartment different influence methods appropriate for specific conditions. In total, selection of the stock should not overcome 15-20%. It is better to carry out cut at the beginning of autumn. By this, during the skidding of the harvested trees, forest litter will be mixed better and this will speed up its dissolution. Around the “openings” with satisfactory number of regeneration it is necessary to select unacceptable trees and leave
9 Natural sciences
samples with good increment. During selection of separate trees or groups of trees for harvesting, it is necessary to conduct individual assessment of the ability of each tree to grow further or need in taking of this tree out of the stand. Special attention should be paid to trees with close to the target parameters in order to preserve samples, which have potential for further growth.
Selective management method will ensure permanent forest cover, formation of stable high productive uneven-age, rich by specie composition and complex by age, vertical and horizontal structure of the stands with domination: in beech types of forest – beech in first layer, well defined middle and bottom layers, also with domination of beech with addition of fir, sycamore maple and other valuable species; in fir forest types – fir in first layer, well defined middle and bottom layers, also with domination of fir with addition of beech, spruce, maple and other valuable species.
Educational sample plot MIZHHIRIA was established in the typical for this area stands with purpose to provide forestry practitioners with theoretical knowledge and practical skills on close to nature silviculture. Educational sample plot consists of three educational sites with the area of 0.49 ha each (square with the sides 70x70 m), where all trees with diameter more than 8 cm and more were recorded with the help of field geo-information system Field-Map including such data as coordinates of each tree, its diameter, height, volume, horizontal crown projection and its spatial situation. Each tree has received individual number, which was painted with white paint on the stem of the tree. At the educational site, which was divided into squares 10x10 m each, in each square for trees with diameter up to 8 cm and undergrowth which forms lower layer, species of trees, which are located there, average height and cover ratio was surveyed and recorded.
The site No1 is situated at the south-western exposition slope. Based on taxation observations and calculations the following was determined: composition of the stand before harvesting 8Fir 2Beech, rarely European spruce, sycamore maple, hornbeam; average diameter – 32.1 cm, average height – 23.2 m, density 0.9, thickness – 480 pieces/ha. At the site 235 growing trees were measured, out of them 119 trees of beech, 113 fir trees and 3 – other. Total stock of these trees is 236.09 m3, which makes 481.8 m3 per 1 hectare. Representation of other valuable coniferous and broadleaf species is very low.
The site No2 is situated at the western exposition slope. Based on taxation observations and calculations following was determined: composition of the stand 6Fir4Beech, rarely European spruce; average diameter – 28.5 cm, average height – 26.7 m, density 0.97, thickness – 753 pieces/ha. At the site 369 growing trees were measured with total stock of 315.5 m3, out of them 199 trees of white fir, 169 beech trees, and 1 tree of European spruce. Total stock of these trees per 1 hectare is 643.9 m3. Average trunk volume of growing trees – 0.85 m3.
The site No3 is situated at the north-western exposition slope. Based on taxation observations and calculations the following was determined: composition of the stand 8Beech2Fir, rarely European spruce, average diameter – 34.1 cm, average height – 27.1 m, density 1.0, thickness – 469 pieces/ha. At the site 230 growing trees were measured, out of them 117 trees of beech, 111 white fir trees and 3 trees of European spruce. Total stock is 276.3 m3, which is 563.9 m3 per 1 hectare. Average trunk volume – 1.20 m3.
Conclusion. Educational sample plot MIZHHIRIA meet main goals and motives of its establishment – possibility to apply in practice knowledge and approaches of close to nature silviculture and to compare condition of the forest stand before and after harvesting operations done in accordance with close to nature silviculture principles. УДК 338.488.2
DETERMINATION OF PROSPECTIVE ZONES OF TOURISM DEVELOPMENT IN VERKHOVYNA REGION BY CLASTERS ASSESSMENT METHOD
Ph.D. Korobeinykova Ya., Ivano-Frankivsk National Technical University of Oil and Gas, Ivano-Frankivsk, Ukraine
Introduction. Verkhovyna district is one of 14 administrative districts of the Ivano-Frankivsk region and is located in the south in the heart of the great Carpathian arch, in the highest mountain

10 Natural sciences
part of Ivano-Frankivsk region. Beautiful Carpathian nature, proximity to the peaks of Chornohora, stormy waves of Cheremosh, original Hutsul culture, folk traditions and rituals attract tourists. However, one of the problems of tourism development there remains insufficient tourism infrastructure. Due to the importance of accelerated development of the tourist infrastructure of Verkhovyna district, research aimed at determining the optimal zones for locating tourist and recreational infrastructure taking into account socio-cultural and natural-recreational sites is of primary importance.
Outline of the material. Verkhovyna district is the only district of the region, completely located on the territory of the Carpathian mountain system. The length of the area from north to south is 62 km, from west to east - 41 km. The territory of Verkhovyna district is 125426 hectares, of which 89462.1 hectares (71.3%) are forests and other areas covered by forest. It is also the only district in the region bordering Romania. The main tourist resources are Verkhovyna National Park, national wildlife reserve, more than 20 local monuments, two hydrological sites, over 10 museums and more. Thus, it is a unique territory for the development of various types of tourism.
The competitiveness of the area, as well as its attractiveness to potential visitors, is enhanced by the greater concentration of recreational resources on its territory. Yes, the availability of two or more types of resources in a given territory while others are the same will play a decisive role in choosing the best place to develop the tourist infrastructure. Considering this factor, the conducted study was aimed at providing information and further recommendations to investors regarding the possibilities and prospects of placing infrastructure elements of tourism within the Verkhovyna district based on the criterion of resource proximity and optimality of offered tourist services.
To identify these promising zones, a method for constructing recreational potential maps has been modified. Suppose on the territories T (Verkhovyna district) the tourist and recreational sites (TROs) are located. Each of them is characterized by a set of indicators that make up its coefficient of recreational attractiveness. This coefficient can be determined by expert assessments. To establish the places of optimal location of tourist complexes in the territory T, the map of this territory with a scale of 1: 75000 is divided into rectangular plots P, which are included in the set T, hence T P. Next, for each rectangular plot, we determine the recreational potential Pkl. Suppose that there is only one TRO with potential R. In the territory T, if the plot is in close proximity to this TRO, then the recreational potential is Pkl = P. With increased distance from the TRO, the plot’s recreational potential declines. The rate of decline of this potential is determined by the potential of this TRO. The greater the potential, the slower it falls with the distance from the TRO. The strategy of choosing the optimal locations of tourist complexes is as follows: new tourist complexes to be placed in the areas with maximum cumulated recreational potential.
In the process of research, the territory of Verkhovyna district was divided into plots 5.2:5.2 km, given the area and geographical shape of the district. Next, we determine the recreational potential of each plot, for this purpose, we identify quantitatively and qualitatively tourist and recreational objects located within them, such as mountain peaks, hiking trails, protected areas, nature monuments, historical and cultural sites, dams, infrastructure facilities, paths, etc. and we rate them at 1 point. Areas with water and forest resources, as particularly valuable recreational resources, are evaluated within each plot of 2 points, thus adding them to the total potential of the concrete plot area. Qualitative assessment of the tourist potential of the area is performed by the method of the scale of regularintervals.
As a result, it was established that the territories of the district center - the town Verkhovyna and its neighboring settlements, villages Iltsi and Kryvorivnia, including the territories that are located within the plots 3.4, 3.5, 3.6 - have high tourist potential.
Conclusions. Thus, the western part of the Verkhovyna district and the locality along the Chornui Cheremosh River should be considered, first of all by local authorities, as areas with potentially high tourist potential, which are attractive from the point of view of tourism infrastructure development. This will increase tourist flows and, accordingly, the local budget. This method of assessment of promising zones for the development of tourist infrastructure can be used in strategic planning of tourism development within individual integrated territorial communities.
11 Natural sciences
УДК 630*5:582.475.2 MODELLING OF ABOVEGROUND PHYTOMASS OF THE TRUNK IN ABSOLUTE DRY
CONDITION OF NORWAY SPRUCES TREES ON THE POLONINSKY RIDGE IN UKRAINIAN CARPATHIAN
Doct. Hrynyk H.H.1,2, Zadorozhnyy A.I.2, Ph.D. Hrynyk O.M.1,2, 1 Ukrainian National Forestry University, Lviv; 2 Uzhhorod National University, Uzhhorod, Ukraine
The object of the study is the trunks of Norway spruce trees in spruce forests-stands in the predominant types of site conditions (TSC) of the Poloninsky Range of the Ukrainian Carpathians. The subject of the study is the density of components of the aboveground phytomass of Norway spruce tree trunks of Norway spruce stands in the studied TSC. The aim of the study – to modelling the dependence of the density of aboveground phytomass on the diameter at breast height (DBH) and total trunk height (TH) of Norway spruce tree trunks in the TSC: moist mixed broadleaved forest C3 and moist broadleaved fores D3.
This paper uses the results of the research data obtained from the laying out of 28 temporary spatial plots (TSP) with the component evaluation of forest stands phytomass in the territory of the Poloninsky ridge in Ukrainian Carpathian. Model trees were selected based on the representativeness of distribution by the degrees of thickness taking into account the height values. The samples from each tree were selected based on a relative height of 0, 0.25, 0.50 and 0.75 of the tree trunk height. The assessment of the tree phytomass density components was performed based on the methodology of Prof. P. Lakyda.
Correlation analysis was carried out in order to create models of dry density dependence of the aboveground phytomass in the studied TSC. The dependence of the density of components of aboveground phytomass has an inverse correlation for both the TH and DBH. Higher values of the correlation coefficients were detected for both researched types of TSC for the wood density of the trunk and the wood density of the branches from the TH. The dependence on the DBH is relatively low. The density of components of phytomass varies in different TSC and also depends on the TH and, to a lesser extent, on the DBH. Therefore, the modelling is done separately for the studied types of site conditions and for both assessment indices:
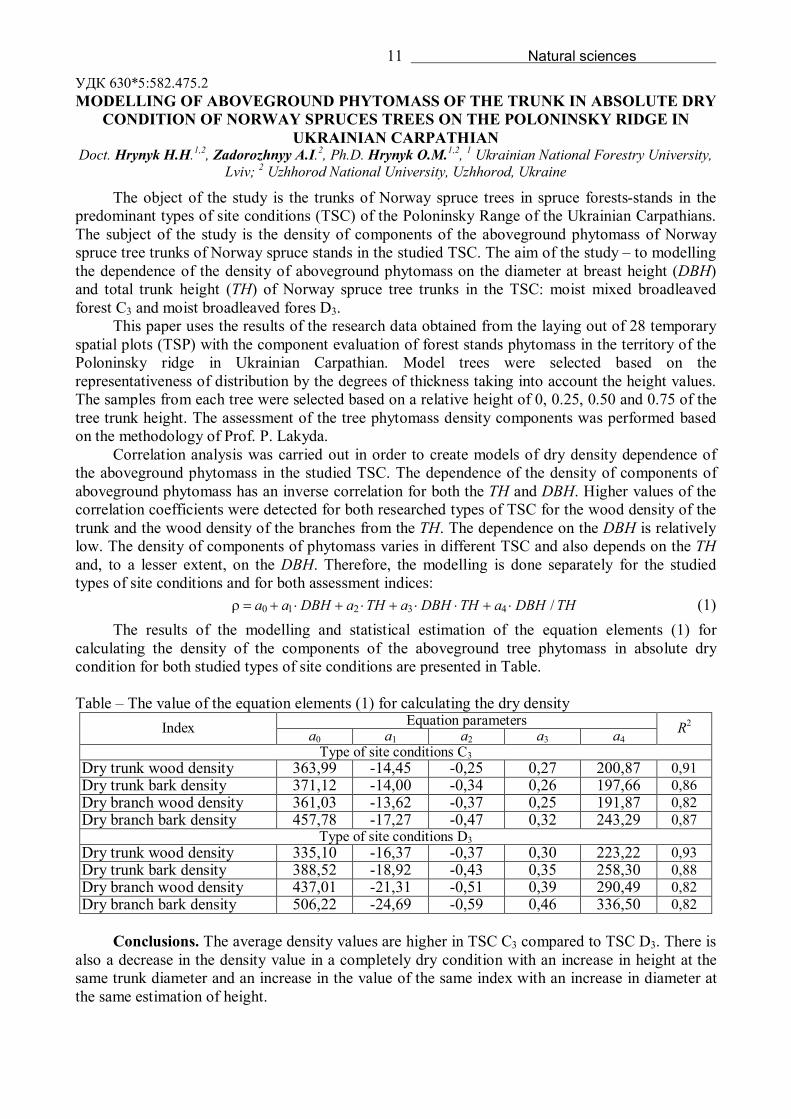
0 1 2 3 4 /a a DBH a TH a DBH TH a DBH TH (1) The results of the modelling and statistical estimation of the equation elements (1) for
calculating the density of the components of the aboveground tree phytomass in absolute dry condition for both studied types of site conditions are presented in Table. Table – The value of the equation elements (1) for calculating the dry density
Equation parameters Index a0 a1 a2 a3 a4 R2
Type of site conditions C3 Dry trunk wood density 363,99 -14,45 -0,25 0,27 200,87 0,91 Dry trunk bark density 371,12 -14,00 -0,34 0,26 197,66 0,86 Dry branch wood density 361,03 -13,62 -0,37 0,25 191,87 0,82 Dry branch bark density 457,78 -17,27 -0,47 0,32 243,29 0,87
Type of site conditions D3 Dry trunk wood density 335,10 -16,37 -0,37 0,30 223,22 0,93 Dry trunk bark density 388,52 -18,92 -0,43 0,35 258,30 0,88 Dry branch wood density 437,01 -21,31 -0,51 0,39 290,49 0,82 Dry branch bark density 506,22 -24,69 -0,59 0,46 336,50 0,82
Conclusions. The average density values are higher in TSC C3 compared to TSC D3. There is
also a decrease in the density value in a completely dry condition with an increase in height at the same trunk diameter and an increase in the value of the same index with an increase in diameter at the same estimation of height.

12 Natural sciences
УДК 629.783:681.3.053 INTERFEROMETRIC SYNTHETIC APERTURE RADAR AS A MONITORING
TOOL FOR A FOREST STAND Ph.D. Bakay B. Ya., Horzov S. V., Ukrainian National Forestry University, Lviv, Didenko P. V., Zhytomyr
National Agroecological University, Zhytomyr, Ukraine
Introduction. In this research, the potential of interferometric synthetic aperture radar (InSAR) as a monitoring tool, is discussed. InSAR compares two synthetic aperture radar (SAR) scenes and measures changes in topography that occurred between the two acquisition dates. Generally, damage from any kind of soil erosion on a slope with forest stands is not as huge as earthquakes, hurricanes, floods and other catastrophes of this scale.
Presentation of the material. At the present moment, common practices of the landslide monitoring are based on ground point observations, including absolute deformation measurements constructed on Global Positioning Systems (GPS), electronic total stations, levels and etc. Relative deformation measurements approach consists on displacement meters, crack meters or fibre sensors and quantitative analysis relies on light detection and ranging (LIDAR) technology [1]. These methods have the advantage of high precision but the number of monitoring points is limited by the large amounts of fieldwork and economic costs involved and as in the result, these methods cannot identify the distribution and dynamics of landslides [2, 3].
In the last years, InSAR has shown excellent application prospects for monitoring landslide displacement and achievement of good results. In order to improve the spatial resolution and success rate of large-scale landslide hazard detection, an adaptive distributed scatterer InSAR (ADS-InSAR) method is proposed. This method automatically adjusts the distributed scatterer (DS) target detection threshold according to the spatiotemporal coherence of different distributed targets, thus improving the spatial distribution density and reliability of DS detection in landslide areas.
Encouraging points for successful application are possible by largely collected and available SAR data libraries by Radar Earth Observation Missions. In particular, free-available SAR data collected by Sentinel-1A and Sentinel-1B satellites, which represent a unique opportunity for applying mentioned methods on a global scale [2-4]. Use of additional data, such as GPS, will be helpful for better constraining the solution of the multi-track combination methods.
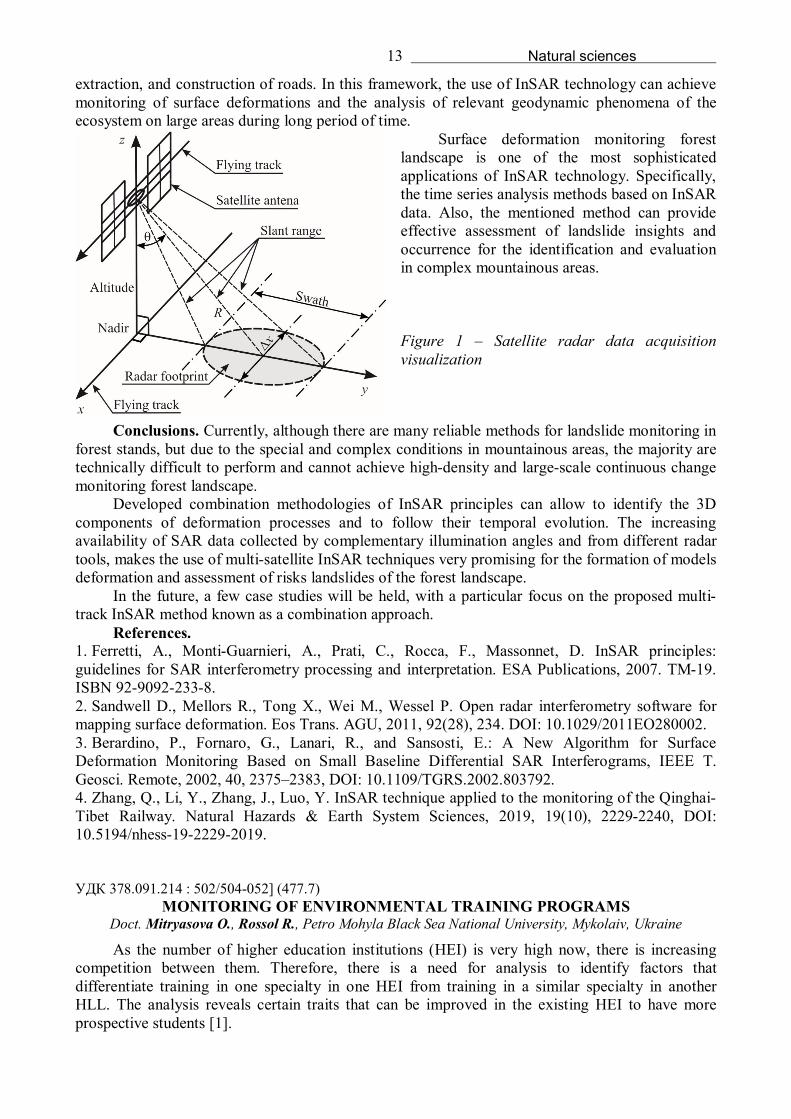
SAR satellites collect swaths of side-looking echoes of forest plots at a typical resolution of 20 m and along-track sampling rate in order to produce high resolution imagery, based on pulse length and the incidence angle, fig. 1. In synthetic aperture method, the image can be focused on a point reflector on the ground by coherently summing plurals of consecutive echoes creating a synthetic aperture. Thus, obtained image contains both amplitude and phase information for each pixel.
InSAR is created by multiplying the reference image by the complex conjugate of the repeat image. When the reference and repeat images are exactly coincident, the phase difference between the two images will not reflect differences, but must be accounted the existence of an offset between the trajectories of the reference and repeat orbits.
The SNAP software can provide reliable output for interferometry, due to available precise orbital information (Sentinel-1, Sentinel-2, ERS-1, ERS-2 etc.) [1, 2].
In the past, studies about deformation of the forest landscape mainly relied on fieldwork, but due to natural complicated conditions this approach lead to huge difficulties during performance. The development of InSAR methods, provides technical support for research about forest landscape and forest roads.
Certain requirements must be met during detection and analysis of forest landscape and road transportation networks. Firstly, areas of the forest landscape and transportation networks requiring large-scale synchronous measurements along with the reference data. Secondly, the forest ecosystems demanding for continuing and near-real-time monitoring, followed by low time-consumption and expenses.
InSAR is a unique tool for the quantitative measurement of the soil surface deformations influenced by a variety of natural and anthropogenic causes, as soil deterioration, ground-water
13 Natural sciences
extraction, and construction of roads. In this framework, the use of InSAR technology can achieve monitoring of surface deformations and the analysis of relevant geodynamic phenomena of the ecosystem on large areas during long period of time.
Surface deformation monitoring forest landscape is one of the most sophisticated applications of InSAR technology. Specifically, the time series analysis methods based on InSAR data. Also, the mentioned method can provide effective assessment of landslide insights and occurrence for the identification and evaluation in complex mountainous areas. Figure 1 – Satellite radar data acquisition visualization
Conclusions. Currently, although there are many reliable methods for landslide monitoring in forest stands, but due to the special and complex conditions in mountainous areas, the majority are technically difficult to perform and cannot achieve high-density and large-scale continuous change monitoring forest landscape.
Developed combination methodologies of InSAR principles can allow to identify the 3D components of deformation processes and to follow their temporal evolution. The increasing availability of SAR data collected by complementary illumination angles and from different radar tools, makes the use of multi-satellite InSAR techniques very promising for the formation of models deformation and assessment of risks landslides of the forest landscape.
In the future, a few case studies will be held, with a particular focus on the proposed multi-track InSAR method known as a combination approach.
References. 1. Ferretti, A., Monti-Guarnieri, A., Prati, C., Rocca, F., Massonnet, D. InSAR principles: guidelines for SAR interferometry processing and interpretation. ESA Publications, 2007. TM-19. ISBN 92-9092-233-8. 2. Sandwell D., Mellors R., Tong X., Wei M., Wessel P. Open radar interferometry software for mapping surface deformation. Eos Trans. AGU, 2011, 92(28), 234. DOI: 10.1029/2011EO280002. 3. Berardino, P., Fornaro, G., Lanari, R., and Sansosti, E.: A New Algorithm for Surface Deformation Monitoring Based on Small Baseline Differential SAR Interferograms, IEEE T. Geosci. Remote, 2002, 40, 2375–2383, DOI: 10.1109/TGRS.2002.803792. 4. Zhang, Q., Li, Y., Zhang, J., Luo, Y. InSAR technique applied to the monitoring of the Qinghai-Tibet Railway. Natural Hazards & Earth System Sciences, 2019, 19(10), 2229-2240, DOI: 10.5194/nhess-19-2229-2019. УДК 378.091.214 : 502/504-052] (477.7)
MONITORING OF ENVIRONMENTAL TRAINING PROGRAMS Doct. Mitryasova O., Rossol R., Petro Mohyla Black Sea National University, Mykolaiv, Ukraine
As the number of higher education institutions (HEI) is very high now, there is increasing competition between them. Therefore, there is a need for analysis to identify factors that differentiate training in one specialty in one HEI from training in a similar specialty in another HLL. The analysis reveals certain traits that can be improved in the existing HEI to have more prospective students [1].

14 Natural sciences
In order to check the relevance of the specialty 101 "Ecology" among entrants and students, a survey was conducted to find out the opinion of students about studying in the specialty 101 "Ecology" and to find out the opinion of stakeholders on the level of preparation of graduates in this specialty.
Additionally, an analysis was made of proposals from employers as to what skills a graduate should possess and a comparative analysis of curricula of the specialty 101 "Ecology" was conducted at several universities in the south of Ukraine to identify characteristics and differences.
The universities that were selected for comparison and analysis were selected: Petro Mohyla Black Sea National University, Kherson State Agrarian University, Odesa State Ecological University. The analysis of educational programs revealed that among the universities of southern Ukraine, Petro Mohyla Black Sea National University has certain competitive features that are not available at other universities, such as: obtaining advanced knowledge in environmental protection, opportunities for obtaining a double diploma during training at the Pomeranian Academy in Slupsk (Poland), mobility under the Erasmus+ Programme, more extensive programmatic learning outcomes (developing skills in the methods of implementation of monitoring systems, etc.) [2; 3].
For students, the following can be stated: the number of students studying at the bachelor's degree in specialty 101 "Ecology" has been increasing every year since 1996. Now there is a decline in the popularity of the specialty among entrants; more than one third of the surveyed students (42%) are those who purposely chose the specialty “Ecology” to work in this direction. A third of students (30%) chose a specialty because of the easy entry requirements; during the course of study, students enjoy practical / laboratory work, the opportunity for on-site internships and ample opportunities to combine teaching and extracurricular activities; do not like the need to keep a lot of notes and diligence, constant presence in the audience, a small amount of time to learn certain subjects.
A survey among stakeholders has shown that they are satisfied with the level of graduate training. The only observation was the need for a more in-depth understanding of environmental legislation.
An analysis of the labor market has shown that graduates have ample opportunities for employment. The requirements for future employees are as follows: higher education in tourism / communications / sales management; ability to manage multiple tasks at once; free use of MS Office; ability to quickly navigate technical programs, owning graphical programs CorelDRAW, Photoshop; knowledge of English is desirable; willingness to work on business trips.
The employee's duties are: development and analysis of internal rules and regulations in the field of wastewater treatment; monitoring compliance with the requirements in the area of treatment facilities; conducting environmental training; accounting and analysis; representing the company to the supervisory authorities; participation in external and internal control, etc.
As a conclusion, it can be stated that higher education institutions now provide ample opportunities for obtaining the required qualification level, the labor market provides ample opportunities for employment of graduates. However, applicants prefer other training areas because they focus on more "popular" training programs. And many students study just for the sake of learning, choosing this program unconsciously and, as a consequence, do not continue to work in this direction.
References 1. Lukyanova L. Theory and practice of environmental education in vocational schools: dissertation. … Dr. Ped. Sciences: 13.00.04 / L. Lukyanova. - K., 2006. - 465 p. 2. Mityrasova O. Status and prospects of development of ecological education / Оlena Mityrasova // Ways of ensuring ecological safety of settlements of Ukraine: Coll. Art. to the science-practice. conf., Mykolaiv, June 7 2012 - Mykolaiv, 2012. - P. 97-993. 3. Biletskaya G.A/ Preparation of a qualified specialist ecologist as one of the ways of solving environmental problems / G.A/ Biletska // Coll. works on materials All-Ukrainian. Research Practice Conf. "Ways to solve environmental problems of urban areas: science, education, practice". - Khmelnitsky: Technologist. Podillya University, 2003. - P. 156–158.

15 Information technology
УДК 004.94 APPLICATION OF VR TECHNOLOGY IN PREPARATION OF FLIGHT DISPATCHER Ph.D. Artemenko O.V., Kovalenko I.K., Flight Academy of the National Aviation University, Kropivnitskiy,
Ukraine
Introduction. Nowadays, global informatization of a society is one of the prevalent trends in the development of civilization. The National program of informatization [1] foresees informatization of science, education and culture in Ukraine. This requires the development and implementation of the most up-to-date training methods in the training process and the arrangement of the best conditions for the future aviation specialist to acquire professional skills. The usage of VR (virtual reality) simulators is one of the ways to significantly bring forward the educational process, make it less expensive, and what is most important - to make it attractive to a student. That is why; it is advantageous that VR technology will be used during a professional training of flight dispatchers.
Curriculum model. In accordance with ICAO documents, a flight dispatcher is a certified airline employee who has undergone an appropriate training regarding conduction of a flight crewmembers briefing and provision of necessary for the fight information and documentation in order to perform safe and efficient flight [2]. In international practice, the functions performed by these specialists are divided into: flight planning, flight control and crew assistance. In Ukraine, training of such specialists is carried out on the basis of Flight academy of the National Aviation University.
Insomuch as the most flight dispatchers will mostly deal with paper work in the future, it seems at first glance that VR can only be used to train pilots and dispatchers (flight simulators, ATC systems, etc.). Nevertheless, even such, at first thought, repetitive and same-type tasks for future pre-flight information preparation specialists can be made interactive. Let’s consider such a task - you need to plot a route from an airport A to an airport B and calculate the required flight level, taking into account MOCA (minimum obstacle clearance altitude). For this, ordinary paper cards or a newer PC-based version can be used. However, the student can do it in virtual reality as well. All you have to do is to put on a helmet and run the simulator. At this time, the instructor can see, on the screen of his/her phone or PC, what the person in the simulator is doing.
Let's give a detailed consideration to the simulator design, and what VR features are key to use during flight dispatcher training. So, the student logged in, entered his name in a common database, and began to complete the task. In front of the student appears a flight plan route that needs to be worked out. The student sees a three-dimensional image of an en-route chart. He/she can have a freedom of movement along the chart and view all terrains. The chart displays airfields, minimum obstacle clearance altitudes, traffic information zones, navigation systems, etc. The student can touch a point on the chart with a hand and get all the needed information (such as airfield information or navigation system). What concerns flight level calculation tasks, the student uses a calculator, which in real time displays a line of heights above the three-dimensional chart. If more than, one student is able to put on a VR helmet, than these helmets can be connected to a local network. In such a way, they will interact with each other, and even simulating the work of several ATS centers.
Upon completion of a familiarization and passing a training, the student passes the final test. Of course in VR, too, because you will be able to use questions related to the material just learned.
Conclusions. Nevertheless, at first glance, this technology does not offer immediate benefits and is cost-intensive, it is the introduction of VR in aviation education that will significantly save money and prepare professionals with up-to-date knowledge and skills and a deep understanding of flight planning and execution processes. Due to the fact that the manufacture of a new full-size simulators takes a lot of time and money, and writing a computer program requires much less time than simulators updates will not be such a problem. New VR-based electronic tools are becoming more widely available for usage in the studying process and are practically used in our lives.
16 Information technology
References. 1. About the National program of informatization: Law of Ukraine of February 4, 1998 No. 74/98-BP // Official gazette. – 1998. – #10. – March 26 – pp. 5–14. 2. Doc 7192 AN/857 Training manual. Flight operations officers/flight dispatchers. Part D-3. – 2nd ed., 1998. – 136 p. УДК 004.023, 539.18
ANALYSIS OF QUANTUM GENETIC ALGORITHM BASED ON MULTILEVEL QUANTUM SYSTEM
Ph.D. Tkachuk V.M., Vasyl Stefanyk Precarpathian National University, Ivano-Frankivsk, Ukraine
Introduction. The Quantum Generic Algorithm is based on the combination of the quantum computing technology and the idea of the classical genetic algorithms. Traditionally, qubit representation is used for the implementation of this algorithm. As illustrated earlier [1,2], the transition the higher-order quantum logic provides an increase in the efficiency of the algorithm both in the run time and in the accuracy of the solution.
Presentation of the material. A qudit is a quantum unit of information, which may be in any of n basis states 0 , 1 , 2 , … 1n or in any superposition of those. The state of the qudit can be generally represented as follows: 1...210 321 nq n (1) with a normalization constraint: 1... 22
322
21 n (2)
The theoretical aspects of the algorithm have not been developed yet, so an empirical study of the mechanisms of complex interaction of traditional evolutionary algorithms and quantum genetic operators underlying their work looks relevant.
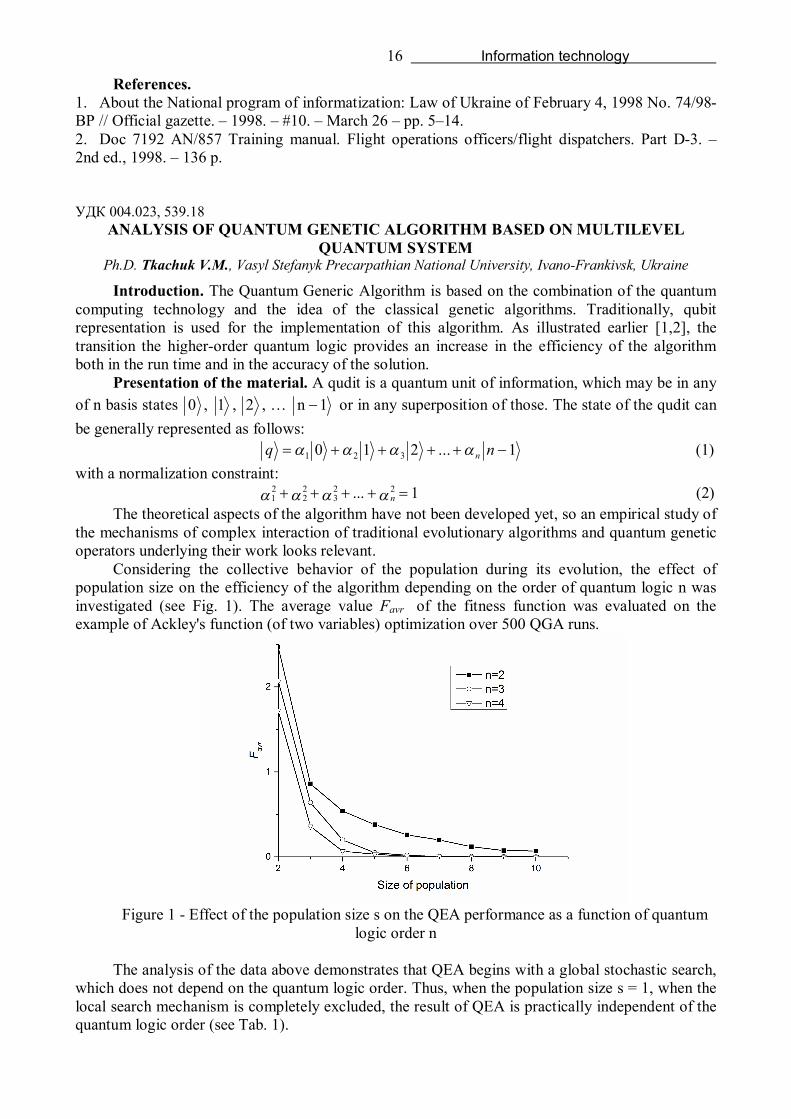
Considering the collective behavior of the population during its evolution, the effect of population size on the efficiency of the algorithm depending on the order of quantum logic n was investigated (see Fig. 1). The average value Favr of the fitness function was evaluated on the example of Ackley's function (of two variables) optimization over 500 QGA runs.
Figure 1 - Effect of the population size s on the QEA performance as a function of quantum
logic order n
The analysis of the data above demonstrates that QEA begins with a global stochastic search, which does not depend on the quantum logic order. Thus, when the population size s = 1, when the local search mechanism is completely excluded, the result of QEA is practically independent of the quantum logic order (see Tab. 1).
17 Information technology
Table 1 - QEA performance as a function of n with s = 1
n 2 3 4 Favr 20.04 20.14 20.24
The length of the quantum chromosome N is determined by the desired accuracy of the solution ε, the size of the search area ],[ minmax xx , and the number of ground states of the quantum system n [2].
1logN minmax
xx
n (3)
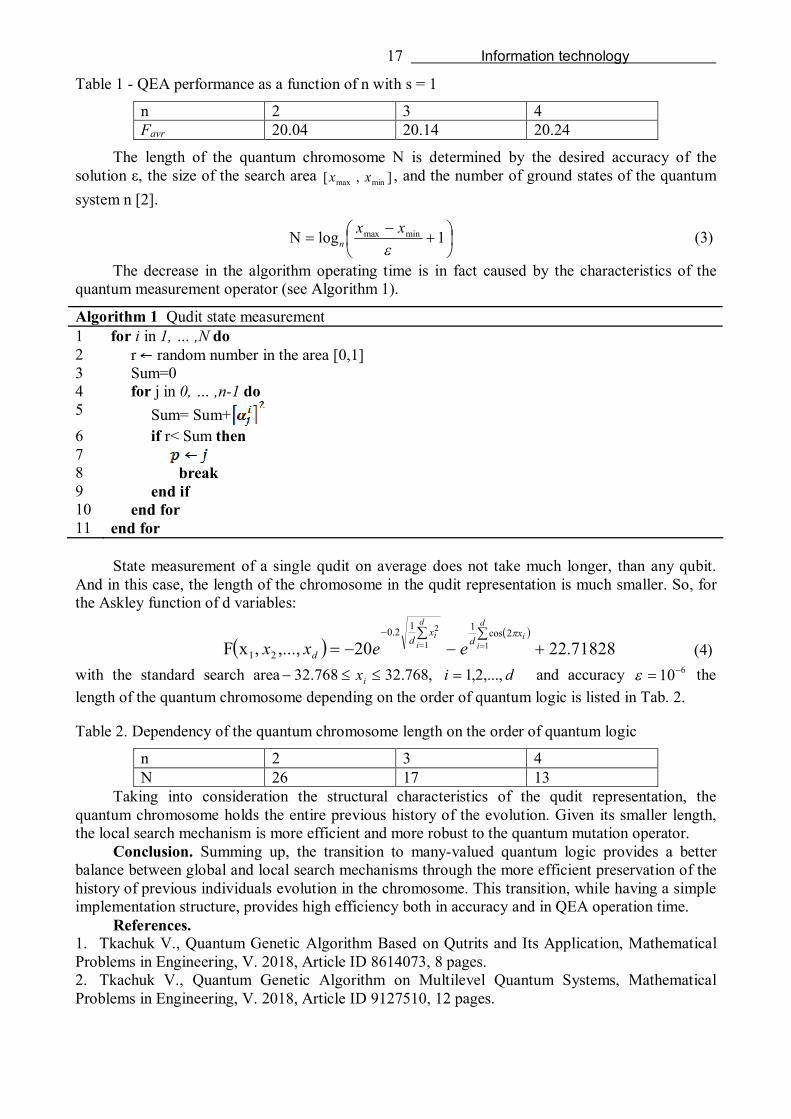
The decrease in the algorithm operating time is in fact caused by the characteristics of the quantum measurement operator (see Algorithm 1).
Algorithm 1 Qudit state measurement 1 for i in 1, … ,N do 2 r random number in the area [0,1] 3 Sum=0 4 for j in 0, … ,n-1 do 5 Sum= Sum+ 6 if r< Sum then 7 8 break 9 end if 10 end for 11 end for
State measurement of a single qudit on average does not take much longer, than any qubit.
And in this case, the length of the chromosome in the qudit representation is much smaller. So, for the Askley function of d variables:
71828.2220,...,,xF 11
2 2cos112.0
21
d
ii
d
ii x
dx
dd eexx
(4) with the standard search area dixi ,...,2,1,768.32768.32 and accuracy 610 the length of the quantum chromosome depending on the order of quantum logic is listed in Tab. 2.
Table 2. Dependency of the quantum chromosome length on the order of quantum logic
n 2 3 4 N 26 17 13
Taking into consideration the structural characteristics of the qudit representation, the quantum chromosome holds the entire previous history of the evolution. Given its smaller length, the local search mechanism is more efficient and more robust to the quantum mutation operator.
Conclusion. Summing up, the transition to many-valued quantum logic provides a better balance between global and local search mechanisms through the more efficient preservation of the history of previous individuals evolution in the chromosome. This transition, while having a simple implementation structure, provides high efficiency both in accuracy and in QEA operation time.
References. 1. Tkachuk V., Quantum Genetic Algorithm Based on Qutrits and Its Application, Mathematical Problems in Engineering, V. 2018, Article ID 8614073, 8 pages. 2. Tkachuk V., Quantum Genetic Algorithm on Multilevel Quantum Systems, Mathematical Problems in Engineering, V. 2018, Article ID 9127510, 12 pages.
18 Information technology
УДК 004 PRINCIPLES OF INTRODUCING SMART CITY TECHNOLOGIES
Belenky V.S., Ph.D. Golian N.V., Kharkiv National University of Radio Electronics, Kharkiv, Ukraine
Introduction. Smart City is an interconnected system of communication and information technologies with the Internet of Things (IoT), which simplifies the management of internal processes of the city and its property, which includes local departments of information systems, schools, libraries, transport, hospitals, power stations, water supply systems and waste management, law enforcement and other public services. Optimization of all the processes that are necessary for life in a metropolis turns the city into one large operating system. It collects and analyzes data on residents, independently updates and simplifies both the solution of everyday issues and the processes of managing the city as a whole. The introduction of smart-technologies allows you to manage the entire city infrastructure from a single center, and residents can instantly access all the services of the city from any device [1].
Presentation of the material. The concept of “smart city” appeared at the beginning of the 2000s, but started talking about it seriously in 1993 in Silicon Valley. Since then, large IT companies have been trying to recreate Smart City technology. Major technological, economic, and environmental changes have created interest in smart cities, including climate change, economic restructuring, and the transition to online trading and entertainment. SIt thus established the first breakthrough technologies, large data centers, smart sensors and automated power grids appeared.
However, the emphasis gradually shifted. It became necessary to understand the extent to which people will really use the innovations. Indeed, even the most non-trivial ways of using surveillance systems, sensors, and applications may not find a response among citizens and therefore may not have any noticeable effect on their lives.
The optimal model of a smart city provides not only the introduction of technological solutions, but also the active participation of citizens in their development. New ways of communication and connection, as well as digitized traditional ones help people use resources and time more efficiently and productively. So people are the main technology for the smart city.
In the world for testing the ideas of the "smart" city there are special laboratories - Smart City Lab. They are in Amsterdam, Barcelona, Tartu and other places. In Ukraine, Smart City Kiev began working in 2015, where the Center for the Development of Technology Companies was opened. You can also distinguish large telecommunication, electrical and IT companies, such as Cisco, Schneider Electric, IBM, Microsoft and UNIT, which have developed new solutions and initiatives for smart cities.
Key aspects of the smart city There are eight key aspects that define a “smart city”: smart management, smart energy, smart
home, smart mobility, smart infrastructure, smart technology, smart healthcare and smart citizen. What is included in the concept of “Smart City”?
Table 1 – Basic Concepts of Smart City mobility
popularization of bicycles and electric vehicles, centralized management of transport infrastructure with the help of online programs
smart environment
"Green energy", improving energy efficiency
lifestyle eco-thinking, healthy lifestyle people increasing the e-literacy, social activity, training management
public participation in urban issues, public information
economy
competitiveness, international cooperation, startup development
In addition, the Smart City movement has the following characteristics: it should be an applied electronic or digital technology that works for the urban
community or city;

19 Information technology
development can use information and digital technologies to transform housing and working conditions in the region;
technology can be integrated to improve local government performance; society and urban specialists can use these technologies on a territorial basis to gain new
knowledge and start an innovative movement. To collect data, the following components of the smart city system are used: Video surveillance and photographic fixation; Intelligent Transport Systems (ITS); Unified emergency call system; Unified dispatching service and situational centers; Internet of Things (IoT); The fifth generation of mobile communications (5G).
These tools for collecting and analyzing information are used to improve the functioning of transport interchange, medicine, industry and other areas that form the model of a digital city.
Consulting agency Navigant Research identifies 6 main components of a smart city [2]. Smart Energy – solutions in the fields of energy supply and energy saving. Programs for
Demand Response, energy efficiency and renewable energy integration. The energy management system (EMS) responds to a request to unload according to a specified algorithm. Depending on other factors in a particular room, the system affects the ventilation and air conditioning systems, lighting and refrigeration equipment.
For example, a pilot project was made in Kiev on the basis of the building of the Desnyanskiy district state administration. The "smart" service uMuni was introduced here. It is an application that allows you to monitor and analyze energy costs,, then to get the opportunity to save their use, where possible.
Smart Water – water management: modernization of water systems, consumption monitoring, environmental safety systems and flood management.
For example, Huawei, Shenzhen Water and China Telecom have launched the world's first commercial project, Smart Water (“smart water”). The companies completely updated the water supply system by installing about 1.2 thousand smart meters of water consumption based on the technology of narrow-band Internet of things (NB-IoT).
The system allows you to analyze consumption patterns, avoid leaks, increase the efficiency of water circulation and optimize the use of resources. Residents get convenient access to utilities.
Smart Buildings are buildings in which all engineering and information systems are integrated into a single management system (BMS - building management system).
Thanks to it, intersystem interaction is possible. For example, preparing the building’s heating system by the beginning of the working day, controlling the power of the ventilation unit depending on temperature, the number of people in the room and air quality, automatically switching to energy-saving mode when there are no people in the building, and so on.
Smart Government – the use of information technology to provide public services to a wide range of people and optimize the work of various departments.
The advent of block chain technologies provides fundamentally new opportunities for the development of e-government (eGovernment). Extreme security of information makes the data entered into the system more reliable than any paper with signatures and seals.
Estonia has the most developed system of e-government and interaction with citizens. Here you can vote online in the elections, register the birth of a child, order a passport and perform dozens of other procedures using a simplified system that reduces labor costs and time.
IT INNOVATIONS company had a hand in introducing smart city in Ukraine. Its applications SMARTBUS and WTM CITY allow to improve the work of public transport and special equipment.
Smart Transportation – intelligent transportation and logistics systems. Monitoring and traffic management, payment of tolls, emergency response, intelligent parking and integrated traffic light management, building smart logistics networks.

20 Information technology
The most interesting and promising area of development of transport and freight traffic. Projects are in a large-scale prototype stage and have not yet been put into practice.
The Netherlands is one of the most technologically advanced countries in Old Europe, which has its own Smart City laboratory. Here the first unmanned bus was launched, a “smart” automobile and bicycle path was laid under it. In Amsterdam, the Smart City laboratory, or rather Smart Citizens, was created on the initiative of the city and the Waag Society. The Netherlands laboratory aims to maximize the involvement of citizens in the process of creating and evaluating smart cities. The space for maneuver in Amsterdam is seen in the use of all kinds of sensors and data from open access, saving city expenses, the availability of hardware tools to improve urban infrastructure.
In Ukraine, they not only talk about Smart City, but also implement individual projects on the initiative of the state or business. The same fare with cards in the metro, tram, GPS beacons in public transport, the electronic line in the clinics of the capital and other things have recently become a reality [3].
Smart Health. And finally, eHealth. This feature will simplify the process of electronic appointment with a doctor. The basis of the system is a single electronic database of patients. In this database, you can immediately get acquainted with what tests were done, what treatment was prescribed in other clinics. Most cities in Ukraine already have an electronic appointment with a doctor.
Smart City Technologies The issue of environmental friendliness in the concept of a "smart" city is given special
attention. In fact, such a global transition to Internet services in Smart City helps to significantly reduce the burden on the environment - thanks to technological waste management, modernization of the electricity system, the rejection of wires and strict territory planning. To ensure that residents do not suffer from industrial emissions, in smart cities, they rationally use resources, solve garbage problems and prefer renewable energy.
By the way, “smart” environmental monitoring tools will minimize emissions into the environment, control possible damage to nature and even avoid natural disasters and environmental disasters.
This complex of automated and computerized processes leads to an improvement in the quality of life in cities without requiring cheap labor, reducing pollution and real-time monitoring of important communication nodes.
The problem of solving the problem remains the construction of a transport system. It is completely impossible to refuse conventional transport: restrictions on use do not lead to the desired effect, environmentally friendly car variants have not yet received widespread use, and they still need traditional roads. But, with the help of high technology, they solve the problems of parking and traffic jams.
The Smart City concept is very attractive both for creating new cities and for integration into existing ones. Many technologies are quite complex in themselves, but they are easy to integrate, they are widely used in projects. Today, several megacities in different countries of the world can be classified as smart thanks to the technologies that are tested and implemented here.
The main asset of the city are: people, processes and technologies. According to statistics, about 85% of active Internet users are smartphone users in Ukraine.
To make the system work, in “smart cities” the technology of the Internet of things (IoT) is used – it is a network of objects (or “things”) connected to the Internet and interacting with each other or with the external environment. This service should provide access to the necessary services around the clock through a single interface with clear quality indicators and operating principles.
The “smart city” has a data transmission infrastructure so that information about services and the city as a whole is up-to-date and constantly updated. Data analysis systems, in turn, allow you to work with this information and obtain useful information, and aggregation and unification systems are used to synchronize all data flows in the city.
The smart city development plan consists of three key components:

21 Information technology
Community definition. Perhaps this installation will determine what you will do in the next steps; this applies to geography, the links between the city and the district and the flow of people between them; in some countries, a situation is possible in which the generally accepted definition of a city / community does not correlate with what really happens in reality.
Learning community. Before deciding to create a “smart city”, you need to understand what it is for. This can be done by identifying the benefits of such an initiative. It is necessary to study the community in order to understand the townspeople, the needs of the business — unique features of the community such as the age of the townspeople, their education, hobbies, and finally attractive features of the city.
Smart city policy development. Develop a policy of promoting initiatives where roles, responsibilities, goals and objectives can be precisely established. Create plans and strategies for how goals can be achieved.
Thus, an intelligent city performs two important tasks: it constantly improves its functions due to the continuous processing and updating of information, as well as through integrated sensors that collect and analyze information received from city residents and using electronic devices. This allows the city government to directly interact with communities and urban infrastructure, and to monitor what is happening in the city, how the city is developing, and what methods can improve the quality of life. Through the use of sensors integrated in real time, the accumulated data from urban residents and devices are processed and analyzed. The information gathered is the key to solving inefficiencies.
Conclusions. There is a need to develop new resources and introduce modern technology. The emergence of digital cities is closely related to the development of the IT industry.
We can conclude that for the efficient operation of Smart City, a deeply integrated system consisting of many subsystems is required. It makes no sense to implement such projects in part, it is necessary to develop a general concept of a “smart city”, which will take into account both the current needs of various city services and development prospects, taking into account all external factors. Therefore, Smart City projects require an integrated approach.
References. 1. Smart City, [Electronic resource]. URL: https://en.wikipedia.org/wiki/Smart_city/ 2. Navigation Research, [Electronic resource]. URL: https://www.navigantresearch.com/ 3. Путівник розумного киянина / під ред. Kyiv Smart City. — К., 2019. — 120 с. УДК 669.162.2:004.94
MATHEMATICAL MODELS FOR THE BLAST FURNACE OPERATION CONTROL Doct. Tarakanov A.K., National metallurgical academy of Ukraine, Dnipro, Ukraine
Introduction. The computerized control of the blast furnace operation considered during last 50 years as one of the most important directions of the progress in iron metallurgy. The computer systems became ordinal and widely used but their main function remains in Ukraine in many cases only monitoring of the blast furnace operation.
When in 1970-s the works on blast furnace automation became very popular all over the world, at our institutes and metallurgical plants they were already curtailing, because it became clear, how difficult to reach the necessary effect in our conditions of the very high level of uncontrolled disturbances, mainly - fluctuations of the charge composition. The comparatively simple determination systems that functioned then quite effectively abroad at the blast furnaces with the well blended ore burden, in our conditions were not effective. We were forced to create the complicated logical algorithms for our automatical systems to ensure their reliable performance even under the conditions of very high level of uncontrolled disturbances. Our systems of automatical control of heat and gasdynamic conditions of the blast furnace process anticipated the creation of modern intellectual systems. As the main industrial object for our works we chose the Blast Furnace № 9 of “Krivorizhstal” mining and metallurgical works (now – “ArselorMittal Kriviy Rig”). This furnace has the volume of 5000 m3 and is equipped by the Paul Wurth charging device.

22 Information technology
Presentation of the material. As to technological control of the blast furnace operation, the created on the BF-9 our complex of systems was one of the most perfect and complete, according to its functional possibilities. But the most effective and utilizing in modern conditions are the computerized charging control system and the interactive system..
The CHARGE system operates a Paul Wurth charging device and appreciably outperforms the original control system both functionally and operationally. The system has a blocked structure, and all its subsystems share one information base. Each block is a self – contained automatic subsystem capable of independent operation. The user may switch on or off any of the blocks, except for the information block, that provides a common information base for all subsystems.
The information space includes no manually inputted data. The user/information-base interactions are limited to periodic control over the system operation and to inputting special signs that change the mode of operation of the system.
Conveyor charge feed block provides synchronism between the discharge of materials into the furnace and the filling of the intermediate hoppers of the bell-less arrangement. This subsystem simulates also travel of change portions along the inclined conveyor. Its output constitutes a command that permits feeding a next change portion onto the conveyor.
Hopper load control block issues a signal that permits downloading a portion into a hopper during a time space equal to that of the portion feed onto the conveyor. Under the old control system, if disruption of downloading a portion occur for some reason, the initial part of the portion would be downloaded into one hopper and the rest of the portion – into the other. In that case the 500 m long conveyor used to be stopped.
Hopper gate control block sees that material dumping into the furnace lasts for desired time. The dumping time is estimated and controlled such that the chute normally makes a whole number of revolutions at each slope. The subsystem can also set and maintain the dumping time in a manner that results in desired nonuniformity of material distribution and thereby enhances or retards gas flow in a given sector of the furnace.
Weighing block is another online automatic subsystem. Its major functions are as follows: to receive the process operator's instructions as to material distribution over the range of chute slopes, to define charge weight to be dumped at each chute position based on the position count and the operator's instruction, to issue control signal to move the chute to next position, to predict the dumping rote and to include lead value in the control signal, and at last to adjust coefficients. The division relative error is considerably less than under the control of original system, because the original control system had not used the predictions.
Bell-less arrangement monitoring block saves, stores and, if requested, reports information on the preset and actual charging parameter values and on the operation modes of individual components and mechanisms of the charging arrangement. It can generate and type on the monitor a report on the actual charging mode for any cycle during several previous days or months.
Imaging subsystem conveniently presents the process of dumping, laying and distributing materials at the furnace top. The subsystem uses actual (real) values of charging parameters, which may virtually differ from the preset values (it happens in practice). First of all the subsystem visualizes the process of filling and emptying the hoppers, distributor chute travel, shaping and modifying the material fall trajectory, laying the stock and developing the stock column structure at furnace top with the help of our original mathematical model.
Commercial operation of the computerized charging control system demonstrated the applicability and utility of such systems for blast furnaces having bell-loss charging arrangements.
The major functions of the INTERACTIVE SYSTEM “BLAST FURNACE OPERATOR’S PC” are the automated search for optimum baseline operation modes related to given process conditions and the principal process engineering calculations.
The system hardware consists of a professional PC; no communication lines between the furnace and the system are necessary. All data needed for simulation and computation is inputted by user at the system's request.

23 Information technology
The system enables a process engineer to carry out computational simulation and engineering calculations, to use their results for bringing current operation mode closer to an optimum for the conditions at hand, and thereby to exploit the vast potential of process engineering measures for improving blast furnace performance.
Burden subsystem realizes the computational search for the burden composition that ensures the minimum cost-price of blast furnace iron and takes into account the indexes of each burden material quality, their influence on the coke rate, the material prices and all the desirable limitations.
Charge subsystem effects computer simulation of material charging by various modifications of bell-and-hopper and bell-less arrangements, estimates locations of burden layers, and calculates distributions of ore/coke ratio and burden basicity along top radius.
Slag subsystem uses a mathematical model to estimate the major properties of slag having a given composition, namely the initial temperatures of melting and crystallization, viscosities at various temperatures, surface tensions, and coefficients of sulfur distribution between slag and iron. Furthermore, it automatically selects a charge blend from materials available, so as to provide desired basicity and optimize slag properties.
Blast subsystem estimates from given parameters of blast its integral characteristics, such as theoretical fuel combustion temperature, blast kinetic energy, the total gas flow energy in the furnace hearth, and the volume rate of tuyere gas formation. Also, it selects estimated values of blast parameters so as to provide the desired optimum levels in a group of integral blast characteristics.
Estimate subsystem calculates blowing-in burden composition, current furnace performance characteristics, and values of furnace output and coke consumption normalized to standard conditions.
Trenager subsystem simulates on speeded up scale of time the functioning of any blast furnace with its individual characteristics and conditions of work. Presentation of the blast furnace process parameters is rather like that as in modern computer control systems. The subsystem promotes formation of uniform correct skills in complex heat and gasdynamic control of the blast furnace process.
Conclusion. These systems are used not only at the blast furnaces, but also for research calculations and for training the students and specialists. УДК 004.89: 65.011.56
HYBRID SCHEME OF A MATHEMATICAL TOOLS COMPLEX FOR FORECASTING ELECTRIC CONSUMPTION IN THE WHOLESALE MARKET
Ph.D. Ostapchenko K.B., Ph.D. Lisovychenko O.I., National Technical University of Ukraine «Igor Sikorsky Kyiv Polytechnic Institute», Kyiv, Doct. Borukaiev Z.H., Pukhov Institute for Modelling in Energy
Engineering National Academy of Sciences of Ukraine, Kyiv, Ukraine
Introduction. Under the conditions of the functioning of the new electricity market, called the bilateral contract market and the balancing market, mechanisms are provided for compensating additional costs in the energy system by those suppliers whose declared volumes exceeded in absolute terms the permissible deviations from the actual volumes of consumed electricity. This circumstance encourages electricity suppliers to use modern modeling and forecasting tools for electricity consumption with increased accuracy requirements when drawing up hourly planned electricity consumption schedules for the next day.
Material presentation. At present, in many energy systems of the world, when creating predictive models, statistical methods are used to analyze dynamic time series, which reflect an ordered sequence of data from observations of time-varying processes [1]. Their practical implementation to reduce the calculation error requires the collection, storage and further use of significant amounts of initial retrospective data of the hourly actual electricity production. And for the constant maintenance of a certain level of accuracy, the implementation will also require taking

24 Information technology
into account other factors affecting the result of the forecast, and as a result, the use of an additional amount of data.
Analysis of a research works carried out in [2] allowed us to conclude that there is no universal method capable of solving the problem of predicting the characteristics of time-varying processes of various natures. However, approaches have been developed based on the use of hybrid methods for constructing forecasting models that provide reliability and accuracy acceptable for practice.
As know, the time series members formed from actual electric consumption data, in addition to the trend, seasonal, and cyclical components, also contain a random component that reflects the influence of complex hard-to-account factors on the electric consumption process. To determine the numerical values of the predicted parameter at given time points, we will use an unformalized mathematical model, the constructing possibility of which is ensured by using the apparatus of Artificial Neural Networks (ANN). However, the presence of a random component in the training sample data can significantly affect the result of its training in constructing the ANN, and, consequently, the forecast quality. Therefore, before using the actual data in the neural network training process, it is necessary to carry out such preliminary preparation as filtering, in order to exclude the influence of time series random member on the training process.
Let )|)(( IitPX ji
actj is the actual electric consumption data of the j-th hour for I days,
)|)(( IitPY ji
predj is the forecast electric consumption data and )|)(( IitPZ j
iplan
j is the planned schedule of electric consumption.
As a result, can present the forecasted, planned, and actual electric consumption data in the following form:
),,( jjjY
j CVUFY , Xjj
Xj EYFZ )( , jjj DZX
where XF , YF are the desired values of the actual and forecast electric consumption schedules, formed from the trend jU , seasonal jV , cyclical jC time series components, X
jE is the random component of external factors affecting the electric consumption process, jD is the random component of deviation of the actual delivery schedule from the planned one.
Denote jXjj
mainj DEXX as filtered component of the time series actual data that do not
contain a random components. To form a time series main
jX , will use a simplified Kalman filter of the following form: mainjj
mainj XKXKX *)1(* 11 (1)
The coefficient K must be determined from the condition ||min 11 jmainj XX . At the same
time, will take into account the fact that the actual electric consumption data is much more accurate than the forecast one, although they contain a random component. Based on the same considerations, assume that 1111 *)1(* XXKXKX main . And all the following components of the desired series are determined by the formula (1).
In general, the electric consumption forecasting model is represented by the following dependency:
ij
niact
mainj
iact
mainj
ipred TtPtPFtP ),(),...,()( 1 ,
where )( ji
pred tP is the forecast value of electric consumption, )(),...,( 1j
niact
mainj
iact
main tPtP are the filtered actual values of electric consumption for Nn previous days of observations, iT is the set of external factors affecting electric consumption.
The use of external factors in forecasting improves the accuracy of the forecast. In this case, the more factors taken into account, the higher the accuracy of the forecast. The categories of days groups of the week, temperature and climatic factors, seasonality, etc. are considered as external factors.
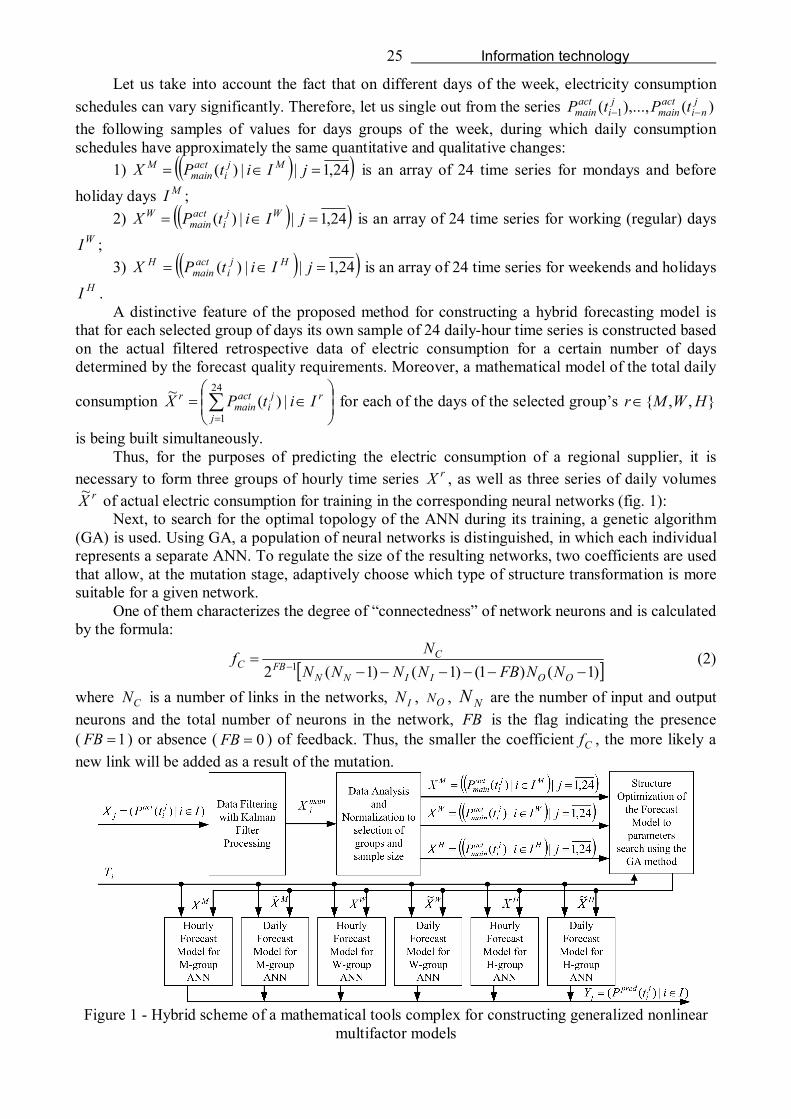
25 Information technology
Let us take into account the fact that on different days of the week, electricity consumption schedules can vary significantly. Therefore, let us single out from the series )(),...,( 1
jni
actmain
ji
actmain tPtP
the following samples of values for days groups of the week, during which daily consumption schedules have approximately the same quantitative and qualitative changes:
1) 24,1||)( jIitPX Mji
actmain
M is an array of 24 time series for mondays and before holiday days MI ;
2) 24,1||)( jIitPX Wji
actmain
W is an array of 24 time series for working (regular) days WI ;
3) 24,1||)( jIitPX Hji
actmain
H is an array of 24 time series for weekends and holidays HI .
A distinctive feature of the proposed method for constructing a hybrid forecasting model is that for each selected group of days its own sample of 24 daily-hour time series is constructed based on the actual filtered retrospective data of electric consumption for a certain number of days determined by the forecast quality requirements. Moreover, a mathematical model of the total daily
consumption
r
j
ji
actmain
r IitPX |)(~ 24
1 for each of the days of the selected group’s },,{ HWMr
is being built simultaneously. Thus, for the purposes of predicting the electric consumption of a regional supplier, it is
necessary to form three groups of hourly time series rX , as well as three series of daily volumes rX~ of actual electric consumption for training in the corresponding neural networks (fig. 1):
Next, to search for the optimal topology of the ANN during its training, a genetic algorithm (GA) is used. Using GA, a population of neural networks is distinguished, in which each individual represents a separate ANN. To regulate the size of the resulting networks, two coefficients are used that allow, at the mutation stage, adaptively choose which type of structure transformation is more suitable for a given network.
One of them characterizes the degree of “connectedness” of network neurons and is calculated by the formula:
)1()1()1()1(2 1
OOIINNFB
CC NNFBNNNN
Nf (2)
where CN is a number of links in the networks, IN , ON , NN are the number of input and output neurons and the total number of neurons in the network, FB is the flag indicating the presence ( 1FB ) or absence ( 0FB ) of feedback. Thus, the smaller the coefficient Cf , the more likely a new link will be added as a result of the mutation.
Figure 1 - Hybrid scheme of a mathematical tools complex for constructing generalized nonlinear
multifactor models
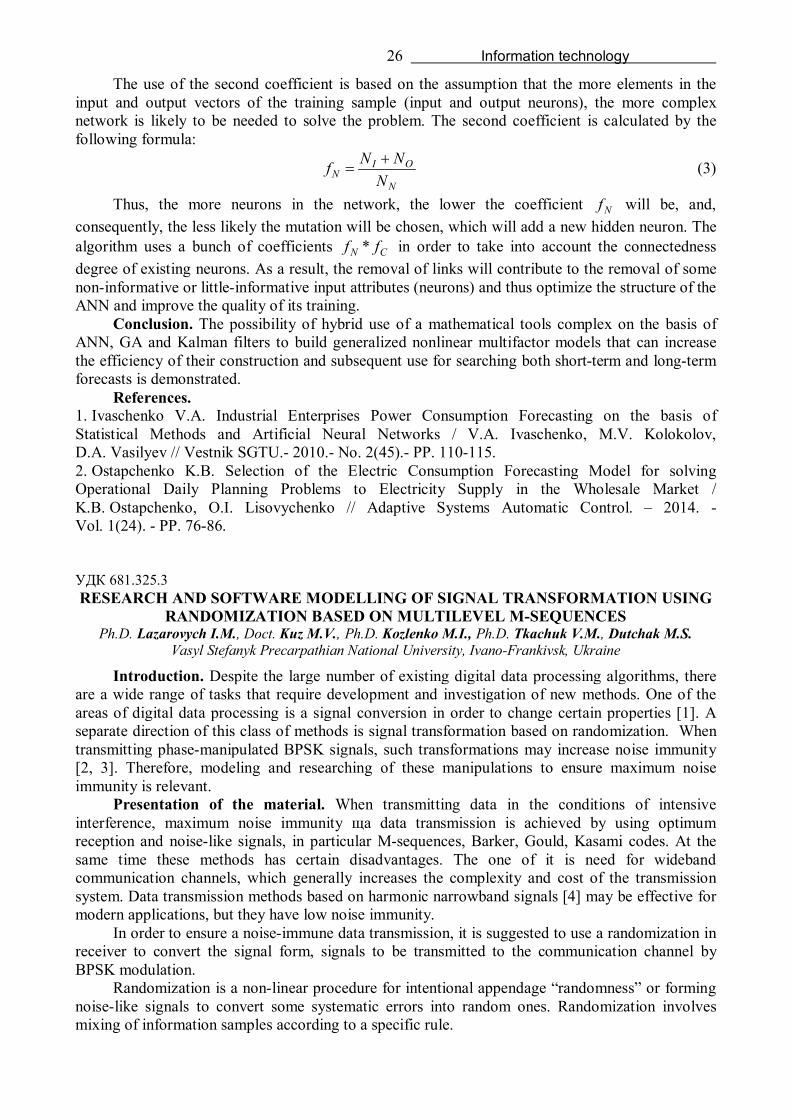
26 Information technology
The use of the second coefficient is based on the assumption that the more elements in the input and output vectors of the training sample (input and output neurons), the more complex network is likely to be needed to solve the problem. The second coefficient is calculated by the following formula:
N
OIN N
NNf (3)
Thus, the more neurons in the network, the lower the coefficient Nf will be, and, consequently, the less likely the mutation will be chosen, which will add a new hidden neuron. The algorithm uses a bunch of coefficients CN ff * in order to take into account the connectedness degree of existing neurons. As a result, the removal of links will contribute to the removal of some non-informative or little-informative input attributes (neurons) and thus optimize the structure of the ANN and improve the quality of its training.
Conclusion. The possibility of hybrid use of a mathematical tools complex on the basis of ANN, GA and Kalman filters to build generalized nonlinear multifactor models that can increase the efficiency of their construction and subsequent use for searching both short-term and long-term forecasts is demonstrated.
References. 1. Ivaschenko V.A. Industrial Enterprises Power Consumption Forecasting on the basis of Statistical Methods and Artificial Neural Networks / V.A. Ivaschenko, M.V. Kolokolov, D.A. Vasilyev // Vestnik SGTU.- 2010.- No. 2(45).- PP. 110-115. 2. Ostapchenko K.B. Selection of the Electric Consumption Forecasting Model for solving Operational Daily Planning Problems to Electricity Supply in the Wholesale Market / K.B. Ostapchenko, O.I. Lisovychenko // Adaptive Systems Automatic Control. – 2014. - Vol. 1(24). - PP. 76-86. УДК 681.325.3 RESEARCH AND SOFTWARE MODELLING OF SIGNAL TRANSFORMATION USING
RANDOMIZATION BASED ON MULTILEVEL M-SEQUENCES Ph.D. Lazarovych I.M., Doct. Kuz M.V., Ph.D. Kozlenko M.I., Ph.D. Tkachuk V.M., Dutchak M.S.
Vasyl Stefanyk Precarpathian National University, Ivano-Frankivsk, Ukraine
Introduction. Despite the large number of existing digital data processing algorithms, there are a wide range of tasks that require development and investigation of new methods. One of the areas of digital data processing is a signal conversion in order to change certain properties [1]. A separate direction of this class of methods is signal transformation based on randomization. When transmitting phase-manipulated BPSK signals, such transformations may increase noise immunity [2, 3]. Therefore, modeling and researching of these manipulations to ensure maximum noise immunity is relevant.
Presentation of the material. When transmitting data in the conditions of intensive interference, maximum noise immunity ща data transmission is achieved by using optimum reception and noise-like signals, in particular M-sequences, Barker, Gould, Kasami codes. At the same time these methods has certain disadvantages. The one of it is need for wideband communication channels, which generally increases the complexity and cost of the transmission system. Data transmission methods based on harmonic narrowband signals [4] may be effective for modern applications, but they have low noise immunity.
In order to ensure a noise-immune data transmission, it is suggested to use a randomization in receiver to convert the signal form, signals to be transmitted to the communication channel by BPSK modulation.
Randomization is a non-linear procedure for intentional appendage “randomness” or forming noise-like signals to convert some systematic errors into random ones. Randomization involves mixing of information samples according to a specific rule.

27 Information technology
Any time-sampled signal can be represented as a sequence X={x1, x2,…xn}. Performing the randomization operator an over the sequence X, we obtain a randomized sequence Y={y1, y2,…yn}. There is a dependence yi=xj between the elements X and Y, where the dependence between і and j, where nji ,1, , j=ki, determines the randomization operator an . Kr={ki} meaning the key-array of randomization operator. It is obvious the randomization key specifies the transformation of the initial signal shape. This property can be used to extend the signal base [1].
Generally Кr is given by a set of arrays, where r=n!. Most of these keys arrays are inappropriate to use, but some of them provide a new useful properties of initial signal.
Randomization allows you to transform the waveform; in particular, you can generate a signal that in its form and correlation function properties is close to pseudorandom.
According to previously investigated of waveform transformation by using randomization [3], the best noise immunity rates can be achieved due using of M-sequences with base p=2. However, in work [5] it was shown the good results of noise-immune data transmission by using M-sequence with the base p>2. This increases the likelihood of correct signal recognition in the face of intense interference, and increases the degree of data protection. In particular, the use of Galois sequences with the base p>2 is promising. The autocorrelation function of such signals is periodic, but each of its periods contains a few peak depending of the base p (not one, as for two-level sequences). For example, at p = 3, the correlation function has 2 peaks, at p = 5 – 3 peaks, at p = 7 – 6. However, for a specific sequence, these peaks have a definite value and are located at known points.
Figure 1 shows: one period of harmonic signal (a), its randomized representation (b) and the correlated function of the randomized signal (c).
a) b) c)
Figure 1 - Example of harmonic signal randomization and its correlation function As can be seen from Figure 1, the using randomization of harmonic signal allows to obtain
the benefits of the noise-like signals since the autocorrelation function of the M-sequence and the randomized harmonic signal are not significantly different. In addition, when using the randomized signal, which is distorted by additive interference, the signal and interference decorrelation is performed, which further increases the potential noise immunity of the method.
Figure 2 shows the structure transmission system with randomization. Digital information bits presented in Rademacher's basis are fed to the transmitter input. The transmitter converts them into a BPSK signal, put it into communication channel, where signal is distorted by an additive interference. The distorted phase-modulated signal from the receiver input is fed to a randomizer, which digitizes the signal, and randomizes it with the specified key.
As a result, at the output of the randomizer we get a signal, signal form approaches the noise-like, for example we can use M-sequence with the base p = 3 and the period N = 26. Next, this signal is fed into two correlators, each of which compares the input signal with reference signals, which presents high and low logical levels. The correlation results are interpreted by a comparator, which concludes the decision of receiving information bits.
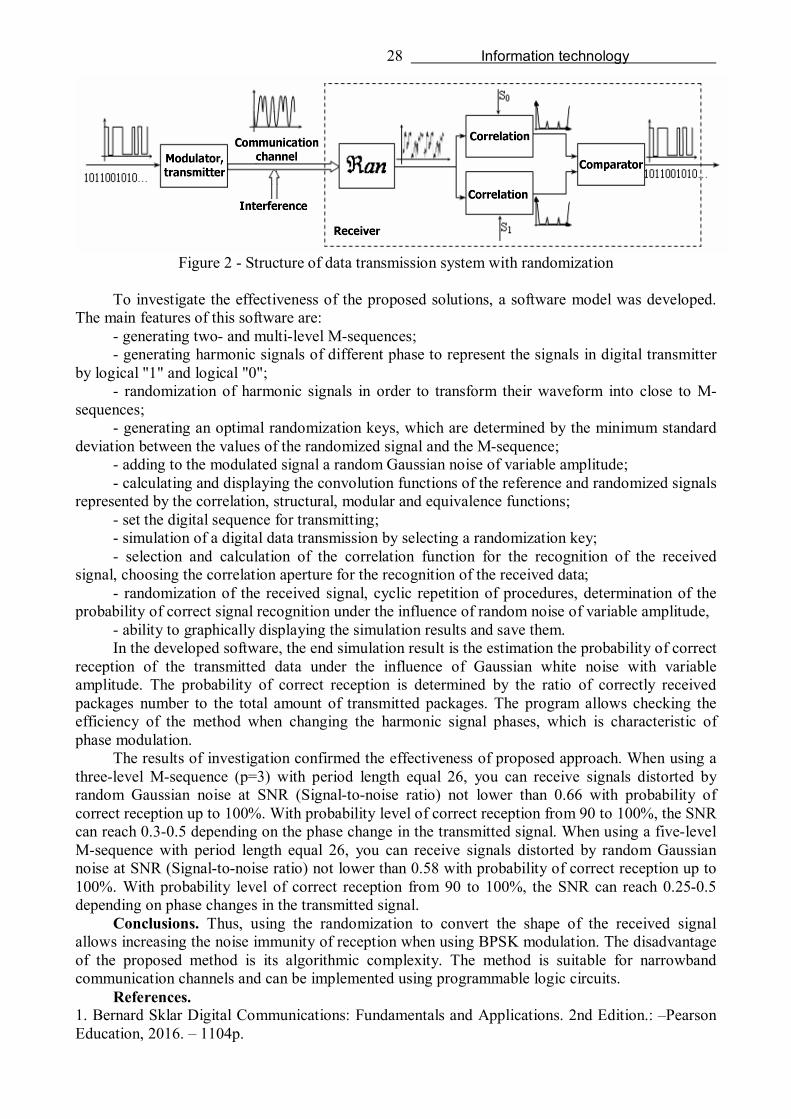
28 Information technology
Figure 2 - Structure of data transmission system with randomization
To investigate the effectiveness of the proposed solutions, a software model was developed.
The main features of this software are: - generating two- and multi-level M-sequences; - generating harmonic signals of different phase to represent the signals in digital transmitter
by logical "1" and logical "0"; - randomization of harmonic signals in order to transform their waveform into close to M-
sequences; - generating an optimal randomization keys, which are determined by the minimum standard
deviation between the values of the randomized signal and the M-sequence; - adding to the modulated signal a random Gaussian noise of variable amplitude; - calculating and displaying the convolution functions of the reference and randomized signals
represented by the correlation, structural, modular and equivalence functions; - set the digital sequence for transmitting; - simulation of a digital data transmission by selecting a randomization key; - selection and calculation of the correlation function for the recognition of the received
signal, choosing the correlation aperture for the recognition of the received data; - randomization of the received signal, cyclic repetition of procedures, determination of the
probability of correct signal recognition under the influence of random noise of variable amplitude, - ability to graphically displaying the simulation results and save them. In the developed software, the end simulation result is the estimation the probability of correct
reception of the transmitted data under the influence of Gaussian white noise with variable amplitude. The probability of correct reception is determined by the ratio of correctly received packages number to the total amount of transmitted packages. The program allows checking the efficiency of the method when changing the harmonic signal phases, which is characteristic of phase modulation.
The results of investigation confirmed the effectiveness of proposed approach. When using a three-level M-sequence (p=3) with period length equal 26, you can receive signals distorted by random Gaussian noise at SNR (Signal-to-noise ratio) not lower than 0.66 with probability of correct reception up to 100%. With probability level of correct reception from 90 to 100%, the SNR can reach 0.3-0.5 depending on the phase change in the transmitted signal. When using a five-level M-sequence with period length equal 26, you can receive signals distorted by random Gaussian noise at SNR (Signal-to-noise ratio) not lower than 0.58 with probability of correct reception up to 100%. With probability level of correct reception from 90 to 100%, the SNR can reach 0.25-0.5 depending on phase changes in the transmitted signal.
Conclusions. Thus, using the randomization to convert the shape of the received signal allows increasing the noise immunity of reception when using BPSK modulation. The disadvantage of the proposed method is its algorithmic complexity. The method is suitable for narrowband communication channels and can be implemented using programmable logic circuits.
References. 1. Bernard Sklar Digital Communications: Fundamentals and Applications. 2nd Edition.: –Pearson Education, 2016. – 1104p.

29 Information technology
2. Lazarowych I.M. Randomization – perspective direction of digital data processing development and constructing of special processors in computer systems Тези // Modern problems of radio engineering, telecommunication, and computer science. Proceedings of the International Conference TCSET‘2004 – February 24-28, 2004, Lviv-Slavsko, Ukraine. – Lviv: LPNU, 2004. – P.403-404. 3. Лазарович І.М. Застосування методів рандомізації для завадостійкого передавання даних в телекомунікаційних системах // Прикладні науково-технічні дослідження : матеріали ІІ міжнар. наук.-практ. конф., 3-5 квітня 2018 р., Івано-Франківськ: матеріали конф. – Академія технічних наук України. – 2018. – С.113-114. 4. Simon Haykin. Communication Systems: 4rd Edition.: NY, John Willey & Sons, 2017. – 556р. 5. Іщеряков С. М. / Структурні властивості ключів багаторівневих М-послідовностей / С. М. Іщеряков, А. Я. Полянчич // Вісник Хмельницького національного університету. – 2005. – No 4. – Частина 1. – Том 2. – Хмельницький, 2005. – С. 65 – 68. УДК 004.9: 159.9.07
REFLEX INTELLECTUAL TEXT PROCESSING SYSTEMS: NATURAL LANGUAGE TEXT ADDRESSING
Ph.D. Kubiavka N.B., Ph.D. Loza V.M., Military Institute of Taras Shevchenko National University of Kyiv, Kyiv, Ukraine
Abstract. The paper describes the method of automatic response to the content of the text of the message, which was based on a probabilistic-reflexive approach. The reflexive approach provided the choice of the most probable response to the set of input influences, with known probabilities of choosing the response for each input effect, as well as some combinations of input influences, and the method developed on its basis allowed to automatically determine the destination of the analyzed text.
Research results analysis. Any information we undergo shape our entire lives and that could be expressed as text. This paper discusses the natural language texts processing and analysis using the influence of such information to us instead of basic lexicon-semantic approach. Different information affects differently, and this is due to a phenomenon such as its addressness. If the message is not correctly addressed it will not be understandable, and on the contrary, the address-oriented message will affect the recipient and will allow him to understand its meaning.
The information management models and methods [1] based on the results of the interaction theory in the context of means of processing natural linguistic information will be used to address the problem.
The reflex probabilistic approach was used to identify the most probable reaction to the incoming message, with known probabilities of choosing the reaction for each input effect, as well as some combinations of input effects [2]. On its basis, the reflex method of automatic response to the message content and the model for determining the most informative components of the natural language text are developed. Any natural language text is considered as a message perceived by the intellectual apparatus of a person.
Here are some definitions to take the point further. Definition 1. Text addressness - is the semantic component of the information, which
determines the information direction of the message content, has corrective influence on the awareness (world view) of the recipient.
Definition 2. The message recipient can be determined from the message itself. Definition 3. The concept of text length is a quantitative indicator of information and conceptual segments in the message part (text).
Definition 3. The concept of text length is a quantitative indicator of information and conceptual segments in the message part (text).
Definition 4. According to the information disseminated (contractors), it should be understood that the notice is communicated and does not lead to changes in these consumers.

30 Information technology
By notice, it will mean any information (telecast, newspaper articles, internet notes, etc.) that will be sent to consumers. It`s received receptions (can take) necessary decisions for us. For the entire flow of information (all messages) used and technologies that provide impact on the interaction contractors, it is necessary to distribute to the address. It has also been recognized as the classical interaction partners (consumer information), and which classical messages will be published in the names of the technologies. Please inform that the information about who to send the message is in the message itself.
And so, the first step, it is necessary to decompose the input text into clusters, among which there will usually be those that determine the necessary reaction under the given conditions. Since it is impossible to know in advance what these clusters are, we will create a series of combinatorial regularities of the input text and select the ones that most affect the recipient.
The acknowledgement that the informational influence of the natural language text leads to an increase or decrease in the probability of the desired reaction in some classes of recipients is the basis of the paper:
),/()( jlklk IApAp where Ai is the recipient reaction (behaviour); Ij is information influence of the message; Pk(Ai) is absolute probability of the reaction (behaviour) Ai in the class of recipients Qk, if this class does not get influenced; pk (A/lj) is the reaction (behaviour) probability Al in the class of recipients Qk after the influence lj.
In addition to the determination of its impact on the recipient, it is necessary to select for each message such classes of recipients, which impact will be maximal. For the given lj and Al we should choose a class of recipients Q*, which impact pk (A/lj) will be maximal:
,)/(max*jlkk
IApQ
where Q * is the class of recipients is chosen to implement the impact. Thus, the function finding that determines the difference between the reaction probability Rt
for the recipient class Q' without influence and with that Aj is a high- priority problem. The information influences repetition is a way to solve this problem, but in practice there had
been no such cases. Each effect is combinatorial and usually consists of many separate, sometimes insignificant elements. Then this problem will be solved in the following way. If message is informative and significantly increases the reaction probability, it means that the message parts (separate sentences, words, combination of letters) are the influence holders on the counterparty. When these parts arise, the reaction probability changes. However, as stated above, the messages are not actually repeated, but the parts definitely are. Therefore, the probability change of one or another reaction can be assessed not from the whole message, but from some of its part.
To obtain this information, the following method is used. 1. An expert is provided with a text message and a list of recipient classes with their
properties. 2. The expert assesses the information and provides for such messages the most likely
addressees (whose probability of the desired reaction will be changed). 3. The statistics accumulation is made possible through the involvement of many experts. 4. Based on the information received, recipients for new text messages are found.
A solution to the problem 4 requires the development of method by which the addressees for new messages are determined on the basis of an expert assessment. Existing methods of solving this problem are quite complex, require the use of linguistic analysis tools that are almost impossible to use for messages of different directions, or their creation will be too expensive, since linguistic systems are usually created for separate text classes.
When using the probabilistic-reflexive approach, it is necessary to determine what is the influence, and what are the reflexes in the means of information technology.
From definition 2, the influence is the natural language text (message), and from definition 4 it follows that the reaction is a class of recipients. Then the possibility of obtaining the correct addressee can be represented through a certain probability.

31 Information technology
,/ ii kibp (1) where pi is the probability that the produced will necessarily bring the desired result (correctly addressed message); bi is tests conducted to correctly identify the information addressness; ki is total number of tests.
Determining the addressness of text messages based on the evaluation of the results of past actions can be presented in the form below.
To determine the quantitative measure of the message classes (forms) influence on recipient classes, expert analysis of processes accompanied decision-making on the message implementation in various influence components and the various functional roles performance has been undertaken. Experts were asked to identify the subjective probability of selecting one or another form of text messages in various influence components and the functional roles implementation.
Table 1. Statistical data of the response development to determine the text addressee
Addressness The number of times the
targeting of text clusters was determined
The number of times the desired result was
obtained A1 k1 b1 A2 k2 b2 … … … Ai ki bi … … … Am km bm
A sociological survey of school-aged children, preschool-age children and psychologists
working in these educational institutions was conducted, an analysis of social surveys on the Internet and the media on these issues, a survey of students and elderly, as well as experts in the field of sociological research, the integrated expert assessment of the subjective probability of implementing one of the model attributes was formulated. The subjective expert relation to the implementation of various message forms in different conditions could be considered in the context of probabilities.
In the process of analysis, subjective-probabilistic performance indicators were identified: the class of messages for children; the class of messages for working youth; the class of messages for young people; the class of messages for entrepreneurs; the class of messages for employees; the class of messages for servicemen; the class of messages for pensioners.
The subjective-probabilistic implementation indicators of the message class were found to be applicable to recipient classes [3], and the data obtained were included in the expert tables.
A recent analysis is a basis for assessing the information actions importance in the process of influence management. This contributed to identifying those forms of text messages that can maximally effectively ensure the implementation of these actions on the recipients. The information provided in the expert tables has become the basis for determining the necessary in formation of optimal, rational or appropriate informational influences on recipients by means of communication. The effective implementation of message tools requires the methods development for identifying information actions and the required forms of communication based on the received subjective-probabilistic characteristics of the scope of application.
The expected outcome of this task is a summary table, in a situation or if there is a problem in the influence management process, evaluating one of the influence components and knowing the information type (functional role), the most suitable and informative message (natural language

32 Information technology
text) can be easily identified. To find a text that will form the necessary relation to the reality (necessary knowledge) of the recipient would be easier with those summary tables. The use of the above method helps to identify the recipient and the text defining to be sent to the specified addressee.
This method is not about "understanding" of a limited natural language, but system that perceives information representations in a natural language without restrictions.
Conclusion. In summary, the authors consider it is necessary to mention such remarkable features of human intelligence as its extraordinary flexibility and mobility. Indeed, as soon as a person learns something, the field of his knowledge immediately expands. One of the main aspects in human learning is not the more he learns the better he can solve a new task, but rather to be able to match, join and combine with all the previous tasks in order to make a decision. The so-called reflex intellectual systems are based on this peculiarity of human consciousness, which are nothing more than software or technical systems that form reactions to influences, based on the reflex algorithm built on introformational methods [2] and works on the principle of forming reaction-response (reflex) on the set of input data (external influence).
The mathematical apparatus of the interaction theory [2] is quite simple and convenient for the implementation of processing natural language text systems. During the implementation of the above method, existing models for identifying the most informative components of the natural language text from the position of automatic addressing of these messages to different classes of recipients have been improved. The model innovativeness is to use a probabilistic-reflex approach to determine the natural-language text addressee. The proposed model differs from the existing in the difference identification of the conditional probabilities of the recipients occurrence as the information influence extent of the natural language text fragments, which automatically identified the most likely addressees of this text.
The developed technology meets the requirements for simplicity, is informatively clear and minimal costly. Its foundation is based on the models and methods of influence management [1, 3], and the results are getting closer and closer to mankind to create a complete artificial intelligence.
References. 1. Kubiavka M.: Modeli ta metody upravlinnya informatsiynym suprovodzhennyam v umovakh hibrydnoyi viyny: synopsis for Ph.D. thesis in Engineering Science: 05.13.06, Kyiv. Taras Shevchenko nat. uni. of Kyiv (2017). 2. Teslya Yu.: Vvedeniye v informatiku prirody. Maklaut, Kiev, Ukraine (2010). 3. Kubiavka M.: The control of information support of the processes of influence on the opponent. Zbirnyk naukovykh prats Viiskovoho instytutu Kyivskoho nats. Univers. imeni Tarasa Shevchenka. vol. 54, pp. 174-181 (2017). УДК 004.9:519.2
CYBERSECURITY: WAVELET ANALYSIS AS A WAY TO DETECT NETWORK ATTACKS
Ph.D. Valeriy Dubrovin, Bogdan Petrik, Ph.D. Hanna Nelasa, National University "Zaporizhzhia Polytechnic", Zaporozhye, Ukraine
Introduction. Network monitoring and analysis is critical to understanding network performance, network reliability, network security, and identifying potential problems. Thus, analyzing network security data is very important in detecting intrusions and attacks. Many data mining methods have been found, but the most effective ones require either the known parameters characterizing the attack and its threshold values, or greater computing power with low reliability of the decisions made. A quick and accurate search for meaningful queries is crucial to ensure that such multiple data streams are protected. In this case, wavelet analysis will be taken with consideration of data streams for detecting abnormal network events and the ability to eliminate noise.
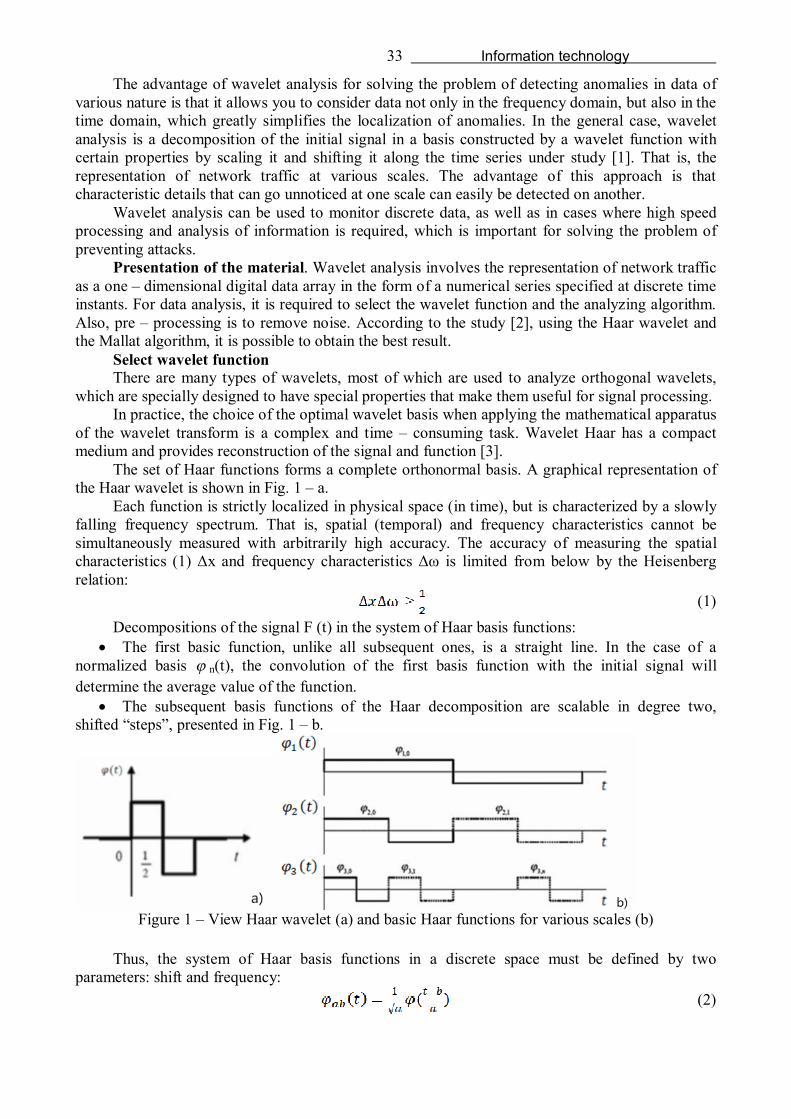
33 Information technology
The advantage of wavelet analysis for solving the problem of detecting anomalies in data of various nature is that it allows you to consider data not only in the frequency domain, but also in the time domain, which greatly simplifies the localization of anomalies. In the general case, wavelet analysis is a decomposition of the initial signal in a basis constructed by a wavelet function with certain properties by scaling it and shifting it along the time series under study [1]. That is, the representation of network traffic at various scales. The advantage of this approach is that characteristic details that can go unnoticed at one scale can easily be detected on another.
Wavelet analysis can be used to monitor discrete data, as well as in cases where high speed processing and analysis of information is required, which is important for solving the problem of preventing attacks.
Presentation of the material. Wavelet analysis involves the representation of network traffic as a one – dimensional digital data array in the form of a numerical series specified at discrete time instants. For data analysis, it is required to select the wavelet function and the analyzing algorithm. Also, pre – processing is to remove noise. According to the study [2], using the Haar wavelet and the Mallat algorithm, it is possible to obtain the best result.
Select wavelet function There are many types of wavelets, most of which are used to analyze orthogonal wavelets,
which are specially designed to have special properties that make them useful for signal processing. In practice, the choice of the optimal wavelet basis when applying the mathematical apparatus
of the wavelet transform is a complex and time – consuming task. Wavelet Haar has a compact medium and provides reconstruction of the signal and function [3].
The set of Haar functions forms a complete orthonormal basis. A graphical representation of the Haar wavelet is shown in Fig. 1 – a.
Each function is strictly localized in physical space (in time), but is characterized by a slowly falling frequency spectrum. That is, spatial (temporal) and frequency characteristics cannot be simultaneously measured with arbitrarily high accuracy. The accuracy of measuring the spatial characteristics (1) Δx and frequency characteristics Δω is limited from below by the Heisenberg relation:
(1) Decompositions of the signal F (t) in the system of Haar basis functions:
The first basic function, unlike all subsequent ones, is a straight line. In the case of a normalized basis n(t), the convolution of the first basis function with the initial signal will determine the average value of the function.
The subsequent basis functions of the Haar decomposition are scalable in degree two, shifted “steps”, presented in Fig. 1 – b.
Figure 1 – View Haar wavelet (a) and basic Haar functions for various scales (b)
Thus, the system of Haar basis functions in a discrete space must be defined by two
parameters: shift and frequency: (2)

34 Information technology
where – the Haar basis functions; a – the frequency of the basis function; b – the shift. Studies [4] showed that it is advisable to use the Haar wavelet to monitor network traffic. Purification of noise from the analyzed signal Noise is considered to be the high – frequency components of the signal. Noise reduction is
an important process of eliminating noise from a useful signal in order to increase its subjective quality or to reduce the level of errors in transmission channels and digital data storage systems.
At the same time, it is possible to set the level of restriction for each coefficient separately, which allows one to build adaptive to signal changes signal cleaning systems from noise based on wavelets [5].
In the wavelet analysis, the signal is decomposed into approximating coefficients, which represent a smoothed signal, and detailed coefficients describing the oscillations. Therefore, the noise component is better reflected in the detail coefficients. Such components can be removed using the procedure of zeroing or recalculating the coefficients of detail, the values of which are smaller compared to the threshold value [6]. The noise elimination procedure [7] has the following algorithm:
1. Signal Decomposition. First, we choose a wavelet, and choose a level N. Then, we compute the wavelet decomposition of the signal S at level N.
2. Detail coefficients threshold. For each level j from 1 to N, select a threshold T and apply soft thresholding to the detail coefficients.
3. Signal Reconstruction. We compute the wavelet–reconstruction signal based on the original approximation coefficients of level N and the modified detail coefficients of levels from 1 to N.
The size of the signal with suppressed noise is much smaller than that of the original noisy signal, so the data will take up less space and are better suited for transmission on the Internet.
Fast wavelet analysis based on the Mall algorithm The essence of the operations of the Mall algorithm is as follows: Representation of a signal
as a set of successive approximations approximating and detailing components to which a set of filters is applied – low – frequency and high – frequency [8].
First, the signal is passed through a low – pass filter, resulting in approximation coefficients that characterize the global trend of the series under study. The original sequence is also passed through a high – pass filter, while the output produces detail coefficients characterizing the local features of the data series. To increase the frequency resolution, repeated decomposition is possible for the approximation coefficients of the previous level (Fig. 2). Under the conditions of intensive traffic from network traffic components, it is of more interest to analyze the local features of the data under investigation in order to detect threats using the parameters generated from the data traffic, to increase the detection efficiency of stealth attacks with low duration and intensity.
Figure 2 – Diagram of the wavelet components of the Mallat algorithm
Conclusions. Considering the features of this work:
Use of wavelet function to increase the probability of correct detection; The ability to use noise reduction in wavelet analysis to specify the data and reduce its
size; The Mallat algorithm allows the analysis of the time – frequency representation of a signal by
low – frequency and high – frequency components, which makes it possible to localize signal anomalies of various kinds.

35 Information technology
References. 1. Astafyeva, N. M. Wavelet analysis: fundamentals of the theory and application examples / N. M.
Astafyeva // Uspekhi fizicheskikh nauk. –1996. – Vol. 166. – No. 11. – pp. 1145–1170. (in Russian) 2. N. A. Tishina, I. G. Dvorova, N. A. Soloviev, Intrusion Detection Based on the Wavelet Analysis
of Network Traffic // Ufa: USATU, 2010. vol. 14, No. 5 (40). pp. 188–194. (in Russian) 3. J. Tverdohleb Wavelet technologies of non-stationary signals analysis / J. Tverdohleb, V.
Dubrovin, M. Zakharova // 1-th IEEE International Conference on Data Stream Mining & Processing. – Ukraine, Lviv: LPNU, 2016. – P. 75–79.
4. Blatter C. Wavelet Analysis. Fundamentals of the theory. M.: TECHSFERA, 2006. pp. 272. (in Russian)
5. Jaffard Stéphane. Wavelets: tools for science & technology / Stéphane Jaffard,Yves Meyer,Robert Dean Ryan. – Philadelphia: Society for Industrial Mathematics, 2001. – 256 p.
6. Smolentsev N.K. Fundamentals of the theory of wavelets. Wavelets in MATLAB / N.K. Smolentsev. – M.: DMK, 2008. – pp. 448. (in Russian)
7. SUN Donghong, SHU Zhibiao, LIU Wu, REN Ping, WU Jian–ping, Analysis of Network Security Data Using Wavelet Transforms Journal of Algorithms & Computational Technology, Vol. 8 No. 1, pp. 59–79, Received: 13/01/2013; Accepted: 19/06/2013, 2013.
8. Shelukhin, O. I. Detection of DOS and DDOS attacks by the method of discrete wavelet analysis / O. I. Shelukhin, A. V. Garmashev // T – Comm – Telecommunications and Transport. – 2011. – No. 1. – pp. 44–46. (in Russian) УДК 519.854: 656.2: 004.75
CONSTRUCTION OF THE MATHEMATICAL MODEL OF THE STRUCTURAL UNIFICATION OF SPECIALIZED COMPUTER SYSTEM ON RAILWAY TRANSPORT
Ph.D. Golovko O.V., Ph.D. Butenko V.M., Ushakov M. V., Ukrainian State University of Railway Transport, Kharkiv, Ukraine
Entry. Nowadays in a railway transport are used the national and foreign microsystems of the train dispatching. And although they execute identical functions however they have separate features as on programmatic as at vehicle level. In time of globalization of world market before railway there are new tasks – integration in the unique complex of the systems and built on railway automation of the different setting that compels cardinally to do logic of functioning of the systems and built on different setting, realizing the system integration and standardization on all levels. Features of every separately taken system the microsystems of traffic control are not presently noticeable because a necessity to be integrated in each other to this time did not arise up. The refore creation of their models becomes actual and research of which allows to analyse the conduct of the system on the whole, to represent co-operation between the elements of the structure, to estimate their influence on each other, to find out «weak» points in a structure. This is important especially for development and planning, and also subsequent operation, informatively – the sensor-based systems of railway automation.
It is efficient in such case to probe the structures of the separate existent systems of modern microprocessor centralizations.
Exposition of material. In this work it is suggested to present the structures of the separate existent systems of modern microprocessor centralizations in the type of the oriented graphs. The got graphs are farther probed by the construction of adjacency and distances matrices, and also receipt on their basis of numerical descriptions[1]. It enables to compare the different systems of microprocessor centralization and draw conclusion about expedience of their use in those or other terms.
In the conducted research the considered structures of two microprocessor centralizations of pointers and signals of “Impuls” and Ebilock-950 that have already used on the railways of the general use of Ukraine. Below resulted table 1, that contains data on the system of microprocessor centralization of “Impuls”.

36 Information technology
Table 1. - Correspondence of “Impuls” structure elements to graph vertices Hierarchy levels Structure element Graph vertix
Operator 1 Engineer 2 Executor level Tuner 3 Operator workstation (main) 4 Operator workstation (reserve) 5 Engineer workstation 6
Provision and planning level
Distance dispatching workstation 7 Communication switch board 1 8 Net Communication switch board 2 9 Control calculator 10 Control calculator 11 Control and check level Control calculator 12
Net Communication module 13,14,15 Microprocessor 1 16,18,20,22,24
Microprocessor 2 17,19,21,23,25 Interface level Wayside apparatus connection 26,27,28,29,30
On the basis of these information the built count fig.1.
Interface level
Control and check level
Provision and planning
level
Executive level
Figure 1 - “Impuls” system structure graph.
During the leadthrough of analysis of the built counts of control system “Impuls” and Ebilock-950 structural surplus(0,172 and 0,11227), structural compactness (0,934 and 0,8231), index of centrality (0,74 and 0,56) and number of basic contours(74 and 20), is certain. It enabled to define
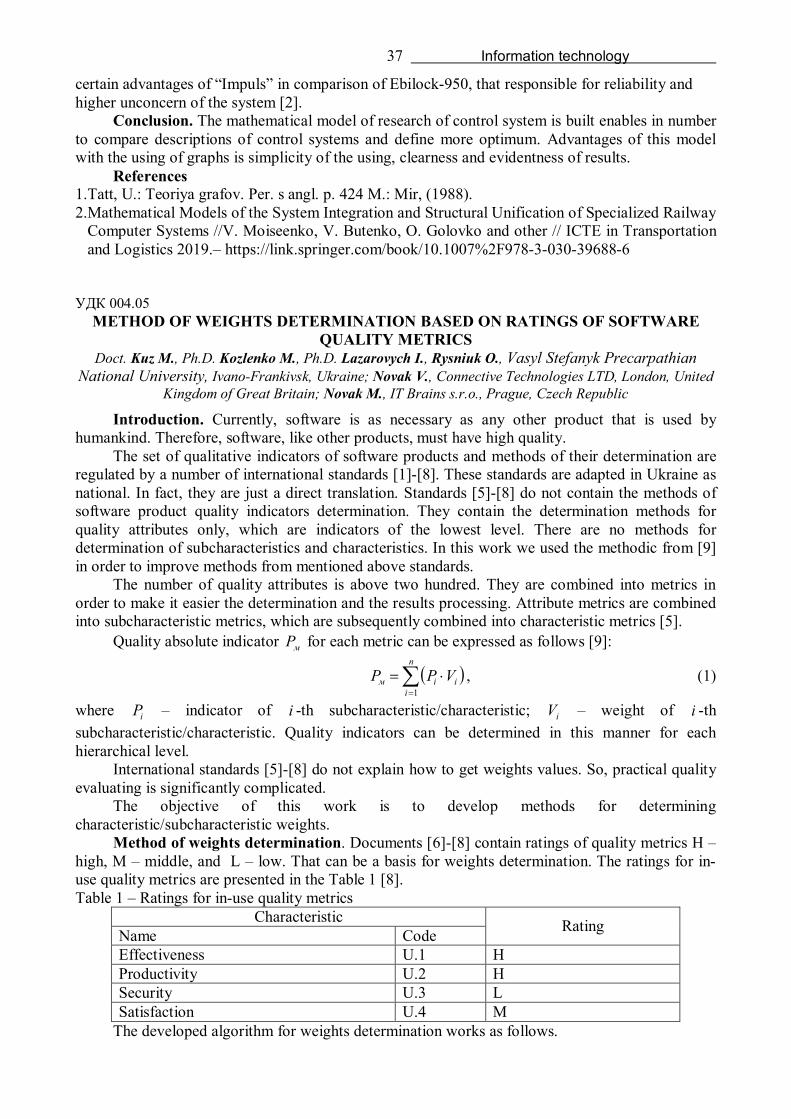
37 Information technology
certain advantages of “Impuls” in comparison of Ebilock-950, that responsible for reliability and higher unconcern of the system [2].
Conclusion. The mathematical model of research of control system is built enables in number to compare descriptions of control systems and define more optimum. Advantages of this model with the using of graphs is simplicity of the using, clearness and evidentness of results.
References 1.Tatt, U.: Teoriya grafov. Per. s angl. p. 424 M.: Mir, (1988). 2.Mathematical Models of the System Integration and Structural Unification of Specialized Railway
Computer Systems //V. Moiseenko, V. Butenko, O. Golovko and other // ICTE in Transportation and Logistics 2019.– https://link.springer.com/book/10.1007%2F978-3-030-39688-6
УДК 004.05
METHOD OF WEIGHTS DETERMINATION BASED ON RATINGS OF SOFTWARE QUALITY METRICS
Doct. Kuz M., Ph.D. Kozlenko M., Ph.D. Lazarovych I., Rysniuk O., Vasyl Stefanyk Precarpathian National University, Ivano-Frankivsk, Ukraine; Novak V., Connective Technologies LTD, London, United
Kingdom of Great Britain; Novak M., IT Brains s.r.o., Prague, Czech Republic
Introduction. Currently, software is as necessary as any other product that is used by humankind. Therefore, software, like other products, must have high quality.
The set of qualitative indicators of software products and methods of their determination are regulated by a number of international standards [1]-[8]. These standards are adapted in Ukraine as national. In fact, they are just a direct translation. Standards [5]-[8] do not contain the methods of software product quality indicators determination. They contain the determination methods for quality attributes only, which are indicators of the lowest level. There are no methods for determination of subcharacteristics and characteristics. In this work we used the methodic from [9] in order to improve methods from mentioned above standards.
The number of quality attributes is above two hundred. They are combined into metrics in order to make it easier the determination and the results processing. Attribute metrics are combined into subcharacteristic metrics, which are subsequently combined into characteristic metrics [5].
Quality absolute indicator мP for each metric can be expressed as follows [9]:
n
iiiм VPP
1, (1)
where iP – indicator of i -th subcharacteristic/characteristic; iV – weight of i -th subcharacteristic/characteristic. Quality indicators can be determined in this manner for each hierarchical level.
International standards [5]-[8] do not explain how to get weights values. So, practical quality evaluating is significantly complicated.
The objective of this work is to develop methods for determining characteristic/subcharacteristic weights.
Method of weights determination. Documents [6]-[8] contain ratings of quality metrics H – high, M – middle, and L – low. That can be a basis for weights determination. The ratings for in-use quality metrics are presented in the Table 1 [8]. Table 1 – Ratings for in-use quality metrics
Characteristic Name Code Rating
Effectiveness U.1 H Productivity U.2 H Security U.3 L Satisfaction U.4 M
The developed algorithm for weights determination works as follows.

38 Information technology
Ratings from the Table I are pairwise compared. After that, the identity matrix is built (Table 2). The right upper part of the matrix is formed as follows [10]:
jijiji
aij
,0,1,2
, (2)
where ija – the item of right upper part of the matrix; i , j – pairwise compared ratings. The left lower part is formed according to the following [10]:
ijji aa 2 , (3) where jia – the item of the left lower part. Table 2 – The matrix for weights determination for in-use quality metrics
j i
U.1 U.2 U.3 U.4
U.1 1 1 2 2 U.2 1 1 2 2 U.3 0 0 1 0 U.4 0 0 2 1
After that, the weights are determined as follows [10]:
n
ii
ii
p
pV
1
2
2 , (4)
where 2ip – integrated importance of second order for i -th characteristics; n – the number of compared characteristics.
The integrated importance 2ip can be obtained as follows [10]:
nfppn
fffi ,1;12
1
, (5)
where
11,011,1
11,2
if
if
if
f
pppppp
, (6)
n
jiji ap
1
1 . (7)
The correctness of the matrix can be tested using the following expression [10]:
2
11 np
n
ii
. (8)
The results of the weights determination for in-use metrics are represented in the Table 3. Table 3 – Results of the weights determination for in-use metrics
j i
U.1 U.2 U.3 U.4 ip (1)
ip (2)
iV
U.1 1 1 2 2 6 20 0,435 U.2 1 1 2 2 6 20 0,435 U.3 0 0 1 0 1 1 0,022 U.4 0 0 2 1 3 5 0,11 16 46 1
39 Information technology
The quality indicator of the i -th characteristic iP can be expressed as follows [11]:
z
kkki VPP
1, (9)
where z – the number of subcharacteristics of i -th characteristic. Using (9), the weights vector kV can be got as follows [11]:
z
kk
kk
P
PV
1
. (10)
The developed method was successfully used for the evaluation of the quality of the entropy demodulation software [12].
Conclusion. The developed determination method of quality characteristics and sub-characteristics weights improves the methods given in international standards. It makes the practical use possible for the software product quality evaluation.
References. 1.ISO/IEC 14598-2:2000 Software engineering – Product evaluation – Part 2: Planning and management. International Organization for Standardization, 2000. 11 p.J. Clerk Maxwell, A Treatise on Electricity and Magnetism, 3rd ed., vol. 2. Oxford: Clarendon, 1892, pp.68-73. 2.ISO/IEC 14598-3:2000 Information technology – Software product evaluation – Part 3: Process for developers. International Organization for Standardization, 2000. 14 p. 1.ISO/IEC 14598-4:1999 Software engineering – Product evaluation – Part 4: Process for acquirers. International Organization for Standardization, 1999. 32 p. 2.ISO/IEC 14598-5:1998 Information technology – Software product evaluation – Part 5: Process for evaluators. International Organization for Standardization, 1998. 25 p. 3.ISO/IEC TR 9126-1:2001 Software engineering – Product quality – Part 1: Quality model. International Organization for Standardization, 2001. 20 p. 4.ISO/IEC TR 9126-2:2003 Software engineering – Product quality – Part. 2: External metrics. International Organization for Standardization, 2003. 85 p. 5.ISO/IEC TR 9126-3:2003 Software engineering – Product quality – Part. 3: Internal metrics. International Organization for Standardization, 2003. 46 p. 6.ISO/IEC TR 9126-4:2004 Software engineering – Product quality – Part. 4: Quality in use metrics. International Organization for Standardization, 2004. 49 p. 7.M. Kuz, S. Melnychuk, and L. Zamikhovskyi, Documentation and qualimetry of software products, 2nd ed., Ivano-Frankivsk, 2014, 116 p. 8.S. Ivanova, “Expert method of importance weights,” Modern technologies, materials and design in construction, V. 19, № 2, pp. 74-77. 9.M. Kuz, Ya Solovko, and V. Andreiko, “The methodic for general software quality criteria under conditions of uncertainty”, Visnyk of Vinnytsia Politechnical Institute, issue 5, 2015, pp. 104-107. 10. M. Kozlenko and A. Bosyi, "Performance of spread spectrum system with noise shift keying using entropy demodulation," 2018 14th International Conference on Advanced Trends in Radioelecrtronics, Telecommunications and Computer Engineering (TCSET), Lviv-Slavske, 2018, pp. 330-333, doi: 10.1109/TCSET.2018.8336213
УДК 004.05
MODELING OF SOFTWARE TIME CHARACTERISTICS Doct. Kuz M., Shevliuk L., Ostafiichuk T., Vasyl Stefanyk Precarpathian National University, Ivano-
Frankivsk, Mishagin R., Roman Shukhevych Lyceum, Ivano-Frankivsk, Ukraine
Introduction. The International Standard [1] provides a nomenclature of software quality indicators, which are combined into characteristics and sub-characteristics. More than 40 of these indicators are estimates of time parameters for certain program functions performance.

40 Information technology
Method of weights determination. Using the analogy method from more than 40 mathematical dependencies, a mathematical model of 7 analytical dependencies that meets requirements of [1] has been developed to determine the time parameters of software quality indicators:
106105
203202201104402303
210201110109108103102
104205107101302202201
301
308302106
301301212208203104305
303301403302203202201
Е,Е,
,С,С,С,С,Н,
Е,Е,Е,Е,Е,Е,Е,
П,Е,Е,Е,З,З,З,
Н,
З,Н,Н,
С,П,Е,Е,Е,Е,З,З,З,Ф,Ф,Ф,Ф,Ф
,
iТАX
СiА
TX
iTTX
iTX
iTT
TX
iАTX
iTАX
ііi
i
ii
аi
ii
ii
aii
ii
i
ii
i
ii
,
where Xi – a quality attribute by index i; Ai – a quantitative parameter of the quality attribute that is equal to:
– number of cases encountered by the users with a difference against to reasonable expected results beyond allowable,
– number of inaccurate computations encountered by users, – number of results encountered by the users with level of precision different from
required, – number of cases in which user failed to exchange data with other software or
systems, – number of times that a major (minor) data corruption event occurred, – number of actual failures detected, – number of observed breakdowns, – number of cases which observed software system entered into recovery, – number of operations which user found unacceptably inconsistent with the user’s
expectation, – number of times that the user succeeds to cancel their error operation, – number of times that the user pauses for a long period or successively and repeatedly
fails at the same operation, because of the lack of message comprehension, – number of occurrences of user’s human error operation, – number of completed tasks,
– number of concurrent tasks observed over set period of time for each evaluation,
– number of warning messages or system failures, – number of warning messages or system failures, – number of registered failures,

41 Information technology
– number of revised versions, – number of registered and removed failures, – number of changes, – number of cases which user encounters failures during operation after software was
changed, – number of any constraints or unexpected failures which user encounter during
operating concurrently with other software; Ti – a time parameter of the quality attribute that is equal to:
– operation time, period of operation time (during operation testing), operating time,
– total down time, – time to recovery downed software system at each opportunity, – mean time taken to learn to use a function correctly,
sum of user operation time until user achieved to perform the specified task within a short time,
user operating time (during observation period), – difference of time of completing correction of specified type errors of performed
task and time of starting correction of specified type errors of performed task, user operating time (observation period), operation time period during observation (or the sum of operating time between
user’s human error operations), difference of time of gaining the result and time of command entry finished,
– quotient of sum of response time for each evaluation and number of evaluations (sampled shots),
– maximum response time among evaluations, – observation time period,
– set period of time for each evaluation, – time between user’s finishing getting output results and user’s finishing request, – quotient of sum of turnaround time for each evaluation (shot) and number of
evaluations (sampled shots), – maximum turnaround time among evaluations,
total time spent waiting, – time of I/O devices occupied,
– user operating time during user observation, – time spent to wait for finish of I/O devices operation, – time devoted to a continuous resource, – difference of time at which the causes of failure are found out ( or reported back to
user) and time at which the failure report is received, difference of time at which user received the revised version release (or status
report) and time at which user finished to send request for maintenance to supplier with problem report,
– difference of time at which the causes of failure are removed with changing the software (or status is reported back to user) and time at which the causes of failures are found out,

42 Information technology
– quotient of work time spent to change and size of software change, – operation time during specified observation period after software is changed,
– time spent to test to make sure whether reported failure was resolved or not, – sum of user operating time spent to complete adaptation of the software to user’s
environment, when user attempt to install or change setup, – time duration of concurrently operating other software;
Tai – a time parameter of the quality attribute that is equal to: – required mean response time, – required maximum response time, – required mean turnaround time, – required maximum turnaround time, – task time, – specified time which is designed to occupy I/O devices, – required time period during which dissimilar media are expected to finish their tasks
with synchronisation, – time to repair.
Conclusion. The proposed model is more convenient considering that from over 40 mathematical dependencies for determinating time parameters of software quality indicators, only 7 analytical dependencies have been defined.
References. 1. ISO/IEC TR 9126-2:2003. Software engineering – Product quality – Part 2: External metrics.

43 Mechanical engineering
УДК 539.32 THE INFLUENCE OF AN AGGRESSIVE ENVIRONMENT ON THE REINFORCED
CONCRETE PLATE STRESS-STRAIN STATE Ph.D. Alekseychuk O.M., National Technical University of Ukraine "Igor Sikorsky Kyiv Polytechnic
Institute", Kyiv, Ukraine
Introduction. The problem of ensuring the durability and safety of industrial facilities and transport facilities is one of the most important components of world research. Reinforced concrete has many advantages, such as: long service life, high resistance to dynamic and static loads, etc. At the same time, aggressive operating environments is one of the main negative factors that’s affecting on working capacity of reinforced concrete engineering structures.
The object of study is a layered reinforced plate based on heavy concrete, with a protective top polymer concrete layer, which operates under conditions of mechanical loading and aggressive operating environment.
Presentation of the material. The analysis of known defining ratios for materials used in corrosive environments leads to the conclusion that the vast majority of them have significant disadvantages that do not allow to take into account important features of their deformation, which can lead to significant errors or omissions in the determination of stress-strain state . In addition, to date, there is a very limited number of mathematical models that would be quite simple and effective in predicting the result of long-term impact of aggressive operating environments on the structural elements of structures, and would be available for implementation on the computer form at the same time [1].
In the work the model of deformation of layered reinforced plates from nonlinear composite materials of different resistance is developed with taking into account the kinetics of aggressive environments, and the algorithm of calculating the plate stress-strain state with taking into account the sensitivity to the type of stress state and physical nonlinearity of the material under the conditions of influence of the external environment.
The finite element method and the model of a hybrid bending triangular finite element (FE) of triangular shape with 5 degrees of freedom in the node [2] are selected for the stress-strain state calculation with taking into account a longitudinal forces and deformations of the transverse shear of the plate.
To take into account the influence of the aggressive operating environment on the protective polymer concrete layer, the material degradation function and the law of penetration of the aggressive medium were proposed in [3].
Conclusion. The conducted studies show the presence of quantitative effects that are related with taking into account a different material resistance, degradation of the layer of protective material under the influence of an aggressive operating environment and damage to the bearing layers. It is shown that as the concentration of the aggressive medium in the polymer concrete layer increases, stress and strain redistribution were occur.
It is proved that when determining the stress-strain state of layered reinforced plates it is necessary to take into account the different resistance of their material and the influence of the aggressive operating environment.
References. 1. Biondini F., Bontempi F., Frangopol D.M., Malerba P.G. Reliability of material and geometrically non-linear reinforced and prestressed concrete structures // Journal of Pure and Applied Algebra. 2004. Vol. 82. №13. Pp. 1021-1031. 2. Пенина О.В. Расчет плит из нелинейно-деформируемого материала с произвольной диаграммой деформирования с учетом воздействия агрессивной эксплуатационной среды / В.В. Петров, О.В. Пенина, П.В. Селяев // Academia. 2008. №3.-С. 87-92. 3. Теличко В.Г., Трещев А.А. Гибридный конечный элемент для расчета плит и оболочек с усложненными свойствами. – // Известия вузов. Строительство / №5. 2003. – С. 17-23.

44 Mechanical engineering
УДК 004.9:620.92 UNDERPINNING OF A DESIGN OF PRECISION SEED DRILL PRESS WHEEL WITH A
VARIABLE CONTACT PLANE Ph.D. Artemenko D.Y., Ph.D. Onopa V.A., Central Ukrainian National Technical University, Kropivnitskiy,
Ukraine
Introduction. The research of soil conditions necessary for germination and cultivated crops germination capacity showed that the seeds swelling and sprouting starts at soil moisture index 12 - 14%, and only upon the availability of more than 20% of moisture index, all viable seeds would germinate. For that reason, in order to obtain high field germination rate, it is necessary to place seeds in a soil layer with a humidity of not less than 20%. Field researches suggest that the greater the depth of seed placement, the lower its field germination rate and more delayed and broken seedlings will be. The main effective method of increasing the rate of cultivated crops emerge on the day surface is the seed rolling. This process should be carried out in such a manner as to provide the most favorable conditions for the rapid crops emerge on the day surface. Preeminently, the quality of soil compaction by means of a press wheel depends on the deformation properties of both the press wheel and the soil. The main factors that effect the mentioned process are the design features of the working tool and the physical and mechanical properties of the soil. In light of this, by improving of the press wheel design, it would be possible to create soil conditions that are close to the required ones and to increase the dynamics of cultivated crops seed germination rate by 10 - 15%. But, nowadays, there has not been manufactured a press wheel that would fully satisfy the agrotechnical requirements targeted at the seeding of cultivated crops seeds. That’s why, there is a need of additional researches regarding the justification of their working surfaces.
Curriculum model. The main disadvantage of the serial press wheel is their cylindrical shape. This shape makes it impossible to evenly compact the soil over the seed, both in the longitudinal and lateral planes. In order to overcome these disadvantages, a new press wheel is made of a combined type Fig. 1 and has a larger contact area. The press wheel includes an outer flexible rim 1, the inner rim 3 is press fitted on the wheel hub 4. The outer and inner rims are connected with the help of membranes of trapezoidal profile 2 with radial walls. These radial walls are flexible and directed towards each other, and in cross section, membranes walls have a variable thickness. The working process of the precision seed drill with the proposed press wheel is as follows: while rolling on the soil surface under the influence of the gravity and the contact spring of the working bodies section, membrane of the trapezoidal profile 2, in the zone of contact of the press wheel with the soil, becomes deformed, and the outer flexible rim 1 forms a straight-line segment of a contact in a longitudinal plane of a row. After a contact, under the influence of flexible walls, the trapezoidal membrane while restoring its shape, makes the outer rim of a radial shape, and upon the availability of adhered moist soil on its surface promotes its shedding.
Fig. 1 – Press wheel with increased contact area
Conclusions. The efficiency of the proposed design of the press wheel is ensured by: 1. Uniform soil density along the length and width of the row in the area of seed placement, as
the result of formation of a constant straight-line segment of a contact, which makes it possible to pull the moisture, improve its germination rate, and create favorable conditions for seed germination.

45 Mechanical engineering
2. The reliability of the pressing process due to the usage of the trapezoidal profile membrane with variable wall thickness in a press wheel design, as well as the press wheel shedding as the result of a constant deformation of the flexible rim. УДК 630.377.22
CALCULATION OF TENSION FORCE OF TRACTION LOAD-LIFTING CABLE OF SUSPENDED CABLE TIMBER TRANSPORTING SYSTEM
Ph.D. Baryliak V.V., Ph.D. Rudko I.M., Ukrainian National Forestry University, Lviv, Ukraine, Shoshyn A.O., Belarusian State Technological University, Minsk, Belarus
Introduction. A considerable part of Ukrainian forest fund is located in the Carpathians. Cable timber transporting systems are economically reasonable and the most environmentally thrifty means of primary transportation of timber in mountainous and inaccessible areas. The improvement of important units construction and the development of new schemes of cable timber transporting systems is the main scientific and practical task, the implementation of which requires the creation of new and improvement of existing calculation methods.
Exposition of a subject matter. In order to study the internal loads arising in the drive links and other structural units of cable timber transporting system, it is necessary to take into account the size and actual nature of external technological efforts, particularly, tension force of traction load-lifting cable.
Typical technological cycle of cable systems operation contains 4 main stages, lasting respectively t1, t2, t3, t4:
Selection of cable weaknesses with gradual increase in tension force of cable to the value of weight of the load; Load lifting ; Locking of load with cargo carriage; Movement of cargo carriage with load along the bearing cable.
Apart from the above-mentioned stages, the additional ones are possible, such as: movement of empty load handling devices and pulling timber from the side to the line of bearing cable.
The dependences for determination of tension force of traction load-lifting cable S(t) and the duration of each stage of the technological cycle have been established:
00
0
0 01
0 02
0
0 ( )
1
1 1
1
1
К К
К К
К КG
К К
К КG G С
К К
КG С
К
К
Q L x t C vt S t tC v L x t
Q L x t Q L x tt H S t
C v v CQ L x t Q L x t
H t H t S tS t v C v C
Q L x tt H t
v C
Q L x tt
v
32 30 00
2 coscos 24
K ККG С
К
S tgq L x tL x t
H tC H
(1)
where 0 1 2 3( ), , ,S t S t S t S t – tension force of traction load-lifting cable respectively when choosing cable weaknesses, lifting load, locking of load with cargo carriage and transporting a cargo carriage along the bearing cable [2, 3]; Q weight of load; 0Кx t coordinate of cargo carriage at the initial time 0t ; GH – height of load lifting; v – velocity of winding of rope onto the drum; – inclination angle of the chord of span to the horizon; КC – longitudinal stiffness of

46 Mechanical engineering
traction lifting cable; H – horizontal component of tension force of cable [2, 3]; Сt – time of load locking [2]; L – span length; Kq – linear cable mass.
An example of calculation based on the proposed dependencies for cable timber transporting system, with carrying capacity of 16 кН and span length of 400 м, is shown in figure. 1.
Figure 1 – Temporal dependence of tension force in the traction load-lifting cable
Conclusions. It is established that the maximal short-term effort in traction load-lifting cable
occurs at the moment of locking of load with the carriage. The obtained dependences, along with corresponding software, are necessary for mathematical modeling of dynamic oscillatory processes in the elements of cable timber transporting systems and substantiation of the choice of their basic constructional parameters and safe regimes of operation.
References 1. Ye. M. Lutyy. Calculation features of variables process loads acting on the cable timbertransporting plants drive/ Ye. M. Lutyy, V.V. Barylyak, O.M. Udovytskyy// Forestry. Forest, Paper and Woodworking Industry. Interdepartmental scient ific and technical research collect ion.–2015. – no. 41, pp. 29-39. 2. M. Adamovsky. Suspended cable timber transporting systems/Adamovsky M., Martyntsiv M., Badera J, - K.: IZMN, 1997. - 156 p. 3.Zanehyn L. Machines and mechanisms for cable logging: [study guide]. Part I / Zanehyn L., Voskoboinikov I., Yeremeev N. – М.: MHUL, 2004. – 446 p. УДК 621.941.1
FEATURES OF THE USE РOLYMETHYLMETHACRYLAT ARE IN COMPOSITION МОР IS AT TREATMENT CUTTING
Doct. Tsyganov V.V., Yarovaia N. S., "Zaporizhzhia Polytechnic" National University, Zaporizhzhya, Ukraine
Introduction. One of methods increase of efficiency metals treatment cutting is application of lubricating-cooling liquid (LCL) optimal chemical composition. Perspective is the use LCL in the complement of that high molecular connections enter with certain physical and chemical properties.
Presentation of the material. During of the use LCL with a polymer in the zone of cutting compound physical and chemical processes and phenomena flow: adsorption of macromols polymer on a surface in the zone of cutting, them thermo and mechanical destruction with formation

47 Mechanical engineering
macroradicals, atomic hydrogen and carbon and other products of destruction polymer. There is a chemosorption of atomic elements on the juvenile surfaces of the treated surface and cutting instrument, their diffusion in a plastic deforming metal and formation of compounds with the alloying elements of metal. Except that macroradicals chemosorption are on a metallic surface, creating strong tapes which divide surfaces that is friction and substantially reduce the level of superficial energy of the processed metal. During a selection to hydrogen with superficial and active environments on the surface of the deformed metal appear cracks as a result mechanical and chemical transformations, which result in the decline durability of the deformed metal.
According to literary given in composition LCL is widely used different additives of polymers. But in our view as high molecular constituent LCL expediency use of рolymethylmethacrylat (PMMA). It is related to that takes place him thermal destruction on 100% at a temperature 160-170˚С, and energy of activating destruction - 27 kkal/moth (for a polyethylene 60-70 kkal/moth), molecular mass of рolymethylmethacrylat makes 100,12 gs/moth. Hit in the zone of treatment (cutting or flowage), PMMA results in more easy process of flowing of thermo and mechanical destruction polymer with formation of active products destruction.
Undertaken previous studies [1] specify on perspective of the use of PMMA at lathe treatment of constructural alloyed steel. Reduction to the wear of cutter is marked on 40-50% and decline of cutting force on 20-30% during treatment with addition to solution of PMMA in an acetone.
It of of is possible to assume that at treatment of difficult processing alloys there will be more substantial reduction to the wear of instrument and force of cutting, improvement of the microgeometry treated surface. The worked out methodology of determination influence of PMMA of is on efficiency of lathe treatment of difficult processing alloys.
Conclusions. An analysis and theoretical ground of use of PMMA are in - process carried out as an additive to LCL at treatment of metals cutting.
References. 1. Tsyganov V.V., Matvieienko L.S. Influence of of polymer lubricating cool liquid on efficiency of treatment metal cutting // Technological systems. - 2018. - №4. - P. 19-23. УДК 630.3(075.8)
ANALYSIS OF THE STRESS-STRAIN STATE OF WOOD DURING ITS DIVISION ALONG THE FIBERS BY SPLITTING
Ph.D. Karatnyk I. R., Ph.D. Kyi V. V., Ph.D. Shevchenko N. V., Ukrainian National Forestry University, Lviv, Ukraine
Introduction. The process of directional division of wood along the fibers by splitting is applying an external load to a solid wedge-shaped body, during which the deformations and stresses in the structure of the anisotropic wood grow to the limit values in the plane of its separation. The description of such a process is related to the properties of the material being divided and the correct choice of the calculation model based on the parameters of the object being processed and the working body.
Outline of the material. During the process of indiscriminate splitting of wood along the fibers by the wedge-shaped splitting object under the action of external force, the efforts to deepen the wedge and tear the pieces of wood in the plane of its destruction mainly take place. The wood structure (elements of the wood (ridge) db) is in a plane stress-strain state, which can be described by the coordinates xyz (Cartesian system) by the stress function φ(x, y). The displacement of points of any part of the wood during its division is parallel to one plane of deformation and do not depend on the coordinate in the direction of normal to the plane of deformation. The stress tensor Тн(σх, ..., τyz) and the strain tensor Тд(εх, ..., γyz) are simplified for a plane model, which is not connected either to the relations between stresses and strains or to the environmental properties of the physical region under study.
The state of the elements of the structure of the wood, which is distributed along the fibers, is described by the Erie force function φ(x, y), which expresses the distribution of stresses that satisfy
48 Mechanical engineering
the equilibrium condition of the dyad "external forces-internal stresses" and expresses the stress distribution, for example, for the plane region D of element db with arbitrary properties. The boundary conditions for the stresses in this case are the conditions for the force function. Thus, the function φ(x, y) is an unambiguous expression of the internal stresses of a bounded region [D+S] and does not depend on a system of external surface forces which are statically zero. At the same time, the equation satisfying the function φ(x, y) for resilient environment (materials) obeys the Hooke’s law and is biharmonic [1]. Therefore, if the stress vectors are given on the contour S of area D, the solution of the plane problem is reduced to finding biharmonic function φ(x, y) in the flat region D bounded by the boundary of S by integrating the given equation by the values of the function itself and its derivatives given by the contour S normal to the outline. As a result of integration along the boundary S, the derivatives of the power function are determined by the coordinates x and y at any point of the boundary S (the boundary area [O, S1]) of the domain D on its unit size [1] and normal at this point dnd :
);(00
Syxx
dSxdS
dS
);(
00
Sxyy
dSydS
dS
(1)
where: 0õ and 0y – the value of derivatives in O; x (S), y (S) are the coordinates of the main vector of surface forces acting on a single plot, for example [О, S1].
dndy
ydndx
xn
. (2)
Therefore, the external forces on the contour S of the domain D determine the value of the force function φ(x, y), and hence there exists a unique solution to this function, which is also proved by the well-known Green-Ostrogradsky formula in which the solution does not depend on the directions of the normal n the boundary S and its bypass:
DS
dSuvvudSnuv
nvu )( , (3)
where: S – is a closed curve on the plane bounding area D; and nu and nv – derivatives in the direction to the outer normal n of contour S according to the functions and; ),( yxuu and
),( yxvv ; u and v are the displacement components. The integral of the left side (3) does not depend on the method of integration (in the single
section [O, S1] or [S1, O]). An integral taken by any closed contour (3) is zero, since the main vector of external forces is applied to the domain D, which is in equilibrium equal to zero.
The existence of a common (regular) solution for equations (1) - (3) at any point in the domain D of a contour containing special points such as angular points (according to the conditions of the Cauchy problem) is important in the position of a single definition of biharmonic in the domain of a function.
We note that (3) is strictly true for a singular finite or infinite region bounded on a complex plane by a closed smooth contour, which permits its existence according to a flat static theory of elasticity, two holomorphic functions in D R1(x, y) = R1(z) і R2(x, y) = R2(z), if they are regular enough near the boundary S [1]. The presence of two specified functions for a bounded domain [D+S] on a complex plane for the representation of biharmonic function indicates the need for two valid boundary conditions.
To solve the boundary value problem of the theory of functions of a complex variable for a known domain [D+S], it is convenient to replace the variables associated with the conformal mapping w = f (z) of the domain to some simple auxiliary domain D1, while obtaining solution with the new variable w. To establish an explicit form of biharmonic function, this technique is particularly appropriate if the area under study is polygonal (polygonal). In this case, the basic contour S of complex coordinates of region D is to which, as a sufficiently smooth one, the above conditions of existence and determination of the force function φ(x, y) at the boundary S and in the middle of region D can be applied. For the area [D+S], it is most convenient to choose the circle of a single radius as the mapping prototype D1 and solve the boundary value problem formulated for

49 Mechanical engineering
the new variable w in the polar coordinate system. In this case, the biharmonic stress function φ(x, y) = φ(z) is modified, that is, using the w = f(z) transformed power function does not satisfy the biharmonic equation. But with the help of the Gur’s formula [1] it is possible to unambiguously set the kind of functions into which the biharmonic mapping φ(z) becomes transformed.
This boundary-value problem for the biharmonic stress function in the initial expression is to find the solution of the Dirichlet internal problem. Such a two-dimensional problem always has the solution [1], which can be obtained using the general Green function method [1], which has full stability:
dSnGyxy(x
S ),(~5,0), , (4)
where: ),(~ yx – the value of the biharmonic in the domain D of the function ),( yx at the boundary S; G – Green's function; n is the outer normal to the boundary S of area D.
The main task for solving the Dirichlet problem is to find the Green function, which is known only for a small number of simple domains [1]. But the Green function can be created for a circle, which will be a necessary and sufficient condition for finding a biharmonic function of the stresses φ(x, y) in the region [D+S] of the form (4).
Conclusion. The proposed method allows to determine the functional relationship between the external system of forces and the internal structural stresses of the study, basing of which it is possible to build easy to use transfer functions of the deformation and destruction process model for the material (for example, wood structure).
References. 1. Mathematical handbook for scientists and engineers: definition, theorems and formulas for reference and review / Granino A. Korn, Theresa M. Korn. – M. : Nauka. 1984. – 833 p. УДК 539.4
PROBABILISTIC PREDICTION OF STRUCTURE MATERIALS STRENGTH AND RELIABILITY
Ph.D. Kvit R.I., Doct. Baitsar R.I., Ph.D. Salo T.M., Lviv Polytechnic National University, Lviv, Ukraine
Introduction. In the context of the growing use of new materials and structures with little operational experience, the behavior of which often depends on a number of poorly studied and difficult to control factors (defectiveness and inhomogeneity of the material structure and, as a result, heterogeneity of the deformation and strength properties, deviations of the sizes and shapes of structures, changes in external influences on them) leads to an increase in the role of the application of probabilistic-statistical methods as a means of scientific prediction of their strength and reliability.
Presentation of the material. A biaxial stress state ( , )P Q P of an elastic isotropic body of volume V is considered, in which N crack-defects of random length and orientation are uniformly distributed. According to the results of papers [1-3], for the specified body the expression of the failure loading distribution function, which is based on the weakest link hypothesis, and determines its probability of failure fP , has the following form
0
0( , ) 1 exp | | ( 1, 2)mi
N fK VF p P N P iN
, 0 P , (1)
where 0N is the number of cracks in a unit volume 0V , the parameters iK are defined in paper [3], 0m is the material homogeneity parameter (the material is more homogeneity with m
increasing). The most probable value (mode) of the failure loading for the distribution function (1) is
determined by the formula

50 Mechanical engineering 1/
0
0
( 1)m
Moi
N mPmK V N
. (2)
We believe that the probability of failure cannot exceed a certain normative value g , which is established on the basis of assumptions or experiments. By the expression of the distribution function (1), we find the value of the failure loading gP (quantile), corresponding to the given probability of failure g
1/
0
0
ln(1 )m
gi
N gPK V N
. (3)
As you can see from formulas (2) and (3), both mode MoP and quantile gP of the failure
loading depend on the same parameters as the mean value of failure loading P [3], that is, on the type of stress state, body size (through the number of defects N ), homogeneity and Poisson’s ratio of the material.
Formula (3) with the relation g gQ P in the parametric form determines the equations of the fracture criterion, which corresponds to given probability of failure.
The value of the probability of failure *g , which makes the curves of the mean value of failure loading [3] and the curves for a given probability of failure coincide, is determined as follows:
* 1 exp (1 1/ )mg m , where ( )z is the Euler integral of the second kind.
Conclusions. Written relations allow us to construct a failure criterion of an elastic isotropic body of volume V according to a given probability of failure and to find the probability of failure value at which this criterion is consistent with the equations of the limiting state curves expressed in mean values of failure loading. The probability of failure value, which corresponds to the mean value of failure loading, decreases with parameter m increasing (the material homogeneity increasing).
References. 1. Y. Matsuo. Statistical fracture theory for multiaxial stress state using Weibull’s three-parameter function // Eng. Fract. Mech. – 1981. – №14(3). – P. 527–538. 2. Y. Matsuo. The formulation of the multiaxial distribution function for a brittle fracture having location parameters and its applications // Trans. Japan Soc. Mech. Eng. – 1983. – №49(437). – P. 46–52. 3. Kvit R.I., Baitsar R.I. On probability of failure estimation for brittle materials under complex stress state // Proceedings of the III International scientific and practical conference “Applied scientific and technical research”, 3-5 April 2019, Ukraine Technical Sciences Academy, Ivano-Frankivsk, Ukraine, 2019. – P. 60. УДК 621.873
EXPERIMENTS DESIGN OF TOWER CRANE SLEWING AND TROLLEY MOVEMENT
Doct. Loveikin V. S., Doct. Romasevych Yu. O., Ph.D. Liashko A. P., Mushtyn D. I., National University of Life and Environmental Sciences of Ukraine, Kyiv, Ukraine
Introduction. In order to confirm the theoretical results and to establish their applicability in the practical conditions, it is necessary to conduct experimental studies. The design of theoretical models, as well as the results obtained on their basis, reflects only the most important factors that influences on the dynamics of the movement of mechanisms. However, there may be situations when certain characteristics of the system (for example, the control system of the drives) have not

51 Mechanical engineering
been properly taken into account. It raises a question of the practical application of the mechanisms’ optimal laws of motion. In order to identify such factors, as well as to provide recommendations for their consideration, it is necessary to carry out experimental studies and to analyze the obtained data.
Main part. The implementation of optimal control is to control the kinematic (angular velocity) or power (torque) characteristics of the AC motor by means of power electronics (frequency inverter). Of course, such control requires some discretion of control cycles and the development of specialized software for this purpose. Thus, the set of activities that defines the program of experimental research can be presented in the following form:
1) establishment of independent factors and levels of their variation, as well as responses of the object of experimental studies, which would correspond to the most significant (kinematic, power, energy) characteristics;
2) selection of an experimental installation (tower crane model) suitable for determining the basic characteristics of the movement of its elements;
3) selection of measuring and recording equipment (analog-to-digital converters, computers) and other devices (power supplies, connecting cables, boards, etc.) to be used in the course of the experiments;
4) selection of frequency inverters, which serve as power sources for engines of mechanisms of a crane slewing and trolley movement;
5) development of software for controlling the operation of frequency inverters and their appropriate setting;
6) selection of methods of processing the arrays of experimental data (separately for each measured parameter) and the method of statistical data analysis);
7) carrying out experimental researches corresponding to the developed plan. Measurement and recording equipment was used in the course of the experimental studies. All
sensor data was transmitted to analog ADC channels, converted to data packets and sent to the PC. They were stored there for further processing and statistical analysis.
In order to investigate the dynamics of system motion at direct start and optimal control, all experimental studies are divided into two stages. In the first stage, the characteristics of the process were measured when the voltage was applied to the motors from the power supply (i.e., direct start of the mechanisms). The purpose of this step is to determine the effect and kinematic and dynamic characteristics of the system parameters (position of the trolley on the boom, weight of the load, length of flexible suspension of load).
In the second stage of experiments, the power source of the drives acted as frequency inverters, which according to the commands coming from the PC, performed the realization of optimal laws of motion of the mechanisms. The purpose of the experimental studies in the second stage is to determine the quality of optimal laws realization.
Conclusions. Conducted experiment design allowed to obtain all the needed information about the tower crane mechanism movement. It will be realized in the conditions of the laboratory. However, obtained data due to the similarity method may be used for explaining the process of the real crane. УДК 631.362.3
RESEARCH OF CONTACT MOTION OF LIGHT IMPURITIES IN PNEUMO-SEPARATING CHANNEL
Ph.D. Nesterenko O.V., Central Ukrainian National Technical University, Ukraine
Introduction. Grain quality .is affected by a number of factors. One of the factors is post-harvest processing, which in turn depends on the efficiency of the grain cleaning machines. As a rule, grain cleaning machines include two systems: sieving and pneumatic. And, as the studies confirm, the efficiency of the air system of many grain-cleaning machines is much lower than that of the sieve, which significantly reduces the quality of separation [1, 2].

52 Mechanical engineering
The reasons for the lack of efficiency of the air systems include large concentration of grain material in the input areas, output areas and uneven distribution in height and width of the pneumatic separation channel [3].
Therefore, it is essential to determine the conditions of concentration of grain material in the pneumatic channel and the interaction of light impurities with grain.
Main material. Our proposed multilevel method of grain input provides separation of grain material into several limited flows, which move into multi-height operating areas of the pneumatic separating channel [4].
Applying this method of the input of grain material, the impurities move in stages. Each stage provides passage of the next layer and the movement between the layers (Fig. 1, a).
The following condition is selected for the quality criterion of pneumatic separator operation:
2i n
гор вер ii n
T T T
, (1)
where горT is the time during which the impurity from the lower layer passes to the back wall of the
channel; верT is the time during which the impurity passes through all upper layers; , / 2, /iT i n is the time during which the impurity passes through i layer; n – number of grain layers.
а)
b)
Figure 1 – Scheme of impurity motion: а) – while passing grain layers; b) – while contacting grain.
Motion of mass centre Oξi of the impurities at the і stage ( 1,i n ) consists of three consequent stages (Fig. 1, b):
- non-contact motion of impurities between the layers – area AiBi; - contact of impurities with grain in B1i; - motion of impurities on the grain C1i, and mass centre of a single particle of impurities is BiCi. Equation of the motion of impurities on grain in a moving coordinate system
, / 2, /iO s i n (Fig. 1, b) is defined by:
2,д пms mk V s mgsin (2)
where β is the contact angle of impurities to the grain. The average values of the time the impurities pass through i layer iT , / 2, /i n and linear
velocity at the moment of leaving the grain layer Vi, / 2, /i n , are defined by the formula:
2 2
(2) (2)
0 0
1 1, ( )2 2
R R
i i i ii iT t d V t d
R , / 2, /i n . (3)
The results of analytical studies allow obtaining averaged trajectories of light particle flight during contact motion through the grain layers located above (Fig. 2).
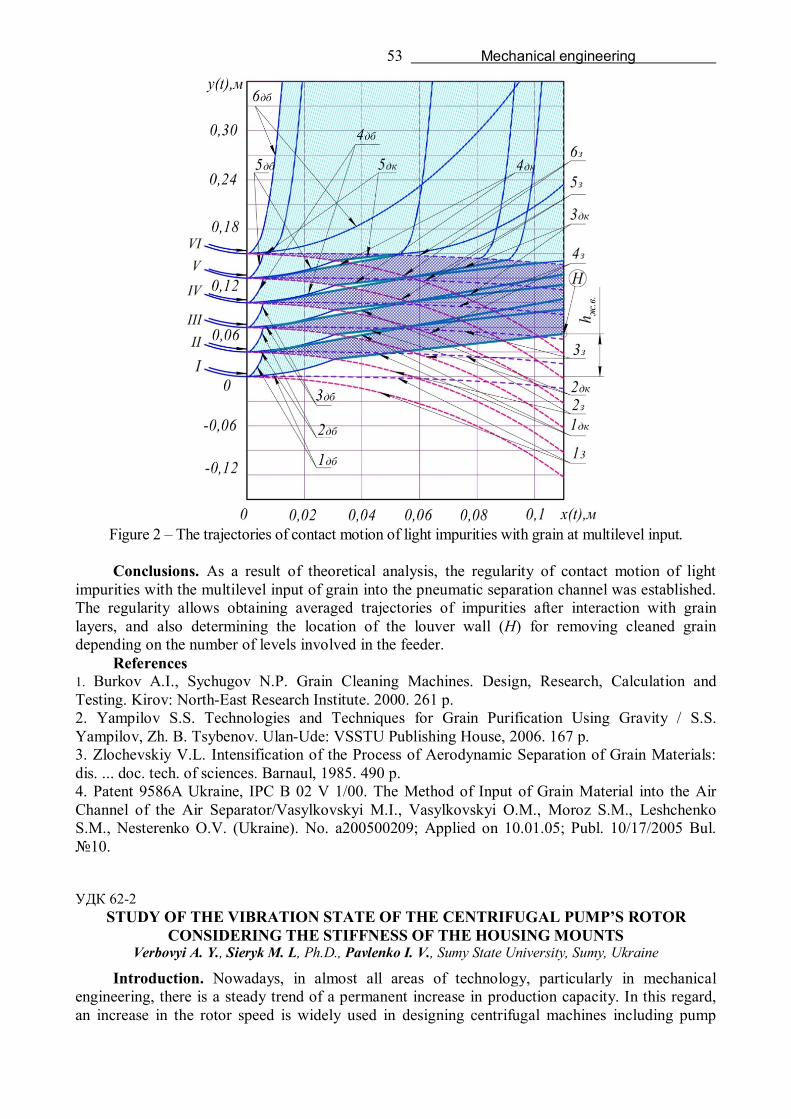
53 Mechanical engineering
Figure 2 – The trajectories of contact motion of light impurities with grain at multilevel input.
Conclusions. As a result of theoretical analysis, the regularity of contact motion of light
impurities with the multilevel input of grain into the pneumatic separation channel was established. The regularity allows obtaining averaged trajectories of impurities after interaction with grain layers, and also determining the location of the louver wall (H) for removing cleaned grain depending on the number of levels involved in the feeder.
References 1. Burkov A.I., Sychugov N.P. Grain Cleaning Machines. Design, Research, Calculation and Testing. Kirov: North-East Research Institute. 2000. 261 p. 2. Yampilov S.S. Technologies and Techniques for Grain Purification Using Gravity / S.S. Yampilov, Zh. B. Tsybenov. Ulan-Ude: VSSTU Publishing House, 2006. 167 p. 3. Zlochevskiy V.L. Intensification of the Process of Aerodynamic Separation of Grain Materials: dis. ... doc. tech. of sciences. Barnaul, 1985. 490 p. 4. Patent 9586A Ukraine, IPC B 02 V 1/00. The Method of Input of Grain Material into the Air Channel of the Air Separator/Vasylkovskyi M.I., Vasylkovskyi O.M., Moroz S.M., Leshchenko S.M., Nesterenko O.V. (Ukraine). No. a200500209; Applied on 10.01.05; Publ. 10/17/2005 Bul. №10. УДК 62-2
STUDY OF THE VIBRATION STATE OF THE CENTRIFUGAL PUMP’S ROTOR CONSIDERING THE STIFFNESS OF THE HOUSING MOUNTS
Verbovyi A. Y., Sieryk M. L, Ph.D., Pavlenko I. V., Sumy State University, Sumy, Ukraine
Introduction. Nowadays, in almost all areas of technology, particularly in mechanical engineering, there is a steady trend of a permanent increase in production capacity. In this regard, an increase in the rotor speed is widely used in designing centrifugal machines including pump

54 Mechanical engineering
units. However, a rotor is an unavoidable source of vibrations. Unsatisfactory vibration level leads to accelerated wear of the main components of the pump unit.
Additionally, in the worst cases, it is a cause for accidents and breakdowns. The reduction of the vibration level for rotor machines by the traditional balancing is not enough to use because the rotor is being installed to the pump’s housing. Moreover, in operational conditions, design features additionally impact the vibrational state of the rotor system.
Research Methodology. Based on the abovementioned, the work is aimed at the development of a reliable mathematical model of rotor dynamics as a component of the comprehensive system “pump unit – platform”. This model considers the influence of the stiffness of the housing mounts on rotor dynamics. To achieve this goal, the following objectives should be solved:
1) creation of the finite element model for the dynamic system “rotor – housing – mounts” considering the rigidity of both the housing mounts and bearings.
2) determination of local stiffness and inertia matrices for each element, as well as the consequent formation of the global matrices for the entire finite element model [1];
3) solution of the generalized eigenvalue problem for determining the critical frequencies; 4) determination of critical frequencies of the rotor without considering the compliance of
supports using the file “Critical frequencies of the rotor” [2] of the computer algebra system “MathCAD”;
5) comparison of the obtained results and evaluation of the influence of the supports’ compliance on critical frequencies of the rotor;
6) verification of the proposed mathematical model by comparing it with the results of numerical simulation (i.e. modal analysis) using the “ANSYS” software.
Conclusions. As a result, a reliable mathematical model of free rotor oscillations of a centrifugal pump unit as a component of the comprehensive dynamic system “pump unit – platform” was created. The model is based on the beam-type finite elements. The eigenfrequencies of free oscillations were estimated.
It should be noted that for solving the problems of ensuring the vibration state of pump units, the developed mathematical model has more advantages than the use of the ANSYS software for the following reasons: the difference in the values of the results obtained is not more than 10 %; calculations with the implementation of the proposed mathematical model does not require high computer performance; the preparatory and calculation time is significantly reduced.
References. 1. Pavlenko I. V., Simonovskiy V. I., Demianenko M. M. Dynamic analysis of centrifugal machines rotors supported on ball bearings by combined application of 3D and beam finite element models. IOP Conference Series: Materials Science and Engineering. 2017. Vol. 233. P. 1–8. 2. The computer program “Critical frequencies of the rotor”: Certificate of authorship, No. 59855, Ukraine / I. V. Pavlenko, V. I. Simonovskiy. 2015.

55 Electrical engineering
УДК 537.322.11 DEVICES FOR MEASURING ELECTRICAL PARAMETERS OF THERMOELECTRIC
GENERATORS Dakus S.V., Ph.D. Krynytsky O.S., Ivano-Frankivsk National Technical University of Oil and Gas,
Ivano-Frankivsk, Ukraine
Introduction. Today, there are widespread devices that have the Seebeck effect called thermoelectric generators, and the Peltier effect called thermoelectric coolers. Thermoelectric generators and coolers are solid state devices that are capable of generating electricity or cooling without any intermediate liquids or chemical processes. They do not have moving parts in themselves, which provides the possibility of long work with minimal maintenance. In addition, it provides quiet cooling compared to conventional compressor-based refrigeration systems. These criteria make thermoelectric devices extremely attractive for many applications.
Presentation of the material. For electricity generation, thermoelectric generators are used in vehicles as devices for the extraction of heat from flue gas in space research for the conversion of thermal energy released during the decay of radioisotopes [1]. Thermoelectric coolers are widely used in heating, ventilation and air conditioning systems in vehicles. Due to their ability to be miniaturized, they are suitable for controlling temperature-sensitive equipment such as surgical instruments, fiber optic lasers in telecommunication systems. Thermoelectric coolers can also be integrated into microprocessors to achieve accurate temperature control [2].
Due to the wide range of applications of thermoelectric devices, mass production of thermoelectric modules has become widespread. Developers seeking to use thermoelectric devices in their systems face the difficult task of choosing the right type of thermoelectric module to meet the requirements for heating, cooling, or energy generation.
Alternatively, an analytical determination of the performance of thermoelectric modules can be offered using simplified or perfect ratios. However, these ratios cannot be used because of the lack of information about the properties of the materials used to produce the module (Seebeck coefficient , electrical conductivity , and thermal conductivity - ), which is not usually available due to privacy or patent protection.
Thus, for the purpose of this study, it is possible to set up an experimental verification of the characteristics of thermoelectric devices submitted by manufacturers.
To investigate the characteristics of TEG we have developed. The module is heated by means of a flat ceramic heater which is connected to the AC mains through a thermostat which provides temperature stabilization on the module. Thermocouples of HC type were used for temperature measurement. The opposite side of the module is cooled by means of an active cooler. Clamping the TEG module to the radiator and heater is realized by means of a clamping mechanism which is implemented by a clamping bar and a spring of a plate type.
Experimental procedure The next one side of the thermoelectric module is kept at a constant temperature. The module is supplied with current iU and 0U a temperature difference occurs. The voltages that occur before and after the interruption of the current supply and, accordingly, are measured together with the temperatures set at the TEG. To eliminate the effects of heat due to the Joule effect, testing is performed twice, once in one polarity and the next time in reverse polarity. The equations allow us to determine the thermoelectric properties of TEG
0 0
1 0;U U
T T
0 0 ;
2i iU U U U
RI
1 1
1 1;
I T TT T
0 0
0 0i i
U URU U U U
where 1T temperature of the cold side of the module, and the mark of the bar - measurement at reverse polarity.
Conclusion. The TEG performance parameters were analyzed, an experimental setup was proposed to test the characteristics provided by the manufacturers for the TEG.
Reference. 1. S. Kim et al., "Thermoelectric power generation system for future hybrid vehicles using hot exhaust gas," Journal of Electronic Materials, vol. 40, no. 5, pp. 778-784, 2011.

56 Electrical engineering
УДК 621.313.333.2 MODELING OF THE CANNED INDUCTION MOTOR
Ph.D. Kimstach O., Chernysh M., Admiral Makarov National University of Shipbuilding, Nikolayev, Ukraine
Introduction. The development of electrical energetics produces the increasing of the number of the nuclear power-stations. Which are characterized by the high efficiency and ecology. Therefore, that produces the requirement of a permanent researching of their equipment.
The reactor coolant pump is a main part of the nuclear power-station [1]. For a drive, it traditionally uses the electrical drive, basing on the canned induction motor. The starting mode of its operation causes a most hard normal transient processes, which researching is very important task.
Presentation of the material. The construction specific of the canned induction motor (there is presence of the metal can [2] in the air-gap between a stator and a rotor) brings to the necessity of rebuilding of the typical induction motor model, which usually based on a mathematical model of the two phase generalised electrical machine [3].
The can may be considered like the additional stopped rotor, as was made in the work [2]. In this case, the model diagram of the canned induction motor takes the form sown in the fig. 1.
In the fig. 1 ωc – a rotating speed of the can; , cu cvi i − the can currents for axis u and axis v. The
can inductance of a loss magnetic flux is too low, that allows it is not take into account.
The interlinkage system for model diagram of the canned induction motor is solved for the currents:
2
2
su su cu s
sv sv cv s
ru ru cu r
rv rv cv r
r s ru sucu cu
s r r s
r s rv svcv cv
s r r s
i L M
i L M
i L M
i L M
L L MiM L M L M L M L M
L L MiM L M L M L M L M
(1)
where M – mutual inductance (took equal for all relation of the windings); ,sL rL – the stator and rotor full inductances.
To simplify a simulation model of the canned induction motor, based on a mathematical model of the two phase generalised electrical machine, take to a rotating speed of the coordinate system is equal the base rotating speed (rotating speed of the stator magnetic flux)
1k r r s , (2) where s – a slip of the canned induction motor.
Corresponding to the eq. (2) for the canned induction motor a mathematical model of the two phase generalised electrical machine is transformed to form:
Figure 1 – Model diagram of the canned induction motor
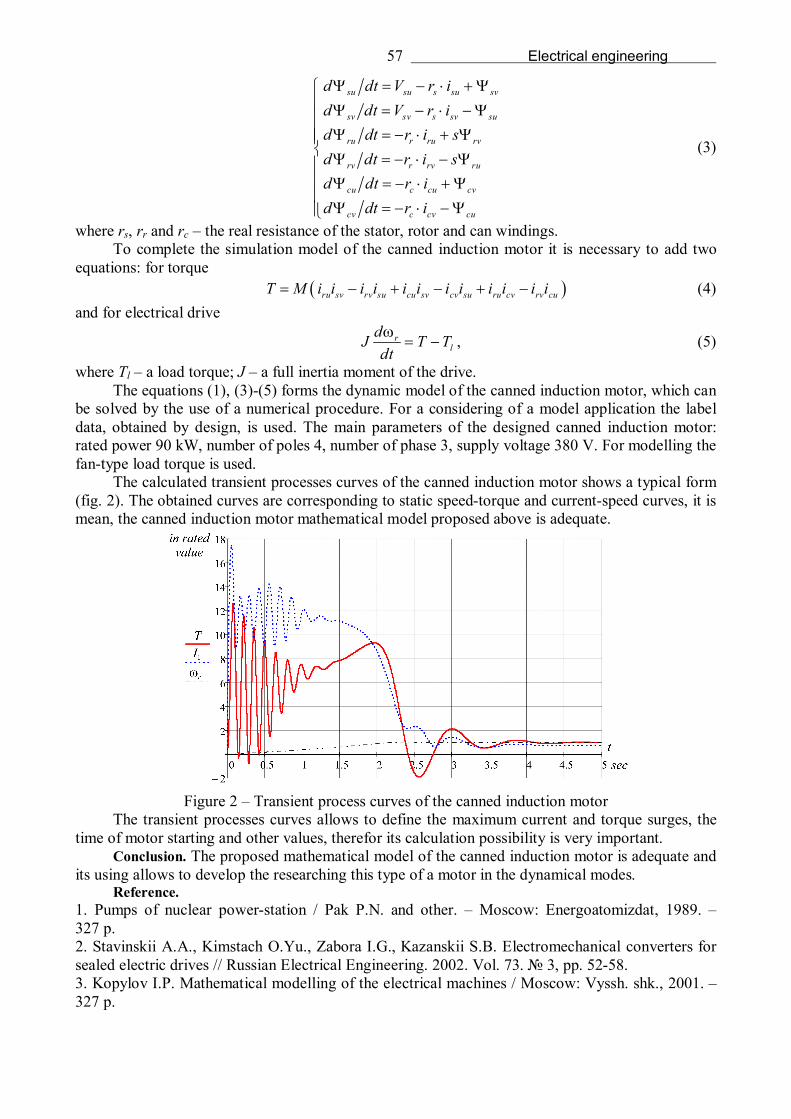
57 Electrical engineering
su su s su sv
sv sv s sv su
ru r ru rv
rv r rv ru
cu c cu cv
cv c cv cu
d dt V r id dt V r id dt r i sd dt r i sd dt r id dt r i
(3)
where rs, rr and rc – the real resistance of the stator, rotor and can windings. To complete the simulation model of the canned induction motor it is necessary to add two
equations: for torque ru sv rv su cu sv cv su ru cv rv cuT M i i i i i i i i i i i i (4)
and for electrical drive r
ldJ T Tdt
, (5)
where Tl – a load torque; J – a full inertia moment of the drive. The equations (1), (3)-(5) forms the dynamic model of the canned induction motor, which can
be solved by the use of a numerical procedure. For a considering of a model application the label data, obtained by design, is used. The main parameters of the designed canned induction motor: rated power 90 kW, number of poles 4, number of phase 3, supply voltage 380 V. For modelling the fan-type load torque is used.
The calculated transient processes curves of the canned induction motor shows a typical form (fig. 2). The obtained curves are corresponding to static speed-torque and current-speed curves, it is mean, the canned induction motor mathematical model proposed above is adequate.
Figure 2 – Transient process curves of the canned induction motor
The transient processes curves allows to define the maximum current and torque surges, the time of motor starting and other values, therefor its calculation possibility is very important.
Conclusion. The proposed mathematical model of the canned induction motor is adequate and its using allows to develop the researching this type of a motor in the dynamical modes.
Reference. 1. Pumps of nuclear power-station / Pak P.N. and other. – Moscow: Energoatomizdat, 1989. – 327 p. 2. Stavinskii A.A., Kimstach O.Yu., Zabora I.G., Kazanskii S.B. Electromechanical converters for sealed electric drives // Russian Electrical Engineering. 2002. Vol. 73. № 3, pp. 52-58. 3. Kopylov I.P. Mathematical modelling of the electrical machines / Moscow: Vyssh. shk., 2001. – 327 p.
58 Electrical engineering
УДК 621.311 ELECTRIC SYSTEMS AND NETWORKS MODES ANALYSIS USING THE SOFTWARE
AND COMPUTING COMPLEX DIGSILENT POWERFACTORY Ph.D. Dovgalyuk O.M., Privalov Yu.L., Bondarenko R.V., Yakovenko I.S., National Technical University
«Kharkiv Polytechnic Institute», Kharkiv, Ukraine
Introduction. The need to calculate and analyze the electric systems and networks modes arises when solving a large number of designing and operational problems in the energy sector. To make prudent decisions in these tasks, high accuracy of calculation results, large quantity analysis of a modes considered, many factors consideration in determining the required parameters, calculations for complex expressions, etc. need to be ensured. All this leads to the necessity of using software-computing complexes (SCCs) to effectively solve the set tasks.
Many scientific works by Kirilenko O.V., Stogniy B.S., Yandulsky O.S., Shidlovsky A.K., Popov V.A., Lezhniuk P.D., Kulik V.V. and others are devoted to the information software using in solving energy problems. In these works the features definition the steady and transient modes parameters of electrical systems and networks using SCCs were investigated, the power systems state assessment was performed, the simulation and optimization of operating modes were performed, system calculations of short-circuit currents were performed, parameter prediction and control of electrical systems and networks were performed and many other studies were performed. However, solving such problems does not lose its relevance due to the constant energy systems development and improvement, which further complicates the calculating their modes process. Thus, the SCCs using to determine the electrical systems and networks modes parameters is one of the important energy tasks today.
Statementing material. A powerful specialized SCCs large quantity that have their own specifics and application features are used to calculate and model the electrical systems and networks modes in the energy sector today [1]. The most famous of these SCCs is SDO-6, RastrWin, EnergyCS, PSS®E, DigSILENT PowerFactory, EUROSTAG and others. The using DigSILENT PowerFactory, developed by the German company DIgSILENT GmbH, has been substantiated for the steady and transient modes study of electric systems and networks, taking into account the electricity quality indicators and electricity supply reliability.
DigSILENT PowerFactory has been developed as an advanced integrated and interactive software system designed to calculate electric systems and control systems analysis to accomplish basic planning and optimization tasks. The DigSILENT PowerFactory advantages are its user-friendly interface, ease of power system model input and control, a large tasks list to be solved, the built-in programming tools availability, convenient calculation results visualization and presentation, the ability to generate reports, the results compatibility obtained by calculations (including the ability to configure an electrical network based on an online or online request to SCADA) and more.
DigSILENT PowerFactory possibilities include the following basic features [2]: - active and reactive power flows calculation for all lines, as well as modules and voltage
angles for all nodes for symmetric and asymmetric steady state modes; - short-circuit currents calculation for all types and their components for single-phase, two-
phase and three-phase networks of arbitrary configuration for alternating and direct current; - the electric network elements congestion analysis, the voltage modes and the reactive power
reserves planning; - the station group regulators simulation, primary regulators and automatic control of
frequency and active power (in particular for the task of active power unbalance distribution between stations and post-emergency modes analysis);
- the power systems and electrical networks modes optimization, their condition assessment; - reliability calculation and analysis for load nodes and power networks; - harmonic analysis, which consists in estimating the electricity quality in the presence of
higher harmonic components in the network (harmonic components calculation of voltages and currents in the electrical network, active filters in the network at a given frequency, harmonic sources simulation, long and short-term flicker analysis);

59 Electrical engineering
- conducting perspective schemes by linking elements to the introduction time and options for the power systems development;
- electromagnetic and electromechanical transients simulation, static and dynamic stability calculations for power systems;
- heavy and emergency modes simulation and analysis for power systems; - calculation, simulation and coordination of relay protection and automation systems, power
electronics devices, FACTS. The following calculations were carried out for electric networks rated voltage 10-330 kV and
Northern Power System elements using DigSILENT PowerFactory: - electricity quality indicators analysis for the electric network after the solar power plant
connection; - static and dynamic stability analysis for the power system when changing the power
generation mode and connections in the United Energy System of Ukraine; - bandwidth verification for power transmission lines and voltage levels at nodes during
electric network reconstruction due to increased loads; - operation modes analysis of the electric network when connected to it distributed generation
sources. Calculation examples for individual fragments of the these tasks are presented in Fig. 1.
а) b)
Figure 1 – Electric network modes calculation using DigSILENT PowerFactory: a) voltage harmonic components; b) mode calculation with active filters
The analysis results of electrical systems and networks operation modes were used to develop
measures to ensure the transmission lines capacity requirements and voltage range in the electric network, electricity quality indicators, conditions for reliable and high-quality power supply to consumers in the studied networks, requirements for ensuring static and dynamic stability power systems, as well as measures to optimize electrical systems and networks by specified criteria.
Conclusions. The using DigSILENT PowerFactory software for calculating and analyzing the electric systems and networks modes greatly facilitates the process studies in complex power objects, provides obtained results high accuracy and helps to reduce the calculations time. It will allow to increase efficiency of management, operation and design processes for modern power systems and their elements.
References: 1. Bezkotnyi P.I. Modern means of electric networks and systems modes calculation / P.I. Bezkotnyi, O.M. Dovgalyuk, Yu.L. Privalov, І.S. Yakovenko // Materials of the ІІІ International Scientific and Technical Conference "Energy Efficiency and Energy Security of Power Systems (EEES-2019)». - Kharkiv: "Madrid Printing House". - 2019. – PP. 12-14. 2. DigSILENT PowerFactory [Online]. – Available: http://regimov.net/content.php/81-programm.

60 Electrical engineering
УДК 621.44 + 621.577 EFFICIENCY OF COGENERATION HEAT PUMP INSTALLATION IN THERMAL
SCHEME OF BOILER-HOUSE OF THE PLANT FOR THE PRODUCTION OF CONCENTRATED JUICES
Ph.D. Ostapenko O.P., Poprotskyi Yar.S., Vinnytsia National Technical University, Vinnytsia, Ukraine
Introduction. In our study the efficiency of using of cogeneration-heat pump installation (CHPI) in the thermal scheme of a boiler-house of the plant for the production of concentrated juices is evaluated.
Presentation of the material. In our study, the analysis of energy and economic efficiency of the CHPI application, using the results of studies from [1 – 2], for the thermal scheme of an industrial-heating boiler-house of the plant for the production of concentrated juices was performed. The industrial-heating boiler-house of the plant provides the technological needs of production and its own needs, for steam production is used the water from the well. In our study, it was proposed to use groundwater heat from a well to generate heat in a heat pump installation. It is proposed to use of CHPI on the basis of steam-compressor heat pump installation (HPI) and gas-piston engine-generator with utilization equipment in the thermal scheme of the boiler-house of the plant. In studies [1 – 2] it was determined that the above-mentioned CHPI provide high rates of energy conversion, the use of CHPI allows to increase the energy and economic efficiency of thermal schemes. In our study the efficiency of three modes of application of CHPI in the thermal scheme of an industrial-heating boiler-house of the plant when working with variable seasonal load of thermal consumers is evaluated, the results of the studies are summarized in table 1.
Table 1 – Indicators of the CHPI efficiency of three modes operation in the thermal scheme of boiler-house of the plant for the production of concentrated juices
Indicator Mode of CHPI operation Water temperature at the inlet of the HPI evaporator, ºC 8 10 15 Coefficient of performance of HPI 2,184 2,669 2,853 Coefficient of performance of CHPI 3,532 4,097 4,280 Saving of equivalent fuel of the boiler-house due to the use of CHPI, % 6,86 6,51 6,36
Reducing of the cost price of heat due to the use of CHPI, % 5,46 5,13 4,99 Conclusions. In study the efficiency of the use of CHPI in the thermal scheme of the boiler-
house of the plant for the production of concentrated juices was evaluated. According to the results of the study it is determined that the use of CHPI with high energy conversion rates in the thermal scheme of the boiler-house of the plant will result in the savings of equivalent fuel by 6,36…6,86% and will reduce the cost price of heat by 4,99…5,46%, depending from the mode of operation.
References. 1. Ostapenko, O. P. (2019). Study of energy-economic efficiency of energy supply systems with cogeneration heat pump installations, using the heat of the industrial and natural sources, in industry and municipal heat power branch of Ukraine. Social and Legal Aspects of the Development of Civil Society Institutions. Part I, (рр. 292 – 308). Warsaw: Institute of European Integration. Bmt Eridia. 2. Ostapenko, O. P. (2019). Analysis of energy, ecological and economic efficiency of steam compressor heat pump installations, as compared with alternative sources of heat supply, with accounting the concept of sustainable development. Sustainable Development Under the Conditions of European Integration. Part II, (pp. 312 – 329). Ljubljana:Visoka šola za poslovne vede. УДК 621.44 + 621.577
EFFICIENCY OF COGENERATION HEAT PUMP INSTALLATION IN THERMAL SCHEME OF BOILER-HOUSE OF THE DAIRY PLANT
Ph.D. Ostapenko O.P., Kokhan V.O., Vinnytsia National Technical University, Vinnytsia, Ukraine
Introduction. In our study the efficiency of using of cogeneration-heat pump installation (CHPI) in the thermal scheme of a boiler-house of a dairy plant is evaluated.

61 Electrical engineering
Presentation of the material. In our study, we analyzed the energy and economic efficiency of CHPI, on the base of the results of studies from [1 – 2], in the case of its use in the thermal scheme of industrial-heating boiler-house of dairy plant. In our study, it was proposed to use of CHPI in the thermal scheme of a boiler-house of a dairy plant, with using the heat of ground water from a well. In our investigation is proposed to use of CHPI, which consists of a steam-compressor heat pump installation (HPI) driven by a gas piston engine-generator with recycling equipment. Based on the analysis of studies [1 – 2], it is determined that the use of CHPI allows to provide the increase of energy and economic efficiency, as well as ecological safety of thermal schemes of the boiler-house. In this study we evaluated the efficiency of the use of CHPI in the thermal scheme of the boiler house of the dairy plant when operating in different modes, in accordance with the change of the seasonal load of the boiler-house; the results of the studies are summarized in table 1. The application of CHPI on the low-temperature heat of groundwater in the thermal scheme of the boiler-house of a dairy plant will provide the production of additional thermal and electric power with high values of the energy conversion efficiency index at CHPI φ = 3,56...4,24, which is caused by an increase in the value of the CHPI coefficient of performance due to the using the recycling heat in the range of Δφ = 1,375...1,389, depending on the mode of operation.
Table 1 – Indicators of the CHPI operation in the thermal scheme of boiler-house of dairy plant Indicator Mode of CHPI operation
Water temperature at the outlet of the HPI evaporator, ºC 3 5 10 Coefficient of performance of CHPI 3,56 4,06 4,24 Increase of the value of CHPI coefficient of performance due to the use of utilization heat 1,375 1,389 1,387
Saving of equivalent fuel of the boiler-house due to the use of CHPI, % 7,22 6,74 6,59
Reducing of the cost price of heat due to the use of CHPI, % 5,74 5,29 5,15 Conclusions. In study the efficiency of the use of the cogeneration-heat pump installation in
the thermal scheme of the boiler-house of a dairy plant was evaluated. According to the results of the study it is determined that the use of CHPI with high rates of energy conversion φ = 3,56...4,24 in the thermal scheme of the boiler-house of the dairy plant will cause the savings of equivalent fuel by 6,59…7,22% and will reduce the cost price of heat by 5,15…5,74%, depending on the mode of operation.
References. 1. Ostapenko, O. P. (2019). Study of energy-economic efficiency of energy supply systems with cogeneration heat pump installations, using the heat of the industrial and natural sources, in industry and municipal heat power branch of Ukraine. Social and Legal Aspects of the Development of Civil Society Institutions. Part I, (рр. 292 – 308). Warsaw: Institute of European Integration. Bmt Eridia. 2. Ostapenko, O. P. (2019). Analysis of energy, ecological and economic efficiency of steam compressor heat pump installations, as compared with alternative sources of heat supply, with accounting the concept of sustainable development. Sustainable Development Under the Conditions of European Integration. Part II, (pp. 312 – 329). Ljubljana:Visoka šola za poslovne vede. УДК 620.9
IMPROVING THE ENERGY EFFICIENCY OF SOLAR PLANTS Ph.d. Vashchyshak І., Ivano-Frankivsk National Technical University of Oil and Gas, Ukraine
Introduction. The relevance of the work is caused due to the expediency of improving the energy efficiency of solar plants through the use of solar energy concentrators. Ways to improve the energy efficiency of solar panels using a system of directional mirrors [1], flat Fresnel lenses [2, 3], spherical concentrators [2] and trackers have been investigated [4].
System of mirrors can increase the energy efficiency of solar batteries by 35-60%. However, thus substantially a temperature increases on the surface of solar panels, the system is difficult to

62 Electrical engineering
configure correctly and it requires the allocation of additional space for placement, which is not always possible and relevant. The energy efficiency of a panels with a lenses will increase by no more than 5% with direct incidence of sun rays, but when the incidence of sun rays is 45°, the energy efficiency of the panels even decrease compared to its efficiency without lenses by 30%. Increasing the energy efficiency of solar panels using spherical concentrators is 27%, but to use them to increase the energy efficiency of large panels it is not practical. The use of trackers provides several benefits at once, but the main advantage is that in the general case they can give an increase in power generation up to 50-55%.
It is established that the most optimal way to improve the energy efficiency of solar panels is to use inexpensive trackers with a simple design.
Presentation of the material. The analysis of known types of solar panels, which differ in materials from which their elements are made, and the coefficients of efficiency – dependence of energy produced by a photocell to the intensity of solar radiation per unit of its surface, and selected the type of solar panels by the criterion “price-quality” has been made. To building a power plant, 40 pieces of EnerGenie EG-SP-M300W-33V9A [5] type panels with a total capacity of 12.0 kW were selected, which is convenient enough for its technical implementation.
Trackers increase the energy efficiency of solar panels by orienting them so that sun rays during the daylight falls on the surface of the panels at right angles. Therefore, it is proposed to develop a tracker that could work with high efficiency, but was simple and cheap.
A tracker design has been developed to track the angle of inclination of solar panels to increase efficiency (Figure 1).
Figure 1 – Design of a solar tracking system
The tracker consists of two frames made of steel of shaped cross-section. The support frame 1
will stand on the ground, frame 2 will rotate about on the hinges. In frame 2, 8 solar panels 3 in framework 4 are mounted (Fig. 1 shows 2 of 8) with steel axes 5 and 6, placed on top and bottom of the frames. With respect to these axes, the panels 3 may rotate in a vertical plane. In order to rotate all the panels in the tracker to the same angle on their lower axles 6 are placed gear wheels, which are interconnected by a chain gear. The movement of the chain transmission is provided by an electric motor with gear 7.
In order to reduce the cost of the tracker, it is suggested to orientate it to the south at once, and to change the inclination angles (30° і 45°) twice a year (in early April and late August), changing the position of the frame with the panels 2 using latches 8 with mounting holes 9. Elements 10 and 11 serve to increase the strength of the frame with panels 2.
The design of the mechanism for turning the two tracker panels in a vertical plane is shown in Figure 2.

63 Electrical engineering
Figure 2 – Rotation mechanism for solar trackers
Panels 1 with respect to their position 2 can return to an angle of 45° to the left and to the
right. An angle of 45° is chosen in order to minimize the size of the tracker. At this angle, given the width of the panel in the frame of 1 m and the shadow zone from the panels, the distance between the centers of the panels L will be 0.42 m. Then the total tracker length will be 11.4 m. The panels are attached to the tracker frame using the upper and lower axles 3. Toothed wheels 4 are mounted on the lower axles. The same wheel is worn on the axis 5 of the electric motor with a reducer 6. All gears are rotated at a certain angle simultaneously by a chain transmission 7. The simplicity and reliability of such a mechanism will ensure its long uninterrupted operation.
The calculation of the energy efficiency of the power plant is carried out in two stages: the first stage calculates how much electricity per year can be obtained from solar panels while adjusting only the angle of the panels to the south; in the second stage, given the increase in energy efficiency of the solar power plant when using the tracker system. The electricity generated by the proposed solar power plant was calculated using an online calculator [6].
Based on the conducted experimental studies [7], the average losses of electric power generation by solar panels are given, depending on the angle of inclination to the sun. Based on these data, it is projected to reduce losses when generating electricity for a given power plant due to the use of a tracker compared to a fixed power system, with the same number of solar panels.
Conclusions. The calculated electricity generation of the proposed solar power plant with tracker confirmed the efficiency and feasibility of using the designed tracker system. The application of the designed tracker system allows to increase the energy efficiency of solar panels by an average of 25%.
References. 1. Kozhemiako V., Dombrovskyi V., Zherdetskyi V., Malinovskyi V., Prytuliak H. (2011)
Analitychnyi ohliad suchasnykh tekhnolohii fotoelektrychnykh peretvoriuvachiv dlia soniachnoi enerhetyky. Optyko-elektronni informatsiino-enerhetychni tekhnolohii, vol. 22, no 2, pp. 141-157. 2. Lens solar panels. Flat and spherical. Available at: https://rodovid.me/solar_power/linzovye-solnechnye-paneli.html. 3. Fresnel lenses. Available at: https://aliexpress.com/popular/fresnel-lens.html. 4. How to place solar panels? Available at: http://dozor.technopark.by/_ projects/index.html#x. 5. Solar power plant EnerGenie EG-SP-M300W-33V9A, 300 Вт / 24В. Available at: https://energenie. com.ua/katalog/jenergosbere-zhenie/1305001.html. 6. Solar Power Calculator. Available at: https://rentechno.ua/ua/solar-calc.html. 7. Efficiency of using solar trackers (solar orientation systems). Available at: http://ust.su/solar/media/section-inner79/11275/. УДК 681.527.2
ACCURACY IMPROVING OF POSITIONING OF A TWO-SPEED ELEVATOR BY THE IDENTIFICATION OF LOADING DEGREE
Ph.D. Nazarova O.S., Ph.D. Osadchyy V.V., Shulzhenko S.S., Zaporizhzhia Polytechnic National University, Zaporizhzhia, Ukraine
Introduction. The main task of upgrading outdated elevators is that the updated equipment meets the high technical requirements and does not give way to its parameters of the new kit, but
64 Electrical engineering
significantly save money. Thus, the development of new passenger elevators and improvement of the quality of existing elevators is relevant not only in Ukraine but also in other countries.
Presentation of the material. A large number of studies was aimed at a detailed study of the effects of electrical interference on the work of the elevator, the study of mechanical and electromechanical characteristics of the electric drive, alternatives to the use of microprocessor ACS. But the identification of the mass of the cargo in the cabin remained almost unattended. For experiments a mathematical model of the elevator was created. For different stages of loading the cabin from 0 to 100%, a 20% step was done to determine the angular speed of rotation. As a result of the theoretical calculations, the dependence of the stop error on the loading level of the elevator cabin is obtained, which allows you to automatically determine the boot load, the required time of braking and stopping, in order to improve the accuracy of the positioning of the elevator [1].
For carrying experiments, a laboratory stand simulating an electric drive of an elevator was developed. Based on the model of the actual elevator developed earlier, a modernized model has been developed in which all parameters of the system have been replaced in accordance with the parameters of the stand. A series of experiments were carried out for various loading degree, both on the stand and on a mathematical model in the Matlab Simulink environment. An analysis of the data obtained experimentally and using the mathematical modeling environment showed that the maximum mean deviation does not exceed 2.27 units. Consequently, we can conclude that as a result of the performed mathematical and physical experiments it is proved that the developed mathematical model of the stand can be used for modeling of processes in the automatic control system of an elevator electric drive.
It was established that the developed method of identification allows for known parameters of the elevator in the course of time of two rotations of the engine shaft to determine the loading degree of two-speed elevator. The developed simulation model allows to automatically determine the start time of braking and indicates the positioning error.
Method of identification of loading degree improves positioning accuracy compared to using average uploads by changing the start time of braking. Thanks to improved positioning accuracy increases the energy efficiency of the system, and the simplicity of the method makes it possible to reduce cost when replacing equipment [2].
Conclusion. Based on the experiments carried out on the mathematical model, it is determined that the developed method for identifying the loading degree of the elevator cabin allows to increase the accuracy of its positioning to ± 5 mm (without using the positioning accuracy method ± 18 mm) due to the change start time of braking.
References. 1. Osadchyy, V., Nazarova O., Shulzhenko S. Identification of the loading rate of a two-speed elevator [Identyfikatsiya stupenya zavantazhennya dvoshvydkisnoho lifta] // Electrical and computer systems, 2018, vol. 27(103), pp. 103-111. DOI: https://doi.org/10.15276/eltecs.27.103.2018.11 2. Nazarova O., Osadchyy V., Shulzhenko S. Accuracy improving of the two-speed elevator positioning by the identification of loading degree // International Conference «Modern Electrical and Energy Systems» (MEES-2019), September 23-25, 2019 Kremenchuk Mykhailo Ostrohradskyi National University, Ukraine, рр. 50 - 53 DOI: 10.1109/MEES.2019.8896414
65 Automation and instrumentation
УДК 532.61 IMPROVEMENT OF THE APPARATUS FOR THE INTERFACE PHASE TENSION BY
THE TURNING DROP METHOD Ph.D. Bilishchuk V.B., Ivano-Frankivsk National Technical University of Oil and Gas, Ivano-Frankivsk,
Ukraine
Introduction. Liquids, their various solutions, solids and gases interact at the boundary of their contacts. The result of such interaction depends on the physicochemical properties at the boundaries of these contacts. The interfacial tension of liquids determines the interaction energy at the interface between two insoluble in one liquid phases and is the determining parameter of this interaction. Measurement of interfacial tension of liquids allows to predict the result and to control the processes in oil refining, chemical, household, oil production and others. industries. Typical values of interfacial tension of liquids are 0.01 ÷ 20 mN / m. Such low values of interfacial tension are measured by rotary-drop devices. In such devices, a drop of lighter fluid is filled into a heavier fluid glass tube, the tube with liquids is rotated, certain droplet sizes are measured, the frequency of rotation and, with a known difference in the density of liquids, the values of interfacial tension are determined.
Presentation of the material. A device for measuring the interfacial tension of liquids [1], which uses an engine speed controller made according to the electrical scheme described in [2], was developed. The disadvantage of this scheme is the poor stabilization of the engine speed at high speeds (above 8000 rpm).
It is known to use discrete proportional-integral-differential (PID) -regulators to stabilize the parameters of the devices and installations. It is proposed to use a discrete PID controller to improve the performance of the device. Such a controller can be executed in the software of the microcontroller of the device. The power and speed of the motor shaft with the tube can be adjusted by the method of pulse width modulation (PWM). A microcontroller with a clock speed above 50 MHz must be used to ensure simultaneously high PWM frequency and low signal discretion. The most suitable for these purposes are microcontrollers of the DSPIC33 family, in particular DSPIC33FJ12MC201.
The microcontroller in the device performs the following tasks: determining the pulse period from the motor tachometer, synchronizing the position of the rotating tube with the pulse illuminator, calculating the frequency of rotation of the tube with liquids, changing the frequency of rotation of the tube according to a predetermined value, stabilizing the frequency of the tube.
The PWM capture and generation modules are used to implement the functions of measuring, adjusting and stabilizing the frequency of the tube. These modules are implemented as the hardware peripherals of the microcontroller. The capture module is used to calculate the length of time (frequency) of the input signal. In the 16-bit register of the capture module is entered the value of the associated timer, in the event of an expected external event (front edge, rear edge). It is possible to calculate the period and frequency of the signal (the frequency of rotation of the tube in the device) based on the binary code recorded in the capture register. The DSPIC33FJ12MC201 microcontroller has a PWM signal generation module. This module can be used to control DC motors.
Conclusion. The proposed enhancements will make it possible to develop a modern electronic unit with fewer elements, and all the functions of the unit control units can be concentrated in the software.
Links. 1. Кісіль І. С. Розроблення приладу для вимірювання динамічного міжфазного натягу рідин методикою фіксованої обертової краплі / І. С. Кісіль, В. Б. Біліщук, Р. Т. Боднар // Збірник тез доповідей IX міжнародної науково-практичної конференції «Приладобудування 2010: стан і перспективи», 10-12 квітня 2010р., м. Київ, ПБФ, НТУУ «КПІ», 2009. с. 133– 34. 2. Сергеев О. Стабилизатор частоты вращения коллекторного двигателя / О. Сергеев // Схемотехника. – 2001. – №4. – с. 6. УДК 621.315.592
PRECISION DEFORMATION AND PRESSURE METERS Doct. Baitsar R.I., Ph.D. Kvit R.I., Telishevskyy A.Yu., Lviv Polytechnic National University, Lviv, Ukraine
Introduction. New, more stringent requirements for measuring transducers and a significantly increased flow of information lead to the need to use digital computer technology and to search for new possibilities for constructing information converters, the output signal of which is consistent with the input of computer complexes.
66 Automation and instrumentation
Presentation of the material. When developing precision measuring instruments, preference is given to resonant converters, which ensure their high metrological and operational characteristics. The most suitable mechanical medium for creating resonant converters is a structurally perfect monocrystal, which is characterized by a change in electrical properties with a change in the mechanical state. In terms of simplicity of design, such converters approach a semiconductor strain gauge. Compared with the latter, they have a more convenient for recording (processing) shape of the output signal and higher sensitivity to deformation and allow the creation of unified measuring instruments for a wide range of purposes. The uniformity of the converters is due to the fact that their basis is a single basic element – a monocrystal resonator, which can be used in various designs of sensors [1]. Using the possibility of converting a mechanical quantity into a deformation of an elastic element (EE), and then deforming into a resonator oscillation frequency, allows you to change the measuring range of a mechanical quantity without changing the design of the sensor by correspondingly changing the thickness of the EE. At the same time, such a semiconductor converter is in good agreement with integrated electronic equipment, which allows it to be connected in a single design with an intermediate signal converter [2]. A converter is used in various modes of operation of analog-to-digital devices: frequency, period, ratio or frequency differences, which are realized using universal digital frequency meters, or directly to a personal computer.
A separate technical problem, which was solved in order to ensure the minimum effect of the deformation of the converter housing on the metrological quality of the membrane module, was the development of a method for its connection with fittings.
Specially developed methods for planting and securing monocrystal strings (resonators) in nodes on the surface of EE (membranes, consoles) using glass-crystal cements ensured the reliability of joints and the stability (quality factor) of their vibrations.
The metrological assessment of pressure sensors was carried out by direct comparisons with exemplary measuring instruments of the MKM and MAD type with subsequent processing of the results. The range of measured pressures is 0-900 mm Hg; multiplicative error is 0.006%; nonlinearity is 1%; zero drift is 0.01-0.03%; the value of the frequency change is 6-13 kHz; the natural frequency of resonator oscillations is 30 kHz. Crystal parameters: length is 2.5 mm; diameter is 12 µm; excitation voltage is 20 V; crystal supply current is 1.5 mA.
Conclusions. The potential capabilities of resonant converters can be realized in measuring devices, for the materials of the elastic elements of which physical and mechanical perfection is characteristic. Therefore, monocrystalline silicon is the most optimal structural material for EE. This allows you to achieve complete coordination of the elements of the membrane-converting unit (module) and create digital measuring devices with improved metrological characteristics.
References. 1. Baitsar R.I., Kvit R.I. Temperature dependence estimation of the vibration and frequency sensor resonator mechanical state. Energy Engineering and Control Systems, 4(1). – 2018. – P. 45–50. 2. Gingin M.P., Baitsar R.I. Intelligent measuring converter based on a resonant sensor using an AVR microcontroller // Proceedings of the International scientific and practical conference “Quality management in education and industry”, Lviv, Ukraine, 2013. – P. 232–233. (in Ukrainian) УДК 532.61
DETERMINATION OF VOLUME OF LIQUID IN VOLTAGE LOCATION TANKS Ph.D. Bodnar R. T., Ivano-Frankivsk National Technical University of Oil and Gas, Ivano-Frankivsk,
Ukraine
Introduction. When transporting and storing liquids, especially petroleum products, there is a problem of controlling the amount of liquid in the tanks under conditions where the bottom of the tank is in a non-horizontal position. In this regard, it is difficult to establish the exact amount of fluid in the tanks.

67 Automation and instrumentation
Due to certain circumstances, the tank may be positioned at a certain angle to the horizontal plane. In this case, the use of traditional methods of determining the volume of the fluid using the measurement of the height of the liquid level will have a significant error. Therefore, adjustments should be made to the process of determining the volume of the fluid, taking into account the tilting of the tank. To solve this problem, a mathematical solution to the problem is developed.
Presentation of the material. For a common type of cylindrical tank, in the case of deviation of its axis from the vertical by the angle α, the volume of liquid in the tank will be equal to:
chDV 4
2, (1)
where D is the diameter of the tank hc is the height of the liquid level on the axis of the tank. Since in most tanks the center of the manhole (neck) for filling the liquid is not at the center
of the circular lid, but at a distance d from the edge, measurements can only be made in height h min from the center of the manhole to the level of the liquid, and not along the axis of the tank.
To determine the height hc the expression:
dDtghHh вC
cos. (2)
where H is the height of the tank; is the slope angle of the tank base If the reservoir of a prismatic shape with a rectangular base is tilted so that one of its sides of
the base is tilted at an angle α and the other - at an angle β (Fig. 1), a more complicated situation arises.
Figure 1 – Angles of inclination of the sides of the tank base relative to the horizontal surface To determine the volume of fluid, we find the equation of the plane in which the bottom is
located at the three points M1, M2, and M3 [1]. The value of the coordinates of the points is obtained by designing these points into the corresponding coordinates: М1(0, 0, (bsinα+asinβ)); M2(acosα, 0, bsinβ); M3(acosβ, bcosα, 0).
Applying the analytical geometry equation, vector analysis and matrix theory, we obtained the equation of the plane of the basis in the form:
Ax + By-Cz-D = 0, (3) where ;cossinsincossincoscossinsincos 222 abbbaabA
;cossincossincossin 2 aababB ;cosaC ).sinsin(cos abaD We obtain the volume of the tank by taking the triple integral of the plane equation [2]:
m n k
dxdydzDCzByAxV0 0 0
,)( (4)
where m = bsinα + asinβ is the upper bound of integration on dz; n = bcosβ is the upper bound of dy integration; k = asinβ is the upper bound of integration by dx.
68 Automation and instrumentation
There are a number of methods for calculating such integrals: Newton, Simpson, Gauss, Chebyshev, the trapezoid method, and others. All these methods give the approximate value of the solution of a certain integral, but the Simpson method is considered to be the most accurate, so it is advisable to use it [3]. Of course, computing should be done using computing.
The angles of inclination are determined by an opto-electronic sensor whose principle of action is to change the resistance of the photoresistor layer on the wall of a closed cell by moving the level of the opaque liquid inside, which is illuminated by a uniform light flux on the opposite side of the photoresistor. The electrical signal of the developed encoder will be proportional to the slope angle.
To determine the distance from the center of the hatch cover to the liquid surface, it is advisable to use the triangulation method, the essence of the latter is to scan the laser surface of the liquid surface and capture the maximum of the reflected signal by the photodetector.
Conclusion. The expressions obtained to determine the volume of fluid in arbitrary tanks allow to avoid subjectivity in the process of determining the volume of liquid and to improve metrological indicators.
Literature. 1. Федорчук В.В. Аналитическая геометрия и линейная алгебра / В.В. Федорчук. – М.: Наука, 1977, 288 с. 2. Каплан И.А. Практические занятия по высшей математике. Часть 4 / И.А. Каплан. – Харьков: Издательство Харьковського университета, 1971. –500 с. 3. Каплан И.А. Практические занятия по высшей математике. Часть 5 / И.А. Каплан. – Харьков: Издательство Харьковського университета, 1971. –500 с. 4. Щуп Т.С. Решение инженерных задач на ЭВМ / Т.С. Щуп . – М.: Мир, 1982. – 235с. УДК 006.86:681.121.4
THEORETICAL RESEARCH OF THE INFLUENCE OF RESISTANCE FORCES IN MEASURING FLOW ON THE VERTICATION EFFECT IN TURBINE GAS METERS
Ph.D. Klochko N.B., Ph.D. Dolishniy B.V., Ivano-Frankivsk National Technical University of Oil and Gas, Ivano-Frankivsk, Ukraine
Introduction. The resistance forces of the measuring (gas) enbironment acting on the turbine, its blades and bushings can cause deviation from the ideal calibrated speed of the turbine [1,2]. This deviation, as is known, can be characterized by the function of the dimensionless ratio of the forces of inertia to the viscosity forces. This relatioт is nothing but a Reynolds number. Basically, these forces slow down the rotation speed of the turbine, respectively, increasing the flow measurement error.
Brief description. Turbine gas meters are designed and calibrated under conditions of uniform axial flow. This means that if turbulence occurs at the turbine inlet in the gas stream, depending on the direction of the turbulence, the turbine may increase or decrease the rotation speed, which will lead to over- or under-reading of the meter, and consequently the consumer or supplier may suffer losses.
The resistance of the gas environment itself, which slows down the rotation speed of the turbine, as mentioned, is a function of the Reynolds number and turbulence, which is a function of the flow velocity. The vorticity of the flow causes ripples, which in turn introduces an additional error in the measurement result.
To begin with, let us dwell on the well-known formula for determining the Reinolds number, Re:
Vd
Re, (1)
where ρ – density of the gas mixture, m3/h; V – gas speed, m/s; d – pipe diameter, m; μ – dynamic viscosity of gas, Pa×s.

69 Automation and instrumentation
Obviously, in order to have an idea of the type of working environment flow, it is necessary to know the parameters of the environment and the geometric dimensions of the pipe section. When it comes to natural gas, the dynamic viscosity factor, taking into account the component composition of gas at pressures up to 0.5 MPa, is calculated by the formula [2,3]:
)(5.108.209.937.1
24.3 5.0
125.05.0
ya xxT
, (2) where xa – molar fraction of nitrogen; xy – molar fraction of carbon dioxide.
Accordingly, the formula for determining the number Re takes the form:
)09.937.1(24.3))(5.108.2(
Re 125.05.0
5.0
TxxVd ya
(3) All the necessary data to determine the Reynolds number by the above formula is known.
Mixture densities, molar parts of nitrogen and carbon dioxide are parameters known before flow measurement begins; gas temperature, pressure and flow rate are the result of multiple measurements. In case if standard test protocols are available, the Reynolds number can be calculated in order to investigate the nature of the change in natural gas flow behavior.
Conclusions. Factors of influence on the the angular velocity formation of the turbine meter during the flow measurement of natural gas have been theoretically established. It is suggested to take into account the design features of the turbine meter, gas flow parameters and hydrodynamic changes of the flow of the medium when processing the results of gas flow measurement. It is also necessary to investigate the influence of the turbine meter design parameters and the influence of the parameters of natural gas on a conversion factor of the gas flow meter.
References.
1. Klochko N.B. Improvement of methods of accuracy estimation for turbine gas meters: dis. Candidate of Technical Sciences: 05.01.02 / Klochko Nataliia Bogdanivna. - Ivano-Frankivsk, 2014. - 158 p. 2. Novitsky P.V. Measurement error estimation. / PV Novitsky, I.A. Zograf - L .: Energoatomizdat, 2001. - 303 p. 3. Gordyukhin A.I. Measurements of gas flow rate and quantity and its accounting / I.A. Gordyukhin, Yu.A. Gordyukhin - L .: Nedra, 1987. - 213 p. 4. Turbine gas meter. Handbook.// Instromet International. Gas measurement and control equipment - 2000. - р.27 УДК 532.61
METROLOGICAL ANALYSIS METHODS FOR DETERMINING THE CONTACT ANGLE OF WETTING POROUS BODIES
Ph.D. Bodnar R. T., Ph.D. Bilishchuk V.B., Ivano-Frankivsk National Technical University of Oil and Gas, Ivano-Frankivsk, Ukraine
Introduction. The wetting of porous oil and gas rocks is one of the indicators that determine
the process of displacement of oil from oil and gas reservoirs. To increase oil production hydrophilize the rock, and to limit the flow of formation water in the oil wells hydrophobize. In such processes, surfactants are used [1]. The effect of the surfactant on wetting depends on the properties of the solid surface of the rock and surfactant, which requires preliminary study. In [2], a method and installation are described to automate the process of control of the contact angle of porous solids using modern optoelectronic instruments. One aspect of measurement is to ensure the metrological characteristics of the instruments. The purpose of this paper is to analyze the constituent uncertainties of the proposed method and device.
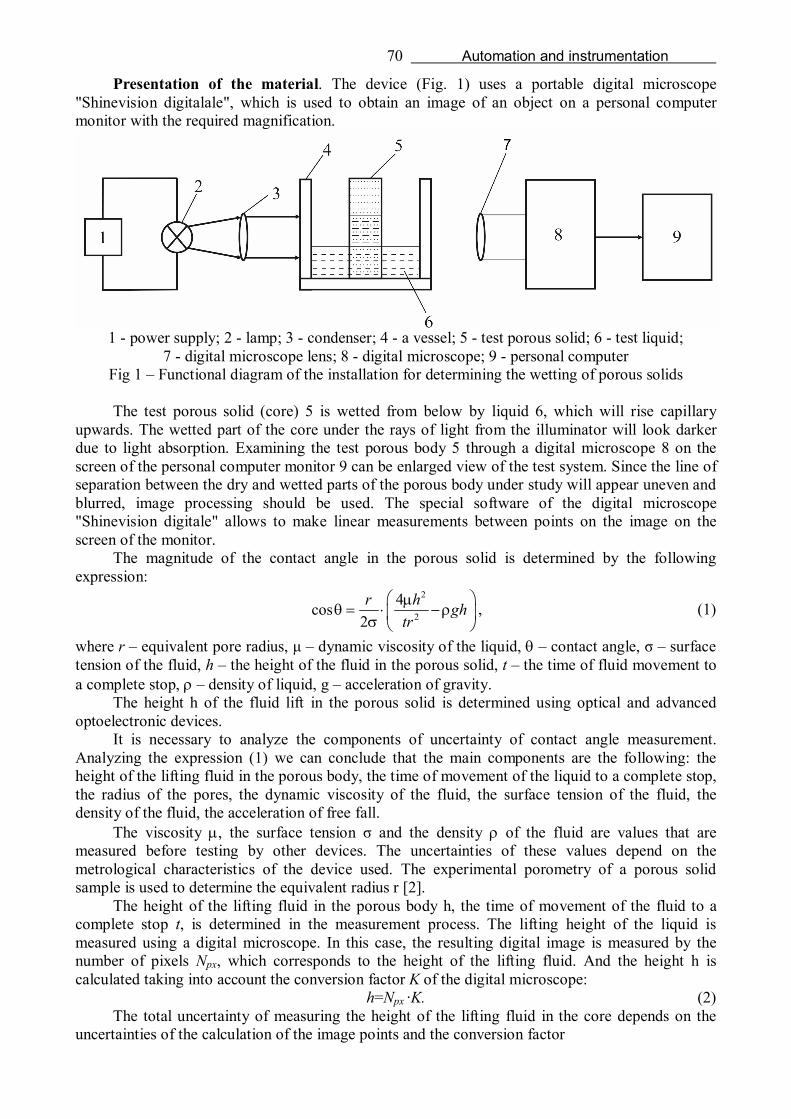
70 Automation and instrumentation
Presentation of the material. The device (Fig. 1) uses a portable digital microscope "Shinevision digitalale", which is used to obtain an image of an object on a personal computer monitor with the required magnification.
1 - power supply; 2 - lamp; 3 - condenser; 4 - a vessel; 5 - test porous solid; 6 - test liquid;
7 - digital microscope lens; 8 - digital microscope; 9 - personal computer Fig 1 – Functional diagram of the installation for determining the wetting of porous solids
The test porous solid (core) 5 is wetted from below by liquid 6, which will rise capillary
upwards. The wetted part of the core under the rays of light from the illuminator will look darker due to light absorption. Examining the test porous body 5 through a digital microscope 8 on the screen of the personal computer monitor 9 can be enlarged view of the test system. Since the line of separation between the dry and wetted parts of the porous body under study will appear uneven and blurred, image processing should be used. The special software of the digital microscope "Shinevision digitale" allows to make linear measurements between points on the image on the screen of the monitor.
The magnitude of the contact angle in the porous solid is determined by the following expression:
2
2
4cos2r h gh
tr
, (1)
where r – equivalent pore radius, μ – dynamic viscosity of the liquid, – contact angle, σ – surface tension of the fluid, h – the height of the fluid in the porous solid, t – the time of fluid movement to a complete stop, – density of liquid, g – acceleration of gravity.
The height h of the fluid lift in the porous solid is determined using optical and advanced optoelectronic devices.
It is necessary to analyze the components of uncertainty of contact angle measurement. Analyzing the expression (1) we can conclude that the main components are the following: the height of the lifting fluid in the porous body, the time of movement of the liquid to a complete stop, the radius of the pores, the dynamic viscosity of the fluid, the surface tension of the fluid, the density of the fluid, the acceleration of free fall.
The viscosity , the surface tension σ and the density of the fluid are values that are measured before testing by other devices. The uncertainties of these values depend on the metrological characteristics of the device used. The experimental porometry of a porous solid sample is used to determine the equivalent radius r [2].
The height of the lifting fluid in the porous body h, the time of movement of the fluid to a complete stop t, is determined in the measurement process. The lifting height of the liquid is measured using a digital microscope. In this case, the resulting digital image is measured by the number of pixels Npx, which corresponds to the height of the lifting fluid. And the height h is calculated taking into account the conversion factor K of the digital microscope:
h=Npx ∙K. (2) The total uncertainty of measuring the height of the lifting fluid in the core depends on the
uncertainties of the calculation of the image points and the conversion factor

71 Automation and instrumentation
222 2px pxu h N u K K u N . (3)
The measurement method considered is indirect. In this case, the total measurement uncertainty is calculated taking into account the weight coefficients of each quantity, and the weight coefficients themselves are defined as partial derivatives [3]
22 2 22 2 2 2
1222 2
2 2 2
cf f f fu f u r u u u hr h
f f fu t u u g ,t g
(4)
де
2
22
2
44
2
hghf htrr tr
, 2
2 2
42
f r h ghtr
, 22f h
tr
, 2
8
2
hr gf trh
,
2
2
2f ht t r
,
2f rgh
,
2f hrg
.
Conclusion. The analysis of the constituent uncertainties allows us to carry out further studies, on the basis of which it is possible to calculate and estimate the total uncertainty of the contact angle measurement.
Links. 1. Використання поверхнево-активних речовин в процесах нафтовидобутку на родовищах ВАТ "Укрнафта"/ В.Д. Михайлюк, М.І. Рудий, Р.Т. Боднар та інші / НДПІ ВАТ "Укрнафта", ПП "Галицька друкарня ПЛЮС", 2009 р. 400 с. 2. Боднар Р.Т. Експрес-метод визначення крайового кута змочування пористих тіл //Методи та прилади контролю якості, № 1 (36), м. Івано-Франківськ, ІФНТУНГ, 2016, с. 30–37 3. Кісіль І.С. Метрологія, точність і надійність результатів та засобів вимірювань: Навчальний посібник для студентів вищих навчальних закладів.– Івано-Франківськ: Видавництво «Факел», Івано-Франківськ, 2002.– 400 с. УДК 681.53/.54; 62-503.55;
MODEL OF MOTORIZED VALVE FOR ACS Ph.D. Vasylenko O.V., Ph.D. Reva V.I., National University "Zaporizhzhya Polytechnic", Zaporizhzhya,
Ukraine
Introduction. The electromechanical motorized regulator is an important regulatory element of Automatic Control Systems (ACS). The main advantage of such regulators is the use of helical transmission of rotational motion to translational one. Also, this transmission acts as link of rotation speed integration of the driven gear reducer. Thus, the task of developing dynamic model of ACS regulator block is actualized.
The valve switching time is usually insignificant compared to the time of the technological cycle, and the control rod position can be monitored either by directly converting the signal from the sensor to the rod position (due to the presence of a rigid connection between the number of revolutions of the driven gear and the movement of the rod), or by parallel integration of the rotation speed signal gears with encoder. In the case of the use of control systems based on an industrial controller (PLC), this does not a big problem.
Presentation of the material. To save the resource of the valve electric control unit, it is necessary to introduce protection against contact bounce, which can be simulated by a deadzone link. To ensure bounce suppression and accurate positioning, the link must provide the following transfer characteristic. A link with a similar characteristic allows us to clearly position the mechanism at a given point (delta = 0) and keep it at rest until the specified limit (dmax) is exceeded.
The positioning loop is drawn up on the basis of the kinematic diagram of the valve, the transmission path of mechanical energy through which is as follows: electric drive – gearbox – reciprocating gear –
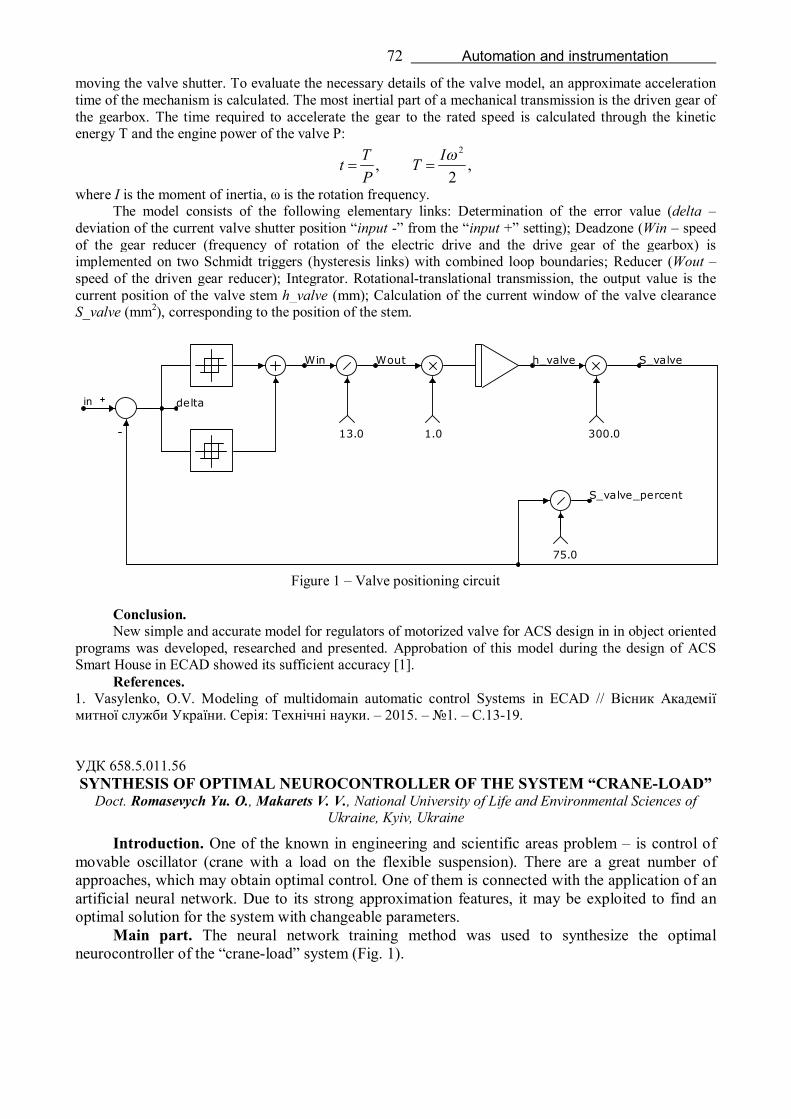
72 Automation and instrumentation
moving the valve shutter. To evaluate the necessary details of the valve model, an approximate acceleration time of the mechanism is calculated. The most inertial part of a mechanical transmission is the driven gear of the gearbox. The time required to accelerate the gear to the rated speed is calculated through the kinetic energy T and the engine power of the valve P:
2
, ,2
T It TP
where І is the moment of inertia, ω is the rotation frequency. The model consists of the following elementary links: Determination of the error value (delta –
deviation of the current valve shutter position “input -” from the “input +” setting); Deadzone (Win – speed of the gear reducer (frequency of rotation of the electric drive and the drive gear of the gearbox) is implemented on two Schmidt triggers (hysteresis links) with combined loop boundaries; Reducer (Wout – speed of the driven gear reducer); Integrator. Rotational-translational transmission, the output value is the current position of the valve stem h_valve (mm); Calculation of the current window of the valve clearance S_valve (mm2), corresponding to the position of the stem.
13.0 1.0 300.0
75.0
delta
Win Wout h_valve S_valve
S_valve_percent
in
Figure 1 – Valve positioning circuit
Conclusion. New simple and accurate model for regulators of motorized valve for ACS design in in object oriented
programs was developed, researched and presented. Approbation of this model during the design of ACS Smart House in ECAD showed its sufficient accuracy [1].
References. 1. Vasylenko, O.V. Modeling of multidomain automatic control Systems in ECAD // Вісник Академії митної служби України. Серія: Технічні науки. – 2015. – №1. – С.13-19. УДК 658.5.011.56 SYNTHESIS OF OPTIMAL NEUROCONTROLLER OF THE SYSTEM “CRANE-LOAD”
Doct. Romasevych Yu. O., Makarets V. V., National University of Life and Environmental Sciences of Ukraine, Kyiv, Ukraine
Introduction. One of the known in engineering and scientific areas problem – is control of movable oscillator (crane with a load on the flexible suspension). There are a great number of approaches, which may obtain optimal control. One of them is connected with the application of an artificial neural network. Due to its strong approximation features, it may be exploited to find an optimal solution for the system with changeable parameters.
Main part. The neural network training method was used to synthesize the optimal neurocontroller of the “crane-load” system (Fig. 1).
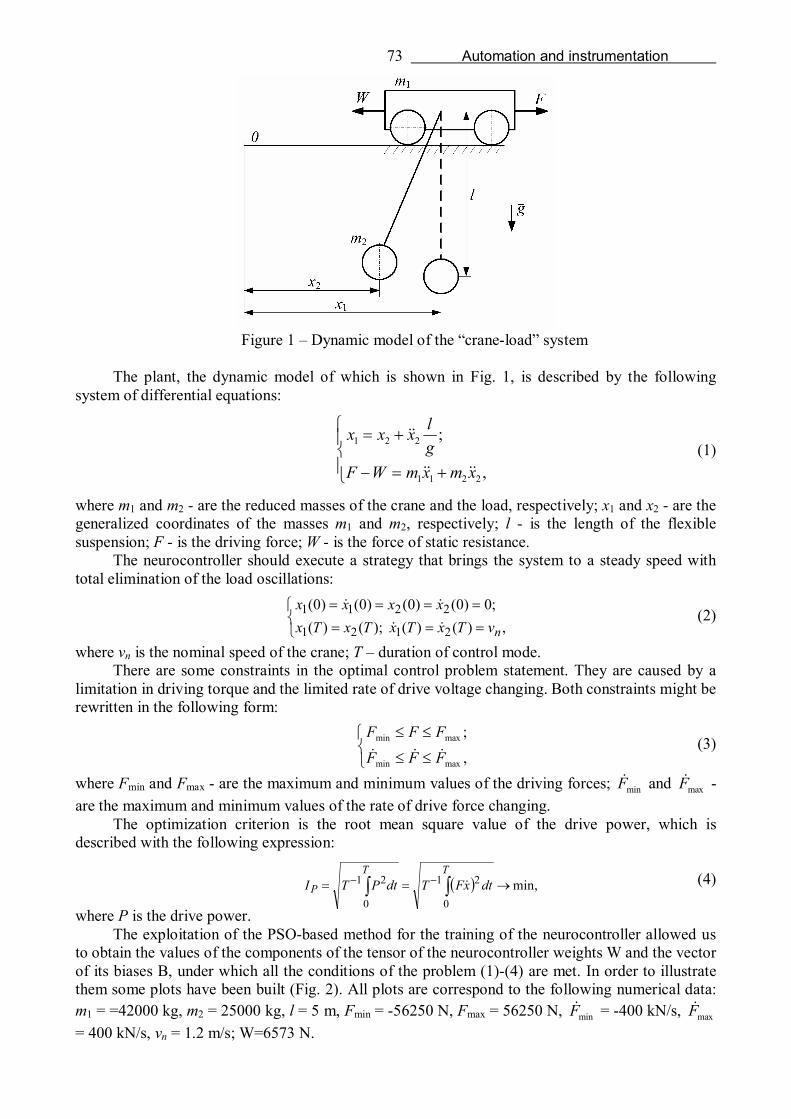
73 Automation and instrumentation
Figure 1 – Dynamic model of the “crane-load” system
The plant, the dynamic model of which is shown in Fig. 1, is described by the following
system of differential equations:
(1)
where m1 and m2 - are the reduced masses of the crane and the load, respectively; x1 and x2 - are the generalized coordinates of the masses m1 and m2, respectively; l - is the length of the flexible suspension; F - is the driving force; W - is the force of static resistance.
The neurocontroller should execute a strategy that brings the system to a steady speed with total elimination of the load oscillations:
(2)
where vn is the nominal speed of the crane; T – duration of control mode.
There are some constraints in the optimal control problem statement. They are caused by a limitation in driving torque and the limited rate of drive voltage changing. Both constraints might be rewritten in the following form:
(3)
where Fmin and Fmax - are the maximum and minimum values of the driving forces; minF and maxF - are the maximum and minimum values of the rate of drive force changing.
The optimization criterion is the root mean square value of the drive power, which is described with the following expression:
(4)
where P is the drive power.
The exploitation of the PSO-based method for the training of the neurocontroller allowed us to obtain the values of the components of the tensor of the neurocontroller weights W and the vector of its biases B, under which all the conditions of the problem (1)-(4) are met. In order to illustrate them some plots have been built (Fig. 2). All plots are correspond to the following numerical data: m1 = =42000 kg, m2 = 25000 kg, l = 5 m, Fmin = -56250 N, Fmax = 56250 N, minF = -400 kN/s, maxF = 400 kN/s, vn = 1.2 m/s; W=6573 N.
,
;
2211
221
хmхmWFglххх
,)()();()(;0)0()0()0()0(
2121
2211
nvТхТхТхТххххх
,
;
maxmin
maxmin
FFFFFF
min,0
21
0
21 ТТ
Р dtxFТdtPТI

74 Automation and instrumentation
a) b)
Figure 2 – Plots of the dynamics of the “crane-load” system: a) non-classical phase portrait of the system movement in coordinates “difference of the crane and cargo positions - difference of the crane and cargo speeds - speed of the crane” (a); b) driving force (gray line) and power (black line)
of the crane drive In Fig. 2 (a) the initial and final values of the phase vector are shown by gray dots. The phase
trajectory of the system starts from one such point and ends at another. Thus the system is moved from initial to the end state.
Conclusions. The synthesis of the neurocontroller has been provided with the use of PSO-based method. It has shown its high efficiency for linear optimal control problems (in the closed-loop form). Further investigations are in study of its efficiency for non-linear and MIMO plants. UDC 006.91+536.5
RESEARCH OF THERMAL IMEGERS’ FEATURES IN INDUSTRIAL USAGE Ph.D. Klochko N.B., Ph.D. Vynnychuk A.H., Halimovskii L.H., Ivano-Frankivsk National Technical
University of Oil and Gas, Ivano-Frankivsk, Ukraine
Introduction. Non-contact methods are widely used in various areas of industry for monitoring and control. An analysis of object’s thermal conditions allows to obtain information about the correctness of its functioning and possible changes, and the spatio-temporal distribution of the surface temperature is a carrier of information about its external and internal structure, hidden defects and their location. The most common means for a non-contact method of measuring temperature with infrared radiation is a thermal imager. These devices are widely used in many industries.
Brief description. The effectiveness of thermal imagers use in industry depends primarily on their metrological characteristics, its software for processing the results of research, as well as on the possibility of taking other factors into account when implementing the measurement procedure.We will study the factors that directly affect the results of radiation measurements under normal calibration conditions [1].
A significant influence on the accuracy of thermal imaging studies results has a methodological component of the error due to the influence of surface emitting properties of the object and the influence of such operating conditions parameters as background radiation of foreign objects and transmission of an intermediate environment. Also, the subjective component error from the measurements correctness and the adding the necessary corrections for the radiating properties of complex objects have a significant impact on the results. In fact, the error of the measurement results from the total effect of these factors under operating conditions can be tens of percent. It

75 Automation and instrumentation
should be noted that in production the values of operating conditions parameters differ from the values under normal conditions, which are adhered to in calibration laboratories. Also, the radiating properties of a real technical object differ from the radiating properties of a reference radiator. It is clear that ensuring the operating conditions of industrial facilities is impossible. It is understood that under operating conditions, intense solar radiation and other powerful sources of radiation from the industrial environment may exist. Thus, when deviating from normal production conditions, an additional error arises [2].
Besides the fact that the emissivity of the studied object is less than 1, its reliable value is often impossible to determine. For example, we indicate that the deviation of the ambient temperature for every 10°C causes an additional error, the value of which is equal to half the main error of the measuring instrument [1]. This leads to the fact that determining the real temperature for the calibration function of the thermal imager installed in the calibration laboratories will be impossible due to the influence on the informative signal of a number of non-informative parameters specific to a particular technological process: emitting properties of the object, background radiation, transmission of intermediate media under operating conditions. Production differ marked by these factors under normal conditions. According to the results of modeling the methodological error of the measurement results, taking into account influence factors, it was found that the value of the methodological component of the error, depending on the values of the influence factors, can be tens of degrees. Consequently, there is a need for amendments to ensure the required accuracy of the measurement results.
To calibrate thermal imagers under operating conditions, it is advisable to use emitters in the form of an extended black body model. The emissivity of the reference extended emitters is in the range of 0.93 ... 0.98. At the same time, for conducting calibration under operating conditions, extended emitters can be used, the emissivity of which is gray in nature, which would allow taking into account the effect of reflected background radiation. This, in turn, can significantly increase the accuracy of temperature measurements with radiation.
Conclusions. So, in production, there is a reasonable need for additional calibration of the thermal imager in order to determine amendments to the temperature measurement results under operating conditions. This can make it possible to take into account not only the value of the emissivity, but also the transmission of the intermediate medium and the influence of background radiation, which are present in the actual conditions of a particular production process, which will significantly reduce the methodological error. The presented proposals can be introduced into the methods of performing measurements with a thermal imager in real operating conditions to increase the accuracy of practical measurements. At the same time, this will expand the scope of the effective use of thermal imagers.
References. 1. http://fortstroi.com.ua/stroitelstvo/stati/item/330-promyshlennye-teplovizory-i-sfery-ikh-primeneniya. 2. https://www.flukeprocessinstruments.com/en-us/products/infrared-temperature-solutions УДК 681.5
AUTOMATIC CONTROL SYSTEM FOR TWO-MASS POSITION ELECTRIC DRIVE
Ph.D. Osadchyy V.V., Ph.D. Nazarova O.S., Olieinikov M.O., National University “Zaporizhzhia Polytechnic”, Ukraine
Introduction. Continuous improvement of technological processes leads to the need for the development of machines and aggregates to which new performance requirements are imposed. The need for position regulation of mechanisms occurs in material-handling machines, metal-cutting machines, manipulators and metallurgical aggregates. Proper design, improved regulation, increased reliability of these systems can improve technological processes in enterprises, improve the quality of finished products, reduce energy consumption of production and raise the level of safety. Therefore, nowadays, this question is relevant.
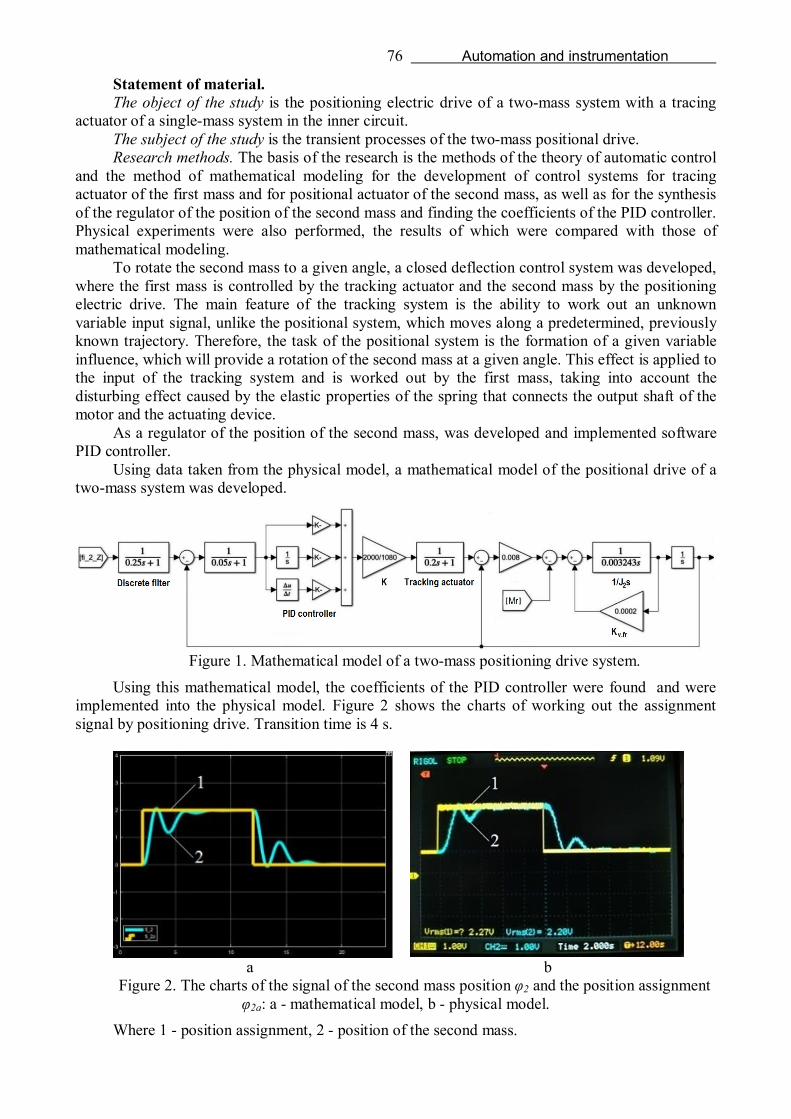
76 Automation and instrumentation
Statement of material. The object of the study is the positioning electric drive of a two-mass system with a tracing
actuator of a single-mass system in the inner circuit. The subject of the study is the transient processes of the two-mass positional drive. Research methods. The basis of the research is the methods of the theory of automatic control
and the method of mathematical modeling for the development of control systems for tracing actuator of the first mass and for positional actuator of the second mass, as well as for the synthesis of the regulator of the position of the second mass and finding the coefficients of the PID controller. Physical experiments were also performed, the results of which were compared with those of mathematical modeling.
To rotate the second mass to a given angle, a closed deflection control system was developed, where the first mass is controlled by the tracking actuator and the second mass by the positioning electric drive. The main feature of the tracking system is the ability to work out an unknown variable input signal, unlike the positional system, which moves along a predetermined, previously known trajectory. Therefore, the task of the positional system is the formation of a given variable influence, which will provide a rotation of the second mass at a given angle. This effect is applied to the input of the tracking system and is worked out by the first mass, taking into account the disturbing effect caused by the elastic properties of the spring that connects the output shaft of the motor and the actuating device.
As a regulator of the position of the second mass, was developed and implemented software PID controller.
Using data taken from the physical model, a mathematical model of the positional drive of a two-mass system was developed.
Figure 1. Mathematical model of a two-mass positioning drive system.
Using this mathematical model, the coefficients of the PID controller were found and were implemented into the physical model. Figure 2 shows the charts of working out the assignment signal by positioning drive. Transition time is 4 s.
a b
Figure 2. The charts of the signal of the second mass position φ2 and the position assignment φ2a: a - mathematical model, b - physical model.
Where 1 - position assignment, 2 - position of the second mass.

77 Automation and instrumentation
Conclusions. 1. The usage of the single-mass electric drive in the internal circuit of the positioning dual-mass electric drive allows the simplifying of the controller synthesis and reducing the required computational power in the simulation by presenting the tracking actuator with a first-order factor. 2. The simulation model of positioning actuator, the adequacy of which is confirmed by a physical experiment, together with the stand can be used in the study of closed-loop dual-mass systems of DC electric drive with microprocessor control. 3. The controller synthesized by the classical method has a low practical value due to the complexity of its implementation, which is conditioned by the high polynomial degree of the transfer function. 4. The usage of mathematical model in the practical method of finding the values of PID coefficients provides the desired static and dynamic characteristics of the system, reduces the searching time and decreases the risk of real equipment damage during debugging. 5. Further research is planned to be led in the direction of increasing the system performance both by improving the dynamic characteristics of the tracking actuator and by refining the mathematical model that will allow obtaining more accurate values of the PID coefficients.
List of references. 1. Osadchii V.V., Nazarova O.S., Oleinikov M.О. Investigation of positional automatic control system with relay current regulator // VI International Scientific and Practical Conference of Young Scientists and Students "Actual Problems of Automation and Control", November 30, 2018.: theses reports, Lutsk, 2018, p. 66 - 72. 2. Nazarova O.S., Oleinikov M.O. Investigation of positional electric drive with relay current controller // 45th International Scientific and Technical Conference of Youth of PJSC "Zaporizhstal", October 18, 2018: abstracts. Zaporozhye: PJSC "Zaporizhstal", 2018, pp. 75-76. Osadchii V.V., Nazarova O.S., Oleinikov M.O. Investigation of the positional electric drive of a dual-mass system with an internal tracking circuit // Bulletin of NTU "KPI", Kharkiv, 2019, pp. 47-54. doi.org/10.20998/2079-8024.2019.16.09 УДК 676.2
THE SECONDARY RAW MATERIALS PAPER PRODUCTION: TECHNOLOGICAL PROCESS AUTOMATION, WAYS OF ITS INVESTIGATION
Ph.D. Tkachuk A.H., Tumchenko E.V., Zhytomyr Polytechnic State University, Zhytomyr, Ukraine
Introduction. According to CEPI (Confederation of European Paper Industry Enterprises) statistics, from 1991 to 2017 in 2007 paper production increased rapidly, gradually decreasing the pace. After 2007 there was a sharp decline primarily related to the world crisis. By 2011 paper production returned to the volume of 2000 and in 2017 it started gradually to decline to the production volume of 1998. Moreover, the production number was continuously decreasing from 1991 to 2017 almost in proportion. At the same time, recycling, paper and cardboard (cardboard is generally paper with the weight more than 200 g/2 produced from recycled material) production has increased twice in Europe since 1991, reaching almost 50 million tonnes, in its turn making half of the paper volume produced in a year. Nowadays, paper and cardboard, as a rule, are produced at mechanized enterprises equipped with modern high-performance equipment. In Ukraine, in 2018 there exist more than 110 paper manufacturing enterprises producing paper from cellulose, wood, waste paper, etc; 10 of them are located in Zhytomyr region and one in Zhytomyr city that is LLC “Zhytomyr cardboard manufacturing combine”.
The paper industry in Ukraine is 98% focused on the waste paper production, all types of paper and cardboard are made of. Waste paper deficiency is covered due to the imports making 45% of total waste production. The volume of industrial paper and cardboard production in Ukraine within the first 11 months of 2017 increased for more than 11% compared to 2016 and it reached 111.7%. The production of cardboard, including fluting, increased by 13.2%, and the production of

78 Automation and instrumentation
boxboard showed a slight increase of 3.2%. Tissue paper production during 11 months of 2017 increased by 4.6%, corrugated board − by 15.3% compared to the same period of 2016.
Therefore, the research work aims at making analysis of the ways to increase the automation level of board manufacturing process from recycled materials being competitive on the market these days.
Proposed work. One of the most important factors affecting the continuous operation of the board plants is the efficient processing and accumulation of paper-pulp, its continuous supply to the pressure box (where it is diluted with water for the required concentration and is continuously fed to the mesh, cloth and drying machine), to rolling, as well as to the finished products warehouses. A large number of equipment and difficult manufacturing conditions seriously complicate the process of managing raw materials supply and ensuring the continuous equipment operation. The board manufacturing process presupposes the following basic operations: dosing, constant accumulation materials supply, mixing, uniform feed across width, conveyor speed, predetermined width trimming, drainage, drying, slicing and the finished mixture dispensing.
Fig. 1 shows a block diagram of the paper feeding process to the wire section of the cardboard machine.
The existing approach to the cutting device control and the slice opening value almost has no automated decisions. The width control in the paper web cutting process is performed completely in manual mode. The operators give commands to switch on or off the actuators from the control panels. Catching up with the set value depends on the values of the output web width at the end of the machine; it is necessary to come up and check it. The operator also performs the slice opening value change. It significantly worsen the accuracy of thickness or cardboard pulp measuring and requires the involvement of a large number of service personnel, requires considerable time, causes defects while setting up the parameters, and therefore negatively affects the quality of production and productivity as a whole. All the mentioned negative effects are eliminated by means of automated execution of these operations and automatic adjusting the system with low speed (reducing PP feed) or insufficient feed (reducing machine speed).
Fig.1. The structural diagram of the paper supply process to the wire section of the cardboard
machine: 1 – machine pool; 2 – adjustable damper; 3 – pressure box; 4 – is a paper-pulp thickness shaper; 5 – wire; 6 – main shafts of the grid part; 7 – electric drive; 8 – auxiliary shafts of the wire section; 9 – a device for cutting paper- pulp width; 10 – auxiliary vacuum drainage; 11 – thrust-
protective design of the wire section.
The necessity arises if it is necessary to produce cardboard of large thickness, paper-pulp, thickness; speed and feed are the dependent values:
LmLhVQ n (1)

79 Automation and instrumentation
where Q is the feed rate of the PP; h is the paper web thickness; V is cardboard machine speed; is PP density; nm –is the cardboard mass g / m² in the pulp and paper industry; L - PP feed length and the output sheet width.
The control system shall provide the following operability: 1 – in the area of PP feed from the pressure box to the wire part of the cardboard machine to
form a cardboard web, the control performance of the following parameters and /or devices is presupposed:
– control of the amount of accumulated PP feed from the machine pool to the pressure box; – control of the size of the slice opening, depending on the cardboard type; – control of the cardboard machine speed, including the wire, depending on cardboard
production approach; – automatic adjustment of the wire velocity constant and PP feed parameters. In case of their
values being maximum and the production of a new cardboard type requiring more capacity: it can be achieved by reducing the value of the maximum parameter at the moment (for example, when the wire velocity decreases with the feed being consistent, the web thickness increases);
– automatic calculation of one of three parameters (h, Q, V), if two of them are given and the possibility of changing the PP concentration/density and the width of the cardboard web;
– automatic recalculation of the proportional cardboard machine shafts speed increase in order to create the tension of the cardboard web;
– emergency control, safety stop; 2 – in the area of PP cutting across the width according to the predetermined control
execution value of the following parameters and/or devices: – switching the actuator on/off in the correct direction of rotation, depending on the task to
increase or decrease the width; – emergency control, safety stop; 3 – the implementation of human-machine interface with the current state visualization of
separate units and devices, displaying the current values of the controlled parameters, the ability to set the defined values and the equipment operating modes, automatic calculation of the required parameters, the impossibility of entering three parameters of h, Q, V (dependence in in this case will affect the change of the cardboard pulp value which may not be common and will lead to the broke installment), tracking the current values of the controlled parameters and also interactive process management from the operator station.
So, the automation of paper making process from recycled materials in the area of PP system feed to the cardboard machine wire should be carried out through building a distributed automated process control system based on a block-modular program logic controller and other industrial equipment.
80 Chemical and bioengineering
УДК 691:662.613 ASH AND SLAGAS A SOURCE OF PRECIOUS COMPONENTS
Ph.D. Khlopytskyi A., Ph.D. Makarchenko N., Doct. Kovalenko І., Didkovska А., Derevianko Ye., Ph.D. Savchenko М.,Ukrainian State University of Chemical Technology,
Dnipro, Ukraine
Ash and slag waste represent ecologically unfavorable accumulation, occupying large areas and spread in the environment, causing a negative impact. Although ash and slag waste cause significant adverse environmental effects, but in turn contain valuable components, which allows them to seizure, namely precious, rare, rare earth elements and other related components. In the last years of TPP in Ukraine formed a huge amount of slag waste, which pay close attention to the purpose of disposal or recycling to improve the environmental situation in the country and solve production problems getting certain types of raw materials.
As a result of the significant amount of thermal power plants of large waste - slag material. In the thermal power plant ash dump accumulated 240 million tons ash and slag. Annually produce about 5 million tons ash and slag. Precious items include the following elements as silver, gold, platinum, ruthenium, palladium, iridium, osmium and other metals is, and palladium, 7 × 10^-6%, which is the most common of platinum group metals is1×10^-6%. They get associated with processing large volumes of raw materials and the process of recovery of metal compounds in which they are found in ore.
This requires large financial costs and leads to environmental problems associated with the accumulation of large amounts of solid waste. These solid waste adversely affect the soil, thereby flora and fauna, the atmosphere, water and the environment as a whole on the environment. Also, a slag waste through recycling can remove rare earth elements such as scandium, yttrium, lanthanum. Yttrium used as a do pant in alloys with various metals. In addition to the iron increases its malleability to aluminum- strength and heat resistance to vanadium- flexibility to chromium - heat resistance. Distribution of yttrium, in the crust - 29 × 10-4% by weight, in the oceans - 1,3 × 10⁻⁹% and in the universe - 7 × 10⁻⁷%.
Now precious elements find their application in the automotive industry which uses rhodium, platinum and palladium catalysts for the production of automotive filters and converters. Also in microelectronics, in nuclear tests in the nuclear industry, jewelry and even dentistry. Also for weak currents at low voltages in circuits used contacts from gold alloys with silver, gold and platinum, gold and silver and platinum.
Most developed countries that withdraw redesign and precious and rare earth elements are: China, USA, Canada. Ukraine is an importer of components. But Ukraine has a lot of resources that can provide internal needs of the country's rare earth and precious metals, but also become exporters in other countries. It is therefore advisable would be in our country implement new, modern, economic and environmental technologies for obtaining components from slag waste. УДК 539.5 : 541.16: 66-95: 678.5
ADVANTAGES OF USING OF ULTRASONIC ТRЕАTMENT IN THE PRODUCTION OF CLASSICAL COMPOSITES AND CARBON NANOCOMPOSITES
Ph.D. Kolosova E. P., Doct. Vanin V. V., Doct. Kolosov A.E., National Technical University of Ukraine «Igor Sikorsky Kyiv Polytechnic Institute», Ukraine
Introduction. At present, in addition to the widespread use of classical polymer composite
materials (PCMs) based on well-studied epoxy matrices [1], innovative world technologies for the creation of a new generation of PCMs are intensively developing. These studies reach the nanoscale molecular level of research into the components that make up PCMs [2]. In connection with this, one of the promising directions in modern science is the production of composites based on polymers filled with carbon nanomaterials, such as carbon nanotubes (CNTs), fibrils, graphene, graphene aerogels, nanoplates, nanofibers, etc. [3]. Moreover, an increasing number of researchers come to the conclusion that the most promising method for improving the properties of reactoplastic

81 Chemical and bioengineering
PCMs is their modification by carbon nanostructured components, including CNTs. The latter possesses a number of unique properties that allow solving the problems arising in the production of nanomodified (NM) reactoplastic PCMs, that is, NM PCMs. And it is known that low-frequency ultrasonic (US) is one of the most common methods of decomposition of CNTs agglomerates [4].
Discussion of the results. The survey material confirms that US technology in the production of classical PCMs and carbon NM PCMs is one of the dominant methods for synthesizing new and physical modifications of existing polymer composites to improve their operational (functional) properties. And the main physical phenomenon associated with US, which has to do with the synthesis of new materials, is low-frequency acoustic cavitation. It manifests itself in the formation, growth and implosive collapse of bubbles in the liquid. This phenomenon creates extreme conditions inside the collapsing bubble and serves as the source of most sonochemical phenomena in liquids or in liquid solutions with fillers.
The main problematic situations in the production of NM PCMs is the need for dispersing (deagglomerating) nanofillers in a liquid matrix. In many cases, US is practically a non-alternative method for solving the above-mentioned problem situations. Besides, use of intense US allows for the tailoring of unique materials from sol-gel processes. This makes high-power US a powerful tool for chemistry and materials’ research and development.
Conclusion. As analysis of available research shows, the use of low-frequency US is currently out of the competition when forming both classical and NM PCMs. And for thermoplastic as well as for thermosetting plastics.
References. 1. A.E. Kolosov, E.P. Kolosova, V.V. Vanin, Anish Khan, “Chapter 25. Ultrasonic Тrеаtment in the Production of Classical Composites and Carbon Nanocomposites,” In: Nano Carbon And Its Composites: Preparation, Properties and Applications. 1st edition. Eds. Anish Khan, S. Mohammad Jawaid, Inamuddin, Abdullah M. Asiri. - Woodhead Publishing (imprint of Elsevier). - 2019. - Pp. 733-780. https://doi.org/10.1016/B978-0-08-102509-3.00025-0 2. A.E. Kolosov, V.I. Sivetskii, E.P. Kolosova, V.V. Vanin, A.V. Gondlyakh, D.E. Sidorov, I. I. Ivitskiy. Use of Physico-Chemical Modification Methods for Producing of Traditional and Nanomodified Polymeric Composites with Improved Operational Properties (a Review). International Journal of Polymer Science, 15 p., vol. 2019. https://doi.org/10.1155/2019/1258727 3. A.E. Kolosov, V.I. Sivetskii, E.P. Kolosova, V.V. Vanin, A.V. Gondlyakh, D.E. Sidorov, I. I. Ivitskiy. Creation of Structural Polymer Composite Materials for Functional Application Using Physicochemical Modification. Advances in Polymer Technology, 12 p., vol. 2019. https://doi.org/10.1155/2019/3501456 4. Kolosov A.E., Kolosova E.P. Modification of Oligomers and Reinforced Polymeric Composites by Carbon Nanotubes and Ultrasonic. Environmental Nanotechnology. In: Dasgupta N., Ranjan S., Lichtfouse E. (eds). Environmental Nanotechnology. Vol. 3. Environmental Chemistry for a Sustainable World. Springer, Cham, 2020. - Pp. 89-116. Series Volume 27. doi: 10.1007/978-3-030-26672-1_3 УДК 539.5 : 541.16: 66-95: 678.5
ULTRASONIC DISTRIBUTION OF NANOPARTICLES IN LIQUID OLIGOMERS Doct. Kolosov A.E., Doct. Gondlyakh A.V., Ph.D. Sivetskii V.I., National Technical University of Ukraine
«Igor Sikorsky Kyiv Polytechnic Institute», Ukraine
Introduction. When obtaining nanomodified (NM) polymer composite materials (PCMs), one of the main problems is to ensure high-quality wetting and uniform distribution of the nanofiller in the liquid polymer matrix. On the one hand, nanosuspension is incorporated into the composition of the polymer binder of carbon nanotubes (CNTs) for the subsequent fabrication of a nanocomposite on its basis, which substantially increases the strength properties of the finished (polymerized) products. Moreover, the optimal concentration and uniform distribution of CNTs in the binder play a decisive role in the final strengthening of NM PCMs [1-4].
82 Chemical and bioengineering
On the other hand, due to the peculiarities of the nanoparticles used (their propensity to mutual attraction and agglomeration), problematic situations in the production of NM PCMs are de-agglomeration and further dispersion of the used nanoparticles in liquid polymer media. It is obvious that the incorporation of CNTs into the structure of the polymer composite affects not only the structure and properties of the liquid polymer binder but also the NM PCM as a whole.
For example, the dimensions of the agglomerate in nanofluids can significantly affect the thermal conductivity and viscosity of nanofluids and lead to different heat transfer characteristics. Analysis of the literature data on the elastic, strength, rheological, electrical properties of composites filled with CNTs shows that neglecting the quality of dispersion generates, in the end, a large dispersion of the service (operational) properties of nanomodified PCMs [2-3].
It is known that low-frequency ultrasonic (US) is one of the most common methods of decomposition of CNTs agglomerates [4]. In addition, its use facilitates the dispersion of nanoparticles in base liquids in the preparation of nano-based liquids, both on the basis of organic solutions and on the basis of liquid polymers. It is also known that the synthesis of aerogels based on graphene is promising the formation of a three-dimensional structure under the influence of low-frequency US.
Numerous studies have found that the use of US contributes to the intensification of the basic operations of the technological process of producing classical PCMs [1]. This, in turn, leads to an improvement in the operational characteristics of the sonicated classical PCMs and NM PCMs. Among them – sonication (sounding) of the polymeric binders (PBs), impregnation, winding, dosed application in the preparation of fibrous prepregs. Also, positive results of using the optimal modes of US treatment are: reduction of the time of hardening of composites and obtaining of defect-free PCM structures.
The above confirms once again that the study of effective methods and the determination of the degree of their influence on the qualitative parameters of the final polymer product, as well as the development of hardware-technological schemes for obtaining classical PCMs and NM PCMs is an urgent and priority area of modern research.
Discussion of the results. Experiments conducted by other researchers confirmed the assumption that it is most advantageous to
incorporate nanofiller particles into a less viscous liquid medium. As the filler, the nanodispersed filler of the baked composite was used. The latter consists of oligoelements (minerals, salts, metals). In particular, oligoelements include carbon, bicarbonates, iron, zinc, magnesium, sodium, manganese. A polymer matrix based on the epoxy oligomer (EO brand) ED-20 was used. For crosslinking epoxy composition (EC), a low molecular weight polyethylene polyamine PEPA hardener was used, which allows the curing of materials at normal temperatures.
PCM was crosslinked by incorporating a curing agent into the composition at a stoichiometric ratio of the components (wt. %) – ED-20 : PEPA = 100 : 10. The nanodispersed filler of the baked composite was incorporated into the PB at a content of 0.05 parts by weight per 100 parts by weight EO brand ED-20. In order to achieve an even distribution of this nanodispersed filler in the EO, a technology was developed for incorporating nanoparticles into the EC.
The technology provides for stage-by-stage mixing with the implementation of temperature-time regimes: 1) preliminary dosing of the oligomer ED-20, heating of the oligomer and nanodispersed filler to a temperature of T = 353 ± 2 K and holding the components at a given temperature for a time τ = 20 ± 0.1 min.; 2) dosing of the nanofiller, its further incorporation into the EO brand ED-20, as well as the hydrodynamic combination of the oligomer ED-20 and the nanofiller for t = 1 ± 0.1 min.; 3) US-treatment of the NM EC during τ = 1.5 ± 0.1 min.; subsequent cooling of the sonicated EC to normal temperature during τ = 60 ± 5 min.; injection of PEPA hardener and mixing of epoxy binder components for τ = 5 ± 0.1 min.; 4) curing of the sonicated EC according to the experimentally investigated regime: molding the samples and holding them for t = 12.0 ± 0.1 hours at a temperature T = 293 ± 2 K, heating with a velocity υ = 3 o/min to a temperature T = 393 ± 2 K, holding for a time t = 2.0±0.05 hours, slow cooling to a temperature T=293±2K.
In order to stabilize the structural processes in the polymer matrix, the samples were held for a time t = 24 hours in air at a temperature of T = 293 ± 2 K, followed by carrying out experimental tests. The obtained data testify to the expediency of performing US treatment of compositions with nanoparticles to obtain a material with a uniformly distributed structure and improved properties.
The process of dispersing nanoparticles in a liquid medium with US vibrations provides cavitation processes, as well as a uniform distribution of nanoparticles in the composition. Cavitation processes that occur in the composition during US lead to the activation of epoxy macromolecules, an additional reduction in the viscosity of the system, and also to an increase in the temperature of the PB due to the maintenance of

83 Chemical and bioengineering
mechanical energy in it. This results in a uniform distribution of the nanofiller in the volume of the binder (due to dispersion), as well as the formation of free radicals (due to cavitation processes).
Using the method of optical microscopy, the fracture surface of initial and US-modified epoxy matrices and nanocomposites based on them was studied. It has been established that, in US-modified NM PCMs, a flat, albeit somewhat corrugated, the surface is formed in comparison with the untreated US of NM PCMs, in which there are no dark inclusions and craters. This is explained by the fact that due to cavitation processes in the composition during US treatment, nanoparticles are intensively wetted and evenly distributed in the PB. This promotes their active physical interaction with macromolecules already at the initial stage of composites formation. And the subsequent chemical interaction causes the formation of a material with improved properties.
However, we have to state that at the moment there are no unambiguously and clearly formulated industrial-technological principles concerning the incorporation, distribution, and stabilization of CNTs dispersions in NM PCMs.
Conclusion. It should nevertheless be noted that in spite of the successes achieved in the synthesis and modification
of both existing classical and new NM PCMs, the basic successes in this direction so far fall to the stage of laboratory research. So when going to the industrial scale of production of such materials, among other things, it will also be necessary to take into account the so-called scale effect. That is, when the automatic transfer of the results of laboratory research to the production level, there will certainly be obstacles and "undercurrents" that can not be simulated in "ideal" laboratory conditions. Obviously, given the pace of development of modern science and technology, this is a matter of the near future.
The new technological methods developed as a result of the research will undoubtedly find wide application in the production of structural and functional both classical PCMs and NM PCMs. For such materials, reducing the mass of the product, due to the improvement of their physico-mechanical and operational characteristics, is an urgent task for resource and energy saving on an industrial scale.
References. 1. A.E. Kolosov, E.P. Kolosova, V.V. Vanin, Anish Khan, “Chapter 25. Ultrasonic Тrеаtment in the Production of Classical Composites and Carbon Nanocomposites,” In: Nano Carbon And Its Composites: Preparation, Properties and Applications. 1st edition. Eds. Anish Khan, S. Mohammad Jawaid, Inamuddin, Abdullah M. Asiri. - Woodhead Publishing (imprint of Elsevier). 2019. Pp. 733-780. https://doi.org/10.1016/B978-0-08-102509-3.00025-0 2. A.E. Kolosov, V.I. Sivetskii, E.P. Kolosova, V.V. Vanin, A.V. Gondlyakh, D.E. Sidorov, I. I. Ivitskiy. Use of Physico-Chemical Modification Methods for Producing of Traditional and Nanomodified Polymeric Composites with Improved Operational Properties (a Review). International Journal of Polymer Science, 15 p., vol. 2019. https://doi.org/10.1155/2019/1258727 3. A.E. Kolosov, V.I. Sivetskii, E.P. Kolosova, V.V. Vanin, A.V. Gondlyakh, D.E. Sidorov, I. I. Ivitskiy. Creation of Structural Polymer Composite Materials for Functional Application Using Physicochemical Modification. Advances in Polymer Technology, 12 p., vol. 2019. https://doi.org/10.1155/2019/3501456 4. Kolosov A.E., Kolosova E.P. Modification of Oligomers and Reinforced Polymeric Composites by Carbon Nanotubes and Ultrasonic. Environmental Nanotechnology. In: Dasgupta N., Ranjan S., Lichtfouse E. (eds). Environmental Nanotechnology. Vol. 3. Environmental Chemistry for a Sustainable World. Springer, Cham, 2020. - Pp. 89-116. Series Volume 27. doi: 10.1007/978-3-030-26672-1_3 УДК 004.451.64:004.94
SOME ASPECTS OF THE ADDITIVE PRODUCTION OF THERMOPLASTIC PRODUCTS
Oleksyshen V.O., Doct. Kolosov A.E., Ph.D. Sokolskyi A.L., National Technical University of Ukraine «Igor Sikorsky Kyiv Polytechnic Institute», Ukraine
Introduction. Additive manufacturing technology has become widespread since the late 1980s. And by the early 2000s, the production of additive equipment had become mass-produced and covered products used in almost all industries and human life.
Since then, there has been a steady upward trend in the world market for additive manufacturing equipment: from 23,000 units in 2011 to 450,000 units in 2016. 6.7 million are expected to be sold in 2020. Devices for additive manufacturing, and the market will grow to $ 21 billion.
84 Chemical and bioengineering
However, there are a number of problems with this technology, some of which are described below.
Discussion of the results. The most common type of polymer material processing equipment, namely Fused Deposition Modeling (FDM), is a 3D printer. The cost of such equipment depends on many factors: the quality of the components of the mechanical part, the size of the working area, the type of raw material, etc. One factor that influences cost is the time it takes to select print settings to get the right product quality.
Although 3D printing technology is a widespread polymeric material, there is often no accurate data for the technological process modes. Most of these values are chosen intuitively, based primarily on practical experience. This is because polymeric materials have complex physicochemical properties and, as a rule, they are not taken into account, or only partially taken into account, when designing 3D printers and in the process of spatial printing of a particular product.
The quality of the formed (printed) product is influenced by such structural and technological parameters as temperature, specific consumption of raw material, cooling mode of the extruded material, speed of movement of the executive bodies, inertia and geometry of moving units. Usually these factors are not taken into account when designing the equipment and preparing the digital model for the product.
They also do not take into account the behavior of the molten material applied to the already frozen (previous) layer of material. It is a priori considered that the material has a geometry constant over time, and therefore the parameters of the cooling process do not affect the shape of the extruded material.
An urgent problem is to determine the interdependence of the basic parameters of the spatial printing, namely the thickness of the layer of the applied polymeric material, the temperature of the extruder, the printing speed, the cooling mode, the study of the physical and mechanical properties of printed polymeric products, including adhesive strength of interlayer, and depending on the size of the interaction the design features of the 3D printer, as well as the improvement of the designs of the printhead for maximum productivity printing.
In turn, the development of methods for analyzing the geometric shape of printed products by the method of spatial scanning and inverse parametric modeling will allow to establish the deviation of the sizes and accuracy of the surfaces of the printed product from the theoretical digital model, depending on the cooling mode of the 3D printing process.
Therefore, the actual subject of research in the additive production of thermoplastic products is the design of typical kinematic schemes of FDM 3D printers and their influence on the dimensional accuracy of the obtained printed polymer products, the study of the influence of the temperature of the extruder, printing speed, mode parameters of cooling, as well as the thickness of the layer thickness on physical and mechanical properties, including interlayer adhesion of printed material, as well as improvements based on the results of nature experiments and efficient numerical simulation (finite element method) of printhead designs.
Conclusion. Actual to solve the problem under study is a comprehensive approach based on the use of the results of experimental studies of the mechanical properties of printed products, the use of modern methods of numerical modeling using the provisions of the theory of continuous medium, the finite element method based on experimentally determined physical and mechanical properties of printed samples.

85 Electronics and telecommunications
УДК 621/39 DEMODULATOR FOR PROCESSING SIGNALS WITH AMPLITUDE MODULATION
OF MANY COMPONENTS Doct.Horbatyi I.V., Tsymbaliuk I.R., Lviv Polytechnic National University, Lviv, Ukraine
Introduction. There will always be a steady demand for the development and improvement of wireless systems due to the steady increase in data rates, which requires new methods to improve the stability and reliability of communication systems. The purpose of this work is to study the modulation technique of amplitude modulation of many components (AMMC) and to propose appropriate demodulation technique and demodulation device.
Main part. To increase the efficiency of telecommunication channels, it is quite promising to use a new type of amplitude-phase shift keying (APSK), the amplitude modulation of many components (AMMC) [1]. The AMMC signal tu AMMC is formed as the sum of its N components that differ in the initial phases n0 + (rad):
n00nmn
N
1=n0AMMC ++costuaU=tu (1)
where na are the proportionality factors for the n-th sub-channels of the modulator, 1/V. This modulation as a whole belongs to the class of non-orthogonal amplitude-phase
manipulations. The number of uM levels of modulating signals tunm affects the total number of
points in the signal constellation. Also, when 2N , the AMMC signal is converted to a quadrature phase shift keying signal (QPSK) at 2uM , 21 and a quadrature amplitude modulation (QAM) signal at 2uM . For other quantities of N-components, the initial phases n0 + , the quantities of the levels of modulating signals uM , one can get many different types of signals, some of which may have some potential for improving signal generation technologies. Compared to other widely used types of amplitude-phase manipulations, AMMC is characterized by a higher noise immunity with the same maximum power and informative [1].
The AMMC modulator generally repeats the structure of the quadrature modulator, but also contains customizable phase shifters. From this difference in the structure comes the main feature of AMMC modulators and demodulators – the ability to reconfigure the receiving or transmitting device to other types of modulation, such as ASK, PSK or QAM (QPSK) or their varieties. Scheme shown in Fig 1 is just a fragment – it is required to stack at least two of these together to generate a 8-AMMC-signal with 3 components (Fig 2).
Figure 1 – Fragment of AMMC modulator Figure 2 – Signal constellations for 8-AMMC-signal with 3 components, 16-AMMC-signal with
3 components and 16-AMMC-signal with 6 components

86 Electronics and telecommunications
Proposed device. In general, the AMMC demodulator (Fig 3) is a mirror image of the AMMC modulator, the only exception being that a separate demodulator is used for each channel. The device consists of a reference high-stability cosine oscillator with PLL relative to the carrier oscillation frequency, N phase shifters to the angles n , N multipliers and N low pass filters, and a binary data generator. The number of phase shifters and multipliers is equal to the number of components N that were used to form the given AMMC. Each phase shifter receives the carrier oscillation with frequency 0 and the initial phase 0 , and it shifts the initial phase of this oscillation to n . The AMMC signal is fed simultaneously to N multipliers, which, together with the low pass filter, are used to produce the low-frequency signals. Low-frequency signals are used to generate the received binary data using the binary data shaper, which provide the required amplitude and duration of the binary data. As well as AMMC modulator, AMMC demodulators also can be stacked together to achieve higher modulation orders. Scheme shown in Fig 3 is also just a fragment and to achieve a bare minimum AMMC signal processing requirements. Three of these are needed to form the demodulator for demodulating of 16-AMMC with 6 components.
Figure 3 – Fragment of AMMC demodulator
One of the features of the higher order AMMC types is the occurrence of such points on the signal constellation that do not correspond to any bit sequence and therefore cant be used to carry any data (at least not in the same way as all other points). Such points can be used for synchronization or transmission line analysis and it’s theoretically possible to use previously proposed demodulator even for such purposes due to most data processing happening in the computer. Both modulator and demodulator are computer controlled, so the unused points can be also used for remote configuration of the device. Phase shifters in both devices are connected to computer through UART interface, and the configuration process is done using terminal programs – cmd.exe on Windows or bash terminal on Linux (Fig 4).
Figure 4 – GNU Screen utility in Ubuntu terminal
Conclusions. The basic features of the AMMC signal were considered, the structure of the AMMC modulator and AMMC demodulator were investigated, which takes into account all the features of the signals of this type of modulation and has the corresponding functionality.
References. 1. Gorbatyy I. V. Investigation of the technical efficiency of state-of-the-art telecommunication systems and networks with limited bandwidth and signal power // Automatic Control and Computer Sciences, 2014, Vol. 48, Issue 1, P. 47–55.

87 Electronics and telecommunications
УДК 621.391 METHODS FOR WIRELESS TRANSMISSION OF DIGITAL INFORMATION BASED
ON ULTRA-WIDEBAND SIGNALS Ph.D. Trubchaninova К.А., Ukrainian State University of Railway Transport, Kharkiv, Ukraine
Introduction. Mobile wireless networks today are faced with two trends that are in contradiction to each other. The growth of computing power of mobile terminals entails the growth of computing capacity, applications that run on them. This, in turn, leads to higher bandwidth requirements of mobile communication channels. At the same time, the efficiency of the available frequency spectrum is close to saturation. And further improvements are likely to be too expensive for implementation and will provide only limited benefit. In order to cope with such significant traffic growth, the development of modern telecommunication systems should be based on the new conceptual approach – the use of ultra-wideband signals.
Presentation of the material. Analysis of existing technological solutions [1-3] shows that they do not have the possibility of simultaneous realization of a complex of modern requirements for high speed data transmission fulfilling the requirements of electromagnetic compatibility of telecommunications systems and their noise immunity against external noise and interference, as well as combating multipath propagation of radio signals. Therefore, the development of models and methods of ultra-wideband wireless communication that would meet the modern requirements, is an extremely urgent problem.
The transmission of information in telecommunication systems with ultra-wideband spectrum is carried out by simultaneous radiation of coherent reference signal and the modulated information signal. In this frequency range for communication systems selected on the basis of requirements of the frequency resource without licensing the use of ultra-wideband signals with low power radiation, which does not exceed the established boundary [4].
The removal of information signals in communication channel with interference is carried out by inverse Fourier transform from the measured power spectrum for the received signal autocorrelation function which has the information of the correlation peak with a shift of 1T or 0T according to a stream of binary bits, and the autocorrelation function for the reference signal and external noise. Further information comparing the correlation peaks with a shift of 1T or 0T determines the largest of them, which corresponds to a transmitted bit "1" or "0".
The influence of the external interference in the communication channel accompanied by the growth of extra random emissions for the autocorrelation function in the field of information peaks, which leads to an increase of the recovery error in the receiver of the transmitted binary information, particularly due to the multiplicity of information or delays .The elimination of these additional intra-system interference consists in the installation of multiple 1T and 0T delays and in the process of code spectral modulation of ultra-wideband signals in the transmitter [3].
Conclusion. A technique has been developed for wireless transmission of digital information on the basis of ultra-wideband signals, which includes a method for generating information signals with code spectral modulations and the method of extracting information signals in the communication channel with interference. The impact of interference on the quality of the recovered information has been evaluated. It is shown that the use of communication channels with an ultra-wide frequency band makes it possible to simultaneously implement a set of requirements for the electromagnetic compatibility of telecommunication systems, high speed information transfer and noise immunity with respect to the effects of external noise and interference.
Reference. 1. Serkov, А. (2019). Ultra Wideband Signals in Control Systems of Unmanned Aerial Vehicles / А. Serkov, V. Kravets, I. Yakovenko, G. Churyumov, V. Tokariev and W. Nannan // 10th International Conference on Dependable Systems, Services and Technologies (DESSERT), Leeds, United Kingdom, 2019, pp. 25-28. Аvailable at: https://doi.org/10.1109/DESSERT.2019.8770039.
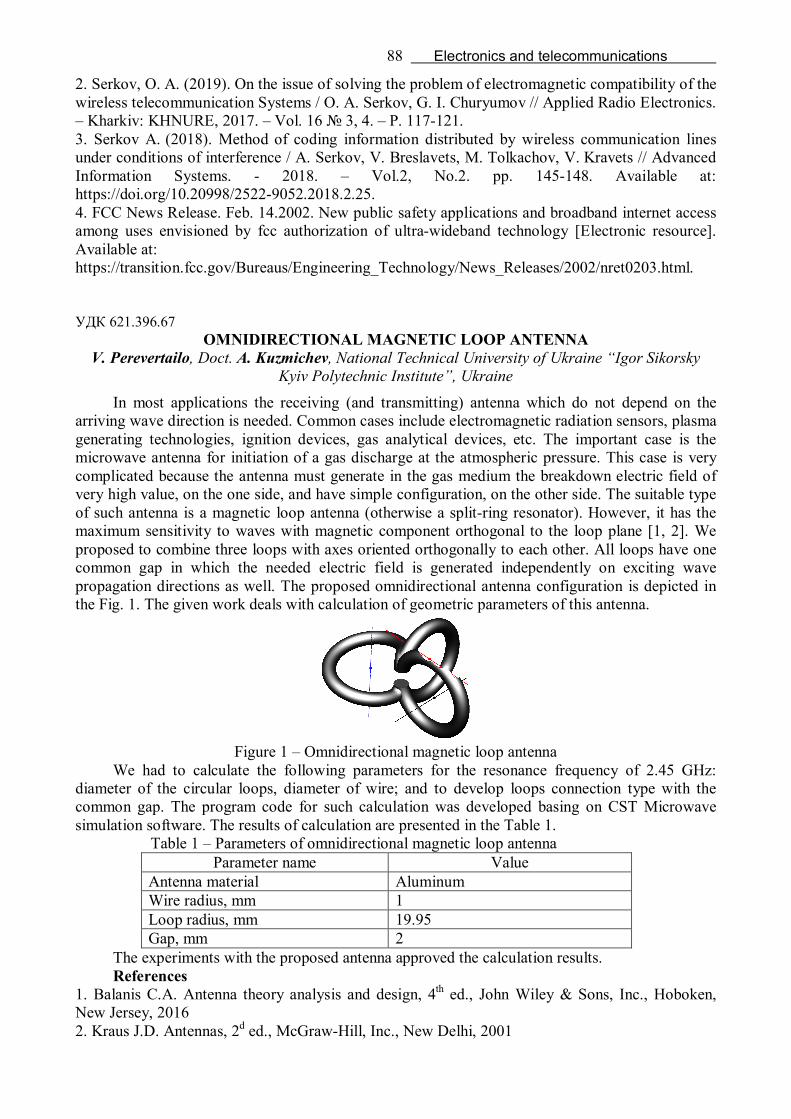
88 Electronics and telecommunications
2. Serkov, О. A. (2019). On the issue of solving the problem of electromagnetic compatibility of the wireless telecommunication Systems / O. А. Serkov, G. I. Churyumov // Applied Radio Electronics. – Kharkiv: KHNURE, 2017. – Vol. 16 № 3, 4. – P. 117-121. 3. Serkov А. (2018). Method of coding information distributed by wireless communication lines under conditions of interference / А. Serkov, V. Breslavets, M. Tolkachov, V. Kravets // Advanced Information Systems. - 2018. – Vol.2, No.2. pp. 145-148. Аvailable at: https://doi.org/10.20998/2522-9052.2018.2.25. 4. FCC News Release. Feb. 14.2002. New public safety applications and broadband internet access among uses envisioned by fcc authorization of ultra-wideband technology [Electronic resource]. Аvailable at: https://transition.fcc.gov/Bureaus/Engineering_Technology/News_Releases/2002/nret0203.html. УДК 621.396.67
OMNIDIRECTIONAL MAGNETIC LOOP ANTENNA V. Perevertailo, Doct. A. Kuzmichev, National Technical University of Ukraine “Igor Sikorsky
Kyiv Polytechnic Institute”, Ukraine In most applications the receiving (and transmitting) antenna which do not depend on the
arriving wave direction is needed. Common cases include electromagnetic radiation sensors, plasma generating technologies, ignition devices, gas analytical devices, etc. The important case is the microwave antenna for initiation of a gas discharge at the atmospheric pressure. This case is very complicated because the antenna must generate in the gas medium the breakdown electric field of very high value, on the one side, and have simple configuration, on the other side. The suitable type of such antenna is a magnetic loop antenna (otherwise a split-ring resonator). However, it has the maximum sensitivity to waves with magnetic component orthogonal to the loop plane [1, 2]. We proposed to combine three loops with axes oriented orthogonally to each other. All loops have one common gap in which the needed electric field is generated independently on exciting wave propagation directions as well. The proposed omnidirectional antenna configuration is depicted in the Fig. 1. The given work deals with calculation of geometric parameters of this antenna.
Figure 1 – Omnidirectional magnetic loop antenna
We had to calculate the following parameters for the resonance frequency of 2.45 GHz: diameter of the circular loops, diameter of wire; and to develop loops connection type with the common gap. The program code for such calculation was developed basing on CST Microwave simulation software. The results of calculation are presented in the Table 1.
Table 1 – Parameters of omnidirectional magnetic loop antenna Parameter name Value
Antenna material Aluminum Wire radius, mm 1 Loop radius, mm 19.95 Gap, mm 2
The experiments with the proposed antenna approved the calculation results. References
1. Balanis C.A. Antenna theory analysis and design, 4th ed., John Wiley & Sons, Inc., Hoboken, New Jersey, 2016 2. Kraus J.D. Antennas, 2d ed., McGraw-Hill, Inc., New Delhi, 2001

89 Production and technology
УДК 621.182.12:628.35 CLEANING OF WASTE WATER FROM OIL PRODUCTS WITH THE USE OF SLUDGE
WATER TREATMENT TPP PhD. Ivanov I.I., National metallurgical academy of Ukraine, Dnepr, Ukraine
Introduction.The problem of water pollution by energy waste, especially oil products, is extremely acute. Oil films on the surface of a reservoir impede aeration and natural self-purification of water.Heavy fractions of petroleum products settle to the bottom, which leads to the death of organisms living on it. Weak oxidizability in water determines their long-term detrimental effect on flora and fauna.In addition, at the stage of water treatment after liming and coagulation, large volumes of sludge are formed in clarifiers. They accumulate in the sludge dumps, increasing the environmental load on the adjacent territories.Dneproenergo TPP alone discharges up to 7 thousand tons of sludge annually. Therefore, it is important to comprehensively solve the problems of cleaning oil-containing effluents and utilizing sludge from water treatment.
Exposition of material.Of the methods for deep wastewater treatment, adsorption processes are promising, which make it possible to extract valuable components from wastewater with their further disposal.For this, it is advisable to use sorbents, which are waste from various industries, since when they are used, two tasks are solved at once: treatment of contaminated water and waste disposal. In conditions of thermal power plants, it is of particular interest to assess the possibility of using sludge from water treatment as an available sorbent for the treatment of oily effluents.
According to the analysis data (table), the main components of CaO and CaCO3 prevail in the sludge of the Dnieper TPP. To determine the sorption capacity, we used dried sludge with a moisture content of 2.5–3.8% and a bulk density of about 560 kg / m3.The granulometric composition of the samples is quite homogeneous, the grain size is 1.2 ÷ 1.9 mm; fine particles are practically absent.Petroleum products in the wastewater of thermal power plants - turbine oil, diesel fuel, gasoline and fuel oil; their source is fuel oil facilities, electrical equipment, support services.
The results of the study of the kinetics of the adsorption process under conditions of immersion of the sample in oily wastewater show that the sludge has a significant sorption capacity, which is realized within the first hour of contact with wastewater and reaches a value of 5.7 g / g (fig.).
Table - The chemical composition of the sludge of the Dnieper TPP, % mass.
СаО SiO2 MgO FeO Al2O3 K2O Na2O СаСО3 43 - 45 10 - 11 2,6 – 2,8 2,5 – 2,7 1,6 – 1,7 0,66 – 0,78 ≤ 0,12 ~40
2
2,5
3
3,5
4
4,5
5
5,5
6
0 50 100 150 200
Sorp
tion
capa
city
, g /
g
Time, minutes Figure - Sorption capacity of sludge for oiled water
Adsorption of petroleum products by sludge of water treatment allows providing a deep (up to
95%) wastewater treatment before discharge into water bodies. Reducing the volume of sludge

90 Production and technology
during storage significantly reduces the environmental load on the environment. Partial replacement of activated carbon used for water post-treatment with sludge for water treatment reduces the cost of sorbent acquisition.
This production waste is generated in large quantities, and the estimated calorific value of the sludge saturated with trapped petroleum products is comparable to the calorific value of fossil fuels (22–23 kJ / kg).Therefore, a rational technological solution is the rejection of regeneration of the spent sorbent and its utilization by adding to the main fuel during combustion at thermal power plants. This eliminates the danger of secondary water pollution associated with regeneration, additional energy appears for the needs of thermal power plants, and natural resources are saved.
Conclusions. The use of water treatment sludge for adsorption of oil products from waste water from TPPs allows to comprehensively solve the problem of preventing oil pollution of water bodies and recycling waste water treatment. УДК 504
POLLUTION OF THE TERRITORIES OF BOARD`S PRODUCTION Doct. Pohrebennyk V.D., Lviv Polytechnic National University, Ph.D. Nester A.A., Prydoloba A.V.,
Khmelnitsky National University, Khmelnitsky, Ukraine
The environment is considered to be safe when its condition meets the criteria, standards, limits and norms in the legislation concerning cleanliness (not pollution), non-exhaustion, environmental sustainability, sanitary requirements, ability to satisfy the interests of citizens.
The problem of industrial and household wastes` utilization is becoming more important nowadays because the volume of waste generation is constantly increasing, while the rate of their processing is incomparably small. As a result, hundreds of millions of tonnes of various solid wastes have been accumulated to date, which must be recycled and disposed of. The scale of annual production and accumulation of solid waste requires the creation of powerful recycling plants with a capacity of millions of tonnes per year for their industrial development. It is good to carry out on the basis of already existing projects developed by advanced countries. The specificity of solid waste production is that in small quantities they do not have a significant impact on the environment, and in large concentrations become environmental disasters. Therefore, research and development of technique and technologies of recycling and waste disposal are actively pursued worldwide. The problem is that bringing the proposals to practical implementation in industry is connected with numerous financial, social and technical difficulties.
The analysis of sludges of galvanic industries, production of printed circuit boards and sludges from sludge collectors showed a high content of metals in them. Under the influence of fallout, especially acid rain, there is a gradual secondary pollution of the environment with this waste. Great watering of the territory, loose water permeable soils complicate the choice of industrial waste landfills and limit their area, create conditions for heavy metal ions contamination not only adjacent to the soil and surface water storage sites, but also groundwater horizons.
At this time, many countries around the world are still using the disposing method of toxic waste by dumping in special landfills using protective materials made of clay, polyethylene, polyvinyl chloride and other waterproof materials. An economic method of sediment burial is often chemical fixation, which is dosed in the sludge of special agents such as sodium silicate, cement. As a result, toxic substances are fixed in the solid mass, but may subsequently wash out.
Among the waste liquids there is a large group of heavy metals that are widely used in various industrial production, and, despite used methods for purification, heavy metal compounds penetrate industrial wastewater. A significant number of these compounds also enter the water through the atmosphere. The environmental hazard of heavy metals is that they are actively absorbed by phytoplankton, and then fall into the human food chain.
Enterprises that use PCB manufacturing processes to make modern electronic technology work are contributing to environmental degradation. Such enterprises include the production of: household appliances; military, cosmodrome equipment; spacecraft, radio and television.

91 Production and technology
For example, let`s take a look at the state of sludge formation while working the lines of etching of printed circuit boards. With a digestive line productivity of 12 м2/h, the amount of sludge in 8 hours will reach a value of approximately 100 kg, which in the case of monthly one-shift work will complete to 2200 kg.
Today's best-in-class enterprises have produced approximately 4·103 m2 of boards, accumulating 2000-3000 tonnes or more of waste on their territory in the form of sludge, which are stored in containers, plastic bags and fall under the act of atmospheric sediment. In the process of action of atmospheric sediments on them, salts are washed out and transferred to soil, surface water, polluting the environment and increasing the level of environmental danger.
To avoid the accumulation of sludge on the territory of enterprises it is proposed to use the technology of regeneration of waste digestion solutions, in which the isolated metal is used as a secondary raw material for copper production, and the recovered solvent is reused for etching of printed circuit boards.
The soil and rock contamination forecast in the sludge storage area (prior to the implementation of the proposed solutions) is proposed to be performed on the basis of the provisions set out below.
As we said before, we have made the forecast for the salinization of soils and rocks of the aeration zone in the technogenically disturbed territory for different periods. Salts from the earth's surface move to the lower horizons of the aeration zone according to the laws of molecular diffusion. According to the theory of physicochemical hydrodynamics of porous media, this process can be described by the equation of motion and conservation of mass of matter in partial derivatives for vertical mass transfer.
The analytical solution of the equation for the problem in this formulation looks like this:
ntD
xerfcCoCnCxm2
)(
where Сx - the estimated salinity at a depth of xm from the earth's surface, %; Cn - salinity on the surface (bulk layer of salts), %; Co - soil salinity before the beginning of storage, %; x - distance of the calculated points from the origin, ie from the surface of the earth, m; t - term of the estimated calculation, 24-hour period; erfc - tabulated exponential function; n - volume humidity.
The scheme of the salt transfer area can be represented as follows: the movement of salts is carried out only in pore space. The pores occupy 0.4 units of rock volume, so the maximum Cn value will be 40% at the boundary of 1 genus-surface of the earth. In our case, we choose to calculate the calculation points after 0.5 m to the groundwater level.
To understand the process let's determine the magnitude of salinity: in the presence of salts less than 0.3% soils are considered saline, 0.3 ... 0.5% - soils poorly saline. All soils contain a certain amount of salts. Salinity is measured as a percentage of dry soil.
When salt is lying on the soil surface, it corresponds to the first-order boundary condition. The following initial data are taken for the forecast calculation:
Co - soil salinity before the beginning of storage will be 0.2%; Dm - molecular diffusion coefficient (1-9)·10-5 m2/day. In the calculations of moving salts, the
values are taken to be maximum, that is, the value 9·10-5 = 0,00009 m2/day. x - the distance of the calculated points from the origin, that is, from the surface of the earth,
will be 0.5 m t - the estimated period is 1 year (365 days). The magnitude of the calculation shows that in 1 year after salting the upper half-meter layer
of the aeration zone will go into the category of low and medium saline. In next years, salt content will increase in time and depth.
With this content of salts, the complete absence of any living organisms and plants is guaranteed for many years and after the liquidation of the composition.
92 Production and technology
Conclusions All above allow to understand the loss of sludge storage on the territory of the enterprise and
give the direction of work for the development of technologies for processing and reuse of etching solutions in the process of etching of printed circuit boards. УДК 622.2
IMPROVEMENT OF ORE RAGGING QUALITY USING INITIAL POTENTIAL IN BREAKING MASS
Doct. Yusupov Kh. A, Rustema S.T., Bakhmagambetova G.B., Satbayev University, Almaty, Republic of Kazakhstan
At present, various effects on ore (physical, mechanical, chemical, biological) used to intensify the leaching process, most of which aimed at accelerating the valuable components transfer from ore to productive solution, with ore size playing an important role [1]. In order to obtain the necessary grain size composition for heap leaching of ore coming from the pit, several crushing stages are carried out, which is from 8 to 16-18% of ore extraction and processing costs.
In order to improve the breaking ore quality and reduce the crushing costs before leaching, the breaking technology using the preliminary stressed state of the massif has been developed.
The object of the study is the "Belaya Gorka" section of the Rodnikovoye field administratively located in the northern part of the Kokpektinsky district territory (on the border with the Zharminsky district) of the East Kazakhstan region. Based on mining technical conditions of development, the method of vertical well charges with short-circuited blasting adopted: at ore mining - on subbenchs with height of 5 m, at opening - on benchs with height of 10 m, drilling diameter of 110 mm. Igdanite, grammonite are used as explosives. The value of the line of least resistance along the bench bottom at production is 4.8 m, and at opening operations - 6.6 m.
For the this deposit conditions, the blasting chamber is a well with a depth of 6 meters, the capacity of 1 m of the well P = 9.5 kg, the charge weight in the well Qwell = 27.6 kg. Energy released by 1 kg of used explosive Eu = 1025 kcal/kg. Then the total potential energy of one well is Eu = 11844.57kJ/kg, with a detonation rate of 3500 m/s, which is the rate of the initial load increase on the well walls.
On one side of the well, this pressure applied to the rock mass volume, one side of which is the slope of the bench, i.e. is free from pressure. On the opposite side, an explosive shock wave coming from the explosion sets pulse to the soil particles. The particle velocity allows us to calculate the kinetic energy spent in the explosion kick of the first soil layer with volume V = 56 m3, which is Ec = 29.8 kJ. Volume of well charge released energy Ewell = 11844.57 kJ.
In order to determine the explosion energy amount consumed to destroy the half-space opposite the discarded part of the dump, from the total explosion energy, we subtract the consumed energy in the form of kinetic energy and obtain Eexcess = 11814.77 kJ.
Determining the energy amount consumed per half-space makes it possible to determine its further dispersion. According to [2], as well as taking into account the breaking stress σ str of aleurolite (the main rocks constituting the massif), it is possible to determine the amount of energy E spent on mechanical action in three zones [3] of the explosion wave action: Е1 = S1 σstr = 0.087 kJ; E2 = S2 σstr = 1.49 kJ; E3 = S3 σstr = 1.87 kJ.
Further, from Eexcess - Е1+Е2+E3 = 11811.32 kJ - the obtained amount of energy spent on elastic deformations beyond the R3 - are initial stresses. As can be seen, the initial stress σstr = 11811.32 kJ is the majority of the explosion energy transferred to the internal initial stress of the rock mass, which changes the soil characteristics. Taking into account the level of initial stresses formed as a result of the previous explosion, it will be possible to reduce the size of the grain size composition of the rock.
Knowing the blast wave zones’ radiuses and the initial stresses level in the elastic region, it is possible to obtain the necessary ragging quality by adjusting the deceleration interval in case of short-circuited blasting.

93 Production and technology
Taking into account the initial stress, when, as a result of the first row wells explosion, pre-stress is created in the rocks and the rocks strength is reduced, for the conditions of the "Belaya Gorka" section of the Rodnikovoye deposit in order to obtain qualitative ragging, it is necessary to take a deceleration interval of 32 ms.
References: 1. Onika S.G. Simulation of explosions’ seismic effect at Mikashevichi quarry/S.G. Onika//Mining mechanics and mechanical engineering. - 2016. № 2. - pages 9-14. 2. Stavrogin A.N., Tarasov B.G. Experimental physics and rocks mechanics. - SPb.: Nauka, 2001 3. Kabetenov T., Yusupov Kh.A., Rustemov S. T. Determination of well breakage rational parameters taking into account the time of explosion pulse action. "Physical and technical problems of mineral resources development" № 2, 2015. Page 75-81. УДК 669.162.1:632.15:504.064.4
WAYS TO REDUCE DIOXIN DANGER IN AGLOMERATION PRODUCTION PhD. Ivanov I.I., National metallurgical academy of Ukraine, Dnepr, Ukraine
Introduction.One of the global environmental problems is environmental pollution by persistent organic pollutants. The most dangerous of these are dioxins and furans (PCDD / F), which are formed by the interaction of chlorine with organic matter when heated.They have high chemical resistance; half-life of 10 - 15 years on the soil surface and 25 - 100 years in depth[1]. PCDD / F are xenobiotics and cumulative poisons, have powerful mutagenic, carcinogenic, teratogenic, embryotoxic, immunosuppressive effects; they are also called chemical AIDS.Half-life of about 7 years; only 10% of them are metabolized[2]. For dioxins, there is no "threshold of action": even one molecule can provoke abnormal cellular activity and cause a chain of reactions that disrupt the body's functions.The most dangerous are 2,3,7,8-tetrachlorodibenzofuran and 2,3,7,8-tetrachlorodibenzo-n-dioxin, against which the toxic equivalent of any mixture is determined. The supertoxicity of the latter is due to the structure and size of its molecules, which coincide with the active centers of the Ah-receptor[3]. Due to this, dioxins block the functions of cells (including DNA), actively disorganize them, launch into them an avalanche chain of destructive processes.
Exposition of material.A powerful source of emissions of dioxin-like substances into the environment is industry. Metallurgical enterprises and adjacent territories are an area of increased dioxin risk.The largest amount of PCDD / F is formed in sinter production; it accounts for more than 80% of annual emissions[4]. The specific yield of these substances is 0.55 - 4.14 ng / kg of agglomerate; their content in sintering gases 1 - 10 ng / m3 at EU norms up to 0.1 ng / m3[5].
The sources of dioxins/furans are organic compounds of sinter and chlorine, which is present (up to 0.01%) in coal fuel, ore, fluxes in the form of NaCl, KCl and others. Addition to the sintering charge of the oil rolled scale, polychlorvinyl coatings and packages where about 57% of chlorine, the presence of catalysts such as copper, many times increase the content of PCDD / F in gases.
The formation of PCDD / F begins in the upper layer of the charge after ignition, and then they condense on a cooler charge below the lying zone during the period of movement of the sintering tape to the point of burning. The process of condensation and evaporation continues until the temperature of the lower charge zone is reached, when the condensation and exit of these substances with gases ceases. Therefore, PCDD / F emissions initially increase rapidly, reach a maximum just before the moment of burning, and then fall sharply to a minimum.
An important condition for preventing or minimizing the formation of PCDD / F is the stable operation of the sinter plant. Failures in the process of sintering, simple, disturbance of the flame front cause an increase in emissions of these substances. Therefore, constant control and stabilization of the speed of the sintering tape, the composition and height of the layer of sintering charge, the normalization of additives in it, minimizing air infiltration through the sintering tape is required.To reduce fugitive emissions, fine raw materials (such as dust filters) must be coarsened

94 Production and technology
before being fed to the agglomeration, and other materials carefully mixed and metered before loading.
Restrictions on the use of contaminated scale in the charge, water with high chloride content, dust from the cleaning apparatus, exclusion of polymer coatings, films, petroleum products, other sources of PCDD / F formation can reduce their emissions by 50 - 70%.
An important area is the improvement of existing gas purification systems that capture up to 60% of dioxins. In EU countries, it is mandatory to use efficient electrostatic precipitators and oxidation catalytic converters on sinter machines[6]. Thermal neutralization of PCDD / F to CO2 and H2O is carried out by combustion of process gases at a temperature of 1100 - 1300 ° C. To prevent the reverse process of their formation, the combustion products are "tempered" by irrigation with water or by mixing with air[7].
The introduction of calcined lime and injection of lignite powder into the stream of process gases before the installation of dust trapping reduces dioxin emissions by more than 97%[8]. The purification of gases from the adsorbent with the captured dioxins occurs together with the process dust in the bag filters, followed by disposal in the charge.The content of dioxins in the discharge gases does not exceed 0.1 ng / m3 at a flow rate of lignite up to 30 mg / m3, but with lignite in excess of 50 mg / m3 there is a risk of dust in the filters.
The content of PCDD / F can be reduced by 60 - 70% due to the recirculation of gases in the tail vacuum chambers of the sintering machine, where the process of their formation at temperatures of 250 - 450 ° C. They fall into the combustion zone with recirculating gas and decompose almost completely[9].
According to Corus[10], an additive in the sintering charge of urea in the amount of about 0.15 kg / t of agglomerate can reduce more than twice the emissions of dioxins / furans and at the same time reduce the emissions of SO2 and NOx by the mechanism of chemisorption capture. Similar data were obtained using ammonium sulfate as an inhibitor of dioxin synthesis in the process of iron ore sintering[11].
Conclusions. Implementation of technological and environmental measures will significantly reduce the emissions of dioxins / furans in the process of agglomeration of iron ore and ensure compliance of their content in agglomerative gases with EU standards.
Список посилань 1.Sinkkonen S., Paasivirta J. Degradation half-life times of PCDDs, PCDFs and PCBs for environmental fate modeling//Chemosphere. - 2000. - v.40, iss.9 - 11. - pp. 943 - 949.http://doi.org/10.1016/s0045-6535(99)00337-9 2.PereiraM. S. Polychlorinateddibenzo-p-dioxins (PCDD), dibenzofurans (PCDF) andpolychlorinatedbiphenyls (PCB): mainsources, environmentalbehaviourandrisktomanandbiota//Química Nova. – 2004. - vol.27, no.6. – pp.934-943 http://doi.org/10.1590/S0100-40422004000600018 3.Мельников Б.И. Экологические аспекты диоксинового загрязнения биосферы: методы идентификации и снижения выбросов/ Б.И. Мельников, В.М. Набивач, Р.В. Смотраев, О.В. Кожура. - Екологія та ноосферологія. - 2008. - Т. 19. - № 3–4. – с. 88 – 103. 4. WangL.-C., LeeW.-J., TsaiP.-J., LeeW.-S. and Chang-ChienG.-P.Emissions of polychlorinated dibenzo-p-dioxins and dibenzofurans from stack flue gases of sinter plants// Chemosphere. – 2003. - vol. 50, no. 9. - pp. 1123–1129. https://doi.org/10.1016/S0045-6535(02)00702-6 5. US EPA. Exposure and Human Health Reassessment of 2,3,7,8-Tetrachlorodibenzo-p-Dioxin (TCDD) and Related Compounds. Path 1, V.2, -Washington, DC, EPA/600/P-00/001Ab, 2000. – 628 p. 6.FinocchioE., BuscaG. and NotaroM. A review of catalytic processes for the destruction of PCDD and PCDF from waste gases// Applied Catalysis B: Environmental. – 2006. - vol. 62, no. 1-2. - pp. 12–20. https://doi.org/10.1016/j.apcatb.2005.06.010 7. БернадинерМ. Н. Диоксинывпирометаллургических процессах и методы их обезвреживания. // Электрометаллургия. - 2000. - № 1. - с. 12-17.
95 Production and technology
8.Новая установка вдувания угля для снижения выбросов диоксина на аглофабрике./ Бонт Л., Бюттьен К., Фурнель Р. и др. // Черные металлы. - 2003. - № 6. - c. 40-43. 9. FanX., YuZ.,GanM.,Chen X. and HuangY.Flue gas recirculation in iron ore sintering process//Ironmaking & Steelmaking. – 2016. -v.43, iss.6. – pp. 403-410. https://doi.org/10.1179/1743281215 Y.0000000029 10.Справочник наилучших доступных технологий в промышленности по переработке черных металлов. - М.: Изд. ООО «ДеловыеМедиа» - 2013. - 612 с. 11.Lechtanska P., Wielgosiski G. The use of ammonium sulfate as an inhibitor of dioxins synthesis in iron ore sintering process//Ecological Chemestri and Engineering S. – 2014 - 21(1). - p. 59-70. https://doi.org/10.2478/eces-2014-0005 УДК 622.276(043) APPLICATION OF LEACHING TECHNOLOGY AT THE URANIUM DEPOSITS SITES
WITH SIGNIFICANT STATIC LEVELS OF UNDERGROUND WATER Omarbekov Ye.U., Satpayev University, Almaty, Kazakhstan
Introduction. This paper presents the advantages and problems in the development of deep-lying uranium deposits with a high-pressure character of groundwater. The proposed technology of "pumping wells" takes into account the static level of underground water, to ensure the necessary flow rate of pumping wells, and normalizes the passage of the leach solution through the ore mass at a natural value of coefficient filtration.
Key words: PSV (underground borehole leaching), high-pressure nature, “pumping wells”, groundwater.
Presently, leaching method is one of the most promising technologies for extracting the uranium, gold as well as a number of other rare and non-ferrous metals. In mining mineral deposits using underground leaching technology, an impact is made on the mineral deposits at the stratification site to transfer useful components into the solution for subsequent extraction, usually through wells drilled from the surface to the location of the deposit. Underground leaching is the more preferred and more effective technology, compared to other traditional mining methods, in the mining of poor deposits, as well as deep deposits, characterized by complex hydrogeological and mining conditions [1].
Currently, about a quarter of all uranium is extracted using underground leaching technology. The idea of underground leaching, which was developed in the USA in the 1950s, has since become the most popularly used method for producing uranium, which is superior to the traditional chemical based mining method. For several years, the United States and the CIS countries have remained the leading countries in the mining of uranium ores at the industrial scale using underground leaching technology, with Kazakhstan and Uzbekistan playing the leading role in commercial productions. Since 1998, almost all of the uranium mining in Kazakhstan has featured underground borehole leaching (PSV). Kazakhstan has one of the world largest proven volumes of uranium deposits, of which 75.3% reservoir-infiltration type is suitable for mining using the PSV method. Since 2009, Kazakhstan has become the leading global producer of uranium supplying almost 28% of world production, 33% in 2010, increased to 41% in 2014 and 39% in 2017 and 2018.
The conditions for applying the PV method is the possibility for free movement of the leaching reagent in the ore zone, i.e. ore-bearing rocks must have natural or artificially created permeability. Unlike the traditional scheme of ore mining and processing, the technological scheme of underground leaching from reservoir deposits with watered productive horizon, does not require a complex set of structures for water supply and treatment of industrial effluents, since the latter are absent in the process. However, in recent times, with the application of the technology at deep horizons replete with high-pressure character of groundwater arose the problem of the formation of "gaps" in the channels through which the solution reaches pumping wells without attaining the
96 Production and technology
required volume of ore. In addition, the high-pressure nature of groundwater increases the frequency of clogging of filters and the filter zone.
To solve this problem, the technology of “pumping wells” was proposed [2] to ensure the necessary flow rate of pumping wells and normalize the passage of the leach solution through the ore mass at a natural value of the filtration coefficient. Thus, reducing drilling costs and time needed for the construction of technological wells. This technological solution requires further research to establish the ratio of "pumping wells" to extracted wells, taking into account the static level of groundwater.
Conclusion. In the new technical solution - adding pump wells to the piping, we get a system of interconnected vessels, which does not require a pump and infrastructure for it to be located at the right point in the block; the required motion vector of formation water at such a point is created remotely using pump wells.
List of references. 1. Karakotskaya I.A. Mathematical model of mining fields, method of borehole underground leaching. // Thesis for the degree of candidate of physics and mathematics sciences. Ekaterinburg: Ural State University. 2006. 2. Omarbekov Ye.U. Development of PSV technology for uranium in conditions of high pressure groundwater. // International scientific-practical conference "Rational use of mineral and industrial raw materials in the conditions of Industry 4.0". Almaty: Satpayev University. 2019. УДК 519.254 MULTICRITERIA DECISION MAKING IN FUZZY CONDITIONS AND APPROACHES
TO SOLVE THEM Ph.D. Bakay B. Ya., Chelepis T. O., Ukrainian National Forestry University, Lviv, Gilpert V. V., Dnipro Polytechnic National Technical University, Dnipro, Ukraine
Introduction. The Multiple-Criteria Decision Making (MCDM) problem for different tasks of industries can be represented in the criterion space or the decision space. Alternatively, if different criteria are combined by a weighted linear function, it is also possible to represent the problem in the weight space.
Presentation of the material. In order to identify scholarly literature pertaining to decision analysis, a search was conducted for common MCDM methods in the title, keywords and abstracts utilizing the following scientific databases of Scopus and Web of Science. These materials were narrowed down to articles that focused on the application of popular MCDM approaches. The following twelve MCDM methods were identified throughout the review: 1) Multi-Attribute Utility Theory (MAUT), 2) Analytic Hierarchy Process (AHP); 3) Fuzzy Set Theory (FST); 4) Case-based Reasoning (CBR); 5) Data Envelopment Analysis (DEA); 6) Simple Multi-Attribute Rating Technique (SMART); 7) Goal Programming (GP); 8) ELimination Et Choice Translating REality (ELECTRE), 9) Preference Ranking Organization method for Enrichment Evaluation (PROMETHEE); 11) Technique for Order of Preference by Similarity to Ideal Solution (TOPSIS); 11) Hesitant Fuzzy Set (HFS); 12) Simple Additive Weighting (SAW).
Making a decision of best suited approach faces a problem about evaluation by particular criteria and correct assessment of it. Content of approach and evaluation criteria are determined by the exciting task goal. Thus, importance, a significance and value of evaluation numbers should be made and compared in terms of chosen criteria when generalization or overall checking is made. At this moment, around twenty groups of methods to calculate the coefficient of importance exist. They vary by type of output information about benefits along with transformation into a coefficient of importance.
With regards to the theory of measurements and usage potential, we created a hierarchical classification of methods to define coefficients of importance criteria and made an overlook of already known criteria, which been developed in past ten years.
The assessment of risks, based on decision making, is becoming increasingly important and

97 Production and technology
urgent in different tasks and fields of life cycles. Therefore, the main objective of this work was to investigate the use a novel hybrid technique by integrating multi-criteria decision analysis and evaluation laboratory (DEMATEL), analytic network process (ANP), weighted linear combinations (WLC) and interval rough numbers (IRN) techniques to a different cases study.
This work presents a hybrid model of MCDM approach by integrating DEMATEL with the different modules (e. i. AHP, FST, CBR etc.). The current research work is based on the set of factors and key criteria that are selected from the existing resource bank and also from earlier research articles. The unique feature of the current study stands from the fact that the real industrial factors are considered as the crucial leading factors for this complex system.
Conclusions. Specifically, we improve the DEMATEL method by applying separate modules to determine connections in the network structure based on criteria and to accept imprecisions during collective decision making. The application of modules can eliminate the necessity of additional information to define uncertain number intervals.
The advantage of the current method stands by its inbuilt flexibility by applying to dissimilar dimensions and varied conditions (mechanical engineering, life and safety, environment, ecology etc.). This feature is also unique with regard to previous studies. УДК 678-13:678.744:678.
RESEARCH OF HYDROGELS BASED ON PVP COPOLYMERS AS MATRICES FOR CHEMICAL REDUCTION OF METAL IONS
Doct. Grytsenko O.M., Doct. Suberlyak O.V., Ph.D. Baran N.M., Lviv National Polytechnic University, Lviv, Ukraine
Introduction. Currently, special attention is paid to metal-filled hydrogels, which are distinguished by a number of valuable operational properties. The searching for composite hydrogels with a set of new properties is relevant, especially the simple technologies for their obtaining. In this work, the researches were conducted in purpose to establish the possibility of using hydrogels based on polyvinylpyrrolidone (PVP) copolymers as matrices for the chemical reduction of metal ions.
Presentation of the material. The porous hydrogel matrix was obtained by copolymerization of HEMA with PVP in the presence of Iron (II) Sulfate at room temperature for 0.3 ... 1 h (depends on the composition). It was established with the help of SEM, that hydrogels based on the obtained pHEMA-gr-PVP copolymers contain macropores with sizes lying within 10 ÷ 30 μm, which in combination with high complexing ability of functional groups of both HEMA and PVP provide the ideal conditions for sorption and retention of precursors of the chemical reduction reaction of metal ions. It has been investigated that pHEMA-gr-PVP copolymers are characterized by high values of equilibrium degree of swelling and conditional porosity, which depending on the composition and temperature are in the range within 0.4-1.4 g/g and 53-85%. The high permeability has been found of the obtained materials relative to low molecular weight compounds (e.g. NaCl), which was evaluated using diffusion and ion permeability coefficients. The results of the behavior study of pHEMA-gr-PVP copolymers and hydrogels in solutions with different concentrations of HNO3, H2SO4, NaOH, C2H5OH had shown their high chemical resistance to aggressive environment.
The immobilization of metals such as nickel, copper and silver was carried out in the hydrogel. The reduction of Ni2+ and Cu2+ was performed from their sulphates, Ag+ – from nitrate, which is explained by the availability and relatively low cost of these substances; the reducing agent for Ni2+ and Cu2+ – sodium hypophosphite was selected, and as a reducing agent for Ag+ – aqueous solution of ethyl alcohol. All reduction processes were carried out in the temperature range between 60÷90 0С for 30-60 min. To increase the activity of NaH2PO2, reduction activator argentum nitrate was added to the reducing agent solution, which gave a possibility to carry out the process at lower temperatures and with higher metal yield.
The presence of precipitated metals particles was confirmed by X-ray crystallography. The formation of metal particles occurs both on the surface of the samples and in volume. On the

98 Production and technology
surface of the sample, micro-agglomerates with the order of magnitude 1 – 30 µ are formed, and photographs of the sample slice indicate on the formation of metal nanoparticles, the size of which reach 10 – 50 nm (e.g. silver).
The influence of the nature and content of the deposited metal, the composition formula and structural parameters of the polymer network of copolymers, the reduction temperature on the kinetics of metal formation and permeability, water absorption, physico-mechanical properties (number of hardness, elasticity and plasticity, tensile strength) and electrical properties (volume resistivity) of the obtained materials were investigated.
Conclusion. According to the conducted researches, it has been proved, that hydrogels based on copolymers of 2-hydroxyethylmethacrylate with polyvinylpyrrolidone, in due to their structural characteristics, the ability to absorb water and other solvents, permeability to low molecular weight compounds and chemical resistance, can be used as matrices for the reduction of metals and for the obtaining composite metal-filled hydrogels on their base. Regularities of chemical reduction of metals in the hydrogels' volume, based on HEMA copolymers with PVP have been established. УДК 622.234.42
PROBLEMS OF SORBENT WASHING WHEN PROCESSING URANIUM ORE Doct. Yussupov Kh.A., Ph.D. Omirgali A.K., Satbayev University, Ph.D. Aben Kh.Kh., KAZ
Minerals, Almaty, Rakhmanberdiyev A. G., limited liability partnership "ORTALYK", Shymkent, Republic of Kazakhstan
Introduction. The resource base of uranium mining companies that use in-situ leaching currently mainly consists of poor deposits of hydrogen genesis, which are located in permeable sand-clay layers of the depressed zones of the earth's crust [1] . Until recently, these deposits, bearing uranium resources, were not involved in industrial development using traditional mining methods for technical and economic problems. However, these problems have been overcome, because of the great economic importance of such deposits. Especially in the last decade, great work has been done on the development and the industrial implementation of geotechnological mining of uranium, by utilizing the underground method in-situ leaching (ISL).
In-situ leaching is a method of extracting uranium by selectively dissolving it with chemical reagents from ores at the place of their occurrence and subsequent extraction from uranium-containing solutions. Despite all the advantages, the use of underground in-situ leaching of uranium still unresolved a number of problems, one of which is an increase in the total cycle of operation of technological wells, an increase in uranium extraction [2, 3].
Currently, the average period of leaching of one process unit is 5.5-6 years. Through the extraction period, operating costs steadily increase, because of the costs for repair and restoration works, power, chemicals, and the drilling/construction of additional wells (including re-drills). Therefore, it is relevant to intensify the process and increase the uranium content in the pregnant solution.
One of the ways to achieve this goal is the use of an artificial oxidizer in the acidification and leaching of uranium. There are various ways to increase the redox potential, such as the use of sodium nitrate, hydrogen peroxide, etc. However, these methods are technologically difficult and expensive to implement.
Statement of material. On the basis of literature data it was concluded that during the in-situ leaching process the significant role is played by oxidation potential – redox of leaching solutions, which is determined by the ratio of the concentrations of Fe (III) and Fe (II). As you know, ferric ions are used in sulfuric acid solution in the process of leaching of uranium ores. An increase in the proportion of ferric iron contributes to an increase in the redox potential, which in turn intensifies the process of in-situ leaching and reduces the specific consumption of sulfuric acid for leaching and acidification. Therefore, the choice of the optimal value of the redox potential and the optimal oxidizing agent can play a significant role.

99 Production and technology
The choice of oxidizing agents for the oxidation of Fe (II) should be made based on the following provisions:
- availability and low cost; - absence of a negative impact on further technological processes (sorption of uranium, etc.); - low specific consumption. One of the easily available and harmless oxidizing agents is dissolved in the air oxygen. With
an increased oxygen content in the leaching solution, it becomes possible to intensify the process of leaching by maintaining a high redox potential along the entire process from injection to production wells. However, in practice, technical problems arise with the saturation of the leach solution with oxygen. We propose a technology in which active mixing of air and water takes place, which contributes to the efficient transfer of oxygen from air to solution, this allows enriching the leaching solution with oxygen at the lowest cost and eliminates the possibility of gas clogging.
Conclusions. An increase in the oxygen concentration in the leaching solution makes it possible to increase the ratio of Fe (III) and Fe (II), which accordingly leads to an intensification of the leaching processes and an increase in the uranium content in the pregnant solution.
List of references. 1. Sukhodolov A. P. World uranium reserves: prospects for supply to the nuclear energy // Bulletin of the Irkutsk State Economic Academy. 2010. No. 4 (72). p. 166–169. 2.Yussupov Kh.A., Dzhakupov D. Research on the use of ammonium bifluoride for chemical treatment of wells. M.: Mining Journal, 2017, No. 4. p.57-59. 3.Aben E., Markenbayev Z., Khairullaev N., Myrzakhmetov S., Aben Kh. Study of change in the leaching solution activity after treatment with a cavitator / mining of mineral deposits Volume: 13, Issue: 4, p. 114-120. УДК 678-13:678.744:678.
THE OPTIMIZATION OF POLYMER HYDROGELS COMPOSITION FORMULA BY SCHEFFE’S METHOD
Doct. Grytsenko O.M., Ph.D. Voloshkevych P.P., Berezhnyy B.V., Lviv National Polytechnic University, Lviv, Ukraine
Introduction. In chemical technologies, in particular, in technology of polymers synthesis, experiment is the main source of information. However, usually the obtaining of experimental data is a process, which needs a lot of material expenses, time, energy, etc. Therefore, for modeling chemical and technological processes a mathematical modeling of experiment is widely using nowadays. The one of the relevant technological issues is planning and optimization of multicomponent systems, and also a prediction of characteristics and properties of produced polymers and composites.
Presentation of the material. A new method of obtaining metal-filled hydrogels based on copolymers 2-hydroxyethylmethacrylate (HEMA) with polyvinylpyrrolidone (PVP) was proposed, which consist in implementation of polymerization with the simultaneous reduction of metal ions by using exoeffect of polymerization [1].
At the same time, the development of technology obtaining metal-filled hydrogels by polymerization method with simultaneously chemical reduction of metal ions suggests the grounding and determination of optimal technological parameters for its realization.
The purpose of this work is to implement an optimization of the composition of the original HEMA/PVP/H2O polymer-monomer composition (PMC) and to obtain the dependences of "composition-technological parameters" with the possibility of forecast the technological conditions for the chemical reduction of metal ions during polymerization.
A start time of gel formation (τs.f.), a duration of gel effect area (τd.e.) and the maximum exothermic temperature (Tmax) were used for a characteristic of the copolymerization process HEMA with PVP. τs.f., τd.e., Tmax parameters have been taken on the base of thermometric polymerization research [1].
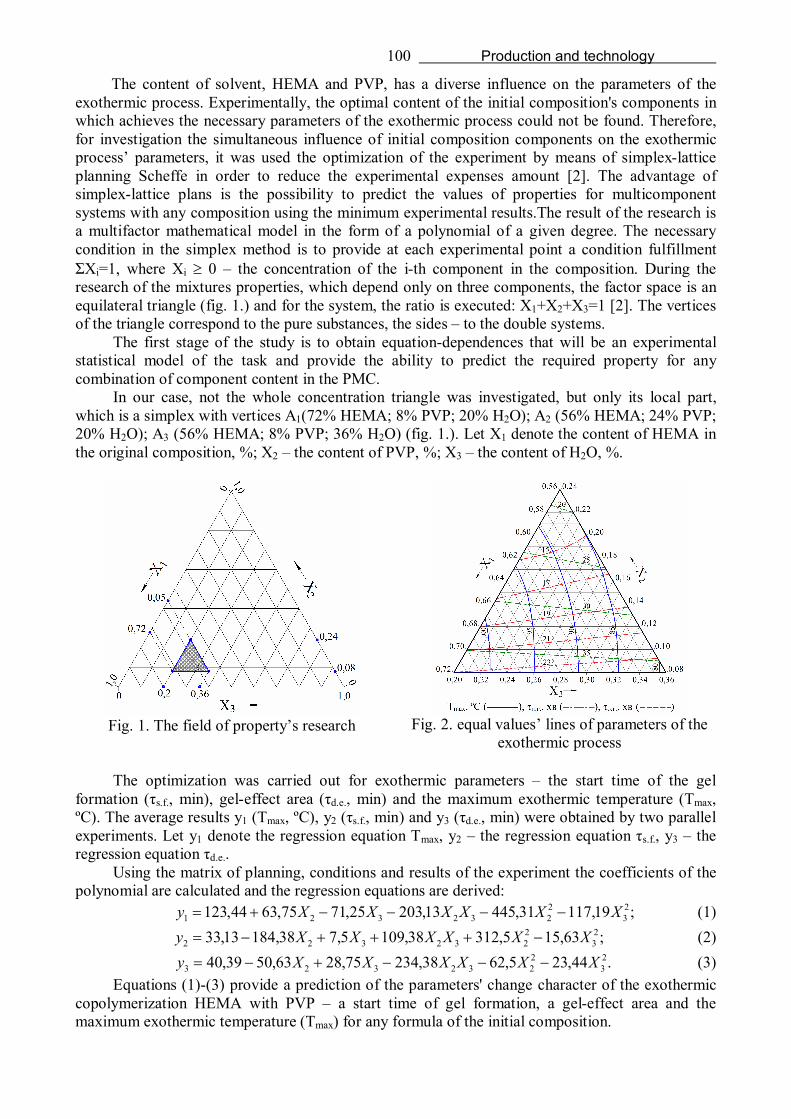
100 Production and technology
The content of solvent, HEMA and PVP, has a diverse influence on the parameters of the exothermic process. Experimentally, the optimal content of the initial composition's components in which achieves the necessary parameters of the exothermic process could not be found. Therefore, for investigation the simultaneous influence of initial composition components on the exothermic process’ parameters, it was used the optimization of the experiment by means of simplex-lattice planning Scheffe in order to reduce the experimental expenses amount [2]. The advantage of simplex-lattice plans is the possibility to predict the values of properties for multicomponent systems with any composition using the minimum experimental results.The result of the research is a multifactor mathematical model in the form of a polynomial of a given degree. The necessary condition in the simplex method is to provide at each experimental point a condition fulfillment ΣХi=1, where Хi 0 – the concentration of the i-th component in the composition. During the research of the mixtures properties, which depend only on three components, the factor space is an equilateral triangle (fig. 1.) and for the system, the ratio is executed: Х1+Х2+Х3=1 [2]. The vertices of the triangle correspond to the pure substances, the sides – to the double systems.
The first stage of the study is to obtain equation-dependences that will be an experimental statistical model of the task and provide the ability to predict the required property for any combination of component content in the PMC.
In our case, not the whole concentration triangle was investigated, but only its local part, which is a simplex with vertices А1(72% HEMA; 8% PVP; 20% Н2О); А2 (56% HEMA; 24% PVP; 20% Н2О); А3 (56% HEMA; 8% PVP; 36% Н2О) (fig. 1.). Let Х1 denote the content of HEMA in the original composition, %; Х2 – the content of PVP, %; Х3 – the content of Н2О, %.
Fig. 1. The field of property’s research
Fig. 2. equal values’ lines of parameters of the
exothermic process The optimization was carried out for exothermic parameters – the start time of the gel
formation (τs.f., min), gel-effect area (τd.e., min) and the maximum exothermic temperature (Tmax, ºС). The average results y1 (Tmax, ºС), y2 (τs.f., min) and y3 (τd.e., min) were obtained by two parallel experiments. Let y1 denote the regression equation Tmax, y2 – the regression equation τs.f., y3 – the regression equation τd.e..
Using the matrix of planning, conditions and results of the experiment the coefficients of the polynomial are calculated and the regression equations are derived:
;19,11731,44513,20325,7175,6344,123 23
2232321 XXXXXXy (1)
;63,155,31238,1095,738,18413,33 23
2232322 XXXXXXy (2)
.44,235,6238,23475,2863,5039,40 23
2232323 ХXXXXXy (3)
Equations (1)-(3) provide a prediction of the parameters' change character of the exothermic copolymerization HEMA with PVP – a start time of gel formation, a gel-effect area and the maximum exothermic temperature (Tmax) for any formula of the initial composition.
101 Production and technology
The second research stage is the isolines construction of changing the exothermic parameters according to the obtained regression equations, depending on each component content of the original composition. (fig. 2.).
The obtained lines of equal parameters’ values provide a quick search for a totality of values of the components’ concentrations in the reaction composition, which make possible to obtain the optimal technological conditions, that are necessary for precipitating the required metal fillers during the polymerization.
Conclusion. Using the Scheffe’s simplex-lattice planning method, the optimization of the experiment was made to forecast the polymerization parameters of HEMA/PVP compositions, which define the technological regime of metals’ chemical precipitation. The obtained regression equations are a mathematical modeling result, which allow analytically establish the relationship of exothermic processes parameters with the technological conditions for the reduction of metal ions, as well as with the formula of the polymer-monomer composition. The obtained lines of equal values of parameters will significantly reduce the experimental search for composite formula with given parameters of the polymerization process exothermy, depending on the nature of the deposited metal.
References. 1. Grytsenko, O., Gajdos, I., Spišák, E., Krasinskyi, V., Suberlyak, O. Novel Ni/pHEMA-gr-PVP Composites Obtained by Polymerization with Simultaneous Metal Deposition: Structure and Properties. Materials. 12, (12). 1956–1973 (2019). 2. Akhnazarova, S. L., Kafarov, V. V. Metody optimizatsii eksperimenta v khimicheskoy tekhnologii. Moskva: Vysshaya shkola (1985) [in Russian]. УДК 620.22
THE USE OF AIR-TIGHT MATERIALS IN CONNECTING AIRCRAFT STRUCTURES PhD. Iryna Yenina, PhD. Rahulin Serhii, Flight Academy of the National Aviation University,
Kropyvnytskyi, Ukraine
Introduction. Sealants are one of the important materials in aviation, their usage started about a hundred years ago and every time their properties become improve. Despite the difficulties and disadvantages of using such material, it is still actively used in modern aviation.
The results presentation. A paste-like composition based on polymers or oligomers is applied to bolts and other connections to prevent leakage of the working medium through structural gaps, waterproofing and sealing. The sealing layer forms directly on the connecting seam as a result of solidification of the polymer base or evaporation of the solvent. There are also sealants which, after being applied to the sealing surface, do not expose any changes, are called drying coatings.
For waterproofing of connections , silicone sealants are used which maintain high temperature and form an elastic seam. Acrylic sealants have a high adhesion to various plastics, are chemically neutral and moisture unresistant, usually used to seal connections of wooden products; after polymerization they can be painted.
The most commonly used type of sealants in aviation technology is thiocol, which is a three-component system consisting of a basic and vulcanizing paste and a vulcanization accelerator. They are intended for surface and internal sealing of riveted, welded and bolted connections, aircraft structures and devices. Thiocol sealants of the U-30MES-5, U-30MES-5HT, UT-32HT, U-30MES-5M, U-30MES-10 brands are used in aircraft construction (sealing of riveted, welded and bolted connections ) and for repair of aviation equipment. The sealants of the U-30M, UT-31 brands are intended for sealing of fixed metal connections (except for brass, copper, silver alloys) operating in different climatic regions. UT-34 sealant is used for sealing various metal joints that come in contact with air and fuel, as well as for plug connectors of various radio and electrical equipment. UT-32 is used for seals, plug connectors, fuel compartments.
Sealants are characterized by good deformability; high protection against ultraviolet radiation, exposure to oxygen; well prevent moisture and air from entering. They are recommended when

102 Production and technology
used in contact with aluminum and magnesium alloys, cadmium and unprotected steel. With the advent of elastic sealants based on rubbers, it was possible to effectively seal cabins, fuel compartments, air ducts, rivets and other connections.
Naftoseal MC aviation sealants are highly resistant to aviation gasoline and jet fuel, as well as to all chemical and petroleum products used in the aviation industry. Naftoseal МС-630-С provides good sealing of contacting surfaces and key connections of fuselage components.
As an effective barrier against the common causes of corrosion on aluminum alloys or between dissimilar metals, sealants with corrosion inhibitors act: P/S 870 (Class A, B, C), PR-1432-GP, PR-1775 (Class B, A). For use on external surfaces, the non-chromate corrosion inhibitor PR-2870 is intended.
The requirements of supersonic aviation meet the silicone rubber based sealants used for surface sealing. Large and inaccessible surfaces, such as fuel compartments, are sealed with polysulphide rubbers based on vulcanizing materials. This sealing allows to place fuel directly in the fuselage and wing compartments, thus eliminating the use of rubber fuel tanks. As a result, the amount of fuel on the aircraft can be increased by 25-40%. The disadvantage of rubber based sealants is low adhesion to many structural materials, but can be eliminated by modification with isocyanates or epoxy resins.
Conclusion. An analysis of sealed materials that can be used when connecting aircraft structures is carried out. With the development of aviation, the need for high-quality materials with high elasticity and adhesion increases, so further study of this issue is relevant. УДК 622.234.42
ON THE ISSUE OF INTENSIFICATION OF URANIUM IN-SITU LEACHING Ph.D. Myrzakhmetov S.S., Ph.D. Aben E.Kh., Toktaruly B., Mukhamedi M. E., Satbayev University,
Almaty, Republic of Kazakhstan
Introduction. Leading global uranium market analysts predict a steadily growing demand for uranium in the long term. Thus, according to the basic scenario of the world nuclear power development , reactor requirements for uranium will increase from the current 73 to 86-88 thousand tons per year by 2030. From 2024, the demand for uranium will begin to exceed the supply, and the deficit will be more than 18 thousand tons by 2030, and in the aggressive scenario of nuclear energy development will reach 48 thousand tons [1].
The Republic of Kazakhstan is ranked 2nd in terms of reserves and 1st in terms of uranium production. It is expected that by 2025-2030, the volume of uranium production in Kazakhstan will amount to 32 % of the world's production. About 74% of all uranium reserves in the Republic of Kazakhstan are suitable for development by underground well leaching [2]. At the same time, the final product in the mines of the Republic of Kazakhstan is "yellow cake" or desorbent. Therefore, after the leaching process, the productive solution is delivered to the recycling center.
The technological scheme for processing productive solutions during underground in-situ leaching of uranium includes sorption and desorption of uranium. In the process of sorption, an ion-exchange resin is used, and nitrates are used for effective desorption of uranium. To regenerate the sorbent into the original one, suitable for reuse in the sorption process, the resin is washed (denitrated).
Resin denitration is performed in columns that are cylindrical mass transfer devices of sorption type with a vertical drainage system for circulating solutions. For processing the available volume of desorbed ionite, the production provides for the use of columns in the modular mode , functioning in the following mode: feeding the initial denitrating solution to the bottom of the column; removing the denitration masterbatch from the column to the desorbing solution preparation unit; unloading the denitrated sorbent from the column for further technological operation.
Presentation of material. Currently, after desorption, the concentration of nitrates in the resin is 5.27 g/l to 11.2 g/l the resin is washed with a solution with a concentration of sulfuric acid

103 Production and technology
20 g/l to 35 g/l. At the same time, the degree of washing (denitration) is on average 43%, i.e. the degree of denitration is clearly insufficient. This leads to a deterioration of the sorption properties of the resin for uranium, loss of nitrate ions, and, as a result, increased consumption of ammonium nitrate.
There are various ways to increase the degree of denitration of the sorbent, such as increasing the temperature of the washing solution, changing the design of the denitration column, using distilled water for washing. These known methods require significant material and labor costs.
To increase the efficiency of the denitration process, it is proposed to change the rheological properties of the denitrating solution by mechanical activation before feeding it to the sorbent washing column. As a result of mechanical action on continuous media, the structure and temperature is changed, which is accompanied by a break in the bonds between the atoms and the destruction of the crystal lattice. Mechanical activation of the solution can be carried out using a generator set or two three-stage devices of streamlined bodies: a three-stage system of rectangular cells that create areas of reduced pressure; a three-stage system of round cells that create areas of reduced pressure.
Conclusions. The proposed mechanical activation of solutions increases the degree of denitration of the sorbent to 10-12%, does not require significant capital expenditures, easily integrated into the existing system, works automatically and environmentally safe.
List of references. 1. Rodionov V. G. Energetika: problems of the present and opportunities of the future – М.: ENAS, 2010. – 352 p. 2. Keeping promises. Create value. JSC " NAC "Kazatomprom". Annual report, 2018. – 263с.

104 Architecture and construction
УДК 625.8 RESEARCH OF MECHANICAL PROPERTIES OF BITUMINOUS CONCRETE AT
LOW-TEMPERATURE Guo Mingjun, Ph.D. Kovalskiy V.P., Vinnytsia National Technical University, Ukraine
Introduction. The occurrence of cracks will have a great impact on driving safety and road life. Low temperature bending test is currently the most commonly used test method to evaluate the low temperature anti-cracking performance of asphalt mixtures. This paper introduces preparation of test beam, instrument, experimental procedure and data processing of low temperature bending test, and briefly evaluate the advantages and disadvantages of the test method.
Presentation of the material. Asphalt pavement, as a continuous flat road without joints, has been widely used in the world due to its many advantages, such as stable driving, comfort, small vibration, no dust, low noise, easy maintenance and repair, recyclable and suitable for staged construction[1]. However, in severe cold areas, cracks may occur due to thermal expansion and contraction of the pavement. This harsh weather condition puts forward high requirements on the pavement performance, and also brings the adaptability of the pavement structure in the area. At the same time, the analysis of relevant literature shows that the main form of pavement damage in high and cold areas is low temperature cracking caused by low temperature and large temperature difference [2]. This early disease of the pavement structure greatly reduces the service life of the pavement, reduces the service level of the road rapidly, which affects the driving quality and leads to a large amount of money wasted in the continuous maintenance process [3]. Therefore, reasonable evaluation of the low temperature anti-cracking performance of asphalt mixture is of great significance for improving the road performance of asphalt mixture and prolonging the service life of the pavement. Low-temperature bending test is a commonly used evaluation method at present. The flexural tensile strength, the maximum flexure tensile strain at the bottom of the beam, and the bending stiffness modulus are the most commonly used evaluation indicators [4].
Preparation of beam. The prepared material is made into a standard plate-like test piece with a size of 300mm×300mm×50mm by the wheel-grind method, and being demolded for at least 12 hours. After demoulding, the test piece is cut into a prism beam with a length of 250mm±2.0mm, a width of 20mm±2.0mm, and a height of 35mm±2.0mm, the span is 200mm±0.5mm.
Instrument. 1.Universal testing machine or press: The load is measured by the sensor, the maximum load should meet the requirements of not exceeding 80% of its range and not less than 20% of its range. 1kN or 5kN should be used with an accuracy of 0.01kN. With beam support, the center distance of the lower support is 200mm, the position of the upper indenter is centered, and the upper indenter and the support are arc-shaped fixed steel bars with a radius of 10mm, the upper indenter can move in close contact with the test piece. The temperature of the environmental insulation box should be accurate to ±0.5°С, and the loading rate can be selected. The testing machine should have a servo system, and the rate is basically unchanged during loading. 2. Mid-span displacement measuring device: LVDT displacement sensor. 3.Data acquisition system or X-Y recorder: Automatically collect electrical signals from sensors and displacement meters, store in the data acquisition system or draw load and mid-span deflection curves on the X-Y recorder. 4.Constant temperature water basin: The temperature range should meet the test requirements, and the temperature control should be accurate to ±0.5°С. When the test temperature is lower than 0°С, the constant temperature water basin can use a 1:1 methanol aqueous solution or an antifreeze as a cold medium. The liquid in the thermostatic water basin should be able to circulate back.
Methodology. 1.Place the test beams in a constant temperature water basin at a specified temperature for not less than 45 minutes until the internal temperature of the test beams reaches the test temperature ±0.5°С. The test beams shall be placed on the supported flat glass during heat preservation, and the distance between the test beams shall not be less than 10mm. 2.Set the environmental insulation box of the testing machine to the required test temperature ±0.5°С. 3.Take the test beams out of the constant temperature water basin, and immediately place it symmetrically on the support. 4.A displacement measuring device is placed in the center of the lower edge of the beam span, and the support is fixed on the testing machine. Select a suitable range, and the effective

105 Architecture and construction
range should be greater than 1.2 times the expected maximum deflection. 5.Connect the load sensor and displacement meter to the data acquisition system or X-Y recorder. Use the x-axis as the displacement and the Y-axis as the load, select an appropriate range and adjust it to zero. The mid-span deflection can be measured with an LVDT displacement sensor. When the displacement of the indenter of the high-precision electrohydraulic servo tester is used as the deflection of the beam, the deflection can be obtained from the loading rate and the time recorded by the X-T recorder. In order to correctly record the mid-span deflection curve, the X-T recorder's x-axis paper speed (or scanning speed) is determined according to the test temperature when the loading rate is 50mm/min. 6.Start the press to apply a concentrated load in the center of the span at the specified rate until the test beam fails. At the same time, the load - span deflection curve was recorded by the recorder.
Data processing. Calculate the flexural tensile strength of the beam, the maximum flexure tensile strain at the bottom of the beam, and the bending stiffness modulus at failure according to the following formulas.
(1)
(2)
(3)
where: -The flexural tensile strength of specimen at failure (MPa); -The maximum flexure tensile strain of beam at failure ( ); - The bending stiffness modulus of beam at failure (MPa);
- The mid-span width of the beam (mm); -The mid-span height of the beam (mm); -The span of the beam (mm);
-Maximum load of the beam at failure (N); -Mid-span deflection of beam at failure (mm).
Conclusion. The low-temperature bending test has simple calculation of flexural tensile strength and flexure tensile strain, clear physical meaning, which is convenient for communication and learning. However, the low-temperature bending test has a high requirement on the uniformity of test beams, so it is necessary for the beams to ensure a small error in the cutting process.
In the actual test, it is found that the variation rule of flexural tensile strength often conflicts with flexure tensile strain. Therefore, it is suggested to adopt bending strain energy as the evaluation index, which takes into account both flexural tensile strength and flexure tensile strain, while flexure tensile strain can better represent the performance at low temperature than flexural tensile strength.
Reference. 1. Bing, C., et al., Impact of Anti-rutting Additive and SBS Modi fier on Road Performance of SMA—13 Asphalt Mixture Highway, 2016. 61(10): p. 196-200. 2. Ping, L., et al., Freezing Point Test of Deicers on Asphalt Pavement in Seasonal Frozen Region. Bulletin of the Chinese Ceramic Society, 2019. 38(05): p. 1561-1567. 3. Ping, L., et al., Prediction Model of Temperature Field for Winter Asphalt Pavement with Measured data in Weiyuan Area of Gansu Province. Journal of Basic Science and Engineering: p. 1-12. 4. Yunfeng, G., et al., Distribution law of low temperature field of asphalt pavement in Qingyang of Gansu. China Building Materials Science & Technology, 2019. 28(04): p. 78-81+89.

106 Civil security
УДК 692.42 INTRODUCTION OF EUROPEAN STANDARDS OF LABOUR PROTECTION IN
ACTIVITY OF UKRAINIAN ENTERPRISES Ph.D. Stolbchenko O.V., Dnipro University of Technology, Dnipro, Ukraine
Introduction. The course on European integration launched by Ukraine raises rather complicated economic, political, social and other tasks, among which the formation of relations with employees on the basis of social responsibility is important. This means that Ukrainian enterprises must learn to build effective, democratic and legal social and labor relations that, on the one hand, contributed to the restoration and growth of the country's economy, but on the other hand, gave each person a sense of self-importance, dignity, respect for rights and freedoms, guaranteed a decent standard of living and created conditions for the full development of personality. In this context, it is necessary to study the possibility of borrowing and implementing the experience of European countries in the field of labor protection standards used by them.
Presentation of the material. The question of efficient organization of work and improvement of relations with workers requires the study of international, first of all, European, norms and standards of labor protection. This question is multifaceted; it includes the issues of social partnership as a principle of normative legal protection of labor protection, formation of relations with employees on the basis of corporate social responsibility, and social policy of the country, and many others. However, the study of European standards of occupational safety and the possibility of their implementation in the activities of Ukrainian enterprises needs to be studied, as it will contribute to the growth of social productivity and the competitiveness of Ukrainian enterprises in the European and world markets, economic growth of the country and increase of the welfare of its population.
The development of the EU labor market is of particular interest to Ukraine, as it is a way to improve the work of Ukrainian enterprises. The Pact on the Association of Ukraine and the European Union envisages the implementation of reforms in the country, both legal and social.
This issue is especially important for our country; as the improvement of working conditions at Ukrainian enterprises will significantly increase the labor productivity of the workers, improve their interest in the company's activities and its development.
Taking into account European experience, in shaping of Ukrainian model of the labor market and employment policy, it is necessary to draw attention to the European employment strategy, the main components of which are: creation of workplaces, quality of work, labor productivity, decent wages, social security, professional and social skills.
Sources of legal regulation of labor in Europe are acts adopted by the European Union and the Council of Europe. The number of agreements, conventions and protocols currently exceeds 160. The adoption of these conventions has enabled Europeans to enjoy decent working conditions and make European companies more successful on the international market.
Part of the European Labor Standards is provided by the European Social Charter. Part I of Article II contains a separate section devoted specifically to the labor sphere. The standard is the definition of expected quality, the approved model, which is the basis of the evaluation process, a document drawn up as a result of the consensus of specialists, approved by the specialized organization and aimed to achieving the optimal degree of ordering in this area. [4]
According to the decree of the President of Ukraine "On Approval of the Strategy of Ukraine's Integration into the European Union," the adaptation of the social policy of Ukraine consists in reforming the legislation in the areas of labor protection, social insurance, health and other branches of social policy in accordance with the EU standards.
For Ukraine's compliance with the European countries, the following tasks must be carried out:
- improve professional standards; - to increase standards of labor protection; - improve employee rights.

107 Civil security
Conclusion. For Ukrainian enterprises, the application of European standards of labor protection will provide opportunities to form relationships with employees on the basis of corporate social responsibility and social partnership; increase the responsibility of enterprises to all stakeholders, such as: consumers, entrepreneurs, employees, community, state and others; will help consolidate its position in the labor market, increase the competitiveness of enterprises; will increase labor productivity of workers, will increase the interest of the personnel in the enterprise and increase the efficiency of their work.
References. 1. The Verkhovna Rada of Ukraine (2014), The Law of Ukraine “About ratification of Agreement about an association between Ukraine, from one side, and by European Union, European concord from a nuclear-power and their states-members, from other side”, Vidomosti Verkhovnoi Rady Ukrainy, vol.40., p.2021. 2. Bajlo O.V. (2013), “Dignity of worker as category of labour right”, Visnyk ONU im. I.I. Mechnykova. Pravoznavstvo, [Online], vol.1 (18), available at: http:// dspace.onu.edu.ua:8080 /bitstream/123456789/4837/1/76-82.pdf 3. Pukhovs'ka L.P. (2014), “Development of qualifications and professional standards is in the countries of European Union”, Porivnial'no-pedahohichni studii, vol. 4(22), pp. 116-122. 4. Kashkyn S.Yu. (2011) “The European Union Charter of Fundamental Rights: Comment”, Yurysprudentsyia, Moskva, Russia. 5. Kolot A.M., Hrishnova O.A., Herasymenko O.O. (2010), Sotsializatsiia vidnosyn u sferi pratsi v konteksti stijkoho rozvytku: monohrafiia [Socialization of relations in the field of labour in the context of steady development: monograph], KNEU, Kyiv, Ukraine. 6. Koliada T.A. (2015), “Conception of deserving labour is in a labour right for Ukraine”, available at: http://www.nbuv.gov.ua/c-journals/FP/2010-3/10ktatpu.pdf (Accessed 24.04.2016) УДК 658.382.3
THE INFLUENCE OF HUMAN PSYCHOLOGY ON THE STATE OF LABOR PROTECTION OF PRODUCTION
Ph.D. Tarasov V.K., Correspondent Member of ATSU, Ph.D. Rumyantsev V.R.,Аssociate of Metallurgy Department, Ukraine
Entry. Analysis of the reasons of accidents on production shows the importance of studying the influence of psychological qualities on the production risk. You must take into account the ergonomic system: people - environment; people –the workforce and to consider the behavior of the employee in case of dangerous situations.
The presentation of the material. Any activity in the production of various forms of ownership related to the issues of labor protection. The analysis of various cases of injury to workers shows errors working in the investigation of psychological aspects of human nature. Statistics show that 50-80% of accidents on manufacture is at fault the victims. Psychological qualities of a person are determined by the sensitivity to the dangers at the time of its discovery and speed the appropriate response. It is particularly important for the motivational part of human actions: the underestimation of risk, inattention, risk-taking. Some errors associated with a mismatch of the system "man-machine" of the display information, controls, and machinery and industrial effects of stress. The latter is caused by the monotony of labour, high rate of production and the peculiarities of its organization. When considering human activities must also take into account a range of ergonomic dual-subsystems: man-environment, man – labour collective. In the first case, the main cause of the dangers is the lack of coordination between man and technological equipment, and the manufacturing process forms the anthropometric and psychophysiological elements of working conditions and work organization. In the second case the labor collective impact on the motivation, level of discipline, conflict, degree of job satisfaction. Interpersonal, informational and collective communication largely ensure the safety of the work. The considered

108 Civil security
factors are in the case of emergencies. They are almost impossible to predict because they relate to the reliability and stability of production processes. Complicates the situation the so-called random factor. However, people often underestimate the reality of occurrence of dangerous situations and idealizes the environment and working environment, which can be dangerous and harmful. The probability of safe work it is possible to determine according to the formula P= N-n / n, where N is the total number of operations performed, n is the number of errors. The security level proportionally increases with the decrease in the number of errors workers, and increases, if it decreases their share in the total number of operations of the process (Fig.1). Of course, to increase the probability P is also possible by simplifying the nature of work and increasing the level of vocational training.
Fig.1 –Effect of number of errors andthe number of executed technological operations for safety
Important for reducing injuries is the nature of employee behavior in case of dangerous situations. Its action can be divided into several stages: the perception and awareness of risk analysis and determining its level; develop appropriate solutions to eliminate risk, taking account of human capabilities and technology. The first stage used the basic human analyzers: sight, hearing, olfactory organs. Information is perceived as a deviation of the elements of the production environment or modes of operation of technological equipment. In the second stage an initial analysis of the received information ,the projected potential negative events and the awareness of the danger. Particular importance has the experience and training of the employee. The following steps produce the overall solution as well as the speed and number of control actions of the employee to address the dangers. In case of negative result of any of the stages of accident occurrence the final score is determined only by the likelihood of undesirable consequences.
However, the turnover in modern enterprises leads to the fact that the work of taking not enough trained specialists. Their reliability does not work in extreme cases. The level of injury also depends on the prestige of the profession, career opportunities, decent wages. With these factors, there is a choice of well-trained specialists from a wide range of willing, or workers with sufficient knowledge. In addition, it is desirable to establish a reliable and secure collective behavior, psychological compatibility, the formal and informal leader. Is determined by important contemporary non-confrontational and rational style of management, ability to solve problems of adaptation beginners.
Conclusions. The influence of psychological aspects of human nature on the likelihood of accidents in the workplace. Taken into account the main ergonomic subsystems: a people-environment and people – the employees. The dependence of the number of errors, number of executed technological operations on the level of safety and built a special graphics.
The need to consider safe collective behavior, psychological compatibility of employees, leadership, modern, non-confrontational style of leadership. A typical sequence of actions of the employee in the event of dangerous situations in order to reduce the risk of injury is proposed.
List of links. 1. Тарасов В.К. Безпека технологічних процесів і обладнання. Навчальний посібник-Запоріжжя ,ЗДІА,2008.- 164с. 2. Адамчук В.В.Эргономика.-М.:Юнити-Дана,1999.-254с.

109 Transport
УДК 656.073 ACTUAL PROBLEMS OF INTERNATIONAL TRANSPORTATION
Ph.D. N. Berezhnaja, O. Kutiya, Kharkov National Technical University of Agriculture named after Petro Vasylenko, Ukraine
Introduction. In today's society there is a constant development and improvement of the transport industry, in particular the role and influence of the logistics component, which is responsible for providing quality transport services to customers, is growing. Expanding the scope of logistics is one of the characteristic trends of the modern economy. Transportation is involved in all stages of logistics - supply, production, distribution.
Presentation of the material. In the logistics process of movement of goods transport provides the movement of material flow, starting from suppliers of raw materials, taking into account all sorts of intermediaries and ending with buyers of finished goods, that is considered a necessary component of the overall transport and production process. The main tasks of logistics for transport are to reduce cost and time costs.
An important problem of international transport logistics in the delivery of goods, and especially in multimodal transportation - is the need to fill a large number of international transport and logistics documents. Also the difference between international transport is the highest requirements for information support and cargo escort.
However, despite the difficulties encountered in international transport logistics, it is gaining momentum. This is due to the positive tendency of increasing the volume of international trade, the transfer of a number of logistics activities to specialized companies, the formation of international, regional unions, which leads to a reduction or even abolition of export-import duties and reduction of customs formalities.
All flows in the logistics system are interconnected and equally affect the efficiency of the international route. This necessitates a comprehensive approach to routing.
Routing international traffic flows is not only the use of different modes of transport, but also the use of tools such as international transport corridors. Most authors agree that the transport corridor is a complex transport system that directs traffic flows in the right direction and provides mass transportation of goods between economic regions of the world.
International transport corridors operate most effectively in a single customs and economic space, as a rule, have a developed transport network and are provided with ancillary infrastructure.
Management of traffic flows together with financial and information flows allows making qualitative decisions on rational choice of the route of international transportation.
As practice shows, the lack of coordinated action by all participants in the international transportation process reduces the efficiency of the route. This has a negative impact on both carriers and businesses interested in timely deliveries.
Very often, shipping costs and delivery times are greatly increased during the transportation process. This is due to the fact that logisticians choose the shortest route with the least amount of time, but in practice more efficient routes are those that have the least number of border crossings, since simple ones at full-control borders significantly slow down the flow of traffic on the route.
Literature 1. Vojtov V., Kutiya О., Berezhnaja N., Karnaukh M., Bilyaeva O. Modeling of reliability of logistic systems of urban freight transportation taking into account street congestion. Eastern-European Journal of Enterprise Technologies. Vol. 4, no. 3 (100), рр. 15-21. 2019. 2. Лавриков, И. Н. Транспортная логистика : учебное пособие / И. Н. Лавриков, Н. В. Пеньшин. – Тамбов : Изд-во ФГБОУ ВО «ТГТУ», 2016. – 92 с. – 100 экз. – ISBN 978-5-8265-1568-6. 3. Довженко Мария Васильевна Международные аспекты транспортной логистики // Символ науки. 2017. №3 4. Буркацкий М.А., Селиванов А.В. Особенности логистического обеспечения международных перевозок грузов промышленных предприятий // Менеджмент социальных и экономических систем. 2018. №1 (9).

110 Transport
УДК 656.073 OPPORTUNITIES OF «SMART» CARGO IN LAST-MILE LOGISTICS
Ph.D. Shulika O., Prykhodko A., Kharkiv National Automobile and Highway University, Kharkiv, Ukraine
Introduction. In the last few decades, the issues of improving the efficiency of the supply chain, the management of logistics of enterprises have been the focus of many scientists around the world, as well as leading enterprises associated with the supply of goods. Smart Cargo or Smart transportation is a holistic concept for smart integration of information and communication technologies to monitor and manage the cargo transportation system in the logistics delivery infrastructure. The purpose of such activities is to improve people's lives by improving the level of comfort and safety, quality and efficiency of service in the field of transport, optimizing the costs of a number of highly exploited resources [1]. Last-mile or last-line logistics is the least efficient step in the supply chain and accounts for up to 50% of the total cost of delivery [2, 3]. Thus, realizing the opportunities of Smart Cargo at the last stage of the supply chain will allow the companies operating in the transport market to improve their efficiency significantly.
Outline of the material. New innovative Industry 4.0 technologies and organizational strategies make it possible to create a real-time planning optimization model, focusing on energy efficiency of operations, developing cargo information management systems, etc. [4]. Industry 4.0 implies a set of innovations, received and implemented in the value chain, aimed at the trends of digitalization, automation, transparency, mobility, modularization, network-collaboration and socializing [5].
The latest technologies, concepts, innovations directly or indirectly influence the development of logistics. Smart transportation systems will automate roadways, reshape the way cargo and merchandise are tracked and delivered, creating substantial business opportunities for system integrators, independent software vendors, service providers, and other solution providers [6]. Intelligent transportation system opportunities abound across a wide range of industries and market segments. Opportunities include:
1. Fleet telematics and management solutions provides routes optimization, fuel economy, and driver productivity.
2. Transport logistics applications help to avoid product spoilage, damage, delays, and theft, optimize routing and logistics.
3. Guidance and control systems allow avoiding collisions and derailments, improve public safety, and optimize traffic flows.
4. Inventory and supply chain management solutions provide optimization of inventories, order processing, shipping, and receiving.
5. Smart vehicle applications let optimize traffic flows and fuel economy; avoid collisions; improve public safety and mobility.
6. Peer-to-peer services optimize traffic flows and fuel economy; avoid collisions; improve public safety and mobility.
7. Security and surveillance systems protect against safety hazards, terrorist threats, and other security concerns.
Thus, intelligent transport logistics solutions help long-haul cargo operators and last-mile delivery providers efficiently manage the transportation and distribution of freight and merchandise. Smart applications gather and analyze data from on-board sensors to track containers and packages, and to monitor environmental conditions, ensuring cargo arrive on time, at the right place, intact.
Conclusion. A wide range of end-customers is looking to the Internet of Things to contain transportation costs, increase fleet productivity, and improve customer satisfaction. Intelligent transport logistics solutions (smart cargo) at the last stage of delivery summarizes common smart transportation applications and end-customer benefits.
Reference. 1. Smart city: технології «розумного міста» та їх цільове призначення. 2018. Режим доступу: https://www.everest.ua/wp-content/uploads/2018/10/Everest-AI-Review-2.pdf

111 Transport
2. Логістика останньої милі: 10 хвилин дають економію в 1 млн євро. 2020. Режим доступу: https://logistics-ukraine.com/ 3. Bányai, T. 2018. Real-time decision making in first mile and last mile logistics: How smart scheduling affects energy efficiency of hyperconnected supply chain solutions. Energies, 11, 7, 1833. 4. Шуліка О.О. Гліта О.С. Роль інформаційно - рекламної діяльності вантажовласників у пошуку клієнтів на вантажоперевезення у великих містах //Збірник наукових праць за матеріалами Міжнародної науково-практичної Internet-конференції «Моделювання та інформаційні технології в науці, техніці та освіті» . – Харків: ХНАДУ, 2018. С.246 – 249. 5. Pfohl, H.-C., Yahsi, B., & Kurnaz, T. 2015. The Impact of Industry 4.0 on the Supply Chain. In: Kersten, W., Blecker, T., & Ringle, C.M. (Eds.) Innovations and Strategies for Logistics and Supply Chains. Technologies, Business Models and Risk Management. Hamburg International Conference of Logistics. Р. 31–58. 6. Smart transportation applications in the internet of things. 2015. Available at: https://www.redhat.com/cms/managed-files/iot-transportation-technology-overview-201608-en.pdf УДК 621.315: 629.92 INTELLECTUAL SYSTEM OF TRACTION POWER SUPPLY OF ELECTRIC ROLLING
STOCK Ph.D. Nerubatskyi V.P., Hordiienko D.A., Ukrainian State University of Railway Transport, Kharkiv,
Ukraine
Introduction. One of the main areas of electricity development is the use of Smart Grid methodology. The Smart Grid concept is a fully integrated, self-regulating and self-renewing power system that has a network topology and includes generating, backbone, distribution networks and electricity consumers that are managed by a single, real-time information system [1].
The implementation of the Smart Grid concept is aimed at ensuring the reliability and energy efficiency of electricity supply, improving the quality of electricity, bandwidth of electrical networks and their controllability, alignment of variable load schedules, organization of monitoring of parameters and control of the state of the grid, integration of renewable energy sources, reduction of grid systems creation of a client-oriented model of functioning of the energy market.
With the development of the Smart Grid concept, there is a need to implement intelligent power supply systems on electric rolling stock and traction substations for rail transport.
Managed power transmissions, thanks to high speed power electronics, are able to quickly affect the processes occurring in power systems, thereby transmitting power from passive means of electricity transportation to active operating modes.
The basis of smart grids is the methodology of distributed power management. In most countries of the world a single vertically integrated dispatching system is used: automated substation control system – regional dispatcher – power system dispatcher – central dispatcher [2].
Presentation of the material. Traction power supply for the application of the methodology of smart grids can be considered as one of the types of distribution networks, and the depth of control of the power supply mode can be considered to end consumers – electric rolling stock. In this case, it is advisable to place the data center on the traction substation and arrange the rolling stock links via the contact network or using radio communication (Fig. 1). The function of the settlement center is the processing of information about the power supply mode (voltages on all switchgear, currents and power factors of all components, information on the state of the equipment). These functions are performed in real time, so all equipment must be securely connected.

112 Transport
Figure 1 – Implementation of the methodology of smart grids in the railway power supply system
As sources of information in distribution networks, in addition to voltage transformers and
current transformers, it is necessary to use "smart" electricity metering, which transmits information about electricity consumption to the settlement center in real time.
Since consumer electricity is a priority for the electricity company, the functions of the settlement center of the distribution network are not so much in the formation of control signals, but in the formulation of proposals to the consumer of electricity to change the parameters of the power supply mode, such as prevailing electricity consumption at certain hours of the day, the desire to perform reconstruction and use of reactive power compensation and other energy-saving and energy-efficient measures orystannya electrical system resources.
The control of traction power supply mode must ensure reliable passage of trains on the site, so when organizing an intelligent traction power supply network, it is necessary to provide for integration (communication channel) of the settlement center with the dispatch center, and one of the types of control effects should be to control traffic signals, which provide traffic lights priority trains when voltage regulation at the substations of the section is not possible with power equipment of intelligent networks (devices regulating load under transformers, controlled converters).
It should be noted that, compared to the electrical distribution networks, the railway power supply system is administratively integrated with the traffic management system, which eliminates the recommended status of control signals. Such administrative subordination is a significant advantage, including for the railway power supply system, allows for deep control of the power supply regime using administrative methods of influencing electricity consumers and, as a result, optimizing the transportation process.
The electric drive used in the electric warehouse of the railways causes a significant emission of higher harmonics of traction currents to the contact network and electric rail circuits of the railway automatics, which exacerbates the issue of the quality of electrical energy in the contact network and electromagnetic compatibility of traction currents and railway automatics [3, 4]. Increasing the energy efficiency of traction power systems is possible through the use of energy efficient semiconductor converters, which will enable the implementation of the principles of smart grid systems Smart Grid, improve the efficiency of traction power and traction systems and reduce electricity consumption. In intelligent electrical networks, the use of active converters with correction of the power factor is promising, which will increase the electromagnetic compatibility with the power supply network and realize a power factor close to one, the possibility of forming an

113 Transport
input current close to sinusoid, and also the implementation of the mode of energy recovery to the power supply network [5].
Conclusion. The concept of applying the methodology of smart grids Smart Grid in the power supply system of rail transport will improve the efficiency of the use of backbone and distribution networks. The proposed methodology is based on the use of unlimited computing power of electronic computers and advanced communication systems. Algorithmization of the control effects on the equipment of the smart grids should be performed in each case in the process of development of design documentation for the modernization (construction) of the section of the electrified railway.
References. 1. Rylatt R. M. Exploring Smart Grid possibilities: a complex system modelling approach. Smart Grid. 2015. Vol. 1, No. 1. P. 1–15. 2. Smolenski R. Conducted electromagnetic interference in Smart Grids. Springer-Verlag London. 2012. P. 160. DOI: 10.1007/978-1-4471-2960-8. 3. Плахтий А. А., Нерубацкий В. П., Кавун В. Е., Машура А. В. Компенсация высших гармоник входных токов в системах с параллельным включением автономных инверторов. Електротехнічні та комп’ютерні системи. 2018. № 27 (103). С. 65–74. DOI: 10.15276/eltecs.27.103.2018.07. 4. Нерубацький В. П., Гордієнко Д. А. Інтелектуальне багаторівневе управління на залізничному транспорті. Тези доповідей першої міжнародної науково-технічної конференції «Інтелектуальні транспортні технології» (Трускавець–Харків, 24–30 січня 2020 р.). Харків: УкрДУЗТ, 2020. С. 90–92. 5. Plakhtii O. A., Nerubatskyi V. P., Kavun V. Ye., Hordiienko D. A. Active single-phase four-quadrant rectifier with improved hysteresis modulation algorithm. Scientific Bulletin of National Mining University. 2019. No. 5 (173). P. 93–98. DOI: 10.29202/nvngu/2019-5/16. УДК 656.073
CHALLENGES IN DELIVERY OF DANGEROUS CARGO BY ROAD TRANSPORT Ph.D. Shulika O., Yashchenko O., Kharkiv National Automobile and Highway University, Kharkiv, Ukraine
Introduction. Delivery of dangerous cargo is a specific type of delivery by road transport. The priority for such delivery is to ensure traffic safety, which requires continuous improvement of all links in the technology of delivery.
Outline of the material. Delivery of dangerous cargoes is an activity related to the transfer of dangerous goods from their place of manufacture or storage to their destination with preparation of cargo, containers, vehicles and crew, acceptance of cargo, carrying out of cargo operations and short-term storage of cargo at all stages of delivery. Thus, delivery of dangerous cargo by road is a complex and time-consuming process that requires special attention from consignors, consignees and carriers. [1].
The current market situation shows that most heads of organizations in various fields prefer to deliver cargo by road. More than 20% is delivery of dangerous cargo. Every year, worldwide, the number of industries that create or use a huge amount of harmful substances is increasing. These substances move along country roads and cross the borders of many countries [2].
In order to prevent possible damage to the dangerous cargo transportation, freight forwarding companies face a number of problems associated with improving the safety of transportation. Conditionally they can be divided into the organization of the transport process, regulation of transportation, management of transportation, elimination of consequences of accidents [3].
Particular attention is paid to the regulation of transportation, namely the development of uniform rules and regulations for the transportation of dangerous cargo, which will allow them to carry out their standardization and unification [4]. However, the regulatory framework at this stage in the field of transportation and supervision of dangerous cargo is not well developed. Although Ukraine acceded to the European Agreement on the International Carriage of Dangerous Goods by

114 Transport
Road in 2000, the issue in Ukraine regarding the publication of relevant literature was not addressed.
Other urgent problems in the organization of transportation of dangerous cargoes are the following:
insufficient development of the unified transport system of Ukraine; low level of equipment of transportation with modern machinery and technologies, low rate
of updating of rolling stock; insufficient application of advanced methods of transportation of dangerous cargoes, decentralized road transport, a large number of non-productive downtime, empty car runs
etc. Conclusion. Dangerous cargoes are objects that require special care when transporting them,
as any emergency can result in considerable damage. That is why the problems associated with the transportation of dangerous cargoes need to be addressed by the state and society, as well as by the enterprises involved in their transportation.
Reference. 1. Дубовіч І.А. Сучасні еколого-економічні проблеми транспортування небезпечних вантажів Львівською залізницею. Науковий вісник НЛТУ України. 2012. Вип. 22.9. C. 66–71. 2. Офіційний сайт Міністерства інфраструктури України. 2019. Режим доступу: https://mtu.gov.ua/content/statistichni-dani-pro-ukrainski-zaliznici.html 3. Гуржій А.В. Підстави адміністративної відповідальності за порушення правил перевезення небезпечних, великоваговагових і великогабаритних вантажів. Наука і правоохорона. 2012. № 1. С. 181–188 4. Гуржій А.В. Проблеми встановлення суб’єкта порушень правил перевезення небезпечних, великовагових і великогабаритних вантажів у процесі адміністративно-правової кваліфікації. Вісник Запорізького національного університету. Серія: Юридичні науки. 2012. № 1. Ч. 2. С. 111–117. УДК 656.025 AREAS OF EFFECTIVE ORGANIZATION OF SUPPLY CHAINS OF GRAIN CARGOES
BY RAIL CARS TO PORTS Doct. Shramenko N.Yu., Kharkiv Petro Vasylenko National Technical University of Agriculture; Ukrainian
State University of Railway Transport, Kharkiv, Ukraine
Introduction. Ukraine is one of the leading grain exporting countries in the world market. Grain logistics in Ukraine is actively developing [1], which is why it requires research into the problems of grain infrastructure and transport and logistics support in supply chains.
Presentation of the material. The analysis of practical experience revealed the shortcomings of the process of supplying grain cargoes by rail to ports [2].
Studies [3, 4] show that forwarding routing is one of the most important areas for improving the system of organization of carriages. Implementation of routing provides acceleration of delivery of goods to consumers, more efficient use of shunting means, reduction of downtime of wagons at technical stations, during transportation.
In order to increase the efficiency of grain transportation from supplier to consumer, including in mixed traffic, it is recommended that:
- apply modern technologies of loading and unloading works on elevators and ports to reduce the idle time of vehicles under cargo operations and, consequently, to accelerate their rotation;
- apply optimization methods in planning and organization of grain transportation in the presence of technological restrictions on the network of railways and highways;
- to make the choice of rational technological parameters in the organization of wagon flows by technological routes in the logistics chain of supply of grain cargo;
115 Transport
- to coordinate technological processes in supply chains and junction modules of different modes of transport in order to prevent inter-operative and non-standard downtime of vehicles and transport and storage resources;
- coordinate the activities of agro suppliers, elevators, carriers, terminals, ports and other market participants in order to achieve synergistic effects throughout the logistics system of grain supply.
Conclusion. Ukraine has significant export potential for the supply of grain cargo. This necessitates the further development of transport and grain infrastructure in the country, as well as improving the efficiency of the organization of supply of grain cargo, especially in the export connection, which will allow to reduce the cost of grain and, consequently, to increase its competitiveness in the world market.
Reference. 1. Shramenko N., Muzylyov D. Forecasting of Overloading Volumes in Transport Systems Based on the Fuzzy-Neural Model. In: Ivanov V. et al. (eds) Advances in Design, Simulation and Manufacturing II. DSMIE 2019. Lecture Notes in Mechanical Engineering. (Springer, Cham), (2020) - pp. 311-320. 2. Problems and optimization of grain freight logistics in Ukraine. [Virtual resource]. - Access mode: http://uga.ua/meanings/problemy-optimizatsiya-logistiki-zernovyh-gruzov-v-ukraine/ 3. Shramenko, N. Y. and Shramenko, V. O., 2018. Mathematical model of the logistics chain for the delivery of bulk cargo by rail transport. Scientific Bulletin of National Mining University, Vol. 5 (167), pp. 136-141. 4. Shramenko, N. Y. and Shramenko, V. O., 2019. Optimization of technological specifications and methodology of estimating the efficiency of the bulk cargoes delivery process. Scientific Bulletin of National Mining University, Vol. 3, pp. 146-151. УДК 656.025
ARTIFICIAL INTELLIGENCE IN TRANSPORT LOGISTICS AND IN SUPPLY CHAIN MANAGEMENT
Ph.D. Prymachenko H.O., Hryhorova Ye.I., Ukrainian State University of Railway Transport, Kharkiv, Ukraine
Introduction. Artificial intelligence is taking up the pace when it comes to global logistics and supply chain management. The on-going evolution in the areas of technologies like artificial intelligence, machine learning, and similar new technologies is said to possess the potential to bring in disruption and lead innovation within these industries.
Presentation of the material. Today, transport logistics solves a set of tasks related to the organization of the movement of goods by public transport. One of the tasks of transport logistics is the creation of transport systems, corridors and chains, in which the use of artificial intelligence approaches is of particular importance and is, even, necessary to support decision-making by the operational staff of the transportation industry [1].
The relationship between material and information flows is obvious, but the responsibility of one stream to another is conditional, since the content of the material flow, as a rule, reflects the data of the information stream, but they may not coincide in terms of time. Material and information streams can be both unidirectional and multidirectional, and this feature allows artificial intelligence to control transport processes [2]. The path in which the information flow moves may generally not coincide with the flow path of the material flow, which significantly complicates the flow control of vehicles.
Talking about artificial intelligence means using robotics. They are used to track, locate and move inventory within the warehouses. Apart from robots, artificial intelligence is also about big data. When the insights of Big Data are used along with artificial intelligence, it helps to improve different areas of supply chain like supply chain transparency and route optimization [2].
Advantages of artificial intelligence for Supply Chain Management [2]:

116 Transport
1. Predictive Analytics. Forecasting of requests helps to upgrade supply chain forms. Ideal inventory levels and decreased holding costs are key advantages of exact interest forecasting.
2. Improving Inventory Management. With an effective inventory management system in place, you can help reduce costs, keep business profitable, analyze sales patterns and predict future sales, and prepare the system for the unexpected.
3. Automated Quality Inspections. The use of artificial intelligence to control automated quality inspections lessens the odds of conveying broken merchandise to customers.
4. Quick High-yield Shipping. These technologies save time of workers, enabling them to give more an incentive to their more important duties or solve other problems in management or technical process.
Conclusion. The introduction of artificial intelligence into supply chain operations can propel logistic business into the future – harnessing automation, optimising supply chain planning, and evaluating multiple scenario outcomes processes in decision-making. That’s a powerful future for transport.
Resourse 1. Білоцерківський, О. Б. Логістика: навчальний посібник / О. Б. Білоцерківський, П. В. Брінь, О. О. Замула, Н. В. Ширяєва. – Харків: НТУ «ХПІ», 2010. – 152 с. 2. Casandra Campbell. You're Probably Losing Money By Not Using These 8 Inventory Management Techniques. [Електронний ресурс]: Shopify blog post. December 30, 2018. Режим доступу: https://www.shopify.com/blog/inventory-management (дата звернення 27.02.2020 р.). – Назва з екрана.
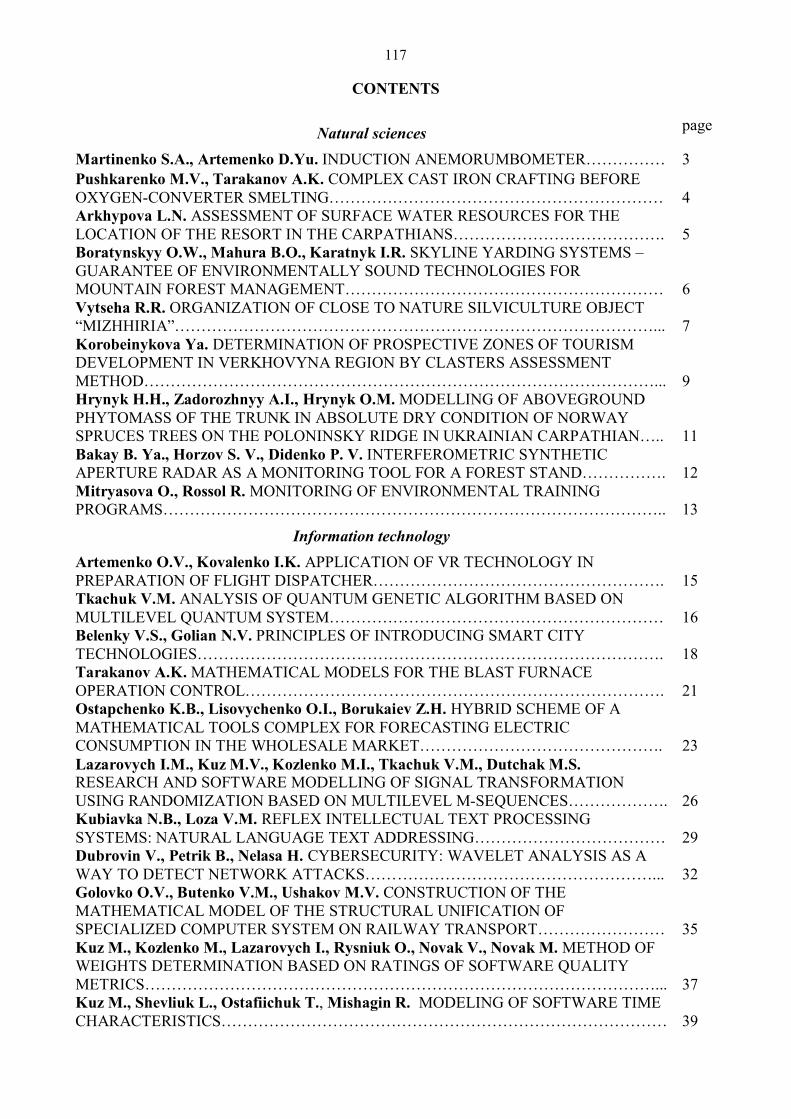
117
CONTENTS
Natural sciences рage
Martinenko S.A., Artemenko D.Yu. INDUCTION ANEMORUMBOMETER…………… 3 Pushkarenko M.V., Tarakanov A.K. COMPLEX CAST IRON CRAFTING BEFORE OXYGEN-CONVERTER SMELTING………………………………………………………
4
Arkhypova L.N. ASSESSMENT OF SURFACE WATER RESOURCES FOR THE LOCATION OF THE RESORT IN THE CARPATHIANS………………………………….
5
Boratynskyy O.W., Mahura B.O., Karatnyk I.R. SKYLINE YARDING SYSTEMS – GUARANTEE OF ENVIRONMENTALLY SOUND TECHNOLOGIES FOR MOUNTAIN FOREST MANAGEMENT……………………………………………………
6
Vytseha R.R. ORGANIZATION OF CLOSE TO NATURE SILVICULTURE OBJECT “MIZHHIRIA”………………………………………………………………………………...
7
Korobeinykova Ya. DETERMINATION OF PROSPECTIVE ZONES OF TOURISM DEVELOPMENT IN VERKHOVYNA REGION BY CLASTERS ASSESSMENT METHOD……………………………………………………………………………………...
9
Hrynyk H.H., Zadorozhnyy A.I., Hrynyk O.M. MODELLING OF ABOVEGROUND PHYTOMASS OF THE TRUNK IN ABSOLUTE DRY CONDITION OF NORWAY SPRUCES TREES ON THE POLONINSKY RIDGE IN UKRAINIAN CARPATHIAN…..
11
Bakay B. Ya., Horzov S. V., Didenko P. V. INTERFEROMETRIC SYNTHETIC APERTURE RADAR AS A MONITORING TOOL FOR A FOREST STAND…………….
12
Mitryasova O., Rossol R. MONITORING OF ENVIRONMENTAL TRAINING PROGRAMS…………………………………………………………………………………..
13
Information technology
Artemenko O.V., Kovalenko I.K. APPLICATION OF VR TECHNOLOGY IN PREPARATION OF FLIGHT DISPATCHER……………………………………………….
15
Tkachuk V.M. ANALYSIS OF QUANTUM GENETIC ALGORITHM BASED ON MULTILEVEL QUANTUM SYSTEM………………………………………………………
16
Belenky V.S., Golian N.V. PRINCIPLES OF INTRODUCING SMART CITY TECHNOLOGIES…………………………………………………………………………….
18
Tarakanov A.K. MATHEMATICAL MODELS FOR THE BLAST FURNACE OPERATION CONTROL…………………………………………………………………….
21
Ostapchenko K.B., Lisovychenko O.I., Borukaiev Z.H. HYBRID SCHEME OF A MATHEMATICAL TOOLS COMPLEX FOR FORECASTING ELECTRIC CONSUMPTION IN THE WHOLESALE MARKET……………………………………….
23
Lazarovych I.M., Kuz M.V., Kozlenko M.I., Tkachuk V.M., Dutchak M.S. RESEARCH AND SOFTWARE MODELLING OF SIGNAL TRANSFORMATION USING RANDOMIZATION BASED ON MULTILEVEL M-SEQUENCES……………….
26
Kubiavka N.B., Loza V.M. REFLEX INTELLECTUAL TEXT PROCESSING SYSTEMS: NATURAL LANGUAGE TEXT ADDRESSING………………………………
29
Dubrovin V., Petrik B., Nelasa H. CYBERSECURITY: WAVELET ANALYSIS AS A WAY TO DETECT NETWORK ATTACKS………………………………………………...
32
Golovko O.V., Butenko V.M., Ushakov M.V. CONSTRUCTION OF THE MATHEMATICAL MODEL OF THE STRUCTURAL UNIFICATION OF SPECIALIZED COMPUTER SYSTEM ON RAILWAY TRANSPORT……………………
35
Kuz M., Kozlenko M., Lazarovych I., Rysniuk O., Novak V., Novak M. METHOD OF WEIGHTS DETERMINATION BASED ON RATINGS OF SOFTWARE QUALITY METRICS……………………………………………………………………………………...
37
Kuz M., Shevliuk L., Ostafiichuk T., Mishagin R. MODELING OF SOFTWARE TIME CHARACTERISTICS…………………………………………………………………………
39

118
Mechanical engineering
Alekseychuk O.M. THE INFLUENCE OF AN AGGRESSIVE ENVIRONMENT ON THE REINFORCED CONCRETE PLATE STRESS-STRAIN STATE…………………….
43
Artemenko D.Y., Onopa V.A. UNDERPINNING OF A DESIGN OF PRECISION SEED DRILL PRESS WHEEL WITH A VARIABLE CONTACT PLANE………………………..
44
Baryliak V.V., Rudko I.M., Shoshyn A.O. CALCULATION OF TENSION FORCE OF TRACTION LOAD-LIFTING CABLE OF SUSPENDED CABLE TIMBER TRANSPORTING SYSTEM…………………………………………………………………
45
Tsyganov V.V., Yarovaia N.S. FEATURES OF THE USE РOLYMETHYLMETHACRYLAT ARE IN COMPOSITION МОР IS AT TREATMENT CUTTING……………………………………………………………………………………..
46
Karatnyk I.R., Kyi V.V., Shevchenko N.V. ANALYSIS OF THE STRESS-STRAIN STATE OF WOOD DURING ITS DIVISION ALONG THE FIBERS BY SPLITTING…...
47
Kvit R.I., Baitsar R.I., Salo T.M. PROBABILISTIC PREDICTION OF STRUCTURE MATERIALS STRENGTH AND RELIABILITY………………………………………...…
49
Loveikin V.S., Romasevych Yu.O., Liashko A.P., Mushtyn D.I. EXPERIMENTS DESIGN OF TOWER CRANE SLEWING AND TROLLEY MOVEMENT……………….
50
Nesterenko O.V. RESEARCH OF CONTACT MOTION OF LIGHT IMPURITIES IN PNEUMO-SEPARATING CHANNEL………………………………………………………
51
Verbovyi A.Y., Sieryk M.L., Pavlenko I.V. STUDY OF THE VIBRATION STATE OF THE CENTRIFUGAL PUMP’S ROTOR CONSIDERING THE STIFFNESS OF THE HOUSING MOUNTS…………………………………………………………………………
53
Electrical engineering
Dakus S.V., Krynytsky O.S. DEVICES FOR MEASURING ELECTRICAL PARAMETERS OF THERMOELECTRIC GENERATORS………………………………...
55
Kimstach O., Chernysh M. MODELING OF THE CANNED INDUCTION MOTOR…… 56 Dovgalyuk O.M., Privalov Yu.L., Bondarenko R.V., Yakovenko I.S. ELECTRIC SYSTEMS AND NETWORKS MODES ANALYSIS USING THE SOFTWARE AND COMPUTING COMPLEX DIGSILENT POWERFACTORY………………………………
58
Ostapenko O.P., Poprotskyi Yar.S. EFFICIENCY OF COGENERATION HEAT PUMP INSTALLATION IN THERMAL SCHEME OF BOILER-HOUSE OF THE PLANT FOR THE PRODUCTION OF CONCENTRATED JUICES………………………………………
60
Ostapenko O.P., Kokhan V.O. EFFICIENCY OF COGENERATION HEAT PUMP INSTALLATION IN THERMAL SCHEME OF BOILER-HOUSE OF THE DAIRY PLANT………………………………………………………………………………………...
60
Vashchyshak І. IMPROVING THE ENERGY EFFICIENCY OF SOLAR PLANTS……... 61 Nazarova O.S., Osadchyy V.V., Shulzhenko S.S. ACCURACY IMPROVING OF POSITIONING OF A TWO-SPEED ELEVATOR BY THE IDENTIFICATION OF LOADING DEGREE………………………………………………………………………….
63
Automation and instrumentation
Bilishchuk V.B. IMPROVEMENT OF THE APPARATUS FOR THE INTERFACE PHASE TENSION BY THE TURNING DROP METHOD………………………………….
65
Baitsar R.I., Kvit R.I., Telishevskyy A.Yu. PRECISION DEFORMATION AND PRESSURE METERS………………………………………………………………………...
65
Bodnar R.T. DETERMINATION OF VOLUME OF LIQUID IN VOLTAGE LOCATION TANKS………………………………………………………………………………………..
66
Klochko N.B., Dolishniy B.V. THEORETICAL RESEARCH OF THE INFLUENCE OF RESISTANCE FORCES IN MEASURING FLOW ON THE VERTICATION EFFECT IN TURBINE GAS METERS…………………………………………………………………….
68

119
Bodnar R.T., Bilishchuk V.B. METROLOGICAL ANALYSIS METHODS FOR DETERMINING THE CONTACT ANGLE OF WETTING POROUS BODIES…………...
69
Vasylenko O.V., Reva V.I. MODEL OF MOTORIZED VALVE FOR ACS………………. 71 Romasevych Yu. O., Makarets V.V. SYNTHESIS OF OPTIMAL NEUROCONTROLLER OF THE SYSTEM “CRANE-LOAD”…………………………….
72
Klochko N.B., Vynnychuk A.H., Halimovskii L.H. RESEARCH OF THERMAL IMEGERS’ FEATURES IN INDUSTRIAL USAGE………………………………………...
74
Osadchyy V.V., Nazarova O.S., Olieinikov M.O. AUTOMATIC CONTROL SYSTEM FOR TWO-MASS POSITION ELECTRIC…………………………………………………..
75
Tkachuk A.H., Tumchenko E.V. THE SECONDARY RAW MATERIALS PAPER PRODUCTION: TECHNOLOGICAL PROCESS AUTOMATION, WAYS OF ITS INVESTIGATION…………………………………………………………………………….
77
Chemical and bioengineering
Khlopytskyi A., Makarchenko N., Kovalenko І., Didkovska А., Derevianko Ye., Savchenko М. ASH AND SLAGAS A SOURCE OF PRECIOUS COMPONENTS……….
80
Kolosova E. P., Vanin V. V., Kolosov A.E. ADVANTAGES OF USING OF ULTRASONIC ТRЕАTMENT IN THE PRODUCTION OF CLASSICAL COMPOSITES AND CARBON NANOCOMPOSITES……………………………………………………...
80
Kolosov A.E., Gondlyakh A.V., Sivetskii V.I. ULTRASONIC DISTRIBUTION OF NANOPARTICLES IN LIQUID OLIGOMERS……………………………………………..
81
Oleksyshen V.O., Kolosov A.E., Sokolskyi A.L. SOME ASPECTS OF THE ADDITIVE PRODUCTION OF THERMOPLASTIC PRODUCTS………………………………………
83
Electronics and telecommunications
Horbatyi I.V., Tsymbaliuk I.R. DEMODULATOR FOR PROCESSING SIGNALS WITH AMPLITUDE MODULATION OF MANY COMPONENTS……………………………….
85
Trubchaninova К.А. METHODS FOR WIRELESS TRANSMISSION OF DIGITAL INFORMATION BASED ON ULTRA-WIDEBAND SIGNALS…………………………...
87
Perevertailo V., Kuzmichev A. OMNIDIRECTIONAL MAGNETIC LOOP ANTENNA.. 88
Production and technology
Ivanov I.I. CLEANING OF WASTE WATER FROM OIL PRODUCTS WITH THE USE OF SLUDGE WATER TREATMENT TPP………………………………………………….
89
Pohrebennyk V.D., Nester A.A., Prydoloba A.V. POLLUTION OF THE TERRITORIES OF BOARD`S PRODUCTION………..……………………………………………………..
90
Yusupov Kh. A, Rustema S.T., Bakhmagambetova G.B. IMPROVEMENT OF ORE RAGGING QUALITY USING INITIAL POTENTIAL IN BREAKING MASS……………
92
Ivanov I.I. WAYS TO REDUCE DIOXIN DANGER IN AGLOMERATION PRODUCTION………………………………………………………………………………..
93
Omarbekov Ye.U. APPLICATION OF LEACHING TECHNOLOGY AT THE URANIUM DEPOSITS SITES WITH SIGNIFICANT STATIC LEVELS OF UNDERGROUND WATER…………………………………………………………………..
95
Bakay B.Ya., Chelepis T.O., Gilpert V.V. MULTICRITERIA DECISION MAKING IN FUZZY CONDITIONS AND APPROACHES TO SOLVE THEM…………………………
96
Grytsenko O.M., Suberlyak O.V., Baran N.M. RESEARCH OF HYDROGELS BASED ON PVP COPOLYMERS AS MATRICES FOR CHEMICAL REDUCTION OF METAL IONS…………………………………………………………………………………………...
97
Yussupov Kh.A., Omirgali A.K., Aben Kh.Kh., Rakhmanberdiyev A. G. PROBLEMS OF SORBENT WASHING WHEN PROCESSING URANIUM ORE………………………
98
Grytsenko O.M., Voloshkevych P.P., Berezhnyy B.V. THE OPTIMIZATION OF

120
POLYMER HYDROGELS COMPOSITION FORMULA BY SCHEFFE’S METHOD…… 99 Yenina I., Rahulin S. THE USE OF AIR-TIGHT MATERIALS IN CONNECTING AIRCRAFT STRUCTURES…………………………………………………………………..
101
Myrzakhmetov S.S., Aben E.Kh., Toktaruly B., Mukhamedi M.E. ON THE ISSUE OF INTENSIFICATION OF URANIUM IN-SITU LEACHING………………………………...
102
Architecture and construction
Guo Mingjun, Kovalskiy V.P. RESEARCH OF MECHANICAL PROPERTIES OF BITUMINOUS CONCRETE AT LOW-TEMPERATURE…………………………………..
104
Civil security
Stolbchenko O.V. INTRODUCTION OF EUROPEAN STANDARDS OF LABOUR PROTECTION IN ACTIVITY OF UKRAINIAN ENTERPRISES…………………………
106
Tarasov V.K., Rumyantsev V.R. THE INFLUENCE OF HUMAN PSYCHOLOGY ON THE STATE OF LABOR PROTECTION OF PRODUCTION……………………………...
107
Transport
Berezhnaja N., Kutiya O. ACTUAL PROBLEMS OF INTERNATIONAL TRANSPORTATION…………………………………………………………………………
109
Shulika O., Prykhodko A. OPPORTUNITIES OF «SMART» CARGO IN LAST-MILE LOGISTICS……………………………………………………………………………………
110
Nerubatskyi V.P., Hordiienko D.A. INTELLECTUAL SYSTEM OF TRACTION POWER SUPPLY OF ELECTRIC ROLLING STOCK……………………………………...
111
Shulika O., Yashchenko O. CHALLENGES IN DELIVERY OF DANGEROUS CARGO BY ROAD TRANSPORT……………………………………………………………………..
113
Shramenko N.Yu. AREAS OF EFFECTIVE ORGANIZATION OF SUPPLY CHAINS OF GRAIN CARGOES BY RAIL CARS TO PORTS……………………………………….
114
Prymachenko H.O., Hryhorova Ye.I. ARTIFICIAL INTELLIGENCE IN TRANSPORT LOGISTICS AND IN SUPPLY CHAIN MANAGEMENT………………………………….
115

Scientific Publication
Publication languages: Ukrainian, English
APPLIED SCIENTIFIC AND TECHNICAL RESEARCH Proceedings of the IV International Scientific and Practical Conference
(April 1–3, 2020, Ivano-Frankivsk)
The materials are published in author’s version. The Organizing Committee does not always share the author’s opinion.
The authors are responsible for the accuracy of materials presented.
Головний редактор В.М. Головчак
Оформлення і комп’ютерна верстка М.В. Кузь
Підп. до друку 30.03.2020 р. Формат 60х84/16. Папір офс. Друк цифровий. Гарн. Тimes new Roman.
Умовн. друк. арк. 10,46. Наклад 400 пр.
Видавець Прикарпатський національний університет
імені Василя Стефаника 76025, м. Івано-Франківськ,
вул. С. Бандери, 1, тел.: 71-56-22 E-mail: [email protected]
Свідоцтво суб’єкта видавничої справи ДК № 2718 від 12.12.2006
Виготовлювач ФОП Семко Я.Ю.
76019, м. Івано-Франківськ, вул. Крайківського, 2 тел. +38-067-342-56-46
Свідоцтво суб’єкта видавничої справи ДК № 3312 від 12.11.2008
ISBN 978-966-640-484-1