finance.pdf - Сумський державний університет
276
INTRODUCTION TO FINANCE: THEORY AND PRACTICE Study guide Recommended by Academic Council of Sumy State University MINISTRY OF EDUCATION AND SCIENCE OF UKRAINE SUMY STATE UNIVERSITY SUMY SUMY STATE UNIVERSITY 2017 Edited by Inna Shkolnyk, Ph. D., Dr. of Economics, Maryna Brychko, Ph. D.
-
Upload
khangminh22 -
Category
Documents
-
view
0 -
download
0
Transcript of finance.pdf - Сумський державний університет
INTRODUCTION
TO FINANCE:
THEORY AND PRACTICE
Study guide
Recommended by Academic Council of Sumy State University
MINISTRY OF EDUCATION AND SCIENCE OF UKRAINE
SUMY STATE UNIVERSITY
SUMY
SUMY STATE UNIVERSITY
2017
Edited by
Inna Shkolnyk, Ph. D., Dr. of Economics,
Maryna Brychko, Ph. D.

УДК 336+658.14/.17+005.915](075.8) ББK 65.26 I
Authors: I. O. Shkolnyk, Doctor of Economics, Professor, Head of Finance, Banking and Insurance
Department, Sumy State University; M. M. Brychko, Ph. D., Senior Lecturer, Department of Finance, Banking and Insurance,
Sumy State University; O. M. Pakhnenko, Ph. D., Associate Professor, Department of Finance, Banking and
Insurance Department, Sumy State University; A. Y. Semenog, Ph. D., Associate Professor, Department of Finance, Banking and Insurance
Department, Sumy State University; V. M. Kremen, Ph. D., Associate Professor, Department of Finance, Banking and Insurance
Department, Sumy State University
Reviewers: Hassan Obeid – Doctor of Finance, Professor, Head of Finance and Accounting Department, European Business School (Paris, France); Angela Ya. Kuznetsova – Doctor of Economics, Professor, First vice-rector, University of Banking (Kiev, Ukraine); Oksana I. Kopylyuk – Doctor of Economics, Professor, Head of the Department of Financial and Economic Security and Banking Business, Lviv Academy of Commerce (Lviv, Ukraine)
Recommended for publication by Academic Council
of Sumy State University as а study guide (minutes № 4 of 13.10.2016)
I
Introduction to finance: theory and practice : study guide / I. O. Shkolnyk, M. M. Brychko, O. M. Pakhnenko et al. ; edited by Inna Shkolnyk, Ph. D., Dr. of Economics, Maryna Brychko, Ph. D. – Sumy : Sumy State University, 2017. – 275 p.
ISBN 978-966-657-664-7
The study guide is intended for students of higher educational institutions of III–IV levels of accreditation (it can be used for studying “Finance”, “Corporate Finance”, and “Financial Analysis”, etc., when writing term papers, theses), for those seeking a qualification in finance and economics. It is also designed to develop skills and core knowledge needed to enter the profession within the finance fields. This study guide provides a wide range of entry points for those who already have diplomas or postgraduate degree in an unrelated to finance field.
УДК 336+658.14/.17+005.915](075.8) ББK 65.26
ISBN 978-966-657-664-7
© Shkolnyk I. O., Brychko M. M., Pakhnenko O. M. et al., 2017 © Sumy State University, 2017

3
About the authors
Inna Shkolnyk (Ph. D., 1999; Doctor of Economics, 2008) is a professor in Finance at the Sumy State University. Currently, she is Head of Department of Finance, Banking and Insurance. Her academic research is focused on financial intermediation, financial market and she has published widely in the leading journals in economics, finance, and business-related fields. In addition, she is a frequent speaker at national and international conferences and is on the editorial board of academic journals. She is the author and editor of numerous books used in leading undergraduate, graduate and postgraduate programs and over one hundred papers. She is a member of the Advisory Committee for Economic Sciences of the Ministry of Education and Science of Ukraine. She has acted as a consultant, teacher, and teacher trainer in a wide range of financial management, financial analysis, financial theory, and international finance fields with more than twenty years of teaching experience. She is a developer and an e-learning project leader. Six Ph. D. students have successfully defended their thesis under her supervision.
Maryna Brychko (Ph. D., 2014) is a senior lecturer at the Sumy State University. Her teaching expertise is in the areas of corporate finance, behavioral finance, financial analysis, and tax management at both the undergraduate and graduate levels. She implements elements of blended learning in the courses that she has been teaching. Her main research agenda is on strategic financial management, corporate financial policy, and corporate governance. She has most recently focused her research on financialization. Her research ideas and findings have been presented at academic and industry conferences, and have been covered in professional and academic journals. In addition, she made comments and proposals to the consultation paper issued by the Central Bank of Ireland (2010) and EU Commission Green Paper (2010). She was the recipient of the Swedish Institute scholarship for PhD studies and research in Sweden (The Swedish Institute Baltic Sea Region Program/Visby Program). She spent the 2012/2013 winter semester as a visiting research scholar at Linnaeus School of Business and Economics (Linnaeus University, Växjö). She is a member of several research centers and has been involved in organizing conferences and open lectures in Ukraine and abroad, international research projects, assisting in publishing journals and books.

4
Olena Pakhnenko (Ph. D., 2012) is an associate professor at the Sumy State University. She teaches courses on insurance, international finance, tax system, and budget system at both the undergraduate and graduate levels. She conducts research in the insurance market, microinsurance, reinsurance, and financial market. She has delivered talks at many national and international conferences, roundtables and workshops. She has published a variety of articles in leading economics and finance science journals. She currently leads educational projects in the field of the enhancing financial literacy to improve school children persistence.
Andrii Semenog (Ph. D., 2011) is an associate professor at the Sumy State University. He received his Bachelor, Master degree, and Ph. D. from Ukrainian Academy of Banking of the National Bank of Ukraine. He teaches classes in finance theory, finance of European Union, introduction to taxation, and financial market fields. He is one of the project managers of the European Studies “Euro Nation” for students that focuses on current developments in European integration. His research interests include financial market, financial market institutions and their impact on economic growth. He has published his research in various popular financial reviews and journals.
Viktoriia Kremen (Ph. D., 2009) is an associate professor at the Sumy State University. Her teaching interests include financial statistics, financial policy, budget system, and finance of European Union. She is one of the project managers of the European Studies “Euro Nation” for students that focuses on current developments in European integration. She has written and published around 70 academic publications in the areas of financial statistics and supervision in the financial sector. She has published widely in the leading academic and practitioner journals.
The authors would like to express their gratitude to the administration at Sumy State University for all support and guidance for this project. The authors also thank the colleagues whose proofreading,
comprehensive feedback, and suggestions for improving the draft material have helped to make a better book for students. Moreover, the authors want to thank their families, who supported and encouraged
them in spite of all the time it took away from them.
5
Contents Р.
Foreword by Hassan Obeid 9 Preface 10 Guided tour of the book 13 Chapter 1: Introduction to finance. Financial categories 14
Summary 14 Recommended reading 22 Key terms 22 Review questions 24 Multiple choice questions 25 Short answer questions 26
Missing word questions 26 True/False/Uncertain questions 27
Computation problems 27 Chapter 2: Evolution of finance. Main financial theories 29
Summary 29 Recommended reading 37 Key terms 38 Review questions 40 Multiple choice questions 41 Short answer questions 43
Missing word questions 43 True/False/Uncertain questions 43
Computation problems 44 Chapter 3: Financial policy. Financial system 47
Summary 47 Recommended reading 52 Key terms 53 Review questions 54 Multiple choice questions 55 Short answer questions 56
Missing word questions 56 True/False/Uncertain questions 57
Computation problems 58 Chapter 4: Introduction to taxation. Tax system of Ukraine 61
Summary 61 Recommended reading 68 Key terms 69 Review questions 70 Multiple choice questions 71 Short answer questions 73
Missing word questions 73 True/False/Uncertain questions 73
6
Computation problems 74 Chapter 5: Budget and budget system 77
Summary 77 Recommended reading 86 Key terms 87 Review questions 88 Multiple choice questions 89 Short answer questions 91
Missing word questions 91 True/False/Uncertain questions 91
Computation problems 92 Chapter 6: Household finance 95
Summary 95 Recommended reading 105 Key terms 105 Review questions 107 Multiple choice questions 108 Short answer questions 109
Missing word questions 109 True/False/Uncertain questions 110
Computation problems 111 Chapter 7: Corporate finance 114
Summary 114 Recommended reading 122 Key terms 123 Review questions 124 Multiple choice questions 125 Short answer questions 127
Missing word questions 127 True/False/Uncertain questions 128
Computation problems 128 Chapter 8: Financial analysis 138
Summary 138 Recommended reading 148 Key terms 149 Review questions 151 Multiple choice questions 152 Short answer questions 154
Missing word questions 154 True/False/Uncertain questions 155
Computation problems 155 Chapter 9: Financial market 165
Summary 165 Recommended reading 173
7
Key terms 173 Review questions 175 Multiple choice questions 176 Short answer questions 178
Missing word questions 178 True/False/Uncertain questions 178
Computation problems 179 Chapter 10: Insurance and insurance market 183
Summary 183 Recommended reading 191 Key terms 191 Review questions 193 Multiple choice questions 194 Short answer questions 195
Missing word questions 195 True/False/Uncertain questions 196
Computation problems 197 Chapter 11: International finance 200
Summary 200 Recommended reading 207 Key terms 208 Review questions 209 Multiple choice questions 210 Short answer questions 212
Missing word questions 212 True/False/Uncertain questions 212
Computation problems 213 Chapter 12: Finance of European Union 216
Summary 216 Recommended reading 227 Key terms 228 Review questions 230 Multiple choice questions 231 Short answer questions 232
Missing word questions 232 True/False/Uncertain questions 233
Computation problems 234 Assignments to the course
Assignment 1: Academic writing in finance 238 Description 238 Guidelines: some practical tips 240 Evaluation criteria 243
Assignment 2: Case study on cash flow analysis 245 Description 245

8
Guidelines: some practical tips 245 Evaluation criteria 248
Assignment 3: Company’s financial analysis team project 249 Description 249 Guidelines: some practical tips 249 Evaluation criteria 252 References 254
Assignment 4: Finance of developed countries 255 Description 255 Guidelines: some practical tips 256 Evaluation criteria 259
References 261 List of Figures 267 List of Tables 268 List of Appendices 269 Index of Key terms 270
9
Foreword by Hassan Obeid
Nowadays finance has become a vital part of the business concern and enlarged with innovative and multi-dimensional functions in the field of business with the effect of industrialization. Finance also developed as corporate finance, business finance, financial management, financial analysis, financial economics, and financial engineering. Therefore, understanding the basic concept of finance becomes an essential part for the students of economics, accounting, commerce and management, and for the practitioners in the domain.
The book itself covers essential concepts and fundamental techniques that a person engaged in finance (financing specialist, financial manager, financial analyst, portfolio manager, financial advisor, etc.) should have in the portfolio of tools within the finance field. The scope of the book is vast: from the basics of financial theories and categories across the financial policy, financial system, financial markets, taxation, budget system, international finance, insurance, and finance of European Union to the ultimate goal of corporate finance, financial analysis, household finance and personal financial decision-making. This book provides detailed information about the finance and finance related area using simple language, and the concepts are explained by easy examples for the benefits of the students.
The book also embraces lots of actual values, historical data, charts, statistics, and latest news about reforms in Ukraine government budget, households, their standards of living and finance, structure of household expenditures in Ukraine and EU 27, structure of EU budget expenditures and revenues.
The book has a comprehensive research bibliography of recommended reading, list of relevant websites (external links) and exhaustive glossary about every important topic within the finance field. This book has various kinds of exams, tests and quizzes to test student's financial literacy and acumen, ability to use their knowledge to solve current problems in the finance area and in the allied fields, as well as evaluate the student’s preparedness for a career within finance.
The following structure of the book that includes brief summary and problem set questions encourages students to think intensively and critically about both the theoretical and practical aspects of the finance field at a number of levels.
International focus of this book is applicable for European students who wish to pursue careers in finance. There are plenty of international differences in legal systems, tax regulations, accounting methods, disclosure practices, etc. to make book invaluable. However, the basic principles of finance are universal and overwhelming majority of case studies, problem sets and quizzes introduced in the book based on familiar and realistic settings. Thus, I would strongly urge everyone, from students up through the persons involved in finance not only in Ukraine but also in Europe to possess this book.
Dr. Hassan Obeid Head of Finance & Accounting Department
European Business School - Paris

10
Preface
“If you want to thrive in today's economy, you must challenge the status quo and get the financial education necessary to succeed”
Robert Kiyosaki
The book is a rigorous introduction to the study of the fundamental concepts, basic principles and approaches of finance and their application to the common financial issues and decision-making process. This book covers almost every aspect of finance with an emphasis on Ukrainian specifics and each of the chapters reflects current practices through appropriate tables, figures, and examples that will aid understanding of the theories, concepts, and practices of finance. In spite of the fact that the focus of the book is on the specific nature of finance in Ukraine, the theories, concepts and practices investigated thoroughly, for the most part, could be applied in the context of finance of all countries in the world. Much of the content of the book is relevant to the general overview of finance both in Ukraine and overseas.
The book is written with the needs of students in mind and attempts to make issues under investigation as more affordable as possible to students need to succeed in the introductory finance course. Since the book is written for the needs of the Ukrainian students, plain friendly English has been used, and superfluous technical language has been avoided. The most technical terms and concepts are highlighted in the box after the summary of each chapter and are included in the index of key terms at the end of the book.
The book is organized into twelve parts as follows: Chapter 1 and Chapter 2 introduce the underlying principles of finance with the
specific focus on the conceptual basis of financial science, it's historical background of emerging and development, its core theories, main financial categories, relations to other fields, and the role of finance in modern economies.
Chapter 3 provides a general introduction to the financial policy while focusing on its types, their contents, goals, objectives, instruments, and tools. This chapter also focuses on the inner and organizing structure of the financial system, its spheres, links, and law-sensitive aspects of general finance.
Chapter 4 examines taxation and covers tax unique features and its similarities with other categories as levy and duty, functions, and objectives of taxation, and its role in modern economies. The chapter further examines the most important elements of the tax system of Ukraine, its concept and principles of construction, types and classes of taxation. In addition, it provides current changes to the tax legislation of Ukraine.
Chapter 5 offers a comprehensive discussion on a budget as a financial category, its essence, purpose while focusing on regulations and legal directives of Ukraine, budget classification, structure of the budget system of Ukraine, budget decentralization process in Ukraine, budget process, its components and organization, and main sources of budget financing.
11
Chapter 6 puts forward the discussion on the basic concept of households as an institutional component of the country economic system, their types, special features and characteristics. The chapter also is concerned with the role of household finance, socio-economic nature of household finance, its specificity, main components for understanding and measuring households’ well-being, and structure of their budget.
Chapter 7 provides a general introduction to the basic insights of corporate finance theory but emphasizes the application of theory to real business decisions. This chapter provides a discussion on corporate finance as a financial category, its certain common and specific features, types of business entities in Ukraine, economic nature, role and classification of financial resources. The chapter also focuses on the cash flows and methods of its calculation based on real life applications.
Chapter 8 introduces basic concepts of financial analysis, corporate financial accounting, reporting, and adopts a decision-maker perspective on finance and accounting by emphasizing the relation between accounting data and the underlying financial meaning generating them with the goal to develop a framework for understanding financial statements. The chapter also provides an intensive introduction to the interpretation and analysis of financial information for creditors, investors, regulatory authorities as external users and managers as internal users.
Chapter 9 focuses on the financial market as an economic category with particular emphasis on its functions, structure according to financial instruments they are trading, key participants in financial markets, types of financial instruments. This chapter covers topics such as money market, capital market, debt market, cash market, derivative market, and stock exchange.
Chapter 10 provides the subsequent discussion of insurance market topics more focused on the basic general principles of insurance, its main functions, insurance classification, elements of the insurance contract, and forms of reinsurance.
Chapter 11 and Chapter 12 are devoted entirely to the international finance. Chapter 11 presents basic material on an international finance as one of the key subsystem of the world economy, main international financial institutions, the international financial management of transnational (multinational) corporations, and covers such topics as international accounts, international investment position, and the balance of payments. Chapter 12 makes a particular emphasis on finance of European Union and surveys the history of EU, financial institutions of EU, the budget of EU, its structure, principles of formation and stages of adoption.
At the end of each summary of the chapter, there are fifteen review questions that are formulated to assess and evaluate how well the readers can recall key points from the topic. Also, each chapter contains up to thirty problems that are developed to assess and evaluate readers’ understanding of the contents of the chapters and tie these concepts to reality through practice questions. Each chapter contains three types of questions: multiple-choice questions, short-answer questions that are divided into missing-word and true/false/uncertain questions, and computation problems. Multiple-choice questions are a form of assessment that requires students to select the best possible answer from among various options (usually, between 4 and 7) from a list that is provided to them. Short-answer questions are a form of assessment that

12
requires a reasonably short students’ answer organized in few words or a paragraph/two. Missing-word questions require a fill-in-the-blank short answer that could range from one word to a phrase or sentence. True/false/uncertain questions require students to respond to the questions by indicating whether the statement is true, false, or uncertain and explain their opinion and demonstrate creativity in one or two paragraphs. Computation problems are a form of assessment of students’ understanding of the theories and concepts that give rise to the various formulas that they need to use while solving specific practical problems or performing specific tasks.
The book is directed at those who are studying finance as a part of bachelor programs and seeking qualification in the finance and economics. It is also designed to develop skills and core knowledge needed to enter into the profession within the finance fields. This book provides a wide range of entry points for those who already have diplomas or an undergraduate degree in an unrelated to finance field.
The authors March 15, 2016

13
Guided tour of the book
Summary. Each chapter begins with a summary of the topic under investigation that highlights the material covered in the chapter and can be used as a quick reminder of the main issues of the topic. Recommended reading. This section comprises a listing of relevant chapters in other textbooks, handbooks and manuals, scholarly publications, etc. that the reader might refer to in order to pursue a topic in more depth or gain an alternative perspective. Relevant websites. They provide full details of suitable sources of information on the World Wide Web. Key terms. The key concepts and techniques in each chapter, where they are newly introduced, uncommon, or specialized, are highlighted in box with precise definitions of terms and concepts in literary theory, along with explanations of what a particular term means, how it is used, and where it comes from, and enables the reader to apply the terms and concepts to their own investigations. Review questions. These short questions encourage the reader to review and/or critically discuss her/his understanding of the main topics covered in each chapter, either individually or in a group. Problems. Towards the end of each chapter, the reader will encounter questions, allowing to check reader’s understanding and progress. The problems consist of multiple-choice questions, short-answer questions comprising missing-word questions and true/false/uncertain questions, and computation problems.

14
CHAPTER 1:
INTRODUCTION TO FINANCE.
FINANCIAL CATEGORIES
SUMMARY
Financial science as a social phenomenon is rather young. It originated in the
mid-ХV century, and in the ХІХ century, it separated from the political economy as
an independent science. Finance as a science studies the phenomenon and processes
that occur in the state according to the creation and use of financial resources funds
for its economic and social development. Simplified, consumer perception of finance
associated with the money relations and financial activities, which are reflected in the
revenues and costs of financial relations’ subjects. Therefore, finance is a set of
money and financial relations connected with the formation, mobilization and
placement of financial resources created as a result of the exchange, distribution and
redistribution of gross domestic product’s value. The financial relationship includes
not only the relations of distribution but also exchange relations – finances are always
associated with the real movement of value that takes place in the following stages of
the reproductive process: distribution and exchange.
In understanding the essence of finance are used such philosophical categories
as its “essence” and “phenomenon”, “content” and “form”.
According to the “essence”, finance is an objective economic category that
reflects the set of economic relations associated with the distribution and
redistribution of GDP in order to form financial resources and money funds for their
use in the social and economic development of a society. According to the
“phenomenon”, finance becomes a tangible expression in the movement of
distributed value with the help of specific types of revenue, income, savings,
payments, expenses, costs, etc., and by the movement of financial resources in
general. Finance as the phenomenon reflects the cash flows of the individuals’
distribution relationships that are characterized by volume, direction and time.
According to the “content”, finance reflects the ultimate goal of distributive and
redistributive processes – the formation and use of money funds. Money funds are the
material content of finance. These funds are the one specific feature that distinguishes

15
finance from all other economic categories. According to the “form”,
finance reflects a material expression of financial relations (revenues, income, savings,
payments, and expenses).
In practice, the subject of finance is realized in financial relations. Financial
relations are money relations that appear between the following:
a) state and enterprises – taxes, fees and charge payments to the budget and
state funds, budget financing in the form of subsidies, grants and
subventions;
b) state and households – taxes and other obligatory payments and receiving
social security (subsidies, pensions, benefits);
c) enterprises – inventory purchases, sales, and services;
d) businesses and employees – salaries, payments, financial aids and transfer of
taxes, fees and charges;
e) some parts of the financial system – the state budget, local budgets, state
credit, etc.;
f) within the enterprises – the allocation of net income, the creation and use of
funds.
Description of financial relations associated with the release of their subjects
and objects.
The objects of financial relations: (i) the value of gross domestic product –
the value added generated by the country’s producers of goods and services during the
year (wages, profits, depreciation, indirect taxes, loan interest, and rent); (ii) national
wealth – the value of accumulated wealth in the country and involved in the
production of natural resources (fixed assets, material resources, gold reserves, and
natural resources). The subjects of financial relationships are stated as legal entities
and individuals. Financial relations are controversial: each individual seeks the largest
possible share of the object that is caused by a natural mismatch between interests of
these relations.
According to material form of finance, it can be centralized and
decentralized.
Centralized finance means the economic relations with the formation and use
of state money funds that are accumulated in the state budget system and government
extra-budgetary funds. Decentralized finance is characterized by money relations

16
that mediate the circulation of enterprises, non-government organizations, and
households.
Finance as an economic category is realized as (i) a money category – finance
has always had a monetary value: the real movement of money is a mandatory
condition for appearance and existence of finance; (ii) a distribution category – due to
financing, the process of centralized and decentralized revenue redistribution is
implemented through the budgetary and extra-budgetary funds, costs of enterprises
and organizations; (iii) a resource forming category – financial relations are always
associated with formation and use of financial resources.
Typical features of finance are the following: (i) exchange-distributive nature;
(ii) monetary nature; (iii) the material embodiment of money funds in the form of
financial resources; (iv) value movement from one to another entity; (v) always money
relationships; (vi) a form of revenue and expenditure; (vii) equivalent effect of
exchange and distribution, but unequal redistribution character.
Financial resources – money savings and revenues that are generated in the
process of distribution, redistribution and use of GDP and national wealth,
concentrated in the relevant funds or in the non-fund form to ensure continuous
production, to meet social needs, and to carry out financial obligations. Financial
resources have the following features:
a) express the property relations;
b) are in constant motion – often replenished and used;
c) have inherent sources and methods of accumulation;
d) are characterized by areas of use;
e) have specific composition of formation, distribution and use.
The role of finance is realized in its two functions: (i) distribution and (ii)
control.
Finance is an instrument of GDP distribution and reallocation. The
mechanism of the distribution function is associated with the stages of GDP
distribution:
a) primary distribution – it is a value added distribution and the primary revenue
formation of distribution elements: for employees – salary, for companies –
profit, for state – taxes, earnings from of government services, profit of
government sector;
17
b) redistribution – it is a creation of centralized and decentralized funds: at the
state level – budget and extra-budgetary funds; at the level of departments –
funds of ministries, committees, and departments; at the regional level – local
budgets and extra-budgetary funds of local authorities; at the level of
enterprises – corporate funds;
c) secondary distribution covers the processes related to the revenue
redistribution through the budget between tangible and intangible areas of
manufacturing, sectors, territories, and households. At this stage are formed
primary revenues – wages of people employed in the public sector, and
secondary revenues in the form of various benefits and free services from
centralized funds to individuals and legal entities.
Finance is an instrument to control the activity of exchange/distribution
relations. Finance numerically shows movement of money flows and provides control
of the proportions’ compliance in GDP distribution, the accuracy in formation,
distribution and use of state financial resources, and its management. Control function
allows solving a number of important objectives: search for increasing the revenues
and profits reserves; fulfillment of financial obligations; mobilization of financial
resources in sufficient to finance social and economic development amounts; effective
distribution and use of financial resources.
Finance functions are implemented simultaneously: each financial transaction
involves the distribution of the social product, national income, and, of course, control
of their distribution. Thus, finance plays an important role in society and social
production, including the following: (i) provides the distribution of GDP and financial
needs of individuals and the state; (ii) provides the circulation of financial resources;
(iii) provides redistribution of revenue between sectors, regions and social groups; (iv)
affects the interests of distribution relationships and determines their financial
capabilities; (v) plays a leading role in the economic methods of economic
management; (vi) forms a system of financial indicators, which act as indicators of
socio-economic development of the society; (vii) provides comprehensive control
subjects of GDP distribution regarding formation and use of money funds.
The conceptual apparatus of finance as a science covers general economic and
financial categories which, in abstract and theoretical forms, describe various aspects
of financial reality. Using financial categories as an instrument of scientific knowledge
helps to reveal the essence of finance, its specifics and peculiarities of functioning.
18
Financial science is based on such fundamental categories as money, credit and
others. In addition to fundamental categories, finance is grounded on such basic
financial categories as financial relations, financial resources, cash flows, taxes, income,
expenses, budgets, subsidies, and others. With the development of the state, there
have appeared the following financial categories: taxes, public credit, government
expenditures, government revenues, and state budget. The emergence of new financial
categories such as corporate finance, financial market, insurance, etc., and their
functioning and evolution are conditioned by the development of the entire system of
financial categories. Financial categories are interconnected. They form an integrated
system within the logical hierarchy and subordination.
The system of financial categories includes the following:
a) categories of revenues. Revenue as a financial category is a part of financial
relations between the different individuals according to the formation of
centralized and decentralized funds – a revenue of businesses, individuals
and the state. To financial revenue categories are related revenues, wages,
dividends, interest, taxes, trust receipts, and mobilization of financial
resources.
b) categories of costs. Costs as the financial category is a part of the financial
relations between the different individuals according to the usage of the
proceeds and revenues – costs of businesses, individuals, and the state. The
financial cost categories include depreciation, wages, fees, penalties, taxes,
etc.
c) categories of money funds. Money funds as the financial category are
characterized by gathering money for specified purpose – budget, fund of
basic and working capital, capital accumulation and consumption fund,
insurance and reserve funds, national funds in forms of budgetary and extra-
budgetary funds, sinking fund, etc.
d) system of formative financial categories acts as an add-on for the previous
groups of categories. This group includes such categories as finance,
financial resources, financial system, financial policy, financial instruments,
financial leverage, financial methods, financial system, financial
management, etc.
Some financial categories (for example taxes) simultaneously belong to different
groups of financial categories, but it does not change their essence. In practice,
19
financial categories are shown as financial instruments and incentives as well as
financial performance indicators.
In distribution relations, finance interacts with other economic categories:
money, prices, wages, and credit.
Money is a commodity that acts as a universal equivalent. In everyday
understanding, Finance is identified with money. An important feature of finance is its
money character. However, finance is not money. The spheres of money and finance
functioning intersect only in some segments. Firstly, finance is impossible without
money, because money is a tool of financial relationships, and cash flow is external,
visible manifestation of this relationship. Secondly, the functioning of money without
finance is meaningless and reduced to purely technical issues of exchange. The main
feature that defines the nature and form of the functioning of finance are cash flows,
which reflect financial relations and financial activities. They always express relations
between two elements of finance: exchange (payment of bills for goods and
services); distribution and redistribution (payment of taxes, dividends, subsidies,
etc.). You can have money and do not have any relation to finance, and vice versa,
with no money, just owning property, property rights, intellectual property rights, you
can make investments, be a co-founder of the firm and a participant of financial and
economic activity of the company. So, money and money circulation significantly
affect the financial position of individuals and businesses in particular and the state in
general. It is impossible to stabilize the financial situation, without establishing normal
cash flows.
Price is a monetary expression of the value. Prices as finance make the
distribution of GDP on the basis of supply and demand in the sales of goods and are
formed on the basis of costs of production and sales, and profits. Price is a starting
point for further distribution process and defines the parameters of money influence
upon all processes associated with the creation and use of the gross domestic
product. But finance can affect both the absolute value of the price and its internal
structure (by changing the depreciation deductions to the social insurance funds, the
introduction of excise duty or VAT). The relationship of finance and the price is that
the price is the basis of financial cost distribution, therefore, finance, based on the
proportions of distribution that is formed under the influence of the prices, that is a
tool that implements money distribution.
20
Wages are the monetary expression of labor cost. The relationship between
finance and wages appears when a company forms the fund of financial resources –
wages fund – that is separate from other money funds. On the other hand, wages,
which charges do not coincide with their payments in time, are the source of
formation of financial resources in the form of stable liabilities. In addition, receiving
of wages indicates that an exchange took place. Meanwhile, workers use their salaries
not only for exchange of essential commodities but also on the creation of money
funds for the purchase of durable goods, and securities to generate income. Finance
and wages are in constant interaction: the state regulates salaries through taxes,
creating money funds to stimulate the development of certain activities by providing
grants and other forms of financial stimulation.
Credit is a system of economic relations according to the movement of loan
value on the basis of payment, maturity, repayment, intended use, and
security. Finance and credit have the same economic nature, while finance is a
distributive and redistributive category, but credit is an only redistributive
category. Finance set the stage for the functioning of credit, credit loans act as a kind
of financial resources. The relationships of finance and credit are reflected in their
integrated use of funds and their promotion of production efficiency: when it is a
shortage of financial resources, company involves loans, on the contrary, when it is a
surplus of financial resources, company can put temporarily free funds use as loans to
other individuals (make deposits). However, credit is given to the borrower for a
specified period and based on repayment contract, while finance has an irreversible
character.
Distribution and redistribution of gross domestic product can be carried out
with different models of financial relations in the society. The basis for the financial
model of the society is the role and place of the state in it. Therefore, the model of
financial relations differs according to two features: (i) the sequence of GDP
distribution, and (ii) the level of GDP centralization by the state.
According to the sequence of GDP distribution, there are two financial
models’ relations – administrative and market.
The administrative model of financial relations is based on the right of the
state to concentrate and centralize the major part of GDP in a budget in the form of
sales tax and a portion of profits. Part of the profit, the amount of which depends on
the views of state’s authorities, remains in the company and is paid to workers in the
21
form of wages. Administrative model of financial relations was used in the former
Soviet Union and other socialist countries. The characteristic feature of this model is
that the state receives the bulk of its revenue in the process of primary distribution of
GDP.
The essence of the market model of financial relations is that firstly realized
the value of GDP is divided between those individuals who are engaged in its creation:
business owners (profit), workers and employees (wages). A characteristic feature of
the model is that the state gets its revenue from redistribution of the GDP (taxation).
Unlike administrative, market model is open and reflects the realities of the society:
reflects revenue level of any individuals; determines the level of taxation; fixes
incentives for revenue growth based on production growth and increased productivity.
However, the selection of these models is quite conditional. Market economy
model has elements of state participation in the primary distribution via indirect taxes.
The model of the administrative economy also includes elements of
redistribution. Thus, the difference between models is primarily in different
proportions. In the market model, the state is dominated in redistribution of GDP and
in administrative model – government interferences in its initial allocation and
distribution.
According to the level of GDP centralization by the state within the
financial models of the market economy are used three models: American,
European, and Scandinavian. The American model is based on the maximum level
of self-financing of individuals. It is characterized by low level of fiscal centralization
(about 25–30 %). Financial intervention in the economy is minimal. This model
provides maximum financial stimulation. The European model is characterized by
moderate GDP’s level of budget centralization (about 35–45 %). Countries with such
model have more extensive state social sphere and social guaranties. The state can
stimulate companies’ growth with budget expenditures on any economical projects.
The Scandinavian model provides a high level of GDP’s level of budget centralization
(about 50–60 %). Accordingly, it is characterized by very extensive government social
guarantees in spheres of education and health care. This model creates a climate of
confidence and social balance. However, this model is possible in countries with a
high level of GDP per capita, high level of public and private consumption; high level
of culture and consciousness of the people, the appropriate attitude to work and
respect to the state.
22
Overall, the choice of the model of financial relations depends on historical
background and traditions of the country, the level of civil society development, a
character of international connections, etc.
RECOMMENDED READING
1. Chang, S. J., 2005, A Theoretical Discussion on Financial Theory: What Should We Teach and How? Journal of Economics and Finance Education, Vol. 4(2), 39–48.
2. Dictionary of Finance and Banking, 2014, United Kingdom: Oxford University Press, 512 p.
3. Jensen, M. C. and Smith, C. W., 1984, The Modern Theory of Corporate Finance, New York : McGraw-Hill Inc., pp. 2–20.
4. Leveau, D., Gander, P., and Orgland, M., 2010, Evolution of Financial Theory. Available at SSRN: http://ssrn.com/abstract=1927124.
5. Weston, J. F., 1981, Developments in Finance Theory, Financial Management, 10, pp. 5–22.
6. Wijst, D. van der., 2013, Finance: a quantitative introduction, Cambridge University Press, 445 p.
Relevant websites 1. Business Dictionary. Available: www.businessdictionary.com 2. Investopedia. Dictionary. Available: www.investopedia.com/dictionary
KEY TERMS
financial resources
are the money available to a business for spending in the form of cash, liquid securities, and credit lines. Before going into business, an entrepreneur needs to secure sufficient financial resources in order to be able to operate efficiently and sufficiently well to promote success. Common financial resources are acquired through a bank or an investor. Small businesses have a difficult time for obtaining bank loans while a large corporation may find its funding through individual or equity investors, mutual funds, and stock. Venture capitalists also invest in companies, although they have many requirements for both small and large businesses. They may require a fixed rate of return, a stake in ownership and input on management decisions.
financial relations
are those relationships in which the individual benefits from receiving a salary, royalty, intellectual property rights, consulting fee, honoraria, ownership interest (e.g., stocks, stock options or other ownership interest, excluding diversified mutual funds), or other financial benefits. Financial benefits are usually associated with roles, such as an independent contractor (including contracted research), consulting, promotional speaking and teaching, membership on advisory committees or review panels, board membership, and other activities for which remuneration is received or expected.
financial capability
is the combination of knowledge, skills, attitudes, and behaviors needed to make sound financial decisions that support one’s well-being. Financial capability is about
23
motivating and supporting consumers to make sound financial decisions. Attention to financial capability is essential for successful financial inclusion initiatives.
financial objective
is an objective set by a company or state authority in which the target is measured in monetary terms, such as a certain amount of profits, or a certain percentage increase in profits over a period of time. Financial objectives are distinct from other types of objectives, such as retention objectives, recruitment objectives, or public relations objectives, the achievement of which cannot easily be measured monetarily.
financial activities
are any transactions or initiatives undertaken by a business to further the fulfillment of economic goals. Financial activities may include buying and selling of products or assets, organizing and maintaining accounts, issuing stocks or bonds, arranging loans, or other business activities with specific monetary objectives.
financial mechanism
is a method or source through which funding is made available, such as bank loans, bond or share issue, reserves or savings, and sales revenue. Different countries use different financial mechanism for redistribution of GDP. It depends on the economic development of the country, historic background, etc.
financial markets
are markets for sale and purchase of stocks (shares), bonds, bills of exchange, commodities, futures and options, foreign currency, etc., which work as exchanges for capital and credit. They provide transaction infrastructure for money cash flows.
financial capital
is a borrowed sum or equity with which the firm's assets are acquired and its operations are funded. You always need to know how much financial capital you can get in your hands in case a big deal comes your way.
financial sector
is the part of an overall economy that is primarily made up of money markets, banking institutions, and brokers. The finance sector is a very important aspect of the most large and highly developed economies, such as those in the United States, the United Kingdom, Japan, and Switzerland.
financial instrument
is a document (such as a check, draft, bond, share, a bill of exchange, and futures or options contract) that has a monetary value or represents a legally enforceable (binding) agreement between two or more parties regarding the right to pay money. See also debt instrument, the equity instrument, and financing instrument.
finance company
is a financial organization that accepts deposits (and pays out interest on them) and lends to consumers and/or businesses. Very often finance companies are called financial intermediaries.
financial performance
is a measure of the results of a firm’s or state’s policies and operations in monetary terms. These results are reflected in the firm’s or state’s return on investment, return on assets, value added, etc.
financial accelerator
is a financial impact that leads to a widespread economic boom or bust. The impact and subsequent reaction create a feedback loop; as conditions worsen, the financial impact becomes more influential. For example, adjustment of interest rates by the Federal Reserve can lead to increased or decreased spending by consumers.
financial economics
is a branch of economics focused on the elements of time, risk, opportunity cost, and other variables related to financial decisions. This field of study concentrates on how financial moves are made under uncertain conditions.

24
financial projection
is a forecast of future revenues and expenses for a business, organization, or country. A financial projection will typically take into account both internal information, such as historical income and cost data, and estimates of the development of external market factors, providing estimated figures in addition to projections of the general financial condition of the company in the future.
REVIEW QUESTIONS
1. What is finance? Describe it according to such philosophical categories as its
“essence” and “phenomenon”, “content” and “form”.
2. What are financial relations? When do they appear? Describe their objects and
subjects.
3. What are the characteristic features of finance? What method uses the science of
finance?
4. Define the centralized and decentralized finance? Give examples.
5. How are financial resources classified? What are their characteristic features?
6. Describe the nature and mechanism of the distribution function of finance. Give
examples.
7. Describe the difference between the distribution and redistribution.
8. What does control function of finance mean? Who implements a control function
in practice?
9. What is money fund? How does it form? Who manages it?
10. On what fundamental categories is financial science based? Describe them.
11. What are the common and different features of finance and money, finance and
price?
12. What are the common and different features of finance and wages, finance and
credit?
13. What is the basis of the financial model of society? Describe features that define
the models.
14. What are the differences between administrative and market models of financial
relations?
15. Define the financial models used in the world according to the level of GDP
centralization by a state.
25
MULTIPLE CHOICE QUESTIONS
Choose the one alternative that best completes the statement or answers the question.
1. The subject of finance is realized in financial relations in the following way: a) between the state, enterprises, and households; b) between gross domestic product and national wealth; c) between income taxes and fees; d) between entities and households.
2. Finance is considered as the following category: a) distribution and credit; b) monetary and historical; c) historical and economic; d) fiscal and economic.
3. What are the functions of finance? a) distribution and control; b) fiscal, distribution, and control; c) control, economic, and stimulating; d) distribution and reproductive.
4. Primary distribution of GDP: a) value added distribution and the formation of primary income distribution; b) creation of centralized and decentralized funds; c) the redistribution of income between the spheres of material and non-material
industries, sectors, territories, segments of the population through the budget system;
d) no right answer.
5. Secondary distribution of GDP: a) creation of centralized and decentralized funds; b) value added distribution and the formation of primary income distribution; c) redistribution of income between the spheres of material and non-material
industries, sectors, territories, segments of the population through the budget system;
d) no right answer.
6. Finance is defines as follows: a) all kinds of state revenues; b) economic relations associated with the formation, distribution and use of
money funds; c) economic relations associated with the formation, and use of the state budget; d) money and credit.
26
7. What features do financial resources have? a) express the property relations; b) have inherent sources and methods of accumulation; c) the specific composition of the formation, distribution, and use; d) all answers are right.
8. What models of financial relations in society can be carried out in distribution and redistribution of gross domestic product? a) administrative and market; b) administrative and monetary; c) American, European, and Scandinavian; d) fiscal and market.
9. Control function allows to solve such important objectives: a) search for increasing revenues and profits reserves; b) mobilization of financial resources to finance social and economic
development; c) fulfillment of financial obligations; d) all answers are right.
10. According to material form of Finance, it can be recognized as follows: a) state and private; b) fund and non-fund; c) centralized and decentralized; d) distributive and redistributive.
SHORT ANSWER QUESTIONS
MISSING WORD QUESTIONS
Choose the correct word to complete each sentence.
1. Finance is a set of monetary relations connected with the formation, mobilization and ___________ of financial resources and the exchange, distribution and _____________ of gross domestic product value based on their use.
2. ___________________ means the economic relations connected with the formation and use of state money funds that are accumulated in the state budget system and government extra budgetary funds.
3. Finance is an instrument of ___________ the activity of exchange-distribution relations.
4. Distribution and redistribution of ______________________ can be carried out with different models of financial relations in society.

27
5. According to ___________________ by state within the financial models of
market economy are used such models as American, European, and Scandinavian.
TRUE/FALSE/UNCERTAIN QUESTIONS
Decide whether the following statements are True, False, or Uncertain. Explain your reasoning. Your score will be based not just on whether you get the True, False, or Uncertain part right but also, to a larger extent, on the quality of your explanation.
1. Finance is a set of economic relations connected with the formation, mobilization
and placement of cash money and the exchange and redistribution of state budget value.
2. Financial resources are money transactions that are generated in the process of
redistribution and use of national wealth concentrated in the non-fund form to ensure continuous production, to meet social needs, and to carry out financial obligations.
3. Finance numerically shows the movement of money flows and provides control of the proportion compliance in GDP distribution, accuracy in formation, distribution and use of state’s financial resources and its management.
4. Finance and credit have the same economic nature: while finance is only a distributive category, credit is both a distributive and redistributive category.
5. The administrative model of financial relations is based on the right of the state to concentrate and centralize the major part of GDP in a budget in the form of sales tax and a portion of profits.
COMPUTATION PROBLEMS
1. Describe and give examples of monetary and financial relations. Define their differences. Characterize monetary relations which are financial relations. Explain the contradiction of financial relations and ways to overcome it.
2. Present structural and logical scheme of finance distribution process in the
economy. Describe stages of primary distribution of GDP, redistribution and secondary distribution of GDP. Define the differences between these stages according to the role of (i) the state, (ii) enterprises and (iii) households.

28
3. Read the following quotations made by greatest scientists (see the box below) and comment them. Express your own opinion based on your knowledge about finance, financial policies, forms of finance, financial relations, etc.
Science quotes and sayings
Science quotes and sayings Author
A budget tells us what we can’t afford, but it doesn’t keep us from buying it
William Feather
Beware of little expenses; a small leak will sink a big ship Benjamin Franklin
It is not the employer who pays the wages. Employers only handle the money. It is the customer who pays the wages
Henry Ford
The way to become rich is to put all your eggs in one basket and then watch that basket
Andrew Carnegie
The avoidance of taxes is the only intellectual pursuit that still carries any reward
John Maynard Keynes
Finance, like time, devours its own children Honore de Balzac
Money is like manure. You have to spread it around or it smells John Paul Getty
The safest way to double your money is to fold it over and put it in your pocket
Kin Hubbard
Finance is the art of passing currency from hand to hand until it finally disappears
Robert W. Sarnoff
I am favor of cutting taxes under any circumstances and for any excuse, for any reason, whenever it's possible. Inflation is taxation without legislation
Milton Friedman
4. Give examples of centralized and decentralized money funds, formed by state
authorities, enterprises, and households. Describe them taking into account their differences of formation and usage. The characteristic should be presented in the form of the box shown below and should consist of founder name, the name of the fund, and fund’s brief characteristic.
The characteristic of money funds
Economic unit Fund Brief characteristic
State
Budget
Pension fund
………..
Enterprise
Reserve fund
Capital investment fund
……..
Household ……….
29
CHAPTER 2:
EVOLUTION OF FINANCE.
MAIN FINANCIAL THEORIES
SUMMARY
The first archeological traces of financial activity appeared in the earliest urban
civilizations in the Near East. In ruins of Mesopotamia, it was found tokens that
represented commodities from people’s daily life: lambs, sheep, cows, dogs, loaves of
bread, jars of oil, honey, beer, milk, clothing, ropes, and even “abstract” goods, such
as units of work, and land. These tokens were elements of “a system of accounting”.
The beginning of the word “finance” has a charming past. Canonical definition
and etymology of the word “finance” was given by the Aristotle near about two
thousand years ago when there was no concept of financing and related issues.
According to the author, “finance” is a related term that all the countries and
government face the situations in which sometimes they need money to buy
households and other things important for the life. Aristotle’s explanation was
restricted to those involved with economical and financial operations of the
government and countries but a type of finance concerning marketable nautical and
other kinds of jobs loaning thrived in the prehistoric world.
The suggestion of the word started to modify over the time as it traveled from
different countries. The word “finance”, first discovered in Latin – «finis», means the
end, finish. This concept was used in monetary relations between the monarch and
people and meant complete cash payment. After the monetary calculation, person,
who paid the fee in favor of state authorities, received a document – fine (the basis of
the term “financia”). This happened in the 13th century in Italy. Then in Old French,
the word transferred into the “finaunce”. The finance was called the same way as
today in Middle English. In 1700’s, the word involved people working in Finance of
Courts, the word “rentiers” was used for those people. These investors supplied
loaning tricks to the governments.
All in all, even before the emergence of the concept of “finance”, the humanity
has money and commodity-money relations, which development was appropriate to
Добавлено примечание ([G5]): Deleted:a
Добавлено примечание ([G1]): Inserted: ,
Добавлено примечание ([G4]): Deleted:,
Добавлено примечание ([G3]): Deleted:u
Добавлено примечание ([G2]): Inserted: a
Добавлено примечание ([G7]): Deleted:as
Добавлено примечание ([G6]): Inserted: ere
Добавлено примечание ([G8]): Inserted: ,

30
the particular political system of the state. But only in the Middle Ages the term
“finance” widespread around the world that can be explained due to the formation of
certain historical background:
Firstly, finances appeared as a result of labor social division and the creation of
commodity production; development of money economy and implementation of basic
money functions; the emergence of independent entities that created the necessary
cash funds; centralized state strengthening, creating a system that provides legal
norms.
Secondly, finance depends on the bourgeois revolutions and limiting the power
of monarchs in Europe to dispose of the treasury itself. It contributed to the
formation of national money funds – budgets. Of course, it revenues and expenditures
must be approved by Parliament – a monarch could not personally manage the
budget. The budget’s formation and usage process seemed to be systematic. It
promoted the appearance of the legislated system of public revenues and expenditures
with strictly defined composition and structure.
Thirdly, taxes in a form of cash acquired preemptive character, while state
revenues were mainly formed by natural labor taxes and duties. Thus, only at this stage
of state development, it became possible to form monetary relations according to the
distribution of the domestic product.
Historical analysis of any phenomenon should precede the selection of its
certain characteristics. In order to find out the genesis of category “finance", it is
necessary to pay attention to its characteristic features. Quite often, in everyday life,
finances are equated with money. But it is wrong. They are two different economic
categories with different social purpose. Money is a category that emerged in the early
stage of human development as a commodity and plays the role of general equivalent,
determining the cost of labor producers. Finance emerged with the appearance of the
state, the existence of which required certain resources in the form of taxes and
physical labor at the beginning, and in the form of money then. Therefore, finance is
always a money relationship.
With the emergence of the state and development of commodity-money
relations in society, there is an objective need for the formation of a redistributive
system of monetary relations, which is finance. Social reproduction implies the
existence of such stages as production, distribution, exchange and
consumption. Finance expresses not all economic relations, but only those that arise at
Добавлено примечание ([G9]): Inserted: the
Добавлено примечание ([G10]): Inserted: of
Добавлено примечание ([G11]): Inserted: the
Добавлено примечание ([G12]): Inserted: a
Добавлено примечание ([G13]): Inserted: the
Добавлено примечание ([G14]): Inserted: o t
Добавлено примечание ([G15]): Inserted: ,
Добавлено примечание ([G16]): Inserted: ,
Добавлено примечание ([G17]): Inserted: the
Добавлено примечание ([G18]): Inserted: a
Добавлено примечание ([G19]): Inserted: ,
31
the stage of distribution. Each body divides income into two parts: consumption and
accumulation. In distribution process is involved the state, which centralizes the funds,
through taxes, compulsory payments and loans, and redistributes them among regions,
industries and business areas, enterprises, and individuals. Companies, receiving
income from their activities, pay taxes into the budgets and other funds. Having
personal incomes, people pay for various services, pay taxes, and repay loans to banks.
The beginning of different terms related to finance, such as debt, credit,
equity, profits and losses, also has a great history. The historic nature of finance is
evident because of new financial relations’ emergence, which is associated with the
development of society and evolution of finance’s forms: taxes, state and local
budgets, extra-budgetary funds, and state and local credits.
Several phases in the evolution of finance can be distinguished.
On the first phase, most of the money were spent on military targets. Finance
didn’t make any substantive impact on the economy. Another feature of this period
was the narrowness of the financial system, because it consisted of one link – the
budget system: all financial relations were concerned only with the formation and
usage of a budget.
The next phase, which was caused by the development of the state and state
institutions, led to the expansion of financial relations. It was reflected in the
formation of the Treasury, development of budgets, and the emergence of public
credit and government securities. Changes in the system of financial relationships were
caused by the fact that the state needed substantial financial resources to perform its
functions – governance, support for defense, regulation of economic proportions,
social financing and social protection, international cooperation, and others.
The third phase of the evolution of finance, which began in the first half of the
twentieth century, is characterized by complex increase of the financial system and the
emergence of its new units – financial market, the stock market, finance of public
enterprises and industries, special and extrabudgetary funds, and households’ finance.
The science of finance was born out of practice in the XV–XVI centuries,
later than other social and political sciences. It is believed that financial theory
emerged simultaneously with the political economy in the cities of northern Italy,
including Florence, Genoa and Venice, which, in those days, experienced economic
growth and cultural development. The appearance of financial concept was a response
Добавлено примечание ([G20]): Inserted: ,
Добавлено примечание ([G21]): Deleted:,
Добавлено примечание ([G22]): Inserted: the
32
to economic, political and social processes (changes in the state system associated with
the emergence of large absolute monarchies and standing large armies).
Formation and development of financial science are characterized by two
stages: (i) classical – began in Roman times and ended in the mid-twentieth century
and was characterized by the dominance of finance of the state; (ii) neoclassical – it is
characterized by the dominance of finance of the private sector, particularly large
companies, and capital markets.
The becoming of classical financial science began at the end of the XV
century, thanks to scientific works of the great scientists of that time J. Locke (1632–
1704) and T. Hobbes (1588–1679). Major their works are devoted to the tax
problems. They believed that the governor had the absolute right to levy taxes on his
subjects, maintaining uniformity and moderation, and giving preference to the
dominance of direct taxes (land tax). English economist and statistician W. Petty
(1623–1687), in his work “Treatise of taxes and contributions”, first gave a scientific
interpretation of the state wealth, the value of money in the economy, and how to use
them; the price of things, which was determined by the amount of time they spent on
their production.
German scientist J. Justi (1717–1771) was the first who laid out the basic
principles of financial science. He formed a common system of financial science by
systemizing the existing financial theories. He proposed rules for the development of
tax policy: taxes should not interfere with the freedom of individuals and harm the
industry; they must be uniform and fair while costs and revenues must meet to benefit
the country and its citizens. It would be in place here to add that the scientist
mentioned not only fiscal function of tax but also regulatory function. In particular, he
saw a special benefit from tax – raising or lowering their sizes, the state government
can direct the economy into the desired direction. Austrian economist J. Sonnenfels
(1733–1817), in his work “The main principles of the police, commerce, and finance”
defined finance as a set of rules for the collection of state revenue in the most
profitable way. He studied in details the historical transition from natural duties to
taxes in the form of money. The basis of the tax system must be formed by
consumption taxes, because such payments return back to workers, merchants, and
officials in the form of premium prices for their services. He introduced into scientific
usage the term «portio sacra», part of revenue, which is not a subject of taxation
(exemption limit).
Добавлено примечание ([G24]): Deleted:A
Добавлено примечание ([G23]): Inserted: The a
Добавлено примечание ([G25]): Inserted: are
Добавлено примечание ([G26]): Deleted:,
Добавлено примечание ([G27]): Inserted: ,
Добавлено примечание ([G28]): Inserted: the
Добавлено примечание ([G29]): Inserted: the
Добавлено примечание ([G30]): Inserted: s

33
The founder of the Physiocrats’ school F. Quesnay (1694–1774) had designed
the famous economic table that displayed social process of reproduction, circulation,
distribution, and consumption of products as a whole, which operated through the
circulation of capital. The founder of the classical school of political economy
A. Smith (1723–1790), in his book “Inquiry into the Nature and Causes of the Wealth
of Nations” (1776), substantiated the theory of public expenditures, government
revenues, and public debt. He represented the theory of finance and financial
justification of national economic science. Swiss scientist S. Sismondi (1773–1842)
mentioned that efficient financial policy improved the economic situation of people.
Finances can be used to achieve an equitable distribution of income and wealth in the
country. The scientist supported the role of small industry and agriculture, demanded
reduction of indirect taxes and setting a minimum tax-free. He voted for a progressive
tax system.
German scientists K. Marx (1818–1883) and F. Engels (1820–1895), in such
works as “Capital”, “Critique of Political Economy”, and numerous articles, devoted
to the analysis of British budgets of the mid-nineteenth century, proved the negative
influence of taxes because it was the burden for all workers. It was an additional
instrument for exploitation of workers. Scientists preferred direct taxes, and especially
income tax, arguing for a progressive form of taxation. However, their ideas are quite
controversial: they denied the possibility of the state in areas of financial policy to
change the ratio between profit, interest, rent and wages; they thought it’s impossible
to reduce negative effect of cyclical policy, using both financial and fiscal policies.
American, Columbia University professor E. Seligman (1861–1939), in his book
“The Shifting and Incidence of Taxation”, identified two varieties of shifting taxes:
from the seller to the buyer (indirect taxation) and from the buyer to the seller (direct
taxation, when the price of the product is high because taxes are too high (excise), that
limits the demand for this product). Italian scientists L. Cossa (1831–1896) and
F. Nitti (1868–1953) believed that financial science is a theory of state property. Its
structure has three sections – public expenditure, government revenues, and their
relationship. The main objective of financial science – to indicate the state economy
management principles.
British economist J. Keynes (1883–1946), whose recommendations have been
used in practice by governments of many countries nearly half a century, based on
financial concepts argued the idea of “effective demand”. He noted that the main
Добавлено примечание ([G31]): Inserted: ,
Добавлено примечание ([G32]): Inserted: the
Добавлено примечание ([G33]): Inserted: the
Добавлено примечание ([G34]): Inserted: ,
34
instruments of state intervention into the cyclical development of the economy should
be financial relations, and, first of all, government spending. Their formation,
structure, and growth are important factors to achieve “effective demand”. Financing
of public expenditure through taxes and loans should revive business activity and
provide an increase in national income, and eliminate unemployment. Keynes “gave”
the leading role to the taxes and their impact on basic “psychological law” according
to which people tend to increase their consumption, but not in such figures as their
income increases (they prefer saving money). It leads to falling demand for goods and
drop of production. Thus, the state should prevent the emergence of this or increase
an effective demand by increasing their costs.
Development and internationalization of capital markets, the increasing role of
transnational corporations, the concentration of production, and increasing
importance of financial resources as a source of economic growth in the mid-
twentieth century led to theoretical rethinking of the role of finance as one of the key
elements of investment, pricing on the financial markets, capital structure, agency and
financial management.
According to the efforts of the Anglo-American finance school, financial theory
has received new content. It promoted the appearance of the neo-classical science
of finance, which assists the idea of free enterprise with limited government
regulation (the theory of “economic proposals”). This concept was based on financial
savings as the basis for economic growth. The state through the tax system and tax
cuts should create necessary conditions for the formation of savings to ensure further
investment in the country. The role of the state and financial system became to
stimulate scientific and technological progress.
In the 1950s, fundamental changes in finance began to occur. The analytical
methods and techniques traditional to economics began to be applied to problems in
finance, and the resulting transformation was significant. This evolution was
accompanied by a change in the focus of the literature from normative questions such
as “What should tax, investment, and finances be?” to positive theories addressing
questions such as “What are the effects of alternative investment, financing, savings or
dividend policies on the value of the firm, bank, state, and household?”. This shift in
research emphasis was necessary to provide the scientific basis for the formation and
analysis of new finance theories. Since 1950 the main areas in finance research are
the following:
Добавлено примечание ([G35]): Inserted: the
Добавлено примечание ([G36]): Inserted: the
35
a) public finance (financing of state budget deficit; state bonds; and tax policy);
b) financial markets (asset pricing; equity, debt, derivatives, and commodity
markets; financial market integration; financial engineering and innovations;
portfolio management and diversification; market efficiency; market
microstructure);
c) financial institutions and intermediaries (banking and non-banking financial
institutions; central banks and regulatory issues; Islamic finance; mutual
funds, hedge funds, and private equity; risk management; investment
banking; venture capital; brokerage; ratings and rating agencies);
d) corporate finance (capital and ownership structure; corporate governance;
corporate diversification; financial modeling; mergers and acquisitions;
valuation; asset pricing; trading volume; bond interest rates; capital
budgeting; fixed investment and inventory studies; bankruptcy; and
liquidation;
e) financial economics (exchange rate modeling, financial crises; foreign direct
investment; international parities; international trade and finance; monetary
and fiscal policy issues; finance and economic development);
f) investment (portfolio choice; investment decisions, multinational firms;
international business; and derivatives);
g) personal finance (personnel management; intertemporal consumer choice;
life cycle models and saving).
According to the areas of finance, the financial theories have formed. Theory
of investment proposed by Miller and Modigliani (1958) argues that “the value of a
firm is independent of its capital structure”. Dividends and capital structure are
irrelevant in the determination of stock prices in the market; instead, the market value
of a firm is based on the “earning power of the assets currently held and on the size
and relative profitability of the investment opportunities”.
Agency Cost Theory proposed by Jensen and Meckling (1976) analyzes the
conflict between shareholders and managers – agents of shareholders. Conflict arises
because shareholders require payouts for their investment, reducing internal resources
controlled by managers. Since managers are compensated on the basis of accounting
profits, it increases the incentives to manipulate information and/or favor projects
with poor NPV if they provide immediate profits. This has negative consequences of
the potential loss in value of public corporations.
Добавлено примечание ([G37]): Inserted: ,
Добавлено примечание ([G38]): Deleted:s
Добавлено примечание ([G39]): Inserted: ,
Добавлено примечание ([G40]): Inserted: the
36
Theory of the stock market efficiency was discussed by Fama (1965) and
French (1965). Efficient markets are characterized by competition among “profit
maximizers” who attempt to estimate the value of securities in the future relying on
the information they have.
The theory of Discounted Cash Flow (DCF) is used in capital budgeting or
project valuation, asset valuation and securities valuation. DCF compares the future
returns of potential projects by discounting the future cash flow at a rate that reflects
the yield of similar securities in the market.
Behavioral finance theory is the study of the impact of psychology on the
behavior of market participants. According to behavioral finance, market prices are in
large part determined by irrational investors affected by these biases. Some of the
most commonly mentioned are:
a) Loss aversion – people have a tendency to prefer avoiding losses to posting
gains. A loss of $100 generally hurts more than a gain of $100 satisfies. This
leads to an increase in risk aversion.
b) Anchoring – people have a tendency to rely too heavily on one piece of
information when making a decision. In the investment world, this bias is
best exemplified by equity research analysts, who are notoriously slow at
adjusting their views.
c) Mental accounting – people have a tendency to code, categorize, and
evaluate economic outcomes. An example of this is the tendency of
investors to frame specific investments.
Capital Asset Pricing Theory (CAPM), presented by Treynor (1961), Sharpe
(1964), Lintner (1965) and Mossin (1966), is used to determine a theoretically
appropriate required rate of return of an asset, if that asset is to be added to an already
well-diversified portfolio, given that asset's non-diversifiable risk. The model takes into
account the asset's sensitivity to non-diversifiable risk (also known as systematic risk
or market risk), as well as the expected return of the market and the expected return of
a theoretical risk-free asset.
Financial liberalization theory of IMF originated in the separate work of
McKinnon (1973) and Shaw (1973). The hypothesis supporting this theory proposed
that financial development and economic growth were strongly attached. The more
liberalization of financial systems, the more growth in economic development.
Добавлено примечание ([G42]): Deleted:C
Добавлено примечание ([G41]): Inserted: The c
Добавлено примечание ([G44]): Deleted:C
Добавлено примечание ([G43]): Inserted: The c
37
Financial structure theory. In the 1960s, Raymond Goldsmith (1969) gave
stylized facts on financial structure and economic development. He found that in the
course of economic development, a country’s financial system grows more rapidly
than national wealth. It appears that the main determinant of the relative size of a
country’s financial system is the separation of the functions of saving and investing
among different (groups of) economic units. This observation sounds remarkably
modern. Since the early 1990s, there has been growing recognition of the positive
impact of financial intermediation on the economy. Both theoretical and empirical
studies find that a well-developed financial system is beneficial to the economy as a
whole. Basically, the argument behind this idea is that the efficient allocation of capital
within an economy fosters economic growth. Financial intermediation can affect
economic growth by acting on the saving rate, on the fraction of saving channeled to
investment, or on the social marginal productivity of investment. In general, financial
development will be positive for economic growth.
Today all over, regardless of the political and economic position of the state,
finances are in a new stage of development. It appears that fundamentally new forms
of financial relations that play major role in country’s future prosperity.
RECOMMENDED READING
1. Chang, S. J., 2005, A Theoretical Discussion on Financial Theory: What Should We Teach and How? Journal of Economics and Finance Education, vol. 4 (2), 39–48.
2. Jensen, M. C. and Smith, C. W., 1984, The Modern Theory of Corporate Finance, New York : McGraw-Hill Inc., pp.2–20.
3. Leveau, D., Gander, P., and Orgland, M., 2010, Evolution of Financial Theory. Available at SSRN: http://ssrn.com/abstract=1927124.
4. Martin, J., Cox, S., and MacMinn, R., 1988, The Theory of Finance, New York : Dryden Press.
5. Miller, M. H., 1998, The History of Finance: An Eyewitness Account. The Revolution in Corporate Finance, New York : Blackwell Publishing, pp. 4–9.
6. Scholtens, B. and Wensveen, D., 2003, The Theory of Financial Intermediation: An Essay on What it Does (Not) Explain, Vienna : SUERF (SUERF Studies: 2003/1).
7. Weston, J. F., 1981, Developments in Finance Theory, Financial Management, 10, pp. 5–22.
Добавлено примечание ([G48]): Deleted:r
Добавлено примечание ([G45]): Inserted: ,
Добавлено примечание ([G46]): Inserted: f
Добавлено примечание ([G47]): Deleted:f
Добавлено примечание ([G51]): Deleted:s
Добавлено примечание ([G49]): Inserted: the
Добавлено примечание ([G50]): Inserted: the
38
KEY TERMS
commodity–money relations
are social relations arising between people by virtue of the production and sale of commodities. Only as a result of the long historical development of the social division of labor, commodity production arise, wherein the exchange of goods has a regular rather than an incidental character.
public debt is defined as how much a country owes to lenders outside of itself. These can include individuals, businesses, and even other governments. The term “public debt” is often used interchangeably with the term sovereign debt. Public debt usually only refers to national debt, but some countries also include the debt owed by states, provinces, and municipalities. Therefore, be careful when comparing public debt between countries to make sure the definitions are the same.
effective demand
is the demand for a product or service which occurs when purchasers are constrained in a different market. It contrasts with national demand, which is the demand that occurs when purchasers are not constrained in any other market. In the aggregated market for goods in general, effective demand is the same thing as aggregate demand when the demand for goods is influenced by spillovers from quantity constraints from other markets. The concept of effective supply parallels the concept of effective demand. The concept of effective demand or supply becomes relevant when markets do not continuously maintain equilibrium prices.
debt consolidation
is a combining of several unsecured debts into a single, new loan that is more favorable. Debt consolidation involves taking out a new loan to pay off a number of other debts. The new loan may result in a lower interest rate, lower monthly payment or both. Consumers can use debt consolidation as a tool to make it easier to get out of student loan debt, credit card debt and other types of debt that aren’t tied to an asset.
financial system
is a system that allows the transfer of money between savers (and investors) and borrowers. Financial systems operate both at national and global levels or at a firm-specific level. The financial system is a set of complex and closely interconnected financial institutions, markets, instruments, services, practices, and transactions.
financial policy
is a criterion describing a corporation's choices regarding its debt/equity mix, currencies of denomination, maturity structure, method of financing investment projects, and hedging decisions with a goal of maximizing the value of the firm to certain stockholders.
financial institution
is an establishment that focuses on dealing with financial transactions, such as investments, loans, and deposits. Conventionally, financial institutions are composed of organizations such as banks, trust companies, insurance companies, and investment dealers. Almost everyone has the deal with a financial institution on a regular basis. Everything from depositing money to taking out loans and exchange currencies must be done through financial institutions.
Добавлено примечание ([G52]): Inserted: the
Добавлено примечание ([G53]): Inserted: ,
Добавлено примечание ([G55]): Deleted:F
Добавлено примечание ([G54]): Inserted: The f
Добавлено примечание ([G57]): Deleted:a
Добавлено примечание ([G56]): Inserted: on
Добавлено примечание ([G58]): Inserted: the
Добавлено примечание ([G59]): Inserted: ,

39
financial intermediary
is an entity that acts as the middleman between two parties in a financial transaction. While a commercial bank is a typical financial intermediary, this category also includes other financial institutions, such as investment banks, insurance companies, broker-dealers, mutual funds and pension funds. Financial intermediaries offer a number of benefits to the average consumer, including safety, liquidity, and economies of scale.
corporate finance
is the area of finance dealing with the sources of funding and the capital structure of corporations and the actions that managers take to increase the value of the firm to the shareholders, as well as the tools and analysis used to allocate financial resources. The primary goal of corporate finance is to maximize or increase shareholder value. Although it is different in principle from managerial finance which studies the financial management of all firms, rather than corporations alone, the main concepts in the study of corporate finance are applicable to the financial problems of all kinds of firms.
financial economics
is a branch of economics that analyzes the use and distribution of resources in markets in which decisions are made under uncertainty. Financial decisions must often take into account future events whether those be related to individual stocks, portfolios, or the market as a whole. Financial economics employs economic theory to evaluate how time, risk (uncertainty), opportunity costs, and information can create incentives or disincentives for a particular decision.
personal finance
is the financial management which an individual or a family unit performs to budget, save, and spend money resources over time, taking into account various financial risks and future life events. When planning personal finances, the individual would consider the suitability to his or her needs of a range of banking products (checking, savings accounts, credit cards, and consumer loans) or investment (stock market, bonds, mutual funds) and insurance (life insurance, health insurance, and disability insurance) products, or participation and monitoring of individual- or employer-sponsored retirement plans, social security benefits, and income tax management.
capital asset pricing model (CAPM)
is a mathematical model used to determine a theoretically appropriate required rate of return of an asset if that asset is to be added to an already well-diversified portfolio, given that asset's non-diversifiable risk.
financial structure
is a specific mixture of long–term debt and equity that a company uses to finance its operations. This financial structure is the mixture that directly affects the risk and value of the business. The main concern for the financial manager of the company is deciding how much money should be borrowed and the best mixture of debt and equity to obtain. The financial manager also has to find the least expensive sources of funds for the company to use.
Добавлено примечание ([G60]): Inserted: ,
Добавлено примечание ([G61]): Deleted:,

40
financial development
can be defined as the policies, factors, and the institutions that lead to the efficient intermediation and effective financial markets. A strong financial system offers risk diversification and effective capital allocation. The greater the financial development is, the higher the mobilization of savings and its allocation to high return projects are. Financial development can be measured by a number of factors including the depth, size, access, and soundness of the financial system. It can be measured by examining the performance and activities of the financial markets, banks, bond markets, and financial institutions. It is observed that the higher the degree of financial development in the country is, the wider the availability of financial services is. A developed financial system offers higher returns with less risk.
financial depth
captures the financial sector relative to the economy. It is the size of banks, other financial institutions, and financial markets in a country, taken together and compared to a measure of economic output. A proxy variable that has received much attention in the empirical literature in this regard is private credit relative to gross domestic product (GDP). More specifically, the variable is defined as a domestic private credit to the real sector by deposit money banks as a percentage of local currency GDP. The private credit, therefore, excludes credit issued to governments, government agencies, and public enterprises. It also excludes credit issued by central banks.
REVIEW QUESTIONS
1. Describe the historical development of the term “finance”. Describe theories and
views of the term “finance” origin.
2. What phases in the evolution of finance are distinguished? Describe them.
3. What are the characteristic features of finance?
4. Define the essence of natural production as the basis for the emergence of
financial relations.
5. Why have commodity-money relations become a catalyst for finance
development?
6. Describe each stage of finance development. What is the main difference between
them?
7. Define the role of taxes in the development of finance.
8. Describe the major stages of finance development in our country.
9. Describe the public finances of the slave, feudal, capitalist, and communist states.
10. Assess the value of financial teachings of J. M. Keynes. How did his ideas
influence the financial policies of developed countries?
11. On what ideas is based neo-classical science of finance? What are the main
theories?
Добавлено примечание ([G62]): Inserted: the
Добавлено примечание ([G63]): Inserted: a
Добавлено примечание ([G64]): Inserted: a

41
12. Mention major building blocks of the modern theory of financial economics.
13. Describe the essence of such finance categories as public finance, financial market,
financial institution, financial intermediary, corporate finance, financial economics,
investment, and personal finance.
14. Describe and explain the essence of behavioral finance theory. Why did this theory
become so popular?
15. What ideas are in the center of financial structure theory? Describe major
categories of it (financial development, financial depth).
MULTIPLE CHOICE QUESTIONS
Choose the one alternative that best completes the statement or answers the question.
1. Which of the factors do not belong to those that contribute the genesis of finance? a) commodity-money relations; b) social labor division; c) emergence of independent entities that create the necessary cash funds; d) lack of independent entities involved in business activity.
2. Finance expresses the economic relations that arise at the following stage: a) production; b) tax collection; c) exchange and consumption; d) distribution.
3. What phase of the evolution of finance is characterized by increase of the financial system complexity? a) first; b) second; c) third; d) fourth.
4. What stage of financial science development is characterized by the dominance of finance of the private sector, particularly large companies and capital markets? a) Classical; b) Mercantilism; c) Neo-classical; d) Keynesianism.
Добавлено примечание ([G65]): Inserted: the
Добавлено примечание ([G66]): Inserted: a

42
5. Who was the first who laid out the basic principles of financial science by systemizing existing financial theories? a) A. Smith; b) J. Justi; c) K. Marx; d) J. Keynes.
6. According to what theory the main instrument of state intervention into the cyclical development is government spending? a) behavioral finance; b) economic proposals; c) CAPM; d) effective demand.
7. An establishment that focuses on dealing with financial transactions, such as investments, loans, and deposits: a) financial institution; b) government; c) financial market; d) stock market.
8. It can be defined as the policies, factors, and the institutions that lead to the efficient intermediation and effective financial markets: a) financial structure; b) financial development; c) financial depth; d) financial policy.
9. The following is the main indicator of country’s financial development: a) GDP; b) government expenditures; c) government debt; d) financial depth.
10. This is the financial management which an individual or a family unit performs to budget, saves, and spends money resources over time, taking into account various financial risks and future life events: a) investment; b) public finance; c) state budget; d) corporate finance.
Добавлено примечание ([G67]): Inserted: ,
Добавлено примечание ([G68]): Inserted: a

43
SHORT ANSWER QUESTIONS
MISSING WORD QUESTIONS
Choose the correct word to complete each sentence.
1. Finances appeared as a result of ___________ and the creation of ____________.
2. On the first phase in the evolution of finance, most of the money were spent on ____________.
3. ________ stage of financial science development is characterized by the dominance of finance of the private sector, particularly large companies and capital markets.
4. According to ________________, market prices are in large part determined by irrational investors affected by these biases.
5. ____________________ can affect economic growth by acting on the saving rate, on the fraction of saving channeled to investment, or on the social marginal productivity of investment. In general, _______________ will be positive for economic growth.
TRUE/FALSE/UNCERTAIN QUESTIONS
Decide whether the following statements are True, False, or Uncertain. Explain your reasoning. Your score will be based not just on whether you get the True, False, or Uncertain part right but, to a larger extent, on the quality of your explanation.
1. Finance emerged with the appearance of the state, the existence of which required
certain resources in the form of taxes and money capital at the beginning, and in the form of commodity later on. Therefore, finance is always production relationship.
2. The second phase of finance evolution is reflected in the formation of the Treasury, development of budgets, the emergence of public credit and government securities.
3. German scientist W. Petty was the first who laid out the basic principles of financial science. He has formed a common system of financial science by systematizing existing financial theories.
4. The neo-classical science of finance assists the idea of free enterprise with limited government regulation and based on financial savings as the basis for economic growth.
Добавлено примечание ([G69]): Inserted: the
Добавлено примечание ([G71]): Deleted:N
Добавлено примечание ([G70]): Inserted: The n
44
5. A financial intermediary is an entity that acts as the middleman between two parties in a financial transaction. Financial intermediation can affect economic growth by acting on the saving rate, on the fraction of saving channeled to investment, or on the social marginal productivity of investment. In general, financial development will be positive for economic growth.
COMPUTATION PROBLEMS
1. Describe the place and role of public finances in the slave, feudal, capitalist, and communist states. The characteristics should be presented in the box below.
Characteristics of finance according to the type of socio-economic system in a country
Type of socio-economic system
Specification of socio-economic system’s type
Example of country / Year of usage
Form of finance in use
2. Describe the evolution of scientific thoughts about finance according to major
economic doctrines. The characteristic should be presented in the box below and should consist of types of economic doctrine, a name of its major representatives, and brief characteristic of their thoughts about finance.
The evolution of scientific thoughts about finance according to major economic doctrines
Type of economic doctrine Name of scientist Brief characteristic of thoughts about finance
Mercantilism
Classical political economy
Socialist doctrine
Historical school and social way of political economy
Marginalism and early neo-classical political economy
Keynesianism, neo- and post- Keynesianism
Monetarism
Institutionalism
Добавлено примечание ([G73]): Deleted:F
Добавлено примечание ([G72]): Inserted: A f
Добавлено примечание ([G74]): Inserted: a
Добавлено примечание ([G75]): Inserted: the
Добавлено примечание ([G76]): Inserted: the
Добавлено примечание ([G77]): Inserted: a
Добавлено примечание ([G78]): Inserted: a
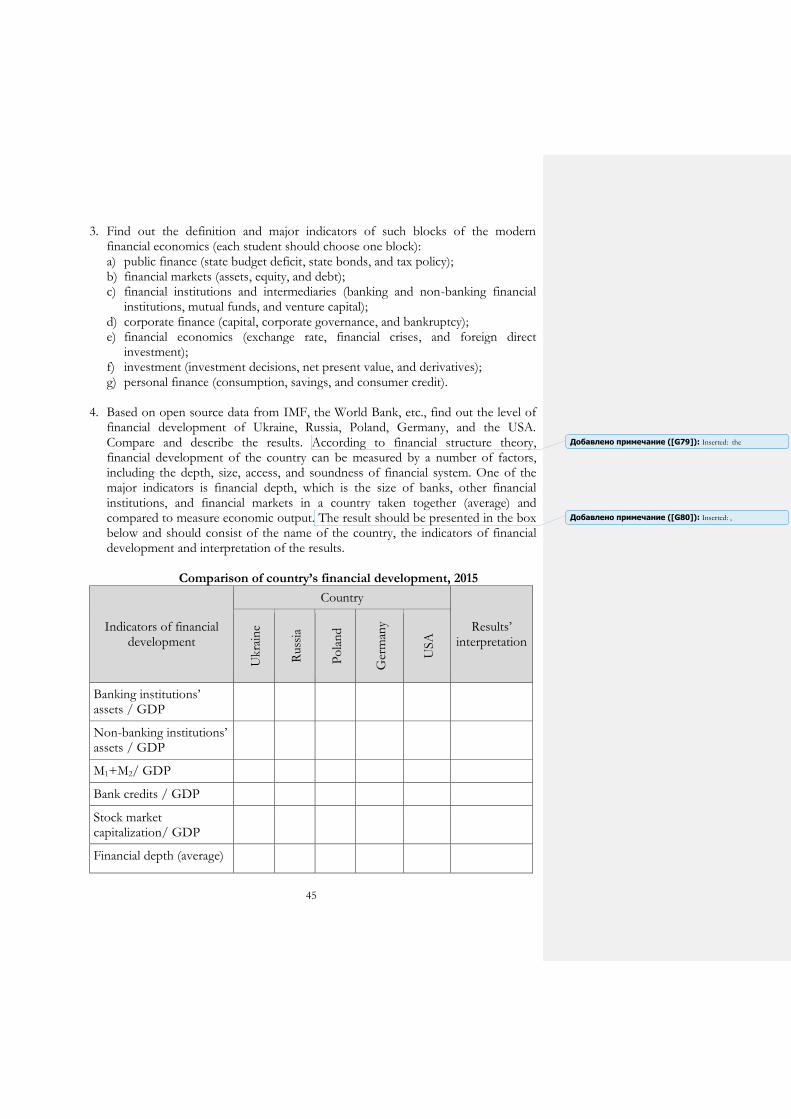
45
3. Find out the definition and major indicators of such blocks of the modern financial economics (each student should choose one block): a) public finance (state budget deficit, state bonds, and tax policy); b) financial markets (assets, equity, and debt); c) financial institutions and intermediaries (banking and non-banking financial
institutions, mutual funds, and venture capital); d) corporate finance (capital, corporate governance, and bankruptcy); e) financial economics (exchange rate, financial crises, and foreign direct
investment); f) investment (investment decisions, net present value, and derivatives); g) personal finance (consumption, savings, and consumer credit).
4. Based on open source data from IMF, the World Bank, etc., find out the level of
financial development of Ukraine, Russia, Poland, Germany, and the USA. Compare and describe the results. According to financial structure theory, financial development of the country can be measured by a number of factors, including the depth, size, access, and soundness of financial system. One of the major indicators is financial depth, which is the size of banks, other financial institutions, and financial markets in a country taken together (average) and compared to measure economic output. The result should be presented in the box below and should consist of the name of the country, the indicators of financial development and interpretation of the results.
Comparison of country’s financial development, 2015
Indicators of financial development
Country
Results’ interpretation
Ukra
ine
Russ
ia
Po
lan
d
Ger
man
y
USA
Banking institutions’ assets / GDP
Non-banking institutions’ assets / GDP
M1+M2/ GDP
Bank credits / GDP
Stock market capitalization/ GDP
Financial depth (average)
Добавлено примечание ([G79]): Inserted: the
Добавлено примечание ([G80]): Inserted: ,

46
5. Describe the evolution of Ukrainian scientific thoughts about finance. The characteristic should be presented in the box below and consist of the name of Ukrainian scientist, his brief characteristic (years of life, major works, job positions, etc.) and a review of his thoughts about finance.
The evolution of Ukrainian scientific thoughts about finance
Name of Ukrainian scientist
Scientist’s brief characteristic
Review of scientist’s thoughts about finance
M. Bunge
M. Baludyanskiy
M. Tugan-Baranovskiy
I. Franko
V. Vernadskiy
M. Yasnopolskiy
M. Dobrilovskiy
M. Mitilino
47
CHAPTER 3:
FINANCIAL POLICY.
FINANCIAL SYSTEM
SUMMARY
Financial policy refers to the actions that governments take in the economic
field, i.g., sphere of the financial activity of the business entities, financial institutions,
households, and the State itself. Government financial policies typically focus on how
to stimulate the economy and thus increase the wealth of corporations and individuals.
There are varying schools of thought on how this is best accomplished. Some believe
that a sound governmental financial policy is to cut taxes; others believe it is best for
the government to spend more money directly on hiring workers and creating new
services for the public. The financial policy covers the systems for setting levels of
taxation, government budgets, the money supply and interest rates as well as the labor
market, national ownership, and many other areas of government interventions into
the economy.
The financial policies include solving tasks of the social-economic development
and working out the measures for gaining the predetermined goals. Such policies are
often influenced by the Ministry of Finance, the Central Bank (National Bank of
Ukraine) as well as political beliefs and the consequent policies of parties, international
institutions like the International Monetary Fund or the World Bank.
The main objective of the financial policy is an optimal distribution of gross
domestic product (GDP) between industries, business entities, households, social
groups, and regions in order to ensure sustainable economic development, to create
financial independence of the territory, implementation of national programs of social
security. The definition of the ambit of "financial policy" explicitly excludes those
financial interventions that are not sectoral but macroeconomic in nature, and are
dealt within Macroeconomic and Growth Policies.
For example, the government can be considered the grand financial intermediary in any
economy, inasmuch as it absorbs, through taxation, a part of the money incomes and,
through borrowing, draws on the savings of the private sector, part of which is transferred
to entities needing funds for investment purposes. Through these means the government
Добавлено примечание ([G84]): Deleted:ve
Добавлено примечание ([G81]): Inserted: f
Добавлено примечание ([G83]): Deleted:,
Добавлено примечание ([G85]): Deleted:F
Добавлено примечание ([G82]): Inserted: The f
Добавлено примечание ([G86]): Inserted: the

48
can seek to ensure the realization in the financial realm of desired rates of savings and the
desired allocation of those savings. However, the government is not a financial intermediary
and is normally not an agent seeking to make a profit from the difference between the cost
of funds and the returns on subsequent transfers. Hence, the extent to which the
government can and should resort to such "intermediation" is not considered the ambit of
financial but fiscal policy. While there is a need to coordinate fiscal and financial policies,
they are conceptually and practically different.
Financial policy in a broad meaning reflects all aspects of financial operating
and includes tax, budgetary, monetary, depreciation, exchange rate and customs
policies. Table 3.1 represents contents and tools of mentioned above financial policies.
Table 3.1 – Description of the financial policies' contents and tools
Elements Goals or Objectives Content Instruments or Tools
1 2 3 4
Tax policy a) full employment; b) price stability; c) accelerating
economic development;
d) optimum allocation of resources;
e) equitable distribution of income and wealth;
f) economic stability; g) capital formation
and growth; h) encouraging
investment
The taxation policy characterizes the activity of the state in the sphere of taxation. Tax policy is the choice by a government as to what taxes to levy, in what amounts, and on whom. The taxation policy reflects the state’s need for money costs and also the influence of taxes on the enterprise and individual’s activity
a) tax legislation, principles, procedures, and rules;
b) types and the total amount of taxes;
c) tax base and taxpayers; d) tax rates; e) tax privileges (benefits); f) tax exemptions; g) fine taxing or tax penalties
Budgetary policy
To generate revenue and to incur expenditure, the government frames a policy called budgetary policy. Budgetary policy refers to government attempts to run a budget in equilibrium or in surplus. The aim is to reduce the public debt
a) budget legislation; b) budget process; c) government expenditures
and revenue; d) the budget deficit, e) subsidies, transfer
payments including welfare programs, contracts to perform all kinds of public works, and, of course, salaries to government employees;
f) the marginal size of the national debt
Depreciation policy
a) economic growth; b) encouraging
investment
Depreciation policy, in fact, relates to the choice of the depreciation method and its suitability for the organizations
a) methods of depreciation; b) provision for depreciation; c) depreciation rates; d) asset class or groups
Добавлено примечание ([G90]): Deleted:,
Добавлено примечание ([G89]): Deleted:a
Добавлено примечание ([G87]): Inserted: the
Добавлено примечание ([G88]): Inserted: ,
Добавлено примечание ([G91]): Inserted: he t
Добавлено примечание ([G92]): Inserted: the
Добавлено примечание ([G93]): Inserted: ,
Добавлено примечание ([G94]): Inserted: ,
Добавлено примечание ([G95]): Inserted: the
Добавлено примечание ([G96]): Inserted: the
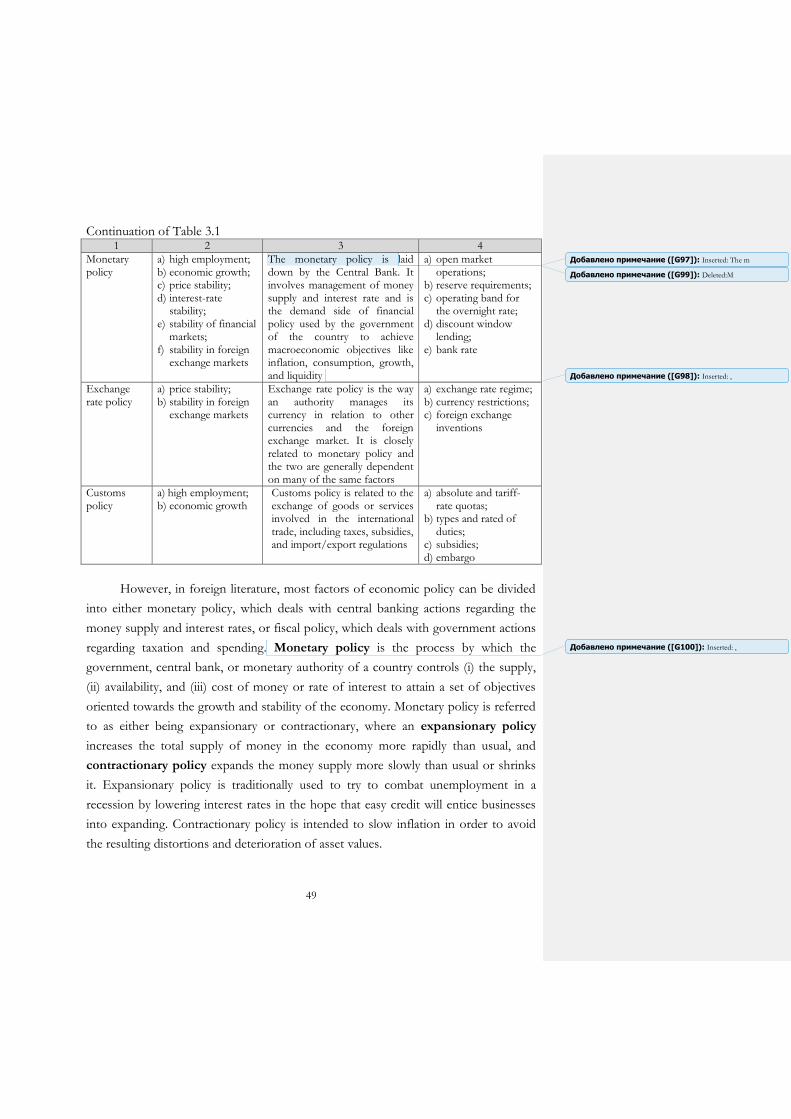
49
Continuation of Table 3.1
1 2 3 4
Monetary policy
a) high employment; b) economic growth; c) price stability; d) interest-rate
stability; e) stability of financial
markets; f) stability in foreign
exchange markets
The monetary policy is laid down by the Central Bank. It involves management of money supply and interest rate and is the demand side of financial policy used by the government of the country to achieve macroeconomic objectives like inflation, consumption, growth, and liquidity
a) open market operations;
b) reserve requirements; c) operating band for
the overnight rate; d) discount window
lending; e) bank rate
Exchange rate policy
a) price stability; b) stability in foreign
exchange markets
Exchange rate policy is the way an authority manages its currency in relation to other currencies and the foreign exchange market. It is closely related to monetary policy and the two are generally dependent on many of the same factors
a) exchange rate regime; b) currency restrictions; c) foreign exchange
inventions
Customs policy
a) high employment; b) economic growth
Customs policy is related to the exchange of goods or services involved in the international trade, including taxes, subsidies, and import/export regulations
a) absolute and tariff-rate quotas;
b) types and rated of duties;
c) subsidies; d) embargo
However, in foreign literature, most factors of economic policy can be divided
into either monetary policy, which deals with central banking actions regarding the
money supply and interest rates, or fiscal policy, which deals with government actions
regarding taxation and spending. Monetary policy is the process by which the
government, central bank, or monetary authority of a country controls (i) the supply,
(ii) availability, and (iii) cost of money or rate of interest to attain a set of objectives
oriented towards the growth and stability of the economy. Monetary policy is referred
to as either being expansionary or contractionary, where an expansionary policy
increases the total supply of money in the economy more rapidly than usual, and
contractionary policy expands the money supply more slowly than usual or shrinks
it. Expansionary policy is traditionally used to try to combat unemployment in a
recession by lowering interest rates in the hope that easy credit will entice businesses
into expanding. Contractionary policy is intended to slow inflation in order to avoid
the resulting distortions and deterioration of asset values.
Добавлено примечание ([G99]): Deleted:M
Добавлено примечание ([G97]): Inserted: The m
Добавлено примечание ([G98]): Inserted: ,
Добавлено примечание ([G100]): Inserted: ,
50
Tax policy coupled with budgetary policy reflects fiscal policy. Fiscal policy
has to decide on the size and pattern of flow of expenditure from the government to
the economy and from the economy back to the government. So, in broad term, fiscal
policy refers to "that segment of national economic policy which is primarily
concerned with the receipts and expenditure of central government." In other words,
fiscal policy refers to the policy of the government with regard to taxation, public
expenditure, and public borrowings. The importance of fiscal policy is high in
underdeveloped countries. The state has to play an active and important role. In a
democratic society, direct methods are not approved. So, the government has to
depend on indirect methods of regulations. In this way, fiscal policy is a powerful
weapon in the hands of government by means of which it can achieve the objectives
of development. With fiscal policy, there will be certain levels of lag time in which
conditions will deteriorate before being recognized. At the same time, the fiscal policy
takes the time to implement due to legislative and administrative processes, and those
same policies will take the time to show results after implementation.
There are two main types of fiscal policy: expansionary and contractionary.
Expansionary fiscal policy, designed to stimulate the economy, is most often
used during a recession, times of high unemployment, or other low periods of the
business cycle. It entails the government spending more money, lowering taxes, or
both. The goal is to put more money in the hands of consumers so that they spend
more and stimulate the economy. Contractionary fiscal policy is used to slow down
economic growth, such as when inflation is growing too rapidly. As opposed to
expansionary fiscal policy, contractionary fiscal policy raises taxes and cuts spending.
Finance includes a great variety of the exchange-allocation relations, which are
expressed by money flows. The essence of these relations is the same but they have
certain peculiarities. According to these peculiarities, the financial relations acquire
certain forms and make up the financial system. Thus, the financial system is a set of
financial relations forms which are interconnected, have certain common features and,
at the same time, certain peculiarities. The financial system is an integral part of the
economy. When the system functions properly, it channels funds from savers to
investors. By increasing productivity, the financial system helps spur economic growth
and raise the standard of living. A financial system can operate on a global, regional or
firm-specific level. The financial system is a set of complex and closely interconnected
financial institutions, markets, instruments, services, practices, and transactions.
Добавлено примечание ([G101]): Inserted: he t
Добавлено примечание ([G102]): Inserted: the
Добавлено примечание ([G103]): Inserted: the
Добавлено примечание ([G104]): Inserted: ,
Добавлено примечание ([G105]): Inserted: n a
Добавлено примечание ([G106]): Inserted: ,
Добавлено примечание ([G107]): Inserted: the
Добавлено примечание ([G108]): Inserted: the
Добавлено примечание ([G109]): Inserted: ,
Добавлено примечание ([G111]): Deleted:F
Добавлено примечание ([G110]): Inserted: The f
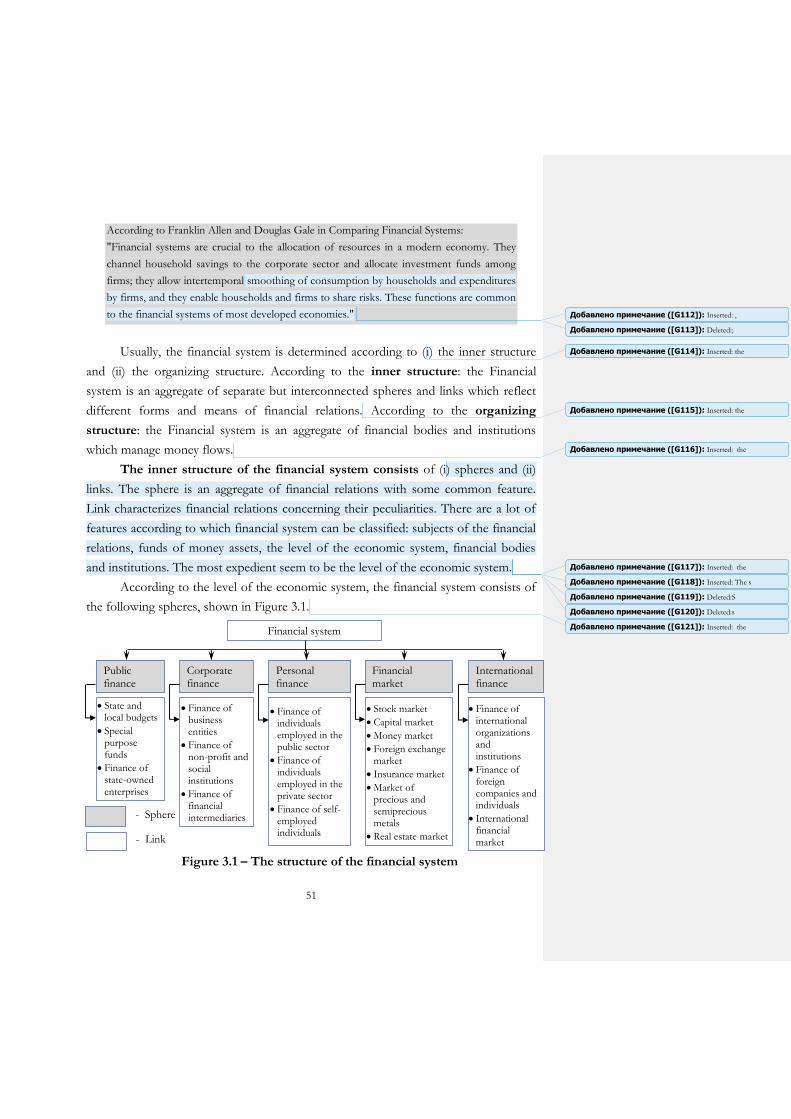
51
According to Franklin Allen and Douglas Gale in Comparing Financial Systems:
"Financial systems are crucial to the allocation of resources in a modern economy. They
channel household savings to the corporate sector and allocate investment funds among
firms; they allow intertemporal smoothing of consumption by households and expenditures
by firms, and they enable households and firms to share risks. These functions are common
to the financial systems of most developed economies."
Usually, the financial system is determined according to (i) the inner structure
and (ii) the organizing structure. According to the inner structure: the Financial
system is an aggregate of separate but interconnected spheres and links which reflect
different forms and means of financial relations. According to the organizing
structure: the Financial system is an aggregate of financial bodies and institutions
which manage money flows.
The inner structure of the financial system consists of (i) spheres and (ii)
links. The sphere is an aggregate of financial relations with some common feature.
Link characterizes financial relations concerning their peculiarities. There are a lot of
features according to which financial system can be classified: subjects of the financial
relations, funds of money assets, the level of the economic system, financial bodies
and institutions. The most expedient seem to be the level of the economic system.
According to the level of the economic system, the financial system consists of
the following spheres, shown in Figure 3.1.
Figure 3.1 – The structure of the financial system
Financial system
Public finance
Corporate finance
Personal finance
Financial market
State and local budgets
Special purpose funds
Finance of state-owned enterprises
Finance of individuals employed in the public sector
Finance of individuals employed in the private sector
Finance of self-employed individuals
Stock market
Capital market
Money market
Foreign exchange market
Insurance market
Market of precious and semiprecious metals
Real estate market
International finance
Finance of international organizations and institutions
Finance of foreign companies and individuals
International financial market
- Sphere
- Link
Finance of business entities
Finance of non-profit and social institutions
Finance of financial intermediaries
Добавлено примечание ([G113]): Deleted:;
Добавлено примечание ([G112]): Inserted: ,
Добавлено примечание ([G114]): Inserted: the
Добавлено примечание ([G115]): Inserted: the
Добавлено примечание ([G116]): Inserted: the
Добавлено примечание ([G120]): Deleted:s
Добавлено примечание ([G117]): Inserted: the
Добавлено примечание ([G119]): Deleted:S
Добавлено примечание ([G118]): Inserted: The s
Добавлено примечание ([G121]): Inserted: the
52
The financial system includes the following components: banks (both
government banks and those in the private sector); financial markets; financial
instruments; and financial services.
According to the organizing structure, the financial system looks as follows:
1. Executive bodies:
a) Ministry of Finance
b) State Taxation Authority
c) State Inspection Committee
d) State Treasury
e) State Securities and Stock Exchange Commission
f) Accounting Chamber
g) Pension Fund
h) Audit Chamber
i) Social Insurance Fund
2. Financial institutions:
a) Central Bank
b) commercial banks
c) non-bank crediting institutions (credit unions, pawnshops as well)
d) Interbank Foreign Currency Exchange
e) stock exchanges
f) institutional investors
g) insurance organizations
RECOMMENDED READING
1. Adao, B., Correia, I., and Teles, P., 2009, On the relevance of exchange rate regimes for stabilization policy, Journal of Economic Theory, 144 (4), pp. 1468–1488.
2. Afonso, A., and Sousa, R. M., 2012, The macroeconomic effects of fiscal policy, Applied Economics, 44 (34), pp. 4439–4454.
3. Blinder, A. S., and Solow, R. M., 1973, Does fiscal policy matter?, Journal of Public Economics, 2 (4), 319–337.
4. Davig, T., and Leeper, E. M., 2011, Monetary-fiscal policy interactions and fiscal stimulus, European Economic Review, 55 (2), pp. 211–227.
5. Easterly, W., and Rebelo, S., 1993, Fiscal policy and economic growth, Journal of Monetary Economics, 32 (3), pp. 417–458.
6. Eijffinger, S., and Haan, J. D., 2000, European monetary and fiscal policy, OUP Catalogue.
Добавлено примечание ([G122]): Inserted: following
53
7. Markiewicz, M., Gorski, U., and Dekhtiarchuk, M., 2009, Monetary policy in Ukraine in 1996–1999, CASE Network Studies and Analyses, (171).
8. Spilimbergo, M. A., Symansky, M. S. A., Cottarelli, M. C., and Blanchard, O. J., 2009, Fiscal policy for the crisis, International Monetary Fund.
KEY TERMS
fiscal policy is the means by which a government adjusts its spending levels and tax rates to monitor and influence a national economy.
transfer payments (or government transfer)
is a one-way payment of money for which no money, good, or service is received in exchange. Governments use such payments as means of income redistribution by giving out money for social welfare programs: social security, old age or disability pensions, student grants, unemployment compensation, etc.
national debt
is the total outstanding borrowings of a central government comprising internal (owing to national creditors) and external (owing to foreign creditors) debt incurred in financing its expenditure.
subsidy is an economic benefit (such as a tax allowance or duty rebate) or financial aid (such as a cash grant or soft loan) provided by a government to support a desirable activity (such as exports), keep prices of staples low, maintain the income of the producers of critical or strategic products, maintain employment levels, or induce investment to reduce unemployment.
taxation is a means by which governments finance their expenditure by imposing financial charges (taxes) or other levy imposed upon a taxpayer (an individual or legal entity) by a state or the functional equivalent of the state to fund various public expenditures.
monetary policy
is an economic strategy chosen by a government in deciding expansion or contraction in the country's money-supply.
discount window
is an instrument of monetary policy that allows eligible institutions to borrow money from the central bank, usually on a short-term basis and to meet temporary shortages of liquidity caused by internal or external disruptions.
open market operations
is buying and selling of government securities in the open market in order to expand or contract the amount of money in the banking system.
reserve requirements
is a minimum amount of cash or cash-equivalents (computed as a percentage of deposits) that banks and other depository institutions (credit unions and insurance companies) are required by law to keep on hand, and which may not be used for lending or investing.
exchange rate regime
is the way an authority manages its currency in relation to other currencies and the foreign exchange market.
import quota is a means of restricting the quantity of imports through import licenses either of a certain item or from a certain country. See also import restrictions.
import duty is a tax on goods imported into a country
currency restriction
is a rule or requirement imposed by a country's monetary authorities to regulate its inflow or outflow.
Добавлено примечание ([G125]): Deleted:unde
Добавлено примечание ([G123]): Inserted: fo
Добавлено примечание ([G124]): Deleted:n

54
embargo is an official suspension of import and/or export of some specific or all goods, to or from a specific port, country, or region, for political, health, or labor related reasons, for a specified or indefinite period.
depreciation is the gradual conversion of the cost of a tangible capital asset or fixed asset into an operational expense (called depreciation expense) over the asset's estimated useful life.
public finance
is a field of economics concerned with paying for collective or governmental activities and with the administration and design of those activities.
corporative finance
is an area of finance dealing with the sources of funding and the capital structure of corporations and the actions that managers take to increase the value of the firm to the shareholders, as well as the tools and analysis used to allocate financial resources.
international finance
is an area of financial economics that deals with monetary interactions between two or more countries, concerning itself with topics, such as currency exchange rates, international monetary systems, foreign direct investment, and issues of international financial management including political risk and foreign exchange risk inherent in managing multinational corporations.
financial market
is a mechanism that allows people to buy and sell (trade) financial securities (such as stocks and bonds), commodities (such as precious metals or agricultural goods), and other fungible items of value at low transaction costs and at prices that reflect the efficient-market hypothesis.
personal finance
is the financial management which an individual or a family unit performs to budget, save, and spend monetary resources over time, taking into account various financial risks and future life events.
REVIEW QUESTIONS
1. What is the primary issue of the financial policy?
2. What are the three expansionary fiscal policy tools the government can use to
expand an economy that is in a recession?
3. Are tax cuts always directed at stimulating aggregate demand? Explain why some
supply-siders think tax cuts may actually increase tax revenues.
4. What are the goals of monetary policy?
5. Is monetary policy effective during financial crises?
6. What is the relation between monetary policy and financial stability?
7. Describe the tools the Central Bank can use to carry out monetary policy.
8. Identify the three tools of monetary policy, and what the Central Bank would do
to increase (or decrease) the (growth of the) money supply.
9. Explain how the Central Bank uses open market operations. Добавлено примечание ([G127]): Deleted:f
Добавлено примечание ([G126]): Inserted: t

55
10. Explain the sequence of links connecting an expansionary monetary policy with
interest rates, intended investment, aggregate demand, and output.
11. Describe the sequences of events in the conduct of contractionary monetary
policy using open market operations.
12. Explain what happens to the value of the currency when there’s an increase (or
decrease) in the supply (or demand) of the currency in the foreign exchange
market.
13. What instruments are used in the exchange rate policy? Explain the role of the
Government and the Central Bank.
14. Explain the major policy tools that countries use to manage the degree of
“openness” of their economies in case of customs policy.
15. What are the tools of depreciation policy?
MULTIPLE CHOICE QUESTIONS
Choose the one alternative that best completes the statement or answers the question. 1. Which of the following is not an example of expansionary fiscal policy?
a) tax reduction; b) increase in government purchases; c) increase in money supply; d) increase in government income transfers.
2. Who uses fiscal policy? a) National Bank of Ukraine (NBU); b) Government; c) public; d) firms.
3. What is the effect of expansionary fiscal policy on the money supply? a) it depends on; b) does not affect it; c) decreases it; d) increases it.
4. Which of the following does fiscal policy directly affect? a) unemployment rate; b) interest rate; c) birth rate; d) reserve requirement rate.
5. What is the effect of contractionary monetary policy on output?
Добавлено примечание ([G128]): Inserted: the
Добавлено примечание ([G129]): Inserted: the
Добавлено примечание ([G130]): Inserted: the
Добавлено примечание ([G131]): Inserted: on
56
a) no effect; b) it depends on; c) it decreases; d) it increases.
6. Which of the following is an example of expansionary fiscal policy? a) decreasing taxes; b) increasing taxes; c) decreasing government spending; d) decreasing the reserve requirement.
7. Which of the following is an example of contractionary fiscal policy? a) selling government bonds in the open market; b) decreasing government spending; c) decreasing taxes; d) increasing the reserve requirement.
8. Suppose the National Bank of Ukraine (NBU) wanted to engage in an expansionary monetary policy. Which of the following should it do?
a) sell bonds in the open market; b) increase the reserve requirement ratio; c) increase the discount rate; d) buy bonds in the open market; e) lower taxes.
9. What is the effect of the NBU selling government bonds on the open market? a) decreases government spending; b) increases government spending; c) decreases the money supply; d) increases the money supply.
10. Which of the following pairs best fit with fiscal policy? a) taxes and government spending; b) open market operations and reserve requirement; c) taxes and open market operations; d) open market operations and government spending.
SHORT ANSWER QUESTIONS
MISSING WORD QUESTIONS
Choose the correct word to complete each sentence.
1. Define contractionary monetary policy.
Добавлено примечание ([G132]): Inserted: on
57
Contractionary monetary policy is policy enacted by the _________________ that _____________ the money supply, ___________________ the interest rate, and _______________ output.
2. Define expansionary fiscal policy. Expansionary fiscal policy is a form of economic policy enacted by the __________________ to increase output. The two major vehicles for expansionary fiscal policy are ______________ taxes and ____________ government spending.
3. When the NBU buys or sells government bonds in the open market, it is conducting _______________________.
4. Define contractionary fiscal policy. Contractionary fiscal policy is a form of fiscal policy enacted by the _________________ to decrease output. The two major vehicles for contractionary fiscal policy are ____________ taxes and ___________________ government spending.
5. How does fiscal policy affect output? Fiscal policy affects output _____________ though __________________ consumption and government spending and _____________________ through the tax and government spending multipliers.
TRUE/FALSE/UNCERTAIN QUESTIONS
Decide whether the following statements are True, False, or Uncertain. Explain your reasoning. Your score will be based not just on whether you get the True, False, or Uncertain part right but also, to a larger extent, heavily on the quality of your explanation.
1. There is no way to expand an economy using fiscal policy without incurring (or
increasing) a budget deficit.
2. A policy tool that can be used to fight inflation (brought about by excessive aggregate demand) is a contractionary fiscal policy.
3. The existence of budget deficits must mean that the government is conducting an expansionary fiscal policy.
4. At any given constant money demand under an expansionary monetary policy, the money supply decreases and interest rates increase.
Добавлено примечание ([G133]): Inserted: an
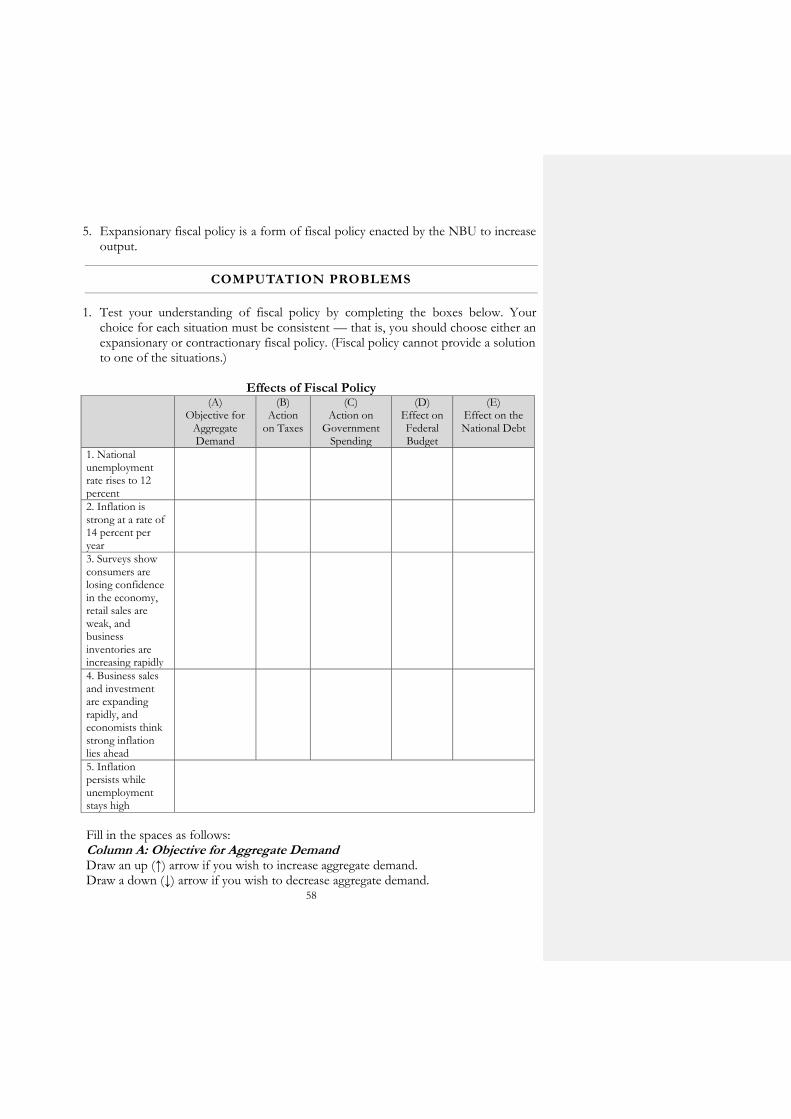
58
5. Expansionary fiscal policy is a form of fiscal policy enacted by the NBU to increase output.
COMPUTATION PROBLEMS
1. Test your understanding of fiscal policy by completing the boxes below. Your choice for each situation must be consistent — that is, you should choose either an expansionary or contractionary fiscal policy. (Fiscal policy cannot provide a solution to one of the situations.)
Effects of Fiscal Policy (A)
Objective for Aggregate Demand
(B) Action
on Taxes
(C) Action on
Government Spending
(D) Effect on Federal Budget
(E) Effect on the National Debt
1. National unemployment rate rises to 12 percent
2. Inflation is strong at a rate of 14 percent per year
3. Surveys show consumers are losing confidence in the economy, retail sales are weak, and business inventories are increasing rapidly
4. Business sales and investment are expanding rapidly, and economists think strong inflation lies ahead
5. Inflation persists while unemployment stays high
Fill in the spaces as follows: Column A: Objective for Aggregate Demand Draw an up (↑) arrow if you wish to increase aggregate demand. Draw a down (↓) arrow if you wish to decrease aggregate demand.

59
Column B: Action on Taxes Draw an up (↑) arrow if you wish to increase taxes. Draw a down (↓) arrow if you wish to decrease taxes. Column C: Action on Government Spending Draw an up (↑) arrow if you wish to increase government spending. Draw a down (↓) arrow if you wish to decrease government spending. Column D: Effect on Federal Budget Write the word “deficit” if your action will increase the deficit (or reduce the surplus). Write the word “surplus” if your action will reduce the deficit (or increase the surplus). Column E: Effect on the National Debt Draw an up (↑) arrow if you think the national debt will increase. Draw a down (↓) arrow if you think the national debt will decrease.
2. Figure 3.2 shows budget deficits as a percentage of GDP in the US economy during 1961–2014. The President is responsible for submitting an annual budget to Congress and has the authority to veto legislation, including irresponsible spending.
Figure 3.2 – Budget deficits as a percentage of GDP (by administration) Use the Figure 3.2 above to answer the following questions:
2.1. Sometimes they say the Republicans are the party of “small government”, whereas Democrats are the “big spenders” and the party of “big government.” Is this confirmed by the historical evidence? Please note that John F. Kennedy, Lyndon B. Johnson, Jimmy Carter, Bill Clinton, and Barack Obama are democrats, while Richard Nixon, Gerald Ford, Ronald Reagan, George H. W. Bush, and George W. Bush are republicans.
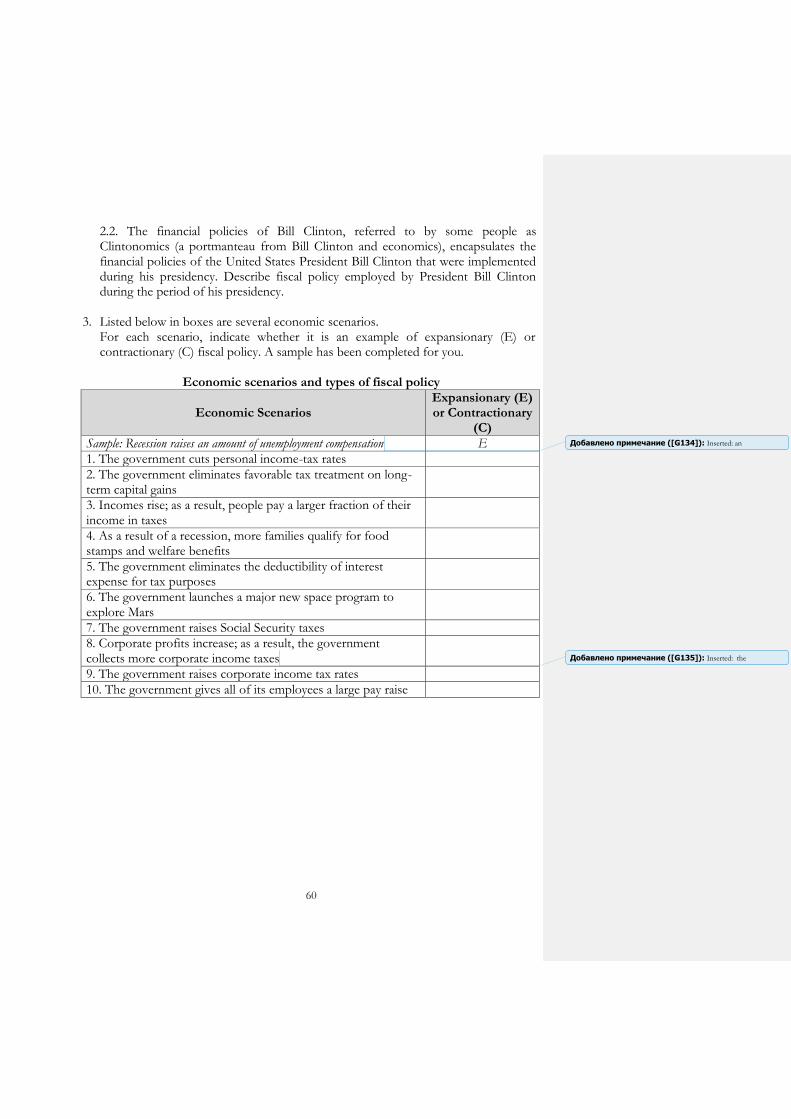
60
2.2. The financial policies of Bill Clinton, referred to by some people as Clintonomics (a portmanteau from Bill Clinton and economics), encapsulates the financial policies of the United States President Bill Clinton that were implemented during his presidency. Describe fiscal policy employed by President Bill Clinton during the period of his presidency.
3. Listed below in boxes are several economic scenarios.
For each scenario, indicate whether it is an example of expansionary (E) or contractionary (C) fiscal policy. A sample has been completed for you.
Economic scenarios and types of fiscal policy
Economic Scenarios Expansionary (E) or Contractionary
(C)
Sample: Recession raises an amount of unemployment compensation E
1. The government cuts personal income-tax rates
2. The government eliminates favorable tax treatment on long-term capital gains
3. Incomes rise; as a result, people pay a larger fraction of their income in taxes
4. As a result of a recession, more families qualify for food stamps and welfare benefits
5. The government eliminates the deductibility of interest expense for tax purposes
6. The government launches a major new space program to explore Mars
7. The government raises Social Security taxes
8. Corporate profits increase; as a result, the government collects more corporate income taxes
9. The government raises corporate income tax rates
10. The government gives all of its employees a large pay raise
Добавлено примечание ([G134]): Inserted: an
Добавлено примечание ([G135]): Inserted: the

61
CHAPTER 4:
INTRODUCTION TO TAXATION.
TAX SYSTEM OF UKRAINE
SUMMARY
Taxation is a compulsory levy imposed on a subject or upon his property by
the government to provide security, social amenities and other amenities for the well-
being of the society. The main purpose of taxation is to raise funds to defray the
expenses incurred for the common interest of the country without reference to special
benefit conferred. A good tax system should, however, create jobs and a tax rise and
should lead to the arrest of wasteful expenditure. It helps in shaping and directing
economic activities, stimulating economic activities, redistributing financial resources,
and using the income generated to finance social welfare.
Tax is defined as a monetary charge imposed by the government on persons,
entities, and transactions or property to yield public revenue. One of the main
characteristics of a tax is that the payer does not demand something equivalent in
return from the government for the payment. It is expected that when taxes are
collected, they are used by the government for public good and not just for those who
make the payment.
Role of taxation:
a) To finance Government recurrent and development expenditure, i.e., paying
salaries for civil servants and funding long-term projects, such as the
construction of schools, hospitals, and roads.
b) It can be used to regulate demand and supply in the economy in times of
inflation.
c) It encourages the development of local industries and protects them from
foreign competition with the view of providing employment and saving
foreign exchange by imposing high duties on competing imports. It
encourages export of goods and services by reducing or removing export
taxes in order to make them more competitive in the world market.
Добавлено примечание ([G136]): Inserted: the
Добавлено примечание ([G137]): Inserted: ,
Добавлено примечание ([G138]): Inserted: ,
Добавлено примечание ([G139]): Inserted: the
Добавлено примечание ([G140]): Inserted: the
Добавлено примечание ([G141]): Inserted: -
Добавлено примечание ([G145]): Deleted:against
Добавлено примечание ([G142]): Inserted: he t
Добавлено примечание ([G143]): Inserted: from
Добавлено примечание ([G144]): Inserted: the
62
d) It protects society from undesirable or harmful products and industries by
imposing high taxes on them, for instance, excise duty on cigarettes and beer
as well as an environmental levy on used vehicles.
e) To achieve greater equality in the distribution of wealth and income, the
government may impose a progressive tax on the incomes and wealth of the
rich. The raised revenue is used then to provide social services for the benefit
of the society.
The functions of taxes are a manifestation of their essence; they are means to
represent the characteristics of taxes. The functions of taxation illustrate its social
purpose of the value-based distribution and redistribution of income. Each of the
functions fulfilled by the taxation instrument is a manifestation of an internal feature,
an indicator, or trait of this economic category.
There are five main functions of taxation: fiscal, allocation, regulatory,
controlling, and incentive. Taxation regulation entails three sub-functions:
stimulating, destimulating, and replication (regeneration).
The main function of taxation is the fiscal one. It is through fiscality that taxes
play their role in the formation of the state budget necessary for the realization of
national and holistic state programs. The fiscal function provides for the achievement
of the main social goal of taxation – the formation of the state’s financial resources
necessary for executing the role of the latter (defense, social, environmental
protection, etc.)
The allocation function of taxation expresses its essence as a special
centralized instrument of allocation relations and consists of the social income
redistribution among various groups of citizens: from wealthy to deprived ones, which
ultimately maintains social stability in the society.
The regulatory function of taxation was initiated as soon as the state began to
take an active part in the economic setup of the society. This function is aimed at
achieving specific goals of the taxation policy through the taxation mechanism.
Taxation regulation entails three sub-functions:
1) The stimulating sub-function is aimed at the development of special socio-
economic processes and is implemented through a system of allowances, exemptions,
and preference arrangements. The legislation in force stipulates the stimulation of a
number of taxpayer categories, such as the owners of small enterprises, the agricultural
producers, capital investors, or charities.
Добавлено примечание ([G146]): Inserted: an
Добавлено примечание ([G147]): Inserted: ,
Добавлено примечание ([G150]): Deleted:r
Добавлено примечание ([G148]): Inserted: f
Добавлено примечание ([G149]): Deleted:a
Добавлено примечание ([G151]): Inserted: an
Добавлено примечание ([G152]): Deleted:,

63
2) The unstimulating sub-function inhibits some socio-economic processes
through the conscious exaggeration of the taxation burden. As a rule, the effect of this
sub-function is related to the introduction of excessive tax rates. These are, for
example, the protectionist measures of the state, aimed at supporting local producers
through prohibitive import customs duties. It is important to keep in mind,
nevertheless, that taxation relations, as any other relations, must replicate
continuously. Taxes must be collected today, tomorrow, and always. This is why the
utilization of this sub-function should not lead to the weakening of the taxation basis,
to suppression, or even to the liquidation of the tax source. Such an exaggeration may
result in a situation where there will be no income/processes to be taxed.
3) The replication (regeneration) sub-function is explained as follows: by
taxing the utilization of natural resources, roads, mineral and primary resources, the
state uses these proceeds in order to regenerate the exploited resources.
The controlling function of taxation – through taxation, the state controls the
financial-economic activity of juridical and natural persons. This also contributes to
controlling the sources of income and the directions of spending.
The incentive function stipulates special taxation arrangements for a certain
group of citizens, who are social achievers (participants in wars, etc.). This function of
taxation has a social facet.
The tax system usually involves a tripartite aspect, namely the policy, the tax
laws, and the tax administration. These are the guidelines underlying a good tax
system. A good tax system is based on the following principles of taxation: certainty,
the economy in collection cost, convenience, efficiency, equity, flexibility, and
neutrality.
There are the following main elements of the tax system: taxpayers; taxable
item; tax base; tax rate; tax calculation procedure; tax period; tax payment period and
procedure; period and procedure for filing tax calculation and payment reporting. In
establishing the tax, tax privileges and application thereof may be provided.
There are various ways in which taxes can be classified depending on the
perspective at which one is looking at taxes. One can classify taxes from the
perspective of the object or subject matter, the determination of amount, the purpose,
the scope, the graduation of rate or the distribution of the tax burden, the tax subject
or the bearers of burden, etc.
Добавлено примечание ([G153]): Inserted: the
Добавлено примечание ([G156]): Deleted:G
Добавлено примечание ([G154]): Inserted: A g
Добавлено примечание ([G155]): Inserted: the
Добавлено примечание ([G157]): Inserted: the
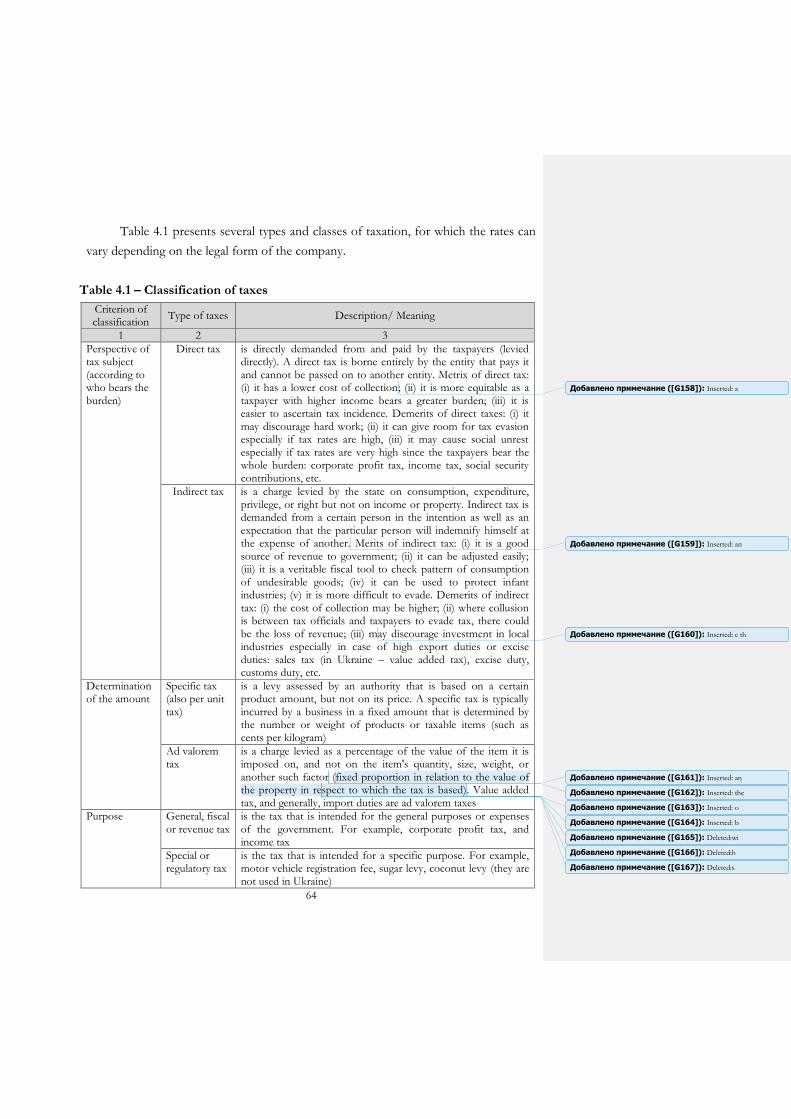
64
Table 4.1 presents several types and classes of taxation, for which the rates can
vary depending on the legal form of the company.
Table 4.1 – Classification of taxes
Criterion of classification
Type of taxes Description/ Meaning
1 2 3
Perspective of tax subject (according to who bears the burden)
Direct tax is directly demanded from and paid by the taxpayers (levied directly). A direct tax is borne entirely by the entity that pays it and cannot be passed on to another entity. Metrix of direct tax: (i) it has a lower cost of collection; (ii) it is more equitable as a taxpayer with higher income bears a greater burden; (iii) it is easier to ascertain tax incidence. Demerits of direct taxes: (i) it may discourage hard work; (ii) it can give room for tax evasion especially if tax rates are high, (iii) it may cause social unrest especially if tax rates are very high since the taxpayers bear the whole burden: corporate profit tax, income tax, social security contributions, etc.
Indirect tax is a charge levied by the state on consumption, expenditure, privilege, or right but not on income or property. Indirect tax is demanded from a certain person in the intention as well as an expectation that the particular person will indemnify himself at the expense of another. Merits of indirect tax: (i) it is a good source of revenue to government; (ii) it can be adjusted easily; (iii) it is a veritable fiscal tool to check pattern of consumption of undesirable goods; (iv) it can be used to protect infant industries; (v) it is more difficult to evade. Demerits of indirect tax: (i) the cost of collection may be higher; (ii) where collusion is between tax officials and taxpayers to evade tax, there could be the loss of revenue; (iii) may discourage investment in local industries especially in case of high export duties or excise duties: sales tax (in Ukraine – value added tax), excise duty, customs duty, etc.
Determination of the amount
Specific tax (also per unit tax)
is a levy assessed by an authority that is based on a certain product amount, but not on its price. A specific tax is typically incurred by a business in a fixed amount that is determined by the number or weight of products or taxable items (such as cents per kilogram)
Ad valorem tax
is a charge levied as a percentage of the value of the item it is imposed on, and not on the item's quantity, size, weight, or another such factor (fixed proportion in relation to the value of the property in respect to which the tax is based). Value added tax, and generally, import duties are ad valorem taxes
Purpose General, fiscal or revenue tax
is the tax that is intended for the general purposes or expenses of the government. For example, corporate profit tax, and income tax
Special or regulatory tax
is the tax that is intended for a specific purpose. For example, motor vehicle registration fee, sugar levy, coconut levy (they are not used in Ukraine)
Добавлено примечание ([G158]): Inserted: a
Добавлено примечание ([G159]): Inserted: an
Добавлено примечание ([G160]): Inserted: e th
Добавлено примечание ([G161]): Inserted: an
Добавлено примечание ([G162]): Inserted: the
Добавлено примечание ([G166]): Deleted:h
Добавлено примечание ([G163]): Inserted: o
Добавлено примечание ([G165]): Deleted:wi
Добавлено примечание ([G167]): Deleted:s
Добавлено примечание ([G164]): Inserted: b
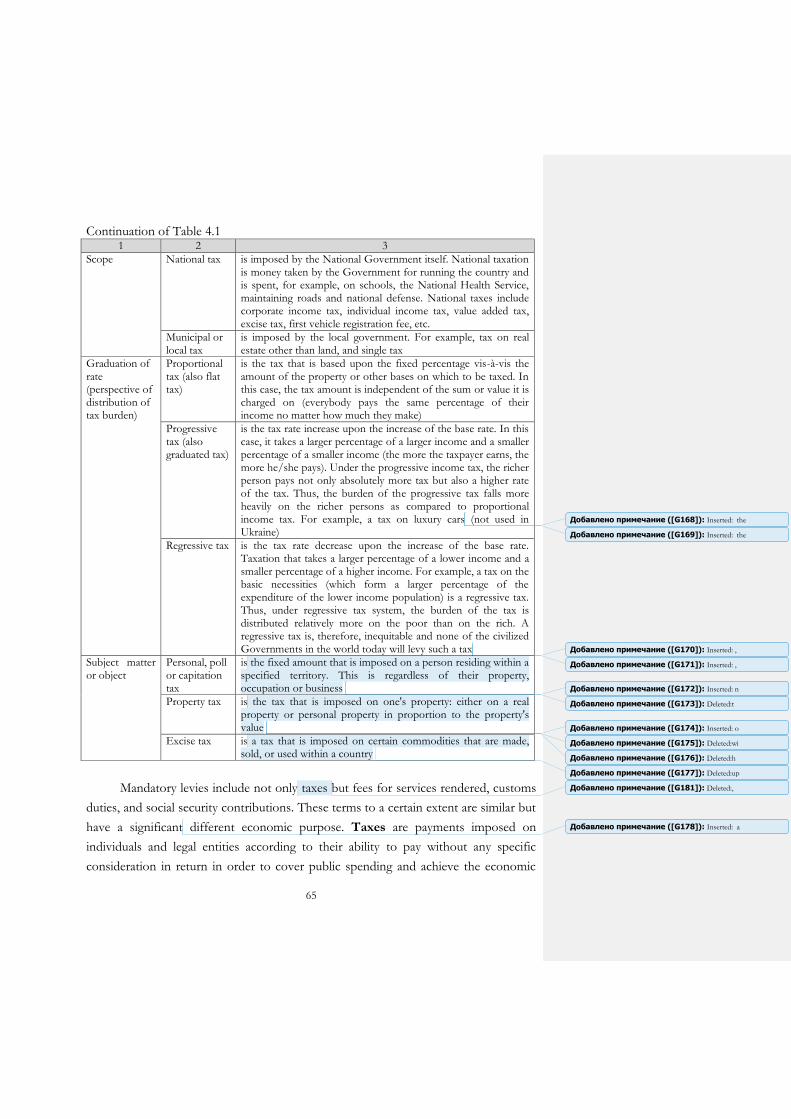
65
Continuation of Table 4.1
1 2 3
Scope National tax is imposed by the National Government itself. National taxation is money taken by the Government for running the country and is spent, for example, on schools, the National Health Service, maintaining roads and national defense. National taxes include corporate income tax, individual income tax, value added tax, excise tax, first vehicle registration fee, etc.
Municipal or local tax
is imposed by the local government. For example, tax on real estate other than land, and single tax
Graduation of rate (perspective of distribution of tax burden)
Proportional tax (also flat tax)
is the tax that is based upon the fixed percentage vis-à-vis the amount of the property or other bases on which to be taxed. In this case, the tax amount is independent of the sum or value it is charged on (everybody pays the same percentage of their income no matter how much they make)
Progressive tax (also graduated tax)
is the tax rate increase upon the increase of the base rate. In this case, it takes a larger percentage of a larger income and a smaller percentage of a smaller income (the more the taxpayer earns, the more he/she pays). Under the progressive income tax, the richer person pays not only absolutely more tax but also a higher rate of the tax. Thus, the burden of the progressive tax falls more heavily on the richer persons as compared to proportional income tax. For example, a tax on luxury cars (not used in Ukraine)
Regressive tax is the tax rate decrease upon the increase of the base rate. Taxation that takes a larger percentage of a lower income and a smaller percentage of a higher income. For example, a tax on the basic necessities (which form a larger percentage of the expenditure of the lower income population) is a regressive tax. Thus, under regressive tax system, the burden of the tax is distributed relatively more on the poor than on the rich. A regressive tax is, therefore, inequitable and none of the civilized Governments in the world today will levy such a tax
Subject matter or object
Personal, poll or capitation tax
is the fixed amount that is imposed on a person residing within a specified territory. This is regardless of their property, occupation or business
Property tax is the tax that is imposed on one's property: either on a real property or personal property in proportion to the property's value
Excise tax is a tax that is imposed on certain commodities that are made, sold, or used within a country
Mandatory levies include not only taxes but fees for services rendered, customs
duties, and social security contributions. These terms to a certain extent are similar but
have a significant different economic purpose. Taxes are payments imposed on
individuals and legal entities according to their ability to pay without any specific
consideration in return in order to cover public spending and achieve the economic
Добавлено примечание ([G168]): Inserted: the
Добавлено примечание ([G169]): Inserted: the
Добавлено примечание ([G170]): Inserted: ,
Добавлено примечание ([G171]): Inserted: ,
Добавлено примечание ([G173]): Deleted:t
Добавлено примечание ([G172]): Inserted: n
Добавлено примечание ([G176]): Deleted:h
Добавлено примечание ([G174]): Inserted: o
Добавлено примечание ([G175]): Deleted:wi
Добавлено примечание ([G177]): Deleted:up
Добавлено примечание ([G181]): Deleted:,
Добавлено примечание ([G178]): Inserted: a
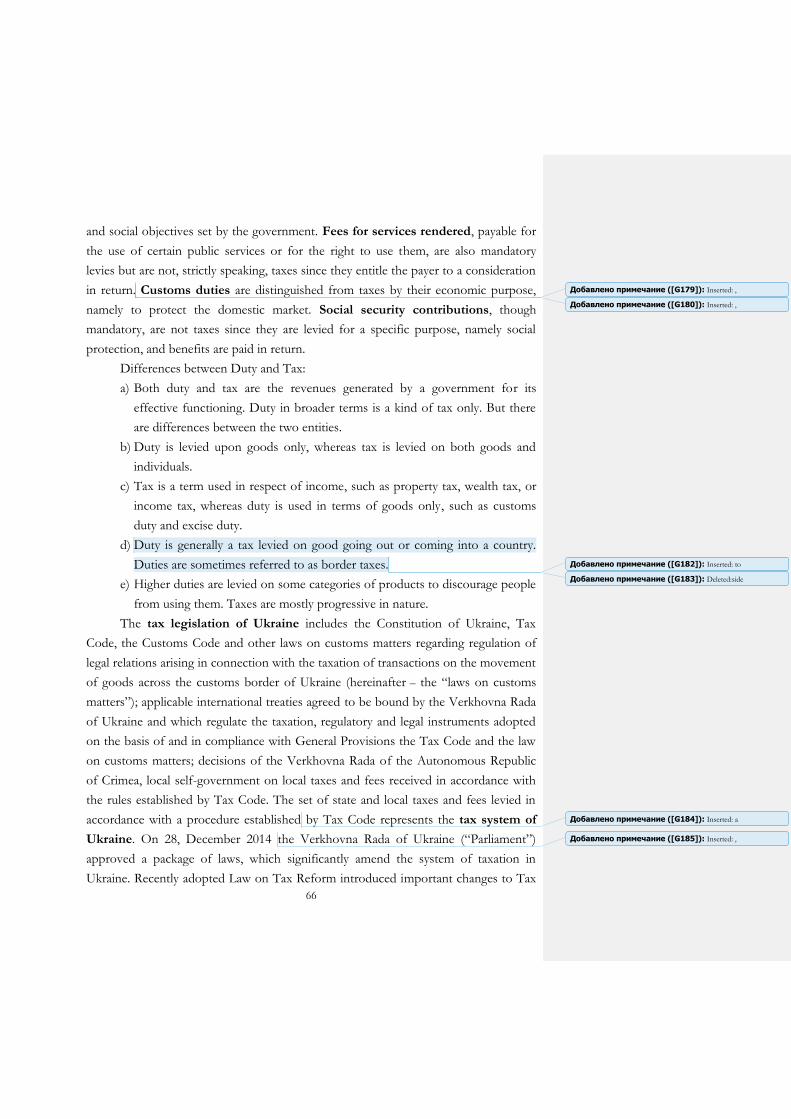
66
and social objectives set by the government. Fees for services rendered, payable for
the use of certain public services or for the right to use them, are also mandatory
levies but are not, strictly speaking, taxes since they entitle the payer to a consideration
in return. Customs duties are distinguished from taxes by their economic purpose,
namely to protect the domestic market. Social security contributions, though
mandatory, are not taxes since they are levied for a specific purpose, namely social
protection, and benefits are paid in return.
Differences between Duty and Tax:
a) Both duty and tax are the revenues generated by a government for its
effective functioning. Duty in broader terms is a kind of tax only. But there
are differences between the two entities.
b) Duty is levied upon goods only, whereas tax is levied on both goods and
individuals.
c) Tax is a term used in respect of income, such as property tax, wealth tax, or
income tax, whereas duty is used in terms of goods only, such as customs
duty and excise duty.
d) Duty is generally a tax levied on good going out or coming into a country.
Duties are sometimes referred to as border taxes.
e) Higher duties are levied on some categories of products to discourage people
from using them. Taxes are mostly progressive in nature.
The tax legislation of Ukraine includes the Constitution of Ukraine, Tax
Code, the Customs Code and other laws on customs matters regarding regulation of
legal relations arising in connection with the taxation of transactions on the movement
of goods across the customs border of Ukraine (hereinafter – the “laws on customs
matters”); applicable international treaties agreed to be bound by the Verkhovna Rada
of Ukraine and which regulate the taxation, regulatory and legal instruments adopted
on the basis of and in compliance with General Provisions the Tax Code and the law
on customs matters; decisions of the Verkhovna Rada of the Autonomous Republic
of Crimea, local self-government on local taxes and fees received in accordance with
the rules established by Tax Code. The set of state and local taxes and fees levied in
accordance with a procedure established by Tax Code represents the tax system of
Ukraine. On 28, December 2014 the Verkhovna Rada of Ukraine (“Parliament”)
approved a package of laws, which significantly amend the system of taxation in
Ukraine. Recently adopted Law on Tax Reform introduced important changes to Tax
Добавлено примечание ([G179]): Inserted: ,
Добавлено примечание ([G180]): Inserted: ,
Добавлено примечание ([G183]): Deleted:side
Добавлено примечание ([G182]): Inserted: to
Добавлено примечание ([G184]): Inserted: a
Добавлено примечание ([G185]): Inserted: ,

67
Code that came into effect in 2015. Some minor taxes were cancelled, new taxes on
businesses introduced, tax rates increased and tax administration procedures changed
significantly for some key taxes. Some main changes are summarized below.
According to the new Tax Code, the number of taxes was reduced from 22
to 11 (including 2 local duties). In fact, few taxes were actually eliminated, while other
taxes were renamed and regrouped under new headings. For example, (i) excise tax, (ii)
vehicle first registration fee, (iii) environmental tax (on oil, gas, fuel), (iv) fee in the
form of an additional levy to the current tariff for electricity and thermal energy except
for electricity generated by qualified co-generation plants were grouped and renamed
as excise tax. An important point is that trade patent tax and securities transaction tax
were abolished, which should be good news for retail businesses and those dealing in
securities. In the upshot, National taxes include: (i) corporate income tax; (ii)
individual income tax; (iii) value added tax; (iv) excise tax; (v) environmental tax; (vi)
rental payment for crude oil and oil products transportation through main pipelines,
the transition of natural gas through natural gas and ammonia pipelines on the
territory of Ukraine; and (vii) customs duty. Local taxes include: (i) tax on real estate,
other than land; (ii) single tax. The local duties include: (i) fee for parking of vehicles,
and (ii) tourist tax.
Changes in Corporate profit tax. As a move towards simplification for
taxpayers, under the new rules, the taxable base for corporate profit tax will be
financial accounting profits adjusted for certain differences (depreciation, royalty and
interest payments, reserves, payments to low-tax jurisdictions and some other
payments). In general, the list of differences is quite shorter, compared to the list of
restricted deductions under the previous rules. Small enterprises (with income below
UAH 20 million per year) may choose not to apply tax corrections and pay corporate
profit tax based on their financial accounting results. Participation exemption for
dividends applies only to dividends received from companies subject to corporate
profit tax (dividends distributed by non-residents are taxable).
New electronic VAT administration system (VAT accounts) started
operating in Ukraine from 1 February 2015 till 1 July 2015 (in test mode) and after
that in the normal mode. The law also introduces electronic VAT invoices only, and
paper invoices are abolished. All invoices are subject to registration with a central
database of tax authority starting from 1 February 2015. Penalties are introduced on
the supplier for failure to register VAT invoice (up to 50 % of the amount of VAT
Добавлено примечание ([G186]): Inserted: the following
Добавлено примечание ([G187]): Inserted: the following
Добавлено примечание ([G188]): Inserted: ,
Добавлено примечание ([G190]): Deleted:y
Добавлено примечание ([G189]): Inserted: ies
Добавлено примечание ([G191]): Inserted: the
Добавлено примечание ([G192]): Inserted: a
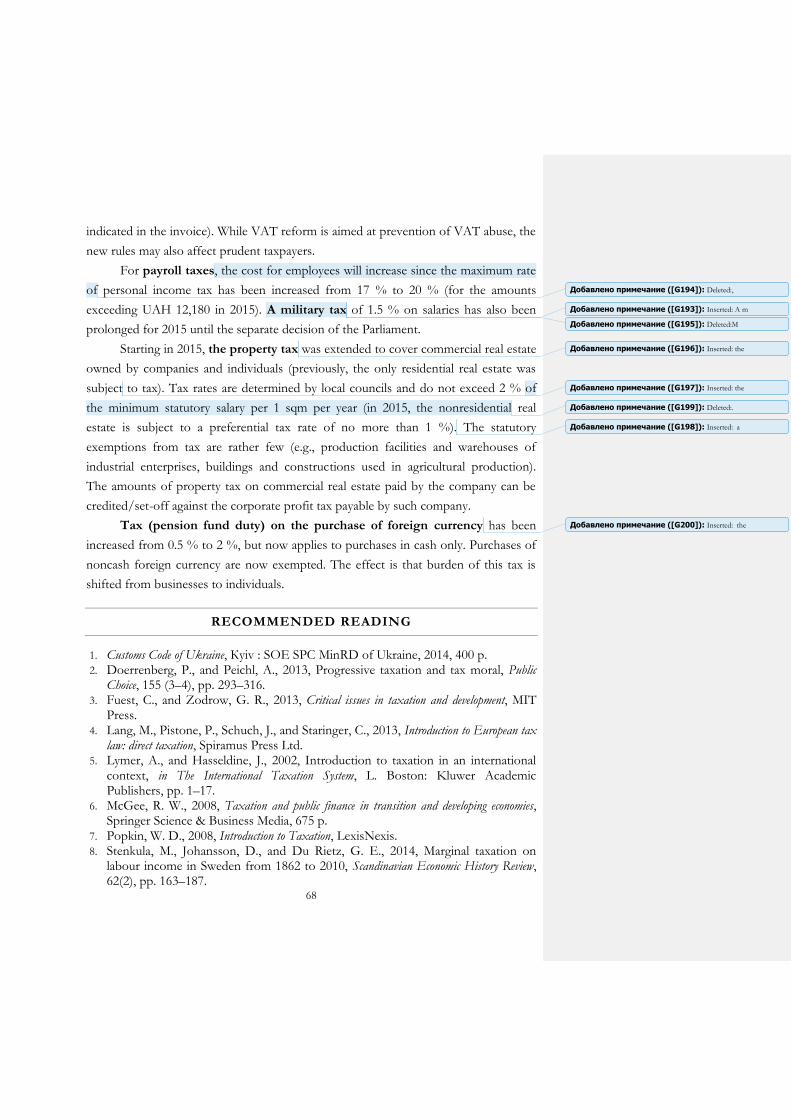
68
indicated in the invoice). While VAT reform is aimed at prevention of VAT abuse, the
new rules may also affect prudent taxpayers.
For payroll taxes, the cost for employees will increase since the maximum rate
of personal income tax has been increased from 17 % to 20 % (for the amounts
exceeding UAH 12,180 in 2015). A military tax of 1.5 % on salaries has also been
prolonged for 2015 until the separate decision of the Parliament.
Starting in 2015, the property tax was extended to cover commercial real estate
owned by companies and individuals (previously, the only residential real estate was
subject to tax). Tax rates are determined by local councils and do not exceed 2 % of
the minimum statutory salary per 1 sqm per year (in 2015, the nonresidential real
estate is subject to a preferential tax rate of no more than 1 %). The statutory
exemptions from tax are rather few (e.g., production facilities and warehouses of
industrial enterprises, buildings and constructions used in agricultural production).
The amounts of property tax on commercial real estate paid by the company can be
credited/set-off against the corporate profit tax payable by such company.
Tax (pension fund duty) on the purchase of foreign currency has been
increased from 0.5 % to 2 %, but now applies to purchases in cash only. Purchases of
noncash foreign currency are now exempted. The effect is that burden of this tax is
shifted from businesses to individuals.
RECOMMENDED READING
1. Customs Code of Ukraine, Кyiv : SOE SPC MinRD of Ukraine, 2014, 400 p. 2. Doerrenberg, P., and Peichl, A., 2013, Progressive taxation and tax moral, Public
Choice, 155 (3–4), pp. 293–316. 3. Fuest, C., and Zodrow, G. R., 2013, Critical issues in taxation and development, MIT
Press. 4. Lang, M., Pistone, P., Schuch, J., and Staringer, C., 2013, Introduction to European tax
law: direct taxation, Spiramus Press Ltd. 5. Lymer, A., and Hasseldine, J., 2002, Introduction to taxation in an international
context, in The International Taxation System, L. Boston: Kluwer Academic Publishers, pp. 1–17.
6. McGee, R. W., 2008, Taxation and public finance in transition and developing economies, Springer Science & Business Media, 675 p.
7. Popkin, W. D., 2008, Introduction to Taxation, LexisNexis. 8. Stenkula, M., Johansson, D., and Du Rietz, G. E., 2014, Marginal taxation on
labour income in Sweden from 1862 to 2010, Scandinavian Economic History Review, 62(2), pp. 163–187.
Добавлено примечание ([G194]): Deleted:,
Добавлено примечание ([G195]): Deleted:M
Добавлено примечание ([G193]): Inserted: A m
Добавлено примечание ([G196]): Inserted: the
Добавлено примечание ([G197]): Inserted: the
Добавлено примечание ([G199]): Deleted:.
Добавлено примечание ([G198]): Inserted: a
Добавлено примечание ([G200]): Inserted: the
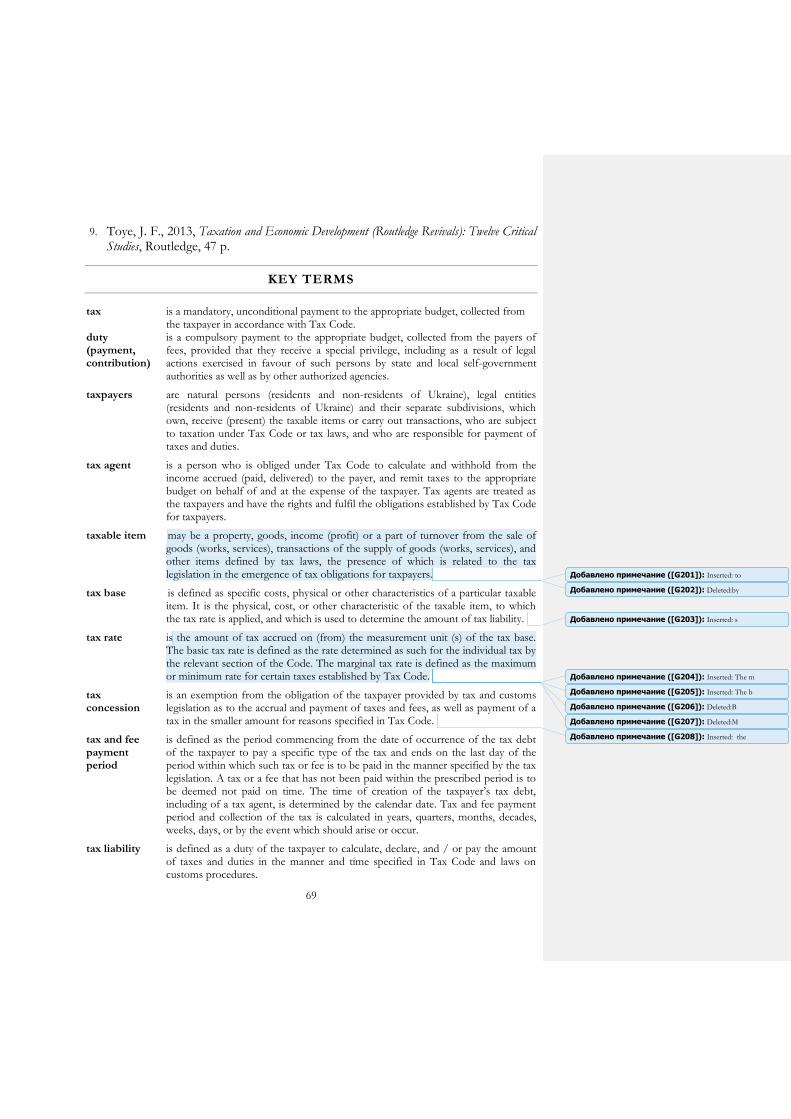
69
9. Toye, J. F., 2013, Taxation and Economic Development (Routledge Revivals): Twelve Critical Studies, Routledge, 47 p.
KEY TERMS
tax is a mandatory, unconditional payment to the appropriate budget, collected from the taxpayer in accordance with Tax Code.
duty (payment, contribution)
is a compulsory payment to the appropriate budget, collected from the payers of fees, provided that they receive a special privilege, including as a result of legal actions exercised in favour of such persons by state and local self-government authorities as well as by other authorized agencies.
taxpayers are natural persons (residents and non-residents of Ukraine), legal entities (residents and non-residents of Ukraine) and their separate subdivisions, which own, receive (present) the taxable items or carry out transactions, who are subject to taxation under Tax Code or tax laws, and who are responsible for payment of taxes and duties.
tax agent is a person who is obliged under Tax Code to calculate and withhold from the income accrued (paid, delivered) to the payer, and remit taxes to the appropriate budget on behalf of and at the expense of the taxpayer. Tax agents are treated as the taxpayers and have the rights and fulfil the obligations established by Tax Code for taxpayers.
taxable item may be a property, goods, income (profit) or a part of turnover from the sale of goods (works, services), transactions of the supply of goods (works, services), and other items defined by tax laws, the presence of which is related to the tax legislation in the emergence of tax obligations for taxpayers.
tax base is defined as specific costs, physical or other characteristics of a particular taxable item. It is the physical, cost, or other characteristic of the taxable item, to which the tax rate is applied, and which is used to determine the amount of tax liability.
tax rate is the amount of tax accrued on (from) the measurement unit (s) of the tax base. The basic tax rate is defined as the rate determined as such for the individual tax by the relevant section of the Code. The marginal tax rate is defined as the maximum or minimum rate for certain taxes established by Tax Code.
tax concession
is an exemption from the obligation of the taxpayer provided by tax and customs legislation as to the accrual and payment of taxes and fees, as well as payment of a tax in the smaller amount for reasons specified in Tax Code.
tax and fee payment period
is defined as the period commencing from the date of occurrence of the tax debt of the taxpayer to pay a specific type of the tax and ends on the last day of the period within which such tax or fee is to be paid in the manner specified by the tax legislation. A tax or a fee that has not been paid within the prescribed period is to be deemed not paid on time. The time of creation of the taxpayer’s tax debt, including of a tax agent, is determined by the calendar date. Tax and fee payment period and collection of the tax is calculated in years, quarters, months, decades, weeks, days, or by the event which should arise or occur.
tax liability is defined as a duty of the taxpayer to calculate, declare, and / or pay the amount of taxes and duties in the manner and time specified in Tax Code and laws on customs procedures.
Добавлено примечание ([G202]): Deleted:by
Добавлено примечание ([G201]): Inserted: to
Добавлено примечание ([G203]): Inserted: s
Добавлено примечание ([G207]): Deleted:M
Добавлено примечание ([G204]): Inserted: The m
Добавлено примечание ([G206]): Deleted:B
Добавлено примечание ([G205]): Inserted: The b
Добавлено примечание ([G208]): Inserted: the
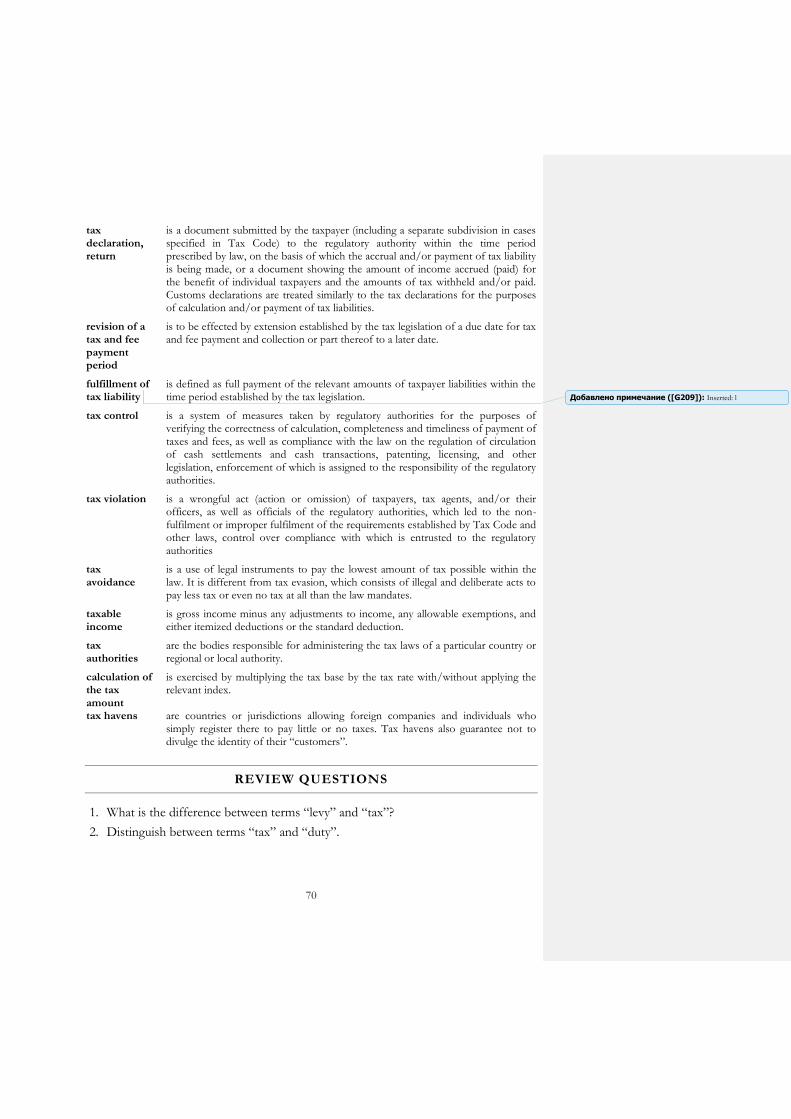
70
tax declaration, return
is a document submitted by the taxpayer (including a separate subdivision in cases specified in Tax Code) to the regulatory authority within the time period prescribed by law, on the basis of which the accrual and/or payment of tax liability is being made, or a document showing the amount of income accrued (paid) for the benefit of individual taxpayers and the amounts of tax withheld and/or paid. Customs declarations are treated similarly to the tax declarations for the purposes of calculation and/or payment of tax liabilities.
revision of a tax and fee payment period
is to be effected by extension established by the tax legislation of a due date for tax and fee payment and collection or part thereof to a later date.
fulfillment of tax liability
is defined as full payment of the relevant amounts of taxpayer liabilities within the time period established by the tax legislation.
tax control is a system of measures taken by regulatory authorities for the purposes of verifying the correctness of calculation, completeness and timeliness of payment of taxes and fees, as well as compliance with the law on the regulation of circulation of cash settlements and cash transactions, patenting, licensing, and other legislation, enforcement of which is assigned to the responsibility of the regulatory authorities.
tax violation is a wrongful act (action or omission) of taxpayers, tax agents, and/or their officers, as well as officials of the regulatory authorities, which led to the non-fulfilment or improper fulfilment of the requirements established by Tax Code and other laws, control over compliance with which is entrusted to the regulatory authorities
tax avoidance
is a use of legal instruments to pay the lowest amount of tax possible within the law. It is different from tax evasion, which consists of illegal and deliberate acts to pay less tax or even no tax at all than the law mandates.
taxable income
is gross income minus any adjustments to income, any allowable exemptions, and either itemized deductions or the standard deduction.
tax authorities
are the bodies responsible for administering the tax laws of a particular country or regional or local authority.
calculation of the tax amount
is exercised by multiplying the tax base by the tax rate with/without applying the relevant index.
tax havens are countries or jurisdictions allowing foreign companies and individuals who simply register there to pay little or no taxes. Tax havens also guarantee not to divulge the identity of their “customers”.
REVIEW QUESTIONS
1. What is the difference between terms “levy” and “tax”?
2. Distinguish between terms “tax” and “duty”.
Добавлено примечание ([G209]): Inserted: l

71
3. Identify the role of the taxation in Ukraine's current economic situation? Does the
role of taxation differ in developed and developing countries with the emergent
market?
4. What are the functions of the tax system?
5. What are the main elements of the tax system?
6. Classify taxes from the perspective of the object or subject matter, the
determination of the amount and the purpose.
7. Classify taxes from the perspective of the scope, the graduation of rate or the
distribution of the tax burden, the tax subject or the bearers of burden.
8. Discuss the advantages and disadvantages of progressive taxation. Do the rich
have a moral obligation towards the poor?
9. Describe tax system of Ukraine.
10. Critically examine changes in tax legislation of Ukraine in 2014.
11. What are popular tools for tax reforms?
12. Describe how can Ukraine best design and develop the tax systems?
13. How do tax systems can differ across countries? For explanation of your opinion,
use main elements of the tax system.
14. Is there a relationship between the level of tax rates and rates of economic
growth?
15. Do you agree that bad tax systems can stifle economic growth; it is unclear
whether good tax systems can substantially increase economic growth?
MULTIPLE CHOICE QUESTIONS
Choose the one alternative that best completes the statement or answers the question. 1. Which two of the following are often claimed to be the advantages of an indirect
system of taxation? a) it helps households to avoid the ‘unemployment trap’; b) it can be varied more quickly and easily; c) it imposes smaller administrative costs; d) it decreases the tax burden as a percentage of GDP; e) it stimulates government revenue when demand is elastic.
2. Which one of the expressions listed underneath most accurately fits the description: A tax system in which the marginal rate of taxation is higher than the average rate? a) a welfare maximizing tax system;
Добавлено примечание ([G211]): Deleted:is
Добавлено примечание ([G210]): Inserted: the
Добавлено примечание ([G212]): Inserted: he t
Добавлено примечание ([G213]): Inserted: the
Добавлено примечание ([G214]): Inserted: the
Добавлено примечание ([G216]): Deleted:be
Добавлено примечание ([G215]): Inserted: he t
Добавлено примечание ([G217]): Inserted: the
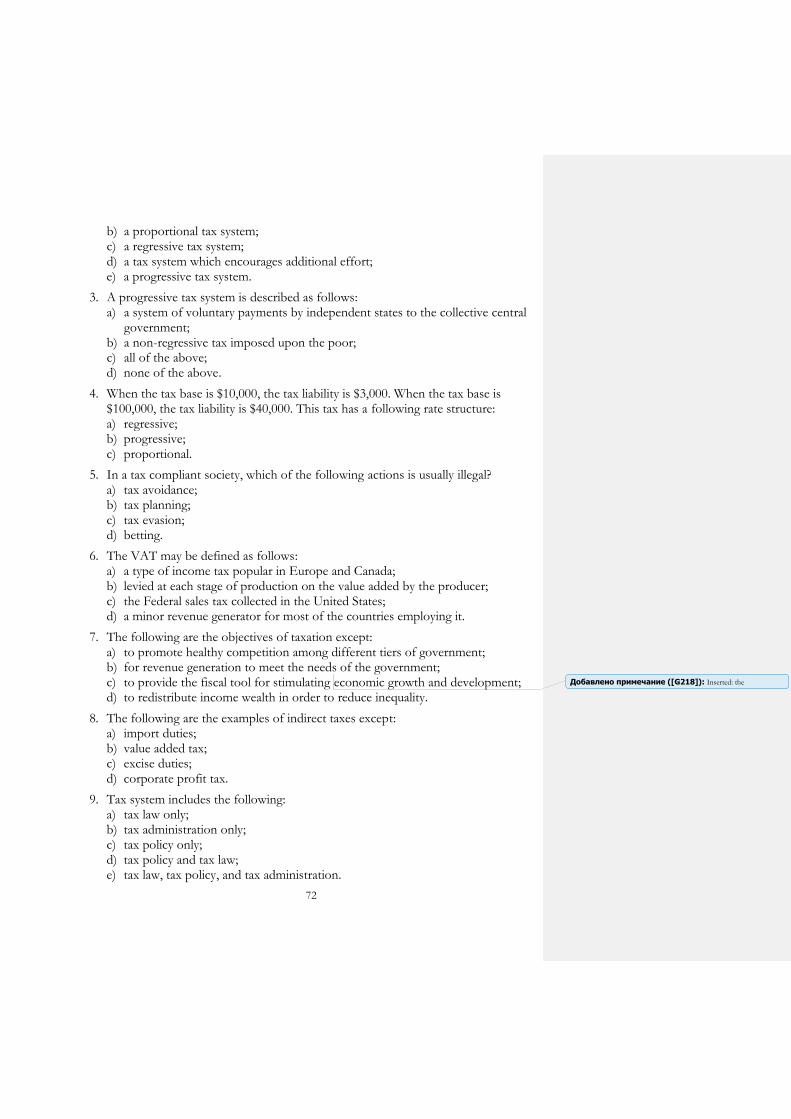
72
b) a proportional tax system; c) a regressive tax system; d) a tax system which encourages additional effort; e) a progressive tax system.
3. A progressive tax system is described as follows: a) a system of voluntary payments by independent states to the collective central
government; b) a non-regressive tax imposed upon the poor; c) all of the above; d) none of the above.
4. When the tax base is $10,000, the tax liability is $3,000. When the tax base is $100,000, the tax liability is $40,000. This tax has a following rate structure: a) regressive; b) progressive; c) proportional.
5. In a tax compliant society, which of the following actions is usually illegal? a) tax avoidance; b) tax planning; c) tax evasion; d) betting.
6. The VAT may be defined as follows: a) a type of income tax popular in Europe and Canada; b) levied at each stage of production on the value added by the producer; c) the Federal sales tax collected in the United States; d) a minor revenue generator for most of the countries employing it.
7. The following are the objectives of taxation except: a) to promote healthy competition among different tiers of government; b) for revenue generation to meet the needs of the government; c) to provide the fiscal tool for stimulating economic growth and development; d) to redistribute income wealth in order to reduce inequality.
8. The following are the examples of indirect taxes except: a) import duties; b) value added tax; c) excise duties; d) corporate profit tax.
9. Tax system includes the following: a) tax law only; b) tax administration only; c) tax policy only; d) tax policy and tax law; e) tax law, tax policy, and tax administration.
Добавлено примечание ([G218]): Inserted: the

73
10. The following are the merits of direct tax except: a) it has the lower cost of collection; b) it is more equitable as the taxpayer with higher income bears a greater burden; c) it is a good source of revenue to a government; d) it is easier to ascertain tax incidence.
SHORT ANSWER QUESTIONS
MISSING WORD QUESTIONS
Choose the correct word to complete each sentence.
1. Minimizing taxes legally is referred to as _________________________________.
2. The attempt to minimize tax liability through subterfuge and fraud is referred to as___________.
3. ______________ is a sales tax levied at each stage of production on value added by the producer.
4. A tax levied on the extraction of natural resources is a ___________________ tax.
5. Tax is a ________________ levy imposed by the _________________ for the purpose of meeting the cost of governance.
TRUE/FALSE/UNCERTAIN QUESTIONS
Decide whether the following statements are True, False, or Uncertain. Explain your reasoning. Your score will be based not just on whether you get the True, False, or Uncertain part right but also, to a larger extent, on the quality of your explanation. 1. Taxes on expenditures (value added tax (VAT), customs and excise) provide more
tax receipts for government than taxes on incomes (income tax, corporate profit tax, etc).
2. Ukrainian direct taxes are progressive while indirect taxes are regressive.
3. A value added tax resembles a national sales tax.
4. An excise tax is a tax on the use, consumption, or storage of property.
5. State governments use the sales tax as one of their primary sources of tax revenues.
Добавлено примечание ([G219]): Inserted: the
Добавлено примечание ([G220]): Inserted: a

74
COMPUTATION PROBLEMS
1. Please, describe taxes using the following main elements of the tax system: taxpayers; taxable item; the tax base; tax rate; tax calculation procedure; the tax period; tax payment period and procedure; period and procedure for filing tax calculation and payment reporting. Main taxes and duties (each student should choose one tax or duty): a) corporate income tax; b) personal income tax; c) military duty; d) value added tax; e) excise tax; f) environmental tax; g) custom duty; h) property tax; i) single tax; j) fee for parking vehicles.
2. Identify which tax applies to the following situations and state whether it is a direct or indirect tax: a) A sole trader earns UAH 100,000 profit in a year. b) A company has a profit of UAH 250,000 in a year and employs 30 employees. c) An individual sells an antique table for UAH 100,000 which cost UAH 40,000
eight years ago. d) A business buys raw materials from a supplier. e) A company sells a factory for UAH 750,000 bought for UAH 250,000 three
years ago. f) An individual dies and bequeaths his estate after a death of UAH 1,000,000 to
his children.
3. A dry cleaning company made the following sales (where taxable value excludes VAT) for the period December 2014 to June 2015: December 2014 ………………………………………..………...………3,500,000 January 2015………………………………………..……………………5,000,000 February 2015 ………………………………..………………………….3,000,000 March 2015 ……………………...…7,340,000 (includes 1,670,000 exempt supply) April 2015 ………………………………………………………………6,000,000 May 2015 ………………………………………..………………………7,500,000 June 2015 ………………………………………………………………..9,300,000 Calculate the total amount of VAT paid by the dry cleaning company, using the
following box:
Добавлено примечание ([G221]): Inserted: the
Добавлено примечание ([G222]): Inserted: a
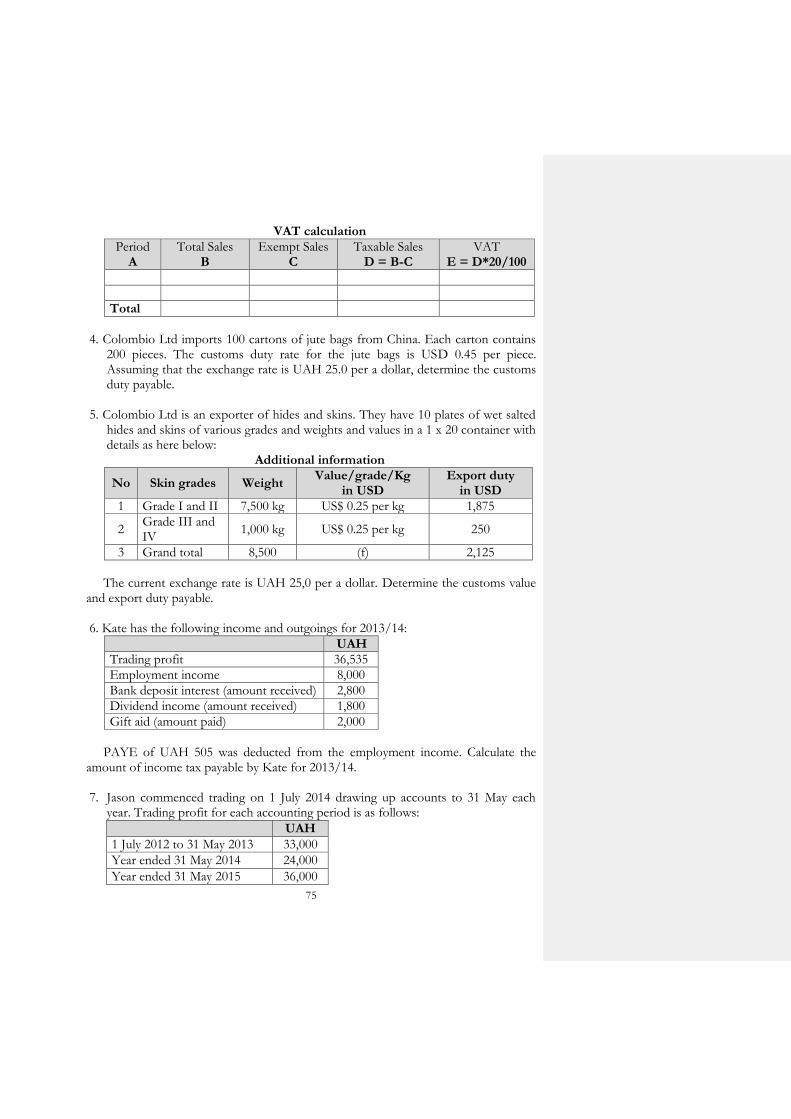
75
VAT calculation
Period A
Total Sales B
Exempt Sales C
Taxable Sales D = B-C
VAT E = D*20/100
Total
4. Colombio Ltd imports 100 cartons of jute bags from China. Each carton contains
200 pieces. The customs duty rate for the jute bags is USD 0.45 per piece. Assuming that the exchange rate is UAH 25.0 per a dollar, determine the customs duty payable.
5. Colombio Ltd is an exporter of hides and skins. They have 10 plates of wet salted hides and skins of various grades and weights and values in a 1 x 20 container with details as here below:
Additional information
No Skin grades Weight Value/grade/Kg
in USD Export duty
in USD
1 Grade I and II 7,500 kg US$ 0.25 per kg 1,875
2 Grade III and IV
1,000 kg US$ 0.25 per kg 250
3 Grand total 8,500 (f) 2,125
The current exchange rate is UAH 25,0 per a dollar. Determine the customs value
and export duty payable.
6. Kate has the following income and outgoings for 2013/14:
UAH
Trading profit 36,535
Employment income 8,000
Bank deposit interest (amount received) 2,800
Dividend income (amount received) 1,800
Gift aid (amount paid) 2,000
PAYE of UAH 505 was deducted from the employment income. Calculate the
amount of income tax payable by Kate for 2013/14.
7. Jason commenced trading on 1 July 2014 drawing up accounts to 31 May each year. Trading profit for each accounting period is as follows:
UAH
1 July 2012 to 31 May 2013 33,000
Year ended 31 May 2014 24,000
Year ended 31 May 2015 36,000
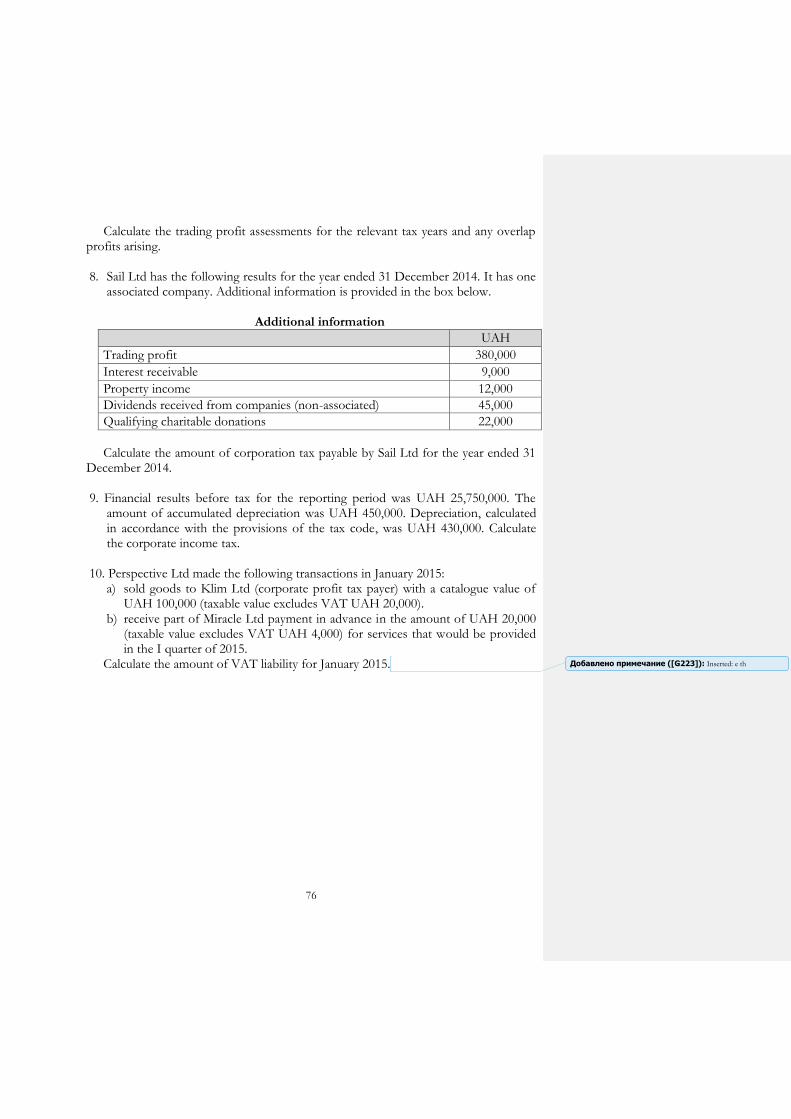
76
Calculate the trading profit assessments for the relevant tax years and any overlap profits arising.
8. Sail Ltd has the following results for the year ended 31 December 2014. It has one
associated company. Additional information is provided in the box below.
Additional information
UAH
Trading profit 380,000
Interest receivable 9,000
Property income 12,000
Dividends received from companies (non-associated) 45,000
Qualifying charitable donations 22,000
Calculate the amount of corporation tax payable by Sail Ltd for the year ended 31
December 2014.
9. Financial results before tax for the reporting period was UAH 25,750,000. The amount of accumulated depreciation was UAH 450,000. Depreciation, calculated in accordance with the provisions of the tax code, was UAH 430,000. Calculate the corporate income tax.
10. Perspective Ltd made the following transactions in January 2015: a) sold goods to Klim Ltd (corporate profit tax payer) with a catalogue value of
UAH 100,000 (taxable value excludes VAT UAH 20,000). b) receive part of Miracle Ltd payment in advance in the amount of UAH 20,000
(taxable value excludes VAT UAH 4,000) for services that would be provided in the I quarter of 2015.
Calculate the amount of VAT liability for January 2015.
Добавлено примечание ([G223]): Inserted: e th
77
CHAPTER 5:
BUDGET AND BUDGET SYSTEM
SUMMARY
In its simplest form, a budget is a document or a collection of documents that
refers to the financial conditions and future plans of the government, including
information on revenues, expenditures, activities, and purposes or goals. In contrast to
an accounting operating statement, which is retrospective in nature, referring to the
past conditions, a budget is perspective, referring to anticipated future revenues,
expenditures, and accomplishments.
A government budget is a government document presenting the government's
proposed revenues and spending for a financial year that is often passed by the
legislature, approved by the chief executive or president, and presented by the Finance
Minister to the nation. The budget is also known as the Annual Financial Statement of
the country. This document estimates the anticipated government revenues and
government expenditures for the ensuing (current) financial year.
Budget Code of Ukraine defines budget as a plan of raising and using
financial resources to ensure achievement of tasks and execution of functions by
bodies of State power, bodies of power of the Autonomous Republic of Crimea and
local self-governmental bodies during a budget period. Regulations and legal
directives of Ukraine that regulate budgetary relations in Ukraine include (i) the
Constitution of Ukraine; (ii) the Budget Code; (iii) Law on the state budget; (iv) other
laws regulating budgetary relations as per art. 1 of the Budget Code; (v) regulations of
the Cabinet of Ministers adopted on the basis and in line with the Budget Code; and
(vi) other laws of Ukraine, regulations of the bodies of executive power adopted on
the basis and in line with the Budget Code, decisions on local budgets as well as
decisions of the bodies of the Autonomous Republic of Crimea, local state
administrations and local self-government bodies adopted according to the Budget
Code.
Consolidated budget is a range of budget indicators used for the analysis and
forecasts of economic and social development of a country. The consolidated budget
of Ukraine includes indicators of the State Budget of Ukraine, the consolidated budget
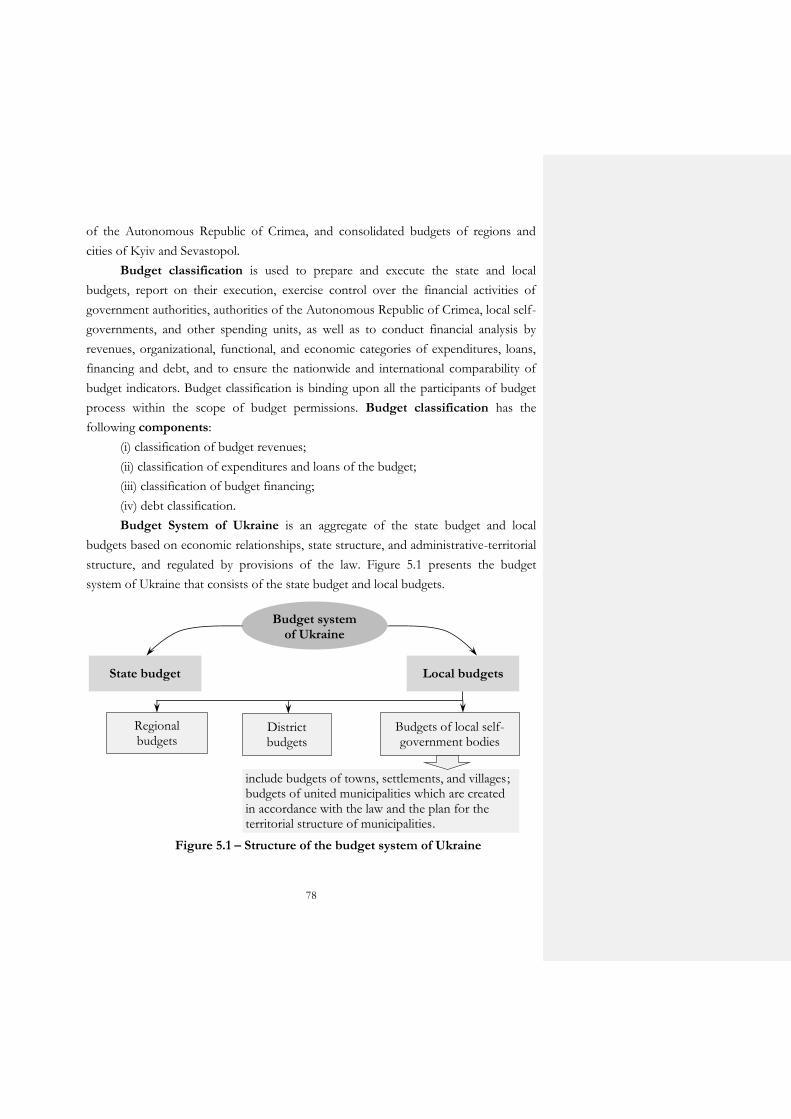
78
of the Autonomous Republic of Crimea, and consolidated budgets of regions and
cities of Kyiv and Sevastopol.
Budget classification is used to prepare and execute the state and local
budgets, report on their execution, exercise control over the financial activities of
government authorities, authorities of the Autonomous Republic of Crimea, local self-
governments, and other spending units, as well as to conduct financial analysis by
revenues, organizational, functional, and economic categories of expenditures, loans,
financing and debt, and to ensure the nationwide and international comparability of
budget indicators. Budget classification is binding upon all the participants of budget
process within the scope of budget permissions. Budget classification has the
following components:
(i) classification of budget revenues;
(ii) classification of expenditures and loans of the budget;
(iii) classification of budget financing;
(iv) debt classification.
Budget System of Ukraine is an aggregate of the state budget and local
budgets based on economic relationships, state structure, and administrative-territorial
structure, and regulated by provisions of the law. Figure 5.1 presents the budget
system of Ukraine that consists of the state budget and local budgets.
Figure 5.1 – Structure of the budget system of Ukraine
Budget system of Ukraine
State budget Local budgets
Regional budgets
District budgets
Budgets of local self-government bodies
include budgets of towns, settlements, and villages; budgets of united municipalities which are created in accordance with the law and the plan for the territorial structure of municipalities.
79
Currently, there are 11761 local budgets (not including the Autonomous
Republic of Crimea and Sevastopol). All local budgets are independent, i.e. they have
necessary revenue sources and the local governments are entitled to decide about
budget expenses in accordance with the law of Ukraine. Respective local councils can
discuss and adopt local budgets by themselves and independently of each other. 672
budgets are directly linked with the state budget (including 24 regional budgets, the
budget of Kyiv, 173 budgets of cities of regional significance, and 474 district
budgets).
Decentralization became a top priority on Ukraine’s political agenda in the
aftermath of Euromaidan in February 2014 as a result of the pronounced public
demand for the devolution of power and resources to local communities and a
subsequently strong commitment by the new political elite to reform the existing
system of local governance.
Beginning from 2015, the budget decentralization process in Ukraine took
place. Active work is being pursued to build up capable municipalities, which is in line
with the concept for the reform of local self-government and territorial government
structure of Ukraine. The budgets of united municipalities to be created in accordance
with the current legislation and the plan for the territorial structure of municipalities
will be linked directly to the state budget. Based on preliminary calculations for the
reform of local self-government and territorial government in Ukraine, it is planned to
build up approximately 1800 local budgets. After the unification of village, settlement
and town municipalities, all local budgets will be linked directly to the state budget.
This is how one of the goals of the budgetary reform will be achieved – transition
from the three- to the two-level budgetary system.
The reform of the budgetary system must achieve the following goals: (i)
local governments must elaborate and adopt their local budgets by themselves without
having to wait for the adoption of the state budget; (ii) the Ministry of Finance does
not impose revenue targets on the local budgets; (iii) local budgets have more revenue
sources which are needed to finance the functions of the local self-government;
(iv) the previous system of balance between the revenues and expenses of the local
budgets is replaced by a totally different system securing horizontal compensation of
tax-collection capacities of different territories depending on the income per capita;
(v) new types of budgetary transfers are introduced (education and health subventions,
subventions for the education of high-skilled workers, basic and reverse subsidies);
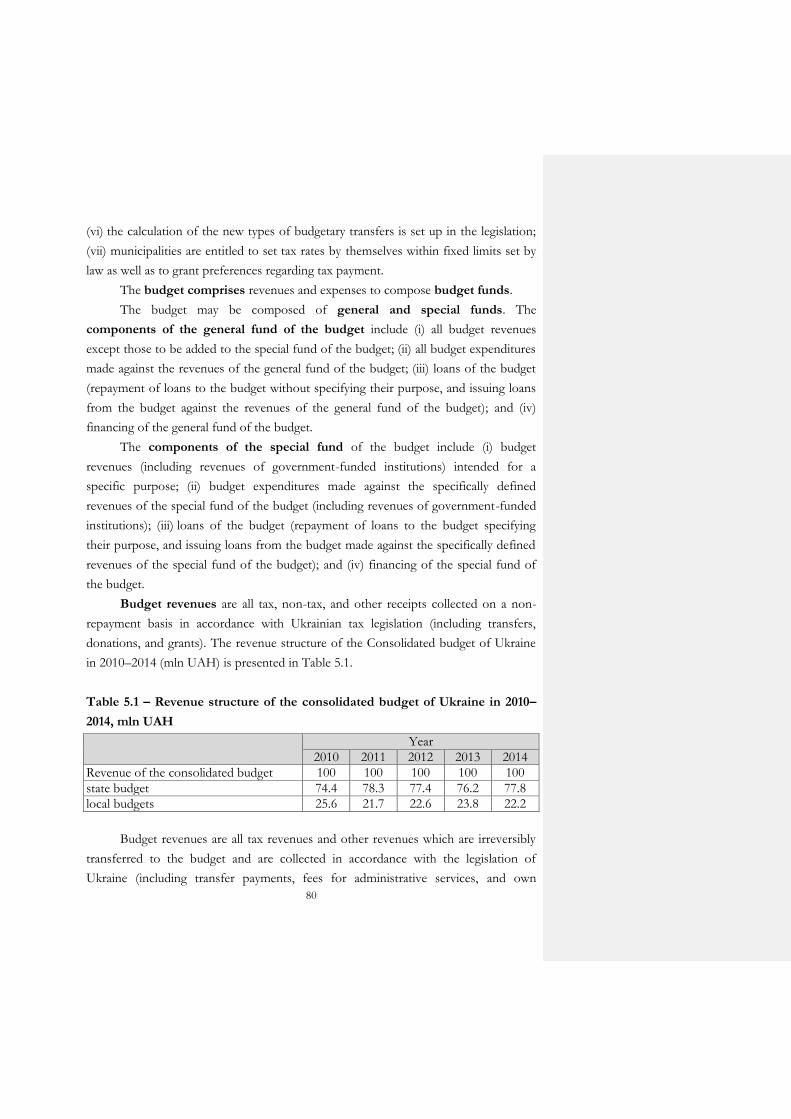
80
(vi) the calculation of the new types of budgetary transfers is set up in the legislation;
(vii) municipalities are entitled to set tax rates by themselves within fixed limits set by
law as well as to grant preferences regarding tax payment.
The budget comprises revenues and expenses to compose budget funds.
The budget may be composed of general and special funds. The
components of the general fund of the budget include (i) all budget revenues
except those to be added to the special fund of the budget; (ii) all budget expenditures
made against the revenues of the general fund of the budget; (iii) loans of the budget
(repayment of loans to the budget without specifying their purpose, and issuing loans
from the budget against the revenues of the general fund of the budget); and (iv)
financing of the general fund of the budget.
The components of the special fund of the budget include (i) budget
revenues (including revenues of government-funded institutions) intended for a
specific purpose; (ii) budget expenditures made against the specifically defined
revenues of the special fund of the budget (including revenues of government-funded
institutions); (iii) loans of the budget (repayment of loans to the budget specifying
their purpose, and issuing loans from the budget made against the specifically defined
revenues of the special fund of the budget); and (iv) financing of the special fund of
the budget.
Budget revenues are all tax, non-tax, and other receipts collected on a non-
repayment basis in accordance with Ukrainian tax legislation (including transfers,
donations, and grants). The revenue structure of the Consolidated budget of Ukraine
in 2010–2014 (mln UAH) is presented in Table 5.1.
Table 5.1 – Revenue structure of the consolidated budget of Ukraine in 2010–
2014, mln UAH
Year
2010 2011 2012 2013 2014
Revenue of the consolidated budget 100 100 100 100 100
state budget 74.4 78.3 77.4 76.2 77.8
local budgets 25.6 21.7 22.6 23.8 22.2
Budget revenues are all tax revenues and other revenues which are irreversibly
transferred to the budget and are collected in accordance with the legislation of
Ukraine (including transfer payments, fees for administrative services, and own
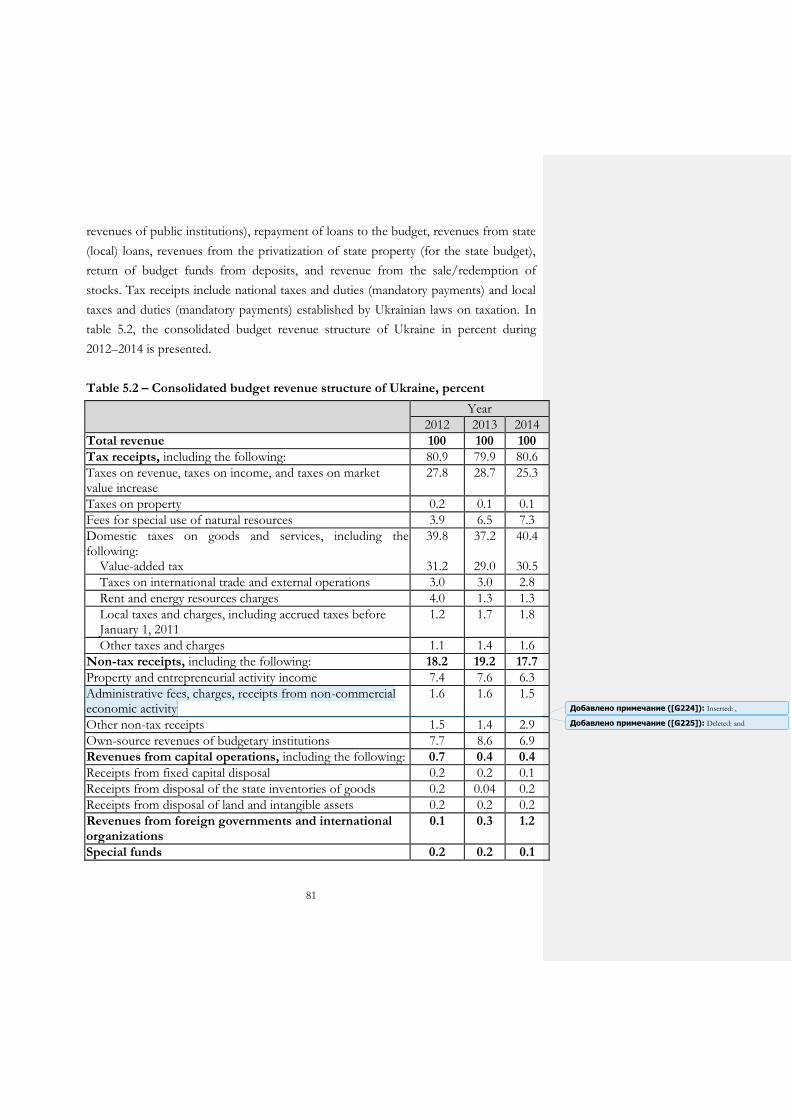
81
revenues of public institutions), repayment of loans to the budget, revenues from state
(local) loans, revenues from the privatization of state property (for the state budget),
return of budget funds from deposits, and revenue from the sale/redemption of
stocks. Tax receipts include national taxes and duties (mandatory payments) and local
taxes and duties (mandatory payments) established by Ukrainian laws on taxation. In
table 5.2, the consolidated budget revenue structure of Ukraine in percent during
2012–2014 is presented.
Table 5.2 – Consolidated budget revenue structure of Ukraine, percent
Year
2012 2013 2014
Total revenue 100 100 100
Tax receipts, including the following: 80.9 79.9 80.6
Taxes on revenue, taxes on income, and taxes on market value increase
27.8 28.7
25.3
Taxes on property 0.2 0.1 0.1
Fees for special use of natural resources 3.9 6.5 7.3
Domestic taxes on goods and services, including the following:
Value-added tax
39.8
31.2
37.2
29.0
40.4
30.5
Taxes on international trade and external operations 3.0 3.0 2.8
Rent and energy resources charges 4.0 1.3 1.3
Local taxes and charges, including accrued taxes before January 1, 2011
1.2 1.7 1.8
Other taxes and charges 1.1 1.4 1.6
Non-tax receipts, including the following: 18.2 19.2 17.7
Property and entrepreneurial activity income 7.4 7.6 6.3
Administrative fees, charges, receipts from non-commercial economic activity
1.6 1.6 1.5
Other non-tax receipts 1.5 1.4 2.9
Own-source revenues of budgetary institutions 7.7 8.6 6.9
Revenues from capital operations, including the following: 0.7 0.4 0.4
Receipts from fixed capital disposal 0.2 0.2 0.1
Receipts from disposal of the state inventories of goods 0.2 0.04 0.2
Receipts from disposal of land and intangible assets 0.2 0.2 0.2
Revenues from foreign governments and international organizations
0.1 0.3 1.2
Special funds 0.2 0.2 0.1
Добавлено примечание ([G225]): Deleted: and
Добавлено примечание ([G224]): Inserted: ,
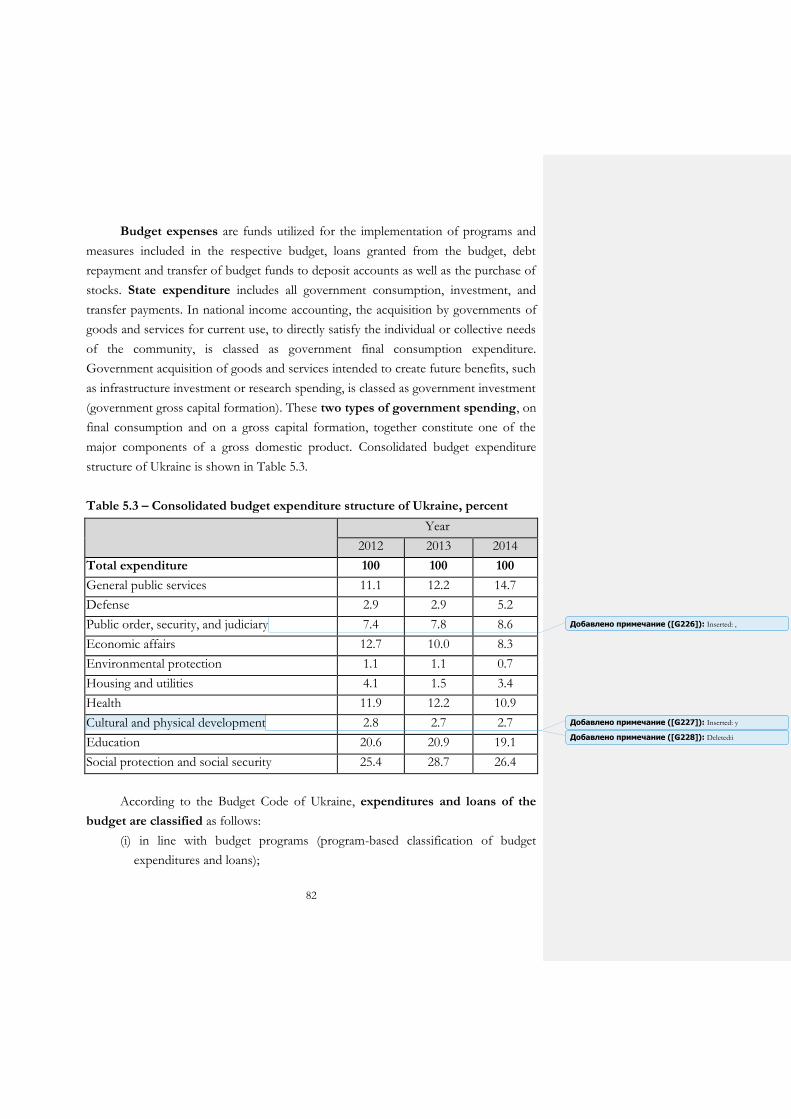
82
Budget expenses are funds utilized for the implementation of programs and
measures included in the respective budget, loans granted from the budget, debt
repayment and transfer of budget funds to deposit accounts as well as the purchase of
stocks. State expenditure includes all government consumption, investment, and
transfer payments. In national income accounting, the acquisition by governments of
goods and services for current use, to directly satisfy the individual or collective needs
of the community, is classed as government final consumption expenditure.
Government acquisition of goods and services intended to create future benefits, such
as infrastructure investment or research spending, is classed as government investment
(government gross capital formation). These two types of government spending, on
final consumption and on a gross capital formation, together constitute one of the
major components of a gross domestic product. Consolidated budget expenditure
structure of Ukraine is shown in Table 5.3.
Table 5.3 – Consolidated budget expenditure structure of Ukraine, percent
Year
2012 2013 2014
Total expenditure 100 100 100
General public services 11.1 12.2 14.7
Defense 2.9 2.9 5.2
Public order, security, and judiciary 7.4 7.8 8.6
Economic affairs 12.7 10.0 8.3
Environmental protection 1.1 1.1 0.7
Housing and utilities 4.1 1.5 3.4
Health 11.9 12.2 10.9
Cultural and physical development 2.8 2.7 2.7
Education 20.6 20.9 19.1
Social protection and social security 25.4 28.7 26.4
According to the Budget Code of Ukraine, expenditures and loans of the
budget are classified as follows:
(i) in line with budget programs (program-based classification of budget
expenditures and loans);
Добавлено примечание ([G226]): Inserted: ,
Добавлено примечание ([G228]): Deleted:i
Добавлено примечание ([G227]): Inserted: y
83
(ii) according to the key spending unit characteristic (institutional classification
of budget expenditures and loans);
(iii) according to the functions related to expenditures and loans of the budget
(functional classification of budget expenditures and loans).
Expenditures of the budget also could be classified by economic nature of the
related transactions (economic classification of budget expenditures). According to the
economic classification, the budget expenditures fall into current and capital
expenditures.
Classification of budget lending systematizes budget lending by type of a
borrower and breaks down lending transactions by issuing loans from budget and
repayment of loans to the budget. The budget expenses (expenditures) include
consumption expenses (expenditures) and development expenses (expenditures)
under the budget classification.
The budget period for all budgets that comprise the budget system must be
one calendar year that begins on the 1st of January of a relevant year and ends on the
31st of December of the same year. Failure of the Verkhovna Rada of Ukraine to
approve the State Budget Law of Ukraine by January 1 will not be a reason to set a
different budget period.
Approval of budget running a deficit is allowed when there are reasonable
sources of financing of the state budget available with reference to the specific
conditions stipulated by the Budget Code. The budget surplus is approved in order to
settle a debt, maintain the established current balance of budget funds, and purchase
the securities. The current balance of budget funds is a portion of the balance of
general fund of the corresponding budget generated to cover temporary cash gaps.
The current balance of budget funds will not exceed 2 percent of the target
expenditures of the general fund of the budget, and is approved by the Law on the
State Budget of Ukraine (decision on the local budget). At the end of the budget
period, the current balance of budget funds will be maintained within the established
amount. The excess of the balance of the general fund budget over the current balance
of budget funds at the end of the budget period constitutes the available balance of
budget funds used to effect the budget expenses in accordance with the Law on the
State Budget of Ukraine and/or changes thereto (changes to the decision on local
budget).
84
There are four main sources of budget financing: (i) proceeds from
government (local) domestic and external borrowings; (ii) proceeds from privatization
of state property (including other revenues directly related to privatization process) -
as regards the state budget; (iii) withdrawal of budget funds from deposits and
proceeds from selling/presenting securities; and (iv) available balance of budget funds.
Money issued by the National Bank of Ukraine cannot constitute a source of budget
financing.
Domestic and foreign government borrowings are made within the established
limit of public debt.
Public debt is the sum of the debt liabilities of a state consisting of pending
loans at the respective reporting date which were taken by the state. Public loans are
taken to finance the public budget deficit. To receive them, a country issues bonds
(debt instruments) for the domestic or international financial market. These funds are
taken to be used in the public sector of the economy and for their effective
transformation into the growth of public revenues. Public debt consists of the direct
debt and the debt guaranteed by the state. Direct debt is the sum of the country’s
debts resulting from taken and pending loans at the respective reporting date.
Debt guaranteed by the state is the sum of the debts of economic entities
residing in Ukraine resulting from taken and pending loans at the respective reporting
date whose repayment is guaranteed by the state. State guarantees are meant to
support the implementation of projects on social and economic development and
pose ones the most popular forms of financial support for infrastructure development.
The new policy on state guarantees, which has been pursued since the second half of
2014, emphasizes that these guarantees are not provided for consumption – they are
mostly granted for development projects supported by international financial
organizations. These projects are implemented in areas like funding of investment,
innovation, infrastructure and other development projects which are of strategic
importance and which contribute to the economic development of Ukraine. Also,
these are projects aimed to increase the energy efficiency and to enhance the
competitive advantages of Ukrainian companies. State guarantees are granted to
support projects related to the social and economic development and are one of the
most popular forms of financial support for infrastructure build-up.
Depending on the source of the loans, the public debt can be
domestic/internal (loans taken from citizens or legal entities buying public domestic
85
bonds) or external (loans taken on the international market). The public debt of
Ukraine is managed jointly by the Cabinet Ministers, the Ministry of Finance, the
National Bank, and the State Treasury which are responsible for the elaboration and
implementation of an effective state debt strategy aimed to secure financial stability
and debt sustainability of the country. The Cabinet Ministers of Ukraine define
conditions to make government borrowings, including their type, currency, term, and
interest rate of a government borrowing. The direct public debt and the debt
guaranteed by the state are regulated by the Constitution of Ukraine, the Budget Code
of Ukraine and other regulations on the re-payment and processing of the public debt
and the debt guaranteed by the state. The limit of public (local) debt and the limit
of government (local) guarantees to be issued are defined for each budget period
by the Law on the State Budget of Ukraine (decision on the local budget). The total
amount of public debt and state-guaranteed debt at the end of the budget period
must not exceed 60 percent of the annual nominal volume of Ukrainian gross
domestic product.
To recover the state financial system and to secure financial stability at the
currency and financial market, the Ministry of Finance is working to reduce the public
debt of Ukraine. To lower the debt burden, the Ministry is active in 2 areas:
(i) Replacement of previously issued bonds by new cheaper financial
instruments. The Ministry of Finance is effectively replacing the expensive
liabilities made in previous years (average interest rate of 8 % p.a. with the
maturity of approx. 8 years) with cheaper loans (average interest rate of up to
3 % p.a. with the maturity above 10 years). Thus, new loans are threefold
more favorable compared to the previous ones.
(ii) Debt restructuring deals with the holders of the Ukrainian bonds: the
agreement between the Ministry of Finance and the Creditors’ Committee on
the Ukraine’s debt restructuring includes the following terms: reduction of
the principal value of the public debt and debt guaranteed by the state by 20
% thus cutting the debt immediately by USD 3.6 bn (USD 3.8 bn if this
“haircut” is also agreed for the foreign debts of companies guaranteed by the
state and for the Eurobonds of Kyiv).
The budget process is a process of drafting, deliberation, approval and
execution of budgets, reporting on budget execution, and exercising control over
compliance with budget legislation regulated by the budget legislation. The
86
participants of the budget process are bodies, institutions, and officials possessing
budget permissions (rights and obligations related to managing budget funds),
including the President of Ukraine, Verkhovna Rada of Ukraine, Cabinet Ministers of
Ukraine, Ministry of Finance, State Treasury, the National Bank of Ukraine, etc.
The following are recognized as stages of the budget process:
(i) drawing up draft budgets;
(ii) deliberating the draft and adopting the Law on the State Budget of Ukraine
(decision on the local budget);
(iii) executing the budget, including introducing changes to the Law on the State
Budget of Ukraine (decision on the local budget);
(iv) drawing up and deliberating a report on budget execution and making the
corresponding decision.
RECOMMENDED READING
1. Alesina, A. F., and Perotti, R., 1999, Budget deficits and budget institutions. In
Fiscal institutions and fiscal performance, University of Chicago Press, pp. 13–36.
2. Allison, John W. F., 1997, Cultural Divergence, The Separation of Powers and the
Public-Private Divide, Esperia Publications, Athens, Greece, 9(2), pp. 305–333.
3. Baskaran, T., 2012, Tax decentralization and public deficits in OECD countries,
Publius: The Journal of Federalism, 42(4), pp. 688–707.
4. Bohn, H., and Inman, R. P., 1996, Balanced-budget rules and public deficits:
evidence from the US states, Carnegie-Rochester conference series on public policy, 45,
pp. 13–76.
5. Costello, A. M., Petacchi, R., and Weber, J., 2012, The Hidden Consequences of
Balanced Budget Requirements, Available at SSRN Electronic Journals, doi:
10.2139/ssrn.2151598 .
6. Diamond, J., 2006, Budget System Reform in Emerging Economies; The Challenges and the
Reform Agenda, No. 245, International Monetary Fund.
7. Gleich, H., 2003, Budget institutions and fiscal performance in Central and
Eastern European countries, Working Paper 215, European Central Bank, Frankfurt,
Germany, February.
8. Momotyuk, L., 2013, State Finance Statistics and its Harmonization with
International Standards, Accounting and Finance, 2, pp. 93–99.

87
9. Tekin-Koru, A., and Özmen, E., 2003, Budget deficits, money growth and
inflation: the Turkish evidence, Applied Economics, 35(5), pp. 591–596.
10. Wagner, R. E., 2012, Deficits, debt, and democracy: Wrestling with tragedy on the fiscal
commons, Northamptan: Edward Elgar, 208 p.
KEY TERMS
budget program
is a systematized list of activities aimed at achieving a general goal and tasks, implementation of which is proposed and fulfilled by a spending unit in accordance with its responsibilities.
budget entity is a body, entity, or organization defined in the Constitution of Ukraine or an establishment or organization formed in compliance with the established order by a body of state power, body of power of the Autonomous Republic of Crimea, or a local self-governmental body that is financed entirely at the expense of the state budget or a local budget, respectively. Budget entities are non-profit.
budget allocation
is an authority granted to a key spending unit to enter into budget commitments and spend budget funds on a specific objective in the process of budget execution consistent with the established appropriations.
budget commitment
is any placement within a budget allocation of an order, entering into a contract, purchase of a good or a service, or implementation of other similar transactions during a certain budget period that requires payments during the same period or in the future.
budget appropriation
is an authority granted to a key spending unit by this Code, the State Budget Law of Ukraine or by the local budget decision, with quantitative and time limits that allows budget allocations.
borrowing is transactions related to securing resources by a budget at the terms of redemption, payback and time limits that result in entering by the State, the Autonomous Republic of Crimea, and local governments into liabilities with payments due to creditors.
inter-governmental transfers
are resources transferred free of redemption and repayment from one budget to another one.
local financial authority
is an agency that executes functions consistent with Ukrainian legislation dealing with formulating and executing local budgets, supervising fund spending by spending units, as well as other functions related to the management of local budget funds. For purposes of the Budget Code, the Ministry of Finance of the Autonomous Republic of Crimea is considered as a local financial authority.
budget receipts
are budget revenues and funds raised by way of issuing debt by the State government, the government of the Autonomous Republic of Crimea, or a local self- governmental body.
the financial standard of budget sufficiency
is the guaranteed by the State within the limits of available budget resources level of financial provision of authorities of the Council of Ministers of the Autonomous Republic of Crimea, local State administrations, and executive bodies of local councils that are used for defining the amount of inter-governmental transfers.
88
draft budget is a draft plan of formation and use of fiscal resources for purposes of implementation of tasks and functions that are fulfilled by bodies of the state power, bodies of power of the Autonomous Republic of Crimea, or local self-governmental bodies; the draft budget is an integral part of the State Budget Law of Ukraine or the draft decision of the respective council on the local budget.
decision on the local budget
is a legislative act adopted by the Verkhovna Rada of the Autonomous Republic of Crimea or relevant local council in accordance with the procedure established by laws of Ukraine that contains approved assignments of the Council of Ministers of the Autonomous Republic of Crimea, local state administration, or executive body of a local council to execute the local budget during the budget period.
spending units
are budget entities and organizations empowered, in the person of their leadership, to receive allocations, undertake commitments, and execute expenditures from the budget.
subventions are inter-governmental transfers of funds to be used for set purposes through procedures defined by the authority that decides to provide the subvention.
budget financing
is receipts and expenses related to changes in the amount of the debt, as well as changes in the balance of cash resources used to cover the gap between budget revenues and budget expenditures.
budget surplus
is the excess of budget revenues over budget expenditures.
budget deficit is the excess of budget expenditures over budget revenues.
key spending units
are budget entities in the person of their managers which receive assignments by way of establishing budget appropriations.
revenue collection units
are tax collecting, customs, and other governmental agencies authorized by law to collect taxes, fees, mandatory payments, and other receipts.
budget apportionment
is a document distributing revenues, budget funding and allocations across key spending units for particular periods of the year in accordance with budget classification.
REVIEW QUESTIONS
1. What is a budget? Discuss the main objectives and features of a budget.
2. What are the major differences between the state and local budgeting?
3. Discuss the budget decentralization process in Ukraine.
4. What is a budget period?
5. Why is a budget classification system important?
6. What are the revenue sources for a government?
7. What are the major classes of public expenditure?
8. Distinguish between revenue expenditure and capital expenditure in a government
budget. Give two examples of each.
89
9. What are the main sources of budget financing?
10. How does the government issue debt?
11. Explain the difference between deficit and debt.
12. Explain the difference between internal and external debt.
13. Distinguish between the primary budget deficit and the reported budget deficit.
Which one is more helpful for economists to analyze the government debt
situation?
14. What tools the Ministry of Finance use in order to reduce the public debt of
Ukraine?
15. List major steps taken in the process of building a state or local government
budget.
MULTIPLE CHOICE QUESTIONS
1. Which objectives government attempts to obtain by budget? a) to promote economic development; b) balanced regional development; c) redistribution of income and wealth; d) all of this.
2. What is the largest source of revenue for states? a) personal income tax; b) property tax; c) license fees; d) sales and gross receipt tax.
3. What are the two biggest areas of state expenditures? a) welfare and corrections; b) corrections and education; c) welfare and education; d) education and healthcare.
4. Expenditures which do not create assets for the government are called as follows: a) revenue expenditure; b) capital expenditure; c) both (a) and (b); d) none of these.
90
5. If government spending exceeds tax collection, a) there is a budget surplus; b) there is the budget deficit; c) private saving is positive; d) public saving is positive; e) none of the above is true.
6. A 'structural' budget deficit is one that a) occurs when countries are in recession; b) occurs regularly irrespective of the state of the economy; c) arises because of high capital expenditure, such as the building of new schools
and hospitals; d) arises because of accounting practice but has no economic significance.
7. The public debt is the total amount of a) debt held by the public; b) government securities held by individuals, businesses, and government
agencies; c) demand deposits held by banks; d) outstanding commercial loans; e) outstanding mortgages.
8. The public debt of a country is not necessarily a burden on the economy to the extent that a) it is paid for by borrowing abroad; b) people are happy to hold government bonds; c) it can be financed without adding to inflation; d) people receive good public services; e) it grows less rapidly than GDP.
9. The level of external debt rises when the Ukrainian Treasury a) prints more money; b) sells securities to Ukrainians; c) increases the deficit; d) decreases the deficit; e) sells securities to foreigners.
10. One reason that the government budget is so difficult to balance is that a) the Treasury is always issuing new securities; b) people enjoy the benefits associated with government spending programs, so
that cuts are unpopular; c) there is very little wasteful spending that could be cut; d) even minor spending cuts and tax increases would be disastrous for the
economy; e) the budget is far too complicated to expect the balance to be achieved.

91
SHORT ANSWER QUESTIONS
MISSING WORD QUESTIONS
Choose the correct word to complete each sentence.
1. ____________ is a fiscal tool in the hands of the government which is effectively
used for the accomplishment of various socio-economic objectives.
2. According to the law of Ukraine, the sum of the debts of economic entities (only those residing in Ukraine) guaranteed by the state which are taken but still pending at the respective reporting date is considered as ___________________. If the respective economic entity is not able to repay its debt, the state budget becomes ________________ for its repayment.
3. The state takes ___________ to cover its budget deficit at the central and regional levels, to arrange targeted funding for various programs, to increase the necessary reserve assets as well as to refinance previous public debts.
4. The situation in financial planning or the budgeting process where total revenues are equal to or greater than total expenses are called ______________.
5. Government expenses include spending on current goods and services, which economists call government _____________; government ____________ expenditures, such as infrastructure investment or research expenditure; and ______________ like unemployment or retirement benefits.
TRUE/FALSE/UNCERTAIN QUESTIONS
Decide whether the following statements are True, False, or Uncertain. Explain your reasoning. Your score will be based not just on whether you get the True, False, or Uncertain part right but also, to a larger extent, on the quality of your explanation.
1. The difference between a deficit and a debt is that a deficit represents the accumulation of debts over many years, while a debt represents the amount by which government spending exceeds tax revenue in a single year.
2. External debt is private debt and internal debt is public debt.
3. The public debt consists of only one year's government securities, which must be paid back at the end of the fiscal year.
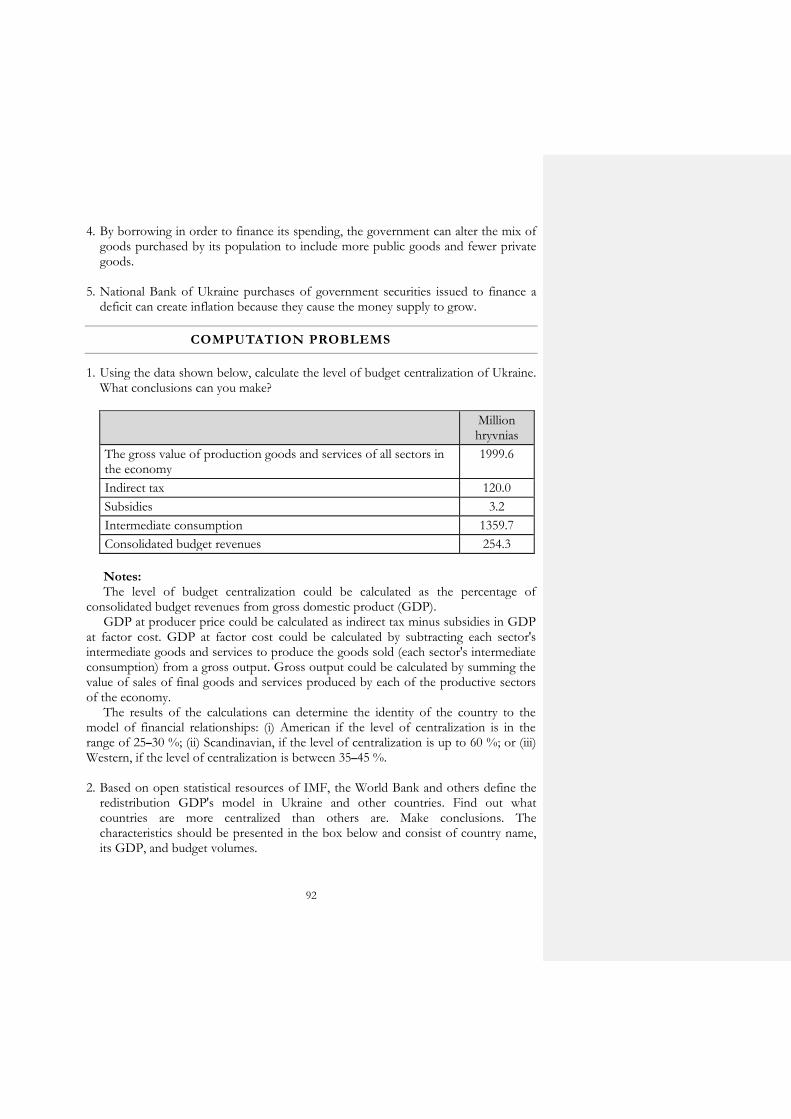
92
4. By borrowing in order to finance its spending, the government can alter the mix of goods purchased by its population to include more public goods and fewer private goods.
5. National Bank of Ukraine purchases of government securities issued to finance a deficit can create inflation because they cause the money supply to grow.
COMPUTATION PROBLEMS
1. Using the data shown below, calculate the level of budget centralization of Ukraine. What conclusions can you make?
Million hryvnias
The gross value of production goods and services of all sectors in the economy
1999.6
Indirect tax 120.0
Subsidies 3.2
Intermediate consumption 1359.7
Consolidated budget revenues 254.3
Notes: The level of budget centralization could be calculated as the percentage of
consolidated budget revenues from gross domestic product (GDP). GDP at producer price could be calculated as indirect tax minus subsidies in GDP
at factor cost. GDP at factor cost could be calculated by subtracting each sector's intermediate goods and services to produce the goods sold (each sector's intermediate consumption) from a gross output. Gross output could be calculated by summing the value of sales of final goods and services produced by each of the productive sectors of the economy.
The results of the calculations can determine the identity of the country to the model of financial relationships: (i) American if the level of centralization is in the range of 25–30 %; (ii) Scandinavian, if the level of centralization is up to 60 %; or (iii) Western, if the level of centralization is between 35–45 %.
2. Based on open statistical resources of IMF, the World Bank and others define the
redistribution GDP's model in Ukraine and other countries. Find out what countries are more centralized than others are. Make conclusions. The characteristics should be presented in the box below and consist of country name, its GDP, and budget volumes.
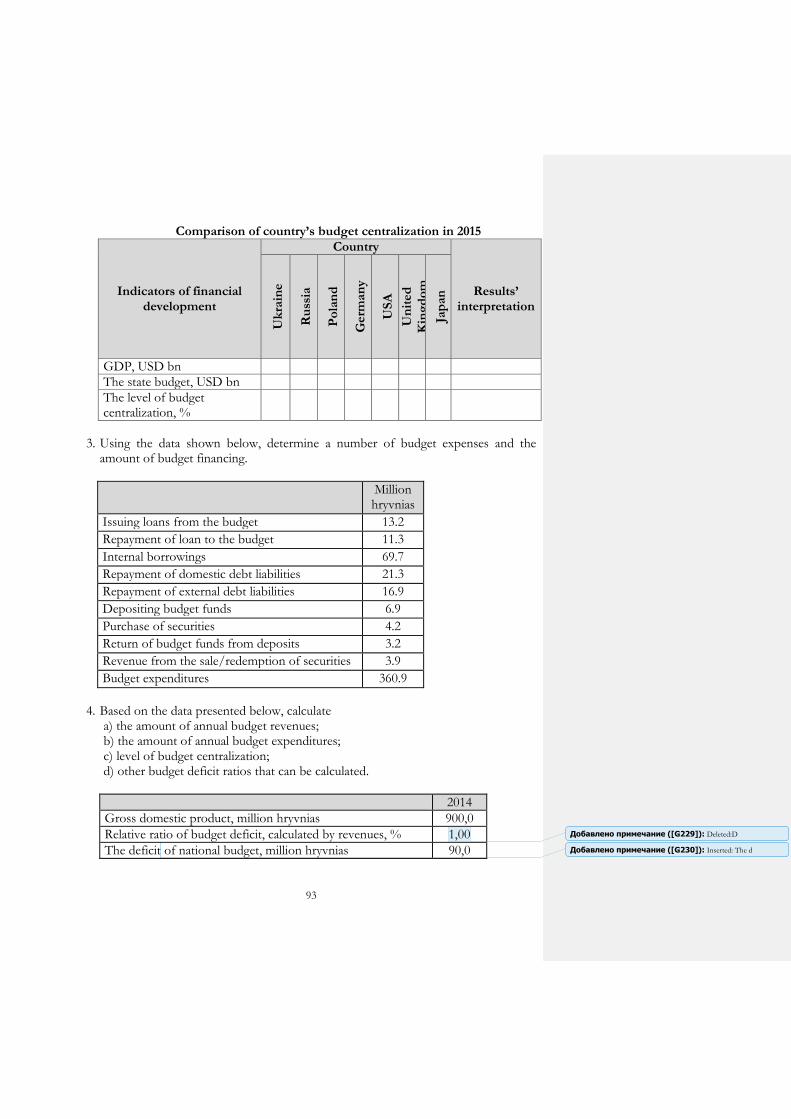
93
Comparison of country’s budget centralization in 2015
Indicators of financial development
Country
Results’ interpretation
Uk
rain
e
Ru
ssia
Po
lan
d
Germ
an
y
US
A
Un
ited
Kin
gd
om
Jap
an
GDP, USD bn
The state budget, USD bn
The level of budget centralization, %
3. Using the data shown below, determine a number of budget expenses and the
amount of budget financing.
Million hryvnias
Issuing loans from the budget 13.2
Repayment of loan to the budget 11.3
Internal borrowings 69.7
Repayment of domestic debt liabilities 21.3
Repayment of external debt liabilities 16.9
Depositing budget funds 6.9
Purchase of securities 4.2
Return of budget funds from deposits 3.2
Revenue from the sale/redemption of securities 3.9
Budget expenditures 360.9
4. Based on the data presented below, calculate
a) the amount of annual budget revenues; b) the amount of annual budget expenditures; c) level of budget centralization; d) other budget deficit ratios that can be calculated.
2014
Gross domestic product, million hryvnias 900,0
Relative ratio of budget deficit, calculated by revenues, % 1,00
The deficit of national budget, million hryvnias 90,0
Добавлено примечание ([G229]): Deleted:D
Добавлено примечание ([G230]): Inserted: The d
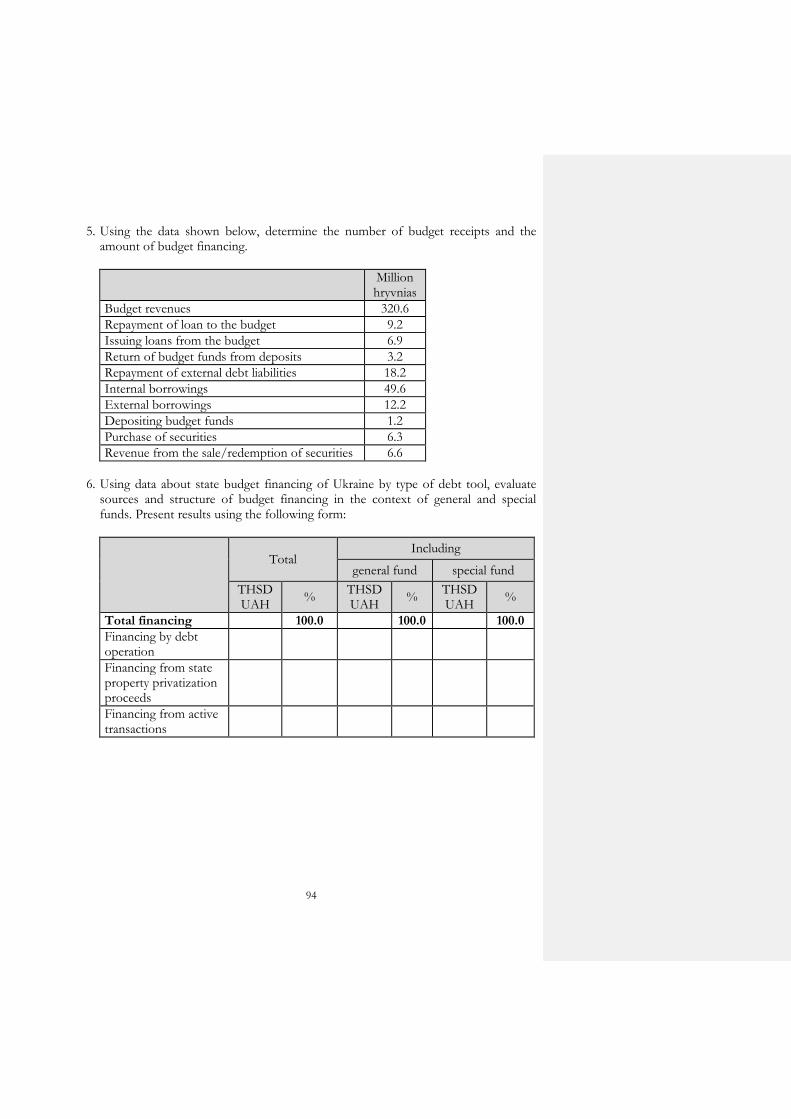
94
5. Using the data shown below, determine the number of budget receipts and the amount of budget financing.
Million hryvnias
Budget revenues 320.6
Repayment of loan to the budget 9.2
Issuing loans from the budget 6.9
Return of budget funds from deposits 3.2
Repayment of external debt liabilities 18.2
Internal borrowings 49.6
External borrowings 12.2
Depositing budget funds 1.2
Purchase of securities 6.3
Revenue from the sale/redemption of securities 6.6
6. Using data about state budget financing of Ukraine by type of debt tool, evaluate
sources and structure of budget financing in the context of general and special funds. Present results using the following form:
Total Including
general fund special fund
THSD UAH
% THSD UAH
% THSD UAH
%
Total financing 100.0 100.0 100.0
Financing by debt operation
Financing from state property privatization proceeds
Financing from active transactions

95
CHAPTER 6:
HOUSEHOLD FINANCE
SUMMARY
Household is an institutional component of the country economic system.
Household is the basic unit of analysis in social science research and in many
microeconomic and government models; it is important to the fields of economics
and inheritance. According to the System of National Accounts, household is
considered as individuals in the country’s economic system that may consist of a single
person or a group of people (not necessarily family) and be united by a common
budget. Household that consists of one or more people living under one roof (in the
same dwelling) or occupying a separate housing unit, have either direct access to the
outside or a separate cooking facility. A single dwelling may contain multiple
households if either meals or living space are not shared. Household may be located in
a housing unit or in a set of collective living quarters, such as a boarding house, a hotel
or a camp, or may comprise the administrative personnel in an institution. The
household can also be homeless. Household as an institutional component of the
country economic system is endowed with the following features: (i) possession of
labor or capital resources; (ii) autonomy in economic decision-making; and (iii)
maximum needs satisfaction.
There are two broad types of households: (i) family-based households and (ii)
nonfamily-based households. Within the family-based households, couple-based
households refer to those with a married head and a spouse in the household. Other
family-based households refer to those without a married head and a spouse in the
household, e.g., lone parent households.
Households and families are basic units of analysis in demography; terms
“household” and “family” are often identified, however, in the overwhelming majority
of cases, it is not quite correct. The concept of household fits better to financial
science. Household includes, but is not limited to the family; it rather describes
economic and financial relations within the group of people bound by certain
obligations established legally or contractually. The concept of household is based on
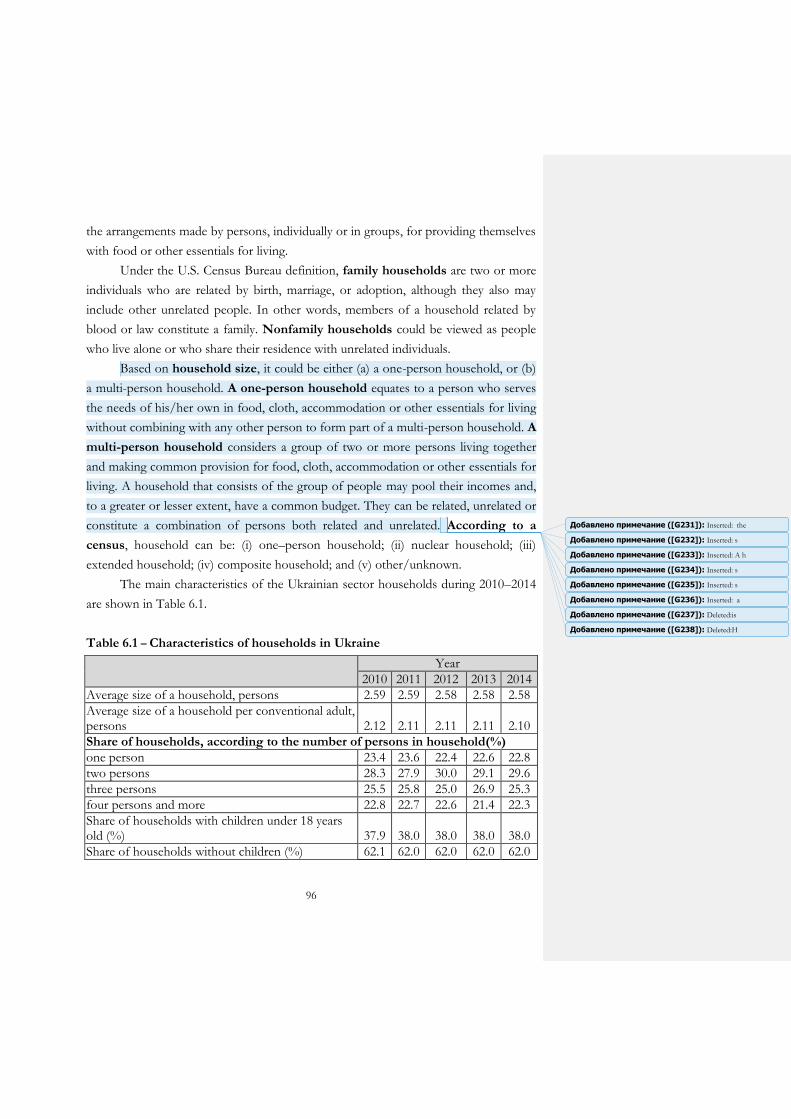
96
the arrangements made by persons, individually or in groups, for providing themselves
with food or other essentials for living.
Under the U.S. Census Bureau definition, family households are two or more
individuals who are related by birth, marriage, or adoption, although they also may
include other unrelated people. In other words, members of a household related by
blood or law constitute a family. Nonfamily households could be viewed as people
who live alone or who share their residence with unrelated individuals.
Based on household size, it could be either (a) a one-person household, or (b)
a multi-person household. A one-person household equates to a person who serves
the needs of his/her own in food, cloth, accommodation or other essentials for living
without combining with any other person to form part of a multi-person household. A
multi-person household considers a group of two or more persons living together
and making common provision for food, cloth, accommodation or other essentials for
living. A household that consists of the group of people may pool their incomes and,
to a greater or lesser extent, have a common budget. They can be related, unrelated or
constitute a combination of persons both related and unrelated. According to a
census, household can be: (i) one–person household; (ii) nuclear household; (iii)
extended household; (iv) composite household; and (v) other/unknown.
The main characteristics of the Ukrainian sector households during 2010–2014
are shown in Table 6.1.
Table 6.1 – Characteristics of households in Ukraine
Year
2010 2011 2012 2013 2014
Average size of a household, persons 2.59 2.59 2.58 2.58 2.58
Average size of a household per conventional adult, persons 2.12 2.11 2.11 2.11 2.10
Share of households, according to the number of persons in household(%)
one person 23.4 23.6 22.4 22.6 22.8
two persons 28.3 27.9 30.0 29.1 29.6
three persons 25.5 25.8 25.0 26.9 25.3
four persons and more 22.8 22.7 22.6 21.4 22.3
Share of households with children under 18 years old (%) 37.9 38.0 38.0 38.0 38.0
Share of households without сhildren (%) 62.1 62.0 62.0 62.0 62.0
Добавлено примечание ([G238]): Deleted:H
Добавлено примечание ([G231]): Inserted: the
Добавлено примечание ([G232]): Inserted: s
Добавлено примечание ([G233]): Inserted: A h
Добавлено примечание ([G237]): Deleted:is
Добавлено примечание ([G234]): Inserted: s
Добавлено примечание ([G235]): Inserted: s
Добавлено примечание ([G236]): Inserted: a
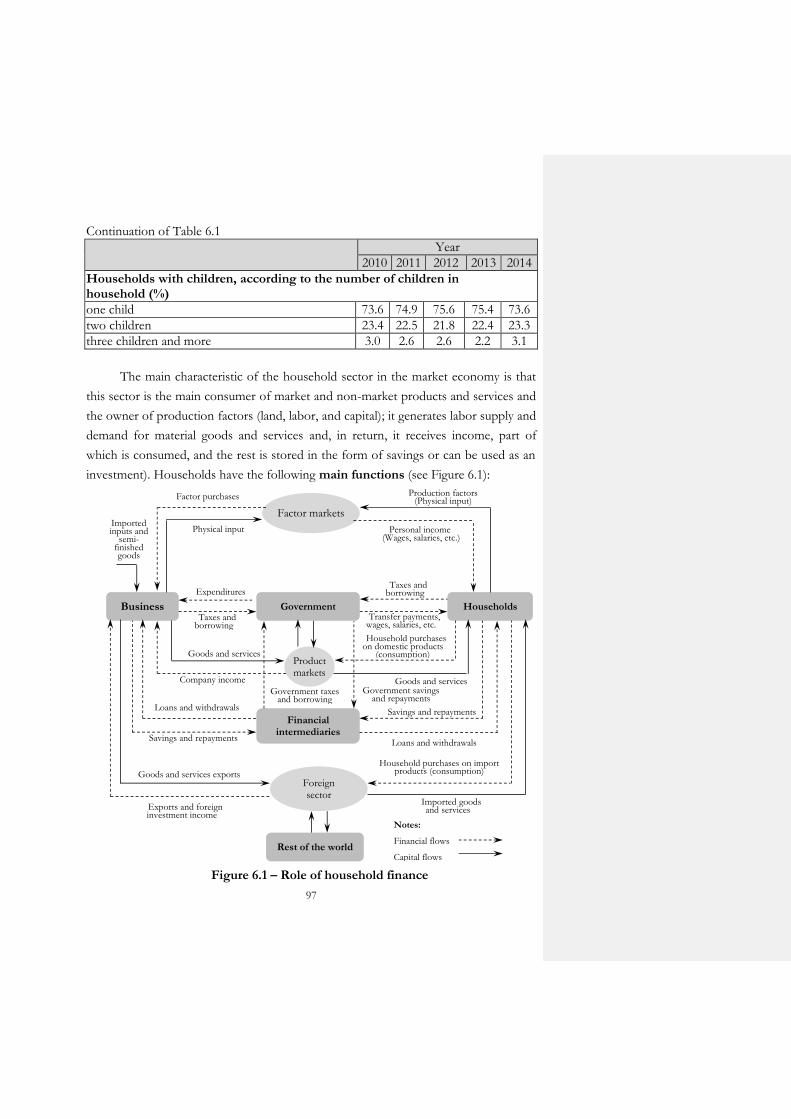
97
Continuation of Table 6.1 Year
2010 2011 2012 2013 2014
Households with children, according to the number of children in household (%)
one child 73.6 74.9 75.6 75.4 73.6
two children 23.4 22.5 21.8 22.4 23.3
three children and more 3.0 2.6 2.6 2.2 3.1
The main characteristic of the household sector in the market economy is that
this sector is the main consumer of market and non-market products and services and
the owner of production factors (land, labor, and capital); it generates labor supply and
demand for material goods and services and, in return, it receives income, part of
which is consumed, and the rest is stored in the form of savings or can be used as an
investment). Households have the following main functions (see Figure 6.1):
Figure 6.1 – Role of household finance
Business Government Households
Factor markets
Product markets
Financial intermediaries
Foreign sector
Rest of the world
Personal income (Wages, salaries, etc.)
Production factors (Physical input)
Taxes and borrowing
Transfer payments, wages, salaries, etc.
Household purchases on domestic products
(consumption)
Goods and services
Savings and repayments
Loans and withdrawals
Household purchases on import products (consumption)
Imported goods and services
Physical input
Factor purchases
Taxes and borrowing
Expenditures
Goods and services
Company income
Savings and repayments
Loans and withdrawals
Exports and foreign investment income
Goods and services exports
Imported inputs and
semi-finished goods
Government taxes and borrowing
Government savings and repayments
Notes: Financial flows Capital flows
98
The primary economic function of households is to supply domestic firms
with needed factors of production – human capital, real capital, enterprise, and
other resources. The factors are supplied by factor owners in return for a reward.
According to the Theory of Household Production, households also act as producers
of goods and services (agricultural products, repair and other services, and family
businesses) using their own labor and capital. In many cases the market and the
household are in direct competition, producing identical or similar goods/services.
Consumption function arises from the fact that households are main consumers of
goods and services in the market. Consumption theory is often predicated on the idea
of diminishing marginal utility. However household consumption is influenced by
different factors, such as income, wealth, expectations about the level and riskiness of
future income or wealth, attitude toward risk, interest rates, age, education, family size,
and consumer’s preferences. The part of households income that is not spent on
current consumption remains saved. The relationship between income and savings
reflect in saving (investing) function of households.
Household finance refers to the management of money and financial decisions
for a person or family including budgeting, investments, retirement planning, and
investments. Households make their own decisions about their own sources of
income, necessity and ways to generate funds, their size, and use. Household finance
has many special features that give the field its character and organized on the basis of
the following principles:
a) the principle of full independence;
b) financial self-sufficiency in the reproduction process;
c) financial planning of household budgets;
d) division of financial resources on equity and borrowed funds;
e) differentiation of main and investment activity;
f) the principle of material interest;
g) internal financial discipline;
h) formation of reserve funds.
Specificity of household finances is that this area of financial relations is
indirectly affected by the state, using various methods of tax and budget (fiscal) policy.
Socio-economic nature of household finances is manifested in connection with
their functions: (i) formation of resources; (ii) distribution; (iii) playback; (iv)
regulation; (v) investment; (vi) consolidation; and (vii) control.
99
Evaluation of the households' financial resources is conducted through
analysis of material living standards indicators and an assessment of the financial
condition and general well-being.
The latest financial research studies consider that well-being consists of more
than a simple measure of material circumstances. Organization for Economic
Cooperation and Development (OECD), in 2011 report, states that since well-being
is a complex concept that consist of a large number of determinants that are strongly
correlated with each other; its assessing should be made with a comprehensive
framework that allows identification of how interrelations of well-being components
shape households’ lives. The OECD’s Better Life Initiative, based on multi-
dimensional approach, determinates three main components for understanding
and measuring household’s well-being: (i) economic well-being (also referred as
material living conditions), which explains household’s consumption possibilities and
their command over resources; (ii) the quality of life, which is reflected in non-
financial attributes of individuals that shape their opportunities and life chances and
has intrinsic value under different cultures and contexts; (iii) sustainability of the socio-
economic and natural systems where households live and work.
The traditional and most common measures of a household’s economic
well-being are financial resources available to the household and expressed in income
and wealth. An alternative measure, indicating the current standard of living
enjoyed by a household, is the household’s consumption of goods and services.
Table 6.2 shows the differentiation of household living standards in Ukraine
using the measure of economic well-being for the period 2010–2014.
Subsistence minimum (also referred as a living wage) is an important
parameter in assessing the household’s financial resources and their financial
conditions because it serves as a basic social standard measure that reflects the
minimal set of products and services that individual should receive for physiological,
spiritual and social needs. Subsistence minimum also could be viewed as the lowest
level of income for the unemployed household member. Subsistence minimum fixed
by the government is a tool of direct impact on the size of the household’s financial
resources since it is used as a basis for the minimum wage, old-age security pensions,
various social transfers, the value of income taxes and the possible spending pattern,
as well as the formation of additional pension fund provided the state guarantees a
certain level of minimum pensions.
Добавлено примечание ([G239]): Inserted: the
Добавлено примечание ([G240]): Inserted: the
Добавлено примечание ([G241]): Inserted: the
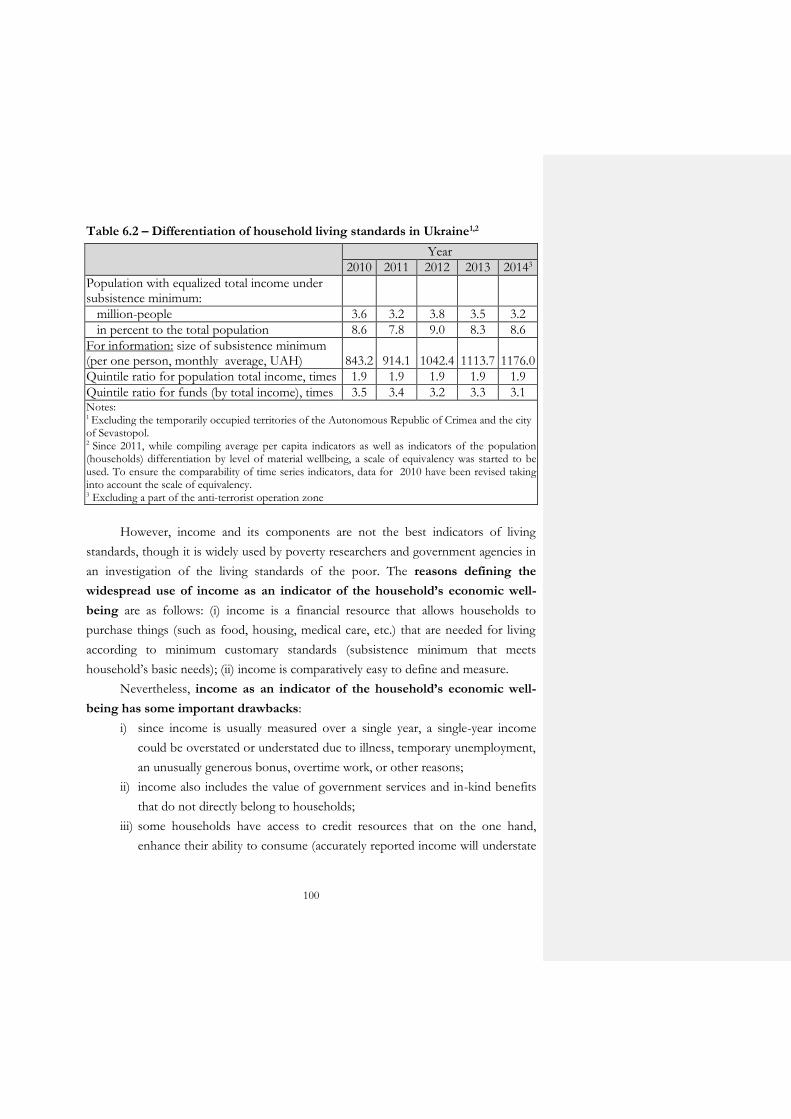
100
Table 6.2 – Differentiation of household living standards in Ukraine1,2
Year
2010 2011 2012 2013 20143
Population with equalized total income under subsistence minimum:
million-people 3.6 3.2 3.8 3.5 3.2
in percent to the total population 8.6 7.8 9.0 8.3 8.6
For information: size of subsistence minimum (per one person, monthly average, UAH) 843.2 914.1 1042.4 1113.7 1176.0
Quintile ratio for population total income, times 1.9 1.9 1.9 1.9 1.9
Quintile ratio for funds (by total income), times 3.5 3.4 3.2 3.3 3.1 Notes: 1 Excluding the temporarily occupied territories of the Autonomous Republic of Crimea and the city of Sevastopol. 2 Since 2011, while compiling average per capita indicators as well as indicators of the population (households) differentiation by level of material wellbeing, a scale of equivalency was started to be used. To ensure the comparability of time series indicators, data for 2010 have been revised taking into account the scale of equivalency. 3 Excluding a part of the anti-terrorist operation zone
However, income and its components are not the best indicators of living
standards, though it is widely used by poverty researchers and government agencies in
an investigation of the living standards of the poor. The reasons defining the
widespread use of income as an indicator of the household’s economic well-
being are as follows: (i) income is a financial resource that allows households to
purchase things (such as food, housing, medical care, etc.) that are needed for living
according to minimum customary standards (subsistence minimum that meets
household’s basic needs); (ii) income is comparatively easy to define and measure.
Nevertheless, income as an indicator of the household’s economic well-
being has some important drawbacks:
i) since income is usually measured over a single year, a single-year income
could be overstated or understated due to illness, temporary unemployment,
an unusually generous bonus, overtime work, or other reasons;
ii) income also includes the value of government services and in-kind benefits
that do not directly belong to households;
iii) some households have access to credit resources that on the one hand,
enhance their ability to consume (accurately reported income will understate
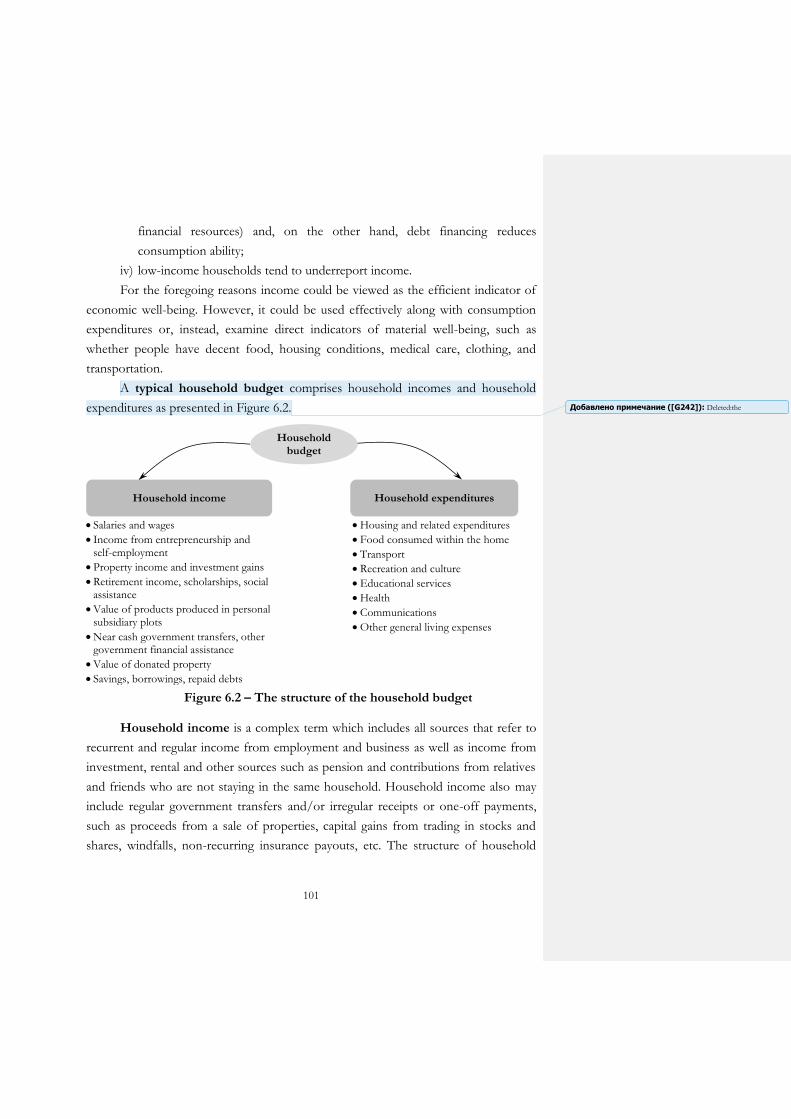
101
financial resources) and, on the other hand, debt financing reduces
consumption ability;
iv) low-income households tend to underreport income.
For the foregoing reasons income could be viewed as the efficient indicator of
economic well-being. However, it could be used effectively along with consumption
expenditures or, instead, examine direct indicators of material well-being, such as
whether people have decent food, housing conditions, medical care, clothing, and
transportation.
A typical household budget comprises household incomes and household
expenditures as presented in Figure 6.2.
Figure 6.2 – The structure of the household budget Household income is a complex term which includes all sources that refer to
recurrent and regular income from employment and business as well as income from
investment, rental and other sources such as pension and contributions from relatives
and friends who are not staying in the same household. Household income also may
include regular government transfers and/or irregular receipts or one-off payments,
such as proceeds from a sale of properties, capital gains from trading in stocks and
shares, windfalls, non-recurring insurance payouts, etc. The structure of household
Household income Household expenditures
Household budget
Salaries and wages
Income from entrepreneurship and self-employment
Property income and investment gains
Retirement income, scholarships, social assistance
Value of products produced in personal subsidiary plots
Near cash government transfers, other government financial assistance
Value of donated property
Savings, borrowings, repaid debts
Housing and related expenditures
Food consumed within the home
Transport
Recreation and culture
Educational services
Health
Communications
Other general living expenses
Добавлено примечание ([G242]): Deleted:the
102
income in Ukraine is shown in Table 6.3. Household income received could be
classified according to the following main sources:
(i) employment income received by working members of the household from
employment before deduction for tax or loan repayment. It includes the basic wage or
salary, employer’s and employee’s contributions, leave allowance and overtime pay,
commissions, tips, wage supplements as well as income in kind provided by the
employer, e.g., food, clothing, and lodging. It also includes one-twelfth of the annual
bonus as well as regular income received from secondary employment;
(ii) business income refers to the average monthly receipts or profits a person
earns from business, trade or profession after deducting all operating expenses
(purchases of materials and services, rent for premises or machineries, the cost of
repair of machineries and fixtures). When a person’s income is derived from a
partnership, his income refers to his share of the net profit. Also included are the
regular incomes received from any secondary business engagements, estimated value
of goods (at a current retail price) taken from shop or farm for household’s own
consumption as well as royalties received;
(iii) rental income includes the gross monthly rentals received from renting out
houses, including subletting of rooms, shops or other fixed assets (e.g., equipment,
machinery, etc.);
(iv) investment income includes interest income (interests received or credited
for saving/fixed deposits with banks, finance companies as well as interest received
from Government securities, interests on loans extended) and dividend income
(amount of dividends received from stocks and shares, exchange traded funds, growth
funds, and unit trusts);
(v) contributions include the average monthly cash contributions given by any
persons who are not members of the same household. It includes alimony or regular
money allowance received by the divorcee;
(vi) pension refers to the payment received by the retired person;
(vii) social welfare grants include public assistance or regular allowances
received by the household or person from the government or charitable organizations;
(viii) bursary, scholarship, and fellowship refer to the average monthly grants
from such awards received by students or persons for studying, training or research in
educational institutions, training or research centers;
Добавлено примечание ([G243]): Inserted: is
Добавлено примечание ([G244]): Inserted: ,
Добавлено примечание ([G246]): Deleted:s
Добавлено примечание ([G245]): Inserted: z
Добавлено примечание ([G249]): Deleted:r
Добавлено примечание ([G247]): Inserted: r
Добавлено примечание ([G248]): Inserted: ,

103
(ix) regular payment from insurance policies refers to the regular (income
loss) compensation payout due to critical illness, disability or other conditions covered
by the insurance protection policy;
(x) government transfers refer to regular government transfers and transfers
that are disbursed on an ad-hoc, irregular basis over a specific period, or at specific life
stages.
Table 6.3 – Structure of total resources in Ukraine1
Year
2010 2011 2012 2013 20142
Average monthly total resources per one household, UAH 3481.0 3853.9 4144.5 4470.5 4563.3
Structure of household total resources, percent
Cash income: 89.1 88.9 91.0 90.8 91.2
- labor remuneration 47.6 48.9 50.8 50.6 48.8
- income from entrepreneurship and self-employment 6.1 4.6 4.1 4.1 5.2
- income from sales of agricultural products 3.4 3.1 2.8 2.8 3.2
- cash pensions, stipends and social benefits 25.8 25.5 27.1 27.1 27.0
- cash support from relatives, other persons, and other cash income 6.2 6.8 6.2 6.2 7.0
Value of consumed products that were produced at private subsistence farms or individually procured 5.0 4.8 3.8 3.9 4.6
Non-cash benefits and subsidies to pay for housing and communal utilities, electricity, and fuel 0.6 0.6 0.6 0.4 0.4
Non-cash benefits to pay for goods and services on health protection, travel services, to pay for places in recreation departments, etc., to pay for transportation and communication services 0.5 0.5 0.5 0.5 0.4
Other receipts 4.8 5.2 4.1 4.4 3.4
For information: total income, UAH 3369.8 3708.2 4031.9 4331.0 4470.9 Notes: 1 Excluding the temporarily occupied territories of the Autonomous Republic of Crimea and the city of Sevastopol. 2 Excluding part of the anti-terrorist operation zone
Household expenditures could be divided into (i) consumption and (ii) non-
consumption expenditures. Household consumption expenditure is the value of
Добавлено примечание ([G250]): Inserted: ,

104
consumer goods and services acquired, used or paid by a household for the
satisfaction of the needs and wants of its members. Non-consumption
expenditures include loan repayments, income taxes, and purchase of houses. The
level and pattern of households’ expenditure provide an indication of the goods and
services they consume. Depending on their profiles and the life stages they are in,
households can finance their expenditure through regular income sources, such as
income from work and investment income, savings, irregular receipts, such as capital
gains, or loans, etc. Household expenses refer to the cost of maintaining a home,
such as paying the rent or the mortgage, utility bills, and groceries for the people living
in the house.
Table 6.4 – Structure of total expenditure1
Year
2010 2011 2012 2013 20142
Average monthly total expenditure per one household, UAH 3073.3 3458.0 3592.1 3820.3 4048.9
Structure of household total expenditure, percent
Total consumption expenditure 89.9 90.1 90.8 90.2 91.6
food and non-alcoholic beverages 51.6 51.3 50.1 50.1 51.9
alcoholic beverages and tobacco 3.4 3.4 3.5 3.5 3.4
manufactured goods and services, including 34.9 35.4 37.2 36.6 36.3
clothing and footwear 6.0 5.7 6.1 5.9 6.0
housing, water, electricity, gas and other fuels 9.2 9.6 9.9 9.5 9.4
furnishing, household equipment and routine maintenance of the house 2.3 2.2 2.3 2.3 2.3
health 3.2 3.2 3.4 3.4 3.6
transport 3.7 4.0 4.3 4.3 4.3
communication 2.7 2.6 2.8 2.8 2.8
recreation and culture 1.8 1.9 2.0 2.1 1.8
education 1.3 1.3 1.3 1.2 1.1
restaurants and hotels 2.4 2.5 2.5 2.5 2.3
miscellaneous goods and services 2.3 2.4 2.6 2.6 2.7
Non-consumption total expenditure 10.1 9.9 9.2 9.8 8.4
For information: payment for housing, communal products, and services 7.6 8.0 8.3 8.0 8.1
Notes: 1 Excluding the temporarily occupied territories of the Autonomous Republic of Crimea and the
city of Sevastopol. 2 Excluding part of the anti-terrorist operation zone
Добавлено примечание ([G251]): Inserted: ,
105
RECOMMENDED READING
1. Christelis, D., Georgarakos, D., and Haliassos, M., 2013, Differences in Portfolios Across Countries: Economic Environment versus Household Characteristics, The Review of Economics and Statistics, 95(1), pp. 220–36.
2. Deaton, A., 1992, Understanding Consumption, Oxford, Oxford University Press. 3. Eymann, A., and Boersch-Supan, A., 2002, Household Portfolios in Germany,
Household Portfolios, Cambridge, MA: MIT Press. 4. Fang, Yang, 2009, Consumption over the Life Cycle: How Different is Housing?,
Review of Economic Dynamics, 12, pp. 423–443. 5. Guiso L., and Jappelli, T., 2002, Household Portfolios in Italy, In L. Guiso,
T. Jappelli and M. Haliassos eds.Household Portfolios, Cambridge, MA: MIT Press. 6. Guiso, L., Haliassos, M., and Jappelli, T., 2001, Household Portfolios, Cambridge,
MA: MIT Press. 7. Guiso L., and Sodini, P., 2013, Household Finance: An Emerging Field, Handbook of
the Economics of Finance, Amsterdam: Elsevier, 2 (B), pp. 1349–1532. 8. Huggett, M., and Ventura, G., 2000, Understanding why High-Income
Households Save More than Low-Income Households, Journal of Monetary Economics, 45, pp. 361–397.
9. Muth, Richard F., 1966, Household Production and Consumer Demand Functions, Econometrica, 34 (3), pp. 699–708.
10. Tufano, P., 2009, Consumer finance, Annual Review of Financial Economics, 1, pp. 227–247.
KEY TERMS
household production
is the production of goods and services by the members of a household, using their own human (hours spent in shopping, cooking, laundry and ironing) and real capital (kitchen equipment, tables, and chairs, kitchen and dining room space), for their own final consumption.
intermediate commodities (producer goods)
are goods used as inputs in the production of other goods and services, such as partly finished goods or raw materials. In the production process, intermediate commodities either become part of the final product or are changed beyond recognition in the process.
final consumption commodities
are goods and services used by end consumers.
household economy
describes the collective economic activities of households.
household final consumption expenditure
is a transaction of the national account's use of income account representing all purchases made by resident households (home or abroad) to meet their everyday needs and wants (consumer spending).
Добавлено примечание ([G252]): Inserted: -
Добавлено примечание ([G253]): Inserted: -
Добавлено примечание ([G254]): Inserted: ,
Добавлено примечание ([G255]): Deleted:,
106
household goods
are goods and products used within households. Examples of household goods include baby items, beds/bedframes, blankets, bedding, linens, towels, blenders, mixers, bookcases, books, chairs, clothes dryers, coffee makers, computers, etc.
main income earner in the household
is the household member, excluding maids, who receives the highest income from all sources and generally covers most household expenses and financially supports the dependents.
head of household
is a status held by the person in a household generally acknowledged as such by other members of the household. The head is normally the oldest member, the main income earner, the owner-occupier of the house or the person who manages the affairs of the household. Where the household comprises a group of unrelated persons, the head of the household refers to the person who manages the affairs of the household or any responsible person who supplied the information pertaining to the other household members.
household size
refers to the total number of members of the household, including maids.
household living arrangement
refers to the classification of a household according to the household composition, age and marital status of household head and age group of the youngest child of the head.
family-based households
refer to households with at least one family nucleus.
non-family-based households
refer to households with no family nucleus.
living wage (subsistence minimum)
is a wage on which it is possible for a wage earner or an individual and his or her family to live at least according to minimum customary standards, that means to meet basic needs, provides with some ability to deal with emergencies, without resorting to welfare or other public assistance.
minimum wage
is the lowest amount of money an employer can pay its employees for work performed as fixed by law.
pension fixed income
refers to pension savings in retirement accounts and pension annuities held directly or indirectly in fixed income instruments.
consumer debt
refers to vehicle loans, other installment loans, lines of credit other than home equity, loans against pension and life insurance, loans made for home improvements that are not collateralized by real estate.
financial investment
refers to pension and current fixed income instruments, pension and current directly and indirectly held equity, cash value life insurance, other trusts and managed investment accounts, other pension savings, and pension and non-pension annuities.
blended family (stepfamily)
is a family where either one or both parents may have children from a previous relationship that are not genetically related to the other parent. Children from a blended family may live with one biological parent, or they may live with each biological parent for a period of time.
family is a group of people related by consanguinity (by recognized birth), affinity (by marriage), or co-residence and/or shared consumption. Members of the immediate
Добавлено примечание ([G257]): Deleted:in
Добавлено примечание ([G256]): Inserted: of
Добавлено примечание ([G258]): Deleted:s
Добавлено примечание ([G259]): Deleted:s
Добавлено примечание ([G260]): Inserted: a
107
family include spouses, parents, brothers, sisters, sons and/or daughters. Members of the extended family may include grandparents, aunts, uncles, cousins, nephews, nieces, and/or siblings-in-law.
family life cycle
is a concept of household finance that attempts to describe the effect of time on a family through the phases of marriage (and divorce) and births and deaths, reflected in the family's income and consumer behavior, and widely used as a basis for market segmentation.
REVIEW QUESTIONS
1. What is the role of household finance in the national economy?
2. How is household finance associated with areas of the financial system?
3. Define the concept of household. Give detailed description of household
characteristics and main functions.
4. Explain the difference between household finance, family finance and personal
finance.
5. What is the living standard? How it could be measured?
6. Could the living standards be changed over time for different types of
households?
7. Do you agree that such variables as family type, place of residence, employment
status of household members, levels and structures of household expenditures
explain household well-being?
8. How do households generate funds? How are they classified?
9. Distinguish between the terms “household income” and “general household
welfare”.
10. What is the subsistence minimum? How is the subsistence minimum calculated?
11. What is the difference between the subsistence minimum and minimum wage?
12. What are the main groups of household expenditures?
13. Identify factors influencing household expenditures.
14. Do you agree that levels and patterns of household expenditures differ across
socio-economic groups, particularly income groups (e.g., poor vs well-to-do
households)?
15. To which extent does household income determine the levels and patterns of
household expenditures?
Добавлено примечание ([G261]): Deleted:s
Добавлено примечание ([G263]): Deleted:F
Добавлено примечание ([G262]): Inserted: The f
108
MULTIPLE CHOICE QUESTIONS
1. The main functions of the households are as follows: a) supply of human and real capital; b) filling the budget incomes; c) delivery of financial resources;
d) all of the above answers.
2. The process of decision making that directly or indirectly involves two or more family members is called a) group decision making; b) joint decision making; c) consumer decision making; d) family decision making; e) household decision making.
3. Michael and his two roommates share an apartment at the university campus. Together they constitute a) family; b) nontraditional family; c) blended family; d) household.
4. Which of the following is the basic consumption unit for products that are purchased for consumption? a) company; b) individual; c) household;
d) family.
5. Which of the following would be considered a household factor that influences purchase and consumption behavior? a) household size; b) household decision process; c) stage of the household life cycle; d) only a and b.
6. Which of the following would be considered as factors influencing households consumer buying behavior? a) culture, subculture or social environment to which the household belongs; b) role specialization of different family members; c) common consumption trends among the family members; d) personal characteristics of the family members; e) all of the above answers.
109
7. John and Dawn have been married for over twenty years. They have lived in their home in Northville, MI (a suburb of Detroit) with their three children for most of those years. According to the Census Bureau, which type of household do they live in? a) suburban household; b) urban household; c) rural household; d) blended family household; e) family household group.
8. The following asset is the highest proportion in the structure of family budget: a) salaries; b) income from part-time farm; c) state transfers; d) rental income; e) investment income.
9. Aggregate household income should not be less than a) minimum wage; b) minimum social pension; c) subsistence minimum; d) all of the above answers.
10. Which of the following is not cash household expenditures? a) the cost of food and non-food products purchased; b) all household cash and in-kind expenses; c) costs of services and costs related to ancillary services; d) only a and c; e) all of the above answers.
SHORT ANSWER QUESTIONS
MISSING WORD QUESTIONS
Choose the correct word to complete each sentence.
1. Broadly speaking, income is composed of four main components: (i) _________________ from labor services; (ii) _________________ from the supply of land, capital, or other assets; (iii) __________________ income; and, (iv) ___________ from government or non-government agencies, or other households.
2. A family could be defined as either a married or cohabiting couple on their own, or
with their never-married children who have no children of their own, or lone parents with similar such children. Thus, members of a family are related by ____________, _____________ or ______________.

110
3. The ___________________ includes factors such as income, quality and availability of employment, class disparity, poverty rate, quality and affordability of housing, hours of work required to purchase necessities, gross domestic product, inflation rate, number of holiday days per year, affordable (or free) access to quality healthcare, quality and availability of education, life expectancy, incidence of disease, cost of goods and services, infrastructure, national economic growth, economic and political stability, political and religious freedom, environmental quality, climate and safety.
4. ___________________ defines the amount of the funds necessary for a household
to provide for the temporary essentials of life of the household’s members at a very modest level.
5. The living wage differs from the _______________ in that the latter is set by law
and can fail to meet the requirements to have a basic quality of life and leaves the family to rely on government programs for additional income.
TRUE/FALSE/UNCERTAIN QUESTIONS
Decide whether the following statements are True, False, or Uncertain. Explain your reasoning. Your score will be based not just on whether you get the True, False, or Uncertain part right but also, to a larger exyent, on the quality of your explanation.
1. Income have not considered home production, although this can be conceived as a form of income.
2. The standard of living is closely related to quality of life.
3. Income is a perfect predictor of the standard of living of households if it is measured by what people consume.
4. The reason that consumption and income give different impressions is that households can borrow or save (including by buying consumer durables), so the amount of consumption in any period is not constrained to be equal to income in that period.
5. The subsistence minimum is used to assess whether an individual or a family needs social protection.
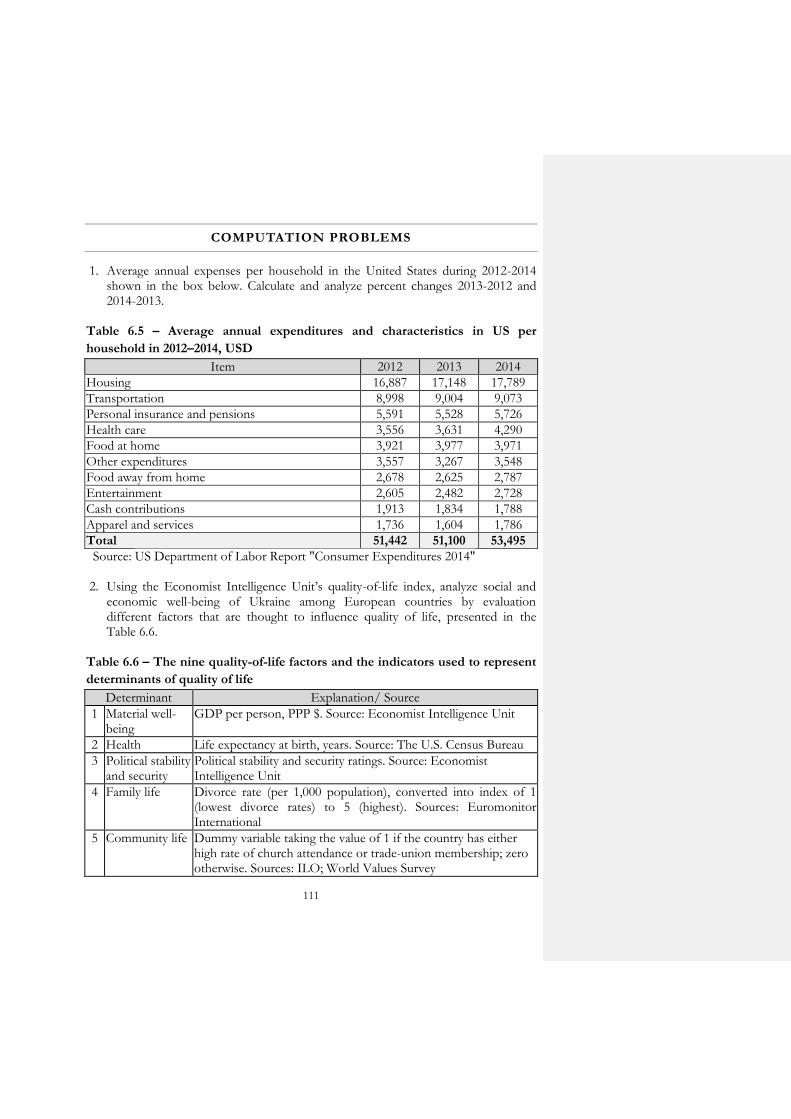
111
COMPUTATION PROBLEMS
1. Average annual expenses per household in the United States during 2012-2014 shown in the box below. Calculate and analyze percent changes 2013-2012 and 2014-2013.
Table 6.5 – Average annual expenditures and characteristics in US per
household in 2012–2014, USD
Item 2012 2013 2014
Housing 16,887 17,148 17,789
Transportation 8,998 9,004 9,073
Personal insurance and pensions 5,591 5,528 5,726
Health care 3,556 3,631 4,290
Food at home 3,921 3,977 3,971
Other expenditures 3,557 3,267 3,548
Food away from home 2,678 2,625 2,787
Entertainment 2,605 2,482 2,728
Cash contributions 1,913 1,834 1,788
Apparel and services 1,736 1,604 1,786
Total 51,442 51,100 53,495
Source: US Department of Labor Report "Consumer Expenditures 2014" 2. Using the Economist Intelligence Unit’s quality-of-life index, analyze social and
economic well-being of Ukraine among European countries by evaluation different factors that are thought to influence quality of life, presented in the Table 6.6.
Table 6.6 – The nine quality-of-life factors and the indicators used to represent
determinants of quality of life
Determinant Explanation/ Source
1 Material well-being
GDP per person, PPP $. Source: Economist Intelligence Unit
2 Health Life expectancy at birth, years. Source: The U.S. Census Bureau
3 Political stability and security
Political stability and security ratings. Source: Economist Intelligence Unit
4 Family life Divorce rate (per 1,000 population), converted into index of 1 (lowest divorce rates) to 5 (highest). Sources: Euromonitor International
5 Community life Dummy variable taking the value of 1 if the country has either high rate of church attendance or trade-union membership; zero otherwise. Sources: ILO; World Values Survey
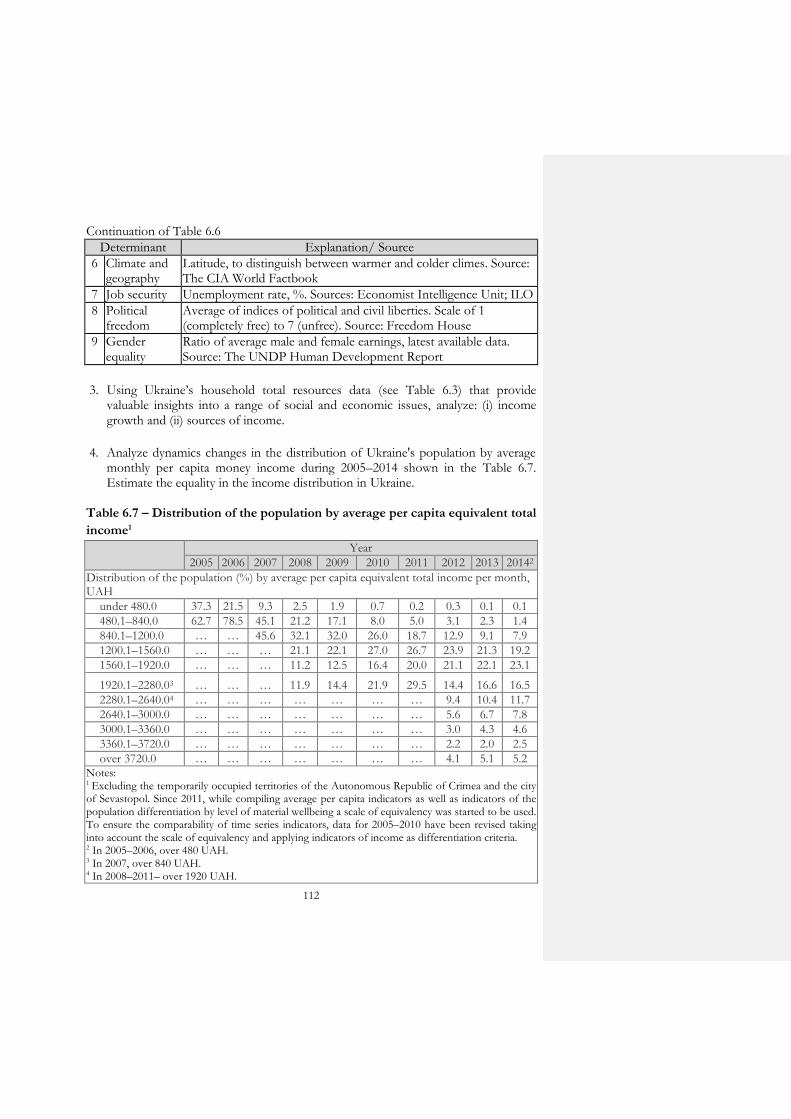
112
Continuation of Table 6.6
Determinant Explanation/ Source
6 Climate and geography
Latitude, to distinguish between warmer and colder climes. Source: The CIA World Factbook
7 Job security Unemployment rate, %. Sources: Economist Intelligence Unit; ILO
8 Political freedom
Average of indices of political and civil liberties. Scale of 1 (completely free) to 7 (unfree). Source: Freedom House
9 Gender equality
Ratio of average male and female earnings, latest available data. Source: The UNDP Human Development Report
3. Using Ukraine’s household total resources data (see Table 6.3) that provide valuable insights into a range of social and economic issues, analyze: (i) income growth and (ii) sources of income.
4. Analyze dynamics changes in the distribution of Ukraine's population by average monthly per capita money income during 2005–2014 shown in the Table 6.7. Estimate the equality in the income distribution in Ukraine.
Table 6.7 – Distribution of the population by average per capita equivalent total
income1
Year
2005 2006 2007 2008 2009 2010 2011 2012 2013 20142
Distribution of the population (%) by average per capita equivalent total income per month, UAH
under 480.0 37.3 21.5 9.3 2.5 1.9 0.7 0.2 0.3 0.1 0.1
480.1–840.0 62.7 78.5 45.1 21.2 17.1 8.0 5.0 3.1 2.3 1.4
840.1–1200.0 … … 45.6 32.1 32.0 26.0 18.7 12.9 9.1 7.9
1200.1–1560.0 … … … 21.1 22.1 27.0 26.7 23.9 21.3 19.2
1560.1–1920.0 … … … 11.2 12.5 16.4 20.0 21.1 22.1 23.1
1920.1–2280.03 … … … 11.9 14.4 21.9 29.5 14.4 16.6 16.5
2280.1–2640.04 … … … … … … … 9.4 10.4 11.7
2640.1–3000.0 … … … … … … … 5.6 6.7 7.8
3000.1–3360.0 … … … … … … … 3.0 4.3 4.6
3360.1–3720.0 … … … … … … … 2.2 2.0 2.5
over 3720.0 … … … … … … … 4.1 5.1 5.2 Notes: 1 Excluding the temporarily occupied territories of the Autonomous Republic of Crimea and the city of Sevastopol. Since 2011, while compiling average per capita indicators as well as indicators of the population differentiation by level of material wellbeing a scale of equivalency was started to be used. To ensure the comparability of time series indicators, data for 2005–2010 have been revised taking into account the scale of equivalency and applying indicators of income as differentiation criteria. 2 In 2005–2006, over 480 UAH. 3 In 2007, over 840 UAH. 4 In 2008–2011– over 1920 UAH.

113
At the end of 2014, the Parliament of Ukraine adopted a legislative package that significantly changes the order and rates of personal income taxation and payment of the Unified Social Tax (UST). In 2013, the rate for employment income and remuneration for civil contracts up to a threshold of 10 times the minimum monthly wage (UAH 1,147 – approx. USD 144 as of January 1, 2013) was 15 %. An increased rate of 17 % is applied to income in excess of this threshold. Starting from January 1, 2015, personal income tax planned to be levied at rate of 15 % (applicable to that part of income not exceeding ten minimal statutory wages) and 20 % (applicable to part of income exceeding ten minimal statutory wages). Analyze the impact of new policies in personal income tax rates on particular people or subpopulations distributed by average per capita equivalent total income per month.
5. Using data about structure of total household expenditure in Ukraine, (i) critically
examine the general changes in expenditure structures and consumption patterns in Ukraine across time. A number of factors are likely to have restrained household spending growth over the recent past, including weak income growth, tight credit conditions, concerns about debt levels, the fiscal consolidation, and uncertainty about future incomes. Decide (ii) what socio-economic determinants affect household spending? Analyze the data in Figure 6.3. (iii) Does the differences in structure of household expenditures reflect economic and social inequalities as well as cultural differences and social distinctions between countries?
Figure 6.3 – Structures of expenditures in Ukraine and EU 27 (Source: Authors’ elaboration based on Eurostat data)
0% 6% 12%18%24%30%36%42%48%54%60%
Housing, water, electricity, gas and other…
Transport
Food and non-alcoholic beverages
Miscellaneous goods and services
Recreation and culture
Restaurants and hotels
Furnishing, household equipment…
Clothing and footwear
Alcoholic beverages, tobacco and narcotics
Health
Communication
Education
EU27 Ukraine
114
CHAPTER 7:
CORPORATE FINANCE
SUMMARY
Every decision made in a business has financial implications, and any decision
that involves the use of money is a corporate financial decision. Defined broadly,
everything that business does fit under the heading of corporate finance. The
definition of “corporate finance” differs considerably across the world. For
example, in the US the term “corporate governance” is used in a much broader way –
to describe activities, decisions, procedures and techniques that are concerned with
various aspects of a company’s finances and capital. The term “corporate finance” in
the UK is connected with transactions in which capital is raised in order to create,
develop, grow or acquire businesses.
In general, corporate finance is related to the financing and investment
decisions made by the management of companies in order to meet financial needs,
achieve the corporate goals and overall objectives of the organization. Thus, corporate
finance focuses on a company's business and financial needs and includes financing,
risk management, capitalization, and budgeting. Corporate finance may be also viewed
as a set of economic relations in the generation, allocation, and use of income and
funds of business entities in the reproduction process.
Corporate finance involves planning and controlling the resource acquisition
(where funds are raised from at the lowest possible cost to the company), the resource
allocation (where funds are deployed to with the intent of increasing shareholder
wealth over time) and, finally, the control of resources (whether funds are being used
effectively or not in order to reach the corporate goals).
Corporate finance (finance of business entities), like finance in general, has
certain common and specific features. The common feature of the corporate finance is
that they express a set of economic relations connected with the distribution of the
social product value. The following are specific features of corporate finance: (i)
subject of the study is financial resources of business entities; (ii) the nature of
economic relations is associated with the distribution of the social product value,
generation and use of the incomes and decentralized funds of financial resources in
115
the company; (iii) the purpose of economic relations is effective business entity
development at all stages of its operations, the implementation of the continuous
manufacturing; (iv) to enhance the efficiency of its operations and financial incentives
for employees; (v) the funds of financial resources, generated by the company, are not
mobilized for further redistribution, but for service of manufacturing process and
services. Different forms of business entities have specific aspects of finance.
There are two types of business entities in Ukraine: (i) economic
organization – legal entities, public companies, utilities and other specifically labelled
types of entities, which are registered in the manner prescribed by law; (ii) citizens of
Ukraine, foreigners and stateless individuals, who are engaged in business activities
and are registered in the manner prescribed by law as entrepreneurs (called as a sole
proprietorship).
Furthermore, the advantages and disadvantages of each type of entity, from a
legal and tax perspective, play an important role in the overall planning process. There
are six types of business entities that could be established according to the types of
business ownership provided for by the legislation of Ukraine. They are as follows:
a) the privately-owned company that operates on the basis of the private
property of individuals or business entity (legal entity);
b) the company that operates on the basis of collective property (collective
ownership)
c) the public utility company that operates on the basis of the communal
property of territorial communities;
d) the state-owned company established on the basis of state property;
e) company based on mixed ownership (based on the mix of various forms of
property ownership);
f) the joint public utility company that operates on the contractual basis of co-
financing the relevant territorial communities.
The specifics of corporate finance at business entities of different types of
ownership, as well as various organizational and legal forms based on the following
factors: (i) formation of the authorized capital; (ii) participants liability; (iii) mechanism
of income and expenses; (iv) profit distribution; (v) features of taxation. Detailed
characteristics of the features of corporate finance in different forms of business
entities are shown in Appendix A (Table A.1).
116
Organization of corporate finance should be read as methods and principles
through which the processes of generation, allocation, and use of financial resources
and control over their circulation in the reproduction process are performed. Business
activities in the market conditions can be organized in three ways: (i) commercial
calculation; (ii) non-profit organization; and (iii) budgeted funding.
The difference between them lies in establishing interdependence between
financial resources and sources of their formation, income, expenses and results of
operations. The commercial calculation is the basic method of business activities’
organization of the domestic companies.
The commercial calculation is based on the following principles:
a) full economic and legal separation (Company operates on the basis of the
statute, organizes it activities in accordance its own constitutive corporate
documents but within the national legislation; it has separate balance
statement, legal status, and bank accounts);
b) self-sufficiency, also called self-containment (Company can cover the cost
of simple reproduction from their own income. There are two forms of
self-sufficiency: full (means that the company covers full costs by income)
and partial (only part of the costs conducted are covered));
c) profitability (The income received by the company can not only cover costs
but also generate a profit);
d) self-financing (Company covers the cost of production development
through earned profit and loans attracted, which are also repaid through
these profits);
e) financial responsibility (Company bears full responsibility for results of its
activities).
Budgeted funding is the act of cost coverage through funding from the
budget and/or state target funds. Budgeted funding could be made through the
government’s financial resources (budget) and/or the centralized corporate funds.
Budgeted funding is based on the following principles:
a) planned nature means that financing is based on and within the limits of
established plan. The estimate is the basic detailed planning document;
b) targeted nature means that allocated funds can be directed only for the
purposes provided in the estimate;

117
c) allocation of the funds based on the actual performance indicators means
that the estimated financing is carried out within estimates but not on the
basis of the normative targets, but based on the actual operational indicators
of the institutions;
d) the financial statements mean establishing financial reporting to disclose an
organization’s financial status to financing agents;
e) bear financial and pecuniary responsibility.
A non-profit activity means that companies operate on the same basis as the
commercial calculation. However, this method does not involve principles of
profitability and self-financing. A specific feature of the formation of the financial
resources is that it’s quite often carried out by sponsorship and other revenues. The
main objective of non-profit organizations is to provide specific social needs rather
than profit. Their activities can be carried out on the non-profit principles. Social
institutions, companies of municipal facilities and others can base their activities
through principles of the non-profit organizations.
Regardless the areas where companies operate, their financial and business
activities are associated with the generation, allocation and use of financial resources.
Financial resources are the material basis of finances. There are many factors that
dictate the size of financial resources, such as (i) production output, (ii) current tax
system, (iii) components and structure of production costs, (iv) components and
structure of sales, and (v) an exchange rate.
Financial resources are a set of cash income and revenues of business entities
that are used to form decentralized funds or financial resources or in the unfunded
form in order to provide the reproduction process and meet financial commitments.
The economic nature and role of financial resources are determined by the structure
and forms of their generation and directions for use.
Table 7.1 presents the types and classification of financial resources.
An important aspect of the business entity financial activity is to generate and
use various money funds in order to provide the process of extended reproduction,
finance scientific and technical developments, mastering and implementation of the
new equipment and technology, and economic incentives.

118
Table 7.1 – Classification of financial resources
Criterion of classification
Type of financial resources
Definition/ Meaning
Source of generation
own financial resources
money that the company has as a result of its business: money that is obtained from within the business, e. g. income (loss) from product sales, net profit of the company, depreciation, contributions to the authorized (share) capital, rents, other internal revenue
borrowed financial resources
money that company can attract under the terms of credit repayment and payment of interest, e. g. bank loans, bonds issue, leasing
financial resources raised
money that the company can attract for a certain period from various sources for a day-to-day operation or extended reproduction and have irreversible manner: securities (shares) issue, budget allocations, insurance reimbursement, reallocation of funds from the industrial structures, charitable contributions, payables
Forms of ownership (property rights)
financial resources of the public sector economy
private financial resources
financial resources of business entities of different types of ownership
finance non-governmental organizations
Circular flow
start-up money, which company has when it starts business activities, e. g. share capital
augmented financial resources
money obtained as a result of business activity
Way of attraction
internal money that is obtained from within the business
external money obtained from outside the business, e. g. borrowed and raised financial resources
Direction of their use
financial resources to make current expenditures
financial resources to meet financial commitments to government agencies and funds
financial resources to finance investment
Nature of the their use
materialized financial resources
those that are invested in fixed assets
financial resources in circulation
current assets
Money funds include authorized capital (share capital in case of JSC), reserves,
production development fund, payroll (fund), depreciation fund, dividend fund,
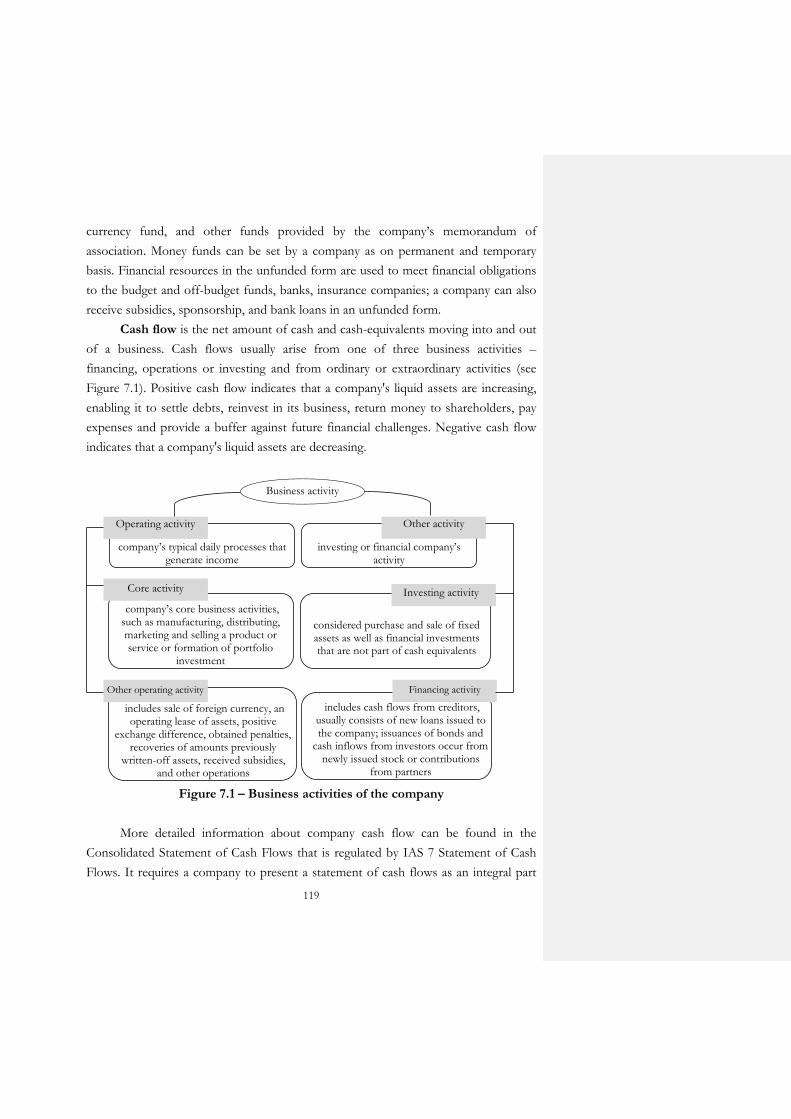
119
currency fund, and other funds provided by the company’s memorandum of
association. Money funds can be set by a company as on permanent and temporary
basis. Financial resources in the unfunded form are used to meet financial obligations
to the budget and off-budget funds, banks, insurance companies; a company can also
receive subsidies, sponsorship, and bank loans in an unfunded form.
Cash flow is the net amount of cash and cash-equivalents moving into and out
of a business. Cash flows usually arise from one of three business activities –
financing, operations or investing and from ordinary or extraordinary activities (see
Figure 7.1). Positive cash flow indicates that a company's liquid assets are increasing,
enabling it to settle debts, reinvest in its business, return money to shareholders, pay
expenses and provide a buffer against future financial challenges. Negative cash flow
indicates that a company's liquid assets are decreasing.
Figure 7.1 – Business activities of the company
More detailed information about company cash flow can be found in the
Consolidated Statement of Cash Flows that is regulated by IAS 7 Statement of Cash
Flows. It requires a company to present a statement of cash flows as an integral part
considered purchase and sale of fixed assets as well as financial investments that are not part of cash equivalents
investing or financial company’s
activity
includes sale of foreign currency, an
operating lease of assets, positive exchange difference, obtained penalties,
recoveries of amounts previously written-off assets, received subsidies,
and other operations
company’s core business activities, such as manufacturing, distributing, marketing and selling a product or service or formation of portfolio
investment
Business activity
company’s typical daily processes that
generate income
Operating activity
Core activity
Other operating activity
Other activity
Investing activity
includes cash flows from creditors, usually consists of new loans issued to the company; issuances of bonds and
cash inflows from investors occur from newly issued stock or contributions
from partners
Financing activity

120
of its primary financial statements. Cash flows are classified and presented by
operating activities (either using the “direct” or “indirect” method), investing activities
or financing activities, with the latter two categories generally presented on a gross
basis. To understand the above point, see 2014 Skandvik Consolidated statement of
cash flows (real life application) is presented in Appendix A (Table A.2).
The definition of ordinary activities is very broad. The ordinary activity is
defined as the usual trading of a company, that is what the company usually does.
Ordinary activities mean activities that are undertaken by a company as part of its
business or to meet its objectives and related activities in which company engages in
furtherance of, incidental to, or arising from activities undertaken to meet its
objectives. Whether an item is clearly distinct from the ordinary activities of the
company and is, therefore, an extraordinary item determined by the nature of the
transaction or other event that gives rise to that item. Extraordinary activities are
attributable to transactions or other events of a type that are outside the ordinary
activities of the entity and are not of a recurring nature. A transaction or event may be
extraordinary for one company but not extraordinary for another because of the
nature of the companies’ respective ordinary activities. Examples of transactions or
other events that may give rise to extraordinary items are: (i) expropriation of assets;
and (ii) an earthquake or other natural disasters.
According to IAS 7, there are two methods of calculating cash flow from
operating activities: (i) direct and (ii) indirect. The direct method shows operating
cash receipts and payments made by the company during the period. It gives more
detailed information about where the cash has come from and where it has been
spent. In contrast, the indirect method of calculating cash flow from operating
activities will show net income followed by the adjustments needed to convert the
total net income to the cash amount from operating activities. Most companies find
the indirect method easier to employ because it is based on the readily available
information.
In corporate finance, it is important to investigate company’s financial progress
during the time period being examined. Consolidated statement of profit or loss and
other comprehensive income measures a company’s sales and expenses during a
specified period of time. Table A.3 (Appendix A) presents a real life Consolidated
statement of profit or loss and other comprehensive income of Sandvik in 2014.
Profit is frequently used as a measure of performance or as the basis for other
121
measures, such as return on investment or earnings per share. The step by step
approach to profit calculation is presented in Figure A.1 (Appendix A). According to
the Conceptual Framework for Financial Reporting, which was issued by the
International Accounting Standards Board (IASB), the elements directly related to the
measurement of profit are income and expenses. Income and expenses may be
presented in the income statement in different ways so as to provide information that
is relevant for economic decision-making.
Income is increased in economic benefits during the accounting period in the
form of inflows or enhancements of assets or decreases of liabilities that result in
increases in equity, other than those relating to contributions from equity participants
(for example owners, partners or shareholders). The definition of income
encompasses both revenue and gains. Revenue arises in the course of the ordinary
activities of the entity and is referred to a variety of different names including sales,
fees, interest, dividends, royalties and rent. Gains represent other items that meet the
definition of income and may, or may not, arise in the course of the ordinary activities
of an entity. Gains include, for example, those arising on the disposal of non-current
assets. The definition of income also includes unrealized gains; for example, those
arising on the revaluation of marketable securities and those resulting from increases
in the carrying amount of long-term assets. Various kinds of assets may be received or
enhanced by income; examples include cash, receivables and goods and services
received in exchange for goods and services supplied. Income may also result from the
settlement of liabilities, for example, an entity may provide goods and services to a
lender in settlement of an obligation to repay an outstanding loan.
Expenses are decreases in economic benefits during the accounting period in
the form of outflows or depletions of assets or incurrences of liabilities that result in
decreases in equity, other than those relating to distributions to equity participants.
The definition of expenses encompasses losses as well as those expenses that arise in
the course of the ordinary activities of the entity. Expenses that arise in the course of
the ordinary activities of the entity include, for example, the cost of sales, wages, and
depreciation. They usually take the form of an outflow or depletion of assets such as
cash and cash equivalents, inventory, property, plant, and equipment. Losses
represent other items that meet the definition of expenses and may, or may not, arise
in the course of the ordinary activities of the entity. Losses include, for example, those
resulting from disasters such as fire and flood, as well as those arising on the disposal

122
of non-current assets. The definition of expenses also includes unrealized losses, for
example, those arising from the effects of increases in the rate of exchange for a
foreign currency in respect of the borrowings of an entity in that currency.
Other comprehensive income is defined as comprising items of income and
expense (including reclassification adjustments) that are not recognized in profit or
loss as required or permitted by other IFRSs. Total comprehensive income is
defined as the change in equity during a period resulting from transactions and other
events, other than those changes resulting from transactions with owners in their
capacity as owners. Items that should be inserted in other comprehensive income can
include: (i) foreign operations (foreign currency translation differences); (ii) equity-
accounted investees (share of other comprehensive income); (iii) available for sale
financial assets (net change in fair value). It is acceptable to either report components
of other comprehensive income net of related tax effects, or before related tax effects
with a single aggregate income tax expense or benefit shown that relates to all of the
other comprehensive income items.
RECOMMENDED READING
1. Berk, J. B., and DeMarzo, P. M., 2007, Corporate Finance, Pearson Education. 2. Bolton, P., and Scharfstein, D. S., 1998, Corporate finance, the theory of the firm,
and organizations, The Journal of Economic Perspectives, pp. 95–114. 3. Clayman, M. R., Fridson, M. S., and Troughton, G. H., 2012, Corporate finance:
A practical approach, John Wiley & Sons. 4. Damodaran, A., 1996, Corporate finance, John Wiley & Sons. 5. Gitman, L. J., Juchau, R., and Flanagan, J., 2010, Principles of Managerial Finance,
Pearson Higher Education AU. 6. Graham, J. R., and Harvey, C. R., 2001, The theory and practice of corporate
finance: Evidence from the field, Journal of Financial Economics, 60 (2), pp. 187–243. 7. Graham, J. R., 2003, Taxes and corporate finance: A review, Review of Financial
Studies, 16 (4), pp. 1075–1129. 8. Mayer, C., 1988, New issues in corporate finance, European Economic Review, 32 (5),
pp. 1167–1183. 9. Ross, S. A., Westerfield, R., and Jordan, B. D., 2008, Fundamentals of Corporate
Finance, Tata McGraw-Hill Education. 10. Tirole, J., 2010, The Theory of Corporate Finance, Princeton University Press.
123
KEY TERMS
business entity is a commercial, corporate and/or other institution that is formed and administered as per commercial law in order to engage in business activities, usually for the sale of a product or a service, have separate property and responsible for its obligations within the property.
monetary fund is a reserve of money set aside for some purpose.
authorized capital (authorized share capital, registered capital or nominal capital)
is the maximum amount of share capital (the maximum value of securities) that the company is authorized by its constitutional documents to issue (allocate) to shareholders. This number is specified in the memorandum of association (or articles of incorporation in the US) when a company is incorporated, but can be changed later with shareholders' approval. Authorized capital is the main source of initial own funds and presents the upper boundary for the actually issued share capital.
issued share capital
is the total of the share capital issued (allocated) to shareholders; it may be less or equal to the authorized capital.
paid up capital is the amount of money that has been received from the shareholders (who have completely paid for their purchased shares) in exchange for shares; it can be less than a company's total capital because a company may not issue all of the shares that it has been authorized to sell.
unpaid capital is the amount of the nominal value of shares remaining unpaid by the shareholders for the shares they have bought.
depreciation fund is a fund (an amount of money) set up by a company to provide money to buy new fixed assets. Every year, the fund invests an amount of money equal to an existing asset's depreciation allowance, giving the company money that can be used to buy new assets.
production-
development fund is a fund (an amount of money) set up by a company to provide funding for feature film development and production.
pay-roll fund is a fund (an amount of money) created by a company for the monetary payments to employees for work performed in accordance with the contract of employment.
dividend fund is a type of mutual fund typically formed in the joint stock companies for the dividend payments to shareholders on a regularly-occurring basis. It is the opposite of a growth fund, which seeks to provide investors with long-term appreciation of capital.
cash inflow is the amount of cash collected (revenue) from different activities that changes a cash account (and/or bank account) during a given period of time (year, month, day).
124
core activity company’s core business activities, such as manufacturing, distributing, marketing and selling a product or service (for manufacturing company) or formation of portfolio investments (for an investment company), that provide the majority of a company’s cash flow and will largely determine whether a company is profitable.
other operating activities
is related activities in which the entity engages in furtherance of, incidental to, or arising from principal activities.
investing
activities is a company activity that make changes in a company's cash position resulting from investments in the financial markets and operating subsidiaries, and changes resulting from amounts spent on investments in capital assets such as plant and equipment.
financing
activities are transactions or business events that affect long-term liabilities and equity; transactions with creditors or investors used to fund either company operations or expansions.
cash and cash equivalents
means bank and cash balances, short term investments which are highly liquid and can be converted into cash within three months.
statement of cash flow
is a basic financial statement that provides information about the cash receipts and cash payments of an entity during a period, classified as operating, investing, and financing activities in a format that reconciles the beginning and ending cash balances.
free cash flow describes the cash remaining from operations after adjusting for payments of capital expenditures and dividends.
profit is a financial benefit that is realized when the amount of revenue gained from a business activity exceeds the expenses, costs and taxes needed to sustain the activity.
net loss is a result that occurs when expenses exceed the income or total revenue produced for a given period of time.
REVIEW QUESTIONS
1. What is corporate finance? Explain common and specific features of corporate
finance.
2. Explain the difference between public joint stock company and company with
limited liability.
3. Outline factors that determine specifics of corporate finance at business entities of
different types of ownership, as well as various organizational and legal forms.
125
4. What is the difference between borrowed financial resources and raised financial
resources?
5. What are some examples of investing activities on the cash flow statement?
6. What are some examples of financing activities on the cash flow statement?
7. What are some examples of financing activities on the cash flow statement?
8. What is the difference between the direct method and the indirect method for the
statement of cash flows?
9. What is included in cash and cash equivalents?
10. What is the difference between net cash flow and net income?
11. What is the difference between income and profit?
12. What is operating profit? How could it be calculated?
13. What is the difference between revenues and gains?
14. What is comprehensive income?
15. What are the elements of Consolidated statement of profit or loss and
comprehensive income?
MULTIPLE CHOICE QUESTIONS
Choose the one alternative that best completes the statement or answers the question.
1. Companies can raise cash to finance their investment activities by: a) making dividend payments; b) selling or issuing financial instruments; c) buying back their financial instruments; d) not producing goods during the current quarter; e) none of the above answers are correct.
2. Which of the following is not a true statement concerning sole proprietorships? a) the equity money that can be raised by the sole proprietor is limited to the
proprietor's personal wealth; b) the life of the sole proprietorship is limited to the life of the sole proprietor; c) the sole proprietor has limited liability for business debts; d) the sole proprietorship is the cheapest to form; e) the sole proprietorship pays no corporate income tax.
Добавлено примечание ([G265]): Deleted:it
Добавлено примечание ([G264]): Inserted: it
126
3. Which of the following would be considered a cash-flow item from a financing activity? a) a cash outflow to the government for taxes; b) a cash outflow to repurchase the firm's own common stock; c) a cash outflow to lenders as interest; d) a cash outflow to purchase bonds issued by another company.
4. Which of the following would be considered a cash-flow item from an operating activity? a) a cash outflow to the government for taxes; b) a cash outflow to repurchase the firm's own common stock; c) a cash outflow to lenders as interest; d) a cash outflow to purchase bonds issued by another company; e) none of the above answers are correct.
5. Which of the following is not a cash outflow for the company? a) depreciation; b) dividends; c) interest payments; d) taxes.
6. Which of the following attributes does not relate to the indirect method? a) it is derived from re-processing and re-classifying data from the income
statement and statement of financial position; b) it reports major classes of operating cash receipts and payments; c) it provides a useful link between the statement of cash flows, the income
statement, and the statement of financial position; d) it focuses on the difference between net income and net cash flow from
operations.
7. A company (non-financial institution) receives dividends from its investment in shares. How should a company disclose the dividends received in the statement of cash flow under IAS 7? a) either as operating cash inflow or as investing cash inflow; b) operating cash inflow; c) either as operating cash inflow or as financing cash inflow; d) financing cash flow.
8. If a company issues 1 million UAH 1 shares at UAH 1.30 per share, what will be the effect on the statement of cash flows? a) cash flows from financing activities will increase by UAH 1.3 million; b) cash flows from investing activities will increase by UAH 1.3 million; c) cash flows from investing activities will increase by UAH 1.0 million; d) cash flows from financing activities will increase by UAH 1.0 million.

127
Refer to the following information for questions 9–10. The following information is extracted from Consolidated statement of profit or loss and comprehensive income of Bananas Company for the year ended 31 Dec 2014
December 2014 UAH’000 Sales revenue 10,000 Cost of sales (8,500) Distribution costs (300) Administrative expenses (200) Net interest paid (150) Taxation (500) Dividends (100)
9. Bananas Company’s gross profit at a year-end amounts to: e) 1,000,000; f) 10,000,000; g) 1,500,000; h) 1,200,000.
10. Bananas Company’s operating profit at a year-end amounts to: a) 1,200,000; b) 1,050,000; c) 1,000,000; d) 1,500,000.
SHORT ANSWER QUESTIONS
MISSING WORD QUESTIONS
Choose the correct word to complete each sentence.
1. Under the _____________ method of determining the net cash provided by operating activities on the statement of cash flows, depreciation is __________ to the net income for the period.
2. Purchase of equipment would be considered as ___________ activity and
___________ cash for the purpose of constructing a statement of cash flows.
3. Borrowing on a long-term note would be considered as ___________ activity that
is ___________ cash for purposes of constructing a statement of cash flows.
Добавлено примечание ([G269]): Deleted:s
Добавлено примечание ([G266]): Inserted: ed
Добавлено примечание ([G268]): Deleted:are
Добавлено примечание ([G267]): Inserted: is
128
4. A company disposes of equipment that it no longer uses in its business. The amount received by the company is more than the amount the asset is carried at in the accounting records. The company will report an _______________________.
5. The profit of a business during an accounting period is equal to total __________
less total ________________.
TRUE/FALSE/UNCERTAIN QUESTIONS
Decide whether the following statements are True, False, or Uncertain. Explain your reasoning. Your score will be based not just on whether you get the true, false, uncertain part right but also heavily on the quality of your explanation. 1. The issuance of capital stock for cash at a price above par would increase the net
cash flow from operating activities.
2. An important distinction between the direct method and the indirect method of preparing a statement of cash flows is that the direct method reconciles accrual-based net income with net cash flow from operations, and the indirect method shows the specific cash inflows and outflows constituting the operating activities.
3. The same amount of “net cash provided by operating activities” will be obtained regardless of whether the direct method or the indirect method is used to construct the statement of cash flows.
4. Interest expense would be classified under operating activities.
5. The following items could be classified as operating expenses: advertising, selling and administrative, lease payments, and depreciation.
COMPUTATION PROBLEMS
1. For the following items indicate whether they will have a positive or negative effect on cash.
Note, that a positive effect could also be thought of as a source of cash, an increase in cash, or a positive amount on the cash flow statement; a negative effect could also be thought of as a use of cash, a decrease in cash, or a negative amount on the cash flow statement.
A. A decrease in supplies on hand. B. The proceeds from the sale of equipment formerly used in the business. C. The loss on the sale of equipment in the previous question. D. An increase in the current liability income taxes payable.
Добавлено примечание ([G272]): Deleted:r
Добавлено примечание ([G270]): Inserted: f
Добавлено примечание ([G271]): Deleted:f

129
E. A decrease in accounts payable. F. Dividends declared and paid. G. Proceeds from the issuance of preferred stock. H. An increase in the long-term asset investment in another company.
2. For each of the following items shown in the box, indicate which part will be affected.
Company’s activity during the period
Operating Investing Financing Supplemental
Depreciation expense
Proceeds from the sale of equipment used in the business
Gain on the sale of automobile formerly used in the business
Declaration and payment of dividends on company's stock
The retirement of long-term bonds payable
Purchase of treasury stock (company's own stock)
The exchange/conversion of long-term bonds into common stock
The proceeds from issuing additional common stock
The amortization of the cost of an intangible asset
3. The following extracts financial statement of Korwell Ltd.
Statement of financial position extracts at:
In thousands of hryvnias 2015 2014
Current assets
Inventories 2,000 2,500
Receivables 1,500 1,375
Current liabilities
Trade payables (1,400) (1,875)
Income tax (100) (200)
Добавлено примечание ([G274]): Deleted: the
Добавлено примечание ([G273]): Inserted: are
Добавлено примечание ([G276]): Deleted:R
Добавлено примечание ([G275]): Inserted: The r
Добавлено примечание ([G278]): Deleted:are
Добавлено примечание ([G277]): Inserted: s

130
Income statement for the year ended 31st March 2015
In thousands of hryvnias
Sales revenue 5,700
Cost of sales (3,500)
Gross profit 2,200
Admin and selling expenses (1,000)
Operating profit 1,200
Interest expense (200)
Investment income 500
Net profit before tax 1,500
Income tax expense (270)
Profit for the year 1,230
Dividends (730)
Retained profit for the year
500
Additional information: depreciation of UAH 50,000 has been charged to the cost
of sales in the income statement. Calculate the operating cash flow as per IAS 7, using the direct method.
4. The opening balance for a property, plant and equipment account was UAH 85
million. The closing balance was UAH 105 million.
During the year disposal was:
UAH million
Original cost 9
Accumulated depreciation 7
Sales proceeds 1
Additional information: (i) revaluation of property resulted in an increase of
UAH 1 million; (ii) new finance leases of UAH 14 million were also capitalized; (iii) depreciation of UAH 13 million was charged to the income statement for the period.
Calculate the cash flow that will appear in investing activities in the statement of cash flows relating to non-current assets.
5. Company’s pays UAH 140,000 to produce some goods (cost of sale). It sells those
goods for UAH 240,000, including VAT. During a month a company incurred the
following expenses: associated with the general administration of the business –
UAH 24,000; incurred by the sales department – UAH 8,000; other operating
expenses – 3,000. Calculate operating profit/loss.
Добавлено примечание ([G279]): Inserted: a
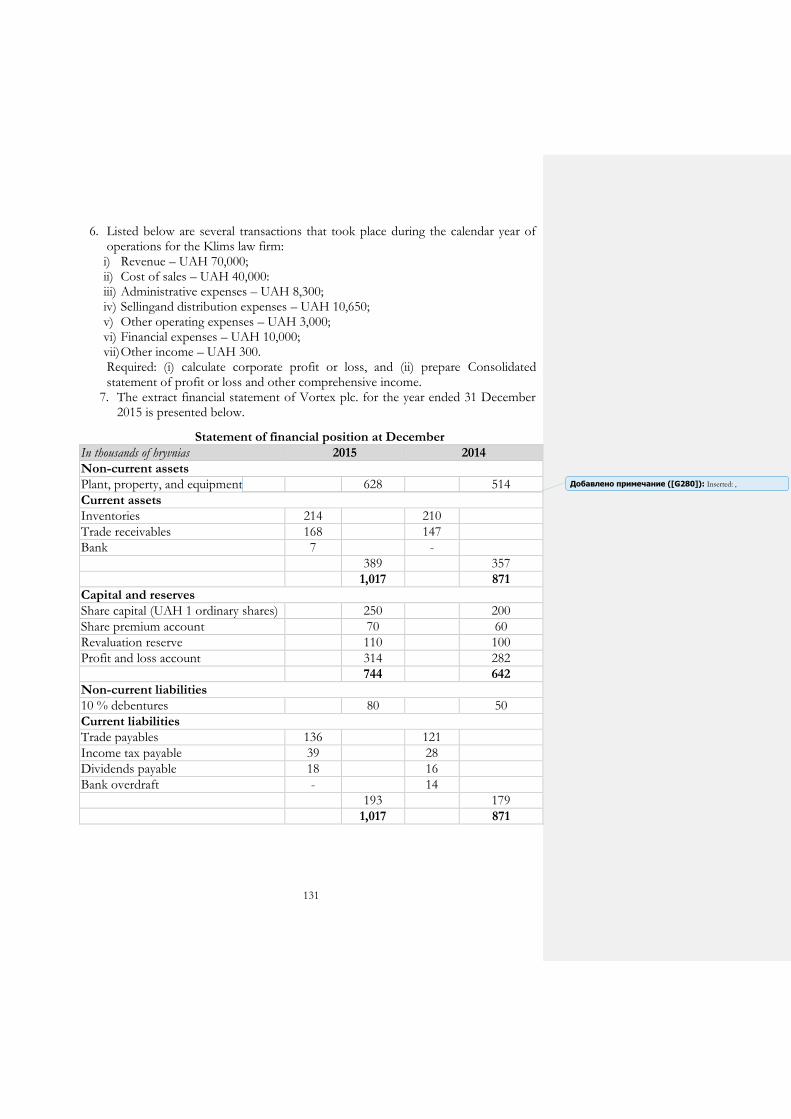
131
6. Listed below are several transactions that took place during the calendar year of operations for the Klims law firm: i) Revenue – UAH 70,000; ii) Cost of sales – UAH 40,000: iii) Administrative expenses – UAH 8,300; iv) Sellingand distribution expenses – UAH 10,650; v) Other operating expenses – UAH 3,000; vi) Financial expenses – UAH 10,000; vii) Other income – UAH 300. Required: (i) calculate corporate profit or loss, and (ii) prepare Consolidated statement of profit or loss and other comprehensive income.
7. The extract financial statement of Vortex plc. for the year ended 31 December 2015 is presented below.
Statement of financial position at December
In thousands of hryvnias 2015 2014
Non-current assets
Plant, property, and equipment 628 514
Current assets
Inventories 214 210
Trade receivables 168 147
Bank 7 -
389 357
1,017 871
Capital and reserves
Share capital (UAH 1 ordinary shares) 250 200
Share premium account 70 60
Revaluation reserve 110 100
Profit and loss account 314 282
744 642
Non-current liabilities
10 % debentures 80 50
Current liabilities
Trade payables 136 121
Income tax payable 39 28
Dividends payable 18 16
Bank overdraft - 14
193 179
1,017 871
Добавлено примечание ([G280]): Inserted: ,
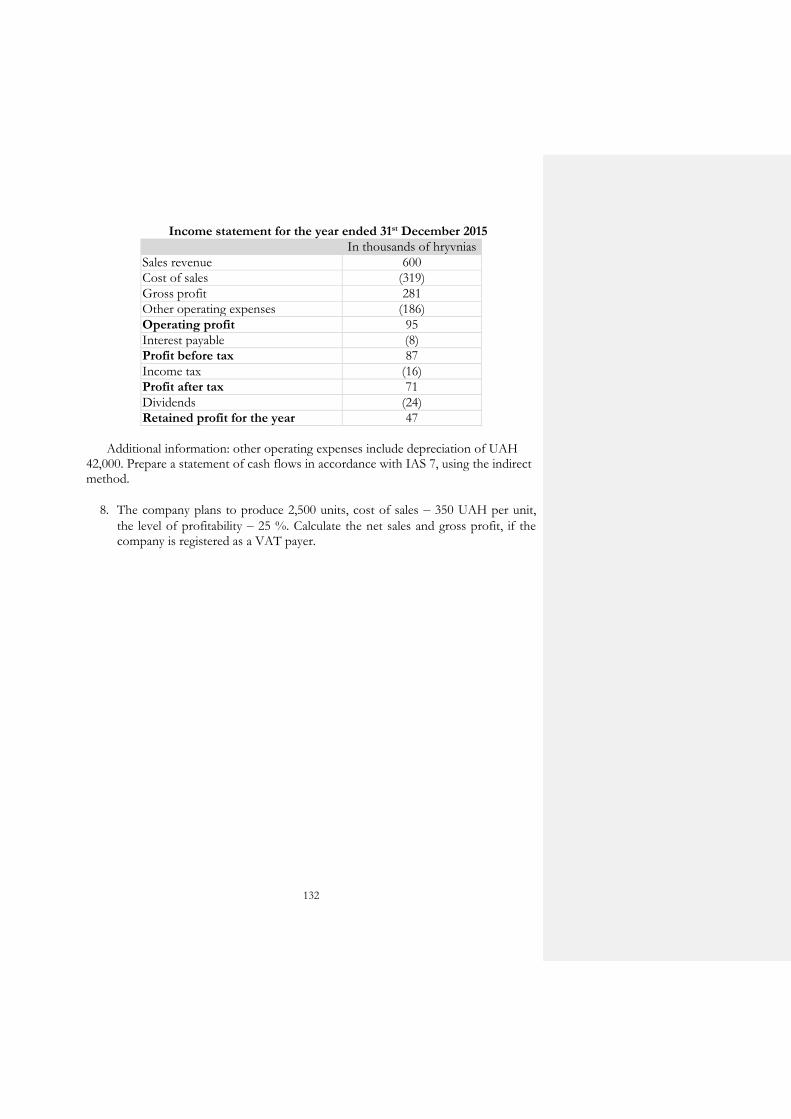
132
Income statement for the year ended 31st December 2015
In thousands of hryvnias
Sales revenue 600
Cost of sales (319)
Gross profit 281
Other operating expenses (186)
Operating profit 95
Interest payable (8)
Profit before tax 87
Income tax (16)
Profit after tax 71
Dividends (24)
Retained profit for the year 47
Additional information: other operating expenses include depreciation of UAH
42,000. Prepare a statement of cash flows in accordance with IAS 7, using the indirect method.
8. The company plans to produce 2,500 units, cost of sales – 350 UAH per unit,
the level of profitability – 25 %. Calculate the net sales and gross profit, if the company is registered as a VAT payer.
133
APPENDIX A
Table A.1 – List of important financial ratios for financial market analysis
Factors
Companies that operate on the basis of collective property Privately-
owned compa
ny
Public Joint Stock
Company
Company
Limited Liability Additional Liability Full Comma
ndite
Capital Divided
into shares
Divided into corporate stock One
owner
Profit distribution
In accordance with the dividend policy. Dividend per share is calculated
With the consent of all partners involved. Their rights and liabilities are fixed in Articles of Association
At the discretion of owner
Investment opportunities from external sources
High. Through loans and securities issuance
Relatively limited by the property value and company attractiveness
Financial owners liability
Within shares they own
Within corporate stock they own
Within corporate stock, they own and their property as a multiple of corporate stock they own
Joint responsibility within their property
Joint responsibility within property of one group of partners and within corporate stock – second group
Within company’s capital
Authorized capital
The minimum size set by
Any size
Добавлено примечание ([G283]): Deleted:m
Добавлено примечание ([G281]): Inserted: f
Добавлено примечание ([G282]): Deleted:fr
Добавлено примечание ([G284]): Inserted: ,

134
law (1250 minimum wages)
Government
By bodies fixed in Articles of Association (general meeting, supervisory board, executive board, audit committee)
With the consent of all partners involved
With the consent of all partners involved
With the consent of all partners involved
By partners with full liability
At the discretion of owner
Memorandum
Composed and operates Composed and operates.
Recorded during registration. Absent
Continuation of the Table A.1
Factors
Companies that operate on the basis of collective property
Privately-owned
company Public Joint
Stock Company
Company
Limited Liability
Additional Liability
Full Commandite
Articles of Association
Recorded during registration
Recorded during registration
Recorded during registration
Absent Absent Recorded during registration
Transparency (Information on business)
Annual financial statements are published. Information confirmed by an auditor
None, except that which is required for registration and financial statements
None, except that which is required for registration and financial statements
Removing partnership share
Not applicable. Shareholders withdraw their capital by selling shares
With the consent of all partners involved At the discretion of owner
Добавлено примечание ([G287]): Deleted:m
Добавлено примечание ([G285]): Inserted: f
Добавлено примечание ([G286]): Deleted:fr
Добавлено примечание ([G290]): Deleted:m
Добавлено примечание ([G288]): Inserted: f
Добавлено примечание ([G289]): Deleted:fr
Добавлено примечание ([G293]): Deleted:m
Добавлено примечание ([G291]): Inserted: f
Добавлено примечание ([G292]): Deleted:fr
Добавлено примечание ([G294]): Inserted: n a
Добавлено примечание ([G297]): Deleted:m
Добавлено примечание ([G295]): Inserted: f
Добавлено примечание ([G296]): Deleted:fr
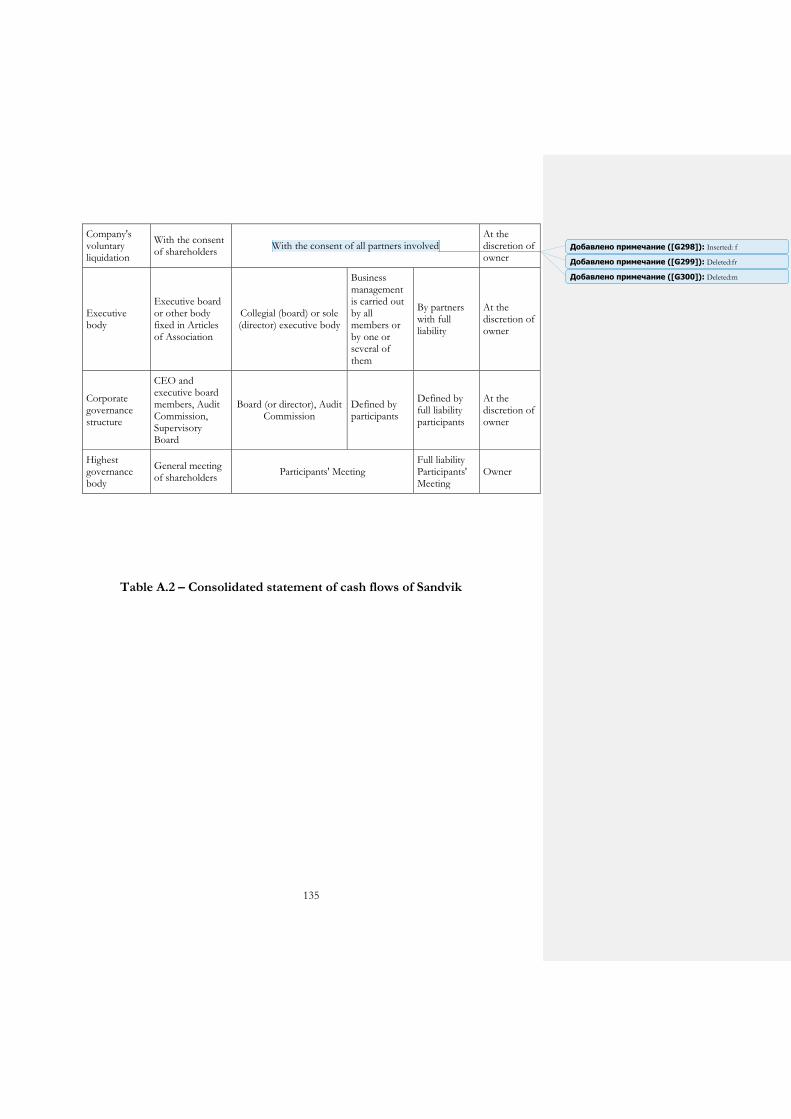
135
Company's voluntary liquidation
With the consent of shareholders
With the consent of all partners involved At the discretion of owner
Executive body
Executive board or other body fixed in Articles of Association
Collegial (board) or sole (director) executive body
Business management is carried out by all members or by one or several of them
By partners with full liability
At the discretion of owner
Corporate governance structure
CEO and executive board members, Audit Commission, Supervisory Board
Board (or director), Audit Commission
Defined by participants
Defined by full liability participants
At the discretion of owner
Highest governance body
General meeting of shareholders
Participants' Meeting Full liability Participants' Meeting
Owner
Table A.2 – Consolidated statement of cash flows of Sandvik
Добавлено примечание ([G300]): Deleted:m
Добавлено примечание ([G298]): Inserted: f
Добавлено примечание ([G299]): Deleted:fr
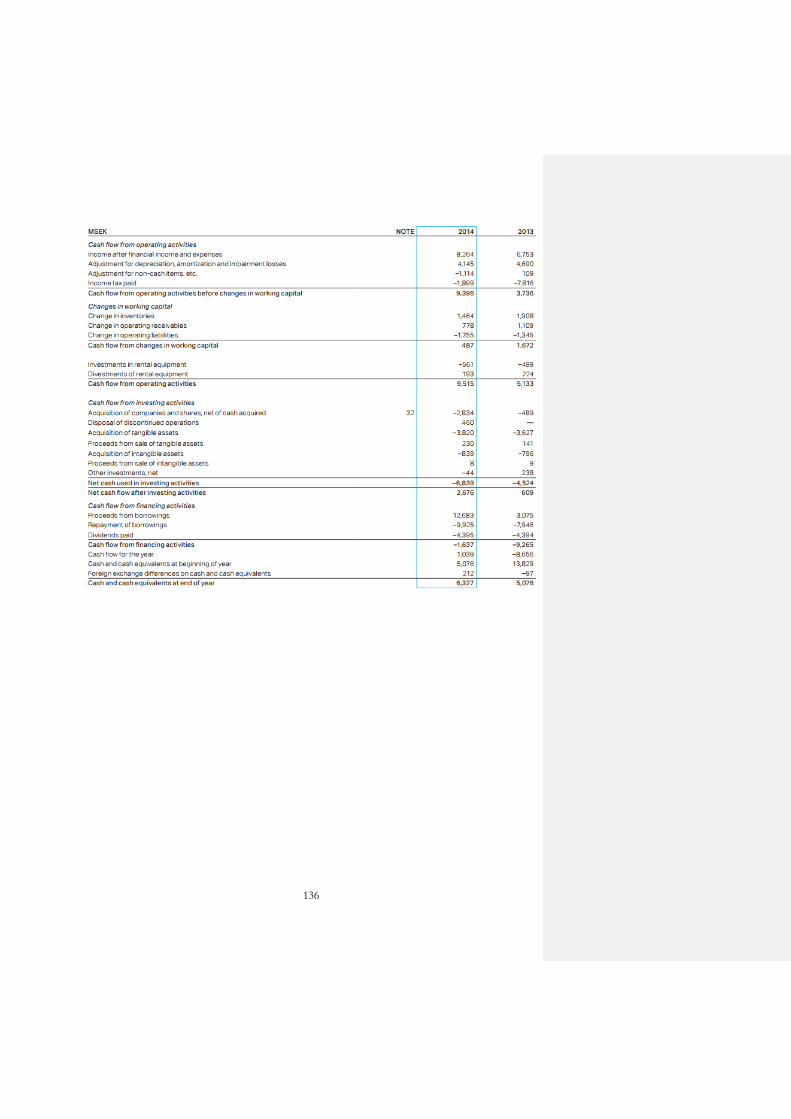
136
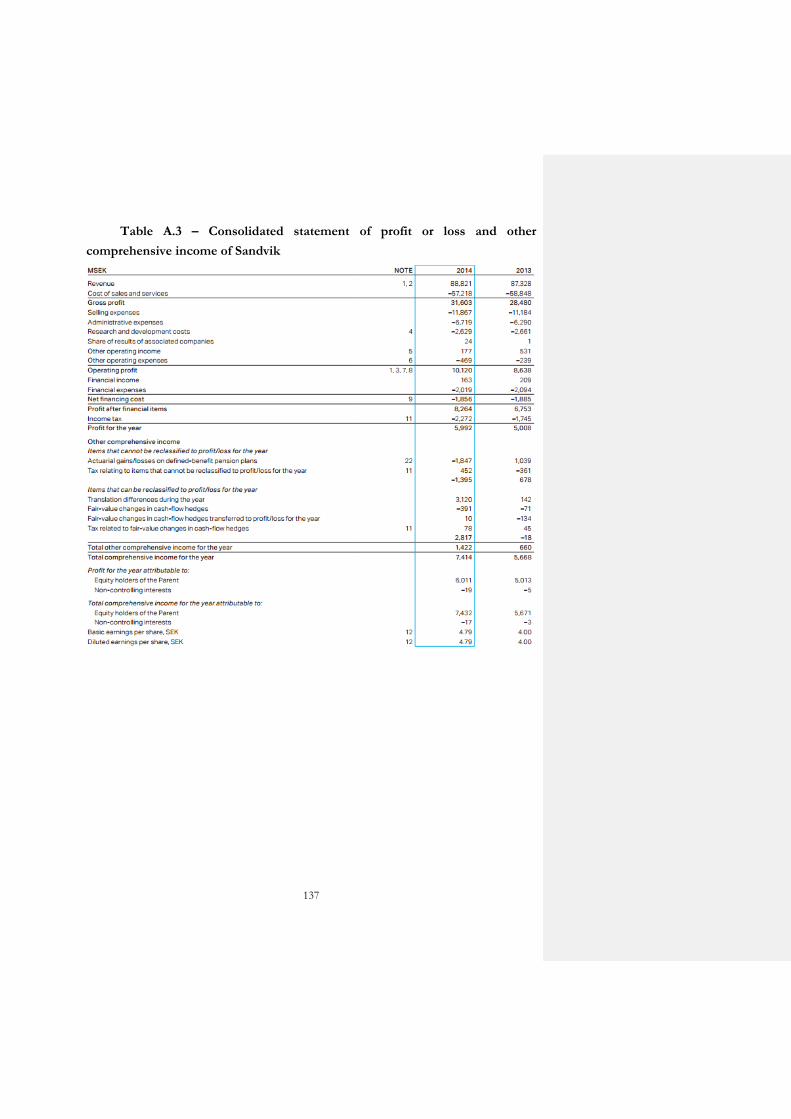
137
Table A.3 – Consolidated statement of profit or loss and other
comprehensive income of Sandvik
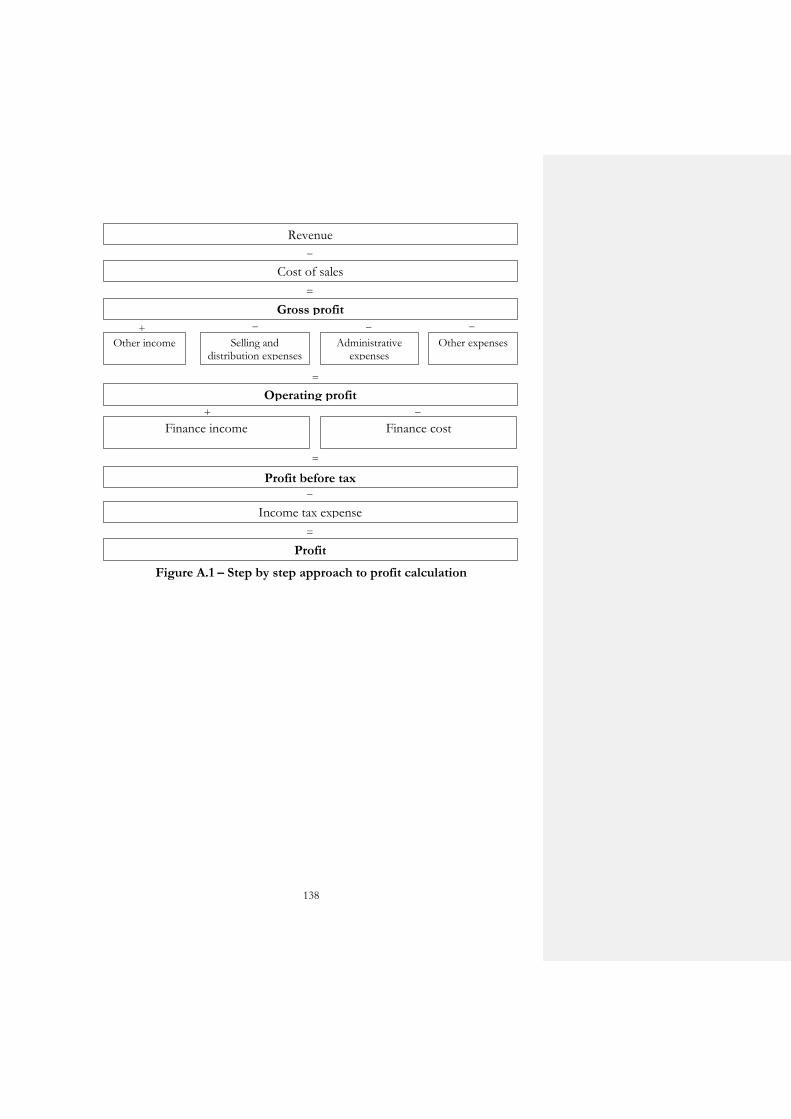
138
Figure A.1 – Step by step approach to profit calculation
Revenue
–
Cost of sales
=
Gross profit
Other income
+
Selling and distribution expenses
Administrative expenses
Other expenses
– – –
=
Operating profit
Finance income Finance cost
+ –
=
Profit before tax –
Income tax expense
=
Profit
139
CHAPTER 8:
FINANCIAL ANALYSIS
SUMMARY
Understanding the financial statements of a firm is critical since it is often the
only source of information with which we must make investment decisions. Financial
analysis is a process of selecting, evaluating, and interpreting financial data, along
with other pertinent information, in order to assist in investment and financial
decision-making or formulate an assessment of a company’s present and future
financial condition and performance. The financial analysis may be used internally to
evaluate issues such as employee performance, the efficiency of operations, and credit
policies, and externally to evaluate potential investments and the credit-worthiness of
borrowers, among other things. Typically, financial analysis is used to analyze whether
an entity is stable, solvent, liquid, or profitable enough to be invested in.
The analyst draws the financial data needed in financial analysis from many
sources. The primary source is the data provided by the company itself in its annual
report and required disclosures. The annual report according IAS 1 covers the form
and content of financial statements, the main components of which are: (i) Statement
of Financial Position; (ii) Statement of Profit or Loss and Comprehensive Income; (iii)
Statement of Changes in Equity; (iv) Statement of Cash Flows; (v) Notes to the
Financial Statements. Certain businesses are required by securities laws to disclose
additional information. Besides information that companies are required to disclose
through financial statements, other information is readily available for financial
analysis. For example, market data (such as the market prices of securities of
publicly-traded corporation or information on stock price indices for industries and
for the market) can be found in the financial press and the electronic media. Another
source of information is economic data (such as the Gross Domestic Product and
Consumer Price Index), can be found in electronic media and official state databases.
Financial statement analysis is an exceptionally powerful tool for a variety of
users of financial statements, each having different objectives in learning about the
financial circumstances of the entity. Users of financial statement analysis are the
following: (i) creditors (anyone who has lent funds to a company is interested in its
Добавлено примечание ([G302]): Deleted:F
Добавлено примечание ([G301]): Inserted: The f

140
ability to pay back the debt, and so will focus on various cash flow measures); (ii)
investors (both current and prospective investors examine financial statements to learn
about a company's ability to continue issuing dividends, or to generate cash flow, or to
continue growing at its historical rate); (iii) management (the company controller
prepares an ongoing analysis of the company's financial results, particularly in relation
to a number of operational metrics that are not seen by outside entities); (iv) regulatory
authorities.
There are two key methods for analyzing financial statements: (i) horizontal
analysis and (ii) vertical analysis.
Horizontal analysis (also referred as dynamic analysis) is the comparison of
financial information over a series of reporting periods while vertical analysis (also
referred as static analysis) is the proportional analysis of a financial statement, where
each line item on a financial statement is listed as a percentage of another item. Thus,
the horizontal analysis is the review of the results of multiple time periods, while
vertical analysis is the review of the proportion of accounts to each other within a
single period. There is an assortment of tools and techniques that could be employed
in analyzing financial statements, they are: comparative financial statements analysis,
statement of changes in working capital, common size analysis, trend analysis, ratio
analysis, etc.
Comparative financial statements analysis is an important method of
analysis which is used to make the comparison between two financial statements. It is
a technique of horizontal analysis that provides meaningful information when
compared to the similar data from Statement of Financial Position or Statement of
Profit or Loss and Comprehensive Income of prior periods; thus, the absolute change
from one period to another may be determined.
Common-size analysis expresses financial data, including entire financial
statements, in relation to a single financial statement item or base. It could be either
vertical common-size analysis (for example, for statement of financial position each
item should be divided by the same period’s total assets; the results expressed as a
percentage) or horizontal common-size analysis (for example, for calculating
percentage increase or decrease of each line item from the prior year. Alternative
presentation is to calculate each item relative to its value in a base year.).
Trend analysis is the main tool of horizontal analysis. It poses a method of
time series data analysis involving calculating ratios of different items and their
Добавлено примечание ([G304]): Deleted:,
Добавлено примечание ([G303]): Inserted: the
Добавлено примечание ([G305]): Inserted: ,
Добавлено примечание ([G306]): Inserted: the
Добавлено примечание ([G307]): Inserted: i
Добавлено примечание ([G308]): Deleted:s
141
comparison over a significantly long period in order to (i) determine a relationship
between associated factors or variables, and (ii) indicate the trend or direction. Trend
analysis could be a useful tool for identification either the financial health of a
company is improving or deteriorating in the lapse of time.
The most popular and widely used tool for analysis of financial statements is
ratio analysis. Ratio analysis is a quantitative analysis of data contained in a
company’s financial statements. The ratios of one item from the Statement of
Financial Position, Statement of Profit or Loss and Comprehensive Income,
Statement of Cash Flow – or a combination of items from Financial Statements – to
another item or combination are then calculated. The ratios calculation makes good
sense when compared with other companies in the same sector or industry averages
(to make comparative evaluations) or when compared over time is studied for trends
(to check if a company’s position is improving or deteriorating). Ratio analysis is a
cornerstone of fundamental analysis and used to evaluate various aspects of a
company’s operating and financial performance. According to the type of information
the ratio provides they could be classified as follows: (i) liquidity ratios, (ii) profitability
ratios, (iii) activity ratios (efficiency ratios), (iv) solvency ratios (debt ratios or
leveraging ratios), and (v) market ratios (valuation ratios). Financial ratio calculation is
presented in the table B.1 (Appendix B).
Liquidity ratios help Financial Statement users evaluate a company’s ability
using assets that are most readily converted into cash to meet its immediate needs or
current obligations. In other words, liquidity ratios evaluate the ability of a company to
convert its current assets into cash and pay short-term, immediate obligations. Current
assets are often referred to as working capital because these assets represent the
resources needed for the day-to-day operations of the company's long-term, capital
investments. Current assets are used to satisfy short-term obligations or current
liabilities. The current liabilities have the following common characteristics: (i)
borrowed funds for use that must be repaid within the fiscal year (12 months) or the
normal operating cycle, (ii) a duty to another party that involves the payment of an
economic benefit, (iii) a duty that obligates the company to another without avoiding
settlement, and (iv) a past transaction that obligates the company. The amount by
which current assets exceed current liabilities is referred to as the net working capital.
There are three commonly used liquidity ratios (definitions and
interpretations):
Добавлено примечание ([G316]): Deleted:f
Добавлено примечание ([G309]): Inserted: the
Добавлено примечание ([G310]): Inserted: i
Добавлено примечание ([G311]): Inserted: r
Добавлено примечание ([G315]): Deleted:a
Добавлено примечание ([G312]): Inserted: f
Добавлено примечание ([G313]): Inserted: a
Добавлено примечание ([G314]): Inserted: the
Добавлено примечание ([G317]): Inserted: the
Добавлено примечание ([G318]): Inserted: e
Добавлено примечание ([G319]): Deleted:,
Добавлено примечание ([G320]): Deleted:,
142
1. Current ratio (also referred as working capital ratio) compares a company's
current assets to its current liabilities. Thus, it indicates a company's ability to satisfy its
current liabilities with its current assets and could be used to evaluate short-term
solvency position. Short-term solvency refers to the ability of a company to pay ( the
company has enough resources to pay) its short-term obligations when they become
due over the fiscal year. Acceptable current ratios vary from industry to industry and
are general between 1.0 and 3 for healthy businesses.
If a company's current ratio is 1 or more means, then it is more likely to meet
its liabilities which fall due in the fiscal year and generally indicates good short-term
financial strength (the company should not face any liquidity problem). If current
liabilities exceed current assets (the current ratio is below 1), then the company may
have problems meeting its short-term obligations (may indicate liquidity problems). In
general, the higher current ratio is better. If a company has abnormally high value of
the current ratio, then it may not be efficiently using its current assets (indicate the
existence of idle or underutilized resources in the company) or its short-term financing
facilities. A very high current ratio may hurt a company’s profitability and efficiency.
2. Quick ratio (also referred as acid test ratio and liquid ratio) indicates a
company's ability to satisfy short-term debts by using the most liquid assets (quick
assets). It shows a company's ability to pay short-term debts immediately. It measures
the relationship between quick assets and current liabilities. Quick assets equal to total
current assets minus inventories and prepaid expenses. Generally, a quick ratio of
0.6–0.8 is considered satisfactory. However, like current ratio, this ratio should also be
interpreted carefully. If the quick ratio of less than 0.6–0.8 indicates that a company
would not be able to repay all its debts by using its cash and near cash current assets (i.
e. accounts receivable and marketable securities). If a company has abnormally high
value of quick ratio, it may indicate inefficiency, for the reason that company has idle
liquid assets which could have been used to create additional projects thus increasing
profits.
3. Absolute liquid ratio (also referred as cash ratio) indicates a company's
ability to repay its current liabilities in the immediate short term by only using its cash
and cash equivalents and nothing else. The absolute liquid ratio is computed by
dividing the absolute liquid assets by current liabilities. The normal value of cash ratio
is somewhere below 1.00.
Добавлено примечание ([G322]): Deleted:ly
Добавлено примечание ([G321]): Inserted: the
Добавлено примечание ([G323]): Inserted: the
Добавлено примечание ([G324]): Inserted: the
Добавлено примечание ([G325]): Inserted: the
Добавлено примечание ([G326]): Inserted: the
Добавлено примечание ([G327]): Inserted: -
Добавлено примечание ([G328]): Inserted: the
Добавлено примечание ([G331]): Deleted:A
Добавлено примечание ([G329]): Inserted: The a
Добавлено примечание ([G330]): Inserted: the
143
Solvency ratios (also referred as long-term solvency ratios) assess a
company's ability to repay its principal amount long-term obligations such as bank
loans, bonds payable, debentures, etc.
Solvency ratios used to assess a company’s financial risk and used to analyze
company’s capital structure, evaluate the company’s ability to pay interest on long-
term borrowings and repay the principal amount of the long-term loans. There are
two types of solvency ratios: component percentages (involve comparing the
elements in the capital structure) and coverage ratios (measure the ability to meet
interest and other fixed financing costs). Some frequently used long-term solvency
ratios are given below:
1. Debt ratio (also referred as debt to assets ratio) is a ratio which measures
company’s debt (a sum of long-term and short-term debt) level as a percentage of its
total assets. Thus, identifies the extent of a company’s leverage and the measure of a
business’s financial risk, the risk that the business’ total assets may not be sufficient to
pay off its debts, and thereon – interest. The debt ratio is a principal indicator of
company’s long-term financial sustainability. If the percentage is too high (high debt
ratio), it might indicate that it is too difficult for the company to pay off its debts and
continue operations (high risk for both debt holders and equity investors). Due to the
high risk, the company may have difficulties in raising money in good terms or may
not be able to obtain money at all. If the company has very low debt ratio, then the
company’s assets are sufficient to meet its obligations, however, may indicate the
existence of idle or underutilized financial resources which may negatively result in
restricted growth.
2. Debt to equity ratio (also referred as external-internal equity ratio)
measures the degree to which the company’s assets are financed by the debts
(provided by creditors) and the shareholders' equity (provided by principal
stockholders/shareholders). It indicates the soundness of the company’s long-term
financial policies. Debt to equity ratio could vary from industry to industry. If a
company's debt to equity ratio is 1, it means that creditors and stockholders equally
contribute to the company’s assets and are normally considered satisfactory for most
of the companies. A value of debt-to-equity ratio lower than 1 means that more
company’s assets are financed by shareholders than those financed by money of
creditors' and vice versa. A low debt-to-equity ratio is more favorable to creditors
because it indicates less risk, and thus greater protection to their money. An
Добавлено примечание ([G332]): Inserted: -
Добавлено примечание ([G333]): Inserted: the
Добавлено примечание ([G334]): Inserted: -
Добавлено примечание ([G335]): Inserted: the
Добавлено примечание ([G342]): Deleted:D
Добавлено примечание ([G336]): Inserted: The d
Добавлено примечание ([G346]): Deleted:at
Добавлено примечание ([G337]): Inserted: in
Добавлено примечание ([G345]): Deleted:e
Добавлено примечание ([G338]): Inserted: ing
Добавлено примечание ([G344]): Deleted:to
Добавлено примечание ([G339]): Inserted: in
Добавлено примечание ([G343]): Deleted:-
Добавлено примечание ([G340]): Inserted: e th
Добавлено примечание ([G341]): Inserted: ,
Добавлено примечание ([G347]): Inserted: the
Добавлено примечание ([G351]): Deleted:L
Добавлено примечание ([G348]): Inserted: A l
Добавлено примечание ([G353]): Deleted:r
Добавлено примечание ([G352]): Deleted:f
144
increasing trend of debt-to-equity ratio is unfavorable because it means that the
percentage of the company’s assets which are financed by the debts is increasing, the
company relies more on external lenders at higher risk, especially at higher interest
rates.
3. Solvency ratio measures company’s ability to meet its short-term and long-
term liabilities. In other words, it determines whether the company has sufficient cash
flow to meet its debts as they come. The higher a company's solvency ratio, the
greater the probability that it will meet financial obligations; companies with lower
scores are seen as posing a greater risk to banks and creditors.
4. Working capital to stockholder’s equity ratio measures the percentage of
the company’s stockholder’s equity used for financing its ongoing business operations
and percentage the company is capitalized. A low working capital to stockholder’s
equity ratio means that the company is keeping a large portion of its equity in
capitalized form and high scores mean that the company is paying a large portion of
its equity to its current operating activities (which in turn mean greater profit gains in
future periods). In general, high scores of working capital to stockholder’s equity ratio
are preferred.
Profitability ratios measure the company’s ability to efficient employment
management to earn the profit for company’s owners. While liquidity ratios and
solvency ratios explain the company’s financial position, profitability ratios and
efficiency ratios communicate its financial performance for a particular period of time.
The following are the most commonly used profitability ratios:
1. Return on assets ratio (ROA) measures how profitable a company's assets
are in generating annual net income (usually displayed as a percentage). ROA indicates
the number of hryvnias earned on each hryvnia of assets they control. Thus, higher
values of ROA show that business is more profitable. ROA calculation makes good
sense when compared competing companies in the same industry.
2. Return on equity ratio (ROE) (also referred as return on shareholders’
investment ratio and return on capital) shows net income as a percentage of
shareholder equity. It is calculated by dividing a company's net income for a year to its
stockholders' equity during that year and is usually expressed in percentage. Higher
ROE means a higher return on shareholders’ investment. Investors search for the
highest return on their investment and a company that has highest ROE in the
industry attracts more investors.
Добавлено примечание ([G349]): Inserted: t
Добавлено примечание ([G350]): Inserted: the
Добавлено примечание ([G354]): Inserted: ,
Добавлено примечание ([G355]): Deleted:s
Добавлено примечание ([G356]): Inserted: the
Добавлено примечание ([G358]): Deleted:s
Добавлено примечание ([G357]): Inserted: ,
Добавлено примечание ([G359]): Inserted: a
Добавлено примечание ([G360]): Inserted: a

145
3. Return on invested capital (ROIC) measures the return that investment
generates for stockholders who have provided capital. It indicates company’s
management efficiency at turning capital into profits.
4. Return on sales (ROS) (also referred as net profit (NP) margin) measures
the percentage of the company’s net income to its net sales. It represents the
proportion of sales that is left over after all relevant expenses have been adjusted. Net
profit margin is used to compare the profitability of competitors in the same industry
or profitability potential of different industries. Influenced by different factors
companies in some industries are able to generate high net profit margin, other
industries offer very narrow margins.
5. Gross profit (GP) margin measures company's ability to make profitably a
product or supply a service by comparing the gross profit and total net sales revenue.
It is a popular tool to evaluate if a company sufficient to cover all expenses and
provide for profit. Generally, a higher ratio is considered better.
6. Expense ratio (also referred as an expense to sales ratio) defines the
relationship between an individual expense or group of expenses (such as
administrative expenses, sales expenses, the cost of goods sold) and sales. The expense
ratio is expressed in percentage. A lower ratio means more profitability and a higher
ratio mean less profitability.
7. Operating ratio (also referred as operating expense ratio (OER)) is
computed by dividing operating expenses by net sales. It shows whether the cost
component in the sales figure is within normal range. A low operating ratio means
high net profit ratio i. e., more operating profit, thus indicating company’s operational
efficiency.
Activity ratios assess the efficiency of the company in generating revenues and
profits by converting its production into cash or sales. These ratios attempt to find out
how frequently the inventories (and other assets) are converted into cash or sales and,
therefore, are frequently used in conjunction with liquidity ratios for a deep analysis of
liquidity. Key activity ratios are:
1. Asset turnover ratio measures of management's ability to use assets to
produce sales. It measures a number of sales (revenues) generated per hryvnia of
assets for a given period. A higher value of asset turnover ratio suggests that
company’s management is making better use of its resources, which could be
translated into a higher rate of return on total assets, and vice versa.
Добавлено примечание ([G361]): Inserted: e th
Добавлено примечание ([G362]): Inserted: ,
Добавлено примечание ([G363]): Inserted: ,
Добавлено примечание ([G364]): Inserted: an
Добавлено примечание ([G365]): Inserted: the
Добавлено примечание ([G367]): Deleted:E
Добавлено примечание ([G366]): Inserted: The e
Добавлено примечание ([G368]): Deleted:s
Добавлено примечание ([G369]): Inserted: the
Добавлено примечание ([G373]): Deleted:t
Добавлено примечание ([G370]): Inserted: umber
Добавлено примечание ([G372]): Deleted:mou
Добавлено примечание ([G371]): Deleted:the

146
2. A fixed asset turnover ratio (also referred as sales to fixed assets ratio)
measures of management's ability to fixed assets to generate its sales revenue. It
indicates fixed asset utilization measure that allows to understand whether a company
requires a large investment in property, plant, and equipment in order to generate sales
revenues. Companies with fixed asset turnover ratios that are higher than their
industry average, or have ratios that increase over time, are desirable.
3. Inventory turnover ratio measures the number of times per period company
sells and replaces its entire batch of inventories during a certain period of time. It
evaluates the liquidity of the company’s inventories. Dividing the cost of goods sold
during a period (which equals the total cost of inventories sold) by the cost of average
inventories balance maintained by company gives hryvnias of sales made per hryvnia
of cash tied up in inventories.
Inventory turnover ratio varies significantly among industries. Businesses which
trade perishable goods have very higher turnover compared to those dealing in
durables. Hence, a comparison should be done between companies in the same
industry or over time (trend analysis). In general, a high inventory turnover ratio
indicates efficient inventories management. A low inventory turnover ratio indicates
slow moving or obsolete inventories in stock and may also be the result of slow-down
in demand or overstocking of inventories.
4. Days inventories outstanding (also referred as DIO or days' sales in
inventory or simply days of inventory) measures the number of days a company
takes to sell its average balance of inventory. It is also an estimate of the number of
days for which the average balance of inventory will be sufficient. Lower values of
DIO are generally favorable and higher values are unfavorable.
5. Accounts payable turnover ratio (also referred as creditors’ turnover ratio
or creditors’ velocity) measures company’s ability to pay off its creditors (suppliers).
It measures the number of times (on average) a company pays its suppliers during a
specific accounting period (typically one year). Accounts payables turnover trends can
help a company assess its cash collection on credit sales and indicates the
creditworthiness of the company. A high ratio means the prompt payment to
suppliers for the goods purchased on credit and a low ratio may be a sign of delayed
payment and may indicate inefficiency in collecting outstanding sales.
6. Day’s payable outstanding (DPO) is the accounts payable turnover
expressed in days.
Добавлено примечание ([G376]): Deleted:F
Добавлено примечание ([G374]): Inserted: A f
Добавлено примечание ([G377]): Deleted:to
Добавлено примечание ([G375]): Inserted: ing
Добавлено примечание ([G378]): Inserted: he t
Добавлено примечание ([G379]): Inserted: ,
Добавлено примечание ([G380]): Deleted:-
Добавлено примечание ([G381]): Inserted: the
147
7. Accounts receivable turnover (also referred as debtors’ turnover ratio)
indicates the velocity of a company's debt collection, the number of times average
company collects outstanding cash balances from its customers during an accounting
period. Accounts receivable turnover is the useful tool in conjunction with short-term
solvency ratios. However, solvency ratios indicate the liquidity of the company as a
whole and accounts receivable turnover ratio measures the liquidity of accounts
receivables. In general, a high ratio indicates that the receivables are more liquid
(collected promptly), and a low ratio indicates less liquid receivables and may reduce
the true company’s liquidity even if the current and quick ratios are satisfactory.
8. A popular variant of the receivables turnover ratio is to convert it into day’s
sales outstanding (also referred as DSO or average collection period in terms of
days), that measures the number of days (on average) needed for a company to collect
its accounts receivables or convert receivables into cash.
9. Equity turnover ratio (also referred as capital turnover or sales to equity
ratio) measures the proportion of a number of sales that a company can generate with
a given amount of stockholders' equity. It is also an asset utilization metric that
indicates the level of capital investment (equity) needed in a specific industry in order
to generate or support a given level of sales.
10. Operating cycle (OC) determines the length of time that elapses between
the moment company’s investment in inventory and the time to be collected in cash
from customers.
11. Net operating cycle (also referred as cash conversion cycle (CCC))
determines the length of time it takes for a company’s investment in inventory to
generate cash, considering that some or all of the inventory is purchased using credit.
The length of the operating cycle (OC) and cash conversion cycles (CCC) is a factor
that determines how much liquidity a company needs.
Market ratios evaluate the current market price of a share of common stock
versus an indicator of the company's ability to generate profits or assets held by the
company. Market ratios are commonly used by current and potential investors to
determine whether a company's shares are overpriced or underpriced. Some
frequently used market ratios are given below:
1. The earnings per share (EPS) ratio measures the portion of company’s
profits (net income) as generated for each share of common stock outstanding. It is
usually expressed in hryvnias. A higher EPS implies higher earnings, strong financial
Добавлено примечание ([G382]): Inserted: ,
Добавлено примечание ([G383]): Inserted: -
Добавлено примечание ([G384]): Inserted: the
Добавлено примечание ([G387]): Deleted:t
Добавлено примечание ([G385]): Inserted: umber
Добавлено примечание ([G386]): Deleted:mou
Добавлено примечание ([G388]): Deleted:-
Добавлено примечание ([G390]): Deleted:E
Добавлено примечание ([G389]): Inserted: The e
148
position and, therefore, a reliable company to invest money. A consistent
improvement in EPS year after year is the indication of continuous improvement in
the earning power of the company.
2. Price to earnings (P/E) ratio measures how many times the earnings per
share have been covered by the current market price of an ordinary share. The result
of calculation indicates whether the share price of a company is fairly valued,
undervalued or overvalued. A higher P/E ratio is the indication of the strong
position of the company in the market.
3. Price to book (P/B) ratio (also referred as the market to book ratio)
measures the proportion of the current market price per share of a company's
common stock to the book value of each share. It indicates whether general value of
the company is above, at or below the face value of the company's assets as they
appear in its financial reports. In general, higher P/B ratio is preferred, since it
indicates that a larger market premium is being paid by investors relative to the net
book value of the assets owned by the company.
4. Dividend payout ratio measures the percentage of the current earnings the
company pays out to investors in the form of dividends and percentage the company
is plowing back (reinvest) in projects for growth in future. A low dividend payout
ratio means that the company is keeping a large portion of its earnings for growth in
future and a high dividend payout ratio means that the company is paying a large
portion of its earnings to its common shareholders (which in turn mean less capital
gains in future periods). Whether a payout ratio is good or bad depends on the
intention of the investor (capital gains or dividends).
5. Dividend yield ratio (also referred as dividend yield percentage) measures
the percentage of the market price of a share a company annually pays to its
stockholders in the form of dividends. It is a very useful tool for investors looking for
dividend income on a continuous basis.
DuPont analysis (also referred as the DuPont identity, DuPont equation,
DuPont model or the DuPont method) measures company's ability to increase its
return on equity (ROE). In other words, DuPont analysis breaks down the return on
equity ratio into three/five parts to explain how companies can increase their return
for investors. DuPont equation uses the relationship among financial statement
accounts to decompose return on equity into several components (Figure 8.1). Five-
component DuPont model is shown in Appendix B (Figure B.1). Three-factor
Добавлено примечание ([G391]): Inserted: the
Добавлено примечание ([G392]): Inserted: the
Добавлено примечание ([G393]): Inserted: the
Добавлено примечание ([G395]): Deleted:ugh
Добавлено примечание ([G394]): Inserted: w
Добавлено примечание ([G396]): Inserted: a
Добавлено примечание ([G397]): Inserted: the

149
DuPont analysis investigates by what the return on equity is affected: (i) total asset
turnover (asset use efficiency); (ii) net profit margin (operating efficiency); (iii) equity
multiplier (financial leverage). The five-factor (also referred as extended) DuPont
analysis provides an additional decomposition of net profit margin, and consist of the
following components: (i) total asset turnover (asset use efficiency); (ii) equity
multiplier (financial leverage); (iii) operating profit margin; (iv) effect of non-operating
items; (v) tax effect.
Figure 8.1 – Three/five component DuPont analysis
RECOMMENDED READING
1. Altman, E. I., 1968, Financial ratios, discriminant analysis and the prediction of corporate bankruptcy. The Journal of Finance, 23 (4), pp. 589–609.
2. Bernstein, L. A., 1989, Financial statement analysis: theory, application, and interpretation, 4 th ed. Richard D. Irwin. Homewood, Ilinois.
3. Brigham, E., and Ehrhardt, M., 2013, Financial management: theory and practice, Cengage Learning.
4. Brochet, F., Jagolinzer, A. D., and Riedl, E. J., 2013, Mandatory IFRS adoption and financial statement comparability, Contemporary Accounting Research, 30 (4), pp. 1373–1400.
5. Fabozzi, F. J., and Peterson, P. P., 2013, Analysis of Financial Statements, Wiley. 6. Henry, E., and Robinson, T. R., 2015, Chapter 1. Financial Statement Analysis: An
Introduction, CFA Institute Investment Books, 2015 (2), pp. 1–35.
Return on equity (ROE)
Net profit margin
Operation profit margin
Tax effect
Effect of non-operating items
Equity multiplier
Total asset turnover
Добавлено примечание ([G399]): Deleted:e
Добавлено примечание ([G398]): Inserted: a
150
7. Ormiston, A., and Fraser, L. M., 2013, Understanding Financial Statements, Pearson Education.
8. Stickney, C., Brown, P., and Press, D., 1990, Financial Statement Analysis, Harcourt Brace Jovanovich.
9. White, G. I., Sondhi, A. C., and Fried, D., 2003, The Analysis and Use of Financial Statements, John Wiley & Sons.
Relevant websites 1. International Federation of Accountants (IFAC). An organization of national
accounting associations and other groups interested in accounting matters. Available at http://www.ifac.org.
2. The International Financial Reporting Standards Foundation, or IFRS Foundation, is a nonprofit accounting organization. Its main objectives include the development and promotion of the International Financial Reporting Standards (IFRSs) through the International Accounting Standards Board (IASB), which it oversees. Available at http://www.ifrs.org.
3. The International Accounting Standards Board (IASB) is the independent, accounting standard-setting body of the IFRS Foundation. Available at http://www.iabs.org.
4. Deloitte's IAS Plus comprehensive source of global accounting news and resources, featuring an extensive collection of information about International Financial Reporting Standards (IFRS), the International Accounting Standards Board (IASB), and broader international financial reporting developments. Available at http://www.iasplus.com.
5. CFA Institute is a global association of investment professionals that sets the standard for excellence in the industry. Available at http://www.cfainstitute.org
6. ACCA (the Association of Chartered Certified Accountants) world’s leading body for professional accountants. Available at http://www.accaglobal.com.
KEY TERMS
fixed asset is a balance sheet accounts that represents long-term tangible company’s property that can be reasonably expected to turn to cash (expected to be sold or exhausted through the normal operations of a business) sooner than at least one year from the date shown in the heading of the company's balance sheet or operating cycle. The following are examples of general categories of fixed assets: buildings, computer equipment, computer software, furniture and fixtures, intangible assets, land, leasehold improvements, machinery, vehicles.
long-term liability is a balance sheet items that represent company's debts or obligations that are not due within a fiscal year (12 months) or the normal operating cycle of a given company (whichever period is longer). The following are examples of general categories of long-term liability: long-term loans, capital leases, bonds payable, postretirement health care liabilities, deferred compensation, deferred revenues, deferred income taxes, etc.
Добавлено примечание ([G402]): Deleted:t is
Добавлено примечание ([G400]): Inserted: re
Добавлено примечание ([G401]): Deleted:th

151
equity (shareholder’s equity or net worth)
defines ownership interest or claim of a holder of common stock (ordinary shares) and some types of preferred stock (preference shares) of a company and represents funds contributed by the owners (stockholders) plus retained earnings or minus the accumulated losses. On a balance sheet, it could be calculated as the value of an asset less the value of all liabilities on that asset.
retained earnings (blowback, accumulated profit/income/surplus, undistributed earnings, or undivided profits)
represent profits generated by a company that are not distributed to stockholders (shareholders) as dividends (paid out) but are either retained by the company to be reinvested in its core business (plowed back) or kept as a reserve for specific objectives (for example, to pay off a debt). It could be calculated by adding net income to (or subtracting net losses from) beginning retained earnings and subtracting dividends paid to shareholders.
Statement of Financial Position (balance sheet)
is one of the main financial statements that reports the amounts of company’s assets, liabilities, and net assets as of the final moment of an accounting period and helps users of financial statements to assess the company’s financial soundness of an entity in terms of liquidity, financial, credit and business risks. The structure of the Statement of Financial Position is similar to the basic accounting equation (Assets = Liabilities + Stockholders' Equity).
Statement of Profit or Loss and Other Comprehensive Income (Income Statement (US English), Profit and Loss Account (UK English), Profit and Loss Statement (P&L), Statement of Financial Performance, Earnings Statement, Operating Statement, or Statement of Operations)
is one of the company’s financial statements which shows the company’s income and expenses resulted in profit or loss and items of other comprehensive income for the reporting period.
reporting period (accounting period)
is the time span for which company or organization reports financial performance and financial position, covered by a set of financial statements. The reporting period is typically defined with respect to the fiscal year. Four quarterly reporting periods correspond to the company's fiscal quarters, and an annual reporting period covers the entire fiscal year.
statement of changes in equity (statement of retained earnings in U.S. GAAP or equity statement)
is a basic company’s financial statements which shows the movement in owners' interest (equity) over a reporting period by presenting the movement in reserves comprising the shareholders' equity.
Добавлено примечание ([G403]): Inserted: b
Добавлено примечание ([G404]): Deleted:p
Добавлено примечание ([G405]): Deleted:n

152
statement of cash flows (cash flow statement)
is one of the company’s financial statements which presents the movement in balance sheet accounts and income affects cash, cash equivalents, and bank balances from operating activities, investing activities, financing activities, and certain supplemental information for the period specified in the heading of the statement.
opening balance represents the balance company's accounts at the beginning of a new accounting period, brought forward from the previous period, on the credit or the debit side of the ledger (depending on whether the firm has a positive or negative balance).
closing balance represents the balance company's accounts at the end of the reporting period as reflected in the financial statements.
off balance sheet refers to items (company's assets or debts) that do not appear on a company's balance sheet. The most common off-balance sheet item is an operating lease.
yield is an income return produced by an investment and is usually expressed annually as a percentage of investment's cost (its current market or face value).
financial leverage refers to the use of borrowed money (debt) to acquire additional assets (increase production volume).
tax effect is a general term describing the consequences of a specific corporate tax scenario with respect to a particular tax-paying company and measures the influence taxes on a company’s net income. It could be calculated as one minus the tax rate and manipulated by the tax breaks and deductions a particular company is able to claim.
REVIEW QUESTIONS
1. What is financial analysis? Do you think there is any substantial and meaningful
difference between financial analysis and financial statement analysis?
2. Define what informational resources are used for financial analysis?
3. Financial ratio analysis is often divided into five areas. Differentiate each of these
areas of analysis from the others. Which is of the greatest concern to creditors,
investors, management, and regulatory authorities?
4. What are key methods for analyzing financial statements?
5. Outline tools and techniques that could be employed in analyzing financial
statements?
6. What are the limitations of ratio analysis?
7. Describe what is meant by liquidity measurement ratios?
8. What is the difference between the current ratio and the quick ratio?
9. What is the difference between the liquidity and solvency financial ratios analysis?
Добавлено примечание ([G406]): Inserted: s
Добавлено примечание ([G407]): Deleted:es
Добавлено примечание ([G408]): Inserted: the

153
10. What financial ratio measures the company’s degree of indebtedness?
11. Describe what is meant by profitability measurement ratios?
12. Describe what is meant by activity measurement ratios?
13. Describe what is meant by market measurement ratios?
14. What is DuPont analysis? What areas of financial ratio analysis are combined in
the DuPont model?
15. What are the drawbacks to using the DuPont analysis?
MULTIPLE CHOICE QUESTIONS
Choose the one alternative that best completes the statement or answers the question. 1. Trends observed in historical accounting information:
a) can be misleading due to changes in accounting procedures; b) can provide a basis for estimating future trends; c) are likely to be more valuable in turnaround situations; d) a and b; e) a and c; f) b and c; g) all of the above.
2. Percent or common-size financial statements are used to do the following: a) focus on the importance of corporate size on the firm; b) compare relative asset allocations across firms; c) compare changes in relative asset allocations for a given firm over time; d) a and b; e) a and c; f) b and c; g) all of the above; h) none of the above.
3. The (cash + marketable securities + accounts receivable)/current liabilities ratio: a) always decreases when management tries to increase the current ratio by
manipulation; b) includes inventory in the numerator; c) includes projected expenditures from future operations in the denominator; d) none of the above.
4. Current asset minus current liabilities is the: a) current ratio; b) acid test ratio; c) net worth; d) working capital.
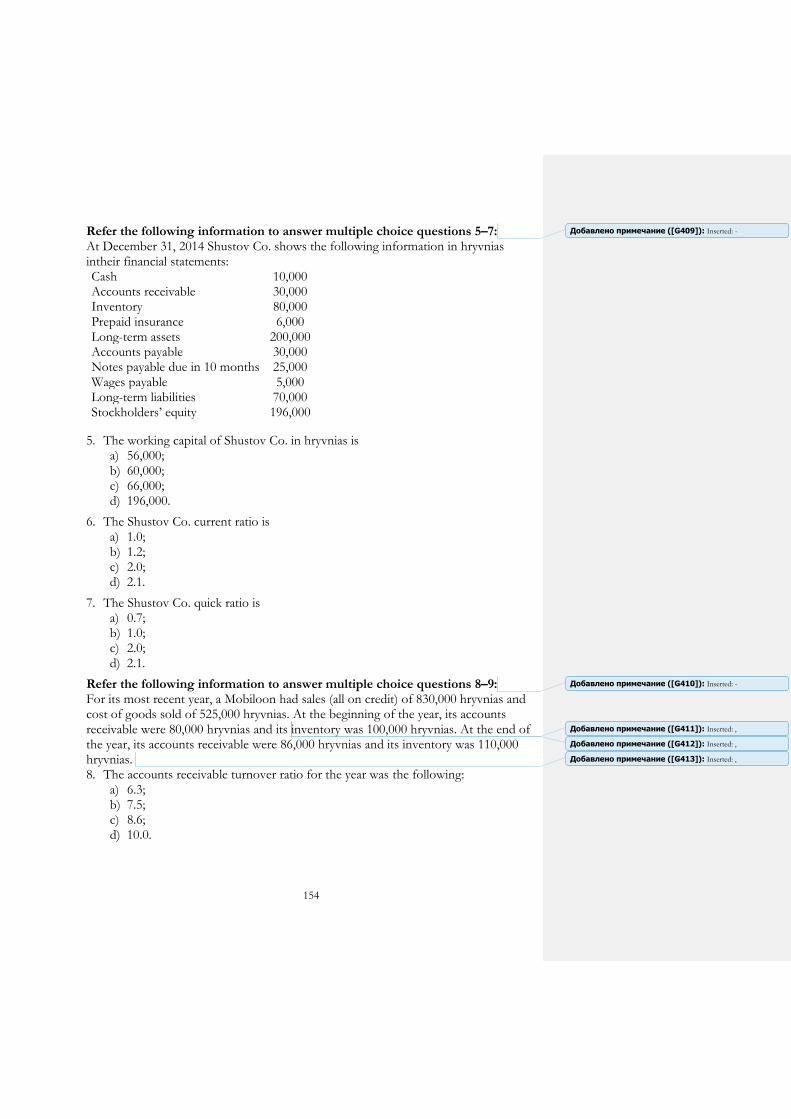
154
Refer the following information to answer multiple choice questions 5–7: At December 31, 2014 Shustov Co. shows the following information in hryvnias intheir financial statements: Cash 10,000 Accounts receivable 30,000 Inventory 80,000 Prepaid insurance 6,000 Long-term assets 200,000 Accounts payable 30,000 Notes payable due in 10 months 25,000 Wages payable 5,000 Long-term liabilities 70,000 Stockholders’ equity 196,000
5. The working capital of Shustov Co. in hryvnias is a) 56,000; b) 60,000; c) 66,000; d) 196,000.
6. The Shustov Co. current ratio is a) 1.0; b) 1.2; c) 2.0; d) 2.1.
7. The Shustov Co. quick ratio is a) 0.7; b) 1.0; c) 2.0; d) 2.1.
Refer the following information to answer multiple choice questions 8–9: For its most recent year, a Mobiloon had sales (all on credit) of 830,000 hryvnias and cost of goods sold of 525,000 hryvnias. At the beginning of the year, its accounts receivable were 80,000 hryvnias and its inventory was 100,000 hryvnias. At the end of the year, its accounts receivable were 86,000 hryvnias and its inventory was 110,000 hryvnias. 8. The accounts receivable turnover ratio for the year was the following:
a) 6.3; b) 7.5; c) 8.6; d) 10.0.
Добавлено примечание ([G409]): Inserted: -
Добавлено примечание ([G410]): Inserted: -
Добавлено примечание ([G411]): Inserted: ,
Добавлено примечание ([G412]): Inserted: ,
Добавлено примечание ([G413]): Inserted: ,
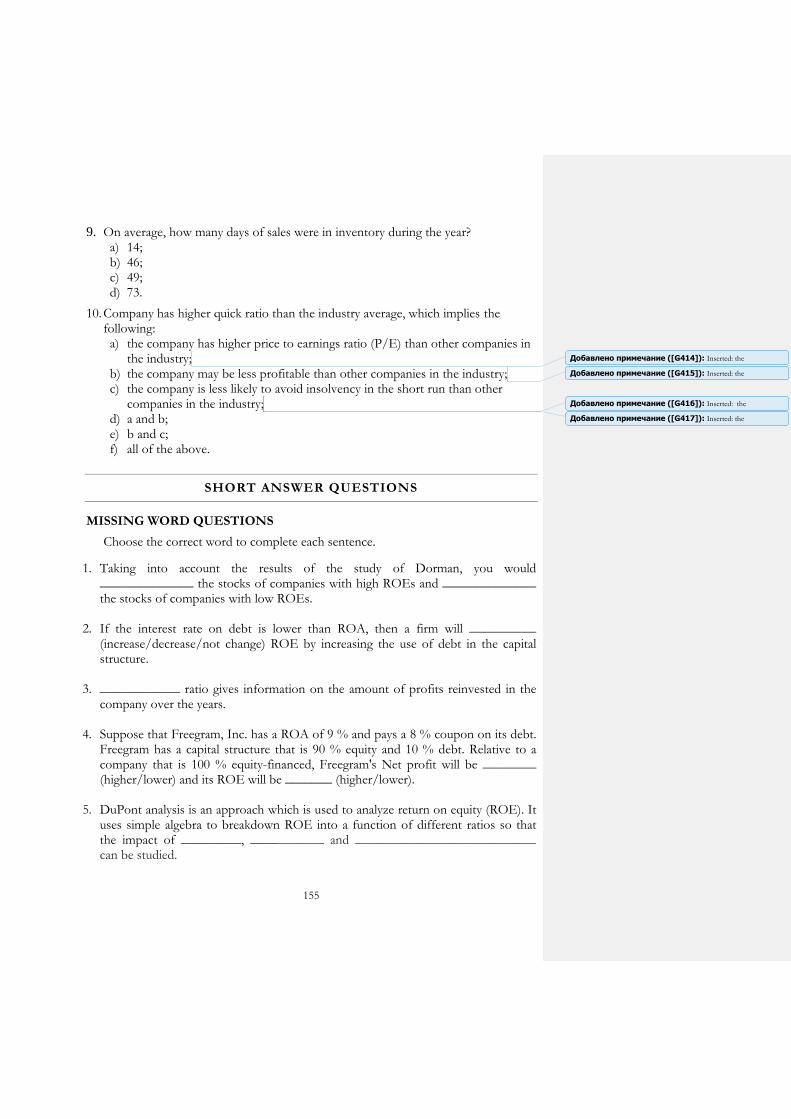
155
9. On average, how many days of sales were in inventory during the year? a) 14; b) 46; c) 49; d) 73.
10. Company has higher quick ratio than the industry average, which implies the following: a) the company has higher price to earnings ratio (P/E) than other companies in
the industry; b) the company may be less profitable than other companies in the industry; c) the company is less likely to avoid insolvency in the short run than other
companies in the industry; d) a and b; e) b and c; f) all of the above.
SHORT ANSWER QUESTIONS
MISSING WORD QUESTIONS
Choose the correct word to complete each sentence.
1. Taking into account the results of the study of Dorman, you would ______________ the stocks of companies with high ROEs and ______________ the stocks of companies with low ROEs.
2. If the interest rate on debt is lower than ROA, then a firm will __________ (increase/decrease/not change) ROE by increasing the use of debt in the capital structure.
3. ____________ ratio gives information on the amount of profits reinvested in the company over the years.
4. Suppose that Freegram, Inc. has a ROA of 9 % and pays a 8 % coupon on its debt. Freegram has a capital structure that is 90 % equity and 10 % debt. Relative to a company that is 100 % equity-financed, Freegram's Net profit will be ________ (higher/lower) and its ROE will be _______ (higher/lower).
5. DuPont analysis is an approach which is used to analyze return on equity (ROE). It uses simple algebra to breakdown ROE into a function of different ratios so that the impact of _________, ___________ and ___________________________ can be studied.
Добавлено примечание ([G414]): Inserted: the
Добавлено примечание ([G415]): Inserted: the
Добавлено примечание ([G416]): Inserted: the
Добавлено примечание ([G417]): Inserted: the
156
TRUE/FALSE/UNCERTAIN QUESTIONS
Decide whether the following statements are True, False, or Uncertain. Explain your reasoning. Your score will be based not just on whether you get the True, False, or Uncertain part right but also, to a larger extent, on the quality of your explanation.
1. Financial statements are an important source of information only to shareholders
and debtholders.
2. To create a common size financial statement analysis divide all items on the balance sheet by owners’ equity.
3. Purchase of treasury stock would likely increase earnings per share (EPS) of a company.
4. Dream team Industries has a debt to equity ratio of 1.9 compared with the industry average of 1.6. This means that the company has less liquidity than other companies in the industry.
5. A company can improve (lower) its debt to total assets ratio by selling common stock.
COMPUTATION PROBLEMS
1. Without referring to the summary, indicate for each of the following ratios the formula for its calculation. Also, indicate the kind of problems, if any, the company is likely to have if the particular ratio is too high/too low relative to the industry average. Fill in the empty blocks of the following box:
Ratio Formula Too high Too low
Current ratio
Absolute liquid ratio
Debt ratio
Working capital to stockholder’s ratio
Return to assets ratio (ROA)
Operating ratio
Inventory turnover ratio
Equity turnover ratio
Price to earnings (P/E) ratio
Dividend payout ratio
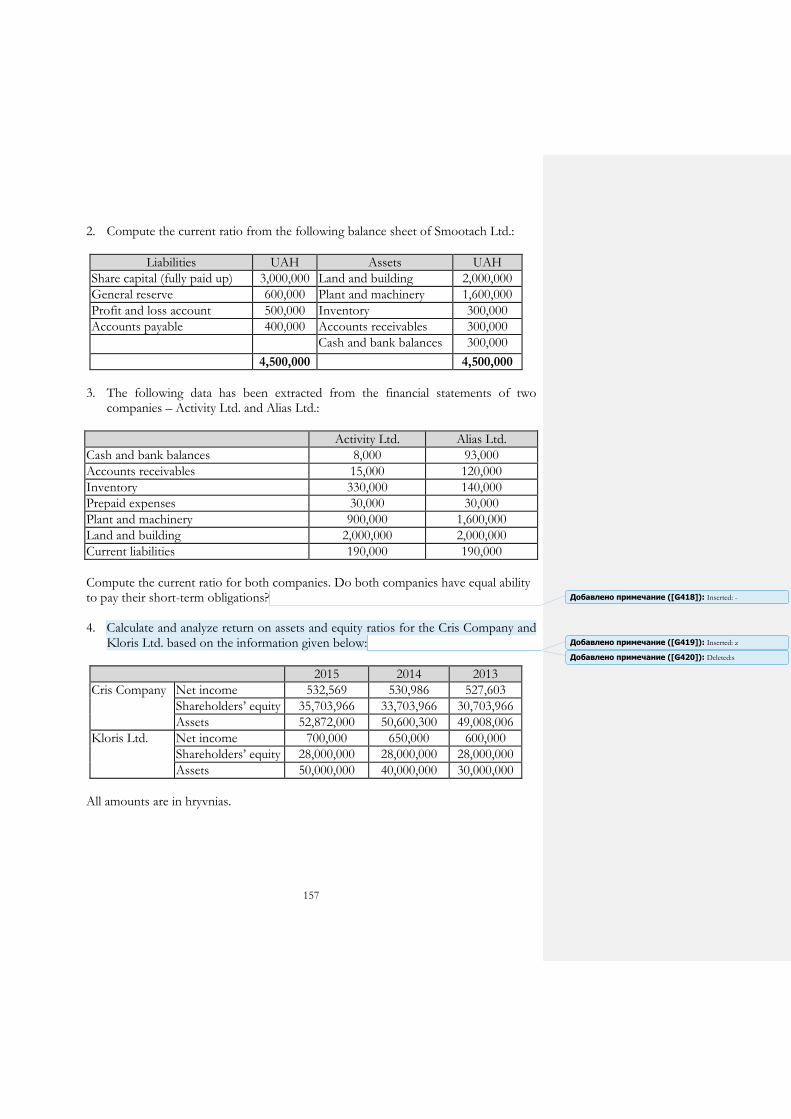
157
2. Compute the current ratio from the following balance sheet of Smootach Ltd.:
Liabilities UAH Assets UAH
Share capital (fully paid up) 3,000,000 Land and building 2,000,000
General reserve 600,000 Plant and machinery 1,600,000
Profit and loss account 500,000 Inventory 300,000
Accounts payable 400,000 Accounts receivables 300,000
Cash and bank balances 300,000
4,500,000 4,500,000
3. The following data has been extracted from the financial statements of two
companies – Activity Ltd. and Alias Ltd.:
Activity Ltd. Alias Ltd.
Cash and bank balances 8,000 93,000
Accounts receivables 15,000 120,000
Inventory 330,000 140,000
Prepaid expenses 30,000 30,000
Plant and machinery 900,000 1,600,000
Land and building 2,000,000 2,000,000
Current liabilities 190,000 190,000
Compute the current ratio for both companies. Do both companies have equal ability to pay their short-term obligations? 4. Calculate and analyze return on assets and equity ratios for the Cris Company and
Kloris Ltd. based on the information given below:
2015 2014 2013
Cris Company Net income 532,569 530,986 527,603
Shareholders’ equity 35,703,966 33,703,966 30,703,966
Assets 52,872,000 50,600,300 49,008,006
Kloris Ltd. Net income 700,000 650,000 600,000
Shareholders’ equity 28,000,000 28,000,000 28,000,000
Assets 50,000,000 40,000,000 30,000,000
All amounts are in hryvnias.
Добавлено примечание ([G418]): Inserted: -
Добавлено примечание ([G420]): Deleted:s
Добавлено примечание ([G419]): Inserted: z
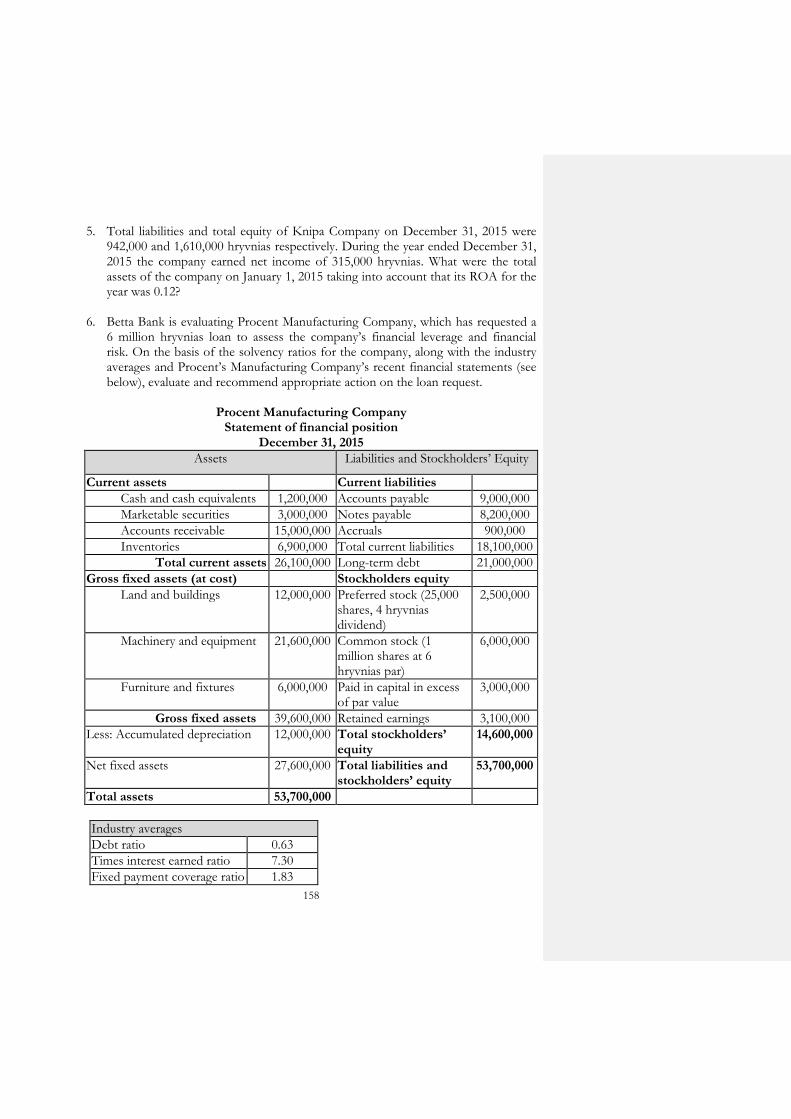
158
5. Total liabilities and total equity of Knipa Company on December 31, 2015 were 942,000 and 1,610,000 hryvnias respectively. During the year ended December 31, 2015 the company earned net income of 315,000 hryvnias. What were the total assets of the company on January 1, 2015 taking into account that its ROA for the year was 0.12?
6. Betta Bank is evaluating Procent Manufacturing Company, which has requested a
6 million hryvnias loan to assess the company’s financial leverage and financial risk. On the basis of the solvency ratios for the company, along with the industry averages and Procent’s Manufacturing Company’s recent financial statements (see below), evaluate and recommend appropriate action on the loan request.
Procent Manufacturing Company Statement of financial position
December 31, 2015
Assets Liabilities and Stockholders’ Equity
Current assets Current liabilities
Cash and cash equivalents 1,200,000 Accounts payable 9,000,000
Marketable securities 3,000,000 Notes payable 8,200,000
Accounts receivable 15,000,000 Accruals 900,000
Inventories 6,900,000 Total current liabilities 18,100,000
Total current assets 26,100,000 Long-term debt 21,000,000
Gross fixed assets (at cost) Stockholders equity
Land and buildings 12,000,000 Preferred stock (25,000 shares, 4 hryvnias dividend)
2,500,000
Machinery and equipment 21,600,000 Common stock (1 million shares at 6 hryvnias par)
6,000,000
Furniture and fixtures 6,000,000 Paid in capital in excess of par value
3,000,000
Gross fixed assets 39,600,000 Retained earnings 3,100,000
Less: Accumulated depreciation 12,000,000 Total stockholders’ equity
14,600,000
Net fixed assets 27,600,000 Total liabilities and stockholders’ equity
53,700,000
Total assets 53,700,000
Industry averages
Debt ratio 0.63
Times interest earned ratio 7.30
Fixed payment coverage ratio 1.83
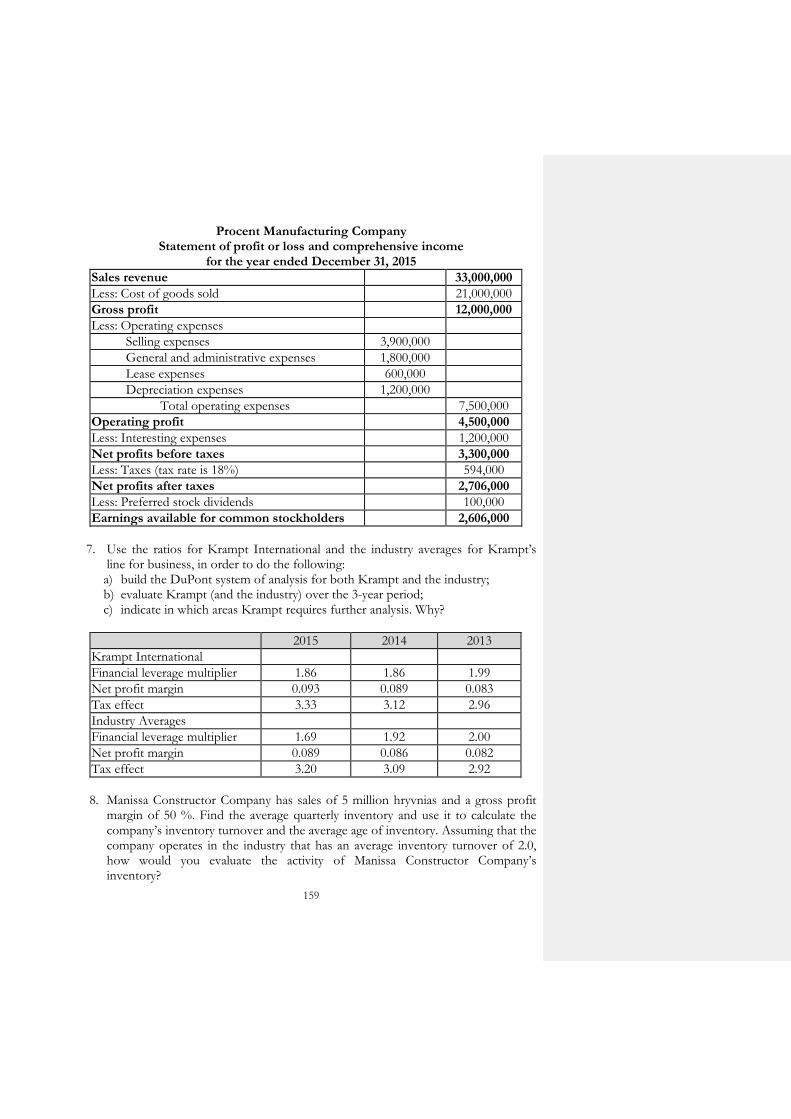
159
Procent Manufacturing Company Statement of profit or loss and comprehensive income
for the year ended December 31, 2015
Sales revenue 33,000,000
Less: Cost of goods sold 21,000,000
Gross profit 12,000,000
Less: Operating expenses
Selling expenses 3,900,000
General and administrative expenses 1,800,000
Lease expenses 600,000
Depreciation expenses 1,200,000
Total operating expenses 7,500,000
Operating profit 4,500,000
Less: Interesting expenses 1,200,000
Net profits before taxes 3,300,000
Less: Taxes (tax rate is 18%) 594,000
Net profits after taxes 2,706,000
Less: Preferred stock dividends 100,000
Earnings available for common stockholders 2,606,000
7. Use the ratios for Krampt International and the industry averages for Krampt’s
line for business, in order to do the following: a) build the DuPont system of analysis for both Krampt and the industry; b) evaluate Krampt (and the industry) over the 3-year period; c) indicate in which areas Krampt requires further analysis. Why?
2015 2014 2013
Krampt International
Financial leverage multiplier 1.86 1.86 1.99
Net profit margin 0.093 0.089 0.083
Tax effect 3.33 3.12 2.96
Industry Averages
Financial leverage multiplier 1.69 1.92 2.00
Net profit margin 0.089 0.086 0.082
Tax effect 3.20 3.09 2.92
8. Manissa Constructor Company has sales of 5 million hryvnias and a gross profit
margin of 50 %. Find the average quarterly inventory and use it to calculate the company’s inventory turnover and the average age of inventory. Assuming that the company operates in the industry that has an average inventory turnover of 2.0, how would you evaluate the activity of Manissa Constructor Company’s inventory?

160
End-of-quarter inventories of the company:
Quarter Inventory
1 360,000
2 900,000
3 1,200,000
4 340,000
Добавлено примечание ([G421]): Inserted: -
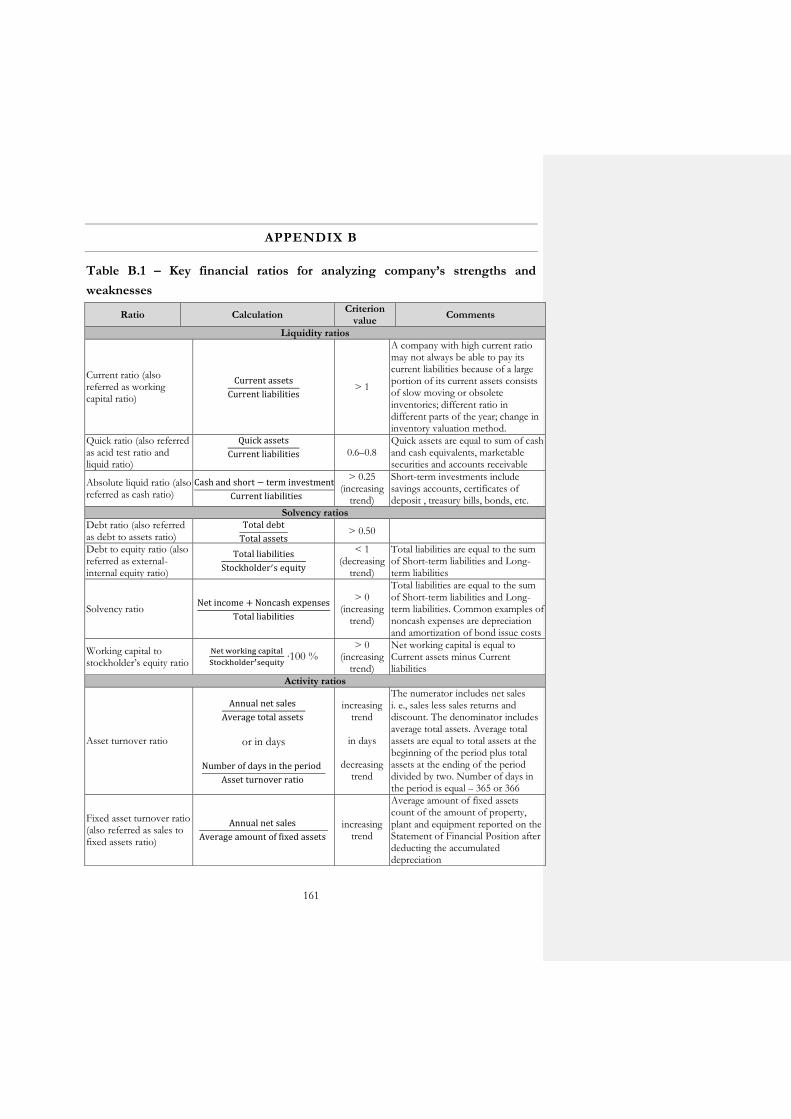
161
APPENDIX B
Table B.1 – Key financial ratios for analyzing company’s strengths and
weaknesses
Ratio Calculation Criterion
value Comments
Liquidity ratios
Current ratio (also referred as working capital ratio)
Current assets
Current liabilities > 1
A company with high current ratio may not always be able to pay its current liabilities because of a large portion of its current assets consists of slow moving or obsolete inventories; different ratio in different parts of the year; change in inventory valuation method.
Quick ratio (also referred as acid test ratio and liquid ratio)
Quick assets
Current liabilities
0.6–0.8
Quick assets are equal to sum of cash and cash equivalents, marketable securities and accounts receivable
Absolute liquid ratio (also referred as cash ratio)
Cash and short − term investments
Current liabilities
> 0.25 (increasing
trend)
Short-term investments include savings accounts, certificates of deposit , treasury bills, bonds, etc.
Solvency ratios
Debt ratio (also referred as debt to assets ratio)
Total debt
Total assets > 0.50
Debt to equity ratio (also referred as external-internal equity ratio)
Total liabilities
Stockholder′s equity
< 1 (decreasing
trend)
Total liabilities are equal to the sum of Short-term liabilities and Long-term liabilities
Solvency ratio Net income + Noncash expenses
Total liabilities
> 0 (increasing
trend)
Total liabilities are equal to the sum of Short-term liabilities and Long-term liabilities. Common examples of noncash expenses are depreciation and amortization of bond issue costs
Working capital to stockholder’s equity ratio
Net working capital
Stockholder′sequity ∙100 %
> 0 (increasing
trend)
Net working capital is equal to Current assets minus Current liabilities
Activity ratios
Asset turnover ratio
Annual net sales
Average total assets
or in days
Number of days in the period
Asset turnover ratio
increasing trend
in days
decreasing
trend
The numerator includes net sales i. e., sales less sales returns and discount. The denominator includes average total assets. Average total assets are equal to total assets at the beginning of the period plus total assets at the ending of the period divided by two. Number of days in the period is equal – 365 or 366
Fixed asset turnover ratio (also referred as sales to fixed assets ratio)
Annual net sales
Average amount of fixed assets
increasing trend
Average amount of fixed assets count of the amount of property, plant and equipment reported on the Statement of Financial Position after deducting the accumulated depreciation
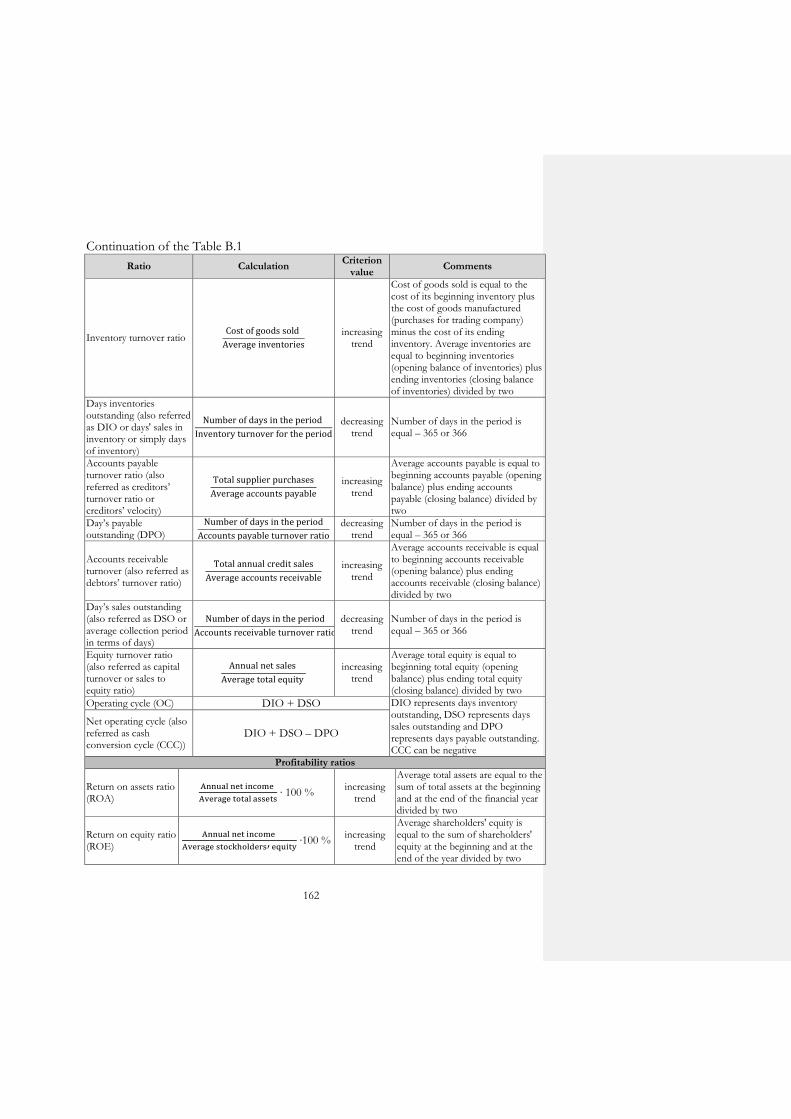
162
Continuation of the Table B.1
Ratio Calculation Criterion
value Comments
Inventory turnover ratio Cost of goods sold
Average inventories
increasing trend
Cost of goods sold is equal to the cost of its beginning inventory plus the cost of goods manufactured (purchases for trading company) minus the cost of its ending inventory. Average inventories are equal to beginning inventories (opening balance of inventories) plus ending inventories (closing balance of inventories) divided by two
Days inventories outstanding (also referred as DIO or days' sales in inventory or simply days of inventory)
Number of days in the period
Inventory turnover for the period
decreasing trend
Number of days in the period is equal – 365 or 366
Accounts payable turnover ratio (also referred as creditors’ turnover ratio or creditors’ velocity)
Total supplier purchases
Average accounts payable
increasing trend
Average accounts payable is equal to beginning accounts payable (opening balance) plus ending accounts payable (closing balance) divided by two
Day’s payable outstanding (DPO)
Number of days in the period
Accounts payable turnover ratio
decreasing trend
Number of days in the period is equal – 365 or 366
Accounts receivable turnover (also referred as debtors’ turnover ratio)
Total annual credit sales
Average accounts receivable
increasing trend
Average accounts receivable is equal to beginning accounts receivable (opening balance) plus ending accounts receivable (closing balance) divided by two
Day’s sales outstanding (also referred as DSO or average collection period in terms of days)
Number of days in the period
Accounts receivable turnover ratio decreasing
trend Number of days in the period is equal – 365 or 366
Equity turnover ratio (also referred as capital turnover or sales to equity ratio)
Annual net sales
Average total equity
increasing trend
Average total equity is equal to beginning total equity (opening balance) plus ending total equity (closing balance) divided by two
Operating cycle (OC) DIO + DSO DIO represents days inventory outstanding, DSO represents days sales outstanding and DPO represents days payable outstanding. CCC can be negative
Net operating cycle (also referred as cash conversion cycle (CCC))
DIO + DSO – DPO
Profitability ratios
Return on assets ratio (ROA)
Annual net income
Average total assets ∙ 100 %
increasing trend
Average total assets are equal to the sum of total assets at the beginning and at the end of the financial year divided by two
Return on equity ratio (ROE)
Annual net income
Average stockholders′ equity ∙100 %
increasing trend
Average shareholders' equity is equal to the sum of shareholders' equity at the beginning and at the end of the year divided by two

163
Continuation of the Table B.1
Ratio Calculation Criterion
value Comments
Return on invested capital (ROIC)
Net operating profit after taxes
Invested capital x
x 100 %
increasing trend
Net operating profit after taxes (NOPAT) = Operating profit • (1 – Tax rate). Invested capital (IC) includes fixed assets such as plant, property and equipment and non-cash working capital contains assets such as accounts receivable and inventory (Non-cash working capital = Current assets – Current liabilities – Cash)
Return on sales (ROS) (also referred as net profit (NP) margin)
Net income
Net sales ∙ 100 %
increasing trend
Gross profit (GP) margin
Gross profit
Net sales
increasing trend
Gross profit is equal to net sales minus cost of goods sold. Net sales are equal to total gross sales less returns inwards and discount allowed
Expense ratio Expenses
Net sales
decreasing trend
Some expenses vary with the change in sales (variable expenses). The ratio for such expenses normally does not change significantly as the sales volume increases or decreases. For fixed expenses (rent of building, fixed salaries etc.), the ratio changes significantly as the sales volume changes
Operating ratio (also referred as operating expense ratio (OER))
Total operating expenses
Net sales
decreasing trend
Total operating expenses are equal to cost of goods sold plus operating expenses. Non-operating expenses such as interest charges, taxes etc., are excluded from the computations
Market ratios
Earnings per share (EPS) ratio
Net income −Dividends on preferred sharesWeighted average number of common shares outstanding
increasing
trend
Since the number of outstanding shares can change over time, the use of weighted average value of common outstanding shares delivers accurate result. However, instead, a simple average or the number of common outstanding share at the end of the year can also be used for simplicity
Price to earnings (P/E) ratio
Market value per share
Annual earnings per share
increasing trend

164
Continuation of Table B.1
Ratio Calculation Criterion
value Comments
Price to book (P/B) ratio (also referred as market to book ratio)
Market price per share
Book value per share
or Total market capitalization
Total book value
increasing trend
Total book value is equal to Total shareholder equity minus Preferred equity
Dividend payout ratio
Dividend per share
Earnings per share
or
Total dividend paid for the period
Net income available for common stockholders
Depends on the intention of the investor
Dividend yield ratio (also referred as dividend yield percentage)
Dividend per share
Stock price or Market price per share
∙ 100 % increasing trend

165
Figure B.1 – Step by step approach to DuPont analysis
Effect of non-operating items
Return on equity (ROE)
Net income
Total assets
Return on assets (ROA)
Net income
Net sales
Net profit
margin
Total assets
Total Stockholdersequity
Equity multiplier
Net sales
Total assets
Total assets turnover
Operating income
Net sales
Income before tax
Operating income 1 −
Tax
Income before tax
Tax effect
Operating profit
margin
Total assets
Total Stockholdersequity
Equity
multiplier
Net sales
Total assets
Total assets turnover
Total assets
Total Stockholdersequity
Equity
multiplier
X X
X X X X

166
CHAPTER 9:
FINANCIAL MARKET
SUMMARY
The financial market is a specialized market that is responsible for channeling
financial resources from the surplus units (agents who have saved funds) to the deficit
units (agents who needed additional funds) to carry out some form of economic
activities. The financial market, therefore, constitutes of all financial institutions that
receive financial resources from the surplus units of the economy in the form of
savings and transfer them to the deficit units through lending activities. This role of
transferring financial resources from the surplus units to the deficit units is what is
referred to as financial intermediation. This function is illustrated quite clearly in
Mishkin’s Figure 9.1, which also serves conveniently to introduce us a number of
other concepts and terms.
Figure 9.1 – The main function of the financial market
Those net flows go through the financial system (or financial sector), but there
are two basic routes through it. One involves direct finance: firms, for example,
which obtain finance directly from householders by selling them bonds or new
equities that could only occur through a financial market. But even that route is not as
direct as it used to be since a large part of new issues of securities are purchased not
only by individuals but also pension funds and insurance companies, financial
Issue securities (liabilities)
Financial Intermediaries
Lenders/Savers
Householders
Businesses
Governments
Foreigners
Borrowers/ Spenders
Householders
Businesses
Governments
Foreigners
Financial Market
Funds Funds
Funds
Funds
Funds Buy securities (financial assets)
INDIRECT
FINANCE
DIRECT FINANCE
Добавлено примечание ([G425]): Deleted:F
Добавлено примечание ([G422]): Inserted: The f
Добавлено примечание ([G423]): Inserted: ,
Добавлено примечание ([G424]): Inserted: ,
167
intermediaries which manage household savings placed with them as pension
contributions or insurance premiums.
The second route involves indirect finance: surplus units such as householders
lend their funds to financial intermediaries, which themselves lend to deficit units such
as firms (or finance them in other ways). These are two basic or pure routes by which
funds flow through a financial system in a simple model. In reality, there are more
complex flows too, which combine different elements.
One point is that not all firms’ finance comes from outside the firm or the firm
sector; much of their investment is financed from their own saving (retained profits).
Another point is that financial intermediaries and markets are not purely separate,
alternative, channels for finance. Financial intermediaries operate on a financial
market, buying and selling securities, instead of only receiving non-marketable
deposits and making non-marketable loans.
Thus, a financial market comprises all institutions that play the role of financial
intermediation. These sets of institutions are therefore referred to as financial
intermediaries. The businessman who needed some additional money to start his
business, the government that needed more funds to undertake developmental
projects, the student who needed a loan to pay his/her college fees, and the company
that needed more finances to expand its operation will find the financial market a
useful avenue to access additional funding.
Financial markets provide the following three major economic functions:
1) Price discovery function means that transactions between buyers and
sellers of financial instruments in a financial market determine the price of the traded
asset. At the same time, the required return from the investment of funds is
determined by the participants in a financial market. The motivation for those seeking
funds (deficit units) depends on the required return that investors demand. These
functions of financial markets signal how the funds available from those who want to
lend or invest funds will be allocated among those needing funds and raise those funds
by issuing financial instruments.
2) Liquidity function provides an opportunity for investors to sell a financial
instrument since it is referred to as a measure of the ability to sell an asset at its fair
market value at any time. Without liquidity, an investor would be forced to hold a
financial instrument until conditions arise to sell it or the issuer is contractually
obligated to pay it off. The debt instrument is liquidated when it matures, and equity
Добавлено примечание ([G426]): Inserted: a
Добавлено примечание ([G427]): Inserted: ,

168
instrument is liquidated until the company is either voluntarily or involuntarily. All
financial markets provide some form of liquidity. However, different financial markets
are characterized by the degree of liquidity.
3) The function of the reduction of transaction costs is performed, when
financial market participants are charged and/or bear the costs of trading financial
instrument. In market economies the economic rationale for the existence of
institutions and instruments is related to transaction costs, thus the surviving
institutions and instruments are those that have the lowest transaction costs.
There are different ways to classify financial markets. They are classified
according to the financial instruments they are trading, features of services they
provide, trading procedures, key market participants, as well as the origin of the
markets. The structure of financial market according to the financial instruments they
are trading is shown in Figure 9.2.
Figure 9.2 – The structure of financial market according to financial
instruments they are trading
From the perspective of country origin, its financial market can be broken
down into an internal market and external one. The internal market, also called the
national market, consists of two parts: the domestic market and the foreign market.
The domestic market is the place where issuers domiciled issue securities in the
country and where those securities are subsequently traded. The foreign market is the
place where securities are sold and traded outside the country of issuers.
External market is the market where securities with the following two
distinguishing features are trading: 1) at issuance they are offered simultaneously to
Financial market
Money market Capital market
Interbank market
Bill market
Foreign exchange market
Market of short-term credit-deposit operations
Stock market Market of long- (and medium-) term credit
operations
Добавлено примечание ([G430]): Deleted:D
Добавлено примечание ([G428]): Inserted: The d
Добавлено примечание ([G429]): Deleted:,
Добавлено примечание ([G431]): Inserted: the
Добавлено примечание ([G432]): Deleted:the
Добавлено примечание ([G433]): Deleted:,

169
investors in a number of countries and 2) they are issued outside the jurisdiction of
any single country. The external market is also referred to as the international market,
offshore market, and the Euromarket (despite the fact that this market is not limited
to Europe).
The money market is the sector of the financial market that includes financial
instruments that have a maturity or redemption date that is one year or less at the time
of issuance (short-term securities). These are mainly wholesale markets. The best
known of short-term securities are probably treasury bills. The capital market is the
sector of the financial market where long- (and medium-) term financial instruments
are issued by corporations and governments trade. Here “long-term” is referred to a
financial instrument with an original maturity greater than one year and perpetual
securities (those with no maturity).
There are two types of capital market securities: those that represent shares of
ownership interest, also called equity, issued by corporations, and those that represent
indebtedness, or debt issued by corporations and by the state and local governments.
Institutional investors (insurance companies and pension funds) and special agents
such as investment banks, brokers and dealers are the major players in the capital
markets. This refers to a distinction within capital markets. An enterprise can typically
raise funds in the capital markets in two distinct ways. First, it can issue or sell a debt
instrument such as a bond, or raise a loan from a bank. The second main way in which
an enterprise can raise finance is through the issue of equities such as common stock
(US) or ordinary shares (UK). The markets for bonds and bank loans are collectively
known as debt markets. While bonds tend to be long-term financial assets, bank
loans typically are short- to medium-term assets, but both pay a rate of interest.
Equities represent future claims on an enterprise’s net profits and a residual claim on
its net assets in the case of liquidation. Equity holders receive periodic (typically
annual) payments, called dividends, from the enterprise. Equities are viewed as long-
term securities since they have no final maturity date, unlike most bank loans and
bonds.
Financial markets can be classified in terms of cash market and derivative
markets. The cash market also referred to as the spot market, is the market for the
immediate purchase and sale of a financial instrument. In contrast, some financial
instruments are contracts that specify that the contract holder has either the obligation
or the choice to buy or sell another something at or by some future date. The
Добавлено примечание ([G435]): Deleted:;
Добавлено примечание ([G434]): Inserted: ,
Добавлено примечание ([G437]): Deleted:M
Добавлено примечание ([G436]): Inserted: The m
Добавлено примечание ([G438]): Deleted:,
Добавлено примечание ([G439]): Deleted:,
170
“something” means that the subject of the contract is called the underlying (asset).
The underlying asset is a stock, a bond, a financial index, an interest rate, a currency,
or a commodity. Because the price of such contracts derives their value from the value
of the underlying assets, these contracts are called derivative instruments and the
market where they are traded is called the derivatives market.
When a financial instrument is first issued, it is sold in the primary market. A
secondary market is such a market in which financial instruments are resold among
investors. No new capital is raised by the issuer of the security. Trading takes place
among investors. Note that the originally issuer or borrower receives funds only when
his securities are first sold in the primary market; the issuer does not receive funds
when his securities are traded in the secondary market. Nevertheless, secondary
markets perform two essential functions: (i) they allow the original buyers of securities
to sell them before the maturity date, if necessary (that is, they make the securities
more liquid); (ii) they allow participants in the primary markets to make judgements
about the value of newly-issued securities by looking at the prices of similar, existing
securities that are traded in the secondary markets. Secondary markets are also
classified in terms of organized stock exchanges and over-the-counter (OTC) markets.
Stock exchanges are central trading locations where financial instruments are traded.
In contrast, an OTC market is market where unlisted financial instruments are
traded.
There is a great variety of financial instruments in the financial marketplace.
The use of these instruments by major market participants depends upon their offered
risk and return characteristics, as well as availability in retail or wholesale markets. In
Table 9.1 the general view on the financial instrument categories is provided.
A financial instrument can be classified by the type of claims that the investor
has on the issuer. A financial instrument in which the issuer agrees to pay the investor
interest and repay the amount borrowed is a debt instrument. A debt instrument also
referred to as an instrument of indebtedness, can be in the form of a note, bond, or
loan. The interest payments that must be made by the issuer are fixed contractually.
For example, in the case of a debt instrument that is required to make payments in
euros, the amount can be a fixed euro amount or it can vary depending upon some
benchmark. The investor in a debt instrument can realize no more than the
contractual amount. For this reason, debt instruments are often called fixed income
instruments.
Добавлено примечание ([G440]): Inserted: -

171
Table 9.1 – Types of financial instruments
Category Risk determinants Expected returns Main participants
Non-tradables and non-transferables
In wholesale money markets: transaction volumes
In wholesale money markets: low
In wholesale money markets: banks
In retail markets: low transparency, lack of standardization, low creditworthiness
In credit markets: low
In retail markets: banks, non-bank firms and households
In foreign exchange markets: high volatility, change of currency
In foreign exchange markets: high
In foreign exchange markets: financial institutions, companies
Securities Market volatility, individual risks, and failures
Comparably high Banks and non-bank firms, individuals
Derivatives Market volatility, leverage Very high Banks and non-bank
firms, individuals
Source: Reszat B. (2008). European Financial Systems in the Global Economy
In contrast to a debt obligation, an equity instrument specifies that the issuer
pays the investor an amount based on earnings, if any, after the obligations that the
issuer is required to make to investors of the firm’s debt instruments have been paid.
Common stock is an example of equity instruments. Some financial
instruments due to their characteristics can be viewed as a mix of debt and equity.
Preferred stock is a financial instrument, which has the attribute of a debt because
typically the investor is only entitled to receive a fixed contractual amount. However, it
is similar to an equity instrument because the payment is only made after payments to
the investors in the firm’s debt instruments are satisfied. Another “combination”
instrument is a convertible bond, which allows the investor to convert debt into
equity under certain circumstances. Because preferred stockholders typically are
entitled to a fixed contractual amount, preferred stock is referred to as a fixed income
instrument. Hence, fixed income instruments include debt instruments and preferred
stock.
Добавлено примечание ([G441]): Inserted: ,

172
The classification of debt and equity is especially important for two legal
reasons. First, in the case of a bankruptcy of the issuer, an investor in debt
instruments has a priority on the claim on the issuer’s assets over equity investors.
Second, the tax treatment of the payments by the issuer can differ depending on the
type of financial instrument class.
The list of important financial ratios for assessment financial instruments, their
volatility and profitability (financial market analysis) is presented in Appendix C.
There are various kinds of participants in financial markets who assume
different kinds of roles. They may be borrowers, lenders, financial intermediaries,
infrastructure providers or regulators (see Figure 9.3).
Figure 9.3 – Key participants in financial markets
Borrowers in the financial market are individuals, business entities, or
governments that have applied, met specific requirements, and received a monetary
loan from a lender with the agreement that the money will be repaid. The individual
initiating the request signs a promissory note agreeing to pay the lien holder back
during a specified timeframe for the entire loan amount plus any additional fees. Thus,
most borrowers borrow at interest, meaning they pay a certain percentage of the
principal amount to the lender as a compensation for borrowing. Most loans also have
a maturity date by which time the borrower must repay the loan. The borrower is
legally responsible for repayment of the loan and is subject to any penalties for not
repaying the loan back based on the lending terms agreed upon.
Lenders in the financial market could be viewed as investors that advance extra
funds to borrowers for a stated period on the condition of getting back the principal
amount together with some interest/profit or charge (for a fixed or variable rate of
interest, with or without a security other than the borrower's signatures). A person
Key players in financial markets
–business entities;
–governments;
–households
Borrowers
–governments;
– institutional investors;
–retail investors
Lenders
–banks;
–non-bank financial intermediaries
Financial intermediaries
– stock exchanges;
– rating agencies;
–depositories;
– accounting firms, etc.
Infrastructure providers
–government organizations;
–non-government organization
Regulators
Добавлено примечание ([G442]): Inserted: an
173
lends money when (i) puts money in a savings account at a bank; (ii) contributes to a
pension plan; (iii) pays premiums to an insurance company; (iv) invests in government
bonds. Companies tend to be lenders of capital. When companies have surplus cash
that is not needed for a short period of time, they may seek to make money from their
cash surplus by lending it via short-term markets called money markets. Alternatively,
such companies may decide to return the cash surplus to their shareholders (e. g. via a
share repurchase or dividend payment).
Borrowing and lending occur informally between family and friends, at the retail
level through banks and on a large scale through governments and institutional
investors.
A financial intermediary is a special financial entity, which performs the role
of efficient allocation of funds when there are conditions that make it difficult for
lenders or investors of funds to deal directly with borrowers of funds in financial
markets. Financial intermediaries include depository institutions, insurance companies,
regulated investment companies, investment banks, pension funds. The role of the
financial intermediaries is to create more favorable transaction terms that could be
realized by lenders/investors and borrowers dealing directly with each other in the
financial market. The financial intermediaries are engaged in: (i) obtaining funds from
lenders or investors, and (ii) lending or investing the funds that they borrow to those
who need funds.
Infrastructure providers that facilitate the clearing, settlement, and recording
of monetary and other financial transactions can strengthen the financial markets they
serve and play a critical role in the smooth functioning of the economy and fostering
financial stability. However, if not properly managed, they can pose significant risks
(systemic risk) to the financial system and be a potential source of contagion,
especially in periods of market stress.
Regulators are government and non-government organizations that influence
on financial markets and companies in the form of regulation or supervision, which
subject financial institutions to certain requirements, restrictions and guidelines,
aiming to maintain the integrity of the financial system. Financial regulation has also
influenced the structure of banking sectors by decreasing borrowing costs and
increasing the variety of financial products available.
Добавлено примечание ([G443]): Inserted: -
Добавлено примечание ([G445]): Deleted:F
Добавлено примечание ([G444]): Inserted: A f
Добавлено примечание ([G446]): Deleted:,

174
RECOMMENDED READING
1. Allen, F., Carletti, E., and Marquez, R., 2011, Credit market competition and
capital regulation, Review of Financial Studies, 24(4), pp. 983–1018. 2. Blake, D., 2000, Financial market analysis, New York: Wiley. 3. Bekaert, G., Harvey, C. R., Lundblad, C. T., and Siegel, S., 2013, The European
Union, the Euro, and equity market integration, Journal of Financial Economics,
109(3), pp. 583–603. 4. Bekaert, G., Harvey, C. R., Lundblad, C. T., and Siegel, S., 2011, What segments
equity markets?, Review of Financial Studies, 24(12), pp. 3841–3890. 5. Duenwald, C. K., Gueorguiev N., and Schaechter, A., 2005, Too much of a good
thing? Credit booms in transition economies: The cases of Bulgaria, Romania, and Ukraine, pp. 1-33.
6. Farmer, R. E., 2012, The stock market crash of 2008 caused the Great Recession:
Theory and evidence, Journal of Economic Dynamics and Control, 36(5), pp. 693–707. 7. Graham, M., Kiviaho, J., and Nikkinen, J., 2012, Integration of 22 emerging stock
markets: A three-dimensional analysis, Global Finance Journal, 23(1), pp. 34–47. 8. Madura, J., 2014, Financial markets and institutions, Cengage learning. 9. Ong, M. L., and Iorgova, S., 2008, The Capital Markets of Emerging Europe:
Institutions, Instruments and Investors, International Monetary Fund, pp. 8–103. 10. Van Rooij, M., Lusardi, A., and Alessie, R., 2011, Financial literacy and stock
market participation, Journal of Financial Economics, 101(2), pp. 449–472. 11. Wurgler, J., 2000, Financial markets and the allocation of capital, Journal of financial
economics, 58(1), pp. 187–214.
KEY TERMS
treasury bills are government securities with a maturity of three to twelve months and thus are seen as approximately risk-free securities.
bond is a promissory note that promises to repay the investor the principal and agreed rate or amount of interest.
retail investor is an individual who purchases a few securities for his or her own personal account rather than for an organization or a company. Retail investors typically trade in much smaller amounts than institutional investors such as mutual funds, pensions, or university endowments.
institutional investor
is a term for large organizations (such as banks, finance companies, insurance companies, labor union funds, pension funds) which pool money to purchase securities, real property and other investment assets or originate loans (have considerable cash reserves that need to be invested). Institutional investors are by far the biggest participants in securities trading and their share of stock market volumes have consistently grown over the years.
Добавлено примечание ([G450]): Deleted:amount o
Добавлено примечание ([G447]): Inserted: ew
Добавлено примечание ([G449]): Deleted:ll
Добавлено примечание ([G448]): Deleted:sm

175
financial intermediary
is a financial institution that facilitates the channeling of funds between lenders and borrowers (acts as the middleman between two parties (surplus and deficit agents) in a financial transaction). While a commercial bank is a typical financial intermediary, this category also includes other financial institutions such as investment banks, insurance companies, broker-dealers, mutual funds and pension funds.
financial instrument
is a document (such as a check, draft, bond, share, bill of exchange, futures or options contract) that has a monetary value or that represents a legally enforceable (binding) agreement between two or more parties regarding a right to payment of money.
debt instrument is a document that serves as a legally enforceable evidence of a debt and the promise of its timely repayment. Banker's acceptance, bills of exchange, bonds, certificates of deposit, debentures, and promissory notes, all are debt instruments.
equity instrument is a document that serves as a legally enforceable evidence of the right of ownership in a firm, such as a share certificate (stock certificate).
securities is a financing or investment instrument issued by a company or government agency that denotes an ownership interest and provides evidence of a debt, a right to share in the earnings of the issuer, or in the distribution of a property. Securities include bonds, debentures, notes, options, shares, and warrants but not insurance policies, and may be traded in financial markets such as stock exchanges.
share is a unit of ownership that represents an equal proportion of a company's capital, that entitles its holder (the shareholder) to an equal claim on the company's profits and an equal obligation for the company's debts and losses.
ordinary shares (common stock)
entitle the shareholder to share in the earnings of the company as they occur, and to vote at the company's annual general meetings and other official meetings.
preference shares (preferred stock)
entitle the shareholder to a fixed periodic income (interest) but generally do not give him voting rights.
interbank market is a market which involves bank borrowing and lending of any funds in reserve accounts at the central bank.
dealer is an agent who buys and sells securities as a principal on its own account, rather than as a broker for his clients. The dealer may function as a broker, or as the market maker.
broker is an agent who executes orders to buy and sell securities on behalf of his clients in exchange for a commission fee.
Добавлено примечание ([G451]): Inserted: a
Добавлено примечание ([G452]): Inserted: a
Добавлено примечание ([G455]): Deleted:D
Добавлено примечание ([G453]): Inserted: the
Добавлено примечание ([G454]): Inserted: The d

176
nominal value (book value or par value or face value)
is the price of security at the time of its issue, that doesn’t change over the time. It may be issued arbitrarily to common stock and recorded on a company balance sheet. These funds are invested directly in the company that issued the stock as a means of infusing cash into the business. The stock represents ownership of a piece of the company. Also referred to as face value or par value, the nominal value is the value shown on the face of a security certificate or instrument, including currency.
market value is the price listed in the exchange or the price at which it is traded in the market. Market value reflects what market is willing to pay for it.
dividend is a distribution of a portion of company's earnings (the after-tax profit of a company), decided by the board of directors, to a class of its shareholders. Dividends can be issued as cash payments, as shares of stock, or other property. The amount and timing of the dividend are decided by the board of directors, who also determine whether it is paid out of current earnings or the past earnings shall be kept as reserve. Holders of preferred stock receive a dividend at a fixed rate and are paid first.
coupon (coupon rate)
is the annual registered interest rate paid on a bond, expressed as a percentage of the face value, that the bond issuer promises to pay until the bond matures. For example, a '10 percent coupon' means a 10 percent annual interest rate.
derivative is a financial instrument (contract) that derives its value from the performance of underlying assets such as stocks, bonds, currency exchange rates, real estate. Derivatives can be used for a number of purposes, including insuring against price movements (hedging), increasing exposure to price movements for speculation or getting access to otherwise hard-to-trade assets or markets. Some of more common derivatives include forwards, futures, options, swaps, and variations, such as synthetic collateralized debt obligations and credit default swaps.
REVIEW QUESTIONS
1. What is a financial market? State its role.
2. What are the functions of a financial market?
3. How does macroeconomic policy affect financial markets and financial
institutions?
4. Who are the main participants in money markets?
5. Explain how different kinds of markets may be distinguished.
6. What is the difference between a primary market and a secondary market? Which
market is bigger for equity securities?
7. What is the capital market? What are its features?
8. What is money market? What are its constituents?
Добавлено примечание ([G456]): Inserted: the
Добавлено примечание ([G457]): Inserted: the
Добавлено примечание ([G460]): Deleted:is
Добавлено примечание ([G458]): Inserted: a
Добавлено примечание ([G459]): Inserted: are
Добавлено примечание ([G461]): Inserted: the
Добавлено примечание ([G462]): Deleted: an
Добавлено примечание ([G463]): Inserted: a
Добавлено примечание ([G465]): Deleted:of
Добавлено примечание ([G464]): Inserted: in
Добавлено примечание ([G466]): Inserted: the
177
9. How does money market differ from capital market?
10. Describe distinction between equity and debt markets.
11. What's the difference between the capital and stock markets?
12. What are financial instruments? How are they classified?
13. Draw the line between debt and equity financial instruments using the following
characteristics: type of relations, time limits, advantages for the firm and for the
investor, disadvantages for the firm and for the investor.
14. What main roles do the borrowers, lenders, financial intermediaries, infrastructure
providers, and regulators play in the financial markets?
15. Discuss the distinction between different types of financial intermediaries.
MULTIPLE CHOICE QUESTIONS
Choose the one alternative that best completes the statement or answers the question.
1. Which of the following is not a characteristic of a preference share? a) ranks last for payment in the event of company liquidation; b) unpaid dividend is accrued until it can be paid; c) does not usually have voting rights unless dividends fall into arrears; d) it is more like debt than a share in its characteristics.
2. Which of the following are not a money market instruments? a) bonds; b) treasury bills; c) certificates of deposit (CDs); d) commercial paper (CP).
3. Which of the following is not a defining quality of a bond? a) dividend yield; b) maturity; c) face value; d) coupon payment frequency.
4. Financial markets and institutions: a) involve the movement of huge flows of money; b) affect the profits of businesses; c) affect the types of goods and services produced in economy; d) all above-mentioned; e) none of the above.
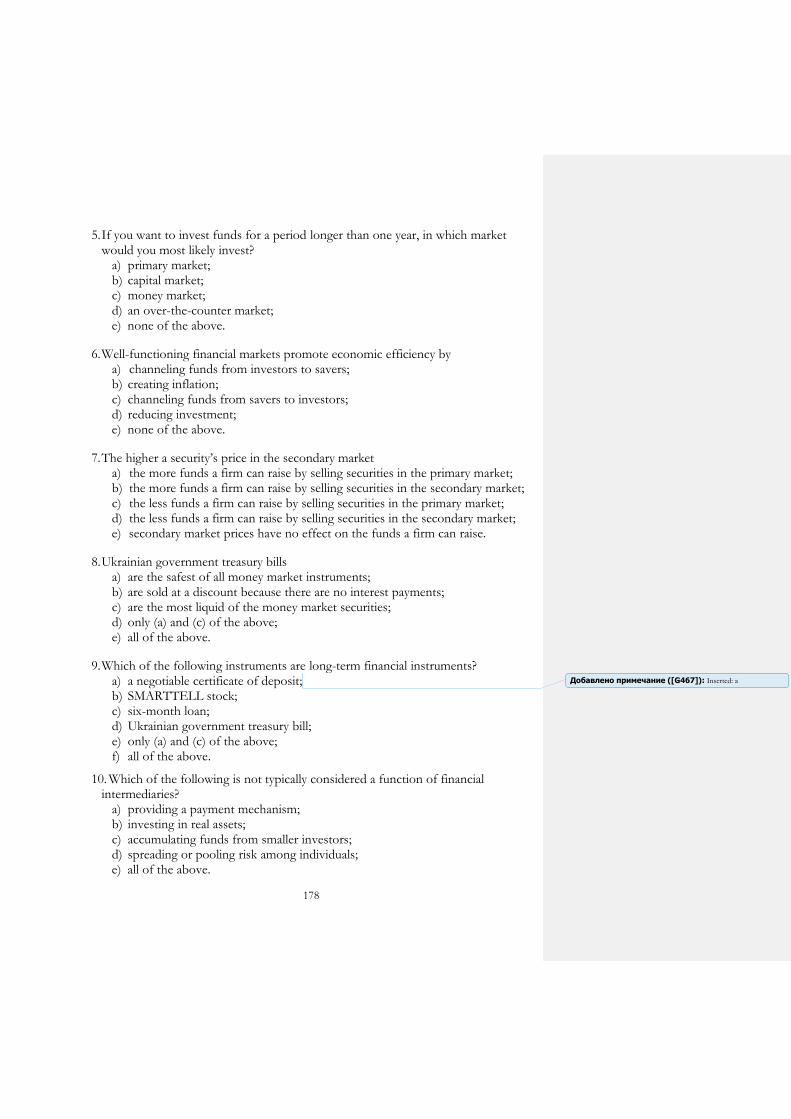
178
5. If you want to invest funds for a period longer than one year, in which market would you most likely invest?
a) primary market; b) capital market; c) money market; d) an over-the-counter market; e) none of the above.
6. Well-functioning financial markets promote economic efficiency by a) channeling funds from investors to savers; b) creating inflation; c) channeling funds from savers to investors; d) reducing investment; e) none of the above.
7. The higher a security’s price in the secondary market a) the more funds a firm can raise by selling securities in the primary market; b) the more funds a firm can raise by selling securities in the secondary market; c) the less funds a firm can raise by selling securities in the primary market; d) the less funds a firm can raise by selling securities in the secondary market; e) secondary market prices have no effect on the funds a firm can raise.
8. Ukrainian government treasury bills a) are the safest of all money market instruments; b) are sold at a discount because there are no interest payments; c) are the most liquid of the money market securities; d) only (a) and (c) of the above; e) all of the above.
9. Which of the following instruments are long-term financial instruments? a) a negotiable certificate of deposit; b) SMARTTELL stock; c) six-month loan; d) Ukrainian government treasury bill; e) only (a) and (c) of the above; f) all of the above.
10. Which of the following is not typically considered a function of financial intermediaries?
a) providing a payment mechanism; b) investing in real assets; c) accumulating funds from smaller investors; d) spreading or pooling risk among individuals; e) all of the above.
Добавлено примечание ([G467]): Inserted: a

179
SHORT ANSWER QUESTIONS
MISSING WORD QUESTIONS
Choose the correct word to complete each sentence.
1. Typically, _______________ securities (with a maturity of __________ one year) are traded in the money markets.
2. Institutional investors (insurance companies and pension funds) and specialist agents such as investment banks (see below), brokers and dealers are the major players in the _____________ market.
3. The main way in which an enterprise can raise finance is through the issue of equities such as _________________________.
4. Once securities have been issued, they are subsequently traded as claims to ownership on _____________ market. The best-known examples of ___________ markets are ____________________, where large already existing stocks of equities are traded.
5. ____________________ a contractual agreement by the issuer of the instrument (the borrower) to pay the holder of the instrument (the lender) fixed dollar amounts (interest and principal payments) at regular intervals until a specified date (maturity date) when a final payment is made.
TRUE/FALSE/UNCERTAIN QUESTIONS
Decide whether the following statements are True, False, or Uncertain. Explain your reasoning. Your score will be based not just on whether you get the True, False, or Uncertain part right but also, to a larger extent, on the quality of your explanation.
1. The main disadvantage of holders of debt instruments is that they do not benefit
from an increase in the value of the borrower’s income or assets.
2. The main function of a primary market is that it allows the original buyers of securities to sell them before the maturity date, if necessary. That is, they make the securities more liquid.
3. The principal capital market instruments are: corporate stocks, corporate bonds, government securities, state and local government (municipal) bonds, bank commercial and consumer loans, which are, by definition, intermediate-term debt instruments, long-term debt instruments, or equities.
Добавлено примечание ([G468]): Inserted: a
Добавлено примечание ([G470]): Deleted:'s
Добавлено примечание ([G469]): Inserted: s
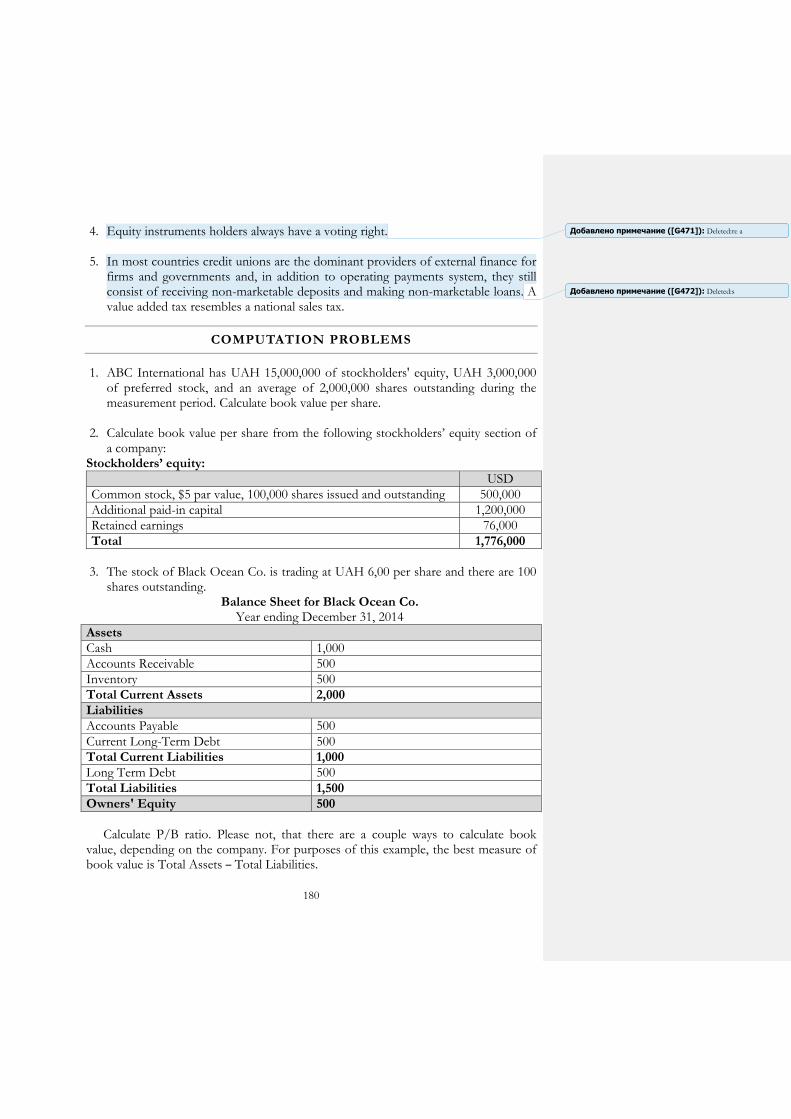
180
4. Equity instruments holders always have a voting right.
5. In most countries credit unions are the dominant providers of external finance for firms and governments and, in addition to operating payments system, they still consist of receiving non-marketable deposits and making non-marketable loans. A value added tax resembles a national sales tax.
COMPUTATION PROBLEMS
1. ABC International has UAH 15,000,000 of stockholders' equity, UAH 3,000,000 of preferred stock, and an average of 2,000,000 shares outstanding during the measurement period. Calculate book value per share.
2. Calculate book value per share from the following stockholders’ equity section of a company:
Stockholders’ equity:
USD
Common stock, $5 par value, 100,000 shares issued and outstanding 500,000
Additional paid-in capital 1,200,000
Retained earnings 76,000
Total 1,776,000
3. The stock of Black Ocean Co. is trading at UAH 6,00 per share and there are 100
shares outstanding. Balance Sheet for Black Ocean Co.
Year ending December 31, 2014
Assets
Cash 1,000
Accounts Receivable 500
Inventory 500
Total Current Assets 2,000
Liabilities
Accounts Payable 500
Current Long-Term Debt 500
Total Current Liabilities 1,000
Long Term Debt 500
Total Liabilities 1,500
Owners' Equity 500
Calculate P/B ratio. Please not, that there are a couple ways to calculate book
value, depending on the company. For purposes of this example, the best measure of book value is Total Assets – Total Liabilities.
Добавлено примечание ([G471]): Deleted:re a
Добавлено примечание ([G472]): Deleted:s

181
4. The lime company has a total of UAH 400,000 dividends paid last year. This amount does not include the one-time payments. The total number of common stock shares outstanding is UAH 1 million. What is the DPS for lime company?
5. Kate bought one share with the book value UAH 1500,00 of Wood Co. which pays 30 % of annual dividends. Calculate that the dividend yield on Wood Co. stock, if the current stock price is UAH 1700,00.
6. A bond pays a coupon of 4 euro every six months, and 100 euro will be repaid at maturity. There are two years to maturity and the next coupon is paid in six months. The redemption yield on similar bonds is 6 % p. a. Estimate the fair price of the bond. An interest rate of 6 % p. a. indicates a rate of 3 % per six month period.
7. Consider the case of a 5 euro annual coupon and an initial interest rate of 10 % p. a. Calculate the fair price of the bond. What would be with the price of the bond if (i) the interest rate falls by 2 percentage points to 8 % p. a.; (ii) interest rate rises by 2 percentage points to 12 % p. a.?
8. An investor has two bonds. Bond A pays a 5 euro annual coupon and matures in five years. Bond B pays a 4 euro coupon semi-annually and matures in three years. The investor needs to sell one bond immediately and hold the other for two years. The current rate of interest, for all maturities up to five years, is 6 % p. a. Which bond would the investor sell if that investor expected interest rates to: (a) increase, (b) decrease?
9. Assume a redemption yield of 8 %. Compute the duration for the following bonds each 100 euro par value. For the 12 % coupon bond compute duration. a) 10 years, zero coupons; b) 10 years, 8 percent; c) 10 years, 12 percent coupon.
10. Determine the interest rate sensitivity of two bonds. Bond 1 is a 12 % coupon bond with a 7-year maturity and a $1000 principal. Bond 2 is a ‘zero-coupon’ bond that pays $1120 after 7 years. The current interest rate is 12 %. Determine the duration of each bond. If the interest rate increases 100 basis points (100 basis points = 1 %), what will be the capital loss on each bond?
Добавлено примечание ([G474]): Deleted:L
Добавлено примечание ([G473]): Inserted: The l
Добавлено примечание ([G475]): Inserted: s
Добавлено примечание ([G476]): Inserted: s

182
APPENDIX C
Table C.1 – List of important financial ratios for financial market analysis
1. Book value per common share (BVPS); measure used by owners of common shares in a firm to determine the level of safety associated with each individual share after all debts are paid accordingly
Book value per common share (BVPS) =
= (𝐸𝑠 − 𝑆𝑝)
𝑁𝑠 or
𝐸𝑐𝑠
𝑁𝑐𝑠
Es – total stockholders' equity; Sp – preference shares; Ns – number of outstanding shares; Ecs – total common stockholders' equity; Ncs – number of common shares
2. Price to book ratio (P/B ratio) is a financial ratio used to compare a company's book value to its current market price. It is calculated by dividing the current closing price of the stock by the latest quarter's book value per share
Price to book ratio (P/B ratio) = = MPPS/BVPS
MPPS – market price per share; BVPS – book value per share
3. Dividend per share (DPS) is the sum of declared dividends for every ordinary share issued. Dividend per share (DPS) is the total dividends paid out over an entire year (including interim dividends but not including special dividends) divided by the number of outstanding ordinary shares issued
Dividend per share (DPS) = 𝐷 − 𝐷𝑠
𝑁𝑠
D – sum of dividends over a period (usually 1 year); Ds – special, one time dividends; Ns – number of outstanding shares for the period
4. Dividend per share for preferred stock (DPSPS)
Dividend per share for preferred stock =
= 𝐷𝑅𝑝𝑠 ∙ 𝑃𝑉𝑃𝑆
𝑁𝑝𝑠
DRps – dividend rate for a specific company's preferred stock; PVPS – par value of the company's preferred stock; Nps – number of preferred stock
5. Dividend yield is a stock's dividend as a percentage of the stock price
Dividend yield = DPS/Ps DPS – dividend per share; Ps – price per share
6. Coupon rate is simply the coupon payment as a percentage of the face value
Coupon rate = C/FV C – coupon payment; FV – face (book) value per bond
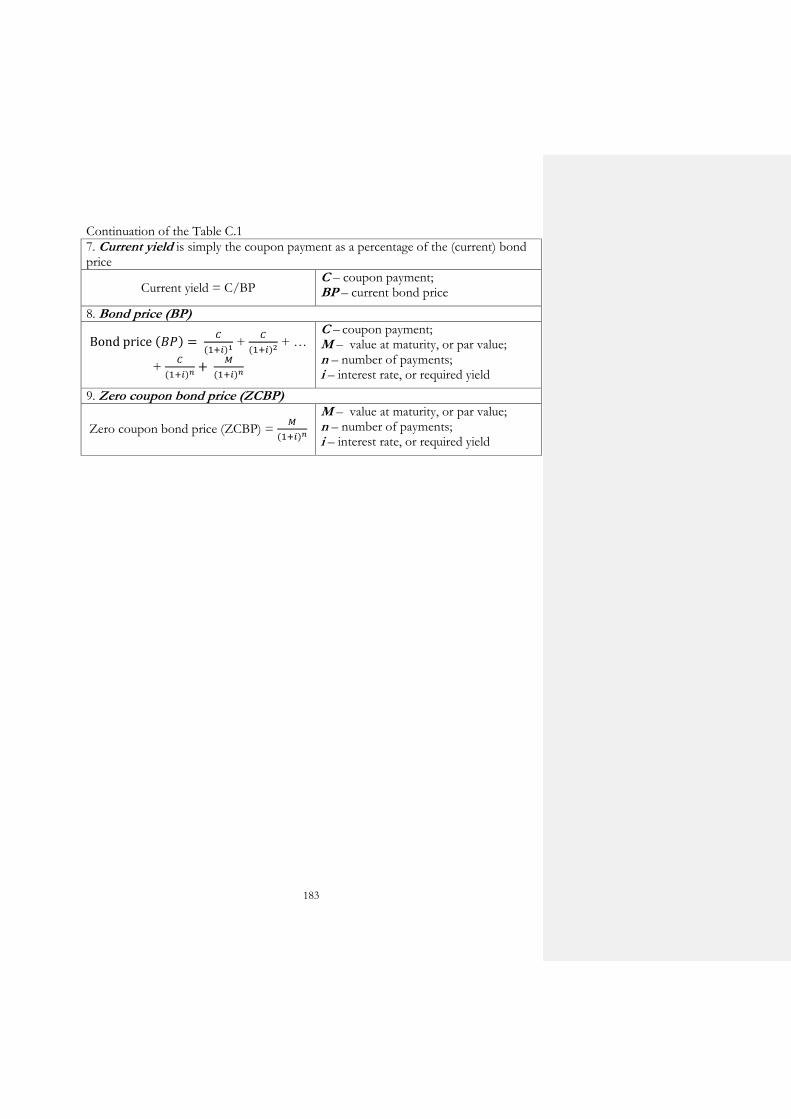
183
Continuation of the Table C.1
7. Current yield is simply the coupon payment as a percentage of the (current) bond price
Current yield = C/BP C – coupon payment; BP – current bond price
8. Bond price (BP)
Bond price (𝐵𝑃) = 𝐶
(1+𝑖)1 +
𝐶
(1+𝑖)2 + …
+ 𝐶
(1+𝑖)𝑛+
𝑀
(1+𝑖)𝑛
C – coupon payment; M – value at maturity, or par value; n – number of payments; i – interest rate, or required yield
9. Zero coupon bond price (ZCBP)
Zero coupon bond price (ZCBP) = 𝑀
(1+𝑖)𝑛
M – value at maturity, or par value; n – number of payments; i – interest rate, or required yield
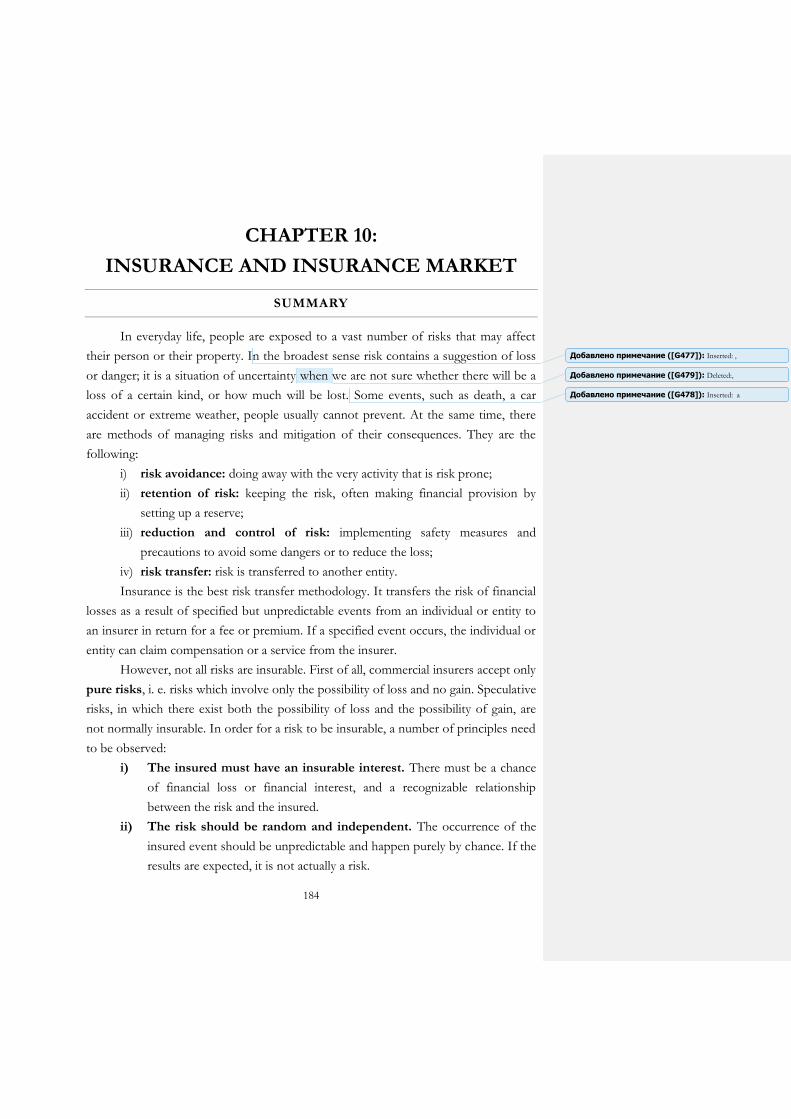
184
CHAPTER 10:
INSURANCE AND INSURANCE MARKET
SUMMARY
In everyday life, people are exposed to a vast number of risks that may affect
their person or their property. In the broadest sense risk contains a suggestion of loss
or danger; it is a situation of uncertainty when we are not sure whether there will be a
loss of a certain kind, or how much will be lost. Some events, such as death, a car
accident or extreme weather, people usually cannot prevent. At the same time, there
are methods of managing risks and mitigation of their consequences. They are the
following:
i) risk avoidance: doing away with the very activity that is risk prone;
ii) retention of risk: keeping the risk, often making financial provision by
setting up a reserve;
iii) reduction and control of risk: implementing safety measures and
precautions to avoid some dangers or to reduce the loss;
iv) risk transfer: risk is transferred to another entity.
Insurance is the best risk transfer methodology. It transfers the risk of financial
losses as a result of specified but unpredictable events from an individual or entity to
an insurer in return for a fee or premium. If a specified event occurs, the individual or
entity can claim compensation or a service from the insurer.
However, not all risks are insurable. First of all, commercial insurers accept only
pure risks, i. e. risks which involve only the possibility of loss and no gain. Speculative
risks, in which there exist both the possibility of loss and the possibility of gain, are
not normally insurable. In order for a risk to be insurable, a number of principles need
to be observed:
i) The insured must have an insurable interest. There must be a chance
of financial loss or financial interest, and a recognizable relationship
between the risk and the insured.
ii) The risk should be random and independent. The occurrence of the
insured event should be unpredictable and happen purely by chance. If the
results are expected, it is not actually a risk.
Добавлено примечание ([G477]): Inserted: ,
Добавлено примечание ([G479]): Deleted:,
Добавлено примечание ([G478]): Inserted: a
185
iii) The risk of loss must be definite as to time and place and difficult to
counterfeit or falsify. Otherwise, there is a high moral hazard: the insured
can influence the risk and facilitate the occurrence of insurance event.
iv) The risk must be definable and financially measurable. The risk must
be fully definable, in order to put a price on the cost of the loss, to remove
any dispute over whether the loss has occurred, and to determine the level
of compensation required.
v) The cost of the insurance must be affordable to the insured. The
amount charged to insure an individual or entity must be a sum that the
insured is willing to pay and should be only a fraction of the value of the
item itself. At the same time, the premium needs to be high enough to
cover future claims on the insurer's pool of risks and its expenses while
still making a profit.
vi) There must be a large number of persons with a similar potential
loss available for the insurance. The law of large numbers is applied
here. When there are sufficient numbers of potential insured with a similar
chance of loss, the insurance company is able to calculate the likelihood of
the risk, predict losses and accumulate adequate insurance funds.
vii) The risk of catastrophically large losses should be limited. If a
catastrophic event occurred or a great number of insured suffered a loss at
the same time, the insurance company wouldn’t be able to pay the loss and
could go bankrupt.
As an economic category, insurance has its functions and principles. The main
functions (or benefits) of insurance are:
i) risk transfer: insurance is essentially a risk transfer mechanism, removing,
for a premium, the potential financial loss from the individual or entity
and placing it upon the insurer;
ii) savings: this is particularly the function of life insurance, which offers a
convenient and effective way of making savings and provides the welfare
of people in old age or family tragedy;
iii) financial compensation: insurance enables businesses to survive major
losses (e. g. accidents, fires) and provides the money to persons in times of
tragedy or other times of need.
Добавлено примечание ([G480]): Inserted: s
Добавлено примечание ([G481]): Inserted: ,
186
iv) loss prevention and loss reduction: the practice of insurance includes
various surveys and inspections related to risk management, which is
usually followed by requirements or recommendations to decrease the
exposure to the risk;
v) investments (economic development): insurance companies are able to
accumulate large amounts of financial resources in their funds and,
therefore, they are important investors in the financial market.
Principles of insurance are the following:
i) Insurance companies have the freedom to choose the line of
insurance business, and policyholders are free to choose the insurer.
This principle is limited in compulsory insurance.
ii) Proximate cause. Not every cause of loss is covered under the insurance
contract. By this criterion, all perils are classified into insured, excepted
(excluded) and uninsured. For the purposes of an insurance claim, only
one dominant cause must be singled out in each case.
iii) Insurable interest. The principle means a person’s legally recognized
relationship to the subject matter of insurance that gives them the right to
effect insurance on it.
iv) Utmost good faith. Each party in insurance contract (policyholder,
insurer) is under a duty to reveal all vital information to the other party,
whether the other party asks for it or not.
v) The principle of indemnity. The principle means providing an exact
financial compensation for an insured loss, and no gain. It cannot be
applied to life insurance.
vi) Deductible. Deductibles are normally provided as cautions in an
insurance policy that determine an amount the insurer will deduct from
the loss before paying up to its policy limits. Depending on the policy, the
deductible may be applied per covered event, or per year. There are two
types of deductibles – ordinary and franchise, their description is
presented in Table 10.1.
vii) Subrogation. The principle allows proceeds of claim against the third
party be passed to insurers, to the extent of their insurance payments.
Добавлено примечание ([G483]): Deleted:are
Добавлено примечание ([G482]): Inserted: is
Добавлено примечание ([G484]): Inserted: ,
Добавлено примечание ([G485]): Inserted: the
Добавлено примечание ([G486]): Inserted: an
Добавлено примечание ([G488]): Deleted:P
Добавлено примечание ([G487]): Inserted: The p
Добавлено примечание ([G489]): Inserted: the
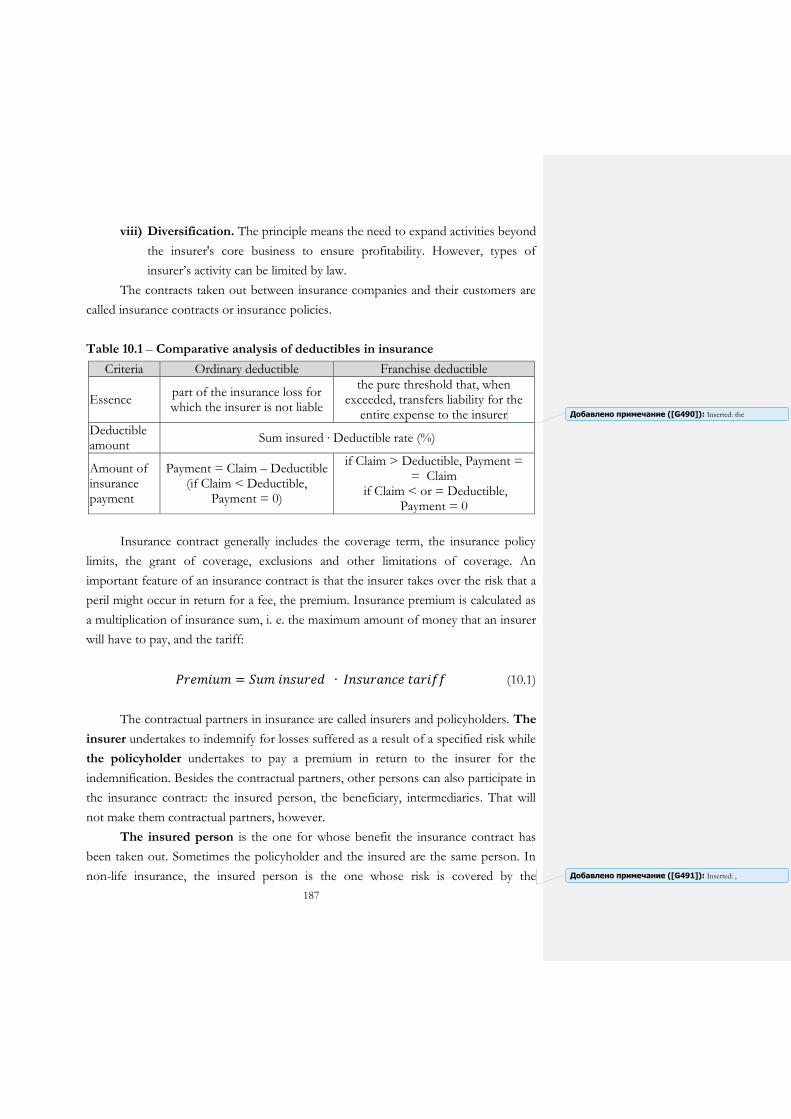
187
viii) Diversification. The principle means the need to expand activities beyond
the insurer's core business to ensure profitability. However, types of
insurer’s activity can be limited by law.
The contracts taken out between insurance companies and their customers are
called insurance contracts or insurance policies.
Table 10.1 – Comparative analysis of deductibles in insurance
Criteria Ordinary deductible Franchise deductible
Essence part of the insurance loss for which the insurer is not liable
the pure threshold that, when exceeded, transfers liability for the
entire expense to the insurer
Deductible amount
Sum insured ∙ Deductible rate (%)
Amount of insurance payment
Payment = Claim – Deductible (if Claim < Deductible,
Payment = 0)
if Claim > Deductible, Payment = = Claim
if Claim < or = Deductible, Payment = 0
Insurance contract generally includes the coverage term, the insurance policy
limits, the grant of coverage, exclusions and other limitations of coverage. An
important feature of an insurance contract is that the insurer takes over the risk that a
peril might occur in return for a fee, the premium. Insurance premium is calculated as
a multiplication of insurance sum, i. e. the maximum amount of money that an insurer
will have to pay, and the tariff:
𝑃𝑟𝑒𝑚𝑖𝑢𝑚 = 𝑆𝑢𝑚 𝑖𝑛𝑠𝑢𝑟𝑒𝑑 ∙ 𝐼𝑛𝑠𝑢𝑟𝑎𝑛𝑐𝑒 𝑡𝑎𝑟𝑖𝑓𝑓 (10.1)
The contractual partners in insurance are called insurers and policyholders. The
insurer undertakes to indemnify for losses suffered as a result of a specified risk while
the policyholder undertakes to pay a premium in return to the insurer for the
indemnification. Besides the contractual partners, other persons can also participate in
the insurance contract: the insured person, the beneficiary, intermediaries. That will
not make them contractual partners, however.
The insured person is the one for whose benefit the insurance contract has
been taken out. Sometimes the policyholder and the insured are the same person. In
non-life insurance, the insured person is the one whose risk is covered by the
Добавлено примечание ([G490]): Inserted: the
Добавлено примечание ([G491]): Inserted: ,

188
insurance policy. In life insurance, if the policyholder takes out a policy on the life of
another, the latter is called the insured person. The insured person is not liable for the
payment of the premium if he is not identical with the policyholder, but he acquires
the rights under the insurance contract. The beneficiary is the person to whom the
policyholder has given the right to request the payment of the sum insured when there
is a claim.
Contractual partners in insurance can be represented by the intermediaries.
There are the insurance broker for the policyholder and the insurance agent for the
insurance company. The insurance agent is appointed commercially by one (tied
agent) or more (multiple agents) insurance companies to arrange insurance contracts.
The responsibilities of the insurance agent include: selling insurance, issuing and
countersigning policies, collecting premiums, and generally providing a link between
the insured and the insurance company. The insurance broker, on the other hand, is
an intermediary, who represents the insured. The broker can advise the policyholder
about the best insurance product on the basis of comprehensive market overview. He
can also be authorized to conclude a contract. In this case, the broker is authorized to
effect the optimal insurance cover for the policyholder.
Besides, there are a lot of other professionals involved in insurance: actuary (a
specialist in the mathematics of insurance who calculates rates, reserves, dividends and
other statistics); underwriter (a financial professional who evaluates the risks of
insuring a particular person or asset and uses that information to set premium pricing
for insurance policies); adjuster (a person who investigates claims and recommends
settlement options based on estimates of damage and insurance policies held) and
others. Insurance is classified in different cross-cutting ways. Classification of
insurance according to the lines of insurance and classes of the insurance business is
presented in Figure 10.1.
Insurance includes two classes of business – long term business (life insurance)
and general business (non-life insurance). Non-life insurance provides protection
against the risk of adverse events with a negative financial consequence. The
policyholder pays a premium in exchange for a promise to be indemnified later for the
financial consequences of a covered event, subject to the conditions stipulated in the
contract. Profitability and solvency of the insurer in non-life insurance primarily
depend on underwriting policy, risk pooling, diversification, and insurance portfolio
policy.
Добавлено примечание ([G493]): Deleted:,
Добавлено примечание ([G492]): Inserted: s
Добавлено примечание ([G494]): Inserted: the
Добавлено примечание ([G495]): Inserted: ,
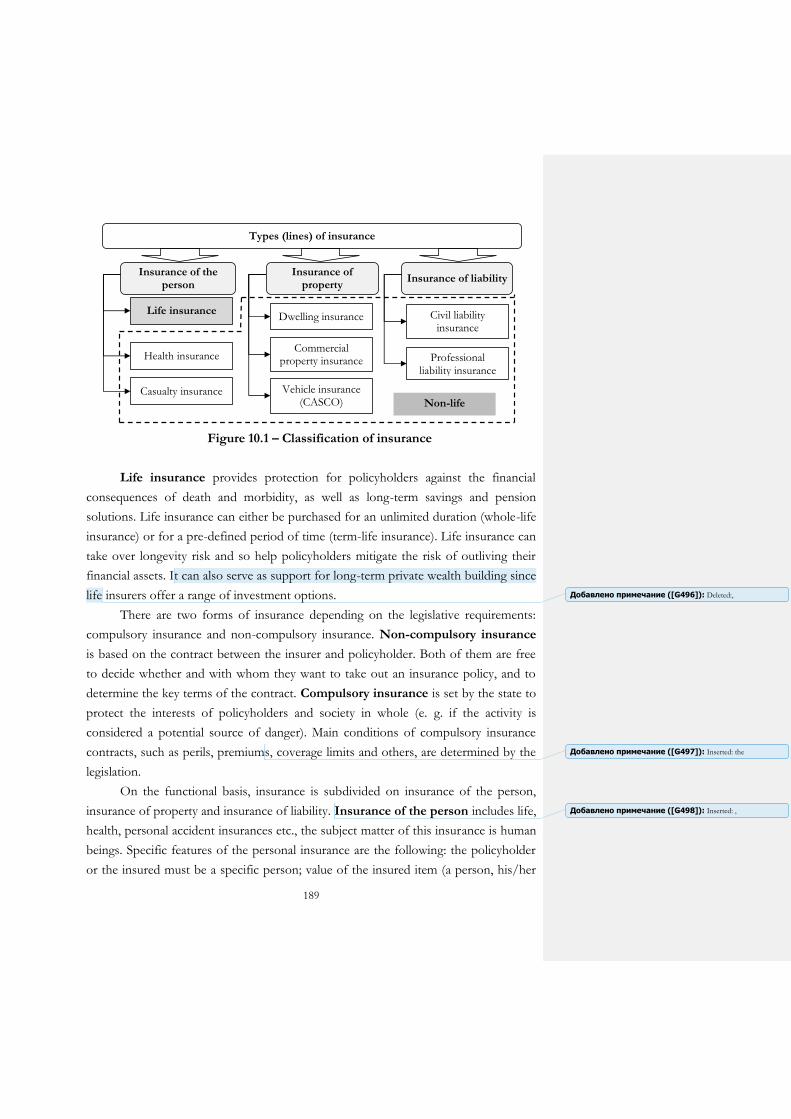
189
Figure 10.1 – Classification of insurance
Life insurance provides protection for policyholders against the financial
consequences of death and morbidity, as well as long-term savings and pension
solutions. Life insurance can either be purchased for an unlimited duration (whole-life
insurance) or for a pre-defined period of time (term-life insurance). Life insurance can
take over longevity risk and so help policyholders mitigate the risk of outliving their
financial assets. It can also serve as support for long-term private wealth building since
life insurers offer a range of investment options.
There are two forms of insurance depending on the legislative requirements:
compulsory insurance and non-compulsory insurance. Non-compulsory insurance
is based on the contract between the insurer and policyholder. Both of them are free
to decide whether and with whom they want to take out an insurance policy, and to
determine the key terms of the contract. Compulsory insurance is set by the state to
protect the interests of policyholders and society in whole (e. g. if the activity is
considered a potential source of danger). Main conditions of compulsory insurance
contracts, such as perils, premiums, coverage limits and others, are determined by the
legislation.
On the functional basis, insurance is subdivided on insurance of the person,
insurance of property and insurance of liability. Insurance of the person includes life,
health, personal accident insurances etc., the subject matter of this insurance is human
beings. Specific features of the personal insurance are the following: the policyholder
or the insured must be a specific person; value of the insured item (a person, his/her
Types (lines) of insurance
Insurance of the person
Insurance of property
Insurance of liability
Life insurance
Health insurance
Casualty insurance
Dwelling insurance
Commercial property insurance
Civil liability insurance
Vehicle insurance (CASCO)
Professional liability insurance
Non-life insurance
Добавлено примечание ([G496]): Deleted:,
Добавлено примечание ([G497]): Inserted: the
Добавлено примечание ([G498]): Inserted: ,
190
life, health) cannot be estimated; the sum insured depends on the financial state of the
policyholder; there may be more than two participants of insurance (the insurer, the
policyholder, the insured and the beneficiary).
Insurance of property covers tangible objects against loss or damage and
includes fire (insurance of buildings and their contents), crime, cargo, casco
insurances, and other types of personal and commercial property insurance. Specific
features of the property insurance are: the object of the insurance contract is specific
property; value of the insured item can be estimated; the sum insured cannot exceed
the actual (residual) value of the property; the fact of damage, theft, destruction is not
a sufficient condition for the insurance payment, the necessary condition is the
existence of loss; indemnity cannot be a source of undue enrichment of the
policyholder; property insurance contracts belong to short-term (usually 1 year)
insurance; there may be three participants of insurance: the insurer, the policyholder,
and the beneficiary.
Insurance of liability covers legal liability for death, injury or property damage
to others. Specific features of the property insurance are: there are always three parties
in liability insurance: the insurer, the insured, the third party – the beneficiary, who will
get the insurance compensation; the beneficiary is not defined in advance; the value of
the insured item is not determined in advance either; liability insurance provides
compensation to a third party and simultaneously protects economic interests of the
policyholder; the sum insured is set in the insurance policy as a limit of the insurer's
liability for every insured event or for a period of time.
It is common for property insurance policies to specify that the insurer may
settle a loss by different methods (cash payment, repair, replacement, reinstatement).
The claim settlement also depends on the sum insured, i. e. whether the property is
insured at full value or underinsured. If the agreed sum insured is the same as the
insurance value (e. g. the reinstatement value of an object), the insurer has to provide
full insurance cover and compensate the amount of the actual loss. Otherwise, if the
property is not insured for the full value, the full amount of the loss will not be paid
out. The “pro rata condition of average” (this is also known as the average clause,
condition of average, principal of average or subject to average) is usually applied in
such case. It means that the amount paid against a claim will be in the same
proportion as the value of the underinsurance. The following formula will be used:
Добавлено примечание ([G499]): Inserted: ,
Добавлено примечание ([G500]): Deleted:n
Добавлено примечание ([G502]): Deleted:is
Добавлено примечание ([G501]): Inserted: the
Добавлено примечание ([G503]): Deleted:-

191
𝑃𝑎𝑦𝑜𝑢𝑡 = 𝐶𝑙𝑎𝑖𝑚 ∙ 𝑆𝑢𝑚 𝑖𝑛𝑠𝑢𝑟𝑒𝑑 𝐶𝑢𝑟𝑟𝑒𝑛𝑡 (𝑟𝑒𝑝𝑙𝑎𝑐𝑒𝑚𝑒𝑛𝑡) 𝑣𝑎𝑙𝑢𝑒⁄ (10.2)
If there is a deductible clause in the insurance policy, this will be subtracted
from the final payment of any claim after the operation of the pro rata condition of
average.
Another approach in partial insurance is to apply first loss policies. Such
insurance policies are most commonly used in the case of theft or burglary insurance
to insure against events where a total loss is extremely rare. First loss insurance
provides payments against insurance claims up to the level of the sum insured and
ignores underinsurance. However, the policyholder does not seek compensation for
losses below the first-loss level.
To avoid or minimize catastrophic risks and accumulation of similar risks
insurance companies use different risk transfer mechanisms. The most common are
coinsurance and reinsurance. Coinsurance is the agreed participation of several
insurers on a large risk in such a way that each takes over a pro rata share of the sum
insured or a certain amount. One insurance policy is concluded between the
policyholder and each coinsurer for the respective share that is covered. In accordance
with the insurance contract, the leading insurance company (usually the insurer with
the largest share) can conduct the negotiations, regulate contractual matters, receive
premiums, and settle claims on behalf of the other participating direct insurers.
Leading insurance company receives a lead office commission for its efforts.
In the simplest meaning, reinsurance is an insurance product for insurance
companies. The direct insurer keeps so much of the insured risk for his own retention
as he can without putting his own portfolio at risk and transfers the rest portion of
risk portfolios to other parties by some form of agreement (reinsurance contract). The
various reinsurance forms are distinguished by the type of contract (see Table 10.2)
and by direct insurer’s purpose.
Depending on the purpose of a direct insurer, there are two types of reinsurance –
proportional and non-proportional. With proportional (based on the sum insured)
reinsurance, the direct insurer transfers a quota share and/or the peaks of certain risks.
The sum insured, premiums and claims are shared pro rata by the direct insurer and
reinsurer. In non-proportional (claims based) reinsurance the reinsurer’s liability is
determined exclusively by the amount of the claim. The reinsurer’s liability begins
when the direct insurer’s deductible is exceeded.
Добавлено примечание ([G504]): Inserted: a
Добавлено примечание ([G505]): Inserted: ,
Добавлено примечание ([G506]): Inserted: the

192
Table 10.2 – Forms of reinsurance according to the types of reinsurance
contracts
Insurer’s and reinsurer’s positions
Insurance company
Obligation to cede the risk
Free to cede the risk
Reinsurance company
Obligation to accept the risk
Obligatory (automatic) reinsurance
Facultative-obligatory reinsurance
Free to accept the risk
Obligatory-facultative reinsurance
Facultative reinsurance
To sum up, the economic and social value of insurance is significant in modern
society. Insurance facilitates economic activity by protecting individuals, industry,
commerce, community and nation from the economic impact of losses, and promotes
economic growth and investments by removing the anxiety of losses and investing the
premium funds.
RECOMMENDED READING
1. Institute of Insurance Sciences; Fundación MAPFRE, 2013, An Introduction to Reinsurance, Madrid.
2. Insurance Europe aisbl, 2012, How Insurance Works, Brussels. 3. , Insurance Information Institute, 2010, Insurance Handbook. A Guide to Insurance:
What it Does and how it Works, New York, NY. 4. Sankar, S., Sharma, M., and Kaikini, A. N., 2014, General Insurance Work Book,
Insurance Institute of India, Mumbai. 5. A Project of the East European Committee of the GDV, Berufsbildungswerk der
Deutschen Versicherungswirtschaft (BWV), 2010,.Study Book for the Insurance Industry. Volume 1 – Basic principles.
6. A Project of the East European Committee of the GDV, Berufsbildungswerk der Deutschen Versicherungswirtschaft (BWV), 2012, Study Book for the Insurance Industry. Volume 2 – Classes of Insurance.
7. Insurance Europe aisbl, 2015, The Benefits of Insurance, Brussels. 8. Insurance Europe aisbl, 2014, Why Insurers Differ from Banks, Brussels.
KEY TERMS
insurance (assurance)
is a contractual relationship that exists when one party (the insurer) for a consideration (the premium) agrees to reimburse another party (the insured) for loss to a specified subject (the risk) caused by designated contingencies (hazards or perils).
Добавлено примечание ([G507]): Inserted: the
Добавлено примечание ([G508]): Inserted: the
Добавлено примечание ([G509]): Inserted: the

193
insurer is an insurance company that undertakes to indemnify for losses and perform other insurance-related operations.
insured is (are) the person(s) protected under an insurance contract.
policyholder contractual partner in the insurance contract who has the obligation to pay the insurance premium.
insurance risk (event risk, pure risk)
is a risk of loss associated with fortuitous occurrences (e. g., fires, hurricanes, tortuous conduct); insurance risk presents no chance of gain, only of loss.
coverage is the scope of protection provided under an insurance policy. In property insurance, coverage lists perils insured against, properties covered, locations covered, individuals insured, and the limits of indemnification. In life insurance, living and death benefits are listed.
insurance premium
is money charged by the insurance company; the price of insurance protection for a specified risk for a specified period of time.
indemnity is restoration to the victim of a loss by payment, repair or replacement.
insurance claim is a demand by an individual or corporation to recover, under a policy of insurance, for loss that may come from that policy.
insurance policy is the written contract effecting insurance that generally includes the coverage term, the insurance policy limits, the grant of coverage, exclusions and other limitations of coverage, and the duties and responsibilities of the insured in the event of a loss.
reinsurance is an “insurance cover for insurance companies”; it is a practice of insurers transferring portions of risk portfolios to other parties by some form of agreement in order to reduce the likelihood of having to pay a large obligation resulting from an insurance claim.
deductible is an amount the insurer will deduct from the loss before paying up to its policy limits.
subrogation is the right of an insurer who has taken over another's loss also to take over the other person's right to pursue remedies against a third party.
property insurance
is the first-party insurance that indemnifies the owner or user of property for its loss, or the loss of its income-producing ability, when the loss or damage is caused by a covered peril.
liability insurance is an insurance that pays and renders service on behalf of an insured for loss arising out of his responsibility, due to negligence, to others imposed by law or assumed by contract.
insurance broker is an insurance salesperson that searches the marketplace in the interest of clients, not insurance companies. While some brokers do have agency contracts with some insurers, they usually remain obligated to represent the interests of insureds rather than insurers.
insurance agent is a person or organization who/that solicits, negotiates, or instigates insurance contracts on behalf of an insurer and can be independent or an employee of the insurer.
Добавлено примечание ([G510]): Deleted:,
Добавлено примечание ([G511]): Inserted: the
Добавлено примечание ([G514]): Deleted:within
Добавлено примечание ([G512]): Inserted: from
Добавлено примечание ([G513]): Inserted: the
194
underwriting is the process of selecting risks for insurance and classifying them according to their degrees of insurability so that the appropriate rates may be assigned; the process also includes rejection of those risks that do not qualify.
actuary is a business professional who analyzes probabilities of risk and risk management including calculation of premiums, dividends, and other applicable insurance industry standards.
insurance adjuster
is a representative of the insurer who investigates claims and recommends settlement options based on estimates of damage and insurance policies held.
REVIEW QUESTIONS
1. What are the main risk management methods? Which method does the insurance
belong to?
2. What is the essence of insurance? Why is it important?
3. Explain the difference between pure and speculative risks? Give the examples.
4. What is an insurable interest? What are the criteria of insurability of risks?
5. Name and explain the basic principles of insurance.
6. Explain the difference between the insured, the insurer, the policyholder, and the
beneficiary. Which of them are contractual partners?
7. Explain the essence and interrelation of basic terms in insurance: sum insured,
tariff, and insurance premium.
8. What does the deductible clause mean in insurance contracts? What is the
difference between ordinary and franchise deductibles?
9. What professionals can participate in insurance? What is the difference in duties
and goals of insurance brokers and insurance agents?
10. What are the approaches to dividing insurance into types and categories?
11. What are life and non-life insurances? What is the specifics of life insurance?
12. What are the distinctive features of liability insurance? Give the examples of its
subcategories.
13. What are the distinctive features of property insurance? Characterize the main
types of property insurance.
14. What methods of insurance covering are used in property insurance? How is the
sum of compensation calculated in first-loss policy and in case of pro rata
condition of average?
15. What is the purpose of coinsurance and reinsurance? Highlight the differences
between these operations.
Добавлено примечание ([G515]): Inserted: ,
Добавлено примечание ([G518]): Deleted:is
Добавлено примечание ([G516]): Inserted: are
Добавлено примечание ([G519]): Deleted:are
Добавлено примечание ([G517]): Inserted: is
Добавлено примечание ([G520]): Inserted: the

195
MULTIPLE CHOICE QUESTIONS
Choose the one alternative that best completes the statement or answers the question. 1. Which of the following statements represents a pure risk?
a) John is a trader on the stock market; he will get a loss if the price of stock goes down;
b) Andrew has a dog and he will be held responsible if the dog bites someone; c) Katya always buys lottery tickets, but never wins; d) the company received a net loss for a fiscal year.
2. Peter’s flat was demolished by the fire because his neighbor Julia forgot to extinguish the candles. The insurance company paid Peter for the damage and filed suit against Julia to recover the amount it paid for the loss. This is an example of: a) deductible; b) coinsurance; c) reinsurance; d) subrogation.
3. The person, who according to the insurance contract has the obligation to pay insurance premium, is called: a) insurer; b) policyholder; c) insured; d) beneficiary.
4. The person, who gets the payment of the sum insured (or of its part), but is not the insured, is called: a) insurer; b) policyholder; c) beneficiary; d) actuary.
5. The amount of money that individual or business must pay to insurance company for insurance coverage is called: a) insurance sum; b) insurance claim; c) insurance loss; d) insurance premium.
6. Intermediary in insurance, who represents interests of policyholder, is called: a) insurance broker; b) insurance adjuster; c) insurance agent; d) underwriter.
Добавлено примечание ([G521]): Inserted: s
Добавлено примечание ([G523]): Deleted:,
Добавлено примечание ([G524]): Deleted:I
Добавлено примечание ([G522]): Inserted: The i
196
7. A store owner decided that in case of burglary or theft he could lose not more than 100 000 UAH and obtained the insurance policy for that amount. The total value of goods in the store is 500 000 UAH. This is an example of: a) pro rata condition of average; b) first-lost policy; c) replacement cost basis; d) over insurance.
8. In what way life insurance differs from other insurance products? a) life insurance contracts are short-term; b) the beneficiary is not specified in life insurance policies; c) life insurance allows the insured to make savings and guarantees an investment
income; d) replacement cost basis is generally employed in life insurance.
9. Tatiana has a property insurance policy, which covers the risk of fire on a replacement cost basis. Tatiana’s furniture was destroyed in a fire. The amount of the loss is 10 000 UAH, the actual value of the furniture is 7 000 UAH. What will be the amount of insurance payment? a) 3 000 UAH; b) 7 000 UAH; c) 10 000 UAH; d) 17 000 UAH.
10. What is the main purpose of reinsurance? a) to reduce the claims loss ratio; b) to reduce risks for the direct insurer; c) to increase the number of intermediaries in the insurance market; d) to increase the profitability of the insurance company.
SHORT ANSWER QUESTIONS
MISSING WORD QUESTIONS
Choose the correct word to complete each sentence.
1. Insurance is essentially a risk ___________ mechanism, removing, for a ___________, the potential financial loss from the individual and placing it upon the insurer.
2. Insurable _____________ arises in a variety of circumstances, which may be considered under insurance of the person, insurance of ____________ and insurance of liability.
Добавлено примечание ([G525]): Inserted: he t
Добавлено примечание ([G526]): Inserted: the
Добавлено примечание ([G527]): Inserted: the

197
3. When the application comes to the insurance company, _______________ review it for its acceptability to the company and evaluate the risk. When the insured event occurs, _____________ investigates claims and recommends settlement options based on estimates of damage.
4. Insurers and _____________ are generally free to decide whether and with whom they want to take out an insurance policy. However, it can be in the public interest that this freedom is restricted by the regulation of a ____________ policy of insurance.
5. Contractual partners in insurance can be represented by someone who acts as an intermediary or takes out insurance contracts commercially; this is the insurance ___________ for the insurance company, and the insurance ____________ for the policyholder.
TRUE/FALSE/UNCERTAIN QUESTIONS
Decide whether the following statements are True, False, or Uncertain. Explain your reasoning. Your score will be based not just on whether you get the True, False, or Uncertain part right but also, to a larger extent, on the quality of your explanation. 1. The insurance company and policyholder are two required partners in insurance.
Others (insured, beneficiary) can also participate in the insurance contract, but not necessarily.
2. As a rule, insurance brokers work for insurance companies and help them to sell insurance products, while insurance agents are usually representatives of policyholders, who search the marketplace and advise on the best terms of insurance.
3. Compulsory insurance requires the presence of insurance policy, but the main terms of insurance (such as sum insured, insurance premium, and perils insured) are up to insurance company and the policyholder.
4. If a policyholder wants to get sufficient insurance cover, he (she) needs insurance at full value without the deductible clause.
5. In coinsurance, a policyholder concludes a contract with several insurance companies, while in reinsurance, he (she) has contractual arrangements with direct insurer only and is not notified of participation of reinsurers.
Добавлено примечание ([G530]): Deleted:I
Добавлено примечание ([G528]): Inserted: The i
Добавлено примечание ([G529]): Inserted: the
Добавлено примечание ([G531]): Inserted: the
Добавлено примечание ([G532]): Inserted: the
Добавлено примечание ([G533]): Inserted: ,
Добавлено примечание ([G534]): Deleted:,
198
COMPUTATION PROBLEMS
1. Determine the risk management method (avoidance, retention, reduction and control, or risk transfer) in each of the following examples (a – d): a) Anna is a very responsible driver: she never exceeds the speed. b) The first thing Luis did after buying the car was getting a motor insurance
policy. c) George decided that he didn't need a health insurance policy because he had
always been in good health. d) The company stopped producing new medicine because of its negative side
effects.
2. In which of the following examples insurance company has the right to refuse payment of insurance compensation? a) Jim has a health insurance contract; he didn’t notify his insurer that his mother
died in a car accident. b) George’s car is insured. It was hijacked from the parking lot. In the evening,
when the car was hijacked, George was drunk. c) Anna’s house is insured against fire and natural disaster risks. While Anna was
sleeping, her house was burglarized. d) Lucas has a life insurance policy. He didn’t mention in the insurer’s
questionnaire about his hereditary diseases. e) Andrew’s house is insured against fire and natural disaster risks. Andrew was
short of money, so he asked his neighbor to set fire to the house to get the insurance indemnity.
f) Maxim broke his leg. He has a casualty insurance policy. Maxim would not have broken his leg if he had not got drunk at the party.
g) Victor's insurance contract was valid until March 17. He decided to renew the contract and paid the insurance premium on March 19. Insurance company received money on March 21. The insured event occurred on March 20.
3. Classify each of the following types of insurance under “compulsory insurance” and “non-compulsory insurance” according to the Ukrainian legislation: a) life insurance; b) automobile liability insurance; c) financial risks insurance; d) mortgage insurance; e) third party liability insurance; f) fire and natural disasters insurance; g) spacecraft liability insurance; h) marine insurance; i) casualty insurance; j) dog owner liability insurance.
Добавлено примечание ([G535]): Inserted: a
Добавлено примечание ([G536]): Deleted:n
Добавлено примечание ([G537]): Deleted:,
Добавлено примечание ([G541]): Deleted:I
Добавлено примечание ([G540]): Deleted:l
Добавлено примечание ([G538]): Inserted: un
Добавлено примечание ([G539]): Inserted: The i
199
4. The property is insured against fire and natural disasters for 60 000 UAH. The insurance policy has a clause of the ordinary deductible of 10 %. What will be the amount of insurance compensation, if the damage caused by the flood is assessed as follows: a) 9 700 UAH; b) 5 500 UAH.
5. The car is insured for 32 000 UAH. The insurance policy has a clause of 3 %
franchise deductible. What will be the amount of insurance compensation if the loss of policyholder is assessed as follows: a) 600 UAH; b) 2 000 UAH.
6. The property of ABC Company is insured. Some of the factory premises were
damaged because of an industrial accident. The value of property, sum insured and amount of loss are given in the box below. Calculate the total amount payable. Use pro rata condition of average if necessary.
Initial data for calculation of insurance payment
Type of property
Value, UAH Sum insured,
UAH Loss, UAH
Amount payable, UAH
Office building 450 000 450 000 20 000
Warehouse 200 000 100 000 170 000
Workshop 800 000 500 000 340 000
Total
7. Irina owns a retail store. She obtained a first-loss insurance policy for 400 000
UAH. The store was burglarized. Calculate the amount of compensation that Irina will receive from the insurance company if the loss was assessed as follows: a) 250 000 UAH; b) 400 000 UAH; c) 540 000 UAH.
8. The property of “Eastern Farmers” is partially insured. Current market value of
the property is 26 million UAH. The sum insured is 15 million UAH. The insurance contract has a clause of 6 % deductible. Damages caused by the earthquake were assessed at 4 million UAH. Calculate the amount of insurance compensation.
9. Four insurance companies participate pro rata in the nuclear insurance contract. Coinsurer’s shares are (A) – 40 % (lead office), (B) – 25 %, (C) – 15 %, and (D) – 20 %. Sum insured is 350 billion UAH. Insurance rate is 1.8%; the lead office receives a lead office commission of 2 % of the premium shares of the other
Добавлено примечание ([G542]): Inserted: the
Добавлено примечание ([G545]): Deleted:o
Добавлено примечание ([G543]): Inserted: the
Добавлено примечание ([G544]): Inserted: i

200
coinsurers. Set up a schedule of distribution. Fill in the results of the calculations in the box below.
Distribution plan
Coinsurer Coinsurer’s
share Sum
insured
Premium (without
commission)
Lead office commission
Premium (considering commission)
A (lead office)
B
C
D
Total
10. The insurance company has a quota share contract with a reinsurer. Reinsurance
quota share is 40 %. Limit of liability of the reinsurer is 3 million UAH for each insurance contract. Calculate reinsurance premiums and reinsurance payments for the following insurance contracts: a) sum insured – 500 000 UAH; insurance premium – 800 UAH; insurance
claim – 100 000 UAH; b) sum insured – 3 000 000 UAH; insurance premium – 4 600 UAH; insurance
claim – 750 000 UAH; c) sum insured – 4 000 000 UAH; insurance premium – 6 500 UAH; insurance
claim – 1 200 000 UAH.
Добавлено примечание ([G546]): Inserted: The i
Добавлено примечание ([G547]): Deleted:I
201
CHAPTER 11:
INTERNATIONAL FINANCE
SUMMARY
International finance is one of the key subsystems of the world economy, which
focuses on the significance of trade imbalances, the determinants of exchange rates,
and the aggregate effects of government monetary and fiscal policies. Main elements
of the international finance are:
– international monetary system, which is characterized by national and reserve
currencies, currency parity, and exchange rates;
– international settlements and the balance of payments, which displays all
transactions related to international payments;
– international financial markets and specific financial instruments – currency,
international loans, and securities;
– international taxation;
– international financial management of TNCs (international investment, risk
management, transnational financing, etc.).
The global financial system is vast and varied; it consists of many different types
of financial institutions, as well as financial markets in stocks, bonds, commodities,
and derivatives. A significant role in providing financial support and professional
advice for economic and social development as well as promoting international
economic cooperation and stability belongs to international financial institutions
(IFIs). Main groups and types of IFIs are presented in Figure 11.1.
IFIs are the largest source of finance development in the world and a primary
source of knowledge development as well as publishing research that frames the
debate on development issues. IFI loans to finance investment projects and policy
reforms in developing countries are intended to reduce poverty and encourage
economic development.
The term international financial institution typically refers to the
International Monetary Fund (IMF) and five multilateral development banks (MDBs):
the World Bank Group, the African Development Bank, the Asian Development
Bank, the Inter-American Development Bank, and the European Bank for
Добавлено примечание ([G549]): Deleted:S
Добавлено примечание ([G548]): Inserted: A s

202
Reconstruction and Development. Each of the last four focuses on a single world
region, and hence they are often called regional development banks. IMF and the
World Bank, in contrast, are global in their scope; they are also specialized agencies in
the UN system but are governed independently of it.
The IMF was conceived at a UN conference in Bretton Woods in 1944. Its
primary purpose is to ensure the stability of the international monetary system. The
IMF does so in three ways: keeping track of the global economy and the economies of
member countries; lending to countries with balance of payments difficulties; and
giving practical help to members. The Fund provides loans to member countries
experiencing actual or potential balance of payments problems. This financial
assistance enables countries to rebuild their international reserves, stabilize their
currencies, continue paying for imports, and to restore conditions for strong economic
growth while undertaking policies to correct underlying problems. Unlike
development banks, the IMF does not lend for specific projects. The biggest
borrowers of the IMF (amounts outstanding as of 3/13/2015) are Portugal, Greece,
Ireland, and Ukraine.
Besides, the IMF helps its member countries design economic policies and
manage their financial affairs more effectively by strengthening their human and
institutional capacity through technical assistance and training.
Figure 11.1 – Main international financial institutions
Multilateral development banks (MDBs)
International financial institutions (IFIs)
International Monetary Fund
(IMF) The World Bank Group UN regional development banks
International Bank for Reconstruction & Development (IBRD)
International Center for Settlement of Investment Disputes (ICSID)
International Finance Corporation (IFC)
Multilateral Investment Guarantee Agency (MIGA)
African Development Bank
Asian Development Bank
European Bank for Reconstruction and Development (EBRD)
Inter-American Development Bank (IDB)
International Development Association (IDA)
Добавлено примечание ([G550]): Deleted:,
203
Founded in 1945 at the same international conference as IMF, the World Bank
at first was involved mainly in the reconstruction of countries devastated by World
War II. At present, the World Bank turned its primary focus to the economic
development of the world’s non-industrialized countries, with the goal of lifting the
world out of poverty.
The World Bank Group is made up of five institutions; each of them plays a
different but important role in the group’s corporate mission of reducing global
poverty and improving living standards in the developing world. Together, they
provide low-interest loans, interest-free credits, and grants to governments and the
private sector in developing countries for investments in education, health,
infrastructure, communications, and many other purposes as well as services in
support of those investments.
The International Bank for Reconstruction & Development (IBRD) focuses on
middle-income countries and creditworthy low-income countries, whereas the
International Development Association (IDA) focuses on the poorest countries in the
world. IBRD lends only to governments, financing these loans primarily by selling
triple-A-rated bonds in the world’s financial markets. Although IBRD earns a small
margin on this lending, the greater proportion of its income comes from lending out
its own capital. This capital consists of reserves built up over the years and money paid
in from the World Bank’s shareholders.
IDA is the world’s largest source of interest-free loans and grant assistance to
the governments of the poorest countries. IDA lends money on concessional terms:
credits have a zero or very low-interest charge, and repayments are stretched over 25
to 38 years, including a 5- to 10-year grace period. IDA also provides grants to
countries at risk of debt distress.
International Center for Settlement of Investment Disputes (ICSID) provides a
forum for mediating disputes between investors and governments and advices
governments in their efforts to attract investment. ICSID provides for settlement of
disputes by conciliation, arbitration or fact-finding.
The International Finance Corporation (IFC) is the largest global development
institution focused exclusively on the private sector in developing countries. In
addition to lending, IFC may take an equity stake in development projects, provide
and mobilize scarce capital, knowledge, and long-term partnerships that can help
Добавлено примечание ([G551]): Inserted: -
Добавлено примечание ([G553]): Deleted:s
Добавлено примечание ([G552]): Inserted: c

204
address critical constraints in areas such as finance, infrastructure, employee skills, and
the regulatory environment.
The Multilateral Investment Guarantee Agency (MIGA) promotes foreign
direct investment in developing countries and difficult operating environments (the
world's poorest countries, fragile and conflict-affected environments, and middle-
income countries) by insuring investors against political or non-commercial risks in
those countries. As a multilateral development agency, MIGA only supports
investments that are developmentally sound and meet high social and environmental
standards.
The economic relationships between residents of that economy and
nonresidents are summarized in the international accounts, such as international
investment position (IPP) and balance of payments (BOP). The international
investment position is a statistical statement that shows at a point in time the value
of financial assets of residents of an economy that are claims on nonresidents or are
gold bullion held as reserve assets and the liabilities of residents of an economy to
nonresidents. The difference between the assets and liabilities is the net position in the
IIP and represents either a net claim on or a net liability to the rest of the world.
An account of all receipts and payments is termed as the balance of
payments. It is a systematic record of all economic transactions between the residents
of the reporting country and residents of foreign countries during a given period of
time; usually, it is all annual statement. A country's balance of payments accounts
keeps track of three types of international transactions and respectively can be divided
into three main categories:
1) transactions that involve the export or import of goods or services and
therefore enter directly into the current account;
2) transactions that involve the purchase or sale of financial assets; they are
recorded in the financial account of the balance of payments;
3) certain other activities resulting in transfers of wealth between countries are
recorded in the capital account. For the most part, these international asset
movements result from nonmarket activities or represent the acquisition or disposal of
unproduced, nonfinancial assets.
Within these three categories there are sub-divisions, each of which accounts
for a different type of international monetary transaction (Table 11.1).
Добавлено примечание ([G554]): Inserted: -
Добавлено примечание ([G555]): Inserted: -
Добавлено примечание ([G556]): Inserted: ,
Добавлено примечание ([G557]): Inserted: ,
Добавлено примечание ([G558]): Inserted: ,
Добавлено примечание ([G562]): Deleted:,
Добавлено примечание ([G559]): Inserted: from
Добавлено примечание ([G560]): Inserted: ,
Добавлено примечание ([G563]): Deleted:no
Добавлено примечание ([G561]): Inserted: u

205
Table 11.1 – Structure of Balance of Payments
Current account
Credits (Receipts) Debits (Payments)
Exports of goods and services Imports of goods and services
Primary income Primary income
Secondary income Secondary income
Capital account
Credits Debits
Disposals of not produced nonfinancial assets
Acquisitions of unproduced nonfinancial assets
Capital transfers Capital transfers
Financial account
Net acquisition of financial assets Net incurrence of liabilities
Foreign direct investments Direct investments abroad
Foreign portfolio investments Portfolio investments abroad
Financial derivatives (other than reserves) and employee stock options
Financial derivatives (other than reserves) and employee stock options
Other investment Other investment
Reserve assets Reserve assets
Net errors and omissions
The balance of trade (BOT) is the largest component of a country's balance
of payments. Debit items include the value of goods and services imported into the
country, credit items include the value of goods and services exported out of a
country. A country has a trade deficit if it imports more than it exports; the opposite
scenario is a trade surplus.
Besides trade in goods and services, the current account is made up of primary
and secondary income. The primary income account shows amounts payable and
receivable in return for providing temporary use to another entity of labor, financial
resources, or unproduced nonfinancial assets (compensation of employees, interest,
rent, reinvested earnings). The secondary income account shows redistribution of
income, that is, when resources for current purposes are provided by one party
without anything of economic value being supplied as a direct return to that party
(current taxes, personal transfers, and current international assistance).
Добавлено примечание ([G565]): Deleted:n
Добавлено примечание ([G564]): Inserted: t
Добавлено примечание ([G567]): Deleted:no
Добавлено примечание ([G566]): Inserted: u
Добавлено примечание ([G569]): Deleted:B
Добавлено примечание ([G568]): Inserted: The b
Добавлено примечание ([G570]): Inserted: ,
Добавлено примечание ([G572]): Deleted:no
Добавлено примечание ([G571]): Inserted: u
Добавлено примечание ([G573]): Deleted:,
206
The current account balance is one of the major measures of a country's foreign
trade. A current account surplus indicates that the value of a country's net foreign
assets (i.e., assets less liabilities) grew over the period in question, and a current
account deficit indicates that it shrank. There are various factors which could cause a
current account deficit in the balance of payments: fixed exchange rate, economic
growth, higher inflation, and borrowing money. A current account deficit can be a
problem if (i) it is persistent; (ii) it forms a large share of GDP; (iii) there are no
compensating inflows of investment income or inward capital account flows; (iv) the
Central Bank has low reserves; and (v) the economy has a poor record of repaying
debt.
The capital account shows credit and debit entries for unproduced
nonfinancial assets and capital transfers between residents and nonresidents. It records
acquisitions and disposals of unproduced nonfinancial assets, such as land sold to
embassies and sales of leases and licenses as well as capital transfers, that is, the
provision of resources for capital purposes by one party without anything of economic
value being supplied as a direct return to that party.
The financial account shows net acquisition and disposal of financial assets
and liabilities; it includes direct investment (investment in an enterprise where the
owners or shareholders have some element of control of the business), portfolio
investment (the investor has no control over the enterprise), financial derivatives
(financial instrument whose underlying value is based on another asset, such as a
foreign currency, interest rates, commodities or indices), and reserve assets (foreign
financial assets, such as gold, Special Drawing Rights, and foreign exchange that are
controlled by monetary authorities).
The current and capital accounts show transactions in gross terms. In contrast,
the financial account shows transactions in net terms, which are shown separately for
financial assets and liabilities.
The balance of payment record is maintained in a standard double-entry book-
keeping method. Every international transaction automatically enters the balance of
payments twice: once as a credit and once as a debit. The payments received from
foreign countries enter as credit, and payments made to other countries – as debit. In
theory, the capital and financial account balance should be equal and ‘opposite’ to the
current account balance. Therefore, the current account balance, the financial account
balance, and the capital account balance automatically add up to zero:
Добавлено примечание ([G576]): Deleted:no
Добавлено примечание ([G574]): Inserted: u
Добавлено примечание ([G577]): Deleted:no
Добавлено примечание ([G575]): Inserted: u
207
Current account + financial account + capital account = 0 (11.1)
In practice, this is only achieved by the use of a balancing item called net errors
and omissions. This device compensates for various errors and omissions in the
balance of payments data, and which brings the final balance of payments account to
zero.
Each country has a currency in which the prices of goods and services are
quoted. Households and companies use the exchange rates to translate foreign
prices into domestic currency terms. Once the money prices of domestic goods and
imports have been expressed in terms of the same currency, households and firms can
compute the relative prices that affect intentional trade flows.
Exchange rates are determined in the foreign exchange market. The major
participants in that market are commercial banks, international corporations, nonbank
financial institutions, and national central banks. Currency vendor provides quotes for
only the most liquid currencies such as the US dollar, Euro, Pound Sterling, etc.
Exchange rates between other currencies are normally calculated as the cross rates
using the quotes for major currencies:
A/C = A/B × B/C (11.2)
where A/C = units of currency A per unit of currency C;
A/B = units of currency A per unit of currency B;
B/C = units of currency B per unit of currency C;
One of the biggest and most obvious problems of internationalization is the
fact that the relative values of any two currencies may alter over time, sometimes with
significant alterations occurring over very short periods. Changes in exchange rates are
described as depreciations or appreciations. When a country's currency depreciates,
foreigners find that its exports are cheaper and domestic residents find that imports
from abroad are more expensive. An appreciation has opposite effects: foreigners pay
more for the country's products and domestic consumers pay less for foreign
products.
Добавлено примечание ([G578]): Inserted: ,
208
An important element of international finance is the international financial
management of transnational (multinational) corporations – TNCs or MNCs.
Multinational firms arise because capital is much more mobile than labor. In general,
the multinational corporation is a business organization whose activities are located
in more than two countries and is the organizational form that defines foreign direct
investment. This form consists of a country location where the firm is incorporated
and of the establishment of branches or subsidiaries in foreign countries.
Operating in many countries, MNCs are subject to multiple tax jurisdictions,
i. e., they must pay taxes to several countries. National tax systems are exceedingly
complex and differ between countries. Differences among national income tax
systems affect the decisions of managers of MNCs, regarding the location of
subsidiaries, financing, and the transfer prices (the prices of products and assets
transferred between various units of MNCs).
Since countries have different tax rates, multinational companies choose low tax
countries to save, invest, and produce. Governments may compete to attract
multinational enterprises by offering them lower tax rates and other incentives. Many
countries, territories, and jurisdictions have offshore financial centers (OFCs). These
include well-known centers like Switzerland, Bermuda, and the Cayman Islands and
less-well-known centers like Mauritius, Dublin, and Belize. The level of regulatory
standards and transparency differs widely among OFCs. Supporters of OFCs argue
that they improve the flow of capital and facilitate international business transactions.
A company may legitimately move offshore for the purpose of tax avoidance or to
enjoy relaxed regulations. Offshore financial institutions can also be used for illicit
purposes, such as money laundering and tax evasion.
RECOMMENDED READING
1. International Monetary Fund, 2009, Balance of payments and international investment position manual, Washington, D.C.
2. Bergsten, C. F., 2005, The United States and the world economy: foreign economic policy for the next decade, The Institute for International Economics, Washington, DC
(Chapter 12, Goldstein, M., The International Financial Architecture, pp. 373–407). 3. Bhargava, V. K., 2006, Global issues for global citizens: an introduction to key development
challenges, The World Bank, Washington, DC (Chapter 20, The role of the international
financial institutions in addressing global issues, pp. 393–409).
Добавлено примечание ([G581]): Deleted:I
Добавлено примечание ([G579]): Inserted: the
Добавлено примечание ([G580]): Inserted: An i
Добавлено примечание ([G582]): Inserted: ,
Добавлено примечание ([G583]): Inserted: ,
209
4. Buiter, W. H., and Lankes, H. P., 2001, International financial Institutions adapting to a world of private capital flows. Perspectives in Global Finance, Routledge, London & New York.
5. Krugman, P., and Obstfeld, M., 2003, International Economics: Theory and Policy, 6th Edition, Addison Wesley World Student Series.
6. Madura, J., 2007, International Financial Management, Abridged 8th Edition, Mason, OH : Thomson South-Western.
7. Moffett, M., Stonehill, A., and Eiteman, D., 2009, Fundamentals of Multinational Finance, 3rd Edition, Pearson Prentice Hall.
8. Mohan, R., Patra, M. D., and Kapur, M., 2013, The international monetary system: where are we and where do we need to go?, IMF Working Paper. Available at http:// http://www.imf.org/external/pubs/ft/wp/2013/wp13224.pdf
9. Myendorff, A., and Thakor, A. V., 2002, Designing Financial Systems in Transition Economics: Strategies for Reform in Central and Eastern Europe, MIT Press.
10. Pilbeam, K., 2006, International Finance, 3rd Edition, New York, NY: Palgrave Macmillan.
11. Root, F. R., 1990, International trade and investment, South-Western Pub. Co.
KEY TERMS
international finance
is an area of financial economics that deals with monetary interactions between two or more countries, concerning itself with topics such as currency exchange rates, international monetary systems, foreign direct investment, and issues of international financial management including political risk and foreign exchange risk inherent in managing multinational corporations.
multilateral development bank (MDB)
is an institution created by a group of countries that provides financing and professional advising for the purpose of development.
international financial institutions (IFIs)
are institutions that provide financial support (via grants and loans) for economic and social development activities in developing countries. International financial institutions include public banks and regional development banks.
International Monetary Fund (IMF)
is an international organization created for the purpose of standardizing global financial relations and exchange rates.
World Bank is an international organization dedicated to providing financing, advice and research to developing nations to aid their economic advancement.
exchange rate is a price for which the currency of a country can be exchanged for another country's currency.
cross rate is an exchange rate between currency A and currency C derived from actual exchange rate between currency A and currency B and between currency B and currency C.
the balance of payments (BOP)
is a statement that summarizes economic transactions between residents and nonresidents during a specific time period. Добавлено примечание ([G584]): Inserted: the

210
current account shows flows of goods, services, primary income, and secondary income between residents and nonresidents.
current account deficit
is a measurement of a country’s trade in which the value of goods and services it imports exceeds the value of goods and services it exports.
current account surplus
is a positive difference between the value of goods and services which the country exports and the value of goods and services it imports.
the balance of trade (BOT or trade balance)
is the difference between a country's imports and its exports.
import is a good or service brought into one country from another.
export is a function of international trade whereby goods produced in one country are shipped to another country for future sale or trade.
capital account shows credit and debit entries for unproduced nonfinancial assets and capital transfers between residents and nonresidents.
financial account shows net acquisition and disposal of financial assets and liabilities.
international investment position (IIP)
is a statistical statement that shows at a point in time the value of financial assets of residents of an economy that are claims on nonresidents or are gold bullion held as reserve assets; and the liabilities of residents of an economy to nonresidents.
transnational /multinational corporation (TNC/MNC)
is a corporation that has its facilities and other assets in at least one country other than its home country. Such companies have offices and/or factories in different countries and usually have a centralized head office where they co-ordinate global management.
transfer price (transfer cost)
is the price at which divisions of a company transact with each other. Transfer prices are used when individual entities of a larger multi-entity firm are treated and measured as separately run entities.
offshore financial center
is a country or jurisdiction with financial centers that contain financial institutions that deal primarily with nonresidents and/or in foreign currency on a scale out of proportion to the size of the host economy. The institutions in the center may well gain from tax benefits not available to those outside the center.
REVIEW QUESTIONS
1. What is international finance? Characterize the main elements of international
finance.
2. What is the international financial institution? What is the main purpose of its
foundation?
3. Explain the difference between regional and public development banks. Name the
main of them.
Добавлено примечание ([G585]): Inserted: the
Добавлено примечание ([G587]): Deleted:no
Добавлено примечание ([G586]): Inserted: u
Добавлено примечание ([G588]): Inserted: the
211
4. Give a detailed description of the objectives and activities of the IMF.
5. What financial institutions are in the World Bank Group? Describe their goals and
activities.
6. Name and explain the essence of international accounts, in which the economic
relationships between residents and nonresidents of the country are summarized.
7. What is the structure of the balance of payments?
8. What method of making records is used in the balance of payments?
9. What types of international transactions are summarized in the current account?
10. What types of transactions are shown in the financial account?
11. Is there any interrelation between current, capital and financial account of the
BOP?
12. What is a cross rate? How could it be calculated?
13. How do the changes in exchange rates affect the financial results of exporters and
importers?
14. What are multinational corporations?
15. What is the offshore financial center? What are benefits and threats of its creation?
MULTIPLE CHOICE QUESTIONS
Choose the one alternative that best completes the statement or answers the question. 1. International finance is a part of:
a) international economy; b) international trade; c) international monetary system; d) global financial market.
2. What’s the primary mission of the World Bank? a) set world interest rates; b) provide short-term financing for countries with balance of payment
problems; c) lend money for economic development; d) end money to international corporations.
3. Which of the following is the primary goal of the IMF? a) promote international cooperation with monetary policy; b) encourage trade; c) encourage exchange stability; d) provide short-term financing for countries with balance of payment
problems;
Добавлено примечание ([G590]): Deleted:it
Добавлено примечание ([G589]): Inserted: it
Добавлено примечание ([G591]): Inserted: the
212
e) all of the answers are correct.
4. These are top borrowers of international financial institutions: a) high-income countries; b) regional development banks; c) developed countries; d) developing countries.
5. Which international financial institution provides lending for the private sector? a) The International Bank for Reconstruction & Development; b) The International Finance Corporation; c) The Multilateral Investment Guarantee Agency; d) the International Development Association.
6. Which of the following equations is correct? a) current account – (financial account + capital account) = 0; b) current account = financial account + capital account; c) сurrent account + (financial account + capital account) = 0; d) no correct answer.
7. The current account in balance of payments pertains to: a) goods, services, income, capital transfers; b) goods, services, income, current transfers; c) capital transfers, acquisition or disposal of unproduced, nonfinancial
assets; d) goods, services, financial assets and liabilities.
8. The following are major components of the capital account in balance of payments: a) goods, services, and income; b) current and capital transfers; c) capital transfers and acquisition/disposal of unproduced, nonfinancial
assets; d) direct investment, portfolio investment, and reserve assets.
9. Reserve assets in balance of payments include: a) monetary gold, special drawing rights, foreign exchange; b) trade credits, loans, currency and deposits; c) equity securities, debt securities, financial derivatives; d) equity capital, reinvested earnings, other capital.
10. Which element is missed in the equation “EUR/UAH = _________ ×USD/UAH”? a) EUR/USD; b) USD/EUR; c) UAH/EUR; d) UAH/USD.
Добавлено примечание ([G592]): Inserted: the
Добавлено примечание ([G594]): Deleted:no
Добавлено примечание ([G593]): Inserted: u
Добавлено примечание ([G595]): Inserted: ,
Добавлено примечание ([G597]): Deleted:no
Добавлено примечание ([G596]): Inserted: u
213
SHORT ANSWER QUESTIONS
MISSING WORD QUESTIONS
Choose the correct word to complete each sentence.
1. The World Bank Group includes ________ financial institutions. Their primary mission is to reduce poverty and encourage economic and social development by providing ___________ to _____________ countries.
2. All economic transactions between the residents of the reporting country and the residents of foreign countries during a given period of time are recorded in the balance of ___________, which can be divided into three categories: current account, financial account, and ____________ account.
3. Every international transaction enters the balance of payments twice: once as a _________ and once as a debit; it means maintaining _________________ book-keeping method.
4. The exchange rate between two currencies, both of which are not the official ___________ of the country in which the exchange rate quote is given in, is usually derived as a __________ rate.
5. _____________ financial centres are often used for the purpose of tax ____________, which is legal, but also they can be used for illicit tax _____________ and money laundering.
TRUE/FALSE/UNCERTAIN QUESTIONS
Decide whether the following statements are True, False, or Uncertain. Explain your reasoning. Your score will be based not just on whether you get the True, False, or Uncertain part right but also, to a larger extent, on the quality of your explanation. 1. If a country has a deficit on the current account, then it must have an equal and
opposite surplus on the capital and financial account.
2. International financial institutes provide loans, grants, and technical assistance to governments of developing countries, but not to private businesses.
3. Business with offshore financial institutions is illegal; it is always associated with money laundering and tax evasion.
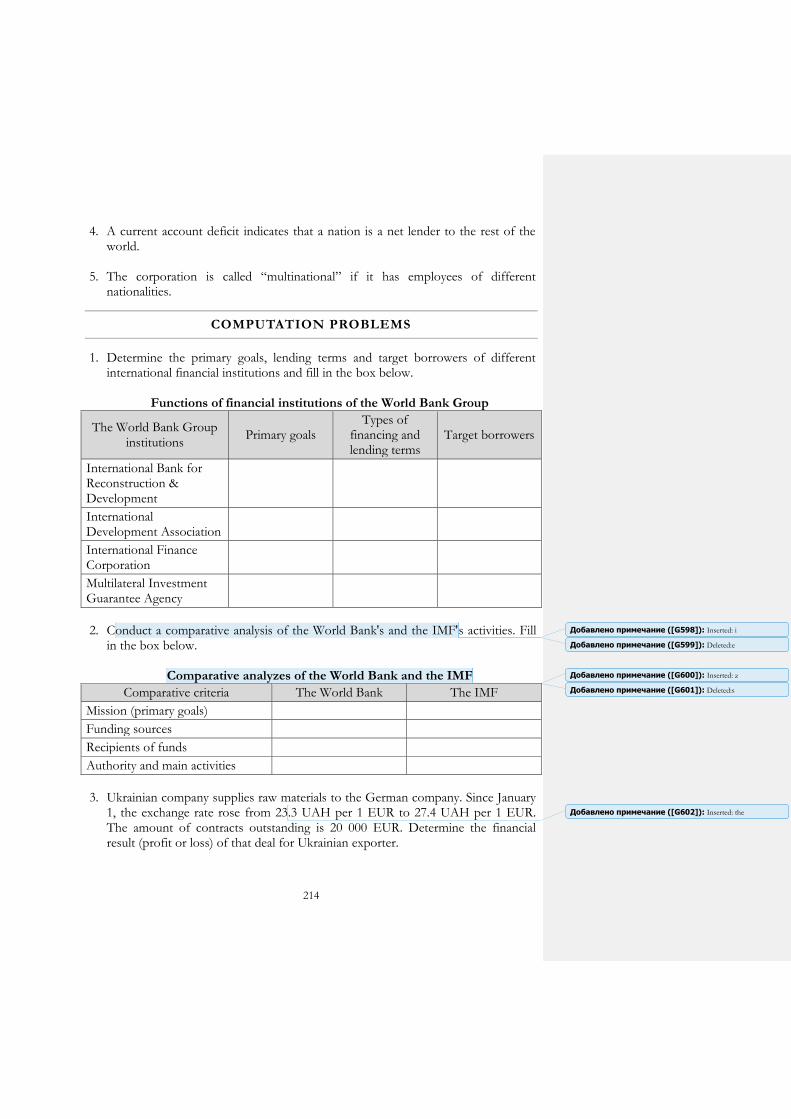
214
4. A current account deficit indicates that a nation is a net lender to the rest of the world.
5. The corporation is called “multinational” if it has employees of different nationalities.
COMPUTATION PROBLEMS
1. Determine the primary goals, lending terms and target borrowers of different international financial institutions and fill in the box below.
Functions of financial institutions of the World Bank Group
The World Bank Group institutions
Primary goals Types of
financing and lending terms
Target borrowers
International Bank for Reconstruction & Development
International Development Association
International Finance Corporation
Multilateral Investment Guarantee Agency
2. Conduct a comparative analysis of the World Bank's and the IMF's activities. Fill
in the box below.
Comparative analyzes of the World Bank and the IMF
Comparative criteria The World Bank The IMF
Mission (primary goals)
Funding sources
Recipients of funds
Authority and main activities
3. Ukrainian company supplies raw materials to the German company. Since January
1, the exchange rate rose from 23.3 UAH per 1 EUR to 27.4 UAH per 1 EUR. The amount of contracts outstanding is 20 000 EUR. Determine the financial result (profit or loss) of that deal for Ukrainian exporter.
Добавлено примечание ([G599]): Deleted:e
Добавлено примечание ([G598]): Inserted: i
Добавлено примечание ([G601]): Deleted:s
Добавлено примечание ([G600]): Inserted: z
Добавлено примечание ([G602]): Inserted: the
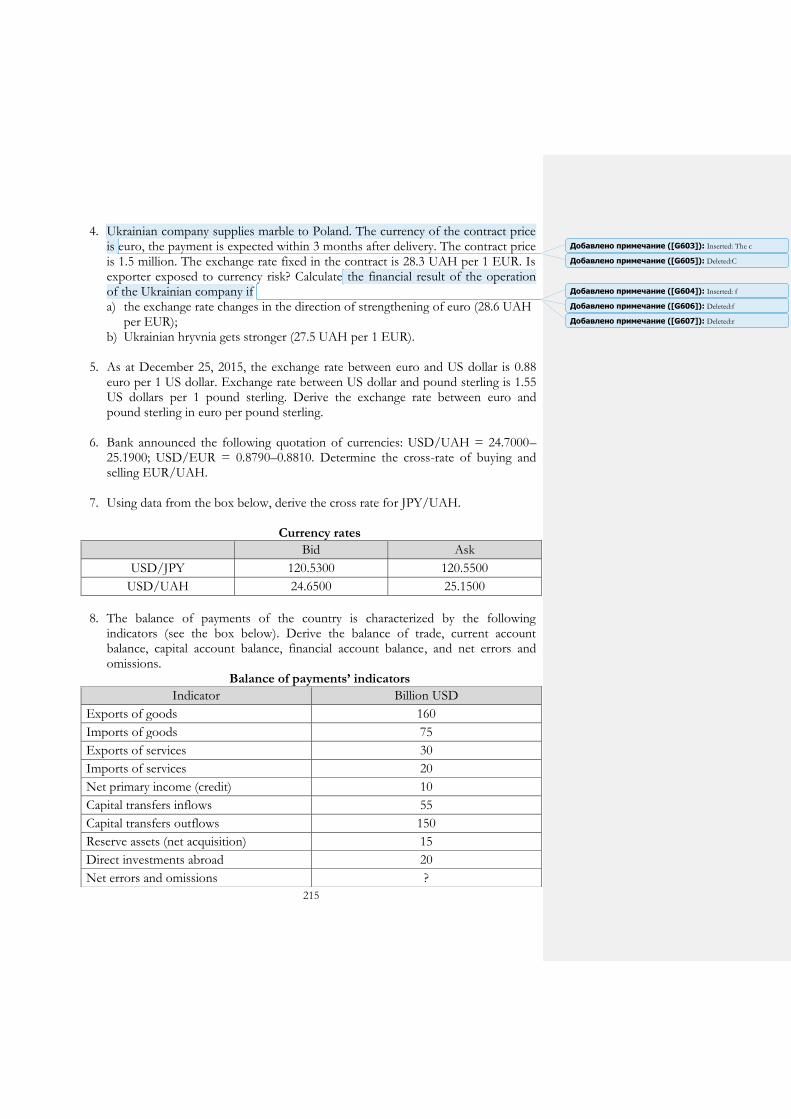
215
4. Ukrainian company supplies marble to Poland. The currency of the contract price is euro, the payment is expected within 3 months after delivery. The contract price is 1.5 million. The exchange rate fixed in the contract is 28.3 UAH per 1 EUR. Is exporter exposed to currency risk? Calculate the financial result of the operation of the Ukrainian company if a) the exchange rate changes in the direction of strengthening of euro (28.6 UAH
per EUR); b) Ukrainian hryvnia gets stronger (27.5 UAH per 1 EUR).
5. As at December 25, 2015, the exchange rate between euro and US dollar is 0.88 euro per 1 US dollar. Exchange rate between US dollar and pound sterling is 1.55 US dollars per 1 pound sterling. Derive the exchange rate between euro and pound sterling in euro per pound sterling.
6. Bank announced the following quotation of currencies: USD/UAH = 24.7000–25.1900; USD/EUR = 0.8790–0.8810. Determine the cross-rate of buying and selling EUR/UAH.
7. Using data from the box below, derive the cross rate for JPY/UAH.
Currency rates
Bid Ask
USD/JPY 120.5300 120.5500
USD/UAH 24.6500 25.1500
8. The balance of payments of the country is characterized by the following
indicators (see the box below). Derive the balance of trade, current account balance, capital account balance, financial account balance, and net errors and omissions.
Balance of payments’ indicators
Indicator Billion USD
Exports of goods 160
Imports of goods 75
Exports of services 30
Imports of services 20
Net primary income (credit) 10
Capital transfers inflows 55
Capital transfers outflows 150
Reserve assets (net acquisition) 15
Direct investments abroad 20
Net errors and omissions ?
Добавлено примечание ([G605]): Deleted:C
Добавлено примечание ([G603]): Inserted: The c
Добавлено примечание ([G607]): Deleted:r
Добавлено примечание ([G604]): Inserted: f
Добавлено примечание ([G606]): Deleted:f
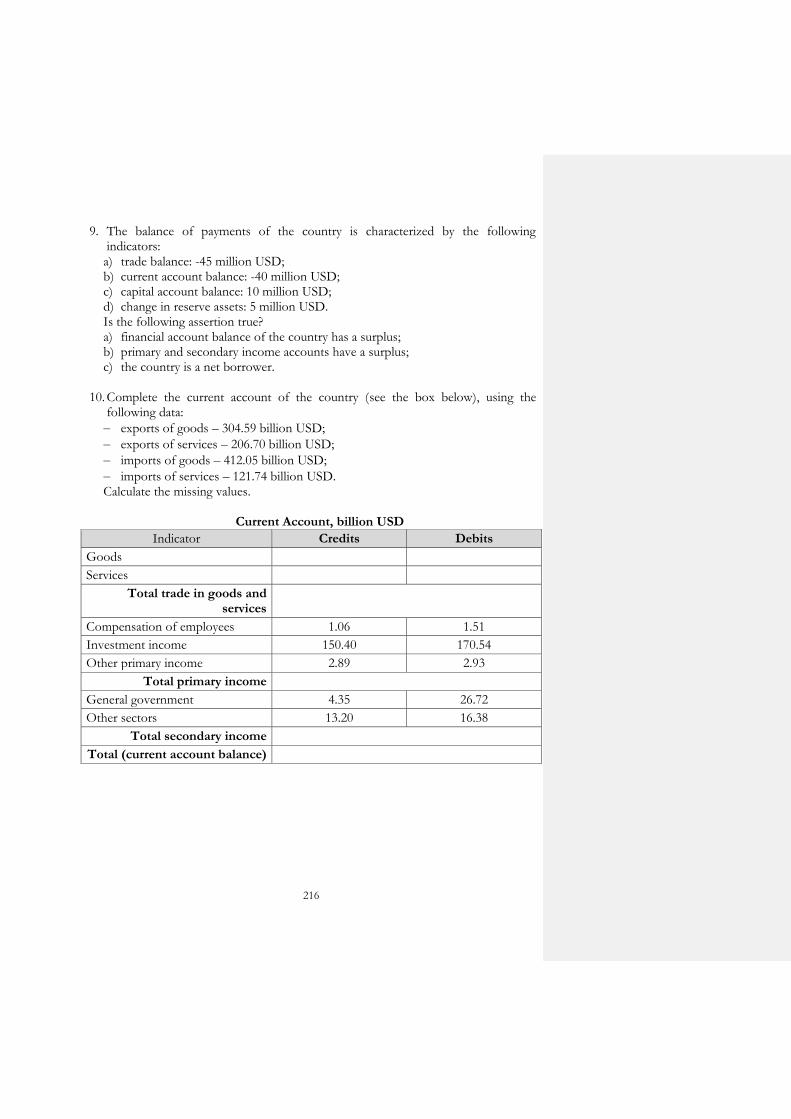
216
9. The balance of payments of the country is characterized by the following indicators: a) trade balance: -45 million USD; b) current account balance: -40 million USD; c) capital account balance: 10 million USD; d) change in reserve assets: 5 million USD. Is the following assertion true? a) financial account balance of the country has a surplus; b) primary and secondary income accounts have a surplus; c) the country is a net borrower.
10. Complete the current account of the country (see the box below), using the following data:
– exports of goods – 304.59 billion USD;
– exports of services – 206.70 billion USD;
– imports of goods – 412.05 billion USD;
– imports of services – 121.74 billion USD. Calculate the missing values.
Current Account, billion USD
Indicator Credits Debits
Goods
Services
Total trade in goods and services
Compensation of employees 1.06 1.51
Investment income 150.40 170.54
Other primary income 2.89 2.93
Total primary income
General government 4.35 26.72
Other sectors 13.20 16.38
Total secondary income
Total (current account balance)
217
CHAPTER 12:
FINANCE OF EUROPEAN UNION
SUMMARY
Despite the problems and criticisms, the European Union is now the only one
successful example of political and economic integration process in the world. The
undeniable fact is that the EU – not only one of the most influential centers of the
world economy but also an attractive socio-economic model of social order that
allows to achieve a high level of human development and at the same time to preserve
national identity and regional features of European nations. Although, its benefits
from the integration process are not realized automatically and require very specific
economic and legal actions of participants. This view is also fully applied to the
Association Agreement between Ukraine and the European Union, which fixed the
intention of Ukraine’s move towards integration with the EU. However, the practical
use of opportunities offered by Ukraine's active participation in European integration
processes requires understanding the essence of European integration, the mechanism
of its implementation and operation. Thus, in the context of our subject, it becomes
especially important to analyze financial aspects of the European Union.
First of all, we consider the nature of European integration, its background, and
development. The term European integration was introduced into international
circulation after the Second World War and means the process of establishing a closer
association, union, or even a federation of Western Europe countries. However,
participation in the European Union does not contradict to the sovereignty of the EU
member states. These states have the only limited exercise of their sovereignty in
certain areas. The basis for the unification of European countries is economic
relations in the form of economic integration – a process of gradual and increasing
integration of national economies, which results in forming a new meta-system within
integration, economic, and international groups.
According to the classical theoretical approach, the integration process often
involves the gradual steps: free trade area, customs union, common market, and
economic and currency union.
Добавлено примечание ([G610]): Deleted:s
Добавлено примечание ([G608]): Inserted: d
Добавлено примечание ([G609]): Deleted:,
Добавлено примечание ([G611]): Inserted: ,
Добавлено примечание ([G620]): Deleted:are
Добавлено примечание ([G612]): Inserted: the
Добавлено примечание ([G613]): Inserted: is
Добавлено примечание ([G619]): Deleted:e
Добавлено примечание ([G614]): Inserted: i
Добавлено примечание ([G618]): Deleted:,
Добавлено примечание ([G615]): Inserted: the
Добавлено примечание ([G616]): Inserted: a
Добавлено примечание ([G617]): Deleted:,

218
Free trade zone is created as a result of the abolition of price and other
limitations (such as quantitative) in the exchange between the states taking part in it.
At the same time, the countries preserve customs and trade autonomy in foreign
relations with other states. The Customs Union is formed with the introduction of
common external customs tariff and a common trade policy between member states.
The common market provides the abolition of restrictions on movement between
countries not only of goods but also of production factors (capital, labor, and
services). Economic and Monetary Union leads to the unification of different areas
of economic policy, conduction of the common monetary policy, and the introduction
of the single currency. Thus, the highest form of economic integration in the world
has been achieved only in the European Union.
The European Union (EU) is a political and economic partnership that
represents a unique form of cooperation among 28 member states. Built through a
series of treaties, it is the latest stage in a process of integration in Europe. It covers an
area of 4,324,782 km2, with an estimated population of over 508 million. The EU in
2014 generated a nominal gross domestic product (GDP) of 18.495 trillion US dollars,
constituting approximately 24 % of global nominal GDP . 26 out of 28 EU countries
have a very high Human Development Index. Since the 1950s, this European
integration project has expanded to encompass all economic sectors, a customs union,
a single market, a common trade policy, a common agricultural policy, many aspects
of social and environmental policy, and a common currency that is used by 19
member states.
European Union: brief history
1951 Germany, France, Italy, the Netherlands, Belgium and Luxembourg sign the Coal and Steel Treaty to manage heavy industries together.
1957 Coal and Steel Treaty members sign the Treaty of Rome, which leads to the creation of a Common market under the European Economic Community (EEC).
1965 The Brussels Treaty merges leadership positions within the three separate organizations into one large body known as the Council of Ministers.
1973 The first enlargement of the EU took place with the addition of Denmark, Ireland, and the United Kingdom.
1974 The European Council is established to specifically set long-term agendas for political and economic integration
Добавлено примечание ([G621]): Inserted: The
Добавлено примечание ([G622]): Inserted: ,
Добавлено примечание ([G625]): Deleted:C
Добавлено примечание ([G623]): Inserted: The c
Добавлено примечание ([G626]): Deleted:,
Добавлено примечание ([G624]): Inserted: the

219
1979 Europeans elect European Parliament members for the first time.
1987 Single European Act comes into enforcement, expanding common market flexibility.
1992 The Maastricht Treaty is signed, which established rules of the common currency in addition to providing further coordination for foreign and security policy. The European Community formally changes its name to the European Union.
1998 A new currency, the euro, was launched in world money markets. It became the unit of exchange for all of the EU states except the United Kingdom, Sweden, and Denmark.
2003 Treaty of Nice entered into force to set forth rules streamlining the size and procedures of EU institutions.
2004 Ten new countries joined the EU, and the European constitution is signed by all 25 EU countries. Ratification failed in 2005.
2007 Bulgaria and Romania join the EU, bringing membership to 27 countries.
2009 Treaty of Lisbon entered into force to provide the EU with modern institutions to address issues, such as globalization, climate change, security, and energy.
2010 At a European Council meeting in Brussels, the EU leaders adopt a 10-year strategy for smart, sustainable and inclusive growth: Europe 2020. They also decide to open accession negotiations with Iceland.
2013 Croatia becomes the 28th country to join the European Union.
The EU member states work together through common institutions to set
policy and promote their collective interests. The EU is governed by several
institutions. They do not correspond exactly to the traditional branches of government
or division of power in representative democracies. Rather, they embody the EU’s
dual supranational and intergovernmental character.
The European Council acts as the strategic guide for EU policy. It is
composed of the Heads of State or Government of the EU’s member states and the
President of the European Commission; it meets several times a year on “EU
summits”. The European Council is headed by a President, appointed by the member
states to organize the Council’s work and facilitate consensus.
The European Commission is essentially the EU’s executive body and
upholds the common interest of the EU. It implements and manages EU decisions
Добавлено примечание ([G627]): Inserted: the

220
and common policies, ensures that the provisions of the EU’s treaties are carried out
properly, and has the sole right of legislative initiative in most policy areas. It is
composed of 28 Commissioners, one from each country, who are approved by the
European Parliament.
The Council of the European Union (also referred to as the Council of
Ministers) represents the 28 national governments. The Council enacts legislation,
usually based on proposals put forward by the Commission. Different ministers from
each country participate in meetings depending on the subject under consideration
(foreign affairs, agriculture, and production).
The European Parliament represents the citizens of the EU. It consists of 751
members, who are directly elected for five-year terms. Each EU country has a number
of seats roughly proportional to the size of its population. Although the Parliament
cannot initiate legislation, it shares legislative power with the Council of Ministers in
many policy areas, giving it the right to accept, amend, or reject the majority of
proposed EU legislation. The Parliament also decides on the allocation of the EU’s
budget jointly with the Council. Members of the European Parliament are presented in
eight political groups and a number of non-attached members.
Other institutions. The Court of Justice interprets EU laws; a Court of
Auditors monitors financial management; the European Central Bank manages the
euro and EU monetary policy; and advisory committees represent economic, social,
and regional interests.
In order to be sure that a state is adequate to be a member of EU in 1993, there
were adopted specific economic criteria (Maastricht Criteria). These five criteria also
must be met by European countries if they wish to adopt the European Union’s single
currency:
i) Inflation of no more than 1.5 percentage points above the average rate of the
three EU member states with the lowest inflation over the previous year.
ii) National budget deficit at or below 3 percent of gross domestic product
(GDP).
iii) The national public debt is not exceeding 60 percent of the gross domestic
product. A country with a higher level of debt can still adopt the euro
provided its debt level is falling steadily.
Добавлено примечание ([G628]): Inserted: ,
Добавлено примечание ([G629]): Inserted: the
221
iv) Long-term interest rates should be no more than two percentage points
above the rate in the three EU countries with the lowest inflation over the
previous year.
v) The national currency is required to enter the ERM 2 exchange rate
mechanism two years prior.
The circulation of finance and monetary funds within the EU is provided by the
European Central Bank, that together with the national central banks constitute the
European economic and monetary system (Eurosystem). The main objective of the
Eurosystem is to maintain price stability: safeguarding the value of the euro. The
European Central Bank is responsible for the prudential supervision of credit
institutions located in the euro area and non-euro area participating member states,
within the Single Supervisory Mechanism, which also comprises the national
competent authorities. It thereby contributes to the safety and soundness of the
banking system and the stability of the financial system within the EU and each
participating member state. The capital of the ECB comes from the national central
banks (NCBs) of all EU member states and amounts to 10.8 billion euros. The NCBs’
shares in this capital are calculated using a key which reflects the respective country’s
share in the total population and gross domestic product of the EU.
Basic tasks to be carried out through the Eurosystem by the ECB are: (i) the
definition and implementation of monetary policy for the euro area; (ii) the conduct of
foreign exchange operations; (iii) the holding and management of the official foreign
reserves of the euro area countries; (iv) the promotion of the smooth operation of
payment systems.
Among the most important EU financial institutions, second place belongs to
the European Investment Bank (EIB), which was founded in 1958 to provide
funding for pan-European projects (construction of railways, highways, airports, etc.)
and small business lending. EIB does not receive money from the EU budget. It is
funded by shareholders (EU) and through borrowing on the financial markets. It has
the highest credit rating (AAA) on the money markets, which gives it the opportunity
to receive a significant competitive capital that can then be invested in European
projects. EIB operates as an autonomous institution that decides on loans, evaluating
the benefits of the project and the financial capacity of the market.
To institutions that play an important role in the financial system of the EU,
also, could be included the European Bank for Reconstruction and Development
Добавлено примечание ([G630]): Deleted:s
Добавлено примечание ([G631]): Inserted: ,
Добавлено примечание ([G632]): Inserted: ,

222
(EBRD), established in 1991. The main task of which is to provide financial support
for the Central and Eastern Europe countries’ economic transition. This bank was
created by the European Economic Community, the EIB, and 39 countries, including
significant shareholders from the USA, Japan, and others. The Bank has an extensive
authorized fund (20 billion euros), so it can freely obtain loans from international
financial markets. The EBRD offers a wide range of financial instruments and takes a
flexible approach to structuring its financial products. The principal forms of direct
financing that the EBRD may offer are loans, equity, and guarantees.
EBRD is a strategic creditor of Ukrainian business. To the end of 2015, it
realized 346 EBRD-financed projects on the amount of 7.4 billion euro. So, EBRD
took 58 % of private sector share of cumulative investment. The spheres of
investments are energy (24 % of EBRD current portfolio), financial institutions
(23 %), industry, commerce and agribusiness (27 %), and infrastructure (26 %). The
examples of EBRD investment projects in Ukraine are presented in Table 12.1.
Effective functioning of any integration association cannot be without own
financial resources for its development. The European Union is not an exception.
Since its launch in the form of Coal and Steel Union, the EU carried out its activities
through contributions from member states and later went on to form its own system
of a single budget. The system of their own financial resources in the form of the EU
budget, which is administered by supranational institutions, makes the EU significantly
different from other international organizations and associations.
Thus, the EU budget is the main financial document and annual financial plan
of the EU which captures all items of revenue and expenditure of the EU. It is
adopted in accordance with the specific budget principles and approved in accordance
with special procedures of the EU institutions. The joint budget is the financial
instrument of integration processes regulation, which implies equalization of income
and financial situation of member states and supranational economic regulation. The
distribution of funds is determined not according to member state’s specific
contribution to a common budget, but according to the role of appropriate program
for socio-economic development in the EU.
Добавлено примечание ([G637]): Deleted:in
Добавлено примечание ([G633]): Inserted: ,
Добавлено примечание ([G634]): Inserted: to
Добавлено примечание ([G635]): Inserted: ,
Добавлено примечание ([G636]): Inserted: ,
Добавлено примечание ([G642]): Deleted:e
Добавлено примечание ([G638]): Inserted: E
Добавлено примечание ([G639]): Inserted: -
Добавлено примечание ([G641]): Deleted:ere
Добавлено примечание ([G640]): Inserted: as
Добавлено примечание ([G643]): Inserted: -
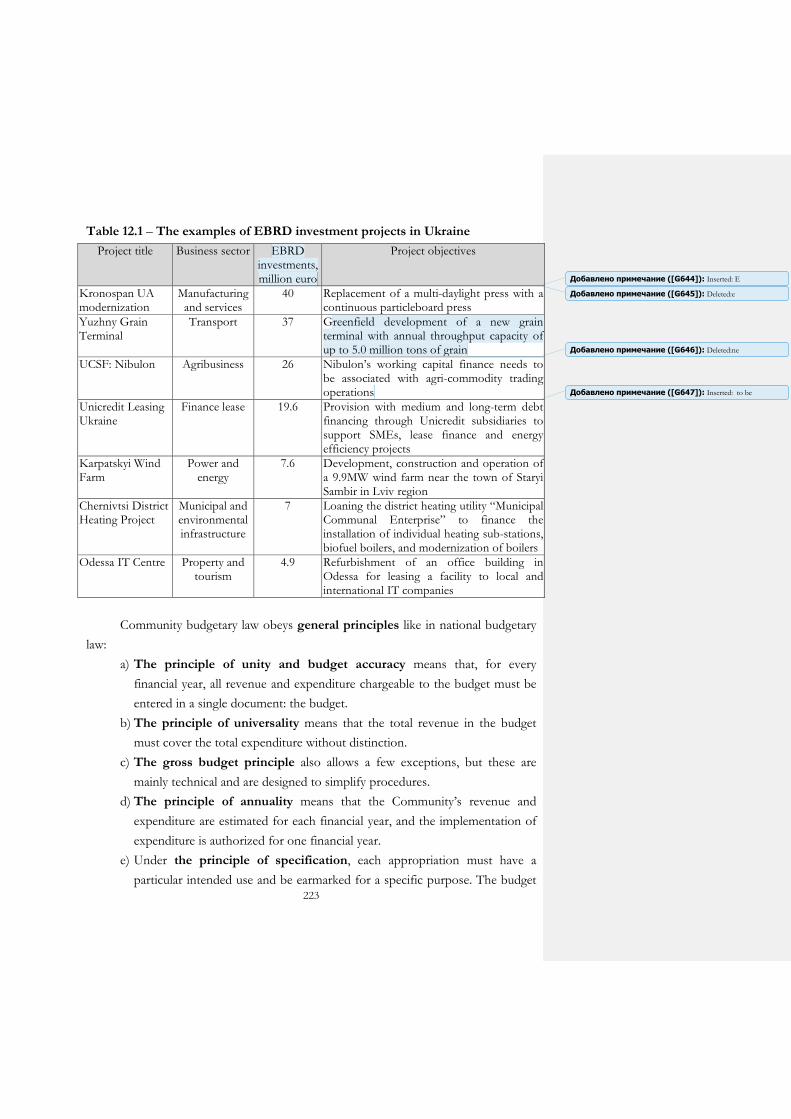
223
Table 12.1 – The examples of EBRD investment projects in Ukraine
Project title Business sector EBRD investments, million euro
Project objectives
Kronospan UA modernization
Manufacturing and services
40 Replacement of a multi-daylight press with a continuous particleboard press
Yuzhny Grain Terminal
Transport 37 Greenfield development of a new grain terminal with annual throughput capacity of up to 5.0 million tons of grain
UCSF: Nibulon Agribusiness 26 Nibulon’s working capital finance needs to be associated with agri-commodity trading operations
Unicredit Leasing Ukraine
Finance lease 19.6 Provision with medium and long-term debt financing through Unicredit subsidiaries to support SMEs, lease finance and energy efficiency projects
Karpatskyi Wind Farm
Power and energy
7.6 Development, construction and operation of a 9.9MW wind farm near the town of Staryi Sambir in Lviv region
Chernivtsi District Heating Project
Municipal and environmental infrastructure
7 Loaning the district heating utility “Municipal Communal Enterprise” to finance the installation of individual heating sub-stations, biofuel boilers, and modernization of boilers
Odessa IT Centre Property and tourism
4.9 Refurbishment of an office building in Odessa for leasing a facility to local and international IT companies
Community budgetary law obeys general principles like in national budgetary
law:
a) The principle of unity and budget accuracy means that, for every
financial year, all revenue and expenditure chargeable to the budget must be
entered in a single document: the budget.
b) The principle of universality means that the total revenue in the budget
must cover the total expenditure without distinction.
c) The gross budget principle also allows a few exceptions, but these are
mainly technical and are designed to simplify procedures.
d) The principle of annuality means that the Community’s revenue and
expenditure are estimated for each financial year, and the implementation of
expenditure is authorized for one financial year.
e) Under the principle of specification, each appropriation must have a
particular intended use and be earmarked for a specific purpose. The budget
Добавлено примечание ([G645]): Deleted:e
Добавлено примечание ([G644]): Inserted: E
Добавлено примечание ([G646]): Deleted:ne
Добавлено примечание ([G647]): Inserted: to be
224
is structured: horizontal structure (separates the general statement of revenue
and expenditure from the sections) and vertical structure (separates by the
type or purpose of the appropriations into sections, titles, chapters, articles,
and items).
f) The principle of equilibrium means that the budget must include the same
amount of revenue and expenditure.
g) The principle of a unit of account means that general budget is to be
expressed in units of account (since 1999, the euro has been the single
currency as the unit of account for the general budget).
h) The principle of sound financial management requires budget
appropriations to be used in accordance with the principles of economy (the
resources used by the institution for the pursuit of its activities should be
made available in due time, in appropriate quantity and quality, and at the
best price), efficiency (the optimum relationship between resources employed
and results achieved), and effectiveness (attaining the specific objectives set
and achieving the intended results).
i) The principle of transparency must be respected at every stage of the
budgetary cycle, from its establishment and implementation to the
presentation of accounts (the budget, the financial statements and the
financial management reports are all published in the Official Journal of the
European Union).
Annual budgets are formed on the basis of the EU Multiannual financial
framework (Long-term financial plan) that is approved by the agreement between the
European Parliament, the Council, and the European Commission. The multiannual
financial framework is adopted once for 7 years and includes the annual and total
volume of appropriations from the budget for priorities and expenditure items. This
mechanism ensures effective planning and financial forecasting the development of
the EU, compliance with budgetary discipline, and balance expenditures and revenues.
The European Union has its “own resources” to finance its expenditure.
Legally, these resources belong to the Union. Member states collect them on behalf of
the EU and transfer them to the EU budget. Own resources are of three kinds:
1. Traditional own resources (TOR) – these mainly consist of duties.
Добавлено примечание ([G648]): Inserted: ,
Добавлено примечание ([G649]): Inserted: a
Добавлено примечание ([G650]): Inserted: the
Добавлено примечание ([G653]): Deleted:M
Добавлено примечание ([G651]): Inserted: The m
Добавлено примечание ([G652]): Inserted: the

225
a) Customs duties that are gained according to the common customs tariff
on import of goods into the customs territory of the EU. These duties
are used for non-member states.
b) Agricultural duties are paid from agricultural products’ import of non-
member states.
c) Sugar levies are paid by member states for the storage of sugar
production according to the common policy of the European sugar
market regulation.
2. The resource based on value added tax (VAT). It is a uniform
percentage rate that is applied to each member state VAT revenue. The tax
base is calculated by the uniform and standardized method, according to
which “VAT own resource” is paid at a flat rate of 0.3 % of the VAT tax
base of each EU state.
3. The resource based on gross national income (GNI). It is formed of
volume of GNI contributions from each state of the EU according to the
uniform interest rate, which is reviewed annually and is calculated using the
same methodology. The “GNI own resources” is the main source of the
budget balancing, because according to the budgetary procedure for the
planned year, firstly, determined is the volume of expenditures, and then,
calculated is the amount of revenue needed to finance them. It is a
balancing item. However, the total amount of own resources, which are
used to cover annual appropriations, can’t exceed 1.24 % of the GNI of all
of the EU member states.
The budget also receives other revenue, such as taxes paid by the EU
staff on their salaries, contributions from non-EU countries to certain EU
programs, and fines on companies that breach competition. These miscellaneous
resources add up to around 1 % of the budget.
The EU budget expenditures are formed according to the priorities of
European Community development:
a) harnessing European economic integration (“single market”) to the broader
goal of sustainable growth, by mobilizing economic, social, and
environmental policies;
b) strengthening the concept of European citizenship by creating an area
of freedom, justice, security, and access to basic public goods and services;
226
c) establishing a coherent role for Europe on the global stage – inspired by its
core values – in the way it assumes its regional responsibilities, promotes
sustainable development, and contributes to civilian and strategic security.
Priorities are gathered in the form of Headings. Talking about 2014–2020
multiannual financial framework, the budget expenditures are divided into 6 headings:
1. Smart and inclusive growth:
a) Competitiveness for growth and jobs. It consists of research and
innovation, education and training, trans-European networks, social
policy, and economic integration policies.
b) Economic, social and territorial cohesion. It consists of convergence of
the least developed EU countries, EU strategy for sustainable
development outside the least prosperous regions, inter-regional
cooperation, technical assistance, and innovative actions.
2. Sustainable growth: natural resources. It includes the common agricultural
policy, common fisheries policy, rural development, and environmental
measures.
3. Security and citizenship. It includes justice and home affairs, border
protection, immigration, and asylum policy, public health, consumer
protection, culture, youth, information and dialogue with citizens.
4. The EU as a global partner covers all external actions (“foreign policy”) by
the EU. It does not include the European development fund.
5. Administration. It covers the administrative expenditures of all the European
institutions, pensions and EU-run schools for staff members’ children
(“European schools”).
6. Compensations. The temporary heading which includes compensatory
payments relating to the latest expansion of the EU.
7. Negative reserve.
8. Special instruments.
The headings are realized in the form of programs and projects. For example,
within the framework of smart and inclusive growth, such programs and projects
are financed: (i) Large infrastructure projects (European satellite navigation systems
(EGNOS and GALILEO), International Thermonuclear Experimental Reactor
(ITER), European Earth Observation Programme (Copernicus)); (ii) Nuclear Safety
and Decommissioning, (iii) Competitiveness of enterprises and small and medium-
Добавлено примечание ([G654]): Inserted: the
Добавлено примечание ([G655]): Inserted: ,
Добавлено примечание ([G656]): Inserted: he t
Добавлено примечание ([G657]): Inserted: the

227
sized enterprises (COSME), (iv) Social Change and Innovation; (v) Connecting
Europe Facility (energy, transport, information and communications technology
(ICT)); (vi) Investment for growth and jobs (regional convergence of less developed
regions, transition regions, competitiveness of more developed regions, outermost,
and sparsely populated regions).
Taking into account the structure of the EU budget (see Table 12.2), we can see
that it is quite well balanced – total revenues are higher than total expenditures.
Programs and projects that stimulate economic growth of the EU take the biggest part
of expenses (more than 87.2 %). Six percent of expenses go to administration, and 5 %
are used for international relations. According to the revenues’ structure, the biggest
source is the GNI-based own resource”. It takes more than 68 % of revenues, and its
level depends on the economic development of EU member states. Almost equal
contributions to the budget are gathered from the VAT-based own resource (12.3 %)
and traditional own resources (11.5 %).
Table 12.2 – Comparison of EU budget’s expenditures and revenues in 2014
Expenditures Revenues
Heading Euro, mln
% Form of revenue Euro, mln
%
Smart and inclusive growth
67683 47.5 Traditional own resources
16430 11.5
Sustainable growth: natural resources
56585 39.7 VAT-based own resource
17664 12.3
Security and citizenship 1711 1.2 GNI-based own resource
99075 68.4
The EU as a global partner
7205 5.1 UK correction -209 0.2
Administration 8819 6.2
Compensations 29 0 Surplus from previous year
1005 0.7 Negative reserve 0.0 0
Special instruments 465 0.3 Other revenue 9973 6.9
Total expenditure 142497 100 Total revenue 143940 100
Добавлено примечание ([G658]): Inserted: ,
Добавлено примечание ([G666]): Deleted:n
Добавлено примечание ([G665]): Deleted:es
Добавлено примечание ([G659]): Inserted: t
Добавлено примечание ([G664]): Deleted:a
Добавлено примечание ([G660]): Inserted: e
Добавлено примечание ([G663]): Deleted:a
Добавлено примечание ([G661]): Inserted: e
Добавлено примечание ([G662]): Inserted: o t
228
The EU budget is approved by the European institutions in accordance with
the budgetary procedure, which includes the planning, approval, and implementation
of the budget. This procedure begins by September 1 of the year proceeding the
budget year. The budget adoption involves five major steps:
i) Presentation of the draft budget by the European Commission to the EU
Council.
ii) Adoption of the preliminary draft budget by the qualified majority of the EU
Council. Transferring the project to the European Parliament not later than
October 5.
iii) The first reading of the draft budget by the European Parliament. If there are
no budget amendments, it is finally adopted.
iv) If the Parliament amends the draft budget, there is a second reading by the
European Council. If the Council approves the amendments, the budget is
considered adopted. If it doesn’t approve, it makes its own amendments and
transfers the project to the European Parliament.
v) Within 15 days of the draft budget being placed before to the European
Parliament, it approves the budget, or may reject or modify the amendments
using a majority of votes. The head of the European Parliament makes final
approval of the budget.
According to the Treaties of the European Union, the European Commission
carries out the budget under its own responsibility and within the designated funds.
RECOMMENDED READING
1. European Commission. Publications Office of the European Union, 2010, The European Union budget at a glance, Luxembourg.
2. European Commission, Publications Office of the European Union, 2013, Multiannual financial framework 2014–2020 and EU budget 2014 – The Figures, Luxembourg,.
Relevant websites 1. Centre of European Innovative Studies, Budgetary principles, Available at
http://www.cvce.eu/obj/les_principes_budgetaires-fr-3f6aa90a-486a-40c7-9a50-76ea3decdabb.html.
2. European Central Bank. Official web site. Available at http://www.ecb.europa.eu/ecb/tasks/ html/index.en.html
Добавлено примечание ([G667]): Inserted: the
Добавлено примечание ([G668]): Inserted: s
Добавлено примечание ([G669]): Inserted: a
229
3. European Commission, Budgetary system, Available at http://ec.europa.eu/budget/ explained/budg_system/index_en.cfm.
4. Reuters, Financila Glossary, Maastricht Criteria, Available at http://glossary. reuters.com/?title=Maastricht_Criteria.
KEY TERMS
EU treaty is a binding agreement between EU member countries. It sets out EU objectives, rules for EU institutions, how decisions are made and the relationship between the EU and its member states. Treaties are amended to make the EU more efficient and transparent, to prepare for new member states and to introduce new areas of cooperation – such as the single currency. Under the treaties, EU institutions can adopt legislation, which the member states then implement.
Economic and Monetary Union
is the process by which participating member states of the European Union adopted a single currency and a single monetary system. It consists of three stages. Stage One, which began in 1990, removed all restrictions on the movement of capital between member states. Stage Two, which began in 1994, set up the European Monetary Institution which coordinated efforts to create a unified monetary policy and a unified central bank. It also set up the Stability and Growth Pact on budgetary discipline, conducted preliminary work on euro notes and coins, launched the European Central Bank (ECB) in 1998 and conducted the preparations for the setting of the conversion rates at which member states’ currencies would join the euro. Stage Three, which began in 1999, was the fixing of currency conversion rates and the launch of the euro as the EU’s unit of account. Euro notes and coins were introduced in 2002.
multiannual financial framework
is a seven-year framework regulating its annual budget. It is laid down in a unanimously adopted Council Regulation with the consent of the European Parliament. The financial framework sets the maximum amount of spending in the EU budget each year for broad policy areas and fixes an overall annual ceiling on payment and commitment appropriations It is agreed by the European Parliament, the Council of Ministers, and the European Commission.
EU budget headings
are the priorities and different social, economic, and political fields of budget expenditures. They are adopted in Multiannual financial framework document.
annual ceiling on payment
is the maximum level permissible in a financial transaction. Ceiling refers to the highest price, the maximum interest rate, or the largest of some other factor involved in a transaction. For example, the interest rate ceiling on a credit card is the highest interest rate that could be charged for purchases. In addition for EU budget procedure, it is a limit of expenditure or revenue fixed by law or by agreement, such as in the own resources decision or in the multiannual financial framework. The latter defines an annual ceiling for each expenditure heading in commitment appropriations and an annual global ceiling for payment appropriations.
EU draft budget
is a document (preliminary version of the budget) prepared by the European Commission consolidating requests from all EU institutions and submitted to the European Parliament and the European Council no later than September 1.
Добавлено примечание ([G672]): Deleted:ed
Добавлено примечание ([G670]): Inserted: s
Добавлено примечание ([G671]): Deleted:is
230
discharge is a decision by which the European Parliament closes an annual budget exercise, on the basis of a recommendation from the Council and a declaration of assurance from the Court of Auditors. It covers the accounts of all the Communities’ revenue and expenditure, the resulting balance, and assets and liabilities, as shown in the balance sheet.
macro-financial assistance
is a form of financial support to neighboring regions, which is mobilized on a case-by-case basis with a view to helping the beneficiary countries in dealing with serious but generally short-term balance-of-payments or budget difficulties. It takes the form of medium-/long-term loans or grants (or an appropriate combination thereof) and generally complements financing provided in the context of an International Monetary Fund’s reform programme.
outturn is any of the three possible outcomes of the budget resulting from the difference between revenue and expenditure: a positive difference (surplus), a negative difference (deficit), and no difference (i. e., zero, or perfect balance between revenue and expenditure).
own resources
is a revenue flowing automatically to the European Union budget, pursuant to the treaties and implementing legislation, without the need for any subsequent decision by national authorities.
EU programme
EU policies implemented through a wide range of programs and funds providing financial support to hundreds of thousands of beneficiaries – farmers, students, scientists, NGOs, businesses, towns, regions, etc.
UK correction
is an agreement between member states (1984, Germany, Belgium, Denmark, France, Greece, Ireland, Italy, Luxembourg, the Netherlands, and the UK) on the rebate to be granted to the UK to reduce its contribution to the EU budget.
territorial cohesion
is a European Union concept which the main idea is to contribute to European sustainable development and competitiveness. It is intended to strengthen the European regions, promote territorial integration, and produce coherence of the European Union (EU).
European Court of Auditors
is the EU’s independent external auditor. It looks after the interests of EU taxpayers. It does not have legal powers but works to improve the European Commission’s management of the EU budget and reports on the EU finances. It audits EU revenue and expenditure, checks that EU funds are correctly raised and spent; checks any person or organization handling EU funds; writes up findings and recommendations in audit reports for the European Commission and national governments; gives its expert opinion to the EU policy-makers on how EU finances could be better managed and made more accountable to citizens.
Erasmus+ is an EU program for education, training, youth, and sport for 2014–2020. The Erasmus+ program aims to boost skills and employability, as well as modernizing education, training, and youth work. It has a budget of 14.7 billion euros. It supports transnational partnerships among education, training, and youth institutions and organizations to foster cooperation and bridge the worlds of education and work in order to tackle the skills gaps we are facing in Europe.
Добавлено примечание ([G673]): Inserted: the
Добавлено примечание ([G674]): Deleted:,
Добавлено примечание ([G675]): Inserted: n
231
REVIEW QUESTIONS
1. Describe the nature of integration. Define the main stages of integration in
Europe.
2. Define the historical and economic conditions of the EU formation. Identify the
main stages.
3. Give a brief characteristic of the main EU institutions. Determine their role and
importance in the management of the EU.
4. What are the main differences in the functioning of state’s public finances and EU
finance?
5. Specify the basic principles of the EU budget and describe them.
6. Define the essence of “financial framework of the EU”. Who designs and
approves it? What are its basic principles?
7. Describe the main stages of the EU budget process. Characterize the budget year
and the system of control over the implementation of the EU budget.
8. Describe the major powers of the EU institutions (European Commission, EU
Council of Ministers, and the European Parliament) in the budget process.
9. Identify the main items of the EU budget revenues. Give examples and analysis of
the revenue structure of the EU budget in recent years. What is the threshold
amount of the EU budget? What is its purpose, and how is it regulated?
10. Identify the main items of the EU budget expenditures. Give examples of
expenditures in the economic sphere, protection, and management of natural
resources, financing of external programs.
11. Analyze the EU budget spending system. Who are the manager and recipient of
the budget? Can be the EU budget adopted with a deficit?
12. Determine the nature of the EU budget strategy. What are its basic principles?
13. Describe the process of the Economic and Monetary Union (EMU) formation.
What is Eurosystem?
14. Describe the functions, principles, and objectives of the European Central Bank.
Expand its role in ensuring the stability of the EU single currency.
15. Analyze and explain “convergence criteria”. What is their importance in ensuring
the European financial stability?
Добавлено примечание ([G676]): Inserted: ,
Добавлено примечание ([G677]): Inserted: ,

232
MULTIPLE CHOICE QUESTIONS
Choose the one alternative that best completes the statement or answers the question.
1. What gradual steps does the integration process often involve? a) free export, customs union, common market, and financial union; b) cooperation area, customs union, common territory, and economic and
currency union; c) free trade area, customs union, common market, and economic and currency
union; d) free import, customs union, commonplace, and financial union.
2. When did the European Community formally change its name to the European Union? a) in 1971; b) in 1951; c) in 2002; d) in 1992.
3. What institution is an executive body and implements the EU decisions and common policies? a) the European Council; b) the European Commission; c) the European Parliament; d) the Council of Ministers.
4. What criteria must European countries meet if they wish to adopt the European Union’s single currency? a) national budget deficit at or below 3 percent of gross domestic product
(GDP); b) national public debt not exceeding 60 percent of gross domestic product; c) inflation of no more than 1.5 percentage points above the average rate of the
three EU member states with the lowest inflation over the previous year; d) all these criteria.
5. What is the main objective of the European Central Bank? a) to maintain price stability; b) to stimulate economic growth; c) to print euros; d) to collect taxes.
Добавлено примечание ([G680]): Deleted:i
Добавлено примечание ([G678]): Inserted: e
Добавлено примечание ([G679]): Inserted: e
233
6. Name the institution that provides funding for pan-European projects and small business lending without receiving money from the EU budget: a) the European Bank for Reconstruction and Development; b) the European Investment Bank; c) the European Central Bank; d) the Economic Parliament Committee.
7. Name the institution that provides funding for Ukrainian business, lending money for economic transition: a) the European Bank for Reconstruction and Development; b) the European Investment Bank; c) the European Central Bank; d) the Economic Parliament Committee.
8. EU budgetary law does not obey this general principle: a) the principle of universality; b) the principle of specification; c) the principle of equilibrium; d) the principle of solvency.
9. The EU budget own resources are of the following kinds: a) traditional own resources, VAT own resources, GNI own resources; b) traditional own resources, agricultural duties, income taxes; c) traditional own resources, customs duties, GNI own resources; d) traditional own resources, agricultural duties, taxes paid on salary.
10. The EU budget expenditures are formed as follows: a) economic conditions; b) headings; c) cohesion strategy; d) ceiling.
SHORT ANSWER QUESTIONS
MISSING WORD QUESTIONS
Choose the correct word to complete each sentence.
1. The term ___________________ was introduced into international circulation after the Second World War and means the process of establishing a closer association, union, or even a federation of Western Europe countries.
Добавлено примечание ([G681]): Inserted: s
Добавлено примечание ([G682]): Inserted: s
Добавлено примечание ([G683]): Inserted: es
Добавлено примечание ([G685]): Deleted:,
Добавлено примечание ([G684]): Inserted: a

234
2. The ____________________ is signed, which established rules of common currency in addition to providing further coordination for foreign and security policy. The European Community formally changes its name to the _________________________.
3. The circulation of finance and monetary funds within the EU is provided by the _______________________ that together with the national central banks constitute the European economic and monetary system.
4. Annual budgets are formed on the basis of the _______________________ (long-term financial plan) that is approved by the agreement between the _______________, the Council, and the _____________________.
5. Priorities are gathered in form of _______________. Talking about 2014–2020 multiannual financial framework budget, ______________ are divided into 6 _______________.
TRUE/FALSE/UNCERTAIN QUESTIONS
Decide whether the following statements are True, False, or Uncertain. Explain your reasoning. Your score will be based not just on whether you get the True, False, Uncertain part right but also, to a larger extent, on the quality of your explanation. 1. Free trade zone provides the abolition of restrictions on movement between
countries not only of goods but also of production factors (capital, labor, and services).
2. The Council of the European Union represents the citizens of the EU. It consists of 751 members who are directly elected for five-year terms.
3. Five criteria must be met by European countries if they wish to adopt the European Union’s single currency. They are devoted to the inflation, national budget deficit, national public debt, long-term interest, and national currency exchange rate.
4. The main task of the European Bank for Reconstruction and Development (EBRD) is to provide financial support for the Central and Eastern Europe countries’ economic transition. This institution doesn’t work in Ukraine.
5. According to the Treaty of European Union establishment, the European Parliament carries out the budget under its own responsibility and within the designated funds.
Добавлено примечание ([G686]): Deleted:,
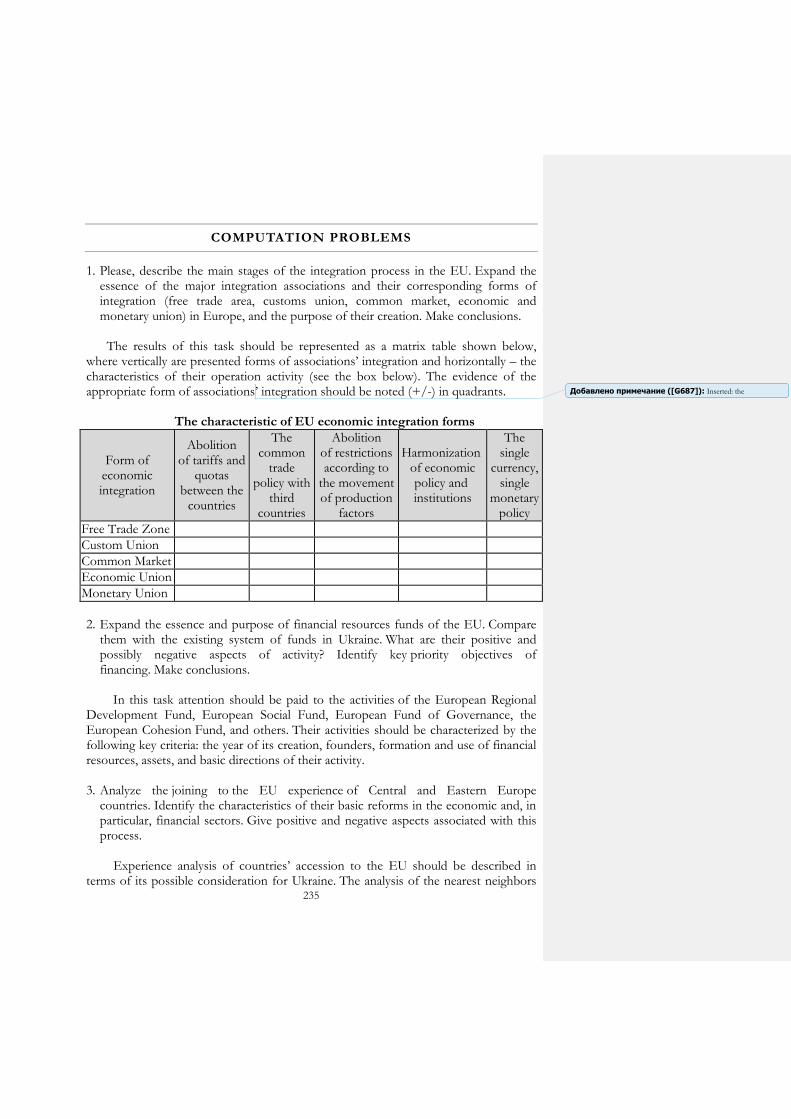
235
COMPUTATION PROBLEMS
1. Please, describe the main stages of the integration process in the EU. Expand the essence of the major integration associations and their corresponding forms of integration (free trade area, customs union, common market, economic and monetary union) in Europe, and the purpose of their creation. Make conclusions.
The results of this task should be represented as a matrix table shown below,
where vertically are presented forms of associations’ integration and horizontally – the characteristics of their operation activity (see the box below). The evidence of the appropriate form of associations’ integration should be noted (+/-) in quadrants.
The characteristic of EU economic integration forms
Form of economic integration
Abolition of tariffs and
quotas between the
countries
The common
trade policy with
third countries
Abolition of restrictions according to
the movement of production
factors
Harmonization of economic policy and institutions
The single
currency, single
monetary policy
Free Trade Zone
Custom Union
Common Market
Economic Union
Monetary Union
2. Expand the essence and purpose of financial resources funds of the EU. Compare
them with the existing system of funds in Ukraine. What are their positive and possibly negative aspects of activity? Identify key priority objectives of financing. Make conclusions.
In this task attention should be paid to the activities of the European Regional Development Fund, European Social Fund, European Fund of Governance, the European Cohesion Fund, and others. Their activities should be characterized by the following key criteria: the year of its creation, founders, formation and use of financial resources, assets, and basic directions of their activity.
3. Analyze the joining to the EU experience of Central and Eastern Europe
countries. Identify the characteristics of their basic reforms in the economic and, in particular, financial sectors. Give positive and negative aspects associated with this process.
Experience analysis of countries’ accession to the EU should be described in terms of its possible consideration for Ukraine. The analysis of the nearest neighbors
Добавлено примечание ([G687]): Inserted: the
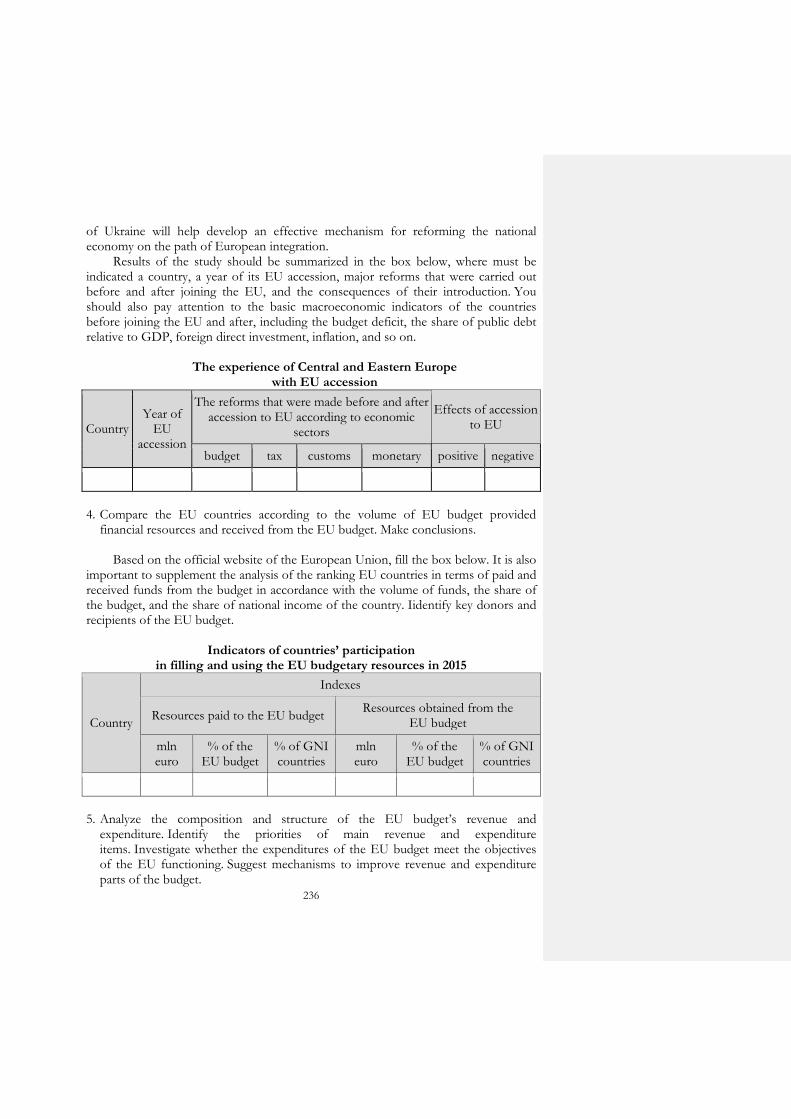
236
of Ukraine will help develop an effective mechanism for reforming the national economy on the path of European integration.
Results of the study should be summarized in the box below, where must be indicated a country, a year of its EU accession, major reforms that were carried out before and after joining the EU, and the consequences of their introduction. You should also pay attention to the basic macroeconomic indicators of the countries before joining the EU and after, including the budget deficit, the share of public debt relative to GDP, foreign direct investment, inflation, and so on.
The experience of Central and Eastern Europe
with EU accession
Country Year of
EU accession
The reforms that were made before and after accession to EU according to economic
sectors
Effects of accession to EU
budget tax customs monetary positive negative
4. Compare the EU countries according to the volume of EU budget provided
financial resources and received from the EU budget. Make conclusions. Based on the official website of the European Union, fill the box below. It is also
important to supplement the analysis of the ranking EU countries in terms of paid and received funds from the budget in accordance with the volume of funds, the share of the budget, and the share of national income of the country. Iidentify key donors and recipients of the EU budget.
Indicators of countries’ participation
in filling and using the EU budgetary resources in 2015
Country
Indexes
Resources paid to the EU budget Resources obtained from the
EU budget
mln euro
% of the EU budget
% of GNI countries
mln euro
% of the EU budget
% of GNI countries
5. Analyze the composition and structure of the EU budget’s revenue and
expenditure. Identify the priorities of main revenue and expenditure items. Investigate whether the expenditures of the EU budget meet the objectives of the EU functioning. Suggest mechanisms to improve revenue and expenditure parts of the budget.
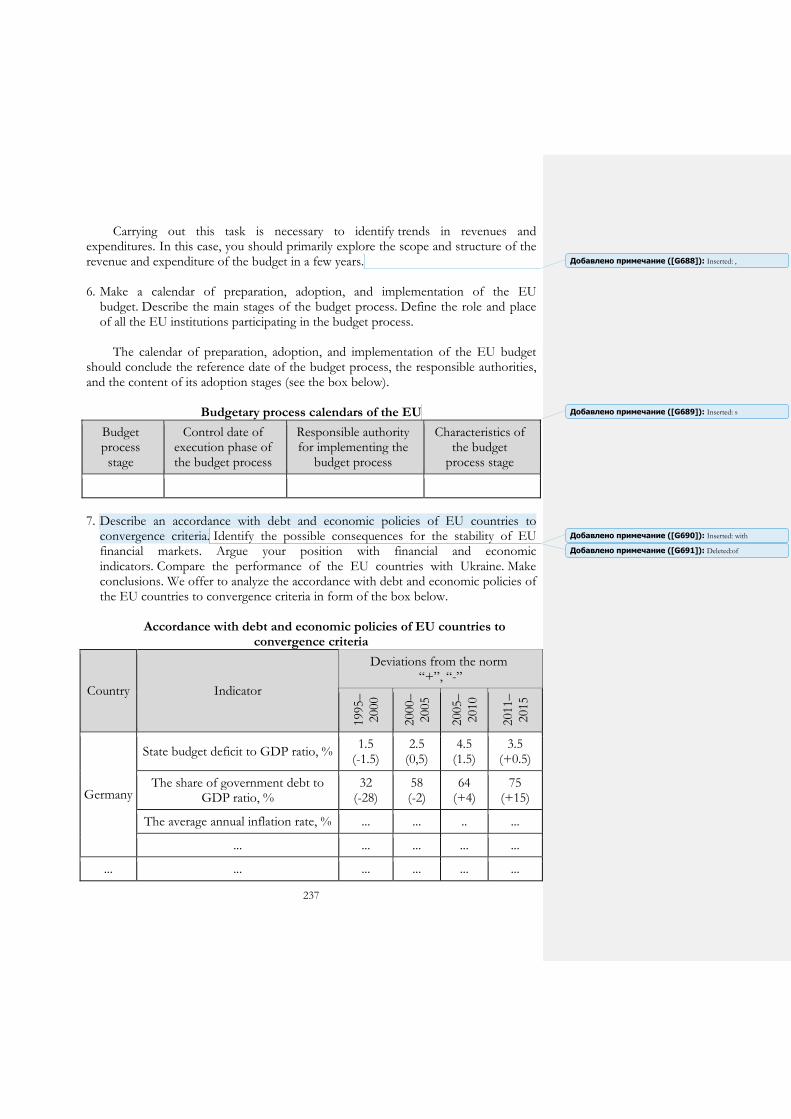
237
Carrying out this task is necessary to identify trends in revenues and expenditures. In this case, you should primarily explore the scope and structure of the revenue and expenditure of the budget in a few years.
6. Make a calendar of preparation, adoption, and implementation of the EU
budget. Describe the main stages of the budget process. Define the role and place of all the EU institutions participating in the budget process.
The calendar of preparation, adoption, and implementation of the EU budget
should conclude the reference date of the budget process, the responsible authorities, and the content of its adoption stages (see the box below).
Budgetary process calendars of the EU
Budget process stage
Control date of execution phase of the budget process
Responsible authority for implementing the
budget process
Characteristics of the budget
process stage
7. Describe an accordance with debt and economic policies of EU countries to
convergence criteria. Identify the possible consequences for the stability of EU financial markets. Argue your position with financial and economic indicators. Compare the performance of the EU countries with Ukraine. Make conclusions. We offer to analyze the accordance with debt and economic policies of the EU countries to convergence criteria in form of the box below.
Accordance with debt and economic policies of EU countries to
convergence criteria
Country Indicator
Deviations from the norm “+”, “-”
1995–
2000
2000–
2005
2005–
2010
2011–
2015
Germany
State budget deficit to GDP ratio, % 1.5
(-1.5) 2.5
(0,5) 4.5
(1.5) 3.5
(+0.5)
The share of government debt to GDP ratio, %
32 (-28)
58 (-2)
64 (+4)
75 (+15)
The average annual inflation rate, % ... ... .. ...
... ... ... ... ...
... ... ... ... ... ...
Добавлено примечание ([G688]): Inserted: ,
Добавлено примечание ([G689]): Inserted: s
Добавлено примечание ([G691]): Deleted:of
Добавлено примечание ([G690]): Inserted: with

238
For the purpose of an objective assessment of the financial situation in the EU, it is necessary to review these indicators in dynamics for the period of 1995–2012. Analysis of variation within the conventional stages will help to determine the countries that contribute to the stability of the EU financial market and countries that slow its development, increasing the risks of instability.
8. Country “A” has the following macroeconomic indicators in 2015: GDP – 746.5 bln EUR; budget deficit – 22.3 bln eur; total state debt – 398.5 bln EUR; last year price level – 345 points, the price level of the year – 398 points; Central Bank interest rate – 5 %; exchange rate fluctuated around 2 %. Determine whether this country has the right to introduce the euro into circulation? Give a detailed answer. Identify areas of financial policy under the terms of the Maastricht Treaty. In this task, you should refer to the requirements of the financial and economic indicators for countries wishing to use the euro. They were adopted in 1992 in the Maastricht.
Добавлено примечание ([G694]): Deleted:ss
Добавлено примечание ([G692]): Inserted: und
Добавлено примечание ([G693]): Deleted:c
Добавлено примечание ([G695]): Inserted: ,
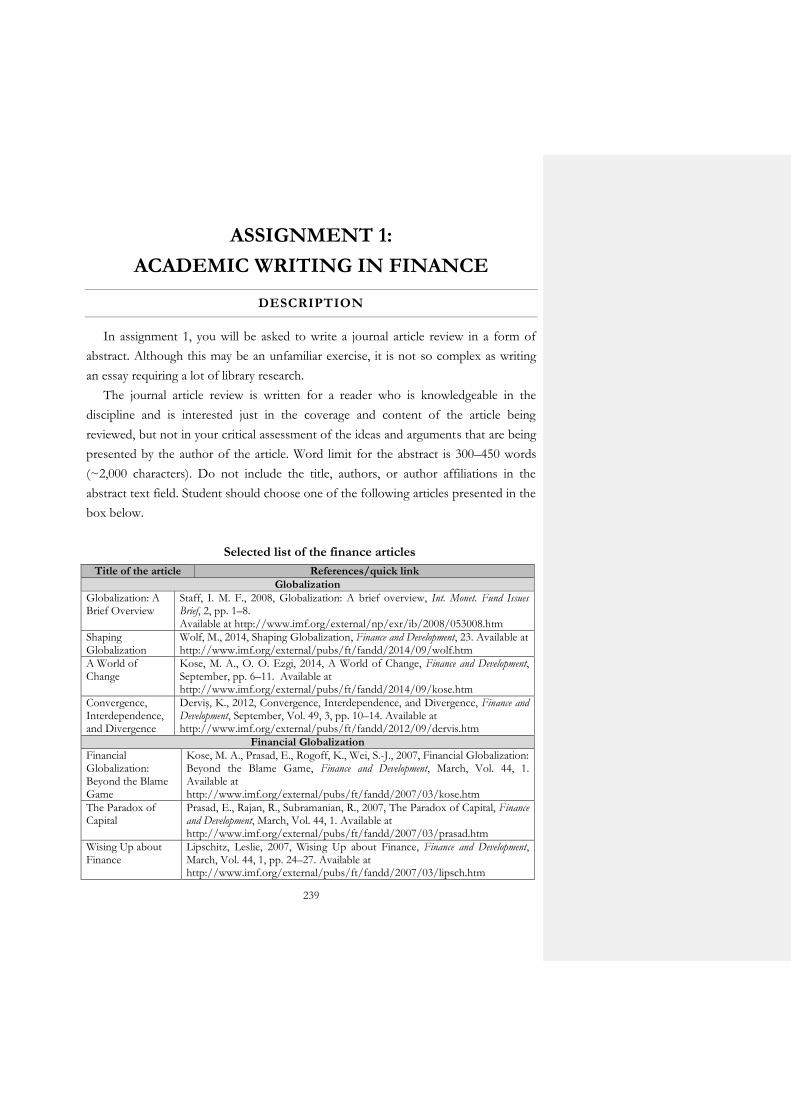
239
ASSIGNMENT 1:
ACADEMIC WRITING IN FINANCE
DESCRIPTION
In assignment 1, you will be asked to write a journal article review in a form of
abstract. Although this may be an unfamiliar exercise, it is not so complex as writing
an essay requiring a lot of library research.
The journal article review is written for a reader who is knowledgeable in the
discipline and is interested just in the coverage and content of the article being
reviewed, but not in your critical assessment of the ideas and arguments that are being
presented by the author of the article. Word limit for the abstract is 300–450 words
(~2,000 characters). Do not include the title, authors, or author affiliations in the
abstract text field. Student should choose one of the following articles presented in the
box below.
Selected list of the finance articles
Title of the article References/quick link
Globalization
Globalization: A Brief Overview
Staff, I. M. F., 2008, Globalization: A brief overview, Int. Monet. Fund Issues Brief, 2, pp. 1–8. Available at http://www.imf.org/external/np/exr/ib/2008/053008.htm
Shaping Globalization
Wolf, M., 2014, Shaping Globalization, Finance and Development, 23. Available at http://www.imf.org/external/pubs/ft/fandd/2014/09/wolf.htm
A World of Change
Kose, M. A., O. O. Ezgi, 2014, A World of Change, Finance and Development, September, pp. 6–11. Available at http://www.imf.org/external/pubs/ft/fandd/2014/09/kose.htm
Convergence, Interdependence, and Divergence
Derviş, K., 2012, Convergence, Interdependence, and Divergence, Finance and Development, September, Vol. 49, 3, pp. 10–14. Available at http://www.imf.org/external/pubs/ft/fandd/2012/09/dervis.htm
Financial Globalization
Financial Globalization: Beyond the Blame Game
Kose, M. A., Prasad, E., Rogoff, K., Wei, S.-J., 2007, Financial Globalization: Beyond the Blame Game, Finance and Development, March, Vol. 44, 1. Available at http://www.imf.org/external/pubs/ft/fandd/2007/03/kose.htm
The Paradox of Capital
Prasad, E., Rajan, R., Subramanian, R., 2007, The Paradox of Capital, Finance and Development, March, Vol. 44, 1. Available at http://www.imf.org/external/pubs/ft/fandd/2007/03/prasad.htm
Wising Up about Finance
Lipschitz, Leslie, 2007, Wising Up about Finance, Finance and Development, March, Vol. 44, 1, pp. 24–27. Available at http://www.imf.org/external/pubs/ft/fandd/2007/03/lipsch.htm
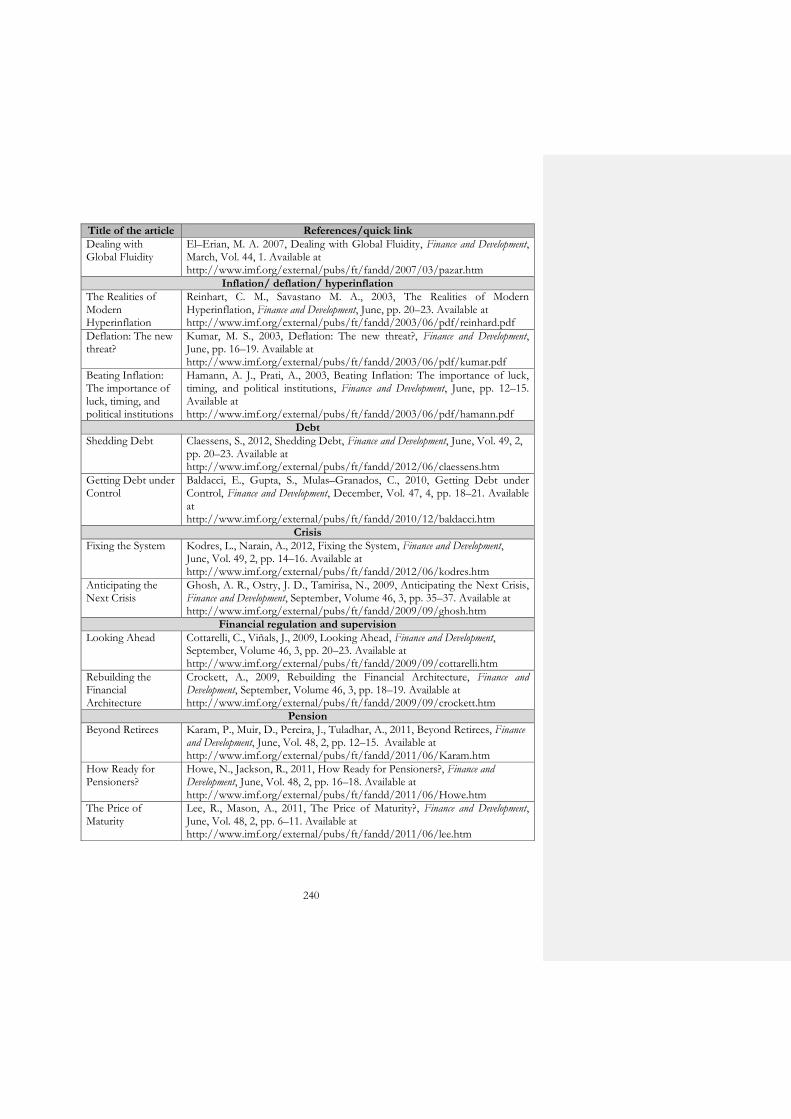
240
Title of the article References/quick link
Dealing with Global Fluidity
El–Erian, M. A. 2007, Dealing with Global Fluidity, Finance and Development, March, Vol. 44, 1. Available at http://www.imf.org/external/pubs/ft/fandd/2007/03/pazar.htm
Inflation/ deflation/ hyperinflation
The Realities of Modern Hyperinflation
Reinhart, C. M., Savastano M. A., 2003, The Realities of Modern Hyperinflation, Finance and Development, June, pp. 20–23. Available at http://www.imf.org/external/pubs/ft/fandd/2003/06/pdf/reinhard.pdf
Deflation: The new threat?
Kumar, M. S., 2003, Deflation: The new threat?, Finance and Development, June, pp. 16–19. Available at http://www.imf.org/external/pubs/ft/fandd/2003/06/pdf/kumar.pdf
Beating Inflation: The importance of luck, timing, and political institutions
Hamann, A. J., Prati, A., 2003, Beating Inflation: The importance of luck, timing, and political institutions, Finance and Development, June, pp. 12–15. Available at http://www.imf.org/external/pubs/ft/fandd/2003/06/pdf/hamann.pdf
Debt
Shedding Debt Claessens, S., 2012, Shedding Debt, Finance and Development, June, Vol. 49, 2, pp. 20–23. Available at http://www.imf.org/external/pubs/ft/fandd/2012/06/claessens.htm
Getting Debt under Control
Baldacci, E., Gupta, S., Mulas–Granados, C., 2010, Getting Debt under Control, Finance and Development, December, Vol. 47, 4, pp. 18–21. Available at http://www.imf.org/external/pubs/ft/fandd/2010/12/baldacci.htm
Crisis
Fixing the System Kodres, L., Narain, A., 2012, Fixing the System, Finance and Development, June, Vol. 49, 2, pp. 14–16. Available at http://www.imf.org/external/pubs/ft/fandd/2012/06/kodres.htm
Anticipating the Next Crisis
Ghosh, A. R., Ostry, J. D., Tamirisa, N., 2009, Anticipating the Next Crisis, Finance and Development, September, Volume 46, 3, pp. 35–37. Available at http://www.imf.org/external/pubs/ft/fandd/2009/09/ghosh.htm
Financial regulation and supervision
Looking Ahead Cottarelli, C., Viñals, J., 2009, Looking Ahead, Finance and Development, September, Volume 46, 3, pp. 20–23. Available at http://www.imf.org/external/pubs/ft/fandd/2009/09/cottarelli.htm
Rebuilding the Financial Architecture
Crockett, A., 2009, Rebuilding the Financial Architecture, Finance and Development, September, Volume 46, 3, pp. 18–19. Available at http://www.imf.org/external/pubs/ft/fandd/2009/09/crockett.htm
Pension
Beyond Retirees Karam, P., Muir, D., Pereira, J., Tuladhar, A., 2011, Beyond Retirees, Finance and Development, June, Vol. 48, 2, pp. 12–15. Available at http://www.imf.org/external/pubs/ft/fandd/2011/06/Karam.htm
How Ready for Pensioners?
Howe, N., Jackson, R., 2011, How Ready for Pensioners?, Finance and Development, June, Vol. 48, 2, pp. 16–18. Available at http://www.imf.org/external/pubs/ft/fandd/2011/06/Howe.htm
The Price of Maturity
Lee, R., Mason, A., 2011, The Price of Maturity?, Finance and Development, June, Vol. 48, 2, pp. 6–11. Available at http://www.imf.org/external/pubs/ft/fandd/2011/06/lee.htm
241
Next section provides detailed suggestions for writing the background, methods,
results, and conclusions of a good abstract.
GUIDELINES: SOME PRACTICAL TIPS
The abstract is typically a condensed version of longer piece of writing that
highlights the major covered points, while concisely describing the content and scope
of the work.
Purposes of the abstract:
provides an overview of the article (readers may not read anything else);
provides context for those who read the article;
is used by journals to assign reviewers;
is used by abstracting and information services to index and retrieve articles;
is used by translation services for foreign readers;
helps reader to decide whether to read the article;
provides reminders for readers after they have read the article;
directs readers’ attention to the highlights of the article.
According to the overall style of the abstract, it is important to be concise: to write
only what is essential, using no more words than necessary to convey the information.
At the same time it is also important to be descriptive; use active verbs.
Characteristics of the abstract:
complete and internally consistent;
no references;
no tables or figures;
no or few abbreviations (must be defined);
conclusions should be based on data/info presented within the abstract;
length: between 300 and 450 words;
an abstract is an original document, not a collection of quotations taken from
the text it summarizes, i. e. it must be able to stand alone;
it does not contain vague statements which force the reader to refer to the
main text.
Content of an abstract:
242
a) motivation and problem statement – the first part of the abstract, where
purpose and scope of study, i. e. the research question, are defined;
b) approach – the next part of the abstract, where used materials and methods are
described;
c) results – the third part of the abstract that summarizes the results of the study;
d) discussion/conclusions – the last part of the abstract that states the conclusions,
their implications or recommendations for future research.
Description of the main parts of the informative abstracts:
1. Motivation: This part should be written by answering one or all of the following
questions:
Why did the author decide to do this study?
Why is this research important?
Why should someone read entire essay?
2. Problem statement: Sometimes it is possible to combine the problem with the
motivation, but it is better to write them separately. One or all of the following
questions should be answered:
What problem does the author try to understand better or solve?
Is the topic newly discovered or has it been ignored in the past?
What is the scope of the study – a general problem, or something specific?
What is the main claim or argument?
3. Approach: This part describes how the author go about solving or making
progress on the problem. Checklist:
Discuss the author research including the variables and approach.
Describe the evidence the author have to support his/her claim.
Give an overview of the most important sources.
4. Results: In this part the result should be put in numbers (if possible). Provide the
results of the author study by answering one or all of the following questions:
What answer did the author reach from research or study?
Was the author hypothesis or argument supported?
What are the general findings?
5. Discussion/Conclusions: The main question of this part is what are the
implications of the author answer? Is it going to change the world, be a significant
243
“win”, be a nice hack, or simply serve as a road sign indicating that this path is a waste
of time (all of the previous results are useful).
Are the author results general, potentially generalizable, or specific to a
particular case?
What is the author interpretation of what these interpretation results mean?
Why should anyone become interested in the author findings?
What are the implications for future research?
The following errors are the most common that students did during writing the
abstract:
a) inconsistency between text and abstract (~50 %);
b) reporting data not present in the paper (~30 %);
c) both (15 %).
Other errors:
a) no questions or questions are stated vaguely;
b) implication is stated instead of the answer;
c) too short or too much detail.
The abstract should not include information not contained in the original work,
references to other work, quotations from the original work or from other works,
lengthy explanations of words and concepts, unexplained acronyms or abbreviations,
tables and maps. An abstract gives the essence of the project in a brief but complete
form to judges and the public viewing the project.
During the writing process, bear in mind that the abstract should be written
continuity (repeat key terms, consistent order, consistent point of view in the question
and answer), be in a parallel form, and verb tenses should be used (present tense for
question and answer (introduction and discussion/conclusions), past tense for
methods and results).
Main writing and revising tips:
simply put, the style of an abstract should always be declarative and not
discursive;
emphasize these aspects: motivation, problem statement, approach, results,
and conclusions;
omit details and discussions;
use the present or past tense to describe;

244
use short sentences, but vary sentence structure;
use complete sentences;
avoid jargon;
use appropriate scientific language;
use concise syntax;
use correct spelling, grammar, and punctuation;
research is interesting for the same reasons.
EVALUATION CRITERIA
General notes: These guidelines are intended to assist the abstract reviewer in
assigning point values for the scoring categories. The evaluation criteria and their
description are presented in the box below. Unlike the research paper, the abstract is
very limited in length (300–450 words (~2,000 characters)) requiring a concise
description of the research. Missing sections may be scored a zero since the rubric was
available to all authors.
Abstract evaluation criteria
Evaluation criteria
Needs Improvement
Acceptable Outstanding Possible Points
Motivation / Need for research
Research is unclear and would have limited implications to the broader community 0–3 points
Research has a regional need and is tied to the research agenda 4 points
Research has a broad need and is tied to the research agenda 5 points
5
Problem statement / Conceptual or theoretical framework
Minimal effort to describe the foundations of this research. No theory is identified. 0–4 points
The framework is appropriate but lacking detail. Theory is identified, but may not be well supported. 5–7 points
The framework clearly shows that this research is based on previous work. A relevant theory is identified. 8–10 points
10
Methodology / Approach
Methods seem inappropriate, poorly described and difficult to follow. 0–3 points
Methodology is generally appropriate, but would be difficult to reproduce from the given description. 4 points
Methodology is very appropriate, well described and can be easily reproduced. 5 points
5
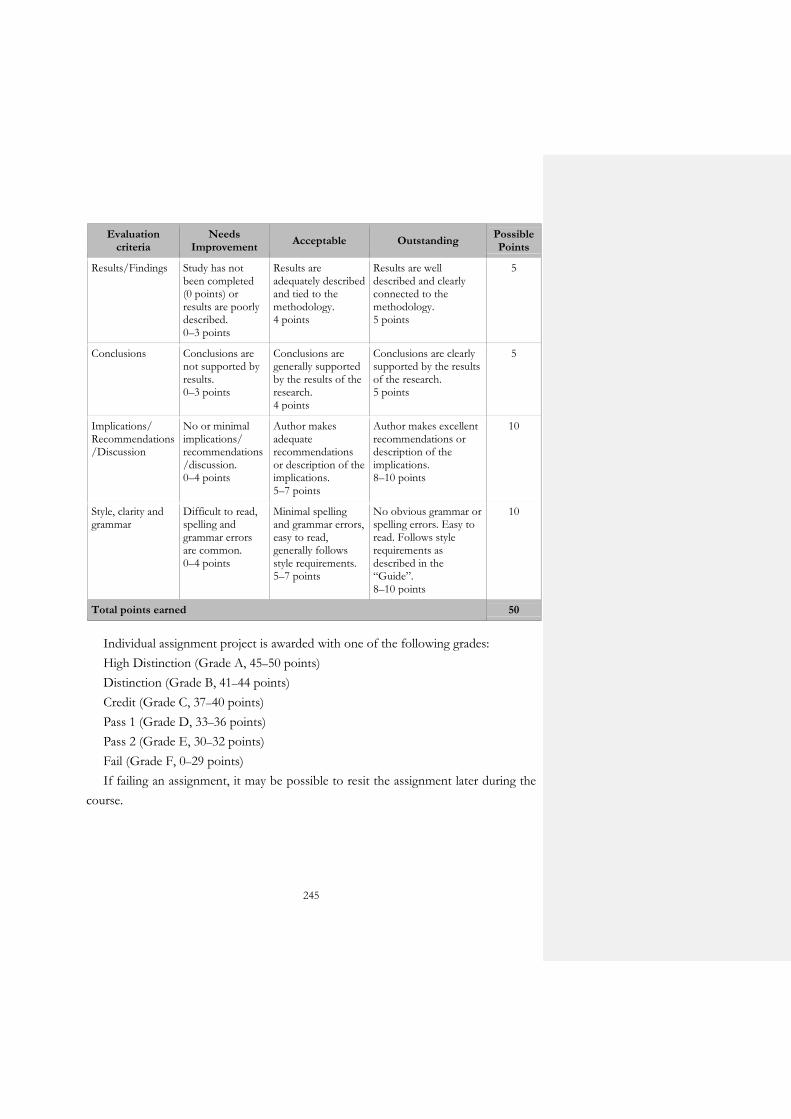
245
Evaluation criteria
Needs Improvement
Acceptable Outstanding Possible Points
Results/Findings Study has not been completed (0 points) or results are poorly described. 0–3 points
Results are adequately described and tied to the methodology. 4 points
Results are well described and clearly connected to the methodology. 5 points
5
Conclusions Conclusions are not supported by results. 0–3 points
Conclusions are generally supported by the results of the research. 4 points
Conclusions are clearly supported by the results of the research. 5 points
5
Implications/ Recommendations/Discussion
No or minimal implications/ recommendations/discussion. 0–4 points
Author makes adequate recommendations or description of the implications. 5–7 points
Author makes excellent recommendations or description of the implications. 8–10 points
10
Style, clarity and grammar
Difficult to read, spelling and grammar errors are common. 0–4 points
Minimal spelling and grammar errors, easy to read, generally follows style requirements. 5–7 points
No obvious grammar or spelling errors. Easy to read. Follows style requirements as described in the “Guide”. 8–10 points
10
Total points earned 50
Individual assignment project is awarded with one of the following grades:
High Distinction (Grade A, 45–50 points)
Distinction (Grade B, 41–44 points)
Credit (Grade C, 37–40 points)
Pass 1 (Grade D, 33–36 points)
Pass 2 (Grade E, 30–32 points)
Fail (Grade F, 0–29 points)
If failing an assignment, it may be possible to resit the assignment later during the
course.

246
ASSIGNMENT 2:
CASE STUDY ON CASH FLOW ANALYSIS
DESCRIPTION
In Assignment 2, you will be asked to write an individual project report on the real
case study. The writing report is required to assess the feasibility of financing capital
expenditures, dependence on external financing, financial flexibility to unanticipated
needs/opportunities, financial practices of management, to analyze company’s ability
in meeting debt service requirements, and to evaluate quality of earnings.
GUIDELINES
Step 1. Download from the official web-site Adecoagro S. A. –
www.adecoagro.com – Consolidated Statements of Cash Flows for the years ended
December 31, 2014, 2013 and 2012. Adecoagro S. A. is one of the leading agro-
industrial companies in the production of food and renewable energy. It owns
productive farmland and industrial facilities distributed across the most productive
regions of Argentina, Brazil and Uruguay, where the company produces over 1.3
million tons of agricultural products, including rice, sugar, milk, sunflower, corn,
wheat, soybean, ethanol, and bio-electricity. More information about the company
profile can be found on the official web-site. Provide a short but substantial
description of the company's cash flow features according to the industry where it
operates, key characteristics of the business area where the company operates,
company's size, etc.
Step 2. Analyze the cash inflows, outflows, and net cash flow stream. For the
writing report, show cash flow results as graphical images in addition to the tabled
figures even when the graph contains the information that can be also read from the
table.
Step 3. Analyze the cash flow from (i) operations before investment in working
capital, (ii) the cash flow from changes in working capital, and (iii) the cash flow from
operating activities to verify that the company is able to generate a cash surplus from
its operations. By doing so try to answer the following questions: How strong is the
company's internal cash flow generation? Is the cash flow from operations positive or
247
negative? If it is negative, why? Is it because the company is growing? Is it because its
operations are unprofitable? Is it having difficulty in managing its working capital
properly? Did company’s cash position increase or decrease during the period being
analyzed? By what amount?
Step 4. Analyze the cash flow from investing activities to verify that the company
is able to generate a cash surplus from investments in financial markets and operating
subsidiaries. By doing so the following questions could be answered: What are the
main company’s investing cash flows? What is the possible significance of a company
generating most of its cash from investing activities? How much the company invest
in growth? Are these investments consistent with its business strategy?
Step 5. Analyze the cash flow from financing activities to verify that the company
is able to raise capital and pays it back to investors through the capital markets. By
doing so the following questions could be answered: Did the company use internal
cash flow to finance growth, or did it rely on external financing? Did the company pay
dividends from internal free cash flow, or did it have to rely on external financing? If
the company had to fund its dividends from external sources, is the company's
dividend policy sustainable? What type of external financing does the company rely
on? Equity, short-term debt, or long-term debt? Is the financing consistent with the
company's overall business risk?
Step 6. Analyze the free cash flow to the company and to equity to verify that the
company has cash to expand, develop new products, buy back stock, pay dividends, or
reduce its debt.
Step 7. Consider and compute the following categories of ratios: (i) cash flow
coverage ratios; (ii) cash flow performance ratios. Calculation (formulas) and meaning
of cash flow analysis rates are shown in the box below. These rates allow accurate
assessment of company’s position and financial performance, but also the associated
financial risk and leverage.
Step 8. Review and evaluate all of the data has been generated. Identify and make a
summary of the strengths, weaknesses and opportunities of the company using
evidence to support your analysis.
General notes:
i) All cash flow analysis must be done taking into consideration the company’s
business, its growth strategy, and its financial policies.
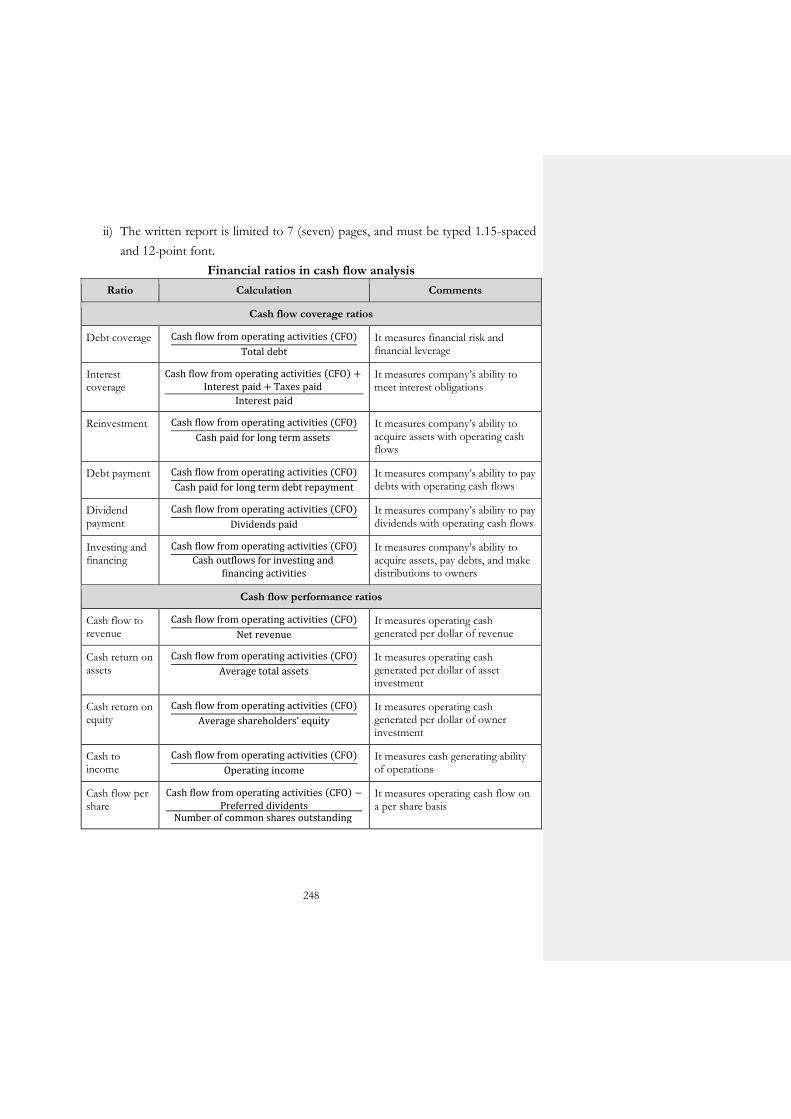
248
ii) The written report is limited to 7 (seven) pages, and must be typed 1.15-spaced
and 12-point font.
Financial ratios in cash flow analysis
Ratio Calculation Comments
Cash flow coverage ratios
Debt coverage Cash flow from operating activities (CFO)
Total debt
It measures financial risk and financial leverage
Interest coverage
Cash flow from operating activities (CFO) + Interest paid + Taxes paid
Interest paid
It measures company’s ability to meet interest obligations
Reinvestment Cash flow from operating activities (CFO)
Cash paid for long term assets
It measures company’s ability to acquire assets with operating cash flows
Debt payment Cash flow from operating activities (CFO)
Cash paid for long term debt repayment
It measures company’s ability to pay debts with operating cash flows
Dividend payment
Cash flow from operating activities (CFO)
Dividends paid
It measures company’s ability to pay dividends with operating cash flows
Investing and financing
Cash flow from operating activities (CFO)
Cash outflows for investing and financing activities
It measures company’s ability to acquire assets, pay debts, and make distributions to owners
Cash flow performance ratios
Cash flow to revenue
Cash flow from operating activities (CFO)
Net revenue
It measures operating cash generated per dollar of revenue
Cash return on assets
Cash flow from operating activities (CFO)
Average total assets
It measures operating cash generated per dollar of asset investment
Cash return on equity
Cash flow from operating activities (CFO)
Average shareholders’ equity
It measures operating cash generated per dollar of owner investment
Cash to income
Cash flow from operating activities (CFO)
Operating income
It measures cash generating ability of operations
Cash flow per share
Cash flow from operating activities (CFO) −Preferred dividents
Number of common shares outstanding
It measures operating cash flow on a per share basis
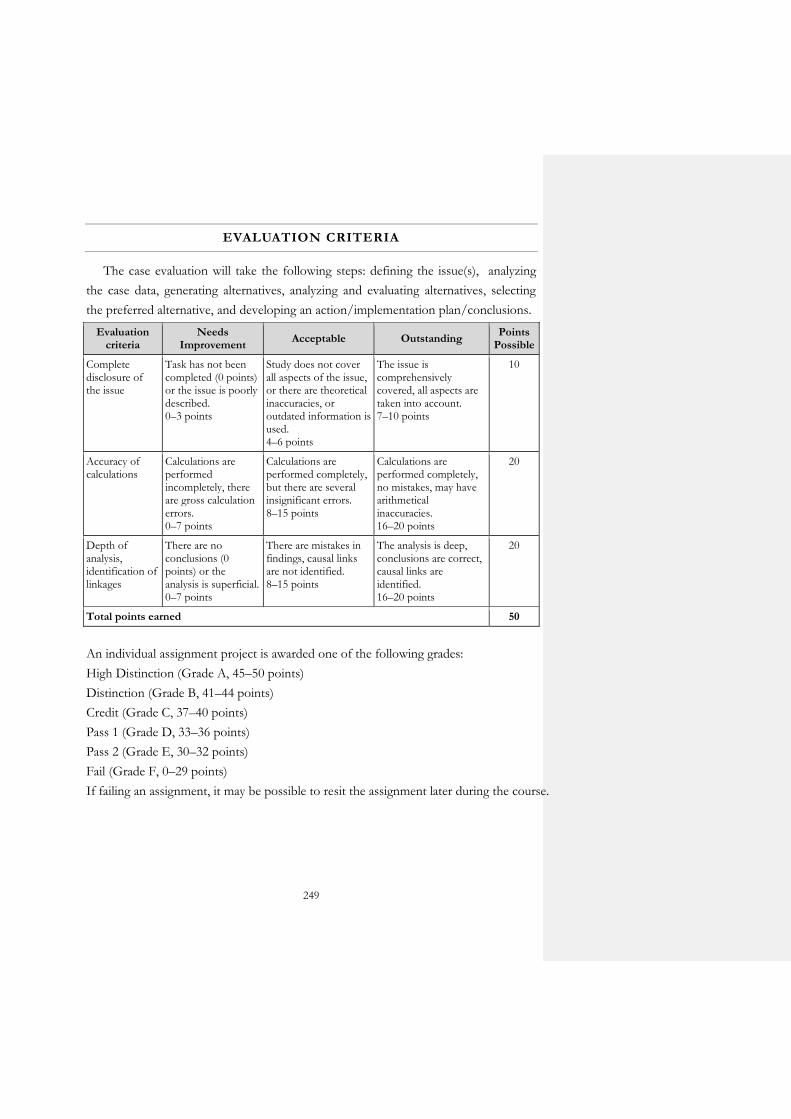
249
EVALUATION CRITERIA
The case evaluation will take the following steps: defining the issue(s), analyzing
the case data, generating alternatives, analyzing and evaluating alternatives, selecting
the preferred alternative, and developing an action/implementation plan/conclusions.
Evaluation criteria
Needs Improvement
Acceptable Outstanding Points
Possible
Complete disclosure of the issue
Task has not been completed (0 points) or the issue is poorly described. 0–3 points
Study does not cover all aspects of the issue, or there are theoretical inaccuracies, or outdated information is used. 4–6 points
The issue is comprehensively covered, all aspects are taken into account. 7–10 points
10
Accuracy of calculations
Calculations are performed incompletely, there are gross calculation errors. 0–7 points
Calculations are performed completely, but there are several insignificant errors. 8–15 points
Calculations are performed completely, no mistakes, may have arithmetical inaccuracies. 16–20 points
20
Depth of analysis, identification of linkages
There are no conclusions (0 points) or the analysis is superficial. 0–7 points
There are mistakes in findings, causal links are not identified. 8–15 points
The analysis is deep, conclusions are correct, causal links are identified. 16–20 points
20
Total points earned 50
An individual assignment project is awarded one of the following grades:
High Distinction (Grade A, 45–50 points)
Distinction (Grade B, 41–44 points)
Credit (Grade C, 37–40 points)
Pass 1 (Grade D, 33–36 points)
Pass 2 (Grade E, 30–32 points)
Fail (Grade F, 0–29 points)
If failing an assignment, it may be possible to resit the assignment later during the course.
250
ASSIGNMENT 3:
COMPANY’S FINANCIAL ANALYSIS.
TEAM PROJECT
DESCRIPTION
In Assignment 3, you will be asked to write a team project and make a
presentation. The writing team project is required to analyze and interpret a company's
financial statements and financial disclosures, to evaluate the company’s performance,
compare companies engaged in the same industry or business area, and to make and
defend diagnosis and recommendations.
The project is to be done in teams of four or five people, balancing the groups
based on both academic major and performance in the class to date, as well as to
achieve diversity. The assignments will be the same for either team. No more than one
group can analyze the same pair of companies.
GUIDELINES: SOME PRACTICAL TIPS
WRITTEN REPORT PROJECT
Step 1. Acquire the most recent company’s financial statements for two companies
in the chosen industry. The following financial statements should contain at least three
to five years:
i) Statement of financial position/Balance sheets;
ii) Statement of profit or loss and other comprehensive income/Income
statement;
iii) Statement of cash flows/Cash flow statements;
iv) Statement of changes in equity/Shareholders’ equity statements.
Step 2. Describe the company profile through providing a short but substantial
description of the company and industry where it operates. By doing so try to answer
the following questions: What business is the company operate in? What are the key
characteristics of the business area where the company operates? What is a brief
history of the company? What is the company's size, in terms of employee numbers,
capital, and revenues? What is the company’s organizational structure?
251
Step 3. Give a quick rule of thumb estimate, through all financial statements, to
identify important movements in specific items over the period being analyzed as well
as notes accompanying the financial statements for additional information that may be
significant to company’s financial analysis. For instance, the following issues could be
explored: What is a general dynamics of company’s revenues? Did revenues have a big
jump, or a big fall, from one particular year to the next? Did total assets grow or fall?
Did the company open a new subsidiary in the region or entered world market? Did
the company have changes in equity capital or shareholders?
Step 4. Analyze the Statement of financial position. Discover changes in overall
components of the company's assets, liabilities, and equity. By doing so the following
questions could be answered: What are level and percentage changes in cash,
inventory, working capital, fixed assets, and debt? Have fixed assets grown rapidly in
one or two years, due to acquisitions or new facilities? How changes in receivables or
inventory influence changes in revenues? Do increases in fixed assets reflect the
company’s desire to expand operations? Discuss whether the company’s performance
related to investigated items of the Statement of financial position appeared to be
improving, deteriorating, or remain stable.
Step 5. Analyze the Statement of profit or loss and other comprehensive income.
Look for trends, the level and percentage changes over time. Calculate and display
result in the tabular form. Graph the growth of the following entries over the past
years. By doing so the following questions could be answered: What is the level and
percentage changes of total revenues, the components of revenues, cost of sales,
major expenses, operating income, net income, or earnings per share over the period
being analyzed? Are they moving in a smooth and consistent fashion, or erratically up
and down? Are the revenues and profits growing over time? What is the trend in the
relationship between revenues and cost of sales, revenues and operating income, or
revenues and net income over the period being analyzed? Identify causes of changes in
the components of the Statement of profit or loss and other comprehensive income
accounts. Investigate favorable or unfavorable trends.
Step 6. Analyze the Statement of changes in equity. Look for trends, the level and
percentage changes over time. By doing so the following questions could be answered:
Did the company issue new shares or bought some back? Has the company completed
stock split or reverse stock split over the period being analyzed? Have the retained
earnings been growing or shrinking over the period being analyzed?
252
Step 7. Analyze company’s cash inflows and outflows from operating, investing,
and financing activities over the period being analyzed as identified in the Statement of
cash flows. Provide results of calculations in tabular and graphical form.
Step 8. Calculate financial ratios in each of the following categories, for each year:
i) liquidity ratios;
ii) solvency ratios (debt ratios or leveraging ratios);
iii) profitability ratios;
iv) activity ratios (efficiency ratios);
v) market ratios (valuation ratios).
Formulas can be found in the Appendix B (Table B.1). A summary of some useful
ratios is given in Chapter 8. Graph the ratios over time to find the trends in the ratios
from year to year. Are the trends going up or down? Is that favorable or unfavorable?
Step 9. Analyze the market data about the company’s stock price and the price to
earnings (P/E) ratio. Make analysis and research using charts and graphs about the
stock market. Have there been any changes in the stock price and P/E over the period
being analyzed? Does the stock market react favorably or unfavorably to the
company’s performance and its strategies for doing business in the future?
Step 10. Analyze the dividend payout. Graph the dividend payout over the period
being analyzed. Examine the company’s dividend policy.
Step 11. Obtain data for the company’s key competitors or data about the industry.
For competitor company, calculate the financial ratios in the same way as for the
company being studied. Compare the financial ratios of the base company with those
of the second company in the industry being studied. By doing so try to answer the
following questions: What are the two companies’ trends in revenues, costs, operating
income, net income, earnings per share, and dividends? What is the relative ability of
the two companies to meet their obligations as evidenced by working capital, acid test
ratios, current ratios, and debt-to-asset ratios? What is relative performance of the two
companies’ equity shares on the stock market? Is the base company favorable in
comparison? Making a decision to invest in one of the two companies, which
company will be chosen? Will your answer differ if the investor is looking for short-
term returns or long-term growth?
Step 12. Review and evaluate all of the data that have been generated. Identify and
make a summary of the strengths, weaknesses, and opportunities of the company,
using evidence to support your analysis.
253
General notes:
i) Students must submit the entire annual reports for each company for each year
being analyzed.
ii) The analysis must include page references to relevant portions of the financial
statements. The written report must also contain appropriate references and
citations for material taken from sources outside the financial statements.
iii) The written report is limited to 15 (fifteen) pages, and must be typed 1.15-
spaced and 12-point font.
PROJECT REPORT PRESENTATION
Each team of students should prepare a 15 minute presentation for the class
summarizing the results of team’s project. Each member of the team must participate
in the presentation. After the presentation, each team should answer the questions, for
5–10 minutes, of both the students and the lecturer.
EVALUATION CRITERIA
Each project team will receive one grade, and every team member will receive the
same grade. No attempt will be made to allow for intra-team differences in effort.
The project will take place in three phases and will be worth a total of 100 points.
The grading policy for the project will be as follows: 5 % – design, 80 % – content,
and 15 % – presentation. The written team projects are worth 85 points and will be
graded in two phases:
Phase 1: the projects will be reviewed for compliance with the basic requirements
and for composition. The projects submitted without the entire annual reports for
both companies or a company and industry being analyzed, without appropriate page
references to the relevant portions of the financial statements, without appropriate
citations for material taken from sources outside the annual reports, and/or with
excessive composition errors, will have to be resubmitted. Projects will be reviewed
for design and will be graded using the following columns:
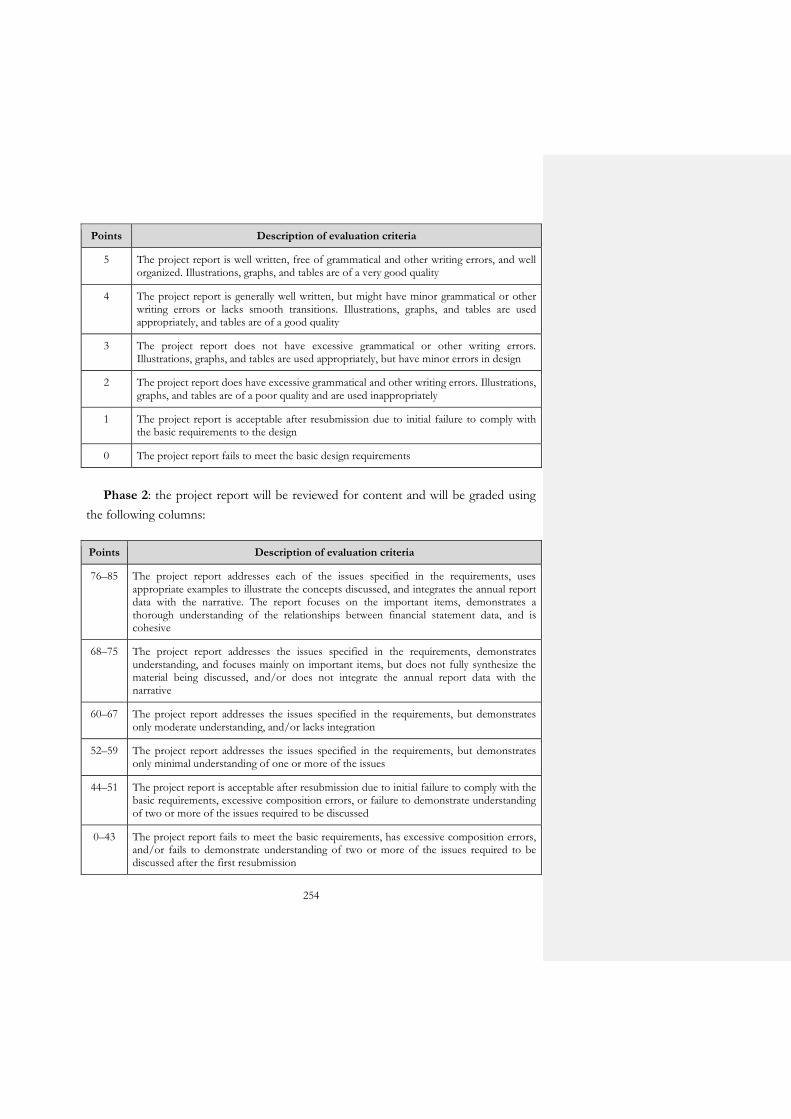
254
Points Description of evaluation criteria
5 The project report is well written, free of grammatical and other writing errors, and well organized. Illustrations, graphs, and tables are of a very good quality
4 The project report is generally well written, but might have minor grammatical or other writing errors or lacks smooth transitions. Illustrations, graphs, and tables are used appropriately, and tables are of a good quality
3 The project report does not have excessive grammatical or other writing errors. Illustrations, graphs, and tables are used appropriately, but have minor errors in design
2 The project report does have excessive grammatical and other writing errors. Illustrations, graphs, and tables are of a poor quality and are used inappropriately
1 The project report is acceptable after resubmission due to initial failure to comply with the basic requirements to the design
0 The project report fails to meet the basic design requirements
Phase 2: the project report will be reviewed for content and will be graded using
the following columns:
Points Description of evaluation criteria
76–85 The project report addresses each of the issues specified in the requirements, uses appropriate examples to illustrate the concepts discussed, and integrates the annual report data with the narrative. The report focuses on the important items, demonstrates a thorough understanding of the relationships between financial statement data, and is cohesive
68–75 The project report addresses the issues specified in the requirements, demonstrates understanding, and focuses mainly on important items, but does not fully synthesize the material being discussed, and/or does not integrate the annual report data with the narrative
60–67 The project report addresses the issues specified in the requirements, but demonstrates only moderate understanding, and/or lacks integration
52–59 The project report addresses the issues specified in the requirements, but demonstrates only minimal understanding of one or more of the issues
44–51 The project report is acceptable after resubmission due to initial failure to comply with the basic requirements, excessive composition errors, or failure to demonstrate understanding of two or more of the issues required to be discussed
0–43 The project report fails to meet the basic requirements, has excessive composition errors, and/or fails to demonstrate understanding of two or more of the issues required to be discussed after the first resubmission

255
Phase 3: the oral presentations are worth 10 points and will be grading as follows:
5 % should be allocated to the importance and relevance of the matters discussed; 3 %
– to the professionalism of the presentation; and 2 % – to the team’s responsiveness
to questions. Every member of the team is required to participate in the presentation.
The team project is awarded one of the following grades:
High Distinction (Grade A, 91–100 points)
Distinction (Grade B, 83–90 points)
Credit (Grade C, 76–82 points)
Pass 1 (Grade D, 68–75 points)
Pass 2 (Grade E, 60–67 points)
Fail (Grade F, 0–59 points)
If failing an assignment, it may be possible to resit the assignment later during the
course.
REFERENCES
Lermack, H., 2003, Steps to a basic company financial analysis, Philadelphia University,
Philadelphia, USA.
Available: http://faculty.philau.edu/lermackh/financial_analysis.htm
Misch, M. B., and Galantine, C. A., 2009, A Financial Statement Analysis Project
for Introductory Financial Accounting, Global Perspectives on Accounting Education, 6(1).
256
ASSIGNMENT 4:
FINANCE OF DEVELOPED COUNTRIES
DESCRIPTION
Each country has particular qualities of its financial system, organization of the
financial market, budget and tax systems. It reveals in such macroeconomic indicators
as GDP, gross savings, investments, revenues, and expenditures of the state.
In this assignment, you will be asked to choose one country from the list and
conduct a comprehensive analysis of its economic development, tax system, state
expenditures, and debt policy. A comparative analysis of the selected country and
Ukraine is desirable.
The recommended list of countries for analysis:
– Austria
– Belgium
– UK
– USA
– Canada
– China
– Czech Republic
– Denmark
– Finland
– France
– Germany
– Greece
– Italy
– Japan
– Netherlands
– Norway
– Poland
– Spain
– Sweden
– Switzerland
It is advisable to use data for the analysis from the official sources. For example, it
is recommended to use databases of the World Bank at the following link:
w.w.w.data.worldbank.org/country
Final paperwork should be about 7–10 pages of typed text; each part of the
assignment (4.1–4.5) should be approximately equal.

256
GUIDELINES: SOME PRACTICAL TIPS
Assignment 4.1. General description of the country's economic development
Required: Provide the review of the country on the following criteria: the level of
economic development, political system, development of industries, living standards,
social security system. Determine the model of the financial system (bank-based or
stock-market-based); analyze the role and development of various financial
institutions. Summarize economic development indicators in the box below. You need
to perform the analysis for at least 3 years in a row.
Indicators of economic development for (selected country)
Indicator Year (at least three in a row) Absolute
change Growth rate, % 20__ 20__ 20__
GDP
GDP per capita
Gross savings
Gross savings, % of GDP
Net savings
Net savings,% of GDP
Current account balance
Assignment 4.2. Central government revenues
Required: Investigate the dynamics and the structure of central government (state
budget) revenues in the selected country for several years. Identify key sources of
revenue and make a conclusion about their stability. Determine the proportion of
revenues to GDP and make a conclusion about the level of GDP redistribution
through the budget. Present the results in the box below.
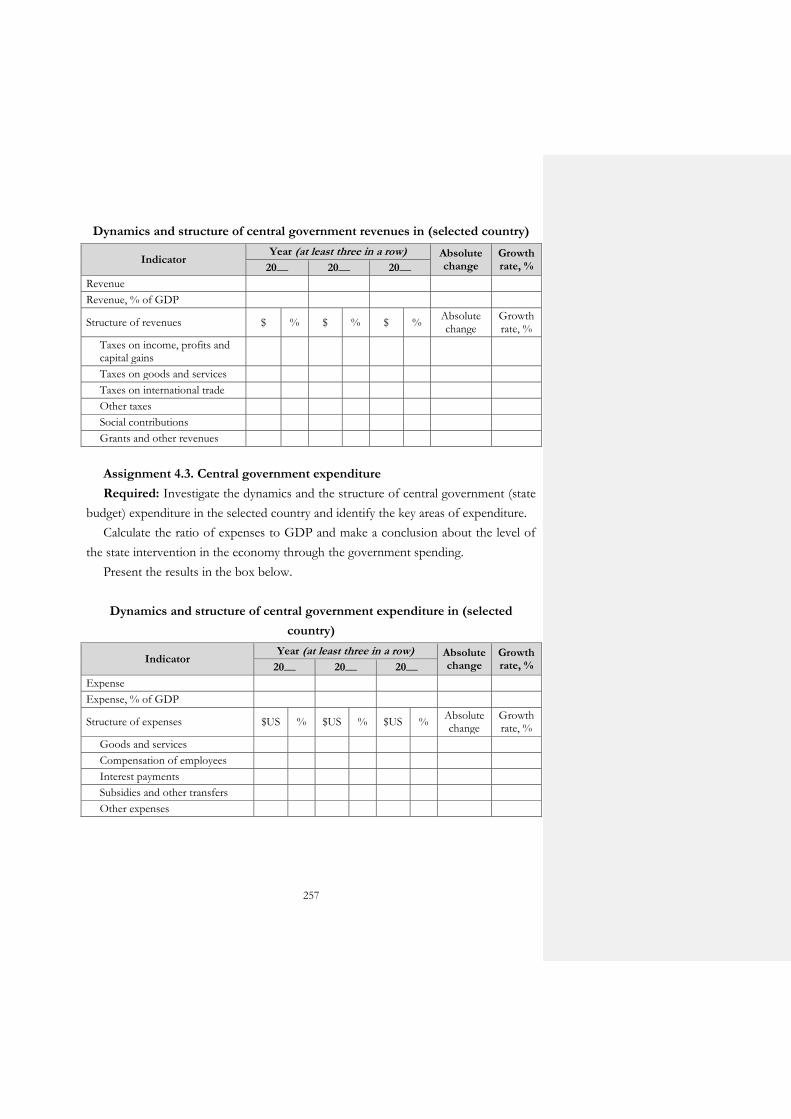
257
Dynamics and structure of central government revenues in (selected country)
Indicator Year (at least three in a row) Absolute
change Growth rate, % 20__ 20__ 20__
Revenue
Revenue, % of GDP
Structure of revenues $ % $ % $ % Absolute change
Growth rate, %
Taxes on income, profits and capital gains
Taxes on goods and services
Taxes on international trade
Other taxes
Social contributions
Grants and other revenues
Assignment 4.3. Central government expenditure
Required: Investigate the dynamics and the structure of central government (state
budget) expenditure in the selected country and identify the key areas of expenditure.
Calculate the ratio of expenses to GDP and make a conclusion about the level of
the state intervention in the economy through the government spending.
Present the results in the box below.
Dynamics and structure of central government expenditure in (selected
country)
Indicator Year (at least three in a row) Absolute
change Growth rate, % 20__ 20__ 20__
Expense
Expense, % of GDP
Structure of expenses $US % $US % $US % Absolute change
Growth rate, %
Goods and services
Compensation of employees
Interest payments
Subsidies and other transfers
Other expenses
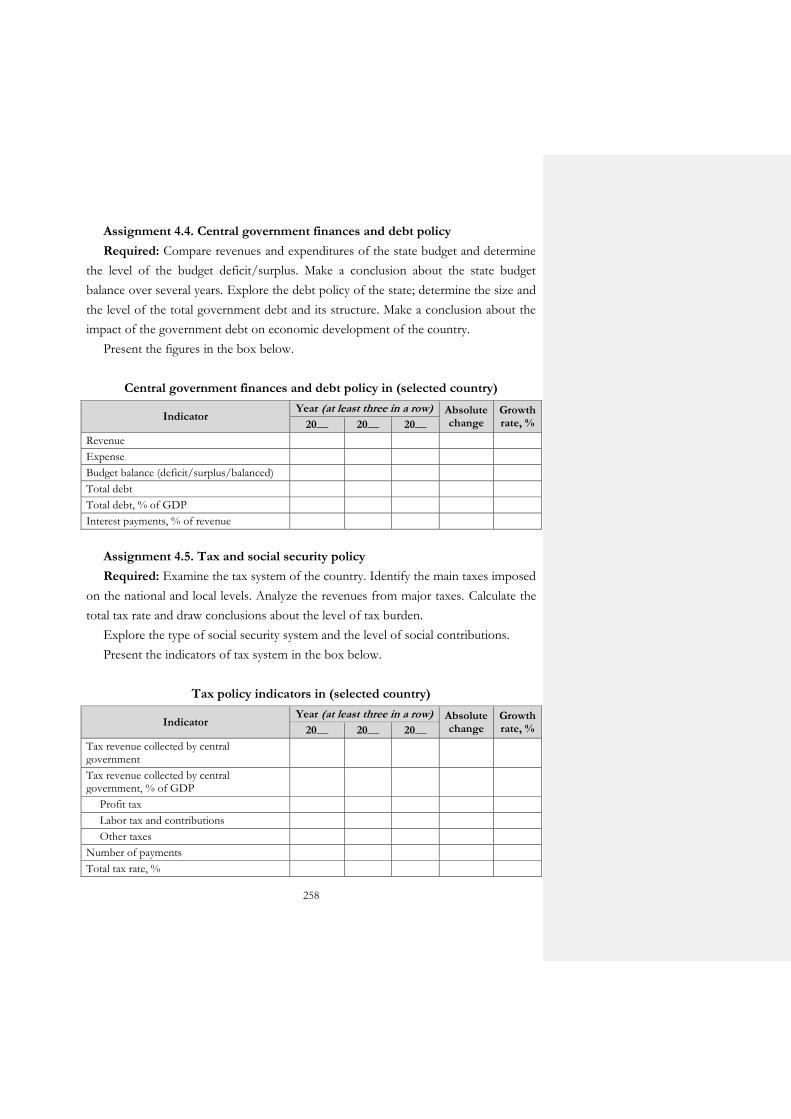
258
Assignment 4.4. Central government finances and debt policy
Required: Compare revenues and expenditures of the state budget and determine
the level of the budget deficit/surplus. Make a conclusion about the state budget
balance over several years. Explore the debt policy of the state; determine the size and
the level of the total government debt and its structure. Make a conclusion about the
impact of the government debt on economic development of the country.
Present the figures in the box below.
Central government finances and debt policy in (selected country)
Indicator Year (at least three in a row) Absolute
change Growth rate, % 20__ 20__ 20__
Revenue
Expense
Budget balance (deficit/surplus/balanced)
Total debt
Total debt, % of GDP
Interest payments, % of revenue
Assignment 4.5. Tax and social security policy
Required: Examine the tax system of the country. Identify the main taxes imposed
on the national and local levels. Analyze the revenues from major taxes. Calculate the
total tax rate and draw conclusions about the level of tax burden.
Explore the type of social security system and the level of social contributions.
Present the indicators of tax system in the box below.
Tax policy indicators in (selected country)
Indicator Year (at least three in a row) Absolute
change Growth rate, % 20__ 20__ 20__
Tax revenue collected by central government
Tax revenue collected by central government, % of GDP
Profit tax
Labor tax and contributions
Other taxes
Number of payments
Total tax rate, %
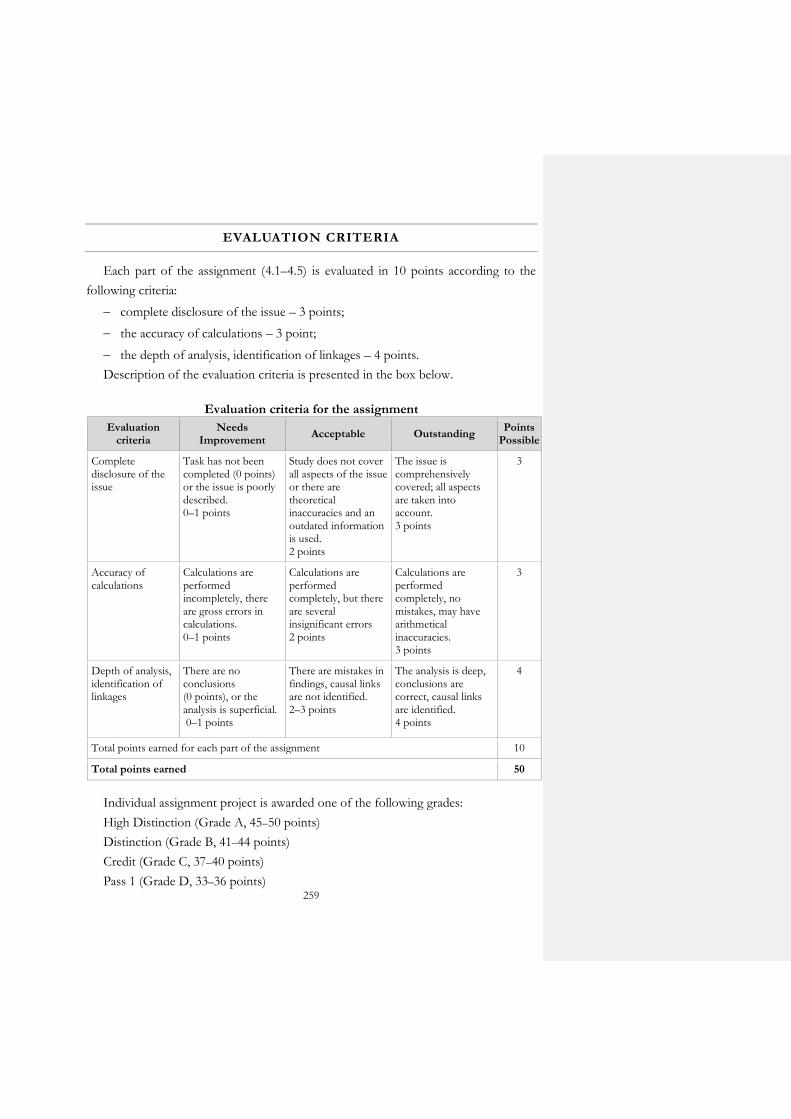
259
EVALUATION CRITERIA
Each part of the assignment (4.1–4.5) is evaluated in 10 points according to the
following criteria:
complete disclosure of the issue – 3 points;
the accuracy of calculations – 3 point;
the depth of analysis, identification of linkages – 4 points.
Description of the evaluation criteria is presented in the box below.
Evaluation criteria for the assignment
Evaluation criteria
Needs Improvement
Acceptable Outstanding Points
Possible
Complete disclosure of the issue
Task has not been completed (0 points) or the issue is poorly described. 0–1 points
Study does not cover all aspects of the issue or there are theoretical inaccuracies and an outdated information is used. 2 points
The issue is comprehensively covered; all aspects are taken into account. 3 points
3
Accuracy of calculations
Calculations are performed incompletely, there are gross errors in calculations. 0–1 points
Calculations are performed completely, but there are several insignificant errors 2 points
Calculations are performed completely, no mistakes, may have arithmetical inaccuracies. 3 points
3
Depth of analysis, identification of linkages
There are no conclusions (0 points), or the analysis is superficial. 0–1 points
There are mistakes in findings, causal links are not identified. 2–3 points
The analysis is deep, conclusions are correct, causal links are identified. 4 points
4
Total points earned for each part of the assignment 10
Total points earned 50
Individual assignment project is awarded one of the following grades:
High Distinction (Grade A, 45–50 points)
Distinction (Grade B, 41–44 points)
Credit (Grade C, 37–40 points)
Pass 1 (Grade D, 33–36 points)

260
Pass 2 (Grade E, 30–32 points)
Fail (Grade F, 0–29 points)
If failing an assignment, it may be possible to resit the assignment later during the
course.
261
REFERENCES
1. Adao, B., Correia, I., and Teles, P., 2009, On the relevance of exchange rate regimes for stabilization policy, Journal of Economic Theory, 144(4), pp. 1468–1488.
2. Afonso, A., and Sousa, R. M., 2012, The macroeconomic effects of fiscal policy. Applied Economics, 44(34), pp. 4439–4454.
3. Alesina, A. F., and Perotti, R., 1999, Budget deficits and budget institutions, in Fiscal institutions and fiscal performance, University of Chicago Press, pp. 13–36.
4. Allen, F., Carletti, E., Marquez, R., 2011, Credit market competition and capital regulation, Review of Financial Studies, 24(4), pp. 983–1018.
5. Allison, John W. F., 1997, Cultural Divergence, The Separation of Powers and the Public-Private Divide, Esperia Publications, Athens, Greece, 9(2), pp. 305–333.
6. Altman, E. I., 1968, Financial ratios, discriminant analysis and the prediction of corporate bankruptcy, The Journal of Finance, 23(4), pp. 589–609.
7. An introduction to reinsurance, 2013, Institute of Insurance Sciences; Fundación MAPFRE, Madrid.
8. IMF, 2009, Balance of payments and international investment position manual, International Monetary Fund, Washington, D.C., 371 p.
9. Baskaran, T., 2012, Tax decentralization and public deficits in OECD countries, Publius: The Journal of Federalism.
10. Bekaert, G., Harvey, C. R., Lundblad, C. T., and Siegel, S., 2011, What segments equity markets?, Review of Financial Studies, 24(12), pp. 3841–3890.
11. Bekaert, G., Harvey, C. R., Lundblad, C. T., and Siegel, S., 2013, The European Union, the Euro, and equity market integration, Journal of Financial Economics, 109(3), pp. 583–603.
12. Goldstein, M., 2005, The International Financial Architecture, Chapter 12 in Bergsten, C. Fred, The United States and the world economy: foreign economic policy for the next decade, The Institute for International Economics, Washington, DC, pp. 373–407.
13. Berk, J. B., and DeMarzo, P. M., 2014, Corporate finance, Pearson, 1136 p. 14. Bernstein, L. A., 1989, Financial statement analysis: theory, application, and
interpretation, 4th edition, Irwin Publishing. 15. Bhargava, V. K., 2006, Global issues for global citizens: an introduction to key
development challenges, The World Bank, Washington, DC, pp. 393–409. 16. Blake, D., 2000, Financial market analysis, Wiley, New York, 748 p. 17. Blinder, A. S., and Solow, R. M., 1973, Does fiscal policy matter? Journal of Public
Economics, 2(4), pp. 319–337. 18. Bohn, H., and Inman, R. P., 1996, Balanced-budget rules and public deficits:
evidence from the US states, Carnegie-Rochester conference series on public policy, 45, pp. 13–76.
19. Bolton, P., Scharfstein, D. S., 1998, Corporate finance, the theory of the firm, and organizations, The Journal of Economic Perspectives, 12(4), pp. 95–114.

262
20. Brigham, E., and Ehrhardt, M., 2013, Financial management: theory and practice, South-Western Cengage Learning, 1167 p.
21. Brochet, F., Jagolinzer, A. D., and Riedl, E. J., 2013, Mandatory IFRS adoption and financial statement comparability, Contemporary Accounting Research, 30(4), pp. 1373–1400.
22. Brychko, M., 2014, Methodical approaches to formation of the system of banks’ financial relationships with their stakeholders, Business inform, 12, pp. 405–410. [Бричко, М. М. Методичні підходи до формування системи фінансових відносин банку зі стейкхолдерами // Бізнес Інформ. – 2014. – №12. – C. 405–410.]
23. Buiter, W. H., and Lankes, H. P., 2001, International financial Institutions adapting to a world of private capital flows, Perspectives in Global Finance, Routledge, London and New York.
24. Chang, S. J., 2005, A Theoretical Discussion on Financial Theory: What Should We Teach and How? Journal of Economics and Finance Education, 4(2), pp. 39–48.
25. Dimitris, C., Georgarakos, D., and Haliassos, M., 2013, Differences in Portfolios Across Countries: Economic Environment versus Household Characteristics, The Review of Economics and Statistics, 95(1), pp. 220–36.
26. Clayman, M. R., Fridson, M. S., Troughton, G. H. and Scanlan, M., 2012, Corporate finance: A practical approach, 2nd Edition, CFA Institute, Wiley, 528 p.
27. Costello, A. M., Petacchi, R., and Weber, J., 2012, The Hidden Consequences of Balanced Budget Requirements, Available at SSRN 2151598.
28. Customs Code of Ukraine, 2014, Кyiv, SOE “SPC MinRD of Ukraine” [Митний кодекс України. К. : Міністерство регіонального розвитку України, 2014. – 400 с].
29. D’yakonova I. I., Makarenko M. I., and Zhuravka F. O., 2013, International Finance, Kyiv, Centre of educational literature. [Міжнародні фінанси : навч. посіб. / І. І. Д’яконова, М. І. Макаренко, Ф. О. Журавка та ін.; за ред. М. І. Макаренка та І. І. Д’яконової. – К. : «Центр учбової літератури», 2013. – 548 с.]
30. Damodaran, A., 1996, Corporate Finance: Theory and Practice, Wiley. 31. Davig, T., and Leeper, E. M., 2011, Monetary-fiscal policy interactions and
fiscal stimulus, European Economic Review, 55(2), pp. 211–227. 32. Deaton, A., 1992, Understanding Consumption, Oxford University Press, Oxford. 33. Diamond, J., 2006, Budget System Reform in Emerging Economies; The Challenges and
the Reform Agenda, International Monetary Fund, Washington, D. C., USA. 34. Dictionary of Finance and Banking, 2014, Oxford University Press, United
Kingdom. 35. Doerrenberg, P., and Peichl, A., 2013, Progressive taxation and tax moral, Public
Choice, 155(3–4), pp. 293–316. 36. Duenwald, C. K., Gueorguiev N., and Schaechter, A., 2005, Too much of a
good thing? Credit booms in transition economies: The cases of Bulgaria, Romania, and Ukraine, IMF Working paper.
263
37. Easterly, W., and Rebelo, S., 1993, Fiscal policy and economic growth, Journal of Monetary Economics, 32(3), pp. 417–458.
38. Eijffinger, S., and Haan, J. D., 2000, European monetary and fiscal policy, OUP Catalogue.
39. Makarenko, M., Kostyuk, A., Dyakonova, I., and others, 2011, Euroasian perspectives of the banking systems development, Virtus Interpress, Sumy, 167 p.
40. Eymann, A. and Boersch-Supan, A., 2002, Household Portfolios in Germany, Household Portfolios, Cambridge, MA: MIT Press.
41. Fabozzi, F. J., and Peterson, P. P., 2013, Analysis of Financial Statements, Wiley. 42. Yang. F., 2009, Consumption over the Life Cycle: How Different is Housing?
Review of Economic Dynamics, 12, pp. 423–443. 43. Farmer, R. E., 2012, The stock market crash of 2008 caused the Great
Recession: Theory and evidence, Journal of Economic Dynamics and Control, 36(5), pp. 693–707.
44. Fuest, C., and Zodrow, G. R., 2013, Critical issues in taxation and development, MIT Press.
45. Gitman, L. J., Juchau, R., and Flanagan, J., 2010, Principles of managerial finance, Pearson Higher Education AU, 895 p.
46. Gleich, H., 2003, Budget institutions and fiscal performance in Central and Eastern European countries, Working Paper 215, European Central Bank, Frankfurt, Germany, February.
47. Goryunova, E. O., 2013, Eurointeagration, Academvydavnytstvo, Kyiv, [Горюнова Є. О. Євроінтеграція : навч. посіб. / Є. О. Горюнова. – К. : Академвидав., 2013. – 224 с. – (Серія «Альма-матер»)].
48. Graham, J. R., 2003, Taxes and corporate finance: A review, Review of Financial studies, 16(4), pp. 1075–1129.
49. Graham, J. R., and Harvey, C. R., 2001, The theory and practice of corporate finance: Evidence from the field, Journal of Financial Economics, 60(2), pp. 187–243.
50. Graham, M., Kiviaho, J., and Nikkinen, J., 2012, Integration of 22 emerging stock markets: A three-dimensional analysis, Global Finance Journal, 23(1), pp.34–47.
51. Guiso, L., and Jappelli, T., 2002, Household Portfolios in Italy, In L. Guiso, M. Halliases, and T. Jappelli (eds.), Household Portfolios, Cambriadge, MA: MIT Press.
52. Guiso, L., and Sodini, P., 2013, Household Finance: An Emerging Field. In Handbook of the Economics of Finance, Elsevier, Amsterdam, 2(B), pp. 1349–1532.
53. Guiso, L., Haliassos, M., and Jappelli, T., 2001, Household Portfolios, Cambridge, MA: MIT Press.
54. Henry, E., and Robinson, T. R., 2015, Chapter 1. Financial Statement Analysis: An Introduction, CFA Institute Investment Books, pp. 1–35.
55. How insurance works, 2012, Insurance Europe aisbl, Brussels.

264
56. Huggett, M., and Ventura, G., 2000, Understanding why High-Income Households Save More than Low-Income Households, Journal of Monetary Economics, 45, pp. 361–397.
57. Insurance handbook. A guide to insurance: what it does and how it works, 2010, Insurance Information Institute, New York, NY.
58. Jensen, M. C. and Smith, C. W., 1984, The Modern Theory of Corporate Finance, McGraw-Hill Inc., New York
59. Kremen, O. S., and Kremen, V. M., 2011, Finance, Centre of educational literature, Kyiv [Кремень О. І., Кремень В. М. Фінанси : навч. посіб. – К. : Центр учбової літератури, 2011. – 424 с].
60. Kremen, V. M., 2014, Financial Statistics, Centre of educational literature, Kyiv [Кремень В. М. Фінансова статистика : навч. посіб. / В. М. Кремень, О. І. Кремень. – К. : Центр учбової літератури, 2014. – 368 с].
61. Krugman, P., and Obstfeld, M., 2003, International Economics: Theory and Policy, 6th Edition, Addison Wesley World Student Series.
62. Lang, M., Pistone, P., Schuch, J., and Staringer, C., 2013, Introduction to European tax law: direct taxation, Spiramus Press Ltd.
63. Leveau, D., Gander, P., and Orgland, M., 2010, Evolution of Financial Theory. Available at SSRN: http://ssrn.com/abstract=1927124.
64. Lymer, A., and Hasseldine, J., 2002, Introduction to taxation in an international context, The International Taxation System, pp. 1–17.
65. Madura, J., 2007, International Financial Management, Abridged 8th Edition, Mason, OH: Thomson South–Western.
66. Madura, J., 2014, Financial markets and institutions, Cengage learning. 67. Makarenko, M. I., Homutenko, L. I., D’yakonova I. I., and others, 2014,
European Inteagration, Centre of educational literature, Kyiv [Європейська інтеграція : навч. посіб. /М. І. Макаренко, Л. І. Хомутенко, І. І. Д’яконова та ін.; за ред. М. І. Макаренка, Л. І. Хомутенко. – К. : Центр учбової літератури, 2014. – 344 с.
68. Markiewicz, M., Gorski, U., and Dekhtiarchuk, M., 2009, Monetary policy in Ukraine in 1996–1999, CASE Network Studies and Analyses.
69. Martin, J., Cox, S., and MacMinn, R., 1988, The Theory of Finance, Dryden Press, New York.
70. Mayer, C., 1988, New issues in corporate finance, European Economic Review, 32(5), pp. 1167–1183.
71. McGee, R. W., 2008, Taxation and public finance in transition and developing economies, Springer Science and Business Media.
72. Miller, M. H., 1998, The History of Finance: An Eyewitness Account. The Revolution in Corporate Finance, Blackwell Publishing, New York.
73. Moffett, M., Stonehill, A., and Eiteman, D., 2009, Fundamentals of Multinational Finance, 3rd Edition, Pearson Prentice Hall.
74. Mohan, R., Patra, M. D., and Kapur, M., 2013, The international monetary system: Where are we and where do we need to go?, IMF Working Paper.
Добавлено примечание ([G696]): Inserted: -
Добавлено примечание ([G697]): Inserted: -
265
75. Momotyuk, L., 2013, State Finance Statistics and its Harmonization with International Standards, Accounting and Finance, (2), pp. 93–99.
76. Multiannual financial framework 2014–2020 and EU budget 2014 – The figures, 2013, European Commission, Publications Office of the European Union, Luxembourg
77. Muth, Richard F., 1966, Household Production and Consumer Demand Functions, Econometrica, 34 (3), pp. 699–708.
78. Myendorff, A., and Thakor, A. V., 2002, Designing Financial Systems in Transition Economics: Strategies for Reform in Central and Eastern Europe, MIT Press.
79. Ong, M. L., and Iorgova, S., 2008, The Capital Markets of Emerging Europe: Institutions, Instruments and Investors, International Monetary Fund, pp. 8–103.
80. Ormiston, A., and Fraser, L. M., 2013, Understanding financial statements, Pearson Education.
81. Pilbeam, K., 2006, International Finance, 3rd Edition, NY: Palgrave Macmillan, New York.
82. Popkin, W. D., 2008, Introduction to Taxation, LexisNexis. 83. Root, F. R., 1990, International trade and investment, South-Western Pub. Co. 84. Ross, S. A., Westerfield, R., and Jordan, B. D., 2008, Fundamentals of corporate
finance, Tata McGraw-Hill Education. 85. Sankar, S., Sharma, M., and Kaikini, A. N., 2014, General insurance work book,
Insurance Institute of India, Mumbai. 86. Scholtens, B., and Wensveen, D., 2003, The Theory of Financial
Intermediation: An Essay On What It Does (Not) Explain, SUERF, Vienna (SUERF Studies: 2003/1).
87. Weston, J. F., 1981, Developments in Finance Theory, Financial Management, 10 (Tenth Anniversary Issue).
88. Sheremet, O. A., Dem’yanenko, I. V., Bagatska K. V., and others, 2013, Finance for Financiers, Centre of educational literature, Kyiv [Фінанси для фінансистів : підручник. / О. А. Шеремет, І. В. Дем’яненко, К. В. Багацька [та ін.]; за заг. ред. Т. А. Говорушко. – К. : Центр учбової літератури, 2013. – 612 с.].
89. Shkolnik, I. O., 2008, Financial Market of Ukraine: current state and development strategy, Mriya, Sumy [Школьник І. О. Фінансовий ринок України: сучасний стан та стратегія розвитку: монографія. – Суми : ВВП Мрія ТОВ, УАБС НБУ, 2008. – 348 с.].
90. Shkolnik, I. O., Boyarko, I. M., Deyneka, O. V., and others, 2016, Financial Analysis, Centre of educational literature, Kyiv [Фінансовий аналіз : навчальний посібник. / І. О. Школьник, І. М. Боярко, О. В. Дейнека та ін.; за заг. ред. І. О. Школьник. – К. : Центр учбової літератури, 2016. – 368 с.].
91. Shkolnik, I. O., Dehtyar, N. A., Lyuta, O. V., and others, 2015, Finance: Practice, UAB, Sumy [Фінанси : практикум / І. О. Школьник, Н. А. Дехтяр, О. В. Люта та ін. // Державний вищий навчальний заклад «Українська академія банківської справи Національного банку України». – Суми : ДВНЗ УАБС НБУ, 2015. – 218 с].
266
92. Shkolnik, I. O., and Kremen V. M., 2014, Financial Management, Centre of educational literature, Kyiv, [Фінансовий менеджмент : навч. посіб. / І. О. Школьник, В. М. Кремень, С. М. Козьменко та ін.; за заг. ред. І. О. Школьник., В. М. Кремень. – К. : Центр учбової літератури, 2014. – 488 с.].
93. Shkolnik, I. O., Kremen, V. M., and Semenog, A. Y., 2013, European Studies in Finance: Practice, UAB, Sumy, [Європейські студії у фінансах : Практикум / уклад.: І. О. Школьник, В. М. Кремень, А. Ю. Семеног та ін. – Суми : ДВНЗ УАБС НБУ, 2013. – 50 с.]
94. Spilimbergo, M. A., Symansky, M. S. A., Cottarelli, M. C., and Blanchard, O. J., 2009, Fiscal policy for the crisis, International Monetary Fund.
95. Stenkula, M., Johansson, D., and Du Rietz, G., 2014, Marginal taxation on labour income in Sweden from 1862 to 2010, Scandinavian Economic History Review, 62(2), pp. 163–187.
96. Stickney, C., Brown, P., and Press, D., 1990, Financial Statement Analysis, Harcourt Brace Jovanovich.
97. Study Book for the Insurance Industry. Volume 1 – Basic principles, 2010, A Project of the East European Committee of the GDV, Berufsbildungswerk der Deutschen Versicherungswirtschaft (BWV) e.V.
98. Study Book for the Insurance Industry. Volume 2 – Classes of Insurance, 2012, A Project of the East European Committee of the GDV, Berufsbildungswerk der Deutschen Versicherungswirtschaft (BWV) e.V.
99. Tekin-Koru, A., and Özmen, E., 2003, Budget deficits, money growth and inflation: the Turkish evidence, Applied Economics, 35(5), pp. 591–596.
100. The benefits of insurance, 2015, Insurance Europe aisbl, Brussels. 101. The European Union budget at a glance, 2010, European Commission, Publications
Office of the European Union, Luxembourg. 102. Tirole, J., 2010, The theory of corporate finance, Princeton University Press. 103. Toye, J. F., 2013, Taxation and Economic Development (Routledge Revivals): Twelve
Critical Studies’, Routledge. 104. Tufano, P., 2009, Consumer finance, Annual Review of Financial Economics, 1,
pp. 227–247. 105. Van Rooij, M., Lusardi, A., and Alessie, R., 2011, Financial literacy and stock
market participation, Journal of Financial Economics, 101(2), pp. 449–472. 106. Wagner, R. E., 2012, Deficits, debt, and democracy: Wrestling with tragedy on the fiscal
commons, Edward Elgar Publishing. 107. Weston, J. F., 1981, Developments in Finance Theory, Financial Management. 108. White, G. I., Sondhi, A. C., and Fried, D., 2003, The analysis and use of financial
statements, Vol. 1, John Wiley and Sons. 109. Why insurers differ from banks, 2014, Insurance Europe aisbl, Brussels. 110. Wijst, D. van der., 2013, Finance: a quantitative introduction, Cambridge University
Press, USA. 111. Wurgler, J., 2000, Financial markets and the allocation of capital, Journal of
financial economics, 58(1), pp. 187–214.
267
List of Figures
3.1 The structure of the financial system 51–52
3.2 Budget deficits as a percentage of GDP (by administration) 59
5.1 Structure of the budget system of Ukraine 78
6.1 Role of household finance 97
6.2 The structure of the household budget 101
6.3 Structures of expenditures in Ukraine and EU 27 113
7.1 Business activities of the company 119
8.1 Three/five component DuPont analysis 148
9.1 The main function of the financial market 165
9.2 The structure of financial market according to financial instruments
they are trading
167
9.3 Key participants in financial markets 171
10.1 Classification of insurance 188
11.1 Main international financial institutions 201

268
List of Tables
3.1 Description of the financial policies' contents and tools 48
4.1 Classification of taxes 64–65
5.1 Revenue structure of the Consolidated budget of Ukraine in 2010-
2014
80
5.2 Consolidated budget revenue structure of Ukraine 81
5.3 Consolidated budget expenditure structure of Ukraine 82
6.1 Characteristics of households in Ukraine 96–97
6.2 Differentiation of household living standards in Ukraine 100
6.3 Structure of total resources in Ukraine 103
6.4 Structure of total expenditure 104
6.5 Average annual expenditures and characteristics in US per
household, 2012-14
111
6.6 The nine quality-of-life factors and the indicators used to represent
determinants of quality of life
111–112
6.7 Distribution of the population by average per capita equivalent total
income
112–113
7.1 Classification of financial resources 118
9.1 Types of financial instruments 170
10.1 Comparative analysis of deductibles in insurance 186
10.2 Forms of reinsurance according to the types of reinsurance contracts 191
11.1 Structure of Balance of Payments 204
12.1 The examples of EBRD investment projects in Ukraine 222
12.2 Comparison of EU budget’s expenditures and revenues in 2014 226
269
List of Appendices
Appendix A Chapter 7
Table A.1 List of important financial ratios for financial market
analysis
133–134
Table A.2 Consolidated statement of cash flows of Sandvik 135
Table A.3
Consolidated statement of profit or loss and other
comprehensive income of Sandvik
136
Figure A.1 Step by step approach to profit calculation 137
Appendix B Chapter 8
Table B.1
Key financial ratios for analyzing company’s strengths and
weaknesses
160–163
Figure B.1 Step by step approach to DuPont analysis 164
Appendix C Chapter 9
Table C.1
List of important financial ratios for financial market
analysis
181–182

270
INDEX OF KEY TERMS
A insurance adjuster 193
actuary 193 insurance agent 192
annual ceiling on payment 228 insurance broker 192
authorized capital (authorized share
capital, registered capital or nominal
capital) 123
insurance claim 192
B insurance policy 192
balance of payments (BOP) 208 insurance premium 192
balance of trade/ trade balance
(BOT) 209
insurance risk (event risk, pure
risk) 192
blended family (stepfamily) 106 insured 192
bond 173 insurer 192
borrowing 87 import duty 53
broker 174 import quota 53
budget allocation 87 indemnity 192
budget appropriation 87 institutional investor 173
budget apportionment 88 interbank market 174
budget commitment 87 inter-governmental transfers 87
budget deficit
88
intermediate commodities
(producer goods) 105
budget entity 87 international finance 54, 208
budget financing
88
international financial
institutions (IFIs) 208
budget program 87 international investment
position (IIP) 209
budget receipts 87 International Monetary Fund
(IMF) 208
budget surplus 88 investing activities 124
business entity 123 issued share capital 123
C K
calculation of the tax amount 70 key spending units 88
271
capital account 209 L
capital asset pricing model (CAPM) 39 liability insurance 192
cash and cash equivalents 124 local financial authority 87
cash inflow 123 long-term liability 149
closing balance 151 living wage (subsistence
minimum) 106
commodity-money relations 38 M
consumer debt 106 macro-financial assistance 229
core activity 124 main income earner in the
household 106
corporate finance 39, 54 market value 175
coupon (coupon rate) 175 minimum wage 106
coverage 192 monetary fund 123
cross rate 208 monetary policy 53
currency restriction
53
multiannual financial
framework 228
current account 209 multilateral development bank
(MDB) 208
current account deficit 209 N
current account surplus 209 national debt 53
D net loss 124
dealer 174 nominal value (book value or
par value or face value) 175
debt consolidation 38 non-family-based households 106
debt instrument 174 O
decision on the local budget 88 off balance sheet 151
deductible 192 offshore financial center 209
depreciation 54 open market operations 53
depreciation fund 123 opening balance 151
derivative
175
ordinary shares (common
stock) 174
discharge 229 other operating activities 124
discount window 53 outturn 229
272
dividend 175 own resources 229
dividend fund 123 P
draft budget 88 pay-roll fund 123
duty (payment, contribution) 69 paid up capital 123
E pension fixed income 106
Economic and Monetary Union 228 personal finance 39, 54
effective demand 38 policyholder 192
embargo 54 preference shares (preferred
stock) 174
equity (net worth, shareholder’s
equity) 150
production-development fund
123
equity instrument 174 profit 124
Erasmus+ 229 property insurance 192
European Court of Auditors 229 public finance 54
EU budget headings 228 public debt 38
EU draft budget 228 R
EU programme 229 reinsurance 192
EU treaty 228 reporting period (accounting
period) 150
exchange rate 208 reserve requirements 53
exchange rate regime 53 retail investor 173
export 209 retained earnings (blowback,
accumulated
profit/income/surplus,
undistributed earnings,
undivided profits) 150
F revenue collection units 88
family 107 revision of a tax and fee
payment period 70
family-based households 106 S
family life cycle 107 securities 174
final consumption commodities 105 share 174
finance company 23 spending units 88
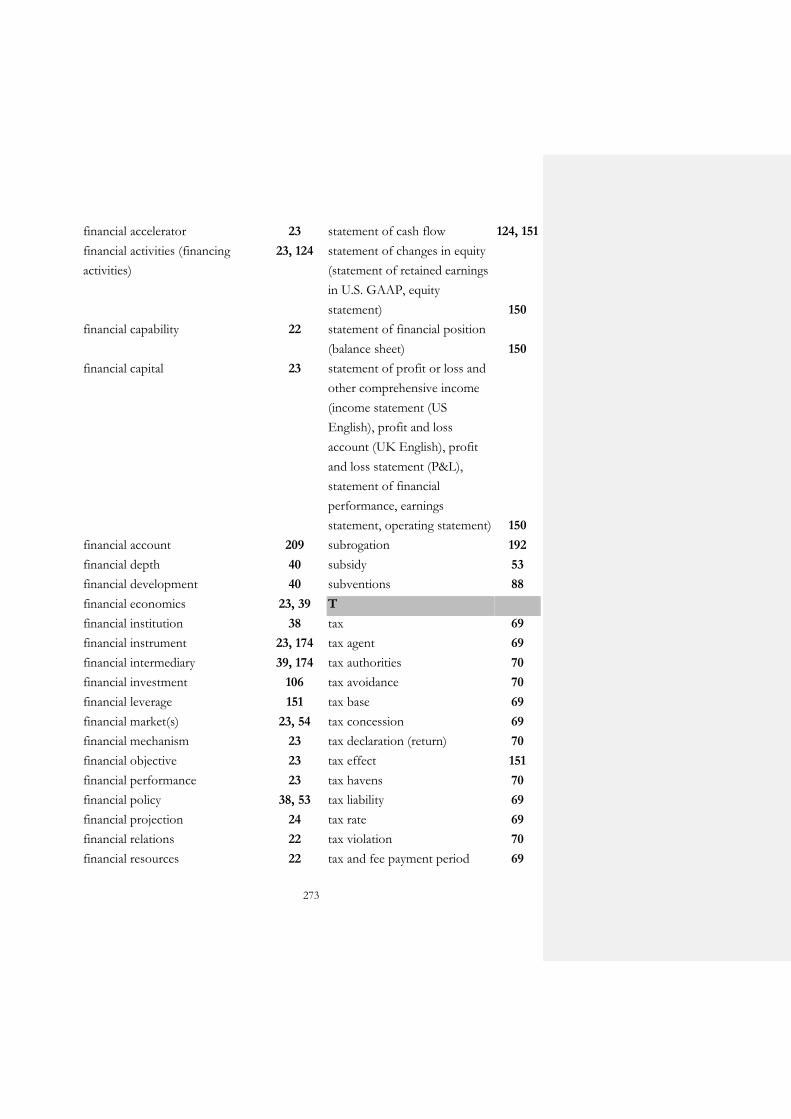
273
financial accelerator 23 statement of cash flow 124, 151
financial activities (financing
activities)
23, 124 statement of changes in equity
(statement of retained earnings
in U.S. GAAP, equity
statement) 150
financial capability 22 statement of financial position
(balance sheet) 150
financial capital 23 statement of profit or loss and
other comprehensive income
(income statement (US
English), profit and loss
account (UK English), profit
and loss statement (P&L),
statement of financial
performance, earnings
statement, operating statement) 150
financial account 209 subrogation 192
financial depth 40 subsidy 53
financial development 40 subventions 88
financial economics 23, 39 T
financial institution 38 tax 69
financial instrument 23, 174 tax agent 69
financial intermediary 39, 174 tax authorities 70
financial investment 106 tax avoidance 70
financial leverage 151 tax base 69
financial market(s) 23, 54 tax concession 69
financial mechanism 23 tax declaration (return) 70
financial objective 23 tax effect 151
financial performance 23 tax havens 70
financial policy 38, 53 tax liability 69
financial projection 24 tax rate 69
financial relations 22 tax violation 70
financial resources 22 tax and fee payment period 69

274
financial sector 23 taxable income 70
financial standard of budget
sufficiency 87
taxable item
69
financial structure 39 taxation 53
financial system 38 taxpayers 69
fixed asset 149 territorial cohesion 229
free cash flow 124 transfer payments (government
transfer) 53
fulfillment of tax liability 70 transfer price (transfer cost) 209
H
transnational/multinational
corporation (TNC/MNC) 209
head of household 106 treasury bills 173
household economy 105 U
household final consumption
expenditure (HFCE) 105
UK correction 229
household goods 106 underwriting 193
household living arrangement 106 unpaid capital 123
household production 105 W
household size 106 World Bank 208
I Y
import 209 yield 151
insurance (assurance) 191
275
Навчальне видання
Школьник Інна Олександрівна, Бричко Марина Михайлівна,
Пахненко Олена Михайлівна та ін.
ВСТУП ДО ФІНАНСІВ:
ТЕОРІЯ І ПРАКТИКА
Навчальний посібник (Англійською мовою)
За редакцією доктора економічних наук, професора І. О. Школьник,
кандидата економічних наук М. М. Бричко
Художнє оформлення обкладинки М. М. Бричко Редактори: О. О. Кучмій, С. В. Чечоткіна Комп'ютерне верстання М. М. Бричко
Формат 60х84/8. Ум. друк. арк. 32,09. Обл.-вид. арк. 28,46. Тираж 300 пр. Зам. №
Видавець і виготовлювач Сумський державний університет,
вул. Римського-Корсакова, 2, м. Суми, 40007 Свідоцтво суб'єкта видавничої справи ДК № 3062 від 17.12.2007.