
CHAPTER-3 CLASSIFICATION OF ELEMENTS AND PERIODICITY IN PROPERTIES OF ELEMENTS
Upload
khangminh22Category
view
4download
0
KOOTENAI COUNTY MULTI-JURISDICTIONAL 2015 ALL HAZARD MITIGATION PLAN
Volume 1: Planning-Area-Wide Elements
August 2015


i
Kootenai County Multi-Jurisdictional All Hazard Mitigation Plan;
Volume 1—Planning-Area-Wide Elements
TABLE OF CONTENTS
Executive Summary .............................................................................................................. ES-1
PART 1 — THE PLANNING PROCESS
Chapter 1. Introduction to the Planning Process.................................................................. 1-1 1.1 Why Prepare This Plan? ....................................................................................................................... 1-1
1.1.1 The Big Picture ................................................................................................................... 1-1 1.1.2 Kootenai County’s Response to the DMA .......................................................................... 1-1 1.1.3 Purposes for Planning ......................................................................................................... 1-2
1.2 Who Will Benefit From This Plan? ..................................................................................................... 1-2 1.3 How to Use This Plan .......................................................................................................................... 1-2 Chapter 2. Plan Update—What Has Changed ....................................................................... 2-1 2.1 The Previous Plan ................................................................................................................................ 2-1 2.2 Why Update? ....................................................................................................................................... 2-1 2.3 Changes in Development ..................................................................................................................... 2-1 2.4 Progress Report on Previous Plan ........................................................................................................ 2-2 2.5 The Updated Plan—What Is Different? ............................................................................................... 2-2 Chapter 3. Plan Methodology ................................................................................................. 3-1 3.1 Formation of the Planning Team ......................................................................................................... 3-1 3.2 Establishment of the Planning Partnership .......................................................................................... 3-2 3.3 Defining the Planning Area.................................................................................................................. 3-3 3.4 The Steering Committee ...................................................................................................................... 3-3 3.5 Coordination with Other Agencies ...................................................................................................... 3-4 3.6 Review of Existing Programs .............................................................................................................. 3-5 3.7 Public Involvement .............................................................................................................................. 3-6
3.7.1 Strategy ............................................................................................................................... 3-6 3.7.2 Public Involvement Results ............................................................................................... 3-12
3.8 Plan Development Chronology/Milestones ....................................................................................... 3-12 Chapter 4. Mission, Goals and Objectives ............................................................................ 4-1 4.1 Guiding Principle ................................................................................................................................. 4-1 4.2 Revised Goals and Objectives .............................................................................................................. 4-1
4.2.1 Revised Goals ..................................................................................................................... 4-1 4.2.2 Revised Objectives .............................................................................................................. 4-2
PART 2 — RISK ASSESSMENT Chapter 5. Identified Hazards of Concern and Risk Assessment Methodology ................ 5-1 5.1 Identified Hazards of Concern ............................................................................................................. 5-1 5.2 Methodology ........................................................................................................................................ 5-2 5.3 Risk Assessment Tools ........................................................................................................................ 5-2
5.3.1 Mapping .............................................................................................................................. 5-2 5.3.2 Earthquake and Flood—Hazus-MH .................................................................................... 5-2 5.3.3 Dam Failure, Landslide, Severe Weather, Volcanic Ash Fall and Wildfire ....................... 5-4 5.3.4 Drought and Avalanche ....................................................................................................... 5-4

Kootenai County Multi-Jurisdictional All Hazard Mitigation Plan; Volume 1—Planning-Area-Wide Elements
ii
5.3.5 Limitations .......................................................................................................................... 5-4 Chapter 6. Kootenai County Profile ....................................................................................... 6-1 6.1 Jurisdictions and Features .................................................................................................................... 6-1 6.2 Historical Overview ............................................................................................................................. 6-1 6.3 Major Past Hazard Events .................................................................................................................... 6-3 6.4 Physical Setting .................................................................................................................................... 6-3
6.4.1 Geology and Soils ............................................................................................................... 6-3 6.4.2 Climate ................................................................................................................................ 6-4
6.5 Land Use .............................................................................................................................................. 6-4 6.6 Critical Facilities and Infrastructure .................................................................................................... 6-8 6.7 Demographics ...................................................................................................................................... 6-9
6.7.1 Population Characteristics ................................................................................................... 6-9 6.7.2 Age Distribution ................................................................................................................ 6-13 6.7.3 Race, Ethnicity and Language ........................................................................................... 6-14 6.7.4 Disabled Populations ......................................................................................................... 6-16
6.8 Economy ............................................................................................................................................ 6-16 6.8.1 Income ............................................................................................................................... 6-16 6.8.2 Industry, Businesses and Institutions ................................................................................ 6-16 6.8.3 Employment Trends and Occupations .............................................................................. 6-17
6.9 Future Trends in Development .......................................................................................................... 6-18 6.10 Laws and Ordinances ....................................................................................................................... 6-19
6.10.1 Federal ............................................................................................................................... 6-19 6.10.2 State ................................................................................................................................... 6-21 6.10.3 Cities and County .............................................................................................................. 6-22
Chapter 7. Avalanche .............................................................................................................. 7-1 7.1 General Background ............................................................................................................................ 7-1 7.2 Hazard Profile ...................................................................................................................................... 7-2
7.2.1 Past Events .......................................................................................................................... 7-2 7.2.2 Location .............................................................................................................................. 7-3 7.2.3 Frequency ............................................................................................................................ 7-3 7.2.4 Severity ............................................................................................................................... 7-3 7.2.5 Warning Time ..................................................................................................................... 7-3
7.3 Secondary Hazards ............................................................................................................................... 7-6 7.4 Exposure .............................................................................................................................................. 7-6
7.4.1 Population ........................................................................................................................... 7-6 7.4.2 Property ............................................................................................................................... 7-6 7.4.3 Critical Facilities ................................................................................................................. 7-6 7.4.4 Environment ........................................................................................................................ 7-6
7.5 Vulnerability ........................................................................................................................................ 7-6 7.6 Future Trends in Development ............................................................................................................ 7-6 7.7 Scenario................................................................................................................................................ 7-7 7.8 Issues .................................................................................................................................................... 7-7 Chapter 8. Dam Failure ............................................................................................................ 8-1 8.1 General Background ............................................................................................................................ 8-1
8.1.1 Causes of Dam Failure ........................................................................................................ 8-1 8.1.2 Regulatory Oversight .......................................................................................................... 8-1
8.2 Hazard Profile ...................................................................................................................................... 8-3 8.2.1 Past Events .......................................................................................................................... 8-3 8.2.2 Location .............................................................................................................................. 8-3 8.2.3 Frequency ............................................................................................................................ 8-6

TABLE OF CONTENTS
iii
8.2.4 Severity ............................................................................................................................... 8-6 8.2.5 Warning Time ..................................................................................................................... 8-8
8.3 Secondary Hazards ............................................................................................................................... 8-8 8.4 Exposure and Vulnerability ................................................................................................................. 8-8
8.4.1 Population ........................................................................................................................... 8-8 8.4.2 Property and Critical Facilities ............................................................................................ 8-8 8.4.3 Environment ........................................................................................................................ 8-9 8.4.4 Dam-Specific Impacts ......................................................................................................... 8-9
8.5 Future Trends in Development .......................................................................................................... 8-10 8.6 Scenario.............................................................................................................................................. 8-10 8.7 ISSUES .............................................................................................................................................. 8-10 Chapter 9. Drought .................................................................................................................. 9-1 9.1 General Background ............................................................................................................................ 9-1
9.1.1 Defining Drought ................................................................................................................ 9-1 9.2 Hazard Profile ...................................................................................................................................... 9-2
9.2.1 Past Events .......................................................................................................................... 9-2 9.2.2 Location .............................................................................................................................. 9-2 9.2.3 Frequency ............................................................................................................................ 9-2 9.2.4 Severity ............................................................................................................................... 9-4 9.2.5 Warning Time ..................................................................................................................... 9-6
9.3 Secondary Hazards ............................................................................................................................... 9-6 9.4 Exposure .............................................................................................................................................. 9-6 9.5 Vulnerability ........................................................................................................................................ 9-6
9.5.1 Population ........................................................................................................................... 9-7 9.5.2 Property ............................................................................................................................... 9-7 9.5.3 Critical Facilities and Infrastructure .................................................................................... 9-7 9.5.4 Environment ........................................................................................................................ 9-7 9.5.5 Economic Impact ................................................................................................................ 9-7
9.6 Future Trends in Development ............................................................................................................ 9-8 9.7 9.7 Scenario.......................................................................................................................................... 9-8 9.8 Issues .................................................................................................................................................... 9-8 Chapter 10. Earthquake ......................................................................................................... 10-1 10.1 General Background ........................................................................................................................ 10-1
10.1.1 How Earthquakes Happen ................................................................................................. 10-1 10.1.2 Earthquake Classifications ................................................................................................ 10-1 10.1.3 Ground Motion .................................................................................................................. 10-3 10.1.4 Effect of Soil Types .......................................................................................................... 10-3
10.2 Hazard Profile .................................................................................................................................. 10-4 10.2.1 Past Events ........................................................................................................................ 10-5 10.2.2 Location ............................................................................................................................ 10-5 10.2.3 Frequency ........................................................................................................................ 10-11 10.2.4 Severity ........................................................................................................................... 10-11 10.2.5 Warning Time ................................................................................................................. 10-13
10.3 Secondary Hazards ......................................................................................................................... 10-13 10.4 Exposure ........................................................................................................................................ 10-13
10.4.1 Population ....................................................................................................................... 10-13 10.4.2 Property ........................................................................................................................... 10-13 10.4.3 Critical Facilities and Infrastructure ................................................................................ 10-13 10.4.4 Environment .................................................................................................................... 10-14
10.5 Vulnerability .................................................................................................................................. 10-14

Kootenai County Multi-Jurisdictional All Hazard Mitigation Plan; Volume 1—Planning-Area-Wide Elements
iv
10.5.1 Population ....................................................................................................................... 10-14 10.5.2 Property ........................................................................................................................... 10-15 10.5.3 Critical Facilities and Infrastructure ................................................................................ 10-18 10.5.4 Environment .................................................................................................................... 10-20
10.6 Future Trends in Development ...................................................................................................... 10-20 10.7 Scenario.......................................................................................................................................... 10-20 10.8 Issues .............................................................................................................................................. 10-21 Chapter 11. Flood ................................................................................................................... 11-1 11.1 General Background ........................................................................................................................ 11-1
11.1.1 Measuring Floods and Floodplains ................................................................................... 11-2 11.1.2 Floodplain Ecosystems...................................................................................................... 11-2 11.1.3 Effects of Human Activities .............................................................................................. 11-2 11.1.4 Federal Flood Programs .................................................................................................... 11-2
11.2 Hazard Profile .................................................................................................................................. 11-5 11.2.1 Principal Flooding Sources ............................................................................................... 11-5 11.2.2 Flood Protection Measures .............................................................................................. 11-10 11.2.3 Past Events ...................................................................................................................... 11-11 11.2.4 Location .......................................................................................................................... 11-16 11.2.5 Frequency ........................................................................................................................ 11-17 11.2.6 Severity ........................................................................................................................... 11-18 11.2.7 Warning Time ................................................................................................................. 11-18
11.3 Secondary Hazards ......................................................................................................................... 11-20 11.4 Exposure ........................................................................................................................................ 11-20
11.4.1 Population ....................................................................................................................... 11-20 11.4.2 Property ........................................................................................................................... 11-20 11.4.3 Critical Facilities and Infrastructure ................................................................................ 11-23 11.4.4 Environment .................................................................................................................... 11-25
11.5 Vulnerability .................................................................................................................................. 11-25 11.5.1 Population ....................................................................................................................... 11-26 11.5.2 Property ........................................................................................................................... 11-28 11.5.3 Critical Facilities and Infrastructure ................................................................................ 11-31 11.5.4 Environment .................................................................................................................... 11-31
11.6 Future Trends ................................................................................................................................. 11-31 11.7 Scenario.......................................................................................................................................... 11-32 11.8 Issues .............................................................................................................................................. 11-33 Chapter 12. Landslide ............................................................................................................ 12-1 12.1 General Background ........................................................................................................................ 12-1 12.2 Hazard Profile .................................................................................................................................. 12-1
12.2.1 Past Events ........................................................................................................................ 12-2 12.2.2 Location ............................................................................................................................ 12-3 12.2.3 Frequency .......................................................................................................................... 12-4 12.2.4 Severity ............................................................................................................................. 12-5 12.2.5 Warning Time ................................................................................................................... 12-5
12.3 Secondary Hazards ........................................................................................................................... 12-6 12.4 Exposure .......................................................................................................................................... 12-6
12.4.1 Population ......................................................................................................................... 12-6 12.4.2 Property ............................................................................................................................. 12-6 12.4.3 Critical Facilities and Infrastructure .................................................................................. 12-6 12.4.4 Environment ...................................................................................................................... 12-7
12.5 Vulnerability .................................................................................................................................... 12-7

TABLE OF CONTENTS
v
12.5.1 Population ......................................................................................................................... 12-7 12.5.2 Property ............................................................................................................................. 12-7 12.5.3 Critical Facilities and Infrastructure .................................................................................. 12-7 12.5.4 Environment ...................................................................................................................... 12-7
12.6 Future Trends in Development ........................................................................................................ 12-7 12.7 Scenario............................................................................................................................................ 12-8 12.8 Issues ................................................................................................................................................ 12-8 Chapter 13. Severe Weather Systems .................................................................................. 13-1 13.1 General Background ........................................................................................................................ 13-1
13.1.1 Lightning ........................................................................................................................... 13-1 13.1.2 Windstorm ......................................................................................................................... 13-3 13.1.3 Hail .................................................................................................................................... 13-4 13.1.4 Tornado ............................................................................................................................. 13-5 13.1.5 Blizzard and Snowstorm ................................................................................................... 13-6 13.1.6 Ice Storm ........................................................................................................................... 13-7 13.1.7 Extreme Cold and Wind Chill ........................................................................................... 13-7 13.1.8 Extreme Heat ..................................................................................................................... 13-8
13.2 Hazard Profile .................................................................................................................................. 13-8 13.2.1 Past Events ........................................................................................................................ 13-8 13.2.2 Location .......................................................................................................................... 13-14 13.2.3 Frequency ........................................................................................................................ 13-17 13.2.4 Severity ........................................................................................................................... 13-17 13.2.5 Warning Time ................................................................................................................. 13-18
13.3 Secondary Hazards ......................................................................................................................... 13-18 13.4 Exposure ........................................................................................................................................ 13-18
13.4.1 Population ....................................................................................................................... 13-18 13.4.2 Property ........................................................................................................................... 13-18 13.4.3 Critical Facilities and Infrastructure ................................................................................ 13-18 13.4.4 Environment .................................................................................................................... 13-19
13.5 Vulnerability .................................................................................................................................. 13-19 13.5.1 Vulnerability by Weather Type ....................................................................................... 13-19 13.5.2 Population ....................................................................................................................... 13-20 13.5.3 Property ........................................................................................................................... 13-20 13.5.4 Critical Facilities and Infrastructure ................................................................................ 13-21 13.5.5 Environment .................................................................................................................... 13-21
13.6 Future Trends in Development ...................................................................................................... 13-22 13.7 Scenario.......................................................................................................................................... 13-22 13.8 Issues .............................................................................................................................................. 13-22 Chapter 14. Volcanic Ash Fall ............................................................................................... 14-1 14.1 General Background ........................................................................................................................ 14-1 14.2 Hazard Profile .................................................................................................................................. 14-1
14.2.1 Past Events ........................................................................................................................ 14-1 14.2.2 Location ............................................................................................................................ 14-2 14.2.3 Frequency .......................................................................................................................... 14-4 14.2.4 Severity ............................................................................................................................. 14-4 14.2.5 Warning Time ................................................................................................................... 14-4
14.3 Secondary Hazards ........................................................................................................................... 14-5 14.4 Exposure .......................................................................................................................................... 14-5 14.5 Vulnerability .................................................................................................................................... 14-5
14.5.1 Population ......................................................................................................................... 14-5

Kootenai County Multi-Jurisdictional All Hazard Mitigation Plan; Volume 1—Planning-Area-Wide Elements
vi
14.5.2 Property ............................................................................................................................. 14-5 14.5.3 Critical Facilities ............................................................................................................... 14-5 14.5.4 Environment ...................................................................................................................... 14-6
14.6 Future Trends in Development ........................................................................................................ 14-6 14.7 Scenario............................................................................................................................................ 14-7 14.8 Issues ................................................................................................................................................ 14-7 Chapter 15. Wildfire ............................................................................................................... 15-1 15.1 General Background ........................................................................................................................ 15-1
15.1.1 Wildfire Types .................................................................................................................. 15-1 15.1.2 Factors Affecting Wildfire Risk ........................................................................................ 15-2 15.1.3 Historical Fire Regime and Current Condition Classification .......................................... 15-2 15.1.4 Tools for Assessing Fire Hazards ..................................................................................... 15-4
15.2 Hazard Profile .................................................................................................................................. 15-7 15.2.1 Past Events ........................................................................................................................ 15-7 15.2.2 Location ............................................................................................................................ 15-7 15.2.3 Frequency .......................................................................................................................... 15-7 15.2.4 Severity ........................................................................................................................... 15-11 15.2.5 Warning Time ................................................................................................................. 15-11
15.3 Secondary Hazards ......................................................................................................................... 15-12 15.4 Exposure ........................................................................................................................................ 15-12
15.4.1 Population ....................................................................................................................... 15-12 15.4.2 Property ........................................................................................................................... 15-12 15.4.3 Critical Facilities and Infrastructure ................................................................................ 15-12 15.4.4 Environment .................................................................................................................... 15-16
15.5 Vulnerability .................................................................................................................................. 15-16 15.5.1 Population ....................................................................................................................... 15-16 15.5.2 Property ........................................................................................................................... 15-17 15.5.3 Critical Facilities and Infrastructure ................................................................................ 15-17
15.6 Future Trends in Development ...................................................................................................... 15-18 15.7 Scenario.......................................................................................................................................... 15-18 15.8 Issues .............................................................................................................................................. 15-19 Chapter 16. Hazards of Interest ............................................................................................ 16-1 16.1 Cyber-Disruption ............................................................................................................................. 16-1
16.1.1 Overview ........................................................................................................................... 16-1 16.1.2 Hazard Profile ................................................................................................................... 16-2 16.1.3 Secondary Hazards ............................................................................................................ 16-3 16.1.4 Vulnerability ..................................................................................................................... 16-3
16.2 Hazardous Material Incidents .......................................................................................................... 16-3 16.2.1 Overview ........................................................................................................................... 16-3 16.2.2 Hazard Profile ................................................................................................................... 16-4 16.2.3 Secondary Hazards ............................................................................................................ 16-6 16.2.4 Vulnerability ..................................................................................................................... 16-6
16.3 Pandemic .......................................................................................................................................... 16-7 16.3.1 Overview ........................................................................................................................... 16-7 16.3.2 Hazard Profile ................................................................................................................... 16-7 16.3.3 Secondary Hazards ............................................................................................................ 16-8 16.3.4 Vulnerability ................................................................................................................... 16-11
16.4 Radiological Material exposure ..................................................................................................... 16-11 16.4.1 Overview ......................................................................................................................... 16-11 16.4.2 Hazard Profile ................................................................................................................. 16-12

TABLE OF CONTENTS
vii
16.4.3 Secondary Hazards .......................................................................................................... 16-12 16.4.4 Vulnerability ................................................................................................................... 16-13
16.5 Civil Unrest .................................................................................................................................... 16-13 16.5.1 Overview ......................................................................................................................... 16-13 16.5.2 Hazard Profile ................................................................................................................. 16-14 16.5.3 Secondary Hazards .......................................................................................................... 16-16 16.5.4 Vulnerability ................................................................................................................... 16-16
16.6 Terrorism........................................................................................................................................ 16-16 16.6.1 Overview ......................................................................................................................... 16-16 16.6.2 Hazard Profile ................................................................................................................. 16-17 16.6.3 Secondary Hazards .......................................................................................................... 16-19 16.6.4 Vulnerability ................................................................................................................... 16-19
Chapter 17. Planning Area Risk Ranking ............................................................................ 17-1 17.1 Probability of Occurrence ................................................................................................................ 17-1 17.2 Impact .............................................................................................................................................. 17-2 17.3 Risk Rating and Ranking ................................................................................................................. 17-4
PART 3 — MITIGATION STRATEGY
Chapter 18. Mitigation Alternatives ...................................................................................... 18-1 Chapter 19. Adoption and Plan Maintenance ...................................................................... 19-1 19.1 Plan Adoption .................................................................................................................................. 19-1 19.2 Plan Maintenance Strategy............................................................................................................... 19-1
19.2.1 Plan Implementation ......................................................................................................... 19-1 19.2.2 Steering Committee and Hazard Mitigation Task Force ................................................... 19-2 19.2.3 Continuing Public Involvement ........................................................................................ 19-2 19.2.4 Annual Progress Report .................................................................................................... 19-2 19.2.5 Plan Update ....................................................................................................................... 19-3 19.2.6 Incorporation into Other Planning Mechanisms ............................................................... 19-3
Appendices A. Acronyms and Definitions B. Public Outreach Materials C. Data sources and Methods Used for Hazard Mapping D. Progress Report Template

Kootenai County Multi-Jurisdictional All Hazard Mitigation Plan; Volume 1—Planning-Area-Wide Elements
viii
LIST OF TABLES No. Title Page No.
Table ES-3. Summary of Hazard Ranking Results ....................................................................................... 5
Table 2-1. Plan Changes Crosswalk .......................................................................................................... 2-3
Table 3-1. County and City Planning Partners .......................................................................................... 3-2 Table 3-2. Special Purpose District Planning Partners .............................................................................. 3-3 Table 3-3. Steering Committee Members .................................................................................................. 3-4 Table 3-4. Summary of Public Meetings ................................................................................................. 3-12 Table 3-5. Plan Development Milestones ................................................................................................ 3-13
Table 6-1. Presidential Disaster Declarations for Hazard Events in the Planning Area ............................ 6-3 Table 6-2. Present Land Use in Planning Area .......................................................................................... 6-8 Table 6-3. Critical Facilities by Jurisdiction and Category ...................................................................... 6-12 Table 6-4. Critical Infrastructure by Jurisdiction and Category .............................................................. 6-12 Table 6-5. Annual Population Data .......................................................................................................... 6-14
Table 8-1. Dams in Kootenai County ........................................................................................................ 8-5 Table 8-2. Corps of Engineers Hazard Potential Classification ................................................................. 8-7
Table 10-1. Mercalli Scale and Peak Ground Acceleration Comparison ................................................ 10-4 Table 10-2. NEHRP Soil Classification System ...................................................................................... 10-4 Table 10-3. Idaho Earthquake Statistics 1973-2009 .............................................................................. 10-11 Table 10-4. Estimated Earthquake Impact on Persons and Households ................................................ 10-15 Table 10-5. Age of Structures in Planning Area .................................................................................... 10-15 Table 10-6. Loss Estimates for Probabilistic Earthquakes ..................................................................... 10-16 Table 10-7. Loss Estimates for 1942 Magnitude 5.5 Scenario Earthquake ........................................... 10-17 Table 10-8. Estimated Earthquake-Caused Debris ................................................................................ 10-17 Table 10-9. Estimated Damage to Critical Facilities from 100-Year Earthquake ................................. 10-18 Table 10-10. Estimated Damage to Critical Facilities from 500-year Earthquake ................................ 10-19 Table 10-11. Functionality of Critical Facilities for 100-Year Event .................................................... 10-19 Table 10-12. Functionality of Critical Facilities for 500-year Earthquake ............................................ 10-20
Table 11-1. Summary of Flood Elevations of Lakes in Kootenai County ............................................... 11-5 Table 11-2. History of Flood Events ...................................................................................................... 11-11 Table 11-3. Summary of Peak Discharges Within the Planning Area ................................................... 11-19 Table 11-4. Area and Structures in the 100-Year Floodplain ................................................................ 11-21 Table 11-5. Area and Structures in the Mapped 500-Year Floodplain .................................................. 11-21 Table 11-6. Value of Structures in 100-Year Floodplain ....................................................................... 11-22 Table 11-7. Value of Structures in 500-Year Floodplain ....................................................................... 11-22 Table 11-8. Land Use Within the Floodplain in Unincorporated Kootenai COunty ............................. 11-23 Table 11-9. Critical Facilities in the 100-Year Floodplain .................................................................... 11-24 Table 11-10. Critical Infrastructure in the 100-Year Floodplain ........................................................... 11-24 Table 11-11. Critical Infrastructure in the 500-Year Floodplain ........................................................... 11-25 Table 11-12. Estimated Flood Impact on Persons and Households ....................................................... 11-26 Table 11-13. Loss Estimates for 100-Year Flood Event ........................................................................ 11-28 Table 11-14. Loss Estimates for 500-Year Flood Event ........................................................................ 11-29 Table 11-15. Flood Insurance Statistics ................................................................................................. 11-30
Table 12-1. Landslides Impacting Planning Area .................................................................................... 12-3
Table 13-1. Past Severe Weather Events Impacting Planning Area ........................................................ 13-9 Table 13-2. Loss Estimates for Severe Weather .................................................................................... 13-21

TABLE OF CONTENTS
ix
Table 14-1. Past Eruptions in the Cascades ............................................................................................. 14-3 Table 14-2. Loss Estimates for Ash Fall .................................................................................................. 14-6
Table 15-1. Fire Regime Condition Class Definitions ............................................................................. 15-4 Table 15-2. U.S. Forest Service Fire Danger Rating ............................................................................... 15-5 Table 15-3. Significant Fires Impacting Planning Area ........................................................................... 15-8 Table 15-4. Area Burned by Wildfire, 2009 – 2014 .............................................................................. 15-11 Table 15-5. Population Within Wildfire Hazard Areas ......................................................................... 15-13 Table 15-6. Exposure and Value of Structures in Low-Moderate Wildfire Hazard Areas .................... 15-13 Table 15-7. Exposure and Value of Structures in Moderate Wildfire Hazard Areas ............................. 15-14 Table 15-8. Exposure and Value of Structures in Moderate-High Wildfire Hazard Areas ................... 15-14 Table 15-9. Land Use Within the Wildfire Hazard Areas ..................................................................... 15-15 Table 15-10. Critical Facilities and Infrastructure in Wildfire Hazard Areas ........................................ 15-15 Table 15-11. Loss Estimates for Wildfire .............................................................................................. 15-17
Table 16-1. State of Idaho Reportable Disease Summary ....................................................................... 16-8 Table 16-2. Phases of a Pandemic ......................................................................................................... 16-10
Table 17-1. Probability of Hazards .......................................................................................................... 17-1 Table 17-2. Impact on People from Hazards ........................................................................................... 17-3 Table 17-3. Impact on Property from Hazards ........................................................................................ 17-3 Table 17-4. Impact on Economy from Hazards ....................................................................................... 17-3 Table 17-5. Hazard Risk Rating ............................................................................................................... 17-4 Table 17-6. Hazard Risk Ranking ............................................................................................................ 17-4
Table 18-1. Catalog of Mitigation Alternatives—Avalanche .................................................................. 18-2 Table 18-2. Catalog of Mitigation Alternatives—Dam Failure ............................................................... 18-3 Table 18-3. Catalog of Mitigation Alternatives—Drought ...................................................................... 18-4 Table 18-4. Catalog of Mitigation Alternatives—Earthquake ................................................................. 18-5 Table 18-5. Catalog of Mitigation Alternatives—Flood .......................................................................... 18-7 Table 18-6. Catalog of Mitigation Alternatives—Landslide ................................................................... 18-9 Table 18-7. Catalog of Mitigation Alternatives—Severe Weather ........................................................ 18-11 Table 18-8. Catalog of Mitigation Alternatives—Volcanic Ash ........................................................... 18-13 Table 18-9. Catalog of Mitigation Alternatives—Wildfire .................................................................... 18-14 Table 18-10. Catalog of Mitigation Alternatives—Hazards of Interest ................................................. 18-16
LIST OF FIGURES No. Title Page No.
Figure 3-1. Sample Screen from Online Hazard Mitigation Questionnaire ............................................... 3-8 Figure 3-2. Public Perception of Risk ........................................................................................................ 3-9 Figure 3-3. Steering Committee approves public review draft of the plan .............................................. 3-10 Figure 3-4. Citizens review maps at public meeting #2 ........................................................................... 3-10 Figure 3-5. Steering Committee Chair, Jody Bieze, reviews maps with citizen at Public Meeting #2.... 3-10 Figure 3-6. Citizens review draft plan at public meeting #2. ................................................................... 3-10 Figure 3-7. Coeur d’Alene Press Advertisement of Public Meeting ....................................................... 3-11 Figure 3-8. Sample Page from Hazard Mitigation Plan Web Site ........................................................... 3-12
Figure 6-1. Main Features of the Planning Area ........................................................................................ 6-2 Figure 6-2. Annual Average Precipitation for Idaho Panhandle ................................................................ 6-5 Figure 6-3. Annual Average Minimum Temperature for Idaho Panhandle ............................................... 6-5 Figure 6-4. Annual Average Maximum Temperature for Idaho Panhandle .............................................. 6-6 Figure 6-5. Annual Average Temperature for Idaho Panhandle ................................................................ 6-6

Kootenai County Multi-Jurisdictional All Hazard Mitigation Plan; Volume 1—Planning-Area-Wide Elements
x
Figure 6-6. Wind Power Class at 50m Height ........................................................................................... 6-7 Figure 6-7. Critical Facilities ................................................................................................................... 6-10 Figure 6-8. Critical Infrastructure ............................................................................................................ 6-11 Figure 6-9. Idaho and Kootenai County Population Growth ................................................................... 6-13 Figure 6-10. Planning Area Age Distribution .......................................................................................... 6-15 Figure 6-11. Planning Area Race Distribution ......................................................................................... 6-15 Figure 6-12. Industry in the Planning Area .............................................................................................. 6-17 Figure 6-13. Idaho and Kootenai County Unemployment Rate .............................................................. 6-18 Figure 6-14. Occupations in the Planning Area ....................................................................................... 6-18
Figure 7-1. Avalanche Fatalities by State, 1950/51 – 2013/14 .................................................................. 7-2 Figure 7-2. Avalanche Danger Scale ......................................................................................................... 7-4 Figure 7-3. Sample Avalanche Advisory for the Selkirk/Cabinets Areas .................................................. 7-5
Figure 8-1. Dams ....................................................................................................................................... 8-4
Figure 9-1. Crop Moisture Index for Week Ending January 10, 2015....................................................... 9-3 Figure 9-2. Palmer Z Index Short-Term Drought Conditions (December 2014) ....................................... 9-3 Figure 9-3. Palmer Drought Severity Index for Week Ending January 10, 2015 ...................................... 9-4
Figure 10-1. Horizontal Extension Creates Normal Faults ...................................................................... 10-2 Figure 10-2. Kootenai County-Area Earthquakes .................................................................................... 10-6 Figure 10-3. 100-Year Probability Earthquake Event Peak Ground Acceleration .................................. 10-7 Figure 10-4. 500-Year Probability Earthquake Event Peak Ground Acceleration .................................. 10-8 Figure 10-5. 1942 M5.5 Historical Event Peak Ground Acceleration ................................................... 10-10 Figure 10-6. PGA with 2-Percent Probability of Exceedance in 50 Years, Western United States ...... 10-12
Figure 11-1. CRS Communities by Class Nationwide as of May 2014 ................................................... 11-4 Figure 11-2. FEMA DFIRM Flood Hazard Areas ................................................................................. 11-17 Figure 11-3. Coeur d’Alene River Hydrograph at Cataldo .................................................................... 11-19 Figure 11-4. Repetitive Loss Areas ........................................................................................................ 11-32
Figure 12-1. Deep Seated Slide................................................................................................................ 12-2 Figure 12-2. Shallow Colluvial Slide ....................................................................................................... 12-2 Figure 12-3. Bench Slide ......................................................................................................................... 12-2 Figure 12-4. Large Slide .......................................................................................................................... 12-2 Figure 12-5. Landslide Potential of the Conterminous U.S. .................................................................... 12-4
Figure 13-1. The Thunderstorm Life Cycle ............................................................................................. 13-2 Figure 13-2. Potential Impact and Damage from a Tornado ................................................................... 13-5 Figure 13-3. Tornado Risk Areas in the United States ............................................................................ 13-6 Figure 13-4. Wind Chill Chart ................................................................................................................. 13-8 Figure 13-5. Heat Index Chart ................................................................................................................. 13-9 Figure 13-6. Annual Number of Thunderstorm Days ............................................................................ 13-15 Figure 13-7. Wind Zones in the United States ....................................................................................... 13-16 Figure 13-8. Average Annual Number of Tornadoes, 1991 - 2010 ....................................................... 13-16 Figure 13-9. Annual Frequency of Hailstorms ...................................................................................... 13-17
Figure 14-1. Mount St. Helens’ 1980 Eruption Ash Fallout .................................................................... 14-2 Figure 14-2. Past Eruptions in the Cascade Range .................................................................................. 14-3
Figure 15-1. Relative Risk to Communities from Wildfire in Idaho ....................................................... 15-9 Figure 15-2. Relative Risk to Communities & Ecosystems from Uncharacteristic Wildland Fire ........ 15-10 Figure 15-3. Kootenai County Growth Potential in the WUI ................................................................ 15-19
Figure 16-1. Pandemic Severity Index ..................................................................................................... 16-9

xi
ACKNOWLEDGMENTS
Project Manager
Sandy Von Behren, Director, Kootenai County Office of Emergency Management
5500 N. Government Way
Coeur d’Alene, ID 83816-9000
Phone: (208) 446-1775
Email: [email protected]
Other Kootenai County Staff
Tamie Eberhard, Preparedness Coordinator, Office of Emergency Management
Jody Bieze, Director, Grants Management Office
Jeffrey Benzon, GIS Analyst
Consultants
Laura Johnston, Project Manager, Tetra Tech, Inc.
Rob Flaner, CFM, Lead Project Planner, Tetra Tech, Inc.
Carol Bauman, GIS/Risk Assessment Lead, Tetra Tech, Inc.
Kristen Gelino, Planner, Tetra Tech, Inc.
Dan Portman, Technical Editor, Tetra Tech, Inc.
Special Acknowledgments
The development of this plan would not have been possible without the dedication and commitment to this process by the Kootenai County Hazard Mitigation Plan Steering Committee (Pg. 3-4), the planning partners (Pg. 3-2), and the stakeholders and citizens of Kootenai County. The dedication of the steering committee volunteers who graciously allocated their time to this process is greatly appreciated. Kootenai County citizens and all who participated in the public process are commended for their participation and contributions to this planning process.


Kootenai County Multi-Jurisdictional All Hazard Mitigation Plan Volume 1: Planning-Area-Wide Elements
EXECUTIVE SUMMARY


ES-1
EXECUTIVE SUMMARY
The Disaster Mitigation Act (DMA) is federal legislation that requires proactive, pre-disaster planning as a prerequisite for some funding available under the Robert T. Stafford Act. The DMA encourages state and local authorities to work together on pre-disaster planning. The enhanced planning network called for by the DMA helps local governments’ articulate accurate needs for mitigation, resulting in faster allocation of funding and more cost-effective risk reduction projects.
Hazard mitigation is the use of long- and short-term strategies to reduce or alleviate the loss of life, personal injury, and property damage that can result from a disaster. It involves strategies such as planning, policy changes, programs, projects, and other activities that can mitigate the impacts of hazards. It is impossible to predict exactly when and where disasters will occur or the extent to which they will impact an area, but with careful planning and collaboration among public agencies, stakeholders and citizens, it is possible to minimize losses that disasters can cause. The responsibility for hazard mitigation lies with many, including private property owners; business and industry; and local, state and federal government.
Kootenai County and a partnership of local governments within the County have developed and maintained a hazard mitigation plan to reduce risks from natural disasters and to comply with the DMA and Title 44 of the Code of Federal Regulations Section 201.6 (44 CFR 201.6). This plan will, and has, acted as the keyway to federal funding afforded under FEMA hazard mitigation grant programs.
PREVIOUS HAZARD MITIGATION PLANNING IN KOOTENAI COUNTY Federal regulations require monitoring, evaluation and updating of hazard mitigation plans. An update provides an opportunity to reevaluate recommendations, monitor the impacts of actions that have been accomplished, and determine if there is a need to change the focus of mitigation strategies. A jurisdiction covered by a plan that has expired is no longer in compliance with the DMA.
The 2009 Kootenai County Multi-Jurisdictional All Hazard Mitigation Plan was a FEMA-required revision and update of the County’s 2004 plan. It was prepared by the Kootenai County Office of Emergency Management, the Local Emergency Planning Committee’s standing All Hazard Mitigation Committee and Risk Analysis Committee, and a planning consultant. Participating jurisdictions included Kootenai County and 10 local municipalities within the Kootenai County Operational Area.
The purpose of the plan was to reduce the physical and economic impacts of natural and man-made disasters or emergency situations on the residents and businesses of Kootenai County and its participating jurisdictions. The plan identified hazards affecting Kootenai County and the county’s vulnerabilities. It provided a countywide strategy of mitigation projects to reduce future disaster losses. The mitigation plan was approved by the FEMA Region 10 on May 27, 2010 and meets the requirements of DMA and Title 44 of the Code of Federal Regulations Section 201.6 (44 CFR 201.6)
THE KOOTENAI COUNTY PLAN UPDATE EFFORT Kootenai County Office of Emergency Management (KCOEM) utilized the plan update process to enhance, expand and reformat the Kootenai County Multi-Jurisdictional All Hazard Mitigation Plan in scope and content. The updated plan differs from the initial plan for a variety of reasons:
• Better guidance now exists on what is required to meet the intent of the DMA.

Kootenai County Multi-Jurisdictional All Hazard Mitigation Plan; Volume 1—Planning-Area-Wide Elements
ES-2
• The scope of the plan has been expanded by including planning partners not covered under the prior plan.
• The initial plan did not use tools such as FEMA’s Hazards U.S. Multi-Hazard (Hazus-MH) computer model or new data such as FEMA’s countywide Digital Flood Insurance Rate Maps (DFIRMs). The updated plan will use these tools and data to provide for a more detailed and accurate risk assessment.
• The risk assessment has been prepared to better support future grant applications by providing risk and vulnerability information that will directly support the measurement of “cost-effectiveness” required under FEMA mitigation grant programs.
• Science and technology have improved since the development of the initial plan.
• The plan meets program requirements of the federal Community Rating System, thus reducing flood insurance premiums in participating jurisdictions.
• There was a strong desire on the part of KCOEM for this plan to be a user-friendly document that is understandable to the general public and not overly technical.
• The plan identifies actions rather than strategies. Strategies provide direction, but actions are fundable under grant programs. This plan replaces strategies with a guiding principal, goals and objectives. The identified actions meet multiple objectives that are measurable, so that each planning partner can measure the effectiveness of their mitigation actions.
Updating the plan consisted of the following phases:
• Phase 1, Organize and Review—a planning team was assembled to provide technical support for the plan update, consisting of key staff from KCOEM and a technical consultant. The first step in developing the plan update was to re-organize the planning partnership. The initial planning effort covered 11 local governments. This partnership was increased to 33 for the update as shown in table ES-1.
A 17-member steering committee was assembled to oversee plan update, consisting of planning partner staff and other stakeholders in the planning area. Coordination with other county, state and federal agencies involved in hazard mitigation occurred throughout the plan update process. This phase included a comprehensive review of the existing plan, the Idaho State Hazard Mitigation Plan, and existing programs that may support or enhance hazard mitigation actions within Kootenai County.
• Phase 2, Update the Risk Assessment— Risk assessment is the process of measuring the potential loss of life, personal injury, economic injury, and property damage resulting from hazards. This process assesses the vulnerability of people, buildings and infrastructure to natural hazards. It focuses on the following parameters:
– Hazard identification and profiling
– The impact of hazards on physical, social and economic assets
– Vulnerability identification
– Estimates of the cost of potential damage or costs that can be avoided through mitigation.

EXECUTIVE SUMMARY
ES-3
TABLE ES-1. PLANNING PARTNERS
Kootenai County Fire Protection Districts / EMS: Municipalities: East Side Fire Athol Hauser Lake Fire Coeur d’Alene Kootenai Emergency Medical Services System Dalton Gardens Kootenai Fire & Rescue Fernan Lake Village Mica Kidd Island Fire Harrison Northern Lakes Fire Hauser Shoshone County Fire No. 2 Hayden Spirit Lake Fire Hayden Lake St. Maries Fire Post Falls Timberlake Fire Rathdrum Worley Fire Spirit Lake Highway Districts: Worley East Side School Districts: Lakes Coeur d’Alene SD #271 Post Falls Kootenai SD #274 Worley Lakeland SD #272 Other Districts: Post Falls SD #273 Panhandle Health District Region 1
The risk assessment for this hazard mitigation plan meets requirements outlined in Title 44 of the Code of Federal Regulations Section 201.6 (44 CFR 201.6) in that it assessed identified natural hazards of concern within the planning area. In addition, a profile of other hazards of interest was provided under this phase. Phase 2 occurred simultaneously with Phase 1, with the two efforts using information generated by one another to create the best possible risk assessment. This was the most comprehensive phase of the plan update process. All facets of the risk assessment of the plan were visited by the planning team and updated with the best available data and technology.
• Phase 3, Engage the Public—A public involvement strategy developed by the Steering Committee was implemented by the planning team. It included public meetings to present the risk assessment as well as the draft plan, distribution of a hazard mitigation survey, a County-sponsored website for the plan update, and multiple media releases.
• Phase 4, Assemble the Updated Plan—The planning team and Steering Committee assembled key information into a document to meet the DMA requirements for all planning partners. The updated plan differs from the prior plan in that it contains two volumes. Volume 1 contains components that apply to all partners and the broader planning area. Volume 2 contains all components that are jurisdiction-specific. Each planning partner has a dedicated chapter in Volume 2.

Kootenai County Multi-Jurisdictional All Hazard Mitigation Plan; Volume 1—Planning-Area-Wide Elements
ES-4
• Phase 5, Plan Adoption/Implementation—Once pre-adoption approval has been granted by Idaho Bureau of Homeland Security and FEMA Region X, the final adoption phase will begin. Each planning partner will individually adopt the updated plan. The plan maintenance process includes a schedule for monitoring and evaluating the plan’s progress periodically and producing a plan revision every 5 years. This plan maintenance strategy also includes a process for continuing public involvement and integration with other programs that can support or enhance hazard mitigation.
RISK ASSESSMENT The cornerstone for this plan is a comprehensive risk assessment that assesses 8 natural hazards of concern based on a review of the Idaho State Hazard Mitigation Plan, and provides a detailed profile of an additional six other hazard of interest. Risk assessment is the process of measuring the potential loss of life, personal injury, economic injury, and property damage resulting from natural hazards. It allows emergency management personnel to establish early response priorities by identifying potential hazards and vulnerable assets. The process focuses on the following elements:
• Hazard identification—Use all available information to determine what types of disasters may affect a jurisdiction, how often they can occur, and their potential severity.
• Vulnerability identification—Determine the impact of natural hazard events on the people, property, environment, economy and lands of the region.
• Cost evaluation—Estimate the cost of potential damage or cost that can be avoided by mitigation.
The risk assessment for this hazard mitigation plan update evaluates the risk of natural hazards prevalent in the planning area and meets requirements of the DMA and Title 44 of the Code of Federal Regulations Section 201.6 (44 CFR 201.6 (c)(2)).
RISK ASSESSMENT RESULTS A risk ranking was performed for the hazards of concern described in this plan. The risk ranking is a key step in developing an action plan. It allows jurisdictions to compare the impacts of one hazard to another. That comparison provides critical information to use in selecting hazard mitigation actions. The results are used in establishing mitigation priorities. This process is not intended to focus all actions on the hazard with the highest rank, but to ensure that jurisdictions do not forget about hazards that have less but still significant impact. The ranking process also identifies hazards that have little or no impact and can be eliminated from consideration for actions. Based on the risk assessment, the natural hazards of concern were ranked as follows for the risk they pose to the overall planning area:
1. Severe Weather (High)
2. Wildfire (High)
3. Earthquake/Volcano-Ash fall (High)
4. Flood (High)
5. Landslide (Medium)
6. Dam Failure (Low)
7. Drought(Low)
8. Avalanche (Low)

EXECUTIVE SUMMARY
ES-5
The plan also profiled the following non-natural hazards of concern: Cyber-disruption, hazardous materials incidents, pandemic, radiologic material exposure, civil unrest and terrorism. While these hazard of concern were profiled, they were not ranked with the natural hazards for the following reasons:
• It is not a requirement of Title 44 of the Code of Federal Regulations Section 201.6 (44 CFR 201.6) to assess non-natural/human caused hazards.
• You cannot compare natural hazards to non-natural hazards on the same plan because of one key parameter used in risk ranking; probability of occurrence. Probabilities are well established for natural hazards because there is historical record of past occurrences that are the basis for probabilities. There is not consistent historical record available either regionally or nationally on non-natural hazards to establish recurrence probabilities.
• Non-natural hazard risk assessments tend to focus on threats and consequences, while natural hazard risk assessments focus on probabilities and vulnerabilities.
Each planning partner also ranked hazards for its own area following the same methodology applied to the area wide risk ranking. Table ES-3 summarizes the categories of high, medium and low (relative to other rankings) based on the numerical ratings that each jurisdiction assigned each hazard.
TABLE ES-3. SUMMARY OF HAZARD RANKING RESULTS
Number of Jurisdictions Assigning Ranking to Hazard High Medium Low Not Ranked
Avalanche 0 0 33 0 Dam Failure 0 0 33 0 Drought 0 4 29 0 Earthquake/Volcano-Ash fall 21 12 0 0 Flood 12 20 1 0 Landslide 4 13 16 0 Severe Weather 33 0 0 0 Wildfire 29 3 1 0
MITIGATION GUIDING PRINCIPLE, GOALS AND OBJECTIVES The following principle guided the Steering Committee and the planning partnership in selecting the initiatives contained in this plan update:
To reduce or eliminate the risk of loss of life and property, encourage long-term reduction of vulnerability and save lives and reduce costly property damage due to natural and/or human caused hazards.
The Steering Committee and the planning partnership established the following goals for the plan update:
1. Reduce the risks associated with natural, technological, and human-caused hazards through planning and emergency response efforts.

Kootenai County Multi-Jurisdictional All Hazard Mitigation Plan; Volume 1—Planning-Area-Wide Elements
ES-6
2. Establish a collaborative and cooperative relationship within the community (Kootenai County) for all hazard risk reduction.
3. Implement actions that protect lives and reduce the impact of hazards on our property, environment, and economy.
4. Maintain a current and actionable mitigation plan.
The following objectives were identified that meet multiple goals, acting as a bridge between the mitigation goals and actions and helping to establish priorities:
1. Create an effective information exchange between the Office of Emergency Management, public information officers, public responders, general public, and media outlets.
2. Develop and promote cooperative agreements between Kootenai County and local jurisdictions, government agencies, and the Tribe that define and implement an ongoing coordinated joint hazard mitigation effort.
3. Develop programs and actions that increase safety, reduce the disruption of services, and decrease property damage from potential hazards.
4. Increase awareness of disaster mitigation actions and resources, and develop education activities emphasizing preparedness and recovery from hazard incidents.
5. Include hazard mitigation planning in Kootenai County’s policy, planning, and budgeting processes, as appropriate.
6. Develop an understanding of natural resource management and its relationship to hazard mitigation planning.
7. Facilitate the building of relationships between public and private sectors to foster hazard mitigation through environmental design.
8. Identify and implement responsible best management practices, such as building in flood prone areas, steep sloped areas, sensitive wildlife or wetland areas, for land development, recreational activities, and commercial/industrial operations to reduce loss from potential disasters on public and private land in Kootenai County.
9. Build upon Kootenai County’s geographic information system (GIS) mapping capability to create maps and overlays of all natural and human-caused hazard areas in Kootenai County, its municipalities, and local jurisdictions.
10. Develop action plans and programs that decrease disruptions to government services and emergency response activities.
11. Support public and private efforts that mitigate and reduce the economic impact of disaster events and post-disaster recovery costs.
12. Develop and prioritize projects in Kootenai County that increase the protection of life, property, environment and historical resources from the impacts of disasters.
13. Build and sustain secure, interoperable, dedicated, and redundant emergency communications infrastructure.
14. Minimize the destruction of public utilities and services during and after a hazard event.
15. Seek public and private financial resources for investment in hazard mitigation planning, implementation of actions, and post-disaster recovery.

EXECUTIVE SUMMARY
ES-7
16. Review, maintain, and update a comprehensive analysis of natural and human-caused hazards impacting Kootenai County municipalities and local jurisdictions, as needed.
17. Minimize development in extreme hazard-prone areas.
18. Implement local codes, ordinances and standards to promote the use of appropriate hazard-resistant structural methods and materials for buildings in areas with potential for significant hazard damage.
19. Identify and implement resilient protective measures that mitigate damage to, and disruption of, critical infrastructure and key resources.
PLAN MAINTENANCE The plan has identified a comprehensive plan maintenance strategy that will help to keep the plan dynamic through its 5-year performance period. This strategy has established protocol for the following maintenance components:
• Implementation measures
• Hazard Mitigation Task Force oversight
• Annual progress reporting
• Procedures for continuing public involvement
• Plan updates
• Plan incorporation into other plans and programs
MITIGATION INITIATIVES Mitigation initiatives presented in this update are activities designed to reduce or eliminate losses resulting from natural hazards. The update process resulted in the identification and prioritization of 280 mitigation initiatives for implementation by individual planning partners, as presented in Volume 2 of this plan. Each initiative has been prioritized as either high, medium of low based upon a standardized prioritization protocol that looks at feasibility, multi-objectivity, cost-effectiveness, available funding and timeline for completion. Of these 280 initiatives, 103 (37%) were given a high priority; 129 (46%) were given a medium priority and 48 (17%) were given a low priority. To illustrate the comprehensive range of alternatives considered by the planning partnership, each initiative was categorized into the 6 hazard mitigation categories:
• Prevention
• Property Protection
• Public Education and Awareness
• Natural Resource Protection
• Emergency Services
• Structural projects
IMPLEMENTATION Full implementation of the recommendations of this plan will require time and resources. Funding resources are always evolving, as are state and federal mandates. Kootenai County and its planning partners will

Kootenai County Multi-Jurisdictional All Hazard Mitigation Plan; Volume 1—Planning-Area-Wide Elements
ES-8
assume responsibility for adopting the recommendations of this plan. The planning partnership developed this plan with extensive public input, and public support of the actions identified in this plan will help ensure the plan’s success.

Kootenai County Multi-Jurisdictional All Hazard Mitigation Plan Volume 1: Planning-Area-Wide Elements
PART 1 — THE PLANNING PROCESS


CHAPTER 1. INTRODUCTION TO THE PLANNING PROCESS
1.1 WHY PREPARE THIS PLAN?
1.1.1 The Big Picture Hazard mitigation is defined as any action taken to reduce or alleviate the loss of life, personal injury, and property damage that can result from a disaster. It involves long- and short-term actions implemented before, during and after disasters. Hazard mitigation activities include planning efforts, policy changes, programs, studies, improvement projects, and other steps to reduce the impacts of hazards.
For many years, federal disaster funding focused on relief and recovery after disasters occurred, with limited funding for hazard mitigation planning in advance. The Disaster Mitigation Act (DMA; Public Law 106-390), passed in 2000, shifted the federal emphasis toward planning for disasters before they occur. The DMA requires state and local governments to develop hazard mitigation plans as a condition for federal disaster grant assistance. Regulations developed to fulfill the DMA’s requirements are included in Title 44 of the Code of Federal Regulations (44 CFR).
The responsibility for hazard mitigation lies with many, including private property owners, commercial interests, and local, state and federal governments. The DMA encourages cooperation among state and local authorities in pre-disaster planning. The enhanced planning network called for by the DMA helps local governments articulate accurate needs for mitigation, resulting in faster allocation of funding and more cost-effective risk-reduction projects.
The DMA also promotes sustainability in hazard mitigation. To be sustainable, hazard mitigation needs to incorporate sound management of natural resources and address hazards and mitigation in the largest possible social and economic context.
1.1.2 Kootenai County’s Response to the DMA Kootenai County has a tradition of proactive planning and preparedness for all phases of emergency management. In 2004, the Kootenai County Office of Emergency Management led a multi-jurisdictional planning effort to fulfill the requirements of the DMA and 44 CFR. The 2004 plan was updated five years later. The County and 34 planning partners adopted the updated Kootenai County Multi-Jurisdictional All Hazard Mitigation Plan in November 2009. Region X of the Federal Emergency Management Agency (FEMA) approved the updated plan on May 27, 2010, establishing compliance with the DMA for the County and the planning partners.
The Multi-Jurisdictional All-Hazard Mitigation Plan is designed to interface with the State of Idaho’s 2013 Hazard Mitigation Plan. It integrates the Kootenai County Fire Mitigation Plan, the Kootenai County Flood Mitigation Plan and the Kootenai County Comprehensive Plan. It is formulated in support of FEMA’s National Flood Insurance Program (NFIP).
1-1

Kootenai County Multi-Jurisdictional All Hazard Mitigation Plan; Volume 1—Planning-Area-Wide Elements
1.1.3 Purposes for Planning This hazard mitigation plan update identifies resources, information, and strategies for reducing risk from natural hazards. Elements and strategies in the plan were selected because they meet a program requirement and because they best meet the needs of the planning partners and their citizens. One of the benefits of multi-jurisdictional planning is the ability to pool resources and coordinate activities within a planning area that has uniform risk exposure and vulnerabilities. The Federal Emergency Management Agency (FEMA) encourages multi-jurisdictional planning under its guidance for the DMA. The plan will help guide and coordinate mitigation activities throughout the planning area. The plan was developed to meet the following objectives:
• Meet or exceed requirements of the DMA.
• Enable all planning partners to continue using federal grant funding to reduce risk through mitigation.
• Meet the needs of each planning partner as well as state and federal requirements.
• Create a risk assessment that focuses on Kootenai County hazards of concern.
• Create a single planning document that integrates all planning partners into a framework that supports partnerships within the County, and puts all partners on the same planning cycle for future updates.
• Meet the planning requirements of FEMA’s Community Rating System (CRS), allowing planning partners that participate in the CRS program to maintain or enhance their CRS classifications.
• Coordinate existing plans and programs so that high-priority initiatives and projects to mitigate possible disaster impacts are funded and implemented.
1.2 WHO WILL BENEFIT FROM THIS PLAN? All citizens and businesses of Kootenai County are the ultimate beneficiaries of this hazard mitigation plan. The plan reduces risk for those who live in, work in, and visit the County. It provides a viable planning framework for all foreseeable natural hazards that may impact the County. Participation in development of the plan by key stakeholders in the County helped ensure that outcomes will be mutually beneficial. The resources and background information in the plan are applicable countywide, and the plan’s goals and recommendations can lay groundwork for the development and implementation of local mitigation activities and partnerships.
1.3 HOW TO USE THIS PLAN This plan has been set up in two volumes so that elements that are jurisdiction-specific can easily be distinguished from those that apply to the whole planning area:
• Volume 1—Volume 1 includes all federally required elements of a disaster mitigation plan that apply to the entire planning area. This includes the description of the planning process, public involvement strategy, goals and objectives, countywide hazard risk assessment, countywide mitigation initiatives, and a plan maintenance strategy.
• Volume 2—Volume 2 includes all federally required jurisdiction-specific elements, in annexes for each participating jurisdiction. It includes a description of the participation requirements established by the Steering Committee, as well as instructions and templates that the partners
1-2

INTRODUCTION TO THE PLANNING PROCESS
1-3
used to complete their annexes. Volume 2 also includes “linkage” procedures for eligible jurisdictions that did not participate in the development of this plan but wish to adopt it in the future.
All planning partners will adopt Volume 1 in its entirety and at least the following parts of Volume 2: the introduction; each partner’s jurisdiction-specific annex; and the appendices.
The following appendices provided at the end of Volume 1 include information or explanations to support the main content of the plan:
– Appendix A—A glossary of acronyms and definitions
– Appendix B—Public outreach information used in preparation of this update
– Appendix C—Data sources and methods used for hazard mapping
– Appendix D—A template for progress reports to be completed as this plan is implemented.


2-1
CHAPTER 2. PLAN UPDATE—WHAT HAS CHANGED
2.1 THE PREVIOUS PLAN The 2009 Kootenai County Multi-Jurisdictional All Hazard Mitigation Plan was a FEMA-required revision and update of the County’s 2004 plan. It was prepared by the Kootenai County Office of Emergency Management, the Local Emergency Planning Committee’s standing All Hazard Mitigation Committee and Risk Analysis Committee, and a planning consultant. Participating jurisdictions included Kootenai County and 34 local municipalities, special purpose districts and planning areas.
The purpose of the plan was to reduce the physical and economic impacts of natural and man-made disasters or emergency situations on the residents and businesses of Kootenai County and its participating jurisdictions. The plan identified hazards affecting Kootenai County and the county’s vulnerabilities. It provided a countywide strategy of mitigation projects to reduce future disaster losses.
The 2009 plan assessed the following hazards of concern:
• Wildfires
• Floods
• Severe winter storms
• Landslides
• Tornadoes
• Windstorms
• Hailstorms
• Lightning
• Earthquakes
• Volcanic ash fall
• Dam failure
• Hazardous materials release
• Civil unrest
• Terrorism.
The participating jurisdictions identified their own mitigation actions for the profiled hazards—a total of 383 actions for all participants.
2.2 WHY UPDATE? Under 44 CFR, hazard mitigation plans must include a schedule for being monitored, evaluated, and updated. This provides an opportunity to reevaluate recommendations, monitor the impacts of actions that have been accomplished, and determine if there is a need to change the focus of mitigation strategies. A jurisdiction covered by a plan that has expired is not able to pursue federal disaster and emergency assistance funding for which a current hazard mitigation plan is a prerequisite.
2.3 CHANGES IN DEVELOPMENT Hazard mitigation plan updates must be revised to reflect changes in development within the planning area during the previous performance period of the plan (44 CFR Section 201.6(d)(3)). The plan must describe changes in development in hazard-prone areas that increased or decreased vulnerability for each jurisdiction since the last plan was approved. If no changes in development impacted overall vulnerability, then plan updates may validate the information in the previously approved plan. The intent of this requirement is to

Kootenai County Multi-Jurisdictional All Hazard Mitigation Plan; Volume 1—Planning-Area-Wide Elements
2-2
ensure that the mitigation strategy continues to address the risk and vulnerability of existing and potential development, and takes into consideration possible future conditions that could impact vulnerability.
The Kootenai County planning area experienced a 32.7 percent increase in population between 2000 and 2013, an average annual growth rate of 2.5 percent per year (U.S. Census). The County and its cities have adopted comprehensive plans that govern land-use decisions and policy-making in their jurisdictions or have zoning codes that regulate land uses. In addition, many of the municipal planning partners have adopted building codes that promote the resiliency of new construction from potential impacts of hazards assessed in this plan. Some new development triggered by the increase in population occurred in hazard areas. All such new development was regulated pursuant to local programs and codes, which are addressed in each jurisdiction’s annex in Volume 2 under Capability Assessments. Therefore, vulnerability should not have increased even if exposure did.
2.4 PROGRESS REPORT ON PREVIOUS PLAN The 2009 plan update included a plan maintenance protocol that called for annual review of the plan and progress reports to be prepared as mitigation actions are implemented. These progress reports were provided to each planning partner participating in the current update. For current planning partners who also participated in the 2009 plan update, status of prior actions is provided in the jurisdictional annexes in Volume 2.
2.5 THE UPDATED PLAN—WHAT IS DIFFERENT? The updated plan differs from the initial plan as follows:
• Better guidance now exists on what is required to meet the intent of the DMA.
• The plan has been divided into two volumes. Volume 1 contains all planning components that apply to the entire planning area (description of the planning process, outreach strategy, goals/objectives, risk assessment and plan maintenance strategy). Volume 2 contains all components that are jurisdiction-specific (jurisdictional profile, risk ranking, capability assessment and action plan).
• The initial plan did not use tools such as FEMA’s Hazards U.S. Multi-Hazard (Hazus-MH) computer model or new data such as FEMA’s countywide Digital Flood Insurance Rate Maps (DFIRMs). The updated plan will use these tools and data to provide for a more detailed and accurate risk assessment.
• The risk assessment has been prepared to better support future grant applications by providing risk and vulnerability information that will directly support the measurement of “cost-effectiveness” required under FEMA mitigation grant programs.
• Science and technology have improved since the development of the previous plan.
• The plan meets program requirements of the federal Community Rating System, thus reducing flood insurance premiums in participating jurisdictions.
• The plan identifies actions rather than strategies. Strategies provide direction, but actions are fundable under grant programs. This plan replaces strategies with goals and objectives. The identified actions meet multiple objectives that are measurable, so that each planning partner can measure the effectiveness of their mitigation actions.
Table 2-1 indicates major changes between the current and previous updates.

PLAN UPDATE—WHAT HAS CHANGED
2-3
TABLE 2-1. PLAN CHANGES CROSSWALK
44 CFR Requirement Previous (2009) Plan Updated Plan
§201.6(b): In order to develop a more comprehensive approach to reducing the effects of natural disasters, the planning process shall include: (1) An opportunity for the public to
comment on the plan during the drafting stage and prior to plan approval;
(2) An opportunity for neighboring communities, local and regional agencies involved in hazard mitigation activities, and agencies that have the authority to regulate development, as well as businesses, academia and other private and non-profit interests to be involved in the planning process; and
(3) Review and incorporation, if appropriate, of existing plans, studies, reports, and technical information.
The planning process was conducted through the County Local Emergency Planning Committee, which has a standing Hazard Mitigation Subcommittee consisting of community volunteers and stakeholders. A public outreach strategy consisting of a survey and public meetings was deployed by the planning team. The oversight committee performed a review of the state hazard mitigation plan as well as the initial Kootenai County plan. The planning team coordinated with neighboring counties.
The planning process, organization resources, agency coordination and public involvement process for the plan update are described in Chapter 1 through Chapter 3 of Volume 1. The plan update was facilitated through a Steering Committee made up of stakeholders within the planning area. The Steering Committee was responsible for defining planning partner expectations, reviewing relevant plans and programs, agency coordination, identifying a vision, goals and objectives, confirming a public involvement strategy, developing a plan maintenance strategy and reviewing and approving the draft plan.
§201.6(c)(2): The plan shall include a risk assessment that provides the factual basis for activities proposed in the strategy to reduce losses from identified hazards. Local risk assessments must provide sufficient information to enable the jurisdiction to identify and prioritize appropriate mitigation actions to reduce losses from identified hazards.
Section 6 of the plan includes a risk assessment of 14 hazards of concern (wildfire, flood, severe winter storms, landslides, tornados, windstorm, hail storms, lightning, earthquakes, volcanic ash, dam failure, hazardous materials, civil unrest and terrorism). Each hazard was profiled sufficiently to enable the planning partners to identify and prioritize appropriate mitigation actions to reduce losses from identified hazards.
Part 2 of Volume 1 presents a comprehensive risk assessment for the planning area that looks at nine hazards of concern: avalanche, dam failure, drought, earthquake, flood, landslide, severe weather, volcano (ash fall) wildfire, and provides a profile of other hazards of interest (non-natural hazards). This assessment used the best available data and science and uses the Hazus-MH risk assessment platform (version 2.2).

Kootenai County Multi-Jurisdictional All Hazard Mitigation Plan; Volume 1—Planning-Area-Wide Elements
2-4
TABLE 2-1. PLAN CHANGES CROSSWALK
44 CFR Requirement Previous (2009) Plan Updated Plan §201.6(c)(2)(i): [The risk assessment shall include a] description of the … location and extent of all natural hazards that can affect the jurisdiction. The plan shall include information on previous occurrences of hazard events and on the probability of future hazard events.
Profiles were provided including maps that illustrate the extent and location of each identified hazard of concern. These profiles included information on previous occurrences of hazard events and on the probability of future hazard events.
The risk assessment profiles were restructured in this plan update. Volume 1, Chapter 7 through Chapter 15 present comprehensive risk assessments of each hazard of concern. Each chapter consists of the following components: • Hazard profile, including maps of
extent and location, historical occurrences, frequency, severity and warning time.
• Secondary hazards • Exposure of people, property, critical
facilities and environment. • Vulnerability of people, property,
critical facilities and environment. • Future trends in development • Scenarios • Issues
§201.6(c)(2)(ii): [The risk assessment shall include a] description of the jurisdiction’s vulnerability to the hazards described in paragraph (c)(2)(i). This description shall include an overall summary of each hazard and its impact on the community
Each hazard profiled includes a subjective vulnerability assessment that classifies the impact of a hazard as high, medium or low in accordance with criteria used in the Idaho State Hazard Mitigation plan.
Vulnerability was assessed for all natural hazards of concern. The Hazus-MH computer model was used for the earthquake and flood hazards. These were abbreviated Level 2 analyses using planning partner and County data. Critical facilities were defined and inventoried using the comprehensive data management system extension to Hazus. Hazus-MH outputs were generated for other hazards by applying an estimated damage function to affected assets. The asset inventory was extracted from the Hazus-MH model. Best available data was used for all analyses. Outputs were generated for each participating planning partner. Results of the risk assessment were used by each planning partner to rank the risk of each hazard as it pertains to their jurisdiction. For this process, Risk = (probability x impact), where impact is the impact on people, property and economy.

PLAN UPDATE—WHAT HAS CHANGED
2-5
TABLE 2-1. PLAN CHANGES CROSSWALK
44 CFR Requirement Previous (2009) Plan Updated Plan §201.6(c)(2)(ii): [The risk assessment] must also address National Flood Insurance Program insured structures that have been repetitively damaged floods
Section 6.3.9 of the plan includes a discussion on the properties identified as repetitive loss within the planning area.
The repetitive loss section was significantly enhanced to meet new DMA and CRS planning requirements. The update includes a comprehensive analysis of repetitive loss areas, with an inventory of the number and types of structures in the repetitive loss area. Repetitive loss areas were delineated, causes of repetitive flooding were cited, and these areas were reflected on maps. National Flood Insurance Program capability for each municipal planning partner is assessed in the jurisdictional annexes in Volume 2.
§201.6(c)(2)(ii)(A): The plan should describe vulnerability in terms of the types and numbers of existing and future buildings, infrastructure, and critical facilities located in the identified hazard area.
Existing building counts and exposure values are provided for some of the hazards (wildfire, flood and hazardous materials. Critical facilities were defined by inventories. Exposure of these facilities was summarized in each hazard profile. Discussion was included on the expected number of future buildings based on the County comprehensive plan for some hazards.
A complete inventory of the numbers and types of buildings exposed was generated for each hazard of concern. The Steering Committee defined “critical facilities” as they pertained to the planning area, and these facilities were inventoried by exposure. Each hazard chapter provides a discussion on future development trends as they pertain to each hazard. Future trends in development were profiled for each hazard.
§201.6(c)(2)(ii)(B): [The plan should describe vulnerability in terms of an] estimate of the potential dollar losses to vulnerable structures identified in paragraph (c)(2)(i)(A) and a description of the methodology used to prepare the estimate.
Loss estimates specified as an aggregate percentage of exposed value were developed for wildfire, flood and hazardous materials. No description of methodology was provided.
Dollar losses were estimated for all hazards of concern. Hazus-MH was used for the earthquake and flood hazards. For the other hazards, loss estimates were generated by applying a regionally relevant damage function to the exposed inventory. In all cases, a damage function was applied to an asset inventory generated in the Hazus-MH model. The asset inventory was the same for all hazards. The methodology is explained in Chapter 5 of Volume 1.

Kootenai County Multi-Jurisdictional All Hazard Mitigation Plan; Volume 1—Planning-Area-Wide Elements
2-6
TABLE 2-1. PLAN CHANGES CROSSWALK
44 CFR Requirement Previous (2009) Plan Updated Plan
§201.6(c)(2)(ii)(C): [The plan should describe vulnerability in terms of] providing a general description of land uses and development trends within the community so that mitigation options can be considered in future land use decisions.
Section 4.5 provides an overview of land use and ownership of the planning area.
There is a discussion on future development trends as they pertain to each hazard of concern. This discussion looks predominantly at the existing land use and the current regulatory environment that dictates this land use.
§201.6(c)(2)(iii): For multi-jurisdictional plans, the risk assessment must assess each jurisdiction’s risks where they vary from the risks facing the entire planning area.
Risk assessment results were reported on a countywide scale by planning area.
Risk assessment results were generated for each planning partner to support the concept of risk ranking, which was performed by each planning partner. Risk ranking was used by each planning partner to provide vision and focus to action plan development.
§201.6(c)(3): The plan shall include a mitigation strategy that provides the jurisdiction’s blueprint for reducing the potential losses identified in the risk assessment, based on existing authorities, policies, programs and resources, and its ability to expand on and improve these existing tools.
The plan identifies actions and strategies. The actions were categorized by the hazard they addressed. The mitigation strategies served as a long-term blueprint for reducing potential losses identified in the risk assessment. The strategies evolved from the development of goals, objectives and prioritized mitigation actions.
Action plans were developed for each planning partner via a facilitated process that includes: • Risk ranking • Capability assessment • Action alternative review • Action selection • Action prioritization • Action category analysis
§201.6(c)(3)(i): [The hazard mitigation strategy shall include a] description of mitigation goals to reduce or avoid long-term vulnerabilities to the identified hazards.
Goals were identified by category and objectives were identified as a subset of each goal. In all, the plan identified 11 goals and 29 objectives
The plan update identifies 4 goals and 19 objectives. These are linear planning components that stand on their own merit. Goals were selected that support the guiding principle, objectives were selected that meet multiple goals, and actions were selected and prioritized based on meeting multiple objectives.

PLAN UPDATE—WHAT HAS CHANGED
2-7
TABLE 2-1. PLAN CHANGES CROSSWALK
44 CFR Requirement Previous (2009) Plan Updated Plan
§201.6(c)(3)(ii): [The mitigation strategy shall include a] section that identifies and analyzes a comprehensive range of specific mitigation actions and projects being considered to reduce the effects of each hazard, with particular emphasis on new and existing buildings and infrastructure.
Goals and objectives were selected for each of six categories of mitigation. Actions were selected by hazard, but are not cross-walked to the goals and objectives. Actions identified address both new and existing structures.
A hazard mitigation catalog was developed through a facilitated process that looks at strengths, weaknesses, obstacles and opportunities in the planning area. This catalog identifies actions that manipulate the hazard, reduce exposure to the hazard, reduce vulnerability, and increase mitigation capability. The catalog further segregates actions by scale of implementation. A table in the action plan section analyzes each action by mitigation type to illustrate the range of actions selected.
§201.6(c)(3)(ii): [The mitigation strategy] must also address the jurisdiction’s participation in the National Flood Insurance Program, and continued compliance with the program’s requirements, as appropriate.
A profile of the NFIP and participation status was provided in the flood hazard profile. Flood mitigation actions associated with the NFIP were identified.
Each municipal planning partner’s jurisdictional annex assesses the partner’s National Flood Insurance Program capability. All participating communities have identified actions supporting continued compliance and good standing under the program.
§201.6(c)(3)(iii): [The mitigation strategy shall describe] how the actions identified in section (c)(3)(ii) will be prioritized, implemented, and administered by the local jurisdiction. Prioritization shall include a special emphasis on the extent to which benefits are maximized according to a cost benefit review of the proposed projects and their associated costs.
Plan applies a criteria-matrix methodology to rank and evaluate mitigation measures. The plan states: “The All Hazard Mitigation Planning Committee will facilitate the review of prioritization of projects annually with emphasis on pre-disaster mitigation that considers people and structures, infrastructure, local economy and the environment.”
Each recommended initiative is prioritized using a qualitative methodology that looked at the objectives the project will meet, the timeline for completion, how the project will be funded, the impact of the project, the benefits of the project and the costs of the project. This prioritization scheme is detailed in Volume 2.
§201.6(c)(4)(i): [The plan maintenance process shall include a] section describing the method and schedule of monitoring, evaluating, and updating the mitigation plan within a five-year cycle.
Section 8 of the plan includes a plan maintenance schedule, guidelines for continuing public involvement and strategies for plan incorporation.
A detailed plan maintenance strategy was developed (see Chapter 19) that includes the follows components: • Annual review and progress reporting • Defined role for a Steering Committee • Plan update triggers • Plan incorporation guidelines • Strategy for continuing public
involvement

Kootenai County Multi-Jurisdictional All Hazard Mitigation Plan; Volume 1—Planning-Area-Wide Elements
2-8
TABLE 2-1. PLAN CHANGES CROSSWALK
44 CFR Requirement Previous (2009) Plan Updated Plan
§201.6(c)(4)(ii): [The plan shall include a] process by which local governments incorporate the requirements of the mitigation plan into other planning mechanisms such as comprehensive or capital improvement plans, when appropriate.
Included in Section 8, plan maintenance section.
Included in the plan maintenance strategy discussed in Chapter 20.
§201.6(c)(4)(iii): [The plan maintenance process shall include a] discussion on how the community will continue public participation in the plan maintenance process.
Included in Section 8, plan maintenance section.
Included in the plan maintenance strategy discussed in Chapter 20.
§201.6(c)(5): [The local hazard mitigation plan shall include] documentation that the plan has been formally adopted by the governing body of the jurisdiction requesting approval of the plan (e.g., City Council, County Commission, Tribal Council).
Resolutions for all adopting planning partners included at the beginning of the plan.
Appendix D contains the resolutions of all planning partners that adopted this plan

3-1
CHAPTER 3. PLAN METHODOLOGY
To develop the Kootenai County Multi-Jurisdictional All Hazard Mitigation Plan, the County followed a process that had the following primary objectives:
• Initiate update process by engaging planning partners and stakeholders
• Hire a technical assistance consultant
• Form a planning team
• Establish a planning partnership
• Define the planning area
• Establish a steering committee
• Coordinate with other agencies
• Review existing programs
• Engage the public.
These objectives are discussed in the following sections.
3.1 FORMATION OF THE PLANNING TEAM Kootenai County hired Tetra Tech, Inc. via a procurement process to assist with development and implementation of the plan. Tetra Tech appointed a project manager who reported directly to a County-designated project manager. A lead project planner from Tetra Tech facilitated the plan process. A planning team was formed to lead the planning effort, made up of the following members:
• Sandy Von Behren, Kootenai County Office of Emergency Management (OEM)—County Project Manager
• Tamie Eberhard, Kootenai County Office of Emergency Management—Consultant/Planning Partner Liaison
• Laura Johnston, Tetra Tech—Project Manager
• Rob Flaner, Tetra Tech—Lead Project Planner
• Carol Bauman, Tetra Tech— GIS/Risk Assessment Lead
• Kristen Gelino, Tetra Tech—Support Planner
• Caitlin Kelly, Tetra Tech—Support Planner
• Dan Portman, Tetra Tech—Technical Editor.

Kootenai County Multi-Jurisdictional All Hazard Mitigation Plan; Volume 1—Planning-Area-Wide Elements
3-2
3.2 ESTABLISHMENT OF THE PLANNING PARTNERSHIP The plan maintenance protocol in the 2009 Mitigation Plan established ongoing communication between Kootenai County OEM and the planning partnership through annual progress reporting. The planning partnership was therefore well established when it came time to initiate the 5-year update to the plan.
When Kootenai County OEM hired a consultant to assist with this update, the Consultant planning team became engaged with the planning partnership at a kickoff meeting on August 22, 2014. Current planning partners were invited to the meeting as well as eligible local governments that did not participate in the prior plan. The planning team made a presentation to introduce the update process and define planning partner expectations. Key meeting objectives were as follows:
• Provide an overview of the Disaster Mitigation Act.
• Describe the reasons for a plan.
• Outline the project work plan.
• Outline planning partner expectations.
• Seek commitment to the planning partnership.
• Seek volunteers for the Steering Committee.
Each jurisdiction wishing to join the planning partnership was asked to provide a “letter of intent to participate” that designated a point of contact for the jurisdiction and confirmed the jurisdiction’s commitment to the process and understanding of expectations. Linkage procedures were established for any jurisdiction wishing to link to the Kootenai County plan in the future (see Volume 2 of this plan). The municipal planning partners covered under this plan are shown in Table 3-1. The special purpose district planning partners are shown in Table 3-2.
TABLE 3-1. COUNTY AND CITY PLANNING PARTNERS
Jurisdiction Point of Contact Title
Kootenai County Sandy Von Behren OEM Manager City of Athol Steven Williams Public Works Director City of Coeur d’Alene Jim Washko Deputy Chief City of Dalton Gardens Cheri Howell Consultant City of Fernan Lake Village Doris Hoffman Council Member City of Harrison Robert Poole Public Works Supervisor City of Hauser Larry Simms Fire Chief City of Hayden Sean Hoisington Public Works Director City of Hayden Lake Lynn Hagman City Clerk City of Post Falls Rob Palus Assistant City Engineer City of Rathdrum Tomi McLean Lieutenant City of Spirit Lake Ann Clapper City Clerk City of Worley Brenda Morris City Clerk/Treasurer

PLAN METHODOLOGY
3-3
TABLE 3-2. SPECIAL PURPOSE DISTRICT PLANNING PARTNERS
District Point of Contact Title
East Side Fire Protection District Doug Allman Fire Chief Hauser Lake Fire Protection District Larry Simms Fire Chief Kootenai County Emergency Medical Services System Christopher Way Chief Kootenai County Fire and Rescue Daniel M. Ryan Division Chief Mica Kidd Island Fire Protection District Jason E. Blubaum Fire Chief Northern Lakes Fire District Pat Riley Deputy Chief St. Maries Fire Protection District Larry Naccarato Fire Chief Shoshone County Fire District No. 2 Mark Aamodt Fire Chief Spirit Lake Fire Protection District John DeBernardi Fire Chief Coeur d’Alene Tribe Lance Mueller Planning Technician Panhandle Health District Andy Helkey Program Manager Timberlake Fire Protection District Kevin Kleinworth Fire Chief Worley Fire Protection District Bob Maines Deputy Chief Coeur d’Alene Public Schools (SD 271) Laura Rumpler Director of Communications Kootenai School District (SD 274) Lynette Ferguson Superintendent Lakeland Joint School District (SD 272) Brad Murray Superintendent Post Falls School District (SD 273) Jerry Keane Superintendent East Side Highway District John Pankratz District Supervisor
Lakes Highway District Eric W. Shanley, P.E. Director of Highways
Post Falls Highway District Kelly Brownsberger Road Supervisor
Worley Highway District Kevin Howard District Supervisor
3.3 DEFINING THE PLANNING AREA The planning area was defined to consist of the unincorporated areas of Kootenai County and the incorporated jurisdictions therein. All partners to this plan have jurisdictional authority within this planning area.
3.4 THE STEERING COMMITTEE Hazard mitigation planning enhances collaboration and support among diverse parties whose interests can be affected by hazard losses. A steering committee was formed to oversee all phases of the plan. The members of this committee included key planning partner staff, citizens, and other stakeholders from within the planning area. Based on feedback from the kickoff meeting with the planning partnership, the planning team assembled a list of candidates representing stakeholder interests within the planning area that could have recommendations for the plan or be impacted by its recommendations. The partnership confirmed a committee of 17 members at the kickoff meeting. Table 3-3 lists the committee members.

Kootenai County Multi-Jurisdictional All Hazard Mitigation Plan; Volume 1—Planning-Area-Wide Elements
3-4
TABLE 3-3. STEERING COMMITTEE MEMBERS
Name Title Jurisdiction/Agency
Debbie Andrews President Twin Lakes Improvement District Jay Baker North Area Field Officer Idaho Bureau of Homeland Security John Beacham Environmental Manager Post Falls Public Works Jody Bieze (Chairperson) Director Kootenai County Grants Management Office Jason Blubaum Fire Chief Mica Kidd Island Fire District David Callahan (Vice Chairperson) Director Kootenai County Community Development Sam Gage Operations Director Silverwood Theme Park Andy Helkey Program Manager Panhandle Health District Joe Jovick Lieutenant Kootenai County Sheriff’s Office Lance Mueller Planning Technician Coeur d’Alene Tribe John Pankratz District Supervisor East Side Highway District Chris Schlothauer Electric Operations Manager Avista Gary Stevens Hydrogeologist Idaho Department of Environmental Quality Jeff Tyler President Home Owners Association of Harbor Island Sandy Von Behren (Spokesperson) Director Office of Emergency Management Jim Washko Deputy Chief Coeur d’Alene Fire Department Terry Werner Volunteer Post Falls Chamber of Commerce
Note: Some members of the steering committee elected to designate alternates to attend on their behalf. Please refer to the hazard mitigation plan website for a full listing. http://oem.kcgov.us
Leadership roles and ground rules were established during the Steering Committee’s initial meeting on October 8, 2014. The Steering Committee agreed to meet monthly as needed throughout the course of the plan’s development. The planning team facilitated each Steering Committee meeting, which addressed a set of objectives based on the work plan established for the plan. The Steering Committee met five times from October 2014 through May 2015. Meeting agendas, notes and attendance logs are available for review upon request. All Steering Committee meetings were open to the public and agendas and meeting notes were posted to the hazard mitigation plan website.
3.5 COORDINATION WITH OTHER AGENCIES Opportunities for involvement in the planning process must be provided to neighboring communities, local and regional agencies involved in hazard mitigation, agencies with authority to regulate development, businesses, academia, and other private and nonprofit interests (44 CFR, Section 201.6(b)(2)). This task was accomplished by the planning team as follows:
• Steering Committee Involvement—Agency representatives were invited to participate on the Steering Committee.
• Adjacent Counties—Shoshone, Benewah and Bonner Counties in Idaho and Spokane County in Washington were apprised throughout the planning update process and were invited to participate.

PLAN METHODOLOGY
3-5
• Agency Notification—The following agencies were invited to participate in the plan development process from the beginning and were kept apprised of plan development milestones:
– Idaho Bureau of Homeland Security
– Idaho Department of Water Resources (State NFIP Coordinating Agency)
– Idaho Department of Environmental Quality
– Idaho Geologic Survey
– Coeur d’Alene Tribe
– The University of Idaho.
These agencies received meeting announcements, meeting agendas, and meeting minutes by email throughout the plan development process or were contacted directly by the planning team during data acquisition for the plan update. These agencies supported the effort by attending meetings or providing feedback on issues.
• Pre-Adoption Review—All the agencies listed above were provided an opportunity to review and comment on this plan, primarily through the hazard mitigation plan website (see Section 3.7). Each agency was sent an email message informing them that draft portions of the plan were available for review. In addition, the complete draft plan was sent to the Idaho Bureau of Homeland Security for a pre-adoption review to ensure program compliance and to FEMA’s Community Rating System (CRS) contractor, the Insurance Services Office, Inc.
• Adoption of the Plan—Upon FEMA review of the plan to ensure it meets all requirements of the Title 44 Code of Regulations (CFR) 201.6, FEMA will send a letter indicating the plan has been approved for adoption by all Planning Partners. Each Planning Partner has an opportunity to individually adopt the updated plan. Records of adoption are forwarded to BHS and FEMA. FEMA will send a letter indicating those planning partners that have adopted the plan and are now eligible for mitigation funding under this plan.
3.6 REVIEW OF EXISTING PROGRAMS Hazard mitigation planning must include review and incorporation, if appropriate, of existing plans, studies, reports and technical information (44 CFR, Section 201.6(b)(3)). Chapter 6 of this plan provides a review of laws and ordinances in effect within the planning area that can affect hazard mitigation initiatives. In addition, the following laws, plans and programs can affect mitigation within the planning area:
• United States Constitution
• State of Idaho Constitution
• Kootenai County Comprehensive Plan
• Kootenai County Code (Titles 1-11)
• Kootenai County 1998 Flood Mitigation Plan
• Kootenai County Community Wildfire Protection Plan
• Kootenai County Emergency Operations Plan
• Kootenai County 2009 Multi-Jurisdictional All Hazard Mitigation Plan
• Idaho 2013 State Hazard Mitigation Plan

Kootenai County Multi-Jurisdictional All Hazard Mitigation Plan; Volume 1—Planning-Area-Wide Elements
3-6
• Coeur d’Alene Tribal Hazard Mitigation Plan
• Comprehensive plans for each incorporated planning partner
• Municipal codes for each municipal planning partner
• FEMA Region X Discovery Report—Upper Spokane River Watershed
• FEMA Region X Risk Report—Upper Spokane River Watershed Study Area Specific to Kootenai County
• Comprehensive Economic Development Strategy; Panhandle Area Council
An assessment of all planning partners’ regulatory, technical and financial capabilities to implement hazard mitigation initiatives is presented in the jurisdiction-specific annexes in Volume 2. Many of plans, studies and regulations listed above are cited in the capability assessment.
3.7 PUBLIC INVOLVEMENT Broad public participation in the planning process helps ensure that diverse points of view about the planning area’s needs are considered and addressed. The public must have opportunities to comment on disaster mitigation plans during the drafting stages and prior to plan approval (44 CFR, Section 201.6(b)(1)). The Community Rating System expands on these requirements by making CRS credits available for optional public involvement activities.
3.7.1 Strategy The strategy for involving the public in this plan emphasized the following elements:
• Include members of the public on the Steering Committee.
• Use a questionnaire to determine if the public’s perception of risk and support of hazard mitigation has changed since the initial planning process.
• Attempt to reach as many planning area citizens as possible using multiple media.
• Identify and involve planning area stakeholders.
Stakeholders and the Steering Committee
Stakeholders are the individuals, agencies and jurisdictions that have a vested interest in the recommendations of the hazard mitigation plan, including planning partners. The effort to include stakeholders in this process included stakeholder participation on the Steering Committee. This committee makeup includes the following representation:
• Citizens
• State emergency management
• County emergency management
• Municipal planning partners
• Special district planning partners
• Business interests.

PLAN METHODOLOGY
3-7
Questionnaire
A hazard mitigation plan questionnaire was developed by the planning team with guidance from the Steering Committee. The questionnaire was used to gauge household preparedness for natural hazards and the level of knowledge of tools and techniques that assist in reducing risk and loss from natural hazards. This questionnaire was designed to help identify areas vulnerable to one or more natural hazards and provide answers to its 33 questions to help guide the Steering Committee in selecting goals, objectives and mitigation strategies. Hard copies of the questionnaires were made available throughout the planning area by multiple means. Additionally, a web-based version of the questionnaire was made available on the hazard mitigation plan website (see Figure 3-1). Over 475 questionnaires were completed during the course of this planning process. One of the key questions of the questionnaire asked citizens which of the hazards of hazards addressed by the plan they were most concerned about. For the natural hazards, the public was most concerned about wildfire. For the non-natural hazards, they were most concerned about hazardous material events. Figure 3-2 provides a graphic representation of the these findings from the questionnaire. The complete questionnaire and a summary of its findings can be found in Appendix B of this volume.
Figure 3-1. Sample Screen from Online Hazard Mitigation Questionnaire

Kootenai County Multi-Jurisdictional All Hazard Mitigation Plan; Volume 1—Planning-Area-Wide Elements
3-8
Figure 3-2. Public Perception of Risk
Public Meetings
An open-house public meeting was held on January 7, 2015 at the Kootenai County Administration Building in Coeur d’Alene (see Figure 3-3, Figure 3-4, Figure 3-5 and Figure 3-6). The event ran from 4:30 to 6:00 p.m. The meeting format allowed attendees to examine maps and handouts and have direct conversations with project staff. Reasons for planning and information generated for the risk assessment were shared with attendees via a PowerPoint presentation. Each citizen attending the open houses was asked to complete a questionnaire, and each was given an opportunity to provide written comments to the Steering Committee. Local media outlets were informed of the open houses by a press release from the County.
Press Releases
Press releases were distributed over the course of the plan’s development as key milestones were achieved and prior to each public meeting. The planning effort received the following press coverage:
• Planning team meeting was advertised in the “Calendar of Events” section of the Coeur d’Alene Press on March 7, 2014.
• Public meeting was advertised in the “Calendar of Events” section of the Coeur d’Alene Press on January 7, 2015 (see Figure 3-7).
• Public meeting was advertised in the “Calendar of Events” section of the Coeur d’Alene Press on March 20, 2015

PLAN METHODOLOGY
3-9
Figure 3-3. Steering Committee approves public review draft of the plan
Figure 3-4. Hazard maps were reviewed at public meeting #2
Figure 3-5. Large scale area maps showing hazard impact areas were reviewed at Public Meeting #2
Figure 3-6. Citizens review draft plan at public meeting #2.
Figure 3-7. Coeur d’Alene Press Advertisement of Public Meeting

Kootenai County Multi-Jurisdictional All Hazard Mitigation Plan; Volume 1—Planning-Area-Wide Elements
3-10
Internet
At the beginning of the plan development process, a website was created to keep the public posted on plan development milestones and to solicit relevant input (see Figure 3-8):
http://www.kcgov.us/departments/disaster/HazardMitigationPlanning/
The site’s address was publicized in all press releases, mailings, questionnaires and public meetings. Information on the plan development process, the Steering Committee, the questionnaire and phased drafts of the plan was made available to the public on the site throughout the process. The County intends to keep a website active after the plan’s completion to keep the public informed about successful mitigation projects and future plan updates.
Figure 3-8. Sample Page from Hazard Mitigation Plan Web Site
3.7.2 Public Involvement Results By engaging the public through the public involvement strategy, the concept of mitigation was introduced to the public, and the Steering Committee received feedback that was used in developing the components of the plan. Details of attendance and comments received are summarized in Table 3-4.
3.8 PLAN DEVELOPMENT CHRONOLOGY/MILESTONES Table 3-5 summarizes important milestones in the development of the plan.
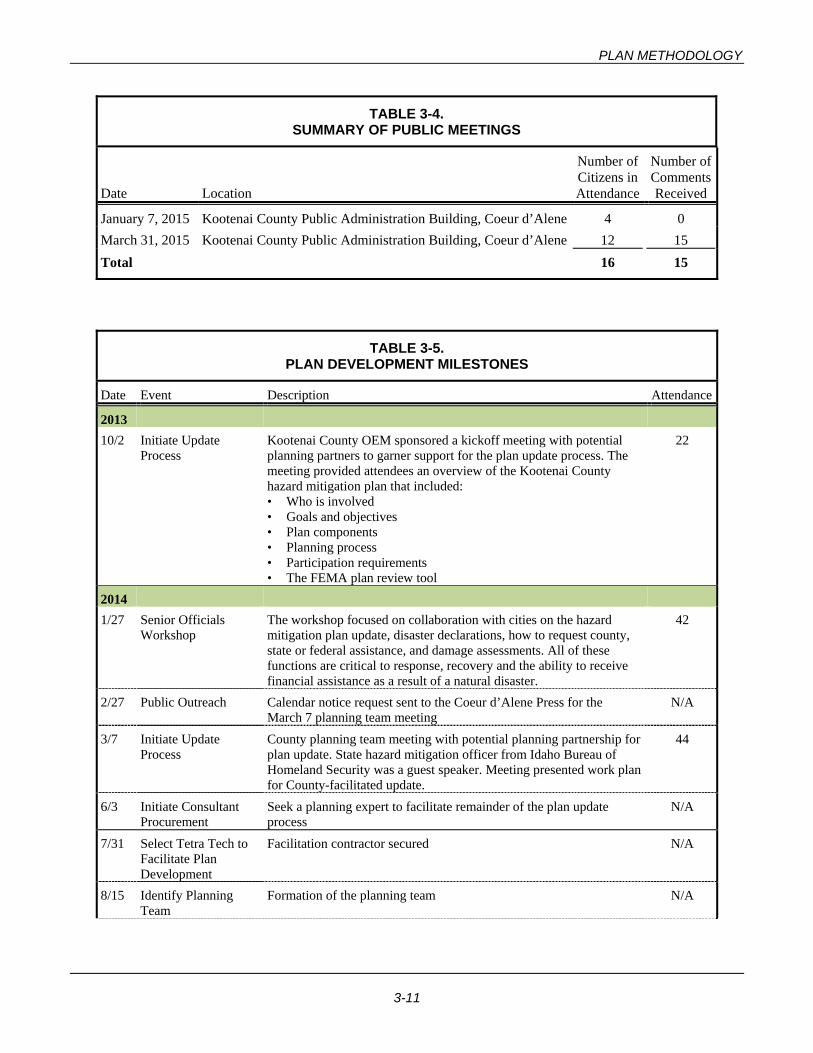
PLAN METHODOLOGY
3-11
TABLE 3-4. SUMMARY OF PUBLIC MEETINGS
Date Location
Number of Citizens in Attendance
Number of Comments Received
January 7, 2015 Kootenai County Public Administration Building, Coeur d’Alene 4 0 March 31, 2015 Kootenai County Public Administration Building, Coeur d’Alene 12 15 Total 16 15
TABLE 3-5. PLAN DEVELOPMENT MILESTONES
Date Event Description Attendance
2013 10/2 Initiate Update
Process Kootenai County OEM sponsored a kickoff meeting with potential planning partners to garner support for the plan update process. The meeting provided attendees an overview of the Kootenai County hazard mitigation plan that included: • Who is involved • Goals and objectives • Plan components • Planning process • Participation requirements • The FEMA plan review tool
22
2014 1/27 Senior Officials
Workshop The workshop focused on collaboration with cities on the hazard mitigation plan update, disaster declarations, how to request county, state or federal assistance, and damage assessments. All of these functions are critical to response, recovery and the ability to receive financial assistance as a result of a natural disaster.
42
2/27 Public Outreach Calendar notice request sent to the Coeur d’Alene Press for the March 7 planning team meeting
N/A
3/7 Initiate Update Process
County planning team meeting with potential planning partnership for plan update. State hazard mitigation officer from Idaho Bureau of Homeland Security was a guest speaker. Meeting presented work plan for County-facilitated update.
44
6/3 Initiate Consultant Procurement
Seek a planning expert to facilitate remainder of the plan update process
N/A
7/31 Select Tetra Tech to Facilitate Plan Development
Facilitation contractor secured N/A
8/15 Identify Planning Team
Formation of the planning team N/A

Kootenai County Multi-Jurisdictional All Hazard Mitigation Plan; Volume 1—Planning-Area-Wide Elements
3-12
TABLE 3-5. PLAN DEVELOPMENT MILESTONES
Date Event Description Attendance8/22 Stakeholder Meeting 2nd kickoff meeting held to introduce Tetra Tech to the planning
partnership and re-engage the partnership with the revised scope of work for the plan update. Attendees were presented planning partner expectations for the revised process and asked for recommendations for Steering Committee participants.
36
10/7 Steering Committee Meeting #1
• Review purposes for update • Organize Steering Committee • Review/revise Steering Committee ground rules • Plan review • Develop public involvement strategy
20
11/12 Steering Committee Meeting #2
• Approve Steering Committee ground rules • Discuss plan review findings • Confirm hazards of concern for plan update • Preview maps • Goal setting • Define critical facilities • Discuss public outreach strategy • Introduce objective exercise
16
12/1 Public Outreach Hazard Mitigation Survey deployed on SurveyMonkey.com NA 12/10 Steering Committee
Meeting #3 • Identify hazards of concern • Preview hazard mapping • Review/approve final objectives • Public outreach strategy • Strengths, weaknesses, obstacles and opportunities
17
12/23 Public Outreach Media release sent to all media outlets in the planning area, advertising the plan update process, the website and the hazard mitigation survey.
N/A
2015 1/07 Strengths,
Weaknesses, Obstacles and Opportunities Session
Steering committee members and planning partners participated in a facilitated brainstorming session to identify strengths, weaknesses, obstacles, and opportunities to hazard mitigation planning in the planning area.
20
1/14 Jurisdictional Annex Workshops
Mandatory session for planning partners. Workshop focused on how to complete the jurisdictional annex template. Separate sessions were held for municipal governments and special purpose districts.
38
2/10 Draft Plan Volume 1 Received by Kootenai County and sent to all partners and the Steering Committee for initial review.
3/3 Draft Plan Volume 2 Received by Kootenai County and sent to all partners and the Steering Committee for initial review.
3/18 Public Outreach Press release sent to all media outlets, announcing draft plan and final public comment period.
N/A
3/25 Draft Plan Internal review draft provided by planning team to Steering Committee N/A 3/25 Public Comment
Period Initial public comment period of draft plan opens. Draft plan posted on plan website with press release notifying public of plan availability
N/A
3/31 Public Outreach Public Meeting on Draft Plan 12

PLAN METHODOLOGY
3-13
TABLE 3-5. PLAN DEVELOPMENT MILESTONES
Date Event Description Attendance4/12 Public Comment
Period Ends Initial Public Comment period of the draft plan ends. Draft Plan changes identified.
N/A
4/15 Changes to Draft Plan Steering Committee reviewed proposed changes to the Draft Plan that will be sent to contractor for final edits.
N/A
4/23 Begin Final Public Comment
Post final plan on website for public comment. N/A
4/30 End Final Public Comment
End Public Comment. Review and determine if any final changes are required.
N/A
5/4 Plan Review by BHS Final draft plan submitted to Bureau of Homeland Security for review and approval.
N/A
Plan Review by FEMA
BHS submits Final draft plan to FEMA for review and pre-adoption approval.
N/A
Plan Approval Final plan approved by FEMA contingent upon adoption by jurisdictions.
N/A
Pre Adoption Packets OEM provides Pre Adoption Packets to each Planning Partner .
Adoption Planning Partners individually adopt the Final Plan. Records of Adoptions are sent to BHS and FEMA. FEMA issues a letter listing the planning partners that are eligible for mitigation funding .
N/A


CHAPTER 4. MISSION, GOALS AND OBJECTIVES
Hazard mitigation plans must identify goals for reducing long-term vulnerabilities to identified hazards (44 CFR Section 201.6(c)(3)(i)). The Steering Committee established a guiding principle, a set of goals and measurable objectives for this plan, based on data from the preliminary risk assessment and the results of the public involvement strategy. The guiding principle, goals, objectives and actions in this plan all support each other. Goals were selected to support the guiding principle. Objectives were selected that met multiple goals. Actions were prioritized based on the action meeting multiple objectives.
4.1 GUIDING PRINCIPLE The Steering Committee reviewed the following mission statement identified for the 2009 plan and determined that it remains appropriate as a guiding principle for this plan update:
To reduce or eliminate the risk of loss of life and property, encourage long-term reduction of vulnerability and save lives and reduce costly property damage due to natural and/or human caused hazards.
4.2 REVISED GOALS AND OBJECTIVES The Steering Committee identified four goals and 19 objectives for the updated plan. All of these planning components support each other, but each stands on its own merits. Selected goals support the guiding principle, selected objectives meet multiple goals, and actions were selected and prioritized based on meeting multiple objectives. This was a change from the 2009 plan, which identified goals by category and objectives as subsets of goals. The revised approach adds versatility to the plan, making it flexible to address changing conditions and partnership capabilities.
4.2.1 Revised Goals The following are the mitigation goals for this plan update:
1. Reduce the risks associated with natural, technological, and human-caused hazards through planning and emergency response efforts.
2. Establish a collaborative and cooperative relationship within the community (Kootenai County) for all hazard risk reduction.
3. Implement actions that protect lives and reduce the impact of hazards on our property, environment, and economy.
4. Maintain a current and actionable mitigation plan.
The effectiveness of a mitigation strategy is assessed by determining how well these goals are achieved.
4-1

Kootenai County Multi-Jurisdictional All Hazard Mitigation Plan; Volume 1—Planning-Area-Wide Elements
4.2.2 Revised Objectives Each selected objective meets multiple goals, serving as a stand-alone measurement of the effectiveness of a mitigation action, rather than as a subset of a goal. The objectives also help to establish priorities. The objectives are as follows:
1. Create an effective information exchange between the Office of Emergency Management, public information officers, public responders, general public, and media outlets.
2. Develop and promote cooperative agreements between Kootenai County and local jurisdictions, government agencies, and the Tribe that define and implement an ongoing coordinated joint hazard mitigation effort.
3. Develop programs and actions that increase safety, reduce the disruption of services, and decrease property damage from potential hazards.
4. Increase awareness of disaster mitigation actions and resources, and develop education activities emphasizing preparedness and recovery from hazard incidents.
5. Include hazard mitigation planning in Kootenai County’s policy, planning, and budgeting processes, as appropriate.
6. Develop an understanding of natural resource management and its relationship to hazard mitigation planning.
7. Facilitate the building of relationships between public and private sectors to foster hazard mitigation through environmental design.
8. Identify and implement responsible best management practices, (such as building in flood prone areas, steep sloped areas, sensitive wildlife or wetland areas) for land development, recreational activities, and commercial/industrial operations to reduce loss from potential disasters on public and private land in Kootenai County.
9. Build upon Kootenai County’s geographic information system (GIS) mapping capability to create maps and overlays of all natural and human-caused hazard areas in Kootenai County, its municipalities, and local jurisdictions.
10. Develop action plans and programs that decrease disruptions to government services and emergency response activities.
11. Support public and private efforts that mitigate and reduce the economic impact of disaster events and post-disaster recovery costs.
12. Develop and prioritize projects in Kootenai County that increase the protection of life, property, environment and historical resources from the impacts of disasters.
13. Build and sustain secure, interoperable, dedicated, and redundant emergency communications infrastructure.
14. Minimize the destruction of public utilities and services during and after a hazard event.
15. Seek public and private financial resources for investment in hazard mitigation planning, implementation of actions, and post-disaster recovery.
16. Review, maintain, and update a comprehensive analysis of natural and human-caused hazards impacting Kootenai County municipalities and local jurisdictions, as needed.
17. Minimize development in extreme hazard-prone areas.
4-2

MISSION, GOALS AND OBJECTIVES
18. Implement local codes, ordinances and standards to promote the use of appropriate hazard-resistant structural methods and materials for buildings in areas with potential for significant hazard damage.
19. Identify and implement resilient protective measures that mitigate damage to, and disruption of, critical infrastructure and key resources.
4-3


Kootenai County Multi-Jurisdictional All Hazard Mitigation Plan Volume 1: Planning-Area-Wide Elements
PART 2 — RISK ASSESSMENT


CHAPTER 5. IDENTIFIED HAZARDS OF CONCERN AND RISK
ASSESSMENT METHODOLOGY
Risk assessment is the process of measuring the potential loss of life, personal injury, economic injury, and property damage resulting from natural hazards. It allows emergency management personnel to establish early response priorities by identifying potential hazards and vulnerable assets. The process focuses on the following elements:
• Hazard identification—Use all available information to determine what types of disasters may affect a jurisdiction, how often they can occur, and their potential severity.
• Vulnerability identification—Determine the impact of natural hazard events on the people, property, environment, economy and lands of the region.
• Cost evaluation—Estimate the cost of potential damage or cost that can be avoided by mitigation.
The risk assessment for this hazard mitigation plan update evaluates the risk of natural hazards prevalent in the planning area and meets requirements of the DMA (44 CFR, Section 201.6(c)(2)).
5.1 IDENTIFIED HAZARDS OF CONCERN For this plan, the Steering Committee considered the full range of natural hazards that could impact the planning area and then selected hazards that present the greatest concern for assessment. The process incorporated review of state and local hazard planning documents, as well as information on the frequency, magnitude and costs associated with hazards that have impacted or could impact the planning area. Anecdotal information regarding natural hazards and the perceived vulnerability of the planning area’s assets to them was also used. Based on the review, this plan addresses the following hazards of concern:
• Avalanche
• Dam failure
• Drought
• Earthquake
• Flood
• Landslide
• Severe weather systems
• Volcanic ash fall
• Wildfire
With the exception of dam failure, this plan does not provide a full risk assessment of technological hazards and human-caused hazards. However, Chapter 16 provides a qualitative discussion of the following additional hazards, referred to in this plan as hazards of interest:
• Cyber-disruption
• Hazardous material incidents
5-1

Kootenai County Multi-Jurisdictional All Hazard Mitigation Plan; Volume 1—Planning-Area-Wide Elements
• Pandemic
• Radiological material exposure
• Civil unrest
• Terrorism.
5.2 METHODOLOGY The risk assessments in Chapter 7 through Chapter 15 describe the risks associated with each identified hazard of concern. Each chapter describes the hazard, the planning area’s vulnerabilities, and probable event scenarios. The following steps were used to define the risk of each hazard:
• Identify and profile each hazard—The following information is given for each hazard:
– Geographic areas most affected by the hazard
– Event frequency estimates
– Severity estimates
– Warning time likely to be available for response.
• Determine exposure to each hazard—Exposure was determined by overlaying hazard maps with an inventory of structures, facilities, and systems to determine the population and property exposed to each hazard.
• Assess the vulnerability of exposed facilities—Vulnerability was evaluated as the likely harm or damage to exposed people, structures and infrastructure. Computer modeling tools were used to perform this assessment where available.
5.3 RISK ASSESSMENT TOOLS
5.3.1 Mapping A review of national, state and county databases was performed to locate available data for mapping hazards in the planning area. When such data was available, maps were produced using GIS software to show the extent and location of hazards. These maps are included in the hazard profile chapters of Volume 1 of this plan and in the jurisdiction-specific annexes in Volume 2. Information regarding the data sources and methodologies employed in these mapping efforts is provided in Appendix C.
5.3.2 Earthquake and Flood—Hazus-MH
Overview In 1997, FEMA developed the standardized Hazards U.S., or Hazus, model to estimate losses caused by earthquakes and identify areas that face the highest risk and potential for loss. Hazus was later expanded into a multi-hazard methodology, Hazus-MH, with new models for estimating potential losses from hurricanes and floods.
Hazus-MH is a GIS-based software program used to support risk assessments, mitigation planning, and emergency planning and response. It provides a wide range of inventory data, such as demographics, building stock, critical facility, transportation and utility lifeline, and multiple models to estimate potential
5-2

IDENTIFIED HAZARDS OF CONCERN AND RISK ASSESSMENT METHODOLOGY
losses from natural disasters. The program maps and displays hazard data and the results of damage and economic loss estimates for buildings and infrastructure. Its advantages include the following:
• Provides a consistent methodology for assessing risk across geographic and political entities.
• Provides a way to save data so that it can readily be updated as conditions change and as mitigation planning efforts evolve.
• Facilitates federal review of mitigation plans because it helps to ensure that FEMA methodologies are incorporated.
• Supports grant applications by calculating benefits using FEMA definitions and terminology.
• Produces hazard data and loss estimates that can be used in communication with local stakeholders.
• Is administered by the local government and can be used to manage and update a hazard mitigation plan throughout its implementation.
Levels of Detail for Evaluation Hazus-MH provides default data for inventory, vulnerability and hazards; this default data can be supplemented with local data to provide a more refined analysis. The model can carry out three levels of analysis, depending on the format and level of detail of information about the planning area:
• Level 1—All of the information needed to produce an estimate of losses is included in the software’s default data. This data is derived from national databases and describes in general terms the characteristic parameters of the planning area.
• Level 2—More accurate estimates of losses require more detailed information about the planning area. To produce Level 2 estimates of losses, detailed information is required about local geology, hydrology, hydraulics and building inventory, as well as data about utilities and critical facilities. This information is needed in a GIS format.
• Level 3—This level of analysis generates the most accurate estimate of losses. It requires detailed engineering and geotechnical information to customize it for the planning area.
Application for This Plan Hazus-MH was used as described below to assess the flood and earthquake risks for this plan.
Flood A Level 2 analysis was performed for the flood hazard. GIS building and assessor data (replacement cost values and detailed structure information) provided by Kootenai County were loaded into Hazus-MH to replace the default general building stock data. An updated inventory was used in place of the Hazus-MH defaults for essential facilities, transportation and utilities.
Where available, detailed information from the FEMA Flood Insurance Study was used together with a U.S. Geological Survey (USGS) 10-meter resolution digital elevation model to create flood depth grids for the 100- and 500-year flood events. Detailed FEMA flood study data for the planning area is limited, which impacts the accuracy of the flood modeling done for this risk assessment. Over half of the planning area has 100-year floodplains delineated by approximate rather than detailed methods. In most of the planning area, no 500-year floodplain mapping at all is available. Of all the planning partners, only the unincorporated county and the cities of Coeur d’Alene, Post Falls and Rathdrum have any 500-year flood mapping; and the mapping in those jurisdictions does not cover the full extent of flood-prone waterways.
5-3

Kootenai County Multi-Jurisdictional All Hazard Mitigation Plan; Volume 1—Planning-Area-Wide Elements
Earthquake A Level 2 analysis was performed to assess earthquake exposure and vulnerability. Historical event and probabilistic data prepared by the USGS were used for the analysis of this hazard. An updated general building stock inventory was developed using replacement cost values and detailed structure information from Kootenai County tax assessor tables. An updated inventory of essential facilities, transportation and utility features was used in place of the Hazus-MH defaults. One historical event and two probabilistic events were modeled:
• The historical event was a Magnitude-5.5 event from 1942 with an epicenter approximately 3.5 miles north of the City of Athol.
• The standard Hazus analyses for the 100- and 500-year probabilistic events were run.
5.3.3 Dam Failure, Landslide, Severe Weather, Volcanic Ash Fall and Wildfire For most of the hazards of concern, historical data was not adequate to model future losses. However, areas and inventory susceptible to some of the hazards of concern were mapped by other means and exposure was evaluated. For other hazards, a qualitative analysis was conducted using the best available data and professional judgment. Locally relevant information was gathered from a variety of sources. Frequency and severity indicators include past events and the expert opinions of geologists, emergency management specialists and others. The primary data source was the Kootenai County GIS, augmented with state and federal data sets. Data sources and methods for specific hazards were as follows:
• Dam Failure—No failure inundation mapping is available for dams in Kootenai County. The risk assessment for this hazard provides a qualitative discussion of exposure and vulnerability. For dams where such information is available, a qualitative description is provided of a probable maximum flood event, produced using the National Weather Service DAMBREAK model.
• Landslide—No landslide hazard area mapping is available for Kootenai County. The risk assessment for this hazard provides a qualitative discussion of exposure and vulnerability.
• Severe Weather—Severe weather data was downloaded from the Natural Resources Conservation Service and the National Climatic Data Center.
• Volcanic Ash Fall—Volcanic ash fall would affect the entire planning area, so specific hazard mapping of exposure is not required. No data is available for estimating losses, so the risk assessment for this hazard provides a qualitative discussion of vulnerability.
• Wildfire—Wildfire hazard data from the Idaho State Assessment of Forest Resources was provided by Kootenai County GIS.
5.3.4 Drought and Avalanche The risk assessment methodologies used for this plan focus on damage to structures. Because drought does not impact structures, the risk assessment for drought was more limited and qualitative than the assessment for the other hazards of concern. Similarly, the avalanche hazard generally is minimal in developed areas, so the risk assessment for that hazard also was limited and qualitative.
5.3.5 Limitations Loss estimates, exposure assessments and hazard-specific vulnerability evaluations rely on the best available data and methodologies. Uncertainties are inherent in any loss estimation methodology and arise
5-4

IDENTIFIED HAZARDS OF CONCERN AND RISK ASSESSMENT METHODOLOGY
in part from incomplete scientific knowledge concerning natural hazards and their effects on the built environment. Uncertainties also result from the following:
• Approximations and simplifications necessary to conduct a study
• Incomplete or outdated inventory, demographic or economic parameter data
• The unique nature, geographic extent and severity of each hazard
• Mitigation measures already employed
• The amount of advance notice residents have to prepare for a specific hazard event.
These factors can affect loss estimates by a factor of two or more. Therefore, potential exposure and loss estimates are approximate and should be used only to understand relative risk. Over the long term, Kootenai County and its planning partners will collect additional data to assist in estimating potential losses associated with other hazards.
5-5


CHAPTER 6. KOOTENAI COUNTY PROFILE
Kootenai County is located in the northern Idaho panhandle (see Figure 6-1). It is the third most populous of Idaho’s 44 counties and the 24th largest in area.
6.1 JURISDICTIONS AND FEATURES Kootenai County is bordered on the west by the state of Washington, on the north by Bonner County, on the east by Shoshone County, and on the south by Benewah County. It includes 14 incorporated cities:
• Athol
• Coeur d’Alene
• Dalton Gardens
• Fernan Lake Village
• Harrison
• Hauser
• Hayden
• Hayden Lake
• Huetter
• Post Falls
• Rathdrum
• Spirit Lake
• State Line
• Worley
Coeur d’Alene, near the center of the county, is the county seat and largest city. Lake Coeur d’Alene is a major geographic feature in the southern half of the county, and Hayden Lake is a large feature in the northern half. Much of the eastern part of the county is within the Coeur d’Alene National Forest. The southwestern tip of the county is within the Coeur d’Alene Indian Reservation.
6.2 HISTORICAL OVERVIEW Kootenai County contains a significant portion of the center of the Coeur d’Alene tribal homeland, as well as the primary east-west trail system that was used by interior Salishan peoples traveling between the Bitterroot Mountains and the Great Plains. The Lewis and Clark expedition through central Idaho in 1805 was the first recorded exploration by people of European descent. In 1842, the first Jesuit mission was founded near St. Maries. Camp Coeur d’Alene (later changed to Fort Sherman) was established in 1878 at the point where Lake Coeur d’Alene flows into the Spokane River.
A community developed around the fort, but it was not until the discovery of gold in 1883-1884 on the North Fork of the Coeur d’Alene River that many settlers arrived. Mining created an economic basis for future developments in timber, transportation and trade in Kootenai, Benewah and Shoshone Counties. In 1883, the Northern Pacific Transcontinental Railroad crossed North Idaho. Rathdrum developed as an agricultural center and supply point for the mining district and remained a railhead until 1886, when D.C. Corbin built a spur line connecting to Coeur d’Alene. By the beginning of the 20th century, the Inland Empire Railroad electric line train made several trips a day from downtown Spokane to Coeur d’Alene.
After 1900, large lumber companies discovered the region’s stands of white pine. Harrison, St. Maries, Rose Lake, Spirit Lake, Twin Lakes, Post Falls, and Coeur d’Alene each developed a large milling industry. By the mid-1920s the lumber industry began to slow down, and many of the smaller mill towns disappeared. World War II saw improvement in the lumber industry; but the days of accessible timber and cheap transportation were over. In the early 1980s an economic decline affected both the forestry and mining economies. Today the County’s economy is more diversified and has seen much growth and prosperity.
6-1

Kootenai County Multi-Jurisdictional All Hazard Mitigation Plan; Volume 1—Planning-Area-Wide Elements
Figure 6-1. Main Features of the Planning Area
6-2

KOOTENAI COUNTY PROFILE
6.3 MAJOR PAST HAZARD EVENTS Presidential disaster declarations are typically issued for hazard events that cause more damage than state and local governments can handle without assistance from the federal government, although no specific dollar loss threshold has been established for these declarations. A presidential disaster declaration puts federal recovery programs into motion to help disaster victims, businesses and public entities. Some of the programs are matched by state programs. The planning area has experienced 14 events since 1956 for which presidential disaster declarations were issued. These events are listed in Table 6-1. Review of these events helps identify targets for risk reduction and ways to increase a community’s capability to avoid large-scale events in the future.
TABLE 6-1. PRESIDENTIAL DISASTER DECLARATIONS FOR HAZARD EVENTS IN THE PLANNING AREA
Type of Event Disaster Declaration # Date
Flooda DR-55 04/21/1956
Flooda DR-76 05/27/1957
Wildfiresa DR-105 07/22/1960
Flooda DR-116 06/26/1961
Flooda DR-120 02/14/1962
Flooda DR-143 02/14/1963
Heavy rains & flooding DR-186 12/31/1964 Forest fires DR-231 8/30/1967 Severe storms, snowmelt & flooding DR-415 1/25/1974 Volcanic eruption, Mt. St. Helens DR-624 5/22/1980 Severe storms and flooding DR-1102 2/6/1996 Severe storms, flooding, mud and landslides DR-1154 11/16/1996 Severe storms, snowmelt, land/mud slides, flooding DR-1177 3/14/1997 Flooding DR-1781 5/15/2008
a. Prior to 1964, federal disaster declaration were not issued specific to counties; pre-1964 declarations listed in this table are for the entire state of Idaho, not Kootenai County specifically
Many natural hazard events do not trigger federal disaster declarations but have significant impacts on their communities. These events are also important to consider in establishing recurrence intervals for hazards of concern.
6.4 PHYSICAL SETTING
6.4.1 Geology and Soils Kootenai County consists primarily of forested, mountainous or hilly terrain. Elevations vary from 2,040 feet above sea level at the Washington-Idaho state line to mountain peaks at elevations above 6,000 feet in the southeastern part of the county.
6-3

Kootenai County Multi-Jurisdictional All Hazard Mitigation Plan; Volume 1—Planning-Area-Wide Elements
The Rathdrum Prairie, crossing northern Kootenai County at an elevation of 2,200 feet, is a glacial-outwash plain with soils deposited by melting glaciers. It has level or gently sloping terraces with moderately steep or steep slopes on the terrace breaks. The southwestern portion of Kootenai County includes part of the rolling and hilly loess-covered prairie region called the Palouse area.
The Coeur d’Alene River enters the Lake Coeur d’Alene from the east and the St. Joe River enters the lake from the south, outside the county boundary. The lake’s outlet in the center of the county is the Spokane River, which flows west into Washington.
6.4.2 Climate In Kootenai County, a prevailing flow of maritime air from the northern Pacific Ocean is lifted and cooled by local highlands, resulting in ample precipitation throughout the county. Average annual precipitation ranges from 25 inches in the lowlands to as much as 70 inches in some mountain areas. The wettest months are November through January, when about 40 percent of the average annual precipitation occurs. Winter weather typically produces periods of rain and snow. Summers are generally dry.
The average high temperature in January, historically the coldest month, is 34.3ºF, and the average low is 21.4ºF. Highlands east of the county generally block extremely cold continental air masses from central Canada, but polar outbreaks sometimes cross the continental divide, producing prolonged periods of extremely cold weather. The record low in Coeur d’Alene of -30ºF occurred on January 30, 1950.
July is the warmest month, with an average high temperature of 85.2ºF and an average low of 52.5ºF in Coeur d’Alene. The record high temperature for the county of 109ºF occurred in Coeur d’Alene on August 4, 1961. The northern sector of the county is somewhat cooler, with the community of Bayview averaging a high of 80ºF and a low of 48ºF.
Average climate conditions across Kootenai County for temperature, precipitation and wind are shown on Figure 6-2 through Figure 6-6.
6.5 LAND USE According to the 2010 Kootenai County Comprehensive Plan (Kootenai County, 2010), Kootenai County has a total area of 1,316 square miles (842,000 acres), of which 71 square miles is water. As of July 2007, incorporated areas in the county covered approximately 32,000 acres, with 69 percent of the county population. At that time, there were 33,349 unincorporated parcels, excluding public lands, averaging 14 acres per parcel. There were 12,843 vacant parcels, with an average size of about 25 acres.
There are approximately 363,000 acres of public land in Kootenai County. This land includes federal, tribal, and state lands and municipalities with corporate boundaries. Coeur d’Alene Tribal Trust lands cover 17,080 acres in the county. Kootenai County has 245,000 acres of federal timberland in the Coeur d’Alene National Forest. Remaining timberlands in the county are owned by private tree farmers, timber companies, the State of Idaho, and other government entities.
There are 7,622 parcels in the Shoreline Development designation; 2,761 of those parcels are vacant. The average lot size of the Shoreline Development parcels is 9.5 acres.
Table 6-2 shows current land use in the planning area. Land use information is analyzed in this plan for each identified hazard that has a defined spatial extent and location. For hazards that lack this spatial reference, the following information serves as a baseline estimate of land use and exposure for the planning area. The distribution of land uses within the county will change over time.
6-4

KOOTENAI COUNTY PROFILE
Figure 6-2. Annual Average Precipitation for Idaho Panhandle
Figure 6-3. Annual Average Minimum Temperature for Idaho Panhandle
6-5

Kootenai County Multi-Jurisdictional All Hazard Mitigation Plan; Volume 1—Planning-Area-Wide Elements
Figure 6-4. Annual Average Maximum Temperature for Idaho Panhandle
Figure 6-5. Annual Average Temperature for Idaho Panhandle
6-6

Athol
HaydenLake
DaltonGardens
Worley
Fernan
Rathdrum
Hayden
Coeurd'Alene
PostFalls
Harrison
StateLine
SpiritLake
Huetter
HauserLake
£¤95
£¤95
£¤95
¬«58
¬«41
¬«97
¬«54
¬«3
¬«41
¬«53
§̈¦90
§̈¦90
Co eur d'Ale ne River
Spoka ne River
LakeCoeur
d'Alene
HaydenLake
LakePend
Oreille
SpiritLake
TwinLakes
/
0 63Miles
Figure Wind Power C lass a t 50m Height
Base Map Data Sources: Kootenai County, U.S. Geological Survey
Kootenai County Hazard Mit igat ion Plan Update
±
PoorMarginalFairGoodExcellentOutstandingSuperb

Kootenai County Multi-Jurisdictional All Hazard Mitigation Plan; Volume 1—Planning-Area-Wide Elements
TABLE 6-2. PRESENT LAND USE IN PLANNING AREA
Present Use Classification Area (acres) % of total
Agricultural 28,770.6 3.7% Grazing 9,331.2 1.2% Timber 260,700.2 33.3% Federal/State 316,728.6 40.5% Commercial 6,122.0 0.8% Industrial 2,304.6 0.3% Residential 10,992.2 1.4% Rural 70,818.8 9.0% Vacant Commercial 2,375.7 0.3% Vacant Industrial 1,610.7 0.2% Vacant Residential 3,592.5 0.5% Vacant Rural 47,384.6 6.1% Unknown 8,150.2 1.0% Vacant Unknown 13,727.5 1.8% Total 782,609.3 100.0%
Note: Present use classifications assigned using Kootenai County 2014 Assessor data. Commercial, industrial, residential, and rural lots without assessed structures were designated as vacant.
6.6 CRITICAL FACILITIES AND INFRASTRUCTURE Critical facilities and infrastructure are those that are essential to the health and welfare of the population. These become especially important after a hazard event. Critical facilities typically include police and fire stations, schools and emergency operations centers. Critical infrastructure can include roads and bridges that provide ingress and egress and allow emergency vehicles access to those in need, and utilities that provide water, electricity and communication services to the community. Also included are “Tier II” facilities and railroads, which hold or carry significant amounts of hazardous materials with a potential to impact public health and welfare in a hazard event. As defined for this hazard mitigation plan update, critical facilities include but are not limited to the following:
• Public and private utilities, infrastructure and transportation systems that are vital to maintaining or restoring normal services to areas damaged by hazard events— communications, water, power, wastewater, roads, bridges, airports, pipelines, etc.
• 9-1-1 centers, police stations, fire stations, vehicle and equipment storage facilities, medical facilities and emergency operations centers that are needed for disaster response before, during and after hazard events
• Structures or facilities that produce, use or store highly volatile, flammable, explosive, toxic or water-reactive materials
• Public gathering places that could be used as evacuation centers during large-scale disasters
6-8

KOOTENAI COUNTY PROFILE
• Government and educational facilities central to governance and quality of life along with response and recovery actions taken as a result of a hazard event.
Figure 6-7 and Figure 6-8 show the location of critical facilities and infrastructure in unincorporated areas of the county. Critical facilities within the cities participating in this plan are shown in maps for each city provided in Volume 2 of the plan. Due to the sensitivity of this information, a detailed list of facilities is not provided. The list is on file with each planning partner. Table 6-3 and Table 6-4 provide summaries of the general types of critical facilities and infrastructure, respectively, in each municipality and unincorporated county areas. All critical facilities and infrastructure were analyzed in Hazus to help rank risk and identify mitigation actions. The risk assessment for each hazard qualitatively discusses critical facilities with regard to that hazard.
6.7 DEMOGRAPHICS Some populations are at greater risk from hazard events because of decreased resources or physical abilities. Elderly people, for example, may be more likely to require additional assistance. Research has shown that people living near or below the poverty line, the elderly (especially older single men), the disabled, women, children, ethnic minorities and renters all experience, to some degree, more severe effects from disasters than the general population. These vulnerable populations may vary from the general population in risk perception, living conditions, access to information before, during and after a hazard event, capabilities during an event, and access to resources for post-disaster recovery. Indicators of vulnerability—such as disability, age, poverty, and minority race and ethnicity—often overlap spatially and often in the geographically most vulnerable locations. Detailed spatial analysis to locate areas where there are higher concentrations of vulnerable community members would assist the County in extending focused public outreach and education to these most vulnerable citizens.
6.7.1 Population Characteristics Knowledge of the composition of the population and how it has changed in the past and how it may change in the future is needed for making informed decisions about the future. Information about population is a critical part of planning because it directly relates to land needs such as housing, industry, stores, public facilities and services, and transportation. Kootenai County is the third largest of Idaho’s 44 The U.S. Census Bureau estimated the planning area’s population at 142,541 as of 2013 (U.S. Census, 2014).
Population changes are useful socio-economic indicators. A growing population generally indicates a growing economy, while a decreasing population signifies economic decline. Figure 6-9 shows the population growth rate in the planning area from 1950 through 2010 compared to that of the State of Idaho. The County’s population increased 455 percent over that period (an average of 2.9 percent per year), compared to the state’s growth of 166 percent (an average of 1.6 percent per year)
A population study was performed for the Idaho Water Resource board and the Idaho Department of Water Resources in 2010 to look at potential impacts to water supply on the Rathdrum Prairie Aquifer. The report estimates that the Rathdrum Prairie Aquifer area population growth is projected to grow from approximately 128,000 people to approximately 400,000 people by the year 2060, reflecting an average growth rate of approximately 2.3% per year. If population growth for the next 50 years is at the same 1.6% annual rate experienced between 1980 and 1990, the 2060 population overlying the aquifer will be approximately 286,000 people. If the population grows at a rate of 3% per year (which is less than the 3.7% annual growth between 1970 and 2007), the 2060 population overlying the Rathdrum Prairie Aquifer will be approximately 581,000 people.
6-9

$
$
$$
$$
$
$$
$$
$$$
$$$$
$
$$
$$$$$
$$
$
$$
$
$
$
$ $$$
$$
$$$
$
$
$
$$$
$
$
$$$$$$
$$
$$$
$$
$$$$$$$$$
$$$
$$$$$$$$$$$
$$$
$
$$
$$$$$$$
$$$$
$$
$
$
$$
$
$
$$
$
$$$
$$
$$$$$$$$
$
$
$$
$
$
$
$$
$
$
$$
$
$c_c_c_c_c_
c_
c_
c_
c_
c_
!F
!F !F
!F
¬«¬«
¬«¬«¬«¬«
¬«
¬«¬«
¬«
¬«
¬«¬«¬«
¬«
¬«
¬«
¬«¬«
¬«
¬«¬«
¬«
¬«¬«
¬«
¬«
¬«
¬«¬«
¬«
¬«
¬«
¬«
¬«
¬«
¬«
¬«
¬«
¬«¬«
¬«
¬«
¬«
¬«
nm
nmnm
nm
nm
nm
nmnm
nmnm
nm
nm
nm
nm nmnm
nm
nm
nm
nm
nmnmnmnmnmnm
nm
nmnm
nm
nmnm
nm
nmnm
nm nmnm nm
nmnmnmnmnmnmnmnmnmnmnmnmnmnmnmnmnmnmnmnmnmnmnmnmnmnmnmnm
nm
nm
nm
nm nm
nm
nmnm
Athol
HaydenLake
DaltonGardens
Worley
Fernan
Rathdrum
Hayden
Coeurd'Alene
PostFalls
Harrison
StateLine
SpiritLake
Huetter
HauserLake
£¤95
£¤95
£¤95
¬«58
¬«41
¬«97
¬«54
¬«3
¬«41
¬«53
§̈¦90
§̈¦90
Co eur d'Ale ne River
Spoka ne River
LakeCoeur
d'Alene
HaydenLake
LakePend
Oreille
SpiritLake
TwinLakes
/
0 63Miles
Figure Crit ical Faci l it ies
Base Map Data Sources: Kootenai County, U.S. Geological Survey
Kootenai County Hazard Mit igat ion Plan Update
±
nm Schools¬« Fire Stations!F Medical Carec_ Police Stations$ Other Facilities

"/
"/"/
"/"/
"/
"/
"/"/"/"/
"/"/
"/"/
"/ "/
"/
"/
"/"/"/
"/
"/
"/
"/"/"/"/"/"/"/"/"/"/"/"/"/"/"/"/"/"/"/"/ "/
"/
"/ "/
"/
"/"/ "/ "/
"/"/
"/
"/
"/
"/"/
"/
"/ "/"/
"/"/
"/"/
"/
"/"/"/
"/
"/
"/
"/
"/"/
"/"/ "/
"/
"/
"/"/
"/
"/
"/
"/
"/
"/"/
"/"/
"/"/"/"/
"/
"/
"/"/"/
"/
"/
"/"/"/
"/
"/
"/
"/"/
"/"/
"/"/"/
"/
"/"/"/
"/"/
"/"/
"/
"/
"/
"/
"/
"/"/ "/"/
"/
"/
"/"/
"/"/
"/"/
"/
"/"/"/"/"/"/
"/"/"/"/"/
"/"/"/
"/"/
"/
"/"/
"/"/"/
"/"/
"/
"/"/
"/
"/
"/
"/
"/"/
"/"/"/"/
"/"/"/
"/
"/
"/
"/"/
"/
"/"/
"/"/
"/
"/"/
"/
"/
"/"/
"/"/
"/
"/
"/
"/"/
"/
"/"/"/
"/"/"/
"/
"/
"/"/
"/"/
"/"/
"/"/"/
"/
"/
"/
"/
"/"/
"/
"/
"/"/
"/
"/
"/
"/
"/"/
"/
"/"/
"/
"/
"/"/
"/
"/
"/"/
"/
"/"/"/
"/"/"/
"/"/
"/"/"/"/"/
"/
"/
"/"/
"/
"/
"/"/
"/"/
"/"/
"/
"/
"/
"/
"/
"/"/
"/"/
"/"/
"/"/
"/
"/
"/
"/
"/"/
"/"/
"/
"/
"/
"/"/
"/
"/
"/"/
"/
"/
"/"/"/
"/
"/
"/
"/
"/
"/
"/"/
"/"/
"/
"/"/
"/"/
"/"/
"/
"/
"/"/
"/"/
"/
"/"/
"/"/"/"/"/
"/"/
"/
"/
"/"/
"/
"/
"/
"/
"/
"/
"/
"/
"/
"/
"/"/"/ "/
"/"/"/
"/
"/"/
"/"/"/
"/
"/"/
"/
"/
"/
"/"/
"/"/"/
"/"/"/
"/"/
"/"/
"/
"/
"/
"/
"/"/
"/
"/"/
"/
"/"/"/"/
"/
"/
"/
"/"/
"/
"/"/
"/
"/
"/
"/
"/
"/"/"/
"/
"/
"/
"/"/
"/
"/
"/"/
"/
"/"/
"/
"/
"/
"/"/
"/"/
"/"/
"/ "/
"/
"/
"/
"/"/
"/
"/"/
"/
"/"/"/"/"/"/
"/"/
"/"/
"/
"/"/
"/
"/"/"/
"/
"/
"/
"/
"/"/
"/
"/
kj
kj
kjkj
kj
kj
kj
kj
kj
kj
kj
kj
kj
kj!(
!(
!(
!(
!(
!(
!(
!(
!(
!(
!(
!(
!(
!(
!(
!(
!(
!(
Ó
M
M
M
M
M
MM
M
M
M
M
M
M
M
M
M
MM
M
M
M
M
M
M
U
U
U
o
Athol
HaydenLake
DaltonGardens
Worley
Fernan
Rathdrum
Hayden
Coeurd'Alene
PostFalls
Harrison
StateLine
SpiritLake
Huetter
HauserLake
£¤95
£¤95
£¤95
¬«58
¬«41
¬«97
¬«54
¬«3
¬«41
¬«53
§̈¦90
§̈¦90
Co eur d'Ale ne River
Spoka ne River
LakeCoeur
d'Alene
HaydenLake
LakePend
Oreille
SpiritLake
TwinLakes
/
0 63Miles
Figure Crit ical In frastructure
Base Map Data Sources: Kootenai County, U.S. Geological Survey
Kootenai County Hazard Mit igat ion Plan Update
±
o Airports
U Bus Facilities
M Docks/Launches
Ó Rail Facilities
!( Highway Bridges
kj Communication Facilities
"/ Potable Water Facilities
"/ Waste Water Facilities

Kootenai County Multi-Jurisdictional All Hazard Mitigation Plan; Volume 1—Planning-Area-Wide Elements
TABLE 6-3. CRITICAL FACILITIES BY JURISDICTION AND CATEGORY
Medical and
Health Government Functions
Protective Functions Schools
Hazardous Materials
Other Critical Functions Total
Athol 0 2 1 1 0 0 4 Coeur d’Alene 2 21 13 44 24 21 125 Dalton Gardens 0 1 1 1 1 0 4 Fernan Lk. Vill. 0 0 0 0 0 0 0 Harrison 0 3 0 0 0 0 3 Hauser 0 2 0 0 0 0 2 Hayden 0 9 1 3 5 1 19 Hayden Lake 0 1 1 0 0 0 2 Huetter 0 0 0 0 0 0 0 Post Falls 2 12 5 11 12 2 44 Rathdrum 0 6 3 6 3 0 18 Spirit Lake 0 3 3 4 0 3 13 Stateline 0 0 0 0 0 0 0 Worley 0 2 1 0 0 2 5 Unincorporated 0 8 26 5 30 44 113
Total 4 70 55 75 75 73 352
TABLE 6-4. CRITICAL INFRASTRUCTURE BY JURISDICTION AND CATEGORY
Bridges Water Supply Wastewater Power Communications Other Total
Athol 0 4 0 0 0 0 4 Coeur d’Alene 0 39 12 0 2 1 54 Dalton Gardens 0 1 0 0 0 0 1 Fernan Lk. Vill. 0 0 0 0 0 0 0 Harrison 0 10 2 0 0 0 12 Hauser 0 3 0 0 0 0 3 Hayden 0 35 12 0 0 0 47 Hayden Lake 0 0 0 0 0 1 1 Huetter 0 0 0 0 0 0 0 Post Falls 0 33 44 0 0 0 77 Rathdrum 0 14 3 1 0 1 19 Spirit Lake 0 4 0 0 2 0 6 Stateline 0 0 0 0 0 0 0 Worley 0 3 0 0 0 1 4 Unincorporated 18 257 4 3 10 25 317
Total 18 403 77 4 14 29 545
6-12

KOOTENAI COUNTY PROFILE
Figure 6-9. Idaho and Kootenai County Population Growth
Table 6-5 shows the population of incorporated municipalities and the combined unincorporated areas in Kootenai County from 1980 to 2013. In 1980, about 43 percent of the planning area’s residents lived outside incorporated areas; by 2013, only 28 percent of the total population lived in unincorporated areas.
6.7.2 Age Distribution As a group, the elderly are more apt to lack the physical and economic resources necessary for response to hazard events and are more likely to suffer health-related consequences making recovery slower. They are more likely to be vision, hearing, and/or mobility impaired, and more likely to experience mental impairment or dementia. Additionally, the elderly are more likely to live in assisted-living facilities where emergency preparedness occurs at the discretion of facility operators. These facilities are typically identified as “critical facilities” by emergency managers because they require extra notice to implement evacuation. Elderly residents living in their own homes may have more difficulty evacuating their homes and could be stranded in dangerous situations. This population group is more likely to need special medical attention, which may not be readily available during natural disasters due to isolation caused by the event. Specific planning attention for the elderly is an important consideration given the current aging of the American population.
Children under 14 are particularly vulnerable to disaster events because of their young age and dependence on others for basic necessities. Very young children may additionally be vulnerable to injury or sickness; this vulnerability can be worsened during a natural disaster because they may not understand the measures that need to be taken to protect themselves from hazards.
0%
10%
20%
30%
40%
50%
60%
70%
80%
1950-1960 1960-1970 1970-1980 1980-1990 1990-2000 2000-2010
10-Y
ear %
Pop
ulat
ion
Cha
nge
Kootenai County
Idaho
6-13

Kootenai County Multi-Jurisdictional All Hazard Mitigation Plan; Volume 1—Planning-Area-Wide Elements
TABLE 6-5. ANNUAL POPULATION DATA
Population 1980a 1990a 2000a 2010b 2013c
Athol 312 346 676 692 689 Coeur d’Alene 19,913 24,563 34,514 44,137 46,402 Dalton Gardens 1,795 1,951 2,278 2,335 2,361 Fernan Lake Village 178 170 186 169 172 Harrison 260 226 267 203 210 Hauser 305 380 668 678 672 Hayden 2,586 3,744 9,159 13,294 13,681 Hayden Lake 273 338 494 574 589 Huetter 65 82 96 100 101 Post Falls 5,736 7,349 17,247 27,574 29,357 Rathdrum 1,369 2,000 4,816 6,826 7,090 Spirit Lake 834 790 1,376 1,945 2,001 State Line 26 26 28 38 45 Worley 206 182 223 257 254 Unincorporated County 25,912 27,648 36,657 39,672 40,917
Total 59,770 69,795 108,685 138,494 144,541
a. 1980, 1990 and 2000 populations from Idaho Department of Labor website, Historical Populations of Cities and Counties (http://www.lmi.idaho.gov/LinkClick.aspx?fileticket=4ahZvz42mOw%3d&tabid=2021&mid=2616)
b. 2010 population from Idaho Department of Labor website Labor Market Information: 2010 Census (http://www.lmi.idaho.gov/2010Census.aspx)
c. 2013 populations from U.S. Census website Population Estimates; Current Estimates Data (http://www.census.gov/popest/data/index.html)
The overall age distribution for the planning area is illustrated in Figure 6-10. Based on U.S. Census data estimates, 15.6 percent of the planning area’s population is 65 or older, compared to the state average of 13.3 percent. According to U.S. Census data, 32.4 percent of the County’s over-65 population has disabilities of some kind and 7 percent have incomes below the poverty line. The Census estimates that 16.2 percent of people under 18 are below the poverty line. It is also estimated that 19.8 percent of the County’s population is 14 or younger, compared to the state average of 21.8 percent.
6.7.3 Race, Ethnicity and Language Research shows that minorities are less likely to be involved in pre-disaster planning and experience higher mortality rates during a disaster event. Post-disaster recovery can be ineffective and is often characterized by cultural insensitivity. Since higher proportions of ethnic minorities live below the poverty line than the majority white population, poverty can compound vulnerability. According to the U.S. Census, the racial composition of the planning area is predominantly white, at 94.5 percent. The largest minority populations are American Indian/Alaska Native at 1.6 percent and Asian at 1.1 percent. Figure 6-11 shows the racial distribution in the planning area.
6-14

KOOTENAI COUNTY PROFILE
Source: (U.S. Census, 2014)
Figure 6-10. Planning Area Age Distribution
Source: (U.S. Census, 2014)
Figure 6-11. Planning Area Race Distribution
0 5,000 10,000 15,000 20,000
Under 5 years
5 to 9 years
10 to 14 years
15 to 19 years
20 to 24 years
25 to 34 years
35 to 44 years
45 to 54 years
55 to 59 years
60 to 64 years
65 to 74 years
75 to 84 years
85 years and over
Number of People
Age
White94.5%
African American0.3%
American Indian and Alaska Native
1.6%Asian1.1%
Native Hawaiian and Other Pacific Islander
0.1%
Other0.4%
Two or More Races2.0%
6-15

Kootenai County Multi-Jurisdictional All Hazard Mitigation Plan; Volume 1—Planning-Area-Wide Elements
The planning area has a 2.2 percent foreign-born population. Other than English, the most commonly spoken language in the planning area is Spanish The census estimates 0.5 percent of the residents speak English “less than very well.”
6.7.4 Disabled Populations The U.S. Census estimates that 38 million non-institutionalized Americans with disabilities live in the U.S. This equates to about one-in-eight persons. People with disabilities are more likely to have difficulty responding to a hazard event than the general population. Local government is the first level of response to assist these individuals, and coordination of efforts to meet their access and functional needs is paramount to life safety efforts. It is important for emergency managers to distinguish between functional and medical needs in order to plan for incidents that require evacuation and sheltering. Knowing the percentage of population with a disability will allow emergency management personnel and first responders to have personnel available who can provide services needed by those with access and functional needs. According to 2013 Census estimates, there are 19,000 individuals with some form of disability within the planning area, 13.6 percent of the total.
6.8 ECONOMY
6.8.1 Income In the United States, individual households are expected to use private resources to prepare for, respond to and recover from disasters to some extent. This means that households living in poverty are automatically disadvantaged when confronting hazards. Additionally, the poor typically occupy more poorly built and inadequately maintained housing. Mobile or modular homes, for example, are more susceptible to damage in earthquakes and floods than other types of housing. In urban areas, the poor often live in older houses and apartment complexes, which are more likely to be made of un-reinforced masonry, a building type that is particularly susceptible to damage during earthquakes. Furthermore, residents below the poverty level are less likely to have insurance to compensate for losses incurred from natural disasters. This means that residents below the poverty level have a great deal to lose during an event and are the least prepared to deal with potential losses. The events following Hurricane Katrina in 2005 illustrated that personal household economics significantly impact people’s decisions on evacuation. Individuals who cannot afford gas for their cars will likely decide not to evacuate.
Based on U.S. Census Bureau estimates, per capita income in the planning area in 2013 was $24,353, and the median household income was $49,481. It is estimated that about 4.9 percent of households receive an income above $150,000 annually. About 9.3 percent of families in the planning area make less than the poverty level.
6.8.2 Industry, Businesses and Institutions The planning area’s economy is strongly based in the education/healthcare/social assistance industry (20.2 percent), followed by the retail trade, arts/recreation and profession/scientific industries. Wholesale trade and information make up the smallest source of the local economy. Figure 6-12 shows the breakdown of industry types in Kootenai County. Major businesses include Kootenai Health, the Coeur d’Alene Tribal Casino and Resort, Center Partners, Silverwood Theme Park, and Esterline Advanced Input Systems (Idaho Department of Labor, 2014).
6-16

KOOTENAI COUNTY PROFILE
Source: (U.S. Census, 2014)
Figure 6-12. Industry in the Planning Area
6.8.3 Employment Trends and Occupations According to the 2013 American Community Survey, 61.7 percent of Kootenai County’s over-16 population is in the labor force, 68 percent of men and 56 percent of women.
Figure 6-13 compares Idaho’s and Kootenai County’s unemployment trends from 20003 through 2013. Kootenai County’s unemployment rate was lowest in 2007, at 3.2 percent. Unemployment rates rose to 10.3 percent in 2010, but have been declining since then.
Occupation categories with the greatest number of jobs in the county are management/business/science/arts, with 30.5 percent of all jobs, sales/office with 28.9 percent, and service with 17.8 percent (see Figure 6-14). The largest employer in the county is Kootenai Health with over 1,800 employees, followed by the Coeur d’Alene Tribal casino, with about 1,400.
The U.S. Census estimates that 81 percent of Kootenai County workers commute alone (by car, truck or van) to work, and mean travel time to work is 20.6 minutes.
Agriculture, forestry, fishing and hunting, and
mining2.6%
Construction9.4%
Manufacturing7.1%
Wholesale trade3.3%Retail trade
15.4%
Transportation and warehousing, and
utilities4.0%
Information1.7%
Finance and insurance, and real estate and rental and leasing
7.4%
Professional, scientific, and management, and
administrative and waste management
services10.0%
Educational services, and health care and
social assistance20.2% Arts, entertainment, and
recreation, and accommodation and
food services10.4%
Other services4.4%
Public administration4.0%
6-17

Kootenai County Multi-Jurisdictional All Hazard Mitigation Plan; Volume 1—Planning-Area-Wide Elements
Source: Idaho Department of Labor, 2014
Figure 6-13. Idaho and Kootenai County Unemployment Rate
Source: (U.S. Census, 2014)
Figure 6-14. Occupations in the Planning Area
6.9 FUTURE TRENDS IN DEVELOPMENT Idaho State Code provides guidance on local land use planning (Chapter 65, Title 67). Some of the municipal planning partners have adopted comprehensive plans that govern land use decision- and policy-making in their jurisdictions. Decisions on land use will be governed by these programs. This plan will work together with these programs to support wise land use in the future by providing vital information on the risk associated with natural hazards in the planning area. Planning partners with land use planning capability will incorporate this hazard mitigation plan update in their comprehensive plans by reference. This will ensure that future development trends can be established with the benefits of the information on risk and vulnerability to natural hazards identified in this plan.
0
2
4
6
8
10
12
2003 2004 2005 2006 2007 2008 2009 2010 2011 2012 2013
Une
mpl
oym
ent R
ate
(%)
Idaho
Kootenai County
Management, Business, Science and Arts
31%
Service18%
Sales & Office29%
Natural Resources, Construction and
Maintenance12%
Production, Transportation, and
Material Moving11%
6-18

KOOTENAI COUNTY PROFILE
6.10 LAWS AND ORDINANCES Existing laws that include the United States and State of Idaho Constitutions, ordinances and plans at the federal, state and local level can support or impact hazard mitigation initiatives identified in this plan. Hazard mitigation plans are required to include a review and incorporation, if appropriate, of existing plans, studies, reports, and technical information as part of the planning process (44 CFR, Section 201.6(b)(3)). Pertinent federal and state laws are described below. Each planning partner has individually reviewed existing local plans, studies, reports, and technical information in its jurisdictional annex, presented in Volume 2.
6.10.1 Federal
Disaster Mitigation Act The DMA is the current federal legislation addressing hazard mitigation planning. It emphasizes planning for disasters before they occur. It specifically addresses planning at the local level, requiring plans to be in place before Hazard Mitigation Grant Program funds are available to communities. This Plan is designed to meet the requirements of DMA, improving the planning partners’ eligibility for future hazard mitigation funds.
Endangered Species Act The federal Endangered Species Act (ESA) was enacted in 1973 to conserve species facing depletion or extinction and the ecosystems that support them. The act sets forth a process for determining which species are threatened and endangered and requires the conservation of the critical habitat in which those species live. The ESA provides broad protection for species of fish, wildlife and plants that are listed as threatened or endangered. Provisions are made for listing species, as well as for recovery plans and the designation of critical habitat for listed species. The ESA outlines procedures for federal agencies to follow when taking actions that may jeopardize listed species and contains exceptions and exemptions. It is the enabling legislation for the Convention on International Trade in Endangered Species of Wild Fauna and Flora. Criminal and civil penalties are provided for violations of the ESA and the Convention.
Federal agencies must seek to conserve endangered and threatened species and use their authorities in furtherance of the ESA’s purposes. The ESA defines three fundamental terms:
• Endangered means that a species of fish, animal or plant is “in danger of extinction throughout all or a significant portion of its range.” (For salmon and other vertebrate species, this may include subspecies and distinct population segments.)
• Threatened means that a species “is likely to become endangered within the foreseeable future.” Regulations may be less restrictive for threatened species than for endangered species.
• Critical habitat means “specific geographical areas that are…essential for the conservation and management of a listed species, whether occupied by the species or not.”
Five sections of the ESA are of critical importance to understanding it:
• Section 4: Listing of a Species—The National Oceanic and Atmospheric Administration Fisheries Service (NOAA Fisheries) is responsible for listing marine species; the U.S. Fish and Wildlife Service is responsible for listing terrestrial and freshwater aquatic species. The agencies may initiate reviews for listings, or citizens may petition for them. A listing must be made “solely on the basis of the best scientific and commercial data available.” After a listing has been proposed, agencies receive comment and conduct further scientific reviews for 12 to
6-19

Kootenai County Multi-Jurisdictional All Hazard Mitigation Plan; Volume 1—Planning-Area-Wide Elements
18 months, after which they must decide if the listing is warranted. Economic impacts cannot be considered in this decision, but it may include an evaluation of the adequacy of local and state protections. Critical habitat for the species may be designated at the time of listing.
• Section 7: Consultation—Federal agencies must ensure that any action they authorize, fund, or carry out is not likely to jeopardize the continued existence of a listed or proposed species or adversely modify its critical habitat. This includes private and public actions that require a federal permit. Once a final listing is made, non-federal actions are subject to the same review, termed a “consultation.” If the listing agency finds that an action will “take” a species, it must propose mitigations or “reasonable and prudent” alternatives to the action; if the proponent rejects these, the action cannot proceed.
• Section 9: Prohibition of Take—It is unlawful to “take” an endangered species, including killing or injuring it or modifying its habitat in a way that interferes with essential behavioral patterns, including breeding, feeding or sheltering.
• Section 10: Permitted Take—Through voluntary agreements with the federal government that provide protections to an endangered species, a non-federal applicant may commit a take that would otherwise be prohibited as long as it is incidental to an otherwise lawful activity (such as developing land or building a road). These agreements often take the form of a “Habitat Conservation Plan.”
• Section 11: Citizen Lawsuits—Civil actions initiated by any citizen can require the listing agency to enforce the ESA’s prohibition of taking or to meet the requirements of the consultation process.
With the listing of salmon and trout species as threatened or endangered, the ESA has impacted most of the Pacific Coast states. Although some of these areas have been more impacted by the ESA than others due to the known presence of listed species, the entire region has been impacted by mandates, programs and policies based on the presumption of the presence of listed species. Most West Coast jurisdictions must now take into account the impact of their programs on habitat.
The Clean Water Act The federal Clean Water Act (CWA) employs regulatory and non-regulatory tools to reduce direct pollutant discharges into waterways, finance municipal wastewater treatment facilities, and manage polluted runoff. These tools are employed to achieve the broader goal of restoring and maintaining the chemical, physical, and biological integrity of the nation’s surface waters so that they can support “the protection and propagation of fish, shellfish, and wildlife and recreation in and on the water.”
Evolution of CWA programs over the last decade has included a shift from a program-by-program, source-by-source, pollutant-by-pollutant approach to more holistic watershed-based strategies. Under the watershed approach, equal emphasis is placed on protecting healthy waters and restoring impaired ones. A full array of issues are addressed, not just those subject to CWA regulatory authority. Involvement of stakeholder groups in the development and implementation of strategies for achieving and maintaining water quality and other environmental goals is a hallmark of this approach.
National Flood Insurance Program The National Flood Insurance Program (NFIP) provides federally backed flood insurance in exchange for communities enacting floodplain regulations. Participation and good standing under NFIP are prerequisites to grant funding eligibility under the Robert T. Stafford Act. The County and most of the partner cities for this plan participate in the NFIP and have adopted regulations that meet the NFIP requirements. At the time
6-20

KOOTENAI COUNTY PROFILE
6-21
of the preparation of this plan, all participating jurisdictions in the partnership were in good standing with NFIP requirements.
6.10.2 State
State and Local Building Codes
Idaho’s building code largely reflects international codes, with provisions for wind, seismic and snow loading. However, if a community does not want to adopt the building code, it is not required to do so. The only structures required to be reviewed under the building code are modular buildings, schools, and state buildings. One- and two-family dwellings are exempted from installing mandatory fire sprinkler systems. Building codes are important in hazard prone areas as they ensure that new construction and improved existing construction are more resilient to local hazards and/or improve life safety functions.
Subdivision Regulations
Subdivision regulations form part of the process utilized by local governments to carry out the requirements of their comprehensive plans and zoning ordinances. In Idaho, local governments have the authority to define the term “subdivision” as they prefer. State enabling authority does not contain standards or requirements that would be considered to exceed those commonly found elsewhere, nor are subdivision regulations mandated. Subdivision regulations are important in hazard prone areas as they can specify requirements for layout and location of infrastructure, lots and other facilities as land is developed.
Comprehensive Plans and Zoning
Title 67, Chapter 65, which is Idaho’s local land use enabling authority, includes a stated, specific purpose of local land use regulation “to protect life and property in areas subject to natural hazards and disasters.” Tools to do this include comprehensive planning and zoning. Consistent with Idaho law, a comprehensive plan provides the policy basis for a community’s zoning ordinance, which contains the specific standards and requirements and processes for making land use and development decisions. In Idaho, a comprehensive plan is required to include a section on hazards (67-6508(g)):
The plan with maps, charts, and reports shall be based on the following components as they may apply to land use regulations and actions unless the plan specifies reasons why a particular component is unneeded … Hazardous Areas -- An analysis of known hazards as may result from susceptibility to surface ruptures from faulting, ground shaking, ground failure, landslides or mudslides; avalanche hazards resulting from development in the known or probable path of snow slides and avalanches, and floodplain hazards.
As part of comprehensive planning, a future land use map is prepared indicating suitable projected land uses for the jurisdiction. The implementation tool to realize the vision in the comprehensive plan is the zoning ordinance. Zoning protects the rights of property owners while promoting the general welfare of the community. By dividing land into categories according to use, and setting regulations for these categories, a zoning ordinance can govern private land use and segregate incompatible uses. The purpose of zoning is to locate particular land uses where they are most appropriate, considering public utilities, road access and the established development pattern.
Floodplain Zoning
Idaho communities are authorized to adopt floodplain zoning to regulate any mapped or unmapped flood hazard area. Additionally, Idaho communities may adopt standards that exceed the minimum standards of the NFIP.

Kootenai County Multi-Jurisdictional All Hazard Mitigation Plan; Volume 1—Planning-Area-Wide Elements
6-22
Idaho Disaster Preparedness Act of 1975
The Idaho Disaster Preparedness Act of 1975 (Chapter 10, Title 46 of the Idaho Code) created the Bureau of Disaster Services and subsequently the Bureau of Homeland Security, and provided for the creation of local organizations for disaster preparedness. According to the Act, it is the policy of the State of Idaho to plan and prepare for disasters and emergencies resulting from natural or manmade causes, enemy attack, sabotage or other hostile action. State law was put into place to do the following:
• Create a bureau of homeland security.
• Prevent and reduce damage, injury, and loss of life and property resulting from natural or man-made catastrophes.
• Prepare assistance for prompt and efficient search, rescue and care.
• Provide for rapid restoration and rehabilitation.
• Prescribe the roles of government in prevention, preparation and response to disaster.
• Authorize and encourage cooperation in disaster prevention, preparation and response.
• Provide for coordination of activities.
• Provide a disaster management system.
• Provide for payment of obligations and expenses incurred by the State of Idaho through the Bureau of Homeland Security.
Idaho Silver Jackets Program
The Silver Jackets Program is the state-level implementation of the Army Corps of Engineers National Flood Risk Management Program. The core member agencies will establish a continuous intergovernmental collaborative team working with other state and federal agencies to do the following:
• Provide assistance in identifying and prioritizing actions to reduce the threat, vulnerability and consequences of flooding in the State of Idaho.
• Facilitate strategic planning and implementation of life-cycle mitigation, response and recovery actions to reduce the threat, vulnerability and consequences of flooding in the State of Idaho.
• Create or supplement a process to collaboratively identify issues and implement or recommend solutions.
• Identify and implement ways to leverage available resources and information between agencies.
• Increase and improve flood risk communication and outreach.
• Promote wise stewardship of the taxpayers’ investments.
• Develop more comprehensive state flood risk management policies and strategies.
• Develop advanced hydrologic predictive services to reduce loss of life and property damage from flooding.
6.10.3 Cities and County Each planning partner has prepared a jurisdiction-specific annex to this plan (see Volume 2). In preparing these annexes, each partner completed a capability assessment that looked at its regulatory, technical and

KOOTENAI COUNTY PROFILE
6-23
financial capability to carry out proactive hazard mitigation. Refer to these annexes for a review of regulatory codes and ordinances applicable to each planning partner.


CHAPTER 7. AVALANCHE
7.1 GENERAL BACKGROUND Avalanches can occur whenever a sufficient depth of snow is deposited on slopes steeper than about 20 degrees, with the most dangerous coming from slopes in the 35- to 40-degree range. Avalanche-prone areas can be identified with some accuracy, since they typically follow the same paths year after year, leaving scarring on their paths. However, unusual weather conditions can produce new paths or cause avalanches to extend beyond their normal paths.
In the spring, warming of the snowpack occurs from below (from the warmer ground) and above (from warm air, rain, etc.). Warming can be enhanced near rocks or trees that transfer heat to the snowpack. The effects of a snowpack becoming weak may be enhanced in steeper terrain where the snowpack is shallow, and over smooth rock faces that may focus meltwater and produce “glide cracks.” Such slopes may fail during conditions that encourage melt.
Wind can affect the transfer of heat into the snowpack and associated melt rates of near-surface snow. During moderate to strong winds, the moistening near-surface air in contact with the snow is constantly mixed with drier air above through turbulence. As a result, the air is continually drying out, which enhances evaporation from the snow surface rather than melt. Heat loss from the snow necessary to drive the evaporation process cools off near-surface snow and results in substantially less melt than otherwise might occur, even if temperatures are well above freezing.
When the snow surface becomes uneven in spring, air flow favors evaporation at the peaks, while calmer air in the valleys favors condensation there. Once the snow surface is wet, its ability to reflect solar energy drops dramatically; this becomes a self-perpetuating process, so that the valleys deepen (favoring calmer air and more heat transfer), while more evaporation occurs near the peaks, increasing the differential between peaks and valleys. However, a warm wet storm can quickly flatten the peaks as their larger surface area exposed to warm air, rain or condensation hastens their melt over the sheltered valleys.
DEFINITIONS
Avalanche—Any mass of loosened snow or ice and/or earth that suddenly and rapidly breaks loose from a snowfield and slides down a mountain slope, often growing and accumulating additional material as it descends.
Slab avalanches—The most dangerous type of avalanche, occurring when a layer of coherent snow ruptures over a large area of a mountainside as a single mass. Like other avalanches, slab avalanches can be triggered by the wind, by vibration, or even by a loud noise, and will pull in surrounding rock, debris and even trees.
Climax avalanches—An avalanche involving multiple layers of snow, usually with the ground as a bed surface.
Loose snow avalanches—An avalanche that occurs when loose, dry snow on a slope becomes unstable and slides. Loose snow avalanches start from a point and gather more snow as they descend, fanning out to fill the topography.
Powder snow avalanches—An avalanche that occurs when sliding snow has been pulverized into powder, either by rapid motion of low-density snow or by vigorous movement over rugged terrain.
Surface avalanches—An avalanche that occurs only in the uppermost snow layers.
Wet snow avalanche—An avalanche in wet snow, also referred to as a wet loose avalanche or a wet slab avalanche. Often the basal shear zone is a water-saturated layer that overlies an ice zone.
7-1

Kootenai County Multi-Jurisdictional All Hazard Mitigation Plan; Volume 1—Planning-Area-Wide Elements
Avalanches can reach speeds of up to 200 miles an hour and can exert forces great enough to destroy structures and uproot or snap off large trees. Avalanche paths consist of three zones (Idaho State Hazard Mitigation Plan, 2013):
• Starting Zone—The zone typically near the top of a ridge, bowl or canyon, with steep slopes of 25 to 50 degrees.
• Track Zone—The reach with mild slopes of 15 to 30 degrees and the area where the avalanche will achieve maximum velocity and considerable mass.
• Run-Out Zone—The area of gentler slopes (5 to 15 degrees) at the base of the path, where the avalanche decelerates and massive snow and debris deposition occurs.
7.2 HAZARD PROFILE
7.2.1 Past Events According to the Colorado Avalanche Information Center, an average of 28 people died in avalanches in the United States over the past 10 winters. Most fatal incidents are investigated, but non-fatal incidents are likely to go unreported. Idaho has the seventh highest number of fatalities resulting from avalanches of all states in the U.S., as shown in Figure 7-1.
Source: Colorado Avalanche Information Center (http://avalanche.state.co.us/accidents/statistics-and-reporting/)
Figure 7-1. Avalanche Fatalities by State, 1950/51 – 2013/14
Of fatalities where travel mode was recorded, 11 were caught while traveling via snowmobile, 3 on snowboard, 8 on skis and 5 on foot. The Idaho State Hazard Mitigation Plan reports no major avalanche events in Kootenai County.
7-2

AVALANCHE
7.2.2 Location Avalanche hazard areas are localized and most likely to occur in areas with slopes greater than 25 degrees. In Kootenai County, avalanches are most likely in mountainous areas where such slopes and requisite snow depths are present. Currently, there is no available mapping to identify the probable extent and location of the avalanche hazard.
7.2.3 Frequency Avalanche events that cause injury or property damage are uncommon in Kootenai County. There have been no recorded instances of an avalanche event resulting in death, injury or property damage since 1960. Minor avalanches resulting in no injuries or damage are likely to occur frequently and go unreported.
7.2.4 Severity A number of weather and terrain factors determine avalanche severity and danger:
• Weather:
– Storms—A large percentage of all snow avalanches occur during and shortly after storms.
– Rate of snowfall—Snow falling at a rate of 1 inch or more per hour rapidly increases avalanche danger.
– Temperature—Storms starting with low temperatures and dry snow, followed by rising temperatures and wetter snow, are more likely to cause avalanches than storms that start warm and then cool with snowfall.
– Wet snow—Rainstorms or spring weather with warm, moist winds and cloudy nights can warm the snow cover, resulting in wet snow avalanches. Wet snow avalanches are more likely on sun-exposed terrain (south-facing slopes) and under exposed rocks or cliffs.
• Terrain:
– Ground cover—Large rocks, trees and heavy shrubs help anchor snow.
– Slope profile—Dangerous slab avalanches are more likely on convex slopes.
– Slope aspect—Leeward slopes are dangerous because windblown snow adds depth and creates dense slabs. South-facing slopes are more dangerous in the springtime.
– Slope steepness—Snow avalanches are most common on slopes of 30 to 45 degrees.
The common factors contributing to the avalanche hazard are old snow depth, old snow surface, new snow depth, new snow type, density, snowfall intensity, precipitation intensity, settlement, wind direction and speed, temperature, and subsurface snow crystal structure.
7.2.5 Warning Time The Idaho Panhandle Avalanche Center provides regional weekend avalanche advisories during winter (Idaho Panhandle Avalanche Center, 2015). The advisories focus on national forest land covering approximately 2.7 million acres in North Idaho, including the Cabinet, Selkirk, St. Joe, Purcell, Coeur d’Alene and Bitterroot mountain ranges (Idaho Panhandle Avalanche Center, 2015). The advisories follow the North American Danger Scale, which ranges from low to extreme danger (see Figure 7-2. An example of this forecast for the Selkirk/Cabinets areas is shown in Figure 7-3.
7-3

Kootenai County Multi-Jurisdictional All Hazard Mitigation Plan; Volume 1—Planning-Area-Wide Elements
Source: Colorado Avalanche Information Center (http://avalanche.state.co.us/wp-content/uploads/2013/09/ads.jpg.)
Figure 7-2. Avalanche Danger Scale
7-4

AVALANCHE
Source: Idaho Panhandle Avalanche Center Website (http://www.idahopanhandleavalanche.org/selkirk--cabinets)
Figure 7-3. Sample Avalanche Advisory for the Selkirk/Cabinets Areas
Weather forecasts and information regarding significantly increased avalanche danger may provide advance warning for individuals participating in activities where avalanches may occur. The advisories are general in nature and simply alert exposed individuals to an increased risk of occurrence. The time of an avalanche release depends on the condition of the snow pack, which can change rapidly during a day, particularly during rainfall. Because of these changing conditions, it is important for individuals in avalanche hazard areas to be able to recognize conditions that may indicate increased likelihood of an avalanche: recent avalanches, signs of unstable snow, heavy snowfall or rain in the proceeding 24 hours, windblown snow, significant warming or persistent weak layers (Avalanche.org, 2015).
7-5

Kootenai County Multi-Jurisdictional All Hazard Mitigation Plan; Volume 1—Planning-Area-Wide Elements
7.3 SECONDARY HAZARDS Avalanches can cause several types of secondary effects, such as blocking roads, which can isolate residents and businesses and delay commercial, public and private transportation. This could result in economic losses for businesses. Other potential problems resulting from avalanches are power and communication failures. Avalanches also can damage rivers or streams, potentially harming water quality, fisheries and spawning habitat.
7.4 EXPOSURE
7.4.1 Population There are no major populations exposed to avalanches in Kootenai County. Most of the avalanche hazard area is uninhabited or has minimal development. Recreational users such as back country skiers, snowboarders, snowmobilers and snowshoers are exposed to avalanches, as well as people working the mountains such as miners and loggers. Travelers moving through avalanche prone areas are also exposed, but the most common transportation routes affected by avalanches in Idaho are outside Kootenai County.
7.4.2 Property There is little built property exposed to avalanches. Buildings exposed include national forest huts and temporary structures belonging to mining and forestry operations.
7.4.3 Critical Facilities There are no critical facilities exposed to avalanches. A small amount of infrastructure could be blocked by avalanches. These include hiking trails, fire roads and logging roads.
7.4.4 Environment Avalanches are a natural event, but they can negatively affect the environment. A large avalanche can knock down many trees and kill the wildlife that lives in them. In spring, this loss of vegetation on the mountains may weaken the soil, causing landslides and mudflows.
7.5 VULNERABILITY In general, everything that is exposed to an avalanche event is vulnerable. As more people work, build and recreate in mountain communities, there will be more people exposed to avalanche hazard areas. These individuals may have little experience with, caution regarding, or preparation for, avalanche conditions.
7.6 FUTURE TRENDS IN DEVELOPMENT Future trends in development cannot be determined until the avalanche hazard areas are accurately mapped. However, it is likely that future development will be predominantly concentrated in incorporated areas of the county that have limited exposure to the avalanche hazard. Any future development in more remote and mountainous areas of the County, such as in scenic or resource/recreation designations, may result in a limited increase in exposure.
7-6

AVALANCHE
7.7 SCENARIO In a worst-case scenario, an avalanche would occur after a series of storms. Storms starting with low temperatures and dry snow, followed by rising temperatures and wetter snow, are more likely to cause avalanches than storms that start warm and then cool with snowfall.
7.8 ISSUES The only issues of concern in the event of an avalanche are the threat to recreational users and property. There is no effective way to keep the public out of avalanche-prone recreational areas, even during times of highest risk. A national program to rate avalanche risk has been developed to standardize terminology and provide a common basis for recognizing and describing hazardous conditions. This United States Avalanche Danger Scale relates degree of avalanche danger (low, moderate, considerable, high, extreme) to descriptors of avalanche probability and triggering mechanism, degree and distribution of avalanche hazard, and recommended action in back country. Figure 7-2 shows key elements of the danger scale.
Measures that have been used in other jurisdictions to reduce avalanche threat include monitoring timber harvest practices in slide-prone areas to ensure that snow cover is stabilized as well as possible, and encouraging reforestation in areas near highways, buildings, power lines and other improvements. The development of a standard avalanche report form, and the maintenance of a database of potential avalanche hazards likely to affect proposed developments in mountain wilderness areas, would be of significant value to permitting agencies.
7-7


CHAPTER 8. DAM FAILURE
8.1 GENERAL BACKGROUND
8.1.1 Causes of Dam Failure Dam failures in the United States typically occur in one of four ways:
• Overtopping of the primary dam structure, which accounts for 34 percent of all dam failures, can occur due to inadequate spillway design, settlement of the dam crest, blockage of spillways, and other factors.
• Foundation defects due to differential settlement, slides, slope instability, uplift pressures, and foundation seepage can also cause dam failure. These account for 30 percent of all dam failures.
• Failure due to piping and seepage accounts for 20 percent of all failures. These are caused by internal erosion due to piping and seepage, erosion along hydraulic structures such as spillways, erosion due to animal burrows, and cracks in the dam structure.
• Failure due to problems with conduits and valves, typically caused by the piping of embankment material into conduits through joints or cracks, constitutes 10 percent of all failures.
The remaining 6 percent of U.S. dam failures are due to miscellaneous causes. Many dam failures in the United States have been secondary results of other disasters. The prominent causes are earthquakes, landslides, extreme storms, massive snowmelt, equipment malfunction, structural damage, foundation failures, and sabotage.
Poor construction, lack of maintenance and repair, and deficient operational procedures are preventable or correctable by a program of regular inspections. Terrorism and vandalism are serious concerns that all operators of public facilities must plan for; these threats are under continuous review by public safety agencies.
8.1.2 Regulatory Oversight The potential for catastrophic flooding due to dam failures led to passage of the National Dam Safety Act (Public Law 92-367). The National Dam Safety Program
DEFINITIONS
Dam—Any artificial barrier, together with appurtenances, constructed for the purpose of storing water, that either (a) is 10 feet or more in height from the natural bed of the stream or watercourse at the downstream toe of the barrier (or from the lowest elevation of the outside limit of the barrier if it is not across a stream channel or watercourse) to the maximum possible water storage elevation; or (b) has an impounding capacity of 50 acre-feet or more. (Idaho Code, Title 42, Chapter 17.)
Dam Failure—An uncontrolled release of impounded water due to structural deficiencies in dam.
Emergency Action Plan—A document that identifies potential emergency conditions at a dam and specifies actions to be followed to minimize property damage and loss of life. The plan specifies actions the dam owner should take to alleviate problems at a dam. It contains procedures and information to assist the dam owner in issuing early warning and notification messages to responsible downstream emergency management authorities of the emergency situation. It also contains inundation maps to show emergency management authorities the critical areas for action in case of an emergency. (FEMA 64)
High Hazard Dam—Dams where failure or operational error will probably cause loss of human life. (FEMA 333)
Significant Hazard Dam—Dams where failure or operational error will result in no probable loss of human life but can cause economic loss, environmental damage or disruption of lifeline facilities, or can impact other concerns. Significant hazard dams are often located in rural or agricultural areas but could be located in areas with population and significant infrastructure. (FEMA 333)
8-1

Kootenai County Multi-Jurisdictional All Hazard Mitigation Plan; Volume 1—Planning-Area-Wide Elements
requires a periodic engineering analysis of every major dam in the country. The goal of this FEMA-monitored effort is to identify and mitigate the risk of dam failure so as to protect the lives and property of the public.
Idaho Department of Water Resources Dam Safety Program The Dam Safety Program of Idaho’s Department of Water Resources (IDWR) monitors dams at the state level. The Department currently regulates nearly 600 water storage dams and more than 20 mine tailings impoundment structures throughout the state. The program regulates dams greater than or equal to 10 feet in height or reservoirs greater than or equal to 50 acre-feet in storage capacity. Each dam inspected by IDWR has a classification for size and risk:
• Large—40 feet high or more or with a storage capacity of more than 4,000 acre feet of water. 104 dams are currently listed as large.
• Intermediate—More than 20 but less than 40 feet high or with a storage capacity of 100 to 4,000 acre feet of water. 198 dams are currently listed as intermediate.
• Small—20 feet high or less and a storage capacity of less than 100 acre feet of water. 244 dams are currently listed as small.
All statutory sized dams must be inspected by the IDWR no less than every five years. The frequency between individual dam inspections depends on such items as the project’s physical condition, method of construction, maintenance record, age, hazard rating, and size and storage capacity. Inspection reports prepared by the IDWR for non-federal dams are available through the state office in Boise (Idaho Dam Safety Web Site, 2011).
U.S. Army Corps of Engineers Dam Safety Program The U.S. Army Corps of Engineers is responsible for safety inspections of some federal and non-federal dams in the United States that meet the size and storage limitations specified in the National Dam Safety Act. The Corps has inventoried dams; surveyed each state and federal agency’s capabilities, practices and regulations regarding design, construction, operation and maintenance of the dams; and developed guidelines for inspection and evaluation of dam safety (U.S. Army Corps of Engineers, 1997).
Federal Energy Regulatory Commission Dam Safety Program The Federal Energy Regulatory Commission (FERC) cooperates with a large number of federal and state agencies to ensure and promote dam safety. More than 3,000 dams are part of regulated hydroelectric projects in the FERC program. Two-thirds of these are more than 50 years old. As dams age, concern about their safety and integrity grows, so oversight and regular inspection are important. FERC inspects hydroelectric projects on an unscheduled basis to investigate the following:
• Potential dam safety problems
• Complaints about constructing and operating a project
• Safety concerns related to natural disasters
• Issues concerning compliance with the terms and conditions of a license.
Every five years, an independent engineer approved by the FERC must inspect and evaluate projects with dams higher than 32.8 feet (10 meters), or with a total storage capacity of more than 2,000 acre-feet.
FERC monitors and evaluates seismic research and applies it in investigating and performing structural analyses of hydroelectric projects. FERC also evaluates the effects of potential and actual large floods on
8-2

DAM FAILURE
the safety of dams. During and following floods, FERC visits dams and licensed projects, determines the extent of damage, if any, and directs any necessary studies or remedial measures the licensee must undertake. The FERC publication Engineering Guidelines for the Evaluation of Hydropower Projects guides the FERC engineering staff and licensees in evaluating dam safety. The publication is frequently revised to reflect current information and methodologies.
FERC requires licensees to prepare emergency action plans and conducts training sessions on how to develop and test these plans. The plans outline an early warning system if there is an actual or potential sudden release of water from a dam due to failure. The plans include operational procedures that may be used, such as reducing reservoir levels and reducing downstream flows, as well as procedures for notifying affected residents and agencies responsible for emergency management. These plans are frequently updated and tested to ensure that everyone knows what to do in emergency situations.
U.S. Bureau of Reclamation The U.S. Bureau of Reclamation’s Dam Safety Program was implemented in 1978 with passage of the Reclamation Safety of Dams Act (Public Law 95-578; amended in 1984, 2000, 2002 and 2004). Program development and administration of dam safety activities are the responsibility of the federal Dam Safety Office in Denver, Colorado.
Dams must be operated and maintained in a safe manner, ensured through inspections for safety deficiencies, analyses using current technologies and designs, and corrective actions based on current engineering practices, if needed. Evaluations should include assessments of benefits foregone with the loss of a dam (or example, a failed dam can no longer provide fish and wildlife benefits).
The primary emphasis of the Safety Evaluation of Existing Dams program is to perform site evaluations and to identify potential safety deficiencies on U.S. Department of Interior dams. The basic objective is to quickly identify dams that pose an increased threat to the public and to quickly complete analyses to expedite corrective action decisions and safeguard the public and associated resources.
The Safety of Dams program focuses on evaluating and implementing actions to resolve safety concerns at U.S. Department of Interior dams. Under this program, the Bureau of Reclamation will complete studies and needed corrective actions. The selected course of action relies on assessments of risks and liabilities, with environmental and public involvement input to the decision-making process.
8.2 HAZARD PROFILE
8.2.1 Past Events According to the Idaho State Hazard Mitigation Plan, there have been two major dam failures in the state: the Teton Dam Failure of 1976 and the Kirby Dam Failure of 1991. Neither of these events directly impacted Kootenai County, nor is there any record of less severe dam failures affecting the County.
8.2.2 Location According to Idaho’s Dam Safety Program, there are 46 dams in Kootenai County, as listed in Table 8-1. Two dams outside the County could impact the planning area in the event of a failure: Cabinet Dam and Albeni Falls Dam. Figure 8-1 shows the location of dams in the county that have been assigned a hazard rating.
8-3

XW
XWXW
XW XWXWXWXWXWXWXW
XW XW
XW
XW
XW
XW
XWXWXWXWXW
XWXWXW
XW
XW
XW XW
XW
Athol
HaydenLake
DaltonGardens
Worley
Fernan
Rathdrum
Hayden
Coeurd'Alene
PostFalls
Harrison
StateLine
SpiritLake
Huetter
HauserLake
£¤95
£¤95
£¤95
¬«58
¬«41
¬«97
¬«54
¬«3
¬«41
¬«53
§̈¦90
§̈¦90
Co eur d'Ale ne River
Spoka ne River
LakeCoeur
d'Alene
HaydenLake
LakePend
Oreille
SpiritLake
TwinLakes
/
0 63Miles
Dams
Base Map Data Sources: Kootenai County, U.S. Geological Survey
Figure 8 Kootenai County Hazard Mit igat ion Plan Update
±
Relative Hazard Rating
XW High
XW Significant
XW Other

DAM FAILURE
TABLE 8-1. DAMS IN KOOTENAI COUNTY
Dam Name Status Hazard Rating State ID
National ID
Normal Storage
(acre-feet) Hydraulic
Height (feet)
Blessing Slough No 3 Non-Regulated Low 94-7082C ID00512 150 5
Caron 95-7030 0 0
Carter 95-8126 0 0
Chapman 94-2225 0 0
Chilco Regulated Significant 95-2036 ID00152 340 16
Colwell 95-8567 0 0
Cougar Gulch 95-XX07 0 0
Davies 95-XX02 D 0 0
Dolan Non-Regulated Low 95-8978 ID00681 6 12.4
Fernan Lake Village Non-Regulated Low 95-4463 ID00500 1700 4
Finney Non-Regulated Low 95-8802 ID00703 9 16.8
French Non-Regulated Low 95-4717 ID00694 4 17.2
Hayden Lake Regulated Low 95-2014 ID00262 38000 10.06
Hidden Island Channel Non-Regulated Low 94-7129A ID00521 95 5
Hidden Island Mrsh No 2 Non-Regulated Low 94-7129B ID00593 95 2
Hoyt Ranch Non-Regulated Low 95-8701 ID00707 8 12
Kiblen North Regulated Significant 95-8547A1 ID00430 23 18.3
Kiblen West Regulated Significant 95-8547A2 ID00696 23 14.3
Killarney Lake Regulated Low 94-7220 ID00501 360 6 Kootenai County 95-4238 0 0
Kootenai South Pond S2 Regulated Low 95-XX08 ID00724 11.8 15.3
Lamb Creek Non-Regulated Low 94-7352 ID00595 6 18.8
Miller 95-7062 0 0
Minzel 95-7026 0 0
Moffitt Non-Regulated Low 94-7294 ID00528 200 5
Moffitt Slough No 2 Non-Regulated Low 94-7082B ID00529 98 4
Mort 95-8994 0 18
Porter Lake 94-7102 0 0
Post Falls Middle Regulated High 95-4518A2 ID00220 225000 58.5
Post Falls North Regulated Significant 95-4518A1 ID00496 225000 26
Post Falls South Regulated High 95-4518A3 ID00497 225500 29.5
Pugh Non-Regulated Low 94-XX24 ID00547 7 17
Richards 95-7246 0 0
Schneider Regulated Low 95-8650 ID00670 7 12
Seivert Marsh 94-7100 0 0
8-5

Kootenai County Multi-Jurisdictional All Hazard Mitigation Plan; Volume 1—Planning-Area-Wide Elements
TABLE 8-1. DAMS IN KOOTENAI COUNTY
Dam Name Status Hazard Rating State ID
National ID
Normal Storage
(acre-feet) Hydraulic
Height (feet) Spirit Lake Non-Regulated Low 95-XX02 ID00538 5000 4
Strobel Non-Regulated Low 94-7170 ID00539 225 5
Swan Lake Non-Regulated Low 94-7181 ID00594 2640 4
Swan Lake No 4 Upper 94-7082D 0 0
Thompson Lake Breached Low 95-7961 ID00503 9 6
Trefz 95-9080 0 0
Twin Lakes Regulated Significant 95-0973 ID00153 9090 12
Twin Lakes 95-0973 D 0 10
Welburn No 1 Non-Regulated Low 95-8788A ID00672 5 10.4
Welburn No 2 Non-Regulated Low 95-8788B ID00673 5 10.4
Welburn No 3 Non-Regulated Low 95-8788C ID00674 7 13.1
Source: IDWR, 2014.
8.2.3 Frequency Dam failure events are infrequent and usually coincide with events that cause them, such as earthquakes, landslides and excessive rainfall and snowmelt. There is a “residual risk” associated with dams. Residual risk is the risk that remains after safeguards have been implemented. For dams, the residual risk is associated with events beyond those that the facility was designed to withstand. However, the probability of any type of dam failure is low in today’s regulatory and dam safety oversight environment.
8.2.4 Severity Dam failure can be catastrophic to all life and property downstream. The U.S. Army Corps of Engineers developed the classification system shown in Table 8-2 for the hazard potential of dam failures. The Idaho Dam Safety Program classifies dams and reservoirs in a three-tier hazard rating system based solely on the potential consequences to downstream life and property that would result from a failure of the dam and sudden release of water (Idaho Dam Safety Web Site, 2011):
• High Hazard—A high-hazard means that if failure were to occur, the consequences likely would be a direct loss of human life and extensive property damage. All high-hazard dams must be properly designed and at all times responsibly maintained and operated. The Department of Water Resources considers the inundation of residential structures with flood water from a dam break to a depth greater than or equal to 2 feet to be a sufficient reason for assigning a high-hazard rating. An up-to-date Emergency Action Plan is a requirement for all owners of high-hazard dams. Two dams in Kootenai County are rated as high-hazard dams: Post Falls Middle and Post Falls South.
8-6

DAM FAILURE
TABLE 8-2. CORPS OF ENGINEERS HAZARD POTENTIAL CLASSIFICATION
Hazard Categorya Direct Loss of Lifeb Lifeline Lossesc Property Lossesd
Environmental Lossese
Low None (rural location, no permanent structures for human
habitation)
No disruption of services (cosmetic or rapidly repairable damage)
Private agricultural lands, equipment, and
isolated buildings
Minimal incremental damage
Significant Rural location, only transient or day-use facilities
Disruption of essential facilities and access
Major public and private facilities
Major mitigation required
High Certain (one or more) extensive residential, commercial, or
industrial development
Disruption of essential facilities and access
Extensive public and private facilities
Extensive mitigation cost or impossible to
mitigate
a. Categories are assigned to overall projects, not individual structures at a project. b. Loss of life potential based on inundation mapping of area downstream of the project. Analyses of loss of life
potential should take into account the population at risk, time of flood wave travel, and warning time. c. Indirect threats to life caused by the interruption of lifeline services due to project failure or operational
disruption; for example, loss of critical medical facilities or access to them. d. Damage to project facilities and downstream property and indirect impact due to loss of project services, such
as impact due to loss of a dam and navigation pool, or impact due to loss of water or power supply. e. Environmental impact downstream caused by the incremental flood wave produced by the project failure,
beyond what would normally be expected for the magnitude flood event under which the failure occurs. Source: U.S. Army Corps of Engineers, 1997
• Significant Hazard—Significant hazard dams are those whose failure would result in significant damage to developed downstream property and infrastructure or that may result in an indirect loss of human life. An example would be a scenario where a roadway is washed out and people are killed or injured in an automobile crash caused by the damaged pavement. Five dams in Kootenai County are rated as significant-hazard dams:
– Chilco
– Kiblen North
– Kiblen West
– Post Falls North
– Twin Lakes.
• Low Hazard—Low hazard dams typically are located in sparsely populated areas that would be largely unaffected by a breach of the dam. Although the dam and appurtenant works may be totally destroyed, damages to downstream property would be restricted to undeveloped land with minimal impacts to existing infrastructure. Twenty-three dams in Kootenai County are rated as low-hazard dams:
The Idaho and Corps of Engineers hazard rating systems are both based only on potential consequences of a dam failure; neither system takes into account the probability of such failures.
8-7

Kootenai County Multi-Jurisdictional All Hazard Mitigation Plan; Volume 1—Planning-Area-Wide Elements
8.2.5 Warning Time Warning time for dam failure varies depending on the cause of the failure. In events of extreme precipitation or massive snowmelt, evacuations can be planned with sufficient time. In the event of a structural failure due to earthquake, there may be no warning time. A dam’s structural type also affects warning time. Earthen dams do not tend to fail completely or instantaneously. Once a breach is initiated, discharging water erodes the breach until either the reservoir water is depleted or the breach resists further erosion. Concrete gravity dams also tend to have a partial breach as one or more monolith sections are forced apart by escaping water. The time of breach formation ranges from a few minutes to a few hours (U.S. Army Corps of Engineers, 1997).
Kootenai County and its planning partners have established protocols for flood warning and response to imminent dam failure in the flood warning portion of its adopted emergency operations plan. These protocols are tied to the emergency action plans created by the dam owners.
8.3 SECONDARY HAZARDS Dam failure can cause severe downstream flooding, depending on the magnitude of the failure. Other potential secondary hazards of dam failure are landslides or avalanches around the reservoir perimeter, bank erosion on the rivers, and destruction of downstream habitat.
8.4 EXPOSURE AND VULNERABILITY Digital dam inundation data was not available for use in the risk assessment portion of this plan; therefore, a qualitative risk assessment for dam failure is provided. Some of the discussion is based on the National Weather Service DAMBREAK model, which has been used to simulate the probable maximum flood wave downstream of some dams. The model is rudimentary, and its output should be used with caution pending further review of the model input and parameters.
8.4.1 Population All populations in a dam failure inundation zone would be exposed to the risk of a dam failure. The potential for loss of life is affected by the capacity and number of evacuation routes available to populations living in areas of potential inundation. Vulnerable populations are all populations downstream from dam failures that are incapable of escaping the area quickly. This population includes the elderly and young who may be unable to get themselves out of the inundation area. The vulnerable population also includes those who would not have adequate warning from a television or radio emergency warning system.
8.4.2 Property and Critical Facilities All property and critical facilities in a dam failure inundation zone would be exposed to the risk of a dam failure. Vulnerable properties and critical facilities are those closest to the dam inundation area. These properties would experience the largest, most destructive surge of water. Low-lying areas are also vulnerable since they are where the dam waters would collect. Transportation routes are vulnerable to dam inundation and have the potential to be wiped out, creating isolation issues. This includes all roads, railroads and bridges in the path of the dam inundation. Those that are most vulnerable are those that are already in poor condition and would not be able to withstand a large water surge. Utilities such as overhead power lines, cable and phone lines could also be vulnerable. Loss of these utilities could create additional isolation issues for the inundation areas.
8-8

DAM FAILURE
8.4.3 Environment Dam failure poses several potential risks to the environment. The inundation could introduce foreign elements into local waterways. This could result in destruction of downstream habitat and could have detrimental effects on many species of animals, especially endangered species such as salmon.
8.4.4 Dam-Specific Impacts
The Post Falls Project The Post Falls Hydroelectric Development includes three structures—the North, Middle, and South Channel dams. The Middle Channel is used for power generation. The project is owned and operated by Avista under FERC regulation. The Post Falls complex is listed as a “high” risk structure, but any actual damage resulting from a failure of the structure would generally be restricted to the river channel. A “super failure” of the complex would lead to a flood that would inundate low areas along the river to a depth of generally less than 3 feet. A fair-weather failure would generally result in a flood that is less than the observed maximum natural flooding of the Spokane River. Overall, the greatest threat to human life during a failure of the complex would be to persons in the river channel itself and to structures close to the dam in the river channel. Further information can be found in the Post Falls Emergency Action Plan.
Chilco Dam Chilco Dam has a risk rating of “moderate/significant” from IDWR and the National Inventory of Dams (NID). According to the National Weather Service DAMBREAK model, a sudden failure of Chilco Dam would create a maximum flood wave of 3.9 feet at a location one mile downstream from the dam.
Kiblen Complex The Kiblen Complex has an IDWR and NID risk rating of “moderate/significant,” mainly for the north structure. According to the National Weather Service DAMBREAK model, a sudden failure of the north structure would create a maximum flood wave of 7.09 feet at a location one mile downstream from the dam.
Hayden Lake Dam Hayden Lake Dam has an IDWR risk rating of “low” and NID risk rating of “significant.” According to the National Weather Service DAMBREAK model, a sudden failure of Hayden Lake Dam would create a maximum flood wave of 0.24 feet at a location one mile downstream from the dam.
Twin Lakes Dam Twin Lakes Dam has an IDWR and NID risk rating of “moderate/significant.” According to the National Weather Service DAMBREAK model, a sudden failure of Twin Lakes Dam would create a maximum flood wave of 0.81 feet at a location one mile downstream from the dam.
Cabinet Dam Cabinet Gorge Dam is on the Clark Fork River in Bonner County. Avista studies indicate that if there is a total failure of Cabinet Gorge Dam, the level of Lake Pond Oreille would be raised approximately 1 foot. This would have an impact in the Bayview/Farragut State Park area.
8-9

Kootenai County Multi-Jurisdictional All Hazard Mitigation Plan; Volume 1—Planning-Area-Wide Elements
Albeni Falls Dam Albeni Falls Dam is owned and operated by the U.S. Army Corps of Engineers. It is assumed that a failure at Albeni Falls would reduce the level of Lake Pond Oreille significantly. Impacts in Kootenai County could be a rapid drawdown of water levels in the Bayview/Farragut State Park area.
8.5 FUTURE TRENDS IN DEVELOPMENT Land use in the planning area will be directed by comprehensive plans and zoning ordinances adopted by the planning partners. Jurisdiction-specific information on land use planning for each planning partner is included in the annexes included in Volume 2 of this plan. Idaho state land use planning guidance requires that comprehensive plans conduct an analysis of known hazards. Many areas that are vulnerable to the impacts from dam inundation are also mapped flood hazard areas. Flood-related policies in available plans and municipal codes will help to reduce the risk associated with the dam failure hazard; however it is likely that there are areas subject to inundation that are not in mapped floodplains. Susceptibility to dam failure inundation is not a required element of local comprehensive plans.
The flood reduction afforded by dams throughout Idaho has allowed the development of lands immediately downstream of these structures. Property and populations downstream from any dam are vulnerable to harm from dam failure. However, communities downstream of high-hazard dams and large canals should pay particular attention to inspection and maintenance activities that keep their communities safe. Existing and new communities need to respect canal easements so that canal operators have sufficient access to properly maintain their canals to ensure public safety and efficient water delivery. Without these activities and oversight, the vulnerability increases significantly. The statewide occurrence of a high hazard dam failure should remain low if IDWR dam safety program duties are adequately funded and implemented and enforcement activities are continued to encourage dam owner responsibility for maintenance and repair, including regular updates and testing of emergency action plans.
8.6 SCENARIO An earthquake in the region could lead to liquefaction of soils around a dam. This could occur without warning during any time of the day. A human-caused activity such as a terrorist attack also could trigger a catastrophic failure of a dam that impacts the planning area.
8.7 ISSUES The most significant issue associated with dam failure involves the properties and populations in the inundation zones. Flooding as a result of a dam failure would significantly impact these areas. There is often limited warning time for dam failure. These events are frequently associated with other natural hazard events such as earthquakes, landslides or severe weather, which limits their predictability and compounds the hazard. Important issues associated with dam failure hazards include the following:
• Federally regulated dams have an adequate level of oversight and sophistication in the development of emergency action plans for public notification in the unlikely event of failure. However, the protocol for notification of downstream citizens of imminent failure needs to be tied to local emergency response planning.
• Mapping for federally regulated dams is already required and available; however, mapping for non-federal-regulated dams that estimates inundation depths is needed to better assess the risk associated with dam failure from these facilities.
8-10

DAM FAILURE
• Most dam failure mapping required at federal levels requires determination of the probable maximum flood. While the probable maximum flood represents a worst-case scenario, it is generally the event with the lowest probability of occurrence. For non-federal-regulated dams, mapping of dam failure scenarios that are less extreme than the probable maximum flood but have a higher probability of occurrence can be valuable to emergency managers and community officials downstream of these facilities. This type of mapping can illustrate areas potentially impacted by more frequent events to support emergency response and preparedness.
• The concept of residual risk associated with structural flood control projects should be considered in the design of capital projects and the application of land use regulations.
• Addressing security concerns and the need to inform the public of the risk associated with dam failure is a challenge for public officials.
• Proactive mitigation measures that increase public awareness can be implemented by local communities.
8-11


CHAPTER 9. DROUGHT
9.1 GENERAL BACKGROUND Drought is a normal phase in the climatic cycle of most geographical regions. According to the National Drought Mitigation Center, drought originates from a deficiency of precipitation over an extended period, usually a season or more. This results in a water shortage for some activity, group or environmental sector. Drought is the result of a significant decrease in water supply relative to what is “normal” in a given location. Unlike most disasters, droughts normally occur slowly but last a long time.
9.1.1 Defining Drought There are four generally accepted operational definitions of drought (National Drought Mitigation Center, 2006):
• Meteorological drought is an expression of precipitation’s departure from normal over some period of time. Meteorological measurements are the first indicators of drought. Definitions are usually region-specific, and based on an understanding of regional climatology. A definition of drought developed in one part of the world may not apply to another, given the wide range of meteorological definitions.
• Agricultural drought occurs when there is not enough soil moisture to meet the needs of a particular crop at a particular time. Agricultural drought happens after meteorological drought but before hydrological drought. Agriculture is usually the first economic sector to be affected by drought.
• Hydrological drought refers to deficiencies in surface and subsurface water supplies. It is measured as stream flow and as lake, reservoir, and groundwater levels. There is a time lag between lack of rain and less water in streams, rivers, lakes and reservoirs, so hydrological measurements are not the earliest indicators of drought. After precipitation has been reduced or deficient over an extended period of time, this shortage is reflected in declining surface and subsurface water levels. Water supply is controlled not only by precipitation, but also by other factors, including evaporation (which is increased by higher than normal heat and winds), transpiration (the use of water by plants), and human use.
• Socioeconomic drought occurs when a physical water shortage starts to affect people, individually and collectively. Most socioeconomic definitions of drought associate it with the supply and demand of an economic good.
Defining when drought begins is a function of the impacts of drought on water users, and includes consideration of the supplies available to local water users as well as the stored water they may have available in surface reservoirs or groundwater basins. Different local water agencies have different criteria for defining drought conditions in their jurisdictions. Some agencies issue drought watch or drought warning announcements to their customers. Determinations of regional or statewide drought conditions are usually based on a combination of hydrologic and water supply factors.
DEFINITIONS Drought—The cumulative impacts of several dry years on water users. It can include deficiencies in surface and subsurface water supplies and generally impacts health, well-being, and quality of life.
Hydrological Drought—Deficiencies in surface and subsurface water supplies.
Socioeconomic Drought—Drought impacts on health, well-being and quality of life.
9-1

Kootenai County Multi-Jurisdictional All Hazard Mitigation Plan; Volume 1—Planning-Area-Wide Elements
9.2 HAZARD PROFILE Droughts originate from a deficiency of precipitation resulting from an unusual weather pattern. If the weather pattern lasts a short time (a few weeks or a couple months), the drought is considered short-term. If the weather pattern becomes entrenched and the precipitation deficits last for several months or years, the drought is considered to be long-term. It is possible for a region to experience a long-term circulation pattern that produces drought, and to have short-term changes in this long-term pattern that result in short-term wet spells. Likewise, it is possible for a long-term wet circulation pattern to be interrupted by short-term weather spells that result in short-term drought.
9.2.1 Past Events According to the Idaho State Hazard Mitigation Plan, meteorological drought conditions existed in the state approximately 30 percent of the time from 1931 to 1982 (Idaho Bureau of Homeland Security, 2013). Kootenai County has experienced significant drought events twice in the past several decades: 1988 and 1992. Neither of these events was part of a federal disaster declaration. According to estimates from the Spatial Hazard Events and Losses Database, these two reported events caused several million dollars in crop damage. The events were likely the result of the same prolonged drought period. The state hazard mitigation plan reports that water supplies were much below normal from 1987 through 1992.
9.2.2 Location The National Oceanic and Atmospheric Administration (NOAA) has developed several indices to measure drought impacts and severity and to map their extent and locations:
• The Palmer Crop Moisture Index measures short-term drought on a weekly scale and is used to quantify drought’s impacts on agriculture during the growing season. Figure 9-1 shows this index for the week ending January 10, 2015.
• The Palmer Z Index measures short-term drought on a monthly scale. Figure 9-2 shows this index for December 2014.
• The Palmer Drought Severity Index measures the duration and intensity of long-term drought-inducing circulation patterns. Long-term drought is cumulative, so the intensity of drought during a given month is dependent on current weather patterns plus the cumulative patterns of previous months. Weather patterns can change quickly from a long-term drought pattern to a long-term wet pattern, and the Palmer Drought Severity Index can respond fairly rapidly. Figure 9-3 shows this index for the week ending January 10, 2015.
9.2.3 Frequency Due to Idaho’s arid conditions, drought is a natural but unpredictable occurrence in the state. Therefore, the probability of a future drought in Kootenai County is high. Kootenai County has experienced notable drought conditions twice since 1977. Averaged over a 37-year timeframe, Kootenai County should expect to experience drought conditions once every 19 years.
9-2

DROUGHT
Source: U.S. Drought Portal
Figure 9-1. Crop Moisture Index for Week Ending January 10, 2015
Source: NOAA National Climatic Data Center
Figure 9-2. Palmer Z Index Short-Term Drought Conditions (December 2014)
9-3

Kootenai County Multi-Jurisdictional All Hazard Mitigation Plan; Volume 1—Planning-Area-Wide Elements
Source: U.S. Drought Portal
Figure 9-3. Palmer Drought Severity Index for Week Ending January 10, 2015
9.2.4 Severity Drought impacts are wide-reaching and may be economic, environmental or societal. The most significant impacts associated with drought in Idaho are those related to water-intensive activities such as agriculture, wildfire protection, municipal usage, commerce, tourism, recreation and wildlife preservation. An ongoing drought may leave an area more prone to beetle kill and associated wildfires. Drought conditions can also cause soil to compact, increasing an area’s susceptibility to flooding, and reduce vegetation cover, which exposes soil to wind and erosion. Reductions of electric power generation and water quality deterioration are also potential problems. Drought impacts increase with the length of a drought, as carry-over supplies in reservoirs are depleted and water levels in streams and groundwater decline.
Drought can have a widespread impact on the environment and the economy, depending on its severity, although it typically does not result in loss of life or damage to property. On average, the nationwide annual impacts of drought are greater than the impacts of any other natural hazard. They are estimated to be between $6 billion and $8 billion annually in the United States and occur primarily in the agriculture, transportation, recreation and tourism, forestry, and energy sectors. Social and environmental impacts are also significant, although it is difficult to put a precise cost on these impacts.
The severity of a drought depends on the degree of moisture deficiency, the duration, and the size and location of the affected area. The longer the drought and the larger the area impacted, the more severe the potential impacts. A drought directly or indirectly impacts all people in affected areas. All people could pay more for water if utilities increase their rates due to shortages. Agricultural impacts can result in loss of work for farm workers and those in related food processing jobs. Other water- or electricity-dependent industries are commonly forced to shut down all or a portion of their facilities, resulting in further layoffs. A drought can harm recreational companies that use water (e.g., swimming pools, water parks, and river rafting companies) as well as landscape and nursery businesses because people will not invest in new plants if water is not available to sustain them.
9-4

DROUGHT
Drought generally does not affect groundwater sources as quickly as surface water supplies, but groundwater supplies generally take longer to recover. Reduced precipitation during a drought means that groundwater supplies are not replenished at a normal rate. This can lead to a reduction in groundwater levels and problems such as reduced pumping capacity or wells going dry. Shallow wells are more susceptible than deep wells. Reduced replenishment of groundwater affects streams. Much of the flow in streams comes from groundwater, especially during the summer when there is less precipitation and after snowmelt ends. Reduced groundwater levels mean that even less water will enter streams when steam flows are lowest.
The National Drought Mitigation Center developed the Drought Impact Reporter in response to the need for a national drought impact database for the United States. Information comes from a variety of sources: on-line drought-related news stories and scientific publications, members of the public who visit the website and submit a drought-related impact for their region, members of the media, and members of relevant government agencies. The database is being populated beginning with the most recent impacts and working backward in time. The Drought Impact Reporter contains information on 123 impacts from droughts that affected Kootenai County between 2004 and December 2014. Most of the impacts, 78, were classified as “agriculture.” Other frequent impact categories include “society and public health” (33), “relief, response & restrictions” (24), “fire” (16), “business & industry” (15) and “water supply and quality” (15). These categories are described as follows (National Drought Mitigation Center, 2015):
• Agriculture—Drought effects associated with agriculture, aquaculture, horticulture, forestry or ranching. Examples of drought-induced agricultural impacts include damage to crop quality; income loss for farmers due to reduced crop yields; reduced productivity of cropland; insect infestation; plant disease; increased irrigation costs; cost of new or supplemental water resource development for agriculture (wells, dams, pipelines); reduced productivity of rangeland; forced reduction of foundation stock; closure/limitation of public lands to grazing; high cost or unavailability of water for livestock, tree farms, forestry, domesticated horses, bees, fish, shellfish, or horticulture.
• Society and Public Health—Drought effects associated with human, public and social health include social- or health-related problems related to reduced water quantity or quality, such as increased concentration of contaminants; loss of human life (e.g., from heat stress, suicide); increased respiratory ailments; increased disease caused by wildlife concentrations; increased human disease caused by changes in insect carrier populations; population migration (rural to urban areas, migrants into the United States); loss of aesthetic values; change in daily non-recreational activities; elevated stress levels; need for drought plans; penalties for violation of water restrictions; higher water rates; cultural/historical disturbance from low water levels; cancellation of communal events; stockpiling water; need for public outreach; protests; and conflicts within the community due to competition for water.
• Relief, Response and Restrictions—This category refers to drought effects associated with disaster declarations, aid programs, requests for disaster declaration or aid, water restrictions, or fire restrictions. Examples include disaster declarations, aid programs, USDA disaster declarations, Small Business Association disaster declarations, government relief and response programs, state-level water shortage or water emergency declarations, county-level declarations, declared states of emergency, requests for declarations or aid, non-profit organization-based relief, water restrictions, fire restrictions, National Weather Service Red Flag warnings, and declarations of drought watches or warnings.
• Fire—Drought often contributes to fires, fire danger, and burning restrictions. Impacts include burning restrictions, fireworks bans, increased fire risk, increased occurrence of fire, states of emergency during periods of high fire danger, closure of roads or land due to fire occurrence or risk, and expenses to state and county governments associated with firefighting.
9-5

Kootenai County Multi-Jurisdictional All Hazard Mitigation Plan; Volume 1—Planning-Area-Wide Elements
• Business and Industry—Drought can affect non-agriculture and non-tourism businesses, such as lawn care, recreational vehicles or gear dealers, and plant nurseries. Typical impacts include reduction or loss of demand for goods or services, reduction in employment, variation in number of calls for service, late opening or early closure for the season, bankruptcy, and permanent business closure.
• Water supply and Quality—Drought effects associated with water supply and water quality include dry wells, water restrictions, changes in water rates, easing of water restrictions, increases in requests for new well permits, changes in water use due to restrictions, greater water demand, decreases in water allocation or allotments, installation or alteration of water pumps or water intakes, changes to allowable water contaminants, water line damage or repairs due to drought stress, drinking water turbidity, and changes in water color or odor.
9.2.5 Warning Time Droughts are climatic patterns that occur over long periods of time. Anomalies of precipitation and temperature may last from several months to several decades. How long they last depends on interactions between the atmosphere and the oceans, soil moisture and land surface processes, topography, internal dynamics, and the accumulated influence of weather systems on the global scale. Empirical studies have shown that meteorological drought is never the result of a single cause. It is the result of many causes, including global weather patterns that produce persistent, upper-level high-pressure systems along the West Coast with warm, dry air resulting in less precipitation.
Predicting drought depends on the ability to forecast precipitation and temperature. Scientists cannot predict drought more than a month in advance for most locations. Only generalized warning can take place, due to the numerous contributing variables.
9.3 SECONDARY HAZARDS The secondary hazard most commonly associated with drought is wildfire. A prolonged lack of precipitation dries out vegetation, which becomes increasingly susceptible to ignition as the duration of the drought extends. Drought also is often accompanied by extreme heat. When temperatures reach 90ºF and above, people are vulnerable to sunstroke, heat cramps and heat exhaustion. Pets and livestock are also vulnerable to heat-related injuries. Crops can be vulnerable as well.
9.4 EXPOSURE All people, property and environments in the planning area would be exposed to some degree to the impacts of moderate to extreme drought conditions.
9.5 VULNERABILITY Drought produces a complex web of impacts that spans many sectors of the economy and reaches well beyond the area experiencing physical drought. This complexity exists because water is integral to the ability to produce goods and provide services. Drought can affect a wide range of economic, environmental and social activities. The vulnerability of an activity to the effects of drought usually depends on its water demand, how the demand is met, and what water supplies are available to meet the demand.
9-6

DROUGHT
9.5.1 Population The planning partnership has the ability to minimize impacts on residents and water consumers should several consecutive dry years occur. No significant life or health impacts are anticipated as a result of drought within the planning area.
9.5.2 Property No structures will be directly affected by drought conditions, though some structures may become vulnerable to wildfires, which are more likely following years of drought. Droughts can also have significant impacts on landscapes, which could cause a financial burden to property owners. However, these impacts are not considered critical in planning for impacts from the drought hazard.
9.5.3 Critical Facilities and Infrastructure Critical facilities will continue to be operational during a drought. The risk to the planning area’s critical facilities inventory will be largely aesthetic. For example, when water conservation measures are in place, landscaped areas will not be watered and may die. These aesthetic impacts are not considered significant.
9.5.4 Environment Environmental losses from drought are associated with damage to plants, animals, wildlife habitat, and air and water quality; forest and range fires; degradation of landscape quality; loss of biodiversity; and soil erosion. Some of the effects are short-term, and conditions quickly return to normal following the end of the drought. Other environmental effects linger for some time or may even become permanent. Wildlife habitat, for example, may be degraded through the loss of wetlands, lakes and vegetation. However, many species will eventually recover from this temporary aberration. The degradation of landscape quality, including increased soil erosion, may lead to a more permanent loss of biological productivity. Although environmental losses are difficult to quantify, growing public awareness and concern for environmental quality has forced public officials to focus greater attention and resources on these effects.
9.5.5 Economic Impact Economic impact will be largely associated with industries that use water or depend on water for their business. For example, landscaping businesses were affected in the droughts of the past as the demand for service significantly declined because landscaping was not watered. Agricultural industries will be impacted if water usage is restricted for irrigation. The state hazard mitigation plan identifies the following economic impacts and vulnerabilities that may impact Kootenai County during a prolonged or severe drought (Idaho Bureau of Homeland Security, 2013):
• Losses from crop, dairy, livestock, timber, and fishery production and associated businesses
• Losses from recreation providers and associated businesses
• Losses related to increased cost resulting from increased energy demand and from shortages caused by reduced hydroelectric generation capacity
• Revenue losses for federal, state, and local governments from a reduced tax base and for financial institutions from defaults and postponed payments.
• Losses from impaired navigability of streams, rivers, and canals
• Long-term loss of economic growth and development.
9-7

Kootenai County Multi-Jurisdictional All Hazard Mitigation Plan; Volume 1—Planning-Area-Wide Elements
9.6 FUTURE TRENDS IN DEVELOPMENT The comprehensive plans of municipal planning partners in this effort include policies directing land use and dealing with issues of water supply and the protection of water resources. These plans provide capability at the local level to protect future development from the impacts of drought. All planning partners reviewed their comprehensive plans under the capability assessments performed for this effort. Deficiencies identified by these reviews can be identified as mitigation initiatives to increase the ability to deal with future trends in development. Vulnerability to drought will increase as population growth increases, putting more demands on existing water supplies.
9.7 9.7 SCENARIO An extreme multiyear drought more intense than the 1988 and 1992 droughts could impact the region. Combinations of low precipitation and unusually high temperatures could occur over several consecutive years. Intensified by such conditions, extreme wildfires could break out throughout the planning area, increasing the need for water. Surrounding communities, also in drought conditions, could increase their demand for water supplies relied upon by Kootenai County, causing social and political conflicts. If such conditions persisted for several years, the economy of Kootenai County could experience setbacks, especially in water dependent industries.
9.8 ISSUES The plan identifies the following drought-related issues:
• Identification and development of alternative water supplies
• Utilization of groundwater recharge techniques to stabilize the groundwater supply
• The promotion of active water conservation even during non-drought periods
• Public education on water conservation.
9-8

CHAPTER 10. EARTHQUAKE
10.1 GENERAL BACKGROUND
10.1.1 How Earthquakes Happen An earthquake is the vibration of the earth’s surface that follows a release of energy in the earth’s crust. This energy can be generated by a sudden dislocation of segments of the crust or by a volcanic eruption. Most destructive quakes are caused by dislocations of the crust. The crust may first bend and then, when the stress exceeds the strength of the rocks, break and snap to a new position. In the process of breaking, vibrations called “seismic waves” are generated. These waves travel outward from the source of the earthquake along the surface and through the earth at varying speeds, depending on the material through which they move.
Geologists have found that earthquakes tend to reoccur along faults, which are zones of weakness in the earth’s crust. Even if a fault zone has recently experienced an earthquake, there is no guarantee that all the stress has been relieved. Another earthquake could still occur. In fact, relieving stress along one part of a fault may increase stress in another part.
Faults often form the boundaries of Earth’s tectonic plates. Idaho is not on a plate boundary, but forces within the western part of the North American plate combine with high heat flow from the underlying mantel to stretch the crust in a northeast-southwest direction. In response to this stretching, the rigid crust breaks and shifts along faults, and the fault movement produces earthquakes. Stretching, or horizontal extension, of the crust produces a type of dipping fault called a “normal” fault (Figure 10-1). The movement of normal faults is characterized by the crust above the fault plane moving down relative to the crust below the fault plane. This up/down movement differs from movement on strike-slip faults like the San Andreas Fault in California, where the crust on one side of the fault slides horizontally past the crust on the other side. Earthquakes in Idaho can be generated by movement on a variety of types of faults, but the faults that are considered capable of generating large surface-faulting earthquakes are mainly normal faults.
10.1.2 Earthquake Classifications Earthquakes are typically classified in one of two ways: By the amount of energy released, measured as magnitude; or by the impact on people and structures, measured as intensity.
DEFINITIONS
Earthquake—The shaking of the ground caused by an abrupt shift of rock along a fracture in the earth or a contact zone between tectonic plates. Epicenter—The point on the earth’s surface directly above the hypocenter of an earthquake. The location of an earthquake is commonly described by the geographic position of its epicenter and by its focal depth. Fault—A fracture in the earth’s crust along which two blocks of the crust have slipped with respect to each other. Focal Depth—The depth from the earth’s surface to the hypocenter. Hypocenter—The region underground where an earthquake’s energy originates Liquefaction—Loosely packed, water-logged sediments losing their strength in response to strong shaking, causing major damage during earthquakes.
10-1

Kootenai County Multi-Jurisdictional All Hazard Mitigation Plan; Volume 1—Planning-Area-Wide Elements
Figure 10-1. Horizontal Extension Creates Normal Faults
Magnitude Currently the most commonly used magnitude scale is the moment magnitude (Mw) scale, with the follow classifications of magnitude:
• Great—Mw > 8
• Major—Mw = 7.0 - 7.9
• Strong—Mw = 6.0 - 6.9
• Moderate—Mw = 5.0 - 5.9
• Light—Mw = 4.0 - 4.9
• Minor—Mw = 3.0 - 3.9
• Micro—Mw < 3
Estimates of moment magnitude roughly match the local magnitude scale (ML) commonly called the Richter scale. One advantage of the moment magnitude scale is that, unlike other magnitude scales, it does not saturate at the upper end. That is, there is no value beyond which all large earthquakes have about the same magnitude. For this reason, moment magnitude is now the most often used estimate of large earthquake magnitudes.
Intensity Currently the most commonly used intensity scale is the modified Mercalli intensity scale, with ratings defined as follows (USGS, 1989):
• I. Not felt except by a very few under especially favorable conditions
• II. Felt only by a few persons at rest, especially on upper floors of buildings.
• III. Felt quite noticeably by persons indoors, especially on upper floors of buildings. Many people do not recognize it is an earthquake. Standing cars may rock slightly. Vibrations similar to the passing of a truck. Duration estimated.
• IV. Felt indoors by many, outdoors by few during the day. At night, some awakened. Dishes, windows, doors disturbed; walls make cracking sound. Sensation like a heavy truck striking building. Standing cars rocked noticeably.
• V. Felt by nearly everyone; many awakened. Some dishes, windows broken. Unstable objects overturned. Pendulum clocks may stop.
10-2

EARTHQUAKE
• VI. Felt by all; many frightened. Some heavy furniture moved; a few instances of fallen plaster. Damage slight.
• VII. Damage negligible in buildings of good design and construction; slight in well-built ordinary structures; considerable in poorly built or badly designed structures. Some chimneys broken.
• VIII. Damage slight in specially designed structures; considerable damage in ordinary buildings with partial collapse. Damage great in poorly built structures. Fall of chimneys, factory stacks, columns, monuments, walls. Heavy furniture overturned.
• IX. Damage considerable in specially designed structures; well-designed frame structures thrown out of plumb. Damage great in substantial buildings, with partial collapse. Buildings shifted off foundations.
• X. Some well-built wooden structures destroyed; most masonry and frame structures destroyed with foundations. Rails bent.
• XI. Few, if any (masonry) structures remain standing. Bridges destroyed. Rails bent greatly.
• XII. Damage total. Lines of sight and level are distorted. Objects thrown into the air.
10.1.3 Ground Motion Earthquake hazard assessment is also based on expected ground motion. This involves determining the annual probability that certain ground motion accelerations will be exceeded, then summing the annual probabilities over the time period of interest. The most commonly mapped ground motion parameters are the horizontal and vertical peak ground accelerations (PGA) for a given soil or rock type. Instruments called accelerographs record levels of ground motion due to earthquakes at stations throughout a region. These readings are recorded by state and federal agencies that monitor and predict seismic activity.
Maps of PGA values form the basis of seismic zone maps that are included in building codes such as the International Building Code. Building codes that include seismic provisions specify the horizontal force due to lateral acceleration that a building should be able to withstand during an earthquake. PGA values are directly related to these lateral forces that could damage “short period structures” (e.g. single-family dwellings). Longer period response components determine the lateral forces that damage larger structures with longer natural periods (apartment buildings, factories, high-rises, bridges). Table 10-1 lists damage potential and perceived shaking by PGA factors, compared to the Mercalli scale.
10.1.4 Effect of Soil Types The impact of an earthquake on structures and infrastructure is largely a function of ground shaking, distance from the source of the quake, and liquefaction, a secondary effect of an earthquake in which soils lose their shear strength and flow or behave as liquid, thereby damaging structures that derive their support from the soil. Liquefaction generally occurs in soft, unconsolidated sedimentary soils. A program called the National Earthquake Hazard Reduction Program (NEHRP) creates maps based on soil characteristics to help identify locations subject to liquefaction. Table 10-2 summarizes NEHRP soil classifications. NEHRP Soils B and C typically can sustain ground shaking without much effect, dependent on the earthquake magnitude. The areas that are commonly most affected by ground shaking have NEHRP Soils D, E and F. In general, these areas are also most susceptible to liquefaction.
10-3

Kootenai County Multi-Jurisdictional All Hazard Mitigation Plan; Volume 1—Planning-Area-Wide Elements
TABLE 10-1. MERCALLI SCALE AND PEAK GROUND ACCELERATION COMPARISON
Modified Potential Structure Damage Estimated PGAa Mercalli Scale Perceived Shaking Resistant Buildings Vulnerable Buildings (%g)
I Not Felt None None <0.17% II-III Weak None None 0.17% - 1.4% IV Light None None 1.4% - 3.9% V Moderate Very Light Light 3.9% - 9.2% VI Strong Light Moderate 9.2% - 18% VII Very Strong Moderate Moderate/Heavy 18% - 34% VIII Severe Moderate/Heavy Heavy 34% - 65% IX Violent Heavy Very Heavy 65% - 124%
X - XII Extreme Very Heavy Very Heavy >124%
a. PGA measured in percent of g, where g is the acceleration of gravity Sources: USGS, 2008; USGS, 2010
TABLE 10-2. NEHRP SOIL CLASSIFICATION SYSTEM
NEHRP Soil Type Description
Mean Shear Velocity to 30 m (m/s)
A Hard Rock 1,500 B Firm to Hard Rock 760-1,500 C Dense Soil/Soft Rock 360-760 D Stiff Soil 180-360 E Soft Clays < 180 F Special Study Soils (liquefiable soils, sensitive clays, organic soils, soft
clays >36 m thick)
10.2 HAZARD PROFILE Earthquakes can last from a few seconds to over five minutes; they may also occur as a series of tremors over several days. The actual movement of the ground in an earthquake is seldom the direct cause of injury or death. Casualties generally result from falling objects and debris, because the shocks shake, damage or demolish buildings and other structures. Disruption of communications, electrical power supplies and gas, sewer and water lines should be expected. Earthquakes may trigger fires, dam failures, landslides or releases of hazardous material, compounding their disastrous effects.
Small, local faults produce lower magnitude quakes, but ground shaking can be strong and damage can be significant in areas close to the fault. In contrast, large regional faults can generate earthquakes of great magnitudes but, because of their distance and depth, they may result in only moderate shaking in an area.
10-4

EARTHQUAKE
10.2.1 Past Events Idaho is among the most active states in terms of the number of earthquakes experienced, with hundreds of small earthquakes recorded since observations began in the mid-20th century (Idaho Geological Survey and Idaho Bureau of Homeland Security, 2009). Figure 10-2 shows past earthquakes recorded by the Idaho Geologic Survey in and near Kootenai County. The county also has experienced seismic activity from earthquakes farther outside its boundaries. Seismic activity of at least Magnitude-4.0 has been recorded in Kootenai County in almost every decade since the 1910s (Kootenai County 2010 Hazard Mitigation Plan).
10.2.2 Location Identifying the extent and location of an earthquake is not as simple as it is for other hazards such as flood, landslide or wild fire. The impact of an earthquake is largely a function of the following components:
• Ground shaking (ground motion accelerations)
• Liquefaction (soil instability)
• Distance from the source (both horizontally and vertically).
Mapping that shows the impacts of these components was used to assess the risk of earthquakes within the planning area. While the impacts from each of these components can build upon each other during an earthquake event, the mapping looks at each component individually. The mapping used in this assessment is described below.
Shake Maps A shake map is a representation of ground shaking produced by an earthquake. The information it presents is different from the earthquake magnitude and epicenter that are released after an earthquake because shake maps focus on the ground shaking resulting from the earthquake, rather than the parameters describing the earthquake source. An earthquake has only one magnitude and one epicenter, but it produces a range of ground shaking at sites throughout the region, depending on the distance from the earthquake, the rock and soil conditions at sites, and variations in the propagation of seismic waves from the earthquake due to complexities in the structure of the earth’s crust. A shake map shows the extent and variation of ground shaking in a region immediately following significant earthquakes.
Ground motion and intensity maps are derived from peak ground motion amplitudes recorded on seismic sensors (accelerometers), with interpolation based on estimated amplitudes where data are lacking, and site amplification corrections. Color-coded instrumental intensity maps are derived from empirical relations between peak ground motions and Modified Mercalli intensity. Two types of shake map are typically generated from the data:
• A probabilistic seismic hazard map shows the hazard from earthquakes that geologists and seismologists agree are likely within a certain timeframe. The maps are expressed in terms of probability of exceeding a certain ground motion, such as the 10-percent probability of exceedance in 50 years. This level of ground shaking has been used for designing buildings in high seismic areas. Figure 10-3 and Figure 10-4 show the estimated ground motion for the 100-year and 500-year probabilistic earthquakes in the planning area.
10-5

Kootenai County Multi-Jurisdictional All Hazard Mitigation Plan; Volume 1—Planning-Area-Wide Elements
Source: Idaho Geological Survey, 2014
Figure 10-2. Kootenai County-Area Earthquakes
10-6

Athol
HaydenLake
DaltonGardens
Worley
Fernan
Rathdrum
Hayden
Coeurd'Alene
PostFalls
Harrison
StateLine
SpiritLake
Huetter
HauserLake
£¤95
£¤95
£¤95
¬«58
¬«41
¬«97
¬«54
¬«3
¬«41
¬«53
§̈¦90
§̈¦90
Co eur d'Ale ne River
Spoka ne River
LakeCoeur
d'Alene
HaydenLake
LakePend
Oreille
0 63Miles
Figure 0100-Year Probabi l ity Earthquake Event Peak Ground Acceleration
Base Map Data Sources: Kootenai County, U.S. Geological Survey
Kootenai County Hazard Mit igat ion Plan Update
±
Mercalli Scale(Potential Damage,Perceived Shaking)
IV (No, Light)

Athol
HaydenLake
DaltonGardens
Worley
Fernan
Rathdrum
Hayden
Coeurd'Alene
PostFalls
Harrison
StateLine
SpiritLake
Huetter
HauserLake
£¤95
£¤95
£¤95
¬«58
¬«41
¬«97
¬«54
¬«3
¬«41
¬«53
§̈¦90
§̈¦90
Co eur d'Ale ne River
Spoka ne River
LakeCoeur
d'Alene
HaydenLake
LakePend
Oreille
0 63Miles
Figure 0500-Year Probabi l ity Earthquake Event Peak Ground Acceleration
Base Map Data Sources: Kootenai County, U.S. Geological Survey
Kootenai County Hazard Mit igat ion Plan Update
±
Mercalli Scale(Potential Damage,Perceived Shaking)
V (very light, moderate)

EARTHQUAKE
• Earthquake scenario maps describe the expected ground motions and effects of hypothetical large earthquakes for a region, often based on an actual event that occurred in the past. The scenario chosen for this plan is the re-creation of an historical event that occurred in 1942 (see Figure 10-5). The Magnitude-5.5 event was modeled using current population and building data. The simulation used an epicenter 3.5 miles north of the City of Athol (Latitude 48 and Longitude -116.7) and 10 kilometers deep.
NEHRP Soil Maps NEHRP soil types define the locations that will be significantly impacted by an earthquake. NEHRP Soils B and C typically can sustain low-magnitude ground shaking without much effect. The areas that are most commonly affected by ground shaking have NEHRP Soils D, E and F. NEHRP soil mapping is not currently available for the planning area.
Liquefaction Maps Soil liquefaction maps are useful tools to assess potential damage from earthquakes. When the ground liquefies, sandy or silty materials saturated with water behave like a liquid, causing pipes to leak, roads and airport runways to buckle, and building foundations to be damaged. In general, areas with NEHRP Soils D, E and F are also susceptible to liquefaction. If there is a dry soil crust, excess water will sometimes come to the surface through cracks in the confining layer, bringing liquefied sand with it, creating sand boils. Liquefaction data is not currently available for the Kootenai County planning area.
Fault Zones The publication, Putting Down Roots in Earthquake Country, describes the Lewis and Clark Fault Zone as follows (Idaho Geological Survey and Idaho Bureau of Homeland Security, 2009):
The Lewis and Clark Zone is a megashear in the earth’s crust, up to 30 miles wide, which cuts some 240 miles through north Idaho and northwestern Montana. Geologic studies have shown that the North American plate has been sheared along this zone repeatedly over the past billion years. The most obvious manifestation of the zone is a set of en echelon valleys that follow brittle fault zones across the grain of the northern Rocky Mountains from Helena through Missoula, Montana to Coeur d’Alene, Idaho. These valleys provided a natural transportation corridor through the mountains used in part by Lewis and Clark in 1806 and the Mullan Trail of the 1850s, and today by Interstate 90.
Along the Lewis and Clark Zone in Idaho, many mining-related seismic events, called rockbursts, have occurred. Rockbursts are spontaneous, violent fractures of rock in deep mines. The sizable magnitudes of some rockbursts, their dominant horizontal strain direction, along with their location within the Lewis and Clark Zone suggest that tectonic stress release may be involved in this mining-related seismicity.
The destructive 1935 magnitude 6.25 and 6 Helena Valley earthquakes occurred near the eastern end of the Lewis and Clark Zone in Montana. The possibility that the western end of the zone is also capable of such large earthquakes, creates a considerable earthquake shaking hazard for the residents of Wallace, Kellogg, Coeur d’Alene, Rathdrum, Sandpoint and surrounding communities.
10-9

Athol
HaydenLake
DaltonGardens
Worley
Fernan
Rathdrum
Hayden
Coeurd'Alene
PostFalls
Harrison
StateLine
SpiritLake
Huetter
HauserLake
£¤95
£¤95
£¤95
¬«58
¬«41
¬«97
¬«54
¬«3
¬«41
¬«53
§̈¦90
§̈¦90
Co eur d'Ale ne River
Spoka ne River
LakeCoeur
d'Alene
HaydenLake
LakePend
Oreille
0 63Miles
Figure 01942 M5.5 Historical Event Peak Ground Acceleration
Base Map Data Sources: Kootenai County, U.S. Geological Survey
Kootenai County Hazard Mit igat ion Plan Update
±
Mercalli Scale(Potential Damage,Perceived Shaking)
IV (no, light)
V (very light/moderate)
VI (light/strong)
EQ Epicenter - Approximately 1.5 miles north of county border

EARTHQUAKE
10.2.3 Frequency Earthquakes are one of the least predictable natural hazards. In Idaho, considerable damage and unease for residents can result from both infrequent, large surface faulting events and more frequent, moderate-sized events (Idaho Geological Survey and Idaho Bureau of Homeland Security, 2009). Table 10-3 summarizes Idaho earthquake statistics from 1973 to 2009.
TABLE 10-3. IDAHO EARTHQUAKE STATISTICS 1973-2009
Number of events
Magnitude 1-2 2 Magnitude 2-3 380 Magnitude 3-4 739 Magnitude 4-5 83 Magnitude 5-6 5 Magnitude 6-7 2 Total 1,225
Source: Reproduced from Idaho Geological Survey and Idaho Bureau of Homeland Security, 2009. Original data source USGS earthquake catalog.
10.2.4 Severity The severity of an earthquake can be expressed in terms of intensity or magnitude. Intensity represents the observed effects of ground shaking on people, buildings, and natural features. The USGS has created ground motion maps based on current information about several fault zones. These maps show the PGA that has a certain probability (2 percent or 10 percent) of being exceeded in a 50-year period. The PGA is measured in numbers of g’s (the acceleration associated with gravity). Figure 10-6 shows the PGAs with a 2-percent exceedance chance in 50 years in the western U.S. The Kootenai County area is a relatively low-risk area compared to the rest of the West.
Magnitude is related to the amount of seismic energy released at the hypocenter of an earthquake. It is determined by the amplitude of the earthquake waves recorded on instruments. Whereas intensity varies depending on location with respect to the earthquake epicenter, magnitude is represented by a single, instrumentally determined value for each earthquake event.
In simplistic terms, the severity of an earthquake event can be measured in the following terms:
• How hard did the ground shake?
• How did the ground move? (Horizontally or vertically)
• How stable was the soil?
• What is the fragility of the built environment in the area of impact?
10-11

Kootenai County Multi-Jurisdictional All Hazard Mitigation Plan; Volume 1—Planning-Area-Wide Elements
Source: USGS, 2015
Figure 10-6. PGA with 2-Percent Probability of Exceedance in 50 Years, Western United States
10-12

EARTHQUAKE
10.2.5 Warning Time There is currently no reliable way to predict the day or month that an earthquake will occur at any given location. Research is being done with warning systems that use the low energy waves that precede major earthquakes. These potential warning systems give approximately 40 seconds notice that a major earthquake is about to occur. The warning time is very short but it could allow for someone to get under a desk, step away from a hazardous material they are working with, or shut down a computer system.
10.3 SECONDARY HAZARDS Earthquakes can cause large and sometimes disastrous landslides, mudslides and avalanches. River valleys are vulnerable to slope failure, often as a result of loss of cohesion in clay-rich soils. Soil liquefaction occurs when water-saturated sands, silts or gravelly soils are shaken so violently that the individual grains lose contact with one another and float freely in the water, turning the ground into a pudding-like liquid. Building and road foundations lose load-bearing strength and may sink into what was previously solid ground. Unless properly secured, hazardous materials can be released, causing significant damage to the environment and people. Earthen dams and levees are highly susceptible to seismic events and the impacts of their eventual failures can be considered secondary risks for earthquakes.
10.4 EXPOSURE
10.4.1 Population The entire population of Kootenai County is potentially exposed to direct and indirect impacts from earthquakes. The degree of exposure is dependent on many factors, including the age and construction type of the structures people live in, the soil type their homes are constructed on, their proximity to fault location, etc. Whether directly impacted or indirectly impacted, the entire population will have to deal with the consequences of earthquakes to some degree. Business interruption could keep people from working, road closures could isolate populations, and loss of functions of utilities could impact populations that suffered no direct damage from an event itself.
10.4.2 Property According to County Assessor records, there are 79,293 buildings in the planning area, with a total replacement value of $33,796,835,614. Since all structures in the planning area are susceptible to earthquake impacts to varying degrees, this total represents the county-wide property exposure to seismic events. Most of the buildings (68.4 percent) are residential.
10.4.3 Critical Facilities and Infrastructure All critical facilities in the planning area (see Table 6-3 and Table 6-4) are exposed to the earthquake hazard. Liquefaction can seriously damage buildings, bridges, pipelines, and roads by undermining their foundations and supports. The impact of earthquake waves can result in ruptured gas mains, which can start fires. At the same time, broken water mains can make firefighting difficult. Transportation routes may be interrupted. Loss of power and communications should be anticipated. Hazardous materials releases can occur during an earthquake from fixed facilities or moving vehicles, leading to the release of materials to the surrounding environment. Facilities holding hazardous materials are of particular concern because of possible isolation of neighborhoods surrounding them. During an earthquake, structures storing hazardous materials could rupture and leak into the surrounding area or an adjacent waterway.
10-13

Kootenai County Multi-Jurisdictional All Hazard Mitigation Plan; Volume 1—Planning-Area-Wide Elements
10.4.4 Environment Secondary hazards associated with earthquakes will likely have some of the most damaging effects on the environment. Earthquake-induced landslides can significantly impact surrounding habitat. It is also possible for streams to be rerouted after an earthquake. This can change the water quality, possibly damaging habitat and feeding areas. There is a possibility of streams fed by groundwater drying up because of changes in underlying geology.
10.5 VULNERABILITY Based on past history and FEMA earthquake risk, Kootenai County in its entirety is susceptible to seismic activity of a low intensity. “Compared to areas in central and southeast Idaho, Kootenai County has a relatively low risk of earthquakes” (Bill Phillips, Idaho Geological Survey, October 28, 2008). Past recorded earthquakes in Kootenai County were not generally large enough to cause significant damage, although older and poorly constructed buildings with unreinforced masonry remain at risk. Falling bricks or parapets can cause injuries and damage on streets and sidewalks below. Risks are associated with unreinforced parapets on buildings, chimneys and appendages such as air conditioning units, which can fall from buildings and cause injury. Nonstructural damage in buildings is also a factor. Items such as bookshelves, computers, and light fixtures can fall, creating injuries and financial loss.
Earthquake vulnerability data was generated using a Level 2 Hazus-MH analysis. Once the location and size of a hypothetical earthquake are identified, Hazus-MH estimates the intensity of the ground shaking, the number of buildings damaged, the number of casualties, the damage to transportation systems and utilities, the number of people displaced from their homes, and the estimated cost of repair and clean up.
10.5.1 Population Three population groups are particularly vulnerable to earthquake hazards:
• Linguistically Isolated Populations—–According to American Community Survey 2013 population estimates, 134 households in the planning area census blocks report limited use of English. This is about 0.24 percent of all residents in these census blocks. Problems arise when there is an urgent need to inform non-English speaking residents of an earthquake event. They are vulnerable because of difficulties in understanding hazard-related information from predominantly English-speaking media and government agencies.
• Population Below Poverty Level—According to American Community Survey 2013 population estimates, 9,391 households in the planning area census block groups are below the poverty level. This is about 16.9 percent of all households in these census blocks. These households may lack the financial resources to improve their homes to prevent or mitigate earthquake damage. Poorer residents are also less likely to have insurance to compensate for losses in earthquakes.
• Population Over 65 Years Old— According to American Community Survey 2013 population estimates, 21,287 residents in the planning area census block groups are 65 years old or older. This is about 15.1 percent of all residents in these census block groups. This population group is more likely to need special medical attention, which may not be available due to isolation caused by earthquakes. Elderly residents also have more difficulty leaving their homes during earthquake events and could be stranded in dangerous situations.
Impacts on persons and households in the planning area were estimated for the 100-year and 500-year earthquakes and the historical scenario event. Table 10-4 summarizes the results.
10-14

EARTHQUAKE
TABLE 10-4. ESTIMATED EARTHQUAKE IMPACT ON PERSONS AND HOUSEHOLDS
Number of Displaced
Households Number of Persons Requiring Short-
Term Shelter
100-Year Earthquake 0 0 500-Year Earthquake 2 1 1942 Magnitude 5.5 Event 0 0
10.5.2 Property
Building Age Building codes are not state-mandated in Idaho. Some jurisdictions in Kootenai County have adopted and enforced strong building code, while others have not. The current status of International Building Code adoption for each participating jurisdiction can be found in the capabilities assessment for each planning partner in Volume 2 of this plan. The lack of a universal application of building codes in the planning area complicates risk assessment of property vulnerability.
Seismic code requirements have principally come from California, due to that state’s immense seismic risk. The California State Building Code Council has identified significant milestones in building and seismic code requirements that can be used as a gauge of structural integrity of existing building stock. Using these time periods, the planning team used Hazus to identify structures in the county by date of construction, in order to provide an assessment of building vulnerability. Table 10-5 shows the results of this analysis.
TABLE 10-5. AGE OF STRUCTURES IN PLANNING AREA
Time Period
Number of Current Planning Area Structures
Built in Period Significance of Time Frame
Pre-1933 379 Before 1933, there were no explicit earthquake requirements in building codes. State law did not require local governments to have building officials or issue building permits.
1933-1940 208 In 1940, the first strong motion recording was made. 1941-1960 1,321 In 1960, the Structural Engineers Association of California
published guidelines on recommended earthquake provisions. 1961-1975 6,483 In 1975, significant improvements were made to lateral force
requirements. 1976-1994 29,459 In 1994, the Uniform Building Code was amended to include
provisions for seismic safety. 1995 - present 41,443 Seismic code is currently enforced in areas that have adopted the
International Building Code. Total 79,293
10-15

Kootenai County Multi-Jurisdictional All Hazard Mitigation Plan; Volume 1—Planning-Area-Wide Elements
The number of structures does not reflect the number of total housing units, as many multi-family units and attached housing units are reported as one structure. Structures constructed after the Uniform Building Code was amended in 1994 to include seismic safety provisions account for 52.3 percent of all structures in the planning area. Only 0.48 percent were built before 1933 when there were no building permits, inspections, or seismic standards.
Loss Potential Property losses were estimated through the Level 2 Hazus-MH analysis for the 100-year and 500-year earthquakes and the historic scenario event. Table 10-6 and Table 10-7 show the results for two types of property loss: structural loss, representing damage to building structures; and non-structural loss, representing the value of lost contents and inventory. The total of the two types of losses is also shown in the tables.
TABLE 10-6. LOSS ESTIMATES FOR PROBABILISTIC EARTHQUAKES
Estimated Loss Associated with Earthquake 100- Year Earthquake 500- Year Earthquake
Jurisdiction Structure Contents Total Structure Contents Total
Athol $17,336 $1,148 $18,484 $219,594 $50,085 $269,680 Coeur d’Alene $692,115 $57,149 $749,264 $10,788,783 $2,731,899 $13,520,682 Dalton Gardens $111,581 $8,244 $119,825 $1,510,132 $378,729 $1,888,862 Fernan Lk. Vill. $2,687 $202 $2,889 $38,618 $7,792 $46,410 Harrison $5,814 $442 $6,256 $75,660 $16,990 $92,650 Hauser $6,549 $444 $6,993 $97,336 $22,541 $119,877 Hayden $217,766 $16,340 $234,106 $3,248,926 $753,382 $4,002,307 Hayden Lake $13,920 $1,032 $14,953 $207,227 $42,416 $249,643 Huetter $4,046 $301 $4,347 $62,725 $14,323 $77,049 Post Falls $372,786 $28,453 $401,239 $5,918,644 $1,415,597 $7,334,241 Rathdrum $75,669 $5,131 $80,800 $1,124,719 $260,461 $1,385,180 Spirit Lake $31,598 $1,937 $33,535 $471,782 $101,596 $573,378 State Line $2,444 $190 $2,634 $38,154 $9,731 $47,885 Worley $4,231 $252 $4,483 $60,423 $12,692 $73,115
Unincorporated $944,184 $65,297 $1,009,481 $13,360,980 $2,979,742 $16,340,721
Total $2,502,726 $186,562 $2,689,289 $37,223,704 $8,797,975 $46,021,679
10-16

EARTHQUAKE
TABLE 10-7. LOSS ESTIMATES FOR 1942 MAGNITUDE 5.5 SCENARIO EARTHQUAKE
Estimated Loss Associated with Earthquake Jurisdiction Structure Contents Total
Athol $540,560 $169,791 $710,351 Coeur d’Alene $1,801,862 $319,901 $2,121,762 Dalton Gardens $363,531 $67,832 $431,364 Fernan Lake Village $5,528 $793 $6,321 Harrison $4,480 $407 $4,887 Hauser $15,537 $2,324 $17,862 Hayden $957,818 $192,060 $1,149,878 Hayden Lake $74,495 $14,394 $88,889 Huetter $7,590 $1,088 $8,678 Post Falls $519,936 $66,326 $586,262 Rathdrum $179,535 $26,859 $206,394 Spirit Lake $240,500 $50,975 $291,475 State Line $2,058 $195 $2,253 Worley $1,221 $48 $1,269
Unincorporated $8,992,362 $2,564,189 $11,556,551
Total $13,707,014 $3,477,182 $17,184,196
A summary of the property-related loss results is as follows:
• For a 100-year probabilistic earthquake, the estimated damage potential is $2,689,289, or0.01 percent of the total replacement value for the planning area.
• For a 500-year probabilistic earthquake, the estimated damage potential is $46,021,679, or0.14 percent of the total replacement value for the planning area.
• For the historic 1942 5.5-magnitude event, the estimated damage potential is $17,184,196, or0.05 percent of the total replacement value for the planning area.
The Hazus-MH analysis also estimated the amount of earthquake-caused debris in the planning area for the 100-year and 500-year earthquakes and the two scenario events, as summarized in Table 10-8.
TABLE 10-8. ESTIMATED EARTHQUAKE-CAUSED DEBRIS
Debris to Be Removed (tons)
100-Year Earthquake 1.32 500-Year Earthquake 14.04 1942 Magnitude 5.5 Event 5.72
10-17

Kootenai County Multi-Jurisdictional All Hazard Mitigation Plan; Volume 1—Planning-Area-Wide Elements
10.5.3 Critical Facilities and Infrastructure
Level of Damage Hazus-MH classifies the vulnerability of critical facilities to earthquake damage in five categories: no damage, slight damage, moderate damage, extensive damage, or complete damage. The model was used to assign a vulnerability category to each critical facility in the planning area except hazmat facilities and “other infrastructure” facilities, for which there are no established damage functions. The analysis was performed for the 100-year event and the 500-year probabilistic events. Table 10-9 and Table 10-10 summarize the results.
Time to Return to Functionality Hazus-MH estimates the time to restore critical facilities to fully functional use. Results are presented as probability of being functional at specified time increments: 1, 3, 7, 14, 30 and 90 days after the event. For example, Hazus-MH may estimate that a facility has 5-percent chance of being fully functional at Day 3, and a 95-percent chance of being fully functional at Day 90. The analysis of critical facilities in the planning area was performed for the 100-year and Hayward/Rodgers Creek Fault earthquake events. Table 10-11 and Table 10-12 summarize the results.
TABLE 10-9. ESTIMATED DAMAGE TO CRITICAL FACILITIES FROM 100-YEAR EARTHQUAKE
Categorya No Damage Slight Damage Moderate Damage
Extensive Damage
Complete Damage
Medical and Health 4 0 0 0 0 Government Functions 55 15 0 0 0 Protective Functions 55 0 0 0 0 Schools 76 0 0 0 0 Other Critical Functions 70 3 0 0 0 Transportation 5 10 8 3 3 Bridges 18 0 0 0 0 Water supply 403 0 0 0 0 Wastewater 77 0 0 0 0 Power 4 0 0 0 0 Communications 14 0 0 0 0
Total 781 28 8 3 3
a. Vulnerability not estimated for hazmat facilities due to lack of established damage functions for these type facilities.
10-18

EARTHQUAKE
TABLE 10-10. ESTIMATED DAMAGE TO CRITICAL FACILITIES FROM 500-YEAR EARTHQUAKE
Categorya No Damage Slight Damage Moderate Damage
Extensive Damage
Complete Damage
Medical and Health 0 4 0 0 0 Government Functions 15 40 8 5 2 Protective Functions 0 55 0 0 0 Schools 0 76 0 0 0 Other Critical Functions 14 55 4 0 0 Transportation 0 3 15 5 6 Bridges 18 0 0 0 0 Water supply 403 0 0 0 0 Wastewater 77 0 0 0 0 Power 3 1 0 0 0 Communications 14 0 0 0 0
Total 544 234 270 10 8
a. Vulnerability not estimated for hazmat facilities due to lack of established damage functions for these type facilities.
TABLE 10-11. FUNCTIONALITY OF CRITICAL FACILITIES FOR 100-YEAR EVENT
# of Critical Probability of Being Fully Functional (%) Planning Unit Facilities at Day 1 at Day 3 at Day 7 at Day 14 at Day 30 at Day 90
Medical and Health 4 67.9 68.6 98.5 99.2 99.9 99.9 Government Functions 70 67.7 68.4 98.4 99.2 99.9 99.9 Protective Functions 55 67.7 68.4 98.4 99.2 99.9 99.9 Schools 76 67.6 68.3 98.4 99.2 99.9 99.9 Other Critical functions 73 67.9 68.6 98.5 99.2 99.9 99.9 Transportation 29 26.1 26.3 26.8 27.8 30.3 42.7 Bridges 18 100.0 100.0 100.0 100.0 100.0 100.0 Water supply 403 99.8 99.9 99.9 99.9 99.9 99.9 Wastewater 77 99.4 99.9 99.9 99.9 99.9 99.9 Power 4 99.8 99.9 99.9 99.9 99.9 99.9 Communications 14 99.9 99.9 99.9 99.9 99.9 99.9 Total/Average 823 77.4 77.8 91.1 91.6 92.2 93.6
10-19

Kootenai County Multi-Jurisdictional All Hazard Mitigation Plan; Volume 1—Planning-Area-Wide Elements
TABLE 10-12. FUNCTIONALITY OF CRITICAL FACILITIES FOR 500-YEAR EARTHQUAKE
# of Critical Probability of Being Fully Functional (%) Planning Unit Facilities at Day 1 at Day 3 at Day 7 at Day 14 at Day 30 at Day 90
Medical and Health 4 17.7 19.3 83.9 85.4 96.8 98.1 Government Functions 70 17.8 19.4 83.9 85.5 96.8 98.1 Protective Functions 55 17.8 19.4 83.9 85.5 96.8 98.1 Schools 76 17.6 19.2 83.8 85.4 96.8 98.1 Other Critical functions 73 17.9 19.5 84.0 85.6 96.8 98.2 Transportation 29 99.8 99.9 100.0 100.0 100.0 100.0 Bridges 18 99.9 99.9 99.9 99.9 99.9 99.9 Water supply 403 92.7 99.4 99.8 99.9 99.9 99.9 Wastewater 77 81.2 96.2 99.5 99.8 99.8 99.9 Power 4 92.7 99.4 99.8 99.9 99.9 99.9 Communications 14 98.0 99.7 99.8 99.9 99.9 99.9
Total/Average 823 60.3 63.6 92.7 93.5 98.5 99.1
10.5.4 Environment The environment vulnerable to earthquake hazard is the same as the environment exposed to the hazard.
10.6 FUTURE TRENDS IN DEVELOPMENT Planning and zoning in Kootenai County were non-existent before 1973. Prior to that year, no standards applied to anything built on a piece of property. Current planning and zoning regulations went into effect in 1973, and the “Idaho Local Planning Act” was created. Now, changes, upgrades and variances must conform to this code and the zoning of the proposed site. Buildings constructed prior to 1973 may be seismically unsafe. To keep up with the latest progressions in seismic design, building codes are revised every three years to incorporate new data findings and knowledge. Buildings constructed in the 1980s would not be as seismically safe as buildings constructed under today’s seismic codes. Structures built according to the current code should be undamaged in minor earthquakes, resist moderate earthquakes without significant structural damage, and resist severe earthquakes without collapse.
10.7 SCENARIO Any seismic activity of 6.0 or greater on faults within the planning area, or larger events outside the planning area, would have significant impacts throughout the county. Potential warning systems could give approximately 40 seconds notice that a major earthquake is about to occur. This would not provide adequate time for preparation. Earthquakes of this magnitude or higher would lead to massive structural failure of property on soft, unstable soils. Levees and revetments built on these poor soils would likely fail, representing a loss of critical infrastructure. These events could cause secondary hazards, including landslides and mudslides that would further damage structures. River valley hydraulic-fill sediment areas are also vulnerable to slope failure, often as a result of loss of cohesion in clay-rich soils. Soil liquefaction would occur in water-saturated sands, silts or gravelly soils.
10-20

EARTHQUAKE
10.8 ISSUES Important issues associated with an earthquake include but are not limited to the following:
• More information is needed on the extent to which buildings in the planning area are built to modern codes with seismic provisions. It is likely that a significant number of structures in the planning area were built without seismic provisions. More than 10 percent of the planning area’s building stock was built prior to 1973, when seismic provisions became uniformly applied through building code applications in jurisdictions that had adopted the code.
• Not all jurisdictions in the planning area have adopted and enforce the International Building Code. Those jurisdictions that have adopted may not have adequate resources for a thorough plan review and permitting process.
• Residents may not be aware or informed of the potential for significant seismic events to affect people and property in Kootenai County. It can be difficult for people to perceive their risk to earthquake hazards that occur somewhat infrequently.
• County residents may not have disaster plans and disaster supply kits.
• Residential structures in the planning area may not have taken steps to retrofit their homes and businesses.
• Based on the modeling of critical facility performance performed for this plan, a number of facilities in the planning area are expected to have complete or extensive damage from scenario events. These facilities are prime targets for structural retrofits.
• Critical facility owners should be encouraged to create or enhance continuity of operations plans using the information on risk and vulnerability contained in this plan.
• Geotechnical standards should be established that take into account the probable impacts from earthquakes in the design and construction of new or enhanced facilities.
• There are many earthen dams in the planning area. Dam failure warning and evacuation plans and procedures should be reviewed and updated to reflect the dams’ risk potential associated with earthquake activity in the region.
• Earthquakes could trigger other natural hazard events that could severely impact the county, such as dam failures and landslides.
• As noted by the Idaho State Hazard Mitigation Plan, the assessment of seismic risk is significantly impaired by a lack of fault characterization data for Idaho’s mapped faults, limited NEHRP soil and liquefaction susceptibility maps, and extremely limited seismic monitoring throughout Idaho.
• As noted by the Idaho State Hazard Mitigation Plan, continued refinement of vulnerability and inventory data will enable continued refinements in the risk assessment process.
10-21


CHAPTER 11. FLOOD
11.1 GENERAL BACKGROUND Floods are the most common natural disaster in north Idaho. Flooding occurs when a river or creek cannot handle the water flowing into it. The stream channel becomes overwhelmed, and the water comes “out of bank,” causing flooding. Factors affecting the level of flooding include the following:
• The amount of water in the channel—The amount of water is governed by local precipitation: snowpack, rainfall, and sometimes storage capacity in a reservoir.
• The capacity of the channel—The channel size, slope and shape control how fast the water flows. A narrow, steep channel tends to move water quickly, while a wide, flat channel moves water slowly. When water moves slowly, it tends to rise or back up, leading to flooding.
• The roughness of the channel—The presence of vegetation and soil can obstruct the flow, reducing the channel’s ability to convey it downstream without flooding.
A floodplain is the area adjacent to a river, creek or lake that becomes inundated during a flood. Floodplains may be broad, as when a river crosses an extensive flat landscape, or narrow, as when a river is confined in a canyon.
When floodwaters recede after a flood event, they leave behind layers of rock and mud. These gradually build up to create a new floor of the floodplain. Floodplains generally contain unconsolidated sediments (accumulations of sand, gravel, loam, silt, and/or clay), often extending below the bed of the stream. These sediments provide a natural filtering system, with water percolating back into the ground and replenishing groundwater. These are often important aquifers, the water drawn from them being filtered compared to the water in the stream. Fertile, flat reclaimed floodplain lands are commonly used for agriculture, commerce and residential development.
Connections between a river and its floodplain are most apparent during and after major flood events. These areas form a complex physical and biological system that not only supports a variety of natural resources but also provides natural flood and erosion control. When a river is separated from its floodplain with levees and other flood control facilities, natural, built-in benefits can be lost, altered, or significantly reduced.
DEFINITIONS
Flood—General and temporary condition of partial or complete inundation of normally dry areas from:
A) The overflow of inland water, and/or
B) The unusual and rapid accumulation of runoff or surface waters from any source.
Floodplain—The land area along the sides of a stream, creek, river or lake that becomes inundated with water during a flood.
100-Year Floodplain—The area flooded by a flood that has a 1-percent chance of being equaled or exceeded each year. This is a statistical average only; a 100-year flood can occur more than once in a short period of time. The 1-percent annual chance flood is the standard used by most federal and state agencies. Return Period—The average number of years between occurrences of a hazard (equal to the inverse of the annual likelihood of occurrence).
Riparian Zone—The area along the banks of a natural watercourse.
11-1

Kootenai County Multi-Jurisdictional All Hazard Mitigation Plan; Volume 1—Planning-Area-Wide Elements
11.1.1 Measuring Floods and Floodplains The frequency and severity of flooding are measured using a discharge probability, which is the probability that a certain river discharge (flow) level will be equaled or exceeded in a given year. Flood studies use historical records to determine the probability of occurrence for the different discharge levels. The flood frequency equals 100 divided by the discharge probability. For example, the 100-year discharge has a 1-percent chance of being equaled or exceeded in any given year. The “annual flood” is the greatest flood event expected to occur in a typical year. These measurements reflect statistical averages only; it is possible for two or more floods with a 100-year or higher recurrence interval to occur in a short time period. The same flood can have different recurrence intervals at different points on a river.
The extent of flooding associated with a one percent annual probability of occurrence (the base flood or 100-year flood) is used as the regulatory boundary by many agencies. Also referred to as the special flood hazard area, this boundary is a convenient tool for assessing vulnerability and risk in flood-prone communities. Many communities have maps that show the extent and likely depth of flooding for the base flood. Corresponding water-surface elevations describe the elevation of water that will result from a given discharge level, which is one of the most important factors used in estimating flood damage.
11.1.2 Floodplain Ecosystems Floodplains can support ecosystems that are rich in plant and animal species. A floodplain can contain 100 or even 1,000 times as many species as a river. Wetting of the floodplain soil releases an immediate surge of nutrients: those left over from the last flood, and those that result from the rapid decomposition of organic matter that has accumulated since then. Microscopic organisms thrive and larger species enter a rapid breeding cycle. Opportunistic feeders (particularly birds) move in to take advantage. The production of nutrients peaks and falls away quickly, but the surge of new growth endures for some time. This makes floodplains valuable for agriculture. Species growing in floodplains are markedly different from those that grow outside floodplains. For instance, riparian trees (trees that grow in floodplains) tend to be very tolerant of root disturbance and very quick-growing compared to non-riparian trees.
11.1.3 Effects of Human Activities Because they border water bodies, floodplains have historically been popular sites to establish settlements. Human activities tend to concentrate in floodplains for a number of reasons: water is readily available; land is fertile and suitable for farming; transportation by water is easily accessible; and land is flatter and easier to develop. But human activity in floodplains frequently interferes with the natural function of floodplains. It can affect the distribution and timing of drainage, thereby increasing flood problems. Human development can create local flooding problems by altering or confining drainage channels. This increases flood potential in two ways: it reduces the stream’s capacity to contain flows, and it increases flow rates or velocities downstream during all stages of a flood event. Human activities can interface effectively with a floodplain as long as steps are taken to mitigate the activities’ adverse impacts on floodplain functions.
11.1.4 Federal Flood Programs
National Flood Insurance Program The NFIP makes federally backed flood insurance available to homeowners, renters, and business owners in participating communities. For most participating communities, FEMA has prepared a detailed Flood Insurance Study. The study presents water surface elevations for floods of various magnitudes, including the 100-year flood and the 500-year flood. Base flood elevations and the boundaries of the 100- and 500-
11-2

FLOOD
year floodplains are shown on Flood Insurance Rate Maps (FIRMs), which are the principle tool for identifying the extent and location of the flood hazard. FIRMs are the most detailed and consistent data source available, and for many communities they represent the minimum area of oversight under their floodplain management program.
Participants in the NFIP must, at a minimum, regulate development in floodplain areas in accordance with NFIP criteria. Three criteria must be met before a participant issues a permit to build in a floodplain:
• New buildings and those undergoing substantial improvements must, at a minimum, be elevated to protect against damage by the 100-year flood.
• New floodplain development must not aggravate existing flood problems or increase damage to other properties.
• New floodplain development must exercise a reasonable and prudent effort to reduce its adverse impacts on threatened salmonid species.
Kootenai County entered the NFIP on March 1, 1982. Structures permitted or built in an NFIP community before the date of its initial FIRM are called “pre-FIRM” structures, and structures built afterwards are called “post-FIRM.” The insurance rate is different for the two types of structures. Recent flood insurance reform legislation (Biggert/Waters Flood Insurance reform Act of 2012) tasked FEMA with revamping the NFIP rating structure. A revised rating structure is anticipated by 2018.
In addition to Kootenai County, 10 municipal planning partners in the county participate in the NFIP. Maintaining compliance under the NFIP is an important component of flood risk reduction. All planning partners that participate in the NFIP are currently in good standing with the provisions of the NFIP and have identified initiatives to maintain their compliance and good standing.
The Community Rating System The CRS is a voluntary program within the NFIP that encourages floodplain management activities that exceed the minimum NFIP requirements. Flood insurance premiums are discounted to reflect the reduced flood risk resulting from community actions meeting the following three goals of the CRS:
• Reduce flood losses.
• Facilitate accurate insurance rating.
• Promote awareness of flood insurance.
For participating communities, flood insurance premium rates are discounted in increments of 5 percent. For example, a Class 1 community would receive a 45 percent premium discount, and a Class 9 community would receive a 5 percent discount. (Class 10 communities are those that do not participate in the CRS; they receive no discount.) The CRS classes for local communities are based on 18 creditable activities in the following categories:
• Public information
• Mapping and regulations
• Flood damage reduction
• Flood preparedness.
Figure 11-1 shows the nationwide number of CRS communities by class as of May 2014, when there were 1,211 communities receiving flood insurance premium discounts under the CRS program.
11-3

Kootenai County Multi-Jurisdictional All Hazard Mitigation Plan; Volume 1—Planning-Area-Wide Elements
Figure 11-1. CRS Communities by Class Nationwide as of May 2014
CRS activities can help to save lives and reduce property damage. Communities participating in the CRS represent a significant portion of the nation’s flood risk; over 66 percent of the NFIP’s policy base is located in these communities. Communities receiving premium discounts through the CRS range from small to large and represent a broad mixture of flood risks, including both coastal and riverine flood risks.
Kootenai County is currently participating in the CRS program. The County entered the program on October 1, 2012 and currently has a classification of 6, providing a 20-percent insurance premium discount for properties inside a special flood hazard area and a 10-percent discount for properties outside such areas. The total annual savings on flood insurance premiums within the planning area is $36,638. Many of the mitigation actions identified in Volume 2 of this plan are creditable activities under the CRS program. Therefore, successful implementation of this plan offers the potential for the County to enhance its CRS classifications and for currently non-participating communities to join the program.
Local Floodplain Management Programs
In 1998, prompted by major floods in the previous two years, Kootenai County adopted the Kootenai County Flood Mitigation Plan. The plan included extensive public input and was incorporated into the 2004 Kootenai County All Hazard Mitigation Plan. Since the adoption of the plan, the Kootenai County Flood Mitigation Committee, now called the All Hazard Mitigation Committee, under the auspices of the Local Emergency Planning Committee, has continued to review, update and ensure the implementation of the plan and its prescribed actions.
The Kootenai County Flood Damage Prevention Ordinance #441, passed in April 21, 2010, meets all the requirements of the NFIP. Additionally, new residential or commercial construction or substantial improvements must be elevated to at least 3 foot above the base flood elevation. Flood encroachments are
0
50
100
150
200
250
300
350
400
450
500
123456789
131788
218
300
471
207
Num
ber o
f Com
mun
ities
Rating Class
11-4

FLOOD
only permitted for existing structures. . A development permit is required for all development activities in the base floodplain (Section 5.1A). The ordinance has additional requirements to preclude flood damage.
11.2 HAZARD PROFILE Most major floods in Kootenai County occur during winter and spring when warm rains fall on melting snow. The highest floods are usually winter floods, which result from heavy rainfall augmented by snowmelt. Winter flows can rise from normal to extreme flood peaks in two days. Spring floods are more frequent but lower, and occur primarily in April and May. Spring floods are basically the result of snowmelt, sometimes in combination with rainfall. They can rise from normal to extreme flood peaks within five days and remain above flood stages for more than two weeks. Low-lying areas of Kootenai County suitable for development are subject to these periodic floods.
11.2.1 Principal Flooding Sources Traditionally flood-prone areas in Kootenai County are described in the sections below.
Lakes Kootenai County has seven major lakes, all of which are susceptible to flooding as a result of rain, snowmelt or both. The flood elevations of the lakes are identified in Table 11-1.
TABLE 11-1. SUMMARY OF FLOOD ELEVATIONS OF LAKES IN KOOTENAI COUNTY
Lake Drainage Area (square miles) 10-Year Elevation (feet) 100-Year Elevation (feet)
Lake Coeur d’Alene 3,700 2,135.6 2,139.3 Fernan Lake 19.6 2,137.9 2,139.3 Hauser Lake 21.8 2,191.8 2,195.0 Hayden Lake 62.3 2,244.8 2,246.8 Lake Pend Oreille 25,792 2,064.0 2,073.96 Spirit Lake 39.4 2,445.8 2,448.1 Twin Lakes 37.2 2,317.8 2,319.6
Source: 2010 FIS which will reference NAVD 88 Datum.
Lake Coeur d’Alene The major water resource in Kootenai County, Lake Coeur d’Alene with over 135 miles of beautiful shoreline, is located in the south-central portion of the county and extends from the southern county line to the City of Coeur d’Alene. It is fed by the Coeur d’Alene River to the east and the St. Joe River in Benewah County to the south. Outflow from Lake Coeur d’Alene at the City of Coeur d’Alene forms the Spokane River, which flows westward. Elevated lake levels may result from heavy rain, rapid snowmelt, or both in either major river system. Warning time for flooding is adequate.
The lake covers 50 square miles, with numerous bays and inlets providing extensive shoreline. The lake supports residential, commercial, industrial and recreational development. Its drainage area covers
11-5

Kootenai County Multi-Jurisdictional All Hazard Mitigation Plan; Volume 1—Planning-Area-Wide Elements
3,700 square miles. The Coeur d’Alene River accounts for 36 percent of this drainage area and the St. Joe River covers most of the rest (FEMA, 1984).
Outflow from Lake Coeur d’Alene forms the Spokane River. Glacial deposits that created the lake restrict the lake outflow, so inflow to the lake can greatly exceed the outflow. Based on flow records on the St. Joe and Coeur d’Alene Rivers, inflow to the lake can exceed 100,000 cubic feet per second (cfs); the maximum outflow to the Spokane River was 50,100 cfs, recorded on December 25, 1933 (USGS, 1996). On that date, the lake level reached 2,139.05 feet, the highest level recorded since record-keeping began in 1891. Flood stage on the lake is 2,133 feet.
Avista Utilities exercises partial control of the lake level at the Post Falls facility. During the summer recreation season, the lake level is held at or near 2,128 feet, the normal summer level. In the fall, the company begins to lower the lake level to provide water flow for power generating and to provide storage capacity for the spring runoff. Every year, without regard to precipitation occurrence or forecast, the company attempts to lower the level of the lake to 2,120.5 feet by late December to mid-January. In warm, wet years, this goal may not be reached if inflow to the lake exceeds the amount of flow that can pass the natural restriction at the outlet to the Spokane River. In the Spring, the river remains in a natural, unrestricted by the Post Falls Project state until the lake level has dropped below 2,128 feet and inflows are forecast to remain low enough that Avista can once again take control of the river to hold the lake at or near 2,128 for the summer.
High water levels on the lake pose a threat to residences, businesses, recreation areas, and roads near the shore. Lake Coeur d’Alene floods create large amounts of floating debris and shoreline debris. The lake reached 2,136.14 feet on May 19, 1997. This flood damaged 62 structures. Most of the flooded structures were residences, but several commercial developments were also affected. The flood covered lakeshore roads in several areas.
The major flood threat to the City of Coeur d’Alene comes from Lake Coeur d’Alene. Nettleton Gulch in the city has been filled in and houses built within it. The flood potential for this area is from runoff upstream of the city. Within the city, the flow will be spread out and hard to define. Local streets will carry some flow, but houses in the general vicinity will be flooded during a 100-year event.
In 1974, the outflow from Lake Coeur d’Alene reached 46,000 cfs, a 50-year flood. The area of Harbor Island, located southwest of Coeur d’Alene, experienced heavy flooding in 1974, 1996 and 1997. The residents of Harbor Island have since constructed a bridge to the island along with “sea walls” of decorative landscaping stone placed around former piles of sandbags to lessen the threat and impact of seasonal floods. Sandbags are still necessary to plug the remaining access points to the Spokane River.
The City of Harrison, located on the banks of Lake Coeur d’Alene, is protected from flooding as it is situated on steep slopes well above the 100-year elevation. Some flooding occurred at the RV park along the edge of Lake Coeur d’Alene in 2008 and 2009.
Fernan Lake Fernan Lake, located in the City of Fernan Lake Village, is influenced by the adjacent Lake Coeur d’Alene during a 100-year flood. This is not the case during a 10-year flood. Major floods on this lake occurred in 1917, 1918, 1933 and 1974. The most severe flood, in December 1933, reached an elevation of 2,139.8 feet, 0.5 feet higher that the 100-year event. During the 1974 flood, an elevation of 2,137.3 feet was recorded, 2 feet below the 100-year event. This flood reached four residences along the lake, making sandbagging necessary.
11-6

FLOOD
Hauser Lake Hauser Lake is in west-central Kootenai County near the Washington State line. Hauser Creek and other small streams flow into the lake from the Selkirk highlands to the north and west. The 625-acre lake supports a mix of agricultural, recreational and residential uses along its shore. The lake level is influenced by heavy rain and snowmelt. Information about flooding on the lake prior to 1974 is sparse. The Flood Insurance Study indicates that Hauser Lake was unaffected by the major event of January 1974 (FEMA, 1984). The lake level was significantly elevated during the spring 1997 event, however, flooding both boat access ramps. Water covered Hauser View Road, several portions of Hauser Lake Road, and Matheson Road. Road closures suspended regular and emergency services for several days. Septic systems were inundated at several points around the lake. Hauser Lake residents attribute flooding to siltation and lack of maintenance at the lake outlet.
Hayden Lake Situated in north-central Kootenai County, Hayden Lake receives inflow from Hayden Creek, Mokins Creek and other small streams. These streams originate in the Bitterroot Range of northeastern Kootenai County and drain more than 62 square miles. The lakeshore supports residential, commercial and recreational development. The original dike and a spillway were constructed at the southwest end of the lake in 1911.
The lake level is influenced by heavy rain and snowmelt. Abnormally large spring runoff can produce high lake levels for extended periods. High lake levels affect residential development along the lake. Outflow from the lake flows into drainage channels and adjacent agricultural land. The outflow area is highly permeable, which permits the water to drain into the underground aquifer. Soil and debris were removed from the outflow area in 1997 to facilitate flow into the aquifer. Lake outflow from recent floods remained within the historical spring flood area and did not affect adjacent developed areas.
In 1996, the lake level peaked at 2,241.86 feet, only 3 inches below the top of the dike. The high water threatened to breach the dike, which would have also damaged gas and sewer lines that run within the dike. The flood damaged 15 homes. After the 1996 flood, the need for increased outflow capacity became urgent. In 1997, a temporary modification of the spillway increased the outflow. Kootenai County completed a permanent reconstruction of the dike and spillway in April 1998.
Lake Pend Oreille Lake Pend Oreille is a large lake that covers 94,600 acres and has 111 miles of shoreline. A small portion of the lake lies in northeast Kootenai County. In Kootenai County the lake supports a state park along with residential, commercial, and recreational development. Lake Pend Oreille receives inflow from the mountains of northern Idaho and northwest Montana. High lake levels in 1974 and 1997 were due to above-normal snow pack, combined with above-normal spring precipitation. Lakeshore developments are threatened by lake levels that are more than 1 foot above the normal summer level. The 1997 lake level of 2065.74 feet was more than 3 feet above the normal summer level, but more than 4 feet below the 100-year flood. This high lake level threatened to raise boathouses above their mooring piers, which would have severed water and sewer lines. Sandbags were deployed to protect homes and businesses along the north shore of the Village of Bayview. The sewer lift station in Bayview nearly flooded in 1997. The flood caused extensive damage to docks. As indicated by the 100-year flood estimate of 2069.8 feet, water levels much higher than the 1997 peak can occur.
Spirit Lake Spirit Lake is tucked next to the highlands of northwest Kootenai County. The lake receives inflow from Brickle Creek, which originates in the Mount Spokane basin. The lake supports residential, commercial,
11-7

Kootenai County Multi-Jurisdictional All Hazard Mitigation Plan; Volume 1—Planning-Area-Wide Elements
and recreational development. Spirit Lake is the flooding source in the City of Spirit Lake. During the 1974 flood, the lake surface reached an elevation of 2,447.9 feet, just 0.2 feet below the 100-year flood elevation of 2,448.1 feet. The 1974 flood inundated the Silver Beach recreation area.
Twin Lakes The Twin Lakes lie in a wooded valley of northeastern Kootenai County, north and east of Rathdrum Mountain. The lakes receive inflow from Fish Creek, which originates to the west in the Selkirk highlands. Outflow from Twin Lakes forms Rathdrum Creek. The lakes support residential, commercial, agricultural, and recreational uses. The Twin Lakes system is managed by Kootenai County’s only flood control district. The Twin Lakes/Rathdrum Flood Control District maintains and controls the lakes’ outlet along with maintenance along Rathdrum Creek. The district also maintains and cleans the sump that drains the lakes’ outflow into the Spokane Valley-Rathdrum Prairie Aquifer.
The lake level is influenced by heavy rain and snowmelt. During the spring of 1997, the lake outflow reached 197 cfs and remained near 200 cfs for over two weeks. The high water caused siltation that affected Gunning Creek and deposited silt at the sump. Water covered roads at Willadsen, Highway 41, Oneida, Rathdrum, and Park Road. Sandbagging was required to protect Fish Lake Road.
Streams
Spokane River The Spokane River flows north from Lake Coeur d’Alene then west to Washington near the City of Post Falls. The river has a relatively narrow floodplain in this area. Residential, commercial, industrial, and recreational developments are present along its course through Kootenai County. The level of Lake Coeur d’Alene affects the river flow. The head of the Spokane River breaches the glacial deposit that formed Lake Coeur d’Alene. This natural restriction limits the water flow into the Spokane River, but elevated lake levels can still dramatically increase Spokane River flows. On December 25, 1933, the river flowed at 50,100 cfs, the highest flow yet recorded, when Lake Coeur d’Alene’s level peaked at 2139.05 feet (FEMA, 1984).
High levels on the river primarily threaten only the developments directly adjacent to the river. A 100-year flood threatens developments on the river islands, such as Harbor Island and Blackwell Island. Recent floods have inundated Blackwell Island and Harbor Island Drive. Damage to residences was largely avoided during the 1996 and 1997 floods due to extensive sandbagging. Some property owners on Harbor Island have converted the sandbag walls into more permanent floodwalls. Flood duration varies greatly along the Spokane River. Winter floods are generally short-lived but spring floods, as in 1997, can produce high water levels for several weeks. Warning time for flooding is considered to be adequate. Major flooding events occurred along the Spokane River in 1894, 1933, 1974, 1996 and 1997.
Latour Creek Latour Creek is a small tributary to the Coeur d’Alene River that drains mountainous terrain in eastern Kootenai County. Latour Creek has a total drainage area of 52.4 square miles. The lower reaches of Latour Creek are well-suited to development, and numerous private residences have been constructed along its relatively flat floodplain. There is a gauging station at the 24.8 square-mile point of Latour Creek. During the 1974 flood event, the flow was estimated at 1,900 cfs. Flooding on the lower reaches of Latour Creek is often elevated by backwater flooding effects of the Coeur d’Alene River. However, Latour Creek can independently cause flooding from rainfall, snowmelt or both.
11-8

FLOOD
Wolf Lodge Creek Wolf Lodge Creek drains the forested foothills of the Bitterroot Range and empties into Wolf Lodge Bay, an arm of Lake Coeur d’Alene. The drainage basin for Wolf Lodge Creek is 63.5 square miles. Elevations vary from 2,136 feet at Lake Coeur d’Alene to over 4,800 square feet atop Huckleberry Mountain. The channel of Wolf Lodge Creek downstream of U.S. Highway 10 is well defined, although it is overgrown in places with heavy brush and trees. Upstream of US 10, the creek ascends rapidly. Numerous meandering channels are overgrown with brush and clogged with debris. The creek carries a heavy load of gravel in its steeper reaches. Flooding on the lower reaches of Wolf Lodge Creek is often elevated by backwater flooding effects of Lake Coeur d’Alene. Wolf Lodge Creek can independently cause flooding from rainfall, snowmelt or both.
Rathdrum Creek Low-lying areas of the City of Rathdrum are subject to periodic flooding caused by the overflow of Rathdrum Creek.
11.2.2 Flood Protection Measures No significant impoundments exist on any of the river systems studied in FEMA’s May 3, 2010 Flood Insurance Study for Kootenai County. Lake Coeur d’Alene is a natural lake with a natural outlet to the Spokane River. The Post Falls Dam on the Spokane River, 9 miles below the outlet from Lake Coeur d’Alene, was constructed by the Washington Water Power Company (now called Avista Utilities) to regulate lake water levels for water power production. Under present Avista operational procedures, the Lake Coeur d’Alene water level is held nearly full through the summer recreation season. In late winter or spring, no lake level control is exercised. During this time control passes from the Post Falls Dam to the natural lake outlet. In this natural “free flow” condition, the flow into the Spokane River is determined by the discharge capacity of the shallow lake outlet.
Several areas of the Coeur d’Alene River have levee systems that provide some flood protection during high-water conditions. These systems are partly railroad embankments and total approximately 10 miles in length. They do not provide adequate protection during the 100-year flood. Levees have also been constructed along the Spokane River and Lake Coeur d’Alene in the southwestern part of the City of Coeur d’Alene. The Seattle District of the U.S. Army Corps of Engineers certified in July 2007 that these levees meet the requirements of 44 CFR 65.10 to provide protection from the 100-year flood. Flood restoration work was accomplished along the lower reaches of Latour Creek after the 1974 flood. Temporary levees were built, but it is estimated that these do not provide protection from the 100-year flood.
Flows for Rathdrum Creek in part are controlled by operation of the outlet structure on Twin Lakes, located 3.3 miles upstream from the Rathdrum corporate limits. Winter flows are contained in storage, and outflow from Twin Lakes is controlled to a maximum of 165 cfs for flood events up to the 100-year flood. The 500-year flood volume is much greater than the available flood storage in Twin Lakes, so it is assumed the lake would have an insignificant effect on 500-year flows in Rathdrum. Rathdrum Creek picks up an additional drainage area of approximately 7 square miles from the Twin Lakes outlet to the downstream corporate limits. A sump was constructed near the downstream corporate limits of Rathdrum for collection of flood flows. This sump is not large enough to have any effect on flood flows during peak flow events.
The cities of Post Falls, Hauser, Spirit Lake, Fernan Lake Village and Harrison have no levees, dams, or other flood control structures. Nonstructural flood protection measures to help prevent flood damage consist of land-use regulations that control building in areas that have a high risk of flooding, including these cities. The City of Coeur d’Alene does have zoning ordinances, Ordinance #441, page 8, that restrict development
11-9

Kootenai County Multi-Jurisdictional All Hazard Mitigation Plan; Volume 1—Planning-Area-Wide Elements
in the floodplain; it is recommended that buildings be built with the finished floor above the 100-year flood level.
11.2.3 Past Events Major floods in Kootenai County occurred in 1894, 1896, 1917, 1933, 1938, 1964, 1974, 1996, 1997 and 2008. Detailed damage reports are available for only the most recent floods of 1964, 1974, 1996, 1997 and 2008. These data provide a good representation of the damage potential. The winter flood of February 1996 caused widespread damage along streams and lakes, but the flooding was generally short-lived. In contrast, the spring flood of 1997 caused high water from April into June and affected county lakes most severely. Table 11-2 summarizes flood events in the planning area since 1955, including six federal disaster declaration events, and with total estimated damage exceeding $20 million. Significant flood events are described in the following sections.
TABLE 11-2. HISTORY OF FLOOD EVENTS
Date Declaration # Description Estimated Damage
12/31/1964 DR-186 Heavy Rains & Flooding $834,972a 1/25/1974 DR-415 Severe Storms, Snowmelt, Flooding $8,438,025a 2/1982 — Flooding $1,000,000a 2/11/1996 DR-1102 Storms/Flooding $10,888,154a 1/04/1997 DR-1154 Severe Storms/Flooding $1,272,641a 6/13/1997 DR-1177 Flood Public Damage = $762,600 7/31/2008 DR-1781 Flooding Public Damage = $1,501,030
a. Data obtained from Spatial Hazard Events and Losses Database for the United States
Flood of 1964 It had been a snowy December and by mid-month an arctic chill sent low temperatures to -20°F. Christmas week 1964 was warmer but a storm also brought more snow. By December 21, the low valleys of Kootenai County had 17 inches of snow on the ground. Then, warm and wet storms from the Pacific caused floods from California to southern Idaho. North Idaho saw a brief but powerful Chinook that caused severe damage in the Coeur d’Alene basin. On December 22 and 23, temperatures warmed to the middle to upper 40s with rainfall amounts of 1.5 to 2 inches. Street flooding occurred in Coeur d’Alene from melting snow and clogged storm drains. By December 24, the upper Coeur d’Alene River basin had serious flooding, which spilled into Cataldo. A foot of water near Cataldo covered U.S. Highway 10. Five area families were evacuated. High water on Latour Creek took out several bridges. Cooler temperatures and a foot of snow ended the flooding by Christmas Day. Lake Coeur d’Alene peaked at 2,133.03 feet on December 25.
Flood of 1974 Following a period of sub-zero temperatures, strong Chinook winds brought rapid warming and widespread rain to north Idaho in January 1974. Temperatures soared to 50°F on January 15 and as much as 9 inches of rain was reported in the upper Coeur d’Alene River drainage over a 4-day period. This flood produced the highest flows ever documented on the Coeur d’Alene River since record keeping began in 1911.
11-10

FLOOD
Reports of flooding began along French Gulch Creek on January 15. By the next day, businesses and homes in Cataldo and Rose Lake were inundated as the Coeur d’Alene River left its banks. The Coeur d’Alene Press reported that “families could be seen loading their belongings into boats in an effort to save as much as possible” (Coeur d’Alene Press 1974). Four feet of water covered the off-ramp at Cataldo. Some homes had as much as 5 feet of water in them. Idaho Highway 3 had water over the roadway in some areas around and south of Rose Lake. On January 16, the USGS computed the Coeur d’Alene River flow to be 79,000 cfs, which is the all-time maximum water flow at Cataldo. This flow level is slightly higher than the 100-year flow estimate (FEMA, 1984).
Latour and Wolf Lodge Creeks broke out of their banks and flooded many homes. One resident recalled “There was 9 inches of snow on the ground and then it started to rain. The snow was completely gone in 24 hours” (Coeur d’Alene Press 1974). The Medimont area was surrounded by water; supplies were flown in by helicopter. Record flow on the Coeur d’Alene River, coupled with heavy flow from the St. Joe River, caused a rapid rise of Lake Coeur d’Alene.
On January 15, the lake level stood at 2,126.49 feet. On January 20 the lake peaked at 2,136.54 feet, rising an average of 2 feet per day. Initially, based on the record flows on the Coeur d’Alene River, officials predicted the lake might exceed the 1933 level of 2,139.05 feet. However, the Coeur d’Alene River accounts for only 36 percent of the total lake drainage area, and flows on the St. Joe River at Calder were significantly less during this event (USGS, 1974). An article in the Coeur d’Alene Press on January 22, 1974 attributed the higher lake level in 1933 to the old Blackwell Bridge and lumber mill, which had been removed before 1974. The bridge and mill were said to have narrowed the outlet and blocked water flow when clogged with debris. The removal of the Blackwell Bridge was believed to have increased the amount of water that can flow into the Spokane River and thus, lessened the probability of flooding on Lake Coeur d’Alene. However, flow measurements at the Post Falls gauge in 1974, which peaked at 46,200 cfs were significantly less than the flows in 1933, which peaked at 50,100 cfs. It is likely that the lower crest in 1974 can be attributed to less cumulative inflow from the Coeur d’Alene and St. Joe Rivers rather than a significant change in outlet capacity at the mouth of the Spokane River.
High lake levels and runoff washed out 130 feet of road in Cougar Gulch, along with both approaches to a bridge about 2.5 miles from US 95. Fernan Lake rose to 2,136.5 feet due to runoff and a backwater effect from Lake Coeur d’Alene, 2 feet below the 100-year flood level. Sandbag operations were accomplished, but reports indicated flooding in several homes with as much as 2 feet of water on the ground floor.
Most residents of Harbor Island evacuated their homes on January 18 as about 6 inches of water covered the access road and the river continued to rise. Residents returned on January 24 to find many water- and mud-damaged homes. Spirit Lake reached an elevation of 2,444.1 feet during this flood. This crest is only 0.2 feet below the 100-year flood estimate. A photograph of Spirit Lake showed water up to the eaves of a boat shelter at Silver Beach, but no other damage reports were noted.
Floods of 1996 February 1996 began with sub-zero temperatures and 2 feet of snow in the low valleys of Kootenai County. By February 7, warm temperatures and rain arrived. After four days of heavy rain and mild temperatures, flooding occurred throughout northern Idaho and caused an estimated $100 million in damage. Damage in the Coeur d’Alene River valley was estimated at $24 million (FEMA, 1996). More than 1,650 people registered for disaster housing assistance in north Idaho following the flood (Butler 1996). On March 6, 1996, the Corps of Engineers estimated that it would take at least $16 million to repair state and county owned levees in north Idaho.
11-11

Kootenai County Multi-Jurisdictional All Hazard Mitigation Plan; Volume 1—Planning-Area-Wide Elements
On February 7, the water level in Hayden Lake was only 3 feet from the top of the dike. If breached, the outflow from the lake would likely damage sewer and gas lines buried in the dike. By February 22, the lake level peaked 3 inches from the top of the dike. Flooding damaged 15 homes, but the dike and spillway held the pressure.
The Coeur d’Alene River at Cataldo reached flood stage of 43 feet by 5 p.m. on February 7. Latour Creek broke from its banks to cause extensive damage to Latour Creek Road. Fears that an ice jam had released an 8- to 10-foot wall of water in the north fork of the Coeur d’Alene River prompted the evacuation of Cataldo; however, the surge from the ice jam dissipated before it reached the community.
Rain and mild temperatures continued on February 8, and water levels throughout the county continued to rise. Two feet of water covered State Highway 41 between Rathdrum and Spirit Lake. The Wolf Lodge Campground was flooded. Roads along Lake Coeur d’Alene were flooded at Beauty Bay and Booth Park. Fourth of July Creek left its banks near Rose Lake. Flooding in French Gulch inundated several homes. The Coeur d’Alene River at Cataldo rose to 4 feet above flood stage. Residents returned to begin sandbagging at Latour Creek Road. The I-90 east exit was closed at Cataldo.
Most flooding peaked on February 9. Residents continued to sandbag at Latour Creek Road and I-90 even after National Guardsmen had been pulled out for safety concerns. At 2 p.m., the river broke through the emergency dike, unleashing 4 to 5 feet of water into the community and forcing 200 people to evacuate. Officials reported the river stage at 53 feet at Cataldo, which is 10 feet above flood stage. The USGS estimated the Coeur d’Alene River peak flow as 70,000 cfs at Cataldo. Water covered the right lane of westbound I-90 near the Coeur d’Alene River bridge. The river raged throughout the Coeur d’Alene basin. An estimated 100 families were stranded in the Latour Creek area. Flooded roads cut off the Rose Lake, Medimont, and Bull Run areas. Helicopters rescued 20 people from the area between Kingston and Cataldo.
By February 12, water pouring into Lake Coeur d’Alene from the Coeur d’Alene and St. Joe basins produced a swift rise on the lake. Flooding was reported in Wolf Lodge Bay, Mica Bay, Kidd Island Bay, and Carlin Bay. The lake peaked at 2,134.82 feet, almost 7 feet above the normal summer level. Rising lake levels and discharge into the Spokane River prompted flood warnings for the Spokane basin. Sandbagging on Harbor Island is credited for saving at least five homes. The Spokane River flow peaked at 38,000 cfs on February 12, which is about a 10-year flood. Rising levels on Fernan Lake threatened 20 homes that were also protected by sandbags.
Flood of 1997 In March 1997, some drainage basins of northern Idaho had almost twice the normal snowpack. Then, above-normal precipitation in the spring of 1997 produced spring flooding that stretched through late June. By March 6, 1997, the Hayden Lake level was within 3.5 feet of the top of the dike and rising. Anticipating runoff from twice the average snowpack, the county undertook an emergency project that enlarged the spillway and protected the dike from erosion. This modified outlet allowed 20 times the outflow of the original culvert. Firefighters, the sheriff’s dive team and construction crews performed numerous repairs to the dike throughout this high water event.
Flooding began near Avondale Golf Course in mid-March. On March 20, flooding was reported in French Gulch, Nettleton Gulch and Gunning Creek. By March 21, the level of Fernan Lake was up. Hauser Lake became the focus of flood problems on April 1. Heavy runoff and scattered rain produced the highest water levels in the past 30 years. Several roads and homes were flooded and damaged. Shoreline erosion occurred and some septic systems were inundated. Some roads remained flooded for over a month. Several roads in the Twin Lakes and Rathdrum areas were also flooded.
11-12

FLOOD
Water levels continued to rise through mid-April, when the snowpack and water equivalent moisture available were still at 150 to 165 percent of normal. By April 22, the Coeur d’Alene River was at 2,144.4 feet at Cataldo, which is a foot and a half above flood stage. As water levels on Lake Coeur d’Alene and the Spokane River continued to rise, residents of Harbor Island began sandbagging on April 22. Harbor Island residents, county personnel, fire and highway personnel, National Guardsmen, and volunteers laid an estimated 103,000 sandbags to form a flood wall a mile long. The wall saved residences from major flood damage, but about half of the docks on the island suffered extensive damage.
Warming temperatures in late April accelerated the snowmelt. By the end of the month, portions of the Coeur d’Alene valley were under water. The river covered parts of Latour Creek Road, CCC Road and River Road by April 28, but Cataldo stayed dry. Soon, flood-prone areas in the Chain Lakes were inundated. Water covered Killarney Lake Road, Simpson Road, Bull Run Lake Road and Black Rock Road. The road closures stranded scores of people throughout the Coeur d’Alene valley. Some roads were affected through mid-May. Saturated ground and the long duration of high water on the river caused some seepage through dikes near Cataldo. One home was threatened by seepage but pumps controlled the ponding.
Lake Coeur d’Alene exceeded the flood stage of 2,133 feet on May 16. Avista records indicate that the lake peaked at 2136.14 feet on May 19, which is the fourth highest level behind 1933, 1894 and 1974. The lake remained above flood stage until May 23. Flooding along the lake caused damage to 62 homes and businesses and covered roads in several areas. The flood also created acres of debris on the lake.
By mid-May, flood concerns shifted to Bayview and Lake Pend Oreille. Due to higher terrain and slower melting in the Lake Pend Oreille drainage, lake levels peaked later and stayed high longer than those in the Coeur d’Alene basin. Lake Pend Oreille exceeded the flood stage of 2,063.5 feet on May 16, 1997 and stayed above flood stage until early July. By May 21, the lake level was at 2,065.2 feet, which initiated the placement of 20,000 sandbags around several homes and businesses along the north shore of Bayview. Several homes and docks along the lake were damaged. Lake Pend Oreille peaked at 2,065.74 feet on June 5, more than 3 feet above the summer level.
Flood of 2008 Kootenai County declared a disaster on May 16, 2008 due to the imminent threat of floods. As the Coeur d’Alene reached flood stage in Cataldo, groundwater and seepage from the dike created flooding in town. A tractor and pump, manned by personnel from the Shoshone County Fire District, was setup in Cataldo and pumping operations began on May 18, 2008. Latour Creek Road was flooded as well as other roads near the Coeur d’Alene River. Due to limited law enforcement and highway district personnel available, flaggers were contracted to staff these sites. The Sheriff’s Marine Division was staged in Cataldo with a boat to provide transportation to the 200-plus residents cut off from access and services. The County’s Emergency Operations Center was activated and staffed on May 20, 2008 to support field operations and perform damage assessment. The County requested state assistance in assigning incident management team personnel to staff the Emergency Operations Center/Incident Command Post.
On May 22, sandbagging began along the Spokane River. On May 23, pumps were brought in to pump water out of Harbor Island. Sand and sandbags were delivered to sites throughout the county for the duration of the incident period. Flooding closed 19 roads at one time or another over the incident period, as well as boat launches and ramps. A no wake zone went into effect on the Coeur d’Alene and Spokane Rivers and Lake Coeur d’Alene during high waters to prevent more damage to homes and erosion of the shores. The Latour Creek Bridge approach was washed out, stranding residents. Roads throughout the county were damaged due by high waters, wind and debris, along with portions of “Rails to Trails.”
11-13

Kootenai County Multi-Jurisdictional All Hazard Mitigation Plan; Volume 1—Planning-Area-Wide Elements
11.2.4 Location Flooding in Kootenai County has been extensively documented by gage records, high water marks, damage surveys and personal accounts. This documentation was the basis for the June 16, 2009 FIRMs generated by FEMA for Kootenai County. The 2009 Flood Insurance Study is the sole source of data used in this risk assessment to map the extent and location of the flood hazard, as shown in Figure 11-2.
11.2.5 Frequency Kootenai County experiences episodes of river flooding almost every winter. Large floods that can cause property damage typically occur every three to seven years. Urban portions of the county experience flooding annually.
11.2.6 Severity The following are the most common types of damage and disruption from flooding in the planning area:
• Damage to roads levees, houses and property
• Road closures resulting in stranded people and domestic animals and the need for evacuations
• Loss of livestock
• Environmental contamination from inundated sewer systems
• Environmental contamination from hazardous materials, such as fuel, solvents and pesticides
• Heavy metal contamination in the Coeur d’Alene River basin, when mine tailings are washeddownstream from the South Fork of the Coeur d’Alene River
• Water contaminating private drinking water systems.
The principal factors affecting flood damage are flood depth and velocity. The deeper and faster flood flows become, the more damage they can cause. Shallow flooding with high velocities can cause as much damage as deep flooding with slow velocity. This is especially true when a channel migrates over a broad floodplain, redirecting high velocity flows and transporting debris and sediment. Flood severity is often evaluated by examining peak discharges; Table 11-3 lists peak flows for the floodplains of Kootenai County.
11.2.7 Warning Time Due to the recognizable weather patterns needed to cause serious flooding, it is unusual for a flood to occur without warning. The warning time is a function of the time between the first measurable rainfall and the first occurrence of flooding. A hydrograph, which is a graph or chart illustrating stream flow in relation to time (see Figure 11-3), is a useful tool for examining a stream’s response to rainfall. Water depth in the stream channel (stage of flow) rises in response to runoff, even after rainfall ends. Eventually, the runoff reaches a peak and the stage of flow crests. At this point, the stream flow shows little change until it begins to fall, eventually subsiding to a level below flooding stage. Floods are generally classed as either slow-rise or flash floods. Slow-rise floods may have a warning time from several hours to days or weeks, allowing time for evacuation and sandbagging to lessen flood damage. Flash floods occur with very little advance warning and often require evacuation within an hour.
11-14

Athol
HaydenLake
DaltonGardens
Worley
Fernan
Rathdrum
Hayden
Coeurd'Alene
PostFalls
Harrison
StateLine
SpiritLake
Huetter
HauserLake
£¤95
£¤95
£¤95
¬«58
¬«41
¬«97
¬«54
¬«3
¬«41
¬«53
§̈¦90
§̈¦90
0 63Miles
Figure 1FEMA DFIRM Flood Hazard Areas
Base Map Data Sources: Kootenai County, U.S. Geological Survey
Kootenai County Hazard Mit igat ion Plan Update
±
1% Annual Chance Flood
0.2% Annual Chance Flood

Kootenai County Multi-Jurisdictional All Hazard Mitigation Plan; Volume 1—Planning-Area-Wide Elements
TABLE 11-3. SUMMARY OF PEAK DISCHARGES WITHIN THE PLANNING AREA
Discharge (cubic feet/second) Source/Location 10-Year 50-Year 100-Year 500-Year
Coeur d’Alene River At the Mouth 41,400 73,500 90,000 136,000
French Gulch At Cross Section A 200 310 380 540 Above Cross Section R 170 260 340 500
Latour Creek At the Mouth 1,890 3,020 3,735 5,420
Nettleton Gulch Above 15th St. 290 430 520 725
Rathdrum Creek Downstream Corporate limits 385 542 676 4600a Above Pine Ave. Bridge 233 355 424 4250a
Spokane River At Washington-Idaho boundary 38,700 46,400 49,000 54,200
Wolf Lodge Creek At mouth 2,250 3,650 4,500 6,550 Above Cedar Creek 1,600 2,550 3,150 4,500 Above Rutherford at Gulch 1,500 2,350 2,900 4,150 Above Marie Creek 850 1,250 1,550 2,150
a. During 500-year, Twin Lakes would not control flow
Figure 11-3. Coeur d’Alene River Hydrograph at Cataldo
11-16

FLOOD
The Kootenai County flood threat recognition system consists of a network of precipitation gages throughout the watershed and stream gages that constantly monitor and report stream levels at strategic locations on the Coeur d’Alene and Spokane Rivers. This information is fed into a USGS forecasting program, which assesses the flood threat based on the flow in the stream. In addition to this program, data and flood warning information is provided by the National Weather Service. All of this information is analyzed to evaluate the flood threat and possible evacuation needs. Response within the Planning area is dictated by the Kootenai County Emergency Operations Plan (May 2009).
11.3 SECONDARY HAZARDS The most problematic secondary hazard for flooding is bank erosion, which in some cases can be more harmful than actual flooding. This is especially true in the upper courses of rivers with steep gradients, where floodwaters may pass quickly and without much damage, but scour the banks, edging properties closer to the floodplain or causing them to fall in. Flooding is also responsible for hazards such as landslides when high flows over-saturate soils on steep slopes, causing them to fail. Hazardous materials spills are also a secondary hazard of flooding if storage tanks rupture and spill into streams, rivers or storm sewers.
11.4 EXPOSURE The Level 2 Hazus-MH protocol was used to assess the risk and vulnerability to flooding in the planning area. The model used census data at the block level and FEMA floodplain data, which has a level of accuracy acceptable for planning purposes. Where possible, the Hazus-MH default data was enhanced using local GIS data from county, state and federal sources.
Where available, detailed information from the FEMA Flood Insurance Study was used to create flood depth grids for the 100- and 500-year flood events. Such detailed FEMA flood study data for the planning area is limited, which impacts the accuracy of the modeling done for this risk assessment. Over half of the planning area has 100-year floodplains delineated by approximate rather than detailed methods. In most of the planning area, no 500-year floodplain mapping at all is available. Of all the planning partners, only the unincorporated county and the cities of Coeur d’Alene, Post Falls and Rathdrum have any 500-year flood mapping; and the mapping in those jurisdictions does not cover the full extent of flood-prone waterways. Enhanced flood studies are needed to provide better risk assessment for the future.
11.4.1 Population Counts of planning area floodplain residents were generated by analyzing building footprints that intersect with the 100-year and 500-year floodplains identified on FIRMs. The number of such buildings was multiplied by the average Kootenai County household size of 2.5 persons per household. This methodology may overestimate exposed population through the inclusion of non-residential structures but underestimate the population through the inclusion of multi-household dwellings.
Using this approach, it was estimated that the population living within the 100-year floodplain is 4,080 for the entire county (2.8 percent of the total county population) and 3,335 for unincorporated areas (8.2 percent of the unincorporated county total). In the limited areas where 500-year flood mapping is available, the analysis estimated a population of 960 in the 500-year floodplain; 413 of those in unincorporated areas. The estimated population exposed to the 500-year flood is less than the estimate for the 100-year flood because 500-year flood mapping covers only a small portion of the flood-prone waterways.
11-17

Kootenai County Multi-Jurisdictional All Hazard Mitigation Plan; Volume 1—Planning-Area-Wide Elements
11.4.2 Property
Structures in the Floodplain Table 11-4 summarizes the total area and number of structures in the 100-year floodplain by municipality. Table 11-5 summarizes the total area and number of structures in the 500-year floodplain for the stream reaches and municipalities where 500-year flood mapping exists. The Hazus-MH model determined that there are 1,632 structures in the 100-year floodplain, about 82 percent of them are in unincorporated areas, 69 percent are residential, and 30 percent are commercial, industrial or agricultural. The analysis identified 384 structures in the 500-year floodplain where 500-year mapping has been completed.
Exposed Value Table 11-6 and Table 11-7 summarize the estimated value of buildings within the mapped floodplains in the planning area. This methodology estimated $572.8 million worth of building-and-contents exposure to the 100-year flood, representing 1.69 percent of the total replacement value of the planning area. Property within the 500-year floodplain where 500-year mapping is available represents $104.7 million worth of building-and-contents exposure.
TABLE 11-4. AREA AND STRUCTURES IN THE 100-YEAR FLOODPLAIN
Area in Floodplain Number of Structures in Floodplain (Acres) Residential Commercial Industrial Agriculture Religion Government Total
Athol 0.00 0 0 0 0 0 0 0 Coeur d’Alene 519.09 147 18 0 0 0 0 165 Dalton Gardens 0.00 0 0 0 0 0 0 0 Fernan Lk. Vill. 6.35 6 1 0 0 0 0 7 Harrison 636.64 0 2 1 0 0 0 3 Hauser Lake 2.50 1 0 0 0 0 0 1 Hayden 12.03 8 0 0 0 0 0 8 Hayden Lake 119.15 19 0 0 0 0 0 19 Huetter 0.00 0 0 0 0 0 0 0 Post Falls 58.73 10 5 0 0 0 0 15 Rathdrum 94.45 45 20 0 0 2 0 67 Spirit Lake 40.09 31 5 0 0 0 0 36 State Line 0.00 0 0 0 0 0 0 0 Worley 2.44 0 0 0 0 0 0 0 Unincorporated 60,285.26 888 430 1 14 0 1 1,334
Total 61,776.73 1155 481 2 14 2 1 1,655
11-18

FLOOD
TABLE 11-5. AREA AND STRUCTURES IN THE MAPPED 500-YEAR FLOODPLAIN
Area in Floodplain Number of Structures in Floodplain (Acres) Residential Commercial Industrial Agriculture Religion Government Total
Coeur d’Alene 27.05 44 12 0 0 0 0 56 Post Falls 0.32 1 0 0 0 0 0 1 Rathdrum 142.34 107 51 0 1 4 0 163 Unincorporated County
644.65 88 75 1 1 0 0 165
Note: 500-year flood mapping has not been completed for the entire extent of flood-prone waterways. Values shown are only for the reaches where 500-year flood mapping is available.
TABLE 11-6. VALUE OF STRUCTURES IN 100-YEAR FLOODPLAIN
Value Exposed % of Total Structure Contents Total Replacement Value
Athol $0 $0 $0 0.00% Coeur d’Alene $96,942,130 $59,301,909 $156,244,039 1.48% Dalton Gardens $0 $0 $0 0.00% Fernan Lake Village $2,177,831 $1,104,001 $3,281,832 9.35% Harrison $801,973 $1,069,739 $1,871,712 2.87% Hauser Lake $238,000 $289,000 $527,000 0.63% Hayden $906,723 $453,362 $1,360,085 0.05% Hayden Lake $208,855 $104,428 $313,283 0.16% Huetter $0 $0 $0 0.00% Post Falls $5,491,565 $3,306,019 $8,797,583 0.16% Rathdrum $11,125,050 $8,058,508 $19,183,558 2.00% Spirit Lake $5,258,443 $2,697,525 $7,955,968 2.12% State Line $0 $0 $0 0.00% Worley $0 $0 $0 0.00% Unincorporated $219,905,008 $153,871,288 $373,776,295 3.26%
Total $343,055,578 $230,255,779 $573,311,355 1.70%
11-19

Kootenai County Multi-Jurisdictional All Hazard Mitigation Plan; Volume 1—Planning-Area-Wide Elements
TABLE 11-7. VALUE OF STRUCTURES IN 500-YEAR FLOODPLAIN
Value Exposed % of Total Structure Contents Total Replacement Value
Coeur d’Alene $11,638,520 $6,673,997 $18,312,516 0.17%
Post Falls $366,104 $220,401 $586,505 0.001%
Rathdrum $24,707,800 $17,411,807 $42,119,607 4.38%
Unincorporated $25,665,865 $18,565,295 $44,231,159 0.39%
Note: 500-year flood mapping has not been completed for the entire extent of flood-prone waterways. Values shown are only for the reaches where 500-year flood mapping is available.
Land Use in the Floodplain Some land uses, such as single-family homes, are more vulnerable to flooding than others, such as agricultural land or parks. Table 11-8 shows the existing land use of all unincorporated-area parcels in the 100-year floodplain and the 500-year floodplain along stream reaches where 500-year mapping is available. About 33 percent of the parcels in the 100-year floodplain are under federal or state ownership. These are favorable, lower-risk uses for the floodplain. The amount of the floodplain that contains vacant, developable land is not known. This would be valuable information for gauging the future development potential of the floodplain.
11.4.3 Critical Facilities and Infrastructure Table 11-9 lists the number of critical facilities within the 100-year floodplain. No critical facilities are present in the areas where 500-year flood mapping has been completed. Table 11-10 and Table 11-11 summarize the critical infrastructure in the 100-year floodplain and the 500-year floodplain along stream reaches where 500-year mapping is available. Details are provided in the following sections.
Tier II Facilities Tier II facilities are those that use or store materials that can harm the environment if damaged by a flood. Five businesses in the 100-year floodplain and no businesses in the 500-year floodplain report having Tier II hazardous materials. During a flood event, containers holding these materials can rupture and leak into the surrounding area, having a disastrous effect on the environment as well as residents.
Utilities and Infrastructure
Roads Roads or railroads that are blocked or damaged can isolate residents and can prevent access throughout the county, including for emergency service providers needing to get to vulnerable populations or to make repairs. The following major roads in the planning area pass through the 100-year floodplain and thus are exposed to flooding: Interstate 90, US Highway 95, US Highway 3, State Highway 53, and State Highway 97. Some of these roads are built above the flood level, and others function as levees to prevent flooding. Still, in severe flood events these roads can be blocked or damaged, preventing access to some areas.
11-20

FLOOD
TABLE 11-8. LAND USE WITHIN THE FLOODPLAIN IN UNINCORPORATED KOOTENAI COUNTY
100-Year Floodplain 500-Year Floodplaina
Land Useb Area (acres) % of total Area (acres) % of total
Agricultural 647.7 2.8% 65.2 10.4% Grazing 1,105.8 4.8% 21.4 3.4% Timber 4,008.9 17.3% 97.0 15.4% Federal/State 7,677.4 33.1% 15.7 2.5% Commercial 242.8 1.0% 45.7 7.3% Industrial 3.0 0.0% 0.0 0.0% Residential 335.4 1.4% 62.2 9.9% Rural 3,367.9 14.5% 227.1 36.1% Vacant Commercial 35.7 0.2% 0.6 0.1% Vacant Industrial 0.5 0.0% 0.0 0.0% Vacant Residential 84.6 0.4% 14.1 2.2% Vacant Rural 4,167.7 17.9% 45.1 7.2% Unknown 193.7 0.8% 32.7 5.2% Vacant Unknown 1,358.0 5.8% 2.1 0.3% Total 23,229.0 100% 628.9 100.0%
a. 500-year flood mapping has not been completed for the entire extent of flood-prone waterways. Areas shown are only for the reaches where 500-year flood mapping is available.
b. Present use classifications assigned using Kootenai County 2014 Assessor data. Commercial, industrial, residential, and rural lots without assessed structures were assigned a vacant status.
TABLE 11-9. CRITICAL FACILITIES IN THE 100-YEAR FLOODPLAIN
Jurisdiction Medical and
Health Services Government
Function Protective Hazardous Materials Schools Other Total
Athol 0 0 0 0 0 0 0 Coeur d’Alene 0 0 0 2 0 0 2 Dalton Gardens 0 0 0 0 0 0 0 Fernan Lk. Vill. 0 0 0 0 0 0 0 Harrison 0 0 0 0 0 0 0 Hauser Lake 0 0 0 0 0 0 0 Hayden 0 0 0 0 0 0 0 Hayden Lake 0 0 0 0 0 0 0 Huetter 0 0 0 0 0 0 0 Post Falls 0 0 0 0 0 0 0 Rathdrum 0 0 0 0 0 0 0 Spirit Lake 0 0 0 0 1 0 1 State Line 0 0 0 0 0 0 0 Worley 0 0 0 0 0 0 0 Unincorporated 0 0 0 3 0 0 3 Total 0 0 0 5 1 0 6
11-21

Kootenai County Multi-Jurisdictional All Hazard Mitigation Plan; Volume 1—Planning-Area-Wide Elements
TABLE 11-10. CRITICAL INFRASTRUCTURE IN THE 100-YEAR FLOODPLAIN
Jurisdiction Bridges Water Supply Wastewater Power Communications Other Total
Athol 0 0 0 0 0 0 0 Coeur d’Alene 0 0 0 0 0 0 0 Dalton Gardens 0 0 0 0 0 0 0 Fernan Lk. Vill. 0 0 0 0 0 0 0 Harrison 0 0 0 0 0 0 0 Hauser Lake 0 0 0 0 0 0 0 Hayden 0 0 0 0 0 0 0 Hayden Lake 0 0 0 0 0 1 1 Huetter 0 0 0 0 0 0 0 Post Falls 0 0 0 0 0 0 0 Rathdrum 0 0 0 0 0 0 0 Spirit Lake 0 0 0 0 0 0 0 State Line 0 0 0 0 0 0 0 Worley 0 0 0 0 0 0 0 Unincorporated 14 22 0 0 0 13 49
Total 14 22 0 0 0 14 50
TABLE 11-11. CRITICAL INFRASTRUCTURE IN THE 500-YEAR FLOODPLAIN
Jurisdiction Bridges Water Supply Wastewater Power Communications Other Total
Coeur d’Alene 0 0 0 0 0 0 0 Post Falls 0 0 0 0 0 0 0 Rathdrum 0 0 0 0 0 0 0 Unincorporated Kootenai County
1 1 0 0 0 0 2
Note: 500-year flood mapping has not been completed for the entire extent of flood-prone waterways. Values shown are only for the reaches where 500-year flood mapping is available.
Bridges Flooding events can significantly impact road bridges. These are important because often they provide the only ingress and egress to some neighborhoods. An analysis showed that there are 14 bridges that are in or cross over the 100-year floodplain and 1 bridge in the 500-year floodplain.
11-22

FLOOD
Water and Sewer Infrastructure Water and sewer systems can be affected by flooding. Floodwaters can back up drainage systems, causing localized flooding. Culverts can be blocked by debris from flood events, also causing localized urban flooding. Floodwaters can get into drinking water supplies, causing contamination. Sewer systems can be backed up, causing wastewater to spill into homes, neighborhoods, rivers and streams.
11.4.4 Environment Flooding is a natural event, and floodplains provide many natural and beneficial functions. Nonetheless, with human development factored in, flooding can impact the environment in negative ways. Migrating fish can wash into roads or over dikes into flooded fields, with no possibility of escape. Pollution from roads, such as oil, and hazardous materials can wash into rivers and streams. During floods, these can settle onto normally dry soils, polluting them for agricultural uses. Human development such as bridge abutments and levees, and logjams from timber harvesting can increase stream bank erosion, causing rivers and streams to migrate into non-natural courses.
11.5 VULNERABILITY Not all areas exposed to flooding experience flood damage. Vulnerability is an estimate of the actual harm or damage to people, property, infrastructure and environment as a result of a hazard event. Floods in Kootenai County may be anticipated to inundate low-lying roads and buildings. They can cause injury and drowning of individuals who do not recognize the hazard and take appropriate precautions. Floods may cause downed power lines, breaks in gas lines (with subsequent fires and explosions), release of hazardous materials, and displaced wildlife. Floods can result in the loss of electricity and power to large areas, disruption of community water supplies and wastewater treatment, degradation of communications, and disruption of transportation. Damage to structures, furnishings, business assets, and records can be overwhelming to individuals and small business owners. Prolonged floods can cause great damage to crops and result in the loss of livestock.
11.5.1 Population
Vulnerable Populations A geographic analysis of demographics using the Hazus-MH and the American Community Survey 2013 population estimates model identified populations vulnerable to the flood hazard as follows:
• Economically Disadvantaged Populations—It is estimated that 14.5 percent of the households within the 100-year floodplain are economically disadvantaged, defined as having household incomes of less than $20,000.
• Population over 65 Years Old—It is estimated that 19.1 percent of the population in the 100-year floodplain are 65 years old or over. Approximately 17.3 percent of the 65-and-over population in the floodplain also have incomes considered to be economically disadvantaged and are considered to be extremely vulnerable.
• Population under 18 Years Old—It is estimated that 20.8 percent of the population within the 100-year floodplain are under 18 years of age.
11-23

Kootenai County Multi-Jurisdictional All Hazard Mitigation Plan; Volume 1—Planning-Area-Wide Elements
Impacts on Persons and Households Impacts on persons and households in the planning area were estimated for the 100-year and 500-year flood events through the Level 2 Hazus-MH analysis. Table 11-12 summarizes the results.
TABLE 11-12. ESTIMATED FLOOD IMPACT ON PERSONS AND HOUSEHOLDS
Number of Displaced Households Number of Persons Requiring Short-Term Shelter
100-Year Flood 2,107 940 500-Year Flooda 919 526
a. 500-year flood mapping has not been completed for the entire extent of flood-prone waterways. Values shown are only for the reaches where 500-year flood mapping is available.
Public Health and Safety Floods and their aftermath present the following threats to public health and safety:
• Unsafe food—Floodwaters contain disease-causing bacteria, dirt, oil, human and animal waste, and farm and industrial chemicals. They carry away whatever lies on the ground and upstream. Their contact with food items, including food crops in agricultural lands, can make that food unsafe to eat and hazardous to human health. Power failures caused by floods damage stored food. Refrigerated and frozen foods are affected during the outage periods, and must be carefully monitored and examined prior to consumption. Foods kept inside cardboard, plastic bags, jars, bottles, and paper packaging are subject to disposal if contaminated by floodwaters. Even though the packages do not appear to be wet, they may be unhygienic with mold contamination and deteriorate rapidly.
• Contaminated drinking and washing water and poor sanitation—Flooding impairs clean water sources with pollutants. Contact with the contaminants—whether through direct food intake, vector insects such as flies, unclean hands, or dirty plates and utensils—can result in waterborne illnesses and life-threatening infectious disease. The pollutants also saturate into the groundwater or can infiltrate into sanitary sewer lines through the ground. Wastewater treatment plants, if flooded and caused to malfunction, can be overloaded with polluted runoff waters and sewage beyond their disposal capacity, resulting in backflows of raw sewage to homes and low-lying grounds. Private wells can be contaminated or damaged severely by floodwaters, while private sewage disposal systems can become a cause of infection if they are broken or overflow. Unclean drinking and washing water and sanitation, coupled with lack of adequate sewage treatment, can lead to disease outbreaks.
• Mosquitoes and animals—Prolonged rainfall and floods provide new breeding grounds for mosquitoes—wet areas and stagnant pools—and can lead to an increase in the number of mosquito-borne diseases such as malaria and dengue and West Nile fevers. Rats and other rodents and wild animals also can carry viruses and diseases. The public should avoid such animals and should dispose of dead animals in accordance with guidelines issued by local animal control authorities. Leptospirosis—a bacterial disease associated predominantly with rats—often accompanies floods in developing countries, although the risk is low in industrialized regions unless cuts or wounds have direct contact with disease-contaminated floodwaters or animals.
11-24

FLOOD
• Mold and mildew—Excessive exposure to mold and mildew can cause flood victims—especially those with allergies and asthma—to contract upper respiratory diseases, triggering cold-like symptoms. Molds grow in as short a period as 24 to 48 hours in wet and damp areas of buildings and homes that have not been cleaned after flooding, such as water-infiltrated walls, floors, carpets, toilets and bathrooms. Very small mold spores can be easily inhaled by human bodies and, in large enough quantities, cause allergic reactions, asthma episodes, and other respiratory problems. Infants, children, elderly people and pregnant women are considered most vulnerable to mold-induced health problems.
• Carbon monoxide poisoning—Carbon monoxide poisoning is a potential hazard after major floods. In the event of power outages following floods, flood victims tend to use alternative sources of fuels for heating or cooking inside enclosed or partly enclosed houses, garages or buildings without an adequate level of air ventilation. Carbon monoxide can be found in combustion fumes such as those generated by small gasoline engines, stoves, generators, lanterns, gas ranges, or the burning of charcoal or wood. Built-up carbon monoxide from these sources can poison people and animals.
• Hazards when reentering and cleaning flooded homes and buildings—Flooded buildings can pose significant health hazards to people entering and cleaning damaged buildings or working to restore utility service after floodwaters recede. Electrical power systems, including fallen power lines, can become hazardous. Gas leaks from pipelines or propane tanks can trigger fire and explosion. Flood debris—such as broken bottles, wood, stones and walls—may cause wounds and injuries to those removing contaminated mud and cleaning damaged buildings. Containers of hazardous chemicals, including pesticides, insecticides, fertilizers, car batteries, propane tanks and other industrial chemicals, may be hidden or buried under flood debris. A health hazard can also occur when hazardous dust and mold in ducts, fans and ventilators of air-conditioning and heating equipment are circulated through a building and inhaled by those engaged in cleanup and restoration.
• Mental stress and fatigue—Having experienced a devastating flood and seen loved ones lost or injured and homes damaged or destroyed, flood victims can experience long-term psychological impact. The expense and effort required to repair flood-damaged homes places severe financial and psychological burdens on the people affected, in particular the unprepared and uninsured. Post-flood recovery—especially when it becomes prolonged—can cause mental disorders, anxiety, anger, depression, lethargy, hyperactivity, sleeplessness, and, in an extreme case, suicide. Behavior changes may also occur in children such as an increase in bed-wetting and aggression. There is also a long-term concern among the affected that their homes can be flooded again in the future.
Current loss estimation models such as Hazus are not equipped to measure public health impacts such as these. The best level of mitigation for these impacts is to be aware that they can occur, educate the public on prevention, and be prepared to deal with them in responding to flood events.
11.5.2 Property Hazus-MH calculates losses to structures from flooding by looking at depth of flooding and type of structure. Using historical flood insurance claim data, Hazus-MH estimates the percentage of damage to structures and their contents by applying established damage functions to an inventory. For this analysis, local data on facilities was used instead of the default inventory data provided with Hazus-MH. The analysis is summarized in Table 11-13 and Table 11-14 for the 100-year and 500-year flood events, respectively.
11-25

Kootenai County Multi-Jurisdictional All Hazard Mitigation Plan; Volume 1—Planning-Area-Wide Elements
TABLE 11-13. LOSS ESTIMATES FOR 100-YEAR FLOOD EVENT
Structures Estimated Loss Associated with Flood % of Total Impacteda Structure Contents Total Replacement Value
Athol 0 $0 $0 $0 0.00% Coeur d’Alene 50 $8,298,000 $8,461,000 $16,759,000 0.16% Dalton Gardens 0 $0 $0 $0 0.00% Fernan Lk. Vill. 2 $1,762,000 $1,066,000 $2,828,000 8.05% Harrison 1 $692,000 $1,162,000 $1,854,000 2.85% Hauser Lake 0 $0 $0 $0 0.00% Hayden 4 $842,000 $631,500 $1,473,500 0.05% Hayden Lake 9 $1,404,000 $903,000 $2,307,000 1.20% Huetter 0 $0 $0 $0 0.00% Post Falls 8 $5,104,000 $5,277,000 $10,381,000 0.19% Rathdrum 25 $2,983,000 $5,177,000 $8,160,000 0.85% Spirit Lake 11 $154,000 $120,000 $274,000 0.07% State Line 0 $0 $0 $0 0.00% Worley 0 $0 $0 $0 0.00% Unincorporated 400 $81,709,000 $90,070,000 $171,779,000 1.50%
Total 510 $102,948,000 $112,867,500 $215,815,500 0.64%
a. Impacted structures are those with finished floor elevations below the 100-year water surface elevation.
TABLE 11-14. LOSS ESTIMATES FOR 500-YEAR FLOOD EVENT
Structures Estimated Loss Associated with Flood % of Total Impacteda Structure Contents Total Replacement Value
Coeur d’Alene 17 $1,827,000 $1,509,000 $3,336,000 0.03% Post Falls 1 $14,000 $29,000 $43,000 0.001% Rathdrum 50 $6,643,000 $9,482,000 $16,125,000 1.68% Unincorporated Kootenai County
53 $6,318,000 $8,483,000 $14,801,000 0.13%
a. Impacted structures are those with finished floor elevations below the 500-year water surface elevation.
Note: 500-year flood mapping has not been completed for the entire extent of flood-prone waterways. Values shown are only for the reaches where 500-year flood mapping is available.
It is estimated that there would be up to $218 million of flood loss from a 100-year flood event in the planning area. This represents 38.1 percent of the total exposure to the 100-year flood and 0.65 percent of the total replacement value for the county. It is estimated that losses in the 500-year floodplain along the reaches of waterways where 500-year mapping has been completed would total $34 million, representing 32.8 percent of the total exposure in those areas.
11-26

FLOOD
National Flood Insurance Program Table 11-15 lists flood insurance statistics that help identify vulnerability in the planning area. Eleven communities in the planning area participate in the NFIP, with 372 flood insurance policies providing $83.8 million in insurance coverage. According to FEMA statistics, 75 flood insurance claims were paid between January 1, 1978 and December 31, 2010, for a total of $606,516, an average of $8,087 per claim.
TABLE 11-15. FLOOD INSURANCE STATISTICS
NFIP# Date of Entrya
# of Policiesb
Insurance In Force
Total Annual
Premium Claimsc
Value of Claims Paidc
CRS (Y or N)
CRS Class
Athol Currently not participating in the NFIP Coeur d’Alene 160078 9/2/1982 47 $9,210,500 $40,052 5 $35,333 N NC Dalton Gardens 160164 4/7/2011 0 $0 $0 0 $0 N NC Fernan Lk. Vill. 160079 2/17/1982 4 $1,230,000 $3,824 1 $4,227 N NC Harrison 160080 8/3/1984 3 $224,665 $2,195 3 $39,335 N NC Hauser Lake Currently not participating in the NFIP Hayden 160170 6/18/2010 1 $350,000 $414 0 $0 N NC Hayden Lake 160082 9/1/1981 1 $350,000 $414 0 $0 N NC Huetter Currently not participating in the NFIP Post Falls 160083 2/17/1982 11 $2,426,000 $3,875 0 $0 N NC Rathdrum 160187 2/17/1982 13 $2,339,800 $16,956 0 $0 N NC Spirit Lake 160084 5/26/1978 5 $1,191,800 $2,610 0 $0 N NC State Line Currently not participating in the NFIP Worley 160085 6/30/1976 0 $0 $0 0 $0 N NC Kootenai County
160076 3/1/1982 287 $66,477,300 $201,874 66 $527,621 Y 6
Total 372 $83,800,065 $272,214 75 $606,516
a. Initial FIRM effective date b. As of 11/30/2014 c. From 11/1978 to 11/30/2014
Properties constructed after a FIRM has been adopted are eligible for reduced flood insurance rates. Such structures are less vulnerable to flooding since they were constructed after regulations and codes were adopted to decrease vulnerability. Properties built before a FIRM is adopted are more vulnerable to flooding because they do not meet code or are located in hazardous areas. The first FIRMs in Kootenai County were available in 1978.
The following information from flood insurance statistics is relevant to reducing flood risk:
• The use of flood insurance in the planning area is below the national average. Only 12.8 percent of insurable buildings in the county are covered by flood insurance. According to an NFIP
11-27

Kootenai County Multi-Jurisdictional All Hazard Mitigation Plan; Volume 1—Planning-Area-Wide Elements
study, about 49 percent of single-family homes in special flood hazard areas are covered by flood insurance nationwide.
• The average claim paid in the planning area represents about 3 percent of the 2014 average replacement value of structures in the floodplain. This correlates to damage functions associated with very shallow flooding with depths less than 1 foot and little or no velocity.
• The percentage of policies and claims outside a mapped floodplain suggests that not all of the flood risk in the planning area is reflected in current mapping. Based on information from the NFIP, 60 percent of policies in the planning area are on structures within an identified special flood hazard area, and 40 percent are for structures outside such areas. Of total claims paid, 21.2 percent were for properties outside an identified 100-year floodplain.
Repetitive Loss A repetitive loss property is defined by FEMA as an NFIP-insured property that has experienced any of the following since 1978, regardless of any changes in ownership:
• Four or more paid losses in excess of $1,000
• Two paid losses in excess of $1,000 within any rolling 10-year period
• Three or more paid losses that equal or exceed the current value of the insured property.
Repetitive loss properties make up only 1 to 2 percent of flood insurance policies in force nationally, yet they account for 40 percent of the nation’s flood insurance claim payments. In 1998, FEMA reported that the NFIP’s 75,000 repetitive loss structures have already cost $2.8 billion in flood insurance payments and that numerous other flood-prone structures remain in the floodplain at high risk. The government has instituted programs encouraging communities to identify and mitigate the causes of repetitive losses. A recent report on repetitive losses by the National Wildlife Federation found that 20 percent of these properties are outside any mapped 100-year floodplain. The key identifiers for repetitive loss properties are the existence of flood insurance policies and claims paid by the policies.
FEMA-sponsored programs such as the CRS require participating communities to identify repetitive loss areas. A repetitive loss area is the portion of a floodplain holding structures that FEMA has identified as meeting the definition of repetitive loss. Identifying repetitive loss areas helps to identify structures that are at risk but are not on FEMA’s list of repetitive loss structures because no flood insurance policy was in force at the time of loss. Figure 11-4 shows Kootenai County repetitive loss areas as of November 30, 2014.
The four identified repetitive loss properties are in the Coeur d’Alene River Basin, in the unincorporated Cataldo/Rose Lake area of Kootenai County. All are in mapped flood hazard areas, so the incidence of repetitive flooding is commensurate with the risk reflected in the flood mapping. Three of the properties have not filed a claim since 1982. Of these, one is a defunct lumber yard with an abandoned, collapsed barn (Repetitive Loss # 0033017), one is a residential property that was repaired and elevated in 1996 with private funds (Repetitive Loss # 0049035), and one is a seasonal campground on the Coeur d’Alene River in the area included in 2004 FIRM maps (Repetitive Loss #0049550). The final property was awarded mitigation funds from the Idaho Bureau of Homeland Security to elevate the structure above the base flood elevation (repetitive loss # 0046601); this mitigation action has been completed.
11-28

Athol
HaydenLake
DaltonGardens
Worley
Fernan
Rathdrum
Hayden
Coeurd'Alene
PostFalls
Harrison
StateLine
SpiritLake
Huetter
HauserLake
£¤95
£¤95
£¤95
¬«58
¬«41
¬«97
¬«54
¬«3
¬«41
¬«53
§̈¦90
§̈¦90
Co eur d'Ale ne River
Spoka ne River
LakeCoeur
d'Alene
HaydenLake
LakePend
Oreille
SpiritLake
TwinLakes
/
0 63Miles
Repeti t ive Loss Areas
Base Map Data Sources: Kootenai County, U.S. Geological Survey
Figure 1 Kootenai County Hazard Mit igat ion Plan Update
±
Repetitive Loss Areas

Kootenai County Multi-Jurisdictional All Hazard Mitigation Plan; Volume 1—Planning-Area-Wide Elements
11.5.3 Critical Facilities and Infrastructure Hazus-MH was used to estimate the flood loss potential to critical facilities exposed to the flood risk. Using depth/damage function curves to estimate the percent of damage to the building and contents of critical facilities, Hazus-MH correlates these estimates into an estimate of functional down-time (the estimated time it will take to restore a facility to 100 percent of its functionality). This helps to gauge how long the planning area could have limited usage of facilities deemed critical to flood response and recovery. The Hazus critical facility analysis found that, on average, critical facilities would receive 8.63 percent damage to the structure and 32.9 percent damage to the contents during a 100-year flood event. The estimated time to restore these facilities to 100 percent of their functionality is 500 days.
11.5.4 Environment Loss estimation platforms are not currently equipped to measure environmental impacts of flood hazards. The best gauge of vulnerability of the environment would be a review of damage from past flood events. Loss data that segregates damage to the environment was not available at the time of this plan. Capturing this data from future events could help assess the vulnerability of the environment for future updates.
11.6 FUTURE TRENDS Kootenai County and its planning partners are equipped to handle future growth within flood hazard areas. All municipal planning partners have general plans that address frequently flooded areas in their safety elements. All partners have committed to linking their general plans to this hazard mitigation plan update. This will create an opportunity for wise land use decisions as future growth impacts flood hazard areas.
Additionally, the County and 10 of the municipal planning partners participate in the NFIP and have adopted flood damage prevention ordinances in response to its requirements. With over 80 percent of the flood risk located within a jurisdiction that participates in the CRS program, there is incentive to adopt consistent, appropriate, higher regulatory standards in communities with the highest degree of flood risk. All NFIP-participating municipal planning partners have committed to maintaining their good standing under the NFIP through initiatives identified in this plan. Communities participating or considering participation in the CRS program will be able to refine this commitment using CRS programs and templates as a guide.
11.7 SCENARIO The primary water courses in Kootenai County have the potential to flood at irregular intervals, generally in response to a succession of intense winter rainstorms. Storm patterns of warm, moist air usually occur between early November and late March. A series of such weather events can cause severe flooding in the planning area. The worst-case scenario is a series of storms that flood numerous drainage basins in a short time. This could overwhelm the response and floodplain management capability within the planning area. Major roads could be blocked, preventing critical access for many residents and critical functions. High in-channel flows could cause water courses to scour, possibly washing out roads and creating more isolation problems. In the case of multi-basin flooding, the County would not be able to make repairs quickly enough to restore critical facilities and infrastructure.
11.8 ISSUES Many homes located in floodplains are vulnerable to flood damage. Adding to this vulnerability is new growth creating pressure to develop marginal land located near floodplains. As development increases, the
11-30

FLOOD
volume of stormwater runoff and the area that it floods will increase. As a result, homes that were once outside mapped floodplains will face a threat of flooding. Currently, 35 to 40 percent of NFIP claims come from outside the mapped floodplains. Human-made developments within floodplains should be limited to non-structures such as parks, golf courses and farms. These facilities have the least potential for damage, but maximize land use.
The public should be made aware of hazardous areas and given information on flood insurance, mitigation, preparedness, response and recovery. Local emergency management plans should establish warning, evacuation, housing and other emergency procedures. The National Weather Service has an extensive river and weather monitoring system and provides flood watch and warning information to the public via radio, television, Internet, Teletype, and telephone. The U.S. Army Corps of Engineers has authority to assist public entities in flood-fighting and rescue operations and to protect, repair, and restore federally constructed flood control works threatened, damaged, or destroyed by a flood (Public Law 84-99).
The planning team has identified the following flood-related issues relevant to the planning area:
• The accuracy of the existing flood hazard mapping produced by FEMA in reflecting the true flood risk within the planning area is questionable. Flood maps need to be updated using the best available data, science and technology.
• The extent of flood-protection provided by flood control facilities (dams, dikes and levees) is not known due to the lack of an established national policy on flood protection standards.
• The risk associated with the flood hazard overlaps the risk associated with other hazards such as earthquake, landslide and fishing losses. This provides an opportunity to seek mitigation alternatives with multiple objectives that can reduce risk for multiple hazards.
• There is no consistency of land-use practices within the planning area or the scope of regulatory floodplain management beyond the minimum requirements of the NFIP. Kootenai County is currently the only community participating in the CRS program which recognizes communities that implement floodplain management programs that exceed the minimum NFIP requirements. More information is needed on flood risk to support the concept of risk-based analysis of capital projects.
• There needs to be a sustained effort to gather historical damage data, such as high water marks on structures and damage reports, to measure the cost-effectiveness of future mitigation projects.
• Ongoing flood hazard mitigation will require funding from multiple sources.
• There needs to be a coordinated hazard mitigation effort between jurisdictions affected by flood hazards in the county.
• Floodplain residents need to continue to be educated about flood preparedness and the resources available during and after floods.
• The concept of residual risk should be considered in the design of future capital flood control projects and should be communicated with residents living in the floodplain.
• The promotion of flood insurance as a means of protecting private property owners from the economic impacts of frequent flood events should continue.
• Existing floodplain-compatible uses such as agricultural and open space need to be maintained. There is constant pressure to convert these existing uses to more intense uses within the planning area during times of moderate to high growth.
11-31

Kootenai County Multi-Jurisdictional All Hazard Mitigation Plan; Volume 1—Planning-Area-Wide Elements
• The economy affects a jurisdiction’s ability to manage its floodplains. Budget cuts and personnel losses can strain resources needed to support floodplain management.
• A buildable-lands analysis that looks at vacant lands and their designated land use would be a valuable tool in helping decision-makers make wise decisions about future development.
• Dam failure inundation data needs to be obtained to support future risk assessments of the dam failure hazard.
• This plan incorporates the latest data and maps obtained from FEMA Flood Insurance Study Number 16055CV000A, Kootenai County Idaho and Incorporated Areas (April 22, 2009). While the maps were new, detailed studies of various communities were not performed. Communities may request such studies for flood-prone areas. A number of property valuation data sets are available but need to be coordinated to manipulate structure and property value and link to structure data sets so a more representative value can be determined, particularly for potential hazard areas, using GIS.
11-32

CHAPTER 12. LANDSLIDE
12.1 GENERAL BACKGROUND A landslide is a mass of rock, earth or debris moving down a slope. Landslides may be minor or very large, and can move at slow to very high speeds. They can be initiated by storms, earthquakes, fires, volcanic eruptions or human modification of the land.
Mudslides (or mudflows or debris flows) are rivers of rock, earth, organic matter and other soil materials saturated with water. They develop in the soil overlying bedrock on sloping surfaces when water rapidly accumulates in the ground, such as during heavy rainfall or rapid snowmelt. Water pressure in the pore spaces of the material increases to the point that the internal strength of the soil is drastically weakened. The soil’s reduced resistance can then easily be overcome by gravity, changing the earth into a flowing river of mud or “slurry.” A debris flow or mudflow can move rapidly down slopes or through channels, and can strike with little or no warning. The slurry can travel miles from its source, growing as it descends, picking up trees, boulders, cars and anything else in its path. Although these slides behave as fluids, they pack many times the hydraulic force of water due to the mass of material included in them. Locally, they can be some of the most destructive events in nature.
All mass movements are caused by a combination of geological and climate conditions, as well as the encroaching influence of urbanization. Vulnerable natural conditions are affected by human residential, agricultural, commercial and industrial development and the infrastructure that supports it.
12.2 HAZARD PROFILE Landslides are caused by one or a combination of the following factors: change in slope of the terrain, increased load on the land, shocks and vibrations, change in water content, groundwater movement, frost action, weathering of rocks, and removing or changing the type of vegetation covering slopes. In general, landslide hazard areas are where the land has characteristics that contribute to the risk of the downhill movement of material, such as the following:
• A slope greater than 33 percent
• A history of landslide activity or movement during the last 10,000 years
• Stream or wave activity, which has caused erosion, undercut a bank or cut into a bank to causethe surrounding land to be unstable
• The presence of an alluvial fan, indicating vulnerability to the flow of debris or sediments
• The presence of impermeable soils, such as silt or clay, which are mixed with granular soilssuch as sand and gravel.
DEFINITIONS
Landslide—The sliding movement of masses of loosened rock and soil down a hillside or slope. Such failures occur when the strength of the soils forming the slope is exceeded by the pressure, such as weight or saturation, acting upon them.
Mass Movement—A collective term for landslides, debris flows, falls and sinkholes.
Mudslide (or Mudflow or Debris Flow)—A river of rock, earth, organic matter and other materials saturated with water.
12-1

Kootenai County Multi-Jurisdictional All Hazard Mitigation Plan; Volume 1—Planning-Area-Wide Elements
12-2
Flows and slides are commonly categorized by the form of initial ground failure. Figure 12-1 through Figure 12-4 show common types of slides. The most common is the shallow colluvial slide, occurring particularly in response to intense, short-duration storms. The largest and most destructive are deep-seated slides, although they are less common than other types.
Figure 12-1. Deep Seated Slide Figure 12-2. Shallow Colluvial Slide
Figure 12-3. Bench Slide Figure 12-4. Large Slide
Slides and earth flows can pose serious hazard to property in hillside terrain. When they move—in response to such changes as increased water content, earthquake shaking, addition of load, or removal of downslope support—they deform and tilt the ground surface. The result can be destruction of foundations, offset of roads, breaking of underground pipes, or overriding of downslope property and structures.
12.2.1 Past Events There is little recorded information regarding landslides in Kootenai County. According to the Spatial Hazard Events and Losses Database for the United States, there have been five recorded landslide events in the planning area since 1960. These events occurred in March 1997, January 2000, January 2006, March and April 2011,May 2012 and January 2015 and were estimated to cause over $757,000 in damage. One of these events coincided with a federal disaster declaration. There are no records in the County of fatalities attributed to landslides. However, many deaths have occurred in the Pacific Northwest as a result of slides and slope collapses. The National Climatic Data Center Storm Events database provides additional information on some of the landslide events that have impacted the planning area. These events are listed in Table 12-1.

LANDSLIDE
12-3
TABLE 12-1. LANDSLIDES IMPACTING PLANNING AREA
Date Deaths Injuries Property Damage
March 1997 Unknown Unknown $1,564,118 Description: In early March 1997, northern Idaho received 12 to 18 inches of snow on top of existing snow pack that exceeded 150 to 170 percent of the average. A subsequent rainstorm caused a rapid snowmelt. The resulting mudslides lasted for an extended period and damaged many public facilities, including county road systems. The President issued a federal disaster declaration (DR-1177) on June 13, 1997, for Kootenai County and the five north Idaho Counties.
January 30, 2000 0 0 $725,400 Description: A major landslide occurred on January 30, 2000 on the outskirts of the community of Bayview. This was followed by another slide on February 11, 2000. The landslides blocked Cape Horn Road, the sole access road from Ravens Point to Bayview, and cut off road access to 75 homes. The clearing of 6,300 truckloads of quartzite debris and subsequent reconstruction of the roadway continued through May. The Governor issued a State Declaration. The request for a Presidential Declaration was not approved. However, federal assistance through the USDA Natural Resources Conservation Services stabilized the banks above the lake and removed debris blocking the roadway. The State assisted the County by paying the non-federal match required by NRCS.
January 15, 2006 0 0 $7,500 Description: A landslide was caused by construction on U.S. Highway 95, north of Worley. It resulted in approximately $7,500 in damage to the project.
March 30, 2011 0 0 $330,000 Description: Two large debris flows occurred around noon along Forest Road 208. The first slide was near the intersection of Lost Creek. The second slide was near the intersection of Clee Circle Road. No injuries were reported; however, 14 residents were trapped due to impassible roads; two of these residents had to be evacuated for medical appointments. A large debris flow that began around noon on March 30 blocked access to six permanent residences.. There was an estimated 25,000 cubic yards of rock and mud over the road with the larger slide and 8000 cubic yards associated with the smaller slide. The debris slide was still sliding the first week of April. The estimated cost to remove the earth and fix the road was $330,000.
April 27, 2011 0 0 $75,000 Description: A landslide along East Hayden Lake Road at mile post 5.5 resulted in half of the road breaking off and sliding down the embankment. Exact cost of road repairs is unknown, but it is thought to be $50,000 to $100,000.
January 8, 2015 0 0 Unknown
Description: A large rock and mudslide occurred just south of the Mineral Ridge boat launch on Hwy 97 near Beauty Bay. The slide blocked both lanes of traffic on Hwy 97 for over six hours.
12.2.2 Location The entire United States experiences landslides, with 36 states having moderate to highly severe landslide hazards. Expansion of urban and recreational developments into hillside areas exposes more people to the threat of landslides each year. Figure 12-5 illustrates the potential for landslides in the United States.
Landslides typically occur in areas of Kootenai County with steep slopes and in locations where construction destabilizes the natural landscape. Natural factors such as soil material, stability, vegetation and precipitation impact an area’s susceptibility to landslides.

Kootenai County Multi-Jurisdictional All Hazard Mitigation Plan; Volume 1—Planning-Area-Wide Elements
Source: USGS 2005 http://pubs.usgs.gov/fs/2005/3156/2005-3156.pdf
Figure 12-5. Landslide Potential of the Conterminous U.S.
The best available predictor of where movement of slides and earth flows might occur is the location of past movements. Past landslides can be recognized by their distinctive topographic shapes, which can remain in place for thousands of years. Most landslides recognizable in this fashion range from a few acres to several square miles. Most show no evidence of recent movement and are not currently active. A small proportion of them may become active in any given year, with movements concentrated within all or part of the landslide masses or around their edges.
The recognition of ancient dormant mass movement sites is important in the identification of areas susceptible to flows and slides because they can be reactivated by earthquakes or by exceptionally wet weather. Also, because they consist of broken materials and frequently involve disruption of groundwater flow, these dormant sites are vulnerable to construction-triggered sliding.
12.2.3 Frequency Landslides are often triggered by other natural hazards such as earthquakes, heavy rain, floods or wildfires, so landslide frequency is often related to the frequency of those hazards. In Kootenai County, landslides typically occur during higher than average rainfall or snowmelt events, so landslide potential largely coincides with the potential for sequential severe storms that saturate steep, vulnerable soils.
For this plan, the probability of future occurrences is defined by the number of events over a specified period of time. There is one recorded federally declared disaster (DR-1177) as a result of mudslides
Red areas have very high potential; yellow areas have high potential; green areas have moderate potential; black areas have low potential. Map not to scale. Circle indicates approximate location of Kootenai County.
12-4

LANDSLIDE
impacting Kootenai County. The historical record may underestimate the true number of events that have taken place in the county. In the last 20 years, there were 12 instances of landslides in Kootenai County. Based on past instances it is reasonable to project that landslides will continue to impact the county. Landslides may also become more frequent as land is developed, especially on sloped terrain.
12.2.4 Severity Landslides destroy property and infrastructure and can take the lives of people. Slope failures in the United States result in an average of 25 lives lost per year and an annual cost to society of about $1.5 billion. In Kootenai County, additional data must be collected and modeled to determine landslide-prone terrain and its relationship to the built environment. Due to the infrequency of landslide incidents, little information has been recorded.
According to the 1995 - 1996 Landslide Study of the Clearwater National Forest, most areas prone to landslides were on slopes above 55 percent, below 5000 feet in elevation and on south, southwest and west slopes. The study discovered that five factors primarily influence landslide-prone areas: geology, slope, landform, aspect and elevation. Climatic conditions and human activities also heavily influence slope stability. An analysis of these factors and the location of populated areas and major transportation systems would be necessary to accurately assess the potential severity of landslide incidents.
The 2013 State of Idaho Hazard Mitigation Plan identifies Kootenai County as having a low landslide incidence but a high ranking for impact. The high impact ranking is due to the proximity of major transportation and utility corridors, public services and commerce that would be susceptible to disruption. The low incidence is due to the infrequency of incidents.
12.2.5 Warning Time Mass movements can occur suddenly or slowly. The velocity of movement may range from a slow creep of inches per year to many feet per second, depending on slope angle, material and water content. Some methods used to monitor mass movements can provide an idea of the type of movement and the amount of time prior to failure. It is also possible to determine what areas are at risk during general time periods. Assessing the geology, vegetation and amount of predicted precipitation for an area can help in these predictions. However, there is no practical warning system for individual landslides. The current standard operating procedure is to monitor situations on a case-by-case basis, and respond after the event has occurred. Generally accepted warning signs for landslide activity include:
• Springs, seeps, or saturated ground in areas that have not typically been wet before
• New cracks or unusual bulges in the ground, street pavements or sidewalks
• Soil moving away from foundations
• Ancillary structures such as decks and patios tilting and/or moving relative to the main house
• Tilting or cracking of concrete floors and foundations
• Broken water lines and other underground utilities
• Leaning telephone poles, trees, retaining walls or fences
• Offset fence lines
• Sunken or down-dropped road beds
• Rapid increase in creek water levels, possibly accompanied by increased turbidity (soil content)
12-5

Kootenai County Multi-Jurisdictional All Hazard Mitigation Plan; Volume 1—Planning-Area-Wide Elements
• Sudden decrease in creek water levels though rain is still falling or just recently stopped
• Sticking doors and windows, and visible open spaces indicating jambs and frames out of plumb
• A faint rumbling sound that increases in volume as the landslide nears
• Unusual sounds, such as trees cracking or boulders knocking together.
12.3 SECONDARY HAZARDS Landslides can cause several types of secondary effects, such as blocking access to roads, which can isolate residents and businesses and delay commercial, public and private transportation. This could result in economic losses for businesses. Other potential problems resulting from landslides are power and communication failures. Vegetation or poles on slopes can be knocked over, resulting in possible losses to power and communication lines. Landslides also have the potential of destabilizing the foundation of structures, which may result in monetary loss for residents. They also can damage rivers or streams, potentially harming water quality, fisheries and spawning habitat.
A landslide of significant size could also fall into a large lake and trigger a seiche. This damaging wave, similar in effect to a tsunami, can damage or destroy shorefront property, boats, and docks in the region. The Bayview community was impacted by seiches in Lake Pend Oreille in 1946 and again in 1963.
12.4 EXPOSURE
12.4.1 Population There are no major populations exposed to landslides in Kootenai County. Since landslides typically occur in areas with steep slopes and in locations where construction destabilizes the natural landscape, populations living near either are considered to be at higher risk. As the population of Kootenai County grows, the potential for residents to be directly impacted by landslide activity increases.
12.4.2 Property Properties on steep slopes or near construction zones are the most exposed in Kootenai County to landslides. This includes newer homes on the slopes above Lake Coeur d’Alene and Hayden Lake. These homes are especially vulnerable after heavy rains or rapid snowmelt and in cases where drainage is inadequate and runoff is pronounced. As more buildings and facilities are built on or downslope of mountainous terrain, there will be more property exposed to landslide hazard areas.
12.4.3 Critical Facilities and Infrastructure In general, the built environment on steep slopes and located downslope is vulnerable to landslides. No loss estimation of these facilities was performed due to the lack of established damage functions for the landslide hazard. A significant amount of infrastructure can be exposed to mass movements:
• Roads—Access to major roads is crucial to life-safety after a disaster event and to response and recovery operations. Landslides can block egress and ingress on roads, causing isolation for neighborhoods, traffic problems and delays for public and private transportation. This can result in economic losses for businesses.
• Bridges—Landslides can impact road bridges. Mass movements can knock out bridge abutments or significantly weaken the soil supporting them, making them hazardous for use.
12-6

LANDSLIDE
• Power Lines—Power lines are generally elevated above steep slopes; but the towers supporting them can be subject to landslides. A landslide underneath a tower could cause it to collapse and rip down the lines. Power and communication failures due to landslides can create problems for vulnerable populations and businesses.
12.4.4 Environment Environmental problems as a result of mass movements can be numerous. Landslides that fall into streams may significantly impact fish and wildlife habitat, as well as affecting water quality. Hillsides that provide wildlife habitat can be lost for prolong periods of time due to landslides.
12.5 VULNERABILITY Vulnerability to landslides is a function of location, soil type, geology, human activity, use, and frequency of events. As more people work, build, and develop in mountain communities, there will be more people exposed to landslide hazard areas. These individuals may have little experience with, caution regarding, or preparations for, landslide conditions. In addition, landslides may impact the economy of Kootenai County by blocking roadways and transportation corridors. Blockage of critical roadways, such as U.S. Highway 95, can result in extensive rerouting, delayed deliveries and services. Blocked roadways can also delay emergency response services and threaten life safety.
12.5.1 Population Due to the lack of specified extent and locations of the landslide hazard, it is difficult to estimate the population vulnerable to landslides in the planning area. Increasing population and the fact that many homes are built on view property atop or below bluffs and on steep slopes subject to mass movement increase the number of lives endangered by this hazard.
12.5.2 Property Although complete historical documentation of the landslide threat in the planning area is lacking, the landslides listed in Table 12-1 suggest a moderate vulnerability. Landslides have caused thousands of dollars in damage to private property and public infrastructure and facilities. Loss estimates have not been developed as the extent and location of the hazard within the planning area is unknown.
12.5.3 Critical Facilities and Infrastructure The number and type of critical facilities and infrastructure exposed to the landslide hazard in the planning area are unknown. Several types of infrastructure are commonly exposed to mass movements, including transportation, water and sewer and power infrastructure. Highly susceptible areas of the county are likely to include mountain roads and transportation infrastructure.
12.5.4 Environment The environment vulnerable to landslide hazard is the same as the environment exposed to the hazard.
12.6 FUTURE TRENDS IN DEVELOPMENT Future trends in development cannot be determined until he landslide hazard areas are accurately mapped. It is likely that remote mountainous areas of the County will continue to become more developed and
12-7

Kootenai County Multi-Jurisdictional All Hazard Mitigation Plan; Volume 1—Planning-Area-Wide Elements
populated. Comprehensive plans produced by local governments in the planning area will guide this development.
12.7 SCENARIO Major landslides in the planning area occur as a result of soil conditions that have been affected by severe storms, groundwater or human development. The worst-case scenario for landslide hazards in the planning area would generally correspond to a severe storm that had heavy rain and caused flooding. Landslides are most likely during late winter when the water table is high. After heavy rains from November to December, soils become saturated with water. As water seeps downward through upper soils that may consist of permeable sands and gravels and accumulates on impermeable silt, it will cause weakness and destabilization in the slope. A short intense storm could cause saturated soil to move, resulting in landslides. As rains continue, the groundwater table rises, adding to the weakening of the slope. Gravity, poor drainage, a rising groundwater table and poor soil exacerbate hazardous conditions.
Continued heavy rains and flooding will complicate the problem further. As emergency response resources are applied to problems with flooding, it is possible they will be unavailable to assist with landslides occurring all over the planning area.
12.8 ISSUES Important issues associated with landslides in the planning area include the following:
• There are existing homes in landslide risk areas throughout the County. The degree of vulnerability of these structures depends on the codes and standards the structures were constructed to.
• Future development could lead to more homes in landslide risk areas. Codes have been put in place to minimize this risk.
• Currently there is no data available to accurately assess risk from the landslide hazard in the planning area. As new data and science become available, assessments of landslide risk should be reevaluated.
• Landslides may cause negative environmental consequences, including water quality degradation.
• The risk associated with the landslide hazard overlaps the risk associated with other hazards such as earthquake, flood and wildfire. This provides an opportunity to seek mitigation alternatives with multiple objectives that can reduce risk for multiple hazards.
12-8

CHAPTER 13. SEVERE WEATHER SYSTEMS
13.1 GENERAL BACKGROUND Severe weather refers to any dangerous meteorological phenomena with the potential to cause damage, serious social disruption, or loss of human life. It includes thunderstorms, downbursts, tornadoes, waterspouts, snowstorms, ice storms, and dust storms.
Severe weather can be categorized into two groups: systems that form over wide geographic areas are classified as general severe weather; those with a more limited geographic area are classified as localized severe weather. Severe weather, technically, is not the same as extreme weather, which refers to unusual weather events at the extremes of the historical distribution for a given area.
13.1.1 Lightning Lightning occurs in all thunderstorms. There are two main types of lightning: intra-cloud lightning and cloud-to-ground lightning. Cloud-to-ground lightning consists of at least one leader and at least one return stroke. The leader initiates the first phase of the a lightning discharge, while a return stroke moves upward along a lightning channel from the ground to the cloud (National Weather Service, 2014).
A thunderstorm is a rain event that includes thunder and lightning. A thunderstorm is classified as “severe” when it contains one or more of the following: hail with a diameter of three-quarter inch or greater, winds gusting in excess of 50 knots (57.5 mph), or tornado.
Three factors cause thunderstorms to form: moisture, rising unstable air (air that keeps rising when disturbed), and a lifting mechanism to provide the disturbance. The sun heats the surface of the earth, which warms the air above it. If this warm surface air is forced to rise (hills or mountains can cause rising motion, as can the interaction of warm air and cold air or wet air and dry air) it will continue to rise as long as it weighs less and stays warmer than the air around it. As the air rises, it transfers heat from the surface of the earth to the upper levels of the atmosphere (the process of convection). The water vapor it contains begins to cool and it condenses into a cloud. The cloud eventually grows upward into areas where the
DEFINITIONS
Freezing Rain—The result of rain occurring when the temperature is below the freezing point. The rain freezes on impact, resulting in a layer of glaze ice up to an inch thick. In a severe ice storm, an evergreen tree 60 feet high and 30 feet wide can be burdened with up to six tons of ice, creating a threat to power and telephone lines and transportation routes.
Severe Local Storm—Small-scale atmospheric systems, including tornadoes, thunderstorms, windstorms, ice storms and snowstorms. These storms may cause a great deal of destruction and even death, but their impact is generally confined to a small area. Typical impacts are on transportation infrastructure and utilities.
Thunderstorm—A storm featuring heavy rains, strong winds, thunder and lightning, typically about 15 miles in diameter and lasting about 30 minutes. Hail and tornadoes are also dangers associated with thunderstorms. Lightning is a serious threat to human life. Heavy rains over a small area in a short time can lead to flash flooding.
Tornado—Funnel clouds that generate winds up to 500 miles per hour. They can affect an area up to three-quarters of a mile wide, with a path of varying length. Tornadoes can come from lines of cumulonimbus clouds or from a single storm cloud. They are measured using the Fujita Scale, ranging from F0 to F5.
Windstorm—A storm featuring violent winds. Southwesterly winds are associated with strong storms moving onto the coast from the Pacific Ocean. Southern winds parallel to the coastal mountains are the strongest and most destructive winds. Windstorms tend to damage ridgelines that face into the winds.
Winter Storm—A storm having significant snowfall, ice, and/or freezing rain; the quantity of precipitation varies by elevation.
13-1

Kootenai County Multi-Jurisdictional All Hazard Mitigation Plan; Volume 1—Planning-Area-Wide Elements
temperature is below freezing. Some of the water vapor turns to ice and some of it turns into water droplets. Both have electrical charges. Ice particles usually have positive charges, and rain droplets usually have negative charges. When the charges build up enough, they are discharged in a bolt of lightning, which causes the sound waves we hear as thunder. Thunderstorms have three stages (see Figure 13-1):
• The developing stage of a thunderstorm is marked by a cumulus cloud that is being pushedupward by a rising column of air (updraft). The cumulus cloud soon looks like a tower (calledtowering cumulus) as the updraft continues to develop. There is little to no rain during thisstage but occasional lightning. The developing stage lasts about 10 minutes.
• The thunderstorm enters the mature stage when the updraft continues to feed the storm, butprecipitation begins to fall out of the storm, and a downdraft begins (a column of air pushingdownward). When the downdraft and rain-cooled air spread out along the ground, they form agust front, or a line of gusty winds. The mature stage is the most likely time for hail, heavyrain, frequent lightning, strong winds, and tornadoes. The storm occasionally has a black ordark green appearance.
• Eventually, a large amount of precipitation is produced and the updraft is overcome by thedowndraft beginning the dissipating stage. At the ground, the gust front moves out a longdistance from the storm and cuts off the warm moist air that was feeding the thunderstorm.Rainfall decreases in intensity, but lightning remains a danger.
Figure 13-1. The Thunderstorm Life Cycle
There are four types of thunderstorms:
• Single-Cell Thunderstorms—Single-cell thunderstorms usually last 20 to 30 minutes. A truesingle-cell storm is rare, because the gust front of one cell often triggers the growth of another.Most single-cell storms are not usually severe, but a single-cell storm can produce a brief severeweather event. When this happens, it is called a pulse severe storm.
• Multi-Cell Cluster Storm—A multi-cell cluster is the most common type of thunderstorm.The multi-cell cluster consists of a group of cells, moving as one unit, with each cell in adifferent phase of the thunderstorm life cycle. Mature cells are usually found at the center ofthe cluster and dissipating cells at the downwind edge. Multi-cell cluster storms can producemoderate-size hail, flash floods and weak tornadoes. Each cell in a multi-cell cluster lasts only
13-2

SEVERE WEATHER SYSTEMS
about 20 minutes; the multi-cell cluster itself may persist for several hours. This type of storm is usually more intense than a single cell storm.
• Multi-Cell Squall Line—A multi-cell line storm, or squall line, consists of a long line of storms with a continuous well-developed gust front at the leading edge. The line of storms can be solid, or there can be gaps and breaks in the line. Squall lines can produce hail up to golf-ball size, heavy rainfall, and weak tornadoes, but they are best known as the producers of strong downdrafts. Occasionally, a strong downburst will accelerate a portion of the squall line ahead of the rest of the line. This produces what is called a bow echo. Bow echoes can develop with isolated cells as well as squall lines. Bow echoes are easily detected on radar but are difficult to observe visually.
• Super-Cell Storm—A super-cell is a highly organized thunderstorm that poses a high threat to life and property. It is similar to a single-cell storm in that it has one main updraft, but the updraft is extremely strong, reaching speeds of 150 to 175 miles per hour. Super-cells are rare. The main characteristic that sets them apart from other thunderstorms is the presence of rotation. The rotating updraft of a super-cell (called a mesocyclone when visible on radar) helps the super-cell to produce extreme weather events, such as giant hail (more than 2 inches in diameter), strong downbursts of 80 miles an hour or more, and strong to violent tornadoes.
13.1.2 Windstorm Damaging winds are classified as those exceeding 60 mph. Damage from such winds accounts for half of all severe weather reports in the lower 48 states and is more common than damage from tornadoes. Wind speeds can reach up to 100 mph and can produce a damage path extending for hundreds of miles. There are seven types of damaging winds:
• Straight-line winds—Any thunderstorm wind that is not associated with rotation; this term is used mainly to differentiate from tornado winds. Most thunderstorms produce some straight-line winds as a result of outflow generated by the thunderstorm downdraft.
• Downdrafts—A small-scale column of air that rapidly sinks toward the ground.
• Downbursts—A strong downdraft with horizontal dimensions larger than 2.5 miles resulting in an outward burst or damaging winds on or near the ground. Downburst winds may begin as a microburst and spread out over a wider area, sometimes producing damage similar to a strong tornado. Although usually associated with thunderstorms, downbursts can occur with showers too weak to produce thunder.
• Microbursts—A small concentrated downburst that produces an outward burst of damaging winds at the surface. Microbursts are generally less than 2.5 miles across and short-lived, lasting only 5 to 10 minutes, with maximum wind speeds up to 168 mph. There are two kinds of microbursts: wet and dry. A wet microburst is accompanied by heavy precipitation at the surface. Dry microbursts, common in places like the high plains and the intermountain west, occur with little or no precipitation reaching the ground.
• Gust front—A gust front is the leading edge of rain-cooled air that clashes with warmer thunderstorm inflow. Gust fronts are characterized by a wind shift, temperature drop, and gusty winds out ahead of a thunderstorm. Sometimes the winds push up air above them, forming a shelf cloud or detached roll cloud.
• Derecho—A derecho is a widespread thunderstorm wind caused when new thunderstorms form along the leading edge of an outflow boundary (the boundary formed by horizontal spreading of thunderstorm-cooled air). The word “derecho” is of Spanish origin and means
13-3

Kootenai County Multi-Jurisdictional All Hazard Mitigation Plan; Volume 1—Planning-Area-Wide Elements
“straight ahead.” Thunderstorms feed on the boundary and continue to reproduce. Derechos typically occur in summer when complexes of thunderstorms form over plains, producing heavy rain and severe wind. The damaging winds can last a long time and cover a large area.
• Bow Echo—A bow echo is a linear wind front bent outward in a bow shape. Damaging straight-line winds often occur near the center of a bow echo. Bow echoes can be 200 miles long, last for several hours, and produce extensive wind damage at the ground.
Windstorms can result in collapsed or damaged buildings, damaged or blocked roads and bridges, damaged traffic signals, streetlights and parks, and other damage. They can also cause direct losses to buildings, people, and vital equipment. There are direct consequences to the local economy resulting from windstorms related to both physical damage and interrupted services.
Wind pressure can create a direct and frontal assault on a structure, pushing walls, doors, and windows inward. Conversely, passing currents can create lift and suction forces that act to pull building components and surfaces outward. As positive and negative forces impact a building’s doors, windows and walls, the result can be roof or building component failures and considerable structural damage. The effects of winds are magnified in the upper levels of multi-story structures.
Debris carried along by extreme winds can contribute directly to loss of life and indirectly to the failure of protective building envelopes. Falling trees and branches can damage buildings, power lines, and other property and infrastructure. Tree limbs breaking in winds of only 45 mph can be thrown over 75 feet, so overhead power lines can be damaged even in relatively minor windstorm events. During wet winters, saturated soils cause trees to become less stable and more vulnerable to uprooting from high winds. Utility lines brought down by summer thunderstorms have also been known to cause fires, which start in dry roadside vegetation. Electric power lines falling down to the pavement create the possibility of lethal electric shock.
Downed trees and power lines, and damaged property also can be major hindrances to emergency response and disaster recovery. Emergency response operations can be complicated when roads are blocked or when power supplies are interrupted. Industry and commerce can suffer losses from interruptions in electric service and from extended road closures.
13.1.3 Hail Hail occurs when updrafts in thunderstorms carry raindrops upward into extremely cold areas of the atmosphere where they freeze into ice. The National Weather Service rates thunderstorms that produce hail at least three-quarters of an inch in diameter as “severe.”
Recent studies suggest that super-cooled water may accumulate on frozen particles near the back-side of a storm as they are pushed forward across and above the updraft by the prevailing winds near the top of the storm. Eventually, the hailstones encounter downdraft air and fall to the ground.
Hailstones grow two ways: by wet growth or dry growth. In wet growth, a tiny piece of ice is in an area where the air temperature is below freezing, but not super cold. When the tiny piece of ice collides with a super-cooled drop, the water does not freeze on the ice immediately. Instead, liquid water spreads across tumbling hailstones and slowly freezes. Since the process is slow, air bubbles can escape, resulting in a layer of clear ice. Dry growth hailstones grow when the air temperature is well below freezing and the water droplet freezes immediately as it collides with the ice particle. The air bubbles are “frozen” in place, leaving cloudy ice.
13-4

SEVERE WEATHER SYSTEMS
Hailstones can have layers like an onion if they travel up and down in an updraft, or they can have few or no layers if they are “balanced” in an updraft. One can tell how many times a hailstone traveled to the top of a storm by counting its layers. Hailstones can begin to melt and then re-freeze together, forming large and very irregularly shaped hail.
13.1.4 Tornado A tornado is a violently rotating column of air extending between, and in contact with, a cloud and the surface of the earth. Tornadoes are often (but not always) visible as a funnel cloud. On a local-scale, tornadoes are the most intense of all atmospheric circulations and wind can reach destructive speeds of more than 300 mph. A tornado’s vortex is typically a few hundred meters in diameter, and damage paths can be up to 1 mile wide and 50 miles long. Figure 13-2, adapted from FEMA, illustrates the potential impacts and damage from tornadoes of different magnitudes. Tornadoes can occur throughout the year at any time of day but are most frequent in the spring during the late afternoon. As shown in Figure 13-3, Idaho has a relatively low risk compared to states in the Midwestern and Southern U.S.
Figure 13-2. Potential Impact and Damage from a Tornado
13-5

Kootenai County Multi-Jurisdictional All Hazard Mitigation Plan; Volume 1—Planning-Area-Wide Elements
Figure 13-3. Tornado Risk Areas in the United States
Tornados in North Idaho are especially rare. Most of those have been reported in May, June and July, with 48 percent of the tornado events occurring between 12:00 pm (noon) and 4:00 pm local time. On average, the Inland Northwest, including North Idaho, experienced one tornado per year. There are two recorded tornados that have occurred in Kootenai County. Both of the tornado events occurred between 12:00 pm (noon) and 7:00 pm local time.
13.1.5 Blizzard and Snowstorm The National Weather Service defines a winter storm as having significant snowfall, ice and/or freezing rain; the quantity of precipitation varies by elevation. Heavy snowfall is 4 inches or more in a 12-hour period, or 6 inches or more in a 24-hour period in non-mountainous areas; and 12 inches or more in a 12-hour period or 18 inches or more in a 24-hour period in mountainous areas. There are three key ingredients to a severe winter storm:
• Cold Air—Below-freezing temperatures in the clouds and near the ground are necessary to make snow and/or ice.
• Moisture—Moisture is required in order to form clouds and precipitation. Air blowing across a body of water, such as a large lake or the ocean, is an excellent source of moisture.
• Lift—Lift is required in order to raise the moist air to form the clouds and cause precipitation. An example of lift is warm air colliding with cold air and being forced to rise over the cold dome. The boundary between the warm and cold air masses is called a front. Another example of lift is air flowing up a mountain side.
Strong storms crossing the North Pacific sometimes slam into the coast from California to Washington. The Pacific provides a virtually unlimited source of moisture for storms. If the air is cold enough, snow falls over Washington and Oregon and sometimes in California. As the moisture rises into the mountains, heavy snow closes the mountain passes and can cause avalanches. Cold air from the north has to filter through
13-6

SEVERE WEATHER SYSTEMS
mountain canyons into the basins and valleys to the south. If the cold air is deep enough, it can spill over the mountain ridge. As the air funnels through canyons and over ridges, wind speeds can reach 100 mph, damaging roofs and taking down power and telephone lines. Combining these winds with snow results in a blizzard. Heavy snow can immobilize a region and paralyze a city, stranding commuters, stopping the flow of supplies, and disrupting emergency and medical services. Accumulations of snow can collapse buildings and knock down trees and power lines. In rural areas, homes and farms may be isolated for days, and unprotected livestock may be lost. In the mountains, heavy snow can lead to avalanches. The cost of snow removal, repairing damages, and loss of business can have large economic impacts on cities and towns.
Areas most vulnerable to winter storms are those affected by convergence of dry, cold air from the interior of the North American continent, and warm, moist air off the Pacific Ocean. Typically, significant winter storms occur during the transition between cold and warm periods.
13.1.6 Ice Storm Ice storms occur when rain falls from a warm, moist, layer of atmosphere into a below freezing, drier layer near the ground. The rain freezes on contact with the cold ground and exposed surfaces causing damage to trees, utility wires, and structures.
With an average elevation over 1,800 feet, Spokane is located on the edge of the Columbia Basin in eastern Washington State. Its location, between the Cascades Range to the west and Rocky Mountains to the east and north, allows cold air to settle into the basin, frequently creating prime conditions for winter weather.
November 19, 1996, produced one of the region’s worst ice storms in 60 years. Before the freezing rain hit, there was already between 2 and 4 inches of snow on the ground around the city. Later that day, up to an inch and a half of freezing rain fell, coating trees, roads, buildings, vehicles, and power lines in a dense slippery glaze. The official weather station for the city at Spokane International Airport recorded a high temperature of only 33°F and 1.24 inches of precipitation, which fell in the form of rain, freezing rain, freezing drizzle, snow, and mist. The station also reported freezing fog in the city that day.
Trees came crashing down everywhere under the immense weight of the ice. The mayor of Spokane declared a state of emergency as over half the city’s residents lost electricity—their worst power outage in 108 years. Three days after the storm, 100,000 people in the surrounding county were without power, and six days after the storm, 20,000 were still without power. Some area residents were without electricity for up to two weeks following the record-breaking storm.
Throughout the devastating ice storm and its aftermath, four people lost their lives in and around Spokane and Kootenai counties, and total damages were estimated at over $22 million in 1996 dollars—$33 million in 2013 dollars. This ice storm remains one of the most severe on record for the area.
13.1.7 Extreme Cold and Wind Chill Weather that constitutes extreme cold varies across different parts of the U.S. In regions relatively unaccustomed to winter weather, near freezing temperatures are considered extreme cold (CDC, 2014a). Extreme cold can often accompany severe winter storms. Wind can exacerbate the effects of cold temperatures by carrying heat away from the body more quickly, thus making it feel colder than is indicated by the temperature. This phenomenon is known as wind chill. Wind chill is the temperature that your body feels when the air temperature is combined with wind speed (CDC, 2014a). Figure 13-4 shows the value of wind chill based on ambient temperature and wind speed.
13-7

Kootenai County Multi-Jurisdictional All Hazard Mitigation Plan; Volume 1—Planning-Area-Wide Elements
Figure 13-4. Wind Chill Chart
13.1.8 Extreme Heat Excessive heat events are defined by the U.S. EPA as “summertime weather that is substantially hotter and/or more humid than average for a location at that time of year” (U.S. EPA, 2006). Heat waves are excessive heat events that typically last two or more days (CDC, 2014b). Because extreme heat is relative to the usual weather in a region, criteria that define an extreme heat event may differ among jurisdictions and with the time of year. In general, extreme heat events can be characterized by temperatures greater than 90°F, warm stagnant air masses and consecutive nights with higher-than-usual minimum temperatures (CDC, 2009).
NOAA’s heat alert procedures are based mainly on heat index values. The heat index, given in degrees Fahrenheit, is a measure of perceived temperature when relative humidity is factored in with the actual air temperature. To find the heat index temperature, the temperature and relative humidity need to be known. The heat index correspond to these values as shown on Figure 13-5. Like wind chill, the heat index indicates the temperature the body feels. Heat index values are devised for shady, light wind conditions. Exposure to full sunshine can increase heat index values by up to 15°F. Strong winds, particularly with very hot dry air, can also be extremely hazardous (NWS 2015).
13.2 HAZARD PROFILE
13.2.1 Past Events Table 13-1 summarizes severe weather events in the planning area that resulted in fatalities, injuries or property damage since 1970, as recorded by the National Oceanic and Atmospheric Administration (NOAA).
13-8

SEVERE WEATHER SYSTEMS
Figure 13-5. Heat Index Chart
TABLE 13-1. PAST SEVERE WEATHER EVENTS IMPACTING PLANNING AREA
Date Type Deaths or Injuries Property Damage
July 23, 2014 Hail 1 injury $200,000 Description: One inch hail was observed at Conkling Park on Lake Coeur d’Alene. As the storm tracked into northern sections of Kootenai County, strong outflow winds became the main threat resulting in a corridor of tree damage from Coeur d’Alene to Athol. The strongest winds surfaced near Athol and knocked down multiple trees in the RV park across the street from Silverwood Theme Park. One person suffered a minor injury in the RV Park. Trees damaged campers, flipped tents, and knocked over smaller campers. January 15, 2005 Heavy Snow 2 deaths $0 Description: A large, moist storm system from the tropics dropped heavy snow on northern and central Idaho before raising snow levels to over 7000 feet by the evening of January 18. 6 inches was reported by a spotter at Bonners Ferry, and 12 miles away a spotter reported 10 inches of snow. About 8 inches fell at the town of Sandpoint. Over the Coeur d’Alene Area, 3 to 4 inches of snow was common but a spotter at the town of Rathdrum reported 6 inches of new snow. Over the Idaho Palouse, 3 to 5 inches of snow was common. Over the Central Panhandle Mountains, 9 inches fell over Silver Mountain and 8-12 inches were common over all other mountain locations. Two Snowboarders died in an avalanche just south of the town of Mullan on the afternoon of January 16
13-9

Kootenai County Multi-Jurisdictional All Hazard Mitigation Plan; Volume 1—Planning-Area-Wide Elements
TABLE 13-1. PAST SEVERE WEATHER EVENTS IMPACTING PLANNING AREA
Date Type Deaths or Injuries Property Damage November 16, 1996 Heavy Snow 0 $6 million Description: An ice storm began on November 16 with heavy snow in Northern Idaho. Some roads were closed. Schools were also closed in Coeur d’Alene, Sandpoint, Nez Perce and Highland in Lewis County where 14 inches of new snow fell. St. Maries and neighboring communities were without power beginning on November 18. On November 19, freezing rain coated many power lines and trees with heavy ice. Clearwater, Idaho and Kootenai Counties were without power due to fallen trees and power lines. In Kootenai County traffic was slowed everywhere. Officials were overwhelmed with traffic accidents and snow removal. Three feet of snow fell at Mullan from the November 17 - 20, closing I-90 for periods of time as well as many other roadways. On November 24, a barn collapsed in Kootenai County killing 7 cows. On November 26, Kootenai and Boundary County residents were still without power. On November 27, narrow roads were still blocked. By November 28, after 10 days with snow, freezing rain, fallen trees, and no power, crews were able to begin power restoration work. Damage estimates were around $6 million for Northern Idaho. January 9, 2001 High Wind 0 $40,000 Description: With a strong jet stream overhead and tight westerly pressure gradient near the surface, strong and damaging winds of 40 to 60 knots were reported. Numerous trees and power lines were downed, leading to power outages. October 22, 2001 High Wind 0 $15,000 Description: A strong low pressure system moving across southern British Columbia swept a cold front across the Idaho panhandle from late evening on October 22 through the early morning of October 23. The strongest winds occurred immediately following the frontal passage. Lewiston-Nez Perce County Airport measured a peak wind gust of 58 mph. The Lines Creek weather station measured a wind gust to 54 mph. Other parts of the panhandle reported wind gusts of 40-50 miles an hour following the frontal passage with another lesser peak in wind speeds during the afternoon of October 23. November 19, 2003 High Wind 0 $150,000 Description: During the morning of November 19, strong winds aloft descended to the surface producing scattered damage from downed trees. A dozen large pine trees fell on summer homes along Lake Pend Oreille. In the Coeur d’Alene area, numerous trees fell on houses and power lines. By 10:00 am a cold front swept through the region ending the strong southwesterly winds. December 14, 2006 High Wind 3 injuries $446,000 Description: A deep low pressure resulted in damaging southwest winds over North Central Idaho, the Idaho Palouse, and the Lewiston area. Numerous power outages and fallen trees occurred. Several trees landed on power lines, vehicles, and homes. Hauser Lake was hit hard by falling trees. Several mobile homes received extensive damage after trees fell on them, with three people injured. A marina on Lake Pend Oreille’s Garfield Bay was also badly damaged. Hayden was hit hard with several downed power poles and transmission lines. Wind gusts from this wind storm include: Northern Idaho Panhandle: Hauser Lake - estimated 75 MPH gusts; Coeur d’Alene area: Hayden - estimated 75 MPH gusts. January 6, 2007 High Wind 0 $3,000 Description: High winds occurred across portions of the Coeur d’Alene area. A wind gust of 67 MPH was measured at Pleasant View. Several trees were knocked down by the winds, with 2,150 people losing power. In Coeur d’Alene, a tree fell on a 2003 Toyota Land Rover. A strong wind gust near Deary led to roof damage. The property damage from this event was estimated at $4,000.
13-10

SEVERE WEATHER SYSTEMS
TABLE 13-1. PAST SEVERE WEATHER EVENTS IMPACTING PLANNING AREA
Date Type Deaths or Injuries Property Damage May 3, 2010 High Wind 0 $15,000 Description: A windstorm over North Idaho resulted in extensive damage for some locations. The Lewiston area was hit especially hard with numerous trees blown down. The Lewiston and Clarkston areas reported 9,000 customers without power. In the Central Panhandle Mountains in Bovill, a tree was blown onto a mobile home. Four miles north of Prichard, several trees were blown down with power out in the area. A total of 283 power outages were reported in Kellogg, and 600 in Deary. In Sandpoint, 2,500 customers lost power. Peak wind gusts from this event include 64 mph 13 miles south of Waha, 63 mph 8 miles north-northeast of Lewiston, 62 mph 4 miles northwest of Winchester, and 60 mph measured at a Coeur d’Alene weather station. May 19, 2010 High Wind 1 injury $425,000 Description: A squall line brought high wind gusts to Moscow as well as Hayden Lake. When the squall line hit Moscow, a roof was ripped off the La Quinta Inn near the Washington and Idaho State Line. Screens were ripped off of windows as well. A concrete planter hit a person, resulting in an injury. When the line hit Hayden Lake, six to eight tall pine trees came down near the Hayden Lake Country Club Golf Course. A tree that was 130 feet tall and 2 to 3 feet in diameter came down on a home, causing significant home damage and injuring one person. Three other homes were hit by falling trees with downed power lines. Three trees fell and totaled a car as well. May 19, 2006 Lightning 0 $10,000 Description: Lightning struck the roof of a house in Hayden and started a fire. The home didn’t suffer any smoke damage, but some water damage along with replacement of trusses in the roof led to an estimated property damage of $10,000. July 5, 2006 Lightning 0 $15,000 Description: Lightning damaged two buildings at Coeur d’Alene Industrial Park. The buildings were made of metal with scrap wood inside. The property damage from this event was estimated at $15,000. June 6, 2004 Lightning 0 $30,000 Description: A 27 foot sailboat sank near Blackwell Island in Coeur d’Alene after lightning struck it. An electrical charge from the lightning also traveled up power lines to a home and blew out two TV’s and damaged several electrical sockets. Other homes and businesses received minor damage. Lightning struck a business putting a hole in a concrete wall. About 2,000 power outages resulted from the storm. July 16, 2012 Lightning 0 $1,000 Description: Thunderstorms over Northern Idaho during the afternoon and evening of July 16 tracked over the Coeur d’Alene area. Lightning struck a reservoir tank on Tubbs Hill causing damage to a sensor. July 17, 2012 Lightning 0 $2,500 Description: Thunderstorms during the morning of July 17 produced frequent lightning strikes in and around the Post Falls area. One bolt struck a man in his car driving to work. The man did not receive any injuries, but his car’s sensors were damaged and he lost all power control while driving, including the brakes. He was able to safely pull the vehicle to the side of the road. Two tires were also blown out from the strike. August 10, 2013 Lightning 0 $200,000 Description: A bolt of lightning started a home on fire on Good Hope Road in Athol. The homeowner got out safely but the fire, fueled by natural gas in the home, destroyed everything inside. July 23, 2014 Lightning 0 $4,500 Description: Four cows and one calf were killed by a lightning strike in Hayden, ID.
13-11

Kootenai County Multi-Jurisdictional All Hazard Mitigation Plan; Volume 1—Planning-Area-Wide Elements
TABLE 13-1. PAST SEVERE WEATHER EVENTS IMPACTING PLANNING AREA
Date Type Deaths or Injuries Property Damage January 10, 2006 Strong Wind 0 $30,000 Description: A powerful Pacific storm system brought heavy snow and wind to northern Idaho January 8 – 11. Many valley locations received 4 to 6 inches of snow and the mountains received 10 to 20 inches. Many trees fell in north Idaho due to the heavy wet snow and winds, causing power outages to 7,000 buildings. In the city of Coeur d’Alene, high winds blew over a very large pine tree, which fell on a house causing roof and structure damage. In the town of Post Falls, a tree was knocked down by high winds causing structure damage to a resident’s carport. March 29, 2010 Strong Wind 0 $45,000 Description: Strong winds led to a few reports of damage in the Coeur d’Alene area as well as power outages. The winds split a 120 foot Ponderosa pine tree, which landed on a home and caused major damage. The winds also uprooted a tree that fell onto a car in Hayden. Kootenai Electric Cooperative had 1,000 customers without power during the wind storm. During the peak of the winds, Coeur d’Alene reported sustained west winds of 35 miles per hour gusting to 49 miles per hour. Property damage from this event was estimated to be $45,000. April 8, 2010 Strong Wind 0 $15,000 Description: Strong gusty winds led to downed trees and power lines over portions of North Idaho. About 3,700 customers lost power in Moscow for about 20 minutes. One tree fell and struck two cars in Moscow. In Kingston, a rotted pine tree fell on a home and damaged the chimney and storage shed. A power line was also taken out when the tree fell. Around 300 customers lost power in Kellogg and St. Maries. In Sandpoint, downed trees led to minor damage, with one tree falling on a pickup truck. A spruce tree, 80 feet tall, was blown down taking out a wooden fence and totaling a car. At Hayden Lake, Harrison, and Coeur d’Alene 1,000 power outages were reported. February 12, 2011 Strong Wind 0 $8,000 Description: Strong winds in the range of 45 to 55 mph were reported, and 369 customers were reportedly without power. A tall ponderosa pine estimated to be 3 feet in diameter snapped on Trevino Drive in Coeur d’Alene. April 8, 1993 Thunderstorm Wind 0 $50,000 Description: In the northern part of Coeur d’Alene, winds from a thunderstorm pushed a 60-foot ponderosa pine tree over onto a parked car. The car was totaled, but no one was injured. October 20, 1994 Thunderstorm Wind 0 $500,000 Description: Strong winds from thunderstorms knock down 50-foot high trees, damaging power poles and law enforcement vehicles. May 31, 1997 Thunderstorm Wind 0 $10,000 Description: A tree blown over by high wind damaged a house in Coeur d’Alene. July 9, 1998 Thunderstorm Wind 0 $20,000 Description: 60 mph wind gust at 4th of July Pass closed Highway 3 from Cataldo to Medimont due to downed trees. April 4, 2000 Thunderstorm Wind 0 $15,000 Description: Strong gradient winds of 20-30 mph persisted for much of the day. Thunderstorms developed in the afternoon.
13-12

SEVERE WEATHER SYSTEMS
TABLE 13-1. PAST SEVERE WEATHER EVENTS IMPACTING PLANNING AREA
Date Type Deaths or Injuries Property Damage June 29, 2007 Thunderstorm Wind 0 $108,000 Description: A line of severe thunderstorms caused extensive damage from Kootenai county north to the United States and Canadian border. Numerous trees were blown down with power outages common due to winds between 60-70 mph. Over 100 power poles had to be replaced, including at least 70 that snapped near Priest Lake. At least 15,000 homes in Kootenai, Bonner, and Boundary counties lost power. Trees fell onto several homes, cars, and roadways, including Highway 95, which was blocked north of Bonners Ferry and between Bonners Ferry and Sandpoint. August 28, 2011 Thunderstorm Wind 0 $300,000 Description: A microburst was thought to be responsible for snapping 20 consecutive power poles between the Setters substation and Highway 95 along Setters Road. It is inconclusive whether the initial wind gust snapped only a few poles or was the direct cause for damaging all the poles. Due to the absence of additional damage in the area, it is speculated that a few poles broke in response to the microburst, resulting in a domino effect to the remaining poles. March 20, 2013 Thunderstorm Wind 0 $175,000 Description: 20 to 30 trees were blown over and another 30 to 40 trees were damaged in a path 150 yards wide and half a mile long. One tree fell on a barn, another on a house, and a third on a trailer. Some of the larger trees that fell were up to 3 feet in diameter. Trees were lying in a southwest to northeast direction. Winds were estimated at 70 to 80 miles per hour. A homeowner was in the basement at the time of the damage and was not injured. A rough estimate was used for the total damage during the event. August 2, 2014 Thunderstorm Wind 0 $50,000 Description: Coeur d’Alene Press reported that thunderstorms brought high winds and downed trees across portions of Post Falls, Hayden, Spirit Lake, and northern Coeur d’Alene. The Stateline Speedway and several other businesses on Pleasant View Road lost power and were forced to cancel the Idaho 200 race. The storm and strong winds also sparked a grass fire causing Love’s Travel Center to evacuate. The storm was blamed for a house fire on Cimmaron Street in Post Falls and another one at Fir and 13th Street caused by downed power lines. September 9, 1994 Tornado 0 $50,000 Description: A funnel cloud touched down south of Stateline village. A number of other funnels had been spotted in eastern Washington. May 31, 1997 Tornado 0 $50,000 Description: An F2 tornado touched down near Athol and caused damage to old growth trees. December 1, 2001 Winter Storm 0 $100,000 Description: Heavy snow fell in the central and northern parts of the panhandle, mainly above 2500 feet elevation. This storm was unusually damaging because it dumped heavy, wet, sticky snow followed by wind gusts of 20 to 30 mph. Most problems in the Idaho panhandle took place in Bonner County, where dozens of downed trees and power lines knocked power out.
13-13

Kootenai County Multi-Jurisdictional All Hazard Mitigation Plan; Volume 1—Planning-Area-Wide Elements
TABLE 13-1. PAST SEVERE WEATHER EVENTS IMPACTING PLANNING AREA
Date Type Deaths or Injuries Property Damage January 2008 Winter Storm 0 $142,038.65 Description: Heavy snowfall in January and February 2008 deposited up to 11 feet of snow in Kootenai County. Kootenai County declared a disaster on January 31. The State of Idaho also declared the winter storm a disaster (ID-01-2008). High winds caused drifting snows, making roads impassable. Falling trees caused power outages. Schools and businesses closed. One business was severely damaged (roof collapse). Schools and other public buildings experienced heavy snow loads on roofs. This resulted in extraordinary costs for snow removal. Medical care agencies reported 214 snow storm related injuries, including a death from a heart attack suffered while shoveling snow. One frostbite case was reported as were two individuals with respiratory problems related to the power outage. Heavy snows caused delay in the response of first responders. Kootenai County Fire and Rescue was slowed in its response to a fire in Post Falls as some of its equipment became stuck on the approach to the property. The home was completely destroyed. Storm related costs to Kootenai County totaled $142,038.65. Losses to school districts, highway districts, Panhandle Health District, cities, and North Idaho College totaled $663,535.34. November 19, 1996 Winter Weather 0 $2,000,000 Description: An ice storm occurred on November 19, 1996. Over 1 inch of rain fell and formed into ice on trees, power lines, and structures. The weight of this ice snapped trees and power lines throughout the region. Falling trees damaged homes and businesses. At least 100,000 businesses and residences lost power. Many went without power for two weeks. Those living in rural areas were without power even longer. Repair crews were brought to the region from other areas of the country to assist in restoring power. President Clinton declared counties in Idaho and Washington as disaster areas after both governors requested the disaster declaration. Washington Water Power (Avista) estimated $10 million to $15 million in losses due to the ice storm. Kootenai Electric estimated losses at $1.3 million. Kootenai County Office of Emergency Management estimated total losses for the County at $2 million. January 20, 2012 Winter Weather 0 $20,000 Description: A combination of light snow and freezing rain created slick driving conditions during the morning of January 21. The slick road conditions were thought to have played a large role in a six-car accident along Highway 95 near Sagle. The accident resulted in one fatality and one serious injury.
13.2.2 Location
Lightning Lightning and thunderstorms affect relatively small areas. Thunderstorms can strike in all regions of the United States; however, they are most common in the central and southern states. It is estimated that there are as many as 40,000 thunderstorms each day worldwide. Figure 13-6 shows the average number of thunderstorm days throughout the United States. Kootenai County has between 20 and 30 thunderstorm days a year (NOAA, 2010a). Areas throughout Kootenai County are subject to lightning strikes, though high elevations and structures are generally more susceptible than low elevations. Communications towers, petroleum storage tanks, and tall-mast boats on Lake Coeur d’Alene, Lake Pend Oreille, and Hayden Lake are all likely targets for lighting strikes. Lightning occurs during every thunderstorm and accounts for 93 deaths and over 300 injuries annually. In Idaho, fatalities average less than one each year Although fatalities from lighting strikes are rare in North Idaho, they do occur.
13-14

SEVERE WEATHER SYSTEMS
Figure 13-6. Annual Number of Thunderstorm Days
Windstorm Figure 13-7 indicates the frequency and strength of windstorms in the United States, based on 40 years of tornado data and 100 years of hurricane data collected by FEMA. States in Wind Zone IV have experienced the greatest number of tornadoes and the strongest tornadoes. Idaho and Kootenai County are in Wind Zone I, which may experience winds up to 130 mph (FEMA, 2012).
Tornado In a typical year, approximately 1,000 tornadoes affect the United States. The peak of the tornado season is April through June, with the highest concentration of tornadoes in the central United States. The potential for a tornado strike is about equal across locations in Kootenai, except in the eastern section of the count which typically has steeper terrain and therefore is less likely to experience tornadoes. Figure 13-8 shows the annual average number of tornadoes between 1991 and 2010. Idaho experienced an average of five tornadoes annually between 1991 and 2010 (NOAA 2013).
Hail Hail causes nearly $2 billion in crop and property damages, on average, each year in the United States. Hail occurs most frequently in the southern and central plain states; however, since hail occurs with thunderstorms, the possibility of hail damage exists throughout the entire United States. Figure 13-9 indicates that Kootenai County experiences fewer than two hailstorms a year, on average (FEMA 1995).
13-15

Kootenai County Multi-Jurisdictional All Hazard Mitigation Plan; Volume 1—Planning-Area-Wide Elements
Figure 13-7. Wind Zones in the United States
Figure 13-8. Average Annual Number of Tornadoes, 1991 - 2010
13-16

SEVERE WEATHER SYSTEMS
Figure 13-9. Annual Frequency of Hailstorms
Blizzard and Snowstorm All of Kootenai County is susceptible to blizzards or snowstorms, given the right condition. The trajectory of the storm center – whether it passes close to the county or at a distance –determines the intensity and the duration of snowfall.
Ice Storm All regions of Kootenai County are subject to ice storms. The distribution of ice storms often coincides with general distribution of snow. A locality’s distance to the passing storm center and type of terrain is often the crucial factor in determining the temperature and type of precipitation during a winter storm.
Extreme Temperatures Temperature extremes can occur throughout Kootenai County, and are not confined to a specific region.
13.2.3 Frequency The severe weather events for Kootenai County shown in Table 13-1 are often related to high winds associated with winter storms and thunderstorms. The planning area can expect to experience exposure to some type of severe weather event at least annually.
13.2.4 Severity The most common problems associated with severe storms are immobility and loss of utilities. Fatalities are uncommon, but can occur. Roads may become impassable due to flooding, downed trees, ice or snow, or a landslide. Power lines may be downed due to high winds or ice accumulation, and services such as water or phone may not be able to operate without power. Lightning can cause severe damage and injury.
13-17

Kootenai County Multi-Jurisdictional All Hazard Mitigation Plan; Volume 1—Planning-Area-Wide Elements
Windstorms can be a frequent problem in the planning area and have been known to cause damage to utilities. The predicted wind speed given in wind warnings issued by the National Weather Service is for a one-minute average; gusts may be 25 to 30 percent higher.
Tornadoes are potentially the most dangerous of local storms, but they are not common in the planning area. If a major tornado were to strike within the populated areas of the county, damage could be widespread. Businesses could be forced to close for an extended period or permanently, fatalities could be high, many people could be homeless for an extended period, and routine services such as telephone or power could be disrupted. Buildings may be damaged or destroyed.
13.2.5 Warning Time Meteorologists can often predict the likelihood of a severe storm. This can give several days of warning time. However, meteorologists cannot predict the exact time of onset or severity of the storm. Some storms may come on more quickly and have only a few hours of warning time.
13.3 SECONDARY HAZARDS The most significant secondary hazards associated with severe local storms are floods, falling and downed trees, landslides and downed power lines. Rapidly melting snow combined with heavy rain can overwhelm both natural and man-made drainage systems, causing overflow and property destruction. Landslides occur when the soil on slopes becomes oversaturated and fails.
13.4 EXPOSURE
13.4.1 Population A lack of data separating severe weather damage from flooding and landslide damage prevented a detailed analysis for exposure and vulnerability. However, it can be assumed that the entire planning area is exposed to some extent to severe weather events. Certain areas are more exposed due to geographic location and local weather patterns. Populations living at higher elevations with large stands of trees or power lines may be more susceptible to wind damage and black out, while populations in low-lying areas are at risk for possible flooding.
13.4.2 Property Most buildings in Kootenai County are residential. Structures built before the adoption of the Uniform Building Code and presently the International Building Code may not conform to current wind resistance standards. All of these buildings are considered to be exposed to the severe weather hazard, but structures in poor condition or in particularly vulnerable locations (located on hilltops or exposed open areas) may risk the most damage. The frequency and degree of damage will depend on specific locations.
13.4.3 Critical Facilities and Infrastructure All critical facilities exposed to flooding (Chapter 11) are also likely exposed to severe weather. Additional facilities on higher ground may also be exposed to wind damage or damage from falling trees. The most common problems associated with severe weather are loss of utilities. Downed power lines can cause blackouts, leaving large areas isolated. Phone, water and sewer systems may not function. Roads may become impassable due to ice or snow or from secondary hazards such as landslides.
13-18

SEVERE WEATHER SYSTEMS
13.4.4 Environment The environment is highly exposed to severe weather events. Natural habitats such as streams and trees are exposed to the elements during a severe storm and risk major damage and destruction. Prolonged rains can saturate soils and lead to slope failure. Flooding events caused by severe weather or snowmelt can produce river channel migration or damage riparian habitat. Storm surges can erode beachfront bluffs and redistribute sediment loads.
13.5 VULNERABILITY
13.5.1 Vulnerability by Weather Type The summary below describes the vulnerability for each severe weather type.
Lightning All locations in Kootenai County are vulnerable to thunderstorms. Lightning strikes primarily occur during the summer. People outside are considered at risk and more vulnerable to a lightning strike than those inside. Lightning is a major cause of range and wildfires every summer. Lightning can also result in death or injury to animals, either from direct strikes or resulting fires. It can cause power outages, damage or destruction of structures, and spark wildfires or structural fires.
Windstorm The entire population of Kootenai County is vulnerable to high wind events. The continued development of the county will increase overall vulnerability to high winds. Windstorms can result in damage to buildings, crops, automobiles and downed power lines. A loss of utilities may occur as a result of damage to power lines. Mobile homes are especially vulnerable.
Hail Hail causes considerable damage to crops and property, occasionally causes death to farm animals, but seldom causes loss of human life. However, motorcycle and bicycle riders without adequate protective gear can sustain injuries in a hailstorm. All areas of the county are considered vulnerable to the effects of hailstorms, but those with farmland and high agricultural yields are more likely to be impacted. Severe hail may cause extensive property damage to vehicle paint and bodywork, glass, shingles and roofs, plastic surfaces, etc.
Tornado Most of Kootenai County is vulnerable to the threat of tornadoes. Tornados can devastate crops and structures, damage exposed pipelines, breach hazardous materials storage facilities and cause extensive damage to buildings with large surface areas that are not reinforced and structurally sound. Loss of utilities may occur due to falling trees damaging power lines. Mobile homes are especially vulnerable. Nearly 40 percent of all fatalities caused by tornados take place in mobile homes. Damage and injury can be caused by flying debris and projectiles.
Blizzard and Snowstorm Winter weather affects the entire county and brings the threats of blizzards and snow. Heavy snows can immobilize a region, isolate rural farms and homes, and cause the death of exposed animals. Winter weather can clog roadways, immobilize transportation assets, and disrupt emergency and medical services. Snow accumulation can collapse rooftops and cause death or injury to its inhabitants. In mountainous regions,
13-19

Kootenai County Multi-Jurisdictional All Hazard Mitigation Plan; Volume 1—Planning-Area-Wide Elements
heavy snowfall can lead to and trigger avalanches. The impact of prolonged winter storms on the local economy can be pronounced, as the cost of snow plowing, de-icing, and overtime can severely impact the budgets of smaller cities and jurisdictions. Disruption of transportation resources can impede the flow of food and supplies, slow the economy and hinder emergency response.
Ice Storm Accumulation of ice can cause collapse of trees, utility poles, and communication towers. Ice can disrupt communications and power for days. Even small amounts of ice can create dangerous conditions for motorists and pedestrians.
Extreme Temperatures Both extreme heat and extreme cold have the potential to impact the entire population of Kootenai County. Vulnerable populations include the homeless, elderly, low-income or linguistically isolated, people with life-threatening illnesses, and residents living in areas that are isolated from major roads. Prolonged exposures of extreme heat can have adverse effects on individuals. Health hazards which can lead to death or serious illness include heat stroke, sunstroke, muscle cramps, heat exhaustion and fatigue. Cold temperatures can put an extra strain on the heart from heavy exertion (shoveling snow, clearing debris, etc.). Other risks associated with extreme cold include hypothermia, frozen pipes and carbon monoxide poisoning due to improper use of outdoor gas grills for heating and cooking.
13.5.2 Population Vulnerable populations are the elderly, low income or linguistically isolated populations, people with life-threatening illnesses, and residents living in areas that are isolated from major roads. Power outages can be life threatening to those dependent on electricity for life support. Isolation of these populations is a significant concern. These populations face isolation and exposure during severe weather events and could suffer more secondary effects of the hazard.
13.5.3 Property All property is vulnerable during severe weather events, but properties in poor condition or in particularly vulnerable locations may risk the most damage. Those in higher elevations and on ridges may be more prone to wind damage. Those that are located under or near overhead lines or near large trees may be vulnerable to falling ice or may be damaged in the event of a collapse.
Loss estimations for the severe weather hazard are not based on damage functions, because no such damage functions have been generated. Instead, loss estimates were developed representing 10 percent, 30 percent and 50 percent of the replacement value of exposed structures. This allows emergency managers to select a range of potential economic impact based on an estimate of the percent of damage to the general building stock. Damage in excess of 50 percent is considered to be substantial by most building codes and typically requires total reconstruction of the structure. Table 13-2 lists the loss estimates.
13-20

SEVERE WEATHER SYSTEMS
TABLE 13-2. LOSS ESTIMATES FOR SEVERE WEATHER
Estimated Loss Potential from Severe Weather Exposed Value 10% Damage 30% Damage 50% Damage
Athol $161,382,189 $16,138,219 $48,414,657 $80,691,095
Coeur d’Alene $10,526,380,916 $1,052,638,092 $3,157,914,275 $5,263,190,458
Dalton Gardens $1,257,056,267 $125,705,627 $377,116,880 $628,528,133
Fernan Lk. Vill. $35,115,335 $3,511,533 $10,534,600 $17,557,667
Harrison $65,142,029 $6,514,203 $19,542,609 $32,571,015
Hauser Lake $83,150,150 $8,315,015 $24,945,045 $41,575,075
Hayden $2,923,692,726 $292,369,273 $877,107,818 $1,461,846,363
Hayden Lake $191,573,503 $19,157,350 $57,472,051 $95,786,752
Huetter $58,825,281 $5,882,528 $17,647,584 $29,412,640
Post Falls $5,600,735,883 $560,073,588 $1,680,220,765 $2,800,367,941
Rathdrum $960,798,644 $96,079,864 $288,239,593 $480,399,322
Spirit Lake $374,915,747 $37,491,575 $112,474,724 $187,457,874
State Line $35,608,091 $3,560,809 $10,682,427 $17,804,045
Worley $56,495,264 $5,649,526 $16,948,579 $28,247,632
Unincorporated $11,465,963,590 $1,146,596,359 $3,439,789,077 $5,732,981,795
Total $33,796,835,614 $3,379,683,561 $10,139,050,684 $16,898,417,807
13.5.4 Critical Facilities and Infrastructure Incapacity and loss of roads are the primary transportation failures resulting from severe weather, mostly associated with secondary hazards. Landslides caused by heavy prolonged rains can block roads. High winds can cause significant damage to trees and power lines, blocking roads with debris, incapacitating transportation, isolating population, and disrupting ingress and egress. Snowstorms in higher elevations can significantly impact the transportation system and the availability of public safety services. Of particular concern are roads providing access to isolated areas and to the elderly.
Prolonged obstruction of major routes due to landslides, snow, debris or floodwaters can disrupt the shipment of goods and other commerce. Large, prolonged storms can have negative economic impacts for an entire region.
Severe windstorms, downed trees, and ice can create serious impacts on power and above-ground communication lines. Freezing of power and communication lines can cause them to break, disrupting electricity and communication. Loss of electricity and phone connection would leave certain populations isolated because residents would be unable to call for assistance.
13.5.5 Environment The vulnerability of the environment to severe weather is the same as the exposure.
13-21

Kootenai County Multi-Jurisdictional All Hazard Mitigation Plan; Volume 1—Planning-Area-Wide Elements
13.6 FUTURE TRENDS IN DEVELOPMENT All future development will be affected by severe storms. The ability to withstand impacts lies in sound land use practices and consistent enforcement of codes and regulations for new construction. The International Building Code is equipped to deal with the impacts of severe weather events; however, not all planning partners have adopted the International Building Code. Land use policies identified in comprehensive plans within the planning area also address many of the secondary impacts (flood and landslide) of the severe weather hazard.
13.7 SCENARIO The planning area is likely to experience a severe weather event at least annually. Impacts can be significant, particularly when secondary hazards of flood and landslide occur. A worst-case event would involve prolonged high winds during a severe storm accompanied by thunderstorms. Such an event would have both short-term and longer-term effects. Initially, schools and roads would be closed due to power outages caused by high winds and downed tree obstructions. In more rural areas, some subdivisions could experience limited ingress and egress. Prolonged rain could produce flooding, overtopped culverts with ponded water on roads, and landslides on steep slopes. Flooding and landslides could further obstruct roads and bridges, further isolating residents.
13.8 ISSUES Important issues associated with severe weather in the planning area include the following:
• Older building stock in the planning area is built to low code standards or none at all. These structures could be highly vulnerable to severe weather events such as windstorms.
• Not all municipalities in the planning area have adopted the International Building Code.
• Redundancy of power supply must be evaluated.
• Above-ground power supply lines and telephone lines are susceptible.
• The capacity for backup power generation is limited.
• Some population centers are isolated.
• Continuity of operations of critical facilities is a vital component to community resilience from severe weather hazards.
13-22

CHAPTER 14. VOLCANIC ASH FALL
14.1 GENERAL BACKGROUND Volcanic eruptions can impact communities close to the erupting volcano as well as communities hundreds of miles away. They can cause significant local and regional economic and health impacts and can damage public and private property. The State of Idaho Hazard Mitigation Plan described these hazards as follows (Idaho Bureau of Homeland Security, 2013):
• Eruption Clouds and Columns—Eruption columns and clouds are created when small fragments of volcanic glass, minerals, and rock (less than about 0.1 inch across) are released during explosive eruptions and rise high into the air. Eruption columns can grow rapidly and reach more than 12 miles above a volcano, forming an eruption cloud. Large eruption clouds can extend hundreds of miles downwind, resulting in falling ash over enormous areas; the wind carries the smallest ash particles the farthest. The volcanic ash in the cloud can pose a serious hazard to aviation; engines of jet aircraft have suddenly failed after flying through clouds of even thinly dispersed material.
• Ash Fall—As an eruption cloud drifts downwind from the volcano, the material that falls from the cloud typically becomes smaller and forms a thinner layer. Though called “ash,” volcanic ash is not the product of combustion, like the soft fluffy material created by burning wood, leaves, or paper. Volcanic ash is hard, does not dissolve in water, is extremely abrasive and mildly corrosive, and conducts electricity when wet.
In large volcanic eruptions, ash is accompanied by rocks having the weight and density of hailstones. This ash is hot near the erupting volcano but cools when it falls at greater distances. Ash fall blocks sunlight, reducing visibility and sometimes causing darkness. Ash fall can be accompanied by lightning.
14.2 HAZARD PROFILE
14.2.1 Past Events In the May 18, 1980 Mount St. Helens eruption in the Cascades, 23 square miles of volcanic material buried the North Fork of the Toutle River and there were 57 human fatalities. Figure 14-1 shows the extent of ash fall distribution resulting from the Mount St. Helens event. Kootenai County was subjected to volcanic ash fall of one-half to 2 inches over nine hours following the eruption.
DEFINITIONS
Stratovolcano—Typically steep-sided, symmetrical cones of large dimension built of alternating layers of lava flows, volcanic ash, cinders, blocks, and bombs, rising as much as 8,000 feet above their bases. The volcanoes in the Cascade Range are all stratovolcanoes.
Volcanic Ash —Ash and fragmented rock material ejected by a volcanic explosion
Volcano—A vent in the planetary crust from which magma (molten or hot rock) and gas from the earth’s core erupts.
14-1

Kootenai County Multi-Jurisdictional All Hazard Mitigation Plan; Volume 1—Planning-Area-Wide Elements
Figure 14-1. Mount St. Helens’ 1980 Eruption Ash Fallout
The ash fall impacted crops, reduced visibility, covered roadways, damaged machinery and vehicles, and caused respiratory and other health issues in residents and animals. A federal disaster declaration (DR-624) covered Kootenai County and nearby jurisdictions. Washington State reported short-term losses of $859 million resulting from volcanic ash fall following the eruption. This included forest damage ($450 million), clean-up ($274 million), property loss ($85 million), agricultural loss ($39 million), reported income loss ($9 million), and transportation costs ($2 million). Records of damage in Kootenai County ascribed to volcanic ash fall are limited.
14.2.2 Location Depending on the location of the volcanic eruption and the prevalent wind direction, ash fall from a major volcanic event, borne by winds, can impact Kootenai County in its entirety. The USGS identifies three active volcano ranges that have the potential to impact communities in Idaho upon eruption (Idaho Bureau of Homeland Security, 2013):
• The Snake River Plain, particularly the Craters of the Moon area in south central Idaho—The Craters of the Moon have been active in the past 15,000 years, with the most recent activity about 2,000 years ago (National Park Service, 2015).
• The Yellowstone Caldera, which overlaps Idaho, Wyoming, and Montana—The Yellowstone Caldera’s most recent activity was 70,000 years ago and consisted of a lava flow rather than an explosive eruption. The Yellowstone Caldera has a history and potential for explosive eruptions. The last such eruption resulted in ash fall covering much of the western United States (Yellowstone Volcano Observatory, 2012).
14-2

VOLCANIC ASH FALL
• The Cascade Mountains to the west— The Cascade Range extends more than 1,000 miles from southern British Columbia into northern California and includes 13 potentially active volcanic peaks in the U.S. Figure 14-2 and Table 14-1 summarize past eruptions in the Cascades.
Figure 14-2. Past Eruptions in the Cascade Range
TABLE 14-1. PAST ERUPTIONS IN THE CASCADES
Volcano Number of Eruptions Type of Eruptions
Mount Adams 3 eruptions in the last 10,000 years, most recent between 1,000 and 2,000 years ago
Andesite lava
Mount Baker 5 eruptions in past 10,000 years; mudflows have been more common (8 in same time period)
Pyroclastic flows, mudflows, ash fall in 1843.
Glacier Peak 8 eruptions in last 13,000 years Pyroclastic flows and lahars Mount Rainier 14 eruptions in last 9000 years; also 4 large mudflows Pyroclastic flows and lahars Mount St Helens
19 eruptions in last 13,000 years Pyroclastic flows, mudflows, lava, and ash fall
14-3

Kootenai County Multi-Jurisdictional All Hazard Mitigation Plan; Volume 1—Planning-Area-Wide Elements
14.2.3 Frequency Many Cascade volcanoes have erupted in the recent past and will be active again in the future. Given an average rate of one or two eruptions per century during the past 12,000 years, these events are not part of our everyday experience; however, in the past hundred years, California’s Lassen Peak and Washington’s Mount St. Helens have erupted with devastating results. The U.S. Geological Survey classifies Glacier Peak, Mt. Adams, Mt. Baker, Mt. Hood, Mt. St. Helens, and Mt. Rainier in Washington State as potentially active volcanoes. Mt. St. Helens is by far the most active volcano in the Cascades, with four major explosive eruptions in the last 515 years.
The Yellowstone Caldera has had only three known eruptions in the past 2.1 million years, making it impossible to predict a recurrence interval. According to the Yellowstone Volcano Observatory, there is no way to know if Yellowstone will erupt again. Future eruptions could occur because the area has a long volcanic history and because there is molten rock beneath the caldera now. Yellowstone is monitored for signs of volcanic activity using seismographs and GPS (Global Positioning System). No signs of activity have been detected that suggest an eruption is imminent. (Yellowstone Volcano Observatory, 2012).
The Craters of the Moon Volcanic Field is classified as a low to very low threat.
Although it is improbable, the potential exists for severe damage in Kootenai County, primarily from volcanic activity in the Cascade Mountains. Based on records of the time between volcanic eruptions in the Cascades that have resulted in ash fall in Kootenai County, the probability of ash fall in Kootenai County in the next 25 years is low.
14.2.4 Severity Fresh volcanic ash is gritty, abrasive and sometimes corrosive. Ash accumulates like heavy snowfall but does not melt. It can abrade and jam machinery as well as contaminate and clog ventilation, water supplies and drains. Ash also causes electrical short circuits. It can carry high static charge for up to two days. Fine ash causes short circuits in electrical transformers, which in turn causes power blackouts. This can occur in transmission lines, computers, and microelectronic devices. Power outages can be expected both during and after ash fall. A 1-inch deep layer of ash weighs an average of 10 pounds per square foot, causing danger of structural collapse. When an ash cloud combines with rain, sulfur dioxide in the cloud combines with the rain water to form diluted sulfuric acid that may cause minor, but painful burns to the skin, eyes, nose, and throat.
14.2.5 Warning Time The USGS maintains five volcano observatories charged with monitoring and researching active volcanoes within the United States. The Cascades Volcano Observatory monitors volcanoes in Washington, Oregon and Idaho and the Yellowstone Volcano Observatory monitors geological activity and processes in the Yellowstone Plateau. Since 1980, Mount St. Helens has settled into a pattern of intermittent, moderate and generally non-explosive activity, and the severity of ash, explosions, and lava flows have diminished. All episodes, except for one very small event in 1984 have been successfully predicted several days to three weeks in advance. However, scientists remain uncertain as to whether the volcano’s current cycle of explosivity ended with the 1980 explosion. The possibility of further large-scale events continues for the foreseeable future. As a result of this constant monitoring, it is likely although not definite that warning time ranging from hours to weeks would be available for any event likely to impact Kootenai County.
14-4

VOLCANIC ASH FALL
14.3 SECONDARY HAZARDS Volcanic ash fall can produce significant secondary impacts including damaging crops and sickening livestock, damaging buildings and building systems, disrupting communications, impacting respiration, eyes and skin, causing widespread power outages, disrupting ground and air transportation systems, and increasing wear and demand on water treatment and conveyance systems (USGS, 2010a).
14.4 EXPOSURE All people, property, critical facilities and environment in the planning area are exposed to ash fall.
14.5 VULNERABILITY
14.5.1 Population The entire population of the planning area is vulnerable to the damaging effects of ash fall in the event of a volcanic eruption. The elderly, very young and those who experience ear, nose and throat problems are especially vulnerable to the hazard. Although ash is not highly toxic, it can trouble infants, the elderly and residents with respiratory ailments. Ash particles can abrade the front of the eye under windy conditions.
14.5.2 Property All of the property exposed to nature in the planning area is exposed to the effects of ash fall. Among these properties, the most vulnerable structures are those that are not as structurally sound and may collapse under the excessive weight of ash and possible rainfall. Vulnerable property includes equipment and machinery left out in the open, such as combines, whose parts can become clogged by the fine dust. Infrastructure, such as drainage systems, is potentially vulnerable to the effects of an ash fall, since the fine ash can clog pipes and culverts. This may be more of a problem if an eruption occurs during winter or early spring when precipitation is highest and floods are most likely.
To estimate the loss potential for this hazard, a qualitative approach was used, based on recommendations from FEMA guidelines on state and local mitigation planning. Loss estimation tools such as Hazus-MH currently do not have the ability to analyze impacts from volcano hazards. For this study, it was decided to use 0.1 percent as the loss ratio for the volcano hazard. Replacement valuations for the entire planning area were the basis for these estimations. The results are summarized in Table 14-2.
14.5.3 Critical Facilities All transportation routes are exposed to ash fall accumulation, which could create hazardous driving conditions on roads and highways and hinder evacuations and response. Machinery and equipment using these transportation routes would also be vulnerable. Water treatment plants and wastewater treatment plants are vulnerable to contamination from ash fall and debris that may be carried by a lahar. Visibility in the short aftermath of an eruption would also be problematic.
14-5

Kootenai County Multi-Jurisdictional All Hazard Mitigation Plan; Volume 1—Planning-Area-Wide Elements
TABLE 14-2. LOSS ESTIMATES FOR ASH FALL
Exposed Value Estimated Loss Potential @ 0.1% Damage
Athol $161,382,189 $1,613,822 Coeur d’Alene $10,526,380,916 $105,263,809 Dalton Gardens $1,257,056,267 $12,570,563 Fernan Lake Village $35,115,335 $351,153 Harrison $65,142,029 $651,420 Hauser Lake $83,150,150 $831,501 Hayden $2,923,692,726 $29,236,927 Hayden Lake $191,573,503 $1,915,735 Huetter $58,825,281 $588,253 Post Falls $5,600,735,883 $56,007,359 Rathdrum $960,798,644 $9,607,986 Spirit Lake $374,915,747 $3,749,157 State Line $35,608,091 $356,081 Worley $56,495,264 $564,953 Unincorporated $11,465,963,590 $114,659,636 Total $33,796,835,614 $337,968,356
14.5.4 Environment The environment is vulnerable to the effects of a volcanic eruption. Ash fall would expose the local environment to lower air quality and other effects that could harm vegetation and water quality. The sulfuric acid contained in volcanic ash could be damaging to vegetation, waters, wildlife and air quality. Rivers and streams are also vulnerable to damage due to ash fall. Fine particle ash may cause up to 38-percent decrease in infiltration of water into the ground; coarse particle ash may result in a 19-percent decrease. Both may result in flooding and an adverse impact on agriculture. (“Mount St. Helens Ash Fallout Impact Assessment Report,” USDA Soil Conservation Service, Spokane, WA, September 1980)
14.6 FUTURE TRENDS IN DEVELOPMENT All future development in the planning area will be susceptible to the potential impacts from volcanic eruptions causing ash fall within the region. While this potential impact on the built environment is not considered to be significant, the economic impact on industries that rely on machinery and equipment such as agriculture or civil engineering projects could be significant. Since the extent and location of this hazard is difficult to gauge because it is dependent upon many variables, the ability to institute land use recommendations based on potential impacts of this hazard is limited. While the impacts of ash fall are sufficient to warrant risk assessment for emergency management purposes, they are not sufficient to dictate land use decisions.
14-6

VOLCANIC ASH FALL
14.7 SCENARIO A large area could be affected by ash fall. The most severe impacts would be on the environment. Depending on weather conditions at the time of eruption, significant eruptions in the Cascade Range would likely produce significant amounts of ash fall in the planning area. The impact would depend on the prevailing wind direction during and after the event. No one in the planning area would likely be injured or killed by ash fall, but businesses and non-essential government would be closed until the cloud passes. People and animals without shelter would be affected. Structures would be safe unless not constructed to modern building codes, but private property left out in the open, such as farm equipment, might be damaged by the fine ash dust.
Clean-up from such an event could be costly, depending upon the magnitude of the event. Economic impacts from volcanic ash fall may be expected to include interruption and delays in transportation of goods and services, forced closing of businesses, damage to machinery, vehicles, homes and structures, degradation in power lines and grids, loss of livestock and vegetation, damage to ecosystems, flooding, and a downturn in area tourism. Public works and highway maintenance budgets would be affected.
14.8 ISSUES Since volcanic episodes have been fairly predictable in the recent past, there is little risk of loss of life, but there is risk of loss of property and infrastructure and environmental impacts. Additionally, ash removal after an event is a significant problem. Ash mixed with water turns to paste. The stacking and storing of ash, if not done properly, may result in recirculation through winds. Additional issues include the following:
• Ash fall can negatively impact Kootenai County’s tourism industry.
• Some structures in the planning area are likely not built to modern building codes and may bevulnerable to collapse in a significant ash fall event.
• Ash re-suspended by wind and human activity can disrupt lives for months after an eruption.Local communities may be seriously disrupted by ash fall. Recovery may take from days toweeks, dependent upon the size of the volcanic eruption and the extent of the amount of ashfall received.
14-7


CHAPTER 15. WILDFIRE
15.1 GENERAL BACKGROUND A wildfire is any uncontrolled fire on undeveloped land that requires fire suppression. Wildfires can be ignited by lightning or by human activity such as smoking, campfires, equipment use and arson. Wildfires occur when all of the necessary elements of a fire come together in a wooded or grassy area: an ignition source is brought into contact with a combustible material such as vegetation that is subjected to sufficient heat and has an adequate supply of oxygen from the ambient air.
A wildfire front is the portion of a wildfire sustaining continuous flaming combustion, where unburned material meets active flames. As the front approaches, the fire heats both the surrounding air and woody material through convection and thermal radiation. First, wood is dried as water in it is vaporized at a temperature of 212ºF. Next, the wood releases flammable gases at 450ºF. Finally, wood can smolder at 720ºF, and ignite at 1,000ºF. Before the flames of a wildfire arrive at a particular location, heat transfer from the wildfire front can warm the air to 1,470ºF, which pre-heats and dries flammable materials, causing them to ignite faster and allowing the fire to spread faster. High temperature and long-duration surface wildfires may encourage flashover or torching: the drying of tree canopies and their subsequent ignition from below.
Large wildfires may affect air currents by the stack effect: air rises as it is heated, so large wildfires create powerful updrafts that draw in new, cooler air from surrounding areas in thermal columns. Great vertical differences in temperature and humidity encourage fire-created clouds, strong winds and fire whirls with the force of tornadoes at speeds of more than 50 mph. Rapid rates of spread, prolific crowning or spotting, the presence of fire whirls, and strong convection columns signify extreme conditions.
15.1.1 Wildfire Types Wildfires generally can be characterized by their fuels as follows:
• Ground fires are fed by subterranean roots, duff and other buried organic matter. This fuel type is especially susceptible to ignition due to spotting. Ground fires typically burn by smoldering, and can burn slowly for days to months.
• Crawling or surface fires are fueled by low-lying vegetation such as leaf and timber litter, debris, grass, and low-lying shrubbery.
• Ladder fires consume material between low-level vegetation and tree canopies, such as small trees, downed logs and vines. Invasive plants that scale trees may encourage ladder fires.
• Crown, canopy or aerial fires burn suspended material at the canopy level, such as tall trees, vines and mosses. The ignition of a crown fire, termed crowning, is dependent on the density of the suspended material, canopy height, canopy continuity, and sufficient surface and ladder fires to reach the tree crowns.
15-1

Kootenai County Multi-Jurisdictional All Hazard Mitigation Plan; Volume 1—Planning-Area-Wide Elements
15.1.2 Factors Affecting Wildfire Risk
Topography Topography can have a powerful influence on wildfire behavior. The movement of air over the terrain tends to direct a fire’s course. Gulches and canyons can funnel air and act as a chimney, intensifying fire behavior and inducing faster rates of spread. Saddles on ridge tops offer lower resistance to the passage of air and will draw fires. Solar heating of drier, south-facing slopes produces upslope thermal winds that can complicate behavior.
Slope is an important factor. If the percentage of uphill slope doubles, the rate of spread of wildfire will likely double. On steep slopes, fuels on the uphill side of the fire are closer physically to the source of heat. Radiation preheats and dries the fuel, thus intensifying fire behavior. Fire travels downslope much more slowly than it does upslope, and ridge tops often mark the end of wildfire’s rapid spread.
Fuels Fuels are classified by weight or volume (fuel loading) and by type. Fuel loading, often expressed in tons per acre, can be used to describe the amount of vegetative material available. If fuel loading doubles, the energy released also can be expected to double. Each fuel type is given a burn index, which is an estimate of the amount of potential energy that may be released, the effort required to contain a fire in a given fuel, and the expected flame length. Different fuels have different burn qualities. Some fuels burn more easily or release more energy than others. Grass, for instance, releases relatively little energy, but can sustain very high rates of spread.
Continuity of fuels is expressed in terms of horizontal and vertical dimensions. Horizontal continuity is what can be seen from an aerial photograph and represents the distribution of fuels over the landscape. Vertical continuity links fuels at the ground surface with tree crowns via ladder fuels.
Another essential factor is fuel moisture. Fuel moisture is expressed as a percentage of total saturation and varies with antecedent weather. Low fuel moistures indicate the probability of severe fires. Given the same weather conditions, moisture in fuels of different diameters changes at different rates. A 1,000-hour fuel, which has a 3- to 8-inch diameter, changes more slowly than a 1- or 10-hour fuel.
Weather Of all the factors influencing wildfire behavior, weather is the most variable. Extreme weather leads to extreme events, and it is often a moderation of the weather that marks the end of a wildfire’s growth and the beginning of successful containment. High temperatures and low humidity can produce vigorous fire activity. The cooling and higher humidity brought by sunset can dramatically quiet fire behavior.
Fronts and thunderstorms can produce winds that are capable of radical and sudden changes in speed and direction, causing similar changes in fire activity. The rate of spread of a fire varies directly with wind velocity. Winds may play a dominant role in directing the course of a fire. The radical and devastating effect that wind can have on fire behavior is a primary safety concern for firefighters. In July 1994, a sudden change in wind speed and direction on Storm King Mountain in Colorado led to a blowup that claimed the lives of 14 firefighters. The most damaging firestorms are usually marked by high winds.
15.1.3 Historical Fire Regime and Current Condition Classification Land managers need to understand historical fire regimes (that is, fire frequency and fire severity prior to significant human settlement) to be able to define ecologically appropriate goals and objectives for an area.
15-2

WILDFIRE
This understanding must include knowledge of how historical fire regimes vary across the landscape. Five historical fire regimes are classified based on average number of years between fires (fire frequency) and the severity of the fire (amount of replacement) on the dominant overstory vegetation:
• 0- to 35-year frequency and low (surface fires most common) to mixed severity (less than 75 percent of the dominant overstory vegetation replaced)
• 0- to 35-year frequency and high (stand replacement) severity (greater than 75 percent of the dominant overstory vegetation replaced)
• 35- to 100-year frequency and mixed severity (less than 75 percent of the dominant overstory vegetation replaced)
• 35- to 100-year frequency and high (stand replacement) severity (greater than 75 percent of the dominant overstory vegetation replaced)
• >200-year frequency and high (stand replacement) severity.
Understanding ecosystem departures (how ecosystems have changed over time) provides a context for managing sustainable ecosystems. Broad-scale alterations of historical fire regimes and vegetation conditions have occurred in many landscapes in the U.S. through the combined influence of land management practices, fire prevention, livestock grazing, insect and disease outbreaks, and invasion of non-native plant species. These departures result in changes to one or more of the following ecological components:
• Vegetation characteristics (species composition, structural stages, stand age, canopy closure and mosaic pattern)
• Fuel composition
• Fire frequency, severity, and pattern
• Associated disturbances (e.g. insect and disease mortality, grazing, and drought).
Characteristic vegetation and fuel conditions are those that occurred within the historical fire regime. Uncharacteristic conditions are those that did not occur within the historical fire regime, such as invasive species (e.g. weeds, insects, and diseases), “high graded” forest composition and structure (e.g. large trees removed in a frequent surface fire regime), or repeated annual grazing that reduces grassy fuels across relatively large areas to levels that will not carry a surface fire.
The fire regime condition class (FRCC) is a classification of a given area’s amount of departure from the historical fire regime. The classifications categorize wildland vegetation and fuel conditions into one of three condition classes, based on the degree of departure: low (FRCC 1), moderate (FRCC 2) and high (FRCC 3) departure from the historical fire regime.
Low departure is considered to be within the historical range of variability, while moderate and high departures are outside. Determination of the amount of departure is based on comparison of a composite measure of fire regime attributes to the central tendency of the historical fire regime. The amount of departure is then classified to determine the fire regime condition class. Table 15-1 presents a simplified description of the fire regime condition classes and associated potential risks.
15-3

Kootenai County Multi-Jurisdictional All Hazard Mitigation Plan; Volume 1—Planning-Area-Wide Elements
TABLE 15-1. FIRE REGIME CONDITION CLASS DEFINITIONS
Description Potential Risks
Fire Regime Condition Class 1 Within the historical range of variability.
• Fire behavior, effects and other associated disturbances are similar to those that occurred prior to fire exclusion (suppression) and other types of management that do not mimic the natural fire regime and associated vegetation and fuel characteristics.
• Composition and structure of vegetation and fuels are similar to the natural (historical) regime.
• Risk of loss of key ecosystem components (e.g. native species, large trees and soil) is low.
Fire Regime Condition Class 2 Moderate departure from the historical regime of variability.
• Fire behavior, effects, and other associated disturbances are moderately departed (more or less severe).
• Composition and structure of vegetation and fuel are moderately altered. • Uncharacteristic conditions range from low to moderate. • Risk of loss of key ecosystem components is moderate.
Fire Regime Condition Class 3 High departure from the historical regime of variability.
• Fire behavior, effects, and other associated disturbances are highly departed (more or less severe).
• Composition and structure of vegetation and fuel are highly altered. • Uncharacteristic conditions range from moderate to high. • Risk of loss of key ecosystem components is high.
15.1.4 Tools for Assessing Fire Hazards Two indices are commonly used to determine the possibility of fire ignitions becoming wildfires:
• The National Fire Danger Rating System’s Buildup Index reflects the combined cumulative effects of daily drying and precipitation in fuels with a 10-day time lag. The Buildup Index can represent 3 to 4 inches of compacted litter or 6 inches or more of loose litter (North Carolina Forest Service 2009).
• The U.S. Forest Service’s Keetch-Byram Drought Index represents the net effect of evapotranspiration and precipitation in producing cumulative moisture deficiency in deep duff and upper soil layers. The index increases each day without rain and decreases when it rains. The scale ranges from zero (no moisture deficit) to 800 (maximum drought possible). The index assumes that 8 inches of moisture in a saturated soil is readily available to vegetation. The depth of soil required to hold 8 inches of moisture varies with soil type. A prolonged drought influences fire intensity, because more fuel is available for combustion. The drying of organic material in the soil can lead to increased difficulty in fire suppression (Florida Forest Service, nd).
Both of these indices are used for fire preparedness planning, which includes campfire and burning restrictions, fire patrol assignments, staffing of fire lookout towers, and readiness status for both observation and firefighting aircraft. The following sections describe tools commonly used to estimate fire potential, extent, danger and growth.
15-4

WILDFIRE
Wildland Fire Assessment System The Wildland Fire Assessment System (WFAS) is an Internet-based information system that provides a national view of weather and fire potential, including national fire danger, weather maps and satellite-derived “greenness” maps. The WFAS was developed by the Fire Behavior Unit at the Fire Sciences Laboratory in Missoula, Montana. It is currently supported and maintained at the National Interagency Fire Center in Boise. Each day during the fire season, the WFAS produces national maps of selected fire weather and fire danger components of the National Fire Danger Rating System. The Fire Danger Rating takes into account information provided by local station managers on current and antecedent weather, fuel types, and live and dead fuel moisture. Table 15-2 describes the fire danger ratings and color codes.
TABLE 15-2. U.S. FOREST SERVICE FIRE DANGER RATING
Fire Danger Rating and Color Description
Low (Dark Green)
Fuels do not ignite readily from small firebrands although a more intense heat source, such as lightning, may start fires in duff or punky wood. Fires in open cured grasslands may burn freely a few hours after rain, but woods fires spread slowly by creeping or smoldering and burn in irregular fingers. There is little danger of spotting.
Moderate (Blue / Light Green)
Fires can start from most accidental causes, but with the exception of lightning fires in some areas, the number of starts is generally low. Fires in open cured grasslands will burn briskly and spread rapidly on windy days. Timber fires spread slowly to moderately fast. The average fire is of moderate intensity, although heavy concentrations of fuel, especially draped fuel, may burn hot. Short-distance spotting may occur, but is not persistent. Fires are not likely to become serious and control is relatively easy.
High (Yellow)
All fine dead fuels ignite readily and fires start easily from most causes. Unattended brush and campfires are likely to escape. Fires spread rapidly and short-distance spotting is common. High-intensity burning may develop on slopes or in concentrations of fine fuels. Fires may become serious and their control difficult unless they are attacked successfully while small.
Very High (Orange)
Fires start easily from all causes and, immediately after ignition, spread rapidly and increase quickly in intensity. Spot fires are a constant danger. Fires burning in light fuels may quickly develop high-intensity characteristics such as long-distance spotting and fire whirlwinds when they burn into heavier fuels.
Extreme (Red)
Fires start quickly, spread furiously, and burn intensely. All fires are potentially serious. Development into high-intensity burning will usually be faster and occur from smaller fires than in the very high fire danger class. Direct attack is rarely possible and may be dangerous except immediately after ignition. Fires that develop headway in heavy slash (trunks, branches, and tree tops) or in conifer stands may be unmanageable while the extreme burning condition lasts. Under these conditions the only effective and safe control action is on the flanks until the weather changes or the fuel supply lessens.
Fire Potential Index The Fire Potential Index (FPI) identifies areas most susceptible to fire ignition based on daily weather and vegetation conditions. Relative greenness and weather information define the moisture condition of live and dead vegetation. The weather information also identifies areas of low humidity, high temperature, and no precipitation to determine areas most susceptible to fire ignition. The U.S. Forest Service provides FPI maps daily. The scale ranges from 0 (low) to 100 (high).
15-5

Kootenai County Multi-Jurisdictional All Hazard Mitigation Plan; Volume 1—Planning-Area-Wide Elements
The parameters used in the National Fire Danger Rating System are not part of the FPI, except for 10-hour moisture content (Burgan et al. 2000). The fuel moisture content is an expression of the cumulative effects of past and present weather events. It is computed by dividing the weight of water in the fuel by the oven-dry weight of the fuel and then multiplying by 100 to get a percentage. There are two kinds of fuel moisture:
• Live fuel moisture is slower to respond to environmental changes and is most influenced by things such as a long droughts, disease and insect infestation, annuals curing out early in the season, timber harvesting, and falling due to windstorms and ice storms.
• Dead fuel moisture is the moisture in any dead plant part, whether attached to a still-living plant or not. Dead fuels absorb moisture through physical contact with water (such as rain and dew) and absorb water vapor from the atmosphere. The drying of dead fuels is accomplished by evaporation. The drying and wetting processes of dead fuels are such that the moisture content of these fuels is strongly affected by fuel size, weather, topography, decay class, fuel composition, surface coating, fuel compactness, and arrangement (Schroeder and Buck, 1970).
Fuels are categorized based on their response to moisture changes. The response time is called a time lag. A fuel’s time lag is proportional to its diameter and is loosely defined as the time it takes a fuel particle to reach two-thirds of its way to equilibrium with its local environment. The categories are as follows:
• 1-hour fuels: up to 0.25-inch diameter—Fine, flashy fuels that respond quickly to weather changes. Computed from observation time, temperature, humidity, and cloudiness.
• 10-hour fuels: 0.25-inch to 1-inch diameter—Computed from observation time, temperature, humidity, and cloudiness or can be an observed value.
• 100-hour fuels: 1-inch to 3-inch diameter—Computed from 24-hour average boundary condition composed of day length (daylight hours), hours of rain, and daily temperature/humidity ranges.
• 1,000-hour fuels: 3-inch to 8-inch diameter—Computed from a seven-day average boundary condition composed of day length, hours of rain, and daily temperature/humidity ranges (National Park Service 2013)
Haines Index The Haines Index, also known as the Lower Atmosphere Stability Index, is a fire-weather index based on stability and moisture content of the lower atmosphere. It measures the potential for existing fires to become large fires. The Haines Index values range from 2 to 6 (USFS, 2014):
• Very Low Potential (2) – moist, stable lower atmosphere
• Very Low Potential (3)
• Low Potential (4)
• Moderate Potential (5)
• High Potential (6) – dry, unstable lower atmosphere
The drier and more unstable the lower atmosphere is, the higher the index. The stability and moisture content of the lower atmosphere are converted to a number that correlates with large fire growth. The stability term is based on temperature difference between two atmospheric layers; the moisture term is based on temperature and dew point difference. The index correlates with large fire growth on initiating and existing fires where surface winds do not dominate fire behavior (USFS, 2013).
15-6

WILDFIRE
The Haines Index is intended to be used all over the United States. It is adaptable for three elevation regimes: low elevation (at or very near sea level), middle elevation (1,000 to 3,000 feet in elevation), and high elevation (above 3,000 feet in elevation).
15.2 HAZARD PROFILE
15.2.1 Past Events Table 15-3 summarizes severe wildfire events in the planning area since 1910, as recorded by the National Oceanic and Atmospheric Administration (NOAA) and the State of Idaho Hazard Mitigation Plan, 2013.
15.2.2 Location Wildfires are a danger to all structures and residents in Kootenai County. Those who live in or near the county’s designated Wildland/Urban Interface (WUI) are most vulnerable. Housing developments alter the structure and function of forests and other wildland areas. Some WUI residents may experience only smoke or evacuation from a wildfire, but others may lose their homes. The WUI is mapped based on structures per acre and population per square mile. Across the United States, 9.3 percent of all land is classified as WUI. The WUI is divided into two categories: intermix and interface. Intermix areas have more than one house per 40 acres and have more than 50-percent vegetation. Interface areas have more than one house per 40 acres and less than 50-percent vegetation and are within 1.5 miles of an area over 1,235 acres that is more than 75 percent vegetated (Stewart et al. 2006).
In Kootenai County, the WUI includes virtually all of the county except cities’ downtown cores. Kootenai County’s WUI has been defined by the Kootenai County Local Emergency Planning Committee’s Wildland Urban Interface Mitigation Task Force as “a zone extending 2 miles outside places of human habitation, and the network of infrastructure that supports those areas”. To facilitate effective fuel treatment and fire suppression, the buffer may be extended to incorporate logical topographic features such as streams, lakes, roads, ridge tops, and other natural breaks. The current dispersion of the population and the forecast rate of growth for Kootenai County indicate that all non-urban areas, from the Washington border east to the state/federal forestland, should be designated as WUI.
Figure 15-1 depicts the relative risk to communities from wildfire in Idaho. Kootenai County ranges from having a low-moderate risk to a moderate-high risk. Most of the county is in the moderate to moderate-high risk zone.
Uncharacteristic wildland fire is defined as an increase in wildfire size, severity and resistance to control compared to that which occurred historically in the native system. The threat of unnaturally intense wildfires increases with mortality from insects and disease, encroaching human development (ignition sources and more development at risk)and the accumulations of fuels as a result of decades of aggressive fire suppression (Idaho State Assessment of Forest Resources, 2010). Kootenai County has a low-moderate to moderate-high risk of uncharacteristic wildland fire (Figure 15-2).
15.2.3 Frequency It is difficult to estimate the number of devastating wildfires in Kootenai County every year because of the many factors that affect the potential for a fire. Based on available data, wildfire will likely continue to present a risk as the WUI becomes more developed and populated. The likelihood of a fire event starting and sustaining itself should be gauged by professional fire managers on a daily basis.
15-7

Kootenai County Multi-Jurisdictional All Hazard Mitigation Plan; Volume 1—Planning-Area-Wide Elements
TABLE 15-3. SIGNIFICANT FIRES IMPACTING PLANNING AREA
Date Location Deaths or Injuries Property Damage Crop Damage
August 20-21, 1910 Idaho & Montana 88 Unknown Unknown Description: The Big Blowup wildfire of 1910 burned more than 3,000,000 acres in Northeastern Idaho and Western Montana and killed 88 people. Although the fire was primarily in adjoining Shoshone County, some acreage in Kootenai County was also damaged. The City of Wallace, Idaho was partially destroyed in this fire. August 26, 1967 Kootenai County 0 $2,255,454 $0 Description: The fire season of 1967 was one of the worst fire seasons on record, with 59 days of very high or extreme fire danger. Lighting ignited fires throughout the summer. National forests were closed until September 11. On July 12, there were 131 fires. A total of 818 fires were started in August. Several fires began on Sundance Mountain at the end of August. Northeast winds began to blow at more than 60 miles an hour. Humidity was less than 35 percent. The winds then quickly shifted from the southwest. On September 1, the fire on the mountain consumed over 56,000 acres in a single day. DR-231 was declared. Property damage was not equivalent to the 1910 fire. October 16, 1991 Kootenai County 2 $15,000,000 Unknown Description: Following a warm dry summer and early fall, by October 15, there had been no rain for 42 days. Several small fires caused by downed power lines were fanned into a firestorm near Hauser Lake on October 16. Spokane County suffered the most damage with 92 wildfires causing 2 deaths and $15 million in damage. August 12, 1998 5 miles SW of Coeur d’Alene 0 $10,000 $15,000 Description: A truck-sparked fire in wheat field damaged 15 acres and destroyed the truck. August 19, 1998 2 miles North of Rose Lake 0 $20,000 $0 Description: Lightning sparked 20 small fires (acre or less) in Coeur d’Alene National Forest. September 14, 1998 4 miles southeast of Worley 0 $20,000 $0 Description: A 30-acre grass fire spread to timber land and closed Sunny Road. 2000 Wildfire Season
Idaho & Montana 15 $10 Billion (combined)
Description: The 2000 wildfire season was the worst since 1910. Over 7 million acres were burned and 15 firefighters killed. Losses exceeded $10 billion. Total suppression costs for all federal agencies were $1,362,367,000—four times the average over the previous seven years. Over 2 million of these acres were in Central Idaho and Western Montana. Western governors and federal officials lobbied Congress for $2.8 billion for fire prevention. Thus wildfire prevention became a national priority. Included in these budgets were monies for prescribed burns as well as mechanical fuel treatments.
15-8

WILDFIRE
Figure 15-1. Relative Risk to Communities from Wildfire in Idaho
15-9

Athol
HaydenLake
DaltonGardens
Worley
Fernan
Rathdrum
Hayden
Coeurd'Alene
PostFalls
Harrison
StateLine
SpiritLake
Huetter
HauserLake
£¤95
£¤95
£¤95
¬«58
¬«41
¬«97
¬«54
¬«3
¬«41
¬«53
§̈¦90
§̈¦90
Co eur d'Ale ne River
Spoka ne River
LakeCoeur
d'Alene
HaydenLake
LakePend
Oreille
0 63Miles
Figure 5Rela t ive Risk to Communit ies & Ecosystems from Uncharacterist ic Wi ldf ire in Idaho
Base Map Data Sources: Kootenai County, U.S. Geological Survey
Kootenai County Hazard Mit igat ion Plan Update
±
Relative Risk
Low-Moderate
Moderate
Moderate-High

WILDFIRE
Natural fire rotation is defined as the number of years necessary for fires to burn over an area equal to that of a defined area. Natural fire rotation is calculated from the historical record of fires by dividing the length of the record period in years by the percentage of total area burned during that period. It represents the average period between fires under a presumed historical fire regime. Kootenai County has averaged approximately 40 fires per year within the Idaho Department of Lands service areas since 1983. The total area burned in this time period was more than 4,000 acres. The predominant cause of these fires was lightning. This yields a natural fire rotation of 300 years for the Idaho Department of Lands service area in Kootenai County. Table 15-4 lists the area burned by cause from 2009 to 2014, which is the performance period of Kootenai County’s 2009 hazard mitigation plan.
TABLE 15-4. AREA BURNED BY WILDFIRE, 2009 – 2014
Burned Idaho Department of Lands Service Area in Kootenai County (acres) Cause 2009 2010 2011 2012 2013 2014
Lightning 53.1 0 1.3 1.1 6.1 335.7 Campfire 0.25 0 0.8 0.1 0.1 1.1 Smoking 0 0.6 0.2 0 8.75 0 Debris Burning 12.45 0.5 5.1 3.7 25.25 181.7 Arson 0.2 0 0 0 0.1 91.8 Equipment Use 0 0 9.3 0 49.1 0.8 Railroad 0 0 0 0 0 0 Children 0 0 0.8 0 0 0 Miscellaneous 0 1 1 1.25 29.9 1.6
Total 2075 2012.1 2029.5 2018.15 2132.3 2626.7
15.2.4 Severity The magnitude and severity of any wildfire depends on weather and human activity. The following factors can determine whether a fire is easily containable or will become a widespread disaster: amount of recent precipitation, wind speed, fuel load, accessibility to the fire and to nearby water sources, and the amount of time taken to provide notice of the blaze to area fire fighters.
The Northern Rockies Observed Fire Danger Class Map (WFAS Map) rates Kootenai County at a low fire danger rating. This map normalizes rating classes using different fuel models, indexes, and station locations. The basis is the fuel model cataloged for the station, fire index rating that reflects staffing levels and climatological class. The information is provided by local station managers. Most managers use the Burning Index, others use the Energy Release Component and staffing level breakpoints set by historical fire weather climatology.
15.2.5 Warning Time Wildfires are often caused by humans, intentionally or accidentally. There is no way to predict when one might break out. Since fireworks often cause brush fires, extra diligence is warranted around the Fourth of July when the use of fireworks is highest. Dry seasons and droughts are factors that greatly increase fire likelihood. Dry lightning may trigger wildfires. Severe weather can be predicted, so special attention can
15-11

Kootenai County Multi-Jurisdictional All Hazard Mitigation Plan; Volume 1—Planning-Area-Wide Elements
be paid during weather events that may include lightning. Reliable National Weather Service lightning warnings are available on average 24 to 48 hours prior to a significant electrical storm.
If a fire does break out and spread rapidly, residents may need to evacuate within days or hours. A fire’s peak burning period generally is between 1 p.m. and 6 p.m. Once a fire has started, fire alerting is reasonably rapid in most cases. The rapid spread of cellular and two-way radio communications in recent years has further contributed to a significant improvement in warning time.
15.3 SECONDARY HAZARDS Wildfires can generate a range of secondary effects, which in some cases may cause more widespread and prolonged damage than the fire itself. Fires can cause direct economic losses in the reduction of harvestable timber and indirect economic losses in reduced tourism. Wildfires cause the contamination of reservoirs, destroy transmission lines and contribute to flooding. They strip slopes of vegetation, exposing them to greater amounts of runoff. This in turn can weaken soils and cause failures on slopes. Major landslides can occur several years after a wildfire. Most wildfires burn hot and for long durations that can bake soils, especially those high in clay content, thus increasing the imperviousness of the ground. This increases the runoff generated by storm events, thus increasing the chance of flooding.
15.4 EXPOSURE The National Fire Plan (www.fireplan.gov) identifies all major communities in Kootenai Co dealing with wildfire hazards. It provides evidence that the County has a serious risk of wildfire and establishes its threat to persons and property.
15.4.1 Population Population could not be directly examined by wildfire relative risk area because census block group areas do not coincide with the fire risk areas. Exposed population for each planning partner was estimated based on a count of buildings in each relative risk zone (low-moderate, moderate, and moderate-high). That count defined a percentage of homes exposed to the hazard at each risk level. Each jurisdiction’s total population was multiplied by those percentages to estimate the exposed population for each relative-risk hazard zone. These estimates are shown in Table 15-5.
15.4.2 Property Table 15-6 through Table 15-8 display the number of structures in each wildfire risk zone in the planning area and their replacement values. The unincorporated county and all cities of Kootenai County have exposure to wildfire hazards to some degree. Table 15-9 shows the general land use of parcels exposed to the moderate-high wildfire classification in the unincorporated portions of the County.
15.4.3 Critical Facilities and Infrastructure Table 15-10 identifies critical facilities exposed to the wildfire hazard in Kootenai County. There are 73 registered Tier II hazardous material containment sites in the moderate or moderate/high wildfire risk zones. These materials could rupture due to excessive heat from a wildfire and act as fuel for the fire, causing rapid spreading and escalating the fire to unmanageable levels. They could leak into surrounding areas, saturating soils and seeping into surface waters, and have a disastrous effect on the environment.
15-12

WILDFIRE
TABLE 15-5. POPULATION WITHIN WILDFIRE HAZARD AREAS
Low-Moderate Moderate Moderate-High Population Population Population Buildings Number % of Total Buildings Number % of Total Buildings Number % of total
Athol 0 0 0% 0 0 0% 380 689 100% Coeur d’Alene 0 0 0% 18,895 46,155 99% 101 247 1% Dalton Gardens 0 0 0% 1,968 2,361 100% 0 0 0% Fernan Lk. Vill. 0 0 0% 57 124 72% 22 48 28% Harrison 0 0 0% 228 210 100% 0 0 0% Hauser Lake 0 0 0% 285 672 100% 0 0 0% Hayden 0 0 0% 6,697 13,681 100% 0 0 0% Hayden Lake 0 0 0% 438 589 100% 0 0 0% Huetter 0 0 0% 234 101 100% 0 0 0% Post Falls 0 0 0% 8,062 20,410 70% 3,534 8,947 30% Rathdrum 0 0 0% 805 2,367 33% 1,606 4,723 67% Spirit Lake 0 0 0% 75 135 7% 1,037 1,866 93% State Line 0 0 0% 29 45 100% 0 0 0% Worley 160 254 100% 0 0 0% 0 0 0% Unincorporated 803 941 2% 23,158 27,139 67% 10,719 12,561 31% Total 963 1,195 1% 60,931 113,989 79% 17,399 29,081 20%
Note: Population estimates were derived by multiplying the percent of exposed buildings in each hazard class by the total population estimates for each jurisdiction.
TABLE 15-6. EXPOSURE AND VALUE OF STRUCTURES IN LOW-MODERATE WILDFIRE HAZARD AREAS
Buildings Value Exposed % of Total Jurisdiction Exposed Structure Contents Total Replacement Value
Athol 0 $0 $0 $0 0% Coeur d’Alene 0 $0 $0 $0 0% Dalton Gardens 0 $0 $0 $0 0% Fernan Lk. Vill. 0 $0 $0 $0 0% Harrison 0 $0 $0 $0 0% Hauser Lake 0 $0 $0 $0 0% Hayden 0 $0 $0 $0 0% Hayden Lake 0 $0 $0 $0 0% Huetter 0 $0 $0 $0 0% Post Falls 0 $0 $0 $0 0% Rathdrum 0 $0 $0 $0 0% Spirit Lake 0 $0 $0 $0 0% State Line 0 $0 $0 $0 0% Worley 160 $30,208,680 $26,286,584 $56,495,264 100% Unincorporated 803 $149,522,405 $120,788,650 $270,311,055 2% Total 963 $179,731,085 $147,075,234 $326,806,319 1%
15-13

Kootenai County Multi-Jurisdictional All Hazard Mitigation Plan; Volume 1—Planning-Area-Wide Elements
TABLE 15-7. EXPOSURE AND VALUE OF STRUCTURES IN MODERATE WILDFIRE HAZARD AREAS
Buildings Value Exposed % of Total Jurisdiction Exposed Structure Contents Total Replacement Value Athol 0 $0 $0 $0 0% Coeur d’Alene 18,895 $6,010,468,334 $4,468,802,513 $10,479,270,847 100% Dalton Gardens 1,968 $674,012,492 $583,043,775 $1,257,056,267 100% Fernan Lk. Vill. 57 $15,808,096 $7,971,932 $23,780,029 68% Harrison 228 $37,221,363 $27,920,666 $65,142,029 100% Hauser Lake 285 $48,100,454 $35,049,696 $83,150,150 100% Hayden 6,697 $1,691,007,160 $1,232,685,566 $2,923,692,726 100% Hayden Lake 438 $123,674,749 $67,898,754 $191,573,503 100% Huetter 234 $30,566,438 $28,258,843 $58,825,281 100% Post Falls 8,062 $2,249,254,327 $1,604,426,513 $3,853,680,840 69% Rathdrum 805 $196,502,419 $148,813,228 $345,315,648 36% Spirit Lake 75 $11,157,687 $5,940,265 $17,097,952 5% State Line 29 $17,954,708 $17,653,383 $35,608,091 100% Worley 0 $0 $0 $0 0% Unincorporated 23,158 $4,667,248,332 $3,317,103,037 $7,984,351,369 70%
Total 60,931 $15,772,976,559 $11,545,568,171 $27,318,544,732 81%
TABLE 15-8. EXPOSURE AND VALUE OF STRUCTURES IN MODERATE-HIGH WILDFIRE HAZARD AREAS
Buildings Value Exposed % of Total Jurisdiction Exposed Structure Contents Total Replacement Value Athol 380 $82,255,901 $79,126,288 $161,382,189 100% Coeur d’Alene 101 $31,042,908 $16,067,161 $47,110,069 0% Dalton Gardens 0 $0 $0 $0 0% Fernan Lk. Vill. 22 $7,546,814 $3,788,492 $11,335,306 32% Harrison 0 $0 $0 $0 0% Hauser Lake 0 $0 $0 $0 0% Hayden 0 $0 $0 $0 0% Hayden Lake 0 $0 $0 $0 0% Huetter 0 $0 $0 $0 0% Post Falls 3,534 $988,218,220 $758,836,823 $1,747,055,043 31% Rathdrum 1,606 $353,900,588 $261,582,409 $615,482,996 64% Spirit Lake 1,037 $200,126,656 $157,691,139 $357,817,795 95% State Line 0 $0 $0 $0 0% Worley 0 $0 $0 $0 0% Unincorporated 10,719 $1,805,297,097 $1,406,004,069 $3,211,301,167 28%
Total 17,399 $3,468,388,183 $2,683,096,382 $6,151,484,565 18%
15-14

WILDFIRE
TABLE 15-9. LAND USE WITHIN THE WILDFIRE HAZARD AREAS
Area in Moderate-High Risk Zone Land Use Area (acres) % of total Agricultural 5,793.3 2.4% Grazing 5,402.8 2.2% Timber 109,984.5 45.1% Federal/State 62,719.6 25.7% Commercial 794.4 0.3% Industrial 599.0 0.2% Residential 2,380.5 1.0% Rural 27,284.2 11.2% Vacant Commercial 508.3 0.2% Vacant Industrial 448.5 0.2% Vacant Residential 842.1 0.3% Vacant Rural 20,580.6 8.4% Unknown 2,318.5 1.0% Vacant Unknown 4,243.2 1.7%
Total 243,899.5 100.0%
Note: Present use classifications assigned using Kootenai County 2014 Assessors data. Lots without assessed structures were assigned a vacant status for commercial, industrial, residential, and rural land use classifications.
TABLE 15-10. CRITICAL FACILITIES AND INFRASTRUCTURE IN WILDFIRE HAZARD AREAS
Number of Critical Facilities in Hazard Zone Low-Moderate Moderate Moderate-High
Medical and Health Services 0 4 0 Government Function 8 52 10 Protective Function 3 37 15 Schools 1 59 16 Hazmat 2 62 11 Other Critical Function 11 75 16 Bridges 0 12 6 Water 11 304 88 Wastewater 1 42 34 Power 0 2 2 Communications 3 6 5
Total 40 655 203
15-15

Kootenai County Multi-Jurisdictional All Hazard Mitigation Plan; Volume 1—Planning-Area-Wide Elements
In the event of wildfire, there would likely be little damage to the majority of infrastructure. Most road and railroads would be without damage except in the worst scenarios. Power lines are the most at risk to wildfire because most are made of wood and susceptible to burning. In the event of a wildfire, pipelines could provide a source of fuel and lead to a catastrophic explosion.
15.4.4 Environment Fire is a natural and critical process in most terrestrial ecosystems, dictating in part the types, structure, and spatial extent of native vegetation. However, wildfires can cause severe environmental impacts:
• Damaged Fisheries—Critical fisheries can suffer from increased water temperatures, sedimentation, and changes in water quality.
• Soil Erosion—The protective covering provided by foliage and dead organic matter is removed, leaving the soil fully exposed to wind and water erosion. Accelerated soil erosion occurs, causing landslides and threatening aquatic habitats.
• Spread of Invasive Plant Species—Non-native woody plant species frequently invade burned areas. When weeds become established, they can dominate the plant cover over broad landscapes, and become difficult and costly to control.
• Disease and Insect Infestations—Unless diseased or insect-infested trees are swiftly removed, infestations and disease can spread to healthy forests and private lands. Timely active management actions are needed to remove diseased or infested trees.
• Destroyed Endangered Species Habitat—Catastrophic fires can have devastating consequences for endangered species.
• Soil Sterilization—Topsoil exposed to extreme heat can become water repellant, and soil nutrients may be lost. It can take decades or even centuries for ecosystems to recover from a fire. Some fires burn so hot that they can sterilize the soil.
Many ecosystems are adapted to historical patterns of fire occurrence. These patterns, called “fire regimes,” include temporal attributes (e.g., frequency and seasonality), spatial attributes (e.g., size and spatial complexity), and magnitude attributes (e.g., intensity and severity), each of which have ranges of natural variability. Ecosystem stability is threatened when any of the attributes for a given fire regime diverge from its range of natural variability.
15.5 VULNERABILITY Structures, above-ground infrastructure, critical facilities and natural environments are all vulnerable to the wildfire hazard. There is currently no validated damage function available to support wildfire mitigation planning. Except as discussed in this section, vulnerable populations, property, infrastructure and environment are assumed to be the same as described in the section on exposure.
15.5.1 Population The accumulation of fuels in the forests of Kootenai County poses health risks to those who live in and around the WUI. Smoke and air pollution from wildfires can be a severe health hazard, especially for sensitive populations, including children, the elderly and those with respiratory and cardiovascular diseases. Smoke generated by wildfire consists of visible and invisible emissions that contain particulate matter (soot, tar, water vapor, and minerals), gases (carbon monoxide, carbon dioxide, nitrogen oxides), and toxics (formaldehyde, benzene). Emissions from wildfires depend on the type of fuel, the moisture content of the
15-16

WILDFIRE
fuel, the efficiency (or temperature) of combustion, and the weather. Public health impacts associated with wildfire include difficulty in breathing, odor, and reduction in visibility.
Wildfire may also threaten the health and safety of those fighting the fires. First responders are exposed to the dangers from the initial incident and after-effects from smoke inhalation and heat stroke.
15.5.2 Property Loss estimations for the wildfire hazard are not based on damage functions, because no such damage functions have been generated. Instead, loss estimates were developed representing 10 percent, 30 percent and 50 percent of the replacement value of exposed structures. This allows emergency managers to select a range of economic impact based on an estimate of the percent of damage to the general building stock. Damage in excess of 50 percent is considered to be substantial by most building codes and typically requires total reconstruction of the structure. Table 15-11 lists the loss estimates for the general building stock for jurisdictions that have an exposure to a moderate-high fire hazard severity zone.
TABLE 15-11. LOSS ESTIMATES FOR WILDFIRE
Estimated Loss Potential from Wildfire Exposed Value 10% Damage 30% Damage 50% Damage
Athol $161,382,189 $16,138,219 $48,414,657 $80,691,095 Coeur d’Alene $47,110,069 $4,711,007 $14,133,021 $23,555,035 Dalton Gardens $0 $0 $0 $0 Fernan Lk. Vill. $11,335,306 $1,133,531 $3,400,592 $5,667,653 Harrison $0 $0 $0 $0 Hauser Lake $0 $0 $0 $0 Hayden $0 $0 $0 $0 Hayden Lake $0 $0 $0 $0 Huetter $0 $0 $0 $0 Post Falls $1,747,055,043 $174,705,504 $524,116,513 $873,527,522 Rathdrum $615,482,996 $61,548,300 $184,644,899 $307,741,498 Spirit Lake $357,817,795 $35,781,780 $107,345,339 $178,908,898 State Line $0 $0 $0 $0 Worley $0 $0 $0 $0 Unincorporated $3,211,301,167 $321,130,117 $963,390,350 $1,605,650,584
Total $6,151,484,565 $615,148,457 $1,845,445,370 $3,075,742,283
15.5.3 Critical Facilities and Infrastructure Critical facilities of wood frame construction are especially vulnerable during wildfire events. In the event of wildfire, there would likely be little damage to most infrastructure. Most roads and railroads would be without damage except in the worst scenarios. Power lines are the most at risk from wildfire because most
15-17

Kootenai County Multi-Jurisdictional All Hazard Mitigation Plan; Volume 1—Planning-Area-Wide Elements
poles are made of wood and susceptible to burning. Fires can create conditions that block or prevent access and can isolate residents and emergency service providers. Wildfire typically does not have a major direct impact on bridges, but it can create conditions in which bridges are obstructed. Many bridges in areas of high to moderate fire risk are important because they provide the only ingress and egress to large areas and in some cases to isolated neighborhoods.
15.6 FUTURE TRENDS IN DEVELOPMENT Development in the WUI has been rapidly expanding over the last two decades. The National Association of Plan Advisors (NAPA) predicts that by 2030, the number of homes in the WUI nationwide will be 40 percent higher than 2001 levels. The Western Wildfire Risk Assessment reports that 245,188 people in Idaho live within WUI areas. The current risk of wildfire (number of square miles of WUI with existing homes) and the potential risk (number of square miles of WUI that remains undeveloped) are both highest in the northern parts of the state, including Kootenai County. In Kootenai County, 8,651 homes are located in the WUI. The county has 29 square miles of developed land in the WUI or 23 percent of the total WUI. With 77 percent of the WUI undeveloped, Kootenai County has one of the largest potentials in Idaho to continue growth and development in the WUI. Figure 15-3 depicts Kootenai County’s statistics and rankings for development in the WUI.
15.7 SCENARIO A major conflagration in the planning area might begin with a wet spring, adding to fuels already present on the forest floor. Flashy fuels would build throughout the spring. The summer could see the onset of insect infestation. A dry summer could follow the wet spring, exacerbated by dry hot winds. Carelessness with combustible materials or a tossed lit cigarette, or a sudden lighting storm could trigger a multitude of small isolated fires.
The embers from these smaller fires could be carried miles by hot, dry winds. The deposition zone for these embers would be deep in the forests and interface zones. Fires that start in flat areas move slower, but wind still pushes them. It is not unusual for a wildfire pushed by wind to burn the ground fuel and later climb into the crown and reverse its track. This is one of many ways that fires can escape containment, typically during periods when response capabilities are overwhelmed. These new small fires would most likely merge. Suppression resources would be redirected from protecting the natural resources to saving more remote subdivisions.
The worst-case scenario would include an active fire season throughout the American west, spreading resources thin. Firefighting teams would be exhausted or unavailable. Many federal assets would be responding to other fires that started earlier in the season. While local fire districts would be extremely useful in the WUI, they have limited wildfire capabilities or experience, and they would have a difficult time responding to the ignition zones. Even though the existence and spread of the fire is known, it may not be possible to respond to it adequately, so an initially manageable fire can become out of control before resources are dispatched.
To further complicate the problem, heavy rains could follow, causing flooding and landslides and releasing tons of sediment into rivers, permanently changing floodplains and damaging sensitive habitat and riparian areas. Such a fire followed by rain could release millions of cubic yards of sediment into streams for years, creating new floodplains and changing existing ones. With the forests removed from the watershed, stream flows could easily double. Floods that could be expected every 50 years may occur every couple of years. With the streambeds unable to carry the increased discharge because of increased sediment, the floodplains and floodplain elevations would increase.
15-18

WILDFIRE
Figure 15-3. Kootenai County Growth Potential in the WUI
15.8 ISSUES The major issues for wildfire are the following:
• Public education and outreach to people living in or near the WUI hazard zones should include information about and assistance with mitigation activities such as defensible space, and advance identification of evacuation routes and safe zones.
• Wildfires could cause landslides as a secondary natural hazard.
• Future growth into interface areas should continue to be managed.
• Area fire districts need to continue to train on WUI events.
• Vegetation management activities. This would include enhancement through expansion of the target areas as well as additional resources.
• Regional consistency of higher building code standards such as residential sprinkler requirements and prohibitive combustible roof standards.
15-19

Kootenai County Multi-Jurisdictional All Hazard Mitigation Plan; Volume 1—Planning-Area-Wide Elements
• Lack of an adequate water supply is a frequent problem to fight fires in certain WUI areas. Water systems are fragmented. Water supply on individual properties provides little support for fire suppression.
• Expand certifications and qualifications for fire department personnel. Ensure that all firefighters are trained in basic wildfire behavior, basic fire weather, and that all company officers and chief level officers are trained in the wildland command and strike team leader level.
• Fuel treatment in the planning area is inadequate.
• There is a need to emphasize fuel reduction, especially with private property owners.
• Continued promotion of Firewise will help reduce wildfire risk.
• Subdivisions and homes built on steep slopes to gain views of lakes and mountain vistas are often constructed without thought to creating defensible space and adequate access for fire-fighting vehicles.
• Access is limited to structures and developments on lake fronts and in other areas deep in the WUI. Many public and private roads provide only one means of access to structures in the WUI.
• Kootenai County has significant potential for growth in the WUI.
15-20

CHAPTER 16. HAZARDS OF INTEREST
16.1 CYBER-DISRUPTION
16.1.1 Overview A cyber-attack is an attack intended to create physical effects or to manipulate, disrupt or delete data. It might range from a denial-of-service operation that temporarily prevents access to a website, to an attack on a power turbine that causes physical damage and an outage lasting for days. Cyber-espionage refers to intrusions into networks to access sensitive diplomatic, military or economic information (Clapper, 2013). Cyber-attacks on infrastructure can originate from governments, criminal organizations, or lone individuals. FEMA characterizes an event profile for a cyber-attack or cyber-espionage as follows:
• Application Mode—Unlawful attacks and threats of attack against computers, networks andinformation stored therein
• Duration/Threat Impact—Minutes to days
• Severity—Generally no direct effects on built environment; secondary impact from systemattacked (e.g., computerized control system regulating water release)
• Mitigating and Exacerbating Conditions—Inadequate security can facilitate access tocritical computer systems, allowing them to be used to conduct attacks, or gather informationto support other terrorist-related activities.
Cyber criminals threaten U.S. economic interests. The Office of the Comptroller of the Currency, which regulates national banks, has issued warnings to banks and business of their potential risk. Since September 2012, attacks have been increasingly aimed at businesses with fewer than 250 employees (Associated Press, 2013).
Cyber criminals sell tools via a growing black market that enable access to critical infrastructure systems. Some commercial companies sell computer intrusion kits on the open market that can give governments and cyber criminals the ability to steal, manipulate or delete information on targeted systems. Other companies sell professional-quality technologies to support cyber-operations—often branding these tools as lawful-intercept or defensive security research products. Many individuals, groups and foreign governments already use some of these tools to target national and local systems.
A March 2013 report by the National Intelligence Agency to the Senate Intelligence Committee indicated only a remote chance over the next two years of a major cyber-attack against U.S. critical infrastructure such as a regional power grid. Less sophisticated attacks, such as denial-of-service attacks against bank websites, are more likely (Strobel and Wilson, 2013).
Water/Wastewater Disruption Water and/or wastewater disruption resulting from a cyber-attack could disrupt the treatment of millions of gallons of waste. Disruption of service could have significant environmental impacts on waterways adjacent to treatment plants. Ninety-seven water service providers operate in Kootenai County (NY Times, 2012).
16-1

Kootenai County Multi-Jurisdictional All Hazard Mitigation Plan; Volume 1—Planning-Area-Wide Elements
Data and Telecommunications Data and telecommunications are a primary service to the community. A loss of data and telecommunications could result in loss of emergency dispatch capabilities, emergency planning services, infrastructure monitoring capabilities, access to statistical data, or financial and personnel records.
Power and Gas Service A power failure is any interruption or loss of electrical service due to disruptions of power generation or transmission. These interruptions can last anywhere from a few seconds to several days. Power failures are significant only if the local emergency management organization is required to coordinate basic services such as the provision of food, water and heating as a result.
There are three main types of power outages. A “dropout” occurs when there is a momentary loss of power. A “brownout” refers to a reduction below normal minimum voltage levels. A “blackout” refers to an instance when power is lost completely (City of Seattle, 2010). A widespread power outage that affected 50 million people in the Northeast and upper Midwest in 2003 catalyzed interest in assessing primary vulnerabilities in power supply systems across the United States.
Power and gas services are provided to Kootenai County by Kootenai Electric Cooperative, Inc., Inland Power & Light Company, Avista Utilities and AmeriGas.
16.1.2 Hazard Profile
Past Events No major direct cyber-disruptions have affected Kootenai County. Still, cyber-terrorism is an emerging hazard that can impact critical infrastructure in the county and thus public systems and services. In the last decade, concerns regarding cyber-terrorism are growing across America. Former FBI director Louis Freeh stated that cyber-terrorism could cripple U.S. infrastructure, government, and economy (ANI 2013).
Location Cyber-disruption to critical infrastructure can be posed by anyone with the capability, opportunity and intent to do harm. Potential threats can be domestic or foreign, internal or external, state-sponsored or enacted by an individual. This disruption can be caused by terrorists, insiders, disgruntled employees or hackers. Across Kootenai County, numerous systems rely on computers for day-to-day operations, including traffic signals, communication sites, HVAC systems, and systems that local governments rely on to operate. A cyber-disruption in one of these systems could range from a nuisance to crippling the county economy.
Frequency Cyber-disruptions are expected to continue in future years. Cyber-attacks by individuals or terrorist groups cannot be predicted.
Severity A cyber-disruption can affect a variety of sectors with potentially severe consequences. The severity of an incident will vary greatly based on the extent and duration of the impact. Severity also will vary based upon which systems are impacted and ability to anticipate the disruption.
16-2

HAZARDS OF INTEREST
Warning Time A cyber-terrorism attack can occur with little or no warning. At the federal level, numerous agencies (such as FBI and CIA) are working collaboratively to thwart cyber-terrorism attacks. The warning time depends upon the ability of these agencies to recognize that a threat exists and to act upon it. Even with these agencies on task to monitor cyber threats, a cyber-attack can occur with no warning.
16.1.3 Secondary Hazards Secondary hazards associated with cyber-disruption events include traffic accidents, limited patient care at hospitals, injuries due to downed power lines and fires due to gas leaks. Utility losses could cause a reduction in employment, wholesale and retail sales, utility repairs, and increased medical risks. The County may lose sales tax and the finances of public utility companies and the businesses that rely on them would be disrupted. Loss of electricity could create life-threatening situations for medically dependent residents. If electricity were disrupted for some time, a general public health threat may ensue.
16.1.4 Vulnerability Due to the difficulty in predicting potential targets of cyber-disruption, assessing vulnerability to this hazard is difficult. No statewide vulnerability assessment exists for the hazard of cyber-disruption. However, the entire population of Kootenai County is considered exposed to the effects of cyber-disruption. Anyone who directly or indirectly uses computers or receives services from automated systems is vulnerable to a cyber-disruption.
Estimate of Potential Dollar Losses A significant portion of Kootenai County’s economy is exposed to the effects of a cyber-disruption. Nationwide, cyber-crimes against banks and other financial institutions can cost hundreds of millions of dollars each year. Cyber-theft of intellectual property and business-confidential information can cost billions, damage a company’s brand and reputation, inflict consumer losses, etc. In the United States, the cost of cyber-crimes is estimated between $24 billion and $120 billion annually—0.2 percent to 0.8 percent of the gross domestic product (McAfee 2013).
Environment Impacts Cyber-disruptions can have a significant impact on the environment if facilities such as nuclear, electrical power, waste treatment, chemical, or petroleum plants are targeted and a release occurs.
16.2 HAZARDOUS MATERIAL INCIDENTS
16.2.1 Overview Hazardous materials are substances that are severely harmful to human health and the environment, as defined by the U.S. Environmental Protection Agency under the Comprehensive Environmental Response, Compensation, and Liability Act, known as the Superfund Law. Many commonly used materials are harmless in their normal uses but dangerous if released in large quantities. The Superfund law designates more than 800 substances as hazardous and identifies many more as potentially hazardous (U.S. EPA 2013). The Superfund law definition of hazardous materials includes the following:
• Any element, compound, mixture, solution, or substance designated as hazardous under Section 102 of the Superfund Law.
16-3

Kootenai County Multi-Jurisdictional All Hazard Mitigation Plan; Volume 1—Planning-Area-Wide Elements
• Any hazardous substance designated under Section 311(b)(2)(a) of the Clean Water Act (CWA), or any toxic pollutant listed under Section 307(a) of the CWA. There are over 400 substances designated as hazardous or toxic under the CWA.
• Any hazardous waste having the characteristics identified or listed under Section 3001 of the Resource Conservation and Recovery Act.
• Any hazardous air pollutant listed under Section 112 of the Clean Air Act, as amended. There are over 200 substances listed as hazardous air pollutants under the Clean Air Act.
• Any imminently hazardous chemical substance or mixture for which the EPA Administrator has “taken action” under Section 7 of the Toxic Substances Control Act (U.S. EPA 2013).
Transportation of hazardous materials on highways involves tanker trucks or tractor trailers. Hazardous material spills on roads have the potential to pollute watersheds and contaminate the water supply. Potential also exists for hazardous materials to be released along rail lines, as collisions and derailments of train cars occur.
Pipelines can transport hazardous liquids and flammable materials such as natural gas and petroleum. Incidents can occur when pipes corrode, are damaged in excavation, incorrectly operated, or damaged by natural hazards or intentional acts.
Hazardous materials are regulated by the EPA, and when in transport, by the U.S. Department of Transportation.
16.2.2 Hazard Profile
Past Events Hazardous material incidents in Kootenai County occur fairly frequently. Most are handled by the North Idaho Regional Hazardous Material Response Team. The number of hazardous material incidents the team responded to from 2004 through 2014 is as follows:
• 2004: 33
• 2005: 26
• 2006: 9
• 2007: 16
• 2008: 5
• 2009: 30
• 2010: 23
• 2011: 18
• 2012: 16
• 2013: 38
• 2014: 13
Location A hazardous material incident could occur virtually anywhere in Kootenai County. Chemicals and radioactive materials can contaminate the county’s air, water systems, and environment. There is no clearly
16-4

HAZARDS OF INTEREST
effective geographic barrier or boundary to the effects of hazardous materials. However, the areas most vulnerable to hazardous material incidents appear to be transport routes and industrial parks where large supplies of hazardous materials are stored.
The primary roadways in Kootenai County, susceptible to hazardous materials being transported, are Interstate 90 (west-east through Post Falls and Coeur d’Alene) and U.S. Highway 95 (north-south through Athol, Hayden, Coeur d’Alene, and Worley). Major railways, pipelines and waterways also routinely transport hazardous materials through Kootenai County.
Idaho facilities covered by the Emergency Planning and Community Right to Know Act must annually submit an emergency and hazardous chemical inventory form to the Idaho Bureau of Homeland Security, the Local Emergency Planning Committee, and their local fire department. These sites are known as Tier II locations. There are 75 facilities in Kootenai County that submitted Tier II information. Though Tier II reporting provides the county with a general overview of stored hazardous materials, it does not provide a comprehensive understanding of the locations and quantity of hazardous materials in the county. The Emergency Planning and Community Right to Know Act only requires Tier II forms for facilities that store extremely hazardous substances or other hazardous materials at or above the materials’ threshold planning quantity. Small businesses and private individuals may store small amounts of hazardous materials in their businesses or homes without formally reporting. Furthermore, some businesses are unaware of the law and fail to report.
Frequency The events that can produce a hazardous materials release vary greatly, so future releases are statistically independent of past events. However, it can reasonably be assumed, based on past occurrences, that future hazardous material incidents are highly likely in the future.
Severity Hazardous materials releases can contaminate air, water and soils, possibly resulting in death and/or injuries. The severity of an incident will depend on whether it is from a fixed or mobile source, the size of the impacted area, the toxicity and properties of the substance, the duration of the release, and environmental conditions (i.e. wind, precipitation, terrain, etc.). The U.S. Department of Transportation classifies hazardous materials into nine classes:
• Class 1: Explosives
• Class 2: Gases
• Class 3: Flammable liquids
• Class 4: Flammable solids
• Class 5: Oxidizers and organic pesticides
• Class 6: Poisons and etiologic materials
• Class 7: Radioactive materials
• Class 8: Corrosives
• Class 9: Miscellaneous.
Past hazardous material releases in Kootenai County were accidental and were not considered acts of terrorism or criminal in nature. The impact from an intentional release of any of these products in large quantity would pose a threat to the county’s population, economy and environment.
16-5

Kootenai County Multi-Jurisdictional All Hazard Mitigation Plan; Volume 1—Planning-Area-Wide Elements
Warning Time A hazardous material incident may be sudden, without any warning, such as an explosion, or develop slowly, such as a leaking container. Facilities that store extremely hazardous substances are required to notify local officials when an incident occurs.
16.2.3 Secondary Hazards Secondary impacts associated with hazardous material releases include those impacting the health of the community and environment. Released hazardous materials can contaminate drinking water, kill wildlife and impact ecosystems. Releases can lead to acute and chronic health issues and have an impact on long-term public health. Hazardous material incidents can also damage infrastructure such as roads, bridges, culverts, etc.
16.2.4 Vulnerability Hazardous materials in various forms can cause death, serious injury, long-lasting health effects, and damage to buildings, homes and other property. Improper release of hazardous materials can contaminate land and water for generations to come. This in turn can destroy crops and vegetation and seriously damage the environment. As a hazardous materials incident can occur at virtually anytime and at any location, time to warn the impacted populace is limited. The effects of a hazardous material release may spread quickly and overcome residents while emergency responders struggle to identify, assess, and notify personnel in the area of the threat and recommend actions to take.
Recovery from a hazardous materials incident can be both time consuming and costly. Cost associated with cleanup of a hazardous material spill can run several thousand dollars for a small spill and into the millions for a large accident. Hazardous material incidents may cause evacuation, the need to shelter-in-place, or closure of facilities. Due to limited alternate transportation corridors in Kootenai County, a hazardous material incident could force temporary or long-term closure of transportation routes with severe impacts on the area economy.
Contamination of waterways and aquifer can occur from a single point and continue to spread through the natural flow of water. Contamination of the aquifer can pose a significant threat and can have a dramatic and prolonged impact on the health of county residents and livestock.
Estimate of Potential Dollar Losses If a significant hazardous material incident occurred, not only would life, safety and the built environment be at risk, but the economy of Kootenai County would be affected as well. A significant incident in an urban area could force businesses to close for an extended period.
Environmental Impacts A hazardous material release may contaminate the air, water, or soil, potentially causing concern for direct human and animal exposure (whether through inhalation, ingestion or dermal exposure), recreational usage, crop irrigation, and fish and wildlife consumption (U.S. EPA 2012).
16-6

HAZARDS OF INTEREST
16.3 PANDEMIC
16.3.1 Overview Pandemic is defined as a disease occurring over a wide geographic area and affecting a high percentage of the population. A pandemic can cause sudden, pervasive illness in all age groups on a local or global scale. An epidemic occurs when new cases of a disease in a given population substantially exceed what is expected. Epidemics are usually restricted to one location; when an epidemic becomes global, it becomes a pandemic. The State of Idaho Hazard Mitigation Plan has identified the following as diseases that could contribute to a serious pandemic in the area:
• Cholera
• Diphtheria
• HIV/AIDS
• Influenza
• Measles
• Pertussis
• Plague
• Polio
• Q Fever
• Severe acute respiratory syndrome (SARS)
• Smallpox
• Tuberculosis
• Typhoid fever
• West Nile virus.
16.3.2 Hazard Profile
Past Events The Idaho Department of Health and Welfare releases an annual reportable disease summary. Table 16-1 lists statewide statistics for 2010 and 2011.
Location The entire county is susceptible to pandemics. However, areas with higher population density are at a higher risk due to the greater exposure to infectious diseases. Therefore, urban centers throughout the county are more susceptible to this hazard.
Frequency It is difficult to predict when a pandemic will occur and how severe it will be. However, future pandemic events are expected. The United States has been working with the World Health Organization and other countries to strengthen detection of disease and response to outbreaks. Preparedness efforts are ongoing at the national, state, and local levels (Barry-Eaton District Health Department 2013).
16-7

Kootenai County Multi-Jurisdictional All Hazard Mitigation Plan; Volume 1—Planning-Area-Wide Elements
TABLE 16-1. STATE OF IDAHO REPORTABLE DISEASE SUMMARY
Number of Reported Cases Reportable Disease 2010 2011
Diphtheria 0 0 HIV 32 50 Pertussis 187 192 Plague 0 0 Q Fever 3 0 SARS (severe acute respiratory syndrome) 0 0 Smallpox 0 0 Tuberculosis 15 12 West Nile Virus Infections 3 3
Source: The State of Idaho Hazard Mitigation Plan, 2013
In Kootenai County, the probability for a future event is dependent on several factors, including population density. Populations that live close to one another are more likely to spread diseases. As population density increases in the county, so too will the probability of a pandemic event.
Severity The severity and length of pandemics cannot be predicted. The Centers for Disease Control and Prevention’s (CDC) Community Strategy for Pandemic Influenza Mitigation in the United States introduced a Pandemic Severity Index (PSI), which uses the case fatality ratio as the critical driver for categorizing the severity of a pandemic. The index is designed to estimate the severity of a pandemic on a population to allow better forecasting of the impact of a pandemic and to enable recommendations on the use of mitigation interventions that are matched to the severity of influenza pandemic. Pandemics are assigned to one of five categories of increasing severity, as shown on Figure 16-1. In 2005 the World Health Organization updated its guidance for pandemic influenza and redefined six phases of a pandemic, as outlined in Table 16-2.
Warning Time Pandemics arrive with little warning. Air travel could hasten the spread of a new virus and decrease the time available for implementing interventions. Outbreaks can occur simultaneously throughout much of the United States, preventing shifts in human and material resources that usually occur in response to other disasters. Warning time for influenza would depend on the origin of the virus and the amount of time needed to identify it.
16.3.3 Secondary Hazards Secondary hazards related to pandemics are related to an outbreak’s direct impact on the population of Kootenai County. Directly affected will be the county’s critical infrastructure and healthcare systems. Approximately 10 percent of the workforce will be absent at a given time during a pandemic. Without workers to fulfill key roles, secondary effects may include utility failures and other critical infrastructure disruptions.
16-8

HAZARDS OF INTEREST
Source: Center for Disease Control and Prevention. Mitigation Slides, date unknown.
Figure 16-1. Pandemic Severity Index
16-9

Kootenai County Multi-Jurisdictional All Hazard Mitigation Plan; Volume 1—Planning-Area-Wide Elements
TABLE 16-2. PHASES OF A PANDEMIC
Phase Description
Inter-Pandemic Period Phase 1 No new influenza virus subtypes have been detected in humans. An influenza virus subtype
that has caused human infection may be present in animals. If present in animals, the risk of human infection or disease is considered to be low.
Phase 2 No new influenza virus subtypes have been detected in humans. However, a circulating animal influenza virus subtype poses a substantial risk of human disease.
Pandemic Alert Period Phase 3 Human infections are reported with a new subtype, but no human-to-human spread or at
most rare instances of spread to a close contact. Phase 4 Small clusters of influenza with limited human-to-human transmission, but spread is highly
localized, suggesting that the virus is not well adapted to humans. Phase 5 Larger clusters of influenza but human-to-human spread is still localized, suggesting that the
virus is becoming increasingly better adapted to humans but may not yet be fully transmissible (substantial pandemic risk).
Pandemic Period Phase 6 Disease has increased and sustained transmission in the general population. Post-Pandemic Period Return to the Inter-Pandemic Period (Phase 1)
Maintaining key functions is important to preserve life and decrease societal disruption. Heat, clean water, waste disposal, and corpse management all contribute to public health. Ensuring functional transportation systems also protects health by making it possible for people to access medical care and by transporting food and other essential goods (Global Security 2011).
Critical infrastructure groups have a responsibility to maintain public health, provide public safety and transportation of medical supplies and food, implement a pandemic response, and maintain societal functions. Public safety workers include police, fire, 9-1-1 dispatchers, and correctional facility staff. Utility workers are essential for maintenance of power, water, and sewage systems. Transportation workers transport fuel, water, food, and medical supplies as well as providing public transportation. Telecommunications is essential in network operations and maintenance as well as public service communications regarding health and safety measures for citizens (Global Security 2011).
Mortuary services will be substantially impacted by the increased numbers of deaths from a pandemic. Impact will be high among the elderly, which is a growing segment of the population. The timely, safe, and respectful disposition of the deceased is an essential component of an effective response. Pandemic influenza may quickly rise to the level of a catastrophic incident that results in mass fatalities, which will place extraordinary demands (including religious, cultural, and emotional burdens) on local jurisdictions and the families of the victims (Global Security 2011).
The healthcare system will be severely taxed if not overwhelmed by the large number of illnesses requiring hospitalization and critical care. CDC models estimate increases in hospitalization and intensive care unit
16-10

HAZARDS OF INTEREST
demand of more than 25 percent, even in a moderate pandemic. In a pandemic, everything from syringes to hospital beds, respirators, masks, and protective equipment would be in short supply. Ventilators will be the most critical shortage in a pandemic (Global Security 2011).
16.3.4 Vulnerability The entire county’s population is vulnerable to the effects of a pandemic. However, more densely populated urban areas would have a higher exposure to contagious diseases and thus a higher risk. Vulnerable populations such as the young and elderly are also considered highly vulnerable.
Estimate of Potential Dollar Losses In addition to life and safety, a pandemic would have a significant impact on the economy in Kootenai County. The effect of absenteeism on workers would impact local, county, state and private services. Procedures for continuity of government operations would need to be implemented. A CDC model suggests that approximately 10 percent of the workforce would be ill or caring for an ill family member at the peak of a pandemic disease (U.S. Department of Health and Human Services 2005). According to Census data, in 2013 there were 69,342 workers in Kootenai County. A 10-percent absentee rate would mean that a shortage of approximately 6,900 employees would impact local, county, state and private facilities and the services they provide. Tourism would likely be affected, depending on the timing of the pandemic.
Environmental Impact The type of disease will determine the severity of a pandemic’s effect on the environment. Diseases that are transmitted from humans to animals or animals to humans (zoonotic) may have agricultural impacts. Sixty percent of emerging infection diseases that affect humans originate in animals. Environmental hazards include infected livestock and poultry populations. With catastrophic pandemics, the necessity for mass burials of animals or humans may impact the environment as well (CDC 2013).
16.4 RADIOLOGICAL MATERIAL EXPOSURE
16.4.1 Overview Radiation is the release of energy from unstable atoms. There are naturally occurring and human-made sources of radioactive materials. Radiation exposure can occur as a result of intentional or unintentional acts. Radiation can occur in two forms:
• Non-ionizing forms are used in many everyday applications including microwaves for heating food, infrared lamps and radio broadcasting.
• Ionizing radiation is more energetic and is able to damage tissue and cause health problems. There are many common uses for ionizing radiation including x-rays, irradiators and research reactors. Naturally occurring ionizing radiation can come from radon, processes occurring in the sun and elements found in the earth.
According to FEMA, radiological contaminants can be dispersed using aerosol sprayers or point or line sources such as munitions. The contaminants may remain hazardous for seconds to years depending on the material used. The initial effects will be localized, depending on meteorological conditions; subsequent behavior of radioactive contaminants may be dynamic. Mitigating and exacerbating conditions that will determine exposure to radiation may include the duration of exposure, the distance from the source of radiation, and the amount of shielding between source and targets (FEMA, 2003).
16-11

Kootenai County Multi-Jurisdictional All Hazard Mitigation Plan; Volume 1—Planning-Area-Wide Elements
Detonation of a nuclear bomb could occur underground, at the surface or in the air. The light, heat flash, blast, and shock wave may last for a few seconds. The resulting radiation and fallout can persist in the environment for years. The initial light, heat and blast effects of a subsurface, ground or air burst are static and determined by the device’s characteristics and employment. The fallout of radioactive contaminants may be dynamic depending on meteorological conditions. Possible mitigating and exacerbating conditions may include the reduction of harmful effects by minimizing the time of exposure and shielding or deflection from terrain, forests or structures (FEMA, 2003).
16.4.2 Hazard Profile
Past Events No major radiological material releases have occurred in Kootenai County.
Location Ionizing particulate and electromagnetic radiation are generated in the environment by naturally occurring radioactive material in the earth’s crust. Idaho has one of the largest concentrations of uranium, a radioactive material used as a nuclear fuel. In addition, a variety of industries (e.g. oil/gas extraction and community drinking water treatment) that process natural material create the unintended concentration of natural radioactivity. This is referred to as technologically enhanced naturally occurring radioactivity (TENORM). Potential concentrations of uranium and TENORM may be disposed of in Kootenai County’s only landfill, the Fighting Creek/Farm Landfill.
Kootenai County does not fall within the 10-mile or 50-mile ingestion zone for any nuclear power plant.
Frequency Currently, there are no identified TENORM issues in Kootenai County, although there is a high potential for TENORM generation given the extractive industries operating in Idaho and the occurrence of uranium and thorium ore deposits.
Severity The risk of radiological exposure is low, but the consequences of exposure are high. Impacts would depend on the location and duration of exposure and the level of radioactive release. The potential public health, agricultural and property impacts are greatest at locations nearest to the point of release.
Warning Time The warning time for a radiological material incident will vary based on the nature and scope of the incident. An incident may be sudden without any warning such as a radiological dispersion device attack, or may be slowly developing such as a leaking container.
16.4.3 Secondary Hazards Public health emergencies and environmental impacts are secondary hazards of a radiological material release. Large amounts of radiation exposure can cause cancer and other damage to tissue at the cellular level (U.S. EPA, 2012).
16-12

HAZARDS OF INTEREST
16.4.4 Vulnerability The risks of radiological incidents in Kootenai County are low, but such incidents could have high consequences. As with hazardous material releases, transportation incident risk may increase through population growth and economic activity.
Estimate of Potential Dollar Losses Exposure of radiological material would impact not only life, safety and the built environment but the economy of Kootenai County as well. A significant incident in an urban area could force businesses to close for an extended period because of contamination or direct damage.
Environment Impacts The impact a radiological event will have on the environment will depend on the location and the extent of irradiation. Humans, animals, plants, crops and other wildlife surrounding the radiological events will be impacted. Underground water and soil can become contaminated when exposed to radiological material.
16.5 CIVIL UNREST
16.5.1 Overview Civil unrest, or civil disorder, is a broad term to describe one or more forms of disturbance by a group of people. Such disturbances arise from actions of civil disobedience, often spontaneous, involving large groups of people. Civil disturbance is typically a protest against socio-political problems such as the following (2013 State of Idaho Hazard Mitigation Plan):
• Acquired Immune Deficiency Syndrome-Human Immunodeficiency Virus
• Bike Transportation
• Feminism
• Immigration
• Poverty
• Anarchists
• Children
• Food/Hunger
• Left-Socialism
• Prison Reform
• Animal Rights
• Civil Liberties
• Gay Lesbian Bisexual Transgendered
• Literacy
• Race Relations
• Abortion
• Consumer Advocacy
• Grass Roots Democracy
• Mental Health
• Tax Reform
• Anti-Government
• Death Penalty
• Gun Control
• Peace
• Trade
• Anti-Nuclear
• Drug Decriminalization
• Housing / Homelessness
• People with Disabilities
• Union
• Anti-Racist
• Environment
• Human Rights
• Police Reform
• Welfare
16-13

Kootenai County Multi-Jurisdictional All Hazard Mitigation Plan; Volume 1—Planning-Area-Wide Elements
The severity of the action correlates with the level of public displeasure. Civil unrest includes actions such as labor unrest, strikes, civil disobedience, demonstrations and riots. It often arises from political grievances and economic conflicts or a decrease in the supply of essential goods and services.
16.5.2 Hazard Profile
Past Events Kootenai County’s history of civil unrest consists of small events that took place without serious consequence:
• Rock Festival. During 1976, a rock festival event was held at the Stateline Speedway west of Post Falls. The participants caused a disturbance that led to the burning of the grandstands and a large crane. Law enforcement and fire departments responded to the disruption.
• Bayview Fireworks Shows. The community of Bayview has held fireworks shows over Lake Pend Oreille since the 1980s. Over the years, crowds became rowdy due to heavy drinking. Several years of discord and confrontation with law enforcement resulted in changes to the community’s laws that have significantly reduced such problems.
• Hydroplane Races on Lake Coeur d’Alene. In the 1980 and 1990s, alcohol and large crowds led to several instances where additional law enforcement assets were called in to maintain law and order. In the aftermath, hydroplane racing was banned in the County.
• Aryan Nations Parades and Demonstrations. From the 1980s through the early 2000s, members of the Aryan Nation, a white supremacy group, conducted parades and demonstrations in the area, which sparked several minor incidents of civil unrest. Thousands of dollars were spent to maintain law and order at these events.
• Car d’Lane. In 1999, a small, unanticipated event occurred during the Car d’Lane Weekend Show in Coeur d’Alene, which necessitated a call for all on- and off-duty law enforcement officers from several agencies to restore law and order.
Location Government buildings, military installations, landmarks, labor buildings, prisons, universities, and areas that receive widespread media coverage are common sites for civil unrest. The more urbanized areas of Kootenai County, where the majority of these sites are located, have the greatest potential for organized demonstrations and riots.
Frequency While the probability of future civil unrest incidents is difficult to predict, given past occurrences, civil unrest is possible. Social trends and emerging social issues should be watched closely.
Severity The magnitude and severity of civil unrest varies greatly from event to event. It can take the form of small peaceful gatherings or a large group disrupting public order. There are two types of large gatherings typically associated with civil disturbances: a crowd and a mob. Crowds are defined as casual, temporary collection of people without a strong, cohesive relationship. Crowds can be classified into four categories (Blumer, 1946):
16-14

HAZARDS OF INTEREST
• Casual Crowd: A casual crowd is a group of people who happen to be in the same place at the same time. Violent conduct does not occur.
• Cohesive Crowd: A cohesive crowd consists of members who are involved in some type of unified behavior. Members of this group are involved in some type of common activity, such as worshipping, dancing, or watching a sporting event. Members of these crowds may have intense internal discipline, and require substantial provocation to arouse to action.
• Expressive Crowd: An expressive crowd is one held together by a common commitment or purpose. They may not be formally organized, and are assembled as an expression of common sentiment or frustration. Members wish to be seen as a formidable influence. One of the best examples of this type is a group assembled to protest.
• Aggressive Crowd: An aggressive crowd is composed of individuals who have assembled for a specific purpose. This crowd often has leaders who attempt to arouse the members or motivate them to action. Members are noisy and threatening and will taunt authorities. They may be more impulsive and emotional, and require only minimal stimulation to arouse violence. Examples of this type of crowd include demonstrators and strikers, though not all demonstrators and strikers are aggressive.
A mob can be defined as a large disorderly crowd. Mobs are usually emotional, loud, tumultuous, violent, and lawless. Mobs are classified as the following (Alvarez and Bachman, 2007):
• Aggressive Mob: An aggressive mob is one that attacks, riots, and terrorizes. The object of violence may be a person, property, or both. An aggressive mob is distinguished from an aggressive crowd only by lawless activity. Examples of aggressive mobs are the inmate mobs in prisons and jails, mobs that act out their frustrations after political defeat, or violent mobs at political protests or rallies.
• Escape Mob: An escape mob is attempting to flee from something such as a fire, bomb, flood, or other catastrophe. Members of escape mobs are generally difficult to control and can be characterized by unreasoning terror.
• Acquisitive Mob: An acquisitive mob is one motivated by a desire to acquire something. Riots caused by other factors often turn into looting sprees. This mob exploits an authority’s lack of control in safeguarding property.
• Expressive Mob: An expressive mob is one that expresses fervor or revelry following some sporting event, religious activity, or celebration. Members experience a release of pent up emotions in highly charged situations.
A worst-case scenario for civil unrest events would be akin to the 1992 riots over a 6-day period throughout the City of Los Angeles. Widespread looting, assault, arson, and murder occurred during the riots, and estimates of property damage topped $1 billion. The rioting ended after soldiers from the California Army National Guard, along with U.S. Marines were called in to manage the situation. In total, 53 people were killed and over 2,000 people were injured (Wilson 2012).
Warning Time Civil disturbances often occur with little to no warning; however, certain events may trigger riots. They can occur as a result of controversial court rulings, unfair working conditions, or general unrest, or be triggered as a result of favorable or unfavorable sports outcomes. Generally there will be a certain degree of warning time that a riot may occur; however, achieving certainty that an incident is imminent is not possible.
16-15

Kootenai County Multi-Jurisdictional All Hazard Mitigation Plan; Volume 1—Planning-Area-Wide Elements
16.5.3 Secondary Hazards Depending on the size and scope of the incident, civil unrest may lead to widespread urban fire, utility failure, transportation interruption, and environmental hazards. The most significant impact of civil unrest is the secondary hazard of interruption of continuity of government. The extent of secondary hazards will vary significantly based on the extent and nature of the civil unrest.
16.5.4 Vulnerability Civil unrest can result in social disruption, damage to property and business, injuries, deaths, and loss of jobs. In recent years, the Kootenai County Sheriff’s Department has been understaffed while being asked to provide security to an ever-increasing palette of community and public events. The County Jail in Coeur d’Alene is at maximum capacity. The urban area of Coeur d’Alene is especially vulnerable to civil unrest due to the extensive number of large-scale community events held in the area. The larger the event or more specialized the group, the greater the risk for an unwanted disturbance to occur. Potential risks would be:
• Injuries to responders:
– Law enforcement officers
– Fire responders
– Medical responders
• Injuries to bystanders
• Property damage
• Potential mass casualty incidents
• Costs associated with the control and restoration of the community
• Bad publicity could impact future events.
Estimate of Potential Dollar Losses Due to the wide range of possible instances of civil unrest, and lacking a clear determination of location, potential loss estimates are unreliable and of little efficacy.
Environmental Impacts Civil unrest can have a significant impact on the environment if petroleum or other chemical facilities are targeted for vandalism or large-scale fires occur.
16.6 TERRORISM
16.6.1 Overview Terrorism is defined as the unlawful use or threatened use of force or violence against people or property with the intention of intimidating or coercing societies or governments. The FBI categorizes terrorism in the U.S. primarily as one of two types:
• Domestic terrorism involves groups or individuals whose terrorist activities are directed at elements of our government or population without foreign direction. The bombing of the Alfred P. Murrah federal building in Oklahoma City is an example of domestic terrorism. The FBI is the primary response agency for domestic terrorism. The FBI coordinates domestic
16-16

HAZARDS OF INTEREST
preparedness programs and activities of the United States to limit acts posed by terrorists, including the use of weapons of mass destruction.
• International terrorism involves groups or individuals whose terrorist activities are foreign based and/or directed by countries or groups outside the United States, or whose activities transcend national boundaries. Examples include the 1993 bombing of the World Trade Center and the attacks of September 11, 2001 at the World Trade Center and the Pentagon.
Many people equate terrorism with the use of weapons of mass destruction, such as chemical, biological, radiological, nuclear and explosive weapons. However, terrorism also includes arson, incendiary and explosive devices, school shootings, sabotage, hazardous materials releases, agro-terrorism and cyber-terrorism. Terrorism can be distinguished from other types of hazards by three important considerations:
• In the case of chemical, biological, and radioactive agents, their presence may not be immediately obvious, making it difficult to determine when and where they were released, who was exposed, and what danger is present for first responders.
• There is limited scientific understanding of how these agents affect the population at large.
• Terrorism evokes very strong emotional reactions, ranging from anxiety to fear to anger to despair to depression.
Terrorists often choose targets with relatively easy public access. They look for visible targets where they can avoid detection before and after an attack, such as international airports, large cities, major special events, and high-profile landmarks. Two terrorist techniques of growing concern in the public safety arena are the targeting of first responders employing secondary explosive devices and hoaxes involving weapons of mass destruction.
16.6.2 Hazard Profile
Past Events In August 1986, the Order II was formed by members of the Aryan Nations. That year, the home of Bill Wassmuth, a Catholic priest and pastor of St. Pius X Church in Coeur d’Alene, was bombed by white supremacists. Father Wassmuth had begun speaking out against the white-supremacist Aryan Nations and was the founder of the Kootenai County Task Force on Human Relations. On September 15, 1986, while Father Wassmuth was in his living room, a pipe bomb shredded the back of his house. On September 29, 1986 the Aryan Nations planted four bombs throughout the city of Coeur d’Alene at a federal building, a restaurant, a retail complex and a military recruiting office, in order to create a diversion that would enable them to rob two local banks and the nearby Army National Guard armory. The robberies never occurred and only three of the bombs detonated. No casualties were reported. Shortly after the bombings, the FBI arrested three members involved in the bombing.
The influence of the Aryan Nations has waned since the death of its leader, Richard Butler, in September 2004. The movement went bankrupt following a lawsuit, the group’s former 20-acre compound was auctioned, and a number of its followers were convicted of acts of violence. The Aryan Nation currently poses no significant threat of terror in the area.
Location Terrorism could occur at any location in Kootenai County, depending on the terrorist group’s agenda. Any facility is vulnerable, as terrorists have historically sent chemical or biological agents through the mail. High-risk targets are often located near high traffic/high visibility routes with convenient transportation
16-17

Kootenai County Multi-Jurisdictional All Hazard Mitigation Plan; Volume 1—Planning-Area-Wide Elements
access that have symbolic value or economic significance. Other targets may include events and locations that garner large crowds. Nationwide, high-risk targets include the following:
• Government office buildings, courthouses, schools, hospitals and shopping centers
• Symbolic targets whose operations, practices or associations represent values in conflict with the terrorists ideology
• Dams, water supplies, electrical and gas distribution systems, pipelines and chemical facilities
• Military installations and suppliers
• Railheads, interstate highways, tunnels, airports, ferries, bridges, seaports and overpasses
• Recreational facilities such as sports stadiums, theaters, parks, casinos, concert halls and public venues
• Financial institutions and banks
• Sites of historical and symbolic significance
• Scientific research facilities, academic institutions and museums
• Telecommunications, newspapers, and radio and television stations
• Chemical, industrial and petroleum plants
• Business offices and convention centers
• Law, fire, emergency medical services, and responder facilities and operations centers
• Special events, parades, religious services, festivals and celebrations
• Planned Parenthood facilities and abortion clinics.
Kootenai County has identified facilities in the following categories as vulnerable to terrorism:
• Government facilities
• Major public venues
• Commercial facilities/centers
• Utilities and other critical infrastructure
• Educational facilities
• Tourist attractions.
Because of the sensitive nature of this information, specific facility names are not included in this hazard mitigation plan.
The County’s proximity to Spokane, Washington, may increase the likelihood of secondary effects (for example, a drain on emergency response resources and medical facilities) as a result of an attack on this major metropolitan area.
Frequency While the potential for future terrorism incidents in Kootenai County is difficult to predict, the combination of past incidents and potential terrorist targets make a terrorism incident possible. Efforts from local, state, and federal officials must be coordinated to prevent future terrorist incidents. However, a terrorist attack may occur in or around the county despite the efforts of these entities.
16-18

HAZARDS OF INTEREST
Severity A terrorism event can cause public fear regarding the use of mass transportation or going outside in the event of a biological or nuclear attack. Public and private communication systems can fail because of an overwhelming amount of usage or damage to infrastructure. Health care facilities can become inundated and must be prepared to triage injured patients, handle mass casualties, and conduct decontamination operations.
Kootenai County does not contain any sites with national symbolism (such as the Statue of Liberty), so a national-level terrorist attack is unlikely. However, terrorism events, typically bomb threats, may occur at local schools, government facilities, places of worship, etc. In Kootenai County, terrorist attacks could vary from a mere threat to an individual facility to the use of a high-yield explosive or other device in a highly populated area.
The most feared scenario for a terrorism event in Kootenai County is a biological or chemical attack. Identifying the agent administered can be difficult, which exacerbates planning and treatment efforts. Contamination can easily spread due to lack of timely identification. Moreover, some agents have no cure or limited vaccines available, which limits response options.
Warning Time It is possible to thwart terrorist attacks through aggressive intelligence monitoring and monitoring of individuals who exhibit radical tendencies. The National Terrorism Advisory System (NTAS) provides detailed information about terrorist threats to the public, government agencies, first responders, airports and other transportation hubs, and the private sector. When there is a threat, an NTAS Alert is announced to the public by the Secretary of Homeland Security. It may include specific information about the nature of the threat, including the geographic region, mode of transportation, or critical infrastructure potentially affected, as well as steps that individuals and communities can take to protect themselves and help prevent, mitigate, or respond to the threat. The alert indicates whether the threat is elevated or imminent. Elevated threats are when there is no specific information about the timing or location. Imminent threats are when it is believed the threat is impending or very soon. The alerts are posted on line and released to the news media for distribution. The Department of Homeland Security also distributes alerts through its social media channels (U.S. Department of Homeland Security 2013).
Some terrorist attacks may show warning signs, such as a suspicious package left unattended. Local, state, and federal officials as well as the general public are responsible for recognizing the warning signs of terrorism incidents and for taking appropriate actions to mitigate against possible attacks.
16.6.3 Secondary Hazards The secondary hazards resulting from a terrorist attack depend on the size and scope of the incident. Some possible secondary hazards include widespread utility failure, health effects such as epidemics or pandemics, flooding (if a dam was destroyed), and environmental contamination. Also of concern is the disruption an attack may cause to government facilities.
16.6.4 Vulnerability Kootenai County does not have facilities, buildings, or landmarks that are more likely to be targeted than other areas in the country. However, numerous schools and government buildings could be considered potential targets for local terrorist activity. These facilities, as well as any of the critical infrastructure in the county, are vulnerable to terrorist attacks. The degree to which they are vulnerable is assessed at the facility level by facility owners and local law enforcement.
16-19

Kootenai County Multi-Jurisdictional All Hazard Mitigation Plan; Volume 1—Planning-Area-Wide Elements
The effects of a terrorist act can include injury, loss of life, property damage, disruptions of key services (electricity, water supply, public transportation and communications), lasting emotional damage, and economic damage. Due to limited resources, delays in treatment and support may be expected. It may take anywhere from several hours to two days before federal assistance is on site and fully functional. Local emergency services personnel will be the first to respond and assist the affected people and environment.
Estimate of Potential Dollar Loss Potential loss estimates are not provided due to security concerns. However, the following are potential economic impacts from terrorist events:
• The cost of a terrorist act would be felt in terms of loss of life and property, disruption of business activity and long-term emotional impacts. Recovery would take significant resources and expense at the local level.
• Utility losses could cause a reduction in employment, wholesale and retail sales, utility repairs, and increased medical risks. Local governments may lose sales tax, and the finances of private utility companies and the businesses that rely on them would be disrupted.
• Significant economic impact can result from computer security breaches associated with data and telecommunications losses.
• Significant economic impact can result from a transportation facility being rendered impassable. The loss of a roadway or railway would have serious effects on the economy and local jurisdictions’ ability to provide services. Loss of travel routes would result in loss of commerce, and could impact the ability to provide emergency services to citizens by delaying response times or limiting routes for equipment such as fire apparatus, police vehicles, and ambulances. The ability to receive fuel deliveries would also be impacted.
Environmental Impacts Depending on the type and location of an act of terrorism, it can impact the environment and result in loss of life for humans and animals. A radiological device or an improvised nuclear device would have a long term impact that could cost billions of dollars to remediate. An attack on waste treatment, natural gas, petroleum, or chemical facilities could also have long-term environmental impacts on Kootenai County.
16-20

CHAPTER 17. PLANNING AREA RISK RANKING
A risk ranking was performed for the hazards of concern described in this plan. The risk ranking is a key step in developing an action plan. It allows jurisdictions to compare the impacts of one hazard to another. That comparison provides critical information to use in selecting hazard mitigation actions. The results are used in establishing mitigation priorities. This process is not intended to focus all actions on the hazard with the highest rank, but to ensure that jurisdictions do not forget about hazards that have less but still significant impact. The ranking process also identifies hazards that have little or no impact and can be eliminated from consideration for actions.
This risk ranking assesses the probability of each hazard’s occurrence as well as its likely impact on the people, property and economy of the planning area. Estimates of risk were generated with data from Hazus-MH using methodologies promoted by FEMA. This chapter presents the ranking for the entire planning area in aggregate. The same process was used by each individual planning partner as described in Volume 2 of this plan.
17.1 PROBABILITY OF OCCURRENCE The probability of occurrence of a hazard is indicated by a factor based on the likely frequency of occurrence:
• High—Hazard event is likely to occur within 25 years (Probability Factor = 3)
• Medium—Hazard event is likely to occur within 100 years (Probability Factor =2)
• Low—Hazard event is not likely to occur within 100 years (Probability Factor =1)
• No exposure—There is no probability of occurrence (Probability Factor = 0)
The assessment of hazard frequency is generally based on past hazard events in the area. Table 17-1 summarizes the probability assessment for each hazard of concern for this plan.
TABLE 17-1. PROBABILITY OF HAZARDS
Hazard Event Probability (high, medium, low) Probability Factor Avalanche Low 1 Dam Failure Low 1 Drought Medium 2 Earthquake Medium 2 Flood High 3 Landslide High 3 Severe Weather High 3 Volcano (Ash fall) Low 1 Wildfire High 3
17-1

Kootenai County Multi-Jurisdictional All Hazard Mitigation Plan; Volume 1—Planning-Area-Wide Elements
17.2 IMPACT Hazard impacts were assessed in three categories: impacts on people, impacts on property and impacts on the local economy. Numerical impact factors were assigned as follows:
• People—Values were assigned based on the percentage of the total population exposed to the hazard event. The degree of impact on individuals will vary and is not measurable, so the calculation assumes for simplicity and consistency that all people exposed to a hazard because they live in a hazard zone will be equally impacted when a hazard event occurs. It should be noted that planners can use an element of subjectivity when assigning values for impacts on people. Impact factors were assigned as follows:
– High—50 percent or more of the population is exposed to a hazard (Impact Factor = 3)
– Medium—25 to 49 percent of the population is exposed to a hazard (Impact Factor = 2)
– Low—25 percent or less of the population is exposed to the hazard (Impact Factor = 1)
– No impact—None of the population is exposed to a hazard (Impact Factor = 0)
• Property—Values were assigned based on the percentage of the total property value exposed to the hazard event:
– High—30 percent or more of the total property value is exposed to a hazard (Impact Factor = 3)
– Medium—15 to 29 percent of the total property value is exposed to a hazard (Impact Factor = 2)
– Low—14 percent or less of the total property value is exposed to the hazard (Impact Factor = 1)
– No impact—None of the total property value is exposed to a hazard (Impact Factor = 0)
• Economy—Values were assigned based on the percentage of the total property value vulnerable to the hazard event. Values represent estimates of the loss from a major event of each hazard in comparison to the total value of the property exposed to the hazard. For some hazards, such as wildfire, landslide and severe weather, vulnerability was considered to be the same as exposure due to the lack of loss estimation tools specific to those hazards. Loss estimates separate from the exposure estimates were generated for the earthquake and flood hazards using Hazus-MH.
– High—Estimated loss from the hazard is 20 percent or more of the total exposed property value (Impact Factor = 3)
– Medium—Estimated loss from the hazard is 10 to 19 percent of the total exposed property value (Impact Factor = 2)
– Low—Estimated loss from the hazard is 9 percent or less of the total exposed property value (Impact Factor = 1)
– No impact—No loss is estimated from the hazard (Impact Factor = 0)
The impacts of each hazard category were assigned a weighting factor to reflect the significance of the impact. These weighting factors are consistent with those typically used for measuring the benefits of hazard mitigation actions: impact on people was given a weighting factor of 3; impact on property was given a weighting factor of 2; and impact on the economy was given a weighting factor of 1.
Table 17-2, Table 17-3 and Table 17-4 summarize the impacts for each hazard.
17-2

PLANNING AREA RISK RANKING
TABLE 17-2. IMPACT ON PEOPLE FROM HAZARDS
Hazard Event Impact (high, medium, low) Impact Factor Multiplied by Weighting Factor (3)
Avalanche Low 1 1x3=3 Dam Failure Low 1 1x3=3 Drought None 0 0x3=0 Earthquake High 3 3x3=9 Flood Medium 2 3x2=6 Landslide Medium 2 3x2=6 Severe Weather High 3 3x3=9 Volcano (Ash fall) High 3 3x3=9 Wildfire High 3 3x3=6
TABLE 17-3. IMPACT ON PROPERTY FROM HAZARDS
Hazard Event Impact (high, medium, low) Impact Factor Multiplied by Weighting Factor (2)
Avalanche Low 1 2x1=2 Dam Failure Low 1 2x1=2 Drought None 0 2x0=0 Earthquake Medium 2 2x2=4 Flood Low 1 2x1=2 Landslide Low 1 2x1=2 Severe Weather High 3 2x3=6 Volcano (Ash fall) Low 1 2x1=2 Wildfire Medium 2 2x2=4
TABLE 17-4. IMPACT ON ECONOMY FROM HAZARDS
Hazard Event Impact (high, medium, low) Impact Factor Multiplied by Weighting Factor (1)
Avalanche Low 1 1x1=1 Dam Failure High 3 1x3=3 Drought Medium 2 1x2=2 Earthquake Low 1 1x1=1 Flood Medium 2 1x2=2 Landslide Low 1 1x1=1 Severe Weather High 3 1x3=3 Volcano (Ash fall) Medium 2 1x2=2 Wildfire High 3 1x3=3
17-3

Kootenai County Multi-Jurisdictional All Hazard Mitigation Plan; Volume 1—Planning-Area-Wide Elements
17.3 RISK RATING AND RANKING The risk rating for each hazard was determined by multiplying the probability factor by the sum of the weighted impact factors for people, property and operations, as summarized in Table 17-5. Based on these ratings, a priority of high, medium or low was assigned to each hazard. Table 17-6 shows the hazard risk ranking.
TABLE 17-5. HAZARD RISK RATING
Hazard Event Probability Factor Sum of Weighted Impact Factors Total (Probability x Impact)
Avalanche 1 (3+2+1) = 5 1x5=5 Dam Failure 1 (3+2+3) = 8 1x8=8 Drought 2 (0+0+3) = 3 2x3=6 Earthquake 2 (9+4+1) = 14 3x14=42 Flood 3 (6+2+2) = 10 3x10=30 Landslide 3 (6+2+1) = 9 3x9=27 Severe Weather 3 (9+6+3) = 18 3x18=54 Volcano (Ash fall) 1 (9+2+2) = 13 1x13=13 Wildfire 3 (9+4+3) = 16 3x16=48
TABLE 17-6. HAZARD RISK RANKING
Hazard Ranking Hazard Event Category
1 Severe Weather High 2 Wildfire High 3 Earthquake High 4 Flood High 5 Landslide Medium 6 Volcano Medium 7 Dam Failure Low 8 Drought Low 9 Avalanche Low
17-4

Kootenai County Multi-Jurisdictional All Hazard Mitigation Plan Volume 1: Planning-Area-Wide Elements
PART 3 — MITIGATION STRATEGY


CHAPTER 18. MITIGATION ALTERNATIVES
Catalogs of hazard mitigation alternatives were developed that present a broad range of alternatives to be considered for use in the planning area, in compliance with 44 CFR (Section 201.6(c)(3)(ii)). One catalog was developed for each hazard of concern evaluated in this plan, and a single catalog was developed for all the identified hazards of interest. The catalogs are presented in Table 18-1 through Table 18-10. The catalogs present alternatives that are categorized in two ways:
• By what the alternative would do:
– Manipulate a hazard
– Reduce exposure to a hazard
– Reduce vulnerability to a hazard
– Increase the ability to respond to or be prepared for a hazard
• By who would have responsibility for implementation:
– Individuals (Personal)
– Businesses (Corporate)
– Government.
Hazard mitigation initiatives recommended in this plan were selected from among the alternatives presented in the catalogs and by each planning partner as they pertain to their area of responsibility. The catalogs provide a baseline of mitigation alternatives that are backed by a planning process, are consistent with the planning partners’ goals and objectives, and are within the capabilities of the partners to implement. Not all of these actions will be feasible for this plan. The purpose of the catalogs was to equip the planning partners with a list of what could be considered to reduce local risks associated with each hazard. All actions identified in Volume 2 of this plan were selected based on the selection criteria described in Chapter 1 of Volume 2. Initiatives in the catalog that are not included for the partnership’s action plan were not selected for one or more of the following reasons:
• The action is not feasible.
• The action is already being implemented.
• There is an apparently more cost-effective alternative.
• The action does not have public or political support.
18-1

Kootenai County Multi-Jurisdictional All Hazard Mitigation Plan; Volume 1—Planning-Area-Wide Elements
TABLE 18-1. CATALOG OF MITIGATION ALTERNATIVES—AVALANCHE
Manipulate Hazard Personal 1. Minimize tree removal. Corporate 1. Minimize tree removal.
2. Institute avalanche control program. Government 1. Minimize tree removal.
2. Institute avalanche control program.
Reduce Exposure Personal 1. Locate structures outside of hazard area (away from known avalanche areas).
2. Avoid avalanche hazard areas during times of elevated risk. Corporate 1. Locate structures outside of hazard area (away from known avalanche areas).
2. Encourage/require avoidance of avalanche hazard areas during times of elevated risk. Government 1. Locate structures outside of hazard area (away from known avalanche areas).
2. Adopt land use policies that prohibit the placement of habitable structures in high risk avalanche areas.
3. Encourage/require avoidance of avalanche hazard areas during times of elevated risk.
Reduce Vulnerability Personal 1. Attend avalanche preparedness and response courses.
2. Increase familiarity with avalanche advisory information. Corporate 1. Provide/encourage avalanche preparedness and response courses.
2. Increase familiarity with avalanche advisory information. Government 1. Provide/encourage avalanche preparedness and response courses.
2. Increase familiarity with avalanche advisory information.
Increase Preparation or Response Capability Personal 1. Educate yourself on risk reduction techniques for avalanche hazards.
2. Contribute to data collection on avalanche events (e.g. avalanche reporting systems). Corporate 1. Develop a continuity of operations plan.
2. Educate employees on the potential exposure to avalanche hazards and emergency response protocols.
3. Contribute to data collection on avalanche events (e.g. avalanche reporting systems). 4. Identify succession planning/opportunities for passing on institutional knowledge.
Government 1. Develop maps of known or likely avalanche hazard areas. 2. Provide technical information and guidance. 3. Enact tools to help manage development in hazard areas: better land controls, tax incentives,
information. 4. Educate the public on the avalanche hazard and appropriate risk reduction alternatives. 5. Fund and train back country rescue teams. 6. Collect data and location information on slide events. 7. Identify succession planning/opportunities for passing on institutional knowledge. 8. Work to improve event notification and response times. 9. Develop system for monitoring impacts on the transportation system. 10. Provide information on hazard in easily accessible website portal. 11. Develop a communication system for general notification when an event occurs.
18-2

MITIGATION ALTERNATIVES
TABLE 18-2. CATALOG OF MITIGATION ALTERNATIVES—DAM FAILURE
Manipulate Hazard Personal None Corporate 1. Remove dams.
2. Remove levees. 3. Strengthen dams/levees.
Government 1. Remove dams. 2. Remove levees. 3. Strengthen dams/levees.
Reduce Exposure Personal 1. Relocate out of dam failure inundation areas. Corporate 1. Replace earthen dams with hardened structures. Government 1. Replace earthen dams with hardened structures.
2. Relocate critical facilities out of dam failure inundation areas. 3. Promote open space land use in designated dam failure inundation areas.
Reduce Vulnerability Personal 1. Elevate your home to appropriate levels.
2. Flood-proof your home to appropriate levels. Corporate 1. Flood-proof facilities within dam failure/inundation areas.
2. Continue/ensure regularly scheduled engineering assessments. Government 1. Adopt higher regulatory floodplain standards in mapped dam failure inundation areas.
2. Retrofit critical facilities within dam failure inundation areas. 3. Consider low density land uses within dam failure inundation areas. 4. Continue/ensure regularly scheduled engineering assessments. 5. Create easements in impoundment and downstream inundation areas.
Increase Preparation or Response Capability Personal 1. Learn about risk reduction to the dam failure hazard.
2. Learn the evacuation routes for a dam failure event. 3. Learn about early warning procedures. 4. Purchase flood insurance.
Corporate 1. Educate employees on the probable impacts of a dam failure. 2. Develop a continuity of operations plan. 3. Develop and update emergency action plans. 4. Educate employees on evacuation routes
Government 1. Create, maintain and update scenario-based dam failure inundation area maps. 2. Enhance emergency operations plan to include a dam failure component. 3. Institute monthly communications checks with dam operators. Maintain up-to-date
communications list. 4. Inform the public on risk reduction techniques and develop a communication plan. 5. Adopt real-estate disclosure requirements for the re-sale of property located within dam failure
inundation areas. 6. Establish early warning systems downstream of high hazard dams. 7. Create and maintain proper inventory of dams and levees. 8. Update evacuation routes and educate the public on these routes. 9. Provide information on hazard in an easily accessible website portal. 10. Identify succession planning and opportunities for passing on institutional knowledge. 11. Develop and update emergency actions plans. 12. Promote the purchase of flood insurance in inundation areas.
18-3

Kootenai County Multi-Jurisdictional All Hazard Mitigation Plan; Volume 1—Planning-Area-Wide Elements
TABLE 18-3. CATALOG OF MITIGATION ALTERNATIVES—DROUGHT
Manipulate Hazard Personal None Corporate None Government 1. Promote groundwater recharge through stormwater management.
2. Implement cloud seeding techniques during dry season.
Reduce Exposure Personal 1. Consider stored water/captured water techniques during dry seasons. Corporate 1. Consider stored water/captured water techniques during dry seasons. Government 1. Identify and create groundwater back up sources.
2. Create/identify new impounded water supply points.
Reduce Vulnerability Personal 1. Plant drought resistant landscapes.
2. Reduce water system losses. 3. Modify plumbing systems, i.e., water saving kits.
Corporate 1. Plant drought resistant landscapes. 2. Reduce private water system losses. 3. Identify alternate water supply sources. 4. Plant drought-resistant crop varieties.
Government 1. Plant drought resistant landscapes on community owned facilities. 2. Use water conflict regulations. 3. Distribute water saving kits. 4. Identify sites ideally suited for groundwater recharge. 5. Implement stormwater retention in regions ideally suited for groundwater recharge. 6. Reduce water system losses.
Increase Preparation or Response Capability Personal 1. Practice active water conservation techniques. Corporate 1. Practice active water conservation techniques.
2. Develop a water conservation plan. 3. Develop a continuity of operations plan.
Government 1. Identify alternative water supplies for time of drought. 2. Develop mutual aid agreements with alternative suppliers. 3. Develop a drought contingency plan. 4. Develop criteria triggers for drought related actions. 5. Improve accuracy of water supply forecasts. 6. Modify rate structures to influence active water conservation techniques. 7. Consider providing incentives to property owners who use drought resistant landscapes in the
design of their home. 8. Develop and implement drought education and notification systems and a communication plan. 9. Emphasize drought’s relationship to other hazards in hazard awareness messaging. 10. Increase capability to enforce water restrictions when such restrictions are in place. 11. Identify succession planning and opportunities for passing on institutional knowledge. 12. Encourage local water users to develop water conservation plans. 13. Increase use of water meters where appropriate. 14. Provide information on hazard in easily accessible website portal.
18-4

MITIGATION ALTERNATIVES
TABLE 18-4. CATALOG OF MITIGATION ALTERNATIVES—EARTHQUAKE
Manipulate Hazard Personal None Corporate None Government None
Reduce Exposure Personal 1. Locate outside of hazard area (off soft soils). Corporate 1. Locate/relocate mission critical functions outside hazard area where possible. Government 1. Locate critical facilities or functions outside of hazard area where possible.
Reduce Vulnerability Personal 1. Retrofit structure (anchor house structure to foundation).
2. Secure household items that can cause injury or damage such as water heaters, bookcases, and other appliances.
3. Build to higher design. Corporate 1. Build redundancy for critical functions and facilities.
2. Retrofit critical buildings and areas housing mission critical functions. 3. Perform non-structural assessments and mitigation activities (e.g., anchor bookcases to the wall).
Government 1. Harden infrastructure. 2. Provide redundancy for critical functions. 3. Implement higher regulatory standards. 4. Adopt the International Building Code. 5. Encourage mitigation of private property. 6. Perform non-structural assessments and mitigation activities (e.g., anchor bookcases to the wall). 7. Perform structural and non-structural retrofits of critical facilities. 8. Implement seismic design code for all new buildings. 9. Protect natural resources that might be impacted by the built environment (i.e., pipelines,
roadways, etc.).
18-5

Kootenai County Multi-Jurisdictional All Hazard Mitigation Plan; Volume 1—Planning-Area-Wide Elements
TABLE 18-4. CATALOG OF MITIGATION ALTERNATIVES—EARTHQUAKE
Increase Preparation or Response Capability Personal 1. Practice “drop, cover and hold.”
2. Develop household mitigation plan, such as creating a retrofit savings account, communication capability with outside, 72-hour self-sufficiency during an event.
3. Increase capability by having cash reserves for reconstruction. 4. Become informed on the hazard- and risk-reduction alternatives available. 5. Participate in drills such as the Great Shakeout 6. Develop a post-disaster action plan for your household.
Corporate 1. Adopt higher standard for new construction. Consider “performance based design’ when building new structures.
2. Increase capability by having cash reserves for reconstruction. 3. Inform your employees on the possible impacts of earthquake and how to deal with them at your
work facility. 4. Develop a continuity of operations plan. 5. Participate in drills such as the Great Shakeout.
Government 1. Produce more accurate hazard maps (e.g., liquefaction and soils maps). 2. Provide technical information and guidance. 3. Enact tools to help manage development in hazard areas: tax incentives, information. 4. Include retrofitting/replacement of critical system elements in capital improvement plan. 5. Develop strategy to take advantage of post-disaster opportunities. 6. Warehouse critical infrastructure components such as pipe, power line, and road repair material. 7. Develop, adopt and update a continuity of operations plan. 8. Initiate triggers guiding improvements, such as: < 50% substantial damage/improvements. 9. Further enhance seismic risk assessment to target high hazard buildings for mitigation
opportunities (e.g., older structures, unreinforced masonry). 10. Develop a post-disaster action plan that includes a grant funding and debris removal components. 11. Participate in drills such as the Great Shakeout. 12. Develop public education and a communication plan. 13. Update public outreach materials to include best available data on earthquake risk. 14. Identify succession planning and opportunities for passing on institutional knowledge. 15. Assess emergency response routes and determine backup options in case of damage or disruption. 16. Provide information on hazard in easily accessible website portal. 17. Increase knowledge of how soils can impact areas by addressing setbacks of unstable soils and
steep slopes. 18. Educate K-12, citizens, developers and businesses on earthquake safety and building codes. 19. Maintain an earthquake response plan to account for secondary hazards, such as fire and
hazardous material spills. 20. Require/encourage rapid damage assessment training. 21. Conduct Applied Technology Council post-earthquake building evaluation training (ATC-20) for
school maintenance staff. 22. Store emergency water supply sufficient for students and staff at school for one day.
18-6

MITIGATION ALTERNATIVES
TABLE 18-5. CATALOG OF MITIGATION ALTERNATIVES—FLOOD
Manipulate Hazard Personal 1. Clear stormwater drains and culverts. Corporate 1. Clear stormwater drains and culverts. Government 1. Clear stormwater drains and culverts.
2. Dredging, levee construction, providing retention areas. 3. Structural flood control: levees, dams, channelization, revetments. 4. Construct regional stormwater control facilities. 5. Harden areas with significant erosion concerns. 6. Promote/retain natural vegetation in areas with significant erosion concerns.
Reduce Exposure Personal 1. Locate outside of hazard area.
2. Elevate utilities above base flood elevation. 3. Institute low impact development techniques on property.
Corporate 1. Locate business-critical facilities or functions outside hazard area. 2. Institute low impact development techniques on property.
Government 1. Locate or relocate critical facilities outside of hazard area. 2. Acquire or relocate identified repetitive loss properties. 3. Promote open space uses in identified high hazard areas via techniques such as: planned unit
developments, easements, setbacks, greenways, sensitive area tracks. 4. Adopt land development criteria such as planned unit developments, density transfers, clustering. 5. Institute low impact development techniques on property. 6. Acquire vacant land or promote open space uses in developing watersheds to control increases in
runoff.
Reduce Vulnerability Personal 1. Retrofit structure (elevate house above base flood elevation).
2. Elevate items with house above base flood elevation. 3. Build new homes above base flood elevation. 4. Flood-proof non-residential structures.
Corporate 1. Build redundancy for critical functions/retrofit critical buildings. 2. Provide flood-proofing measures when new critical infrastructure must be located in floodplains.
Government 1. Strengthen existing infrastructure. 2. Provide redundancy for critical functions and infrastructure. 3. Adopt appropriate regulatory standards such as cumulative substantial improvement/damage,
freeboard, lower substantial damage threshold, compensatory storage. 4. Stormwater management regulations and master planning. 5. Adopt “no-adverse impact” floodplain management policies that strive to not increase the flood
risk on downstream communities. 6. Encourage mitigation of private property. 7. Reduce likelihood of secondary effects from Superfund sites. 8. Perform regular inspections/assessments of locally owned or maintained flood control
infrastructure. 9. Replace undersized culverts. 10. Provide permanent protection for pump stations at risk of flooding. 11. Identify and mitigate drainage issues resulting in ponding. 12. Enhance road drainage programs. 13. Ensure permitting process is consistent with the adopted floodplain management ordinance. 14. Elevate or relocate roads subject to frequent flooding.
18-7

Kootenai County Multi-Jurisdictional All Hazard Mitigation Plan; Volume 1—Planning-Area-Wide Elements
TABLE 18-5. CATALOG OF MITIGATION ALTERNATIVES—FLOOD
Increase Preparation or Response Capability Personal 1. Comply with National Flood Insurance Program.
2. Buy flood insurance. 3. Develop household mitigation plan, such as retrofit savings, communication capability with
outside, 72-hour self-sufficiency during and after an event. 4. Be aware of evacuation routes.
Corporate 1. Increase capability by having cash reserves for reconstruction. 2. Support and implement hazard disclosure for the sale or resale of property in identified risk zones. 3. Solicit partnerships with private sector stakeholders on projects with multiple benefits.
Government 1. Produce more accurate flood hazard maps or identify areas for further study. 2. Provide technical information and guidance. 3. Enact tools to help manage development in hazard areas (stronger controls, tax incentives,
information, enforcement of the National Flood Insurance Program). 4. Incorporate retrofitting/replacement of critical system elements in capital improvement plan. 5. Develop strategy to take advantage of post-disaster opportunities. 6. Warehouse critical infrastructure components. 7. Develop and adopt a continuity of operations plan. 8. Join Community Rating System program or maintain/improve class. 9. Maintain existing data and gather new data needed to define risks and vulnerability. 10. Provide training for staff and decision-makers in floodplain management. 11. Create a building and elevation inventory of structures in the floodplain 12. Develop and implement a public information strategy and communication plan. 13. Charge a hazard mitigation fee on all new permits to create a hazard mitigation funding source for
initiatives or grant cost share requirements. 14. Form a flood task force. 15. Continue to pre-stage flood response equipment. 16. Integrate floodplain management policies into other planning mechanisms in the planning area. 17. Develop/maintain system for perishable data collection after a flood event occurs. 18. Develop framework/continue efforts for cooperation between agencies/districts in flood mitigation
activities (e.g., sand and sand bag deployment). 19. Retain good standing in National Flood Insurance Program. 20. Integrate flood mitigation opportunities into capital improvement programs. 21. Create a fund/earmark funds for in-kind contributions as grant opportunities become available. 22. Continue to produce after-action reports on flood events. 23. Continue to coordinate with local incident management team. 24. Identify succession planning/opportunities for passing on institutional knowledge. 25. Identify areas where current floodplain maps are inaccurate. 26. Provide information on hazard in easily accessible website portal. 27. Develop hazard communication plan and expand community-level partnerships. 28. Develop/update evacuation routes. 29. Participate in information sharing with other agencies (e.g., U.S. Army Corps of Engineers,
National Weather Service). 30. Develop and update memorandums of understanding with other local jurisdictions. 31. Educate citizens and respondents on flood response in Superfund sites. 32. Identify all hazard representatives and develop education and partnership opportunities. 33. Identify sources of nuisance flooding. 34. Review and update floodplain damage prevention ordinances. 35. Identify lake debris collection sites. 36. Require/encourage rapid damage assessment training. 37. Map locations of storm drains, catch basins and dry wells so that they may be located and cleared.
18-8

MITIGATION ALTERNATIVES
TABLE 18-6. CATALOG OF MITIGATION ALTERNATIVES—LANDSLIDE
Manipulate Hazard Personal 1. Stabilize slope (dewater, armor toe).
2. Reduce weight on top of slope. 3. Minimize vegetation removal and the addition of impervious surfaces.
Corporate 1. Stabilize slope (dewater, armor toe). 2. Reduce weight on top of slope. 3. Minimize vegetation removal and the addition of impervious surfaces.
Government 1. Stabilize slope (dewater, armor toe). 2. Reduce weight on top of slope. 3. Minimize vegetation removal and the addition of impervious surfaces. 4. Monitor/review accumulated effects from piecemeal development on steep slopes. 5. Implement post-fire vegetation management plans. 6. Coordinate with logging/paper companies to identify potential risks from logging areas.
Reduce Exposure Personal 1. Locate structures outside of hazard area (off unstable land and away from slide run-out area). Corporate 1. Locate structures outside of hazard area (off unstable land and away from slide run-out area). Government 1. Acquire properties located in high risk landslide areas.
2. Adopt land use policies that prohibit the placement of habitable structures in high risk landslide areas.
3. Adopt land use policies that limit accumulated effects in landslide risk areas.
Reduce Vulnerability Personal 1. Retrofit homes on steep slopes. Corporate 1. Retrofit at-risk facilities. Government 1. Adopt higher regulatory standards for new development in unstable slope areas.
2. Armor/retrofit critical infrastructure from the impact of landslides. 3. Post signage in landslide hazard areas. 4. Stockpile response/preparedness supplies.
18-9

Kootenai County Multi-Jurisdictional All Hazard Mitigation Plan; Volume 1—Planning-Area-Wide Elements
TABLE 18-6. CATALOG OF MITIGATION ALTERNATIVES—LANDSLIDE
Increase Preparation or Response Capability Personal 1. Institute warning system and develop evacuation plan.
2. Increase capability by having cash reserves for reconstruction. 3. Educate yourself on risk reduction techniques for landslide hazards.
Corporate 1. Institute warning system and develop evacuation plan. 2. Increase capability by having cash reserves for reconstruction. 3. Develop a continuity of operations plan. 4. Educate your employees on the potential exposure to landslide hazards and your emergency
response protocol. Government 1. Produce landslide hazard risk maps.
2. Provide technical information and guidance. 3. Enact tools to help manage development in hazard areas: better land controls, tax incentives,
information, limit new impervious surfaces. 4. Develop strategy to take advantage of post-disaster opportunities. 5. Warehouse critical infrastructure components. 6. Develop and adopt a continuity of operations plan. 7. Educate the public on the landslide hazard and appropriate risk reduction alternatives. 8. Develop memorandums of understanding with other communities for response and recovery
efforts. 9. Collect and compile landslide event history database. 10. Develop a strategy for communicating risk to property owners and the community recently
affected by wildfires. 11. Identify succession planning and opportunities for passing on institutional knowledge. 12. Increase regulatory authority for post-fire mitigation enforcement. 13. Establish and communicate post-event repair responsibilities (e.g., roads that are impacted). 14. Provide information on hazard in easily accessible website portal. 15. Identify residential communities with substantial landslide risk and educate the public on these
risks. 16. Request or perform a detailed landslide study. 17. Conduct geological engineering studies of potential slide areas.
18-10

MITIGATION ALTERNATIVES
TABLE 18-7. CATALOG OF MITIGATION ALTERNATIVES—SEVERE WEATHER
Manipulate Hazard Personal None Corporate None Government None
Reduce Exposure Personal None Corporate None Government None
Reduce Vulnerability Personal 1. Insulate house or structure.
2. Provide redundant heat and power. 3. Plant appropriate trees near home and power lines (“Right tree, right place” National Arbor Day
Foundation Program). Corporate 1. Relocate critical infrastructure, such as power lines, underground.
2. Reinforce or relocate critical infrastructure such as power lines so that it meets performance expectations.
3. Install tree wire. Government 1. Strengthen infrastructure (such a locating utilities underground).
2. Trim trees back from power lines. 3. Designate snow routes and strengthen critical road sections and bridges. 4. Continue/expand participation in Storm Ready programs. 5. Continue to support/maintain/improve notification and warning systems. 6. Support/continue/formalize shelter agreements. 7. Ensure critical facilities have back-up power generation capabilities. 8. Install lightning protection devices on critical facilities and communications equipment. 9. Inspect/ensure facilities can withstand high winds. 10. Encourage construction of guard rails where appropriate. 11. Ensure critical facilities/shelters can easily transition to generator produced power. 12. Stockpile response/preparedness supplies.
18-11

Kootenai County Multi-Jurisdictional All Hazard Mitigation Plan; Volume 1—Planning-Area-Wide Elements
TABLE 18-7. CATALOG OF MITIGATION ALTERNATIVES—SEVERE WEATHER
Increase Preparation or Response Capability Personal 1. Trim or remove trees that could affect power lines.
2. Promote 72-hour self-sufficiency. 3. Obtain a NOAA weather radio. 4. Obtain an emergency generator. 5. Identify locations of emergency shelters. 6. Participate in amateur radio groups. 7. Sign up for reverse 911 systems/other notification options. 8. Post address so as to be visible to first responders.
Corporate 1. Trim or remove trees that could affect power lines. 2. Create redundancy. 3. Equip facilities with a NOAA weather radio. 4. Equip vital facilities with emergency power sources.
Government 1. Support/continue programs such as “Tree Watch” that proactively manage problem areas by use of selective removal of hazardous trees, tree replacement, etc.
2. Establish and enforce building codes that require all roofs to withstand snow loads. 3. Improve communication alternatives/redundancy. 4. Modify land use and environmental regulations to support vegetation management activities that
improve reliability in utility corridors. 5. Modify landscape and other ordinances to encourage appropriate planting near overhead power,
cable, and phone lines. 6. Establish formal mutual aid agreements. 7. Provide NOAA weather radios to the public. 8. Continue outreach efforts for family disaster planning. 9. Encourage coordination with amateur radio groups. 10. Identify/earmark funding opportunities for generator purchases. 11. Develop evacuation and emergency road plans and prioritize roads for response efforts. 12. Encourage residents to sign up for reverse 911 services or other notification services. 13. Develop and implement call trees in remote areas. 14. Provide information on hazard in easily accessible website portal. 15. Develop and implement a communication plan for the hazard. 16. Identify succession planning and opportunities for passing on institutional knowledge. 17. Develop snow volume management plan. 18. Increase resources available and develop back-up plans for response to widespread disasters (e.g.,
man power, funding, materials). 19. Encourage or require residents to post addresses where they are visible to first responders. 20. Promote flagging of fire hydrants in the event of heavy snows. 21. Develop memorandums of understanding and areas of responsibility for snow removal. 22. Evaluate/inspect government facilities for snow load capacity. 23. Develop snow removal plan for roofs of public buildings and critical facilities. 24. Map locations of storm drains, catch basins and dry wells so that they may be located and cleared. 25. Appoint a full time flood coordinator. 26. Identify debris collection sites and develop a plan to keep them clear. 27. Develop a plan to access funds/bank accounts in the event of a prolonged power outage.
18-12

MITIGATION ALTERNATIVES
TABLE 18-8. CATALOG OF MITIGATION ALTERNATIVES—VOLCANIC ASH
Manipulate Hazard Personal None Corporate None Government None
Reduce Exposure Personal 1. Identify equipment and resources that may be negatively impacted by ash fall and develop a plan
to move indoors and protect. Corporate 1. Identify equipment and resources that may be negatively impacted by ash fall and develop a plan
to move indoors and protect. Government 1. Identify equipment and resources that may be negatively impacted by ash fall and develop a plan
to move indoors and protect.
Reduce Vulnerability Personal None Corporate 1. Build redundancy for critical facilities and functions. Government 1. Build redundancy for critical facilities and functions.
2. Adopt International Building Code. 3. Retrofit older building stock to be able to support accumulated ash fall loads.
Increase Preparation or Response Capability Personal None Corporate 1. Develop continuity of operations plan. Government 1. Public outreach, awareness.
2. Support detailed wind/ash fall studies. 3. Develop post-event cleanup plan. 4. Provide information on hazard in easily accessible website portal. 5. Identify succession planning and opportunities for passing on institutional knowledge. 6. Develop and implement a communication plan.
18-13

Kootenai County Multi-Jurisdictional All Hazard Mitigation Plan; Volume 1—Planning-Area-Wide Elements
TABLE 18-9. CATALOG OF MITIGATION ALTERNATIVES—WILDFIRE
Manipulate Hazard Personal 1. Clear potential fuels on property: dry, overgrown underbrush, diseased trees. Corporate 1. Clear potential fuels on property: dry, overgrown underbrush, diseased trees. Government 1. Clear fuels (dry underbrush, diseased trees) on land that can trigger and maintain wildfires.
2. Implement best management practices on public lands. 3. Partner with local communities to create fire breaks.
Reduce Exposure Personal 1. Create and maintain defensible space around structures.
2. Locate outside of hazard areas. 3. Mow regularly. 4. Stay clear of hazard areas during a wildfire event.
Corporate 1. Create and maintain defensible space around structures and infrastructure. 2. Locate outside of hazard area.
Government 1. Create and maintain defensible space around structures and infrastructure. 2. Locate outside of hazard area. 3. Enhance building code to include use of fire-resistant materials in high hazard areas.
Reduce Vulnerability Personal 1. Create and maintain defensible space around structures, provide water on site.
2. Use fire-retardant building materials. 3. Create defensible spaces around your home.
Corporate 1. Create and maintain defensible space around structures and infrastructure, provide water on site. 2. Use fire-retardant building materials.
Government 1. Create and maintain defensible space around structures and infrastructure. 2. Use fire-retardant building materials. 3. Develop and implement higher regulatory standards. 4. Develop or support biomass reclamation initiatives. 5. Increase regulatory requirements/code enforcement for fire risk reduction or incentivize higher
standards. 6. Develop fire smart building code regulations. 7. Implement roadside vegetation management best practices. 8. Conduct pre-construction building inspections that include fire prevention requirements and
provide emphasis on a fire resistant structure. 9. Conduct private road design reviews at building permit applications in rural areas. 10. Develop programs to identify/install wildfire water supply systems such as cisterns, ponds and dry
hydrants.
18-14

MITIGATION ALTERNATIVES
TABLE 18-9. CATALOG OF MITIGATION ALTERNATIVES—WILDFIRE
Increase Preparation or Response Capability Personal 1. Employ Firewise techniques to safeguard your home.
2. Identify alternative water supplies for firefighting. 3. Install/replace roofing material with non-combustible roofing materials.
Corporate 1. Support Firewise community initiatives. 2. Create stored water supplies to be utilized for firefighting. 3. Develop post-evacuation plans.
Government 1. Establish or improve public outreach and education efforts. 2. Investigate possible use of weapons of mass destruction funds available to enhance fire capability
in high risk areas. 3. Identify and create emergency vehicle access in high hazard areas. 4. Seek alternative water supplies in wildland/urban interface areas. 5. Become a Firewise community. 6. Utilize academia to study wildfire impacts and solutions. 7. Establish/maintain mutual aid agreements between fire service agencies. 8. Create/implement/update wildfire protection plans. 9. Develop evacuation and emergency road plans and prioritize roads for response efforts. 10. Encourage residents to sign up for reverse 911 services or other notification services. 11. Develop and implement call trees in remote areas. 12. Provide information on hazard in easily accessible website portal. 13. Develop and implement a communication plan for the hazard. 14. Identify succession planning and opportunities for passing on institutional knowledge. 15. Collect perishable data and develop after-action reports. 16. Provide public outreach to increase understanding of forest management practices. 17. Utilize/improve warning systems. 18. Continue to develop/utilize county community development fire reports. 19. Enhance/provide redundant communication infrastructure. 20. Develop memorandum of understanding for waterborne access or evacuation from waterfront
areas during emergencies. 21. Promote participation in the Keep Idaho Green Program. 22. Pre-plan responses to wildland/urban interface areas. 23. Encourage or require residents to post addresses where they are visible to first responders. 24. Encourage or require rapid damage assessment training. 25. Promote public awareness on the prevention of chimney fires. 26. Produce and disseminate information pamphlets. 27. Encourage local camps and property owners to develop and educate campers on ingress and
egress routes during emergencies. 28. Partner with railroads to provide public education and training of responders to enhance their
ability to communicate with firefighters during an incident.
18-15

Kootenai County Multi-Jurisdictional All Hazard Mitigation Plan; Volume 1—Planning-Area-Wide Elements
TABLE 18-10. CATALOG OF MITIGATION ALTERNATIVES—HAZARDS OF INTEREST
Manipulate Hazard Personal None Corporate None Government None
Reduce Exposure Personal None Corporate None Government 1. Regulate amount of hazardous materials that can be stored in residential areas.
2. Construct recreational vehicle pump-out stations to prevent illegal dumping of waste.
Reduce Vulnerability Personal None Corporate 1. Add further security equipment and enhanced warning systems to high risk facilities. Government 1. Retrofit critical facilities with barricades.
2. Consider purchasing electromagnetic-pulse protective boxes. 3. Increase fuel storage capabilities. 4. Develop and maintain offsite isolated servers. 5. Add further security equipment and enhanced warning systems to high risk facilities. 6. Work with private industry to improve storage and containment of hazardous materials. 7. Anchor/brace hazardous material storage containers. 8. Install gates at railroad crossings. 9. Stockpile preparedness/response supplies. 10. Coordinate training and planning for radiological response with the pre-incident prevention
protocols for federal, state, and local law enforcement and emergency response agencies, as described in the Idaho Hazardous Materials/Weapons of Mass Destruction Incident Command and Support Plan
11. Provide timely, accurate, and credible information about public health threats. 12. Develop and purchase vaccines and vaccine production capacity. 13. Stockpile antivirals, supplies, and other countermeasures, such as diagnostic and surveillance
tools. 14. Increase cyber-security appliances and applications. 15. Back up and develop procedures to restore critical data/information. 16. Enhance encryption capabilities. 17. Develop authentication, access, and accounting systems. 18. Ensure redundant equipment and networks. 19. Alternate delivery methods. 20. Share malware signatures. 21. Utilize ICS-CERT information to reduce vulnerabilities to information technology systems
Increase Preparation or Response Capability Personal 1. Prepare for 72-hour self-sufficiency.
2. Obtain an emergency generator. 3. Sign up for reverse 911 or other notification systems.
Corporate 1. Develop continuity of operations plan. 2. Train staff on emergency response procedures/protocols.
18-16

MITIGATION ALTERNATIVES
TABLE 18-10. CATALOG OF MITIGATION ALTERNATIVES—HAZARDS OF INTEREST
Increase Preparation or Response Capability (continued) Government 1. Develop a continuity of operations plan.
2. Attend CST training and information sessions. 3. Acquire mobile antennas. 4. Develop subject matter expertise on specific hazards. 5. Coordinate with subject matter experts. 6. Form public/private partnerships. 7. Develop and execute training exercises. 8. Identify succession planning and opportunities for passing on institutional knowledge. 9. Develop plan for bringing in outside resources. 10. Develop transportation/evacuation plan. 11. Develop communication plan for hazards. 12. Develop website portal to house relevant information. 13. Promote 72-hour self-sufficiency. 14. Warehouse critical infrastructure components. 15. Develop a catalog of hazard threat planning scenarios. 16. Enhance joint training opportunities to include human-caused event scenarios. 17. Promote or develop shelter-in-place training. 18. Implement an incident command system. 19. Develop a jurisdiction-specific risk management plan. 20. Create and maintain on-site response plans as needed. 21. Maintain terrorism awareness level training for all department personnel. 22. Ensure up-to-date contact information is on hand for the gas line company. 23. Provide hazardous material response training. 24. Acquire additional equipment for firefighters in order to detect gas leaks. 25. Educate the public on safe handling of fuels and other hazardous materials. 26. Acquire and stage spill response equipment. 27. Partner with/encourage local businesses to improve emergency plans. 28. Develop partnerships to respond to civil unrest/terrorism. 29. Conduct lock-down drills. 30. Inventory hazardous materials at schools annually. 31. Conduct improvised incendiary explosive device recognition training. 32. Train all key personnel in ICS-100. 33. Implement an emergency notification system for parents. 34. Improve security features at school entrances. 35. Promote/develop neighborhood watch programs. 36. Create a public education campaign for pandemic flu. 37. Develop and encourage the development of actions regarding consumption, food production and
processing, sheltering animals and covering stored water and feed in the event of a radiological event.
38. Participate in radiological training programs. 39. Increase public awareness, knowledge, and adoption of influenza prevention, mitigation, and
treatment recommendations. 40. Monitor disease spread nationally and internationally to support rapid response. 41. Develop pandemic preparedness checklists and guidance materials. 42. Conduct cyber-security training and exercises. 43. Participate in ISP and web hosting reviews. 44. Coordinate automated responses to cyber-attacks. 45. Map suspicious cyber/information technology activities.
18-17


19-1
CHAPTER 19. ADOPTION AND PLAN MAINTENANCE
19.1 PLAN ADOPTION A hazard mitigation plan must document that it has been formally adopted by the governing body of the jurisdiction requesting federal approval of the plan (44 CFR Section 201.6(c)(5)). For multi-jurisdictional plans, each jurisdiction requesting approval must document that is has been formally adopted. This plan will be submitted for a pre-adoption review to the Idaho Bureau of Homeland Security and FEMA Region X prior to adoption. Once pre-adoption approval has been provided, all planning partners will formally adopt the plan. All partners understand that DMA compliance and its benefits cannot be achieved until the plan is adopted. Copies of the resolutions adopting this plan for all planning partners can be found in Volume 2 of this plan.
19.2 PLAN MAINTENANCE STRATEGY A hazard mitigation plan must present a plan maintenance process that includes the following (44 CFR Section 201.6.c.4):
• A section describing the method and schedule of monitoring, evaluating, and updating the mitigation plan over a 5-year cycle
• A process by which local governments incorporate the requirements of the mitigation plan into other planning mechanisms, such as comprehensive or capital improvement plans, when appropriate
• A discussion on how the community will continue public participation in the plan maintenance process.
This chapter details the formal process that will ensure that the Kootenai County Hazard Mitigation Plan remains an active and relevant document and that the planning partners maintain their eligibility for applicable funding sources. The plan maintenance process includes a schedule for monitoring and evaluating the plan annually and producing an updated plan every five years. This chapter also describes how public participation will be integrated throughout the plan maintenance and implementation process. It explains how the mitigation strategies outlined in this Plan will be incorporated into existing planning mechanisms and programs, such as comprehensive land-use planning processes, capital improvement planning, and building code enforcement and implementation. The Plan’s format allows sections to be reviewed and updated when new data become available, resulting in a plan that will remain current and relevant.
19.2.1 Plan Implementation The effectiveness of the hazard mitigation plan depends on its implementation and incorporation of its action items into partner jurisdictions’ existing plans, policies and programs. Together, the action items in the plan provide a framework for activities that the planning partners can implement over the next five years. The planning team and the steering committee have established goals and objectives and have prioritized mitigation actions that will be implemented through existing plans, policies, and programs.
The Kootenai County Office of Emergency Management will have lead responsibility for overseeing the plan implementation and maintenance strategy. Plan implementation and evaluation will be a shared

Kootenai County Multi-Jurisdictional All Hazard Mitigation Plan; Volume 1—Planning-Area-Wide Elements
responsibility among all planning partners and agencies identified as lead agencies in the mitigation action plans in Volume 2 of this plan.
19.2.2 Steering Committee and Hazard Mitigation Task Force The steering committee is a total volunteer body that oversaw the development of this plan and made recommendations on key elements, including the maintenance strategy. Steering committee members will be encouraged to join the Hazard Mitigation Task Force, which has an active role in the plan maintenance strategy. The Hazard Mitigation Task Force should strive to include representation from the planning partners, as well as other stakeholders in the planning area.
The principal role of the Hazard Mitigation Task Force in the plan maintenance strategy will be to review the annual progress report and provide input to Kootenai County on possible enhancements to be considered at the next update. Future plan updates will be overseen by the Hazard Mitigation Task Force. Completion of the progress report is the responsibility of each planning partner, not the responsibility of the Hazard Mitigation Task Force. It will be the Hazard Mitigation Task Force’s role to review the progress report in an effort to identify issues needing to be addressed by future plan updates.
19.2.3 Continuing Public Involvement The public will continue to be apprised of the plan’s progress through the Kootenai County website. Each planning partner should provide links to the County hazard mitigation plan website on their individual jurisdictional websites to increase avenues of public access to the plan. The Kootenai County Office of Emergency Management has agreed to maintain the hazard mitigation plan website. This site will not only house the final plan, it will also become the one-stop shop for information regarding the plan, the partnership and plan implementation. Copies of the plan will be distributed to the Kootenai County Library system. Upon initiation of future update processes, a new public involvement strategy will be initiated based on guidance from a new steering committee. This strategy will be based on the needs and capabilities of the planning partnership at the time of the update. At a minimum, this strategy will include the use of local media outlets within the planning area.
19.2.4 Annual Progress Report The minimum task of each planning partner will be the evaluation of the progress of its individual action plan during a 12-month performance period. This review will include the following:
• Summary of any hazard events that occurred during the performance period and the impact these events had on the planning area
• Review of mitigation success stories
• Review of continuing public involvement
• Brief discussion about why targeted strategies were not completed
• Re-evaluation of the action plan to determine if the timeline for identified projects needs to be amended (such as changing a long-term project to a short-term one because of new funding)
• Recommendations for new projects
• Changes in or potential for new funding options (grant opportunities)
• Impact of any other planning programs or initiatives that involve hazard mitigation
The Kootenai County Office of Emergency Management will assume the responsibility of initiating the annual progress reporting process. A template to guide the planning partners in preparing a progress report
19-2

ADOPTION AND PLAN MAINTENANCE
19-3
has been created as part of this planning process (see Appendix D). The Office of Emergency Management will then prepare a formal annual report on the progress of the plan. This report should be used as follows:
• Posted on the Kootenai County website page dedicated to the hazard mitigation plan
• Provided to the local media through a press release
• Presented to planning partner governing bodies to inform them of the progress of actions implemented during the reporting period
• For those planning partners that participate in the Community Rating System, the report can be provided as part of the CRS annual re-certification package. The CRS requires an annual recertification to be submitted by October 1 of every calendar year for which the community has not received a formal audit. To meet this recertification timeline, the planning partners will strive to complete progress reports between June and September each year.
Uses of the progress report will be at the discretion of each planning partner. Annual progress reporting is not a requirement specified under 44 CFR. However, it may enhance the planning partnership’s opportunities for funding. While failure to implement this component of the plan maintenance strategy will not jeopardize a planning partner’s compliance under the DMA, it may jeopardize its opportunity to partner and leverage funding opportunities with the other partners.
19.2.5 Plan Update 44 CFR requires that local hazard mitigation plans be reviewed, revised if appropriate, and resubmitted for approval in order to remain eligible for benefits under the DMA (Section 201.6.d.3). The planning partners intend to update the hazard mitigation plan on a five-year cycle from the date of initial plan adoption. This cycle may be accelerated to less than five years based on the following triggers:
• A federal disaster declaration that impacts the planning area
• A hazard event that causes loss of life
• A comprehensive update of the county or participating city’s comprehensive plan
It will not be the intent of future updates to develop a complete new hazard mitigation plan for the planning area. The update will, at a minimum, include the following elements:
• The update process will be convened through a steering committee.
• The hazard risk assessment will be reviewed and, if necessary, updated using best available information and technologies.
• The action plans will be reviewed and revised to account for new planning partners, any initiatives completed, dropped, or changed and to account for changes in the risk assessment or new partnership policies identified under other planning mechanisms (such as the comprehensive plan).
• The draft update will be sent to appropriate agencies and organizations for comment.
• The public will be given an opportunity to comment on the update prior to adoption.
• The partnership governing bodies will adopt their respective portions of the updated plan.
19.2.6 Incorporation into Other Planning Mechanisms The information on hazard, risk, vulnerability, and mitigation contained in this plan is based on the best science and technology available at the time this plan was prepared. The Kootenai County Comprehensive

Kootenai County Multi-Jurisdictional All Hazard Mitigation Plan; Volume 1—Planning-Area-Wide Elements
Plan and the comprehensive plans of the partner cities are considered to be integral parts of this plan. The County and partner cities, through adoption of comprehensive plans and zoning ordinances, have planned for the impact of natural hazards. The plan development process provided the County and the cities with the opportunity to review and expand on policies contained within these planning mechanisms. The planning partners used their comprehensive plans and the hazard mitigation plan as complementary documents that work together to achieve the goal of reducing risk exposure to the citizens of Kootenai County. An update to a comprehensive plan may trigger an update to the hazard mitigation plan.
All municipal planning partners should attempt to create a linkage between the hazard mitigation plan and their individual comprehensive plans by identifying a mitigation initiative as such and giving that initiative a high priority. Other planning processes and programs may be coordinated with the recommendations of the hazard mitigation plan to include the following:
• Planning partner emergency response plans
• Capital improvement programs
• Municipal codes
• Basin planning
• Community design guidelines
• Water-efficient landscape design guidelines
• Stormwater management programs
• Water system vulnerability assessments
• Community Wildfire Protection Plans
Some action items do not need to be implemented through regulation. Instead, these items can be implemented through the creation of new educational programs, continued interagency coordination, or improved public participation. As information becomes available from other planning mechanisms that can enhance this plan, that information will be incorporated via the update process.
19-4

REFERENCES
Alvarez, A. and R. Bachman. 2008. Violence: the enduring problem. Thousand Oaks, CA: Sage Publications.
ANI. 2013. Former FBI Director warns of ‘crippling effect’ cyber-terrorism can have in US infrastructure. News Track India. July 8. Available online at: http://www.newstrackindia.com/newsdetails/2013/07/08/169-Former-FBI-director-warns-of-crippling-effect-cyber-terrorism-can-have-on-US-infrastructure.html
Avalanche.org. Website of avalanche.org accessed January 2015, http://www.avalanche.org/.
Barry-Eaton District Health Department. n.d. Pandemic Influenza. Available online at: http://www.barryeatonhealth.org/Influenza/PandemicInfluenza.aspx
Blumer, H. 1946. “Collective Behavior,” in New Outline of the Principles of Sociology. New York, NY: Barnes and Noble, Inc., pp. 167-222.
Center for Disease Control and Prevention: Mitigation Slides, date unknown. Available online at, http://www.cdc.gov/media/pdf/MitigationSlides.pdf
Colorado Avalanche Information Center. No date. Website accessed May 2014/January 2015, http://avalanche.state.co.us/about-us/.
Federal Emergency Management Agency (FEMA). 1995. Available online at, http://www.fema.gov/media-library-data/20130726-1545-20490-4583/mhira_n1.pdf
Federal Emergency Management Agency (FEMA). 2001. Understanding Your Risks; Identifying Hazards and Determining your Risks. FEMA (386-2). August 2001
Federal Emergency Management Agency (FEMA). 2002. Getting Started; Building support for Mitigation Planning; FEMA (386-1). September 2002
Federal Emergency Management Agency (FEMA). 2003. Developing the Mitigation Plan; Identifying Mitigation Actions and Implementing Strategies. FEMA (386-3). April 2003
Federal Emergency Management Agency (FEMA). 2004. Using Hazus-MH for Risk Assessment, How to Guide, FEMA (433). August 2004
Federal Emergency Management Agency (FEMA). 2007. FEMA, National Flood Insurance Program, Community Rating System; CRS Coordinator’s Manual FIA-15/2007 OMB No. 1660-0022
Federal Emergency Management Agency (FEMA). 2012. Wind Zones in the United States. Available online at: http://www.fema.gov/safe-rooms/wind-zones-united-states
Federal Emergency Management Agency (FEMA). 2013. What is Mitigation? Last updated September 2013, http://www.fema.gov/what-mitigation.
Florida Forest Service. n.d. About the Keetch-Byram Drought Index. Florida Department of Agriculture and Consumer Services. Available online at: http://www.floridaforestservice.com/fire_weather/information/kbdi.html
R-1

Kootenai County Multi-Jurisdictional All Hazard Mitigation Plan; Volume 1—Planning-Area-Wide Elements
Global Security. 2013. Flu Pandemic Secondary Hazards / Events. Available online at: http://www.globalsecurity.org/security/ops/hsc-scen-3_flu-pandemic-hazards.htm
Idaho Geological Survey and Idaho Bureau of Homeland Security. 2009. Putting Down Roots in Earthquake Country. Available on line at http://www.bhs.idaho.gov/pages/Preparedness/Hazards/PDF/ Putting%20Down%20Roots%20in%20EQ%20Country.pdf
Idaho Panhandle Avalanche Center. Website of the Idaho Panhandle Avalanche Center accessed January 2015, http://www.idahopanhandleavalanche.org/.
Idaho Bureau of Homeland Security. 2013. Idaho State Hazard Mitigation Plan. Available online at, http://www.bhs.idaho.gov/Pages/Plans/Mitigation/SHMP.aspx.
Idaho Department of Labor. 2014. Kootenai County Workforce Trends. October 2014 bulleting prepared by Idaho Department of Labor. Post Falls, ID/
Idaho Department of Water Resources (IDWR). 2011. Dam Safety Web Site. Accessed April 29, 2011. http://www.idwr.idaho.gov/WaterManagement/StreamsDams/DamSafety/dams.htm
Idaho Department of Water Resources (IDWR). 2012. Idaho Flood and Seismic Risk Portfolio, Effective 2012 – 2017.
Idaho Department of Water Resources (IDWR). 2014. IDWR Dam Search Website. Accessed November 4, 2014 at http://www.idwr.idaho.gov/apps/ExtSearch/DamSafetySearch/default.aspx
Idaho Geological Survey. 2014. Web Site: Earthquakes in Idaho 1872-2000. Accessed November 4, 2014 at http://www.idahogeology.org/livemaps/IdahoEpicenters/index.html
Kootenai County Comprehensive Plan. Adopted December 30, 2010
Kootenai County Office of Emergency Management (OEM). 2009. Kootenai County Multi-Jurisdictional All Hazard Mitigation Plan. Coeur d’Alene, Idaho. November 2009
McAfee. 2013. The Economic Impact of Cybercrime and Cyber-Espionage. Center for Strategic and International Studies. July. Available online at: http://www.mcafee.com/us/resources/reports/rp-economic-impact-cybercrime.pdf
NAC Architecture. 2012. Kootenai County Master Plan. Available online at, http://www.kcgov.us/%5Cfiles%5Ccommissioners%5CKootenai%20County%20Master%20Plan.pdf
National Aeronautics and Space Administration (NASA). 2004. http://earthobservatory.nasa.gov/Newsroom/view.php?id=25145 NASA Earth Observatory News Web Site Item, dated August 2, 2004.
National Drought Mitigation Center. The website of the National Drought Mitigation Center. “Drought Impact Reporter Help.” Accessed January 2015, available online http://public.droughtreporter.unl.edu/help/
National Oceanic and Atmospheric Administration (NOAA). 2010. http://www4.ncdc.noaa.gov/cgi-win/wwcgi.dll?wwEvent~Storms. NOAA, National Climatic Data Center website, accessed 2010
R-2

REFERENCES
National Oceanic and Atmospheric Administration (NOAA). 2010a. JetStream – Online School for Weather. On-Line Address: http://www.srh.noaa.gov/jetstream/tstorms/tstorms_intro.htm
National Oceanic and Atmospheric Administration (NOAA). 2011. National Oceanic and Atmospheric Administration Web Site. 2010 Tied For Warmest Year on Record. Accessed 3/16/2012.
National Oceanic and Atmospheric Administration NOAA. 2013. Average Annual Number of Tornadoes. Available online at, http://www.ncdc.noaa.gov/climate-information/extreme-events/us-tornado-climatology
National Oceanic and Atmospheric Administration (NOAA). 2015. National Oceanic and Atmospheric Administration Web Site. January 16, 2015. NASA, NOAA Find 2014 Warmest Year in Modern Record. Available on-line at, http://www.nasa.gov/press/2015/january/nasa-determines-2014-warmest-year-in-modern-record/#.VLqvaSvF_VU.
National Park Service. 2015. Craters of the Moon National Monument and Preserve: Geological Activity. Last updated January 8, 2015, http://www.nps.gov/crmo/naturescience/geologicactivity.htm
National Weather Service (NWS). National Oceanic Atmospheric Administration (NOAA). Office of Climate, Water, and Weather Services. “Heat: A Major Killer”. January 27, 2015. Accessed 2015. <http://www.nws.noaa.gov/os/heat/index.shtml>. Storm Prediction Center. n.d. Haines Index. National Oceanic and Atmospheric Administration. Available online at: http://www.spc.noaa.gov/exper/firecomp/INFO/hainesinfo.html
U.S. Army Corps of Engineers. Engineering and Design; Dam Safety Assurance Program. EP 1110-2-1155. Department of the Army U.S. Army Corps of Engineers. Washington, DC 20314-1000. September 12, 1997.
U.S. Census. 2014. 2013 American Community Survey 3-Year Estimates for Kootenai County Idaho. U.S. Census Bureau American FactFinder website. Accessed October 24, 2014 at http://factfinder2.census.gov/faces/nav/jsf/pages/searchresults.xhtml?refresh=t
U.S. Department of Health and Human Services. 2005. HHS Pandemic Influenza Plan. November. Available online at: http://www.cdc.gov/flu/pdf/professionals/hhspandemicinfluenzaplan.pdf
U.S. Environmental Protection Agency. 2012. Paulsboro Train Derailment. December 19. Available online at: http://www.epa.gov/region2/superfund/removal/paulsboro/
U.S. Environmental Protection Agency (EPA). 2013g. “Release Chemical Report.” Available online at: http://iaspub.epa.gov/triexplorer/tri_release.chemical
U.S. Forest Service (USFS). 2013. Available online at, http://www.fs.fed.us/
U.S. Geological Survey (USGS). 1989. The Severity of an Earthquake. U.S. Government Printing Office: 1989-288-913. Accessed online at: http://pubs.usgs.gov/gip/earthq4/severity_text.html
U.S. Geological Survey (USGS). 2005. Landslide Hazards – A National Threat. Available online at http://pubs.usgs.gov/fs/2005/3156/2005-3156.pdf
R-3

Kootenai County Multi-Jurisdictional All Hazard Mitigation Plan; Volume 1—Planning-Area-Wide Elements
U.S. Geological Survey (USGS). 2008. An Atlas of ShakeMaps for Selected Global Earthquakes. U.S. Geological Survey Open-File Report 2008-1236. Prepared by Allen, T.I., Wald, D.J., Hotovec, A.J., Lin, K., Earle, P.S. and Marano, K.D.
U.S. Geological Survey (USGS). 2010. PAGER—Rapid Assessment of an Earthquake’s Impact. U.S. Geological Survey Fact Sheet 2010-3036. September 2010.
U.S. Geological Survey (USGS). 2010a. Volcanic Ash: What it can do and how to prevent damage. Last updated January 19, 2010, http://volcanoes.usgs.gov/ash/index.html
U.S. Geological Survey (USGS). 2012. Yellowstone Volcano Observatory: Questions about Yellowstone Volcanic History. Last updated July 6, 2012, http://volcanoes.usgs.gov/volcanoes/yellowstone/yellowstone_sub_page_54.html
U.S. Geological Survey (USGS). 2015. Two-percent probability of exceedance in 50 years map of peak ground acceleration. USGS map accessed online at http://earthquake.usgs.gov/hazards/products/conterminous/2014/2014_pga2pct50yrs.pdf
Washington Military Department Emergency Management Division and U.S. Geological Survey, Cascades Volcano Observatory. 1999. Volcanic Ash fall: How to be prepared for an ash fall. Vancouver Washington.
Wilson, Stan. 2012. “Riot anniversary tour surveys progress and economic challenges in Los Angeles.” CNN. April 25. Available online at: http://www.cnn.com/2012/04/25/us/california-post-riot/index.html?hpt=us_t4
World Health Organization (WHO). 2009. Pandemic Influenza Preparedness and Response: A WHO Guidance Document. Available online at, http://www.ncbi.nlm.nih.gov/books/NBK143061/
R-4

Kootenai County Multi-Jurisdictional All Hazard Mitigation Plan
APPENDIX A. ACRONYMS AND DEFINITIONS


APPENDIX A. ACRONYMS AND DEFINITIONS
ACRONYMS CFR—Code of Federal Regulations cfs—cubic feet per second CIP—Capital Improvement Plan CRS—Community Rating System DFIRM—Digital Flood Insurance Rate Maps DHS—Department of Homeland Security DMA —Disaster Mitigation Act EPA—U.S. Environmental Protection Agency ESA—Endangered Species Act FEMA—Federal Emergency Management Agency FERC—Federal Energy Regulatory Commission FIRM—Flood Insurance Rate Map FPI—Fire Potential Index FRCC—Fire regime condition class GIS—Geographic Information System Hazus-MH—Hazards, United States-Multi Hazard IBC—International Building Code IDWR—IdahoDepartment of Water Resources MM—Modified Mercalli Scale NEHRP—National Earthquake Hazards Reduction Program NFIP—National Flood Insurance Program NID—National Inventory of Dams NOAA—National Oceanic and Atmospheric Administration NWS—National Weather Service PGA—Peak Ground Acceleration SHELDUS—Special Hazard Events and Losses Database for the US TENORM—Technologically enhanced naturally occurring radioactivity USFS—U.S. Forest Service USGCRP—U.S. Global Change Research Program USGS—U.S. Geological Survey WFAS—Wildland Fire Assessment System WUI—Wildland/urban interface
DEFINITIONS 100-Year Flood: The term “100-year flood” can be misleading. The 100-year flood does not necessarily occur once every 100 years. Rather, it is the flood that has a 1 percent chance of being equaled or exceeded in any given year. Thus, the 100-year flood could occur more than once in a relatively short period of time. The Federal Emergency Management Agency (FEMA) defines it as the 1 percent annual chance flood, which is now the standard definition used by most federal and state agencies and by the National Flood Insurance Program (NFIP).
A-1

Kootenai County Multi-Jurisdictional All Hazard Mitigation Plan; Volume 1—Planning-Area-Wide Elements
Acre-Foot: An acre-foot is the amount of water it takes to cover 1 acre to a depth of 1 foot. This measure is used to describe the quantity of storage in a water reservoir. An acre-foot is a unit of volume. One acre foot equals 7,758 barrels; 325,829 gallons; or 43,560 cubic feet. An average household of four will use approximately 1 acre-foot of water per year.
Asset: An asset is any man-made or natural feature that has value, including, but not limited to, people; buildings; infrastructure, such as bridges, roads, sewers, and water systems; lifelines, such as electricity and communication resources; and environmental, cultural, or recreational features such as parks, wetlands, and landmarks.
Base Flood: The flood having a 1% chance of being equaled or exceeded in any given year, also known as the “100-year” or “1% chance” flood. The base flood is a statistical concept used to ensure that all properties subject to the National Flood Insurance Program (NFIP) are protected to the same degree against flooding.
Basin: A basin is the area within which all surface water—whether from rainfall, snowmelt, springs, or other sources—flows to a single water body or watercourse. The boundary of a river basin is defined by natural topography, such as hills, mountains, and ridges. Basins are also referred to as “watersheds” and “drainage basins.”
Benefit: A benefit is a net project outcome and is usually defined in monetary terms. Benefits may include direct and indirect effects. For the purposes of benefit-cost analysis of proposed mitigation measures, benefits are limited to specific, measurable, risk reduction factors, including reduction in expected property losses (buildings, contents, and functions) and protection of human life.
Benefit/Cost Analysis: A benefit/cost analysis is a systematic, quantitative method of comparing projected benefits to projected costs of a project or policy. It is used as a measure of cost effectiveness.
Building: A building is defined as a structure that is walled and roofed, principally aboveground, and permanently fixed to a site. The term includes manufactured homes on permanent foundations on which the wheels and axles carry no weight.
Capability Assessment: A capability assessment provides a description and analysis of a community’s current capacity to address threats associated with hazards. The assessment includes two components: an inventory of an agency’s mission, programs, and policies, and an analysis of its capacity to carry them out. A capability assessment is an integral part of the planning process in which a community’s actions to reduce losses are identified, reviewed, and analyzed, and the framework for implementation is identified. The following capabilities were reviewed under this assessment:
• Legal and regulatory capability
• Administrative and technical capability
• Fiscal capability
Community Rating System (CRS): The CRS is a voluntary program under the NFIP that rewards participating communities (provides incentives) for exceeding the minimum requirements of the NFIP and completing activities that reduce flood hazard risk by providing flood insurance premium discounts.
Critical Area: An area defined by state or local regulations as deserving special protection because of unique natural features or its value as habitat for a wide range of species of flora and fauna. A sensitive/critical area is usually subject to more restrictive development regulations.
A-2

…APPENDIX A. ACRONYMS AND DEFINITIONS
Critical Facility: Facilities and infrastructure that is critical to the health and welfare of the population. These become especially important after any hazard event. Critical facilities include:
• Public and private utilities, infrastructure and transportation systems that are vital to maintaining or restoring normal services to areas damaged by hazard events. i.e. Communications, Water, Power, Waste Water, Roads, Bridges, Airports, Pipelines, etc.
• 9-1-1 Centers, police stations, fire stations, vehicle and equipment storage facilities, medical facilities and emergency operations centers that are needed for disaster response before, during and after hazard events
• Institutional facilities, nursing homes, and housing likely to contain occupants who may not be sufficiently mobile to avoid death or injury during a hazard event
• Structures or facilities that produce, use or store highly volatile, flammable, explosive, toxic or water-reactive materials
• Public gathering places that could be used as evacuation centers during large-scale disasters
• Government and educational facilities central to governance and quality of life along with response and recovery actions taken as a result of a hazard event.
Cubic Feet per Second (cfs): Discharge or river flow is commonly measured in cfs. One cubic foot is about 7.5 gallons of liquid.
Dam: Any artificial barrier or controlling mechanism that can or does impound 10 acre-feet or more of water.
Dam Failure: Dam failure refers to a partial or complete breach in a dam (or levee) that impacts its integrity. Dam failures occur for a number of reasons, such as flash flooding, inadequate spillway size, mechanical failure of valves or other equipment, freezing and thawing cycles, earthquakes, and intentional destruction.
Debris Flow: Dense mixtures of water-saturated debris that move down-valley; looking and behaving much like flowing concrete. They form when loose masses of unconsolidated material are saturated, become unstable, and move down slope. The source of water varies but includes rainfall, melting snow or ice, and glacial outburst floods.
Debris Slide: Debris slides consist of unconsolidated rock or soil that has moved rapidly down slope. They occur on slopes greater than 65 percent.
Disaster Mitigation Act of 2000 (DMA); The DMA is Public Law 106-390 and is the latest federal legislation enacted to encourage and promote proactive, pre-disaster planning as a condition of receiving financial assistance under the federal disaster and emergency assistance programs. The DMA emphasizes planning for disasters before they occur. Under the DMA, a pre-disaster hazard mitigation program and new requirements for the national post-disaster hazard mitigation grant program were established.
Drainage Basin: A basin is the area within which all surface water- whether from rainfall, snowmelt, springs or other sources- flows to a single water body or watercourse. The boundary of a river basin is defined by natural topography, such as hills, mountains and ridges. Drainage basins are also referred to as watersheds or basins.
Drought: Drought is a period of time without substantial rainfall or snowfall from one year to the next. Drought can also be defined as the cumulative impacts of several dry years or a deficiency of precipitation over an extended period of time, which in turn results in water shortages for some activity, group, or
A-3

Kootenai County Multi-Jurisdictional All Hazard Mitigation Plan; Volume 1—Planning-Area-Wide Elements
environmental function. A hydrological drought is caused by deficiencies in surface and subsurface water supplies. A socioeconomic drought impacts the health, well-being, and quality of life or starts to have an adverse impact on a region. Drought is a normal, recurrent feature of climate and occurs almost everywhere.
Earthquake: An earthquake is defined as a sudden slip on a fault, volcanic or magmatic activity, and sudden stress changes in the earth that result in ground shaking and radiated seismic energy. Earthquakes can last from a few seconds to over 5 minutes, and have been known to occur as a series of tremors over a period of several days. The actual movement of the ground in an earthquake is seldom the direct cause of injury or death. Casualties may result from falling objects and debris as shocks shake, damage, or demolish buildings and other structures.
Exposure: Exposure is defined as the number and dollar value of assets considered to be at risk during the occurrence of a specific hazard.
Extent: The extent is the size of an area affected by a hazard.
Fire Behavior: Fire behavior refers to the physical characteristics of a fire and is a function of the interaction between the fuel characteristics (such as type of vegetation and structures that could burn), topography, and weather. Variables that affect fire behavior include the rate of spread, intensity, fuel consumption, and fire type (such as underbrush versus crown fire).
Fire Frequency: Fire frequency is the broad measure of the rate of fire occurrence in a particular area. An estimate of the areas most likely to burn is based on past fire history or fire rotation in the area, fuel conditions, weather, ignition sources (such as human or lightning), fire suppression response, and other factors.
Flash Flood: A flash flood occurs with little or no warning when water levels rise at an extremely fast rate
Flood Insurance Rate Map (FIRM): FIRMs are the official maps on which the Federal Emergency Management Agency (FEMA) has delineated the Special Flood Hazard Area.
Flood Insurance Study: A report published by the Federal Insurance and Mitigation Administration for a community in conjunction with the community’s Flood Insurance rate Map. The study contains such background data as the base flood discharges and water surface elevations that were used to prepare the FIRM. In most cases, a community FIRM with detailed mapping will have a corresponding flood insurance study.
Floodplain: Any land area susceptible to being inundated by flood waters from any source. A flood insurance rate map identifies most, but not necessarily all, of a community’s floodplain as the Special Flood Hazard Area.
Floodway: Floodways are areas within a floodplain that are reserved for the purpose of conveying flood discharge without increasing the base flood elevation more than 1 foot. Generally speaking, no development is allowed in floodways, as any structures located there would block the flow of floodwaters.
Floodway Fringe: Floodway fringe areas are located in the floodplain but outside of the floodway. Some development is generally allowed in these areas, with a variety of restrictions. On maps that have identified and delineated a floodway, this would be the area beyond the floodway boundary that can be subject to different regulations.
A-4

…APPENDIX A. ACRONYMS AND DEFINITIONS
Fog: Fog refers to a cloud (or condensed water droplets) near the ground. Fog forms when air close to the ground can no longer hold all the moisture it contains. Fog occurs either when air is cooled to its dew point or the amount of moisture in the air increases. Heavy fog is particularly hazardous because it can restrict surface visibility. Severe fog incidents can close roads, cause vehicle accidents, cause airport delays, and impair the effectiveness of emergency response. Financial losses associated with transportation delays caused by fog have not been calculated in the United States but are known to be substantial.
Freeboard: Freeboard is the margin of safety added to the base flood elevation.
Frequency: For the purposes of this plan, frequency refers to how often a hazard of specific magnitude, duration, and/or extent is expected to occur on average. Statistically, a hazard with a 100-year frequency is expected to occur about once every 100 years on average and has a 1 percent chance of occurring any given year. Frequency reliability varies depending on the type of hazard considered.
Fujita Scale of Tornado Intensity: Tornado wind speeds are sometimes estimated on the basis of wind speed and damage sustained using the Fujita Scale. The scale rates the intensity or severity of tornado events using numeric values from F0 to F5 based on tornado wind speed and damage. An F0 tornado (wind speed less than 73 miles per hour (mph)) indicates minimal damage (such as broken tree limbs), and an F5 tornado (wind speeds of 261 to 318 mph) indicates severe damage.
Goal: A goal is a general guideline that explains what is to be achieved. Goals are usually broad-based, long-term, policy-type statements and represent global visions. Goals help define the benefits that a plan is trying to achieve. The success of a hazard mitigation plan is measured by the degree to which its goals have been met (that is, by the actual benefits in terms of actual hazard mitigation).
Geographic Information System (GIS): GIS is a computer software application that relates data regarding physical and other features on the earth to a database for mapping and analysis.
Hazard: A hazard is a source of potential danger or adverse condition that could harm people and/or cause property damage.
Hazard Mitigation Grant Program: Authorized under Section 202 of the Robert T. Stafford Disaster Relief and Emergency Assistance Act (Public Law 100-107), the program is administered by FEMA and provides grants to states, tribes, and local governments to implement hazard mitigation actions after a major disaster declaration. The purpose of the program is to reduce the loss of life and property due to disasters and to enable mitigation activities to be implemented as a community recovers from a disaster
Hazards U.S. Multi-Hazard (Hazus-MH) Loss Estimation Program: Hazus-MH is a GIS-based program used to support the development of risk assessments as required under the DMA. The Hazus-MH software program assesses risk in a quantitative manner to estimate damages and losses associated with natural hazards. Hazus-MH is FEMA’s nationally applicable, standardized methodology and software program and contains modules for estimating potential losses from earthquakes, floods, and wind hazards. Hazus-MH has also been used to assess vulnerability (exposure) for other hazards.
Hydraulics: Hydraulics is the branch of science or engineering that addresses fluids (especially water) in motion in rivers or canals, works and machinery for conducting or raising water, the use of water as a prime mover, and other fluid-related areas.
Hydrology: Hydrology is the analysis of waters of the earth. For example, a flood discharge estimate is developed by conducting a hydrologic study.
A-5

Kootenai County Multi-Jurisdictional All Hazard Mitigation Plan; Volume 1—Planning-Area-Wide Elements
Intensity: For the purposes of this plan, intensity refers to the measure of the effects of a hazard.
Inventory: The assets identified in a study region comprise an inventory. Inventories include assets that could be lost when a disaster occurs and community resources are at risk. Assets include people, buildings, transportation, and other valued community resources.
Landslide: Landslides can be described as the sliding movement of masses of loosened rock and soil down a hillside or slope. Fundamentally, slope failures occur when the strength of the soils forming the slope exceeds the pressure, such as weight or saturation, acting upon them.
Lightning: Lightning is an electrical discharge resulting from the buildup of positive and negative charges within a thunderstorm. When the buildup becomes strong enough, lightning appears as a “bolt,” usually within or between clouds and the ground. A bolt of lightning instantaneously reaches temperatures approaching 50,000ºF. The rapid heating and cooling of air near lightning causes thunder. Lightning is a major threat during thunderstorms. In the United States, 75 to 100 Americans are struck and killed by lightning each year (see http://www.fema.gov/hazard/thunderstorms/thunder.shtm).
Liquefaction: Liquefaction is the complete failure of soils, occurring when soils lose shear strength and flow horizontally. It is most likely to occur in fine grain sands and silts, which behave like viscous fluids when liquefaction occurs. This situation is extremely hazardous to development on the soils that liquefy, and generally results in extreme property damage and threats to life and safety.
Local Government: Any county, municipality, city, town, township, public authority, school district, special district, intrastate district, council of governments (regardless of whether the council of governments is incorporated as a nonprofit corporation under State law), regional or interstate government entity, or agency or instrumentality of a local government; any Indian tribe or authorized tribal organization, or Alaska Native village or organization; and any rural community, unincorporated town or village, or other public entity.
Magnitude: Magnitude is the measure of the strength of an earthquake, and is typically measured by the Richter scale. As an estimate of energy, each whole number step in the magnitude scale corresponds to the release of about 31 times more energy than the amount associated with the preceding whole number value.
Mass movement: A collective term for landslides, mudflows, debris flows, sinkholes and lahars.
Mitigation: A preventive action that can be taken in advance of an event that will reduce or eliminate the risk to life or property.
Mitigation Actions: Mitigation actions are specific actions to achieve goals and objectives that minimize the effects from a disaster and reduce the loss of life and property.
Objective: For the purposes of this plan, an objective is defined as a short-term aim that, when combined with other objectives, forms a strategy or course of action to meet a goal. Unlike goals, objectives are specific and measurable.
Peak Ground Acceleration: Peak Ground Acceleration (PGA) is a measure of the highest amplitude of ground shaking that accompanies an earthquake, based on a percentage of the force of gravity.
Preparedness: Preparedness refers to actions that strengthen the capability of government, citizens, and communities to respond to disasters.
A-6

…APPENDIX A. ACRONYMS AND DEFINITIONS
Presidential Disaster Declaration: These declarations are typically made for events that cause more damage than state and local governments and resources can handle without federal government assistance. Generally, no specific dollar loss threshold has been established for such declarations. A Presidential Disaster Declaration puts into motion long-term federal recovery programs, some of which are matched by state programs, designed to help disaster victims, businesses, and public entities.
Probability of Occurrence: The probability of occurrence is a statistical measure or estimate of the likelihood that a hazard will occur. This probability is generally based on past hazard events in the area and a forecast of events that could occur in the future. A probability factor based on yearly values of occurrence is used to estimate probability of occurrence.
Repetitive Loss Property: Any NFIP-insured property that, since 1978 and regardless of any changes of ownership during that period, has experienced:
• Four or more paid flood losses in excess of $1000.00; or
• Two paid flood losses in excess of $1000.00 within any 10-year period since 1978 or
• Three or more paid losses that equal or exceed the current value of the insured property.
Return Period (or Mean Return Period): This term refers to the average period of time in years between occurrences of a particular hazard (equal to the inverse of the annual frequency of occurrence).
Riverine: Of or produced by a river. Riverine floodplains have readily identifiable channels. Floodway maps can only be prepared for riverine floodplains.
Risk: Risk is the estimated impact that a hazard would have on people, services, facilities, and structures in a community. Risk measures the likelihood of a hazard occurring and resulting in an adverse condition that causes injury or damage. Risk is often expressed in relative terms such as a high, moderate, or low likelihood of sustaining damage above a particular threshold due to occurrence of a specific type of hazard. Risk also can be expressed in terms of potential monetary losses associated with the intensity of the hazard.
Risk Assessment: Risk assessment is the process of measuring potential loss of life, personal injury, economic injury, and property damage resulting from hazards. This process assesses the vulnerability of people, buildings, and infrastructure to hazards and focuses on (1) hazard identification; (2) impacts of hazards on physical, social, and economic assets; (3) vulnerability identification; and (4) estimates of the cost of damage or costs that could be avoided through mitigation.
Risk Ranking: This ranking serves two purposes, first to describe the probability that a hazard will occur, and second to describe the impact a hazard will have on people, property, and the economy. Risk estimates for the City are based on the methodology that the City used to prepare the risk assessment for this plan. The following equation shows the risk ranking calculation:
Risk Ranking = Probability + Impact (people + property + economy)
Robert T. Stafford Act: The Robert T. Stafford Disaster Relief and Emergency Assistance Act, Public Law 100-107, was signed into law on November 23, 1988. This law amended the Disaster Relief Act of 1974, Public Law 93-288. The Stafford Act is the statutory authority for most federal disaster response activities, especially as they pertain to FEMA and its programs.
Sinkhole: A collapse depression in the ground with no visible outlet. Its drainage is subterranean. It is commonly vertical-sided or funnel-shaped.
A-7

Kootenai County Multi-Jurisdictional All Hazard Mitigation Plan; Volume 1—Planning-Area-Wide Elements
Special Flood Hazard Area: The base floodplain delineated on a Flood Insurance Rate Map. The special flood hazard area is mapped as a Zone A in riverine situations and zone V in coastal situations. The special flood hazard area may or may not encompass all of a community’s flood problems
Stakeholder: Business leaders, civic groups, academia, non-profit organizations, major employers, managers of critical facilities, farmers, developers, special purpose districts, and others whose actions could impact hazard mitigation.
Stream Bank Erosion: Stream bank erosion is common along rivers, streams and drains where banks have been eroded, sloughed or undercut. However, it is important to remember that a stream is a dynamic and constantly changing system. It is natural for a stream to want to meander, so not all eroding banks are “bad” and in need of repair. Generally, stream bank erosion becomes a problem where development has limited the meandering nature of streams, where streams have been channelized, or where stream bank structures (like bridges, culverts, etc.) are located in places where they can actually cause damage to downstream areas. Stabilizing these areas can help protect watercourses from continued sedimentation, damage to adjacent land uses, control unwanted meander, and improvement of habitat for fish and wildlife.
Steep Slope: Different communities and agencies define it differently, depending on what it is being applied to, but generally a steep slope is a slope in which the percent slope equals or exceeds 25%. For this study, steep slope is defined as slopes greater than 33%.
Sustainable Hazard Mitigation: This concept includes the sound management of natural resources, local economic and social resiliency, and the recognition that hazards and mitigation must be understood in the largest possible social and economic context.
Thunderstorm: A thunderstorm is a storm with lightning and thunder produced by cumulonimbus clouds. Thunderstorms usually produce gusty winds, heavy rains, and sometimes hail. Thunderstorms are usually short in duration (seldom more than 2 hours). Heavy rains associated with thunderstorms can lead to flash flooding during the wet or dry seasons.
Tornado: A tornado is a violently rotating column of air extending between and in contact with a cloud and the surface of the earth. Tornadoes are often (but not always) visible as funnel clouds. On a local scale, tornadoes are the most intense of all atmospheric circulations, and winds can reach destructive speeds of more than 300 mph. A tornado’s vortex is typically a few hundred meters in diameter, and damage paths can be up to 1 mile wide and 50 miles long.
Vulnerability: Vulnerability describes how exposed or susceptible an asset is to damage. Vulnerability depends on an asset’s construction, contents, and the economic value of its functions. Like indirect damages, the vulnerability of one element of the community is often related to the vulnerability of another. For example, many businesses depend on uninterrupted electrical power. Flooding of an electric substation would affect not only the substation itself but businesses as well. Often, indirect effects can be much more widespread and damaging than direct effects.
Watershed: A watershed is an area that drains downgradient from areas of higher land to areas of lower land to the lowest point, a common drainage basin.
Wildfire: These terms refer to any uncontrolled fire occurring on undeveloped land that requires fire suppression. The potential for wildfire is influenced by three factors: the presence of fuel, topography, and air mass. Fuel can include living and dead vegetation on the ground, along the surface as brush and small trees, and in the air such as tree canopies. Topography includes both slope and elevation. Air mass includes temperature, relative humidity, wind speed and direction, cloud cover, precipitation amount, duration, and
A-8

…APPENDIX A. ACRONYMS AND DEFINITIONS
the stability of the atmosphere at the time of the fire. Wildfires can be ignited by lightning and, most frequently, by human activity including smoking, campfires, equipment use, and arson.
Windstorm: Windstorms are generally short-duration events involving straight-line winds or gusts exceeding 50 mph. These gusts can produce winds of sufficient strength to cause property damage. Windstorms are especially dangerous in areas with significant tree stands, exposed property, poorly constructed buildings, mobile homes (manufactured housing units), major infrastructure, and aboveground utility lines. A windstorm can topple trees and power lines; cause damage to residential, commercial, critical facilities; and leave tons of debris in its wake.
Zoning Ordinance: The zoning ordinance designates allowable land use and intensities for a local jurisdiction. Zoning ordinances consist of two components: a zoning text and a zoning map.
A-9


Kootenai County Multi-Jurisdictional All Hazard Mitigation Plan
APPENDIX B. PUBLIC OUTREACH MATERIALS


Kootenai County ID All Hazard Mitigation Plan Update Community SurveyKootenai County ID All Hazard Mitigation Plan Update Community SurveyKootenai County ID All Hazard Mitigation Plan Update Community SurveyKootenai County ID All Hazard Mitigation Plan Update Community Survey
A partnership of local governments and other stakeholders in Kootenai County are working together to update the Kootenai County All Hazard Mitigation Plan. In response to Federal programs that enable the partnership to use pre and post-disaster financial assistance to reduce the exposure of County residents to risks associated with hazards, all communities must have a current, adopted mitigation plan in place. In order to identify and plan for future natural disasters, we need your assistance. This questionnaire is designed to help us gage the level of knowledge local citizens already have about natural disaster issues and to find out from local residents about areas vulnerable to various types of disasters. The information you provide will help us coordinate activities to reduce the risk of injury or property damage in the future. The survey consists of 33 questions plus an opportunity for any additional comments at the end. The survey should take less than 15 minutes to complete and is anonymous. When you have finished the survey, please click "Done" on the final page. The Kootenai County All Hazard Mitigation Steering Committee thanks you for taking the time to participate in this information-gathering process.
1. Where in Kootenai County do you live?
2. Do you work in Kootenai County?
1.�Survey Introduction
*Athol
�����
Coeur d'Alene
�����
Conkling Park
�����
Dalton Gardens
�����
Fernan Lake Village
�����
Harrison
�����
Hauser
�����
Hayden
�����
Hayden Lake
�����
Huetter
�����
Post Falls
�����
Rathdrum
�����
Rockford Bay
�����
Spirit Lake
�����
State Line
�����
Worley
�����
Unicorporated Kootenai County
�����
I live outside the County
�����
Other (please specify)
�����
Yes
����� No
�����

Kootenai County ID All Hazard Mitigation Plan Update Community SurveyKootenai County ID All Hazard Mitigation Plan Update Community SurveyKootenai County ID All Hazard Mitigation Plan Update Community SurveyKootenai County ID All Hazard Mitigation Plan Update Community Survey3. Which of the following hazard events have you or has anyone in your household experienced in the past 20 years within Kootenai County? (Check all that apply)
Avalanche
���
Cyber Terrorism
���
Dam Failure
���
Drought
���
Earthquake
���
Flooding
���
Hazardous Material Spill
���
Ice
���
Landslide
���
Lightening
���
Pandemic
���
Radiological Material Exposure
���
Severe Weather
���
Snow
���
Terrorism
���
Wildfire
���
Wind
���
Winter Storm
���
None
���
Other (please specify)
���

Kootenai County ID All Hazard Mitigation Plan Update Community SurveyKootenai County ID All Hazard Mitigation Plan Update Community SurveyKootenai County ID All Hazard Mitigation Plan Update Community SurveyKootenai County ID All Hazard Mitigation Plan Update Community Survey
4. How prepared is your household to deal with a hazard event?
5. Which of the following have provided you with useful information to help you be prepared for a hazard event? (Check all that apply)
6. Which of the following steps has your household taken to prepare for a hazard event? (Check all that apply)
2.�Hazard Preparedness
*Not at all prepared Somewhat prepared Adequately prepared Well prepared Very well prepared
Check one: ����� ����� ����� ����� �����
Emergency preparedness information from a government source
(e.g., federal, state, or local emergency management)
���
Personal experience with one or more natural hazards/disasters
���
Locally provided news or other media information
���
Schools and other academic institutions
���
Attended meetings that have dealt with disaster preparedness
���
Community Emergency Response Training (CERT)
���
Church
���
None
���
Other (please specify)
���
Received first aid/CPR training
���
Made a fire escape plan
���
Designated a meeting place
���
Identified utility shut offs
���
Sand bags
���
Prepared a disaster supply kit
���
Installed smoke detectors on each level of the house
���
Stored food and water
���
Stored flashlights and batteries
���
Stored a battery-powered radio
���
Stored a fire extinguisher
���
Stored medical supplies (first aid kit, medications)
���
Natural hazard insurance (Flood, Earthquake, Wildfire)
���
None
���
Other (please specify)
���

Kootenai County ID All Hazard Mitigation Plan Update Community SurveyKootenai County ID All Hazard Mitigation Plan Update Community SurveyKootenai County ID All Hazard Mitigation Plan Update Community SurveyKootenai County ID All Hazard Mitigation Plan Update Community Survey7. How concerned are you about the following hazards in Kootenai County?
(Check one response for each hazard)
8. Which of the following methods do you think are most effective for providing hazard and disaster information? (Check all that apply)
*Not Concerned Somewhat Concerned Concerned Very Concerned Extremely Concerned
Avalanche ����� ����� ����� ����� �����
Cyber Terrorism ����� ����� ����� ����� �����
Dam Failure ����� ����� ����� ����� �����
Drought ����� ����� ����� ����� �����
Earthquake ����� ����� ����� ����� �����
Flooding ����� ����� ����� ����� �����
Hazardous Material Spill ����� ����� ����� ����� �����
Landslide ����� ����� ����� ����� �����
Pandemic ����� ����� ����� ����� �����
Radiological Material Exposure
����� ����� ����� ����� �����
Severe Weather ����� ����� ����� ����� �����
Terrorism ����� ����� ����� ����� �����
Wildfire ����� ����� ����� ����� �����
None ����� ����� ����� ����� �����
*
(Please specify other natural hazard)
Newspaper
���
Telephone Book
���
Informational Brochures
���
City Newsletters
���
Public Meetings
���
Disaster Preparedness Presentations
���
Workshops
���
Schools
���
TV News
���
TV Ads
���
Radio News
���
Radio Ads
���
Internet
���
Outdoor Advertisements
���
Fire Department/Rescue
���
Law Enforcement
���
Church (faith-based institutions)
���
CERT Classes
���
Public Awareness Campaign (e.g.,
Flood Awareness Week, Winter Storm Preparedness Month)
���
Books
���
Chamber of Commerce
���
Academic Institutions
���
Public Library
���
Red Cross Information
���
Community Safety Events
���
Fair Booths
���
Word of Mouth
���
Social Media (Twitter, Facebook,
LinkedIn)
���
Other (please specify)
���

Kootenai County ID All Hazard Mitigation Plan Update Community SurveyKootenai County ID All Hazard Mitigation Plan Update Community SurveyKootenai County ID All Hazard Mitigation Plan Update Community SurveyKootenai County ID All Hazard Mitigation Plan Update Community Survey9. Is your property located in or near a FEMA designated floodplain?
10. Do you have flood insurance?
11. Is your property located near an earthquake fault?
12. Do you have earthquake insurance?
13. Is your property located in an area at risk for wildfires?
14. Have you ever had problems getting homeowners or renters insurance due to risks from hazards?
*
*
*
*
*
Yes
����� No
����� Not Sure
�����
Yes
����� No
����� Not Sure
�����
Yes
����� No
����� Not Sure
�����
Yes
����� No
����� Not Sure
�����
Yes
����� No
����� Not Sure
�����
Yes
����� No
����� Not Sure
�����
If "yes," which natural hazard was involved?

Kootenai County ID All Hazard Mitigation Plan Update Community SurveyKootenai County ID All Hazard Mitigation Plan Update Community SurveyKootenai County ID All Hazard Mitigation Plan Update Community SurveyKootenai County ID All Hazard Mitigation Plan Update Community Survey
15. When you moved into your home, did you consider the impact a disaster could have on your home?
16. Was the presence of a hazard risk zone (e.g., dam failure zone, flood zone, landslide hazard area, high fire risk area) disclosed to you by a real estate agent, seller, or landlord before you purchased or moved into your home?
17. Would the disclosure of this type of hazard risk information influence your decision to buy or rent a home?
18. How much money would you be willing to spend to retrofit your home to reduce risks associated with natural disasters? (for example, by clearing brush and plant materials from around your home to create a "defensible space" for wildfire, performing seismic upgrades, or replacing a combustible roof with non-combustible roofing)
19. Which of the following incentives would encourage you to spend money to retrofit your home to protect against natural disasters? (Check all that apply)
20. If your property were located in a designated “high hazard” area or had received repetitive damages from a hazard event, would you consider a ”buyout” offered by a public agency?
3.�Hazard Mitigation
*
*
*
*
*
Yes
����� No
����� Not Sure
�����
Yes
����� No
����� Not Sure
�����
Yes
����� No
����� Not Sure
�����
$10,000 or above
�����
$5,000 to $9,999
�����
$1,000 to $4,999
�����
Less than $1,000
�����
Nothing
�����
Not Sure
�����
Insurance premium discount
���
Mortgage discount
���
Low interest rate loan
���
Grant funding
���
None
���
Other (please specify)
���
Yes
����� No
����� Not Sure
�����

Kootenai County ID All Hazard Mitigation Plan Update Community SurveyKootenai County ID All Hazard Mitigation Plan Update Community SurveyKootenai County ID All Hazard Mitigation Plan Update Community SurveyKootenai County ID All Hazard Mitigation Plan Update Community Survey21. Would you support the regulation (restriction) of land uses within known high hazard areas?
22. What types of projects do you believe the County, State or Federal government agencies should be doing in order to reduce damage and disruption from hazard events within Kootenai County? Please rank each option as a high, medium or low priority.
23. Please indicate how you feel about the following statement: It is the responsibility of government (local, state and federal) to provide education and programs that promote citizen actions that will reduce exposure to the risks associated with hazards.
High Medium Low
Retrofit and strengthen essential facilities such as police, fire, schools and hospitals.
����� ����� �����
Retrofit infrastructure such as roads, bridges, drainage facilities, levees, water supply, wastewater and power supply facilities.
����� ����� �����
Capital projects such as dams, levees, flood walls, drainage improvements and bank stabilization projects.
����� ����� �����
Strengthen codes and regulations to includehigher regulatory standards in hazard areas.
����� ����� �����
Acquire vulnerable properties and maintain as open space.
����� ����� �����
Assist vulnerable property owners with securing funding for mitigation.
����� ����� �����
Enhance public information about risk, and the exposure to hazards within the operational area.
����� ����� �����
Perform projects that restore the natural environments capacity to absorb the impactsfrom natural hazards.
����� ����� �����
Perform projects that mitigate the potential impacts from climate change.
����� ����� �����
Enhance emergency communication and dissemination of disaster information.
����� ����� �����
Strongly Disagree Somewhat DisagreeNeither Agree nor
DisagreeSomewhat Agree Strongly Agree
Choose one: ����� ����� ����� ����� �����
Would support
�����
Would not support
�����

Kootenai County ID All Hazard Mitigation Plan Update Community SurveyKootenai County ID All Hazard Mitigation Plan Update Community SurveyKootenai County ID All Hazard Mitigation Plan Update Community SurveyKootenai County ID All Hazard Mitigation Plan Update Community Survey24. Please indicate how you feel about the following statement: It is my responsibility to educate myself and take actions that will reduce my exposure to the risks associated with hazards.
25. Please indicate how you feel about the following statement: Information about the risks associated with natural hazards is readily available and easy to locate.
Strongly Disagree Somewhat DisagreeNeither Agree nor
DisagreeSomewhat Agree Strongly Agree
Choose one: ����� ����� ����� ����� �����
Strongly Disagree Somewhat DisagreeNeither Agree nor
DisagreeSomewhat Agree Strongly Agree
Choose one: ����� ����� ����� ����� �����

Kootenai County ID All Hazard Mitigation Plan Update Community SurveyKootenai County ID All Hazard Mitigation Plan Update Community SurveyKootenai County ID All Hazard Mitigation Plan Update Community SurveyKootenai County ID All Hazard Mitigation Plan Update Community Survey
The following demographic information will aid in evaluating the responses to this questionnaire. The answers will be used only for the preparation of this plan and will not be provided to any other group or interest.
26. Please indicate your age range:
27. Please indicate the primary language spoken in your household.
28. Please indicate your gender:
29. Please indicate your highest level of education.
30. How long have you lived in Kootenai County?
31. Do you own or rent your place of residence?
32. Do you have regular access to the Internet?
4.�General Household Information
Under 18
�����
18 to 30
�����
31 to 40
�����
41 to 50
�����
51 to 60
�����
61 or older
�����
English
�����
Spanish
�����
Other Indo-European Languages
�����
Asian and Pacific Island Languages
�����
Other (please specify)
�����
Female
����� Male
�����
Grade school/No schooling
�����
Some high school
�����
High school graduate/GED
�����
Some college/Trade school
�����
College degree
�����
Graduate degree
�����
Other (please specify)
�����
Less than 1 year
�����
1 to 5 years
�����
6 to 10 years
�����
11 to 20 years
�����
More than 20 years
�����
Own
����� Rent
�����
Yes
����� No
����� Not Sure
�����

Kootenai County ID All Hazard Mitigation Plan Update Community SurveyKootenai County ID All Hazard Mitigation Plan Update Community SurveyKootenai County ID All Hazard Mitigation Plan Update Community SurveyKootenai County ID All Hazard Mitigation Plan Update Community Survey
If you have additional information you would like to share about your knowledge and experience regarding local hazards and disasters, we invite you to provide your information on this page. This survey and your comments are greatly appreciated. Thank you for your time!
33. Comments
5.�Comments (Optional)
��

Q1 Where in Kootenai County do you live?Answered: 494 Skipped: 0
1 / 42
Kootenai County ID All Hazard Mitigation Plan Update Community Survey

6.07% 30
Athol
Coeur d'Alene
Conkling Park
Dalton Gardens
Fernan LakeVillage
Harrison
Hauser
Hayden
Hayden Lake
Huetter
Post Falls
Rathdrum
Rockford Bay
Spirit Lake
State Line
Worley
UnicorporatedKootenai County
I live outsidethe County
Other (pleasespecify)
0% 10% 20% 30% 40% 50% 60% 70% 80% 90% 100%
Answer Choices Responses
Athol
2 / 42
Kootenai County ID All Hazard Mitigation Plan Update Community Survey

29.15% 144
0.00% 0
1.62% 8
0.61% 3
1.42% 7
1.82% 9
10.73% 53
1.82% 9
0.00% 0
21.66% 107
6.88% 34
0.40% 2
1.62% 8
0.20% 1
0.20% 1
6.68% 33
5.26% 26
3.85% 19
Total 494
Coeur d'Alene
Conkling Park
Dalton Gardens
Fernan Lake Village
Harrison
Hauser
Hayden
Hayden Lake
Huetter
Post Falls
Rathdrum
Rockford Bay
Spirit Lake
State Line
Worley
Unicorporated Kootenai County
I live outside the County
Other (please specify)
3 / 42
Kootenai County ID All Hazard Mitigation Plan Update Community Survey

81.02% 380
18.98% 89
Q2 Do you work in Kootenai County?Answered: 469 Skipped: 25
Total 469
Yes
No
0% 10% 20% 30% 40% 50% 60% 70% 80% 90% 100%
Answer Choices Responses
Yes
No
4 / 42
Kootenai County ID All Hazard Mitigation Plan Update Community Survey

Q3 Which of the following hazard eventshave you or has anyone in your household
experienced in the past 20 years withinKootenai County? (Check all that apply)
Answered: 486 Skipped: 8
5 / 42
Kootenai County ID All Hazard Mitigation Plan Update Community Survey
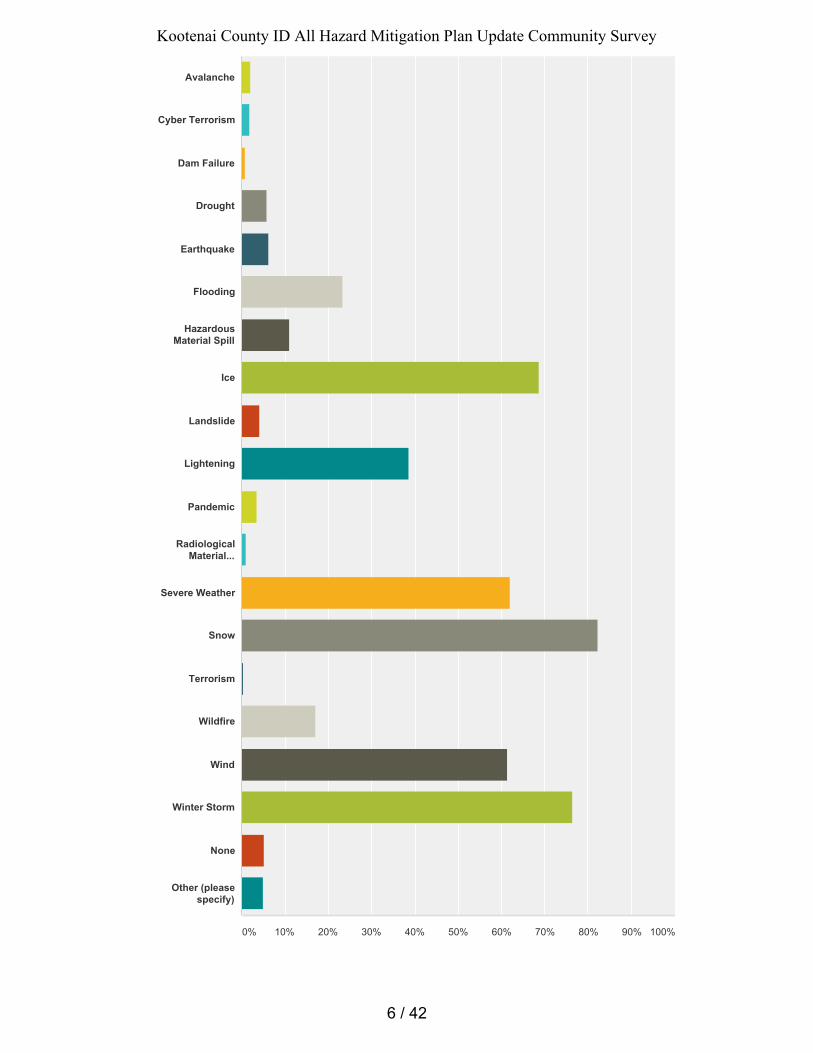
Avalanche
Cyber Terrorism
Dam Failure
Drought
Earthquake
Flooding
HazardousMaterial Spill
Ice
Landslide
Lightening
Pandemic
RadiologicalMaterial...
Severe Weather
Snow
Terrorism
Wildfire
Wind
Winter Storm
None
Other (pleasespecify)
0% 10% 20% 30% 40% 50% 60% 70% 80% 90% 100%
6 / 42
Kootenai County ID All Hazard Mitigation Plan Update Community Survey

2.06% 10
1.85% 9
0.82% 4
5.76% 28
6.17% 30
23.46% 114
11.11% 54
68.72% 334
4.12% 20
38.68% 188
3.50% 17
1.03% 5
61.93% 301
82.30% 400
0.41% 2
17.08% 83
61.32% 298
76.34% 371
5.14% 25
4.94% 24
Total Respondents: 486
Answer Choices Responses
Avalanche
Cyber Terrorism
Dam Failure
Drought
Earthquake
Flooding
Hazardous Material Spill
Ice
Landslide
Lightening
Pandemic
Radiological Material Exposure
Severe Weather
Snow
Terrorism
Wildfire
Wind
Winter Storm
None
Other (please specify)
7 / 42
Kootenai County ID All Hazard Mitigation Plan Update Community Survey

Q4 How prepared is your household to dealwith a hazard event?
Answered: 452 Skipped: 42
6.19%28
43.14%195
30.31%137
14.82%67
5.53%25
452
2.70
Check one:
0 1 2 3 4 5 6 7 8 9 10
Not at allprepared
Somewhatprepared
Adequatelyprepared
Wellprepared
Very wellprepared
Total WeightedAverage
Checkone:
8 / 42
Kootenai County ID All Hazard Mitigation Plan Update Community Survey

44.12% 199
61.42% 277
47.89% 216
11.09% 50
26.61% 120
11.31% 51
8.43% 38
7.32% 33
9.76% 44
Q5 Which of the following have providedyou with useful information to help you be
prepared for a hazard event? (Check all thatapply)
Answered: 451 Skipped: 43
Total Respondents: 451
Emergencypreparedness...
Personalexperience w...
Locallyprovided new...
Schools andother academ...
Attendedmeetings tha...
CommunityEmergency...
Church
None
Other (pleasespecify)
0% 10% 20% 30% 40% 50% 60% 70% 80% 90% 100%
Answer Choices Responses
Emergency preparedness information from a government source (e.g., federal, state, or local emergency management)
Personal experience with one or more natural hazards/disasters
Locally provided news or other media information
Schools and other academic institutions
Attended meetings that have dealt with disaster preparedness
Community Emergency Response Training (CERT)
Church
None
Other (please specify)
9 / 42
Kootenai County ID All Hazard Mitigation Plan Update Community Survey

70.35% 318
44.47% 201
36.06% 163
Q6 Which of the following steps has yourhousehold taken to prepare for a hazard
event? (Check all that apply)Answered: 452 Skipped: 42
Received firstaid/CPR...
Made a fireescape plan
Designated ameeting place
Identifiedutility shut...
Sand bags
Prepared adisaster sup...
Installedsmoke detect...
Stored foodand water
Storedflashlights ...
Stored abattery-powe...
Stored a fireextinguisher
Stored medicalsupplies (fi...
Natural hazardinsurance...
None
Other (pleasespecify)
0% 10% 20% 30% 40% 50% 60% 70% 80% 90% 100%
Answer Choices Responses
Received first aid/CPR training
Made a fire escape plan
Designated a meeting place
10 / 42
Kootenai County ID All Hazard Mitigation Plan Update Community Survey

57.30% 259
3.98% 18
32.30% 146
87.61% 396
55.53% 251
78.54% 355
35.40% 160
69.91% 316
65.93% 298
13.94% 63
3.54% 16
2.88% 13
Total Respondents: 452
Identified utility shut offs
Sand bags
Prepared a disaster supply kit
Installed smoke detectors on each level of the house
Stored food and water
Stored flashlights and batteries
Stored a battery-powered radio
Stored a fire extinguisher
Stored medical supplies (first aid kit, medications)
Natural hazard insurance (Flood, Earthquake, Wildfire)
None
Other (please specify)
11 / 42
Kootenai County ID All Hazard Mitigation Plan Update Community Survey

Q7 How concerned are you about thefollowing hazards in Kootenai County?(Check one response for each hazard)
Answered: 452 Skipped: 42
82.82%352
15.06%64
1.65%7
0.47%2
0.00%0
425
1.20
28.57%124
38.25%166
21.20%92
9.45%41
2.53%11
434
2.19
Avalanche
Cyber Terrorism
Dam Failure
Drought
Earthquake
Flooding
HazardousMaterial Spill
Landslide
Pandemic
RadiologicalMaterial...
Severe Weather
Terrorism
Wildfire
None
0 1 2 3 4 5 6 7 8 9 10
NotConcerned
SomewhatConcerned
Concerned VeryConcerned
ExtremelyConcerned
Total WeightedAverage
Avalanche
Cyber Terrorism
12 / 42
Kootenai County ID All Hazard Mitigation Plan Update Community Survey

73.36%314
18.46%79
6.31%27
1.40%6
0.47%2
428
1.37
53.66%227
30.97%131
10.87%46
3.78%16
0.71%3
423
1.67
53.90%228
35.22%149
8.98%38
1.65%7
0.24%1
423
1.59
32.79%142
37.88%164
21.71%94
5.54%24
2.08%9
433
2.06
22.76%99
36.78%160
20.23%88
17.24%75
2.99%13
435
2.41
52.24%222
30.59%130
11.53%49
4.71%20
0.94%4
425
1.72
32.63%139
34.74%148
21.13%90
10.09%43
1.41%6
426
2.13
51.18%217
29.25%124
13.21%56
5.66%24
0.71%3
424
1.75
7.03%31
30.84%136
34.69%153
22.68%100
4.76%21
441
2.87
29.79%129
33.95%147
21.94%95
10.16%44
4.16%18
433
2.25
8.20%36
27.33%120
31.44%138
23.23%102
9.79%43
439
2.99
96.00%24
0.00%0
0.00%0
0.00%0
4.00%1
25
1.16
Dam Failure
Drought
Earthquake
Flooding
Hazardous Material Spill
Landslide
Pandemic
Radiological MaterialExposure
Severe Weather
Terrorism
Wildfire
None
13 / 42
Kootenai County ID All Hazard Mitigation Plan Update Community Survey

Q8 Which of the following methods do youthink are most effective for providing
hazard and disaster information? (Check allthat apply)
Answered: 452 Skipped: 42
Newspaper
Telephone Book
InformationalBrochures
CityNewsletters
Public Meetings
DisasterPreparedness...
Workshops
Schools
TV News
TV Ads
Radio News
Radio Ads
Internet
OutdoorAdvertisements
FireDepartment/R...
Law Enforcement
Church(faith-based...
CERT Classes
14 / 42
Kootenai County ID All Hazard Mitigation Plan Update Community Survey

44.25% 200
3.98% 18
29.42% 133
15.27% 69
26.33% 119
41.81% 189
22.12% 100
29.87% 135
67.92% 307
28.54% 129
61.95% 280
25.44% 115
PublicAwareness...
Books
Chamber ofCommerce
AcademicInstitutions
Public Library
Red CrossInformation
CommunitySafety Events
Fair Booths
Word of Mouth
Social Media(Twitter,...
Other (pleasespecify)
0% 10% 20% 30% 40% 50% 60% 70% 80% 90% 100%
Answer Choices Responses
Newspaper
Telephone Book
Informational Brochures
City Newsletters
Public Meetings
Disaster Preparedness Presentations
Workshops
Schools
TV News
TV Ads
Radio News
Radio Ads
15 / 42
Kootenai County ID All Hazard Mitigation Plan Update Community Survey

65.04% 294
14.38% 65
39.82% 180
41.59% 188
26.33% 119
12.17% 55
42.04% 190
5.31% 24
11.06% 50
9.96% 45
23.67% 107
27.88% 126
31.42% 142
26.55% 120
31.42% 142
49.78% 225
2.43% 11
Total Respondents: 452
Internet
Outdoor Advertisements
Fire Department/Rescue
Law Enforcement
Church (faith-based institutions)
CERT Classes
Public Awareness Campaign (e.g., Flood Awareness Week, Winter Storm Preparedness Month)
Books
Chamber of Commerce
Academic Institutions
Public Library
Red Cross Information
Community Safety Events
Fair Booths
Word of Mouth
Social Media (Twitter, Facebook, LinkedIn)
Other (please specify)
16 / 42
Kootenai County ID All Hazard Mitigation Plan Update Community Survey

4.65% 21
75.44% 341
19.91% 90
Q9 Is your property located in or near aFEMA designated floodplain?
Answered: 452 Skipped: 42
Total 452
Yes
No
Not Sure
0% 10% 20% 30% 40% 50% 60% 70% 80% 90% 100%
Answer Choices Responses
Yes
No
Not Sure
17 / 42
Kootenai County ID All Hazard Mitigation Plan Update Community Survey

8.41% 38
80.97% 366
10.62% 48
Q10 Do you have flood insurance?Answered: 452 Skipped: 42
Total 452
Yes
No
Not Sure
0% 10% 20% 30% 40% 50% 60% 70% 80% 90% 100%
Answer Choices Responses
Yes
No
Not Sure
18 / 42
Kootenai County ID All Hazard Mitigation Plan Update Community Survey

5.53% 25
57.74% 261
36.73% 166
Q11 Is your property located near anearthquake fault?
Answered: 452 Skipped: 42
Total 452
Yes
No
Not Sure
0% 10% 20% 30% 40% 50% 60% 70% 80% 90% 100%
Answer Choices Responses
Yes
No
Not Sure
19 / 42
Kootenai County ID All Hazard Mitigation Plan Update Community Survey

3.10% 14
81.86% 370
15.04% 68
Q12 Do you have earthquake insurance?Answered: 452 Skipped: 42
Total 452
Yes
No
Not Sure
0% 10% 20% 30% 40% 50% 60% 70% 80% 90% 100%
Answer Choices Responses
Yes
No
Not Sure
20 / 42
Kootenai County ID All Hazard Mitigation Plan Update Community Survey

42.04% 190
47.12% 213
10.84% 49
Q13 Is your property located in an area atrisk for wildfires?
Answered: 452 Skipped: 42
Total 452
Yes
No
Not Sure
0% 10% 20% 30% 40% 50% 60% 70% 80% 90% 100%
Answer Choices Responses
Yes
No
Not Sure
21 / 42
Kootenai County ID All Hazard Mitigation Plan Update Community Survey

2.22% 10
95.33% 429
2.44% 11
Q14 Have you ever had problems gettinghomeowners or renters insurance due to
risks from hazards?Answered: 450 Skipped: 44
Total 450
Yes
No
Not Sure
0% 10% 20% 30% 40% 50% 60% 70% 80% 90% 100%
Answer Choices Responses
Yes
No
Not Sure
22 / 42
Kootenai County ID All Hazard Mitigation Plan Update Community Survey

49.88% 213
47.78% 204
2.34% 10
Q15 When you moved into your home, didyou consider the impact a disaster could
have on your home?Answered: 427 Skipped: 67
Total 427
Yes
No
Not Sure
0% 10% 20% 30% 40% 50% 60% 70% 80% 90% 100%
Answer Choices Responses
Yes
No
Not Sure
23 / 42
Kootenai County ID All Hazard Mitigation Plan Update Community Survey

12.18% 52
75.18% 321
12.65% 54
Q16 Was the presence of a hazard risk zone(e.g., dam failure zone, flood zone, landslidehazard area, high fire risk area) disclosed to
you by a real estate agent, seller, orlandlord before you purchased or moved
into your home?Answered: 427 Skipped: 67
Total 427
Yes
No
Not Sure
0% 10% 20% 30% 40% 50% 60% 70% 80% 90% 100%
Answer Choices Responses
Yes
No
Not Sure
24 / 42
Kootenai County ID All Hazard Mitigation Plan Update Community Survey

67.92% 290
20.84% 89
11.24% 48
Q17 Would the disclosure of this type ofhazard risk information influence your
decision to buy or rent a home?Answered: 427 Skipped: 67
Total 427
Yes
No
Not Sure
0% 10% 20% 30% 40% 50% 60% 70% 80% 90% 100%
Answer Choices Responses
Yes
No
Not Sure
25 / 42
Kootenai County ID All Hazard Mitigation Plan Update Community Survey

4.45% 19
8.20% 35
21.55% 92
21.55% 92
12.18% 52
32.08% 137
Q18 How much money would you be willingto spend to retrofit your home to reduce
risks associated with natural disasters? (forexample, by clearing brush and plant
materials from around your home to createa "defensible space" for wildfire,
performing seismic upgrades, or replacinga combustible roof with non-combustible
roofing)Answered: 427 Skipped: 67
Total 427
$10,000 orabove
$5,000 to$9,999
$1,000 to$4,999
Less than$1,000
Nothing
Not Sure
0% 10% 20% 30% 40% 50% 60% 70% 80% 90% 100%
Answer Choices Responses
$10,000 or above
$5,000 to $9,999
$1,000 to $4,999
Less than $1,000
Nothing
Not Sure
26 / 42
Kootenai County ID All Hazard Mitigation Plan Update Community Survey

66.74% 285
51.76% 221
38.88% 166
60.66% 259
11.48% 49
3.98% 17
Q19 Which of the following incentiveswould encourage you to spend money to
retrofit your home to protect against naturaldisasters? (Check all that apply)
Answered: 427 Skipped: 67
Total Respondents: 427
Insurancepremium...
Mortgagediscount
Low interestrate loan
Grant funding
None
Other (pleasespecify)
0% 10% 20% 30% 40% 50% 60% 70% 80% 90% 100%
Answer Choices Responses
Insurance premium discount
Mortgage discount
Low interest rate loan
Grant funding
None
Other (please specify)
27 / 42
Kootenai County ID All Hazard Mitigation Plan Update Community Survey

55.42% 235
13.68% 58
30.90% 131
Q20 If your property were located in adesignated “high hazard” area or had
received repetitive damages from a hazardevent, would you consider a ”buyout”
offered by a public agency?Answered: 424 Skipped: 70
Total 424
Yes
No
Not Sure
0% 10% 20% 30% 40% 50% 60% 70% 80% 90% 100%
Answer Choices Responses
Yes
No
Not Sure
28 / 42
Kootenai County ID All Hazard Mitigation Plan Update Community Survey

62.26% 259
37.74% 157
Q21 Would you support the regulation(restriction) of land uses within known high
hazard areas?Answered: 416 Skipped: 78
Total 416
Would support
Would notsupport
0% 10% 20% 30% 40% 50% 60% 70% 80% 90% 100%
Answer Choices Responses
Would support
Would not support
29 / 42
Kootenai County ID All Hazard Mitigation Plan Update Community Survey

Q22 What types of projects do you believethe County, State or Federal
governmentagencies should be doing inorder to reduce damage and disruption
from hazard events within KootenaiCounty? Please rank each option as a high,
medium or low priority.Answered: 418 Skipped: 76
60.92%251
29.85%123
9.22%38
412
1.48
69.47%289
26.92%112
3.61%15
416
1.34
38.46%160
50.24%209
11.30%47
416
1.73
26.75%111
43.86%182
29.40%122
415
2.03
Retrofit andstrengthen...
Retrofitinfrastructu...
Capitalprojects suc...
Strengthencodes and...
Acquirevulnerable...
Assistvulnerable...
Enhance publicinformation...
Performprojects tha...
Performprojects tha...
Enhanceemergency...
0 1 2 3 4 5 6 7 8 9 10
High Medium Low Total WeightedAverage
Retrofit and strengthen essential facilities such as police, fire, schools and hospitals.
Retrofit infrastructure such as roads, bridges, drainage facilities, levees, water supply,wastewater and power supply facilities.
Capital projects such as dams, levees, flood walls, drainage improvements and bank stabilizationprojects.
Strengthen codes and regulations to include higher regulatory standards in hazard areas.
30 / 42
Kootenai County ID All Hazard Mitigation Plan Update Community Survey

18.45%76
38.83%160
42.72%176
412
2.24
18.45%76
49.76%205
31.80%131
412
2.13
44.69%185
48.55%201
6.76%28
414
1.62
37.68%156
41.79%173
20.53%85
414
1.83
17.76%73
38.93%160
43.31%178
411
2.26
57.18%235
35.28%145
7.54%31
411
1.50
Acquire vulnerable properties and maintain as open space.
Assist vulnerable property owners with securing funding for mitigation.
Enhance public information about risk, and the exposure to hazards within the operational area.
Perform projects that restore the natural environments capacity to absorb the impacts fromnatural hazards.
Perform projects that mitigate the potential impacts from climate change.
Enhance emergency communication and dissemination of disaster information.
31 / 42
Kootenai County ID All Hazard Mitigation Plan Update Community Survey

Q23 Please indicate how you feel about thefollowing statement:It is the responsibilityof government (local, state and federal) to
provide education and programs thatpromote citizen actions that will reduceexposure to the risks associated with
hazards.Answered: 422 Skipped: 72
12.09%51
13.03%55
18.48%78
42.18%178
14.22%60
422
3.33
Choose one:
0 1 2 3 4 5 6 7 8 9 10
StronglyDisagree
SomewhatDisagree
Neither Agree norDisagree
SomewhatAgree
StronglyAgree
Total WeightedAverage
Chooseone:
32 / 42
Kootenai County ID All Hazard Mitigation Plan Update Community Survey

Q24 Please indicate how you feel about thefollowing statement:It is my responsibility
to educate myself and take actions that willreduce my exposure to the risks associated
with hazards.Answered: 425 Skipped: 69
2.59%11
2.12%9
2.82%12
24.24%103
68.24%290
425
4.53
Choose one:
0 1 2 3 4 5 6 7 8 9 10
StronglyDisagree
SomewhatDisagree
Neither Agree norDisagree
SomewhatAgree
StronglyAgree
Total WeightedAverage
Chooseone:
33 / 42
Kootenai County ID All Hazard Mitigation Plan Update Community Survey

Q25 Please indicate how you feel about thefollowing statement:Information about the
risks associated with natural hazards isreadily available and easy to locate.
Answered: 424 Skipped: 70
4.48%19
15.57%66
27.36%116
37.74%160
14.86%63
424
3.43
Choose one:
0 1 2 3 4 5 6 7 8 9 10
StronglyDisagree
SomewhatDisagree
Neither Agree norDisagree
SomewhatAgree
StronglyAgree
Total WeightedAverage
Chooseone:
34 / 42
Kootenai County ID All Hazard Mitigation Plan Update Community Survey

0.00% 0
5.74% 24
15.31% 64
20.81% 87
30.38% 127
27.75% 116
Q26 Please indicate your age range:Answered: 418 Skipped: 76
Total 418
Under 18
18 to 30
31 to 40
41 to 50
51 to 60
61 or older
0% 10% 20% 30% 40% 50% 60% 70% 80% 90% 100%
Answer Choices Responses
Under 18
18 to 30
31 to 40
41 to 50
51 to 60
61 or older
35 / 42
Kootenai County ID All Hazard Mitigation Plan Update Community Survey

100.00% 419
0.00% 0
0.00% 0
0.00% 0
0.00% 0
Q27 Please indicate the primary languagespoken in your household.
Answered: 419 Skipped: 75
Total 419
English
Spanish
OtherIndo-Europea...
Asian andPacific Isla...
Other (pleasespecify)
0% 10% 20% 30% 40% 50% 60% 70% 80% 90% 100%
Answer Choices Responses
English
Spanish
Other Indo-European Languages
Asian and Pacific Island Languages
Other (please specify)
36 / 42
Kootenai County ID All Hazard Mitigation Plan Update Community Survey

55.26% 231
44.74% 187
Q28 Please indicate your gender:Answered: 418 Skipped: 76
Total 418
Male
Female
0% 10% 20% 30% 40% 50% 60% 70% 80% 90% 100%
Answer Choices Responses
Male
Female
37 / 42
Kootenai County ID All Hazard Mitigation Plan Update Community Survey

0.00% 0
0.00% 0
5.00% 21
35.24% 148
41.67% 175
17.38% 73
0.71% 3
Q29 Please indicate your highest level ofeducation.
Answered: 420 Skipped: 74
Total 420
Gradeschool/No...
Some highschool
High schoolgraduate/GED
Somecollege/Trad...
College degree
Graduate degree
Other (pleasespecify)
0% 10% 20% 30% 40% 50% 60% 70% 80% 90% 100%
Answer Choices Responses
Grade school/No schooling
Some high school
High school graduate/GED
Some college/Trade school
College degree
Graduate degree
Other (please specify)
38 / 42
Kootenai County ID All Hazard Mitigation Plan Update Community Survey

2.91% 12
8.74% 36
12.38% 51
29.85% 123
46.12% 190
Q30 How long have you lived in KootenaiCounty?
Answered: 412 Skipped: 82
Total 412
Less than 1year
1 to 5 years
6 to 10 years
11 to 20 years
More than 20years
0% 10% 20% 30% 40% 50% 60% 70% 80% 90% 100%
Answer Choices Responses
Less than 1 year
1 to 5 years
6 to 10 years
11 to 20 years
More than 20 years
39 / 42
Kootenai County ID All Hazard Mitigation Plan Update Community Survey

89.61% 371
10.39% 43
Q31 Do you own or rent your place ofresidence?
Answered: 414 Skipped: 80
Total 414
Own
Rent
0% 10% 20% 30% 40% 50% 60% 70% 80% 90% 100%
Answer Choices Responses
Own
Rent
40 / 42
Kootenai County ID All Hazard Mitigation Plan Update Community Survey

97.60% 407
1.92% 8
0.48% 2
Q32 Do you have regular access to theInternet?
Answered: 417 Skipped: 77
Total 417
Yes
No
Not Sure
0% 10% 20% 30% 40% 50% 60% 70% 80% 90% 100%
Answer Choices Responses
Yes
No
Not Sure
41 / 42
Kootenai County ID All Hazard Mitigation Plan Update Community Survey

Q33 CommentsAnswered: 69 Skipped: 425
42 / 42
Kootenai County ID All Hazard Mitigation Plan Update Community Survey

Kootenai County Multi-Jurisdictional All Hazard Mitigation Plan
APPENDIX C. DATA SOURCES AND METHODS USED FOR HAZARD
MAPPING


APPENDIX C. DATA SOURCES AND METHODS USED FOR HAZARD
MAPPING
EARTHQUAKE MAPPING
Probabilistic Peak Ground Acceleration Maps Peak ground acceleration data for probabilistic earthquake maps are generated by Hazus-MH 2.1. In Hazus’ probabilistic analysis procedure, ground shaking demand is characterized by spectral contour maps developed by the U.S. Geological Survey (USGS) as part of a 2008 update of the National Seismic Hazard Maps. USGS probabilistic seismic hazard maps are revised about every six years to reflect newly published or reviewed earthquake science and to keep pace with regular updates of the building code.
Hazus includes maps for eight probabilistic hazard levels: ranging from ground shaking with a 39% probability of being exceeded in 50 years (100-year return period) to ground shaking with a 2% probability of being exceeded in 50 years (2,500-year return period). Earthquake mapping for this plan used the 100-year and 500-year probabilistic events.
Scenario Earthquake Event Using an Historical Earthquake Epicenter For a scenario event in Hazus-MH 2.1, the location, depth and magnitude of the scenario earthquake are specified from a Hazus database of historical earthquakes. The historical event analyzed for this plan is a 1942 earthquake with the following characteristics:
• Magnitude: 5.5
• Epicenter: N48 W116.7 (approximately 3.5 miles north of the City of Athol)
• Depth: 10 km.
FLOOD MAPPING Flood hazard areas are mapped as depicted on effective FEMA Digital Flood Insurance Rate Maps. Repetitive flood loss data was provided by FEMA as of November 30, 2014. Property addresses were geo-coded and then mapped at a countywide scale. Addresses listed in the repetitive loss report that could not be geo-coded are not represented on the repetitive flood loss map or included in the spatial assessment.
WEATHER MAPPING
Wind Power Class at 50-Meter Height Annual average wind resource potential data are provided by the National Renewable Energy Laboratory. Wind power class is an indicator of likely resource strength, with a higher wind power class representing higher wind resource levels. The classification information is for utility-scale applications at a 50-meter height.
C-1

Kootenai County Multi-Jurisdictional All-Hazards Mitigation Plan; Volume 1—Planning-Area-Wide Elements
WILDFIRE MAPPING
Relative Risk from Uncharacteristic Wildland Fire The Idaho State Assessment of Forest Resources (SAFR) defines uncharacteristic wildland fire as follows (Stephenson, David, and Kimball, Steve 2010. Idaho State Assessment of Forest Resources: Issues, Discussion, Data, Methodologies, and Maps, Final Draft):
… an increase in wildfire size, severity and resistance to control compared to that which occurred historically in the native system. The threat of these unnaturally intense wildfires has increased with mortality from insects and disease, the effect of increasing human population (ignition sources and more development at risk), and the accumulations of fuels developed from decades of aggressive fire suppression.
SAFR used the Relative Risk to Communities from Wildland Fire in Idaho model, developed by the Idaho Interagency Wildland Fire Plan Working Group, and USDA’s LANDFIRE Fire Regime Condition Classes to create a data layer of relative risk to communities and ecosystems. The methodology is described in the SAFR documentation.
C-2

Kootenai County Multi-Jurisdictional All Hazard Mitigation Plan
APPENDIX D. PROGRESS REPORT TEMPLATE


D-1
APPENDIX D. PROGRESS REPORT TEMPLATE
Kootenai County Multi-Jurisdictional All Hazard Mitigation Plan
Annual Progress Report
Reporting Period: (Insert reporting period) Background: Kootenai County and participating cities and special purpose districts in the county developed a hazard mitigation plan to reduce risk from all hazards by identifying resources, information, and strategies for risk reduction. The federal Disaster Mitigation Act of 2000 requires state and local governments to develop hazard mitigation plans as a condition for federal disaster grant assistance. To prepare the plan, the participating partners organized resources, assessed risks from natural hazards within the county, developed planning goals and objectives, reviewed mitigation alternatives, and developed an action plan to address probable impacts from natural hazards. By completing this process, these jurisdictions maintained compliance with the Disaster Mitigation Act, achieving eligibility for mitigation grant funding opportunities afforded under the Robert T. Stafford Act. The plan can be viewed on-line at:
http://oem.kcgov.us
Summary Overview of the Plan’s Progress: The performance period for the Hazard Mitigation Plan became effective on ____, 2015, with the final approval of the plan by FEMA. The initial performance period for this plan will be 5 years, with an anticipated update to the plan to occur before ______, 2020. As of this reporting period, the performance period for this plan is considered to be __% complete. The Hazard Mitigation Plan has targeted __ hazard mitigation initiatives to be pursued during the 5-year performance period. As of the reporting period, the following overall progress can be reported:
• __ out of __ initiatives (__%) reported ongoing action toward completion.
• __ out of __ initiatives (__%) were reported as being complete.
• __ out of __ initiatives (___%) reported no action taken.
Purpose: The purpose of this report is to provide an annual update on the implementation of the action plan identified in the Kootenai County Multi-Jurisdictional All Hazard Mitigation Plan. The objective is to ensure that there is a continuing and responsive planning process that will keep the Hazard Mitigation Plan dynamic and responsive to the needs and capabilities of the partner jurisdictions. This report discusses the following:
• Natural hazard events that have occurred within the last year
• Changes in risk exposure within the planning area (all of Kootenai County)
• Mitigation success stories
• Review of the action plan
• Changes in capabilities that could impact plan implementation
• Recommendations for changes/enhancement.

Kootenai County Multi-Jurisdictional All-Hazards Mitigation Plan; Volume 1—Planning-Area-Wide Elements
D-2
The Hazard Mitigation Taskforce: The Hazard Mitigation Taskforce, made up of planning partners and stakeholders within the planning area, reviewed and approved this progress report at its annual meeting held on _____, 201_. It was determined through the plan’s development process that a taskforce would remain in service to oversee maintenance of the plan. At a minimum, the Hazard Mitigation Taskforce will provide technical review and oversight on the development of the annual progress report. It is anticipated that there will be turnover in the membership annually, which will be documented in the progress reports. For this reporting period, the Hazard Mitigation Taskforce membership is as indicated in Table 1.
TABLE 1.
HAZARD MITIGATION TASKFORCE MEMBERS
Name Title Jurisdiction/Agency
Natural Hazard Events within the Planning Area: During the reporting period, there were __ natural hazard events in the planning area that had a measurable impact on people or property. A summary of these events is as follows:
• __________________________
• __________________________
Changes in Risk Exposure in the Planning Area: (Insert brief overview of any natural hazard event in the planning area that changed the probability of occurrence or ranking of risk for the hazards addressed in the hazard mitigation plan) Mitigation Success Stories: (Insert brief overview of mitigation accomplishments during the reporting period)

APPENDIX D. PROGRESS REPORT TEMPLATE
D-3
Review of the Action Plan: Table 2 reviews the action plan, reporting the status of each initiative. Reviewers of this report should refer to the Hazard Mitigation Plan for more detailed descriptions of each initiative and the prioritization process. Address the following in the “status” column of the following table:
• Was any element of the initiative carried out during the reporting period?
• If no action was completed, why?
• Is the timeline for implementation for the initiative still appropriate?
• If the initiative was completed, does it need to be changed or removed from the action plan?
TABLE 2.
ACTION PLAN MATRIX
Action Taken? (Yes or No) Time Line Priority Status
Status (X, O,)
Initiative #__—______________________[description] Initiative #__—______________________[description] Initiative #__—______________________[description] Initiative #__—______________________[description] Initiative #__—______________________[description] Initiative #__—______________________[description] Initiative #__—______________________[description] Initiative #__—______________________[description] Initiative #__—______________________[description] Initiative #__—______________________[description] Initiative #__—______________________[description] Initiative #__—______________________[description] Initiative #__—______________________[description]

Kootenai County Multi-Jurisdictional All-Hazards Mitigation Plan; Volume 1—Planning-Area-Wide Elements
D-4
TABLE 2. ACTION PLAN MATRIX
Action Taken? (Yes or No) Time Line Priority Status
Status (X, O,)
Initiative #__—______________________[description] Initiative #__—______________________[description] Initiative #__—______________________[description] Initiative #__—______________________[description] Initiative #__—______________________[description] Initiative #__—______________________[description] Initiative #__—______________________[description] Initiative #__—______________________[description] Initiative #__—______________________[description] Initiative #__—______________________[description] Initiative #__—______________________[description] Initiative #__—______________________[description] Initiative #__—______________________[description] Initiative #__—______________________[description] Initiative #__—______________________[description]
Completion status legend: = Project Completed O = Action ongoing toward completion X = No progress at this time

APPENDIX D. PROGRESS REPORT TEMPLATE
D-5
Changes That May Impact Implementation of the Plan: (Insert brief overview of any significant changes in the planning area that would have a profound impact on the implementation of the plan. Specify any changes in technical, regulatory and financial capabilities identified during the plan’s development) Recommendations for Changes or Enhancements: Based on the review of this report by the Hazard Mitigation Taskforce, the following recommendations will be noted for future updates or revisions to the plan:
• __________________________
• __________________________
• __________________________
• __________________________
• __________________________
• __________________________
Public review notice: The contents of this report are considered to be public knowledge and have been prepared for total public disclosure. Copies of the report have been provided to the governing boards of all planning partners and to local media outlets and the report is posted on the Kootenai County Office of Emergency Management website, http://oem.kcgov.us. Any questions or comments regarding the contents of this report should be directed to:
Sandy Von Behren Office of Emergency Management 5500 North Government Way Coeur d’Alene, ID 83815 208-446-1775

Copyright © 2022 FDOKUMEN