
vol.52, no.1, winter 2021 - Message from the President
100
VOL.52, NO.1, WINTER 2021
-
Upload
khangminh22 -
Category
Documents
-
view
1 -
download
0
Transcript of vol.52, no.1, winter 2021 - Message from the President

AGRICULTURAL MECHANIZATION IN ASIA, AFRICA, AND LATIN AMERICA 2016 VOL.47 NO.4
VO
L.52, NO
.1, WIN
TER 2021
VOL.52, NO.1, WINTER 2021
AGRICULTURAL MECHANIZATION IN ASIA, AFRICA, AND LATIN AMERICA 2021 VOL.52 NO.1
VOL.52, No.1, WINTER 2021

Yoshisuke Kishida, Publisher & Chief EditorContributing Editors and Cooperators
EDITORIAL STAFF(Tel.+81-(0)3-3291-3674)
Yoshisuke Kishida, Chief EditorShinjiro Tetsuka, Managing EditorPeeyush Soni, Editorial Consultant
ADVERTISING(Tel.+81-(0)3-3291-3674)
Yuki Komori, Director (Head Office)Advertising Rate: 300 thousand yen per page
CIRCULATION(Tel.+81-(0)3-3291-3674)(Fax.+81-(0)3-3291-5717)
Editorial, Advertising and Circulation Headquarters1-12-3, Kanda Nishikicho, Chiyoda-ku, Tokyo 101-0054, Japan
URL: https://www.agriculturalmechanization.com/E-Mail: [email protected]
Copylight © 2021 byFARM MACHINERY INDUSTRIAL RESEACH CORP.
in SHIN-NORINSHA Co., LtdPrinted in Japan
This is the 186th issue since its maiden issue in the Spring of 1971
AFRICAKayombo, Benedict (Botswana)Fonteh, Fru Mathias (Cameroon)Ndindeng, Sali Atanga (Cote d’Ivoire)Abdallah, Said Elshahat (Egypt)El Behery, A. A. K. (Egypt)Addo, Ahmad (Ghana)Bani, Richard Jinks (Ghana)Djokoto, Israel Kofi (Ghana)Some, D. Kimutaiarap (Kenya)Gitau, Ayub N. (Kenya)Houmy, Karim (Morocco)Alonge, Akindele Folarin (Nigeria)Oyelade, O. A. (Nigeria)Bindir, Umar B. (Nigeria)Igbeka, Joseph C. (Nigeria)Odigboh, E. U. (Nigeria)Oni, Kayode C. (Nigeria)Opara, U. L. (South Africa)Kuyembeh, N. G. (Sierra Leone)Abdoun, Abdien Hassan (Sudan)Saeed, Amir Bakheit (Sudan)Khatibu, Abdisalam I. (Tanzania)Tembo, Solomon (Zimbabwe)
AMERICASCetrangolo, Hugo Alfredo (Argentina)Nääs, Irenilza de Alencar (Brazil)Ghaly, Abdelkader E. (Canada)Hetz, Edmundo J. (Chile)Roudergue, Marco Antonio Lopez (Chile) Aguirre, Roberto (Colombia)Ulloa-Torres, Omar (Costa Rica)Mesa, Yanoy Morejón (Cuba)Rondon, Pedro Paneque (Cuba)Luna-Maldonado, A. I. (Mexico)Magaña, S. G. Campos (Mexico)Ortiz-Laurel, H. (Mexico)Bora, C. Ganesh (U.S.A.)Goyal, Megh Raj (U.S.A.)Mahapatra, Ajit K. (U.S.A.)
ASIA and OCEANIAFarouk, Shah M. (Bangladesh)Hussain, Daulat (Bangladesh)Mazed, M. A. (Bangladesh)Ali, Rostom (Bangladesh)Wangchen, Chetem (Bhutan)Basunia, M. A. (Brunei)Li, M. (China)Luo, X. (China)Ilyas, S. M. (India)
Mani Indra (India)Mehta, C. R. (India)Michael, A. M. (India)Nath, Surya (India)Pathak, B. S. (India)Salokhe, Vilas M. (India)Singh, Gajendra (India)Verma, S. R. (India)Soni, Peeyush (India)Abdullah, Kamaruddin (Indonesia)Behroozi-Lar, Mansoor (Iran)Minaei, Saeid (Iran)Mahdavian, Alireza (Iran)Abdul-Munaim, Ali Mazin (Iraq)Hasegawa, Hideo (Japan)Snobar, Bassam A. (Jordan)Chung, Jong Hoon (Korea)Lee, In-Bok (Korea)Bardaie, Muhamad Zohadie (Malaysia)Gonchigdorj, Enkhbayar (Mongolia)Pariyar, Madan P. (Nepal)Jayasuriya, Hemanatha P. W. (Oman)Khan, Alamgir A. (Pakistan)Mughal, A. Q. A. (Pakistan)Mirjat, Muhammad Saffar (Pakistan)Abu-Khalaf, Nawaf A. (Palestine)Lantin, Reynaldo M. (Philippines)Venturina, Ricardo P. (Philippines)Al-suhaibani, Saleh Abdulrahman (Saudi Arabia)Al-Amri, Ali Mufarreh Saleh (Saudi Arabia)Illangantileke, S. G. (Sri Lanka)Chen, Suming (Taiwan) Krishnasreni, Suraweth (Thailand)Phongsupasamit, Surin (Thailand)Senanarong, Akkapol (Thailand)Ertekin, Can (Turkey)Haffar, Imad (United Arab Emirates)Hay, Nguyen (Viet Nam)Lang, Pham Van (Viet Nam)
EUROPEKatardjiev, Tihomir Hristov (Bulgaria)Kic, Pavel (Czech)Müller, Joachim (Germany)Ferentinos, Konstantinos P. (Greece)Sigrimis, Nick (Greece)Gasparertto, Ettore (Itaty)Lobachevsky, Y. (Russia)Martinov, Milan (Serbia)Jaime, Ortiz-Cañavate (Spain)Sims, Brian G. (U.K.)
EDITORIAL
Yoshisuke KishidaChief EditorJanuary, 2021
Happy New Year to AMA readers around the world. The 20th century was over and after the beginning of the 21st century, 20 years has already passed. During the past century, the world suffered various wars, handled severe conflicts and struggled with food shortages, but the world’s population has been steadily increasing toward 10 billion people. However, the extend of agricultural land in the world has not increased. So the agricultural land per capita in the world continues to decrease. The divide between rich and poor in the world continues to be widen. In such condition, stress is mounting high and tougher competition for resources leads to major conflicts.
Agriculture produces food that supports the lives of humankind, but the farmers in the world who carry agriculture are never rich. The reason being both unfavorable and unfair trade conditions for agricultural practitioners, as compared to the non-agricultural side. Employees at factories and companies have ways to show their dissatisfaction and to de-mand fair compensation, if their salary is low, but due to lack of formalized benchmarking system, the farmers may not even do so. They continue to produce food silently and hon-estly for the people in the world.
It can be said that Japanese rice has been maintained at a fairly high price by government policy. It costs you about 200 yen per kg of brown rice. However If you buy two 500cc PET bottles at a convenience store, you have to pay 200 yen or more. Although it is claimed that Japanese rice is the most expensive in the world, but it is still cheaper than water. This is the market situation for the farmers. Of course, there are some farmers who run very large-scale farm and make big sales and profit, but there are a lot of small-scale farmers in the world. Japan is a mountainous country, and nearly 60% of agricultural land exists in the mountainous areas, and the operational land for farming are very small and difficult for mechanization with higher labor productivity.
There are many such farmlands all over the world. Similarly in China, about one-third of the total farmland area is in the mountains. In North America with very large operational section where one section is about 250 hectares, they can increase the labor productivity of agriculture by using big and powerful machines and expanding work width. That’s not the case with mountain or small scale farming. There is the need for new mechanization ap-proach that can increase the labor productivity of agriculture considering such many sepa-rated small plots.
We are entering new era where it is possible. In other words, instead of using a 1000 horsepower from tractors, new system could use 200 small agricultural robots with 5 horse-power each. I believe that the future agricultural mechanization of the world will be the agricultural mechanization of the brain using AI.
AMA started publishing in 1971. AMA aims to promote agricultural mechanization for developing countries in order to reduce the gap between the farmers in developing coun-tries and the cities in developed countries. For realizing the peaceful world, we must raise the income of farmers and they can live happily by promoting new mechanization. AMA celebrated its 50th anniversary last year, and I would like to continue to do my best for the agricultural mechanization of the new world, aiming for the next 100th anniversary.
Thank you for your cooperation.

Yoshisuke Kishida
V. V. AwareA. K. Mehta
S. ZareeJ. Khodaei
Guillen Sánchez JuanSantos G. CamposMagaña
Carlos Sánchez LópezOscar M. González-Brambila
Gabriela Ramírez-Fuentes
Shrinivas DeshpandeG. Senthil Kumaran
A. Carolin Rathinakumari
N. R. Nwakuba
R. Pandiselvam, M. R. ManikantanA. C. Mathew, Shameena Beegum
K. B. Hebbar
Nawaf Abu-KhalafYasser A. R. Natour
Ajay Kumar VermaSamir Santiya
K. P. Singh, Dilip JatAvinash Kumar Gautam
M. P. S. Chouhan
Qizhi Yang, Jing Cai, Xin ZhouIbrar Ahamd, Jianping Hu, Jun Gu
Said Elshahat AbdallahWael Mohamed Elmessery
Ahmed Elseify
A. M. MousaE. A. Darwish
Engin ERGÜLBülent ÇAKMAK
5
7
13
17
24
30
39
44
48
55
61
67
74
81
Editorial
Development of Pedal Operated Arecanut Dehusker Based on Ergo-nomical and Mechanical Considerations
Determination of Essential Indexes in Assessing the Status of Agri-cultural Mechanization in Kurdistan, Iran
Evaluation Parameters Effeccting the Performance of Vibrating Vertical Tillage Equipment, First Stage
Development of a Watermelon (Citrullus lanatus) Seed Extractor
Optimization of Energy Consumption of Okra Slices in a Solar-assisted Electric Crop Dryer
Design, Development and Evaluation of Minimal Processing Ma-chine for Tender Coconut (Cocos nucifera)
Agricultural Machinery Manufacturing Sector in Palestine - Real-ity and Challenges
Modification of Rotary Unit of Power Tiller for Biasi (Interculture Operation) Rice Cultivation in Eastern India
Design of Rotary Assisted Broad Bed Former-cum-Seeder for Ver-tisols
The Optimization of Topological Mechanism and Dimension De-sign of Parallel Transplanting Machine in Greenhouse
Implementation of Image Processing and Fuzzy Logic Discrimina-tor of Hatching Eggs Fertility
Performance Evaluation of a Multi-crop Shelling/Cracking Machine for Shelling of Peanut Pods
Power Requirement and Fuel Consumption Reduction of Forage Harvester Chopper Blades by Thermal Coating
CONTENTSAGRICULTURAL MECHANIZATION IN ASIA, AFRICA AND LATIN AMERICA
Vol.52, No.1, Winter 2021
Retirement Message (R. L. Kushwaha) ..............23New Consultant Editor (P. Soni) .........................54
Co-operating Editors ..........................................91Subscription Information ...................................98

VOL.52 NO.1 2021 AGRICULTURAL MECHANIZATION IN ASIA, AFRICA AND LATIN AMERICA 7
Development of Pedal Operated Arecanut Dehusker Based on Ergonomical and Mechanical Considerations
byV. V. AwareAssociate ProfessorDepartment of Farm Machinery and Power,College of Agril. Engineering and Technology,Dr. BSKKV, Dapoli, Dist.: Ratnagiri - 415 712 (MS)[email protected]
A. K. MehtaHeadDepartment of Farm Machinery and Power,College Technology and Engineering,MPUAT, Udaipur - 313 001 (Raj)INDIA
AbstractThe dimensions of pedal operated
arecanut dehusker that is hopper height, handle diameter and length, saddle height, etc. were optimised based on anthropometric data of male agricultural workers. The di-ameter and length of the dehusking cylinder were 350 mm and 500 mm, respectively. The cylinder opera-tional parameters viz, peripheral speed and feed rate were 7 m/s and 15 kg/h, respectively. The flywheel weighing 12.5 kg with rim diameter as 350 mm was opted for reducing cylinder speed f luctuations. The developed pedal operated arecanut dehusker was ergonomically and mechanically evaluated to insure its performance. The mean work-ing heart rate, oxygen consumption rate and energy expenditure rate were 126.5 (± 8.4) beats/min, 1.30
L/min and 27.23 (± 2.79) kJ/min, respectively. The average dehusk-ing capacity, efficiency and kernel breakage were 15.1 kg/h, 77.9% and 4.3%, respectively using single con-cave. Dehusking efficiency and ker-nel breakage were 96.6% and 6.7%, respectively when both concaves were used one after another.
IntroductionArecanut is a kernel obtained
from the fruit of arecanut palm (Areca catechu Linn.). Arecanut is a tropical crop belonging to the family Palmae. During 2006-07, total-world area under arecanut was about 703 thousand ha with produc-tion of 854 thousand tonnes (Anon., 2008) and productivity 1,215 kg/ha. In India, arecanut was grown on 414 thousand ha with production of 535 thousand MT and productivity of 1,292 kg/ha during the year 2011-12 (Anon., 2015).
The moisture content of freshly harvested arecanut fruit is about 68 to 70% (w.b.) (Anonymous, 2012). Arecanuts are harvested when those reaches physiological maturity. After harvesting, fruits are dried to reduce moisture content up to 8 to 10% (w.b.). Arecanut fruits are dried in sun spreading evenly in single layer on the ground or on the
roof top (concrete or tin sheet as per availability). The fruits are turned over at regular intervals to facilitate uniform drying. Moisture content of fruits reaches up to 8 to 10% within 35-40 days. After drying, arecanuts are dehusked manually using coun-try kitchen tool direct at farmer’s house or at small scale processing units. The kitchen tool being used for the purpose has a wooden plank and curved MS blade. The whole kernel is separated by taking two to three cuts to the dried fruit. Each in-dividual fruit is handled separately which makes the dehusking process time consuming, labour intensive, uneconomical and above all unsafe for fingers and palms. It is observed that dehusking operation constitutes about 35 to 40% of the total cost of processing (Varghese and Jacob, 1998).
Traditional arecanut dehusking process with arecanut fruit and kernel are shown in Plate 1. In order to increase productivity few scientists have developed motor-ized arecanut dehusking machines (Balasubramanian (1985), Varghese and Jacob (1998) and Bundit J. et al. (2009). Also, these machines were developed for arecanut of particular varieties available at the respective region. When used for other variet-ies, these machines give poor de-husking efficiency and high kernel
Plate 1 Injury prone traditional arecanut dehusking (a), Arecanut fruit (b) and kernel (c)
(a) (c)
(b)
AGRICULTURAL MECHANIZATION IN ASIA, AFRICA AND LATIN AMERICA 2021 VOL.52 NO.18
breakage. Hence, it was necessary to have arecanut dehsuker suitable for the varieties available in Konkan region. Effort was made by Baboo (1981) for manual dehusking ma-chine of arecanut but much success was not achieved because of low ca-pacity of machine. In view of this, a manual arecanut dehusking machine suitable for small and marginal farmers was needed. Human energy has generally been utilised through arms, hands and back. The capac-ity for arm exercise is dependent upon the amounts of muscle mass engaged (Shephard, 1967). A person can generate more power (about four times) by pedalling than by hand cranking (Wilson, 1986). The use of pedal power seems to be potentially advantages in agriculture sector, where electrical or internal combus-tion engine power is unavailable (Tiwari et. al., 2011). Hence con-sidering all these points, the pedal operated arecanut dehusker was de-veloped based on ergonomical and mechanical parameters.
Materials and Methods Power Output and Pedalling Rate
Shah (2005) reported that pedal powered electricity generator unit could generate 80 W by pedalling for an hour at the pedalling rate of 40 to 50 rpm. Chen et al. (1999) reported that minimum oxygen consumption rate was at 60 rpm and increased at both higher and lower pedalling rates. Wilson (1986) reported that the reasonable workload for continu-ous power generation for the western population would be about 75 W for a young and healthy person. He also reported that pedalling at a load of about 90 W could be sustained for around 60 minutes. In view of these facts, the power outcome from a farm worker was considered as 75 W for one hour duration. The present arecanut dehusker was developed to be operated with 75 W power and 60 rpm pedalling rate.
Arecanut DehuskingPower required for the dehuk-
ing of arecanut fruit in different modes of force applications was studied. It was observed that power required for dehusking in compres-sion, impact and shear loading were 18.3, 25.2 and 107.2 W, respectively (Aware, 2012). Hence, the mecha-nism comprising of combined effect of compression, impact and shear in descending order i.e., maximum compression, medium impact and least shear would be suitable for are-canut dehusking. Hence, a mecha-nism comprising dehusking cylinder and concave with openings which would impart the combined action of compression, impact and shear, was adopted. The diameter and length
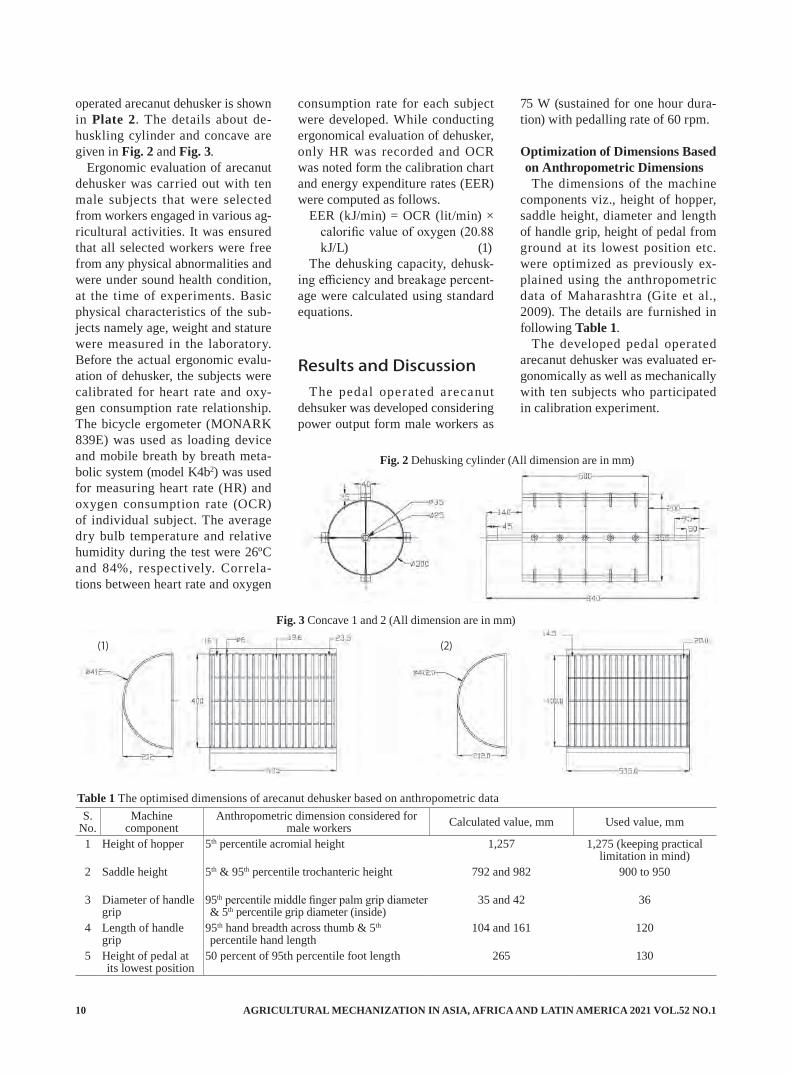
of cylinder were 300 mm and 500 mm, respectively. There were four beating elements fabricated with MS flat having width and thickness 40 mm and 10 mm, respectively. Rubber pads having width equal to width of MS flat and thickness as 15 mm, were pasted on the MS flat and fixed with flat headed counter sunk bolts with washers. Hence, the diam-eter of cylinder at rubber beater top surface was 350 mm. Two concaves were developed; one was having ap-erture size varying from 16 to 23.5 mm, with average as 19.8 mm. The criteria for selecting the range of ap-erture size of 16-23.5 mm were the spatial dimensions of fruit and ker-nel. (Aware et al., 2012). The lower opening of 16 mm was based on the
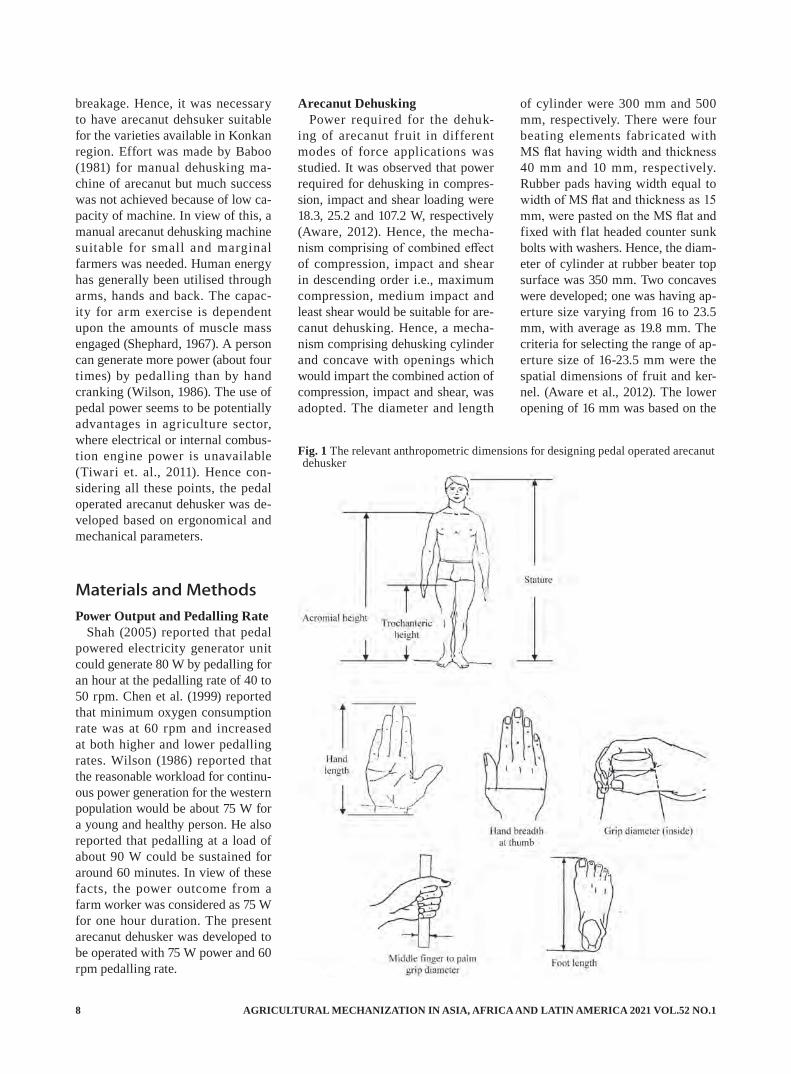
Fig. 1 The relevant anthropometric dimensions for designing pedal operated arecanut dehusker

VOL.52 NO.1 2021 AGRICULTURAL MECHANIZATION IN ASIA, AFRICA AND LATIN AMERICA 9
5th percentile kernel minor diameter (15.4 mm) while the upper opening, 23.5 mm was based on 95th percen-tile of the same dimension (23.7 mm) and 15th percentile arecanut fruit minor diameter (23.5 mm). The rationale behind this was to have the provision for passing all kernels and less than 15 per cent fruits which could be dehusked using the second concave. The second concave was with aperture size varying from 14.5 to 20 mm with average 17.2 mm. The range of aperture size was se-lected on the basis that about all ker-nels (as 5th percentile kernel minor diameter was 15.4 mm) and less than 5% arecanut fruits (as 5th percentile fruit minor diameter was 20.4 mm) could pass through it.
Optimization of Dimensions of De-husker Based on Anthropometric DataThe dimensions for the pedal op-
erated arecanut dehusker were op-timised based on the design guide-lines as suggested by Gite et al. (2009) with anthropometric data of male workers of Maharashtra. The relevant anthropometric dimensions considered are shown in Fig. 1.1. Height of hopper: It should be
about acromial height. Limiting user was 5th percentile male. The 5th percentile acromial height for male in Maharashtra was 1,257 mm. The height of hopper was kept as 1,275 mm (less than 1.5 excess over acromial).
2. Saddle height: The utmost saddle height should be based on the 95th percentile trochanteric height
(vertical distance from standing surface to the trochanterion) and should be taken as 96 percent of it. The 5th and 95th percentile trochanteric heights of agricul-tural workers of Maharashtra are 792 and 982 mm, respectively. Therefore, the lowest and highest saddle height came to be 760 and 943 mm, respectively. The saddle height was made adjustable vary-ing from 900 to 950 mm.
3. Crank length: The standard crank being used on adult bicycle was of 178 mm. The same crank was used.
4. Diameter of handle: The diam-eter of handle grip should be such that while holding the handle, the operator’s longest finger should not touch the palm. At the same time the grip should not exceed the internal grip diameter. As the equipment was to be operated by male workers, 95th percentile middle finger palm grip diameter was the lowest limit and 5th per-centile grip diameter (inside) was considered as the upper limit. As per anthropometric data of Maha-rashtra, these values were 35 mm and 42 mm, respectively. Hence, commercially available bike grip having outer diameter as 36 mm was used.
5. Length of handle: The minimum handle length should be 95th per-centile of hand breadth across thumb of male workers, which was 104 mm. Considering the dif-ferent positions in which a person holds the handle, the handle grip length should be up to 5th percen-tile of hand length, which was 161 mm. Commercially available bike grip having length as 120 mm was used.
6. Height of pedal at its lowest posi-tion: The height of pedal from the ground surface when the pedal is at its lowest position should be such that the toes should not touch the ground even when the foot is in fully flexed. This clearance should be based on 95th percentile
foot length. The rear half of the foot must be on the pedal. Hence, the clearance of pedal from the ground surface should be about 50% of foot length. The 95th per-centile foot length of agricultural workers of Maharashtra was 265 mm; therefore the clearance was 130 mm.
Mechanical Parameters in Devel-opment of DehuskerThe diameter up to top surface
of rubber beater was 350 mm. The length of cylinder was taken as 1.5 times the diameter. Considering op-timum peripheral velocity as 7 m/s, the cylinder speed was calculated as 382 rpm. The speed ratio between pedal shaft and cylinder shaft was 382/60 = 6.36. The speed ratio was achieved in two steps using chain and sprocket drive. The number of teeth on pedal shaft sprocket and that of on the intermediate shaft sprocket were 44 and 18, respec-tively in the first step. Similarly, in the second step, the numbers of teeth were 44 and 17, respectively. Standard pitch roller chains having pitch equal to 12.7 mm were used to transmit power from pedal shaft to the intermediate shaft and thereafter to the drum shaft.
During operation, the rotary speed of cylinder fluctuated due to varia-tion in load. Hence, the f lywheel was incorporated to smoothen the motion of the cylinder. Assuming maximum fluctuation in pedalling rate as 10 percent, the maximum and minimum pedalling rates were 55 and 65 rpm, which resulted the cylinder speed variations from 411 to 348 rpm (maximum and mini-mum), with average speed 380 rpm. The flywheel was designed adopting the standard procedure. Accord-ingly, the weight of f lywheel was calculated as 12.5 kg. The outer di-ameter, width and thickness of rim were 350 mm, 40 mm and 20 mm, respectively, resulting rim thickness to width ratio as 0.5.
The developed prototype of pedal
Plate 2 Pedal operated arecanut dehusker with feeding hopper
AGRICULTURAL MECHANIZATION IN ASIA, AFRICA AND LATIN AMERICA 2021 VOL.52 NO.110
operated arecanut dehusker is shown in Plate 2. The details about de-huskling cylinder and concave are given in Fig. 2 and Fig. 3.
Ergonomic evaluation of arecanut dehusker was carried out with ten male subjects that were selected from workers engaged in various ag-ricultural activities. It was ensured that all selected workers were free from any physical abnormalities and were under sound health condition, at the time of experiments. Basic physical characteristics of the sub-jects namely age, weight and stature were measured in the laboratory. Before the actual ergonomic evalu-ation of dehusker, the subjects were calibrated for heart rate and oxy-gen consumption rate relationship. The bicycle ergometer (MONARK 839E) was used as loading device and mobile breath by breath meta-bolic system (model K4b2) was used for measuring heart rate (HR) and oxygen consumption rate (OCR) of individual subject. The average dry bulb temperature and relative humidity during the test were 26ºC and 84%, respectively. Correla-tions between heart rate and oxygen
consumption rate for each subject were developed. While conducting ergonomical evaluation of dehusker, only HR was recorded and OCR was noted form the calibration chart and energy expenditure rates (EER) were computed as follows.
EER (kJ/min) = OCR (lit/min) × calorific value of oxygen (20.88 kJ/L) (1)
The dehusking capacity, dehusk-ing efficiency and breakage percent-age were calculated using standard equations.
Results and DiscussionThe pedal operated arecanut
dehsuker was developed considering power output form male workers as
75 W (sustained for one hour dura-tion) with pedalling rate of 60 rpm.
Optimization of Dimensions Based on Anthropometric DimensionsThe dimensions of the machine
components viz., height of hopper, saddle height, diameter and length of handle grip, height of pedal from ground at its lowest position etc. were optimized as previously ex-plained using the anthropometric data of Maharashtra (Gite et al., 2009). The details are furnished in following Table 1.
The developed pedal operated arecanut dehusker was evaluated er-gonomically as well as mechanically with ten subjects who participated in calibration experiment.
Table 1 The optimised dimensions of arecanut dehusker based on anthropometric dataS.
No.Machine
componentAnthropometric dimension considered for
male workers Calculated value, mm Used value, mm
1 Height of hopper 5th percentile acromial height 1,257 1,275 (keeping practical limitation in mind)
2 Saddle height 5th & 95th percentile trochanteric height 792 and 982 900 to 950
3 Diameter of handle grip
95th percentile middle finger palm grip diameter & 5th percentile grip diameter (inside)
35 and 42 36
4 Length of handle grip
95th hand breadth across thumb & 5th percentile hand length
104 and 161 120
5 Height of pedal at its lowest position
50 percent of 95th percentile foot length 265 130
Fig. 2 Dehusking cylinder (All dimension are in mm)
Fig. 3 Concave 1 and 2 (All dimension are in mm)
(1) (2)
VOL.52 NO.1 2021 AGRICULTURAL MECHANIZATION IN ASIA, AFRICA AND LATIN AMERICA 11
Calibration of SubjectsThe details about subjects, that are
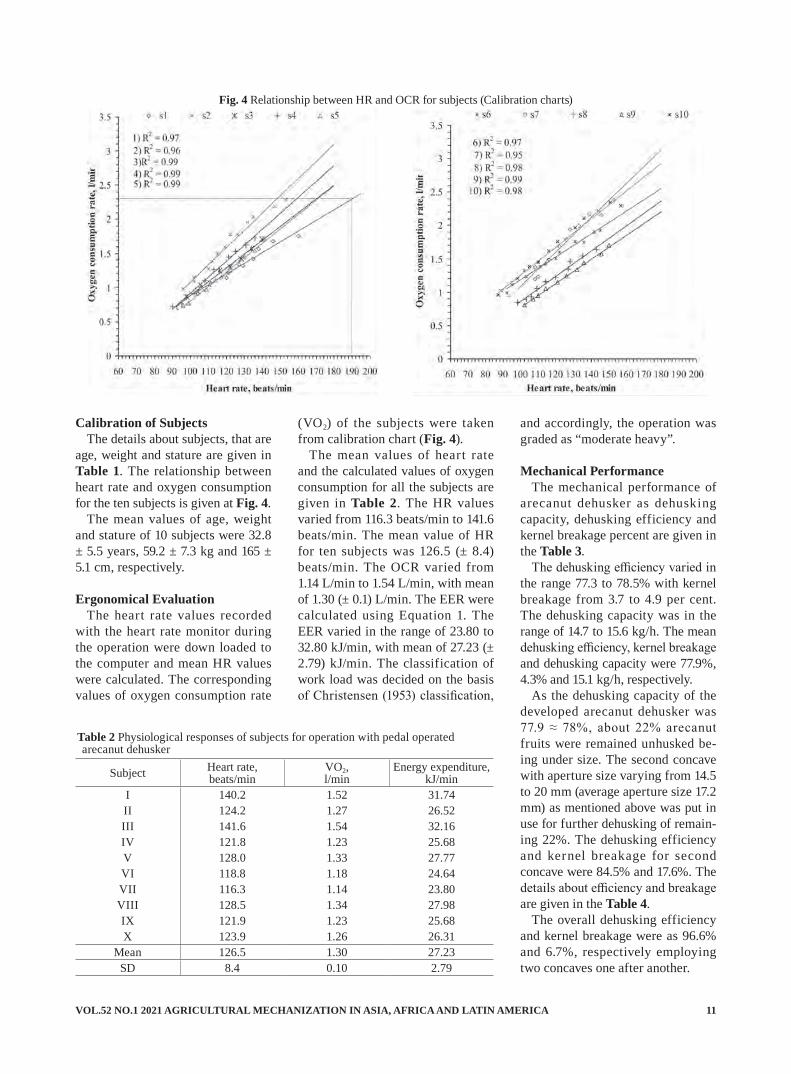
age, weight and stature are given in Table 1. The relationship between heart rate and oxygen consumption for the ten subjects is given at Fig. 4.
The mean values of age, weight and stature of 10 subjects were 32.8 ± 5.5 years, 59.2 ± 7.3 kg and 165 ± 5.1 cm, respectively.
Ergonomical Evaluation The heart rate values recorded
with the heart rate monitor during the operation were down loaded to the computer and mean HR values were calculated. The corresponding values of oxygen consumption rate
Table 2 Physiological responses of subjects for operation with pedal operated arecanut dehusker
Subject Heart rate,beats/min
VO2,l/min
Energy expenditure,kJ/min
I 140.2 1.52 31.74II 124.2 1.27 26.52III 141.6 1.54 32.16IV 121.8 1.23 25.68V 128.0 1.33 27.77VI 118.8 1.18 24.64VII 116.3 1.14 23.80VIII 128.5 1.34 27.98IX 121.9 1.23 25.68X 123.9 1.26 26.31
Mean 126.5 1.30 27.23SD 8.4 0.10 2.79
(VO2) of the subjects were taken from calibration chart (Fig. 4).
The mean values of heart rate and the calculated values of oxygen consumption for all the subjects are given in Table 2. The HR values varied from 116.3 beats/min to 141.6 beats/min. The mean value of HR for ten subjects was 126.5 (± 8.4) beats/min. The OCR varied from 1.14 L/min to 1.54 L/min, with mean of 1.30 (± 0.1) L/min. The EER were calculated using Equation 1. The EER varied in the range of 23.80 to 32.80 kJ/min, with mean of 27.23 (± 2.79) kJ/min. The classification of work load was decided on the basis of Christensen (1953) classification,
and accordingly, the operation was graded as “moderate heavy”.
Mechanical Performance The mechanical performance of
arecanut dehusker as dehusking capacity, dehusking efficiency and kernel breakage percent are given in the Table 3.
The dehusking efficiency varied in the range 77.3 to 78.5% with kernel breakage from 3.7 to 4.9 per cent. The dehusking capacity was in the range of 14.7 to 15.6 kg/h. The mean dehusking efficiency, kernel breakage and dehusking capacity were 77.9%, 4.3% and 15.1 kg/h, respectively.
As the dehusking capacity of the developed arecanut dehusker was 77.9 ≈ 78%, about 22% arecanut fruits were remained unhusked be-ing under size. The second concave with aperture size varying from 14.5 to 20 mm (average aperture size 17.2 mm) as mentioned above was put in use for further dehusking of remain-ing 22%. The dehusking efficiency and kernel breakage for second concave were 84.5% and 17.6%. The details about efficiency and breakage are given in the Table 4.
The overall dehusking efficiency and kernel breakage were as 96.6% and 6.7%, respectively employing two concaves one after another.
Fig. 4 Relationship between HR and OCR for subjects (Calibration charts)

AGRICULTURAL MECHANIZATION IN ASIA, AFRICA AND LATIN AMERICA 2021 VOL.52 NO.112
ConclusionsA pedal operated arecanut dehu-
sker was developed considering 75 W as the sustained power output from male worker for one hour with 60 rpm pedalling rate. The workers could operate it comfortably with a mean working heart rate of 127 beats/min. The values for dehusk-ing capacity, dehusking efficiency and kernel breakage were 15.1 kg/h, 77.9% and 4.3%, respectively using single concave of 19.8 mm mean ap-erture size. The dehusking efficiency and breakage values were 96.6% and 6.7%, respectively with two con-caves (having mean aperture sizes as 19.8 mm and 17.2 mm) were put one after another and used for dehu-sking. Therefore, it is recommended to dehusk arecanuts using two concaves of size 19.8 mm and 17.2 mm put one after another to achieve maximum dehusking efficiency.
REFERENCES
Anonymous. 2008. Area and pro-duction statistics of Arecanut and spices. Directorate of Arecanut and Spices Development, Calicut, Kerala, 9-10.
Anonymous. 2015. Area production and productivity of arecanut. Di-rectorate of Arecanut and Spices Development, Calicut, Kerala, http://dasd.gov.in/index.php/sta-tistics.html?start=1, visited on 4/8/2015.
Anonymous. 2012a. Progress report, AICRP on ESA, Dr. Balasaheb Sawant Konkan Krishi Vidy-apeeth, Dapoli. Presented in 6th Workshop of AICRP on ESA at CIAE, Bhopal.
Aware, V. V. 2012. Ergonomi-cal interventions in developing pedal operated arecanut dehu-sker. Unpublished Ph.D. Thesis. Department of Farm Machinery and Power Engineering, CTAE, MPUAT, Udaipur.
Baboo, B. 1981. A device for de-
Table 3 Mechanical performance of arecanut dehusker
Replications Dehusking capacity, kg/h
Dehusking efficiency, %
Kernel breakage,%
1 15.6 78.0 3.92 15.0 78.2 3.73 14.7 78.0 4.14 15.1 78.0 4.85 15.0 78.2 4.96 14.8 77.5 3.87 14.9 77.7 4.78 15.3 77.3 4.69 15.6 78.5 4.510 15.0 77.7 4.0
Mean 15.1 77.9 4.3
Table 4 Dehusking efficiency and kernel breakage
Concave Dehusking efficiency, %
Kernel breakage,%
Concave 1 77.9 4.3Concave 2 84.5 17.6Using both concaves one after another 96.6 6.7
husking arecanut. Journal of Agricultural Engineering (ISAE), 19(1), 63-65.
Balasubramanian, M. 1985. Studies on parameters of arecanut dehu-sking. Unpublished Ph.D. Thesis. Division of Agricultural Enginee-ing, Indian Agricultural Research Institute, New Delhi.
Bandit, J., Suttiporm, N. and T. Anupum. 2009. Development and testing of a husking machine for dry betel nut (Areaca Catechu Linn.). Biosystem Engineering, 102: 83-89.
Chen, B., Jones, N. L. and K. J. Killan. 1999. Is there a conf lict between minimizing efforts and the energy expenditu re with increasing velocities of muscle contraction in humans? Journal of Physiology, 518(3): 933-940.
Christensen, E. H. 1953. Physiologi-cal valuation of work in Nykroppa iron works. In W.F. Floyd and Wellford (eds), Ergonomics Soci-ety Symposium on fatigue, Lewis, London: 93-108.
Gite, L. P., Mujumder, J., Mehta, C. R. and A. Khadatkar. 2009. Anthropometric and strength data of Indian agricultural workers for farm equipment design. Central
Institute of Agricultural Engi-neering, Bhopal.
Shah, N. 2005. Integrating village industry with human and animal power. Rural Technology. Centre for Technology Alternatives for Rural Area (CTARA), IIT, Mum-bai.
Shephard, R. J. 1967. Physiological determinants of cardio respiratory fitness. J. Sports Med. Phys. Fit-ness (7), 111-134.
Tiwari, P. S., Gite, L. P., Panbey, M. M. and A. K. Shrivastava. 2011. Pedal power for occupational ac-tivities: Effect of power output and pedalling rate on physiological responses. International journal of industrial ergonomics, 41: 261-267.
Varghese, F. and J. Jakob. 1998. De-sign fabrication and testing of area nut dehusker. Agricultural Mecha-nization in Asia, Africa and Latin America, 29(1): 27
Wilson, G. D. 1986. Understanding pedal power. Volunteers in Tech-nical Assistance, Virginia, USA.
■■
VOL.52 NO.1 2021 AGRICULTURAL MECHANIZATION IN ASIA, AFRICA AND LATIN AMERICA 13
Determination of Essential Indexes in Assessing the Status of Agricultural Mechanization in Kurdistan, Iran
byS. ZareeiAssistant ProfessorDepartment of Biosystems Engineering, University of Kurdistan, [email protected]
J. KhodaeiAssistant ProfessorDepartment of Biosystems Engineering, University of Kurdistan, SanandajIRAN
AbstractIn order to develop a proper plan
for agricultural management in a region, adequate understanding of the current situation in the field of agricultural mechanization is a ne-cessity. In this study, a comprehen-sive assessment was conducted on developmental situation of agricul-tural mechanization in Kurdistan, Iran. For this purpose, some factors such as the degree of mechaniza-tion, level of mechanization, coeffi-cient of productivity and operational power were calculated. The degree of mechanization in major crops was generally calculated for tillage, planting, growing and harvesting throughout the province, separately. The ratio of this index was highest for tillage operations (nearly 100%) and lowest for the growing opera-tions (less than 50%). The average index of the tractor mechanization level was estimated to be 1.67 (hp/ha) which is higher than the national average (1.5 hp/ha). The coefficient of productivity and machinery us-age in the region was estimated to be 71%.
IntroductionTools, implements, and pow-
ered machinery are essential and
major inputs to agriculture. The term “mechanization” is generally considered as the overall applica-tion of these inputs (Clarke, 2000). Mechanization, defined as the use of machines and mechanical tools in agriculture for overcoming techni-cal and climate limitations as well as time constraints, has facilitated the possibility to increase the area under cultivation and production in the agricultural sector. Adequate understanding of current situation of mechanization is necessary for proper planning in regional agricul-ture, such that a suitable solution can be offered for the development and institutionalization of mecha-nization. Basic indices should be used for any type of comparison to provide an accurate analysis. Several indices such as degree of mechanization, mechanization level and coefficient of productivity are used to investigate the agricultural mechanization status in any region.
Singh and De (1999) reviewed the methodologies adopted by several authors to express a mechanization indicator. Mechanization planning requires a quantitative assessment of mechanization indexes (Singh, 2006). Rasouli Sharabiani and Ran-jbar (2008) calculated agricultural mechanization indices in Sarab, I ran. They est imated regional mechanization level to be about 0.83
(hp/ha). Literatures have showed that the degree of mechanization for most agricultural operations has been very low. It has been also estimated that 775 tractors are re-quired to compensate the deficit in the region to achieve the mecha-nization level of 1.5 hp/ha. Olyaoe and Rotimi (2010) calculated the mechanization index in two states in southwestern Nigeria and ana-lyzed the efficiency in both regions which were 31.3% and 28.6, while total efficiency was in the range of 0.0115 to 0.0951 (ha/kW.h). Yield of corn was in the range of 1.2 to 1.7 (tons/ha).The mentioned conditions showed an undesirable situation in terms of agricultural mechanization. In a study, conducted by Fortune and Tawanda (2013) on indices of agricultural mechanization related to the production of tobacco in Zim-babwe, the mechanization level was equal to 0.42 (hp/ha) that was too far from the desirable value (1.5 to 2 hp/ha). Pishbin (2013) calculated the mechanization indices for crops and horticulture products in Fars, Iran. The results of their study showed that mechanization capacity, regard-less of the product was 1,711.3 (hp.h/ha) and considering the 50% of orchards, it was 1,410.7 (hp.h/ha). The mechanization level index was calculated to be 1.89 (hp/ha), indi-cating that the mechanization level
AGRICULTURAL MECHANIZATION IN ASIA, AFRICA AND LATIN AMERICA 2021 VOL.52 NO.114
was higher than the national aver-age. The role of mechanization in the production efficiency of potato has been studied by Fouladi et al. (2013) in Ardabil, Iran. Their results showed that 98% of plowing, 35% of planting and 57% of growing opera-tions were mechanized which can be improved by compensating the regional power deficits.
Agricultural mechanization status in Bangladesh has been studied by Ziaudin and Zia (2014). According to their results, the use of mechani-cal farm power has had a rapid in-crease over the last 2 decades. Bello et al. (2015) investigated the index of mechanization and other produc-tivity functions as indicators of as-sessing the impact of mechanization on agricultural production in North of Nigeria.
So far, a comprehensive assess-ment of the status of agricultural mechanization has not been carried out in the province of Kurdistan, Iran. The results of this study can provide an integrated insight into the identification of problems re-lated to agricultural mechanization in terms of accurate planning and improving of the present situation.
Materials and MethodsClimate and Geography of Kurd-istan[Kurdistan is a province located
in the West of Iran, between 34º, 44′ to 36º and 30′ of the north latitude and 45º degrees 36 and 31 minutes to 48 degrees 16 minutes of the east longitude of the Greenwich merid-ian.] Kurdistan is a mountainous region with high plains and wide valleys spread across the region. Ac-cording to the latest division of the country in 2011, it has 10 cities. Ar-able lands of the province are 1100 thousand hectares of which about 700 thousand hectares are allocated to crops and 400 thousand hectares are allocated to horticulture prod-ucts. The main crops of the prov-
ince are wheat, barley, corn, beans, forage plants, potatoes as well as horticulture crops including grapes, strawberries, walnuts, etc. specific to cold regions. Annual production of crops is about 1.75 million tons and horticulture crops is about 0.25 million tons.
Statistical and Research Method-ologyStatistical data and information
on the operational status of land and machine, the main products and farming calendar of the region were collected through direct ob-servation, discussion with farmers and the ministry of agriculture sta-tistics. The aim of this study was a comprehensive review of the status of agricultural mechanization de-velopment in Kurdistan province using indices such as the degree of mechanization, mechanization level, operational power and coefficient of productivity.
Degree of MechanizationThe degree of mechanization is an
index that considers the quantity of issues associated with mechaniza-tion and it is defined as the area un-der mechanized operations divided by the total area under cultivation. The value of this index for main products of Kurdistan province, which has a higher cultivation area, is generally calculated separately for tillage, planting, growing and harvesting operations all over the province.
Mechanization LevelMechanization level index inves-
tigates the quality of mechanization. This index is the ratio of total avail-able tractor power to the total area under cultivation (hp/ha) (Lak and Almassi, 2011). To calculate this index, the number of active trac-tors used in the agricultural sector is estimated. The actual power was calculated by multiplying the total nominal power by 0.75. The cultiva-tion area is related to all products,
while fallow area is not calculated.
Operational PowerOperational power is an index to
determine the area that can be cov-ered by machine services during the time which is calculated in terms of area. To calculate this index, the ta-ble of cultivation area of a cropping year is provided and machine opera-tion calendar is then checked for months of the year in major crops. According to this calendar, machine operation peak is considered. Usu-ally land preparation and planting operations need more tractors than other operations, i.e. if the farm manager provides the machines required for the preparation and cul-tivation of wheat and barley there won’t be any machine problem, in other months. This index is calcu-lated using the following equation:
Operational power = (n × ta) / tr (1)Where, n is the number of trac-
tors, ta available working time, and tr required time for cultivation per hectare.
Coefficient of ProductivityThe coefficient of productivity or
area coefficient of productivity is the ratio of area under cultivation to operational power of machine in a region. It represents the efficiency of operational power according to the power required.
Results and DiscussionThe degree of mechanization in-
dex for tillage, planting, growing and harvesting operations was cal-culated separately for the province. This index was highest for tillage operations and lowest for growing operations. Fig. 1 demonstrates that in the mechanization of tillage op-erations, the province is in a reason-ably good condition. In the section of planting operation, the degree of mechanization was lower than that of tillage operation; such that even the available resources to supply

VOL.52 NO.1 2021 AGRICULTURAL MECHANIZATION IN ASIA, AFRICA AND LATIN AMERICA 15
the requirements of planting opera-tions were not properly used and in some areas the seeds are manually sprinkled. The number of seeder machines is low; these are not prop-erly managed and are not available to all farmers. The degree of mecha-nization in growing operations was more related to spraying and other operations such as thinning and weeding were not usually fully mechanized. The degree of mecha-nization in the harvest of wheat and barley was almost 100% and this number could be considered real and reasonable by eliminating the exceptions of manual harvesting or obsolete traditional methods that is because in this part, the combines with proper power corresponding to harvest requirements (as observed and declaration of regional experts) are used and in the border areas, migrant combines are also used dur-ing peak harvest times. Of course, this state was only for the harvest
of wheat and barley, and there was a lack of mechanized harvesting for other crops such as alfalfa.
The average of mechanization level index of tractor in the prov-ince was estimated to be 1.67 (hp ha-1). The amount of this index in the cities of the Kurdistan province is presented in Table 1. Now, the average agricultural mechaniza-tion level in Iran is equal to 1.5 (hp/ha). Since this index in Kurdistan is higher, this can prove that the strategic planning for agricultural mechanization has been success-ful. On the other hand, despite the higher mechanization level index in Kurdistan compared to the national average, the degree of mechaniza-tion for some operations such as planting and growing are still low due to a large number of old trac-tors used in the region, the use of tractors in works rather than farm-ing operations as well as the lack of management in the proper use of ag-
ricultural machines. The results also showed that city of Marivan with 5.44 hp/ha and the city of Kamyaran with 1.24 hp/ha have the highest and the lowest levels of mechanization index in the province, respectively.
Current operational power of the province was determined according to collected crop information. The number of effective working days in this region is calculated based on the 60 days and the number of rainy days which is equal to 10 days during the 60 days. The number of rainy days will be doubled and subtracted from the 60 days, work-ing out to be 40 days as effective working days if 8 hours per day is considered as working time during a day. On the other hand, the time required for preparing the ground for one hectare of wheat and barley with conventional operations was calculated to be 7 hours. According to the existence of 23,623 tractors in the entire province and 320 proper hours in the field operations in the region, the operational power was calculated by substituting these numbers in the related equation that would be equal to 1,079,908.57 per hectare.
The coefficient of productivity for tractors according to the value ob-tained for operational power of the cultivation area was estimated to be 71%; which means that at this time, about one third of the operational power of tractors has been wasted. It is also found that at the peak of the working season which requires more machines, there are problems with providing machines for opera-tions. Therefore, the operations can-not be performed on time. On the other hand, the power of tractors in the region is not fully utilized due to a lack of proper management in terms of distribution and applica-tion. Even though, the number of worn-out tractors in the region is high, resulting in relatively high level of mechanization, the incorrect use of machines and their improper maintenance can cause a low ef-
Table 1 Tractor power, area under cultivation and mechanization level in the cities of Kurdistan
City Total tractor power (hp)
Area under cultivation (ha)
Mechanization level(hp/ha)
Dehgolan 190,938 106,808 1.34Sarvabad 17,960 7,372 2.11Kamyaran 90,900 54,673 1.24Divandarreh 376,650 110,353 2.56Marivan 77,523 10,685 5.44Qorveh 237,683 103,052 1.73Sanandaj 102,903 41,994 1.83Saqqez 272,046 117,603 1.73Bijar 321,150 178,525 1.35Baneh 44,553 12,434 2.68
Total 1,732,306 775,717 1.67
Fig. 1 Degree of mechanization for important crops in Kurdistan province
AGRICULTURAL MECHANIZATION IN ASIA, AFRICA AND LATIN AMERICA 2021 VOL.52 NO.116
ficiency and quality of operational operations in the farms.
Conclusions and Sugges-tions
In this study, a comprehensive assessment was conducted on devel-opmental situation of agricultural mechanization in Kurdistan, Iran, and some factors were calculated such as the degree of mechaniza-tion, mechanization levels, coeffi-cient of productivity and operational power. The indexes of mechaniza-tion degree in dominant products were generally calculated for tillage, planting, growing and harvesting operations throughout the province, separately. This index for tillage operations was the highest (nearly 100%) and for growing operations was the least (less than 50%). The average index of mechanization level for tractor in the province was estimated to be 1.67 (hp/ ha) which was higher than the national aver-age (1.5 hp/ha) and the average cal-culated value for some parts of the country (Pishbin, 2013). Operational power in this region was calculated in 1,079,908.57 hectares. Accord-ing to the calculated operational power and the total cultivation area in the province, the coefficient of productivity and the use of tractors and machines in the region were estimated to be 71%. The most im-portant actions that can be effective in improving mechanization are as follows:1. Promotion of mechanized opera-
tions and training farmers and machine owners;
2. Providing tractors and farm ma-chines required for the region;
3. Allocation of loans to replace old tractors and machines as well as equipment repair shops;
4. Education of users and repairmen to fix, adjust, operate and main-tain the machines;
5. Control and regulation of manu-facturers and dealers of agricul-
tural machines for proper provi-sion of after-sale-services.
REFERENCES
Bello, R. S., Onyeanula, P., Saidu, M. J. and M. B. Bello. 2015. Mechanization and agricultural productivity functions in Umua-hia North LGA, Abia Nigeria. Science Journal of Business and Management. Special Issue: Sus-tainable Entrepreneurial Devel-opments in Agribusiness, 3(1-5): 21-25.
Clarke, L. J. 2000. Strategies for agricultural mechanization devel-opment. Agricultural Engineering Branch, Agricultural Support Sys-tems Division, FAO, Rome, Italy.
Fortune, C. F. and D. Tawanda. 2013. An assessment of agricul-tural mechanization index and evaluation of agricultural produc-tivity of some fast track resettle-ment farms in Bindura district of Mashonaland central province: Zimbabwe. International Journal of Social Science and Interdisci-plinary Research, 2(7): 62-82.
Fouladi, F., Shahnavazi, A. and M. Zabolestani. 2013. The role of mechanization in the productiv-ity of potato production in Ard-abil city. International Journal of Farming and Allied Sciences, 2(22): 1003-1009.
Lak, M. B. and M. Almassi. 2011. An analytical review of parame-ters and indices affecting decision making in agricultural mechani-zation. Australian Journal of Ag-ricultural Engineering, 2(5): 140-146.
Olaoye, J. O. and A. O. Rotimi. 2010. Measurement of agricul-tural mechanization index and analysis of agricultural productiv-ity of some farm settlements in south west, Nigeria. Agricultural Engineering International: CIGR Journal, 12(1): 125-134.
Pishbin, S. 2013. Measurement of indexes agricultural mechaniza-
tion in agriculture and horticul-ture crops in Fars Province. Inter-national Journal of Biosciences, 3(12): 81-89.
Rasooli Sharabiani, V. and I. Ran-jbar. 2008. Determination of the degree, level and capacity indices for agricultural mechanization in Sarab region. Journal of Agricul-tural Science and Technology, 10: 215-223.
Singh, G. and D. De. 1999. Quantifi-cation of a mechanization indica-tor for Indian agriculture. Applied Engineering in Agriculture, 15(3): 197-204.
Singh, G. 2006. Estimation of a mechanization index and its im-pact on production and economic factors a case study in India. Bio-system Engineering, 93(1): 99-106.
Ziauddin, A. T. M. and T. Zia. 2014. Present status of Agricultural mechanization in Bangladesh. Ag-ricultural Mechanization in Asia, Africa and Latin America, 45(2): 168-176.
■■
VOL.52 NO.1 2021 AGRICULTURAL MECHANIZATION IN ASIA, AFRICA AND LATIN AMERICA 17
Evaluation Parameters Effeccting the Performance of Vibrating Vertical Tillage Equipment, First Stage
byGuillen Sánchez JuanPosgraduate student at Instituto Tecnológico de AguascalientesMEXICO
Santos G. CamposMagaña*Agraria Antonio Narro (UAAAN).Antonio Narro Avenue No. 1723 Saltillo-25315,Coahuila, MEXICO*Corresponding author: [email protected]
AbstractThe aim of this work was to eval-
uate an alternative to reduce energy consumption applied to primary soil tillage. To do this an experimental apparatus was developed to evaluate the operation of vibration induced tillage parameters. The components that integrated the system for field valuation were: frame tool carrier that includes a system of three-point hitch and depth control mechanism; three sensors were included to mea-sure tillage force, torque and the frequency of the subsoiler oscilla-tion. Oscillatory impact force was applied through a rod and crank mechanism through a subsoiler tine whose movement is provided by a hydraulic motor. The apparatus evaluation was complemented by a system of data acquisition and signal conditioner that allows the registration of the variables of inter-ests such as draft power, penetration force, applied torque and speed of oscillation of the system. The re-sults of the calibration of the sensors showed a system correlation higher than 95%. The results obtained dur-ing field system verification at dif-
ferent speed, amplitude and depth of tillage showed a reduction of the draft force up to 50% using the os-cillated induced tillage compared to the non-vibrating tine condition. The study shows a significant in-crease in the magnitude of the draft force and torque applied by 33% when the working depth increased from 0.30 to 0.40 m and an increase of 21% of draft force was produced when the amplitude of oscillation was reduced from 0.070 to 0.060 m. No significant difference was found when the tractor speed was increased from 1.5 to 2.5 km h-1. For future work the developed appara-tus will allow to determine how the amplitude and the working depth and oscillation frequency of the tine could affect the draft force in tillage work.
Keywords: oscillatory subsoiler, draft force, energy consumption, amplitude of oscillations.
IntroductionVer t ical convent ional t i l lage
implements have soil-working tools, which do not move relative to the
implement frame. Their draft re-quirements are comparatively high as they are always in contact with the soil and the power for operat-ing these implements is transmit-ted through traction with tractive efficiency varying between 40 to 75% (Witney, 1995). To improve the tractive efficiency, the tractor drive wheels are ballasted with additional weights. However, this practice causes soil compaction, which is detrimental crop efficiency. Sev-eral researchers have reported that oscillating soil-working tools have lower draft requirements and break up the soil better than do their non-oscillating tine implements when working under identical conditions. Therefore, an oscillating soil-work-ing tool may reduce the number of operations to prepare an acceptable seedbed and minimize soil compac-tion, thus providing a better physical environment for plant growth. In ad-dition, oscillatory tillage uses more efficient tractor power-take-off by 90 to 95% to mechanically oscillate tines (Hendrick, 1980). Lower draft requirement of oscillatory tillage reduces the reliance on less efficient drawbar power; leading to a lower
Carlos Sánchez LópezInstituto Tecnológico de AguascalientesMEXICO
Oscar M. González-BrambilaCentro de Ingeniería y Desarrollo IndustrialMEXICO
Gabriela Ramírez-FuentesUniversidad Autónoma Agraria Antonio NarroMEXICO

AGRICULTURAL MECHANIZATION IN ASIA, AFRICA AND LATIN AMERICA 2021 VOL.52 NO.118
overall demand on engine power may occur (Slattery and Desbiolles, 2003), also is generally recognized that the draft force of a vibratory tillage implement can be reduced by 30% to 80%.
Bandalan et al. (1999) performed an experimental study on the till-age performance of an oscillatory subsoiler, determining the opti-mum combination of operating parameters of the subsoiler such as frequency of oscillation, amplitude and working speed the pull-force and the total power consumed were measured.
Sahay et al. (2009) developed an equipment induced vibration tillage that change the transmission fre-quency of vibration from 9 to 13 Hz and from 15 to 35 Hz. Experiments showed that the real depth of the os-cillatory system work was 0.153 m while the same equipment without vibration was 0.074 m.
Shahgoli et al. (2009) in their study reported the evaluation of the effect of the angle of swing of the tine in the performance of the sub-soiler. The objective of this study was to quantify the optimal angle of oscillation for the reduction of the strength of pull, low require-ment of power, low specific draft-force, maximum disturbed area and minimum vibration transmitted to the operator’s seat. In terms of per-formance, -22.5° was the optimum angle of oscillation for the reduction of the draft force and power.
Shahgoli et al. (2010a, 2010b) claimed in his study on the optimi-zation of the oscillatory frequency of vibratory tillage, the tines were oscillated with an amplitude of ± 69 mm at an angle of 27° using a working speed of 3 km h-1. The fre-quency of oscillation was changed from 1.9 to 8.8 Hz. There was an optimal frequency near 3.3 Hz (1.5 speed ratio), which minimized the total engine power required to oper-ate a subsoiler. It was estimated a decrement of engine power demand above 26% compared to a rigid till-
age equipment. Studies of oscillatory tillage cited
by (Shahgoli et al., 2009 and 2010a) reported that the induced oscillation of a longitudinal or vertical tillage in directions tool can significantly reduce by 50% the draft-force re-quirements. They also mentioned that the oscillatory frequency, am-plitude of swing, swing angle, speed of the tractor, tool design and soil properties those are important fac-tors affecting the functioning of a vibrating tool.
Campos et al. (2015a) modified a vertical tillage implement call multicultivador and conducting a series of investigations by applying the theory of critical depth in tillage equipment. The modifications that were made by the researchers team, basically consist of place shallow tines on the front; and greater length at the rear tines. In the tines of the rear, wings of different sizes were evaluated to increase the disturbed cross sectional area. Field tests were conducted with this arrangement and experimentally was demon-strated that there is a decrease in the specific soil resistance by more than 20% in comparison with primary tillage using tines at the same work-ing depth.
The purpose of the present re-search work was to develop an ap-paratus that allows determining the effect that has the variation of the most important parameters in vibra-tion induced tillage such as ampli-
tude and frequency of oscillation, as well as the effect of this vibration on the reduction of the draft force on the vertical tillage.
Materials and MethodsThe experimental apparatus was
design to be mounted to a tractor category II with three points hitch system, and the oscillatory system was powered by the hydraulic sys-tem of the tractor. This device al-low adjustment of the frequency of oscillation from 3.3 to 4.9 Hz and amplitudes from 0.060 and 0.070 m. Figs. 1 and 2 show the main com-ponents of the device designed and built by the Tecnomec Agricola S. A. de C.V. Company. The apparatus is integrated by an oscillation tine (1), an oscillatory mechanism con-necting rod crank (2), an extended octagonal transducer (3), structure or chassis (4), a hydraulic motor (5), a torque transducer (6) and an oscil-lation frequency sensor (7).
The chassis corresponds to the structure of the apparatus in which all the components including the three-point hitch system are mount-ed. A crank connecting rod mecha-nism provides the swing of the tine as shown in Figs. 1 and 2. This mechanism is operated by means of a hydraulic motor for high torque and low speed of rotation. The fre-quency of rotation is controlled by a f low regulator valve. A torque
Fig. 1 Side view of the vibrating tillage equipment. 1. Oscillating tine, 2. Oscillatory mechanism, 3. Extended octagonal ring transducer.
(1)
(2)(3)
Fig. 2 Isometric view of the vibrating tillage equipment. 4. Chassis, 5. Hydraulic motor, 6. Torque transducer, 7. Frequency sensor.
(4)
(5)(6)
(7)

VOL.52 NO.1 2021 AGRICULTURAL MECHANIZATION IN ASIA, AFRICA AND LATIN AMERICA 19
transducer with a capacity of 25 kW at a frequency of 9 Hz was coupled between the hydraulic motor and os-cillating mechanism to measure the torque that is generated at the time of soil tillage.
To measure horizontal and ver-tical forces applied to the soil an extended octagonal ring transducer (OAE) with capacity of 40 k N was built which dimensions are shown in Fig. 3.
An electronic card was developed to determine the frequency of oscil-lation in real time of the vibrating apparatus, using an infrared opto-electronic sensor H21A1 (Fairchild Semiconductors, USA) and a mi-crocontroller PIC 16f84 (Micro-chip company, USA) to eliminate rebounds produced by the effect of magnetic noise.
The construction of the apparatus and mounting of sensors were built at Tecnomec Agricola S. A. de C. V., Aguascalientes State, Mexico, during the period from February to December 2014. Laboratory re-search and field test was carried out from January to October 2015 in the Agricultural Engineering De-partment and the experimental Sta-tion “El Bajío” at the Universidad Autónoma Agraria Antonio Narro. Located at the State of Coahuila, Mexico, at 25° 21.52" N, 101° 50" W and at altitude of 1,740.5 m over the sea level in a clay soil with re-sistance to penetration of 2.45 k Pa, and average soil moisture of 18%.
A John Deere tractor JD6403, single traction with 105 HP at the engine, was used for the field test. Instrumented tractor include the fol-
lowing equipment: analog to digi-tal converter Logbook360 (Iotech Company, USA), calibrated at a fre-quency of 20 Hz sampling rate and signal conditioner model DBK43A from the same made, calibrated to a gain of 2500 micro strain (µδ).
In order to measure forces in the horizontal and vertical direction (Figs. 4 and 5), it was necessary to make a static calibration of the trans-ducer (OAE) using known loads of (470.8, 470.8, 716.13, 343.35, 343.35, 294.30, and 294.30 N). To run the calibration; a loading and unloading of the weights were carried out and each operation was carried out using 5 replicates.
In order to measure the torque ap-plied to the tine from the hydraulic system of the tractor was necessary a torque transducer calibration, the same Logbook360 data acquisition system was used. Calibration was performed with two-arm lever (0.65 and 0.85 m) and four loading and unloading weights: 294, 294, 343 and 343.5 N, each position was rep-licated 5 times (Fig. 6).
Data analysis was performed with the method of spectral analysis described by Campos and Wills, (1995) using Matlab V2010a and Fast Fourier Transform algorithm to obtain the mean values, curves and calibration constants, using a lin-ear regression of the data analysis. Analysis of variance was performed using Minitab V15 statistical analy-sis software. The field Treatments performed for two depths of 0.30 and 0.40 m, two working speed at
Fig. 4 Calibration of transducer OAE for horizontal force
Fig. 5 Calibration of the transducer OAE to determine vertical force constant
Fig. 6 Calibration of torque transducer
Fig. 3 Dimensions and characteristics in the extended octagonal ring transducer in mm

AGRICULTURAL MECHANIZATION IN ASIA, AFRICA AND LATIN AMERICA 2021 VOL.52 NO.120
1.5 and 2.5 km h-1 and two ampli-tudes of 0.060 and 0.070 m for a single oscillatory speed of 3 Hz. A control test with not vibrating tine at two working depths of 0.30 and 0.40 m at a speed of 1.5 km h-1 was also performed. A total of 10 treat-ments were conducted and four rep-lications were carried out by each arrangement; each trial was carried out on plots of 50 m long by 2.5 m wide.
Results and Discussion Construction of the Apparatus
Fig. 7 shows instrumented ap-paratus (a) for vibrating tillage, a transducer OAE (b) that (c) was employed to measure the torque required for impact the soil, an in-frared optoelectronic sensor (d) to measure the frequency of the oscil-lating mechanism and a data acqui-sition system (e) for collecting all data information from the transduc-ers in real-time to be subsequently analysed.
To obtain the same reliability of measurement in the two transduc-ers, it was necessary to standardize the coefficient of constant by means of the calibration adjustment on 3 channels of the amplifier that cor-respond to each sensor and adjust the input gain, the compensator and the excitation voltage. Fig. 8 shows an example of a step graph of OAE corresponding to the vertical force transducer calibration. Fig. 9 shows the equation of regression with a constant of 75.00 mV N-1, with a correlation coefficient of 99.8%.
Fig. 10 shows an example Graph
corresponding to the horizontal force of OAE transducer calibration and Fig. 11 the linear calibration of horizontal force. In addition, shows the equation of regression with a constant of 47.74 mV N-1 with a cor-relation coefficient of 99.7%.
Fig. 12 shows an example of the graph of the deformation in mV generated from the ascent and de-scent of four loads with a lever arm
of 0.85 m and Fig. 13 shows the equation of regression with constant 0.4538 mV N m-1 with a correlation coefficient of the 98.8%. Similar results were obtained by (Campos et al. 2015b) for the calibration of sen-sors of the type of OAE.
Tests Under Field ConditionsFig. 14 shows the forces obtained
in field for the vertical force by com-
(a) Apparatus for vibratory tillage (c) Torque transducer(b) Transducer OAE
Fig. 7 Instrumented apparatus for field evaluation
(d) Sensor optoelectronic (e) Data acquisition system
Fig. 8 Cycles of loading and unloading of the OAE transducer during calibration with different weights for the vertical force
Fig. 9 Graph showing the linearity of calibration of OAE transducer for vertical force. The obtained equation was: Force (N) = 8.073 + 75.00* Voltage (mV)
Fig. 10 Cycles of loading and unloading of the OAE transducer during calibration with different weights for the horizontal force
Fig. 11 Shows the Linearity of calibration of horizontal force. The obtained equation was: Force (N) = 21.97 + 47.74 Voltage (mV)
VOL.52 NO.1 2021 AGRICULTURAL MECHANIZATION IN ASIA, AFRICA AND LATIN AMERICA 21
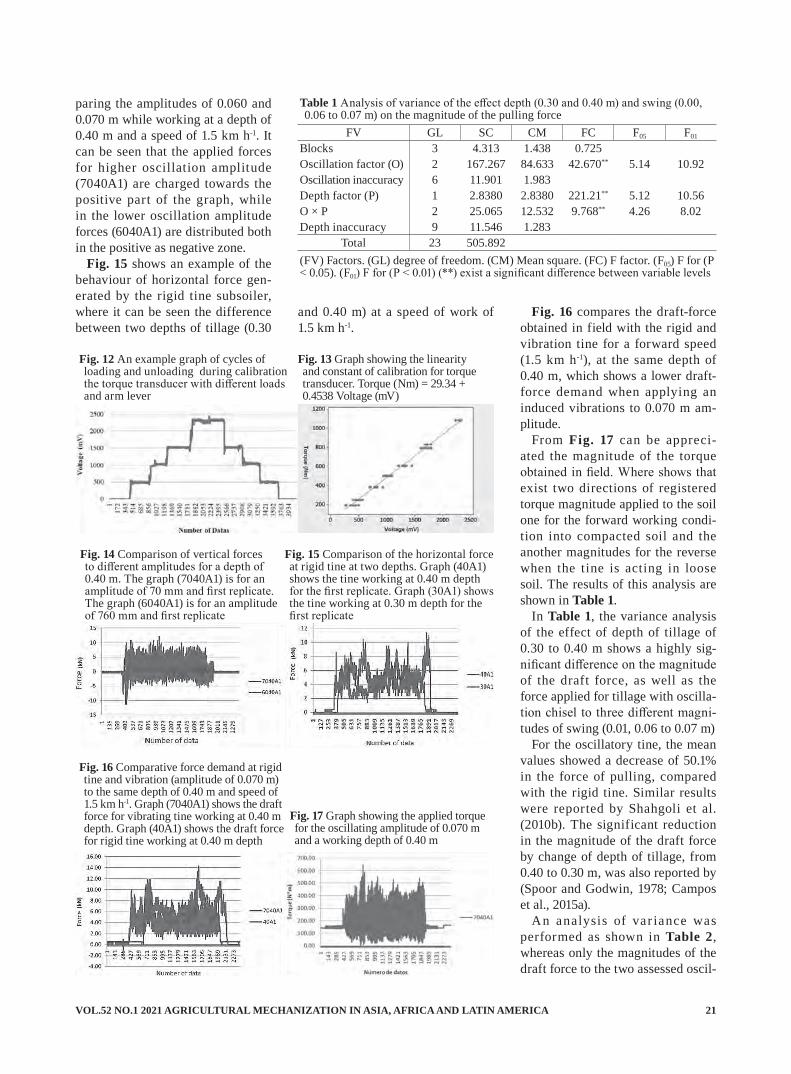
paring the amplitudes of 0.060 and 0.070 m while working at a depth of 0.40 m and a speed of 1.5 km h-1. It can be seen that the applied forces for higher oscillation amplitude (7040A1) are charged towards the positive part of the graph, while in the lower oscillation amplitude forces (6040A1) are distributed both in the positive as negative zone.
Fig. 15 shows an example of the behaviour of horizontal force gen-erated by the rigid tine subsoiler, where it can be seen the difference between two depths of tillage (0.30
and 0.40 m) at a speed of work of 1.5 km h-1.
Fig. 16 compares the draft-force obtained in field with the rigid and vibration tine for a forward speed (1.5 km h-1), at the same depth of 0.40 m, which shows a lower draft-force demand when applying an induced vibrations to 0.070 m am-plitude.
From Fig. 17 can be appreci-ated the magnitude of the torque obtained in field. Where shows that exist two directions of registered torque magnitude applied to the soil one for the forward working condi-tion into compacted soil and the another magnitudes for the reverse when the tine is acting in loose soil. The results of this analysis are shown in Table 1.
In Table 1, the variance analysis of the effect of depth of tillage of 0.30 to 0.40 m shows a highly sig-nificant difference on the magnitude of the draft force, as well as the force applied for tillage with oscilla-tion chisel to three different magni-tudes of swing (0.01, 0.06 to 0.07 m)
For the oscillatory tine, the mean values showed a decrease of 50.1% in the force of pulling, compared with the rigid tine. Similar results were reported by Shahgoli et al. (2010b). The significant reduction in the magnitude of the draft force by change of depth of tillage, from 0.40 to 0.30 m, was also reported by (Spoor and Godwin, 1978; Campos et al., 2015a).
An analysis of var iance was performed as shown in Table 2, whereas only the magnitudes of the draft force to the two assessed oscil-
Table 1 Analysis of variance of the effect depth (0.30 and 0.40 m) and swing (0.00, 0.06 to 0.07 m) on the magnitude of the pulling force
FV GL SC CM FC F05 F01
Blocks 3 4.313 1.438 0.725Oscillation factor (O) 2 167.267 84.633 42.670** 5.14 10.92Oscillation inaccuracy 6 11.901 1.983Depth factor (P) 1 2.8380 2.8380 221.21** 5.12 10.56O × P 2 25.065 12.532 9.768** 4.26 8.02Depth inaccuracy 9 11.546 1.283
Total 23 505.892(FV) Factors. (GL) degree of freedom. (CM) Mean square. (FC) F factor. (F05) F for (P < 0.05). (F01) F for (P < 0.01) (**) exist a significant difference between variable levels
Fig. 12 An example graph of cycles of loading and unloading during calibration the torque transducer with different loads and arm lever
Fig. 13 Graph showing the linearity and constant of calibration for torque transducer. Torque (Nm) = 29.34 + 0.4538 Voltage (mV)
Fig. 14 Comparison of vertical forces to different amplitudes for a depth of 0.40 m. The graph (7040A1) is for an amplitude of 70 mm and first replicate. The graph (6040A1) is for an amplitude of 760 mm and first replicate
Fig. 15 Comparison of the horizontal force at rigid tine at two depths. Graph (40A1) shows the tine working at 0.40 m depth for the first replicate. Graph (30A1) shows the tine working at 0.30 m depth for the first replicate
Fig. 16 Comparative force demand at rigid tine and vibration (amplitude of 0.070 m) to the same depth of 0.40 m and speed of 1.5 km h-1. Graph (7040A1) shows the draft force for vibrating tine working at 0.40 m depth. Graph (40A1) shows the draft force for rigid tine working at 0.40 m depth
Fig. 17 Graph showing the applied torque for the oscillating amplitude of 0.070 m and a working depth of 0.40 m

AGRICULTURAL MECHANIZATION IN ASIA, AFRICA AND LATIN AMERICA 2021 VOL.52 NO.122
lation amplitudes of 0.060 and 0.070 m finding significant difference. Variance analysis shows the effect is also at two-tillage speed, 1.5 and 2.5 km h-1 on the draft force, finding not significant difference in force for the effect of change of speed. In this analysis was corroborated the significant effect that produces the depth of tillage on draft-force (Cam-pos et al., 2015c).
In comparison to the change of amplitude of oscillation, Table 3 shows a significant difference in the measurement of the draft force in the order of 21.0% when increases the oscillation amplitude from 0.060 to 0.070 m.Similar results were ob-tained by (Shahgoli et al, 2010a).
From Table 4, the oscillation of the tine increases the magnitude of the vertical force to a 47.0% be-tween the vibrating and the rigid tine when tillage speed increases from 1.5 to 2.5 km h-1. Likewise, the magnitude of the torque is increased up to 33.0% when tillage depth is increased from 0.30 m to 0.40 m un-less this increase has to do with the increased speed of 1.5to 2.5 km h-1. Similar magnitudes were reported by (Xin et al., 2013).
ConclusionsThe device designed and built by
TecnomecAgricola S. A. de C. V. allowed mounting of sensors for the on-field measurement of horizontal and vertical forces acting on the tine tool as well as frequency of oscilla-tion and torque of impact of the tine in a satisfactory manner.
In the field-testing for verification of the system functions, data record-ed at different amplitudes of swing revealed that the apparatus could re-duce the draft force up to 50% using the oscillated induced tillage com-pared to the non-vibrating condition. There was a significant increase in the magnitude of the draft force and torque applied by 33% when the working depth increased from 0.30
to 0.40 m. Besides, an increase of 21% draft force was produced when the amplitude of oscillation was re-duced from 0.070 to 0.060 m.
No signif icant difference was found when the tractor speed was increased from 1.5 to 2.5 km h-1. Then, based on the above results, it was confirmed that there is a sig-nificant reduction in the draft-force between a rigid tines versus one vibrating at lower oscillation ampli-tude.
REFERENCES
Bandalan, E. P., Salokhe, V. M., Gupta, C. P. and T. Niyamapa. 1999. Performance of an oscillat-ing subsoiler in breaking a hard-pan. Journal of Terramechanics, 36(2): 117-125.
Campos-Magaña, S. G. and B. M. D. Wills. 1995. Force Measurement and Recording and data analy-sis for tillage tools. Agricultural Mechanization in Asia, Africa and
Table 4 Comparisons of means values of the vertical forces and torque for the evaluated treatments
Treatment Average force (kN)
Applied torque (Nm)
60 mm swing tine + 0.40 m Depth + 2.5 km h-1 8.93a 304.3a70 mm swing tine + 0.40 m Depth + 2.5 km h-1 7.85a 303.1aRigid tine to 0.40 m Depth + 1.5 km h-1 4.13bc ---70 mm swing tine + 0.40 m Depth + 1.5 km h-1 4.04bc 318.1a60 mm swing tine + 0.40 m Depth + 1.5 km h-1 3.96bc 310.2a60 mm swing tine + 0.30 m Depth + 2.5 km h-1 3.28cd 186.5b60 mm swing tine + 0.30 m Depth + 1.5 km h-1 3.62cd 203.8b70 mm swing tine + 0.30 m Depth + 2.5 km h-1 2.39de 169.7bc70 mm swing tine + 0.30 m Depth + 1.5 km h-1 2.14e 108.78cRigid tine to 0.30 m Depth + 1.5 km h-1 1.84e ---Means in the same column followed by the same letter do not differ significantly (P < 0.05) by DUNCAN test.
Table 2 The variance analysis of the effect of working speed and depth, oscillating frequency and amplitude over the magnitude of the draft force
FV GL SC CM FC F05 F01
Blocks 3 1.598 0.533 1.251Speed factor (V) 1 0.001 0.001 0.002 10.13Speed error 3 1.51 0.350Oscillation factor (O) 1 14.005 14.005 44.691** 5.99 13.75V × O 1 1.129 1.129 3.602 5.99Oscillation error 6 1.88 0.313Depth factor (P) 1 118.157 118.157 186.240** 4.26 7.82V × P 1 24.939 1.129 39.310**
O × P 1 2.571 24.939 4.052V × O × P 1 3.194 2.571 5.035*
Total error 24 7.613 3.194Total 31 176.138 0.634
(FV) Factors. (GL) degree of freedom. (CM) Mean square. (FC) F factor. (F05) F for (P < 0.05). (F01) F for (P < 0.01) (**) exist a significant difference between variable levels
Table 3 Comparison of means values of the magnitude of the draft forces at different frequencies of oscillation and depths of the tine work
Oscillation amplitude (mm) Average force (kN) Depth (m) Average force (kN)
060 7.929a 030 5.153b070 6.236b 0.40 8.96a
Means in the same column followed by the same letter do not differ significantly (P < 0. 05) by DUNCAN test.
VOL.52 NO.1 2021 AGRICULTURAL MECHANIZATION IN ASIA, AFRICA AND LATIN AMERICA 23
Latin America, 26(1): 13-16.Campos-Magaña, S. G., Cadena-
Zapata, M., Ramírez-Fuentes, G., Pacheco-Lopez, J. L., Reynolds-Chávez, M. A. and J. R. Valenzu-ela-García. 2015a. An experimen-tal determination of specific soil resistance of a sandy loam soil using vertical soil tillage in the northeast of Mexico. Agricultural Mechanization in Asia, Africa, and Latin America, 46(1): 53-57.
Campos-Magaña, S. G., López-López, J. A., Cadena-Zapata, M., Reynolds-Chávez, M. A., Cuervo-Piña, N. and G. Ramírez-Fuentes. 2015b. Desarrollo de un penetró-metro integrado con tecnología GPS-RTK para la generación de mapas de resistencia a la pen-etración del suelo. Terra Latino-americana, 33(2): 119-128.
Campos-Magaña, S. G., Reynolds-Chávez, M. A., Cadena-Zapata, M., J. López-López, J. A., Cuervo-Piña, N. and G. Ramírez-Fuentes. 2015c. Desarrollo de un sistema
integral de medición de fuerzas para la evaluación de implementos de labranza. Terra Latinoameri-cana, 33(2): 139-149.
Hendrick, J. G. 1980. A powered ro-tary chisel. Trans of ASAE, 23(4): 1349-1352.
Sahay, C. S., Thomas, E. V. and K. K. Satpathy. 2009. Performance evaluation of a novel power tiller operated oscillatory tillage imple-ment for dry land tillage. Biosys-tems Engineering, 102(4): 385-391.
Shahgoli, G., Saunders, C., Desbio-lles, J. and J. M. Fielke. 2009. The effect of oscillation angle on the performance of oscillatory tillage. Soil and Tillage Research, 104(1): 97-105.
Shahgoli, G., Fielke, J., Desbiolles, J. and C. Saunders. 2010a. Opti-mising oscillation frequency in oscillatory tillage. Soil and Till-age Research, 106(2): 202-210.
Shahgoli, G., Desbiolles, J., Fielke, J. and C. Saunders. 2010b. Simu-lation of the dynamic behaviour
of a tractor-oscillating subsoiler system. Biosystems Engineering, 106(2): 147-155.
Slattery, M. and J. Desbiolles. 2003. Effect of vibrating tines, multi-depth and multi-pass subsoiling on soil loosening and t ractor power use, paper presented at the E-Proc. of 13 International Soil Tillage Research Organization Conference, Brisbane, Australia. 1149-1156.
Spoor, G. and R. J. Godwin. 1978. An experimental investigation into the deep loosening of soil by rigid tines. Journal of Agricultur-al Engineering Research, 23(3): 243-258.
Witney, B. D. 1995. Choosing and Using Far m Machines. Land Technology Ltd., Edinburgh
Xin, L., Liang, J. and L. Qiu. 2013. Dynamic analysis and experimen-tal research of vibratory subsoiler system. Journal of Theoretical and Applied Information Technol-ogy, 48(4): 1195-1201.
■■
Sincere congratulation to the Farm Machinery In-dustrial Research Corporation in cooperation with the Shin-Norinsha Co., Ltd and the International Farm Mechanization Research Service, Tokyo on the 50th anniversary of publishing the AMA (Agricultural Mechanization in Asia, Africa and Latin America). It has seen great transformations in its 50-year history in agricultural mechanization thus wishing the AMA a Very Happy Golden Anniversary and anticipates its continuation for many more years to come!
The AMA has nearly one hundred Contributing Editors and Co-operators worldwide. I have been as-sociated with AMA publication for the last seven years as Consulting Editor reading/correcting every submis-sion. I have witnessed progress in every sector food production including crops, vegetables, fruits and fibre production in developing and developed nations. These papers addressed several aspects of mechanization of agriculture such as use of robots and artificial intel-
ligence and even going to organic farming to meet the food and fibre demands of growing world population. It has been an excellent experience to witness this kind of progress in agricultural mechanization and food production in various areas of the world.
My sincere thanks are extended to Yoshisuke Kishi-da for providing this opportunity to be part of AMA Journal. I also thank various members of staff related to AMA publication who had been corresponding regularly and keeping track of various papers.
Wishing everyone all the best!
R. Lal Kushwaha, P. Eng., Ph. D.Prof. Emeritus
Chemical & Biological Eng.University of Saskatchewan
Saskatoon, SK, S7N 5A9CANADA
Retirement Message

AGRICULTURAL MECHANIZATION IN ASIA, AFRICA AND LATIN AMERICA 2021 VOL.52 NO.124
Development of a Watermelon (Citrullus lanatus) Seed Extractor
byShrinivas Deshpande*Ph.D. ScholarUniversity of Agricultural Sciences,RaichurINDIA*Corresponding author: [email protected]
G. Senthil KumaranPrincipal Scientist & HeadSection of Agricultural Engineering,Indian Institute of Horticultural Research,[email protected]
AbstractEngineering properties such as
physical and textural properties of the matured watermelon (Citrul-lus lanatus) fruit and its seeds were measured in order to design and develop the watermelon seed extrac-tor. The developed seed extractor consisted of following systems for (i) watermelon cutting, (ii) watermelon seed extraction, (iii) seed separation and (iv) power transmission. The extractor was evaluated with three types of scrapers namely stainless steel, wooden and nylon; two cutting planes that of transverse and longi-tudinal planes and three rotational speeds of 50, 100 and 150 rpm. The best combination was observed to be for transverse cutting with nylon scraper at a speed of 100 rpm. The best performance for capacity, ex-traction efficiency, seed loss, seed damage, germination percentage and vigour index were found to be 1.98 kg of seeds/h, 99.49%, 0.19%, 0.26%, 97.04% and 3,284, respectively.
Keywords: Watermelon, water-melon seed, seed extractor
IntroductionWatermelon (Citrullus lanatus)
is one of the important vegetable crop which belongs to the family Cucurbitaceae is a vine-like flower-ing plant originally from Southern Africa. It is a special kind of fruit referred by botanists as a “pepo”, a berry which has a thick rind (exo-carp) and f leshy center (mesocarp and endocarp). The skin is smooth, with dark green rind or sometimes pale green stripes that turn yellow-ish green when ripe. Watermelon is an important summer season crop whose peak season of harvest falls on the hot summer days and is highly relished due to its cool and thirst quenching property. The pulp is juicy and sweet, with an attractive red colour that attracts consumers (Shankara et al., 2012).
Coming to the seed extraction process, most of the government and private agencies are extracting the watermelon seeds manually. This manual method of extracting melon seeds involves manual cracking of the fruits with wooden clubs or cut-
ting off the head or tail then boring the fruits with a knife. The fruit so treated is left about 1-2 days to decompose, and then the seeds are removed by washing in clean water. Thus the manual process is both time and effort-consuming process (Amir, 2004). Once the seed extrac-tion is performed, the whole fruit is being wasting or it is only used as animal feed.
In India, watermelon is cultivated in an area of 74,640 hectare with a total production of 1,810 million tonne with a productivity of 24.2 t/ha. Similarly in the state of Kar-nataka the watermelon cultivated area is about 9,500 ha with the total production of 317 million tonne and productivity of 33.4 t/ha during the year 2013-14 (Anonymous, 2014).
In India, the recommended seed rate for cultivation of watermelon is 0.3 kg/ha and one kg/ha for hybrids and varieties respectively. Thus the estimated seed requirement to culti-vate 9,500 and 74,640 ha of land is about 9 and 72 tonnes, respectively for Karnataka and India. This tradi-tional method requires a lot of time,
A. Carolin RathinakumariSenior ScientistSection of Agricultural Engineering,Indian Institute of Horticultural Research,[email protected]

VOL.52 NO.1 2021 AGRICULTURAL MECHANIZATION IN ASIA, AFRICA AND LATIN AMERICA 25
labour and tedious. By traditional method of extraction process the demand of seeds is difficult to meet economically due to time and en-ergy constraints.
By considering all these points, there is a need to develop a machine to extract good quality or high vigour watermelon seeds from the fruit to meet out seed requirement as well as to extract good quality watermelon juice for further value addition.
Materials and MethodsPhysical and Textural Properties of Matured Watermelon Fruit and SeedsPhysical properties such as, linear
dimensions (i.e. length, breadth and thickness), arithmetic mean diam-eter, geometric mean diameter and sphericity of fruit and seeds were measured (Mohsenin, 1970) includ-ing rind thickness in order to design the different components of the ex-tractor.
The different textural properties such hardness of the watermelon rind, cutting strength of watermelon rind, cutting strength of watermelon seed and puncture test of watermel-on seed were studied with the help
of texture analyzer (Make: Stable Microsystems Ltd, UK; Model - HDi) using suitable probes and operation settings to design the fruit cutting and extraction system.
Development of a Watermelon Seed Extractor The machine was developed for the
extraction of seeds as well as qual-ity juice from the whole watermelon fruit. The watermelon seed extractor was designed, developed and fabri-cated in the Section of Agricultural Engineering, Indian Institute of Hor-ticultural Research, Hessaraghatta, Bengaluru. The various physical and
textural properties of matured water-melon fruit as well as its seeds were measured in order to design various systems of the seed extractor and were as follows (Fig. 1);
i. Watermelon cutting systemii. Watermelon seed extracting
systemiii. Seed separation system iv. Power transmission system
Watermelon Cutting SystemThe watermelon cutting system
consisted of a fruit holding trolley, circular cutting blade, a hopper and main frame. A stainless steel circu-lar serrated blade of 400 mm diam-
Fig. 1 Performance evaluation of developed watermelon seed extractor

AGRICULTURAL MECHANIZATION IN ASIA, AFRICA AND LATIN AMERICA 2021 VOL.52 NO.126
eter and 2 mm thick was mounted above the frame with necessary shaft, bush and fasteners.
The top surface of trolley frame was covered with 1 mm thickstain-less steel sheet. A stainless steel flat of 25 × 3 mm was bent into semicir-cular form and fitted on the frame to hold the fruit while cutting. Four wheels were provided at four cor-ners of the frame so that the frame could be moved forward and back-ward. Handle was provided to move the fruit holding trolley in forward and backward movement while cut-ting the fruit.
The hopper of the cutting system has 620 mm length, 450 mm width with the hopper bottom of 50 mm diameter, which was fabricated us-ing 1 mm stainless steel sheet in order to collect the juice and seeds while cutting.
Watermelon Seed Extracting Sys-temThe watermelon seed extracting
system consisted of a scraper fitted to stainless steel shaft, and power transmission system. A scraper shaft of 725 mm length, 20 mm diameter made up of stainless steel was mounted on a main frame with the help of pillow bearing blocks. The scrapers with different materi-als were fabricated such as stainless steel, wooden and nylon. The scrap-er was fixed on the scraper shaft with the help of nut and bolt. The scraper shaft was driven by chain and sprocket arrangement with nec-essary speed reduction ratio.
Seed Separation SystemThe seed separation system con-
sisted of (i) concentric cylindrical drums viz. perforated cylindrical drum and solid cylindrical drum, (ii) pulp beaters and (iii) drive transmis-sion system. The cylindrical drums were fabricated out of stainless steel (SS 304 grade) of 1 mm thickness stainless steel material had diame-ters of 220 mm and 300 mm respec-tively for perforated and solid drum,
respectively. Two types of perforated drums having 3 mm and 5 mm di-ameter perforations were fabricated to conduct the preliminary studies on juice separation system.
Beater holders which were fabri-cated out of 85 mm, 60 mm and 5 mm stainless steel flats. The beaters were fitted to the beater holder and fabricated in ‘T’ shape. These beat-ers were mounted on a shaft of 25 mm diameter at an interval of 60 mm at spiral arrangement in order to push and move forward material. The shaft was driven by necessary belt and pulley from the main power source.
Power Transmission System The extraction unit was fitted with
a three phase 50 rpm, one hp geared motor. Provision was made at the base point to move the motor to and fro to provide required belt tension. The cutting system is driven by the geared motor with the help of ‘V’ belt and pulley. Further the power at the end of the cutting system shaft was transmitted to the load shaft with the help of bevel gears. From this load shaft, scraper shaft got the power through chain drive and crushing shaft got the power from the load shaft through crossed ‘V’ belt and pulley to rotate the beater shaft in clock wise direction.
Performance Evaluation of the Watermelon Seed ExtractorThe developed seed extractor was
tested as per the combinations of various treatments as given in Table 1. The watermelon fruit was fed through fruit cutting unit where it
cut the fruit into two halves. After the cutting one half of fruit was fed to scraper manually. The pulp, juice along with seeds was scraped out from fruit and collected in the seed separation unit. In seed separation unit, juice was collected through juice outlet and the uncrushed pulp along with the seeds was collected from the seed outlet. The collected pulp along with the seeds from seed outlet was kept for fermentation for a duration of 24 h. Once the fermen-tation period was completed, the seeds were separated by washing the fermented pulp with the help of clean water and were dried under shade. The same procedures were followed for all the trials and were carried out with 3 replications to overcome the experimental errors. After recording all the observations various dependent parameters like Capacity, Seed extraction efficiency, Percentage seed damage, Percent-age Seed loss and Seed vigour index were measured by using the follow-ing formulae where as germination study was carried out in the walk in germinator chamber which was maintaining 20 ± 1 °C temperature and 90% relative humidity.
Extraction capacity (%) = Weight of seeds extraced (kg) / Time taken (h)
Extraction efficiency (%) = (Total weight of the seed collected at seed outlet (g) / Total weight of the seed collected at all outlets (g)) × 100
Percentage seed loses = (Mo / Mt) × 100
Percentage of damage seeds = (Md / Mt) × 100
Table 1 Experimental designIndependent parameters Levels Dependent parameters Replications
Scraper typeSc1 (Stainless steel)Sc2 (Wooden)Sc3 (Nylon)
1. Capacity of the extractor 2. Seed extraction efficiency 3. Percentage seed damage 4. Seed loss5. Germination percentage6. Seed vigour index
3Cutting plane Cp1 (Transverse)Cp2 (Longitudinal)
Peripheral speedS1 (50 rpm)S2 (100 rpm)S3 (150 rpm)

VOL.52 NO.1 2021 AGRICULTURAL MECHANIZATION IN ASIA, AFRICA AND LATIN AMERICA 27
Seed vigour index (VI) = [Whole seedling length (mm) × Germi-nation (%)]
Where,Mo = Total weight of seeds ex-
pelled out of the machine with peel and washed water (g)
Mt = Total weight of the seeds contained in the fruit sample (g)
Md = Total weight of damaged seeds collected from all outlets (g)
Statistical Analysis The results of the machine per-
formance for different treatments of watermelon seed extraction were analyzed using Factorial Completely Randomized Design (FCRD) with three replications by using AGRES software (Fisher and Yates, 1963).
Experimental ResultsPhysical and Textural Properties of Matured Watermelon Fruit and SeedsThe results of different physical
and textural of matured watermelon fruit and seeds were tabulated in Table 2 and Table 3. respectively. Based on these properties, the dif-ferent components of the extractor were designed in order to extract the
seeds with negligible damage.
Performance Evaluation of Wa-termelon Seed ExtractorThe prototype watermelon seed
extractor was tested for its perfor-mance with three different scrapers, two cutting planes and three operat-ing speed with three replications. For each trial one fruit was fed and various observations were recorded. The performance parameters name-ly capacity of the seed extractor, seed extraction efficiency, percent-age seed loss, percentage seed dam-age, germination percentage and seed vigour index for three scrapers, two cutting planes and three operat-ing speed were tested and results were tabulated in Table 4.
Capacity of the Seed Extractor The results of the extractor ca-
pacity revealed that, the capacity of developed seed extractor was increased with increase in the speed for stainless steel and wooden scraper whereas the capacity of the extractor was decreased with increase in speed for nylon scraper. The data presented in the Table 4 observed that different scrapers, cutting planes and operating speeds had higher significant effect over the capacity of the extractor. The ny-
lon scraper with transverse cutting plane at 50 rpm operating speed showed the highest capacity of 1.98 kg seeds/h. whereas lowest capacity was found forwooden scraper (0.40 kg seeds/h) with transverse cut at an operating speed of 50 rpm. Be-cause, in this combination enough time was available to the seeds to get separated from the fruit as well as sufficient area of contact between the scraper and fruit. The similar findings were obtained for extrac-tion watermelon seeds machine by Eliwa and Elfatih (2012).
Seed Extraction EfficiencyThe results of the extraction ef-
ficiency indicate that, the extraction efficiency of developed seed extrac-tor was increased with increase in the speed for all scrapers in both cutting planes. The data presented in the Table 4 observed that dif-ferent scrapers, cutting planes and operating speeds had higher sig-nificant effect over the extraction efficiency of the extractor. The ny-lon scraper with transverse cutting plane operated at a higher speed of 150 rpm showed the highest extrac-tion efficiency of 99.49% compared to all combinations. Because, of the shape and material factor, serra-tions provided on the nylon scraper and sharp edge provided at the front which improves the penetration into the fruit. The extractor had shown the highest extraction efficiency at higher speed of 150 rpm because at higher speed almost all the pulp and seed were removed by the scraper irrespective of juice conversion. This resulted in higher extraction ef-ficiency at higher speed. The results of Eliwa and Elfatih (2012) showed that higher extraction efficiency was found at higher speed with trans-verse cutting plane.
Percentage Seed LossThe results of the percentage seed
loss showed that, the seed loss of developed seed extractor was de-creased with increase in the speed
Table 2 Physical properties of matured watermelon fruit and seed
PropertyWatermelon fruit Watermelon seed
Mean Standard deviation Mean Standard
deviationLinear dimensionsa. Length, mm 253.66 17.88 10.64 1.11b. Breadth, mm 152.50 12.20 5.42 0.78c. Thickness, mm 143.16 9.30 2.16 0.66a. Arithmetic mean diameter, mm 183.11 11.58 6.07 0.62b. Geometric mean diameter, mm 176.82 11.23 4.93 0.74c. Sphericity 69.78 2.60 46.64 6.90
Table 3 Textural properties of matured watermelon fruit and seedSl.No Property Mean Standard
deviation1 Hardness of watermelon rind, N 11.05 1.602 Cutting strength of watermelon rind, N 244.09 0.983 Cutting strength of watermelon seed, N 15.62 1.954 Puncture force for seeds, N 8.45 2.08
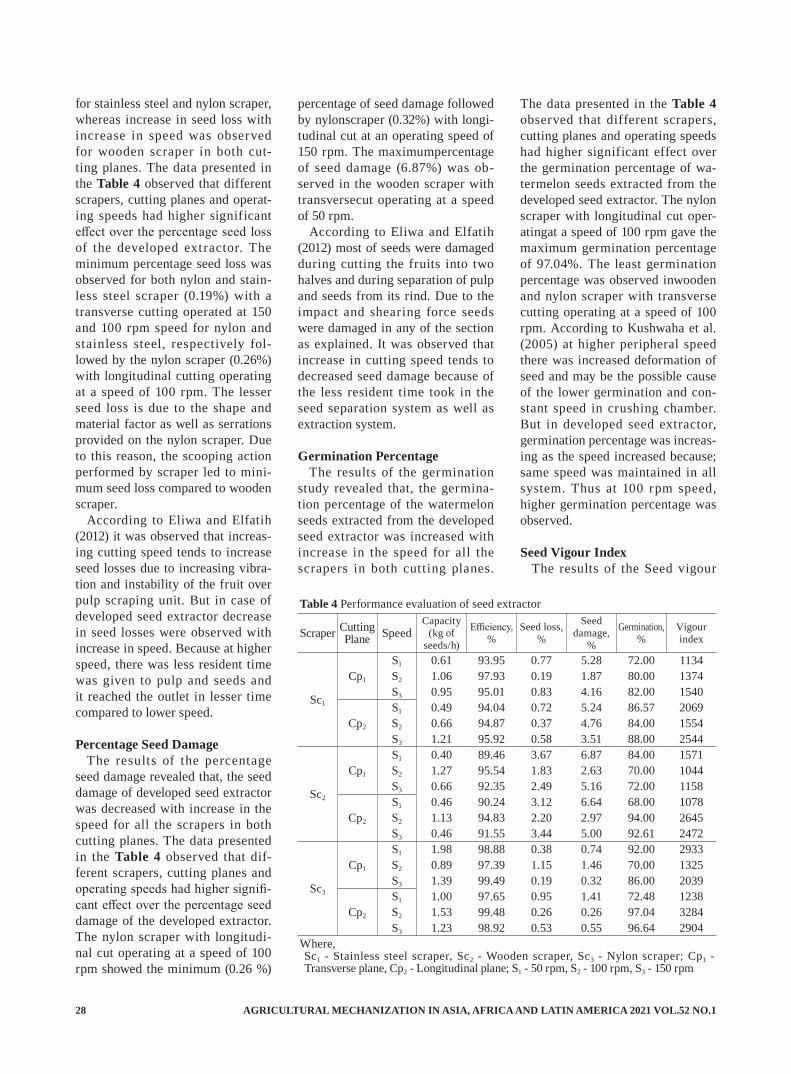
AGRICULTURAL MECHANIZATION IN ASIA, AFRICA AND LATIN AMERICA 2021 VOL.52 NO.128
for stainless steel and nylon scraper, whereas increase in seed loss with increase in speed was observed for wooden scraper in both cut-ting planes. The data presented in the Table 4 observed that different scrapers, cutting planes and operat-ing speeds had higher significant effect over the percentage seed loss of the developed extractor. The minimum percentage seed loss was observed for both nylon and stain-less steel scraper (0.19%) with a transverse cutting operated at 150 and 100 rpm speed for nylon and stainless steel, respectively fol-lowed by the nylon scraper (0.26%) with longitudinal cutting operating at a speed of 100 rpm. The lesser seed loss is due to the shape and material factor as well as serrations provided on the nylon scraper. Due to this reason, the scooping action performed by scraper led to mini-mum seed loss compared to wooden scraper.
According to Eliwa and Elfatih (2012) it was observed that increas-ing cutting speed tends to increase seed losses due to increasing vibra-tion and instability of the fruit over pulp scraping unit. But in case of developed seed extractor decrease in seed losses were observed with increase in speed. Because at higher speed, there was less resident time was given to pulp and seeds and it reached the outlet in lesser time compared to lower speed.
Percentage Seed Damage The results of the percentage
seed damage revealed that, the seed damage of developed seed extractor was decreased with increase in the speed for all the scrapers in both cutting planes. The data presented in the Table 4 observed that dif-ferent scrapers, cutting planes and operating speeds had higher signifi-cant effect over the percentage seed damage of the developed extractor. The nylon scraper with longitudi-nal cut operating at a speed of 100 rpm showed the minimum (0.26 %)
percentage of seed damage followed by nylonscraper (0.32%) with longi-tudinal cut at an operating speed of 150 rpm. The maximumpercentage of seed damage (6.87%) was ob-served in the wooden scraper with transversecut operating at a speed of 50 rpm.
According to Eliwa and Elfatih (2012) most of seeds were damaged during cutting the fruits into two halves and during separation of pulp and seeds from its rind. Due to the impact and shearing force seeds were damaged in any of the section as explained. It was observed that increase in cutting speed tends to decreased seed damage because of the less resident time took in the seed separation system as well as extraction system.
Germination Percentage The results of the germination
study revealed that, the germina-tion percentage of the watermelon seeds extracted from the developed seed extractor was increased with increase in the speed for all the scrapers in both cutting planes.
The data presented in the Table 4 observed that different scrapers, cutting planes and operating speeds had higher significant effect over the germination percentage of wa-termelon seeds extracted from the developed seed extractor. The nylon scraper with longitudinal cut oper-atingat a speed of 100 rpm gave the maximum germination percentage of 97.04%. The least germination percentage was observed inwooden and nylon scraper with transverse cutting operating at a speed of 100 rpm. According to Kushwaha et al. (2005) at higher peripheral speed there was increased deformation of seed and may be the possible cause of the lower germination and con-stant speed in crushing chamber. But in developed seed extractor, germination percentage was increas-ing as the speed increased because; same speed was maintained in all system. Thus at 100 rpm speed, higher germination percentage was observed.
Seed Vigour IndexThe results of the Seed vigour
Table 4 Performance evaluation of seed extractor
Scraper Cutting Plane Speed
Capacity(kg of
seeds/h)
Efficiency,%
Seed loss,%
Seed damage,
%
Germination, %
Vigour index
S1 0.61 93.95 0.77 5.28 72.00 1134Cp1 S2 1.06 97.93 0.19 1.87 80.00 1374
Sc1S3 0.95 95.01 0.83 4.16 82.00 1540S1 0.49 94.04 0.72 5.24 86.57 2069
Cp2 S2 0.66 94.87 0.37 4.76 84.00 1554S3 1.21 95.92 0.58 3.51 88.00 2544S1 0.40 89.46 3.67 6.87 84.00 1571
Cp1 S2 1.27 95.54 1.83 2.63 70.00 1044
Sc2S3 0.66 92.35 2.49 5.16 72.00 1158S1 0.46 90.24 3.12 6.64 68.00 1078
Cp2 S2 1.13 94.83 2.20 2.97 94.00 2645S3 0.46 91.55 3.44 5.00 92.61 2472S1 1.98 98.88 0.38 0.74 92.00 2933
Cp1 S2 0.89 97.39 1.15 1.46 70.00 1325
Sc3S3 1.39 99.49 0.19 0.32 86.00 2039S1 1.00 97.65 0.95 1.41 72.48 1238
Cp2 S2 1.53 99.48 0.26 0.26 97.04 3284S3 1.23 98.92 0.53 0.55 96.64 2904
Where, Sc1 - Stainless steel scraper, Sc2 - Wooden scraper, Sc3 - Nylon scraper; Cp1 - Transverse plane, Cp2 - Longitudinal plane; S1 - 50 rpm, S2 - 100 rpm, S3 - 150 rpm

VOL.52 NO.1 2021 AGRICULTURAL MECHANIZATION IN ASIA, AFRICA AND LATIN AMERICA 29
index indicated that, the vigour of the watermelon seeds extracted from the developed seed extractor was increased with increase in the speed for all the scrapers in both cutting planes. The data presented in the Table 4 observed that dif-ferent scrapers, cutting planes and operating speeds had higher signifi-cant effect over the vigour index of watermelon seeds extracted from the developed seed extractor. The highest seedvigour index (3284) was observed in nylon scraper with longitudinal cut operating at aspeed of 100 rpm whereas the least seed vigour index (1044) was observedin wooden scraper with transverse cut operating at a speed of 100 rpm. Ac-cording to Kushwaha et al. (2005) at higher peripheral speed there was increased deformation of seed and may be the possible cause of the lower germination. This lesser ger-mination percentage results in lower vigour values. Thus at 100 rpm speed higher Seed vigour index was observed with longitudinal cutting plane.
ConclusionsBy considering the overall ma-
chine performance, the nylon scrap-er with transverse cutting plane at 100 rpm operating speed was rec-ommended as the best combination for watermelon seed extractor based to extract high vigour seeds as well as good quality juice for further value addition.
Acknowledgements: It gives me an immense pleasure to acknowl-edge University of Agricultural Sci-ences, GKVK, Bengaluru and ICAR - Indian Institute of Horticultural Research Institute, Bengaluru for providing different infrastructural facility to carry out this work. I am also grateful to The Institution of Engineers (India) for giving the fi-nancial assistance in the form IE(I) R & D Grant-in-aid to carry out the
proposed work.
REFERENCES
Amir, I. F. S. 2004. Construction and performance of machine for separating watermelon seeds. Un-published P.hd. Thesis, Mansoura University, Egypt.
Anonymous. 2014. Indian Horticul-ture Database. National Horticul-ture Board, Ministry of Agricul-ture, Government of India.
Eliwa, A. A. and A. Elfatih. 2012. Developing a local extraction wa-termelon seeds machine. Journal of Applied Sciences Research, 8(1): 474-482.
Fisher, R. A. and F. Yates. 1963. Statistical table for biological, ag-ricultural and medicinal research. Oliver and Boyel, Edinburg.
Kushwaha, H. L., Srivastava, A. P. and H. Singh. 2005. Development and performance evaluation of an okra seed extractor. Agricultural Engineering International: The CIGR Ejournal. 1-13.
Mohsenin, N. N. 1970. Physical properties of plant and animal materials. Gordon and Breach Science Publishers, New York.
Shankara Swamy J., Pawan Kumar and Rajeev Kumar. 2012. Pro-cessing and quality evaluation of watermelon squash. IOSR J. Scientific and Applied Research, 3(1): 79-85.
■■

AGRICULTURAL MECHANIZATION IN ASIA, AFRICA AND LATIN AMERICA 2021 VOL.52 NO.130
Optimization of Energy Consumption of Okra Slices in a Solar-assisted Electric Crop Dryer
byN. R. NwakubaLecturerDept. of Agricultural and Bioresources Engineering, Michael Okpara University of Agriculture, Umudike, P.M.B. 7267, Umuahia, Abia [email protected]
AbstractOptimization of energy consump-
tion of okra slices in a solar-assisted electric dryer was presented. Re-sponse surface methodology (RSM) was adopted to optimize the energy consumption of the drying process as well as the drying parameters: air velocity (1.0, 1.5 and 2.0 ms-1), slice thickness (10, 15 and 20mm) and temperature (50, 60 and 70 °C). The central composite rotatable design of the Design Expert 7.0 statisti-cal package was used for the three drying parameters. The energy con-sumed for drying each 1000 g batch of okra slices at varying parameters was measured and recorded by an arduino microprocessor. A second order polynomial model was found suitable for energy consumption re-sponse with high R2 value of 0.9984. Statistical analyses were conducted to verify the suitability of the model. A predictive energy consumption model was developed and validated with the experimental data. The process parameters had significant effects on the energy consumption as well as its interaction effects. Results obtained showed that the maximum and minimum energy consumed in drying 1000 g batch of sliced okra were 33.94 and 1.02 kW-h, respec-tively. The mean energy consump-tion was found to decrease with tem-perature at constant air velocity and
vice versa, as well as increasing with air velocity at constant temperature. The maximum energy consumption values were obtained at: 50 °C and 1.0 ms-1; 20 mm and 50 °C; and 1.0 ms-1 and 20 mm; whereas the mini-mum values were obtained at: 70 °C and 2.0 ms-1; 10 mm and 70 °C; and 10 mm and 2 ms-1. The optimum drying conditions of 1.54 ms-1 air velocity, 15.45 mm slice thickness and 54.8 °C temperature were found at a predicted energy consumption value of 34.27 kW-h for okra slices in a hybrid solar-electric dryer. A recommendation for further work was stated.
Keywords: Energy consump-tion, optimization, crop dryer, okra slices, response surface method
Introduction Okra (Hisbiscus esculentus or
Abelmoschus esculentus L.) is an economically important vegetable crop grown in tropical and sub-trop-ical parts of the world. It is widely cultivated as a garden crop as well as on large commercial farms for its fibrous fruit or pods (containing round, white seeds) which is used as a vegetable both in its green and dried state. It is a good source of vitamin C, vitamin A, dietary fiber, calcium and is low in saturated fat (Doymaz, 2005). Each 100 g of ed-
ible portion of okra contains about 89.6 g of water, 1.9 g of protein, 0.2 g of fat, 6.4 g of carbohydrate, 0.7 g of minerals and 1.2 g of fibre (Kumar et al., 2011). FAOSTAT (2008) reports that okra is grown commercially in India, Turkey, Iran, Western Africa, Yugoslavia, Bangladesh, Afghani-stan, Pakistan, Burma, Japan, Ma-laysia, Brazil, Ghana, Ethiopian, Cy-prus and the Southern United States. India ranks first in the world produc-tion of okra with 3.5 million tonnes accounting for 70% of the total world production which is obtained from over 0.35 million ha of land. Okra is known by many local names in dif-ferent parts of the world. It is called lady’s finger in England, gumbo in the United States of America, guino-gombo in Spanish, guibeiro in Portuguese and bhindi in India. It is quite popular in India because of ease of cultivation, dependable yield and adaptability to varying moisture conditions (Schalau, 2002). In the Eastern States of Nigeria, many good local varieties exist such as perkin’s long pod, new lady’s finger, nwaidu etc. (Anyawu et al., 1986).
It is usually available in large quantities between April and Decem-ber in the South eastern part of Ni-geria. Two distinct seasons exist for its production in Nigeria: the peak and the lean seasons. During the lean season (October to March), the prod-uct is produced in small quantities

VOL.52 NO.1 2021 AGRICULTURAL MECHANIZATION IN ASIA, AFRICA AND LATIN AMERICA 31
and the product becomes very scarce and expensive. Large quantities are produced in the peak season (April to September) in excess of the con-sumption capacity of the local popu-lace and thereby it requires some level of preservation. Owolarafe and Shotonde (2004) reported that the traditional method of preserving okra in Nigeria and most African countries involves spreading it in the open in cold weather or refrigera-tion. This can only preserve okra for a limited period of time. Due to its perishable nature, the fruit deterio-rates easily. This causes appreciable economic loss in the annual revenue of the farmer. Preservation of the fruit is commonly done by slicing the pod with a sharp knife, sun-drying and storing in calabash gourds or in a jute bag under normal room temperature. Drying has proved to be one of the most effective ways of preserving vegetable crops. The success of any drying operation de-pends on removing enough moisture from the food material to achieve a water activity too low to inhibit mi-crobiological growth to take place. This in turn means that there must be sufficient transfer of heat to pro-vide the latent heat of vaporization needed. As a result of the relatively high moisture content (88-90% w.b)
of okra at harvest (Doymaz, 2005; Kumar et al., 2011; Tiwari, 2012), considerable amounts of energy is consumed during its drying pro-cess to a desired safe moisture level (Nwakuba et al., 2016). Drying is a highly energy-consuming process which has significant effects on the dried product quality such as its nutritional values, colour, shrinkage and other organoleptic properties (Darvishiet al., 2013). Therefore, the energy consumption of crop drying is important for the following major reasons: (i) in order to estimate the optimum quantity of temperature, air flow, and drying time most suitable for a particular sliced crop so as to avoid over drying which is conse-quent to undermining the nutritional value of the dried product; (ii) ap-plied he design of appropriate cost effective drying system which would consume minimum amount of en-ergy to convey the required sensible and latent heat given the crop’s phys-ical and biological characteristics; (iii) for simulation of drying systems. Therefore, with increasing pressures to reduce environmental degrada-tion, both from the public and gov-ernments, it is necessary to improve drying processes by optimizing its process parameters to reduce its high energy consumption and greenhouse
gas (GHG) emissions, while still pro-viding a high quality product with minimal increase in economic input. This, in all would reduce the cost of drying operation, enhance the crop shelf-life, product diversity, substan-tial volume reduction, availability and acceptance of dried food prod-ucts in the market at a reasonable price (Maskan, 2001; El-Mesery and Mwithiga, 2012).
Materials and MethodsDryer Description
The hybrid solar-electric convec-tive dryer consists of two major integral components namely: the air heater units (solar collector and resistance wire) and the drying chamber having two layer of drying racks made of wire mesh where the sliced crop samples are placed in for drying as shown in Fig. 1.
Other components of the dryer include: solar panel (80 W, 12 V), DC battery (75 Amps, 12 V), control unit, liquid crystal display (LCD), inverter system, weighing balance, pyranometer (Apogee model) inlet and exhaust fans, plain glass of 4 mm thick, temperature and relative humidity sensors (LM-35 transduc-ers), weighing balances, weight sensors, resistance wire (1,500 W), frame support (angle iron), and roll-ers. The air heater unit (solar collec-tor) is in the shape of a wooden box. The box was made with a special type of plywood (NBF laminated board) and was lagged with fiber-glass. A mild steel plate was formed in the shape of an open box of ap-proximately the same size as the solar box and inserted in the solar box to act as an absorber plate. The whole unit was painted dull black (inside and outside) to enhance ab-sorptivity of solar radiation. A 15 cm diameter hole is located in front of the solar collector with a suction fan to draw ambient air into the solar collector and subsequently into the drying chamber. A hood was formed
Fig. 1 Sectional view of the hybrid convective solar-electric crop dryer
1. Chimney, 2. Outlet/exhaust fan housing, 3. Drying chamber hood, 4. Heating chamber, 5. Plain glass, 6. Inlet sensor fan, 7. Rollers, 8. Solar collector, 9. Angle iron support, 10. Solar panel, 11. Solar panel cable, 12. Inverter/battery unit, 13. Control unit cable, 14. Control unit
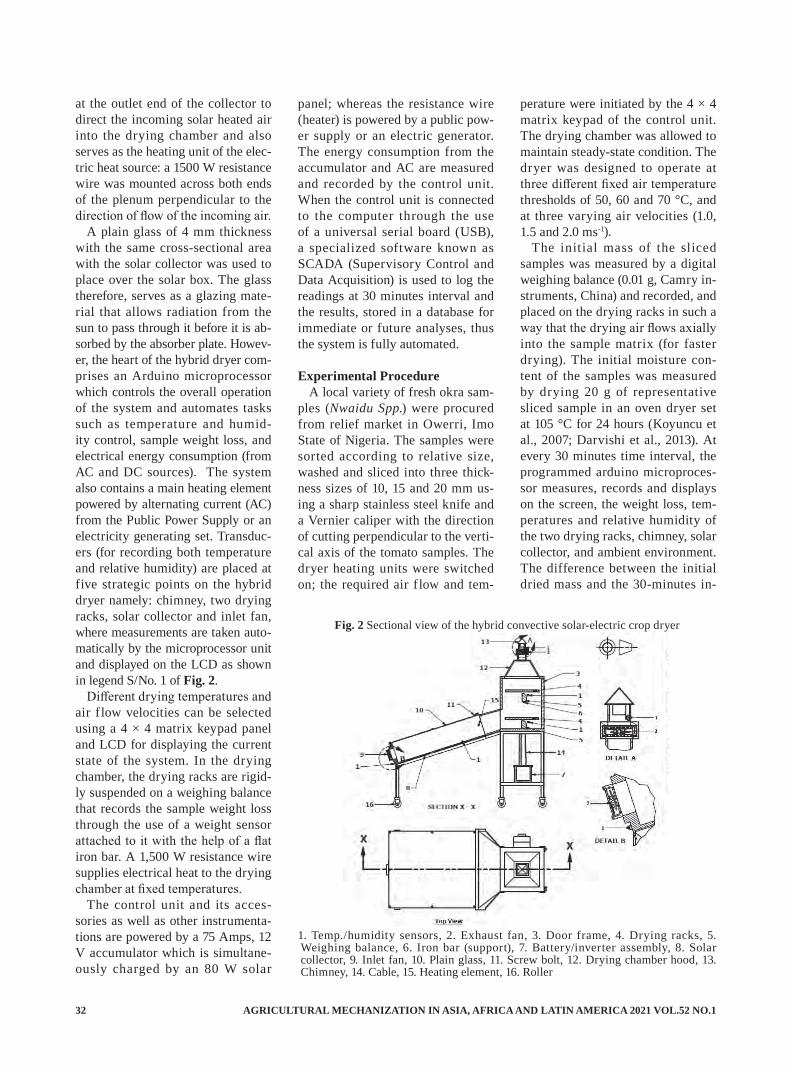
AGRICULTURAL MECHANIZATION IN ASIA, AFRICA AND LATIN AMERICA 2021 VOL.52 NO.132
at the outlet end of the collector to direct the incoming solar heated air into the drying chamber and also serves as the heating unit of the elec-tric heat source: a 1500 W resistance wire was mounted across both ends of the plenum perpendicular to the direction of flow of the incoming air.
A plain glass of 4 mm thickness with the same cross-sectional area with the solar collector was used to place over the solar box. The glass therefore, serves as a glazing mate-rial that allows radiation from the sun to pass through it before it is ab-sorbed by the absorber plate. Howev-er, the heart of the hybrid dryer com-prises an Arduino microprocessor which controls the overall operation of the system and automates tasks such as temperature and humid-ity control, sample weight loss, and electrical energy consumption (from AC and DC sources). The system also contains a main heating element powered by alternating current (AC) from the Public Power Supply or an electricity generating set. Transduc-ers (for recording both temperature and relative humidity) are placed at five strategic points on the hybrid dryer namely: chimney, two drying racks, solar collector and inlet fan, where measurements are taken auto-matically by the microprocessor unit and displayed on the LCD as shown in legend S/No. 1 of Fig. 2.
Different drying temperatures and air f low velocities can be selected using a 4 × 4 matrix keypad panel and LCD for displaying the current state of the system. In the drying chamber, the drying racks are rigid-ly suspended on a weighing balance that records the sample weight loss through the use of a weight sensor attached to it with the help of a flat iron bar. A 1,500 W resistance wire supplies electrical heat to the drying chamber at fixed temperatures.
The control unit and its acces-sories as well as other instrumenta-tions are powered by a 75 Amps, 12 V accumulator which is simultane-ously charged by an 80 W solar
panel; whereas the resistance wire (heater) is powered by a public pow-er supply or an electric generator. The energy consumption from the accumulator and AC are measured and recorded by the control unit. When the control unit is connected to the computer through the use of a universal serial board (USB), a specialized software known as SCADA (Supervisory Control and Data Acquisition) is used to log the readings at 30 minutes interval and the results, stored in a database for immediate or future analyses, thus the system is fully automated.
Experimental ProcedureA local variety of fresh okra sam-
ples (Nwaidu Spp.) were procured from relief market in Owerri, Imo State of Nigeria. The samples were sorted according to relative size, washed and sliced into three thick-ness sizes of 10, 15 and 20 mm us-ing a sharp stainless steel knife and a Vernier caliper with the direction of cutting perpendicular to the verti-cal axis of the tomato samples. The dryer heating units were switched on; the required air f low and tem-
perature were initiated by the 4 × 4 matrix keypad of the control unit. The drying chamber was allowed to maintain steady-state condition. The dryer was designed to operate at three different fixed air temperature thresholds of 50, 60 and 70 °C, and at three varying air velocities (1.0, 1.5 and 2.0 ms-1).
The initial mass of the sliced samples was measured by a digital weighing balance (0.01 g, Camry in-struments, China) and recorded, and placed on the drying racks in such a way that the drying air flows axially into the sample matrix (for faster drying). The initial moisture con-tent of the samples was measured by drying 20 g of representative sliced sample in an oven dryer set at 105 °C for 24 hours (Koyuncu et al., 2007; Darvishi et al., 2013). At every 30 minutes time interval, the programmed arduino microproces-sor measures, records and displays on the screen, the weight loss, tem-peratures and relative humidity of the two drying racks, chimney, solar collector, and ambient environment. The difference between the initial dried mass and the 30-minutes in-
Fig. 2 Sectional view of the hybrid convective solar-electric crop dryer
1. Temp./humidity sensors, 2. Exhaust fan, 3. Door frame, 4. Drying racks, 5. Weighing balance, 6. Iron bar (support), 7. Battery/inverter assembly, 8. Solar collector, 9. Inlet fan, 10. Plain glass, 11. Screw bolt, 12. Drying chamber hood, 13. Chimney, 14. Cable, 15. Heating element, 16. Roller
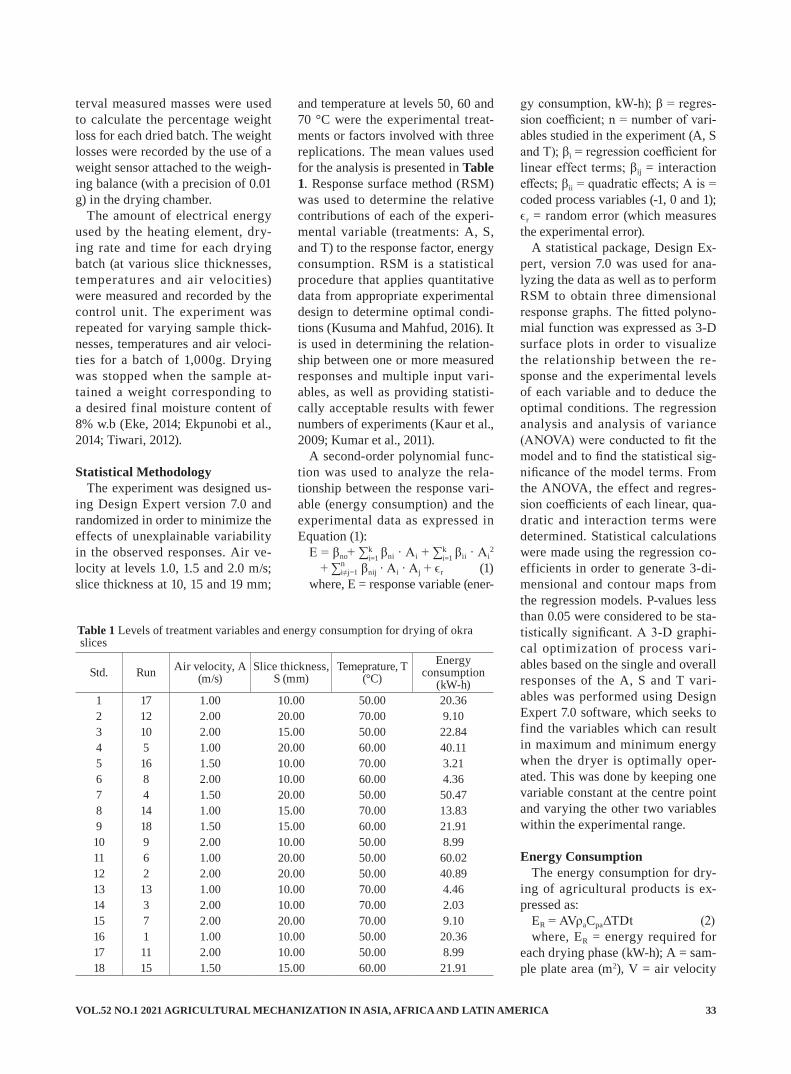
VOL.52 NO.1 2021 AGRICULTURAL MECHANIZATION IN ASIA, AFRICA AND LATIN AMERICA 33
terval measured masses were used to calculate the percentage weight loss for each dried batch. The weight losses were recorded by the use of a weight sensor attached to the weigh-ing balance (with a precision of 0.01 g) in the drying chamber.
The amount of electrical energy used by the heating element, dry-ing rate and time for each drying batch (at various slice thicknesses, temperatures and air velocities) were measured and recorded by the control unit. The experiment was repeated for varying sample thick-nesses, temperatures and air veloci-ties for a batch of 1,000g. Drying was stopped when the sample at-tained a weight corresponding to a desired final moisture content of 8% w.b (Eke, 2014; Ekpunobi et al., 2014; Tiwari, 2012).
Statistical MethodologyThe experiment was designed us-
ing Design Expert version 7.0 and randomized in order to minimize the effects of unexplainable variability in the observed responses. Air ve-locity at levels 1.0, 1.5 and 2.0 m/s; slice thickness at 10, 15 and 19 mm;
and temperature at levels 50, 60 and 70 °C were the experimental treat-ments or factors involved with three replications. The mean values used for the analysis is presented in Table 1. Response surface method (RSM) was used to determine the relative contributions of each of the experi-mental variable (treatments: A, S, and T) to the response factor, energy consumption. RSM is a statistical procedure that applies quantitative data from appropriate experimental design to determine optimal condi-tions (Kusuma and Mahfud, 2016). It is used in determining the relation-ship between one or more measured responses and multiple input vari-ables, as well as providing statisti-cally acceptable results with fewer numbers of experiments (Kaur et al., 2009; Kumar et al., 2011).
A second-order polynomial func-tion was used to analyze the rela-tionship between the response vari-able (energy consumption) and the experimental data as expressed in Equation (1):
E = βno+ ∑ik=1 βni ∙ Ai + ∑i
k=1 βii ∙ Ai
2
+ ∑in≠j=1 βnij ∙ Ai ∙ Aj + ϵr (1)
where, E = response variable (ener-
gy consumption, kW-h); β = regres-sion coefficient; n = number of vari-ables studied in the experiment (A, S and T); βi = regression coefficient for linear effect terms; βij = interaction effects; βii = quadratic effects; A is = coded process variables (-1, 0 and 1); ϵr = random error (which measures the experimental error).
A statistical package, Design Ex-pert, version 7.0 was used for ana-lyzing the data as well as to perform RSM to obtain three dimensional response graphs. The fitted polyno-mial function was expressed as 3-D surface plots in order to visualize the relationship between the re-sponse and the experimental levels of each variable and to deduce the optimal conditions. The regression analysis and analysis of variance (ANOVA) were conducted to fit the model and to find the statistical sig-nificance of the model terms. From the ANOVA, the effect and regres-sion coefficients of each linear, qua-dratic and interaction terms were determined. Statistical calculations were made using the regression co-efficients in order to generate 3-di-mensional and contour maps from the regression models. P-values less than 0.05 were considered to be sta-tistically significant. A 3-D graphi-cal optimization of process vari-ables based on the single and overall responses of the A, S and T vari-ables was performed using Design Expert 7.0 software, which seeks to find the variables which can result in maximum and minimum energy when the dryer is optimally oper-ated. This was done by keeping one variable constant at the centre point and varying the other two variables within the experimental range.
Energy ConsumptionThe energy consumption for dry-
ing of agricultural products is ex-pressed as:
ER = AVρaCpaΔTDt (2)where, ER = energy required for
each drying phase (kW-h); A = sam-ple plate area (m2), V = air velocity
Table 1 Levels of treatment variables and energy consumption for drying of okra slices
Std. Run Air velocity, A (m/s)
Slice thickness, S (mm)
Temeprature, T (°C)
Energy consumption
(kW-h)1 17 1.00 10.00 50.00 20.362 12 2.00 20.00 70.00 9.103 10 2.00 15.00 50.00 22.844 5 1.00 20.00 60.00 40.115 16 1.50 10.00 70.00 3.216 8 2.00 10.00 60.00 4.367 4 1.50 20.00 50.00 50.478 14 1.00 15.00 70.00 13.839 18 1.50 15.00 60.00 21.9110 9 2.00 10.00 50.00 8.9911 6 1.00 20.00 50.00 60.0212 2 2.00 20.00 50.00 40.8913 13 1.00 10.00 70.00 4.4614 3 2.00 10.00 70.00 2.0315 7 2.00 20.00 70.00 9.1016 1 1.00 10.00 50.00 20.3617 11 2.00 10.00 50.00 8.9918 15 1.50 15.00 60.00 21.91
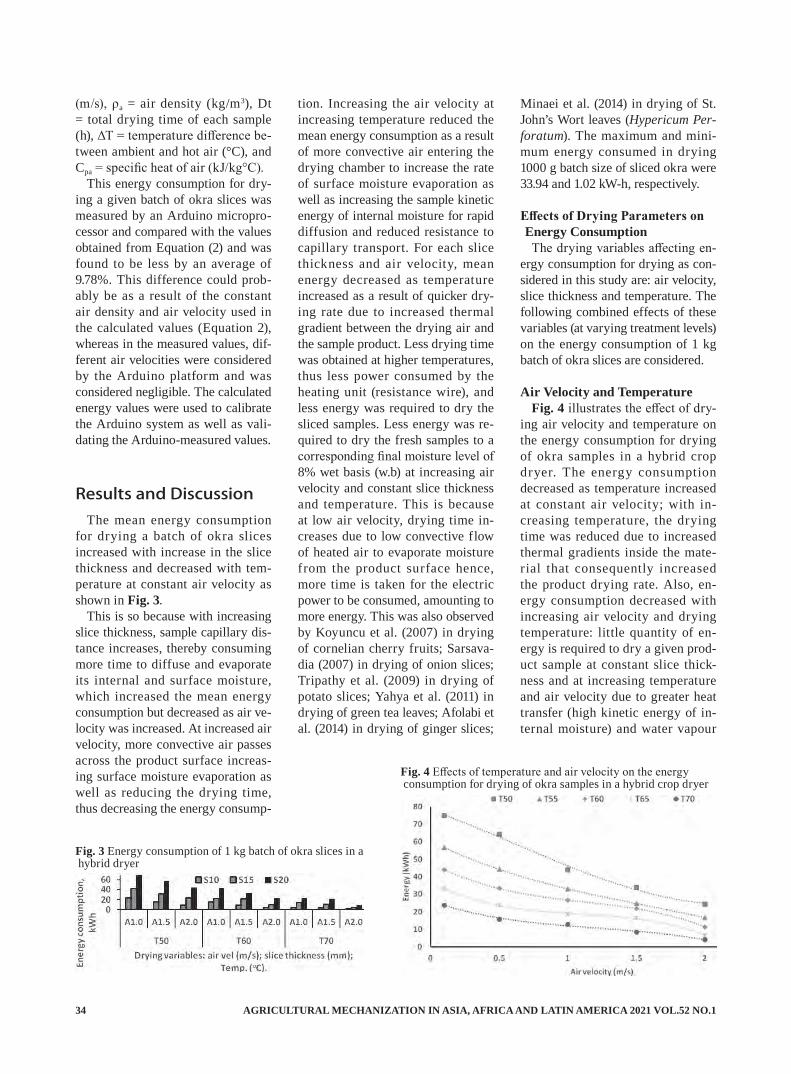
AGRICULTURAL MECHANIZATION IN ASIA, AFRICA AND LATIN AMERICA 2021 VOL.52 NO.134
(m/s), ρa = air density (kg/m3), Dt = total drying time of each sample (h), ΔT = temperature difference be-tween ambient and hot air (°C), and Cpa = specific heat of air (kJ/kg°C).
This energy consumption for dry-ing a given batch of okra slices was measured by an Arduino micropro-cessor and compared with the values obtained from Equation (2) and was found to be less by an average of 9.78%. This difference could prob-ably be as a result of the constant air density and air velocity used in the calculated values (Equation 2), whereas in the measured values, dif-ferent air velocities were considered by the Arduino platform and was considered negligible. The calculated energy values were used to calibrate the Arduino system as well as vali-dating the Arduino-measured values.
Results and DiscussionThe mean energy consumption
for drying a batch of okra slices increased with increase in the slice thickness and decreased with tem-perature at constant air velocity as shown in Fig. 3.
This is so because with increasing slice thickness, sample capillary dis-tance increases, thereby consuming more time to diffuse and evaporate its internal and surface moisture, which increased the mean energy consumption but decreased as air ve-locity was increased. At increased air velocity, more convective air passes across the product surface increas-ing surface moisture evaporation as well as reducing the drying time, thus decreasing the energy consump-
tion. Increasing the air velocity at increasing temperature reduced the mean energy consumption as a result of more convective air entering the drying chamber to increase the rate of surface moisture evaporation as well as increasing the sample kinetic energy of internal moisture for rapid diffusion and reduced resistance to capillary transport. For each slice thickness and air velocity, mean energy decreased as temperature increased as a result of quicker dry-ing rate due to increased thermal gradient between the drying air and the sample product. Less drying time was obtained at higher temperatures, thus less power consumed by the heating unit (resistance wire), and less energy was required to dry the sliced samples. Less energy was re-quired to dry the fresh samples to a corresponding final moisture level of 8% wet basis (w.b) at increasing air velocity and constant slice thickness and temperature. This is because at low air velocity, drying time in-creases due to low convective flow of heated air to evaporate moisture from the product surface hence, more time is taken for the electric power to be consumed, amounting to more energy. This was also observed by Koyuncu et al. (2007) in drying of cornelian cherry fruits; Sarsava-dia (2007) in drying of onion slices; Tripathy et al. (2009) in drying of potato slices; Yahya et al. (2011) in drying of green tea leaves; Afolabi et al. (2014) in drying of ginger slices;
Minaei et al. (2014) in drying of St. John’s Wort leaves (Hypericum Per-foratum). The maximum and mini-mum energy consumed in drying 1000 g batch size of sliced okra were 33.94 and 1.02 kW-h, respectively.
Effects of Drying Parameters on Energy ConsumptionThe drying variables affecting en-
ergy consumption for drying as con-sidered in this study are: air velocity, slice thickness and temperature. The following combined effects of these variables (at varying treatment levels) on the energy consumption of 1 kg batch of okra slices are considered.
Air Velocity and TemperatureFig. 4 illustrates the effect of dry-
ing air velocity and temperature on the energy consumption for drying of okra samples in a hybrid crop dryer. The energy consumption decreased as temperature increased at constant air velocity; with in-creasing temperature, the drying time was reduced due to increased thermal gradients inside the mate-rial that consequently increased the product drying rate. Also, en-ergy consumption decreased with increasing air velocity and drying temperature: little quantity of en-ergy is required to dry a given prod-uct sample at constant slice thick-ness and at increasing temperature and air velocity due to greater heat transfer (high kinetic energy of in-ternal moisture) and water vapour
Fig. 3 Energy consumption of 1 kg batch of okra slices in a hybrid dryer
Fig. 4 Effects of temperature and air velocity on the energy consumption for drying of okra samples in a hybrid crop dryer
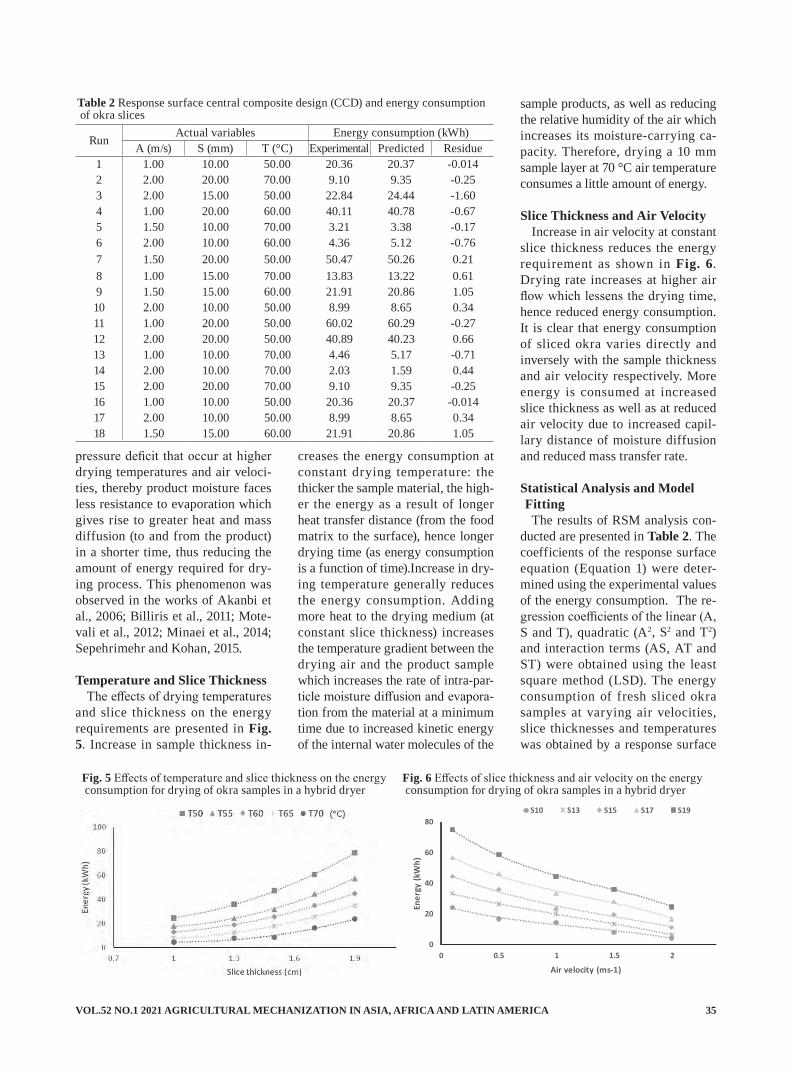
VOL.52 NO.1 2021 AGRICULTURAL MECHANIZATION IN ASIA, AFRICA AND LATIN AMERICA 35
pressure deficit that occur at higher drying temperatures and air veloci-ties, thereby product moisture faces less resistance to evaporation which gives rise to greater heat and mass diffusion (to and from the product) in a shorter time, thus reducing the amount of energy required for dry-ing process. This phenomenon was observed in the works of Akanbi et al., 2006; Billiris et al., 2011; Mote-vali et al., 2012; Minaei et al., 2014; Sepehrimehr and Kohan, 2015.
Temperature and Slice Thickness The effects of drying temperatures
and slice thickness on the energy requirements are presented in Fig. 5. Increase in sample thickness in-
creases the energy consumption at constant drying temperature: the thicker the sample material, the high-er the energy as a result of longer heat transfer distance (from the food matrix to the surface), hence longer drying time (as energy consumption is a function of time).Increase in dry-ing temperature generally reduces the energy consumption. Adding more heat to the drying medium (at constant slice thickness) increases the temperature gradient between the drying air and the product sample which increases the rate of intra-par-ticle moisture diffusion and evapora-tion from the material at a minimum time due to increased kinetic energy of the internal water molecules of the
sample products, as well as reducing the relative humidity of the air which increases its moisture-carrying ca-pacity. Therefore, drying a 10 mm sample layer at 70 °C air temperature consumes a little amount of energy.
Slice Thickness and Air VelocityIncrease in air velocity at constant
slice thickness reduces the energy requirement as shown in Fig. 6. Drying rate increases at higher air flow which lessens the drying time, hence reduced energy consumption. It is clear that energy consumption of sliced okra varies directly and inversely with the sample thickness and air velocity respectively. More energy is consumed at increased slice thickness as well as at reduced air velocity due to increased capil-lary distance of moisture diffusion and reduced mass transfer rate.
Statistical Analysis and Model FittingThe results of RSM analysis con-
ducted are presented in Table 2. The coefficients of the response surface equation (Equation 1) were deter-mined using the experimental values of the energy consumption. The re-gression coefficients of the linear (A, S and T), quadratic (A2, S2 and T2) and interaction terms (AS, AT and ST) were obtained using the least square method (LSD). The energy consumption of fresh sliced okra samples at varying air velocities, slice thicknesses and temperatures was obtained by a response surface
Fig. 6 Effects of slice thickness and air velocity on the energy consumption for drying of okra samples in a hybrid dryer
0
20
40
60
80
0 0.5 1 1.5 2 2.5
Ener
gy (k
Wh)
Air velocity (ms-1)
S10 S13 S15 S17 S19
Fig. 5 Effects of temperature and slice thickness on the energy consumption for drying of okra samples in a hybrid dryer
Table 2 Response surface central composite design (CCD) and energy consumption of okra slices
Run Actual variables Energy consumption (kWh)A (m/s) S (mm) T (°C) Experimental Predicted Residue
1 1.00 10.00 50.00 20.36 20.37 -0.0142 2.00 20.00 70.00 9.10 9.35 -0.253 2.00 15.00 50.00 22.84 24.44 -1.604 1.00 20.00 60.00 40.11 40.78 -0.675 1.50 10.00 70.00 3.21 3.38 -0.176 2.00 10.00 60.00 4.36 5.12 -0.767 1.50 20.00 50.00 50.47 50.26 0.218 1.00 15.00 70.00 13.83 13.22 0.619 1.50 15.00 60.00 21.91 20.86 1.0510 2.00 10.00 50.00 8.99 8.65 0.3411 1.00 20.00 50.00 60.02 60.29 -0.2712 2.00 20.00 50.00 40.89 40.23 0.6613 1.00 10.00 70.00 4.46 5.17 -0.7114 2.00 10.00 70.00 2.03 1.59 0.4415 2.00 20.00 70.00 9.10 9.35 -0.2516 1.00 10.00 50.00 20.36 20.37 -0.01417 2.00 10.00 50.00 8.99 8.65 0.3418 1.50 15.00 60.00 21.91 20.86 1.05
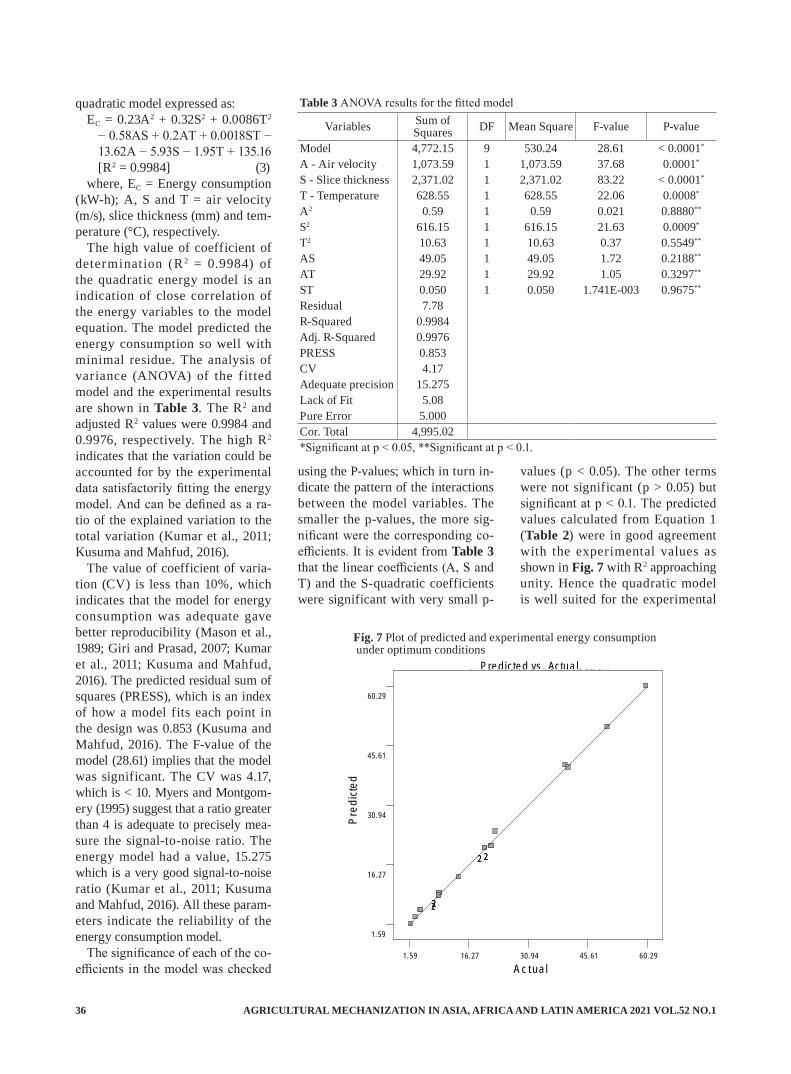
AGRICULTURAL MECHANIZATION IN ASIA, AFRICA AND LATIN AMERICA 2021 VOL.52 NO.136
quadratic model expressed as:EC = 0.23A2 + 0.32S2 + 0.0086T2
− 0.58AS + 0.2AT + 0.0018ST − 13.62A − 5.93S − 1.95T + 135.16 [R2 = 0.9984] (3)
where, EC = Energy consumption (kW-h); A, S and T = air velocity (m/s), slice thickness (mm) and tem-perature (°C), respectively.
The high value of coefficient of determination (R 2 = 0.9984) of the quadratic energy model is an indication of close correlation of the energy variables to the model equation. The model predicted the energy consumption so well with minimal residue. The analysis of variance (ANOVA) of the f it ted model and the experimental results are shown in Table 3. The R2 and adjusted R2 values were 0.9984 and 0.9976, respectively. The high R2 indicates that the variation could be accounted for by the experimental data satisfactorily fitting the energy model. And can be defined as a ra-tio of the explained variation to the total variation (Kumar et al., 2011; Kusuma and Mahfud, 2016).
The value of coefficient of varia-tion (CV) is less than 10%, which indicates that the model for energy consumption was adequate gave better reproducibility (Mason et al., 1989; Giri and Prasad, 2007; Kumar et al., 2011; Kusuma and Mahfud, 2016). The predicted residual sum of squares (PRESS), which is an index of how a model fits each point in the design was 0.853 (Kusuma and Mahfud, 2016). The F-value of the model (28.61) implies that the model was significant. The CV was 4.17, which is < 10. Myers and Montgom-ery (1995) suggest that a ratio greater than 4 is adequate to precisely mea-sure the signal-to-noise ratio. The energy model had a value, 15.275 which is a very good signal-to-noise ratio (Kumar et al., 2011; Kusuma and Mahfud, 2016). All these param-eters indicate the reliability of the energy consumption model.
The significance of each of the co-efficients in the model was checked
using the P-values; which in turn in-dicate the pattern of the interactions between the model variables. The smaller the p-values, the more sig-nificant were the corresponding co-efficients. It is evident from Table 3 that the linear coefficients (A, S and T) and the S-quadratic coefficients were significant with very small p-
values (p < 0.05). The other terms were not significant (p > 0.05) but significant at p < 0.1. The predicted values calculated from Equation 1 (Table 2) were in good agreement with the experimental values as shown in Fig. 7 with R2 approaching unity. Hence the quadratic model is well suited for the experimental
Table 3 ANOVA results for the fitted model
Variables Sum of Squares DF Mean Square F-value P-value
Model 4,772.15 9 530.24 28.61 < 0.0001*
A - Air velocity 1,073.59 1 1,073.59 37.68 0.0001*
S - Slice thickness 2,371.02 1 2,371.02 83.22 < 0.0001*
T - Temperature 628.55 1 628.55 22.06 0.0008*
A2 0.59 1 0.59 0.021 0.8880**
S2 616.15 1 616.15 21.63 0.0009*
T2 10.63 1 10.63 0.37 0.5549**
AS 49.05 1 49.05 1.72 0.2188**
AT 29.92 1 29.92 1.05 0.3297**
ST 0.050 1 0.050 1.741E-003 0.9675**
Residual 7.78R-Squared 0.9984Adj. R-Squared 0.9976PRESS 0.853CV 4.17Adequate precision 15.275Lack of Fit 5.08Pure Error 5.000Cor. Total 4,995.02*Significant at p < 0.05, **Significant at p < 0.1.
Fig. 7 Plot of predicted and experimental energy consumption under optimum conditions
2
2
2
22
2
2
2
A c t u a l
Pred
icted
P re d ic te d vs . Actu a l
1.59
16.27
30.94
45.61
60.29
1.59 16.27 30.94 45.61 60.29
2
2
2
22
2
2
2
A c t u a l
Pred
icted
P re d ic te d vs . Actu a l
1.59
16.27
30.94
45.61
60.29
1.59 16.27 30.94 45.61 60.29
2
2
2
22
2
2
2
A c t u a l
Pred
icted
P re d ic te d vs . Actu a l
1.59
16.27
30.94
45.61
60.29
1.59 16.27 30.94 45.61 60.29
2
2
2
22
2
2
2
A c t u a l
Pred
icted
P re d ic te d vs . Actu a l
1.59
16.27
30.94
45.61
60.29
1.59 16.27 30.94 45.61 60.29

VOL.52 NO.1 2021 AGRICULTURAL MECHANIZATION IN ASIA, AFRICA AND LATIN AMERICA 37
set up and described the energy consumed by okra slices in a hot air convective solar-electric dryer.
Only air velocity, slice thickness and temperature had significant ef-fects on the energy consumption (p ≤ 0.05); whereas the cross product terms had significant effects (p ≤ 0.1) on the energy consumption of sliced okra samples. The effects of the drying parameters on the energy consumption are shown in Fig. 8.
From Fig. 8(a-c), increasing dry-ing temperature at constant air velocity, decreased mean energy consumption and vice-versa. In-creasing the air velocity at constant temperature increases the evapora-tion rate of the surface moisture, thus increasing the drying rate and reducing the energy consumption. Maximum energy consumption is obtained at the lowest temperature and air velocity (50 °C and 1.0 ms-1 respectively); thickest sample slice and lowest temperature (20 mm and 50 °C respectively); lowest air veloc-ity and thickest sample slice (1.0 ms-1 and 20 mm respectively). Whereas the minimum energy occurred at the highest temperature and air velocity (70 °C and 2.0 ms-1); and the lowest slice thickness and highest tempera-ture (10 mm and 70 °C respectively); lowest slice thickness and highest air velocity (10 mm and 2 ms-1 re-spectively). The optimum values of
the process variables, obtained from desirability function using Design Expert 7.0 statistical package were: 1.54 m/s air velocity, 15.45 mm slice thickness and 54.8 °C temperature. Energy consumption of about 34.27 kW-h was predicted for drying of sliced okra in the hybrid solar-elec-tric dryer under AST conditions.
ConclusionsOptimization of energy consump-
tion for drying of sliced okra in a hybrid solar-electric dryer using re-sponse surface method has effective-ly estimated its interaction effects with the three independent variables: air velocity, slice thickness and tem-perature, as well as predicting the optimal operational conditions. A batch of 1000 g of okra slices (Nwai-du spp.) was dried from initial mois-ture content of 87.7% w.b to desired final moisture content of 8% w.b us-ing a hybrid convective hot air dryer. Drying experiments were performed varying the process parameters: A (1.0, 1.5 and 2 ms-1), S (10, 15 and 20 mm) and T (50, 60 and 70 °C) using a central composite rotatable design. The drying parameters were optimized based on the energy con-sumption of the drying process. The process parameters had significant effects on the energy consumption
as well as interaction effects. The mean energy consumption decreases with increasing drying temperature at constant air velocity and vice versa, as well as increasing with the air velocity at constant temperature. Maximum energy consumption val-ues were obtained at: 50oC and 1.0 ms-1; 20 mm and 50 °C; and 1.0 ms-1 and 20 mm; whereas the minimum values were obtained at: 70 °C and 2.0 ms-1; 10 mm and 70 °C; and 10 mm and 2 ms-1. Based on the analy-sis of variance and the agreement of the experimental and predicted results, the generated energy model consumption model was suitable for the simulation of solar-assisted elec-tric drying of okra slices under the stated treatment combination. The drying conditions of 1.54 ms-1 air velocity, 15.45 mm slice thickness and 54.8 °C temperature were found optimum for solar-assisted electric drying of okra slices.
Optimization of energy consump-tion of solar-electric crop dryers with heat recovery units for differ-ent sliced fruit vegetables is recom-mended for further studies.
REFERENCES
Afolabi, T. J., Akintunde, T. Y. and O. J. Oyelade. 2014. Influence of drying conditions on the effective
1 6 .0 0 1 3
2 4 .0 8 0 5
3 2 .1 5 9 8
4 0 .2 3 9
4 8 .3 1 8 3
ENE
RGY
(kJ)
0 .1 0
0 .5 8
1 .0 5
1 .5 2
2 .0 0
5 0 .0 0
5 5 .0 0
6 0 .0 0
6 5 .0 0
7 0 .0 0
A : A IR V E L( m /s ) C : T E M P . ( D eg C )
9 .8 8 8 8 9
1 9 .8 6 9 1
2 9 .8 4 9 3
3 9 .8 2 9 5
4 9 .8 0 9 7
ENE
RGY
1 0 .0 0
1 2 .2 5
1 4 .5 0
1 6 .7 5
1 9 .0 0
5 0 .0 0
5 5 .0 0
6 0 .0 0
6 5 .0 0
7 0 .0 0
B : S LIC E T H IC K . C : T E M P
9 .4 9 1 9 5
2 0 .5 6 6 7
3 1 .6 4 1 5
4 2 .7 1 6 3
5 3 .7 9 1
ENE
RGY
0 .1 0
0 .5 8
1 .0 5
1 .5 2
2 .0 0
1 0 .0 0
1 2 .2 5
1 4 .5 0
1 6 .7 5
1 9 .0 0 A : A IR V E L
B : S LIC E T H IC K .
Fig. 8a Response surface plot of the interaction effect between temperature and air velocity on the energy consumption for drying of sliced okra samples in a hybrid crop dryer
Fig. 8c Response surface plot of the interaction effect between air velocity and slice thickness on the energy consumption for drying of sliced okra samples in a hybrid crop dryer
Fig. 8b Response surface plot of the interaction effect between temperature and slice thickness on the energy consumption for drying of sliced okra samples in a hybrid crop dryer
AGRICULTURAL MECHANIZATION IN ASIA, AFRICA AND LATIN AMERICA 2021 VOL.52 NO.138
moisture diffusivity and energy re-quirements of ginger slices. Journal of Food Research, 3(5): 103-112.
Akanbi, C. T., Adeyemi, R. S. and A. Ojo. 2006. Drying character-istics and sorption isotherm of tomato slices. Journal of Food Engineering, 73: 141-146.
Anyanwu, A. C., Anyanwu, B. O. and V. A. Anyanwu. 1986. A Text-book of Agriculture for School Certificate (4th Edition). Africana-Fep Publishers Limited, Ibadan, Pp. 124-136.
Billiris, M. A., Siebenmorgen, T. J. and A. Mauromoustakos. 2011. Estimating the theoretical energy required to dry rice. Journal of Food Engineering, 107: 253-261.
Darvishi, H., Asi, R. A., Asghari, A., Najafi, G. and H. A. Gazori. 2013. Mathematical modeling, moisture diffusion, energy consumption and efficiency of thin-layer drying of potato slices. Journal of Food Process Technology 4 (3): 215-229.
Doymaz, I. 2005. Drying character-istics and kinetics of okra. Journal of Food Engineering, 69: 275-279.
Eke, A. B. 2014. Investigation of low cost solar collector for drying vegetables in rural areas. Agricul-tural Engineering International: CIGR E-Journal: 16(1): 118-125.
Ekpunobi, U. E, Ukatu, S. C., Ngene, B. O., Onyema, C. T. and P. U. Ofora. 2014. Investigation of the thermal properties of selected fruits and vegetables. American Journal of Science and Technol-ogy, 1(5): 293-297.
EL-Mesery, H. S. and G. Mwithiga. 2012. Comparison of a gas fired hot-air dryer with an electrically heated hot-air dryer in terms of drying process, energy consump-tion and quality of dried onion slices. African Journal of Agricul-tural Research, 7(3): 4440-4452.
FAOSTAT. 2008. Vegetables. (http://www.fao.org/vegetable_produc-tion_pdf).
Giri, S. K. and S. Prasad. 2007. Op-timization of microwave-vacuum drying of button mushrooms us-
ing response-surface methodol-ogy. Drying Technology, 25(5): 901-911.
Kasuma, H. S. and M. Mahfud. 2016. Response surface methodol-ogy for optimization studies of microwave-assisted extraction of sandalwood oil. Journal of Mate-rial and Environmental Sciences, 7(6): 1958-1971.
Koyuncu, T. Tosun, I. and Y. Pinar. 2007. Drying characteristics and heat energy requirement of corne-lian cherry fruits (Cornus mas L.). Journal of Food Engineering, 78: 735-739.
Kumar, D., Prasad, S. and G. S. Murthy. 2011. Optimization of microwave-assisted hot air drying conditions of okra using response surface methodology. Journal of Food Science and Technology, 4(2): 1-13.
Kaur, C., Khurdiya, D. S., Paul, R. K. and H. C. Kapoor. 1999. Effects of microwave heating and convention-al processing of nutritional quali-ties of tomato juices. Food Science and Technology, 36: 331-333.
Mason, R. L., Gunst, R. F. and J. L. Hess. 1989. Statistical Design and Analysis of Experiments: With Ap-plications to Engineering and Sci-ence. Wiley Series in Probability and Mathematical Statistics, John Wiley and Sons, 1st ed. Pp. 103-119.
Maskan, M. 2001. Drying shrinkage and rehydration characteristic of kiwi fruit during hot air and mi-crowave drying. Journal of Food Engineering, 48: 177-182.
Minaei, S., Cheuarbon, H. A., Mote-vali, A. and A. Arabhosseim. 2014. Energy consumption, thermal uti-lization efficiency and hypericum content in drying leaves of St. John’s wort. Journal of Energy in Southern Africa, 25(3): 27-35.
Myers, R. H. and D. C. Montgomery. 1995. Response surface methodol-ogy: process and product optimi-zation using designed experiments. John Willey and Sons, New York.
Motevali, A., Abbaszadeh, A., Minaei, S., khostaghaza, M. H.
and B. Ghobadian. 2012. Effective moisture diffusivity, activation energy and energy consumption in thin-layer drying of jujube (Zi-zyphus jujube Mill). Journal of Agricultural Science and Technol-ogy, 14: 523-532.
Nwakuba, N. R., Asoegwu, S. N. and K. N. Nwaigwe. 2016. Energy requirements for drying of sliced agricultural products: a review. Agricultural Engineering Inter-national: CIGR E-Journal, 18(2): 144-155.
Owolarafe, O. K. and H. O. Shotonde. 2004. Some physical properties of fresh okra fruit. Journal of Fodd Engineering, 68(2): 191-196.
Sarsavadia, P. N. 2007. Develop-ment of a solar-assisted dryer and evaluation of energy requirement for the drying of onion. Renew-able Energy, 32: 2529-2547.
Schalau, J. 2002. Backyard garden-er: growing okra. http://ag.arizona.edu/yavapai/anr/hort/byg/archive/ growingokra.html
Sepehrimehr, B. and A. Kohan. 2015. Evaluating a hybrid passive solar-electrical dryer for drying grapes. Advances in Environmen-tal Biology, 9(3): 353-355.
Tiwari, G. N. 2012. Solar Energy Fundamentals, Design, Modeling and Application. Narosa Publish-ing House PVT Ltd., New Delhi; Pp. 203-250.
Tripathy, P. P. and S. Kumar. 2009. Modeling of heat transfer and energy analysis of potato slices and cylinders during solar drying. Journal of Applied Thermal Engi-neering, 29: 884-891.
Yahya, M., Ruslan, M. H., Othman, M. Y., Yatim, B., Sulaiman, M. Y., Mat, S., Lim, C. H., Alghoul, M. A., Zaharim, A. and K. Sopian. 2011. Evaluation of energy require-ment for drying of green tea using a solar assisted drying system (V-groove solar collector); Proceed-ings of the 3rd WSEAS Interna-tional Conference on Renewable Energy Sources; Pp. 298-303.
■■
VOL.52 NO.1 2021 AGRICULTURAL MECHANIZATION IN ASIA, AFRICA AND LATIN AMERICA 39
Design, Development and Evaluation of Minimal Processing Machine for Tender Coconut (Cocos nucifera)
byR. Pandiselvam*Physiology, Biochemistry and Post-HarvestTechnology Division,ICAR - Central Plantation Crops Research Institute, Kasaragod - 671124INDIA*Corresponding author: [email protected]
M. R. ManikantanPhysiology, Biochemistry and Post-HarvestTechnology Division,ICAR - Central Plantation Crops Research Institute, Kasaragod - 671124INDIA
AbstractThis research involved design-
ing and developing a prototype for minimal processing of tender coco-nut that could trim the outer husk to make a pentagonal shape coconut that could be cut open easily. The prototype consisted of a trimming unit and a power transmission sys-tem. The trimming unit consisted of a tender nut holder, shoulder-trimming knife, and bottom cutting knife. Shoulder trimming knife was set to the angle of 60° giving rise to minimum fibrous surface and short processing time. During operation, the tender coconut was placed ver-tically at the holder and clamped before the shoulder trimming took place. When the fruit rotated, the operator manually adjusted the trimming blades to trim the shoul-der part of the fruit. The results show that the coconut trimming ma-chine could trim 160 tender nuts. h-1 with a trimmed husk of 52.56 kg/h when the rotational speed was set at 428 rpm.
IntroductionTender coconut water is a pure
and healthiest natural beverage with many medicinal properties. The husk and hard shell of coconut is an exceptional package for the inside water which contains es-sential minerals, sugars, complex carbohydrates, ascorbic acid and vitamin-B complex, amino acids, phytohormones, electrolytes and cytokine (Harach and Jarimopas, 1995). It is an alternative to sports drinks and aerated beverages and low in calories. According to Sports Science Institute (USA), tender co-conut water suitable for the budding sports drink market. Due to high perishable nature of tender coconut, it gets lost natural freshness within 24 to 36 h even under cold condi-tions unless treated scientifically (Geetha et al., 2016). Maturity and development of the tender coconut also strongly affects the fruit quality (Jarimopasa and Kuson, 2007).
The tender coconut is a bulky commodity due to husk that poses lot of transportation, packaging and
handling problems. The average tender coconut weight is 1.5 kg of which the husk constitute of two-third of the volume of tender coco-nut or 65% of the total weight (Raju et al., 2002; Haseena et al., 2010). Hence, handling of tender coconuts will be easy if a major part of the husk is removed. But, the partial removal of husk resulted in rapid spoilage of nuts due to biochemi-cal and enzymatic reactions are constrains in marketing of trimmed tender coconut in areas where co-conut not grown (Haseena et al., 2010). To retain the wholesomeness, freshly harvested tender coconuts are transported to the processing house for trimming of individual nuts. The tender coconuts should be minimum six months old and the trimming process should allow the husk at least 1 cm thickness over the soft eye for minimal process-ing of tender coconut (Mohpraman and Siriphanich, 2012). The tender coconut is usually trimmed like pentagonal shape (conical shaped top with tapered cylindrical body and a flat base) to remove 50-60%
A. C. MathewPhysiology, Biochemistry and Post-HarvestTechnology Division,ICAR - Central Plantation Crops Research Institute, Kasaragod - 671124INDIA
Shameena BeegumPhysiology, Biochemistry and Post-HarvestTechnology Division,ICAR - Central Plantation Crops Research Institute, Kasaragod - 671124INDIA
K. B. HebbarPhysiology, Biochemistry and Post-HarvestTechnology Division,ICAR - Central Plantation Crops Research Institute, Kasaragod - 671124INDIA

AGRICULTURAL MECHANIZATION IN ASIA, AFRICA AND LATIN AMERICA 2021 VOL.52 NO.140
of the outer husk, and then shrink wrapped before being packed in corrugated boxes. The technology for preservation of trimmed tender coconut developed by Raju et al. (2002) involves dipping partially dehusked tender coconut in a citric acid (0.50%) and potassium metabi-sulphate (0.50%) solution for three minutes. They found that dipped tender coconut can be stored up to 24 days in refrigerated condition (5-7 °C). By using this process, ten-der coconut can be exported to dis-tant place and served like other soft drinks.
Minimal processing of tender coconut reduces transportation cost and facilitates ease of packaging. Conventional t r imming process requires skilled labour to shear the husk of tender coconut with sharp knife (Jarimopas and Ruttanadat, 2007). Hence, it is requires signifi-cant physical strength and extremely dangerous procedure. Other troubles related with conventional trimming process are the shortage of skilled labour, product is not uniform size, high production cost, and the time consumption (Yahya and Mohd Zainal, 2014). Consequently, several food engineers and coconut growers have attempted to develop tender coconut trimming machine (Harach and Jarimopas, 1995; Jarimopas and Pechsamai, 2002; Jarimopas and Ruttanadat, 2007; Jarimopas et al., 2009). Unfortunately, their ma-chines were unacceptable by farm-ers, processors, exporters and trad-ers due to low trimming capacity and complicate procedure involved during trimming process. Jarimopas and Ruttanadat (2007) developed a machine to trim tender coconut by horizontal lathe cutting mechanism. However, most of the operating time was wasted to reposition of the tender nut and readjustment of trimming knife for each trimming operation (Jarimopas et al., 2009).
In fact, many coconut growers, traders, exporters and entrepreneurs have expressed the interest to have
machinery that is able to trim the tender coconut into a pentagonal shape (flat bottom, round body and pyramid top) as fast as can currently be done by labor. Therefore, there is an urgent need for minimal process-ing machine to trim the tender nuts in simple and safer way. The main aim of the present study was devel-opment and performance evaluation of minimal processing machine for tender coconut with vertical holding and trimming mechanism.
Materials and MethodsRaw Materials
Freshly harvested tender coconuts were obtained at Farm Office, Cen-tral Plantation Crops Research Insti-tute (CPCRI), Kasaragod. Knowl-edge on the physical properties of the coconut was substantial in de-signing the tender coconut trimming machine. Hence, 50 of intact tender coconuts from west cost tall (WCT) variety were selected and measured to determine the diameter, height and husk thickness of each tender coconut using the vernier caliper. It is important to ensure that the ten-der coconuts were free from physi-cal damage beforehand. Each tender coconut was dehusked manually to determine the husk thickness.
Machine DesignThe design concept was to trim
the vertically rotating tender coco-nut by applying an inclined knife in translation motion in order to get the desired shape of the tender co-conut. The tender coconut trimming machine consisted of a main frame, spring arm, sliding slot, tender co-conut holder, a shoulder trimming knife, a bottom cutting knife and power transmission unit. Fig. 1 il-lustrates the engineering diagram of the machine and its important com-ponents.
The horse power of motor re-quired to rotate tender coconut holder was calculated by using the
following formula (Khurmi and Gupta, 2006),
Hp required to operate tender coconut minimal processing machine = 2πNT / 4500
Where,N= rpm of tender-nut holder,T= Torque, kg-m,Self weight of the spring arm =
4.5 kgAverage tender coconut weight =
1.2 kgForce required to trim the tender
coconut (0.4 cm) = 19.8 kgDiameter of tender coconut holder
= 0.09 mSpeed of tender coconut holder =
450 rpm Torque required = load × distance
= 25.5 × 0.09 = 2.295 kg mHp required to operate tender
coconut trimming machine = (2πNT × 2.295 × 450) / 4500 = 1.44 hp ≈ 1.5 hp
The machine was driven by a single phase electric motor. An AC motor of 1.5 hp with maximum speed of 1,425 rpm was used. How-ever, around 400 to 450 rpm was normally applied for trimming the
Fig. 1 Engineering diagram of minimal processing machine for tender coconut
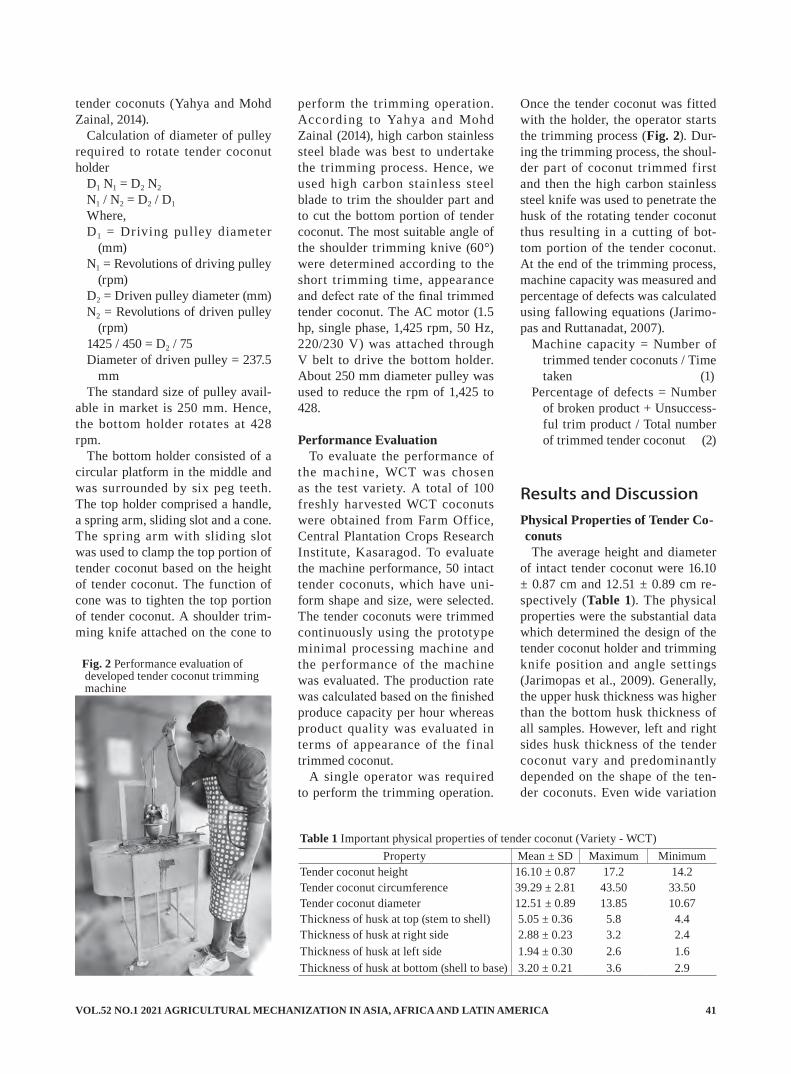
VOL.52 NO.1 2021 AGRICULTURAL MECHANIZATION IN ASIA, AFRICA AND LATIN AMERICA 41
tender coconuts (Yahya and Mohd Zainal, 2014).
Calculation of diameter of pulley required to rotate tender coconut holder
D1 N1 = D2 N2
N1 / N2 = D2 / D1
Where,D1 = Driving pulley diameter
(mm)N1 = Revolutions of driving pulley
(rpm)D2 = Driven pulley diameter (mm)N2 = Revolutions of driven pulley
(rpm)1425 / 450 = D2 / 75Diameter of driven pulley = 237.5
mmThe standard size of pulley avail-
able in market is 250 mm. Hence, the bottom holder rotates at 428 rpm.
The bottom holder consisted of a circular platform in the middle and was surrounded by six peg teeth. The top holder comprised a handle, a spring arm, sliding slot and a cone. The spring arm with sliding slot was used to clamp the top portion of tender coconut based on the height of tender coconut. The function of cone was to tighten the top portion of tender coconut. A shoulder trim-ming knife attached on the cone to
perform the trimming operation. According to Yahya and Mohd Zainal (2014), high carbon stainless steel blade was best to undertake the trimming process. Hence, we used high carbon stainless steel blade to trim the shoulder part and to cut the bottom portion of tender coconut. The most suitable angle of the shoulder trimming knive (60°) were determined according to the short trimming time, appearance and defect rate of the final trimmed tender coconut. The AC motor (1.5 hp, single phase, 1,425 rpm, 50 Hz, 220/230 V) was attached through V belt to drive the bottom holder. About 250 mm diameter pulley was used to reduce the rpm of 1,425 to 428.
Performance EvaluationTo evaluate the performance of
the machine, WCT was chosen as the test variety. A total of 100 freshly harvested WCT coconuts were obtained from Farm Office, Central Plantation Crops Research Institute, Kasaragod. To evaluate the machine performance, 50 intact tender coconuts, which have uni-form shape and size, were selected. The tender coconuts were trimmed continuously using the prototype minimal processing machine and the performance of the machine was evaluated. The production rate was calculated based on the finished produce capacity per hour whereas product quality was evaluated in terms of appearance of the final trimmed coconut.
A single operator was required to perform the trimming operation.
Once the tender coconut was fitted with the holder, the operator starts the trimming process (Fig. 2). Dur-ing the trimming process, the shoul-der part of coconut trimmed first and then the high carbon stainless steel knife was used to penetrate the husk of the rotating tender coconut thus resulting in a cutting of bot-tom portion of the tender coconut. At the end of the trimming process, machine capacity was measured and percentage of defects was calculated using fallowing equations (Jarimo-pas and Ruttanadat, 2007).
Machine capacity = Number of trimmed tender coconuts / Time taken (1)
Percentage of defects = Number of broken product + Unsuccess-ful trim product / Total number of trimmed tender coconut (2)
Results and DiscussionPhysical Properties of Tender Co-conutsThe average height and diameter
of intact tender coconut were 16.10 ± 0.87 cm and 12.51 ± 0.89 cm re-spectively (Table 1). The physical properties were the substantial data which determined the design of the tender coconut holder and trimming knife position and angle settings (Jarimopas et al., 2009). Generally, the upper husk thickness was higher than the bottom husk thickness of all samples. However, left and right sides husk thickness of the tender coconut vary and predominantly depended on the shape of the ten-der coconuts. Even wide variation
Fig. 2 Performance evaluation of developed tender coconut trimming machine
Table 1 Important physical properties of tender coconut (Variety - WCT)Property Mean ± SD Maximum Minimum
Tender coconut height 16.10 ± 0.87 17.2 14.2Tender coconut circumference 39.29 ± 2.81 43.50 33.50Tender coconut diameter 12.51 ± 0.89 13.85 10.67Thickness of husk at top (stem to shell) 5.05 ± 0.36 5.8 4.4Thickness of husk at right side 2.88 ± 0.23 3.2 2.4Thickness of husk at left side 1.94 ± 0.30 2.6 1.6Thickness of husk at bottom (shell to base) 3.20 ± 0.21 3.6 2.9

AGRICULTURAL MECHANIZATION IN ASIA, AFRICA AND LATIN AMERICA 2021 VOL.52 NO.142
in tender coconuts shape, size and husk thickness exist within types and populations (Chan and Elevitch, 2006).
Performance EvaluationThe distance between top and
bottom holder of tender coconut was designed according to the av-erage height of WCT variety (160 mm). In order to hold the different variety of tender coconuts including Chowghat Orange Dwarf (COD), Chowghat Green Dwarf (CGD), Malayan Orange Dwarf (MOD) and Malayan Yellow Dwarf (MYD) an additional of 80 mm height was provided. Hence, the total clearance provided between top and bottom holder was 240 mm. Jarimopas et al., (2009) provided shoulder knife height of 180 mm for trimming of ‘‘Namhom’’ variety.
The average holding time taken by the operator to set the tender coconut was 11 s nut-1. This was considered as time consuming as the operator had to manually posi-tions the tender coconut. A total of 2% of the coconuts were damaged during the trimming process due to broken shell as a result of excessive trimming. The optimum operating conditions of the prototype machine were as follows: a) 428 rpm rota-tional speed; b) the trimming knives need to be changed or sharpened
after 80 tender coconuts had been trimmed; c) average shoulder trim-ming time (machine) was about 9 s/nut; d) average bottom-up cutting time (manual) was about 3 s/nut. The total processing rate of this prototype machine was 160 nuts per hour including the holding, trim-ming and bottom cutting, which was almost four times faster than con-ventional manual trimming method. Moreover, the trimmed tender co-conut produced by unskilled labors during manual trimming was not presentable due to uneven contour (Yahya and Mohd Zainal, 2014), whereas the developed machine managed to trim the tender coconut uniformly. A shoulder knife angle of 60o gave the best result in terms of final product quality. Jarimopas and Ruttanadat (2007) also found that shoulder knife angle between the knife and the XY-plane (61°) gave the best result in lathe cutting machine mechanism.
As shown in Fig. 3, the output of tender coconut using prototype ma-chine had less protruding fibre and there were no marked differences in terms of appearance compared to manual trimming. In comparison with the previous work done by Ja-rimopas and Ruttanadat (2007) and Yahya and Mohd Zainal (2014), their prototype machine could trim 21 and 49 nuts per hour at 300 and 400
rpm rotation, respectively (Table 2).
ConclusionA prototype of semi automatic
tender coconut trimming machine was developed and evaluated. The mechanism used features a sharp inclined knife which operates in translation motion in a ver tical plane to trim the fruit, which is clamped tightly and rotates about a vertical axis. Machine components include a main frame, a shoulder-trimming station, a base-cutting sta-tion, rotary base holder, and a power drive. Optimal settings included 428 rpm rotation of the trimmed fruit, and a shoulder knife angle of 60°. The cutting edge angles of the shoulder knives have proven to generate smooth trimming with less protruding fibres on the final prod-uct. The machine performance test indicated a trimming (shoulder) and
Fig. 3 Trimmed tender coconut
Table 2 Comparison of tender coconut trimming machines
Method Mechanism Capacity (nuts. h-1) Product Quality Operation Reference
Manual trimming method using knife
Shearing and cutting
35 Shape is depends on skills of labour
Risky operation and time consuming process
Jarimopas et al. (2009)
Young coconut fruit trimming machine
Lathe cutting machine mechanism
21 Uniform shape and size
Safe and time consuming operation (knife angles 61° produced the least amount of fibers)
Jarimopas and Ruttanadat (2007)
Young coconut fruit opening machine
Shearing the rotating trimmed young coconut by a stationary knife
120 Uniform shape and size
Safe operation (An angle of 50° was considered the optimum)
Jarimopas and Kuson (2007)
Automatic trimming machine
Vertical trimming mechanism with 3 fruit holders
86 Uniform shape and size
Safe operation and knife changes were necessary after 50 trimming operations.
Jarimopas et al. (2009)
Young coconut shaping machine
lathe trimming mechanism
49 Uniform shape and size
Safe operation but the trimming knives need to be changed after 30 trimming operations
Yahya and Mohd Zainal (2014)
VOL.52 NO.1 2021 AGRICULTURAL MECHANIZATION IN ASIA, AFRICA AND LATIN AMERICA 43
cutting of bottom portion of tender coconut with total holding and trim-ming process of about 160 nuts per hour. About 328.5 g of husk can be removed from each tender coconut by trimming operation. The trim-ming knives need to be sharpened or changed after 80 fruits had been trimmed. Grading and sorting of the tender coconuts are not necessary to perform trimming operation in the developed machine, because of the large clearance (240 mm) and slid-ing slot between holders. The devel-oped machine could trim the tender coconuts at higher level of efficiency compared to the manual method.
Acknowledgements: The authors wish to acknowledge Director, ICAR-CPCRI, Kasaragod for his support and guidance in conducting this study. The authors would like to thank PC Unit, AICRP on PHET for the financial support for fabrication and performance evaluation of ma-chine.
REFERENCES
Chan, E. and C. R. Elevitch. 2006. Cocos nucifera (coconut). Species Profiles for Pacific Island Agro-forestry, 2: 1-27.
Geetha, V., Mohan Kumar, A. S., Chetana, R., Gopala Krishna, A. G. and G. Suresh Kumar. 2016. Effect of shelf stable concentrates of tender coconut water and testa phenolics on lipid profile and liver antioxidant enzymes in high fat fed rats. Global Journal of Biol-ogy, Agriculture and Health Sci-ence, 5(2): 25-30.
Harach, C. and B. Jarimopas. 1995. Young coconut peeling machine. Kasetsar t University Journal (Natural Science), 29: 393-403.
Jarimopas, B. and A. Pechsamai. 2002. Design and development of young coconut peeling machine. Thai Agricultural Research Jour-nal, 20(2): 91-110.
Jarimopas, B. and P. Kuson. 2007. A
young coconut fruit opening ma-chine. Biosystems Engineering, 98(2): 185-191.
Jarimopas, B. and N. Ruttanadat. 2007. Development of a young coconut fruit trimming machine. Journal of Food Engineering, 79: 752-757.
Jarimopas, B., Ruttanadat, N. and A. Terdwongworakul. 2009. An automatic trimming machine for young coconut fruit. Biosystems Engineering, 103: 167-175.
Khurmi, R. S. and J. K. Gupta. 2006. A textbook of machine de-sign. Eurasia Publishing House Pvt Ltd. New Delhi, India.
Raju, V. K., Thangaraj, T. and M. G. R. Carvalho. 2002. Standardissa-tion of minimal processing tech-nology for marketing tender coco-nut as a chilled natural beverages. Proceedings of Placrosym XV: 668-677.
Haseena, M., Bai, K. K. and S. Padmanabhan. 2010. Post-harvest quality and shelf-life of tender coconut. Journal of Food Science and Technology, 47(6): 686-689.
Mohpraman, K. and J. Siriphanich. 2012. Safe use of sodium metabi-sulfite in young coconuts. Post-harvest Biology and Technology, 65: 76-78.
Yahya, S. and I. Mohd Zainal. 2014. Design and performance of young coconut shaping machine. Journal of Tropical Agriculture and Food Science, 42(1): 19-28.
■■

AGRICULTURAL MECHANIZATION IN ASIA, AFRICA AND LATIN AMERICA 2021 VOL.52 NO.144
Agricultural Machinery Manufacturing Sector in Palestine - Reality and Challenges
byNawaf Abu-Khalaf*College of Agricultural Sciences and Technology, Palestine Technical University-Kadoorie (PTUK),P.O.Box 7, TulkarmPALESTINE*Corresponding author: [email protected]
Yasser A. R. NatourDeputy Director of Field Crops andAgricultural Mechanization Department, Palestinian Ministry of Agriculture (MOA),[email protected]
AbstractThis paper presents brief ly the
current status of agricultural ma-chinery manufacturing sector in Palestine. The current agricultural mechanization status, workshops names, locations and activities are mentioned. In addition, companies dealing with agricultural mechani-zation are listed. The motivations for improving agricultural machin-ery manufacturing sector are also discussed. Some technical recom-mendations for improving this man-ufacturing capacity are provided.
IntroductionAgricultural plays a fundamen-
tal role in national economy and food security. There is diversity in Palestinian agricultural products due to climate condition, which is similar to the Mediterranean region,
i.e. warm in summer and mild in winter. Nevertheless, it is character-ized by geographical and terrain di-versity, featuring the coastal plains (high fertility) and the mountains with varying altitudes ranging be-tween 150-1,050 m that span from the north to the south of the country. There are also the eastern valley re-gions with suitable temperatures in winter that is a unique environment to produce vegetables and some of crops, e.g. grapes and citrus. More-over, there are the internal plains,
which are an important source of food for the production chain and self-sufficiency in Palestine, where a range of cereals and summer veg-etables are cultivated. The diversity of the geology and climate in the country has given a unique histori-cal advantage, a great botanical bio-diversity, as well as a wide range of animal husbandry. The mountainous highlands have different soil depths and thickness, and they are gener-ally rocky. Moreover, they have different rainfall rates, slopes and
Fig. 4 Nylon rolls spreading machine Fig. 5 Mounted chisel plow with seven blades
Fig. 1 Mounted moldboard plow
Fig. 3 Two-ton trailer that has a braking system and rear lights
Fig. 2 Mounted chisel plow with nine blades
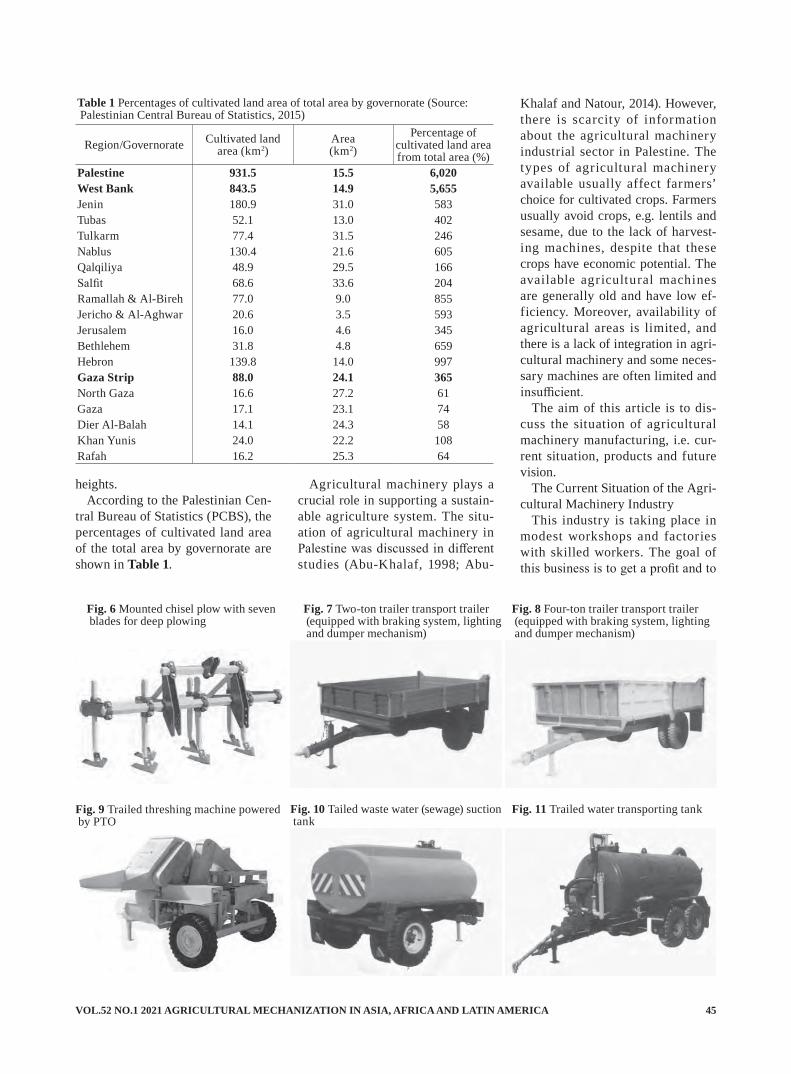
VOL.52 NO.1 2021 AGRICULTURAL MECHANIZATION IN ASIA, AFRICA AND LATIN AMERICA 45
Table 1 Percentages of cultivated land area of total area by governorate (Source: Palestinian Central Bureau of Statistics, 2015)
Region/Governorate Cultivated land area (km2)
Area(km2)
Percentage of cultivated land area from total area (%)
Palestine 931.5 15.5 6,020West Bank 843.5 14.9 5,655Jenin 180.9 31.0 583Tubas 52.1 13.0 402Tulkarm 77.4 31.5 246Nablus 130.4 21.6 605Qalqiliya 48.9 29.5 166Salfit 68.6 33.6 204Ramallah & Al-Bireh 77.0 9.0 855Jericho & Al-Aghwar 20.6 3.5 593Jerusalem 16.0 4.6 345Bethlehem 31.8 4.8 659Hebron 139.8 14.0 997Gaza Strip 88.0 24.1 365North Gaza 16.6 27.2 61Gaza 17.1 23.1 74Dier Al-Balah 14.1 24.3 58Khan Yunis 24.0 22.2 108Rafah 16.2 25.3 64
heights. According to the Palestinian Cen-
tral Bureau of Statistics (PCBS), the percentages of cultivated land area of the total area by governorate are shown in Table 1.
Agricultural machinery plays a crucial role in supporting a sustain-able agriculture system. The situ-ation of agricultural machinery in Palestine was discussed in different studies (Abu-Khalaf, 1998; Abu-
Khalaf and Natour, 2014). However, there is scarcity of information about the agricultural machinery industrial sector in Palestine. The types of agricultural machinery available usually affect farmers’ choice for cultivated crops. Farmers usually avoid crops, e.g. lentils and sesame, due to the lack of harvest-ing machines, despite that these crops have economic potential. The available agricultural machines are generally old and have low ef-ficiency. Moreover, availability of agricultural areas is limited, and there is a lack of integration in agri-cultural machinery and some neces-sary machines are often limited and insufficient.
The aim of this article is to dis-cuss the situation of agricultural machinery manufacturing, i.e. cur-rent situation, products and future vision.
The Current Situation of the Agri-cultural Machinery Industry
This industry is taking place in modest workshops and factories with skilled workers. The goal of this business is to get a profit and to
Fig. 6 Mounted chisel plow with seven blades for deep plowing
Fig. 8 Four-ton trailer transport trailer (equipped with braking system, lighting and dumper mechanism)
Fig. 7 Two-ton trailer transport trailer (equipped with braking system, lighting and dumper mechanism)
Fig. 11 Trailed water transporting tankFig. 10 Tailed waste water (sewage) suction tank
Fig. 9 Trailed threshing machine powered by PTO

AGRICULTURAL MECHANIZATION IN ASIA, AFRICA AND LATIN AMERICA 2021 VOL.52 NO.146
provide the needed machines for the agricultural market in the current circumstances. Some agricultural equipment locally produced are shown in Figs. 1-11.
The owners and the workers in workshops or factories are often qualified with modest local indus-trial experience. Most of their expe-rience is inherited from parents and grandparents, who have an agricul-tural background. In addition, some workers obtained their experience by working and practicing in work-shops and factories, or by attending agricultural and industrial voca-tional education.
There are several factories and workshops developing agricultural equipment in Palestine. Table 2 shows some of these factories. Some of these workshops and factories have ISO certifications (regardless their levels), and they are able to cover the minimum requirements of the local mechanization market.
However, most of the workshops lack equipment for welding, turning, bending, cutting and metalworking, and this limits the ability to produce certain needed parts. The type of agricultural machinery produced depends on the quality and extent of the integration of equipment and processes in workshops or factories. Moreover, these manufacturers and technical workers still lack interna-tional expertise, exchange of infor-mation, technical skills, ideas and technology transfer.
There are some advanced agricul-tural machines that are still miss-ing in the agricultural machinery market. For example, there is a lack of potatoes cultivation and seeds sowing machines for field crops. Also row crop planter and precision planting machines to grow some crops such as spinach, onions and carrots are also still missing, as well as harvesters, straw pressing and balers.
This problem can be overcome by importing. Nevertheless, the cost is relatively high even from some of the nearby countries such as Turkey, Egypt and Italy. Table 3 shows a list of several dealers, who import some agricultural equipment brands.
Some of the workshops are locat-ed close to the countryside and have direct contact with farmers. While others (large factories), which have advanced manufacturing equip-ment and tools, are located inside or near cities, because they need high electric power loads to operate their machines (Farmers and owners of workshops and machine factories, 2018). This can be considered as an obstacle in the communication be-tween farmers and manufacturers.
The local workshops in country-side carry out maintenance works (e.g. welding, fixing and adjusting) for many agricultural machines. Some of the workers in the field come up with innovation solutions to fit local models. These solutions are inspired by imported models.
They also make some modifications to local machines, such as seeders and potatoes farming machines, and sometimes agricultural machinery used in agricultural research or dif-ferent farming systems, for example minimum tillage or conservation agriculture, which is carried out with high expertise.
Future visionThe challenges for developing
agricultural manufacturing sector can be summarized in: limited agri-cultural area in general, increasing of urbanization, growing demand for agricultural crops and food (food security) and lack of specialized en-gineering expertise in manufactur-ing of agricultural machinery.
In order to overcome these chal-lenges, it is necessary to develop the agricultural machinery manufactur-ing sector in Palestine. There is a need to build a large scale of this sector, to cover all agricultural op-erations from preparing the land to the final product. This will contrib-ute to food security needed to meet the demand of Palestinian people.
It can be suggested to take actions in these issues:1. Optimal use of the available ag-
ricultural land: this will help in achieving the best utilization and introducing of modern agricultural machines and to obtain the highest quality and quantity production.
Table 2 Some of workshops and factories producing agricultural equipment in Palestine (Source: Farmers and owners of workshops and machine factories. 2018)No. Factory/workshop name Area Type of work1 Haddad Factory Jenin Industrial Zone - Jenin Manufacturing of heavy agricultural machinery2 Waleed Al - Ardaa Factory Sanur - Jenin Manufacturing of heavy agricultural machinery3 Haj Raafat Factory Arrabeh - Jenin Manufacturing of heavy agricultural machinery4 Al-Jalbouni Factory Jenin Industrial Zone - Jenin Manufacturing of heavy agricultural machinery5 Fattair Workshop Askar - Nablus Manufacturing of agricultural machinery6 Awni Al-Yamoni Workshop Alyamoon - Jenin Manufacturing and modification of agricultural machinery7 Abu Ammar Al - Saadi (Fayek Al - Saadi) Faqua - Jenin Manufacturing and modification of agricultural machinery8 Sulieman Al-Khateeb Workshop Beit Qad - Jenin Manufacturing and modification of agricultural machinery9 Noor El Din Zakarneh Workshop Deir Ghazala - Jenin Manufacturing and modification of agricultural machinery10 Abdel Baset M. Ameen Workshop Faqua - Jenin Manufacturing and modification of agricultural machinery11 Muayad Hamdan Workshop Arraba - Jenin Manufacturing and modification of agricultural machinery

VOL.52 NO.1 2021 AGRICULTURAL MECHANIZATION IN ASIA, AFRICA AND LATIN AMERICA 47
Table 3 Authorized dealers and importers companies dealing (or used to deal) in agricultural machinery (Source: Importers of agricultural machinery, 2018)No. Company name / Brand Area1 Palestinian Tractors Co. Industrial Area - Ramallah2 Mr. Munther Salah /
Thomson Authorized dealer3 Arab Investment Company / Al-Salam Arrabeh - Jenin4 New Holland Dealer Industrial Zone - Jerusalem Road - Ramallah 5 Al-Junidi Company Deir Sharaf Junction (Importer)6 Al-Shafi' Company Qabatiya - Jenin (Importer)
2. Applying Ministry of Agricul-ture’s law that protects agricul-tural land with high agricultural value (fertility, availability of wa-ter, availability of large areas and suitability for agricultural mecha-nization) against urban expansion.
3. Introducing a specific law for large agricultural areas belong-ing to several owners, i.e. family inheritance, that enables treating large areas with high productiv-ity as one unit in all agricultural operations, and then distributes the revenue between land owners. It is expected that this suggested law will attract the attention of legislators in the country. It is pro-posed that these large areas can be rented as one unit, to increase the quantity of agricultural produc-tion through mechanization, mak-ing it feasible to use agricultural machinery with high technology and performance in order to in-crease food production.
4. The development or importing small (compact) agricultural ma-chines suitable for using in moun-tains area. This will contributes in encouraging owners of narrow areas to use them.
5. Carrying out more research and development (R&D) in agricultur-al machinery: the responsibility of investment in scientific research lies upon the Ministry of Agricul-ture and local universities to cre-ate research groups specialized in agricultural mechanization, and to lead this type of research that provide solutions for the problems facing agricultural mechanization in Palestine. It should be noted
there is not any university offer-ing agricultural engineering (i.e. mechanization) degree until now in Palestine (Kishida, 2017).
6. Development and supporting of existing factories and workshops: by expanding and increasing their production lines, to achieve great-er diversity of products, meet the needs of local agricultural market and allow the exporting to neigh-boring countries, some of which have similar agricultural condi-tions to Palestine (e.g. Jordan, Ye-men, Iraq, etc.). Also, providing technical support for working in this area to enhance their ability.
ConclusionsAgricultural mechanization sec-
tor is an important economical and agricultural factor that contribut-ing significantly to improving food security. There are several skilled workshops who are working in this area and many locally made agri-cultural machines are produced in Palestine. However, this sector is facing several cumbersome factors limiting its expanding and technical development. There is a potential for improving this sector in several methods, e.g. providing technical training for workers and forming re-search groups in agricultural mecha-nization.
REFERENCES
Abu-Khalaf, N. 1998. Agricultural machinery and mechanization in
Palestine. Proceeding of Japanese Society of Agricultural Machin-ery (JSAM), 3rd. April, Yamagata University, Japan, pp. 23-33.
Abu-Khalaf, N. and Y. A. R. Natour. 2014. Agricultural mechanization situation in the Palestinian territo-ries. Agricultural Mechanization in Asia, Africa and Latin Ameri-ca, 45(3), 18-21.
Farmers and owners of workshops and machine factories. 2018. Per-sonal contact.
Importers of agricultural machin-ery. 2018. Personal contact.
Kishida, Y. 2017. Farm machinery yearbook. Shin-Norinsha Co., Ltd. Tokyo, Japan.
Palestinian Central Bureau of Sta-tistics (PCBS). 2015. State of Palestine, Annual Statistical Book of Palestine: Palestine Statistical Yearbook, http://www.pcbs.gov.ps/Downloads/book2173.pdf.
■■

AGRICULTURAL MECHANIZATION IN ASIA, AFRICA AND LATIN AMERICA 2021 VOL.52 NO.148
Modification of Rotary Unit of Power Tiller for Biasi (Interculture Operation) Rice Cultivation in Eastern India
byAjay Kumar VermaProfessor & Principal ScientistDept. of Farm Machinery and Power Engineering,Faculty of Agril. Engineering, IGKV,Raipur, [email protected]
Samir SantiyaSubject Matter Specialist (Agril. Engineering)KVK, IGKV,Janjgir, ChhattisgarhINDIA
AbstractBiasi (Beushening) is a traditional
method of rice cultivation in rainfed risk prone areas of Eastern India. It is performed by animal drawn plough. The productivity of rice drastically reduces due to delayed Biasi opera-tion by the use of animal drawn im-plement. Therefore, effort was made to develop a tiller-based rotary unit Biasi implement. Design consider-ations included soil condition during Biasi operation for Inceptisols and Vertisols soils [soil moisture content 60-65% (db) flooded, specific weight 14-18 kN/m3 & Cone Index 48-54 kPa]. Accordingly, the cage wheel parameters (73 cm wheel diameter, 30 cm wheel width, 450 lug angle and 20 cm lug pitch) for Biasi opera-tion were optimized. The rotary unit of a 13 hp power tiller was modified for Biasi operation. The rotary unit with 8 tines, 152 rpm rotor speed for 70 cm working width, blade distance 18 cm, length of soil slice 7-9 cm at 0.4 m/s forward speed was found suitable. The study revealed that the modified rotary unit of power tiller was found suitable for Biasi opera-tion under rainfed rice cultivation because of their higher field capac-
ity, better quality of work and higher benefit cost ratio as compare to tradi-tional method.
IntroductionBiasi or Beushening method of
rice cultivation is commonly used under highly variable climates and a poor resource base. In this sys-tem, rice seeds are broadcasted in dry or wet soils after normal field preparation. The rice plants as well as weeds grow simultaneously up to 30-40 days and thereafter shal-low ploughing (single or cross) is done in presence of 5-10 cm of wa-ter in standing rice crop by animal drawn indigenous plough followed by manual weeding and gap filling. This operation is called Biasi. Un-der rainfed situation, Biasi is neces-sary because it helps to maintain the plant population, better plant growth and development of roots. In India, more than 1.5 million ha area of rice is under Biasi system of rice culti-vation. Indian farmers, particularly the small and marginal, have been dependent on human and animal power for performing various farm operations. Animals meet the power
requirements of small and marginal farms with associated limitations. The availability of draught animals power has come down from 0.133 kW/ha in 1971-72 to 0.094 kW/ha in 2012-13 (Mehta et al., 2014), where-as the share of tractors and power tillers has increased during the same period. Since the traditional method of Biasi gives low output resulting in delayed operation with high cost, mechanization of this particular op-eration through mechanical means plays a major role to enhance the field efficiency with minimum loss of time, energy and materials. Chan-dravanshi (1989) informed that di-rect seeded rainfed Biasi cultivation of rice occupies 87% of the rice area in Chhattisgarh. Fujisaka (1991), emphasized that Biasi (Beusani) is a common crop establishment prac-tice in rainfed lowland rice. Biasi is used in dry seeded lowland fields to control weeds. Biasi reduces not only the weed population, but also the rice plants population. Kawade (2001) reported that farmers ad-opted Biasi method to minimize the labour requirement in weeding operation, and to enhance the plant growth. Mishra (2010) developed an animal drawn Biasi implement.

VOL.52 NO.1 2021 AGRICULTURAL MECHANIZATION IN ASIA, AFRICA AND LATIN AMERICA 49
The field capacity (0.80 ha/day) was significantly high; which was more than four times than that of local Bi-asi plough, (0.18 ha/day). It was due to proper shape and arrangement of curved tines in the developed Biasi implement, which facilitated self-unclogging and minimized the time lost in removal of clogging. The draught requirement of developed Biasi implement was within the draught capacity of local bullocks (55-65 kgf).
As the t radit ional method of Biasi gives low output resulting in delayed operation with high cost, mechanization of this particular operation plays a major role to enhance the field efficiency with minimum loss of time, energy and materials. But its mechanization is not up to the level of farmers’ expectations till date. So if an inter-cultural power operated implement can be introduced, it will reduce drudgery of farmers and also in-
crease the yield due to timeliness of field operation. In order to bring down the area work pressure on ani-mate power and to assess the possi-bility of mechanization of the Biasi operation, the power-operated Biasi implement was designed, developed and tested.
Material and MethodsTo develop a rotary Biasi imple-
ment, various research findings on crop and soil parameters for Biasi operation available in literature were taken in to consideration, and are given in Table 1.
Features of Power Tillers That Outfit the Biasi OperationThe reasons for taking power til-
ler to perform Biasi operation was its compact construction and good trafficability. The lightness and low centre of gravity facilitate easy op-
eration, low sinkage on submerged soils and rare casualties. The nar-row wheel tread enables them to go through the narrow patch in the country side. Due to absence of two front wheels and narrow wheel tread, power tillers have short turn-ing radius. Thus less land was left untilled during field operations. Rotary type power tiller have been selected for Biasi operation because the reduction in traction demanded of power tiller driving wheels due to the ability of the soil working blades to provide some forward thrust (Benny et al., 1970).
Modification in Rotary Power Til-ler Unit for Biasi OperationModification work in rotary power
tiller units for Biasi rice cultivation was carried out during the year 2013 to 2015. During this period the cage wheel parameters such as type and number of blades, and their combi-nations were optimized through field experiments for Biasi operation. The technical specifications of the power tiller taken for development of rotary Biasi are given in Table 2.
Development of Rotary Unit for Biasi OperationVarious research findings sup-
ported to choose C-shaped rotary blades for Biasi operation because of hooking between the rotary blades and plants (low plant mor-tality), less torque and power con-sumption (unclogging in submerged rice f ield). Salokhe et al. (1993) studied the power requirement and puddling of a rotavator in wet clay soil. It was observed that rotor of C-shaped blades consumed less power than the rotor of L-shaped blades. Cher tkiat t ipol et.al. (2007) ex-plained that it was the phenomenon of reaction forces between soil and tillage tool that related to soil failure pattern. The torque acting on the rotary shaft of L- shaped blades was slightly higher than for the Japanese C-shaped blade. Design of rotary tiller blades depends on soil types,
Table 1 Crop and soil parameters for Biasi operationParticulars. Value Reference
Soil type Loam, silt clay loam, clay loam Verma et. al. (2006) Field preparation Two cross ploughing by tractor
with cultivator depth of ploughing 8-12 cm, bulk density 1.3-1.4 Mg/m3
Verma et. al. (2006)
Seed rate 80-100 kg/haLakpale and Shrivastava (2012)
Time of Biasi 30-40 days after sowingDepth of water in the field at the time of Biasi
5-10 cm
Distance of Biasi (distance between furrow)
20 ± 3 cmKawade (2001)
Depth of Biasi 6-8 cmGap -filling process Within 3 days of Biasi operation Lakpale and
Shrivastava (2012)Plant population 125 plants/m2
Table 2 Technical specifications of power tillerSpecification Value
Engine Type Vertical Diesel EngineNumber of cylinder 1Engine maximum power at 2400 rpm 13 hpEngine maximum torque at 1900 rpm 4.2 kNmTilling Width 800 mmTilling Depth 160-220 mmNo. of Tynes 24Gears 6 forward & 2 reverseRotational speed PTO shaft 540 rpmTotal weight 120 kg
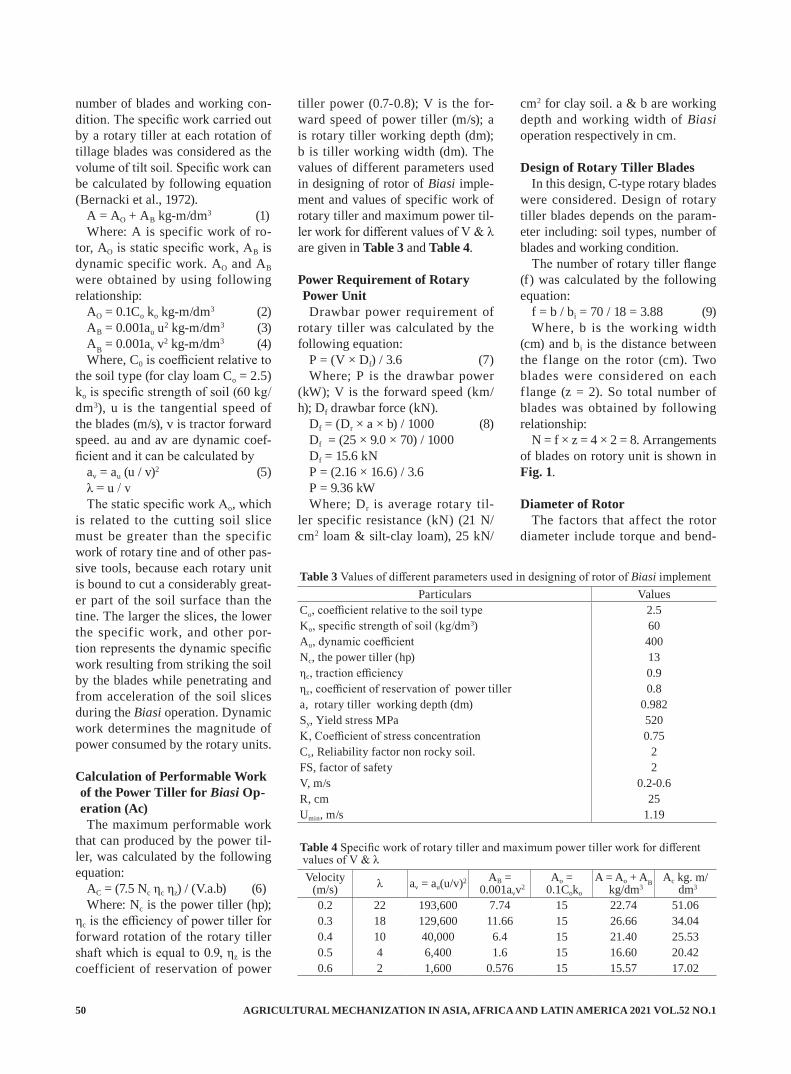
AGRICULTURAL MECHANIZATION IN ASIA, AFRICA AND LATIN AMERICA 2021 VOL.52 NO.150
number of blades and working con-dition. The specific work carried out by a rotary tiller at each rotation of tillage blades was considered as the volume of tilt soil. Specific work can be calculated by following equation (Bernacki et al., 1972).
A = AO + AB kg-m/dm3 (1)Where: A is specific work of ro-
tor, AO is static specific work, AB is dynamic specific work. AO and AB were obtained by using following relationship:
AO = 0.1Co ko kg-m/dm3 (2)AB = 0.001au u2 kg-m/dm3 (3)AB = 0.001av v2 kg-m/dm3 (4)Where, C0 is coefficient relative to
the soil type (for clay loam Co = 2.5) ko is specific strength of soil (60 kg/dm3), u is the tangential speed of the blades (m/s), v is tractor forward speed. au and av are dynamic coef-ficient and it can be calculated by
av = au (u / v)2 (5)λ = u / vThe static specific work Ao, which
is related to the cutting soil slice must be greater than the specific work of rotary tine and of other pas-sive tools, because each rotary unit is bound to cut a considerably great-er part of the soil surface than the tine. The larger the slices, the lower the specific work, and other por-tion represents the dynamic specific work resulting from striking the soil by the blades while penetrating and from acceleration of the soil slices during the Biasi operation. Dynamic work determines the magnitude of power consumed by the rotary units.
Calculation of Performable Work of the Power Tiller for Biasi Op-eration (Ac)The maximum performable work
that can produced by the power til-ler, was calculated by the following equation:
AC = (7.5 Nc ηc ηz) / (V.a.b) (6)Where: Nc is the power tiller (hp);
ηc is the efficiency of power tiller for forward rotation of the rotary tiller shaft which is equal to 0.9, ηz is the coefficient of reservation of power
tiller power (0.7-0.8); V is the for-ward speed of power tiller (m/s); a is rotary tiller working depth (dm); b is tiller working width (dm). The values of different parameters used in designing of rotor of Biasi imple-ment and values of specific work of rotary tiller and maximum power til-ler work for different values of V & λ are given in Table 3 and Table 4.
Power Requirement of Rotary Power UnitDrawbar power requirement of
rotary tiller was calculated by the following equation:
P = (V × Df) / 3.6 (7)Where; P is the drawbar power
(kW); V is the forward speed (km/h); Df drawbar force (kN).
Df = (Dr × a × b) / 1000 (8)Df = (25 × 9.0 × 70) / 1000Df = 15.6 kNP = (2.16 × 16.6) / 3.6P = 9.36 kWWhere; Dr is average rotary til-
ler specific resistance (kN) (21 N/cm2 loam & silt-clay loam), 25 kN/
cm2 for clay soil. a & b are working depth and working width of Biasi operation respectively in cm.
Design of Rotary Tiller BladesIn this design, C-type rotary blades
were considered. Design of rotary tiller blades depends on the param-eter including: soil types, number of blades and working condition.
The number of rotary tiller flange (f) was calculated by the following equation:
f = b / bi = 70 / 18 = 3.88 (9)Where, b is the working width
(cm) and bi is the distance between the f lange on the rotor (cm). Two blades were considered on each f lange (z = 2). So total number of blades was obtained by following relationship:
N = f × z = 4 × 2 = 8. Arrangements of blades on rotory unit is shown in Fig. 1.
Diameter of Rotor The factors that affect the rotor
diameter include torque and bend-
Table 3 Values of different parameters used in designing of rotor of Biasi implementParticulars Values
Co, coefficient relative to the soil type 2.5Ko, specific strength of soil (kg/dm3) 60Au, dynamic coefficient 400Nc, the power tiller (hp) 13ηc, traction efficiency 0.9ηz, coefficient of reservation of power tiller 0.8a, rotary tiller working depth (dm) 0.982Sy, Yield stress MPa 520K, Coefficient of stress concentration 0.75Cs, Reliability factor non rocky soil. 2FS, factor of safety 2V, m/s 0.2-0.6R, cm 25Umin, m/s 1.19
Table 4 Specific work of rotary tiller and maximum power tiller work for different values of V & λVelocity
(m/s) λ av = au(u/v)2 AB = 0.001avv2
Ao = 0.1Coko
A = Ao + AB kg/dm3
Ac kg. m/dm3
0.2 22 193,600 7.74 15 22.74 51.060.3 18 129,600 11.66 15 26.66 34.040.4 10 40,000 6.4 15 21.40 25.530.5 4 6,400 1.6 15 16.60 20.420.6 2 1,600 0.576 15 15.57 17.02

VOL.52 NO.1 2021 AGRICULTURAL MECHANIZATION IN ASIA, AFRICA AND LATIN AMERICA 51
ing moment. Torque is an important factor that was affected by the di-mension of rotor diameter. For safe design of rotor diameter, careful se-lection of rotor axle and torque was important. Diameter was calculated by the following relationship:
d = 3√ [(16 Ms) / τπ] (10)Where; d is the diameter of the
rotor (cm); Ms is maximum torque at rotor axle in N.cm; τ is allowable shear stress at the rotor axle N/cm2.
τ = (0.577 K Sy) / FS (11)τ = (0.577 × 0.75 × 520) / 2τ = 112.5 N/cm2 Where; K is coefficient of stress
concentration, Sy is yield stress (MPa) based on material of rotor; FS is factor of safety.
Ms = Ks × R (12)Ms =294.95 kN.mWhere, R is the rotor radius (mm)Ks = (75 Cs Nc ηc ηz) / umin (13)Ks = 1179.83 kgWhere, Ks is the maximum tan-
gential force at the rotor axle (kg); u is minimum linear velocity of rotor (m/s); Cs is reliability factor taken as 1.5 for non-rocky soil and 2 for rocky soil. By using the equations (11-13) the optimal diameter of rotor was calculated as 5.03 cm.
Development of Rotary Unit of Power Tiller for Biasi OperationIn the rotary unit, power was
transferred to the tiller from the engine via the power-take-off drive.
A shaft containing blades was lo-cated at 90° to the line of travel and rotated in the same direction as the forward travel of the power tiller. Since the shaft turns at a rate that was considerably faster than the corresponding power tiller speed, soil churning was accomplished. The proper selection of forward speed was dependent on the tan-gential speed of the blades (that is a function of rotational speed of rotor) and the length of sliced soil. The tangential speed of the blades (u), the rotational speed of the rotor (N), and the length of sliced soil (L) could be obtained by the following equations:
U = (2 πnR) / 6000 (14)n = 6000λv / 2πR (15)L = 2πR / λZ (16)Where,R = rotor radius (cm),v = forward speed (m/s),Z = number of blades on each side
of the rotor flanges.In this design, two blades were
considered on each side of the flanges (Z = 2). Lakpale and Shriv-astava (2012) reported that for better rice yield, the Biasi operation can be performed at the working width of 20 ± 3 cm and 8-10 cm depth. Therefore, the design parameters considered for the development of rotary Biasi unit were a definite line of spacing and 10 cm depth of op-eration. Matyashin (1968) suggested that the radius of rotor for rotary til-lers selected should be greater than the working depth. Considering these explanations, a 50 cm diam-eter was determined to be appro-priate for the rotary tiller rotor. By incorporating the selected values for the rotor diameter in the equations (15) and (16) become:
n = 6000λv / 2πR = 38.21λv (17)L = (2π × 25) / (λ×2) = 25π / λ (18)The possible selections for the
rotary tiller working width (b), for-ward speed (v) and rotational speed of rotor (n) are presented in Table 5 and Table 6; which were obtained through equations (17) and (18). For
Table 5 Possible selections for the rotary tiller working width, forward speed and rotational speed of rotor
S. No.
Working width (cm)
Forward speed (m/s)
Rotor speed (rpm) λ
Length of sliced soil(L) (cm)
1
60
0.2 168.08 22 3.572 0.3 206.28 18 4.363 0.4 152.80 10 7.854 0.5 76.40 4 19.635 0.6 45.84 2 39.276
70
0.2 168.08 22 3.577 0.3 183.36 16 4.918 0.4 122.24 8 9.829 0.5 57.30 3 26.18
Table 6 Modification in rotary unit of Power Tiller for Biasi operationParticulars General Operation Biasi operation
Blades (tines) numbers 20 numbers 6/8 numbersBlades (tines) Distance 2-4 cm 18 cmGear I Forward heavy I Forward heavyRPM 2000-1800 2000-1800Blade specification C-shaped blade (4.5-cm
tilling blade width), Length 28 cm, Heat -Treatment process
15° lengthwise slice angle, 2.5-cm tilling blade width Length 32 cm, Heat -Treatment process
Fig. 1 Arrangements of blades on rotory unit
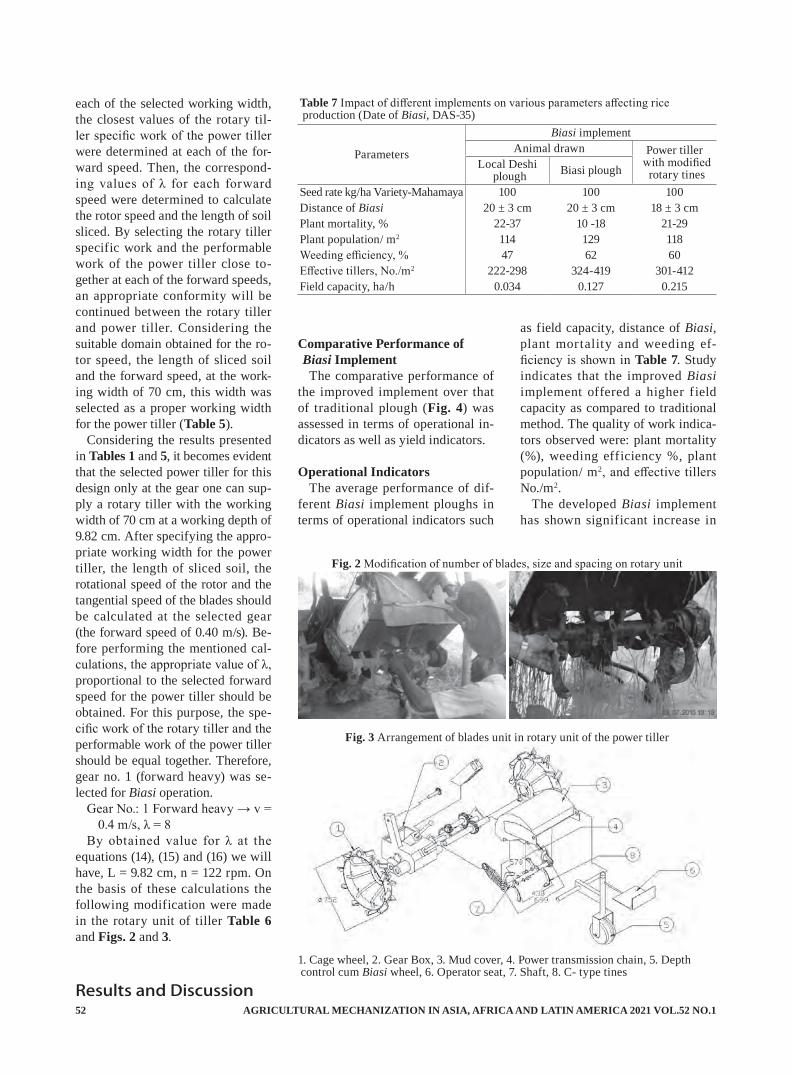
AGRICULTURAL MECHANIZATION IN ASIA, AFRICA AND LATIN AMERICA 2021 VOL.52 NO.152
each of the selected working width, the closest values of the rotary til-ler specific work of the power tiller were determined at each of the for-ward speed. Then, the correspond-ing values of λ for each forward speed were determined to calculate the rotor speed and the length of soil sliced. By selecting the rotary tiller specific work and the performable work of the power tiller close to-gether at each of the forward speeds, an appropriate conformity will be continued between the rotary tiller and power tiller. Considering the suitable domain obtained for the ro-tor speed, the length of sliced soil and the forward speed, at the work-ing width of 70 cm, this width was selected as a proper working width for the power tiller (Table 5).
Considering the results presented in Tables 1 and 5, it becomes evident that the selected power tiller for this design only at the gear one can sup-ply a rotary tiller with the working width of 70 cm at a working depth of 9.82 cm. After specifying the appro-priate working width for the power tiller, the length of sliced soil, the rotational speed of the rotor and the tangential speed of the blades should be calculated at the selected gear (the forward speed of 0.40 m/s). Be-fore performing the mentioned cal-culations, the appropriate value of λ, proportional to the selected forward speed for the power tiller should be obtained. For this purpose, the spe-cific work of the rotary tiller and the performable work of the power tiller should be equal together. Therefore, gear no. 1 (forward heavy) was se-lected for Biasi operation.
Gear No.: 1 Forward heavy → v = 0.4 m/s, λ = 8
By obtained value for λ at the equations (14), (15) and (16) we will have, L = 9.82 cm, n = 122 rpm. On the basis of these calculations the following modification were made in the rotary unit of tiller Table 6 and Figs. 2 and 3.
Results and Discussion
Comparative Performance of Biasi ImplementThe comparative performance of
the improved implement over that of traditional plough (Fig. 4) was assessed in terms of operational in-dicators as well as yield indicators.
Operational IndicatorsThe average performance of dif-
ferent Biasi implement ploughs in terms of operational indicators such
as field capacity, distance of Biasi, plant mortality and weeding ef-ficiency is shown in Table 7. Study indicates that the improved Biasi implement offered a higher field capacity as compared to traditional method. The quality of work indica-tors observed were: plant mortality (%), weeding efficiency %, plant population/ m2, and effective tillers No./m2.
The developed Biasi implement has shown significant increase in
Table 7 Impact of different implements on various parameters affecting rice production (Date of Biasi, DAS-35)
Parameters
Biasi implementAnimal drawn Power tiller
with modified rotary tines
Local Deshi plough Biasi plough
Seed rate kg/ha Variety-Mahamaya 100 100 100Distance of Biasi 20 ± 3 cm 20 ± 3 cm 18 ± 3 cmPlant mortality, % 22-37 10 -18 21-29Plant population/ m2 114 129 118Weeding efficiency, % 47 62 60Effective tillers, No./m2 222-298 324-419 301-412Field capacity, ha/h 0.034 0.127 0.215
Fig. 2 Modification of number of blades, size and spacing on rotary unit
Fig. 3 Arrangement of blades unit in rotary unit of the power tiller
1. Cage wheel, 2. Gear Box, 3. Mud cover, 4. Power transmission chain, 5. Depth control cum Biasi wheel, 6. Operator seat, 7. Shaft, 8. C- type tines

VOL.52 NO.1 2021 AGRICULTURAL MECHANIZATION IN ASIA, AFRICA AND LATIN AMERICA 53
Table 8 Effect of different Biasi implements/ploughs on rice yield (q/ha)
Biasi Plough Yield, qha-1 % yield increase* B:C ratio
Trifal Biasi plough 39.2 21** 2.11**
Power tiller operated modified rotary Biasi implement
38.2 18** 2.34**
Traditional (Control) 32.4 - 1.65* As compared to using traditional Biasi plough, ** - significant
grain yield due to minimized plant mortality and better root stimula-tion that led to better crop growth and development of yield attributes. The benefit-to-cost (B:C) ratio was highest for power tiller operated modified rotary tines (2.34) and the lowest for traditional method (1.65). The study clearly indicates that by mechanization, timeliness of opera-tion can be achieved and the cost of production is reduced, and eventu-ally significant increase in yield is observed.
Yield IndicatorsThe comparative performance of
different Biasi implements in terms of rice yield is shown in Table 8. All the implements used for Biasi oper-ation performed better with regards to grain yield of rice as compared to that of the traditional plough used for Biasi. The highest grain yield was recorded in Trifal Biasi plough followed by power operated 5 tines plough and power tiller operated modified rotary Biasi implement. The lowest yield was recorded in traditional plough which served as control. The rice grain yield was recorded as 39.2 qha-1 (Trifal), 36.2 qha-1 (power tiller operated modi-fied rotary Biasi implement), and
32.4 qha-1 (traditional). Significantly highest rice yield over traditional plough was obtained in Trifal Biasi plough (21%), followed by power tiller operated modified rotary Biasi implement power tiller operated modified rotary Biasi implement (17.9%).
ConclusionThe s t udy revealed that the
mechanized Biasi implement could be adopted under rainfed Biasi rice cultivation. The improved Biasi im-plement was found suitable because of its higher field capacity, better quality of work and better benefit-cost ratio.
Acknowledgement: The authors are grateful to ICAR New Delhi, Niche Area of Excellence Pro-gramme- Farm Mechanization in Rainfed Agriculture, for granting fi-nancial assistance during the course of investigation.
REFERENCES
Beeny, J. M. and D. C. P. Khoo. 1970. Preliminary investigations
into the performance of differ-ent shaped blades for the rotary tillage of wet rice soil. Journal of Agricultural Engineering Re-search. 15(1): 27-33.
Bernacki, H., Haman, J. and C. Z. Kanafojski. 1972. Agricultural machines, theory and construc-tion. US Department of Com-merce, National Technical In-formation Service, Springfield, Virginia 22151.
Chertkiattipol, S., Niyamapa, T. and V. M. Salokhe. 2007. ”Influence of rotary blade shapes of three rotary blade types on character-istic of tillage resistance torque and specific tilling energy”, Pro-ceedings of International Confer-ence on Agricultural, Food and Biological Engineering and Post Harvest/Production Technology, Khon Kaen, Thailand: 8-15.
Chandravanshi, B.S. 1989. “Rice farming in Chhattisgarh “A report of IGAU Raipur.
Fujisaka, S., Ingram, K. T. and K. Moody. 1991. Crop Establishment (Beusani) in Cuttak District, In-dia, IRRI, Research paper series Number 148 : 2-7
Kawade, S. C. 2001. Design, Devel-opment and Evaluation of Biasi Implement, Unpublished M.Tech. thesis, Faculty of Agricultural En-gineering, Indira Gandhi Krishi Vishwavidyalaya, Raipur (Chhat-tisgarh).
Lakpale, R. and G. K. Shrivas-tava. 2012. Traditional system of rice cultivation in Chhattisgarh (Biasi): limitation, advantages and practices for improvement Model
Fig. 4 Operation with different Biasi implements
AGRICULTURAL MECHANIZATION IN ASIA, AFRICA AND LATIN AMERICA 2021 VOL.52 NO.154
Training Course on Rice Produc-tion Technology Directorate of Extension Services, IGKV, Raipur (CG) Feb., 22-29: 101-107
Matyashin, Yu. 1968. Means of de-creasing energy requirements of rotary tillers. Vestink Selskokho-zyais Ven noi Nuaki 1968; 9:131-133.
Mehta, C. R., Chandel, N. S. and T. Senthil Kumar. 2014. Trends of Agricultural Mechanization in
India, CSAM Policy Brief, Issue No. 02, June 2014: 2-3
Mishra, B. P. 2010. “Biasi Equip-ments and Improved Practices for Broadcast Biasi System of Rice Cultivation”. Faculty of Agricul-tural Engineering, Indira Gandhi Krishi Vishwavidyalaya, Raipur (Chhattisgarh).
Salokhe, V. M., Miah, M. H. and M. Hoki. 1993. Effect of blade type on power requirement and
puddling quality of a rotavator in wet Clay soil, Journal of Terrame-chanics, Vol. 30, No. 5: 337-350
Verma, A. K. and M. L. Dewangan. 2006. “Efficiency and energy use in puddling of lowland rice grown on Vertisol in Central India” Soil & Tillage Research, The Nether-lands Vol. 90: 100-107
■■
Biosketch** Vice-President (Elect) Section-II Asian Association
for Agricultural Engineering (AAAE) (2014-2018)** Secretary General (Elect) Asian Association for
Agricultural Engineering (AAAE) (2007-2009)** Associate Editor – Farm Machinery and Power Ag-
ricultural Engineering Today (AET), Indian Society of Agricultural Engineers (ISAE), ISSN 0970-2962 (2019- continuing)
** International Consultant / Expert- UN-CSAM (2006, 2009, 2010, 2015, 2016, 2017); FAO (2010, 2013) Program
** Principal Investigator / Consultant Various re-search projects (CIRAD-France; GATSBY-Africa; USAID; SQU-Oman; SHUATS-India; John Deere; CTCN-UNEP; SABIC-Netherlands; Mahindra & Mahindra- India)
Award Career• Senior Professional Engineer (Academic) Award
CTAE Alumni Society, Maharana Pratap University of Agriculture and Technology, Udaipur, India (2020)
• ScienceDirect Top 25 publications (Journal of Ter-ramechanics 2013; Agricultural Systems 2013; Bio-systems Engineering 2005)
• Best Paper Award The best technical paper present-ed at the 2011 ISTVS Conference; The International society for Terrain-Vehicle Systems; Sept. 18-22, 2011, Blacksburg, Virginia, USA (2011)
• AMA-ShinNorinsha-AAAE Young Researcher Award For outstanding contributions to the advance-ment of Agricultural Engineering profession; Asian As-sociation for Agricultural Engineering (AAAE) (2010)
• AIT Alumni Association Prize For the most out-standing academic performance in the School of En-vironment, Resources and Development, 98th Batch, Asian Institute of Technology (2003)
• Y. Y. Kishida Prize For the most outstanding aca-demic performance among students in Agricultural Engineering, Asian Institute of Technology (2003)
New Consultant Editor
Dr. Peeyush SoniPresent Position-Associate Professor(Farm Machinery and Power)Agricultural and Food Engineering Department,Indian Institute of Technology KharagpurKharagpur - 721 302, West Bengal, India

VOL.52 NO.1 2021 AGRICULTURAL MECHANIZATION IN ASIA, AFRICA AND LATIN AMERICA 55
Design of Rotary Assisted Broad Bed Former-cum-Seeder for Vertisols
byK. P. SinghPrincipal ScientistAgricultural Mechanization DivisionICAR-Central Institute of Agricultural Engineering, [email protected]
Dilip JatScientistAgricultural Mechanization DivisionICAR-Central Institute of Agricultural Engineering, [email protected]
Avinash Kumar GautamSenior Research FellowAgricultural Mechanization DivisionICAR-Central Institute of Agricultural Engineering, [email protected]
M. P. S. ChouhanAssistant Chief Technical OfficerAgricultural Mechanization DivisionICAR-Central Institute of Agricultural Engineering, [email protected]
AbstractA tractor operated rotary assisted
broad bed former-cum-seeder was designed and developed at ICAR-Central Institute of Agricultural Engineering, Bhopal, India. The basic aim of this development was to performed rotary tillage followed by broad bed formation, sowing and reshaping of bed by using dumbbell shape re-shaper. Performance of developed machine was evaluated and compared with flatbed sowing for soybean and wheat crops at ten randomly selected farmer’s field in vertisols. The field capacity and fuel consumption of developed machine were found as 0.32 ha/h and 15 L/ha respectively. The grain yield un-der broad bed seeded soybean was found 0.96 t/ha, however, conven-tionally sown soybean yielded 0.71 t/ha. Thus, the yield gain in soybean crop under broad bed technology was found 35.95%. The yield of broad bed and conventionally sown wheat, were found 4.99 and 4.15 t/ha, respectively. Therefore, grain
yield increased by 20% in wheat crop due to the sowing with devel-oped machine under broad bed con-dition. This machine saved 17.3% cost of operation as compared to the traditional flatbed sowing.
Keywords: Broad bed former, Vertisols, Rolling type bed shaper and Seeder.
IntroductionVertisols are potentially produc-
tive soils within the dry semi-arid regions of central India. These soils have high water holding capacity, low water infiltration, high inci-dence of inundation, accelerated runoff and soil erosion during high rainfall year and drought stress during the low rainfall year. Conse-quently, crop yields on vertisols us-ing traditional systems of manage-ment are low (Lal, 1995). Vertisols of the central part of the country have a fairly high potential for crop production when improved soil and water conservation practices are ad-
opted. The improved technique with engineering interventions to drain excess water can help to increase the productivity of vertisols and allow farmers to harness the maximum crop productivity.
Broad bed and furrow (BBF) crop production system has been devel-oped as a measure for water conser-vation in vertisol, to deal with wa-terlogging and improving soil struc-ture. BBF technique requires less quantity of water by crops. It drains out the excess amount of water au-tomatically which is not possible on flat beds. Ghani et al. (2007) has found 36% water saving for broad beds, about 10 % for narrow beds and grain yield increase of about 6% for wheat crop, 33% of maize crop. Thus, constructing broad beds and furrows has been a new idea which draws soil from the furrows on either side of the bed and thrown on top of the bed. It involves mak-ing beds of height 150 to 300 mm (Gupta and Undadi, 1994) and width of 1.7 to 2.0 m alternatively to allow drainage of excess water (Astatke et

AGRICULTURAL MECHANIZATION IN ASIA, AFRICA AND LATIN AMERICA 2021 VOL.52 NO.156
al., 2002).Wheat has t radit ionally been
planted on flat beds either by drill-ing closed spaced rows 100-300 mm apart or broadcasting and then incorporating it by means of shal-low tillage operation (Sayre and Moreno-Ramos, 1997). Sowing on broad beds has improved yield, in-creased fertilizer and irrigation use efficiency, reduced weed incidence, facilitate better field management by providing passage to mobility in cropped field and save seed, fertil-izer and irrigation water (Mandal et al., 2013; Rao et al., 2015; Shriv-astava et al., 2017). Also, broad bed seeded crops cope up with excess and continuous rainfall conditions. The objective of the present study was to investigate the sowing of soybean and wheat crops on broad bed and compared to the conven-tional method of sowing on f lat surface at farmers field. Thus in view of climate worthiness of the bed seeding system, rotary assisted broad bed former-cum-seeder has been designed and developed by ICAR-CIAE, Bhopal. Rolling type bed shaping system enables reshaper to make better quality beds even in poor tilled soil. The paper presents details of the developed machine and its performance results com-pared to the commercial bed planter and f latbed method of sowing for soybean and wheat crops.
Materials and MethodsDesign Consideration
Design of the rotary assisted bed former cum seeder mainly consist of design of seed box, design of fer-tilizer box, design of ridger bottom, design of frame and design of bed shaper cum ground wheel. Techni-cal specifications of the developed rotary assisted broad bed former-cum-seeder are shown in Table 1.
Drilling Unit: Five row drilling unit was used for fertilizer and seed placement on broad bed. Main com-
ponents of the drilling unit were seed box, fertilizer box, fluted roller metering mechanism, frame, rate controller, furrow opener and seed and fertilizer tubes. The frame was made of mild steel square box of 50 × 50 × 5 mm. Length and width of the frame were 2000 and 700 mm. The frame was fabricated having three members i.e. front, middle and rear. Rotary unit was mounted on front member. The middle member of frame was used to stagger the three tynes and two ridgers. While the rest of the tynes and bed shaper unit were attached to the rear mem-ber. The frame of seed drill is sub-jected to both torsion and bending moment due to the horizontal and vertical force acting on the tynes. Tynes were bolted to the frame with the help of clamp to provide easy adjustment of tynes to meet the suit-able spacing. Seed and fertilizer box was mounted on the main frame. They were made of mild steel sheet. It was designed for the seed rate of 100 kg/ha. Two seed rate controllers were fitted on the box for seed and fertilizer, separately.
Design of Seed Box: Among the seed used for owing by the seed
drill, Wheat has the maximum seed rate 70-100 kg/ha. Therefore the seed drill may be designed for the seed application rate of 100 kg per ha. The effective field capacity of machine was calculated by follow-ing formula:
Effective field capacity of drill = (W × S) / 10 × η
Where, W is the working width of the machine (m), S is the operating speed of the machine (km/h) and η is the field efficiency (%).
The effective field capacity of seed drill was calculated as 0.42 ha/h considering the speed of opera-tion of 4 km/h and field efficiency of 70%. The design of the seed box with capacity was calculated on the basis of refilling of seed require-ment after 1 hour.
Therefore, the weight of seed to be used in 2 h = seed rate (kg/ha) × area covered /h × time = 100 × 0.42 × 1 = 42 kg
Now, volu me of seed box = Weight of seed / Bulk density of seed = 42 / 800 = 0.052 m3
Consider spillage losses of 10%. Therefore, total volume of seed drill is calculated as:
Volume of seed box (Vs) = 0.052
Table 1 Technical specification of rotary assisted bed former cum seederParticulars Description
Dimension of machine 1760 × 2600 × 1160 mm (Length × Width × Height)Number of furrow opener 5Type of furrow opener Shovel typeSeed metering mechanism Sliding fluted roller typeWeight of machine 550 kgNumber of ridger 2Width of furrow 80 mmDimension of bed Top width: 1200 mm and bed height: 200 mmRow to Row spacing AdjustablePlant to Plant spacing AdjustableFertilizer attachment Sliding fluted roller type with metering mechanismMetering unit drive Drive to the metering unit is provided from rear mounted
two rolling dump bell with spring loaded chainGround Wheel Two 517 mm diameter spiked roller with spring to
maintain contact with ground.Hitching 3 point linkage is providedShaper Rolling dump bell is provided for seed coveringPower Transmission Chain and sprocketsRequired tractor power (hp) With rotavator: 60-70 hp (44.74-52.2 kW)
Without rotavator: 40 hp (29.83 kW)
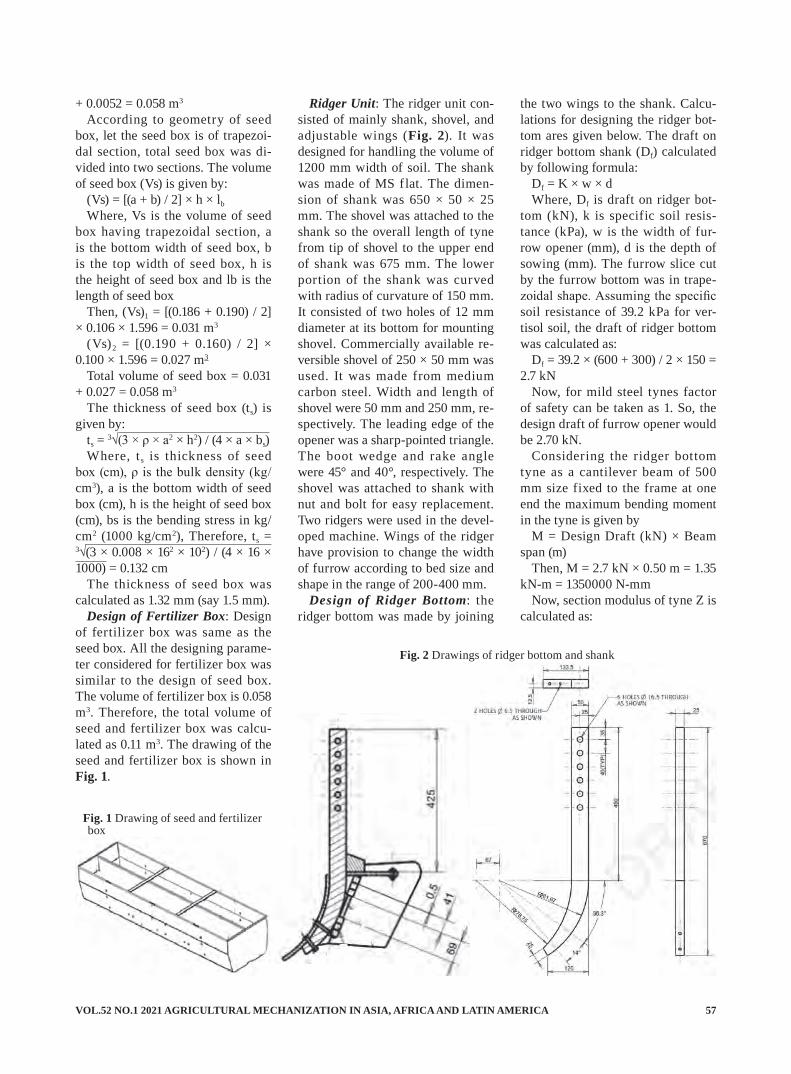
VOL.52 NO.1 2021 AGRICULTURAL MECHANIZATION IN ASIA, AFRICA AND LATIN AMERICA 57
+ 0.0052 = 0.058 m3
According to geometry of seed box, let the seed box is of trapezoi-dal section, total seed box was di-vided into two sections. The volume of seed box (Vs) is given by:
(Vs) = [(a + b) / 2] × h × lb
Where, Vs is the volume of seed box having trapezoidal section, a is the bottom width of seed box, b is the top width of seed box, h is the height of seed box and lb is the length of seed box
Then, (Vs)1 = [(0.186 + 0.190) / 2] × 0.106 × 1.596 = 0.031 m3
(Vs)2 = [(0.190 + 0.160) / 2] × 0.100 × 1.596 = 0.027 m3
Total volume of seed box = 0.031 + 0.027 = 0.058 m3
The thickness of seed box (ts) is given by:
ts = 3√(3 × ρ × a2 × h2) / (4 × a × bs)Where, t s is thickness of seed
box (cm), ρ is the bulk density (kg/cm3), a is the bottom width of seed box (cm), h is the height of seed box (cm), bs is the bending stress in kg/cm2 (1000 kg/cm2), Therefore, ts = 3√(3 × 0.008 × 162 × 102) / (4 × 16 × 1000) = 0.132 cm
The thickness of seed box was calculated as 1.32 mm (say 1.5 mm).
Design of Fertilizer Box: Design of fertilizer box was same as the seed box. All the designing parame-ter considered for fertilizer box was similar to the design of seed box. The volume of fertilizer box is 0.058 m3. Therefore, the total volume of seed and fertilizer box was calcu-lated as 0.11 m3. The drawing of the seed and fertilizer box is shown in Fig. 1.
Ridger Unit: The ridger unit con-sisted of mainly shank, shovel, and adjustable wings (Fig. 2). It was designed for handling the volume of 1200 mm width of soil. The shank was made of MS flat. The dimen-sion of shank was 650 × 50 × 25 mm. The shovel was attached to the shank so the overall length of tyne from tip of shovel to the upper end of shank was 675 mm. The lower portion of the shank was curved with radius of curvature of 150 mm. It consisted of two holes of 12 mm diameter at its bottom for mounting shovel. Commercially available re-versible shovel of 250 × 50 mm was used. It was made from medium carbon steel. Width and length of shovel were 50 mm and 250 mm, re-spectively. The leading edge of the opener was a sharp-pointed triangle. The boot wedge and rake angle were 45° and 40°, respectively. The shovel was attached to shank with nut and bolt for easy replacement. Two ridgers were used in the devel-oped machine. Wings of the ridger have provision to change the width of furrow according to bed size and shape in the range of 200-400 mm.
Design of Ridger Bottom: the ridger bottom was made by joining
the two wings to the shank. Calcu-lations for designing the ridger bot-tom ares given below. The draft on ridger bottom shank (Df) calculated by following formula:
Df = K × w × dWhere, Df is draft on ridger bot-
tom (kN), k is specific soil resis-tance (kPa), w is the width of fur-row opener (mm), d is the depth of sowing (mm). The furrow slice cut by the furrow bottom was in trape-zoidal shape. Assuming the specific soil resistance of 39.2 kPa for ver-tisol soil, the draft of ridger bottom was calculated as:
Df = 39.2 × (600 + 300) / 2 × 150 = 2.7 kN
Now, for mild steel tynes factor of safety can be taken as 1. So, the design draft of furrow opener would be 2.70 kN.
Considering the ridger bottom tyne as a cantilever beam of 500 mm size fixed to the frame at one end the maximum bending moment in the tyne is given by
M = Design Draft (kN) × Beam span (m)
Then, M = 2.7 kN × 0.50 m = 1.35 kN-m = 1350000 N-mm
Now, section modulus of tyne Z is calculated as:
Fig. 1 Drawing of seed and fertilizer box
Fig. 2 Drawings of ridger bottom and shank

AGRICULTURAL MECHANIZATION IN ASIA, AFRICA AND LATIN AMERICA 2021 VOL.52 NO.158
σb = MC / I = M / Z (as Z = I / C)Where, σb is bending stress in
tyne, N/mm2 (for mild steel 100 N / mm2), M is bending moment in tyne (N-mm), C is distance from neutral axis to the point at which stress is calculated (mm), I is polar moment of inertia of rectangular section (mm4) and Z is section modules of tyne (m3).
Also, for rectangular sectionZ = t × b2 / 6The ratio between the thickness
and width (t:b) is 1:2.Therefore, Z = t × (2t)2 / 6 Also, Z = M/ σb = 1350000/10013500 = 4t3 / 6t3 = 20250t = 27 mm (say 25 mm)b = 25 × 2 = 50 mm Therefore, cross section of the
tyne was 25 × 50 mm. Therefore, the mild steel f lat of 25 × 50 mm was selected for the tyne of ridger seeder. The drawing of the ridger bottom is shown in Fig. 2.
Design of Frame: The frame was fabricated having five members to stagger the five furrow openers on seed drill. The frame of the seed drill was considered as simply sup-ported beam with point load. The maximum banding moment was acting at the centre of the beam at point. Maximum bending moment (M) is given by:
M = (800 × 3p) − (1000 × p) − (600 × p) − (200 × p), Where, p is the maximum load per tyne.
Therefore, M = (2400 − 1000 − 600 − 200) × 60 × 9.8 = 352800 N.mm
Again, Torque produced on toolbar (T)
= maximum bending moment × ground clearance × number of fur-row openers
Then, T =60× 9.8 × 350 × 6 = 1234800 N.mm
The equivalent torque (Te) is given by:
Te = √(M2 + T2)So, Te = √3528002 + 12348002 =
1284211 N.mmAgain equivalent torque is given
by:Ss / Y = Te / IOr I / Y = Te / Ss
And I / Y = d3 / 6Where, Ss is shear stress, Te is
equivalent torque, I is moment of in-ertia, y is the distance from the neu-tral axis to the point at which stress is determined and d is size of square rod.
So, d3 = 1284211 / 60 × 6 d = 50.4 or say 50 mmTherefore, the square box of 50
mm was used for the fabrication of frame of the machine. The drawing of frame of seed drill is shown in Fig. 3.
Rolling type Bed Shaper: Broad bed seeder consists of a rolling type bed shaping system which creates an intact and smooth bed with a proper height. The design of bed shaper was done for achieving the bed top width, bottom width and height of 1200, 1500 and 200 mm, respectively. The rolling type bed shaping system consisted of shaft, dumbbell shape re-shaper, levelling pipe and pegs. The shaft was made of MS rod having length and diam-eter of 2000 and 25 mm, respec-tively. One end of the shaft was con-nected to the sprocket of 14 teeth. It
is rolling type bed shaping system which has also been used as power wheel which is a special feature of this seeder. Dumbbell shape re-shaper is also used as power source for metering device. The distance between levelling pipe and the edge of the dumbbell was kept 200 mm for making 200 mm bed height. Twelve numbers of triangular shape mild steel pegs of 25 mm width were kept for providing smooth ro-tation to drilling unit. Due to rolling action of bed shaper, the clods get burrowed in the bed and achieve the desired geometry of broad bed.
Design of Bed Shaper-cum-Ground Wheel: The design of bed shaper was done according to size of bed and as per tractor wheel base. The beds were in size of 1200 mm of top width, 1500 mm of bottom width and 200 mm height. The dis-tance between bed to leveling pipe and edge of the shaper was kept 200 mm for making 200 mm bed height and pegs were kept 25 mm for pro-viding smooth rotation to metering device. Due to rolling action of bed shaper the clods get burrowed in the bed which is desirable for intact shape of bed and better look. The drawing of bed shaper-cum-ground wheel is given in Fig. 4.
Field Testing of Developed MachinePerformance evaluation of devel-
oped machine was carried out at ten randomly selected farmer’s field from Kachhiberkheda village in Bhopal district of Madhya Pradesh, India. The soil type was vertisols (12.6% sand, 32.7% silt and 54.7% clay) and bulk density varying from
Fig. 3 Drawing of frame of machine Fig. 4 Drawing of bed shaper-cum-ground wheel
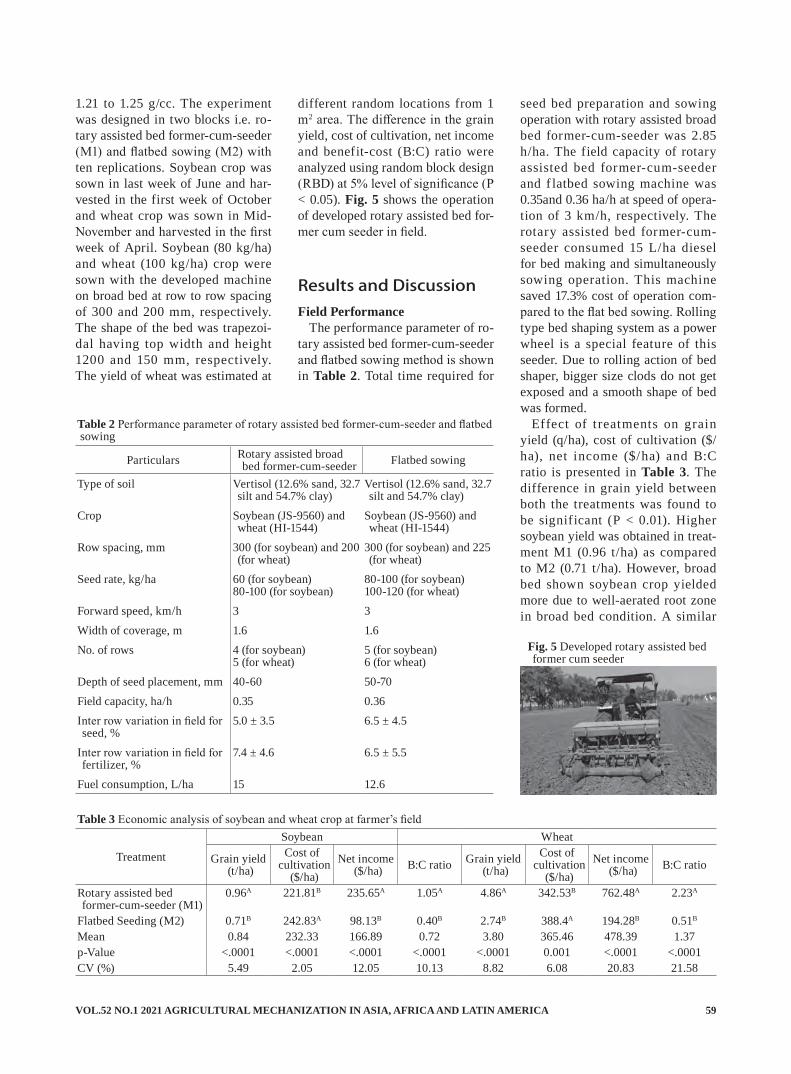
VOL.52 NO.1 2021 AGRICULTURAL MECHANIZATION IN ASIA, AFRICA AND LATIN AMERICA 59
1.21 to 1.25 g/cc. The experiment was designed in two blocks i.e. ro-tary assisted bed former-cum-seeder (M1) and flatbed sowing (M2) with ten replications. Soybean crop was sown in last week of June and har-vested in the first week of October and wheat crop was sown in Mid-November and harvested in the first week of April. Soybean (80 kg/ha) and wheat (100 kg/ha) crop were sown with the developed machine on broad bed at row to row spacing of 300 and 200 mm, respectively. The shape of the bed was trapezoi-dal having top width and height 1200 and 150 mm, respectively. The yield of wheat was estimated at
different random locations from 1 m2 area. The difference in the grain yield, cost of cultivation, net income and benefit-cost (B:C) ratio were analyzed using random block design (RBD) at 5% level of significance (P < 0.05). Fig. 5 shows the operation of developed rotary assisted bed for-mer cum seeder in field.
Results and DiscussionField Performance
The performance parameter of ro-tary assisted bed former-cum-seeder and flatbed sowing method is shown in Table 2. Total time required for
seed bed preparation and sowing operation with rotary assisted broad bed former-cum-seeder was 2.85 h/ha. The field capacity of rotary assisted bed former-cum-seeder and f latbed sowing machine was 0.35and 0.36 ha/h at speed of opera-tion of 3 km/h, respectively. The rotary assisted bed former-cum-seeder consumed 15 L/ha diesel for bed making and simultaneously sowing operation. This machine saved 17.3% cost of operation com-pared to the flat bed sowing. Rolling type bed shaping system as a power wheel is a special feature of this seeder. Due to rolling action of bed shaper, bigger size clods do not get exposed and a smooth shape of bed was formed.
Effect of t reatments on grain yield (q/ha), cost of cultivation ($/ha), net income ($/ha) and B:C ratio is presented in Table 3. The difference in grain yield between both the treatments was found to be significant (P < 0.01). Higher soybean yield was obtained in treat-ment M1 (0.96 t/ha) as compared to M2 (0.71 t/ha). However, broad bed shown soybean crop yielded more due to well-aerated root zone in broad bed condition. A similar
Table 3 Economic analysis of soybean and wheat crop at farmer’s field
Treatment
Soybean Wheat
Grain yield (t/ha)
Cost of cultivation
($/ha)Net income
($/ha) B:C ratio Grain yield (t/ha)
Cost of cultivation
($/ha)Net income
($/ha) B:C ratio
Rotary assisted bed former-cum-seeder (M1)
0.96A 221.81B 235.65A 1.05A 4.86A 342.53B 762.48A 2.23A
Flatbed Seeding (M2) 0.71B 242.83A 98.13B 0.40B 2.74B 388.4A 194.28B 0.51B
Mean 0.84 232.33 166.89 0.72 3.80 365.46 478.39 1.37p-Value <.0001 <.0001 <.0001 <.0001 <.0001 0.001 <.0001 <.0001CV (%) 5.49 2.05 12.05 10.13 8.82 6.08 20.83 21.58
Table 2 Performance parameter of rotary assisted bed former-cum-seeder and flatbed sowing
Particulars Rotary assisted broad bed former-cum-seeder Flatbed sowing
Type of soil Vertisol (12.6% sand, 32.7 silt and 54.7% clay)
Vertisol (12.6% sand, 32.7 silt and 54.7% clay)
Crop Soybean (JS-9560) and wheat (HI-1544)
Soybean (JS-9560) and wheat (HI-1544)
Row spacing, mm 300 (for soybean) and 200 (for wheat)
300 (for soybean) and 225 (for wheat)
Seed rate, kg/ha 60 (for soybean)80-100 (for soybean)
80-100 (for soybean)100-120 (for wheat)
Forward speed, km/h 3 3Width of coverage, m 1.6 1.6No. of rows 4 (for soybean)
5 (for wheat)5 (for soybean)6 (for wheat)
Depth of seed placement, mm 40-60 50-70Field capacity, ha/h 0.35 0.36Inter row variation in field for seed, %
5.0 ± 3.5 6.5 ± 4.5
Inter row variation in field for fertilizer, %
7.4 ± 4.6 6.5 ± 5.5
Fuel consumption, L/ha 15 12.6
Fig. 5 Developed rotary assisted bed former cum seeder
AGRICULTURAL MECHANIZATION IN ASIA, AFRICA AND LATIN AMERICA 2021 VOL.52 NO.160
trend was found in wheat crop also. Higher net returns in treatment M1 for soybean crop (235.65 $/ha) was observed as compared to M2 (98.13 $/ha). The cost of cultivation in M2 was 242.83$/ha and it was higher than M1 (221.81$/ha). The B:C ratio in M1 for soybean was found higher (1.05) as compared to M2 (0.40). Lower B:C ratio in M2 was due to the high cost of cultivation and low net income per hectare. Similar trends for grain yield, cost of cul-tivation, net income and B:C ratio were observed for wheat cultivation also. The results of increase in yield in wheat and soybean crops under broad bed conditionin vertisol are in agreement with the study reported by Shrivastava et al., 2017 and Jat et al., 2017. This suggests that rotary assisted bed former-cum-seeder helped to increase economic benefit of the farmers adopting broad bed seeding technology.
ConclusionsThe rotary assisted broad bed
former-cum-seeder is useful for seeding of soybean and wheat crops on broad beds. Provision has been made for attachment of a rotavator in order to form fresh bed or per-form sowing operation with reshap-ing of bed by using bed shaper only. The field capacity of rotary assisted bed former-cum-seeder was 0.32 ha/h at speed of 3 km/h. This ma-chine consumed 15 L/ha fuel during operation. Field demonstration of this technology showed higher grain yield for soybean and wheat crops as compared to flatbed sowing. The higher net return was obtained with the use of rotary assisted broad bed former-cum-seeder technology. The rotary assisted broad bed former-cum-seeder helped to increase economic benefit of the farmers by suggesting them the management practices suitable for sowing under broad beds conditions.
REFERENCES
Astatke, A., Jabbar, M., Saleem, M. M., and T. Erkossa. 2002. Techni-cal and economic performance of animal-drawn implements for minimum tillage: experience on vertisols in Ethiopia. Experimen-tal Agriculture 38(2): 185-196.
Ghani A., G., Hussain, Z. and M. Yasin. 2007. Problems and po-tentials of permanent raised bed cropping systems in Pakistan. Pakistan Journal of Water Re-sources 11(1): 11-21.
Gupta C. P. and A Undadi. 1994. Development of two wheel trac-tor operated seed-cum-fertilizer drill. Agricultural Mechanization in Asia Africa and Latin America 25(1): 25-28.
Jat, D., Singh, K. P., Mathur, R. and H. Tripathi. 2017. Effect of two stage fer tilizer application on growth and yield of soybean crop in permanent broad beds. Bhar-tiya Krishi Anusandhan Patrika 32(1), 19-22.
Lal, R. 1995. Tillage systems in the tropics, management options and sustainability implications. FAO Soils bulletin 71, Rome, Italy.
Mandal, K. G., Hati, K. M., Misra, A. K., Bandyopadhyay, K. K. and A. K. Tripathi. 2013. Land surface modification and crop diversifica-tion for enhancing productivity of a vertisol. International Journal of Plant Production 7(3): 455-472.
Rao, V. N., Meinke, H., Craufurd, P. Q., Parsons, D., Kropff, M. J., Anten, N. P., Wani, S. P. and T. J. Rego. 2015. Strategic double crop-ping on vertisols: a viable rainfed cropping option in the Indian SAT to increase productivity and reduce risk. European Journal of Agronomy 62: 26-37.
Sayre, K. D. and O. H. Moreno-Ra-mos. 1997. Applications of raised-bed planting systems to wheat. Wheat Special Report 31, Mexico.
Shrivastava, P., Khandelwal, N. K., Jat, D. and B. S. Narwariya. 2017. Techno-Economic Evaluation
of Tractor Operated Raised Bed Planters and Seed Drills for Culti-vation of Wheat Crop. Internation-al Journal of Agricultural Science and Research, 7(2), 349, 362.
■■

VOL.52 NO.1 2021 AGRICULTURAL MECHANIZATION IN ASIA, AFRICA AND LATIN AMERICA 61
The Optimization of Topological Mechanism and Dimension Design of Parallel Transplanting Machine in Greenhouse
byQizhi YangProfessorSchool of Agricultural Equipment Engineering,Jiangsu University ZhenjiangCHINA
AbstractThe t ransplanting machine is
designed based on the parallel mechanism in view of recent facil-ity agriculture which is expensive and with huge size. And the layout of convey line and the demands are put forward before designing the main body of transplanting machine by analyzing the demands for trans-planting and operation. Then the position and posture relationship of workspace and accessible space are analyzed by selecting the optimal parallel mechanism from 5 kinds of parallel mechanisms. The difficulty of size optimization through the special point on a workspace is re-duced to achieve the optimal size by Ergodic search method.
IntroductionIt is the key work that replant-
ing seedlings from higher density plug to lower during the growth process of vegetables and f lowers in greenhouse. Transplanting ma-chines which are imported from other countries couldn’t be used in China efficiently, because the scale of greenhouse in China is smaller than other countries, even the distri-bution isn’t concentrated (X. Wang et al., 2010). An automatic seedling transplanting machine with 6 pick-ing seedling claws has been devel-oped by Visser and the transplanting rate of this automatic transplanting machine is 15-20 times higher than the transplanting rate of conven-tional transplanting machine (Neth-erland VISSER).
Vegetable transplanting robot with 4 fingers has been developed by Dong, the capacity of this trans-planting robot is 2,800 pots/hour and the rate of success is 99% in 2012 (Dong, 2012). In the present age, the use of vegetable transplant-
ing machines in greenhouse is de-veloping rapidly (ZU, 2015; Y. Na-gasaka et al., 2013). X. Y. Yan has designed a high speed transplanting machine to achieve picking and planting seedlings in the two dimen-sional plane (Yan et al., 2012; J. Ma et al., 2013). L. Han has designed a simple automatic transplanting machine with effective outcomes (L. Han et al., 2016).
Recently, plug seedlings in green-house is associated with the pre-set trajectory along the straight line path during operation, and picking seedling claw can only pick seed-lings from pre-set position because the program of transplanting is in row, so it couldn’t remove the re-sidual and illness seedlings from the plugs during the operation effective-ly. Tandem transplanting machine has a high cumulative error and big-ger volume, while transplanting ma-chine with parallel mechanism has the advantages of high transplanting
Jing Cai Xin Zhou Ibrar Ahamd Jianping Hu Jun Gu Post-graduate Post-graduate Post-graduate Professor Post-graduate
School of Agricultural Equipment Engineering,Jiangsu University,
ZhenjianCHINA
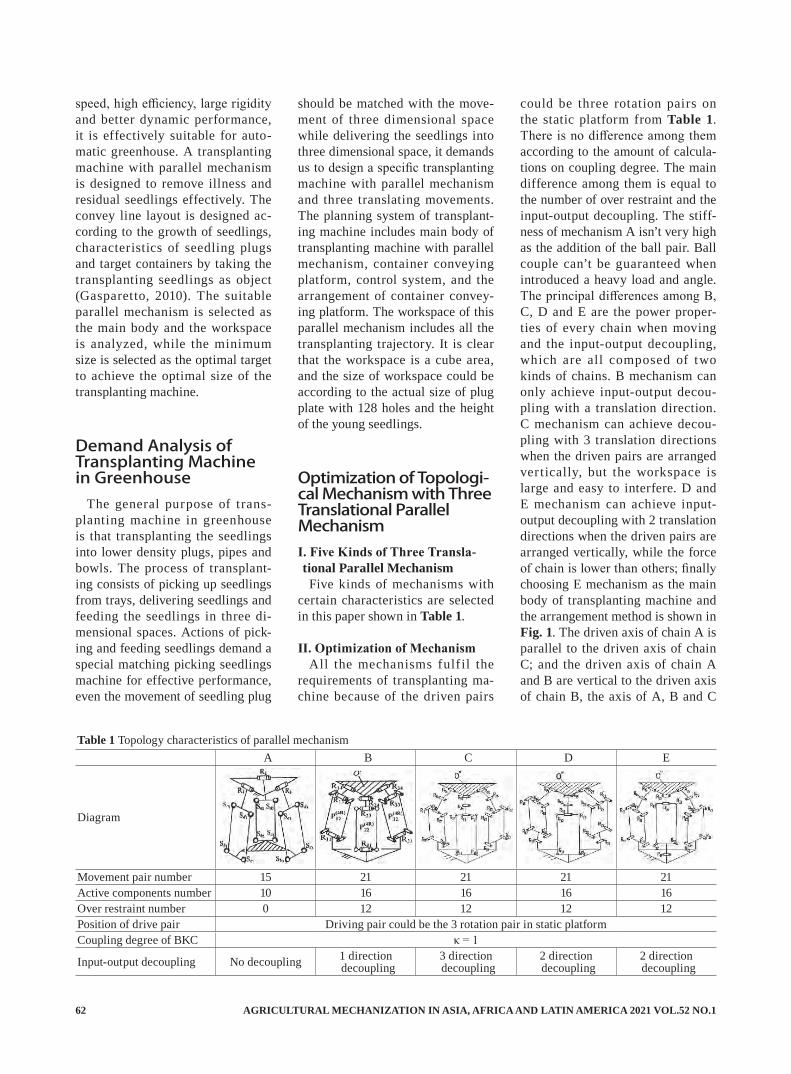
AGRICULTURAL MECHANIZATION IN ASIA, AFRICA AND LATIN AMERICA 2021 VOL.52 NO.162
speed, high efficiency, large rigidity and better dynamic performance, it is effectively suitable for auto-matic greenhouse. A transplanting machine with parallel mechanism is designed to remove illness and residual seedlings effectively. The convey line layout is designed ac-cording to the growth of seedlings, characteristics of seedling plugs and target containers by taking the transplanting seedlings as object (Gasparetto, 2010). The suitable parallel mechanism is selected as the main body and the workspace is analyzed, while the minimum size is selected as the optimal target to achieve the optimal size of the transplanting machine.
Demand Analysis of Transplanting Machine in Greenhouse
The general purpose of trans-planting machine in greenhouse is that transplanting the seedlings into lower density plugs, pipes and bowls. The process of transplant-ing consists of picking up seedlings from trays, delivering seedlings and feeding the seedlings in three di-mensional spaces. Actions of pick-ing and feeding seedlings demand a special matching picking seedlings machine for effective performance, even the movement of seedling plug
should be matched with the move-ment of three dimensional space while delivering the seedlings into three dimensional space, it demands us to design a specific transplanting machine with parallel mechanism and three translating movements. The planning system of transplant-ing machine includes main body of transplanting machine with parallel mechanism, container conveying platform, control system, and the arrangement of container convey-ing platform. The workspace of this parallel mechanism includes all the transplanting trajectory. It is clear that the workspace is a cube area, and the size of workspace could be according to the actual size of plug plate with 128 holes and the height of the young seedlings.
Optimization of Topologi-cal Mechanism with Three Translational Parallel MechanismⅠ. Five Kinds of Three Transla-tional Parallel MechanismFive kinds of mechanisms with
certain characteristics are selected in this paper shown in Table 1.
Ⅱ. Optimization of Mechanism All the mechanisms fulf il the
requirements of transplanting ma-chine because of the driven pairs
could be three rotation pairs on the static platform from Table 1. There is no difference among them according to the amount of calcula-tions on coupling degree. The main difference among them is equal to the number of over restraint and the input-output decoupling. The stiff-ness of mechanism A isn’t very high as the addition of the ball pair. Ball couple can’t be guaranteed when introduced a heavy load and angle. The principal differences among B, C, D and E are the power proper-ties of every chain when moving and the input-output decoupling, which are all composed of two kinds of chains. B mechanism can only achieve input-output decou-pling with a translation direction. C mechanism can achieve decou-pling with 3 translation directions when the driven pairs are arranged ver tically, but the workspace is large and easy to interfere. D and E mechanism can achieve input-output decoupling with 2 translation directions when the driven pairs are arranged vertically, while the force of chain is lower than others; finally choosing E mechanism as the main body of transplanting machine and the arrangement method is shown in Fig. 1. The driven axis of chain A is parallel to the driven axis of chain C; and the driven axis of chain A and B are vertical to the driven axis of chain B, the axis of A, B and C
Table 1 Topology characteristics of parallel mechanismA B C D E
Diagram
Movement pair number 15 21 21 21 21Active components number 10 16 16 16 16Over restraint number 0 12 12 12 12Position of drive pair Driving pair could be the 3 rotation pair in static platformCoupling degree of BKC κ = 1
Input-output decoupling No decoupling 1 direction decoupling
3 direction decoupling
2 direction decoupling
2 direction decoupling
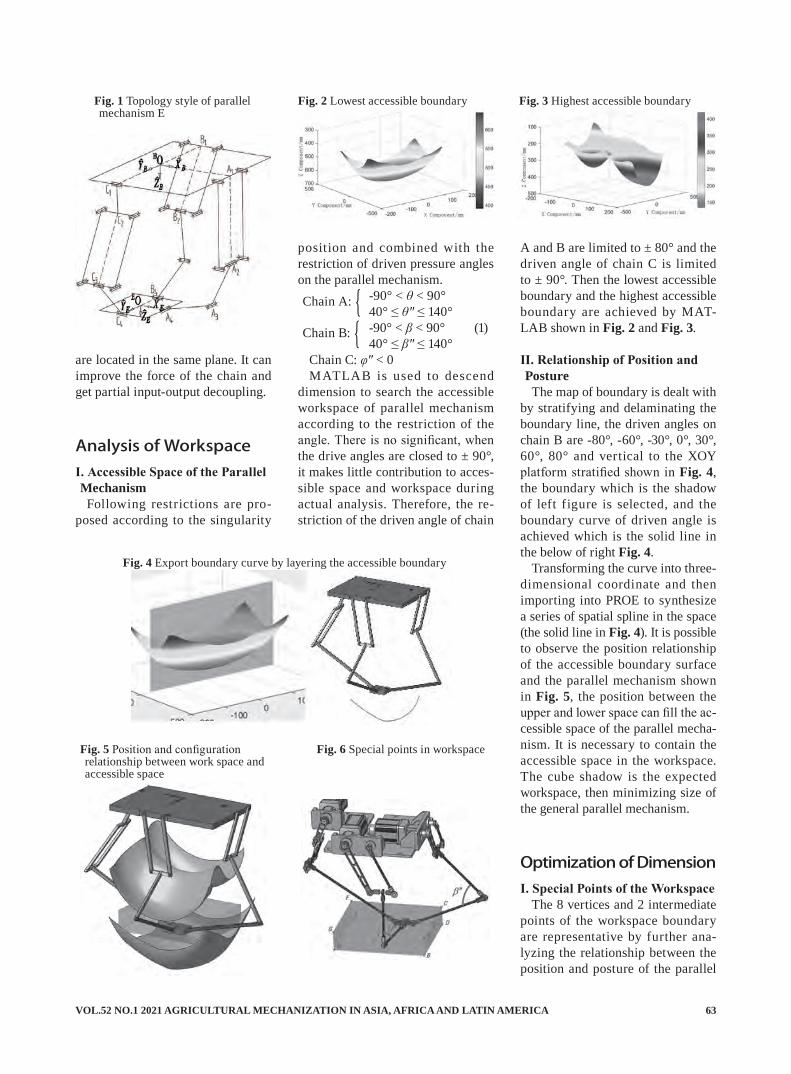
VOL.52 NO.1 2021 AGRICULTURAL MECHANIZATION IN ASIA, AFRICA AND LATIN AMERICA 63
are located in the same plane. It can improve the force of the chain and get partial input-output decoupling.
Analysis of WorkspaceⅠ. Accessible Space of the Parallel MechanismFollowing restrictions are pro-
posed according to the singularity
position and combined with the restriction of driven pressure angles on the parallel mechanism.
-90° < θ < 90° 40° ≤ θ" ≤ 140° -90° < β < 90° (1) 40° ≤ β" ≤ 140°Chain C: φ" < 0MATLAB is used to descend
dimension to search the accessible workspace of parallel mechanism according to the restriction of the angle. There is no significant, when the drive angles are closed to ± 90°, it makes little contribution to acces-sible space and workspace during actual analysis. Therefore, the re-striction of the driven angle of chain
A and B are limited to ± 80° and the driven angle of chain C is limited to ± 90°. Then the lowest accessible boundary and the highest accessible boundary are achieved by MAT-LAB shown in Fig. 2 and Fig. 3.
Ⅱ. Relationship of Position and Posture The map of boundary is dealt with
by stratifying and delaminating the boundary line, the driven angles on chain B are -80°, -60°, -30°, 0°, 30°, 60°, 80° and vertical to the XOY platform stratified shown in Fig. 4, the boundary which is the shadow of left figure is selected, and the boundary curve of driven angle is achieved which is the solid line in the below of right Fig. 4.
Transforming the curve into three-dimensional coordinate and then importing into PROE to synthesize a series of spatial spline in the space (the solid line in Fig. 4). It is possible to observe the position relationship of the accessible boundary surface and the parallel mechanism shown in Fig. 5, the position between the upper and lower space can fill the ac-cessible space of the parallel mecha-nism. It is necessary to contain the accessible space in the workspace. The cube shadow is the expected workspace, then minimizing size of the general parallel mechanism.
Optimization of DimensionⅠ. Special Points of the Workspace
The 8 vertices and 2 intermediate points of the workspace boundary are representative by further ana-lyzing the relationship between the position and posture of the parallel
Chain A: { Chain B: {
Fig. 2 Lowest accessible boundary Fig. 3 Highest accessible boundary
Fig. 4 Export boundary curve by layering the accessible boundary
Fig. 5 Position and configuration relationship between work space and accessible space
Fig. 6 Special points in workspace
Fig. 1 Topology style of parallel mechanism E
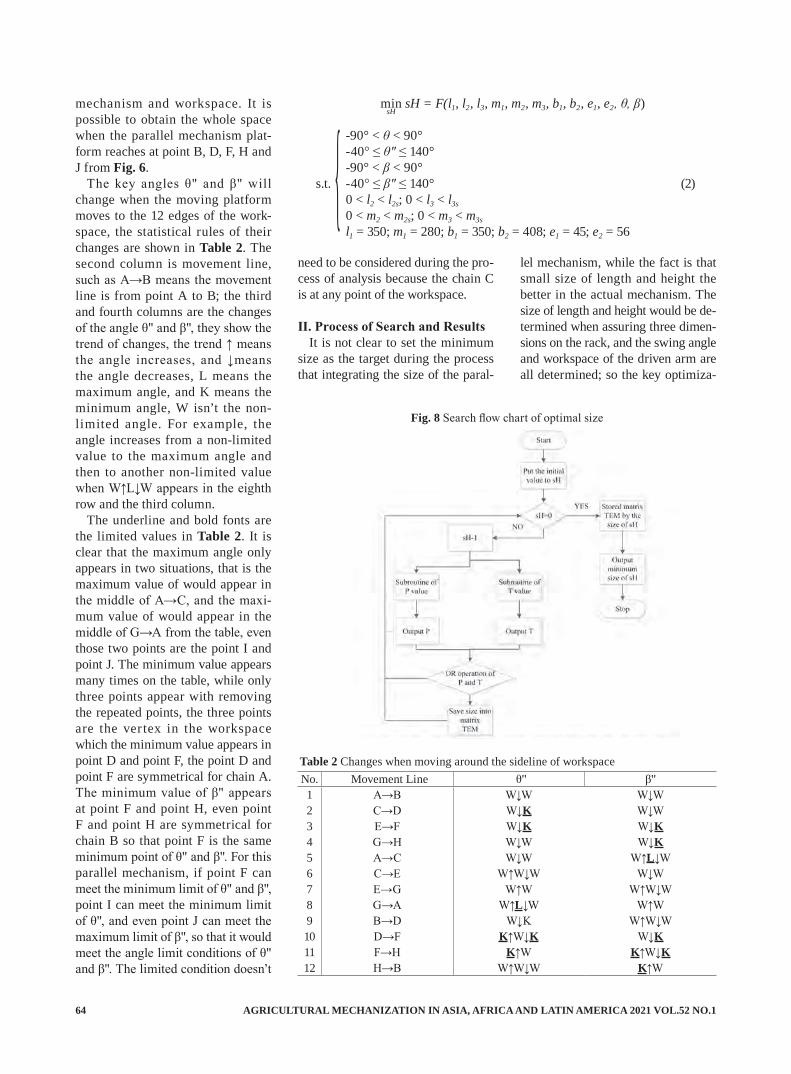
AGRICULTURAL MECHANIZATION IN ASIA, AFRICA AND LATIN AMERICA 2021 VOL.52 NO.164
mechanism and workspace. It is possible to obtain the whole space when the parallel mechanism plat-form reaches at point B, D, F, H and J from Fig. 6.
The key angles θ" and β" will change when the moving platform moves to the 12 edges of the work-space, the statistical rules of their changes are shown in Table 2. The second column is movement line, such as A→B means the movement line is from point A to B; the third and fourth columns are the changes of the angle θ" and β", they show the trend of changes, the trend ↑ means the angle increases, and ↓means the angle decreases, L means the maximum angle, and K means the minimum angle, W isn’t the non-limited angle. For example, the angle increases from a non-limited value to the maximum angle and then to another non-limited value when W↑L↓W appears in the eighth row and the third column.
The underline and bold fonts are the limited values in Table 2. It is clear that the maximum angle only appears in two situations, that is the maximum value of would appear in the middle of A→C, and the maxi-mum value of would appear in the middle of G→A from the table, even those two points are the point I and point J. The minimum value appears many times on the table, while only three points appear with removing the repeated points, the three points are the vertex in the workspace which the minimum value appears in point D and point F, the point D and point F are symmetrical for chain A. The minimum value of β" appears at point F and point H, even point F and point H are symmetrical for chain B so that point F is the same minimum point of θ" and β". For this parallel mechanism, if point F can meet the minimum limit of θ" and β", point I can meet the minimum limit of θ", and even point J can meet the maximum limit of β", so that it would meet the angle limit conditions of θ" and β". The limited condition doesn’t
need to be considered during the pro-cess of analysis because the chain C is at any point of the workspace.
Ⅱ. Process of Search and ResultsIt is not clear to set the minimum
size as the target during the process that integrating the size of the paral-
lel mechanism, while the fact is that small size of length and height the better in the actual mechanism. The size of length and height would be de-termined when assuring three dimen-sions on the rack, and the swing angle and workspace of the driven arm are all determined; so the key optimiza-
Table 2 Changes when moving around the sideline of workspaceNo. Movement Line θ'' β''1 A→B W↓W W↓W2 C→D W↓K W↓W3 E→F W↓K W↓K4 G→H W↓W W↓K5 A→C W↓W W↑L↓W6 C→E W↑W↓W W↓W7 E→G W↑W W↑W↓W8 G→A W↑L↓W W↑W9 B→D W↓K W↑W↓W10 D→F K↑W↓K W↓K11 F→H K↑W K↑W↓K12 H→B W↑W↓W K↑W
msHin sH = F(l1, l2, l3, m1, m2, m3, b1, b2, e1, e2, θ, β)
-90° < θ < 90° -40° ≤ θ" ≤ 140° -90° < β < 90° s.t. { -40° ≤ β" ≤ 140° (2) 0 < l2 < l2s; 0 < l3 < l3s
0 < m2 < m2s; 0 < m3 < m3s
l1 = 350; m1 = 280; b1 = 350; b2 = 408; e1 = 45; e2 = 56
Fig. 8 Search flow chart of optimal size
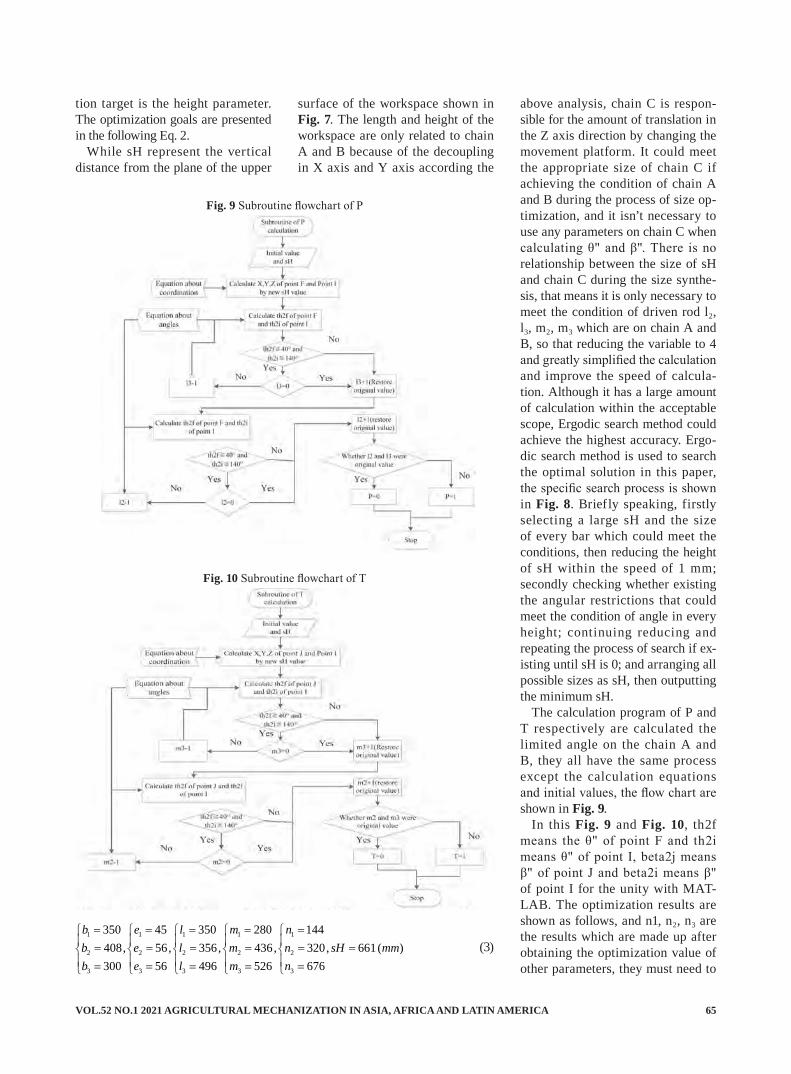
VOL.52 NO.1 2021 AGRICULTURAL MECHANIZATION IN ASIA, AFRICA AND LATIN AMERICA 65
tion target is the height parameter. The optimization goals are presented in the following Eq. 2.
While sH represent the vertical distance from the plane of the upper
surface of the workspace shown in Fig. 7. The length and height of the workspace are only related to chain A and B because of the decoupling in X axis and Y axis according the
above analysis, chain C is respon-sible for the amount of translation in the Z axis direction by changing the movement platform. It could meet the appropriate size of chain C if achieving the condition of chain A and B during the process of size op-timization, and it isn’t necessary to use any parameters on chain C when calculating θ" and β". There is no relationship between the size of sH and chain C during the size synthe-sis, that means it is only necessary to meet the condition of driven rod l2, l3, m2, m3 which are on chain A and B, so that reducing the variable to 4 and greatly simplified the calculation and improve the speed of calcula-tion. Although it has a large amount of calculation within the acceptable scope, Ergodic search method could achieve the highest accuracy. Ergo-dic search method is used to search the optimal solution in this paper, the specific search process is shown in Fig. 8. Briefly speaking, firstly selecting a large sH and the size of every bar which could meet the conditions, then reducing the height of sH within the speed of 1 mm; secondly checking whether existing the angular restrictions that could meet the condition of angle in every height; continuing reducing and repeating the process of search if ex-isting until sH is 0; and arranging all possible sizes as sH, then outputting the minimum sH.
The calculation program of P and T respectively are calculated the limited angle on the chain A and B, they all have the same process except the calculation equations and initial values, the flow chart are shown in Fig. 9.
In this Fig. 9 and Fig. 10, th2f means the θ" of point F and th2i means θ" of point I, beta2j means β" of point J and beta2i means β" of point I for the unity with MAT-LAB. The optimization results are shown as follows, and n1, n2, n3 are the results which are made up after obtaining the optimization value of other parameters, they must need to
Fig. 10 Subroutine flowchart of T
Fig. 9 Subroutine flowchart of P
1 1 1 1 1
2 2 2 2 2
3 3 3 3 3
350 45 350 280 144408, 56, 356, 436, 320, 661( )300 56 496 526 676
b e l m nb e l m n sH mmb e l m n
� � � � �� � � � �� � � � �� � � � � �� � � � �� � � � �� � � � �� � � � �
(3)

AGRICULTURAL MECHANIZATION IN ASIA, AFRICA AND LATIN AMERICA 2021 VOL.52 NO.166
meet the requirements of the con-straints on chain C (Eq. 3).
ConclusionsIn this paper, it is put forward
the layout of transplanting machine convey line and design requirements of the main body on transplanting machine. Special parameters of to-pological mechanism are calculated according to the five selected series of parallel mechanisms, then the 2-HSOC{-R//R//R-P4R-}1-HSOC{-R//R(-P4R)//R-} parallel mechanism is determined to be the main body mechanism of transplanting ma-chine which contained partial de-coupling with high over-constrained and rigidity.
The accessible workspace of par-allel mechanism based on the sin-gular position and posture has been achieved and gotten the accessible position and posture of workspace. By reducing the difficulty of the size optimization of special points on workspace and taking the minimum size as the target, a set of optimiza-tion assemble is achieved finally. In this case, it will contribute to the development of transplanting robot in greenhouse.
Acknowledgements: This work is supported by the National Natu-ral Science Foundation of China (51475216, 51675239);” Twelf th Five - Year Plan” National Science and Technology Program Coop-eration Project in Rural Areas, China (2013BAD08B03-1); Natural Fund of Jiangsu Province, China (BK20161344); Project supported by the six talents summit of Jiangsu Province, China (ZBZZ-022); Proj-ect supported by the construction work of dominant subjects of higher education of Jiangsu Province, Chi-na (Su Cai (2014) No.37).
REFERENCES
Wang, X. and H. Li. 2010. Current research status and development trend of greenhouse in China[J]. Journal of Drainage & Irrigation Machinery Engineering, 28(2): 179-184
Netherland VISSER Company. Available at http://www.visserite.com/index.php?id=64
Dong Hyeon Kang and Dong Eok Kim et al. 2012. Development of a Vegetable Transplanting Robot[J]. Journal of Biosystems Engineer-ing, 37(3): 201-208.
Bashar, Z. U., Wayayok, A., Amin, M. S. M. and M. R. Mahadi. 2015. Single seedling nursery tray: An innovative breakthrough to qual-ity seedling raising technique for SRI transplanting machine[J]. Research Journal of Applied Sci-ences Engineering, 10(11): 1258-1265.
Nagasaka, Y. et al. 2013. A Global Positioning System guided au-tomated rice transplanter[J].Ifac Proceedings Volumes, 46(18): 41-46.
Yan, X. Y. and J. P. Hu, et al. 2013. Design and Research on the Con-trol System of Magnetic Plate-type Seeding Production Line [J]. Advanced Materials Research, 694-697: 2051-2056.
Thierry Fraichard. 2012. Trajectory planning in a dynamic workspace: a state-time space approach[J]. Advanced Robotics, 13(1): 75-94.
Ma, J., Hu, J P., Yan, X. Y., Qi, C. H. and J. Guan. 2013. Transplant-ing path planning and motion functions research of the high-speed tray seedling transplanting robot[J]. Advanced Materials Re-search, 694-697(3): 1747-1752.
Han, L., Mao, H. and J. Hu et al. 2016. Design and test of automatic transplanter for greenhouse plug seedlings[J]. Transactions of the Chinese Society of Agricultural Machinery, 47(11): 59-67.
Gasparetto, A. and V. Zanotto. 2010. Optimal trajectory planning for
industrial robots[J]. Advances in Engineering Software, 41(41): 548-556.
■■
VOL.52 NO.1 2021 AGRICULTURAL MECHANIZATION IN ASIA, AFRICA AND LATIN AMERICA 67
Implementation of Image Processing and Fuzzy Logic Discriminator of Hatching Eggs Fertility
bySaid Elshahat AbdallahProfessor Department of Agricultural Engineering Faculty of Agriculture, Kafrelsheikh UniversityKafr Elsheikh [email protected]
Wael Mohamed ElmesseryAssociate Professor Department of Agricultural EngineeringFaculty of Agriculture, Kafrelsheikh UniversityKafrElsheikh 33516EGYPT
Ahmed ElseifyAgricultural EngineerDepartment of Agricultural EngineeringFaculty of Agriculture, Kafrelsheikh University, Kafr Elsheikh 33516EGYPT
AbstractThe capability to automatically
identify fertile eggs for incuba-tion could achieve high profits of hatcheries. Infertile eggs manually detection and removal cost a lot and can lead a pathogen contamination of chicks. Many systems engineer-ing software are developed in last few decades for applications that re-quire test, measurement and control with rapid access to hardware and data insights. LabView™ is one of these systems engineering software which offers a graphical program-ming approach. Fertility detection techniques are expensive to be ap-plied widely, hence an investigation of the possibility of using a low-cost method. Egg fertility visualization using machine vision are expensive, but the using LabView™ software package can provide a suitable low-cost method for egg fertility by vi-sualization using image processing and fuzzy-logic system control kits, a suitable candling unit designed for illuminating the eggs which po-
tentially enables an camera with 13 Mega Pixels in fifth day of incuba-tion. Captured images by camera mobile phone (Huawei Y6 Pro), and results extract four rules from fuzzy logic and Pixels value histo-grams results showed a significant difference between the mean pixels values of fertile and infertile eggs at 95% confidence level.
IntroductionWith the huge development in ma-
chine vision systems and image pro-cessing, the usage of such methodol-ogies became a focus of attention by those who are interested in poultry reproduction. Hence non-destructive methods for detecting fertility using machine vision and using different types of imaging were investigated before (Klein et al., 2002; Jones et al., 2005; Bain et al., 2007; Zhu and Ma, 2011; and Liu and Ngadi, 2013) because invasive and semi-invasive methods cause damages to the egg (Cain et al., 1967; Howe
et al., 1995; Akiyama et al., 1999; Tazawa et al., 1999; Moriya et al., 1999, 2000; Kato et al., 2002; and Liang et al., 2011). If poultry hatch-ing facilities needs to achieve hatch success rate of 86-95% according to USDA (2006), they will need a proper, non-invasive and quick detection of infertile eggs because they could cause a contamination and taking space and time (Smith et al., 2008; Zhu and Ma, 2011; Liu and Ngadi, 2013; Hai-ling et al., 2016; and Önler et al., 2017). Image processing is one of methods that are non-invasive and quick for de-tecting fertility of hatching eggs, so different methods like color pattern matching, pixel value histograms and color spectrum were investi-gated to determine the feasibility of using these methods in sorting infertile eggs. LabView™ program-ming software package is used in many engineering and scientif ic applications (Hahn and Elmessery, 2011; Elmessery, 2011; Elmessery and Abdallah, 2014). Candling is a followed procedure for identifying
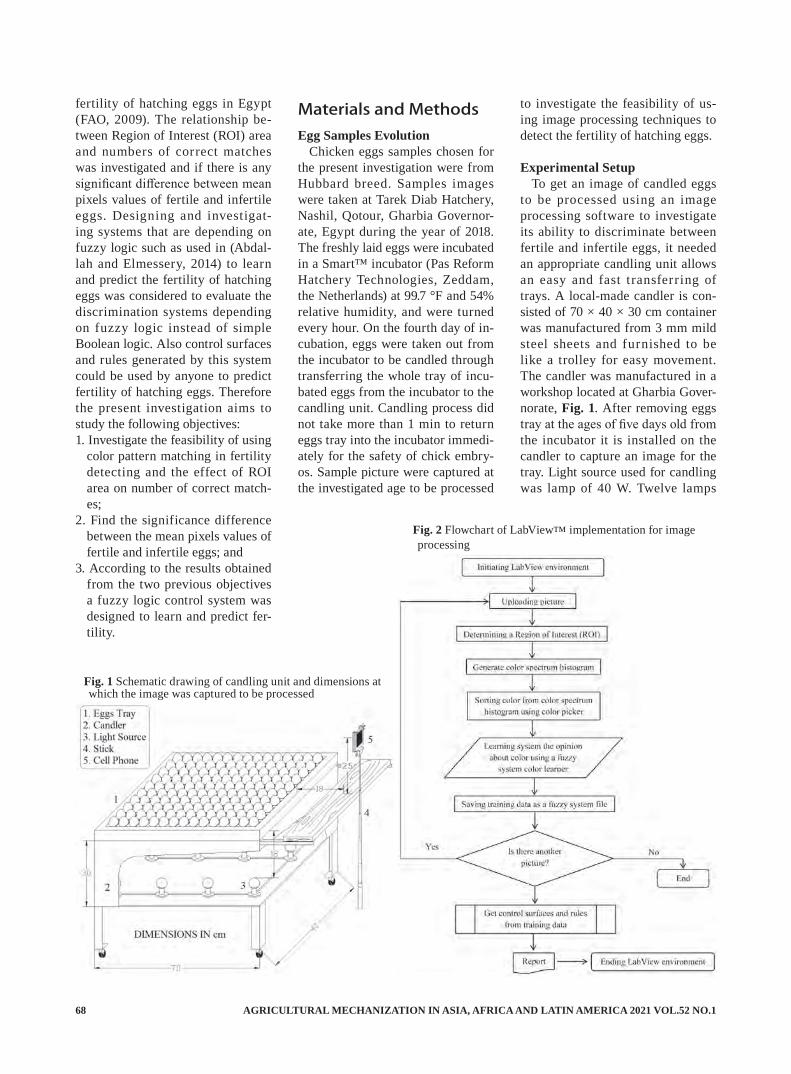
AGRICULTURAL MECHANIZATION IN ASIA, AFRICA AND LATIN AMERICA 2021 VOL.52 NO.168
fertility of hatching eggs in Egypt (FAO, 2009). The relationship be-tween Region of Interest (ROI) area and numbers of correct matches was investigated and if there is any significant difference between mean pixels values of fertile and infertile eggs. Designing and investigat-ing systems that are depending on fuzzy logic such as used in (Abdal-lah and Elmessery, 2014) to learn and predict the fertility of hatching eggs was considered to evaluate the discrimination systems depending on fuzzy logic instead of simple Boolean logic. Also control surfaces and rules generated by this system could be used by anyone to predict fertility of hatching eggs. Therefore the present investigation aims to study the following objectives:1. Investigate the feasibility of using
color pattern matching in fertility detecting and the effect of ROI area on number of correct match-es;
2. Find the significance difference between the mean pixels values of fertile and infertile eggs; and
3. According to the results obtained from the two previous objectives a fuzzy logic control system was designed to learn and predict fer-tility.
Materials and Methods Egg Samples Evolution
Chicken eggs samples chosen for the present investigation were from Hubbard breed. Samples images were taken at Tarek Diab Hatchery, Nashil, Qotour, Gharbia Governor-ate, Egypt during the year of 2018. The freshly laid eggs were incubated in a Smart™ incubator (Pas Reform Hatchery Technologies, Zeddam, the Netherlands) at 99.7 °F and 54% relative humidity, and were turned every hour. On the fourth day of in-cubation, eggs were taken out from the incubator to be candled through transferring the whole tray of incu-bated eggs from the incubator to the candling unit. Candling process did not take more than 1 min to return eggs tray into the incubator immedi-ately for the safety of chick embry-os. Sample picture were captured at the investigated age to be processed
to investigate the feasibility of us-ing image processing techniques to detect the fertility of hatching eggs.
Experimental SetupTo get an image of candled eggs
to be processed using an image processing software to investigate its ability to discriminate between fertile and infertile eggs, it needed an appropriate candling unit allows an easy and fast transferring of trays. A local-made candler is con-sisted of 70 × 40 × 30 cm container was manufactured from 3 mm mild steel sheets and furnished to be like a trolley for easy movement. The candler was manufactured in a workshop located at Gharbia Gover-norate, Fig. 1. After removing eggs tray at the ages of five days old from the incubator it is installed on the candler to capture an image for the tray. Light source used for candling was lamp of 40 W. Twelve lamps
Fig. 1 Schematic drawing of candling unit and dimensions at which the image was captured to be processed
Fig. 2 Flowchart of LabView™ implementation for image processing
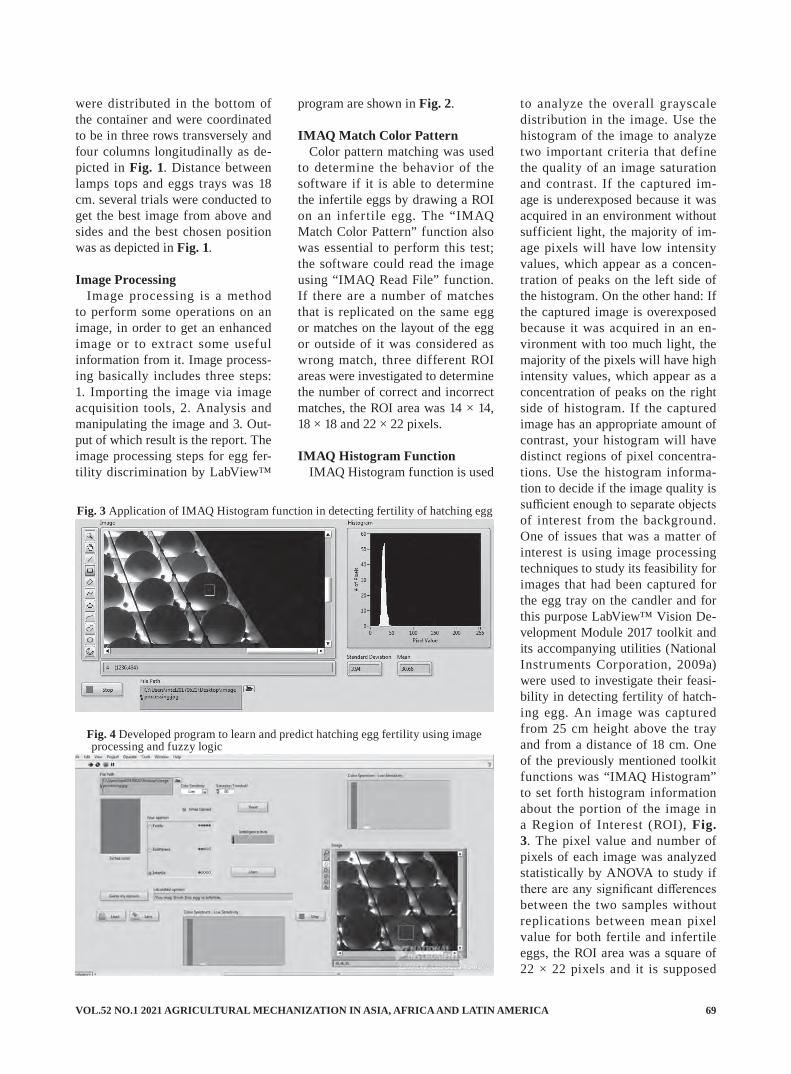
VOL.52 NO.1 2021 AGRICULTURAL MECHANIZATION IN ASIA, AFRICA AND LATIN AMERICA 69
were distributed in the bottom of the container and were coordinated to be in three rows transversely and four columns longitudinally as de-picted in Fig. 1. Distance between lamps tops and eggs trays was 18 cm. several trials were conducted to get the best image from above and sides and the best chosen position was as depicted in Fig. 1.
Image ProcessingImage processing is a method
to perform some operations on an image, in order to get an enhanced image or to extract some useful information from it. Image process-ing basically includes three steps: 1. Importing the image via image acquisition tools, 2. Analysis and manipulating the image and 3. Out-put of which result is the report. The image processing steps for egg fer-tility discrimination by LabView™
program are shown in Fig. 2.
IMAQ Match Color PatternColor pattern matching was used
to determine the behavior of the software if it is able to determine the infertile eggs by drawing a ROI on an infertile egg. The “IMAQ Match Color Pattern” function also was essential to perform this test; the software could read the image using “IMAQ Read File” function. If there are a number of matches that is replicated on the same egg or matches on the layout of the egg or outside of it was considered as wrong match, three different ROI areas were investigated to determine the number of correct and incorrect matches, the ROI area was 14 × 14, 18 × 18 and 22 × 22 pixels.
IMAQ Histogram FunctionIMAQ Histogram function is used
to analyze the overall grayscale distribution in the image. Use the histogram of the image to analyze two important criteria that define the quality of an image saturation and contrast. If the captured im-age is underexposed because it was acquired in an environment without sufficient light, the majority of im-age pixels will have low intensity values, which appear as a concen-tration of peaks on the left side of the histogram. On the other hand: If the captured image is overexposed because it was acquired in an en-vironment with too much light, the majority of the pixels will have high intensity values, which appear as a concentration of peaks on the right side of histogram. If the captured image has an appropriate amount of contrast, your histogram will have distinct regions of pixel concentra-tions. Use the histogram informa-tion to decide if the image quality is sufficient enough to separate objects of interest from the background. One of issues that was a matter of interest is using image processing techniques to study its feasibility for images that had been captured for the egg tray on the candler and for this purpose LabView™ Vision De-velopment Module 2017 toolkit and its accompanying utilities (National Instruments Corporation, 2009a) were used to investigate their feasi-bility in detecting fertility of hatch-ing egg. An image was captured from 25 cm height above the tray and from a distance of 18 cm. One of the previously mentioned toolkit functions was “IMAQ Histogram” to set forth histogram information about the portion of the image in a Region of Interest (ROI), Fig. 3. The pixel value and number of pixels of each image was analyzed statistically by ANOVA to study if there are any significant differences between the two samples without replications between mean pixel value for both fertile and infertile eggs, the ROI area was a square of 22 × 22 pixels and it is supposed
Fig. 3 Application of IMAQ Histogram function in detecting fertility of hatching egg
Fig. 4 Developed program to learn and predict hatching egg fertility using image processing and fuzzy logic

AGRICULTURAL MECHANIZATION IN ASIA, AFRICA AND LATIN AMERICA 2021 VOL.52 NO.170
that the pixel value of infertile eggs is greater than the fertile one.
Developing a Fuzzy Logic System to Learn and Predict FertilityFrom the conclusion of the results
obtained by the first investigation of egg fertility discrimination (Abdal-lah et al., 2018), the Boolean egg fertility discrimination (the value of 1 is completely true and 0 is com-pletely false) that method used by (Abdallah et al., 2018) could be forti-fied by applying fuzzy logic system. In this paper a fuzzy logic system is developed to handle the partial truth which is not completely true (fertile) or false (infertile) according the data achieved from processed images of eggs. Fuzzy logic is a method of rule-based decision mak-ing used for expert systems and pro-cess control (National Instruments Corporation, 2009b). To develop a system that is based on fuzzy logic; it could learn and predict eggs fer-tility it is needed to gather between “Fuzzy Logic VIs” and “NI Vision” functions. The captured egg image is processed to color spectrum his-togram and then the color picker is applied to choose among obtained colors on the histogram then the fuzzy color learner is going to guess if the egg is fertile or not after mak-ing numbers of trains. Color spec-trum histogram that was generated using “IMAQ Color Learner” func-tion was essential because using the color picker directly on the egg tray image are going to generate large number of colors and that is difficult to be sorted by the fuzzy system but color spectrum histogram gener-ate an indicated number of colors, Fig. 4. In this fuzzy system at the beginning if there is no training there are no rules after training the rules will be created programmati-cally. The “RGB to binary number-ing” RGB numeric representation function converts a red, green and blue value from 0 to 255 to the corresponding color of red, green and blue. After twenty-three times
trained (ten infertile, ten fertile and two indifferent eggs) the rules was generated and acquired and also the three dimensional control surfaces graphs. It was noticed from color spectrum that the common color between infertile eggs was the red so it was chosen to learn the system that it is infertile egg and for fertile one it was the black, indifferent egg which is known as infertile but the red color does not appear while the brown color appears so it was chosen to learn the system that it is indifferent egg. Data of training was saved as a fuzzy system file and loaded again to calculate the opin-ion at any time as shown in Fig. 4.
The fuzzification method was Min-Max method, there were three input variable (Red, Green and Blue) each input variable membership function can describe a measurable form that the system can take (Eyabi, 1999), Each input variable has a range of [0, 255] while the output variable has a range of [0, 5], Fig. 5. The de-fuzzification method was used was center-of-Area method.
Results and Discussion Pixel Value Histograms
For infertile eggs mean pixel val-ues taken from ten samples ranged
Fig. 5 Input and output membership functions: (A) sigmoid shape for the three input variables Red, Green and Blue; (B) Triangle shape for output variable
Table 1 Data summary of pixels values for both fertile and infertile eggSummary Count Sum Average Variance
Fertile 10 363.06 36.306 137.168Infertile 10 670.51 67.051 337.379
Table 2 ANOVA of pixels values for both fertile and infertile eggSource of Variation SS df MS F P-value F crit
ROI 1,897.734 9 210.859 0.800 0.628 3.179Fertile or Infertile 4,726.275 1 4,726.275 17.924 0.002 5.117
Error 2,373.185 9 263.687Total 8,997.194 19

VOL.52 NO.1 2021 AGRICULTURAL MECHANIZATION IN ASIA, AFRICA AND LATIN AMERICA 71
from 32.46 ± 3.93 to 88.09 ± 6.67 and for the other ten samples also of fertile eggs ranged from 22.62 ± 4.52 to 56.19 ± 19.5. As shown in Fig. 6 the mean value of depicted
samples from both fertile and infer-tile eggs, pixel value is higher in the infertile one, Table 1. The ANOVA results shows that P-value is less than 0.05, indicating that they are
significantly different from 0 at 95% confidence level, Table 2.
Color Matching PatternsAs listed in Table 3 the number
of correct match increased with the decrease in ROI area. Sorting efficiency was calculated by divid-ing correct matches number on the total matches and for the average sorting efficiency for each ROI area was calculated and it was 62, 48 and 57% for 14 × 14, 18 × 18 and 22 × 22-pixels ROI area.
Fuzzy System ResultsFour rules were generated after
training the system as set forth in Table 4. As shown in Fig. 7 the relationship between every two in-put variables and the opinion was obtained by the control surface graphs. Control surface with four rules demonstrating a linear char-acteristic and it means that it is less sensitive to small changes about the set point, i.e., when the input variables are zero (flatness) (Eyabi, 1999). As shown in Fig. 7-D and to understand the control surface if the input variables values for Red, Green and Blue are 113.182, 99.545 and 0, respectively the output value of the opinion would be 2.0167 and this invokes the fourth rule in Table 4 because backing to Fig. 5-B this value is ranging in ‘do not like’ opinion.
Conclusions1. Color matching patterns results
shows an increase in number of correct matches with the decrease in Region Of Interest ROI area although numbers of incorrect matches increased also, so this methods is not recommended;
2. Pixels value histograms results showed a significant difference between the mean pixels values of fertile and infertile eggs at 95% confidence level; and
3. Control surfaces were less sensi-
Fig. 6 Samples of pixel values of ROI taken from (A) fertile and (B) infertile eggs
Table 3 The number of correct and incorrect matches at three different ROI areas
ROI Area, pixels Trial No. No. of matches at max No. of matches = 26 Correct Incorrect
14 × 14
1 4 12 4 23 15 114 10 12
18 × 18
1 1 02 0 03 9 134 13 12
22 × 22
1 3 42 6 43 9 74 11 4
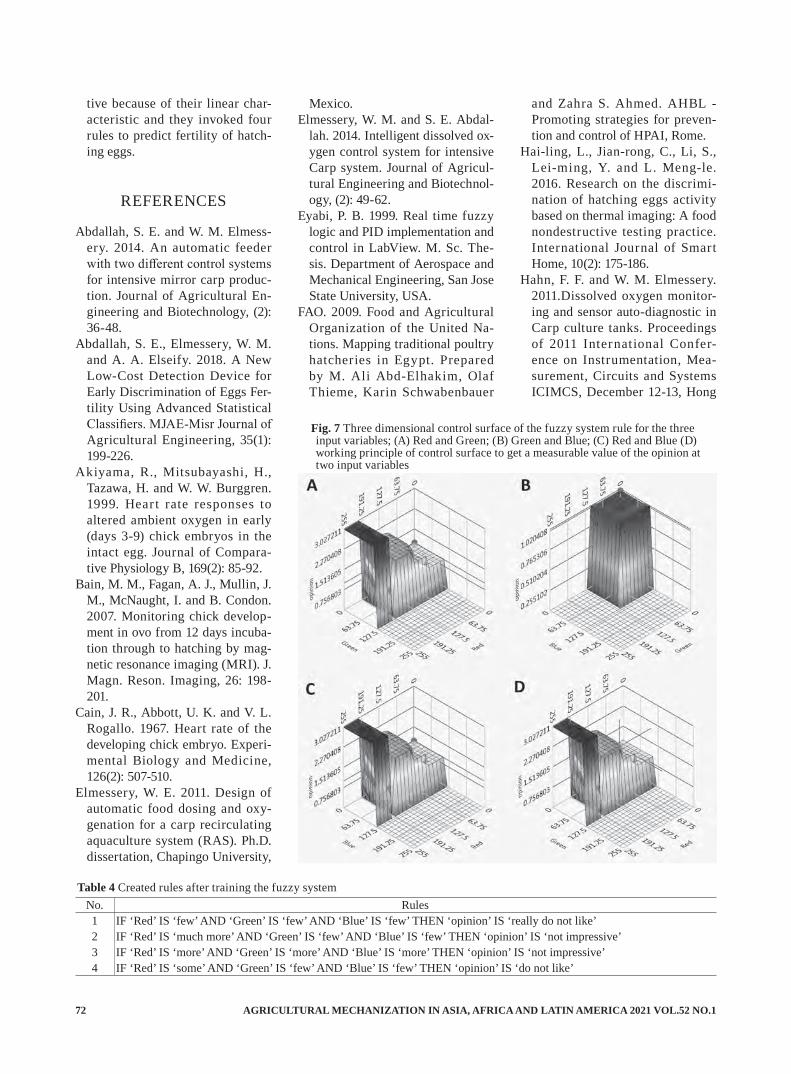
AGRICULTURAL MECHANIZATION IN ASIA, AFRICA AND LATIN AMERICA 2021 VOL.52 NO.172
tive because of their linear char-acteristic and they invoked four rules to predict fertility of hatch-ing eggs.
REFERENCES
Abdallah, S. E. and W. M. Elmess-ery. 2014. An automatic feeder with two different control systems for intensive mirror carp produc-tion. Journal of Agricultural En-gineering and Biotechnology, (2): 36-48.
Abdallah, S. E., Elmessery, W. M. and A. A. Elseify. 2018. A New Low-Cost Detection Device for Early Discrimination of Eggs Fer-tility Using Advanced Statistical Classifiers. MJAE-Misr Journal of Agricultural Engineering, 35(1): 199-226.
Akiyama, R., Mitsubayashi, H., Tazawa, H. and W. W. Burggren. 1999. Hear t rate responses to altered ambient oxygen in early (days 3-9) chick embryos in the intact egg. Journal of Compara-tive Physiology B, 169(2): 85-92.
Bain, M. M., Fagan, A. J., Mullin, J. M., McNaught, I. and B. Condon. 2007. Monitoring chick develop-ment in ovo from 12 days incuba-tion through to hatching by mag-netic resonance imaging (MRI). J. Magn. Reson. Imaging, 26: 198-201.
Cain, J. R., Abbott, U. K. and V. L. Rogallo. 1967. Heart rate of the developing chick embryo. Experi-mental Biology and Medicine, 126(2): 507-510.
Elmessery, W. E. 2011. Design of automatic food dosing and oxy-genation for a carp recirculating aquaculture system (RAS). Ph.D. dissertation, Chapingo University,
Mexico.Elmessery, W. M. and S. E. Abdal-
lah. 2014. Intelligent dissolved ox-ygen control system for intensive Carp system. Journal of Agricul-tural Engineering and Biotechnol-ogy, (2): 49-62.
Eyabi, P. B. 1999. Real time fuzzy logic and PID implementation and control in LabView. M. Sc. The-sis. Department of Aerospace and Mechanical Engineering, San Jose State University, USA.
FAO. 2009. Food and Agricultural Organization of the United Na-tions. Mapping traditional poultry hatcheries in Egypt. Prepared by M. Ali Abd-Elhakim, Olaf Thieme, Karin Schwabenbauer
Table 4 Created rules after training the fuzzy systemNo. Rules1 IF ‘Red’ IS ‘few’ AND ‘Green’ IS ‘few’ AND ‘Blue’ IS ‘few’ THEN ‘opinion’ IS ‘really do not like’ 2 IF ‘Red’ IS ‘much more’ AND ‘Green’ IS ‘few’ AND ‘Blue’ IS ‘few’ THEN ‘opinion’ IS ‘not impressive’3 IF ‘Red’ IS ‘more’ AND ‘Green’ IS ‘more’ AND ‘Blue’ IS ‘more’ THEN ‘opinion’ IS ‘not impressive’4 IF ‘Red’ IS ‘some’ AND ‘Green’ IS ‘few’ AND ‘Blue’ IS ‘few’ THEN ‘opinion’ IS ‘do not like’
Fig. 7 Three dimensional control surface of the fuzzy system rule for the three input variables; (A) Red and Green; (B) Green and Blue; (C) Red and Blue (D) working principle of control surface to get a measurable value of the opinion at two input variables
and Zahra S. Ahmed. AHBL - Promoting strategies for preven-tion and control of HPAI, Rome.
Hai-ling, L., Jian-rong, C., Li, S., Lei-ming, Y. and L. Meng-le. 2016. Research on the discrimi-nation of hatching eggs activity based on thermal imaging: A food nondestructive testing practice. International Journal of Smart Home, 10(2): 175-186.
Hahn, F. F. and W. M. Elmessery. 2011.Dissolved oxygen monitor-ing and sensor auto-diagnostic in Carp culture tanks. Proceedings of 2011 International Confer-ence on Instrumentation, Mea-surement, Circuits and Systems ICIMCS, December 12-13, Hong
VOL.52 NO.1 2021 AGRICULTURAL MECHANIZATION IN ASIA, AFRICA AND LATIN AMERICA 73
Kong, China.Howe, R. S., Burggren, W. W. and
S. J. Warburton. 1995. Fixed pat-terns of bradycardia during late embryonic development in domes-tic fowl with C locus mutations. American Journal of Physiology-Heart and Circulatory Physiology, 268(1): H56-H60.
Jones, S. T., Ruby, E. S. and Artifi-cial Intelligence CENTER. 2005. Detection of Early Embryonic De-velopment in hatching eggs: a hy-per spectral imaging systems and neural network approach. Johns Hopkins APL Technical Digest, 1: 67-73.
Kato, K., Moriya, K., Dzialowski, E., Burggren, W. W. and H. Tazawa. 2002. Cardiac rhythms in prenatal and perinatal emu embryos. Com-parative Biochemistry and Physiol-ogy Part A: Molecular & Integra-tive Physiology, 131(4): 775-785.
Klein, S., Rokitta, M., Baulain, U., Thielebein, J., Haase, A. and F. Ellendorff. 2002. Localization of the fertilized germinal disc in the chicken egg before incubation. Poultry science, 81(4): 529-536.
Liang, S., Liu, J., Zhang, Z. S. and X. Li. 2011. Monitoring of live chick embryo based on acoustic and vibration signals with a new semi-invasive technology. Austra-lian Journal of Agricultural Engi-neering, 2(5): 127-131.
Liu, L. and M. O. Ngadi. 2013. De-tecting fertility and early embryo development of chicken eggs us-ing near-infrared hyper spectral imaging. Food and Bioprocess Technology,6(9): 2503-2513.
Moriya, K., Pearson, J. T., Burg-gren, W. W., Ar, A. and H. Taza-wa. 2000. Continuous measure-ments of instantaneous heart rate and its fluctuations before and af-ter hatching in chickens. Journal of Experimental Biology, 203(5): 895-903.
Moriya, K., Höchel, J., Pearson, J. T. and H. Tazawa. 1999. Cardiac rhythms in developing chicks. Comparative Biochemistry and
Physiology Part A: Molecular& Integrative Physiology,124(4): 461-468.
National Instruments Corporation. 2009. LabView™ PID and Fuzzy Logic Toolkit User Manual.
National Instruments Corporation. 2009. NI Vision for LabWin-dows™/CVI™ User Manual.
Önler, E., Çelen, I. H., Gulhan, T. and B. Boynukara. 2017. A study regarding the fertility discrimina-tion of eggs by using ultrasound. Indian Journal of Animal Re-search, 51(2): 322-326.
Smith, D. P., Lawrence, K. C. and G. W. Heitschmidt. 2008. Fertil-ity and embryo development of broiler hatching eggs evaluated with a hyper spectral imaging and predictive modeling system. International Journal of Poultry Science, 7(10): 1001-1004.
Tazawa, H., Mitsubayashi, H., Hira-ta, M., Höchel, J. and J. T. Pearson. 1999. Cardiac rhythms in chick embryos during hatching. Compar-ative Biochemistry and Physiology Part A: Molecular & Integrative Physiology, 124(4): 511-521.
USDA. 2006. Poultry: Chickens and eggs. United States Department of Agriculture, National Agricul-tural Statistics Service (NASS), Washington, DC.
Zhu, Z. and M. Ma. 2011. The iden-tification of white fertile eggs pri-or to incubation based on machine vision and least square support vector machine. African Journal of Agricultural Research, 6(12): 2699-2704.
■■
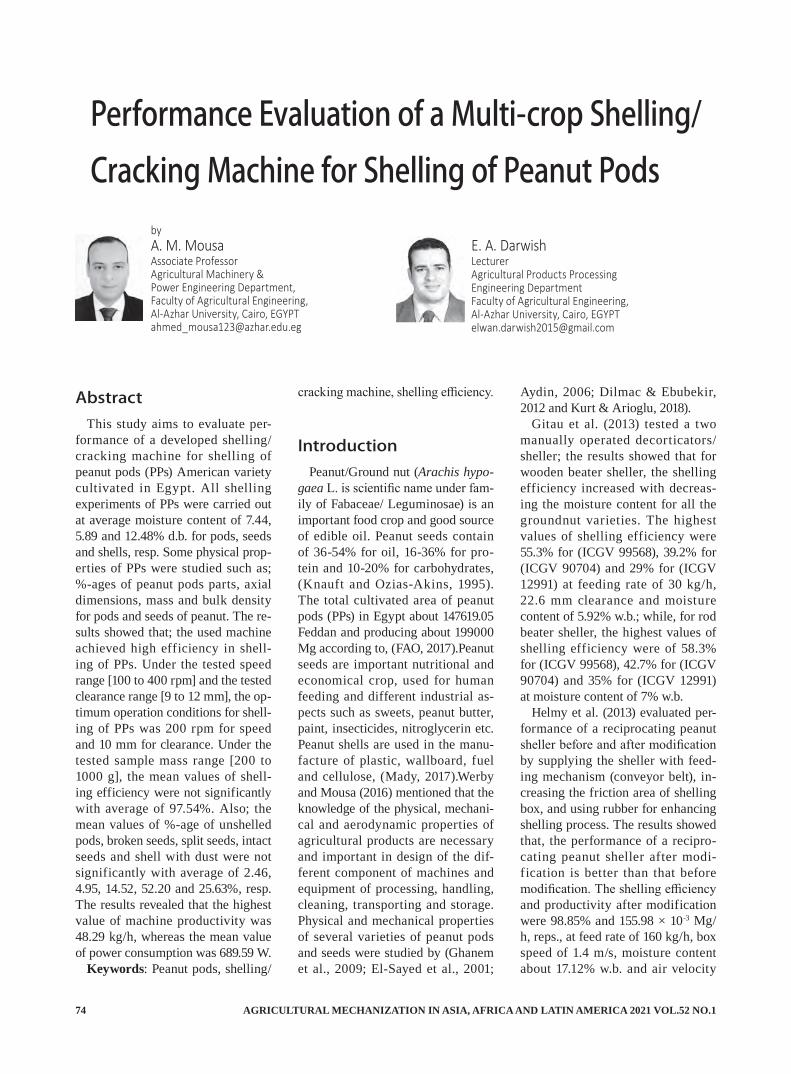
AGRICULTURAL MECHANIZATION IN ASIA, AFRICA AND LATIN AMERICA 2021 VOL.52 NO.174
Performance Evaluation of a Multi-crop Shelling/Cracking Machine for Shelling of Peanut Pods
byA. M. MousaAssociate Professor Agricultural Machinery &Power Engineering Department, Faculty of Agricultural Engineering, Al-Azhar University, Cairo, EGYPT [email protected]
E. A. DarwishLecturer Agricultural Products Processing Engineering DepartmentFaculty of Agricultural Engineering, Al-Azhar University, Cairo, EGYPT [email protected]
AbstractThis study aims to evaluate per-
formance of a developed shelling/cracking machine for shelling of peanut pods (PPs) American variety cultivated in Egypt. All shelling experiments of PPs were carried out at average moisture content of 7.44, 5.89 and 12.48% d.b. for pods, seeds and shells, resp. Some physical prop-erties of PPs were studied such as; %-ages of peanut pods parts, axial dimensions, mass and bulk density for pods and seeds of peanut. The re-sults showed that; the used machine achieved high efficiency in shell-ing of PPs. Under the tested speed range [100 to 400 rpm] and the tested clearance range [9 to 12 mm], the op-timum operation conditions for shell-ing of PPs was 200 rpm for speed and 10 mm for clearance. Under the tested sample mass range [200 to 1000 g], the mean values of shell-ing efficiency were not significantly with average of 97.54%. Also; the mean values of %-age of unshelled pods, broken seeds, split seeds, intact seeds and shell with dust were not significantly with average of 2.46, 4.95, 14.52, 52.20 and 25.63%, resp. The results revealed that the highest value of machine productivity was 48.29 kg/h, whereas the mean value of power consumption was 689.59 W.
Keywords: Peanut pods, shelling/
cracking machine, shelling efficiency.
IntroductionPeanut/Ground nut (Arachis hypo-
gaea L. is scientific name under fam-ily of Fabaceae/ Leguminosae) is an important food crop and good source of edible oil. Peanut seeds contain of 36-54% for oil, 16-36% for pro-tein and 10-20% for carbohydrates, (Knauft and Ozias-Akins, 1995). The total cultivated area of peanut pods (PPs) in Egypt about 147619.05 Feddan and producing about 199000 Mg according to, (FAO, 2017).Peanut seeds are important nutritional and economical crop, used for human feeding and different industrial as-pects such as sweets, peanut butter, paint, insecticides, nitroglycerin etc. Peanut shells are used in the manu-facture of plastic, wallboard, fuel and cellulose, (Mady, 2017).Werby and Mousa (2016) mentioned that the knowledge of the physical, mechani-cal and aerodynamic properties of agricultural products are necessary and important in design of the dif-ferent component of machines and equipment of processing, handling, cleaning, transporting and storage. Physical and mechanical properties of several varieties of peanut pods and seeds were studied by (Ghanem et al., 2009; El-Sayed et al., 2001;
Aydin, 2006; Dilmac & Ebubekir, 2012 and Kurt & Arioglu, 2018).
Gitau et al. (2013) tested a two manually operated decorticators/sheller; the results showed that for wooden beater sheller, the shelling efficiency increased with decreas-ing the moisture content for all the groundnut varieties. The highest values of shelling efficiency were 55.3% for (ICGV 99568), 39.2% for (ICGV 90704) and 29% for (ICGV 12991) at feeding rate of 30 kg/h, 22.6 mm clearance and moisture content of 5.92% w.b.; while, for rod beater sheller, the highest values of shelling efficiency were of 58.3% for (ICGV 99568), 42.7% for (ICGV 90704) and 35% for (ICGV 12991) at moisture content of 7% w.b.
Helmy et al. (2013) evaluated per-formance of a reciprocating peanut sheller before and after modification by supplying the sheller with feed-ing mechanism (conveyor belt), in-creasing the friction area of shelling box, and using rubber for enhancing shelling process. The results showed that, the performance of a recipro-cating peanut sheller after modi-fication is better than that before modification. The shelling efficiency and productivity after modification were 98.85% and 155.98 × 10⁻³ Mg/h, reps., at feed rate of 160 kg/h, box speed of 1.4 m/s, moisture content about 17.12% w.b. and air velocity

VOL.52 NO.1 2021 AGRICULTURAL MECHANIZATION IN ASIA, AFRICA AND LATIN AMERICA 75
of 8.37 m/s. But before modifica-tion, the shelling efficiency and productivity after modification were 95.32% and 89.20 × 10⁻³ Mg/h, reps., at feed rate of 100 kg/h and the other studied operating conditions.
Mady (2017) manufactured and evaluated a peanut sheller under the following operational conditions; drum rotary speeds of 150, 200, 250 and 300 rpm, feeding rates of 170, 210 and 250 kg/h and air speeds of 4.9, 6.8 and 8.8 m/s. The results showed that the highest shelling effi-ciency was 96.23% at drum speed of 150 rpm and feeding rate of 170 kg/h. The highest productivity of ma-chine was 250 kg/h at drum speed of 300 rpm and feeding rate of 250 kg/h, whereas the highest cleaning ratio was 98% was at drum speed of 150 rpm and air speed of 8.8 m/s.
Prem et al. (2017) mentioned that the shelling of pods is very difficult
and very time-consuming operation in case of carrying out manually. In addition to unavailable of small shelling machines in Egypt, Mousa (2018) developed a shelling/cracking machine depends on friction rubbing action for some agricultural prod-ucts and evaluated performance for shelling of Jatropha curcas L. fruits (JCFs) cultivated in Egypt. The results showed that the suggested design of the developed machine achieved high efficiency in shelling of JCFs. The speed of 600 rpm is the optimal for the shelling efficiency at clearance of 12 mm. Also; the mass sample of 1000 g is the optimal for shelling efficiency and productivity of machine, the results revealed that the highest value of machine produc-tivity was 226.08 kg/h. Meanwhile; the average values of shelling ef-ficiency, %-age of broken seeds, un-shelled fruits and intact seeds were 95.90, 0.43, 4.10 and 57.93%, resp., as well as; he concluded that testing and evaluate performance of the de-veloped shelling/cracking machine for shelling of peanut pods; So; this study was carried out to evaluate performance of the developed shell-ing/cracking machine for shelling of peanut pods cultivated in Egypt.
Materials and Methods The shelling/cracking machine
was developed by Mousa, (2018). The shelling experiments of peanut pods “PPs” (American variety) were carried out in the Laboratory of Agric. Mech. and Power Eng. Dept., Fac. of Agric. Eng., Al-Azhar Univ., Cairo, Egypt.
2.1. Materials2.1.1. Shelling/Cracking Machine
The main components of the shelling/cracking machine included: frame, feed hopper, shelling/crack-ing chamber, discharge outlet and source of power, as shown in Fig. 1. Frame of the Machine:
The main frame of the machine
was constructed from iron channel sections. It is main dimensions were 50 mm depth, 25 mm flange width and 5 mm web thickness, the frame was jointed using helical screws to ease any modification and was fixed on four wheels to facilitate transfer of machine.Feed Hopper:
The experimental hopper was constructed from galvanized iron sheet and composed of four sides. These sides were joined with heli-cal screws. The two parallel sides of motor axis were fixed, while the other two sides are crossed and con-nected with joint from the top for ease articulation motion and control in feed slot. In addition; a gate pre-vents the fruits before the shelling/cracking chamber. The depth of hopper from top to the gate was 36 cm and the top area of hopper was 32.0 cm × 21.5 cm.Shelling/Cracking Chamber:
The shelling/cracking process in the developed machine depends on friction or rubbing action. The shell-ing/cracking chamber was composed of; fixed part (external) and rotary part (internal), as shown Fig. 2. The fixed part is conical shaped and made from stainless steel (SS”304”) sheet with protrusions (1.6 mm height) to avoid slipping the fruits or seeds during shelling/cracking pro-cess. The conical shape was formed using plate rolling machine then was welded with the following dimen-sions: 35 cm upper internal diameter, 20 cm lower internal diameter and 37.5 cm depth. The conical part was put into a hollow square plate, in ad-dition to four screws and four parts from steel angle sections to adjust the level of the conical part.
The rotary part consists of a coni-cal block in the top and cylindrical block in the bottom. These blocks are made from low carbon steel (mild steel) and turned by lathe machine. The lower block was cov-ered with the same material of fixed conical part. The thickness of sheet without protrusions is 5 mm. Also;
Fig. 1 3D drawing of developed shelling/cracking machine
1. Feed hopper, 2. Frame, 3. Shelling chamber, 4. AVO-meter, 5. On/off switch, 6. Discharge outlet, 7. Wheels, 8. Electric motor, 9. Sprocket wheels and chains, 10. Transparent cover, 11. Rotational shaft, 12. Scale of clearance, 13. Pointer

AGRICULTURAL MECHANIZATION IN ASIA, AFRICA AND LATIN AMERICA 2021 VOL.52 NO.176
the shelling surface was formed us-ing plate rolling machine, then was welded to take cylindrical shape with external diameter of 20 cm. The di-mensions of fixed conical and rotary parts (friction surfaces) were cho-sen for the following reasons: Each height of 5 mm of the rotary part produces increases for the final clear-ance of 1 mm, to give clearance be-tween two friction surfaces ranging from 0 to 75 mm and to possibly test of dry agricultural products which need the shelling/cracking. The SS material was used to form the two fraction surfaces for the following reasons: High toughness, acceptable forming and welding, high resistance to corrosion and rusting; in addi-tion to, the SS material is safe for agricultural products. A screw rod with length of 57.66 cm was attached with the rotary part from bottom us-ing two thrust ball bearings and was tied using nut into the rotary part. A handle was fitted in the bottom of the screw rod to adjust the required clearance. The screw rod is passed through a fixed nut in steel channel section under the shelling chamber. In addition, two moving nuts were put in the top and bottom of the fixed nut to lock the screw rod after adjust-ing the required clearance. A smooth rod with diameter of 25 mm and length of 58.9 cm was installed in the rotary part from the top through two bearings (FL 205). A pointer was installed above the smooth rod to indicate the value of clearance on a vertical scale; this scale was installed inside the frame at the top. Discharge Outlet:
The discharge outlet was in-stalled under the shelling chamber and composed of three parts: two parts were installed vertical into the frame on the two parallel sides of the motor, whose dimensions were 45.5 cm × 30.7 cm for both of them; whereas the other part has an inclination and was put to receive the shelled/cracked material, the dimensions of the inclined part were 61 cm × 25.6 cm and was installed
with two hinges for ease motion and control in the angle of inclination. The discharge outlet was construct-ed from galvanized iron sheet with thickness of 0.5 mm.Source of Power:
An electric motor “AC” was used to operate the shelling/cracking machine with power of 1.5 kW and speed of 1400 rpm. The power was transmitted to the rotary shaft using sprocket wheels and chains on three stages to reduce the speed of motor to the required speed.
2.1.2. Measuring Instruments(1) An electric oven was used to
determine the moisture content of pods, seeds and shells. (2) A digital electric balance with accuracy of 0.01 g was used to weigh the mass of samples before and after shelling. (3) A digital stopwatch with accu-racy of 0.01 s to measure the time of shelling. (4) A digital Vernier-caliper with accuracy of 0.01 mm was used to measure the dimensions of pods and seeds. (5) A digital ta-chometer was used to measure the rotational speed “rpm”. The specs of tachometer are as follows: Non-contact but; with laser photo, range of the measurement is 2.5 to 99999 rpm and its accuracies are 0.1 rpm through the speed 2.5 to 999.9 and 1 rpm over 1000 rpm. (6) A digital AVO-meter was used to measure the consumed electrical current (Amperes “A”) during the shelling process. The specs of device are as follows: accuracy of device is 0.001, range of the measurement AC/DC voltage up to 600V and AC/DC cur-rent up to 10 A.
2.1.3. Sample of Peanut Pods The peanut used in the shelling
process is variety of American and cultivated in Egypt. Some physical properties of peanut were carried out such as (%-ages of peanut pods parts “%, by wt.”, axial dimensions “mm”, mass “g” and bulk density “g/cm3”) for pods and seeds of peanut were studied.
2.2. Methods2.2.1. The Experimental Procedure
The developed machine was eval-uated using four clearances (C) were; 9, 10, 11 and 12 mm. For each clear-ance, four speeds were tested; 100 (1.047), 200 (2.094), 300 (3.142) and 400 rpm (4.189 m/s). These variables were tested using 200 g of PP switch batch system. Then; the optimal clearance and speed were constant at study the variable of sample mass. This variable was studied using five masses with batch system were; 200, 400, 600, 800 and 1000g. The exper-iments were carried out according the following steps: after adjustment of the required clearance and speed; the known mass of PPs was poured into the hopper above the gate. Then the machine was switched on and stayed for about one minute. Then the gate of hopper was removed quietly to allow the pods go to the
Fig. 2 3D drawing of longitudinal section of shelling/cracking chamber
1. Fixed part, 2. Base of shelling chamber, 3. Screw for balance, 4. Handel, 5. Two nuts to tie screw, 6. Screw rod, 7. Fixed nut, 8. Rotary part, 9. Protrusion, 10. Pillow block bearing, 11. Sprocket wheel, 12. Rotational shaft, 13. Pointer

VOL.52 NO.1 2021 AGRICULTURAL MECHANIZATION IN ASIA, AFRICA AND LATIN AMERICA 77
shelling chamber under the grav-ity. At the end; the shelling product were carefully collected in collector, then; classified into five categories by manual separation; then weighed. These categories were as follow: un-shelled pods (unshelled whole pods and partially shelled), broken seeds, split seeds, intact seeds, and shells with dust. At study of the sample mass variable; the shelling time was measured at the moment when it reaches the shelled pods to half input sample mass of PPs by using the balance under the collector. This value was multiplied by 2 to give the total time required for shelling the same input mass in case of continu-ous feeding. All experiments were replicated three times.
2.2.2. Performance Evaluation Moisture Content:
The moisture content (MC; “%, d.b.”) of pods, seeds and shells were determined by drying method in a hot air oven at 130 °C for 7 hours. This test was repeated three times. The moisture content was determined by using the following equation:
MC = (mb − ma) / ma × 100 (1)Where; mb: mass of sample before
drying (g) and ma: mass of sample afterdrying (g).Performance Evaluation:
The following equations were used for the performance evaluation
of shelling process of peanut pods:PU = (MU / Mt) × 100 (2),PBS = (MBS / Mt) × 100 (3),PSS = (MSS / Mt) × 100 (4),PIS = (MIS / Mt) × 100 (5),PShD = (MShD / Mt) × 100 (6), andηSh = [1 − (MU / Mt)] × 100 (7).Where; PU: is the %-age of un-
shelled pods (%), MU: mass of un-shelled pods (g), Mt: total mass of input pods (g), PBS: %-age of broken seeds (%), MBS: mass of broken seeds (g), PSS: %-age of split seeds (%), MSS: mass of split seeds (g), PIS: %-age of intact seeds (%), MIS: mass of intact seeds (g), PShD: %-age of shells with dust (%), MShD: mass of shells with dust (g) and ηSh: shelling efficiency (%).Shelling Capacity (Productivity):
The shelling capacity (Q; “kg/h”) was calculated according to the fol-lowing equation:
Q = (Mt / 1000) / T (8).Where; T: is the time required to
shell the sample (h).Power Consumption:
The power requirement of shell-ing process (P; “W”) was calculated using the following equation:
P = I × V × cosφ × ηm (9).Where; P: is the total power re-
quirement with load (W), I: current consumed with load (Amperes), V: voltage difference (Volts), cosφ: power factor assumed 0.80, φ: phase angle between current and voltage
and ηm: mechanical efficiency of motor assumed 85%.
The obtained results were statisti-cally analyzed using spread sheet software program: Microsoft Excel and SPSS; V. “23”.
Results and DiscussionsAll experiments of shelling for
peanut pods (PPs) were carried out under the average moisture content of 7.44, 5.89 and 12.48% d.b. for whole pods, seeds and shells, resp. Some physical properties of peanut were studied such as; %-ages of pea-nut pods parts (%, by weight), axial dimensions (mm), mass (g) and bulk density (g/cm3) for whole pods and seeds of peanut as shown in Table 1.
Effect of Rotational Speed and Clea-rance on Performance IndicatorsThe shelling mixing of PPs output
from used machine was separated manually to determine all %-ages of PPs parts as shown in Fig. 3. Table 2 illustrates the average %-ages of peanut pods (PPs) parts after shell-ing process at tested four speeds [100, 200, 300 and 400 rpm]. For each speed (S) four clearances (C) were: 9, 10, 11 and 12 mm.For the %-age of unshelled PPs:
Generally; the unshelled PPs de-creased with increasing the speed and decreasing the clearance. The %-age of unshelled PPs decreased from 32.49 to 0.36% at speed of 400 rpm, 41.47 to 0.23% at speed of 300 rpm, 46.55 to 1.54% at speed of 200 rpm and 44.86 to 1.08% at speed of 100 rpm when decreasing the clear-ance from 12 to 9 mm as shown in Table 2. The Duncan Multiple-Range Test (DMRT) in Table 3 showed that the mean effect of speed on the %-age of unshelled PPs. The mean values of unshelled PPs de-creased significantly (at 5% level “P < 0.05”) from 17.60 to 10.07% with increasing the speed from 200 to 400 rpm. Also; Table 4 shows the result of Duncan’s test for the mean
Table 1 Some physical properties for pods and seeds of peanutS, (rpm) C,(mm) Min. Max. Mean SD CV, (%)
MC (%, d.b.)Pods 7.29 7.54 7.44 ± 0.13 1.76Seeds 5.86 5.96 5.89 ± 0.06 0.94Shells 12.41 12.61 12.48 ± 0.12 0.92
%-ages of PPs parts, (%, by wt.)
Seeds 74.31 75.81 74.91 ± 0.79 1.06Shells 24.49 25.80 25.25 ± 0.68 2.69
Axial dimensions, (mm)
PodsL 23.70 52.89 39.19 ± 5.59 14.26W 13.35 20.05 15.74 ± 1.50 9.52T 11.39 17.42 13.98 ± 1.14 8.12
SeedsL 13.36 23.30 20.17 ± 2.24 11.09W 7.20 12.93 10.42 ± 1.14 10.90T 6.29 10.41 8.78 ± 0.77 8.79
Mass, (g) Pods 1.25 3.46 2.40 ± 0.58 24.09Seeds 0.30 1.36 0.97 ± 0.22 22.27
Bulk density, (g/cm3) Pods 0.278 0.300 0.287 ± 0.01 2.93Seeds 0.598 0.613 0.602 ± 0.01 1.05
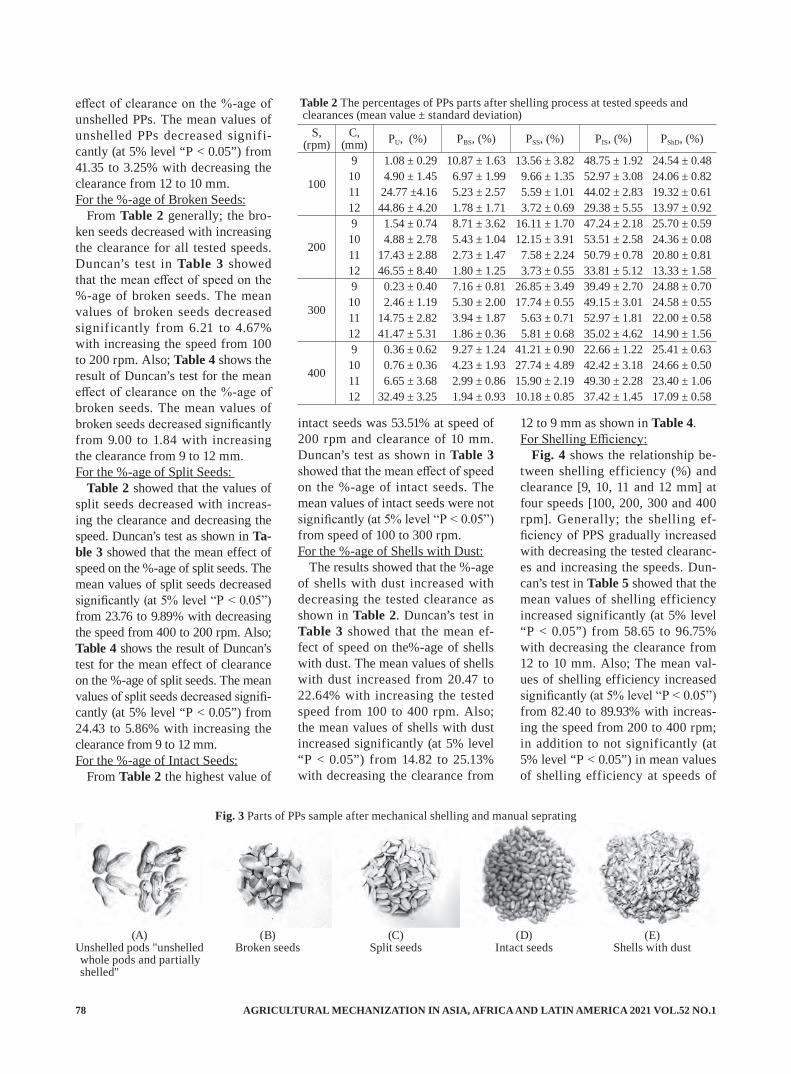
AGRICULTURAL MECHANIZATION IN ASIA, AFRICA AND LATIN AMERICA 2021 VOL.52 NO.178
effect of clearance on the %-age of unshelled PPs. The mean values of unshelled PPs decreased signifi-cantly (at 5% level “P < 0.05”) from 41.35 to 3.25% with decreasing the clearance from 12 to 10 mm.For the %-age of Broken Seeds:
From Table 2 generally; the bro-ken seeds decreased with increasing the clearance for all tested speeds. Duncan’s test in Table 3 showed that the mean effect of speed on the %-age of broken seeds. The mean values of broken seeds decreased significantly from 6.21 to 4.67% with increasing the speed from 100 to 200 rpm. Also; Table 4 shows the result of Duncan’s test for the mean effect of clearance on the %-age of broken seeds. The mean values of broken seeds decreased significantly from 9.00 to 1.84 with increasing the clearance from 9 to 12 mm.For the %-age of Split Seeds:
Table 2 showed that the values of split seeds decreased with increas-ing the clearance and decreasing the speed. Duncan’s test as shown in Ta-ble 3 showed that the mean effect of speed on the %-age of split seeds. The mean values of split seeds decreased significantly (at 5% level “P < 0.05”) from 23.76 to 9.89% with decreasing the speed from 400 to 200 rpm. Also; Table 4 shows the result of Duncan’s test for the mean effect of clearance on the %-age of split seeds. The mean values of split seeds decreased signifi-cantly (at 5% level “P < 0.05”) from 24.43 to 5.86% with increasing the clearance from 9 to 12 mm.For the %-age of Intact Seeds:
From Table 2 the highest value of
intact seeds was 53.51% at speed of 200 rpm and clearance of 10 mm. Duncan’s test as shown in Table 3 showed that the mean effect of speed on the %-age of intact seeds. The mean values of intact seeds were not significantly (at 5% level “P < 0.05”) from speed of 100 to 300 rpm.For the %-age of Shells with Dust:
The results showed that the %-age of shells with dust increased with decreasing the tested clearance as shown in Table 2. Duncan’s test in Table 3 showed that the mean ef-fect of speed on the%-age of shells with dust. The mean values of shells with dust increased from 20.47 to 22.64% with increasing the tested speed from 100 to 400 rpm. Also; the mean values of shells with dust increased significantly (at 5% level “P < 0.05”) from 14.82 to 25.13% with decreasing the clearance from
12 to 9 mm as shown in Table 4.For Shelling Efficiency:
Fig. 4 shows the relationship be-tween shelling efficiency (%) and clearance [9, 10, 11 and 12 mm] at four speeds [100, 200, 300 and 400 rpm]. Generally; the shelling ef-ficiency of PPS gradually increased with decreasing the tested clearanc-es and increasing the speeds. Dun-can’s test in Table 5 showed that the mean values of shelling efficiency increased significantly (at 5% level “P < 0.05”) from 58.65 to 96.75% with decreasing the clearance from 12 to 10 mm. Also; The mean val-ues of shelling efficiency increased significantly (at 5% level “P < 0.05”) from 82.40 to 89.93% with increas-ing the speed from 200 to 400 rpm; in addition to not significantly (at 5% level “P < 0.05”) in mean values of shelling efficiency at speeds of
Fig. 3 Parts of PPs sample after mechanical shelling and manual seprating
(A)Unshelled pods "unshelled whole pods and partially shelled"
(E)Shells with dust
(B)Broken seeds
(D)Intact seeds
(C)Split seeds
Table 2 The percentages of PPs parts after shelling process at tested speeds and clearances (mean value ± standard deviation)
S,(rpm)
C,(mm) PU, (%) PBS, (%) PSS, (%) PIS, (%) PShD, (%)
9 1.08 ± 0.29 10.87 ± 1.63 13.56 ± 3.82 48.75 ± 1.92 24.54 ± 0.48
100 10 4.90 ± 1.45 6.97 ± 1.99 9.66 ± 1.35 52.97 ± 3.08 24.06 ± 0.8211 24.77 ±4.16 5.23 ± 2.57 5.59 ± 1.01 44.02 ± 2.83 19.32 ± 0.6112 44.86 ± 4.20 1.78 ± 1.71 3.72 ± 0.69 29.38 ± 5.55 13.97 ± 0.929 1.54 ± 0.74 8.71 ± 3.62 16.11 ± 1.70 47.24 ± 2.18 25.70 ± 0.59
200 10 4.88 ± 2.78 5.43 ± 1.04 12.15 ± 3.91 53.51 ± 2.58 24.36 ± 0.0811 17.43 ± 2.88 2.73 ± 1.47 7.58 ± 2.24 50.79 ± 0.78 20.80 ± 0.8112 46.55 ± 8.40 1.80 ± 1.25 3.73 ± 0.55 33.81 ± 5.12 13.33 ± 1.589 0.23 ± 0.40 7.16 ± 0.81 26.85 ± 3.49 39.49 ± 2.70 24.88 ± 0.70
300 10 2.46 ± 1.19 5.30 ± 2.00 17.74 ± 0.55 49.15 ± 3.01 24.58 ± 0.5511 14.75 ± 2.82 3.94 ± 1.87 5.63 ± 0.71 52.97 ± 1.81 22.00 ± 0.5812 41.47 ± 5.31 1.86 ± 0.36 5.81 ± 0.68 35.02 ± 4.62 14.90 ± 1.569 0.36 ± 0.62 9.27 ± 1.24 41.21 ± 0.90 22.66 ± 1.22 25.41 ± 0.63
400 10 0.76 ± 0.36 4.23 ± 1.93 27.74 ± 4.89 42.42 ± 3.18 24.66 ± 0.5011 6.65 ± 3.68 2.99 ± 0.86 15.90 ± 2.19 49.30 ± 2.28 23.40 ± 1.0612 32.49 ± 3.25 1.94 ± 0.93 10.18 ± 0.85 37.42 ± 1.45 17.09 ± 0.58
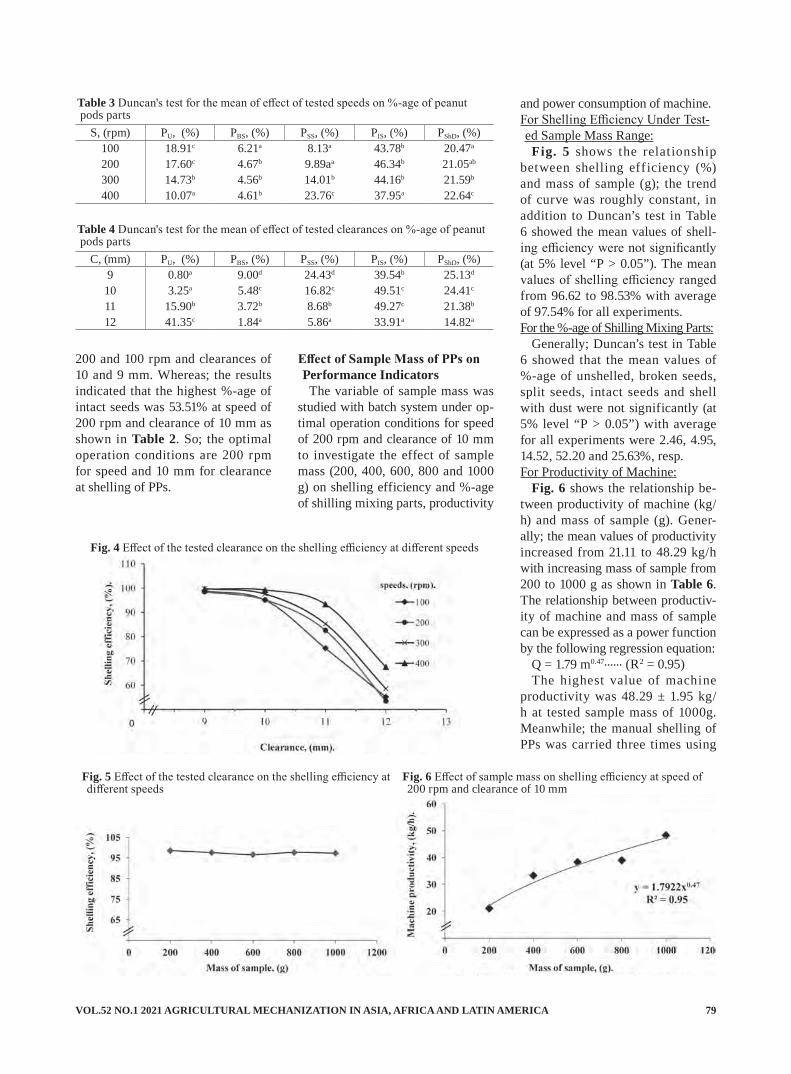
VOL.52 NO.1 2021 AGRICULTURAL MECHANIZATION IN ASIA, AFRICA AND LATIN AMERICA 79
200 and 100 rpm and clearances of 10 and 9 mm. Whereas; the results indicated that the highest %-age of intact seeds was 53.51% at speed of 200 rpm and clearance of 10 mm as shown in Table 2. So; the optimal operation conditions are 200 rpm for speed and 10 mm for clearance at shelling of PPs.
Effect of Sample Mass of PPs on Performance IndicatorsThe variable of sample mass was
studied with batch system under op-timal operation conditions for speed of 200 rpm and clearance of 10 mm to investigate the effect of sample mass (200, 400, 600, 800 and 1000 g) on shelling efficiency and %-age of shilling mixing parts, productivity
and power consumption of machine.For Shelling Efficiency Under Test-ed Sample Mass Range:Fig. 5 shows the relationship
between shelling eff iciency (%) and mass of sample (g); the trend of curve was roughly constant, in addition to Duncan’s test in Table 6 showed the mean values of shell-ing efficiency were not significantly (at 5% level “P > 0.05”). The mean values of shelling efficiency ranged from 96.62 to 98.53% with average of 97.54% for all experiments.For the %-age of Shilling Mixing Parts:
Generally; Duncan’s test in Table 6 showed that the mean values of %-age of unshelled, broken seeds, split seeds, intact seeds and shell with dust were not significantly (at 5% level “P > 0.05”) with average for all experiments were 2.46, 4.95, 14.52, 52.20 and 25.63%, resp.For Productivity of Machine:
Fig. 6 shows the relationship be-tween productivity of machine (kg/h) and mass of sample (g). Gener-ally; the mean values of productivity increased from 21.11 to 48.29 kg/h with increasing mass of sample from 200 to 1000 g as shown in Table 6. The relationship between productiv-ity of machine and mass of sample can be expressed as a power function by the following regression equation:
Q = 1.79 m0.47...... (R2 = 0.95)The highest value of machine
productivity was 48.29 ± 1.95 kg/h at tested sample mass of 1000g. Meanwhile; the manual shelling of PPs was carried three times using
Table 4 Duncan's test for the mean of effect of tested clearances on %-age of peanut pods parts
C, (mm) PU, (%) PBS, (%) PSS, (%) PIS, (%) PShD, (%)9 0.80a 9.00d 24.43d 39.54b 25.13d
10 3.25a 5.48c 16.82c 49.51c 24.41c
11 15.90b 3.72b 8.68b 49.27c 21.38b
12 41.35c 1.84a 5.86a 33.91a 14.82a
Table 3 Duncan's test for the mean of effect of tested speeds on %-age of peanut pods parts
S, (rpm) PU, (%) PBS, (%) PSS, (%) PIS, (%) PShD, (%)100 18.91c 6.21a 8.13a 43.78b 20.47a
200 17.60c 4.67b 9.89aa 46.34b 21.05ab
300 14.73b 4.56b 14.01b 44.16b 21.59b
400 10.07a 4.61b 23.76c 37.95a 22.64c
Fig. 6 Effect of sample mass on shelling efficiency at speed of 200 rpm and clearance of 10 mm
Fig. 5 Effect of the tested clearance on the shelling efficiency at different speeds
Fig. 4 Effect of the tested clearance on the shelling efficiency at different speeds

AGRICULTURAL MECHANIZATION IN ASIA, AFRICA AND LATIN AMERICA 2021 VOL.52 NO.180
Table 6 Duncan's test for effect of tested masses on shelling efficiency, %-age of shilling mixing parts, productivity and power consumption
MS, (g) 200 400 600 800 1000ηSh, (%) 98.53a 97.59a 96.62a 97.67a 97.28a
%-age of shilling mixing parts
PU 1.47a 2.41a 3.38a 2.33a 2.72a
PBS 5.03a 4.43a 4.55a 5.68a 5.06a
PSS 14.91a 12.94a 14.97a 14.75a 15.04a
PIS 51.89ab 54.69b 51.81ab 51.74ab 50.88a
PShD 26.52a 25.15a 25.24a 25.27a 25.93a
Q, (kg/h) 21.11a 34.36b 38.33b 38.99b 48.29c
P, (W) 666.79a 677.21a 680.86a 676.69a 698.59b
Table 5 Values of shelling efficiency at tested clearances and speeds (mean value ± standard deviation) and result of Duncan's test
C, (mm)Shelling efficiency, (%)
S, (rpm)100 200 300 400 Mean
9 98.92 ± 0.29 98.46 ± 0.74 99.77 ± 0.40 99.64 ± 0.62 99.20a
10 95.10 ± 1.45 95.12 ± 2.78 97.54 ± 1.19 99.24 ± 0.36 96.75a
11 75.23 ± 4.16 82.57 ± 2.88 85.25 ± 2.82 93.35 ± 3.68 84.10b
12 55.14 ± 4.20 53.45 ± 8.40 58.53 ± 5.31 67.51 ± 3.25 58.65c
Mean 81.10c 82.40c 85.27b 89.93a --------
sample of 150 g. The results indicat-ed that the productivity of manual shelling was 1.09 ± 0.19 kg/h.For Power Consumption:
Duncan’s test in Table 6 showed that the mean effect of sample mass on the power consumption (W). The mean values of power consumption are not significantly (at 5% level “P < 0.05”) from 200 to 800 g and sig-nificantly (at 5% level “P > 0.05”) when increasing the sample mass from 800 to 1000 g.
Conclusions and Recom-mendations• The used machine achieved high
efficiency in shelling of PPs. Under the tested speed range [100 (1.047) to 400 rpm (4.189 m/s)] and the tested clearance range [9 to 12 mm].The optimum operation conditions for shelling of PPs was 200 rpm for speed and 10 mm for clearance.
• Under the tested sample mass range [200 to 1000 g], the mean values of shelling efficiency were not significantly with average of 97.54%. Also; the mean values of %-age of unshelled, broken seeds, split seeds, intact seeds and shell with dust were not significantly with average of 2.46, 4.95, 14.52, 52.20 and 25.63%, resp.
• The results revealed that the high-est value of machine productivity was 48.29 kg/h; whereas the mean value of power consumption was 689.59 W.
• To increase the productivity of ma-chine at shelling of peanut pods preferable add a screw or blades from suitable material on drum of machine (rotary part).
REFERENCES
Aydin, C. 2007. Some engineering properties of peanut and kernel. (Turkey) - J. Food Eng., (79): 810-816.
Dilmac, M. and A. Ebubekir. 2012.
Selected some engineering prop-erties of peanut and its kernel. (Turkey) - Int. J. Food Eng., 8 (2), Art. 20.
El-Sayed, A. S., Yahaya, R., Wack-er, P. and H. D. Kutzbach. 2001. Characteristic attributes of the peanut (Arachis hypogaea L.) for its separation. (Germany) - Int. Agrophysics., (15): 225-230.
FAO. 2017. Food and Agriculture Organization of the United Na-tions. http://www.fao.org/faostat/en/#data/QC
Ghanem, T. H., Shetawy, M. E. and A. K. Zaalouk. 2009. Physical properties of hulled peanuts and kernels. (Egypt) - The 16th. An-nual Conference of Misr Society of Ag. Eng., 1598-1609.
Gitau, A. N., Mboya, P., Njoroge, B. N. K. and M. Mburu. 2013. Optimizing the performance of a manually operated groundnut (Arachis hypogaea) decorticator. (Kenya) - OJOp., 2: 26-32.
Helmy, M. A., Mitrroi, A., Abdallah, S. E. and M. A. Basiouny. 2013. Modification and performance evaluation of a reciprocating ma-chine for shelling peanut. (Egypt) - AMA, 44(3): 18-24.
Knauft, D. A. and P. Ozias-Akins, 1995. Recent methodologies for germplasm enhancement and breeding. In: Pattee H.E. & H.T. Stalker (Eds.), Advances in Pea-nut Science.American Peanut Research and Education Society, Stillwater, Oklahoma, pp. 54-94.
Kurt, C. and H. Arioglu. 2018. Physi-cal and mechanical properties of some peanut varieties grown in Mediterranean environment. (Tur-key) - CercetăriAgronomiceîn Mol-dova Vol. LI, No. 2 (174): 27-34.
Mady, M. A. 2017. Manufacture and evaluation of a simple prototype of peanut sheller (Egypt) - Misr J. Ag. Eng., 34 (2):751-766.
Mousa, A. M. 2018. Developing and evaluation of a shelling/cracking machine some agricultural products (Shelling of Jatropha Fruits). (Egypt) - Misr J. Ag. Eng., 35(3): 785-806.
Prem, M., Ranjan, P., Pragi, S. J., Dabhi, K. L. and A. V. Baria. 2017. Pod shelling machines - A review. (India) - IJASR, 7 (1): 321-326.
Werby, R. A. and A. M. Mousa 2016. Some physical and mechanical properties of Jatropha fruits. (Egypt) - Misr J. Ag. Eng., 33(2): 475-490.
■■

VOL.52 NO.1 2021 AGRICULTURAL MECHANIZATION IN ASIA, AFRICA AND LATIN AMERICA 81
Power Requirement and Fuel Consumption Reduction of Forage Harvester Chopper Blades by Thermal Coating
byEngin ERGÜLDokuz Eylül University,Izmir Vocational School,Department of Technical Programs,Buca, Izmir, 35390, [email protected]
Bülent ÇAKMAK*Ege University, Department of Agricultural Machinery andTechnologies Engineering,Bornova, Izmir, 35100, TURKEY*Corresponding author: [email protected]
AbstractThe objective of this study wasto
scrutinize the improvement of cut-ting efficiency of chopper blades used in forage harvesters and to determine the change in energy consumption by this means. The chopper blades used convention-ally were coated thermally with two type coating powder alloys in the study. The coated blades and conventional ones were used on the same machine during all harvest season. Power requirement and fuel consumption of the harvest machine
during harvesting were determined separately by using conventional and coated blades. It was deter-mined that the blades coated with WC-Ni-Cr-Co-B-Si powder alloy (WC+Co) generated high rate of en-ergy saving in comparison to both conventional blades and other coat-ed blades. It was determined that conventional blades have higher fuel consumption than the coated blades. The fuel consumption of WC+Co powder alloy coated blades was ap-proximately 22.5% lower than that of conventional blade. This differ-ence increased as the harvested area increased. The fuel consumption difference between conventional blade and WC+Co powder alloy coated blades reached 3.89 Lh-1 (40.65%) when the harvested area reached 3 ha.
Keywords: Fuel cost, HVOF, Pow-der alloy, power requirement
IntroductionSilo forage is a gross forage
source used for economic, bal-anced and adequate nourishment of ruminants and made of numerous products (Saner, 1993; Konca et al., 2005; Avcıoğlu et al., 1998; Kılıç,
1986). Particularly corn silage is used frequently for providing forage to ruminants due to its high efficien-cy and easily digestible property and its taste and storability (Kılıç, 1986, Komleh et al., 2011). More than 70% of silo forage is corn si-lage in World (Yaylak and Alçiçek, 2003). Harvesting is one of the most critical cost parameters in the pro-duction of silage (Barut et al., 2011). The plant must be harvested and chopped in an appropriate length to make silage. Forage harvester har-vests forage plants to make silage (Fig. 1). Various types of harvesters are used in silage corn harvesting. Even though the machines used for harvesting are different in construc-tion, the work is similar. Single row forage harvesters widely used in Turkey and also in the Middle East countries.
The plant is cut-chopped and conveyed during harvesting. Cut-ter/chopper blades are active com-ponents of forage harvesters for cutting and chopping plants. The blades apply cutting force at high rotation speed to the stem and chop-ping is made. It is essential that the plant is chopped in an appropriate length for a sought silage quality. The number of the blades, blade ma-
Fig. 1 Single row forage harvester

AGRICULTURAL MECHANIZATION IN ASIA, AFRICA AND LATIN AMERICA 2021 VOL.52 NO.182
terial properties and blade geometry are critical for quality of cutting and chopping (Reily et al., 2004). Chop-ping length, quality and especially needed well-compacting product during silage production is impor-tant for obtaining silage in sought characteristics (Komanduri et al., 1998). However, blades lose their cutting effectiveness due to wear like all machine components during cutting porcess. These worn blades with less cutting effect cannot chop neatly and the product chopping length homogeneity is lost. In this case, silage quality reduces and more power is required for cutting and chopping (Komanduri et al., 1998; Chen et al., 2004). Because of this, fuel consumption and carbon emissions increased (Houshyar et al., 2015).
The features of the blades used in forage harvester affect the machine eff iciency and chopped product quality directly therefore, improve-ments of the chopper blades change machine effectiveness and the re-sulting product quality positively. One of these improvements is to in-crease wear resistance of the blades. Industrial solutions are applied in different sectors for this purpose. The most general and low cost of these solutions is coating the equip-ment surface with a harder material.
In this study, improvement of cutting effectiveness of the chop-per blades used in forage harvesters was aimed. The coated blades werer used in single row forage harvesters in real harvest conditions.
Single row forage harvesters are mounted on a three point linkage of a tractor. The active component of forage harvesters is the chopper blades and there are 10 or 12 blades generally in a single row forage har-vester (Fig. 2).
Forage harvester has a drum (cut-terhead) or a flywheel with 12 chop-per blades fixed. The chopped crop and the silage blows out a discharge spout of the harvester into a forage wagon that is connected either to the
harvester or to another vehicle driv-ing alongside. The dimension and features of the product harvested in forage harvester depends on the sharpness of the chopper blades and the sustained time of this sharpness (O’Dogherty, 1982).
Corn cutting force is high when compared with other products used for forage (Table 1) (Persson, 1987). The blades quickly blunt while the plant cutting force is high. Higher cutting force will be needed as the cutting blades become blunt (Prasad and Gupta , 1975; Xu and Yao, 2009). Blades are manufactured of medium carbon steel and generally hardened or selected areas (cut-ting edge) induction hardened to sustain their cutting features for a long time. Effectiveness of chopping blades diminishes after a certain operation time depending on some basic parameters including the vari-ety of the chopped product, product moisture, harvested area, operator’s skill, blade material quality and heat treatment of blades
Decreasing the cutting efficiency of the blades during harvest increas-es the shear force and increases the
fuel consumption (Akritidis, 1974; Reily et al., 2004, Kathirvel et al., 2009, Mathanker et al., 2015). On the other hand, crushing and tatter-ing occurs instead of cutting and chopping due to the loss of sharp-ness (Persson, 1987; Atkins, 2009). In this case, juice loss of the tattered and crushed corns increases rela-tively. Therefore, blades are grinded by a system equipped with a blade-gr inding stone mounted on the machine for improving chopping efficiency of blunt blades. Grinding process is carried out for all blades simultaneously. This process goes on periodically until the cutting edge of the blades is completely worn out. Each gr inding work causes the shortening of the cut-ting edge of the blades superficially than the amount of the lost material annually due to grinding. Further-more, the effective usage period of the blades after each grinding de-creases relatively.
It is critical to minimize sharp-ness losing of the chopper blades of forage harvesters and to form a controlled abrading mechanism for ensuring usage of the blades for a
Fig. 2 Chopper blade mounted disc used in single row harvester and dimensions of chopper blade before coating
Table 1 Values of material load in cutting devices common in agricultural cutting devices
Material load in cutting
device(Mg mm-2)
Material solid thickness
(mm)
Moisture content,
wet basis(%)
Sickle-bar mower, grasses 0.22 0.15 74Forage harvester (flywheel type), alfalfa 5.30 3.70 70Forage harvester (cylinder type), alfalfa 3.00 2.00 70Forage harvester, corn 11.00 7.60 60

VOL.52 NO.1 2021 AGRICULTURAL MECHANIZATION IN ASIA, AFRICA AND LATIN AMERICA 83
longer time without grinding and for continuity of cutting effective-ness and machine efficiency (Lau et al., 2000). For this purpose, coating of the surface used in other indus-trial sectors with a harder material and improvement of abrasion resis-tance is a practical solution. Hence, a section of the surface of conven-tional chopper blades used in forage harvesters was coated with special powder alloys by using thermal spraying method. The abrading sec-tion of blade for improving of abra-sion resistance and continuity of blade cutting effectiveness was coat-ed with harder material than blade material.Thus, power requirement and fuel consumption of forage harvesters will goes down. It was
reported that increasing in energy efficiency of forage harvester and diminishing greenhouse gas emis-sion has been achieved by this way (Alluvione et al., 2011; Soltani et al., 2013; Khoshnevisan et al., 2014).
Materials and MethodsHarvesting studies were carried
out in Izmir city located in the west-ern part of Turkey. The harvest area is situated at 38°34' north latitudes and 27°02' east longitudes and its level from the sea level is approxi-mately 10 m.
The operator, tractor and single row forage ha r veste r was not changed during harvesting works for determinig power requirement and fuel consumption of blades. The chopper blades used in the machine were the conventional (uncoated) and the blades coated with a coating having two different powder alloys by using thermal spraying method.
CropA KWS6565 FAO 570 variety hy-
brid corn seed was used for harvest crop production. This variety is a very early variant. It can be grown as main crop or second crop and has no soil selectivity. Average crop yield in all area of study is carried out as 6.5 Mg ha-1 ± 0.01. Corn grown as a second crop was harvested by using single row forage harvester.
Single Row Forage HarvesterIn the study was used single row
forage harvester. Some technical specifications of the machine used in the experiments were given in the Table 2.
The power requirement and fuel consumption of the machine during harvesting was separately deter-mined while working both conven-tional blade and coated blades.
TractorLandini Powerfarm 75 model
tractor was used in the all harvest trials. The power of the tractor is 67 HP and the maximum torque is 272.6 Nm. The selected tractor is suitable for harvesting according to its technical specifications and is capable of operating with single row harvester (Table 3).
Blade Material and Coating Pow-der AlloysThe quality of the steel used for
the blades on forage harvester is AISI 1040 and the hardening is car-ried out locally in the heat treatment furnance (Hardening at 845 °C and Normalizing at 540 °C). AISI 1040 steel is defined as medium carbon steel because of the middle amount of carbon it contains and commonly used for single row forage harvest-ers’ blade (conventional blade). The chemical, physical and mechanical properties of AISI 1040 quality steel are given in Table 4 and Table 5 respectively.
The conventional blades’ selected surface coated with a harder materi-al to improve of abrasion resistance. Tungsten carbide (WC) among
Table 3 Technical specifications of tractor used in harvest trials
EngineModel Perkins 1104 C-44Type Diesel, Liqued-
cooledPower 67 HP/ 50 kWNumber of Cylinder 4Cylinder volume 4400 cm3
Fuel tank capacity 103 LPower Take-off
PTO Shaft Rear PTORotational speed 540 min-1
Transmitted power 62 HP/ 46.2 kW Power transmission
Gear box 12 forward and reverse
Max. speed 40 km h-1
Lift capacity 3692 kgfHydraulic pump flow 52.3 L min-1
Table 2 Technical specifications of single row forage harvester used in studyLenght, mm 2500 mmWidht, mm 2300 mmHeight, mm 3500 mmShredder blades 12 piecesPTO Minimum 540 min-1
Chopping crop lenght
5-20 mm
Attaching to tractor
With 3 point linkage sytem
Working speed 7-9 km h-1
Working capacity 35 Mg h-1
Table 5 Some mechanical and physical properties of AISI 1040 steelMechanical Properties Physical Properties
Young's modulus 200000 MPa Thermal expansion 10.10-6 K-1
Tensile strength 650-880 MPa Specific heat 460 J kg-1 K-1
Elongation 8-25 % Melting temperature 1450-1510 °CFatigue 275 MPa Density 7700 kg m-3
Yield strength 350-550 MPa
Table 4 Chemical composition (content in %) of AISI 1040 steelCarbon
(C)Silicon
(Si)Manganese
(Mn)Phosphorus
(P) ≤Sulfur (S) ≤
0.37-0.44 0.07-0.06 0.60-0.90 0.03 0.05

AGRICULTURAL MECHANIZATION IN ASIA, AFRICA AND LATIN AMERICA 2021 VOL.52 NO.184
coating materials is preferred and used for improvement of abrasion resistance (Nascimento et al., 2001). The chemical composition and some physical properties of two different powder alloys are given in Table 6.
MethodsCoating
Thermal spraying method was selected for coating blade surfaces since its application is rapid and easy and its cost is lower in com-parison to other methods (Tafralı, 2006; Pawlowski, 2008). The abra-sion resistance of coating is directly related with the hardness of coating (Bozzi and de Mello, 1999). Two different powder alloys prepared with tungsten carbide and were used for improve effectiveness of blade. Coating powder alloys (A and B) were applied as a band form (select-ed surface) on the back side of the cutting edges of the chopper blades by using thermal spraying method (Fig. 3). Twelve blades were coated with each powder alloy and used in the machine.
Both powders were thermally sprayed on to degreased and grit blasted AISI 1040 Carbon Steel substrates to an average thickness of 630 µm. Coating were carried out using the HVOF (High velocity oxy-gen fuel thermal spray) system. The HVOF spraying method were per-formed by oxygen and acetylene as the fuel gas and two kinds of com-mercial powder alloys were used as coating materials (Table 7).
The chopper blades in forage har-vesters were used by coding them in the following way (3 × 12 sets as conventional and coated); • Blade S; is the conventional blade
(with no coating) situated in the machine as mounted in the fac-tory and used without making any changes.
• Blade A; is coated with coating material coded “A” powder alloys by thermal spraying application (12 blades were coated).
• Blade B; is coated with coating
material codes “B” powder alloys by thermal spraying application (12 blades were coated).
Hardness, Microstructures and Element Analyses of Blade Mate-rial and Coating The randomly selected cross-sec-
tions of coated blade were prepared to measure hardness, determination of microstructures and element con-tents. The cross-sections of coated blade cold-mounted in polyester resin were grinded using 2500 mesh SiC paper and diamond slurries (up to 0.5 μm) and were polished by colloidal silica slurry. Vickers micro hardness (HV/0.5/20) measurement test was made on cross-sections of blades and coating separately. The
measurements were repeated three times for the thermal coating and main material.
The microstructures of coating and blade material (AISI 1040) were studied by scanning electron microscopy (X-ray diff raction, Rigaku-Rint 2200/PC-Ultima 3). Additionally, Energy Dispersive Spect roscopy (EDS) technique (JEOL JSM-6060) was used for ele-mental analysis of blade and coating materials.
Determination of Fuel Consump-tionA total 3.0 ha area was harvested
for each blade set during harvest. While the power requirement was determined during harvesting and
Table 6 Chemical composition of coating A and B powder alloys
Designation of powder
Composition of weigh
percent %Element Weight
Percent %Manufacturing
methodParticle size
µm
Particlespeedm s-1
A powderalloys
60
Carbon 0.7-0.8
Agglomerated and sintered 20-45 700-800
Boron 3.0-3.4Silicon 3.9-4.9
Iron 2.4-4.6Chrome 14.0-16.0Nickel Balance
40Carbon 3.6-4.3Cobalt 11.0-13.0
Tungsten Balance
Bpowder alloys
88
Carbon 0.7-0.8Boron 3.0-3.4Silicon 3.9-4.9
Iron 2.4-4.6Chrome 14.0-16.0Nickel Balance
12 Carbon 3.8-4.3Tungsten Balance
Table 7 Technological parameters of the high velocity oxygen fuel thermal spray (HVOF) process
Powber Alloys
Fuel flow rateL min-1
Oxygen flow rateL min-1
Powder feeding rate g min-1
Spraying distance mm
A 240 900 90 370B 210 850 80 370
Fig. 3 Coating selected face of forage harvester chopper blade by using thermal spraying method
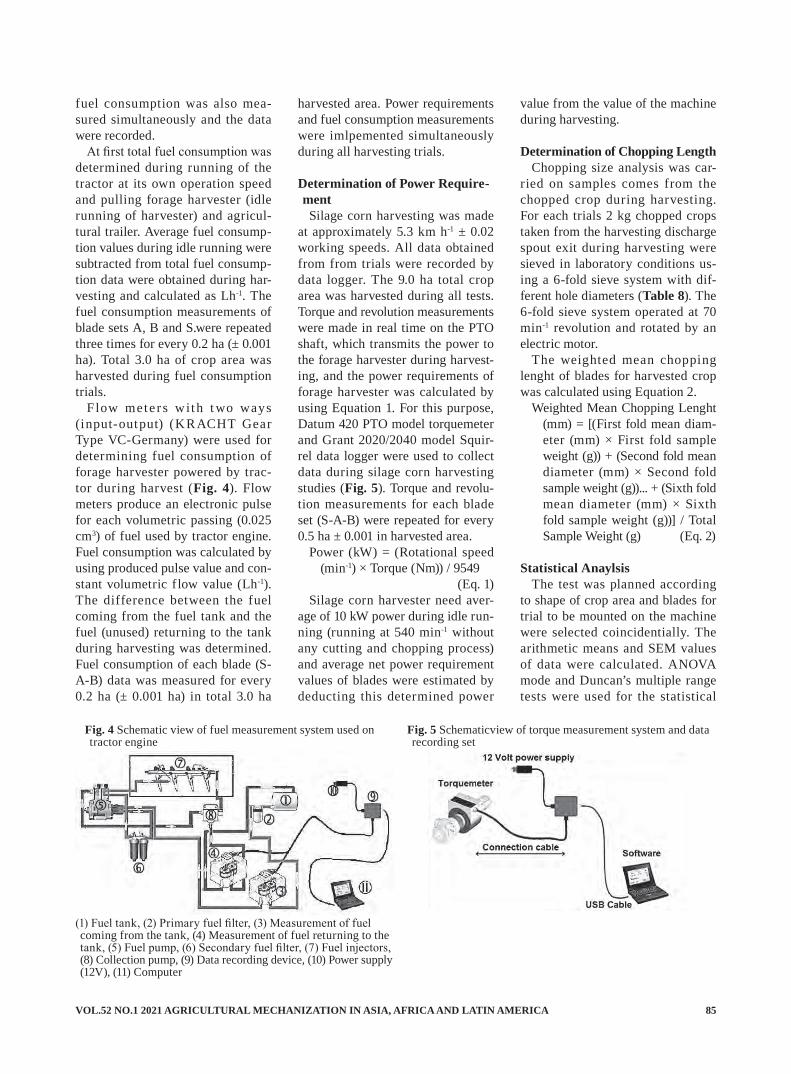
VOL.52 NO.1 2021 AGRICULTURAL MECHANIZATION IN ASIA, AFRICA AND LATIN AMERICA 85
fuel consumption was also mea-sured simultaneously and the data were recorded.
At first total fuel consumption was determined during running of the tractor at its own operation speed and pulling forage harvester (idle running of harvester) and agricul-tural trailer. Average fuel consump-tion values during idle running were subtracted from total fuel consump-tion data were obtained during har-vesting and calculated as Lh-1. The fuel consumption measurements of blade sets A, B and S.were repeated three times for every 0.2 ha (± 0.001 ha). Total 3.0 ha of crop area was harvested during fuel consumption trials.
F low mete r s with t wo ways (input-output) (KRACHT Gear Type VC-Germany) were used for determining fuel consumption of forage harvester powered by trac-tor during harvest (Fig. 4). Flow meters produce an electronic pulse for each volumetric passing (0.025 cm3) of fuel used by tractor engine. Fuel consumption was calculated by using produced pulse value and con-stant volumetric f low value (Lh-1). The difference between the fuel coming from the fuel tank and the fuel (unused) returning to the tank during harvesting was determined. Fuel consumption of each blade (S-A-B) data was measured for every 0.2 ha (± 0.001 ha) in total 3.0 ha
harvested area. Power requirements and fuel consumption measurements were imlpemented simultaneously during all harvesting trials.
Determination of Power Require-mentSilage corn harvesting was made
at approximately 5.3 km h-1 ± 0.02 working speeds. All data obtained from from trials were recorded by data logger. The 9.0 ha total crop area was harvested during all tests. Torque and revolution measurements were made in real time on the PTO shaft, which transmits the power to the forage harvester during harvest-ing, and the power requirements of forage harvester was calculated by using Equation 1. For this purpose, Datum 420 PTO model torquemeter and Grant 2020/2040 model Squir-rel data logger were used to collect data during silage corn harvesting studies (Fig. 5). Torque and revolu-tion measurements for each blade set (S-A-B) were repeated for every 0.5 ha ± 0.001 in harvested area.
Power (kW) = (Rotational speed (min-1) × Torque (Nm)) / 9549
(Eq. 1) Silage corn harvester need aver-
age of 10 kW power during idle run-ning (running at 540 min-1 without any cutting and chopping process) and average net power requirement values of blades were estimated by deducting this determined power
value from the value of the machine during harvesting.
Determination of Chopping LengthChopping size analysis was car-
ried on samples comes from the chopped crop during harvesting. For each trials 2 kg chopped crops taken from the harvesting discharge spout exit during harvesting were sieved in laboratory conditions us-ing a 6-fold sieve system with dif-ferent hole diameters (Table 8). The 6-fold sieve system operated at 70 min-1 revolution and rotated by an electric motor.
The weighted mean chopping lenght of blades for harvested crop was calculated using Equation 2.
Weighted Mean Chopping Lenght (mm) = [(First fold mean diam-eter (mm) × First fold sample weight (g)) + (Second fold mean diameter (mm) × Second fold sample weight (g))... + (Sixth fold mean diameter (mm) × Sixth fold sample weight (g))] / Total Sample Weight (g) (Eq. 2)
Statistical AnaylsisThe test was planned according
to shape of crop area and blades for trial to be mounted on the machine were selected coincidentially. The arithmetic means and SEM values of data were calculated. ANOVA mode and Duncan’s multiple range tests were used for the statistical
Fig. 4 Schematic view of fuel measurement system used on tractor engine
Fig. 5 Schematicview of torque measurement system and data recording set
(1) Fuel tank, (2) Primary fuel filter, (3) Measurement of fuel coming from the tank, (4) Measurement of fuel returning to the tank, (5) Fuel pump, (6) Secondary fuel filter, (7) Fuel injectors, (8) Collection pump, (9) Data recording device, (10) Power supply (12V), (11) Computer
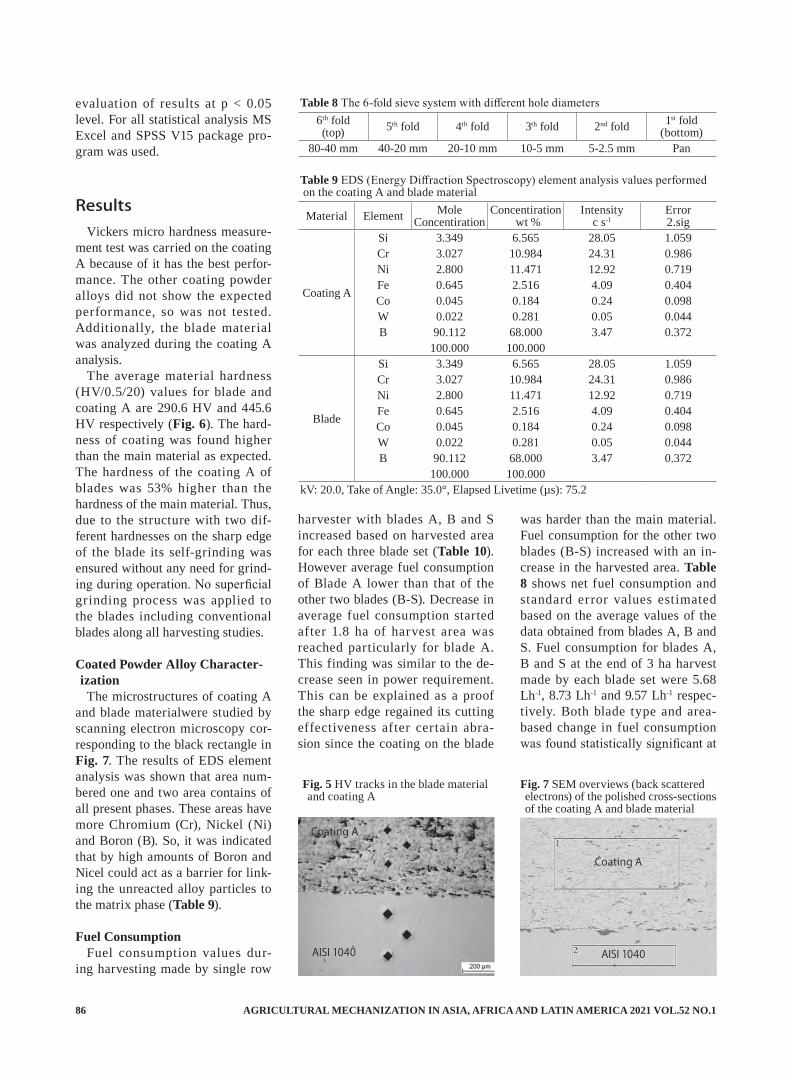
AGRICULTURAL MECHANIZATION IN ASIA, AFRICA AND LATIN AMERICA 2021 VOL.52 NO.186
evaluation of results at p < 0.05 level. For all statistical analysis MS Excel and SPSS V15 package pro-gram was used.
Results Vickers micro hardness measure-
ment test was carried on the coating A because of it has the best perfor-mance. The other coating powder alloys did not show the expected performance, so was not tested. Additionally, the blade material was analyzed during the coating A analysis.
The average material hardness (HV/0.5/20) values for blade and coating A are 290.6 HV and 445.6 HV respectively (Fig. 6). The hard-ness of coating was found higher than the main material as expected. The hardness of the coating A of blades was 53% higher than the hardness of the main material. Thus, due to the structure with two dif-ferent hardnesses on the sharp edge of the blade its self-grinding was ensured without any need for grind-ing during operation. No superficial grinding process was applied to the blades including conventional blades along all harvesting studies.
Coated Powder Alloy Character-ization The microstructures of coating A
and blade materialwere studied by scanning electron microscopy cor-responding to the black rectangle in Fig. 7. The results of EDS element analysis was shown that area num-bered one and two area contains of all present phases. These areas have more Chromium (Cr), Nickel (Ni) and Boron (B). So, it was indicated that by high amounts of Boron and Nicel could act as a barrier for link-ing the unreacted alloy particles to the matrix phase (Table 9).
Fuel ConsumptionFuel consumption values dur-
ing harvesting made by single row
harvester with blades A, B and S increased based on harvested area for each three blade set (Table 10). However average fuel consumption of Blade A lower than that of the other two blades (B-S). Decrease in average fuel consumption started after 1.8 ha of harvest area was reached particularly for blade A. This finding was similar to the de-crease seen in power requirement. This can be explained as a proof the sharp edge regained its cutting effectiveness after certain abra-sion since the coating on the blade
was harder than the main material. Fuel consumption for the other two blades (B-S) increased with an in-crease in the harvested area. Table 8 shows net fuel consumption and standard error values estimated based on the average values of the data obtained from blades A, B and S. Fuel consumption for blades A, B and S at the end of 3 ha harvest made by each blade set were 5.68 Lh-1, 8.73 Lh-1 and 9.57 Lh-1 respec-tively. Both blade type and area-based change in fuel consumption was found statistically significant at
Table 8 The 6-fold sieve system with different hole diameters6th fold(top) 5th fold 4th fold 3th fold 2nd fold 1st fold
(bottom)80-40 mm 40-20 mm 20-10 mm 10-5 mm 5-2.5 mm Pan
Fig. 5 HV tracks in the blade material and coating A
Coating A
AISI 1040 AISI 1040
Coating A
Fig. 7 SEM overviews (back scattered electrons) of the polished cross-sections of the coating A and blade material
Table 9 EDS (Energy Diffraction Spectroscopy) element analysis values performed on the coating A and blade material
Material Element MoleConcentiration
Concentiration wt %
Intensityc s-1
Error2.sig
Coating A
Si 3.349 6.565 28.05 1.059Cr 3.027 10.984 24.31 0.986Ni 2.800 11.471 12.92 0.719Fe 0.645 2.516 4.09 0.404Co 0.045 0.184 0.24 0.098W 0.022 0.281 0.05 0.044B 90.112 68.000 3.47 0.372
100.000 100.000
Blade
Si 3.349 6.565 28.05 1.059Cr 3.027 10.984 24.31 0.986Ni 2.800 11.471 12.92 0.719Fe 0.645 2.516 4.09 0.404Co 0.045 0.184 0.24 0.098W 0.022 0.281 0.05 0.044B 90.112 68.000 3.47 0.372
100.000 100.000kV: 20.0, Take of Angle: 35.0°, Elapsed Livetime (µs): 75.2
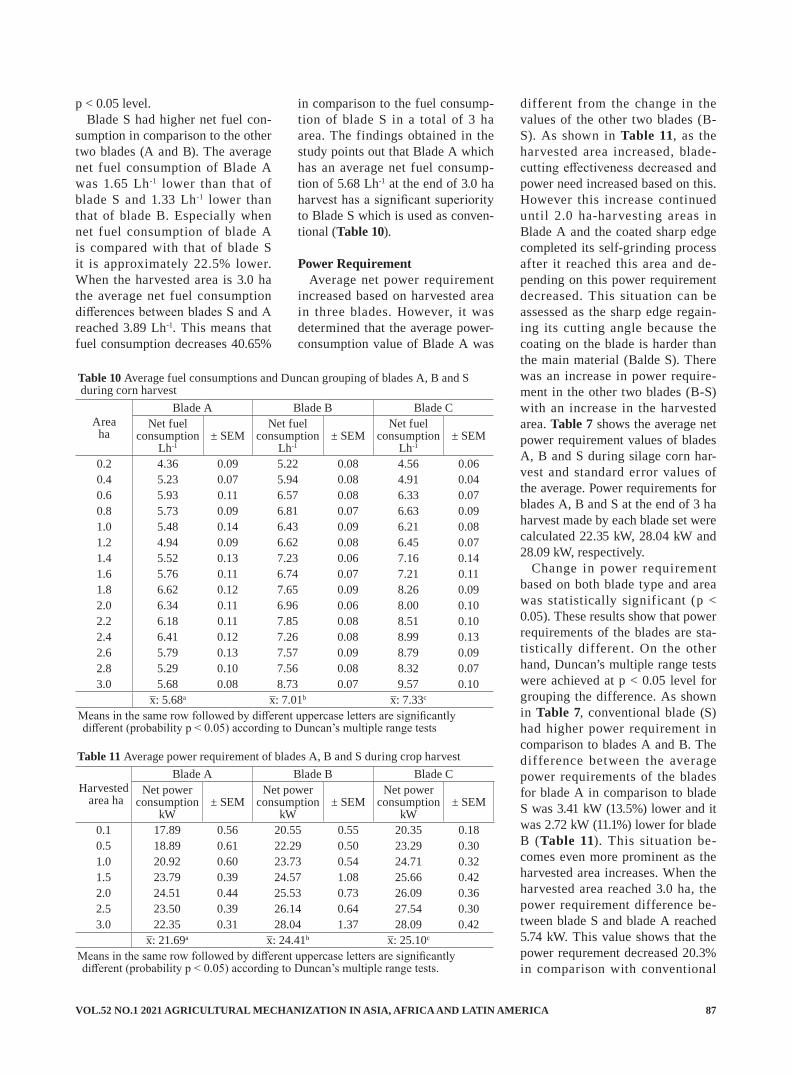
VOL.52 NO.1 2021 AGRICULTURAL MECHANIZATION IN ASIA, AFRICA AND LATIN AMERICA 87
p < 0.05 level.Blade S had higher net fuel con-
sumption in comparison to the other two blades (A and B). The average net fuel consumption of Blade A was 1.65 Lh-1 lower than that of blade S and 1.33 Lh-1 lower than that of blade B. Especially when net fuel consumption of blade A is compared with that of blade S it is approximately 22.5% lower. When the harvested area is 3.0 ha the average net fuel consumption differences between blades S and A reached 3.89 Lh-1. This means that fuel consumption decreases 40.65%
in comparison to the fuel consump-tion of blade S in a total of 3 ha area. The findings obtained in the study points out that Blade A which has an average net fuel consump-tion of 5.68 Lh-1 at the end of 3.0 ha harvest has a significant superiority to Blade S which is used as conven-tional (Table 10).
Power RequirementAverage net power requirement
increased based on harvested area in three blades. However, it was determined that the average power-consumption value of Blade A was
different from the change in the values of the other two blades (B-S). As shown in Table 11, as the harvested area increased, blade-cutting effectiveness decreased and power need increased based on this. However this increase continued until 2.0 ha-harvesting areas in Blade A and the coated sharp edge completed its self-grinding process after it reached this area and de-pending on this power requirement decreased. This situation can be assessed as the sharp edge regain-ing its cutting angle because the coating on the blade is harder than the main material (Balde S). There was an increase in power require-ment in the other two blades (B-S) with an increase in the harvested area. Table 7 shows the average net power requirement values of blades A, B and S during silage corn har-vest and standard error values of the average. Power requirements for blades A, B and S at the end of 3 ha harvest made by each blade set were calculated 22.35 kW, 28.04 kW and 28.09 kW, respectively.
Change in power requirement based on both blade type and area was statistically significant (p < 0.05). These results show that power requirements of the blades are sta-tistically different. On the other hand, Duncan’s multiple range tests were achieved at p < 0.05 level for grouping the difference. As shown in Table 7, conventional blade (S) had higher power requirement in comparison to blades A and B. The difference between the average power requirements of the blades for blade A in comparison to blade S was 3.41 kW (13.5%) lower and it was 2.72 kW (11.1%) lower for blade B (Table 11). This situation be-comes even more prominent as the harvested area increases. When the harvested area reached 3.0 ha, the power requirement difference be-tween blade S and blade A reached 5.74 kW. This value shows that the power requrement decreased 20.3% in comparison with conventional
Table 10 Average fuel consumptions and Duncan grouping of blades A, B and S during corn harvest
Areaha
Blade A Blade B Blade CNet fuel
consumptionLh-1
± SEMNet fuel
consumptionLh-1
± SEMNet fuel
consumptionLh-1
± SEM
0.2 4.36 0.09 5.22 0.08 4.56 0.060.4 5.23 0.07 5.94 0.08 4.91 0.040.6 5.93 0.11 6.57 0.08 6.33 0.070.8 5.73 0.09 6.81 0.07 6.63 0.091.0 5.48 0.14 6.43 0.09 6.21 0.081.2 4.94 0.09 6.62 0.08 6.45 0.071.4 5.52 0.13 7.23 0.06 7.16 0.141.6 5.76 0.11 6.74 0.07 7.21 0.111.8 6.62 0.12 7.65 0.09 8.26 0.092.0 6.34 0.11 6.96 0.06 8.00 0.102.2 6.18 0.11 7.85 0.08 8.51 0.102.4 6.41 0.12 7.26 0.08 8.99 0.132.6 5.79 0.13 7.57 0.09 8.79 0.092.8 5.29 0.10 7.56 0.08 8.32 0.073.0 5.68 0.08 8.73 0.07 9.57 0.10
x: 5.68a x: 7.01b x: 7.33c
Means in the same row followed by different uppercase letters are significantly different (probability p < 0.05) according to Duncan’s multiple range tests
Table 11 Average power requirement of blades A, B and S during crop harvest
Harvested area ha
Blade A Blade B Blade CNet power
consumptionkW
± SEMNet power
consumptionkW
± SEMNet power
consumptionkW
± SEM
0.1 17.89 0.56 20.55 0.55 20.35 0.180.5 18.89 0.61 22.29 0.50 23.29 0.301.0 20.92 0.60 23.73 0.54 24.71 0.321.5 23.79 0.39 24.57 1.08 25.66 0.422.0 24.51 0.44 25.53 0.73 26.09 0.362.5 23.50 0.39 26.14 0.64 27.54 0.303.0 22.35 0.31 28.04 1.37 28.09 0.42
x: 21.69a x: 24.41b x: 25.10c
Means in the same row followed by different uppercase letters are significantly different (probability p < 0.05) according to Duncan’s multiple range tests.

AGRICULTURAL MECHANIZATION IN ASIA, AFRICA AND LATIN AMERICA 2021 VOL.52 NO.188
blade.
Particle Size Distribution of Har-vested CropIn the crop harvest trials conduct-
ed with all three blades, the particle dist r ibution was car r ied out in predominantly in the range of 0-20 mm chopping length. The weighted mean chooping lenght of the blades were close to each other but blade A showed better performance (91.8%) as aparticle distribution rates (Table 12).
Economic Evaluation Coating cost of the blades is ap-
proximately half of the obtaining cost. Coating cost of the prototype study was $10 US (including VAT) per blade. This cost reduces even more in serial production. Twelve blades were coated for each chop-ping set. Price of fuel (diesel oil) used by agricultural tractors in Tur-key is approximately $1.3 US L-1. Total fuel cost of the harvest in 3 ha area made by the chopping blades in the study was $65 US (49.42 L) $100
US (75.95 L) and $109 US (83.26 L) for blades A, B and S respectively (Table 13). The fuel cost difference for blades A and S for 3 ha harvest was $44 US.
Duscussion A portion of the cutting surface
of the chopper blade used in single row forage harvester was coated with different powder alloys by us-ing thermal coating method. Chop-ping action made during silage corn harvest-process is an event caus-ing abrasion of the blades rapidly. In this study the coated surface is harder than the other portion of the blade in order to improve abra-sion resistance of the blades during
chopping. In the study was predict-ed that relatively soft blade material will wear off before than the hard coating of cutter edge of blade. This situation ensured self-grinding of the blade cutting edge. In the study, no measurement was made to deter-mine how the blade-cutting angle changed. But the results gave aspect that the cutting angle of the sharp edge was protected for a long time since the hard coating was abraded less in comparison to the blade main material during cutting process. Therefore, there was no need for grinding process for sharpening of blades which were needed to be ap-plied in the conventional method by forming a self-grinding mechanism.
Blade S had higher net fuel con-sumption in comparison to the
Table 12 Sieve analysis results of crop chopping lenght and the distribution
Blade Weighted mean chopping lenghtmm
Particle size distribution range of 0-20 mm %
S 14.2 87.2A 13.9 91.8B 14.3 86.6
Table 13 Total fuel consumptions of blades A, B and S depending on the harvest area
Harvested , ha
Blade A Blade B Blade CFuel consumption, Lh
-1
Cum
ulative harvesting tim
e, h
Cum
ulative fuel consum
ption , L
Fuel consumtion, L ha
-1
Fuel consumption, Lh
-1
Cum
ulative harvesting tim
e, h
Cum
ulative fuel consum
ption , L
Fuel consumtion, L ha
-1
Fuel consumption, Lh
-1
Cum
ulative harvesting tim
e, h
Cum
ulative fuel consum
ption , L
Fuel consumtion, L ha
-1
0.2 4.36 0.58 2.53 5.22 0.58 3.03 4.56 0.58 2.640.4 5.23 1.16 6.07 5.94 1.16 6.89 4.91 1.16 5.700.6 5.93 1.74 10.32 6.57 1.74 11.43 6.33 1.74 11.010.8 5.73 2.32 13.29 6.81 2.32 15.80 6.63 2.32 15.381.0 5.48 2.90 15.89 15.89 6.43 2.90 18.65 18.65 6.21 2.90 18.01 18.651.2 4.94 3.48 17.19 6.62 3.48 23.04 6.45 3.48 22.451.4 5.52 4.06 22.41 7.23 4.06 29.35 7.16 4.06 29.071.6 5.76 4.64 26.73 6.74 4.64 31.27 7.21 4.64 33.451.8 6.62 5.22 34.56 7.65 5.22 39.93 8.26 5.22 43.122.0 6.34 5.80 36.77 20.88 6.96 5.80 40.37 21.72 8.00 5.80 46.40 28.392.2 6.18 6.38 39.43 7.85 6.38 50.08 8.51 6.38 54.292.4 6.41 6.96 44.61 7.26 6.96 50.53 8.99 6.96 62.572.6 5.79 7.54 43.66 7.57 7.54 57.08 8.79 7.54 66.282.8 5.29 8.12 42.95 7.56 8.12 61.39 8.32 8.12 67.563.0 5.68 8.70 49.42 12.64 8.73 8.70 75.95 35.58 9.57 8.70 83.26 36.86

VOL.52 NO.1 2021 AGRICULTURAL MECHANIZATION IN ASIA, AFRICA AND LATIN AMERICA 89
other two blades (A and B). The average net fuel consumption of Blade A lower than that of blade S and blade B. Especially when net fuel consumption of blade A is compared with that of blade S it is approximately 22.5% lower. When the harvested area reaches 3.0 ha the average net fuel consumption difference between blades S and A reached 3.89 Lh-1. This means that fuel consumption of blade A decreases 40.65% in comparison to the fuel consumption of blade S in a total of 3 ha area. The findings obtained in the study points out that Blade A which has an average net fuel consumption of 5.68 Lh-1 at the end of 3.0 ha harvest has a signifi-cant superiority to Blade S which is used as conventional. The average net power requirement was 21.69 kW for blade A. It was 24.41 kW for blade B and 25.10 kW for blade S.
Blade A was coated with WC-Ni-Cr-Co-B-Si powder alloy. It was reported that WC within powder alloy used in coating improved anti-adhesion and corrosion resistance characteristic as well (Mo and Zhu, 2011; Bolelli et al., 2014; Liao et al., 2000). The best harvest perfor-mance was achieved by blade A in terms of fuel consumption and power requirement according to these data. The abrasion resistance of blade A was improved by coating it with WC-Ni-Cr-Co-B-Si powder alloy. The coating of blade B could not holded on to the main material surface and was separated from the surface. This is the reason why seperating of coating from surface was seen locally during the study due to the lack of Co which has a binding characteristic within the powder alloy used for the coating of blade B and/or inadequate amount of similar alloy elements. Addition-ally Cobalt eliminates thermal effect during coating (Geng et al., 2015).
While the harvested area in-creased, the difference between the total fuel consumptions of the chopping blades increased. On the
other hand, the grinding system that is used conventionally will not be added to the machine and the ma-chine production cost will decrease since there is no need for a manual grinding process. In addition, con-trolled abrasion achieved by coating of the chopper blades will eliminate material loss formed by superficial abrasion made in the conventional method. This situation means that usage time of the chopper blades increases relatively. This means that the period of use of the chop-per blades has increased relatively. However, in order to consolidate these considerations, work should be continued using different coating materials in larger harvest areas.
ConclusionsThe main outcomes of this study
can be summarized as continuoing usage of chopper blades without manual grinding, reducing the fuel consumption and power require-ments of forage harvester and dem-onstrate the economic impact of the new implementation.
Tungsten carbide-cobalt which is commonly used cotaing powder alloy in other sectors was used for improving abrasion resistance of chopping blade. Coating cost of the blades is approximately half of the obtaining cost as mentioned before. This cost can be reduced with serial production. In addition coating cost is acceptable when considering the saving considerable fuel consump-tion. For instance the fuel cost dif-ference for blades A (coated) and S (conventional) for solely 3 ha harvest is $44 US. Beside this, removing the grinding system from the machine design and reducing the amount of material worn by grinding will re-duce operatioanl costs. Both of these solvings are serious saving in forage harvest for farmers input costs.
REFERENCES
Akritidis, C. B. 1974. The Me-chanical Characteristics of Maize Stalks in Relation to the Charac-teristics of Cutting Blade. Journal of Agricultural Engineering Re-search, 19(1): 1-12. doi: 10.1016/ 0021-8634(74)90002-X
Alluvione, F., Moretti, B., Sacco, D. and C. Grignani. 2011. EUE (En-ergy Use Efficiency) of Cropping Systems for a Sustainable Agricul-ture. Energy, 36 (7), 4468-4481. doi:10.1016/j.energy.2011.03.075
Atkins, T. 2009. The Science and Engineering of Cutting, Chapter 9?Sharpness and Bluntness: Ab-solute or Relative?: Tool Materials and Tool Wear. Linacre House, Jordan Hill, Oxford OX2 8DP, UK: Elsevier.
Avcıoğlu, R., Soya, H., Geren, H. and A. Cevheri. 1998. The status of grassland and pastureland in the Ege region, problems and solutions. Ege Region First Agri-culture Congress, Volume 2: 235-242, Aydın.
Barut, Z. B., Ertekin, C. and H. A. Karaagaç. 2011. Tillage Effects on Energy Use for Corn Silage in Mediterranean Coastal of Turkey. Energy, 36(9): 5466-5475. doi: 10.1016/j.energy.2011.07.035
Bolelli, G., Berger, L. M., Bonetti, M. and L. Lusvarghi. 2014. Com-parative Study of the Dry Sliding Wear Behavior of HVOF-Sprayed WC-(W, Cr)2 C-Ni and WC-CoCr Hardmetal Coatings. Wear, 309 (1-2): 96-111. doi: 10.1016/j.wear. 2013.11.001
Bozzi, A. C. and J. D. B. de Mello. 1999. Wear Resistance and Wear Mechan isms of WC-12% Co Ther mal Sprayedcoat ings in Three-Body Abrasion. Wear, 233-235: 575-587. doi: 10.1016/S0043-1648(99)00206-9
Chen, Y. J., Gratton, L. and J. Liu. 2004. Power Requirements of Hemp Cutting and Conditioning. Biosystem Engineering, 87(4): 417-424. doi: 10.1016/j.biosystemseng.
AGRICULTURAL MECHANIZATION IN ASIA, AFRICA AND LATIN AMERICA 2021 VOL.52 NO.190
2003.12.012Geng, Z., Li, S., Duan D. L. and Y.
Liu. 2015. Wear Behavior of WC-Co HVOF Coatings at Different Temperatures in Air and Argon. Wear, 330-331: 348-353. doi: 10.1016/j.wear.2015.01.035
Houshyar, E., Zareifard, H. R., Grundmann, P. and P. Smith. 2015. Determining Eff iciency of Energy Input for Silage Corn Production: An Econometric Ap-proach. Energy, 93(2): 2166-2174. doi: 10.1016/j.energy.2015.09.105
Khoshnevisan, B., Shariati, H. M., Rafiee, S. and H. Mousazadeh. 2014. Comparison of Energy Con-sumption and GHG Emissions of Open Field and Greenhouse Strawberry Production. Energy, 29: 316-324. doi: 10.1016/j.rser. 2013.08.098
Kılıç, A. 1986. Silage Feed. Bilge-han Basımevi, Izmir.
Kathirvel, K., Suthakar, B. and D. Manohar Jesudas. 2009. Mechani-cal Harvesting of Fodder Maize as Influenced by Crop, Machine and Operational Parameters. Ag-ricultural Mechanization in Asia, Africa and Latin America, 40(4), pp. 52-56
Komanduri, R., Chandrasekaran, N. and L. M. Raff. 1998. Effect of Tool Geometry in Nanometric Cutting: A Molecular Dynam-ics Simulation Approach. Wear, 219(1): 84-97. doi: 10.1016/S0043-1648(98)00229-4
Komleh, P. S., Keyhani, A., Rafiee, S. and P. Sefeedpary. 2011. En-ergy Use and Economic Analysis of Corn Silage Production under Three Cultivated Area Levels in Tehran Province of Iran. Energy, 36(5): 3335-3341. doi:10.1016/j.energy. 2011.03.029
Konca, Y., Alçiçek, A. and E. Yayal-ak. 2005. Determination of Qual-ity of the Silage Made in Dairy Cattle Farms. Animal Production, 46(2): 6-13. (Abstract in English)
Lau, K. H., Mei, D., Yeung, C. F. and H. C. Man. 2000. Wear Char-acteristics and Mechanisms of A
Thin Edge Cutting Blade. Journal of Materials Processing Technolo-gy, 102(1-3): 203-207. doi: 10.1016/S0924-0136(99)00410-0
Liao, H., Normand, B. and C. Cod-det. 2000. Inf luence of Coating Microstructure on the Abrasive Wearresistance of WC/Co Cermet Coatings. Surface and Coatings Technology, 124(2-3): 235-242. doi: 10.1016/S0257-8972(99)00653-2
Mathanker, S. K., Grift, T. E. and A. C. Hansen. 2015. Effect of Blade Oblique Angle and Cutting Speed on Cutting Energy for Energy-cane Stems. Biosystems Engi-neering, 133: 64-70. doi: 10.1016/j.biosystemseng.2015.03.003
Mo, J. L., and M. H. Zhu. 2011. Tri-bological Investigation of WC/C Coating Under Dry Sliding Condi-tions. Wear, 271(9-10): 1998-2005. doi:10.1016/j.wear.2010.12.016
Nascimento, M. P., Souza, R. C., Miguel, I. M., Pigatin, W. L. and H. J. C. Voorwald. 2001. Effects of Tungsten Carbide Thermal Spray Coating Hp/Hvof and Hard Cromiun Electroplating on AISI 4340 High Strenght Steel. Surface and Coatings Technology, 138(2-3): 113-124. doi:10.1016/S0257-8972(00)01148-8
O’Dogherty, M. J. 1982. A Review of Research on Forage Chopping. Journal of Agricultural Engineer-ing Research, 27(4): 267-289. doi: 10.1016/0021-8634(82)90068-3
Pawlowski, L. 2008. The Science and Engineer ing of Ther mal Spray Coatings. Chapter 3: Ther-mal Spraying Techniques John Wiley and Sons Ltd, West Susex, England. pp: 67-113
Persson, S. 1987. Mechanics of Cut-ting Plant Material. American Society of Agircultural Engineers, St. Joseph, Michigan, 49085 USA.
Prasad, T. and C. P. Gupta. 1975. Mechanical Properties of Maize Stalk as Related to Harvesting. Journal of Agricultural Engineer-ing Research, 20(1): 79-87. doi: 10.1016/0021-8634(75)90098-0
Reily, G. A., Mc Cormack, B. A.
O. and D. Taylor. 2004. Cutting Sharpness Measurement: a Criti-cal Review. Journals of Materials Processing Technology, 153-154: 261-267. doi:10.1016/j.jmatprotec. 2004.04.297
Saner, G. 1993. A Study on The Economical Evaluation of Dairy Cattle Businesses for Marketing in Izmir Region. PhD Thesis. Ege University Graduate School of Natural and Applied Sciences, Izmir. (Abstract in English)
Soltani, A., Rajabi, M. H., Zeinali, E. and E. Soltani. 2013. Energy Inputs and Greenhouse Gases Emissions in Wheat Production in Gorgan, Iran. Energy, 50: 54-61. doi: 10.1016/j.energy.2012.12.022
Tafralı, M. 2006. Thermal Spray Systems. Surface Finishing and Blasting News, 38-41.
Xu, L. and H. Yao. 2009. Research on shear characteristics of Chi-nese cabbage rootstalk. Agri-cultural Mechanization in Asia, Africa and Latin America, 40(3), pp. 30-34
Yaylak, E. and Alçiçek, A. 2003. An Inexpensive Raw Feed Source in Cattle Breeding: Corn Silage. Animal Production, 44 (2): 29-36. (Abstract in English)
■■

VOL.52 NO.1 2021 AGRICULTURAL MECHANIZATION IN ASIA, AFRICA, AND LATIN AMERICA 91
-AFRICA-Benedict KayomboAssoc. Prof. of Soil and Water Eng., Dept. of Agric. Eng. and Land Planning, Botswana College of Ag-ric., Univ. of Botswana, Private Bag 0027, Gaborone, BOTSWANA. TEL+267-3650125, [email protected]
Mathias Fru FontehDirector, The College of Technology, The Uni-versity of Bamenda, P.O. Box 811, Mankon Bam-enda, Mezam Division, NW Region, CAMEROON. [email protected]
Sali Atanga NdindengDr., Rice Processing and Value-Addition Specialist, Africa Rice Center (AfricaRice), Sustainable Produc-tivity Enhancement, M’ bé Research Station, 01 B. P. 2551, Bouaké 01, COTE D’ IVOIRE, [email protected]
Said Elshahat AbdallahDr., Prof. of Agricultural Process Engineering De-partment of Agricultural Engineering, Faculty of Agriculture Kafrelsheikh University, Kafr Elsheikh 33516, EGYPT. TEL+20473148949, [email protected]; [email protected]
Ahmed Abdel Khalek El BeheryAgric Eng. Research Institute, Agril. Research Cen-ter, Nadi El-Said St. P.O. Box 256, Dokki 12311, Giza, EGYPT. [email protected]
Ahmad AddoAssoc. Prof., Department of Agril. Engg, Kwame Nkrumah Univ. of Sci. and Tech. (KNUST) Kumasi, GHANA. TEL+233-3220-60242, [email protected]
Richard Jinks BaniLecturer & Co-ordinator, Agric. Eng. Div., Faculty of Agric., Univ. of Ghana, Legon, GHANA
Israel Kofi DjokotoProf., Israel Kofi Djokoto, Associate Prof. Univ. of Science and Technology, P.O.Box 420 ust, Kumasi, GHANA, [email protected]
Ayub N. GitauChairman and Associate Prof., Dept. of Environ-
mental and Biosystems Engineering, University of Nairobi, P.O Box 30197, Nairobi, KENYA, [email protected]; [email protected]
David Kimutaiarap SomeEng. Prof. Dept. of Agril & Biosystems Eng., School of Engg Chepkoilel University College of Moi Univ., P.O. Box: 2405-30100, Eldoret, KENYA, [email protected]
Karim HoumyDr., International Consultant on Agricultural Mech-anization, 2 Rue Ali Al Haddani, Route Akrach, Sou-issi, Rabat, MOROCCO. TEL+212-7-680512, [email protected]
Akindele Folarin AlongePh.D, R. Eng, MNIM, Professor of Agricultural and Food Engineering/Consultant, Dept. of Agricul-tural & Food Engineering, Faculty of Engineer-ing, University of Uyo, P. M. B 1017, Uyo, Akwa-Ibom State, 52003, NIGERIA. Tel+2348033603462, [email protected]
O. A. OyeladeAssitant Director (Engineering), Farm Power and Machinery Dept., National Centre for Agril. Mecha-nization (NCAM), P.M.B. 1525, Ilorin, Kwara State, NIGERIA. TEL+2348069030588, [email protected]
Umar Buba BindirSecretary to the Adamawa State Government, The Government House, Yola, Adamawa State, NIGE-RIA. TEL+234-8-033-156-117, [email protected]
Joseph Chukwugotium IgbekaProf., Dept. of Agril. Eng., Univ. of Ibadan,, Ibadan, NIGERIA. TEL+234-2-810-1100-4, [email protected]
Emmanuel Uche OdigbohProf., Agril. Engg Dept., Faculty of Eng., Univ. of Ni-geria, Nsukka, Enugu state, NIGERIA. TEL+234-042-771676, [email protected]
Kayode C. OniDept. of Agril. & Biosystems Eng., Faculty of Eng. & Technology, Univ. of Ilorin, PMB 1515, Ilorin, NIGE-RIA. TEL+234-803-5724708, [email protected]
Umezuruike L. OparaResearch Prof., S. Africa Research Chair in Post-harvest Technology, Faculty of AgriSciences, Stel-lenbosch Univ., Private Bag X1, Stellenbosch 7602, SOUTH AFRICA. TEL+27-21-808-4604, [email protected]
Nathaniel Gbahama KuyembehAssoc. Prof., Njala Univ. Colle, Univ. of Sierra Le-one, Private Mail Bag, Free Town, SIERRA LEONE. TEL+249-11-778620/780045
Abdien Hassan AbdounMember of Board, Amin Enterprises Ltd., P.O. Box 1333, Khartoum, SUDAN. TEL+249-77860-780045
Amir Bakheit SaeedAssoc. Prof., Dept. of Agric. Eng., Faculty of Agric., Univ. of Khartoum, 310131 Shambat, SUDAN. TEL+249-11-310131, [email protected]
Abdisalam I. KhatibuP. O. Box 2138, Zanzibar, TANZANIA. [email protected]
Solomon Tembo52 Goodrington Drive, PO Mabelreign, Sunridge, Harare, ZIMBABWE.
-AMERICAS-Hugo Alfredo CetrangoloFull Prof. and Director of Food and Agribusiness Program Agronomy College Buenos Aires Univ., Av. San Martin 4453, (1417) Capital Federal, ARGEN-TINA. TEL+54-11-4524-8041/93, [email protected]
Irenilza de Alencar NääsProf. Paulista University, São Paulo, Brazil: R. Dr. Bacelar, 1212 - Vila Clementino Cep: 04026-002, São Paulo – S.P., BRAZIL. [email protected]
Abdelkader E. GhalyProf., Emeritus of Biological & Environmental Eng. Dalhousie Univ., P.O. Box 1500, 1360 Barrington St., Halifax, Nova Scotia, B3H 4R2, CANADA. [email protected]
Edmundo J. HetzProf., Dept. of Agric. Eng. Univ. of Concepcion, Av.
B Kayombo M F Fonteh A A KEl Behery
S E Abdallah
R J Bani I K Djokoto D K Some
K Houmy J C Igbeka E U-Odigboh
K C Oni N GKuyembeh
A HAbdoun
A B Saeed I de A Nääs A E Ghaly E J Hetz R Aguirre O Ulloa-Torres
Co-operating Editors
U L OparaUmar BBindir
M A L Roudergue
O A Oyelade
H ACetrangolo
Ahmad Addo
S Tembo
A N GITAU
A I Khatibu
S ANdindeng
A F Alonge

AGRICULTURAL MECHANIZATION IN ASIA, AFRICA, AND LATIN AMERICA 2021 VOL.52 NO.192
Surya Nath
A KMahapatra
V. Mendez 595, P.O. Box 537, Chillan, CHILE. TEL+56-42-216333, [email protected]
Marco A. L. RoudergueMechanization and Energy Dept., Agril. Eng. Fac-ulty, Campus Chillan, Univ. of Concepcion, Chile. Vicente Mendez #595, CHILE. TEL+56-42-2208709, [email protected]
Roberto AguirreAssoc. Prof., National Univ. of Colombia, A.A. 237, Palmira, COLOMBIA. TEL+57-572-271-7000, [email protected]
Omar Ulloa-TorresProf., Escuela de Agricultura de la Region, Tropi-cal Humeda(EARTH), Apdo. 4442- 1000, San Jose, COSTA RICA. TEL+506-255-2000, [email protected]
Yanoy Morejón MesaAgril. Engineer Univ. Agraria de La Habana, Facul-tad de Ciencias Técnicas Autopista Nacional y Car-retera de Tapaste Apartado, 18-19 San José de las Lajas, Mayabeque, CP 32700 CUBA. [email protected]
Pedro Paneque RondonAssoc. Prof., Universidad Agraria de La Habana, Facultad de Ciencias Técnicas, Autopista Nacional y Carretera de Tapaste, Apartado 18-19, San José de las Lajas, Mayabeque, CP 32700 CUBA. [email protected]
S. G. Campos Magan~aPhD. and Prof., Paseo de los Claveles #398, Colonia Parques de la Cañada. CP 25080, Saltillo, Coahuila, MEXICO. [email protected]
Hipolito Ortiz-LaurelHead of Agric. Eng. and Mechanization Dept./ Postgraduate College, Iturbide 73, Salinas de Hgo, S.L.P., C.P. 78600, MEXICO. TEL+52-496-30448
Alejandro Isabel Luna MaldonadoProf. and Head of the Dept. of Agricultural and Food Engineering, Autonomous University of Nuevo Leon, Nuevo León, MEXICO. [email protected]; [email protected]
Ganesh C. BoraAssociate Prof., Dept. of Agricultural and Biological Engineering, Mississippi State Univ., 130 Creel-man St., Room 242, P.O. Box 9632, MS 39762, U.S.A. [email protected]
Megh R. GoyalSenior Acquisitions Editor, Agric. & Biomedical Eng. and Retired Professor in Agric. & Biomedical Eng. Univ. of Puerto Rico, Mayaguez P.O. BOX 86, Rincon, PR-00677, U.S.A. [email protected]
Ajit K. MahapatraAgric. & Biosystems Eng. Dept., South Dakota State Univ., P.O. Box 2120 Brookings, SD 57007-1496, U.S.A. TEL+1-605-688-5291, [email protected]
-ASIA and OCEANIA-Daulat HussainDean, Faculty of Agric. Eng. and Technology, Ban-gladesh Agril. Univ., Mymensingh-2202, BANGLA-DESH. TEL+880-91-52245
Mohammed A. MazedMember-Director, Bangladesh Agri. Res. Council, Farmgate, Dhaka, BANGLADESH. [email protected]
Rostom AliProf., Dept. of Farm Power and Machinery, Bangla-desh Agricultural University, Mymensingh-2202, BANGLADESH. [email protected]
Chetem WangchenProgramme Director Agril. Machinery Centre Ministry of Agric. Royal Government of Bhutan, Bondey Paro Bhutan 1228, BHUTAN. [email protected]
Mohammad Ali Basunia Associate Prof., Mechanical Engineering Pro-gramme, Institute Teknologi Brunei (ITB), Jalan Tungku Link, Gadong BE 1410, BRUNEI DARUS-SALAM. [email protected]
Minzan LiProf. of College of Information and Electrical Engi-neering, China Agricultural University, P.O. Box 125, China Agricultural University (East Campus), Qin-ghua Donglu 17, Haidian District, Beijing, 100083, CHINA. [email protected]
Xiwen LuoProf. of South China Agricultural University; Aca-demician of Chinese Academy of Engineering, Wushan, Guangzhou, 510642, CHINA. [email protected]
S. M. IlyasProf. Green View Apartment, Flat-699; Pocket-2;
Sector-19; Dwarka, NEW DELHI-110 075, INDIA. Tel+91-95608 48971, [email protected]
Surya NathFlat #1143, G Block, Galaxy North Avenue, GC-3, Gaur City, Greater Noida. UP. 201009, INDIA. TEL +234-042-771676, [email protected]
Indra ManiProf., Head of Division of Agril. Eng. IARI, New Delhi-110012, INDIA. [email protected]
C. R. MehtaProject Coordinator, AICRP on Farm Implements and Machinery, ICAR - Central Institute of Agricul-tural Engineering, Nabi-bagh, Berasia Road, Bhopal - 462 038, INDIA. [email protected]
A. M. Michael1/64, Vattekunnam, Methanam Road, Edappally North P.O., Cochin, 682024, Kerala State, INDIA. [email protected]
B. S. PathakAdjunct Prof., Indian Agril. Research Institute, KC5, Kavi Nagar, Ghaziabad- 201002, INDIA. [email protected]
Vilas M. SalokheProf., Flat B-1, Royal Gateway Apartment Near Yal-lama Temple, Main Road Kasaba Bawada Kolhapur - 416006, INDIA. [email protected]
Gajendra SinghAdjunct Professor, Indian Agricultural Research Institute (IARI), 86-C, Millennium Apartments, Sector-61, NOIDA, U. P. 201301, INDIA. TEL+91-99-71087591, [email protected]
Sitaram Dagdupant KulkarniDr., Flat No. 105, Guruprasad Apptts., Plot No. 85 & 86, Survey No. 78, Left Bhusari Colony, Kothrud, Pune - 411038, INDIA. [email protected]
S. R. VermaEx-Dean & Prof. of Agr. Eng., H. No. 14, Good Friends Colony, Barewal Road, Ludhiana 141012. Punjab, INDIA. TEL+91-161-2551096, [email protected]
Peeyush SoniAssociate Prof., Dept. of Agricultural and Food Engineering, Indian Institute of Technology Kharagpur, Kharagpur, West Bengal -721302, INDIA. TEL+91-3222-283100, [email protected]
DaulatHussain
M A Mazed
Chetem Wangchen
S M Ilyas A MMichael
M ABasunia
Xiwen Luo Indra Mani C R Mehta
Saeid Minaei
M R Goyal
MBehroozi-Lar
Kamaruddin Abdullah
G C BoraH Ortiz-Laurel
S G CMagan~a
S R Verma
P P Rondon
G Singh
A I Luna Maldonado
V MSalokhe
R Ali
A Mahdavian
B S Pathak
Minzan Li
P Soni
Y M Mesa
A M Abdul-Munaim

VOL.52 NO.1 2021 AGRICULTURAL MECHANIZATION IN ASIA, AFRICA, AND LATIN AMERICA 93
R PVenturina
Kamaruddin AbdullahThe Graduate School/Renewable Energy, Darma Persada University, JI. Radin Inten II, Pondok Ke-lapa, East Jakarta, 13450, INDONESIA. TEL+64-21-8649051, [email protected]
Mansoor Behroozi-LarProf., Emeritus Tehran Uni. Agr. Eng., Ph. D., Jalal All Ahmad Nasim St. Nasim Danesh Complex Block #35, second floor Tehran, IRAN. [email protected]
Saeid MinaeiAssoc. Prof., Dept. of Agr. Machinery Eng., Tarbiat Modarres Univ., P.O.Box 14115-336, Tehran, IRAN. TEL+9821-44180537, [email protected]
Alireza MahdavianAssistance Prof., Department of Biosystems Engi-neering, Tarbiat Modares Univ., P.o.Box 14115-336, Tehran -14977-13111, IRAN. TEL +98-912-3346506, al .mahdavian@gmail .com; a [email protected]
Ali Mazin Abdul-MunaimAssistant Prof., Dept. of Agril. Machines and Equip-ments, College of Agric., Univ. of Baghdad, IRAQ. TEL+964-778-4561, [email protected]
Hideo HasegawaAssoc. Prof., Institute of Science and Technology, Niigata University, 8050 Ikarashi 2-no-cho, Nishi-ku, Niigata 950-2181 JAPAN. +81-25-262-6690, [email protected]
Bassam A. SnobarProf., Univ. of Jordan, Faculty of Agriculture, Am-man 11492, JORDAN. [email protected]
Jong Hoon ChungProf., Dept. of Biosystems & Biomaterials Science and Eng., College of Agril. and Life Sciences, Seoul National Univ., Bldg 200 Rm 2216 1 Gwanangno, Gwanak-Gu, Seoul, 151-742, KOREA. TEL+82-2-880-4601, [email protected]
In-Bok LeeProf., Laboratory of Aero-Environmental & Energy Engineering (A3EL), Dept. of Rural Systems Eng., College of Agril. & Life Sciences, Seoul National Univ., San 56-1, Shillim-dong, Gwanak-gu, Seoul-city, KOREA. TEL+82-2-880-4586, [email protected]
Muhamad Zohadie BardaieProf., Dept. of Agril. and Biosystems Eng., Univ. Putra Malaysia, 43400 upm, Serdang, Selangor,
MALAYSIA. TEL+60-3-8946-6410
Enkhbayar GonchigdorjDirector, School of Eng. & Technology, Mongo-lian University of Life Sciences, Ulaanbaatar, Zai-san, 17024, MONGOLIA. [email protected]
Madan P. PariyarConsultant, Rural Development through Selfhelp Promotion Lamjung Project, German Technical Cooperation. P.O. Box 1457, Kathmandu, NEPAL.
Hemanatha P. W. JayasuriyaCollege of Agril. and Marine Sciences, P.O. Box 34, PC 123Al-khod, Muscat Sultanate, OMAN. TEL+968-2414-1223, [email protected]
Alamgir A. KhanResearch Engineer, Agricultural Mechanization Re-search Institute, Multan, PAKISTAN. [email protected]
A. Q. A. MughalResearch Professor, Greenwich Univ., DK-10, Street 38t, Darakshan, DHA Phase-6, Karachi-75500, PAKI-STAN. [email protected]
Muhammad Saffar MirjatDean, Faculty of Agril. Eng., Sindh Agriculture Univ. Tandojam, PAKISTAN. TEL+92-221653160, [email protected]
Nawaf A. Abu-KhalafAssistant Prof., Palestine Technical Univ. -Kadoorie (PTUK), P.O.Box 405, Hebron, West Bank, PALES-TINE. TEL+972-2-2227-846/7, [email protected]
Reynaldo M. LantinRetired Professor, College of Engineering and Agro-Industrial Technology, University of the Phil-ippines Los Banos, College, Laguna 4031, PHILIP-PINES. TEL+63-49-536-2792, [email protected]
Ricardo P. VenturinaPHILIPPINES.
Saleh Abdulrahman Al-suhaibaniProf., Agril. Eng. Dept.,College of Agric., King Saud Univ., P.O. Box 2460 Riyadh 11451, SAUDI ARABIA. [email protected]
Ali Mufarreh Saleh Al-AmriProf., Dept. of Agril. Systems Eng., College of Agril. Sciences & Food, King Faisal Univ., P.O.Box 55035, Al-Ahsa, 31982 SAUDI ARABIA. [email protected]
Sarath G. IllangantilekeProf., Sarath Ilangantileke, Consultant in Agric Engineering, Mechanization and Education, 4/567 Victoria Range Bungalows, Kengalla, SRI LANKA. [email protected]
Suming ChenProf., Dept. of Bio-Industrial Mechatronics Eng., National Taiwan Univ., 1, Section 4, Roosevelt Road, Taipei, TAIWAN. TEL+886-2-33665350, [email protected]
Suraweth KrishnasreniEmeritus Prof. 24/77 Baan Kasemsan 1, Soi Kasemsan 1 Rama 1 Rd., Wangmai, Pathumwan, Bangkok 10330, THAILAND, [email protected]
Surin PhongsupasamitPresident, Institute for Promotion of Teaching Sci-ence and Technology, 924 Sukumit Rd. Klong Toey Bangkok, THAILAND, [email protected]
Akkapol SenanarongAgricultural Engineering Research Institue De-partment of Agriculture, 50 Phaholyothin Rd., Jatuchak Bangkok 10900, THAILAND, [email protected]
Can ErtekinProf., Dpt. of Farm Machinery and Technologies Eng., Faculty of Agril., Akdeniz University, 07070, Antalya, TURKEY. [email protected]
Imad HaffarManaging Director, Palm Water Jumeirah Village (SIte Office Gate #10) Al Khail Road, P.O. Box 215122, Dubai, U.A.E. Tel+971-4-375-1196, [email protected]
Nguyen HayProf., President of Nong Lam Univ., Linh Trung Ward, Thu Duc District, Ho Chi Minh City, VIET NAM. [email protected]
Pham Van LangVIET NAM. [email protected]
-EUROPE-Tihomir Hristov KatardjievGeneral Manager at Yogurtson Trade Ltd., Omachi 216-74, Ichikawa-shi, Chiba-ken 272-0801, Japan (BULGARIA). [email protected]
S AAl-Suhaibani
A M SAl-Amri
R M Lantin S G Illangantileke
B A Snobar M P Pariyar H P W Jayasuriya
A Q AMughal
Alamgir A Khan
Suming Chen
P V Lang J MüllerP KicT HKatardjiev
N Hay
Enkhbayar Gonchigdorj
I Haffar
M ZBardaie
C Ertekin
In-Bok LeeJ H Chung
ASenanarong
N AAbu-Khalaf
M S Mirjat
HHasegawa
SKrishnasreni
K P Ferentinos
S Phong-supasamit
Nick Sigrimis
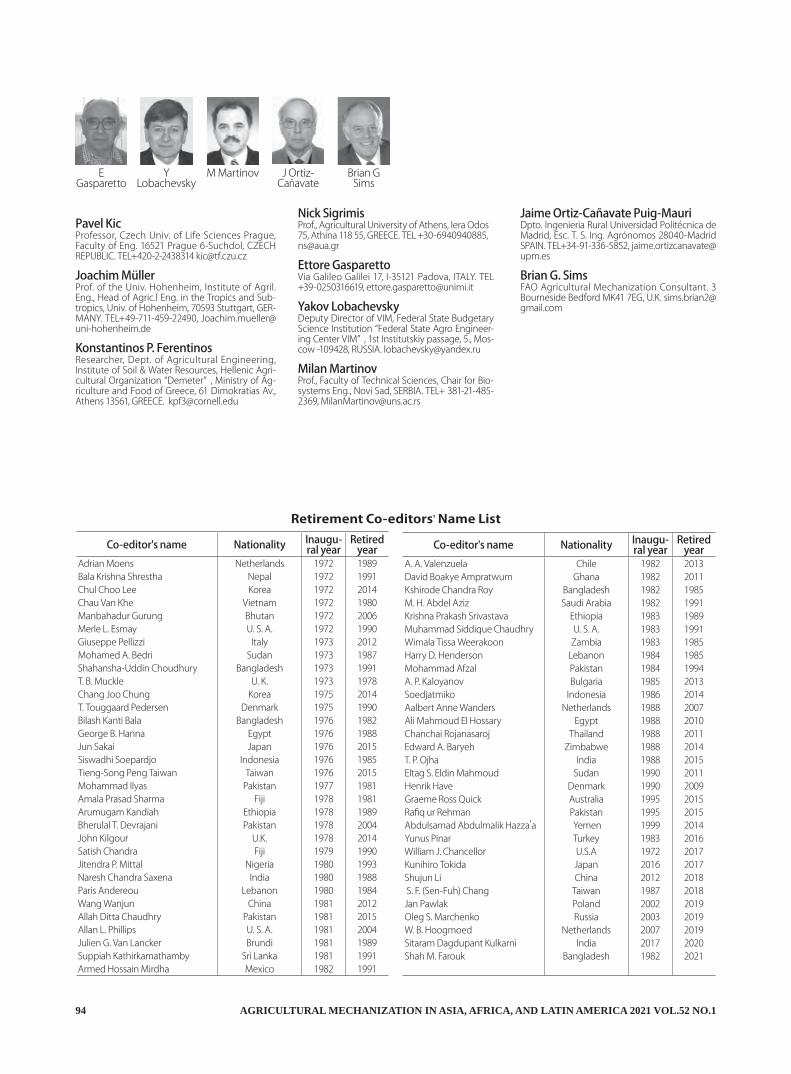
AGRICULTURAL MECHANIZATION IN ASIA, AFRICA, AND LATIN AMERICA 2021 VOL.52 NO.194
Co-editor's name Nationality Inaugu-ral year
Retired year
Adrian Moens Netherlands 1972 1989Bala Krishna Shrestha Nepal 1972 1991Chul Choo Lee Korea 1972 2014Chau Van Khe Vietnam 1972 1980Manbahadur Gurung Bhutan 1972 2006Merle L. Esmay U. S. A. 1972 1990Giuseppe Pellizzi Italy 1973 2012Mohamed A. Bedri Sudan 1973 1987Shahansha-Uddin Choudhury Bangladesh 1973 1991T. B. Muckle U. K. 1973 1978Chang Joo Chung Korea 1975 2014T. Touggaard Pedersen Denmark 1975 1990Bilash Kanti Bala Bangladesh 1976 1982George B. Hanna Egypt 1976 1988Jun Sakai Japan 1976 2015Siswadhi Soepardjo Indonesia 1976 1985Tieng-Song Peng Taiwan Taiwan 1976 2015Mohammad Ilyas Pakistan 1977 1981Amala Prasad Sharma Fiji 1978 1981Arumugam Kandiah Ethiopia 1978 1989Bherulal T. Devrajani Pakistan 1978 2004John Kilgour U.K. 1978 2014Satish Chandra Fiji 1979 1990Jitendra P. Mittal Nigeria 1980 1993Naresh Chandra Saxena India 1980 1988Paris Andereou Lebanon 1980 1984Wang Wanjun China 1981 2012Allah Ditta Chaudhry Pakistan 1981 2015Allan L. Phillips U. S. A. 1981 2004Julien G. Van Lancker Brundi 1981 1989Suppiah Kathirkamathamby Sri Lanka 1981 1991Armed Hossain Mirdha Mexico 1982 1991
Co-editor's name Nationality Inaugu-ral year
Retired year
A. A. Valenzuela Chile 1982 2013David Boakye Ampratwum Ghana 1982 2011Kshirode Chandra Roy Bangladesh 1982 1985M. H. Abdel Aziz Saudi Arabia 1982 1991Krishna Prakash Srivastava Ethiopia 1983 1989Muhammad Siddique Chaudhry U. S. A. 1983 1991Wimala Tissa Weerakoon Zambia 1983 1985Harry D. Henderson Lebanon 1984 1985Mohammad Afzal Pakistan 1984 1994A. P. Kaloyanov Bulgaria 1985 2013Soedjatmiko Indonesia 1986 2014Aalbert Anne Wanders Netherlands 1988 2007Ali Mahmoud El Hossary Egypt 1988 2010Chanchai Rojanasaroj Thailand 1988 2011Edward A. Baryeh Zimbabwe 1988 2014T. P. Ojha India 1988 2015Eltag S. Eldin Mahmoud Sudan 1990 2011Henrik Have Denmark 1990 2009Graeme Ross Quick Australia 1995 2015Rafiq ur Rehman Pakistan 1995 2015Abdulsamad Abdulmalik Hazza
,a Yemen 1999 2014
Yunus Pinar Turkey 1983 2016William J. Chancellor U.S.A 1972 2017Kunihiro Tokida Japan 2016 2017Shujun Li China 2012 2018 S. F. (Sen-Fuh) Chang Taiwan 1987 2018Jan Pawlak Poland 2002 2019Oleg S. Marchenko Russia 2003 2019W. B. Hoogmoed Netherlands 2007 2019Sitaram Dagdupant Kulkarni India 2017 2020Shah M. Farouk Bangladesh 1982 2021
Retirement Co-editors' Name List
Pavel KicProfessor, Czech Univ. of Life Sciences Prague, Faculty of Eng. 16521 Prague 6-Suchdol, CZECH REPUBLIC. TEL+420-2-2438314 [email protected]
Joachim MüllerProf. of the Univ. Hohenheim, Institute of Agril. Eng., Head of Agric.l Eng. in the Tropics and Sub-tropics, Univ. of Hohenheim, 70593 Stuttgart, GER-MANY. TEL+49-711-459-22490, [email protected]
Konstantinos P. FerentinosResearcher, Dept. of Agricultural Engineering, Institute of Soil & Water Resources, Hellenic Agri-cultural Organization “Demeter” , Ministry of Ag-riculture and Food of Greece, 61 Dimokratias Av., Athens 13561, GREECE. [email protected]
Nick SigrimisProf., Agricultural University of Athens, Iera Odos 75, Athina 118 55, GREECE. TEL +30-6940940885, [email protected]
Ettore GasparettoVia Galileo Galilei 17, I-35121 Padova, ITALY. TEL +39-0250316619, [email protected]
Yakov LobachevskyDeputy Director of VIM, Federal State Budgetary Science Institution “Federal State Agro Engineer-ing Center VIM” , 1st Institutskiy passage, 5., Mos-cow -109428, RUSSIA. [email protected]
Milan MartinovProf., Faculty of Technical Sciences, Chair for Bio-systems Eng., Novi Sad, SERBIA. TEL+ 381-21-485-2369, [email protected]
Jaime Ortiz-Cañavate Puig-MauriDpto. Ingenieria Rural Universidad Politécnica de Madrid, Esc. T. S. Ing. Agrónomos 28040-Madrid SPAIN. TEL+34-91-336-5852, [email protected]
Brian G. SimsFAO Agricultural Mechanization Consultant. 3 Bourneside Bedford MK41 7EG, U.K. [email protected]
M Martinov J Ortiz-Cañavate
Brian G Sims
EGasparetto
Y Lobachevsky
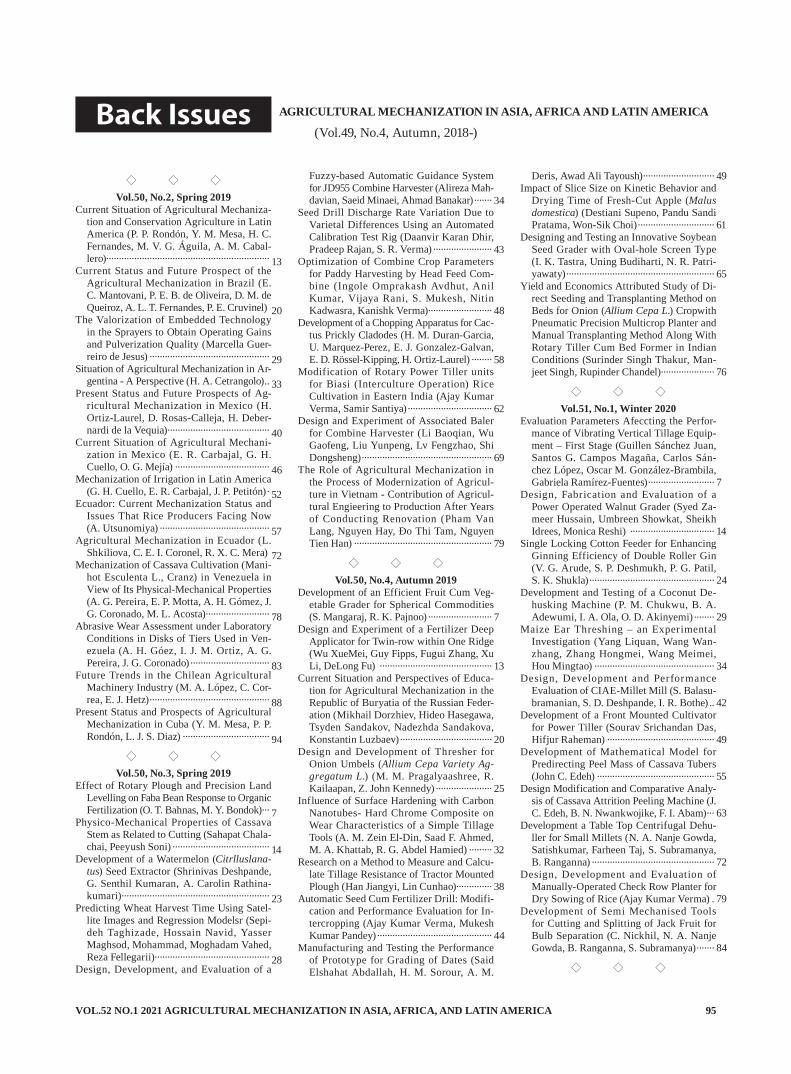
VOL.52 NO.1 2021 AGRICULTURAL MECHANIZATION IN ASIA, AFRICA, AND LATIN AMERICA 95
Back Issues AGRICULTURAL MECHANIZATION IN ASIA, AFRICA AND LATIN AMERICA
(Vol.49, No.4, Autumn, 2018-)
◇ ◇ ◇Vol.50, No.2, Spring 2019
Current Situation of Agricultural Mechaniza-tion and Conservation Agriculture in Latin America (P. P. Rondón, Y. M. Mesa, H. C. Fernandes, M. V. G. Águila, A. M. Cabal-lero)................................................................
Current Status and Future Prospect of the Agricultural Mechanization in Brazil (E. C. Mantovani, P. E. B. de Oliveira, D. M. de Queiroz, A. L. T. Fernandes, P. E. Cruvinel)
The Valorization of Embedded Technology in the Sprayers to Obtain Operating Gains and Pulverization Quality (Marcella Guer-reiro de Jesus) ...............................................
Situation of Agricultural Mechanization in Ar-gentina - A Perspective (H. A. Cetrangolo) ..
Present Status and Future Prospects of Ag-ricultural Mechanization in Mexico (H. Ortiz-Laurel, D. Rosas-Calleja, H. Deber-nardi de la Vequia) ........................................
Current Situation of Agricultural Mechani-zation in Mexico (E. R. Carbajal, G. H. Cuello, O. G. Mejía) .....................................
Mechanization of Irrigation in Latin America (G. H. Cuello, E. R. Carbajal, J. P. Petitón) .
Ecuador: Current Mechanization Status and Issues That Rice Producers Facing Now (A. Utsunomiya) ...........................................
Agricultural Mechanization in Ecuador (L. Shkiliova, C. E. I. Coronel, R. X. C. Mera)
Mechanization of Cassava Cultivation (Mani-hot Esculenta L., Cranz) in Venezuela in View of Its Physical-Mechanical Properties (A. G. Pereira, E. P. Motta, A. H. Gómez, J. G. Coronado, M. L. Acosta) .........................
Abrasive Wear Assessment under Laboratory Conditions in Disks of Tiers Used in Ven-ezuela (A. H. Góez, I. J. M. Ortiz, A. G. Pereira, J. G. Coronado) ...............................
Future Trends in the Chilean Agricultural Machinery Industry (M. A. López, C. Cor-rea, E. J. Hetz) ...............................................
Present Status and Prospects of Agricultural Mechanization in Cuba (Y. M. Mesa, P. P. Rondón, L. J. S. Diaz) ..................................
◇ ◇ ◇Vol.50, No.3, Spring 2019
Effect of Rotary Plough and Precision Land Levelling on Faba Bean Response to Organic Fertilization (O. T. Bahnas, M. Y. Bondok) ...
Physico-Mechanical Properties of Cassava Stem as Related to Cutting (Sahapat Chala-chai, Peeyush Soni) ......................................
Development of a Watermelon (Citrlluslana-tus) Seed Extractor (Shrinivas Deshpande, G. Senthil Kumaran,A. Carolin Rathina-kumari) ..........................................................
Predicting Wheat Harvest Time Using Satel-lite Images and Regression Modelsr (Sepi-deh Taghizade, Hossain Navid, Yasser Maghsod, Mohammad, Moghadam Vahed, Reza Fellegarii) .............................................
Design, Development, and Evaluation of a
Fuzzy-based Automatic Guidance System for JD955 Combine Harvester (Alireza Mah-davian, Saeid Minaei, Ahmad Banakar) .......
Seed Drill Discharge Rate Variation Due to Varietal Differences Using an Automated Calibration Test Rig (Daanvir Karan Dhir, Pradeep Rajan, S. R. Verma) .......................
Optimization of Combine Crop Parameters for Paddy Harvesting by Head Feed Com-bine (Ingole Omprakash Avdhut, Anil Kumar, Vijaya Rani, S. Mukesh, Nitin Kadwasra, Kanishk Verma) .........................
Development of a Chopping Apparatus for Cac-tus Prickly Cladodes (H. M. Duran-Garcia, U. Marquez-Perez, E. J. Gonzalez-Galvan, E. D. Rössel-Kipping, H. Ortiz-Laurel) ........
Modification of Rotary Power Tiller units for Biasi (Interculture Operation) Rice Cultivation in Eastern India (Ajay Kumar Verma, Samir Santiya) .................................
Design and Experiment of Associated Baler for Combine Harvester (Li Baoqian, Wu Gaofeng, Liu Yunpeng, Lv Fengzhao, Shi Dongsheng) ...................................................
The Role of Agricultural Mechanization in the Process of Modernization of Agricul-ture in Vietnam - Contribution of Agricul-tural Engieering to Production After Years of Conducting Renovation (Pham Van Lang, Nguyen Hay, Ðo Thi Tam, Nguyen Tien Han) ......................................................
◇ ◇ ◇Vol.50, No.4, Autumn 2019
Development of an Efficient Fruit Cum Veg-etable Grader for Spherical Commodities (S. Mangaraj, R. K. Pajnoo) .........................
Design and Experiment of a Fertilizer Deep Applicator for Twin-row within One Ridge (Wu XueMei, Guy Fipps, Fugui Zhang, Xu Li, DeLong Fu) ............................................
Current Situation and Perspectives of Educa-tion for Agricultural Mechanization in the Republic of Buryatia of the Russian Feder-ation (Mikhail Dorzhiev, Hideo Hasegawa, Tsyden Sandakov, Nadezhda Sandakova, Konstantin Luzbaev) ....................................
Design and Development of Thresher for Onion Umbels (Allium Cepa Variety Ag-gregatum L.) (M. M. Pragalyaashree, R. Kailaapan, Z. John Kennedy) ......................
Influence of Surface Hardening with Carbon Nanotubes- Hard Chrome Composite on Wear Characteristics of a Simple Tillage Tools (A. M. Zein El-Din, Saad F. Ahmed, M. A. Khattab, R. G. Abdel Hamied) .........
Research on a Method to Measure and Calcu-late Tillage Resistance of Tractor Mounted Plough (Han Jiangyi, Lin Cunhao)..............
Automatic Seed Cum Fertilizer Drill: Modifi-cation and Performance Evaluation for In-tercropping (Ajay Kumar Verma, Mukesh Kumar Pandey) .............................................
Manufacturing and Testing the Performance of Prototype for Grading of Dates (Said Elshahat Abdallah, H. M. Sorour, A. M.
Deris, Awad Ali Tayoush) ............................Impact of Slice Size on Kinetic Behavior and
Drying Time of Fresh-Cut Apple (Malus domestica) (Destiani Supeno, Pandu Sandi Pratama, Won-Sik Choi) ..............................
Designing and Testing an Innovative Soybean Seed Grader with Oval-hole Screen Type (I. K. Tastra, Uning Budiharti, N. R. Patri-yawaty) ..........................................................
Yield and Economics Attributed Study of Di-rect Seeding and Transplanting Method on Beds for Onion (Allium Cepa L.) Cropwith Pneumatic Precision Multicrop Planter and Manual Transplanting Method Along With Rotary Tiller Cum Bed Former in Indian Conditions (Surinder Singh Thakur, Man-jeet Singh, Rupinder Chandel).....................
◇ ◇ ◇Vol.51, No.1, Winter 2020
Evaluation Parameters Afeccting the Perfor-mance of Vibrating Vertical Tillage Equip-ment – First Stage (Guillen Sánchez Juan, Santos G. Campos Magaña, Carlos Sán-chez López, Oscar M. González-Brambila, Gabriela Ramírez-Fuentes) ..........................
Design, Fabrication and Evaluation of a Power Operated Walnut Grader (Syed Za-meer Hussain, Umbreen Showkat, Sheikh Idrees, Monica Reshi) .................................
Single Locking Cotton Feeder for Enhancing Ginning Efficiency of Double Roller Gin (V. G. Arude, S. P. Deshmukh, P. G. Patil, S. K. Shukla) .................................................
Development and Testing of a Coconut De-husking Machine (P. M. Chukwu, B. A. Adewumi, I. A. Ola, O. D. Akinyemi) ........
Maize Ear Threshing – an Experimental Investigation (Yang Liquan, Wang Wan-zhang, Zhang Hongmei, Wang Meimei, Hou Mingtao) ...............................................
Design, Development and Performance Evaluation of CIAE-Millet Mill (S. Balasu-bramanian, S. D. Deshpande, I. R. Bothe) ..
Development of a Front Mounted Cultivator for Power Tiller (Sourav Srichandan Das, Hifjur Raheman) ..........................................
Development of Mathematical Model for Predirecting Peel Mass of Cassava Tubers (John C. Edeh) ..............................................
Design Modification and Comparative Analy-sis of Cassava Attrition Peeling Machine (J. C. Edeh, B. N. Nwankwojike, F. I. Abam) ...
Development a Table Top Centrifugal Dehu-ller for Small Millets (N. A. Nanje Gowda, Satishkumar, Farheen Taj, S. Subramanya, B. Ranganna) ................................................
Design, Development and Evaluation of Manually-Operated Check Row Planter for Dry Sowing of Rice (Ajay Kumar Verma) .
Development of Semi Mechanised Tools for Cutting and Splitting of Jack Fruit for Bulb Separation (C. Nickhil, N. A. Nanje Gowda, B. Ranganna, S. Subramanya) .......
◇ ◇ ◇
13
20
29
33
40
46
52
57
72
78
83
88
94
7
14
23
28
34
43
48
58
62
69
79
7
13
20
25
32
38
44
49
61
65
76
7
14
24
29
34
42
49
55
63
72
79
84

AGRICULTURAL MECHANIZATION IN ASIA, AFRICA, AND LATIN AMERICA 2021 VOL.52 NO.196
Vol.51, No.2, Spring 2020Could Conservation Tillage Farming Be the
Solution for Agricultural Soils in Iraq? (Ali Mazin Abdul-Munaim, David A. Light-foot, Dennis G. Watson) ...............................
Design, Development and Testing of 4-Row Tractor Drawn Gladiolus (Gladiolus Grandiflorus L.) Planter for Uniformity in Corm Spacing (T. P. Singh, Vijay Guatam, Padam Singh, Santosh Kumar) ....................
Design and Development of Power Operated Walking Type Weeder (Ajay Kumar Verma)
Optimization of Parameters of Axial Flow Paddy Thresher (Ritu Dogra, Desai Kishor Waman, Baldev Dogra, Ajeet Kumar) ........
Measuring Spray and Spray Deposition on Plant and Unwanted in Field Under Iraqi South Conditions (Majid H. Alheidary, Qusay. Sameer, Abdul Salam G. Maki, Ali. F. Nasir) .........................................................
Current Situation and Perspectives for Soy-bean Production in Amur Region, Russian Federation (Boris Boiarskii, Hideo Hasega-wa, Anna Lioude, Elizaveta Kolesnikova, Valentina Sinegovskaia) ...............................
Development and Evaluation of Rasp Bar Mechanism for the Extraction of Onion (Allium Cepa L.) Seeds (R. Pandiselvam, R. Kailappan, Anjineyulu Kothakota, B. Kamalapreetha, G. K. Rajesh) .....................
Design and Development of Low Cost Multi-Row Manual Jute Seed Drill (V. B. Shamb-hu) ..................................................................
Performance of Milking Machine at Different Vacuum Levels in Crossbred Dairy Cows Milked in Automated Herringbone Parlour (A. Fahim, M. L. Kamboj, A. S. Sirohi) ......
Development of Integrated Small Scale Lac Processing Unit (S. C. Sharma, N. Prasad, S. K. Pandey, V. K. Bhargava) .....................
Design and Construction of a Farm Scale Evaporative Cooling System (Gürkan Alp Kağan Gürdil, Pavel Kic, Bahadır Demirel, Emel Demirbas Yaylagül) ............................
Development and Performance Evaluation of Tractor Drawn Cultivator Cum Spike-Roller (V. R. Vagadia, Rajvir Yadav, D. B. Chavda, Geeta Tomar, D. V. Patel) ..............
Development of Mat Nursery Raising and Uprooting Techniques for Paddy (Oryza Sativa L.) Crop and Their Field Evaluation with Mechanical Transplanter for South East Asia (Mahesh Kumar Narang, Ru-pinder Chandel, Baldev Dogra, Gursahib Singh Manes) ................................................
◇ ◇ ◇Vol.51, No.3, Summer 2020
Specual Issue: VIM 90th AnniversaryThe Federal Scientific Agro-engineering
Center VIM: History of Foundation and Development (Andrey Yu. Izmailov, Yuli-ya S. Tsench, Yakov P. Lobachevsky) .........
Technical Support of Vegetable Growing in Countries of the Eurasian Economic Union (Aleksandr G. Aksenov, Aleksei V. Sibirev)
The Prospect of Using Gas Turbine Power Plants in the Agricultural Sector (Valentin A. Gusarov, Zakhid A. Godzhaev, Elena V. Gusarova) ......................................................
The State, Promising Directions and Strate-gies for the Development of the Energy
Base of Agriculture (Andrey Yu. Izmaylov, Yakov P. Lobachevsky, Dmitry A. Tik-homirov, Anatoly V. Tikhomirov) ...............
Regional Features of Scientific-technical and Technological Modernization of Agro-industrial Sector of Bashkortostan at the Present Stage (Pavel A. Iofinov, Ildar I. Gabitov, Salavat G. Mudarisov, Denis A. Mironov, Badry H. Akhalaya) .....................
Technological Support of Soybean Cultiva-tion (Aleksei S. Dorokhov, Marina E. Belyshkina, Ivan A. Starostin, Narek O. Chilingaryan) ................................................
Strategy of Technical Support of Grain Har-vesting Operations in Republic of Kazakh-stan (Vladimir L. Astaf’yev, Vladimir A. Golikov, Eduard V. Zhalnin, Sergey A. Pavlov, Igor A. Pekhalskiy) ..........................
The Methodology of Modeling and Optimi-zation of Technologies in Crop Produc-tion (Vladimir V. Мikheev, Andrey G. Ponomarev, Pavel A. Eremin, Vladislav S. Mikheev) .......................................................
Benefits of Using Liquid Nitrogen Fertilizers for Russian Farm Enterprises (Leonid A. Marchenko, Igor G. Smirnov, Tatiana V. Mochkova, Rashid K. Kurbanov) ................
Trends in the Use of the Microwave Field in the Technological Processes of Drying and Disinfection of Grain (Alexey N. Vasil’yev, Alexey S. Dorokhov, Dmitry A. Budnikov, Alexey A. Vasil’yev) ....................................
The Main Stages of Agriculture Mechaniza-tion in Russia (Yuliya S. Tsench) ................
The Choice of Combine Harvesters and Their Adapters for the Conditions of Northern Kazakhstan (Mikhail E. Chaplygin, Sergey V. Tronev, Igor A. Pekhalskiy).....................
The Trend of Tillage Equipment Development (Sergey I. Starovoytov, Badri H. Akhalaya, Sidorov S. A., Mironova A. V.) ....................
N. A. Borodin’s Firsthand Study of the USA Power Farming Experience: the Lessons from History (Roman A. Fando, Maria M. Klavdieva) .....................................................
Agricultural Robots in the Internet of Agri-cultural Things (Vyacheslav K. Abrosi-mov, Zakhid A. Godzhaev, Alexander V. Prilukov) .......................................................
Improving the Resource, Reliability and Ef-ficiency of Worn-out Machines with New Methods of Their Maintenance (Anatoliy V. Dunayev, Sergey A. Sidorov) ..................
◇ ◇ ◇Vol.51, No.4, Autumn 2020
Specual Issue: AMA50th AnniversarySDGs of Agricultural Machinery Industry in
Japan (Masatoshi Kimata) ...........................Smart Agriculture Research in IAM-NARO
(Ken Kobayashi) ...........................................As a Successful Contribution for New Agri-
culture Paradigm (Yasushi Hashimoto) ......Smart Agriculture for 9 Billion People’s Food
Production and Environmental Conserva-tion Aiming SDGs (Naoshi Kondo) ............
Smart Robots for Production Agriculture for SDGs (Noboru Noguchi) .............................
Digital Farming Strategy toward Agricultural Transformation (Sakae Shibusawa) .............
Mechanization, Digitizing and Innovations in Agriculture (Teruaki Nanseki) ....................
Need for Mechanization of Agriculture with Environmental Protection in Developing Countries (Kenji Omasa) .............................
Overseas Expansion of Japanese Agricultural Machinery through Cooperation with International Cooperation Agency (Hideo Hasegawa) .....................................................
SDGs and Kubota’s Vision (Yuichi Kitao) ......Agricultural Mechanization in the United
States of America (John K. Schueller) ........Fifty Years of Progress in Agricultural Mech-
anization (Brian Sims, Josef Kienzle) .........50 Years of AMA, the SDGs and Agriculture
in Germany Karl Th. Renius) ......................Development Trend “Digital Agriculture”
from a German Perspective (Peter Pickel) ..Mechanization of Agriculture in Germany
(Peter Schulze Lammers) .............................The Role of Life Sciences Universities in Re-
lation and Strategy of Sustainable Develop-ment Goals (P. Kic).......................................
Serbian Agriculture, Agricultural Engineer-ing – Past and Future (M. Martinov, Dj. Djatkov, S. Bojic, M. Viskovic) ...................
Sustainable Development of Chinese Agricul-ture and Food Security (Chen Zhi)..............
50 Years of Agricultural Mechanization in China (Yang Minli, Li Minzan, Luo Xi-wen) ...............................................................
Current Status and Prospects of Agricultural Mechanization in China (Zhao Yanshui) ....
SDGs and Agricultural Mechanization in In-dia (Indra Mani) ...........................................
Smart Farm Mechanization for Sustainable Indian Agriculture (C. R. Mehta, N. S. Chandel, Y. A. Rajwade) ..............................
Agricultural Mechanization in Bangladesh: Status and Challenges towards Achieving the Sustainable Development Goals (SDGs) (A. Rahman, Md. R. Ali, Md. S. N. Kabir, Md. M. Rahman, Md. R. A. Mamun, Md. A. Hossen) .....................................................
The Regional Network for Agricultural Ma-chinery (Reynaldo M. Lantin) .....................
Agricultural Mechanization Today in Indo-nesia in Relation to the SDGs (Kamaruddn Abdullah) ......................................................
Sustainable Development for Agricultural Products Processing Industry and Agricul-tural Mechanization in Vietnam (Nguyen Hay) ...............................................................
Egyptian Agriculture and Current Situation of Agricultural: Tractors and Equipment in Egypt 2009-2018 (Taher Kadah, Rania Khamis Ibrahim, Hanafi Radwan, Ahmed El Behery) .....................................................
SDGs and Storage Obstacles of Agricultural Production in Egypt (Said Elshahat Abdal-lah, Wael Mohamed Elmessery) ..................
SDGs and Agricultural Mechanization Prac-tice in Nigeria (Oyelade, Opeyemi Adeniyi)
Agricultural Mechanization Today in Nigeria in Relation to Sustainable Development Goals (Akindele Folarin Alonge) ................
Draft Efforts’ Behavior of a Vibratory Tool to Different Forward Speeds (L. O. M. Ca-brera, A. M. Rodriguez, A. G. de la Figal Costales, Y. M. Mesa) ..................................
■■
7
10
16
22
28
33
39
46
52
58
67
72
79
7
12
19
24
36
42
46
52
58
63
69
74
77
82
87
93
31
36
38
40
42
48
53
55
5658
60
64
67
70
74
77
82
84
86
93
96
99
106
121
133
135
137
146
151
155
157

VOL.52 NO.1 2021 AGRICULTURAL MECHANIZATION IN ASIA, AFRICA, AND LATIN AMERICA 97
INSTRUCTIONS TO AMA CONTRIBUTORSThe Editorial Staff of the AMA requests of articles for publication to observe the following editorial
policy and guidelines in order to improve communication and to facilitate the editorial process:
The article must bear the writer(s) name, title/designa-tion, office/organization, nationality and complete mailing address.
Article must be sent by E-mail with Word File and PDF File attached.The data for graphs and photographs must be saved into piecemeal data and enclosed (attached) with the article.Whether the article is a technical or popular contribu-tion, lecture, research result, thesis or special report, the format must contain the following features:(i) brief and appropriate title;(ii) the writer(s) name, designation/title, office/orga-nization; and mailing address;(iii) an abstract following ii) above;(iv) body proper (text/discussion);(v) conclusion/recommendation; and a(vi) bibliographyTables, graphs and diagrams must be numbered. Table numbers must precede table titles, e.g., "Table 1 Rate of Seeding per Hectare". Such table number and title must be typed at the top center of the table. On the other hand, graphs, diagrams, maps and photo-graphs are considered figures in which case the cap-tions must be indicated below the figure and preceded by number, e.g., "Fig. 1 View of the Farm Buildings".Papers are printed in black and white. Tables and fig-ures must be made so as to be clearly understood in black and white.The data for the graph must also be included. (e.g. EXCEL for Windows)Tables and figures must be preceded by texts or discussions. Inclusion of such tables and figures not otherwise referred to in the text/discussion must be avoided.Tables must be typed clearly without vertical lines or partitions. Horizontal lines must be drawn only to contain the sub-title heads of columns and at the bot-tom of the table.Express measurements in the metric system and crop yields in metric tons per hectare (t/ha) and smaller units in kilogram or gram (kg/plot or g/row).Indicate by footnotes or legends any abbreviations or symbols used in tables or figures.Convert national currencies in US dollars and use the later consistently.Round off numbers, if possible, to one or two decimal units, e.g., 45.5 kg/ha instead of 45.4762 kg/ha.When numbers must start a sentence, such numbers must be written in words, e.g., Forty-five workers..., or Five tractors..."instead of 45 workers..., or, 5 trac-tors.
c.
Format/Style Guidancea.
b.
c.
d.
e.
f.
g.
h.
i.
j.
k.
l.
m.
Criteria for Article SelectionPriority in the selection of article for publication is given
to those that –a.b.
c.
d.
e.
f.
g.
h.
Rejected/Accepted Articlesa.
b.
c.d.
Procedurea.
b.
are written in the English language;are relevant: to the promotion of agricultural mecha-nization, particularly for the developing countries;have not been previously published elsewhere, or, if previously published are supported by a copyright permission;deal with practical and adoptable innovations by, small farmers with a minimum of complicated for-mulas, theories and schematic diagrams;have a 50 to 100-word abstract, preferably preceding the main body of the article;are printed, double-spaced, under 3,000 words (ap-proximately equivalent to 6 pages of AMA-size pa-per) ; and those thatart: supported by authentic sources, reference or bib-liography.written in MS DOS format.
As a rule, articles that are not chosen for AMA publi-cation are not returned. At the earliest time possible, the writer(s) is advised whether the article is rejected or accepted.When an article is accepted but requires revision/modification, the details will be indicated in the re-turn reply from the AMA Chief Editor in which case such revision/modification must be completed and returned to AMA within three months from the date of receipt from the Editorial Staff.The AMA does not pay for articles published. Complimentary copies: Following the publishing, three successive issue are sent to the author(s).
Articles for publication (original and one-copy) must be sent to AMA through the Co-operating Editor in the country where the article originates. (Please refer to the names and addresses of Co-operating Editors in any issue of the AMA). However, in the absence of any Co-operating Editor, the article needs to be sent to Co-operating Editor in the writer’s neighbor-ing country. Please note that it is AMA Chief Editor that decide whether publish each submitted paper on AMA or not. Even if Co-operating Editor found your manuscript suitable for publication on AMA, it can not the case with AMA Chief Editor. Contributors of articles for the AMA for the first time are required to attach a passport size ID photograph (black and white print preferred) to the article. The same applies to those who have contributed articles three years earlier. In either case, ID photographs taken within the last 6 months are preferred.

SUBSCRIPTION/ORDER FORMAGRICULTURAL MECHANIZATION IN ASIA, AFRICA AND LATIN AMERICA ( AMA )
Issued Quarterly
AMA has Achieved an IMPACT FACTOR!!AMA has been read by those involved in agricultural machinery and industry all over the world since the first
publishment in 1971. Thanks to many contributions from both the readers and writers, in 2012, we have achieved an Impact Factor, established by Thomson Reuters in U.S.A. AMA is the only Japanese agricultural machinery and industry related magazine which achieved an Impact Factor.
Subscription Rate (includes surface mail postage)
Annual (4 issues)...........................¥8,000 Single copy .......................................¥2,500
(Check one)□ Please send me/us an invoice□ I/We enclose remittance for ¥ □ Please charge my/our credit card □ VISA □ MASTER Card. No.
Exp. date
Signature
We deeply appreciate your payment by credit card (NO EXTRA CHARGE NEEDED).We charge you extra 4,000 JPY when paid by check or wire transfer.
******************************Name:
Firm:
Position:
Address: (block letters)
FARM MACHINERY INDUSTRIAL RESEARCH CORP.1-12-3 Kanda-Nishikicho, Chiyoda-ku, Tokyo 101-0054, Japan
Tel. +81-3-3291-3674, Fax. +81-3-3291-5717URL: http://www.shin-norin.co.jp
E-Mail: [email protected]

VOL.52 NO.1 2021 AGRICULTURAL MECHANIZATION IN ASIA, AFRICA, AND LATIN AMERICA

VO
L.50, NO
.4, AU
TUM
N 2019
VOL.51, NO.1, WINTER 2020