
VOL. 25 No. 1 June, 2015
252
ASCRS ASSOCIATION OF SOILS AND CROPS RESEARCH SCIENTISTS NAGPUR (M.S.) INDIA ISSN 0971-2836 VOL. 25 No. 1 June, 2015
-
Upload
khangminh22 -
Category
Documents
-
view
0 -
download
0
Transcript of VOL. 25 No. 1 June, 2015

ASCRS
ASSOCIATION OF SOILS AND
CROPS RESEARCH SCIENTISTS
N A G P U R ( M . S . ) I N D I A
ISSN 0971-2836
VOL. 25 No. 1 June, 2015
JOURNAL OF SOILS AND CROPSCAB International abstracted and
NAAS rated (3.77) Journal
(Six Monthly Research Journal Registered with the Registrar of Newspapers of IndiaNo. 042515 / 30 / AU / TC / 91)
MEMBERSDr. D.R. Kene
Dr. N.N. Khune
Prof. N.V. Sorte
Prof. D.B. Matte
Dr. G.N. Bobde
Prof. U.R. Vishwakarma
Dr. R. D. Deotale
Dr. K.K. Thakare
Prof. B.K. Sharnagat
Dr. K.S. Yawalkar
Prof. Y.D. Deotale
EXECUTIVE COUNCILPresident :
Vice-President:
Secretary :
Dr. D. R. Kene
Prof. D. B. Matte
Dr. R. D. Deotale
Joint Secretary :
Executive Members :
Dr. K. K. Thakare
Dr. N. N. Khune
Prof. N.V. Sorte
Prof. Y.D. Deotale
ADVISORY BOARDDr. K. S. Yawalkar (Ex. Prof., IARI, New Delhi)
EDITORIAL BOARDEditor-in-Chief :
Managing Editor :
Technical Editor :
Associate Editors :
Dr. D. R. Kene
Dr. R. D. Deotale
Prof. B. K. Sharnagat
Dr. H. B. Babalad (UAS, Dharwad), Dr. K. Jeevan Rao (ANGRA Uni., Hyderabad), Dr. Jagdish Prasad (NBSS & LUP, Nagpur), Dr. S.R. Ghadekar (A.C. Nagpur), Dr. A.K. Singh (Medziphema, Nagaland), Dr. Shanti R. Patil (A.C., Nagpur), Dr. N. Lakpale (IGAU, Raipur), Dr. S.D. Sawarkar (JNKVV, Jabalpur), Dr. S. N. Soni (COA. Khandwa), Dr. R.B. Singandhupe (CICR, Nagpur), Dr. R.N. Prasad (ICAR, Sahanshapur, Varanasi),Dr. G. Ravindrachary (CRIDA, Hydrabad), Dr. (Mrs) Suman Bala Singh (CICR, Nagpur), Dr .S. S. Dhaliwal (PAU, Ludhiana), Dr. Ashish P. Lambat (SMM,Nagpur),Dr.Shamarao Jahagirdar (UAS, Dharwad), Dr. V. K. Kharche (A.C. Nagpur)
Published By : Association of Soils and Crops Research Scientists
21 Anand Nagar, Atrey Lay-out, Near Datta Meghe
College, Ranapratap Nagar Post Office Nagpur,440022
(M.S.) India. Tel : 0712-2235023
Composed by : Tuljai Graphics, C-5 Neelkamal Aprt. Bajaj Nagar Nagpur -10.
Printed at : Sukhkarta Printers, 62, Bajaj Nagar, Nagpur.
Copyright @ by : J. Soils and Crops (No. 04251 / 30 / AU / TC / 91).
Visit atE-mail
: www.ascrsnagpur.com: [email protected]
Journal of Soils and CropsVolume 25 Number 1 June 2015
C O N T E N T SIncreasing fodder beet productivity by intercropping with some field crops 1 - 12Magda, R. Nady, Azza, Kh. Salem and A.M. Abdel-Galil
The molecular structure of green fluorescent protein 13 - 20Shreedhar Gadge, Jonathan K. Philip, K.Volmostree
Sugar beet productivity and profitability as affected by three cropping systems and 21 - 30mineral nitrogen fertilizer ratesAbdel-Galil M. Abdel-Galil, Yaser E. El-Ghobashy and Mohamed M. Lamlom
TMEffect of multicote Agri slow release fertilizers on a new Israel mandarian variety 31 - 36Dubi Raber, Yosi Sofer, Boaz Giladi, Golan and Oscar
Efficiency of intercropping soybean with corn under two corn plant distributions and 37 - 47three mineral nitrogen fertilizer rates Moshira A. El-Shamy, T.I. Abdel-Wahab, Sh.I. Abdel-Wahab and S.B. Ragheb
Integrated effect of organic manures and inorganic fertilizers on soil available nutrient 48 - 53status and yield of maize-spinach cropping systemI. Usha Rani and G. Padmaja
Effect of different doses of NPK fertilizers on local rice (Oryza sativa L.) under 54 - 61direct-seeded upland conditionKarsangla Ao and T. Gohain
Yield, nutrient uptake by Japanese mint and soil fertility status under drip fertigation 62 - 70M. S. Behera, P. K. Mahapatra, R. B. Singandhupe, O.P.Verma and A. Kumar
Evaluation of in-situ rain water retaining capacity of cultivated land in central 71 - 80Vindhyan plateau of Barkachha, Mirzapur District, Uttar PradeshVimal Kumar, Sandeep Kumar Tripathi and Priyankar Raha
Combining ability analysis for seed yield and its component quantitative traits in 81 - 84Indian mustard [Brassica juncea (L.) Czern and Coss.]Moti Lal Saini, and M.P. Patel
Effect of industrial waste water and irrigation methods on residual concentration 85 - 91of agricultural produce in Konkan region of Maharashtra
M.S. Mane, R.P. Aher and P.M.Ingle
Stability analysis of yield and yield components in sesame (Sesamum indicum L.) 92 - 99 V. S. Patil, P. B. Wadikar, S. K. Chavan, H. V. Patil and B. P. Sudrik
Pathogenic, morphological, biochemical variations in the isolates of 100 - 108Colletitrichum truncatumDamayanti D. Guldekar and S. R. Potdukhe
Combinig ability studies in maize (Zea mays L.) 109 - 115A. T. Nartam, M. K. Moon, S. A. Sapakal, S. R. Patil and P.D.Peshattiwar
Food consumption pattern in Maharashtra 116 - 121N.V.Shende, B. N. Ganvir and M.R.Wayakar
Yield, chemical composition and in vitro dry matter digestibility of azolla at 122 - 125different stages of harvest Pranita Sahane, R. M. Zinjarde, Meenal Parhad and Monali Musale

Exploitation of genetic variability in early segregating generation of mustard 126 - 132 (Brassica juncea L.)R. Gowthami, Shanti R. Patil, Bharti Dandade, A. R. Lende, Ritu Choudhary
Effect of integrated nutrient management on yield and changes in soil fertility status 133 - 139under sorghum based intercropping systemPriya P. Gurav, R.P. Gawande, P.L. Choudhari, B. A. Patil and A.S. Gajare
Effect of foliar sprays of nitrate salts on chemical, biochemical parameters and yield of 140 - 144green gramS.A. Mahale, R. D. Deotale, P. P. Sawant, A. N. Sahane and P. N. Bobade
Genetic studies in F population of mustard (Brassica juncea) 145 - 1562
Tinkeshwari V. Bohare, Beena Nair, Ritu Choudhary, R. Gowthami and Bharti Dandade
Response of Helicoverpa armigera (Hubner) to organophosphate along with synergist in 157 - 162 Vidarbha region of MaharashtraA. S. Kalinkar, D. B. Undirwade, S. S. Gurve and K. A. Patil
Effect of foliar application of zinc and iron on growth and yield of marigold 163 - 167S. M. Raghatate, S. S. Moon, V. J. Tembhare and M. V. Mohalkar
Utilization of gulkand in the preparation of Shrikhand 168 - 172 N.T. Pendawale, V.G. Atkare, R.M. Zinjarde, Rohini Naroteand S.S. Shirke
Studies on productive performance and quality of milk of crossbred cows 173 - 177Rohini Narote, V. G. Atkare, S. G. Gubbawar and N. T. Pendawale
Influence of foliar sprays of growth retardant TIBA on biochemical, yield and yield 178 - 184contributing parameters of chickpeaP. P. Sawant, R. D. Deotale, S. A. Mahale, S. N. Sahane and Y. A. Wagh
Half sib recurrent selection studies for yield in safflower (Carthamus tinctorius L.) 185 - 191K. B. Patole, S.U. Charjan, S.R. Patil, P. D. Peshattiwar and A. W. Wakade
Utilization of carrot (Dacus carota) juice for preparation of flavoured milk 192 - 197 S.S. Shirke, R.M.Zinjarde, V.G. Atkare and N.T. Pendawale
Effect of planting time and nitrogen on growth, yield and quality of spider lily 198 - 201S. R. Maske, N. K. Chopde and S. A. Thakre
Genetic variability created through biparental mating in mustard (Brassica juncea L.) 202 - 209B.H.Dandade, S.R.Patil, R. Gowthami, A.T. Nartam and B.A. Bhoyar
Effect of antitranspirants and frequency of irrigations on growth, yield attributes and 210 - 214yield of Indian mustard (Brassica juncea L.)K. E. Badukale, D. D. Mankar, S. G. Jaiswal, A.M.Jamankar and Aditi Desai
Effect of foliar application of GA and NAA on growth, flowering, yield and quality of 215 - 2193
African marigoldPranali Meshram, Shalini Badge, Vandana Kalamkar and Ashvini Gaidhani
Effect of land configuration and fertilizer management in kharif maize (Zea mays L.) 220 - 225B. P.Manwar and D.D. Mankar
Studies on feeding practices of buffaloes in Warora tahsil of Chandrapur district 226 - 231Monali Musale, A. S. Ingole, S. M. Khupse and Pranita Sahane
Role of foliar sprays of ethrel on growth and yield of soybean 232 - 237A.N.Sahane, R. D. Deotale, P. P. Sawant, S.A. Mahale and Suvarna S.Gare
Effect of nirogen levels and chlormequat on growth and yield of wheat 238 - 241S. R. Meena, V. S. Khawale and B. A. Bhoyar
ABSTRACT
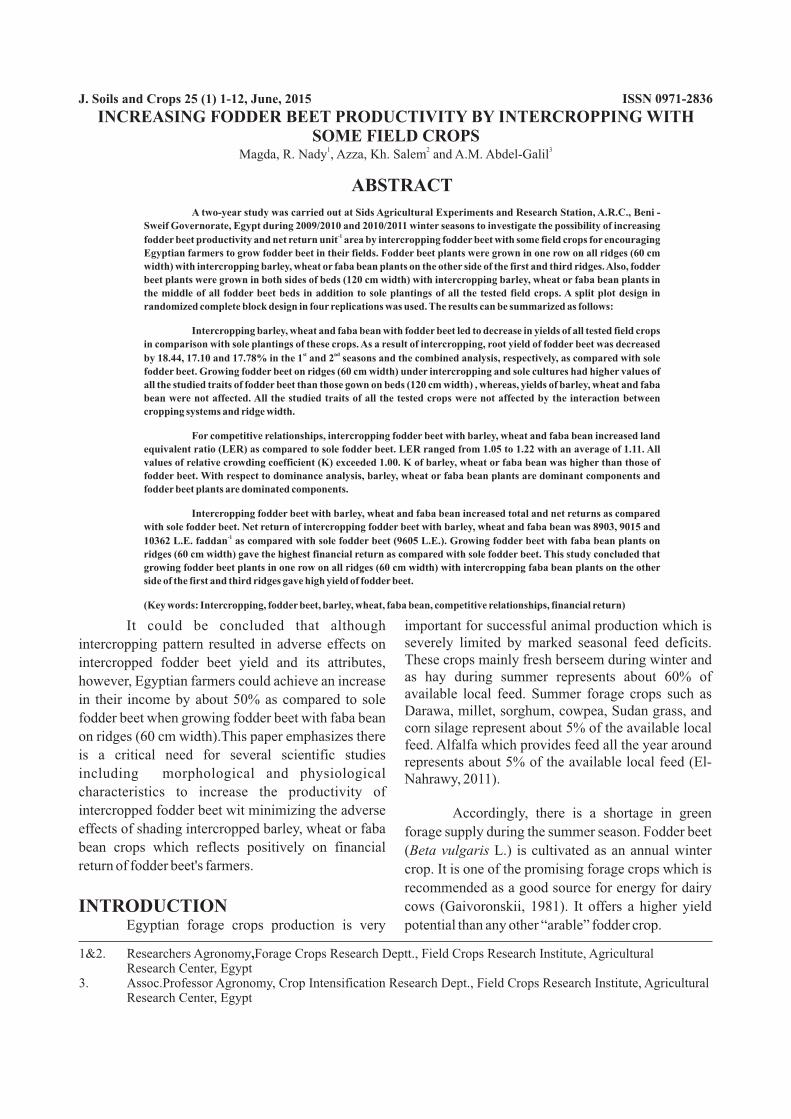
A two-year study was carried out at Sids Agricultural Experiments and Research Station, A.R.C., Beni -
Sweif Governorate, Egypt during 2009/2010 and 2010/2011 winter seasons to investigate the possibility of increasing -1fodder beet productivity and net return unit area by intercropping fodder beet with some field crops for encouraging
Egyptian farmers to grow fodder beet in their fields. Fodder beet plants were grown in one row on all ridges (60 cm
width) with intercropping barley, wheat or faba bean plants on the other side of the first and third ridges. Also, fodder
beet plants were grown in both sides of beds (120 cm width) with intercropping barley, wheat or faba bean plants in
the middle of all fodder beet beds in addition to sole plantings of all the tested field crops. A split plot design in
randomized complete block design in four replications was used. The results can be summarized as follows:
Intercropping barley, wheat and faba bean with fodder beet led to decrease in yields of all tested field crops
in comparison with sole plantings of these crops. As a result of intercropping, root yield of fodder beet was decreased st ndby 18.44, 17.10 and 17.78% in the 1 and 2 seasons and the combined analysis, respectively, as compared with sole
fodder beet. Growing fodder beet on ridges (60 cm width) under intercropping and sole cultures had higher values of
all the studied traits of fodder beet than those gown on beds (120 cm width) , whereas, yields of barley, wheat and faba
bean were not affected. All the studied traits of all the tested crops were not affected by the interaction between
cropping systems and ridge width.
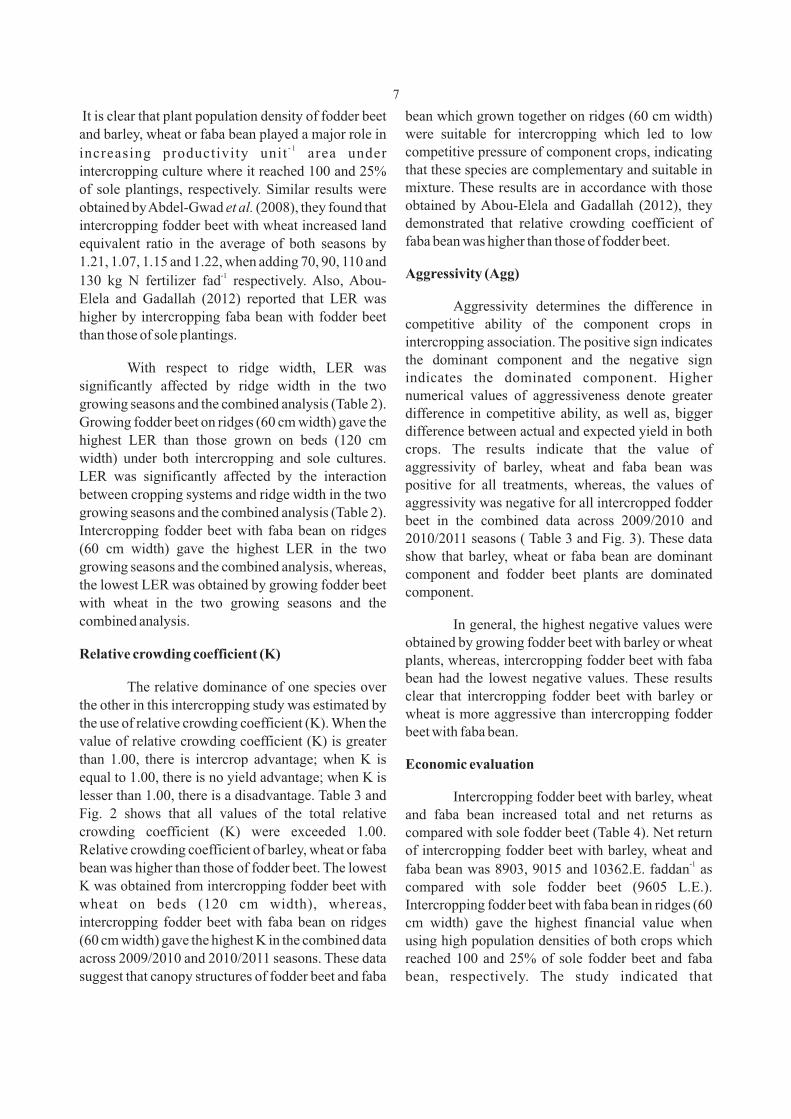
For competitive relationships, intercropping fodder beet with barley, wheat and faba bean increased land
equivalent ratio (LER) as compared to sole fodder beet. LER ranged from 1.05 to 1.22 with an average of 1.11. All
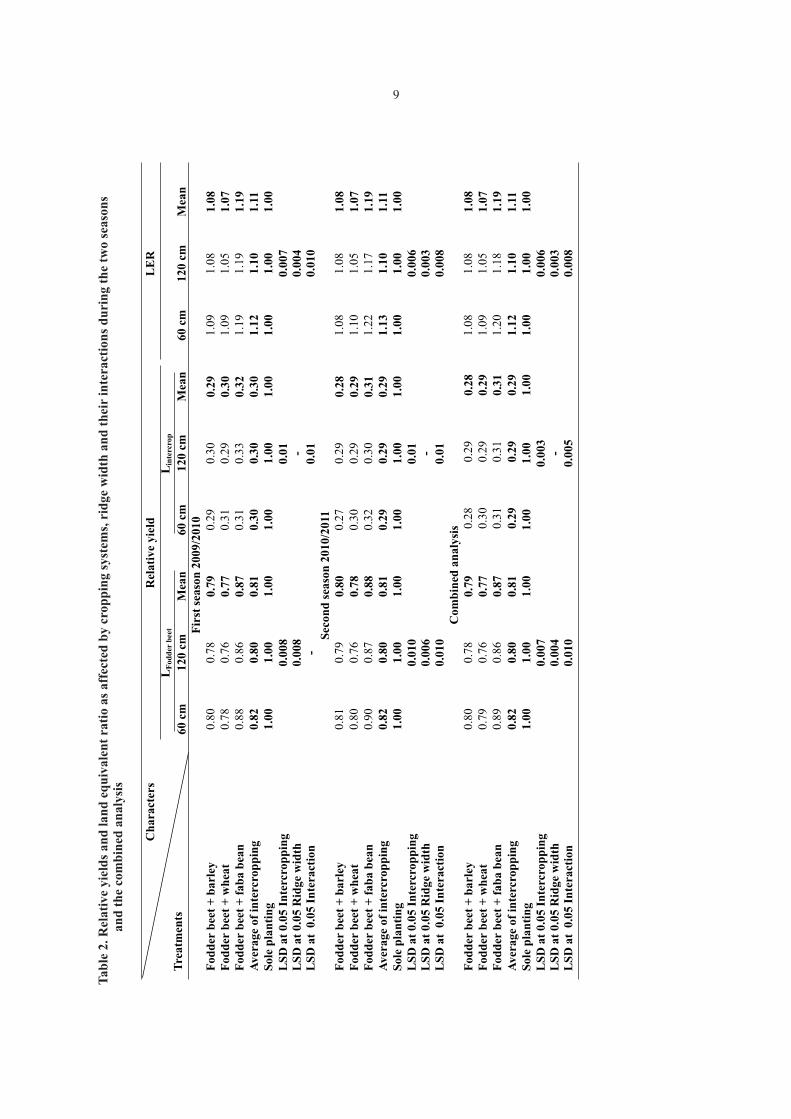
values of relative crowding coefficient (K) exceeded 1.00. K of barley, wheat or faba bean was higher than those of
fodder beet. With respect to dominance analysis, barley, wheat or faba bean plants are dominant components and
fodder beet plants are dominated components.
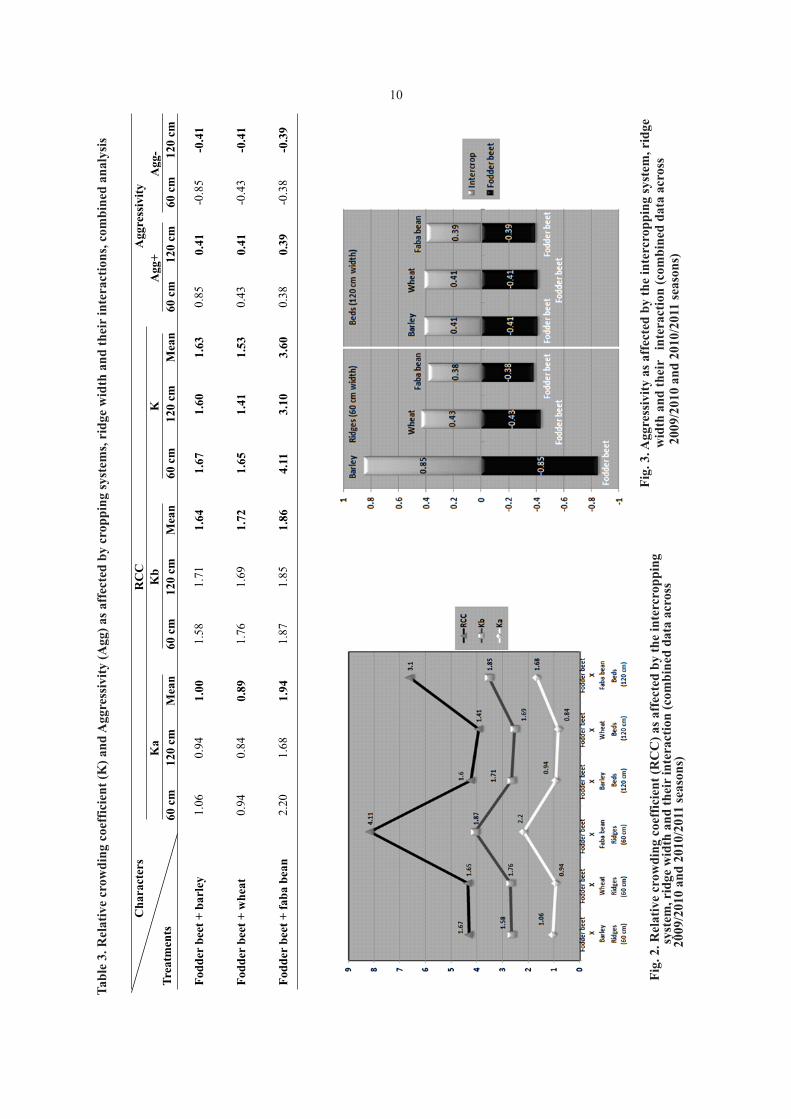
Intercropping fodder beet with barley, wheat and faba bean increased total and net returns as compared
with sole fodder beet. Net return of intercropping fodder beet with barley, wheat and faba bean was 8903, 9015 and -110362 L.E. faddan as compared with sole fodder beet (9605 L.E.). Growing fodder beet with faba bean plants on
ridges (60 cm width) gave the highest financial return as compared with sole fodder beet. This study concluded that
growing fodder beet plants in one row on all ridges (60 cm width) with intercropping faba bean plants on the other
side of the first and third ridges gave high yield of fodder beet.
(Key words: Intercropping, fodder beet, barley, wheat, faba bean, competitive relationships, financial return)
It could be concluded that although important for successful animal production which is severely limited by marked seasonal feed deficits. intercropping pattern resulted in adverse effects on These crops mainly fresh berseem during winter and intercropped fodder beet yield and its attributes, as hay during summer represents about 60% of however, Egyptian farmers could achieve an increase available local feed. Summer forage crops such as in their income by about 50% as compared to sole Darawa, millet, sorghum, cowpea, Sudan grass, and fodder beet when growing fodder beet with faba bean corn silage represent about 5% of the available local
on ridges (60 cm width).This paper emphasizes there feed. Alfalfa which provides feed all the year around
is a critical need for several scientific studies represents about 5% of the available local feed (El-including morphological and physiological Nahrawy, 2011).characteristics to increase the productivity of
intercropped fodder beet wit minimizing the adverse Accordingly, there is a shortage in green effects of shading intercropped barley, wheat or faba forage supply during the summer season. Fodder beet bean crops which reflects positively on financial (Beta vulgaris L.) is cultivated as an annual winter return of fodder beet's farmers. crop. It is one of the promising forage crops which is
recommended as a good source for energy for dairy
cows (Gaivoronskii, 1981). It offers a higher yield INTRODUCTIONEgyptian forage crops production is very potential than any other “arable” fodder crop.
1&2. Researchers Agronomy,Forage Crops Research Deptt., Field Crops Research Institute, Agricultural Research Center, Egypt
3. Assoc.Professor Agronomy, Crop Intensification Research Dept., Field Crops Research Institute, Agricultural Research Center, Egypt
INCREASING FODDER BEET PRODUCTIVITY BY INTERCROPPING WITH SOME FIELD CROPS
1 2 3Magda, R. Nady , Azza, Kh. Salem and A.M. Abdel-Galil
J. Soils and Crops 25 (1) 1-12, June, 2015 ISSN 0971-2836
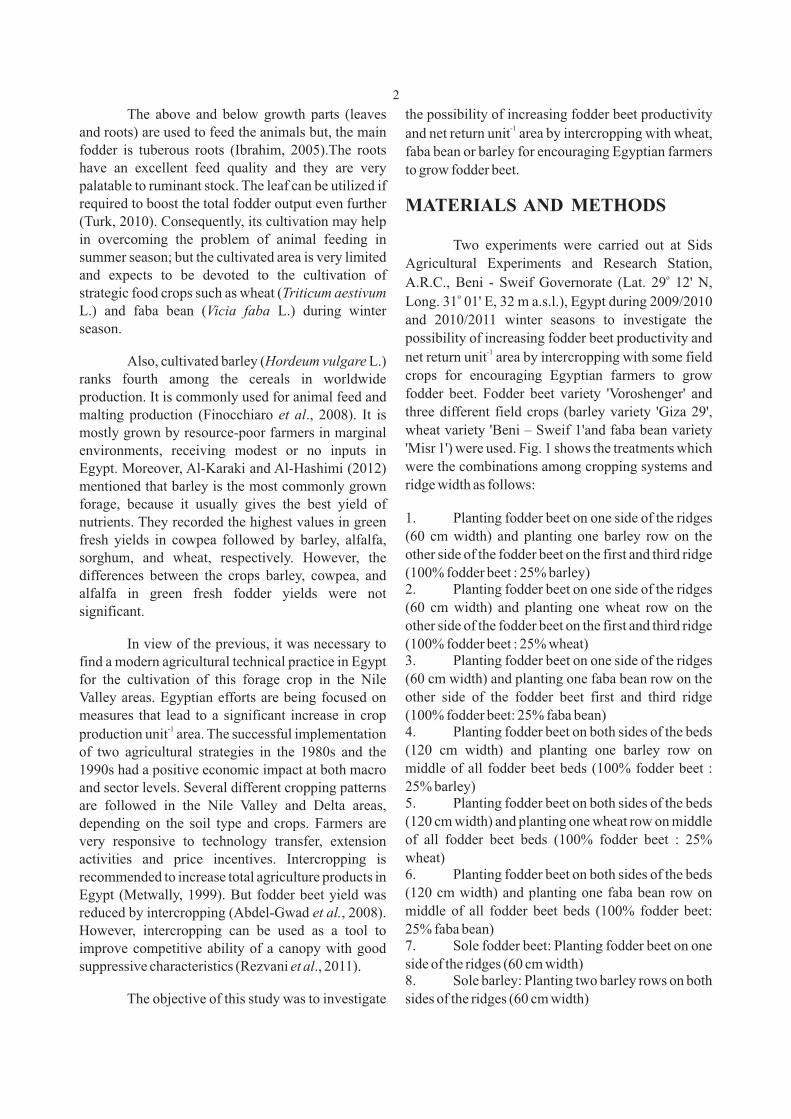
The above and below growth parts (leaves the possibility of increasing fodder beet productivity -1and roots) are used to feed the animals but, the main and net return unit area by intercropping with wheat,
fodder is tuberous roots (Ibrahim, 2005).The roots faba bean or barley for encouraging Egyptian farmers have an excellent feed quality and they are very to grow fodder beet.palatable to ruminant stock. The leaf can be utilized if required to boost the total fodder output even further MATERIALS AND METHODS(Turk, 2010). Consequently, its cultivation may help in overcoming the problem of animal feeding in Two experiments were carried out at Sids summer season; but the cultivated area is very limited Agricultural Experiments and Research Station,
oand expects to be devoted to the cultivation of A.R.C., Beni - Sweif Governorate (Lat. 29 12' N,
strategic food crops such as wheat (Triticum aestivum oLong. 31 01' E, 32 m a.s.l.), Egypt during 2009/2010
L.) and faba bean (Vicia faba L.) during winter and 2010/2011 winter seasons to investigate the
season. possibility of increasing fodder beet productivity and
-1net return unit area by intercropping with some field Also, cultivated barley (Hordeum vulgare L.) crops for encouraging Egyptian farmers to grow ranks fourth among the cereals in worldwide fodder beet. Fodder beet variety 'Voroshenger' and production. It is commonly used for animal feed and three different field crops (barley variety 'Giza 29', malting production (Finocchiaro et al., 2008). It is wheat variety 'Beni – Sweif 1'and faba bean variety mostly grown by resource-poor farmers in marginal 'Misr 1') were used. Fig. 1 shows the treatments which environments, receiving modest or no inputs in were the combinations among cropping systems and Egypt. Moreover, Al-Karaki and Al-Hashimi (2012) ridge width as follows: mentioned that barley is the most commonly grown
forage, because it usually gives the best yield of 1. Planting fodder beet on one side of the ridges nutrients. They recorded the highest values in green (60 cm width) and planting one barley row on the fresh yields in cowpea followed by barley, alfalfa, other side of the fodder beet on the first and third ridge sorghum, and wheat, respectively. However, the (100% fodder beet : 25% barley)differences between the crops barley, cowpea, and 2. Planting fodder beet on one side of the ridges alfalfa in green fresh fodder yields were not (60 cm width) and planting one wheat row on the significant. other side of the fodder beet on the first and third ridge (100% fodder beet : 25% wheat)In view of the previous, it was necessary to 3. Planting fodder beet on one side of the ridges find a modern agricultural technical practice in Egypt (60 cm width) and planting one faba bean row on the for the cultivation of this forage crop in the Nile other side of the fodder beet first and third ridge Valley areas. Egyptian efforts are being focused on
measures that lead to a significant increase in crop (100% fodder beet: 25% faba bean)-1 4. Planting fodder beet on both sides of the beds production unit area. The successful implementation
(120 cm width) and planting one barley row on of two agricultural strategies in the 1980s and the middle of all fodder beet beds (100% fodder beet : 1990s had a positive economic impact at both macro 25% barley)and sector levels. Several different cropping patterns 5. Planting fodder beet on both sides of the beds are followed in the Nile Valley and Delta areas, (120 cm width) and planting one wheat row on middle depending on the soil type and crops. Farmers are of all fodder beet beds (100% fodder beet : 25% very responsive to technology transfer, extension wheat)activities and price incentives. Intercropping is 6. Planting fodder beet on both sides of the beds recommended to increase total agriculture products in (120 cm width) and planting one faba bean row on Egypt (Metwally, 1999). But fodder beet yield was middle of all fodder beet beds (100% fodder beet: reduced by intercropping (Abdel-Gwad et al., 2008). 25% faba bean)However, intercropping can be used as a tool to 7. Sole fodder beet: Planting fodder beet on one improve competitive ability of a canopy with good side of the ridges (60 cm width)suppressive characteristics (Rezvani et al., 2011).8. Sole barley: Planting two barley rows on both sides of the ridges (60 cm width)The objective of this study was to investigate
2
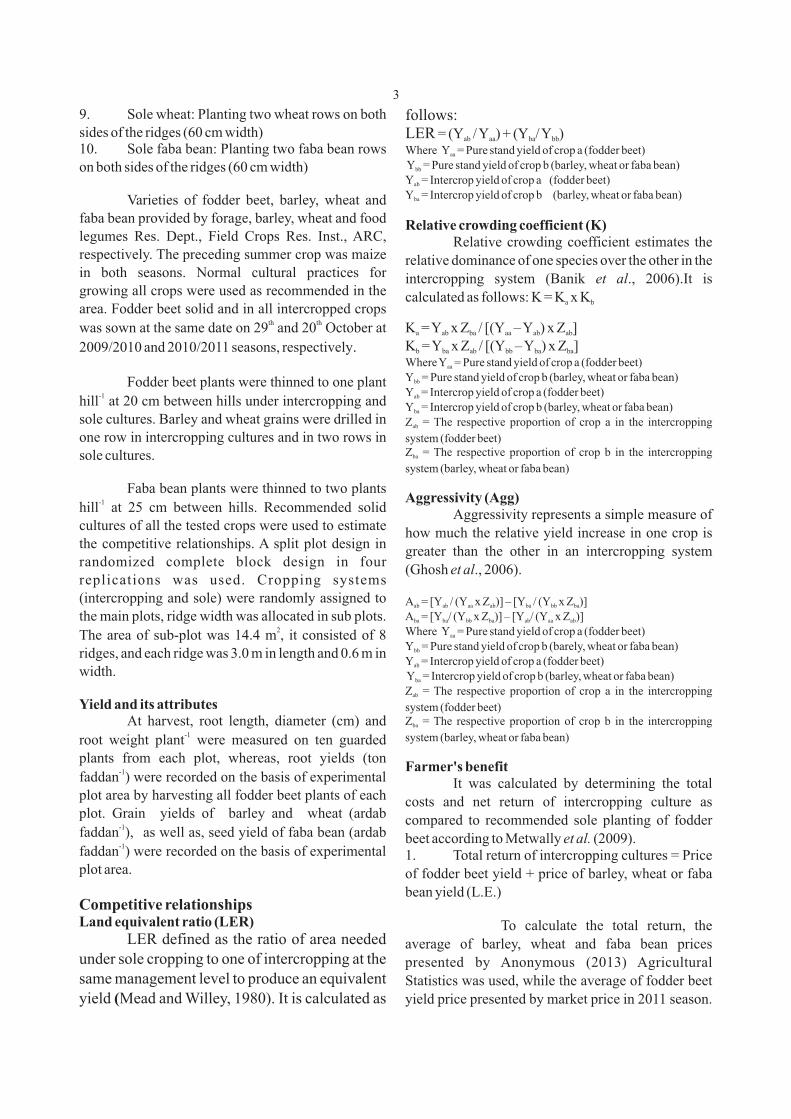
9. Sole wheat: Planting two wheat rows on both follows:sides of the ridges (60 cm width) LER = (Y / Y ) + (Y / Y )ab aa ba bb
10. Sole faba bean: Planting two faba bean rows Where Y = Pure stand yield of crop a (fodder beet) aa
Y = Pure stand yield of crop b (barley, wheat or faba bean)on both sides of the ridges (60 cm width) bb
Y = Intercrop yield of crop a (fodder beet) ab
Y = Intercrop yield of crop b (barley, wheat or faba bean)baVarieties of fodder beet, barley, wheat and faba bean provided by forage, barley, wheat and food Relative crowding coefficient (K)legumes Res. Dept., Field Crops Res. Inst., ARC, Relative crowding coefficient estimates the respectively. The preceding summer crop was maize relative dominance of one species over the other in the in both seasons. Normal cultural practices for intercropping system (Banik et al., 2006).It is growing all crops were used as recommended in the calculated as follows: K = K x Ka barea. Fodder beet solid and in all intercropped crops
thwas sown at the same date on 29 and 20 October at K = Y x Z / [(Y – Y ) x Z ] a ab ba aa ab ab
K = Y x Z / [(Y – Y ) x Z ]2009/2010 and 2010/2011 seasons, respectively. b ba ab bb ba ba
Where Y = Pure stand yield of crop a (fodder beet) aa
Y = Pure stand yield of crop b (barley, wheat or faba bean)bbFodder beet plants were thinned to one plant Y = Intercrop yield of crop a (fodder beet) ab-1
hill at 20 cm between hills under intercropping and Y = Intercrop yield of crop b (barley, wheat or faba bean)ba
sole cultures. Barley and wheat grains were drilled in Z = The respective proportion of crop a in the intercropping ab
system (fodder beet)one row in intercropping cultures and in two rows in Z = The respective proportion of crop b in the intercropping basole cultures.system (barley, wheat or faba bean)
Faba bean plants were thinned to two plants Aggressivity (Agg)-1hill at 25 cm between hills. Recommended solid Aggressivity represents a simple measure of
cultures of all the tested crops were used to estimate how much the relative yield increase in one crop is
the competitive relationships. A split plot design in greater than the other in an intercropping system
randomized complete block design in four (Ghosh et al., 2006).
replications was used. Cropping systems (intercropping and sole) were randomly assigned to A = [Y / (Y x Z )] – [Y / (Y x Z )] ab ab aa ab ba bb ba
A = [Y / (Y x Z )] – [Y / (Y x Z )]the main plots, ridge width was allocated in sub plots. ba ba bb ba ab aa ab
2 Where Y = Pure stand yield of crop a (fodder beet) aaThe area of sub-plot was 14.4 m , it consisted of 8 Y = Pure stand yield of crop b (barely, wheat or faba bean) bbridges, and each ridge was 3.0 m in length and 0.6 m in Y = Intercrop yield of crop a (fodder beet) ab
width. Y = Intercrop yield of crop b (barley, wheat or faba bean)ba
Z = The respective proportion of crop a in the intercropping ab
Yield and its attributes system (fodder beet)Z = The respective proportion of crop b in the intercropping At harvest, root length, diameter (cm) and ba
-1 system (barley, wheat or faba bean)root weight plant were measured on ten guarded plants from each plot, whereas, root yields (ton
Farmer's benefit-1faddan ) were recorded on the basis of experimental It was calculated by determining the total plot area by harvesting all fodder beet plants of each costs and net return of intercropping culture as plot. Grain yields of barley and wheat (ardab compared to recommended sole planting of fodder
-1faddan ), as well as, seed yield of faba bean (ardab beet according to Metwally et al. (2009).
-1faddan ) were recorded on the basis of experimental 1. Total return of intercropping cultures = Price plot area. of fodder beet yield + price of barley, wheat or faba
bean yield (L.E.) Competitive relationshipsLand equivalent ratio (LER) To calculate the total return, the
LER defined as the ratio of area needed average of barley, wheat and faba bean prices under sole cropping to one of intercropping at the presented by Anonymous (2013) Agricultural same management level to produce an equivalent Statistics was used, while the average of fodder beet yield (Mead and Willey, 1980). It is calculated as yield price presented by market price in 2011 season.
th
3
Fig. 1. Intercropping barley, wheat and faba bean with fodder beet and sole cultures
Barley Barley
fodder beet fodder beet fodder beet fodder beet
Barley
fodder beet
Barley
fodder beet fodder beet fodder beet
120 cm width120 cm width60 cm width60 cm width60 cm width60 cm width
Wheat
Intercropping fodder beet with barley
Wheat Wheat Wheat
fodder beetfodder beetfodder beetfodder beetfodder beetfodder beetfodder beetfodder beet
60 cm width60 cm width 60 cm width 60 cm width
Intercropping fodder beet with wheat
120 cm width 120 cm width
fodder beet fodder beet fodder beetfodder beetfodder beetfodder beetfodder beetfodder beet
Faba bean Faba bean
Intercropping fodder beet with faba bean
Faba bean Faba bean
120 cm width120 cm width60 cm width60 cm width60 cm width60 cm width
fodder beet fodder beet fodder beet fodder beet
Barley Barley Barley Barley
60 cm width60 cm width60 cm width60 cm width60 cm width60 cm width60 cm width60 cm width
Wheat Faba bean
Sole fodder beet
Wheat Wheat Wheat Faba bean Faba bean Faba bean
Sole barley
Sole wheat Sole faba bean
60 cm width60 cm width60 cm width60 cm width60 cm width60 cm width60 cm width60 cm width
4
5
7

Tab
le 1
. Eff
ect
of c
rop
pin
g sy
stem
s, r
idge
wid
th a
nd
th
eir
inte
ract
ion
s on
fod
der
bee
t yi
eld
an
d i
ts a
ttri
bu
tes,
as
wel
l as
, yie
lds
of b
arle
y, w
hea
t an
d f
aba
b
ean
du
rin
g tw
o se
ason
s an
d t
he
com
bin
ed a
nal
ysis
Ch
ara
cter
s
T
reatm
ents
Roo
t le
ng
th
(c
m)
Root
dia
met
er
(c
m)
-1R
oo
t w
eig
ht
pla
nt
(k
g)
Root
yie
ld o
f fo
dd
er b
eet
(t
on
fad
dan
)-1
Gra
in y
ield
of
ba
rley
(a
rdab
fa
dd
an
)-1
Gra
in
yie
ld o
f w
hea
t(a
rda
b f
ad
dan
)-1
See
dyie
ld o
f fa
ba
bea
n(a
rda
b f
ad
da
n)
-1
60
cm
120 c
m
Mea
n
60 c
m
120 c
m
Mea
n
60 c
m
12
0 c
m
Mea
n
60
cm
120 c
m
Mea
n
60 c
m
120
cm
M
ean
60
cm
120 c
mM
ean
60
cm
120 c
mF
irst
sea
son
20
09/2
01
0F
od
der
bee
t +
barl
ey
27.7
5
26
.00
2
6.8
71
3.2
5
12.7
51
3.0
0
1.2
5
1.2
2
1.2
3
38.4
1
37
.28
37.8
4
4.8
5
5.0
34
.94
----
----
--F
od
der
bee
t +
wh
eat
26.2
5
2
5.7
5
2
6.0
01
2.0
0
11
.25
11.6
2
1
.23
1
.20
1
.21
37.0
8
3
6.2
136.6
4
--
--
--
5.8
65.6
15
.73
----
Fod
der
bee
t +
fa
ba b
ean
29.0
0
2
8.0
0
2
8.5
01
4.5
0
14.0
01
4.2
5
1.3
4
1
.32
1
.33
42.0
7
4
1.0
541.5
6
--
--
----
----
2.5
62
.70
Aver
ag
e of
inte
rcro
pp
ing
27.6
6
26
.58
27
.12
13
.25
12.6
61
2.9
5
1.2
7
1.2
4
1.2
5
39.1
8
38
.18
38.6
8
4.8
5
5.0
34
.94
5.8
65.6
15
.73
2.5
62
.70
Sole
pla
nti
ng
31.0
03
1.0
0
31
.00
16
.00
16.0
01
6.0
01
.42
1.4
2
1.4
247.4
3
47
.43
47.4
3
16
.69
16
.69
16.6
91
8.8
318
.83
18.8
38.1
68
.16
Aver
ag
e of
rid
ge
wid
th
29.3
32
8.7
9
29
.06
14
.62
14.3
31
4.4
71
.34
1.3
3
1.3
343.3
0
42
.80
43.0
5
10
.77
10
.86
10.8
11
2.3
412
.22
12.2
85.3
65
.43
0.0
5 I
nte
rcro
pp
ing
0.0
5 R
idg
e w
idth
0.0
5 I
nte
ract
ion
1.9
3- -
3.1
3- -
0.0
30
.01
-
2.1
70.5
8-
3.2
6- -
3.1
6- -
0.7
0- -
Sec
on
d s
easo
n 2
01
0/2
011
Fod
der
bee
t +
barl
ey
26.2
5
25
.50
25
.87
13
.40
12.6
0
13
.00
1.2
1
1.1
9
1.2
0
38.2
5
37
.50
37.8
7
4.6
0
4.9
64
.78
----
----
--F
od
der
bee
t +
wh
eat
25.7
5
24
.25
25
.00
12
.47
11.7
7
12
.12
1.2
0
1.1
8
1.1
9
37.7
5
36
.75
37.2
5
--
--
--5.6
35.5
35
.58
----
Fod
der
bee
t +
fa
ba b
ean
29.5
0
28
.75
29
.12
14
.55
13.3
5
13
.95
1.2
9
1.2
7
1.2
8
42.8
5
41
.32
42.0
8
--
--
----
----
2.8
22
.64
Aver
ag
e of
inte
rcro
pp
ing
27.1
62
6.1
6
26
.66
13
.47
12.5
7
13
.02
1.2
3
1.2
1
1.2
239.6
1
38
.52
39.0
6
4.6
0
4.9
64
.78
5.6
35.5
35
.58
2.8
22
.64
Sole
pla
nti
ng
30.9
03
0.9
0
30
.90
15
.50
15.5
0
15
.50
1.3
4
1.3
4
1.3
447.1
2
47
.12
47.1
2
16
.56
16
.56
16.5
61
8.6
81
8.6
81
8.6
88.6
68
.66
Aver
ag
e of
rid
ge
wid
th
29.0
3
28
.53
28
.78
14
.48
14.0
3
14
.25
1.2
8
1.2
7
1.2
7
43.3
6
42
.82
43.0
9
10
.58
10
.76
10.6
71
2.1
51
2.1
01
2.1
25.7
45
.65
LS
D a
t 0
.05
In
terc
rop
pin
g
LS
D a
t 0
.05
Rid
ge
wid
th
LS
D a
t 0
.05
In
tera
ctio
n
2.6
00.5
9-
1.7
50
.58
-
0.0
10.0
1-
1.5
30.4
9-
1.6
6- -
0.6
9- -
1.3
0- -
Co
mb
ined
an
aly
sis
Fod
der
bee
t +
barl
ey
27.0
0
25
.75
26
.37
13
.32
12.6
71
2.9
9
1.2
3
1.2
0
1.2
1
38.3
2
37
.39
37.8
5
4.7
2
4.9
94
.85
----
----
--F
od
der
bee
t +
wh
eat
26.0
02
5.0
0
25
.50
12
.23
11.5
111
.87
1.2
1
1.1
9
1.2
037.4
1
36
.48
36.9
4
--
--
--5.7
45
.57
5.6
5--
--F
od
der
bee
t +
fa
ba b
ean
29.2
52
8.3
7
28
.81
14
.52
13.6
71
4.0
91
.31
1.2
9
1.3
042.4
6
41
.18
41.8
2
--
--
----
----
2.6
82.6
6A
ver
ag
e of
inte
rcro
pp
ing
27.4
12
6.3
7
26
.89
13
.35
12.6
11
2.9
81
.25
1.2
2
1.2
339.3
9
38
.35
38.8
7
4.7
2
4.9
94
.85
5.7
45
.57
5.6
52
.68
2.6
6S
ole
pla
nti
ng
30.9
53
0.9
53
0.9
51
5.7
515.7
51
5.7
51
.38
1.3
81
.38
47.2
84
7.2
847.2
81
6.6
21
6.6
21
6.6
21
8.7
518.7
51
8.7
58
.40
8.4
0
Aver
ag
e of
rid
ge
wid
th29.1
82
8.6
62
8.9
21
4.5
514.1
81
4.3
61
.31
1.3
01
.30
43.3
34
2.8
143.0
71
0.6
71
0.8
01
0.7
31
2.2
412.1
61
2.2
05
.54
5.5
3L
SD
at
0.0
5 I
nte
rcro
pp
ing
L
SD
at
0.0
5 R
idg
e w
idth
L
SD
at
0.0
5 I
nte
ract
ion
1.8
00
.50
-
1.6
60.3
7-
0.0
2 0.0
08
-
1.4
30.4
1-
1.5
8- -
1.4
2- -
0.8
4- -
Mea
n
-- --2
.63
2.6
38
.16
5.3
9L
SD
at
LS
D
at
LS
D
at
-- --2
.73
2.7
38
.66
5.6
9
--
--2
.67
2.6
78
.40
5.5
3
8
Tab
le 2
. Rel
ativ
e yi
eld
s an
d l
and
eq
uiv
alen
t ra
tio
as a
ffec
ted
by
crop
pin
g sy
stem
s, r
idge
wid
th a
nd
th
eir
inte
ract
ion
s d
uri
ng
the
two
seas
ons
a
nd
th
e co
mb
ined
an
alys
is
C
hara
cter
s
Tre
atm
ents
Rel
ati
ve
yie
ld
LE
R
LF
od
der
bee
t L
inte
rcro
p
60 c
m
120 c
m
Mea
n
60 c
m
120 c
m
Mea
n
60 c
m
120 c
m
Mea
n
Fir
st s
easo
n 2
009/2
010
Fod
der
bee
t +
barl
ey
0.8
0 0.7
8 0.7
9 0.2
9 0.3
0 0.2
9 1.0
9 1.0
8 1.0
8 F
od
der
bee
t +
wh
eat
0.7
8 0.7
6 0.7
7 0.3
1 0.2
9 0.3
0 1.0
9 1.0
5 1.0
7 F
od
der
bee
t +
fab
a b
ean
0.8
8 0.8
6 0.8
7 0.3
1 0.3
3 0.3
2 1.1
9 1.1
9 1.1
9 A
ver
age
of
inte
rcro
pp
ing
0.8
2 0.8
0 0.8
1 0.3
0 0.3
0 0.3
0 1.1
2 1.1
0 1.1
1
Sole
pla
nti
ng
1.0
0 1.0
0 1.0
0 1.0
0 1.0
0 1.0
0 1.0
0 1.0
0 1.0
0 L
SD
at
0.0
5 I
nte
rcro
pp
ing
LS
D a
t 0.0
5 R
idge
wid
th
LS
D a
t 0
.05 I
nte
ract
ion
0.0
08
0.0
08
-
0.0
1 -
0.0
1
0.0
07
0.0
04
0.0
10
Sec
on
d s
easo
n 2
010/2
011
F
od
der
bee
t +
barl
ey
0.8
1 0.7
9 0.8
0 0.2
7 0.2
9 0.2
8 1.0
8 1.0
8 1.0
8 F
od
der
bee
t +
wh
eat
0.8
0 0.7
6 0.7
8 0.3
0 0.2
9 0.2
9 1.1
0 1.0
5 1.0
7 F
od
der
bee
t +
fab
a b
ean
0.9
0 0.8
7 0.8
8 0.3
2 0.3
0 0.3
1 1.2
2 1.1
7 1.1
9 A
ver
age
of
inte
rcro
pp
ing
0.8
2 0.8
0 0.8
1 0.2
9 0.2
9 0.2
9 1.1
3 1.1
0 1.1
1
Sole
pla
nti
ng
1.0
0 1.0
0 1.0
0 1.0
0 1.0
0 1.0
0 1.0
0 1.0
0 1.0
0 L
SD
at
0.0
5 I
nte
rcro
pp
ing
LS
D a
t 0.0
5 R
idge
wid
th
LS
D a
t 0
.05 I
nte
ract
ion
0.0
10
0.0
06
0.0
10
0.0
1 -
0.0
1
0.0
06
0.0
03
0.0
08
Com
bin
ed a
naly
sis
Fod
der
bee
t +
barl
ey
0.8
0 0.7
8 0.7
9 0.2
8 0.2
9 0.2
8 1.0
8 1.0
8 1.0
8 F
od
der
bee
t +
wh
eat
0.7
9 0.7
6 0.7
7 0.3
0 0.2
9 0.2
9 1.0
9 1.0
5 1.0
7 F
od
der
bee
t +
fab
a b
ean
0.8
9 0.8
6 0.8
7 0.3
1 0.3
1 0.3
1 1.2
0 1.1
8 1.1
9 A
ver
age
of
inte
rcro
pp
ing
0.8
2 0.8
0 0.8
1 0.2
9 0.2
9 0.2
9 1.1
2 1.1
0 1.1
1
Sole
pla
nti
ng
1.0
0 1.0
0 1.0
0 1.0
0 1.0
0 1.0
0 1.0
0 1.0
0 1.0
0 L
SD
at
0.0
5 I
nte
rcro
pp
ing
LS
D a
t 0.0
5 R
idge
wid
th
LS
D a
t 0
.05 I
nte
ract
ion
0.0
07
0.0
04
0.0
10
0.0
03
- 0.0
05
0.0
06
0.0
03
0.0
08
9
Tab
le 3
. Rel
ativ
e cr
owd
ing
coef
fici
ent
(K)
and
Agg
ress
ivit
y (A
gg)
as a
ffec
ted
by
crop
pin
g sy
stem
s, r
idge
wid
th a
nd
th
eir
inte
ract
ion
s, c
omb
ined
an
alys
is
C
hara
cter
s
Tre
atm
ents
RC
C
Aggre
ssiv
ity
Ka
Kb
K
A
gg+
A
gg-
60 c
m
120 c
m
Mea
n
60 c
m
120 c
m
Mea
n
60 c
m
120 c
m
Mea
n
60 c
m
120 c
m
60 c
m120 c
m
Fod
der
bee
t +
barl
ey
1.0
6
0.9
4
1.0
0
1.5
8
1.7
1
1.6
4
1.6
7
1.6
0
1.6
3
0.8
5
0.4
1
-0.8
5
-0.4
1
Fod
der
bee
t +
wh
eat
0.9
4
0.8
4
0.8
9
1.7
6
1.6
9
1.7
2
1.6
5
1.4
1
1.5
3
0.4
3
0.4
1
-0.4
3
-0.4
1
Fod
der
bee
t +
fab
a b
ean
2.2
0
1.6
8
1.9
4
1.8
7
1.8
5
1.8
6
4.1
1
3.1
0
3.6
0
0.3
8
0.3
9
-0.3
8
-0.3
9
Fig
. 2.
Rel
ativ
e cr
owd
ing
coef
fici
ent
(RC
C)
as a
ffec
ted
by
the
inte
rcro
pp
ing
sys
tem
, ri
dge
wid
th a
nd
th
eir
inte
ract
ion
(co
mb
ined
dat
a ac
ross
2
009/
2010
an
d 2
010/
2011
sea
son
s)
Fig
. 3. A
ggre
ssiv
ity
as a
ffec
ted
by
the
inte
rcro
pp
ing
syst
em, r
idge
wid
th a
nd
th
eir
in
tera
ctio
n (
com
bin
ed d
ata
acro
ss
200
9/20
10 a
nd
201
0/20
11 s
easo
ns)
10
Tab
le 4
. Fin
anci
al r
etu
rn a
s af
fect
ed b
y cr
opp
ing
syst
ems,
rid
ge w
idth
an
d t
hei
r in
tera
ctio
ns
(com
bin
ed d
ata
acro
ss 2
009/
2010
an
d 2
010/
2011
sea
son
s)
Ch
ara
cter
s
T
reatm
ents
F
inan
cial
re
turn
F
od
der
bee
t
In
terc
rop
s
T
ota
l
N
et
60 c
m
120 c
m
Mea
n
60 c
m
120 c
m
Mea
n
60 c
m
120 c
m
M
ean
60 c
m
120 c
m
Mea
n
Fod
der
bee
t +
barl
ey
13412
13086
13249
1434
1516
1475
14846
14602
14724
8781
8903
Fod
der
bee
t +
wh
eat
13093
12768
12930
2020
1960
1990
1511
3
14728
14920
8823
9015
Fod
der
bee
t +
fab
a b
ean
14861
14413
14637
1597
1585
1591
16458
15998
16228
10132
10362
Aver
age
of
inte
rcro
pp
ing
13788
13422
13605
1683
1689
1686
15472
15109
15290
9245
9426
Sole
pla
nti
ng o
f fo
dd
er b
eet
15165
15165
15165
--
--
--
15165
15165
15165
9025
9208
10592
9608
9605
9605
9605
Pri
ces
of m
ain
prod
ucts
are
that
of 2
011:
-1
350
L.E
.to
n of
fodd
er b
eet
-130
4 L
.E.
arda
b of
bar
ley
-135
2 L
.E.
arda
b of
whe
at-1
596
L.E
.ar
dab
of fa
ba b
ean
Inte
rcro
ppin
g fo
dder
bee
t w
ith
faba
bea
n in
crea
sed
vari
able
cos
ts o
f in
terc
ropp
ing
cult
ure
757
L.E
. ov
er t
hose
of
sole
fo
dder
bee
t
11
332.intercropping fodder beet with faba bean is more El-Nahrawy, M.A. 2011. Country Pasture/Forage Resource Profiles:
profitable to farmers than sole fodder beet by using Egypt. Food and Agriculture Organization of the United Nations, Rome, Italy.suitable intercropping pattern. These results are in
El-Shereif , E.M. Dina, 2013. Effect of intercropping faba bean and wheat harmony with those obtained by Abdel-Gwad et al.
on sugar beet yield and its components . M.Sc. Thesis, Fac. (2008), they reported that the highest return between Agric., Kaferelsheikh Univ.
Finocchiaro, F., A. Gianinetti, B. Ferrari and A.M. Stanca, 2008.Effect of growing fodder beet as sole crop and its growing with beta-glucans and starch type on glycaemic response after
-1thwheat was collected when adding 130 kg N fad consumption of barley breed. proc. 10 International Barley
Genetics Symposium, ICARDA, Alexandria, Egypt: 584 – (2718.80 L.E.).588.
Freed, R.D. 1991.MSTATC Microcomputer Statistical Program. It could be concluded that although Michigan State Univ., East Lansing, Michigan, USA.
Fustec, J., F. Lesuffleur, S. Mahieu and J.B. Cliquet, 2010. N intercropping pattern resulted in adverse effects on rhizodeposition of legumes. A review. Agron. Sustain Dev.,
intercropped fodder beet yield and its attributes, 30:57–66. Gaivoronskii, B.A. 1981. Tubers in diet for cows. Poferativnyi Zhrnal, 58: however, Egyptian farmers could achieve an increase
12 – 15. Nut. Abstr. and Rev., 5: 768 (CF Computer Search). in their income by about 50% as compared to sole Ghosh, P.K., M.C. Manna, K.K. Bandyopadhyay, K. Ajay, A.K. Tripathi,
fodder beet when growing fodder beet with faba bean R.H. Wanjari, K.M. Hati, A.K. Misra and C.L. AcharyaSubbaRao, 2006. Interspecific interaction and on ridges (60 cm width).This paper emphasizes there nutrient use in soybean/sorghum intercropping system. Agron.
is a critical need for several scientific studies J., 98: 1097 – 1108.Gomez, K.A. and A.A. Gomez, 1984.Statistical Procedures for including morphological and physiological
Agricultural Research. John Eilley and Sons, Inc. New York. characteristics to increase the productivity of Hauggaard-Nielsen, H. and E.S. Jensen, 2005.Facilitative root
intercropped fodder beet with minimizing the adverse interactions in intercrops. Plant Soil, 274:237–250. Ibrahim, Y.M. 2005. Ranges and forage (In Arabic). Dar Azza for effects of shading intercropped barley, wheat or faba
Publication, Khartoum, Sudan, 300p (CF Computer Search). bean crops which reflected positively on the financial Mack, H.J. 1979.Effects of row spacings, fertilizers, and harvest dates on
table beets. J. Amer. Soc. Hort. Sci., 104:717–720 (CF return of fodder beet's farmer. Computer Search).
Mead, R. and R.W. Willey, 1980.The concept of a "land equivalent ratio" and advantages in yields from intercropping. Exp. Agric., 16: REFERENCES217 – 228.
Metwally, A.A. 1999. Intensive cropping system in the battle against food stAbdel-Gwad, M.S.A., T.K.A. Abd El-Aziz and A.M. Abd El-Galil, crises. Proc. 1 Conf. in Recent technologies, Fac. Agric, Cairo
2008.Effect of intercropping wheat with fodder beet under Univ., 27- 29 Nov., 11: 333 – 341.Metwally, A.A., M.M. Shafik, K.I. EL-Habbak and Sh.I. Abdel-Wahab, different levels of N-application on yield and quality. Ann.
Agric. Sci., 53: 353 – 362. 2009. Step forward for increasing intercropped soybean yield thAbou-Elela, A.M. and R.A. Gadallah, 2012. Effect of transplanted with maize. The 4 Conf., Recent Technologies in Agric., 3-5
seedling age of intercropped fodder beet with faba bean and Nov., Cairo Univ., 2: 256 – 269. Rezvani, M., F. Zaefarian, M. Aghaalikhani, H. Rahimian Mashhadi, and nitrogen fertilizer levels on yield and it's component of fodder
39 E. Zand, 2011.Investigation corn and soybean intercropping beet and faba bean. Zagazig J. Agric. Res., (6): 1057 – 1067. Al-Karaki, G.N. and M. Al-Hashimi, 2012.Green fodder production and advantages in competition with redroot pigweed and
water use efficiency of some forage crops under hydroponic jimsonweed. World Academy Sci., Engin. and Techno., 5: 9 – conditions. ISRN Agronomy, (2012): 1 – 5. 21.
Anonymous, 2013.Winter Crops. Agriculture Statistics and Economic Turk, M. 2010. Effects of fertilization on root yield and quality of fodder st
beet (Beta vulgaris var. Crassamansf.). Bulgarian J. Agric. Sector, 1 Ed., Ministry of Agriculture and Land Reclamation,
Sci., 16 (2): 212 – 219 (CF Computer Search). Egypt.Waghmare, A.B. and S.P. Singh, 1984. Sorghum-legume intercropping Banik, P.,B.K. Midya, Sarkar and S.S. Ghose, 2006. Wheat and chickpea
and the effects of nitrogen fertilization. I. Yield and nitrogen intercropping systems in an additive series experiment: 2024 uptake by crops. Exp. Agric., :251 – 259.advantages and weed smothering. Eur. J. Agron., : 325 –
Rec. on 10.12.2014 & Acc. on 30.12.2014
12
ABSTRACT
The research was done in department of Biochemistry and Cell Biology and the Reddick center for
computational Biology, Edinburg university, Edinburg during year 2013 .The crystal structure of recombinant wild-
type green fluorescent protein (GFP) has been solved to a resolution of 1.9 Å by multi-wavelength anomalous
dispersion (MAD) phasing methods. The protein is in the shape of a cylinder, comprising 11 strands of -sheet with an -
helix inside and short helical segments on the ends of the cylinder. This motif with -structure on the outside and -helix
on the inside, represents a new protein fold, which we have named the?-can. Two promoters pack closely together to
form a dimer in the crystal. The fluorophores are protected inside the cylinders, and their structures are consistent 66with the formation of aromatic systems made up of Tyr with reduction of its C - C bond coupled with cyclization of
the neighboring glycine and serine residues. The environment inside the cylinder explains the effects of many existing
mutants of GFP and suggests which side chains could be modified to change the spectral properties of GFP.
Furthermore, the identification of the dimer contacts may allow mutagenic control of the state of assembly of the
protein. It is concluded that, the study of protein dimer indices will helpful in identifying the new era for rice research
which will help in developing protein rich rice which can provide a dietary supplement for people.
(Key words: Protein, wavelength, flurophore, amino acids ) secretory pathwayKaether and Gerdes,1995), plasma INTRODUCTION
membrane (Marshall et al., 1995) and cytoskeleton
Green fluorescent protein, GFP, is a (Kahana et al.,1995) can be achieved via fusions both spontaneously fluorescent protein isolated from to whole proteins and individual targeting sequences. coelenterates, such as the Pacific jellyfish, Aequoria The enormous flexibility as a noninvasive marker in
1victoria . Its role is to transduce, by energy transfer, living cells allows for numerous other applications the blue chemiluminescence of another protein, such as a cell lineage tracer, reporter of gene
aequorin, into green fluorescent light (Ward,1979). expression and as a potential measure of protein-
The molecular cloning of GFP cDNA (Prasher et protein interactions (Mitra et al.,1996). Green al.,1992) and the demonstration by Chalfie that GFP fluorescent protein is comprised of 238 amino acids.
can be expressed as a functional transgene (Chalfie et Its wild-type absorbance/ excitation peak is at 395 nm al.,1994) have opened exciting new avenues of with a minor peak at 475 nm with extinction
-1 -1investigation in cell, developmental and molecular coefficients of roughly 30,000 and 7,000 M cm , biology. Fluorescent GFP has been expressed in respectively( Kahana and Silver,1996). The emission
bacteria (Chalfie et al.,1994), yeast (Kahana et peak is at 508 nm. Interestingly, excitation at 395 nm
al.,1995), slime mold ( Moores et al.,1996 ), plants leads to decrease over time of the 395 nm excitation (Casper and Holt,1996 ; Epel et al.,1996) , drosophila peak and a reciprocal increase in the 475 nm
et alet excitation band (Cubitt .,1995). This presumed (Wang and Hazelrigg,1994), zebrafish(Amsterdam
al et al photoisomerization effect is especially evident with .,1996), and in mammalian cells (Ludin .,1996 ;
DeGiorgi et al.,1996) . GFP can function as a protein irradiation of GFP by UV light. Analysis of a hexapeptide derived by proteolysis of purified GFP tag, as it tolerates N- and C-terminal fusion to a broad led to the prediction that the fluorophore originates variety of proteins many of which have been shown to
from an internal Ser-Tyr-Gly sequence which is post-retain native function (Moores et al.,1996 ; Cubitt et translationally modified to 4(phydroxybenzylidene)- al.,1995 ; Olsen et al.,1995). When expressed in
imidazolidin-5-one, structure (Cody et al.,1993). mammalian cells fluorescence from wild type GFP is Studies of recombinant GFP expression in E. coli led typically distributed throughout the cytoplasm and to a proposed sequential mechanism initiated by a nucleus, but excluded from the nucleolus and
65 67 rapid cyclization between set and Gly to form a vesicular organelles (reviewed by Cubitt et al., 1995, imidazolin-5 one intermediate followed by a much LG Moss unpublished observations). However,
66slower (hours) rate-limiting oxygenation of the Tyr highly specific intracellular localization including the
side chain by O (Heim et al., 1994). Combinatorialnucleus, mitochondria (Rizzuto et al.,1996), 2
1. Principal Scientist, Deptt. of Biochemistry and Cell Biology and the Reddick Center for Computational Biology, Edinburg University, Edinburg, TX 77005-1892
2& 3. Technical Scientist, Division of Endicrinology, Deptt. of Medicine, Tufts University School of Medicine and the New England Medical Center, Boston, USA
J. Soils and Crops 25 (1) 13-20, June, 2015 ISSN 0971-2836
THE MOLECULAR STRUCTURE OF GREEN FLUORESCENT PROTEIN 1 2 3Shreedhar Gadge , Jonathan K. Philip and K.Volmostree
67 of the 395 nm excitation peak with a major increase in mutagenesis suggests that the Gly is required for blue excitation ( Delagrave et al.,1995 ; Heim et formation of the fluorophore (Delagrave et al.,1995).
65While no known co-factors or enzymatic components al.,1995 ). When combined with Ser mutants, are required for this apparently auto-catalytic process, mutations at other sites near the fluorophore such as
68 72it is rather thermosensitive with the yield of Val Leu and Ser Ala can further enhance the fluorescently active to total GFP protein decreasing at intensity of green fluorescence produced by
temperatures greater than 30 C( Lim et al.,1995). excitation at 488 nm ( Delagrave et al.,1995 ; However, once produced GFP is quite thermostable. Cormack et al., 1996 ). However, amino acid
substitutions significantly outside this region also Physical and chemical studies of purified affect the protein's spectral character. For example,
202 203GFP have identified several important characteristics. Ser Phe and Thr Ile both cause the loss of
It is very resistant to denaturation requiring treatment excitation in the 475 nm region with preservation of
with 6 M guanidine hydrochloride at 90 C or pH of 395 nm excitation ( Chalfie et al.,1994 ; Heim et al.,
<4.0 or >12.0. Partial to near total renaturation occurs 1671994 ; Ehrig et al., 1995 ). Ile Thr results in a within minutes following reversal of denaturing reversed ratio of 395 to 475 nm sensitivity ( Cubitt et conditions by dialysis or neutralization ( Ward and 222
al., 1995 ), while Glu Gly is associated with the Bokman,1982). Circular dichroism predicts
elimination of only the 395 nm excitation ( Ehrig et significant amounts of sheet structure that is 163 al., 1995). Another change, Val Arg, not only subsequently lost on denaturation. (Ward and 65 enhances the magnitude of the Ser Thr mutant, but Bokman,1982) Over a non-denaturing range of pH,
also increases the temperature tolerance for increasing pH leads to a reduction in fluorescence by
functional GFP expression (Kahana and Silver, 395 nm excitation and an increased sensitivity to 475 1996). Molecular evolution techniques have been nm excitation (Ward et al., 1982). Reduction of
reported to improve GFP fluorescence ( Crameri et purified GFP by sodium dithionite results in a rapid al., 1996 ). Unfortunately, a roster of substitutions loss of fluorescence that slowly recovers in the associated with complete loss of function has not been presence of room air. While insensitive to sulfhydryl published.reagents such as 2-mercaptoethanol, treatment with
the sulfhydral reagent di-thiobisnitrobenzoic acid Because GFP in crystallum exhibits a nearly (DTNB) irreversibly eliminates fluorescence( Inouye
identical fluorescence spectrum and lifetime to that and Tsuji,1994 ).
for GFP in aqueous solution ( Perozzo et al., 1988 )
and fluorescence is not an inherent property of the The availability of E. coli clones expressing isolated fluorophore, the elucidation of its three-GFP has led to extensive mutational analysis of GFP dimensional structure will help provide an function. Truncation of more than 7 amino acids from explanation for the generation of fluorescence in the the C-terminus or more than the N-terminal Met lead
mature protein, as well as the mechanism of to total loss of fluorescence ( Dopf and autocatalytic fluorophore formation. Furthermore, Horiagan,1996 ). All non-fluorescent mutants also the development of fluorescent proteins with failed to exhibit absorption spectra characteristic of
the intact fluorophore, implying a possible defect in additional emission and excitation characteristics
would dramatically expand their biological post-translational processing. Screens of random and
applications. Color vision is based on the fact that directed point mutations for changes in fluorescent behavior have uncovered a number of informative spectral properties of a common fluorophore, cis-
66amino acid substitutions. Mutation of Tyr in the retinal, are altered as a function of protein
environment within red, blue, or green opsins( Merbs fluorophore to His results in a shift of the excitation maximum to the UV (383 nm) with emission now in and Nathans , 1992 ). The GFP from the sea pansy,
66the blue at 448 nm ( Heim et al., 1994 ). A Tyr Trp Renilla reniformis, which exhibits a single major
excitation peak at 498 nm, apparently utilizes an mutant is blue-shifted albeit to a lesser degree. Both changes are associated with a severe weakening of identical core fluorophore to that of A. victoria GFP . fluorescence intensity compared to wild type GFP. These findings taken together with the spectral
65changes exerted by substitutions in amino acids over Mutation of Ser to Thr, Ala, Cys or Leu causes a loss
14
100 residues from the GFP fluorophore suggest that a Multi-wavelength anomalous dispersion rational strategy to modify and expand the (MAD) data were taken at Brookhaven beam line fluorescence behavior of GFP based on protein X4A at four wavelengths. The wavelengths to be used structure may be possible. Here we report the X-ray were determined by reference and crystal absorption diffraction structure derived from a crystal of wild- scans. The data were taken at liquid nitrogen type, recombinant A. victoria green fluorescent
temperature using inverse-beam geometry in wedges protein.
of four degrees and processed using DENZO
(Otwinowski, 1993). Native and selenio-methionine MATERIALS AND METHODSdata sets were also taken in the laboratory on an R-
Green fluorescent protein was purified from AXIS IIC detector with CuK radiation. The native E. coli strain BL21(DE3)pLysS (Novagen)
data set used in the refinement had a R of 7.7% to mergecontaining plasmid pTu58, bearing the wild-type 1.9 Å resolution (99+% complete in all shells with 5-Aequorea victoria green fluorescent protein (Chalfie
fold average redundancy). Selenium atoms were et al.,1994). For the seleniomethionine protein, the located initially by standard difference Patterson plasmid was moved to E. coli methionine auxotroph maps between selenium-substituted and native strain B834(DE3)pLysS (Novagen). The purification
protein using SHELX96 (Sheldrick et al.,1993) and involved cell lysis, centrifugation of cell debris, and
four column chromatography steps: DEAE anion HEAVY (Terwilliger et al.,1987) and confirmed by exchange column (Sigma, CL-6B) with a zero to 1M Patterson maps using the MAD data. MADSYS
NaCl gradient in 10 m M phosphate, 2 m M EDTA, 2 software (Yang et al.,1990) was used to give the m M DTT, pH 7; a hydrophobic interaction column
anomalous diffraction differences shown in table 2 (Sigma, CL-4B) with a 0.1 to zero M phosphate
and to extract Fa, Ft, and phase information. gradient in 2 m M EDTA, 2 m M DTT, pH 7; an HPLC anion exchange column (Bio-Rad, Bio-Gel DEAE-
The resulting MAD-phased map was solvent 5PW) with a zero to 1M NaCl gradient in 10 mM
flattened and two-fold averaged based on the phosphate, 2 m M EDTA, 2 m M DTT, pH 7; and an selenium sites using CCP4 (Anonymous,1994), HPLC gel filtration column (Bio-Rad, Bio-Gel SEC-
skeletonized using the program O (Jones et al.,1991), 125) with 0.1 M phosphate, 2 m M EDTA, 2 m M and immediately revealed two 11-stranded DTT, pH 7. Gel filtration columns run at 10 m M
cylindrical -barrels. The polypeptide chain was traced phosphate showed predominately a 2-fold higher molecular weight species. Matrix-assisted laser for one of the barrels beginning from the desorption ionization mass spectrometry was seleniomethionines and extending the structure in performed by the University of Texas Health Sciences each direction, helped by the recognition of the Center analytical chemistry service. 66
modified tyrosine in the middle of the barrel as Tyr , The protein was crystallized in sitting drop
the nucleus of the fluorophore. The correct vapor diffusion wells (Hampton Research) at room enantiomorph is space group P4 2 2, as confirmed by 1 1temperature using 58% 2-methyl-2,4-pentanediol
(Aldrich), 50mM morpholino ethane sulfonic acid, the handedness of the ?-barrel and the ?-helices. 0.1% sodium azide at pH 6.8. The protein Refinement has been started using the program X-
-1 concentration varied, but was typically 20-30 mg ml . Plor (Brunger,1992) using the native data collected at Crystals grew as green fluorescent square bipyramids room temperature; the current R-factor at 1.9 Å is up to 0.5 mm on a side. The space group was 0.21 with an R-free of 0.26, with good geometry (rms) determined to be P4 2 2 or its enantiomorph, with 1 1 bond and angle deviations from ideality of 0.013 Å a=b=87.15 Å and c=119.85 Å at cryogenic
and 1.8, respectively) and tight restraint of the non-temperatures, and a=b= 89.23 Å and c= 119.78 Å at
crystallographic symmetry. All measured data were room temperature. The unit cell also varies with included in the refinement. Coordinates and structure changes in ionic strength, and this effect thwarted factors have been deposited at the Brookhaven solution by multiple isomorphous replacement. Protein Data Bank under accession numbers 1GFL Packing density calculations suggested that there
were probably two molecules per asymmetric unit. and R1GFLSF, respectively.
15
Mass spectrometry studies of the bacterially RESULTS AND DISCUSSIONexpressed wild-type and selenio- methionyl protein show masses of 26836.1 (±0.9) and 27069.3 (±1.4) g The structure of GFP has been solved using
-1mole , respectively. The masses calculated for the seleniomethionyl-substituted protein and multi-known pTu58 gene sequence, including the original wavelength anomalous dispersion (MAD) phasing
80inadvertent Gln Arg PCR error during the cloning of methods. The electron density maps produced by the
the gene for GFP (Chalfie et al.,1994) and the MAD phasing were very clear, revealing a dimer cyclization and oxidation of the tyrosine are 26835.5 comprised of two quite regular -barrels with 11 and 27070.0 for the seleniomethionine, respectively. strands on the outside of cylinders (Figure 1,2,3).
-1The differences of 0.6 and -0.7 g mole are small and These cylinders have a diameter of about 30 Å and a the results are therefore consistent with essentially length of about 40 Å. Inspection of the density within complete fluorophore formation, including the loss of the cylinders reveals modified tyrosine side chains as water after cyclization. The error limits do not allow a part of an irregular -helical segment (Figure 4). accurate determination of the degree of oxidation of Small sections of -helix also form caps on the ends of the dehydrotyrosine, however. These results indicate the cylinders. This motif, with a single -helix inside a the starting material for the crystallization was very uniform cylinder of ?-sheet structure, represents essentially fully formed GFP and the lack of a new protein class, as it is not similar to any other difference density in Fo-Fc maps in this region shows known protein structure.that the crystal contains fully cyclized GFP.
The fluorophore is highly protected, located The remarkable cylindrical fold of the protein on the central helix within a couple of Ångstroms of
seems ideally suited for the function of the protein. the geometric center of the cylinder. The pocket The strands of -sheet are tightly fitted to each other containing the fluorophore has a surprising number of like staves in a barrel, and form a regular pattern of charged residues in the immediate environment hydrogen bonds. Together with the short -helices and (Figure 5 and Table 1). The environment around the loops on the ends, the 'can' structure forms a single fluorophore includes both apolar and polar amino
64 46 compact domain and does not have obvious clefts for acid side chains. Phe and Phe are near the 63 easy access of diffusable ligands to the fluorophore. fluorophore and separate the single tryptophan, Trp
This fold, taken with the observation that the from direct contact with fluorophore (closest distance fluorophore is near the geometric center of the of 13 Å). A table of all atoms that come in contact with molecule explains the observed protection of the the fluorophore and their distances to the fluorophore fluorophore from collisional quenching by oxygen is provided (Table 1).
-1 -1 34(K < 0.004 M s ) and hence reduction of the bm
The crystallographic contacts are all rather quantum yield. Perhaps more ser iously, tenuous, consisting of a few amino acids side chains photochemical damage by the formation of singlet for each. The non-crystallographic symmetry is oxygen through intersystem crossing is reduced by maintained by extensive contacts and thus is likely to the structure. The tightly constructed -can would be the source of the dimerization seen in solution appear to serve this role nicely, as well as provide studies (Figure 6). The dimer contacts are fairly tight overall stability and resistance to unfolding by heat and consist of a core of hydrophobic side chains from and denaturants.
206 221 223Ala , Leu , and Phe from each of the two monomers and a wealth of hydrophilic contacts The location of certain amino acid side chains
39 142 144 146 147(Figure 5), including Tyr , Glu , Asn , Asn , Ser , in the vicinity of the fluorophore also begins to 149 151 168 170 172 200 202 204 explain the fluorescence and the behavior of certain Asn , Tyr , Arg , Asn , Glu , Tyr , Ser , Gln ,
208 mutants of the protein. At least two resonant forms of and Ser . Contacts with other crystallographic the fluorophore can be drawn, one with a partial molecules are not extensive, and the salt-dependence
66negative charge on the benzyl oxygen of Tyr , and of this dimer interface and/or the loose contacts with
neighboring molecules may explain the difficulties one with the charge on the carbonyl oxygen of the with isomorphism in initial heavy atom phasing imidazolidone ring. Interestingly, basic residues studies. appear to form hydrogen bonds with each of these
16
148 66 94 96 expression and/or folding of the protein. The crystal oxygen atoms, His with Tyr and Gln and Arg 65structure of the Ser Thr mutant has also been solved with the imidazolidone. These bases presumably act
(Ormo et al.,1996), and it will be interesting to to stabilize and possibly further delocalize the charge
compare the two structures for clues about the on the fluorophore. Most of the other polar residues in
fluorescence and other differences. The report of the pocket form an apparent hydrogen-bonding 66 improvements in GFP by DNA shuffling (Crameri et network on the side of Tyr that requires abstraction
100 154al.,1996), comprising mutations Phe Ser, Met Thr of protons in the oxidation process. It is tempting to 164speculate that these residues help abstract the protons. and Val Ala are difficult to explain based on the
203As for the mutants, atoms in the side chains of Thr , structure. Positions 154 and 164 are on the surface of
222 167Glu , and Ile are in van der Waals contact with the protein and may exert their effects through 66 improved solubility and/or reduced aggregation. The Tyr , so their mutation would have direct steric
Phe-Ser mutation at first glance would appear to effects on the fluorophore and would also change its destabilize the core of the protein and we have no idea electrostatic environment if the charge were changed,
how it would improve the system.as suggested previously (Ehrig et al.,1995). A quantitative explanation will require further
The mechanism of activation of the examination. It seems likely that other mutations of fluorophore from ordinary protein structure is the residues identified to be near the fluorophore consistent with a non-enzymatic cyclization would also have effects on the absorption and/or mechanism like that of Asn-Gly deamidation emission spectra, and such experiments to change the
(Wright,1991) followed by oxidation of the tyrosine electrostatic environment around the fluorophore are to dehydrotyrosine, as previously suggested. The role in progress. By virtue of their varied fluorophore of molecular oxygen in this mechanism and in GFP environments and hence altered spectra, these fluorescence is paradoxical, however. Molecular mutants should lead to expanded uses of green oxygen is proposed to be needed for formation of the fluorescent protein as gene markers, cell lineage double bond between C and C on the tyrosine to form markers, and encourage other uses in biotechnology.an extended aromatic system, but oxygen must also be excluded from regular interactions with the Mutations in regions of the sequence
adjacent to the fluorophore, i.e. in the range of fluorophore or else collisional quenching of the
positions 65-67, have been systematically explored fluorescence or damaging photochemistry will occur.
(Delagrave et al.,1995), some having significant The low bimolecular quenching rate suggests that the
wavelength shifts and most suffer a loss of protein's design sacrifices efficient fluorophore
fluorescence intensity. For example, mutation of the formation for stability and higher quantum yields central Tyr to Phe or His shifts the excitation bands once fully formed.but there is an overall loss of intensity. Secondary
The excited state dynamics of GFP have been mutations to compensate for the deleterious intensity 65 studied using Stark, steady state, and time-resolved effects should also now be possible. The Ser Thr
fluorescence spectroscopies (Chattoraj et al.,1996)mutant is particularly interesting because of its (and Youvan and Michel-Beyerle, personal reported increase in fluorescence intensity (Heim et
communication) . The results suggest that proton al.,1994; Heim et al.,1995). The mechanism for transfer is involved in interconversions within two increased fluorescence may be reduced collisional ground and two excited states. The extended set of quenching, as the additional methyl group may make polar interactions around the flourophore could easily for better packing in the interior of the protein. On the accomodate proton rearrangements, with the most other hand, the effect has been suggested to be
148likely direct effects being associated with the His through improved conversion of the tyrosine to 66 96
with the hydroxyl of Tyr , Arg interactions with the dehydrotyrosine. However, the fact that we see 222imidazolidone, or Glu interactions with the significantly altered structure relative to standard
65 65 222protein conformations in the wild-type argues against hydroxyl of Ser . Since the Ser /Glu mutants have a dramatic increase in cyclization and/or oxidation. both lost their native interactions together with their
~400 nm absorption bands, one possibility is that This effect is most likely produced by increased
17
the 400nm band arises from the abstraction of the the crystal is likely to be the same one formed in 65 222 solution, since the ionic strength of the crystallization Ser hydroxyl proton by Glu . This is speculation
buffer is low, and we see dimers at low (<100 mM) however, but similar spectroscopic studies on mutants at these positions may be able to differentiate the roles ionic strengths in solution. Thus, it is not surprising to of these sites in excited state dynamics. us to see the large number of hydrophilic dimer
contacts. The smaller hydrophobic patch could The N- and C-termini t runcat ion conceivably be involved in physiological interactions
studies(Dopf and Horiagan,1996) and the fluorescent with aequorin, as there would be a natural advantage fusion products(Moores et al.,1996;Cubitt et to close proximity for efficient energy transfer. It is
al.,1995;Olsen et al.,1995) are now understandable, not known at present whether dimers form in given the structure of the protein. Since the C- physiological circumstances, or what the effect of terminus loops back outside the cylinder and the last
dimerization is on energy transfer, aside from the seven or so amino acids are disordered it shouldn't be
circumstantial inferences on the excitation spectra critical to have them present and further addition
previously reported on the native protein(Ward et would seem to be easily tolerated. These residues do
al.,1982) . The dimer contacts should now be able to not form a stave of the barrel. The role of the N-
be modified in such a way to disrupt the formation of terminus is a little less clear, as the first strand in the
dimers without affecting stability and folding. Other barrel does not begin until amino acid 10 or 11. Thus
nearby residues could also be converted to barrel formation does not require the N-terminal hydrophobic residues to enhance dimer stability if region. The N-terminal segment, is however, an desired. Control of the dimerization will be important integral part of the 'cap' on one end of the protein, and for fluorescence resonance energy transfer (FRET) may be essential in folding events or in protecting the studies of protein-protein interactions using GFP, as fluorophore. Again, extensions at the N-terminus one would not want to induce association and hence would not disrupt the motif structure of the protein.resonance energy transfer between the differently
colored GFP proteins by mechanisms other that of the The chemical modification studies (Inouye and Tsuji,1994) using sulfhydral reagents can be target protein interactions. Mutants may also be partially explained. Reaction of one of the cysteines developed for reduction of aggregation during
70expression and hence fewer problems with inclusion near one end of the cylinder, Cys , would appear to
disrupt the packing of the cap on that end, and hence bodies. allow quenching of the fluorophore. Significant
Thus, the three-dimensional structure of GFP fluorescence intensity effects by the modification of 48 has provided a physico-chemical basis of many Cys on the exterior of the protein would not be
observed features of the protein, including its expected, a priori. The structure determination of the stability, protection of it fluorophore, behavior of dithionite-reduced, non-fluorescent species has not mutants, and dimerization properties. The structure yet been studied, but should provide additional data
on the nature of the fluorophore. The pH dependence will also allow directed mutation studies to
of the excitation bands at 395 nm and 475 nm(Ward et complement random and combinatorial approaches.148
al.,1982) is almost certainly due to His , whose N 66 From above research it is concluded that, the atom is 3.3 Å from the Tyr hydroxyl oxygen atom of
study of protein dimer indices will helpful in the fluorophore, although NMR pKa measurements identifying the new era for rice research which will or mutagenesis studies would be needed for help in developing protein rich rice which can provide confirmation.a dietary supplement for people.The dimer we see as the asymmetric unit in
18
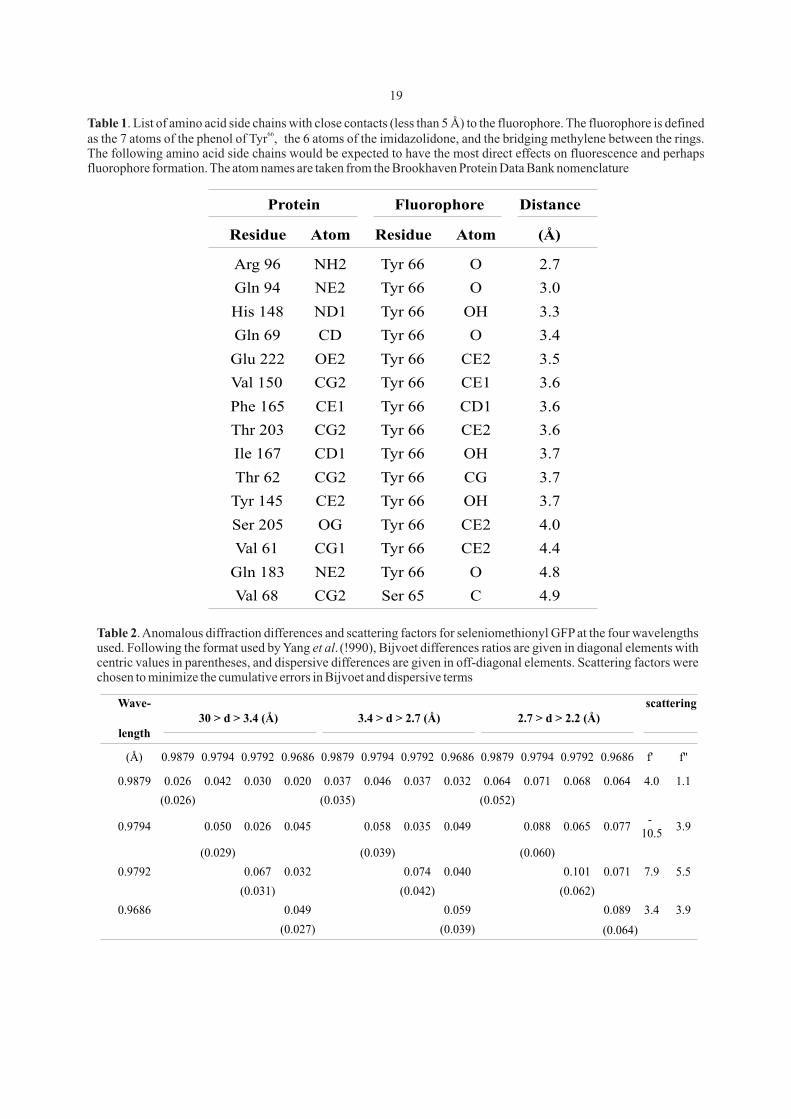
Table 1. List of amino acid side chains with close contacts (less than 5 Å) to the fluorophore. The fluorophore is defined 66as the 7 atoms of the phenol of Tyr , the 6 atoms of the imidazolidone, and the bridging methylene between the rings.
The following amino acid side chains would be expected to have the most direct effects on fluorescence and perhaps fluorophore formation. The atom names are taken from the Brookhaven Protein Data Bank nomenclature
Protein Fluorophore Distance
Residue Atom Residue Atom (Å)
Arg 96 NH2 Tyr 66 O 2.7
Gln 94 NE2 Tyr 66 O 3.0
His 148 ND1 Tyr 66 OH 3.3
Gln 69 CD Tyr 66 O 3.4
Glu 222 OE2 Tyr 66 CE2 3.5
Val 150 CG2 Tyr 66 CE1 3.6
Phe 165 CE1 Tyr 66 CD1 3.6
Thr 203 CG2 Tyr 66 CE2 3.6
Ile 167 CD1 Tyr 66 OH 3.7
Thr 62 CG2 Tyr 66 CG 3.7
Tyr 145 CE2 Tyr 66 OH 3.7
Ser 205 OG Tyr 66 CE2 4.0
Val 61 CG1 Tyr 66 CE2 4.4
Gln 183 NE2 Tyr 66 O 4.8
Val 68 CG2 Ser 65 C 4.9
Table 2. Anomalous diffraction differences and scattering factors for seleniomethionyl GFP at the four wavelengths used. Following the format used by Yang et al. (!990), Bijvoet differences ratios are given in diagonal elements with
centric values in parentheses, and dispersive differences are given in off-diagonal elements. Scattering factors were chosen to minimize the cumulative errors in Bijvoet and dispersive terms
Wave-
length
30 > d > 3.4 (Å) 3.4 > d > 2.7 (Å) 2.7 > d > 2.2 (Å)scattering
(Å) 0.9879
0.9794
0.9792 0.9686
0.9879
0.9794
0.9792 0.9686
0.9879
0.9794 0.9792 0.9686 f' f''
0.9879 0.026
0.042
0.030
0.020
0.037
0.046
0.037
0.032
0.064
0.071 0.068 0.064 4.0 1.1
(0.026)
(0.035)
(0.052)
0.9794 0.050
0.026
0.045
0.058
0.035
0.049
0.088 0.065 0.077-
10.53.9
(0.029)
(0.039)
(0.060)
0.9792
0.067
0.032
0.074
0.040
0.101 0.071 7.9 5.5
(0.031) (0.042) (0.062)
0.9686 0.049 0.059 0.089 3.4 3.9
(0.027) (0.039) (0.064)
19
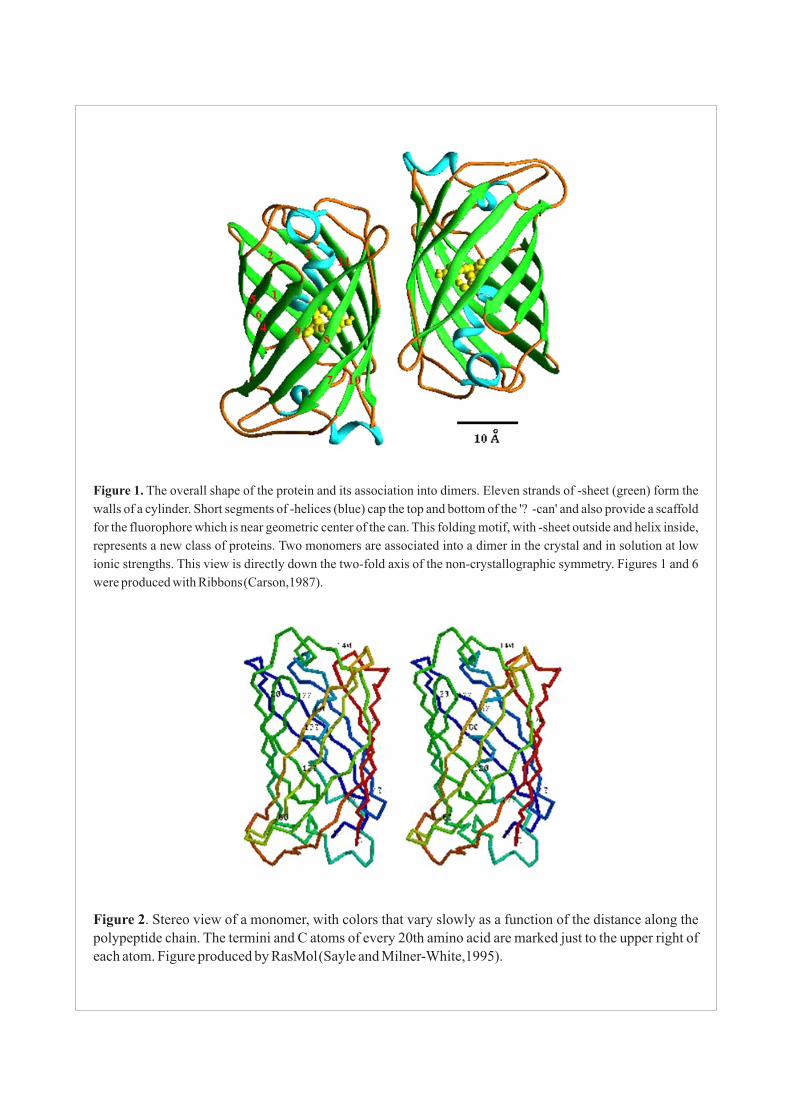
Figure 1. The overall shape of the protein and its association into dimers. Eleven strands of -sheet (green) form the
walls of a cylinder. Short segments of -helices (blue) cap the top and bottom of the '? -can' and also provide a scaffold
for the fluorophore which is near geometric center of the can. This folding motif, with -sheet outside and helix inside,
represents a new class of proteins. Two monomers are associated into a dimer in the crystal and in solution at low
ionic strengths. This view is directly down the two-fold axis of the non-crystallographic symmetry. Figures 1 and 6 were produced with Ribbons(Carson,1987).
Figure 2. Stereo view of a monomer, with colors that vary slowly as a function of the distance along the
polypeptide chain. The termini and C atoms of every 20th amino acid are marked just to the upper right of each atom. Figure produced by RasMol(Sayle and Milner-White,1995).
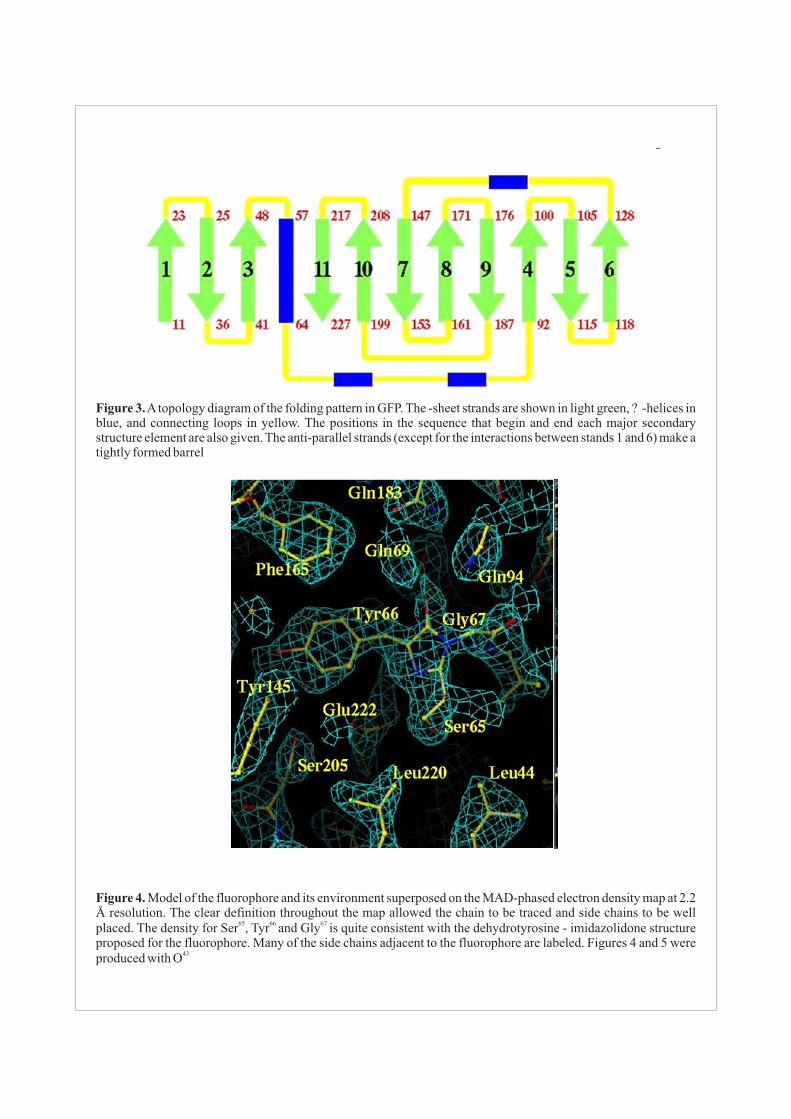
Figure 3. A topology diagram of the folding pattern in GFP. The -sheet strands are shown in light green, ? -helices in blue, and connecting loops in yellow. The positions in the sequence that begin and end each major secondary structure element are also given. The anti-parallel strands (except for the interactions between stands 1 and 6) make a tightly formed barrel
Figure 4. Model of the fluorophore and its environment superposed on the MAD-phased electron density map at 2.2 Å resolution. The clear definition throughout the map allowed the chain to be traced and side chains to be well
65 66 67 placed. The density for Ser , Tyr and Gly is quite consistent with the dehydrotyrosine - imidazolidone structure proposed for the fluorophore. Many of the side chains adjacent to the fluorophore are labeled. Figures 4 and 5 were
43 produced with O
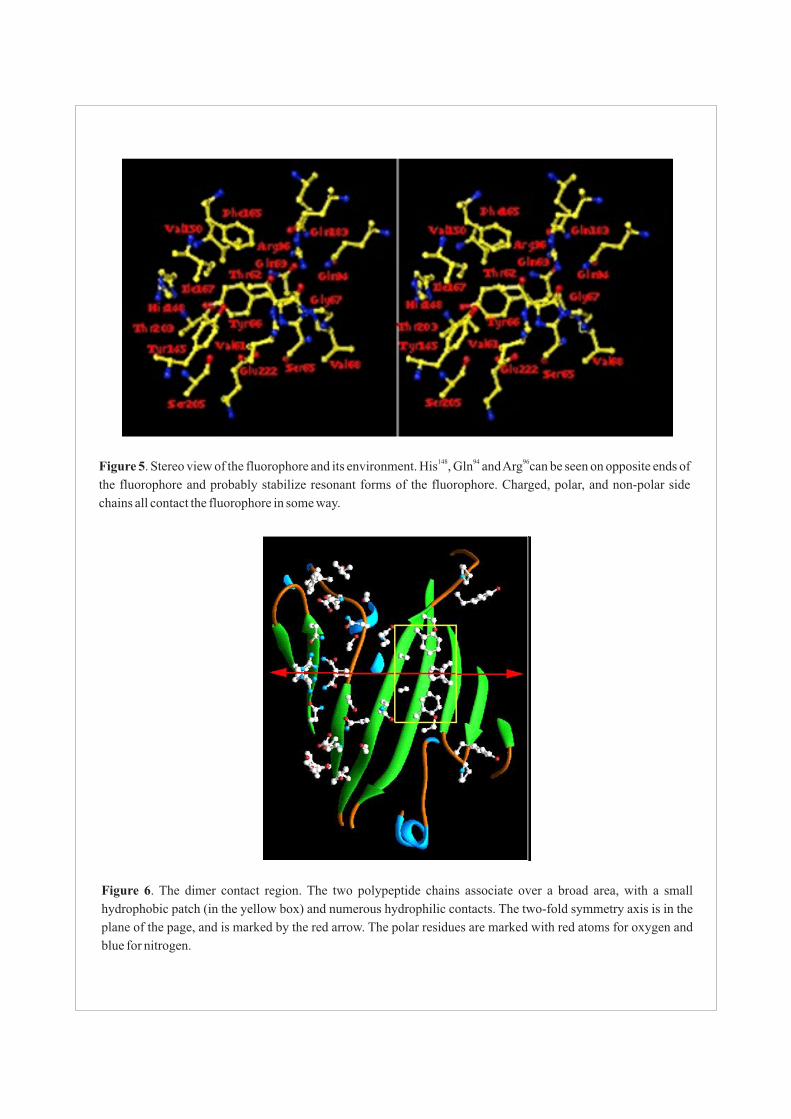
148 94 96Figure 5. Stereo view of the fluorophore and its environment. His , Gln and Arg can be seen on opposite ends of
the fluorophore and probably stabilize resonant forms of the fluorophore. Charged, polar, and non-polar side
chains all contact the fluorophore in some way.
Figure 6. The dimer contact region. The two polypeptide chains associate over a broad area, with a small
hydrophobic patch (in the yellow box) and numerous hydrophilic contacts. The two-fold symmetry axis is in the
plane of the page, and is marked by the red arrow. The polar residues are marked with red atoms for oxygen and
blue for nitrogen.
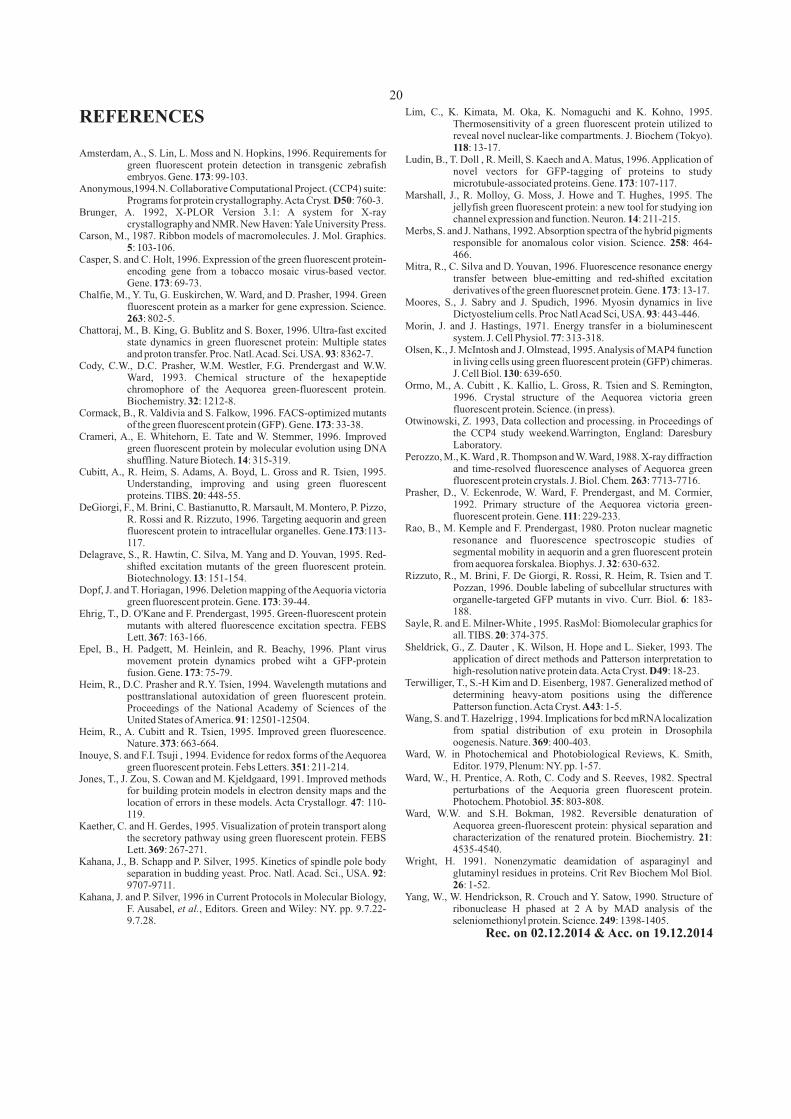
Lim, C., K. Kimata, M. Oka, K. Nomaguchi and K. Kohno, 1995. REFERENCES Thermosensitivity of a green fluorescent protein utilized to reveal novel nuclear-like compartments. J. Biochem (Tokyo). 118: 13-17.
Amsterdam, A., S. Lin, L. Moss and N. Hopkins, 1996. Requirements for Ludin, B., T. Doll , R. Meill, S. Kaech and A. Matus, 1996. Application of
green fluorescent protein detection in transgenic zebrafish novel vectors for GFP-tagging of proteins to study
embryos. Gene. 173: 99-103.microtubule-associated proteins. Gene. 173: 107-117.
Anonymous,1994.N. Collaborative Computational Project. (CCP4) suite: Marshall, J., R. Molloy, G. Moss, J. Howe and T. Hughes, 1995. The Programs for protein crystallography. Acta Cryst. D50: 760-3.
jellyfish green fluorescent protein: a new tool for studying ion Brunger, A. 1992, X-PLOR Version 3.1: A system for X-ray channel expression and function. Neuron. 14: 211-215.crystallography and NMR. New Haven: Yale University Press.
Merbs, S. and J. Nathans, 1992. Absorption spectra of the hybrid pigments Carson, M., 1987. Ribbon models of macromolecules. J. Mol. Graphics. responsible for anomalous color vision. Science. 258: 464-5: 103-106.466.Casper, S. and C. Holt, 1996. Expression of the green fluorescent protein-
Mitra, R., C. Silva and D. Youvan, 1996. Fluorescence resonance energy encoding gene from a tobacco mosaic virus-based vector. transfer between blue-emitting and red-shifted excitation Gene. 173: 69-73.derivatives of the green fluorescnet protein. Gene. 173: 13-17.Chalfie, M., Y. Tu, G. Euskirchen, W. Ward, and D. Prasher, 1994. Green
Moores, S., J. Sabry and J. Spudich, 1996. Myosin dynamics in live fluorescent protein as a marker for gene expression. Science. Dictyostelium cells. Proc Natl Acad Sci, USA. 93: 443-446.263: 802-5.
Morin, J. and J. Hastings, 1971. Energy transfer in a bioluminescent Chattoraj, M., B. King, G. Bublitz and S. Boxer, 1996. Ultra-fast excited system. J. Cell Physiol. 77: 313-318.state dynamics in green fluorescnet protein: Multiple states
Olsen, K., J. McIntosh and J. Olmstead, 1995. Analysis of MAP4 function and proton transfer. Proc. Natl. Acad. Sci. USA. 93: 8362-7.in living cells using green fluorescent protein (GFP) chimeras. Cody, C.W., D.C. Prasher, W.M. Westler, F.G. Prendergast and W.W. J. Cell Biol. 130: 639-650.Ward, 1993. Chemical structure of the hexapeptide
Ormo, M., A. Cubitt , K. Kallio, L. Gross, R. Tsien and S. Remington, chromophore of the Aequorea green-fluorescent protein. 1996. Crystal structure of the Aequorea victoria green Biochemistry. 32: 1212-8.fluorescent protein. Science. (in press).Cormack, B., R. Valdivia and S. Falkow, 1996. FACS-optimized mutants
Otwinowski, Z. 1993, Data collection and processing. in Proceedings of of the green fluorescent protein (GFP). Gene. 173: 33-38.the CCP4 study weekend.Warrington, England: Daresbury Crameri, A., E. Whitehorn, E. Tate and W. Stemmer, 1996. Improved Laboratory.green fluorescent protein by molecular evolution using DNA
Perozzo, M., K. Ward , R. Thompson and W. Ward, 1988. X-ray diffraction shuffling. Nature Biotech. 14: 315-319.and time-resolved fluorescence analyses of Aequorea green Cubitt, A., R. Heim, S. Adams, A. Boyd, L. Gross and R. Tsien, 1995. fluorescent protein crystals. J. Biol. Chem. 263: 7713-7716.Understanding, improving and using green fluorescent
Prasher, D., V. Eckenrode, W. Ward, F. Prendergast, and M. Cormier, proteins. TIBS. 20: 448-55.1992. Primary structure of the Aequorea victoria green-DeGiorgi, F., M. Brini, C. Bastianutto, R. Marsault, M. Montero, P. Pizzo, fluorescent protein. Gene. 111: 229-233.R. Rossi and R. Rizzuto, 1996. Targeting aequorin and green
Rao, B., M. Kemple and F. Prendergast, 1980. Proton nuclear magnetic fluorescent protein to intracellular organelles. Gene.173:113-resonance and fluorescence spectroscopic studies of 117.segmental mobility in aequorin and a gren fluorescent protein Delagrave, S., R. Hawtin, C. Silva, M. Yang and D. Youvan, 1995. Red-from aequorea forskalea. Biophys. J. 32: 630-632.shifted excitation mutants of the green fluorescent protein.
Rizzuto, R., M. Brini, F. De Giorgi, R. Rossi, R. Heim, R. Tsien and T. Biotechnology. 13: 151-154.Pozzan, 1996. Double labeling of subcellular structures with Dopf, J. and T. Horiagan, 1996. Deletion mapping of the Aequoria victoria organelle-targeted GFP mutants in vivo. Curr. Biol. 6: 183-green fluorescent protein. Gene. 173: 39-44.188.Ehrig, T., D. O'Kane and F. Prendergast, 1995. Green-fluorescent protein
Sayle, R. and E. Milner-White , 1995. RasMol: Biomolecular graphics for mutants with altered fluorescence excitation spectra. FEBS all. TIBS. 20: 374-375.Lett. 367: 163-166.
Sheldrick, G., Z. Dauter , K. Wilson, H. Hope and L. Sieker, 1993. The Epel, B., H. Padgett, M. Heinlein, and R. Beachy, 1996. Plant virus application of direct methods and Patterson interpretation to movement protein dynamics probed wiht a GFP-protein high-resolution native protein data. Acta Cryst. D49: 18-23.fusion. Gene. 173: 75-79.
Terwilliger, T., S.-H Kim and D. Eisenberg, 1987. Generalized method of Heim, R., D.C. Prasher and R.Y. Tsien, 1994. Wavelength mutations and determining heavy-atom positions using the difference posttranslational autoxidation of green fluorescent protein. Patterson function. Acta Cryst. A43: 1-5.Proceedings of the National Academy of Sciences of the
Wang, S. and T. Hazelrigg , 1994. Implications for bcd mRNA localization United States of America. 91: 12501-12504.from spatial distribution of exu protein in Drosophila Heim, R., A. Cubitt and R. Tsien, 1995. Improved green fluorescence. oogenesis. Nature. 369: 400-403.Nature. 373: 663-664.
Ward, W. in Photochemical and Photobiological Reviews, K. Smith, Inouye, S. and F.I. Tsuji , 1994. Evidence for redox forms of the Aequorea Editor. 1979, Plenum: NY. pp. 1-57.green fluorescent protein. Febs Letters. 351: 211-214.
Ward, W., H. Prentice, A. Roth, C. Cody and S. Reeves, 1982. Spectral Jones, T., J. Zou, S. Cowan and M. Kjeldgaard, 1991. Improved methods perturbations of the Aequoria green fluorescent protein. for building protein models in electron density maps and the Photochem. Photobiol. 35: 803-808.location of errors in these models. Acta Crystallogr. 47: 110-
Ward, W.W. and S.H. Bokman, 1982. Reversible denaturation of 119.Aequorea green-fluorescent protein: physical separation and Kaether, C. and H. Gerdes, 1995. Visualization of protein transport along characterization of the renatured protein. Biochemistry. 21: the secretory pathway using green fluorescent protein. FEBS 4535-4540.Lett. 369: 267-271.
Wright, H. 1991. Nonenzymatic deamidation of asparaginyl and Kahana, J., B. Schapp and P. Silver, 1995. Kinetics of spindle pole body separation in budding yeast. Proc. Natl. Acad. Sci., USA. 92: glutaminyl residues in proteins. Crit Rev Biochem Mol Biol. 9707-9711. 26: 1-52.
Kahana, J. and P. Silver, 1996 in Current Protocols in Molecular Biology, Yang, W., W. Hendrickson, R. Crouch and Y. Satow, 1990. Structure of F. Ausabel, et al., Editors. Green and Wiley: NY. pp. 9.7.22- ribonuclease H phased at 2 A by MAD analysis of the
seleniomethionyl protein. Science. 249: 1398-1405.9.7.28.Rec. on 02.12.2014 & Acc. on 19.12.2014
20

ABSTRACT
Agriculture occupies a dominant position in the Egyptian economy. The sugar industry is a main strategic
industry in Egypt. A two-year study was carried out at El-Serw Agricultural Experiments and Research Station,
A.R.C., Domiatte governorate, Egypt during 2012-2013 and 2013-2014 winter seasons to determine the effect of
intercropping wheat and faba bean on sugar beet yield and its attributes and agro - feasibility under different mineral
nitrogen (N) fertilizer rates of sugar beet. The treatments were the combinations between three cropping systems
(intercropping wheat with sugar beet, intercropping faba bean with sugar beet and sugar beet solid culture) and three -1mineral N fertilizer rates of sugar beet under intercropping and solid cultures (125.0, 166.6 and 208.2 kg N ha ). Sugar
beet plants were grown in both sides of beds (120 cm width) with intercropping wheat or faba bean plants in the
middle of all sugar beet beds in addition to solid cultures of all the tested crops. A split plot design in three replicates -1was used. The results showed that sugar beet solid culture had maximum root length and diameter, root weight plant ,
-1 -1 -1root yield ha yield and sugar quality traits. Root weight plant and root yield ha were decreased by 27.48 and 18.97
per cent, respectively, as compared with sugar beet solid culture. Increasing mineral N fertilizer rates from 125.0 to -1166.6 kg N ha increased sugar beet yield by 5.17 and 6.34% under intercropping and solid cultures, respectively. All
the studied traits of sugar beet were affected significantly by the interaction between cropping systems and mineral N
fertilizer rates. Land equivalent ratio (LER) ranged from 0.98 to 1.26 with an average of 1.14. All values of relative
crowding coefficient (RCC) were exceeded 1.00 except at intercropping wheat with sugar beet that fertilized by 125.0 -1kg N ha . Wheat or faba bean plants are dominant components and sugar beet plants are dominated components.
-1Maximum financial return $410 ha was recorded by intercropping faba bean with sugar beet was fertilized by 75% -1of the recommended mineral N fertilizer rate (125.0kg N ha ).
(Key words: Intercropping, sugar beet, wheat, faba bean, competitive relationships, financial return)
Accordingly, one of the main problems INTRODUCTIONassociated with the Egyptian agricultural system is
-1Egypt is bridging the gap between sugar the low size of cultivated land farmer . This led to an consumption and production through imports. After increase need to maximize land usage to enhance sugarcane, sugar beet (Beta vulgaris L.) is considered farmer's income. In view of the previous, it was the second important sugar crop in Egypt and also in necessary to find a modern agricultural technical
-1many countries in the world. By 1880, sugar beet had practice in Egypt for increasing sugar yield unit area replaced sugarcane as the main source of sugar in without any significant change in crop structure. continental Europe (Anonymous, 2009). Although Intercropping is the best agricultural practice to demand for sugar in the Egyptian market is maximize land usage without negative change for the intensively increasing but sugarcane production and sugar beet cultivated area. However, crop species in area are stable with no expectations for change due to intercropping pattern must be carefully chosen to scarce land and water resources in Egypt, in addition minimize competition and enhance the efficient use to sugar beet area is not expanding. Always, there is a of water, light and nutrients (Sayed Galal et al., 1983). severely competition between sugarcane and the There are some socio-economic advantages of other winter field crops for land, water, light and intercropping over monoculture system (Ofori and nutrients according to production costs and lower net Stern, 1987). Increased productivity, optimal use of returns. Sugar beet cultivated area reached about available resources and increasing the efficiency of 193,482 ha in 2012 season with an average yield of land use (Dhima et al., 2007) are considered the
-151.91 tons ha , while the other strategic winter food benefits of cereals or legumes intercropping crops such as wheat and faba bean (Vicia faba) which compared to their solid cultures. their cultivated area reached about 1,419,275 and
-1On the other hand, output improvement in a crop 44,082 with an average yield of 6.66 and 3.53 tons ha
in 2012 season, respectively, (Anonymous, 2012). production system is related to the better use of
1. Assoc. Professor, Crop Intensification Research Deptt. Field Crops Research Institute, Agricultural Research Center, Egypt
2 & 3. Researcher, Crop Intensification Research Deptt. Field Crops Research Institute, Agricultural Research Center, Egypt
J. Soils and Crops 25 (1) 21-30, June, 2015 ISSN 0971-2836
SUGAR BEET PRODUCTIVITY AND PROFITABILITY AS AFFECTED BY THREE CROPPING SYSTEMS AND MINERAL NITROGEN
FERTILIZER RATES1 2 3Abdel-Galil M. Abdel-Galil , Yaser E. El-Ghobashy and Mohamed M. Lamlom
resources. Among the plant nutrients, N plays a very 4. Wheat solid culture by planting two wheat important role in crop productivity (Zapata and rows on both sides of the ridges (60 cm width).Cleenput, 1986). It is considering as balance wheel of sugar beet nutrition due to the fact that the efficiency 5. Faba bean solid culture by planting two faba of other nutrients and productivity of sugar beet are bean rows on both sides of the ridges (60 cm width). depended on N availability. In this concern, Jahedi This pattern resulted in 266,560 plants of faba bean.and Noroozi (2010) revealed that increasing N fertilizer levels substantially improved root, top and Sugar beet variety kindly provided by Sugar sugar yields, as well as, its components, whereas Crops Res. Institute, ARC. Varieties of wheat and faba quality parameters were decreased. So, the present bean kindly provided by Wheat and Food Legumes study was conducted to determine the effect of Res. Depts., Field Crops Res. Inst., ARC, intercropping wheat and faba bean on sugar beet yield respectively. The preceding summer crop was rice in and its attributes and agro - feasibility under different both seasons. Normal cultural practices for growing mineral N fertilizer rates. all crops were used as recommended in the area. Faba
bean seeds were inoculated with Rhizobium MATERIALS AND METHODS
leguminosarum and gum arabic was used as a sticking
agent. Mineral N fertilizer was applied at rates of 44.6 A two-year study was carried out at El-Serw -1Agricultural Experiments and Research Station, and 8.9 kg N ha for wheat and faba bean,
oA.R.C., Domiatte governorate (Lat. 31 24' 59'' N, respectively, under intercropping systems. The
o -Long. 31 48' 47'' E, 16 m a.s.l.), Egypt during 2012- previous rates were applied by 178.5 and 35.7 kg N ha1203 and 2013-2014 winter seasons to determine the for wheat and faba bean, respectively, under solid
effect of intercropping wheat and faba bean on sugar culture. All the tested crops were sown at the same beet yield and its attributes and agro - feasibility under st thdate on 21 and 10 October at 2012 and 2013 different mineral N fertilizer rates. Sugar beet variety
seasons, respectively. Sugar beet plants were thinned Cleopatra and two field crops (wheat variety Misr 1 -1
to one plant hill at 20 cm between hills under and faba bean variety Giza 716) were used. The
intercropping and solid cultures. Wheat grains were treatments were the combinations between three drilled in one row in intercropping culture and in two cropping systems (intercropping wheat with sugar rows in solid culture. Faba bean plants were thinned to beet, intercropping faba bean with sugar beet and
-1two plants hill at 25 cm between hills. sugar beet solid culture) and three mineral N fertilizer Recommended solid cultures of all the tested crops rates of sugar beet (75%, 100% and 125% of the were used to estimate the competitive relationships. A recommended mineral N fertilizer rates of sugar beet
-1 split plot design with three replicates was used. as expressed by 125.0, 166.6 and 208.2 kg N ha , respectively). Cropping systems were illustrated in Cropping systems (intercropping and solid) were Figure 1 as follows: randomly assigned to the main plots, mineral N
fertilizer rates were allotted in sub plots. The area of 21. Planting sugar beet on both sides of the beds sub-plot was 14.4 m , it consisted of 8 ridges, and each
(120 cm width) and planting one wheat row on middle ridge was 3.0 m in length and 0.6 m in width.
of all sugar beet beds. This pattern resulted in 83,300 -1plants of sugar beet ha (100% sugar beet : 25% Yield and its attributes
wheat).
At harvest, root length and diameter (cm) and 2. Planting sugar beet on both sides of the beds
plant root weight (g) were measured on ten guarded (120 cm width) and planting one faba bean row on -1
plants from each plot, whereas, root yield ha (ton) middle of all sugar beet beds. This pattern resulted in
were recorded on the basis of experimental plot area 83,300 and 66,640 plants of sugar beet and faba bean -1 by harvesting all sugar beet plants of each plot. Grain ha , respectively (100% sugar beet: 25% faba bean).
-1yields of wheat ha (ton) and seed yield of faba bean 3. Sugar beet solid culture by planting sugar
-1ha (ton) were recorded on the basis of experimental beet on one side of the ridges (60 cm width). This plot area.pattern resulted in 83,300 plants of sugar beet.
22
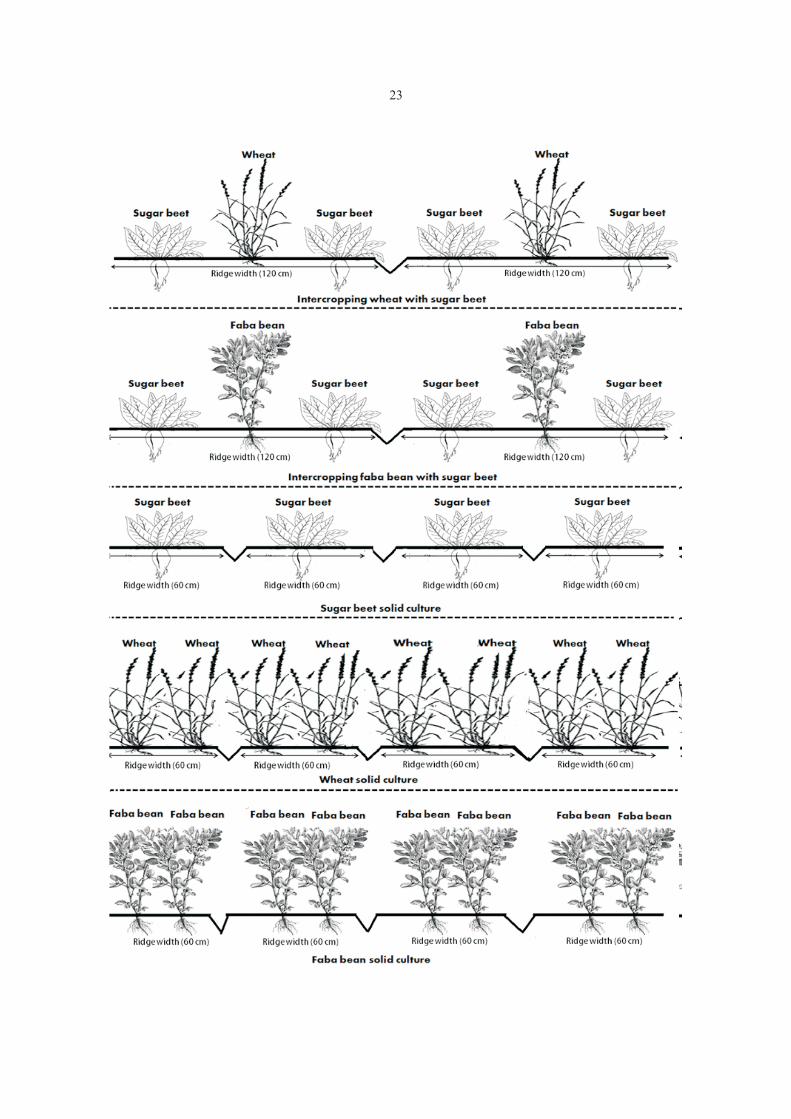
23
Competitive relationships bean), Y = Intercrop yield of crop a (sugar beet), Y ab ba
Land equivalent ratio (LER) = Intercrop yield of crop b (wheat or faba bean), Z = ab
The respective proportion of crop a in the LER defined as the ratio of area needed under
intercropping system (sugar beet), Z = The basole cropping to one of intercropping at the same respective proportion of crop b in the intercropping
management level to produce an equivalent yield system (wheat or faba bean)
(Mead and Willey, 1980). It is calculated as follows:
Farmer's benefitLER = (Y / Y ) + (Y / Y )ab aa ba bb
Where Y = Pure stand yield of crop a (sugar aa It was calculated by determining the total beet), Y = Pure stand yield of crop b (wheat or faba bb costs and net return of intercropping culture as bean), Y = Intercrop yield of crop a (sugar beet), Y ab ba compared to recommended solid planting of sugar = Intercrop yield of crop b (wheat or faba bean) beet according to Metwally et al. (2009).
Land equivalent coefficient (LEC) Total return of intercropping cultures = Price LEC is a measure of interaction concerned of sugar beet yield + price of wheat or faba bean yield
with the strength of relationship (Adetiloye et al., (American dollars $).1983). It is calculated as follows: LEC = L x L a b
To calculate the total return, the average of Where L = LER of crop a (sugar beet), L = a b sugar beet, wheat and faba bean prices presented by
LER of crop b (wheat or faba bean) Anonymous (2014) was used.
-1Relative crowding coefficient (RCC) Net return ha = Total return – (fixed cost of sugar beet + variable costs of wheat or faba bean
RCC estimates the relative dominance of one according to intercropping pattern).
species over the other in the intercropping system (Banik et al., 2006). It is calculated as follows: K = K a Statistical Manipulationx Kb
Analysis of variance of the obtained results of K = Y x Z / [(Y – Y ) x Z ] K = Y x Z / [(Y – each season was performed. The homogeneity test a ab ba aa ab ab b ba ab bb
Y ) x Z ] was conducted of error mean squares and ba ba
accordingly, the combined analysis of the two Where Y = Pure stand yield of crop a (sugar aa experimental seasons was carried out. The measured
beet), Y = Pure stand yield of crop b (wheat or faba variables were analyzed by ANOVA using MSTATC bb
statistical package (Freed, 1991). Mean comparisons bean), Y = Intercrop yield of crop a (sugar beet), Y ab ba
were done using least significant differences (L.S.D) = Intercrop yield of crop b (wheat or faba bean), Z = ab
method at 5 % level of probability to compare The respective proportion of crop a in the differences between the means (Gomez and Gomez, intercropping system (sugar beet), Z = The ba
1984).respective proportion of crop b in the intercropping system (wheat or faba bean)
RESULTS AND DISCUSSIONAggressivity
Aggressivity represents a simple measure of Yield and its attributeshow much the relative yield increase in one crop is Cropping systemsgreater than the otherin an intercropping system
Intercropping sugar beet with wheat or faba (Willey, 1979).A = [Y / (Y x Z )] – [Y / (Y x Z )] A = [Y / bean affected significantly root length and diameter, ab ab aa ab ba bb ba ba ba
-1 -1(Y x Z )] – [Y / (Y x Z )] root weight plant , root yield ha , total soluble solids bb ba ab aa ab
(T.S.S.) and sucrose percentages in the combined Where Y = Pure stand yield of crop a (sugar aa analysis of the two seasons (Table 1). Intercropping
beet), Y = Pure stand yield of crop b (wheat or faba wheat or faba bean with sugar beet decreased root bb
24
25
Competitive relationships faba bean plants (as legume crop) have ability to biological N fixation, legumes are largely involved in
Relative yields of sugar beet and wheat or N facilitation and N dynamic in the plant community faba bean were affected significantly by the cropping and in agrosystems. It is clear that plant population systems in the combined data across 2012/2013 and density of sugar beet and wheat or faba bean played a
-12013/2014 seasons (Table 2). Intercropping faba bean major role in increasing productivity unit area under with sugar beet had higher values of relative yields of intercropping culture where it reached 100 and 25% sugar beet and intercrops as compared with of solid cultures, respectively. Similar results were intercropping wheat with sugar beet. These data may obtained by Abdel-Gwad et al. (2008) who found that be due to faba bean plants (as legume crop) have intercropping fodder beet with wheat increased land ability to biological N fixation, legumes are largely equivalent ratio in the average of both seasons by involved in N facilitation and N dynamic in the plant 1.21, 1.07, 1.15 and 1.22, when adding 70, 90, 110 and
-1community and in agrosystems. 130 kg N fertilizer fad ., respectively. Also, Abou-Elela and Gadallah (2012) reported that LER was
Relative yield of sugar beet was affected higher by intercropping faba bean with fodder beet significantly by mineral N fertilizer rates, meanwhile, than those of sole plantings. relative yield of intercrops was not affected in the combined data across 2012/2013 and 2013/2014 With respect to mineral N fertilizer rates, seasons (Table 2). Adding the lowest mineral N LER was affected significantly by mineral N fertilizer
-1fertilizer rate (125.0 kg N ha ) resulted in decrease in rates in the combined data across 2012/2013 and relative yield of sugar beet as compared to those that 2013/2014 seasons (Table 2). Increasing mineral N
-1received the other mineral N fertilizer rates. fertilizer rates from 125.0 to 166.6 or 208.2 kg N ha increased LER in the combined analysis of the two
Relative yield of sugar beet was affected seasons. LER was affected significantly by the significantly by the interaction between cropping interaction between cropping systems and mineral N systems and mineral N fertilizer rates, meanwhile, fertilizer rates in the combined data across 2012/2013 relative yield of intercrops were not affected in the and 2013/2014 seasons (Table 2). Intercropping
-1 combined data across 2012/2013 and 2013/2014 wheat with sugar beet that received 125.0 kg N haseasons (Table 2). Intercropping faba bean with sugar gave the lowest LER, meanwhile, the highest LER beet had higher values of relative yield of sugar beet was obtained by intercropping faba bean with sugar
-1with different mineral N fertilizer rates in comparison beet that received 166.6 or 208.2 kg N ha .with intercropping wheat with sugar beet that received the lowest mineral N fertilizer rate (125.0 kg Land equivalent coefficient (LEC)
-1N ha ). LEC is a measure of interaction concerned
Land equivalent ratio (LER) with the strength of relationship. LEC is used for a two- crop mixture the minimum expected
The values of LERs were estimated by using productivity coefficient (PC) is 25 per cent, that is, a data of recommended solid cultures of all the tested yield advantage is obtained if LEC value was crops. LER was affected significantly by the cropping exceeded 0.25. LEC was affected by the cropping systems in the combined analysis of the two seasons systems, meanwhile, mineral N fertilizer rates or the (Table 2). In general, intercropping wheat or faba interaction between cropping systems and mineral N bean with sugar beet increased LER as compared to fertilizer rates did not affect LEC in the combined data sugar beet solid culture in the combined data across across 2012/2013 and 2013/2014 seasons (Table 2). 2012/2013 and 2013/2014 seasons (Table 2). It Mean LEC of intercropped wheat with sugar beet was ranged from 0.98 (by intercropping wheat with sugar not reached 0.25 and consequently the wheat – sugar
-1beet that fertilized by 125.0 kg N ha to 1.26 by beet intercropping had yield disadvantage. On intercropping faba bean with sugar beet that fertilized contrary, mean LEC of intercropped faba bean with
-1sugar beet was exceeded 0.25 and consequently the by 166.6 kg N ha with an average of 1.14. The faba bean – sugar beet intercropping had yield advantage of the highest LER by intercropping faba advantage. bean with sugar beet over the others could be due to
26

Relative crowding coefficient (RCC) dominated component.
The relative dominance of one species over In general, the highest negative values were the other in this intercropping study was estimated by obtained by growing wheat with sugar beet that
-1the use of relative crowding coefficient (k). When the fertilized by 125.0 kg N ha , whereas, intercropping value of relative crowding coefficient (k) is greater faba bean with sugar beet that fertilized by the than 1.00, there is intercrop advantage; when k is previous mineral N rate had the lowest negative equal to 1.00, there is no yield advantage; when k is values. These results clear that intercropping wheat lesser than 1.00, there is a disadvantage. Figure 2 with sugar beet is more aggressive than intercropping shows that all values of the total relative crowding faba bean with sugar beet especially under the lowest
-1coefficient (RCC) were exceeded 1.00 except mineral N fertilizer rate (125.0 kg N ha ).intercropping wheat with sugar beet that fertilized by
-1125.0 kg N ha in the combined data across Financial evaluation2012/2013 and 2013/2014 seasons. The lowest k was
Net return of intercropping sugar beet with obtained from intercropping wheat with sugar beet -1-1 wheat and faba bean was $ 3729 and 4766 ha as that fertilized by 125.0 kg N ha , whereas, -1intercropping faba bean with sugar beet that fertilized compared with sugar beet solid culture ($ 4362 ha ) in
-1by 166.6 kg N ha had the highest k. These data the combined data across 2012/2013 and 2013/2014 seasons (Table 3). Intercropping faba bean with sugar suggest that canopy structures of faba bean and sugar
-1beet that fertilized by 166.6 kg N ha formed better beet increased total and net returns by 7.63 and
9.26%, respectively, as compared with sugar beet performance to decrease competitive pressure of solid culture. The study indicated that intercropping component crops under intercropping conditions,
indicating that these species are complementary and faba bean with sugar beet is more profitable to -1
farmers than sugar beet solid culture by using suitable suitable in mixture with adding 166.6 kg N ha for intercropped sugar beet. These results are in intercropping pattern. On the contrary, intercropping accordance with those obtained by Abou-Elela and wheat with sugar beet that fertilized by different Gadallah (2012) who demonstrated that relative mineral N fertilizer rates is not profitable to farmers crowding coefficient of faba bean was higher than than sugar beet solid culture. Although increasing
-1those of fodder beet. mineral N fertilizer rate (208.2 kg N ha ) above 25% of the recommended mineral N fertilizer rate (166.6
-1Aggressivitykg N ha ), however, intercropping wheat with sugar beet caused financial loss (11.27%) than sugar beet Aggressivity determines the difference in solid culture. These results are in harmony with those competitive ability of the component crops in obtained by Abdel-Gwad et al. (2008) who reported intercropping association. The positive sign indicates that the highest return between growing fodder beet as the dominant component and the negative sign sole crop and its growing with wheat was collected indicates the dominated component. Higher
-1when adding 130 kg N fad (2718.80 L.E.). Also, numerical values of aggressiveness denote greater Usmanikhail et al. (2012) concluded that sugar beet difference in competitive ability, as well as, bigger yields and monetary benefits were maximum in lentil difference between actual and expected yield in both intercropping compared to cereals and oilseeds crops. The results indicate that the value of intercropping. aggressivity of wheat and faba bean was positive for
all treatments, whereas, the values of aggressivity was It could be concluded that growing one row negative for all intercropped sugar beet in the
of faba bean on middle of all sugar beet beds with combined data across 2012/2013 and 2013/2014 fertilizing sugar beet plant by 75% of the seasons (Figure 3). recommended mineral N fertilizer rate (125.0 kg N
-1 -1These data show that wheat or faba bean are ha ) achieved $ 410 ha over than sugar beet solid
dominant component and sugar beet plants are culture.
27

Tab
le 1
. Eff
ect
of c
rop
pin
g sy
stem
s, m
iner
al n
itro
gen
fer
tili
zer
rate
s an
d t
hei
r in
tera
ctio
ns
on s
uga
r b
eet
yiel
d a
nd
its
att
rib
ute
s, a
s w
ell
as, y
ield
s of
wh
eat
an
d f
aba
bea
n (
com
bin
ed a
nal
ysis
of
the
two
seas
ons)
Tre
atm
ents
R
oo
t
len
gth
(cm
)
Root
dia
met
er
(cm
)
-1R
oot
wei
gh
t p
lan
t
(kg)
Ro
ot
yie
ld-1
ha
(to
n)
125
.0 k
g
208
.2 k
g
Mea
n
12
5.0
kg
16
6.6
kg
20
8.2
kg
Mea
n
12
5.0
kg
208.2
kg
Mea
n
125.0
kg
166.6
kg
208.2
kg
-1N
ha
bee
t +
wh
eat
25.9
5 2
6.2
2 2
6.3
3 26.1
6
11.3
1
11.5
0
11.6
8
11.5
0
0.7
3
0.84
0.9
2
0.8
362.2
8
69.7
770.1
8
bee
t +
fab
a b
ean
28.4
9 2
8.5
1 2
8.5
1 28.5
0
13.1
9
13
.19
13
.22
13
.20
1.0
8
1.0
7
1.1
0
1.0
883
.31
83.3
683.2
7
Aver
age
of
inte
rcro
pp
ing
27.2
2 2
7.3
6 2
7.4
2 27.3
3
12.2
5
12
.34
12
.45
12
.34
0.9
0
0.9
5
1.0
1
0.9
572.7
9
76.5
677.6
2
Soli
d c
ult
ure
30.8
1
30.9
9
31.0
1
30.9
4
15.6
1
15
.77
15
.78
15
.72
1.1
5
1.3
7
1.3
3
1.2
884
.78
90.4
190
.29
Aver
age
of n
itro
gen
fer
tili
zer
rate
s
28.4
1
28.5
7
28.6
2
28.5
3
13.3
7
13
.49
13
.56
13
.47
0.9
9
1.0
9
1.1
1
1.0
6
76.7
9
81.1
881.2
5
L.S
.D. 0
.05 C
rop
pin
g s
yst
ems
L.S
.D. 0
.05 N
itro
gen
fert
iliz
er
rate
s
L
.S.D
. 0
.05 I
nte
ract
ion
0.1
8
0
.06
0
.18
0.1
0
0
.08
0
.12
0.1
5
0.0
7
0.1
6
0.1
2
0.1
0
0.1
3
Tre
atm
ents
T
.S.S
.
(%)
Su
cro
se
(%
)G
rain
yie
ld o
f w
hea
t
(to
n)
See
d
yie
ld o
f fab
a b
ean
(ton
-1h
a)
125.0
kg
166
.6 k
g
20
8.2
kg
Mea
n
12
5.0
kg
166
.6 k
g
20
8.2
kg
Mea
n
125.0
kg
166.6
kg
Mea
n
125.0
kg
166.6
kg
208.2
kg
Mea
n
bee
t +
wh
eat
20
.53
19
.66
18
.33
19
.51
18
.86
17.9
6
17.1
6
18
.00
2.0
4
2.0
3
2.0
5
2.04
---
--
-
---
bee
t +
fab
a b
ean
20
.70
20
.76
20
.56
20
.67
18
.66
18.8
6
18.5
6
18.7
0
---
--
-
---
--
-1.1
4
1.1
6
1.1
5
Aver
age
of
inte
rcro
pp
ing
20
.61
20
.21
19
.44
20
.08
18
.76
18.4
1
17.8
6
18
.34
2.0
4
2.0
3
2.0
5
2.0
41.1
4
1.1
6
1.1
5
Soli
d c
ult
ure
21
.86
21
.96
20
.66
21
.50
20
.80
20.4
3
19.4
6
20
.23
6.7
7
6.8
0
6.7
8
6.7
83.3
5
3.3
6
3.3
4
Aver
age
of n
itro
gen
fer
tili
zer
rate
s21
.03
20
.80
19
.85
20
.52
19
.44
19.0
8
18.4
0
18
.97
4.4
0
4.4
1
4.4
2
4.4
1
2.2
4
2.2
6
2.2
4
L.S
.D.
0.0
5 C
rop
pin
g s
yst
ems
L
.S.D
. 0
.05
Nit
rog
en f
erti
lize
r
rate
s
L
.S.D
. 0
.05
In
tera
ctio
n
0.5
9
0
.46
0
.77
0.5
9
0
.39
0
.69
0.0
6
N
.S.
N
.S.
0.0
2
N.S
.
N.S
.
-1N
ha
-1N
ha
-1N
ha
166.8
kg
-1N
ha
-1N
ha
-1N
ha
-1N
ha
-1N
ha
-1N
ha
-1N
ha
-1N
ha
166
.6 k
g
-1N
ha
-1N
ha
-1N
ha
-1N
ha
-1N
ha
-1N
ha
-1N
ha
-1N
ha
-1N
ha
-1N
ha
-1N
ha
-1h
a
Mea
n
Su
gar
67.4
1
Su
gar
83.3
1
75.2
2
88.
49
79.7
4
Su
gar
---
Su
gar
1.1
5
1.1
5
3.3
5
2.2
5
28

Tre
atm
ents
R
elati
ve
yie
ld
LE
R
LE
C
L su
ga
r b
eet
L
inte
rcro
ps
125.0
kg
-1N
ha
16
6.6
kg
20
8.2
kg
Mea
n
125.0
kg
166.6
kg
20
8.2
kg
Mea
n
125.0
kg
16
6.6
kg
20
8.2
kg
Mea
n1
25.0
kg 1
66.6
kg
208.2
kg
Mea
n
Su
gar
bee
t +
wh
eat
0.6
8
0.7
7
0.7
7
0.7
4
0.3
0
0.2
90.3
0
0.2
9
0.9
8
1.0
6
1.0
7
1.0
3
0.2
00.2
20.2
30.2
1
Su
gar
bee
t +
fab
a b
ean
0.9
2
0.9
2
0.9
2
0.9
2
0.3
3
0.3
40.3
4
0.3
3
1.2
5
1.2
6
1.2
6
1.2
5
0.3
00.3
10.3
10.3
0
Aver
age
of
inte
rcro
pp
ing
0.8
0
0.8
4
0. 8
4
0.8
2
0.3
1
0.3
10.3
2
0.3
1
1.1
1
1.1
6
1.1
6
1.1
4
0.2
50.2
60.2
70.2
6
Soli
d c
ult
ure
1.0
0
1.0
0
1.0
0
1.0
0
1.0
0
1.0
0
1.0
0
1.0
0
1.0
0
1.0
0
1.0
0
1.0
0
1.0
0
1.0
01.0
01.0
0
L.S
.D. 0.0
5 C
rop
pin
g s
yst
ems
L
.S.D
. 0.0
5 N
itro
gen
fer
tili
zer
rate
s
L
.S.D
. 0.0
5 I
nte
ract
ion
0.0
4
0.0
1
0.0
4
0.0
4
N
.S.
N
.S.
0.0
3
0.0
2
0.0
3
0.0
4
N.S
.
N.S
.
Tab
le 2
. Rel
ativ
e yi
eld
s, l
and
eq
uiv
alen
t ra
tio
and
lan
d e
qu
ival
ent
coef
fici
ent
as a
ffec
ted
by
crop
pin
g sy
stem
s, m
iner
al n
itro
gen
fer
tili
zer
rate
s an
d
th
eir
inte
ract
ion
s (c
omb
ined
an
alys
is o
f th
e tw
o se
ason
s)
Tab
le 3
. Fin
anci
al r
etu
rn a
s af
fect
ed b
y cr
opp
ing
syst
ems,
min
eral
nit
roge
n f
erti
lize
r ra
tes
and
th
eir
inte
ract
ion
s (c
omb
ined
of
the
two
seas
ons)
Tre
atm
ents
F
ina
nci
al
retu
rn
Su
gar
bee
tIn
terc
rop
T
ota
l
Net
12
5.0
kg
16
6.6
kg
20
8.2
kg
Mea
n
12
5.0
kg
1
66
.6 k
g
20
8.2
kg
Mea
n
12
5.0
kg
16
6.6
kg
20
8.2
kg
Mea
n1
25
.0 k
g
16
6.6
kg
2
08
.2 k
g
Mea
n
Su
gar
bee
t +
wh
eat
3
437
3
851
3873
372
0
7
50
747
7
54
750
4
18
7
4
59
8
4627
4470
346
1
3856
387
03
72
9
Su
gar
bee
t +
fab
a b
ean
4598
4601
4596
459
8
766
779
773
772
536
4
538
0
5369
5371
477
2
4776
475
24
76
6
Aver
age
of
inte
rcro
pp
ing
4017
4226
4234
415
9
758
763
763
761
477
5
498
9
4998
4920
411
6
4316
4311
424
7
Su
gar
bee
t so
lid
cu
ltu
re
499
0
---
499
0
436
2
Pri
ces
of m
ain
pro
du
cts
are
that
of
2013
: $
55.2
for
ton
of
suga
r b
eet;
$ 3
68.0
for
ton
of
wh
eat;
$ 6
72.2
for
ton
of
fab
a b
ean
; in
terc
rop
pin
g fa
ba
bea
n w
ith
su
gar
bee
t in
crea
sed
var
iab
le c
osts
of
inte
rcro
pp
ing
cult
ure
$ 4
04 o
ver
thos
e of
su
gar
bee
t sol
id c
ult
ure
.
-1N
ha
-1N
ha
-1N
ha
-1N
ha
-1N
ha
-1N
ha
-1N
ha
-1N
ha
-1N
ha
-1N
ha
-1N
ha
-1N
ha
-1N
ha
-1N
ha
-1N
ha
-1N
ha
-1N
ha
-1N
ha
-1N
ha
-1N
ha
-1N
ha
-1N
ha
-1N
ha
29

rhizodeposition of legumes. A review. Agron. Sustain Dev., REFERENCES30:57–66.
Gomez, K. A. and A. A. Gomez, 1984. Statistical Procedures for ndAgricultural Research, 2 ed. John Willey and Sons, Toronto, Abdel-Gwad M. S. A., T. K. A. Abd El-Aziz and A. M. Abd El-Galil,
ON, Canada.2008.Effect of intercropping wheat with fodder beet under Hauggaard-Nielsen, H. and E.S. Jensen, 2005. Facilitative root different levels of N-application on yield and quality. Ann.
interactions in intercrops. Plant Soil, 274:237–250. Agric. Sci. 53: 353 – 362, Egypt. López-Bellido L, J. E. Castillo and M. Fuentes, 1994. Nitrogen uptake by
autumn sown sugar beet. Fertilizer research, Volume 38, Issue Abou-Elela A. M. and R. A. Gadallah, 2012. Effect of transplanted seedling age of intercropped fodder beet with faba bean and 2, pp. 101 – 109.nitrogen fertilizer levels on yield and it's component of fodder Mead, R. and R. W. Willey, 1980. The concept of a "land equivalent ratio"
1639 and advantages in yields from intercropping. Exp. Agric., : beet and faba bean. Zagazig J. Agric. Res. (6): 1057 – 1067, Egypt. 217 – 228.
Adetiloye, P. O., F. O. C. Ezedinma and B. N. Okigbo, 1983. A land Metwally, A. A., M. M. Shafik, K. I. EL-Habbak and Sh. I. Abdel-Wahab, equivalent coefficient concept for the evaluation of 2009. Step forward for increasing intercropped soybean yield competitive and productive interactions on simple complex with maize. The 4th Conf., Recent Technologies in Agric., 3-5 mixtures. Ecological Modelling. 19: 27-39. Nov., Cairo Univ., 2: 256 – 269, Egypt.
Anonymous, 2009. Sugar Beet-White Sugar. Agribesnisess Handbook. Ofori, F. and W. R. Stern, 1987. Cereal legume intercropping systems. FAO, 2009. Adv. Agron., 41: 41-90.
Anonymous, 2012. Bulletin of Statistical Cost Production and Net Return. Sanginga, N. and P. L. Woomer, 2009. Integrated Soil Fertility Winter Field Crops and Vegetables and Fruit, Agriculture Management in Africa: Principles, Practices and Development Statistics and Economic Sector, Ministry of Egyptian Process. (eds.). Tropical Soil Biology and Fertility Institute of Agriculture and Land Reclamation, Part (2), February 2012, the International Centre for Tropical Agriculture. Nairobi. Egypt. pp.263.
Anonymous, 2014. Winter Crops. Agriculture Statistics and Economic Sayed Galal Jr, M. M. F. Abdalla and A. A. Metwally, 1983. Intensifying stSector, 1 Ed., Ministry of Agriculture and Land Reclamation, land and nutrient equivalent ratios by intercropping corn and
Egypt. soybean in Egypt. Soybean in tropical and subtropical
cropping systems. In: Proceedings of Symposium, Tsukubo, Banik, P., B. K. Midya and S. S. Sarkar Ghose, 2006. Wheat and chickpea Japan, pp. 101 – 106.intercropping systems in an additive series experiment:
Usmanikhail, M. U., S. D. Tuniol, G. H. Jamroi, F. C. Oadi, S. W. Ul advantages and weed smothering. Eur. J. Agron., 24: 325 –
Hassani, Q. D. Chachari, M. A. Khanzadai and A. W. Gandahi, 332.2012. Agronomic and economic effect of intercropping sugar Dhima, K.V., A.S. Lithourgidis, L.B. Vasilakoglou and ,C.A. Dordas, beet with oil seeds and lentil. Pak. J. Bot., 44(6): 1983-1988. ` 2007. Competition indices of common vetch and cereal
Willey, R W. 1979. Intercropping its importance and research needs. Part intercrops in two seeding ratio. Field Crops Res. 100: 249-256.I. Competition and yield advantage. Fld. Crops Absts.32:1–10.Freed, R. D. 1991. MSTATC Microcomputer Statistical Program.
Zapata, F. and O. V. Cleenput, 1986. Recovery of N15 labeled fertilizer by Michigan State University, East Lansing, Michigan, USA.sugar beet spring wheat and winter sugar beet cropping
Fustec, J., F. Lesuffleur, S. Mahieu and J. B. Cliquet, 2010. N sequences. Fertil. Res. 8: 269–278.
Rec. on 15.12.2014 & Acc. on 29.12.2014
30
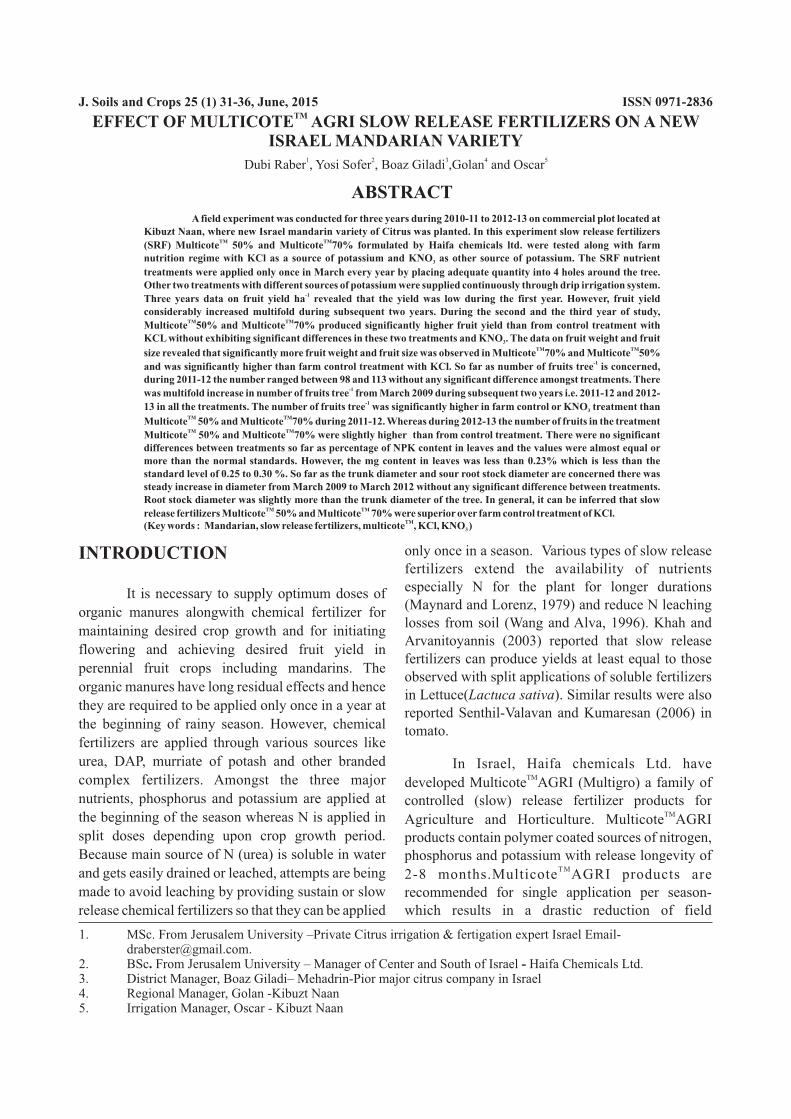
ABSTRACT
A field experiment was conducted for three years during 2010-11 to 2012-13 on commercial plot located at Kibuzt Naan, where new Israel mandarin variety of Citrus was planted. In this experiment slow release fertilizers
TM TM(SRF) Multicote 50% and Multicote 70% formulated by Haifa chemicals ltd. were tested along with farm nutrition regime with KCl as a source of potassium and KNO as other source of potassium. The SRF nutrient 3
treatments were applied only once in March every year by placing adequate quantity into 4 holes around the tree. Other two treatments with different sources of potassium were supplied continuously through drip irrigation system.
-1Three years data on fruit yield ha revealed that the yield was low during the first year. However, fruit yield considerably increased multifold during subsequent two years. During the second and the third year of study,
TM TMMulticote 50% and Multicote 70% produced significantly higher fruit yield than from control treatment with KCL without exhibiting significant differences in these two treatments and KNO . The data on fruit weight and fruit 3
TM TMsize revealed that significantly more fruit weight and fruit size was observed in Multicote 70% and Multicote 50% -1and was significantly higher than farm control treatment with KCl. So far as number of fruits tree is concerned,
during 2011-12 the number ranged between 98 and 113 without any significant difference amongst treatments. There -1was multifold increase in number of fruits tree from March 2009 during subsequent two years i.e. 2011-12 and 2012-
-113 in all the treatments. The number of fruits tree was significantly higher in farm control or KNO treatment than 3
TM TMMulticote 50% and Multicote 70% during 2011-12. Whereas during 2012-13 the number of fruits in the treatment TM TMMulticote 50% and Multicote 70% were slightly higher than from control treatment.
differences between treatments so far as percentage of NPK content in leaves and the values were almost equal or more than the normal standards. However, the mg content in leaves was less than 0.23% which is less than the standard level of 0.25 to 0.30 %. So far as the trunk diameter and sour root stock diameter are concerned there was steady increase in diameter from March 2009 to March 2012 without any significant difference between treatments. Root stock diameter was slightly more than the trunk diameter of the tree. In general, it can be inferred that slow
TM TMrelease fertilizers Multicote 50% and Multicote 70% were superior over farm control treatment of KCl.TM(Key words : Mandarian, slow release fertilizers, multicote , KCl, KNO )3
There were no significant
only once in a season. Various types of slow release INTRODUCTIONfertilizers extend the availability of nutrients especially N for the plant for longer durations It is necessary to supply optimum doses of (Maynard and Lorenz, 1979) and reduce N leaching
organic manures alongwith chemical fertilizer for losses from soil (Wang and Alva, 1996). Khah and
maintaining desired crop growth and for initiating Arvanitoyannis (2003) reported that slow release
flowering and achieving desired fruit yield in fertilizers can produce yields at least equal to those
perennial fruit crops including mandarins. The observed with split applications of soluble fertilizers
organic manures have long residual effects and hence in Lettuce(Lactuca sativa). Similar results were also
they are required to be applied only once in a year at reported Senthil-Valavan and Kumaresan (2006) in
the beginning of rainy season. However, chemical tomato.fertilizers are applied through various sources like
urea, DAP, murriate of potash and other branded In Israel, Haifa chemicals Ltd. have TMcomplex fertilizers. Amongst the three major developed Multicote AGRI (Multigro) a family of
nutrients, phosphorus and potassium are applied at controlled (slow) release fertilizer products for TMthe beginning of the season whereas N is applied in Agriculture and Horticulture. Multicote AGRI
split doses depending upon crop growth period. products contain polymer coated sources of nitrogen, Because main source of N (urea) is soluble in water phosphorus and potassium with release longevity of
T Mand gets easily drained or leached, attempts are being 2-8 months.Multicote AGRI products are made to avoid leaching by providing sustain or slow recommended for single application per season-
which results in a drastic reduction of field release chemical fertilizers so that they can be applied
1. MSc. From Jerusalem University –Private Citrus irrigation & fertigation expert Israel Email- [email protected].
2. BSc. From Jerusalem University – Manager of Center and South of Israel - Haifa Chemicals Ltd. 3. District Manager, Boaz Giladi– Mehadrin-Pior major citrus company in Israel4. Regional Manager, Golan -Kibuzt Naan5. Irrigation Manager, Oscar - Kibuzt Naan
TMEFFECT OF MULTICOTE AGRI SLOW RELEASE FERTILIZERS ON A NEW ISRAEL MANDARIAN VARIETY
J. Soils and Crops 25 (1) 31-36, June, 2015 ISSN 0971-2836
1 2 3 4 5Dubi Raber , Yosi Sofer , Boaz Giladi ,Golan and Oscar
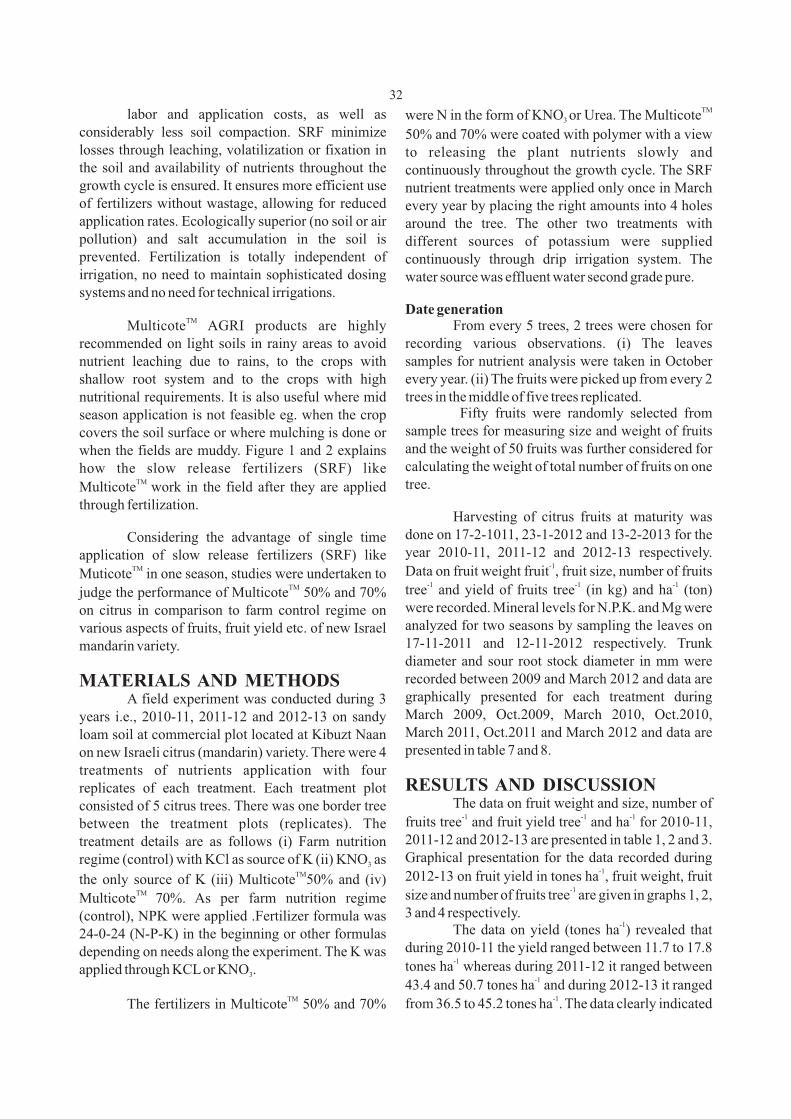
TMlabor and application costs, as well as were N in the form of KNO or Urea. The Multicote 3
considerably less soil compaction. SRF minimize 50% and 70% were coated with polymer with a view losses through leaching, volatilization or fixation in to releasing the plant nutrients slowly and the soil and availability of nutrients throughout the continuously throughout the growth cycle. The SRF growth cycle is ensured. It ensures more efficient use nutrient treatments were applied only once in March of fertilizers without wastage, allowing for reduced every year by placing the right amounts into 4 holes application rates. Ecologically superior (no soil or air around the tree. The other two treatments with pollution) and salt accumulation in the soil is different sources of potassium were supplied prevented. Fertilization is totally independent of continuously through drip irrigation system. The irrigation, no need to maintain sophisticated dosing water source was effluent water second grade pure.systems and no need for technical irrigations.
Date generation TMMulticote AGRI products are highly From every 5 trees, 2 trees were chosen for
recommended on light soils in rainy areas to avoid recording various observations. (i) The leaves nutrient leaching due to rains, to the crops with samples for nutrient analysis were taken in October shallow root system and to the crops with high every year. (ii) The fruits were picked up from every 2 nutritional requirements. It is also useful where mid trees in the middle of five trees replicated.
Fifty fruits were randomly selected from season application is not feasible eg. when the crop sample trees for measuring size and weight of fruits covers the soil surface or where mulching is done or and the weight of 50 fruits was further considered for when the fields are muddy. Figure 1 and 2 explains calculating the weight of total number of fruits on one how the slow release fertilizers (SRF) like
TM tree.Multicote work in the field after they are applied through fertilization.
Harvesting of citrus fruits at maturity was done on 17-2-1011, 23-1-2012 and 13-2-2013 for the Considering the advantage of single time year 2010-11, 2011-12 and 2012-13 respectively. application of slow release fertilizers (SRF) like
-1TM Data on fruit weight fruit , fruit size, number of fruits Muticote in one season, studies were undertaken to -1 -1 -1TM tree and yield of fruits tree (in kg) and ha (ton) judge the performance of Multicote 50% and 70%
were recorded. Mineral levels for N.P.K. and Mg were on citrus in comparison to farm control regime on analyzed for two seasons by sampling the leaves on various aspects of fruits, fruit yield etc. of new Israel 17-11-2011 and 12-11-2012 respectively. Trunk mandarin variety.diameter and sour root stock diameter in mm were recorded between 2009 and March 2012 and data are MATERIALS AND METHODSgraphically presented for each treatment during A field experiment was conducted during 3 March 2009, Oct.2009, March 2010, Oct.2010, years i.e., 2010-11, 2011-12 and 2012-13 on sandy March 2011, Oct.2011 and March 2012 and data are loam soil at commercial plot located at Kibuzt Naan presented in table 7 and 8.on new Israeli citrus (mandarin) variety. There were 4
treatments of nutrients application with four RESULTS AND DISCUSSIONreplicates of each treatment. Each treatment plot
The data on fruit weight and size, number of consisted of 5 citrus trees. There was one border tree -1 -1 -1
fruits tree and fruit yield tree and ha for 2010-11, between the treatment plots (replicates). The 2011-12 and 2012-13 are presented in table 1, 2 and 3. treatment details are as follows (i) Farm nutrition Graphical presentation for the data recorded during regime (control) with KCl as source of K (ii) KNO as 3
-1TM 2012-13 on fruit yield in tones ha , fruit weight, fruit the only source of K (iii) Multicote 50% and (iv) -1TM size and number of fruits tree are given in graphs 1, 2, Multicote 70%. As per farm nutrition regime
3 and 4 respectively.(control), NPK were applied .Fertilizer formula was -1The data on yield (tones ha ) revealed that 24-0-24 (N-P-K) in the beginning or other formulas
during 2010-11 the yield ranged between 11.7 to 17.8 depending on needs along the experiment. The K was -1
tones ha whereas during 2011-12 it ranged between applied through KCL or KNO . 3-143.4 and 50.7 tones ha and during 2012-13 it ranged
TM -1The fertilizers in Multicote 50% and 70% from 36.5 to 45.2 tones ha . The data clearly indicated
32
Table 1. First yield, picked at 17-2-11- Any statistical significance was not found
Treatments Yield (t ha-1)
Fruit weight of I fruit (g)
Fruit size (mm)
Yield (kg tree-1)
Fruit no. tree-1
Farm Control Kcl 11.7 161 67 17.6 110KNO3 11.7 179 69.5 17.5 98MulticoteTm
50 % 17.8 189 71.6 21.4 113
MulticoteTm 70 % 13.1 198 73 19.6 99
Treatments Average 14.0 182 70 19 105
Table 2. First yield, picked at 23-1-12- Statistical significance was found
Treatments Yield (t ha-1)
Fruit weight of I fruit (g)
Fruit size (mm)
Yield (kg tree-1)
Fruit no. tree-1
Farm Control Kcl 43.4 B 161 B 62 B 89.5 B 787 B
KNO3 50.7 A 179 B 68 A 104 A 803 B
MulticoteTm
50 % 48.4 A 189 A 66 A 99.7 A 647 AMulticoteTm
70 % 47.5 A 198 A 68 A 97.9 A 682 ATreatments Average 47 135 66 98 730
Table 3. First yield, picked at 13-2-13- Statistical significance was found
Treatments Yield (t ha-1)
Fruit weight of I fruit (g)
Fruit size (mm)
Yield (kg tree-1)
Fruit no. tree-1
Farm Control Kcl 36.5 B 115 B 61.7 B 75.3 B 654 AB
KNO3 40 AB 136 A 65.9 A 83.3 A 615 BMulticoteTm
50 % 43.4 A 127 A 63.8 A 89.6 A 705 A
MulticoteTm 70 % 45.2 A 130 A 64.6 A 93.3 A 715 A
Treatments Average 41 127 64 85.4 672-1Table 4. Comparison of the yields tones ha of three years 2010-2011-2012
Treatments 2010-11 2011-12 2012-13 Accumulation of yields
Accumulation difference against control
Farm Control Kcl 11.7 43.4 B 36.5 B 91.4 0 KNO3 11.7 50.7 A 40.0 AB 102.8 10.8 MulticoteTm
50 % 17.8 48.4 A 43.4 A 109.6 18.2 MulticoteTm
70 % 13.1 47.5 A 45.2 A 105.8 14.4
Treatments Average 13.6 47.5 41.3 102.4
Table 5.Mineral levels of leaves sampled date 17-11-2011- Not significance
Treatments N % P % K % Mg %
Farm Control Kcl 2.91 0.13 0.78 0.23
KNO3 2.62 0.14 0.65 0.24MulticoteTm
50 % 2.85 0.14 0.72 0.23MulticoteTm
70 % 2.71 0.14 0.66 0.23Treatments Average 2.773 0.139 0.700 0.231
Table 6.Mineral levels of leaves sampled date 12-11-2012- Not significance
Treatments N % P % K % Mg %Farm Control Kcl 2.42 0.13 0.78 0.23 KNO3 2.34 0.14 0.65 0.24 MulticoteTm 50 % 2.38 0.14 0.72 0.23 MulticoteTm 70 % 2.46 0.14 0.66 0.23 Treatments Average 2.398 0.151 0.668 0.159
Table 7. Trunk diameter (mm) of the new Israel mandarin variety from March 2009 - March 2012 Period
Nutritional Treatments
Control KCl only
Only KNO3 MulticoteTM
50%MulticoteTM
70%
Average
March 09 43 45 44 45 44.2Oct. 09 57 58 59 60 58.5March 10 65 65 66 68 65.8Oct. 10 73 74 75 77 74.8March 11 79 84 83 86 83.2Oct.11 91 92 92 92 91.9March 12 95 96 98 100 97.2
33

Table 8. Trunk diameter (mm) of sour orange root stock from March 09 to March 2012
Period Treatments
Control KCl only
Only KNO3 MulticoteTM 50%
MulticoteTM 70%
Average
March 09 50 54 52 54 52.5
Oct. 09 65 70 71 74 69.9
March 10 74 75 76 77 75.7
Oct. 10 83 84 85 86 84.7
March 11 93 96 97 99 96.6
Oct.11 104 105 105 106 105.00
March 12 108 113 113 114 112.00
-1Graph 1 .Yield Tones ha - 13-2-13- Values with different letter means Significant difference
Graph 2.One fruit weight (Gr) - 13-2-13
34
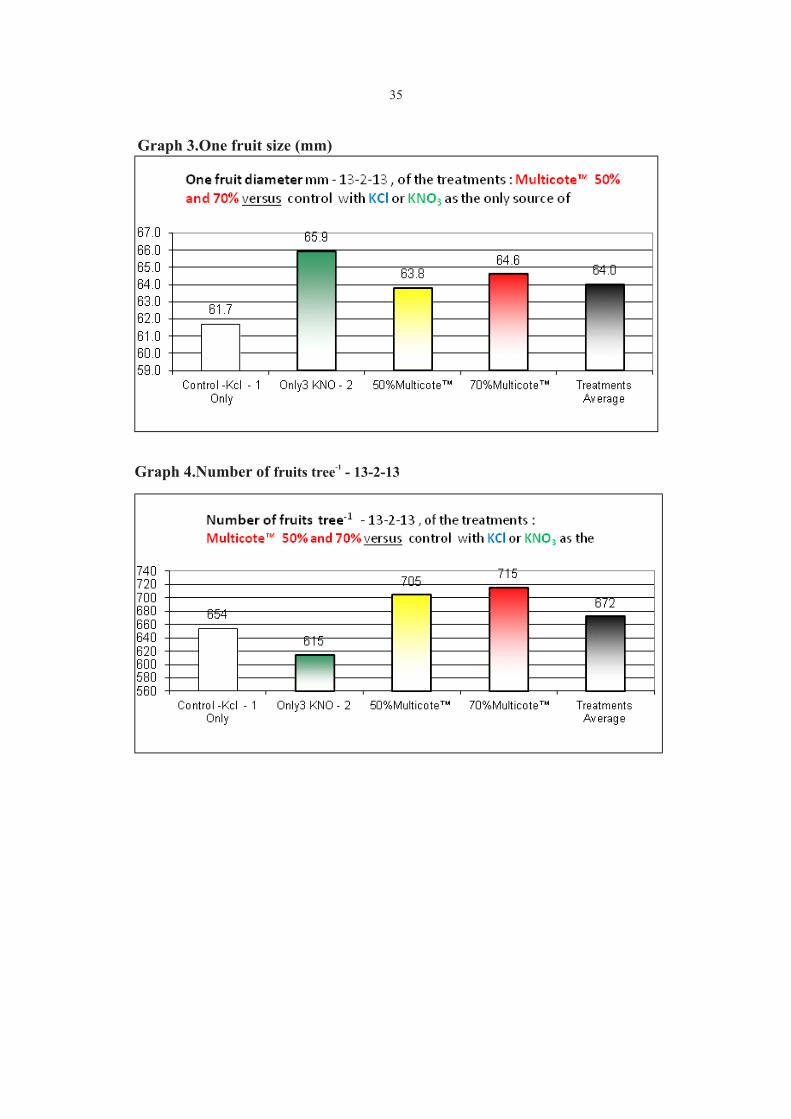
Graph 3.One fruit size (mm)
-1Graph 4.Number of fruits tree - 13-2-13
35

Release is complete , After the release is complete, the coating will degrade gradually, leaving
no residues in the soil

-1 -1 that the least yields were recorded in farm control tree and 615 to 715 fruits tree respectively. The TM TMpractice with KCl. Multicote 50% recorded the number of fruits was significantly less in Multicote
-1highest yield of 17.8 tones ha during 2010-11 50% and 70% compared to KNO and farm control 3
TM -1with KCL during 2011-12 but during 2012-13 the followed by Multicote 70% (13.1tones ha ). The
TMfruit yield was considerably increased during fruits numbers were significantly higher in Multicot subsequent two years, however, the maximum yield 70% and 50% than remaining treatments.
-1 The data from table 5 and 6 pertaining to (50.7 ha ) was recorded in KNO treatment followed 3
TM -1 TM mineral levels of nutrients revealed that the content of by Multicote 50% (48.4 t ha ) and Multicote 70% -1 N was in general higher during 2011-12 compared to (47.5 t ha ) without executing any significant
2012-13. It ranged from 2.62% to 2.91% during 2011-difference. However, during 2012-13 the yield of 45.2 -1 TM 12 and 2.34% to 2.46 % during 2012-13. However, t ha was obtained in Multicote 70% followed by
TM -1 -1 there were no significant differences. The content of P Multicote 50% (43.4 t ha ) and KNO (40 t ha ) 3in leaves for both the years ranged between 0.13% and
without exhibiting any significant difference, but 0.14% without exhibiting significant difference. This
KNO treatment was also at par with farm control with 3 level is considered satisfactory. K levels during both KCl.
the years ranged between 0.65 and 0.78% without any Considering the data of three years,
significant difference. This level is also considered as TMnutritional supply through Multicote 50% and 70%
normal level. The mg content in leaves ranged appeared superior over remaining treatments.
between 0.23 to 0.24% without any significant Hutchinson et al. (2003) on potato and Koivunen and
difference. Normal range of mg content in leaves is Horwath (2005) on tomato reported that more N was
0.3 to 0.4% .Thus, the Mg level was less than the made available by slow release fertilizer to meet the
normal levels in the present studyneeds of growth and fruit production. The present The trunk diameter (Table 7) recorded during results also justify the advantage of slow release March 2009 ranged between 43 to 45 mm. The trunk fertilizers. Khah and Arvanitoyannis (2003) reported size gradually increased subsequently up to the last that slow release fertilizers can produce yields at least observation recorded during March 2012. During this equal to those observed with split applications of period the trunk diameter ranged between 95 and 100 soluble fertilizers in lettuce (Lactuca sativa). mm. However, there was no considerable increase in
trunk diameter in test treatments. Similarly, sour -1So far as fruit weight fruit is concerned it orange root stock (Table 8) diameter did not show any
ranged between 161 and 198 g during 2010-11 and significant difference between these treatments. The
2011-12. However, the fruit weight was less and it sour orange root stock diameter was slightly more
ranged between 115 to 136 g. The fruit size in KNO , 3 than the trunk diameter. The root stock diameter TM TM
Multicote 50% and Multicote 70% was ranged between 52 to 54 mm during March 2009 and significantly higher during all the three years over 108 to 114 mm during March 2012.farm practice (control).
The fruit size ranged between 67 to 73 mm in REFERENCES.diameter during 2010-11, 62 to 68 mm diameter Hutchinson,C., E.Simsonme, P.Solano, J. Meldrum, P.Livingston-Way,
2003. Testing of controlled release fertilizer programs for deep during 2011-12 and 61.7 to 65.9 mm diameter during irrigated irish potato production. J. Plant Nutr. 26:1709-1723.
2012-13. In this respect also, farm control treatment Khah, E.M. and I.S.Arvanitoyannis, 2003. Effect of fertilizers on Lettuce (Lactuca sativa) yield, physical and organoleptic properties. with KCl was significantly inferior over the best Adv. Hort. Sci. 17: 47-57.
treatments. The fruit size during 2010-11 appears to Koivunen, M.E. and W.R.Horwath, 2005. Methylene urea as a slow-release nitrogen source for processing tomatoes. Nutrient be larger than 2011-12 and 2012-13, because of cycling Agroecosystmes, 71: 177-190.1bearing of less number of fruits tree recorded during Maynard, D.N. and O.A.Lorenz, 1979. Controlled release fertilizers for horticultural crops. Hort. Rev. (American Soc. Hort. Sci.) 1: 2010-11.79-140.-1 The data on number of fruits tree were found Senthil-Valaran, P. and K.R. Kumaresan, 2006. Relative efficiency of controlled release and water soluble fertilizers on the yield and non-significant, but the number of fruits during 2010-quality of tomato (Lycopersicon esculentum Mill.) J. Agron. 5:
11 ranged between 98 and 113.There was 519-522.Wang, F.L. and A.K.Alva, 1996. Leaching of nitrogen from slow release considerable increase in number of fruits during
urea source in sandy soils. Soil Sci.Soc.America J. 60: 1454-2011-12 and 2012-13 ranging from 647 to 803 fruits 1458.
Rec. on 15.11.2014 & Acc. on 30.12.2014
36
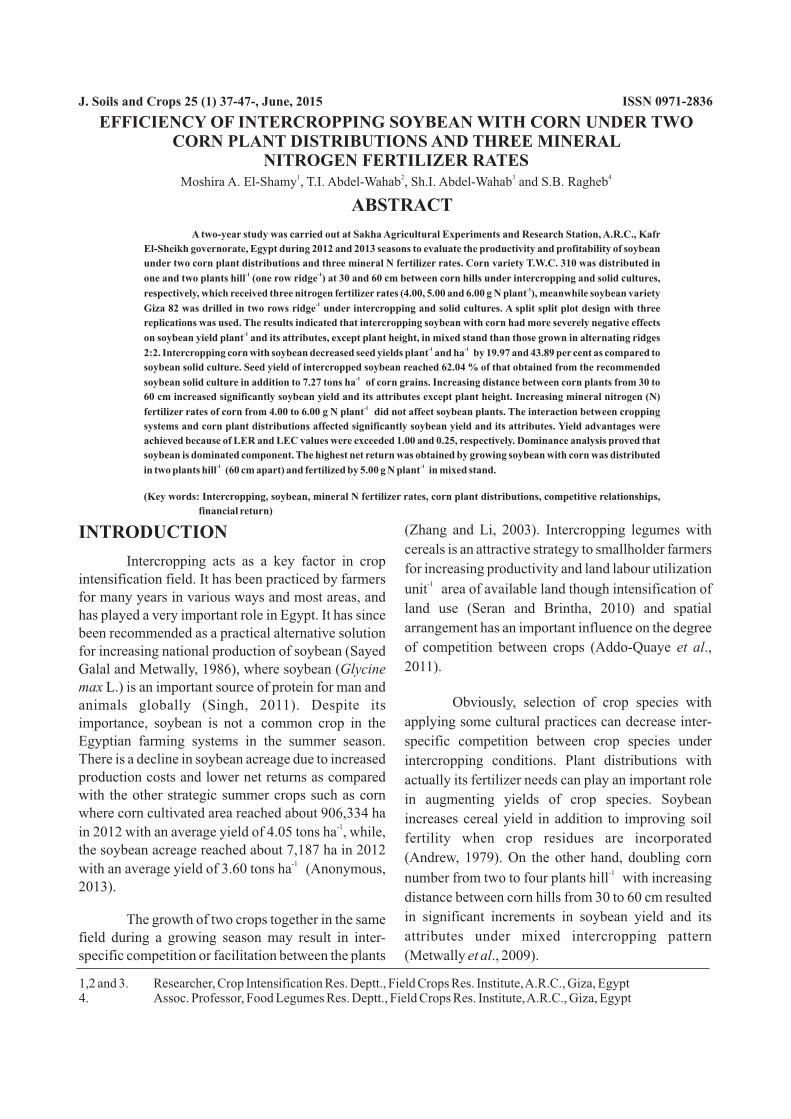
ABSTRACT
A two-year study was carried out at Sakha Agricultural Experiments and Research Station, A.R.C., Kafr
El-Sheikh governorate, Egypt during 2012 and 2013 seasons to evaluate the productivity and profitability of soybean
under two corn plant distributions and three mineral N fertilizer rates. Corn variety T.W.C. 310 was distributed in -1one and two plants hill (one row ridge ) at 30 and 60 cm between corn hills under intercropping and solid cultures,
-1respectively, which received three nitrogen fertilizer rates (4.00, 5.00 and 6.00 g N plant ), meanwhile soybean variety -1Giza 82 was drilled in two rows ridge under intercropping and solid cultures. A split split plot design with three
replications was used. The results indicated that intercropping soybean with corn had more severely negative effects -1on soybean yield plant and its attributes, except plant height, in mixed stand than those grown in alternating ridges
-1 -12:2. Intercropping corn with soybean decreased seed yields plant and ha by 19.97 and 43.89 per cent as compared to
soybean solid culture. Seed yield of intercropped soybean reached 62.04 % of that obtained from the recommended -1soybean solid culture in addition to 7.27 tons ha of corn grains. Increasing distance between corn plants from 30 to
60 cm increased significantly soybean yield and its attributes except plant height. Increasing mineral nitrogen (N) -1fertilizer rates of corn from 4.00 to 6.00 g N plant did not affect soybean plants. The interaction between cropping
systems and corn plant distributions affected significantly soybean yield and its attributes. Yield advantages were
achieved because of LER and LEC values were exceeded 1.00 and 0.25, respectively. Dominance analysis proved that
soybean is dominated component. The highest net return was obtained by growing soybean with corn was distributed -1 -1in two plants hill (60 cm apart) and fertilized by 5.00 g N plant in mixed stand.
(Key words: Intercropping, soybean, mineral N fertilizer rates, corn plant distributions, competitive relationships,
financial return)
-1
(Zhang and Li, 2003). Intercropping legumes with INTRODUCTIONcereals is an attractive strategy to smallholder farmers
Intercropping acts as a key factor in crop for increasing productivity and land labour utilization
intensification field. It has been practiced by farmers -1unit area of available land though intensification of for many years in various ways and most areas, and
land use (Seran and Brintha, 2010) and spatial has played a very important role in Egypt. It has since arrangement has an important influence on the degree been recommended as a practical alternative solution of competition between crops (Addo-Quaye et al., for increasing national production of soybean (Sayed 2011). Galal and Metwally, 1986), where soybean (Glycine
max L.) is an important source of protein for man and Obviously, selection of crop species with animals globally (Singh, 2011). Despite its
applying some cultural practices can decrease inter-importance, soybean is not a common crop in the Egyptian farming systems in the summer season. specific competition between crop species under There is a decline in soybean acreage due to increased intercropping conditions. Plant distributions with production costs and lower net returns as compared actually its fertilizer needs can play an important role with the other strategic summer crops such as corn in augmenting yields of crop species. Soybean where corn cultivated area reached about 906,334 ha increases cereal yield in addition to improving soil
-1in 2012 with an average yield of 4.05 tons ha , while, fertility when crop residues are incorporated the soybean acreage reached about 7,187 ha in 2012
(Andrew, 1979). On the other hand, doubling corn -1with an average yield of 3.60 tons ha (Anonymous, -1number from two to four plants hill with increasing
2013). distance between corn hills from 30 to 60 cm resulted
in significant increments in soybean yield and its The growth of two crops together in the same attributes under mixed intercropping pattern field during a growing season may result in inter-
specific competition or facilitation between the plants (Metwally et al., 2009).
1,2 and 3. Researcher, Crop Intensification Res. Deptt., Field Crops Res. Institute, A.R.C., Giza, Egypt4. Assoc. Professor, Food Legumes Res. Deptt., Field Crops Res. Institute, A.R.C., Giza, Egypt
J. Soils and Crops 25 (1) 37-47-, June, 2015 ISSN 0971-2836
EFFICIENCY OF INTERCROPPING SOYBEAN WITH CORN UNDER TWO CORN PLANT DISTRIBUTIONS AND THREE MINERAL
NITROGEN FERTILIZER RATES 1 2 3 4Moshira A. El-Shamy , T.I. Abdel-Wahab , Sh.I. Abdel-Wahab and S.B. Ragheb
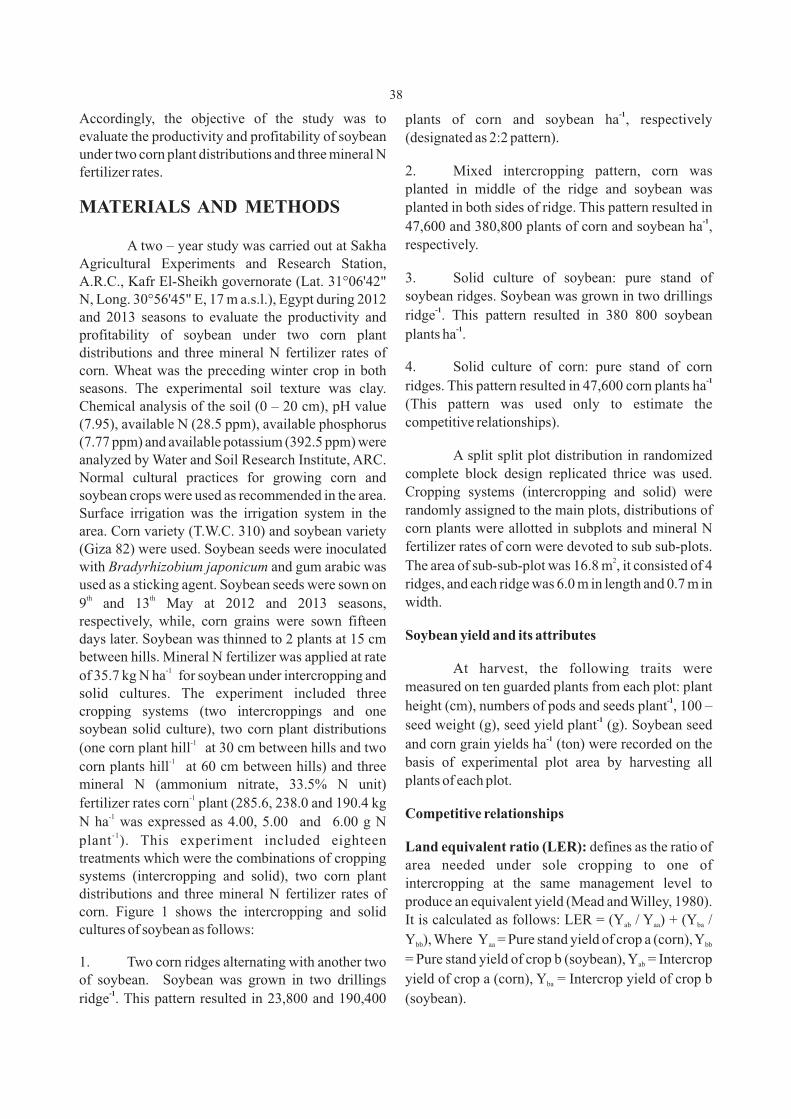
-1Accordingly, the objective of the study was to plants of corn and soybean ha , respectively evaluate the productivity and profitability of soybean (designated as 2:2 pattern).under two corn plant distributions and three mineral N
2. Mixed intercropping pattern, corn was fertilizer rates. planted in middle of the ridge and soybean was planted in both sides of ridge. This pattern resulted in MATERIALS AND METHODS
-147,600 and 380,800 plants of corn and soybean ha , respectively.A two – year study was carried out at Sakha
Agricultural Experiments and Research Station, 3. Solid culture of soybean: pure stand of A.R.C., Kafr El-Sheikh governorate (Lat. 31°06'42" soybean ridges. Soybean was grown in two drillings N, Long. 30°56'45" E, 17 m a.s.l.), Egypt during 2012
-1ridge . This pattern resulted in 380 800 soybean and 2013 seasons to evaluate the productivity and -1 plants ha .profitability of soybean under two corn plant
distributions and three mineral N fertilizer rates of 4. Solid culture of corn: pure stand of corn corn. Wheat was the preceding winter crop in both
-1ridges. This pattern resulted in 47,600 corn plants ha seasons. The experimental soil texture was clay. (This pattern was used only to estimate the Chemical analysis of the soil (0 – 20 cm), pH value competitive relationships).(7.95), available N (28.5 ppm), available phosphorus
(7.77 ppm) and available potassium (392.5 ppm) were A split split plot distribution in randomized analyzed by Water and Soil Research Institute, ARC.
complete block design replicated thrice was used. Normal cultural practices for growing corn and Cropping systems (intercropping and solid) were soybean crops were used as recommended in the area. randomly assigned to the main plots, distributions of Surface irrigation was the irrigation system in the corn plants were allotted in subplots and mineral N area. Corn variety (T.W.C. 310) and soybean variety fertilizer rates of corn were devoted to sub sub-plots. (Giza 82) were used. Soybean seeds were inoculated
2The area of sub-sub-plot was 16.8 m , it consisted of 4 with Bradyrhizobium japonicum and gum arabic was ridges, and each ridge was 6.0 m in length and 0.7 m in used as a sticking agent. Soybean seeds were sown on
th th width.9 and 13 May at 2012 and 2013 seasons, respectively, while, corn grains were sown fifteen
Soybean yield and its attributesdays later. Soybean was thinned to 2 plants at 15 cm between hills. Mineral N fertilizer was applied at rate
-1 At harvest, the following traits were of 35.7 kg N ha for soybean under intercropping and measured on ten guarded plants from each plot: plant solid cultures. The experiment included three
-1height (cm), numbers of pods and seeds plant , 100 – cropping systems (two intercroppings and one -1seed weight (g), seed yield plant (g). Soybean seed soybean solid culture), two corn plant distributions
-1-1 and corn grain yields ha (ton) were recorded on the (one corn plant hill at 30 cm between hills and two
-1 basis of experimental plot area by harvesting all corn plants hill at 60 cm between hills) and three plants of each plot.mineral N (ammonium nitrate, 33.5% N unit)
-1fertilizer rates corn plant (285.6, 238.0 and 190.4 kg
Competitive relationships -1N ha was expressed as 4.00, 5.00 and 6.00 g N
-1plant ). This experiment included eighteen Land equivalent ratio (LER): defines as the ratio of treatments which were the combinations of cropping area needed under sole cropping to one of systems (intercropping and solid), two corn plant intercropping at the same management level to distributions and three mineral N fertilizer rates of
produce an equivalent yield (Mead and Willey, 1980). corn. Figure 1 shows the intercropping and solid
It is calculated as follows: LER = (Y / Y ) + (Y / ab aa bacultures of soybean as follows:Y ), Where Y = Pure stand yield of crop a (corn), Y bb aa bb
= Pure stand yield of crop b (soybean), Y = Intercrop ab1. Two corn ridges alternating with another two yield of crop a (corn), Y = Intercrop yield of crop b of soybean. Soybean was grown in two drillings ba
-1ridge . This pattern resulted in 23,800 and 190,400 (soybean).
38

Figure 1. Intercropping soybean with corn and solid cultures of both crops
39

40

41
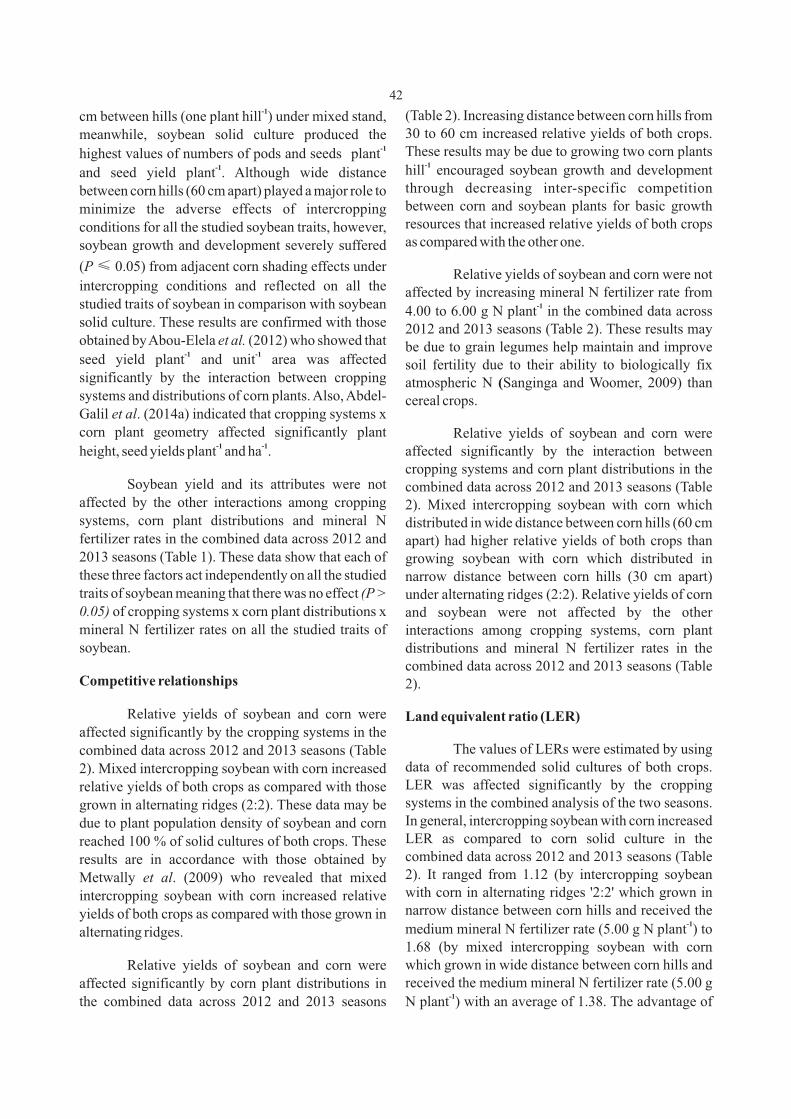
42
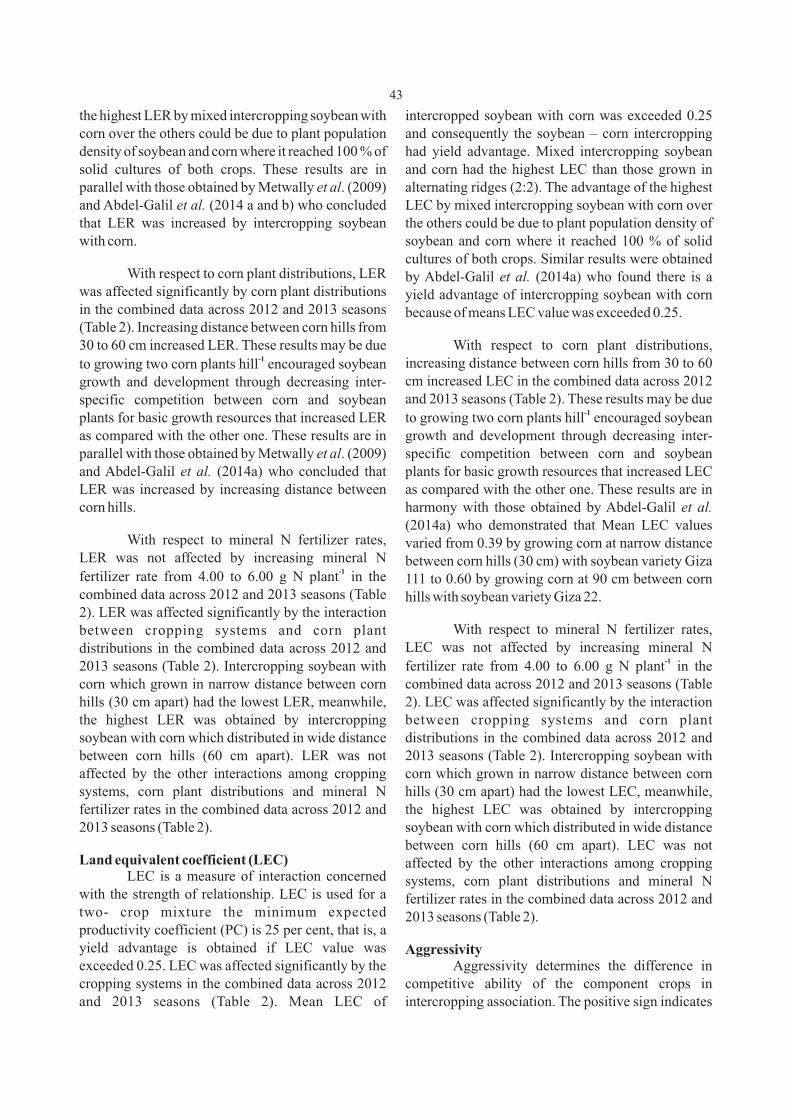
the highest LER by mixed intercropping soybean with intercropped soybean with corn was exceeded 0.25 corn over the others could be due to plant population and consequently the soybean – corn intercropping density of soybean and corn where it reached 100 % of had yield advantage. Mixed intercropping soybean solid cultures of both crops. These results are in and corn had the highest LEC than those grown in parallel with those obtained by Metwally et al. (2009) alternating ridges (2:2). The advantage of the highest and Abdel-Galil et al. (2014 a and b) who concluded LEC by mixed intercropping soybean with corn over that LER was increased by intercropping soybean the others could be due to plant population density of with corn. soybean and corn where it reached 100 % of solid
cultures of both crops. Similar results were obtained With respect to corn plant distributions, LER by Abdel-Galil et al. (2014a) who found there is a
was affected significantly by corn plant distributions yield advantage of intercropping soybean with corn in the combined data across 2012 and 2013 seasons because of means LEC value was exceeded 0.25. (Table 2). Increasing distance between corn hills from 30 to 60 cm increased LER. These results may be due With respect to corn plant distributions,
-1 increasing distance between corn hills from 30 to 60 to growing two corn plants hill encouraged soybean cm increased LEC in the combined data across 2012 growth and development through decreasing inter-and 2013 seasons (Table 2). These results may be due specific competition between corn and soybean
-1plants for basic growth resources that increased LER to growing two corn plants hill encouraged soybean as compared with the other one. These results are in growth and development through decreasing inter-parallel with those obtained by Metwally et al. (2009) specific competition between corn and soybean and Abdel-Galil et al. (2014a) who concluded that plants for basic growth resources that increased LEC LER was increased by increasing distance between as compared with the other one. These results are in corn hills. harmony with those obtained by Abdel-Galil et al.
(2014a) who demonstrated that Mean LEC values With respect to mineral N fertilizer rates, varied from 0.39 by growing corn at narrow distance
LER was not affected by increasing mineral N between corn hills (30 cm) with soybean variety Giza -1
fertilizer rate from 4.00 to 6.00 g N plant in the 111 to 0.60 by growing corn at 90 cm between corn combined data across 2012 and 2013 seasons (Table hills with soybean variety Giza 22.2). LER was affected significantly by the interaction
With respect to mineral N fertilizer rates, between cropping systems and corn plant LEC was not affected by increasing mineral N distributions in the combined data across 2012 and
-12013 seasons (Table 2). Intercropping soybean with fertilizer rate from 4.00 to 6.00 g N plant in the corn which grown in narrow distance between corn combined data across 2012 and 2013 seasons (Table hills (30 cm apart) had the lowest LER, meanwhile, 2). LEC was affected significantly by the interaction the highest LER was obtained by intercropping between cropping systems and corn plant soybean with corn which distributed in wide distance distributions in the combined data across 2012 and between corn hills (60 cm apart). LER was not 2013 seasons (Table 2). Intercropping soybean with affected by the other interactions among cropping corn which grown in narrow distance between corn systems, corn plant distributions and mineral N hills (30 cm apart) had the lowest LEC, meanwhile, fertilizer rates in the combined data across 2012 and the highest LEC was obtained by intercropping 2013 seasons (Table 2). soybean with corn which distributed in wide distance
between corn hills (60 cm apart). LEC was not Land equivalent coefficient (LEC) affected by the other interactions among cropping
LEC is a measure of interaction concerned systems, corn plant distributions and mineral N with the strength of relationship. LEC is used for a fertilizer rates in the combined data across 2012 and two- crop mixture the minimum expected 2013 seasons (Table 2). productivity coefficient (PC) is 25 per cent, that is, a yield advantage is obtained if LEC value was Aggressivityexceeded 0.25. LEC was affected significantly by the Aggressivity determines the difference in cropping systems in the combined data across 2012 competitive ability of the component crops in and 2013 seasons (Table 2). Mean LEC of intercropping association. The positive sign indicates
43
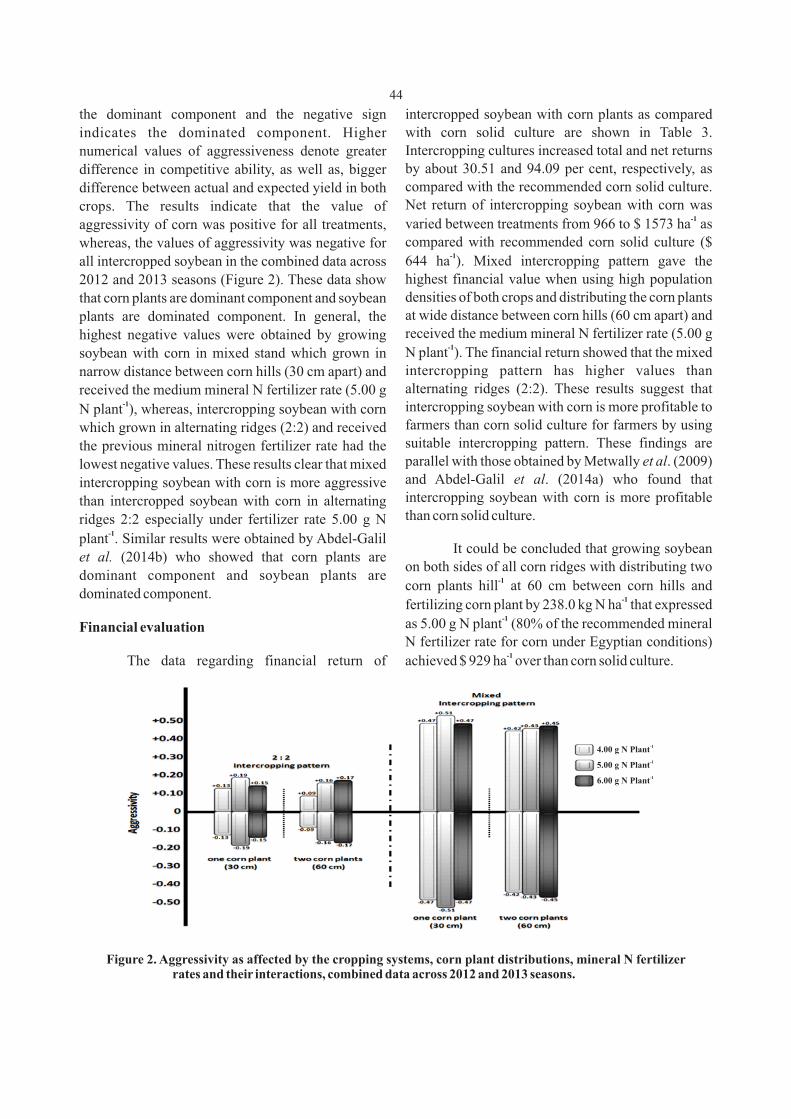
the dominant component and the negative sign intercropped soybean with corn plants as compared
indicates the dominated component. Higher with corn solid culture are shown in Table 3. Intercropping cultures increased total and net returns numerical values of aggressiveness denote greater by about 30.51 and 94.09 per cent, respectively, as difference in competitive ability, as well as, bigger compared with the recommended corn solid culture. difference between actual and expected yield in both Net return of intercropping soybean with corn was crops. The results indicate that the value of
-1varied between treatments from 966 to $ 1573 ha as aggressivity of corn was positive for all treatments, compared with recommended corn solid culture ($ whereas, the values of aggressivity was negative for
-1all intercropped soybean in the combined data across 644 ha ). Mixed intercropping pattern gave the
highest financial value when using high population 2012 and 2013 seasons (Figure 2). These data show densities of both crops and distributing the corn plants that corn plants are dominant component and soybean at wide distance between corn hills (60 cm apart) and plants are dominated component. In general, the received the medium mineral N fertilizer rate (5.00 g highest negative values were obtained by growing
-1N plant ). The financial return showed that the mixed soybean with corn in mixed stand which grown in intercropping pattern has higher values than narrow distance between corn hills (30 cm apart) and alternating ridges (2:2). These results suggest that received the medium mineral N fertilizer rate (5.00 g
-1 intercropping soybean with corn is more profitable to N plant ), whereas, intercropping soybean with corn farmers than corn solid culture for farmers by using which grown in alternating ridges (2:2) and received suitable intercropping pattern. These findings are the previous mineral nitrogen fertilizer rate had the parallel with those obtained by Metwally et al. (2009) lowest negative values. These results clear that mixed and Abdel-Galil et al. (2014a) who found that intercropping soybean with corn is more aggressive intercropping soybean with corn is more profitable than intercropped soybean with corn in alternating than corn solid culture.ridges 2:2 especially under fertilizer rate 5.00 g N
-1plant . Similar results were obtained by Abdel-Galil
It could be concluded that growing soybean et al. (2014b) who showed that corn plants are
on both sides of all corn ridges with distributing two dominant component and soybean plants are -1
corn plants hill at 60 cm between corn hills and dominated component. -1fertilizing corn plant by 238.0 kg N ha that expressed
-1as 5.00 g N plant (80% of the recommended mineral Financial evaluationN fertilizer rate for corn under Egyptian conditions)
-1The data regarding financial return of achieved $ 929 ha over than corn solid culture.
Figure 2. Aggressivity as affected by the cropping systems, corn plant distributions, mineral N fertilizer rates and their interactions, combined data across 2012 and 2013 seasons.
44
-14.00 g N Plant
-15.00 g N Plant
-16.00 g N Plant
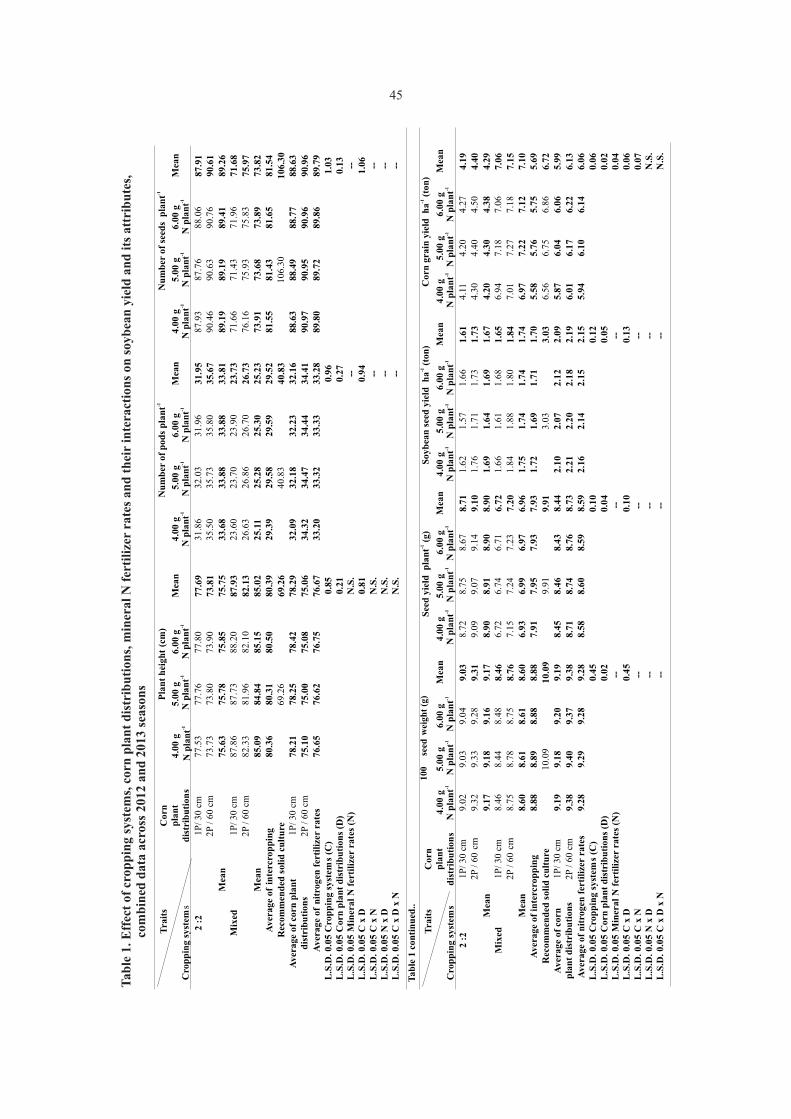
Tab
le 1
. Eff
ect
of c
rop
pin
g sy
stem
s, c
orn
pla
nt
dis
trib
uti
ons,
min
eral
N f
erti
lize
r ra
tes
and
th
eir
inte
ract
ion
s on
soy
bea
n y
ield
an
d i
ts a
ttri
bu
tes,
co
mb
ined
dat
a ac
ross
201
2 an
d 2
013
seas
ons
Tra
its
Cro
pp
ing
sy
stem
s
Co
rn
p
lan
t
dis
trib
uti
on
s
Pla
nt
hei
gh
t(c
m)
-1
Nu
mb
er o
f p
od
s p
lan
tN
um
ber
of
seed
s p
lan
t-1
4.0
0
g
-1
N p
lan
t 5.0
0
g
6.0
0 g
Mea
n
4.0
0
g
5.0
0
g
6.0
0 g
Mea
n
4.0
0
g
5.0
0g
6.0
0 g
Mea
n
2 :
2
1P
/ 3
0 c
m77
.53
7
7.7
6 7
7.8
0 77.6
9
31
.86
3
2.0
3
31.9
6
31
.95
87
.93
87.7
688
.06
87.9
12P
/ 6
0 c
m73
.73
7
3.8
0 7
3.9
0 73.8
1
35
.50
3
5.7
3
35.8
0
35
.67
90
.46
90.6
390
.76
90.6
1M
ean
75
.63
7
5.7
8 7
5.8
5 75.7
5
33
.68
3
3.8
8
33.8
8
33
.81
89
.19
89.1
989
.41
89.2
6M
ixed
1P
/ 3
0 c
m87
.86
8
7.7
3 8
8.2
0 87.9
3
23
.60
2
3.7
0
23
.90
23
.73
71
.66
71
.43
71
.96
71.6
82P
/ 6
0 c
m82
.33
8
1.9
6 8
2.1
0 82.1
3
26
.63
2
6.8
6
26
.70
26
.73
76
.16
75
.93
75
.83
75.9
7M
ean
85
.09
8
4.8
4 8
5.1
5 85.0
2
25
.11
2
5.2
8
25.3
0
25
.23
73
.91
73.6
873
.89
73.8
2A
ver
age
of
inte
rcro
pp
ing
80
.36
8
0.3
1 8
0.5
0 80.3
9
29
.39
2
9.5
8
29.5
9
29
.52
81
.55
81.4
381
.65
81.5
4R
eco
mm
end
ed s
oli
d c
ult
ure
6
9.2
6
6
9.2
6
4
0.8
3
40
.83
10
6.3
0
10
6.3
0A
ver
age
of
corn
pla
nt
dis
trib
uti
on
s
1P
/ 3
0 c
m78
.21
78.2
5
78
.42
78.2
9
32
.09
32.1
8
32.2
3
32
.16
88
.63
88.4
988
.77
88.6
32P
/ 6
0 c
m75
.10
75.0
0
75
.08
75.0
6
34
.32
34.4
7
34.4
4
34
.41
90
.97
90.9
590
.96
90.9
6A
ver
age
of
nit
rogen
fer
tili
zer
rate
s
76
.65
76.6
2
76
.75
76.6
7
33
.20
33.3
2
33.3
3
33
.28
89
.80
89.7
289
.86
89.7
9L
.S.D
. 0
.05
Cro
pp
ing s
yst
ems
(C)
L
.S.D
. 0
.05
Co
rn p
lan
t d
istr
ibu
tion
s (D
)
L
.S.D
. 0
.05
Min
era
l N
fer
tili
zer
rate
s (N
)
L
.S.D
. 0
.05
C x
D
L
.S.D
. 0
.05
C x
N
L
.S.D
. 0
.05
N x
D
L.S
.D. 0
.05
C x
D x
N
0.8
5
0.2
1
N
.S.
0
.81
N
.S.
N
.S.
N.S
.
0.9
6
0
.27
--
0
.94
--
--
--
1.0
30.1
3--
1.0
6-- -- --
Tra
its
Cro
pp
ing s
yst
ems
Co
rn
pla
nt
dis
trib
uti
on
s
10
0
seed
wei
gh
t (g
)
See
d y
ield
p
lan
t (
g)
-1
Soy
bea
n s
eed
yie
ld
ha
(to
n)
-1C
orn
gra
in y
ield
h
a (
ton
)-1
4.0
0g
5.0
0
g
6.0
0 g
Mea
n
4.0
0
g
5.0
0
g
6.0
0 g
Mea
n4
.00
g
5.0
0
g
6.0
0 g
Mea
n
4.0
0
g
5.0
0
g
6.0
0 g
Mea
n
2 :
21P
/ 3
0 c
m9.0
2
9.0
3
9.0
4
9.0
3
8.7
2
8.7
5
8.6
78
.71
1.6
2
1.5
71.6
6
1.6
1
4.1
1
4.2
0
4.2
74.1
92P
/ 6
0
cm9.3
2
9.3
3
9.2
8
9.3
1
9.0
9
9.0
7
9.1
49
.10
1.7
6
1.7
11.7
3
1.7
3
4.3
0
4.4
0
4.5
04.4
0M
ean
9.1
7
9.1
8
9.1
6
9.1
7
8.9
0
8.9
1
8.9
08
.90
1.6
9
1.6
41.6
9
1.6
7
4.2
0
4.3
0
4.3
84.2
9M
ixed
1P
/ 3
0 c
m8.4
6
8.4
4
8.4
8
8.4
6
6.7
2
6.7
4
6.7
16
.72
1.6
6
1.6
11.6
8
1.6
5
6.9
4
7.1
8
7.0
67.0
62P
/ 6
0
cm8.7
5
8.7
8
8.7
5
8.7
6
7.1
5
7.2
4
7.2
37
.20
1.8
4
1.8
81.8
0
1.8
4
7.0
1
7.2
7
7.1
87.1
5M
ean
8.6
0
8.6
1
8.6
1
8.6
0
6.9
3
6.9
9
6.9
76
.96
1.7
5
1.7
41.7
4
1.7
4
6.9
7
7.2
2
7.1
27.1
0A
ver
age
of
inte
rcro
pp
ing
8.8
8
8.8
9
8.8
8
8.8
8
7.9
1
7.9
5
7.9
37
.93
1.7
2
1.6
91.7
1
1.7
0
5.5
8
5.7
6
5.7
55.6
9R
ecom
men
ded
so
lid
cu
ltu
re
10
.09
10.0
9
9.9
1
9.9
1
3.0
33
.03
6.5
6
6.7
5
6.8
66.7
2A
ver
ag
e of
corn
p
lan
t d
istr
ibu
tio
ns
1P
/ 3
0 c
m
9.1
9
9.1
8
9.2
0
9.1
9
8.4
5
8.4
6
8.4
38
.44
2.1
0
2.0
72.1
2
2.0
9
5.8
7
6.0
4
6.0
65.9
92P
/ 6
0 c
m
9.3
8
9.4
0
9.3
7
9.3
8
8.7
1
8.7
4
8.7
68
.73
2.2
1
2.2
02.1
8
2.1
9
6.0
1
6.1
7
6.2
26.1
3A
ver
ag
e of
nit
rogen
fer
tili
zer
rate
s
9.2
8
9.2
9
9.2
8
9.2
8
8.5
8
8.6
0
8.5
98
.59
2.1
6
2.1
42.1
5
2.1
5
5.9
4
6.1
0
6.1
46.0
6L
.S.D
. 0
.05 C
rop
pin
g s
yst
ems
(C)
L.S
.D. 0
.05
Corn
pla
nt
dis
trib
uti
on
s (D
)
L.S
.D. 0
.05
Min
era
l N
fer
tili
zer
rate
s (N
)
L.S
.D. 0
.05
C x
DL
.S.D
. 0
.05
C x
NL
.S.D
. 0
.05
N x
DL
.S.D
. 0
.05
C x
D x
N
0.4
5
0.0
2
--
0.4
5-- -- --
0.1
0
0.0
4
--
0.1
0-- -- --
0.1
2
0.0
5
--
0.1
3-- -- --
0.0
60.0
20.0
40.0
60.0
7N
.S.
N.S
.
-1N
pla
nt
-1N
pla
nt
-1N
pla
nt
-1N
pla
nt
-1N
pla
nt
-1N
pla
nt
-1N
pla
nt
-1N
pla
nt
-1N
pla
nt
-1N
pla
nt
-1N
pla
nt
-1N
pla
nt
-1N
pla
nt
-1N
pla
nt
-1N
pla
nt
-1N
pla
nt
-1N
pla
nt
-1N
pla
nt
-1N
pla
nt
-1N
pla
nt
Tab
le 1
co
nti
nu
ed..
45

Tab
le 2
. Rel
ativ
e yi
eld
s of
cor
n a
nd
soy
bea
n, l
and
eq
uiv
alen
t ra
tio
(LE
R)
and
lan
d e
qu
ival
ent
coef
fici
ent
(LE
C)
as a
ffec
ted
by
crop
pin
g sy
stem
s, c
orn
pla
nt
dis
trib
uti
ons,
min
eral
N f
erti
lize
r ra
tes
and
th
eir
inte
ract
ion
s, c
omb
ined
dat
a ac
ross
201
2 an
d 2
013
seas
ons
Tra
its
C
rop
pin
g s
yst
ems
Corn
p
lan
t
dis
trib
uti
on
s
Rel
ati
ve
yie
ld (
RY
)
LE
R
LE
C
RY
m
RY
s
4.0
0g
-1N
pla
nt
5.0
0g
6.0
0 g
Mea
n
4.0
0
g
5.0
0
g
6.0
0 g
Mea
n
4.0
0
g
5.0
0
g
6.0
0 g
Mea
n4
.00
g
5.0
0g
6.0
0 g
Mea
n
2 :
2
1P
/ 30 c
m
0.6
00.6
10.6
2 0
.61
0.5
3 0.5
1
0.5
4
0.5
2
1.1
3
1.1
2
1.1
6
1.1
3
0.3
10.3
10.3
30.3
12P
/ 6
0 c
m0.6
30.6
40.6
5 0
.64
0.5
8 0.5
6
0.5
7
0.5
7
1.2
1
1.2
0
1.2
2
1.2
1
0.3
60.3
50.3
70.3
6M
ean
0.6
10.6
20.6
3 0
.62
0.5
5 0.5
3
0.5
5
0.5
4
1.1
7
1.1
6
1.1
9
1.1
7
0.3
30.3
30.3
50.3
3M
ixed
1P
/ 30 c
m
1.0
11.0
41.0
3 1
.02
0.5
4 0.5
3
0.5
5
0.5
4
1.5
5
1.5
7
1.5
8
1.5
6
0.5
40.5
50.5
60.5
52P
/ 6
0 c
m1.0
21.0
61.0
4 1
.04
0.6
0 0.6
2
0.5
9
0.6
0
1.6
2
1.6
8
1.6
3
1.6
4
0.6
10.6
50.6
10.6
2M
ean
1.0
11.0
51.0
3 1
.03
0.5
7 0.5
7
0.5
7
0.5
7
1.5
8
1.6
2
1.6
0
1.6
0
0.5
70.6
00.5
80.5
8A
ver
age
of
inte
rcro
pp
ing
0.8
10.8
30.8
3 0
.82
0.5
6 0.5
5
0.5
6
0.5
5
1.3
7
1.3
9
1.3
9
1.3
8
0.4
50.4
60.4
60.4
5A
ver
age
of
corn
p
lan
t d
istr
ibu
tion
s
1P
/ 30 c
m
0.8
00.8
20.8
2 0
.81
0.5
3 0.5
2
0.5
4
0.5
3
1.3
4
1.3
4
1.3
7
1.3
5
0.4
20.4
30.4
40.4
32P
/ 6
0
cm0.8
20.8
50.8
4 0
.83
0.5
9 0.5
9
0.5
8
0.5
8
1.4
1
1.4
4
1.4
2
1.4
2
0.4
80.5
00.4
90.4
9S
oli
d c
ult
ure
1.0
01.0
0
1.0
0
1.0
0
1.0
0
1.0
0
1.0
0
1.0
0
1.0
0
1.0
0
1.0
0
1.0
0
1.0
01.0
01.0
01.0
0L
.S.D
. 0.0
5 C
rop
pin
g s
yst
ems
(C)
L
.S.D
. 0.0
5 C
orn
pla
nt
dis
trib
uti
on
s
(D)
L
.S.D
. 0.0
5 M
iner
al
N f
erti
lize
r ra
tes
(N)
L
.S.D
. 0.0
5 C
x D
L
.S.D
. 0.0
5 C
x N
L
.S.D
. 0.0
5 N
x D
L
.S.D
. 0.0
5 C
x D
x N
0.0
29
0.0
08
--
0.0
28
--
--
--
.
0.0
02
0.0
11
--
0.0
17
--
--
--
0.0
14
0.0
09
--
0.0
17
--
--
--
0.0
18
0.0
06
--0.0
18
-- -- --
Tab
le 3
. Fin
anci
al r
etu
rn a
s af
fect
ed b
y cr
opp
ing
syst
ems,
cor
n p
lan
t d
istr
ibu
tion
s, m
iner
al N
fer
tili
zer
rate
s an
d t
hei
r in
tera
ctio
ns,
com
bin
ed d
ata
acro
ss
201
2 an
d 2
013
seas
ons
Tra
its
C
rop
pin
g s
yst
ems
Corn
p
lan
t
d
istr
ibu
tion
s
Fin
an
cia
l re
turn
ha
(A
mer
ican
doll
ars
$)
-1
C
orn
Soyb
ean
To
tal
Net
4.0
0g
5.0
0
g
6.0
0 g
Mea
n
4.0
0
g
5.0
0
g
6.0
0 g
Mea
n
4.0
0
g
5.0
0
g
6.0
0 g
Mea
n4
.00
g
5.0
0g
6
.00
g
2 :
2
1P
/ 30
cm
12
70
12
98
132
0
1296
95
2
923
97
6
950
2222
22
21
22
96
22
46
98
19
66
1027
2P
/ 6
0 c
m1
32
913
60
139
1
1360
1035
1005
1017
1019
2364
23
65
24
08
23
79
1123
111
011
39
Mea
n
12
99
13
29
135
5
1327
99
3
964
99
6
984
2293
22
93
23
52
23
12
10
52
10
38
1083
Mix
ed
1P
/ 30
cm
21
45
22
19
218
2
2182
97
6
946
98
8
970
3121
31
65
31
70
31
52
13
70
13
86
1363
2P
/ 6
0 c
m2
16
722
47
221
9
2211
1082
110
5
1058
1081
3249
33
52
32
77
32
92
14
98
15
73
1470
Mea
n2
15
622
33
220
02196
1029
1025
1023
1025
3185
32
58
32
23
32
22
14
34
14
79
1416
Av
era
ge
of
inte
rcro
pp
ing
17
27
17
81
177
71761
1011
994
1009
1004
2739
27
75
27
87
27
67
12
43
12
58
1249
Co
rn s
oli
d c
ult
ure
212
0--
-2
12
0
Pri
ces
of m
ain
pro
du
cts
are
that
of
2012
: $
309.
1 fo
r to
n o
f co
rn;
$ 58
8.1
for
ton
of
soyb
ean
; in
terc
rop
pin
g co
rn w
ith
soy
bea
n i
ncr
ease
d v
aria
ble
cos
ts o
f in
terc
rop
pin
g cu
ltu
re fr
om $
347
– 8
69 o
ver
thos
e of
cor
n s
olid
cu
ltu
re.
Mea
n
991
112
41057
1373
1513
1443
1250
64
4
-1N
pla
nt
-1N
pla
nt
-1N
pla
nt
-1N
pla
nt
-1N
pla
nt
-1N
pla
nt
-1N
pla
nt
-1N
pla
nt
-1N
pla
nt
-1N
pla
nt
-1N
pla
nt -1
N p
lan
t-1
N p
lan
t-1
N p
lan
t-1
N p
lan
t-1
N p
lan
t-1
N p
lan
t-1
N p
lan
t-1
N p
lan
t-1
N p
lan
t-1
N p
lan
t-1
N p
lan
t-1
N p
lan
t
46

tall sorghum on competitive ability of soybean and economic REFERENCESyield at Otobi, Benue State, Nigeria. J. Cereals and Oilseeds
1(1): 1-10.Abdel-Galil, A. M., T. I. Abdel-Wahab and Sh I. Abdel-Wahab, 2014a. Freed, R. D. 1991. MSTATC Microcomputer Statistical Program.
Productivity of four soybean varieties as affected by Michigan State University, East Lansing, Michigan, USA.Gomez, K A and A. A. Gomez, 1984. Statistical Procedures for intercropping and corn planting geometry. Soybean
ndResearch 12 (1): 36 - 58. Agricultural Research, 2 ed. John Willey and Sons, Toronto, Abdel-Galil, A. M., Sh I. Abdel-Wahab and T. I. Abdel-Wahab, 2014b. ON, Canada.
Compatibility of some maize and soybean varieties for Mead, R. and R. W. Willey, 1980. The concept of a "land equivalent ratio" intercropping under sandy soil conditions. Soybean and advantages in yields from intercropping. Experimental Research (special issue): pp. 22 – 44. Agric. 16: 217-228.
Abou-Elela, A. M., U. A. Abd El-Razek and U. A. Khalil, U. A.2012. Yield Metwally, A. A., M. M. Shafik, K. I. EL-Habbak and Sh. I. Abdel-Wahab, and its components of maize/soybean intercropping systems 2009. Step forward for increasing intercropped soybean yield
thas affected by planting time and distribution. Australian J. with maize. The 4 Conference, Recent Technologies in Basic and Applied Sci. 6(13): 238-245. Agriculture, 3-5 November, Cairo University. 2: 256-269,
Addo-Quaye, A.A., A.A. Darkwa and G. K. Ocloo, 2011. Growth Egypt. analysis of component crop in maize - soybean crops in maize - Metwally, A. A., M. M. Shafik, K. E. El-Habbak and Sh I. Abdel-Wahab, soybean intercropping system as affected by time of planting 2012. Yield and soybean characters under some intercropping and spatial arrangement. ARPN J. agric. and Bio.Sci. 6(6): 34- patterns with corn. Soybean Res. 10: 24- 42.
Olufajo, O. O., 1992. Response of soybean intercropping with maize on a 44. Adetiloye P O, F. O. C. Ezedinma and B. N. Okigbo, 1983. A land sub-humid tropical environment. Tropical Oilseeds J. 1(1):
equivalent coefficient concept for the evaluation of 27-33.Putnam, D. H., S. J.Herbert and A. Vargas, 1985. Intercropping corn competitive and productive interactions on simple complex
19 soybean densities. I. Yield complementarity. Experimental mixtures. Ecological Modelling. : 27-39.Andrews, R. W. 1979. Intercropping: Its importance and research needs I. Agric. 21:41–51.
32 Sanginga, N and P. Woomer, 2009. Integrated Soil Fertility Management Competition and yield advantages. Fld. Crops Abstr. : pp.1-
in Africa: Principles, Practices and Developmental Process. 10, II Agronomy and research approaches . Fld. Crop Abstr. 32 Tropical Soil Biology and Fertility Institute of the : pp.73-85.
Anonymous,2013. Bulletin of Statistical Cost Production and Net Return. International Centre for Tropical Agriculture (TSBF-CIAT).Sayed Galal Jr and A. A. Metwally, 1986. Science in practice. In: 2013. Summer and Nili Field Crops and Vegetables and Fruit,
ndAgriculture Statistics and Economic Sector, Ministry of Proceedings of 2 Conference of Agronomy, Alexandria Egyptian Agriculture and Land Reclamation, Part (2), August University, Egypt. 1: 489-503 . 2013, Egypt. Seran, T. H. and I. Brintha, 2010. Review on Maize Based Intercropping.
Banik, R. L. and D. K. Sharma, 2009. Management of Gregariously J. Agron. 9 (3): 135–145. flowered bamboo areas in Tripura NTFP Centre of excellence. Singh, G. 2011. Response of soybean (Glycine max) genotypes to plant
Tripura-JICA Project Forest Development (Agartala, Tripura) population and planting geometry in Northern India. Int. J.
pp. 1-80. Agric. Res., 6: 653 -659. Board, J. E. and B. G. Harville, 1992. Explanations for greater light Weil, R. R. and M. E. McFadden, 1991. Fertility and weed stress effects on
interception in narrow vs wide-row soybean. Crop Sci. 32: performance of maize/soybean intercrop. Agron. J. 198- 202. 83:717–721.
Chui, J. N. 1984. Effects of nitrogen fertilizer and maize intercrop Willey, R W. 1979. Intercropping its importance and research needs. Part configuration on the performance of soyabean (Glycine max I. Competition and yield advantage. Fld. Crop Abstr. 32: 1–10.
Zhang, F. and L. Li, 2003. Using competitive and facilitative interactions (4.) Merr) intercrop. Agri.Drupal, Kenya Agricultural in intercropping systems enhances crop productivity and Research Institute, Muguga South, Kikuyu, Kenya. nutrient use efficiency. Plant and Soil. 248: 305-312.Egbe ,O, M. 2010. Effects of plant density of intercropped soybean with
Rec. on 18.12.2014 & Acc. on 30.12.2014
47
ABSTRACT
A field experiment was conducted on a sandy loam soil during rabi (maize) and summer (spinach) seasons of 2009-2010 with a view to study the effect of organic manures and inorganic fertilizers on soil available nutrient status and yield of maize-spinach cropping system. Among the different combinations application of 75% RDF + 25%
-1through vermicompost recorded significantly highest grain and stover yield (52.38, 60.77 q ha ) at harvest but, on par with75% RDF + 25% through poultry manure and 75% RDF + 25% through FYM. The spinach crop was grown during summer responded favourably to the residual and cumulative treatments and the highest fresh leaf yield
-1(14.68 t ha ) was recorded in cumulative treatments. Application of 75% RDF + 25% through VC, PM and FYM to -1the maize crop showed highest available nitrogen at vegetative and tasseling stages (264.5 and 248.6 kg ha ) and
-1highest phosphorus and potassium was recorded with 100% poultry manure. The highest available N (240.3 kg ha ) -1and K O (335.8 kg ha ) in soil at the end of maize-spinach cropping system showed significantly highest values at 2
-1100% vermicompost whereas available P O (40.43 kg ha ) was highest under 100% poultry manure treated plots 2 5
under cumulative treatments. These changes in soil available nutrients from initial status to harvest of maize-spinach cropping system gives an indication that growing heavy feeders like maize cannot sustain the soil fertility for next crop. Even if any nutrients are left, they cannot meet the nutrient requirement of the crop. Some amount of inorganic fertilizers need to be applied viz., 75% RDF to a short duration crop like spinach to obtain economic yields.
(Key words: Organic manures, inorganic fertilizers, available nutrients, maize, spinach)
cent of nitrogen and small fractions of phosphorus INTRODUCTIONand potassium in organic manure may become
Integrated use of organic manures and available to immediate crop while the rest may be
chemical fertilizers generally produce higher crop utilized by the subsequent crop.
yields than their sole application. This increase in crop productivity may be due to combined effect of
Keeping in view the significance of nutrient supply, synergism and improvement in soil
integrated nutrient management in maintaining the physical and biological properties (Sarawad et al.,
soil health and improvement in the productivity of 2005). Thus, Integrated Nutrient Management (INM)
crops, an experiment was conducted to study the system envisages the use of inorganic fertilizers,
effect of organic manures and inorganic fertilizers on organic manures, crop residues and biofertilizers
soil nutrient status in maize-spinach cropping system.besides taking into account the fertility status of the soils. Organic manures such as Farm Yard Manure
MATERIALS AND METHODS(FYM), Poultry Manure (PM), Vermicompost (VC)
A field experiment was conducted on a sandy are few among the important components of loam soil at College Farm, College of Agriculture, integrated nutrient management.Rajendranagar, Hyderabad during rabi (maize) and
In recent years emphasis has been shifted summer (spinach) seasons of 2009-2010. During from individual crops to cropping system as a rabi, an experiment was laid out in randomized block
design with 12 treatments, replicated thrice. The whole since the responses of the component treatments included T (Control), T (50% RDNF crops in the cropping system are influenced by 1 2
through inorganic fertilizer + 50% RDNF through the preceding crops and inputs applied to them. vermicompost), T (75% RDNF through inorganic 3Therefore, the concept of integrated nutrient fertilizer + 25% RDNF through vermicompost), T management (INM) is more effective for 5
(100% RDNF through inorganic fertilizer), T (50% cropping systems rather than individual crops as 6
RDNF through inorganic fertilizer + 50% RDNF it takes care of residual effect of nutrients through poultry manure), T (75% RDNF through particularly of nitrogenous and phosphatic 7
inorganic fertilizer + 25% RDNF through poultry fertilizers and organic sources of nutrients manure), T (100% RDNF through poultry manure),(Randhawa and Brar, 2004). About less than 30 per 8
1. Asstt. Professor, Deptt. of Soil Science and Agril. Chemistry, College of Agriculture, Rajendanagar, Hyderabad2. Professor, Deptt. of Soil Science and Agril. Chemistry, College of Agriculture, Rajendanagar, Hyderabad
INTEGRATED EFFECT OF ORGANIC MANURES AND INORGANIC FERTILIZERS ON SOIL AVAILABLE NUTRIENT STATUS AND
YIELD OF MAIZE-SPINACH CROPPING SYSTEM
J. Soils and Crops 25 (1) 48-53, June, 2015 ISSN 0971-2836
1 2I. Usha Rani and G. Padmaja
T (50% RDNF through inorganic fertilizer + 50% lowest and highest grain and stover yields were 9
recorded at control ( and 75% RDNF through farm yard manure), T (75% RDNF 10
RDNF + 25% VC ( respectively. through inorganic fertilizer + 25% RDNF through However, the yield recorded at 75% RDNF + 25% VC farm yard manure), T (100% RDNF through farm 11
was on par with that recorded at 75% RDNF + 25% yard manure), and T (25% RDNF through inorganic 12 -1
PM (51.28, 59.53 q ha ), 75% RDNF + 25% FYM fertilizer + 25% RDNF through vermicompost + -1
(50.46, 58.49 q ha ) and 100% RDNF (49.26, 57.23 q 25% RDNF through poultry manure + 25% RDNF -1
ha ) and significantly superior over all other through farm yard manure). Maize was test crop during rabi season with RDF applied as N : P O5 : treatments. The per cent increase in grain yield of 2
-1 75% RDNF + 25% VC over the control, 100% RDNF, K O @120:60:60 kg ha . In summer season, 2
100% VC, 100% PM and 100% FYM was 143.4, spinach was taken up as a test crop to that 75 per cent 6.33, 18.9, 20.5, and 22.0, respectively. Conjunctive of recommended dose of N, P and K were applied in use of different levels of chemical fertilizers with any half of the plot pertaining to each treatment. No one of the organics produced higher yields as fertilizers were applied to another half of the plot to compared to their individual applications. This was know the residual effects. Entire quantity of due to the direct availability of nutrients from phosphorus, half of nitrogen and potassium were inorganic fertilizers and also the vermicompost applied as basal in the form of single super phosphate, containing higher available N, P and K contents. The urea and muriate of potash. Remaining half of enrichment of biological activity and release of nitrogen and potassium were applied in two equal organic acids might have degraded and mobilized the splits at 15 and 30 DAS. Soil samples collected from occluded soil nutrients to available form (Reddy and the surface layers to a depth of 0-15 cm. Soil of the Reddy, 1998). Thus, favorable effect of poultry experimental field is a sandy loam, slightly alkaline in
-1 manure and vermicompost in the root zone resulted in reaction (pH: 7.21, non saline (EC: 0.19 dS m ), increased availability and uptake of nutrients by the medium in organic carbon (0.46%) and available
-1 plants which in turn was reflected through increase in nitrogen (217.8 kg ha ), medium in available P O 2 5
-1 -1 maize grain and stover yield. (28.7 kg ha ) and K O (285.6 kg ha ). Apart from the 2
initial soil analysis, the organic manures used for the Fresh leaf yield of spinach
study viz., FYM, poultry manure and vermicompost The spinach crop grown during summer also analyzed for their nutrient contents. Among all responded favourably to the residual and cumulative the organic manures, poultry manure found to have treatments after harvest of maize crop and the highest highest nitrogen (1.84%), phosphorus (0.82%) and -1
leaf yield (t ha ) were recorded in cumulative potassium (1.12%) followed by vermicompost (1.18,
treatments than their respective residual treatments 1.07 and 0.85%) and FYM (0.50, 0.75 and 0.75%).
(Table 1).Available nitrogen was estimated by alkaline Among the cumulative and residual effects, potassium permanganate method (Subbaiah and the green leaf yield of spinach ranged from 6.71 to Asija, 1956). Available phosphorus content was -1 -1
14.68 t ha and 4.89 to 12.37 t ha , respectively. In estimated by Olsen's method (Olsen et al., 1954),
both cumulative and residual effects, the treatments available potassium was extracted by using neutral
which rece ived 100% organ ic manures normal ammonium acetate method (Jackson, 1973)
(VC/PM/FYM) during preceding maize crop showed and determined by flame photometer. Observations
higher leaf yields of spinach than those with -1on fresh leaf yield (t ha ) of spinach was recorded at combined application of organic manures and -1
45DAS and 60DAS. Grain and stover yield (q ha ) of inorganic fertilizers.maize were also recorded. Among the cumulative treatments, the lowest
-1green leaf yield was observed in control (6.71 t ha ) RESULTS AND DISCUSSION and highest was recorded in the treatment (14.68 t
-1ha ) which received, 100% VC during previous rabi Grain and stover yield of maizeand 75% RDF to spinach recorded highest fresh leaf yield but was on par with 100% poultry manure and
The 100% farm yard manure.
-121.52, 29.94 q ha )
-152.38, 60.77 q ha )
The grain and stover yield of maize was significantly influenced by different levels of organic manures and inorganic fertilizers (Table 1).
49

-1 -1Table 1. Effect of INM on grain and stover yield (q ha ) of maize and fresh leaf yield of spinach (t ha )
Treatments Grain yield
Stover yield
Fresh leaf yield (t ha-1)
Cumulative Residual
T1
Control
21.52
29.94 6.71 4.89
T2 50% N + 50% VC
48.16
55.47 12.82 10.78
T3
75% N + 25% VC
52.38
60.77 9.85 8.57
T4
100% VC
44.04
48.13 14.68 12.37
T5
100% RDNF
49.26
57.23 8.84 7.24
T6
50% N + 50% PM
47.34
53.48 12.24 10.39
T7 75% N + 25% PM
51.28
59.53 9.73 8.42
T8 100% PM
43.46
47.41 14.55 12.14
T9 50% N + 50% FYM
46.84
53.02 12.79 10.47
T10 75% N + 25% FYM
50.46
58.49 9.46 8.27
T11 100% FYM
42.90
46.89 14.30 12.04
T12 25% N + 25% VC + 25% PM +25% FYM
44.64 50.15 13.38 11.68
SE(m) ± 1.70 1.90 0.60 0.57
CD at 5% 3.53 3.94 1.25 1.19
Table 2. Change in content of available nutrients in control plots after harvest of crops in maize-spinach
cropping system
Particulars Available nutrientsNitrogen Phosphorus Potassium
After maize
Initial content (mg kg-1)
217.80
28.70 285.60Content after maize (mg kg-1)
175.50
26.30 248.50
Changes in content (%)
-19.42
-8.36 -12.99After spinach (Cumulative effect)
Content after spinach (mg kg-1)
182.4
27.76 255.70Changes in content (%)
3.93
5.55 2.90Changes in content after the sequence (%)
-16.25
-3.28 -10.47After spinach (Residual effect)
Content after spinach (mg kg-1)
165.70
23.57 245.80Changes in content (%) -5.58 -10.38 -1.09Changes in content after the sequence (%) -23.92 -17.87 -13.94
50

-1T
able
3.
Eff
ect
of I
NM
on
ava
ilab
le N
, P
O a
nd
KO
(k
g h
a)
in s
oil
at d
iffe
ren
t gr
owth
sta
ges
of m
aize
an
d a
t fi
nal
har
vest
of
spin
ach
25
2
Tre
atm
en
ts
Veg
etat
ive
stag
e
Tas
seli
ng
stag
e
Har
vest
N
P
2O
5 K
2O
N
P2O
5
K2O
N
P2O
5
K2O
N
P2O
5
K2O
C
um
ula
tive
Res
idu
alC
um
ula
tive
Res
idu
alC
um
ula
tive
Res
idu
al
T1
20
3.6
34
.6
279.
6 18
7.4
29.5
26
5.4
17
5.5
26
.3
248.
5
182.
4
165.
7
27.7
6
23.5
7
255.
724
5.8
T2
24
6.4
38
.5
308.
4 23
2.5
33.5
29
8.5
22
7.3
31
.7
286.
3
232.
2
208.
3
32.2
6
29.5
6
292.
529
2.5
T3
26
4.5
37
.2
300.
5 24
8.6
31.6
28
7.6
22
3.4
28
.4
281.
4
228.
6
204.
2
29.4
6
26.7
2
287.
727
6.2
T4
22
5.2
45.8
349.
2
203.
7
41.6
345.
7
238.
6
39.5
329.
1
240.
3
215.
6
40.4
3
37.2
6
335.
832
2.7
T5
25
6.5
35.7
288.
5
241.
4
30.5
275.
4
216.
3
27.3
258.
3
211.
2
189.
1
28.5
3
25.7
4
264.
825
3.3
T6
24
5.4
40.4
310.
4
230.
6
35.2
299.
6
225.
2
32.1
286.
2
230.
8
206.
4
33.2
6
30.4
3
291.
829
1.5
T7
263.
7
36.7
301.
7
247.
3
32.4
289.
3
221.
4
29.6
282.
4
226.
9
202.
3
30.6
1
27.3
4
286.
527
5.5
T8
224.
7
47.2
355.
7
202.
2
42.5
346.
2
236.
1
41.3
329.
6
239.
6
213.
2
42.3
7
38.1
6
334.
932
1.6
T9
243.
8
37.4
305.
8
229.
9
33.9
295.
9
224.
3
30.2
285.
3
228.
7
205.
1
31.2
3
28.5
3
291.
229
0.7
T10
262.
6
36.6
298.
6
245.
8
31.8
284.
8
220.
6
28.5
279.
6
224.
2
201.
5
28.5
4
26.1
5
285.
927
4.8
T11
223.
6
44.3
347.
6
201.
5
40.8
342.
5
235.
4
38.5
327.
4
236.
4
212.
5
41.0
3
36.6
7
332.
832
0.9
T12
236.
3
42.5
345.
3
228.
9
37.7
340.
9
230.
6
36.2
325.
6
234.
5
211.
6
38.2
6
34.2
6
330.
631
8.3
SE
(m)
±5.
772.
925.
774.
561.
584.
565.
091.
615.
093.
463.
142.
972.
536.
965.
80
CD
at
5%11
.96
6.04
11.9
79.
463.
289.
4610
.56
3.34
10.5
67.
186.
516.
185.
26-
-
51
Among the residual effects, the green leaf Further, addition of mineral N along with organic -1 sources will narrow down the C:N ratio of organic yield of spinach varied from 4.89 to 12.37 t ha . The
-1 manures and this enhances the rate of mineralization lowest green leaf yield (4.89 t ha ) was recorded in and result in rapid release of nutrients. Hence, to meet control where no fertilizers were applied. Though the crop requirement during entire growth period, application of 100% VC to rabi maize resulted in
-1 integrated use of both organic and inorganic highest green leaf yield of 12.37 t ha , it was on par fertilizers is idealwith 100% PM and 100% FYM. But it was
significantly superior to all the other combined Available phosphorus and potassiumtreatments.
With regard to available phosphorus and potassium (Table 3) the values decreased from The results clearly indicated that application vegetative to harvesting stages in all the treatments. of 75% RDF to spinach apart from the application of The highest values of available P O (47.2, 42.5 and 2 5inorganic and organic manures to maize crop was
-1 -141.3 kg ha ) and K O (355.7, 346.2and 329.6 kg ha ) sufficient as it ensured ample supply of nutrients and 2
were recorded in the treatment which received 100% favoured better growth. The additional fresh green PM at vegetative, tasseling and harvesting stage of the leaf yield under cumulative effects might be due to the crop, respectively. However, the values were on par fact that an adequate and balanced supply of nutrients with 100% VC and 100% FYM and was significantly with 75% RDF application had favourable effect on differed from all other treatments at all growth stages. leaf and root growth resulting in improvement in the Organic manures during the decomposition release a yield attributes. Similar observations were made by large number of organic acids like vanillic acid, Reddy (2007). He reported that use of 75% RDF protocatecholic acid, which react with the insoluble along with application of vermicompost resulted in iron, aluminium and calcium phosphates and release better growth of maize crop in maize-groundnut phosphates slowly into the solution, resulting in cropping sequence.higher phosphate availability in plots treated with
Soil available nutrient status in maize organic manures. Further the organic matter acts as a The soil samples collected at different growth coating over iron and aluminium oxides and reduces
stages of maize and at final harvest of spinach were phosphate fixing capacity of the soil (Parmar and analyzed for available N, P O and K O to study the 2 5 2 Sharma, 2002). Increase in available P might be due to effect of organic manures and inorganic fertilizers on the decomposition of organic matter accompanied by nutrient availability. the release of appreciable quantities of CO . The CO 2 2
released during decomposition of organic matter Available nitrogen forms carbonic acid which solublizes certain primary
The data pertaining to available nitrogen are minerals too (Anup Das et al., 2010).
given in table 3. The available nitrogen in soil decreased from vegetative to harvesting stage of The buildup of available K in soil was due to maize in all the treatments. The highest available beneficial effect of organic manures on the reduction
-1nitrogen viz., 264.5 and 248.6 kg ha was recorded at of potassium fixation, releasing K due to interaction vegetative and tasseling stages in 75% RDNF + 25% of organic matter with clay, and direct addition of K to VC, but was on par with 100% RDNF, 75% RDNF + the available pool of soil.25% PM and 75% RDNF + 25% FYM. In these treatments where organic and inorganic fertilizers The lower values of available N, P O and K O (216.3, 2 5 2
-1were applied, inorganic fertilizers contributed to 27.3 and 258.4 kg ha ) in 100% RDNF treatment at nutrient uptake by plants in early stages. The available the time of harvest may be attributed to the maximum nitrogen content in the treatments receiving only utilization of applied nutrients by the crop, which are organic manures increased at harvest compared to in most available form.integrated application of organic and inorganic fertilizers. This might be due to slow release of nitrogen due to decomposition of organic matter by increased microbial activity and reduction in N loss through formation of organo mineral complexes.
(Rathod et al., 2010).
From the results it was also clear that the N, P and K availability to maize crop was there throughout the growth period. The increase in nutrient contents and uptake by crop from vegetative to harvest gives
52
53
and uptake by crop from vegetative to harvest gives an indication that integrated use of inorganic fertilizers and organic manures (75% RDNF+ 25% organic manures) is ideal for effective supply and utilization by crops.
found that the available N, P O and K O depleted to 2 5 2
an extent of 19.42, 8.36 and 12.99 per cent, respectively after harvest of maize crop (Table 2).
The cumulative and residual effects of INM treatments on spinach indicated that there was negative balance in available nutrient status by the Soil available nutrient status in spinach
-1 end of maize-spinach cropping system. The N, P O 2 5Available nitrogen (kg ha )and K O depletion was more under residual 2Among the cumulative treatments, the treatments where no fertilizers were applied to available nitrogen contents after final cutting of
-1 spinach (23.92, 17.87 and 13.94 per cent). While there spinach ranged from 182.4 to 240.3 kg ha .The was decrease in available nutrients in soil by 16.25,
treatment which received 100% RDF applied to 3.28 and 10.47 per cent under cumulative effects.
maize and 75% RDF to spinach recorded significantly -1lower available N content (211.2 kg ha ) than other These changes in soil available nutrients
organic and integrated treatments. The treatment from initial status to harvest of maize-spinach which received 100% VC during maize and 75% RDF cropping system gives an indication that growing during spinach showed highest available nitrogen heavy feeders like maize cannot sustain the soil
-1content (240.3 kg ha ). fertility for next crop. Even if any nutrients are left,
Among the residual treatments, the treatment they cannot meet the nutrient requirement of the crop. which received 100% VC during maize showed Some amount of inorganic fertilizers needs to be
-1highest available nitrogen content (215.6 kg ha ). But applied viz., 75% RDF to a short duration crop like it was significantly superior to all the other spinach to obtain economic yields.treatments. In residual treatments, the available
-1nitrogen content varied from 165.7 to 215.6 kg ha . REFERENCES
-1Available phosphorus (kg ha )
Anup Das, D.P. Patel, G.C. Munda and P.K. Ghosh, 2010. Effect of Among the cumulative treatments, after final organic and inorganic sources of nutrients on yield, nutrient
harvest of spinach, the lowest available phosphorus uptake and soil fertility of maize (Zea mays)- mustard -1 (Brassica campestis) cropping system. Indian J. Agric. Sci. was recorded in control (27.76 kg ha ) and the highest
80(1): 85-88.available phosphorus was observed in the treatment Jackson, M.L. 1973. Soil Chemical Analysis. Prentice-Hall of India Pvt.
-1 Ltd., New Delhi.(42.37 P O kg ha ), which received 100% PM during 2 5 Olsen, S.R., C.V. Cole, F.S. Watanabe and L.A. Dean, 1954. Estimation of available phosphorus in soils by extraction with sodium previous rabi and 75% RDF to spinach but was on par bicarbonate. Circulation from USDA, 939.
with 100% VC and 100% farm yard manure and it was Parmar, D.K. and S.C. Sharma, 2002. Studies on long term application of fertilizers and manures on yield of maize-wheat rotation and significantly superior to other treatments.soil properties under rainfed conditions in Western Himalayas. Among the residual treatments, the available J. Indian Soc. Soil Sci. 50(3): 311-312.
-1Prativa, K.C. and B.P. Bhattarai, 2011. Effect of Integrated Nutrient P O content ranged from 23.57 to 38.16 kg ha . The 2 5
Management on the Growth, Yield and Soil Nutrient Status in treatment which received 100%PM for first crop Tomato. Nepal J. Sci. and Tech. 12 : 23-28.
Randhawa, J.S. and R.S. Brar, 2004. Management of nutrients in a (maize) showed highest available P content (38.16 cropping system. Indian Farmers' Dig. 37(5-6):18-21.-1P O kg ha ). However, the values were on par with Rathod, N.D., B.S. Indulkar, G. R. Kadam and N.B. Ghube, 2010. 2 5
Influence of various organics on physico-chemical properties 100% VC and 100% farm yard manure.of soil and availability of nutrients to tomato. Agric. Biol. Res. -1
Available potassium (kg ha ) 26 (2): 96-103.Reddy, B.G. and M.S. Reddy, 1998. Effect of organic manures and There was no significant differences
nitrogen levels on soil available nutrient status in maize-observed in case of available K content both in soybean cropping system. J. Indian Soc. Soil Sci. 46(3): 474-cumulative and residual treatments. Prativa and 476.
Reddy, K.P.C. 2007. Effect of integrated use of inorganic and organic Bhattarai (2011) revealed that the integration of sources of nutrients in maize-groundnut cropping system of
organic manures in combination with inorganic Alfisols. Ph.D thesis submitted to Acharya N G Ranga Agricultural University, Hyderabad.fertilizers was found significant in improving the
Sarawad, I.M., M.B. Guled, and S.S. Gundlur, 2005. Influence of overall plant growth, yield and soil macro nutrient integrated nutrient supply system for rabi sorghum- chickpea
status than the sole application of either of these crop rotation on crop yields and soil properties. Karnataka J. Agric. Sci. 18: 673-679.nutrients.
Subbaiah, B.V. and G.L. Asija, 1956. A rapid procedure for the With regard to changes in available nutrient determination of available nitrogen in soils. Curr. Sci. 25: 259-status of the soil, taking control plot as a check, it was 260.
Rec. on 21.02.2014 & Acc. on 10.03.2014
ABSTRACT
A field study was conducted during rainy (kharif) season of 2013 to assess the response of local rice (Oryza
sativa L.) cultivars to different levels of NPK doses under direct-seeded upland condition at the experimental research
farm of School of Agricultural Sciences, Nagaland University, Medziphema campus. The treatments consisted of
factorial combination of five local rice cultivars viz., Haccha, Inglongkiri, Dehangi, Maizu Biron and Dimroo and -1 -1 -1three doses of NPK viz., 0 NPK kg ha , 60:30:30 NPK kg ha and 90:45:45 NPK kg ha laid out in a randomized block
-1design and replicated three times. The results showed that 90:45:45 NPK kg ha fertilizer dose significantly increased -1 -1plant height, number of green leaves plant , number of tillers hill and plant population. The NPK doses at 90:45:45
-1 -2 -1kg ha recorded maximum number of panicles m , length of panicle, number of grains panicle and the overall grain -1yield. Among the cultivars, Dehangi produced the highest grain yield (2338.42 kg ha ) followed by Dimroo (2186.39
-1kg ha ). The interaction effects between rice cultivars and fertilizer doses were found to be non-significant. From the
present experiment it was revealed that cultivar 'Dehangi' was found to be the most suitable rice cultivar under
direct-seeded upland condition of Nagaland followed by Dimroo, Haccha and Inglongkiri. Increase in the doses of
NPK fertilizer significantly enhanced growth characteristics and increased yields attributes of the upland rice
cultivars. The result showed that among the different local rice cultivars Dehangi recorded highest grain yield
followed by Dimroo. Yield increased due to NPK doses at 90:45:45 found to be 51 per cent compared to no fertilizer
application.
(Key words: Cultivars, nutrient management, growth and yield attributes)
improve the quality of rice (Alam et al., 2009). INTRODUCTIONChemical fertilizer offers nutrients which are readily
Rice is the most consumed cereals grain in soluble in soil solution and thereby instantly available the world, constituting the dietary staple food for to plants. So, the appropriate fertilizer input that is not more than half of human population of the planet. only for getting high grain yield but also for attaining India is the second largest producer after China and maximum profitability (Khuang et al., 2008). The has an area of over 42.2 million ha and production of major nutrients required by rice are nitrogen,
-1104.32 million tonnes with productivity of 2.37 t ha phosphorus and potassium. There are several factors (Anonymous, 2013). Even then rice self-sufficiency responsible for low productivity of rice in Nagaland.
These can be enumerated as use of local varieties of in India is precarious. The country's population of -1 low genetic potential, leaching loss of N, more than a billion is growing at 1.8% year ,
unfavourable growth conditions, low inputs and outpacing the 1.4% annual growth rate of rice heavy infestation of weeds, insects and pests attack production. India's population is expected to be 1.4 clubbed with inefficient resources management billion by the year 2025 and 300 million tonnes of practices. Almost negligible use of fertilizers also food grains will be required by 2025. India need to limits the productivity. Keeping this idea in view and raise its foodgrains targets at a rate of more than 4
-1 realising the importance of the needs and problems, million tonnes annum and to maintain self-an investigation was undertaken to study the effects of sufficiency, annual production need to increase by different doses of NPK fertilizers on local rice two million tonnes every year. The annual cultivars on their growth, productivity and economics consumption of fertilizers, in nutrient terms (N, P and of the rice cultivars under study.K), has increased from 0.07 million tonnes in 1951-52
to more than 28 million tonnes in 2010-11 and -1 MATERIALS AND METHODS
hectare consumption has increased from less than 1
kg in 1951-52 to the level of 135 kg in 2010-11 The experiment was carried out during kharif (Anonymous, 2012). An adequate and balanced season of 2013 at research farm of School of supply of plant nutrients is a prerequisite to maximize Agricultural Sciences, Nagaland University, crop production. Judicious and proper use of Medziphema. The soil of the experimental plot was
sandy loam, having pH 4.5 with electrical fertilizers can markedly increase the yield and
1. P. G. Student, Deptt. of Agronomy, SASRD, Nagaland University, Medziphema-7971062. Sr. Asst. Professor, Deptt. of Agronomy, SASRD, Nagaland University, Medziphema
EFFECT OF DIFFERENT DOSES OF NPK FERTILIZERS ON LOCAL RICE (Oryza sativa L.) UNDER DIRECT-SEEDED UPLAND CONDITION
J. Soils and Crops 25 (1) 54-61, June, 2015 ISSN 0971-2836
1 2Karsangla Ao and T. Gohain
-1conductivity 0.227 dSm , organic carbon 1.25 per RESULTS AND DISCUSSIONcent and available N, P O and K O 36.27, 248.40 and 2 5 2
-1 9.22 kg ha respectively. The experiment comprised Growth parameters
of five different local rice cultivars viz., Haccha, It was observed from the table 1, that Inglongkiri, Dehangi, Maizu Biron and Dimroo as
significant variations were observed in growth identified by RRS, Karbi Anlong, Diphu, Assam attributes at various stages. Plant height differed Agricultural University and three different NPK significantly among the different rice cultivars. It was doses F -N P K F -N P K and F -N P K 1 0 0 0 , 2 60 30 30 3 90 45 45
observed that the cultivar 'Dehangi' was significantly respectively. The experiment with these treatments superior over other varieties in terms of plant height was laid out in factorial randomized block design with (109.77cm) followed by Inglongkiri (108.09cm) and three replications. Treated seeds of rice were dibbled Dimroo (107.98cm). Maximum number of at proper spacing 20 cm x 10 cm in the second week of functional leaves (5.73) were recorded by cultivar June 2013, after basal application of fertilizer as per Dehangi followed by Inglongkiri (5.6) and Dimroo treatments. The soil samples were collected before
-2(5.6). Maximum number of plant population (304m ) sowing and after the harvest of rice crop with the help were recorded in cultivar Dehangi followed by of tube auger (stainless steel) from each plot at 0-
-2 -2Haccha (283 m ) and Dimroo (283 m ) and the lowest 15cm soil depth. Soil pH was determined by glass
-2in Maizu Biron (262 m ). There were significant electrode pH meter (Pipper, 1966). Organic carbon
-1differences on number of tillers hill and the was determined by Walkey and Black Method as
-1maximum tillers hill (8.41) were associated with outlined by Jackson (1976). For available N by cultivar 'Haccha'. The significant difference observed Alkaline potassium permanganate method (Subbiah
-1in the number of tillers hill can be ascribed to and Asija, 1956), available P was extracted with 0.03 N, NH F in 0.025 N HCL solutions. Available K was differences in the ability of the cultivars to utilize the 4
fertilizer as well as partition their photosynthates and extracted from 5g of soil by shaking with 25 ml of accumulation dry matter. The present findings were in neutral ammonium acetate (pH 7) solution for half an agreement with the results of Sheela and Thomas hour and the extract was filtered immediately through Alexander (1995) who reported that growth the filter paper (Whatman no. 1) and then potassium parameters showed significant variations due to concentration in the extract was determined by Flame varieties. Different doses of NPK fertilizers recorded Photometer (Hanway and Heidal, 1952). Weeds were significant differences in growth parameters. controlled by manually at 20 DAS and 45 DAS However, treatment F (N P K ) recorded maximum 3 90 45 45respectively. Observations on growth attributes viz., value in all growth parameters. Interaction effect of plant height, number of leaves, plant population, cultivars and fertilizer doses could not record any tillering and yield attributes viz., number of panicles significant variations in different growth parameters, -2 -1m , number of grains panicles , test weight, grain however, leaf area index found to be significant due to
yield and straw yield were recorded. The observations cultivars and fertilizer doses. Highest LAI (2.10) was
were recorded on randomly selected 5 samples and recorded by the cultivar 'Dimroo' at fertilizer dose of
their mean were taken for analysis 90 days after N P K90 45 45.sowing. Observations on yield attributing characters
were recorded at harvest stage and thereafter. The Yield attributesoven-dried plant samples were ground to powder and analysed for N, P and K (%). Uptakes of nutrient were Data from table 2 indicated that Cultivar
-1 -1calculated multiplying total biomass (dry wt. kg ha 'Dehangi' recorded highest number of grains panicle basis) with respective nutrient content in per cent. The (195.68), longest panicle length (25.38 cm), filled data related to each character were analysed grains percentage (72.52 %) and test weight (25.65 g). statistically by applying the technique on analysis of Test weight showed significant difference among the variance and the significance of different sources of five different cultivars. These present findings are variation was tested by F test (Panse and Sukhatme, being supported by Satapathy and Nanda (1978) and 1967). , who reported that 1000-grains Chavan et al. (2014)
55

weight significantly varied with different varieties. and increased the N content of the soil. This was also The poorest performance was recorded in cultivar in close conformity with Naing Oo et al. (2010) who 'Maizu Biron' in terms of panicle length, number of reported that application of FYM together with
-1grains panicle , filled grains percentage and test inorganic fertilizers significantly increased soil weight. The reason might be poor adaptability and organic matter, CEC and available NPK in the soil.less vigour. The results regarding yield of five The interaction effect of cultivars and
different levels of NPK were found to be significant cultivars, showed significant differences. The cultivar 'Dehangi' out classed four other varieties by yielding on soil available nitrogen, phosphorus and potash.
-1Higher levels of NPK (F ) recorded maximum soil 2338.42 kg ha followed by Dimroo, Haccha, 3
Inglongkiri and Maizu Biron with the production of available NPK irrespective of rice cultivars, however -1 -1 -12186.39 kg ha , 1839.50 kg ha , 1843.87 kg ha and V F (Inglongkiri x NPK dose 90:45:45) recorded 2 3 -1
-11692.59 kg ha , respectively. The findings of present maximum soil available N (370.48kg ha ), V F 4 3
investigation were in close conformity with Dwivedi (Maizu biron x NPK dose 90:45:45) recorded and Meshram (2014), who also reported that grain maximum P O (35.48) and V F (Dimroo x NPK dose 2 5 5 3yield was found to be positively correlated with -1
90:45:45) recorded maximum K O (225.02 kg ha ) 2number of productive tillers, a number of grains respectively.-1panicle both at genotypic and phenotypic levels. The
-1grain yields varied from 1292.38 kg ha in the control Nutrient uptake-1
plot (F ) to 2020.88 kg ha in F (60:30:30 NPK kg 1 2
-1 -1 -1ha ) to 2627.27 kg ha in F (90:45:45 NPK kg ha ). There was a significant difference in NPK 3
et al. uptake due to different cultivars (Table 4). Cultivar This is in consonance with Purushotham (1993) who reported that grain yield was highest with the Dehangi recorded the highest uptake of N, P and K. highest NPK dose. Highest value of harvest index This type of variability may be attributed to genetic (40.03 %) was noticed under highest NPK dose as variability and varied capacity of different cultivars to compared to control (F ) and F . Murali and Setty utilize the applied fertilizers. The effect of fertilizer 1 2
(2000) also reported that application of higher NPK doses on NPK uptake was found to be significant. The dose recorded significantly higher growth, yield highest value of NPK uptake was associated with high
-1attributes and yield compared to lower NPK doses. rate of NPK i.e., 90:45:45 kg NPK ha . The
interaction effects of cultivars x fertilizer doses on Soil nutrient status NPK uptake of plant were found to be significant.
Cultivar Inglongkiri recorded maximum uptake of N A significant variation could be observed on -1 -1(71.72 kg ha ) and P (23.88 kg ha ) at F level of NPK 3pH, organic carbon, available nitrogen, available
and cultivar Dimroo recorded highest uptake of K phosphorus and available potassium due to cultivars -1
(123.02 kg ha ) when applied highest level (F ) of 3(Table 3). Cultivar 'Maizu Biron' reported the highest K O. The variations might be due to genetic factors, pH (4.72). Cultivar 'Dimroo' recorded the highest 2
value of organic carbon (2.04 %) and available better adaptability to the present climatic condition or -1potassium (208 kg ha ). While, the highest value of high responsive character of cultivars to the applied
available nitrogen was reported in cultivar fertilizers. 'Inglongkiri' and cultivar 'Dehangi' recorded the
The result showed that among the different highest value of available phosphorus. The highest local rice cultivars Dehangi recorded highest grain value of available NPK, pH and organic carbon was
associated with highest NPK dose (90:45:45 NPK kg yield followed by Dimroo. Yield increased due to -1 NPK doses at 90:45:45 found to be 51 per cent ha ). Masthana et al. (2005) reported that application
of NPK significantly improved the soil P and K status compared to no fertilizer application.
56
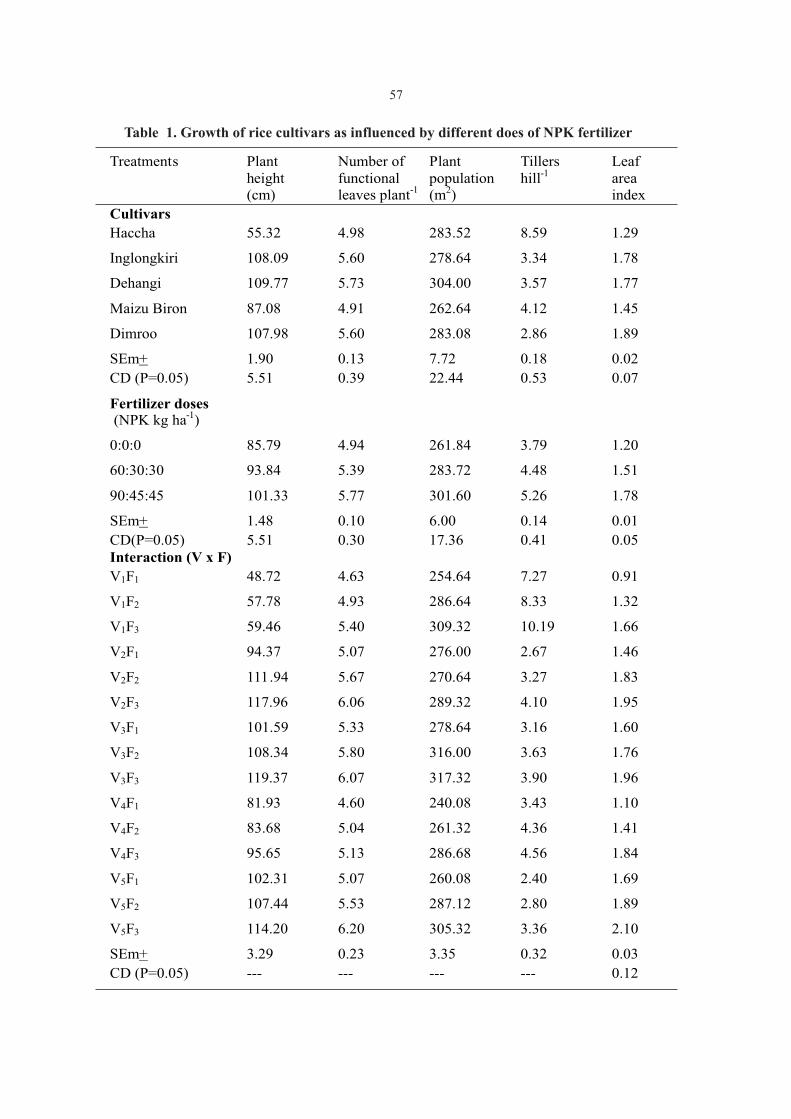
Table 1. Growth of rice cultivars as influenced by different does of NPK fertilizer
Treatments Plant Number of Plant Tillers Leaf height functional population hill-1 area (cm) leaves plant-1
(m2) index Cultivars Haccha
55.32
4.98
283.52
8.59
1.29
Inglongkiri
108.09
5.60
278.64
3.34
1.78
Dehangi
109.77
5.73
304.00
3.57
1.77
Maizu Biron
87.08
4.91
262.64
4.12
1.45
Dimroo
107.98
5.60
283.08
2.86
1.89
SEm+
1.90
0.13
7.72
0.18
0.02
CD (P=0.05)
5.51
0.39
22.44
0.53
0.07
Fertilizer doses
(NPK kg
ha-1)
0:0:0
85.79
4.94
261.84
3.79
1.20
60:30:30
93.84
5.39
283.72
4.48
1.51
90:45:45
101.33
5.77
301.60
5.26
1.78
SEm+
1.48
0.10
6.00
0.14
0.01
CD(P=0.05)
5.51
0.30
17.36
0.41
0.05
Interaction (V x F)
V1F1
48.72
4.63
254.64
7.27
0.91
V1F2
57.78
4.93
286.64
8.33
1.32
V1F3
59.46
5.40
309.32
10.19
1.66
V2F1
94.37
5.07
276.00
2.67
1.46
V2F2
111.94
5.67
270.64
3.27
1.83
V2F3
117.96
6.06
289.32
4.10
1.95
V3F1
101.59
5.33
278.64
3.16
1.60
V3F2
108.34
5.80
316.00
3.63
1.76
V3F3
119.37
6.07
317.32
3.90
1.96
V4F1
81.93
4.60
240.08
3.43
1.10
V4F2
83.68
5.04
261.32
4.36
1.41
V4F3
95.65
5.13
286.68
4.56
1.84
V5F1
102.31
5.07
260.08
2.40
1.69
V5F2
107.44
5.53
287.12
2.80
1.89
V5F3 114.20 6.20 305.32 3.36 2.10
SEm+ 3.29 0.23 3.35 0.32 0.03
CD (P=0.05) --- --- --- --- 0.12
57

Table 2. Yield attributes of rice cultivars as influenced by different doses of NPK fertilizer
Treatments Length Grains Fertility Test Grain Harvest
of panicle panicle-1 (%) weight yield index
(cm) (g) (kg ha-1) (%)
Cultivars Haccha
23.12
141.34
59.98
21.41
1843.87
28.64
Inglongkiri
25.24
192.59
69.04
25.57
1839.50
24.64
Dehangi
24.72
195.68
72.52
25.65
2338.42
29.82
Maizu Biron
22.36
139.09
54.88
15.64
1692.59
28.20
Dimroo
24.47
187.32
67.38
19.73
2186.39
29.80
SEm+
0.50
8.00
1.05
0.42
78.94
0.87
CD (P=0.05)
1.45
23.18
3.05
1.23
228.68
2.54
Fertilizer doses
(NPK kg
ha-1)
0:0:0
21.52
144.04
53.45
20.14
1292.38
22.45
60:30:30
23.90
159.48
67.14
21.81
2020.88
28.86
90:45:45
26.53
210.08
73.70
22.84
2627.27
33.95
SEm+
0.38
6.20
0.81
0.32
61.14
0.67
CD(P=0.05)
1.12
17.96
2.36
0.95
177.13
1.96Interaction (V x F)
V1F1
20.88
112.34
48.66
20.24
1197.49
22.88
V1F2
23.32
131.87
62.94
21.55
1883.59
30.83
V1F3
24.97
179.79
68.35
22.46
2450.54
35.22
V2F1
21.83
145.84
59.81
24.56
1112.49
20.19
V2F2
25.29
162.57
69.38
25.92
1960.82
25.41
V2F3
28.61
269.36
77.93
26.45
2445.19
28.32
V3F1
22.53
165.65
56.61
22.49
1378.05
22.23
V3F2
24.94
184.21
75.55
26.45
2360.32
28.99
V3F3
26.69
237.19
85.41
28.00
3276.90
38.24
V4F1
20.63
120.64
44.33
14.68
1259.43
23.74
V4F2
21.60
133.81
56.93
15.76
1758.62
28.04
V4F3
24.85
162.83
63.41
16.50
2059.71
32.83
V5F1
21.72
175.76
57.85
18.77
1514.43
23.20
V5F2 24.16 184.97 70.94 19.38 2141.06 31.03
V5F3 27.55 201.24 73.36 21.03 2903.68 35.16
SEm+ 0.86 13.86 1.82 0.73 136.73 1.52
CD (P=0.05) --- --- --- --- --- ---
58
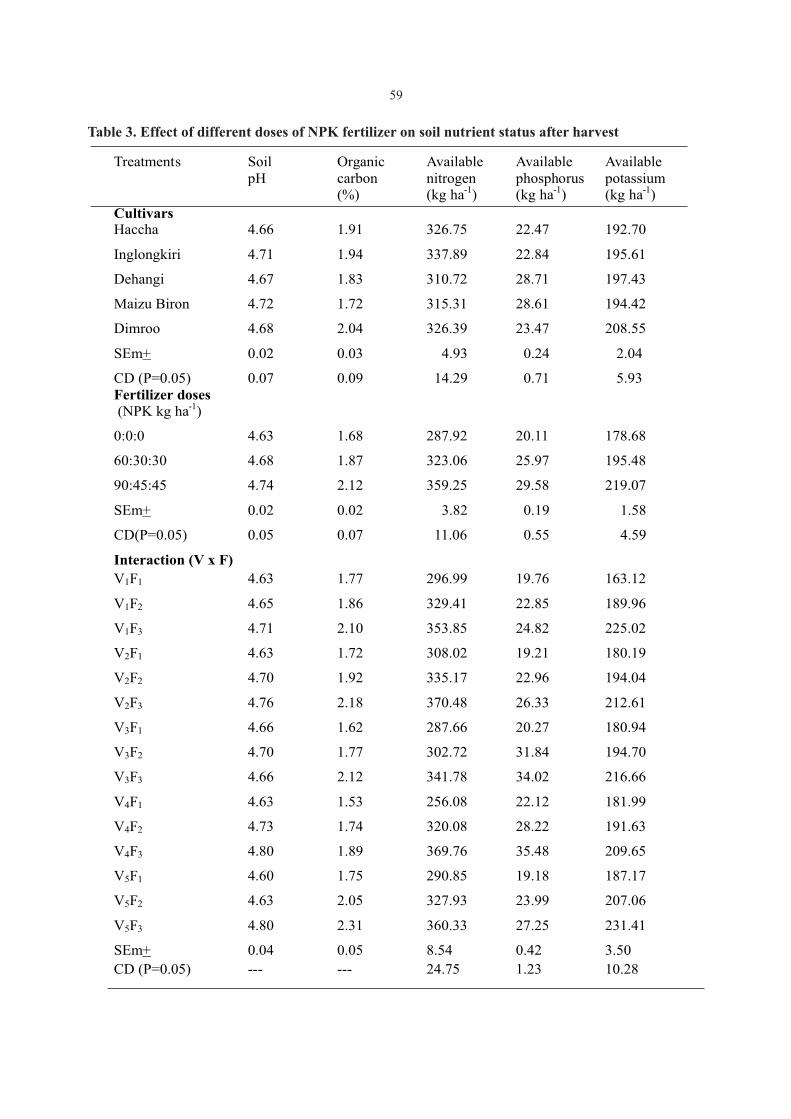
Table 3. Effect of different doses of NPK fertilizer on soil nutrient status after harvest
Treatments Soil Organic Available Available Available
pH carbon nitrogen phosphorus potassium(%) (kg ha-1) (kg ha-1) (kg ha-1)
Cultivars Haccha
4.66
1.91
326.75
22.47
192.70
Inglongkiri
4.71
1.94
337.89
22.84 195.61
Dehangi
4.67
1.83
310.72
28.71 197.43
Maizu Biron
4.72
1.72
315.31
28.61 194.42
Dimroo
4.68
2.04
326.39
23.47
208.55
SEm+
0.02
0.03
4.93
0.24
2.04
CD (P=0.05)
0.07
0.09
14.29
0.71
5.93Fertilizer doses
(NPK kg
ha-1)
0:0:0
4.63
1.68
287.92
20.11
178.68
60:30:30
4.68
1.87
323.06
25.97
195.48
90:45:45
4.74
2.12
359.25
29.58
219.07
SEm+
0.02
0.02
3.82
0.19
1.58
CD(P=0.05)
0.05
0.07
11.06
0.55
4.59
Interaction (V x F)
V1F1
4.63
1.77
296.99
19.76
163.12
V1F2
4.65
1.86
329.41
22.85
189.96
V1F3
4.71
2.10
353.85
24.82
225.02
V2F1
4.63
1.72
308.02
19.21
180.19
V2F2
4.70
1.92
335.17
22.96
194.04
V2F3
4.76
2.18
370.48
26.33
212.61
V3F1
4.66
1.62
287.66
20.27
180.94
V3F2
4.70
1.77
302.72
31.84
194.70
V3F3
4.66
2.12
341.78
34.02
216.66
V4F1
4.63
1.53
256.08
22.12
181.99
V4F2
4.73
1.74
320.08
28.22
191.63
V4F3
4.80
1.89
369.76
35.48
209.65
V5F1
4.60
1.75
290.85
19.18
187.17
V5F2
4.63
2.05
327.93
23.99
207.06
V5F3 4.80 2.31 360.33 27.25 231.41
SEm+ 0.04 0.05 8.54 0.42 3.50
CD (P=0.05) --- --- 24.75 1.23 10.28
59

Table 4. Effect of fertilizer doses on nitrogen (N), phosphorus (P) and potassium (K) uptake
by the rice cultivars
Treatments Nitrogen Phosphorus Potassium
uptake uptake uptake(kg ha-1) (kg ha-1) (kg ha-1)
Cultivars (V) Haccha
41.49
14.06
86.52
Inglongkiri
50.98
16.64
92.33
Dehangi
49.98
13.18
76.24
Maizu Biron
48.94
11.96
77.45
Dimroo
47.03
13.64
89.15
SEm+
1.03
0.44
1.11
CD (P=0.05)
3.00
1.29
3.24
Fertilizer doses
(F)
(NPK kg ha-1)
0:0:0
30.23
8.42
66.06
60:30:30
49.16
15.63
81.55
90:45:45
63.66
19.26
105.40
SEm+
0.80
0.46
0.86
CD(P=0.05)
2.32
1.03
2.51
Interaction (V x F)
V1F1
26.77
9.25
77.67
V1F2
40.57
16.88
84.41
V1F3
57.12
19.72
97.48
V2F1
27.79
8.03
75.89
V2F2
53.45
19.34
94.47
V2F3
71.72
23.88
106.63
V3F1
32.68
8.44
55.82
V3F2
51.52
15.75
67.74
V3F3
65.74
17.29
105.16
V4F1
36.82
6.53
57.80
V4F2
46.41
13.07
79.82
V4F3
63.60
16.29
94.74
V5F1
27.10
9.85
63.12
V5F2
53.84
13.10
81.31
V5F3 60.14 19.15 123.02
SEm+ 1.79 0.77 1.93
CD (P=0.05) 5.20 2.24 5.61
60
Masthana, R.B.G., P.S. Pattar and P.H. Kuchnur, 2005. Response of rice REFERENCES to poultry manure and graded levels of NPK under irrigated condition. Oryza. 42(2): 109-111.
Murali, M.K. and R.A. Setty, 2000. Effect of levels of NPK, Alam, M.M., M. Hassanuzzaman and K. Nahar, 2009. Tiller dynamics of
vermicompost and growth regulator (triacontanol) on growth three irrigated rice varieties under varying phosphorus levels.
and yield of scented rice (Oryza sativa L.). Mysore J. agril. Sci. American–Eurasia J. Agron. 2(2): 89-94. 34(4): 335-339.
Anonymous, 2012. Report of the working group on fertilizer industry for Naing Oo, A., P. Banterng, A. Polthance, and V. Trelo-Ges. 2010, The the twelfth plan (2012-17). Department of Fertilizers, effect of different fertilizers management strategies on growth Ministry of Chemical and Fertilizers, GoI, New Delhi. pp.3. and yield of upland black glutinous rice and soil property.
Anonymous, 2013. Directorate of Economics and Statistics, Department Asian J. Plant Sci. 9(7): 414-422.of Agriculture and Corporation, DAC, New Delhi. Panse, V. G. and P. V. Sukhatme, 1967. Statistical method for Agricultural
Chavan, A.P., N.K. Jain and U.V. Mahadkar, 2014. Direct and residual workers, ICAR publication, New Delhi.effects of fertilizers and biofertilizers on yield, nutrient uptake Pipper, C.S. 1966. Soil and Plant Analysis, Et. Hans Publishers, Bombay. and economics of groundnut (Arachis hypogaea)-rice (Oryza p.368.sativa) cropping system. Indian J. Agron. 59 (1):53-58. Purushotham, S.M.M. Hosmani and K.M.S. Sharma, 1993. Performance
Dwivedi, S.K. and M.R. Meshram, 2014. Effect of customized fertilizer of three kharif paddy varieties at four fertility levels in Kolar on productivity and nutrient uptake of rice (Oryza sativa), district. Karnataka J. agril. Sci. 6(2): 166-170.Indian J. Agron. 59 (2): 247-250. Satapathy, D. and A.K. Nanda, 1978. Interrelationship between yield and
Hanway, J. and H.S. Heidal, 1952. Soil testing laboratory procedures. some associated characters in upland rice grown under rainfed Jowa Agriculture. 57: 1-31. conditions. Oryza. 15(1): 12-18.
Jackson, M.L. 1976. Soil chemistry analysis practice. Hall of India Pvt. Sheela, K.R. and V. Thomas Alexander, 1995. Performance of rainfed rice Ltd., New Delhi, pp. 31. as influenced by varieties and nutrient levels. Indian J. Agron.
Khuang, T.Q., T.T. Huan, and C.V. Hach, 2008. Study on fertilizer rates 40(3): 407-411.Subbiah , B.V. and G.L. Asija, 1956. A rapid procedure for the estimation for getting maximum grain yield and profitability of rice
production. Omonrice. 16: 93-99. of available nitrogen in soils. Curr. Sci. 28:256-260.
Rec. on 05.12.2013 & Acc. on 10.02.2014
61
ABSTRACT
An experiment was conducted for two years during rabi seasons of 2005-06 and 2006-07 to study the effect of fertigation on yield and net return of Japanese mint. The treatments consist of three irrigation regimes ( Drip irrigation I at 100% PE, I - at 80% PE and I -60% PE) and three fertility levels(F -100%, F – 75% and F - 50% of 1- 2 3 1 2 3
recommended dose of NPK) with an extra (control) treatment having surface irrigation and soil application of -1fertilizer @150-60-60 kg N, P O and K O ha . Irrigating the crop at 100% PE with 100% RDF produced the highest 2 5 2
herb and oil yield than other treatment combinations. Drip irrigation at 100% PE produced more herbage (32034 kg -1 -1ha ) and oil yield (236 kg ha ) of mint. Application of irrigation at 100% PE and 100% RDF recorded the highest
-1herbage yield of 35798 kg and oil yield of 260 kg ha . Application of irrigation at 100% PE helped the plant to absorb maximum amount of nutrients, which was at par with that of 80% PE. NPK uptake increased with an increase in the level of fertilizer. Application of irrigation at 100% PE and full fertilizer dose (100% RDF) absorbed maximum
-1amount of NPK (306 kg ha ) consisting of 125 kg N, 37 kg P and 144 kg K. In post harvested soil N, P and K depletion were noticed in the soil at lower levels of irrigation and fertilizer.
(Key words: Herbage yield, Japanese mint, nutrient uptake, pan evaporation)
1 Sr. Scientist (Agronomy), CRIJAF, Barrackpore 2 Former Dean, OUAT, Bhubaneswar, Odisha
3 Principal Scientist, (Agronomy) CICR, Nagpur, Maharashtra4 Scientist, Directorate of Water Management, Bhubaneswar-751023, Odisha5 Director, Directorate of Water Management, Bhubaneswar-751023, Odisha
YIELD, NUTRIENT UPTAKE BY JAPANESE MINT AND SOIL FERTILITY STATUS UNDER DRIP FERTIGATION
J. Soils and Crops 25 (1) 62-70, June, 2015 ISSN 0971-2836
1 2 3 4 5M. S. Behera , P. K. Mahapatra , R. B. Singandhupe , O.P.Verma and A. Kumar
yield of this crop irrigation should be scheduled at INTRODUCTION35% depletion of available soil moisture (Mitchell et al., 1993). Mint has a high nutrient demand. Singh Menthol mint (Mentha arvensis L.) is an (1994) calculated the N, P and K removal to the extent important cash crop in India. It has become
- 1of 150, 25 and 100 kg ha , respectively. Mint crop increasingly popular among small holders. In India, it responds well to high levels of N fertilizer (150 to 250 is a potential source of natural menthol and other
-1kg N ha ) depending on agro-climatic conditions ingredients viz., mint terpenes, menthone,
(Saxena and Singh, 1996; Patra et al., 2000 and isomenthone, menthyl acetate etc., which are
Shormin et al., 2009). For harvesting good crop extensively used in pharmaceutical, cosmetic, food
yield, water and nitrogen are the important factors, and flavour industries. Essential oil and their valuable
which influence the essential oil production in mint. commercial constituents obtained from menthol mint
The studies on fertilizer management on other crops, have great export potential. Presently India is the
whose economic part is leaf, revealed that optimum largest producer of Mentha oil in world contributing
availability of nutrients throughout the growing about 85% of total production, and rest is contributed
by China followed by Brazil and US (Chainani, period increases leaf production when applied
2010). Today , India is the major global producer and through fertigation due to placement of fertilizer in
supplier of mint oil and its derivatives . Regarding effective crop root zone and less leaching loss.
productivity on an average, 20-25 tonnes of green Keeping this in view, the present investigation was -1 carried out to assess the effect of fertigation on herb hectare can be obtained in three cutting yields to
-1 herbage, oil yield, and nutrient removal by mint crop. 125-200 kg of Mentha oil , annum and its
derivatives, valued at Rs. 6000–8000 millions are MATERIALS AND METHODSexported from India (Anonymous, 2010). Mint is a
shallow rooted and high water demanding crop. The
The field experiment was conducted in the water requirement of this crop varies from location to
Central Experimental Farm of the Directorate of location depending upon soil and climatic factors.
Water Management (Formerly known as Water Both, high soil moisture content and water potential
et al., Technology Centre for Eastern Region), decrease the oil yield (Shormin 2009).
Bhubaneswar during regimes and fertigation levels Similarly, moisture stress during the growing season
severely reduces its productivity. So, to harvest good on mint (Mentha arvensis, L.) grown in the rice
fallow. It was laid out in Factorial Randomized Block The crop was harvested by taking the first cut Design with three replications. The treatments consist at 115 days after planting and the second cut at 75 days of three irrigation regimes (I - drip irrigation at 100% after the first cut during both the years. It was done in 1
PE, I - drip irrigation at 80% PE and I - drip irrigation bright sunny weather with the help of a sickle from 2 2 3
at 60% PE) and three fertility levels (F -100%, F – to 3 cm above the ground level when the lower leaves 1 2
start yellowing. The fresh harvested herbage from net 75% and F - 50% of the recommended dose of NPK) 3
with an extra (control) treatment having surface plot was weighed by an electronic balance and the -1irrigation and soil application of fertilizer (150-60-60 data were converted to kg ha . Similar procedure was
-1kg N, P O and K O ha ). The experimental soil was also followed in second harvest. Both the yields were 2 5 2
sandy loam in texture with pH 5.7, low in organic added to obtain the total herbage yield. The herbage -1
carbon (0.46%), available nitrogen (159 kg ha ); was dried for two days. The essential oil was extracted -1
medium in phosphorus (21 kg ha ) and potassium from the fresh herbage through steam distillation -1
(183 kg ha ). The suckers of variety “Koshi” were method using Clevenger`s type extracting apparatus transplanted at a spacing of 60 cm x 10 cm on 10 made of glass (Clevenger, 1928). The volume of oil December 2005 and 11 December 2006. The total was recorded and oil per cent was computed by the amount of rainfall received during the cropping following formula.season was 464 mm in 2005-06 and 359 mm in 2006-
Weight of oil07 in 42 and 23 rainy days, respectively. Mint Oil content (w/w %) on fresh weight basis= ---------------------------- X 100
received 105 mm more rainfall in 2005-06 than 2006- Weight of fresh herb
07. Full dose of phosphorus was applied basally at the The oil per cent was multiplied with time of planting. It was placed in open furrows about
corresponding fresh herbage yield of each treatment 2.5 cm below the suckers and mixed well with the soil to get the oil yield. Total NPK uptake by plant was by a small stick. Fertigation was given in equal splits worked out by adding the uptake in different plant at fortnightly interval from 15 days after planting
(DAP) upto 30 days before final harvest as per parts. The oven-dried samples were grounded using treatment. Required amount of urea and potash was Willey Mill and analysed for nitrogen, phosphorus dissolved in water and fed to the drip system through a and potassium content. Plant samples were wet ventury. The weighed amount of 35 g Urea and 11 g digested in di-acid mixture (3HNO :1HCl) for 3
-1MOP plot (net plot size-4.60 m x 2.40 m) was applied determination of P and K. Phosphorus was through drip irrigation in one split. Fertigation was determined by the Vanadomolybdo-phosphoric acid made by regulating the taps of the laterals by allowing yellow colour method and neutral normal NH OAc 4the solution to the specified plots as per fertilizer
extractable K by flame photometer. N was determined levels (In F -150-60-60, F -112.5-45-45 and F -75-1 2 3 by modified micro Kjeldahl method (Jackson, 1973). -130-30 kg N, P O and K O ha ). As per treatment, 2 5 2 Uptake in a particular plant was determined by differential amount of water was supplied on the basis
multiplying the NPK concentration with of two days cumulative pan evaporation (CPE) -1corresponding dry matter and expressed in kg ha .through meteorological approach (Pruitt, 1966 and Jenson, et al. 1961). Cumulative pan evaporation for
RESULTS AND DISCUSSIONdifferent treatments was computed using data from a Herbage yieldstandard US Weather Bureau Class A open pan
evaporimeter. The depth of irrigation water was 60 The Herbage yield was higher in 2006-07
mm in case of surface irrigation. The water was drawn than 2005-06 except that of drip irrigation @ 100% from the secondary reservoir. First irrigation was PE and drip irrigation @ 80% PE (Table1). It was given one day prior to planting. Subsequent more (39% to 53%) in the second harvest than the first irrigations were given at two days interval in drip one. The yield was reduced by 1.0% to 3.0% in 2006 irrigation and at 60 mm CPE value in case of surface as compared to 2007 due to drainage congestion. The irrigation method. If rainfall event occurred between method of irrigation significantly affected the irrigation cycles, then the rainfall amount was herbage yield. The yield declined from 12.4% to deducted and irrigation water was applied
accordingly. 12.6% during the first and from 14.2% to 14.6%
63
during the second harvest under surface irrigation as (2011). They reported that application of N, P and K -1compared to drip irrigation at 100% PE. Maximum (120:50:40 kg ha ) fertilizer gave maximum herb
-1 -1yield of 32034 kg ha was recorded with drip yield (204.42 q ha ). Rahman et al. (2003) conducted irrigation which increased the yield by 15.8% as field experiment at Chittongang( Bangladesh ) to compared to surface irrigation (control). The herbage assess the effect of three levels each of nitrogen ( 0,
-1 -1yield was affected by different irrigation levels during 100 and 200 kg ha ) , phosphorus( 0, 60, 120 kg ha ) -1both the seasons (Table 1). Maximum herbage yield and potassium (0,40, and 80 kg ha ) on herbage and
-1(35132 to 34463 kg ha ) was obtained from irrigation oil yield of menthal mint( M. arvensis ). The treatment -1 at 100% PE. The minimum yield of 28079 to 29010 combination of N 200, P 60 and K 40 kg ha
-1-1 kg ha was recorded with 60% PE (I ). Application of 3 produced highest dry matter of 7.1 t ha . The
irrigation at 100% PE increased the total yield from interaction effect was not significant during both the 6.7% to 21.9%. Shormin et al. (2009) in Bangladesh seasons. conducted pot experiment with five levels of nitrogen
-1 Oil content( 0,60,120,180 and 240 kg ha ) and four levels of irrigation water ( 100, 75, 50 and 25 % field capacity )
Higher oil content was recorded with the first in mint crop and reported maximum herb yield of -1 -1 harvest than the second one (Table 2). In present 103.54 g pot and very low yield of 31.67 g pot . They
study application of more water decreased the oil further suggested that highest dose of nitrogen and content, whereas high fertilizer dose increased it. Drip irrigation level is quite beneficial to harvest potential irrigation increased the oil content due to optimum yield of mint. In semi-arid sub -tropical climate at supply of nutrients throughout the crop growth Lucknow (India), application of irrigation at 1.2
-1 period. Oil content was maximum (0.70% to 0.83%) IW:CPE ratio in combination 200 kg N ha and -1 with drip irrigation at 60% PE(I ). It decreased by 3sugarcane trash mulch @7 t ha produced highest
0.01% to 0.03% in case of irrigation at 100% PE( I 1)benefit as compared to 0.9 IW:CPE ratio with same and 80 % PE (I as compared to irrigation at 60% amount of nitrogen and mulch material tested in mint 2)
PE(I ).Different doses of fertilizer affected oil content crop (Ram et al., 1995 and 2006). Saxena and Singh 3
(1998) conducted field experiment at Pantnagar for in plants. The oil content was maximum (0.70% to two years (1989 and 1990)with irrigation regimes , 0.83%) with the application of 100% RDF (F ) as 1
nitrogen levels and mulches on yield of Japanese compared to 75% and 50% RDF due to more mint (cv. MAS 1). They found that frequent vegetative growth resulting in accumulation of more irrigations (1.0 IW:CPE ratio) increased the herb metabolites to form more oil. An increase in leaf yield by 46.8% compared with that of 0.3 IW:CPE number increased the photosynthetic area. It ratio. facilitated the crop for more vegetative growth and
accumulation of secondary metabolites to develop Variation in fertilizer level affected the more oil.
herbage yield during both the years except in case of second harvest in 2007 (Table1). Application of 100% Oil yield RDF (F ) produced maximum yield (32558 kg to 1
-1 -1 Drip fertigation at 100% RDF produced 32586 kg ha ) with a mean yield of 32572 kg ha . On -1
an average, the mean yield decreased by 1.9% to 3.4% maximum oil of 236 kg ha (Table 2). Balanced application of water and fertilizer through drip due to reduction in fertilizer dose by 25% to 50% from
-1 100% RDF. The total herbage yield decreased only by irrigation increased the oil yield by 34 kg ha (16.7%). 1.4% to 1.7% by further reduction of 25% fertilizer Singh et al. (1989) and Ram et al. (2006) recorded from 75% RDF (F ). Adequate supply of nutrients significant increase in herbage and oil yields due to N 2
application in Japanese mint under optimum moisture increased herbage yield due to production of taller -1 conditions. Application of adequate amount of plants, more branches and leaves plant , superior
phosphorus helps in ramification of the root system, leaf- stem ratio and increased dry matter accumulation and crop growth rate. High yield of which increased the number of suckers in the plant. menthol mint with high rate of NPK has been reported More sucker production resulted in higher herbage
and oil yield.on soils with low N content by Kumar and Sood
64
-1 Nutrient uptakeThe highest quantity of oil (253 kg ha ) was Nitrogen recorded in higher irrigation regime (100% PE) due to
adequate availability of soil moisture to the crop. Ram The nitrogen uptake was more in 2006-07 et al. (1995 and 2006) reported increase in oil yield
than 2005-06 (Table 4). Drip irrigation increased the by 23.5 % and 15.5 % when irrigation to mint was -1nitrogen uptake (115.46 kg ha ) as compared to provided at IW/CPE ratio 1.5 and 1.l2 as compared to
-1surface irrigation (95.39 kg ha ) by 21.0%. 0.9 when significant degree of water stress was Application of irrigation water at high frequency created during each irrigation cycle. Oil yield increased the uptake. Maximum amount (119.67 kg decreased by 5.5% with irrigation at 80% PE and 15%
-1ha ) was taken up by plants through irrigation at at 60% PE due to inadequate moisture availability -1et al., 100% PE followed by 80% PE (119.43 kg ha ) and under reduced irrigation frequency (Shormin
-12009). 60% PE (107.29 kg ha ). There was no conspicuous
difference in uptake between 100% PE and 80% PE. The crop showed positive response to N, P The uptake increased by 11.5% (100% PE) due to the
and K application. N plays an important role on plant former as compared to 60% PE. Application of water growth and development. It promotes vegetative at 80% PE increased N uptake by 11.3% more than growth through cell enlargement, multiplication and that of 60% PE. High moisture regimes maintained increase in the rate of photosynthesis. Application of during summer months proved significantly better for 100% RDF (F ) produced maximum oil yield (246 kg 1 efficient utilization of water and nutrient by the crop
-1 -1 -1ha ) followed by F (236 kg ha ) and F (226 kg ha ). 2 3 (Ram et al., 1995).The total oil yield was reduced by 3.9 % with 75% of the recommended does of fertilizer (F ) and by 7.8% Maximum nitrogen was taken up by plants, 2
-1which received 100% RD (119.57 kg ha ). It with 50% RDF (F ). Anwar et al. (2010) reported 3
increased from 2.6% to 8.4% as compared to 75% and favourable effect of graded levels of NPK fertilizers 50% RDF. Reduction of 25% fertilizer from 100% (150 kg N, 60 kg P and 60 kg K) on oil yield of mint. RDF decreased the uptake by 2.6% and that of 50% Zheljazkov et al.(2010) studied the effect of three
-1 fertilizer by 7.7%. Application of 75% RDF (F ) levels of nitrogen ( 0, 80 and 160 kg ha ) on herbage 2
increased the nitrogen uptake by 5.6% more than 50% yield and oil yield of two cultivars ( Arvensis 2 and Arvensis 3 ) of Japanese corn mint at North RDF (F ). The interaction effect was not significant. 3
Mississippi Research Station and Extension Centre Ram et al. (2006) reported the higher N uptake under for two years during 2007 and 2008 . They found that different water and N treatments. Application of N at
-1 -1under different nitrogen levels oil content in fresh 200 kg ha in the sugarcane trash @ 7 t ha mulched herbage varied from 0.25 to 0.37 %. Nitrogen plots significantly enhanced the N uptake by the crop
-1 application increased oil yield from 46 kg ha in (Ram et al., 2006). Under water stress condition, the
-1 -1control to 136 kg ha in 80 kg N ha dose. With further N-uptake by mint plant was considerably low -1 addition of nitrogen dose to 160 kg ha , the oil yield (Shormin et al., 2009).
was not improved substantially. Hence the nitrogen -1 Phosphorus (P)dose of 80 kg ha was sufficient under Mississippi
Drip irrigation increased the phosphorus condition. In a two years fertilizer study of -1
uptake (29.14 kg ha ) by 48.75% more than the Japanese cornmint (M. arvensis), Zheljazkov and surface irrigation (Table 4). Decrease in irrigation Margina (1996) reported oil yields of Mentolna-18'
–1 water decreased the uptake and highest uptake was of M. arvensis between 67 (N at 0 kg ha ) and 111 kg
-1–1 –1 recorded with 100% PE (32.04 kg ha ) followed by I 2ha (N at 151 kg ha ) . The interaction effect of
-1 -1(30.93 kg ha ) and I (24.45 kg ha ). Phosphorus 3irrigation and fertilizer was found significant in case uptake decreased from 3.5% to 23.7% in case of I and of total oil yield. Application of irrigation at 100% 2
I as compared to I . Application of irrigation at 80% PE(I ) with 100% RDF(F ) produced 259.51 kg oil 3 11 1-1-1 PE had higher uptake (30.93 kg ha ) than that of 60% ha because of optimum supply of moisture and
-1PE (24.45 kg ha ).nutrients ( Table 3).
65
Application of 100 % RDF (F ) increased the N content was observed with irrigation at 60% PE in 1
both the years. With increase in irrigation frequency phosphorus uptake from 13.7% to 25.2% more than up to 100% PE, the reduction in soil N content was 75% and 50% RDF. Reduction of 25% and 50% 2.5% and 1.5% in 2006 and 2007, respectively over fertilizer from recommended dose decreased the 60% PE. The application of 100% NPK fertilizer in uptake by 12.1% and 20.2%, respectively. the soil had higher N content than 75% and 50% NPK. Application of 75% RDF helped the plants to take up On an average, of two years about 1.5% and 1% less N 10.1% more P than that of 50% RDF. The interaction content was estimated in 50% and 75% NPK, effect was not significant respectively over 100% NPK treatment. The interaction was not significant.Potassium (K)
Phosphorus contentDrip irrigation had the highest uptake of -1
132.70 kg ha , which was 16.3% higher than the The effect of irrigation regimes on soil P surface irrigation (Table 4). Reduction in irrigation
content was significant only in 2006-07 (Table 5). The level by 40% PE decreased the potassium uptake by application of 100% PE and 80% PE irrigation had
10.8% as compared to that of 100% PE. I remained at 2statistically similar effect on P content. The maximum
par with I . Application of irrigation at 80% PE 1 P content was observed with 60% PE irrigation and increased the potassium uptake by 11.9% more than the magnitude of depletion was 5.1% over 100% PE. that of 60% PE. Different amount of fertilizers significantly
influenced P content in soil during both the years. The An increase in fertilizer dose increased the
maximum P content in soil was estimated with 100% uptake of potassium. Application of 100% RDF
NPK fertilizer rate. On an average, the reduction in increased the uptake by 2.4% to 9.3% and had
soil P content was 5.2% and 9.5% due to 75% and -1maximum value of 137.67 kg ha as compared to F 2 50% NPK application over 100% NPK.and F .By reducing the RDF by 25% decreased the 3
Potassium contentuptake by 2.3% and that of 50% RDF by 8.5% in comparison with 100% RDF. The uptake was 6.8%
The significant effect of drip fertigation on more in case of F than F . The interaction effect was 2 3
soil K content in soil was found only in second year not significant. (Table 5). Irrigation and fertilizer levels significantly affected the K content in soil during both the years. Nutrient status in post harvested soilThe maximum K content was recorded with irrigation Nitrogen contentat 60% PE followed by 80% and 100% PE. It
Irrigation methods significantly influenced indicated that under moisture conditions, K was not the nitrogen content in soil in both the years (Table 5). utilized efficiently by mint plants. Among various
fertilizer rates, 100% NPK observed the highest Irrigation levels significantly influenced the N amount of K content in soil than other treatments.content in soil at both the harvests. The maximum soil
66
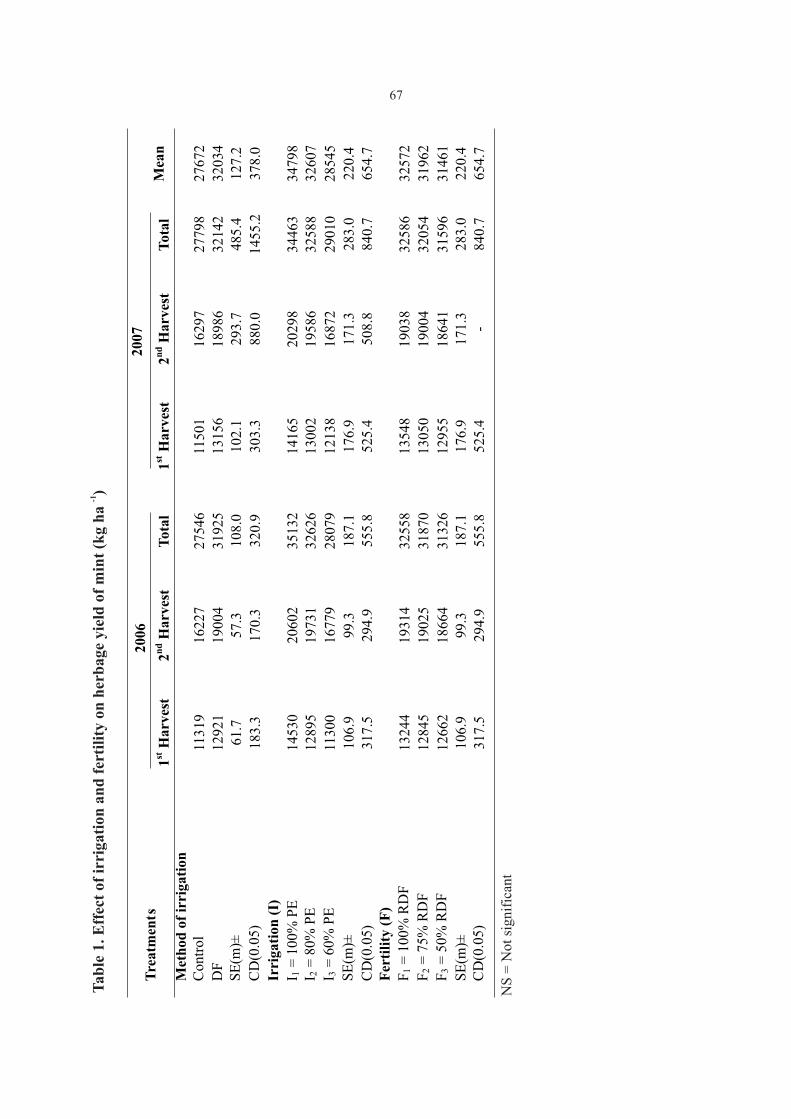
-1T
ab
le 1
. Eff
ect
of
irri
gati
on a
nd
fer
tili
ty o
n h
erb
age
yie
ld o
f m
int
(kg
ha
)
Tre
atm
ents
20
0620
07
M
ean
1stH
arve
st2n
dH
arve
stT
otal
1stH
arve
st2n
dH
arve
stT
otal
Met
hod
of
irri
gati
on
Con
trol
11
319
16
227
27
546
11
501
16
297
2779
8
2767
2D
F
1292
1
1900
4
3192
5
1315
6
1898
6 32
142
32
034
SE
(m)±
61.7
57
.3
108.
0
102.
1
293.
7 48
5.4
12
7.2
CD
(0.0
5)
183.
3
170.
3
320.
9
303.
3
880.
0 14
55.2
37
8.0
Irri
gati
on (
I)
I 1 =
100
% P
E
1453
0
2060
2
3513
2
1416
5
2029
8 34
463
34
798
I 2 =
80%
PE
12
895
19
731
32
626
13
002
19
586
3258
8
3260
7I 3
= 6
0% P
E
1130
0
1677
9
2807
9
1213
8
1687
2 29
010
28
545
SE
(m)±
10
6.9
99
.3
18
7.1
17
6.9
17
1.3
283.
0
22
0.4
CD
(0.0
5)
317.
5
294.
9
555.
8
525.
4
508.
8
840.
7
654.
7F
erti
lity
(F
)
F
1
= 1
00%
RD
F
1324
4
1931
4
3255
8
1354
8
1903
8
3258
6
3257
2F
2
= 7
5% R
DF
1284
5
1902
5
3187
0
1305
0
1900
4
3205
4
3196
2F
3
= 5
0% R
DF
1266
2
1866
4
3132
6
1295
5
1864
1
3159
6
3146
1S
E(m
)±10
6.9
99.3
187.
117
6.9
171.
328
3.0
220.
4C
D(0
.05)
317.
529
4.9
555.
852
5.4
-84
0.7
654.
7
NS
= N
ot s
ign
ific
ant
67
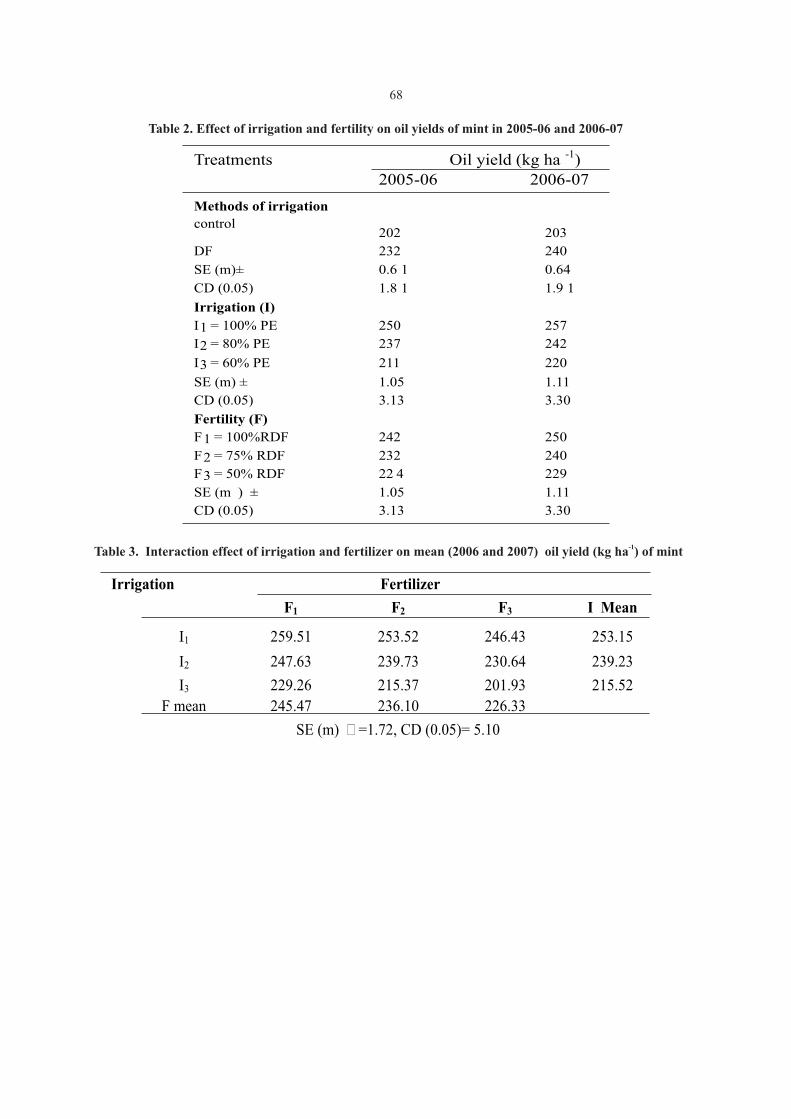
Table 2. Effect of irrigation and fertility on oil yields of mint in 2005-06 and 2006-07
Treatments Oil yield (kg ha -1)2005-06 2006-07
Methods of irrigation
control
202 203
DF 232 240
SE (m)± 0.6 1 0.64
CD (0.05) 1.8 1 1.9 1
Irrigation (I)
I1 = 100% PE 250 257
I2 = 80% PE 237 242
I3 = 60% PE 211 220
SE (m) ± 1.05 1.11
CD (0.05) 3.13 3.30
Fertility (F)
F1 = 100%RDF 242 250
F2 = 75% RDF 232 240
F3 = 50% RDF 22 4 229
SE (m ) ± 1.05 1.11
CD (0.05) 3.13 3.30
-1Table 3. Interaction effect of irrigation and fertilizer on mean (2006 and 2007) oil yield (kg ha ) of mint
Irrigation Fertilizer
F1 F2 F3 I Mean
I1 259.51 253.52 246.43 253.15
I2 247.63 239.73 230.64 239.23
I3 229.26 215.37 201.93 215.52
F mean 245.47 236.10 226.33
SE (m) ? =1.72, CD (0.05)= 5.10
68
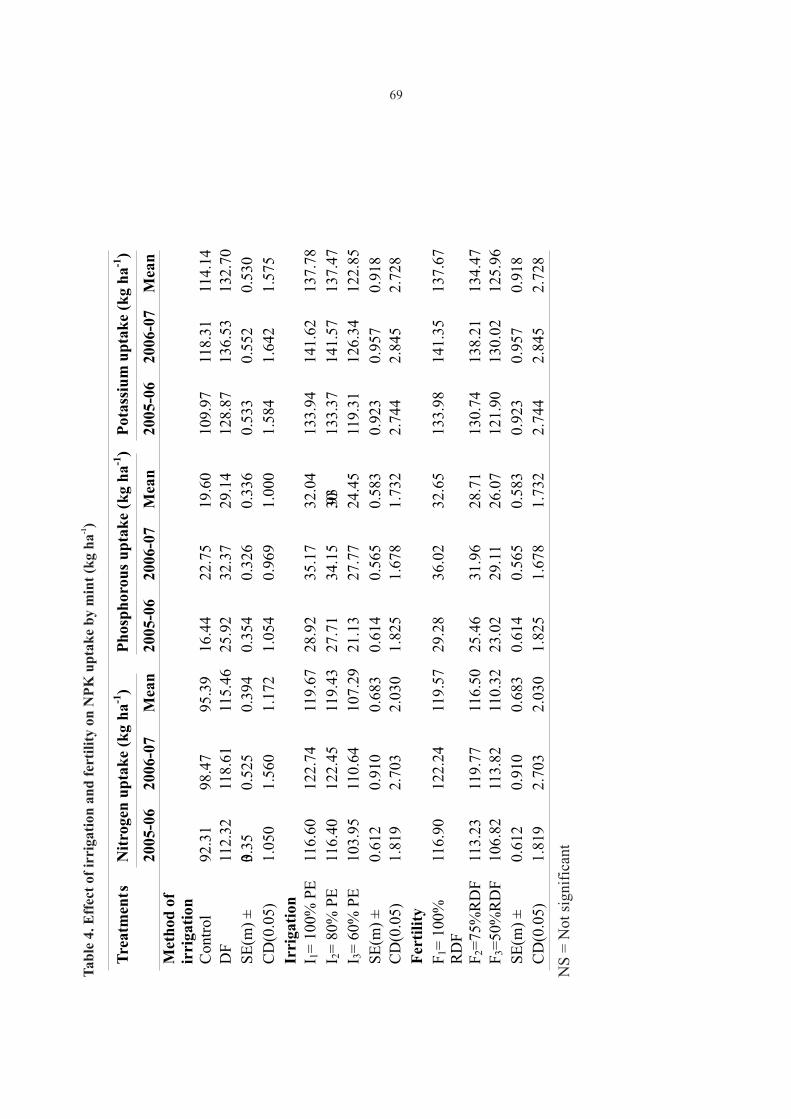
-1T
ab
le 4
. Eff
ect
of i
rrig
atio
n a
nd
fer
tili
ty o
n N
PK
up
tak
e b
y m
int
(kg
ha
)
Tre
atm
ents
N
itro
gen
up
tak
e (k
g h
a-1
) P
hosp
horo
us
up
tak
e (k
g h
a-1)
Pota
ssiu
m u
pta
ke
(kg h
a-1)
2005
-06
2006
-07
Mea
n
2005-0
6
2006-0
7
Mea
n
2005-0
6
2006-0
7
Mea
n
Met
hod
of
irri
gati
on
Contr
ol
92.3
1
98.4
7
95.3
9
16.4
4
22.7
5
19.6
0
109.9
7
118.3
1
114.1
4
DF
11
2.3
2
118.6
1
115.4
6
25.9
2
32.3
7
29.1
4
128.8
7
136.5
3
132.7
0
SE
(m)
±
0.3
53
0.5
25
0.3
94
0.3
54
0.3
26
0.3
36
0.5
33
0.5
52
0.5
30
CD
(0.0
5)
1.0
50
1.5
60
1.1
72
1.0
54
0.9
69
1.0
00
1.5
84
1.6
42
1.5
75
Irri
gati
on
I 1=
100%
PE
11
6.6
0
122.7
4
119.6
7
28.9
2
35.1
7
32.0
4
133.9
4
141.6
2
137.7
8
I 2=
80%
PE
11
6.4
0
122.4
5
119.4
3
27.7
1
34.1
5
30
.93
133.3
7
141.5
7
137.4
7
I 3=
60%
PE
103.9
5
110.6
4
107.2
9
21.1
3
27.7
7
24.4
5
119.3
1
126.3
4
122.8
5
SE
(m)
±
0.6
12
0.9
10
0.6
83
0.6
14
0.5
65
0.5
83
0.9
23
0.9
57
0.9
18
CD
(0.0
5)
1.8
19
2.7
03
2.0
30
1.8
25
1.6
78
1.7
32
2.7
44
2.8
45
2.7
28
Fer
tili
ty
F1=
100%
R
DF
11
6.9
0
122.2
4
119.5
7
29.2
8
36.0
2
32.6
5
133.9
8
141.3
5
137.6
7
F2=
75%
RD
F
113.2
3
119.7
7
116.5
0
25.4
6
31.9
6
28.7
1
130.7
4
138.2
1
134.4
7
F3=
50%
RD
F
106.8
2
113.8
2
110.3
2
23.0
2
29.1
1
26.0
7
121.9
0
130.0
2
125.9
6
SE
(m)
±
0.6
12
0.9
10
0.6
83
0.6
14
0.5
65
0.5
83
0.9
23
0.9
57
0.9
18
CD
(0.0
5)
1.8
19
2.7
03
2.0
30
1.8
25
1.6
78
1.7
32
2.7
44
2.8
45
2.7
28
NS
= N
ot s
igni
fica
nt
69
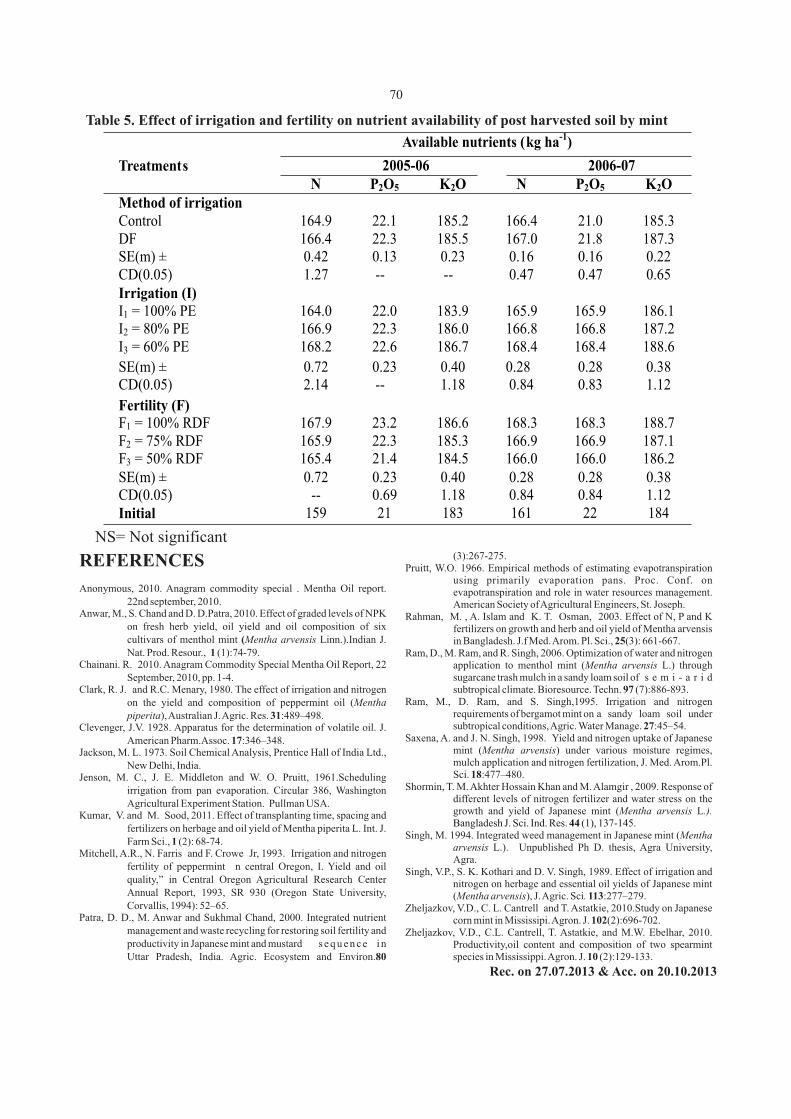
Table 5. Effect of irrigation and fertility on nutrient availability of post harvested soil by mint
Treatments
2005-06 2006-07
Available nutrients (kg ha-1)
N
P2O5
K2O
N
P2O5
K2OMethod of irrigation
Control
164.9 22.1 185.2
166.4
21.0
185.3DF
166.4 22.3 185.5
167.0
21.8
187.3SE(m) ±
0.42
0.13 0.23 0.16 0.16
0.22CD(0.05)
1.27
-- -- 0.47 0.47
0.65Irrigation (I)
I1
= 100% PE
164.0 22.0 183.9
165.9
165.9
186.1I2
= 80% PE
166.9 22.3 186.0
166.8
166.8
187.2I3
= 60% PE
168.2 22.6 186.7
168.4
168.4
188.6
SE(m) ±
0.72
0.23 0.40 0.28
0.28
0.38
CD(0.05)
2.14
-- 1.18 0.84 0.83 1.12
Fertility (F)
F1
= 100% RDF
167.9 23.2 186.6
168.3
168.3
188.7
F2
= 75% RDF
165.9 22.3 185.3
166.9
166.9
187.1
F3
= 50% RDF
165.4 21.4 184.5
166.0
166.0
186.2
SE(m) ±
0.72
0.23 0.40 0.28 0.28 0.38
CD(0.05)
--
0.69 1.18 0.84 0.84 1.12
Initial 159 21 183 161 22 184
NS= Not significant(3):267-275.REFERENCES Pruitt, W.O. 1966. Empirical methods of estimating evapotranspiration using primarily evaporation pans. Proc. Conf. on
Anonymous, 2010. Anagram commodity special . Mentha Oil report. evapotranspiration and role in water resources management. 22nd september, 2010. American Society of Agricultural Engineers, St. Joseph.
Anwar, M., S. Chand and D. D.Patra, 2010. Effect of graded levels of NPK Rahman, M. , A. Islam and K. T. Osman, 2003. Effect of N, P and K on fresh herb yield, oil yield and oil composition of six fertilizers on growth and herb and oil yield of Mentha arvensis cultivars of menthol mint (Mentha arvensis Linn.).Indian J. in Bangladesh. J.f Med. Arom. Pl. Sci., 25(3): 661-667.Nat. Prod. Resour., 1 (1):74-79. Ram, D., M. Ram, and R. Singh, 2006. Optimization of water and nitrogen
Chainani. R. 2010. Anagram Commodity Special Mentha Oil Report, 22 application to menthol mint (Mentha arvensis L.) through September, 2010, pp. 1-4. sugarcane trash mulch in a sandy loam soil of s e m i - a r i d
subtropical climate. Bioresource. Techn. 97 (7):886-893.Clark, R. J. and R.C. Menary, 1980. The effect of irrigation and nitrogen Ram, M., D. Ram, and S. Singh,1995. Irrigation and nitrogen on the yield and composition of peppermint oil (Mentha
requirements of bergamot mint on a sandy loam soil under piperita), Australian J. Agric. Res. 31:489–498. subtropical conditions, Agric. Water Manage. 27:45–54. Clevenger, J.V. 1928. Apparatus for the determination of volatile oil. J.
Saxena, A. and J. N. Singh, 1998. Yield and nitrogen uptake of Japanese American Pharm.Assoc. 17:346–348.mint (Mentha arvensis) under various moisture regimes, Jackson, M. L. 1973. Soil Chemical Analysis, Prentice Hall of India Ltd., mulch application and nitrogen fertilization, J. Med. Arom.Pl. New Delhi, India. Sci. 18:477–480.Jenson, M. C., J. E. Middleton and W. O. Pruitt, 1961.Scheduling
Shormin, T. M. Akhter Hossain Khan and M. Alamgir , 2009. Response of irrigation from pan evaporation. Circular 386, Washington different levels of nitrogen fertilizer and water stress on the Agricultural Experiment Station. Pullman USA. growth and yield of Japanese mint (Mentha arvensis L.). Kumar, V. and M. Sood, 2011. Effect of transplanting time, spacing and
fertilizers on herbage and oil yield of Mentha piperita L. Int. J. Singh, M. 1994. Integrated weed management in Japanese mint (Mentha
Farm Sci., 1 (2): 68-74.arvensis L.). Unpublished Ph D. thesis, Agra University,
Mitchell, A.R., N. Farris and F. Crowe Jr, 1993. Irrigation and nitrogen Agra.
fertility of peppermint n central Oregon, I. Yield and oil Singh, V.P., S. K. Kothari and D. V. Singh, 1989. Effect of irrigation and quality,” in Central Oregon Agricultural Research Center nitrogen on herbage and essential oil yields of Japanese mint Annual Report, 1993, SR 930 (Oregon State University, (Mentha arvensis), J. Agric. Sci. 113:277–279.Corvallis, 1994): 52–65. Zheljazkov, V.D., C. L. Cantrell and T. Astatkie, 2010.Study on Japanese
Patra, D. D., M. Anwar and Sukhmal Chand, 2000. Integrated nutrient corn mint in Mississipi. Agron. J. 102(2):696-702.management and waste recycling for restoring soil fertility and Zheljazkov, V.D., C.L. Cantrell, T. Astatkie, and M.W. Ebelhar, 2010. productivity in Japanese mint and mustard s e q u e n c e i n Productivity,oil content and composition of two spearmint Uttar Pradesh, India. Agric. Ecosystem and Environ.80 species in Mississippi. Agron. J. 10 (2):129-133.
Bangladesh J. Sci. Ind. Res. 44 (1), 137-145.
Rec. on 27.07.2013 & Acc. on 20.10.2013
70

ABSTRACT
Barkachha, a part of central Vindhyan plateau of Mirzapur district is rocky and undulating and thus the underground water resources are uncertain, unpredictable and inadequate to meet the requirement of agriculture. The present study was undertaken to evaluate the in-situ rain water retention capacity of the soil from Barkachha under rainfed farming system during the rainy season of 2012. Soil samples from six profile layers were collected in pre and post monsoon period, represented different cultivated and uncultivated lands of Barkachha. The soil moisture retention is ranged from 2.22-6.91 % in surface layers and 2.89-11.33 % in subsurface layers. Moisture
*retention in surface layer was negatively and significantly correlated (r = -0.95 ) with the bulk density of the soils in cultivated land. In sub-surface layer, the soil moisture retention was positively and significantly correlated with the
* *porosity and organic matter content (r = 0.47 and 0.45 , respectively) in cultivated land. The order of moisture retention after rainfall in both surface and subsurface soil were as fallow: mustard > guava > wheat > jatropha > fallow > pasture land.
(Key words: Rain water, soil moisture retention, Vindhyan plateau)
2008). Other reasons for low yields in the stressed INTRODUCTIONenvironments of rainfed areas (Kerr, 1996) is soil deficiency (Chen et al., 2010) in terms of infiltration Rainfall is the principal source of water, and water holding capacity (Abdel-Nasser, 2007); all which augment soil moisture, ground water and the rainfall does not infiltrate and /or not all that surface flow. Agriculture and several of the other infiltrates is beneficially utilized. economic activities in sub-tropical to dry areas
depend on rains. Rainfall in dry areas is of convective Barkachha (Fig. 1) in Mirzapur district is
nature and usually occurs at a very high intensity for situated about 8 km South-West of Mirzapur town on
shorter duration generating high runoff in response of Robertsganj highway. Physiographically and even little rainfall. Rainfall is partitioned in two climatologically, the area represents the entire categories of fresh water resource: a green water Vindhyan tract covering parts of Uttar Pradesh, which resource, i.e. the soil moisture generated from is mainly inhabited by tribes. The area being rocky infiltrated rainfall that is available for root water and undulating, the underground water resources are uptake by plants, and which constitutes the main uncertain, unpredictable and inadequate to meet the water resource in rainfed agriculture; and a blue water requirement of agriculture. Due to undulating resource, i.e. the stored runoff in dams, lakes and topography many small rivulets and channels aquifers, which is the main water source for irrigated intersecting the area, quickly wash away the bounties agriculture (Falkenmark, 1995). These green and blue of rainfall. Due to dry conditions setting after the water resources generate flows in the hydrological rains, the few wells and other water bodies that are cycle. Of the 1.5 billion ha (11 % of the world's land present in the area start drying after November. The surface of 13.4 billion ha) of crop land world wide, area comes under the grip of drought and scarcity of 1.223 billion ha (82 %) is rainfed (Anonymous, water after March every year. 2005). Farmers' yields in rainfed regions in the developing countries are low largely due to low The land of Barkachha farm, Rajiv Gandhi rainwater use efficiency. Lack of clear and sound South Campus (RGSC) was classified (ICAR, 1971) water policy in rainfed agriculture is among the in five soil series (Fig. 2). According to their survey
report of ICAR (1971) through NBSS & LUP, reasons for the low yield and water productivity in these areas (Rockstrom et al., 2007 and Wani et al., Regional Center, New Delhi, nearly 40 % land of this
1. Ph.D. Student, Deptt. of Soil Science and Agricultural Chemistry, Institute of Agricultural Sciences, Banaras Hindu University, Varanasi - 221005, Uttar Pradesh
2. UGC Project Fellow, Deptt. of Soil Science and Agricultural Chemistry, Institute of Agricultural Sciences, Banaras Hindu University, Varanasi - 221005, Uttar Pradesh
3. Professor, Deptt. of Soil Science and Agricultural Chemistry, Institute of Agricultural Sciences, Banaras Hindu *
University, Varanasi - 221005, Uttar Pradesh, India Email: [email protected]
J. Soils and Crops 25 (1) 71-80, June, 2015 ISSN 0971-2836
EVALUATION OF IN-SITU RAIN WATER RETAINING CAPACITY OF CULTIVATED LAND IN CENTRAL VINDHYAN PLATEAU OF
BARKACHHA, MIRZAPUR DISTRICT, UTTAR PRADESH1 2 3Vimal Kumar , Sandeep Kumar Tripathi and Priyankar Raha
farm is rocky, i.e. surface with bed-rock exposure (wheat, maize, rice etc.), pulse and oil seed crops (bengal gram, black gram, red gram, mustard etc.), (1 to 25 % slope). Approximately 60 % farm land is
low to moderate depth soil, mostly 1-5 % slope with vegetables (cauliflower, cabbage, tomato, bottle slight to moderate surface erosion. Rainfed farming gourd etc.), fruit crops (guava, ber, sapota etc.), system is developed at Barkachha through the biofuel crop (jatropha) are cultivated in Barkachha development of rain water harvesting project farm, Mirzapur. There is a vast land used for pasture (Tripathi and Raha, 2014), viz., check dam reservoirs land for grazing of livestock animal, other part of land (Tripathi et al., 2014) and river water lifting project. are low density forest and barren. The layer wise soil Thus, the objective of the present work was the samples were air-dried, ground and passed through 2 assessment of in-situ rain water retaining capacity of mm sieve for laboratory analysis. Their properties the cultivated/uncultivated soils at Barkachha for the viz., pH, electrical conductivity, organic matter, management of water of check dam reservoirs and calcium carbonate, particle distribution, bulk density, river water lifting project as a supplementary particle density, porosity and water holding capacity irrigation. were then determined following the standard
procedures (Jackson, 1973; Bouyoucos, 1962 and MATERIALS AND METHODS Walkley and Black, 1934).
Description of location Soil moisture determination
A field experiment was conducted during the The moisture recharging in cultivated (viz., rainy season of 2012 at the Barkachha farm (Fig. 1) wheat, mustard, guava and jatropha) and uncultivated popularly known as Rajiv Gandhi South Campus land (viz., pasture, and fallow) of Barkachha farm was
0(RGSC), Mirzapur, India, and lies between 25 00' to determined in post monsoon for the assessment of 0 0 025 15' Northern latitude, 82 05' to 83 11' Eastern rainwater retaining capacity of the soil. Soil samples
longitude and altitude 180.59 m above mean sea level. were collected during pre and post monsoon from 0-The Barkachha farm is situated in the central 15, 15-30, 30-45, 45-60, 60-75 and 75-100 cm depths Vindhyan plateau region. The topography of the farm with the help of core sampler. The sample was is undulating and surface is rough. The Barkachha transferred to a previously weighed aluminum box farm has an area of 1010 ha and is situated from 8 km and dried in a hot air oven at 105 °C for 24 hours till South-West of Mirzapur - Robertsganj highway. The the constant weight was assured. The weight of oven river Khjuri flow on the eastern border of the farm, dry soil was then determined. The loss of weight of many streamlets flow across the area resulting in the soil sample on drying accounts for the water excessive runoff during rainy season. The climate is present in it. The moisture content was estimated semi-arid and sub-tropical. Normal annual rainfall is
gravimetrically using the equation suggested by 1060 mm, 90% of it received during South-West Gardner (1965),monsoon (June to September). Rainfall is highly variable, erratic and unpredictable, at times causing drought spells of varying degree and duration. May is the hottest and January is the coldest month with a normal mean temperature value ranging from 13.5 to
Where, 34.0 °C. The atmospheric mean temperature begin to qm = Soil moisture content in peercentagerise towards the end of February and reach to
maximum during May. The mean relative humidity is 62%. q = Weight of dry soil, (g)2
å = indicates summation of moisture for Soil properties analysis
different soil layers.
Soil samples from 6 depths (0-15, 15-30, 30-The percentage moisture was then 45, 45-60, 60-75 and 75-100 cm) were collected from
converted to depth of soil moisture by using the Barkachha farm locations represented different cultivated and uncultivated lands. Different cereals equation.
q = Weight of moist soil, (g)1
1000 2
21 ´-
=å=
n
i
mq
qqq
72
density and particle density of sub-surface soil of -3cultivated soils ranged from 1.20 to 1.28 Mg m ,
respectively, while uncultivated soils ranged from -3 -3
1.21 to 1.22 Mg m and 2.43 to 2.46 Mg m , Where,
respectively. Perusal of the data revealed that the bulk d = Depth of soil moisture in cm
density of the surface soil of all the pedons, both qm = Soil moisture content in percentage
cultivated and uncultivated lands was comparatively -3bd = Bulk density mg m
lower than sub-surface layers. The bulk density is D = Depth of soil in cm.generally higher in lower profile layers. But due to å = indicates summation of moisture for undulating plateau geomorpholly in Barkachha farm,
different soil depths.the clays are deposited from the higher sloppy elevation to lower region. Therefore, bulk density was
Statistical analysis comparatively higher in surface soil than in the sub-surface soil. The average porosity of cultivated lands Data on mean, standard deviation (S.D.) and of the surface and sub-surface soils ranged from 39.31 coefficient of variation (C.V.) of the soil properties to 48.61 and 47.03 to 49.46 %, respectively, whereas and soil moisture at different depths of the farm land porosity of uncultivated lands of the surface and sub-were statistically analyzed (Gomez and Gomez, surface soils ranged 40.41 to 46.80 and 50.27 to 50.68 1984). The correlations of soil properties (physical %, respectively. The mean water holding capacity and chemical properties) with the rain water retaining (WHC) of the surface and sub-surface soils of capacity in soil were statistically calculated. cultivated lands ranged from 31.18 to 36.15 and 37.01 Evaluation of moisture recharging in different to 41.86 %, respectively, the WHC also found lower probability distribution (Sharma and Singh, 2010) value in surface layer than sub-surface layer. It was like Beta, Cauchy, Laplace, Weibull and Gamma has revealed from the data that the pH of the surface soils been calculated. were very strongly acid to slightly acid in nature except the pasture land (6.9). It was also observed that RESULTS AND DISCUSSIONthe soil reaction (pH) of the sub-surface layers of all profiles was gradually increased. Alkalinity in sub-Soil properties surface soil profile particularly in pasture land was due to the presence of carbonates of calcium. The The soil and climate sets the parameters for mean EC of all the studied soils at different depths agro-ecosystems. Thus, the soils at different depths of
-1ranged from 0.26 to 0.96 dSm . The surface soils are the cultivated and uncultivated lands in Barkachha more exposed to the atmosphere that enhances the farm were characterized thoroughly. The particle weathering of rocks and minerals, which releases distribution of the surface soils, both in cultivated soluble salts in soil solution. But, EC of the soils were (viz., wheat, mustard, guava and jatropha) and
-1uncultivated lands (viz., pasture and fallow land) of below 1 dSm , thus soil salinity problem was not Barkachha farm are presented in table 1. According to observed in Barkachha farm. The mean range of broad textural classes of soil, all the soils were loam calcium carbonate in different soils of Barkachha
farm was 4.0 to 11.2 %. Calcium carbonate content in and the subdivision was found as sandy loam, loam the wheat cultivated field was found comparatively and sandy clay loam. Bulk density, particle density as higher than other cultivated and uncultivated field. well as porosity of the cultivated and uncultivated Parent materials in these regions are also rich in lime. soils showed in table 2. There is a wide variation of the Thus, through the calcification process, calcium ions bulk and particle density of cultivated and
uncultivated soils at different soil depths (0-15, 15- are converted into insoluble calcium carbonate in soil. 30, 30-45, 45-60, 60-75 and 75-100 cm). The mean Organic carbon in surface and subsurface soils (Table
-1 bulk and particle density of the surface soil of 2) were very low ranged from 6.46 to 12.4 g kg-3
cultivated soils ranged from 1.27 to 1.46 Mg m and throughout the soil profile in all the soils under -32.40 to 2.45 Mg m , respectively, whereas these studied; consequently mean organic matter content
-1values in uncultivated soils ranged from 1.33 to 1.43 was very low i.e. below 10 g kg regardless of -3 -3
Mg m and 2.40 to 2.50 Mg m , respectively. Bulk cultivated and uncultivated lands. For the
Dbdm
d ´́=å100
q
73

enhancement of the productivity of land and moisture and the highest in month of August. The monthly average temperature was the highest in the month of retention, organic matter can be improved by May and the lowest in the month of January and the adopting conservation agriculture technology and variation of temperature was very wide. The annual addition of organic matter, such as animal and plant average sunshine and evaporation were 7.3 hour and wastes.
-14.4 mm day , respectively in the year 2012.Rainfall pattern and rainfall index
Rain water retention capacity of soilPerusal of data from table 3 revealed that,
th The soil moisture recharging in soil was period of onset of monsoon in this region was 4 week
st determined in cultivated (viz., wheat, mustard, guava of April which lasted upto 1 week of October. More and jatropha) and uncultivated (viz., pasture and than 90 % of the annual rainfall was received during fallow) lands by gravimetric method. Rain water monsoon period (i.e. June to September), but it was retention capacity by the soils of the respective lands erratic and unpredictable i.e. not uniform distribution. was assessed by subtracting the soil moisture content, Out of 365 days, only 40 days were rainy days in 2012 from post-monsoon period to pre-monsoon period. and total rainfall was 1380.6 mm. Maximum rainfall The data regarding the soil moisture content in wheat, occurred in the month of August, i.e. 38.16 % of the mustard, guava, jatropha, pasture and fallow lands are total annual rainfall. The intensity of rainfall
-1 presented in table 5. Comparative soil moisture (monthly average) was high (58.53 mm day ) in the conserved after the monsoon period in surface and month of August (Fig. 3) followed by the month of
-1 subsurface (0-100 cm) soil of different lands in September (30.5 mm day ). Most of the rainfall rainfed farm of Barkachha was estimated. events have a short duration but a high intensity in this Considering the mean soil moisture content in pre and period. There was a light shower during the month of post monsoon period of different cultivated and April and May and it helped summer ploughing of the uncultivated lands of Barkachha farm and the total field. The month of January, February, March, volume of moisture conserved in different layers of November and December in experimental year 2012 soil profiles, the order of moisture retention (Fig. 4) were practically rainless. Thus, precipitation received after rainfall was as follows: mustard > guava > wheat for approximately six months (except 1 day in April) > Jatropha > fallow > pasture land. The moisture and the peak was August to September. This trend of retention by the soils at different depths was monsoon rains coupled with existing toposequence of controlled by soil organic matter and the crop canopy the central Vindhyan plateau of Mirzapur, Barkachha of the cultivated plants. The organic matter was leads to imbalance between rain received and
-1comparatively very low (10.0 g kg ) in pasture land. vegetation water demand. In order to classify the The soil moisture retention at surface layer (Table 5) annual rainfall amounts, the rainfall index was observed the highest in mustard field (6.91 %) (Schiettecatte et al., 2005) can be used. In this way, and the lowest in the field of jatropha (2.23 %). The the year 2012 was classified (Table 4) as wet year. conserved soil moisture at sub-surface layer (upto 60 But, considering the annual average rainfall (i.e. 1060 cm) was comparatively higher in guava planted field. mm), Barkachha in Mirzapur district should fall Thus, rhizosphere influenced the moisture retention under the medium rainfall area (semi-arid). in cropped land. The sub-surface soil moisture According to rainfall criteria (Kerr, 1996), the rainfed retention was noticed highest in rhizosphere zone of areas are subdivided into three categories; a low mustard (11.34 %) in the depth of 30-45 cm. The sub-rainfall area (> 750 mm per annum), medium rainfall surface soil moisture retention from 30-100 cm depth area (750-1125 mm) and high rainfall area (> 1125 was very low in pasture land due to limited root mm), sometimes described as the arid, semi-arid and growth of grasses (uptp 30 cm). The moisture humid areas. Considering the monthly average (Table retention at sub-surface layers (30-100 cm) was 3) data on temperature, humidity, sunshine and observed to be the lowest in pasture land. In fallow evaporation of Mirzapur, the climate in the region of
-1Barkachha is warm and semi-arid. The average land, due to higher organic matter (10.4 g kg ), relative humidity varied from 20.2 to 84.2 % and the conserved moisture was found higher than pasture lowest humidity was showed in the month of April and jatropha plantation lands.
74
75
Correlation of the rain water retention with probability distribution on the basis of highest rank different soil properties with minimum value of test statistic. The highest
Correlation of the soil properties with rain value (0.2507) was obtained in mustard cultivated water retention capacity by the soil in different lands at Barkachha with Laplace distribution. The profiles of Barkachha farm was studied. The soil lowest value (0.1629) was attained with Cauchy moisture retention in surface layer was negatively and distribution in wheat-cultivated land at Barkachha. In significantly correlated with the bulk density of the guava and jatropha best fitted probability soils in cultivated land and particle density of the soils distributions are respectively Weibull and beta. On
*in uncultivated land with the value (r = -0.95 ) in the the basis of minimum value of test statistics Gamma different layers of the soil profile. In sub-surface (0.2110) and Cauchy (0.1643) distribution were layer, the soil moisture retention was positively and found best on pasture and fallow respectively.significantly correlated with the porosity and organic
* *matter content (r = 0.47 and 0.45 ), respectively in The moisture retention capacity in the surface cultivated land and calcium carbonate and organic soils of farm land varied from 2.22-6.91 %, whereas
* *matter (r = 0.75 and 0.71 ), respectively in in subsurface soils, it varied from 2.89-11.33 %. The uncultivated land in the different layers of the profile. variation of moisture retention was depended on crop The diurnal and seasonal variations of soil coverage in the respective land. The order of temperature were also quite high in the Vindhyan rainwater retention in different soil profiles was as plateau of Barkachha farm. Thus, for the follow: mustard > guava > wheat > jatropha > fallow improvement of soil bulk density, organic matter > pasture land. The moisture retention by soils at content in soil and consequently the significant different depths was controlled by soil organic matter. amount of rain water retention by soil, crop
The diurnal and seasonal variations of soil cultivation under agroforestry system will be most
temperature are quite high in the Vidhyan plateau of suitable in Barkachha farm. The agroforestry system
Barkachha farm, which also governed the moisture of crop cultivation would improve the micro-climate
retention in soil. Thus, for the enhancement of soil by reducing soil temperature and enhancing soil
moisture retention in surface and subsurface soil organic matter. The rain water will be retained more
profile in farm land and consequently the amount in this condition.
improvement of the productivity of land, organic
matter in soil could be improved. In this situation and The distributions for each data set were considering the agroclimatic condition, agroforestry computed for different probability distribution system of crop cultivation will be most suitable (Sharma and Singh, 2010). First rank probability cultivation practices in rainfed farm of Barkachha distributions of moisture recharging (%) capacity of farm, rather than typical food grain (rice, wheat, cultivated and uncultivated soils are presented in table pulse, oil seeds etc.) production techniques in plain 6. Statistical goodness of fit, Kolmogorov–Smirnov
test was carried out in order to select the best fit land.
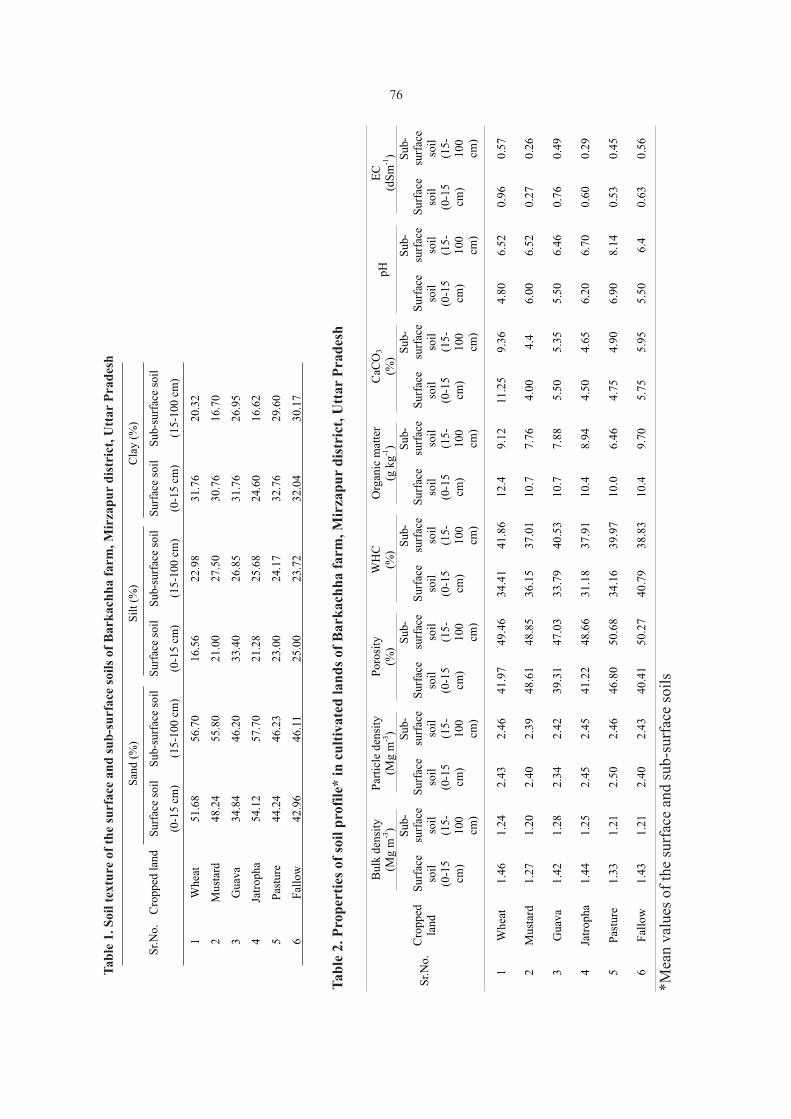
Ta
ble
2. P
rop
erti
es o
f so
il p
rofi
le*
in c
ult
iva
ted
la
nd
s of
Bar
kac
hh
a fa
rm, M
irza
pu
r d
istr
ict,
Utt
ar
Pra
des
h
Sr.
No.
C
ropp
ed
land
Bul
k de
nsit
y (M
g m
-3)
Par
ticl
e de
nsit
y
(Mg
m-3
)P
oros
ity
(%
)W
HC
(%
)O
rgan
ic m
atte
r
(g k
g-1
)C
aCO
3
(%)
pH EC
(d
Sm
-1)
Sur
face
so
il
(0-1
5 cm
)
Sub
-su
rfac
e so
il
(15
-10
0 cm
) S
urfa
ce
soil
(0
-15
cm)
Sub
-su
rfac
e so
il
(15
-10
0 cm
)
Sur
face
so
il
(0-1
5 cm
)
Sub
-su
rfac
e so
il
(15
-10
0 cm
)
Sur
face
so
il
(0-1
5 cm
)
Sub
-su
rfac
e so
il
(15
-10
0 cm
)
Sur
face
so
il
(0-1
5 cm
)
Sub
-su
rfac
e so
il
(15
-10
0 cm
)
Sur
face
so
il
(0-1
5 cm
)
Sub
-su
rfac
e so
il
(15
-10
0 cm
)
Sur
face
so
il
(0-1
5 cm
)
Sub
-su
rfac
e so
il
(15
-10
0 cm
)
Sur
face
so
il(0
-15
cm)
Sub
-su
rfac
e so
il(1
5-
100
cm)
1
W
heat
1.
46
1.
24
2.
43
2.46
41
.97
49
.46
34
.41
41
.86
12
.4
9.
12
11
.25
9.
36
4.
80
6.
52
0.
960.
57
2
Mus
tard
1.27
1.20
2.40
2.39
48.6
1
48.8
5
36.1
5
37.0
1
10.7
7.76
4.00
4.4
6.00
6.52
0.27
0.26
3
Gua
va
1.42
1.28
2.34
2.42
39.3
1
47.0
3
33.7
9
40.5
3
10.7
7.88
5.50
5.35
5.50
6.46
0.76
0.49
4
Jatr
opha
1.44
1.25
2.45
2.45
41.2
2
48.6
6
31.1
8
37.9
1
10.4
8.94
4.50
4.65
6.20
6.70
0.60
0.29
5
Pas
ture
1.33
1.21
2.50
2.46
46.8
0
50.6
8
34.1
6
39.9
7
10.0
6.46
4.75
4.90
6.90
8.14
0.53
0.45
6F
allo
w1.
431.
212.
402.
4340
.41
50.2
740
.79
38.8
310
.49.
705.
755.
955.
506.
40.
630.
56
*Mea
n v
alu
es o
f th
e su
rfac
e an
d su
b-su
rfac
e so
ils
Tab
le 1
. Soi
l te
xtu
re o
f th
e su
rfac
e an
d s
ub
-su
rfac
e so
ils
of B
ark
ach
ha
farm
, Mir
zap
ur
dis
tric
t, U
ttar
Pra
des
h
Sr.
No
. C
rop
ped
lan
d
San
d (
%)
S
ilt
(%)
C
lay (
%)
Su
rfac
e so
il
(0-1
5 c
m)
Su
b-su
rfac
e so
il
(15
-10
0 c
m)
Su
rfac
e so
il
(0-1
5 c
m)
Su
b-su
rfac
e so
il
(15
-10
0 c
m)
Surf
ace
soil
(0
-15
cm
)
Sub-
surf
ace
soil
(15
-10
0 c
m)
1
Wh
eat
5
1.6
8
56
.70
1
6.5
6
22
.98
31
.76
20
.32
2
Must
ard
4
8.2
4
55
.80
2
1.0
0
27
.50
30
.76
16
.70
3
G
uav
a
3
4.8
4
4
6.2
0
3
3.4
0
2
6.8
5
31
.76
26
.95
4
Jatr
op
ha
54
.12
57
.70
21
.28
25
.68
24
.60
16
.62
5
Pas
ture
44
.24
46
.23
23
.00
24
.17
32
.76
29
.60
6F
allo
w4
2.9
64
6.1
12
5.0
02
3.7
232
.04
30
.17
76
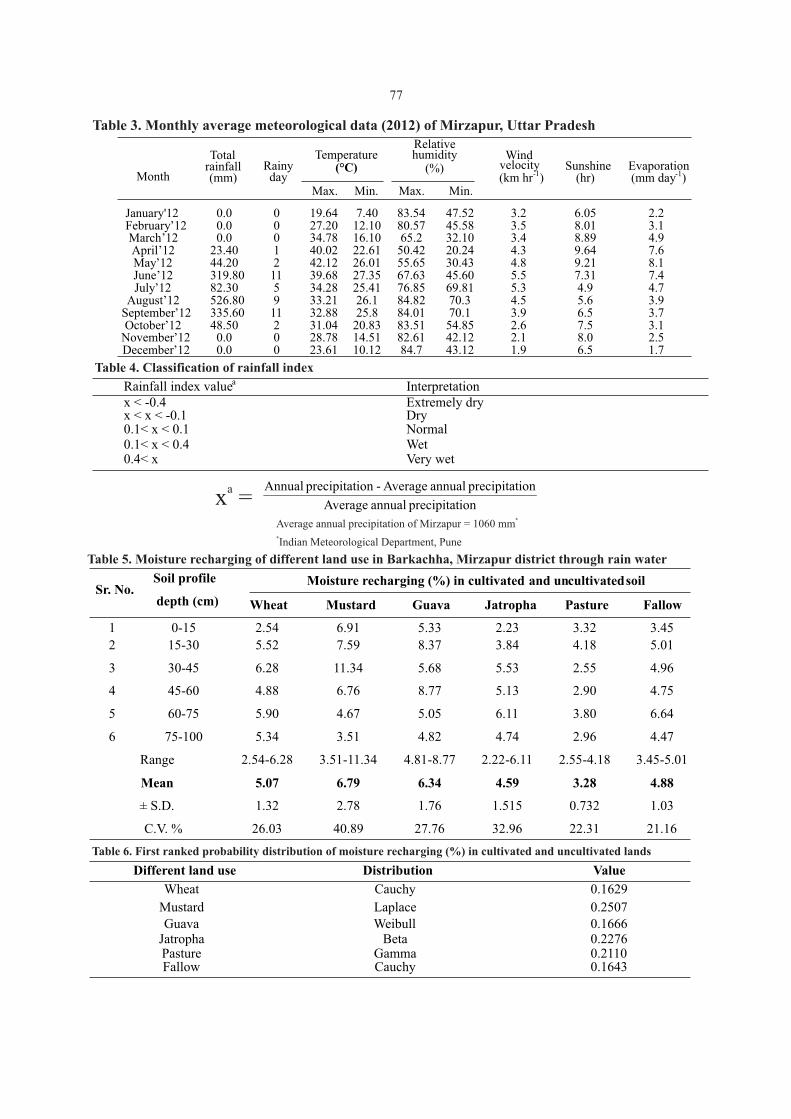
Table 3. Monthly average meteorological data (2012) of Mirzapur, Uttar Pradesh
Month
Total rainfall (mm)
Rainy day
Temperature(°C)
Relative humidity
(%)
Wind velocity(km hr-1)
Sunshine(hr)
Evaporation
(mm day-1)
Max. Min. Max. Min.
January'12 0.0 0 19.64 7.40 83.54 47.52 3.2 6.05 2.2 February’12 0.0 0 27.20 12.10 80.57 45.58 3.5 8.01 3.1 March’12 0.0 0 34.78 16.10 65.2 32.10 3.4 8.89 4.9 April’12 23.40 1 40.02 22.61 50.42 20.24 4.3 9.64 7.6 May’12 44.20 2 42.12 26.01 55.65 30.43 4.8 9.21 8.1 June’12 319.80 11 39.68 27.35 67.63 45.60 5.5 7.31 7.4 July’12 82.30 5 34.28 25.41 76.85 69.81 5.3 4.9 4.7
August’12 526.80 9 33.21 26.1 84.82 70.3 4.5 5.6 3.9 September’12 335.60 11 32.88 25.8 84.01 70.1 3.9 6.5 3.7 October’12 48.50 2 31.04 20.83 83.51 54.85 2.6 7.5 3.1 November’12
0.0
0
28.78
14.51
82.61
42.12
2.1
8.0
2.5 December’12
0.0
0
23.61
10.12
84.7
43.12
1.9 6.5 1.7
Table 4. Classification of rainfall index
Rainfall index valuea Interpretation x < -0.4 Extremely dry x < x < -0.1 Dry 0.1< x < 0.1 Normal 0.1< x < 0.4 Wet 0.4< x Very wet
ionprecipitat annual Average
ionprecipitat annual Average -ion precipitat Annualax = *
Average annual precipitation of Mirzapur = 1060 mm*Indian Meteorological Department, Pune
Table 5. Moisture recharging of different land use in Barkachha, Mirzapur district through rain water
Sr. No. Soil profile
depth (cm)
Moisture recharging (%) in cultivated and uncultivated soil
Wheat Mustard Guava Jatropha Pasture Fallow
1 0-15 2.54 6.91 5.33 2.23 3.32 3.45
2 15-30 5.52 7.59 8.37 3.84 4.18 5.01
3 30-45 6.28 11.34 5.68 5.53 2.55 4.96
4 45-60 4.88 6.76 8.77 5.13 2.90 4.75
5 60-75 5.90 4.67 5.05 6.11 3.80 6.64
6 75-100 5.34 3.51 4.82 4.74 2.96 4.47
Range 2.54-6.28 3.51-11.34 4.81-8.77 2.22-6.11 2.55-4.18 3.45-5.01
Mean 5.07 6.79 6.34 4.59 3.28 4.88
± S.D. 1.32 2.78 1.76 1.515 0.732 1.03
C.V. % 26.03 40.89 27.76 32.96 22.31 21.16
Table 6. First ranked probability distribution of moisture recharging (%) in cultivated and uncultivated lands
Different land use Distribution Value
Wheat Cauchy 0.1629
Mustard Laplace 0.2507 Guava Weibull 0.1666
Jatropha Beta 0.2276 Pasture Gamma 0.2110 Fallow Cauchy 0.1643
77

Fig. 1. Location map of study area
78

Fig. 2. Major soil series identified in Barkachha farm, Mirzapur (Soil Survey Report No. 423, ICAR, March, 1971)
Fig. 3. Monthly average rainfall intensity (2012) in Barkachha, Mirzapur district
79

Fig. 4. Moisture content in surface and sub-surface profiles of different land use
D.C., U.S.A., pp. 7.REFERENCES Rockström, J., S. Wani, T. Oweis and N. Hatibu, 2007. Managing water in
rainfed agriculture. In: Water for Food, Water for Life: a
Comprehensive Assessment of Water Management in Abdel-Nasser, G. 2007. Impact of natural cauliflowers on water Agriculture. Sponsored by Ramsar, CGIAR, FAO and CBD. retention, infiltration and evaporation characteristics of sandy Earthscan, London, UK, pp. 315-348.soil. J. Applied Sci. 7(13): 1699-1708.
Anonymous, 1971. Soil Survey Report No. 423, N.B.S.S. & L.U.P., Schiettecatte, W., M. Ouessar, O. Gabriels, S. Tanghe, S. Heirman and F.
Abdelli, 2005. Impact of water harvesting techniques on soil Regional Centre, Delhi, Indian Council of Agricultural Research, New Delhi, March, 1971. and water conservation: a case study on a micro-catchment in
Anonymous, 2005. Food and Agricultural Organization (FAO), Rome, South-Eastern Tunisia. J. Arid Environ. 61: 297-313.http://faostat.fao.org Sharma, M.A. and J.B. Singh, 2010. Use of Probability Distribution in
Bouyoucos, G.J. 1962. Hydrometer method improved for making Rainfall Analysis, New York Sci. J. 3(9): 40-49.particles size analysis of soil. Agron. J. 54: 469. Tripathi, S.K. and P. Raha, 2014. Rainwater Harvesting: Challenges and
Chen, H., W. Zhang, K. Wang and W. Fu, 2010. Soil moisture dynamics Opportunity. Environ. and Ecol. 32 (2A): 609-612.under different land uses on karst hillslope in northwest Tripathi, S.K., P. Raha and R. Tripathi, 2014. Assessment of Rainwater Guangxi, China. Environ. Earth Sci. 61:1105–1111. Harvesting Capacity of Check Dam Reservoirs in Barkachha,
Falkenmark, M. 1995. Land-water Linkages: a synopsis. In: Land and a part of Central Vindhyan Plateau of Mirzapur District, Uttar Water Integration and River Basin Management. FAO Land
Pradesh, India. International J. Agric., Environ. and Biotech. 7 and water Bulletin No. 1. Food and Agriculture Organization
(1): 121-128.of the United Nations (FAO), Rome, Italy, pp. 15-16. Walkey, A.J. and C.A. Black, 1934. Estimation of soil organic carbon by
Gardener, W.H. 1965. Water content, in methods of soil analysis. the chromic acid titration method. Soil Sci. 37: 29-38.
American Soc. of Agron. 9: 128-129.Wani, S.P., P.K. Joshi, Y.S. Ramakrishna, T. K. Sreedevi, P. Singh, and P.
Gomez, K. and Gomez, A., 1984. Statistical procedures or agricultural Pathak, 2008. A new paradigm in watershed management: a research. New York: John Wiley and Sons, Inc.must for development of rainfed areas for inclusive growth. In: Jackson, M.L. 1973. Soil chemical analysis, Prentice Hall of India Pvt. Swarup, A., S. Bhan, and J.S. Bali, (eds.). Conservation Ltd., New Delhi.Farming: Enhancing Productivity and Profitability of Rain-Kerr, J.M., 1996. Sustainable development of rainfed agriculture in India. fed Areas. Soil Conservation Society of India, New Delhi, Environment and Production Technology Division, India, pp. 163-178.International Food Policy Research Institute, Washington,
Rec. on 07.04.2014 & Acc. on 30.07.2014
80

ABSTRACT
The experiment was conducted at Main Castor – Mustard Research Station, S.D. Agricultural University, Sardarkrushinagar-385 506 Gujarat (India) during rabi 2011-12 and rabi 2012-13 to identify the best parents and hybrids for gca and sca effects in Indian mustard by using diallel analysis without reciprocals involving ten parents. The study revealed the importance of non-additive gene effects reflected by high value of sca variance than gca variance for all the characters. Parents GM1 and Pusa Bold were good general combiners for seed yield and its related attributes. Three cross combinations namely, GM1 X BIO902, GM3 x GDM4 and Pusa bold X Kranti were observed to be promising as these possessed significant and positive sca effects for seed yield and its related component quantitative traits.
(Keywords: Combining ability, GCA, SCA, seed yield, component characters, Indian mustard)
Panse and Sukhatme (1978) to test the differences INTRODUCTIONbetween genotypes for all the characters under study. The Analysis of variance for combining ability for Indian mustard [Brassica juncea (L.) Czern partitioning the total genetic variance into general & Coss] is the second important oilseed crop at combining ability, representing additive type of gene national level after groundnut and contributes nearly action and specific combining ability as a measure of 27% to edible oil pool of the country. For faster non additive gene action was carried out by the advances and getting tangible results in plant procedure suggested by Griffing (1956) method 2 and breeding, it is necessary to know the existing genetic model-I.variability and combining abilities of the breeding
materials. In quantitative genetics, the study of RESULTS AND DISCUSSION different type of gene actions helps in the
The analysis of variance for combining identification and selection of suitable parental lines ability indicated that the mean squares due to general to be included in hybridization to develop superior F1 combining ability and specific combining ability hybrids. This technique can also be exploited for the were significant for days to 50 per cent flowering, choice of appropriate breeding procedures (Hayman, days to maturity, plant height, number of branches 1954 and Griffing, 1956). Keeping this background in
-1 -1 -1plant , number of siliquae plant , seed yield plant view, the present investigation was undertaken in and 1000 seed weight. The variance due to sca was Indian mustard.higher than that of due to gca for all the characters under study indicated the predominant role of non-MATERIALS AND METHODSadditive gene action, which would be necessitate the The experimental materials comprised of 10 maintenance of heterozygosity in the population.parents which were crossed in diallel mating fashion
and 45 F hybrids were developed. The research was 1
The preponderance of non-additive gene carried out at Main Castor-mustard research station, effects were reported for days to maturity (RahmanSardarkrushinagar, S.D. Agricultural University,
-1et al., 2011), number of branches plant (Gupta et al., Sardarkrushinagar (Gujarat). All the F S along with -112006) and seeds siliquae ( Azizinia., 2012). Similarly
parents were grown in a randomized block design preponderance of additive genetic effects were
with three replications during rabi 2012-2013. Five observed in the inheritance of days to 50% flowering plants were randomly selected for each genotype and and plant hight (Gupta et al., 2006), number of
-1 -1 -1 the average value plant was computed for recording siliquae plant (Dar et al., 2011), seed yield plantobservations for eight quantitative traits. Analysis of (Rahman et al., 2011 and Dar et al., 2011) and 1000 variance was followed as per method suggested by seed weight ( Azizinia, 2012).
1. P.G. Student, S.D. Agricultural University, Sardarkrushinagar-385 506 Gujarat (India)2. Asstt. Professor, Deptt. of Genetics & Plant Breeding, College of Horticulture,S.D. Agricultural
University, Sardarkrushinagar-385 506 Gujarat (India)
1 2Moti Lal Saini , and M.P. Patel
J. Soils and Crops 25 (1) 81-84, June, 2015 ISSN 0971-2836
COMBINING ABILITY ANALYSIS FOR SEED YIELD AND ITS COMPONENT QUANTITATIVE TRAITS IN INDIAN MUSTARD
[Brassica juncea (L.) Czern and Coss.]
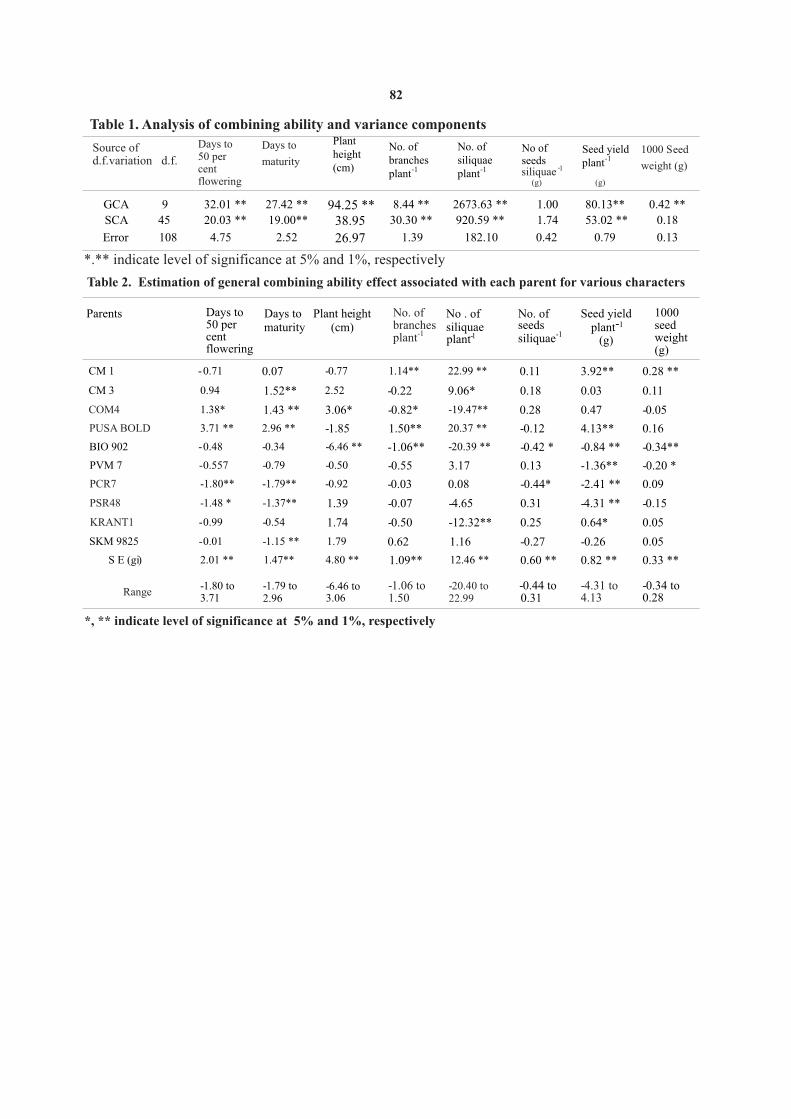
Table 1. Analysis of ability combining and variance components
Source of d.f.variation
Days to
maturity
Plant height (cm)
No. of branches plant-1
siliquae -1
(g)
Seed yield plant-1
1000 Seed
weight (g)
GCA 9 32.01 ** 27.42 ** 94.25 ** 8.44 ** 2673.63 ** 1.00 80.13** 0.42 ** SCA 45 20.03 ** 19.00** 38.95 30.30 ** 920.59 ** 1.74 53.02 ** 0.18
Error 108 4.75 2.52 26.97 1.39 182.10 0.42 0.79 0.13
Days to 50 percent flowering
No. of siliquaeplant-1
No ofseeds
*.** indicate level of significance at 5% and 1%, respectively
Table 2. Estimation of general combining ability effect associated with each parent for various characters
Parents Days to 50 per cent flowering
Days to maturity
Plant height (cm)
No. of branches plant-1
No . of siliquae
plant -1
No. of seeds siliquae-1
Seed yield plant-1
(g)
1000 seed weight (g)
CM 1 -0.71 0.07 -0.77 1.14** 22.99 ** 0.11 3.92** 0.28 **
CM 3 0.94 1.52** 2.52 -0.22 9.06* 0.18 0.03 0.11
COM4 1.38* 1.43 ** 3.06* -0.82* -19.47** 0.28 0.47 -0.05
PUSA BOLD 3.71 ** 2.96 ** -1.85 1.50** 20.37 ** -0.12 4.13** 0.16
BIO 902 -0.48 -0.34 -6.46 ** -1.06** -20.39 ** -0.42 * -0.84 ** -0.34**
PVM 7 -0.557 -0.79 -0.50 -0.55 3.17 0.13 -1.36** -0.20 *
PCR7 -1.80** -1.79** -0.92 -0.03 0.08 -0.44* -2.41 ** 0.09
PSR48 -1.48 * -1.37** 1.39 -0.07 -4.65 0.31 -4.31 ** -0.15
KRANT1 -0.99 -0.54 1.74 -0.50 -12.32** 0.25 0.64* 0.05
SKM 9825 -0.01 -1.15 ** 1.79 0.62 1.16 -0.27 -0.26 0.05
S E (gi) 2.01 ** 1.47** 4.80 ** 1.09** 12.46 ** 0.60 ** 0.82 ** 0.33 **
Range -1.80 to 3.71
-1.79 to 2.96
-6.46 to 3.06
-1.06 to 1.50
-20.40 to 22.99
-0.44 to 0.31
-4.31 to 4.13
-0.34 to 0.28
*, ** indicate level of significance at 5% and 1%, respectively
d.f.
(g)
82
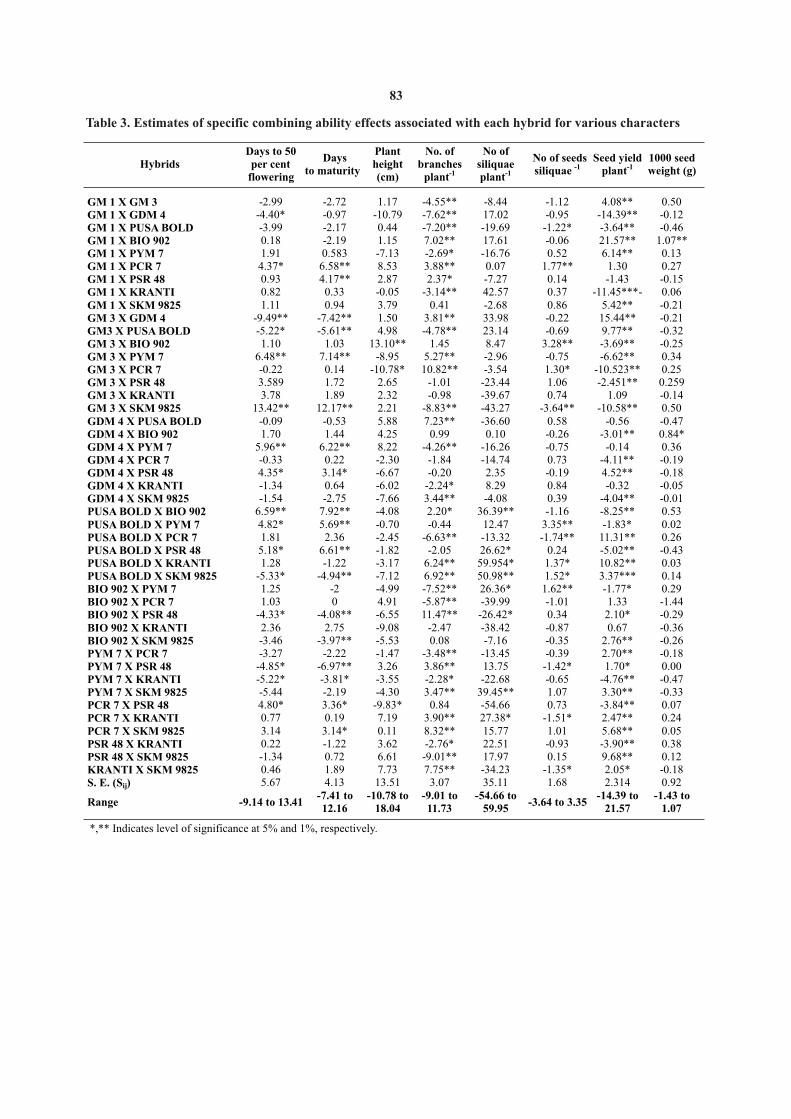
Table 3. Estimates of specific combining ability effects associated with each hybrid for various characters
Hybrids Days to 50 per cent
flowering
Days to maturity
Plant height (cm)
No. of branches
plant-1
No of siliquae plant-1
No of seeds siliquae -1
Seed yield plant-1
1000 seed weight (g)
GM 1 X GM 3 -2.99 -2.72 1.17 -4.55** -8.44 -1.12 4.08** 0.50GM 1 X GDM 4 -4.40* -0.97 -10.79 -7.62** 17.02 -0.95 -14.39** -0.12GM 1 X PUSA BOLD -3.99 -2.17 0.44 -7.20** -19.69 -1.22* -3.64** -0.46GM 1 X BIO 902
0.18 -2.19 1.15 7.02** 17.61 -0.06 21.57** 1.07**GM 1 X PYM 7
1.91
0.583
-7.13
-2.69*
-16.76
0.52
6.14**
0.13
GM 1 X PCR 7
4.37*
6.58**
8.53 3.88**
0.07
1.77**
1.30
0.27
GM 1 X PSR 48
0.93
4.17**
2.87
2.37*
-7.27
0.14
-1.43
-0.15GM 1 X KRANTI
0.82
0.33
-0.05
-3.14**
42.57
0.37
-11.45***-
0.06
GM 1 X SKM 9825
1.11
0.94
3.79
0.41
-2.68
0.86 5.42**
-0.21
GM 3 X GDM 4
-9.49**
-7.42**
1.50 3.81**
33.98
-0.22
15.44**
-0.21
GM3 X PUSA BOLD
-5.22*
-5.61**
4.98 -4.78**
23.14
-0.69
9.77**
-0.32
GM 3 X BIO 902
1.10
1.03
13.10** 1.45
8.47
3.28**
-3.69**
-0.25
GM 3 X PYM 7
6.48**
7.14**
-8.95 5.27**
-2.96
-0.75
-6.62**
0.34
GM 3 X PCR 7
-0.22
0.14
-10.78*
10.82**
-3.54
1.30*
-10.523**
0.25
GM 3 X PSR 48
3.589
1.72
2.65
-1.01
-23.44
1.06
-2.451**
0.259GM 3 X KRANTI
3.78
1.89
2.32
-0.98
-39.67
0.74
1.09
-0.14GM 3 X SKM 9825
13.42**
12.17**
2.21
-8.83**
-43.27
-3.64**
-10.58**
0.50GDM 4 X PUSA BOLD
-0.09
-0.53
5.88
7.23**
-36.60
0.58
-0.56
-0.47GDM 4 X BIO 902
1.70
1.44
4.25
0.99
0.10
-0.26
-3.01**
0.84*GDM 4 X PYM 7
5.96**
6.22**
8.22
-4.26**
-16.26
-0.75
-0.14
0.36GDM 4 X PCR 7
-0.33
0.22
-2.30
-1.84
-14.74
0.73
-4.11**
-0.19GDM 4 X PSR 48
4.35*
3.14*
-6.67
-0.20
2.35
-0.19
4.52**
-0.18GDM 4 X KRANTI
-1.34
0.64
-6.02
-2.24*
8.29
0.84
-0.32
-0.05GDM 4 X SKM 9825
-1.54
-2.75
-7.66
3.44**
-4.08
0.39
-4.04**
-0.01PUSA BOLD X BIO 902
6.59**
7.92**
-4.08
2.20*
36.39**
-1.16
-8.25**
0.53PUSA BOLD X PYM 7
4.82*
5.69**
-0.70
-0.44
12.47
3.35**
-1.83*
0.02PUSA BOLD X PCR 7
1.81
2.36
-2.45
-6.63**
-13.32
-1.74**
11.31**
0.26PUSA BOLD
X PSR 48
5.18*
6.61**
-1.82
-2.05
26.62*
0.24
-5.02**
-0.43PUSA BOLD X KRANTI
1.28
-1.22
-3.17
6.24**
59.954*
1.37*
10.82**
0.03PUSA BOLD X SKM 9825
-5.33*
-4.94**
-7.12
6.92**
50.98**
1.52*
3.37***
0.14BIO 902 X PYM 7
1.25
-2
-4.99
-7.52**
26.36*
1.62**
-1.77*
0.29BIO 902 X PCR 7
1.03
0
4.91
-5.87**
-39.99
-1.01
1.33
-1.44BIO 902 X PSR 48
-4.33*
-4.08**
-6.55
11.47**
-26.42*
0.34
2.10*
-0.29BIO 902 X KRANTI
2.36
2.75
-9.08
-2.47
-38.42
-0.87
0.67
-0.36BIO 902 X SKM 9825
-3.46
-3.97**
-5.53
0.08
-7.16
-0.35
2.76**
-0.26PYM 7 X PCR 7
-3.27
-2.22
-1.47
-3.48**
-13.45
-0.39
2.70**
-0.18PYM 7 X PSR 48
-4.85*
-6.97**
3.26
3.86**
13.75
-1.42*
1.70*
0.00PYM 7 X KRANTI
-5.22*
-3.81*
-3.55
-2.28*
-22.68
-0.65
-4.76**
-0.47PYM 7 X SKM 9825
-5.44
-2.19
-4.30
3.47**
39.45**
1.07
3.30**
-0.33PCR 7 X PSR 48
4.80*
3.36*
-9.83*
0.84
-54.66
0.73
-3.84**
0.07PCR 7 X KRANTI
0.77
0.19
7.19
3.90**
27.38*
-1.51*
2.47**
0.24PCR 7 X SKM 9825
3.14
3.14*
0.11
8.32**
15.77
1.01
5.68**
0.05PSR 48 X KRANTI
0.22
-1.22
3.62
-2.76*
22.51
-0.93
-3.90**
0.38PSR 48 X SKM 9825
-1.34
0.72
6.61
-9.01**
17.97
0.15
9.68**
0.12KRANTI X SKM 9825 0.46 1.89 7.73 7.75** -34.23 -1.35* 2.05* -0.18S. E. (Sij) 5.67 4.13 13.51 3.07 35.11 1.68 2.314 0.92
Range -9.14 to 13.41-7.41 to 12.16
-10.78 to 18.04
-9.01 to 11.73
-54.66 to 59.95
-3.64 to 3.35-14.39 to
21.57-1.43 to
1.07
*,** Indicates level of significance at 5% and 1%, respectively.
83
The parents Pusa bold and GM1 were good through heterosis breeding or should be used in -1 recombination programme for tapping desirable general combiner for seed yield plant , number of
-1 -1 transgressive segregants in segregating generations. branches plant , number of siliquae plant and 1000 The intermating between selected segregants in seed weight. Above parents can be considered as a advance generations of segregation would help to good source of favourable genes for increasing seed accumulate favourable, desirable alleles for further yield along with other yield attributes. It is evident improvement in seed yield and its component from these results that high gca effects for seed yield
-1 characters in Indian mustard.plant was mainly due to high gca effects for yield contributing characters. Therefore, it would be
REFERENCESworthwhile to use above parental lines in the hybridization programmes. However, PCR 7, PSR 48
Akbar, M. Tahira, B.M. Atta and M. Hussain, 2008. Combining abilityand Kranti were good combiners for earliness but studies in Rapeseed (Brassica napus). Int. J. Agri. Biol. 10:
poor general combiners for seed yield. From these 205-208. Azizinia, S. 2012. Combining ability analysis of yield componentresults it may be concluded that high SCA alone could
parameters in winter rapeseed genotypes(Brassica napusL.).not be a sole criterion for getting a heterotic hybrid. J. Agric. Sci. 4 (4): 87-94.
Dar, Z.A., S.A. Wani, M.A Wani, I. Ahmad, Khan, M.H. Habib, A.Similar results have earlier been reported by Ishfaque and Gulzaffar, 2011. Heterosis and combining
Swarnkar et al. (2002) in Indian mustard. Any sort of ability analysis for seed yield and its attributes in (Brassica rapa spp. brown sarsori). J. Oilseed Brassica, 2 (1) : 21-28. combination among the parents could give hybrid
Griffing, B. 1956. Concept of general and specific combining ability in vigour which might be due to favourable dominant relation to diallel crossing systems. Aust. J. Biol. Sci. 9 : 463-
genes or epistatic action. Above findings were 493.Gupta, S.K., N. Karuna and T.Dey, 2006.Heterosis and combining ability supported by Sood et al. (2000) in Indian mustard.
in Rapeseed (Brassica napus. L ). J. Res., SKUASTJ. 5 (1).Top three crosses viz., GM1 x BIO 902, GM3 x Hayman, B.I. 1954. The theory and analysis of diallel crosses. Genetics,
39 : 789-809. Kempthorne, O. 1957.An introduction to GDM4 and Pusa bold x Kranti exhibited high sca -1 genetical statistics. John Willey and Sons Inc., New York.effects for yield plant involved at least one good Nasrin, Shamima, F. Nur, Mst. K. Nasreen, Md.S.R. Bhuiyun, S. Sarkar
general combiner, indicated additive x dominance and M. M. Islam, 2011.Heterosis and combining ability analysis in Indian mustard (Brassica juncea L.).Bangladesh type of gene interaction, which could produce Res. Pub. J. 6(1): 65-71.
desirable transgressive segregants in subsequent Panse, V.G. and P.V. Sukhatme, 1978.Statistical Methods for Agricultural Workers. ICAR Publications, New Delhi.generations. Akbar et al. (2008), and Singh and Lallu
Rahman, M.M., M.A.Z. Chowdhury, M.G. Hossain, M.N. Amin, M.A. (2004) have reported the involvement of additive x Muktadir and Rashid, 2011. Gene action for seed yield and
yield contributing characters in turnip rape (Brassica rapa additive, additive x dominance and epistatic type of L.). J. Expt. Biosci . 2(2) : 67-76.gene action in expression of yield and other traits in
Sharma, P., D.P. Pant, S.P. Singh, A.K. Singh and R. Singh, 2008.Diallel Brassica family. The crosses, where poor x poor and analysis for yield and yield component traits in toria(Brassica
rapa L.). Ind. J. PI. Genetic Resources, 21 (2) : 121-124.poor x good general combiners produced high sca Singh,M. and R. Lallu, 2004.Heterosis in relation to combining ability for
effects may be attributed due to presence of genetic seed yield and its contributing traits in Indian mustard [Brassica juncea (L.) Czern & Coss].J.Oilseeds Res., 21(1): diversity in the form of heterozygous loci for specific 140-142.traits.
Sood, O. P., V.K. Sood and H.L. Thakur, 2000. Combining ability and heterosis for seed yield traits involving natural and synthetic
Based upon the results obtained in the present Indian mustard [Brassica juncea (L.) Czern and Coss.]. Ind. J. Genet. 60 (4): 561-563.study, it is summed up that the parents Pusa bold and
Sprague, G.F. and L.A. Tatum, 1942. General versus specific combining GM1 were identified as good general combiners for ability in single crosses in corn. Agron. J. 34: 923-932.
Swarnkar. G. B., M. Singh, L. Prasad and R. K. Dixit, 2002. Combining most of the characters and the specific crosses ability for seed yield and its contributing characters in Indian
combinations namely GM1 x BIO 902, GM3 x mustard (Brassica juncea.) Czern and coss.PI. Archives, 2(1):
GDM4 and Pusa bold x Kranti should be exploited 5-14.
Rec. on 05.01.2014 & Acc. on 10.03.2014
84
ABSTRACT
An investigation entitled 'Effect of industrial waste water and irrigation methods on residual concentration of agriculture produce in Konkan region of Maharashtra' was carried out during the year 2009-10. Most of the waste water of Rasayani industrial area is being discharged in the Patalganga River through different drains. The 10 observation points in the drain contributing to Patalganga river were selected. The nearby field was selected for conducting the experiment on which Spinach crop was grown. The soil samples were analyzed before and after crop period. In the experiment two irrigation sources viz., waste water and well water were used as main treatments. Three irrigation methods viz., check basin, raised bed and ridges and furrow were used as sub-treatments. The biometric observations of the plants irrigated with waste water showed that the growth and yield of spinach crop (181.76 g) was better than that of the well water irrigated plants (143.89 g). The average plant weight was significantly higher in irrigation with industrial waste water (155.85 g) as compared to irrigation with fresh water
-1(132.85 g). The highest average plant weight 162.82 g plant was observed in check basin, while the minimum average -1 plant weight of 135.06 g plant was observed in ridges and furrows. The effect of irrigation methods was significant. In
case of interaction maximum plant weight of 181.76 g was reported in the treatment combination of irrigation with industrial waste water and checks basin method and was significantly superior over all other treatment combinations. The analysis of crop samples in atomic adsorption spectrometer showed that the concentration of micro-nutrients like Cu, Zn, Fe and Mn was in trace amount. Though the effect of waste water on yield was significant, the long term effect of this waste water on soil needs to be studied.
(Key words: Industrial waste water, spinach, residue analysis)
I cities is 16,652.5 MLD. Out of this, about 59 per cent INTRODUCTIONgenerated by 23 metro cities (Patankar, 2001). The
Rapid industrialization, intensive agriculture state of Maharashtra alone contributes about 23 per and other anthropogenic activities have led to land cent, while the Ganga river basin contributes about 31 degradation, environmental pollution and decline in per cent of the total wastewater generated in class-I crop productivity and sustainability causing great
cities.concern to human and animal health. One of the prominent sources contributing to increased soil Banerjee and Sawant (1996) monitored the contamination is disposal of municipal waste water. heavy metals in industrial and traffic area. The The city sewage water is being largely used for investigation of heavy metals in industrial irrigation in the adjoining areas of the cities for
environment was carried out at two sites viz., Thane growing vegetable crops. In order to maintain the
and Sion circle and King circle, Mumbai. Roadside soils in better fertility as well as productivity for
deposits, surface soil, grass, leaves and water samples supply of essential plant nutrients for crop production
were collected and were analysed for Pb, Zn, Cu, Cr, on sustainable basis without deteriorating the soil
Ni and As. The samples were collected on seasonal health, it becomes imperative to make thorough
basis. The data showed higher concentration of these studies on impact of sewage water applied to
metals in water samples. Pb was found to be much agriculture lands. The city sewage water contains above the permissible limit. Summer and winter significant organic matter and macro-micro-nutrients collections showed maximum concentration of the essential for plant growth. However, it may also heavy metals, whereas monsoon collections showed contain potential contaminants such as heavy metals lower concentrations. The data indicated increasing like Ni, Cd, As, Cr etc. and pathogens and therefore, it trend in the metal content with the time during the must be used cautiously. This is a matter of great study period in Thane and Sion circle. The results concern, because of persistence of metal pollutants in showed that metal content in the Thane and Sion soil, uptake by crops and cumulative effects on health circle area was comparatively higher than that at of animals and human beings. Kings circle.The total wastewater generated by 299 class-
1. Professor and Head, Deptt. of Irrigation & Drainage Engineering, C.A.E.T., Dapoli2. Ex. M.Tech. student, Deptt. of Irrigation & Drainage Engineering, C.A.E.T., Dapoli3. Asstt. Professor , Deptt. of Irrigation & Drainage Engineering, C.A.E.T., Dapoli
1 2 3M.S. Mane , R.P. Aher and P.M.Ingle
J. Soils and Crops 25 (1) 85-91, June, 2015 ISSN 0971-2836
EFFECT OF INDUSTRIAL WASTE WATER AND IRRIGATION METHODS ON RESIDUAL CONCENTRATION OF AGRICULTURAL PRODUCE IN
KONKAN REGION OF MAHARASHTRA
Kulkarni and Tekale (1998) demonstrated the located in the M.I.D.C. Rasayani, Tal.-Panvel, use of waste water for irrigation purpose at field of District, Raigad. The co-ordinates of the locations are
0 0Water and Land Management Institute (WALMI), 18.89 N, 73.15 E. At present in the industrial area Aurangabad (India). The study revealed that the waste various industries such as chemical industries and water having maximum pH (8.20) and EC (0.45 fertilizer industries are present. Most of the waste
-1 water from various chemical industries in Rasayani mmhos cm ) were found to be safe to use as irrigation industrial area is received by the perennial drain water. The yield of sugarcane, groundnut, wheat
-1 -1 which is contributed to the Patalganga River.obtained were 66.37 t.ha , 17.04 q.ha and 24.25 -1q.ha , respectively. This water can be categorised as
-1 To study the effect of industrial waste water good water (0.45 mmhos.cm ) as suggested by on crop, the field trial was conducted on the field Wilcox (1948). From the study, it was revealed that owned by local farmer Mr. Mali Dharma Kanu, at there was not any adverse effect after the use of waste village Rasayani, Tal.-Panvel, District, Raigad. For water on light and medium soil field at WALMI. Also the trial 250 sq m field area was used. The strip plot there was increase in the yield especially in case of design was used for the study.wheat, maize, pearl millet and groundnut. Raw
sewage water was used for the experiment.To study effect of industrial waste water
irrigation on plant, short duration leafy vegetable Lone et al. (2003) observed the increase in Spinach (Spinacia oleracea L.) was cultivated. In the
heavy metal contents of vegetables irrigated by experiment two irrigation sources viz., waste water
sewage/ tube well water at Hassanabad area of district (S ) and fresh water (S ) were used. Also three 1 2Attock in Pakistan. Three adjacent fields were irrigation methods viz., check basin method (I ), 1selected for each crop and separately irrigated by raised bed (I ) and ridges and furrows method (I ) 2 3sewage water, tube well water and mixture of sewage were used. Before planting in plot, beds were and tube well water. Okra (Abelmoschus esculentus) prepared. Dimension of the bed was 2 m x 3 m. There and spinach (Spinacea oleracea L.) were planted in were 7 replications of six combinations of the spring and winter, respectively. The heavy metal and treatments of irrigation water and irrigation methods. micronutrient contents in both vegetables were
present in significantly higher amount in order of thThe seeds of spinach were sown on 05 sewage >sewage and tube well water >tube well water
January, 2010. After sowing the crop was irrigated at except Cu and Fe which showed variation for both the the interval of 7 days with both waste water and fresh crops. Spinach leaves showed higher accumulation of water. The study of effect of waste water irrigation heavy metals and micronutrients as compared to okra and fresh water irrigation on soil and crop was done. fruits.The well, present in the field was used as a source of fresh water irrigation. The irrigation schedule was The review indicated that the waste water can done after every 7 days. The recommended fertilizer be used for irrigating the agricultural crops. This
-1dose for spinach was 100:50:50 kg N:P:K ha . For water will not only meet the crop water need but also giving fertilizer, water soluble fertilizer 19:19:19 was increase the yield of crop. In the area where water is in used and was applied in two splits, the first at 7 and scarcity, this water would be a good option to be used second at 14 days after sowing. For meeting as irrigation water source. Hence, the present study
-1additional requirement of nitrogen, i.e. 50 kg N ha , was planned with the following objectives,urea was used. It was applied by broadcasting in equal 1. To study the quality parameters of waste doses on 21 and 28 days after sowing of crop. The last water.
2. To assess the effect of waste water as an two broadcasts were of urea. Before harvesting the irrigation source on residual content of crop, biometric observations such as height of plant, agricultural produce. length of plant leaves, width of leaves and weight of
-1sample plants were taken. Twenty plants plot were
MATERIALS AND METHODS selected as a sample for the study. Experimental site
The crop was harvested 45 days after sowing.The experiment was conducted in the field
86
solution, 0.5 g of zinc metal was dissolved in a Samples of harvested crop were then taken immediately to the laboratory of M/s. Aditya minimum volume of (1+1) HCl and diluted to 1 litre
with 1 per cent (v/v) HCl. Then 4.398 g of ZnSO Environmental Services Pvt. Ltd., Rasayani for plant 4
residue analysis, as this facility was not available at 7H O was dissolved in distilled water and volume was 2
the University laboratory. The samples were collected made upto 1000 ml. This gave a solution of 1000 ppm from all 7 replications for each treatment zinc. 10 ml of this solution was diluted to 100 ml for combination. The collected samples were analysed getting 100 ppm Zn solution. The final standard for heavy metals like copper (Cu), manganese (Mn), solution was prepared from this 100 ppm solution.iron (Fe) and zinc (Zn). The analysis of the samples The determination of Fe, Mn, Zn and Cu was
done by using atomic absorption spectrophotometer was done with the help of DTPA method proposed by with the following specifications (Tandon, 2004) for Tandon (2004).mono element hollow cathode lamp.
The chemical analysis of soil samples was done in the laboratory of Department of Agricultural Chemistry and Soil Science, College of Agriculture, Dapoli. The micronutrients were determined with the help of atomic absorption spectrophotometer (AAS). The method of sample preparation was same for all the micronutrients. 1 g oven dried plant samples were For determination of Zn, instead of hollow digested using diacid mixture and made upto 100 ml cathode lamps, electrode less discharge lamp (EDL) using deionized water on cooling. For determining was used. EDL provided improved sensitivity and Cu, 1000 ppm solution was prepared by dissolving 1 g lower detection limits than hollow cathode lamp.of copper metal in minimum volume of 1 ml HNO . 3
Then, it was diluted to 1 litre with 1 per cent (v/v) RESULTS AND DISCUSSIONHNO . Then 3.929 g CuSO . 5H O was dissolved in 3 4 2
distilled water and volume was made upto 1000 ml. Effect of waste water and irrigation methods on This gives a solution of 1000 ppm Cu. 10 ml of this residual concentration of the plant parts'solution was diluted to 100 ml to get 100 ppm solution of Cu. For determining the Mn, the similar procedure The effect of irrigation water and irrigation was used. Then 1 g of Mn metal was dissolved in a methods on residual concentration of Cu, Zn, Fe and
Mn in spinach crop was studied and the results are minimum volume of 1 ml NHO and diluted to 1 litre 3
given hereafter. with 1 per cent (v/v) HCl. Then dissolve 3.076 g of MnSO H O in deionized water and make volume 4 2
Concentration of Cu (ppm)upto 1000 ml. This gave a solution of 1000 ppm Mn. Then10 ml of this solution was diluted to 100 ml for The analysis of Cu concentration in the getting a solution of 100 ppm Mn. This solution was residue of plant was done and reported in table 1. It used for preparation of final standards. For was in the range of 0.028 to 0.061 ppm for interaction determining the Fe, the procedure for sample between irrigation source and irrigation method. preparation was same. For determining the stock Maximum average concentration of Cu (0.060 ppm) standard solution, 1 g of pure iron wire was dissolved was found in plants irrigated with waste water, while in 50 ml of (1+1) analytical grade HNO . This was 3 minimum average concentration (0.031 ppm) was diluted to 1 litre with deionized water. Then 7.022 g of reported in fresh water irrigation source. In the analytical grade (NH ) Fe (SO ) 6H O was dissolved 4 2 4 2 2 irrigation methods viz., check basin, raised bed and in 400 ml deionized water. Then 5 ml of con. H SO ridges and furrows, the average concentration of Cu 2 4
was added to it. This gave a stock solution of 1000 was in the range of 0.0444 to 0.0468 ppm and its effect ppm Fe. From this, solution of 100 ppm was prepared was non-significant. The effect of water source which was used for preparation of final standard showed significant effect on crop residue, while the solutions. For determining Zn, the procedure of effect of irrigation methods and their interaction was sample preparation was same. For stock standard non-significant.
Specifications Fe Mn Zn Cu
Lamp current (mA) 30 20 6 15
wave length (A0) 2483 2795 2139 3248
Linear range (ppm) 0 to 5 0 to 2 0 to 1 0 to 5
Slit width (A0) 2 2 7 7
Integration time (sec)
2
2
2
2
87
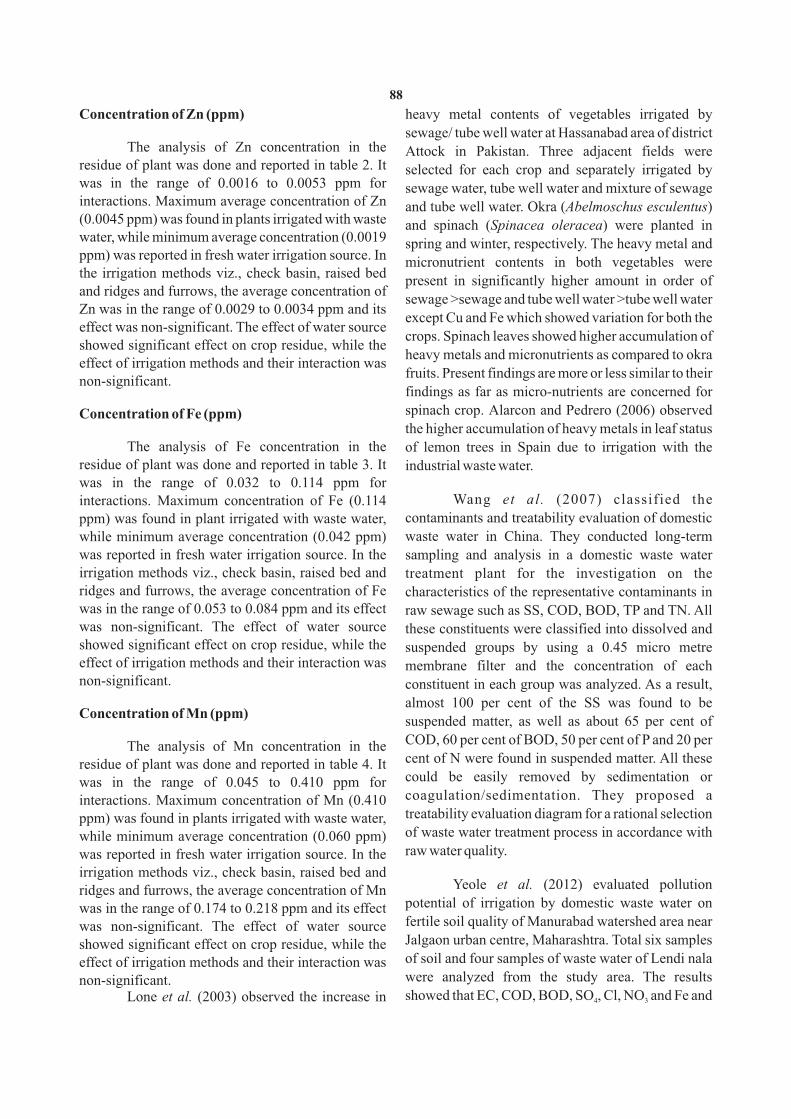
Concentration of Zn (ppm) heavy metal contents of vegetables irrigated by
sewage/ tube well water at Hassanabad area of district The analysis of Zn concentration in the Attock in Pakistan. Three adjacent fields were
residue of plant was done and reported in table 2. It selected for each crop and separately irrigated by was in the range of 0.0016 to 0.0053 ppm for sewage water, tube well water and mixture of sewage interactions. Maximum average concentration of Zn and tube well water. Okra (Abelmoschus esculentus) (0.0045 ppm) was found in plants irrigated with waste and spinach (Spinacea oleracea) were planted in water, while minimum average concentration (0.0019 spring and winter, respectively. The heavy metal and ppm) was reported in fresh water irrigation source. In micronutrient contents in both vegetables were the irrigation methods viz., check basin, raised bed
present in significantly higher amount in order of and ridges and furrows, the average concentration of
sewage >sewage and tube well water >tube well water Zn was in the range of 0.0029 to 0.0034 ppm and its
except Cu and Fe which showed variation for both the effect was non-significant. The effect of water source
crops. Spinach leaves showed higher accumulation of showed significant effect on crop residue, while the
heavy metals and micronutrients as compared to okra effect of irrigation methods and their interaction was
fruits. Present findings are more or less similar to their non-significant.
findings as far as micro-nutrients are concerned for
spinach crop. Alarcon and Pedrero (2006) observed Concentration of Fe (ppm)the higher accumulation of heavy metals in leaf status
The analysis of Fe concentration in the of lemon trees in Spain due to irrigation with the residue of plant was done and reported in table 3. It industrial waste water.was in the range of 0.032 to 0.114 ppm for
Wang et al. (2007) classified the interactions. Maximum concentration of Fe (0.114 contaminants and treatability evaluation of domestic ppm) was found in plant irrigated with waste water,
while minimum average concentration (0.042 ppm) waste water in China. They conducted long-term
sampling and analysis in a domestic waste water was reported in fresh water irrigation source. In the irrigation methods viz., check basin, raised bed and treatment plant for the investigation on the ridges and furrows, the average concentration of Fe characteristics of the representative contaminants in was in the range of 0.053 to 0.084 ppm and its effect raw sewage such as SS, COD, BOD, TP and TN. All was non-significant. The effect of water source these constituents were classified into dissolved and showed significant effect on crop residue, while the suspended groups by using a 0.45 micro metre effect of irrigation methods and their interaction was membrane filter and the concentration of each non-significant. constituent in each group was analyzed. As a result,
almost 100 per cent of the SS was found to be Concentration of Mn (ppm)
suspended matter, as well as about 65 per cent of
COD, 60 per cent of BOD, 50 per cent of P and 20 per The analysis of Mn concentration in the cent of N were found in suspended matter. All these residue of plant was done and reported in table 4. It could be easily removed by sedimentation or was in the range of 0.045 to 0.410 ppm for coagulation/sedimentation. They proposed a interactions. Maximum concentration of Mn (0.410 treatability evaluation diagram for a rational selection ppm) was found in plants irrigated with waste water, of waste water treatment process in accordance with while minimum average concentration (0.060 ppm) raw water quality. was reported in fresh water irrigation source. In the
irrigation methods viz., check basin, raised bed and Yeole et al. (2012) evaluated pollution ridges and furrows, the average concentration of Mn
potential of irrigation by domestic waste water on was in the range of 0.174 to 0.218 ppm and its effect fertile soil quality of Manurabad watershed area near was non-significant. The effect of water source Jalgaon urban centre, Maharashtra. Total six samples showed significant effect on crop residue, while the of soil and four samples of waste water of Lendi nala effect of irrigation methods and their interaction was were analyzed from the study area. The results non-significant.showed that EC, COD, BOD, SO , Cl, NO and Fe and Lone et al. (2003) observed the increase in 4 3
88
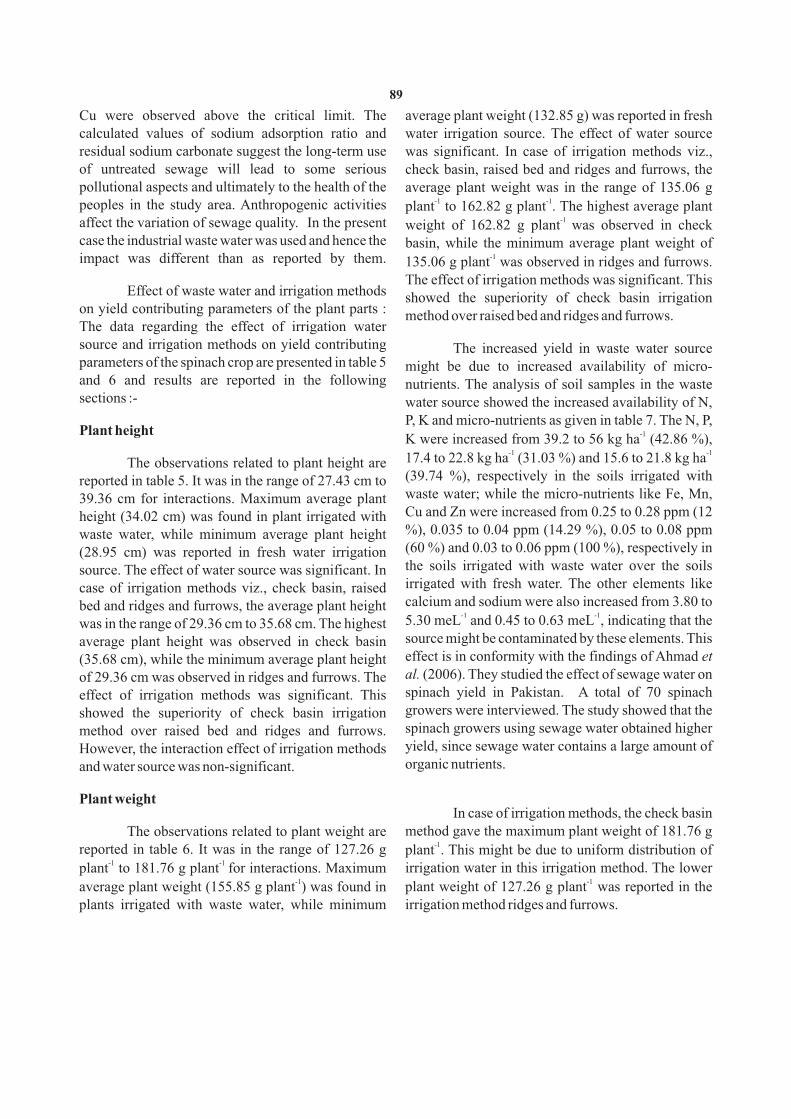
Cu were observed above the critical limit. The average plant weight (132.85 g) was reported in fresh water irrigation source. The effect of water source calculated values of sodium adsorption ratio and was significant. In case of irrigation methods viz., residual sodium carbonate suggest the long-term use check basin, raised bed and ridges and furrows, the of untreated sewage will lead to some serious
pollutional aspects and ultimately to the health of the average plant weight was in the range of 135.06 g -1 -1peoples in the study area. Anthropogenic activities plant to 162.82 g plant . The highest average plant
-1 affect the variation of sewage quality. In the present weight of 162.82 g plant was observed in check case the industrial waste water was used and hence the basin, while the minimum average plant weight of
-1impact was different than as reported by them. 135.06 g plant was observed in ridges and furrows. The effect of irrigation methods was significant. This
Effect of waste water and irrigation methods showed the superiority of check basin irrigation on yield contributing parameters of the plant parts : method over raised bed and ridges and furrows. The data regarding the effect of irrigation water source and irrigation methods on yield contributing The increased yield in waste water source parameters of the spinach crop are presented in table 5 might be due to increased availability of micro-and 6 and results are reported in the following nutrients. The analysis of soil samples in the waste sections :- water source showed the increased availability of N,
P, K and micro-nutrients as given in table 7. The N, P, Plant height -1
K were increased from 39.2 to 56 kg ha (42.86 %), -1 -1
17.4 to 22.8 kg ha (31.03 %) and 15.6 to 21.8 kg ha The observations related to plant height are (39.74 %), respectively in the soils irrigated with reported in table 5. It was in the range of 27.43 cm to waste water; while the micro-nutrients like Fe, Mn, 39.36 cm for interactions. Maximum average plant Cu and Zn were increased from 0.25 to 0.28 ppm (12 height (34.02 cm) was found in plant irrigated with %), 0.035 to 0.04 ppm (14.29 %), 0.05 to 0.08 ppm waste water, while minimum average plant height (60 %) and 0.03 to 0.06 ppm (100 %), respectively in (28.95 cm) was reported in fresh water irrigation the soils irrigated with waste water over the soils source. The effect of water source was significant. In irrigated with fresh water. The other elements like case of irrigation methods viz., check basin, raised calcium and sodium were also increased from 3.80 to bed and ridges and furrows, the average plant height
-1 -15.30 meL and 0.45 to 0.63 meL , indicating that the was in the range of 29.36 cm to 35.68 cm. The highest source might be contaminated by these elements. This average plant height was observed in check basin effect is in conformity with the findings of Ahmad et (35.68 cm), while the minimum average plant height al. (2006). They studied the effect of sewage water on of 29.36 cm was observed in ridges and furrows. The spinach yield in Pakistan. A total of 70 spinach effect of irrigation methods was significant. This growers were interviewed. The study showed that the showed the superiority of check basin irrigation spinach growers using sewage water obtained higher method over raised bed and ridges and furrows. yield, since sewage water contains a large amount of However, the interaction effect of irrigation methods organic nutrients. and water source was non-significant.
Plant weightIn case of irrigation methods, the check basin
method gave the maximum plant weight of 181.76 g The observations related to plant weight are -1reported in table 6. It was in the range of 127.26 g plant . This might be due to uniform distribution of
-1 -1 plant to 181.76 g plant for interactions. Maximum irrigation water in this irrigation method. The lower -1 -1
average plant weight (155.85 g plant ) was found in plant weight of 127.26 g plant was reported in the plants irrigated with waste water, while minimum irrigation method ridges and furrows.
89
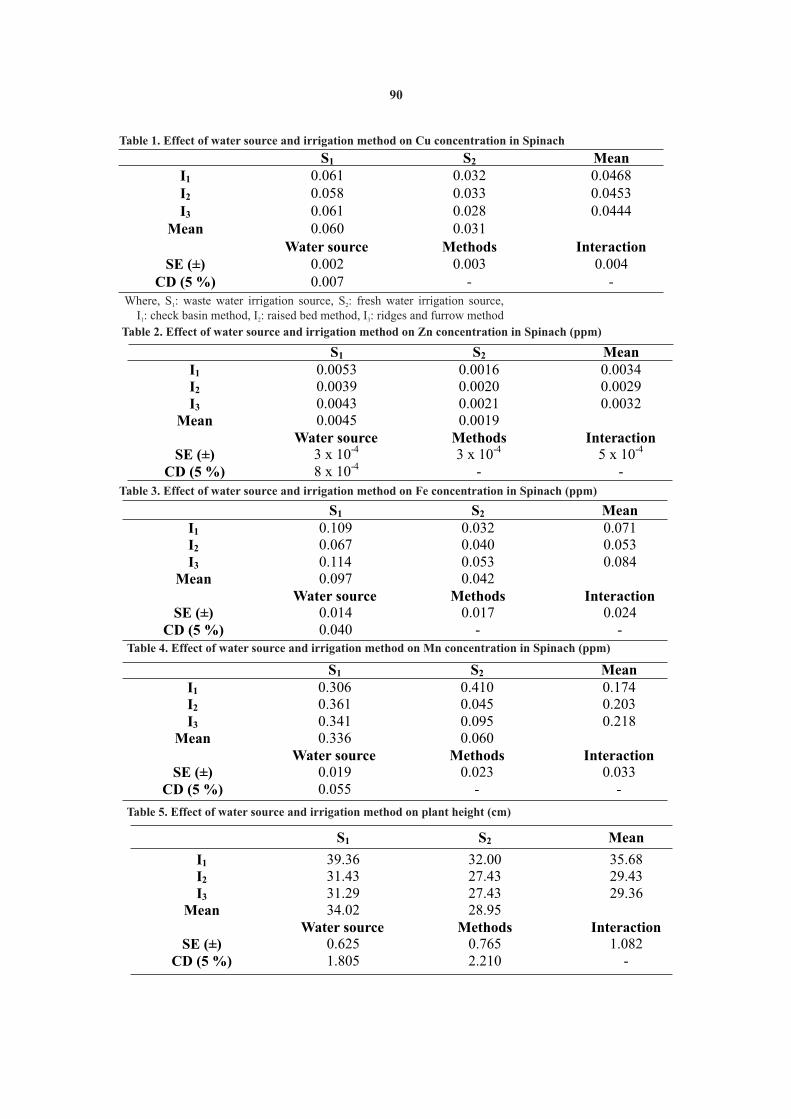
Table 1. Effect of water source and irrigation method on Cu concentration in Spinach
S1 S2 MeanI1 0.061 0.032 0.0468I2 0.058 0.033 0.0453I3 0.061 0.028 0.0444
Mean 0.060
0.031
Water source
Methods
Interaction
SE (±) 0.002
0.003
0.004CD (5 %)
0.007
-
-
Where, S : waste water irrigation source, S : fresh water irrigation source, 1 2
I : check basin method, I : raised bed method, I : ridges and furrow method 1 2 3
Table 2. Effect of water source and irrigation method on Zn concentration in Spinach (ppm)
S1
S2
Mean
I1
0.0053
0.0016
0.0034I2
0.0039
0.0020
0.0029I3
0.0043
0.0021
0.0032Mean
0.0045
0.0019
Water source
Methods
InteractionSE (±)
3 x 10⁻⁴
3 x 10⁻⁴
5 x 10⁻⁴
CD (5 %)
8 x 10⁻⁴
-
-
Table 3. Effect of water source and irrigation method on Fe concentration in Spinach (ppm)
S1 S2 MeanI1
0.109
0.032
0.071I2
0.067
0.040
0.053I3
0.114
0.053
0.084Mean
0.097
0.042
Water source
Methods
InteractionSE (±)
0.014
0.017
0.024CD (5 %) 0.040 - -
Table 4. Effect of water source and irrigation method on Mn concentration in Spinach (ppm)
S1
S2
MeanI1
0.306
0.410
0.174I2
0.361
0.045
0.203I3
0.341
0.095
0.218Mean
0.336
0.060
Water source Methods InteractionSE (±) 0.019 0.023 0.033
CD (5 %) 0.055 - -
Table 5. Effect of water source and irrigation method on plant height (cm)
S1 S2 Mean
I1 39.36 32.00 35.68I2 31.43 27.43 29.43I3
31.29
27.43
29.36Mean
34.02
28.95
Water source
Methods
InteractionSE (±)
0.625
0.765
1.082
CD (5 %)
1.805
2.210
-
90

Table 6. Effect of water source and irrigation method on plant weight (gm) S1
S2
Mean
I1
181.76
143.89
162.82
I2
142.94
127.40
135.17
I3
142.87
127.26
135.06
Mean
155.85
132.85
Water source
Methods
Interaction
SE (±)
2.603
3.189
4.509
CD (5 %)
7.519
9.209
13.020
Table 7. Chemical properties of soil irrigated with industrial waste water
Sr.No. Parameters Soil before irrigation
Soil after irrigation with
waste water
Soil after irrigation with fresh
water
Unit
1 Total dissolved salts (TDS) 714.88 841.12 721.30 mgL-1
2 Electrical conductivity (EC) 0.30 0.59 0.36 dSm-1
3 Acidity/basicity, pH 7.00 7.25 7.18 --4
Calcium
3.80
5.30
4.06
meL-1
5
Sodium
0.45
0.63
0.48
meL-1
6
Carbonate
--
--
-
meL-1
7
Bicarbonate
6.50
8.70
6.90
meL-1
8
Fe
0.25
0.28
0.26
ppm 9
Mn
0.035
0.040
0.039
ppm
10
Cu
0.050
0.080
0.060
ppm
11
Zn
0.030
0.060
0.040
ppm
Major Nutrients
12
N
39.20
56.00
41.30
-1Kg ha13
P
17.40
22.80
17.80
Kg ha-1
14
K
15.60
21.80
15.90
Kg ha-1
Eurasian J. Agric. Environ. Sci., 4 (1): 86-92.REFERENCES Kulkarni, S.M. and G.R. Tekale, 1998. Use of waste water for irrigation purpose. J. Irrigation Dev. 2 :19-22.
Lone, M.I., S.Saleem, T.Mahmood, K.Saifullah and G.Hussain, 2003. Ahmad, B., Khuda B.Akhsh and Sarfraz Hazzan, 2006. Effect of sewage The heavy metal contents of vegetables irrigated by sewage/
water on spinach yield. Int. J. Agric. and Biology. 2 (2) : tube well water. Int. J. Agric. and Biology. 5 (4) : 533–535.
423–425.Patankar, S.N. 2001. Reuse of treated waste water and sludge for
Akan, J.C., F.I.Abdulrahman, V.O.Ogugbuaja and J.T.Ayodele, 2009. agriculture in India- case study. 52nd IEC Meeting of the
Heavy Metals and Anion Levels in Some Samples of International Commission on Irrigation and Drainage.
Vegetable Grown Within the Vicinity of Challawa Industrial International Workshop on Wastewater Reuse Management,
Area, Kano State, Nigeria. American J. Appl. Sci. 6 (3): 534-Seoul, Korea, 19-20 September. pp. 203-212.
542. Tandon, HLS, 2004. Methods of analysis of soils, plants, waters and Alarcón, J.J. and F.Pedrero, 2006. Effects of treated waste water irrigation fertilizers. Fertilizer Development and Consultation
on lemon trees. Agency for International Development; Organisation, New Delhi.EPA/625/R-04/108 : 180. Wang Ziaochang, Jin Penskang, Zhao Honger and Meng Lingba, 2007.
Banerjee, P.K. and R.D.Sawant, 1996. Monitoring of heavy metals in Classificaiton of contaminants and treatability evalution of thindustrial and traffic area. Proc. 5 National symposium on domestic wastewater. Environ, Sci, Engg. China 1 (1): 57-62.
environment held from 3 to 5 September at Mumbai Wilcox. I.V. 1948. The quality of water for irrigation use. U.S. University, Mumbai, on use of industrial waste water for Department Agric. Technology, Bull No. 962.agriculture use, pp. 94-99. Yeole, Deepali, S.N.Patil and N.D.Wagh, 2012. Evaluating pollution
Bigdeli, M. and Mohsen Seilsepour, 2008. Investigation of metals potential of irrigation by domestic waste water on fertile soil quality of Mamurabad watershed area near Jalgaon urban accumulation in some vegetables irrigated with waste water in
Shahre Rey-Iran and Toxicological Implications. American- centre, Maharashtra, India. J. Environ. 1 (3): 84-92.
Rec. on 06.11.2013 & Acc. on 04.02.2014
91

ABSTRACT
Twenty sesame genotypes including two checks viz, JLT-7 and GT-1 were subjected for stability analysis in
three environments during kharif 2011-2012 at three locations viz, Research Farm, Department of Agriculture
Botany, College of Agriculture Latur (E ), Research farm, Safflower Research Station, M.K.V. Parbhani (E ), and 1 2
Agriculture Research Station, Badnapur (E ). Data were generated on various growth and yield attributes. Stability 3
and character association were carried out as per model of Eberhart and Russell (1966). Mean squares for genotypes
and linear component of environments were significant for all characters. Genotype x environment (G X E)
interactions were highly significant for all the growth and yield characters except capsule length. On the basis of
stability analysis genotypes IC-413189, IC-413201, IC-413205 were found stable for early 50% flowering whereas IC-
413214, IC-413216 showed stable performance for days to maturity but identified as late genotype. However, the -1genotype IC-413214 exhibited wider adaptability for number of branches plant . Regarding the most important
-1character seed yield plant the genotype IC-413223 showed wide adaptability to all environments.
(Key words: Sesame, genotype x environment interaction, adaptability, stability)
identify stable genotypes that can give high seed yield INTRODUCTIONunder a wide range of growing conditions.
Sesame (Sesamum indicum L.) known as gingelly, til or beniseed is a most important and ancient oilseed crop. It is rich in oil (53.53%) and protein (26.25%). Sesame oil is noted for its stability and quality. As it is a short day plant and sensitive to photoperiod, temperature and prolonged moisture stress, the yield of sesame is not stable and varies widely (Velu and Shunmugavalli, 2005). A specific difference in environment may have a greater effect on some genotypes than others (Falconer, 1981). When genotypes respond differently to a change in the environment, the phenomenon of Genotype x Environment Interaction (GEI) is said to occur. Information on the adaptation and stability of the genotypes over seasons and over sites is useful for recommending the varieties that should be grown under particular production environments and predicting the yield expectations of the test varieties (genotypes). A variety or genotype is considered to be the most adaptive or stable one if it has a high mean
-1
yield but a low degree of fluctuation in yielding ability when grown over diverse environments (Arshad et al. 2003). A significant portion of the resources of crop breeding is devoted determining GEI through replicated multilocation trial. Hence, present investigation was taken up utilizing 20 genotypes to study the nature and magnitude of genotype x environment interaction of seed yield of sesame genotypes grown at different locations and to
MATERIALS AND METHODS
The experimental material consisted 18
genotypes along with two checks viz., JLT-7 and GT-1
which were evaluated at three locations viz.,
Department of Agriculture Botany, College of
Agriculture Latur (E1), Research farm Safflower
Research Station, Marathwada Krishi Vidyapeeth.
Parbhani (E2) and Agriculture Research Station,
Badnapur (E3) during kharif 2011-2012 under
rainfed condition. These locations were situated
within the altitudinal ranges of 409 to 633.8 m and
have soil characteristics of Heavy black, Medium to
heavy black and Medium black (Table 1).
The experiment was laid out in a randomized
block design with three replications in each
environment. The unit plot size in a replication
measured 4 m in length and 1.5 m in width
accommodating 5 rows of 200 plants genotype after
thinning keeping row distance to 0.3 m and plant to
plant distance 0.1 m. Normal cultural practices were
followed. The observations were recorded on five
randomly selected plants for days to 50 per cent -1flowering, number of branches plant , plant height at
-1maturity (cm), number of capsules plant , number of -1seeds capsule , length of capsule (cm), days to
maturity, 1000- seed weight (gm), oil content (%) and
1, 3 &4. Ph.D. (Agril.) Scholar,V.N.M.K.V., Parbhani 431402.(Email: [email protected])2. Asstt. Professor, Deptt. of Agril. Botany, College of Agriculture, latur5. P.G. Student, Deptt. of Agril. Botany , College of Agriculture, latur
J. Soils and Crops 25 (1) 92-99, June, 2015 ISSN 0971-2836
STABILITY ANALYSIS OF YIELD AND YIELD COMPONENTS IN SESAME (Sesamum indicum L.)
1 2 3 4 5V. S. Patil ,P. B. Wadikar S. K. Chavan H. V. Patil and B. P. Sudrik, ,

-1 revealed that the variances due to environment + seed yield plant (gm) and were analyzed for stability (Genotype x Environment) interaction were highly parameters by using Eberhart and Russell model significant for days to maturity, number of branches (1966). Oil content was estimated by using NMR
-1plant , 1000 seed weight, plant height, number of (Nuclear Magnetic Resonance) spectrometer.
-1capsules plant and oil content indicating that the
RESULTS AND DISCUSSION genotype interacted significantly with environments. Further the environment (linear) was highly significant for all characters indicating the presence Analysis of variance for ten characters over three of linear variation among genotypes. Krishnaswami environments and Appadurai (1985) also reported significant
The analysis of variances for ten traits in each environment (linear) for plant height, number of -1 -1environment revealed that the mean square due to capsules plant , number of branches plant .
genotypes were highly significant for all characters in Considering the stability performance of genotypes all environment indicating the existence of sufficient for different characters across the environments, it variability among the genotypes. Pooled analysis of was observed that the variance due to non linear variances for ten characters over three environments component of environment (pooled deviation) was revealed that the mean square due to genotype was significant for all the characters under study except significant for all characters and in case of days to 50% flowering, capsule length, number of
-1 -1environment were highly significant for all characters seeds capsule and seed yield plant indicating the except capsule length (Table 1). Muhammad et al. role of unpredictable portion of environment (2013) reported that pooled analysis of variance influencing this trait. Kumaresan and Nadarajan revealed highly significant difference among the (2005) also reported similar results of unpredictable
-1 -1genotype for branches plant , capsules plant and portion of environment for characters days to -1seed yield. This suggest that the effect of the maturity, plant height, number of capsules plant , oil
-1environment on the expression of the genotype was content, number of branches plant and 1000 seed much pronounced on this character, on the other hand weight. The high magnitude of environment (linear) influence of environment was the least on capsule effect in comparison to genotype x environments length, this suggest that the least influence characters (linear) for all characters were observed which may could be improved to the extent expected on the basis be responsible for adaptation in relation to yield and of individual environment. Variance due to G X E yield contributing components of sesame.interaction were highly significant for all the characters except capsule length indicating the Stability parametersdifferential response of genotype in expression of the character to varying environments, the existence of G Estimates of regression coefficients and the X E interaction for days to 50% flowering, days to deviation from regression (Table 3) showed a wide
-1 range of values for each character. The phenotypic maturity, plant height, number of branches plant , -1 -1 stability of the genotype was measured by three number of capsules plant , number of seeds capsule
parameters namely, mean performance over the and oil content. Velu and Shunmugavalli (2005) and environments, linear regression and deviations from Kumar et al. (2006) estimated that the variance under regression function. A stable genotype should have different environments brought out the differential high mean performance, unit linear regression (bi) response of characters to varied environmental
2and deviation from regression (S di) as small as effects. The phenotypic and genotypic variances were possible (Eberhart and Russell, 1966).comparatively high for number of capsules, plant
-1height and number of seeds capsule , indicating wide
In the present investigation genotypes IC-range of variability in these characters. Significant 413189, IC-413201 and IC-413205 identified as early genotype x environment interaction effects were genotypes for 50% flowering, while IC-413216 as observed for all characters except for capsule length.late stable genotype as they possessed (bi) near to
2The data regarding analysis of variance for unity and non significant (S di). In respect to days to
maturity IC-413216 and IC-413214 were stable stability parameters are presented in table 2, which
93
genotypes, while the genotype IC-413238 was stable significant regression coefficient from deviation indicating unstable performance and eight genotypes genotype for days to maturity but identified as late for this characters specially adapted to poor genotype. Cherinet and Tadesse (2014) indicated that environment. For 1000 seed weight, the genotypes genotype by environment interaction was statistically IC-413231 and IC-413223 had unit regression significant for days to maturity and showed stable coefficient (bi) with non significant deviation from genotype in linseed. The genotypes IC-413240, IC-
2413253 had high mean and regression coefficient regression coefficient (S di) and higher mean higher than unity (bi>1) means above average performance indicates sui table over a l l indicated its suitability for better environment. The environmental conditions and hence considered as genotypes IC-413187, IC-413189, IC-413201, IC- stable genotypes, while the genotypes IC-413190, IC-413205, IC-413221 and IC-413238 had regression 413114, IC-413216, IC-413221, IC-413229, IC-coefficient more than unity (bi>1) with significant 413253 and GT-1 had high mean and below average
2deviation from regression coefficient (S di) indicates stability indicates and were recommended for poor unstable over environment. For number of branches environment.
-1plant the genotype IC-413214 showed wider
The genotypes IC-413205 and IC-413221 adaptability as they possessed high mean and had high mean with below average stability (bi<1) regression coefficient near to unity. Diana et al. with non significant deviation from regression (2013) had also reported two stable genotypes in
2coefficient (S di) showed their adaptabilities to poor mustard for number of primary branches. The environment, while the genotypes IC-413190, IC-genotypes IC-413189 and IC-413221 indicated 413197, IC-413201, IC-413114, IC-413216, IC-adaptabilities to better environments and genotypes 413231, IC-413238, IC-413248, JLT-7 and GT-1 IC-413193, IC-413204, IC-413231, IC-413248
2were observed with significant S di. Zenebe and adapted to poor environment. Hussien (2009) showed the high-yielding genotypes
-1In respect to number of capsules plant the Tatte, Mehado-80 and E were unstable and
genotypes indicating IC-413223 and IC-413238 had specifically adapted in sesame. Regarding seed yield -1regression coefficient near to unity indicates wider plant the genotype IC-413223 showed wide
adaptability over all environments. Kumaresan and adaptability to all environments. Nadarajan (2010) evaluated high mean and low interaction effects that are generally adaptable to all environments for number of capsules. While The nine genotypes IC-413189, IC-413190, IC-genotypes IC-413216, IC-413231, IC-413240, IC- 413193, IC-413214, IC-413216, IC-413223, IC-413253 and JLT-7(C) had low mean with regression 413229 and IC-413231 had low mean with non
2coefficient less than unity (bi<1) revealed that it's significant S di showed considerable degree of adaptability specially to poor environments. stability to poor environment. Such type of low mean
with non significant regression coefficient results were also observed by Anuradha and Reddy (2005), Kumar et al. (2006), Kumaresan and Nadarajan (2005), Raghuwanshi et al. (2003) and
The genotype . IC-413223 had high mean with regression coefficient (bi) near to unity indicates wider adaptability for On the basis of mean performance and
-1number of seeds capsule . Cherinet and Tadesse stability analysis the genotype IC 413223 found for (2014) reported that genotype x environment high seed yield and showed wider adaptability and the interaction was significant for number of seeds genotypes IC-413189, IC-413190, IC-413193, IC-
-1 capsule in linseed. While genotypes IC-413187, IC 413214, IC-413216, IC-413221, IC-413229 and IC-413189, IC 413190, IC413193, IC-413216, IC- 413231 were found specially to adapted to poor 413221, IC-413231, IC-413238 and IC-413240 had environments.
Suvarna et al. (2011) reported significant differences for seed yield and identified different promising genotypes in sesame.
Muhammad et al. (2013) reported that the two varieties (V-90005 and PARS-1) had regression coefficients with negative sign and below average response, hence suitable for poor environment Muhammad et conditions and were stable in sesame. al. (2013)
94
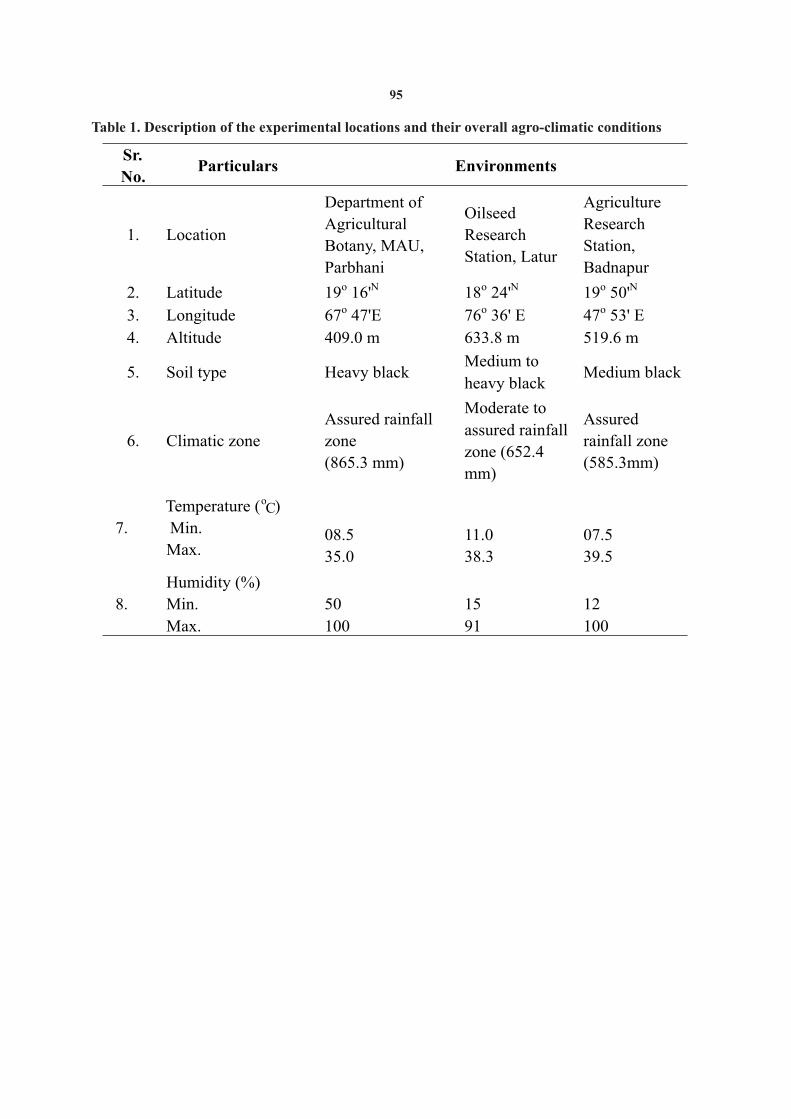
Table 1. Description of the experimental locations and their overall agro-climatic conditions
Sr.
No. Particulars Environments
1. Location
Department of
Agricultural
Botany, MAU,
Parbhani
Oilseed
Research
Station, Latur
Agriculture
Research
Station,
Badnapur
2. Latitude 19o 16'N 18o 24'N 19o 50'N
3. Longitude 67o 47'E 76o 36' E 47o 53' E
4. Altitude 409.0 m 633.8 m 519.6 m
5. Soil type Heavy black Medium to
heavy black Medium black
6. Climatic zone
Assured rainfall
zone
(865.3 mm)
Moderate to
assured rainfall
zone (652.4
mm)
Assured
rainfall zone
(585.3mm)
7.
Temperature ( C)
Min.
Max.
08.5
35.0
11.0
38.3
07.5
39.5
8.
Humidity (%)
Min.
Max.
50
100
15
91
12
100
o
95
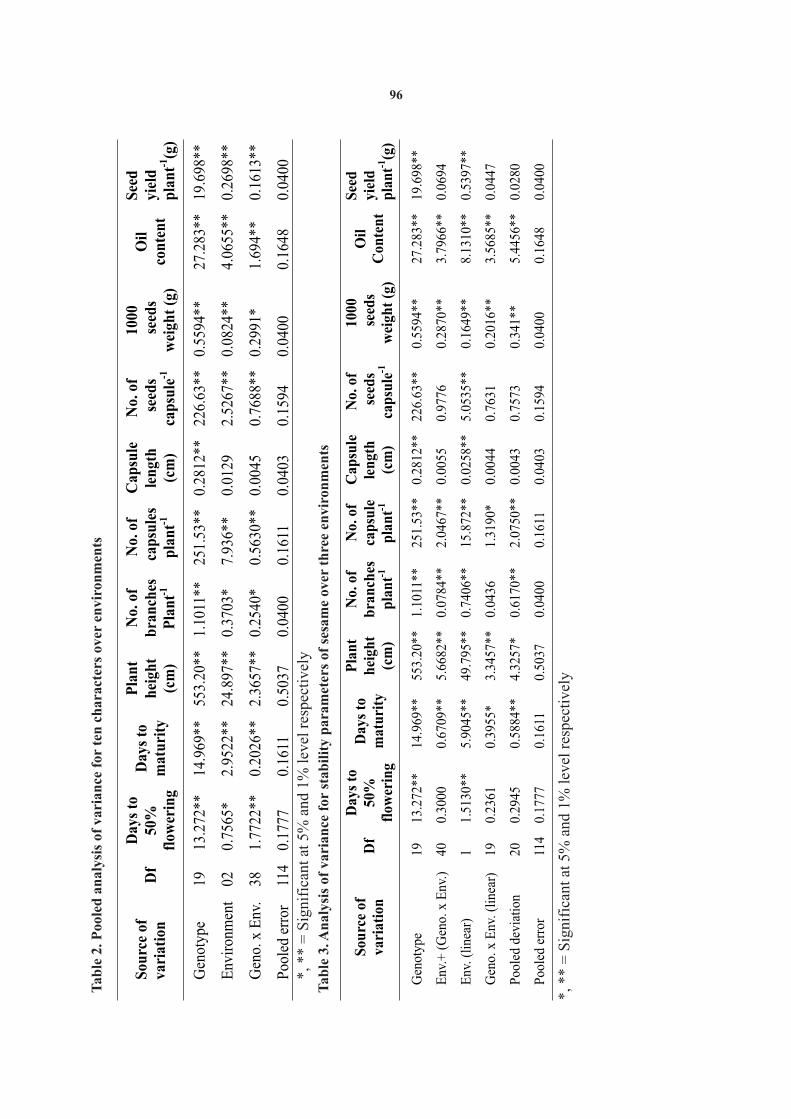
Tab
le 2
. Po
oled
an
aly
sis
of
var
ian
ce f
or
ten
ch
ara
cter
s o
ver
env
iron
men
ts
S
ourc
e of
va
riat
ion
D
f
Day
s to
50
%
flow
erin
g
Day
s to
m
atu
rity
Pla
nt
hei
ght
(c
m)
No.
of
bra
nch
es
Pla
nt-1
No.
of
ca
psu
les
p
lan
t-1
Cap
sule
le
ngt
h
(cm
)
No.
of
se
eds
ca
psu
le-1
1000
se
eds
w
eigh
t(g
)
Oil
co
nte
nt
See
dyi
eld
pla
nt-1
(g)
G
enot
ype
19
13
.272
** 1
4.96
9**
553.
20**
1.
1011
**
251.
53**
0.
2812
**
226.
63**
0.
5594
**
27.2
83**
19
.698
**
E
nvir
onm
ent
02
0.75
65*
2.
9522
** 24
.897
**
0.37
03*
7.93
6**
0.
0129
2.
5267
**
0.08
24**
4.
0655
**
0.26
98**
G
eno.
x E
nv.
38
1.77
22**
0.20
26**
2.36
57**
0.
2540
* 0.56
30**
0.
0045
0.
7688
**
0.29
91*
1.
694*
*
0.16
13**
Poo
led
erro
r11
40.
1777
0.16
110.
5037
0.04
000.
1611
0.04
030.
1594
0.04
000.
1648
0.04
00*
, **
= S
ign
ific
ant
at 5
% a
nd
1%
lev
el r
espe
ctiv
ely
Tab
le 3
. An
aly
sis
of
var
ian
ce f
or
sta
bil
ity
par
am
eter
s o
f se
sam
e o
ver
thre
e en
viro
nm
ents
Sou
rce
of
vari
atio
n
Df
Day
s to
50
%
flow
erin
g
Day
s to
m
atu
rity
Pla
nt
hei
ght
(c
m)
No.
of
bra
nch
es
pla
nt-1
No.
of
ca
psu
le
pla
nt-1
Cap
sule
le
ngt
h
(cm
)
No.
of
se
eds
ca
psu
le-1
1000
se
eds
w
eigh
t(g
)
Oil
C
onte
nt
See
dyi
eld
pla
nt-1
(g)
Gen
otyp
e
19 13
.272
** 14
.969
**
553.
20**
1.
1011
**
251.
53**
0.
2812
**
226.
63**
0.
5594
**
27.2
83**
19.6
98**
Env
.+ (
Gen
o. x
Env
.) 40
0.30
00
0.67
09**
5.
6682
**
0.07
84**
2.
0467
**
0.00
55
0.97
76
0.28
70**
3.
7966
**0.
0694
Env
. (li
near
)
1
1.51
30**
5.90
45**
49
.795
**
0.74
06**
15
.872
**
0.02
58**
5.
0535
**
0.16
49**
8.
1310
**0.
5397
**
Gen
o. x
Env
. (li
near
) 19
0.23
61
0.39
55*
3.34
57**
0.
0436
1.
3190
*
0.00
44
0.76
31
0.20
16**
3.
5685
**0.
0447
Poo
led
devi
atio
n
20 0.
2945
0.
5884
**
4.32
57*
0.
6170
**
2.07
50**
0.
0043
0.
7573
0.
341*
*
5.44
56**
0.02
80
Poo
led
erro
r11
40.
1777
0.16
110.
5037
0.04
000.
1611
0.04
030.
1594
0.04
000.
1648
0.04
00
*, *
* =
Sig
nif
ican
t at
5%
an
d 1
% l
evel
res
pect
ivel
y
96

Ta
ble
4. E
stim
ate
s o
f st
ab
ilit
y p
ara
met
ers
of s
esa
me
over
th
ree
env
iron
men
ts
Sr.
N
o.
Gen
oty
pes
Da
ys
to 5
0%
flo
wer
ing
D
ays
to m
atu
rity
P
lan
t h
eig
ht
(cm
) Nu
mb
er
of
b
ran
ches
p
lan
t-1
Nu
mb
er o
f ca
psu
les
pla
nt-1
Mea
n b
i
S²d
iM
ean
b
i S
²di
M
ean
b
i
S²d
i
Mea
n
bi
S
²di
M
ean
b
iS
²di
1
IC-4
131
87
38.6
6 -0
.89
0.4
8**
84
.88
-0
.87
0.7
5**
11
1.7
3
2.5
7*
10
.45
**
3
.66
1
.97
*
0.0
3*
5
3.2
6
0.1
70.5
4*
*
2
IC-4
131
89
38.3
3 0
.86
-0
.03
84
.61
0.0
9
-0.1
2
116
.35
1.9
5
14
.63
**
4
.26
1
.49
0.0
0
54
.10
-0
.34
0.5
0*
*
3
IC
-4131
90
39.3
3
0.8
6
-0
.03
84
.67
0.0
7
-0
.06
11
1.0
3
-0
.41
-0
.41
3
.96
0
.60
0.0
1
5
5.7
7
-0
.46
0.3
2*
*
4
IC-4
131
93
37.6
6
-1.0
0
-0.1
7
83
.53
-1.1
5
0.0
5
10
6.9
3
-0.9
7
-0.5
0
3.9
0
-1.4
2
-0.0
3
59
.40
-0.4
2-0
.06
5
IC-4
131
97
38.3
3
-1.0
0
-0.1
7
84
.30
-0.1
6
-0.0
1
113
.20
-0.7
6
-0.1
6
4.4
3
-0.2
2
-0.0
3
65
.93
1.2
70.6
5*
*
6
IC-4
132
01
37.3
3
0.8
6
-0.0
3
82
.51
-0.2
0
-0.1
4
10
9.9
3
0.1
6
1.8
0**
4.3
0
-0.5
2
-0.0
3
54
.06
4.3
2*
*1.2
7*
*
7
IC-4
132
04
38.0
0
-1.0
0
-0.1
7
83
.20
-0.5
9
-0.1
2
99
.40
-0.0
0
-0.0
3
3.3
6
-0.3
4
-0.0
3
48
.86
-0.6
00.2
7*
*
8
IC-4
132
05
38.6
6
0.7
5
0.0
2
85
.01
0.2
4
-0.1
3
114
.40
0.7
7
3.1
8*
*
4.5
0
-0.5
2
-0.0
2
54
.26
0.0
30.5
8*
*
9
IC-4
132
14
40.6
6
2.6
2*
-0.1
7
85
.53
0.4
1
-0.0
3
10
7.9
3
-0.4
6
0.3
3
4.2
0
0.7
3
-0.0
3
40
.60
0.2
3-0
.15
10
IC-4
132
16
42.0
0
0.7
5
0.0
2
86
.17
0.3
3
-0.0
1
10
8.0
6
-0.3
8
4.3
9*
*
4.4
6
-0.3
4
-0.0
0
41
.60
-0.0
7-0
.02
11
IC-4
132
21
38.0
0
-1.0
0
-0.1
7
83
.54
-1.0
6
1.0
1**
112
.00
0.7
3
0.7
9**
3.4
6
1.8
0*
-0.0
2
50
.10
-0.0
00.2
6*
*
12
IC-4
132
23
39.0
0
-1.0
0
-0.1
7
84
.44
-0.1
2
-0.1
4
111
.26
-0.3
3
-0.4
7
4.1
4
-1.0
8
-0.0
1
51
.53
0.4
4-0
.15
13
IC-4
132
29
39.0
0
-1.0
0
-0.1
7
84
.68
-0.3
3
-0.0
7
10
9.5
9
-0.4
5
-0.4
5
4.9
3
0.1
4
-0.0
3
52
.40
-0.9
0-0
.15
14
IC-4
132
31
38.6
6
-1.0
0
-0.1
7**
84
.04
-0.8
7
-0.1
6
10
9.2
3
-0.0
6
-0.4
9
3.4
0
-0.2
1
-0.0
1*
*
38
.20
-0.9
9-0
.14
15
IC-4
132
38
46.3
3
2.6
2*
-0.1
6
91
.50
0.8
7
-0.0
7
12
7.6
6
0.5
3
2.3
0**
5.5
2
0.4
3
0.0
5
54
.23
0.4
01.2
7
16
IC-4
132
40
40.6
6
2.7
3*
0.3
7**
86
.53
1.5
9
-0.1
4
112
.63
-0.0
3
-0.4
8
4.2
0
-0.5
2
-0.0
0
42
.26
-0.4
8-0
.13
17
IC-4
132
48
39.3
3
-1.1
1
0.4
8**
89
.73
3.0
1**
-0.0
4
98
.51
-0.7
5
-0.4
4
3.3
0
-0.5
7
-0.0
3
37
.56
0.1
41.9
7*
*
18
IC-4
132
53
40.3
3
-1.1
1
0.4
8**
85
.54
1.1
0
0.1
4**
90
.33
-0.3
4
-0.2
1
4.5
6
-0.4
0
-0.3
3
39
.13
-0.0
80.3
1
19
JL
T-7
(C)
42.6
6-1
.00
-0.1
787
.83
-0.6
1-0
.16
10
0.5
3-0
.89
-0.0
73
.56
-0.4
5-0
.01
33
.70
-0.8
4-0
.11
20
GT
-1(C
)39.3
3-1
.00
-0.1
783
.30
-0.1
80.1
159
.20
-0.8
60.2
82
.80
-0.5
2-0
.03
32
.26
-0.6
10.4
1*
*
Mea
n39.6
185
.27
10
6.2
44
.03
47
.96
*, *
* =
Sig
nifi
can
t at
5%
and
1%
lev
el r
esp
ecti
vely
97

Ta
ble
4. C
ontd
..
Gen
otyp
e
Nu
mb
er o
f se
eds
cap
sule
-1
1000
See
d w
eigh
t (g
)
Oil
con
ten
t (%
)
See
d y
ield
p
lan
t-1
(g)
Mea
n
bi
S
²di
M
ean
bi
S
²di
M
ean
b
i
S²d
i
Mea
n b
i
S²d
i
IC-4
1318
7
57.8
2
2.39
5.
53**
2.6
1
2.02
0.
02*
49
.50
-0
.60
-0
.15
8.
44
1.10
0.
06**
IC-4
1318
9
54.1
6
-0.2
4
0.16
*
2.89
-0
.16
-0
.03
49
.66
-0
.63
0.
02
8.41
0.
32
0.00
IC-4
1319
0
53.0
0
-0.5
6
0.48
** 3
.16
-0
.73
-0
.03
49
.52
-1
.39
0.
21**
8.1
9
-0.2
0
-0.0
1
IC-4
1319
3
52.9
0
-1.4
8
2.68
** 2.
50
-0.0
9
-0.0
3
52.0
8
-0.1
7
1.19
** 7.
80
-1.1
9
-0.0
2
IC-4
1319
7
52.3
3
-0.6
9
-0.1
5
2.63
-0
.36
-0
.04
48
.96
-0
.39
0.
28**
9.60
0.
59
-0.0
3
IC-4
1320
1
53.6
3
3.50
*
-0.0
1
2.60
-0
.09
-0
.03
51
.46
-0
.78
0.
32**
9.13
0.
52
-0.0
3
IC-4
1320
4
46.7
6
-0.1
5
-0.1
1
2.46
-0
.63
-0
.03
49
.60
-1
.60
0.
07
6.40
1.
01
-0.0
4
IC-4
1320
5
62.9
0
-0.1
4
0.02
3.
83
3.52
** -0
.03
52
.88
-0
.46
0.
10
13.5
3
0.13
0.
01
IC-4
1321
4
42.8
8
-0.7
1
-0.0
4
3.30
-0
.00
-0
.03
47
.97
-0
.01
0.
66**
6.14
-0
.53
-0
.03
IC-4
1321
6
48.2
3
-0.2
8
0.12
*
3.62
-0
.71
-0
.04
49
.57
0.
36
0.54
** 7.
40
-0.1
9
0.00
IC-4
1322
1
50.6
3
-0.8
8
0.12
*
3.10
-0
.00
-0
.03
50
.42
-0
.31
-0
.15
7.
71
-0.8
4
-0.0
2
IC-4
1322
3
66.2
0
1.05
-0
.07
3.
33
3.52
** -0
.03
48
.95
-2
.22
-0
.15
10
.36
1.
06
-0.0
3
IC-4
1322
9
51.3
7
-1.6
9
0.40
** 3.
70
-0.0
9
-0.0
3
45.6
8
-1.5
4
-0.1
6
8.50
0.
19
-0.0
3
IC-4
1323
1
59.2
0
0.19
0.
62**
2.83
0.
63
-0.0
3
54.1
7
-0.4
7
1.31
** 6.
06
-0.1
4
-0.0
3
IC-4
1323
8
71.4
3
0.81
1.
14**
2.46
-0
.73
-0
.03
43
.62
-1
.80
1.
07**
15.0
3
-0.0
7
-0.0
4
IC-4
1324
0
70.2
6
0.51
0.
68**
3.33
-1
.27
-0
.03
49
.80
-0
.69
-0
.10
13
.36
-0
.14
-0
.03
IC-4
1324
8
68.8
5
-0
.05
0.
06
2.
76
-0
.73
-0
.03
49
.50
-1
.17
0.
07
9.
16
-0
.33
-0
.03
IC-4
1325
3
71.4
3
-0.6
9
-0.1
5
3.53
-1.2
7
-0.0
3
50.3
0
-0.6
3
1.29
**
11.7
3
-0.2
6
-0.0
2
JLT
-7(C
)
63.5
6
-0.1
4
0.02
2.96
-1.5
4
-0.0
1
52.3
8
-1.1
3
0.18
**
12.2
6
-0.1
5
0.16
**
GT
-1(C
)
60.5
2
-0.7
0
-0.1
1
3.13
-1.2
7
-0.0
3
54.1
2
0.00
0.25
**
10.5
6
-1.3
6
0.55
**
Mea
n57
.92
3.04
50.2
99.
49
*, *
* =
Sig
nifi
can
t at
5%
an
d 1
% l
evel
res
pect
ivel
y
Sr.
N
o.
1
2
3
4
5
6
7
8
9
10
11
12
13
14
15
16
17
18
19
20
98
Kumar, P.S., S. Sasivannan and J. Ganesan, 2006. Stability analysis in REFERENCES .sesame (Sesamum indicum L.). Crop Res. 31(3):394-395.
Kumaresan, D. and N. Nadarajan, 2005. Association of yield with some Anuradha, T. and G.L. Lakshmikanta Reddy, 2005. Phenotypic stability of biometrical and physiological characters over different yield and yield attributes in sesame (Sesamum indicum L.). J environment in sesame (Sesamum indicum L.). Indian J. .Oils .Res. 22(1): 25-28.
Arshad, M., B. Ahmad, A.M. Haggani and Bashier Muhammad, 2003. Agric. Res. 39: 60-63.Kumaresan, D and N. Nadarajan, 2010. Genotype x environment Genotype x Environment Interaction for grain yield in chick
pea (Cicer arietinum L.). Pak. J. Bot. 35(22): 181-186. interactions for seed yield and its components in sesame Cherinet, A. and D. Tadesse, 2014. Study on Genotype x Environment of (Sesamum indicum L.). Elect. J. Plt. Breed. 1(4): 1126-1132.
seed yield, oil content, fatty acid profile and stability analysis Muhammad, Y.M., M.A. Khan, M. Amjad and M.S. Nawaz, 2013. of yield related trait in linseed (Linum usitatissimum L.) in Stability analysis for economic traits in sesame (Sesamum North Western Ethiopia. Int. J. Plt. Breed. Genet., 8 (2): 66-73. indicum L.).
Diana, S., N.B. Singh, T.R. Devi, S.H. Wani, A. Haribhushan, N. G. Singh Raghuwanshi, K.M.S., S.S. Duhoon, B.R. Singh and R.B. Singh, 2003. and J.M. Laishram, 2013. Genotype x environment interaction Genetic variability and correlation, regression studies in in Indian mustard (Brassica juncea L. Czern and coss) under
sesame (Sesamum indicum L.). J. Intera Cademica, 7 (2): 144-Manipur valley conditions. Indian J. Genet., 73(3): 332-334.
146.Eberhart, S.A. and W.S. Russell, 1966. Stability parameters for
comparing varieties. Crop Sci. 6: 36-40. Falconer, D.S. 1981. Introduction to Quantitative Genetics. 2nd ed.
Longman Group Limited, New York. pp. 340.Velu, G. and N. Shunmugavalli, 2005. Genetic variation and genotypes x Krishnaswami and R. Appadurai, 1985. Performance of sesamum
environment interaction in sesame (Sesamum indicum L.). J. genotypes over season at Coimbatore. J. Oils. Res. 2: 134-Oils. Res. 22 (1): 178-179. 136.
Zenebe, M. and M. Hussien, 2009. Study on genotype × environment Kumar, D. 1988. Phenotypic stability for quantitative traits of sesame interaction of yield in sesame (Sesamum indicum L.). J. under rainfed conditions of arid environment. J. Oils. Res. 5:
8-12. Phytol. 1(4): 199-205.
Pak. J. Agric. Res. 26 (3): 168-177.
Suvarna, M., H. Manjunath, S.D. Nehru and A. Manjunath, 2011.
Stability analysis of sesame varieties during early .Indian J.
Agric. Res. 45(3): 244-248.
Rec. on 07.08.2013 & Acc. on 28.07.2014
99
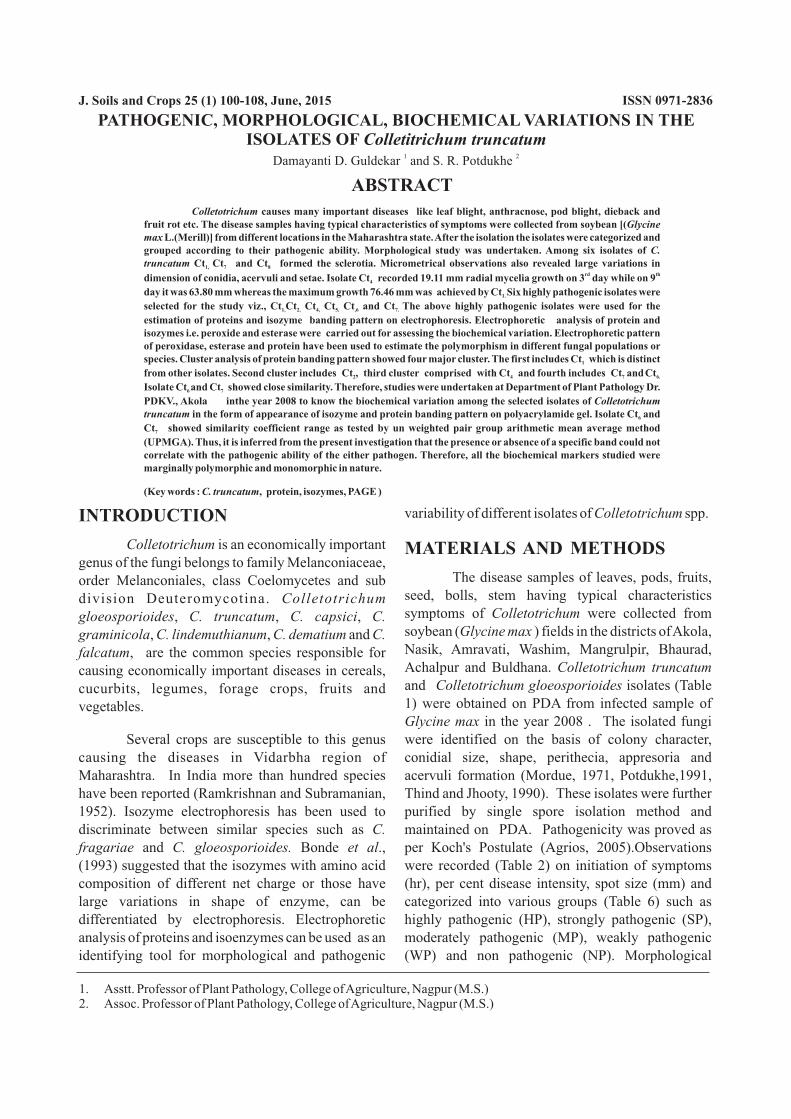
ABSTRACT
Colletotrichum causes many important diseases like leaf blight, anthracnose, pod blight, dieback and fruit rot etc. The disease samples having typical characteristics of symptoms were collected from soybean [(Glycine max L.(Merill)] from different locations in the Maharashtra state. After the isolation the isolates were categorized and grouped according to their pathogenic ability. Morphological study was undertaken. Among six isolates of C. truncatum Ct Ct and Ct formed the sclerotia. Micrometrical observations also revealed large variations in 1, 7 8
rd thdimension of conidia, acervuli and setae. Isolate Ct recorded 19.11 mm radial mycelia growth on 3 day while on 9 4
day it was 63.80 mm whereas the maximum growth 76.46 mm was achieved by Ct Six highly pathogenic isolates were 1.
selected for the study viz., Ct Ct Ct Ct Ct and Ct The above highly pathogenic isolates were used for the 1, 2, 4, 5, ,6 7.
estimation of proteins and isozyme banding pattern on electrophoresis. Electrophoretic analysis of protein and isozymes i.e. peroxide and esterase were carried out for assessing the biochemical variation. Electrophoretic pattern of peroxidase, esterase and protein have been used to estimate the polymorphism in different fungal populations or species. Cluster analysis of protein banding pattern showed four major cluster. The first includes Ct which is distinct 1
from other isolates. Second cluster includes Ct , third cluster comprised with Ct and fourth includes Ct andCt2 4 7 6.
Isolate Ct and Ct showed close similarity. Therefore, studies were undertaken at Department of Plant Pathology Dr. 6 7
PDKV., Akola inthe year 2008 to know the biochemical variation among the selected isolates of Colletotrichum truncatum in the form of appearance of isozyme and protein banding pattern on polyacrylamide gel. Isolate Ct and 6
Ct showed similarity coefficient range as tested by un weighted pair group arithmetic mean average method 7
(UPMGA). Thus, it is inferred from the present investigation that the presence or absence of a specific band could not correlate with the pathogenic ability of the either pathogen. Therefore, all the biochemical markers studied were marginally polymorphic and monomorphic in nature.
(Key words : C. truncatum, protein, isozymes, PAGE )
INTRODUCTION
Colletotrichum is an economically important genus of the fungi belongs to family Melanconiaceae, order Melanconiales, class Coelomycetes and sub division Deuteromycotina. Colletotrichum gloeosporioides, C. truncatum, C. capsici, C. graminicola, C. lindemuthianum, C. dematium and C. falcatum, are the common species responsible for causing economically important diseases in cereals, cucurbits, legumes, forage crops, fruits and vegetables.
Morphological
variability of different isolates of Colletotrichum spp.
MATERIALS AND METHODS
The disease samples of leaves, pods, fruits, seed, bolls, stem having typical characteristics symptoms of Colletotrichum were collected from soybean (Glycine max ) fields in the districts of Akola, Nasik, Amravati, Washim, Mangrulpir, Bhaurad, Achalpur and Buldhana. Colletotrichum truncatum and Colletotrichum gloeosporioides isolates (Table 1) were obtained on PDA from infected sample of Glycine max in the year 2008 . The isolated fungi
Several crops are susceptible to this genus were identified on the basis of colony character, causing the diseases in Vidarbha region of conidial size, shape, perithecia, appresoria and Maharashtra. In India more than hundred species acervuli formation (Mordue, 1971, Potdukhe,1991, have been reported (Ramkrishnan and Subramanian, Thind and Jhooty, 1990). These isolates were further 1952). Isozyme electrophoresis has been used to purified by single spore isolation method and discriminate between similar species such as C. maintained on PDA. Pathogenicity was proved as fragariae and C. gloeosporioides. Bonde et al., per Koch's Postulate (Agrios, 2005).Observations (1993) suggested that the isozymes with amino acid were recorded (Table 2) on initiation of symptoms composition of different net charge or those have (hr), per cent disease intensity, spot size (mm) and large variations in shape of enzyme, can be categorized into various groups (Table 6) such as differentiated by electrophoresis. Electrophoretic highly pathogenic (HP), strongly pathogenic (SP), analysis of proteins and isoenzymes can be used as an moderately pathogenic (MP), weakly pathogenic identifying tool for morphological and pathogenic (WP) and non pathogenic (NP).
1. Asstt. Professor of Plant Pathology, College of Agriculture, Nagpur (M.S.)2. Assoc. Professor of Plant Pathology, College of Agriculture, Nagpur (M.S.)
J. Soils and Crops 25 (1) 100-108, June, 2015 ISSN 0971-2836
PATHOGENIC, MORPHOLOGICAL, BIOCHEMICAL VARIATIONS IN THE ISOLATES OF Colletitrichum truncatum
1 2Damayanti D. Guldekar and S. R. Potdukhe
characters ( Table 3) of 10 isolates pertaining to (1979) observed that C. dematium var. truncatum was colony growth, conidia characters, setae and acervuli responsible for pod blight of soybean and studied its of different Colletotrichum spp. were studied on PDA pathogenicity. Koch et al. (1989), Gaikwad et al. (Table 3). Ten isolates of Colletotrichum belongs to (1993) and Bhale et al. (1999) observed the soybean crop of which nine isolates of symptoms of anthracnose in soybean. Similar work Colletotrichum truncatum and one isolate of C. was conducted by Rathaiah and Sharma (2004) on gloeosporioides. Radial mycelial growth of the leaf spot disease on mungbean caused by fungus was recorded on third, fifth, seventh and ninth Colletotrichum truncatum forming blood red spots of day respectively. The colony diameter was measured 8-11 mm diameter on the upper surface of leaves. in (mm) in two marked directions at right angles to Sharma and Kaushal (2001) categorised eleven each other, passing through the centre of colony. infected leaf sample of urdbean on the basis of colony
characters found by the isolates. Among 10 Dimension of conidia, setae and acervuli
Colletotrichum spp. nine isolates belongs to C. were measured by using ocular micrometer. The
truncatum and one C. gloeosporioides. Similar o b s e r v a t i o n s w e r e b a s e d o n h u n d r e d
studies were carried by Lambat et al. (1969) who conidia/setae/acervuli and the mean size were worked
isolated C. truncatum from soybean seed.out under Olympus 91885 research microscope. Six isolates from C. truncatum species were selected on It is revealed from the observations (Table 2) the basis of aggressiveness for further studies. The that there were differences on initiation of symptom pathogenic isolates were grouped and categorized on
(DAI) ranging from 4 – 8 days depending on aggressiveness of the pathogen. Proteins and isozyme
Colletotrichum species and hosts . Ten markers are the constituents for determination of
Colletotrichum isolates were inoculated on leaves of biochemical variation and pathogenic ability of
soybean to study the pathogenicity. It was observed fungal isolate. These molecular markers are
from the data that Ct , Ct and Ct isolates developed 5 6 7comparatively more stable and reliable than that of the symptoms within 4-5 days recording 72.00 to conventional methods. Therefore, SDS-PAGE 74.00 per cent disease intensity having spot size in the method has been used to estimate the protein and range of 3-4 to 4-5 mm. These isolates produced isozyme pattern of different selected isolates of typical symptoms on leaves with brown margin at Colletotrichum truncatum in the form of appearance centre of spots and categorized as highly pathogenic of isozyme and protein banding pattern on isolates. Similarly Ct and Ct isolates initiated the 1 2polyacrylamide gel. Electrophoresis of protein and symptoms from 4 to 5 days after inoculation with isozyme in polyacrylamide gel was carried out in disease intensity ranged between 70.10 to 72.00 per buffer gel (native PAGE) in vertical gel cent with a characteristics margins on developed electrophoresis using the procedure given by spots and also grouped under highly pathogenic (HP) Sadasivam and Manickam (1996).group. Rest of the isolates were less efficient as
compared to other isolates. The categorization of RESULTS AND DISCUSSIONdifferent isolates was made on the basis of literature of
Beynon et al. (1995) in coffee berry disease caused by The characteristic symptoms under field C. kahawae. Based on the above category further condition most often observed on soybean leaves, investigation were undertaken. Palarpawar and stems, pods and petioles in the form of irregular Ghurde (1994) categorized the isolates of C. shaped brown areas ( Table 2). In advance stages truncatum into two categories as a aggressive and less infected tissues were covered with black fruiting aggressive.bodies (acervuli). Several spots coalesce and
blighting of leaves appeared, on pods and pedicel, C. truncatum isolates exhibited variations dark brown lesions consisting of acervuli and setae
(Table 3) among the same species collected from were also observed. Under artificial conditions, different geographical areas in the form of colony circular brown spots with dark brown margin all over colour with circular growth, sickle shaped conidia the leaf area was observed. C. truncatum was isolated and acervuli formation. Isolates Ct , Ct , Ct , Ct and from soybean seed (Lambat et al., 1969), Girard 1 2 4 6
101
Ct exhibited thick black colony colour with grey µm and 94.6 x 5.43 µm in Ct . It clearly indicates the 7 6
variation in size among these isolates collected from mycelium, circular growth forming concentric rings, different geographical areas. Potdukhe (1991) studied with sickle shaped conidia. Acervuli were prominent
and bigger in size, whereas isolate Ct exhibited dark the size of acervuli, setae and conidia. Maximum 5
conidial size was measured in isolate Ct i.e. 28.60 x brown to black with a felt of grey mycelium. Acervuli 3
were minute in size ( Ct ) as compared to other Ct 4.97 µm whereas minimum in Cg 8.29 x 3.86 µm. 6 5
isolates. Conidia falcate, apices obtuse and globulate However, variable size in acervuli was also noticed at the centre, conidial mass was honey coloured and with maximum in Cg (292.96 x 239.11 µm) while the sclerotia formed in abundance. Acervuli were minimum in Cg (60.80 x 61.99 µm). The 4
sparse at the margin and aggregated in the centre micrometrical data of present study coincides with the forming concentric rings were observed in isolate Ct C. 1 reports published by Sirsat (1970) in and Ct . These cultural characteristics on morphology gloeosporioides recording variation in size, shape and 4
and the differences in micrometry i.e. dimension of mean size of conidia ranging between 14.83 x 5.42µ, conidia, setae and acervuli revealed the variability. Mordue (1971) in C. dematium with16 to 30 x 2.5 to These variations coincides with the reports of Sharma 4.0 µ in size of conidia, Sharma and Kausal (2001) in and Kausal (2001) in Vigna mungo and McGhee C. truncatum and Dhambhare (1981) in C. (1992) in soybean. The isolates of C. gloeosporioides gloeosporioides with 8-10 to 10-12 µ conidial size (Cg ) showed grayish white to dark grey coloured and Potdukhe (1991) reported the variation in size of 1
conidia in C. gloeosporioides and C. capsici. The colonies with abundant grayish mycelium. Conidia were hyaline oblong, one celled with the presence of results of the present investigation showed the conspicuous oil globule at the centre. Sirsat (1970) existence of the variability among all the isolates in observed similar colony character and conidial relation to dimension to conidia, setae and acervuli morphology of C. gloeosporioides of papaya isolate. and significant variation in conidial dimension of
different C. casici isolates was reported by Akhtar Colletotrichum truncatum (Ct ) recorded 4 Jameel and Singh (2007).
rd19.11 mm radial mycelial growth (Table 4) on 3 day
th The pathogenicity of Colletotrichum spp. while on 9 day it was 63.80 mm whereas, the was tested on various respective host from which they maximum growth i.e. 76.46 mm was achieved by Ct . 1
were originally isolated. Only C. truncatum and C. The radial mycelial growth of colonies in all the capsici were categorized on the basis of isolate indicated the variation as they showed the aggressiveness as highly pathogenic, weakly ability to utilize the nutrient at different proportion pathogenic, moderately pathogenic and non through their metabolic activities. Maximum growth pathogenic (Table 6). The categorization of different was attained by Cg (84.86 mm) while minimum was 2
isolates was made on the basis of literature of Beynon recorded by Ct isolate (54.90 mm). Thus, the rate 7
et al. (1995) in coffee berry disease caused by C. and magnitude of growth on PDA clearly establish the kahawae. Based on the above category further facts that all the isolate differed from each other. This investigation were undertaken. Palarpawar and may be because of differences in their abilities to Ghurde (1994) categorized the isolates of C. utilize nutrient present in medium. Akhtar Jameel and truncatum into two categories as a aggressive and less Singh (2007) reported the differences in radial aggressive. Zuiefield et al. (1977) classified 18 mycelial growth on PDA of C. capsici.isolates of Fusarium oxysporium f.sp. narcissi based on their pathogenic behaviour as virulent, avirulent Micrometrical observations (Table 5) and low virulent. Giri (2002) classified four groups of revealed the differences among the isolates of
Colletotrichum spp. causing diseases to different Fusarium udum as highly pathogenic, weakly hosts. However, C. truncatum conidial length and pathogenic, moderately pathogenic and strongly breadth ranges between 23.39–27.31 x 3.74 - 5.03 µm pathogenic. Choi et al. (2011) also studied the while Ct had 27.31 x 4.57 µm. The measurement of pathogenicity of C. panacicola causing anthracnose 1
acervuli was ranged from 75.27 – 292.96 x 74.61 – of korcan ginseng. Girard (1979) observed that C. 239.11µm length and breadth. The dimension of setae dematium var. truncatum was responsible for pod was measured in the range of 59.77 – 170 x 3.80 – 7.15 blight of soybean and studied its pathogenicity.
102

Gaikwad et al. (1993) and Bhale et al. (1999) This indicates the variation though isolate belongs to observed the symptoms of anthracnose in soybean. same species, but exhibiting the biochemical Similar work was also conducted by Rathaiah and variations. There is no existence correlation with the Sharma (2004) on leaf spot disease on mungbean bands and pathogenic ability of isolates. Significant caused by Colletotrichum truncatum forming blood variation was observed among the six isolates with red spots of 8-11 mm diameter on the upper surface of respect to protein and esterase pattern. Variations in leaves. Sharma and Kaushal (2001) categorised banding pattern of isozymes were observed in eleven infected leaf samples of urdbean on the basis Colletotrichum truncatum. Similar observations were of colony characters found in the isolates. Rojas et al. recorded by Zuber and Manibhushanrao (1982) who (2010) studied pathogenecity of C. gloeosporioides in reported marked variation in five isolates of R. solani bromacacao. and observed no correlation in enzyme pattern and
virulence of the isolates. No correlation was Electrophoretic banding pattern of proteins obtained with the enzyme pattern and virulence of the
from different Colletotrichum truncatum of soybean isolates. The data in respect of virulence or contained 17 protein bands of different molecular aggressiveness does not correlates with the presence weight with Rm value ranging from 0.08 to 0.77. or absence of any isozyme bands. These results Isolate Ct exhibited only Pt band, whereas Ct 7 4 5 support the present investigation on this studies could exhibited only Pt band (Rm value 0.21). The not ascertain any correlation with banding pattern and 6
pathogenic ability of isolates. presence and absence of protein band in all the isolates showed the variation among the six isolates of
Cluster analysis of protein banding pattern C. truncatum. exhibited four major clusters among six isolates.
Data presented in table7, plate 1 and fig. 1 on Isolate Ct and Ct showed close similarity. While 6 7
electrophoretic banding pattern of proteins from peroxidase and esterase showed short similarity different Colletotrichum truncatum of soybean coefficient range as tested by UPMGA. Uma Devi et contained 17 protein bands of different molecular al. (2001) reported the variability on the basis of weight with Rm value ranging from 0.08 to 0.77. isozyme and protein profile in twelve isolates of Isolate Ct exhibited only Pt band, whereas Ct Ascochyta rabiae. Biochemical markers were found 7 4 5
exhibited only Pt band (Rm value 0.21). The to be supplementary to prove the heterogenity among 6
the tested six isolates from each group. Isozyme presence and absence of protein band in all the pattern of polyphenol oxidases, peroxidases, acetyl isolates showed the variation among the six isolates of esterases, acid and alkali phosphate in mycelia and C. truncatum.extra cellular extracts were used to differentiate the
With regard to peroxidase and esterase avirulent and virulent isolates of Rhizoctonia solani showed ( Table 8, plate 2 and fig. 2) above similarity by PAGE.and all the isolates of Colletotrichum truncatum were
A phylogenetic tree (dendrogram) was grouped closely and exhibited the very short constructed based on protein pattern profile by cluster similarity coefficient range on the basis of peroxidase method using unweighted pair group arithmetic mean and esterase. Banding pattern of peroxidase in isolate average method (UPMGA). Cluster analysis of Ct and Ct exhibited five isozyme bands, whereas Ct 1 4 2
protein banding pattern showed four major clusters. exhibited 4 bands, while Ct and Ct showed only two 5 6
The first includes Ct which is distinct from other 1bands in Colletotrichum truncatum.isolates. The second cluster consists of Ct which is 2
The isozyme pattern of esterase are shown in also distinct with other. The third comprised Ct 4
table 9 plate 3 and fig. 3. Six esterase isozyme bands while the fourth comprised sub cluster of two isolates were observed in isolate Ct , Ct , Ct and Ct ranging 1 2 4 5 i.e. Ct , Ct and Ct at separate place. Isolates Ct and 7 6 5 6
the Rm value from 0.09 to 0.44 whereas isolate Ct 6 Ct showed close similarity while in C. capsici short 7
exhibited five bands of esterase isozyme and absence similarity coefficient range was observed. of E of 0.44 Rm value. Isolate Ct liberated only three 6 7 Phylogenetic relationship of Colletotrichum esterase bands with an absence E , E and E bands. acutatum have been reported by Garrido et al. ( 2009), 3 5 6
103
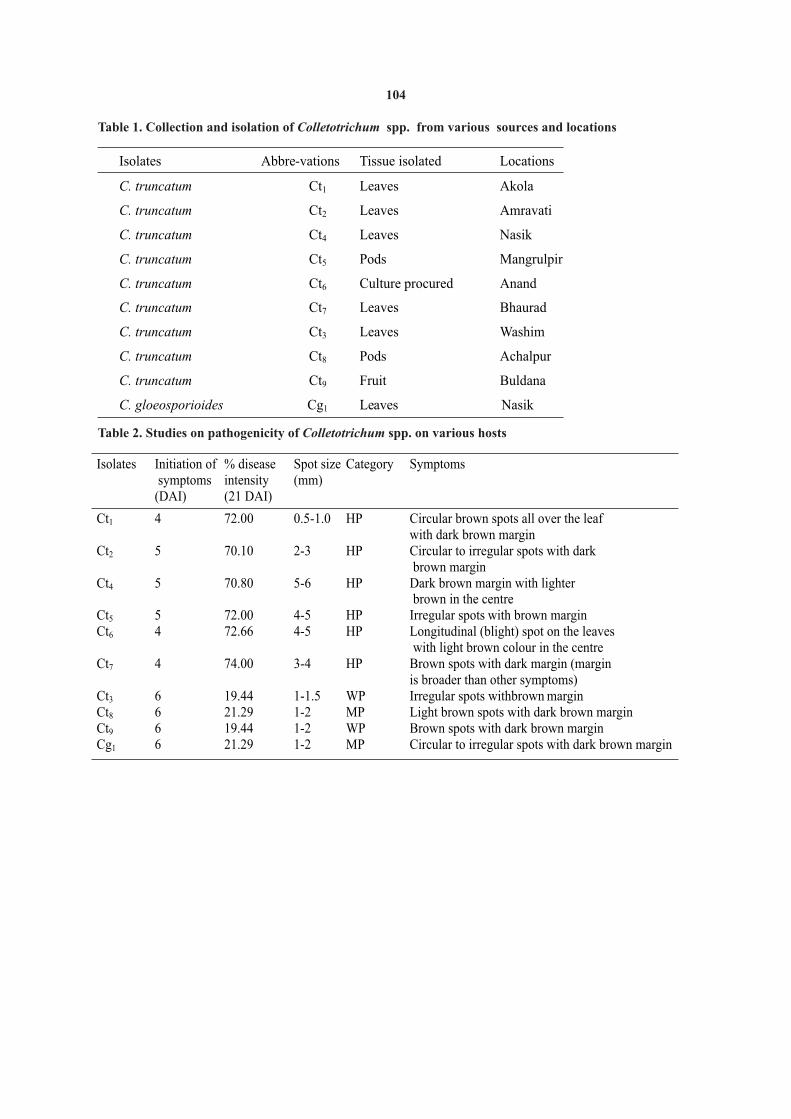
Table 1. Collection and isolation of Colletotrichum spp. from various sources and locations
Isolates Abbre-vations Tissue isolated Locations
C. truncatum Ct1 Leaves Akola
C. truncatum Ct2 Leaves Amravati
C. truncatum Ct4 Leaves Nasik
C. truncatum Ct5 Pods Mangrulpir
C. truncatum Ct6 Culture procured Anand
C. truncatum Ct7 Leaves Bhaurad
C. truncatum Ct3 Leaves Washim
C. truncatum Ct8 Pods Achalpur
C. truncatum Ct9 Fruit Buldana
C. gloeosporioides Cg1 Leaves Nasik
Table 2. Studies on pathogenicity of Colletotrichum spp. on various hosts
Isolates Initiation of symptoms (DAI)
% disease intensity (21 DAI)
Spot size (mm)
Category Symptoms
Ct1 4 72.00 0.5-1.0 HP Circular brown spots all over the leaf with dark brown margin
Ct2 5 70.10 2-3 HP Circular to irregular spots with dark brown margin
Ct4 5 70.80 5-6 HP Dark brown margin with lighter brown in the centre
Ct5 5 72.00 4-5 HP Irregular spots with brown margin Ct6 4 72.66 4-5 HP Longitudinal (blight) spot on the leaves
with light brown colour in the centre Ct7 4 74.00 3-4 HP Brown spots with dark margin (margin
is broader than other symptoms) Ct3 6 19.44 1-1.5 WP Irregular spots withbrown margin Ct8 6 21.29 1-2 MP Light brown spots with dark brown margin Ct9 6 19.44 1-2 WP Brown spots with dark brown margin Cg1 6 21.29 1-2 MP Circular to irregular spots with dark brown margin
104

Tab
le 3
. M
orp
hol
ogic
al c
har
acte
rs o
f C
olle
totr
ich
um
tru
nca
tum
on
PD
A
Isol
ates
G
eogr
aphi
cal
trac
ks
Col
ony
char
acte
rs
Con
idia
l ch
arac
ters
A
cerv
uli
Iden
tifi
cati
on o
f
isol
ate
Ct 1
A
kola
C
olon
y m
ediu
m, t
hick
, bla
ck i
n co
lour
, cir
cula
r, w
hite
m
ycel
ium
in
conc
entr
ic r
ings
for
mat
ion,
whi
te p
atch
es f
orm
in
betw
een
colo
ny, m
ediu
m a
cerv
uli
prod
ucti
on, s
low
gro
wth
, re
vers
e ba
ck g
rey
blac
k in
col
our.
Con
idia
sic
kle
shap
e, h
yali
ne p
oint
ed a
t bo
th e
nds,
con
idia
pin
kish
whe
n in
mas
s, o
il
glob
ules
at
the
cent
re.
Ace
rvul
i pr
omin
ent
wit
h lo
ng
seta
e C
.tru
ncat
um
Ct 2
A
mra
vati
C
olon
y m
ediu
m t
o th
ick,
aer
ial,
gre
y m
ycel
ial
grow
th f
orm
s co
ncen
tric
rin
gs, c
ircu
lar,
rev
erse
bac
k bl
ack
in c
olou
r.
Con
idia
sic
kle
shap
e, h
yali
ne p
oint
ed a
t bo
th e
nds,
con
idia
lig
ht p
inki
sh w
hen
in
mas
s, o
il g
lobu
les
at t
he c
entr
e.
Ace
rvul
i bi
gger
in
size
an
d sp
arse
gro
wth
at
the
mar
gin
and
aggr
egat
ed i
n th
e ce
ntre
for
min
g co
ncen
tric
rin
gs.
C.t
runc
atum
Ct 4
N
asik
C
olon
y co
lour
bla
ck, c
ircu
lar
grow
th, c
once
ntri
c ri
ngs,
fo
rmat
ion
of a
cerv
uli
min
ute,
ove
rall
app
eara
nce
give
s sh
inin
g,
reve
rse
back
dar
k bl
ack
in c
olou
r.
Con
idia
sic
kle
shap
ed, h
yali
ne, p
oint
ed a
t bo
th e
nds,
con
idia
l m
ass
ligh
t pi
nkis
h in
co
lour
, oil
glo
bule
s at
the
cen
tre.
Ace
rvul
i sm
alle
r in
siz
e an
d sp
arse
gro
wth
at
the
mar
gin
and
aggr
egat
ed i
n th
e ce
ntre
for
min
g co
ncen
tric
rin
gs.
C.t
runc
atum
Ct 5
M
angr
ulpi
r
Col
ony
colo
ur d
ark
brow
n to
bla
ck w
ith
a fe
lt o
f gr
ayis
h m
ycel
ium
thr
ough
whi
ch t
he t
ufte
d to
irr
egul
ar o
ften
con
flue
nt
blac
k sc
lero
tial
pro
trud
e oc
casi
onal
ly w
ith
scat
tere
d tu
fts
to
pale
gre
y to
whi
te.
Con
idia
fal
cate
, api
ces,
obt
use,
glu
ttul
ate,
oi
l gl
obul
e at
the
cen
tre.
Con
idia
l m
ass
hone
y co
lour
ed.
Scl
erot
ia f
orm
ed i
n ab
unda
nce
C
.tru
ncat
um
Ct 6
A
nand
C
olon
y gr
owth
cir
cula
r, g
rey,
con
cent
ric
ring
s, m
inut
e ac
ervu
li,
reve
rse
back
gra
yish
bla
ck i
n co
lour
. C
onid
ia s
ickl
e sh
aped
, hya
line
, acu
te e
nds,
co
nidi
al m
ass
ligh
t pi
nkis
h in
col
our,
oil
gl
obul
es a
t th
e ce
ntre
.
Ace
rvul
i m
inut
e C
.tru
ncat
um
Ct 7
B
haur
ad
Col
ony
grow
th c
ircu
lar,
gre
y, c
once
ntri
c ri
ngs,
whi
te p
atch
es
are
form
ed i
n be
twee
n co
lony
. Rev
erse
bac
k gr
ayis
h bl
ack
in
colo
ur.
Con
idia
sic
kle
shap
ed, h
yali
ne, p
oint
ed
acut
e en
ds, f
lask
sha
ped
scle
roti
al
form
atio
n, o
il g
lobu
les
at t
he c
entr
e.
Big
ace
rvul
i sp
arse
at
the
mar
gin
C
.tru
ncat
um
Ct 3
W
ashi
m
Col
ony
med
ium
to
thic
k, a
eria
l, w
hite
myc
elia
l gr
owth
for
m
conc
entr
ic r
ings
wit
h sc
lero
tia
l fo
rmat
ion,
col
ony
gray
ish
type
, re
vers
e ba
ck g
rayi
sh b
lack
in
colo
ur.
Con
idia
sic
kle
shap
e, h
yali
ne, p
oint
ed a
t bo
th e
nds,
con
idia
lig
ht p
inki
sh w
hen
in
mas
s, o
il g
lobu
les
at t
he c
entr
e.
Ace
rvul
i bi
gger
in
size
and
ag
greg
ated
in
the
cent
re a
nd
spar
se a
t th
e m
argi
n. A
cerv
uli
form
s co
ncen
tric
rin
gs.
C.t
runc
atum
Ct8
Ach
alpu
r
Aer
ial m
ycel
ial g
row
th, d
ark
gray
ish
in c
olou
r, ir
regu
lar
grow
th, r
ever
se b
ack
dark
bla
ck.
Con
idia
l mas
s li
ght p
ink
in c
olou
r, si
ckle
sh
aped
con
idia
wit
h fl
ask
shap
ed s
cler
otia
, oi
l glo
bule
s at
the
cent
re.
Ace
rvul
i dar
k bl
ack
in c
olou
r, er
upti
ng u
pwar
d.
C.tr
unca
tum
Ct 9
B
ulda
na
Col
ony
grow
th a
eria
l, da
rk b
lack
in c
olou
r, ci
rcul
ar, r
ever
se
back
dar
k bl
ack.
L
ight
pin
k co
lour
con
idia
l mas
s ha
ving
ob
tuse
end
s w
ith
sick
le s
hape
d co
nidi
a w
ith
sler
otia
l for
mat
ion,
fla
sk s
hape
d, o
il
glob
ules
at t
he c
entr
e.
Ace
rvul
i med
ium
siz
e.
C.c
apsi
ci
Cg 1
N
asik
C
olon
y ci
rcul
ar, a
eria
l myc
eliu
m, c
olon
y co
lour
whi
te to
dul
l w
hite
. C
onid
ia h
yali
ne, o
blon
g, o
ne c
elle
d,
Con
idia
l mas
s, p
inki
sh in
col
our
A
cerv
uli d
ark
and
show
ed
slig
htly
rai
sed
coni
dial
mas
s.
Set
ae n
ot c
lear
ly o
bser
ved.
C.g
loeo
spor
ioid
es
105
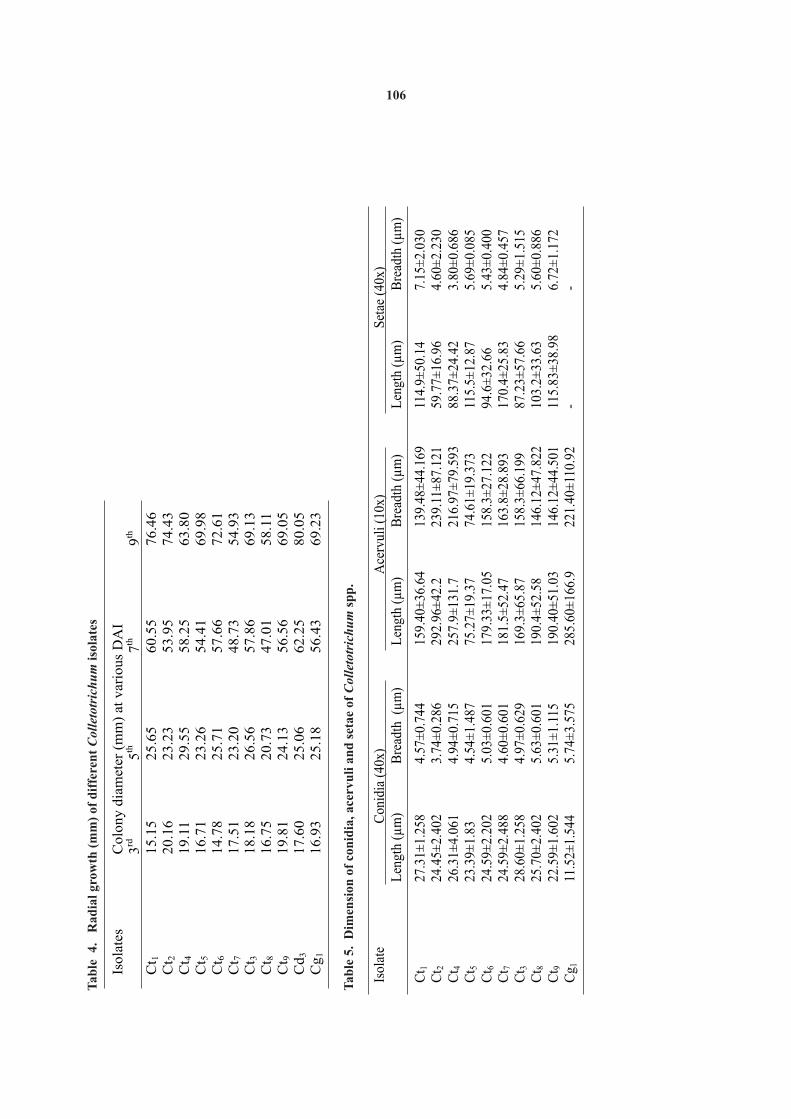
Tab
le 4
. R
adia
l gr
owth
(m
m)
of d
iffe
ren
t C
olle
totr
ich
um
iso
late
s
Isola
tes
Colo
ny d
iam
eter
(m
m)
at v
ario
us
DA
I 3
rd
5th
7th
9th
Ct 1
15.1
5
25.6
5
60.5
5
76.4
6
Ct 2
20.1
6
23.2
3
53.9
5
74.4
3
Ct 4
19.1
1
29.5
5
58.2
5 63.8
0
Ct 5
16.7
1
23.2
6
54.4
1
69.9
8
Ct 6
14.7
8
25.7
1
57.6
6
72.6
1
Ct 7
17.5
1
23.2
0
48.7
3
54.9
3
Ct 3
18.1
8
26.5
6
57.8
6
69.1
3
Ct 8
16.7
5
20.7
3
47.0
1
58.1
1
Ct 9
19.8
1
24.1
3
56.5
6
69.0
5
Cd
3
17.6
0
25.0
6
62.2
5
80.0
5
Cg
116.9
325.1
856.4
369.2
3
Tab
le 5
. D
imen
sion
of
con
idia
, ace
rvu
li a
nd
set
ae o
f C
olle
totr
ich
um
sp
p.
Isol
ate
Con
idia
(40
x)A
cerv
uli (
10x)
Set
ae (
40x)
Len
gth
(µm
)B
read
th(µ
m)
Len
gth
(µm
)B
read
th (
µm
)L
engt
h (µ
m)
Bre
adth
(µ
m)
Ct 1
27
.31±
1.25
8 4.
57±
0.74
4 15
9.40
±36
.64
139.
48±
44.1
69
114.
9±50
.14
7.15
±2.
030
Ct 2
24
.45±
2.40
2 3.
74±
0.28
6 29
2.96
±42
.2
239.
11±
87.1
21
59.7
7±16
.96
4.60
±2.
230
Ct 4
26
.31±
4.06
1 4.
94±
0.71
5 25
7.9±
131.
7 21
6.97
±79
.593
88
.37±
24.4
2 3.
80±
0.68
6 C
t 5
23.3
9±1.
83
4.54
±1.
487
75.2
7±19
.37
74.6
1±19
.373
11
5.5±
12.8
7 5.
69±
0.08
5 C
t 6
24.5
9±2.
202
5.03
±0.
601
179.
33±
17.0
5 15
8.3±
27.1
22
94.6
±32
.66
5.43
±0.
400
Ct 7
24
.59±
2.48
8 4.
60±
0.60
1 18
1.5±
52.4
7 16
3.8±
28.8
93
170.
4±25
.83
4.84
±0.
457
Ct 3
28
.60±
1.25
8 4.
97±
0.62
9 16
9.3±
65.8
7 15
8.3±
66.1
99
87.2
3±57
.66
5.29
±1.
515
Ct 8
25
.70±
2.40
2 5.
63±
0.60
1 19
0.4±
52.5
8 14
6.12
±47
.822
10
3.2±
33.6
3 5.
60±
0.88
6 C
t 9
22.5
9±1.
602
5.31
±1.
115
190.
40±
51.0
3 14
6.12
±44
.501
11
5.83
±38
.98
6.72
±1.
172
Cg 1
11
.52±
1.54
4 5.
74±
3.57
5 28
5.60
±16
6.9
221.
40±
110.
92
- -
106
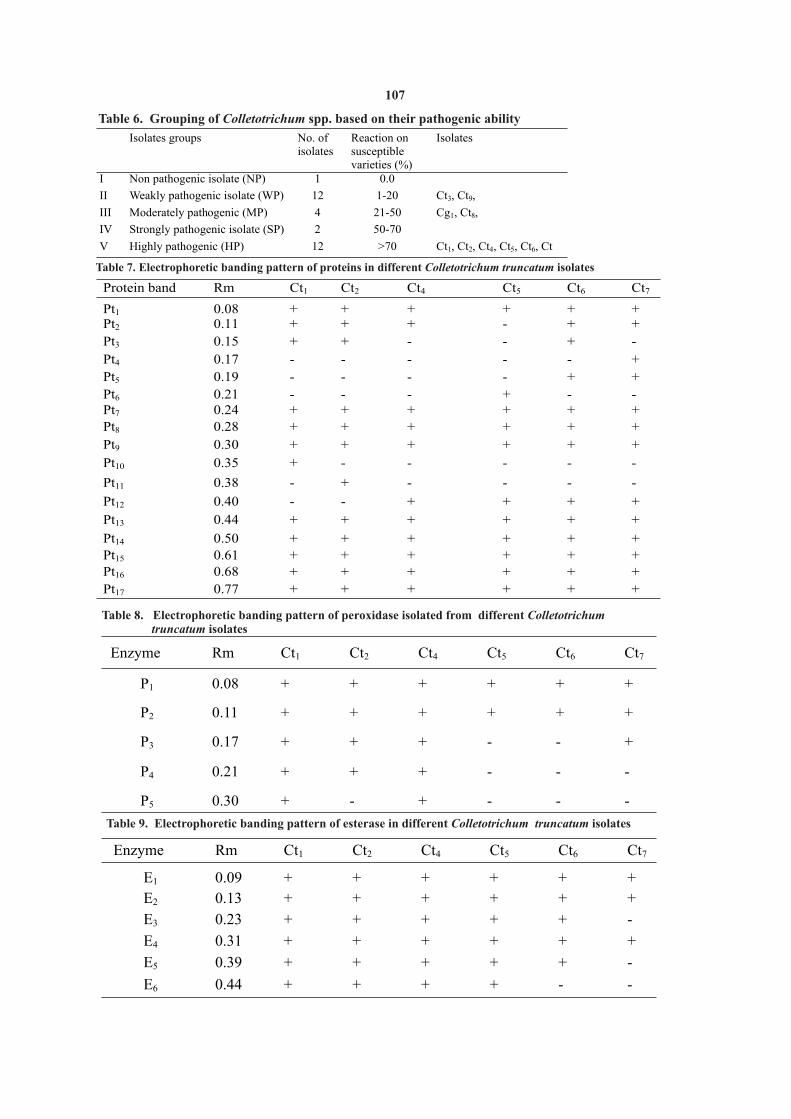
Table 8. Electrophoretic banding pattern of peroxidase isolated from different Colletotrichum truncatum isolates
Enzyme Rm Ct1 Ct2 Ct4 Ct5 Ct6 Ct7
P1 0.08 + + + + + +
P2 0.11
+
+
+
+
+
+
P3
0.17
+
+
+
-
-
+
P4
0.21
+
+
+
-
-
-
P5
0.30
+
-
+
-
-
-
Table 9. Electrophoretic banding pattern of esterase in different Colletotrichum truncatum isolates
Enzyme
Rm
Ct1
Ct2
Ct4
Ct5
Ct6 Ct7
E1
0.09
+
+
+
+
+
+
E2
0.13
+
+
+
+
+
+
E3
0.23
+
+
+
+
+
-
E4 0.31 + + + + + +
E5 0.39 + + + + + -
E6 0.44 + + + + - -
Table 6. Grouping of Colletotrichum spp. based on their pathogenic ability
Isolates groups No. of isolates
Reaction on susceptible varieties (%)
Isolates
I
Non pathogenic isolate (NP)
1 0.0
II
Weakly pathogenic isolate (WP)
12
1-20
Ct3, Ct9,
III
Moderately pathogenic (MP)
4
21-50
Cg1, Ct8,
IV
Strongly pathogenic isolate (SP)
2
50-70
V Highly pathogenic (HP) 12 >70 Ct1, Ct2, Ct4, Ct5, Ct6, Ct
Table 7. Electrophoretic banding pattern of proteins in different Colletotrichum truncatum isolates
Protein band Rm Ct1 Ct2 Ct4 Ct5 Ct6 Ct7
Pt1 0.08 + + + + + + Pt2 0.11 + + + - + + Pt3 0.15 + + - - + - Pt4 0.17 - - - - - + Pt5 0.19 - - - - + + Pt6 0.21 - - - + - - Pt7 0.24 + + + + + + Pt8
0.28
+
+
+
+
+
+
Pt9 0.30
+
+
+
+
+
+
Pt10
0.35
+
-
-
-
-
-
Pt11
0.38
-
+
-
-
-
-
Pt12
0.40
-
-
+
+
+
+
Pt13
0.44
+
+
+
+
+
+
Pt14
0.50
+
+
+
+
+
+
Pt15
0.61
+
+
+
+
+
+
Pt16
0.68
+
+
+
+
+
+
Pt17 0.77 + + + + + +
107

Ct1 Ct2 Ct4 Ct5 Ct6 Ct7Rmvalue Ct1 Ct2 Ct4 Ct5 Ct6 Ct7
P1 0.08
P2 0.11
P3 0.17
P4 0.21
P5 0.30
Ct1 Ct2 Ct4 Ct5 Ct6 Ct7Rmvalue Ct1 Ct2 Ct4 Ct5 Ct6 Ct7
E1 0.09
E2 0.13
E3 0.23
E4 0.31
E5 0.39
E6 0.44
Plate 2. Peroxidase banding pattern in the isolates of Colletotrichum truncatum
Fig 2. Peroxidase isozyme zymogram in the isolates of Colletotrichum truncatum
Plate 3. Electrophoretic banding pattern of esterase isolates from Colletotrichum truncatum Fig 3. Esteraseisozyme zymogrm in the isolates
of Colletotrichum truncatum
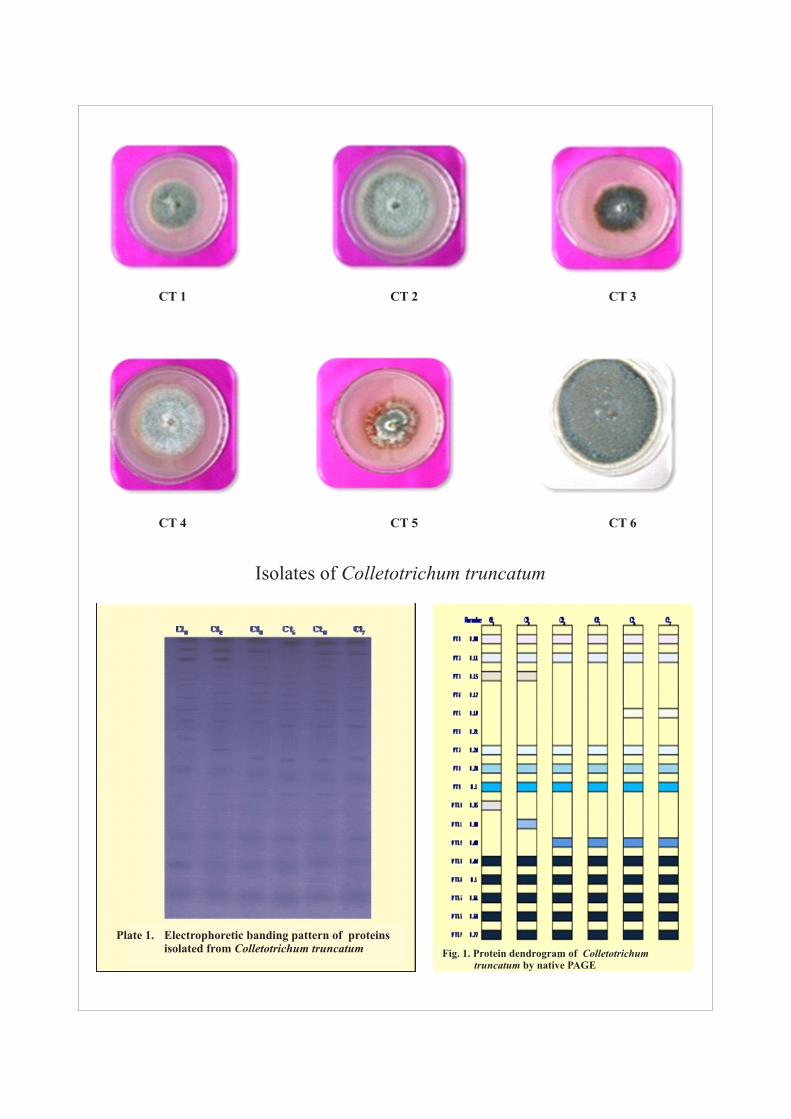
Isolates of Colletotrichum truncatum
CT 1 CT 2 CT 3
CT 4 CT 5 CT 6
Plate 1. Electrophoretic banding pattern of proteins isolated from Colletotrichum truncatum Fig. 1. Protein dendrogram of Colletotrichum
truncatum by native PAGE

Thesis ( Unpublished) submitted to Dr. PDKV, Akola.Glomerella sp. in apple by Giaretto et al. (2010), Hemelrijk, W. Van, J. Debode, K. Heungens, M. Maes and P. Creemers,
Colletotrichum isolates in strawberry by Hemelrijk 2010. Phenotypic and genetic characterization of Colletotrichum isolates from Begian strawberry fields. Plant (2010) and C. boninense in avocado by Silva et al. Pathol 59: 853-861.
(2011). Thus, it is inferred from the present Lambat, A. K., S. P. Raichoudhari, V. C. Lele and R. P. Nath, 1969. Fungi intercepted to imported soybean seed. Indian Phytopath. 23 (3) investigation that the presence or absence of a : 327-330.
specific band could not correlate with the pathogenic Mc Ghee, D.C. 1992. Soybean diseases A reference source for seed technologist.Minnesota (USA) published by American ability of the either pathogen. Therefore, all the Phytopathological Society, pp.3-7.
biochemical markers studied were marginally Mordue , J.E. M. 1971. CMI description of pathogenic fungi and bacteria in set No. 32,315,317. CMI, UK.polymorphic and monomorphic in nature.
Palarpawar, M.Y. and V. R. Ghurde, 1994. Variability in Colletotrichum curcumae the incitent of leaf spot of turmeric in Vidarbha.Indian Phytopath. 47 (2): 207-210.REFERENCES
Potdukhe, S. R. 1991. Variation in isolates of two species of Colletotrichum. PKV Res. J. 15 (2) : 162-163.
th Ramkrishnan, K. and C.V. Subramanian, 1952. Fungi of India 1938-Agrios, G.N. 2005. Plant Pathology. Elsevier Publication 5 Edition. 1951. J. Madras Univ. 22B: 250-252.391-396.
Rathaiah, Y. and Sangib K. R. Sharma, 2004. A new spot disease on Akhtar Jameel and M.K.Singh, 2007. Studies on the variability in mungbean caused Colletotrichum truncatum. J. Mycol. Pl. Colletotrichum capsici causing Chilli anthracnose. Indian Pathol. 34 (2): 176- 178.
Phytopath., 60 (1): 63-67.Rojas, E. I., S. A. Rehner, G. J. Samuels, S. A. Van Bael, and E. A. Herro,
Beynon, S.M., A. L. Coddingston, B. G. Lewis and V. Vorzea, 1995. 2010. Colletotrichum gloeosporioides S1 associated with Genetic variation in the coffee berry disease pathogen Theobrome cacao and other plants in Pnama: multilocus Colletotrichum kahawae. Physiological and Molecular Plant phylogenies distinguish and endophytic clades. Mycologia Pathology, 46 (6): 457-470.102: 1318 – 1338. Bhale, M.S., N. D. Raut and D. Khare, 1999. Working sheet of seed borne
Sadasivam, S. and A. Manickam, 1996. Biochemical method. II Edn. (P), disease of soybean. Published by National Seed Project Crops), IARI, New Delhi, pp.1-4. Ltd., Publishers and TNAU, Coimbatore.
Bonde, M. R., J. A. Micales and G.L. Peterson, 1993. The use of isozyme Sharma, Rajan and R.P.Kaushal, 2001. Cultural and morphological analysis for identification of plant pathogenic fungi. Plant Dis. variability in Colletotrichum truncatum, a leaf spot pathogen 10: 961 - 968. of urdbean (Vigna mungo (L.) Hepper). J. Mycol. Pl. Pathol,
Choi, K. J., W.G. Kim, H. W. Choi and Y. K. Lee, 2011. Morphology, 31 (2): 196-198.molecular phylogeny and pathogenicity of Colletotrichum Rojas, H.V. and G. D. Avila Quezada, 2011. Phylognetic and panacicola causing anthracnose of Korean ginsing. J. Plant morphological identification of C. boninense : a novel causal Pathol, 27: 1-7.
agent of anthracnose in avocado. Plant Pathol, 60: 899- 908.Dambhare, R.D. 1981. Studies on fungi assoicated with citrus in
Sirsat, A.M. 1970. Studies on anthracnose leaf spot of papaya (Carica Vidarbha. M.Sc. (Agri.) (unpublished) thesis submitted to
papaya L.) caused by Colletotrichum gloeosporioides. Penz. PKV, Akola.M.Sc. (Agri.) Thesis (Unpublished) submitted to PKV, Akola.Dharmadhikari, R. D. 1981. Studies on fungi associated with citrus in
Thind, T.S. and J.S.Jhooty, 1990. Studies on variability in two Vidarbha . M. Sc. Thesis (Unpublished) submitted to PKV, Colletotrichum species coming anthracnose and fruit rot of Akola. chillies in Punjab. Indian Phytopath. 43 (1): 53-58.Gaikwad, S. J., R. T. Gohokar and S. W. Meshram 1993. Occurrence of
Uma Devi, G. Mahendra Pal and Neena Mitter, 2001. Isozyme variability pod blight of soybean caused by Colletotrichum dematium. J. Maharashtra agric. Univ. 18 (3): 489-491. among isolates of Ascochyta rabiae. Indian Phytopath. 54 (1):
Garrido, C., M. Carbum, F. J. Fernandez Acero, I. Vallejoi and J. M. 16-22.Cantoral, 2009. Phylogenetic relationship and genome Zuiefield, C., A. H. Lilien Kiphis, A. Borochor and A. H. Haloury, 1977. organization of Colletotrichum acutatum causing Variation in pathogenicity, morphology and conidial anthracnose in strawberry. European J. Plant Pathology, 125: agglutination of Fusarium oxysporum f. sp. narcize and 397-411.
resistance to basal rot in Narcissins. Proceedings of the Girard, J.C. 1979. Detection of two diseases on soybean from Senegal.
seventh International Symposium on flower bulbs Vol. II Agro. Tropical, 34 (3): 305-307. Herzliya Israel. Acta Horticulture. 430: 597-604.Giaretta, D. R., A. Bogo, C.M.M. Coelho, A. F. Guidolin and A. C. M.
Zuber, M. and K.Manibhushanrao, 1982. Studies on comparative gel Dantas, 2010. ITS-r DNA phylogeny of Colletotrichum spp. electrophoretic patterns of proteins and enzymes from isolates causal agent of apple Glomerella leaf spot. Ciencia Rural, 40: Rhizoctonia solani causing sheath blight disease in rice. 806-812.
Giri, G. K. 2002. Pathogenic variability in Fusarium udum Butler. Ph. D Canadian J. Microbiol. 28:762-771.
Silva,
Rec. on 05.01.2014 & Acc. on 20.03.214
108
ABSTRACT
Thirty two F crosses obtained by crossing four females and eight males in a line x tester fashion were used 1
to study the general and specific combining ability effects of parents and crosses respectively. Thirty two crosses and
twelve parents along with check Rajarshi were raised in kharif 2013-14 and observations on days to 50 % tasseling, -1days to 50 % silking, days to maturity, plant height, length of internode, cob length, cob girth, number of grains cob ,
-1 -1 -1 100 grain weight, grain yield plant , grain yield plot and fodder yield plot were recorded high significant sca effect in
the desirable direction. The gca and sca effects showed wide variation in the level of significance for different
characters. The parents NM-32-1-1, NM-62-4- 1 and NM-60-4 were identified as good general combiner for yield and
yield contributing characters. Among the crosses NM-32-1-1 x NM-62-4-1 and NM-32-1-1 x NM-60-4 were identified
as best crosses on the basis of high per se performance and high significant sca effect in the desirable direction. Hence,
it is suggested that these parents could be utilised for the development of either the synthetic varieties or elite breeding
population and these two crosses identified could be directly used for heterosis breeding in maize.
(Key words: Maize, gca effects, sca effects and combining ability)
parents and desirable cross combinations and at the INTRODUCTIONsame time reveals the nature of gene action involved
Maize (Zea mays L.) is the third most in the inheritance of various traits and thereby helps in important cereal grain in the world after wheat and formulation of breeding methodology to be used. The rice. Maize is of American origin, particularly information derived from this research work will help Mexico. Maize belongs to family Poaceae also called in identifying superior inbreds for further breeding as Graminae and subfamily Panicoideae. Wild programme. species of maize are Zea mexicana (2n = 20), Zea perennis (2n = 40), Zea luxurians (2n = 20), Zea MATERIALS AND METHODSdiploperennis (2n = 20). Maize is monoecious plant,
Four females were crossed with eight males highly cross pollinated species. It is also one of the by following line x tester mating design to produce first plant species identified to photosynthesize by C 4
thirty two crosses in rabi 2012. These thirty two path way with high yield potential. (Dass et al., 2010).crosses along with twelve parents and one check (Rajarshi) were grown in Randomized Complete Maize being a cross-pollinated crop there is Block design in two replications with the spacing of wide scope for the development of single cross 60 cm x 20 cm accommodating 15 plants in each row hybrids and varieties. The per se performance of for the estimation of combining ability analysis in parents themselves does not always gives a correct kharif 2013. Recommended package of practices indication of their breeding potential, therefore, were followed to raise a good crop. The data were important to single cross hybrids and varieties. The recorded on five randomly selected plants from each per se performance of parents themselves does not genotype on following six characters viz., length of always gives a correct indication of their breeding internode, cob length, cob girth, number of grains potential, therefore, important to study the general
-1cob , 100 grain weight and grain yield. The data on combining ability of parents and specific combining days to 50 % tasseling, days to 50% silking and days ability of crosses which gives high level of heterosis. to maturity were recorded on plot basis. The analysis This information concerning to breeding behaviour of of variance for experimental design was analysed by parents is of prime importance in planning the the method given by Panse and Sukhatme (1954) and breeding programme.the combining ability analysis was carried out by following the methodology of Kempthorne (1957) Information on combining ability provides with fixed effect model (model I) of Eisenhart (1947).guidelines to the plant breeders in selecting the elite
1 & 3. P. G Students, Agril. Botany Section, College of Agriculture, Nagpur2. Assoc. Professor, Agril. Botany Section, College of Agriculture, Nagpur4. Asstt. Professor, Agril. Botany Section, College of Agriculture, Nagpur5. Sr. Res. Asstt., Agril. Botany Section, College of Agriculture, Nagpur
J. Soils and Crops 25 (1) 109-115, June, 2015 ISSN 0971-2836
COMBINIG ABILITY STUDIES IN MAIZE (Zea mays L.)1 2 3 4 5A. T. Nartam , M. K. Moon , S. A. Sapakal , S. R. Patil and P.D.Peshattiwar
NM-60-4 was also identified as a good general RESULTS AND DISCUSSIONcombiner as it exhibited significant positive gca effect
-1 -1for grain yield plot , grain yield plant and 100 grains The present study was undertaken to assess weight. From this study three parents NM-32-1-1, the general and specific combining ability of parents NM-62-4-1 and NM-60-4 were identified as best and crosses respectively and to identify superior general combiner for yield and other yield parents and crosses. The results on per se contributing characters.performance and sca effects revealed that the cross
NM-32-1-1 x NM-62-4-1 was found to be The significant sca effect observed in
significantly superior over check Rajarshi for grain different crosses for different characters had the -1 -1 -1yield plant , grain yield plot , number of grains cob , combination of either high x high, high x low, low x
days to maturity. Similarly the cross NM-32-1-1 x high or low x low combining parents. It is important
NM-60-4 performed significantly superior over to note that among the crosses showing significant sca
-1 -1 check Rajarshi for grain yield plant , grain yield plot in desirable direction in respect to all the traits either and 100 grain weight. Another cross NM-32-1-1 x involved or did not involved one or both the parents as NM-78-1 showed significant superiority over check good general combiner for the concerned trait. This
-1 -1 Rajarshi for number of grains cob , grain yield plot indicated that non-additive type gene action, which and days to maturity. The mean performance of thirty are non-fixable were predominant in these crosses. It two crosses when compared with the check hybrid was also inferred that all the crosses which exhibited Rajarshi, the crosses NM-32-1-1 x NM-62-4-1, NM- high mean were not necessarily having significant sca 32-1-1 x NM-60-4 and NM-32-1-1 x NM-78-1 were effect indicating the non-correspondence between identified as superior crosses. Therefore, these three per se performance and sca effects, but in few cases crosses were identified as potential crosses for correspondence between per se performance and sca exploiting heterosis on the basis of per se effect were observed.performance.
Out of thirty two crosses studied two crosses Estimates of gca and sca effects among the viz., NM-32-1-1 x NM-62-4-1 and NM-32-1-1 x NM-
parents and crosses showed wide variation in the level 60-4 were identified as superior crosses on the basis of significance for different characters. Some of the of per se performance and sca effects. These crosses parents and crosses had significant gca and sca effects were also found to exhibit positive significant sca in the desirable direction for most of the characters effects for yield and yield contributing characters like
-1 studied. The significant gca and sca effects were also number of grains cob or 100 grain weight. The reported by Hossain et al. (2007), Wani et al. (2007), superiority of these crosses having high sca effect Legesse et al. (2009), Singh and Gupta (2009), Udasi involved high x high, combiner as parents. This could et al. (2012) and Tajwar and Chakraborty (2013) in be explained on the basis of interaction between the maize. The estimates of gca effects showed that positive alleles from two good combiner parents. The among the lines NM-32-1-1 was found to be the best high performance of such crosses is due to non-general combiner as it recorded significant positive fixable dominant gene action and thus could be
-1 -1gca effect for grain yield plant , grain yield plot , exploited for heterosis breeding (Iqbal et al., 2007).
-1number of grains cob , cob girth and length of Therefore, these two crosses NM-32-1-1 x NM-62-internode. Among the testers, NM-62-4-1 was 4-1 and NM-32-1-1 x NM-60-4 were identified to identified as good general combiner as it recorded be suitable for direct use in hybrid production in
-1significant positive gca effect for grain yield plot , order to utilize the hybrid vigour expressed in F 1,
-1 -1instead of going for selecting segregants in advance grain yield plant , number of grains cob , cob girth,
cob length, days to 50% tasseling. Similarly tester generation.
110
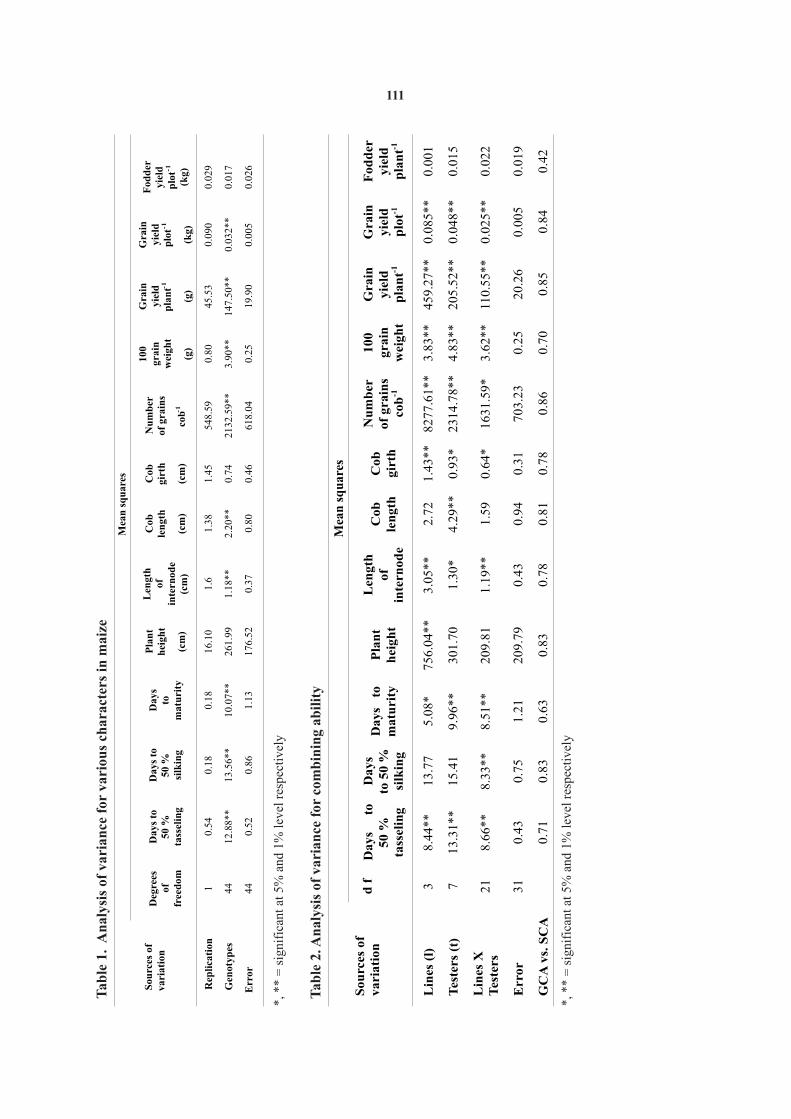
Ta
ble
1.
An
aly
sis
of
var
ian
ce f
or
var
iou
s ch
ara
cter
s in
ma
ize
Sou
rces
of
vari
atio
n
M
ean
sq
uar
es
Deg
rees
of
fr
eed
om
Day
s to
50
%
tass
elin
g
Day
s to
50 %
si
lkin
g
Day
s
to
mat
uri
ty
Pla
nt
hei
ght
(cm
)
Len
gth
of
in
tern
ode
(cm
)
Cob
le
ngt
h
(cm
)
Cob
gi
rth
(cm
)
Nu
mb
er
of g
rain
s
cob-1
100
grai
n
wei
ght
(g)
Gra
in
yiel
d
pla
nt-1
(g)
Gra
in
yiel
d
plo
t-1
(kg)
Fod
der
yi
eld
p
lot-1
(kg)
Rep
lica
tion
1
0.54
0.
18
0.18
16
.10
1.
6
1.38
1.
45
548.
59
0.80
45
.53
0.
090
0.
029
Gen
otyp
es
44
12.8
8**
13
.56*
*
10.0
7**
26
1.99
1.
18**
2.
20**
0.
74
2132
.59*
*
3.90
**
147.
50**
0.
032*
*
0.01
7
Err
or
44
0.52
0.
86
1.1
3
176.
52
0.37
0.
80
0.46
61
8.04
0.
25
19.9
0
0.00
5
0.02
6
*, *
* =
sig
nifi
cant
at
5% a
nd 1
% l
evel
res
pect
ivel
y
Tab
le 2
. An
alys
is o
f v
aria
nce
fo
r co
mb
inin
g a
bil
ity
Sou
rces
of
vari
ati
on
d
f
Mea
n s
qu
ares
Days
to
50 %
ta
ssel
ing
Days
to
50 %
si
lkin
g
Days
to
m
atu
rity
P
lan
t h
eigh
t L
ength
of
inte
rnod
e
Cob
le
ngth
C
ob
gir
th
Nu
mb
er
of
gra
ins
cob
-1
100
gra
in
wei
gh
t
Gra
in
yie
ld
pla
nt-1
Gra
in
yie
ld
plo
t-1
Fod
der
yie
ld
pla
nt-1
Lin
es (
l)
3
8.4
4**
13.7
7
5.0
8*
756.0
4**
3.0
5**
2.7
2
1.4
3**
8277.6
1**
3
.83**
459.2
7**
0.0
85**
0.0
01
Tes
ters
(t)
7
13.3
1**
15.4
1
9.9
6**
301.7
0
1.3
0*
4.2
9**
0.9
3*
2314.7
8**
4.8
3**
205.5
2**
0.0
48**
0.0
15
Lin
es X
T
este
rs
21
8.6
6**
8.3
3**
8.5
1**
209.8
1
1.1
9**
1.5
9
0.6
4*
1631.5
9*
3.6
2**
110.5
5**
0.0
25**
0.0
22
Err
or
31
0.4
3
0.7
5
1.2
1
209.7
9
0.4
3
0.9
4
0.3
1
703.2
3
0.2
5
20.2
6
0.0
05
0.0
19
GC
A v
s. S
CA
0.7
1
0.8
3
0.6
3
0.8
3
0.7
8
0.8
1
0.7
8
0.8
6
0.7
0
0.8
5
0.8
4
0.4
2
*, *
* =
sig
nifi
cant
at
5% a
nd 1
% l
evel
res
pect
ivel
y
111
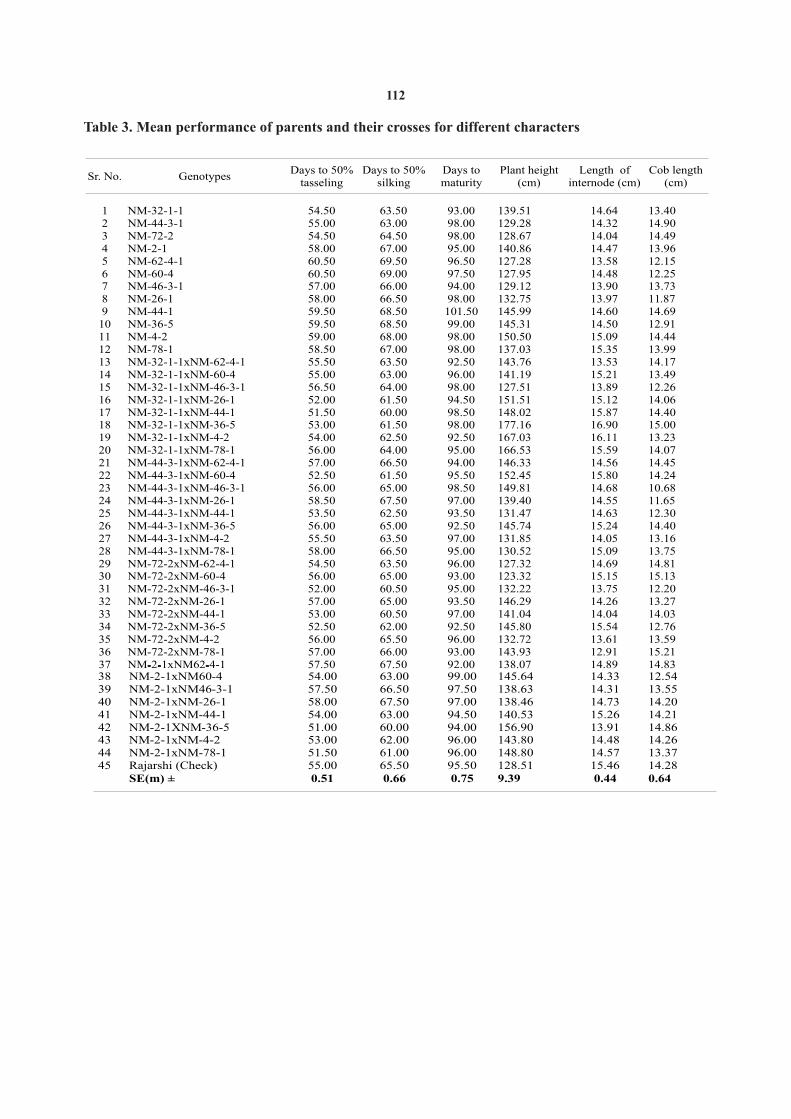
Table 3. Mean performance of parents and their crosses for different characters
Sr. No.
Genotypes
Days to 50% tasseling
Days to 50% silking
Days to maturity
Plant height (cm)
Length of internode (cm)
Cob length (cm)
1
NM-32-1-1 54.50 63.50 93.00 139.51 14.64 13.402
NM-44-3-1 55.00 63.00 98.00 129.28 14.32 14.90
3
NM-72-2 54.50 64.50 98.00 128.67 14.04 14.49
4
NM-2-1 58.00 67.00 95.00 140.86 14.47 13.965
NM-62-4-1 60.50 69.50 96.50 127.28 13.58 12.156
NM-60-4 60.50 69.00 97.50 127.95 14.48 12.257
NM-46-3-1 57.00 66.00 94.00 129.12 13.90 13.738
NM-26-1 58.00 66.50 98.00 132.75 13.97 11.879
NM-44-1 59.50 68.50 101.50 145.99 14.60 14.6910
NM-36-5
59.50 68.50 99.00 145.31 14.50 12.9111
NM-4-2
59.00 68.00 98.00 150.50 15.09 14.4412
NM-78-1
58.50 67.00 98.00 137.03 15.35 13.9913
NM-32-1-1xNM-62-4-1
55.50 63.50 92.50 143.76 13.53 14.1714
NM-32-1-1xNM-60-4
55.00 63.00 96.00 141.19 15.21 13.4915
NM-32-1-1xNM-46-3-1
56.50 64.00 98.00 127.51 13.89 12.2616
NM-32-1-1xNM-26-1
52.00 61.50 94.50 151.51 15.12 14.0617
NM-32-1-1xNM-44-1
51.50 60.00 98.50 148.02 15.87 14.4018
NM-32-1-1xNM-36-5
53.00 61.50 98.00 177.16 16.90 15.0019
NM-32-1-1xNM-4-2
54.00 62.50 92.50 167.03 16.11 13.2320
NM-32-1-1xNM-78-1
56.00 64.00 95.00 166.53 15.59 14.0721
NM-44-3-1xNM-62-4-1
57.00 66.50 94.00 146.33 14.56 14.4522
NM-44-3-1xNM-60-4
52.50 61.50 95.50 152.45 15.80 14.2423
NM-44-3-1xNM-46-3-1
56.00 65.00 98.50 149.81 14.68 10.6824
NM-44-3-1xNM-26-1
58.50 67.50 97.00 139.40 14.55 11.6525
NM-44-3-1xNM-44-1
53.50 62.50 93.50 131.47 14.63 12.3026
NM-44-3-1xNM-36-5
56.00 65.00 92.50 145.74 15.24 14.4027
NM-44-3-1xNM-4-2
55.50 63.50 97.00 131.85 14.05 13.1628
NM-44-3-1xNM-78-1
58.00 66.50 95.00 130.52 15.09 13.7529
NM-72-2xNM-62-4-1
54.50 63.50 96.00 127.32 14.69 14.8130
NM-72-2xNM-60-4
56.00 65.00 93.00 123.32 15.15 15.1331 NM-72-2xNM-46-3-1 52.00 60.50 95.00 132.22 13.75 12.2032 NM-72-2xNM-26-1 57.00 65.00 93.50 146.29 14.26 13.2733 NM-72-2xNM-44-1 53.00 60.50 97.00 141.04 14.04 14.0334 NM-72-2xNM-36-5 52.50 62.00 92.50 145.80 15.54 12.7635 NM-72-2xNM-4-2 56.00 65.50 96.00 132.72 13.61 13.5936 NM-72-2xNM-78-1 57.00 66.00 93.00 143.93 12.91 15.2137 NM-2-1xNM62-4-1 57.50 67.50 92.00 138.07 14.89 14.83- - -38 NM-2-1xNM60-4 39 NM-2-1xNM46-3-1 40 NM-2-1xNM-26-1 41 NM-2-1xNM-44-1
42 NM-2-1XNM-36-5
43 NM-2-1xNM-4-2
44 NM-2-1xNM-78-145 Rajarshi (Check)
SE(m) ±
54.0057.5058.0054.0051.0053.0051.5055.000.51
63.00
66.50
67.50
63.00
60.00
62.0061.0065.500.66
99.00
97.50
97.00
94.50
94.00
96.0096.0095.500.75
145.64138.63138.46140.53156.90143.80148.80128.519.39
14.3314.3114.7315.2613.9114.4814.5715.460.44
12.5413.5514.2014.2114.8614.2613.3714.280.64
112

Table 3a. Mean performance of parents and their crosses for different characters
Sr. No. GenotypesCob
Girth (cm)
Number of grains cob-1
100 grain wt. (g)
Grain yieldplant-1
(g)
Grain yieldplot-1
(kg)
Fodder yield plot
(kg)
1
NM-32-1-1 11.45
200.20 23.40
47.40 0.71 1.352
NM-44-3-1 11.91
205.10 23.68
48.60 0.73 1.50
3
NM-72-2 12.04
228.90 24.47
54.10 0.77 1.254
NM-2-1 11.52
220.50 24.12
53.88 0.81 1.25
5
NM-62-4-1 11.40
161.30 22.72
32.82 0.49 1.286
NM-60-4 11.44
235.70 20.37
49.35 0.74 1.407
NM-46-3-1 11.67
231.90 23.15
50.15 0.75 1.308
NM-26-1 12.02
198.10 23.46
40.52 0.61 1.409
NM-44-1 11.20
236.50 22.65
44.51 0.67 1.2510
NM-36-5
11.10
225.90 21.04
42.90 0.64 1.2011
NM-4-2
11.29
279.50 23.87
59.14 0.89 1.3812
NM-78-1
10.48
200.60 20.10
41.11 0.62 1.3013
NM-32-1-1xNM-62-4-1
12.20
300.60 23.50
72.95 1.09 1.4314
NM-32-1-1xNM-60-4
12.70
251.30 24.50
66.30 0.99 1.3115
NM-32-1-1xNM-46-3-1
12.18
233.00 23.98
53.54 0.80 1.3516
NM-32-1-1xNM-26-1
12.47
206.50 22.90
44.01 0.66 1.3417
NM-32-1-1xNM-44-1
11.80
208.40 21.08
43.25 0.60 1.4318
NM-32-1-1xNM-36-5
12.91
271.20 24.39
61.80 0.93 1.4019
NM-32-1-1xNM-4-2
11.94
247.40 23.40
49.34 0.74 1.4520
NM-32-1-1xNM-78-1
12.38
289.50 21.23
61.21 0.92 1.2721
NM-44-3-1xNM-62-4-1
13.08
258.30 22.24
56.74 0.85 1.4022
NM-44-3-1xNM-60-4
12.31
225.70 23.94
53.53 0.80 1.5523
NM-44-3-1xNM-46-3-1
11.37
195.60 25.30
51.14 0.74 1.2524
NM-44-3-1xNM-26-1
10.87
192.10 20.28
37.72 0.57 1.3425
NM-44-3-1xNM-44-1
12.19
232.90 24.49
51.44 0.79 1.3526
NM-44-3-1xNM-36-5
12.44
206.30 24.61
42.95 0.64 1.4327
NM-44-3-1xNM-4-2
11.61
163.50 22.81
35.93 0.54 1.3528
NM-44-3-1xNM-78-1
11.01
210.30 24.79
50.36 0.75 1.4029
NM-72-2xNM-62-4-1
12.60
187.20 24.26
50.61 0.76 1.3530
NM-72-2xNM-60-4
11.81 172.70 25.36
41.29 0.69 1.3331
NM-72-2xNM-46-3-1
11.29 156.70 22.60
32.64 0.50 1.3832 NM-72-2xNM-26-1 11.35 193.50 21.55 42.63 0.69 1.3333 NM-72-2xNM-44-1 11.20 200.30 20.11 42.24 0.63 1.4534 NM-72-2xNM-36-5 11.50 250.70 21.85 53.96 0.81 1.3535 NM-72-2xNM-4-2 11.47 178.60 22.35 37.43 0.56 1.3636 NM-72-2xNM-78-1 11.58 242.10 21.75 52.82 0.79 1.4337 NM-2-1xNM62-4-1 12.82 215.00 22.49 48.11 0.72 1.3238 NM-2-1xNM60-439 NM-2-1xNM46-3-140 NM-2-1xNM-26-1
41 NM-2-1xNM-44-1
42 NM-2-1XNM-36-5
43 NM-2-1xNM-4-2
44 NM-2-1xNM-78-1
45 Rajarshi (Check)
SE (m) ±
11.7211.6912.7811.7310.8511.5112.6411.880.48
253.40236.60224.20243.80191.60195.30223.10225.3017.58
23.9324.1423.4524.6622.6923.5722.8523.010.35
1.501.581.401.401.331.351.031.350.9
57.5559.1252.68
58.69
43.81
45.86
48.57
55.20
3.15
0.860.890.79
0.88
0.69
0.69
0.73
0.83
0.05
113

T
able
4. G
ener
al
com
bin
ing
ab
ilit
y ef
fect
s o
f p
aren
ts
Gen
oty
pes
D
ays
to
50 %
ta
ssel
ing
Days
to
matu
rity
Pla
nt
hei
gh
t
(cm
)
Len
gth
of
inte
rnod
e (c
m)
Cob
le
ngth
(cm
)
Cob
gir
th
(cm
)
Nu
mb
er
of
gra
ins
cob
-1
100
gra
in
wt.
(g
)
Gra
in
yie
ld
pla
nt-1
Gra
in
yie
ld
plo
t-1
(kg)
1-
-0.6
6**
0.3
1
9.2
8*
0.5
5**
0.1
4
0.3
9**
30.4
4**
-0.0
4
6.5
4**
0.0
9**
3-
1.0
3**
0.0
6
-2.6
1
0.1
0
-0.6
1*
-0.0
8
-9.9
6
0.4
0**
-2.5
3*
-0.0
4
2
-0.0
9
-0.8
1**
-6.9
8
-0.4
8**
0.1
8
-0.3
4*
-1
-0.2
8
0.4
4
0.3
0
-0.1
7
0.2
9
0.0
3
2.3
3
0.3
2
1.7
9
0.0
3
S.E
.(gi)
0.1
6
0.2
7
3.6
2
0.1
6
0.2
4
0.1
4
6.6
3
0.1
2
1.1
2
0.0
2
4-
1.2
8**
-1.6
9**
-4.6
9
-0.3
1
0.8
7**
0.7
4**
19.7
3*
-0.0
4
7.1
0**
0.1
0**
4
-0.4
7*
0.5
6
-2.9
1
0.4
0
0.1
6
0.2
0
5.2
3
1.2
8**
4.6
6**
0.0
9**
3-
0.6
6**
1.9
4**
-6.5
1
-0.5
7*
-0.3
1
-15.0
7
0.8
5**
-0.9
0
-0.0
2
1
1.5
3**
0.1
9
0.3
6
-0.0
6
-0.4
0
-0.0
7
-16.4
7
1
-1.8
4**
0.5
6
-3.2
9
0.2
2
0.0
4
-0.2
1
0.8
1
-1.1
0
-0.0
3
5
-1.7
2**
-1.0
6**
12.8
5*
0.6
7**
0.5
6
-0.0
1
9.4
1
0.2
3
0.6
2
0.0
1
2
-0.2
2
0.0
6
0.3
0
-0.1
6
-0.1
3
-0.3
1
-24.3
4*
-0.1
3
1
0.7
8**
-0.5
6
3.8
9
-0.1
9
0.4
1
-0.0
4
19.7
3*
3.2
3
0.0
5*
S.E
.(gj)
0.2
3
0.3
9
5
.12
0.2
3
0.3
4
0.2
0
9.3
7
0.1
8
1.5
9
0.0
2
*, *
* =
sig
nifi
cant
at
5% a
nd 1
% l
evel
res
pect
ivel
y
-1N
ote
:GC
A e
ffec
t of
par
ent
for
day
s to
50%
sil
kin
g an
d f
odd
er y
ield
plo
t w
ere
not
cal
cula
ted
as
its
mea
n s
qu
are
was
non
-sig
nif
ican
t
1 1 1 11.5
2**
-22.8
2**
0.0
8**
- 5.8
0**
- 0.0
7**
-1.1
1**
-5.7
5**
-0.0
8**
-0
.50**
-0.5
7**
-7.8
7**
-0
.12**
Sr.
N
o.
Lin
es
1
NM
-32-
2
NM
-44-
3
NM
-72-
4
NM
-2-
T
este
rs
1
NM
-62-
2
NM
-60-
3
NM
-46-
4
NM
-26-
5
NM
-44-
6
NM
-36-
7
NM
-4-
8
NM
-78-
114

Table 5. Specific combining ability effects of crosses
Sr. No.
Genotypes
Days to
50 %
tasseling
Days to
50 % silking
Days to maturity
Length of
internode
Cob length
Cob girth
Number of
grains cob-
1
100 grain
wt.
Grainyield
plant-1
Grainyieldplot-1
Fodderyieldplot-1
Crosses
1
NM-32-1-1xNM-62- 0.03
-0.61
-1.44*
-1.44**
-0.54
-0.86*
29.88
0.42
9.30** 0.150 0.0522
NM-32-1-1xNM-60- 1.28**
1.02*
-0.19
-0.46
-0.50
0.18
-4.92
0.10
5.09 0.067 -0.1113
NM-32-1-1xNM-46- 1.66**
1.14*
0.44
-0.82
-0.06
0.16
-2.92
0.01
-2.11 -0.017 -0.0374
NM-32-1-1xNM-26- -3.72**
-2.73**
-1.31*
-0.10
0.62
0.22
-28.02
0.89
-6.79* -0.105 -0.0135
NM-32-1-1xNM-44- -0.84
-0.36
2.31*
0.37
0.52
-0.32
-43.39*
-12.20* 0.0196
NM-32-1-1xNM-36- 0.53
0.52
3.44*
0.95
0.60
0.60
10.81
1.04** 4.63 0.071 0.0257
NM-32-1-1xNM-4-2
0.03
0.27
-3.19*
1.00*
-0.47
-0.08
20.76
0.41
0.66 0.019 0.0748
NM-32-1-1xNM-78- 1.03*
0.77
-0.06
0.50
-0.17
0.09
17.81
1.43 0.031 -0.0109
NM-44-3-1xNM-62- -0.16
0.14
0.31
0.04
0.50
0.48
27.98
2.17 0.035 0.01510
NM-44-3-1xNM-60- -2.91**
-2.73**
-0.44
0.58
1.00
0.25
9.88
-0.89* 1.39 0.007 0.11711
NM-44-3-1xNM-46- -0.53
-0.11
1.19*
0.43
-0.88
-0.19
0.08
0.90* 4.56 0.050 -0.14912
NM-44-3-1xNM-26- 1.09*
1.02*
1.44*
-0.21
-1.03
-0.92
-2.02
-4.01 -0.069 -0.02513
NM-44-3-1xNM-44- -0.53
-0.11
-2.44*
-0.42
-0.82
0.54
21.51
1.51** 5.07 0.110* -0.06814
NM-44-3-1xNM-36- 1.84**
1.77**
-1.81*
-0.26
0.76
0.59
-13.69
0.83* -5.15 -0.081 0.03915
NM-44-3-1xNM-4-2
-0.16
-0.98
1.56*
-0.61
0.21
0.06
-22.74
-0.62 -3.68 -0.051 -0.03816
NM-44-3-1xNM-78- 1.34**
1.02
0.19
0.45
0.26
-0.82*
-20.99
1.73** -0.35 -0.001 0.10917
NM-72-2xNM-62-4- -1.53**
-1.61**
3.19*
0.76
0.06
0.26
-30.26
1.82** -0.69 -0.023 -0.02218
NM-72-2xNM-60-4
1.72**
2.02**
-2.06*
0.51
1.10
0.01
-30.26
1.61** -7.57* -0.071 -0.09519
NM-72-2xNM-46-3- -3.41**
-3.36**
-1.44*
0.08
-0.16
-0.01
-25.96
-0.73* -0.01120
NM-72-2xNM-26-1
0.72
-0.23
-1.19
0.08
-0.21
-0.18
12.24
0.19
4.17 0.087 -0.02221
NM-72-2xNM-44-1
0.09
-0.86
1.94*
-0.43
0.11
-0.19
1.77
-0.86 -0.019 0.04522
NM-72-2xNM-36-5
-0.53
0.02
-0.94
0.63
-1.68
-0.09
43.57*
-0.86* 9.13** 0.116* -0.02323
NM-72-2xNM-4-2
1.47**
2.27**
1.44*
-0.47
-0.15
0.18
5.22
0.00
1.10 0.003 -0.02024 NM-72-2xNM-78-1 1.47** 1.77** -0.94 -1.15* 0.93 0.02 23.67 -0.23 5.38 0.068 0.14725 NM-2-1xNM62-4-1 1.66** 2.08** -2.06* 0.64 -0.02 0.12 -27.61 -0.95* -0.04526 NM-2-1xNM60-4 -0.09 -0.30 2.69* -0.63 -1.60* -0.45 25.29 -0.82* 1.09 -0.003 0.08827 NM-2-1xNM46-3-1 2.28** 2.33** -0.19 0.32 1.09 0.03 28.79 -0.18 8.22* 0.128* 0.197
28 NM-2-1xNM-26-1 1.91** 1.95** 1.06 0.23 0.62 0.88* 17.79 1.09** 6.63* 0.086 0.06029 NM-2-1xNM-44-1 1.28** 1.33* -1.81* 0.48 0.19 -0.03 20.12 1.76** 7.99* 0.126* 0.00330 NM-2-1XNM-36-5 -1.84** -2.30** -0.69 -1.32** 0.32 -40.68* -8.61* -0.106* -0.04131 NM-2-1xNM-4-2 -1.34** -1.55** 0.19 0.08 0.41 -0.15 -3.23 0.22 1.92 0.028 -0.01732 NM-2-1xNM-78-1 -3.84** -3.55** 0.81 0.20 -1.02 0.71 -20.48 -0.12 -6.46 -0.098 -0.246*
SE (ij) 0.46 3.49 0.78 0.46 0.68 0.39 18.75 0.35 3.18 0.05 0.10
*, ** = significant at 5% and 1% level respectively
Note: SCA effect of crosses for days plant height was not calculated as its mean square was non-significant
Legesse, B. W., K. V. Pixley, A. A. Myburg, S. T. Afriyie, A. M. Botha, REFERENCES2009. Combining ability and heterotic grouping of highland
transition maize inbred lines. African Crop Science
Conference Proceedings.9: 487-491.Dass, S., A. Manivannan, J. Kaul, A. Singode, J. C. Sekhar and G. K. Chikappa, 2010. Inbred – Hybrid technology in maize. DMR Panse, V. G. and P. V. Sukhatme, 1954. Statistical methods for agricultural Technical bulletin. 1:52. workers. ICAR, New Delhi, pp. 54-57.
Eisenhart, C. 1947. The assumption underlying the analysis of variance. Singh, S. B. and B. B. Gupta, 2009. Heterotic expression and combining Biometrics, 3: 1-27. ability analysis for yield and its components in maize (Zea
Hossain, F., B. M. Prasanna, R. Kumar, S. B. Singh, R. Singh, Om Prakash mays L.) inbreds. Prog. Agri. 9(2):184-191.and M.Z.K. Warsi, 2007. Genetic analysis of grain yield and Tajwar, I. and M. Chakraborty, 2013. Combining ability and heterosis for endosperm protein quality in the quality protein maize (QPM) grain yield and its components in maize inbreds over lines. Indian J. Genet. 67(4):315-322.
environment (Zea mays L.). African J. agric. Res. 8(25). 3276-Iqbal, A. M., F. A. Nehvi, S. A. Wani, R. Qadir, Z. A. Dar, 2007.
3280. Combining ability analysis for yield and yield related traits in
Udasi, R. N., S. R. Patil, S. L. Jamdar, A. E. Patil and K. R. Dond, 2012. maize (Zea mays L.). Int. J. Plant Breed. Genet. 1(2):101- 105.
Evaluation of newly developed inbred lines for general Kempthorne, O. 1957. An Introduction to Genetic Statistics. John Wiley combining ability in maize. J. Soils and Crops, 22(1):177-182.& Sons. Inc. New York, Chapman and Hall Ltd., London, pp.
Wani, S. A., A. Gowhar, A. Ishfaq, A. G. Rather, G. Zaffar and M. I. 468-470.Makhdoomi, 2007. Heterosis and combining ability for grain Kumar, P. Senthil and P. Bharathi, 2009. Studies on relationship between yield and its components in higher altitude maize inbreds (Zea gca and sca effects in maize (Zea mays L). Electro. J. Plant
Breed, 1:24-27. mays L.). Indian J. Genet. 67 (1): 81-82.
Rec. on 31.05.2014 & Acc. on 26.07.2014
-1.47**
-1.39**-1.28**
-2.17**
-1.79**
-1.11** -1.01**
-10.78** -0.162*
-0.161*-10.07*
-0.216**
115
ABSTRACT
In present study an attempt has been made to examine food consumption pattern in Maharashtra. The study was based on Secondary data collected from National Sample Survey Organisation (NSSO) respondents
stlocated in urban area and rural area of Maharashtra state. The household consumer expenditure data of the 61 thround of the NSSO conducted in 2004-05 and 66 round 2009-10 were used as the main source of secondary data for
the study. Percentages were calculated to analyze the changes in the pattern of food consumption over the years. The -1monthly capita cereal consumption was declined from10.51 kgs to 10.34 kgs in rural areas, while the corresponding
decrease in the urban area sector was from 8.40 kgs to 8.20 kgs. The percentage of urban area (-2.3) was decrease more than rural area (-1.6). Thus the consumption of cereals has declined in Maharashtra over the periods. The monthly
-1capital consumption of pulses varied from 0.82 kgs and 0.86 kgs a marginal decline of -2.33 per cent was noticed in -1urban areas while no change was observed in rural areas. The monthly capita expenditure (MPCE) on food was
Rs.291.03 during the year 2004-05 in rural areas and it increased to Rs.617 during 2009-10, the percentage increase was 112 per cent over the base period in rural area. The percentage in urban area, the MPCE increased from Rs.445.24 to Rs.995.60 witnessed about 123 per cent change over the base period. The expenditure elasticities for different food items varied between 0.371 to 0.474 in the case of in rural areas and the elasticity of urban area was 0.622 to 0.831. The highest expenditure elasticities was observed for clothing (2.458) followed by and milk and milk product in urban areas. An increase in income would shift the consumption expenditure for clothing and milk and milk product in urban areas
-1(Key words : Monthly capita expenditure, expenditure elasticity, food consumption )
-1study. Time series data on monthly capita INTRODUCTIONexpenditure for Maharashtra were collected from various issues of National Sample Survey The consumption pattern is very important Organization (NSSO) published by Government Of because it reveals a clear picture of standard of living
thIndia (GOI). The published data of NSSO of 27 of people, poverty level, human development and the st thround (1972-73), 61 round (2004-05) and 66 round nature of its economic growth. The average monthly
-1 (2009-10) were collected for the present study and capita consumer expenditure (MPCE) in 2009-10 was used to analyze the changes in food consumption stood at Rs. 1053 in rural India and Rs. 1984 in urban
-1 pattern for the recent years. Further, the data on India. The capita consumption expenditure in urban physical quantities on selected food items (cereals areas stood 88 per cent more than that of rural areas.
thand pulses) were collected from 50 round (1993-94) (Anonymous, 2013). It facts necessary to study the onwards. The percentages and per cent changes were consumption pattern under the changing situations of calculated to analyze the pattern of food liberalization, privatization and globalization. consumption. The functional analysis was done to estimate expenditure elasticities. The proportional The analysis of temporal and spatial change response of consumption to a given proportional in food consumption pattern would help in designing increase in expenditure typically declines as appropriate policies related to food production, expenditure rises. Therefore, it is desirable to use processing and distribution. Hence, the study was functional form which exhibits this characteristic. under taken with the objectives viz., to analyze the The function was selected on the basis of the nature of changes in food consumption pattern and to estimate the data. The log-inverse function and log-log inverse expenditure elasticities of demand for food in rural function were used. The log-log inverse function has and urban area.the property that it can model an increase in consumption followed by a consumption decline as MATERIALS AND METHODSexpenditure rises through time .These two functional
The study was conducted in the year2012- relationships were estimated (Musebe and Kumar, 2006) to compute the expenditure elasticities of 13.The present study utilized the secondary data for
evaluating and analyzing the specific objectives of the demand for different food items.
1. Assoc. Professor, Agricultural Economics and Statistics section, College of Agriculture Nagpur 440001 (MS) 2. Professor, Agricultural Economics and Statistics section, College of Agriculture Nagpur 440001 (MS)3. P.G. Student, Agricultural Economics and Statistics section, College of Agriculture Nagpur 440001 (MS)
J. Soils and Crops 25 (1) 116-121, June, 2015 ISSN 0971-2836
FOOD CONSUMPTION PATTERN IN MAHARASHTRA 1 2 3N.V.Shende , B. N. Ganvir and M.R.Wayakar
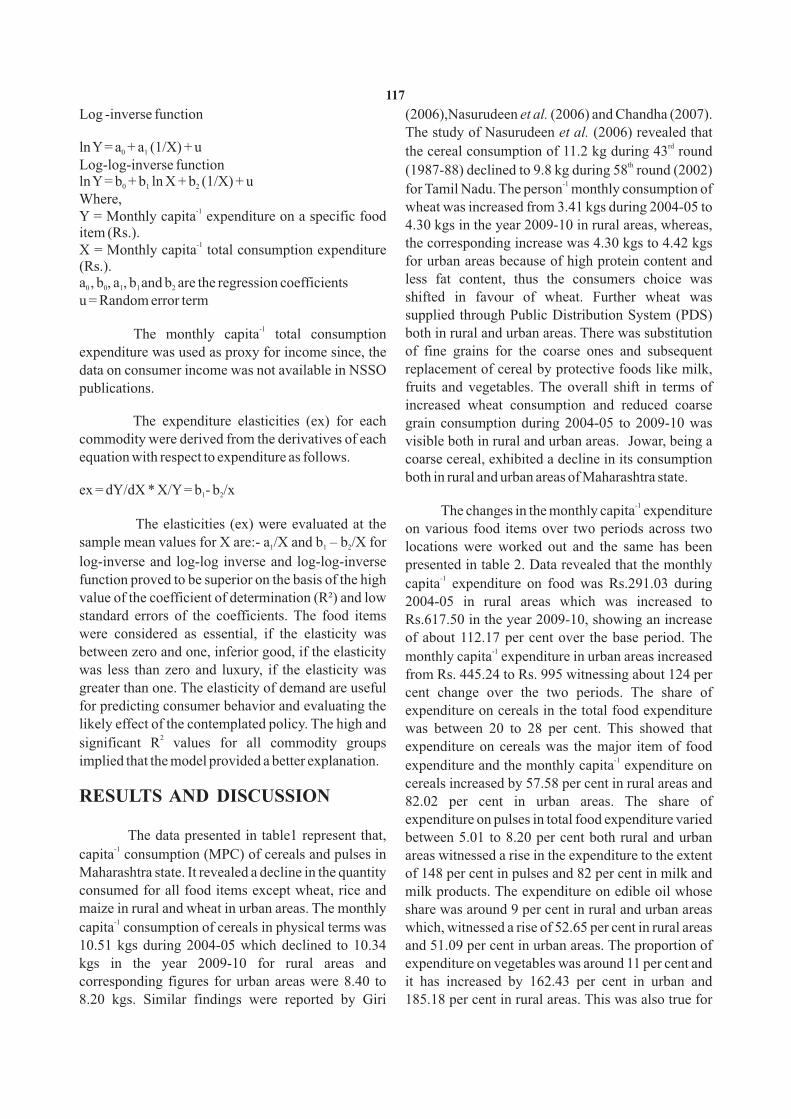
Log -inverse function (2006),Nasurudeen et al. (2006) and Chandha (2007). The study of Nasurudeen et al. (2006) revealed that
rdln Y = a + a (1/X) + u0 1 the cereal consumption of 11.2 kg during 43 round thLog-log-inverse function (1987-88) declined to 9.8 kg during 58 round (2002)
-1ln Y = b + b ln X + b (1/X) + u0 1 2 for Tamil Nadu. The person monthly consumption of Where,
wheat was increased from 3.41 kgs during 2004-05 to -1Y = Monthly capita expenditure on a specific food
4.30 kgs in the year 2009-10 in rural areas, whereas, item (Rs.).
-1 the corresponding increase was 4.30 kgs to 4.42 kgs X = Monthly capita total consumption expenditure for urban areas because of high protein content and (Rs.).less fat content, thus the consumers choice was a , b , a , b and b are the regression coefficients0 0 1 1 2
shifted in favour of wheat. Further wheat was u = Random error termsupplied through Public Distribution System (PDS)
-1 both in rural and urban areas. There was substitution The monthly capita total consumption of fine grains for the coarse ones and subsequent expenditure was used as proxy for income since, the replacement of cereal by protective foods like milk, data on consumer income was not available in NSSO fruits and vegetables. The overall shift in terms of publications.increased wheat consumption and reduced coarse
The expenditure elasticities (ex) for each grain consumption during 2004-05 to 2009-10 was commodity were derived from the derivatives of each visible both in rural and urban areas. Jowar, being a equation with respect to expenditure as follows. coarse cereal, exhibited a decline in its consumption
both in rural and urban areas of Maharashtra state.ex = dY/dX * X/Y = b - b /x1 2
-1 The changes in the monthly capita expenditure
The elasticities (ex) were evaluated at the on various food items over two periods across two sample mean values for X are:- a /X and b – b /X for 1 1 2 locations were worked out and the same has been log-inverse and log-log inverse and log-log-inverse presented in table 2. Data revealed that the monthly
-1function proved to be superior on the basis of the high capita expenditure on food was Rs.291.03 during value of the coefficient of determination (R²) and low 2004-05 in rural areas which was increased to standard errors of the coefficients. The food items Rs.617.50 in the year 2009-10, showing an increase were considered as essential, if the elasticity was of about 112.17 per cent over the base period. The
-1between zero and one, inferior good, if the elasticity monthly capita expenditure in urban areas increased was less than zero and luxury, if the elasticity was from Rs. 445.24 to Rs. 995 witnessing about 124 per greater than one. The elasticity of demand are useful cent change over the two periods. The share of for predicting consumer behavior and evaluating the expenditure on cereals in the total food expenditure likely effect of the contemplated policy. The high and was between 20 to 28 per cent. This showed that
2significant R values for all commodity groups expenditure on cereals was the major item of food -1implied that the model provided a better explanation. expenditure and the monthly capita expenditure on
cereals increased by 57.58 per cent in rural areas and RESULTS AND DISCUSSION 82.02 per cent in urban areas. The share of
expenditure on pulses in total food expenditure varied The data presented in table1 represent that, between 5.01 to 8.20 per cent both rural and urban
-1capita consumption (MPC) of cereals and pulses in areas witnessed a rise in the expenditure to the extent Maharashtra state. It revealed a decline in the quantity of 148 per cent in pulses and 82 per cent in milk and consumed for all food items except wheat, rice and milk products. The expenditure on edible oil whose maize in rural and wheat in urban areas. The monthly share was around 9 per cent in rural and urban areas
-1which, witnessed a rise of 52.65 per cent in rural areas capita consumption of cereals in physical terms was and 51.09 per cent in urban areas. The proportion of 10.51 kgs during 2004-05 which declined to 10.34 expenditure on vegetables was around 11 per cent and kgs in the year 2009-10 for rural areas and it has increased by 162.43 per cent in urban and corresponding figures for urban areas were 8.40 to 185.18 per cent in rural areas. This was also true for 8.20 kgs. Similar findings were reported by Giri
117

food items like fruits and nuts, sugar, spices and of total non-food expenditure in both the periods in rural and urban areas. The expenditure on fuel and beverages. The expenditure on meat, fish, and egg
increased by more than 185.47 per cent in rural and light was increased by 55.50 per cent in urban areas urban areas. and 64.40 per cent in rural areas.
-1 -1The changes in capita expenditure on The monthly capita expenditure in clothing individual commodities affect the relative importance increased from Rs.42.97 to Rs.94.20 in urban areas of these commodities as measured by their proportion and from Rs.19.43 to Rs.39.16 in rural areas The in expenditure. As far as individual food commodity expenditure on durables was increased by 325.45 per groups were concerned, it was observed that there cent in urban area and by 92.94 per cent in rural areas. was a decline in the proportion of expenditure on Among non-food items, the expenditure on cereals. In rural areas it was declined from 28.30 per miscellaneous goods and services, rent, tax had the
-1cent during 2004-05 to 21.01 per cent in the year highest percentage share in capita monthly non-food 2009-10 and in urban areas it was declined from 19.90 expenditure both in rural and urban areas.per cent during 2004-05 to 16.25 per cent in the year 2009-10 to 16.20 per cent. The increasing trend over Expenditure elasticity of demand for food items the years was seen in the case of pulses both in rural and urban Maharashtra. The rise in the proportion of The table 4 revealed that the estimated expenditure on Vegetables, Meat, fish, egg, spices and expenditure elasticity of demand for all food items beverages were higher in rural Maharashtra than that was positive except durable goods in rural as well as in urban Maharashtra. The similar results were shown in urban areas. The elasticities were less than one for by Biswanger et al. (1984); and Nasurudeen et al. almost all the food items in urban areas, whereas the (2006). They observed higher consumption of these expenditure elasticities were more than one for milk products in rural area than urban. The improvement in and milk product, clothing, and fruit in rural areas. economic access to food due to increased income, did The expenditure elasticity was the highest for not result in a higher consumption of cereals, but has clothing 2.458 in of urban area and was the lowest increased the consumption of vegetables, fruits and 1.865 for durable goods in urban areas. For both rural nuts and livestock products, especially milk and eggs. and urban sample households, cereals form the basic
necessary item of consumption. It was found that the -1The total monthly capita food expenditure
elasticity of expenditure on cereals was higher for was higher (Rs. 995.60) due to higher income,
urban household (0.627) compared to rural urbanization and varied preferences. While it was
households (0.474). This substantiates the result put -1 -1Rs.617.50 person month in rural areas during 2009-
forward by Geeta (2011) i.e. for cereals it was higher 10.
for urban household (0.72) as compared to rural -1 households (0.70).Capita expenditure on non food items
-1 The expenditure elasticities for different food Table 3 shows that the monthly capita items varied between 0.371 and 0.474 in the case of expenditure of rural consumer on non-food items was pulses in rural areas and 0.627 to 0.831 in urban areas. Rs.274.46 in 2004-05 which increased to Rs.495.81 The highest expenditure elasticity was observed for in 2009-10 and similarly rural consumers was clothing (2.458) followed by and milk and milk Rs.684.00, which was increased to Rs.1405.23 in the product in urban areas. An increase in income would year 2009-10. shift the consumption expenditure for clothing and milk and milk product in urban areas. Thus, rural The expenditure made on miscellaneous areas expenditure elasticities for Cereals, Pulses, goods and services, rent and taxes accounted for
-1 Edible-oil, Sugar and Eggs were 0.474, 0.371, 0.361, major share in the monthly capita expenditure on 0.554 and 0.461 respectively. It considered as non-food items and this expenditure was increased by essential commodity, while milk and milk product 82.52 per cent in rural area and by 97.95 per cent in
urban areas. The expenditure on intoxicants, fuel and 1.245 and fruits 1.288 were found to be luxuries because its elasticities were greater than one.light and clothing also shared a considerable portion
118
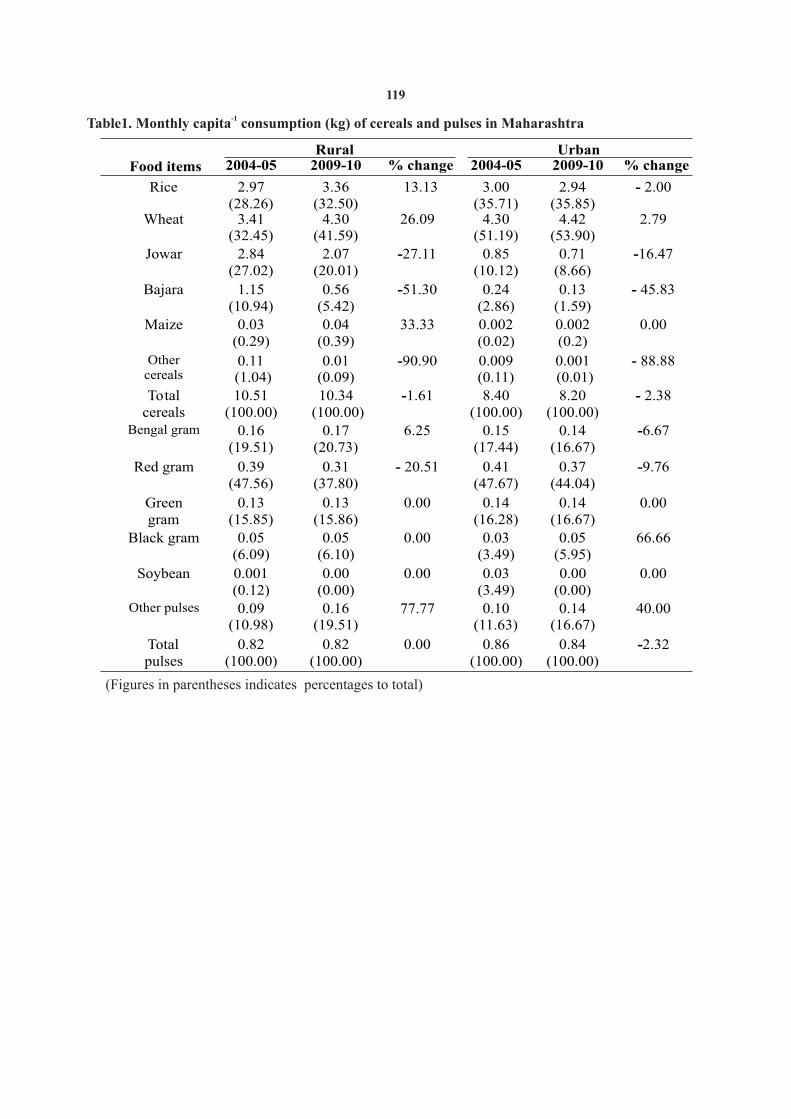
-1Table1. Monthly capita consumption (kg) of cereals and pulses in Maharashtra
Food items
Rural Urban2004-05
2009-10
% change 2004-05 2009-10 % change
Rice 2.97 (28.26)
3.36 (32.50)
13.13 3.00 (35.71)
2.94 (35.85)
- 2.00
Wheat 3.41 (32.45)
4.30 (41.59)
26.09 4.30 (51.19)
4.42 (53.90)
2.79
Jowar 2.84 (27.02)
2.07 (20.01)
-27.11 0.85 (10.12)
0.71 (8.66)
-16.47
Bajara 1.15 (10.94)
0.56 (5.42)
-51.30 0.24 (2.86)
0.13 (1.59)
- 45.83
Maize
0.03
(0.29)
0.04
(0.39)
33.33
0.002
(0.02)
0.002
(0.2)
0.00
Other cereals
0.11
(1.04)
0.01 (0.09)
-90.90
0.009 (0.11)
0.001
(0.01)
-
88.88
Total cereals
10.51 (100.00)
10.34
(100.00)
-1.61
8.40 (100.00)
8.20 (100.00)
-
2.38
Bengal gram
0.16 (19.51)
0.17 (20.73)
6.25
0.15 (17.44)
0.14 (16.67)
-6.67
Red gram
0.39 (47.56)
0.31 (37.80)
-
20.51
0.41 (47.67)
0.37 (44.04)
-9.76
Green gram
0.13 (15.85)
0.13 (15.86)
0.00
0.14 (16.28)
0.14 (16.67)
0.00
Black gram
0.05 (6.09)
0.05 (6.10)
0.00
0.03 (3.49)
0.05 (5.95)
66.66
Soybean
0.001
(0.12)
0.00
(0.00)
0.00
0.03
(3.49)
0.00
(0.00)
0.00
Other pulses
0.09
(10.98)
0.16
(19.51)
77.77
0.10
(11.63)
0.14
(16.67)
40.00
Total pulses
0.82 (100.00)
0.82 (100.00)
0.00 0.86 (100.00)
0.84 (100.00)
-2.32
(Figures in parentheses indicates percentages to total)
119

Table 2. Monthly capita expenditure on food item in (Rs.) Maharashtra -1
Food items
Rural Urban2004-05 2009-10 % change 2004-05 2009-10 % change
Cereals 82.36 (28.30)
129.79 (21.01)
57.58 88.61 (19.90) 161.29 (16.20)
82.02
Pulses 22.44
(7.71)
50.64 (8.20)
125.66 22.34 (5.01) 60.80 (6.11) 172.15
Milk & MP 34.65 (11.91)
61.36 (9.94)
77.08 72.45 (16.27) 136.73 (13.73)
88.72
Edible oil 33.90 (11.65)
51.75 (8.38)
52.65 44.15 (9.92) 66.71 (6.70) 51.09
Meat, fish, egg 14.24 (4.89) 44.04 (7.13)
209.27 26.57 (5.97) 75.85 (7.62) 185.47
Vegetables
28.95 (9.95)
82.56 (13.37)
185.18
45.52 (10.23)
119.46 (12.0)
162.43
Fruits & nuts
17.97 (6.17)
47.58 (7.72)
164.77
34.56 (7.76) 94.12 (9.45)
172.33
Sugar
18.10 (6.22)
32.64 (5.29)
80.33
17.56 (3.94) 32.43 (3.26)
84.68
Salt
1.15 (0.40)
1.94 (0.31)
68.69
1.47 (0.33) 2.30 (0.23)
56.46
Spices
13.49 (4.64)
37.39 (6.05)
177.16
16.07 (3.61) 44.39 (4.46)
176.22
Beverages
23.78 (8.17)
77.81 (12.60)
227.20
75.94 (17.06)
201.52 (20.24)
165.36
Total Food 291.03 (100.00)
617.5 (100.00)
112.17 445.24 (100.00)
995.6 (100.00)
123.60
(Figures in the parentheses indicates percentages to total)
Table 3. Monthly capita expenditure on non-food items (Rs.) in Maharashtra-1
Non FoodItems
Rural Urban
2004-05 2009-10
% change 2004-05 2009-10 % change
Pan, tobacco, intoxicants
11.62 (4.23)
18.2 (3.67)
56.62 15.30 (2.24)
18.86 (1.34)
23.26
Fuel & light 61.39 (22.37)
100.93 (20.36)
64.40 113.50 (16.60)
176.50 (12.56)
55.50
Clothing 19.43 (7.08)
39.16 (7.90)
101.54 42.97 (6.28)
94.20 (6.70)
119.22
Footwear
2.87 (1.05)
7.84 (1.58)
173.17
7.41 (1.08)
19.82 (1.41)
167.47
Miscellaneous goods & services, rent, tax
153.35 (55.87)
279.9 (56.45)
82.52
462.33 (67.59)
915.19 (65.13)
97.95
Durable good
25.80 (9.40)
49.78 (10.04)
92.94
42.47 (6.21)
180.69 (12.86)
325.45
Total non-food
274.46 (100.00)
495.81 (100.00)
80.64
684.00 (100.00)
1405.23 (100.00)
105.45
(Figures in the parentheses indicates percentages to total)
120
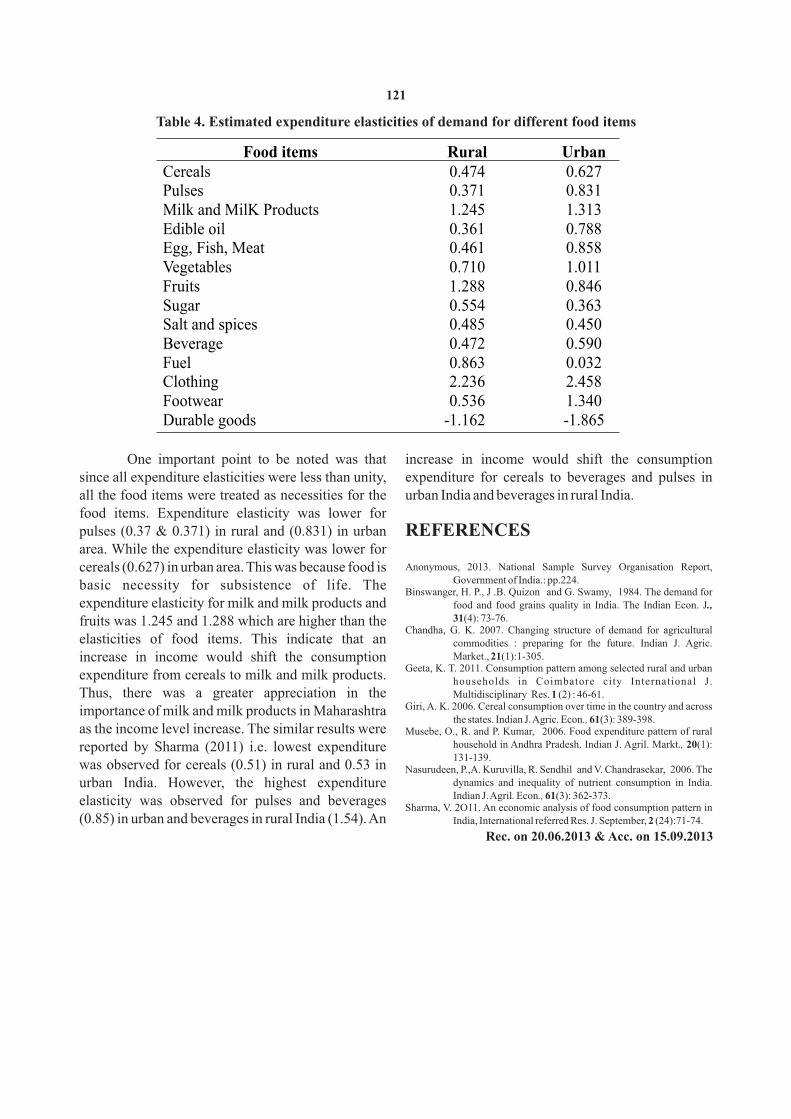
Table 4. Estimated expenditure elasticities of demand for different food items
Food items Rural UrbanCereals 0.474 0.627Pulses 0.371 0.831Milk and MilK Products 1.245 1.313Edible oil 0.361 0.788Egg, Fish, Meat 0.461 0.858Vegetables
0.710 1.011
Fruits
1.288 0.846Sugar
0.554 0.363
Salt and spices
0.485 0.450Beverage
0.472 0.590
Fuel
0.863 0.032Clothing
2.236 2.458
Footwear
0.536 1.340Durable goods -1.162 -1.865
One important point to be noted was that increase in income would shift the consumption since all expenditure elasticities were less than unity, expenditure for cereals to beverages and pulses in all the food items were treated as necessities for the urban India and beverages in rural India. food items. Expenditure elasticity was lower for
REFERENCESpulses (0.37 & 0.371) in rural and (0.831) in urban area. While the expenditure elasticity was lower for
Anonymous, 2013. National Sample Survey Organisation Report, cereals (0.627) in urban area. This was because food is Government of India.: pp.224.basic necessity for subsistence of life. The
Binswanger, H. P., J .B. Quizon and G. Swamy, 1984. The demand for expenditure elasticity for milk and milk products and food and food grains quality in India. The Indian Econ. J.,
31(4): 73-76.fruits was 1.245 and 1.288 which are higher than the Chandha, G. K. 2007. Changing structure of demand for agricultural
elasticities of food items. This indicate that an commodities : preparing for the future. Indian J. Agric. Market., 21(1):1-305.increase in income would shift the consumption
Geeta, K. T. 2011. Consumption pattern among selected rural and urban expenditure from cereals to milk and milk products. households in Coimbatore city International J. Thus, there was a greater appreciation in the Multidisciplinary Res. 1 (2) : 46-61.
Giri, A. K. 2006. Cereal consumption over time in the country and across importance of milk and milk products in Maharashtra the states. Indian J. Agric. Econ., 61(3): 389-398.
as the income level increase. The similar results were Musebe, O., R. and P. Kumar, 2006. Food expenditure pattern of rural household in Andhra Pradesh. Indian J. Agril. Markt., 20(1): reported by Sharma (2011) i.e. lowest expenditure 131-139.
was observed for cereals (0.51) in rural and 0.53 in Nasurudeen, P.,A. Kuruvilla, R. Sendhil and V. Chandrasekar, 2006. The dynamics and inequality of nutrient consumption in India. urban India. However, the highest expenditure Indian J. Agril. Econ., 61(3): 362-373.elasticity was observed for pulses and beverages
Sharma, V. 2O11. An economic analysis of food consumption pattern in (0.85) in urban and beverages in rural India (1.54). An India, International referred Res. J. September, 2 (24):71-74.
Rec. on 20.06.2013 & Acc. on 15.09.2013
121

ABSTRACT
Azolla (Azolla pinnata), one of the high yielding fodder, it is a genus of aquatic fern with world wide distribution in temperate and tropical regions. The present study was conducted during rabi season of the year 2013-2014 at Animal Husbandry and Dairy Science Section, College of Agriculture, Nagpur, to study the yield, chemical composition and in vitro dry matter digestibility of azolla at different stages of harvest with four treatments in
th th nd thCompletely Randomized Block Design. The treatments comprised in different days of harvest (18 , 20 ,22 and 24 ). nd -1The results showed that, on the 22 day of harvest significantly maximum yield of Azolla on wet basis (7.33 tons ha )
-1and dry basis (0.47 tons ha ) was recorded. Crude protein (25.60%), ether extract (4.32%) and total ash (16.36%) nd thwere maximum on 22 day of harvest, dry matter (6.68%) and crude fibre were maximum on 24 day of harvest,
thwhereas nitrogen free extract (45.55%) was significantly maximum on the 18 day of harvest. In- vitro dry matter nddigestibility of Azolla was significantly maximum (72.40 %) on the 22 day of harvest.
(Key words: Azolla, yield, chemical composition and in vitro dry matter digestibility, days of harvest)
concentrate has been estimated to be 12 to 14 per cent, INTRODUCTION25 to 30 per cent and 30 to 35 per cent, respectively
(Mathur et al., 2013). The shortage of fodder is, The name Azolla is derived from the two therefore, compensated with the use of readymade Greek words, Azo (to dry) and Ollyo (to kill) thus commercial feed resulting in increased cost of milk reflecting that the fern is killed by drought. Azolla is a production. The search for alternatives to green genus of six species of aquatic ferns, the only genus in fodder and concentrates led to a wonderful plant. the family Azollaceae. It grows naturally in stagnant Azolla, which holds the promise of providing a water in drains, canals, ponds, rivers and water bodies sustainable feed for livestock (Mathur et al., 2013).including marshy lands with temperature range of 15-
35°C(Chatterjee et al., 2013).Azolla has long been used as a green manure
and as a feed for poultry (Basak et al., 2002), pig and The rural population of India is more than fish (Nwanna and Falaye, 1997). Feeding azolla to 833 million, accounting for 69 per cent of total poultry improves the weight of broiler chickens and population. Over 70 million rural households own increases the egg production of layers (Pillai et al., cattle and income from cattle constitute 20 per cent of 2005). Azolla can also be fed to sheep, goats, pigs and their total earnings (Giridhar and Rajendran, 2013). In rabbits. In China, cultivation of azolla along with recent times, the share of agricultural residues that paddy and fish is said to have increased the rice form the bulk of cattle feed is declining due to reasons production by 20 per cent and fish production by 30 like low straw to grain ratio of high-yielding varieties, per cent (Pillai et al., 2005).use of the combined harvester that cause wastage of
straw in the field and also, burning of residues. The Azolla cultivation can be easily practiced in nutritional quality of straw is also low (Giridhar and
minimum area by the dairy farmers. It is very Rajendran, 2013). With shrinking grazing lands and economical to produce. Azolla improves the monthly expanding cities, marginal dairy farmers have to
-1milk yield by 10 litres animal in the low yielders depend more and more on commercial cattle feed. (Giridhar and Rajendran, 2013).It is a nutritive feed Azolla, an aquatic free floating fern, holds promise as supplement for the livestock. The cost of milk a nutritive supplemental feed. It is widely used as a production can be reduced by replacing a part of bio-fertilizer in many rice-growing regions of the concentrate requirement with Azolla (Giridhar and world (Giridhar and Rajendran, 2013).Rajendran, 2013).
Despite India being largest producer of milk, there is acute shortage of feed and fodder for dairy Azolla is rich in protein (25 - 35%), minerals
animals. Shortage of dry fodder, green fodder and (10 - 15%), amino acids (7 - 10%), vitamins and
1 , 3 and 4. P.G. Students, Animal Husbandry and Dairy Science Section, College of Agriculture, Nagpur (M.S.), India2. Asstt. Professor, Animal Husbandry and Dairy Science Section, College of Agriculture, Nagpur (M.S.), India
YIELD, CHEMICAL COMPOSITION AND IN VITRO DRY MATTER DIGESTIBILITY OF AZOLLA AT DIFFERENT STAGES OF HARVEST
J. Soils and Crops 25 (1) 122-125, June, 2015 ISSN 0971-2836
1 2 3 4 Pranita Sahane , R. M. Zinjarde , Meenal Parhad and Monali Musale
th th nd thgrowth promoting intermediates. Its nutritional treatments on 18 ,20 , 22 and 24 days after composition makes it an efficient and ideal feed inoculation in all the replications. Fresh yield on wet supplement for livestock, poultry, pigs and fish basis was recorded treatment wise at harvest. (Prabina and Kumar, 2010). Immediately after harvesting azolla was washed
thoroughly with fresh water and dried in oven till Azolla produces more than 4 to 5 times of constant weight was stabilised and was stored in
protein of excellent quality in comparison to lucerne plastic containers for yield on dry basis, chemical and hybrid napier. Besides this, the bio- mass composition and in- vitro dry matter digestibility.production is almost 4 to 10 times when compared with hybrid napier and lucerne, respectively. These Based on achieving constant dry matter two parameters are very important to enhance weight of Azolla, treatment wise dry matter yield of
-1 -1economic livestock production to establish that Azolla was recorded treatment plot replication and -1Azolla is reckoned as “The Super Plant” (Mathur et thus, mean yield plot was determined and was then
-1al., 2013). converted into dry matter yield hectare . From this treatment wise dry matter yield, the required (4)
Azolla also can be used as fodder for samples of dry matter were ground in feed mill to pass
livestock and as fish feed because of its high nutrient through 1 mm sieve and then stored in airtight
content. It has protein, vitamins, calcium, containers, labelled and used for further analysis to
phosphorus, iron, copper, magnesium, beta carotene determine chemical composition i.e. crude protein,
and amino acids. It can be fed to cattle without crude fibre, ether extract, total ash, nitrogen free
chaffing because of its small size. Azolla supplies extract and In vitro dry matter digestibility.
fodder throughout the year if planned and cultivated properly. Azolla grows on water and floats on it with The dry matter, crude protein, crude fibre, small, closely overlapping scale like leaves with roots total ash and ether extract percentage were in the water (Anonymous, 2012).Keeping the above determined as per the procedure recommended by views in mind a study was undertaken to assess the BIS (IS: 7874, part I 1975) (Anonymous, 1975). yield, chemical composition and in vitro dry matter
Nitrogen free extract was calculated by subtracting digestibility of Azolla.
total sum of crude protein, crude fibre, ether extract and total ash from 100 and in vitro dry matter
MATERIALS AND METHODSdigestibility was determined as per the procedure recommended by Barnes et al. (1971) using crossbred
A field experiment on Azolla was conducted male animal rumen liquor.at an experimental farm of Section of Animal Husbandry and Dairy Science, College of RESULTS AND DISCUSSIONAgriculture, Nagpur. The present investigation was undertaken during the rabi season of 2013-2014. The
Yield of Azolla yield, chemical composition and in-vitro dry matter
Yield of Azolla obtained from four different digestibility of Azolla under four treatments of th th nd th
days of harvest i.e.18 , 20 , 22 and 24 day for harvest at different stages of Azolla in Completely
different parameters i.e. wet basis and dry basis varied Randomized Design (CRD) with five replications
significantly(P< 0.05) (Table 1). The maximum yield were studied. The treatments comprised of different -1
of Azolla on wet basis (7.33 tons ha ) and dry basis th th nd thdays of Azolla harvest viz.,18 , 20 , 22 and 24 day -1 nd
(0.47 tons ha ) was recorded on 22 day of harvest after inoculation.
whereas minimum yield of Azolla was recorded on th -1the 18 day of harvest (5.12 and 0.25 tons ha The culture of Azolla for multiplication was
respectively). The next best treatment was the harvest received from Maharashtra Animal and Fishery th -1-2 on 24 day after inoculation(6.74 ton ha and 0.45 ton Science University, Nagpur and about 20 g m of
-1ha on wet and dry basis respectively) and was fresh Azolla seeds were inoculated into each tank of
thfollowed by the harvest on 20 day after inoculation in size 0.91× 0.60×0.30 cm (LBD). Each tank was dosed
-1 -1 with 50 g of superphosphate at 15 days interval. which 6.20 ton ha wet and 0.34 ton ha dry yield was Complete harvesting of Azolla was done as per obtained.
123
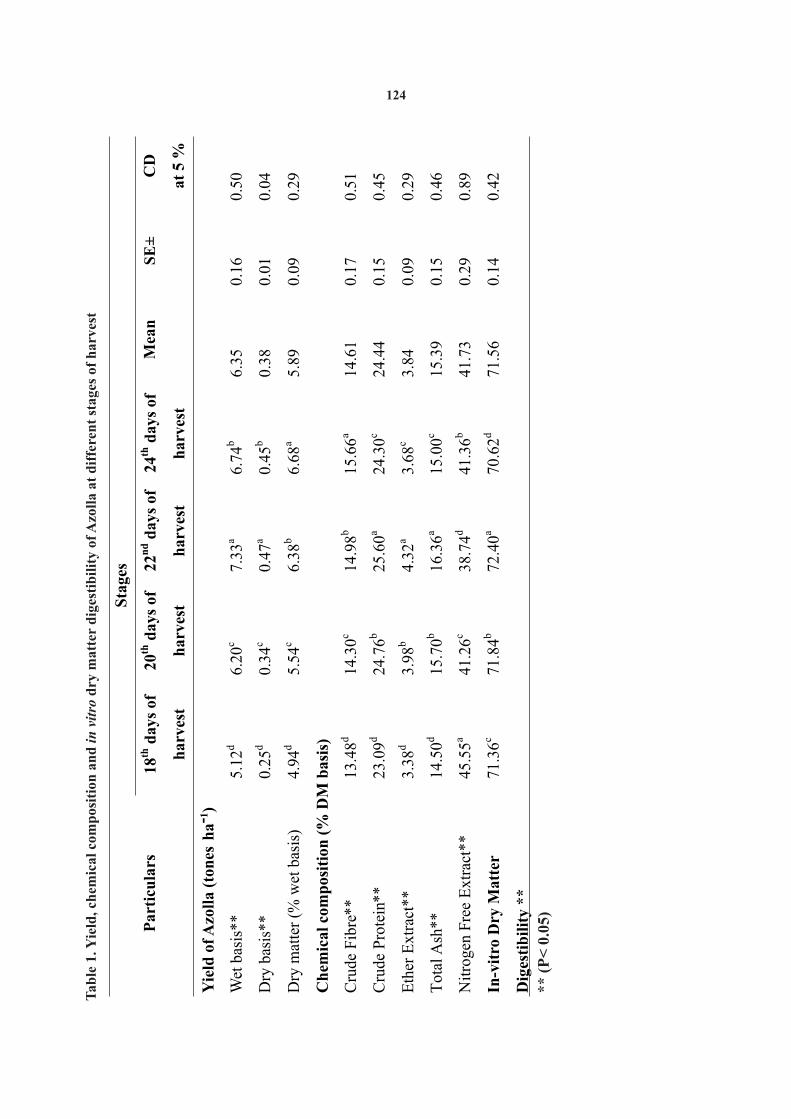
Tab
le 1
. Yie
ld, c
hem
ica
l co
mp
osi
tion
an
d i
n v
itro
dry
ma
tter
dig
esti
bil
ity
of
Azo
lla
at
dif
fere
nt
stag
es o
f h
arv
est
Par
ticu
lars
Sta
ges
Mea
n
SE
±C
D
at 5
%
18th
day
s of
har
vest
20th
day
s of
har
vest
22n
d d
ays
of
har
vest
24th
day
s of
har
vest
Yie
ld o
f A
zoll
a (t
ones
ha-
1 )
Wet
bas
is**
5.
12d
6.20
c 7.
33a
6.74
b 6.
35
0.16
0.
50
Dry
bas
is**
0.
25d
0.34
c 0.
47a
0.45
b 0.
38
0.01
0.
04
Dry
mat
ter
(% w
et b
asis
) 4.
94d
5.54
c 6.
38b
6.68
a 5.
89
0.09
0.
29
Ch
emic
al c
omp
osit
ion
(%
DM
bas
is)
Cru
de F
ibre
**
13.4
8d 14
.30c
14.9
8b 15
.66a
14.6
1 0.
17
0.51
Cru
de P
rote
in**
23
.09d
24.7
6b 25
.60a
24.3
0c 24
.44
0.15
0.
45
Eth
er E
xtra
ct**
3.
38d
3.98
b 4.
32a
3.68
c 3.
84
0.09
0.
29
Tot
al A
sh**
14
.50d
15.7
0b 16
.36a
15.0
0c 15
.39
0.15
0.
46
Nit
roge
n F
ree
Ext
ract
**
45.5
5a 41
.26c
38.7
4d 41
.36b
41.7
3 0.
29
0.89
In-v
itro
Dry
Mat
ter
Dig
esti
bil
ity
**
71.3
6c 71
.84b
72.4
0a 70
.62d
71.5
6 0.
14
0.42
**
(P
< 0
.05)
124
Rivaie et al. (2013) recorded the yield of Azolla on Parashuramulu et al.(2013) reported 47.30 per cent -1 nitrogen free extract content. Their value is slightly wet basis as 4, 6 and 8 tons ha and Gevrek (2004)
-1 more than the values found in present investigation.recorded the dry basis yield of 1 ton ha .
In vitro dry matter digestibilityThe significantly maximum average dry th In- vitro dry matter digestibility of Azolla at matter (6.68 per cent) was obtained on 24 day of
nd different stages of harvest differed significantly. The harvest followed by 22 day of harvest (6.38 per nd
th highest value of 72.40 per cent was recorded on 22 cent), 20 day of harvest (5.54 per cent) and least on th
th day of harvest followed by 20 day of harvest (71.84 18 day of harvest (4.94 per cent). The results th thper cent), 18 day of harvest (71.36 per cent) and 24 obtained by Sujatha et al.(2013) showed that the dry
day of harvest (70.62 per cent). Parashuramulu and matter content of Azolla was 6.6 per cent. The present Nagalakshmi (2012) reported 72.30 per cent in vitro results are in general agreement with them for the dry matter digestibility of Azolla. Thus, the present th nd
harvesting on 24 and 22 day after inoculation.results are in general agreement with them.
Chemical composition of AzollaREFERENCESChemical compositions of Azolla obtained from pure Anonymous, 1975. BIS. Beauro of Indiam Standered, Manaik Bhavan,
dried samples were ground in feed mill to pass New Delhi.Anonymous. 2012, Azolla as fodder for cattle and green manure.through 1 mm sieve.
http://www.veterinarytechinfo.com/ azolla-fodder-cattle-green-manure.
The significantly maximum average crude th J.Anim. Sci. fibre (15.66 per cent) was obtained on 24 day of
33:881-884.nd thharvest followed by 22 day of harvest (14.98 %), 20 Basak, Md., A. H. Parmanik, M. S. Rahman, S.U. Tarafdar and B. C. Roy,
th 2002. Azolla (Azolla pinnata) as a feed ingredient in broiler day of harvest (14.30 %) and least on 18 day of ration. Int. J. Poult Sci.1(1):19-34.
harvest (13.48%). The crude fibre content of Azolla Chatterjee, A., P. Sharma, M.K. Ghosh, M. Mandal and P.K. Roy, 2013. Utilization of Azolla microphylla as Feed Supplement for increases as the plant matures due to the Crossbred Cattle. Int. J. Agric. and Fd. Sci. Tech. 4(3): 207-lignifications. Results obtained by Sujatha et al. 214.
(2013) showed that the crude fibre content of Azolla Giridhar, K. and D. Rajendran, 2013. Cultivation and usage of azolla as supplemental feed for dairy cattle. In: Value addition of feed was 14.6±0.54 per cent respectively. Thus, the present and fodder for dairy cattle, National Institute of Animal
results are in general agreement with them. Nutrition and Physiology (NIANP), Bangalore. pp. 32-34.Gevrek, M. N., 2004. The relationship between inoculation time and dry
matter of azolla (Azolla mexicana-2026) plant in the The maximum average crude protein, ether Mediterranean regions. Ege Universitesi Ziraat Fakultesi ndextract and total ash in Azolla were obtained on 22 Dergisi. 41(2):59-67.
Indira, D., K.S. Rao, J. Suresh, K. V. Naidu and A. Ravi ,2009. Azolla day of harvest (25.60, 4.32 and 16.36 per cent (Azolla pinnata) as feed supplement in buffalo calves on th
respectively) followed by 20 day of harvest (24.76, growth performance. Indian J. Anim. Nutr.26 (4):345-348.th Mathur, G N., R. Sharma and P.C. Choudhary, 2013. Use of Azolla (Azolla 3.98 and 15.70 per cent respectively), 24 day of
pinnata) as Cattle Feed Supplement. J Krishi Vigyan. 2(1) 73-harvest (24.30, 3.68 and 15.00 per cent respectively) 75.
th Nwanna, L.C. and A.E. Falaye, 1997. Substitution of Azolla meal for and 18 day of harvest (23.09, 3.38 and 14.50 per cent groundnut cake in diets for Nile tilapia, Oreochromis niloticus
respectively).The findings of the present experiment (L). Appl. Trop. Agri. 2: 139-143.Parashuramulu, S. and D. Nagalakshmi, 2012. Azolla – A potential protein corroborate well with the findings of Chatterjee et
supplement for livestock. Livestok line. 6(4):16-19. al.(2013), who revealed that crude protein content of Parashuramulu, S., P. S. Swain and D. Nagalakshmi ,2013. Protein Azolla ranged from 22 to 26 per cent, while Indira et fractionation and in vitro digestibility of Azolla in Ruminants.
Online J. Anim. and Feed Res. 3(3): 129-132.al.(2009), reported that the ether extract and total ash Prabina, B. J. and K. Kumar ,2010. Dried Azolla as a nutritionally rich cost
were in the range from 2.73-4.6 per cent and 14.80- effective and immuno-modulatory feed supplement for broilers. The Asian J. Anim. Sci. 5(1): 20-22.15.30 per cent respectively.
Pillai, P. K., S. Premalatha and S. Rajamony, 2005. Azolla: a sustainable feed for livestock. Leisa magazine. 21(3): 26-27.
The average reported values of nitrogen free Rivaie, A. A., S. Isnaini and Maryati. 2013. Changes in Soil N, P, K, Rice th Growth and Yield Following the Application of Azolla extract were maximum on the 18 day of harvest
pinnata. J. Biol. Agric. and Healthcare. 3(2):112-117.th
(45.55 per cent) followed by 24 days of harvest Sujatha, T., A. Kundu, S. Jeyakumar and M.S.Kundu, 2013. Azolla th supplementation: Feed Cost Benefit in Duck Ration in (41.36 per cent), 20 day of harvest (41.26 per cent)
Andaman Islands. Tamilnadu J. Vet. Anim. Sci. 9 (2):130 – nd
and 22 day of harvest (38.74 per cent). 136.
Barnes, R.F., L. D. Muller, L.F. Bauman and V.F.Colenbrander, 1971. Determination of in vitro dry matter digestibility.
Rec. on 30.05.2014 & Acc. on 15.07.2014
125
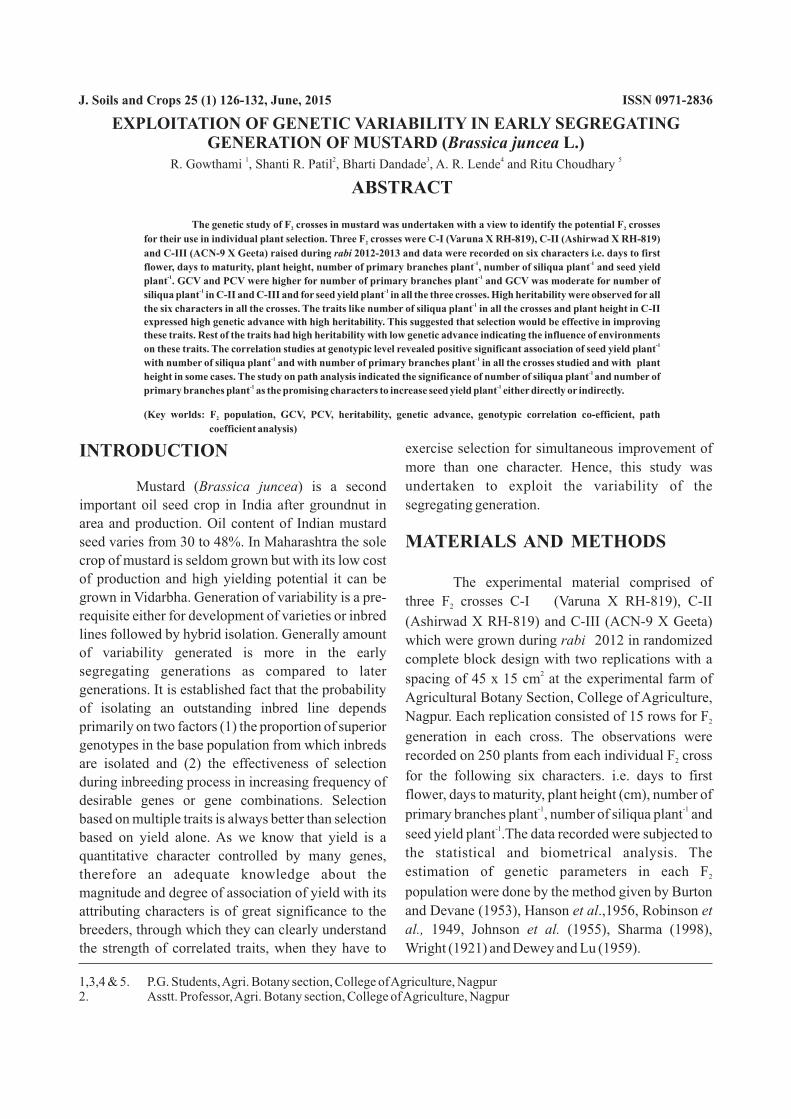
ABSTRACT
The genetic study of F crosses in mustard was undertaken with a view to identify the potential F crosses 2 2
for their use in individual plant selection. Three F crosses were C-I (Varuna X RH-819), C-II (Ashirwad X RH-819) 2
and C-III (ACN-9 X Geeta) raised during rabi 2012-2013 and data were recorded on six characters i.e. days to first -1 -1flower, days to maturity, plant height, number of primary branches plant , number of siliqua plant and seed yield
-1 -1plant . GCV and PCV were higher for number of primary branches plant and GCV was moderate for number of -1 -1siliqua plant in C-II and C-III and for seed yield plant in all the three crosses. High heritability were observed for all
-1the six characters in all the crosses. The traits like number of siliqua plant in all the crosses and plant height in C-II expressed high genetic advance with high heritability. This suggested that selection would be effective in improving these traits. Rest of the traits had high heritability with low genetic advance indicating the influence of environments
-1 on these traits. The correlation studies at genotypic level revealed positive significant association of seed yield plant-1 -1with number of siliqua plant and with number of primary branches plant in all the crosses studied and with plant
-1 height in some cases. The study on path analysis indicated the significance of number of siliqua plant and number of -1 -1primary branches plant as the promising characters to increase seed yield plant either directly or indirectly.
(Key worlds: F population, GCV, PCV, heritability, genetic advance, genotypic correlation co-efficient, path 2
coefficient analysis)
1,3,4 & 5. P.G. Students, Agri. Botany section, College of Agriculture, Nagpur2. Asstt. Professor, Agri. Botany section, College of Agriculture, Nagpur
EXPLOITATION OF GENETIC VARIABILITY IN EARLY SEGREGATING GENERATION OF MUSTARD (Brassica juncea L.)
J. Soils and Crops 25 (1) 126-132, June, 2015 ISSN 0971-2836
exercise selection for simultaneous improvement of INTRODUCTIONmore than one character. Hence, this study was
undertaken to exploit the variability of the Mustard (Brassica juncea) is a second
important oil seed crop in India after groundnut in segregating generation.
area and production. Oil content of Indian mustard
seed varies from 30 to 48%. In Maharashtra the sole MATERIALS AND METHODScrop of mustard is seldom grown but with its low cost
of production and high yielding potential it can be The experimental material comprised of grown in Vidarbha. Generation of variability is a pre- three F crosses C-I (Varuna X RH-819), C-II 2
requisite either for development of varieties or inbred (Ashirwad X RH-819) and C-III (ACN-9 X Geeta) lines followed by hybrid isolation. Generally amount which were grown during rabi 2012 in randomized of variability generated is more in the early complete block design with two replications with a
2segregating generations as compared to later spacing of 45 x 15 cm at the experimental farm of
generations. It is established fact that the probability Agricultural Botany Section, College of Agriculture,
of isolating an outstanding inbred line depends Nagpur. Each replication consisted of 15 rows for F 2primarily on two factors (1) the proportion of superior generation in each cross. The observations were
genotypes in the base population from which inbreds recorded on 250 plants from each individual F cross 2are isolated and (2) the effectiveness of selection for the following six characters. i.e. days to first during inbreeding process in increasing frequency of flower, days to maturity, plant height (cm), number of desirable genes or gene combinations. Selection
-1 -1primary branches plant , number of siliqua plant and based on multiple traits is always better than selection -1
seed yield plant .The data recorded were subjected to based on yield alone. As we know that yield is a the statistical and biometrical analysis. The quantitative character controlled by many genes, estimation of genetic parameters in each F 2therefore an adequate knowledge about the population were done by the method given by Burton magnitude and degree of association of yield with its and Devane (1953), Hanson et al.,1956, Robinson et attributing characters is of great significance to the
breeders, through which they can clearly understand al., 1949, Johnson et al. (1955), Sharma (1998),
Wright (1921) and Dewey and Lu (1959).the strength of correlated traits, when they have to
R. 1 2 3 4 5Gowthami , Shanti R. Patil , Bharti Dandade , A. R. Lende and Ritu Choudhary
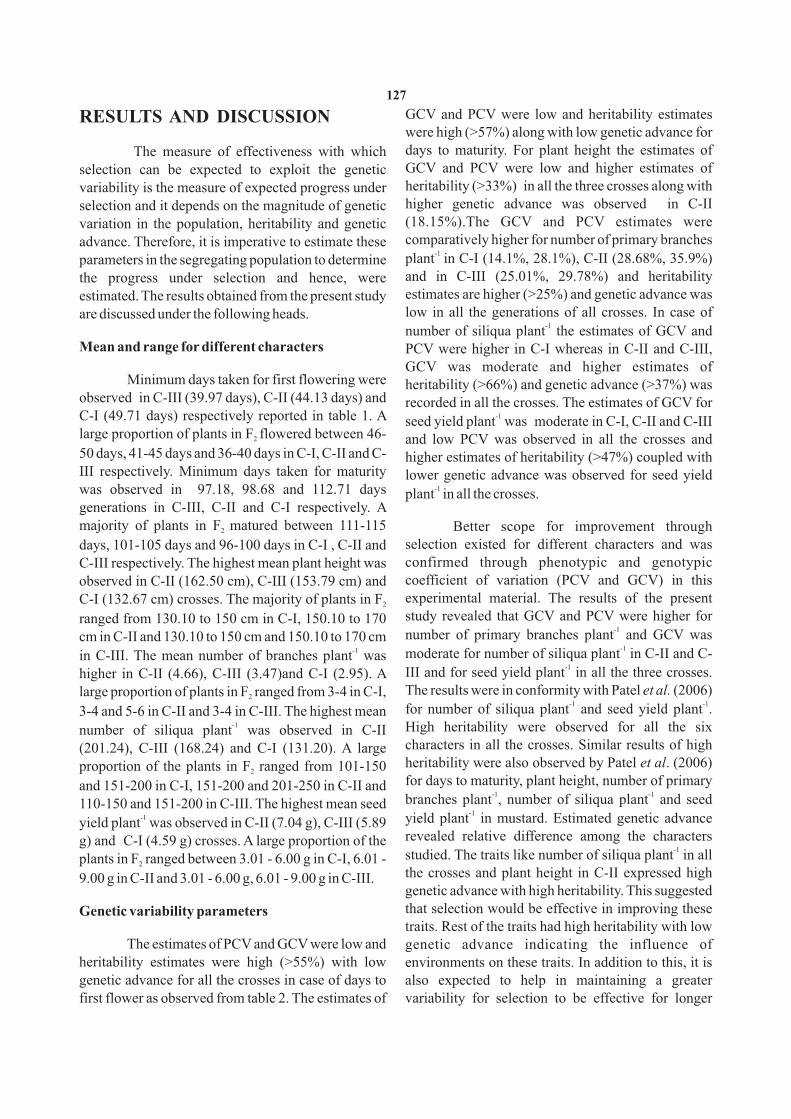
GCV and PCV were low and heritability estimates RESULTS AND DISCUSSIONwere high (>57%) along with low genetic advance for days to maturity. For plant height the estimates of The measure of effectiveness with which GCV and PCV were low and higher estimates of selection can be expected to exploit the genetic heritability (>33%) in all the three crosses along with variability is the measure of expected progress under higher genetic advance was observed in C-II selection and it depends on the magnitude of genetic (18.15%).The GCV and PCV estimates were variation in the population, heritability and genetic comparatively higher for number of primary branches advance. Therefore, it is imperative to estimate these
-1 plant in C-I (14.1%, 28.1%), C-II (28.68%, 35.9%) parameters in the segregating population to determine and in C-III (25.01%, 29.78%) and heritability the progress under selection and hence, were estimates are higher (>25%) and genetic advance was estimated. The results obtained from the present study low in all the generations of all crosses. In case of are discussed under the following heads.
-1number of siliqua plant the estimates of GCV and Mean and range for different characters PCV were higher in C-I whereas in C-II and C-III,
GCV was moderate and higher estimates of Minimum days taken for first flowering were heritability (>66%) and genetic advance (>37%) was
observed in C-III (39.97 days), C-II (44.13 days) and recorded in all the crosses. The estimates of GCV for -1C-I (49.71 days) respectively reported in table 1. A seed yield plant was moderate in C-I, C-II and C-III
large proportion of plants in F flowered between 46-2 and low PCV was observed in all the crosses and 50 days, 41-45 days and 36-40 days in C-I, C-II and C- higher estimates of heritability (>47%) coupled with III respectively. Minimum days taken for maturity lower genetic advance was observed for seed yield
-1was observed in 97.18, 98.68 and 112.71 days plant in all the crosses.generations in C-III, C-II and C-I respectively. A majority of plants in F matured between 111-115 Better scope for improvement through 2
selection existed for different characters and was days, 101-105 days and 96-100 days in C-I , C-II and confirmed through phenotypic and genotypic C-III respectively. The highest mean plant height was coefficient of variation (PCV and GCV) in this observed in C-II (162.50 cm), C-III (153.79 cm) and experimental material. The results of the present C-I (132.67 cm) crosses. The majority of plants in F 2
study revealed that GCV and PCV were higher for ranged from 130.10 to 150 cm in C-I, 150.10 to 170 -1number of primary branches plant and GCV was cm in C-II and 130.10 to 150 cm and 150.10 to 170 cm
-1-1 moderate for number of siliqua plant in C-II and C-in C-III. The mean number of branches plant was -1
III and for seed yield plant in all the three crosses. higher in C-II (4.66), C-III (3.47)and C-I (2.95). A The results were in conformity with Patel et al. (2006) large proportion of plants in F ranged from 3-4 in C-I, 2
-1 -1for number of siliqua plant and seed yield plant . 3-4 and 5-6 in C-II and 3-4 in C-III. The highest mean
-1 High heritability were observed for all the six number of siliqua plant was observed in C-II characters in all the crosses. Similar results of high (201.24), C-III (168.24) and C-I (131.20). A large heritability were also observed by Patel et al. (2006) proportion of the plants in F ranged from 101-150 2
for days to maturity, plant height, number of primary and 151-200 in C-I, 151-200 and 201-250 in C-II and -1 -1
branches plant , number of siliqua plant and seed 110-150 and 151-200 in C-III. The highest mean seed -1
-1 yield plant in mustard. Estimated genetic advance yield plant was observed in C-II (7.04 g), C-III (5.89 revealed relative difference among the characters g) and C-I (4.59 g) crosses. A large proportion of the
-1studied. The traits like number of siliqua plant in all plants in F ranged between 3.01 - 6.00 g in C-I, 6.01 - 2
the crosses and plant height in C-II expressed high 9.00 g in C-II and 3.01 - 6.00 g, 6.01 - 9.00 g in C-III. genetic advance with high heritability. This suggested that selection would be effective in improving these Genetic variability parameters traits. Rest of the traits had high heritability with low
The estimates of PCV and GCV were low and genetic advance indicating the influence of environments on these traits. In addition to this, it is heritability estimates were high (>55%) with low also expected to help in maintaining a greater genetic advance for all the crosses in case of days to
first flower as observed from table 2. The estimates of variability for selection to be effective for longer
127
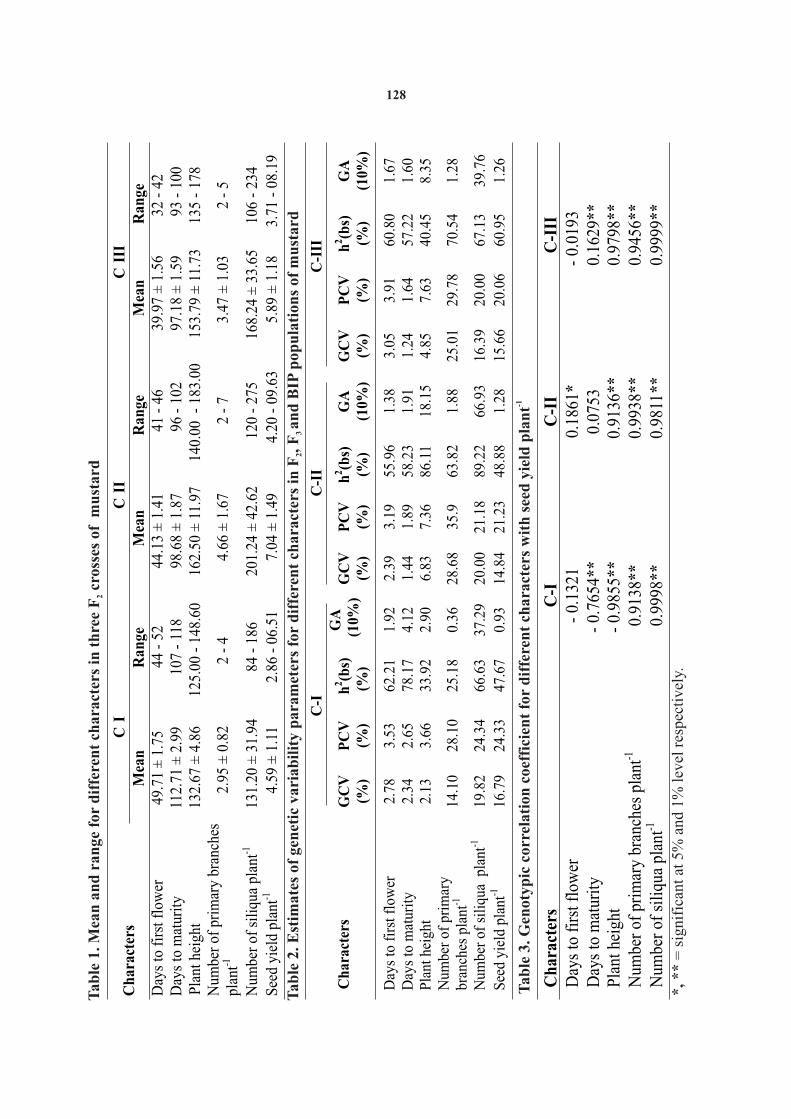
Ta
ble
1. M
ean
an
d r
ange
for
dif
fere
nt
char
acte
rs i
n t
hre
e F
cros
ses
of
mu
sta
rd2
Ch
arac
ters
C
IC
IIC
III
Mea
nR
ange
Mea
nR
ange
Mea
nR
ange
Day
s to
fir
st f
low
er
49
.71
± 1
.75
44 -
52
44.1
3 ±
1.4
1
41 -
46
39
.97
± 1
.56
32 -
42D
ays
to m
atur
ity
11
2.71
± 2
.99
107
-
118
98
.68
± 1
.87
96
-
102
97.1
8 ±
1.5
9
93
-10
0P
lant
hei
ght
13
2.67
± 4
.86
12
5.00
-
14
8.60
162.
50 ±
11.
97
140.
00 -
18
3.00
15
3.79
± 1
1.73
13
5 -
178
Num
ber
of p
rim
ary
bran
ches
pl
ant-1
2.
95 ±
0.8
2
2 -
4
4.
66 ±
1.6
7
2
-
7
3.
47 ±
1.0
3
2 -
5
Num
ber
of s
iliq
ua p
lant
-1
13
1.20
± 3
1.94
84
-
186
20
1.24
± 4
2.62
12
0 -
27
5
16
8.24
± 3
3.65
10
6 -
234
See
d yi
eld
plan
t-1
4.
59 ±
1.1
1
2.86
-
06.5
1
7.04
± 1
.49
4.
20 -
09
.63
5.
89 ±
1.1
8
3.
71 -
08.1
9
Ta
ble
2. E
stim
ates
of
gen
etic
va
ria
bil
ity
pa
ram
eter
s fo
r d
iffe
ren
t ch
ara
cter
s in
F, F
and
BIP
pop
ula
tio
ns
of
mu
star
d
23
Ch
arac
ters
C-I
C-I
IC
-III
GC
V
(%)
PC
V
(%)
h2 (b
s)
(%)
GA
(1
0%)
GC
V
(%)
PC
V
(%)
h2 (b
s)
(%)
GA
(1
0%)
GC
V
(%)
PC
V
(%)
h2 (b
s)
(%)
GA
(1
0%)
Day
s to
fir
st f
low
er
2.78
3.
53 62
.21
1.92
2.
39
3.19
55
.96
1.
38
3.05
3.
91
60.8
01.
67D
ays
to m
atur
ity
2.
34
2.65
78.1
7 4.12
1.
44
1.89
58
.23
1.
91
1.24
1.
64
57.2
21.
60P
lant
hei
ght
2.
13
3.66
33.9
2 2.90
6.
83
7.36
86
.11
18
.15
4.85
7.
63
40.4
58.
35N
umbe
r of
pri
mar
y br
anch
es p
lant
-1
14.1
0 28
.10
25.1
8 0.36
28
.68
35
.9
63.8
2
1.88
25
.01
29.7
870
.54
1.28
Num
ber
of s
iliq
ua p
lant
-119
.82
24.3
4 66
.63
37
.29
20
.00
21
.18
89
.22
66
.93
16.3
920
.00
67.1
339
.76
See
d yi
eld
plan
t-116
.79
24.3
347
.67
0.93
14.8
421
.23
48.8
81.
2815
.66
20.0
660
.95
1.26
-1
Ta
ble
3. G
enot
yp
ic c
orre
lati
on
co
effi
cien
t fo
r d
iffe
ren
t ch
arac
ters
wit
h s
eed
yie
ld p
lan
t
Ch
arac
ters
C
-I
C-I
I C
-III
D
ays
to f
irst
flo
wer
-
0.13
21
0.18
61*
- 0.
0193
D
ays
to m
atur
ity
- 0.
7654
**
0.07
53
0.16
29**
Pla
nt h
eigh
t -
0.98
55**
0.
9136
**
0.97
98**
N
umbe
r of
pri
mar
y br
anch
es p
lant
-1
0.91
38**
0.
9938
**
0.94
56**
N
umbe
r of
sil
iqua
pla
nt-1
0.
9998
**
0.98
11**
0.
9999
**
*, *
* =
sig
nifi
can
t at
5%
an
d 1
% l
evel
res
pect
ivel
y.
128
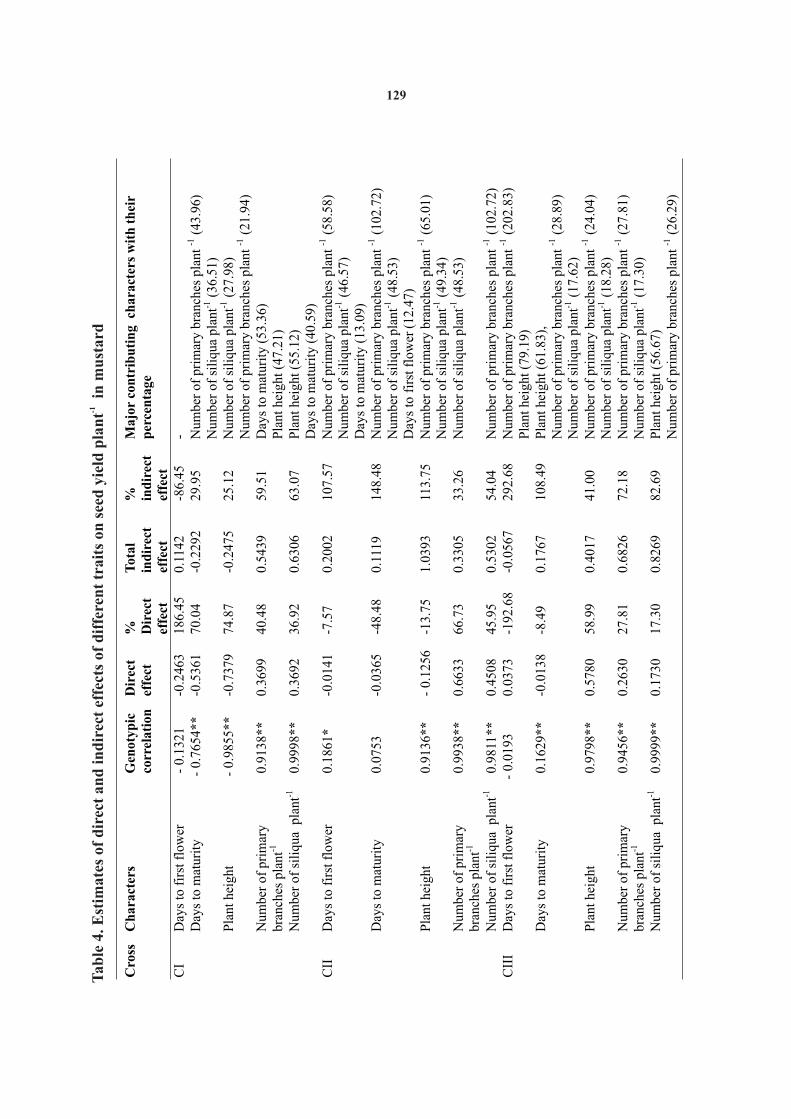
-1T
ab
le 4
. Est
ima
tes
of
dir
ect
and
in
dir
ect
effe
cts
of
dif
fere
nt
tra
its
on s
eed
yie
ld p
lan
t i
n m
ust
ard
Cro
ss C
har
acte
rs
Gen
otyp
ic
corr
elat
ion
Dir
ect
effe
ct
%
Dir
ect
effe
ct
Tot
al
ind
irec
t ef
fect
%
ind
irec
t ef
fect
Maj
or c
ontr
ibu
tin
g c
har
acte
rs w
ith
th
eir
per
cen
tage
CI
Day
s to
fir
st f
low
er
-
0.13
21
-0.2
463
18
6.45
0.
1142
-8
6.45
-
D
ays
to m
atur
ity
-
0.
7654
**
-0.5
361
70
.04
-0
.229
2
29.9
5
Num
ber
of p
rim
ary
bran
ches
pla
nt -1
(43.
96)
Num
ber
of s
iliq
ua p
lant
-1
(3
6.51
)P
lant
hei
ght
-
0.
9855
**
-0
.737
9
74
.87
-0
.247
5
25
.12
N
umbe
r of
sil
iqua
pla
nt-1
(2
7.98
)N
umbe
r of
pri
mar
y br
anch
es p
lant
-1(2
1.94
)N
umbe
r of
pri
mar
y br
anch
es p
lant
-1
0.91
38**
0.36
99
40.4
8
0.54
39
59.5
1
Day
s to
mat
urit
y
(53.
36)
P
lant
hei
ght
(47.
21)
N
umbe
r of
sil
iqua
pla
nt-1
0.99
98**
0.36
92
36.9
2
0.63
06
63.0
7
Pla
nt h
eigh
t (5
5.12
)
D
ays
to m
atur
ity
(40.
59)
C
II
Day
s to
fir
st f
low
er
0.18
61*
-0.0
141
-7.5
7
0.20
02
107.
57
Num
ber
of p
rim
ary
bran
ches
pla
nt -1
(58.
58)
Num
ber
of s
iliq
ua p
lant
-1
(46.
57)
Day
s to
mat
urit
y (1
3.09
)
Day
s to
mat
urit
y
0.07
53
-0.0
365
-48.
48
0.11
19
148.
48
Num
ber
of p
rim
ary
bran
ches
pla
nt -1
(102
.72)
Num
ber
of s
iliq
ua p
lant
-1
(48.
53)
Day
s to
firs
t fl
ower
(12
.47)
Pla
nt h
eigh
t
0.91
36**
-
0.12
56
-13.
75
1.03
93
113.
75
Num
ber
of p
rim
ary
bran
ches
pla
nt -1
(65.
01)
Num
ber
of s
iliq
ua p
lant
-1(4
9.34
)N
umbe
r of
pri
mar
y br
anch
es p
lant
-1
0.99
38**
0.66
33
66.7
3
0.33
05
33.2
6
Num
ber
of s
iliq
ua p
lant
-1
(48.
53)
Num
ber
of s
iliq
ua p
lant
-1
0.98
11**
0.45
08
45.9
5
0.53
02
54.0
4
Num
ber
of p
rim
ary
bran
ches
pla
nt -1
(102
.72)
CII
I
Day
s to
fir
st f
low
er
-
0.01
93
0.03
73
-192
.68
-0.0
567
292.
68
Num
ber
of p
rim
ary
bran
ches
pla
nt -1
(202
.83)
Pla
nt h
eigh
t
(79.
19)
Day
s to
mat
urit
y
0.16
29**
-0.0
138
-8.4
9
0.17
67
108.
49
Pla
nt h
eigh
t (6
1.83
),
Num
ber
of p
rim
ary
bran
ches
pla
nt -1
(28.
89)
Num
ber
of s
iliq
ua p
lant
-1
(17.
62)
Pla
nt h
eigh
t
0.97
98**
0.57
80
58.9
9
0.40
17
41.0
0
Num
ber
of p
rim
ary
bran
ches
pla
nt -1
(24.
04)
Num
ber
of s
iliq
ua p
lant
-1(1
8.28
)N
umbe
r of
pri
mar
y br
anch
es p
lant
-10.
9456
**0.
2630
27.8
10.
6826
72.1
8N
umbe
r of
pri
mar
y br
anch
es p
lant
-1(2
7.81
)N
umbe
r of
sil
iqua
pla
nt-1
(17.
30)
Num
ber
of s
iliq
ua p
lant
-10.
9999
**0.
1730
17.3
00.
8269
82.6
9P
lant
hei
ght
(56.
67)
Num
ber
of p
rim
ary
bran
ches
pla
nt -1
(26.
29)
129
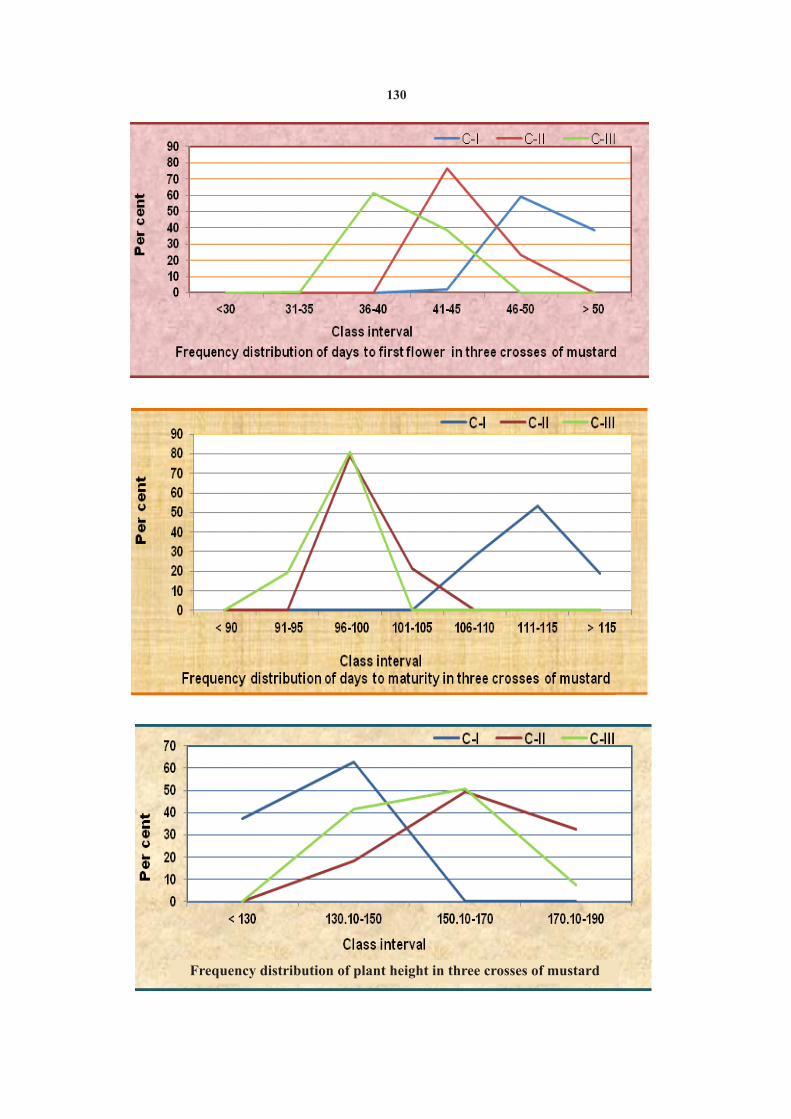
130
Frequency distribution of plant height in three crosses of mustard

131

-1period in crops like mustard where lack of variability crosses revealed that seed yield plant was highly -1has been implicated as one of the important causes for influenced directly by number of siliqua plant
-1limited progress. followed by number of primary branches plant in all the crosses as observed from table 4. Similar to this
-1-1Interrelationship of seed yield plant with results direct effect of number of siliqua plant on
component traits seed yield was also reported by Patel et al. (2000), Badsra and Choudhary (2001), Singh (2004), Kardam
The knowledge of interrelationship of plant and Singh et al. (2005) in mustard. Number of -1
-1 characters with seed yield plant also help the primary branches plant was found to be the next breeders in improvement of a complex character like significant character. This study on path analysis seed yield for which direct selection is not much -1
indicated the significance of number of siliqua plant-1effective. Recombination in segregating generation
and number of primary branches plant as the leads to formation of new pattern of association of -1promising characters to increase seed yield plant linked characters, hence the genotypic correlation co-
either directly or indirectly.-1efficient of different characters with seed yield plant
were estimated and presented in table 3. REFERENCES
It was observed from the correlation study Badsra, S. R. and L. Chaudhary, 2001. Association of yield and its
that strength and direction of correlation in different components in Indian mustard. Agric. Sci. Digest, 21(2): 83-86. character combinations depends on the nature of the
Burton, G. W. and E. M. Devane, 1953. Estimating heritability in tall experimental material and environmental condition fescue (Festuca circunclinaceae) from replicated clonal-
material. Agron. J. 45: 478-481.in which they have been studied. The correlation Dewey, D. R. and K. H. Lu, 1959.A correlation and path coefficient
studies at genotypic level carried out in three F 2 analysis of components of crested wheat grass seed production. Agron. J. 51: 515-518.crosses in the existing agroclimatic situation of
Hanson, G. H., H. F. Robinson and R. E. Comstock, 1956, Biometrical Nagpur revealed positive significant association of
studies of yield in segregating populations of Korean -1 -1seed yield plant with number of siliqua plant and Lespedza. Agron. J. 48: 268-272.
-1 Johnson, H. W., H. F. Robinson and H. S. Comstock, 1955. Estimation with number of primary branches plant in all the
of genetic and environmental variability in soybean. Agron. J. 47: 314-318.crosses studied. Plant height was also associated with
-1 Kardam, D. K. and V.V.Singh, 2005.Correlation and path analysis in seed yield plant in some cases. This indicates that an Indian mustard (Brassica juncea (L.) Czern and Coss) grown
increase in any one of these three characters under rainfed condition. J. Spices Arom. Crops, 14(1): 56-60.-1 Mahla, H. R., S. J. Jambhulkar, D. K. Yadav and R. Sharma, 2003. Genetic especially number of siliqua plant and number of
variability, correlation and path analysis in Indian mustard -1primary branches plant can result in increase in the (Brassica juncea (L.) Czern and Coss). Indian J. Genet. Pl.
Breed. 63(2): 171-172.seed yield of mustard. Hence, it is stressed that more Patel, K. M., P. G. Patel and H. Pathak, 2000. Path analysis in Indian
-1emphasis should be given for number of siliqua plant mustard (Brassica juncea (L.) Czern and Coss). Madras agric.
-1 J. 87: 330-331. and number of primary branches plant as they Patel, J. M., K. M. Patel, C. J. Patel and K. P. Prajapati, 2006. Genetic
showed very high degree of positive association with parameters and Inter-relationship analysis in Indian mustard. -1 J.Oilseeds Res. 23(2): 159-160.seed yield plant . Similar results of positive
Robinson, H. F., R. E. Comstock and V. H. Harvey, 1949. Estimates of -1
significant correlation of number of siliqua plant , studies on yield in segregating populations. Agron. J. 41: 353--1 359.number of primary branches plant with seed yield
Sharma, J. R. 1998. Statistical and Biometrical Techniques in Plant -1
plant were also reported by Patel et al. (2000), Breeding. Age Intl.. (p) Ltd. Publication, New Delhi.Singh, B. 2004. Character association and path analysis under dryland Badsra and Choudhary (2001), Mahla et al. (2003)
condition in India mustard (Brassica juncea). Cruciferae and Kardam and Singh (2005) in mustard. Newslet, 25: 99-100.
Singh, K. H., K. K. Srivastava and J. S. Chauhan, 2005. Response to selection in F and in the F generation in Indian mustard 2 5 Path co-efficient analysis(Brassica juncea (L.) czern & Coss.). Indian. J. Genet. 65 (4): 274-277.
Path analysis studies carried out in three Wright. S. 1921. Correlation and causation. J. agric. Res. 20: 202-209.
Rec. on 02.01.2014 & Acc. on 05.03.2014
132
ABSTRACT
The field experiment was conducted to study the effect of integrated nutrient management on yield and changes in soil fertility status under sorghum based intercropping system during kharif season of 2010-11 at the farm of Agronomy section, College of Agriculture, Nagpur. The experiment was laid out in split plot design with three nutrient supply combinations replicated four times. Basically, four main cropping systems viz., C -(sole sorghum), C -1 2
(sorghum + green gram), C -(sorghum + black gram), C -(sorghum + soybean) and three sub treatments viz., N1-RDF 3 4
-1 -1(80:40:40 kg NPK ha ), N - 75% RDF (60:30:30 kg NPK ha ) + 25%N through vermicompost + Azospirillum + PSB , 2
-1N -50% RDF (40:20:20 kg NPK ha ) + 25% N through vermicompost + Azospirillum + PSB were selected. Soil pH, 3
electrical conductivity and organic carbon were improved with the application of 75%RDF + 25% N through -1vermicompost + Azospirillum + PSB. The highest available N status of soil (284.22 kg ha ) was recorded under
sorghum + soybean intercropping system in the treatment of 75% RDF + 25% N through vermicompost + -1Azospirillum + PSB which remained statistically at par in sorghum + green gram (273.98 kg ha ) intercropping system -1under same nutrient supply system. The lowest value of available N status of soil (239.83 kg ha ) was registered under
sole sorghum with the application of 100% RDF. Observations showed that the highest sorghum equivalent grain -1 -1yield (35.94 q ha ) was obtained under 100% RDF followed by 75% RDF + 25% N (34.65 q ha ) was obtained under
-1100% RDF followed by 75% RDF + 25% N (34.65 q ha ) through vermicompost + Azospirillum + PSB whereas the -1highest sorghum equivalent straw yield (413.75 q ha ) was recorded under 50% RDF + 25% N through vermicompost
+ Azospirillum + PSB. Inclusion of leguminous crop in cropping system helps to improve the soil quality through maintenance of physico-chemical properties of the soil. The findings showed that sorghum + soybean intercropping system with 75% RDF in conjunction with vermicompost and biofertilizers proved superior over sole cropping of sorghum for maintaining fertility status of soil.
(Key words: Sorghum based intercropping, INM Vertisol, grain and straw yield, soil fertility status)
1 ,3 & 4. P.G. Students, Soil Science & Agril. Chemistry Section, College of Agriculture, Nagpur2. Asstt. Professor, Soil Science & Agril. Chemistry Section, College of Agriculture, Nagpur5. P.G. Student, Soil Science & Agril. Chemistry Section, College of Agriculture, Latur
EFFECT OF INTEGRATED NUTRIENT MANAGEMENT ON YIELD AND CHANGES IN SOIL FERTILITY STATUS UNDER SORGHUM
BASED INTERCROPPING SYSTEM
J. Soils and Crops 25 (1) 133-139, June, 2015 ISSN 0971-2836
1 2 3 4 5Priya P. Gurav , R.P. Gawande , P.L. Choudhari , B. A. Patil and A.S. Gajare
nutrient management helps in the maintenance of soil INTRODUCTIONfertility and it supplies plant nutrient to an optimum
level for sustaining desired crop productivity through Sorghum (Sorghum bicolor) ranks the third optimization of benefits from all possible sources of in the major food crops in India whereas it is the fourth plant nutrients in an integrated manner (Blaise and food grain crop of the world. Maharashtra is the Prasad, 2005). The appropriate combination of highest contributor in respect of acreage and chemical fertilizer, organic manures, crop residues production. In India it is grown over an area of 7.53 and bio-fertilizers varies according to the system of million hectares with the production of 7.25 million
-1 land use considering ecological, social and economic tones with an average productivity of 962 kg ha condition. The use of organic material is much more (Anonymous, 2010). The low productivity of useful in maintaining soil fertility and especially sorghum has been attributed to the fact that large area useful in improving the physical, chemical and is under rainfed situation. Under such situation, biological properties of soils which contribute in inclusion of grain legumes as intercrops can increases adequate plant nutrient supply (Rathore and Rathore, the productivity of the system (Elmore and Jackobs, 2006).1986). Introducing or improving an intercropping
system with these crops can significantly benefit the Intercropping is an important agronomic small holders by increasing yield on a limited amount
practice to insure against the failure of crops owing to of land, reducing risk of total crop failure, and unexpected abiotic and biotic stresses. It results in maximizing the efficiency of labour utilization.ensuring some yield under such situations in one or
Integrated nutrient management is actually other component crops. Cereal-legume intercropping
the technical managerial component of achieving the plays an impotant role in subsistence food production
objective of integrated Plant Nutrient Supply System in both developed and developing countries, epecially
et al.,et al. in situations of limited water resources (Tsubo under farm situation (Mader , 2002). Integrated
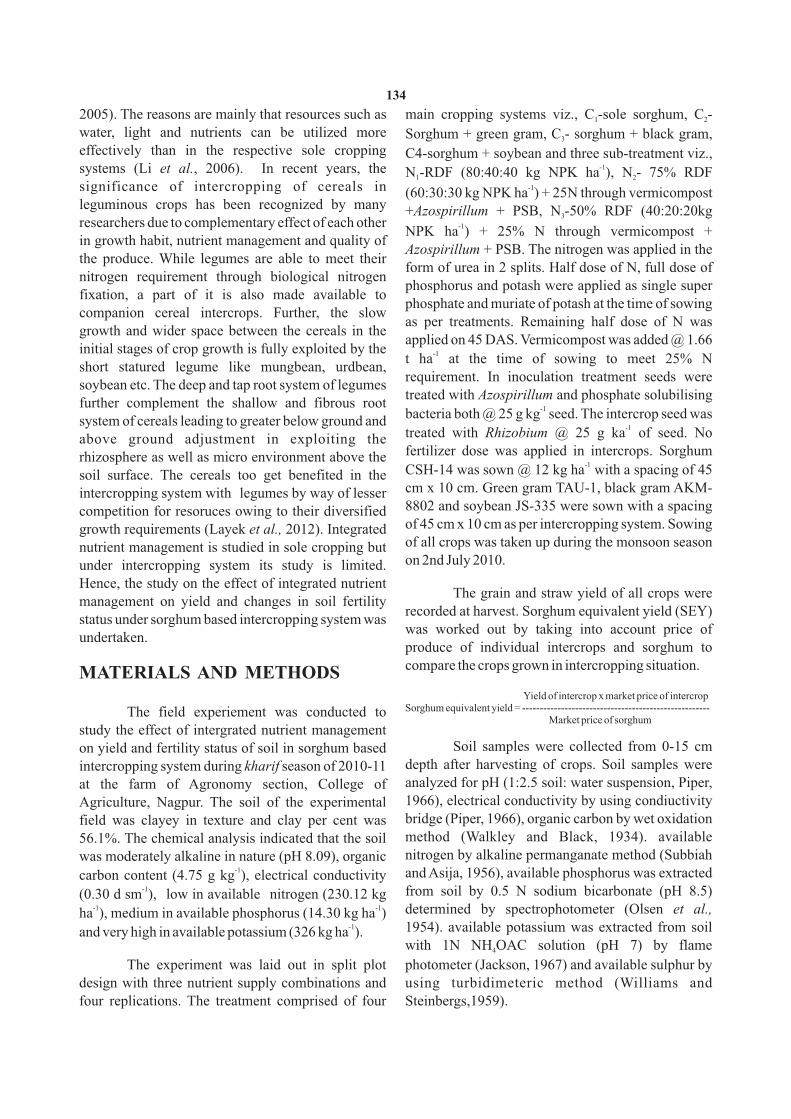
main cropping systems viz., C -sole sorghum, C -2005). The reasons are mainly that resources such as 1 2
water, light and nutrients can be utilized more Sorghum + green gram, C - sorghum + black gram, 3
effectively than in the respective sole cropping C4-sorghum + soybean and three sub-treatment viz., -1systems (Li et al., 2006). In recent years, the N -RDF (80:40:40 kg NPK ha ), N - 75% RDF 1 2
-1significance of intercropping of cereals in (60:30:30 kg NPK ha ) + 25N through vermicompost leguminous crops has been recognized by many +Azospirillum + PSB, N -50% RDF (40:20:20kg 3researchers due to complementary effect of each other -1NPK ha ) + 25% N through vermicompost + in growth habit, nutrient management and quality of
Azospirillum + PSB. The nitrogen was applied in the the produce. While legumes are able to meet their
form of urea in 2 splits. Half dose of N, full dose of nitrogen requirement through biological nitrogen
phosphorus and potash were applied as single super fixation, a part of it is also made available to
phosphate and muriate of potash at the time of sowing companion cereal intercrops. Further, the slow
as per treatments. Remaining half dose of N was growth and wider space between the cereals in the
applied on 45 DAS. Vermicompost was added @ 1.66 initial stages of crop growth is fully exploited by the -1t ha at the time of sowing to meet 25% N short statured legume like mungbean, urdbean,
requirement. In inoculation treatment seeds were soybean etc. The deep and tap root system of legumes
treated with Azospirillum and phosphate solubilising further complement the shallow and fibrous root -1
bacteria both @ 25 g kg seed. The intercrop seed was system of cereals leading to greater below ground and -1
treated with Rhizobium @ 25 g ka of seed. No above ground adjustment in exploiting the fertilizer dose was applied in intercrops. Sorghum rhizosphere as well as micro environment above the
-1CSH-14 was sown @ 12 kg ha with a spacing of 45 soil surface. The cereals too get benefited in the cm x 10 cm. Green gram TAU-1, black gram AKM-intercropping system with legumes by way of lesser 8802 and soybean JS-335 were sown with a spacing competition for resoruces owing to their diversified of 45 cm x 10 cm as per intercropping system. Sowing growth requirements (Layek et al., 2012). Integrated of all crops was taken up during the monsoon season nutrient management is studied in sole cropping but on 2nd July 2010.under intercropping system its study is limited.
Hence, the study on the effect of integrated nutrient The grain and straw yield of all crops were
management on yield and changes in soil fertility recorded at harvest. Sorghum equivalent yield (SEY)
status under sorghum based intercropping system was was worked out by taking into account price of
undertaken.produce of individual intercrops and sorghum to compare the crops grown in intercropping situation.MATERIALS AND METHODS
Yield of intercrop x market price of intercropSorghum equivalent yield = -----------------------------------------------------The field experiement was conducted to
Market price of sorghumstudy the effect of intergrated nutrient management
Soil samples were collected from 0-15 cm on yield and fertility status of soil in sorghum based depth after harvesting of crops. Soil samples were intercropping system during kharif season of 2010-11 analyzed for pH (1:2.5 soil: water suspension, Piper, at the farm of Agronomy section, College of 1966), electrical conductivity by using condiuctivity Agriculture, Nagpur. The soil of the experimental bridge (Piper, 1966), organic carbon by wet oxidation field was clayey in texture and clay per cent was method (Walkley and Black, 1934). available 56.1%. The chemical analysis indicated that the soil nitrogen by alkaline permanganate method (Subbiah was moderately alkaline in nature (pH 8.09), organic
-1 and Asija, 1956), available phosphorus was extracted carbon content (4.75 g kg ), electrical conductivity -1 from soil by 0.5 N sodium bicarbonate (pH 8.5) (0.30 d sm ), low in available nitrogen (230.12 kg
-1 -1 determined by spectrophotometer (Olsen et al., ha ), medium in available phosphorus (14.30 kg ha ) -1 1954). available potassium was extracted from soil and very high in available potassium (326 kg ha ).
with 1N NH OAC solution (pH 7) by flame 4
The experiment was laid out in split plot photometer (Jackson, 1967) and available sulphur by design with three nutrient supply combinations and using turbidimeteric method (Williams and
Steinbergs,1959).four replications. The treatment comprised of four
134
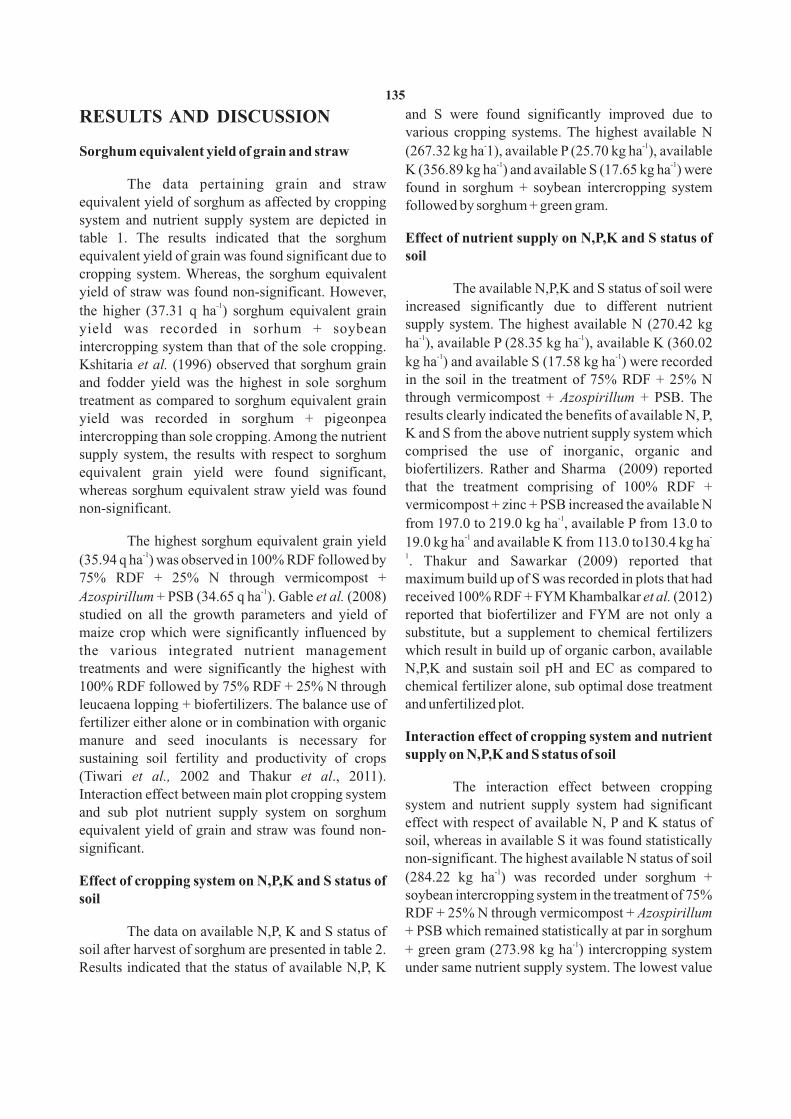
and S were found significantly improved due to RESULTS AND DISCUSSIONvarious cropping systems. The highest available N
- -1(267.32 kg ha 1), available P (25.70 kg ha ), available Sorghum equivalent yield of grain and straw
-1 -1K (356.89 kg ha ) and available S (17.65 kg ha ) were The data pertaining grain and straw found in sorghum + soybean intercropping system
equivalent yield of sorghum as affected by cropping followed by sorghum + green gram.system and nutrient supply system are depicted in table 1. The results indicated that the sorghum Effect of nutrient supply on N,P,K and S status of equivalent yield of grain was found significant due to soilcropping system. Whereas, the sorghum equivalent
The available N,P,K and S status of soil were yield of straw was found non-significant. However, -1 increased significantly due to different nutrient the higher (37.31 q ha ) sorghum equivalent grain
supply system. The highest available N (270.42 kg yield was recorded in sorhum + soybean -1 -1ha ), available P (28.35 kg ha ), available K (360.02 intercropping system than that of the sole cropping.
-1 -1kg ha ) and available S (17.58 kg ha ) were recorded Kshitaria et al. (1996) observed that sorghum grain in the soil in the treatment of 75% RDF + 25% N and fodder yield was the highest in sole sorghum through vermicompost + Azospirillum + PSB. The treatment as compared to sorghum equivalent grain results clearly indicated the benefits of available N, P, yield was recorded in sorghum + pigeonpea K and S from the above nutrient supply system which intercropping than sole cropping. Among the nutrient comprised the use of inorganic, organic and supply system, the results with respect to sorghum biofertilizers. Rather and Sharma (2009) reported equivalent grain yield were found significant, that the treatment comprising of 100% RDF + whereas sorghum equivalent straw yield was found vermicompost + zinc + PSB increased the available N non-significant.
-1from 197.0 to 219.0 kg ha , available P from 13.0 to -1 -The highest sorghum equivalent grain yield 19.0 kg ha and available K from 113.0 to130.4 kg ha
-1 1(35.94 q ha ) was observed in 100% RDF followed by . Thakur and Sawarkar (2009) reported that 75% RDF + 25% N through vermicompost + maximum build up of S was recorded in plots that had
-1et al.Azospirillum et al. received 100% RDF + FYM Khambalkar (2012) + PSB (34.65 q ha ). Gable (2008)
studied on all the growth parameters and yield of reported that biofertilizer and FYM are not only a maize crop which were significantly influenced by substitute, but a supplement to chemical fertilizers the various integrated nutrient management which result in build up of organic carbon, available treatments and were significantly the highest with N,P,K and sustain soil pH and EC as compared to
chemical fertilizer alone, sub optimal dose treatment 100% RDF followed by 75% RDF + 25% N through and unfertilized plot.leucaena lopping + biofertilizers. The balance use of
fertilizer either alone or in combination with organic Interaction effect of cropping system and nutrient manure and seed inoculants is necessary for supply on N,P,K and S status of soilsustaining soil fertility and productivity of crops
(Tiwari et al., 2002 and Thakur et al., 2011). The interaction effect between cropping
Interaction effect between main plot cropping system system and nutrient supply system had significant
and sub plot nutrient supply system on sorghum effect with respect of available N, P and K status of
equivalent yield of grain and straw was found non-soil, whereas in available S it was found statistically
significant.non-significant. The highest available N status of soil
-1(284.22 kg ha ) was recorded under sorghum + Effect of cropping system on N,P,K and S status of soybean intercropping system in the treatment of 75% soilRDF + 25% N through vermicompost + Azospirillum + PSB which remained statistically at par in sorghum The data on available N,P, K and S status of
-1+ green gram (273.98 kg ha ) intercropping system soil after harvest of sorghum are presented in table 2. under same nutrient supply system. The lowest value Results indicated that the status of available N,P, K
135

-1 -1of available N status of soil (239.83 kg ha ) was kg ) after the completion of 5 year in soybean based registered under sole sorghum with the application of cropping system. The increased organic carbon 100% RDF. content might be due to use of chemical fertilizer plus
direct incorporation of organic matter through FYM -1
The highest available P (29.33 kg ha ) status which attributed the higher contribution of biomass to of soil were recorded under sorghum + soybean % the soil in the form of better root growth, crop stubbles intercropping system in the treatment containing 75% biomass and residues (Katyal et al., 2003 and Gathala RDF + 25% N through vermicompost + Azospirillum et al., 2007).+ PSB which remained statistically at par with
-1available P (28.48 kg ha ) and available K (364.14 kg Interaction effect of cropping system and nutrient -1
ha ) in sorghum + black gram intercropping system supply system on chemical properties of soilunder the same nutrient supply whereas the lowest
-1 The interaction effect between cropping value of available P (24.11 kg ha ) and available K -1 system and nutrient supply system on chemical (325.85 kg ha ) were recorded under sole sorghum in
properties of soil was found non-significant with the treatment of 100% RDF. This clearly shows that respect to pH and electrical conductivity, while the continuous inclusion of leguminous crops along organic carbon content in soil was found significant. with inorganic, organic and biofertilizers registered
-1The highest organic carbon content (6.5 g kg ) was more available N status in soil than inorganic treatment in cereals. Sharma and Bajpai (1986) found under sorghum + soybean intercropping reported that the available N in soil increased after system in the treatment containing 75% RDF + 25% rabi legumes (pea, chickpea) and kharif legumes N through vermicompost + Azospirillum + PSB. (Green gram and black gram) as compared to those Sharma and Bajpai (1986) also reported that the under their respective cereal crops in rabi wheat, in organic carbon content of soil increased due to kharif sorghum and fallow. cultivation of leguminous crop (0.41%) as compared
to soil under cereal (0.38%) and fallow (0.36%) Effect of cropping system on chemical properties Ravankar et al. (2000) reported that the addition of
50% N through manure increased the organic carbon The data presented in table 4 revealed that the
content from 0.71% to 0.73%. Khambalkar et al. pH and electrical conductivity of soil was found non-(2012) reported that biofertilizer and FYM are not significant with cropping system whereas the organic only a substitute, but a supplement to chemical carbon content of soil was found significant with fertilizers in build up of organic carbon and in cropping system. The highest organic carbon content
-1 sustaining soil pH and EC as compared to chemical (6.02 g kg ) was observed in sorghum + soybean fertilizer alone.intercropping followed by sorghum + black gram
-1(5.54 g kg ).It is inferred from the above revelation that
continuous use of inorganic fertilizers along with Effect of nutrient supply system on chemical organic and biofertilizers favourable influenced grain propertiesyield, uptake of nutrients, organic carbon and available nutrients, over inorganic fertilizer alone. The pH and electrical conductivity of soil Inclusion of leguminous crops in cropping system can were found non-significant, while organic carbon
content was found significant when correalated with check the resource degradation and sustain the productivity of cropping systems by imporving the nutrient supply. The highest organic carbon status
-1(5.93 g kg ) was noticed under the treatment of 75% soil quality through maintenance of physico-
Azospirillum chemical properties of the soil. These findings RDF + 25% N through vermicompost + + PSB. Babhulkar et al. (2000) reported that organic showed that sorghum + soybean intercropping system
-1with 75% RDF in conjunction with vermicompost carbon content of soil (6.2 g kg ) increased slightly
-1 and biofertilizers proved over sole cropping for with the application of FYM @ 7.5 t ha along with maintaining fertility status of soil.half dose of N and P to soybean over the RDF (5.3 g
136
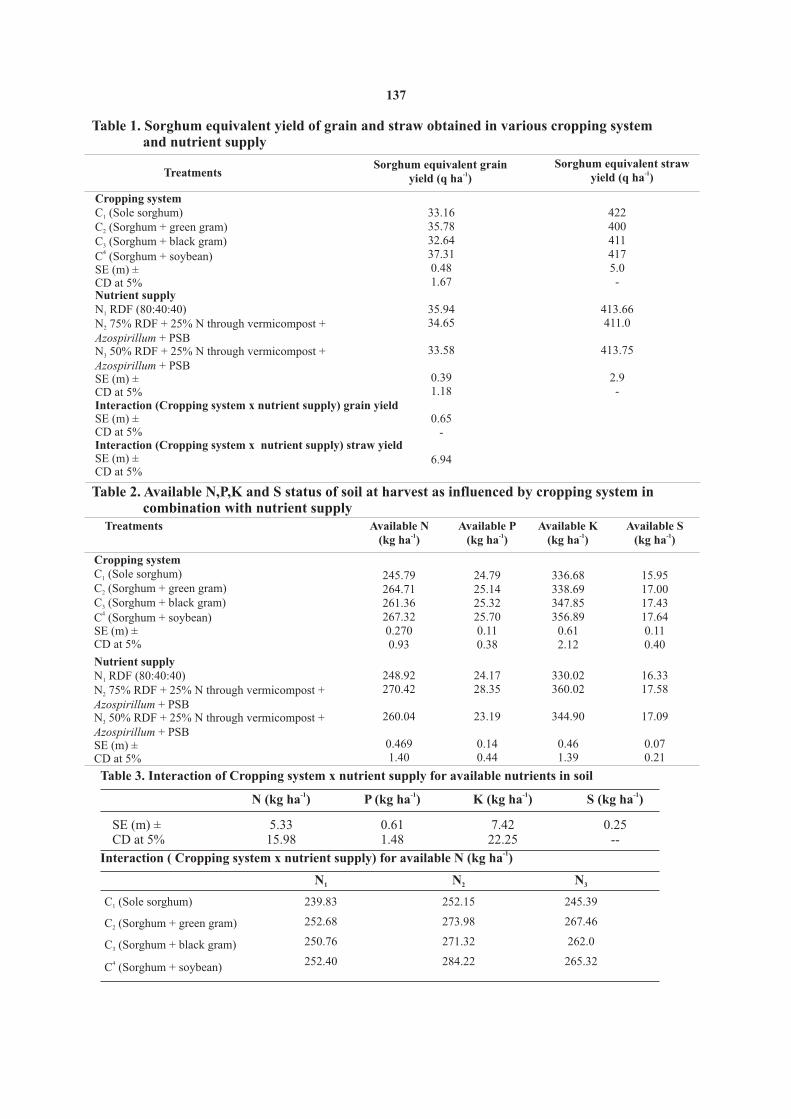
Table 1. Sorghum equivalent yield of grain and straw obtained in various cropping system and nutrient supply
TreatmentsSorghum equivalent grain
-1yield (q ha )Sorghum equivalent straw
-1yield (q ha )
Cropping systemC (Sole sorghum)1
C (Sorghum + green gram)2
C (Sorghum + black gram)34C (Sorghum + soybean)
SE (m) ±CD at 5%Nutrient supplyN RDF (80:40:40)1
N 75% RDF + 25% N through vermicompost +2
Azospirillum + PSBN 50% RDF + 25% N through vermicompost + 3
Azospirillum + PSBSE (m) ±CD at 5%Interaction (Cropping system x nutrient supply) grain yield SE (m) ±CD at 5%Interaction (Cropping system x nutrient supply) straw yieldSE (m) ±CD at 5%
33.1635.7832.6437.310.481.67
35.9434.65
33.58
0.391.18
0.65-
6.94
4224004114175.0-
413.66411.0
413.75
2.9-
Table 2. Available N,P,K and S status of soil at harvest as influenced by cropping system in combination with nutrient supply
Treatments Available N-1(kg ha )
Available P-1(kg ha )
Available K-1(kg ha )
Available S-1(kg ha )
Cropping systemC (Sole sorghum)1
C (Sorghum + green gram)2
C (Sorghum + black gram)34C (Sorghum + soybean)
SE (m) ±CD at 5%
Nutrient supplyN RDF (80:40:40)1
N 75% RDF + 25% N through vermicompost +2
Azospirillum + PSBN 50% RDF + 25% N through vermicompost + 3
Azospirillum + PSBSE (m) ±CD at 5%
245.79264.71261.36267.320.2700.93
248.92270.42
260.04
0.4691.40
24.7925.1425.3225.700.110.38
336.68338.69347.85356.890.612.12
15.9517.0017.4317.640.110.40
24.1728.35
23.19
0.140.44
330.02360.02
344.90
0.461.39
16.3317.58
17.09
0.070.21
137
Table 3. Interaction of Cropping system x nutrient supply for available nutrients in soil
-1N (kg ha ) -1P (kg ha ) -1K (kg ha ) -1S (kg ha )
SE (m) ±CD at 5%
5.3315.98
0.611.48
7.4222.25
0.25--
-1Interaction ( Cropping system x nutrient supply) for available N (kg ha )
C (Sole sorghum)1
C (Sorghum + green gram)2
C (Sorghum + black gram)3
4C (Sorghum + soybean)
N1 N2 N3
239.83
252.68
250.76
252.40
252.15
273.98
271.32
284.22
245.39
267.46
262.0
265.32
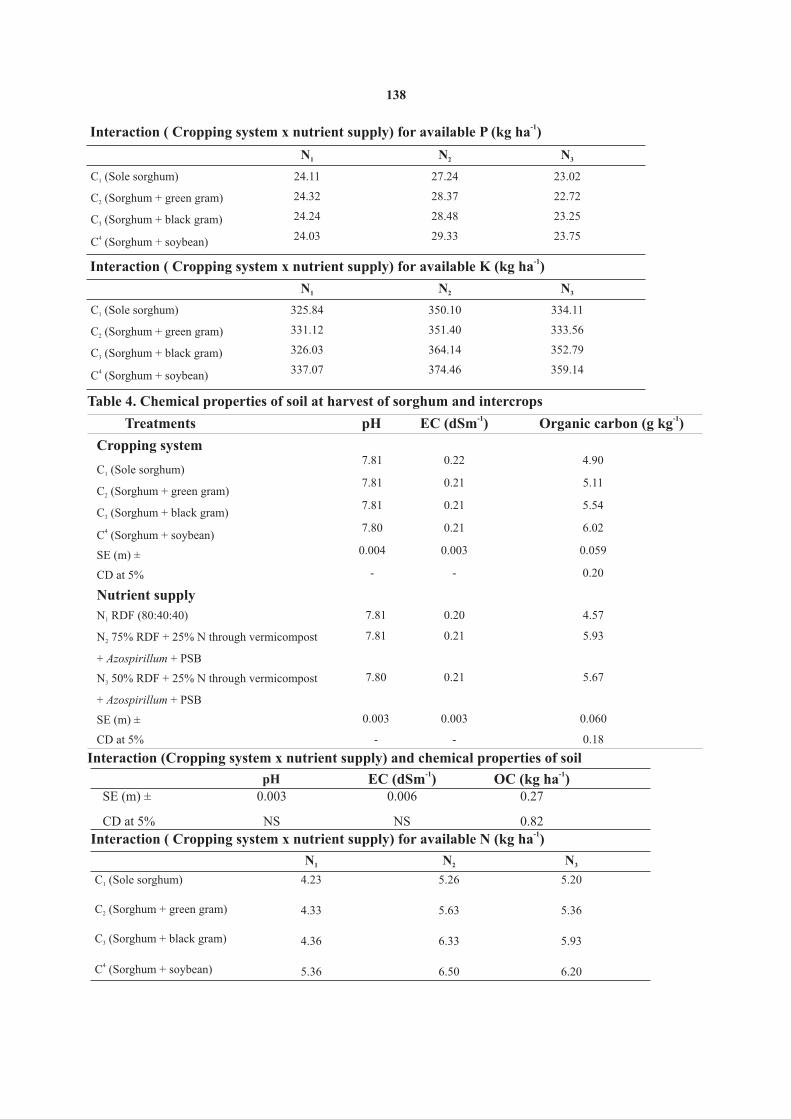
-1Interaction ( Cropping system x nutrient supply) for available P (kg ha )
C (Sole sorghum)1
C (Sorghum + green gram)2
C (Sorghum + black gram)3
4C (Sorghum + soybean)
N1 N2 N3
24.11
24.32
24.24
24.03
27.24
28.37
28.48
29.33
23.02
22.72
23.25
23.75
-1Interaction ( Cropping system x nutrient supply) for available K (kg ha )
C (Sole sorghum)1
C (Sorghum + green gram)2
C (Sorghum + black gram)3
4C (Sorghum + soybean)
N1 N2 N3
325.84
331.12
326.03
337.07
350.10
351.40
364.14
374.46
334.11
333.56
352.79
359.14
138
Table 4. Chemical properties of soil at harvest of sorghum and intercrops
Treatments
Cropping system
C (Sole sorghum)1
C (Sorghum + green gram)2
C (Sorghum + black gram)3
4C (Sorghum + soybean)
SE (m) ±
CD at 5%
Nutrient supply
N RDF (80:40:40)1
N 75% RDF + 25% N through vermicompost2
+ Azospirillum + PSB
N 50% RDF + 25% N through vermicompost 3
+ Azospirillum + PSB
SE (m) ±
CD at 5%
7.81
7.81
7.81
7.80
0.004
-
7.81
7.81
7.80
0.003
-
pH-1
EC (dSm )-1
Organic carbon (g kg )
0.22
0.21
0.21
0.21
0.003
-
4.90
5.11
5.54
6.02
0.059
0.20
0.20
0.21
0.21
0.003
-
4.57
5.93
5.67
0.060
0.18
Interaction (Cropping system x nutrient supply) and chemical properties of soil
pH
SE (m) ±
CD at 5%
0.003
NS
0.006
NS
0.27
0.82-1Interaction ( Cropping system x nutrient supply) for available N (kg ha )
C (Sole sorghum)1
C (Sorghum + green gram)2
C (Sorghum + black gram)3
4C (Sorghum + soybean)
N1 N2 N3
4.23
4.33
4.36
5.36
5.26
5.63
6.33
6.50
5.20
5.36
5.93
6.20
-1EC (dSm )
-1OC (kg ha )

Mader, P., D. Fleibach, L. Dubios and N.U. Fried, 2002. Soil fertility REFERENCESbiodiversity in organic farming. Curr. Sic. 296: 1694-1697.
Olsen, S.R., C.V. Cole, F.S. Watanabe and L.A. Dean, 1954. Estimation of Anonymous, 2010. Agriculture statistics at a glance. Directoate of available phosphorous in soil by extraction with sodium
Economics and Statistics. Ministry of Agriculture, Govt. of bicarbonate. United States Department of Agriculture, India, New Delhi. Circular 939. pp. 19.
Babhulkar, P.S., P.S. Wandile, W.P. Badole and S.S. Balpande, 2000. Piper, C.S. 1966. Soil and plant analysis IV edition, University of Residual effect of long term application of FYM and fertilizers Adelaide, Australia. pp. 135-200.
Rather Shabir Ahmad and Narinderlal Sharma, 2009. Effect of integrated on properties (Vertisols) and yield of soybean J. Indian. Soc. 48 nutrient management in wheat on soil properties and fertility Soil Sci. (1): 89-92.
Blaise, D and R. Prasad, 2005. Intergrated plant nutrient supply system - status. An Asian J. Soil Sci. 4 (1): 55.1 Rathore, K. and S.S. Rathore, 2006. Comprehensive Nutrient an approach to sustained after production. Indian J. Fert. (4):
Management for optimum Soil Health and Sustained crop 37-44.Dhingra, O.D. and J.B. Sinclair, 1993. Basic plant pathology methods, productivity. Indian J. Fertilizers. 2 (9) : 141-150.
Ravankar, H. N., R.B. Puranik and P.W. Deshmukh, 2000. Soil fertility CRC Lewise Publisher Boca Raton, London, Tokyo. pp. 392.Elmore, R.W. and J.A. Jackobs, 1986. Yield and nitrogen yield of sorghum management with legume- wheat sequence. P.K.V. Res. J. 22
intercropped with nodulating and non-nodulating soybeans. (1): 15-18.78 Sharma, C.P. and P.D. Bajpai, 1986. Residual Effect of leguminous crop Agron. J. : 780-782.
Ghathala, M.K., P.C. Kanthaliya, A. Verma and M.S. Chahar, 2007. Effect on some chemical and Microbiological properties of soil. J. of integrated nutrient management on soil properties and Indian Soc. Soil Sci. 34 (6): 206-208.
Subbiah, B. V. and G.L. Asija, 1956. A rapid procedure for the estimation humus fractions in long-term fertilizer experiments. J. Indian
2555 of available nitrogen in soil. Curr. Sci. : 259-260.Soc. Soil Sci. (3): 360-363.Thakur, R., S.D. Sawarkar, U. K. Vaishya and M. Singh, 2011. Impact of Jackson, M.L. 1967. Soil chemical analysis, Prentice Hall of India. Private
continuous use of inorganic fertilizers and organic manure on Limited, New Delhi, India. pp. 452.Katyal, V., S.K. Gangwar and B. Gangwar, 2003. Long-term effect of soil properties and productivity under soybean-wheat
fertilizer use on yield sustainability and soil fertility in rice- intensive cropping of Vertisols. J. Indian Soc. Soil Sci. 59 (1): wheat system in sub-tropical India. Fertilizer News. 48 (7): 43- 74-81.
Thakur, R. and S.D. Sawarkar, 2009. Influence of Long Term continuous 47.Khambalkar Priyadarshani A., P.S. Tomar and S.K. Verma, 2012. Long application of Nutrients and Spatial Distribution of Sulphur on
term effects of integrated nutrient management on Soybean-wheat cropping sequence. J. Soils and Crops. 19 (2): p roduc t iv i ty and so i l f e r t i l i t y in pea r lmi l l e t 225-228.(Pennisetum glaucum) - mustard (Brassica juncea) cropping Tiwari, A., A. K. Dwivedi and P.R. Dikshit, 2002. Long term influence of sequence. Indian J. Agron. 57 (3): 222-228. organic and inorganic fertilization on soil fertility and
Khishtaria, M.K., M.G. Khokhana and D.R. Padmani, 1996. productivity of soybean-wheat system in Vertisol. J. Indian Intercropping and important pulses and oilseeds in sorghum Soc. Soil Sci. 50 (4): 472-475.under rainfed condition. J. Maharashtra agric.Univ. 21 (3): Tsubo, M. S. Walkar and H. O. Ogindo, 2005. A simulation model of 388-390. cereal legume intercropping system for semi-arid regions.
Layek, J., B.G. Shivakumar, D.S. Rana, S. Munda and K. Lakshman, Department of soil, crop and climate sciences, University of 2012.Growth pattern, physiological indices and productivity the free state. Fld. Crop Res. 93 (1) : 23-33.of different soybean (Glycine max) based intercrops as Walkley, A. and I. A. Black, 1934. An examination of the degtiareff influenced by nitrogen nutrition. Indian J. Agron. 57 (4): 349- method for determining Soil organic matter and a proposed 356. modification of the Chromic acid titration method. Soil. Sci.
Li, L., H.J. Sun, F.S. Zhang, X.L. Li, S.C. Yang and Z. Rengel, 2006. 37 : 29-38.Wheat/maize or wheat/soybean strip intercropping I. Yield Williams, C. H. and A. Steinbergs, 1959. Soil sulphur fractions as advantage and interspecific interactions on nutrients. Fld. chemical indices of available sulphur in some Australian soils.
-1Crop Res. 71 : 123-137.(5.54 g kg ). Aust. J. Agric. Res. 10 : 340-352.
Rec. on 10.10.2013 & Acc. on 20.12.2013
139
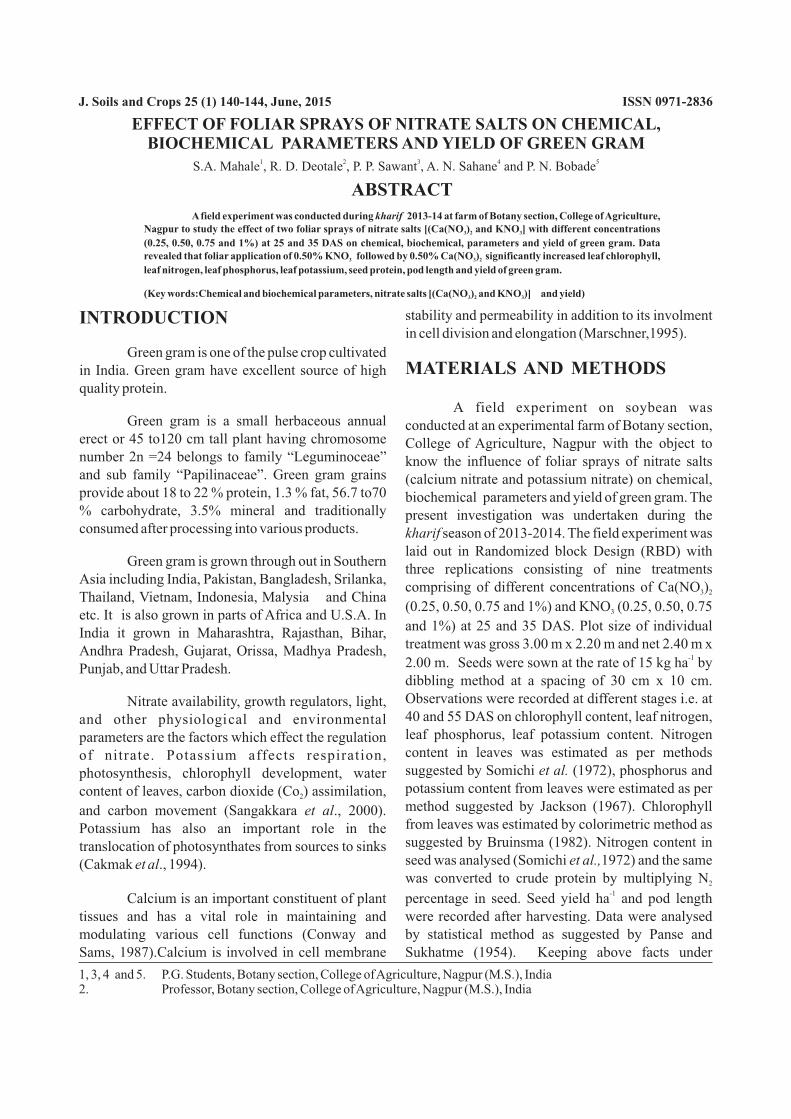
ABSTRACT
A field experiment was conducted during kharif 2013-14 at farm of Botany section, College of Agriculture, Nagpur to study the effect of two foliar sprays of nitrate salts [(Ca(NO ) and KNO ] with different concentrations 3 2 3
(0.25, 0.50, 0.75 and 1%) at 25 and 35 DAS on chemical, biochemical, parameters and yield of green gram. Data revealed that foliar application of 0.50% KNO followed by 0.50% Ca(NO ) significantly increased leaf chlorophyll, 3 3 2
leaf nitrogen, leaf phosphorus, leaf potassium, seed protein, pod length and yield of green gram.
(Key words:Chemical and biochemical parameters, nitrate salts [(Ca(NO ) and KNO )] and yield)3 2 3
1, 3, 4 and 5. P.G. Students, Botany section, College of Agriculture, Nagpur (M.S.), India2. Professor, Botany section, College of Agriculture, Nagpur (M.S.), India
EFFECT OF FOLIAR SPRAYS OF NITRATE SALTS ON CHEMICAL, BIOCHEMICAL PARAMETERS AND YIELD OF GREEN GRAM
J. Soils and Crops 25 (1) 140-144, June, 2015 ISSN 0971-2836
stability and permeability in addition to its involment INTRODUCTIONin cell division and elongation (Marschner,1995).
Green gram is one of the pulse crop cultivated MATERIALS AND METHODSin India. Green gram have excellent source of high
quality protein.
A field experiment on soybean was Green gram is a small herbaceous annual conducted at an experimental farm of Botany section,
erect or 45 to120 cm tall plant having chromosome College of Agriculture, Nagpur with the object to number 2n =24 belongs to family “Leguminoceae” know the influence of foliar sprays of nitrate salts and sub family “Papilinaceae”. Green gram grains (calcium nitrate and potassium nitrate) on chemical, provide about 18 to 22 % protein, 1.3 % fat, 56.7 to70 biochemical parameters and yield of green gram. The % carbohydrate, 3.5% mineral and traditionally present investigation was undertaken during the consumed after processing into various products. kharif season of 2013-2014. The field experiment was
laid out in Randomized block Design (RBD) with Green gram is grown through out in Southern
three replications consisting of nine treatments Asia including India, Pakistan, Bangladesh, Srilanka,
comprising of different concentrations of Ca(NO ) 3 2Thailand, Vietnam, Indonesia, Malysia and China (0.25, 0.50, 0.75 and 1%) and KNO (0.25, 0.50, 0.75 3etc. It is also grown in parts of Africa and U.S.A. In and 1%) at 25 and 35 DAS. Plot size of individual India it grown in Maharashtra, Rajasthan, Bihar, treatment was gross 3.00 m x 2.20 m and net 2.40 m x Andhra Pradesh, Gujarat, Orissa, Madhya Pradesh,
-12.00 m. Seeds were sown at the rate of 15 kg ha by Punjab, and Uttar Pradesh.dibbling method at a spacing of 30 cm x 10 cm. Observations were recorded at different stages i.e. at Nitrate availability, growth regulators, light, 40 and 55 DAS on chlorophyll content, leaf nitrogen, and other physiological and environmental leaf phosphorus, leaf potassium content. Nitrogen parameters are the factors which effect the regulation content in leaves was estimated as per methods of nitrate. Potassium affects respiration, suggested by Somichi et al. (1972), phosphorus and photosynthesis, chlorophyll development, water potassium content from leaves were estimated as per content of leaves, carbon dioxide (Co ) assimilation, 2
method suggested by Jackson (1967). Chlorophyll and carbon movement (Sangakkara et al., 2000). from leaves was estimated by colorimetric method as Potassium has also an important role in the suggested by Bruinsma (1982). Nitrogen content in translocation of photosynthates from sources to sinks seed was analysed (Somichi et al.,1972) and the same (Cakmak et al., 1994).was converted to crude protein by multiplying N2
-1Calcium is an important constituent of plant percentage in seed. Seed yield ha and pod length
tissues and has a vital role in maintaining and were recorded after harvesting. Data were analysed modulating various cell functions (Conway and by statistical method as suggested by Panse and Sams, 1987).Calcium is involved in cell membrane Sukhatme (1954). Keeping above facts under
1 2 3 4 5S.A. Mahale , R. D. Deotale , P. P. Sawant , A. N. Sahane and P. N. Bobade
consideration, an experiment was carried out to study Nitrogen deficiency causes chlorosis and the response of nitrate salts on chemical, biochemical malfunctioning of the photosynthesis process. Plant parameters and yield of green gram. cells require adequate supply of N for normal cell
division and growth of the plant. Tender shoots, tips RESULTS AND DISCUSSION of shoots buds, leaves contains higher nitrogen.Biochemical and chemical observations
Data on leaf nitrogen content were recorded Observations on chlorophyll, nitrogen, at two stages viz., 40 and 55 DAS.
phosphorus and potassium content in leaves were recorded at 40 and 55 DAS. Protein content in seeds At 40 DAS significantly maximum leaf was also recorded. nitrogen content was recorded with the foliar
application of 0.50% KNO (T ) over control. Next to 3 7Leaf chlorophyll content
this treatment foliar application of 0.50% Ca(NO ) 3 2At 40 DAS all the treatments showed their (T ) and 0.75% KNO (T ) significantly increased 3 3 8significance in leaf chlorophyll content and nitrogen content over control (T ) and rest of the 1significantly maximum leaf chlorophyll content was treatments under observation.Treatments T (0.75% noticed with the foliar application of 0.50% KNO 4 3
Ca (NO ) ), T (1% KNO ), T (1% Ca(NO ) ), T(T ) followed by foliar application of 0.50% Ca(NO ) 3 2 9 3 5 3 2 6 7 3 2
(0.25% KNO ) and T (0.25% Ca(NO ) ) were found (T ) and 0.75% KNO (T ) when compared with 3 2 3 23 3 8
at par with treatment T (control). control (T ) and rest of the treatments under study. 11
Similarly foliar application of 0.75% Ca(NO ) (T ), 3 2 4
At 55 DAS significantly maximum leaf 1% KNO (T ) and 1% Ca(NO ) (T ) in a descending 3 9 3 2 5
nitrogen content was recorded with the foliar manner also significantly increased leaf chlorophyll application of 0.50% KNO (T ) followed by foliar 3 7content when compared with control (T ) and rest of 1
application of 0.50% Ca(NO ) (T ) and 0.75% KNO3 2 3 3 the treatments. But treatments T (0.25% KNO ) and 6 3
(T ) when compared with control (T ) and rest of the 8 1T (0.25% Ca(NO ) ) were found at par with treatment 2 3 2
treatments under observation. Similarly foliar T (control).1
application of 0.75% Ca(NO ) (T ) and 1% KNO 3 2 4 3
At 55 DAS significantly maximum leaf (T ) also increased nitrogen content significantly 9
chlorophyll content was noticed with the foliar when compared with control T and rest of the 1
application of 0.50% KNO (T ) followed by foliar 3 7 treatments. But treatments T (1% Ca(NO ) ), T5 3 2 6
application of 0.50% Ca(NO ) (T ) when compared 3 2 3 (0.25% KNO ) and T (0.25% Ca(NO ) ) were found 3 2 3 2
with control (T ) and rest of the treatments under 1 at par with treatment T (control). 1
study. Similarly foliar application of 0.75% KNO3
(T ) 0.75% Ca(NO ) (T ), 1% KNO (T ) and 1% Basole et al. (2003) conducted an experiment 8 3 2 4 3 9
Ca(NO ) (T ) were also increased leaf chlorophyll to study the effect of foliar sprays of hormone i.e. 50 3 2 5
content when compared with control (T ) and rest of ppm NAA and nutrients (FeSO , KNO , ZnSO and 1 4 3 4
treatments under observation. Treatments T (0.25% MgSO 0.55%) on soybean and found increase in N 6 4
KNO ) and T (0.25% Ca(NO ) ) were found at par content in leaves significantly.3 2 3 2
with treatment T (control).1
Basole et al. (2003) conducted an experiment to study the effect of foliar sprays of hormone i.e. 50 ppm NAA and nutrients (FeSO , KNO , ZnSO and 4 3 4
MgSO 0.55%) on soybean and found increase in 4
chlorophyll content in leaves significantly.Leaf phosphorus content
Leaf nitrogen contentData on Leaf phosphorus content were Nitrogen is the important constituent of
recorded at two stages viz., 40 and 55 DAS. protein and protoplasm and essential for plant growth.
Brar and Brar (2004) observed that foliar
application of potassium nitrate increased the N and K
contents by 4.2 and 31.6%, while urea enhanced the N
and K content by 11.3 and 21.1% in cotton leaves,
respectively.
141
At 40 DAS significantly maximum leaf (0.25% KNO ) and T (0.25% Ca(NO ) ) were found 3 2 3 2
phosphorus content was noticed with the foliar at par with treatment T (control). 1
application of 0.50% KNO (T ) followed by foliar 3 7
At 55 DAS significantly maximum leaf application of 0.50% Ca(NO ) (T ) when compared 3 2 3
potassium content was recorded with the foliar with control (T ) and rest of the treatments under 1
application of 0.50% KNO (T ) followed by foliar study. Similarly foliar application of 0.75% KNO 3 73
application of 0.50% Ca(NO ) (T ) and 0.75% KNO3 2 3 3 (T ) 0.75% Ca(NO ) (T ), 1% KNO (T ) and 1% 8 3 2 4 3 9
(T ) significantly increased leaf potassium content Ca(NO ) (T ) were also increased leaf phosphorus 83 2 5
when compared with control (T ) and rest of the content when compared with control (T ) and rest of 11
treatments under observation. Similarly foliar treatments under observation. Treatments T (0.25% 6
application of 0.75% Ca(NO ) (T ) and 1% KNO 3 2 4 3KNO ) and T (0.25% Ca(NO ) ) were found at par 3 2 3 2
(T ) also increased potassium content significantly with treatment T (control). 91
when compared with control (T ) and rest of the 1
At 55 DAS significantly maximum leaf treatments. But treatments T (1% Ca(NO ) ), T5 3 2 6
phosphorus content was recorded with the foliar (0.25% KNO ) and T (0.25% Ca(NO ) ) were found 3 2 3 2
application of 0.50% KNO (T ) followed by 3 7 at par with treatment T (control). 1
treatments 0.50% Ca(NO ) (T ) and 0.75% KNO (T ) 3 2 3 3 8
when compared with control (T ) and rest of the 1
treatments under observation. Similarly foliar application of 0.75% Ca(NO ) (T ) and 1% KNO 3 2 4 3
(T ) also increased phosphorus content significantly 9
when compared with control (T ) and rest of the 1
treatments. But treatments T (1% Ca(NO ) ), T5 3 2 6
Protein content in seed(0.25% KNO ) and T (0.25% Ca(NO ) ) were found 3 2 3 2
at par with treatment T (control). 1 The maximum seed protein were recorded with the foliar application of 0.50% KNO (T ) 3 7Basole et al. (2003) conducted an experiment followed by foliar application of 0.50% Ca(NO ) 3 2to study the effect of foliar sprays of hormone i.e. 50 (T ), 0.75% KNO (T ) and 0.75% Ca(NO ) (T ) when 3 3 8 3 2 4ppm NAA and nutrients (FeSO , KNO , ZnSO and 4 3 4
compared with control (T ) and rest of the treatments. 1MgSO 0.55%) on soybean and found increase in P 4
Similarly treatments T (1% KNO ), T (1% 9 3 5 content in leaves significantly.Ca(NO ) ), T (0.25% KNO ), T (0.25% Ca(NO ) ) in 3 2 6 3 2 3 2
Leaf potassium conent a descending manner were found at par with treatment T (control).1
Data on leaf potassium content were recorded at the two growth stages i.e. 40 and 55 DAS Nitrogen is the constituent of protein. Hence, gave significant variation. increase in nitrogen content ultimately resulted in the
increase in protein content in seeds of green gram in At 40 DAS significantly maximum leaf
the present investigation.potassium content was noticed with the foliar application of 0.50% KNO (T ) followed by foliar 3 7 Borowski and S³awomir Micha³ek (2009) application of 0.50% Ca(NO ) (T ) significantly 3 2 3 found that foliar application potassium salts (1% increased leaf potassium content when compared solutions of KCl, KNO , K SO and C H K O ·H O) 3 2 4 6 5 3 7 2
with control (T ) and rest of the treatments under 1 resulted increase in protein content in spinach.study. Similarly foliar application of 0.75% KNO3
(T ) 0.75% Ca(NO ) (T ), 1% KNO (T ) and 1% 8 3 2 4 3 9
Ca(NO ) (T ) were also increased leaf potassium 3 2 5
content when compared with control (T ) and rest of 1
the treatments under observation. Treatments T 6
Brar and Brar (2004) observed that foliar application of potassium nitrate increased the N and K contents by 4.2 and 31.6%, while urea enhanced the N and K content by 11.3 and 21.1% in cotton leaves, respectively.
Zheng and Zhang (2010) tried foliar spray of KNO on wheat in the heading stage at 100 mM 3
NaCl+10 mM KNO and recorded higher protein 3
content over the control.
142
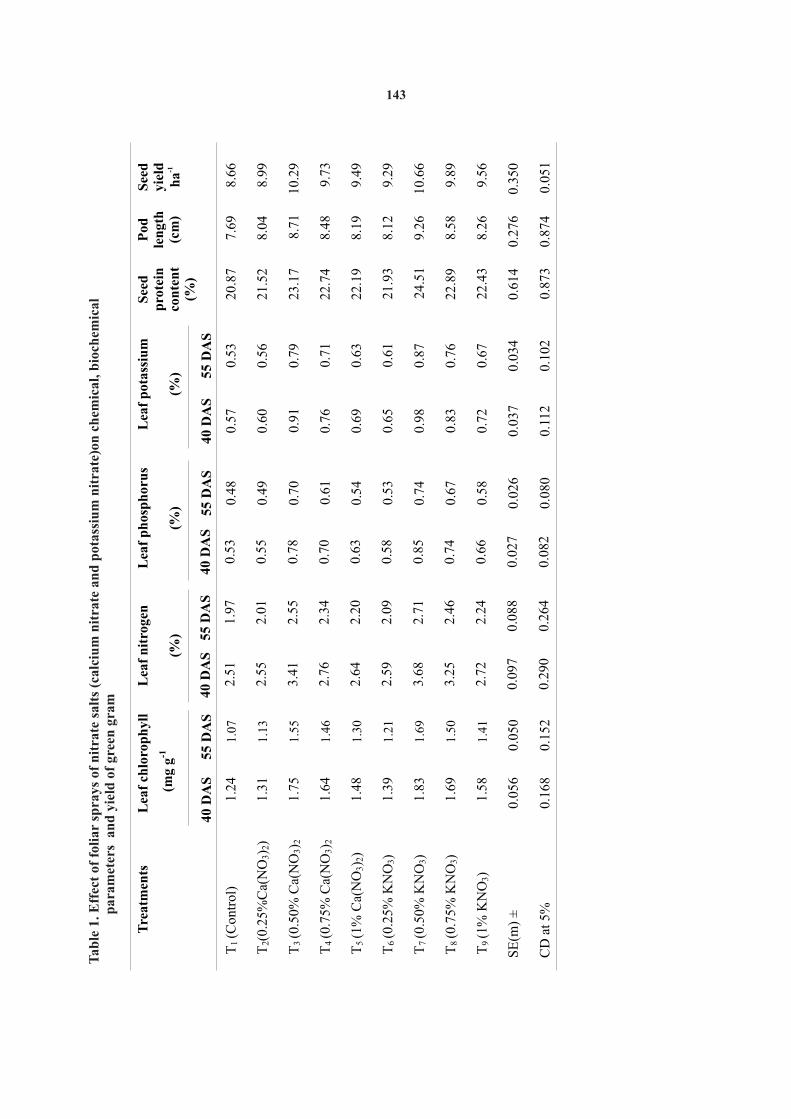
Tab
le 1
. Eff
ect
of f
olia
r sp
rays
of
nit
rate
sal
ts (
calc
ium
nit
rate
an
d p
otas
siu
m n
itra
te)o
n c
hem
ical
, bio
chem
ical
p
aram
eter
s a
nd
yie
ld o
f gr
een
gra
m
Tre
atm
ents
Lea
f ch
loro
ph
yll
(mg
g-1
Lea
f n
itro
gen
(%)
L
eaf
ph
osp
hor
us
(%)
Lea
f p
otas
siu
m
(%)
40
DA
S
55
DA
S40
DA
S
55 D
AS
55 D
AS
40 D
AS
55
DA
S
T1 (C
ontr
ol)
1.24
1.07
2.51
1.97
0.48
0.57
0.53
T2(
0.25
%C
a(N
O3) 2
)1.
311.
132.
552.
010.
490.
600.
56
T3 (0
.50%
Ca(
NO
3) 2
1.75
1.55
3.41
2.55
0.70
0.91
0.79
T4 (0
.75%
Ca(
NO
3) 2
1.64
1.46
2.76
2.34
0.61
0.76
0.71
T5 (1
%
Ca(
NO
3) 2
)
1.48
1.30
2.64
2.20
0.54
0.69
0.63
T6 (0
.25%
KN
O3)
1.39
1.21
2.59
2.09
0.53
0.65
0.61
T7 (0
.50%
KN
O3)
1.83
1.69
3.68
2.71
0.74
0.98
0.87
T8 (0
.75%
KN
O3)
1.69
1.50
3.25
2.46
0.67
0.83
0.76
T9 (1
%
KN
O3)
1.58
1.41
2.72
2.24
0.58
0.72
0.67
SE
(m)
±
0.05
60.
050
0.09
70.
088
0.02
60.
037
0.03
4
CD
at
5%0.
168
0.15
20.
290
0.26
4
40 D
AS
0.53
0.55
0.78
0.70
0.63
0.58
0.85
0.74
0.66
0.02
7
0.08
20.
080
0.11
20.
102
See
dp
rote
inco
nte
nt
(%)
20.8
7
21.5
2
23.1
7
22.7
4
22.1
9
21.9
3
24.5
1
22.8
9
22.4
3
0.61
4
0.87
3
Pod
len
gth
(cm
)
7.69
8.04
8.71
8.48
8.19
8.12
9.26
8.58
8.26
0.27
6
0.87
4
See
dyi
eld -1
ha
8.66
8.99
10.2
9
9.73
9.49
9.29
10.6
6
9.89
9.56
0.35
0
0.05
1
143

Pod length 0.5% KNO exhibited maximum increase in grain 3
yield over the control (23 and 19%, respectively). Significantly more pod length was recorded
with the foliar application of 0.50% KNO (T ) 3 7 REFERENCESfollowed by treatments 0.50% Ca(NO ) (T ) and 3 2 3
0.75% KNO (T ) when compared with control (T ) 3 8 1 Basole, V.D., R. D. Deotale, S.R. Ilmulwar, B. S. Kadwe and Sneha S. Raut, 2003. Effect of hormone and nutrients on biochemical and rest of the treatments under observation. But characters and yield of soybean. J. Soils and Crops, 13 (2) : treatments T (0.75% Ca(NO ) ), T (1% KNO ), T 4 3 2 9 3 5 322-326.
(1% Ca (NO ) ), T (0.25% KNO ) and T (0.25% Bonilla, I., A. EL-Hamadaoui and L. Bolano, 2004. Boron and calcium 3 2 6 3 2
increase Pisum sativum seed germination and seedling Ca(NO ) ) were found at par with T (control) in 3 2 1 development under salt stress. Plant and Soil, 267:97-107.Borowski, E. and S. Michalek, 2009. The effect of foliar feeding of respect of pod length in green gram.
potassium salts and urea in spinach on gas exchange, leaf yield and quality. Acta agrobotanica , 62(1): 155-162.
The treatment combination of 0.25% KNO + Brar, M. S. and A. S. Brar, 2004. Foliar nutrition as a supplement to soil 3
fertilizer application to increase yield of upland cotton 0.20% Ca(NO ) showed highest pod length in 3 2 (Gossypium hirsutum). Indian J. agric. Sci. 74 (9): 472-475.groundnut (Sarkar et al., 1999). Bruinsma J. 1982. A comment on spectrophotometric determination of
chlorophyll. Bio-chemistry, Bio-Physics, Acta. 52 : 576-578.Cakmak, I., C. Hengeler and H. Marschner, 1994. Partitioning of shoot
Pal and Keorah (2012) conducted a field and root dry matter and carbohydrate in bean plants suffering from phosphorus, potassium and magnesium deficiency. J. experiment to find out the effect of nitrate salts on Exp. Bot. 45: 1245-1250. green gram. Foliar spray of nitrate salts (i.e. 0.5%
Conway, W. S. and C. E. Sams, 1987. The effects of postharvest potassium nitrate with 0.4% calcium nitrate) infiltration of calcium, magnesium, or strontium on decay,
firmness, respiration, and ethylene production in apple. J. increased the pod length as compared to control.Amer. Soc. Hort. Sci. 112(2): 300-303.
El-Yazied, A. A., M. E Ragab, E. I. Rawia and S. M. A. El-Wafa, 2007. -1 Effect of nitrogen fertigation levels and chelated calcium Seed yield ha (q)
foliar application on the productivity of sweet corn. Arab Uni. J. Agric. Sci. 15 (1): 131-139.
-1 Jackson M.L. 1967. Soil Chemical analysis, Printice Hall of India Pvt. Significantly maximum seed yield ha were
Ltd., New Delhi. pp. 25-28.recorded with the foliar application of 0.50% KNO nd3 Marschner, M. 1995. Mineral nutrition of higher plants. 2 Edn., Academic Press, London and New York, pp. 200-205.(T ) followed by foliar application of 0.50% Ca(NO ) 7 3 2
Pal, A. K. and B. Keorah, 2012. Pre-sowing seed treatment and foliar (T ), 0.75% KNO (T ) and 0.75% Ca(NO ) (T ) 3 3 8 3 2 4 spray of nitrate salts on yield of summer green gram [Vigna when compared with control (T ) and rest of the radiata (L.) Wilczek] in alluvial soil of West Bengal. Crop 1
Res. (Hisar) 44(1/2): 42-44.treatments. While, treatments T (1% KNO ), T (1% 9 3 5 Panse, V.G. and P.V. Sukhatme, 1954. Statistical methods for agriculture workers. ICAR ,New Delhi. pp. 107-109.Ca(NO ) ), T (0.25% KNO ) and T (0.25% Ca 3 2 6 3 2
Sangakkara, U. R., M. Frehner and J. Nosberger. 2000. Effect of soil (NO ) ) were found at par with treatment T (control).3 2 1 moisture and potassium fertilizer on shoot water potential, photosynthesis and partitioning of carbon in mungbean and cowpea. Crop Sci.185: 201-207.Sarkar and Pal (2006) studied the effect of
Sarkar, R. K. and P. K. Pal, 2006. Effect of pre-sowing seed treatment and pre-sowing seed treatment with Rhizobium foliar spray of nitrate salts on growth and yield of green gram
(Vigna radiata). Indian J. agric. Sci. 76(1): 62-65. (Bradyrhizobium japonicum) and foliar spray of Somichi, Y, S.Y. Doughlus and A. P. James, 1972. Laboratory manual.
nitrate salts on the growth and yield of green gram Physiological studies in rice analysis for total nitrogen (organic N) in plant tissue. The inter. Research Institute Los (Vigna radiata). Foliar spray of nitrate salts during Banos, Languna, Phillipine : II.50% flowering stage showed beneficial effect on Zheng YanHai Xu XianBin Simmons and M. Zhang Chao Gao FengJu Li ZengJia, 2010. Responses of physiological parameters, grain growth parameters and yield attributes, thereby yield, and grain quality to foliar application of potassium increasing grain yield by 7 to 23%. Among the foliar nitrate in two contrasting winter wheat cultivars under salinity
spray treatments, spray of 0.406% Ca (NO ) and stress. J. Pl. Nutri. and Soil Sci. 173(3): 444-452.3 2
Rec. on 20.05.2014 & Acc. on 12.07.2014
144
ABSTRACT
Genetic analysis of F crosses in mustard was undertaken with a view to identify the potential F crosses for 2 2
their use in individual plant selection. Ten F crosses along with eight parents (Rohini, BIOYSR, JD-6, BIO-902, 2
Laxmi, GM-2, PCR-7 and Pusa bahar) and two checks (Shatabdi and Pusa bold) were raised during rabi 2013-14 and data were recorded on six characters i.e. days to maturity, plant height at maturity (cm), number of primary
-1branches plant number of siliqua plant , yield plant , and oil content (%) with fatty acid composition. The high -1 -1genotypic coefficient of variation was recorded for yield plant and number of siliqua plant . High heritability
estimates were recorded for all the characters under study. The expected genetic advance among all the F crosses 2
-1 indicated significant progress under selection for number of siliqua plant and plant height at maturity which was ranging from 39.24 to 65.46 and 8.03 to 41.10 respectively. The ten F population i.e. Rohini x JD-6, Rohini x Laxmi, 2
Rohini x BIO-902, Rohini x PCR-7, Rohini x GM-2, Rohini x Pusa bahar, BIOYSR x JD-6, BIOYSR x BIO-902, BIOYSR x Laxmi and BIOYSR x GM-2 were identified on the basis of high mean performance, genotypic coefficient
-1 of variation, heritability in broad sense and genetic advance for economic characters like number of siliqua plant and -1yield plant which were subjected to individual plant selection. The percentage of individual plant selected in these
ten crosses were 13.33%, 11.11%, 16.00%, 17.33%, 12.28%, 11.31%, 12.44%, 9.77%, 10.22% and 12.88% -1 respectively for number of siliqua plant and 12.44%, 13.33%, 15.55%, 17.33%, 14.61%, 10.40%, 12.88%, 11.11%,
-112.00% and 14.44% respectively for yield plant .
(Key words: F population, GCV, PCV, heritability, genetic advance)2
-1 -1
1,3,4 and 5. P.G. Students, Botany Section, College of Agriculture, Nagpur
2. Jr. Mustard Breeder, AICRP on Oilseeds, College of Agriculture, Nagpur
GENETIC STUDIES IN F POPULATION OF MUSTARD (Brassica juncea)2
J. Soils and Crops 25 (1) 145-156, June, 2015 ISSN 0971-2836
of F and their eight parents viz., Rohini, JD-6, 1INTRODUCTIONBIOYSR, BIO-902, Laxmi, GM-2, PCR-7 and Pusa
Indian mustard (Brassica juncea) called as bahar. Ten F crosses, eight parents involved in the 2'rai', 'raya' or 'laha' is an important oil seed crop next to crosses and two checks (Shatabdi and Pusa bold) were groundnut in India for both area and production which grown during rabi, 2013-2014 to detect the presence belonging to Brassicae group. The Oil content in of F variance, genotypic variance, phenotypic 2Indian mustard seed varies from 30 to 48%. At variance, heritability and genotypic advance for present, mustard is a minor oilseed crop in Vidarbha different traits and identify potential F crosses and 2region. In Mharashtra the sole crop of mustard is parents for mustard breeding programme. The seldom grown but with its low cost of production and experimental material was sown in randomized high yielding potential it can be grown in Vidarbha. complete block design with three replications. The The important breeding programme in mustard is seed material of each F cross was hand dibbled in an oriented to develop new varieties with high potential, 2
individual plot which consist of ten rows, three meter wider adaptability, disease resistance and oil content. long, spaced 45 cm apart with an intra-row spacing of Designing efficient and desirable plant type requires 15 cm. The parental seeds and that of checks were the existence of genetic variability in the material. In dibbled in an individual plot which consisted of two order to incorporate desirable characters to maximize rows, three meter long, spaced 45 cm apart with an economic yields, the information on the nature and intra-row spacing of 15 cm. Experiment was sown on extent of genetic variability present in a population
th 29 October 2013. The recommended cultural for desirable characters, their association and relative practices and plant protection measures were contribution to yield constitutes the basic
requirement. F generation provides an active undertaken as per the schedule to raise a healthy crop. 2
The observations were recorded on 225 plants from breeding material from which desirable plants may be each individual F cross and five randomly selected selected. Considering the above facts genetic studies 2
in F population of mustard (Brassica juncea) was plants in each parent for six characters i.e. days to 2
maturity, plant height (cm), number of primary undertaken.-1 -1 -1
branches plant , number of siliqua plant , yield plant MATERIALS AND METHODS and oil content with fatty acid composition. Oil
The experimental material comprised of ten content was estimated by Soxhlet apparatus F crosses selected on the basis of yield performance (Sankaram,1965) and palmitic acid, oleic acid,2
1 2 3 4 5Tinkeshwari V. Bohare , Beena Nair , Ritu Choudhary , Gowthami and Bharti DandadeR.
linoleic acid, linolenic acid, Arachid acid and erucic Laxmi (107 to 122 days) whereas minimum range acid composition by liquid gas chromatography was recorded in Rohini x Pusa bahar (94 to 99 days).method (Chauhan et al., 2001).
The maximum F variance and genotypic 2
The data recorded were subjected to the coefficient of variation was recorded in the F cross 2
statistical and biometrical analysis. Analysis of BIOYSR x GM-2 (9.61 and 2.77 % respectively) variance was done by the method given by Panse and followed by Rohini x GM-2 (7.29 and 2.44% Sukhatme (1967) and estimation of genetic
respectively) and Rohini x JD-6 (7.24 and 2.53% parameters in each F population were done through 2 respectively). Phenotypic coefficient of variation was method given by Burton (1953), Allard (1960) and
maximum in BIOYSR x GM-2 (2.81%) followed by Johnson et al. (1955).
Rohini x JD-6 (2.58%) and Rohini x JM-2 (2.47%).
Estimates of heritability was maximum in Rohini x RESULTS AND DISCUSSION
GM-2 (97.47%) followed by BIOYSR x GM-2
(97.11%) and Rohini x Laxmi (97.07%). Maximum Data regarding analysis of variance for five different characters are presented in table 1. The mean genetic advance was observed in F cross BIOYSR x 2
squares due to genotypes (crosses + parents + GM-2 (6.20) followed by Rohini x GM-2 (5.42) and checks) were significant for all the characters namely Rohini x JD-6 (5.35).
-1days to maturity, number of primary branches plant , -1
plant height (cm), number of siliqua plant , and yield The data regarding genetic parameters were -1
plant indicating a substantial genetic variability calculated for days to maturity revealed that for most among the genotypes. This revealed that the genetic of the crosses having high heritability and high parameters can be estimated for all these characters genotypic coefficient of variation, genetic advance under study. These results were in confirmity with were found to be low indicating significant role of that of Bansod et al. (2006) and Lole et al. (2012) who non-additive gene action. Higher heritability values also reported significant variability among the observed in the crosses indicated the significant role genotype for all the characters under study in of environment and hence, it is not effective for mustard. making selection for early maturing plant in
segregating generation. These results were not in Estimation of magnitude of genetic variation
confirmation with Singh et al. (2012) who observed in the population heritability and genetic advance is to
low heritability with low genetic advance for days to determine the progress under selection. The data
maturity and Titare (2000) observed high heritability regarding mean performance of parents and crosses,
with high genetic advance for days to maturity.range, variance, genotypic coefficient of variation, phenotypic coefficient of variation, heritability and
Plant height (cm)genetic advance of each F cross are presented in the 2
Maximum plant height at maturity was table 2 to table 7. recorded for the parent GM-2 (121 cm) followed by
Days to maturity Rohini (110.13 cm). The minimum plant height was
recorded in the parent PCR-7 (91.73 cm) followed by Among the ten parents JD-6 (101.80 days) Shatabdi (94.07 cm) and BIO-902 (94.13 cm) as matured early followed by PCR-7 (103.53 days) and observed in table 3. Cross combination of Rohini x BIOYSR (104.67 days) as observed from table 2. The PCR-7 (128.08 cm) recorded the maximum plant F cross of BIOYSR x BIO-902 matured earlier in 2
height whereas minimum plant height was observed 93.03 days followed by BIOYSR x JD-6 (95.42 days) in BIOYSR x BIO-902 (102.11 cm) followed by and Rohini x Pusa bahar (96.30 days). The F cross of 2
BI0YSR x Laxmi (103.04 cm) and Rohini x GM-2 BIOYSR x Laxmi took maximum number of days to (105.92 cm). Maximum range for plant height was mature (112.16 days) followed by Rohini x Laxmi observed in F cross of BIOYSR x BIO-902 (49 to158 (111.98 days). The maximum range (Table 4) for days 2
to maturity was recorded in F cross of BIOYSR x cm). The minimum range of plant height was 2
GM-2 (100 to 117 days) followed by BIOYSR x observed in cross Rohini x PCR-7 (100 to156 cm).
146

The maximum F variance was recorded in GM-2 (0.65). Maximum genotypic coefficient of 2
variation was recorded in the cross BIOYSR x BIO-the cross BIOYSR x Laxmi (484.67) followed by 902 (32.53%) followed by BIOYSR x Laxmi Rohini x Laxmi (317.73) and Rohini x GM-2 (25.77%) and Rohini x GM-2 (25.20). The cross (316.85). The cross combination of BIOYSR x Laxmi BIOYSR x BIO-902 (34.63%) recorded maximum was found to have maximum genotypic coefficient of phenotypic coefficient of variation followed by variation i.e. 19.04% followed by Rohini x GM-2 BIOYSR x Laxmi (27.62%) and Rohini x GM-2 (16.07%) and BIOYSRx GM-2 (14.25%). F cross of 2
(26.98%). The highest heritability estimates were BIOYSR x Laxmi recorded maximum phenotypic observed in cross BIOYSR x BIO-902 (88.25%) coefficient of variation (21.36%) followed by Rohini followed by Rohini x GM-2 (87.23%) and BIOYSR x x GM-2 (16.80%) and Rohini x Laxmi (15.66%). GM-2 (87.06%). The expected genetic advance was highest in the cross BIOYSR x BIO-902 (1.68) Maximum heritability estimates were followed by Rohini x GM-2 (1.45) and Rohini x PCR-recorded in the cross Rohini x GM-2 (91.73%) 7 (1.39).followed by BIOYSR x GM-2 (91.02%) and
BIOYSR x Laxmi (90.63%). Maximum genetic The genetic parameters calculated for advance was recorded in F cross of BIOYSR x Laxmi 2 -1
number of primary branches plant revealed that the (41.10) followed by Rohini x GM-2 (33.64) and crosses BIOYSR x BIO-902 and Rohini x GM-2 BIOYSR x GM-2 (33.35).possessed maximum F variance, high genotypic 2
coefficient of variation, high heritability but low The crosses BIOYSR X Laxmi and Rohini x genetic advance hence, selection of these crosses in F GM-2 had high F variance, genotypic coefficient of 22
generation would not be rewarding as there is variation, heritability and high genetic advance which significant role of environment in the expression of indicated the predominance of additive gene action character. Mahmood et al. (2003) observed low for these trait, there by suggesting amenability of estimates of heritability for number of primary these characters through selection. High heritability
-1 branches plant which was in contrast to the result coupled with high genetic advance for plant height obtained in the presence study. Singh et al. (2011) also was observed by Singh et al. (2004) and Singh et al. recorded high heritability along with moderate (2012). genetic advance for number of primary branches
-1 -1Number of primary branches plant plant . High heritability was observed in present study but genetic advance was low.
Maximum number of primary branches (Table 4) was observed in parent JD-6 and GM-2 -1Number of siliqua plant (3.20) followed by Laxmi (3.13) and BIOYSR (3.00)
Laxmi (86.60) was a parent which produced whereas the minimum number of primary branches -1-1 maximum number of siliqua plant which was plant was observed in the parent BIO-902 (2.33).The
followed by GM-2 (84.67) and Rohini (78.13) as crosses exhibiting maximum number of primary -1 observed in table 5 and BIO-902 (57.40) a parent branches plant were Rohini x BIO-902 (3.75),
-1which produced minimum number of siliqua plant . Rohini x PCR-7 (3.29) and BIOYSR x GM-2 (3.10) -1The maximum number of siliqua plant was produced while the cross exhibiting minimum number of
-1 by the cross Rohini x BIO-902 (86.73) which was primary branches plant was BIOYSR x Laxmi followed by Rohini x PCR-7 (85.85) and Rohini x JD-(2.64). The maximum range for the character, number
-1-1 6 (82.53). The minimum number of siliqua plant was of primary branches plant was observed in the cross produced by the F cross observed BIOYSR x Laxmi BIOYSR x BIO-902 (1 to 6) and almost all other 2
(60.52). The maximum range was recorded in F cross crosses exhibited a range of 1 to 5 for number of 2
-1 of BIOYSR x Laxmi (26 to 252) followed by Rohini x primary branches plant .JD-6 (38 to 249) whereas the minimum range was
The F variance was maximum in the cross recorded in BIOYSR x JD-6 (32 to 156) as noticed 2
from table 7.BIOYSR x BIO-902 (0.86) followed by Rohini x
147
Among the F variance maximum variance followed by Rohini x Laxmi (59.87% and 62.94% 2
respectively) and BIOYSR x BIO-902 (57.15% and was recorded in the cross Rohini x PCR-7 (1100.86) 58.18% respectively). The crosses Rohini x PCR-7 followed by Rohini x Laxmi (890.42) and Rohini x and Rohini x BIO-902 also exhibited higher values GM-2 (871.71). The highest genotypic coefficient of for genotypic coefficient for variation (52.97% and variation was observed in the cross Rohini x GM-2
(45.28%) followed by BIOYSR x Laxmi (43.17%) 41.18% respectively) and phenotypic coefficient of variation (53.93% and 41.84% respectively).and BIOYSR x BIO-902 (42.06%). The crosses
Rohini x Laxmi (41.59%) and Rohini x PCR-7 The highest heritability estimate was observed (37.71%) also exhibited higher genotypic coefficient
in the F cross Rohini x BIO-902 (96.90%) followed of variation. Estimated heritability was maximum in 2
by BIOYSR x BIO-902 (96.50%) and Rohini x PCR-F cross of Rohini x JD-6 (97.74%) followed by 2
7 (96.47%). The highest genetic advance was Rohini x JD-6 (96.73%) and BIOYSR x BIO-902 recorded by the F cross of Rohini x PCR-7 (3.18) (96.41%). The crosses Rohini x PCR-7 (96.33%) and 2
followed by Rohini x Laxmi (2.54) and Rohini x BIO-Rohini x Laxmi (93.68) also exhibited higher 902 (2.34). heritability. The F cross of Rohini x PCR-7 (65.46) 2
exhibited maximum genetic advance followed by The crosses, Rohini x BIO-902 and Rohini x Rohini x Laxmi (57.58) and Rohini x GM-2 (57.51).
PCR-7 exhibited relatively higher values of F 2
Higher values of F variance, genotypic variance, genotypic coefficient of variation, 2
phenotypic coefficient of variance and lower values coefficient of variation, heritability and expected for expected genetic advance. High heritability genetic advance were exhibited by the crosses Rohini
x Laxmi and Rohini x PCR-7. This indicated that coupled with low genetic advance indicates the predominant role of additive gene action for the presence of non-additive gene action, and that the
-1selection of superior plants in F generation for seed character number of siliqua plant and hence 2
selection in the F generation will be effective. yield would not be rewarding. The results of the 2
Several other workers have reported similar findings present study for high heritability were in confirmity of high heritability and corresponding genetic with Khulbe et al. (2000), Chauhan et al. (2001), advance (Mahmood et al., 2003, Bansod et al. 2007 Mahla et al. (2003), Mahmood et al. (2003), Bansod and Lole et al., 2012). et al. (2007), Lole et al. (2012) and Singh et al. (2012)
but in all these studies estimates of genetic advance -1 Yield plant (g) were also higher whereas in the present study genetic
Among the parents GM-2 yielded highest -1advance was found to be lower for seed yield plant as
(2.57g) followed by Laxmi (2.51g), JD-6 (2.31g) and observed by Singh et al. (2011), Singh et al. (2002)
lowest yielders were the parent BIO-902 (1.07g) and who also observed high heritability coupled with low
PCR-7 (1.51g) as observed from table 6. The -1genetic advance for seed yield plant .
maximum seed yield was recorded by F cross of 2
Rohini x PDR-7 (2.97g) followed by Rohini x BIO- Oil content (%) and fatty acid composition902 (2.80g). The F cross of BIOYSR x BIO-902 2 The mean oil content (%) and fatty acid yielded the lowest (1.62g). composition of parents, checks and crosses were
estimated from bulk samples and data are presented in The data from table 6 showed that the table 7.
-1maximum range for seed yield plant was observed in the F cross of Rohini x Laxmi (0.6 to 11.5g) and Among the eight parents and two checks 2
BIOYSR x JD-6 (0.8 to 5.1g) scored the lowest range studied, mean oil content of Rohini, JD-6, Shatabdi -1
and Pusa Bold were highest with 40% followed by for seed yield plant . The highest F variance was 2
Laxmi and Pusa bahar (36% for both). The highest oil recorded in Rohini x PCR-7 (2.56) followed by content was recorded in F cross of Rohini x Laxmi Rohini x Laxmi (1.86). The highest genotypic 2
coefficient of variation and phenotypic coefficient of and Rohini x Pusa bahar (40% for both) followed by variation were observed in the F cross of Rohini x Rohini x JD-6, Rohini x GM-2 and BIOYSR x BIO-2
902 (36% for all).Pusa bahar (65.72% and 68.07% respectively)
148

Among parents PCR-7 (3.58%) content high mainly oriented to develop suitable variety, which Palmitic acid whereas parent BIO-902 (2.71%) have high yield, high oil and desirable level of fatty having low level of palmitic acid. Within F crosses acid composition. Knowledge of relative magnitude 2
of heritability and additive and non-additive genetic Rohini x BIO-902 (3.19%) exhibits high level of variation for these quantitative traits would help to palmitic acid followed by BIOYSR x BIO-902 decide most probably breeding method to be followed (3.09%) and cross BIOYSR x GM-2 (2.48%) content in mustard. The information about mean performance low level of palmitic acid. High level of oleic acid was magnitude of genetic variance heritability and genetic found in parent Shatabdi (12.41%) whereas low in advance in the F population will determine the 2JD-6 (8.62%). F crosses BIOYSR x JD-6 (13.17%) 2
success of selecting potential F and the possibility of 2content high oleic acid followed by Rohini x JD-6 and extracting superior or segregating generation. Since F cross Rohini x BIO-902 (9.93%) content in low 2
only the genetic portion of the total variability level. High level of linoleic acid was found in parent contributes to gain under selection, the important of Shatabdi (21.58%) and low level found in JD-6 information about the parameter of genotype (18.92%) as well as high level of linoleic acid found in enrichment complex should be clear to the breeder as F cross BIOYSR x BIO-902 (20.31%) and low level 2
the better estimate of these parameters, the breeder found in Rohini x JD-6 (16.65%). High level of will be able to anticipate that he can expect from Linolenic acid was observed in parent BIOYSR different intensity of selection. (Allard, 1960).(12.14%) and low in Pusa bold (10.55%). F crosses 2
Rohini x BIO-902 (12.82%) exhibited high level of Therefore, the presence investigation were
linolenic acid whereas BIOYSR x BIO-902 (9.96%) conducted to estimate the additive and dominant exhibited in low level. The high level of arachidic acid component of different characters, to estimate content was recorded in parent Shatabdi (9.50%) and heritability and genetic advance for different F 2low level in parent JD-6 (5.58%). F cross BIOYSR x 2 crosses and to identify potential F crosses for further 2 JD-6 (8.88%) exhibited high level of arachidic acid
selection. Moderately high coefficient of variation and low in Rohini x GM-2 (6.69%). High erucic acid -1
was observed for number of siliqua plant (11.84%) level was found in parent JD-6 (51.95%) whereas low -1
and seed yield plant (15.43%) whereas days to first in parent Shatabdi (41.14%). F cross Rohini x JM-2 2 flower (1.10%), days to maturity (0.41%) plant height (49.70%) exhibited high level of erucic acid and F2 at maturity (7.76%), and number of primary branches cross BIOYSR x JD-6 exhibited low in level -1 plant (6.65%) showed lower coefficient of variation. (43.76%).
-1Hence, only number of siliqua plant and seed
Fatty acid profiles determine the quality -1yield plant were considered as objectives of
mustard oil, which is an important component of selection in this study. The crosses Rohini x JD-6,
Indian diet prevalent mustard varieties, including Rohini x Laxmi, Rohini x Bio-902, Rohini x PCR-7,
those involved in the present study, yields oil having Rohini x GM-2, Rohini x Pusa bahar, BIOYSR x JD-
low (about 7%) standard fatty acid (palmitic + steric 6, BIOYSR x BIO-902, BIOYSR x Laxmi, and
acid), high erucic acid (50%), low oleic (9-18%) and BIOYSR x GM-2 were observed to record high mean,
linolic and linolenic acid (13-25%) as reported by variance, heritability for both number of siliqua
Chauhan et al. (2006). The preferred oil should have -1 -1plant and yield plant , but genetic advance was high
low saturated fatty acid (around 4%), low erucic acid -1 for number of siliqua plant and low for seed yield
(less than 2%) and appreciable amount of unsaturated -1plant , hence these ten crosses were identified and
fatty acid (olic and linolic acid) i.e. 40 to 45% olic, 30 subjected to individual plant selection. Chauhan et al.
to 35% linolic and 15 to 20% linolenic acid.(2001) and Lole et al. (2012) also reported the scope of single plant selection in F in mustard which was 2As oil content and fatty acid composition was inline with the present findings. Selection criteria for estimated from bulk samples of parents, checks and individual plant selection was based on mean of best crosses the data were not subjected to analysis of check ± S. E. Plants exhibiting greater value than genetic parameters.
-1 mean of best check ± S. E. for number of siliqua plant
-1 and seed yield plant were selected. The percentage of Crop improvement programme in mustard is
149
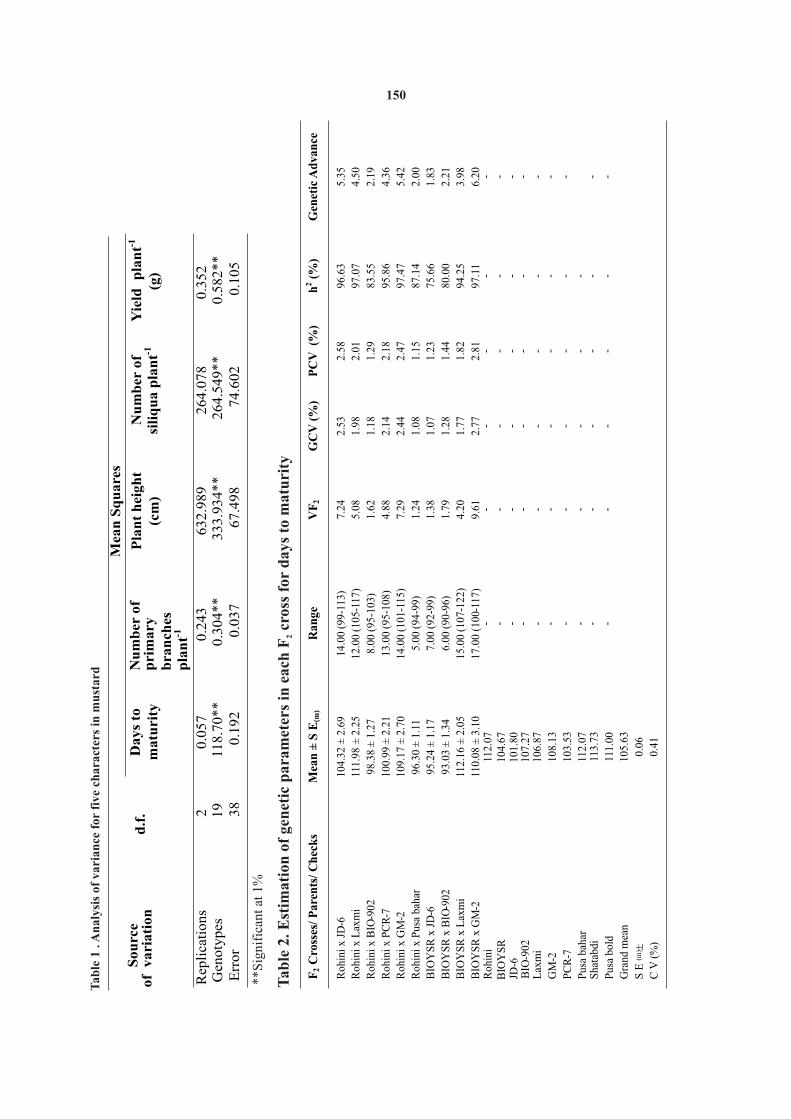
Tab
le 1
. A
naly
sis
of
var
ian
ce f
or f
ive
char
acte
rs i
n m
ust
ard
Sou
rce
vari
ati
on
d
.f.
Mea
n S
qu
are
s
D
ays
to
matu
rity
Nu
mb
er
of
pri
mary
b
ran
ches
p
lan
t-1
Pla
nt
hei
gh
t
(cm
)
Nu
mb
er
of
sili
qu
a p
lan
t-1
Yie
ld
pla
nt
(g)
Rep
lica
tions
2
0.0
57
0.2
43
632.9
89
264.0
78
0.3
52
Gen
oty
pes
19
118.7
0**
0.3
04**
333.9
34**
264.5
49**
0.5
82**
Err
or
38
0.1
92
0.0
37
67.4
98
74.6
02
0.1
05
**S
igni
fica
nt a
t 1%
of
- 1
Tab
le 2
. Est
ima
tio
n o
f g
enet
ic p
aram
eter
s in
ea
ch F
cro
ss f
or d
ays
to m
atu
rity
2
F2 C
ross
es/
Par
ents
/ C
hec
ks
M
ean
±
S
E(m
)
Ran
ge
VF
2 G
CV
(%
)
PC
V (
%)
h
2
(%)
G
enet
ic A
dva
nce
Roh
ini
x JD
-6
104.
32
±
2.69
14
.00
(9
9-11
3)
7.24
2.
53 2
.58
96
.63
5.
35
Roh
ini
x L
axm
i
111.
98
±
2.25
12
.00
(1
05-1
17)
5.
08
1.98
2.01
97
.07
4.
50
Roh
ini
x B
IO-9
02
98.3
8
±
1.27
8.
00
(95-
103)
1.
62
1.18
1.29
83
.55
2.
19
Roh
ini
x P
CR
-7
100.
99
±
2.21
13
.00
(9
5-10
8)
4.88
2.
14 2.
18
95.8
6
4.36
Roh
ini
x G
M-2
10
9.17
±
2.
70
14.0
0
(101
-115
)
7.29
2.
44 2.
47
97.4
7
5.42
Roh
ini
x P
usa
baha
r
96.3
0
±
1.11
5.
00
(94-
99)
1.
24
1.08
1.15
87
.14
2.
00
BIO
YS
R x
JD
-6
95.2
4
±
1.17
7.
00
(92-
99)
1.
38
1.07
1.23
75
.66
1.
83
BIO
YS
R x
BIO
-902
93
.03
±
1.
34
6.00
(9
0-96
)
1.79
1.
28 1.
44
80.0
0
2.21
BIO
YS
R x
Lax
mi
11
2.16
±
2.
05
15.0
0
(107
-122
)
4.20
1.
77 1.
82
94.2
5
3.98
BIO
YS
R x
GM
-2
110.
08 ±
3.
10
17.0
0 (1
00-1
17)
9.
61
2.77
2.81
97
.11
6.
20 -R
ohin
i
112.
07
-
-
-
-
-
BIO
YS
R
104.
67
-
-
-
-
-
- -JD
-6
101.
80
-
-
-
-
-
BIO
-902
107.
27
-
-
-
-
-
-
Lax
mi
106.
87
-
-
-
-
-
-
GM
-2
108.
13
-
-
-
-
-
- -
PC
R-7
103.
53
-
-
-
-
-
P
usa
baha
r
112.
07
-
-
-
-
-
Sha
tabd
i
113.
73
-
-
-
-
-
-
Pus
a bo
ld
111.
00
-
-
-
-
-
-
Gra
nd m
ean
105.
63
S E
(m) +
0.06
C V
(%
)0.
41
150
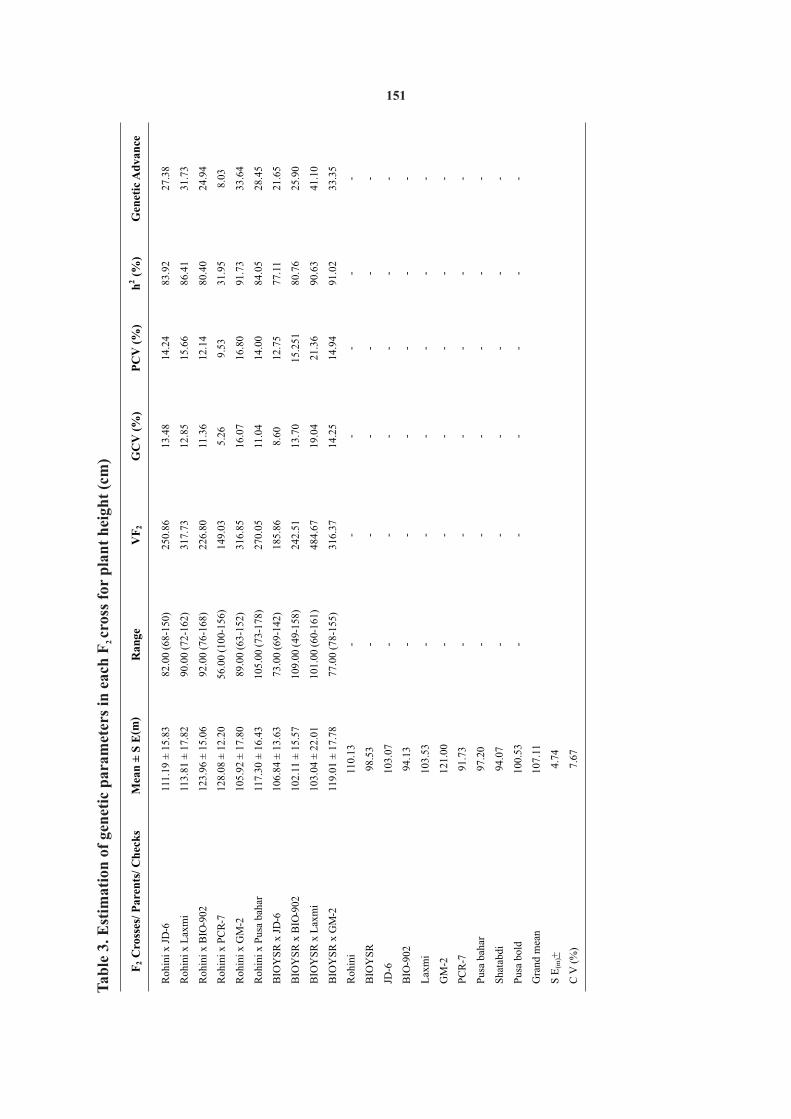
Tab
le 3
. Est
ima
tio
n o
f g
enet
ic p
ara
met
ers
in e
ach
Fcr
oss
for
pla
nt
hei
ght
(cm
)2
F2
Cro
sses
/ P
aren
ts/
Ch
eck
s
Mea
n
±
S E
(m)
R
ange
V
F2
GC
V (
%)
P
CV
(%
)
h2
(%
)
Gen
etic
Ad
van
ce
Roh
ini
x JD
-6
111.
19
±
15.8
3
82.0
0
(68
-150
)
250.
86 13
.48
14
.24
83
.92
27
.38
Roh
ini
x L
axm
i
113.
81
±
17.8
2
90.0
0
(72
-162
)
317.
73 12
.85
15
.66
86
.41
31
.73
Roh
ini
x B
IO-9
02
123.
96
±
15.0
6
92.0
0
(76
-168
)
226.
80 11
.36
12
.14
80
.40
24
.94
Roh
ini
x P
CR
-7
128.
08
±
12.2
0
56.0
0
(100
-156
) 14
9.03
5.26
9.
53
31.9
5
8.03
Roh
ini
x G
M-2
105.
92
±
17.8
0
89.0
0
(63
-152
)
316.
85
16.0
7
16.8
0
91.7
3
33.6
4
Roh
ini
x P
usa
baha
r
117.
30
±
16.4
3
105.
00
(73-
178)
270.
05
11.0
4
14.0
0
84.0
5
28.4
5
BIO
YS
R x
JD
-6
106.
84
±
13.6
3
73.0
0
(69-
142)
185.
86
8.60
12.7
5
77.1
1
21.6
5
BIO
YS
R x
BIO
-902
102.
11
±
15.5
7
109.
00
(49-
158)
242.
51
13.7
0
15.2
51
80.7
6
25.9
0
BIO
YS
R x
Lax
mi
103.
04
±
22.0
1
101.
00
(60-
161)
484.
67
19.0
4
21.3
6
90.6
3
41.1
0
BIO
YS
R x
GM
-2
119.
01
±
17.7
8
77.0
0
(78
-155
)
316.
37
14.2
5
14.9
4
91.0
2
33.3
5
Roh
ini
110.
13
-
-
-
-
-
-
BIO
YS
R
98.5
3
-
-
-
-
-
-
JD-6
103.
07
-
-
-
-
-
-
BIO
-902
94.1
3
-
-
-
-
-
-
Lax
mi
103.
53
-
-
-
-
-
-
GM
-2
121.
00
-
-
-
-
-
-
PC
R-7
91.7
3
-
-
-
-
-
-
Pus
a ba
har
97.2
0
-
-
-
-
-
-
Sha
tabd
i
94.0
7
-
-
-
-
-
-
Pus
a bo
ld
100.
53
-
-
-
-
-
-
Gra
nd m
ean
107.
11
S E
(m)+
4.74
C V
(%
)7.
67
151

-1T
able
4. E
stim
ati
on
of
gen
etic
pa
ram
eter
s in
ea
ch F
cro
ss f
or
nu
mb
er o
f p
rim
ary
bra
nch
es p
lan
t2
F2 C
ross
es/
Par
ents
/ C
hec
ks
M
ean
±
S E
(m)
R
ange
V
F2
G
CV
(%
)
PC
V (
%)
h
2
(%)
G
enet
ic A
dva
nce
Roh
ini
x JD
-6
3.05
±
0.
72
4.00
(1
-5)
0.
52
21.3
6
23.7
6
80.8
3 1
.21
Roh
ini
x L
axm
i
2.74
±
0.
71
4.00
(1
-5)
0.
50
23.8
3
25.9
0
84.6
6 1.
23
Roh
ini
x B
IO-9
02
3.75
±
0.
80
4.00
(1
-5)
0.
64
19.4
7
21.3
7
82.9
7 1.
37
Roh
ini
x P
CR
-7
3.29
±
0.
80
4.00
(1
-5)
0.
64
22.4
0
24.4
0
84.3
2 1.
39
Roh
ini
x G
M-2
2.
99
±
0.80
4.
00
(1-5
)
0.65
25
.20
26
.98
87
.23
1.45
Roh
ini
x P
usa
baha
r
2.98
±
0.
67
4.00
(1
-5)
0.
45
19.6
8
22.6
0
75.8
8 1.
05
BIO
YS
R x
JD
-6
3.00
±
0.
75
4.00
(1
-5)
0.
56
22.8
4
25.0
0
83.4
9 1.
29
BIO
YS
R x
BIO
-902
2.
68
±
0.
92
5.
00
(1
-6)
0.
86
32
.53
34
.63
88
.25
1.68
BIO
YS
R x
Lax
mi
2.64
±
0.73
3.00
(1-4
)
0.53
25.7
7
27.6
2
87.0
6
1.31
BIO
YS
R x
GM
-2
3.10
±
0.75
4.00
(1-5
)
0.56
22.6
2
24.2
7
86.8
1
1.34
Roh
ini
2.73
-
-
-
-
-
-
BIO
YS
R
3.00
-
-
-
-
-
-
JD-6
3.20
-
-
-
-
-
-
BIO
-902
2.33
-
-
-
-
-
-
Lax
mi
3.13
-
-
-
-
-
-
GM
-2
3.20
-
-
-
-
-
-
PC
R-7
2.80
-
-
-
-
-
-
Pus
a ba
har
2.67
-
-
-
-
-
-
Sha
tabd
i
2.60
-
-
-
-
-
-
Pus
a bo
ld
2.60
-
-
-
-
-
-
Gra
nd m
ean
2.92
S E
(m)+
0.11
C V
(%
)6.
65
152
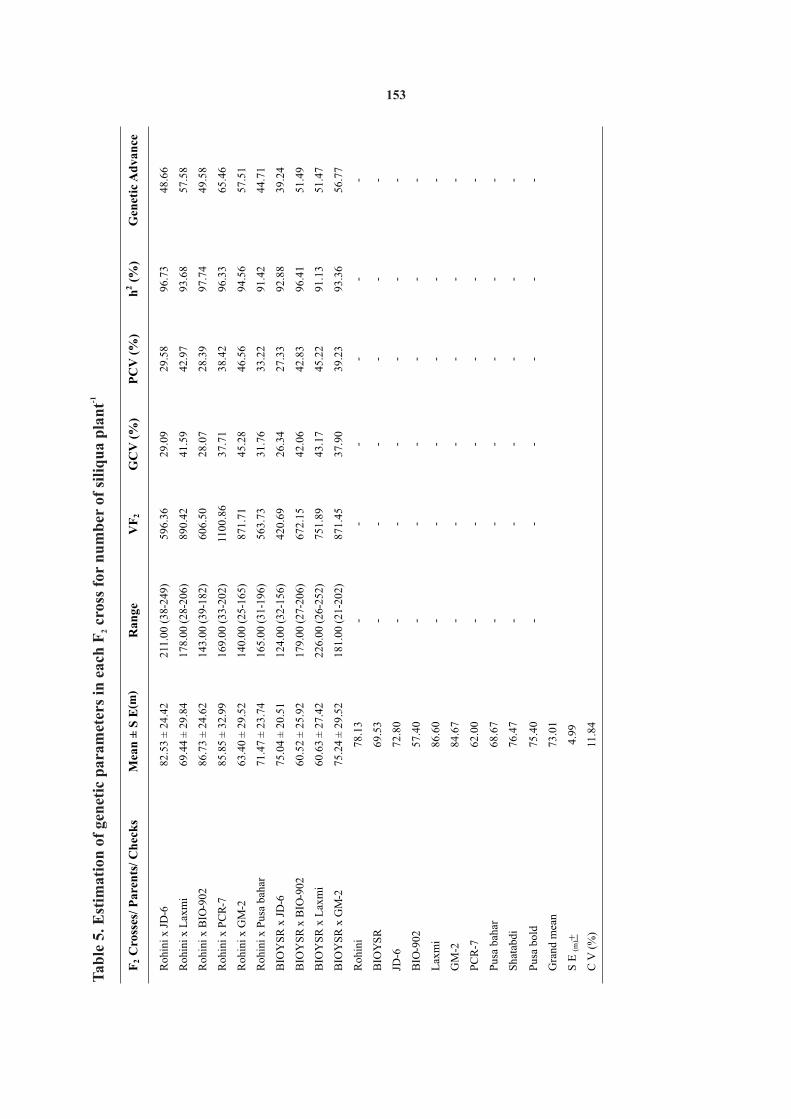
-1T
ab
le 5
. Est
imat
ion
of
gen
etic
par
amet
ers
in e
ach
F c
ross
for
nu
mb
er o
f si
liq
ua
pla
nt
2
F2 C
ross
es/
Pa
ren
ts/
Ch
eck
s
Mea
n
±
S E
(m)
R
an
ge
V
F2
GC
V (
%)
P
CV
(%
)
h2
(%
)
Gen
etic
Ad
van
ce
Rohin
i x J
D-6
82
.53
±
24.4
2
211
.00
(3
8-249)
596.3
6 2
9.0
9 2
9.5
8
96.7
3 4
8.6
6
Rohin
i x L
axm
i
69.4
4
±
29.8
4
178.0
0
(28-
206)
890.4
2 4
1.5
9 4
2.9
7
93.6
8 5
7.5
8
Rohin
i x B
IO-9
02
86.7
3
±
24.6
2
143.0
0
(39-
182)
606.5
0 2
8.0
7 2
8.3
9
97.7
4 4
9.5
8
Rohin
i x P
CR
-7
85.8
5
±
32
.99
169.0
0
(33-
202)
1100
.86
37.7
1 3
8.4
2
96.3
3 6
5.4
6
Rohin
i x G
M-2
63.4
0
±
29.5
2
140.0
0
(25-
165)
871.7
1 4
5.2
8 4
6.5
6
94.5
6 5
7.5
1
Rohin
i x P
usa
bah
ar
71.4
7
±
23.7
4
165.0
0
(31-
196)
563.7
3 3
1.7
6 3
3.2
2
91.4
2 4
4.7
1
BIO
YS
R x
JD
-6
75.0
4
±
20.5
1
124.0
0
(3
2-156)
420.6
9
26.3
4
27.3
3
92.8
8
39.2
4
BIO
YS
R
x B
IO-9
02
60.5
2
±
25.9
2
179.0
0
(27-
206)
672.1
5
42.0
6
42.8
3
96.4
1
51.4
9
BIO
YS
R x
Lax
mi
60.6
3
±
27.4
2
226.0
0
(26-
252)
751.8
9
43.1
7
45.2
2
91.1
3
51.4
7
BIO
YS
R x
GM
-2
75.2
4
±
29.5
2
181.0
0
(21-
202)
871.4
5
37.9
0
39.2
3
93.3
6
56.7
7
Rohin
i
78.1
3
-
-
-
-
-
-
BIO
YS
R
69.5
3
-
-
-
-
-
-
JD-6
72.8
0
-
-
-
-
-
-
BIO
-902
57.4
0
-
-
-
-
-
-
Lax
mi
86.6
0
-
-
-
-
-
-
GM
-2
84.6
7
-
-
-
-
-
-
PC
R-7
62.0
0
-
-
-
-
-
-
Pusa
bah
ar
68.6
7
-
-
-
-
-
-
Shat
abdi
76.4
7
-
-
-
-
-
-
Pusa
bold
75.4
0
-
-
-
-
-
-
Gra
nd m
ean
73.0
1
S E
(m)+
4.9
9
C V
(%
)11
.84
153
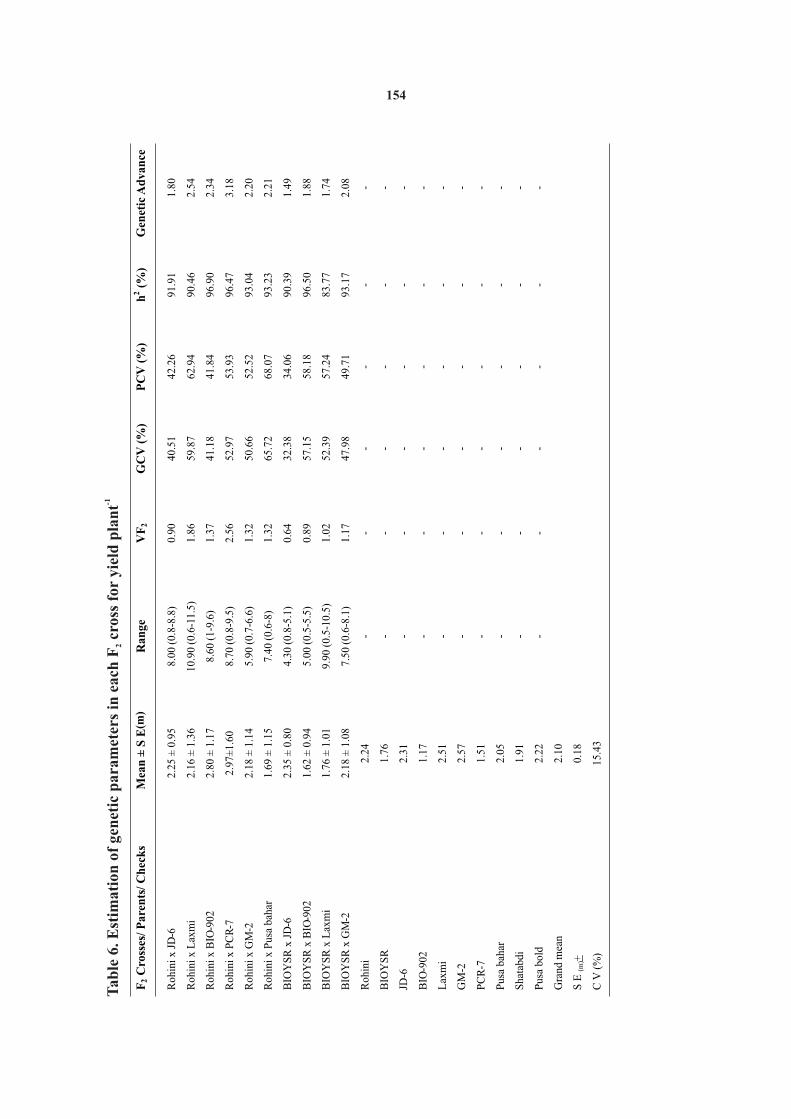
F2 C
ross
es/
Par
ents
/ C
hec
ks
M
ean
±
S
E(m
)
Ran
ge
VF
2 G
CV
(%
)
PC
V (
%)
h
2
(%)
G
enet
ic A
dva
nce
Roh
ini
x JD
-6
2.25
±
0.
95
8.00
(0
.8-8
.8)
0.
90
40.5
1 42
.26
91
.91
1.8
0
Roh
ini
x L
axm
i
2.16
±
1.
36
10.9
0
(0.6
-11.
5)
1.86
59
.87
62.9
4
90.4
6 2.
54
Roh
ini
x B
IO-9
02
2.80
±
1.
17
8.60
(1
-9.6
)
1.37
41
.18
41.8
4
96.9
0 2.
34
Roh
ini
x P
CR
-7
2.97
±1.
60
8.70
(0
.8-9
.5)
2.
56
52.9
7 53
.93
96
.47
3.18
Roh
ini
x G
M-2
2.
18
±
1.14
5.
90
(0.7
-6.6
)
1.32
50
.66
52.5
2
93.0
4 2.
20
Roh
ini
x P
usa
baha
r
1.69
±
1.
15
7.40
(0
.6-8
)
1.32
65
.72
68.0
7
93.2
3 2.
21
BIO
YS
R x
JD
-6
2.
35 ±
0.8
0
4.
30
(0
.8-5
.1)
0.
64
32
.38
34.0
6
90
.39
1.49
BIO
YS
R x
BIO
-902
1.62
±
0.94
5.00
(0.5
-5.5
)
0.89
57.1
5
58.1
8
96.5
0
1.88
BIO
YS
R x
Lax
mi
1.76
±
1.01
9.90
(0.5
-10.
5)
1.02
52.3
9
57.2
4
83.7
7
1.74
BIO
YS
R x
GM
-2
2.18
±
1.08
7.50
(0.6
-8.1
)
1.17
47.9
8
49.7
1
93.1
7
2.08
Roh
ini
2.24
-
-
-
-
-
-
BIO
YS
R
1.76
-
-
-
-
-
-
JD-6
2.31
-
-
-
-
-
-
BIO
-902
1.17
-
-
-
-
-
-
Lax
mi
2.51
-
-
-
-
-
-
GM
-2
2.57
-
-
-
-
-
-
PC
R-7
1.51
-
-
-
-
-
-
Pus
a ba
har
2.05
-
-
-
-
-
-
Sha
tabd
i
1.91
-
-
-
-
-
-
Pus
a bo
ld
2.22
-
-
-
-
-
-
Gra
nd m
ean
2.10
S E
(m)+
0.18
C V
(%
)15
.43
-1T
ab
le 6
. Est
imat
ion
of
gen
etic
pa
ram
eter
s in
eac
h F
cro
ss f
or
yie
ld p
lan
t2
154
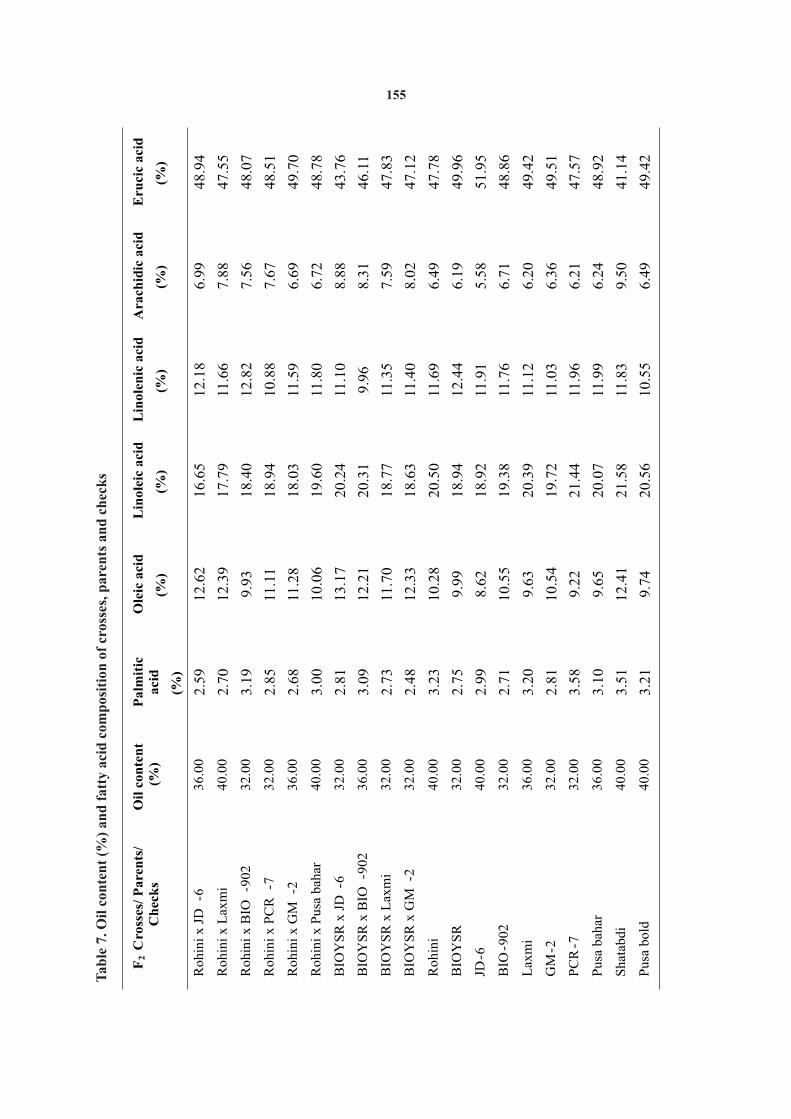
Ta
ble
7. O
il c
onte
nt
(%)
an
d f
atty
aci
d c
om
pos
itio
n o
f cr
osse
s, p
aren
ts a
nd
ch
eck
s
Cro
sses
/ P
are
nts
/ C
hec
ks
Oil
con
ten
t (%
)
Palm
itic
aci
d
(%)
Ole
ic a
cid
(%)
Lin
ole
ic a
cid
(%)
Lin
ole
nic
aci
d
(%)
Ara
chid
ic
aci
d
(%)
Eru
cic
aci
d
(%)
Rohin
i x J
D-6
36.0
0
2.5
9
12.6
2
16.6
5
12.1
8
6.9
9
48.9
4
Rohin
i x L
axm
i
40.0
0
2.7
0
12.3
9
17.7
9
11.6
6
7.8
8
47.5
5
Rohin
i x B
IO-9
02
32.0
0
3.1
9
9.9
3
18.4
0
12.8
2
7.5
6
48.0
7
Rohin
i x P
CR
-7
32.0
0
2.8
5
11.1
1
18.9
4
10.8
8
7.6
7
48.5
1
Rohin
i x G
M-2
36.0
0
2.6
8
11.2
8
18.0
3
11.5
9
6.6
9
49.7
0
Rohin
i x P
usa
bah
ar
40.0
0
3.0
0
10.0
6
19.6
0
11.8
0
6.7
2
48.7
8
BIO
YS
R x
JD
-6
32.0
0
2.8
1
13.1
7
20.2
4
11.1
0
8.8
8
43.7
6
BIO
YS
R x
BIO
-902
36.0
0
3.0
9
12.2
1
20.3
1
9.9
6
8.3
1
46.1
1
BIO
YS
R x
Lax
mi
32.0
0
2.7
3
11.7
0
18.7
7
11.3
5
7.5
9
47.8
3
BIO
YS
R x
GM
-2
32.0
0
2.4
8
12.3
3
18.6
3
11.4
0
8.0
2
47.1
2
Rohin
i
40.0
0
3.2
3
10.2
8
20.5
0
11.6
9
6.4
9
47.7
8
BIO
YS
R
32.0
0
2.7
5
9.9
9
18.9
4
12.4
4
6.1
9
49.9
6
6
40.0
0
2.9
9
8.6
2
18.9
2
11.9
1
5.5
8
51.9
5
BIO
-902
32.0
0
2.7
1
10.5
5
19.3
8
11.7
6
6.7
1
48.8
6
Lax
mi
36.0
0
3.2
0
9.6
3
20.3
9
11.1
2
6.2
0
49.4
2
-2
32.0
0
2.8
1
10.5
4
19.7
2
11.0
3
6.3
6
49.5
1
PC
R-7
32.0
0
3.5
8
9.2
2
21.4
4
11.9
6
6.2
1
47.5
7
Pusa
bah
ar
36.0
0
3.1
0
9.6
5
20.0
7
11.9
9
6.2
4
48.9
2
Shat
abdi
40.0
0
3.5
1
12.4
1
21.5
8
11.8
3
9.5
0
41.1
4
Pusa
bold
40.0
03.2
19.7
420.5
610.5
56.4
949.4
2
F2
JD
-
GM
155

Khulbe, D. P. Pant and N. Saxena, 2000. Variability, heritability andselected plants ranges from 9.77 % to 17.33 % for genetic advance in Indian mustard (Brassica juncea L). Crop -1
number of siliqua plant and from 10.40 % to 17.33 % Res. 20 (3): 551-552.-1 Mahla, H. R., S. J. Jambhulkar, D. K. Yadav and R. Sharma, 2003. Genetic for seed plant . These selected plants are
variability, correlation and path analysis in Indian mustard recommended for forwarding to next generation for (Brassica juncea (L.) czern and coss.). Indian J. Genet. 63
(1):171-172. evaluating the performance of progeny. Mean Lole, M. D., S. R. Patil, R. B. Tele, S. C. Bansod. Gowthami R. and M. R. -1
performance of number of siliqua plant and yield Puttawar, 2012. Genetic studies of F population in mustard 2-1
plant of selected plants indicate the chances of (Brassica juncea). J. Soils and Crops, 22 (2) : 379-386.Mahmood, T., A. Muhammad, T. Shahid and A. Muhammad, 2003. getting good progenies with high yield in further
Genetic variability and heritability estimates in summer generations. mustard (Brassica juncea). Asian J. Genet. 17 (2): 318-328.
Panse, S.K. and P.V. Sukhatme, 1967. Statistical methods for agricultural workers. Indian council of Agricultural Research, New Delhi, REFERENCES rd3 edition : pp. 341.
Rameeh, V. 2010. Combining ability and factor analysis in F diallel 2
Allard, R. W. 1960. Principles of Plant Breeding, John Wiley and Sons, crosses of Rapseed varieties. Plant Breed. and Seed Sci. 62 : 73-Inc., New York. 83.
Bansod, S., B. Nair, S. Patil, V. Kalamkar, and P. D. Budhanwar, 2007. Sankaram, A. 1965. A laboratory manual of Agril. Chem.. Asia Genetic study of F generation in mustard (Brassic juncea). J. 2 Publication Bombay. pp. 258.Res. Crops, 8(3). 638-640. Singh, A., R. Krishna, L. Singh and R. Jeet, 2011. Heritability and genetic
Burton, G. W. and E. M. Devane,1953. Estimating heritability in tall advance in Indian mustard [Brassica juncea (L.) Czern and fescue (Festuca circunclinaceae) from replicated clonal- Coss.]. J. Current Adv. Agri. Sci. 3(1): 52-53. material. Agron. J. 45: 478-481. Singh, D. K., K. Kumar and P. Singh, 2012. Heterosis and heritability
Chauhan, J. S., M. K. Tyagi, P. Tyagi, P. R. Kumar, S. K. Yadav and Kumar, analysis for different crosses in Brassica juncea. 18 J. 2001. Analysis of fatty acid profile of F hybrids and their 1 Oilseed Brassica, 3(1): 18-26.parents in Indian mustard (Brassica juncea L. Czern and Coss.). Singh, M., G. B. Swarnkar, L. Prasad and G. Rai, 2002. Genetic
Annals Agri. Bio. Res. 6 (2):201-206. variability, heritability and genetic advance for quality traits in Chauhan, J. S., M. K. Tyagi, P. Tyagi. M. Singh, A. Kumar and N.B. Singh, Indian mustard [Brassica juncea (L.) Czern and Coss.]. J. Plant
2006. Genetic architecture of fatty acid profile in cross of Indian Archives, 2(1): 27-31.mustard, Brassica juncea (L.) Czern and Coss. J. Oilseed Res. Singh, M., H. L. Singh, Satyendra and R. K. Dixit, 2004. Studies on 23(2): 277-280. genetic variability, heritability, genetic advance and correlation
Chauhan, J. S., S. S. Meena and S. S. Yadava, 2001. Segregation pattern in Indian mustard [Brassica juncea (L.) Czern and Coss.]. J. and estimation of genetic parameters in F population of Indian Plant Archives, 4 (2): 291-294. 2
Titare, V. P. 2000. Genetic analysis of yield and yield components in mustard. J. Maharashtra agric. Univ. 26(1): 56-59. Johanson, H. W., H. F. Robinson and H. S. Comstock, 1955. Estimates of Indian mustard (Brassica juncea (L.) Czern and Coss.
genetic and environmental variability in soybean. Agron. J. 47: MSc.(Agri) thesis (unpub.) submitted to Dr. P.D.K.V., 314-318. Akola (M.S.).
Rec. on 30.05.2014 & Acc. on 28.07.2014
156
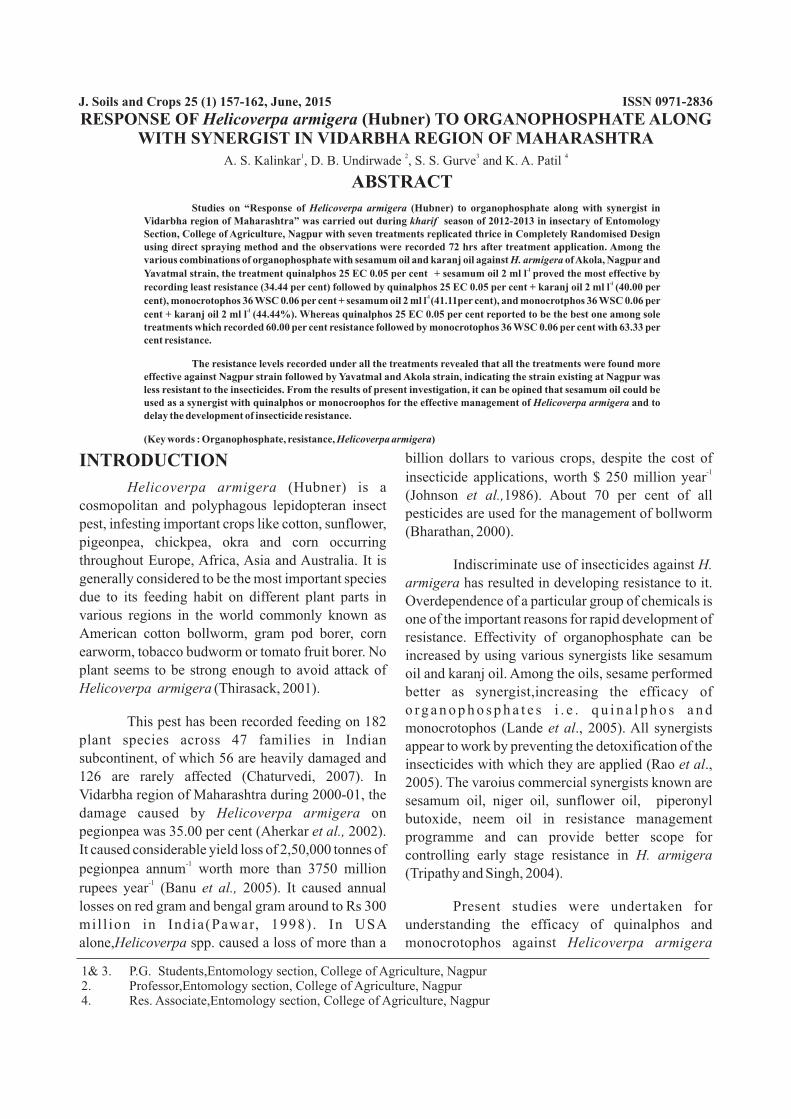
ABSTRACT
Studies on “Response of Helicoverpa armigera (Hubner) to organophosphate along with synergist in Vidarbha region of Maharashtra” was carried out during kharif season of 2012-2013 in insectary of Entomology Section, College of Agriculture, Nagpur with seven treatments replicated thrice in Completely Randomised Design using direct spraying method and the observations were recorded 72 hrs after treatment application. Among the various combinations of organophosphate with sesamum oil and karanj oil against H. armigera of Akola, Nagpur and
-lYavatmal strain, the treatment quinalphos 25 EC 0.05 per cent + sesamum oil 2 ml l proved the most effective by -lrecording least resistance (34.44 per cent) followed by quinalphos 25 EC 0.05 per cent + karanj oil 2 ml l (40.00 per
-l cent), monocrotophos 36 WSC 0.06 per cent + sesamum oil 2 ml l (41.11per cent), and monocrotphos 36 WSC 0.06 per -lcent + karanj oil 2 ml l (44.44%). Whereas quinalphos 25 EC 0.05 per cent reported to be the best one among sole
treatments which recorded 60.00 per cent resistance followed by monocrotophos 36 WSC 0.06 per cent with 63.33 per cent resistance.
The resistance levels recorded under all the treatments revealed that all the treatments were found more effective against Nagpur strain followed by Yavatmal and Akola strain, indicating the strain existing at Nagpur was less resistant to the insecticides. From the results of present investigation, it can be opined that sesamum oil could be used as a synergist with quinalphos or monocroophos for the effective management of Helicoverpa armigera and to delay the development of insecticide resistance.
(Key words : Organophosphate, resistance, Helicoverpa armigera)
1& 3. P.G. Students,Entomology section, College of Agriculture, Nagpur2. Professor,Entomology section, College of Agriculture, Nagpur4. Res. Associate,Entomology section, College of Agriculture, Nagpur
J. Soils and Crops 25 (1) 157-162, June, 2015 ISSN 0971-2836
billion dollars to various crops, despite the cost of INTRODUCTION-1 insecticide applications, worth $ 250 million year
Helicoverpa armigera (Hubner) is a (Johnson et al.,1986). About 70 per cent of all
cosmopolitan and polyphagous lepidopteran insect pesticides are used for the management of bollworm
pest, infesting important crops like cotton, sunflower, (Bharathan, 2000).
pigeonpea, chickpea, okra and corn occurring throughout Europe, Africa, Asia and Australia. It is Indiscriminate use of insecticides against H. generally considered to be the most important species armigera has resulted in developing resistance to it. due to its feeding habit on different plant parts in Overdependence of a particular group of chemicals is various regions in the world commonly known as one of the important reasons for rapid development of American cotton bollworm, gram pod borer, corn resistance. Effectivity of organophosphate can be earworm, tobacco budworm or tomato fruit borer. No increased by using various synergists like sesamum plant seems to be strong enough to avoid attack of oil and karanj oil. Among the oils, sesame performed Helicoverpa armigera (Thirasack, 2001). better as synergist,increasing the efficacy of
o rg a n o p h o s p h a t e s i . e . q u i n a l p h o s a n d This pest has been recorded feeding on 182 monocrotophos (Lande et al., 2005). All synergists
plant species across 47 families in Indian appear to work by preventing the detoxification of the subcontinent, of which 56 are heavily damaged and insecticides with which they are applied (Rao et al., 126 are rarely affected (Chaturvedi, 2007). In 2005). The varoius commercial synergists known are Vidarbha region of Maharashtra during 2000-01, the sesamum oil, niger oil, sunflower oil, piperonyl damage caused by Helicoverpa armigera on butoxide, neem oil in resistance management pegionpea was 35.00 per cent (Aherkar et al., 2002). programme and can provide better scope for It caused considerable yield loss of 2,50,000 tonnes of controlling early stage resistance in H. armigera
-1pegionpea annum worth more than 3750 million (Tripathy and Singh, 2004).
-1rupees year (Banu et al., 2005). It caused annual
Present studies were undertaken for losses on red gram and bengal gram around to Rs 300
understanding the efficacy of quinalphos and mil l ion in India(Pawar, 1998) . In USA alone,Helicoverpa spp. caused a loss of more than a monocrotophos against Helicoverpa armigera
RESPONSE OF Helicoverpa armigera (Hubner) TO ORGANOPHOSPHATE ALONG WITH SYNERGIST IN VIDARBHA REGION OF MAHARASHTRA
1 2 3 4A. S. Kalinkar , D. B. Undirwade , S. S. Gurve and K. A. Patil
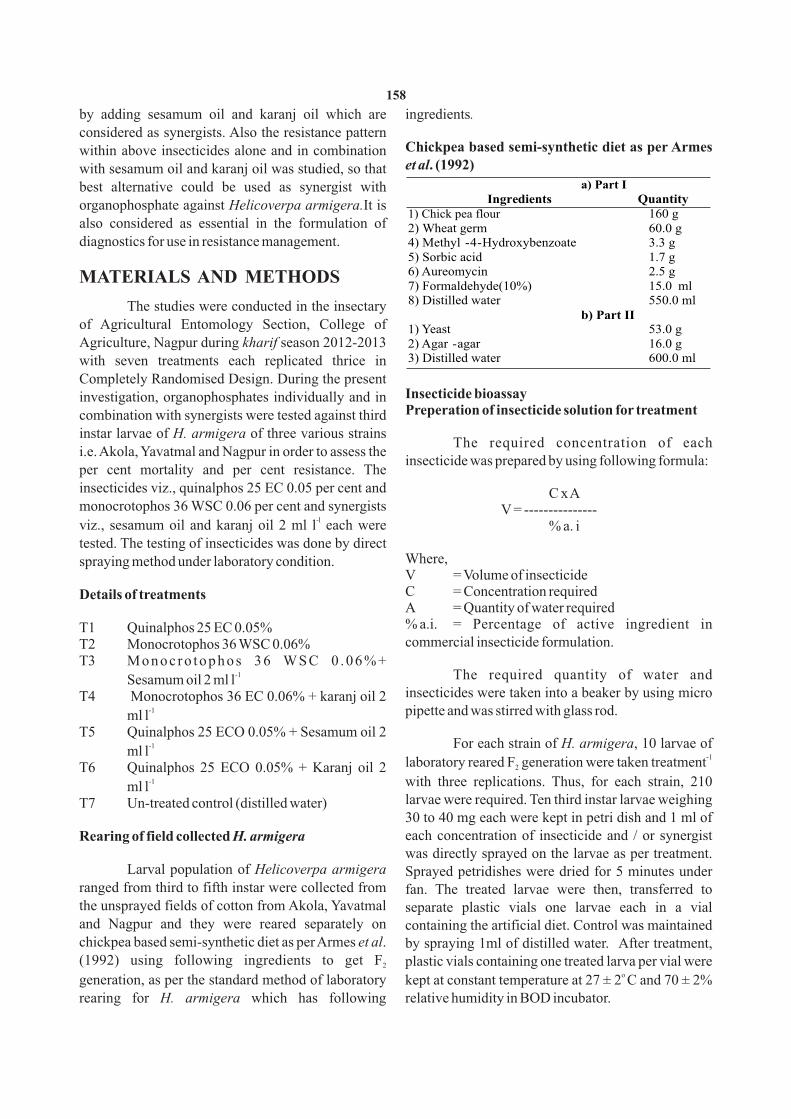
by adding sesamum oil and karanj oil which are ingredients.considered as synergists. Also the resistance pattern
Chickpea based semi-synthetic diet as per Armes within above insecticides alone and in combination et al. (1992)with sesamum oil and karanj oil was studied, so that
best alternative could be used as synergist with organophosphate against Helicoverpa armigera.It is also considered as essential in the formulation of diagnostics for use in resistance management.
MATERIALS AND METHODS
The studies were conducted in the insectary of Agricultural Entomology Section, College of Agriculture, Nagpur during kharif season 2012-2013 with seven treatments each replicated thrice in Completely Randomised Design. During the present
Insecticide bioassayinvestigation, organophosphates individually and in Preperation of insecticide solution for treatmentcombination with synergists were tested against third
instar larvae of H. armigera of three various strains The required concentration of each
i.e. Akola, Yavatmal and Nagpur in order to assess the insecticide was prepared by using following formula:
per cent mortality and per cent resistance. The insecticides viz., quinalphos 25 EC 0.05 per cent and C x Amonocrotophos 36 WSC 0.06 per cent and synergists V = ---------------
-lviz., sesamum oil and karanj oil 2 ml l each were % a. itested. The testing of insecticides was done by direct
Where,spraying method under laboratory condition.V = Volume of insecticideC = Concentration requiredDetails of treatmentsA = Quantity of water required% a.i. = Percentage of active ingredient in T1 Quinalphos 25 EC 0.05%commercial insecticide formulation.T2 Monocrotophos 36 WSC 0.06%
T3 Monoc ro tophos 36 WSC 0 .06%+ -1 The required quantity of water and Sesamum oil 2 ml l
insecticides were taken into a beaker by using micro T4 Monocrotophos 36 EC 0.06% + karanj oil 2 -1 pipette and was stirred with glass rod.ml l
T5 Quinalphos 25 ECO 0.05% + Sesamum oil 2 -1 For each strain of H. armigera, 10 larvae of
ml l-1
laboratory reared F generation were taken treatment 2T6 Quinalphos 25 ECO 0.05% + Karanj oil 2 -1 with three replications. Thus, for each strain, 210 ml l
larvae were required. Ten third instar larvae weighing T7 Un-treated control (distilled water)30 to 40 mg each were kept in petri dish and 1 ml of each concentration of insecticide and / or synergist Rearing of field collected H. armigerawas directly sprayed on the larvae as per treatment.
Larval population of Helicoverpa armigera Sprayed petridishes were dried for 5 minutes under ranged from third to fifth instar were collected from fan. The treated larvae were then, transferred to the unsprayed fields of cotton from Akola, Yavatmal separate plastic vials one larvae each in a vial and Nagpur and they were reared separately on containing the artificial diet. Control was maintained chickpea based semi-synthetic diet as per Armes et al. by spraying 1ml of distilled water. After treatment, (1992) using following ingredients to get F plastic vials containing one treated larva per vial were 2
o kept at constant temperature at 27 ± 2 C and 70 ± 2% generation, as per the standard method of laboratory
rearing for H. armigera which has following relative humidity in BOD incubator.
a) Part IIngredients Quantity
1) Chick pea flour 160 g2) Wheat germ
60.0 g 4) Methyl -4-Hydroxybenzoate
3.3 g5) Sorbic acid
1.7 g6) Aureomycin
2.5 g7) Formaldehyde(10%)
15.0 ml8) Distilled water
550.0 mlb) Part II
1) Yeast
53.0 g2) Agar -agar
16.0 g
3) Distilled water 600.0 ml
158
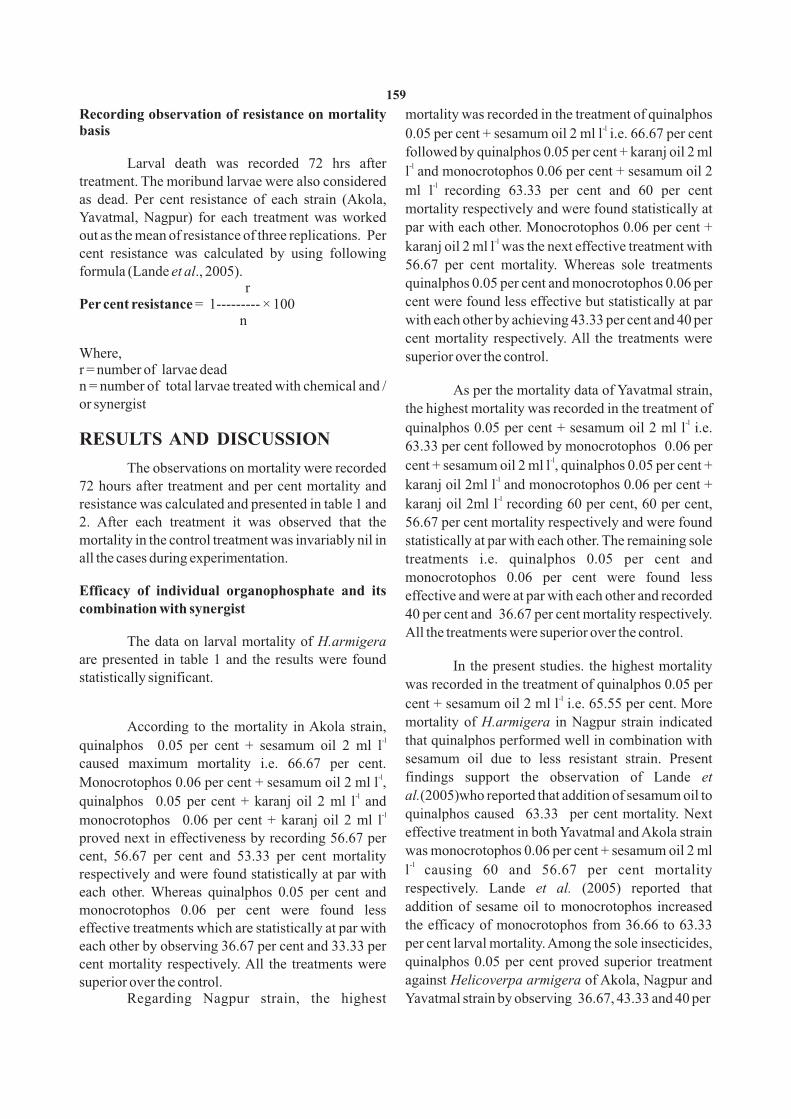
Recording observation of resistance on mortality mortality was recorded in the treatment of quinalphos -lbasis 0.05 per cent + sesamum oil 2 ml l i.e. 66.67 per cent
followed by quinalphos 0.05 per cent + karanj oil 2 ml Larval death was recorded 72 hrs after -ll and monocrotophos 0.06 per cent + sesamum oil 2
treatment. The moribund larvae were also considered -l ml l recording 63.33 per cent and 60 per cent
as dead. Per cent resistance of each strain (Akola, mortality respectively and were found statistically at
Yavatmal, Nagpur) for each treatment was worked par with each other. Monocrotophos 0.06 per cent +
out as the mean of resistance of three replications. Per -lkaranj oil 2 ml l was the next effective treatment with cent resistance was calculated by using following
56.67 per cent mortality. Whereas sole treatments formula (Lande et al., 2005).quinalphos 0.05 per cent and monocrotophos 0.06 per rcent were found less effective but statistically at par Per cent resistance = 1--------- × 100 with each other by achieving 43.33 per cent and 40 per ncent mortality respectively. All the treatments were
Where, superior over the control.r = number of larvae deadn = number of total larvae treated with chemical and / As per the mortality data of Yavatmal strain, or synergist the highest mortality was recorded in the treatment of
-lquinalphos 0.05 per cent + sesamum oil 2 ml l i.e.
RESULTS AND DISCUSSION 63.33 per cent followed by monocrotophos 0.06 per -l
cent + sesamum oil 2 ml l , quinalphos 0.05 per cent + The observations on mortality were recorded -lkaranj oil 2ml l and monocrotophos 0.06 per cent + 72 hours after treatment and per cent mortality and -l
resistance was calculated and presented in table 1 and karanj oil 2ml l recording 60 per cent, 60 per cent,
56.67 per cent mortality respectively and were found 2. After each treatment it was observed that the mortality in the control treatment was invariably nil in statistically at par with each other. The remaining sole all the cases during experimentation. treatments i.e. quinalphos 0.05 per cent and
monocrotophos 0.06 per cent were found less Efficacy of individual organophosphate and its effective and were at par with each other and recorded combination with synergist 40 per cent and 36.67 per cent mortality respectively.
All the treatments were superior over the control.The data on larval mortality of H.armigera
are presented in table 1 and the results were found In the present studies. the highest mortality statistically significant. was recorded in the treatment of quinalphos 0.05 per
-lcent + sesamum oil 2 ml l i.e. 65.55 per cent. More
mortality of H.armigera in Nagpur strain indicated According to the mortality in Akola strain, -l that quinalphos performed well in combination with quinalphos 0.05 per cent + sesamum oil 2 ml l
sesamum oil due to less resistant strain. Present caused maximum mortality i.e. 66.67 per cent. -l findings support the observation of Lande et Monocrotophos 0.06 per cent + sesamum oil 2 ml l ,
-l al.(2005)who reported that addition of sesamum oil to quinalphos 0.05 per cent + karanj oil 2 ml l and -l quinalphos caused 63.33 per cent mortality. Next monocrotophos 0.06 per cent + karanj oil 2 ml l
effective treatment in both Yavatmal and Akola strain proved next in effectiveness by recording 56.67 per was monocrotophos 0.06 per cent + sesamum oil 2 ml cent, 56.67 per cent and 53.33 per cent mortality
-l l causing 60 and 56.67 per cent mortality respectively and were found statistically at par with respectively. Lande et al. (2005) reported that each other. Whereas quinalphos 0.05 per cent and addition of sesame oil to monocrotophos increased monocrotophos 0.06 per cent were found less the efficacy of monocrotophos from 36.66 to 63.33 effective treatments which are statistically at par with per cent larval mortality. Among the sole insecticides, each other by observing 36.67 per cent and 33.33 per quinalphos 0.05 per cent proved superior treatment cent mortality respectively. All the treatments were against Helicoverpa armigera of Akola, Nagpur and superior over the control.
Regarding Nagpur strain, the highest Yavatmal strain by observing 36.67, 43.33 and 40 per
159
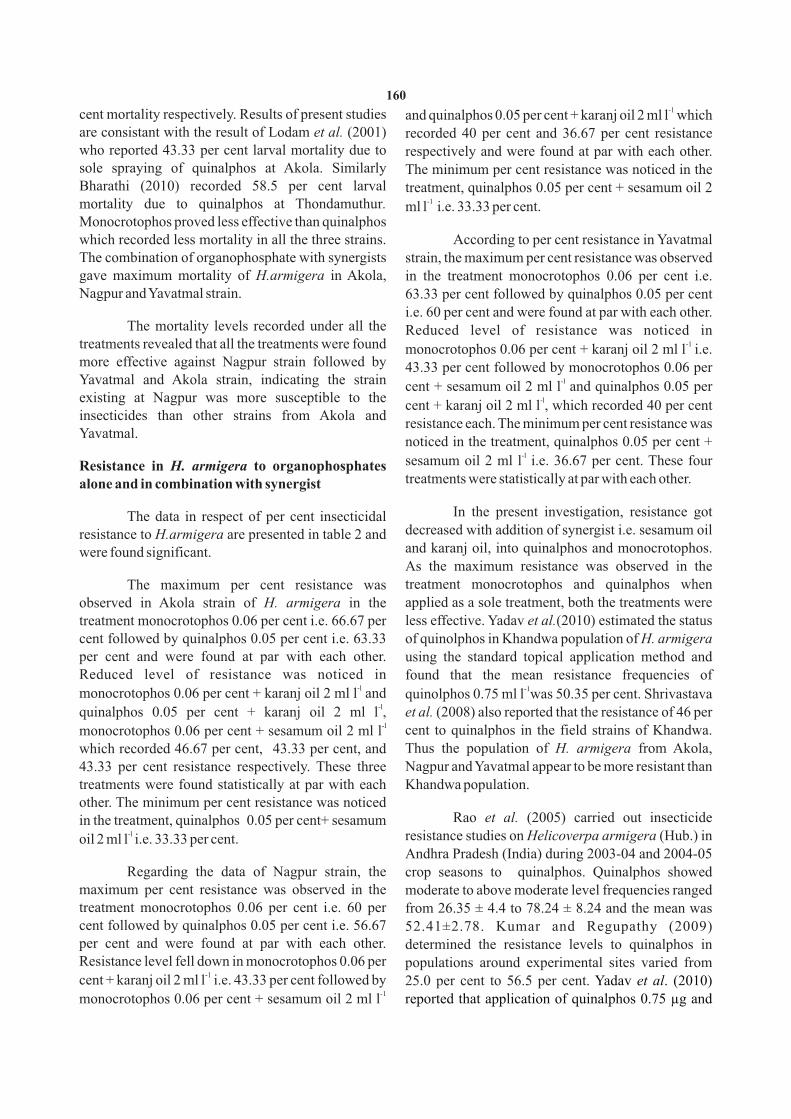
-1cent mortality respectively. Results of present studies and quinalphos 0.05 per cent + karanj oil 2 ml l which are consistant with the result of Lodam et al. (2001) recorded 40 per cent and 36.67 per cent resistance who reported 43.33 per cent larval mortality due to respectively and were found at par with each other. sole spraying of quinalphos at Akola. Similarly The minimum per cent resistance was noticed in the Bharathi (2010) recorded 58.5 per cent larval treatment, quinalphos 0.05 per cent + sesamum oil 2
-1 mortality due to quinalphos . ml l i.e. 33.33 per cent. Monocrotophos proved less effective than quinalphos which recorded less mortality in all the three strains. According to per cent resistance in Yavatmal
strain, the maximum per cent resistance was observed The combination of organophosphate with synergists gave maximum mortality of H.armigera in Akola, in the treatment monocrotophos 0.06 per cent i.e. Nagpur and Yavatmal strain. 63.33 per cent followed by quinalphos 0.05 per cent
i.e. 60 per cent and were found at par with each other. The mortality levels recorded under all the Reduced level of resistance was noticed in
-1 treatments revealed that all the treatments were found monocrotophos 0.06 per cent + karanj oil 2 ml l i.e. more effective against Nagpur strain followed by 43.33 per cent followed by monocrotophos 0.06 per
-lYavatmal and Akola strain, indicating the strain cent + sesamum oil 2 ml l and quinalphos 0.05 per existing at Nagpur was more susceptible to the -lcent + karanj oil 2 ml l , which recorded 40 per cent insecticides than other strains from Akola and
resistance each. The minimum per cent resistance was Yavatmal.
noticed in the treatment, quinalphos 0.05 per cent + -lsesamum oil 2 ml l i.e. 36.67 per cent. These four Resistance in H. armigera to organophosphates
treatments were statistically at par with each other.alone and in combination with synergist
In the present investigation, resistance got The data in respect of per cent insecticidal decreased with addition of synergist i.e. sesamum oil resistance to H.armigera are presented in table 2 and and karanj oil, into quinalphos and monocrotophos. were found significant.As the maximum resistance was observed in the treatment monocrotophos and quinalphos when The maximum per cent resistance was applied as a sole treatment, both the treatments were observed in Akola strain of H. armigera in the
treatment monocrotophos 0.06 per cent i.e. 66.67 per less effective. Yadav et al.(2010) estimated the status of quinolphos in Khandwa population of H. armigera cent followed by quinalphos 0.05 per cent i.e. 63.33 using the standard topical application method and per cent and were found at par with each other.
Reduced level of resistance was noticed in found that the mean resistance frequencies of -l -1monocrotophos 0.06 per cent + karanj oil 2 ml l and quinolphos 0.75 ml l was 50.35 per cent. Shrivastava
-let al. (2008) also reported that the resistance of 46 per quinalphos 0.05 per cent + karanj oil 2 ml l ,
-l cent to quinalphos in the field strains of Khandwa. monocrotophos 0.06 per cent + sesamum oil 2 ml l Thus the population of H. armigera from Akola, which recorded 46.67 per cent, 43.33 per cent, and
43.33 per cent resistance respectively. These three Nagpur and Yavatmal appear to be more resistant than Khandwa population.treatments were found statistically at par with each
other. The minimum per cent resistance was noticed Rao et al. (2005) carried out insecticide in the treatment, quinalphos 0.05 per cent+ sesamum
-l resistance studies on Helicoverpa armigera (Hub.) in oil 2 ml l i.e. 33.33 per cent.Andhra Pradesh (India) during 2003-04 and 2004-05 crop seasons to quinalphos. Quinalphos showed Regarding the data of Nagpur strain, the
maximum per cent resistance was observed in the moderate to above moderate level frequencies ranged treatment monocrotophos 0.06 per cent i.e. 60 per from 26.35 ± 4.4 to 78.24 ± 8.24 and the mean was cent followed by quinalphos 0.05 per cent i.e. 56.67 52.41±2.78. Kumar and Regupathy (2009) per cent and were found at par with each other. determined the resistance levels to quinalphos in Resistance level fell down in monocrotophos 0.06 per populations around experimental sites varied from
-1cent + karanj oil 2 ml l i.e. 43.33 per cent followed by 25.0 per cent to 56.5 per cent. -1
monocrotophos 0.06 per cent + sesamum oil 2 ml l
at Thondamuthur
Yadav et al. (2010) reported that application of quinalphos 0.75 µg and
160
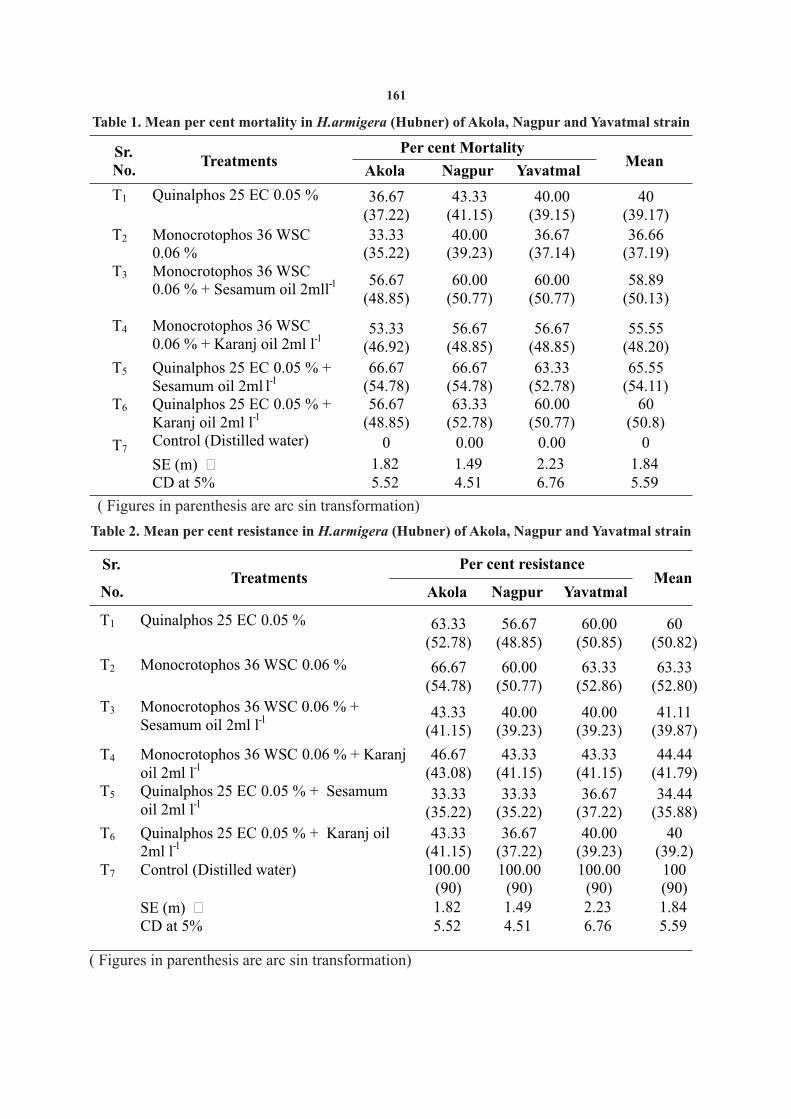
Table 1. Mean per cent mortality in H.armigera (Hubner) of Akola, Nagpur and Yavatmal strain
Sr. No.
Treatments Per cent Mortality
MeanAkola Nagpur Yavatmal
T1 Quinalphos 25 EC 0.05 % 36.67 (37.22)
43.33 (41.15)
40.00 (39.15)
40(39.17)
T2 Monocrotophos 36 WSC 0.06 %
33.33 (35.22)
40.00 (39.23)
36.67 (37.14)
36.66(37.19)
T3 Monocrotophos 36 WSC 0.06 % + Sesamum oil 2ml l-l
56.67 (48.85)
60.00 (50.77)
60.00 (50.77)
58.89(50.13)
T4 Monocrotophos 36 WSC
0.06 % + Karanj oil 2ml
l-l
53.33
(46.92)
56.67
(48.85)
56.67
(48.85)
55.55(48.20)
T5
Quinalphos 25 EC
0.05 % +
Sesamum oil 2ml l-l
66.67 (54.78)
66.67 (54.78)
63.33 (52.78)
65.55(54.11)
T6
Quinalphos 25 EC
0.05 % + Karanj oil 2ml
l-l
56.67 (48.85)
63.33 (52.78)
60.00 (50.77)
60(50.8)
T7Control (Distilled water)
0
0.00
0.00
0
SE (m) ? 1.82 1.49 2.23 1.84CD at 5% 5.52 4.51 6.76 5.59
( Figures in parenthesis are arc sin transformation)
Table 2. Mean per cent resistance in H.armigera (Hubner) of Akola, Nagpur and Yavatmal strain
Sr.
No. Treatments
Per cent resistance Mean
Akola Nagpur Yavatmal
T1 Quinalphos 25 EC 0.05 % 63.33 (52.78)
56.67 (48.85)
60.00 (50.85)
60 (50.82)
T2 Monocrotophos 36 WSC 0.06 % 66.67 (54.78)
60.00 (50.77)
63.33 (52.86)
63.33 (52.80)
T3 Monocrotophos 36 WSC 0.06 % + Sesamum oil 2ml l-l
43.33 (41.15)
40.00 (39.23)
40.00 (39.23)
41.11 (39.87)
T4 Monocrotophos 36 WSC
0.06 % + Karanj
oil 2ml l-l
46.67
(43.08)
43.33
(41.15)
43.33
(41.15)
44.44
(41.79)
T5 Quinalphos 25 EC
0.05 % + Sesamum
oil 2ml l-l
33.33 (35.22)
33.33 (35.22)
36.67 (37.22)
34.44 (35.88)
T6
Quinalphos 25 EC 0.05 % + Karanj oil
2ml l-l
43.33 (41.15)
36.67 (37.22)
40.00 (39.23)
40 (39.2)
T7
Control (Distilled water)
100.00 (90)
100.00 (90)
100.00 (90)
100 (90)
SE (m) ?
1.82
1.49
2.23
1.84
CD at 5% 5.52 4.51 6.76 5.59
( Figures in parenthesis are arc sin transformation)
161
-1Chlorpyriphos 1.0 µg larvae showed low to moderate resistance and monocrotophos 1.0 µg
-1 larvae showed constant moderate to high resistance throughout the season.
µ
Bharathan, G. 2000. Bt. Cotton in India. Anatomy of a controversy. Curr. Sci.79 (8) : 1067-1075.
Wargantiwar et al. (2013) reported that the cultivators have resorted to
Chaturvedi, I. 2007. Status of insecticide resistance in the cotton indiscriminate and excessive use of chemical bollworm, Helicoverpa armigera (Hubner). J. Central
insecticides to control H. armigera. This has led to European Agric. 8(2) : 172.Jadhav, Y.T., R.V. Kanase, D.S. Thaware and B. A. Shinde, 2011. A study emergence of serious problem of resistance
on organophosphate resistance frequencies in Helicoverpa development to different groups of insecticides such armigera. Int J. of Plant Protec. 4 (1):27-29
Johnson, S. J., E. G. King and J. R. Bradlay, 1986. Theory and tactics of as pyrethroids (Cypermethrin 0.75 ug) and Heliothis population management:Cultural and Biological organophosphate (Monocrotophos 1.0 g). Mironidis Control. South. Coop. Ser. Bull., pp. 316-361.
Kumar, B. V. N. and A.Regupathy, 2009. Quinalphos 25 EC resistance in et al. (2013) found relatively moderate resistance Helicoverpa armigera Hub.: laboratory measured vs. field level against third instar larvae of H. armigera with control in cotton. Resistant Pest Management Newsletter. 18
resistance ratios below 10- fold for organophosphate (2) : 22-27.Lande, G. N., D. B.Undirwade, S. B.Dhurve, V. Y.Deotale, R. O. Deotale and carbamate and up to 16- fold for the pyrethroid
and P. N.Dawane, 2005. Relative performance of alpha-cypermethrin. Results of the present
organophosphates alone and in combination with synergist investigation are consistant with the findings of above against Helicoverpa armigera (Hubner). J. Soils and Crops. 15
(1) : 168-172.mentioned authors.Lodam, A. B.,S. V.Sarode and Indira Bhojane, 2001. Efficacy of some
organophosphates in combination with neem seed against In the present studies, least resistance was Helicoverpa armigera (Hubner). PKV Res. J. 25 (2) : 121-123.
Mironidis, G. K., D. Kapantaidaki, M. Bentila, E. Morou, M. Savopoulou-recorded in the treatment of quinalphos 0.05 per cent Soultani, J. Vontas, 2013. Resurgence of the cotton bollworm -l+ sesamum oil 2 ml l i.e. 34.44 per cent. More Helicoverpa armigera in Northern Greece associated with insecticide resistance. Insect Sci. 20 (4):505-512.mortality of H.armigera in Nagpur strain indicated
Pawar, C. S. 1998. Helicoverpa- A national problem which needs a that quinalphos performed well in combination with national policy and commitment for its management.
Pestology. 22 (7): 56.sesamum oil due to less resistant strain.The resistance Rao, G. M. V., N.Prasada, H.Rao and K.Raju, 2005. Insecticide levels recorded under all the treatments revealed that
Resistance in field population of Helicoverpa armigera Hub. all the treatments were found more effective against Resistant Pest Management Newsletter.15 (1).19.
Shrivastava, V. K., A. S.Yadav, R. K.Choudhary, S. P. S.Tomar and S. Nagpur strain followed by Yavatmal and Akola strain, K.Parsai, 2008. Detection of insecticide resistance in
indicating the strain existing at Nagpur was less Helicoverpa armigera (Hubner) larvae collected from two locations in Madhya Pradesh, India. Resistant Pest resistant to the insecticides. Management Newsletter, 18(1) :19.
Thirasack, S. 2001. Yield losses assessment due to pests on cotton in Lao PDR. J. National Sci.35: 271–283.REFERENCES
Tripathy, M. K. and H. N.Singh, 2004. Synergistic potential of neem seed Aherkar, S. K., A. K. Sadawarte and S. P. Ukey, 2002. Studies on powder extract to several insecticides against Helicoverpa
Helicoverpa armigera pupal population in heavily infested armigera(Hubner) larvae in India. J. Pl. Prot. and field of Cajanuscajan. Insect Environ. 7 (4):191-192. Environ.2(1) : 57-61.
Armes, N. J., G. S.Bond, and R. J. Cooter, 1992. The laboratory culture Yadav, A. S., P. K.Singh and V. K.Shrivastava, 2010. Insecticidal and Development of Helicoverpa armigera. Natural research resistance status of newer insecticides vis-a-vis conventional institution, The scientific arm of the overseas developmental insecticides against American bollworm, Helicoverpa administration Bulletin. 57. pp. 1-46 armigera (Hubner). Resistant Pest Management Newsletter.
19 (2) : 54-59.Wargantiwar, R. K., B. K. Kang, Balwinder Singh, 2013. Tomato fruit
borer, Helicoverpa armigera (Hubner) - review on insecticide resistance and mechanisms. J. Insect Sci (Ludhiana). 26 (2):141-149.
Banu, M. R., A. R. Muthiah and S.Ashok, 2005. Evaluation of pigeonpea th genotypes against Helicoverpa armigera. 4 International
Food Legume Res. Confer. onFood Legumes for Nutritional Security and Sustainable Agriculture, Oct. 18-22, 2005, New Delhi, India. pp. 317.
Bharathi, K., S. Kuttalam, T.Manoharan, M. Ravi and T. Ramasubramanian, 2010. Development and use of species-specific insecticide mixtures: a novel concept for the management of insecticide resistance in Helicoverpa armigera. Indian J. agric. Sci.80(6) : 555.
Rec. on 25.10.2013 & Acc. on 10.01.2014
162
ABSTRACT
An investigation was conducted to study the effect of foliar application of zinc and iron on growth, flowering and yield of marigold at the field of Horticulture Section, College of Agriculture, Nagpur during the year 2013-2014. Experiment was laid out in Randomized Block Design with three replications and nine treatments of foliar application of zinc and iron with different concentrations alone and in combinations viz., 0.5% FeSO , 1% FeSO , 4 4
0.5% ZnSO , 1% ZnSO , 0.5% FeSO + 0.5% ZnSO , 0.5% FeSO + 1% ZnSO , 1% FeSO + 0.5% ZnSO , 1% FeSO + 4 4 4 4 4 4 4 4 4
1% ZnSO and control. It is evident from the experimental findings that, in terms of growth parameters viz., height of 4
-1plant (42.97 cm), stem diameter (1.38 cm), number of branches plant (18.53) and spread of plant at 50% flowering (32.92 cm), flowering parameters viz., early flower bud initiation (31.43 days), minimum days to fully opened flower (13.05 days), minimum days to 50% flowering (44.00 days), minimum days to first harvesting after transplanting
-1(49.67 days), maximum flowering span (68.00 days) and yield parameter viz., flower yield hectare (21.97 t) were found maximum with the foliar application of 0.5% FeSO + 0.5% ZnSO followed by 0.5% ZnSO when compared 4 4 4
with control and rest of the treatments under study.
(Key words: Marigold, zinc, iron, foliar spray)
against boils and carbuncles. Leaf extract is a good INTRODUCTIONremedy for earache. Flower extract is consider a blood
Marigold is one of the most popular annual purifier, a cure for bleeding piles and is also a good flowers in India for garden display as well as for remedy for eye diseases and ulcers.commercial cultivation. In India marigold rank first
Micronutrients like zinc and iron have major among the loose flowers. Marigold is a native of role in growth and flowering of ornamental plants and Central and South America especially Mexico and therefore, these nutrients are becoming extremely belongs to family 'Asteraceae' and genus Tagetes. The important and valuable in the commercial floriculture name Tagetes was given after 'Tages' a demigod for increasing the growth and yield of flower crops. known for its beauty. The African marigold (Tagetes These micronutrients generally activate several erecta L.) is hardy annual about 90 cm tall, erect and enzymes and involve themselves in chlorophyll produces branches. Leaves are pinnately divided and synthesis and various physiological activities by leaflets are lanceolate and serrated. The flowers are which plant growth and development are encouraged. single to fully double and of large size with globular The nutrition of marigold is concentrated on major heads. The florets are either two lipped or quilled. The nutrients only. The application of micronutrients are flower colour varies from lemon yellow or yellow, neglected due to lack of its knowledge. Further the golden yellow or orange. Because of its size, shape marigold crop is general cultivated on shallow soils and colour the African marigold are popular among which are many times deficient in micronutrients. The the people. It is an important raw material for perfume results of micronutrient on flower crops showed industries. The essential oil from plant and flower can promises. Hence, considering the important role of be readily extracted by steam distillation. The oil has a optimum level of foliar application of zinc and iron in pronounced odour and it acts as repellent to flies. It enhancing the growth, flowering and yield of flowers, has been found that the marigold plants are highly the present study was undertaken to study the effect of
useful for suppressing the population of nematodes in foliar application of zinc and iron on growth and yield
the field. Roots of nursery plants of apple and rose are of marigold.
almost free from Pratylenchus species of nematodes
when they were grown in a two years rotation with MATERIALS AND METHODS
marigold. Infestation of fruit borer can be reduced by
planting of marigold as an intercrop in the crops. Both An investigation entitled, “Effect of foliar leaves and flowers are equally important from the application of zinc and iron on growth, flowering and
yield of marigold” was carried out at the experimentalmedicinal point of view. Leaf paste is externally used
1, 3 & 4. P. G. Students, Horticulture Section, College of Agriculture, Nagpur2. Asstt. Professor, Horticulture Section, College of Agriculture, Nagpur
EFFECT OF FOLIAR APPLICATION OF ZINC AND IRON ON GROWTH AND YIELD OF MARIGOLD
J. Soils and Crops 25 (1) 163-167, June, 2015 ISSN 0971-2836
1 2 3 4S. M. Raghatate , S. S. Moon , V. J. Tembhare and M. V. Mohalkar
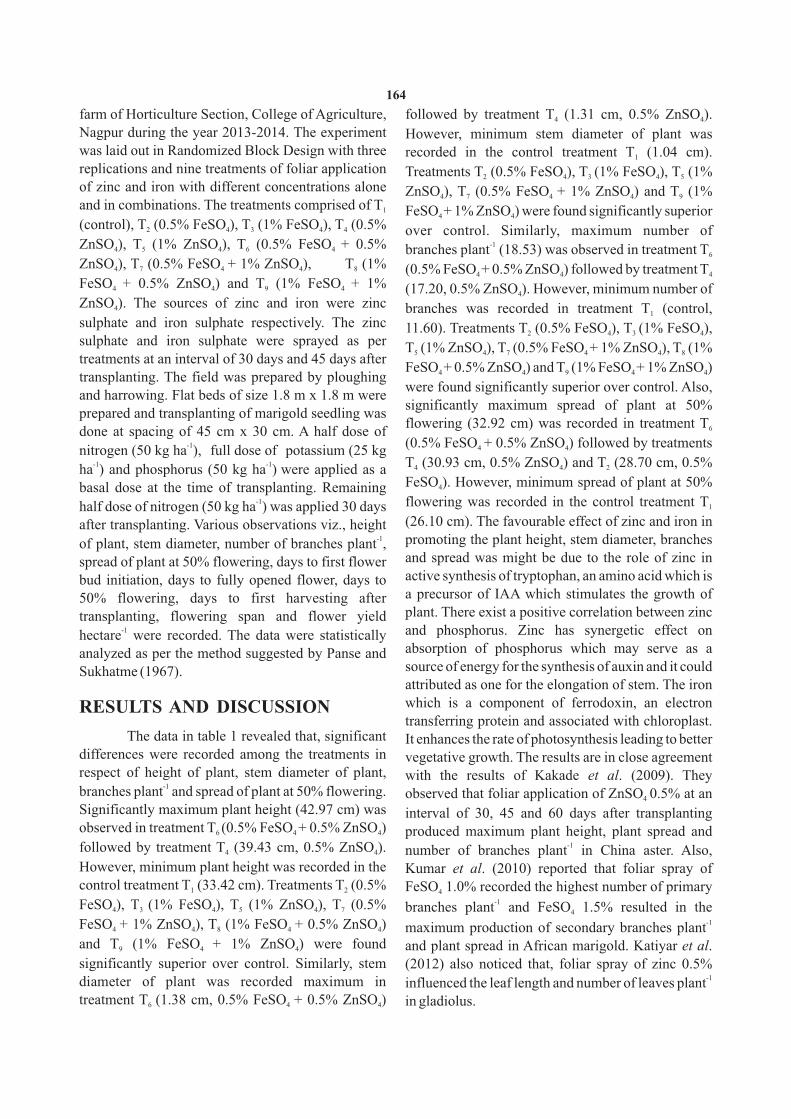
farm of Horticulture Section, College of Agriculture, followed by treatment T (1.31 cm, 0.5% ZnSO ). 4 4
Nagpur during the year 2013-2014. The experiment However, minimum stem diameter of plant was was laid out in Randomized Block Design with three recorded in the control treatment T (1.04 cm). 1
replications and nine treatments of foliar application Treatments T (0.5% FeSO ), T (1% FeSO ), T (1% 2 4 3 4 5
of zinc and iron with different concentrations alone ZnSO ), T (0.5% FeSO + 1% ZnSO ) and T (1% 4 7 4 4 9
and in combinations. The treatments comprised of T 1 FeSO + 1% ZnSO ) were found significantly superior 4 4
(control), T (0.5% FeSO ), T (1% FeSO ), T (0.5% 2 4 3 4 4 over control. Similarly, maximum number of -1ZnSO ), T (1% ZnSO ), T (0.5% FeSO + 0.5% 4 5 4 6 4 branches plant (18.53) was observed in treatment T6
ZnSO ), T (0.5% FeSO + 1% ZnSO ), T (1% 4 7 4 4 8 (0.5% FeSO + 0.5% ZnSO ) followed by treatment T 4 4 4
FeSO + 0.5% ZnSO ) and T (1% FeSO + 1% 4 4 9 4 (17.20, 0.5% ZnSO ). However, minimum number of 4
ZnSO ). The sources of zinc and iron were zinc 4 branches was recorded in treatment T (control, 1
sulphate and iron sulphate respectively. The zinc 11.60). Treatments T (0.5% FeSO ), T (1% FeSO ), 2 4 3 4
sulphate and iron sulphate were sprayed as per T (1% ZnSO ), T (0.5% FeSO + 1% ZnSO ), T (1% 5 4 7 4 4 8treatments at an interval of 30 days and 45 days after
FeSO + 0.5% ZnSO ) and T (1% FeSO + 1% ZnSO ) 4 4 9 4 4transplanting. The field was prepared by ploughing were found significantly superior over control. Also,
and harrowing. Flat beds of size 1.8 m x 1.8 m were significantly maximum spread of plant at 50%
prepared and transplanting of marigold seedling was flowering (32.92 cm) was recorded in treatment T6 done at spacing of 45 cm x 30 cm. A half dose of
-1 (0.5% FeSO + 0.5% ZnSO ) followed by treatments 4 4nitrogen (50 kg ha ), full dose of potassium (25 kg -1 -1 T (30.93 cm, 0.5% ZnSO ) and T (28.70 cm, 0.5% 4 4 2ha ) and phosphorus (50 kg ha ) were applied as a
FeSO ). However, minimum spread of plant at 50% 4basal dose at the time of transplanting. Remaining -1 flowering was recorded in the control treatment T 1half dose of nitrogen (50 kg ha ) was applied 30 days
(26.10 cm). The favourable effect of zinc and iron in after transplanting. Various observations viz., height -1 promoting the plant height, stem diameter, branches of plant, stem diameter, number of branches plant ,
and spread was might be due to the role of zinc in spread of plant at 50% flowering, days to first flower active synthesis of tryptophan, an amino acid which is bud initiation, days to fully opened flower, days to a precursor of IAA which stimulates the growth of 50% flowering, days to first harvesting after plant. There exist a positive correlation between zinc transplanting, flowering span and flower yield
-1 and phosphorus. Zinc has synergetic effect on hectare were recorded. The data were statistically absorption of phosphorus which may serve as a analyzed as per the method suggested by Panse and source of energy for the synthesis of auxin and it could Sukhatme (1967).attributed as one for the elongation of stem. The iron which is a component of ferrodoxin, an electron RESULTS AND DISCUSSIONtransferring protein and associated with chloroplast.
The data in table 1 revealed that, significant It enhances the rate of photosynthesis leading to better differences were recorded among the treatments in vegetative growth. The results are in close agreement respect of height of plant, stem diameter of plant, with the results of Kakade et al. (2009). They
-1branches plant and spread of plant at 50% flowering. observed that foliar application of ZnSO 0.5% at an 4
Significantly maximum plant height (42.97 cm) was interval of 30, 45 and 60 days after transplanting observed in treatment T (0.5% FeSO + 0.5% ZnSO ) 6 4 4 produced maximum plant height, plant spread and
-1followed by treatment T (39.43 cm, 0.5% ZnSO ). 4 4 number of branches plant in China aster. Also, However, minimum plant height was recorded in the Kumar et al. (2010) reported that foliar spray of control treatment T (33.42 cm). Treatments T (0.5% FeSO 1.0% recorded the highest number of primary 1 2 4
-1FeSO ), T (1% FeSO ), T (1% ZnSO ), T (0.5% branches plant and FeSO 1.5% resulted in the 4 3 4 5 4 7 4
-1FeSO + 1% ZnSO ), T (1% FeSO + 0.5% ZnSO ) 4 4 8 4 4 maximum production of secondary branches plant and T (1% FeSO + 1% ZnSO ) were found and plant spread in African marigold. Katiyar et al. 9 4 4
significantly superior over control. Similarly, stem (2012) also noticed that, foliar spray of zinc 0.5% -1diameter of plant was recorded maximum in influenced the leaf length and number of leaves plant
treatment T (1.38 cm, 0.5% FeSO + 0.5% ZnSO ) in gladiolus.6 4 4
164

Similarly, significant differences were (0.5% FeSO + 1% ZnSO ) and T (1% FeSO + 0.5% 4 4 8 4
recorded among the treatments in respect of days to ZnSO ) were found significantly superior over 4
first flower bud initiation, days to fully opened flower, control. Application of zinc and iron resulted in the days to 50% flowering, days to first harvesting and earliest initiation of first flower bud and fully opened flowering span. Significantly minimum days to first flower which might have reduced the days required flower bud initiation (31.43 days) was recorded in for 50% flowering and first harvesting after treatment T (0.5% FeSO + 0.5% ZnSO ) followed by 6 4 4 transplanting. Balkrishnan et al. (2007) reported that, treatment T (33.63 days, 0.5% ZnSO ). However, 4 4 spraying of African marigold with 0.5% zinc sulphate maximum days to first flower bud initiation was + 0.5% ferrous sulphate recorded the early flowering.recorded in the control treatment T (37.33 days). 1
Similarly, flowering span (68.00 days) was Treatment T (0.5% FeSO ) was found significantly 2 4
found significantly maximum in treatment T (0.5% 6 superior over control. Similarly, minimum days to FeSO + 0.5% ZnSO ) followed by treatment T fully opened flower (13.05 days) was recorded in the 4 4 4
treatment T (0.5% FeSO + 0.5% ZnSO ) followed by (65.33 days, 0.5% ZnSo ). Whereas, minimum 6 4 4 4
flowering span was observed in the control treatment treatment T (13.94 days, 0.5% ZnSO ). However, 4 4
T (55.67 days). Treatments T (0.5% FeSO ), T (1% maximum days to fully opened flower was recorded 1 2 4 3
in the control treatment T (16.22 days). Treatments T FeSO ), T (1% ZnSO ), T (0.5% FeSO + 1% ZnSO ) 1 2 4 5 4 7 4 4
(0.5% FeSO ), T (1% FeSO ), T (1% ZnSO ), T and T (1% FeSO + 1% ZnSO ) were found 4 3 4 5 4 7 9 4 4
(0.5% FeSO + 1% ZnSO ), T (1% FeSO + 0.5% significantly superior over control. The positive 4 4 8 4
ZnSO ) and T (1% FeSO + 1% ZnSO ) were found impact of zinc might be due to the ability of this 4 9 4 4
nutrient in activating several enzymes catalase, significantly superior over control. Zinc plays vital peroxidase, tryptophan synthate and its involvement role in growth and development of plant because of its in chlorophyll synthesis and various physiological stimulatory and catalyst effect on various activities, ultimately leading the longer blooming physiological and metabolic processes of plant. Zinc period over all the treatments. Kumar et al. (2009) favours the storage of more carbohydrates through
photosynthesis, which may be the attributing factor reported in chrysanthemum that the duration of for the positive effectiveness of zinc on early flowering was recorded maximum with foliar spray of
FeSO 0.2% (62.3 days).flowering. Also, iron is involved in the synthesis of 4
plant hormones and also plays an important role in The data from the table 1 revealed that, chlorophyll synthesis, photosynthesis and
significant differences were recorded among the respiration. This might have been the reason for early -1et al. treatments in respect of flower yield hectare . flowering. Kumar (2010 a) recorded 150 ppm Fe
-1spray at 15 and 30 days after transplanting required Maximum flower yield hectare (21.97 t) was found minimum days taken to first flower bud appearance in treatment T (0.5% FeSO + 0.5% ZnSO ) followed 6 4 4
and earlier opening of flower in African marigold. by treatment T (19.34 t, 0.5% ZnSO ). However, 4 4
-1Similarly, minimum days to 50% flowering (44.00 minimum flower yield hectare was recorded in the days) was recorded in treatment T (0.5% FeSO + 6 4 control treatment T (14.28 t). Treatments T (0.5% 1 2
0.5% ZnSO ) followed by treatment T (47.33 days, 4 4 FeSO ), T (1% FeSO ), T (1% ZnSO ), T (0.5% 4 3 4 5 4 7
0.5% ZnSO ). However, maximum days to 50% 4 FeSO + 1% ZnSO ), T (1% FeSO + 0.5% ZnSO ) 4 4 8 4 4
flowering was recorded in the control treatment T 1 and T (1% FeSO + 1% ZnSO ) were found 9 4 4
(54.00 days). Treatments T (0.5% FeSO ) and T (1% 2 4 3 significantly superior over control. Zinc and iron play FeSO ) were found significantly superior over 4 vital role in the production of vegetative growth control. Similarly minimum days to first harvesting ultimately encourage the number of branches by after transplanting (49.67 days) was recorded in involving in oxidation-reduction process, treatment T (0.5% FeSO + 0.5% ZnSO ) followed by 6 4 4 photosynthesis and breakdown of IAA, auxin and treatment T (53.00 days, 0.5% ZnSO ). However, 4 4 protein synthesis. Also, more zinc and iron received maximum days to first harvesting was recorded in the by plant produced larger canopy development, control treatment T (61.00 days). Treatments T 1 2 associated with leaf area, resulting in accumulation of (0.5% FeSO ), T (1% FeSO ), T (1% ZnSO ), T higher amount of photosynthate which showed the 4 3 4 5 4 7
165
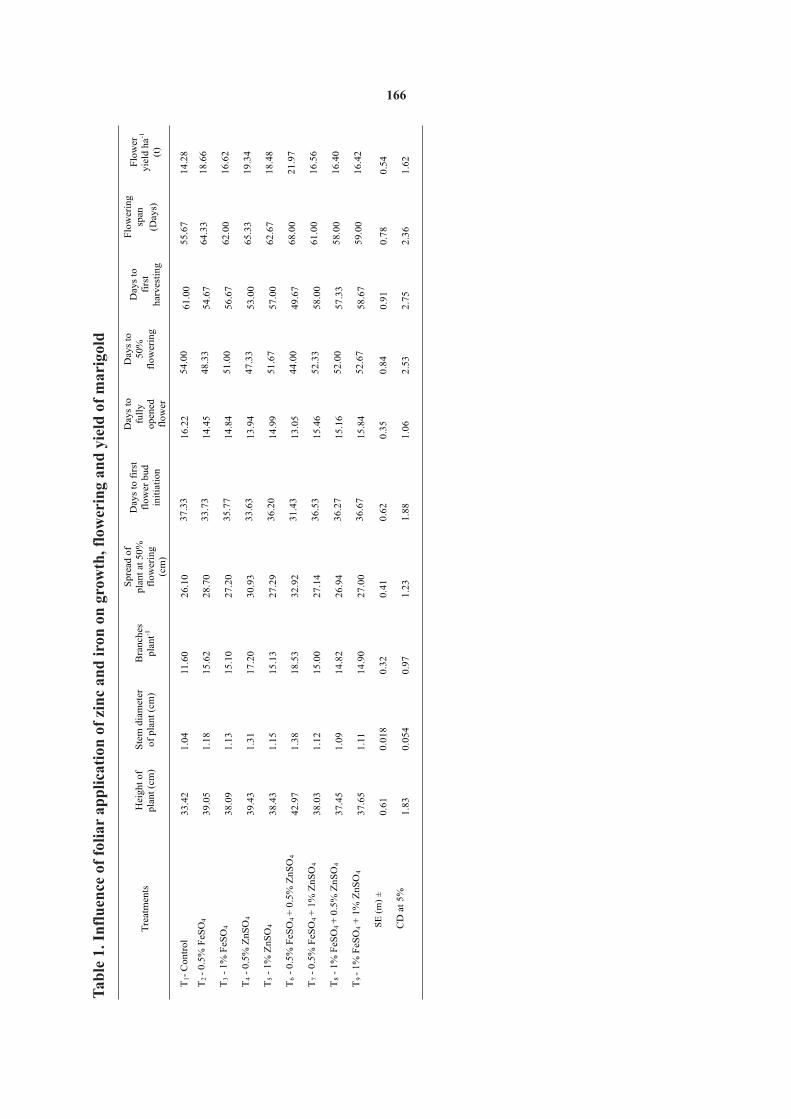
Tab
le 1
. In
flu
ence
of
foli
ar
ap
pli
cati
on o
f zi
nc
and
iro
n o
n g
row
th, f
low
erin
g an
d y
ield
of
ma
rig
old
Tre
atm
ents
H
eig
ht
of
pla
nt
(cm
) S
tem
dia
met
er
of
pla
nt
(cm
)
Bra
nch
es
pla
nt-1
Sp
read
of
pla
nt
at 5
0%
fl
ow
erin
g
(cm
)
Day
s to
fir
st
flo
wer
bu
d
init
iati
on
Day
s to
fu
lly
o
pen
ed
flo
wer
Day
s to
5
0%
fl
ow
erin
g
Day
s to
fi
rst
har
ves
tin
g
Flo
wer
ing
sp
an
(Day
s)
Flo
wer
y
ield
ha-1
(t)
T1- C
on
tro
l
33
.42
1
.04
11
.60
2
6.1
0
37
.33
1
6.2
2 54
.00
6
1.0
0
55
.67
14
.28
T2
- 0
.5%
FeS
O4
3
9.0
5
1.1
8
15
.62
2
8.7
0
33
.73
1
4.4
5 48
.33
5
4.6
7
64
.33
18
.66
T3 - 1
% F
eSO
4
3
8.0
9
1.1
3
15
.10
2
7.2
0
35
.77
1
4.8
4 51
.00
5
6.6
7
62
.00
16
.62
T4
- 0.5
% Z
nS
O4
3
9.4
3
1.3
1
17
.20
3
0.9
3
33
.63
1
3.9
4 47
.33
5
3.0
0
65
.33
19
.34
T5
- 1%
Zn
SO
4
3
8.4
3
1.1
5
15
.13
2
7.2
9
36
.20
1
4.9
9 51
.67
5
7.0
0
62
.67
18
.48
T6
- 0.5
% F
eSO
4 +
0.5
% Z
nS
O4
42
.97
1
.38
1
8.5
3
3
2.9
2
31
.43
1
3.0
5
44
.00
4
9.6
7
68
.00
21
.97
T7
- 0.5
% F
eSO
4 +
1%
Zn
SO
4
38
.03
1.1
2
15
.00
27
.14
36
.53
1
5.4
6
52
.33
5
8.0
0
61
.00
16
.56
T8
- 1%
FeS
O4
+ 0
.5%
Zn
SO
4
37
.45
1.0
9
14
.82
26
.94
36
.27
15.1
6
52
.00
57
.33
58
.00
16
.40
T9
-
1%
FeS
O4
+ 1
% Z
nS
O4
3
7.6
5
1.1
1
14
.90
27
.00
36
.67
15.8
4
52
.67
58
.67
59
.00
16
.42
SE
(m
) ±
0.6
1
0.0
18
0.3
2
0.4
1
0.6
2
0.3
5
0.8
4
0.9
1
0.7
8
0.5
4
CD
at
5%
1.8
30
.05
40
.97
1.2
31
.88
1.0
62
.53
2.7
52
.36
1.6
2
166
xanthophyll content in African marigold (Tagetes erecta L.). positive effect on yield contributing characters. These J. Orna. Hort. 10(3) :153-156.
results are in conformity with the result obtained by Ganga, M., V. Jegadeeswari, K. Padmadevi and M. Jawaharlal, 2008.
Ganga et al. (2008). They reported in chrysanthemum Response of chrysanthemum cv Co.1 to the application of
micronutrients. J. Orna. Hort. 11(3) : 220-223.that foliar spray of zinc sulphate at 0.4 per cent Jagtap, H. D., V. J. Golliwar and S. A. Thakre, 2012. Effect of foliar -1increased the flower yield plant and total yield
application of micronutrients on growth and flowering of rose -1hectare . Kumar et al. (2010 b) also reported in under polyhouse conditions. Asian J. Hort. 7(1) : 25-17.
Kakade, D. K., S. G. Rajput and K. I. Joshi, 2009. Effect of foliar African marigold that foliar spray of FeSO 1.5% 4application of Fe and Zn on growth, flowering and yield of -1 increased maximum flower yield plant and flower China aster (Callistephus chinensis L. Nees). Asian J. Hort.
-14(1) : 138-140.yield hectare . Jagtap et al. (2012) also reported in
Katiyar, P., O. P. Chutervedi and Dheerendra Katiyar, 2012. Effect of rose that foliar spray of 0.3 % ZnSO + 0.3 % MnSO + 4 4 foliar spray of zinc, calcium and boron on spike production of 0.3% FeSO increased flower yield. Sharma et at. Gladiolus cv. Eurovision. Hortflora Res. Spect. 1(4) : 334-338.4
Kumar, P. N., R. L. Misra, S. R. Dhiman, M. Ganga and L. Kameswari, (2013) observed that the foliar spray of zinc 0.75% 2009. Effect of micronutrient sprays on growth and flowering
increased yield of spike and corms in gladiolus. of chrysanthemum. Indian J. Agri. Sci. 79(6) : 426-428.
Kumar, P., Deepti Singh and Santosh Kumar, 2010 a. Effect of pre-harvest
Keeping in view the results summarized micronutrient foliar spray on growth, flowering and seed
production in marigold. Prog. Agri. 10 (1) : 182-183. above it may be concluded that the foliar spraying of Kumar, P., J. K. Umrao and V. K. Rajbeer, 2010 b. Effect of nitrogen and
0.5% FeSO + 0.5% ZnSO to marigold plant was 4 4 iron on growth and flowering parameters in African marigold
effective in influencing the growth, flowering and (Tagetes erecta L.) cv. Pusa Narangi Gainda. Ann. Hort. 3(1) :
118-119.yield parameters followed by 0.5% ZnSO4 Panse, S. K. and P. V. Sukhatme, 1967. Statistical Methods for
application. Agricultural Workers, Indian Council of Agricultural rdResearch, New Delhi, 3 edition : pp. 341.
Sharma, J., A. K. Gupta, Chandan Kumar and R. K. S. Gautam, 2013. REFERENCESInfluence of zinc, calcium and boron on vegetative and
flowering parameters of gladiolus cv. Aldebran. The Bioscan Balakrishnan, V., Jawaharlal, T. Senthil Kumar and M. Ganga, 2007. An Int. J. Life Sci. 8(4) : 1153-1158.Response of micro nutrients on flowering, yield and
M.
Rec. on 31.05.2014 & Acc. on 25.07.2014
167

ABSTRACT
The shrikhand was prepared with constant level of sugar (40 per cent by weight of chakka) and different levels of gulkand viz., 1.5, 2.0, 2.5 and 3.0 per cent by replacing the chakka in formulation. The product was analyzed for chemical composition like fat, total solids, protein, titratable acidity and ash as well as for sensory attributes like flavour, body and texture, colour and appearance in completely randomized design. The cost of production was also calculated by considering the retail market prices of different ingredients used. The results showed that fat, protein and titratable acidity were significantly decreased, while the total solids and ash percentage were significantly increased with the increase in the levels of gulkand. The significantly highest score for flavour, body and texture, colour and appearance and overall acceptability were obtained in shrikhand prepared with 2.5 per cent gulkand.
Good quality shrikhand can prepared by using 2.5 per cent gulkand had mild pleasant flavour, smooth body and texture and light reddish colour. The cost cost of shrikhand increased with increase in the levels of gulkand. However, it is opined that superior quality shrikhand can be produced by addition of 2.5 per cent of gulkand with cost
of production of Rs. 117.26 Kg .
(Key words: Shrikhand, gulkand, physicochemical parameters, sensory attributes, cost structure)
-1
Damascus rose is the most common variety used. INTRODUCTIONtraditionally gulkand has been used as a cooling tonic
Cultured dairy products are the vital to combat fatigue, lathery, muscular aches, component of the human diet in India. Apart from biliousness itching, and heat-related conditions. It is imparting nutrition and novelty, these products help good for memory and eyesight as well as a good blood to preserve the precious nutrients in milk which tend purifier. Gulkand also helps reducing hyperacidity. It to quick deterioration. The indigenous fermented is also rich in calcium and has antioxidant properties. milk based dessert, most popular in many parts of the It can be used year-round by persons of all country. The importance of milk and milk products in constitutions, especially Vata and Pitta. Indian India is realized since vedic period. Due to high Ayurvedic doctors, use it combined with other nutritive characteristics flavour, taste, palatable specific herbs for several types of cancer patients nature and possible therapeutic value of shrikhand is undergoing radiation or chemotherapies to counter
the ill effects of these therapies (Sundaram, 2010).one amongst the most preferred dairy products in western India. Shrikhand is a traditional indigenous
Addition of gulkand may enhance the fermented semi soft, sweetened whole milk product flavour, colour, body and texture and overall prepared using Chakka (strained dahi). Further, taste acceptability of shrikhand. As the gulkand is having and the appearance of the product can be improved by nutritional and medicinal importance, it is expected adding sugar and other ingredients like nuts, colours that the product may fulfil consumers appeal etc. Because of the change in the economic status and regarding nutritional quality to the newly formulated food habit of consumers the other varieties of product. Gulkand and rose petals can be used as shrikhand such as fruit shrikhand are also in great flavouring and colouring agent in Shrikhand without demand (Laxmi et al., 2013).adversely affecting the quality of the product (Nadaf et al., 2012).Gulkand is an Arabic word Gul means Rose
and Kand means Sugar. Gulkand is undoubtedly the Therefore, it was planned to study on
most delicious ayurvedic preparation known to utilization of gulkand in the preparation of shrikhand.
mankind. Gulkand is commonly used as an ingredient of Paan, a popular dessert and digestive of India,
MATERIALS AND METHODSPakistan and Bangladesh. The flowers of Rosa damascena, more commonly known as the Damascus During the entire study fresh, clean, whole
cow milk was obtained from Section of Animal rose, are used for making Gulkand. Though there are suggestions of some other varieties of roses also, Husbandry and Dairy Science, College of
1, 4 and 5. P.G. Students, Animal Husbandry and Dairy Science, College of Agriculture, Nagpur2. Assoc. Professor, Animal Husbandry and Dairy Science, College of Agriculture, Nagpur3. Asstt. Professor, Animal Husbandry and Dairy Science, College of Agriculture, Nagpur
J. Soils and Crops 25 (1) 168-172, June, 2015 ISSN 0971-2836
UTILIZATION OF GULKAND IN THE PREPARATION OF SHRIKHAND1 2 3 4 5N.T. Pendawale , V.G. Atkare , R.M. Zinjarde , Rohini Narote and S.S. Shirke
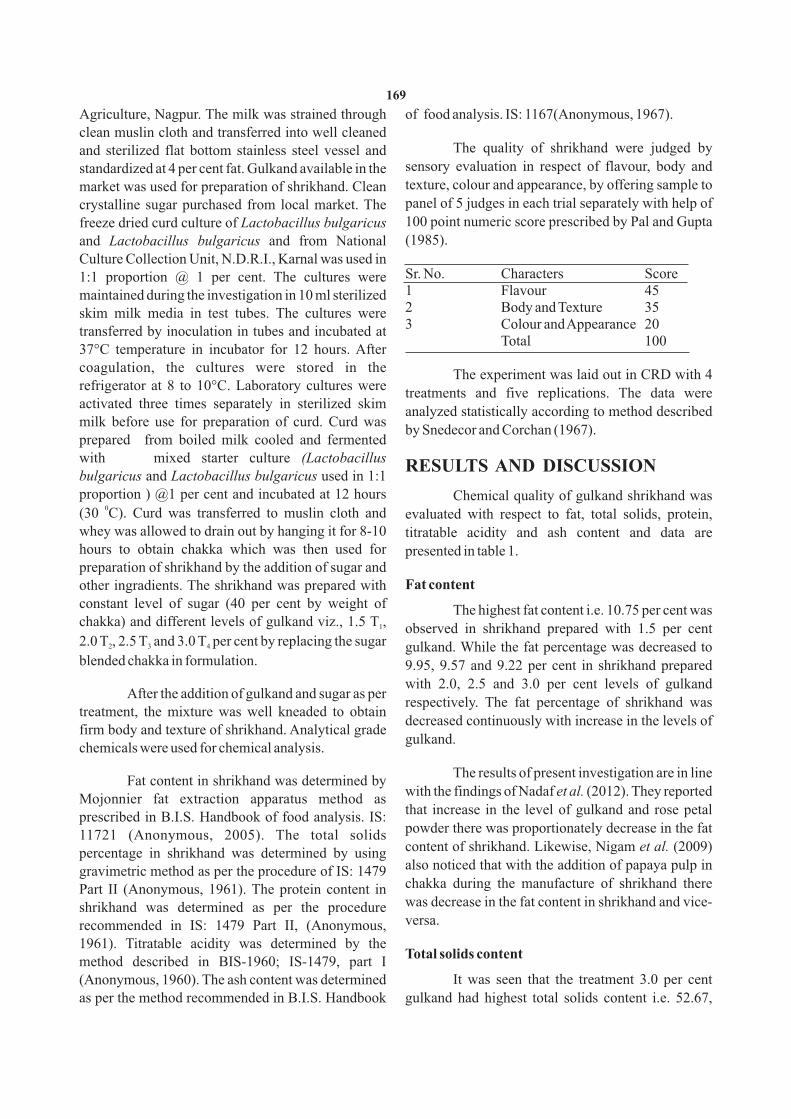
Agriculture, Nagpur. The milk was strained through of food analysis. IS: 1167(Anonymous, 1967).clean muslin cloth and transferred into well cleaned
The quality of shrikhand were judged by and sterilized flat bottom stainless steel vessel and sensory evaluation in respect of flavour, body and standardized at 4 per cent fat. Gulkand available in the texture, colour and appearance, by offering sample to market was used for preparation of shrikhand. Clean panel of 5 judges in each trial separately with help of crystalline sugar purchased from local market. The 100 point numeric score prescribed by Pal and Gupta freeze dried curd culture of Lactobacillus bulgaricus (1985). and Lactobacillus bulgaricus and from National
Culture Collection Unit, N.D.R.I., Karnal was used in Sr. No. Characters Score1:1 proportion @ 1 per cent. The cultures were 1 Flavour 45maintained during the investigation in 10 ml sterilized 2 Body and Texture 35skim milk media in test tubes. The cultures were 3 Colour and Appearance 20transferred by inoculation in tubes and incubated at
Total 10037°C temperature in incubator for 12 hours. After coagulation, the cultures were stored in the The experiment was laid out in CRD with 4 refrigerator at 8 to 10°C. Laboratory cultures were
treatments and five replications. The data were activated three times separately in sterilized skim
analyzed statistically according to method described milk before use for preparation of curd. Curd was
by Snedecor and Corchan (1967).prepared from boiled milk cooled and fermented with mixed starter culture (Lactobacillus RESULTS AND DISCUSSIONbulgaricus and Lactobacillus bulgaricus used in 1:1 proportion ) @1 per cent and incubated at 12 hours Chemical quality of gulkand shrikhand was
0(30 C). Curd was transferred to muslin cloth and evaluated with respect to fat, total solids, protein, whey was allowed to drain out by hanging it for 8-10 titratable acidity and ash content and data are hours to obtain chakka which was then used for presented in table 1.preparation of shrikhand by the addition of sugar and
Fat contentother ingradients. The shrikhand was prepared with constant level of sugar (40 per cent by weight of The highest fat content i.e. 10.75 per cent was chakka) and different levels of gulkand viz., 1.5 T , 1 observed in shrikhand prepared with 1.5 per cent 2.0 T , 2.5 T and 3.0 T per cent by replacing the sugar 2 3 4 gulkand. While the fat percentage was decreased to blended chakka in formulation. 9.95, 9.57 and 9.22 per cent in shrikhand prepared
with 2.0, 2.5 and 3.0 per cent levels of gulkand After the addition of gulkand and sugar as per
respectively. The fat percentage of shrikhand was treatment, the mixture was well kneaded to obtain
decreased continuously with increase in the levels of firm body and texture of shrikhand. Analytical grade
gulkand.chemicals were used for chemical analysis.
The results of present investigation are in line Fat content in shrikhand was determined by
with the findings of Nadaf et al. (2012). They reported Mojonnier fat extraction apparatus method as
that increase in the level of gulkand and rose petal prescribed in B.I.S. Handbook of food analysis. IS:
powder there was proportionately decrease in the fat 11721 (Anonymous, 2005). The total solids content of shrikhand. Likewise, Nigam et al. (2009) percentage in shrikhand was determined by using also noticed that with the addition of papaya pulp in gravimetric method as per the procedure of IS: 1479 chakka during the manufacture of shrikhand there Part II (Anonymous, 1961). The protein content in was decrease in the fat content in shrikhand and vice-shrikhand was determined as per the procedure versa.recommended in IS: 1479 Part II, (Anonymous,
1961). Titratable acidity was determined by the Total solids content
method described in BIS-1960; IS-1479, part I (Anonymous, 1960). The ash content was determined It was seen that the treatment 3.0 per cent
gulkand had highest total solids content i.e. 52.67, as per the method recommended in B.I.S. Handbook
169
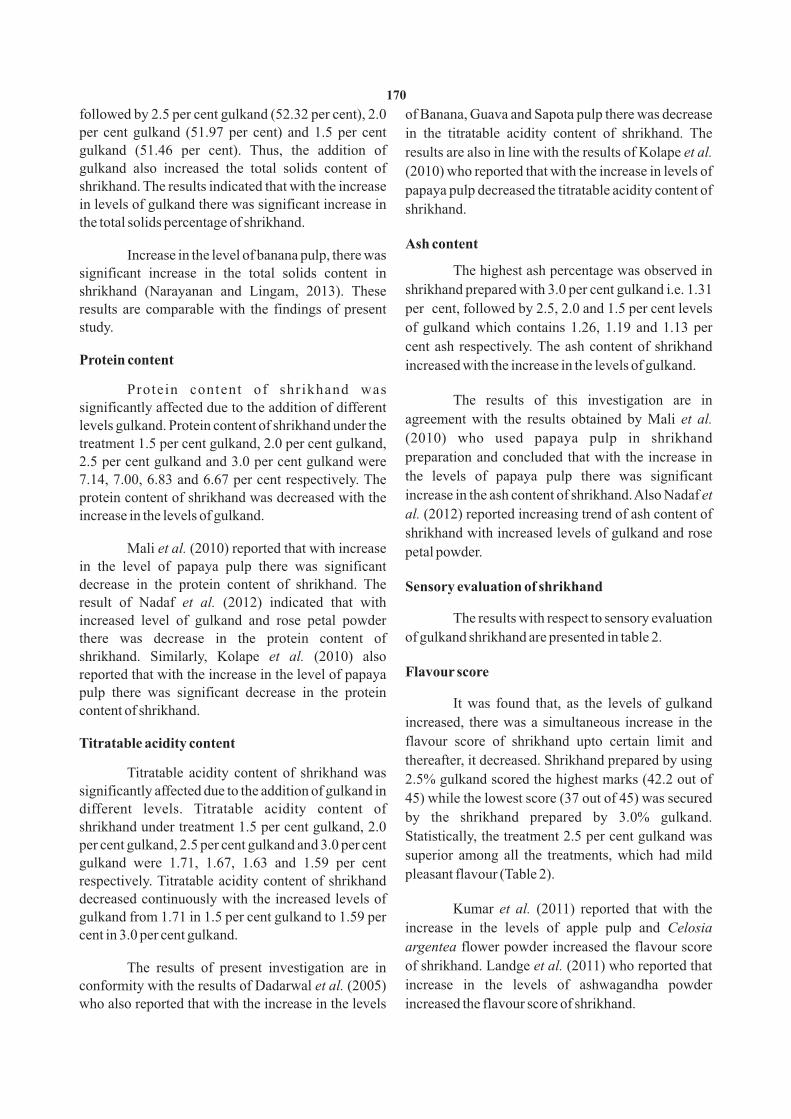
followed by 2.5 per cent gulkand (52.32 per cent), 2.0 of Banana, Guava and Sapota pulp there was decrease per cent gulkand (51.97 per cent) and 1.5 per cent in the titratable acidity content of shrikhand. The gulkand (51.46 per cent). Thus, the addition of results are also in line with the results of Kolape et al. gulkand also increased the total solids content of (2010) who reported that with the increase in levels of shrikhand. The results indicated that with the increase papaya pulp decreased the titratable acidity content of in levels of gulkand there was significant increase in shrikhand.the total solids percentage of shrikhand.
Ash contentIncrease in the level of banana pulp, there was
The highest ash percentage was observed in significant increase in the total solids content in shrikhand prepared with 3.0 per cent gulkand i.e. 1.31 shrikhand (Narayanan and Lingam, 2013). These per cent, followed by 2.5, 2.0 and 1.5 per cent levels results are comparable with the findings of present of gulkand which contains 1.26, 1.19 and 1.13 per study.
cent ash respectively. The ash content of shrikhand Protein content increased with the increase in the levels of gulkand.
Protein content of shrikhand was The results of this investigation are in
significantly affected due to the addition of different agreement with the results obtained by Mali et al. levels gulkand. Protein content of shrikhand under the (2010) who used papaya pulp in shrikhand treatment 1.5 per cent gulkand, 2.0 per cent gulkand,
preparation and concluded that with the increase in 2.5 per cent gulkand and 3.0 per cent gulkand were the levels of papaya pulp there was significant 7.14, 7.00, 6.83 and 6.67 per cent respectively. The increase in the ash content of shrikhand. Also Nadaf et protein content of shrikhand was decreased with the al. (2012) reported increasing trend of ash content of increase in the levels of gulkand.shrikhand with increased levels of gulkand and rose
Mali et al. (2010) reported that with increase petal powder.in the level of papaya pulp there was significant decrease in the protein content of shrikhand. The Sensory evaluation of shrikhandresult of Nadaf et al. (2012) indicated that with
The results with respect to sensory evaluation increased level of gulkand and rose petal powder of gulkand shrikhand are presented in table 2.there was decrease in the protein content of
shrikhand. Similarly, Kolape et al. (2010) also Flavour scorereported that with the increase in the level of papaya
pulp there was significant decrease in the protein It was found that, as the levels of gulkand content of shrikhand.
increased, there was a simultaneous increase in the
flavour score of shrikhand upto certain limit and Titratable acidity contentthereafter, it decreased. Shrikhand prepared by using
Titratable acidity content of shrikhand was 2.5% gulkand scored the highest marks (42.2 out of significantly affected due to the addition of gulkand in
45) while the lowest score (37 out of 45) was secured different levels. Titratable acidity content of
by the shrikhand prepared by 3.0% gulkand. shrikhand under treatment 1.5 per cent gulkand, 2.0
Statistically, the treatment 2.5 per cent gulkand was per cent gulkand, 2.5 per cent gulkand and 3.0 per cent
superior among all the treatments, which had mild gulkand were 1.71, 1.67, 1.63 and 1.59 per cent
pleasant flavour (Table 2).respectively. Titratable acidity content of shrikhand decreased continuously with the increased levels of
Kumar et al. (2011) reported that with the gulkand from 1.71 in 1.5 per cent gulkand to 1.59 per
increase in the levels of apple pulp and Celosia cent in 3.0 per cent gulkand.argentea flower powder increased the flavour score
of shrikhand. Landge et al. (2011) who reported that The results of present investigation are in increase in the levels of ashwagandha powder conformity with the results of Dadarwal et al. (2005)
who also reported that with the increase in the levels increased the flavour score of shrikhand.
170
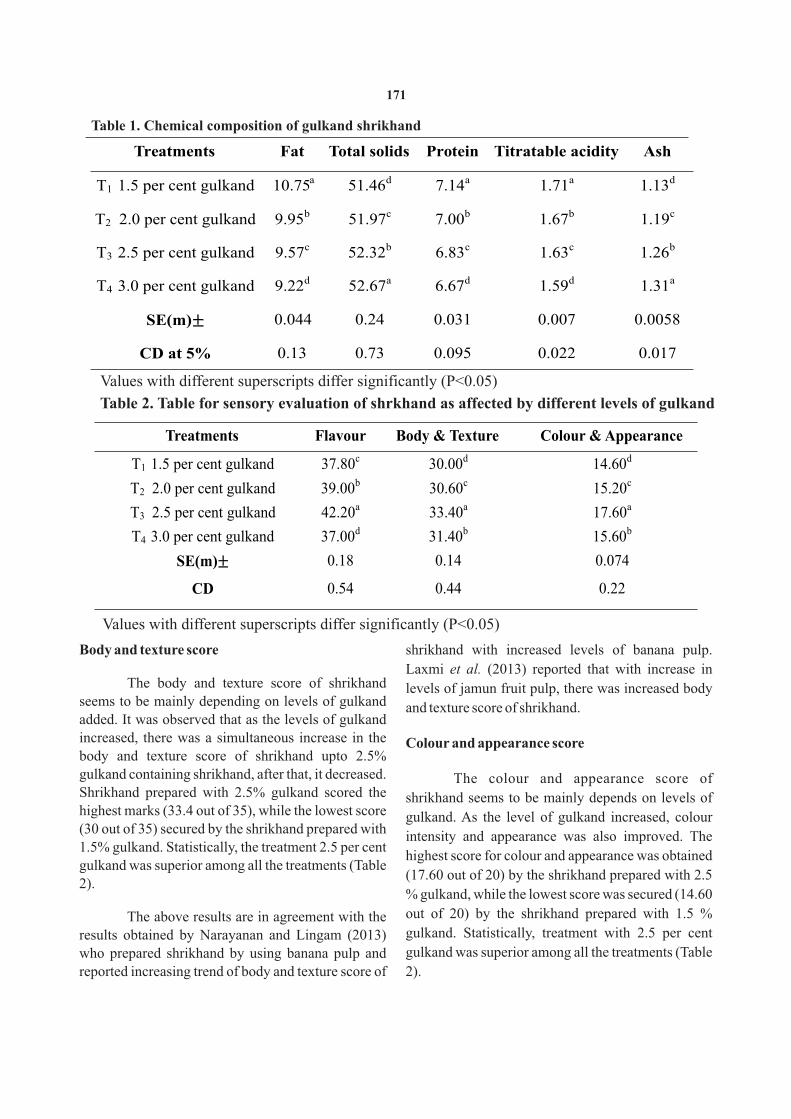
Table 1. Chemical composition of gulkand shrikhand
Treatments Fat Total solids Protein Titratable acidity Ash
T1 1.5 per cent gulkand 51.46d 7.14a 1.71a 1.13d
T2 2.0 per cent gulkand 9.95b 51.97c 7.00b 1.67b
1.19c
T3 2.5 per cent gulkand 9.57c 52.32b 6.83c 1.63c
1.26b
T4 3.0 per cent gulkand 9.22d 52.67a 6.67d 1.59d
1.31a
SE(m) 0.24 0.031 0.007 0.0058
CD at 5% 0.13 0.73 0.095 0.022 0.017
Values with different superscripts differ significantly (P<0.05)
Table 2. Table for sensory evaluation of shrkhand as affected by different levels of gulkand
Treatments Flavour Body & Texture Colour & Appearance
T1 1.5 per cent gulkand 37.80c 30.00d
14.60d
T2 2.0 per cent gulkand 39.00b 30.60c
15.20c
T3 2.5 per cent gulkand
42.20a 33.40a
17.60a
T4 3.0 per cent gulkand
37.00d 31.40b
15.60b
SE(m)
0.18 0.14
0.074
CD 0.54 0.44 0.22
Values with different superscripts differ significantly (P<0.05)
10.75a
0.044
Body and texture score shrikhand with increased levels of banana pulp.
Laxmi et al. (2013) reported that with increase in The body and texture score of shrikhand levels of jamun fruit pulp, there was increased body
seems to be mainly depending on levels of gulkand and texture score of shrikhand.added. It was observed that as the levels of gulkand increased, there was a simultaneous increase in the Colour and appearance scorebody and texture score of shrikhand upto 2.5% gulkand containing shrikhand, after that, it decreased. The colour and appearance score of Shrikhand prepared with 2.5% gulkand scored the shrikhand seems to be mainly depends on levels of highest marks (33.4 out of 35), while the lowest score gulkand. As the level of gulkand increased, colour (30 out of 35) secured by the shrikhand prepared with
intensity and appearance was also improved. The 1.5% gulkand. Statistically, the treatment 2.5 per cent
highest score for colour and appearance was obtained gulkand was superior among all the treatments (Table
(17.60 out of 20) by the shrikhand prepared with 2.5 2).
% gulkand, while the lowest score was secured (14.60
out of 20) by the shrikhand prepared with 1.5 % The above results are in agreement with the gulkand. Statistically, treatment with 2.5 per cent results obtained by Narayanan and Lingam (2013) gulkand was superior among all the treatments (Table who prepared shrikhand by using banana pulp and
reported increasing trend of body and texture score of 2).
171
Institute, Manak Bhavan, New Delhi. Tale (2013) reported that with increase in the Anonymous, 1960. Method of test for Dairy industry, chemical analysis of
level of turmeric powder, colour and appearance milk. IS 1479. Part I, Indian Standard Institute, Manak
Bhavan, New Delhi. score of shrikhand was also increased. Also Nadaf et Anonymous, 1961.Method of test for Dairy industry, chemical analysis of al. (2012) used gulkand and rose petal powder to
milk. IS 1479. Part II, Indian Standard Institute, Manak enhance the flavour and colour of shrikhand and they Bhavan, New Delhi.
Anonymous, 1967. Specification for milk powder (whole and skim). IS noticed that increase in the levels of gulkand and rose 1167. Indian Standard Institute, Manak Bhavan, New Delhi.
petal powder, there was increased in colour and Dadarwal, R., B.S. Beniwal and R. Singh, 2005. Process standardization
for preparation of fruit flavoured shrikhand. J. Food Sci. and appearance score of shrikhand. Similarly, Mali et al. Technol. 42 (1): 22-26.(2010) reported the increased colour and appearance
Kolape, R.H., B.K.Pawar, D.M. Choudhari, D.K Kamble and. R.J. score with increased levels of papaya pulp. Desale, 2010.Evaluation of chemical, microbial and
organoleptic quality of papaya shrikhand. Asian J. Animal
Sci. 5 (1): 47-52.Cost of productionKumar, S., Z.F. Bhat and P. Kumar, 2011. Effect of apple pulp and Celosia
argentea on the quality characteristics of shrikhand. American The cost of production of 1 kg gulkand J. Food Technol. 6 (9): 817-826.
Landge, U.B., B.K. Pawar and D. M. Choudhari, 2011. Preparation of shrikhand under various treatments 1.5 per cent Shrikhand using ashwagandha powder as additive. J. Dairy
gulkand, 2.0 per cent gulkand, 2.5 per cent gulkand Sci. Foods and Home Sci. 30 (2): 79-84.
and 3.0 per cent gulkand were Rs. 115.57, 116.42, Laxmi, R., B. Ranganna and K.B. Suresha, 2013. Development of value
rich jamun fruit shrikhand. Mysore J. agric. Sci. 47 (2): 307-117.26 and 118.11 respectively. The cost of 313.
production increases with increased levels of Mali, R.S., D.H. Dhapke and R.M. Zinjarde, 2010. Effect of papaya pulp
on quality and cost structure of shrikhand. J. Soils and Crops. gulkand. The lowest cost of production Rs. 115.57 20 (1): 290-294.was recorded in case of shrikhand prepared with 1.5
Meshram, S.K. 2010. Utilization of orange concentrate in the preparation per cent gulkand, while the highest cost of production of shrikhand. M.Sc.Thesis (Unpub.) Dr. PDKV, Akola (M.S.)
India. recorded in shrikhand prepared with 3.0 per cent Nadaf, N.Y., R.S. Patil and C.H. Zanzurne, 2012. Effect of addition of
gulkand. However, the cost of production of gulkand and rose petal powder on chemical composition and
organoleptic properties of shrikhand. Recent Res. in Sci. and shrikhand prepared with 2.5% gulkand was found to -1 Technol. 4 (10): 52-55.be Rs. 117.26 kg which is the best treatment selected
Naraynan, R. and J. Lingam, 2013. Sensory analysis of banana blended by judges for sensory evaluation. shrikhand. African J. of agric. Res. 8 (44): 5518-5521.
th nNelson, J.A. and G.M. Trout, 1964. Judging Dairy products 4 Ed . The
Olsen publishing Co. Milwankee Official methods of analysis Tale (2013) also conducted similar type of chemists. Washington.
work by using turmeric powder and concluded that Nigam, N., R. Singh and P.K. Upadhayay, 2009. Incorporation of chakka
by papaya pulp in the manufacture of shrikhand. J. Dairy Sci. with increase in the level of turmeric powder, cost of Foods and Home Sci. 28 (2): 115-118.shrikhand was also increased. Meshram (2010)
Pal, D. and S.K. Gupta, 1985. Sensory evaluation of Indian Milk Products. noticed that cost of shrikhand increased with the Indian Dairyman. 37 (10): 465-467.
Snedecor, G.W. and W.G. Cochran, 1967. Statistical method. Oxford and increase in the levels of orange concentrate.th nIBH Publishing Co. Bombay. 6 Ed . pp. 172-196.
Sundaram,T.S., 2010. Benefits of gulkand. at http://www.nutrihealth.in
/guest-articles/benefits-of-gulkand.REFERENCESTale, A.A. 2013. Preparation of shrikhand by using turmeric powder.
Anonymous, 2005. Dried milk and dried milk products -Determination of Unpublished M.Sc. (Agric.) Thesis Dr. PDKV, Akola. (M.S.)
fat content - Gravimetric method. IS 11721. Indian Standard India.
Rec. on 28.05.2014 & Acc. on 10.07.2014
172
ABSTRACT
The investigation on productive performance and quality of milk of total 126 crossbred cows (Jersey x Sahiwal) was carried out at College Dairy Farm, Animal Husbandry and Dairy Science section, College of
thAgriculture, Nagpur during the year 2013-2014. The ten year data (2004-2013) on milk yield upto 4 lactation and chemical quality in terms of fat, SNF and TS percentage in milk of crossbred cows were collected and analysed statistically to see the productive performance and to know the chemical quality of milk.
rd stAverage maximum lactation milk yield was recorded during the 3 lactation and minimum in the 1 st thlactation. Average maximum weekly milk yield did not show any distinct trend during 1 to 8 week of lactations.
Whereas, in all lactations performance remained constant with respect to weekly milk yield for a period of four weeks th th th th thfrom. 9 to 12 week after attaining peak yield. In 17 to 24 week of lactations maximum milk yield was recorded 20
thweek of lactation, thereafter declining trend was observed upto 24 week of lactation. In relation to chemical quality the overall fat, SNF and TS were recorded as 4.40 %, 8.67% and 13.08% respectively. These three components in milk of crossbred cows were unaffected by lactation numbers.
rdThe results indicated that the milk production increased with the advancement of lactation upto the 3 lactation. The chemical quality of milk of crossbred cows in terms of fat, SNF and TS percentage remained more or less constant under different lactations.
(Key words: Productive performance, quality of milk, crossbred cows) )
status of dairy cows, but also indicate the nutritional INTRODUCTIONvalue of milk and dairy products. Therefore, it is
Milk is an important product that contains necessary to study the chemical quality of milk almost all the nutrients required for human life by through scientific management of feeding nutritional virtue of its composition, high nutritive value and supplementation (Yang et al., 2013).digestibility. It advocates itself as a very important article of diet from the Vedic period. Milk has got Keeping this in mind the above revelations an prime importance in diet of human being. The total attempt was made to study the productive milk production of India was estimated at 127 million performance and quality of milk of crossbred cows tonnes during the year 2012 (Anonymous, 2012). (Jersey x Sahiwal).
Now a days the demand for crossbred cows MATERIALS AND METHODSare very high because of higher production of milk
-1 The crossbred animal (Jersey x Sahiwal) (ranging between 10 -15 kg day ). It is interesting to having 50% exotic inheritances irrespective of their note that a reasonable number of landless and parental breeds were selected on the basis of lactation marginal farmers have found crossbred cows as a number viz., I, II, III and IV for the study. The milking profitable enterprises under improved nutrition,
thcows upto 4 lactation were searched out from the better disease control and management. No record maintained at College Dairy Farm , Animal specialized breed has yet developed in the country to Husbandry and Dairy Science Section, College of gear up the milk production (Mondal et al., 2005).Agriculture, Nagpur during the period of 2004 to The demand for milk and its products 2013 . During this period, crossbred cows which increased sharply now a days with the increase in completed four lactations were traced out and data on population worldwide. The selective breeding and various aspects were gathered during first to fourth crossbreeding are the main tools to enhance the milk tactations of these crossbred cows. The information production potentiality of tropical indigenous cattle. regarding weekly milk yield upto 24 weeks in each Marked improvement in cattle has been reported, lactation for each of the 126 cows were complied and through crossbreeding (Eleman et al., 2012).
The proportion of chemical constituents of finally weekly milk yield of these cows was raw milk not only reflect the dairy quality and health determined.
1 and 4. P.G. Students, Animal Husbandry and Dairy Science, College of Agriculture, Nagpur2. Assoc.Professor, Animal Husbandry and Dairy Science, College of Agriculture, Nagpur3. Asstt.Professor, Animal Husbandry and Dairy Science, College of Agriculture, Nagpur
J. Soils and Crops 25 (1) 173-177, June, 2015 ISSN 0971-2836
STUDIES ON PRODUCTIVE PERFORMANCE AND QUALITY OF MILK OF CROSSBRED COWS
1 2 3 4 Rohini Narote , V. G. Atkare , S. G. Gubbawar and N. T. Pendawale

nd th stWith a view to determining the chemical 2 (37.64±1.48 l.), 4 lactation (35.66±1.68l.) and 1 st th
quality of milk during 1 to 4 lactation, milk samples lactation (34.18±1.53 l ), respectively with coefficient were collected from morning milking of crossbred of variation 21.29, 19.31, 23.19, 21.96 respectively.
-1cows. The first milk sample from each lactation cow
It was observed that average weekly milk was collected after the period of colostrums milk thyield showed inclined performance upto 8 week of period after calving was over. Thereafter, four
stlactation in all lactations except 1 lactation. samples of morning milk were collected at an interval
-1 Maximum weekly milk yield was recorded (50.95 l ) of 5 days. Thus, in all 5 samples cow were collected th
during 4 week of lactations, while minimum milk during each lactation and used for analysing various thyield was recorded (24.03 l) during 24 week of composition of milk. The fat content in the milk
lactations. After attaining the peak yield , the during each lactation was determined by Gerber's productive performance examined was more or less method as described in IS: 1224 (part-I),
th thconstant for a period of four weeks i.e.9 to 12 week (Anonymous, 1977). SNF content was calculated by
stwith respect of average weekly milk yield during 1 to using ISI lactometer and total solids content was th nd rd4 lactations. On the otherhand, during 2 and 3 calculated by addition of fat and SNF content in milk.
lactation peak yield did not show any distinct trends. thThe data collected in respect of all above After 16 week of all lactations declined trend was
thparameters were tabulated and subjected to statistical observed upto the 24 week of lactation in average evaluation by adopting the standard technique weekly milk yield.prescribed by Panse and Sukhatme (1985). To find out mean, standard deviation and coefficient of variation The results of present investigation are in so as to estimate the central value and the extent at general agreement with the results obtained by Haider variability in the data. The standard deviation and et al. (1984) who recorded highest lactational milk
rdcoefficient of variation was calculated by adopting yield in J x S and F x ND crossbred cows during 3 the following formula. lactation. Ahmad et al. (2011 ) reported that the milk
st rdyield increased gradually from the 1 to 3 lactations.
rdThe highest milk yield was recorded in 3 lactation
stand the lowest in 1 lactation. These findings are more or less supported the results of present study. Where,
= Standard deviationThe milk yield tended to increase with = Values of the variables
lactation number in crossbred cows but maximum = Meanmilk yield was recorded in third lactation (Bhaskar et = Number of observation of the seriesal. 2007). Likewise, Lateef et al. (2008) recoded the Coefficient of variation was used to compare
rdmaximum lactation milk yield in the 3 lactation in the magnitude of relative dispersion among the data IHF, IJ, FBHF cows. of different variations.
S. D.Chemical quality of milk Fat (%) C.V. = --------- × 100
XIt is seen from table 2 that the fat percentages
Where, st thin 1 to 4 lactations with their standard error were C.V. = Coefficient of variationrecorded as 4.27±0.36, 4.39 ± 0.17,4.25 ± 0.02, 4.72 ± S.D. = Standard Deviation0.17 % respectively. The overall average fat % in milk X = Meanof crossbred cows was recorded as 4.40 ± 0.10 %.
RESULTS AND DISCUSSIONBhaskar et al. (2007) recorded 4.43% fat in
It is evident from the table 1 that the overall milk of crossbred cows (1st to 4th lactations). They average weekly milk yield based on 126 calvings over further noticed that the lactation number had little
tha period of experimental period i.e. upto 24 week of effect on fat percentage. Krovvidi et al. (2013) also lactation was 36.94±1.48 l. Maximum milk yield was reported that the fat percentage showed non-
rdrecorded in 3 lactation (40.36±1.75 l.) followed by significant effect due to lactation order.
åX Xi=
( )2
ns
174
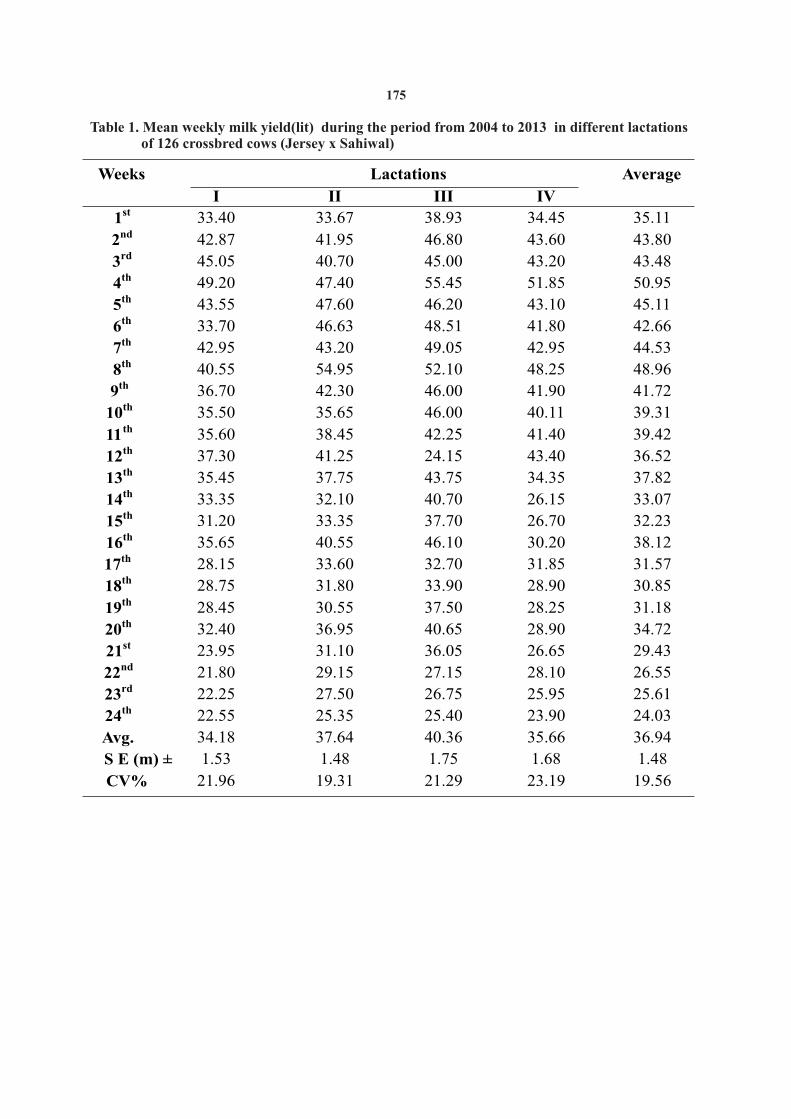
Table 1. Mean weekly milk yield(lit) during the period from 2004 to 2013 in different lactations of 126 crossbred cows (Jersey x Sahiwal)
Weeks Lactations Average
I II III IV
1st 33.40 33.67 38.93 34.45 35.11
2nd 42.87 41.95 46.80 43.60 43.80
3rd 45.05 40.70 45.00 43.20 43.48
4th 49.20 47.40 55.45 51.85 50.95
5th 43.55 47.60 46.20 43.10 45.11
6th 33.70 46.63 48.51 41.80 42.66
7th 42.95 43.20 49.05 42.95 44.53
8th 40.55 54.95 52.10 48.25 48.96
9th 36.70 42.30 46.00 41.90 41.72
10th 35.50 35.65 46.00 40.11 39.31
11th 35.60 38.45 42.25 41.40 39.42
12th 37.30 41.25 24.15 43.40 36.52
13th 35.45 37.75 43.75 34.35 37.82
14th 33.35 32.10 40.70 26.15 33.07
15th 31.20 33.35 37.70 26.70 32.23
16th 35.65 40.55 46.10 30.20 38.12
17th 28.15 33.60 32.70 31.85 31.57
18th 28.75 31.80 33.90 28.90 30.85
19th 28.45 30.55 37.50 28.25 31.18
20th 32.40 36.95 40.65 28.90 34.72
21st 23.95 31.10 36.05 26.65 29.43
22nd 21.80 29.15 27.15 28.10 26.55
23rd 22.25 27.50 26.75 25.95 25.61
24th 22.55 25.35 25.40 23.90 24.03
Avg. 34.18 37.64 40.36 35.66 36.94
S E (m) ± 1.53 1.48 1.75 1.68 1.48
CV% 21.96 19.31 21.29 23.19 19.56
175
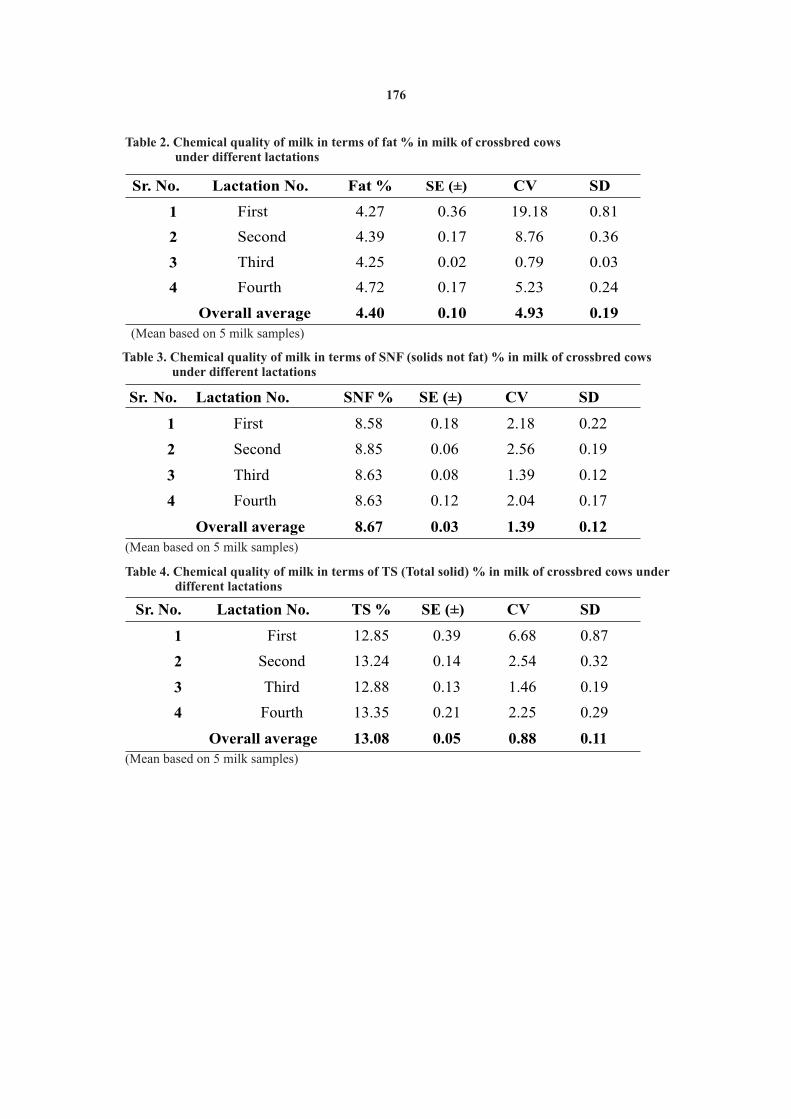
Table 2. Chemical quality of milk in terms of fat % in milk of crossbred cows under different lactations
Sr. No. Lactation No. Fat % SE (±) CV SD
1 First 4.27 0.36 19.18 0.81
2 Second
4.39 0.17 8.76
0.36
3 Third
4.25 0.02 0.79
0.03
4 Fourth
4.72 0.17 5.23
0.24
Overall average 4.40 0.10 4.93 0.19
(Mean based on 5 milk samples)
Table 3. Chemical quality of milk in terms of SNF (solids not fat) % in milk of crossbred cows under different lactations
Sr. No. Lactation No. SNF % SE (±) CV SD
1 First 8.58 0.18 2.18 0.22
2 Second 8.85 0.06 2.56 0.19
3 Third
8.63
0.08
1.39 0.12
4 Fourth
8.63
0.12
2.04 0.17
Overall average
8.67
0.03
1.39 0.12
(Mean based on 5 milk samples)
Table 4. Chemical quality of milk in terms of TS (Total solid) % in milk of crossbred cows under different lactations
Sr. No. Lactation No. TS % SE (±) CV SD
1 First 12.85 0.39 6.68 0.87
2 Second 13.24 0.14 2.54 0.32
3 Third 12.88
0.13
1.46 0.19
4 Fourth
13.35
0.21
2.25 0.29
Overall average
13.08
0.05
0.88 0.11
(Mean based on 5 milk samples)
176
SNF (solids not fat- % ) The present investigation further revealed
that the chemical composition in terms of fat It is evident from table 3 that the SNF per cent percentage was marginally affected, SNF and TS
st thfrom 1 to 4 lactations were recorded as 8.58±0.18, percentage in milk of crossbred cows remained 8.85±0.06, 8.63±0.08, 8.63±0.12 % respectively. The unaffected by the lactation numbers. Therefore, the overall SNF percentage in milk of crossbred cows results from present study suggested that the was recorded as 8.67±0.06 with standard deviation crossbred should be provided quality nutrition and 0.12 and coefficient of variation 1.39. Average protection from the environmental condition for maximum SNF % (8.85±0.18%) was recorded during maintaining calving pattern, rate of milk production
nd2 lactation and minimum ( 8.58%) was recorded in every lactation and chemical quality of milk.
stduring 1 lactation.The results indicated that the SNF
stpercentage in milk of crossbred cows was lower in 1 REFERANCES
ndlactation (8.85±0.18%) which increased in 2 lactation (8.85±0.06 %) and remained constant Effects of lactation number
rd thand different stage of lactation on milk yield of Indigenous and thereafter in the subsequent lactations i.e.,3 and 4 Crossbred cows in Bangladesh. lactations (8.63 %).However, the variations were not
alarming.
Bhasker et al. (2007) reported the lower Anonymous, 2012. India to produce 127 MT milk in 2012. Food and st
percentage of SNF in milk during 1 lactation. It Agriculture Organization at http://www.financiand
xpress.com/news.increased in 2 lactation and remaind static Bhaskar, M.L., M.P. Gupta and K.P. Singh, 2007. Effect of lactation thereafter in subsequent lactations. Likewise,
number on production and quality of milk of crossed cows and Krovvidi et al. (2013) also reported that the order of Murrah buffalo. Indian J. Dairy Sci. 60(6): 426-431.
Eleman, M. B. and A. M. Abu Nekhella, 2012. Some productive traits of lactation showed significant effect on SNF crossbred dairy cows in the farm of university of percentage.Khartoum,Sudan.Emir.J.Food Agric.24(2):155-158.
Fadlelmoula, A. A., A. Nekheila and I. A. Yousif, 2007. Studied on
TS (Total solids) % lactation performance of crossbred dairy cows in the Sudan.
Res. J. Agric. and Bio. Sci.3(5):389-393.
From table 4 it is seen that the total solid percentage in milk of crossbred cows under different
st thlactations i.e. 1 to 4 were as 12.85±0.39,
Krovvidi, S., S. Panneerselvam, A. K. Thiruvenkadan, J. Abraham and G. 13.24±0.14, 12.88±0.13, 13.35±0.21% respectively. Vinodkumar, 2013. Factors affecting milk composition of Average maximum TS % (13.35±0.21%) was crossbred dairy cattle in Sourthen India.International J.Food,
th Agric. and Vet. Sci.3(1):229-233.recorded in the 4 lactation and minimum st
(12.85±0.39%) recorded in the 1 lactation.
The results indicated that the total solid percentage in different lactations remained
st thunaffected in 1 to 4 lactations.
Talukder et al. (2013) recorded overall total Panse, V. G. and P. V. Sukhatme, 1985. Statistical methods for agricultural
solid percentage in the range of 13.01 to 13.81 % in workers, I. C. A. R., New Delhi.Talukder, M. A. I., J. M. Panandam, Y. Halimatun and I. Idris, 2013. Milk milk of Sahiwal and Friesian crossbred cows, the
composition and quality of Sahiwal-Friesian crossbred cows findings of the present study are almost similar to
studied in Malaysia. The Agriculturist Scientific J. Krishi their findings. Likewise, Bhaskar et al. (2007) Foundation.11 ( 2):58-65.
reported that the total solid percentage in milk of crossbred cows remained unaffected by the lactation number.
Ahmad, S., FMA Hossain and N. Islam. 2011.
International J. Natural Sci.
1(1):222-225.Anonymous, 1977. Determination of fat by Gerber's method. IS 1224.
Part 1, First revision. Bureau of Indian Standards, Manak
Bhavan, New Delhi.
Haider, I., M. Zaman, M. A. Farooq and S. Shah, 1984. Productive and
reproductive performance of crossbred cows under the
subtropical environmental condition of Punjab. Pakistan J.
Agric. Res. 5 (3):190-197.
Lateef, M., K. Z. Gondal, M. Younas and M. Sarwar, 2008. Milk
production potential of pure breed Holstein Friesian and
Jersey cow in sub tropical environment of Pakistan. Pakistan
Vet. J. 2008, 28(1):9-12.Mondal, S. C., M. M. Alam, M. M. Rashid, M. Y. Ali and M. M. Hossain,
2005. Comparative study on the productive and reproductive
performance of different dairy genotypes reared in
Bangladesh Agricultural University Dairy Farm. Pakistan
J.Nutr.4 (4):222-225.
Yang, L. Q. Yang, M. Yi Z. H. Pang. 2013. Pang studies on the effect of
seasonal and parity on raw milk composition and related
indices in Chinese Holstein cows in Northern China . J. Dairy
Sci. pp.6863-6869.
Rec. on 30.05.2014 & Acc. on 20.07.2014
177

ABSTRACT
The present study was carried out during year rabi 2013-14. The experiment was laid out in RBD with four replications comprising of different concentrations of TIBA. Spraying of TIBA was done at 25 and 40 DAS. The different treatments tested were control, 25 ppm TIBA, 50 ppm TIBA, 75 ppm TIBA, 100 ppm TIBA, 125 ppm TIBA and 150 ppm TIBA. Foliar sprays of growth retardant TIBA showed their significance over control. Foliar sprays of 50 ppm TIBA followed by 25 ppm TIBA significantly increased leaf chlorophyll, nitrogen, phosphorus and potassium,
-1 -1 -1 -1protein content in seed, number of pods plant , number of unfilled pods plant , grain yield plant , grain yield plot and harvest Index of chickpea.
(Key words: Chickpea, TIBA, N, P, K and protein)
genotype, concentration used and method of INTRODUCTIONapplication, stage of plant and various other factors which influence the uptake and translocation of the Chickpea is one of the most important pulses chemicals.crop in the world. India ranks first in the world in
respect of production. Chickpea plays an important The inhibitory effects of TIBA were
role in cereal based diet because of its high protein proportional to its concentration. Thus, TIBA which
content which is used for making dal. Chickpea grains might be expected to be a direct auxin competitor, has
provide about 18 to 22 % protein, 4 to 10 % fat and 52 been shown to lower the auxin levels of treated root to
to 70 % carbohydrate. The vegetative parts of vanishingly low values and may exert part of its
chickpea are covered with glandular hairs which antagonistic action (Audus and Thresh, 1956).
exclude and acidic liquid which contains about 94.2% Another way in which the normal functioning of
malic acid, 5.6% oxalic acid and 0.2% acetic acid.auxin may be impeded is by blocking its movement in the plant. This kind of action may underlie the In India area under chickpea crop during antagonisms of TIBA (Niedergang and Skoog, 1956; 2012-13 was 85.67 million hectares with the Kese and Vardar, 1953).production of 82.21 million tonnes having
-1productivity of yield was 932 kg ha (Anonymous,
Sabins and Audus (1957) found that TIBA 2013 a). In Maharashtra total area under chickpea
may block IAA uptake for example in segment of cultivation during 2012-13 was 10.55 million
Avena coleoptile, yet another effects seems to be that hectares with the production of 9.20 million tonnes
TIBA immobile in pea tissues, presumably by -1having average productivity of 790 kg ha
promoting its binding to protein (Winter, 1968) and (Anonymous, 2013 b). In Maharashtra, Vidharbha
this has been suggested as the main cause of its region contributes major share in area as well as
blockage of IAA transport. Considering the above production of chickpea.
facts present investigation was undertaken to see the effect of foliar sprays of growth retardant TIBA on In Vidharbha total area under chickpea was chemical and biochemical, yield and yield 4.98 million hectares with a total production of about
-1 contributing parameters of chickpea.4.54 million tonnes having productivity of 780 kg ha during the year 2012-13 (Anonymous , 2013 c).
MATERIALS AND METHODSCathey (1964) defines a growth retardant as a
chemical that decreases the cell division and cell The present studies on the influence of foliar elongation in the shoot apex and regulates plant sprays of growth retardant TIBA on biochemical, height physiologically without formative effects. The yield and yield contributing parameters of chickpea effects of growth retardant vary with species, was conducted in field of Agril. Botany Section,
1, 3, 4 and 5. PG Students, Botany Section, College of Agriculture, Nagpur (M.S.), India.2. Professor, Botany Section, College of Agriculture, Nagpur.
INFLUENCE OF FOLIAR SPRAYS OF GROWTH RETARDANT TIBA ON BIOCHEMICAL, YIELD AND YIELD CONTRIBUTING
PARAMETERS OF CHICKPEA
J. Soils and Crops 25 (1) 178-184, June, 2015 ISSN 0971-2836
1 2 3 4 5P. P. Sawant , R. D. Deotale , S. A. Mahale , S. N. Sahane and Y. A. Wagh
College of Agriculture, Nagpur during rabi 2013-14. While, treatments T (75 ppm TIBA), T (100 ppm 4 5
Growth retardant TIBA like T control, T (25 ppm TIBA), T (125 ppm TIBA) and T (150 ppm TIBA) 1 2 6 7
TIBA), T (50 ppm TIBA), T (75 ppm TIBA), T (100 also gave significantly more chlorophyll content 3 4 5
ppm TIBA), T (125 ppm TIBA) and T (150 ppm when compared with control (T ). Similar trend was 6 7 1
TIBA) were tested. Chickpea seed variety Jaki-9218 found at 85 DAS. At 85 DAS chlorophyll content in -1was used for experimentation. Observations on leaves ranged from 0.99 – 2.02 mg g . The variation in
biochemical parameters like leaf chlorophyll chlorophyll content due to different concentrations of (colorimetric method, Bruinsma, 1982), nitrogen TIBA may be attributed to decrease chlorophyll (Kjeldhal's method, Piper, 1966), phosphorus degradation and increase chlorophyll synthesis. From (vanadomolybdate yellow colour method, the data, it is clear that chlorophyll content was Jackson,1967) and potassium (flame photometer by maximum at 65 DAS and decreased at later stages di-acid extract method, Jackson1967) were analyzed which may be attributed due to senescence of leaves at 45, 65 and 85 DAS stage. Whereas, protein content (Arteca and Dong, 1981).(Kjeldhal's method, Piper, 1966) in seed was also estimated. Observations on yield and yield
-1contributing parameters like, number of pods plant ,
-1 -1number of unfilled pods plant , grain yield plant , -1
grain yield plot and harvest Index was also worked out. The data collected were subjected to statistical analysis suggested by Panse and Sukatme (1954).
RESULTS AND DISCUSSION
Biochemical parametersLeaf chlorophyll content
The greenness of the leaf is generally considered to be a parameter contributing to yielding ability of the cultivar. Leaves constitute most important aerial organ of the plants, playing a major The experiment was conducted by Tripathi et role in the anabolic activities by means of the so called al. (2003) on chickpea cv. Avarodhi by the application "green pigments or chlorophyll" is the sole medium of of different growth regulators i.e. 20 ppm TIBA, 1000 the photosynthetic progress which in turn is the major ppm ALAR [daminozide], 5 ppm Miraculam, 50 ppm synthesis pathway operatives in plants. IAA, 50 ppm gibberellic acid, 50 ppm NAO [2-
naphthoxyacetic acid], and 50 ppm Planofix [NAA], Data pertaining to leaf chlorophyll content in
5 ppm cytokinin, 10 ppm Mixtalol [triacontanol] and leaves of chickpea are presented in table 1. At 45, 65
4000 ppm CCC [chlormequat] . Chlorophyll content and 85 DAS significantly highest chlorophyll content
was highest with 20 ppm TIBA treatment at pre and was found in treatment T (50 ppm TIBA) followed by 3 post-anthesis (2.60 and 2.82, respectively).treatment T (25 ppm TIBA). Similarly foliar 2
application of 75 ppm TIBA (T ), 100 ppm TIBA (T ) 4 5 Leaf nitrogen contentand 125 ppm TIBA (T ) observed significantly more 6
The data obtained about the nitrogen content chlorophyll content when compared with control (T ) 1
in leaves are given in table1. At 45 DAS, significantly and rest of the treatments. Treatment T (150 ppm 7
maximum leaf nitrogen content was recorded in TIBA) was found at par with control (T ).1
treatment T (50 ppm TIBA) followed by foliar 3
application of 25 ppm TIBA (T ) when compared with At 65 DAS chlorophyll content in leaves 2
-1 control and rest of the treatments under study. ranged from 1.58 – 2.10 mg g . Significantly highest chlorophyll content was found in treatment T (50 Whereas foliar application of 75 ppm TIBA (T ), 100 3 4
ppm TIBA (T ) and 125 ppm TIBA (T ) were also ppm TIBA) followed by treatment T (25 ppm TIBA). 5 62
Ganiger et al. (2002) studied the effect of foliar application of plant growth regulators NAA (250 or 500 ppm), TIBA (25 or 50 ppm), gibberellic acid (25 or 50 ppm), cycocel [chlormequat] (250 or 500 ppm), cytozyme (500 or 1000 ppm) and 2% urea on the growth of cowpea cv. C 152. TIBA (25 and 50 ppm) and GA (50 ppm) recorded significantly more chlorophyll 'a' content than control. TIBA 25 and 50 ppm recorded significantly more chlorophyll 'b' content than control. TIBA 25 ppm recorded
-1maximum chlorophyll content (3.09 mg g fresh weight). More chlorophyll content in these treatments has helped in increasing the photosynthetic rate and there by seed yield.
179
recorded higher nitrogen content in a descending found at par with treatment T (control).1
manner when compared with control (T ). 1
At 65 DAS significantly maximum leaf Application of 150 ppm TIBA (T ) was found at par 7
phosphorus content was recorded in treatment T (50 3with control (T ).1
ppm TIBA) followed by treatment T (25 ppm TIBA), 2
At 65 DAS significantly maximum leaf T (75 ppm TIBA) and T (100 ppm TIBA) in a 4 5
nitrogen content was recorded in treatment T (50 descending manner when compared with control and 3
rest of the treatments under study. Treatments T (125 ppm TIBA) followed by foliar application of 25 ppm 6
TIBA (T ) when compared with control and rest of the ppm TIBA) and T (150 ppm TIBA) were found at par 2 7
treatments. Next to this treatments foliar application with treatment T (control).1
of 75 ppm TIBA (T ), 100 ppm TIBA (T ), 125 ppm 4 5
At 85 DAS significantly maximum leaf TIBA (T ) and 150 ppm TIBA (T ) were also recorded 6 7
phosphorus content was recorded in treatment T (50 3higher nitrogen content in a descending manner when ppm TIBA) followed by treatment T (25 ppm TIBA), 2compared with treatment control (T ). 1
T (75 ppm TIBA), T (100 ppm TIBA) and T (125 4 5 6
At 85 DAS significantly maximum leaf ppm TIBA) in a descending manner when compared nitrogen content was recorded in treatment T (50 with control and rest of the treatments. But 3
ppm TIBA) followed by treatments T (25 ppm application of 150 ppm TIBA (T ) was found at par 2 7
TIBA), T (75 ppm TIBA) and T (100 ppm TIBA) in a with control (T ).4 5 1
descending manner when compared with control and It is evident from the data that phosphorus rest of the treatments. While, treatments T (125 ppm 6
content in leaves was increased gradually upto 45-65 TIBA) and T (150 ppm TIBA) were also recorded 7
DAS and decreased at 85 DAS. It might be due to more nitrogen content as compared to control (T ). 1translocation of leaf phosphorus and it's utilization for development of food storage organ. It was also known Poonkodi (2003) stated that decrease in that growth hormone increases the uptake of nutrients nitrogen content at later stage might be due to from soil and also increases metabolic activities in the translocation and utilization of nutrient for flower and plant cell (Sagare and Naphade, 1987). pod formation.
Leaf potassium contentDeotale et al. (1994) conducted field experiment on physiological studies in safflower
Data regarding the leaf potassium content at (Carthamus tinctorius L.) cv. Bhima. Plants were
45, 65 and 86 DAS are presented in table 1. At 45 and sprayed with 100-1100 ppm TIBA at 40 days after
85 DAS significantly more leaf potassium content sowing. TIBA application @ 600 ppm significantly
was noticed in treatment T (50 ppm TIBA) followed 3increased leaf nitrogen contents over control and rest by treatments T (25 ppm TIBA) and T (75 ppm 2 4of the treatments.TIBA) when compared with control (T ) and rest of 1
the treatments under observations. Similarly Leaf phosphorus contenttreatments T (100 ppm TIBA), T (125 ppm TIBA) 5 6
The data with respect to phosphorus content and T (150 ppm TIBA) also gave more potassium 7
in leaves are tabulated in table1. At 45 DAS content in a descending manner when compared with significantly maximum leaf phosphorus content was control (T ). 1
recorded in treatment T (50 ppm TIBA) followed by 3
treatments T (25 ppm TIBA) and T (75 ppm TIBA) At 65 DAS significantly maximum leaf 2 4
potassium content was noticed in treatment T (50 when compared with control and rest of the 3
treatments under study. Next to this treatments foliar ppm TIBA). Next to this treatment foliar application application of 100 ppm TIBA (T ) and 125 ppm TIBA of 25 ppm TIBA (T ) also increased leaf potassium 5 2
(T ) were also increased phosphorus content content significantly when compared with control 6
and rest of the treatments under observations. significantly when compared with control and rest of Whereas foliar application of 75 ppm TIBA (T ), 100 the treatments. Treatment T (150 ppm TIBA) was 47
180
ppm TIBA (T ), 125 ppm TIBA (T ) and 150 ppm Yield and yield contributing parameters5 6-1Number of pods plantTIBA (T ) were also recorded maximum potassium 7
content in a descending manner as compared to -1
Significantly more number of pods planttreatment T (control).1were recorded in treatment receiving T (50 ppm 3
TIBA) followed by treatments T (25 ppm TIBA), T Shanmugam and Muthuswamy (1974) 2 4
(75 ppm TIBA) and T (100 ppm TIBA) in a conducted an experiment on Crysanthemum indicum 5
plants, receiving supplementary light and spread with descending manner when compared with treatment T 1
GA, MH and TIBA or CCC at various rates. All long (control) and rest of the treatments under study. day treatments increased foliar N, K, Ca and While, treatments T (125 ppm TIBA) and T (150 6 7
Carbohydrate. K was greater in plants treated with ppm TIBA) were also found significantly superior CCC or TIBA and GA. Carbohydrate was increased over control (T ).1
by CCC and TIBA while reduced by MH and GA.
Kumar et al. (2006) reported that foliar Protein content in seed application of TIBA (50 ppm), cycocel (250 ppm) and
mepiquat chloride (1000 ppm) on soybean recorded Data regarding protein content in seeds are
-1highest number of pods plant and shelling given in table 1. The maximum seed protein was percentage as compared to control.recorded in treatment T (50 ppm TIBA) followed by 3
treatments T (25 ppm TIBA), T (75 ppm TIBA), T 2 4 5 Tripathi et al. (2009) studied the effect of (100 ppm TIBA) and T (125 ppm TIBA) when 6 foliar application of TIBA (2, 3, 5-triiodobenzoic
-1compared with control (T ) and rest of the treatments 1 acid, 25 mg and 50 mg l ) on flower drop, growth and in a descending manner. But application of 150 ppm yield of pigeonpea variety 'UPAS-120'. Spraying of
-1TIBA (T ) was found at par with control (T ).7 1 TIBA (50 mg l ) significantly increased number of -1
pods plant over control.Nitrogen is the constituent of protein. Hence,
-1increase in nitrogen content ultimately resulted in the Number of unfilled pods plantincrease in protein content in seeds of chickpea in the present investigation. Significantly lowest number of unfilled pods
-1 plant was recorded in treatment T (50 ppm TIBA) 3The experiment was conducted by Tripathi et followed by treatment T (25 ppm TIBA) when 2al. (2003) on chickpea cv. Avarodhi by the application compared with treatment T (control) and rest of the 1of different growth regulators i.e. 20 ppm TIBA, 1000 treatments under observations. Similarly, ppm ALAR [daminozide], 5 ppm Miraculam, 50 ppm
-1significantly lowest number of unfilled pods plant IAA, 50 ppm gibberellic acid, 50 ppm NAO [2-was also observed in treatments T (75 ppm TIBA), T 4 5naphthoxyacetic acid], and 50 ppm Planofix [NAA], (100 ppm TIBA), T (125 ppm TIBA) and T (150 5 ppm cytokinin, 10 ppm Mixtalol [triacontanol] and 6 7
4000 ppm CCC [chlormequat]. Protein and starch ppm TIBA) in a descending manner over control (T ).1
content were highest with the 20 ppm TIBA, 5 ppm Gavisiddappa et al. (2013) studied the effects cytokinin and 50 ppm IAA treatments, respectively.
of foliar application of growth regulator and micro-nutrients on sunflower hybrid KBSH-53. Spraying of TIBA at 50 ppm was recorded lowest number of
-1 unfilled seeds capitalum (163.80) when compared with control (291.60).
100 seed weight (g)
Variation in data of 100 seed weight owing to different concentrations of TIBA was significant. Spraying of 50 ppm TIBA (T ) gave significantly 3
Tripathi and Kumar (2006) noticed that application of different plant growth regulator treatments, i.e. TIBA (500 ppm), GA (50 ppm), AA [ascorbic acid] (50 ppm), IAA (50 ppm), NAA (50 ppm), cytokinin (5 ppm), miraculan [triacontanol] (10 ppm) and CCC [chlormequat] (4000 ppm) on pea cv. Rachana. The growth regulators were sprayed twice at 35 and 75 days after sowing. Cytokinin and TIBA significantly increased protein content when compared with the other treatments.
181
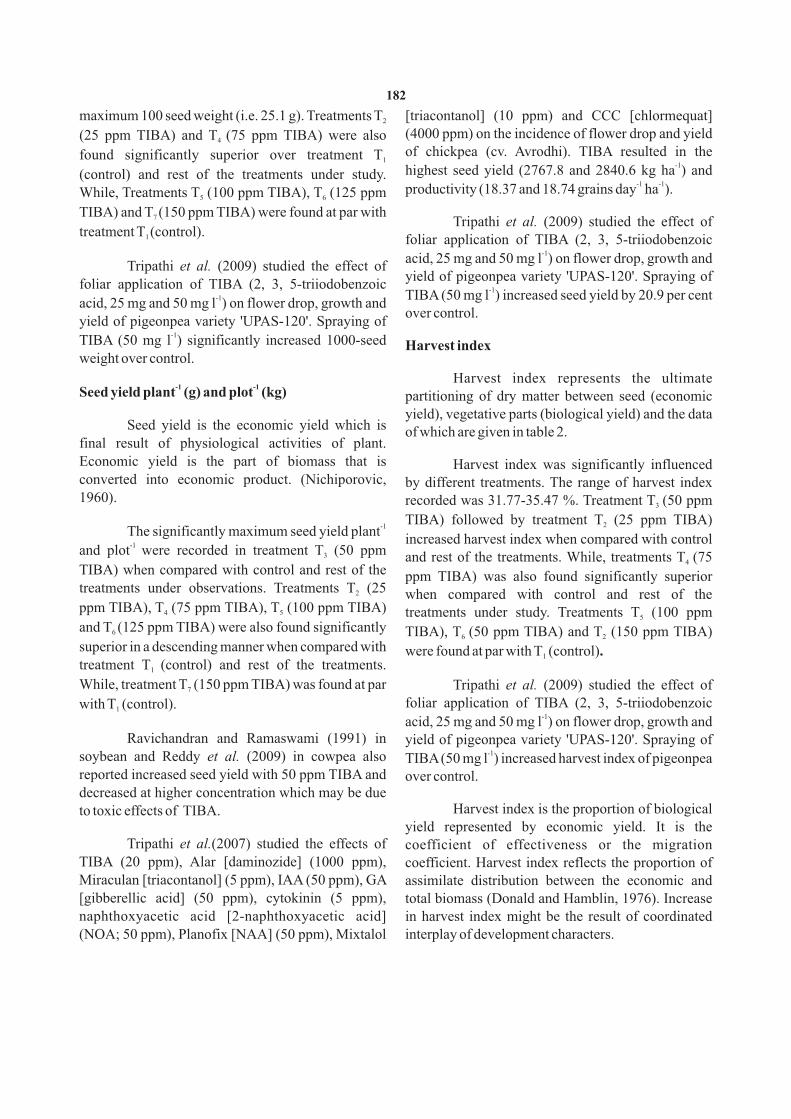
maximum 100 seed weight (i.e. 25.1 g). Treatments T [triacontanol] (10 ppm) and CCC [chlormequat] 2
(4000 ppm) on the incidence of flower drop and yield (25 ppm TIBA) and T (75 ppm TIBA) were also 4
of chickpea (cv. Avrodhi). TIBA resulted in the found significantly superior over treatment T 1-1highest seed yield (2767.8 and 2840.6 kg ha ) and (control) and rest of the treatments under study.
-1 -1productivity (18.37 and 18.74 grains day ha ).While, Treatments T (100 ppm TIBA), T (125 ppm 5 6
TIBA) and T (150 ppm TIBA) were found at par with 7 Tripathi et al. (2009) studied the effect of treatment T (control).1 foliar application of TIBA (2, 3, 5-triiodobenzoic
-1acid, 25 mg and 50 mg l ) on flower drop, growth and Tripathi et al. (2009) studied the effect of
yield of pigeonpea variety 'UPAS-120'. Spraying of foliar application of TIBA (2, 3, 5-triiodobenzoic -1TIBA (50 mg l ) increased seed yield by 20.9 per cent -1acid, 25 mg and 50 mg l ) on flower drop, growth and
over control.yield of pigeonpea variety 'UPAS-120'. Spraying of
-1TIBA (50 mg l ) significantly increased 1000-seed Harvest indexweight over control.
Harvest index represents the ultimate -1 -1Seed yield plant (g) and plot (kg) partitioning of dry matter between seed (economic
yield), vegetative parts (biological yield) and the data Seed yield is the economic yield which is of which are given in table 2.
final result of physiological activities of plant. Economic yield is the part of biomass that is Harvest index was significantly influenced converted into economic product. (Nichiporovic, by different treatments. The range of harvest index 1960). recorded was 31.77-35.47 %. Treatment T (50 ppm 3
TIBA) followed by treatment T (25 ppm TIBA) 2-1 The significantly maximum seed yield plantincreased harvest index when compared with control
-1 and plot were recorded in treatment T (50 ppm 3 and rest of the treatments. While, treatments T (75 4
TIBA) when compared with control and rest of the ppm TIBA) was also found significantly superior treatments under observations. Treatments T (25 2 when compared with control and rest of the ppm TIBA), T (75 ppm TIBA), T (100 ppm TIBA) 4 5 treatments under study. Treatments T (100 ppm 5
and T (125 ppm TIBA) were also found significantly 6 TIBA), T (50 ppm TIBA) and T (150 ppm TIBA) 6 2
superior in a descending manner when compared with were found at par with T (control).1
treatment T (control) and rest of the treatments. 1
While, treatment T (150 ppm TIBA) was found at par Tripathi et al. (2009) studied the effect of 7
foliar application of TIBA (2, 3, 5-triiodobenzoic with T (control).1-1acid, 25 mg and 50 mg l ) on flower drop, growth and
Ravichandran and Ramaswami (1991) in yield of pigeonpea variety 'UPAS-120'. Spraying of -1soybean and Reddy et al. (2009) in cowpea also TIBA (50 mg l ) increased harvest index of pigeonpea
reported increased seed yield with 50 ppm TIBA and over control.decreased at higher concentration which may be due
Harvest index is the proportion of biological to toxic effects of TIBA.yield represented by economic yield. It is the
Tripathi et al.(2007) studied the effects of coefficient of effectiveness or the migration TIBA (20 ppm), Alar [daminozide] (1000 ppm), coefficient. Harvest index reflects the proportion of Miraculan [triacontanol] (5 ppm), IAA (50 ppm), GA assimilate distribution between the economic and
total biomass (Donald and Hamblin, 1976). Increase [gibberellic acid] (50 ppm), cytokinin (5 ppm),
in harvest index might be the result of coordinated naphthoxyacetic acid [2-naphthoxyacetic acid] (NOA; 50 ppm), Planofix [NAA] (50 ppm), Mixtalol interplay of development characters.
182
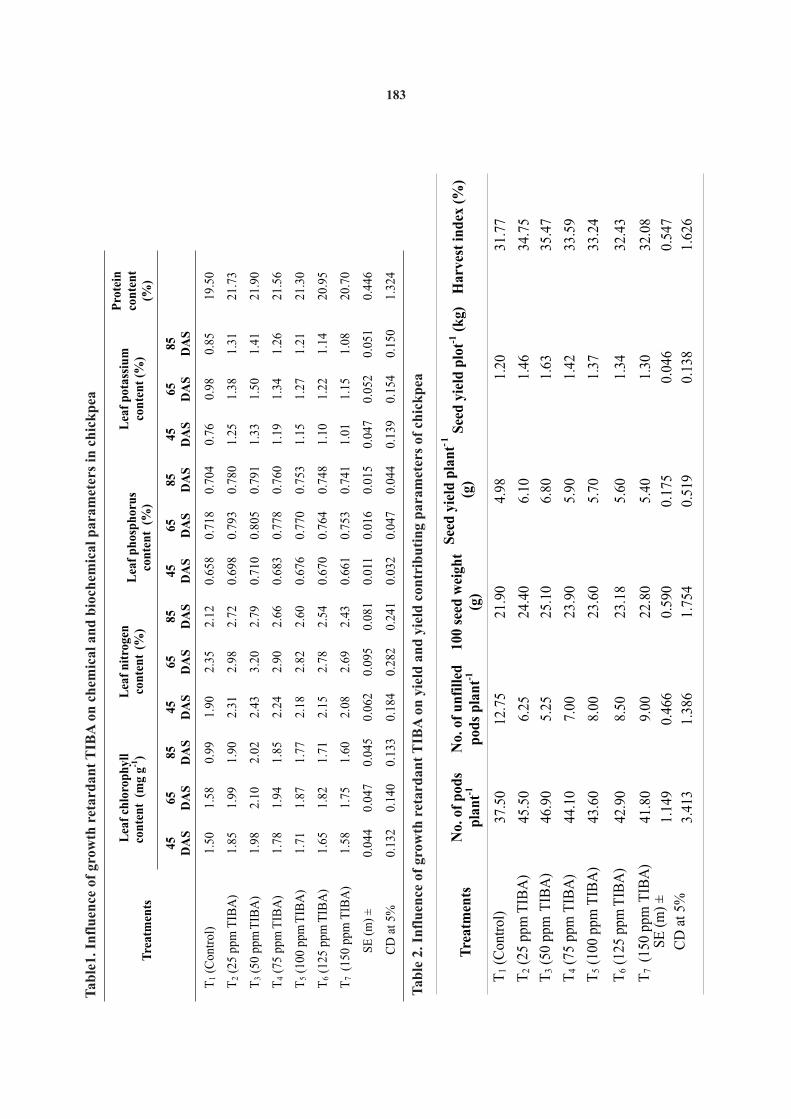
Tab
le1.
In
flu
ence
of
gro
wth
ret
ard
an
t T
IBA
on
ch
emic
al a
nd
bio
chem
ical
par
am
eter
s in
ch
ick
pea
Tre
atm
ents
Lea
f ch
loro
ph
yll
(mg
g-1)
Lea
f n
itro
gen
Lea
f p
hos
ph
oru
sco
nte
nt
(%
)
Lea
f p
otas
siu
m
con
ten
t (%
)
Pro
tein
co
nte
nt
(%)
45
DA
S
65
DA
S
85
DA
S
45
DA
S
65
DA
S
85
DA
S
45
DA
S
65
DA
S
85
DA
S
45
DA
S65
D
AS
85
DA
S
T1
(Con
trol
)
1.50
1.58
0.99
1.90
2.35
2.12
0.65
8
0.71
8
0.70
4
0.76
0.98
0.85
19.5
0
T2
(25
ppm
TIB
A)
1.85
1.99
1.90
2.31
2.98
2.72
0.69
8
0.79
3
0.78
0
1.25
1.38
1.31
21.7
3
T3
(50
ppm
TIB
A)
1.98
2.10
2.02
2.43
3.20
2.79
0.71
0
0.80
5
0.79
1
1.33
1.50
1.41
21.9
0
T4
(75
ppm
TIB
A)
1.78
1.94
1.85
2.24
2.90
2.66
0.68
3
0.77
8
0.76
0
1.19
1.34
1.26
21.5
6
T5
(100
ppm
TIB
A)
1.71
1.87
1.77
2.18
2.82
2.60
0.67
6
0.77
0
0.75
3
1.15
1.27
1.21
21.3
0
T6
(125
ppm
TIB
A)
1.65
1.82
1.71
2.15
2.78
2.54
0.67
00.
764
0.74
81.
101.
221.
1420
.95
T7
(150
ppm
TIB
A)
1.58
1.75
1.60
2.08
2.69
2.43
0.66
10.
753
0.74
11.
011.
151.
0820
.70
SE
(m
) ±
0.04
40.
047
0.04
50.
062
0.09
50.
081
0.01
10.
016
0.01
50.
047
0.05
20.
051
0.44
6
CD
at
5%0.
132
0.14
00.
133
0.18
40.
282
0.24
10.
032
0.04
70.
044
0.13
90.
154
0.15
01.
324
con
ten
t(%
)co
nte
nt
Tab
le 2
. In
flu
ence
of
gro
wth
ret
ard
an
t T
IBA
on
yie
ld a
nd
yie
ld c
on
trib
uti
ng
pa
ram
eter
s of
ch
ick
pea
Tre
atm
ents
No.
of
pod
s p
lan
t-1
No.
of
un
fill
ed
pod
s p
lan
t-1
100
se
ed w
eigh
t
(g)
See
d y
ield
pla
nt-
(g
) S
eed
yie
ld p
lot-1
(k
g)
Har
vest
in
dex
(%
)
(Con
trol
)37
.50
12
.75
21
.90
4.
98
1.20
31
.77
(25
ppm
TIB
A)
45.5
0
6.25
24
.40
6.
10
1.46
34
.75
(50
ppm
TIB
A)
46.9
0
5.25
25
.10
6.
80
1.63
35
.47
(75
ppm
TIB
A)
44.1
0
7.00
23.9
0
5.90
1.42
33.5
9
(100
ppm
TIB
A)
43.6
0
8.00
23.6
0
5.70
1.37
33.2
4
(125
ppm
TIB
A)
42.9
0
8.
50
23
.18
5.
60
1.
34
32
.43
(150
ppm
TIB
A41
.80
9.00
22.8
05.
401.
3032
.08
SE
(m
) ±
1.14
9
0.46
6
0.59
0
0.17
5
0.04
6
0.54
7C
D a
t 5%
3.41
31.
386
1.75
40.
519
0.13
81.
626
1
)
T1
T2
T3
T4
T5
T6
T7
183

soybean genotypes. Legume Res. 29 (3): 191-195. REFERENCES Nichiporovic, A. A. 1960. Photosynthesis and the theory of obtaining higher yield. Fld. Crops Abstr. 13: 169-175.
Niedergang, K.E. and F. Skoog, 1956. Studies on polarity and auxin Anonymous, 2013 (a). Directorate of economics and statistic department
transport in plants. Pl. Physiol. 11: 60-73.of Agriculture and cooperation. www.indiastat.com.
Panse, V.G. and P.V. Sukhatme, 1954. Statistical methods for agriculture Anonymous, 2013 (b). Economic survey of Maharashtra. workers. ICAR ,New Delhi. pp. 107-109.www.mahaagri.gov.in.
Piper, C. S. 1966. Soil and plant analysis, Hans publishers, Bombay, Anonymous, 2013 (c). Joint directorate of agriculture, Nagpur division. Monograph from the waits. Agric. Res. Institute, Univ. MS (India).Adelaide, pp. 47-111, 197-200.Arteca, R. N. and C. N. Dong, 1981. Increased photosynthetic rates
Poonkodi, P. 2003. Phosphorus use efficiency in black gram with following gibberelic acid treatments to the roots of tomato pressmad. Adv. Pl. Sci. 17 (1): 239 -241.plants. Photosynth. Res. 2(2) : 243-249.
Ravinchandran, V.K. and C. Ramaswami, 1991. Source and sink Audus, K.V. and W.D. Thresh, 1956. The action of triiodobenzoic acid on relationship in soybean as influenced by TIBA. Indian J. Pl. growth. Pl. Physiol. 23: 151-156.Physiol. 34 (1): 80-83.Bruinsma, J. 1982. A comment on spectrophotometric determination of
Reddy, P., B. T. Ninganur, M. B. Chetti and S. M. Hiremath, 2009. Effect chlorophyll. Bio-chem., Bio-Phy., Acta. 52: 576-578.of growth retardants and nipping on chlorophyll content, Cathey, H.M. 1964. Physiology of plant growth retarding chemicals. Ann. nitrate reductase activity, seed protein content and yield in Rev. Plant. Physiol. 15: 271-302.cowpea (Vigna unguiculata L.). Karnataka J. Agric. Sci., Deotale, R.D., R.M. Bhiwapurkar, N.V. Sorte, B.H. Nimje, H.U. 22(2): 289-292.Waghmare and M.W. Allurwar, 1994. Growth and yield
Sabnis, S.K. and P. Audus, 1957. Plant growth substances. Mcgraw Hill components of safflower (Carthemus tinctorius L.) as publication, New Delhi, pp. 105.influenced by 2, 3, 5 triiodo benzoic acid. J. Soil and Crops, 4:
Sagare, B. N. and K. T. Naphade, 1987. Effect of hormone on yield, 125-127. economics and nutrients uptake by groundnut (Arachis Donald, C. M. and J. Hamblin, 1976. Growth and development in hypogea L.). P.K.V. Res. J. 11 (1): 19-21.physiology of crop plants, 2nd Ed. Scientific publishers.
Shanmugam, A. and S. Muthuswamy, 1974. Effect of CCC and TIBA on Jodhapur, pp. 198 -199.chrysanthemum (Chrysanthemum indicum Linn.). Indian J. Ganiger, T. S., S.R. Kareekatti and B.C. Patil, 2002. Effect of plant growth Hort. 31 (4): 370-374.regulators on yield and yield components in cowpea.
Tripathi, D.K., Arun Kumar and U.D. Awasthi, 2009. Response of bio-Karnataka. J. Agril. Sci. 15 (4) : 693-695.regulators on flower drop, growth and yield of pigeonpea Gavisiddappa, Rame Gowda, K. Mallikarjun, T. Basavaraja, M. Asif and (Cajanus cajan). Curr. Adv. Agril. Sci. 1 (1): 33-34.L.V. Kumar, 2013. Effect of growth regulator (TIBA) and
Tripathi, D.K., Bhushan Lallu Chandra and R.S. Baghel, 2007. Effect of micronutrient application on seed quality and economics of some growth regulators on flower drop and yield of chickpea. sunflower hybrid KBSH-53 (Helianthus annuus L.). Env. Eco. J. Food Legumes, 20 (1): 117-118.31 (2A): 704-707.
Tripathi, D.K., H.C. Singh and S.K. Parihar, 2003. Effect of growth Jackson, M.L. 1967. Soil Chemical analysis, Printice Hall of India Pvt. regulators on quality parameters in chickpea (Cicer Ltd. New Delhi, pp. 25-28.arietinum). Farm Sci. J. 12 (2): 156-157. Kese, M.K. and A.P. Vardar, 1953. Effect of 2, 3, 5 Triidobenzoic acid on
Tripathi, D. K. and Mithlesh Kumar, 2006. Response of growth regulators the growth of lateral bud and tropism of petiole. Mem. Coll. Univ. Kyoto, serv. 20: 207-216. on growth, yield and protein content of pea seeds (Pisum
Kumar Pankaj, S.M. Hiremath and M.B. Chetti, 2006. Influence of growth sativum). Farm Sci. J. 15 (1): 80-81.regulators on dry matter production and distribution and Winter, V.S. 1968. Growth and development. In Amar Singh. Plant shelling percentage in determinate and semideterminate physiology. Bobay Asia Publishing House, pp. 69.
Rec. on 20.05.2014 & Acc. on 15.07.2014
184
ABSTRACT
The 80 half-sib families along with four checks Bhima, A1, AKS-207 and PKV Pink were evaluated in rabi
2013 in the experimental farm of College of Agriculture, Nagpur with the objectives to determine the expected
genetic gain for seed yield and its components from half-sib selection method, to estimate the correlation and to assess
the frequency of half-sib families significantly superior over checks. Mean, range, variance and heritability estimates -1 -1 revealed the significance of plant height, days to 50% flowering, number of seed capitilum , seed yield plant and
-1number of capitulum plant for selecting superior half-sib families. The narrow sense heritability estimates on family -1 -1mean basis were high for oil content (0.90) followed by seed yield plant (0.86), number of primary branches plant
-1(0.77), number of seeds capitulum (0.75), 100 seed weight (0.71), days to 50 % flowering (0.67), number of capitula -1plant (0.65), plant height (0.39), and days to maturity (0.19) respectively. Expected genetic advance was 56.91 per
cent and 38.24 per cent at 10 per cent selection intensity over population mean and Bhima respectively for the seed -1yield plant . Expected genetic advance was 56.91 per cent and 111.96 per cent at 10 per cent selection intensity over
-1 -1population mean and PKV Pink respectively for the seed yield plant . 100 seed weight, number of capitula plant , -1 -1 number of seeds capitulum and number of primary branches plant were positive and significantly correlated with
-1seed yield plant indicating the significance of these traits for indirect selection of high yielding families. This
indicated that the half sib recurrent selection is effective in increasing population mean and extraction of superior
recombination lines better than check varieties. Eight half sibs families i.e. (HS-60, HS-18, HS-21, HS-14, HS-15, HS-
48, HS-71 and HS-41) were identified as promising half sibs for forwarding to the next cycle.
(Key words: Safflower, half sib, recurrent selection)
Similarly there is no breakthrough in the INTRODUCTIONimprovement of oil content in the last seven decades.
Safflower (Carthamus tinctorius L.) is one of This is mainly due to the use of pedigree selection
the ancient oilseed crop of India. Out of 25 species in technique in population derived from two line crosses
the genus Carthamus only Carthamus tinctorius (L.) and negative correlation between seed yield and oil
(2n=24) is under cultivation. Safflower is usually content. The conventional breeding methods have considered to be a self-pollinated crop. Classen been very useful only for recombining simple (1950), however, reported cross pollination ranging inherited characters. Therefore, these conventional from zero to 100 per cent although in most of the
plants he used, the detectable crossing ranged from 5 breeding methods have not been very efficient for to 40 per cent. It contains 30% oil in Indian varieties. improving quantitatively inherited characters like Safflower oil is preliminary used for cooking. The oil seed yield, oil content, tolerance to stresses and contains high amount of linoleic acid (76%), which is horizontal resistance to diseases and insects. very useful for patients suffering from heart diseases.
Moreover, the crossing and record keeping procedure The unsaturated fatty acids of safflower lower the
are often both money and time consuming for the rate serum cholesterol (Nimbkar, 2002).of progress attained. Conventional method have
The safflower improvement programme in several limitations such as limited use of available India was started in 1931 and N-630, the first variety genetic variability resulting in the development of was released in 1940. In India 25 varieties and five varieties with a narrow genetic base, successive loss safflower hybrids were released in last four decades
of genes in the segregating generation with no chance viz., DSH-129, MKH-11, NARINH-1, MRSA-521
of recombination for genes linked for yield and oil and NARI-H-15. These varieties have the genetic
-1 content (Jensen, 1970). These limitations can be over potential to give yield of 15-20 q ha with oil content come by application of recurrent selection method in of about 30% under optimal condition. However, self pollinating crops and hence this study was attempts to further improve the yield and oil content undertaken in safflower.were not successful for the last four decades.
1 and 5. P.G. Students, College of Agriculture, Nagpur2 and 3. Asstt. Professsors, Botany Section, College of Agriculture, Nagpur4. Sr. Res. Assistant, Botany Section, College of Agriculture, Nagpur
1 2 3 4 5K. B. Patole , S.U. Charjan , S.R. Patil , P. D. Peshattiwar and A. W. Wakade
J. Soils and Crops 25 (1) 185-191, June, 2015 ISSN 0971-2836
HALF SIB RECURRENT SELECTION STUDIES FOR YIELD IN SAFFLOWER (Carthamus tinctorius L.)
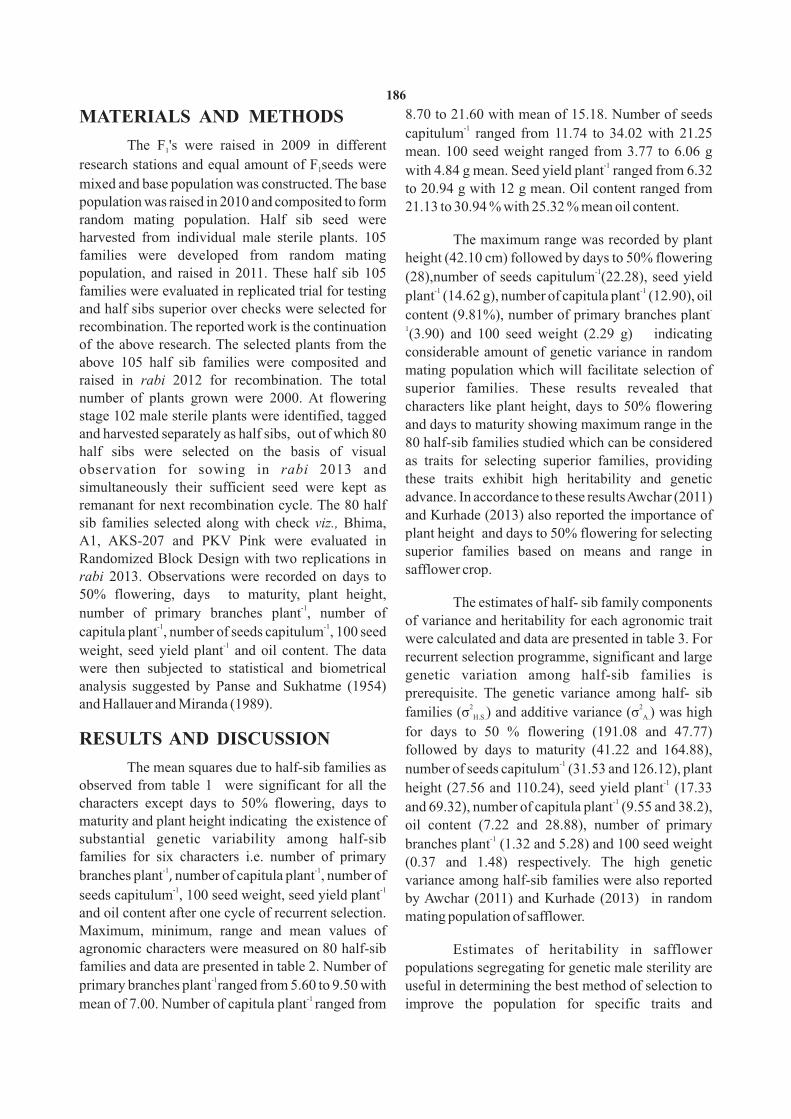
8.70 to 21.60 with mean of 15.18. Number of seeds MATERIALS AND METHODS-1capitulum ranged from 11.74 to 34.02 with 21.25
The F 's were raised in 2009 in different 1 mean. 100 seed weight ranged from 3.77 to 6.06 g -1research stations and equal amount of F seeds were 1 with 4.84 g mean. Seed yield plant ranged from 6.32
mixed and base population was constructed. The base to 20.94 g with 12 g mean. Oil content ranged from population was raised in 2010 and composited to form 21.13 to 30.94 % with 25.32 % mean oil content.random mating population. Half sib seed were harvested from individual male sterile plants. 105 The maximum range was recorded by plant families were developed from random mating height (42.10 cm) followed by days to 50% flowering
-1population, and raised in 2011. These half sib 105 (28),number of seeds capitulum (22.28), seed yield -1 -1families were evaluated in replicated trial for testing plant (14.62 g), number of capitula plant (12.90), oil
-and half sibs superior over checks were selected for content (9.81%), number of primary branches plantrecombination. The reported work is the continuation 1
(3.90) and 100 seed weight (2.29 g) indicating of the above research. The selected plants from the
considerable amount of genetic variance in random above 105 half sib families were composited and
mating population which will facilitate selection of raised in rabi 2012 for recombination. The total
superior families. These results revealed that number of plants grown were 2000. At flowering
characters like plant height, days to 50% flowering stage 102 male sterile plants were identified, tagged
and days to maturity showing maximum range in the and harvested separately as half sibs, out of which 80
80 half-sib families studied which can be considered half sibs were selected on the basis of visual
as traits for selecting superior families, providing observation for sowing in rabi 2013 and
these traits exhibit high heritability and genetic simultaneously their sufficient seed were kept as
advance. In accordance to these results Awchar (2011) remanant for next recombination cycle. The 80 half
and Kurhade (2013) also reported the importance of sib families selected along with check viz., Bhima,
plant height and days to 50% flowering for selecting A1, AKS-207 and PKV Pink were evaluated in
superior families based on means and range in Randomized Block Design with two replications in safflower crop.rabi 2013. Observations were recorded on days to
50% flowering, days to maturity, plant height, The estimates of half- sib family components -1
number of primary branches plant , number of of variance and heritability for each agronomic trait
-1 -1capitula plant , number of seeds capitulum , 100 seed were calculated and data are presented in table 3. For
-1weight, seed yield plant and oil content. The data recurrent selection programme, significant and large were then subjected to statistical and biometrical genetic variation among half-sib families is analysis suggested by Panse and Sukhatme (1954) prerequisite. The genetic variance among half- sib and Hallauer and Miranda (1989). 2 2
families (ó ) and additive variance (ó ) was high H.S. A.
for days to 50 % flowering (191.08 and 47.77) RESULTS AND DISCUSSIONfollowed by days to maturity (41.22 and 164.88),
-1The mean squares due to half-sib families as number of seeds capitulum (31.53 and 126.12), plant -1observed from table 1 were significant for all the height (27.56 and 110.24), seed yield plant (17.33
-1characters except days to 50% flowering, days to and 69.32), number of capitula plant (9.55 and 38.2), maturity and plant height indicating the existence of oil content (7.22 and 28.88), number of primary
-1substantial genetic variability among half-sib branches plant (1.32 and 5.28) and 100 seed weight families for six characters i.e. number of primary (0.37 and 1.48) respectively. The high genetic
-1 -1branches plant , number of capitula plant , number of variance among half-sib families were also reported -1 -1seeds capitulum , 100 seed weight, seed yield plant by Awchar (2011) and Kurhade (2013) in random
and oil content after one cycle of recurrent selection. mating population of safflower.Maximum, minimum, range and mean values of agronomic characters were measured on 80 half-sib Estimates of heritability in safflower families and data are presented in table 2. Number of populations segregating for genetic male sterility are
-1primary branches plant ranged from 5.60 to 9.50 with useful in determining the best method of selection to -1 mean of 7.00. Number of capitula plant ranged from improve the population for specific traits and
186
expressing the reliability of the phenotypic value as a (21.21 and 18.18), days to 50 % flowering (10.82 and guide to the breeding value. In the present study the 9.25,) plant height (6.81 and 5.82), and days to narrow sense heritability estimates on family mean maturity (4.63 and 3.96) respectively.basis were high for oil content (0.90) followed by seed
-1 - The expected genetic advance expressed as yield plant (0.86), number of primary branches plant1 -1 per cent over PKV Pink at 5 and 10 per cent selection (0.77), number of seeds capitulum (0.75), 100 seed
-1intensity was highest for seed yield plant (130.98 and weight (0.71), days to 50 % flowering (0.67), number -1-1 111.96) followed by number of capitula plant (54.78 of capitula plant (0.65), plant height (0.39), and days -1to maturity (0.19) respectively. High estimates of and 46.80), number of primary branches plant (43.33
-1 heritability were also reported in random mating and 37.08), number of seeds capitulum (36.36 and population of safflower for several agronomic traits 31.07), 100 seed weight (28.76 and 24.65), oil content like days to 50 % flowering, plant height, days to (22.19 and 18.96), days to 50 % flowering (10.72 and
-1maturity, number of primary branches plant , number 9.16,) plant height (7.12 and 6.08)and days to
-1 -1of capitula plant , number of seeds capitulum , 100 maturity (4.45 and 3.81) respectively. The expected -1
seed weight and seed yield plant by Gawande genetic advance from single trait selection, expressed (2010), Awchar (2011) and Kurhade (2013) in as per cent of population mean and over check Bhima safflower. and PKV Pink revealed the importance of seed yield
-1 -1plant and number of capitula plant as they exhibited The data regarding expected genetic advance maximum genetic advance. The heritability in narrow
per cycle from single trait selection using half-sib sense for these two characters was 86 % and 65 % family selection and expected genetic advance respectively. Hence, selection of 5 % or 10 % superior expressed as per cent of population mean are -1half-sibs based on seed yield plant and number of presented in table 4. The expected genetic advance -1
capitula plant will definitely result in improved from single trait selection at 5 and 10 per cent of half-
performance in the next cycle. sib families was high for days to 50 % flowering (11.69 and 9.99 respectively), followed by number of In accordance to this study in safflower,
-1 -1seeds capitulum (10.05 and 8.59), seed yield plant Gawande (2010) reported that expected genetic (7.99 and 6.83), days to maturity (6.82 and 5.83), oil advance was 28.88 per cent and 22.78 per cent at 10 content (5.56 and 4.75), plant height (6.25 and 5.34), per cent selection intensity over population mean and
-1number of capitula plant (5.15 and 4.40), number of -1
Bhima respectively for seed yield plant and 8.86 per -1
primary branches plant (2.08 and 1.78) and 100 seed -1cent and 8.37 per cent for number of capitula plant weight (1.05 and 0.90).
after third cycle of recurrent selection. Awchar (2011)
reported 60.95, 52.10 and 41.40 per cent genetic The expected genetic advance expressed as -1
advance in seed yield plant and 16.65, 14.24 and per cent of population mean at 5 and 10 per cent was -1
-1 11.33 per cent in number of capitula plant at 5, 10 and highest for seed yield plant (66.58 and 56.91) -1 20 per cent selection intensity for mean population followed by number of seeds capitulum (47.29 and
-1 respectively. The genetic advance over Bhima at 5, 10 40.42), number of capitula plant (33.92 and 28.98), -1 and 20 per cent selection intensity were 46.22, 39.51 number of primary branches plant (29.71 and 25.42),
and 31.40 per cent respectively and for number of oil content (21.95 and 18.75), 100 seed weight (21.69 -1
capitula plant were 15.78,13.51 and 10.74 per cent and 18.59), days to 50% flowering (11.47 and 9.80), respectively after third cycle of recurrent selection. plant height (6.97 and 5.95) and days to maturity (4.67 Kurhade (2013) reported that expected genetic and 3.99). The expected genetic advance expressed as advance was 42.48 per cent and 48.23 per cent at 10 per cent over Bhima at 5 and 10 per cent selection
-1 per cent selection intensity over population mean and intensity was highest for seed yield plant (44.73 and -1-1 Bhima respectively for the seed yield plant .This 38.24) followed by number of capitula plant (36.26
-1 clearly indicates the accumulation of favorable genes and 30.98), number of seed capitulum (35.79 and -1 for yield and important yield component i.e. number 30.59), number of primary branches plant (23.11 and
-1of capitula plant .19.77), oil content (21.68 and 18.52), 100 seed weight
187

Tab
le 1
. An
alys
is o
f va
rian
ce f
or e
xper
imen
tal
des
ign
Rep
lica
tion
1
16
2.05
18
2.29
93
.60
0.67
0.
29
15.1
3
0.45
0.95
4.3
8
Gen
otyp
es
(Hal
f si
bs +
83
70.8
0
69.1
7
89.5
9 1.70
**
14.5
7**
41.7
0**
0.52
**
19.9
2**
8.
04**
8323
.03
41.6
148
.37
0.38
5.02
10.1
70.
152.
590.
82
Sou
rces
of
Var
iati
ond
.f.
Day
s to
50%
flo
wer
ing
Day
s t
o m
atu
rity
Pla
nt
hei
ght
(cm
)
No.
of
pri
mar
y b
ran
ches
-1
pla
nt
No.
of
cap
itu
la
-1p
lan
t
No.
of s
eed
s -1ca
pit
ula
100
seed
wei
ght
(g)
See
d
yiel
d
-1
pla
nt
(g)
Oil
con
ten
t (
%)
Mea
n s
qu
are
Err
or
chec
ks)
** S
igni
fica
nt a
t 1
% l
evel
Tab
le 2
. Mea
n v
alu
es o
f ag
ron
omic
ch
arac
ters
mea
sure
d o
n h
alf-
sib
fam
ilie
s
Ch
arac
ters
D
ays
to
50 %
flo
wer
ing
Day
s to
m
atu
rity
Pla
nt
hei
ght
(c
m)
No.
of
pri
mar
y b
ran
ches
p
lan
t-1
No.
of
cap
itu
la
pla
nt-1
No.
of
seed
s
cap
itu
la-1
100
se
ed
wei
ght
(g
)
See
d y
ield
p
lan
t-1
(g)
Oil
co
nte
nt
(
%)
Max
imum
11
6
160.
00
117.
00
9.50
21
.60
34
.02
6.
06
20.9
4
30.9
4
Min
imum
88
13
2.00
74
.90
5.
60
8.70
11
.74
3.
77
6.32
21
.13
Ran
ge
28
28.0
0
42.1
0
3.90
12
.90
22
.28
2.
29
14.6
2
9.81
Mea
n(H
.S.)
*
101.
86
145.
86
89.6
7
7.00
15
.18
21
.25
4.
84
12.0
0
25.3
2
Ch
eck
Var
ieti
es**
Bhi
ma
10
8
147.
00
91.7
0
9.00
14
.20
28
.08
4.
95
17.8
6
25.6
4
A1
12
0.50
16
4.50
74
.90
4.
20
6.00
18
.54
4.
51
8.60
24
.35
A
KS
-207
10
1.50
14
5.50
76
.50
7.
40
15.4
0
22.4
6
5.24
10
.10
22
.43
P
KV
-Pin
k10
915
3.00
87.7
04.
809.
4027
.64
3.65
6.10
25.0
5
* M
ean
perf
orm
ance
of
80 h
alf-
sib
fam
ilie
s**
Mea
n pe
rfor
man
ce o
f 4
line
s of
che
cks
188
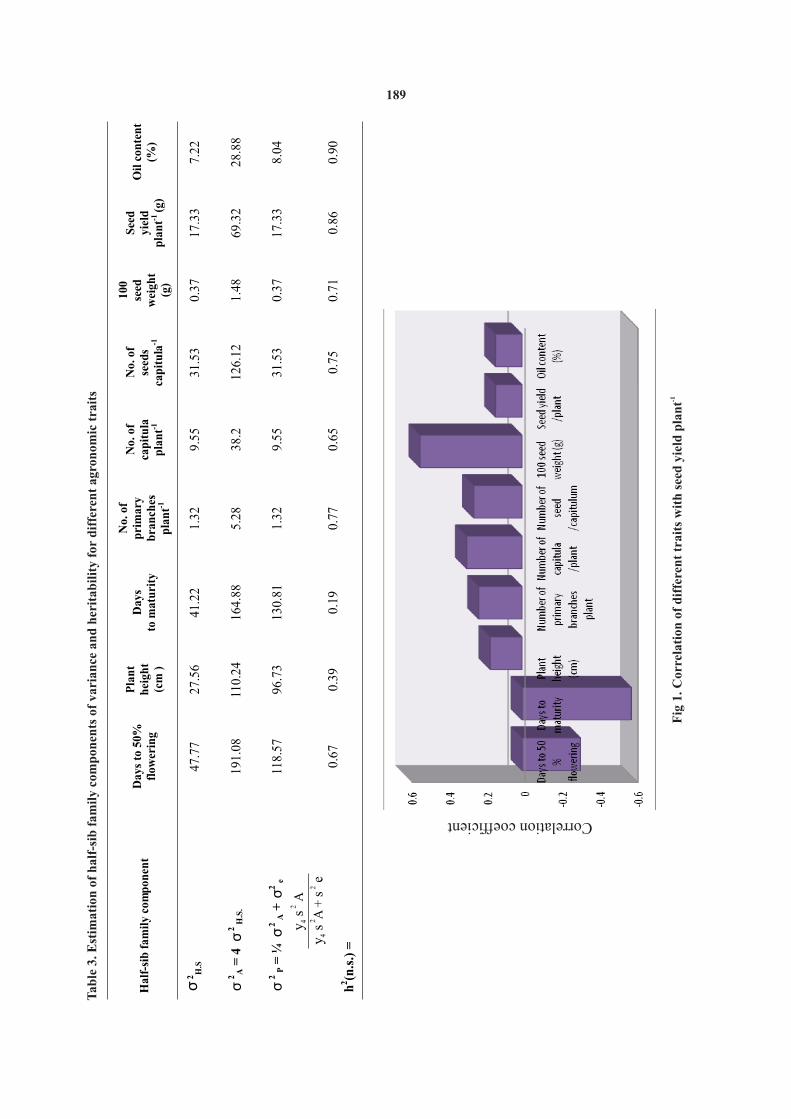
Tab
le 3
. Est
imat
ion
of
hal
f-si
b f
amil
y co
mp
onen
ts o
f va
rian
ce a
nd
her
itab
ilit
y fo
r d
iffe
ren
t ag
ron
omic
tra
its
Hal
f-si
b f
amil
y co
mp
onen
t D
ays
to 5
0%
flow
erin
g
Pla
nt
hei
ght
(c
m )
Day
s
to m
atu
rity
No.
of
pri
mar
y
bra
nch
es
pla
nt-1
No.
of
cap
itu
la
pla
nt-1
No.
of
se
eds
ca
pit
ula
-1
100
se
ed
wei
ght
(g)
See
d
yiel
d
pla
nt-1
(g)
Oil
con
ten
t
(%)
ó2
H.S
47
.77
27
.56
41
.22
1.
32
9.55
31
.53
0.
37
17.3
3
7.22
ó2
A =
4 ó
2 H
.S.
191.
08
110.
24
164.
88
5.28
38
.2
126.
12
1.48
69
.32
28
.88
ó2
P =
¼ ó
2 A
+ó
2 e
118.
57
96.7
3
130.
81
1.32
9.
55
31.5
3
0.37
17
.33
8.
04
h2(n
.s.)
=
0.67
0.
39
0.19
0.
77
0.65
0.
75
0.71
0.
86
0.90
Correlation coefficient
-1F
ig 1
. Cor
rela
tion
of
dif
fere
nt
trai
ts w
ith
see
d y
ield
pla
nt
y 4
2s
A
y 4
22
sA
+ s
e
189
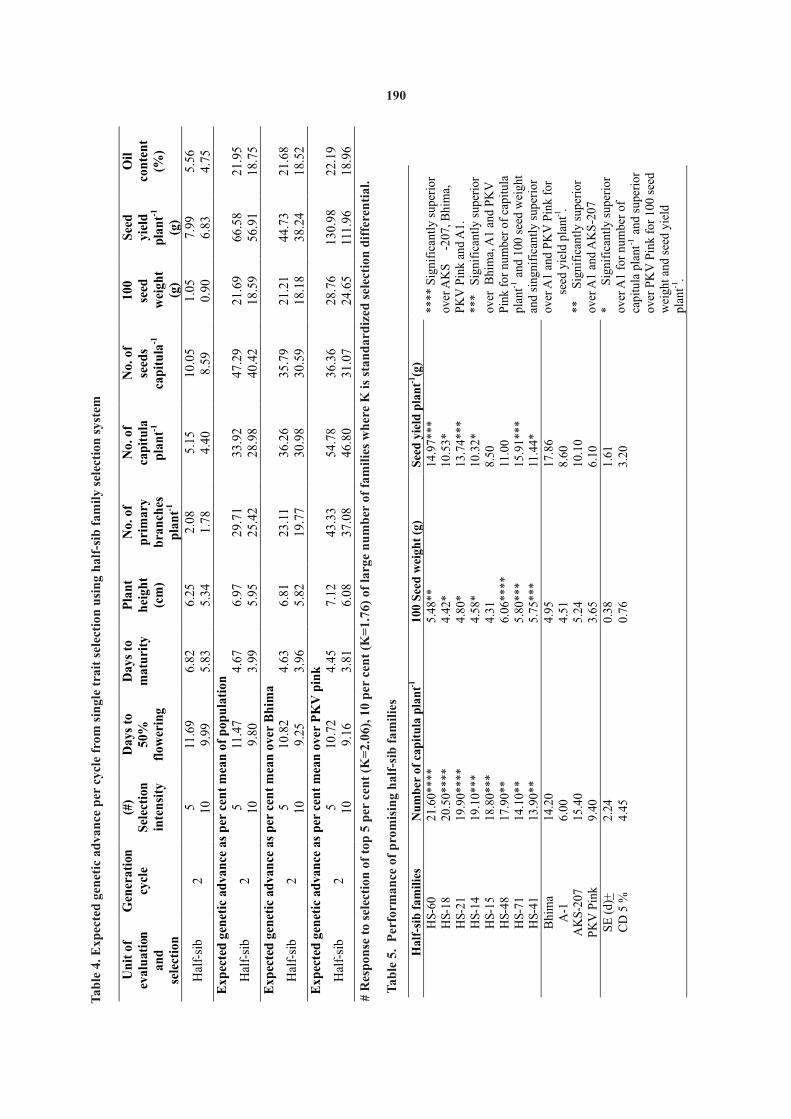
Tab
le 4
. Exp
ecte
d g
enet
ic a
dva
nce
per
cyc
le f
rom
sin
gle
trai
t se
lect
ion
usi
ng
hal
f-si
b f
amil
y se
lect
ion
sys
tem
Un
it o
f ev
alu
atio
n
and
se
lect
ion
Gen
erat
ion
cy
cle
(#
)
Sel
ecti
on
inte
nsi
ty
Day
s to
50
%
flow
erin
g
Day
s to
m
atu
rity
P
lan
t h
eigh
t
(cm
)
No.
of
pri
mar
y
bra
nch
es
pla
nt-1
No.
of
cap
itu
la
pla
nt-1
No.
of
se
eds
ca
pit
ula
-1
100
se
ed
wei
ght
(g)
See
d
yiel
d
pla
nt-1
(g)
Oil
co
nte
nt
(%
)
Hal
f-si
b
2
5
11.6
9
6.82
6.
25
2.08
5.
15
10.0
5
1.05
7.
99
5.56
10
9.
99
5.83
5.
34
1.78
4.
40
8.59
0.
90
6.83
4.
75
Exp
ecte
d g
enet
ic a
dva
nce
as
per
cen
t m
ean
of
pop
ula
tion
Hal
f-si
b
2
5
11.4
7
4.67
6.
97
29.7
1
33.9
2
47.2
9
21.6
9
66.5
8
21.9
5
10
9.80
3.
99
5.95
25
.42
28
.98
40
.42
18
.59
56
.91
18
.75
E
xpec
ted
gen
etic
ad
van
ce a
s p
er c
ent
mea
n o
ver
Bh
ima
Hal
f-si
b
2
5
10.8
2
4.63
6.
81
23.1
1
36.2
6
35.7
9
21.2
1
44.7
3
21.6
8
10
9.25
3.
96
5.82
19
.77
30
.98
30
.59
18
.18
38
.24
18
.52
E
xpec
ted
gen
etic
ad
van
ce a
s p
er c
ent
mea
n o
ver
PK
V p
ink
Hal
f-si
b
2
5
10.7
2
4.45
7.
12
43.3
3
54.7
8
36.3
6
28.7
6
130.
98
22.1
9
10
9.16
3.
81
6.08
37
.08
46
.80
31
.07
24
.65
11
1.96
18
.96
#
Res
pon
se t
o se
lect
ion
of
top
5 p
er c
ent
(K=
2.06
), 1
0 p
er c
ent
(K=
1.76
) of
lar
ge n
um
ber
of
fam
ilie
s w
her
e K
is
stan
dar
diz
ed s
elec
tion
dif
fere
nti
al.
Tab
le 5
. P
erfo
rman
ce o
f p
rom
isin
g h
alf-
sib
fam
ilie
s
Hal
f-si
b f
amil
ies
N
um
ber
of
cap
itu
la p
lan
t-1
100
See
d w
eigh
t (g
)
See
d y
ield
p
lan
t-1(g
)
**
** S
igni
fica
ntly
sup
erio
r ov
er A
KS
-207
, Bhi
ma,
P
KV
Pin
k an
d A
1.
***
S
igni
fica
ntly
sup
erio
r ov
er B
him
a, A
1 an
d P
KV
P
ink
for
num
ber
of c
apit
ula
plan
t-1
an
d 10
0 se
ed w
eigh
t an
d si
ngni
fica
ntly
sup
erio
r ov
er A
1 an
d P
KV
Pin
k fo
r
seed
yie
ld p
lant
-1.
**
S
igni
fica
ntly
sup
erio
r ov
er A
1
and
AK
S-2
07
*
Sig
nifi
cant
ly s
uper
ior
over
A1
for
num
ber
of
capi
tula
pla
nt-1
and
supe
rior
ov
er P
KV
Pin
k fo
r 10
0 se
ed
wei
ght
and
seed
yie
ld
pl
ant-1
.
HS
-60
H
S-1
8
HS
-21
H
S-1
4
HS
-15
H
S-4
8
HS
-71
H
S-4
1
21.6
0***
*
20.5
0***
*
19.9
0***
*
19.1
0***
18
.80*
**
17.9
0**
14
.10*
*
13.9
0**
5.48
**
4.42
*
4.80
*
4.58
*
4.31
6.
06**
**
5.80
***
5.
75**
*
14.9
7***
10
.53*
13
.74*
**
10.3
2*
8.50
11
.00
15
.91*
**
11.4
4*
Bhi
ma
A
-1
AK
S-2
07
PK
V P
ink
14.2
0
6.00
15
.40
9.
40
4.95
4.
51
5.24
3.
65
17.8
6
8.60
10
.10
6.
10
SE
(d)
+
2.
24
0.
38
1.
61
C
D 5
%
4.
45
0.
76
3.
20
190
The recurrent selection experiments are thirteen over A1, PKV Pink and twenty eight over -1mainly designed and conducted for improving seed only PKV Pink for seed yield plant . As none of the
-1 half sib families were observed to be significantly yield plant . However, this does not mean that other -1superior over all the four checks for seed yield plant . traits are unimportant. The simple correlations of
-1 In the present study selection of promising half sib different traits with seed yield plant is reported in families for forwarding to the next cycle was done figure 1. The correlation coefficient of seed yield
-1 considering the important yield component i.e. plant with different traits revealed that number of -1 -1 - number of capitula plant and100 seed weight. These primary branches plant , number of capitula plant
1 -1 two traits were considered as they have exhibited ,number of seeds capitulum and 100 seed weight -1 maximum positive significant correlation coefficient were positively associated with seed yield plant
-1with seed yield plant . Based on this criteria, out of 80 while days to 50% flowering and days to maturity
-1 half sib families three half sib families (HS-18, HS-were negatively associated with seed yield plant . Oil 21 and HS-60) significantly superior over all the content and plant height had positive but non
-1 four checks and two half sib family HS-14, HS-15 significant association with seed yield plant . Usually significantly superior over all the check except AKS-quality characters like oil content were found to be 207, three half sibs HS-48, HS-41 and HS-71 were negatively correlated with yield parameter. But in this identified and found significantly superior over A1 study this type of association has been broken due to
-1and AKS-207 for number of capitula plant (Table 5). random mating and positive association though non All these eight half-sib families were superior over significant was obtained between oil content and seed
-1-1 one or other check for seed yield plant . Hence, the yield plant . It can be concluded from the correlation
remnant seeds of all these eight selected half sib studies that 100 seed weight exhibiting the maximum families is suggested to be used for recombination -1
correlation coefficient with seed yield plant cycle in next cycle.-1
followed by number of capitula plant ,number of - 1
seeds capitulum and number of primary branches REFERENCES-1
plant . Hence, these traits can be used for indirect -1 Awchar. P. C. 2011. Evaluation of second cycle of half-sib recurrent selection to improve seed yield plant in safflower.
selection for seed yield and its component in safflower Deshmukh (2009) and Kurhade (2013) reported that (Carthamus tinctorius L.) (Agril.). M. Sc. Thesis (unpub.)
submitted to Dr. PDKV, Akola.days to 50 % flowering and days to maturity had Classen, C. E. 1950. Natural and controlled crossing in safflower -1negative correlation with seed yield plant indicating (Carthamus tinctorius L.). Agron. J. 42: 381-384. Deshmukh, S. G. 2009. Genetic gain from half-sib recurrent in safflower breaking of positive correlation to negative
(Carthamus tinctorius L). M.Sc. (Agril) thesis (Unpub.) correlation. submitted to Dr.PDKV, Akola.
Gawande, N. G. 2010. Evaluation of recurrent selection derived lines in safflower (Carthamus tinctorius L.). M.Sc. (Agril.) thesis The objective of any recurrent selection (Unpub.) submitted to Dr. PDKV, Akola.
method is to increase the frequency of desirable genes Hallaur, A. R. and J. B. Miranda, Fo, 1989. Selection and breeding methods in K.J. Frey (ed.) Plant breeding II. The Iowa State thereby increase the frequency of lines than check University Press, Ames. USA.
varieties. In the present study, when 80 half sib Jensen, N. F. 1970. A diallel selective mating systems for cereal breeding. Crop Sci. 10 (6) 629-635.families were compared with check, it was found that
Kurhade, G.2013. Studies on recurrent selection in random mating none of the families were significantly superior over population in safflower (Carthamus tinctoriusL.).
check Bhima (high yielding check) for seed yield M.Sc. (Agril.) thesis (Unpub) submitted to Dr.PDKV, Akola.-1 Nimbkar. N. 2002. Safflower rediscovered. Times Agril J. 2 (1): 32-36.plant . Twenty three half-sib families were superior
Panse, V.G. and P.V. Sukhatme, 1954. Statistical methods for agricultural over three checks AKS-207, A1 and PKV Pink, workers.ICAR, New Delhi.pp. 54-57.
Rec. on 31.05.2014 & Acc. on 27.07.2014
191
ABSTRACT
The present investigation entitled “Utilization of carrot juice (Dacus carota) for preparation of flavoured milk” was undertaken during Dec. 2013-May 2014. Flavoured milk was prepared using standardized milk containing 3 per cent fat with constant level of sugar (8 per cent) and different levels of carrot juice viz, 2% (T ), 4% (T ), 6% (T ) 1 2 3
and 8% (T ). The product was analyzed for chemical composition as well as for sensory attributes in completely 4
randomized design. The cost of production was also calculated by considering the retail market prices of different ingredients used. The results showed that fat, total solids, solids not fat, and protein were significantly decreased with the increase in concentration of carrot juice flavoured milk. The fat content was decreased from 2.72 to 2.62 per cent, total solids content decreased from 19.20 to 18.81 per cent, protein content decreased from 3.35 to 3.18 per cent and SNF content decreased from 16.48 to 16.19 per cent. On the other hand, the titrable acidity and ash percentage were significantly increased with the increase in the levels of carrot juice. Titrable acidity increased from 0.14 to 0.21 per cent and ash content increased from 0.75 to 0.84 per cent respectively. The significantly highest scores for colour and general appearance (28 out of 30), taste (46 out of 50), acceptability (18.66 out of 20) and overall acceptability (92.66 out of 100) were obtained in flavoured milk containing 4 per cent of carrot juice. The cost of flavoured milk increased with the increase in the levels of carrot juice. It is inferred from the above results that acceptable quality flavoured
-1milk can be produced by blending carrot juice to the extent of 4 per cent with cost of production of Rs. 51.09 l .
(Key words: Flavoured milk, carrot juice, physicochemical parameters, sensory attributes, cost structure)
tissues and helps the body to fight with infections, INTRODUCTIONkeeps eyes healthy, nourish epithelial tissues in the
lungs, as well as of the skin. Apart from being high in Flavoured milks are the milks to which some carotenoids, carrots are also high in dietary fibres flavours are added. The very common flavours that (Singh et al., 2006). are added to the milk are cocoa and chocolate.
Flavoured milk can be prepared and marketed for The use of carrot juice as the natural growing children and adults. Flavoured milk is
flavouring agent in the preparation of carrot juice refreshing drink and it is served as cold drink. This flavoured milk may prove to be beneficial due to can be prepared and marketed in any season of the highly nutritious nature of carrot as compared to year as blending material such as different types of artifitial flavours used generally for preparation of flavours i.e. rose, vanilla, cardamom, chocolate, flavoured milk. The carrot juice is not consumed as orange and pineapple are also available throughout such because of its somewhat bitter taste and needs the year. special treatment for its processing to develop an
acceptable beverage. Ritu et al. (2011) prepared Carrot (Dacus carota L.) is inexpensive and herbal flavoured milk using double toned milk and highly nutritious as it contains appreciable amount of extract of 10 medicinal herbs viz, amla, vitamins B (0.04 mg), B (0.02 mg) and B (0.2 mg), 2 6 12
ashwagandha, atibala, bael, brahmi, rasna, saptala, vitamin C (4 mg) besides being rich in carotene (5.33 saunf, triphala, vacha. Repate et al. (2010) prepared a mg) (Gopalan et al.,1991). Bose et al. (2003) reported
-1 safflower flavoured milk by using milk which is that nutritive value of edible portion of carrot 100 g standardized at 3 % fat and 9 % SNF and blended with i.e. 86.0 g moisture, 0.9 g protein, 0.2 g fat, 10.6 g different proportions of safflower milk. Singh et al. carbohydrate, 1.2 g fibre, 3150 IU vitamin A, 1.1 g (2005) prepared carrot flavoured milk, their studies minerals, 3.0 mg vitamin C, 80 mg calcium, 30 mg revealed that although all the combinations (10,20,30 phosphorus, 2.2 m iron, 14 mg magnesium and 27 mg per cent carrot juice containing flavoured milk) were sulphur. High carotenoid intake is associated with found generally acceptable, flavoured milk lowering risk of many cancer diseases, especially the
prostate cancer. Further, vitamin A (12000 IU) is an containing 20 per cent carrot juice was highly
acceptable. Dalim et al. (2012) evaluated chickoo andantioxidant which is key to the growth and repair of
1 and 4. P.G. Students, Animal Husbandry and Dairy Science, College of Agriculture, Nagpur2. Asstt. Professor, Animal Husbandry and Dairy Science, College of Agriculture, Nagpur3. Assoc. Professor, Animal Husbandry and Dairy Science, College of Agriculture, Nagpur
UTILIZATION OF CARROT (Dacus carota) JUICE FOR PREPARATION OF FLAVOURED MILK
J. Soils and Crops 25 (1) 192-197, June, 2015 ISSN 0971-2836
1 2 3 4S.S. Shirke , R.M.Zinjarde , V.G. Atkare and N.T. Pendawale

banana flavoured milk for the physico-chemical cooling the same was transferred in the sterilized characteristics. It was inferred by them that chickoo bottle and kept under refrigeration storage at until use.
flavoured milk based beverage was more acceptable Analytical grade chemicals were used for than that of banana flavoured milk based beverage.
chemical analysis of carrot flavoured milk. Fat content in flavoured milk was determined by Gerber's Therefore, it was planned to study on method as prescribed in BIS bulletin no IS: 1224, Part utilization of carrot juice in the preparation of 1(Anonymous,1977). The total solids percentage in flavoured milk.flavoured milk was determined by using gravimetric method as described in BIS handbook of food MATERIALS AND METHODSanalysis SP-18 part XI, Dairy products (Anonymous,
The present invest igat ion enti t led 1981). The protein content in flavoured milk was
“Utilization of carrot juice (Dacus carota) for determined by microkjeldahl method as per
preparation of flavoured milk” was undertaken procedure recommended in IS 1479(part II)
during the period Dec. 2013-May 2014.During the (Anonymous, 1961). SNF content was determined as
entire study fresh, clean, whole cow milk was per procedure recommended IS 1183 (Anonymous,
obtained from the Section of Animal Husbandry and 1965). Titratable acidity was determined as per the
Dairy Science, College of Agriculture, Nagpur. The procedure recommended in BIS Handbook of food
milk was strained through clean muslin cloth and analysis, SP-18, (Part XI) Dairy products transferred into well cleaned and sterilized flat bottom (Anonymous, 1981).stainless steel vessel and standardized at 3 per cent fat. Carrot juice prepared from fresh carrots of local The quality of flavoured milk was judged by varieties available in the market was, used for sensory evaluation in respect of flavour, body and preparation of flavoured milk. Clean crystalline sugar texture, colour and appearance, by offering sample to purchased from local market was used as a panel of 5 judges in each trial separately with help of sweetening agent. The flavoured milk was prepared 100 point numeric score prescribed by Pal and Gupta with constant level of sugar (8 per cent) and different (1985). levels of carrot juice viz, 2% (T ), 4% (T ), 6% (T ) 1 2 3
Sr. No. Characters Scoreand 8% (T ) were added in carrot flavoured milk.4 1 Colour and general appearance 30 2 Taste 50
Gupta et al. (2005) reported the nutritive 3 Acceptability 20-1 Total 100value of carrot juice 100 ml i.e. 90.51 g
moisture,0.88 g protein,0.20 g fat,0.9 g ash,9.49 g The experiment was laid out in CRD with 4 total solids,1.01 g fibre,238.58 mg calcium,8.83 mg treatments and five replications. The data were iron 539.57ug carotenoids and 464.13 ug â carotene analyzed statistically according to method described and Salwa et al. (2004) reported that the average by Snedecor and Corchan (1994).chemical composition of carrot juice is around moisture 92.85 %, fat 0.20 %, protein 0.88 %, total RESULTS AND DISCUSSIONsolids 7.15 %, ash 0.90 % and acidity 2.58 %.
Chemical quality of carrot juice flavoured milk was evaluated with respect to fat, total solids, Method of preparation of flavoured milk
suggested by De (2003) was used. Sugar was weighed protein, titratable acidity and ash content and data are as per proportion (8%). At the same time milk was presented in table 1.
standardized to 3 per cent fat by using Pearson's Fat contentSquare method. The Milk was filtered and pre-heated
oto 35 to 40 C. After standardization, boiling of milk Fat content of flavoured milk was was carried out. The sugar and carrot juice were added significantly affected due to the addition of different in milk in desired amount. The mixture was then levels of carrot juice. It was noticed that with the
0increase in proportion of carrot juice the fat content pasteurized at 71 C for 30 minutes. The mixture was
then kept for cooling to room temperature and after gradually decreased. Thus, significantly highest fat
193
content (2.72 %) was noticed in 2 per cent carrot juice milk prepared with different concentrations of carrot juice viz., 2% (T ), 4% (T ), 6% (T ), and 8% (T ) flavoured milk and the lowest fat content (2.62 %) 1 2 3 4
was noticed in 8 per cent carrot juice flavoured milk. treatments were 16.48, 16.39, 16.30 and 16.19 per cent respectively. It indicates that with the addition of
The results of present investigation are in line carrot juice in flavoured milk there was slight with the findings of Shelke et al. (2008) who reported decrease in SNF content with the increase in carrot that fat content of rose, vanilla, cardamom, juice concentration in flavoured milk but the strawberry, kesar, pineapple and mango flavoured decreasing variations were not statistically milks slightly decreased as compared to original milk. significant.
Total solids content The results of present investigation are in general agreement with the findings of Shelke et al. Total solids content of flavoured milk was (2008). They observed that SNF content of different significantly affected due to the addition of different flavoured milk beverages was ranging from 17.02 to levels carrot juice. Significantly highest total solids 17.13. Deore (2013) reported that solid not fat per content (19.20 %) was noticed in 2 per cent carrot cent decreased with increased fat content of pineapple juice flavoured milk and the lowest total solids flavoured milk.content (18.81 %) was noticed in 8 per cent carrot
juice flavoured milk. It indicated that total solids Titratable acidity contentcontent in flavoured milk decreased with the increase
in the level of carrot juice. Titratable acidity content of flavoured milk was significantly affected due to the addition of carrot
The results of present investigation are in juice in different levels. Significantly highest acidity general agreement with the findings of Singh et al. content (0.21 %) was noticed in 8 per cent carrot juice (2005). They reported that with increase in the level of flavoured milk and the lowest acidity content (0.14 carrot juice, there was proportionate decrease in the %) was noticed in 2 per cent carrot juice flavoured total solids content of carrot flavoured milk. Likewise milk. It indicated that acidity content in flavoured Repate et al. (2010) also noticed that the increase of milk increased with the increased carrot juice level in safflower concentration in flavoured milk during the flavoured milk.manufacture of safflower flavoured milk, there was decrease in the total solids content in flavoured milk. The results of present investigation are in
agreement with the findings of Singh et al. (2005). Protein content They reported that with the increase in the level of
carrot juice, there was proportionate increase in the Protein content of flavoured milk was acidity content of flavoured milk.significantly affected due to the addition of different
levels of carrot juice. Significantly highest total Ash contentprotein content (3.35%) was noticed in 2 per cent
carrot juice flavoured milk and the lowest protein Ash content of flavoured milk was content (3.18%) was noticed in 8 per cent carrot juice significantly affected due to the addition of carrot flavoured milk. It indicated that protein content in juice in different levels. Significantly highest ash flavoured milk decreased with the increased level of content (0.84 %) was noticed in 8 per cent carrot juice carrot juice. flavoured milk and the lowest ash content (0.75 %)
was noticed in 2 per cent carrot juice flavoured milk. The results of present investigation were in It indicated that ash content in flavoured milk
general agreement with the findings of Repate et al. increased with the increased carrot juice level.(2010) who noticed that with the increase in concentration of flavoring agents protein content of The results of present investigation are in flavoured milk beverage gradually decreased. agreement with the findings of Jothylingam and
Pugazhenthi (2013). They reported that ash content of SNF content dietic flavoured milk was ranging from 0.75 to 0.78
Average values of SNF content in flavoured per cent.
194
Sensory evaluation of flavoured milk Acceptability score
The acceptability score of flavoured milk The data with respect to sensory evaluation of
seems to be mainly dependent on levels of carrot carrot juice flavoured milk are presented in table 2.juice. The highest score for acceptability was obtained (18.66 out of 20) by the flavoured milk Colour and general appearance scoreprepared with 4 per cent of carrot juice , while the lowest score was secured (14.66 out of 20) by the While studying the effect of different levels flavoured milk prepared with 8 per cent carrot juice. of carrot juice on the colour and general appearance of Statistically, 4 per cent carrot juice flavoured milk flavoured milk, flavoured milk prepared by using 4 was superior among all the treatments. The results per cent of carrot juice scored the highest marks (28 from table 2 indicate that second best treatment was 2 out of 30), while the lowest score (23.33 out of 30) per cent carrot juice containing flavoured milk. Thus, was secured by the flavoured milk prepared by 8 per acceptability of flavoured milk declined beyond 4 per cent carrot juice. Statistically, flavoured milk with 4 cent carrot juice containing flavoured milk. per cent of carrot juice was superior among all the
treatments, which had pleasant colour and general Ramasamy et al. (2005) observed that appearance. It was followed by flavoured milk with 2,
flavoured milk with carrot and cardamom obtained 6 and 8 per cent carrot juice.the highest acceptability scores (8.5 out of 10) and flavoured milk while only beetroot flavoured milk Khandawe (2003) reported that colour and obtained the lowest acceptability scores (3 out of 10).appearance of chocolate flavoured milk depends on
chocolate levels.Whereas Shelke (2005) reported that Cost of productionmango flavour had scored the highest marks while
strawberry flavour had scored the lowest marks for Considering the cost structure of flavoured colour and appearance of flavoured milk. milk prepared from different treatment combinations,
it was observed that the flavoured milk with 2.0 % Taste score carrot juice had the lowest cost of production i.e.
-1Rs.50.67 l . While, the highest cost of production The taste score of flavoured milk seems to be -1
Rs.51.93 l was observed the flavoured milk with 8.0 mainly depending on levels of carrot juice addition. per cent carrot juice. The cost of most acceptable Flavoured milk prepared with 4 per cent of carrot flavoured milk at the 4% carrot juice level was juice scored the highest marks (46 out of 50), while
-1the lowest score (41.33 out of 50) was secured by the Rs.51.09 l .flavoured milk prepared with 8 per cent carrot juice. Statistically, flavoured milk containing 4 per cent carrot juice was superior among all the treatments.
Repate et al. (2010) observed that sensory scores for taste attribute of safflower flavoured milk was decreased with the increase in concentration of flavouring agent i.e. safflower milk.
Repate et al. (2010) who prepared the safflower flavoured milk with different proportion of cow milk blended with safflower milk and reported that the cost of flavoured milk could be minimized by using safflower milk and cow milk blended together and blending could be done to the maximum proportion of 50:50.
195

Table 1. Chemical composition of carrot juice flavoured milk (%)
Treatments Fat Total solids Protein SNF Titratable acidity Ash
T1 (2 % carrot juice) 2.72a 19.20a 3.35a 16.48a
0.14d 0.75d
T2 (4 % carrot juice) 2.69b 19.08b 3.31b 16.39b
0.16c 0.78c
T3 (6 % carrot juice) 2.65c 18.95c
3.24c 16.30c
0.19b 0.82b
T4 (8 % carrot juice) 2.62d 18.81d
3.18d 16.19d
0.21a 0.84a
SE(m)
0.012 0.088
0.015 0.074 0.006 0.004
CD at 5%
0.036 0.262
0.046 0.223 0.018 0.012.Values with different superscripts differ significantly (P<0.05)
Treatments Colour and general
appearance
(Out of 30)
Taste (Out of 50)
Acceptability
(Out of 20)
Overall score(Out of 100)
T1 (2% carrot juice) 25.33c
42.00c 17.00b
84.33 T2 (4% carrot juice)
28.00a
46.00a
18.66a
92.66
T3 (6% carrot juice)
25.33b
42.66b
15.33c
83.32
T4 (8%
carrot juice)
23.33d
41.33d
14.66d
79.32
SE(m)
0.12
0.20
0.074
CD 0.35 0.59 0.22
Table 2. Sensory evaluation of flavoured milk as affected by different levels of carrot juice
Values with different superscripts differ significantly (P<0.05)
Table 3. Cost of production of 1 litre carrot flavoured milk blended with various levels of carrot juice
Item Treatments T1 T2 T3 T4
Qty Value(Rs)
Qty Value (Rs)
Qty Value (Rs)
Qty Value(Rs)
Cow milk (ml) @ Rs 29l-1.
(3 % fat/toned milk)
980 28.42
960
27.84
940
27.26
920 26.68
Carrot juice (ml) @ Rs 50
l-1.
20 1.00
40
2.00 60
3.00
80
4.00
Sugar
(gm) @ Rs 32 kg-1
80 2.56
80
2.56
80
2.56
80
2.56
Fuel Charges LPG (g)
Rs [email protected] kg-1
1.69
53.5
1.69
53.5
1.69
27.66 1.69
Electricity charges @Rs. 5 Unit-1
2.00
0.40
2.00
0.40
2.00
0.40 2.00
Total
-
50.67
-
51.09
-
51.51
51.93
T - Flavoured milk with 2 per cent carrot juice1
T - Flavoured milk with 4 per cent carrot juice2
T - Flavoured milk with 6 per cent carrot juice3
T - Flavoured milk with 8 per cent carrot juice4
196

properties, Int. J. Food Agric. and Vet. Sci. 3(1): 54-57.REFERENCES Khandwe, D. J. 2003. Utilization of low fat milk for preparation of chocolate flavoured milk. Unpublished M.Sc. (Agric.) thesis
Anonymous, 1961. Method of test for Dairy industry IS 1479 (Part II). submitted to Dr. P.D.K.V, Akola (M.S.).
chemical analysis of milk. Bureau of Indian Standards , Manak Kubde, S.P. 2004. Use of cardamom for the preparation of flavoured milk.
Bhavan , Bahadurshah Zafar Marg, New Delhi.Unpublished M. Sc. (Agric.) thesis submitted to Dr. PDKV,
Anonymous, 1967. Specification for milk powder (whole and skim). Akola (M.S.).Bureau of Indian Standards, Manak Bhavan, New Delhi.
Pal, D. and S.K. Gupta, 1985. Sensory evaluation of Indian Milk Products. Anonymous, 1977. Determination of fat by Gerber's method IS 1224( part Indian Dairyman, 37(10):465-467. I).First revision. Bureau of Indian Standards, Manak Bhavan,
Ramasamy, D.,R.J.J. Abraham and A. Manoharan, 2005. Organoleptic New Delhi.
study on naturally coloured and flavoured sterilized milk with Anonymous, 1981. Handbook of food analysis in SP- 18 part XI. Bureau extracts of plant. J. Vet. Public Health. 3(2): 115-117. of Indian Standards, Manak Bhavan, New Delhi.
Repate, K.C., V.J. Kamble, B.A. Hassan and B.M. Thombre, 2010. Anonymous,1965. Determination of SNF of milk products by formula Studies on preparation of flavoured milk from cow milk method IS 1183 (part1). Bureau of Indian Standards , Manak blended with safflower milk. J. Dairying, Foods and Home Bhavan, New Delhi. Sci. 29(2): 92–96.Bose, T.K., J. Kabir, P. Das and P.P. Joy, 2003. Chemical composition,
Ritu, D., P. Kumari and M. Singh, 2011. Efficacy of Herbal Flavoured functional properties and processing of carrot—a review. J. Sterilized Milk-A Dairy Based Nutraceutical, Trends in Food. Sci. Technol. 49(1): 22–32.Biosciences. 4(2): 198-200.Dalim, M., M. Khaskheli and M.H. Baloch, 2012. Production and
Salwa, A.A., E.A. Galal and A.E. Neimat, 2004. Carrot Yoghurt: Sensory, Comparison of Banana and Chikoo Flavoured Milk-based Chemical, Microbiological Properties and Consumer Beverages. Pak. J. Nutr.11(6): 600-604. Acceptance. Pak. J. Nutri. 3(6): 322-330.De, S., 2003. Flavoured milks. Outlines of Dairy Technology. New Delhi,
Shelke, M.A., R.A. Patil and A.A. Bhagat, 2008. Chemical composition Oxford University Press. pp. 99-100.and cost structure of flavoured milk. RVJI, 4 (I): 57-59.Deore, A.M. 2013. Effect of different fat levels of milk on the quality of
Singhal, S.C. 2003. Production and utilization of soybean production flavoured milk. Unpublished M.Sc.(Agric.) thesis submitted in india. SOPA Digest. pp. 14-16.to Dr. PDKV, Akola (M.S.).
Singh, C. , K. S. Grewal and H. K. Sharma, 2005. Preparation and Gopalan, C., B.V. Ramasastry and S.C. Balasubramanian,1991. Nutritive properties of carrot flavoured milk beverage J. Dairying, foods value of Indian foods. National Institute of Nutrition, and H.S. 24 (3/4) : 184-189.Hyderabad, pp. 47.
Singh, B., P. S. Panesar and V. Nanda, 2006. Utilization of carrot Pomace Gupta. M, U. Bajwa and K.S. Sangu,2005.Opttimization of variables for the preparation of a value added product. World. J. Dairy associated with the processing of carrot milk cake,J.food.Sci. and Food Sci. 1 (1) : 22-27.Technol.42(1):16-22.
Snedecor, G.W. and W.G. Cochran, 1994. Statistical method. Oxford and Jothylingam, S. and T.R. Pugazhenthi, 2013. Development of dietetic th
herbal flavoured milk and analysis for its physico chemical IBH Publishing Co. Bombay. 6 Edn pp. 172- 196.
Rec. on 31.05.2014 & Acc. on 27.07.2014
197
ABSTRACT
A field investigation was carried out at Satpuda Botanic Garden, College of Agriculture, Nagpur in 2013 to study the effect of planting time and nitrogen on growth, yield and quality of spider lily. It was revealed that, the
-1 -1 -1vegetative growth viz., plant height and leaf area, yield parameters viz., flowers plant , bulbs plant , bulbs hectare -1and offsets plant , flowering span and length of flower bud in spider lily were influenced non-significantly due to
-1different treatments of planting time. However, significantly maximum plant height, leaf area, flowers plant , bulbs -1 -1 -1plant , bulbs hectare , offsets plant , flowering span and length of flower bud were noted with the application of 400
-1 -1kg N ha (N ), whereas, all these parameters were recorded minimum under the control treatment i.e. 0 kg N ha . 4
Interaction effect of planting time and nitrogen was found non-significant in respect of all vegetative, flowering, yield and quality parameters of spider lily except days for first flower bud emergence which was noted significantly
th -1 thminimum under 15 March planting with 0 kg N ha , whereas, flower bud emergence was delayed under 15 January -1planting with 400 kg nitrogen ha .
(Key words: Planting time, nitrogen, spider lily, offsets, bulbs)
th th15 February and 15 March and four levels of INTRODUCTION-1 -1 -1nitrogen i.e. 0 kg N ha , 200 kg N ha , 300 kg N ha
Spider lily (Hymenocallis littoralis L.) is -1and 400 kg N ha with three replications. The bigger
native to South America and belongs to the family and uniform sized bulbs of spider lily were selected
Amaryllidaceae. It is a bulbous ornamental plant and then planted at a spacing of 60 cm x 45 cm in the
which is 45-60 cm tall and has long, broad shaped flat beds on different dates as per the treatment. At the
green leaves. It is now emerging as an important -1
time of land preparation, well-rotted FYM @ 20 t ha commercial flower crop in Maharashtra. The flowers was mixed uniformly in the soil before last of spider lily are largely used in garlands and gajra harrowing. A recommended dose of phosphorus and making, mandap, marriages and social ceremonies
-1potassium i.e. 100 and 50 kg ha , respectively was and various flower decorations.applied to all the treatment plots as a full dose at the
time of bed preparation before planting, while, the Nitrogen is one of the important nutrient which helps to increase yield and quality of flowers. It dose of nitrogen was applied as per the treatments. It is also found that, production of flowers can be was splitted in three equal splits and each was applied regulated by adopting proper time of planting of at the time of planting, one month after planting and flower crops, so that, the produce can be made two months after planting. The growth parameters
2available in the market whenever there is a good viz., plant height (cm) and leaf area (cm ) were demand of flowers. Considering the important role of observed at 120 days after planting and quality planting time and nitrogen for increasing the profit parameters viz., length of flower bud (cm) and yield
-1and productivity of flower crops, the present parameters viz., flowers plant were recorded after investigation was proposed on effect of planting time -1 -1
120 DAP. Similarly, bulbs plant , bulbs hectare and and nitrogen on growth, yield and quality of spider -1
offsets plant were recorded at the time of harvesting.lily.
RESULTS AND DISCUSSIONMATERIALS AND METHODSGrowth
The investigation was carried out at Satpuda The data presented in table 1 exhibited that, Botanic Garden, College of Agriculture, Nagpur
during January, 2013 to September, 2013 in factorial vegetative growth in terms of plant height and leaf
area was influenced non-significantly by planting randomized block design. The treatments comprised th
time. of three treatments of planting time i.e. 15 January,
1. P.G. Student, Horticulture Section, College of Agriculture, Nagpur (M.S.)2. Asstt. Professor, Horticulture Section, College of Agriculture, Nagpur (M.S.)3. Sr. Res. Assitant Satpuda Botanic Garden, Nagpur (M.S.)
EFFECT OF PLANTING TIME AND NITROGEN ON GROWTH, YIELD AND QUALITY OF SPIDER LILY
1 2 3S. R. Maske , N. K. Chopde and S. A. Thakre
J. Soils and Crops 25 (1) 198-201, June, 2015 ISSN 0971-2836
However, in respect of nitrogen levels, flower bud initiation of spider lily due to which the juvenile phase of the plant might have been extended. significantly the maximum plant height (95.16 cm)
2and leaf area (329.08 cm ) were noticed under the Suman Kumari et al. (2011) obtained contrast results
-1 in gladiolus. They reported an early emergence of treatment N i.e. 400 kg N ha and the plant height and 4 th
spike under the earliest planting date i.e. 25 October.leaf area were recorded minimum under the control -1 2
treatment i.e. 0 kg N ha (92.02 cm and 310.15 cm The data regarding the days for first flower respectively). In respect of plant height, the treatment
-1 bud emergence and flowering span (days) in spider N i.e. 400 kg N ha was found at par with the treatment 4
-1 lily showed significant differences amongst the N i.e. 300 kg N ha (94.04 cm). This might be due to 3
different levels of nitrogen. It was observed that, the general improvement in growth and development of -1control treatment (0 kg N ha ) took significantly plant by suitable dose of nitrogenous fertilizer as
minimum period (137.66 days) for emergence of first nitrogen is an essential part of nucleic acid which flower bud which was followed by the treatment N 2plays a vital role in promoting plant growth. These
-1i.e. 200 kg N ha (144.88 days), whereas, the treatment results are in close conformity with the results of -1
N (400 kg N ha ) took maximum days for emergence 4
of first flower bud (147.66 days). However, in respect of flowering span, significantly the maximum
-1 flowering span (30.55 days) was recorded with the ha Siraj and -1treatment N (400 kg N ha ) which was followed by Al-Safar (2006) in gladiolus. They found that, 4
-1 -1application of the highest dose i.e. 75 kg N ha the treatment N i.e. 300 kg N ha (28.24 days) and the 3 2
reported maximum leaf area (8.17 cm ) in gladiolus control treatment recorded minimum (25.00 days) flowering span. Delay in flower bud emergence due to
Interaction effect of planting time and the highest dose of nitrogen might be due to nitrogen was found to be non-significant in respect of encouraged vegetative growth of plant by nitrogen plant height, however it was significant in case of leaf which might have prolonged the time required by the area. The data from table 2 revealed that, significantly plant to enter into reproductive phase from vegetative
2maximum leaf area (330.60 cm ) was recorded with phase. Increased total flowering span might be due to
ththe treatment combination of T N (15 January with 1 4 better turgidity of flowers as a result of application of
-1400 ha ) which was statistically at par with the higher dose of nitrogen. These results are in close th
treatment combination of T N i.e. 15 February with 2 4 conformity with the results of Devi and Singh (2010) -1 2
400 ha (328.90 cm ) and minimum leaf area in tuberose who noticed that, the highest level of 2 -1(309.40 cm ) was recorded under the treatment nitrogen i.e. 220 kg N ha recorded maximum
th -1combination of T N (15 February with 0 ha ) duration of flower. They also reported that, flowering 2 1 .
-1was advanced by control upto 40 kg N ha and delayed This might be due to the combined effect of planting time and nitrogen applied to spider lily crop. by higher level of nitrogen in tuberose.
Flowering
The data presented in table 1 indicated that, a day for first flower bud emergence in spider lily was
ththsignificantly influenced by various planting time. 15 he treatment combination of T N (15 March 3 1
March planting recorded less number of days (125.66 -1planting with 0 kg N ha ) recorded an earlier flower days) for emergence of first flower bud, whereas,
bud emergence (122.66 days) which was found at par thmaximum days were required under 15 January thwith the treatment combinations of T N (15 March 3 2 planting (165.91 days). However, the flowering span -1 th planting with 200 kg N ha ), T N (15 March planting 3 3 in spider lily was influenced non-significantly due to
-1 th with 300 kg N ha ) and T N (15 March planting with 3 4 different treatments of planting time. The flower bud
-1th 400 kg N ha ), however, it was found late under the emergence was delayed under 15 January (T ) 1th
treatment combination of T N (15 January planting 1 4planting which might have been due to non--1with 400 kg N ha ). availability of required temperature and day length for
Ghule et al. (2003) in spider lily who reported that, the height of spider lily plant increased significantly with the application of higher level of nitrogen (300 kg
). Similar results were also obtained by
.
kg N
kg N
kg N
Interaction effect of planting time and nitrogen was found to be significant in respect of days for first flower bud emergence, however, it was found non-significant in respect of flowering span in spider
lily. T
199

Table 1. Effect of planting time and nitrogen on growth, yield and quality of spider lily
Treatments
Plant height (cm)
Leaf area
(cm2)
Days for first
flower bud
emergence
Flowering span
(days)
Length of
flower bud (cm)
Flowers plant-1
Offsets plant-1
Bulbs plant-1
Bulbs ha-1
(lakh)
Planting time
(T)
T1
–
15th
Jan.
94.11 320.80
165.91
28.25
28.08
17.25
8.09
8.35 2.82
T2
–
15th
Feb.
93.71 319.70
141.00
27.83
27.66
16.95
7.71
8.03 2.76
T3 –
15th
March
92.90 320.62
125.66
26.58
27.55
15.85
6.93
7.97 2.56
SE (m) ?
0.34
0.44
1.15
0.47
0.17
0.47
0.33
0.31 0.07
CD at 5%
-
-
3.39
-
-
-
-
-
-
Nitrogen
(N)
N1
–
0 kg ha-1
92.02
310.15
137.66
25.00
25.80
15.01
6.07
6.18 2.45
N2
–
200 kg ha-1
93.07
319.23
144.88
26.22
27.42
16.31
7.27
7.63 2.60
N3
–
300 kg ha-1
94.04
322.93
146.55
28.24
28.31
17.18
7.90
8.91 2.82
N4
–
400 kg ha-1
95.165
329.08
147.66
30.55
29.53
18.25
9.06
9.75 3.00
SE (m) ? 0.40 0.51 1.33 0.54 0.20 0.54 0.38 0.36 0.08
CD at 5%
1.17
1.51
3.92
1.60
0.59
1.60
1.13
1.07 0.24
Interaction (TXN)
SE (m) ? 0.69 0.89 2.31 0.94 0.35 0.95 0.66 0.63 0.14
CD at 5% - 2.62 6.79 - 1.02 - - - -
Table 2. Interaction effect of planting time and nitrogen on growth, yield and quality of spider lily
Treatments
combination
Leaf area
(cm2)
Days for first flower bud emergence
(days)
Length of flower bud
(cm)
T1N1 310.20 153.00 25.93 T1N2 318.73 168.66 27.53
T1N3 323.70 170.66 28.53 T1N4 330.60 171.33 30.33 T2N1 309.40 137.33 25.06
T2N2 320.10 141.00 27.63
T2N3 320.43 142.66 28.60 T2N4 328.90 143.00 29.36
T3N1 310.86 122.66 26.40
T3N2 318.86 125.00 27.10
T3N3 324.66 126.33 27.80
T3N4 327.08 128.66 28.90
SE (m) ? 0.89 2.31 0.35
CD at 5% 2.62 6.79 1.02
200
Yield due to different treatments of planting time. However, different levels of nitrogen significantly influenced
The data presented in table 1 revealed that, the length of flower bud.the yield of spider lily in respect of total number of
-1-1 -1 -1 The treatment N i.e. 400 kg N ha noted flowers plant , bulbs plant , bulbs ha and offsets 4
-1 significantly maximum length of flower bud (29.53 plant was non-significantly influenced by different cm) which was closely followed by the treatment Nplanting time. However, different levels of nitrogen 3
-1influenced all these yield parameters significantly. i.e. 300 kg N ha (28.31 cm), whereas, the control -1 treatment i.e. 0 kg N ha produced minimum length of
Significantly the maximum number of flower bud (25.80 cm). The improvement in length of -1 -1 -1
flowers plant (18.25), bulbs plant (9.75), bulbs ha flower bud due to higher dose of nitrogen might be -1
(3.00 lakh) and offsets plant (9.06) were counted due to an increased vigour of spider lily plant which -1
with the treatment N i.e. 400 kg N ha which was provided maximum food material for development of 4
spider lily flowers. These results are in accordance statistically at par with the treatment N i.e. 300 kg N 3
-1 with the findings of Khalaj and Edrisi (2012) ha (17.18, 8.91, 2.82 lakh and 7.90, respectively), They recorded that, the highest dose of whereas, significantly minimum values were noted
-1 nitrogen resulted in maximum spike length (27.66 with the control treatment i.e. 0 kg N ha (15.01, 6.18, cm).2.45 lakh and 6.07, respectively).
The interaction effect due to planting time An increased yield of flowers with the and nitrogen on length of flower bud in spider lily was highest dose of nitrogen might be due to adequate found to be significant (Table 2). The treatment supply of nitrogen to the plants resulted in the proper
th -1combination of T N (15 January with 400 kg N ha ) 1 4 development of required photosynthetic system produced significantly maximum (30.33 cm) length which helps to increase the production of flowers. of flower bud and it was found statistically at par with Nitrogen is one of the essential elements for growth
th the treatment combination of T N (29.36 cm) i.e. 152 4and development of plants and sufficient levels of -1February planting with 400 kg N ha , however, the nitrogen provides better growth and development and
thtreatment combination of T N (15 February with 0 helps in translocation of photosynthates from source 2 1
-1to sink (bulbs) which might have been resulted into kg N ha ) produced minimum length of flower bud higher yield of bulbs. The results are in congruent (25.06 cm). An increased length of flower bud might with the findings of Khan et al. (2012) who reported be due to combined effect of earlier planting with the that, the application of higher dose of nitrogen i.e. 60 highest dose of nitrogen.
-1 kg ha showed significant effect on number of spikes -1 -1
plant and number of cormels plant as compared to REFERENCES -1
other treatments (0, 20 and 40 kg ha ) in freesia. Similar results were obtained by tuberose
Ghule, A. D., P. V. Patil and K. T. Kantharaju, 2003. Effect of different levels of nitrogen and phosphorus on growth and flowering of spider lily. J. Maharashtra agric. Uni. 28 (2):128-130.
Khalaj, M. A. and B. Edrisi, 2012. Effect of plant spacing and nitrogen levels on quantity and quality characteristics of tuberose (Polianthes tuberosa L.) under field experiment. International J. Agric. Sci. 2 (3): 244-255.The interaction effect of planting time and
-1 -1 -1 Khan, M. K., M. Sajid, A. Rab, I. Jan, H. Zada, M. Zamin, I. Haq, A. nitrogen on flowers plant , bulbs plant , bulbs ha and Zaman, S. T. Shah and A. Rehman, 2012. Influence of nitrogen
-1 and phosphorus on flower and corm production of freesia. offsets plant in spider lily was found to be non-African J. Biotech. 11 (56): 11936-11942.significant (Table 1).
Suman Kumari, B. S. Patel and L. N. Mahawer, 2011. Influence of gibberellic acid and planting dates on vegetative growth and
Quality flower production in gladiolus cv. Yellow Frilled. Progressive Hort. 43 (2): 219-224.
The data showed that, the length of flower gladiolus corms
bud in spider lily had influenced non-significantly
in tuberose.
Devi, K. L. and U. C. Singh, 2010. Effect of nitrogen on growth, flowering
Devi and Singh and yield of cv. Single. J. Orna. Hort. 13 (3): 228-232.
(2010) who suggested that, higher dose of nitrogen -1(220 kg ha ) produced significantly maximum yield
of bulbs in tuberose.
Siraj, Y. S. and M. S. Al-Safar, 2006. Effect of GA and nitrogen on growth 3
and development of . Pak. J. Biol. Sci. 9 (13): 2516-2519.
Rec. on 31.05.2014 & Acc. on 25.07.2014
201

ABSTRACT
Biparental mating was attempted in the population F of four intervarietal crosses Kranti x ACN-9, Seeta 2
x Ashirwad, Bio-902 x Ashirwad and Vardhan x Kranti of mustard using NCD I mating model during rabi 2013. The analysis of variance for experimental design revealed that the BIP progenies obtained from the four crosses had substantial genetic variability among themselves for yield and most of the yield components, which allowed the
-1further estimation of different parameters. The maximum range was observed for number of siliqua plant , followed -1by plant height, days to maturity, days to first flower and seed yield plant in the four crosses. Comparison of mean
value of BIP with check varieties revealed that upper limit value of BIP progenies for days to first flower, plant height, -1 -1 -1number of primary branches plant , number of siliqua plant and seed yield plant were higher than best check
varieties for respective characters. Genotypic variance and phenotypic variance were found to be maximum for -1number of siliqua plant followed by plant height in all the four crosses. High GCV and PCV were observed for seed
-1 -1yield plant and number of primary branches plant for all the four crosses. Selection of superior BIPs, were done on the basis of significant superiority of BIPs over check and their index score. Based on this criteria 8.59 %, 17.96 %, 7.8 % and 16.40 % of BIPs over total 128 BIPs evaluated were selected from the cross Kranti x ACN-9, Seeta x Ashirwad, Bio-902 x Ashirwad and Vardhan x Kranti respectively for forwarding next generation and selection should be based
-1 -1on progeny testing through rather half sib or full sib for improvement of number of siliqua plant and seed yield till homozygosity is attained.
(Key words: Biparental mating, variability, mustard)
ACN-9, Seeta x Ashirwad , Bio-902 x Ashirwad, INTRODUCTIONVardhan x Kranti of mustard were used to generate
biparental progenies by adopting North Carolina Mustard is one of the important oilseed crops Design I (Comstock and Robinson, 1952) during rabi of India. It is a self-pollinated crop. Autogamous 2012. Eight plants were randomly chosen from the F 2species place a restriction on genetic recombination generation of each cross and used as pollen (male) because of the fact selfing leads to rapid fixation of parents. From F population of each cross 32 plants linked genes, precludes free exchange of favourable 2
were randomly tagged to be used as female plants. genes and also prevents emergence of desirable gene Each of the eight pollen plants (males) were crossed constellations, thereby limits variability. However, to four different female plants. Resulting 32 progeny genetic variability is the most essential requirement families were divided into two sets, each comprising for the success of any crop improvement programme. of 4 male group. The seeds from each of the BIP As such biparental mating systems (Comstock and crosses were harvested separately. Each set along Robinson, 1948, 1952) are suggested to overcome the
defects of conventional methods of breeding, and with their six parents and check Pusa bold were
help to create new populations with higher planted during rabi 2013 in randomized block design
with three replications at the experimental farm of frequencies of rare combinations which can not be
Agricultural Botany section, College of Agriculture, realized in small segregating populations. Though
Nagpur. Data were recorded on five randomly chosen there are studies on the biparental mating and its
impact on various aspects on crop likes wheat and plants from BIP progenies, parents and check for barley, reports on sesame are scanty and hence, the recording observations in each of five crosses. present work was undertaken in mustard with four Observations were recorded on days to first flower, crosses viz., Kranti x ACN-9, Seeta x Ashirwad , Bio- days to maturity, plant height, number of primary
-1 -1902 x Ashirwad, Vardhan x Kranti. branches plant , number of siliqua plant and seed -1
yield plant . The data were subjected to statistical and MATERIALS AND METHODS biometrical analysis as per the method described by
Panse and Sukhatme (1954), Burton and Devane The F generation of four crosses Kranti x (1953), and Sivasubramanian and Menon (1973).2
1,3 and 4. P.G. students, Botany section, College of Agriculture, Nagpur5. P.G. students, Agronomy section, College of Agriculture, Nagpur2. Asstt. Professor, Botany section, College of Agriculture, Nagpur
GENETIC VARIABILITY CREATED THROUGH BIPARENTAL MATING IN MUSTARD (Brassica juncea L.)
1 2 3 4 5B.H.Dandade , S.R.Patil , Gowthami , A.T. Nartam and B.A. BhoyarR.
J. Soils and Crops 25 (1) 202-209, June, 2015 ISSN 0971-2836
-1number of primary branches plant , number of siliqua RESULTS AND DISCUSSION-1 -1plant and seed yield plant were found to be higher
The mean square due to genotypes (BIP than best check varieties for respective characters as progenies+ checks) as observed from table1 were observed from Figure1a and Figure1b. Days to highly significant for all the characters except number maturity in most of the cases, the upper limit values of
-1of primary branches plant in the cross Kranti x ACN- BIP progenies were higher, but in Kranti x ACN-9 and 9. Similarly it was highly significant for all the Bio-902 x Ashirwad were at par with the best check characters except days to first flower and days to varieties. This indicates the availability of promising maturity in the cross Seeta x Ashirwad, except days to BIP progenies superior than check, hence the BIP first flower in Bio-902 x ACN-9 and significant for all progenies can be subjected to selection for superior the traits in the cross Vardhan x Kranti. This reveals progenies for the above mentioned traits like number
-1 -1that the BIP progenies obtained from the four crosses of siliqua plant , seed yield plant , plant height, had substantial genetic variability among themselves -1
number of primary branches plant , if these traits also for yield and most of the yield components which record a good extend of heritability and genetic allows the further estimation of different parameters advance.in the experimental materials. Similar to this result
-12 2wide variability for seed yield plant and yield Variability parameters like ó g, ó p, GCV (%)
contributing characters in mustard were also and PCV (%) were estimated in BIP progenies of all observed by Singh and Murty (2003) in mustard. the four crosses and data are presented in table 4. The
2 2estimates of ó g and ó p were low in the BIP progenies
The maximum range (Table2) was recorded of all the four crosses for days to first flower, days to -1
by number of siliqua plant (117.8, 117.03, 108.46 and -1maturity, number of primary branches plant and seed 111.14) followed by plant height (35.53, 38.53, 37.13 -1yield plant . Genotypic variance and phenotypic and 38.8), days to maturity (7.4, 5.73, 5.13 and 19.93)
variance were found to be maximum for number of days to first flower (7.27, 4.67, 5.87 and 8.46 ) and -1
siliqua plant followed by plant height in all the four -1 seed yield plant (4.6, 7.27, 5.02 and 6.97) in the four crosses. Wide differences between genotypic and
crosses Kranti x ACN 9, Seeta x Ashirwad, Bio-902 x phenotypic variance was observed for all the
Ashirwad and Vardhan x Kranti respectively. This characters in BIP progenies of all the four crosses.
indicated the presence of considerable amount of This indicates influence of environment in the
genetic variance in BIP progenies. These results expression of different traits. -1revealed that characters like number of siliqua plant ,
-1 Comparison of genotypic and phenotypic plant height and seed yield plant showing maximum variance between different characters in different range in BIP progenies of four crosses can be consider progenies is not that much appropriate. Hence, they as traits for selecting superior progenies. Such high are expressed as percentage of mean i.e. in terms of proportion of mean values were also reported by co-efficient of variation. Therefore, genotypic co-Anuradha and Reddy (2004) in sesame, Kampli et al. efficient of variation and phenotypic co-efficient of (2002) in chickpea and Gowthami (2013) in mustard. variation were estimated and data are presented in Higher mean values of BIP generation could be table 3. The estimates of genotypic co-efficient of attributed to the advantages of increase variation and phenotypic co-efficient of variation heterozygosity at many loci for the said characters, so were low for days to first flower and days to maturity also pushing the mean values towards the positive in the BIP progenies of all the four crosses studied. side could be of immense value in throwing superior Genotypic co-efficient of variation was also observed segregants in advance generation (Anuradha and to be low (< 10%) in BIP progenies of all the four Reddy, 2004). Comparison of range indicated that in crosses, whereas phenotypic co-efficient of variation BIP progenies upper limit increased in recombination was found to be low in BIP progenies of Seeta x of latent variability that tends to remain locked under Ashirwad and moderate in BIP progenies of Kranti x linkage.ACN-9, Bio-902 x Ashirwad and Vardhan x Kranti. Genotypic co-efficient of variation estimate were low Mean values of BIP progenies (Table 2) when
-1compared with check varieties, upper limit value of for number of branches plant in BIP progenies of BIP progenies for days to first flower, plant height, Kranti x ACN-9 (5.74%) and Bio-902 x Ashirwad
203
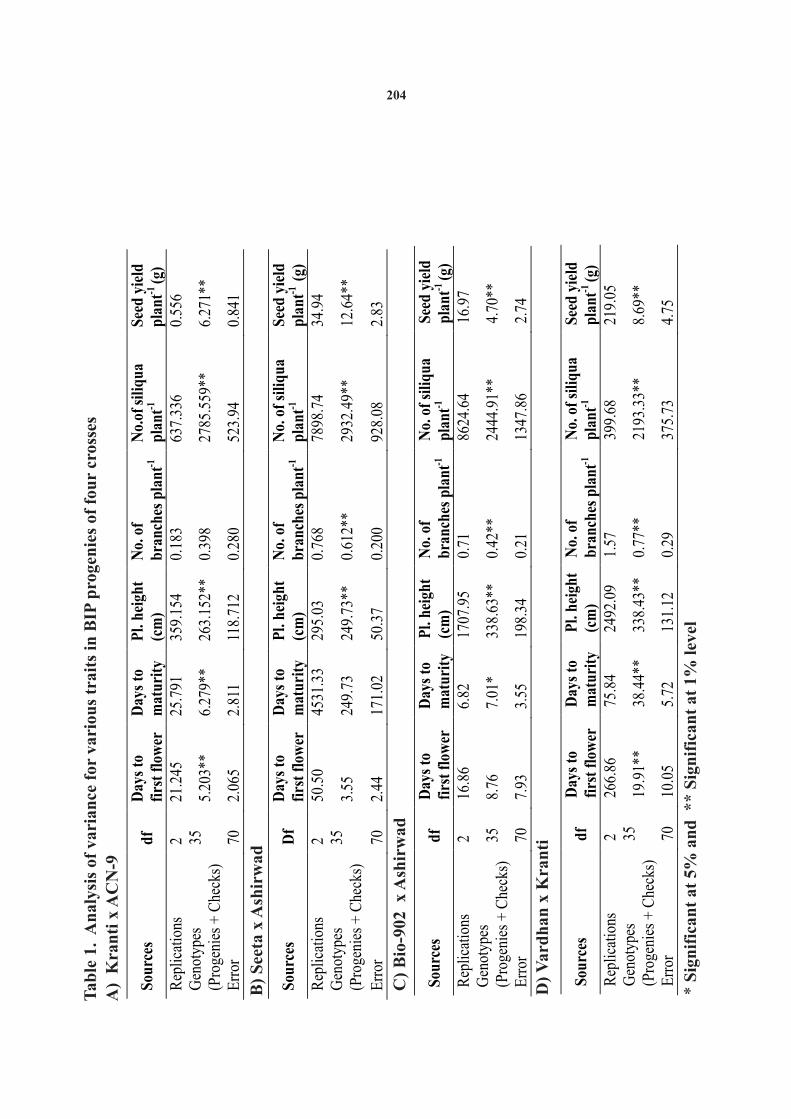
Tab
le 1
. A
naly
sis
of v
aria
nce
for
var
iou
s tr
aits
in
BIP
pro
gen
ies
of f
our
cross
esA
) K
ran
ti x
AC
N-9
C)
Bio
-902
x A
shir
wad
Sour
ces
df
Day
s to
fi
rst
flow
er
D
ays
to
mat
urit
y
P
l. he
ight
(cm
)
N
o. o
f
bran
ches
pla
nt-1
N
o. o
f si
liqua
pl
ant-1
Se
ed y
ield
pl
ant-1
(g)
Rep
licat
ions
2
16.8
6
6.82
1707
.95
0.71
8624
.64
16.9
7
Gen
otyp
es
(Pro
geni
es +
Che
cks)
35
8.76
7.01
*
338.
63**
0.42
**
2444
.91*
*
4.70
**
Err
or
70
7.93
3.55
198.
34
0.21
1347
.86
2.74
Sour
ces
Df
D
ays
to
firs
t fl
ower
D
ays
to
mat
urit
y
Pl.
heig
ht
(cm
)
No.
of
bran
ches
pl
ant-1
N
o. o
f si
liqua
pl
ant-1
Se
ed y
ield
pl
ant-1
(g)
Rep
licat
ions
2
50.5
0
4531
.33
295.
03
0.76
8
7898
.74
34.9
4
Gen
otyp
es
(Pro
geni
es +
Che
cks)
35
3.55
249.
73
249.
73**
0.61
2**
2932
.49*
*
12.6
4**
Err
or
70
2.44
171.
02
50.3
7
0.20
0
928.
08
2.83
B)
See
ta x
Ash
irw
ad
Sour
ces
df D
ays
to
firs
t fl
ower
D
ays
to
mat
urit
y
Pl.
heig
ht
(cm
)
No.
of
bran
ches
pla
nt-1
N
o.of
sili
qua
plan
t-1
Seed
yie
ld
plan
t-1 (g
)
Rep
licat
ions
2 21
.245
25.7
91
359.
154
0.
183
63
7.33
6
0.55
6
Gen
otyp
es
(Pro
geni
es +
Che
cks)
35
5.20
3**
6.
279*
*
263.
152*
*
0.39
8
2785
.559
**
6.27
1**
Err
or
70 2.
065
2.
811
11
8.71
2
0.28
0
523.
94
0.84
1
D)
Vard
han
x K
ran
ti
Sour
ces
df
Day
s to
fi
rst
flow
er
Day
s to
m
atur
ity
Pl.
heig
ht
(cm
)
No.
of
bran
ches
pla
nt-1
No.
of
siliq
ua
plan
t-1
Seed
yie
ld
plan
t-1 (g
)
Rep
licat
ions
2
266.
86
75.8
4
2492
.09
1.57
399.
68
219.
05
Gen
otyp
es
(Pro
geni
es +
Che
cks)
35
19.9
1**
38.4
4**
338.
43**
0.77
**
2193
.33*
*
8.69
**
Err
or
70
10.0
5
5.72
131.
12
0.29
375.
73
4.75
* S
ign
ific
an
t at
5%
an
d *
* S
ign
ific
ant
at
1% l
evel
204

Tab
le 2
. Mea
n a
nd
ra
ng
e fo
r d
iffe
ren
t tr
aits
in
th
e B
IP p
rog
enie
s o
f fo
ur
cros
ses
Cro
sses
C
har
acte
rs D
ays
to
firs
t fl
ower
Day
s to
m
atu
rity
Pla
nt
hei
ght
(cm
)
Nu
mb
er o
f p
rim
ary
bra
nch
es
pla
nt-1
Nu
mb
er o
f si
liq
ua
pla
nt-1
See
d
yiel
d -1
(g)
Kra
nti
x A
CN
-9
Max
imum
44
.80
99.0
0
137.
60 4.
53
179.
27
5.87
Min
imum
37
.53
91.6
0
102.
07 2.
80
61.4
7
1.27
Ran
ge 7.
27 7.
4
35.5
3
1.73
11
7.8
4.
6
Mea
n (B
IPS
) 38
.81
93.7
0
119.
58 3.
51
124.
64
3.42
See
ta x
A
shir
wad
Max
imum
44
.67
99.8
0
135.
80 4.
47
205.
40
8.78
Min
imum
40
.00
94.0
7
97.2
7
2.87
88
.37
1.
51
Ran
ge 4.
67 5.
73 38
.53
1.
6
117.
03
7.27
Mea
n (B
IPS
) 42
.30
96.5
5
121.
99 3.
73
151.
54
5.24
Bio
-902
x
Ash
irw
ad
Max
imum
44
.67
98.1
3
140.
40 4.
40
179.
73
6.15
Min
imum
38
.80
93.0
0
103.
27 3.
20
71.2
7
1.13
Ran
ge 5.
87 5.
13 37
.13
1.
2
108.
46
5.02
Mea
n (B
IPS
) 40
.42
95.2
1
119.
58 3.
63
124.
00
3.20
Var
dhan
x
Kra
nti
Max
imum
47.7
3
102.
73
142.
13
4.87
188.
47
8.20
Min
imum
39.2
7
82.8
0
103.
33
2.80
77.3
3
1.23
Ran
ge
8.46
19.9
3
38.8
2.07
111.
14
6.97
Mea
n (B
IPS
) 42
.66
95.5
8
125.
06
3.58
127.
29
4.57
Ave
rage
of
che
cks
AC
N-9
41.5
6
94.3
3
112.
18
2.93
71.4
4
2.01
Pus
a bo
ld
43.4
5
99.0
0
97.2
7
3.07
90.7
5
1.42
205
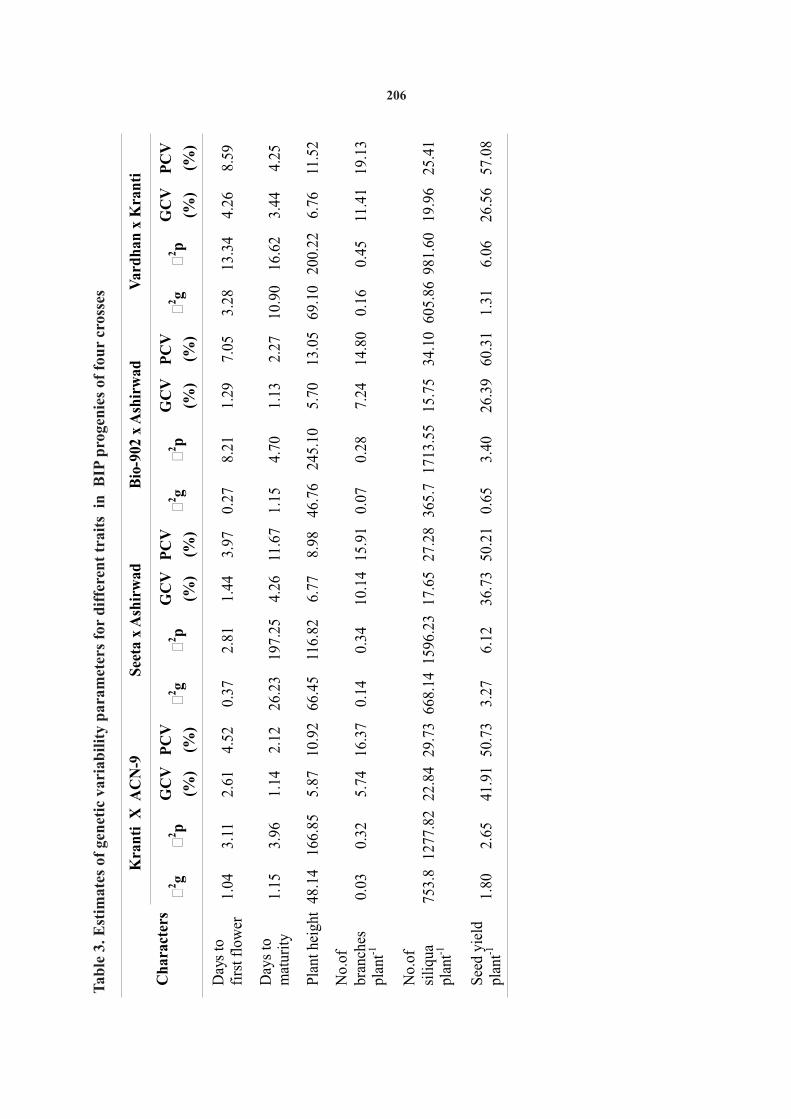
Ta
ble
3. E
stim
ates
of
gen
etic
va
ria
bil
ity
pa
ram
eter
s fo
r d
iffe
ren
t tr
aits
in
BIP
pro
gen
ies
of
fou
r cr
oss
es
Ch
arac
ters
Kra
nti
X A
CN
-9
See
ta x
Ash
irw
ad
Bio
-902
x A
shir
wad
V
ard
han
x K
ran
ti
?2 g
?
2 p
GC
V
(%)
P
CV
(%)
?
2 g
?2 p
G
CV
(%)
P
CV
(%)
?
2 g
?2 p
G
CV
(%)
P
CV
(%)
?
2 g
?2 p
G
CV
(%)
P
CV
(%)
Day
s to
fi
rst
flow
er
1.04
3.11
2.61
4.52
0.37
2.81
1.44
3.97
0.27
8.21
1.29
7.05
3.28
13.3
44.
268.
59
Day
s to
m
atur
ity
1.15
3.96
1.14
2.12
26.2
3
197.
25
4.26
11.6
7
1.15
4.70
1.13
2.27
10.9
0
16.6
2
3.44
4.25
Pla
nt h
eigh
t
48.1
4
166.
85
5.87
10.9
2
66.4
5
116.
82
6.77
8.98
46.7
6
245.
10
5.70
13.0
5
69.1
0
200.
22
6.76
11.5
2
No.
of
bran
ches
pl
ant-1
0.03
0.32
5.74
16.3
7
0.14
0.34
10.1
4
15.9
1
0.07
0.28
7.24
14.8
0
0.16
0.45
11.4
1
19.1
3
No.
of
sili
qua
plan
t-1
753.
8
1277
.82
22.8
4
29.7
3
668.
14
1596
.23
17.6
5
27.2
8
365.
7
1713
.55
15.7
5
34.1
0
605.
86
981.
60
19.9
6
25.4
1
See
d yi
eld
plan
t-1
1.80
2.65
41.9
1
50.7
3
3.27
6.12
36.7
3
50.2
1
0.65
3.40
26.3
9
60.3
1
1.31
6.06
26.5
6
57.0
8
206
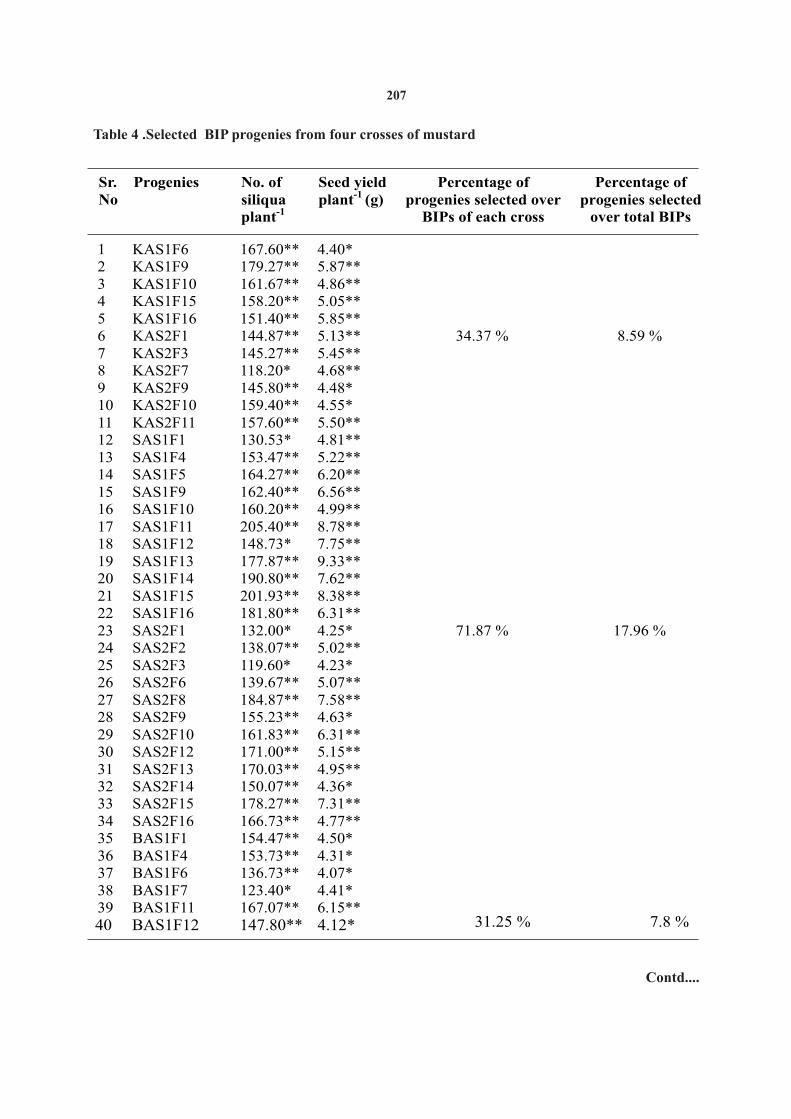
Table 4 .Selected BIP progenies from four crosses of mustard
Sr.No
Progenies No. of siliqua plant-1
Seed yield plant-1 (g)
Percentage of progenies selected over
BIPs of each cross
Percentage of progenies selected
over total BIPs
1 KAS1F6 167.60** 4.40*
34.37 %
8.59 %
2 KAS1F9 179.27** 5.87** 3 KAS1F10 161.67** 4.86** 4 KAS1F15 158.20** 5.05** 5
KAS1F16
151.40**
5.85**
6
KAS2F1
144.87**
5.13**
7
KAS2F3
145.27**
5.45**
8
KAS2F7
118.20*
4.68** 9
KAS2F9
145.80**
4.48*
10
KAS2F10
159.40** 4.55*
11
KAS2F11
157.60** 5.50**
12
SAS1F1
130.53*
4.81**
71.87 %
17.96 %
13
SAS1F4
153.47** 5.22**
14
SAS1F5
164.27** 6.20**
15
SAS1F9
162.40** 6.56**
16
SAS1F10
160.20**
4.99**
17
SAS1F11
205.40**
8.78**
18
SAS1F12
148.73*
7.75**
19
SAS1F13
177.87**
9.33**
20
SAS1F14
190.80**
7.62**
21
SAS1F15
201.93**
8.38**
22
SAS1F16
181.80**
6.31**
23
SAS2F1
132.00*
4.25*
24
SAS2F2
138.07**
5.02**
25
SAS2F3
119.60*
4.23*
26
SAS2F6
139.67**
5.07**
27
SAS2F8
184.87**
7.58**
28
SAS2F9
155.23**
4.63*
29
SAS2F10
161.83**
6.31**
30
SAS2F12
171.00**
5.15**
31
SAS2F13
170.03**
4.95**
32
SAS2F14
150.07**
4.36*
33
SAS2F15
178.27**
7.31**
34
SAS2F16
166.73**
4.77**
35
BAS1F1
154.47**
4.50*
36
BAS1F4
153.73**
4.31*
37
BAS1F6
136.73**
4.07*
38 BAS1F7 123.40* 4.41*39 BAS1F11 167.07** 6.15**
31.25 % 7.8 %40 BAS1F12 147.80** 4.12*
Contd....
207
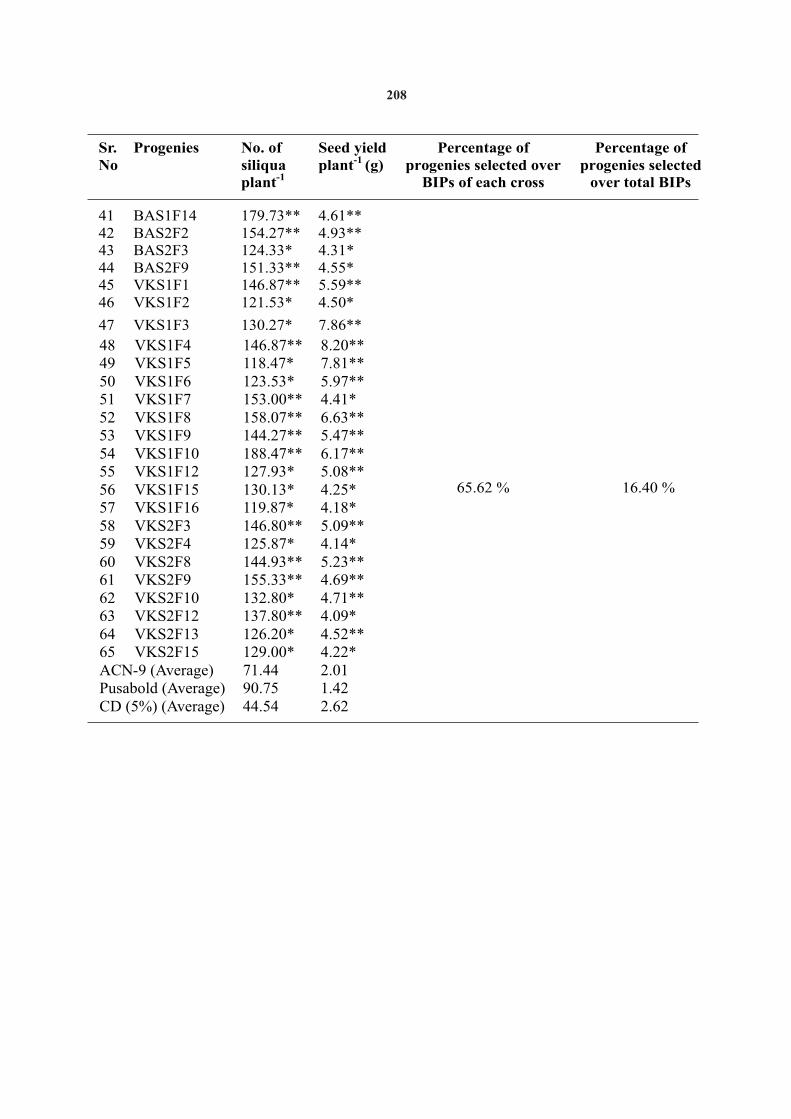
Sr.No
Progenies No. of siliquaplant-1
Seed yield plant-1 (g)
Percentage of progenies selected over
BIPs of each cross
Percentage of progenies selected
over total BIPs
41
BAS1F14
179.73**
4.61**42
BAS2F2
154.27**
4.93**43
BAS2F3
124.33*
4.31*44
BAS2F9
151.33**
4.55*45
VKS1F1
146.87**
5.59**46
VKS1F2
121.53*
4.50*
47
VKS1F3
130.27*
7.86**
48
VKS1F4
146.87**
8.20**49
VKS1F5
118.47*
7.81**50
VKS1F6
123.53*
5.97**51
VKS1F7
153.00**
4.41* 52
VKS1F8
158.07**
6.63**
53
VKS1F9
144.27**
5.47**54
VKS1F10
188.47**
6.17** 55
VKS1F12
127.93*
5.08**56
VKS1F15
130.13*
4.25* 57
VKS1F16
119.87*
4.18*58
VKS2F3
146.80**
5.09**59
VKS2F4
125.87*
4.14*60
VKS2F8
144.93**
5.23**61
VKS2F9
155.33**
4.69**62
VKS2F10
132.80*
4.71**63
VKS2F12
137.80**
4.09*64
VKS2F13
126.20*
4.52**65 VKS2F15 129.00* 4.22*ACN-9 (Average) 71.44 2.01Pusabold (Average) 90.75 1.42CD (5%) (Average) 44.54 2.62
65.62 % 16.40 %
208
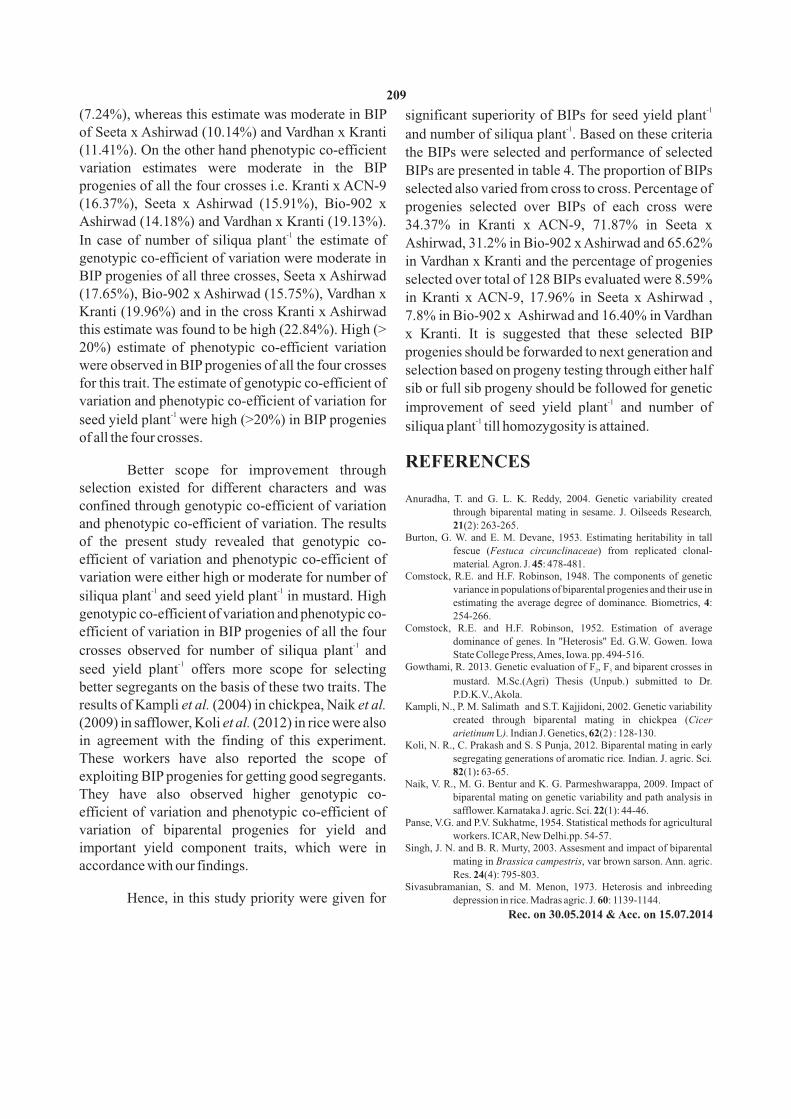
-1(7.24%), whereas this estimate was moderate in BIP significant superiority of BIPs for seed yield plant -1of Seeta x Ashirwad (10.14%) and Vardhan x Kranti and number of siliqua plant . Based on these criteria
(11.41%). On the other hand phenotypic co-efficient the BIPs were selected and performance of selected variation estimates were moderate in the BIP BIPs are presented in table 4. The proportion of BIPs progenies of all the four crosses i.e. Kranti x ACN-9 selected also varied from cross to cross. Percentage of (16.37%), Seeta x Ashirwad (15.91%), Bio-902 x progenies selected over BIPs of each cross were Ashirwad (14.18%) and Vardhan x Kranti (19.13%). 34.37% in Kranti x ACN-9, 71.87% in Seeta x
-1 In case of number of siliqua plant the estimate of Ashirwad, 31.2% in Bio-902 x Ashirwad and 65.62% genotypic co-efficient of variation were moderate in in Vardhan x Kranti and the percentage of progenies BIP progenies of all three crosses, Seeta x Ashirwad selected over total of 128 BIPs evaluated were 8.59% (17.65%), Bio-902 x Ashirwad (15.75%), Vardhan x in Kranti x ACN-9, 17.96% in Seeta x Ashirwad , Kranti (19.96%) and in the cross Kranti x Ashirwad 7.8% in Bio-902 x Ashirwad and 16.40% in Vardhan this estimate was found to be high (22.84%). High (> x Kranti. It is suggested that these selected BIP 20%) estimate of phenotypic co-efficient variation progenies should be forwarded to next generation and were observed in BIP progenies of all the four crosses selection based on progeny testing through either half for this trait. The estimate of genotypic co-efficient of sib or full sib progeny should be followed for genetic
-1variation and phenotypic co-efficient of variation for improvement of seed yield plant and number of -1
-1seed yield plant were high (>20%) in BIP progenies siliqua plant till homozygosity is attained.of all the four crosses.
REFERENCESBetter scope for improvement through selection existed for different characters and was
Anuradha, T. and G. L. K. Reddy, 2004. Genetic variability created confined through genotypic co-efficient of variation through biparental mating in sesame. J. Oilseeds Research, and phenotypic co-efficient of variation. The results 21(2): 263-265.
Burton, G. W. and E. M. Devane, 1953. Estimating heritability in tall of the present study revealed that genotypic co-fescue (Festuca circunclinaceae) from replicated clonal-
efficient of variation and phenotypic co-efficient of material. Agron. J. 45: 478-481.Comstock, R.E. and H.F. Robinson, 1948. The components of genetic variation were either high or moderate for number of
-1 -1 variance in populations of biparental progenies and their use in siliqua plant and seed yield plant in mustard. High
estimating the average degree of dominance. Biometrics, 4: genotypic co-efficient of variation and phenotypic co- 254-266.
Comstock, R.E. and H.F. Robinson, 1952. Estimation of average efficient of variation in BIP progenies of all the four dominance of genes. In ''Heterosis'' Ed. G.W. Gowen. Iowa -1crosses observed for number of siliqua plant and State College Press, Ames, Iowa. pp. 494-516.
-1 Gowthami, R. 2013. Genetic evaluation of F , F and biparent crosses in 2 3seed yield plant offers more scope for selecting mustard. M.Sc.(Agri) Thesis (Unpub.) submitted to Dr. better segregants on the basis of these two traits. The P.D.K.V., Akola.
results of Kampli et al. (2004) in chickpea, Naik et al. Kampli, N., P. M. Salimath and S.T. Kajjidoni, 2002. Genetic variability created through biparental mating in chickpea (Cicer (2009) in safflower, Koli et al. (2012) in rice were also arietinum L). Indian J. Genetics, 62(2) : 128-130.
in agreement with the finding of this experiment. Koli, N. R., C. Prakash and S. S Punja, 2012. Biparental mating in early segregating generations of aromatic rice. Indian. J. agric. Sci. These workers have also reported the scope of 82(1): 63-65.exploiting BIP progenies for getting good segregants.
Naik, V. R., M. G. Bentur and K. G. Parmeshwarappa, 2009. Impact of They have also observed higher genotypic co- biparental mating on genetic variability and path analysis in
safflower. Karnataka J. agric. Sci. 22(1): 44-46.efficient of variation and phenotypic co-efficient of Panse, V.G. and P.V. Sukhatme, 1954. Statistical methods for agricultural
variation of biparental progenies for yield and workers. ICAR, New Delhi.pp. 54-57.Singh, J. N. and B. R. Murty, 2003. Assesment and impact of biparental important yield component traits, which were in
mating in Brassica campestris, var brown sarson. Ann. agric. accordance with our findings.Res. 24(4): 795-803.
Sivasubramanian, S. and M. Menon, 1973. Heterosis and inbreeding Hence, in this study priority were given for depression in rice. Madras agric. J. 60: 1139-1144.
Rec. on 30.05.2014 & Acc. on 15.07.2014
209

ABSTRACT
A field experiment was conducted during rabi season of 2013-14 at College of Agriculture, Nagpur. The experiment was laid out in split plot design with four treatments of irrigation levels under main plot viz., I - No 0
irrigation, I - One irrigation ( at pod filling stage i.e. at 55 DAS), I - Two Irrigations (at flowering i.e. at 35 DAS and 1 2
at pod filling i.e. at 55 DAS), I - Three irrigations (at 35, 55 and 75 DAS) and three antitranspirants as sub plot 3
treatments viz., A - Control i.e. No antitranspirant, A - Kaolin @ 6%( two sprays at 35 DAS and at 55 DAS) and A 0 1 2
– PMA ( Phenyl mercuric acetate) @ 250 ppm (two sprays at 35 DAS and at 55 DAS) forming 12 treatment combinations replicated three times.
-1Growth contributing characters viz., mean plant height, mean number of branches plant , mean leaf area -1 -1 -1plant , mean dry matter accumulation plant and yield contributing characters viz., number of siliqua plant ,
-1 -1 -1 -1number of seeds siliqua , test weight, seed yield plant and stover yield plant , and seed and straw yield kg ha were significantly more due to three irrigations at 35, 55 and 75 DAS as compared to no irrigation (control). Antitranspirant PMA @ 250 ppm recorded significantly more values of growth contributing characters viz., mean
-1 -1 -1plant height, mean number of branches plant , mean leaf area plant , mean dry matter accumulation plant . Yield -1 -1 -1contributing characters such as number of siliqua plant , number of seeds siliqua , test weight, seed yield plant ,
-1 -1 -1stover yield plant , seed yield kg ha and straw yield kg ha were significantly higher due to PMA @ 250 ppm as compared to no antitranspirant. However, Kaolin @ 6% was at par with PMA @ 250 ppm.
(Key words: Anti transpirauts, irrigaition, Indian mustard)
resulted in significant increase of all biometric INTRODUCTIONparameters. In a three year study the increase in seed
yield of 3.6, 6.93 and 9.4% and stalk yield of 5.67, In India area under mustard crop is 6.5 10.17 and 15.17% was recorded with PMA + Kaolin million hectares producing about 7.67 million tons of
-1 combined spray, followed by PMA and Kaolin seeds with an average productivity of 1179 kg ha . respectively (Singh and Rana, 2006). Hence, the Area under mustard cultivation in Maharashtra was present study was conducted with the objective to 7700 hectares and production was 3000 tons with
-1 find out the optimum frequency of irrigation required the productivity of 383 kg ha and in Vidarbha area to mustard crop for better growth and yield and to under this crop was 2200 hectares with the
-1 study the effect of antitranspirant . production of 800 tons and productivity of 312 kg ha(Anonymous, 2013).
MATERIALS AND METHODSAmong the various natural resources, water
is the most important resource for exploiting yield A field experiment was conducted during potential of selected crop. It is necessary to have rabi season of 2013-14 at college of Agriculture, proper planning for optimal use of water to maximize Nagpur. The soil of the experimental field was clayey production of oilseed crops. This can be achieved by -1in texture, medium in nitrogen content (175.1kg ha ), additional development, conservation and efficient -1medium in phosphorus (24 .2 kg ha ) and rich in management of available water resources. However,
-1potash (264.3kg ha ). Organic carbon content was information on how many irrigations are required for medium (0.58 %), soil reaction was slightly alkaline higher yield is meagre. Spraying of antitranspirants in nature ( pH 7.7). Field capacity was 31.1 %, like phenyl mercuric acetate (PMA) and kaolin can permanent wilting point was 14.5 % and bulk density go a way in economizing water and making it
2was 1.5 g cm . The experiment was laid out in split available to the plant for growth and seed production. plot design with four treatments of irrigation levels The application of antitranspirant PMA and Kaolin under main plots viz., I - No irrigation, I - One alone and in combination through foliar spray 0 1
1,3, 4 and 5. P.G. Students, Agronomy section, College of Agriculture, Nagpur 2 . Asstt. Professor, Agronomy section, College of Agriculture ( Dr. P. D. K. V., Akola), Nagpur-
440001.(M.S.), India. Corresponding author : [email protected]
EFFECT OF ANTITRANSPIRANTS AND FREQUENCY OF IRRIGATIONS ON GROWTH, YIELD ATTRIBUTES AND YIELD OF INDIAN
MUSTARD (Brassica juncea L.)1 2 3 4 5K. E. Badukale , D. D. Mankar , S. G. Jaiswal , A.M.Jamankar and Aditi Desai
J. Soils and Crops 25 (1) 210-214, June, 2015 ISSN 0971-2836
irrigation ( at pod filling stage i.e. at 55 DAS), I - significantly more plant height at harvest , number of 2-1 -1 2
branches plant at harvest,more leaf area plant (dm ) Two Irrigations (at flowering i.e. at 35 DAS and at pod -1 at 80 DAS and dry matter production plant at harvest filling i.e. at 55 DAS), I - Three irrigations (at 35, 55 3
(12.71g) over the control, but kaolin 6 % recorded at and 75 DAS) and three antitranspirants as sub plot par height with PMA @ 250 ppm. These results are in treatments viz., A - Control i.e. No antitranspirant, 0
close accordance with the findings of Singh and A - Kaolin @ 6%( two sprays at 35 DAS and at 55 1
Tejsingh (2006), also reported significantly more DAS) and A – PMA ( Phenyl mercuric acetate) @ 2-1plant height, leaf area plant , number of branches 250 ppm (two sprays at 35 DAS and at 55 DAS)
-1 -1 plant and dry matter production plant due to foliar forming 12 treatment combinations replicated three spray of PMA and kaolin alone and in combination. times. Kantwa and Meena (2002) also reported more
-1 number of branches plant due to PMA @ 250 ppm. The gross plot size was 4.5 m × 4.8 m and Thakuria et al. (2004) reported that kaolin 6% spray net plot size was 3.6 m × 4.2 m. The pusa bold variety
resulted in better dry matter production in sunflower of mustard was sown at spacing of 45 cm × 10 cm. which support the present findings. The recommended fertilizer dose used was 50:40:00
-1kg NPK ha . The growth observations on height of -1 Interaction effectplant (cm) at harvest, number of branches plant at
-1harvest, leaf area plant at 80 DAS were recorded on The Interaction effect due to irrigation levels
five plants and dry matter at harvest was recorded on and antitranspirant on height of plant and number of
two plants. The yield contributing characters viz., -1 branches plant was found to be non-significant. The -1number of siliqua plant , test weight (g), number of -1Interaction effect on mean leaf area plant at 80 DAS -1 -1 -seeds siliqua , seed yield plant (g), stover yield plant -1
and dry matter plant at harvest was found significant. 1 (g) were recorded on five observational plants. The Three irrigations without any spray of antitranspirant -1
yield ha was calculated from the net plot yield. (I A ) recorded maximum and significantly more leaf 3 0
-1 area plant at 80 DAS over rest of the interactions RESULTS AND DISCUSSIONexcept three irrigations with kaolin @ 6% (I A ) and 3 1Growth attributes three irrigations with PMA @ 250 ppm (I A ) which 3 2Effect of irrigation frequency were at par. Three irrigations with PMA @ 250 ppm
-1 Three irrigations recorded maximum and (I A ) recorded highest dry matter plant at harvest 3 2
significantly more plant height at harvest, number of (17.7 g) but was at par to three irrigations with no -1 -1
branches plant at harvest, leaf area plant at 80 DAS antitranspirant (I A ). 3 0-1 and dry matter production plant at harvest over other
Yield attributesirrigation frequencies. These better growth characters Effect of irrigation frequencydue to three irrigations might be due to better
availability of soil moisture leading to better -1
Maximum number of siliqua plant (231.7), utilization of nutrients. These results obtained during -1 -1
number of seeds siliquae (15.03), seed yield plantthe investigation are in close accordance with the -1
(3.73), stover yield plant and test weight (1000 seed) finding of Jadhav et al. (1995), who also reported were recorded due to three irrigations which were more plant height due to three irrigations given at 35, significantly more over control,one irrigation and two 50 and 75 DAS to mustard crop. Nagdive et al. (2007)
-1 irrigations. However, one irrigation and two also reported maximum leaf area plant due to three irrigations also recorded significantly more values in irrigations applied at branching, flowering and respect of these parameters over no irrigation. The siliquae development stages and Kantwa and Meena significant increase in these yield attributes due to (2002) also reported more growth characters viz.,
-1 increase in irrigation might be due to better plant plant height and dry matter plant due to three height, number of branches, more leaf area and more irrigations.dry matter which again might have due to better soil moisture availability at proper stage. These results are Effect of antitranspirants
PMA @ 250 ppm recorded maximum and in conformity with the findings of Dudwal et al.
211
-1 (2013), who also reported significant increase in Seed, stover yield (kg) ha and harvest index(%)-1 Effect of irrigation frequencystover yield plant due to three irrigations over no
The three irrigations recorded maximum and irrigation. Nagdive et al. (2007) also recorded significantly higher seed and stover yield than rest of maximum values of test weight due to three the treatments. The three, two and one irrigation irrigations one each at branching, flowering and increased 103.7%, 89% and 20% more yield over no siliquae development stages which supports the
-1irrigation. The significant seed and stover yield ha present findings.
due to three irrigations might be cumulative effect of Effect of antitranspirant growth and yield contributing characters. The results
-1The number of siliqua plant , number of seed obtained in this investigation are in close
-1 -1 -1siliquae , seed yield plant , stover yield (g) plant accordance with the finding of Dudwal et al. (2013),
and test weight (1000 seed) were significantly higher who also reported significant increase in seed yielddue to two sprays of PMA @ 250 ppm as compared to due to three irrigation over one irrigation, Meena et no antitranspirant (control). This might be due to al. (2013) and Sharma et al. (2013) reported more judicious use of water conserved in plant by maximum seed and stover yield of mustard crop controlling the transpiration due to PMA @ 250 ppm.
under three irrigations and significantly improved The results obtained during the investigation are in
productivity over one and two irrigations. Two close accordance with the findings of Singh and Rana
irrigations recorded higher harvest index over one and (2006) who also reported significantly more seed
three irrigations.-1yield plant and test weight due to application of PMA antitranspirant. Effect of antitranspirant
-1The mean seed yield (600 kg ha ) and stover Interaction effect -1 -1yield ha (2216 kg ha ) was maximum and Three irrigations with PMA @ 250 ppm
-1 significantly higher due to PMA @ 250 ppm over (I A ) recorded highest number of siliquae plant3 2control. The kaolin @ 6% also given significantly
(247.33) and was significantly superior over all other higher yield over control. This might be due to interactions but three irrigations with kaolin @ 6% cumulative effect of yield and growth parameters .(I A ) was found at par with it. The Interaction effect 3 1
-1 These results are in close accordance with the on number of seeds siliquae was found non- findings of Singh and Rana (2006), who also significant. reported significantly more seed yield due to foliar
-1 spray of PMA and kaolin alone and in combination. The highest seed yield plant (3.94 g) was The harvest index was maximum due to no recorded by three irrigations with PMA @ 250 ppm antitranspirant. (I A ) and was significantly superior over rest of the 3 2
combinations but three irrigations with Kaolin @ 6% Interaction effect(I A ) and two irrigations with PMA @ 250 ppm (I A ) 3 1 2 2
Three irrigations with two spray of PMA @ were at par with it.
250 ppm (I A ) recorded maximum and significantly 3 2
-1higher seed yield (742 kg ha ) over rest of the Three irrigations with PMA @ 250 ppm treatments except three irrigations with two sprays of (I A ) recorded maximum and significantly more 3 2
-1 Kaolin @ 6% (I A ) and two irrigations with two 3 1stover yield plant (37 g) over rest of the treatments.spray of PMA @ 250 ppm (I A ) which recorded at par 2 2
Three irrigations with kaolin @ 6% (I A ) 3 1 yield.recorded maximum and significantly higher test
weight (3.16 g) but found at par with three irrigations The two irrigations with PMA @ 250 ppm
(I A ) recorded maximum stover yield (215.5 kg without antitranspirant (I A ), three irrigations with 2 23 0
-1PMA @ 250ppm (I A ), two irrigations without ha ) and was significantly superior over rest of the 3 2
antitranspirant (I A ), two irrigations with kaolin @ interactions but three irrigations with PMA @ 250 2 0
ppm (I A ) and three irrigations with Kaolin 6% 6% (I A ) and two irrigations with PMA @ 250 ppm 3 22 1
(I A ). (I A ) were at par with it.2 2 3 1
212

Tab
le 1
. G
row
th, y
ield
att
rib
ute
s an
d y
ield
of
mu
star
d a
s in
flu
ence
d b
y va
riou
s tr
eatm
ents
an
d i
nte
ract
ion
s
Tre
atm
ents
Gro
wth
att
rib
ute
sY
ield
at
trib
ute
sY
ield
(kg h
a-1)
HI
(%)
Pla
nt
hei
gh
t a
t ha
rves
t
(cm
)
No. o
f b
ran
ches
p
lan
t-1 a
t
harv
est
Lea
f are
a
at
80
DA
S
(dm
2)
Dry
m
att
er
pla
nt-1
at
ha
rves
t(g
) N
o.
of
sili
q-
uae
pla
nt-1
Tes
t W
ei-
gh
t
(g)
No.
of
seed
s si
liq
-u
ae-1
See
d
yie
ld
pla
nt-1
(g
)
Sto
ver
y
ield
p
lan
t-1
(g)
S
eed
S
tover
Main
-Irr
igati
on
fre
qu
enci
es
I 0 -
No
irr
igat
ion
9
7.8
2.7
9
1.8
8
8.6
5
85
1
.95
11.0
7 2
.14
13
.3
34
1 7
94
30.7
I 1 -
One
irri
gat
ion
10
7.8
3.6
2
2.1
5
11.1
6
122
2.4
2 12
.51
2.5
2 1
6.9
42
7 12
54
27.1
I 2 -T
wo
irr
igat
ion
s
115
.3
4.0
9
3.6
8
12.5
1
147
3.0
8 14
.63
3.5
1 2
5.0
64
6 18
71
33.4
I 3 -T
hre
e ir
rig
atio
ns
12
7.3
4.7
6
5.1
2
15.5
6
232
3.0
9 15.0
3 3
.73
33
.3
69
5 29
51
19.8
SE
(m)
±
2.6
0.1
3
0.0
7
0.4
6
3.1
0.0
5 0
.40
0.0
6 0
.69
14.0
57
-
CD
at
5%
8
.9
0.4
5
0.2
5
1.5
8
10
.6 0
.18
1.3
7 0
.22
2.3
8
48.4
19
8
-S
ub
-An
titr
an
spir
an
ts
A
0
-Con
trol
10
1.9
3.5
8
3.0
0
11.2
1
131
2.4
8 12.6
5 2
.69
21
.1
46
5 12
25
31.7
A1
- K
aoli
n @
6%
113
.7
3.8
6
3.2
0
12.0
0
144
2.6
5 13.4
6 2
.93
22
.1
51
7 17
12
26.3
A2 - P
MA
@ 2
50 p
pm
12
0.5
4.0
0
3.4
2
12.7
1
166
2.7
7 13.8
3 3
.30
23
.2
60
0 22
16
25.2
SE
(m)
±
3.8
0.1
1
0.1
1
0.2
8
4.5
0.0
5 0
.32
0.0
7 0
.54
15.4
64
-
CD
at
5%
11
.4
0.3
3
0.3
2
0.8
3
13
.4 0
.16
0.9
5 0
.21
1.6
1
46.3
19
3
-
Inte
ract
ion
s
I 0
x A
0
-
-
1.3
7
7.4
0
83
2
.00
-
2.0
9 1
0.9
33
2 6
48
-
I 1 x
A0
-
-
1.6
8
9.7
0
93
1
.70
-
2.0
6 1
4.2
32
4 10
59
-I 2
x A
0
-
-
3.7
1
11.1
0
140
3.1
0
-
3.2
0 2
7.1
57
9 6
44
-
I 3 x
A0
-
-
5.2
4
16.5
0
208
3.1
3
-
3.4
0 3
2.2
62
3 25
51
-I 0
x A
1
-
-
1
.90
9
.36
8
7
1.6
0
-
2.1
6 1
8.2
34
4 9
87
-
I 1 x
A1
-
-
1
.80
14.8
0
109
2.7
4
-
2.3
1 2
1.6
38
2 10
92
-I 2
x A
1
-
-
3
.93
11
.36
1
38
3.1
0
-
3.4
0 1
7.9
62
3 17
15
-I 3
x A
1
-
-
5
.16
12.4
0
240
3.1
6
-
3.8
4 3
0.4
72
1 30
54
-I 0
x A
2
-
-
2
.36
9
.18
8
7
2.2
5
-
2.1
6 1
0.8
34
8 7
46
-
I 1 x
A2
-
-
2
.97
8
.81
1
64
2.8
3
-
3.1
8 1
4.8
57
5 16
13
-I 2
x A
2
-
-
3
.41
15.0
7
163
3.0
3
-
3.9
1 3
0.0
73
5 32
54
-I 3
x A
2
-
-
4
.96
17.7
0
247
2.9
7
-
3.9
4 3
7.0
74
2 32
49
-S
E(m
) ±
7
.6
0.2
2
0
.22
0
.56
8
.9
0.1
0
0.6
4
0.1
4
1.0
7
30.9
12
8
C
D a
t 5%
--
0.6
61
.67
26
.70
.31
-0.4
23.2
292.5
38
5
213
K. Sumeriya and N. K. Padiwal, 2013. Growth and REFERENCESproductivity of mustard [Brassica juncea (L.) Czern and
Coss.] as influenced by irrigation levels and agrochemicals. Anonymous, 2013. Directorate of Economics and Statistics Department Ann. Agri. Bio. Res. 18(3): 312-317.of Agriculture and Co-operation. www.sopa.org/crop.po.doc
Nagdive, S. J., P. D. Bhalerao and U. R. Dongarwar, 2007. Effect of Dudwal, B. L., S. K. Yadav, Rakesh Kumar, R. L. Meena and M. Hassim, irrigation and integrated nutrient management on growth and 2013. Performance and production potential of mustard yield of Indian mustard. Annals Plant Physio. 21(2): 182-185.(Brassica juncea L.) to different levels of irrigation in the
Sharma, K. K., B. L. Kumawat, Sita Kumawat and Amit Kumawat, 2013. Central plain zone of Uttar Pradesh, India. agric. Sci. Digest, Productivity and field water use efficiency of mustard in typic 33(1): 33-37.ustipsamments as affected by compaction, irrigation and Jadhav, N. D., S. N. Jadhav and S. B. Gangawane, 1995. Influence of sulphur levels. Environ. and Ecol. 31(2): 962-966. irrigation, method of nitrogen application on growth, seed
Singh, T. and K. S. Rana, 2006. Effect of moisture conservation and yield and water use of mustard (Brassica juncea). Indian J. fertility on Indian mustard and lentil intercropping system Agron. 40 (1): 120-122.under rainfed condition. Indian J. Agron. 51(4): 267-270. Kantwa, S. R. and N. L. Meena, 2002. Effect of irrigation, phosphorus and
Thakuria, R. K., H. Singh and Tejsingh, 2004. Effect of irrigation and PSB on growth and yield of mustard. Ann. agric. Res. 23(3): antitranspirants on growth and yield of spring sunflower 456-460.
Meena, R. K., D. D. Sharma, G. S. Chouhan, K. B. Shukla, H. (Helianthus annus L.) Annals Agric. Res. 25 : 433-438.
Rec. on 30.05.2014 & Acc. on 28.07.2014
214

ABSTRACT
A field experiment was conducted at farm of Horticulture Section, College of Agriculture, Nagpur during winter season of 2013-2014 with view to study the effect of different concentrations of GA (100, 200, 300 and 400 ppm) 3
and NAA (50,100, 150 and 200 ppm) on growth, yield and quality in African marigold. The results revealed that,
vegetative growth viz., height of plant (43.56 cm), number of branches (10.83), spread of plant at 50 % flowering stage E-W (24.77) and N-S (24.92) was recorded significantly maximum with the treatment of GA at 400 3
ppm, whereas, stem diameter (1.27 cm) of plant was found maximum with the treatment NAA 50 ppm. As regards flowering parameters, viz., days for first flower bud initiation (21.41 days), 50 % flowering (35.21 days) and first harvesting of flower (37.33 days) were found minimum in treatment of GA at 400 ppm. Regarding yield contributing 3
-1 -1 -1parameters, viz., number of flowers plant (48.66), flower yield plant (254.00 g) and ha (187.96 q) were recorded maximum at GA 400 ppm. In respect of quality parameters, viz., length of pedicel (7.05 cm), shelf life (4.68 days) were 3
found maximum with the treatment of GA 400 ppm whereas, treatment NAA 50 ppm had produced significantly 3 maximum weight of flower(6.10 g) and diameter of fully opened flower (6.51 cm).
(Key words: Marigold, GA , NAA, foliar application)3
-1 plant
group of plant hormones. Gibberellic acid and NAA INTRODUCTIONplays a vital role in improving the vegetative growth
Marigold is one of the commercially characters of the plants as it enhances the elongation exploited flower crops that belong to the family and cell division by promoting the DNA synthesis in Asteraceae and genus Tagetes. Marigold is broadly the cell. It reduced the juvenile phase due to increase divided into two groups, viz., Tagetes erecta (L.) and in photosynthesis and respiration with enhanced CO 2
Tagetes patula (L.) which have their origin in Mexico fixation in the plant. Gibberellic acid helps to produce and South Africa, respectively. Tagetes erecta (L.) is the good quality flower and increased flower yield in popularly known as “African marigold” while marigold.Tagetes patula (L.) as “French Marigold”. Marigold, which is also known as “Tagetes” is of Indian origin, Therefore, present experiment was although it appears that its natural home is Mexico undertaken in order to study the effect of GA , NAA 3
compared to other flowering annuals. Marigold is on growth and yield of African marigold.easily adaptable to various growing conditions. It is propagated by seeds and growth is well in all types of MATERIALS AND METHODSsoil. Tagetes erecta, the African marigold is a hardy,
A field experiment was carried out at farm of about 90 cm tall, erect branched and flowers are Horticulture Section, College of Agriculture, Nagpur
generally large in size with bright shades, ranging during rabi season of the year 2013-2014.The
from yellow to orange and are the best for experiment was laid out in a Randomized Block
combination in any flower arrangement.Design with three replications. The experiment comprised with nine treatments viz., T - GA 100 1 3Marigold is mostly grown for cut flowers as ppm, T - GA 200 ppm, T - GA 300 ppm, T - GA 2 3 3 3 4 3well as loose flowers for making garlands or grown as 400 ppm, T - NAA 50 ppm, T - NAA 100 ppm, T -bedding flowering plant in garden display. The 5 6 7
NAA 150 ppm and T - NAA 200 ppm and T - Control.globular shaped flowers with long stalks are used for 8 9
cut flower purpose. The African marigold variety F hybrid seed 1
Now a days the use of growth regulators play was procured from local source. The seeds were sown an important role by increasing, reducing or after filling the mixture of 70% cocopeat, 15% perlite modifying the physiological process within plant and and 15% soil in protray under controled condition.
The seed was sown on 27 September 2013. Four week which ultimately affect the growth, flowering and old seedlings were used by transplanting. The yield. Gibberellins and NAA fall in growth promoter
1 & 4. P.G. Students, Horticulture Section, College of Agriculture, Nagpur2. Asstt. Professor, Horticulture Section, College of Agriculture, Nagpur 3. Jr. Res. Assistant, Horticulture Section, College of Agriculture, Nagpur
1 2 3 4Pranali Meshram , Shalini Badge , Vandana Kalamkar and Ashvini Gaidhani
J. Soils and Crops 25 (1) 215-219, June, 2015 ISSN 0971-2836
EFFECT OF FOLIAR APPLICATION OF GA AND NAA ON GROWTH 3
FLOWERING, YIELD AND QUALITY OF AFRICAN MARIGOLD
transplanting was done at a spacing of 45 cm×30 cm height (38.68 cm), was recorded significantly distance. A recommended dose of fertilizers viz., 100 maximum under the treatment NAA 50 ppm which kg nitrogen, 50 kg phosphorus and 25 kg potassium was statistically at par with the treatments NAA 100
-1 ppm. Stem diameter (1.27 cm) was recorded ha were applied through urea, single super phosphate significantly maximum under the treatment NAA 50 and muriate of potash. Half dose of nitrogen and full ppm which was statistically at par with the treatments dose of phosphorus and potash were applied at the
-1NAA 100 ppm. Number of branches plant (9.43) was time of transplanting in all treatment plots and the recorded significantly maximum under the treatment remaining half of nitrogen was applied as top dressing NAA 50 ppm which was significantly superior over after 30 days of transplanting. all other treatments followed by treatments NAA 100
Regarding treatments of GA at 100, 200, 300 ppm, NAA 150 ppm and NAA 200 ppm. Spread of 3
and 400 ppm and NAA at 50,100,150,200 ppm were plant E-W (22.34 cm) and N-S (22.76 cm) were prepared as per treatment concentration with distilled recorded significantly maximum under the treatment water just before their use. Foliar application of GA NAA 50 ppm which was statistically at par with the 3
treatments NAA 100 ppm, NAA 150 ppm and NAA and NAA were applied twice at 15 and 30 days after 200 ppm in E-W and NAA 100 ppm in N-S. However, transplanting as per treatment. Spraying was done in minimum plant height (31.69 cm), stem diameter the morning hours on both the surface of the leaves
-1(1.13), number of branches plant (8.34) and spread and apical meristem. Various observations were of plant E-W (31.69 cm) and N-S (24.68 and 24.71 recorded on five randomly selected plants in each cm) were recorded in control treatment. treatment plot and in each replication on various
growth parameters like, height of plant, Stem -1 From above results, it is showed that diameter (cm) and branches plant were recorded at
gibberellic acid 400 ppm and NAA 50 ppm had 90 days of transplanting, spread of plant was recorded significantly increased vegetative parameters in at 50 % flowering stage, flowering parameters like, African marigold viz., plant height, stem diameter, days to first flower bud initiation, days to 50 %
-1number of branches plant and spread of plant E-W flowering and days to first harvesting were recorded and N-S. This might be due to the fact that, an at flowering stage and yield parameters like number
-1 -1 application of gibberellic acid at different of flowers, yield of flowers plant and ha were concentrations the growth of plant increased by recorded at the time of harvesting.increasing internodal length, cell division, cell enlargement and enhancement of apical dominance. RESULTS AND DISCUSSION
The results are in conformity with the Growth parametersfindings of Yadav et al. (2013), they found that foliar
Data from table 1 revealed that, plant height application of GA 300 ppm significantly enhanced 3 (43.56 cm) was recorded significantly maximum
-1plant height and number of branches plant in African under the treatment GA 400 ppm which was 3marigold. Pandey and Chandra (2008) reported that
statistically at par with the treatments GA 300 ppm. 3 foliar application of GA 450 ppm significantly 3Stem diameter was recorded significantly maximum enhanced stem diameter in African marigold. Tyagi
under the treatment GA 400 ppm which was 3 and Kumar (2006) reported that foliar application of statistically at par with the treatments NAA100 ppm.
GA 200 ppm significantly enhanced plant spread in -1 3Branches plant (10.83) were recorded significantly
African marigold.maximum under the treatment GA 400 ppm which 3
was significantly superior over all the other Similarly, NAA plays a vital role in treatments followed by treatment GA 300 ppm and 3 improving the vegetative growth characters of the GA 200 ppm. Spread of plant at 50 % flowering E-W plants might be due to the fact that NAA, being a 3
(24.77 cm) and N-S (24.92 cm) were recorded member of auxin group promotes vegetative growth significantly maximum under the treatment GA 400 by active cell division and cell elongation. Kanwar 3
and Khandelwal (2013) reported that foliar ppm which was statistically at par with the treatments application of NAA 200 ppm enhanced plant height GA 300 ppm and GA 200 ppm.3 3
-1As regards foliar application of NAA, plant and number of branches plant significantly in
216

African marigold. Pandey and Chandra (2008) would have been utilized by plants for cellular reported that foliar application of NAA 200 ppm expansion and tissue growth resulting in the significantly enhanced stem diameter in African improvement on all flowering parameters. marigold. Girisha et al. (2012) reported that foliar
The results are in conformity with the application of NAA 150 ppm significantly enhanced
findings of Swaroop et al. (2007). They reported that plant spread in Daisy.
foliar application of NAA 300 ppm significantly
reduced days to bud initiation in African marigold. Flowering parametersGirisha et al. (2012) reported that foliar application of
Data from table 1 revealed that, minimum NAA 25 ppm significantly reduced days for 50 %
days required for first flower bud initiation (21.41 flowering. Pandey and Chandra (2008) reported that days) under the treatment GA 400 ppm which was 3foliar application of NAA 100 ppm significantly
statistically at par with the treatments GA 300 ppm, 3reduced days for first harvesting.
GA 200 ppm, NAA 50 ppm and NAA 100 ppm. 3
Yield parameters Minimum days required for 50 % flowering (35.21 days) under the treatment GA 400 ppm which was 3 The data from table 2 revealed that, treatment statistically at par with the treatments GA 300 ppm. 3 GA 400 ppm recorded maximum number of flowers 3
-1The treatment GA 400 took significantly minimum 3 plant (48.66) which was found to be at par with the period for first harvesting (37.33 days) and it was treatment GA 300 ppm. The treatment GA 400 ppm 3 3statistically at par with the treatments GA 300 ppm -1 3 recorded maximum yield of flower plant (254.00 g) and GA 200 ppm.3 -1
ppm and ha (187.96 q) which was found to be at par
with NAA 50 ppm. However, significantly minimum As regards foliar application of Naphthalene -1
number of flowers plant (29.33), yield of flower acetic acid, NAA 50 ppm took significantly minimum -1 -1
plant (110.86 g) and ha (82.09 q) were recorded in period for days to first flower bud initiation (23.66 control treatment.days), 50 per cent flowering (44.86 days) and first
harvesting (41.46 days) which was significantly From above results, it is showed that superior over all the other treatments followed by
gibberellic acid 400 ppm and NAA 50 ppm had treatments NAA100 ppm, NAA150 ppm and NAA
significantly increased yield parameters in African 200 ppm. However, maximum days to first flower bud -1marigold viz., number of flowers plant , yield of initiation (26.87 days), 50 per cent flowering (47.07
-1 -1flowers plant and ha . This might be due to the fact days) and first harvesting (43.68 days) were recorded that, GA spray might have helped to enhance the 3in control treatment.uptake of nitrogen, phosphorus and potassium by the
From above results, it is showed that plant and this better uptake of nutrient might have
gibberellic acid 400 ppm and NAA 50 ppm had supported the vegetative growth viz., plant height and
significantly increased flowering parameters viz., number of branches and finally might have increased
minimum days to first flower bud initiation, 50 per -1the number of flowers plant . Production and cent flowering and first harvesting in African
accumulation of more photosynthates which would marigold. This might be due to the fact that, an have diverted to the sink resulting into flower yield application of gibberellic acid at different
-1 -1 plant and yield of flowers ha in African marigold. concentrations might have reduced the juvenile phase and the shoot apical meristem converted into the
The results are in conformity with the flower primordia instead of producing leaves due to findings of Swaroop et al. (2007), they reported that which minimum days required for initiation of first foliar application of GA 300 ppm significantly 3 flower bud as well as 50 per cent flowering and early
-1enhanced maximum number of flowers plant and harvesting.
-1yield of flowers plant in African marigold. Kanwar Similarly, NAA plays a vital role in and Khandelwal (2013) reported that foliar improving the flowering characters of the plants as it application of GA 200 ppm significantly enhanced enhanced the cell division and rate of respiration, 3
-1yield of flowers ha in African marigold.resulting in production of metabolic energy which
217

Tab
le 1
. E
ffec
t of
foli
ar a
pp
lica
tion
of
GA
an
d N
AA
on
gro
wth
an
d f
low
erin
g in
Afr
ican
mari
gold
3
Tre
atm
ents
H
eig
ht
of
pla
nt
(cm
) S
tem
dia
met
er
(cm
)
Bra
nch
es
pla
nt-1
Sp
rea
d o
f p
lan
t a
t
50
% f
low
erin
g (
cm)
Da
ys
to
firs
t
flo
wer
bu
din
itia
tio
n (
da
ys)
Da
ys
to 5
0 %
flo
wer
ing
(da
ys)
Da
ys
to
firs
t
ha
rves
tin
g
E-W
N
-S
GA
3
10
0 p
pm
38
.73
1.1
7
9.4
5
2
2.6
8
2
3.1
9
2
4.1
6
41.5
54
1.2
1
GA
3
20
0 p
pm
39
.10
1.1
8
9.4
9
24
.19
24
.66
23
.06
41.3
83
8.2
8
GA
3
30
0 p
pm
41
.85
1.1
9
9.8
1
2
4.6
8
2
4.7
1
2
2.1
9
37.4
73
7.3
7G
A3
40
0 p
pm
43
.56
1.2
0
10
.83
24
.77
24
.92
21
.41
35.2
13
7.3
3N
AA
5
0 p
pm
38
.68
1.2
7
9.4
3
22
.34
22
.76
23
.66
44.8
64
1.4
6
NA
A 1
00
pp
m
34
.62
1.2
6
9.4
1
21
.41
22
.24
23
.92
45.0
54
2.3
9
NA
A 1
50
pp
m
33
.56
1.2
1
9.2
6
21
.22
21
.42
24
.41
46.3
54
2.9
2
NA
A 2
00
pp
m
32
.82
1.2
1
9.2
0
20
.95
21
.20
24
.27
46.2
94
3.2
4
Co
ntr
ol
(Wat
er s
pra
y)
31
.69
1.1
3
8.3
4
19
.32
20
.61
26
.87
47.0
74
3.6
8
SE
(m
) ±
1.4
6
0.0
1
0.2
7
0.6
8
0.4
4
0.8
6
1.8
71
.23
CD
at
5%
4.3
9
0.0
5
0.8
2
2.0
5
1.3
2
2.5
8
5.6
33
.69
T1
–
T
2
–
T
3
–
T
4
–
T
5
–
T
6 –
T7
–
T8
–
T9
–
T
ab
le 2
. Eff
ect
of
foli
ar a
pp
lica
tion
of
GA
an
d N
AA
on
flo
wer
yie
ld a
nd
qu
ali
ty i
n A
fric
an
mari
gold
3
Tre
atm
ents
Nu
mb
er o
f fl
ower
s p
lan
t-1
Yie
ld o
f fl
ower
s p
lan
t-1
(g)
Yie
ld o
f fl
ower
s h
a-1
(q)
Wei
ght
of
flow
er
(g)
Dia
met
er
of f
ull
y op
ened
flow
er (
cm)
Len
gth
of
ped
icel
(c
m)
Sh
elf
life
(day
s)
GA
3
100
ppm
42.3
3
180.
45
133.
64
4.23
5.36
6.16
2.08
GA
3
200
ppm
43.0
0
180.
34
133.
33
4.38
5.53
6.30
2.13
GA
3
300
ppm
46.6
6
214.
63
158.
95
4.60
5.56
6.84
3.26
GA
3
400
ppm
48.6
6
254.
00
187.
96
5.22
5.64
7.05
4.68
NA
A 5
0 pp
m
41.3
3
252.
11
186.
72
6.10
6.51
6.19
3.25
NA
A 1
00 p
pm
39.3
3
210.
80
155.
86
5.36
6.31
6.17
2.12
NA
A 1
50 p
pm
37.3
3
195.
60
144.
75
5.24
6.20
5.84
2.06
NA
A 2
00 p
pm35
.33
157.
5711
6.66
4.46
5.63
5.72
2.03
Con
trol
(W
ater
spr
ay)
29.3
311
0.86
82.0
93.
784.
584.
522.
02
SE
(m
) ±
1.58
11.3
86.
860.
280.
280.
250.
14
CD
at
5%4.
7634
.13
20.5
70.
840.
850.
750.
42
– – – – – – – – –
T1
T2
T3
T4
T5
T6
T7
T8
T9
218
Similarly, NAA plays a vital role in floral and yield characters might be due to the fact that improving the yield parameters of the plants as it NAA enhanced rate of respiration resulting in enhanced the cell division and rate of respiration, production of metabolic energy which would have resulting in production of metabolic energy which been utilized by plants for cellular expansion and would have been utilized by plants for cellular tissue growth resulting in the improvement in weight expansion and tissue growth resulting in the of flowers and diameter of fully opened flower. An improvement on all flowering parameters viz., application of gibberellic acid noted maximum length
-1 -1 of pedicel due to the cell elongation and rapid cell number of flowers plant , yield of flowers plant and -1 stimulation. Foliar application of yield of flowers ha . Pandey and Chandra (2008)
reported that foliar application of NAA 450 ppm significantly enhanced maximum number of flowers
-1 -1plant and yield of flowers plant in French marigold. Kanwar and Khandelwal (2013) reported that foliar application of NAA 200 ppm significantly enhanced
-1maximum yield of flowers ha in African marigold. The results are in conformity with the
findings of Yadav et al. (2013). They reported Quality parameters
African marigold by the application of GA 300 . Data from table 2 revealed that, weight of 3
flower (6.10 g) was recorded significantly maximum Pandey and Chandra (2008) reported that GA 3003
under the treatment NAA 50 ppm which was diameter of fully opened statistically at par with the treatment NAA 100 ppm. flower Tyagi and Kumar (2006) Diameter of fully opened flower (6.51 cm) was reported that GA 2003
recorded significantly maximum under the treatment African marigold. Kumar et al. (2010) NAA 50 ppm which was statistically at par with the reported that GA 2003
treatments NAA 100 ppm and NAA 150 ppm. African marigold.Lengths of pedicel (7.05 cm) was recorded significantly maximum under the GA 400 ppm 3 REFERENCEStreatment which was statistically at par with the
Girisha, R., A. M. Shirol, K. V. Patil and B. S. Kulkarni, 2012. Effect of treatments GA 300 ppm and GA 200 ppm. Shelf life 3 3 different plant growth regulators on growth, flowering, and
quality of Daisy (Aster amellus L.) cv. Dwarf pink. Indian (4.68 days) was recorded significantly maximum Hort. J. 2(1-2):39-42.under the treatment GA 400 ppm and it was 3 Kanwar, J. and S.K. Khandelwal, 2013. Effect of plant growth and yield of African marigold (Tagetes erecta L.). Madras agric. J. 100 significantly superior over all other treatments (1-3): 45-47.followed by GA 300 ppm and NAA 50 ppm. 3 Effect of GA and 3
However, minimum weight of flower (3.78 g), ethrel on growth and flowering of African marigold cv. Pusa Narangi Gainda.diameter of fully opened flower (4.58 cm), Lengths of
pedicel (4.52 cm) and Shelf life (2.02 days) were recorded in control treatment.
Sunitha, H. M., Ravi Hunje, B. S. Vyakaranahal and H. B. Bablad, 2007. Effect of pinching and growth regulators on plant growth, From above results, it is showed that flowering and seed yield in African marigold (Tagetes erecta gibberellic acid 400 ppm and NAA 50 ppm had L.) J. Orna. Hort. 10 (2): 91-95.
significantly increased quality parameters in African growth, flowering and seed characters of African marigold marigold viz., weight of flower, diameter of fully (Tagetes erecta L.) as influenced by different growth
opened flower, length of pedicel and shelf life. This substances during mild off season.
might be due to the fact that, an application of Yadav, H. K., A. K. Singh, H. K. Singh and Bhupendra Kumar, 2013. naphthalene acetic acid noted maximum weight of
Response of African marigold (Tagetas erecta L.) to various flower in African marigold. The increase in these plant growth regulators. Agric. and Bio. Res. 29(2):139-141.
gibberellic acid recorded maximum shelf life of flower. This might be due to more vegetative growth, early initiation of flowering, increased pedicel length and more diameter of flower which might have helped the flower to last longer in ambient temperature.
maximum weight of flower and length of pedicel in ppm
ppm recorded maximum in French marigold.
ppm recorded maximum length
of pedicel in ppm recorded maximum shelf
life of flower in
Pandey, A. K. and Hem Chandra, 2008. Effect of various plant growth regulators on growth and flowering of French marigold (Tagetes patula L.). Indian J. Hort. 40 (1): 96-99.
Kumar Ramesh, Ram Mohan and G. S. Gaur, 2010.
Indian J. Hort. 67: 362-366.
Swaroop, Kishan, K. P. Singh and D. V. S. Raju, 2007. Vegetative
J. Orna. Hort. 10 (4): 268 - 270.
Rec. on 02.06.2014 & Acc. on 10.08.2014
219
ABSTRACT
The experiment was carried out during the kharif 2012-13 at Agriculture College Farm, Nagpur. The experiment was laid out in split plot design replicated thrice with three land configuration treatments as main factor viz., L -Broad bed method (The broad bed furrow prepared at sowing with distance of 120 cm with two rows of maize 1
) , L -Ridges and furrow (Ridges and furrow opened at the time of sowing with dibbling of seeds on ridge) and L -Flat 2 3
-1bed and four nutrient management treatments as sub factor viz., F -100% RDF (120:60:30 kg NPK ha ), F -125% 1 2
-1 -1RDF (150:75:37.5 kg NPK ha ), F -75% RDF (90:45:22.5 kg NPK ha )+25 % N through vermi-compost, F - 75% 3 4
-1RDF (90:45:22.5 kg NPK ha )+25 % N through FYM.
The ridges and furrow showed maximum and significantly higher plant height(201.9 cm), number of 2 -1 -1 -1functional leaves(12.78), leaf area(105.13 dm ), mean dry matter plant (140.6 g plant ) , number of cobs plant (1.51),
-1 -1 -1 number of grains cob (399), grain weight cob (85.35 g ), test weight(21.76), grain yield plant (128.6)and grain yield -1 -1 -1 ha (56.69 q), straw yield plant (175.76 g) and straw yield ha (70.56 q), gross monetary returns (Rs 71561), net
monetary returns (Rs 44981) and benefit: cost ratio(2.76)over flat bed, followed by broad bed furrow method which also recorded significantly more over flat bed for above parameters.
-1The nutrient management practices 125% RDF (150:75:37.5 kg NPK ha ) recorded significantly higher 2 -1 plant height(201.8 cm), number of functional leaves(12.24), leaf area(106.38 dm ), mean dry matter plant (139.1 g)
-1 -1 -1 number of cobs plant (1.41), number of grains cob (400), grain weight cob (89.77), test weight(22.76), grain yield -1 -1 -1 -1 plant (127.76 g ) and grain yield ha (56.88 q), straw yield plant (70.11 g ) and straw yield ha (70.11 q) over 100%
-1RDF. The 75% RDF (90:45:22.5 kg NPK ha ) + 25% N through vermi-compost recorded at par values with 100% -1RDF but 75% RDF (90:45:22.5 kg NPK ha ) + 25% N through FYM recorded significant reduction over 100% RDF
in respect of above parameters. Gross monetary returns (GMR) and net monetary returns (NMR) were highest (Rs -171761 and 48461 respectively) in treatment 125% RDF (150:75:37.5 kg NPK ha ) over 100% RDF. While 75% RDF +
25% N through vermi-compost and 75% RDF + 25% N through FYM recorded significantly lower GMR. Nutrient management treatment of 100% RDF registered higher B:C ratio over all other treatments. Interaction results were non significant.
((Key words : Maize, land configuration, fertilizer, growth, yield, economics)
productivity by supplying organics manures. INTRODUCTIONArulkumar et al. (2005) with ridges and furrows recorded significantly maximum grain yield of maize Maize crop can tolerate different over other practices and recorded increase in yield
environments and can be grown on variety of soils. It over normal sowing. Asghar et al. (2010) studied that
responds to various agronomic practices. Various too low or high NPK levels reduced the yield and
factors of production deciding the maize productivity yield parameters of maize crop. Treatment of
under rainfed condition are stress, plant density, -1175:80:60 kg NPK ha seems to be the most
fertilizer use and land configuration. Out of these appropriate level to obtained maximum grain yield
factors, land configuration and fertilizer use have under the prevailing conditions. Application of NPK -1significance in stepping up the yield of maize during
beyond treatment of 175:85:60 kg NPK ha proved the kharif season or under irrigated condition. un-economical.
The fertilizer management is of paramount The land configuration not only improves importance in crop cultivation. Any variety of the soil drainage but also leads to efficient use of limited crop for its high potential will require a optimum dose water for profitable crop production. For uniform of nutrients. Plant nutrients are lost from the soil in distribution of irrigation water as well as rain water, different ways. Large quantities are removed from the broad bed furrow, ridges and furrow and flat-bed in soil through harvest of crop. Due to very expensive standing crop may be required. With proper land fertilizers, it is necessary to minimize the expenses on layout or configuration, the fertilizer use and nutrient fertilizer and at the same time we can sustain the crop use efficiency might be enhanced.
1. P.G. Student, Agronomy section, College of Agriculture, Nagpur2. Asstt. Professor of Agronomy (Mustard Agronomist), AICRP on Mustard, College of Agriculture ( Dr. P. D.
K. V., Akola), Nagpur-440001 (M.S.) India Corresponding author : [email protected]
EFFECT OF LAND CONFIGURATION AND FERTILIZER MANAGEMENT IN KHARIF MAIZE (Zea mays L.)
J. Soils and Crops 25 (1) 220-225, June, 2015 ISSN 0971-2836
1 2B. P.Manwar and D.D. Mankar
-1 Among several factors responsible for crop at harvest. The yield ha was recorded on net plot area production land configuration and nutrient while the growth and yield contributing characters management play an important role. The present were recorded on five observational plant from the net investigation therefore was undertaken to study the plot area as per the standard procedure. response of maize to various land configuration and nutrient management treatment through different RESULTS AND DISCUSSIONsources as well as their interaction under rainfed condition with the objective to study the effect of Growth attributesland configuration and fertilizer management on growth, yield and economics of kharif maize. Data regarding plant height (cm), number of
-1 -1functional leaves plant , leaf area plant , leaf area -1MATERIALS AND METHODS index and dry matter accumulation plant are
presented in table 1.The experiment was carried out during the
Effect of land configuration methodskharif 2012-13 at Agriculture College Farm, Nagpur. The experiment was laid out in split plot design
It is observed from the data that ridges and replicated thrice with three land configuration furrow method recorded maximum and significantly treatments as main factor viz., L -Broad bed method 1
more plant height at harvest(201.9 cm), number of (The broad bed furrow prepared at sowing with -1 -1
functional leaves plant (12.78), leaf area plantdistance of 120 cm for two rows of maize ), L -2 2(105.13 dm ), leaf area index at 90 DAS(8.76) and dry Ridges and furrow ( Ridges and furrow opened at the
-1 -1 matter accumulation plant (140.6 g plant ) at harvest time of sowing with dibbling of seeds on ridge at 60 over flat-bed method. Broad bed furrow method also cm spacing ) and L -Flat bed and four nutrient 3
recorded significantly more in respect of above management treatments as sub factor viz., viz., F -1growth parameters over flat-bed method. Flat-bed -1
100% RDF (120:60:30 kg NPK ha ), F -125% RDF 2 recorded least values of growth parameters. This -1
(150:75:37.5 kg NPK ha ), F -75% RDF (90:45:22.5 3 might be due to more favorable soil environment in -1kg NPK ha )+25 % N through vermi-compost, F - 4 ridges and furrow method followed by broad bed
-175% RDF (90:45:22.5 kg NPK ha )+25 % N through furrow method compared to flat-bed during kharif FYM. The soil of experimental plot was clayey in season. Ramakichenin et al. (2002) also reported
-1texture, low in available nitrogen (263.60 kg ha ), significant increase in height, number of functional
-1 -1 -1medium in available phosphorus (20.32 kg ha ) and leaves plant , leaf area plant and leaf area index due organic carbon (0.52 %), very high in available to ridges and furrow method. These result support the
-1potassium (414.42 kg ha ) and slightly alkaline in present findings.reaction (pH 7.76). The permanent wilting point was
Effect of nutrient management14.22 % and field capacity was 32.66 %.
Application of 125% RDF was found The average annual precipitation is about significantly superior over 100 % RDF in respect of 1022.4 mm. The total rainfall during growth period plant height at harvest (201.8 cm), number of was 756.1 mm distributed in 49 rainy days. The gross
-1 -1 functional leaves plant (12.24), leaf area plant at 90 and net plot sizes were 3.6 m × 3.6 m and 3.0 m × 3.0
2DAS (106.38 dm ), leaf area index at 90 DAS(8.86) m respectively with variety PKV-M Shatak sown on
-1 spacing of 60 cm × 20 cm. The sowing was done on and dry matter accumulation plant (139.1 g) at 20.7.2012 and harvesting was done on 30.10.2012. harvest. Other treatments 75 % RDF + 25 % N The observations were recorded on various aspects of through vermi-compost was at par and 75 % RDF + growth such as number of functional leaves at 90 25 % N through FYM recorded significantly less DAS, leaf area at 90 DAS and leaf area index at 90 plant height than 100% RDF at all the growth stages. DAS, plant height, dry matter accumulation, number This might be due to availability of nutrients,
-1 -1of cobs plant , number of grain cob , grain weight particularly nitrogen through 125% RDF as this crop
-1 -1 -1 cob , test weight, grain and straw yield plant and ha require more nutrients. The full N might not be
221
available for crop immediately when applied through The data revealed that, ridges and furrow and broad bed furrow method recorded significantly FYM compare to vermi-compost and fertilizers
-1therefore 75 % RDF + 25 % N through vermi- higher grain yield plant (128.6 and 111.1 g compost (F ) might be at par and 75 % RDF + 25 % N respectively ) over flat-bed method (97.35 g). Gaur 3
through FYM might have recorded less height. The (2002) stated that ridging increased mean yield of maize grain yield over flat sowing. While plant growth characters like plant height and number Ramakichenin et al. (2002) reported that among the of leaves was fully reflected in the total dry matter
-1 management practices, farming ridges and furrows accumulation plant . Increased dry matter accumulation might be due to the adequate resulted superiority in yield components. These availability of nutrients and better growth with the results are in close accordance with the present
findings. application of 125% RDF. The results obtained during the investigation are in close accordance with the
The increase in straw yield might be due to finding of Jayaprakash et al. (2004) in respect of dry more growth attributes in the treatments, like plant matter accumulation who also reported higher dry
-1 height, dry matter and number of leaves. The results matter accumulation plant due to 125 % RDF. obtained during the investigation are in close
Interaction effects accordance with the finding of Gaur (2002) who also Interaction effects were found to be non- reported that the mean straw yield increased by
significant in respect of all the growth parameters ridging over the flat bed.studied.
Effect of nutrient managementYield attributes
Application of 125% RDF recorded -1 -1 The data regarding number of cobs plant , significantly higher number of cobs plant (1.41),
-1 -1 -1 -1 number of grains cob , grain weight (g) cob , test number of grains cob (400), grain weight (g) cob -1 -1 -1weight, grain yield plant and straw yield plant are (89.77), test weight (22.76 g ) grain yield plant
-1 presented in table 2. (127.26 g) and straw yield plant (173.85 g) as compared to 100% RDF. However, 75% RDF + 25%
Effect of land configuration methodsN through vermi-compost was at par in respect of the above parameters, but 75% RDF + 25% N through -1Maximum number of cobs plant (1.51), FYM recorded significantly less than 100% RDF. -1 number of grains cob (399), grain weight (85.35 g)
-1 -1cob , test weight(21.76 g),grain yield plant (128.60 This might be due to comparatively higher -1g) and straw yield plant (175.75 g) were recorded in availability of nutrient through 125% RDF and more
treatment ridges and furrow which was significantly or less similar availability of nutrient through 75% more over flat-bed method. The broad bed furrow RDF + 25% N through vermi-compost treatment. method also recorded significantly more in respect of Mithun and Mondal (2006) also reported more test these yield contributing characters over flat bed. weight with increasing RDF. These findings supports
the present increase in test weight with more -1The higher number of grains cob might be RDF(125%).
due to larger size cobs which again might be due to better growth condition provided by the ridges and Interaction effectsfurrow and broad bed furrow method. Gaur (2002) Interaction effect of land configuration and Sakthivel et al. (2003) also found the higher methods and fertilizer management was found non-
-1number of grains cob due to ridges and furrow and significant in respect of various yield and yield broad bed furrow method. These results are in close contributing characters. accordance with the present findings. The more grain
-1 -1weight cob might be due to more number of grains Yield study (qha )-1-1 The data regarding, seed yield (qha ), straw cob . Ramakichenin et al. (2002) also found
-1 maximum test weight with ridges and furrows method yield (qha ) and harvest index are presented in table
2.which resembles the present findings.
222
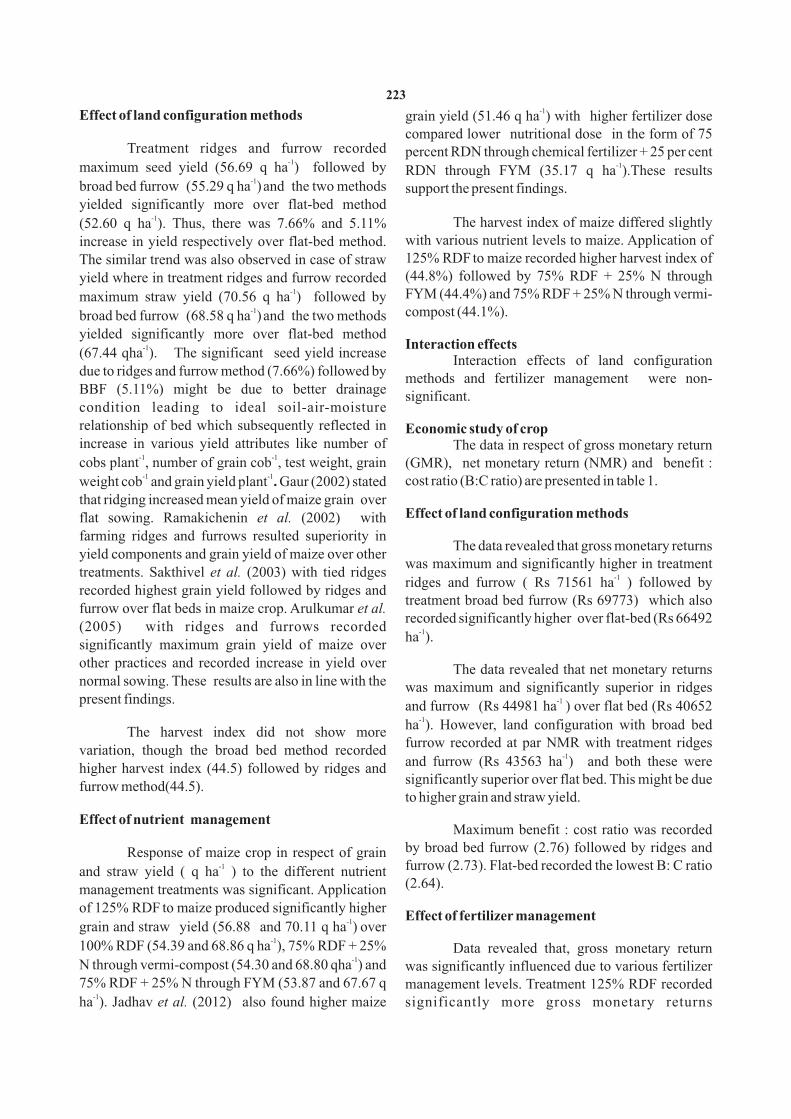
-1Effect of land configuration methods grain yield (51.46 q ha ) with higher fertilizer dose compared lower nutritional dose in the form of 75
Treatment ridges and furrow recorded percent RDN through chemical fertilizer + 25 per cent -1 -1maximum seed yield (56.69 q ha ) followed by RDN through FYM (35.17 q ha ).These results
-1 broad bed furrow (55.29 q ha )and the two methods support the present findings. yielded significantly more over flat-bed method
-1 The harvest index of maize differed slightly (52.60 q ha ). Thus, there was 7.66% and 5.11% with various nutrient levels to maize. Application of increase in yield respectively over flat-bed method. 125% RDF to maize recorded higher harvest index of The similar trend was also observed in case of straw
(44.8%) followed by 75% RDF + 25% N through yield where in treatment ridges and furrow recorded -1 FYM (44.4%) and 75% RDF + 25% N through vermi-maximum straw yield (70.56 q ha ) followed by
-1 compost (44.1%).broad bed furrow (68.58 q ha )and the two methods yielded significantly more over flat-bed method
Interaction effects-1(67.44 qha ). The significant seed yield increase
Interaction effects of land configuration due to ridges and furrow method (7.66%) followed by
methods and fertilizer management were non-BBF (5.11%) might be due to better drainage significant. condition leading to ideal soil-air-moisture relationship of bed which subsequently reflected in Economic study of cropincrease in various yield attributes like number of The data in respect of gross monetary return
-1 -1(GMR), net monetary return (NMR) and benefit : cobs plant , number of grain cob , test weight, grain
-1 -1 cost ratio (B:C ratio) are presented in table 1.weight cob and grain yield plant . Gaur (2002) stated that ridging increased mean yield of maize grain over
Effect of land configuration methodsflat sowing. Ramakichenin et al. (2002) with farming ridges and furrows resulted superiority in
The data revealed that gross monetary returns yield components and grain yield of maize over other
was maximum and significantly higher in treatment treatments. Sakthivel et al. (2003) with tied ridges -1ridges and furrow ( Rs 71561 ha ) followed by recorded highest grain yield followed by ridges and
treatment broad bed furrow (Rs 69773) which also furrow over flat beds in maize crop. Arulkumar et al.
recorded significantly higher over flat-bed (Rs 66492 (2005) with ridges and furrows recorded -1
ha ).significantly maximum grain yield of maize over other practices and recorded increase in yield over The data revealed that net monetary returns normal sowing. These results are also in line with the was maximum and significantly superior in ridges present findings. -1 and furrow (Rs 44981 ha ) over flat bed (Rs 40652
-1ha ). However, land configuration with broad bed
The harvest index did not show more furrow recorded at par NMR with treatment ridges
variation, though the broad bed method recorded -1and furrow (Rs 43563 ha ) and both these were higher harvest index (44.5) followed by ridges and
significantly superior over flat bed. This might be due furrow method(44.5).to higher grain and straw yield.
Effect of nutrient managementMaximum benefit : cost ratio was recorded
by broad bed furrow (2.76) followed by ridges and Response of maize crop in respect of grain -1 furrow (2.73). Flat-bed recorded the lowest B: C ratio and straw yield ( q ha ) to the different nutrient
(2.64). management treatments was significant. Application of 125% RDF to maize produced significantly higher Effect of fertilizer management
-1 grain and straw yield (56.88 and 70.11 q ha ) over
-1100% RDF (54.39 and 68.86 q ha ), 75% RDF + 25% Data revealed that, gross monetary return
-1N through vermi-compost (54.30 and 68.80 qha ) and was significantly influenced due to various fertilizer 75% RDF + 25% N through FYM (53.87 and 67.67 q management levels. Treatment 125% RDF recorded
-1et al. significantly more gross monetary returnsha ). Jadhav (2012) also found higher maize
223
Tab
le 1
. Mea
n g
row
th a
nd
yie
ld c
on
trib
uti
ng
char
act
ers,
yie
ld a
nd
eco
no
mic
s as
in
flu
ence
d b
y v
ari
ou
s tr
eatm
ents
Mea
n g
row
th c
on
trib
uti
ng
ch
ara
cter
sM
ean
yie
ld c
on
trib
uti
ng
ch
ara
cter
sY
ield
stu
dy
Eco
no
mic
s
Tre
atm
ents
Hei
gh
t
( cm
) a
t h
arv
est
Nu
mb
er
of
lea
ves
a
t 9
0
DA
S
Lea
f a
rea
(d
m2)
at
9
0D
AS
LA
I
at
90
D
AS
DM
p
lan
t-1
at
ha
rves
t
(g)
N
o.
of
C
ob
s
pla
nt-
1
No
. o
f g
rain
s
Co
b-1
Gra
in
wt.
C
ob
-1
(g)
Tes
t
wt.
(1
00
S
eed
)
(g)
Gra
in
Yie
ld
pla
nt-
1
(g)
Str
aw
Y
ield
p
lan
t-
1
(g)
G
rain
Y
ield
(q
h
a-1)
Str
aw
Y
ield
(q
h
a-1)
HI
(%
)
C
OC
(R
s h
a-1)
GM
R(R
s h
a-1)
NM
R(R
s h
a-1)
B :
C
ra
tio
La
nd
C
on
fig
ura
tio
n
L1 –
Bro
ad b
ed
furr
ow
19
8.2
12
.17
10
3.1
6
8
.59
1
25.6
1.3
5
3
91
8
2.6
6
2
1.2
9
11
1.1
1
57
.04
55
.29
6
8.5
8
4
4.6
26
21
0
6
977
34
35
63
2.7
3
L2 –
Rid
ges
an
d f
urr
ow
20
1.9
12
.78
10
5.1
3
8.7
6
14
0.6
1.5
1
39
9
85
.35
21
.76
12
8.6
17
5.7
5
56
.69
70
.56
44
.5
26
58
0
71
56
14
49
81
2.7
6
L3 –
Fla
t b
ed
19
6.8
11.5
0
10
1.1
1
8.4
2
112
.9
1.2
6
38
2
77
.32
20
.43
97
.35
14
1.1
6
52
.60
67
.44
43
.8
26
84
0
66
49
24
06
52
2.6
4
SE
(m
) +
0.4
7
0.1
3
0.2
5
0.0
2
1.2
4
0.0
2
1.0
0
0.5
0
0.1
0
1.5
0
1.5
5
0.2
8
0.1
7
-
-
39
33
93
-
CD
at
5%
1.8
6
0.5
0
0.9
8
0.0
8
4.8
6
0.0
6
3.9
4
1.9
4
0.3
9
5.8
9
6.0
8
1.1
1
0.6
5
-
-
15
44
15
44
-
Nu
trie
nt
ma
na
gem
ent
F1 –
10
0
%
RD
F
19
8.5
12
.34
10
3.4
7
8.6
2
12
4.4
1.3
7
39
0
79
.94
20
.83
10
9.7
3
15
5.4
5
54
.39
68
.86
44
.1
22
02
8
68
70
54
66
77
3.1
2
F2 –
12
5 %
R
DF
20
1.8
12
.76
10
6.3
8
8.8
6
13
9.1
1.4
1
40
0
89
.77
22
.76
12
7.2
6
17
3.8
5
56
.88
70
.11
44
.8
23
30
0
71
76
14
84
61
3.0
8
F3 –
75
%
RD
F +
25
%
N t
hro
ug
h
ver
mi-
com
po
st
19
8.3
12
.00
10
1.3
9
8.4
5
12
3.5
1.3
7
38
8
79
.36
20
.70
10
8.7
1
15
4.3
1
54
.30
68
.80
44
.1
26
75
6
68
60
14
18
45
2.5
6
F4 –
75
%
RD
F +
25
%
N t
hro
ug
h
FY
M
19
7.2
11.5
0
10
1.2
9
8.4
4
118
.7
1.3
3
38
5
78
.03
20
.34
10
3.7
1
14
8.3
2
53
.87
67
.67
44
.4
32
75
6
68
03
23
52
76
2.0
8
SE
(m
) +
0.2
3
0.0
7
0.2
2
0.0
2
0.6
8
0.0
1
0.7
7
0.4
1
0.0
6
0.8
1
0.8
5
0.0
8
0.1
1
0.4
9
-
12
01
20
-
CD
at
5%
0.6
9
0.2
1
0.6
6
0.0
6
2.0
2
0.0
2
2.2
8
1.2
0
0.1
8
2.4
1
2.5
3
0.2
4
0.3
2
1.4
6
-
35
73
57
-
Inte
ract
ion
s
SE
(m
) +
0.4
00
.12
0.3
90
.03
1.1
80
.01
1.3
30
.70
0.1
11
.40
1.4
70
.14
0.1
90
.85
-2
08
12
08
-
CD
at
5%
--
--
--
--
--
--
--
--
--
DM
: D
ry m
atte
r, L
AI
: le
af a
rea
inde
x ,
HI:
har
vest
ind
ex,
CO
C:
Cos
t of
cul
tiva
tion
, GM
R:
gros
s m
onea
tary
ret
urn,
NM
R:
Net
mon
etar
y re
turn
, -1
-1M
arke
t ra
te S
eed
:Rs1
200
q s
traw
Rs
50 q
224
-1 -1 methods and fertilizer management was found to be (Rs 71761 ha ) over 100% RDF (Rs 68705 ha ). non-significant in respect of gross monetary returns.However, 75% RDF + 25% N through vermi-compost
-1(Rs 68601 ha ) and 75% RDF + 25% N through -1 REFERENCESFYM (Rs 68032 ha ) showed lower gross monetary
return as compared to 100% RDF. This might be due Arulkumar, P. , V. S. Shinde, P. S. Solunke and V.D. Kadam, 2005. Effect to higher yield in 125% RDF and less yield in other
of in-situ moisture conservation techniques on growth, yield treatment. attributes and yield of rainfed maize. PKV, Res. J. 29(2) : 237-
238.Data revealed that, net monetary return was Asghar, A., A. Ali, W. H. Syed, M. Asif, T. Khaliq and A. A. Abid, 2010.
significantly influenced due to various fertilizer Growth and yield of maize (Zea mays L.) cultivars affected by management levels. Treatment of 125% RDF NPK application in different production. Pakistan J. Sci. 62
(4): 211-216.recorded significantly more net monetary returns (Rs Gaur, B. L. 2002. Performance of improved technologies of rainfed maize
-148461 ha ) over treatment of 100% RDF (Rs 46777 in on farm trials of watershed area. Indian J. Dryland Agric. -1 Res. and Dev. 17(1):74-75.ha ). However, 75% RDF + 25% N through vermi-
Jadhav, K. L., R. L. Bhilare and N. T. Kunjir, 2012. Effect of integrated -1
nutrient management on yield, nutrient uptake and economics compost (Rs 41845 ha ) and 75% RDF + 25% N -1 of maize (Zea mays L.) J. Agric. Res. Technol. 37 (3): 479-481.through FYM (Rs 35276 ha ) showed lower net
Jat, R. A. and J. S. Balyan, 2004. Effect of integrated nitrogen monetary return as compared to other treatment. This management on dry matter, yield attributes, yield and total N
uptake. Annals agric. Res. 25(1): 153-154.might be due to more GMR in 125% RDF and higher Jayaprakash, T. C., V. P. Nagalikar, B. T., Pujari and R. A. Setty, 2004.
cost of vermi-compost and FYM application. Pawar Dry matter and its accumulation pattern in maize as influenced by organics and inorganics. Karnataka J. agric. Sci. 17(2): 327-et al. (2005) found significantly higher monetary 329.
returns with application of 125% RDF than the lower Mithun Saha and S. S. Mondal, 2006. Influence of integrated plant nutrient supply on growth, productivity and quality of baby fertilizer doses. These results are in line with the corn (Zea mays) in Indo-Gangetic plains. Indian J. Agron. present findings.51(3): 202-205.
Treatment 100% RDF registered highest Pawar, P. P. , H. E. Patil, P. M. Chaudhari and R. H. Hankare, 2005. Effect of maize based cropping systems and fertility levels on benefit: cost ratio (3.12) followed by treatment 125% productivity of rainfed maize. J.Maharashtra. agric.Uni.
RDF (3.08). The lowest benefit : cost ratio was 30(3): 343-344. Ramakichenin, B., N. Sakthivel and A. Balasubramanian, 2002. Effect of recorded in 75% RDF + 25% N through FYM (2.08).
pre-monsoon sowing and land configuration practices on This might be due to more cost of vermi-compost and growth, yield parameters and yield of rainfed maize. Madras FYM in comparison to 25% reduced RDF. agric. J. 89(1): 177-179.
Sakthivel, N., A. Balasubramanian, S. Radhamani and P. Subbiah, 2003. Effect of in-situ moisture conservation practices and
Interaction effects intercropping system on yield of rainfed maize in western zone Interaction effects of land configuration of TamilNadu. Madras agric. J. 90(7-9):411-415.
Rec. on 02.02.2013 & Acc. on 05.05.2013
225

ABSTRACT
The present investigation was carried out in Warora tahsil of Chandrapur district during the year 2013-
2014, to know the feeding practices adopted by buffalo owners. Four villages from Warora tahsil were selected with 6
farmers each from small, medium and large category of farmers based on land holding. Thus, in all there were 72
respondent buffalo owners considered for the study through pre tested questionnaire. The information on feeding
management was collected by personally contacting with each of the buffalo owner. Amongst the 72 respondents,
36.11, 23.61 and 20.83 per cent buffalo owners belonged to the age group of 41-50, 31-40 and 51-60 respectively. Thus,
80.55 buffalo owners belonged to the age group of 31 to 60. Only 15.27 and 4.17 belonged the old age (60 to70) and
young age (21 to 30) respectively. It was observed that 58.13 and 41.86 per cent of small, 46.00 and 54.00 per cent of
medium and 45.90 and 54.10 per cent of large category of buffalo owners had body weight 400 to 450 and 451 to 500. It
was observed that 49.35 per cent buffaloes had the body weight in the range of 400-450 kg, while 50.68 per cent
buffaloes had a body weight in the range of 451-500 kg with an average weight of 424.95 kg. The overall gap of feeding
management practices in buffaloes was worked out to 12.30 and 63.30 per cent for green fodder and concentrates
respectively. The dry fodder was fed in excess to the extent of 49.83 per cent in buffaloes over the recommended
feeding practices. There was a small feeding gap in respect of green fodder and concentrates in buffalo farmers and
the rearing of buffaloes was found profitable.
(Key words: Warora tahsil, buffaloes, feeding practices)
world. It is estimated that milk production in India INTRODUCTIONwas around 127.9 metric tons during the year 2011-The role of dairy farming in the Indian rural 2012 (Anonymous, 2012).economy is very outstanding. The significance is
heightened by it's massive contribution of livelihood The low productivity of milk in buffalo is of India's rural population. Over 73 per cent of India's
mainly due to lack of proper knowledge for balanced households have their own livestock. Grazing, feeding. Farmers from rural area feed their buffaloes feeding and milking cows and buffaloes is one of the with roughages and concentrates but, they do not largest source of productive employment in rural have knowledge about quality and quantity of feed India (Ahirwar, 2010).and also do not follow proper management practices
Buffaloes are the backbone of rural which lead to dairy business uneconomical (Shitole, developing economy in many developing countries of et at., 2009).the Asian region including India. Buffaloes occupy a
Keeping these in mind, an attempt was made prominent place in the social, economic and cultural life of Indian rural communities and are useful as a to study the feeding and management practices of triple purpose animal for milk, meat and draft power buffaloes in Warora tahsil of Chandrapur district. (Kishore, 2013).
MATERIALS AND METHODS
Buffalo is the main dairy animal of India, This study was conducted in Warora tahsil of
which provides economic stability to farmers through Chandrapur district during the year 2013-2014. Four sale of milk and sale of animal due to uncertainties villages viz., Wanoja, Chinora, Majara and Kondala associated with crop farming in dryland/rainfed area, were randomly selected. The list of buffalo owners which is 70 per cent of arable land of India. Buffalo was prepared for each village with the help of population of nearly 94 millons contributes about 56 Gramsevak and Livestock Development Officers of per cent of total milk production as compared to that Warora Panchayat Samiti. From each of the four of nearly 218 million cattle population of the country villages, total buffalo owners based on land holding in (Sastry, 2003). the catagory of small (upto 2.00 ha), medium (upto 2
to 8.00 ha) and large (above 8 ha) were identified and India ranks first in milk production in the
1, 3 and 4. P.G. Students, Animal husbandry and dairy science, College of Agriculture, Nagpur (M.S.), India2. Professor, Animal husbandry and dairy Science, College of Agriculture, Nagpur (M.S.), India
STUDIES ON FEEDING PRACTICES OF BUFFALOES IN WARORA TAHSIL OF CHANDRAPUR DISTRICT
1 2 3 4Monali Musale , A. S. Ingole , S. M. Khupse and Pranita Sahane
J. Soils and Crops 25 (1) 226-231, June, 2015 ISSN 0971-2836

then from each category 6 buffalo owners were Occupation selected. Thus, for all four villages 72 buffalo were
Majority of the buffalo owners (76.39 per considered for the study from 3 categories of buffalo cent) were involved in farming occupation followed owners. In the present study, general information viz., by business oriented buffalo owners (19.44 per cent). age, occupation and education, and following Only 4.17 per cent buffalo owners were found in the information were obtained from these selected category of farmers whose family member is in buffalo owners through pre-tested questionnaire. service. Ravat and Chandavat (2011) reported that the
Information on feeding management majority of dairy farmers in Matur taluka of Kheda practices information was obtained on the following district were engaged in agriculture. aspects: 1. Feeding management viz., feeding of green fodder, dry fodder, concentrates and feed intake Educationof buffaloes, body weight of buffalo and overall gap
It was seen from table 1 that 62.49 per cent of feeding management practices over recommended buffalo owners had obtained seondary education practices in each category of farmers. whereas 20 per cent of them had primary education.
Plan of work Only 4.17 per cent buffalo owners possessed higher
secondary education and 12.50 per cent buffalo Following formula suggested by Prasad owners were illiterate. Gour (2002) noticed that, 62
(1997) was used to determine the body weight of per cent of the dairy farmers had obtained secondary
buffaloes owned by the selected farmers.education, whereas 16 per cent of them had primary
2 education. Only 4 per cent people had higher G × L×0.003secondary education and 6 per cent of respondents Estimated live weight (kg) = --------------------- were illiterate. 2.2
Land holdingWhere, G = Girth of animal in inches
Land holding is an important factor that L = Length of animal in inchesdetermines the economic factor and potentially of
Based on the body weight of individual dairy farmers for adoption of new practices in dairy buffaloes, recommended food intake was estimated farming. The average size of land holding in small, and this recommended food intake was considered for medium and large size group was 1.26, 4.02 and 10.35 finding the gap in feeding practices. ha respectively. The overall average size land holding
was estimated to 5.21 ha. Durgga (2009) observed RESULTS AND DISCUSSION that, small dairy farmers were having 1 to 2 ha of land
holdings.General observations
Number of buffaloes owned by the different Age category of farmers
It was seen from table 1 that out of the 72 respondents, 36.11, 23.61 and 20.83 per cent buffalo It was observed that, the small farmers had 43 owners belonged to the age group of 41-50, 31-40 and buffaloes, medium category of farmers had 50 51-60 respectively. Thus, 80.55 buffalo owners buffaloes and large category of farmers had 61 belonged to the age group of 31 to 60. Only 15.27 and buffaloes. Thus, in all 154 buffaloes were considered 4.17 belonged the old age (60 to70) and young age (21 for study.to 30) respectively. Bhatt (2006) observed that majority of the dairy farmers belonged to middle age Feeding practicesgroup (52 per cent) followed by old age group (30 per
The data obtained on this respect are cent) and the younger generation is less interested in presented in table 2 and described as under. taking up dairy farming as its occupation.
227
Feed intake of buffaloes concentrates respectively was observed at the small farmers level in case of feeding buffaloes. Patange et
It was revealed from table 2 that, farmers of al. (2002) observed the nutrient availability of milch -1 -1
large category fed 9.20 kg dry fodder day buffalo Marathawadi buffaloes reared by different categories followed by medium (9.22 kg) and small (8.50 kg) of farmers in the Marathwada region of Maharashtra categories of buffalo owners. It is also observed that, state. Overall ration of milch buffalo consisted of
-1medium category of farmers fed more quantities of 6.60, 6.00 and 2.16 kg day of green fodder, dry -1 -1
green fodder (9.22 kg) day buffalo followed by fodder and concentrate respectively.large (8.70 kg) and small (8.40 kg) categories of
Gap of feeding management practices over farmers. Similarly, the medium category of farmers -1 recommended practices in medium category of fed more quantity of concentrate (1.95 kg) day
-1 buffalo owners buffalo followed by large (1.60 kg) and small (1.15 kg) categories of farmers. On an overall level, farmers
It was observed from table 5 that, the existing fed 8.99 kg dry fodder, 8.77 kg green fodder and 1.56
feeding practices followed at the dairy farmers level -1kg concentrate with the total of 19.32 kg feed day
in case of medium farmers worked out to 9.29, 9.22 -1buffalo . The medium category of farmers offered -1 -1and 1.95 kg day animal of dry fodder, green fodder
more feed (20.46 kg) than large (19.50 kg) and small and concentrates, respectively in case of buffaloes. -1 -1
(18.05 kg) categories of farmers day buffalo . Patil While, the recommended quantities of feed were
and Kamble (2002) suggested feed requirement for 6.00, 10.00 and 4.25 kg dry fodder, green fodder and buffaloes as 6 to 7 kg dry fodder, 10 to 15 kg green -1
concentrate day respectively. The dry fodder was -1 -1
fodder and 1 kg concentrates day buffalo . fed more to the extent of 54.83 per cent over recommendations. However, there was a wide gap in
Body weight of buffalo feeding of green fodder (7.80 per cent) and concentrates (54.12 per cent) in case of feeding It was observed from table 3 that, 58.13 and buffaloes by medium category buffalo owners. 41.86 per cent of small, 46.00 and 54.00 per cent of
medium and 45.90 and 54.10 per cent of large Gap of feeding management practices over
category of buffalo owners had body weight 400 to recommended practices in large category of
450 and 451 to 500 respectively. The average body buffalo owners
weight of buffao in small, medium and large category of farmers were 421.64, 425.42, 427.79. It was It was observed from table 6 that, the existing observed that 49.35 per cent buffaloes had the body feeding practices followed at the dairy farmers level weight in the range of 400-450 kg while, 50.68 per in case of large farmers worked out to 9.20, 8.70 and
-1 -1cent buffaloes had a body weight in the range of 451- 1.60 kg day animal of dry fodder, green fodder and 500 kg with an average weight of 424.95 kg. concentrate, respectively. While in case of large
farmer category indicating 53.33 per cent excess Gap of feeding management practices over
feeding of dry fodder over recommended practices in recommended practices in small category of
case of buffaloes. However, there was wide gap in buffalo owners
feeding of green fodder 13.00 per cent and concentrates 62.36 per cent in case of feeding After going through the existing practices buffalo. Bainwad et al. (2007) from studies in
followed at dairy farmers level in case of small Parbhani district of Marathwada region reported that
farmers, it is observed from table 4 that, small farmers the maximum green (8.69 kg), dry fodder (9.25 kg) -1fed dry fodder to the extent of 8.50 kg day as against and concentrates (1.25 kg) available to milch -1
6.00 kg day recommended feed indicating 41.66 per buffaloes was found in large farmers.
cent more over recommended practices. Whereas, green fodder and concentrates were fed 8.40 and 1.15 Overall gap of feeding management practices
-1 -1kg day as against 10.00 and 4.25 kg day recommended practices in buffalo owners recommended feeds, respectively. Thus, a wide gap of
The overall gap of feeding practices of three 16.00 and 72.95 per cent in case of green fodder and
228
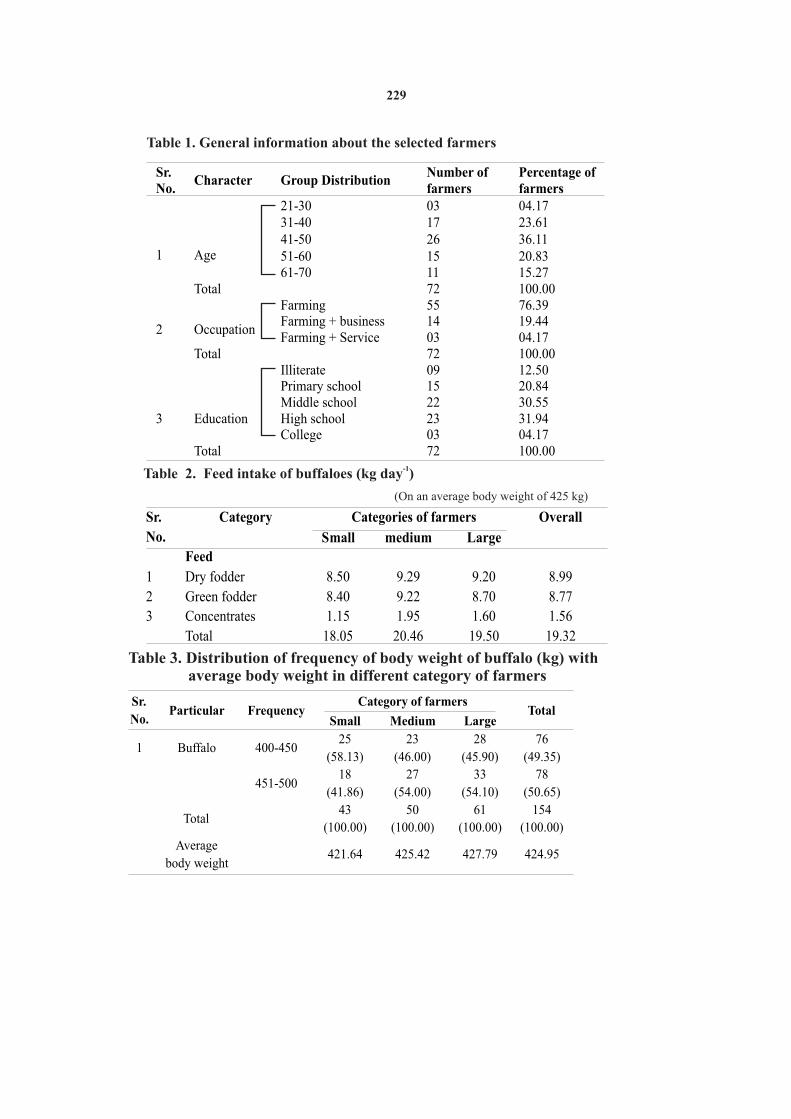
Table 1. General information about the selected farmers
Sr. No.
Character Group Distribution Number of farmers
Percentage of farmers
1
Age
21-30 03 04.1731-40 17 23.6141-50 26 36.1151-60
15
20.83
61-70
11
15.27
Total
72
100.00
2
Occupation
Farming
55
76.39Farming + business
14
19.44
Farming + Service
03
04.17
Total
72
100.00
3
Education
Illiterate
09
12.50
Primary school
15
20.84Middle school
22
30.55High school
23
31.94College
03
04.17
Total
72
100.00-1
Table 2. Feed intake of buffaloes (kg day )
(On an average body weight of 425 kg)
Sr. No.
Category
Feed
Categories of farmers Overall
Small medium Large
1 Dry fodder 8.50 9.29 9.20 8.99
2
Green fodder
8.40
9.22
8.70
8.77
3
Concentrates
1.15
1.95
1.60
1.56
Total
18.05
20.46
19.50
19.32
Table 3. Distribution of frequency of body weight of buffalo (kg) with average body weight in different category of farmers
Sr.
No. Particular Frequency
Category of farmers Total
Small Medium Large
1
Buffalo
400-450 25
(58.13)
23
(46.00)
28
(45.90)
76
(49.35)
451-500
18 (41.86)
27 (54.00)
33
(54.10)
78
(50.65)
Total
43
(100.00)
50
(100.00)
61
(100.00)
154
(100.00)
Average
body weight421.64 425.42 427.79 424.95
229
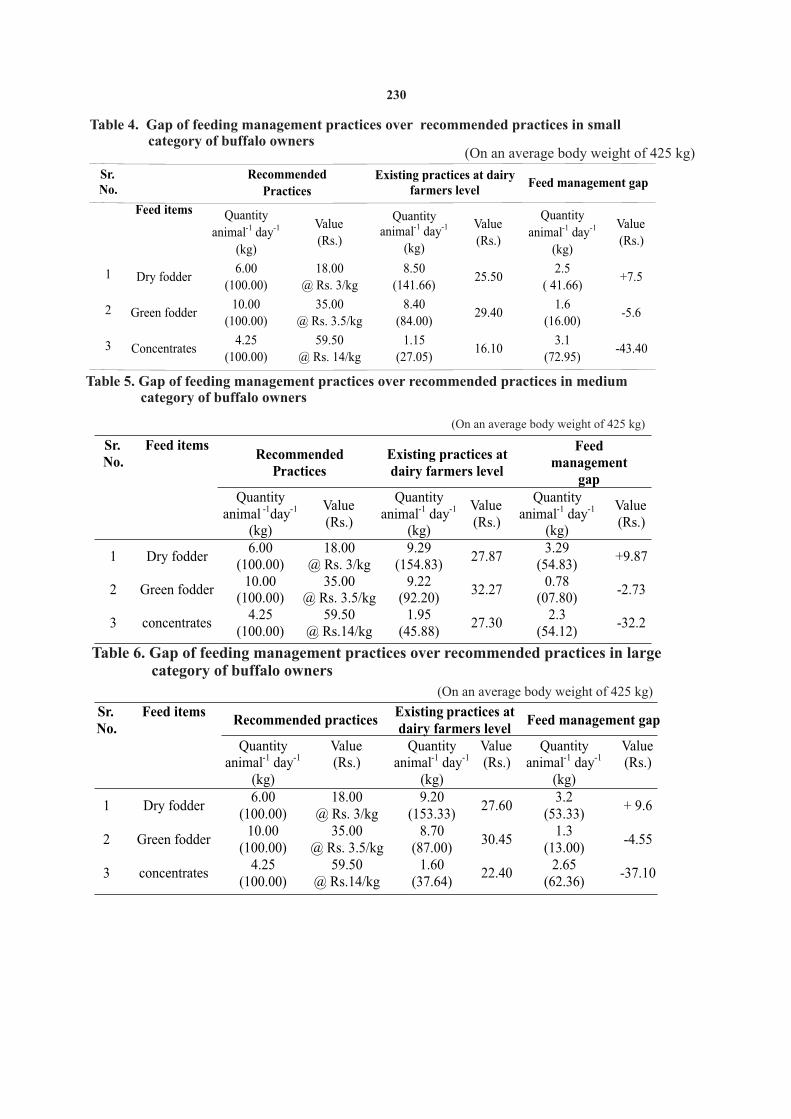
Table 4. Gap of feeding management practices over recommended practices in small category of buffalo owners
Sr. No.
Feed items
Recommended Practices
Existing practices at dairy farmers level
Feed management gap
Quantity
animal-1
day-1
(kg)
Value (Rs.)
Quantity animal-1
day-1
(kg)
Value (Rs.)
Quantity
animal-1 day-1
(kg)
Value
(Rs.)
1
Dry fodder
6.00
(100.00)
18.00
@ Rs. 3/kg
8.50
(141.66)
25.50
2.5
( 41.66)+7.5
2
Green fodder
10.00
(100.00)
35.00
@ Rs. 3.5/kg
8.40
(84.00)
29.40
1.6
(16.00)-5.6
3 Concentrates4.25
(100.00)
59.50
@ Rs. 14/kg
1.15
(27.05)
16.103.1
(72.95)-43.40
(On an average body weight of 425 kg)
Table 5. Gap of feeding management practices over recommended practices in medium category of buffalo owners
Sr. No.
Feed items Recommended Practices
Existing practices at dairy farmers level
Feed management
gap
Quantity animal
-1day-1
(kg)
Value (Rs.)
Quantity animal-1
day-1
(kg)
Value (Rs.)
Quantity animal-1
day-1
(kg)
Value(Rs.)
1
Dry fodder
6.00 (100.00)
18.00 @ Rs. 3/kg
9.29 (154.83)
27.87
3.29 (54.83)
+9.87
2
Green fodder
10.00 (100.00)
35.00 @ Rs. 3.5/kg
9.22 (92.20)
32.27
0.78 (07.80)
-2.73
3
concentrates
4.25 (100.00)
59.50 @ Rs.14/kg
1.95 (45.88)
27.30
2.3 (54.12)
-32.2
(On an average body weight of 425 kg)
Table 6. Gap of feeding management practices over recommended practices in large category of buffalo owners
Sr. No.
Feed items Recommended practices Existing practices at dairy farmers level
Feed management gap
Quantity animal-1 day-1
(kg)
Value (Rs.)
Quantity animal-1 day-1
(kg)
Value (Rs.)
Quantity animal-1 day-1
(kg)
Value(Rs.)
1
Dry fodder
6.00
(100.00)
18.00
@ Rs. 3/kg
9.20
(153.33) 27.60
3.2
(53.33)
+ 9.6
2
Green fodder
10.00 (100.00)
35.00 @ Rs. 3.5/kg
8.70 (87.00)
30.45
1.3 (13.00)
-4.55
3
concentrates
4.25 (100.00)
59.50 @ Rs.14/kg
1.60 (37.64)
22.40
2.65 (62.36)-37.10
(On an average body weight of 425 kg)
230
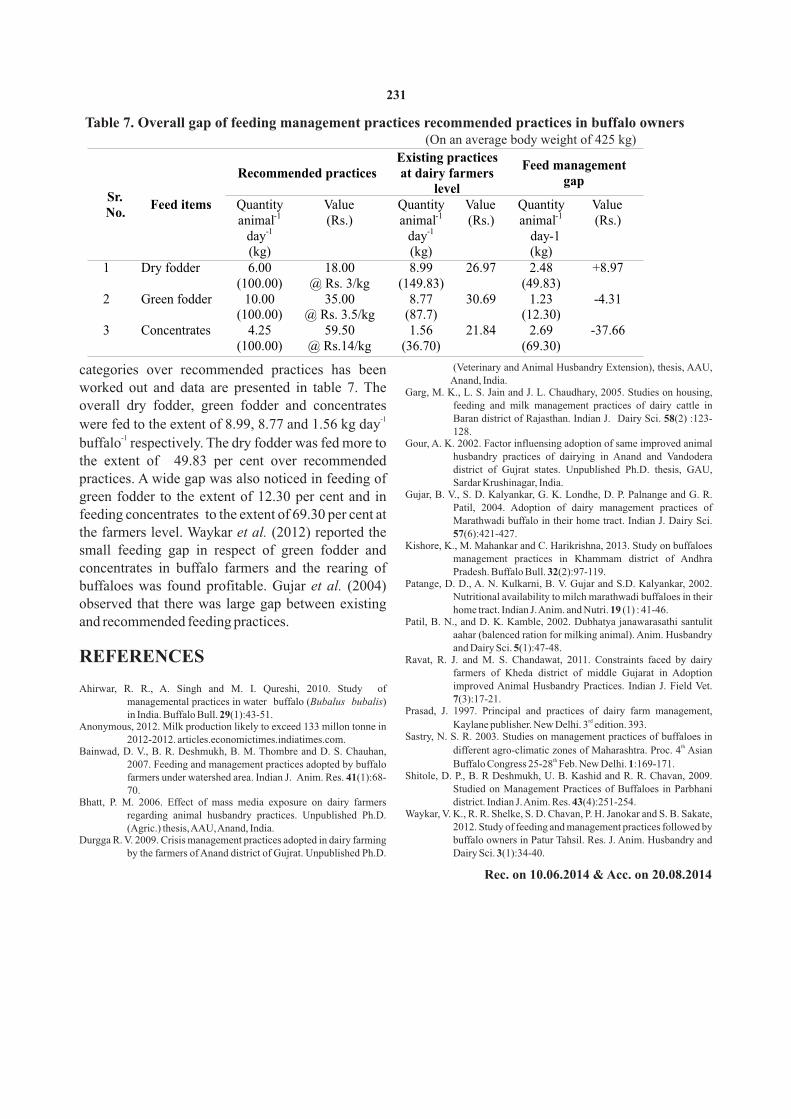
Table 7. Overall gap of feeding management practices recommended practices in buffalo owners
Sr. No.
Feed items
Recommended practices
Existing practices at dairy farmers
level
Feed managementgap
Quantity animal-1
day-1
(kg)
Value (Rs.)
Quantity animal-1
day-1
(kg)
Value (Rs.)
Quantity animal-1
day-1
(kg)
Value(Rs.)
1
Dry fodder
6.00
(100.00)
18.00
@ Rs. 3/kg
8.99
(149.83)
26.97
2.48
(49.83)
+8.97
2
Green fodder
10.00
(100.00)
35.00
@ Rs. 3.5/kg
8.77
(87.7)
30.69
1.23
(12.30)
-4.31
3
Concentrates
4.25
(100.00)
59.50
@ Rs.14/kg
1.56
(36.70)
21.84
2.69
(69.30)
-37.66
(On an average body weight of 425 kg)
(Veterinary and Animal Husbandry Extension), thesis, AAU, categories over recommended practices has been Anand, India.
worked out and data are presented in table 7. The Garg, M. K., L. S. Jain and J. L. Chaudhary, 2005. Studies on housing, feeding and milk management practices of dairy cattle in overall dry fodder, green fodder and concentrates
-1 Baran district of Rajasthan. Indian J. Dairy Sci. 58(2) :123-were fed to the extent of 8.99, 8.77 and 1.56 kg day 128.
-1Gour, A. K. 2002. Factor influensing adoption of same improved animal buffalo respectively. The dry fodder was fed more to
husbandry practices of dairying in Anand and Vandodera the extent of 49.83 per cent over recommended district of Gujrat states. Unpublished Ph.D. thesis, GAU,
practices. A wide gap was also noticed in feeding of Sardar Krushinagar, India.Gujar, B. V., S. D. Kalyankar, G. K. Londhe, D. P. Palnange and G. R. green fodder to the extent of 12.30 per cent and in
Patil, 2004. Adoption of dairy management practices of feeding concentrates to the extent of 69.30 per cent at Marathwadi buffalo in their home tract. Indian J. Dairy Sci.
57(6):421-427.the farmers level. Waykar et al. (2012) reported the Kishore, K., M. Mahankar and C. Harikrishna, 2013. Study on buffaloes small feeding gap in respect of green fodder and
management practices in Khammam district of Andhra concentrates in buffalo farmers and the rearing of Pradesh. Buffalo Bull. 32(2):97-119.
Patange, D. D., A. N. Kulkarni, B. V. Gujar and S.D. Kalyankar, 2002. buffaloes was found profitable. Gujar et al. (2004) Nutritional availability to milch marathwadi buffaloes in their
observed that there was large gap between existing home tract. Indian J. Anim. and Nutri. 19 (1) : 41-46.Patil, B. N., and D. K. Kamble, 2002. Dubhatya janawarasathi santulit and recommended feeding practices.
aahar (balenced ration for milking animal). Anim. Husbandry and Dairy Sci. 5(1):47-48.
REFERENCES Ravat, R. J. and M. S. Chandawat, 2011. Constraints faced by dairy farmers of Kheda district of middle Gujarat in Adoption improved Animal Husbandry Practices. Indian J. Field Vet. Ahirwar, R. R., A. Singh and M. I. Qureshi, 2010. Study of 7(3):17-21. managemental practices in water buffalo (Bubalus bubalis)
Prasad, J. 1997. Principal and practices of dairy farm management, in India. Buffalo Bull. 29(1):43-51.rdKaylane publisher. New Delhi. 3 edition. 393.Anonymous, 2012. Milk production likely to exceed 133 millon tonne in
Sastry, N. S. R. 2003. Studies on management practices of buffaloes in 2012-2012. articles.economictimes.indiatimes.com.thdifferent agro-climatic zones of Maharashtra. Proc. 4 Asian Bainwad, D. V., B. R. Deshmukh, B. M. Thombre and D. S. Chauhan,
thBuffalo Congress 25-28 Feb. New Delhi. 1:169-171.2007. Feeding and management practices adopted by buffalo Shitole, D. P., B. R Deshmukh, U. B. Kashid and R. R. Chavan, 2009. farmers under watershed area. Indian J. Anim. Res. 41(1):68-
Studied on Management Practices of Buffaloes in Parbhani 70. Bhatt, P. M. 2006. Effect of mass media exposure on dairy farmers district. Indian J. Anim. Res. 43(4):251-254.
Waykar, V. K., R. R. Shelke, S. D. Chavan, P. H. Janokar and S. B. Sakate, regarding animal husbandry practices. Unpublished Ph.D. 2012. Study of feeding and management practices followed by (Agric.) thesis, AAU, Anand, India.
Durgga R. V. 2009. Crisis management practices adopted in dairy farming buffalo owners in Patur Tahsil. Res. J. Anim. Husbandry and Dairy Sci. 3(1):34-40.by the farmers of Anand district of Gujrat. Unpublished Ph.D.
Rec. on 10.06.2014 & Acc. on 20.08.2014
231
ABSTRACT
The present study examined the effectiveness of foliar sprays of ethrel on growth and yield of soybean
(Glycine max). A field experiment was conducted at an experimental farm of Botany section, College of Agriculture,
Nagpur by growing soybean during the kharif season in the crop area spanning from July 2013 – November 2013,
using randomized block design. The effectiveness of foliar sprays of ethrel was studied as control (water spray) and
with 5 different levels of ethrel (100, 150, 200, 250 and 300 ppm). Soybean plants were sprayed two times at 15 day
intervals at 30 and 45 DAS with different concentrations of ethrel. Recorded data showed that all morpho-
physiological parameters including plant height, number of branches, leaf area, dry matter production, RGR and -1NAR as well as yield ha of soybean plants showed positive and significant responses with the foliar application of 150
ppm ethrel followed by 100 ppm ethrel when compared with control.
(Key words: Soybean, ethrel, growth and yield)
utilized for promoting pod growth as Abbas (1991) INTRODUCTIONhad shown that early pod development is related to
higher ethylene levels, thus decreasing flower and Soybean (Glycine max L.) is one of the pod shedding and thereby reducing abscission and important oilseed as well as leguminous crop. improving better pod set. Soybean is a diploid species having chromosome
number 2n=40.It belongs to family “Leguminoseae” Hence, an attempt has been made in the and subfamily “Papilionoidae”. It is annual
present investigation to asses the influence of foliar leguminous herbaceous plant. sprays of ethrel on morpho-physiological parameters
and yield of soybean.Among, oilseeds soybean ranks fifth in the world. The important soybean growing countries in
MATERIALS AND METHODSworld are America, Brazil, Argentina, China and India. The largest soybean producing states in India are Madhya Pradesh, Maharashtra and Rajasthan. In A field experiment on soybean was India Maharashtra having Second rank in production. conducted at an experimental farm of Botany section,
College of Agriculture, Nagpur. The present Soybean is also known as “Gold of Soil” due investigation was undertaken during the kharif season
to its various qualities such as ease in cultivation, less of 2013-2014. The field experiment was laid out in requirement of fertilizers and labour resulting in high Randomized block Design (RBD) with four cost : benefit ratio. Soybean being a legume crop is replications consisting of six treatments with different gifted naturally to fix atmospheric nitrogen in the root
concentrations of ethrel (100, 150, 200, 250 and 300 nodules with the help of Rhizobium. It fixes 69 to 168
ppm). Spraying of ethrel was done two times at 30 and -1 kg of nitrogen ha which helps in maintaining soil
45 DAS with hand sprayer. Observations on plant fertility.
height, number of branches, leaf area and dry matter
were recorded at different stages i.e. at 45, 60 and 75 Ethylene (ethrel) is a plant growth regulator DAS. RGR and NAR were recorded and calculated at involved in various aspects of growth and
-1 45-60 and 60-75 DAS. Seed yield ha was also noted. photosynthesis of plants at both whole plant and The crop was kept free from disease and pest during cellular levels (Abeles et al., 1992; Fiorani et al., the growth period. Harvesting was under taken after 2002; Pierik et al., 2006).the crop attained maturity. Data was analysed by
statistical method suggested by Panse and Sukhatme Ethylene released from ethrel (2-chloroethylphosphonic acid) could possibly be (1954).
1,3,4 and 5. P.G. Students, Botany section, College of Agriculture, Nagpur (M.S.), India2. Professor, Botany section, College of Agriculture, Nagpur (M.S.), India
ROLE OF FOLIAR SPRAYS OF ETHREL ON GROWTH AND YIELD OF SOYBEAN
1 2 3 4 5A.N.Sahane , R. D. Deotale , P. P. Sawant , S.A. Mahale and Suvarna S.Gare
J. Soils and Crops 25 (1) 232-237, June, 2015 ISSN 0971-2836
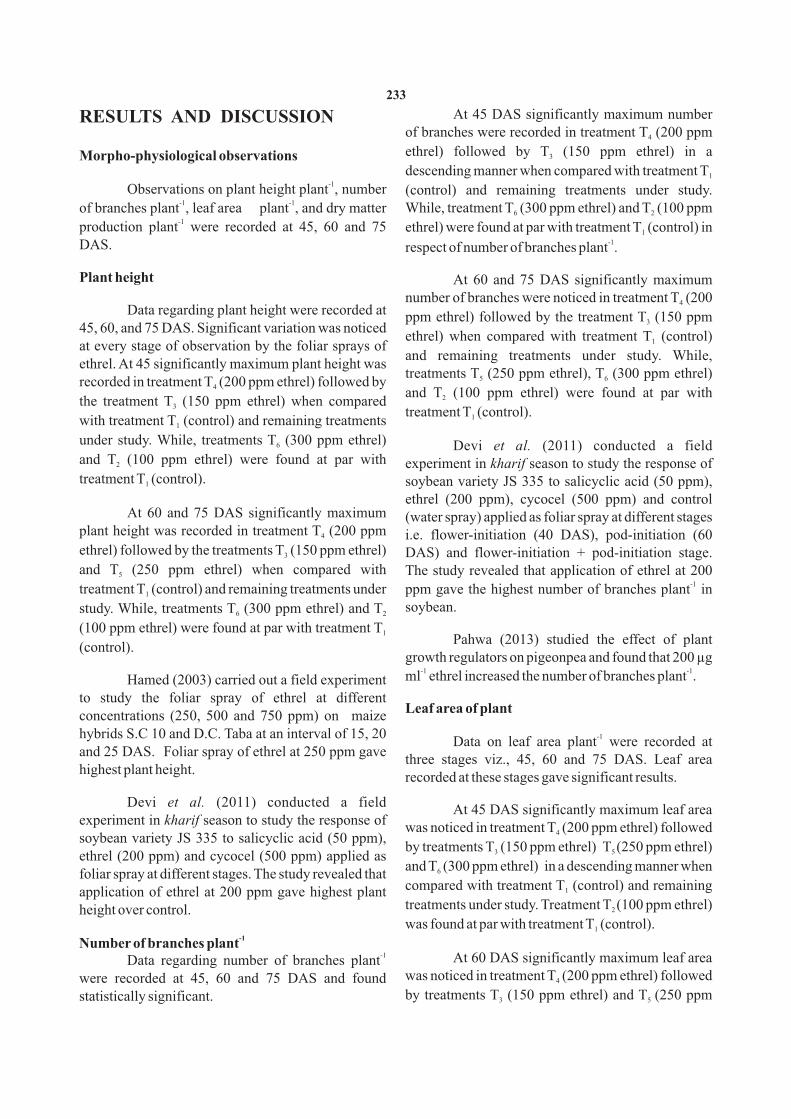
At 45 DAS significantly maximum number RESULTS AND DISCUSSIONof branches were recorded in treatment T (200 ppm 4
ethrel) followed by T (150 ppm ethrel) in a 3Morpho-physiological observationsdescending manner when compared with treatment T 1
-1Observations on plant height plant , number (control) and remaining treatments under study.
-1 -1of branches plant , leaf area plant , and dry matter While, treatment T (300 ppm ethrel) and T (100 ppm 6 2-1
ethrel) were found at par with treatment T (control) in production plant were recorded at 45, 60 and 75 1
-1DAS. respect of number of branches plant .
Plant height At 60 and 75 DAS significantly maximum number of branches were noticed in treatment T (200 4
Data regarding plant height were recorded at ppm ethrel) followed by the treatment T (150 ppm 345, 60, and 75 DAS. Significant variation was noticed
ethrel) when compared with treatment T (control) 1at every stage of observation by the foliar sprays of and remaining treatments under study. While,
ethrel. At 45 significantly maximum plant height was treatments T (250 ppm ethrel), T (300 ppm ethrel) 5 6recorded in treatment T (200 ppm ethrel) followed by 4and T (100 ppm ethrel) were found at par with 2the treatment T (150 ppm ethrel) when compared 3treatment T (control).1with treatment T (control) and remaining treatments 1
under study. While, treatments T (300 ppm ethrel) 6 Devi et al. (2011) conducted a field and T (100 ppm ethrel) were found at par with 2 experiment in kharif season to study the response of treatment T (control). soybean variety JS 335 to salicyclic acid (50 ppm), 1
ethrel (200 ppm), cycocel (500 ppm) and control At 60 and 75 DAS significantly maximum (water spray) applied as foliar spray at different stages
plant height was recorded in treatment T (200 ppm 4 i.e. flower-initiation (40 DAS), pod-initiation (60 ethrel) followed by the treatments T (150 ppm ethrel) DAS) and flower-initiation + pod-initiation stage. 3
and T (250 ppm ethrel) when compared with The study revealed that application of ethrel at 200 5
-1ppm gave the highest number of branches plant in treatment T (control) and remaining treatments under 1
soybean.study. While, treatments T (300 ppm ethrel) and T 6 2
(100 ppm ethrel) were found at par with treatment T 1Pahwa (2013) studied the effect of plant
(control).growth regulators on pigeonpea and found that 200 µg
-1 -1ml ethrel increased the number of branches plant .Hamed (2003) carried out a field experiment
to study the foliar spray of ethrel at different Leaf area of plant
concentrations (250, 500 and 750 ppm) on maize hybrids S.C 10 and D.C. Taba at an interval of 15, 20 -1Data on leaf area plant were recorded at and 25 DAS. Foliar spray of ethrel at 250 ppm gave
three stages viz., 45, 60 and 75 DAS. Leaf area highest plant height.
recorded at these stages gave significant results.
Devi et al. (2011) conducted a field At 45 DAS significantly maximum leaf area
experiment in kharif season to study the response of was noticed in treatment T (200 ppm ethrel) followed 4
soybean variety JS 335 to salicyclic acid (50 ppm), by treatments T (150 ppm ethrel) T (250 ppm ethrel) 3 5 ethrel (200 ppm) and cycocel (500 ppm) applied as and T (300 ppm ethrel) in a descending manner when 6foliar spray at different stages. The study revealed that compared with treatment T (control) and remaining 1application of ethrel at 200 ppm gave highest plant treatments under study. Treatment T (100 ppm ethrel) 2 height over control.was found at par with treatment T (control). 1
-1Number of branches plant-1 At 60 DAS significantly maximum leaf area Data regarding number of branches plant
was noticed in treatment T (200 ppm ethrel) followed 4were recorded at 45, 60 and 75 DAS and found by treatments T (150 ppm ethrel) and T (250 ppm statistically significant. 3 5
233

ethrel) in a descending manner when compared with matter was noticed in treatment T (200 ppm ethrel) 4
treatment T (control) and remaining treatments under followed by treatment T (150 ppm ethrel) when 1 3
study. While, Treatment T (100 ppm ethrel) was compared with treatment T (control) and remaining 2 1
found at par with treatment T (control). treatments under study. Also, treatments T (250 ppm 1 5
ethrel) and T (300 ppm ethrel) were found 6
At 75 DAS significantly maximum leaf area significantly superior over treatment T (control). 1was noticed in treatment T (200 ppm ethrel) followed 4 Treatment T (100 ppm ethrel) was found at par with 2 by treatment T (150 ppm ethrel) when compared with 3 treatment T (control). 1treatment T (control) and remaining treatments under 1
study. While, Treatment T (100 ppm ethrel) was 2 Significant increase in dry matter from 45-75 found at par with treatment T (control). 1 DAS might be due to increase in the leaf area and
photosynthetic capacity.Hence, it can be stated that the higher leaf
area might be due to ethrel enhanced ethylene Aurcharmal et al. (2008) reported that foliar biosynthesis. The higher ethylene evolution led to spray of ethrel at 50 ppm significantly increased dry higher leaf area and thus greater light interception and weight of a plant in urdbean.photosynthesis (Mir et al., 2010).
Devi et al. (2011) observed that application Lone et al. (2010) studied the effect of ethrel of ethrel at 200 ppm increased dry weight of plant
-1 -1(200 µ l l ) and nitrogen (0, 40, 80 and 120 kg N ha. ) significantly in soybean.-1on mustard. Ethrel treated with 200 µl l at flowering
Growth analysisstage along with basal application of nitrogen at 80 kg -1 Growth analysis is one of the measure of ha were recorded the highest leaf area.
assessing the yield of plant. The physiological basis of yield difference can be measured through an Singh et al. (2011) reported that foliar evolution of difference in growth parameters and their application of ethrel at 200 ppm significantly
increased leaf area in soybean. impact on yield. The productivity of crop may be related with parameters such as relative growth rate
Dry matter production (RGR) and net assimilation rate (NAR).Data on dry matter production were recorded
at the three growth stages i.e. 45, 60 and 75 DAS gave Relative growth rate significant variation. Relative growth rate (RGR) represents total
dry weight gained over existing dry weight in unit At 45 DAS significantly maximum dry time. This was originally termed an “efficiency
matter was noticed in treatment T (200 ppm ethrel) 4 index” because it expresses growth in terms of a rate when compared with treatment T (control) and 1 of increase in size per unit of size. As such, it permits remaining treatments under study. Also, treatments T more equitable comparisons between organisms than 3
does absolute growth rate. Normally, relative growth (150 ppm ethrel) T (250 ppm ethrel), T (300 ppm 5 6-1
rate deals with total dry weight plant , though other ethrel) and T (100 ppm ethrel) were found 2
measures of size have also been used. Data regarding significantly superior over treatment T (control). 1
RGR are given in table 2. At 60 DAS significantly maximum dry
At 45-60 DAS significantly maximum RGR matter was noticed in treatment T (200 ppm ethrel) 4
was observed in treatment T (200 ppm ethrel) over 4when compared with treatment T (control) and 1
treatment T (control) and remaining treatments under 1remaining treatments under study. Also, treatments T 3
study. While, treatments T (150 ppm ethrel), T (250 3 5(150 ppm ethrel) and T (250 ppm ethrel) found 5
ppm ethrel), and T (300 ppm ethrel) were found 6significantly superior over treatment T (control). 1
significantly superior over treatment T (control). 1Treatments T (300 ppm ethrel) and T (100 ppm 6 2
Treatment T (100 ppm ethrel) was found at par with ethrel) were found at par with treatment T (control). 21
treatment T (control).At 75 DAS significantly maximum dry 1
234

At 60-75 significantly highest RGR was treatment T (150 ppm ethrel) over treatment T 3 1
observed in treatment T (200 ppm ethrel) followed by (control) and remaining treatments under study. 4
While, treatment T (100 ppm ethrel) was found at par treatments T (150 ppm ethrel) and T (250 ppm 23 5
with treatment T (control). ethrel) over treatment T (control) and remaining 11
treatments under study. Treatment T (300 ppm ethrel) 6
Aucharmal et al. (2008) carried out a field was found significantly superior over treatment T 1experiment to study the influence of different growth
(control). While, treatment T (100 ppm ethrel) was 2 regulators on urdbean and observed that application found at par with treatment T (control). 1 of planofix at 40 ppm and ethrel at 50 ppm
significantly increased NAR.Aucharmal et al. (2008) carried out a field
-1experiment to study the influence of different growth Seed yield ha (q)regulators on urdbean. They found that application of
-1 planofix at 40 ppm and ethrel at 50 ppm significantly Significantly maximum seed yield ha was increased RGR. recorded in treatment T (200 ppm ethrel) followed by 4
treatments T (150 ppm ethrel) and T (250 ppm 3 5Pahwa (2013) carried out a field experiment
ethrel) when compared with control and remaining to study the effect of plant growth regulators on
treatments under study. While, treatments T (300 6 pigeonpea and observed that application of ethrel at ppm ethrel) and T (100 ppm ethrel) were found at par -1 2100 µ ml enhanced RGR.with treatment T (control).1
Net assimilation rateThe use of plant hormone may prove its
potential as it has been found to enhance growth and NAR is the rate of increasing the dry weight -1 productivity of the crop plants. It also improve the of a plant unit of active growing material. NAR is
crop manipulating source-sink relationship at pod any attribute of the plant which is primarily concerned development stage, several naturally occurring in carbon assimilation and thus has some claims to be phytohormones ethylene influences about all aspects taken as a measure of the internal factor for growth. of plant growth and development as well as the
NAR is closely associated with photosynthesis induction of some plant defense responses. Ethrel
efficiency of leaves, but it is not a pure measure of involved in diverse array of cellular, developmental
photosynthesis. NAR depends upon the excess dry and stress released processes in plants. It reduces the
matter gained, over the loss in respiration. It is problem of pod shattering by restricting the flower -1increase in plants dry weight unit area of and pod abortions, Mir et al. (2010).-1assimilation tissues unit time.
Devi et al. (2011) conducted experiment to At 45-60 DAS maximum NAR was observed study the effect of salicylic acid, ethrel and cycocel
in treatment T (200 ppm ethrel) over treatment T 4 1 (50, 200 and 500 ppm) on soybean and observed that -1(control) and remaining treatments under study. ethrel at 200 ppm gave highest number of pods plant ,
-1While, treatments T (300 ppm ethrel) and T (100 6 2 100 seed weight and seed yield ha .ppm ethrel) were found at par with treatment T 1
Sharma and Sardana (2012) tried ethrel and (control). mepiquat chloride as foliar spray on groundnut and
At 60-75 DAS maximum NAR was observed observed that IAA at 7.5 ppm + ethrel 25 ppm in treatment T (200 ppm ethrel) followed by the increased pod yield.4
235
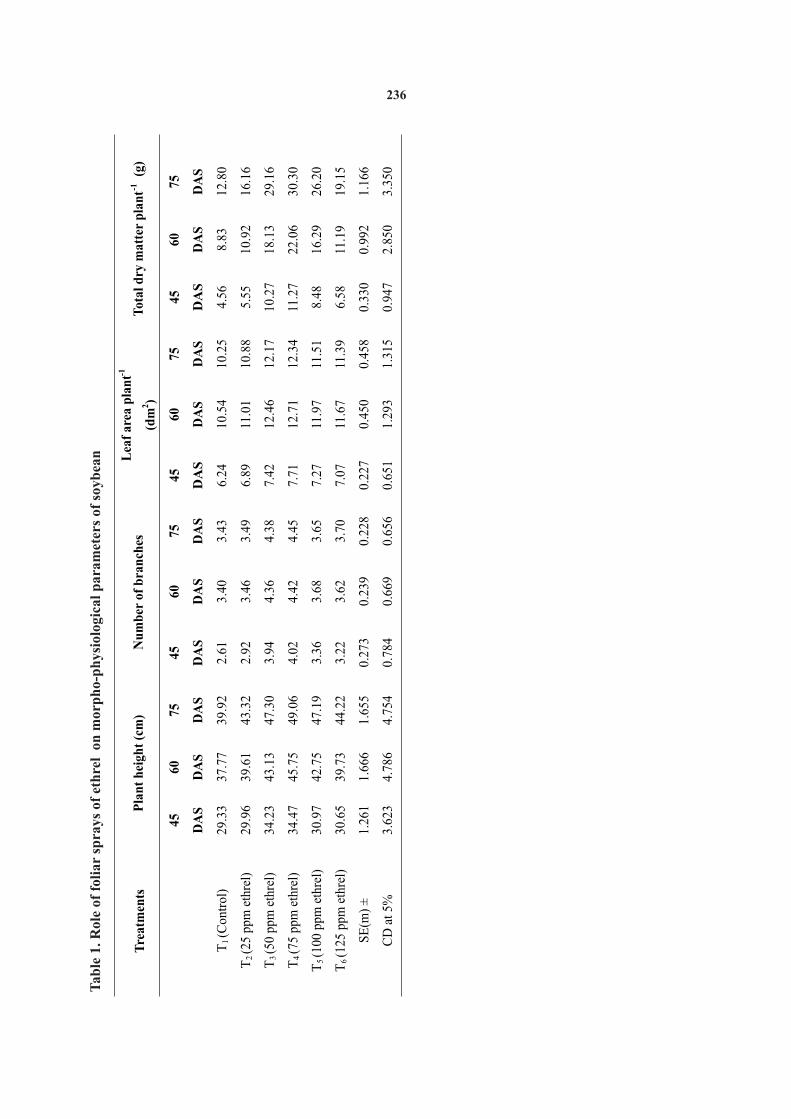
Ta
ble
1. R
ole
of f
olia
r sp
ray
s o
f et
hre
l o
n m
orp
ho-
ph
ysi
olo
gica
l p
aram
eter
s of
so
ybea
n
Tre
atm
ents
Pla
nt
hei
ght
(cm
)
Nu
mb
er o
f b
ran
ches
L
eaf
area
pla
nt-1
(dm
2 )T
otal
dry
mat
ter
pla
nt-1
(g)
45
DA
S
60
DA
S
75
DA
S
45
DA
S
60
D
AS
75
DA
S
60
DA
S
75
DA
S
45
60 DA
S
75 DA
S
T1 (C
ontr
ol)
29
.33
37.7
7 39
.92
2.61
3.40
3.
43
6.24
10
.54
10
.25
4.
56
8.83
12.8
0
T2 (2
5 pp
m e
thre
l)
29.9
6 39
.61
43.3
2 2.92
3.46
3.
49
6.89
11
.01
10
.88
5.
55
10.9
216
.16
T3 (5
0 pp
m e
thre
l)
34
.23
43.1
3
47.3
0
3.94
4.36
4.
38
7.
42
12
.46
12
.17
10
.27
18
.13
29.1
6
T4 (7
5 pp
m e
thre
l)
34.4
7
45.7
5
49.0
6
4.02
4.42
4.45
7.71
12.7
1
12.3
4
11.2
7
22.0
630
.30
T5 (1
00 p
pm e
thre
l)
30.9
7
42.7
5
47.1
9
3.36
3.68
3.65
7.27
11.9
7
11.5
1
8.48
16.2
926
.20
T6 (1
25 p
pm e
thre
l)
30.6
5
39.7
3
44.2
2
3.22
3.62
3.70
7.07
11.6
7
11.3
9
6.58
11.1
919
.15
SE
(m)
±1.
261
1.66
61.
655
0.27
30.
239
0.22
80.
227
0.45
00.
458
0.33
00.
992
1.16
6
CD
at
5%3.
623
4.78
64.
754
0.78
40.
669
0.65
60.
651
1.29
31.
315
0.94
72.
850
3.35
0
DA
S
45
DA
S
236
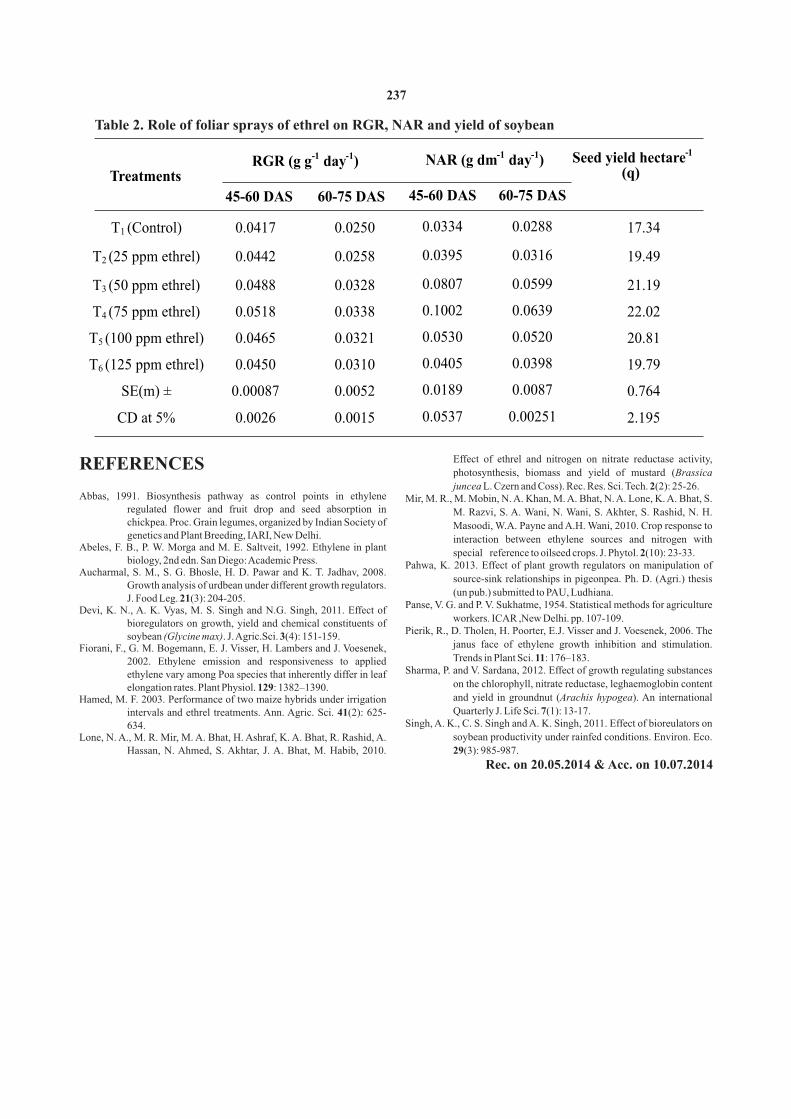
Effect of ethrel and nitrogen on nitrate reductase activity, REFERENCESphotosynthesis, biomass and yield of mustard (Brassica
juncea L. Czern and Coss). Rec. Res. Sci. Tech. 2(2): 25-26.Abbas, 1991. Biosynthesis pathway as control points in ethylene Mir, M. R., M. Mobin, N. A. Khan, M. A. Bhat, N. A. Lone, K. A. Bhat, S.
regulated flower and fruit drop and seed absorption in M. Razvi, S. A. Wani, N. Wani, S. Akhter, S. Rashid, N. H. chickpea. Proc. Grain legumes, organized by Indian Society of Masoodi, W.A. Payne and A.H. Wani, 2010. Crop response to genetics and Plant Breeding, IARI, New Delhi. interaction between ethylene sources and nitrogen with
Abeles, F. B., P. W. Morga and M. E. Saltveit, 1992. Ethylene in plant special reference to oilseed crops. J. Phytol. 2(10): 23-33.
biology, 2nd edn. San Diego: Academic Press. Pahwa, K. 2013. Effect of plant growth regulators on manipulation of Aucharmal, S. M., S. G. Bhosle, H. D. Pawar and K. T. Jadhav, 2008.
source-sink relationships in pigeonpea. Ph. D. (Agri.) thesis Growth analysis of urdbean under different growth regulators.
(un pub.) submitted to PAU, Ludhiana.J. Food Leg. 21(3): 204-205.
Panse, V. G. and P. V. Sukhatme, 1954. Statistical methods for agriculture Devi, K. N., A. K. Vyas, M. S. Singh and N.G. Singh, 2011. Effect of
workers. ICAR ,New Delhi. pp. 107-109.bioregulators on growth, yield and chemical constituents of Pierik, R., D. Tholen, H. Poorter, E.J. Visser and J. Voesenek, 2006. The
soybean (Glycine max). J. Agric.Sci. 3(4): 151-159.janus face of ethylene growth inhibition and stimulation. Fiorani, F., G. M. Bogemann, E. J. Visser, H. Lambers and J. Voesenek, Trends in Plant Sci. 11: 176–183.2002. Ethylene emission and responsiveness to applied
Sharma, P. and V. Sardana, 2012. Effect of growth regulating substances ethylene vary among Poa species that inherently differ in leaf on the chlorophyll, nitrate reductase, leghaemoglobin content elongation rates. Plant Physiol. 129: 1382–1390.and yield in groundnut (Arachis hypogea). An international Hamed, M. F. 2003. Performance of two maize hybrids under irrigation Quarterly J. Life Sci. 7(1): 13-17.intervals and ethrel treatments. Ann. Agric. Sci. 41(2): 625-
Singh, A. K., C. S. Singh and A. K. Singh, 2011. Effect of bioreulators on 634. soybean productivity under rainfed conditions. Environ. Eco. Lone, N. A., M. R. Mir, M. A. Bhat, H. Ashraf, K. A. Bhat, R. Rashid, A.
Hassan, N. Ahmed, S. Akhtar, J. A. Bhat, M. Habib, 2010. 29(3): 985-987.
Rec. on 20.05.2014 & Acc. on 10.07.2014
Table 2. Role of foliar sprays of ethrel on RGR, NAR and yield of soybean
Treatments RGR (g g-1 day-1) NAR (g dm-1 day-1) Seed yield hectare-1
(q)
45-60 DAS 60-75 DAS 45-60 DAS 60-75 DAS
T1 (Control) 0.0250 0.0334 0.0288
T2 (25 ppm ethrel) 0.0258 0.0395 0.0316
T3 (50 ppm ethrel) 0.0328 0.0807 0.0599
T4 (75 ppm ethrel) 0.0338 0.1002 0.0639
T5 (100 ppm ethrel) 0.0321 0.0530 0.0520
T6 (125 ppm ethrel) 0.0310 0.0405 0.0398
SE(m) ± 0.0052 0.0189 0.0087
CD at 5%
0.0417
0.0442
0.0488
0.0518
0.0465
0.0450
0.00087
0.0026 0.0015 0.0537 0.00251
17.34
19.49
21.19
22.02
20.81
19.79
0.764
2.195
237
ABSTRACT
A field experiment was conducted during rabi season of 2013-2014 at Agronomy Section, college of Agriculture, Nagpur. The experiment was laid out in split plot design with three treatments of nitrogen levels under
-1 -1 -1main plot viz., N - 100 kg N ha , N - 125 kg N ha , N - 150 kg N ha and four chlormequat levels as sub plot treatments 1 2 3
viz., C – Control i.e. (no inoculation, no foliar application), C - Seed inoculation of chlormequat @ 1000 ppm, C - 0 1 2
Foliar application of chlormequat @ 1000 ppm at maximum tillering stage and C - Seed inoculation of chlormequat 3
@ 1000 ppm + foliar application of chlormequat @1000 ppm at maximum tillering stage, forming 12 treatment combinations replicated three times. Growth contributing characters viz., mean plant height, mean number of leaves
-1 -1 -1 -1plant , mean leaf area plant , mean number of tillers plant , mean dry matter accumulation plant and yield -1 -1contributing characters viz., length of spike, number of grains spike , grain weight spike , test weight, grain yield and
-1 -1 -1straw yield (q ha ) were significantly more due to 150 kg N ha as compared to 100 kg and 125 kg N ha . Seed inoculation of chlormequat @ 1000 ppm + foliar application of chlormequat @1000 ppm at maximum tillering stage
-1recorded significantly more values of growth contributing characters viz., mean number of leaves plant , mean leaf -1 -1 -1area plant , mean number of tillers plant , mean dry matter accumulation plant and found lowest value of plant
-1 -1height. Yield contributing characters viz., length of spike, number of grains spike , grain weight spike , grain yield -1and straw yield (q ha ) were significantly higher due to seed inoculation of chlormequat @ 1000 ppm + foliar
application of chlormequat @1000 ppm at maximum tillering stage as compared to control and seed inoculation of chlormequat @ 1000 ppm but was at par with foliar application of chlormequat @1000 ppm at maximum tillering stage. Test weight found to be non significant with the application of chlormequat.
(Key words: Wheat, nitrogen, chlormequat, growth, yield)
productivity. Similarly the profitable use of any INTRODUCTIONgrowth retardant will also be helpful for reducing the
plant height, preventing lodging and reducing Wheat is one of the most important staple transpiration from plant.food crops of India grown in diverse agroclimatic
conditions from 11°N- 35°N latitude and 72°E- 92°E MATERIALS AND METHODSlongitudes. It is most widely cultivated as stable food
crop of the world. The field experiment was conducted in field
Indian soils are deficient in nitrogen. No.15 at Agronomy farm, college of Agriculture, Deficiency of this major element is a limiting factor in Nagpur during rabi season of 2013-2014. The crop production in this country. It is, therefore, topography of experimental site was fairly uniform required to be added in appropriate quantity to the soil and leveled. The soil analyzed in experimental site at a time when it could be best utilized by the crop have loamy clayey in texture, medium in nitrogen
-1plant for their optimum responses for increasing yield content (206.98 kg ha ), low in phosphorus (16.15 kg -1 -1of wheat. ha ) and rich in potash (350.00 kg ha ) and soil
reaction was slightly alkaline (pH 7.7) in nature.
The experiment was replicated thrice in split Meera and Poonam (2010) reported that application
plot design with 3 levels of nitrogen, i.e. 100, 125 and of cycocel @ 1000 and 2000 ppm significantly -1150 kg ha and four levels of chlormequat, i.e. increased yield attributing characters in comparison
Control (no inoculation, no foliar application)(C ), 0to the untreated control in wheat crop. The highest Seed inoculation of chlormequat @ 1000 ppm (C ), 1yield was obtained when wheat was treated with 1000 Foliar application of chlormequat @ 1000 ppm at ppm cycocel. maximum (C ) tillering stage and seed inoculation of 2
The outcome of present study will be useful chlormequat @ 1000 ppm + foliar application of
for optimising the use of nitrogen with more chlormequat @1000 ppm at maximum tillering stage
Application of chlormequat before or during tillering may improve tiller production (Green 1986).,
1 & 3. P. G. Students, Agronomy Section, College of Agriculture, Nagpur (M. S.)2. Assoc. Professor of Agronomy, College of Agriculture, Nagpur (M. S.)
J. Soils and Crops 25 (1) 238-241, June, 2015 ISSN 0971-2836
EFFECT OF NIROGEN LEVELS AND CHLORMEQUAT ON GROWTH AND YIELD OF WHEAT
1 2 3S. R. Meena , V. S. Khawale and B. A. Bhoyar
-1 -1(C ). After seed bed preparation, sowing was done by leaf area plant , number of tillers plant and dry 3
-1matter plant in wheat crop. Dastan et al. (2011) drilling. reported that the CCC application decreased plant
The gross plot size was 4.5 m x 4.8 m and net height and stem length, but increased ear length and -1plot size was 3.6 m x 4.2 m. The growth observations total tillers plant as compared control in barley crop.
-1on plant height (cm) at harvest, number of tillers pant
-1 This might to be the source-sink relationship at harvest, number of leaves and leaf area plant at 90 by way of pertaining of dry matter accumulation at DAS were recorded on five plants and dry matter at later stage of growth instead at early phase of growth harvest was recorded on two plants. The yield of wheat crop.contributing characters viz., spike length, number of
-1 -1grains spike , grain weight spike , test weight (g)
-1 Interaction effectwere recorded on five plants. The yield ha was calculated from the net plot yield.
The interaction effect due to nitrogen levels and chlormequat on plant height, number of leaves
RESULTS AND DISCUSSION -1and leaf area plant was found to be non significant. -1.The interaction effect on number of tillers plant and
Growth attributes -1dry matter plant at harvest was found significant.
Effect of nitrogen levels-1Application of 150 kg N ha along with seed
-1 inoculation of chlormequat @ 1000 ppm + foliar Application of 150 kg N ha recorded application of chlormequat @1000 ppm at maximum maximum and significantly more plant height at
-1 tillering stage (N x C ) recorded higher number of 3 3harvest, number of tillers plant at harvest, number of -1
-1 -1 tillers plant (37.20) which was significantly superior leaves plant , leaf area plant at 90 DAS and dry -1 over all the other treatment combinations. matter production plant at harvest over other
-1Application of 150 kg N ha along with seed nitrogen levels. These better growth characters due to inoculation of chlormequat @ 1000 ppm + foliar 150 kg N ha might due to be vigorous vegetative application of chlormequat @1000 ppm at maximum growth of wheat plant, as proper nitrogen levels tillering stage (N x C ) recorded highest dry matter 3 3encourages plant growth and helps a plant to thrive
-1accumulation plant (32.96 g) which was well. Similar results were reported by Kumar and -1 significantly superior over all other treatment Sharma (2000), who reported more dry matter plant
-1 combinations. However, it was at par with the and tillers plant with the increasing nitrogen levels to -1
application of 150 kg N ha along with seed wheat crop. Kumar et al. (2007) also reported -1 -1 inoculation of chlormequat @ 1000 ppm + foliar maximum plant height plant , leaves plant and leaf
-1 application of chlormequat @1000 ppm at maximum area plant due to increasing nitrogen levels in wheat tillering stage (N x C ) and application of 125 kg N 3 2crop.
-1ha along with seed inoculation of chlormequat @ Effect of chlormequat levels 1000 ppm + foliar application of chlormequat @1000
ppm at maximum tillering stage (N XC ).2 2
Seed inoculation of chlormequat @ 1000 ppm + foliar application of chlormequat @1000 ppm Yield attributesat maximum tillering stage recorded maximum and Effect of nitrogen levels
-1significantly more number of leaves plant , leaf area -1 -1 Maximum length of spike (6.58 cm), number plant at 90 DAS, number of tillers plant at harvest,
-1 -1 -1 of grains spike (36.72), grain weight spike (5.94), dry matter production plant and lowest height at
-1 test weight (1000 seed) (38.50 g), grain yield q haharvest over other treatments but was at par with -1
(30.05) and straw yield q ha (39.94) were recorded foliar application of chlormequat @1000 ppm at -1
due to application of 150 kg N ha which were maximum tillering stage. These results are in close -1 -significantly more over 100 kg N ha and 125 kg N haaccordance with the finding of Meera and Poonam
1. The significant increase in these yield attributes due (2010). They reported that foliar spray of cycocel
to increase in nitrogen level might be due to better 1000 and 2000 ppm on wheat significantly increased
239
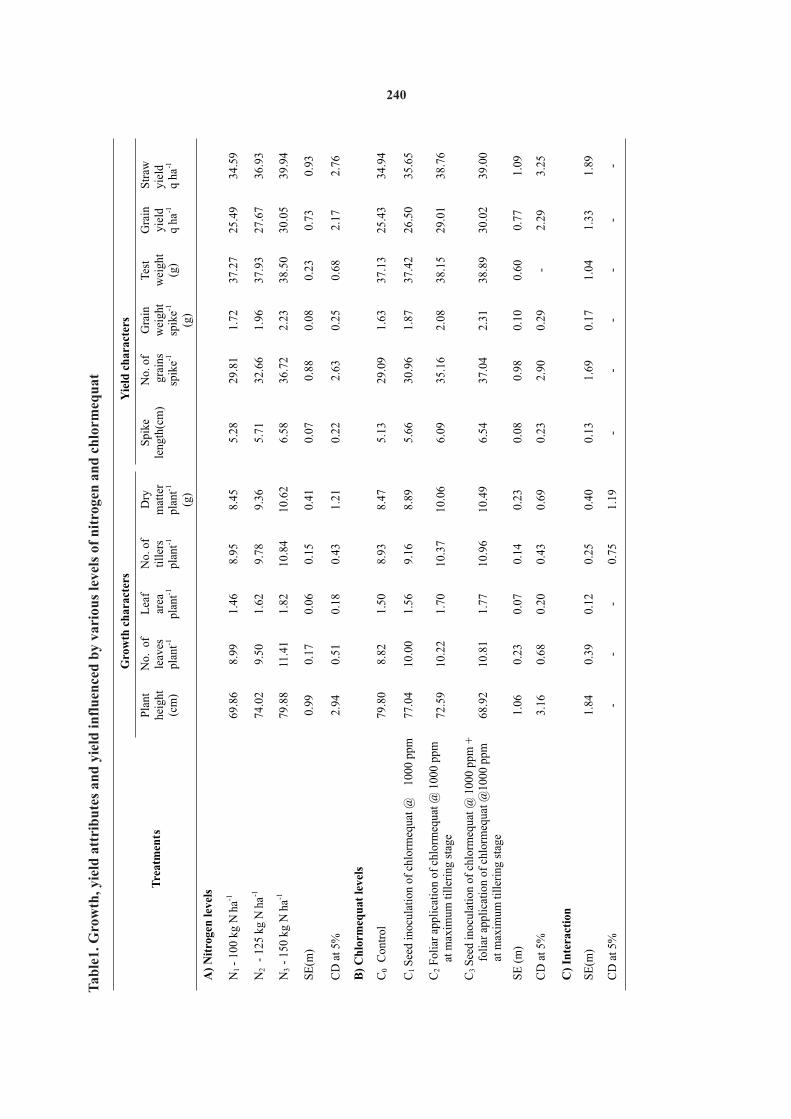
Ta
ble
1. G
row
th, y
ield
att
rib
ute
s a
nd
yie
ld i
nfl
uen
ced
by
var
iou
s le
vel
s o
f n
itro
gen
an
d c
hlo
rmeq
uat
Tre
atm
ents
G
row
th c
har
acte
rs
Yie
ld c
har
acte
rs
Pla
nt
heig
ht
(cm
)
No.
of
leav
es
plan
t-1
Lea
f ar
ea
plan
t-1
No.
of
till
ers
plan
t-1
Dry
m
atte
r pl
ant-1
(g)
Spi
ke
leng
th(c
m)
No.
of
grai
ns
spik
e-1
Gra
in
wei
ght
spik
e-1
(g
)
Tes
t w
eigh
t
(g)
Gra
in
yiel
d
q
ha-1
Str
aw
yiel
d
q ha
-1
A)
Nit
roge
n l
evel
s
N1 -
100
kg N
ha-1
69
.86
8.
99
1.
46
8.
95
8.
45
5.
28
29
.81
1.
72
37
.27
25
.49
34.5
9
N2
-
125
kg N
ha-1
74.0
2
9.50
1.62
9.78
9.36
5.71
32.6
6
1.96
37.9
3
27.6
736
.93
N3
-
150
kg N
ha-1
79.8
8
11.4
1
1.82
10.8
4
10.6
2
6.58
36.7
2
2.23
38.5
0
30.0
539
.94
SE
(m)
0.99
0.17
0.06
0.15
0.41
0.07
0.88
0.08
0.23
0.73
0.93
CD
at
5%
2.94
0.51
0.18
0.43
1.21
0.22
2.63
0.25
0.68
2.17
2.76
B)
Ch
lorm
equ
at l
evel
s
C
0
Con
trol
79.8
0
8.82
1.50
8.93
8.47
5.13
29.0
9
1.63
37.1
3
25.4
334
.94
C1 S
eed
inoc
ulat
ion
of c
hlor
meq
uat
@
100
0 pp
m
77.0
4
10.0
0
1.56
9.16
8.89
5.66
30.9
6
1.87
37.4
2
26.5
035
.65
C2
Fol
iar
appl
icat
ion
of c
hlor
meq
uat
@ 1
000
ppm
at
max
imum
til
leri
ng s
tage
72.5
9
10.2
2
1.70
10.3
7
10.0
6
6.09
35.1
6
2.08
38.1
5
29.0
138
.76
C3
See
d in
ocul
atio
n of
chl
orm
equa
t @
100
0 pp
m +
fo
liar
app
lica
tion
of
chlo
rmeq
uat
@10
00 p
pm
at m
axim
um ti
ller
ing
stag
e
68.9
2
10.8
1
1.77
10.9
6
10.4
9
6.54
37.0
4
2.31
38.8
9
30.0
239
.00
SE
(m
)
1.06
0.23
0.07
0.14
0.23
0.08
0.98
0.10
0.60
0.77
1.09
CD
at
5%
3.16
0.68
0.20
0.43
0.69
0.23
2.90
0.29
-
2.29
3.25
C)
Inte
ract
ion
SE
(m)
1.84
0.39
0.12
0.25
0.40
0.13
1.69
0.17
1.04
1.33
1.89
CD
at
5%-
--
0.75
1.19
--
--
--
240
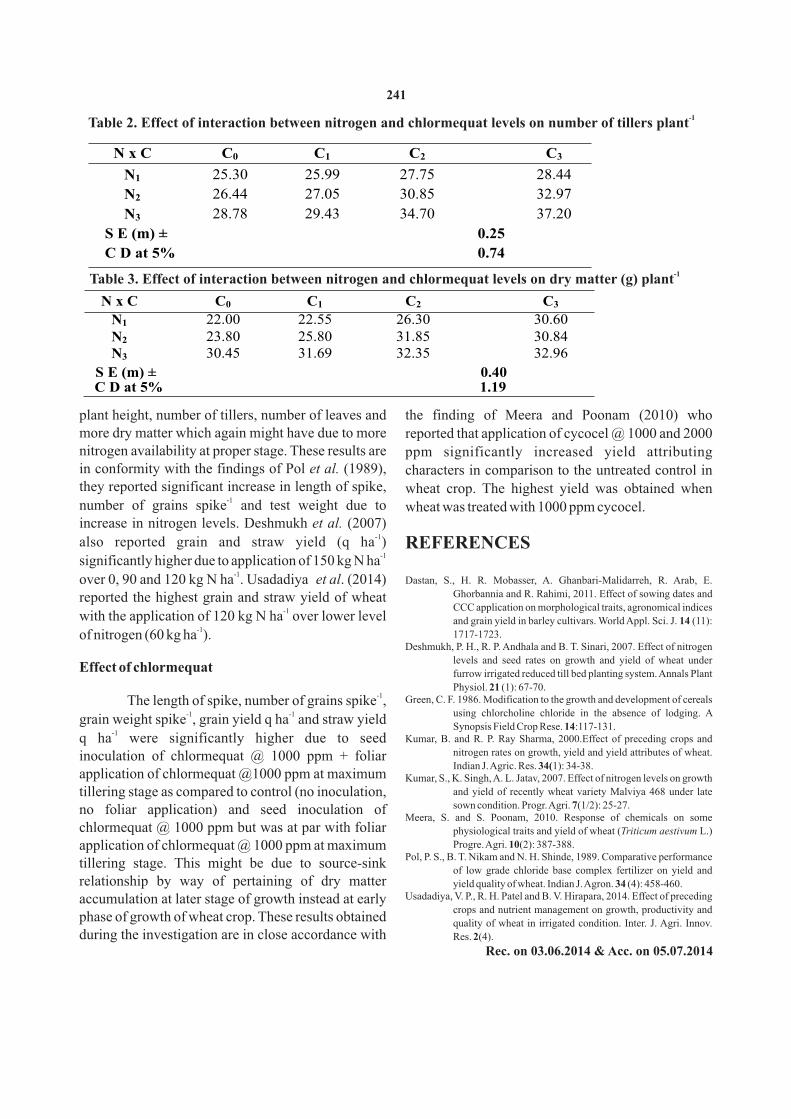
-1Table 2. Effect of interaction between nitrogen and chlormequat levels on number of tillers plant
N x C C0 C1 C2 C3
N1 25.30 25.99 27.75 28.44
N2 26.44 27.05 30.85 32.97
N3 28.78 29.43 34.70 37.20
S E (m) ±
0.25
C D at 5% 0.74
-1 Table 3. Effect of interaction between nitrogen and chlormequat levels on dry matter (g) plant
N x C C0 C1 C2 C3
N1 22.00 22.55 26.30 30.60N2 23.80 25.80 31.85 30.84N3
30.45
31.69
32.35
32.96
S E (m) ± 0.40C D at 5% 1.19
plant height, number of tillers, number of leaves and the finding of Meera and Poonam (2010) who more dry matter which again might have due to more reported that application of cycocel @ 1000 and 2000 nitrogen availability at proper stage. These results are ppm significantly increased yield attributing in conformity with the findings of Pol et al. (1989), characters in comparison to the untreated control in they reported significant increase in length of spike, wheat crop. The highest yield was obtained when
-1number of grains spike and test weight due to wheat was treated with 1000 ppm cycocel.increase in nitrogen levels. Deshmukh et al. (2007)
-1also reported grain and straw yield (q ha ) REFERENCES
-1significantly higher due to application of 150 kg N ha
-1over 0, 90 and 120 kg N ha . Usadadiya et al. (2014) Dastan, S., H. R. Mobasser, A. Ghanbari-Malidarreh, R. Arab, E.
Ghorbannia and R. Rahimi, 2011. Effect of sowing dates and reported the highest grain and straw yield of wheat CCC application on morphological traits, agronomical indices -1with the application of 120 kg N ha over lower level and grain yield in barley cultivars. World Appl. Sci. J. 14 (11):
-11717-1723.of nitrogen (60 kg ha ).
Effect of chlormequat
-1 Green, C. F. 1986. Modification to the growth and development of cereals The length of spike, number of grains spike , -1 -1 using chlorcholine chloride in the absence of lodging. A
grain weight spike , grain yield q ha and straw yield Synopsis Field Crop Rese. 14:117-131.
-1Kumar, B. and R. P. Ray Sharma, 2000.Effect of preceding crops and q ha were significantly higher due to seed
nitrogen rates on growth, yield and yield attributes of wheat. inoculation of chlormequat @ 1000 ppm + foliar Indian J. Agric. Res. 34(1): 34-38.
application of chlormequat @1000 ppm at maximum Kumar, S., K. Singh, A. L. Jatav, 2007. Effect of nitrogen levels on growth
and yield of recently wheat variety Malviya 468 under late tillering stage as compared to control (no inoculation, sown condition. Progr. Agri. 7(1/2): 25-27.no foliar application) and seed inoculation of
Meera, S. and S. Poonam, 2010. Response of chemicals on some chlormequat @ 1000 ppm but was at par with foliar physiological traits and yield of wheat (Triticum aestivum L.)
Progre. Agri. 10(2): 387-388.application of chlormequat @ 1000 ppm at maximum Pol, P. S., B. T. Nikam and N. H. Shinde, 1989. Comparative performance
tillering stage. This might be due to source-sink of low grade chloride base complex fertilizer on yield and
relationship by way of pertaining of dry matter yield quality of wheat. Indian J. Agron. 34 (4): 458-460.
accumulation at later stage of growth instead at early phase of growth of wheat crop. These results obtained during the investigation are in close accordance with
Deshmukh, P. H., R. P. Andhala and B. T. Sinari, 2007. Effect of nitrogen
levels and seed rates on growth and yield of wheat under
furrow irrigated reduced till bed planting system. Annals Plant
Physiol. 21 (1): 67-70.
Usadadiya, V. P., R. H. Patel and B. V. Hirapara, 2014. Effect of preceding
crops and nutrient management on growth, productivity and
quality of wheat in irrigated condition. Inter. J. Agri. Innov.
Res. 2(4).
Rec. on 03.06.2014 & Acc. on 05.07.2014
241

JO
UR
NA
L
OF
S
OI
LS
&
C
RO
PS