Vol. 4, No 1 (2014): January-June
113
Transcript of Vol. 4, No 1 (2014): January-June


Editorial Team
Editor in Chief
Alfonso Vargas-Sánchez, University of Huelva, Spain
Associate Editor
T.C. Huan, National Chiayi University, Taiwan
Books Review Editor
Steve Watson, York St. John University, United Kingdom
Secretariat
Cinta Borrero-Domínguez, University of Huelva, Spain
Mirko Perano, University of Salerno, Italy
Style reviewer and text editor
Beatriz Rodríguez-Arrizabalaga, University of Huelva, Spain
Editorial Board
José Manuel Alcaraz, Barna Business School, República Dominicana Mario Castellanos-Verdugo, University of Seville, España José Antonio Fraiz-Brea, University of Vigo, España José Manuel Hernández-Mogollón, University of Extremadura, España Shaul Krakover, Ben Gurion University, Israel Jean Pierre Levy-Mangin, University of Quebec, Canadá Tomás López-Guzmán, University of Córdoba, España Alfonso Morvillo, National Research Council (CNR), Italia Yasuo Ohe, Chiba University, Japón María de los Ángeles Plaza-Mejía, University of Huelva, España Nuria Porras-Bueno, University of Huelva, España João Albino Silva, Algarve University, Portugal
Advisory Board (Spanish Members)
César Camisón-Zornoza, Jaume I University, Spain Enrique Claver-Cortés, University of Alicante, Spain María Teresa Fernández-Alles, University of Cádiz, Spain José Luis Galán-González, University of Seville, Spain Félix Grande-Torraleja, University of Jaén, España Inmaculada Martín-Rojo, University of Málaga, Spain Antonio Manuel Martínez-López, University of Huelva, España Francisco José Martínez-López, University of Huelva, Rector, España María Jesús Moreno-Domínguez, University of Huelva,
España Pablo A. Muñoz-Gallego, University of Salamanca, España Francisco Riquel-Ligero, University of Huelva, España Josep Francesc Valls-Giménez, ESADE, España
Advisory Board (Other European Members)
Paulo Aguas, Algarve University, Portugal Gustavo Barresi, University of Messina, Italy Carlos Costa, Aveiro University, Portugal Salvatore Esposito de Falco, University of Rome “La Sapienza", Italy Sheila Flanagan, Dublín Institute of Technology, Ireland Tania Gorcheva, Tsenov Academy of Economics, Bulgaria Tadeja Jere-Lazanski, University of Primorska, Slovenia Metin Kozak, Mugla University, Turkey Álvaro Matias, Lusiada University, Portugal Claudio Nigro, University of Foggia, Italy Angelo Presenza, University "G. D'Annunzio" of Chieti-Pescara, Italy Renee Reid, Glasgow Caledonian University, United Kingdom
Advisory Board (Members from the rest of the world)
John Allee, American University of Sharjah, United Arab
Emirates
Nestor Pedro Braidot, National University of La Plata,
Argentina
Roberto Elias Canese, Columbia University, Rector,
Paraguay
Luca Casali, Queensland University of Technology, Australia
Nimit Chowdhary, Indian Institute of Tourism and Travel
Management, India
Steven Chung-chi Wu, National Pingtung University of
Science and Technology, Taiwán
Dianne Dredge, Southern Cross University, Australia
Daniel Fesenmaier, Temple University, United States
Babu George, University of Southern Mississippi, United
States
Dogan Gursoy, Washington State University, United States
Kanes Rajah, Tshwane University of Technology, South
Africa
Albert Yeh Shangpao, I-SHOU University, Taiwán
Pauline Sheldon, University of Hawaii, United States
Germán A. Sierra-Anaya, University of Cartagena de Indias,
Rector, Colombia
Xiaohua Yang, University of San Francisco, United States
javascript:openRTWindow('http://www.uhu.es/publicaciones/ojs/index.php/et/about/editorialTeamBio/6')
javascript:openRTWindow('http://www.uhu.es/publicaciones/ojs/index.php/et/about/editorialTeamBio/7')
javascript:openRTWindow('http://www.uhu.es/publicaciones/ojs/index.php/et/about/editorialTeamBio/8')

Ramjit S.
Enlightening Tourism. A Pathmaking Journal, Vol 4, No 1 (2014), pp. 1-29 ISSN 2174-548X
1
EVALUATING AND UNDERSTANDING THE TOURIST
EXPERIENCE: AN EMPIRICAL STUDY IN JAMMU
AND KASHMIR
Ramjit S.
Central University of Kashmir (India)
ABSTRACT
The aim of the present study is to identify and understand the tourist experience construct, and how it differs by their age, sex, income level, education and to suggest and recommend the strategies to develop the Jammu and Kashmir as a tourist destination and enhance its brand image. The study was carried out by collecting relevant information from secondary data sources, which included books, journals and reports published by government of India, Government of Jammu and Kashmir. A self structured Questionnaire was designed and distributed among the domestic and international tourists who visited Jammu & Kashmir. The sample size was 291 and the study was conducted in the whole state of Jammu and Kashmir. Data analysis was done by applying factor analysis, and descriptive statistics. There were five factors those constituted the tourist experience like ''Transportation and Service by the different Carriers', 'Services at the Destination', 'Hotels and restaurants', 'Infrastructure at the destination' and Safety Security and Crowd Management' and out of these the first two leaves the implications for further improving and developing the destinations in Jammu and Kashmir. The outcomes of the study as whole have significant managerial implications for destination marketing managers.
KEYWORDS Tourist; Experience; Demographic Factors; Destination Development; Brand Image; Jammu and Kashmir; India. ECONLIT KEYS
L83; M30
Ramjit S.
Enlightening Tourism. A Pathmaking Journal, Vol 4, No 1 (2014), pp. 1-29 ISSN 2174-548X
2
1. INTRODUCTION
The Tourism industry, which benefits the Transportation, Accommodation,
Catering, Entertainment, and Retailing sectors, has been blooming in the past few
decades. Tourism has been a critical factor in the economic development strategy of
many countries (Lea, 1988). In recent years, tourism has been one of the most
important and consistent growth industries worldwide, and is currently held to be one
of the major service industries (Bansal and Eiselt, 2004; Sang et al., 2004). All over
the world, with 846 million international tourist arrivals, corresponding to an increase
of 5.4% over the previous year, 2006 exceeded expectations. Of these 43 million, 22
million were in Europe, 12 million in Asia and the Pacific, and 3 million for each of the
remaining regions – the Americas, Africa and the Middle East. The tourism sector
continued to enjoy above average results and recorded a third year of sustained
growth.
The India travel and tourism industry ranked 5th in the long-term (10-year) growth
and is expected to be the second largest employer in the world by 2019. India has
been ranked the “best country brand for value-for-money” in the Country Brand Index
(CBI) survey conducted by Future Brand, a leading global brand consultancy. India
also claimed the second place in CBI’s “best country brand for history”, as well as
appears among the top 5 in the best country brand for authenticity and art & culture,
and the fourth best new country for business. India made it to the list of "rising stars"
or the countries that are likely to become major tourist destinations in the next five
years, led by the United Arab Emirates, China, and Vietnam.
From the various studies and it has been found that tourism carries advantages for
any country or destination and it should be utilized as an instrument for development
at the particular destination, especially where it is having various opportunities to
develop the various tourism products and services (Van Hill, 2001; Bodlender et al.,
1991). A tourist destination is then simply described as a “geographic location to
which a person is travelling” (Metelka, 1990). Buhalis (2000) broadens this definition
by stating that the geographical location “is understood by its visitors as a unique
entity, with a political and legislative framework for tourism marketing and planning”.
Ramjit S.
Enlightening Tourism. A Pathmaking Journal, Vol 4, No 1 (2014), pp. 1-29 ISSN 2174-548X
3
(Lynch and Tinsley, 2001) state that most studies tend to look at the tourist
destination as a “system containing a number of components such as attractions,
accommodation, transport, and other services and infrastructure”. Each of these
components is then “dependent upon other parts for success in attracting, servicing,
and satisfying the tourist” (Mill and Morrison, 1985). Yet, according to the Laws
(1995), a destination’s primary resource comprises its climate, ecology, traditions and
architecture. Its secondary resources are then those developments brought in
especially for tourists, such as catering, accommodation, transport and activities.
The state of Jammu and Kashmir is not merely the Vale of Kashmir. The state of
Jammu and Kashmir comprises of three distinct regions and is the largest Himalayan
state in India. These regions are Jammu, mainly the Hindu region lies in the foothills
in the south; Srinagar and the Vale of Kashmir is mainly the Muslim region and lies in
the centre; Leh and Ladakh, from the eastern highlands across the great Himalayan
axis and comprises of mainly the Buddhists. Therefore, by knowing the fact that
Jammu and Kashmir has great potential for tourism and there is no as such study
been conducted before on the tourists experience and its relationship with the
demographic profile of the tourists, it becomes imperative to conduct the study on
this particular theme by identify and understand the tourist experience construct, and
how it differs by their age, sex, income level, education and to suggest and
recommend the actions to develop the Jammu and Kashmir as a tourist destination
and enhance its brand image.
2. REVIEW OF LITERATURE AND HYPOTHESES DEVELOPMENT
The various authors who had carried out the discussions and investigation of the
tourists or visitors experiences concept in the literature differs in context, such as
“consumption experience” (Hirschman and Holbrook, 1982; Holbrook, 2000; Carù
and Cova, 2003) “experiential marketing” (Hirschman and Holbrook,1982; Schmitt,
1999), and “co-creation experiences” (Prahalad and Ramaswany, 2004). Their
contribution through their carried research have imparted knowledge to us on tourist
or visitor behavior as well as the use of experience as a marketing tool in the global
competition in order to build up the brand image. What do you mean by experience?

Ramjit S.
Enlightening Tourism. A Pathmaking Journal, Vol 4, No 1 (2014), pp. 1-29 ISSN 2174-548X
4
For this answer the plethora of studies has been carried out by many authors and
researchers, Although the experience has been discussed by many authors, the
concept lacks a common understanding in various situations at the various
destinations and business setting. The disparity amongst academics has resulted in
a fuzzy understanding of the concept (Moscardo, 2009; Murray et al., 2010) and no
clear consensus of the conceptualization of what constitutes an experience has been
reached (Konu and Kampala, 2012). Experience is defined as a business approach
in which “memorable events” are attached to economic offerings to “engage the
consumer in a personal way”. Pine and Gilmore, 1999; Schmitt, 2008) has rightly
said “private events that occur in response to any stimulation". In this regard,
memorable events can be referred to as things created by businesses in anticipation
to stimulate or “engage consumer’s emotions” (Le Bel and Cooke, 2008). This act
depicts experience as a deliberate construct by businesses to increase the value of
their offerings (Pine and Gilmore, 1998). Li (as cited in Morgan et al. 2010) reviews
the various definitions of the tourist experience, which include a contrived and
created act of consumption, a response to problems with ordinary life, a search for
authenticity and a multifaceted leisure activity. The only thing Li found to be common
to all definitions is that the tourist experience is significant for the individual. Oh et al.
(2007, p. 129) contends that ‘the experience economy has been introduced to the
tourism literature at an introductory conceptual level’ and needs much more research
to understand the components and characteristics of tourist experiences (Larsen,
2007).
In the present scenario in tourism and hospitality, identifying the tourist experience
or factors or dimensions laid stress on service providers, Destination marketers and
Organization to design and create experiences for consumers in order to make their
experience memorable and get their intention to revisit again on a particular
destination. It has been argued that consumers’ interactions with destination service
provider’s results in the co-creation of distinctive experiences (Prahalad and
Ramaswamy, 2004). Before it used to happen like the service providers decide on
the offerings in the market, but this has changed to include consumers by identifying
their needs and desires in order to develop the products and services or offering,
according to meet with the satisfaction levels with them and build the unique brand or

Ramjit S.
Enlightening Tourism. A Pathmaking Journal, Vol 4, No 1 (2014), pp. 1-29 ISSN 2174-548X
5
identity among the others destination throughout the world. This suggests that some
experience offering are produced on the demands of the consumer. This approach is
also considered as the way in which destination organization and service providers
bring to light “new sources of competitive advantage” (Prahalad and Ramaswamy,
2004).
Visiting a particular tourist destination is typically motivating less by the elaborated
physical characteristics of the site than by the powerful mental and emotional image,
or “pre-experience” the tourist has for the expected experience of the destination.
Tourists flocked to the bridges of Madison County in rural Iowa to immerse, at least
temporarily, in the romantic fantasy involving the film’s two lovers more than to see
the actual details of the bridge. In essence, what tourists primarily seek and consume
at destinations is engaging experiences accompanied by the goods and/or service
components of the destinations. Hence, entire tourist destinations are beginning to
be positioned as “experiences” (Richards, 2001). Experience has served as a key
construct in travel and tourism research as well as destination positioning. Central to
McConnell’s (1989) tourist experience, for example is, the tourist’s quest for an
authentic experience; tourism destinations are viewed as a means to stage the
authenticity that cannot be found in the tourist’s daily life. Searching for self identity
as a tourist was an early classification criterion in the phenomenology of tourist
experiences (Cohen, 1979).
Several researchers have conducted studies on the relationship between tourism
planning, development, visitor satisfaction, host perception (Kintnuntaviwat, 2008)
psychology of tourist experience (Larsen, 2007). Tourism has been a crucial factor in
the economic development strategy of many countries (Lea, 1988) or destinations. It
has been recorded an important and consistent tourism growth industries worldwide,
and is currently known and emerged to be one of the major service industries
(Bansal and Eiselt, 2004; Zang et al., 2004). Destination management is one of the
major concerns of any country or any region or destination in any part of the world.
The nature of the destination, resources available, hosts, the visitor’s behavior and
experiences and management of tourism resources optimally is studied in this
subject area. Therefore, it is the responsibility of the concerned destination
management of development offices or potential authorities to have defined

Ramjit S.
Enlightening Tourism. A Pathmaking Journal, Vol 4, No 1 (2014), pp. 1-29 ISSN 2174-548X
6
approach for improving the sustainability of tourism destination will help the
management of tourist destinations and make the tourists experiences memorable
and enhance the satisfaction along with improving the brand image of the destination
in the competitive with other destinations. (Schiantez and Kavanagh, 2007; Manhas,
and Ramjit. 2011).
The development of a destination can be characterized by the phases it goes
through (Laws, 1995). It is having two phases pre tourism in a ‘pre-tourism phase’,
the destination is visited and experiences mainly for the purpose of visiting friends
and relatives, or for business. In the second phase the destination develop and the
local residents or community begin to study the tourists behavior and try to study the
requirements needs and desires like traditional dress codes, social relationships,
working patterns and styles of eating change, type of accommodation they required
to craft the tourists memorable experience particular destination. The ‘tourism
management phase’ comes out as a result of these changes. The destination’s
authorities try to anticipate the changing tastes of the tourists. Furthermore, local
government will have to face an increasing and changing resident population as
tourism managers and employees are attracted by new job opportunities. This arrival
of new residents leads to alterations in the original tourist-community relationship and
may cause frictions with the local job-seeking people. This overall change in the
nature of the destination may signify that it will attract different types of visitors at the
different development phases (Laws, 1995).
In 1977, Baud-Bovey and Lawson worked out a plan for tourism development
which they entitled Products Analysis Sequence for Outdoor Leisure Procedure
(Baud-Bovy and Lawson, 1998). Clarke and Godfrey (2000) also simplified the
management of tourism development. They used a three-step scheme to follow: first
has to be found out what tourism resources are present in the destination, than the
type of tourists they want to attract has to be selected and finally has to be decided
on how to reach the desired result (ibid). Similarly, Goeldner et al. (2000) divided the
process of tourism policy formulation in four phases: a definitional, an analysis, an
operational and an implementation phase. Here, the three-step scheme of Clarke
and Godfrey (2000) will be followed and, where needed, complemented by other
findings.

Ramjit S.
Enlightening Tourism. A Pathmaking Journal, Vol 4, No 1 (2014), pp. 1-29 ISSN 2174-548X
7
Sharpley (2002, p. 27) described the development as “the continuous and positive
change in the economic, social, political and cultural dimensions of the human
condition, guided by the principle of freedom of choice and limited by the capacity of
the environment to sustain such change”. This description highlights the fact that
when putting destination development into practice, one should acknowledge that
development is a multidimensional concept. Consequently, destination developers
should not only consider the economic factor of tourism, but also attempt to match it
with all other stakeholders.
Besides the beneficial effect on the economy, tourism has also the potential to be
utilised as a tool to reach development (Schlüter, 1998; Nagle, 1999). In order to
become a successful destination, decisions will have to be taken on how to develop
the destination’s infrastructure and the tourism facilities. In addition, investment and
staff recruitment and training will have to be decided about. Furthermore, promotion
has to be carried out creating an image that best suites the destination’s
characteristics and the type of visitors aspired (Laws, 1995). Baloglu and McCleary
(1999) found that the greater the variety of information sources used to advertise the
destination, the more positive is the contribution to the shaped image. The same
authors also point out that word-of-mouth recommendations are the primary source
in forming a tourism image; consequently, offering a satisfying experience to the
tourist is of great importance.
Due to the globalization and competition around the world, where destinations are
also becoming more and highly choice, the service providers and the destination
marketing offices are so keen to attract the tourists or visitors at their destinations
and participating in branding initiatives, such as the use of taglines and logos in order
to attract visitors and expenditures to their respective destinations (Pike and Ryan,
2004, Blain, Levy and Ritchie, 2005). As places seek to become distinctive,
destination personality is viewed as a viable metaphor for understanding tourists’
perceptions and experiences of destinations and for building a unique destination
identity (Caprara, Barbaranelli and Guido, 2001; Crask and Henry, 1990; Morgan,
Pritchard and Piggott, 2002, Triplett, 1994).
The destination brand image is defined as the consumer’s mental representation
of the offering (Dobni and Zinjkan, 1990) where symbolic meanings are associated

Ramjit S.
Enlightening Tourism. A Pathmaking Journal, Vol 4, No 1 (2014), pp. 1-29 ISSN 2174-548X
8
with the specific features of a product (Padgett and Allen, 1997) or destination. With
a clear and powerful brand image, destinations are able to position their products and
directly appeal to the needs of their customers (Aaker, 1991; Baloglu and Brindberg,
1997; Cai, 2002).
Destination Brands generally generate sets of quality expectations or images of
the destination that individuals usually desire prior to consumption (Metelka, 1981)
and positioned the destinations after the consumption by negatively or positively.
Several studies have also focused on the brand image attributes of destinations
(Embacher and Buttle, 1989; Echtner and Ritchie, 1993; Walmsley and Jenkins,
1993). The concept of brand image is defined based on the definitions of tourist
image and destination image and acknowledges that these terms can be used
interchangeably. The brand image is developed largely from marketing stimuli
provided by formal marketing communication tools and development for the particular
destination. The brand image is also influenced by informal promotional tools being
WOM (Berry and Parasuraman, 1991) and the consumers’ own experiences of the
destination which they had after paying the visit and consuming the different services
which are provided by the different service providers and stakeholders. (Berry and
Seltman, 2007). These numerous factors create mental pictures representing what
tourists observe and feel/experience about the destination.
The tourism policy makers or destination organization and service providers have
to be set up that “seeks to provide high-quality visitor experiences that are profitable
to destination stakeholders while ensuring that the destination is not compromised in
terms of its environmental, social, and cultural integrity” and development should be
carried out in order to make a memorable tourists experience and to get their
behavioural Intention to revisit at the particular destination ,Goeldner et al. (2000). it
is assumed that it will result in a positive image of a destination, loyalty to tourist
destinations and satisfaction felt by tourists, such as variables (Coban, 2012; Manhas
and Ramjit. 2013).
In the present study the following hypotheses are developed.
Hypothesis: There exists a significant difference among the perceptions of tourist
experience demographically. It can be further subdivided into the following.
H1: There is no significant difference in the tourist experience by gender.

Ramjit S.
Enlightening Tourism. A Pathmaking Journal, Vol 4, No 1 (2014), pp. 1-29 ISSN 2174-548X
9
H2: Tourists experience differs significantly by marital status.
H3: Tourists experience differs significantly by age.
H4: Tourists experience differs significantly by income.
3. RESEARCH METHODOLOGY
3.1) DESIGN OF THE STUDY
The aim of the present study is to identify and understand the tourist experience
construct, and how it differs by their age, sex, income level, education and to suggest
and recommend the actions to develop the Jammu and Kashmir as a tourist
destination and enhance its brand image. The current research used a descriptive
and explorative design to determine the levels of tourist experience and to investigate
relationships between some demographic variables, such as gender, age, income.
To test the hypotheses, the study used survey approach to collect data and to draw
the results and conclusions.
3.2) SAMPLE
Data was collected in the month of September 2013 with the help of the BBA,
hotel management students of School of Hospitality and Tourism Management,
University of Jammu. The data collection was carried out at hotels, guesthouses, tour
operators, airlines operators, travel agencies offices Railways stations. The total 350
questionnaires was distributed out of 305 was received in filled and due to
incomplete and missing values marked by the respondents, 14 were discarded
completely before coding and feeding into the SPSS data sheet. The tour operators
and others stakeholders were also contacted and taken the feedback about the
destination development other services they were providing to the visitors and taken
into consideration to compare the data analyzed. Questionnaires, as well as cover
letters to describe how the questionnaire should be answered, were distributed to all
participants.

Ramjit S.
Enlightening Tourism. A Pathmaking Journal, Vol 4, No 1 (2014), pp. 1-29 ISSN 2174-548X
10
3.3) MEASURES The study is done by collecting relevant information from primary and secondary
data sources, which include books, journals and reports published by government of
India, Government of Jammu. A Questionnaire has been designed by consulting the
previous literature with five point likert scale 1 very dissatisfied and 5 very satisfied
and distributed among the domestic and international tourists who visited to Jammu
region winter capital of the Jammu and Kashmir.
3.4) DATA ANALYSIS TOOLS USED
Data analysis is done by factor analysis, analysis of variance, and descriptive
statistics. The findings of the study can be implicated by the service providers and
tourism organization in order to enhance the memorable tourist experience and
encourage repeat visitors by developing the destination and its brand image among
the other destinations in India and all over the world too. ANOVA and independent t-
test was applied in order to test the hypothesis.
4. RESULTS & DISCUSSION
Factor analysis with the principle component method was applied to identify the
tourists or visitors experience constructs and investigate the relationship among the
different attributes which indicates the satisfaction of the tourists.
The first part of the study is demographic of the tourists who visited to the Jammu
and Kashmir. It was included gender, age, and marital status, average length of stay,
education level and average annual income. The tourists were selected on random
basis. The sex ratio was 53:44, 186 (53 %) were males and 44 (105 %) females. The
majority of the tourists were found married and travelling with their family members.
The Majority of people, 48.1% in the 20-35 years age group, followed by 36-50 years,
33.3%; 15.2% and 51years or above percentage was 18.6 %. The people who had
visited to Jammu and Kashmir had varied purposes like pilgrimage, business and to
experience the beauty and climate of Kashmir and ladakh region, temples and

Ramjit S.
Enlightening Tourism. A Pathmaking Journal, Vol 4, No 1 (2014), pp. 1-29 ISSN 2174-548X
11
shrines of the Jammu. These are the positive part of the Jammu and Kashmir as a
stunning destination in this world. But it is having the negative part too, like safety
and security concern of the tourists due to the infiltrations and militancy in the state,
especially in the Kashmir valley. The maximum tourist percentage i.e. 66 % comes to
Jammu and Kashmir by using the railways and 33 % flights and 11 % others modes
of transportation .Main destination within the India, where the tourists are coming
from like Punjab, Himachal Delhi, Bhopal. Patna, Lucknow, Dehradun, Jaipur, Indore
and other parts of the India. The education level of the tourist was high school and
below- 11.6 (34%), senior high school-55 respondents, 18.9 %, Graduate- 123
respondents (42.2 %), Master and Higher education- 89 (30.5%). The annual income
of the tourists were highest percentage, 150 (51.5%) - 2 to 5 Lakh and followed by 88
respondents (30.2%), 18.2 % for 6-10 Lakh and less than 90 thousands - 11% and at
the last 6% for 11 lakh and above. The tourist’s average length of stay was 4-8 days.

Ramjit S.
Enlightening Tourism. A Pathmaking Journal, Vol 4, No 1 (2014), pp. 1-29 ISSN 2174-548X
12
VARIABLES MEAN PERCENTAGE
Gender Male Female Total
186 105
291
63.9 36.1
100
Marital status Married Unmarried
197 94
67.7 32.3
Age 20-35 years 36-50 years 51 and above
140 97 54
48.1 33.3 18.6
Income 2-5 lakh 6-10 lakh 11 lakhs &above
150 88 53
51.5 30.2 18.2
Educational level High school and below-, Senior high school Graduate Master and Higher education-
34 55
123 79
11.6 18.9 42.2
27.14
Table 1: Characteristic of the Respondents
Initially 36 variables were identified based on secondary data and respondents
were asked to list their experiences on these variables and deleted one by one which
were not able to attain (.50 )variance or more than it, these values were sorted by
size and suppressed. Finally 32 variables were taken for the present study, the result
of the Principle Component analysis of all the variables are shown in the table 2. The
Principle component analysis was employed to extract the factor underlying the
relationship between a number of variables. The KMOs (Kaiser-Meyer-Olkin) value
was .936 which indicates that the adequacy and sufficiency of the data. However,
Comrey (1973) suggested that anything above 0.44 could be considered salient with
increased loading becoming more vital in determining the factor loading. The index

Ramjit S.
Enlightening Tourism. A Pathmaking Journal, Vol 4, No 1 (2014), pp. 1-29 ISSN 2174-548X
13
for present solution accounts for 74.957 % of the total variance for choosing the
destination. It is a pretty good extraction as it can be economize on the number of
factors (from 36 It has reduced to 5 Factors).
FACTOR ALPHA FACTOR LOADING
EIGEN VALUES
VARIANCE EXPLAINED
(%)
COMMUNALITIES
1. Transportation and service by the different carriers. 1. Connectivity 2.Airlines services 3. Behavior of the aviation staff. 4.Inflight services 5.Railways service 6.Train connectivity 7. Road connectivity 8. Services by railways staff 9. Local conveyance 10. Assistant by local transporters
.82
.970
.970
.970
.970
.892
.862
.859
.762
.760
.668
10.997
22.342
.822
.796
.932
.920
.823
.801
.856
.844
.843
.834 2. Services at the destination 1. Assistance by tourists’ reception department. 2. Tourist guide services 3. Services by local transporters. 4.Accommodation quality at the destination 5. Availability of the tourist information. 6. Local sightseeing. 7. Ease of communication 8.Medical facilities 9.Night life and entertainment services
.79
.891
.881
.883
.873
.878
.816
.811
.792
.698
7.849
19.934
.775
.655
.802
.774
.656
.573
.687
.674
.812
3.Hotels and restaurants 1.Rooms service facilities and service 2. Restaurant ambience 3.Professionalism of staff 4.Varieties and qualities of hotel accommodation 5.Choice and quality of food 6.Service delivery time
.76 .863 .829 .827
.825 .686 .645
3.685 14.087 .780 .711 .644
.788 .496 .462
4. Infrastructures at the destination 1. Maintenance and management of Destination infrastructure 2. Shopping markets and Bazaars 3. Attractions and sites 4. Infrastructure at the destinations
.71
.849
.802
.561
.526
2.549 11.373
.761
.752
.796
.439 5. Safety and security and crowd management 1.Safety and security of the visitors 2.Assistance by the local police 3.Crowd levels of visitors
.74
.896
.863
.799
1.904
7.221
.867
.832
.889 Total variance Explained 74.957
Extraction Method: Principle Component Analysis. Rotation Method: Varimax with Kaiser Normalization. A. Rotation Converged into 7 iterations.
Table 2: Factor Analysis

Ramjit S.
Enlightening Tourism. A Pathmaking Journal, Vol 4, No 1 (2014), pp. 1-29 ISSN 2174-548X
14
Factor 1: Transportation and Service by the different Carriers - The table
2 shows that factor 1 has high loading on Connectivity (.970), Airlines services (.970)
Behaviour of aviation staff (.970), In flight services (.970), Railway services(.892),
Train connectivity (.862), Road connectivity (.859), Service by railway catering staff
(.762), local conveyance(.760), assistance by local transporter(.668) explained the
22.34 % total variance, (Table 2).
Factor 2 : Services at the Destination- shows high loadings on Assistance
by tourists reception department (.891), Tourists guide services (.883), Services by
local transporters (.883), Accommodation quality at the destination (.878), Availability
of the tourists information (.878), Local sightseeing (.816), Ease of communication
(.811), Medical facilities (.712), Night life and entertainment services (.698) explained
the 19.93 % total variance (Table No 1).Offices, shopping markets and bazaars, local
conveyances and assistance by the local residents and it can be named as
destination services and information.
Factor 3: Hotels and restaurants: table 1 Shows high loadings on the
Rooms service facilities and service (.863), Restaurants ambience (.829),
Professionalism of staff (827), Varieties and qualities of hotel accommodation (.825),
Choice and quality of food (.686), Service delivery time (.645) and explained the
14.087 % total variance (Table 1).
Factor 4: Infrastructure at the destination- Table 1 shows the highest
loading Maintenance and management of Destination infrastructure (.943), Shopping
markets and Bazaars (.943), Attractions and sites (.896), Infrastructure at the
destinations (.883) explained the total 11.37% variance (Table 1).
Factor 5: Safety Security and Crowd Management: Table 1 Shows highest
loading on Safety and security of the visitors (.896), Assistance by the local police
(.863), Crowd levels of visitors (.799) and explained the 7.221 % Total variance
(Table 1).
The various factors on which tourists had given their priorities on the following
areas like 1. Safety and security, and local police or regulating body assistance
2.Improvents of infrastructures and supers structures 3. Availability of the information
about the Destination and Awareness programmes conducted by the tourism
departments 4.Cleanliness of the destination i.e. natural environment.5.effecient any
Ramjit S.
Enlightening Tourism. A Pathmaking Journal, Vol 4, No 1 (2014), pp. 1-29 ISSN 2174-548X
15
means of Transportation 5.skilled and professional competency based staff. The
tourists who are visiting to Jammu and Kashmir they have a little fear in mind due to
the insurgency and militancy in this area. Therefore, they had put on the first priority
to ensure the efficient safety and security measures so, that peace can build up
destination, which would be getting more and more tourist in every year and
development of the state can be seen in the future.
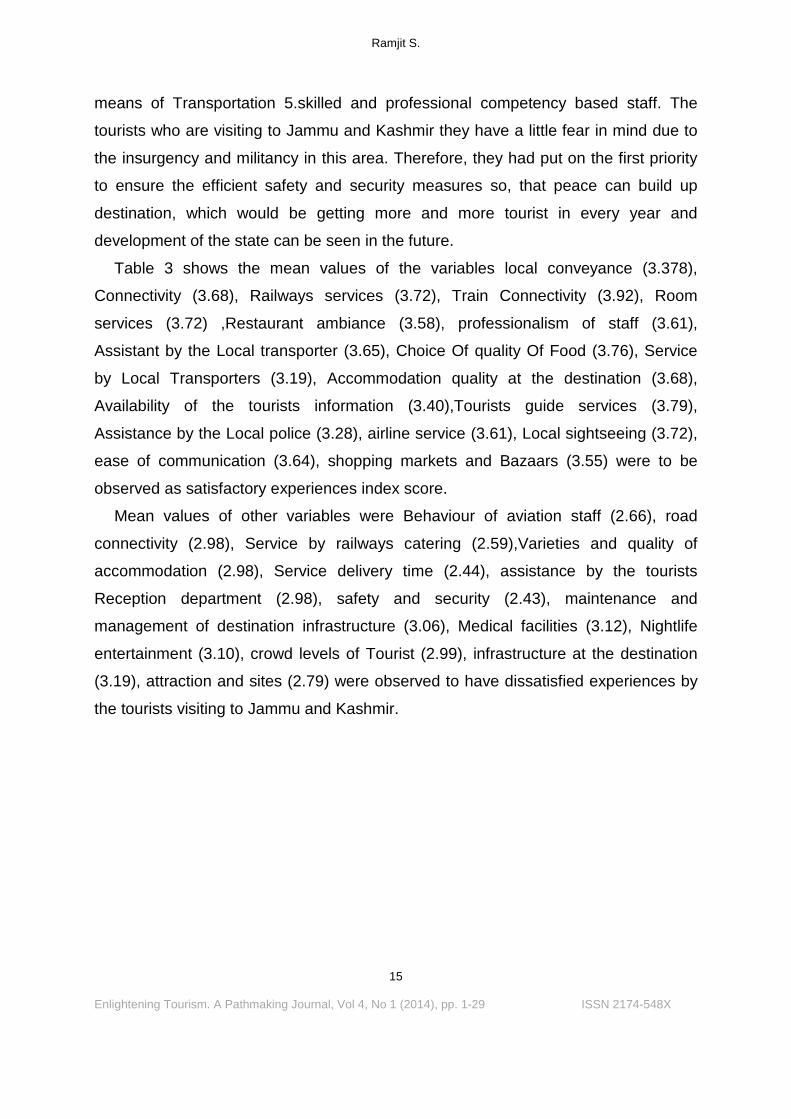
Table 3 shows the mean values of the variables local conveyance (3.378),
Connectivity (3.68), Railways services (3.72), Train Connectivity (3.92), Room
services (3.72) ,Restaurant ambiance (3.58), professionalism of staff (3.61),
Assistant by the Local transporter (3.65), Choice Of quality Of Food (3.76), Service
by Local Transporters (3.19), Accommodation quality at the destination (3.68),
Availability of the tourists information (3.40),Tourists guide services (3.79),
Assistance by the Local police (3.28), airline service (3.61), Local sightseeing (3.72),
ease of communication (3.64), shopping markets and Bazaars (3.55) were to be
observed as satisfactory experiences index score.
Mean values of other variables were Behaviour of aviation staff (2.66), road
connectivity (2.98), Service by railways catering (2.59),Varieties and quality of
accommodation (2.98), Service delivery time (2.44), assistance by the tourists
Reception department (2.98), safety and security (2.43), maintenance and
management of destination infrastructure (3.06), Medical facilities (3.12), Nightlife
entertainment (3.10), crowd levels of Tourist (2.99), infrastructure at the destination
(3.19), attraction and sites (2.79) were observed to have dissatisfied experiences by
the tourists visiting to Jammu and Kashmir.

Ramjit S.
Enlightening Tourism. A Pathmaking Journal, Vol 4, No 1 (2014), pp. 1-29 ISSN 2174-548X
16
TOURIST EXPERIENCE VARIABLES MEAN STD. DEVIATION
Local conveyance 3.3780 .87969 Connectivity 3.6804 .84543 Behavior of the aviation staff 2.6667 1.10277 Airline service 3.6117 .83278 In flight services 2.9828 1.15208 Railways services 3.7216 .96213 Train connectivity 3.9210 .88509 Rooms service facilities and service 3.7216 .96213 Restaurants ambience 3.5808 .87662 Professionalism of staff 3.6117 .83278 Road connectivity 2.9828 1.15208 Service by railways catering staff 2.9588 1.21130 The towns and cities.* 2.6667 1.07746 Assistant by local transporters 3.6529 .87483 Varieties and qualities of hotel accommodation 2.9828 1.15208 Choice and quality of food 3.7698 .78691 Service delivery time 2.4467 1.03378 Assistance by tourists reception department 2.9828 1.15208 Safety and security of the visitors 2.4399 1.14123 Services by local transporters 3.1959 .82595 Accommodation quality at the destination. 3.6804 .84543 Availability of the tourists information 3.4021 .86295 Maintenance and management of Destination infrastructure
3.0619 1.03205
Pollution free environment 2.9931 .77010 Attractions and sites 2.7973 .99488 Infrastructure at the destinations 3.1959 .82595 Tourists guide services 3.7904 .90632 Assistance by the local police 3.2852 .86169 Crowd levels of visitors 2.9931 .77010 Local sightseeing 3.7216 .91058 Ease of communication 3.6426 .96281 Medical facilities 3.1237 .99576 Night life and entertainment services 3.1037 .99579 Service by local tour operators 3.1237 .99576 Shopping markets and Bazaars 3.5533 .94308
* Variables, deleted after factor analysis, Scale 1 very dissatisfied to 5 very satisfied.
Table 3: Descriptive Statistics

Ramjit S.
Enlightening Tourism. A Pathmaking Journal, Vol 4, No 1 (2014), pp. 1-29 ISSN 2174-548X
17
4.1 ) HYPOTHESIS TESTING
In the present study the following hypotheses are developed.
There exists a significance difference among the perceptions of tourists experience
demographically. It can be further subdivided into the following:
H1:- There is significance difference in tourists experience by gender.
H2:- Tourists experience differs significantly by marital status.
H3: Tourists experience differs significantly by age.
H4: Tourists experience differs significantly by income.
Independent t- test was applied in order to determine the difference in the means
of male and female group.
FACTORS MALE FEMALE T-TEST
Transportation and services by different carriers 3.34 3.38 0.40 Services at the destination 3.41 3.39 0.67 Hotels and restaurants 3.36 3.33 0.55 Infrastructure at the destination 3.08 3.26 0.00** Safety and security and crowd management 2.95 2.82 0.08
Table 4: Independent T- test
FACTORS MALE FEMALE T-TEST Transportation and services by different carriers 3.31 3.37 0.24 Services at the destination 3.40 3.40 0.88 Hotels and restaurants 3.37 3.30 0.18 Infrastructure at the destination 3.12 3.19 0.31 Safety and security and crowd management 2.89 2.92 0.60 ** P <. 05
Table 5: Independent t- Test
Independent samples t tests were conducted to examine whether the tourist
experience (at the factor level) differs significantly by gender. Table above shows the
results of these tests. The results revealed that there were no significant differences
in the tourist experience regarding the four factors except one, i.e. Infrastructure at
the destination, which is consisting of the variables like "maintenance and
management of destination infrastructure, shopping markets and bazaars, attractions

Ramjit S.
Enlightening Tourism. A Pathmaking Journal, Vol 4, No 1 (2014), pp. 1-29 ISSN 2174-548X
18
and sights, infrastructure at the destinations" Hence, gender did not significantly
influence the tourist’s experience, and by this H1 is rejected. It leaves the
Implications for the destination marketers and government development agencies
like Jammu and Kashmir development corporations and Ministry of Tourism in India
to concentrate on this particular factor in order to accommodate the large traffic of the
tourist visiting to the Jammu and Kashmir.
In order to prove the H2: there is significance difference among the tourists by
their marital status. The independent t test was applied and table 4 shows the results
of these tests. The results have given the idea that there was no significance
difference among the tourists experience regarding their marital status, So, H2 is
rejected.
One way ANOVA’s were conducted to Refer table no 5 and 6 Anova was applied
with post hoc analysis in order to check the H3: tourists experience differ significantly
by age. Post hoc tests were carried out to determine which age groups differed
significantly from each regarding these tourists experience factors. All the t values
P>0.05 referred that the tourists experience not differed significantly by any age
group. Hence this particular hypothesis is rejected.
Similarly H4 was rejected, all t (significant) values P>0.05 refer table no 6 that
means no significance difference found on each factor regarding each group of
incomes. So, in short we can conclude that all the hypotheses in the present study
were stand rejected and concluded that the tourists experiences did not differ tourist
demographically.

Ramjit S.
Enlightening Tourism. A Pathmaking Journal, Vol 4, No 1 (2014), pp. 1-29 ISSN 2174-548X
19
Table 6: One way Anova, Tukey HSD multiple comparison by age (Post Hoc Analysis)
Dependent Variable (I) age (J) age Mean
Difference (I-J)
Std. Error
Sig. ( t )
95% Confidence
Interval
Lower Bound
Upper Bound
Upper Bound
Lower Bound
Transportation and services by different carriers 20-35 36-50 -0.02 0.05 0.91 -0.14 0.103
51 years and
above -0.13 0.06 0.08 -0.28 0.01
36-50 20-35 0.020 0.05 0.91 -0.10 0.14
51 years and
above -0.11 0.06 0.21 -0.27 0.04
51 years and
above 20-35 0.13 0.06 0.08 -0.01 0.28
36-50 0.11 0.06 0.21 -0.04 0.27 Services at the destination 20-35 36-50 -0.019 0.04 0.90 -0.13 0.09
51 years and
above -0.02 0.05 0.89 -0.16 0.10
36-50 20-35 0.01 0.04 0.90 -0.09 0.13
51 years and
above -0.00 0.06 0.99 -0.14 0.13
51 years and
above 20-35 0.02 0.05 0.89 -0.10 0.16
36-50 0.00 0.06 0.99 -0.13 0.14 Hotels and restaurants 20-35 36-50 0.00 0.05 0.99 -0.13 0.14
51 years and
above 0.016 0.07 0.97 -0.15 0.18
36-50 20-35 -0.00 0.05 0.99 -0.14 0.13
51 years and
above 0.01 0.07 0.98 -0.16 0.19
51 years and
above 20-35 -0.01 0.07 0.97 -0.18 0.15
36-50 -0.01 0.07 0.98 -0.19 0.16 Infrastructure at the destination 20-35 36-50 -0.13 0.07 0.15 -0.30 0.03
51 years and
above 0.000 0.08 0.99 -0.20 0.20
36-50 20-35 0.13 0.07 0.15 -0.03 0.30
51 years and
above 0.13 0.09 0.31 -0.08 0.35
51 years and
above 20-35 -0.00 0.08 0.99 -0.20 0.20
36-50 -0.13 0.09 0.31 -0.35 0.08
Safety and security and crowd management 20-35 36-50 -0.02 0.08 0.96 -0.21 0.16
51 years and
above -0.07 0.09 0.74 -0.30 0.15
36-50 20-35 0.02 0.08 0.96 -0.16 0.21
51 years and
above -0.04 0.10 0.88 -0.29 0.197
51 years and
above 20-35 0.07 0.09 0.74 -0.15 0.30
36-50 0.04 0.10 0.88 -0.19 0.29

Ramjit S.
Enlightening Tourism. A Pathmaking Journal, Vol 4, No 1 (2014), pp. 1-29 ISSN 2174-548X
20
Dependent Variable (I) income (J) income Mean
Difference (I-J)
Std. Error Sig.
95% Confidence
Interval
Lower Bound
Upper Bound ( t ) Upper
Bound Lower Bound
Transportation and services by different carriers
2-5 lakh 6-10 lakh -0.038 0.05 0.76 -0.16 0.08
11 lakh and above -0.09 0.06 0.29 -0.24 0.05
6-10 lakh 2-5 lakh 0.03 0.05 0.76 -0.08 0.16
11 lakh and above -0.05 0.06 0.68 -0.22 0.1
11 lakh and above 2-5 lakh 0.09 0.06 0.29 -0.05 0.24
6-10 lakh 0.05 0.06 0.68 -0.1 0.22 Services at the destination 2-5 lakh 6-10 lakh 0.06 0.04 0.34 -0.04 0.17
11 lakh and above 0.02 0.05 0.93 -0.11 0.15
6-10 lakh 2-5 lakh -0.06 0.04 0.34 -0.17 0.045
11 lakh and above -0.04 0.06 0.73 -0.19 0.09
11 lakh and above 2-5 lakh -0.02 0.05 0.93 -0.15 0.11
6-10 lakh 0.04 0.06 0.73 -0.09 0.19 Hotels and restaurants 2-5 lakh 6-10 lakh -0.06 0.06 0.56 -0.2 0.08
11 lakh and above -0.05 0.07 0.7 -0.22 0.11
6-10 lakh 2-5 lakh 0.06 0.06 0.56 -0.08 0.2
11 lakh and above 0 0.07 0.99 -0.18 0.18
11 lakh and above 2-5 lakh 0.05 0.07 0.7 -0.11 0.22
6-10 lakh 0 0.07 0.99 -0.18 0.18 Infrastructure at the destination
2-5 lakh 6-10 lakh 0.05 0.07 0.7 -0.11 0.23
11 lakh and above 0.1 0.08 0.42 -0.09 0.31
6-10 lakh 2-5 lakh -0.05 0.07 0.7 -0.23 0.11
11 lakh and above 0.05 0.09 0.85 -0.17 0.27
11 lakh and
above 2-5 lakh -0.1 0.08 0.42 -0.31 0.09
6-10 lakh -0.05 0.09 0.85 -0.27 0.17 Safety and security and crowd management 2-5 lakh 6-10 lakh 0 0.08 0.99 -0.19 0.18
11 lakh and above 0.08 0.09 0.66 -0.14 0.31
6-10 lakh 2-5 lakh 0 0.08 0.99 -0.18 0.19
11 lakh and above 0.08 0.1 0.68 -0.16 0.33
11 lakh and above 2-5 lakh -0.08 0.09 0.66 -0.31 0.14
6-10 lakh -0.08 0.1 0.68 -0.33 0.16
Table 7: ANOVA, Tukey HSD multiple comparisons by Income Group

Ramjit S.
Enlightening Tourism. A Pathmaking Journal, Vol 4, No 1 (2014), pp. 1-29 ISSN 2174-548X
21
4. SUMMARY, CONCLUSION AND RECOMMENDATIONS
The purpose of the present study was to identify the underlying factors of the
tourist experience. The present study was conducted in the three provinces of
Jammu and Kashmir. The three provinces consisted of Jammu, Kashmir and Ladakh.
The investigation itself was carried out at hotels, guesthouses, tour operators,
airlines, operators, travel agencies offices Railways stations.
This study discussed the various experiences of the tourist or visitors on the thirty
six and finally on thirty two variables or attributes like connectivity, local conveyance,
Railway services, restaurant and ambience, assistance from local police, assisted by
the tour guide, assisted by local transporters and local residents and so on, who
visited Jammu and Kashmir. The data have been collected on a random basis from
the visitors from the three regions of the state. The data analyzed by applying the
various research tools like factor analysis, descriptive analysis on SPSS 17.0
version. The study found five factors ''Transportation and Service by the different
Carriers', 'Services at the Destination', 'Hotels and restaurants', 'Infrastructure at the
destination' and Safety Security and Crowd Management''.
It has given an idea that factors ''Transportation and Service by the different
Carriers', 'Services at the Destination', the most important for the improvement,
development and building up of an image of the destination. The findings of the study
suggested that the variables like airline service, Road connectivity, service by railway
catering, service delivery time, assisted by tourist reception department, maintenance
and management of destination infrastructure crowd levels, Infrastructures, Crowd
management safety and security, professionalism of staff at hotels, were having low
mean value ranges. This implied that the tourists were not having a satisfactory
experience on these parameters. There was an urgent need to upgrade the services
in these areas in order to make the experiences of the tourists memorable. It was
found out that if the destination management organizations and other stakeholders
upgraded their services on these parameters, it would really help to improve and
build up the brand image of the Jammu and Kashmir (Manhas, P. S. & Ramjit. 2011).

Ramjit S.
Enlightening Tourism. A Pathmaking Journal, Vol 4, No 1 (2014), pp. 1-29 ISSN 2174-548X
22
Developing and Improvement of infrastructure, tourist safety and crowd
management are a very serious concern now these days. Many countries have
warned their tourist about insecurity in India and have issued travel advisories. The
respondents were also of the opinion that the existing facilities are insufficient to
meet the growing demands. Tourist are really concerned about the safety and
security like militant attacks, crimes, looting, fraudulence etc., Crowd management
therefore there must be efficient safety and security arrangements taken in order to
make Jammu and Kashmir a peaceful and calm destination. There must be
sufficiently designed and constructed infrastructure at destinations like shopping
mart, accommodation quality, restaurants Ambience. As these are the areas which
the tourists felt that it was inadequately managed. The following are the suggestions
and recommendations for developing the Jammu and Kashmir as a destination
Brand not within in India but also outside the India.
• Destination Management Organizations must include the development of all
tourist attractions, major access points, internal transportation networks,
specific resort and other tourism sites, types of urban tourism development
needed, regional tour patterns and traffic patterns.
• Planning in a province should involve improvements of hotels and other types
of accommodation; commercial, cultural, and sometimes national and
international conferences.
• There must be awareness programmes organized for the local community,
accenting the benefits and opportunities of tourism, if they are able to provide
a clean and safe stay to the tourist.
• There is a dire need to improve the proper and sufficient infrastructure at the
destinations.
• The tourism websites must provide the exact and up to date information
about the attractions or destination.
• Safety and security of the tourists must be ensured.
• Any tourism development programme will be successful only when the
involvement of local communities is ensured.

Ramjit S.
Enlightening Tourism. A Pathmaking Journal, Vol 4, No 1 (2014), pp. 1-29 ISSN 2174-548X
23
• All the DMOs (Destination Management Organisations) and NTOs (National
and Tourist Organisations) should work in coordination with each other and
actively participate in promotional activities.
• Training programmes or refresher courses must be organised at regular
intervals to impart the knowledge of tourism among the general public, staff or
employees of hotel and travel agencies and the entrepreneurs /businessman.
• Subsidies and tax escapism may be provided to the entrepreneurs who are
investing in the tourism industry.
Future research should seek to determine whether tourists experience vary
between tourists who travel themselves and those who travel as couples or with large
families. Other potential ante-cedents that can be investigated include occupation
type, personality, and values.
References
Aaker, D. Managing Brand Equity: Capitalizing on the Value of a Brand Name. New
York: Free Press, 1991.
Baloglu, S. and Brindberg, D. Affective images of tourism destinations. Journal of
Travel Research. N° 35 (4), 1997, pp. 11-15.
Bansal, H. and Eiselt, H.A., Exploratory research of tourist motivations and planning.
Tourism Management N° 25, 2004, pp. 387-396.
Baud-Bovy, M. and Lawson, F. Tourism and recreation handbook of planning and
design. Oxford: Architectural Press, 1988.
Berry, L.L. and Parasuraman, A. (1991). Marketing Services: Competing Through
Quality. New York: Free Press
Berry, L.L. and Seltman, K.D. Building a strong services brand: lessons from Mayo
Clinic. Business Horizons. 50, 2007, pp. 199-209, ISSN: 0007-6813.

Ramjit S.
Enlightening Tourism. A Pathmaking Journal, Vol 4, No 1 (2014), pp. 1-29 ISSN 2174-548X
24
Blain, C., Levy, S.E. and Brent Ritchie, J.R.. Destination Branding: Insights and
Practices from Destination Management Organizations. Journal of Travel Research,
43 (4), 2005, pp. 328-338, ISSN. 0047-2875
Bodlender, J., Jefferson, A., Jenkins, C. and Lickorish, L., (1991). “Developing
tourism destinations: policies and perspectives”. Essex: Longman.
Buhalis, D. Marketing the competitive destination of the future. Tourism
management, 21 (1), 2000, 97-116
Caprara, G.V., Barbaranelli, C. and Guido, G.. Brand Personality: How to Make the
Metaphor Fit? Journal of Economic Psychology, N° 22, 2001, pp. 377-395.
Carù, A. and Cova, B. Revisiting consumption experience: a more humble but
complete view of the concept. Marketing Theory Articles, Vol.3 (2), 2003, pp. 267-
286.
Clarke, J. and Godfrey, K. The tourism development handbook: a practical approach
to planning and marketing. London: Cassell, 2000.
Coban, S. The Effects of the Image of Destination on Tourist Satisfaction and
Loyalty: The Case of Cappadocia. European Journal of Social Science, Vol. 29 (2),
2012, pp. 222-232.
Comrey, A.L. A first course in Factor analysis .San Diego: Academic Press, 1973.
Crask, M.R. and Henry, A.L. A Positioning- Based Decision Model for Selecting
Advertising Messages. Journal of Advertising Research, Vol. 30 (4), 1990, pp. 32-38.

Ramjit S.
Enlightening Tourism. A Pathmaking Journal, Vol 4, No 1 (2014), pp. 1-29 ISSN 2174-548X
25
Dobni, D. and Zinjkan, G.M. In search of brand image: a foundation analysis. In
Goldberg M.E. and Pollay R.W. (Eds.) Advances in Consumer Research. Association
for Consumer Research (pp. 110-119). UT: Provo, 1990.
Echtner C.M. and Ritchie, B. The measurement of destination image: an empirical
assessment, Journal of Travel Research, Vol. 31 (3), 1993, pp. 3-13.
Embacher, J. and Buttle, F. A repertory grid analysis of Austria’s image as a summer
vacation destination, Journal of Travel Research, N° 28, 1989, pp. 3-7.
Goeldner, C.R., Mcintosh, R.W., and RitchieI, J.R.B. Tourism: principles, practices,
philosophies. 8th ed. Toronto: John Wiley & Sons, Inc., 2000.
Hirschman, E.C. and Holbrook, M.B. Hedonic consumption: emerging concepts,
methods and preposition. Journal of Marketing, Vol. 46, 1982, pp. 92-101.
Holbrook, M.B. The millennial consumer in the texts of our times: Experience and
entertainment. Journal of Micromarketing, Vol. 20. (2), 2000, pp.178-192.
Konu, H. and Komppula, R. (2012). Do Wellbeing Tourists Expect Memorable
Experiences? The World Conference for Graduate Research in Tourism, Hospitality
and Leisure, pp. 462-474.
Kozak, M. and Decrop, A. (Eds.) Handbook of Tourist Behavior. New York:
Routledge, 2009, pp. 99-115.
Larsen, S. Aspects of a psychology of the Tourist Experience. Scandinavian Journal
of Hospitality and Tourism, Vol. 7 (1), 2007, pp. 7-18.
Lawse, E. Tourist destination management: issues, analysis and policies. London:
Routledge, 1995.

Ramjit S.
Enlightening Tourism. A Pathmaking Journal, Vol 4, No 1 (2014), pp. 1-29 ISSN 2174-548X
26
Lea, J, Tourism and development in the third world. London: Routledge, 1988.
Le Bel, J.L. and Cooke, N. Branded food spokes characters: consumer’s contribution
to narratives of commerce. Journal of Product & Brand Management, Vol.17 (3),
2008, pp.143-153.
Lynch, P. and Tinsley, R. Small tourism business networks and destination
development. International Journal of Hospitality Management, 20, 2001, 367-378.
McConnell, D. The Tourist: A New Theory of the Leisure Class. New York: Schocken
Books, 1989.
Manhas, P.S. and Ramjit. Accessing the tourist experience and its relationship with
destination development. Proceedings of International Conference on Business and
Marketing Management, IEEE, Shanghai, China, March 11–13, 2011, pp. 404 – 408,
ISBN: 978-1-4244-9543-6.
Manhas, P.S. & Ramjit. Customer Experience and Its Relative Influence on
Satisfaction and Behavioural Intention in Hospitality and Tourism Industry. South
Asian Journal for Tourism & Heritage, Vol. 6 (1), January, 2013, pp. 53 - 68. ISSN:
0974-5432.
Metelka, C.J. The Dictionary of Tourism, Merton House, Wheaton, IL, 1981.
Metelka, C.J. The dictionary of hospitality, travel and tourism 3rd ed. New York:
Delmar Publishers Inc., 1990.
Mill, C.R. and Morrison, A.M. The tourism system: an introductory text. London:
Prentice Hall, 1985.

Ramjit S.
Enlightening Tourism. A Pathmaking Journal, Vol 4, No 1 (2014), pp. 1-29 ISSN 2174-548X
27
Morgan, N., and A. Pritchard. Contextualizing Destination Branding. In Destination
Branding - Creating the Unique Destination Proposition, edited by N Morgan, A.
Pritchard, and R. Pride. Oxford: Butterworth-Heinemann, 2002, pp. 11-41.
Morgan, M., Lugosi, P. and Ritchie, J.B.R. The Tourism and Leisure Experience:
Consumer and Managerial Perspective'. Channel View, Bristol, 2010.
Moscardo, G. Understanding tourist experience through mindfulness theory. In
Kozak, M. and Decrop, A. (Eds.) Handbook of Tourist Behavior. New York:
Routledge, 2009, pp. 99-115.
Murray, N., Foley, A. and Lynch, P. Understanding the Tourist Experience:
Concept, 2010. Internet source:
http://repository.wit.ie/1543/1/F%C3%81ILTE_GO_SL%C3%81INTE_UNDERSTAN
DING_THE_TOURIST_EXPERIENCE_CONCEPT.pdf (accessed from 16.5.2014)
Nargundkar, R. Marketing Research: Text and Cases, Tata McGraw Hill, New Delhi,
2002.
Oh, H., Fiore, A.M. and Jeong, M. Measuring Experience Economy Concepts:
Tourism Applications. Journal of Travel Research 46, 2007, pp. 119-132.
Pike, S. and Ryan C. Destination Positioning Analysis Through a Comparison of
Cognitive, Affective, and Conative Perceptions. Journal of Travel Research, N° 42
(May), 2004, pp. 333-342.
Pine II, B.J. and Gilmore, J.H. Welcome to the experience economy. Harvard
Business Review, July-August 1998, pp. 97-105.
Pine, B.J., & Gilmore, J.H. The experience economy. Boston: Harvard Business
Review, 1999.

Ramjit S.
Enlightening Tourism. A Pathmaking Journal, Vol 4, No 1 (2014), pp. 1-29 ISSN 2174-548X
28
Prahalad C.K. and Ramaswany V. Co-creation experiences: The next practice in
value creation. Journal of Interactive Marketing, Vol. 18 (3), 2004, pp. 5-14.
Richards, G. The Experience Industry and the Creation of Attractions. In Cultural
Attractions and European Tourism, edited by G. Richards. Oxfordshire, UK, 2001,
CABI Publishing, pp. 55–69.
Sharpley, R. (2002). Snow business: a study of the international ski industry - Simon
Hudson; Cassell, London, 2000.
The World Economic Forum. Tourism Competitiveness Report, 2013, retrieved from
http://www.weforum.org/issues/travel-and-tourism-competitiveness on 28.8.2013.
Triplett, T. Brand Personality Must Be Managed or It Will Assume a Life of Its Own.
Marketing News, Vol. 28 (10), 1994, p. 9.
Virut, K., John, C.S. Tang Residents’ Attitudes, Perception and Support for
Sustainable Tourism Development. Tourism and Hospitality Planning &
Development, Vol. 5 (1), 2008, pp. 45–60.
Walmsley, D.J. and Jenkins, J.M. Tourism cognitive mapping of unfamiliar
environments, Annals of Tourism Research. N° 19, 1993, pp. 268-286.
Wanhill, S. Issues in public sector involvement. In: Faulkner, B., Laws, E. and
Moscardo, G. (Eds.). Tourism in the twenty-first century: lessons from experience.
London: Continuum, 2001, pp. 222-242.
Zhang, H. Q., Qu, H., & Tang, V.M.Y. A case study of Hong Kong residents’ leisure
travel. Tourism Management, N° 25, 2004, pp. 267-373.

Ramjit S.
Enlightening Tourism. A Pathmaking Journal, Vol 4, No 1 (2014), pp. 1-29 ISSN 2174-548X
29
Article info: Received 18/04/14. Accepted 02/06/14. Refereed anonymously.

S. Hajdinjak
30 Enlightening Tourism. A Pathmaking Journal, Vol 4, No 1 (2014), pp. 30-51 ISSN 2174-548X
IMPACT OF TOURISM ON ECONOMIC GROWTH IN
CROATIA
Sanja Hajdinjak
Central European University (Hungary)
ABSTRACT
Although impact of tourism on the economy has been researched in the literature, the results of studies deliver varying conclusions leaving the field open to further studies. While the literature has so far dealt with cases of large tourism sectors, there has been no research on cases of dominant tourism sector in transitional post-socialist economies. Tourism certainly plays an important role in the Croatian economy, but so far research tested the impact it actually has on economic growth. This paper attempts to fill this gap by testing what is the long-term impact of tourism on growth of GDP. The author tests whether tourism enables increase in level of productive factors and indirectly ensures long-term development (TKIG hypothesis), or it contributes by delivering short-term profits. The results of the paper imply that TKIG hypothesis is confirmed in the case of Croatia. Tourism receipts can enable increase in capital goods imports and there is a mechanism through which increase in tourism specific productive factors leads to economic growth. However, the organization of the tourism sector, as well as political elite’s attitudes towards tourism have an important effect on determining impact tourism has on the economy.
KEY WORDS
VAR model; tourism sector; capital goods; imports; economic growth; Croatia.
ECONLIT KEYS C32; H54; L83; O11.

31 Enlightening Tourism. A Pathmaking Journal, Vol. 4 No 1 (2014), pp. 30-51 ISSN 2174-548X
1. INTRODUCTION
Importance of tourism exports for the growth of the economy has recently started
to gain momentum. While the current body of literature provides quite extensive
research of the relationship between tourism and growth, the debate is still largely
opened. Moreover, the literature has so far not focused on the cases of post-socialist
countries where tourism has a large contribution to GDP and exports structure.
This paper focuses on the case of Croatia where tourism is one of the most
important sectors, but so far, there has been no research aimed at testing the
relationship between tourism and economic growth. Moreover, it is a case of
transitional post-socialist economy in which tourism was initially part of planned,
rather than market economy. The paper contributes to the existing literature by
focusing on this relationship in a tourism dependant, service sector focused economy
which has so far pursued a ‘middle way’ between mass, low-income and diversified,
high-income, elite type of tourism. Croatia is also an interesting case because it is a
relatively small country which can be dependent on coastal tourism and yet it is much
different from small island tourism countries which have little option than to rely on
tourism for their development (Brown, 1998).
Methodologically, the paper tests for Granger causality between tourism exports,
capital goods imports and economic growth in the case of Croatia. Due to nature of
the statistical data the paper explores the hypothesized relationships through a
Vector Autoregression model. Statistical analysis shows that that there is a positive
relationship between tourism receipts and imports of capital goods, which further
translates into economic growth. However, lack of relationship between economic
growth and goods for further production tentatively implies that revenues fail to be
invested properly into other sectors of the economy. The findings seems to confirm
earlier research according to which tourism development without monopoly over
production of tourism good does not provide a clear channel for growth (Nowak et al.,
2007).
Paper is organized as follows. Second section reviews the existing literature on
the relationship between tourism exports and growth and highlights the niche this
paper is planning to research. In the third section I provide background on Croatian

32 Enlightening Tourism. A Pathmaking Journal, Vol. 4 No 1 (2014), pp. 30-51 ISSN 2174-548X
economic development, on the role tourism plays in Croatian economy and on the
type of transition tourism and the overall economy went through in last three
decades. In the fourth section I introduce the method of analysis, data and the results
of the Vector Autoregression model and Granger causality. Fifth section discusses
the results of the statistical analysis in the Croatian context. Sixth section discusses
the results, provides some concluding remarks and suggests possibilities for future
research.
2. LITERATURE REVIEW
After Shan and Wilson initially proposed the so-called tourism led growth
hypothesis (TLGH) (Shan and Wilson, 2001), it has been tested on a wide sample of
countries and regions. Several regions such as the Mediterranean (Dritsakis, 2004;
Katircioglu, 2009) and Asia-Pacific (Chen and Chiou-Wei, 2009; Khalil et al., 2007;
Kim et al., 2006; Lee and Chang, 2008) have been widely researched through single
case study analyses, and most of the results imply either that tourism-led growth or
growth-led tourism development occurs. Proenca and Soukiazis brought some
evidence that tourism in certain South European countries from 1990-2004 was
conducive to income convergence (Proenca and Soukiazis, 2008). Fayissa et al. on
the sample of 17 Latin American countries show that profits from the tourism industry
and investments in physical and human capital have a positive contribution to GDP
and economic growth (Fayissa et al., 2009). The authors draw the same conclusion
on the case of 47 African countries (Fayissa et al., 2007).
However, some papers have also argued that effects of tourism might not be
unambiguously positive for the growth. Studies of Copeland and Chao et al. have
been first to introduce the theoretical possibility of negative impact tourism might
have on growth. Both show through mathematical simulations and models that
tourism can lead to immiserizing growth (Chao et al., 2006; Copeland, 1991). Their
research efforts were supported through work on impact tourism has on welfare,
either through national and sub-regional case studies, or through theoretical models
(Hazari and Nowak, 2003; Hazari et al., 2003; Nowak et al., 2003, 2005).
Holzner’s paper tested the existence of “beach disease” on a sample including 134
countries and argued that countries with higher income from tourism have both

33 Enlightening Tourism. A Pathmaking Journal, Vol. 4 No 1 (2014), pp. 30-51 ISSN 2174-548X
higher levels of investment and secondary school enrolment which are explained by
increased demand for transport infrastructure and foreign languages acquisition
(Holzner, 2010). The author’s analysis shows that countries dependant on tourism
are rather outward oriented with low levels of real exchange rate distortion. Countries
that have high income from tourism also have high revenues from taxes on goods
and services and moreover, opposite to the conclusions of Copeland and Chao,
tourism does not seem to lead to a contraction of the manufacturing sector. Cross-
country growth regressions on income level sub-samples also show that tourism
specialization had a significant impact only in countries with above average income
per capita levels. This finding is comparable to additional panel data studies which
also show that investments in tourism tend to be more profitable in countries with
higher levels of physical capital. However, the author adds a warning that his results
are short-to-medium term based and that in the long run, Copeland’s model of
negative impact tourism has on the growth could be correct.
Arguably different is the study of Capo et al. on the case of the sub-national
Balearics and the Canary Islands, whose economies are heavily orientated towards
tourism (Capo et al., 2007). The authors argue that both show signs of Dutch tourism
disease and that, as a result, their economic growth is compromised in the coming
years. The tourist boom that took place in the early 1960s led to a considerable
increase in wealth, thanks to the new recreational use that was found for the islands’
natural coastal resources. Tourism and non-tradable commodities (services and
construction) received greater investments, while agriculture and especially industry
received only marginal attention. Even though the incomes of the population have
risen considerably as a result of this shift in production, long-term sustainability of
these growth rates has been shown to be illusory. The paper singles out depletion of
natural resources and lowering profits due to low levels of education and training,
innovation and technological progress.
The relationship between tourism and development was also tested on the case of
small tourism countries (STC) where the general conclusion was that tourism
specialization is correlated with faster growth. One of the most important studies in
this group is written by Brau et al. on growth of tourism micro-states with less than 1
million inhabitants. The authors show that tourism is a viable option for less
developed countries in which development through industrialization is not easy due

34 Enlightening Tourism. A Pathmaking Journal, Vol. 4 No 1 (2014), pp. 30-51 ISSN 2174-548X
to the existence of persistent gaps in technology levels. They document that small
tourism countries grow faster specifically due to tourism specialization than oil,
OECD, less developed countries (LCD) and other small countries do. However, they
do suggest that two mechanisms can explain these results –first, terms of trade effect
which enables sustainable fast growth in the long run and second, environment
exploitation where STCs obtain fast growth for a period by accelerating the
exploitation of the environment to which tourists are attracted (Brau et al., 2007). It
should be noted that even the long-run growth scenario can be pessimistic if the
dynamics of sectoral productivities are in favour of high-tech industries, as suggested
by much of the endogenous growth literature.
Directly opposing Brau et al. (Brau et al., 2007) positive findings on STC is the
research undertaken by Figini and Vici. They show that previous studies have been
plagued by methodological misspecifications and have not fully encompassed long
term effects of tourism specialization. Finally, their study argues that there was not
any significant causal relationship between tourism specialisation and economic
growth in micro-size tourism countries (Figini and Vici, 2010).
Literature identifies two main channels through which tourism can help in
delivering economic growth. First channel is through the so called tourism exports led
growth hypothesis which assumes that tourism leads to increase in total factor
productivity and through spill-over effect acts as technological improvement. The
second channel which has been termed tourism exports – capital goods imports –
growth hypothesis (TKIG) has until recently been neglected. In this framework,
tourism revenues ensure foreign currency needed for further finance of capital
imports. Even if tourism does not lead to technological progress, it promotes capital
accumulation through expansion of the volume of imports. Tourism-capital goods
imports-growth hypothesis (TKIG) has been originally tested on the case studies of
Spain (Nowak et al., 2007) and Tunisia (Cortes-Jimenez et al., 2011). Cortes-
Jimenez confirms that tourism, through providing finance for capital goods, has had a
positive impact on the economic growth in Spain. Tunisian case is to an extent even
more interesting since the authors argue that tourism does seem to finance imports
of capital and intermediary good, but that transmission effect from capital imports to
growth applies only in the short run. They argue that in the long-run, although tourism

35 Enlightening Tourism. A Pathmaking Journal, Vol. 4 No 1 (2014), pp. 30-51 ISSN 2174-548X
contributes significantly to Tunisian economy, the role of tourism has not been
instrumental in supporting growth and development.
While the relationship between tourism exports and growth has been extensively
researched, the literature review show unclear findings as to in which situation is the
impact positive or negative in the long run. There has been no research on a case
study which is characterised by the middle way between mass “sun, sea and sand”
and diversified high income type of tourism. In addition, based on the literature review
I argue that Croatia represents an interesting case study for re-testing the
relationships between tourism exports due to its relative dependence on tourism
sector. Next section outlines the role of tourism in Croatian economy and classifies
the type of tourism pursued.
3. THE ROLE OF TOURISM IN THE CROATIAN ECONOMY
Development of Croatian economy has been strongly impacted by recent war for
independence which resulted in secession from Socialist Federative Republic of
Yugoslavia and transition from socialist self-management to capitalism. Much of the
economic activity in Croatia still reflects impacts of socialism, tourism not being an
exception. After Croatia became independent large branches of industrial sector
collapsed due to the lack of profitability and mismanaged privatization. Service sector
became increasingly important, especially real estate, financial and insurance
activities, as well as trade and tourism related services(Croatian Bureau of Statistics,
2012). For Croatia, one of the most important foreign policies was opening up and re-
joining the Europe, especially through membership in the European Union. In this
sense, the role of tourism was important in turning Croatia towards service dominated
economy as opposed to socialist orientation towards large and mostly unprofitable
industries (Poljanec-Borić, 2010).
Tourism had a significant and strategic role even while Croatia was part of
Yugoslavia. During the period of socialism, tourism served as economic confirmation
of non-aligned status of Yugoslavia. As argued by Poljanec-Boric, tourism was a
source of foreign currency and it was considered to be strategically important sector
since identity-wise it turned the country towards the West, as compared to heavy
industrialization which was designed under the impact of the socialist block. On the

36 Enlightening Tourism. A Pathmaking Journal, Vol. 4 No 1 (2014), pp. 30-51 ISSN 2174-548X
country level, considering that 88% of tourism receipts came from Croatia it has also
been interiorised as part of Croatian national economic identity within Yugoslavia
(Poljanec-Borić, 2010).
In the phase of initial international tourism development, Croatia was a part of a
socialist country which resulted in tourism sector being systematically shaped
through strategy of low prices and high numbers of guests with specific focus on
workers right for vacation. Development of the sector in socialism led to creation of
uniform, “bathing tourism” characterized by overall low costs and cheap
accommodation. Additionally, tourism was focused primarily on the coast which
received 95% of overnights, while the inner part remained tourism-wise mostly
underdeveloped. However, such orientation has started to change from since 1970s
in accordance with global orientation towards sustainable development in general
and tourism specifically (Kobasic, 1987).
According to World Tourism and Travel Council (WTTC), tourism remained among
important sources of revenue even during the war. Hence it is not surprising that it is
continued to be seen as one of the most important economic sectors. Additionally,
total tourism revenues in the last decade generated more than 25% of the Croatian
GDP. Values are available in Table 1 in the Appendix.
Infrastructure inherited from Yugoslavia reflects well socialist philosophy of tourism
for masses. Just before the war escalated, Yugoslavia had 450,000 accommodation
units in private housing, or more than twice as much as in hotel accommodation,
where it had 266,000 units. This relationship was even stronger in Croatia since
coastal based tourism was mostly developed through construction of private summer
houses and development of camping sites. Hotels and apartments villages were
significantly less represented, which reflected mass and low cost tourism. Moreover,
while the number of tourist arrivals grew almost up until the war started, the rise in
quantity substituted, rather than supplemented rise in quality (Kobasic, 1987).
There has been significant change in the attitude towards mass type of tourism in
the meanwhile and currently both academics and practitioners advocate sustainable
tourism. To an extent this has also had an impact on Croatian policy makers.
Regardless of their political orientation Croatian governments have strongly
emphasized the need for further development of tourism sector. There is formal
acknowledgment that tourism sector needs to be based on principles of sustainability,

37 Enlightening Tourism. A Pathmaking Journal, Vol. 4 No 1 (2014), pp. 30-51 ISSN 2174-548X
but policy implementation does not necessarily follow the rhetoric. In certain cases
emphasis on sustainability seems to include “on the surface” adaptation of ideas that
are advocated by academia and international organizations, rather than real
dedication to a certain policy goal Hence, tourism strategies developed have so far
reflected declarative acceptance of sustainability principles, while application of
principles is still lagging behind. Moreover, tourism coordination requires substantial
capacities since it requires cooperation of private, public and state institutions.
Therefore, beside in lack of motivation, implementation of certain plans oriented
towards more sustainable and diversified tourism might also be problematic due to
coordination problems.
Therefore, although there has been declarative change of orientation towards
sustainable practices and towards an increase in the quality of the offer, quantity still
seems to be prevailing policy goal. Moreover, tourism still tends to be mostly
connected to coastal regions which have strong natural advantage in pursuing
summer oriented - sun, sea and beach tourism. Inner parts of the country remain
largely underused. The capital city Zagreb is slowly becoming a touristic destination,
but for most of the tourists arriving to Croatia it is still rather a transitory than a goal
point. Moreover, tourism is still characterized by distinct seasonal patterns, where
most of the visitors arrive in the summer months and existing tourism offer is
concentrated on this period (Institute for Tourism, 2013). Pre- and post-season can
be characterized by lack of tourism offer, even though necessary natural and cultural
resources could enable either longer or whole year season (Corak and Marusic,
2009). Due to strongly expressed regional and seasonal character, tourism can
hardly be considered as a key sector of the economy (Poljanec-Boric, 2011). This
assessment is only supported by the type of the infrastructure tourism is based on in
which complementary accommodation capacities, such as private accommodation
and campsites, have a more pronounced role than primary ones.
This section has provided a short background on the role of tourism in Croatian
economy as one of the main sectors contributing to GDP. Moreover, I have also
outlined how tourism developed in Croatia and what are its characteristics; strong
seasonality, regional character, orientation to mass rather than quality tourism and
focus on sun, sea and beach type of tourism product. Finally, I have pointed out that

38 Enlightening Tourism. A Pathmaking Journal, Vol. 4 No 1 (2014), pp. 30-51 ISSN 2174-548X
based on these characteristics tourism should perhaps not be considered as the key
economic sector of the economy.
4. ECONOMETRIC ANALYSIS AND RESULTS
Based on the outlined importance of tourism for Croatian economy, as well as
country specificity in development of mid-way tourism type characterized by quantity
rather than quality I proceed with quantitative analysis of the impacts tourism has on
economic growth. The paper tests for Granger causality between tourism exports,
capital goods imports and economic growth in the case of Croatia. The hypothesis is
that imports of capital goods financed through tourism revenues enable increase of
productivity and result in economic growth. Variables used are real gross domestic
product (GDP), real imports of capital goods (CIG) and tourism expenditures
(TOUR).Time series plot of variables is shown as Figure 1 in the Appendix.
The analysis can be summarized in following steps. I start by checking if the
variables are stationary or integrated of first order. I further test if the variables are
cointegrated by using Johansen trace test. In the cases when variables are not
cointegrated, the literature suggests proceeding with Vector Autoregression Model
and appropriate tests for Granger causality.
There were two sources of data available for the tourism variable. I originally
tested the model with the data for tourists’ expenditures available from WTTC
database. I used the cointegration method and Granger causality analysis based on
the vector error correction model, but since data was available only from 1988 there
were no clear findings on the relationship between economic growth and tourism.
However, tourism expenditures were also available from Currie et al. (Currie et al.,
2004), available from 1980 till 2002 which adjust the existing data from Croatian
Bureau of Statistics to current methodology of measuring tourism expenditures by
Croatian National Bank. These data were complemented with Croatian National
Bank’s data available till 2011. Hence, I have decided to use Currie and CNB’s data
which provide observations also for earlier years and increase the reliability of the
results and power of the model. The problem with data is that it includes pre-
independence data which are methodologically relatively consistent, but represent
relationships between three variables in two different countries. While this is

39 Enlightening Tourism. A Pathmaking Journal, Vol. 4 No 1 (2014), pp. 30-51 ISSN 2174-548X
methodologically problematic, I assume that there is a certain level of institutional
continuity from Yugoslav period to independent Croatia. Therefore, within this
theoretical framework encompassing observations from final Yugoslavian period,
from 1980 to 1991, should not be too problematic. However, further studies with
additional time points should enable checking the validity of this analysis.
Source for GDP growth and imports of capital goods (CIG) variables is Croatian
Bureau of statistics (CBS). All of the variables are expressed in American (USD)
dollars and have been transformed into real terms by using consumer price index
with 2000 as a base year. Plot of the level and growth variables are available as
Figure 1 and Figure 2 in the Appendix.
In the first step I use two unit root tests for checking stationary of the variables: the
augmented Dickey Fuller test (ADF) and Kwiatkowski Phillips Schmidt Shin (KPSS)
test. Enders elaborates that variables are stationary when mean and the variance of
a series are constant through time and the autocovariance of the series is not time
varying (Enders, 1995). Optimal lag length is chosen based on Akaike's information
criterion (AIC), since it provided a more conservative suggestion than Schwarz's
Bayesian information criterion (SBIC) and the Hannan and Quinn information criterion
(HQIC). Output is presented in Table 2 of the Appendix. All three tests include a
constant in the regression and do not reject the null hypothesis that there are no unit
roots, hence GDP, CIG, TOUR are non-stationary in levels and integrated of first
order. Output of both tests is shown in Table 3 in the Appendix.
In the next step I check if the variables are related in the long-term, by using
Johansen test for cointegration. Results show that there is no long-run equilibrium
between LTOU, LIMP and LY series. Since there are no cointegrating vectors among
LY, LIMP and LTOUR I proceed with a Vector Auteregression (VAR) instead of
Vector Error Correction (VECM) model, which allows application of conventional
causality tests with non-cointegrated variables. Output is presented in the Table 4.
Generating the first differences and re-running the tests for unit root shows that
variables CIG and TOUR are stationary in first differences, while tests for stationarity
in first differences ∆GDP deliver mixed results. Both Augmented Dickey Fuller and
KPSS test shows that first differences are stationary only on 90% confidence level. In
order to avoid excessive differentiation of GDP variable I construct a GDP growth
variable which is integrated of first order. Output is represented in the Appendix as

40 Enlightening Tourism. A Pathmaking Journal, Vol. 4 No 1 (2014), pp. 30-51 ISSN 2174-548X
Table 3. I run a basic autoregressive model specified with one lag for ∆GDP growth,
∆CIG and ∆TOUR, followed by a Granger causality test. In this case, the VAR model
can be notated as:
Where α is the vector of the constant term and β, γ and δ are the coefficients of
the lagged variables. In order to test whether ∆CIG Granger causes GDP growth,
joint significance of the coefficients is examined with F-test. Same applies
for the hypothesis that ∆TOUR Granger causes GDP growth; if are jointly
significant it would imply that results favour that there is Granger causality from
∆TOUR to ∆GDP growth. Output of Granger causality Wald test is shown in Table 5
of the Appendix.
We start analysing the results from the perspective of tourism-capital goods
import-economic growth hypothesis. Based on these results it can be argued that
there is Granger causality from tourism receipts to imports of capital goods. Due to
small p-value it can be concluded that the coefficients on the lags of ∆TOUR are not
jointly zero in the equation for ∆CIG, indicating the alternative hypothesis that tourism
receipts Granger cause capital goods imports. This finding confirms that tourism
revenues were instrumental in financing goods for further production over the period
of 1980 to 2011. But the results also show that this relationship is bidirectional since
imports of capital goods also Granger cause tourism receipts. Significance of this
relationship implies that tourism development is boosted by capital goods, such as
roads, hotels and other parts of infrastructure developed for tourism in past three
decades.
Moreover, the output seems to imply on a 90% confidence level that capital goods
imports Granger cause GDP growth. Therefore, since tourism receipts finance capital
goods imports and GDP growth is encouraged by imports of capital goods, the

41 Enlightening Tourism. A Pathmaking Journal, Vol. 4 No 1 (2014), pp. 30-51 ISSN 2174-548X
tourism – capital goods import – growth hypothesis in the case of Croatia is
confirmed. On the other hand, results do not indicate that GDP growth Granger
causes import of capital goods, which would indicate that increase in real gross
domestic product does not lead to investments into capital goods required for further
production. These two relations, between tourism receipts and imports of capital
goods and lack of unidirectional causality between GDP growth and capital goods
imports could imply that tourism enables import of capital goods necessary and
specific for tourism development, but that overall GDP growth boosted by tourism
does not lead to further imports of productive means necessary for development of
other sectors. While one should be careful in the interpretation of the data, lack of
relationship between GDP growth and capital goods imports CIG could perhaps be
interpreted as a type of policy failure. There seems to be no causal relationship from
economic growth to capital goods imports, while the existing Granger causality from
tourism receipts to imports of capital goods, leads to GDP growth. Imported
intermediary goods are used for tourism development and revenues obviously fill the
central budget, but tourism revenues are not reinvested for the development of
productive means in other sectors of the economy. Reasons for suggested policy
failure should be searched for within institutional environment which relatively
successfully develops tourism sector while neglecting other parts of the economy.
From the perspective of tourism led growth hypothesis, it can be argued that
tourism receipts do not directly Granger cause economic growth. Based on the result
in Table 5 coefficients on the lags of ∆TOUR in the equation for GDP growth are not
jointly zero. While tourism is an important part of GDP in Croatia, this finding can be
interpreted as lack of sectorial ability to influence growth potential, perhaps because
other sectors would also need to contribute to growth in a cross-sector connected
economy.
Such an explanation would also be in agreement with theoretical background of
TKIG model; namely growth through tourism can only be achieved through offer
diversification and monopoly over tourism good. Croatia provides a tourism good that
is easily substituted by the tourism product of other Mediterranean countries. In
conditions of dependency on tour operators (Cavlek, 2005) and a small number of
countries tourists come from, the prices of tourism product are forced downwards, but
so is the quality of the product. These factors have a negative impact on the ability of

42 Enlightening Tourism. A Pathmaking Journal, Vol. 4 No 1 (2014), pp. 30-51 ISSN 2174-548X
the tourism to be the key sector in the economy and to contribute to economic growth
in the long-run. Simultaneously, tourism revenues grow due to increase of tourism
sector productive volume, rather than quality. Such a strategy has a rather short term
focus and should be complemented by emphasis on redistribution of other sectors of
the economy.
5. DISCUSSION
While the results of this study are not generalizable to other developing countries,
they imply that high dependency on tourism is perhaps not the optimal way for
development. While Croatian case delivers differing results from already existing
studies on Spain and Tunisia(Cortes-Jimenez et al., 2011; Nowak et al., 2007), it
confirms that increase in accommodation capacity without quality increase can
deliver a short term growth, but that mass type of tourism is not the best
developmental model. Utilization of natural resources, such as beautiful scenery and
climate can enable high participation of tourism in the GDP levels, but due to certain
type of policy failure there is no diversification of the economy. In the absence of
quality increase, countries like Croatia are facing a danger of overusing their natural
beauties, while effectively failing to encourage wider economic development through
tourism revenues.
In this sense, the paper confirms Nowak et al. findings; tourism development
based on un-differentiated sun, sea and sand tourism which does not enable
monopoly over production of tourism good does not seem to be a clear channel for
growth (Nowak et al., 2007). However, it can help maintain a relative social peace
due to extremely high rents that specialization in tourism offers in short run. Relying
on tour operators and a small number of source countries leads to a type of race to
the bottom in producing the same tourism good for lowest prices and quality of the
product. Two hypotheses which seem to provide mechanisms of how tourism sector
receipts translate to growth do not seem to be plausible in mass tourism locations
with no diversification in product offer. There is no technological progress and
economic diversification, while increase of productive means contributes only to
tourism sector growth, which can be instructive in the course of further economic
development of Croatia. While tourism cannot be dismissed as valuable source of

43 Enlightening Tourism. A Pathmaking Journal, Vol. 4 No 1 (2014), pp. 30-51 ISSN 2174-548X
income, development of other sectors which could deliver technological progress
would be a policy worth pursuing. Moreover, relying on tourism sector in creating
revenues even when there is no specific policy followed for its development or
sufficient efforts of coordination between sectors in implementation should be a
strategy to avoid. Partnerships between public and business sector as well as
cooperation of all decision-makers are instrumental for development of tourism
product which can incentivize further economic development. Finally, even if ad-hoc
tourism development, engineered without following a specific policy design does help
in filling the budget, it would not be a long-term potential since mass tourism
inevitably destroys the very ground on which it is made, natural environment.
Environmental degradation as well as cultural blending undoubtedly have a negative
impact on the potential of tourism to be a long-term engine of growth in tourism
dependant countries.
6. CONCLUSION, STUDY LIMITATIONS AND FUTURE RESEARCH
The paper has researched whether tourism exports-capital goods imports-growth
hypothesis can be inferred for the case of Croatia. Moreover, the paper tests if there
is direct causal relationship between tourism receipts and economic growth. In order
to test these two hypotheses I use a Granger Causality test and Vector
Autoregression model due to lack of cointegration among non-stationary variables.
The case of Croatia is especially important since it is one of the new examples of
tourism dependency in a non-island, but still a small open economy, which has in
observed period gone through a transition from socialist self-management to
capitalism system. Moreover, it pursuits a middle way of mass tourism with relatively
undifferentiated tourism offer in classical sun, sea and beach model, dependence on
tour operators and strong regional bias. Additionally, the country is an interesting
case study due to its services orientation, but is still considered to be among
developing countries.
The paper confirms the tourism exports – imports of capital goods – economic
growth hypothesis; tourism receipts and imports of capital goods are in a bidirectional
causal relationship and imports of capital goods spill over to economic growth.
However, growth of productive means seems to be limited to tourism sector since
44 Enlightening Tourism. A Pathmaking Journal, Vol. 4 No 1 (2014), pp. 30-51 ISSN 2174-548X
achieved growth does not translate to further technological progress and economic
diversification. This hypothesis would require further testing with more robust
specification that depicts a complex relationships technological progress and growth
of human capital on the basis of tourism revenues. Nevertheless, the results of
Granger causality test imply that tourism should not be considered a key sector of
Croatian economy since its contributions to growth of Croatian economy have been
overemphasized. Further research should focus on elaborating what is preventing
use of achieved economic growth through increase in productive means to close a
loop and further inspire imports of capital goods in sectors other than tourism.
This paper suggests two explanations. First, type of tourism sector in Croatia does
not enable monopoly over production of tourism good, hence preventing long term
positive impacts of increased capital goods in delivering economic growth. This would
confirm previous research arguing that mass “bathing” type of tourism oriented to
sea, sun and beach, can be seen only as short-term developmental policy in
developing countries. Second explanation would refer to a policy failure in the use of
increased capital goods for which it should also be further researched to understand
how it relates to tourism dependency. Finally, results of this model should be taken
with caution; in order to increase the number of observations data was gathered also
for the Croatian pre-independence period. With the passage of time and perhaps
quarterly acquired data one should be able to test impacts of tourism on the
economic growth solely on the basis of data from the period after Croatia gained
independence.
References
Brau, R., Lanza, A. and Pigliauru, F. How fast are small tourism countries growing?
Evidence from the data from 1980-2003. Tourism Economics. 2007, Vol. 13, Nº. 4,
pp. 603-614. ISSN 1354-8166.
Brown, F. Tourism Reassessed: Blight or Blessing? Oxford: Butterworth Heinemann
Publications, 1998. ISSN 0 7506 4705 1.

45 Enlightening Tourism. A Pathmaking Journal, Vol. 4 No 1 (2014), pp. 30-51 ISSN 2174-548X
Capo, J., Font, A. and Nadal, J. Dutch Disease in Tourism Economies: Evidence
from the Balearics and the Canary Islands. Journal of Sustainable Tourism. 2007,
Vol. 15, Nº. 6. ISSN 0966-9582.
Čavlek, N. The Impact of Tour Operators on Tourism Development: A Sequence of
Events. Aramberri, J. and Butler, R. (Eds.). Tourism Development: Issues for a
Vulnerable Industry. Great Britain: Channel View Publications, 2005. ISBN 1 873150
96 2.
Chao, Chi-Chur et al. Tourism, Dutch Disease and Welfare in an Opend Dynamic
Economy. Japanese Economic Review [online]. 2006, Vol. 57, Nº. 4. [4th of May
2012], pp. 501-515. ISSN 1468-5876.
Chen, Ching-Fu, Chiou-Wei, Song Zan. Tourism expansion, tourism uncertainty and
economic growth: New evidence from Taiwan and Korea. Tourism Management
[online]. 2009, Vol. 30, Nº. 6. [6th of May 2012], pp. 812-818. ISSN 0261-5177.
Copeland, B. Tourism, Welfare and De-industrialization in a Small Open Economy.
Economica. 1991, Vol. 58, Nº. 23, pp. 515-529. ISSN 0013-0427.
Čorak, S. and Marušić, Z. Tomas Trendovi - Stavovi i potrošnja turista u Hrvatskoj
1987.-2008. Zagreb: Znanstvena edicija Instituta za turizam, 2009. ISBN 978-953-
6145-21-8.
Cortes-Jimenez, I., Nowak, J.J. and Sahli, M. Mass beach tourism and economic
growth: lessons from Tunisia. Tourism Economics [online]. 2011, Vol. 17, Nº. 3. [16th
of December 2012], pp. 531–547. ISSN 1354-8166.
Croatian Bureau of Statistics. Statistical Yearbook 2012. Zagreb: Croatian Bureau of
Statistics, 2012. 44. ISBN 1333-3305.
46 Enlightening Tourism. A Pathmaking Journal, Vol. 4 No 1 (2014), pp. 30-51 ISSN 2174-548X
Dritsakis, N. Tourism as long-run economic growth factor: an empirical investigation
for Greece using a causality test. [06th of May 2012]. Available on:
http://users.uom.gr/~drits/publications/tourism-economic_growth.pdf.
Enders, W. Applied Econometric time series. Somerset, New Yersey: Wiley& Sons
Inc. 1995. ISBN 0471039411.
Fayissa, B., Nsiah, Ch. and Tadesse, B. The Impact of Tourism on Economic Growth
and Development in Africa. Department of Economics and Finance Working Papers.
2007.
Fayissa, B., Nsiah, Ch. and Tadesse, B. Tourism and Economic Growth in Latin
American Countries: Further Empirical Evidence. Working Papers. 2009.
Figini, P. and Vici, L. Tourism and growth in a cross section of countries. Tourism
Economics. 2010, Vol. 16, Nº. 4, pp. 789–805. ISSN 1354-8166.
Hazari, B.R. and Nowak, J.J. Tourism, taxes and immiserization: a trade theoretic
analysis. Pacific economic review [online]. 2003, Vol. 8, Nº. 3. [ 13th of April 2013],
pp. 279–287. ISSN 1361-374X.
Hazari, B.R. et al. Tourism and regional immiserization. In: Pacific economic review
[online]. 2003, Vol. 8, Nº. 3. [13th of April 2013], pp. 269–278. ISSN 1361-374X.
Holzner, M. Tourism and Economic Development: the Beach Disease. Vienna
Institute for International Economic Studies Working Papers. 2010, Vol. 66.

47 Enlightening Tourism. A Pathmaking Journal, Vol. 4 No 1 (2014), pp. 30-51 ISSN 2174-548X
Institute for Tourism. Croatian Tourism in Numbers. In: Croatian Tourism in Numbers.
2013, Vol. 7, Nº. 1. ISSN 1847-3369.
Katircioglu, S.T. Revisiting the tourism-led-growth hypothesis for Turkey using the
bounds test and Johansen approach for cointegration. Tourism Management [online].
2009, Vol. 30, Nº. 1. [6th of May 2012], pp. 17-20. ISSN 0261-5177.
Khalil, S., Kakar, M.K., et al. Role of Tourism in Economic Growth: Empirical
Evidence from Pakistan Economy. The Pakistan Development Review. 2007, Vol. 46,
Nº. 4, pp. 985–995.
Kim, Hyun Jeong, Chen, Ming-Hsiang and Jang, Soo Cheong “Shawn”. Tourism
expansion and economic development: The case of Taiwan. In: Tourism
Management [online]. 2006, Vol.. 27, N.. 5. [6th of May 2012], pp. 925-933. ISSN
0261-5177.
Kobašić, A. Turizam u Jugoslaviji. Zagreb: Informator, 1987. 86-301-0130-X.
Lee, Chien-Chiang and Chang, Chun-Ping. Tourism development and economic
growth: A closer look at panels. Tourism Management [online]. 2008, Vol. 29, Nº. 1.
[6th of May 2012], pp. 180-192. ISSN 0261-5177.
Nowak, J.J, Mondher, S., and Sgro, P.M. Tourism, trade and domestic welfare.
Pacific Economic Review. 2003, Vol. 8, Nº. 3. ISSN 1361-374X.
Nowak, J.J., Mondher, S. and Cortes-Jimenez, I. Tourism, capital good imports and
economic growth: theory and evidence for Spain. Tourism Economics [online]. 2007,
Vol. 13, Nº. 4. [11th of April 2013], pp. 515–536. ISSN 1354-8166.

48 Enlightening Tourism. A Pathmaking Journal, Vol. 4 No 1 (2014), pp. 30-51 ISSN 2174-548X
Nowak, J.J. et al. Tourism, increasing returns and welfare. The economics of tourism
and sustainable development [online]. 2005. [13th of April 2013], pp. 87-103. ISSN 1-
84542-401-8.
Poljanec - Borić, S. Hrvatsko društvo i turizam - Prilog socioekonomiji lokalnog
razvoja. Zagreb: Jesenski i Turk, 2011. ISBN: 9789532223903.
Brown, F. Tourism Reassessed: Blight or Blessing? Oxford: Butterworth Heinemann
Publications, 1998. ISSN 0 7506 4705 1.
Proenca, S, Soukiazis, E. Tourism as an economic growth factor: a case study for
Southern European countries. Tourism Economics. 2008, Vol. 14, Nº. 4, pp. 791-806.
ISSN 2044-0375.
Shan, J. and Wilson, K. Causality between trade and tourism: empirical evidence
from China. Applied Economics Letters. 2001, Vol. 8, pp. 279-283.ISSN 1466-4291.

49 Enlightening Tourism. A Pathmaking Journal, Vol. 4 No 1 (2014), pp. 30-51 ISSN 2174-548X
Appendix
2000
030
000
4000
050
000
6000
070
000
GD
P
020
0000
040
0000
060
0000
080
0000
01.
00e
+07
CIG
, TO
UR
1980 1990 2000 2010year
TOUR CIGGDP
Figure 1 Time series plot of GDP, CIG, TOUR Source: Croatian Statistical Bureau, annual statistical reports and Croatian National Bank
-.2
-.1
0.1
.2.3
GD
P g
row
th
-1-.
50
.51
CIG
, TO
UR
gro
wth
1980 1990 2000 2010year
TOUR growth CIG growthGDP growth
Figure 2 Time series plot of GDP growth, CIG growth, TOUR growth
Source: Croatian Statistical Bureau, annual statistical reports and Croatian National Bank

50 Enlightening Tourism. A Pathmaking Journal, Vol. 4 No 1 (2014), pp. 30-51 ISSN 2174-548X
Year Total tourism contribution to GDP
Year Total tourism contribution to GDP
1988 21.5 2000 16.2 1989 17.3 2001 18 1990 13.7 2002 26.7 1991 10.8 2003 26.2 1992 9.7 2004 27.9 1993 17.1 2005 28.6 1994 17.8 2006 27.8 1995 11.5 2007 29.1 1996 15.9 2008 25.3 1997 17.6 2009 26.9 1998 17.1 2010 26.3 1999 15.4 2011 27.8
Table 1 Total tourism contribution as percentage of GDP Source: World Travel and Tourism Council
Augmented Dickey Fuller test GDP GDP growth CIG TOUR
Constant -0.966 -2.687* -1.424 0.221 Result I(0) Unclear I(0) I(0)
∆GDP ∆GDP growth
∆CIG ∆TOUR
Constant -2.857* -4.723*** -4.408*** -4.389***
Result unclear I(1) I(1) I(1) Notes: *,**, *** denote significance at 10%, 5% and 1%, respectively
Table 3a. Augmented Dickey Fuller stationarity test
LAGS AIC HQIC SBIC 0 56.84 56.88 56.98 1 56.19 56.36* 56.77* 2 56.17* 56.47 57.18 3 56.54 56.96 57.98 4 56.78 57.34 58.66
Table 2 VAR lag selection criteria

51 Enlightening Tourism. A Pathmaking Journal, Vol. 4 No 1 (2014), pp. 30-51 ISSN 2174-548X
KPSS test GDP GDP growth CIG TOUR
Constant 0.787481*** 0.065 1.36077*** 1.36127*** Result I(0) I(1) I(0) I(0)
∆GDP ∆GDP growth
∆CIG ∆TOUR
Constant 0.376276* 0.0548193 0.096675 0.247104 Result Unclear I(1) I(1) I(1)
Notes: *,**, *** denote significance at 10%, 5% and 1%, respectively Table 3b. KPSS stationarity test
Article info: Received 20/10/13. Accepted 06/02/14. Refereed anonymously.
Maximum rank Trace statistic 5% critical variable 0 21.9672 29.68 1 9.2767 15.41 2 0.0397 3.76 3
Table 4. Johansen test for cointegration (2 lags)
Equation Excluded Chi2 DF Prob>chi2
GDP growth ∆CIG 3.05 1 0.08 GDP growth ∆TOUR 1.00 1 0.32 GDP growth ALL 3.08 2 0.22
∆CIG GDP growth 0.52 1 0.47 ∆CIG ∆TOUR 3.73 1 0.05 ∆CIG ALL 5.94 2 0.05 ∆TOUR GDP growth 0.97 1 0.32 ∆TOUR ∆CIG 7.45 1 0.01 ∆TOUR ALL 10.01 2 0.01
Table 5. Granger Causality Wald tests

J. Vázquez-Illa Navarro
52 Enlightening Tourism. A Pathmaking Journal, Vol 4, No 1 (2014), pp. 52-78 ISSN 2174-548X
UNFOLDING THE SPA INDUSTRY:
SPA BUSINESS MODELS TROUGH THE PRODUCT
LIFE CYCLE
Javier Vázquez-Illa Navarro
Consultant & Entrepreneur for Wellness Hotels (Spain)
ABSTRACT This article pursues inspiring theory building that helps in the understanding of spas. The industry’s life cycle is subject to examination to ascertain its predominant business model. Employed methodologies are literature review, study of a sample of European and American spas, and case study research on a European spa company. The amenity spa is singled out as the prevalent business model: its value proposition offers a more comprehensive experience than the traditional destination spa. The consequences of the present model’s choices: high amortization and fixed costs, besides market confusion, are highlighted as the industry enters its early maturity stage, after two decades of growth. Future prospects are optimistic, though, due to the linkage of spas with well-rooted social trends, provided incumbents fine-tune their competitive strategies and implement more efficient operations. The spa industry’s partial nonconformity to the product life cycle theory remains unresolved and will require further research.
KEYWORDS
Spa; Product Life Cycle; Business Models; Strategy
ECONLIT KEYS
L830; M130; E320
1. INTRODUCTION
Spas have existed for centuries. Whether you consider them places for taking the
waters or places to help one achieve physical and inner balance, spas have been

J. Vázquez-Illa Navarro
53 Enlightening Tourism. A Pathmaking Journal, Vol 4, No 1 (2014), pp. 52-78 ISSN 2174-548X
universally present. Until recently, however, their economic impact has not been
clearly assessed (ISPA, 2002-2008), despite this sector accounting for approximately
$438.6 billion worldwide, about 14% of all domestic and international tourism
expenditures (Stanford Research Institute, 2013).
Otherwise, hardly any attempt has been made to explain the industry’s evolution
within a theoretical structure (Kapczynski and Szromek, 2008; Mak et al., 2009; Bell–
Vazquez-Illa, 1996). The explanation and evolution of the spa industry has been built
around professional magazines and industry report analysis (Intelligent Spa Pte
Limited, 2009; Hartman Group, 2006; La Gazette Officielle du Thermalisme, 1997).
Cases have been described (Montenson, 2008; Montenson and Singer, 2009), but
with an empirically-driven approach, lacking a theoretical framework that establishes
compelling propositions and predicts facts and relationships.
There is, then, an opportunity to relate theory and practice in order to generate a
theoretical construct that serves to anticipate the evolution of the spa industry. This
paper represents an attempt to tackle the research gap between practice and theory
in relation to the spa industry.
Following Kapczynski’s and Szromek’s works on the life cycle of Polish spas
(2008), the present study applies the product life cycle theory (PLC) (Levitt, 1965-
1966) to analyse spa industry evolution since the beginning of the Contemporary Age
in Western societies. The business models theory (Zott et al., 2011) is also used to
help in the depiction of the predominant spa business model at every stage of its life
cycle.
Employed methodologies are literature review, study of a sample of European and
American spas, and in-depth case study research on a European spa company.
Research methodology includes both primary and secondary approaches (web-
based). More than 50% of Spain’s resort spas or spa resorts, plus the ten most
distinguished European and North American destination spas, have been subject to
direct observation. Near 20 of them have been directly managed by this research’s
author.
The use of qualitative methodologies derives from the embryonic state of works in
this sector and, consequently, the lack of a commonly-shared theory to aid in the
explanation of the whole phenomenon that would justify the deductive method.
Abercrombie et al. (1984), Yin (1984), Eisenhardt (1989) highlight the usefulness
of the case-study methodology in the preliminary stages of a research task, because

J. Vázquez-Illa Navarro
54 Enlightening Tourism. A Pathmaking Journal, Vol 4, No 1 (2014), pp. 52-78 ISSN 2174-548X
it allows the development of hypothesis that eventually may be proved with a higher
number of cases.
Although qualitative methodology is mainly reserved for the development of theory
by using the inductive method, this does not belie the principle that recommends the
use of a series of theoretical propositions as a template for the researcher (Glaser
and Strauss, 1967).
Accordingly, the work is presented in the following way. First, the theoretical
propositions are developed. Second, spa definition and taxonomy are tackled. Third,
a discussion on the spa industry’s conformity to the propositions is carried out, and
the predominant spa business model is depicted. Fourth, the analysis is further
enhanced with the presentation of a case study, the company TermaEuropa, which is
an illustrative example of the transition from the thermal paradigm to the well-being
one. Finally, conclusions are drawn.
The analysis of the spa industry literature, the sector’s direct observation, and the
assessment of the case study, has established the industry’s limited conformity to the
product life cycle theory. Neither early entry into the industry, nor size seems to be a
critical factor for success for spa companies. The emergence of a dominant design
does not deter new entrants, either.
The amenity spa becomes the most popular business model: its value proposition
offers a more comprehensive experience than the traditional destination spa. The
consequences of the present model’s choices: high amortization costs, high fixed
costs, and market confusion, are emphasized as the industry enters its early maturity
stage, after two decades of dramatic growth. Future prospects are optimistic, though,
due to the linkage of spas with well-rooted social trends, provided incumbents fine-
tune their competitive strategies and implement more efficient operations.
More case studies will be needed to fully extend, through analytical generalization,
the results obtained with this research. The study of how innovation shapes the
industry will also contribute to enriching the theory about the spa industry.

J. Vázquez-Illa Navarro
55 Enlightening Tourism. A Pathmaking Journal, Vol 4, No 1 (2014), pp. 52-78 ISSN 2174-548X
2. THEORETICAL PROPOSITIONS
2.1 Proposition 1:
A product, or industry, undergoes several stages: introduction, growth, maturity
and decline (Levitt, 1965-1966; Kotler, 1988; Agarwal et al., 2002; Mansfield and
Fourie, 2004).
The product life cycle, though a secret for marketing success in its inception, has
progressively extended to most disciplines as a valuable instrument for industry
analysis. From a sort of self-fulfilling theory, it has developed into a methodology that
helps industries compete more effectively. Several studies (Klepper, 1997) agree on
its usefulness to unveil how different industries evolve. Even those companies with
dissimilar behaviours tend to share some common principles.
2.2 Proposition 2:
At every stage of the life cycle it is possible to ascertain the predominant business
model (Kuhn, 1962; Agarwal and Audretsch, 2001).
A business model is made up of the basic elements that describe how a company
carries out its ordinary operations. Following product life cycle theory, the dominant
business model within the companies belonging to an industry throughout the
different stages covered by the specific product can be established.
2.3 Proposition 3:
Business models explain how companies create value and capture value with
transactions (Magretta, 2002; Casadesus-Masanel and Ricart, 2011).
As a result, any business model must contain information regarding company
fundamentals: value proposition, target market, distribution channel, customer
relationship, value configuration, capability, partnership, revenue model and cost.
2.4 Proposition 4:
The emergence of a dominant design at the mature stage discourages the entry of
new competitors and decreases the survival rate of incumbents (Carrol and Hannan,
1989; Utterback and Suarez, 1993; Klepper, 1997; Agarwal et al., 2002).
The growth stage is characterized by low population density and reduced
competition intensity. This encourages new entrants up to a point when a dominant

J. Vázquez-Illa Navarro
56 Enlightening Tourism. A Pathmaking Journal, Vol 4, No 1 (2014), pp. 52-78 ISSN 2174-548X
design prevails at the maturity stage that forces most unsuccessful incumbents out of
the market and increases entry barriers for new competitors.
2.5 Proposition 5:
Company survival rates depend on their size -the larger the better- and early entry
into the industry (Stigler, 1951; Porter, 1980; Abernathy and Clark, 1985; Klepper,
1997; Sutton, 1997; Klepper and Simons, 1999; Christensen et al., 2000; Caves and
Porter, 1997).
Early entry gives companies the possibility of escalating the learning curve of an
industry from the very beginning. Large size makes it possible for most companies to
beat competition and overcome entry barriers. Size is not an issue at maturity stage,
in technological environments, and in market-niche strategies.
3. THE SPA CONCEPT
3.1 Spa definition and taxonomy
The spa industry enjoys a long tradition, but a relatively short one as a relevant
phenomenon. The industry’s dramatic growth in the past few years (ISPA, 2002-
2008) builds on its link with well-rooted social trends (see table one).
1. Fast-paced lifestyle (International Spa Associat ion, 2009)
2. Pampering yourself is viewed favourably (Bjursta m, 2010)
3. Increasing life expectancy (European Travel Comm ission, 2006)
4. The desire to be forever young (Deloitte-New Yor k University, 2006)
5. Prevention is better than curing (Kyricos, 2010)
6. Alternative medicine boom (European Travel Commi ssion, 2006)
7. Splitting of leisure time (European Travel Commi ssion, 2006)
Table 1: Trends promoting spa demand
Source: own
Many definitions and spa classifications coexist, as the necessary consequence
of its consideration as an emerging industry.
The International Spas Association (ISPA) defines spas as places meant to
provide well-being through professional services that allow the renewal of mind, body

J. Vázquez-Illa Navarro
57 Enlightening Tourism. A Pathmaking Journal, Vol 4, No 1 (2014), pp. 52-78 ISSN 2174-548X
and spirit. According to ISPA, spas may be classified taking into account the
following distinguishing factors: star service, type of water used, and location.
Spa Finder (“the world’s largest marketing company for the wellness industry”)
adds other categories such as connoisseur spas, lifestyle spas, real estate spas,
casino spas, medical spas, cosmetic and wellness spas, dental spas, mobile spas,
and airport spas.
The spa concept and its taxonomy may be observed from a perspective that
permits a clearer vision of the industry as a whole. Table 2 presents a typology of
spas according to three distinguishing elements: water kind, customers’ dominant
motivation, and location. Each category derives from applying every distinguishing
factor to the spa diversity.
DIFFERENTIATING
FACTOR CATEGORIES
Kind of water used Thermal Spas Thalassotherapies Spas
(Thermal water) (Sea-water spas) (Running water)
Motivation Destination Spas Amenity Spas
(Spa as the main driver) (Spa as an ancillary service)
Location Day Spas Resort Spas
(Urban setting) Spa Resorts
Table 2: Taxonomy of spas
- According to the Kind of Water Used.
• Mineral Springs Spas: establishments whose service offering is based on the
exploitation of mineral springs. Its chemical composition and temperature,
depending on each water variety, makes it useful for the treatment of multiple
ailments.
• Thalassotherapies: establishments whose service offering is based on the
exploitation of pure sea water, heated to body temperature, and the marine
climate.
• Spas: a centre where running water is used for the providing of services. Even
in the US, most centres using the word spa do not offer hydrotherapy.
- According to the Customer Motivation.

J. Vázquez-Illa Navarro
58 Enlightening Tourism. A Pathmaking Journal, Vol 4, No 1 (2014), pp. 52-78 ISSN 2174-548X
• Destination spas: institutions where their clients’ main motivation relates to
health.
• Amenity spas: establishments where their clients’ predominant motivation is
not only health; health is not the main driver for stays at the resort or for
acquiring club membership as in the case of an urban spa.
- According to the Location.
• Day Spas: urban centres operating daytime. They may be located at hotels or
work as independent units. Day spas could be destination spas or amenity
spas, depending on the motivation of their primary segment.
• Resort spas or spa resorts/destination spas (depending if their customers’
main motivation is the resort or the spa).
Additional classifications are also possible. There are spas with a preponderant
body focus as opposed to a spiritual one, and there are more health- or leisure-
inclined spas than others within the same category.
The spa configuration map (see figure 1) depicts a more comprehensive
arrangement, according to a broader list of differentiating factors.
Figure 1: Spa configuration map
Source: Deloitte, 2005-2007
The higher competitive intensity (figure 1) is identified within the spas with a
stronger body approach (lower part of the map), while the number of centres whether
Retreathomes
Mindgeared spas Personal
growth geared spas
Hollisticwellnescenters
LeisureThalasso
Medical Spa
Recreationalhealth resort
Urban spa
Spa fitnesscenters
Amenity spa
Beauy farm
SportsSpa
Thermludicplace
Traditionalhealing
thalassoTraditional
health resort
Spa classifiedby treatments/ingredients
Service Focus
Product F
ocus
Health
Corporal
Spiritual
Leisure
Retreathomes
Retreathomes
Mindgeared spas
Mindgeared spas Personal
growth geared spas
Personal growth
geared spasHollisticwellnescenters
Hollisticwellnescenters
LeisureThalassoLeisureThalasso
Medical Spa
Medical Spa
Recreationalhealth resortRecreationalhealth resort
Urban spaUrban spa
Spa fitnesscentersSpa fitnesscenters
Amenity spaAmenity spa
Beauy farmBeauy farm
SportsSpa
SportsSpa
Thermludicplace
Thermludicplace
Traditionalhealing
thalasso
Traditionalhealing
thalassoTraditional
health resortTraditional
health resort
Spa classifiedby treatments/ingredientsSpa classifiedby treatments/ingredients
Service Focus
Product F
ocus
Health
Corporal
Spiritual
Leisure

J. Vázquez-Illa Navarro
59 Enlightening Tourism. A Pathmaking Journal, Vol 4, No 1 (2014), pp. 52-78 ISSN 2174-548X
they be with a health focus or a leisure one is almost equally divided; this highlights
the fact that most spas combine both approaches.
The traditional spa, with a clear-cut focus on health, is different from the
recreational spa or recreational health resort positioned in the beauty and relaxation
segment (within the health focus quadrant) but is much closer to the leisure one. The
former draws its main market from subsidized stays promoted by health authorities in
Europe. The latter is a spa resort; as with the spa an array of complementary
services and amenities have been developed to attract new segments.
A similar distinction is made between the traditional thalasso and the recreational
one. The former holds a greater medical focus, especially rehabilitation, and follows
the model that was coined in France in the 1950s. The latter is a result of the need
for covering new segment expectations since the 1980s. This vision means that
areas for recreation and medical therapy are clearly separated.
The medical spa are those centres with weight loss and anti-ageing programs,
segments not usually present at the older spas, and are more common at American
spas.
Spas classified by treatments/ingredients refer to a variety of minority spas, with a
medium-high rate positioning, whose attractiveness lies in the strengthening of their
theme. Examples are centres offering macrobiotic diets, such as Sha Wellness Clinic
in Alicante, Spain, or wine spas.
Mind-geared spas are not very common. They usually have a medium-low price
positioning. The reason for this positioning has to do with their spa philosophy
fostering back to basics, disregarding unnecessary luxuries and material assets.
Retreat homes represent the most Spartan option and correspond to areas of
religious interest.
Personal-growth geared spas have been subject to more media attention. Their
products are directed to company groups willing to reinforce their personal and
labour links to bring about a group spirit to beat the competition more easily. The
New Age Health Spa in New York State is the paradigmatic example.
Beauty farms are spas more focused on light beauty treatments, with no surgery.
The international model is Main Chance in Arizona, with high-cost positioning (there
are no low-cost centres in the beauty segment).
Spa fitness centres and those related are amenity spas with distinct features:
fitness, recreation and/or sports.

J. Vázquez-Illa Navarro
60 Enlightening Tourism. A Pathmaking Journal, Vol 4, No 1 (2014), pp. 52-78 ISSN 2174-548X
At present, most popular kinds of spas are those in the lower part of the map,
hence with a body focus, and close to the line separating both parts of the rectangle,
but with a tendency to move upwards, gradually incorporating treatments that are
geared towards the mind (ISPA, 2002-2008).
4. DISCUSSION OF THE SPA INDUSTRY’S CONFORMITY TO THEORETICAL
PROPOSITIONS AND THE CURRENT SPA BUSINESS MODEL
4.1 Conformity to the theoretical propositions
Life cycle fundamentals are observed in the historic evolution of the spa industry,
as stated by propositions 1 to 3. There exists, however, no conformity to the theory in
propositions 4 and 5.
The end of the “Ancien Régime” and the beginning of the Late Modern Period, in
the late 18th century, coincide with the resurgence of the spa industry, represented
by the only model at that time: the traditional thermal destination spa. After the Early
Modern Period’s in which the leisure sector was almost non-existent, and where the
culture of taking the waters prompted social contempt (Cátedra, 2009), a new class
was born, the bourgeoisie, who declared the need for spa vacations, leading the
industry to experience a period of growth throughout the 19th century (Soto-Roland,
2006).
The growth stage of destination thermal spas, with their more rigid health
approaches in their service providing, lasted until the third quarter of the 19th century
(see figure two). The questioning of the Hygienic movement, whose principles
fostered the change of environment, like the one typically experienced at a stay in a
spa, as the best remedy for any disease, and the rising competition of beach resorts
coalesced to endorse the paradigm shift (San Pedro, 1994).
The paradigm crisis ended in a stage of decline that extended over several
decades. Its effects were worsened as a result of the world wars. The sector only
held out in countries such as France, Italy and Germany where thermal treatments
were reimbursed by the social security system, and where the state, mainly in the
German case, had played a prominent role in the development of the great spa
towns in the second half of the 19th century (Weisz, 2001). The visibility of the sector
and its strength in those countries also helped to arouse state support and, as a
consequence, to guarantee its own feasibility (Bacon, 1997).

J. Vázquez-Illa Navarro
61 Enlightening Tourism. A Pathmaking Journal, Vol 4, No 1 (2014), pp. 52-78 ISSN 2174-548X
Figure 2: Life cycle of the spa industry and its business models. This figure presents the product life cycle of the
spa industry, and, superposed, the life cycle of the prevalent spa business model (amenity spa or destination spa)
at each stage. Under the curve, the paradigm of the industry at each time is defined.
A new growth curve was not observed until the mid-1960s in the US, which
brought about a more modern way of considering spa vacations. The destination spa
continues to be the predominant business model, although with a totally different
product presentation. The spa is no longer a centre to provide anti-rheumatic
treatments, but a place to eat healthy food and get fit as the best way to attain beauty
(Tabacchi, 2010). The new destination spa did not have anything to do with its
predecessor, nor were its customers the same, nor its treatments, aside from thermal
waters and opting for strict diets and strenuous exercises as the way to beauty.
In Europe, however, the traditional destination spa survived, slowly incorporating
some of the services provided by the American spas (Bywater, 1990; Intelligent Spa
Pte Limited, 2009). The influence of the fitness craze is more evident in the
increasing number of fitness day spas that started to open since then.
The fitness destination spa model was gradually replaced by the amenity spa
business model in the US in the 90s (Orbeta Heytens & Tabacchi, 1995; Van Putten,
2003).
In Europe, the transition from the pseudo-traditional destination spa to the amenity
spa business model took place in a more drastic way, bringing about a new paradigm
(Bell & Vazquez-Illa, 1996). The spa sector experienced a radical change due to the

J. Vázquez-Illa Navarro
62 Enlightening Tourism. A Pathmaking Journal, Vol 4, No 1 (2014), pp. 52-78 ISSN 2174-548X
questioning of the thermal spa paradigm in order to open industry establishments to
younger clients yearning for relaxation treatments. This was very distant in concept
and execution from the traditional rheumatic treatments in the older segments.
The amenity spa, with its more open business concept, without the strict diets and
exhausting fitness sessions in North-American destination spas, and without the
single use of facilities for therapeutic treatments at European spas, was widely
adopted as the model to be developed. The amenity spa, whether in the US or
Europe, adds a more user-friendly presentation, through selecting tourist destinations
as usual locations, covering, besides, its customers’ seek and escape needs (Mak et
al, 2009). Amenity spas focus on the most attractive segment, the users in search of
relaxation, those who seek to feel recovered after their stay and happy during their
vacations, enjoying a unique experience (Keri et al, 2007). Travellers for whom
wellness is a secondary purpose (those who typically attend amenity spas) represent
87% of wellness tourism trips (Stanford Research Institute, 2013).
At the beginning of the 21st century, the spa sector has gone a little further in
proposing holistic treatments for the body, mind and spirit. Inner balance is the next
objective after getting fit and being relaxed (Tabacchi, 2010). The current paradigm is
quite prevalent and has allowed for the blurring of differences between European and
American spas (Bywater, 1990; Intelligence Spa Pte Limited, 2009).
The recent enlargement of the spa offering -adding relaxation treatments for mind
and spirit- has not triggered a shift in the dominant business model, which continues
to be the amenity spa (Hartman Group, 2006; Trucco, 2000). At the same time, a
very successful business model, the day spa, has been launched in the market,
complementing the amenity spa and, in a few instances, the destination spa (ISPA,
2002-2008). Though it deals with the same customers, it intends to cover their needs
in different circumstances of place and time, capitalizing on its urban setting.
At present, the industry seems to be entering into a new maturity stage, after two
decades of dramatic growth, characterized by dwindling growth rates and the
targeting of “dependent” clients -consumers who mirror other people’s behaviour, are
more on a budget and travel less frequently- instead of clients, innovators or early
entrants (DBK, 2009; Keri at al. 2007; Tabacchi, 2010; PKF, 2009; Lerner, 2010;
ISPA, 2002-2008, Plog, 2001).
The sector does not conform, nevertheless, to propositions 4 and 5. When a
prevailing design is adopted, unsuccessful spa competitors do not usually abandon

J. Vázquez-Illa Navarro
63 Enlightening Tourism. A Pathmaking Journal, Vol 4, No 1 (2014), pp. 52-78 ISSN 2174-548X
the market since real estate investments are not easily discarded (DBK, 2009; PKF,
2009).
Furthermore, neither early industry nor size determines a company’s survival rate,
as the disappearance of the powerful English spa sector in the 19th century
emphasizes (Lerner, 2010; Tabacchi, 2010; Instituto de Empresa, 2006; Bacon,
1997). The kind of innovation present at spas, and how innovation shapes industry
evolution may help explain this standoff from the norm; which will require further
research.
As a result, the intensity of competition continues to increase due to the fact that
ineffective incumbents do not leave the market, coupled with a relentless entry of
new competitors enticed by the apparently easy way to gain a position in this market,
as the logical outcome of nonconformity to propositions 4 and 5.
4.2 The spa current business model
Following Stewart & Zhao (2000) the business model is a statement of how a firm
will make money and sustain its profit stream over time. The prototypical spa
business model, however, evidences the same confusion that characterizes the spa
industry as a whole, due to its booming growth in the past few years, as a result of an
increasing demand that arises from well-rooted social trends regarding holistic health
(Instituto de Empresa, 2006). In a context where demand prevails, every solution
works until market intensity, incumbents’ learning curve, or dwindling consumption,
as a consequence of a crisis, lead companies to consider whether their strategy is
the right one, or their product design is suitable (Porter, 1980).
The spa industry has recently enjoyed the above mentioned situation and is now
enduring its consequences. The state of “anything works” has reduced entry barriers,
and many centres have been planned to cater to their suppliers’ interests, bringing
about establishments without the required layout to meet customers’ expectations
regarding relaxation and holistic health (Pastor, 2007).
The model’s choices or fundaments are: heavy investment in real estate, an
approach focused on health and leisure and a body focus. The consequences of
those choices are: high amortization costs, high fixed costs and market confusion
(see figure 3).
Each spa category is characterized by demanding real estate investments. Most
spas feature an area for collective use, i.e., a dynamic pool (a pool with massage
J. Vázquez-Illa Navarro
64 Enlightening Tourism. A Pathmaking Journal, Vol 4, No 1 (2014), pp. 52-78 ISSN 2174-548X
jets, whirlpool, air seats and lazy river) and/or a water course with pools at different
temperatures, sauna and steam room. Conversely, an area for individual treatments,
whether with a therapeutic focus or a relaxation one, is set up (Pastor, 2008).
The choice of making strong investments in real estate generates high
amortization costs and reduces operating margins, fostering a differentiation
strategy1 to overcome the initial disadvantage.
High investment triggers a medium-high price positioning, requiring, therefore, a
differentiation strategy to present the product as unique. Being that most companies
seek to appear as distinctive, competitive intensity and market confusion increase.
The differentiation strategy encourages a loaded treatment menu to cater to the
needs of an array of market segments in order to enhance the spa feasibility, leading
to more market turmoil, since non-segmented communication is broadly used to get
the product closer to the customer.
The variety of target markets involves a large staff that increases overhead and a
specialized staff that increases training costs and fixed costs dramatically. The high
fixed costs reduce operating margins, strengthening the negative impacts from the
amortization costs, which eventually, encompasses the implementation of a
differentiation strategy.
A differentiation strategy is also promoted by the two other choices. The twofold
positioning, towards the holistic health segment and to the peripheral segment,
prompts market confusion, allowing for the adoption of a differentiation strategy that
activates the cycle of consequences already mentioned. Twofold positioning pushes
companies into an environment of high competitive intensity, validating the
implementation of a differentiation strategy, whether or not the company holds the
necessary exclusive features.
The body focus, by being adopted by most spas, intensifies competition and
encourages a differentiation strategy that, in turn, gives rise to the emphasized
negative consequences in the end.

J. Vázquez-Illa Navarro
65 Enlightening Tourism. A Pathmaking Journal, Vol 4, No 1 (2014), pp. 52-78 ISSN 2174-548X
Figure 3: The current spa business model
Overall, the spa business model portrays the current state of the spa industry,
characterized, on the supply side, by inadequate product design offering
compromising feasibility, and confusion or/and discontent on the demand side.
5. TERMAEUROPA CASE STUDY
5.1 Justification
The selection of the subject-company, TermaEuropa, responds to its consideration
as the first hotel spa company that was launched in Spain (2001) to cater to the
emerging segments’ needs (the relaxation segment). The company represents the
transition from the older paradigm, the thermal spa, to the new one, the wellness and
well-being paradigm.
This is a case study with multiple levels of analysis. Its justification is derived from
Yin’s (1984) and Eisendhardt’s (1989) defence of the selection of a single case with
multiple levels of analysis in order to better illustrate the occurrence of a
phenomenon in its preliminary stages.
Eisendhardt (1989) points out that case-study methodology combines ways of
gathering data such as: archives analysis, interviews, surveys and observation. In the
case of TermaEuropa the instrument has been the analysis of archives with
qualitative and quantitative information, observation and empirical evidence.
Big Investment in Fixed Assets
High amortization costs Medium-highprice positioning
Low net operating income
High overhead
Market confusion
Health and Leisure Approach
Body Approach
High training costs
Large staff
Specialized equipment
High intensity competition
Wide range target segments
Wide menu of treatments
Differentiation strategy
Non segmented communication

J. Vázquez-Illa Navarro
66 Enlightening Tourism. A Pathmaking Journal, Vol 4, No 1 (2014), pp. 52-78 ISSN 2174-548X
The rigor of the analysis is demonstrated by the observation of the principles of
internal validity (there is a cause/effect relationship between the company’s strategy
and the achieved results), construct validity (the variables subject to study are set
forth), external validity (analytical generalization to the theoretical propositions is
possible) and reliability (the absence of random error is assured through the
possibility of examining original documents by other researchers) (Campbell and
Stanley, 1963).
5.2 Relationship between PLC and the emergence of TermaEuropa
The European spa industry is the scene of a heated debate in the 1990s, between
those in favour of catering to the emerging segments’ needs regarding relaxation
programmes, and those fostering the traditional way, based on taking care of seniors’
rheumatic ailments (Bywater, 1990; La Gazette Officiel du Thermalisme, 1997; Les
Dossiers de la Lettre Touristique, 1992).
Eventually, most spas changed gears and decided to revamp to adapt to market
changes. However, at the beginning, only a selected group managed to understand
the paradigm crisis in place; TermaEuropa Company is an illustrative example.
Table 3 compares the distinguishing features of the older paradigm, still prevailing
in the 1990s, with the emerging one, whose main points are incorporated into
TermaEuropa’s strategy.
• Thermal water loses its magical appeal and broadens its uses. It is not merely
used for medical purposes, but also for relaxation and, even, for providing fun
through leisure pools.
• More segments are targeted and rheumatic sufferers stop being the only
consumers of spas. Stays are shortened as a way of complying with the
demand’s tendency to split vacation periods throughout the year. As a
consequence, the sector becomes economically stronger and drops its
seasonality.
• Spartan facilities and meagre service are replaced by refurbished rooms and
flexibility to improve the customer’s perception of quality. More ancillary
services are added, transforming most traditional spas into spa resorts and
traditional resorts into resort spas. Business models with open innovation
(Chesbrough, 2003) turn out to be common. As a result, products are quickly
subject to substitution.

J. Vázquez-Illa Navarro
67 Enlightening Tourism. A Pathmaking Journal, Vol 4, No 1 (2014), pp. 52-78 ISSN 2174-548X
• Customer loyalty dwindles since the therapeutic effects of mineral waters are
questioned and new segments prefer variety regarding their choice of where to
spend their holidays. Bundle products become a critical factor of success.
• Packages become paramount, and it is possible to buy and book a hotel stay
and a spa treatment in advance.
Spa industry paradigm components until the 1990s in Europe
Exclusive use of thermal waters for treatments
Single target market: seniors suffering from rheumatic ailments
Long stays at resorts
Seasonality of business: most resorts only operate at summer season
Spartan facilities and unattractive and inefficient service provision
Lack of ancillary services
Customer loyalty is out of the question
Lack of packages
Spa industry paradigm components since the 1990s in Europe
Thermal water is used for clients who search for different benefits
Less seasonality
Increase in the number of target markets
Short stays at resorts
Room comfort goes to the forefront
Business models with open innovation
More ancillary services
Perception of quality improves
Loss of customer loyalty
Products burn out quickly
Table 3: Thermal paradigm versus well-being paradigm
The launching of TermaEuropa coincides with the repositioning of the older health
resorts and the appearance of new hotel spas in order to capitalize on the emerging
social trends promoting relaxation treatments while on vacation from 1995 to 2002
(Metra Seis, 1997, 2000, 2004).

J. Vázquez-Illa Navarro
68 Enlightening Tourism. A Pathmaking Journal, Vol 4, No 1 (2014), pp. 52-78 ISSN 2174-548X
TermaEuropa is created with the mission of becoming the first hotel spa company
in Spain, with open innovation, catering to segments with different motivations, in
centres run under a rigid quality policy.
TermaEuropa’s vision is the offering of centres located in nature, but not too far
from big cities, and with an array of health-related programmes. Health means, in this
case relaxation, feeling well, looking younger.
TermaEuropa has the following positioning strategy:
• As a company:
– Being a leading company at the Spanish market and expanding through the
development of new products, market penetration and targeting of new
segments.
• As a product:
– Offering the highest market quality with the exclusive use of mineral springs
water or sea water in secluded locations.
• For their clients:
– Providing the best service, guaranteeing quality and safety at the same time.
Its expansion strategy comprises the development of new hotel spas as well as
the addition of third-party projects, participating in their designs from the very
beginning through the attainment of lease agreements:
- Arnedillo Spa Resort is the first hotel to be managed. On a highland zone of
La Rioja-Spain, the Arnedillo mineral springs spa has existed since 1847. In
the mid-1990s the resort initiated a repositioning strategy (Bell and Vazquez-
Illa, 1996) that lead it to focus on the emerging relaxation segments. Its entry
into TermaEuropa reinforces its recently-adopted strategy.
- Carlos III Spa Resort, located in Trillo (Guadalajara, Spain), is the first
Spanish mineral springs spa that was laid out during the Age of Enlightment.
After its decadence throughout the 20th century, the resort reopened in
August 2005, as a result of a deal between TermaEuropa and the town hall of
Trillo.
- Coma-Ruga Spa Resort is a mineral springs spa situated in close proximity to
the Mediterranean Sea, hence capitalizing on its two main drivers: the spa
and the beach. Its opening as a new venture took place in July 2006. The
hotel incorporates the typical characteristics of TermaEuropa’s health resorts:
J. Vázquez-Illa Navarro
69 Enlightening Tourism. A Pathmaking Journal, Vol 4, No 1 (2014), pp. 52-78 ISSN 2174-548X
dynamic pools, Roman baths, thermal treatment rooms, and beauty and
massage rooms.
- In the heart of the city of Valencia stands the Alameda mineral springs day
spa, which had its heyday during most of the 20th century until its decline.
The venue revamping in 2006 would add to the city’s tourist positioning, while
it would offer locals the possibility to enjoy the array of services of an urban
mineral springs spa.
5.3 TermaEuropa’s business model
TermaEuropa’s business model incorporates the predominant spa model’s
distinctive features (the amenity spa), although keeping its singularity as a
destination spa with thermal waters. To this respect, it integrates the social trends
that foster hotel stays motivated by the need for relaxation, and the average client’s
expectations regarding health and leisure. Its differentiation strategy is here justified
due to TermaEuropa’s unique value proposition that merges the essence of the older
paradigm, the mineral springs spa, with a pristine product presentation clearly linked
to its medium-high target market.
TermaEuropa’s main contribution stems from the fact that developing an open
business model, targeted to several segments and with a variety of options, does not
belie its profile of destination spa, where its clients come due to health motivations in
a broad sense. Its clients’ main motivation involves health concerns. In fact, it is
observed that former innovators (first customers) motivated by relaxation
considerations in their stays at spa resorts at the beginning, evolve gradually to be
stimulated by health reasons.
The choices and consequences of the model are:
- Thermal waters. The management of mineral springs spas provides the basis
for a differentiation strategy in relation to the ordinary spa, making it possible
for the customer to obtain a greater benefit from the treatments.
- Proximity to the market. The location of resorts close to their primary markets’
places of residence, make it possible for the resort to focus on short stays
(weekend vacations mainly), constitutes a key factor for success.
- Attractive surroundings. The attractiveness of the landscape adds to the
customer’s experience and reinforces their satisfaction.

J. Vázquez-Illa Navarro
70 Enlightening Tourism. A Pathmaking Journal, Vol 4, No 1 (2014), pp. 52-78 ISSN 2174-548X
- Full panoply of effective programs. The customer is reinforced in their decision
power by presenting them with a variety of services that eventually improve
the perception of the service provided.
- Classic hotel renovated and spa with modern design. Spas add contemporary
features in order to eliminate the older image of decadence associated with
old-fashioned spas and municipal properties. However, the linkage with history
is established through the reproduction of pictures of the old facility on the spa
walls. Both elements contribute to the company’s differentiation and to the
strengthening of its market positioning.
- Strict policy of cleaning and disinfection. Cleaning and disinfection procedures
are enforced and communicated to the client. As a result, customer trust and
loyalty are increased.
- Standardized providing of the service and product customization. The
standardization of the service makes it possible to keep labour costs within
limits by blurring the differences between therapists, and avoiding the situation
of a therapist with an excessive work-load while others are practically idle.
Flexibility to adapt to the customer’s needs is considered respecting the strict
time limits of the treatment.
- Target markets: RX, NRR. Every model’s choice is bond to the primary
segment targeted by the company: the RX or relaxation segment that pushes
the growth rate experienced by the industry since the mid-1990s. The other
segment, the NRR (new rich rheumatic) comprises the first clients who
attended spas due to relaxation motivations, but, ten years later, start to be
seduced by health motivations.
- Capacity to get in touch with the target markets. The RX segment is a large
one, whose needs are well known, with whom the company may
communicate, due to the previous experience with Arnedillo spa resort.

J. Vázquez-Illa Navarro
71 Enlightening Tourism. A Pathmaking Journal, Vol 4, No 1 (2014), pp. 52-78 ISSN 2174-548X
6. CONCLUSIONS
The research’s objectives were the creation of theory to help in the understanding
of the spa industry evolution and future prospects.
The undertaken research yields the following results:
1. The spa industry’s conformity to product life cycle and business model
theories has been ascertained except for the crucial role played by early
entrants at maturity stage, and the high-impact effects of the dominant design,
also at maturity stage, which forces unsuccessful incumbents out of the
industry and deters new entrants. The kind of innovation present at the spa
industry and how it shapes its evolution should be further studied for a
comprehensive assessment of the phenomenon.
2. The current and predominant spa business model is the amenity spa whose
value proposition offers a more comprehensive experience than the traditional
destination spa.
3. The current model’s deficiencies derive from the model’s choices: heavy
investment in real estate, a health and leisure approach and a body focus. The
consequences of those choices are: high amortization costs, high fixed costs
and market confusion.
4. The industry’s future prospects look, however, encouraging since the sector is
highly related to long-range social trends.
5. Working on improving the prevalent spa business model, through the
development of low-cost alternatives and focus strategies, will help moderate
the highly competitive environment, as nonconformity to propositions 4 and 5
brings to the fore, and, eventually, will foster a new growth curve that prevents
the industry from entering into a phase of stagnation.

J. Vázquez-Illa Navarro
72 Enlightening Tourism. A Pathmaking Journal, Vol 4, No 1 (2014), pp. 52-78 ISSN 2174-548X
References
Abercrombie, N.; Hill, S. and Turner, B. The dominant ideology thesis. G. Allen &
Unwin (London and Boston), 1980.
Abernathy, W. and Clark, K. Innovation: Mapping the winds of creative destruction.
Research Policy, N° 14, 1985, pp. 3-22.
Agarwal, R. and Audretsch, D.B. Does entry size matter? The impact of the life cycle
and technology on firm survival. Journal of Industrial Economics. Vol. 49, Nº 1, 2001,
pp. 21-43.
Agarwal, R.; Sarkar, M.B. and Echambadi, R. The conditioning effect of time on firm
survival: An industry life cycle approach. Academy of Management Journal. Vol. 45,
Nº 5, 2002, pp. 971-994.
Bacon, W. The rise of the German and the demise of the English spa industry: a
critical analysis of business success and failure. Leisure Studies, N°16, 1997,
pp.173-187.
Bell, R. and Vazquez-Illa, J. Planning for a competitive strategy in a declining
industry. Positioning Spain’s Arnedillo hotel spa, L.C. Harrinson and W. Husband,
Eds.: Practicing Responsible Tourism. International Case Studies in Tourism
Planning, Policy and Development, John Wiley and Sons, New York, 1996.
Bjurstam, A. Hotel spas, a focus on results. In Hotel Yearbook 2010. École Hotelière
de Laussane – Cornell University Hotel School, 2010, pp.190-193.
Bywater, M. Spas and health resorts in the EC. Travel & Tourism Analyst. N° 6 , The
Economist Intelligence Unit, 1990.
Campbell, D. and Stanley, J. Experimental and quasi-experimental designs for
research. Houghton Mifflin Company Boston, 1963.

J. Vázquez-Illa Navarro
73 Enlightening Tourism. A Pathmaking Journal, Vol 4, No 1 (2014), pp. 52-78 ISSN 2174-548X
Carrol, G. and Hannan, M. Density dependence in the evolution of populations of
newspapers organizations. American Sociological Review; Vol. 54, Nº 4, 1989, pp.
524-541.
Casadesus-Masanell, R. and Ricart, J. How to design a winning business model.
Harvard Business Review, January-February, 2011, pp. 101-107.
Cátedra, M. El Agua que cura. Revista de Dialectología y Tradiciones Populares,
Vol. LXIV, Nº1, 2009, pp. 177-210.
Caves, R. and Porter, M. From entry barriers to mobility barriers. Quarterly Journal of
Economics. Vol. 91, Nº 2, 1977, pp. 241-262.
Chesbrough, H. Open business models: How to thrive in the new innovation
landscape. Harvard Business School Press, 2007.
Christensen, C.; Bohmer, R. and Kenagy, J. Will disruptive innovations cure health
care? Harvard Business Review, 2000.
DBK. Estudio Balnearios, 2009.
Deloitte. Estudios sobre oferta y demanda de turismo de salud, 2005-2007.
Deloitte-New York University. Hospitality 2010. Deloitte Hospitality, Tourism and
Leisure, 2006.
Eisenhardt, K. Building theories from case study research. Academy of Management
Review, Vol. 14, Nº 4, 1989, pp. 532-550.
European Travel Commission. Tourism Trends for Europe. www.etc-corporate.org,
2006.
Glaser, B. and Strauss, B. The discovery of grounded theory: strategies for
qualitative research. New York: Aldine Publishing Company, 1967.

J. Vázquez-Illa Navarro
74 Enlightening Tourism. A Pathmaking Journal, Vol 4, No 1 (2014), pp. 52-78 ISSN 2174-548X
Hartman Group. Consumer trends report: Variations and trends on the consumer spa
experience. Lexington, KY: International Spa Association, 2006.
Intelligent Spa Pte Limited. 2009 Global Spa Summit. Spa Benchmark Report.
Singapore: Intelligent Spa Pte Limited, 2009.
International Spa Association (ISPA). The International SPA Association Pinpoints
Spa Trends for 2010. http://www.hotelschool.cornell.edu/research/, 2009.
International Spa Association (ISPA). Spa industry reports. Lexington, KY: ISPA.
www.experienceispa.com, 2002-2008.
Instituto de Empresa. Relax Center, Análisis de Mercado, 2006.
Kapczynski, A. and Szromek, A.R. Hypothesis concerning the development of Polish
spas in the years 1949-2006. Tourism Management, N° 29, 2008, pp. 1035-1037,
Elsevier.
Keri, K.; Ottenbacher, M.; and Harrington, R.J. The North-American spa industry: an
examination of emergent trends. Florida International University Hospitality Review,
Vol. 25, nº 1, 2007, pp. 50-60.
Klepper, S. Industry life cycles. Industrial and Corporate Change, Vol. 6, Nº 1, 1997,
pp. 145-181.
Klepper, S. and Simons, K. Industry shakeouts and technological change. Carnegie
Mellon University, 1999.
Kotler, P. Marketing Management: Analysis, Planning, Implementation & Control.
Prentice-Hall, Inc., Englewood Cliffs, New Jersey, 1988.
Kuhn, T.S. The structure of scientific revolutions. The University of Chicago Press,
1962.

J. Vázquez-Illa Navarro
75 Enlightening Tourism. A Pathmaking Journal, Vol 4, No 1 (2014), pp. 52-78 ISSN 2174-548X
Kyricos, M. Spa, more than an indulgent promise. Hotel Yearbook 2010. École
Hotelière de Laussane – Cornell University Hotel School, 2010, pp. 186-189.
La Gazette Officielle Du Thermalisme. Journée Nationale du Thermalisme. Pau,
Samedi 9 novembre 1996 – Parlement de Navarre. Nº 46, 1997, Numéro Spécial.
Les Dossiers De La Lettre Touristique. Quelle politique pour quel thermalisme? Les
thermalismes européens. Produits cherchent marchés. Les Dossiers de la Lettre
Touristique, 1992.
Lerner, G. Hotel Spas Recession Overload. PKF Consulting, 2010.
Levitt, T. Exploit the Product Life Cycle. Harvard Business Review. November-
December, 1965, pp. 81-84.
Levitt, T. Putting the Product Life Cycle to Work. Harvard Business Review. January,
1966, pp. 19-23.
Magretta, J. Why Business Models Matter. Harvard Business Review. May, 2002, pp.
3-8.
Mansfield, G.H. and Fourie L.C.H. Strategy and business models – strange
bedfellows? A case for convergence and its evolution into strategic architecture.
South African Journal Business Management. Vol. 35, Nº 1, 2004, pp. 35-44.
Mak, A., Wong, K. and Chang, R. Health or Self-indulgence? The Motivations and
Characteristics of Spa-goers. International Journal of Tourism Research. Vol. 11, Nº
2, 2009, pp. 185-199.
Metra Seis. Estudio sobre el turismo termal – Encuesta a usuarios potenciales, 1997.
Metra Seis. Actitudes hacia balnearios, 2000 y 2004.

J. Vázquez-Illa Navarro
76 Enlightening Tourism. A Pathmaking Journal, Vol 4, No 1 (2014), pp. 52-78 ISSN 2174-548X
Montenson, P. Spas can be profitable. Hotel and Motel Management. February 4,
2008, pp. 12.
Montenson, P.; Singer, J. Back to Basics. Lodging Hospitality. August, 2009, pp. 8-9.
Orbeta Heytens, A. and Tabacchi, M. A Market Survey of Non Spa-Goers.
Monograph, Faculty of Graduate School of Cornell University, 1995.
Pastor, A. La coyuntura en los balnearios urbanos y spas. Jornadas Técnicas de la
Asociación Española de Balnearios Urbanos. Madrid, 2008.
Pastor, A. ¿Cuidarse, Vida Sana… o Simple Culto al Cuerpo? Spa & Wellness,
Maximun, 2007, pp. 88-90.
PKF. Consulting and PKF Hospitality Research, Trends in the hotel spa industry,
2009.
Plog, S. Why destination areas rise and fall in popularity. Cornell Hotel and
Restaurant Administration Quarterly. Vol. 42, Nº 3, 2001, pp. 1-12.
Porter, M. Competitive strategy. New York: Free Press, 1980.
San Pedro, M. El turismo balneario de interior en Cantabria. El caso de Puente
Viesgo (1796-1936). Revista de Estudios Turísticos, N° 121, 1994, pp. 27-66.
Soto Roland, F. La limpieza en la historia. www.monografias.com, 2006.
Stanford Research Institute. The global wellness tourism economy. Presented at the
2013 Global Wellness Tourism Congress in New Delhi, India, 2013.
Stewart, D. and Zhao, Q., Internet marketing, business models and public policy.
Journal of Public Policy & Marketing. Nº 19, 2000, pp. 287-296.

J. Vázquez-Illa Navarro
77 Enlightening Tourism. A Pathmaking Journal, Vol 4, No 1 (2014), pp. 52-78 ISSN 2174-548X
Stigler, G. The division of labor is limited by the extent of the market. The Journal of
Political Economy. Vol. LIX, N° 3, 1951, pp. 185-193.
Sutton, J. Gibrat’s legacy. Journal of Economic Literature. Vol. 35, Nº 1, 1997, pp.
40-59.
Tabacchi, M. Current research and events in the spa industry. Cornell Hospitality
Quarterly. Vol. 51, Nº 1, 2010, pp. 102-117.
Trucco, T. Feel the Burn? It's More of a Glow. The New York Times on the Web,
2000.
Utterback, J. and Suárez, F. Innovation, competition, and industry structure.
Research Policy, N° 22, 1993, pp. 1-21.
Van Putten, F. Spa Trends. International Spa Association, 2003.
Weisz, G. Spas, Mineral Waters, and Hydrological Science in Twentieth-Century
France. Journal of the history of science in society. Vol. 92, Nº 3, 2001, pp. 451-483.
Yin, R. Case study research. Beverly Hills, CA: Sage Publications, 1984.
Zott, C.; Amit, R. and Massa, L. The Business Model: Recent Developments and
Future Research. Journal of Management, published online 2 May 2011.
Article info: Received 08/12/13. Accepted 24/02/14. Refereed anonymously.

J. Vázquez-Illa Navarro
78 Enlightening Tourism. A Pathmaking Journal, Vol 4, No 1 (2014), pp. 52-78 ISSN 2174-548X
1 Differentiation strategy, as in Porter’s, 1980, seeks to create something that is perceived industry wide as unique. Costs, however, are the firm’s main concern in a cost leadership strategy. A focus strategy will concentrate on a particular segment, product line or geographic market; the firm will achieve cost leadership, differentiation or both with regard to its market niche.

A. Botti; S. Esposito de Falco; M. Vesci
79
Enlightening Tourism. A Pathmaking Journal, Vol 4, No 1 (2014), pp. 79-107 ISSN 2174-548X
A MODEL OF ANALYSIS FOR THE EVALUATION OF
TOURIST DESTINATION APPEAL: THE AMALFI COAST.
A CASE STUDY
Antonio Botti
University of Salerno (Italy)
Salvatore Esposito de Falco
University of Rome “La Sapienza” (Italy)
Massimiliano Vesci
University of Salerno (Italy)
ABSTRACT
Core resources and attractors have long been at the center of studies on the competitiveness
of tourist destinations. However, such studies treat factors of appeal in a cumulative way
without, or at least rarely, integrating the perspectives of both supply and demand. Our paper
intends to verify whether the scale of importance of the attractors detains an absolute value or
whether such value varies on the basis of type of destination. The study proposes a model of
analysis of destination appeal which takes into account the perception that both hotel
management and potential tourists have of such attractors.
KEY WORDS
Destination Management, Territorial Competitiveness, Hotel Management.
ECONLIT KEYS
L83, M10, M21, O10

Enlightening Tourism. A Pathmaking Journal, Vol 4, No 1 (2014), pp. 79-107 ISSN 2174-548X
80
1. INTRODUCTION
The studies on tourist destination competitiveness can be identified substantially by
means of two approaches: one with a focus on the specifics (core resources and
attractors) of the destination and the other that considers more general elements of
competitiveness that can be applied not only to tourism enterprises but also to any other
kind of enterprise. In the first approach numerous studies address attention to the image
and appeal of a destination (Chon, Weaver, Kim, 1991, Hu, Ritchie, 1993, Gallarza, Saura,
Garcia, 2002) linking the capacity to attract tourists by the presence of specific factors
such as climate, scenery and accommodation.
Crouch and Ritchie’s approach to destination competitiveness (1999) broaden previous
studies that focus on destination image or appeal. Enright and Newton (2004) maintain
that in order to analyze the competitive capacity of a destination besides the traditional
factors of tourist appeal it is necessary to consider also factors that impact on corporate
competitiveness in terms of available tourist product. A destination is competitive if it
succeeds in attracting and satisfying the needs of potential tourists. Consequently, core
resources, attractors and firm’s competitiveness capacity are essential.
Our paper starts from the perspective of analysis based on core resources and
attractors and attempts to examine the same in terms of matching supply and demand as
suggested by Formica (2002), and Formica and Uysal (2006). In this context, the paper
focuses on two objectives:
– Ascertain whether the scale of importance of the attractors has an absolute value. i.e.
whether the attractors proposed for the analysis of the competitiveness of a tourist
destination can be classified within a single scale.
– Assess whether the attractors are attributed the same degree of importance by
potential tourists and enterprises alike.
In the first instance, the paper puts in place a comparative analysis between two tourist
destinations: Hong Kong and the Amalfi Coast, in terms of the importance attributed to
destination attractors by tourist firms. Subsequently, importance is measured in terms of
demand (tourist potential) and of supply (tourist firms). The analysis is elaborated by
means of an attribute based perspective (Enright, Newton, 2004; Crouch, Ritchie, 1999;
Ritchie, Crouch, 2000; Ritchie, Crouch, 2003).

Enlightening Tourism. A Pathmaking Journal, Vol 4, No 1 (2014), pp. 79-107 ISSN 2174-548X
81
2. DESTINATION AND TERRITORY COMPETITIVENESS
One of the main issues in defining the concept of competitiveness of a destination or
territory lies in the identifying of factors that decree its success. Currently, the literature on
territorial competitiveness has begun to shift from a strictly micro-economic approach
based on the results of individual firms, to a wider vision envisaging the territory as a
‘source’ of competitiveness.
The territory in other words, becomes a factor of competitiveness when it is able to offer
the enterprises a favorable environment of ‘intense’ social and economic relations, open to
cooperation and participation in the numerous networks external to the firms, fundamental
in determining success1. The concept of territorial competitiveness proposed by Scott and
Storper (2003)2 encloses the concept of relational capital, albeit preserving competitive
advantage in line with Porter’s approach. The need to take into account a wider territorial
dimension as concerns the study of destination competitiveness is evidenced by Keller
(2000) who maintains that tourist service packages cannot be separated from the territory
itself, for which tourist product and destination tend to overlap. Mannell and Iso-Ahola
(1987) acknowledge the existence of many points of view in defining destinations but they
evidence how from the client’s point of view, the idea of destination is the sum of their
experience, expectations, and degree of satisfaction. Consequently, the uniqueness of the
tourist product resulting from a tourist’s experience and the destination can be considered
as Tamma (2000) observes, on a par with an ‘ideal concept’: it is a ‘category of syntheses’.
The same approach is evidenced in Buhalis (2000, p. 97-98) who goes beyond the
traditional conceptions3 remarking that a destination can also be “…a perceptual concept,
which can be interpreted subjectively by consumers, depending on their travel itinerary,
cultural background, purpose of visit, educational level and past experience …
destinations are considered to be a defined geographical region which is understood by its
1 Esposito De Falco (2012) analyzed a model for the study of the competitiveness of tourism firms based on the ability to influence of the territorial system. Cfr. Esposito De Falco S., 2012, p. 39-57.
2 “… theory that we shall attempt to elaborate here puts considerable emphasis on the role of the region as a source of critical developmental assets in the form of increasing returns effects and positive externalities” Scott e Storper (2003, pag. 193).
3 In particular the reference is to those who consider a destination as a well defined geographical area, such as a
Nation, an Island, or a city (Davidson, Maitland, 1997).

Enlightening Tourism. A Pathmaking Journal, Vol 4, No 1 (2014), pp. 79-107 ISSN 2174-548X
82
visitors as a unique entity, with a political and legislative framework for tourism marketing
and planning”.
Murphy, Pritchard and Smith (2000) evidence that a tourist destination product includes
both service infrastructure (hospitality, refreshment, transport, shops, leisure services,
etc.) and environmental elements. The concept of competitiveness therefore, takes on a
much wider and multidimensional perspective considering not only economic growth in the
strictest sense but also the qualitative-quantitative enhancement of all the other
dimensions of the territory including sustainability (Gemmiti, 2007; Kitson, Martin, Tayler,
2004). In this sense Ejarque (2003, p.7) maintains that “…destination is made up of a
series of attractors and services ” for which “… it is no longer sufficient just to have
services in the same way that it is no longer sufficient to have only attractors”.
The association between the competitiveness of the tourism sector and the territorial
dimension is the object of research studies relative to Systems of Tourism Supply (Rispoli,
Tamma, 1995; Della Corte, 2000) and destination management (Ritchie, 1993; Laws,
1995; Bieger, 2000; Buhalis, 2000; Franch, 2002). Such studies compared to sociological
and industrial analysis introduce the element of the strategic-managerial approach, without
neglecting the systems element which pivots on the capacity of the destination to offer
integrated, coordinated and differentiated services proper to a specific territory (Della
Lucia, Franch, Martini, Tamma, 2007, p. 5).
Returning to the issue of competitiveness it is quite evident that the concept cannot be
considered from an absolute dimension but has to be seen from the perspective of
competitors. Thus a further element of complexity has to be considered given that such
comparison necessitates a multidimensional measuring, based on a plurality of elements
(Scott and Lodge, 1985).
The success of a tourist destination depends on a variety of factors which can only in
part be governed. The destination, besides possessing attractors equal or superior to
those of competitors, has to offer excellent quality in terms of services. The attaining of
such services requires cooperation and collaboration among the stakeholders (Edgell,
Haenisch, 1995).
3. FACTORS OF COMPETITIVENESS
The success of tourist destinations being influenced by their competitiveness both in
terms of structural elements of the territory and to its factors of competitiveness (Porter,

Enlightening Tourism. A Pathmaking Journal, Vol 4, No 1 (2014), pp. 79-107 ISSN 2174-548X
83
1998; Enright, Newton, 2004) and to the dynamic aspect of strategic corporate behavior
(Claver-Corte´s, Molina-Azorìn, Pereira-Moliner, 2007).
Enright, Scott e Dodwell (1997) proposed a model of analysis of tourist destination
competitiveness wherein they divide factors of competitiveness into six categories:
“inputs”, “industrial and consumer demand”, “inter-firm competition and cooperation”,
“industrial and regional clustering”, “internal corporate organization and strategy”,
“institutions, social structures and agendas”. For his part, Buhalis (2000) has proposed a
model of the “six A” to define the factors of competitiveness of a destination. For Buhalis
(2000, page 98) most destinations have numerous “attractions available (natural, man-
made, artificial, purpose built, heritage, special events), accessibility (entire transportation
system comprising of routes, terminals and vehicles), amenities (accommodation and
catering facilities, retailing, other tourist services), available packages (pre-arranged
packages by intermediaries and principals), activities (all activities available at the
destinations and what consumers will do during their visit), ancillary services (services
used by tourists such as banks, telecommunications, post, newsagents, hospitals, etc.)”.
On the other hand, De Holan and Phillips (1997, page. 781) using as reference Porter’s
“competitiveness diamond of nations” (1990), maintain that for “…countries like Cuba, the
existence of world-class ‘‘sun and sand’’ provides a basis for competitiveness in tourism,
but it does not guarantee development or success in the tourism industry. Other factor
conditions, such as human resources, infrastructure and capital, and the other three
determinants that make up the diamond stand as potential barriers to development”.
Consequently, the availability of core resources acknowledged on a worldwide scale in the
case of the sun and sand in Cuba is no guarantee for success if other resources are not
available.
Chon and Mayer (1995), for their part, taking inspiration from the general model of
competitiveness elaborated by Porter (1990), develop a model of analysis of tourist
destination competitiveness by defining five dimensions: appeal, management,
organization, information and efficiency. Furthermore, they incorporate in their study also
tourism specific issues (such as the intangibility of the tourism product). Crouch and
Ritchie, (1993) too, using Porter’s diamond paradigm (1990), proposed a model based on
four components: “core resources and attractors”, “supporting factors and resources”,
“destination management”, “qualifying determinants”. The model has been extended and
updated several times (Crouch, Ritchie, 1999) becoming an effective point of reference in

Enlightening Tourism. A Pathmaking Journal, Vol 4, No 1 (2014), pp. 79-107 ISSN 2174-548X
84
the evaluation of the competitiveness of a destination and comprising besides the basic
elements indicated, also destination policy, planning and development and the distinct
concept of sustainability (Ritchie, Crouch, 2000; Ritchie, Crouch, 2003).
The model of Crouch and Ritchie (1999) has been adapted to a certain extent by
Enright and Newton (2004) who have identified fifteen items defined “attractors” and thirty
seven items defined “business-related factors” useful for measuring and comparing the
competitiveness of a destination. The attractors include items that derive in substance,
directly from the resources and from the fundamental factors of appeal included in Crouch
e Ritchie’s (1999) model and specific items deriving from studies on urban tourism. The
business related factors on the other hand, mainly concern those deriving from Porter’s
(1990) diamond.
Core resources and attractors are primary elements which generate the capacity to
attract tourists; consequently, they can be considered the structural factors of
competitiveness. They do not however, guarantee the success of a destination but have to
be integrated and enhanced through synergic action on the part of all the stakeholders
involved in the successful realization of an excellent “tourism product”.
In the literature, core resources and attractors are classified as any factor from a tourist
viewpoint constituting the fundamental reason for their choice of a particular destination.
Usually these factors are represented (Crouch & Ritchie, 1999, Ritchie & Crouch, 2000,
Enright, Newton, 2004, Kim, 1998) by geo-morphological (climate, panorama, etc.),
historical cultural elements, the presence of specific ties (between residents and the
Regions of origin of the tourists), by particular events or tourist structures (hospitality
services, catering, transport, appeal factors, etc.).
The models proposed by scholars in the literature consider core resources and
attractors on the same plane4. In our paper, however, the focus is placed on the attractors
in order to verify whether the importance attributed to them creates a stable hierarchical
structure or whether such structure varies on the basis of type of destination and kind of
tourism. At the same time, the paper attempts to develop the analytical perspective
suggested by Formica (2002) and Formica and Uysal (2006) evaluating for the Amalfi
Coast, the perception of importance attributed to the attractors by demand and supply.
In short, the paper intends to respond to the following research questions:
4 Vargas (2011, 93-110), in particular, highlights that the evolution in the tourism research is determined on active research groups, centers and networks concerned with tourism that exist in the country at the moment.

Enlightening Tourism. A Pathmaking Journal, Vol 4, No 1 (2014), pp. 79-107 ISSN 2174-548X
85
1. Does the importance attributed to the attractors by those who predispose supply
(hotels in particular) result in a univocal hierarchical structure or does such structure vary
on the basis of type of destination?
2. Is the perception of the importance attributed to the attractors by supply similar to
that attributed by demand?
4. METHODOLOGY
To respond to the first question (verify whether the importance attributed by enterprises
to the attractors is univocal) a comparison was carried out between the evaluations
reported in the study by Enright and Newton (2004). For this reason an homogeneous
analytical tool was constructed compared to the one used by the two researchers. Enright
and Newton (2004), in effect evaluated the importance attributed to factors of appeal for
destinations in Hong Kong. Enright and Newton’s analysis was carried out by submitting a
questionnaire to enterprises working in the tourism sector (hotels) that were part of the
HKTA (Hong Kong Tourist Association). In the present study, a similar questionnaire was
submitted relative to the tourist structures of the Amalfi Coast5.
It emerges that the Amalfi Coast, on the basis of the classification of tourist destinations
proposed by Buhalis (2000), fits adequately entrance criteria for the so-called seaside
destinations and according to the model, numbers several characteristics that would
collocate the such destination in a phase of maturity or even, decline6.
The questionnaire was sent to all of the 108 hotel facilities classified as three, four and
five star respectively. The period covering data collecting ranged from March to May 2012,
with 52 questionaires returned. The uncompleted ones were discarded. This left a dataset
of 38 units. The hospitality structure of the respondents is illustrateed in Table 1 where
distribution by category is reported with respect to the composition of the area. The sample
represents 35% of the total and the distribution frequency of the responses on the basis of
5 The choice of the Amalfi Coast was selected for analysis as it represents a context that goes beyond the territorial dimension issues of competitiveness. In paragraph 2 differing opinions as to whether competitiveness has to be evaluated at individual destination scale or territorial scale was highlighted. The Amalfi Coast acknowledged as a World Heritage Site by UNESCO, represents an example in which the image of the single destinations is equal to that of the entire territorial area. Consequently, its dimensions (single destination or territorial area as a whole) cannot be clearly distinguished either in terms of its geographic profile or from the perspective of potential client perceptions.
6 In the Amalfi Coast area, hospitality capacity is high while that of the employment rate in the structures is low. Profits
are on the decline and generally, with the exception of the exclusive destinations such as Positano and Ravello), the hospitality structures mainly cater for the mass market not necessarily characterized by the international segment.

Enlightening Tourism. A Pathmaking Journal, Vol 4, No 1 (2014), pp. 79-107 ISSN 2174-548X
86
number of stars reflects to a satisfactory extent the hospitality structures as a whole; it
follows that the result can thus be considered representative of the total.
Values in absolute Values in percentage
Stars Random sample Valid questionnaires Random sample
Valid questionnaires
5 16 3 15% 8% 4 38 10 35% 26% 3 54 25 50% 66%
Totale 108 38 100% 100% Table 1: Distribution of frequency of the sample by number of stars
Source: OWN ELABORATION.
In order to respond to the first research question, the enterprises were asked to
evaluate the importance and the presence of twelve attractors. Obviously, in order to carry
out the comparison between the two destinations (clearly belonging to different categories)
reference was made only to attractors that both Hong Kong and the Amalfi Coast have in
common.
To respond to the second research question, the same question was submitted to the
entire cohort of students registered for the ‘Magistrale’ Degree Courses of the Faculty of
Economics, equal to 579 in number. 174 questionnaires were returned and selected: in
particular, the ones where the respondents were familiar with or at least had been on
holiday to the Amalfi Coast were selected. The comparison of this circumstance and how
Italian families are structured with that of subjects who influence the choice of holiday
destinations enabled us to match the opinions of the students with that of potential or
effective clients of the structures7.
As concerns the role of offspring in choosing holiday destinations, this has been widely
underestimated in the past and little studied. Anyway, Ryan (1992) has evidenced that
children play an important role in determining adult satisfaction in that a holiday is
satisfactory for the family when all its members are happy and content. Gram (2005) also
points out that opportune choices combining the needs of all the family are fundamental.
According to Ryan (1992) children influence the behavior and decisions of the rest of the
family both in terms of negotiating power and of the specific requests that they make. This
capacity for influence is clearly greater in families with what Carlson and Grossberg (1988)
7 With reference to the liking expressed by young tourist destination appeal, see also M. Viassone (2012, 96-116).

Enlightening Tourism. A Pathmaking Journal, Vol 4, No 1 (2014), pp. 79-107 ISSN 2174-548X
87
define as democratic and permissive parents. At International scale, Gram (2007) in a
research carried out in Denmark and Germany, evidenced how in decisions relative to
family purchases, children exert great influence directly and indirectly, consciously and
unconsciously. In this context, Watne and Winchester (2011) studied the influence
adolescent children have over their parents with regard to holiday decisions. The research
shows that families in general do not see their adolescent children as more knowledgeable
than the parents when it comes to holidays. However, the level of knowledge the family
perceives the children to have is strongly related to how much influence the children then
have over their parents. Generally daughters have a greater influence on their parents’
holiday decision making than sons. Fontana e Maeran (2009) highlight how also in Italy
the influence children have in the choice of holiday is significant.
Thus children generally speaking, have remarkable influence on the choice of tourist
destinations and as they get older and acquire more knowledge so their influence grows.
Consequently, the decision to interview a sample of university students derived from at
least three considerations:
– they are mature enough to influence parental or family decision making;
– they could be potential clients;
– in Italy the cultural model rarely envisages children leaving the family before marriage
(Inps, Ministero del Lavoro e delle Politiche Sociali, Istat, 2013, Kuijsten, 1996)8.
Student responses indicated a perceptive framework relative to the importance of the
attractors selected and their presence in the Amalfi Coast area. The subsequent
comparison between the evaluations of enterprises and the students indicated a
framework of the extent to which supply and eventual demand concur with regard to the
importance attributed to factors of appeal as well as the extent to which the subjects
themselves perceive the presence of such factors in the area.
This ulterior analysis enabled us to investigate the appeal of the the Amalfi Coast area
by examining relations between supply and demand indicators. The importance has been
underlined in the literature of proceeding by means of joint analyses of demand and supply
8 The latest Report on Social Cohesion (Inps, Ministero del Lavoro e delle Politiche Sociali, Istat, 2013) evidences that in Italy over 60% of unmarried men under 35 (6,964,000) still live with at least one parent , an increase of 2% compared to the previous year. Youngsters between the age of 18 and 24 living at home with their parents number 3,864,000; the number is not much lower as concerns the age group 25-34 (3,100,000). Consequently, unmarried young people aged between 20 and 30 in almost 50% of cases live at home with their parents. This is more accentuated in the South of Italy - where the Amalfi Coast is situated – arriving at a percentage of 68.3% of young people living at home.
Enlightening Tourism. A Pathmaking Journal, Vol 4, No 1 (2014), pp. 79-107 ISSN 2174-548X
88
also in the tourism sector (Formica, 2002). Also Formica and Uysal (2006) perceived
destination attractiveness to be the relationship between the availability of attractions and
their perceived importance to the tourist.
The questionnaire was submitted on-line. To evaluate importance and presence a Likert
5 point scale was used with 1= none and 5 =all.
A comparison was then made between means scores and in particular, between the
mean score of importance and the acknowledged presence assigned to each group by the
various groups of respondents. To evaluate whether the difference between the results
reported in the two distributions were statistically significant a T-Test – typically formulated
for independent samples –was carried out. This format resolved problems related to the
varying dimensions of the sample. In order to transform the indications from the statistical
analysis into pragmatic indications suggesting an eventual course of action and in order to
evaluate jointly the perception of supply and demand, a grid was devised similar to that of
the importance-performance tool elaborated by Martilla and James (1977).
4.1) THE IMPORTANCE PERFORMANCE ANALYSIS: A TOOL IN EVOLUTION FOR
CONSIDERING BOTH SUPPLY AND DEMAND.
Martilla and James (1977) presented the IPA Grid (Importance-Performance Analysis)
as a simple but useful tool for transforming the results obtained from research into actions.
In particular, the tool proposed by the two Authors evaluates factors of success compared
to the characteristics of importance and perfomance. The tool has often been used in
studies on tourism (Evans & Chon, 1989; Go & Zhang, 1997; Guadagnolo, 1985;
Hollenhorst, Olson, & Fortney, 1992; Enright & Newton, 2004). In our study a matrix by
means of which the factors with regard to perceptions two categories of subjects have, i.e.
the client of the destination (demand) and the hospitality structures themselves (supply), is
proposed.
The result of the analysis is represented by two matrices in which the perceptions of
potential clients are compared to those of hotel managers (see par. 6):
– one focuses on the importance attributed to theattractors;
– the other evidences the presence perceived of such attractors in the Amalfi Coast
area.
The interpretation of the matrices is not so different from that proposed by Martilla and
James (1977) since it enables a quick comparison of the coherence between the

Enlightening Tourism. A Pathmaking Journal, Vol 4, No 1 (2014), pp. 79-107 ISSN 2174-548X
89
expectations of hotel management with respect to the ‘destination’in which they are placed
compared to the expectations the tourists have with regard to the destination themselves.
In the same way as for the IPA Grid, also in this paper, the representation of the
variables has been carried out using as the start axes, the mean score observed for all the
indicators.
In the case of attributed “importance” we have:
− a quadrant characterized by the perception of ‘very important’ both on the part of the
tourists and of hotel management. All the attractors in this quadrant are considered
important both by hotel management and by tourists. Destination Management
Organization (DMO) will have to take this element into account when setting up tourism
supply as it cannot disregard its strong impact;
− a quadrant characterized by the perception of ‘not very important’ on the part of hotel
management and of ‘very important’ on the part of tourists. The attractors of this quadrant
are perceived differently from those of demand and supply. Potential tourists consider
them important while hotel management doesn’t. Evidently, hotel management will have to
reassess its competitive strategies seeing as the attributes of supply to which they refer
differ radically from those which interest potential tourists. This quadrant, as is the one
that follows, results as rather problematic for the DMO since contrasting indications
emerge on the part of two components of the system. In other words, two important
stakeholders (hospitality structures and tourists) give different indications on the modality
of composing the system of tourism supply;
− a quadrant characterized by a perception of ‘very important’ by hotel manangement
and’not very important’ by tourists. The previous considerations apply also for this
quadrant with the aggravating factor of the clientele considering the attractors of little
relevance. The DMO, in this case could eventually agree to satisfy tourist needs in the
event tourists could be considered a market segment for the destination. Should the DMO
decide to put such a strategy in place, hotel management would also have to refocus their
strageies;
− a quadrant characterized by a perception of attractors as ‘not very important’ both by
hotel management and by tourists does not create any problem given that both groups
consider the attractors irrelevant and consequently, they can be classified among those of
low priority attractors.

Enlightening Tourism. A Pathmaking Journal, Vol 4, No 1 (2014), pp. 79-107 ISSN 2174-548X
90
The matrix constructed on the basis of the perception of the presence of various
attractors generate implications above all in relation to the needs of the DMO and in any
event, should be read jointly with the previous matrix. In that case the result would be:
− a quadrant characterized by perceptions of ‘high presence’ both on the part of the
tourists and on the part of hotel management. In relation to such attractors the evaluations
on the part of the hotels were coherent with those of the market thus not generating any
implications. Also for DMO the attractors in this quadrant did not pose any problem given
that the attractors were considered positively from a performance perspective both by
demand and supply. In any event, a comparative analysis can be carried out using the
matrix of presence. In particular the attributes of this quadrant could be compared with
those of the first quadrant of the matrix discussed above. In the event of non-coherence
between the attributes of the present quadrant and those detected in the first quadrant of
the presence matrix, most likely the overall strategy put in place by DMO with regard to the
destination suffers from an issue of incoherency;
− a quadrant characterized by perceptions of ‘low presence’ by hotel management and
‘high’ by tourists. In this case the implication for management is represented by the need
to rethink perceptions of the ‘destination system’ in which it operates; i.e. management
perceiving as negative the characteristics of a system which tourists viceversa perceive
positively; DMO in this case, could decide not to take into account the expectations of
hotel management and privilege on the contrary the expectations (in this case positive) of
the clientele of the destination;
− a quadrant characterized by a ‘high presence’ on the part of hotel management and
‘low’ on the part of tourists. The same considerations apply in this instance to those
relative to the previous quadrant, with in addition, the perception of negative performance
on the part of potential tourists;
− a quadrant characterized by a percepion of ‘low presence’ both on the part of hotel
management and by the tourists. In this case DMO has a precise indication since both
hotel manangement and tourists do not consider such characteristics present in the
destination. In any event, before putting in place any strategies DMO should verify
whether such attributes are considered important with respect to the generating of tourist
flows. In the event the attribute is not considered relevant by either hotel management or
the tourists, it is evidently a factor that no category of stakeholders analyzed through the
two matrices considers worthy of intervention.

Enlightening Tourism. A Pathmaking Journal, Vol 4, No 1 (2014), pp. 79-107 ISSN 2174-548X
91
5. FINDINGS
In Table 2 the attractors are classified on the basis of importance assigned by Hong-
Kong enterprises. Hong Kong is prevalently characterized by urban citizen tourism closely
linked to the many opportunities for shopping. The Amalfi Coast on the contrary, is a
destination considered mainly for its sun and beach tourism.
The table shows that the mean scores for each factor and for each destination were
considered to be relevant (all mean scores are above the ‘‘neutral’’ 3). Therefore, it can be
concluded that the view of respondents confirms the frameworks of tourism
competitiveness proposed. The most important attractors in the case of Hong Kong,
according to the Enright and Newton study (2004), are safety, cuisine, dedicatedtourism
attractions, visual appeal, and well-known landmarks. In the case of the Amalfi Coast,
according to respondents, the most important attractors are well-known landmarks, safety,
visual appeal, climate, museum and galleries.
The T-test evidences a significant statistical difference between groups for museum and
galleries, nightlife, well-known landmarks, climate, dedicatedtourism attractions.
Although the findings are more or less expected for climate, well-known landmarks and
nightlife, they are surprising in other cases seeing as:
– Museum and galleries are at 14th place on the scale of importance of the attractors
for Hong-Kong and at 5th place in the case of the Amalfi Coast. Perhaps less importance
attributed to museums and galleries was expected in the case of sun and beach
destination.
– Dedicated tourism attractions is at 3rd place on the scale of importance of attractors
for Hong Kong and at 11th in the case of the Amalfi Coast; Perhaps not such a low degree
of importance was expected relative to the factor dedicatedtourism attractions in the case
of a sun and beach destination.
An initial result of the analysis therefore, is that the ranking of the factors relative to the
Amalfi Coast does not exactly match that proposed by Enright and Newton (2004) for
Hong Kong. On the basis of this result it can be hypothesised that the scale of the
attractors varies on the basis of the type of destination, type of tourist or in other words, of
segment of demand catered for .
Table 3 reports the comparison between attractors with reference to perception of
importance for the Amalfi Coast, hospitality structures and potential clientele.

Enlightening Tourism. A Pathmaking Journal, Vol 4, No 1 (2014), pp. 79-107 ISSN 2174-548X
92
Attractors Importance
Hong Kong – N=183 Importance
Amalfitana coast – N=38 T-test p-value
Rank Mean SD SE Rank mean SD SE
Museum and Galleries 14 3.42 0.77 0.06 5 4.24 1.283 0.208 3.80 0.00
Nightlife 6 4.06 0.67 0.05 12 3.5 0.952 0.154 3.45 0.00
Well-Known Landmarks 5 4.12 0.65 0.05 1 4,.8 0.962 0.156 3,43 0,00
Climate 12 3.71 0.8 0.06 4 4.32 1.042 0.169 3,41 0,00
Dedicated tourism attractions 3 4.33 0.73 0.05 11 3.74 1.032 0.167 3,35 0.00
Cuisine 2 4.36 0.63 0.05 6 4.05 1.064 0.173 1,73 0.09
Visual Appeal 4 4.2 0.67 0.05 3 4.47 1.033 0.168 1,55 0.13
Interesting architecture 11 3.72 0.74 0.05 7 4.03 1.241 0.201 1,49 0.14
Different Culture 7 3.98 0.74 0.05 10 3.76 1.324 0.215 0,99 0.33
Safety 1 4.64 0.55 0.04 2 4.5 1.007 0.163 0,83 0.41
Special Events 8 3.6 0.72 0.05 8 3.82 1.291 0.21 0,65 0.52
Local way of life 10 3.73 0.87 0.06 9 3.82 1.87 0.176 0,48 0.63 Table. 2: Distribution frequency of attractors (Hong Kong and Amalfi Coast) by mean score of importance
If an initial consistent finding of the analysis is the acknowledgement of a degree of
variability in the ranking of the factors of attraction, the second relevant point of the
analysis is represented by the evaluation of importance and presence of the factors taking
into account the comparative interpretation put in place by hotel management and
clientele. This second analysis was applied only with reference to the Amalfi Coast.
Table 3 shows that the mean scores for each factor and for each typology of respondent
were considered to be relevant (all mean scores are above the ‘‘neutral’’ 3). The most
important attractors, according to hotels manager, are well-known landmarks, safety,
visual appeal, climate, museum and galleries while, according to tourist respondents, are
well-known landmarks, climate, safety, nightlife, special events.
The T-test evidences a significative statistical difference between groups for visual
appeal, nightlife, different culture, well-known landmarks, interesting architecture.

Enlightening Tourism. A Pathmaking Journal, Vol 4, No 1 (2014), pp. 79-107 ISSN 2174-548X
93
Attractors Importance Hotel
Management– N = 38 Importance stud - N=174 T-test p-value
Rank mean SD SE Rank mean SD SE
Visual Appeal 3 4.47 1.033 0.168 7 3.855 0.986 0.075 3.349 0.002
Nightlife 12 3.5 0.952 0.154 4 4.069 1.049 0.080 3.278 0.002
Different Culture 11 3.76 1.324 0.215 12 3.162 1.219 0.093 2.558 0.014
Well-Known Landmarks 1 4.68 0.962 0.156 1 4.277 0.898 0.068 2.364 0.022
Interesting architecture 7 4.03 1.241 0.201 11 3.520 1.060 0.081 2.352 0.023
Safety 2 4.5 1.007 0.163 3 4.179 0.957 0.073 1.795 0.078
Museum and Galleries 5 4.24 1.283 0.208 8 3.855 1.027 0.078 1.730 0.090
Cuisine 6 4.05 1.064 0.173 9 3.728 1.090 0.083 1.681 0.098
Dedicated tourism attractions 10 3.74 1.032 0.167 6 3.890 0.961 0.073 0.822 0.415
Special Events 8 3.82 1.291 0.21 5 3.977 0.940 0.071 0.709 0.482
Local way of life 8 3.82 1.087 0.176 10 3.688 0.974 0.074 0.691 0.493
Climate 4 4.32 1.042 0.169 2 4.243 0.970 0.074 0.419 0.677 Table. 3: Distribution frequency of attractors (Amalfi Coast) by mean score of importance attributed by Hotel
Management and potential clients
In order to check that the differences in the rankings are not due to a simple sampling
error, table 3 shows the standard error (Kline, 2000) at 95% confidence level for each
result. The ranking of the importance of the factors in the perception of the enterprises is
sufficiently stable, in fact by adding to or subtracting from the mean score standard error,
the classification does not vary except for:
– different culture and well-known landmarks which in one case only (mean score +
s.e.) change places;
– special events and local way of life which in one case only (mean score + s.e.)
change places.
Also the ranking of importance of the factors in the perception of potential clients is
sufficiently stable in that in a single case (mean score + s.e.) visual appeal and museum
and galleries change places.
An initial observation is that nearly 50% of the factors are perceived differently in terms
of impact on competitiveness, occurring also in the case in which the factors receive the
same ranking by the two groups of respondents. For instance, the factor well known
landmarks is placed at first place both by hotel management and tourists. However, the
perception each group of respondents has to this factor differs significantly as evidenced
by the t-test which presents a p-value <.05.
A further finding is that hotel management does not consider important offering or
setting up leisureactivity services organized directly by the hotel; viceversa the potential

Enlightening Tourism. A Pathmaking Journal, Vol 4, No 1 (2014), pp. 79-107 ISSN 2174-548X
94
tourists consider fundamental a widespread presence in the territory of such activities.
Hence it can be deduced that the market target of the hotels most likely does not
correspond with that represented by the potential clients interviewed.
While the “importance” of attractors gives information about the theoretical relevance of
each factor in destination competitiveness, it is necessary to address attention to the
dimension of the “presence” of those attractors in the destination if an analysis of how a
specific destination is performing is required. Table 4 explores this issue reporting the
“presence” of each factor as it is perceived by potential tourists in the Amalfi Coast area.
Here the mean scores ranged from a high of 4.45 to a low of 2.69, indicating a wide
variation in Amalfi Coast performance.
Attractors Presence Hotel – N =
38 Presence stud N=174 T-test p-value
Rank mean SD SE Rank mean SD SE
Museum and Galleries 12 2.69 0.8 0.06 7 3.710983 0.887737 0.067493 6.984 0.000
Climate 5 3.46 0.78 0.06 2 4.416185 0.869492 0.066106 6.702 0.000
Well-Known Landmarks 6 3.38 0.89 0.06 1 4.456647 0.852237 0.064794 6.807 0.000
Visual Appeal 4 3.73 0.75 0.06 3 4.381503 0.851882 0.064767 4.730 0.000
Different Culture 7 3.38 0.84 0.07 5 3.953757 0.975365 0.074156 3.701 0.000
Interesting architecture 10 3.29 0.88 0.07 6 3.82659 0.90476 0.068788 3.388 0.001
Safety 2 4.04 0.83 0.06 10 3.514451 1.076206 0.081822 3.338 0.001
Cuisine 1 4.34 0.74 0.06 4 3.99422 0.955383 0.072636 2.466 0.016
Nightlife 3 3.82 0.89 0.07 11 3.479769 1.128848 0.085825 2.027 0.047
Special Events 9 3.35 0.79 0.06 9 3.641618 0.963823 0.073278 1.977 0.052
Local way of life 8 3.36 0.84 0.06 8 3.647399 0.956895 0.072751 1.862 0.068
Dedicated tourism attractions 11 3.18 0.94 0.07 12 3.080925 1.053419 0.08009 0.576 0.567 Table. 4: Distribution frequency of attractors (Amalfi Coast) by mean score of presence pperceived by Hotel
Management and potential clients
Also in this case, as for the characteristic of importance, table 4 shows standard error at
95% confidence level for each result in order to check whether the differences in the
ranking are due merely to a sampling error. The ranking of presence of factors in the
perception of enterprises and potential clients is extremely stable. By adding to or
subtracting from the mean score, standard error, the classification never varies for
potential clients while for the enterprises a single case is evidenced (mean score + s.e.) in
which different culture and well-known landmarks change places.
The most present attractors, according to hotel management are cuisine, safety,
nightlife and visual appeal, climate while according to tourist respondents they are well-
known landmarks, climate, visual appeal, cuisine, and different culture.

Enlightening Tourism. A Pathmaking Journal, Vol 4, No 1 (2014), pp. 79-107 ISSN 2174-548X
95
T-test evidences a significative statistical difference between groups for museum and
galleries, climate, well-known landmarks, visual appeal, different culture, interesting
architecture, safety, cuisine and nightlife.
In practice, the perception of the presence of 8 attractors out of 12 results statistically
different in the two groups of respondents. This results is of remarkable significance for
hotel management in that there is a substantial gap between the perception of destination
competitiveness on the part of hotel management and the perception of such
competitveness that the potential clients have.
6. MANAGERIAL IMPLICATIONS
Fig. 1 and Fig. 2 report the matrices for the evaluation of the attractors9. In particular
Fig. 1 reports the matrix of the importance attributed to the attractors by the group
represented by demand (tourists) and the group represented by supply (hotels).
Fundamental elements of competition are considered climate and well known
landmarks and safety. Collocated as problematic issues in the two quadrants are
nightlife, special events, dedicated tourism attractions, museum and galleries and visual
appeal. The remaining attractors are collocated in the fourth quadrant (low importance for
both categories of respondents) and consequently of scarce priority status.
9 Both matrices have been constructed measuring the distance between each attractor by the mean score of all the attractors. It follows that the coordinates of each attractor are given by x = value of the attractor in the distribution α – mean score of all the factors in the same distribution; y = value of the attractor in the distribution β – mean score of all the factors in the same distribution.

Enlightening Tourism. A Pathmaking Journal, Vol 4, No 1 (2014), pp. 79-107 ISSN 2174-548X
96
Figure 1 – Matrix of ‘Importance’of Attractors in the Amalfi Coast Area
The matrix reported in Fig 2 indicates two types of information:
– in the first place by describing perceptions on the part of both supply and demand
relative to the tourism system, inferences can be made relative to the univocal nature of
the interpretation of the supply system;
– in the second place, indications are offered to DMO relative to the modality of
strategic management of the tourist territory.
As concerns the former element, the more the divergence existing between the
perception of the presence of the various attributes the more it emerges that demand and
supply are interpreting the tourist product system in a contrasting way. For instance, as
represented in Fig 2 hotel management and potential tourists are in agreement on 7
factors relative to what is present and what is not present while they differ in agreement as
concerns the remaining 5.
In relation to the latter element on the contrary, the fundamental quadrant to observe is
that characterized by a perception of low presence on the part of both categories of
interviewees.
Information can be deduced from the quadrant only by means of a comparative reading
with respect to the information provided by the importance matrix. In particular two types of
comparison are possible:

Enlightening Tourism. A Pathmaking Journal, Vol 4, No 1 (2014), pp. 79-107 ISSN 2174-548X
97
– the first with the quadrant of the importance matrix that identifies the attractors
considered of scarce importance (both by hotel management and by potential tourists). If
there are factors considered not present by both categories of respondents and such
factors are considered also not important by both categories, the indication energing is that
such factors are not considered relevant attractors for the destination. This for example is
the case for the attribute ‘local way of life’, considered not present by both categories of
respondents and at the same time, evalued as of little importance;
– the second with the quadrant of the importance matrix isolating the attractors
detected as problematic (i.e. evaluated with differing indications on the part of demand and
supply). This type of evaluation enables the isolating of factors the development of which
meets the expectations of one category of subjects (demand or supply), while it does not
produce any effects on the satisfaction of the other. DMO will therefore be called upon to
select which factor to develop in coherence with the specific relation it intends to develop
with the relevant stakeholder. For example, the factor ‘special events’ is reported as being
important only by some of the tourists. It follows that if DMO decides to active support
strategies for that factor, it will meet expectations on the part of demand but will not
achieve any appreciation from hotel management or those who offer hospitality services
in the territory.

Enlightening Tourism. A Pathmaking Journal, Vol 4, No 1 (2014), pp. 79-107 ISSN 2174-548X
98
Figure 2 – Matrix of ‘Presence’ of Attractors on the Amalfi Coast
7. CONCLUSION
The work analyzes the factors of appeal of a tourist destination evaluating two
elements:
– The potential defining of a univocal hierarchical scale.
– The perception of the attractors in terms of demand and supply with respect to a
specific territorial area. The perception of demand and supply is evaluated from a
comparative perspective by means of matrices. This analytical tool enables the deducing
of specific managerial implications both for the hospitality structures and for the
Destination Management Organization.
The limit of the study consists in the fact that the research has been tested with
reference to just one local area within the confines of one timescale. Furthermore the
sample of respondents in the case of the hospitality structures is slightly above that
considered the established threshold for the application of a t-test in the formulation for
independent samples. It would be opportune to retest the value of the attractors with

Enlightening Tourism. A Pathmaking Journal, Vol 4, No 1 (2014), pp. 79-107 ISSN 2174-548X
99
reference to a different spatial context and timescale. A further limit is represented by not
taking into account a part of the clientele structure (that of international importance).
In relation to the first research question, the analysis starting from a systematic study of
Enright and Newton (2004) evidences that no full correspondence can be achieved in the
ranking of the factors of appeal. The test carried out on the sample of respondents showed
that the hospitality structures of Hong Kong and those of the Amalfi Coast assign a
differing degree of importance to the twelve factors selected. The analysis evidences that
for the 5 attractors (museum and galleries, nightlife, well known landmarks, climate and
dedicated tourism attractions) a statistically significant difference emerges in the score
attributed by the respondents of the various destinations. It can be hypothesized therefore,
that the importance of the attractors can depend on the type of destination and type of
tourism segment catered for. It can also be argued that variability in the importance
assigned to the attractors linked to the period or to the life cycle of the destination can
exist. The research hypotheses formulated open the way for future research to broaden
the scope of the numerous studies already in place (Iso-Ahloa, 1982; Pyo, Mihalik and
Uysal, 1989; Yuan and Mc Donald, 1990; Buhalis, 2000; Konu and Laukkanen, 2010;
Prayag and Ryan, 2011).
This initial conclusion however, is limited by the fact that only two types of destination
have been considered in the study and consequently, two types of potential tourism
segments. It would therefore be necessary to extend the analysis and to compare
destinations catering for diverse segments of the tourism market. From this point of view,
the work can be considered an explorative study with regard to the research questions
proposed and only a more in-depth analysis could confirm a definitive generalization. In
any event, it should be underlined that the hypothesis of linking the scale of importance to
competitive decision making and to the type of segment catered for, albeit in some cases
indirect or with reference to specific segments, has already been proposed by numerous
authors (Gibson and Yiannakis, 2002; Buhalis, 2000; Konu and Laukkanen, 2010).
The need to respond to the second research question has enabled the devising and
developing of a functional model for the joint evaluation of the perceptions of demand and
supply. Two matrices were constructed in which the perceived importance and presence of
attractors on the part of hotel management and potential tourists were measured. The
methodology of analysis convinces us to consider jointly the perception of demand and
supply in order that useful indications can emerge which are useful both for hotel

Enlightening Tourism. A Pathmaking Journal, Vol 4, No 1 (2014), pp. 79-107 ISSN 2174-548X
100
management and for Destination Management Organizations (Formica. Uysal. 2006).
Furthermore, the matrices of the importance of attractors and that of perception of
performance of the attractors lend themselves to an independent interpretation on the one
hand and a comparative one on the other. In relation to the first case:
- the matrix of the importance of the attractors represents the expectations nurtured
relative to the components of the supply system requested by two among the numerous
stakeholders involved (e.g. the attractor ‘different culture’ has no relevance in the Amalfi
Coast in that it is considered of little importance both by hotel management and by the
potential clientele while ‘nightlife’ is a problematic factor in that it is not considered
strategic by hotel management while it is considered important by potential clients);
- at the same time, the matrix of the perception of performance of the attractors
describing the perception of demand and supply, enables inference in terms of a univocal
interpretation of supply (e.g.’nightlife’ is considered important, but lacking by potential
clients, while hotel management consider it on average, less important than the other
attractors, but on the whole, quite present. This consequently highlights an evident gap
between demand and supply in the evaluation of the tourism product).
An evaluation of the factors of appeal from the perspective of demand and supply
determines the possibility for enterprise to define linear competitive strategies, in other
words, based on particular perceptions of appeal factors. If potential tourists evaluate
appeal factors differently from enterprises this means there is a need to redefine
competitive strategies. In other words enterprises have to reconsider the order of
importance of the appeal factors and adapt their own competitive strategies to the new
order10.
In relation to the second element, the two matrices enable the obtaining of indications
on the modality of strategic management of the tourist territory on the part of the DMO
(returning to the discourse on ‘nightlife’ the circumstance that demand and supply evaluate
differently the importance and presence of this factor renders problematic decision making
on the part of the DMO: if the DMO decides to satisfy the expectations of demand and
invest in these attractors, it risks not being supported in this choice by a large quota of the
supply system, i.e. the hospitality structures. On the other hand, if it decides to neglect the
request of potential clients. it risks losing them).
10 Cfr. Valls, J.F.; Parera A.; Andrade M.J., 2012, pp. 142-176.

Enlightening Tourism. A Pathmaking Journal, Vol 4, No 1 (2014), pp. 79-107 ISSN 2174-548X
101
In reference to both modalities of interpreting data, this does not mean we have devised
a complete and definitive tool of analysis. On the contrary, the two matrices still require
numerous studies above all in relation to the quadrant that classifies the attractors both in
terms of importance/non importance (e.g. special events, nightlife, dedicated tourism
attractions, museum and galleries) and in terms of results good performance/weak
performance of the attractor (e.g. nightlife, safety, well known landmarks, climate and
different culture). For all these quadrants, it would be more opportune to proceed with
refining the tool to a greater degree i.e. a comparative interpretation by means of ulterior
elements or critical factors of success that can impact on the competitive strategies for the
destination.
At the same time undoubtedly the comparative interpretation of the two matrices
proposed provides enormous support in terms of strategic indications for Destination
Management Organizations inasmuch as in the case of quadrants that do not show
elements of contradiction (i.e. that go in the direction of concordant variables of the type
both positive or both negative).
References
Bieger, T. Destination management e finanziamenti. In H. Pechlaner and K. Weiermair
(Eds.). Destination Management. Fondamenti di marketing e gestione delle destinazioni
turistiche. Touring Editore, 2000, Milano. pp. 85-110.
Buhalis, D. Marketing the competitive destination of the future. Tourism Management. Vol.
21, 1, 2000, pp. 97-116.
Carlson, L. and Grossberg, S. Parental style and consumer socialization of children.
Journal of Consumer Research, 15, 1988, pp. 77-94.
Chon, K.S. and Mayer, K.J. Destination Competitiveness Models in Tourism and Their
Application to Las Vegas. Journal of Tourism Systems and Quality Management. Vol. 1,
2–4, 1995, pp. 227-246.

Enlightening Tourism. A Pathmaking Journal, Vol 4, No 1 (2014), pp. 79-107 ISSN 2174-548X
102
Chon, K.S.; Weaver, P.A. and Kim, C.Y. Marketing your community: Image analysis in
Norfolk. The Cornell Hotel and Restaurant Administration Quarterly. Vol. 31, 4, 1991, pp.
24-27.
Claver-Cortés, E.; Molina-Azorìn, J.F. and Pereira-Moliner J. Competitiveness in mass
tourism. Annals of Tourism Research. Vol. 34, 3, 2007, pp. 727-745.
Crouch, R.I. and Ritchie, J.R.B. Tourism Competitiveness and Social Prosperity. Journal of
Business Research, 44, 1999, pp.137–152.
Davidson, R. and Maitland, R. Tourism Destinations. Hodder & Stoughton, 1997, London.
De Holan, P.M. and Phillips, N. Sun. sand. and hard currency tourism in Cuba. Annals of
Tourism Research. Vol. 24, 4, 1997, pp. 777–795.
Della Corte, V. La gestione dei sistemi locali di offerta turistica. Cedam, 2000, Padova.
Della Lucia, M.; Franch, M.; Martini, U. and Tamma, M. Metodologia della ricerca. In S.
Sciarelli (Ed.). Il management dei sistemi turistici locali. Strategie e strumenti per la
governance. Giappichelli. Torino. 2007, pp. 3-30.
Edgell, D.L. and Haenisch, R.T. Coopetition: Global Tourism Beyond The Millennium.
International. Policy Publishing, 1995, Kansas City. MO.
Ejarque, J. La destinazione turistica di successo. Hoepli, 2003, Milano.
Enright, M.J. and Newton, J. Tourism destination competitiveness: a quantitative
approach. Tourism Management. Vol. 25, 2004, pp. 777–788.
Enright, M.J.; Scott, E.E. and Dodwell. D. The Hong Kong advantage. Oxford University
Press, 1997, Hong Kong.

Enlightening Tourism. A Pathmaking Journal, Vol 4, No 1 (2014), pp. 79-107 ISSN 2174-548X
103
Esposito De Falco, S. A model for the analysis of territorial competitiveness. In A. Morvillo
(Ed.). Advances in Tourism Studies. In memory of Clara Stefania Petrillo. McGraw-Hill,
2012, Milano, pp. 39-57.
Evans, M.R. and Chon, K. Formulating and evaluating tourism policy using importance–
performance analysis. Hospitality Education and Research Journal. Vol. 13, 3, 1989, pp.
203-213.
Fontana, M. and Maeran, R. Bambini e turismo: il ruolo dei genitori nella scelta della
vacanza. Turismo e Psicologia. Nº. 2, 2009, pp. 191-200.
Formica, S. Measuring Destination Attractiveness: A Proposed Framework. Journal of
American Academy of Business. Vol. 1, 2, 2002, pp. 350–355.
Formica, S. and Uysal. M. Destination attractiveness based on supply and demand
evaluations: An analytical framework. Journal of Travel Research. Vol. 44, 4. 2006, pp.
418-430.
Franch, M. (Ed.). Destination management. Governare il turismo tra locale e globale.
Giappichelli, 2002, Torino.
Gallarza, M.G.; Saura, I.G. and Garcìa, H.C. (2002). Destination image towards a
conceptual framework. Annals of Tourism Research. Vol. 29, 1, 2002, pp. 56–72.
Gemmiti, R. Competitività territoriale in sostenibilità. L’interpretazione alla base della
ricerca. In M. Prezioso and F. Bencardino (Eds). Competitività in sostenibilità: la
dimensione territoriale nell'attuazione dei processi di Lisbona/Gothenburg nelle regioni e
nelle province italiane. Geotema. Special Issue, Nº. 31-32, 2007.
Gibson, H. and Yiannakis, A. Tourist Roles: Needs and the Life Course. Annals of
Tourism Research. Vol. 29, 2002, pp. 358–383.

Enlightening Tourism. A Pathmaking Journal, Vol 4, No 1 (2014), pp. 79-107 ISSN 2174-548X
104
Go, F. and Zhang, W. Applying importance–performance analysis to Beijing as an
international meeting destination. Journal of Travel Research. Spring 1997, pp. 42-49.
Gram, M. Family Holidays. A Qualitative Analysis of Family Holiday Experiences.
Scandinavian Journal of Hospitality and Tourism. Vol. 5, 1, 2005, pp. 2-22.
Gram, M. Children as co-decision makers in the family? The case of family holidays.
Young Consumers. Vol. 8, 1, 2007, pp. 19-28.
Guadagnolo, F. The importance–performance analysis: an evaluation and marketing tool.
Journal of Park and Recreation Administration. Vol. 2, 1985, pp. 13-22.
Hollenhorst, S.; Olson, D. and Fortney, R. Use of importance–performance analysis to
evaluate state park cabins: the case of the West Virginia state park system. Journal of
Park and Recreation Administration. Vol. 10, 1. 1992, pp. 1-11.
Hu, Y.Z. and Ritchie. J.R.B. Measuring destination attractiveness: A contextual approach.
Journal of Travel Research, Vol. 32, 2, 1993, pp. 25-35.
INPS. Ministero del Lavoro e delle Politiche Sociali. ISTAT. Rapporto sulla Coesione
Sociale. Anno 2013. Sistema Statistico Nazionale, 2013, Roma.
Iso-Ahola, S. Toward a social psychology theory of tourism motivation. Annals of Tourism
Research. Vol. 12, 1982, pp. 256-262.
Keller P. Destination Marketing: strategic areas of inquiry. In M. Manente and M. Cerato M.
(Eds). From destination to destination marketing and management. Ciset. Edizione
Libreria Editrice Cafoscarina, 2000, Venezia.
Kim, H.B. Perceived attractiveness of Korean destinations. Annals of Tourism Research.
Vol. 25, 2, 1998, pp. 340–361.

Enlightening Tourism. A Pathmaking Journal, Vol 4, No 1 (2014), pp. 79-107 ISSN 2174-548X
105
Kitson, M.; Martin, R. and Tyler, P. Regional Competitiveness: an Elusive yet Key
Concept? Regional Studies. Vol. 38, 9, 2004, pp. 991-999.
Kline, P. Handbook of psychological testing. Routledge, 2000, London.
Konu, H. and Laukkanen, T. Predictors of Tourists' Wellbeing Holiday Intentions in Finland.
Journal of Hospitality and Tourism Management. Vol. 17, 1, 2011, pp. 144-149.
Kuijsten, A.C. Changing Family Patterns in Europe: A Case of Divergence? European
Journal of Population, Nº. 12, 1996, pp. 115-143.
Laws. E. Tourist Destination Management. Routledge, 1995, London.
Mannell, R.C. and Iso-Ahola, S.E. Psychological nature of leisure and tourism experience.
Annals of Tourism Research. Vol. 14, 1987, pp. 314-331.
Martilla, J.A. and James, J.C. Importance–performance analysis. Journal of Marketing.
January 1977, pp. 77-79.
Murphy, P.; Pritchard, M.P. and Smith, B. The destination product and its impact on
traveler perceptions. Tourism Management. Vol. 21, 1, 2000, pp.43-52.
Porter M.E. The Competitive Advantage of Nations. The Free Press, 1990, New York.
Porter M.E. Clusters and the New Economics of Competition. Harvard Business Review.
Vol. 76, 6, 1998, pp. 77–90.
Prayaga, G. and Ryan, C. The relationship between the ‘push’ and ‘pull’ factors of a tourist
destination: the role of nationality – an analytical qualitative research approach. Current
Issues in Tourism. Vol.14, 2, 2011, pp. 121-143.
Pyo, S.; Mihalik, B. and Uysal, M. (1989). Attraction attributes and motivations: a canonical
correlation analysis. Annals of Tourism Research. Vol. 12, 2, 1989, pp. 277-282.

Enlightening Tourism. A Pathmaking Journal, Vol 4, No 1 (2014), pp. 79-107 ISSN 2174-548X
106
Rispoli, M. and Tamma, M. Risposte strategiche alla complessità. Le forme di offerta dei
prodotti alberghieri. Giappichelli, 1995, Torino.
Ritchie, J.R.B. Crafting a destination vision: putting the concept of resident-responsive
tourism into practice. Tourism Management. Vol. 14, 1993, pp. 379-389
Ritchie, J.R.B. and Crouch, I. The competitive destination. A sustainable tourism
perspective. Cabi Publishing, 2003, Cambridge (MA).
Ritchie J.R.B. and Crouch R.I. The competitive destination: A sustainability perspective.
Tourism Management. Vol. 21, 2000, pp.1–7.
Ryan, C. The child as a visitor. World Travel and Tourism Review, 1992, pp. 135-159.
Scott, A.J. and Storper, M. Regions. Globalization. Development. Regional Studies. Vol.
37, 6-7, 2003, pp. 579-593.
Scott, B.R. and Lodge, G.C. U.S. Competitiveness in the World Economy. Harvard
Business School Press, 1985, Boston. MA.
Tamma, M. Aspetti strategici del destination management. In H. Pechlaner and K.
Weiermair (Eds.). Destination Management. Fondamenti di marketing e gestione delle
destinazioni turistiche. Touring Editore, 2000, Milano.
Vargas, A. Tourism research in Spain: the state of the art. Enlightening Tourism. A
Pathmaking Journal. Vol. 1, 1, 2011, pp. 93-110.
Valls, J.F.; Parera, A. and Andrade, M.J. Tourism innovations and competitiveness in
times of crisis. Enlightening Tourism. A Pathmaking Journal. Vol. 2, 2, 2012, pp. 142-176.
Viassone, M. On the choice of a mountain tourist destination. The evaluation of drivers by
young people. Enlightening Tourism. A Pathmaking Journal. Vol. 2, 2, pp. 96-116.

Enlightening Tourism. A Pathmaking Journal, Vol 4, No 1 (2014), pp. 79-107 ISSN 2174-548X
107
Watne, T. and Winchester, T. Family holiday decision making: the knowledge and
influence of adolescent children and parents. ANZMAC 2011 conference proceedings:
Marketing in the Age of Consumerism: Jekyll or Hyde? ANZMAC, 2011, Perth W.A., pp. 1-
9.
Yuan, S. and Mc Donald, C. Motivational determinants of international pleasure time.
Journal of Travel Research. Vol. 29, 1, 1990, pp. 42-44.
Article info: Received 06/12/13. Accepted 29/05/14. Refereed anonymously.

S. Watson
Enlightening Tourism. A Pathmaking Journal, Vol. 4, No 1 (2014), pp. 108-111 ISSN 2174-548X
108
BOOK REVIEW:
Sugar Heritage and Tourism in Transition, (2013) edited by Lee
Joliffe, Tourism and Cultural Change, Channel View;
ISBN: 978-1-84541-387-3 (hbk), ISBN-13: 978-1-84541-386-6
(pbk), 225 pps.
Steve Watson
York St. John University (UK)
This is another fascinating book in what has become a landmark series from
Channel View, under the series editorship of Alison Phipps and Mike Robinson. The
fascination here is in the breadth and depth of material that has been so lucidly
derived from what at first seems a rather unpromising title. Lee Joliffe, however, is an
experienced and skilful editor, and has made and facilitated all manner of revealing
connections between sugar and tourism in ways that also shed light on both heritage
and tourism generally and their contemporary cultural meanings.
The book itself is part of Joliffe’s own ‘series within a series’ as it builds on her
previous studies that have used every day products as a way of prompting thoughts
and reflections about the nature of heritage and tourism as cultural practices. This
way of opening up such connections and relationalities inevitably invites
interdisciplinary perspectives and these are very evident in her own writing and in the
range and variety of contributions to this book and indeed its predecessors.

S. Watson
Enlightening Tourism. A Pathmaking Journal, Vol. 4, No 1 (2014), pp. 108-111 ISSN 2174-548X
109
So, an unusual theme, ‘sweet yet dark’ as Joliffe puts it in her
acknowledgements, but as she makes clear in her insightful and clearly written
introductory chapter, there are some fascinating connections to be made between
sugar, sugar history, heritage and tourism. At first sight such connections might seem
overly-contrived or even forced, but as Joliffe suggests, they flow very naturally from
the role that sugar has played in the evolution of sugar consumption, the
relationships between Europe and the sugar producing areas and contemporary
globalisation. These connections are then used to draw out what she refers to as the
research framework of the book: Contexts, points of view and issues, within each of
which she organises her key themes. The Contexts are: historic; economic; cultural
change and cultural heritage management; the points of view: are postcolonialism;
commodification and sustainability, and the issues are defined as politics,
globalisation and tourism development. At this point it becomes evident that the
editor has created a very substantial agenda with all the editorial challenges that are
consequently posed. For the reader it becomes equally evident that there is more
here than might have been anticipated, and more there certainly is.
The contributors are drawn from a range of disciplines in several different
countries, and apart from the editor’s own sole- authored chapters, another ten
cover a range of topics that are cognate with the book’s research framework,
although the connections are not always explicitly made. Following the editor’s
introduction, the subsequent section explores the perspectives of sugar-producing
countries, looking at the potential that sugar heriatge has in creating tourism. Linda
Joyce Forristal offers an intriguing account of the Indian subcontinent as a locus for
sugar tourism, placing emphasis on the variety of tourist types that could be created,
from heritage and cultural tourism to agri-tourism as well as rural and culinary
tourism, with the right kind of planning and marketing strategies. Peter Griggs
employs an Australian perspective to explore the relationship between the history of
tourism and sugar production and discusses the challenges of presenting this in an
informative and engaging way for an international tourism audience, whilst Angela
Cabral Flecha and Linda Joyce Forristal use a similar approach in their case study of

S. Watson
Enlightening Tourism. A Pathmaking Journal, Vol. 4, No 1 (2014), pp. 108-111 ISSN 2174-548X
110
the potential for sugar heritage tourism in Brazil. These studies are presented with
great clarity and on the basis of well researched source material.
The next section begins with three chapters on Caribbean contexts. Tara A.
Innis and Lee Joliffe examine sugar heritage at world heritage sites, and Rachel
Dodds and Lee Joliffe offer a compelling postcolonial perspective on the past
development and potential in St Kitts. Mechelle N. Best and Winston F. Phulgence
produce one of the most incisive chapters of the book, looking at the representation,
or more precisely the non-representation, of slavery through the production of
heritage tourism in Barbados and St Lucia. The ‘silence of the slaves’, they conclude,
‘is deafening’. Abby Liu presents a lucid account of a familiar topic in tourism, the
transition from other forms of capital accumulation into tourism and the managerial
challenges of the new service sector. A substitute economy of leisure and tourism
thus occupies the spaces once dedicated to industrial production and in doing so
evokes new sensibilities around ecological concerns, cultural exchange and
nostalgia.
The final substantive section of the book deals with the consumption aspects
of sugar heritage with a wide-ranging account of the relationship between sugar and
food tourism in Devon (England), one of the country’s long established tourism
destination areas. The way that food products have developed alongside tourism and
evoke its traditions through locally-specific food souvenirs and their distinctive
heritage- styled packaging was a particularly interesting perspective. The two
subsequent chapters turn to Australia and New Zealand, with Leanne White’s
comprehensive exploration of the complex of heritage attractions that have
developed around sugar production in North Queensland and Jane Legget’s
fascinating account of the way that sugar-related industrial heritage has gained
recognition in New Zealand, and the challenges it has faced in doing so. Lee Joliffe
rounds off this section with an account of the way that sugar is represented in the
museum sector and the ways in which developments in museology have affected
these representations.
It is invidious to single out particular chapters in such a collection of high
quality contributions, but Best and Phulgence provide, for me, the stand out chapter
S. Watson
Enlightening Tourism. A Pathmaking Journal, Vol. 4, No 1 (2014), pp. 108-111 ISSN 2174-548X
111
in their analysis of the politics and vestigial colonialism that still dominate the sugar
industry and its heritage. Joliffe provides the concluding chapter and highlights
succinctly and cogently the key movements and themes that have emerged from the
book – a challenge in itself considering the richness and diversity of the contributions.
My one minor criticism is that having established a very clear framework for
the book around the themes of historical, points of view and issues, these are not
then followed through in organizing the book and forming its subsequent sections.
Instead, they are used to ‘set the scene’. It does seem a shame, however, that in
establishing such a coherent research framework and making such a compelling
case for all the connections and insights it reveals, that the remainder of the book
seems to follow a different plan. But this is a minor point, one of the vagaries of
edited volumes, and certainly does not detract from the depth and scope of this
excellent collection.
This book is thoroughly recommended for anyone with a scholarly or
professional interest in heritage and tourism and offers a depth of theoretical and
practitioner concerns that is difficult and not always successfully achieved in this
field. One can only look forward to Lee Joliffe’s next voyage of exploration.
P.S.: If you would like to review a new or recent book, or you have a suggestion
for a book to be reviewed in the journal, please contact Steve Watson, Book
Reviews Editor, at [email protected]