DIJSER Vol. 1 No. 1 June, 2018 - Federal University Dutse
215
i
-
Upload
khangminh22 -
Category
Documents
-
view
3 -
download
0
Transcript of DIJSER Vol. 1 No. 1 June, 2018 - Federal University Dutse
i

ii
Dutse International Journal of Social and Economic Research
(DIJSER)
Center for Social and Economic Research,
Federal University Dutse
P.M.B 7156, Dutse,
Jigawa State, Nigeria
Vol. 1 No. 1 June, 2018
ISSN: 2645 -3169

ii
Dutse International Journal of Social and Economic Research (DIJSER) is a publication
of:
Center for Social and Economic Research,
Federal University Dutse Jigawa State – Nigeria.
For Online Access: http://fud.edu.ng/dijser.html
Language: English
Frequency: Bi-annual
Printed by:
KABOD LIMITED
NL 7 Lokoja Road, Kaduna State, Nigeria.
+234(0)8030628933
ISSN: 2645 -3169
Copy rights:
All rights of this publication are reserved. No part of this Journal may be reproduced, stored
in a retrieval system or transmitted in any form by any means without prior permission of the
publisher, except for academic purposes.
Note:
The articles published in this Journal do not in any way reflect the views or position of
DIJSER. Authors are individually responsible for all issues relating to their articles. Except
for publication and copy rights, any issue arising from an article in this Journal should be
addressed directly to the Author.

iii
ABOUT DIJSER
DIJSER is a peer-reviewed and professional journal that publishes review and scholarly
research articles in all areas of social and economic arena. The journal is a forum for scholars
from around the globe to share their research experiences for the advancement of social and
economic issues. As a multi-disciplinary journal, it focuses on social and economic
development issues ranging from society, culture, politics, education, gender, poverty,
inequality, social security, health and to other socio-economic aspects of the society in
general.
iv
EDITORIAL BOARD
Prof. Ummu A. Jalingo Department of Economics,
Bayero University Kano, Nigeria.
Prof. Ibrahim Ahmed Kiyawa
Department of Economics,
Federal University Dutse,
Jigawa - Nigeria.
Prof. Salisu A. Abdullahi Department of Sociology,
Federal University Dutse,
Jigawa - Nigeria.
Prof. Amina Bashir
Department of English,
Federal University Dutse,
Jigawa - Nigeria.
Prof. Khalid Suleiman Department of Sociology,
Usman Danfodio University Sokoto,
Nigeria.
Prof. Habu Muhammad Fagge
Department of Political Science,
Bayero University Kano, Nigeria.
Prof. Muhammad Liman Department of Accounting,
Bayero University Kano, Nigeria.
Prof. Hassan Bulami
Department of Economics,
University of Maiduguri, Nigeria.
Prof. Mohd Zaini Abd Karim
Department of Economics,
Universiti Utara Malaysia

v
CALL FOR PAPERS
DIJSER invites review and scholarly research articles from authors all over the globe. The
journal is accepting papers all year around for consideration into publication in its bi-annual
journal. There is no specific deadline for submission, articles submitted up to 31st May will be
published in July issue, while articles submitted up to 31st October will be published in
December issue. DIJSER publishes peer-reviewed original research papers, case studies,
review articles and technical notes relating to social-economic issues. The journal allows free
access to its contents, which attracts more readers and citations to articles published in
DIJSER.
AUTHOR GUIDELINES
Authors are highly encouraged to read the following guidelines carefully before
submitting the manuscript:
1. The Journal accepts only original and innovative submissions written in English on
the understanding that the work has not been unpublished and is not being considered
for publication elsewhere.
2. The Original Research article should include Title, Authors‘ names and their
affiliations, Abstract, Keywords, Introduction, Literature Review, Methodology,
Results & Discussion, Conclusions, and References. The complete paper should have
a more than of five-six sections.
3. When submitting papers for potential publication in the DIJSER, please submit an
original editable file in MS-WORD format. All figures, images, tables, appendices,
references etc., should be embedded into the original file. The entire manuscript
should not exceed 15 pages long.
4. Authors accept the terms of Honor Code and Plagiarism Statement for Paper
Submission, and that the paper is original research contribution with the references
properly cited in the manuscript using APA referencing style.
5. Manuscripts should be type written in Times New Roman, font size 12, Title shall be
in a font size 14. All section titles shall be in font size 12, bold face in capital letters.
Subtitles in each section shall be in font size 12, bold face lower case followed by a
colon. Double spacing all portions of the manuscript and margins 2.5 cm each side.
6. The full formatted manuscript should be submitted electronically in a single MS-
Word file attachment to [email protected] . Each submission of an article attracts a
nonrefundable assessment and review fee of N3,000. Manuscripts that passed the
assessment and review process may be sent back to authors for a minor or major
correction. Final accepted manuscripts for publication in DIJSER are subject to a
payment of N15,000 publication fees. Both payments should be made into the
following Bank Account at any branch of the Fidelity Bank nationwide. Note in
making the payment, after the depositor name, this account number should be added -
1100008649 (e.g. Author’s name/ 1100008649).
Account Name: FUD Microfinance Bank
Account Number: 4011006737 Fidelity Bank
vi
EDITORIAL CONTACT
The Editor in Chief
Prof. Ummu A Jalingo, Director CSER,
Journal of Social and Economic Research,
Center for Social and Economic Research,
NDIC Building, Federal University Dutse, Ibrahim, Aliyu By-pass,
P.M.B 7156, Jigawa State, Nigeria.
Email: or [email protected]
Managing Editor
Abubakar Hassan, Research Assistant,
Center for Social and Economic Research,
NDIC Building, Federal University Dutse, Ibrahim, Aliyu By-pass,
P.M.B 7156, Jigawa State, Nigeria.
Email: [email protected]
For Manuscript Submission/ Inquiry:
Email: [email protected]
Phone Number: +2348030676264
Dutse International Journal of Social and Economics Research Vol. 1, No. 1 June 2018
1
Modelling Monetary Policy Impact on
Nigerian Economy:
An ARDL approach
*Abubakar Hassan1
& Prof. Ummu A Jalingo2
1Department of Economics & Development Studies, Federal University Dutse.
2Department of Economics, Bayero University Kano
*Corresponding Author‘s email: [email protected]
Abstract: This paper is set up to model the impact of monetary policy on economic growth in
Nigeria using annual time series data covering the periods of 1985 to 2016. The paper
applies the ARDL bounds testing co-integration approach in investigating the long -run and
short -run dynamics between monetary policy and economic growth. The results of the Bound
test for conintegration show that there is no long-run relationship between growth rate of
real GDP and monetary policy variables in the case of Nigeria. But, in the short run, broad
money supply (M2) was found to be positively related to real GDP and the relationship is
statically significant at 5% level. Similarly, Cash reserve ratio (CRR) and loan to deposit
ratio (LDR) were found to have positive and negative impact on real GDP, respectively. And
these findings are consistent with the theoretical expectations and lend empirical support to
the monetarists view that ‗money matters at least in the short run‘. The implication of these
findings is that, the monetary policy has an impact on real GDP in Nigeria, at least in the
short run. Thus, the study concluded that the CBN can use its monetary policy to stabilize
output and price in the short run. In line with these findings, the study recommended that the
monetary authority should use the quantity-based anchor (M2) when it want to stabilize
economic activities in the country.
Keywords: Monetary Policy, Money Supply, Interest Rate, Co-integration, Nigeria.
JEL Classification: C51, E52, E58, F43
1.0 Introduction
The investigation into the relationship between monetary policy variables and real
macroeconomic variables is one of the oldest areas in the history of macroeconomic theory.
This area has attracted the interest of many academicians, economists as well as policy
makers even though it is one of those areas where extensive theoretical and empirical
researches have been carried out. Quoting some pioneering researchers in this field, Bernanke
and Gertler (1995) asserted that ―the impact of monetary policy on the real economic
variables has been a contentious area of debate in macroeconomics‖. The main reason for
this is that- there is a serious dispute among the vast majority of economists and even among
the theoretical thinkers about the actual and magnitude of monetary policy impact on real
economic activities and how it is transmitted. Some believe that money does not matter and
monetary policy is ineffective of influencing real economic variables such as employment,
and real output (economic growth). While others claim that money matters and monetary
policy can influence real economic activities at least in the short run and again there are those
in between these two opponents who believe that the link between money and output is
actually reverse causation not the other way round.

Dutse International Journal of Social and Economics Research Vol. 1, No. 1 June 2018
2
Various schools of economic thoughts identify a number of different channels of transmission
mechanism of monetary policy. The monetarists led by the Milton Friedman posit that money
matters and argue that monetary policy is transmitted through either interest rate, exchange
rate channel or both. While for early Keynesians oppose the effectiveness of the monetary
policy and held the belief that monetary policy works through bank lending and balance sheet
channel. And again, for the intermediary school (Real business cycle) see money as neutral-
that is they neither belief that money neither matters nor deny the effectiveness of monetary
policy on the economy. However, they argue that there is reverse causation running from
other important economic variables such as asset price to the supply of money (i.e. asset price
channel).
In the same vein, the bulk of the empirical literatures have not reached a resounding
conclusion on how monetary policy is propagated to the economy, especially in the
developing and low income countries. Although there are various channels of monetary
transmissions, bank lending channel seems to command popularity in most advanced
countries of the world (Eichenbaum, 1992; Kashyap and Stein, 2000; Morsink and Bayoumi,
2001; and Elbourne, 2008). However, for the developing and the low income countries the
empirical evidences are mixed and full of contradictions (Aleem, 2010; Disyatat &
Vongsinsirikul , 2003; Çi, 2007; Mugume et al., 2011; Mengesha & Holmes, 2013; Davoodi
et al., 2013; Abradu-otoo et al., 2013; Chileshe et al., 2014; and Ghazanchyan, 2014).
Moreover, from Nigeria, there have been a very limited number of well-known scholarly
researches that investigate the monetary policy transmission mechanism of the Central Bank
of Nigeria (CBN). Chuku (2009) was the first to examine the monetary policy transmission
mechanism in Nigeria using SVAR approach. He used quarterly data series from 1986Q1 to
2008Q4 and discovered that money supply (M2) as a quantity anchor has a moderate effect
on both output and prices, while the price-based anchor (monetary policy rate and real
effective exchange rate) have neutral effect on output.
From the forgoing, one can easily and clearly identify a lots of research voids to be bridged
and hence the main thrust of this research work is to critically appraise the Central Bank of
Nigeria (CBN) monetary policy actual and potential impact on economic growth in Nigeria,
with a view of modelling the apex bank‘s monetary policy impact on the economy. The paper
is organized in five sections, with the forgoing (section one) as introduction. Section two
reviews the empirical literature, section three dwells on the methodology of the paper, section
four presents empirical results and discussion of findings and finally, section five concludes
the paper and offers some policy recommendations.
2.0 Empirical Literature Review
The investigations into the existence and nature of the link between monetary policy and
economic growth have experienced a long history. Milton Friedman and Anna Schwartz
(1963) were the first to observe that changes in monetary aggregates lead to changes in real
economic activity (Hussain, 2009).
Vector Autoregressive (VAR) models are the most commonly used in the empirical analysis
of monetary policy issues. Eichenbaum (1992) considers VAR on four variables i.e. M1 as a
measure of money supply, federal funds rate as a measure of short-term interest rates, prices
and output. He establishes that a positive M1 shock leads to an increase in the funds rate and
a decline in output where M1 shocks measure the impact of monetary policy. ) Sims (1992)
Dutse International Journal of Social and Economics Research Vol. 1, No. 1 June 2018
3
examines VAR between money and output separately in France, Germany, Japan, United
Kingdom and the United States. The variables include industrial production, consumer prices,
and short-term interest rate as a monetary policy tool, money supply, exchange rate and an
index of commodity prices. In all the five countries, monetary shocks lead to output
following a hump-shaped pattern.
In Parkistan, Hussain (2009) employed VAR approach to estimate the relative impact of
monetary policy on two key economic variables namely, output and inflation, covering the
period 1964-M1 to 2007-M12. The empirical result of the study indicated that exchange rate
is the only significant monetary policy instrument in Pakistan case for controlling inflation
and minimizing output variance in the economy.
Masagus et-el (2010) investigated the causes of variation in the impact of monetary policy on
economic development. They used Meta-analysis to draw their sample of observations from
primary studies and applied VAR models. The findings revealed that capital intensity,
financial deepening, the inflation rate and economic size are important in explaining the
variation in outcomes across regions and overtime.
To examine the links between the monetary policy instruments inflation in Poland,
Gottschalk and Moove (2007) made use of VAR in order to provide empirical evidence. By
examining the effects of an exchange rate shock and interest rate shock on the price level,
they find out that although the exchange rate seems to be effective with respect to output and
prices, the direct linkage between the interest rate and inflation do not appear to be very
strong.
In order to assess the predictability of inflation in Korea, Hottmaister (1999) makes an
empirical exploration using the VAR model to calculate impulse responses to exogenous
monetary policy. The study examines the impulse response to a negative M2 shock of
inflation, output, real interest rate, real exchange rate, and capital flows it is reported that
inflation in korea is a predictable as it was in inflation targeting prior to their adoption of
inflation targeting.
Other researches on the impact of monetary policy on economic growth use Granger
Causality tests to establish link between the two terms. For example, Ho (1982) carried out
causality tests in a trivariate case by taking into account money, domestic and import prices
in Hong Kong. He established unidirectional causality from domestic prices to money and
observed significant impact of import prices on domestic prices. Ibrahim (1998) examined
causality between money (M1 and M2) and prices (CPI), real industrial production index and
one-year Treasury bill rate for Malaysia over the period 1976-I to 1995-IV by using seasonal
data. Engle-Granger causality test was used among two variables (money and output), three
variables (money, output and prices) and four variables (money, output, price and interest
rate). Results showed that models with three and four variables were cointegrated with M2.
However, bi-directional causality exists between M2 and real industrial production and M2
and prices.
Muhammad Tahir (2003) carried out a study to estimate the effectiveness of monetary policy
in Pakistan from 1972-2002. Vector Error Correction Model (VECM) derived from
Johansen‘s multivariate co-integrating procedure were used to test the effectiveness of
monetary policy. Results showed that exchange rate and money (M1 and M2) jointly
determined prices, interest rates and real output variables. Tariq Mehmood and Muhammad

Dutse International Journal of Social and Economics Research Vol. 1, No. 1 June 2018
4
Farooq Arby (2005) examined short run and long run relationships among four
macroeconomic variables in Pakistannamely M2, call money rate as a measure of interest
rate, CPI for prices and Real GDP at factor cost as a measure of output. To test for
cointegration Johansen and Juselius (1990) cointegration tests are carried out and for
examining short run causality ECMs have been used. Annual data from 1993 to 2003 has
been used for the analysis. They establish that growth in money causes real GDP growth but
does not cause inflation.
The empirical evidence on monetary policy and economic growth nexus from Nigeria is also
not different from evidence found in other countries of the world. Adesoye et-el (2012)
examined the dynamic interaction between monetary policy tools in stimulating economic
growth in Nigeria. The study considered key time series variables and real growth of output
in formulating Vecto-Autoregressive (VAR) models which showed interdependence
interaction between the period of 1970 and 2007. The study also used Granger-causility tests
and showed that the growth rate of real output is not leading indicator for any monetary
variables. Bogunjoko (1997) analyzed the efficacy of monetary policy as a stabilization tool,
using modified St. Louis model to take account of the peculiarity of the Nigeria economy.
Using an error correction model and data covering the period 1970 to 1993; the study found
that money matters in Nigeria economy and the appropriate monetary target is the domestic
credit of the banking sector. Chimobi and Uche (2010) examined the relationship between
Money, Inflation and Output in Nigeria. The study adopted co-integration and granger-
causality test analysis. The co-integrating result of the study showed that the variables used in
the model exhibited no long run relationship among each other. Nevertheless money supply
was seen to granger cause both output and inflation. The result of the study suggested that
monetary stability can contribute towards price stability in the Nigerian economy.
The Error Correction Mechanism and Cointegration technique was employed by Adefeso and
Mobolaji (2010) to estimate the relative effectiveness of fiscal and monetary policy on
economic growth in Nigeria using annual data from 1970-2007. The empirical result showed
that the effect of monetary policy is stronger than fiscal policy and the exclusion of the
degree of openness did not weak this conclusion. Also Ajisafe and Folorunso (2002)
examined the relative effectiveness of monetary and fiscal policy on economic activity in
Nigeria using co-integration and error correction modeling techniques and used annual time
series data for the period 1970 to 1998. The study revealed that monetary rather than fiscal
policy exerts a greater impact on economic activity in Nigeria and concluded that emphasis
on fiscal action by the government has led to greater distortion in the Nigerian economy.
Amassoma et al. (2011) examined the effect of monetary policy on macroeconomic variables
in Nigeria for the period 1986 to 2009 by adopting a simplified Ordinary Least Squared
technique found that that monetary policy had a significant effect on exchange rate and
money supply while monetary policy was observed to have an insignificant influence on
price instability. Onyeiwu (2012) examines the impact of monetary policy on the Nigerian
economy using the Ordinary Least Squares Method (OLS) to analyse data between 1981 and
2008. The result of the analysis shows that monetary policy presented by money supply
exerts a positive impact on GDP growth and Balance of Payment but negative impact on rate
of inflation.. Furthermore, the findings of the study support the money-prices-output
hypothesis for Nigerian economy.
In a recent study by Osuyi and Akujuobi (2012), using three VAR models, one with two
variables (money supply and prices) and the other two with nominal exchange rate and

Dutse International Journal of Social and Economics Research Vol. 1, No. 1 June 2018
5
interest rates. The study revealed that the two variables VAR model is an inertial
phenomenon in Nigeria and Ghana, while the other two VAR models showed that monetary
policy instruments, exchange rate and interest rate do not have any significant improvements
in the models.
3.0 Methodology
Data and Variables
Annual time series data for the years 1981-2016 were used in empirical investigation of this
study. Real Gross Domestic Product (RGDP) was used as a proxy for economic growth to
serve as the dependent variable. While Broad Money Supply (M2), Monetary Policy Rate
(MPR), Cash Reserve Ratio (CRR) and Liquidity Ratio (LR) were used as the monetary
policy variables, all of them serving as the indedepent variables. In addition, an additional
explanatory variable, Exchange rate (EXR) is added as the control variable to capture the
impact of external shocks on the Nigerian economy. All the data set used in this study were
sourced from Central Bank of Nigeria (CBN) Statistical Bulletin of various editions (2011 to
2016 edition), except for the real GDP data set which were sourced from World Bank
Development Indicators (WDI, 2016).
Model Specification
To estimate the magnitude and overall impact of monetary policy on economic growth in
Nigeria, this study specifies an economic growth equation using real GDP (RGDP) as a proxy
for economic growth and monetary policy variables which include, Broad Money Supply
(M2), Monetary Policy Rate (MPR), Cash Reserve Ratio (CRR) and Liquidity Ratio (LR). In
addition, exchange rate (EXR) is added as a control variable to capture the impact of external
shocks on the Nigerian economic growth. Therefore, the following functional form of
economic growth equation is specified:
………………………………. (1)
Equation (1) above is the functional form of the relationship between RGDP as the dependent
variable and as the independent variables. Algebraically, the
relationship can be expressed as follows
………….(2)
The above equation is the mathematical model for the economic growth equation expressed
in algebraic form. The theoretical (a priori) expectation of the model is that: β_1, β_2, and
β_3<0 while β_4>0. Strictly in econometric terms, the equation (2) above can be transformed
as follows:
………(3)
The linear transformation of the equation (2) results in an econometric model in equation (3)
where µ is added to take into account the influence of omitted variables as well as any error
of measurements. The µ is the random term and it is assumed to be normally and identically
distributed around zero mean and constant variance (µ~NIDD {0, 1}).

Dutse International Journal of Social and Economics Research Vol. 1, No. 1 June 2018
6
The first step in any empirical investigation, particularly one involving time series data is an
overview of the data itself and this study carried out preliminary check on all the data series
using time series plots (see Appendix A).
Estimation Techniques
The overall objective of this paper is to estimate the dynamic impact of monetary policy on
economic growth in Nigeria and this can be achieved more systematically by estimating
autoregressive distributed lag (ARDL) model which is developed by Pesaran and Pesaran
(1997) and expanded by Pesaran, Shinb and Smith (2001). The ARDL model is used in
testing short and long run analysis. It is suitable for this current study for a number reasons:
firstly, the ARDL model allows one to estimate the level relationships because the model
proposes that once the order of the ARDL has been established, the relationship can be
estimated by the usual OLS (Pesaran et al., 2001). Secondly, the long-run relationship of a
given set of variables can be tested irrespective of whether the variables are I(1) and or I(0) or
combination of both. Therefore, this means that the ARDL model has the advantage of not
requiring a specific identification of the order of integration of the underlying time series data
(Atiff, et al., 2010). Thirdly, the ARDL model is suitable for small or finite sample size
(Pesaran et al., 2001) contrary to the Engle–Granger and the Johansen techniques which are
not suitable for small sample sizes (Narayan, 2004). Overall, the short run equilibrium (error
correction model (ECM)) can be derived from ARDL through a simple linear transformation,
which integrates short run adjustment parameters with long run equilibrium without any loss
of vital information.
Before the estimation of the ARDL model, unit root test will be carried out on the variables
of interest in order to ensure that none of them is integrated at second order (i.e. all series are
less than I (2)); and that the dependent variable is essentially nonstationary, while, some of
the independent variables are either I (1) or I (0). Failure of any of these conditions to hold
will render the ARDL model invalid.
Therefore, this study employs the two most popular unit root tests, namely: Augmented
Dickey Fuller (ADF) and Philips Peron (PP) tests in order to ascertain the level of stationarity
of the variables of interest. The reason for using two-unit root tests is to confirm the exact
nature of the level of integration of the variables and that the variables satisfy the
preconditions for running an ARDL model as mentioned before.
After our model passed the aforementioned unit root tests‘ preconditions for the estimation of
the ARDL model, the study will proceed to estimate the ARDL model. The ARDL model
estimation involves two procedures. Firstly, the procedure begins with a test of no co-
integration using the Wald test to derive the F-statistic (i.e. ARDL bound test for co-
integration). Secondly, if the F-statistic is above the upper bound, the null hypothesis of no
cointegration is rejected and thus we estimate the ARDL-ECM (in the second step) where the
short-run and long-run elasticities are determined. However, the first step in estimating the
model is to select the correct lag orders as suggested by Schwarz Information Criteria (SIC)
and Akaike Information Criteria (AIC) using a vector autoregressive (VAR) model. This is
then followed by ARDL-ECM estimation. Therefore, the ARDL model of equation (1) is
estimated as follows:
∑ ∑
∑
∑ ∑
……………………………….(4)
Dutse International Journal of Social and Economics Research Vol. 1, No. 1 June 2018
7
From the equation (4), the null hypothesis of no cointegration is tested against the alternative
hypothesis, thus:
(No long-run relationship)
(Long-run relationship exists)
If a long-run relationship exist based on the Wald test, then the second stage is the estimation
of the short-run and the long run coefficients. The ARDL-ECM coefficients are represented
with error correction term to capture the speed of adjustment towards the long run
equilibrium, thus:
∑ ∑
∑
∑ ∑
……………………….(5)
In the equation (5), the last term, ECT is the error correction term which was resulted from
the varied long run equilibrium relationship and λ signifies the speed of convergence towards
the long run equilibrium.
To ensure the robustness of the results, additional diagnostic tests on the ARDL-ECM will be
conducted. These include, serial correlation test, heteroskedasticity test, and normality test. In
addition, a test of stability will be conducted using the cumulative sum of recursive residuals
(CUSUM) and the cumulative sum of square of recursive residuals (CUSUMSQ) all of which
had been introduced by Brown, Durbin and Evans (1975). Pesaran et al., (2001) argued that it
is very important to ascertain the constancy of the long-run multipliers by way of testing the
above error-correction model for the stability of its parameters.
4.0 Empirical Results & Discussion
Unit Root Test Results
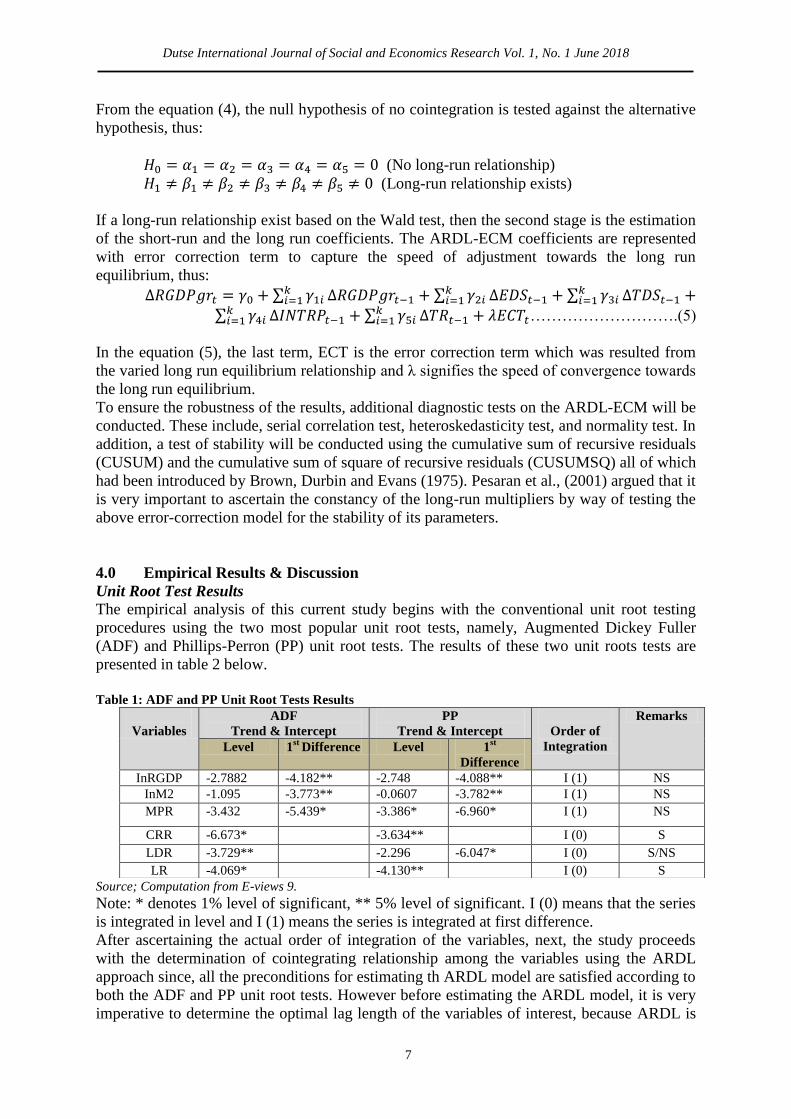
The empirical analysis of this current study begins with the conventional unit root testing
procedures using the two most popular unit root tests, namely, Augmented Dickey Fuller
(ADF) and Phillips-Perron (PP) unit root tests. The results of these two unit roots tests are
presented in table 2 below.
Table 1: ADF and PP Unit Root Tests Results
Source; Computation from E-views 9.
Note: * denotes 1% level of significant, ** 5% level of significant. I (0) means that the series
is integrated in level and I (1) means the series is integrated at first difference.
After ascertaining the actual order of integration of the variables, next, the study proceeds
with the determination of cointegrating relationship among the variables using the ARDL
approach since, all the preconditions for estimating th ARDL model are satisfied according to
both the ADF and PP unit root tests. However before estimating the ARDL model, it is very
imperative to determine the optimal lag length of the variables of interest, because ARDL is
Variables
ADF
Trend & Intercept
PP
Trend & Intercept
Order of
Integration
Remarks
Level 1st
Difference Level 1st
Difference
InRGDP -2.7882 -4.182** -2.748 -4.088** I (1) NS
InM2 -1.095 -3.773** -0.0607 -3.782** I (1) NS
MPR -3.432 -5.439* -3.386* -6.960* I (1) NS
CRR -6.673* -3.634** I (0) S
LDR -3.729** -2.296 -6.047* I (0) S/NS
LR -4.069* -4.130** I (0) S

Dutse International Journal of Social and Economics Research Vol. 1, No. 1 June 2018
8
very sensitive to that. Table 2 below shows that all lag selection criteria suggested Lag 2 as
the optimal lag length for our study with the exception of only Schwarz information criterion
which suggested optimal lag length of one (1).
Table 2: Lag Order Selection Criteria
Consequently, the ARDL conintegration test result presented in table 3 and table 4 for the
short run and long run coefficients, respectively, was estimated with lag 2 as suggested by SC
and AIC.
The Bound test for conintegration in table 3 is computed from the ARDL model. Thus, table
3 shows that the F-statistic of 1.8393 is less than the upper bound value calculated by
Narayan (2005) at both 95% and 90% confidence level and therefore, this means that there is
no co-integration (long run) relationship between real GDP and monetary policy variables.
This finding is inline with the theoretical postulation of the Keynesian school of thought who
believe that monetary policy is ineffective in the long run. In other words, monetary policy is
a short run phenomenon and hence there is no long run relationship between economic
growth and monetary policy. This finding is also similar to empirical results found by some
previous researchers such as
Table 3: ARDL Cointegration Test Result
Level of Sig. 95 % Confidence Level 90% Confidence Level
Critical Bound Lower
I(0)
Upper
I(1)
Lower
I(0)
Upper
I(1)
Critical Value 3.1184 4.5577 2.5782 3.8238
F-statistics 1.8393
Source: Computation from Microfit 5.0
Since, ARDL cointegration test reveals that long run relationship does not exists between monetary policy
variables and economic growth (real GDP), the study proceeds to estimate the short run dynamic of the
relationship existing among the variables. Table 4 below shows
Error correction representation of the foregoing long run relationship is reported in table 4
below. The error correction representation captures the short run dynamics of the relationship
between debt burden indicators and real GDP growth rate. The error correction model under
the ARDL approach shows that external debt stock, interest rate payment and total reserve
are statistically insignificant, while total debt service and error correction term are
statistically significant at 10% and 1% level, respectively.
Lag LogL LR FPE AIC SC HQ
0 -407.1151 NA 36823.58 27.54101 27.82125 27.63066
1 -257.1316 229.9747 19.44104 19.94211 21.90378* 20.56966
2 -210.4141 52.94651* 13.04317* 19.22761* 22.87072 20.39307*
Source: Extracted from E-views 9.0
* indicates lag order selected by the criterion. LR: sequential modified LR test statistic (each test at 5% level);
FPE stands for Final prediction erro; AIC stands for Akaike information criterion; SC stands for Schwarz
information criterion; and HQ: Hannan-Quinn information criterion

Dutse International Journal of Social and Economics Research Vol. 1, No. 1 June 2018
9
Table 3: Short Run/Error Correction Relationships for the ARDL Model ( 1,0,0,0)
Variable Coefficient Std. Error t-Statistic Prob.
ΔInM2 0.0426 0.0157 2.7162* 0.0120
ΔMPR 0.0012 0.0018 0.6261 0.5370
ΔCRR -0.0002 0.0004 -0.3639 0.7190
ΔLDR 0.0002 0.0005 0.4938 0.6260
ECM(-1) -0.1389 0.0780 -1.7801 0.0870
Statistical Tests R
2
0. 2717
0.281640
AIC 65.3717
7.009361
SC 65.3717
7.009361
F-statistic 1.8655
Source; Computation from Microfit 5.02
The table 3 above shows the estimated short run relationships between real GDP (InRGDP)
as the dependent variable and Monetary policy variables (InM2, MPR, CRR and LDR) as the
explanatory variables. It can be observed that the quantity based anchor (broad money
supply) has the correct positive sign as expected and it is statistically significant at 5% level.
This implies that an increase in money supply by one percent (i.e. an expansionary monetary
policy) through the buying of government bonds and securities in the open market
operation(OMO) will lead to an outward shift of the Liquidity-Money (LM) supply curve to
the right and consequently real output (InGDP) will increase by approximately 4.3% in the
short run. This finding is in line with the monetarists views that money matters at least in the
short run. In contrast, the price based anchor (monetary policy rate) turns out with the
unexpected positive sign and it is statistically insignificant. This means that monetary policy
through the use of policy rate (MPR) is not effective in Nigeria and surprisingly, contrary to
theoretical expectation of the model, an increase in MPR by one percent will lead to 0.1 %
increase in InRGDP.
On the other hand, the other two quantitative instruments of monetary policy, CRR and LDR
possess the correct negative and positive signs, respectively. And these are in line with the
theoretical postulations of our model, that is an increase in cash reserve ratio, will decrease
the amount of money available for borrowings and investment in the economy and hence will
lead to a decrease in real GDP. While an increase in loan to deposit ratio (LDR) will result in
increase in investments in the economy and thereby leading to an increase in real economic
activities in the economy and thus accelerate economic growth. Although, the coefficients of
both CRR and LDR are correct in term of signs and sizes, they are statistically insignificant
in the short run. These findings imply that, CBN cannot stabilize the economy or accelerate
real output in the short run using either CRR or LDR.
The error correction term has the correct negative sign and it is statistically significant at 10
percent level of significance suggesting that real GDP adjusts to deviations from its long run
equilibrium path. The negative coefficient of the ECT-1 (-0.138) implies that 14 percent of the
previous year‘s disequilibrium is restored within each year. Therefore, the speed of
adjustment of the model is very sluggish as it will take on average 7 years two months for the
full long run equilibrium to be attained after some major monetary shocks in the economy.
Overall, the model does not fit the data very well as can be inferred from the very low value
of R2 which is 0.27. This means that only 27% of the total variation in real GDP is explained
Dutse International Journal of Social and Economics Research Vol. 1, No. 1 June 2018
10
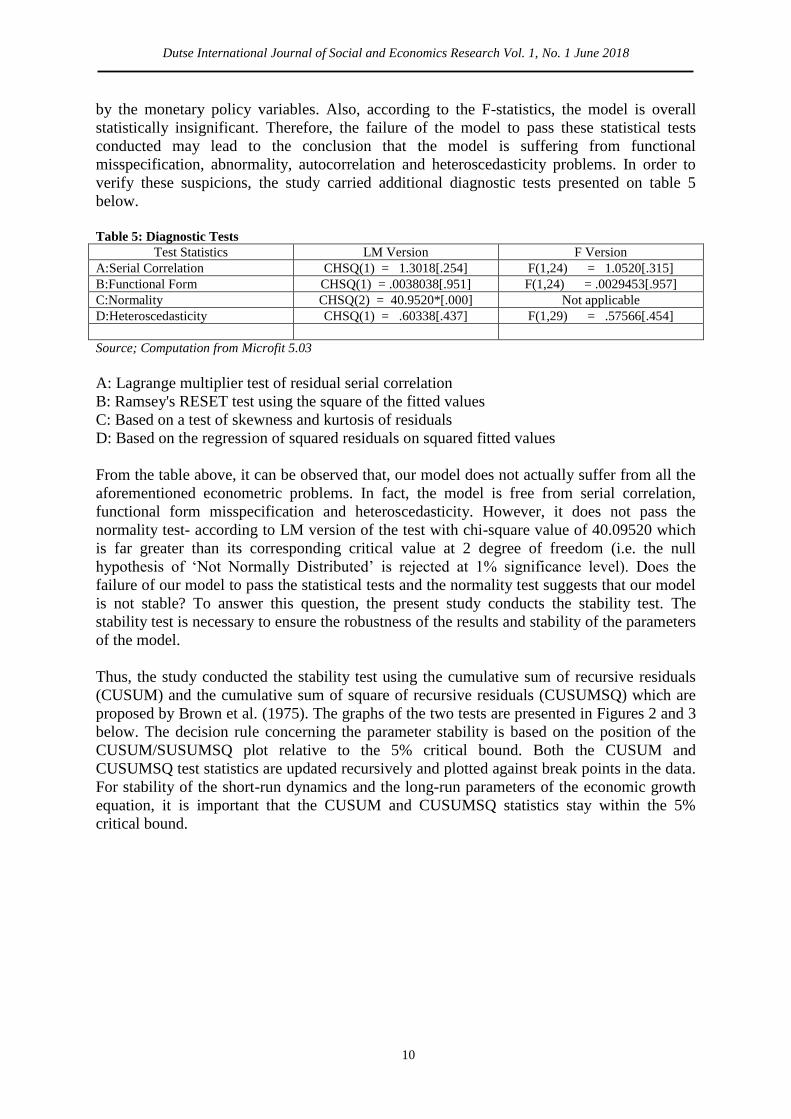
by the monetary policy variables. Also, according to the F-statistics, the model is overall
statistically insignificant. Therefore, the failure of the model to pass these statistical tests
conducted may lead to the conclusion that the model is suffering from functional
misspecification, abnormality, autocorrelation and heteroscedasticity problems. In order to
verify these suspicions, the study carried additional diagnostic tests presented on table 5
below.
Table 5: Diagnostic Tests
Test Statistics LM Version F Version
A:Serial Correlation CHSQ(1) = 1.3018[.254] F(1,24) = 1.0520[.315]
B:Functional Form CHSQ(1) = .0038038[.951] F(1,24) = .0029453[.957]
C:Normality CHSQ(2) = 40.9520*[.000] Not applicable
D:Heteroscedasticity CHSQ(1) = .60338[.437] F(1,29) = .57566[.454]
Source; Computation from Microfit 5.03
A: Lagrange multiplier test of residual serial correlation
B: Ramsey's RESET test using the square of the fitted values
C: Based on a test of skewness and kurtosis of residuals
D: Based on the regression of squared residuals on squared fitted values
From the table above, it can be observed that, our model does not actually suffer from all the
aforementioned econometric problems. In fact, the model is free from serial correlation,
functional form misspecification and heteroscedasticity. However, it does not pass the
normality test- according to LM version of the test with chi-square value of 40.09520 which
is far greater than its corresponding critical value at 2 degree of freedom (i.e. the null
hypothesis of ‗Not Normally Distributed‘ is rejected at 1% significance level). Does the
failure of our model to pass the statistical tests and the normality test suggests that our model
is not stable? To answer this question, the present study conducts the stability test. The
stability test is necessary to ensure the robustness of the results and stability of the parameters
of the model.
Thus, the study conducted the stability test using the cumulative sum of recursive residuals
(CUSUM) and the cumulative sum of square of recursive residuals (CUSUMSQ) which are
proposed by Brown et al. (1975). The graphs of the two tests are presented in Figures 2 and 3
below. The decision rule concerning the parameter stability is based on the position of the
CUSUM/SUSUMSQ plot relative to the 5% critical bound. Both the CUSUM and
CUSUMSQ test statistics are updated recursively and plotted against break points in the data.
For stability of the short-run dynamics and the long-run parameters of the economic growth
equation, it is important that the CUSUM and CUSUMSQ statistics stay within the 5%
critical bound.

Dutse International Journal of Social and Economics Research Vol. 1, No. 1 June 2018
11
Figure 2: CUSUM of recursive residuals of the economic growth equation for Nigeria ( 1985-2016)
Figure 3: CUSUMSQ of recursive residuals of the economic growth equation for Nigeria (1985-2016)
-20
-10
0
10
20
1986 1994 2002 2010 2016
The straight lines represent critical bounds at 5% significance level
Plot of Cumulative Sum of Recursive Residuals
-0.4
-0.2
0.0
0.2
0.4
0.6
0.8
1.0
1.2
1.4
1986 1994 2002 2010 2016
The straight lines represent critical bounds at 5% significance level
Plot of Cumulative Sum of Squares of Recursive Residuals
Dutse International Journal of Social and Economics Research Vol. 1, No. 1 June 2018
12
As it can be observed from the two figures, neither the CUSUM nor CUSUMSQ plots cross
the 5% critical boundaries, therefore, we can conclude that the estimated parameters for the
short-dynamics of the economic growth equation in Nigeria are very stable. In other words, a
stable economic growth equation exists over the entire sample period of the study.
5.0 Conclusion and Policy Implications
This study has examined the impact of monetary policy on economic growth in Nigeria
during the period of 1985 to 2016 using annual time series data. The study employed the
ARDL bounds testing co-integration approach to investigate the long -run and short -run
relationships between monetary policy and economic growth (real GDP). The results of the
Bound test for conintegration show that there is no long-run relationship between growth rate
of real GDP and monetary policy variables in the case of Nigeria. Consequently, the short run
relationship existing between various instruments of monetary policy (variables) and real
GDP were estimated together with the error correction term. In the short run, broad money
supply (M2) was found to be positively related to real GDP and the relationship is statically
significant at 5% level. While monetary policy rate (MPR) was found to have a positive
impact on real GDP and this discovery is contrary to the theoretical expectation. Cash reserve
ratio (CRR) and loan to deposit ratio (LDR) were found to have positive and negative impact
on real GDP, respectively. And these findings are consistent with the theoretical expectations
and lend empirical support to the monetarists view that ‗money matters at least in the short
run‘. The implication of these findings is that, the monetary policy has an impact on real GDP
in Nigeria, at least in the short run. Thus, we can conclude that the CBN can use its monetary
policy to stabilize output and price in the short run. In line with these findings, the present
study recommends that the monetary authority should use the quantity based anchor (M2)
when it want to stabilize economic activities in the country.
References
Abradu-otoo, P., Amoah, B., & Bawumia, M. (2003). An Investigation of the Transmission
Mechanisms of Monetary Policy in Ghana: A Structural Vector Error Correction
Analysis. Bank of Ghana, WorkingPpaper, 1–37.
Aleem, A. (2010). Transmission mechanism of monetary policy in India. Journal of Asian
Economics, 21(2), 186–197. http://doi.org/10.1016/j.asieco.2009.10.001
Anyanwu, J. C. (1993). Monetary Economics: Theory, policy, and Institutions. Hybrid
Publishers.
Ayo, E. J. (1988). Money and Banking: Analysis and Policy in the Nigeria Context. Nigeria:
George Allen and Union Publishers.
Bernanke, B. S., & Blinder, A. S. (1988). Credit, money, and aggregate demand (No.
w2534). National Bureau of Economic Research.
Bernanke, B. S., & Gertler, M. (1995). Inside the black box: the credit channel of monetary
policy transmission (No. w5146). National bureau of economic research.
Central Bank of Nigeri (2010). Monetary Policy Transmission Mechanism in Nigaria,
Research Department.
Central Bank of Nigeria (2011). Understanding Monetary Policy Series No 2 CBN
Chileshe, P., Mbao, F. Z., Mwanza, B., Mwansa, L., & Zgambo, P. (2014). Monetary Policy
Transmission Mechanism in Zambia **, 1–49.
Chimobi, O.P. and U.C. Uche,(2010). Money, price and output.A causality test for nigeria.
American Journal of Scientific Research, 8: 78-87.
Chuku, C. A. (2009). Measuring the Effects of Monetary Policy Innovations in Nigeria : a
Structural Vector Autoregressive ( Svar ) Approach I . 5(5), 112–129.
Dutse International Journal of Social and Economics Research Vol. 1, No. 1 June 2018
13
Çi, E. B. A. Ş. (2007). The monetary transmission mechanism in Turkey : new
developments Özgür ÖZEL Ça ğ r ı SARIKAYA June 2007, (07).
Dabla-Norris, E., & Floerkemeier, H. (2006). Transmission mechanisms of monetary policy
in Armenia: evidence from VAR analysis.
Davoodi, H. R., Dixit, S. V. S., & Pinter, G. (2013). Monetary Transmission Mechanism in
the East African Community: An Empirical Investigation. IMF Working Papers,
13(39), 1. http://doi.org/10.5089/9781475530575.001
Dickey, D.A. and Fuller, W.A. (1981). Likelihood Ratio Statistics for Autoregressive Time
Series with a Unit Root. Econometrica, Vol. 49 (, pp. 1057-1072.
Disyatat, P., & Vongsinsirikul, P. (2003). Monetary policy and the transmission mechanism
in Thailand. Journal of Asian Economics, 14(3), 389–418.
http://doi.org/10.1016/S1049-0078(03)00034-4
Eichenbaum, M. (1992). ―Interpreting the macroeconomic time series facts: The effects of
monetary policy.‖ European Economic Review, 36(5), 1001–1011.
http://doi.org/10.1016/0014-2921(92)90042-U
Elbourne, A. (2008). The UK housing market and the monetary policy transmission
mechanism: An SVAR approach. Journal of Housing Economics, 17(1), 65–87.
http://doi.org/10.1016/j.jhe.2007.09.002
FolaIwo, A. O. and Osinubi, T. S. (2006) ―Monetary Policy and Macroeconomic Instability
in Nigeria: A Rational Expectation Approach‖. Journal of Social Science. Vol. 12, no.
2, pp. 93-100.
Friedman, M., & Meiselman, D. (1987). The Relative Stability of Monetary Velocity and
Investiment Multiplier in The United States, in ―Stabilization Policies‖ Englewood
Cliffs.
Furness, E. (1975). Money and credit in Developing Africa. New York: Macmillian Press
Ltd.
Galí, J. (2008). Monetary Policy, Inflation, and the Business Cycle: An Introduction to the
New Keynesian Framework. Shock (Vol. 95). Princeton University Press.
Ghazanchyan, M. M. (2014). Unraveling the Monetary Policy Transmission Mechanism in
Sri Lanka (No. 14-190). International Monetary Fund.
Hall, S. G., Henry, S. G. B., & Wilcox, J. B. (1989). The long-run determination of the UK
monetary aggregates. Bank of England.
Harcourt, P., State, R., & Harcourt, P. (2011). The Impact of Monetary Policy on Nigeria‘s
Macroeconomic Stability (1970 - 2009) Nenbee, S. G., 2(2), 174–183.
Horváth, C., Krekó, J., & Naszódi, A. (2006). Is there a bank lending channel in Hungary?
Evidence from bank panel data (No. 2006/7). MNB Working Papers.
Ismail, O. (2014). Does Monetary Policy Influence Economic Growth in Nigeria ?, 12(1),
1–32.
Johansen, S., & Juselius, K. (1990). Maximum likelihood estimation and inference on
cointegration with applications to the demand for money. Oxford Bulletin of
Economics and statistics, 52(2), 169-210.
Kashyap, A. K., & Stein, J. C. (2000). What do a million observations on banks say about the
transmission of monetary policy? American Economic Review, 90(3), 407–428.
http://doi.org/10.1257/aer.90.3.407
Kuttner, K. N., & Mosser, P. C. (2002). The Monetary Transmission Mechanism : Some
Answers and Further Questions. FRBNY Economic Policy Review, (May), 15–26.
Lashkary, M., & Kashani, B. H. (2011). The Impact of Monetary Variables on Economic
Growth in Iran: A Monetarists‘ Approach. World Applied Sciences Journal, 15(3),
449-456.
Dutse International Journal of Social and Economics Research Vol. 1, No. 1 June 2018
14
Liew, Venus Khim−Sen, (2004) "Which Lag Length Selection Criteria Should We Employ?"
Economics Bulletin, Vol. 3, No. 33 pp. 1−9
Mashat, R. Al, Billmeier, A., & Fund, I. M. (2008). The Monetary Transmission Mechanism
in Egypt Rania Al-Mashat and Andreas Billmeier Working Paper 411 June 2008.
Mengesha, L. G., & Holmes, M. J. (2013). Monetary policy and its transmission mechanisms
in Eritrea. Journal of Policy Modeling, 35(5), 766–780.
http://doi.org/10.1016/j.jpolmod.2013.06.001
Mishkin, F. S. (1995). Symposium on the Monetary Transmission Mechanism. Journal of
Economic Perspectives, 9(4), 3–10. http://doi.org/10.1257/jep.9.4.3
Mishkin, F. S. (2009). Is monetary policy effective during financial crises? (No. w14678).
National Bureau of Economic Research.
Mishra, P., Montiel, P. J., & Spilimbergo, A. (2011). How Effective Is Monetary
Transmission in Developing Countries? A Survey of the Empirical Evidence.
Montiel, P. J. (1991). The transmission mechanism for monetary policy in developing
countries. Staff Papers-International Monetary Fund, 83-108.
Mugume, A. (2009). Monetary transmission mechanisms in Uganda. The Bank of Uganda,
4(1), 3–52.
Pesaran, M.H., Pesaran, B. (1997). Working with Microfit 4.0. Camfit Data Ltd, Cambridge.
Phiromswad, P. (2015). Measuring monetary policy with empirically grounded restrictions:
An application to Thailand. Journal of Asian Economics, 38, 104–113.
http://doi.org/10.1016/j.asieco.2015.04.005
Sims, C. A. (1992). Interpreting the macroeconomic time series facts: The effects of
monetary policy. European Economic Review, 36(5), 975-1000.

Dutse International Journal of Social and Economics Research Vol. 1, No. 1 June 2018
15
Achieving Economic Growth through
Diversification in Nigeria:
The Role of Agriculture
Prof. Ummu A. Jalingo
1 & *Magaji Saleh
2
1Economics Department, Bayero University Kano, PMB 3011, Kano Nigeria
2Sociology Department, Federal University Dutse, PMB 7156, Jigawa State, Nigeria
*Corresponding Author‘s email: [email protected]
Abstract: The paper explored the possibility of achieving economic development through
diversification with specific emphasis on revitalization of agriculture sector. The study used
literature review and analysed the finding qualitatively, using content analysis.It is the
finding of the study that agriculture has a historic relevance as far as human socio-economic
development is concern. From its independence in 1960 till date, Nigeria has been wallowing
in various developmental trajectories, but little or no meaningful achievement was realised.
This does not suggest that agriculture was not part of Nigeria‘s development plans; instead,
it means that the agriculture has not been given duesignificant attention in terms of proper
support for small scale farmers, and revitalisation of the overall agricultural practices for
both small-scale and large-scale farmers in Nigeria. In view of this, the paper concluded that
diversification of the Nigerian economy through agricultural development is essential for
achieving economic growth. In other words, Nigerian economy can become robust if the
country gives serious attention to agribusiness. Thus, the paper recommended that: the
government should invest more in technology to revitalize the agriculture; privatesector to be
supported by the public sector in terms of agri-business development and directing
agricultural production towards large volume of locally produced stable foodsupply to satisfy
internal market and export more for global markets.
Keywords: Agriculture, Development, Diversification, Economic Development, Nigeria
JEL Classification: L25, N97, O40
1. Introduction
The history of the world provides overwhelmingglobal evidence that general
economicgrowth of any nation must be preceded, or atleast accompanied by, solid
agricultural growth.Agriculture has played this central role since theEnglish Agricultural
Revolution which paved theway for the Industrial Revolution (Rukuni, 2006). Three-quarters
of the world‘s poorest people get their food and income from farming small plots of land-
typically the size of a football field or smaller-and most of them labor under difficult
conditions. They grow a diversity of local crops and must deal with unique diseases, pests,
and drought, as well as unproductive soil(Global Development Programme, 2011). Their
livestock arefrequently weak or sick, resulting in reduced production of eggs and milk to eat
or sell. Reliable markets for their products and good information about pricing are hard to
come by. Most often, government policies do not adequately serve their interests (Global
Development Programme, 2011).

Dutse International Journal of Social and Economics Research Vol. 1, No. 1 June 2018
16
Nigeria got her independence in 1960. Few years after its independence, Nigeria derived its
export earnings from cocoa, groundnut, rubber, palm produce, cotton, millet, etc. Crude oil
then contributed a negligible percentage of export earnings (Mukhtar, Mukhtar& Abdullahi,
2014). In the 1964-1965 fiscal years, agriculture contributed 59.2% of Nigeria‘s GDP. In
1964, agricultural sector also contributed over 80% of export earnings. In contrast, the
proportion of crude oil in total export was about 15.2% in the 1964 and its share of GDP was
about 36. In 1983 crude oil contributed 17.5% of the nation‘s GDP and accounted for over
80% of the country‘s foreign exchange. The sudden wealth brought by oil led to many social
dislocations in the economy (Ijeoma, 2002, as cited in Mukhtar et al. 2014).
Nigeria is currently facing economic recession and insecurity. This problem has arguably
emanated from neglect of agriculture sector and giving supremacy to oil or petroleum. In the
last half-century, the country was not experiencing this kind of economic quagmire.In the
1960s, the country was a self-sufficient agrarian economy. Now that Nigeria is paying price
of adopting mono-cultural economy (i.e. sole dependency on oil), making a transition to a
more diversified and faster growing economy is the key to sustainedpoverty reduction for the
country. This is pertinent because it is the increasing agricultural productivity thathas allowed
many poor countries to make the initial step on to the ladder leading to prosperity. This is
particularly the case for labor-intensive, small-scale agriculture with its strong links to growth
inother areas. No poor country has ever successfully reduced poverty through agriculture
alone, butalmost none have achieved it without first increasing agricultural productivity. This
reveals the fact that agriculture has important role to play economic development of
developing nations, such as Nigeria.
Many studies have been conducted on the role of agriculture in Nigeria‘s economic
development. For instance, Manggoel, Ajiji, Damar, Damiyal, Da‘ar, &Zarmai (2012),
Abdullahi &Sulaiman (2013),Mendali& Gunter (2013) and Mukhtar et al. (2014) have all
conducted studies on the relevance of agriculture, but none of them have made attempt to
investigate the role of agriculture in economic diversification in Nigeria. To fill this research
gap, this paper is set to find out how agriculture will facilitate economic diversification and,
by implication, economic development in Nigeria. The objectives of the study are: 1) to
examine the means ofrevitalising agriculture in order to promote the agricultural sector in
Nigeria;and 2)tofind out if Nigerian economy can be diversified through agriculture in
Nigeria. Thus, the study will provide answers to the following research questions:
1) Can revitalisation of agriculture help in promoting the agricultural sector in Nigeria?
2) And how can Nigerian economy by diversified through agriculture in Nigerian?
The paper is divided into seven sections: section one introduces the paper; section two
provides the conceptual explanation; section three deals with theoretical framework;
section four explains the methods and tools used in the study; section five discusses the
revitalisation of agricultural sector and economic growth in Nigeria; section six provides
some policy implications for achieving economic diversification through agriculture in
Nigeria; and section seven concluded the paper.
2. Conceptualization: Agriculture, Economic Development, and Diversification
2.1 Concept of Agriculture:
Agriculture is the cultivation and rearing of animals, plants, fungi and other life form of food,
fiber and other products used to sustain life. Agriculture was the key implement in the rise of
sedentary human civilization whereby farming of domesticated species created food surpluses
Dutse International Journal of Social and Economics Research Vol. 1, No. 1 June 2018
17
that nurtured development of civilization. The study of agriculture known as
―agriculturalscience‖ is also observed in certain species of ant and termite, but generally
speaking refers to human activities (Sharma, 2013, cited in Mukhtar et al. 2014).However, all
farming generally relies on techniques to expand and maintain the lands suitable for raising
domesticated species. For plants, these usually requires some form of irrigation, although
there are methods of dry land farming, pastoral herding on range land is still the most
common mean of raising livestock.
2.2 Concept of Economic Development:
Economy is a structure that deals with production, distribution and consumption of goods and
services. It deals with how resources are produced and utilized. Economy is one of the
various social institutions, alongside political institution, religious institution, and educational
institution. Development is defined variously. It meant different things to different people.
One of the various definitions of development is the―modification in one or all social
institution(s): economy, politics, education, family, etc‖ (Mukhtar, Mukhtar, Mohammed &
Abdullahi, 2014: 421). Development is any change or significant transformation in a society
or in one of its structures-economy, politics, or education. Development in this context,
development refers to economic change. This development shall mean to improve the living
standard of the citizens and to make the country (Nigeria) respected in the comity of nations
because it achieved some considerable level of economic buoyancy in term of foreign
reserve, competitive advantage, more exportation of goods and services ratherthan
importation, national per capita, GDP (Gross Domestic Product) and GNP (Gross National
Product).
Income per head in a country is naturally measured in units of its own currency,but if
international comparisons of living standards are to be made, each country‘sper capita
income has to be converted into a common unit of account at some rate ofexchange. The
convention is to take the US dollar as the unit of account and convert each country‘s per
capita income into dollars at the official exchange rate (Thirlwall, 2010). A country‘s official
exchange rate, however, is not necessarily a good measure of therelative purchasing power of
currencies, because it only reflects the relative prices ofgoods that enter into international
trade. But many goods that people buy are nottraded, and the relative price of these non-
traded goods tends to be lower the poorerthe country is, reflecting much lower relative labor
costs.
An exchange rate isrequired which reflects the purchasing power parity (PPP) of countries‘
currencies,and this is now provided by various international organizations, such as the
WorldBank, which uses US$1.25 per day measured at PPP to define the level of
absolutepoverty (Thirlwall, 2010).Moreover, Rapley (2007) notes, given the state of the
industrial countries at thattime, and the lessons their experiences had taught, industrialization-
and in particular, the creation of a country‘s capacity to manufacture finished goods-was seen
as essential.
2.3 Concept of Diversification:
Is the process of expanding activity into new areas,In this context, diversification refers to the
expansion of Nigeria‘s economic activity into new areas of businesses or expansion of
theeconomic structure intonew sectors, such as revitalizing agriculture as a new area and
making it robust commercial activity to represent a viable venture for economic development
in the country.Economic diversification, on the other hand, is the strategy or process of
increasing more source(s) of income. This strategy can be at individual, group, organizational
or national level. For example, when Nigerian government formulates a policy of extending

Dutse International Journal of Social and Economics Research Vol. 1, No. 1 June 2018
18
its economic sources beyond oil and gas towards manufacturing industries, tourism,
agriculture, and entertainment industries, it could be said it aims to diversify its economy.
The focus of this study is economic diversification through agricultural economy. However,
diversificationis often easiest for the more progressive, better off farmers than for more
marginal ones,reflecting both access to necessary resources as well as the human resources in
terms of skills,attitudes and motivation.
2.4 Theoretical framework
The study adopts the W. W. Rostow‘s stages of economic growth theory to explain the role of
agricultural development in economic diversification in Nigeria.The stage of economic
growth theory is one of the many strands of modernization perspective.The modernization
theories posit that development of the third world countriesof Africa, Asia and the Latin is
possible if these countriesfollow the same patterns the developed countries went through. The
Rostowian theoryidentifies the stages of economic growth as follows:
1. Primitive society: The stage is characterized by subsistence farming and barter trade.
2. Preparation for take-off: The characteristics of the stage are; specialization, production of
surplus goods and trade. Transport infrastructure is developed to support trade. The stage
encourages savings and investment
3. Take-off: At this stage industrialization increases and the economy switches from
agriculture to manufacturing.
4. Drive to maturity: At this stage the economy diversifies into new areas and there is less
reliance on imports.
5. Period of mass consumption: At this stage, the economy gears on mass production and
service sector becomes increasingly dominating.
Thus, Nigeria‘s economic diversification through agricultural development is possible by
passing through the process of modernization, i.e. modernization the agricultural sector; use
of modern science and technology just as adopted by the developed countries. This can be
achieved by providing infrastructural facilities, especially the transportation system (stage
two) and promoting the agriculture to feed the manufacturing industry (stage three); and then
diversify the economy through the agricultural development (stage four), in terms of
competitive advantage, where cash crops and food crops will be produced concurrently to
satisfy the domestic market and compete in the global market, etc.
3. Methodology
This research is exploratory in nature because it seeks to explore the role of agriculture in
economic diversification in Nigeria. The study used secondary data all through. Secondary
qualitative method for data collection was used. The secondary sources of data collection are
newspapers, magazines, journal articles, internet materials, seminar papers, conference
proceedings, etc. In other words, the research is dominantly literature review. This enable the
researcher to synthesise or combine, assess and even criticise the diverse views of the
authors/writers on the role of agriculture in economic diversification and economic
development in Nigeria.For the fact that secondary sources were the sole data being used, the
method of data analysis used was content analysis. The data was presented in terms of the
literature reviewed, as well as based on the aim of the study. The essence is to find plausible
answers to the research question, viz: can revitalisation of agriculture help in promoting the
agricultural sector in Nigeria? And how can Nigerian economy by diversified through
agriculture in Nigerian?

Dutse International Journal of Social and Economics Research Vol. 1, No. 1 June 2018
19
4. Revitalisation of Agricultural Sector in Nigeria
There are various strategies proposed for revitalizing agriculture in Nigeria. Foremost is the
need for government to direct its economic policies towards bringing back the glory of the
agriculture sector as it used to be since before independence, i.e. the 1800s to 1950s. There is
also the need for government and NGOs to support agricultural research to develop more
productive and nutritious versions of the staple crops grown and consumed by farm families.
These, according to Global Development Programme (2011) include varieties that thrive in
different soil types and are resistant to disease, pests, and environmental stresses such as
drought. We fund research to find ways to better manage soil and water resources and reduce
crop loss after harvest. We are also supporting efforts that improve the health and
productivity of farmers‘ livestock.
Helping farmers to grow more crops is the smartest way to fighthunger and poverty. It is
essential to addressing the need to feed a growing population and improving their nutrition.
When farmers can grow more food and earn more income, they can achieve self-sufficiency
and live better lives. Improvements in agricultural productivity create social and economic
ripple effects. With increased incomes, small farmers can better feed their families, send their
children to school, provide for their health, and invest in their farms. This makes their
communities economically stronger and more stable (Global Development Programme,
2011). Thereare organisedprogrammes byFoodand AgricultureOrganisation (FAO) and
International Fund for Agricultural Development (IFAD) on research that focuses on
theirhighest priorities and needs-commercial access tofertilizer, seeds and other inputs-and
build profitablemarket chains for their products. Through these programs, farmers are also
provided with skills in order to increase the flow of relevant information amongthe groups
and speeding the transfer of innovations, indigenous knowledge and technical advances
(Bage, 2006).
In Sub-Saharan Africa, and South Asia, women are vital contributors to farm work, and
typically in charge of selecting food for, and feeding their families. Yet compared to their
male counterparts, women farmers are less productive and unable to reach their full potential.
Yields on women‘s plots are typically 20 percent to 40 percent less than men‘s, putting rural
families and communities at risk of not having enough nutritious food to eat or any extra to
sell at the market.
To improve agricultural business in Nigeria, there is also the need to address factors that lead
to gender gap in agricultural activities; that is women having less access to improved seeds
and other inputs, training, and markets. This gap has real consequences: households are less
productive, new approaches and technologies that could increase the amount of food they
grow are less likely to be adopted by women, and children in poor household are
undernourished. It has been understood that agricultural development programs must
understand and be designed for women farmers in order to effectively reduce hunger and
poverty. Therefore, government shall develop a gender-impact strategy to guide grant-making
scheme that includes: a ―gender checklist‖ that guides the development of foundation grants
from the beginning to ensure the optimal role for women; proposal templates to help grantees
and foundation staff ensure each grant has specific and sufficient measures in place to
effectively address gender; a toolkit on best practices and approaches developed by others to
design programs that target the gender gap;and additional tools, technical assistance, and
resources to help support grantees and partners from proposal design to implementation.

Dutse International Journal of Social and Economics Research Vol. 1, No. 1 June 2018
20
In addition to integrating a gender-responsive approach in our agricultural development work,
there should also have be dozen grants that focus on the main constraints that limit the
productivity of women farmers. These grants target women farmers‘ lack of access to
improved seeds and other inputs, the underrepresentation of women‘s needs, women‘s
limited participation in agricultural research and development, and the importance of
strengthening the role of the entire household to ensure long-term, increased productivity.
4.1 Economic Diversification through Agriculture in Nigeria
Agriculture is regarded as an important economic base of many countries in the world. It
generates income and employment to the vast majority of population in Nigeria; it is the
viable medium for investments, and a source of foreign exchange earnings (Mukhtar et al.
2014). Thus, economic diversification through agriculture is a viable venture. The
intensification of agriculture and the transformationof agricultural and natural resource
products will lead to additionalnon-farm employment, increased local incomes, and
greaterdemand for local agricultural and non-farm products.
Agriculture is important in economic development because it will provide a dependable
source of national income in terms of revenue generation by local and foreign markets. In
addition, not only confining it to Nigeria, virtually all African countries are taking their prides
with agriculture because majority of Africans live in rural areas. Africa‘s position in the
world is changing and will continue to evolve if agriculture is taken serious. With new
development and commercial partners like China and India, recent discoveries of additional
natural resources, and millions of young people entering the labor force, Nigeria as the
populous African country has the opportunity to take charge of its own development path
(Foresight Africa, 2014).
Nigeria can therefore aim at stimulating and enhancing the sectoral links betweenagriculture,
agribusiness-which forward and backward links toagriculture; and non-agricultural economic
activities, includingservice provision.There are multiple untapped, perhaps hidden
agricultural opportunities that Nigerian farmers can venture into and they will prove
rewarding to them and the national economic growth. For instance, date fruit is produced in
large quantity. USAID (2008) conducted study which examined key elements of the
international date market as an opportunity for Iran to strengthen its economy in terms of
imports andexports, production and processing, the date value chain, quality and price.
USAID (2008) observed that Leading importers of dates are Europe (highest market value),
India (highest volume), UAE mainly for re-export to other Asian countries such as India, Sri
Lanka, Indonesia, Malaysia andBangladesh. There is no correlation whatsoever between
production and exports. Tunisia andIsrael, for example, are two top exporters to the EU,
despite producing less than 2% of theglobal date supply.
The above scenario indicated that Nigeria can join the global date producers and marketers
even if it does not produce large volume of date in comparison with Iran. The best way to
boost the agricultural market is to take entrepreneurs and the private sector as the maindrivers
of sustainable economic development, and to believe in theimportance of providing an
enabling environment for market-orientedeconomic activities. Public policy needs to strike a
balance between the public interest inreducing poverty levels and improving the livelihoods
of the majorityof the population on the one hand and, on the other, stimulatingefficient
markets as a basic element of sustainable economicdevelopment (REED, 2003).

Dutse International Journal of Social and Economics Research Vol. 1, No. 1 June 2018
21
The relevance of agriculture for Nigeria‘s economic development could only be realised if
the subsistence farming, which is dominant agricultural practice in the country is replaced
with large-scale agriculture. But as observed by Manggoelet al.(2012), large-scale agriculture
is not common. Despite an abundant watersupply, a favorable climate, and wide areas of
arableland, productivity is restricted owing to low soil fertility inmany areas and inefficient
methods of cultivation.Effective land tenure reform and provision of training indevelopment
of agriculture related industries suitable forunskilled Nigerians could make agriculture a more
viablesource of employment opportunities and building wealthfor citizens. Also,
governmental organizations andlandowners could be encouraged to make land availableto
poor Nigerians on a more equitable basis foragricultural related industries.
4.2 Policy Implications
Despite the opportunities Nigeria has in terms of revitalising itsagricultural sector, and by
implication making its economy a robust one, the country still faces several challenges to
sustainable agriculture, economic growth and development As (Bage, 2006) suggested,
agricultural growth and development require investmentand technology. With them huge
productivity gains arepossible. In addition, government should ensure that public sector is
essentially supporting the private for a successful agricultural revitalization in Nigeria. A
dynamic private sector holds the key to future agricultural and overall economic growth in
Africa. Consequently, promoting agri-business and assisting to strengthen linkages between
farmers and agro-industry in order to improve farmers' access to markets is critical for
generating and sustaining economic growth. Strong linkages with agro-industry and an
efficient marketing infrastructure will contribute to improve value-added to agriculture,
reduce post-harvest losses and, stimulate supply response.
As observed in the previous section, Nigeria can also learn from the experiences of other
parts of the globe. For example, in the past 20 years, increases in government spending on
agriculture in East and South Asia havebeen clearly linked to rapid growth in agricultureand
to progress towards achieving the MillenniumDevelopment Goals. Few agricultural
producersmight have adequate access to information,advice, training or technical assistance
that enable them to carry out a situation analysis ontheir own terms, trace their own path or
generate innovations without being over burdenedwith inappropriate models in the country.
Yet producers and rural communities do require technical assistance to mobilise their
resources in order to respond to the pressures ofcompetitive markets.
The case with Nigeria is today is that the government-Federal and States- seem to be ready to
revitalise the agriculture and diversify the economy but the emphasis should not be mainly on
empowering rural small-scale farmers, neither should it be only on large-scale famers.
Instead, government should promote both at a time for the agriculture to satisfy local and
global markets.This is because some producers can be individually large enough to compete
effectively in national orglobal markets; as a result, almost paradoxically informal co-
operation willremain on the increase, while huge larger agricultural firms are also
growing.The success of co-operative societies will depend upon local initiatives, individual
motivations, consensus and voluntaryparticipation. To survive and grow many new groups
will also have to be dynamic, creative, flexible, responsive to change and probably somewhat
optimistic. Most importantlythey will need to be well structured and managed, continuously
aim to improve their activities,identify competitive and added value market opportunities,
focus on quality and service, andmost essentially, maintain a committed and active
membership.

Dutse International Journal of Social and Economics Research Vol. 1, No. 1 June 2018
22
In order to change their attitudes and approach toproduction, the projects, echoing the
literature review, found that women needed a variety of factors to be in place.They needed
help to assess accurately the financial viabilityof enterprises. They needed guidance on
analyzing andtargeting potential markets. They needed access to businessnetworks that would
enable them to expand their businessesoutside of their immediate environment. Finally, they
needed support to take measured risks on new projects if they were togrow significantly.
5. Conclusion
In conclusion, Nigerian economy can become robust if the country gives serious attention to
agribusiness. In this regard, it is crucial todirect agricultural production towards large volume
of locally produced stable foodsupply to satisfy internal market and export more for global
markets. This will also require competitivenessand sustainability if Nigerian economy is to
survive the present global economic realities. The competitive advantage is crucial for the
agricultural goods to entice global marketers and sustainability is necessary to preserve and
conserve the environment to avoid biohazard. Before closing the conclusive section, it is also
important to note that there are needed skills to improveproductivity, increase adaptability to
deal with changeand crisis, and facilitate the diversification of livelihoods. These help
tomanage risks which are at a premium in most of the Nigerian rural areas. In many
cases,these skills are an issue of survival. Providing these skillseffectively is one of the key
challenges of rural development,usually because thecontextual factors that prevent small
farmers from accessingand applying training have not been addressed despite the current
economic struggles to overcome the plaguing economic recession.
References Abdullahi, A. &Sulaiman, N. N. (2013). Factors That Influence the Interest of Youths in
Agricultural Entrepreneurship. International Journal of Business and Social Science,
Vol. 4,No. 3, p.288-302.
Bage, L. (2006). ―Seeds of Hope‖. In United Nation Environment Program (UNEP) Our
Planet. Pp. 4-5. www.unep.org (Accessed on: 2/11/2016).Nairobi, Kenya.
Global Development Programme (2011). Agricultural Development: Strategy Overview.
Retrieved from: www.gatesfoundation.org (Accessed on: 30th
October, 2016).
Manggoel, W., Ajiji, I., Damar, W. K., Damiyal, D. M., Da‘ar, J. W., Zarmai, D. U. (2012).
Agriculture as a mitigating factor to unemployment in Nigeria.International Research
Journal of Agricultural Science and Soil Science,2(11): pp. 465-468.
Mendali, R. & Gunter, L. F. (2013). Impact of Agricultural Productivity Changes on Poverty
Reduction in Developing Countries.Selected Paper prepared for presentation at the
Southern Agricultural Economics Association (SAEA) Annual Meeting, Orlando,
Florida, 3‐5 February 2013.
Mukhtar, U., Mukhtar, J.I. & Abdullahi, M.A. (2014). Revitalization of Agriculture as a
Strategy for Reducing Poverty in Nigeria. In International Journal of Research in
Social Sciences, 4(4): 429-440.
Rapley, J. (2007).Understanding Development: Theory and Practice in the Third World
(Third Edition). Boulder: Lienne Publishers.
REED (2003). Guide to Rural Economic and Enterprise Development. Working paper edition
1.0, November 2003.
Rukuni, M. (2006). ―The growing business‖. In United Nation Environment Program
(UNEP) Our Planet. Pp. 12-13. www.unep.org (Accessed on: 2/11/2016).Nairobi,
Kenya.
Thirlwall, A.P. (2010).―Development and economic growth‖. In V. Desai & B. Potter (eds.)
The companion of development studies. London: Routledge.Pp. 61.65.
Dutse International Journal of Social and Economics Research Vol. 1, No. 1 June 2018
23
USAID (2008). Dates Value Chain Analysis and Opportunities for Iraq. Inma-Iraq,
International Agribusiness Program. No. 267-C-00-07-00500-00
Wilson, B. K. (2009). Economic Diversification and Prospects for Sustainable Rural
Livelihoods in a Dryland Agrarian Village: A Case Study in Bijapur District
Karnataka, India. A Master‘s Thesis Submitted to the Faculty of Graduate Studies In
Partial Fulfillment of the Requirements For the Degree of Master of Natural
Resources Management. Clayton H. Riddell Faculty of Environment Earth and
Resources Natural Resources Institute, University of Manitoba, Winnipeg,
ManitobaR3T 2N2.
Dutse International Journal of Social and Economics Research Vol. 1, No. 1 June 2018
24
Empirical Assesment of Money Growth
and Inflation in Nigeria
*Aminu Hassan Jakada1, Murtala Abdu
2, Abdullahi Daiyabu Marmara
3
123Department of Economics and Development Studies, Federal University Dutse,
Jigawa State, Nigeria.
*Corresponding Author‘s email: [email protected]
Abstract: In general, the monetary policy as an instrument of macroeconomic management is
aim at promoting price stability, full employment, economic growth and balance of payment
equilibrium. The study examines the effects of money growth on inflation in Nigeria. The
study used annual time series data from 1970 to 2016. Johansen cointegration approach is
used to check the long run relationship among the variables while Vector Error Correction
Model (VECM) is used to check the short run dynamics. The empirical result confirms that in
the long run money supply growth, interest rates and import have positive significant effects
on inflation while exchange rates and GDP have negative significant effects on inflation.
However, in the short run lagged value of GDP, lagged value of import and lagged value of
interest rates have significant impacts on inflation while lagged value of money supply
growth and lagged value of exchange rate do not have any significant effects on inflation.
The study found out that controlling money supply growth, improvement of GDP, reducing
interest rate, strong import restrictions as well as exchange rate depreciation along with
import substitution strategy are compulsory for price stability and inflation control in
Nigeria.
Keywords: Inflation, Money Growth, Johansen Cointegration, Vector Error Correction
Model.
JEL Classification: E31, E51, C22.
1.0 Introduction
In general, the monetary policy as an instrument of macroeconomic management is aim at
promoting price stability, full employment, economic growth and balance of payment
equilibrium. Monetary policy whether conveyed in the form of interest rates or growth of
monetary aggregates has been geared increasingly toward the attainment of low and stable
inflation. Central bankers and most other spectators view price stability as a worthy objective
since they thinkthat inflation is costly. Some of these costs consist of the average rate of
inflationand others relate to the uncertainty and variability of inflation. Nevertheless,
theoverall idea is that household and businesses are thought to performpoorly when inflation
is high and unpredictable (Barro, 2013).
The factors that cause the problem of inflation would be discuss from the balance of payment,
monetary and the fiscal aspects point of view (Akinbobola, 2012). From the monetary point
of view aspect, excess supply of money could be serves as a major cause of inflation while
from the fiscal aspect inflation arises because of the budget deficit. Since budget deficit are
often finance by the government through the creation of money in most of the developing
countries, therefore fiscal aspect is likely to be linked with the explanation of the monetary

Dutse International Journal of Social and Economics Research Vol. 1, No. 1 June 2018
25
aspect of inflation. From the balance of payment point of view exchange rate is consider the
major emphasis. Explicitly a fall of exchange rate cause inflation either by higher prices of
imports and a rise in the inflationary expectation which are frequently as a result of wage
indexation mechanism (Akinbobola, 2012).
As a nation, Nigeria has been battling along with the problem of instability in the general
price level, an instance measured through inflation, fluctuating around a double and single
digit. High volatility is one of the major features of Nigerian inflation, over the years Nigeria
has acknowledge several outbreak of high inflation. For instance, just recentlythe year-on-
year headline inflation crept upwards for the fourth consecutive month in the year 2015. The
inflation rate rose from 8.2 per cent in January 2015 to 8.5 per cent in March and further to
8.7 per cent and also to 16.48 per cent in June 2016, from 15.58 per cent in May; 13.72 per
cent in April, 12.77 per cent in March and 11.38 per cent in February 2016. However, the
headline inflation (year-on-year), declined for the first time in 15 months, dropping by 0.94
percent point to 17.78 per cent in February, from the 18.72 per cent recorded in January 2017,
and 18.55 per cent in December, 2016 seemingly reversing the monthly upward momentum
recorded since January, 2016. The moderation in headline inflation in February, 2017
reflected base effect as well as decline in the core component, which fell by 1.90 percentage
points from 17.90 per cent in January to 16.0 per cent in February, 2017. The food index,
however, rose to 18.53 per cent in February, a 0.71 percentage point increase over the 17.87
per cent recorded in January, 2017 (National Bureau of Statistics, 2017). Therefore, in a
nutshell the Inflation rate doubled from 9.5 per cent in December 2015 to 18.5 per cent in
December 2016.
In Nigeria, monetary growth has been the leading factor for both the variability and the level
of inflation (Olanipekun&Akeju, 2013). The increase in growth rate of money were
responsible by the following factors such as the huge monetization of the inflows of oil, wage
and salaries minimum adjustment and the increase in budget deficit financed by the
government through the Central Bank (Olanipekun&Akeju, 2013). Therefore, the rate at
which the money supply grew per outweight its contraction in Nigeria because broad money
supply (M2) declined by 1.70 per cent in February 2014 and grew by 7.29 per cent at the end
of December 2014. Henceforth, in April, 2015 broad money supply increased by 1.80 percent
but contracted by 2.23 percent and 3.75 in August and October 2015, it rose by 5.90 percent
in December, 2015 over the level at the end of December, 2014. Broad money supply (M2)
grew by 2.29 per cent in February, 2016 and by 10.50 per cent in September, 2016, compared
with the 8.08 per cent in August, 2016. When annualized, M2 grew by 14.0 per cent in
September 2016, above the growth benchmark of 10.98 per cent for 2016 and finally
contracted by 5.73 per cent in February 2017, annualized at -34.38 per cent in contrast to the
provisional growth benchmark of 10.29 per cent for 2017 (NBS, 2017).
However, studies on the issue of inflation are lacking still in Nigeria, despite the fact that
inflation cause distortion in the country‘s economic growth and development and it is also
one of the most crucial macroeconomic problem the nation is facing (Sola & Peter, 2013).
The question is whether inflation is purely a monetary phenomenon or not.Therefore, on this
basis the study adds to the existing literature by examining the sole effect of money growth
on inflation in Nigeria. The findings of this research would be greatly significant to the
government and the policy makers, because it will help them to understand the impact of
money growth on inflation as well as developing policies that will help in achieving stability
in the economy.

Dutse International Journal of Social and Economics Research Vol. 1, No. 1 June 2018
26
The rest of the paper is organized as follows. The next section presents the literature review.
The third and fourth sections present the methodology and empirical analysis. Finally, the
concluding remarks are offered in the fifth section.
2.0 Literature Review
Diverse hypothesis has been progressed by different theories for the past two centuries about
the creation as well as the acceleration of inflation. Such remarkable effort revealed how
inflation serves as a crucial concern to macroeconomists. However, regardless of this
numerous literature on the theory of inflation, still there is no consensus among the
economists from different school of thought with regard to the basic determinants factors of
inflation. Therefore, numerous theories have developed to explain the diverse cause of
inflation in order to understand the inflation process better.
The quantity theory of money is among the most established enduring doctrines of
economics. The theory has declared that changes in the overall price level are fundamentally
set by alterations in the amount of money available in an economy. The classical economists
as well as the few after them gave the first dynamic methodology analysis on how the effect
of a monetary changes blowout from one segment of the economy into another, adjusting
relative prices as well as the quantity in the process. Hume (1752) gave considerable
extension, refinement and elaboration to the quantity theory of money, by identifying a direct
relationship between the inflation and money supply.Fisher (1933) spelled out his eminent
equation MV=PT. This and other different equations, for instance Cash Balance Cambridge
equation that relates with the rising utilization of mathematics in the analysis of neo-
economics, characterize unequivocally under the condition in which the proportionate
assumption is valid. Fisher and other economists, for instance Pigou (1949) of Cambridge
revealed that the objectives of monetary policy control could be accomplished in a fractional
reserve-banking system through the regulation of an exogenously determined amount of
money in stock.
John Maynard Keynes as well as his supporters accentuated that the major cause of demand-
pull inflation is the rise in aggregate demand. Therefore, the aggregate demandincludes
government expenditure, investment, consumptions as well as net export. If the level of
aggregate demand surpasses the level of aggregate supply at the level of full employment, the
resulting effect is the inflationary gap. According to Keynes (1936) a policy that would
decrease every component of aggregate demand is more effective and more reliable in
reducing demand pressure and inflation. Government expenditure can be decrease through
the increase in tax and management of money supply alone or together, this can be efficient
in reducing aggregate demand as well as inflation control.
The cost-push inflation arises as a result of increase in wages through agitation by union as
well as increase in profit by employers. This type of inflation is not a new phenomenon
because it exists since the medieval time. Nevertheless, during the 1950s and 1970s, it
reviewed as a major cause of inflation. It came to be known additionally as ―new inflation‖.
Cost-push inflation arises as a result of profit-push and wage-push to prices (Javed, Farooq,
&Akram, 2010; Seelig, 1974; Totonchi, 2011).
The concept of structural inflation has been in economic research and discussion for almost
40 years ago. It is on the view that structural factors are the causes of inflation. Structuralists
are on the belief that inflation is essential with growth. According to this theory as the
economy improves, rigidities occur that would result in structural inflation (Jhingan, 2003).
Dutse International Journal of Social and Economics Research Vol. 1, No. 1 June 2018
27
Conclusively, from the concise review of the different theories of inflation, it could be deduce
that the different factors that cause inflation can be generally categorized into four different
major groups; supply factors, demand factors, political factors and inertial factors of inflation.
The existence of these diverse factors in clarifying the process of inflation gives backing to
those studies that regard inflation as a macroeconomic as well as institutional phenomenon.
Previously many researchers have conducted several studies on the relationship between
money growth and inflation as well as the proposition of the quantity theory of money, which
is one of the theories that have been extensively studied by previous researches. The studies
employed many techniques of econometrics such as Ordinary Least Square (OLS) method,
the Granger causality test, the Johansen Cointegration test, the Vector Error Correction model
(VECM) as well as the Vector Autoregressive (VAR) model. Henceforth, these studies have
come out with conflicting findings on the relationship between inflation and money growth.
For instance, a study byGrauwe and Polan (2005) used the panel and cross-section analysis
for testing the quantity theory of money from the period 1969-1999 in 116 countries. Their
study finds a robust positive relationship between inflation and money growth in countries
with a high inflation rate and the relationship is weak in countries with low level of inflation
rate.
Qayyum (2006) used time series annual data for the period of 1960 to 2005 to study the
linkages between inflation as well as money growth in Pakistan thereby testing the monetarist
stance validity that inflation is always a monetary phenomenon. Therefore, the result from the
techniques of ARDL reveals that money growth is the major determinant of inflation in
Pakistan. The findings from the study resolved that in Pakistan inflation is a monetarist
phenomenon that supports the monetarist proposition.
Similarly, the short run and the long run relationship among the government expenditure,
money supply, economic growth and inflation were studied in Cyprus by Georgantopoulos
and Tsamis (2012). The study employed the Johansen cointegration test, approach of ECM
and the Granger causality test. The result from the study reveals that a unidirectional causal
relationship found to exists running from inflation to money supply growth. Henceforth, the
relationship between inflation and money growth is positive in both the short run as well as
the long run.
Likewise, Adenuga et al. (2012) investigated whether inflation in Nigeria is purely a
monetary phenomenon. They used data on annual time series covering the range of 1970 to
2009. Thus, the result from the OLS method reveals that in Nigeria inflation is not purely
monetary phenomenon in nature as the coefficient of the money growth relation with
inflation is less than unity. This signifies the fact that other factors other than money growth
cause inflation in Nigeria.
In addition,
Doyin and Ikechukwu (2013) examined within the context of Nigerian economy whether
inflation is everywhere and always a monetary phenomenon. They used time series annual
data for the period of 1970 to 2011. The result from the techniques of Autoregressive
Regressive Distributive Lag (ARDL) reveals that the relationship between inflation and
money growth is negative and statistically insignificant. Therefore, the study concludes that
in Nigeria inflation is not purely a monetary phenomenon.
Dutse International Journal of Social and Economics Research Vol. 1, No. 1 June 2018
28
Moreover, Chiaraah and Nkegbe (2014) conducted study on the effect of money growth,
GDP growth and exchange rate on inflation in Ghana. They used a time series data from 1980
to 2010. They employed techniques of cointegration and ECM. The findings of the study
show the presence of long run equilibrium relationship between inflation and money supply.
Based on the theoretical assumptions, the findings of the study present that in Ghana money
supply and inflation are positively related in the long-run.
As well, Bakare, Adesanya and Bolarinwa (2014) studied the relationship among the money
supply, budget deficit and inflation over the period of 1975 to 2012 in Nigeria. They
employed Johansen cointegration test and ECM for the purpose of analyzing the relationship
amongst the variables. Thus, the study reveals the existence of positive and significant
association between money supply and the inflation rate in Nigeria both in the short as well
as in the long run.
Contrarily, Onyeiwu (2012) studied the effect of monetary policy on economy in Nigeria,
using annual data based on time series from the period 1981 to 2008. The result of the study
from the statistical method of OLS indicates that money supply is influencing inflation rate
negatively while it is positively relate with balance of payment and GDP in Nigeria.
In the same vein, Wimanda (2011) used annual data based on time series from the period
1980 to 2008 to study the effect of exchange rate as well as money growth on inflation in
Indonesia. The study employed the techniques of Phillip curve equation through the threshold
model. The result of the study indicates that the effect of money growth on inflation rate is
not linear. The greatest influence of money growth rate is between 0 and 7.1 percent, the
moderate influence of money growth rate is between 7.1 percent and 9.8 percent and the
lowest influence is when the money growth is above 9.8 percent. As the rate of money
growth is getting higher, its effect on inflation rate is decreasing. Nonetheless, most of the
above-mentioned studies present a contradictory and inconclusive findings as such additional
research are still needed.
3.0 Methodology
The study employs the conventional techniques of econometric to critically dissect the
relationship between money growth and inflation in Nigeria within Vector Error Correction
Model (VECM) framework. The study incorporates various determinants of inflation such as
broad money growth, real effective exchange rate, and real interest rate, import of goods and
services, real GDP as a proxy for the economic growth and Consumer Price Index as a proxy
for the inflation.
3.1 Data Sources and Description
This study utilized the secondary type of data based on annual time series covering the period
of 1970 to 2015. The data were obtained from the world Development indicators (2014). The
data used in this study contained 45 observations and is reasonably sufficient to perform time
series estimation.
3.2 Model Specification
Since the determinants of inflation differ across different countries, several studies have
developed diverse form of inflation models. The econometric model used in this study has
been developed based on the quantity theory of money model, but the model is modified to
accommodate other independent variables that influence inflation. Previous researchers used
the variables that have been selected and included in the model commonly. Therefore,
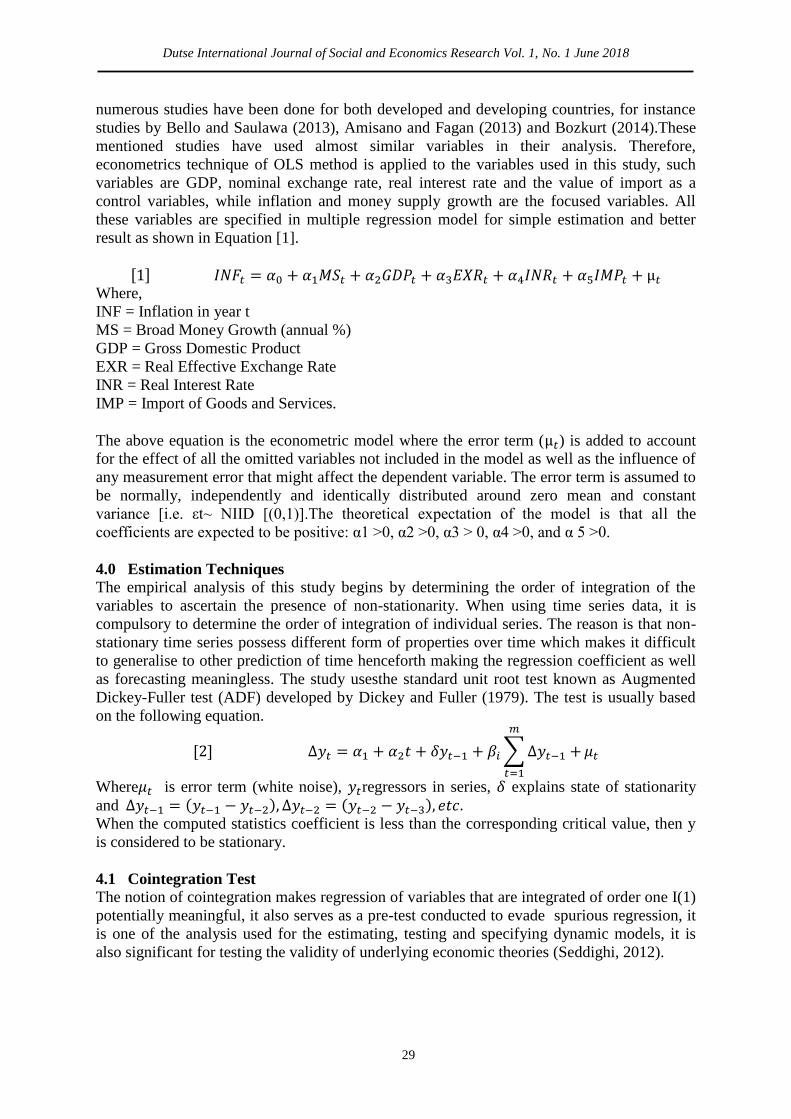
Dutse International Journal of Social and Economics Research Vol. 1, No. 1 June 2018
29
numerous studies have been done for both developed and developing countries, for instance
studies by Bello and Saulawa (2013), Amisano and Fagan (2013) and Bozkurt (2014).These
mentioned studies have used almost similar variables in their analysis. Therefore,
econometrics technique of OLS method is applied to the variables used in this study, such
variables are GDP, nominal exchange rate, real interest rate and the value of import as a
control variables, while inflation and money supply growth are the focused variables. All
these variables are specified in multiple regression model for simple estimation and better
result as shown in Equation [1].
[ ] Where,
INF = Inflation in year t
MS = Broad Money Growth (annual %)
GDP = Gross Domestic Product
EXR = Real Effective Exchange Rate
INR = Real Interest Rate
IMP = Import of Goods and Services.
The above equation is the econometric model where the error term ( ) is added to account
for the effect of all the omitted variables not included in the model as well as the influence of
any measurement error that might affect the dependent variable. The error term is assumed to
be normally, independently and identically distributed around zero mean and constant
variance [i.e. εt~ NIID [(0,1)].The theoretical expectation of the model is that all the
coefficients are expected to be positive: α1 >0, α2 >0, α3 > 0, α4 >0, and α 5 >0.
4.0 Estimation Techniques
The empirical analysis of this study begins by determining the order of integration of the
variables to ascertain the presence of non-stationarity. When using time series data, it is
compulsory to determine the order of integration of individual series. The reason is that non-
stationary time series possess different form of properties over time which makes it difficult
to generalise to other prediction of time henceforth making the regression coefficient as well
as forecasting meaningless. The study usesthe standard unit root test known as Augmented
Dickey-Fuller test (ADF) developed by Dickey and Fuller (1979). The test is usually based
on the following equation.
[ ] ∑
Where is error term (white noise), regressors in series, explains state of stationarity
and When the computed statistics coefficient is less than the corresponding critical value, then y
is considered to be stationary.
4.1 Cointegration Test
The notion of cointegration makes regression of variables that are integrated of order one I(1)
potentially meaningful, it also serves as a pre-test conducted to evade spurious regression, it
is one of the analysis used for the estimating, testing and specifying dynamic models, it is
also significant for testing the validity of underlying economic theories (Seddighi, 2012).

Dutse International Journal of Social and Economics Research Vol. 1, No. 1 June 2018
30
The Johansen‘s techniques is a method of maximum likelihood that decides the number of
cointegrating vectors in a VAR of non-stationary time series with restrictions imposed,
known as VECM. The estimation model of Johansen‘s method is shown in Equation [3]:
[3] Yt = A1Yt – 1 + ------- + ApYt – p + βϰ t + εt
Where Yt is a non-stationary I(1) vector of the variables, ϰ t is a deterministic vector of the
variables and εt is an innovations vector as indicated in Equation [4].
[ ] ∑
If is estimated as integrated of order zero I(0) hence the Yt and ϰ t variables are integrated
of order one I(1). It will have the advantage of having information on both long-run and
short-run. For instance if r = 1 hence the relationship among the variables would be seen in
Equation [5].
[ ] [
] *
+ ∑[
]
[
] *
+ [ ] [
]
Where the β vector represent r the cointegrating linear relationship among the variables,
where α is referred to as the adjustment parameters (Johansen and Juselius 1990). The test
proposed two distinct test of cointegration under the Johansen method: the Trace test (TR) as
well as the Maximum Eigenvalue Test (L-Max). The ratio of the likelihood statistic for the
TR test is shown in Equation [6].
[ ] ∑
The TR test is a kind of joint test that test the null hypothesis of no cointegration (H0: r =
0) contrary to alternative hypothesis of there are cointegration (H1: r >0).
While the L-Max test test is based on the Equation [7].
[ ] The test of the Maximum eigenvalue conducts a test on each eigenvalue separately. It then
test the null hypothesis that the number of cointegrating vectors is equal to r contrary to the
alternative hypothesis of r + 1 cointegrating vectors (Johansen and Juselius 1990).
4.2 Vector Error Correction Model (VECM)
Once co-integration between the time-series variables have been detected, long-run
equilibrium relationship exist between them so VECM will be used in order to estimate the
properties of the short-run co-integrated series. The rationale behind VECM is to show the
speed of adjustment from the short-run equilibrium to the state of long-run equilibrium.
Therefore, we can develop our vector error correction model as presented on Equation [8].
[ ]
From Equation [8], is the error correction component, which is also the estimate of the
lagged error series and is the random error term. However, the adjustment speed of the
model of this study will be expressed by this method.
5.0 Empirical Results and Discussion
The empirical result of this study will be presented and discussed in this section. It discussed
the descriptive statistics first. The clarification of the developed model of inflation rate in

Dutse International Journal of Social and Economics Research Vol. 1, No. 1 June 2018
31
Nigeria is followed that has been empirically analyzed using the techniques of Cointegration
and VECM.
5.1 Unit Root Test
The ADF test has been employed to perform the unit test for all the variables. The unit root
test result for all the variables are presented in Table 1.
Table 1: Unit Root Test Result
Variables Level First Difference
Constant Constant and trend Constant Constant and
trend
EXR 0.304[0] (0.956) -2.061[0] (0.551) -5.102[0]
(0.000)*
-5.051[0] (0.001)*
GDP 0.459[0] (0.983) -0.481[0] (0.980) -5.331[0] (0.000)* 5.342[0] (0.000)*
IMP -0.787[0] (0.812) -1.503[0] (0.812) -4.622[0] (0.000)* -4.216[2]
(0.010)*
INF -0.503[1] (0.871) -2.301[1] (0.424) -3.183[0] (0.029)* -3.884[1]
(0.025)*
INR -1.728[0] (0.419) -0.880[0] (0.948) -6.328[0] (0.000)* -6.540[0]
(0.000)*
MS -0.231[2] (0.926) -2.379[2] (0.384) -4.011[0] (0.003)* -3.982[1]
(0.018)*
Source: Author‘s computation using Eviews9
Notes: * denote rejection of the null hypothesis based on Mackinon‘s critical value at five percent
level of significant respectively. [ ] show lag specification, ( ) is the Mackinnon (1996) P-value.
The result of the test reveals that at level the Mackinon‘s critical values are greater than the τ-
statistic values for all the variables. Therefore, H0 should be failed to be rejected meaning that
the variables are non-stationary at five percent level of significance. This means that all the
variables are non-stationary at level. However, after taking the first difference for all the
variables, the standard τ-critical values are less than the τ-statistics values for all the
variables. Therefore, H0 should be rejected that the variables are non-stationary at five
percent level of significance. This means that all the variables are stationary after taking the
first difference.This outcome satisfies the condition for conducting cointegration test which
requires that all the variables must be integrated of the same order either at first difference or
higher difference. Hence, the next sub-section present the results for the cointegration test.
5.2 The Johansen Co-integration Analysis
The test of Johansen cointegration is used basically to test the existence of long run
relationship among the series that are not stationary. The requirement for Johansen co-
integration test is that all the series must be integrated in the same order that is order one I
(1). The procedure of Johansen co-integration test proposes a maximum likelihood techniques
of estimation that provides two different test statistics namely eigenvalue test and trace test
statistics. The results are presented in Table 2.
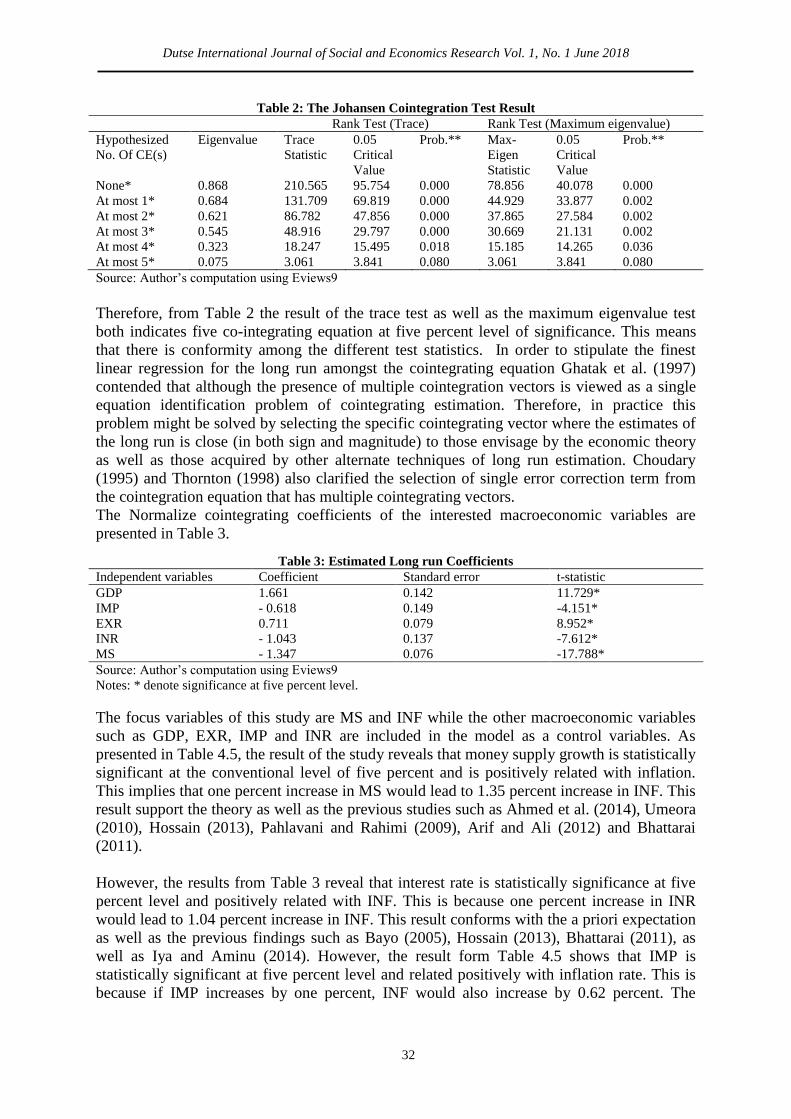
Dutse International Journal of Social and Economics Research Vol. 1, No. 1 June 2018
32
Table 2: The Johansen Cointegration Test Result
Rank Test (Trace) Rank Test (Maximum eigenvalue)
Hypothesized
No. Of CE(s)
Eigenvalue Trace
Statistic
0.05
Critical
Value
Prob.** Max-
Eigen
Statistic
0.05
Critical
Value
Prob.**
None* 0.868 210.565 95.754 0.000 78.856 40.078 0.000
At most 1* 0.684 131.709 69.819 0.000 44.929 33.877 0.002
At most 2* 0.621 86.782 47.856 0.000 37.865 27.584 0.002
At most 3* 0.545 48.916 29.797 0.000 30.669 21.131 0.002
At most 4* 0.323 18.247 15.495 0.018 15.185 14.265 0.036
At most 5* 0.075 3.061 3.841 0.080 3.061 3.841 0.080
Source: Author‘s computation using Eviews9
Therefore, from Table 2 the result of the trace test as well as the maximum eigenvalue test
both indicates five co-integrating equation at five percent level of significance. This means
that there is conformity among the different test statistics. In order to stipulate the finest
linear regression for the long run amongst the cointegrating equation Ghatak et al. (1997)
contended that although the presence of multiple cointegration vectors is viewed as a single
equation identification problem of cointegrating estimation. Therefore, in practice this
problem might be solved by selecting the specific cointegrating vector where the estimates of
the long run is close (in both sign and magnitude) to those envisage by the economic theory
as well as those acquired by other alternate techniques of long run estimation. Choudary
(1995) and Thornton (1998) also clarified the selection of single error correction term from
the cointegration equation that has multiple cointegrating vectors.
The Normalize cointegrating coefficients of the interested macroeconomic variables are
presented in Table 3.
Table 3: Estimated Long run Coefficients
Independent variables Coefficient Standard error t-statistic
GDP 1.661 0.142 11.729*
IMP - 0.618 0.149 -4.151*
EXR 0.711 0.079 8.952*
INR - 1.043 0.137 -7.612*
MS - 1.347 0.076 -17.788*
Source: Author‘s computation using Eviews9
Notes: * denote significance at five percent level.
The focus variables of this study are MS and INF while the other macroeconomic variables
such as GDP, EXR, IMP and INR are included in the model as a control variables. As
presented in Table 4.5, the result of the study reveals that money supply growth is statistically
significant at the conventional level of five percent and is positively related with inflation.
This implies that one percent increase in MS would lead to 1.35 percent increase in INF. This
result support the theory as well as the previous studies such as Ahmed et al. (2014), Umeora
(2010), Hossain (2013), Pahlavani and Rahimi (2009), Arif and Ali (2012) and Bhattarai
(2011).
However, the results from Table 3 reveal that interest rate is statistically significance at five
percent level and positively related with INF. This is because one percent increase in INR
would lead to 1.04 percent increase in INF. This result conforms with the a priori expectation
as well as the previous findings such as Bayo (2005), Hossain (2013), Bhattarai (2011), as
well as Iya and Aminu (2014). However, the result form Table 4.5 shows that IMP is
statistically significant at five percent level and related positively with inflation rate. This is
because if IMP increases by one percent, INF would also increase by 0.62 percent. The

Dutse International Journal of Social and Economics Research Vol. 1, No. 1 June 2018
33
finding of this result is in line with the a priori expectation as well as the previous studies
such as Arif and Ali (2012) and Armesh et al. (2011).
Consequently, the result in Table 3 exhibit that GDP is statistically significant at five percent
level and negatively related with INF. This result indicates that when GDP increase by one
percent INF on the other hand will decrease by 1.66 percent. This result is in consonance with
the a priori expectation as well as previous studies such as Yadav and Lagesh (2011), Haile
(2013) and Shams et al. (2013). EXR as shown from the Table 3 is statistically significant at
five percent level and negatively related with the INF, where one percent increase in EXR
would lead to 0.71 percent decrease in INF. This finding contradicts with the a priori
expectation as well as previous studies such as Iyaand Aminu (2014), Akinbola (2012) and
Bayo (2005). The probable justification of this is that the production base of Nigeria is very
weak due to the lack of infrastructural facilities, political instability, lack of security and
weak technological base all these translate into a high cost of production that make it difficult
for the locally produced goods to compete with the foreign goods. The locally produced
goods are substandard and comparably expensive than the foreign goods, because of these
problems the nominal depreciation in the Naira may not have impact on real price of the
imported commodities. Therefore, depreciation in Nigeria will not discourage import since
the imported goods are more cheaper than the locally produced ones and exportation will also
not be encouraged since the locally produced goods are substandard and expensive. So there
will be no demand pressure on locally produced goods no matter the extents to which the
domestic currency is depreciated.
5.3 Short Run Relationship
Once cointegration is confirmed to exist between the variables, then the next step requires the
construction of ECM to model dynamic relationship. The purpose of ECM is to indicate the
speed of adjustment from the short run equilibrium to the long run equilibrium state. The
ECM estimation result is presented in Table 4.
Table 4: Estimated Short run Coefficients
Variables Coefficient Standard error t-statistic
Constant 0.231 0.068 3.374*
ECTt - 1 -0.674 0.147 -4.590*
∆INFt – 1 0.456 0.217 2.101*
∆MSt – 1 -0.069 0.137 -0.509
∆GDPt – 1 0.398 0.163 2.434*
∆IMPt – 1 -0.151 0.068 -2.216*
∆EXRt – 1 -0.028 0.051 -0.553
∆INRt – 1 -0.251 0.120 -2.083*
Source: Author‘s computation using Eviews9
Notes: * denote significance at five percent level.
The ECT indicates the rate of adjustment from the short run to the long run equilibrium state.
It is derived basically from the Johansen cointegration adjustment coefficient. The ECM
result reveals that ECT is statistically significant at five percent level with a proper negative
sign as needed for dynamic stability. The ECT estimated coefficient is equall to - 0.67. This
result indicates that the ECM speed of adjustment from the short equilibrium towards the
long run dynamics is 67 percent. This implies that in the short run about 67 percent of the
errors are corrected in the long run on annual basis. As presented in Table 4 the lagged value
INF is positively related with the current value of INF and statistically significant at five
percent level in the short run.

Dutse International Journal of Social and Economics Research Vol. 1, No. 1 June 2018
34
This means that a one percent increase in the lagged value of INF would lead to 46 percent
increase in the current INF. This result is in line with the result of Akinbola(2012), Shams et
al. (2013) and Ahmed et al. (2013). In the same vein, the lagged valueof MS is statistically
insignificant and negatively related with ∆INF. The result indicates that one percent increase
in ∆MS would lead to 6.9 decrease in ∆INF in the short run, this result is in line with the
findings of Adusei (2013), Doyin and Ikechukwu (2013). Likewise, the lagged value ∆GDP
is positively related with ∆INF and statistically significance at five percent level in the short
run. This implies that when value of ∆GDP increase by one percent ∆INF would increase by
39 percent. This result supports the findings of Pahlavani and Rahimi (2009), Odusanya and
Atanda (2010) and Shams et al. (2013). Similarly, ∆IMP is statistically significant and
negatively related with ∆INF in the short run. Meaning that a one percent increases in lagged
value of ∆IMP would result in to 15 percent decreases in ∆INF. This finding supports the
results of Ahmed et al. (2013) and Arif and Ali (2012). Similarly, lagged value of ∆EXR is
negatively related with ∆INF and statistically insignificant in the short run, which implies that
∆INF would decrease by 2.8 percent if lagged value of ∆EXR increase by one percent. This
result supports the findings of Ashwani (2014), Haile (2013), Ahmed et al. (2014) and
Akinbola (2012). Lastly, the lagged value of ∆INR is negatively related with the ∆INF and
statistically significant in the short run. Meaning that a one percent increases in the lagged
value of ∆INR would lead 12 percent decrease in ∆INF. This result is in line with the findings
of Odusanya and Atanda (2012) and Haile (2013).
5.4 Diagnostic Checks
Diagnostic test is carried in order to check the reliability of a model. Consequently, LM test is
carried out to check the existence of autocorrelation through the use of Breusch-Godfrey test,
ARCH test to check the problem of heteroskedasticity and finally the test of normality to
detect the distribution of the residuals.
Table 5: Diagnostic Test Result
Test Probability
B-G Serial CorrelationLM Test 0.598
ARCH Test 0.862
Jarque-Bera Test 5.941
Source: Author‘s computation using Eviews9
In addition to the individual test of significance and other statistical tests conducted, the
model is further evaluated based on econometric criterion. Generally, the model is
econometrically satisfactory as it was found to be statistically significant (having highly
statistically significant coefficients) and theoretically meaningful (possessing correct signs
and magnitudes). Specifically, the model passed all the major econometric tests, namely
autocorrelation test and normally test according to the Breusch-Godfrey Serial Correlation
test and Jarque-Bera Normality test, respectively. Overall, these additional diagnostic tests
provide strong evidence of the robustness of our model and hence assuring valid inferences to
be drawn with high level of confidence.
6.0 Conclusion and Recommendation
The study concludes that the effect of money supply growth on inflation in Nigeria during the
period of 1970 to 2012. The results of this study reveal that inflation in Nigeria is determine
mainly by money supply growth, GDP, exchange rate, value of import, as well as the interest
rate. Therefore, controlling money supply, improvement of GDP, reducing interest rate,
strong import restrictions as well as the depreciation of exchange rate along with import
substitution industrial strategy that will encourage the production of goods that were imported
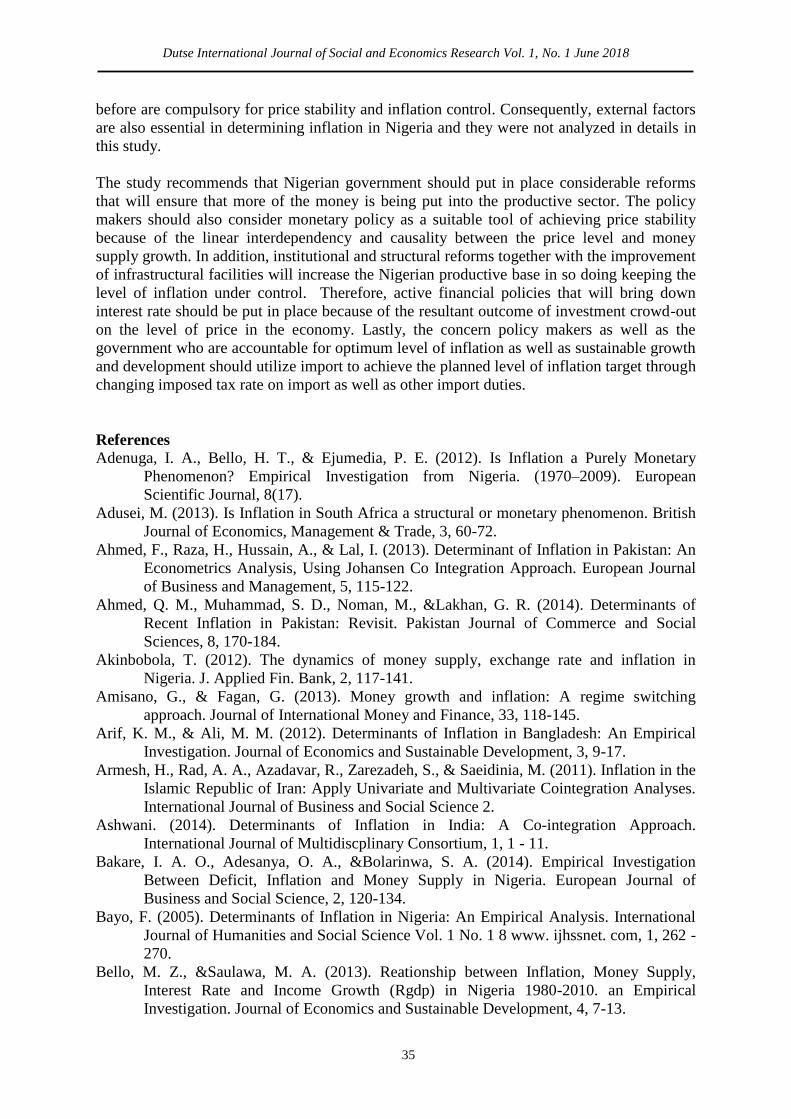
Dutse International Journal of Social and Economics Research Vol. 1, No. 1 June 2018
35
before are compulsory for price stability and inflation control. Consequently, external factors
are also essential in determining inflation in Nigeria and they were not analyzed in details in
this study.
The study recommends that Nigerian government should put in place considerable reforms
that will ensure that more of the money is being put into the productive sector. The policy
makers should also consider monetary policy as a suitable tool of achieving price stability
because of the linear interdependency and causality between the price level and money
supply growth. In addition, institutional and structural reforms together with the improvement
of infrastructural facilities will increase the Nigerian productive base in so doing keeping the
level of inflation under control. Therefore, active financial policies that will bring down
interest rate should be put in place because of the resultant outcome of investment crowd-out
on the level of price in the economy. Lastly, the concern policy makers as well as the
government who are accountable for optimum level of inflation as well as sustainable growth
and development should utilize import to achieve the planned level of inflation target through
changing imposed tax rate on import as well as other import duties.
References
Adenuga, I. A., Bello, H. T., & Ejumedia, P. E. (2012). Is Inflation a Purely Monetary
Phenomenon? Empirical Investigation from Nigeria. (1970–2009). European
Scientific Journal, 8(17).
Adusei, M. (2013). Is Inflation in South Africa a structural or monetary phenomenon. British
Journal of Economics, Management & Trade, 3, 60-72.
Ahmed, F., Raza, H., Hussain, A., & Lal, I. (2013). Determinant of Inflation in Pakistan: An
Econometrics Analysis, Using Johansen Co Integration Approach. European Journal
of Business and Management, 5, 115-122.
Ahmed, Q. M., Muhammad, S. D., Noman, M., &Lakhan, G. R. (2014). Determinants of
Recent Inflation in Pakistan: Revisit. Pakistan Journal of Commerce and Social
Sciences, 8, 170-184.
Akinbobola, T. (2012). The dynamics of money supply, exchange rate and inflation in
Nigeria. J. Applied Fin. Bank, 2, 117-141.
Amisano, G., & Fagan, G. (2013). Money growth and inflation: A regime switching
approach. Journal of International Money and Finance, 33, 118-145.
Arif, K. M., & Ali, M. M. (2012). Determinants of Inflation in Bangladesh: An Empirical
Investigation. Journal of Economics and Sustainable Development, 3, 9-17.
Armesh, H., Rad, A. A., Azadavar, R., Zarezadeh, S., & Saeidinia, M. (2011). Inflation in the
Islamic Republic of Iran: Apply Univariate and Multivariate Cointegration Analyses.
International Journal of Business and Social Science 2.
Ashwani. (2014). Determinants of Inflation in India: A Co-integration Approach.
International Journal of Multidiscplinary Consortium, 1, 1 - 11.
Bakare, I. A. O., Adesanya, O. A., &Bolarinwa, S. A. (2014). Empirical Investigation
Between Deficit, Inflation and Money Supply in Nigeria. European Journal of
Business and Social Science, 2, 120-134.
Bayo, F. (2005). Determinants of Inflation in Nigeria: An Empirical Analysis. International
Journal of Humanities and Social Science Vol. 1 No. 1 8 www. ijhssnet. com, 1, 262 -
270.
Bello, M. Z., &Saulawa, M. A. (2013). Reationship between Inflation, Money Supply,
Interest Rate and Income Growth (Rgdp) in Nigeria 1980-2010. an Empirical
Investigation. Journal of Economics and Sustainable Development, 4, 7-13.
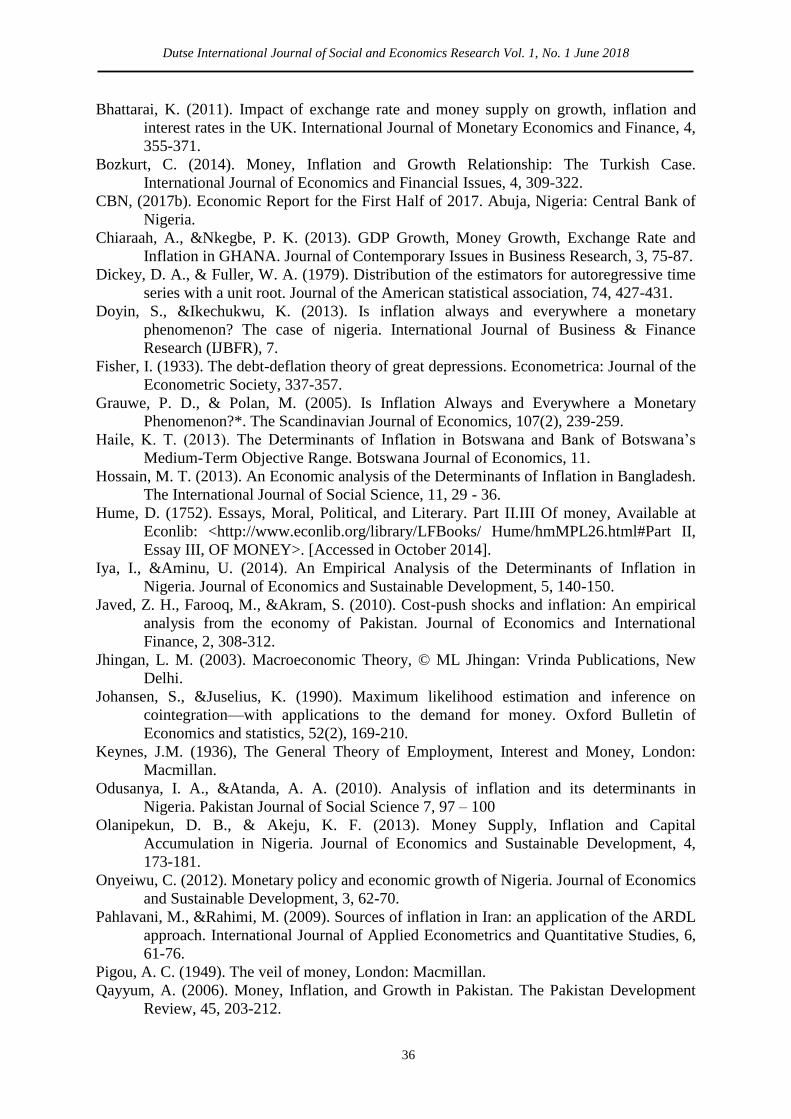
Dutse International Journal of Social and Economics Research Vol. 1, No. 1 June 2018
36
Bhattarai, K. (2011). Impact of exchange rate and money supply on growth, inflation and
interest rates in the UK. International Journal of Monetary Economics and Finance, 4,
355-371.
Bozkurt, C. (2014). Money, Inflation and Growth Relationship: The Turkish Case.
International Journal of Economics and Financial Issues, 4, 309-322.
CBN, (2017b). Economic Report for the First Half of 2017. Abuja, Nigeria: Central Bank of
Nigeria.
Chiaraah, A., &Nkegbe, P. K. (2013). GDP Growth, Money Growth, Exchange Rate and
Inflation in GHANA. Journal of Contemporary Issues in Business Research, 3, 75-87.
Dickey, D. A., & Fuller, W. A. (1979). Distribution of the estimators for autoregressive time
series with a unit root. Journal of the American statistical association, 74, 427-431.
Doyin, S., &Ikechukwu, K. (2013). Is inflation always and everywhere a monetary
phenomenon? The case of nigeria. International Journal of Business & Finance
Research (IJBFR), 7.
Fisher, I. (1933). The debt-deflation theory of great depressions. Econometrica: Journal of the
Econometric Society, 337-357.
Grauwe, P. D., & Polan, M. (2005). Is Inflation Always and Everywhere a Monetary
Phenomenon?*. The Scandinavian Journal of Economics, 107(2), 239-259.
Haile, K. T. (2013). The Determinants of Inflation in Botswana and Bank of Botswana‘s
Medium-Term Objective Range. Botswana Journal of Economics, 11.
Hossain, M. T. (2013). An Economic analysis of the Determinants of Inflation in Bangladesh.
The International Journal of Social Science, 11, 29 - 36.
Hume, D. (1752). Essays, Moral, Political, and Literary. Part II.III Of money, Available at
Econlib: <http://www.econlib.org/library/LFBooks/ Hume/hmMPL26.html#Part II,
Essay III, OF MONEY>. [Accessed in October 2014].
Iya, I., &Aminu, U. (2014). An Empirical Analysis of the Determinants of Inflation in
Nigeria. Journal of Economics and Sustainable Development, 5, 140-150.
Javed, Z. H., Farooq, M., &Akram, S. (2010). Cost-push shocks and inflation: An empirical
analysis from the economy of Pakistan. Journal of Economics and International
Finance, 2, 308-312.
Jhingan, L. M. (2003). Macroeconomic Theory, © ML Jhingan: Vrinda Publications, New
Delhi.
Johansen, S., &Juselius, K. (1990). Maximum likelihood estimation and inference on
cointegration—with applications to the demand for money. Oxford Bulletin of
Economics and statistics, 52(2), 169-210.
Keynes, J.M. (1936), The General Theory of Employment, Interest and Money, London:
Macmillan.
Odusanya, I. A., &Atanda, A. A. (2010). Analysis of inflation and its determinants in
Nigeria. Pakistan Journal of Social Science 7, 97 – 100
Olanipekun, D. B., & Akeju, K. F. (2013). Money Supply, Inflation and Capital
Accumulation in Nigeria. Journal of Economics and Sustainable Development, 4,
173-181.
Onyeiwu, C. (2012). Monetary policy and economic growth of Nigeria. Journal of Economics
and Sustainable Development, 3, 62-70.
Pahlavani, M., &Rahimi, M. (2009). Sources of inflation in Iran: an application of the ARDL
approach. International Journal of Applied Econometrics and Quantitative Studies, 6,
61-76.
Pigou, A. C. (1949). The veil of money, London: Macmillan.
Qayyum, A. (2006). Money, Inflation, and Growth in Pakistan. The Pakistan Development
Review, 45, 203-212.
Dutse International Journal of Social and Economics Research Vol. 1, No. 1 June 2018
37
Seddighi, H. (2012). Inroductory Econometrics: A practical Approach. Abingdon, Oxon:
Routledge.
Seelig, S. A. (1974). Rising interest rates and cost push inflation. The Journal of Finance, 29,
1049-1061.
Shams, A., Parveen, S., &Ramzan, M. (2013). Fiscal Determinant of Inflation in Pakistan.
Interdisciplinary Journal of Contemporary Research in Business, 5, 241-248.
Totonchi, J. (2011). Macroeconomic Theories of Inflation. International Proceedings of
Economics Development & Research, 4.
Umeora, C. E. (2010). Effects of Money Supply And Exchange Rates On Inflation In
Nigeria. Journal of Management, 2.
Wimanda, R. E. (2011). The impact of exchange rate depreciation and the money supply
growth on inflation: the implementation of the threshold model1. Bulletin of
monetary, economics and banking, 22, 391.
Yadav, I. S., & Lagesh, M. (2011). Macroeconomic relationship in India: ARDL evidence on
cointegration and causality. Journal of Quantitative Economics, 9, 156-168.
Dutse International Journal of Social and Economics Research Vol. 1, No. 1 June 2018
38
Infant Mortality Rates in Selected
Sub-Saharan Africa Nations
during 2000-2015:
A Comparative Analysis
*Popoola, Oladayo Timothy1
1Department of Economics, Ahmadu Bello University, Zaria, Nigeria
*Corresponding Author‘s email: [email protected]
Abstract: Infant mortalities are often used not only as demographic measure, but also as an
important measure of living standard of citizens as well as health indicator of nations.
However, infant mortality rate in sub-Saharan Africa region is the highest among all regions
of the world, with several of her countries still far from reaching the health-related targets of
the recent past United Nations‘ Millennium Development Goals (MDGs). The paper
therefore seeks to investigates the main drivers of infant mortality in eight Sub-Saharan
Africa Countries (Angola, Cameroon, Chad, Cote d‘Ivoire, Equatorial Guinea, Gabon,
Nigeria and Congo Republic).The empirical findings from panel regressions reveals that
infant mortality is negative and statistically significant with the quality and availability of
water supplies, sanitation facility, improved standard of living; but positively related and
statistically significant to the increase in pollution level these countries. The study therefore
recommend that effective policy should be directed at providing water and sanitation
facilities and reducing pollution to decrease the high infant mortalities in Sub-Saharan Africa
nations. Finally, government‘s efforts should also be directed towards enhancing effective
child healthcare services and citizens‘ welfare.
Key words: Infant Mortality, Children Health Outcomes, Economic Growth
JEL Classification: I15, I38, J13
1.0 Introduction
Infant mortality is frequent used not only as a demographic measure, but also as an important
measure of living standard of citizens as well as health indicator of nations. This further
reflects country‘s level of socio-economic development and quality of life. In year 2000,
World Health Organization (WHO) observed that reduced rate of infant mortality can best be
achieved through collective efforts and good health system, which should be the ultimate
obligation of government, with private system providing supplementary supports. In general,
increase child-health financing is important because; one, it‘s citizens‘ human right (see for
example, Sen, 1999; Fiala and Arthur, 2014); two, infant mortality often measures socio-
economic outcomes of citizens, from children‘s health, nutrition and education to their future
labour supply, employment and productivity. Three, it determines economic growth, fostering
economic development and reduces poverty (see Roemer, 1956; Anyanwu and Erthijakpor,
2007; Amiri and Gerdtham, 2013; Pillai, Maleku and Wei, 2013; and Kotsadam et al. 2017).

Dutse International Journal of Social and Economics Research Vol. 1, No. 1 June 2018
39
As observes by Amiri and Gerdtham (2013), the health children are fundamental to economic
development as reflected in the recent past Millennium Development Goal (MDGs) 4
(reducing child mortality). Additionally, the Sustainable Development Goal (SDG) three
emphasis the important of healthy citizens. However, the chance that an infant makes it to his
or her first birthday depends on a numbers of factors (Kotsadam et al. 2017). For instance, the
health of mother, infections, access to immunizations, clean drinkable water, access to food,
and sanitation are all paramount to the reducing infant and maternal mortalities rates for more
efficient quality of living and economic productivities.
Although the world has recorded some appreciable progress in reducing global infant
mortality rate over the recent years due majorly to various action plans, efficient health
policies and interventions targeted at various deadly diseases, reproductive healthcare and
other childhood infections which have been major causes of mortalities (see World Bank,
2017). However, the situation seems to remain unchanged in sub-Saharan Africa countries, as
approximately half of childhood deaths occur in Africa, despite the region having only one
fifth of the world‘s children population (UNDP, 2013 and UN, 2015). Unlike other regions of
the world, sub-Saharan Africa (SSA) nations are also lagging behind in achieving the recent
past Millennium Development Goals (MDGs) particularly those which are directly affects
children health outcomes (Amiri and Gerdtham, 2013). For example, in every single day,
Nigeria loses an estimated 2,300 under-five year olds children which makes her the second
largest contributor to under-five mortality rates worldwide after Republic of Chad (UNICEF,
2016; World Bank, 2017).
Furthermore, the average infant mortality rate in SSA stood at 1 in every 14 live births
against the global average of 1 in 27 live births; and under-five mortality ratio for SSA
average stand at 1 in every 9 births compare to global average of 1 in 20 births (UNICEF,
2013). Notably, the majority of these deaths often occur within the first week of newborn
babies mainly due to complications during pregnancy, delivery and post-delivery; reflecting
the intimate link between newborn survival and quality of maternal care during and after
pregnancy (UNICEF, 2016). Kotsadam et al. (2017) observe that the proximate determinant
of poor infant deaths is the health of mother. Again, an Africa woman‘s risk of dying from
pregnancy or child birth is 1 of 39 over her life time, compared to the global average of 1 in
180. Meanwhile, in developed regions of the world, a woman‘s risk of maternal death is 1 in
3,800 (WHO, 2012).
In Nigeria (for example), 40,000 women die annually in pregnancy or childbirth, and another
1 to 1.6 million women suffer from serious and permanent disabilities from pregnancy- and
birth-related causes (United State Agency for International Development – USAID, 2012).
More so, 10 per cent of the world‘s maternal mortality happen in Chad (UNPF, 2016); while
on the average between 120 and 150 women die due to child birth every day in Republic of
Congo. Majority of these maternal deaths occur within the first week of newborn babies
reflecting the intimate link between their survival and quality of their welfare during and after
pregnancy (UNICEF, 2016). Most of these deaths could be prevented if infants had easy
access to basic healthcare services during pregnancy, childbirth and postpartum period.
Empirically, Burchett and Mayhew (2009), Mesiko and Mojekwu (2012), Pillai et al. (2013),
Amiri and Gerdtham (2013), Fagbamigbe and Alabi (2014), Osawe (2014), Adepoju (2015),
Stidham et al. (2015), and Kotsadam et al. (2017) reports disparities in infant healthcare
service delivery to health financing, socio-economic factors, environmental factors, child
nutritional status, parental income and proximate to health facility in SSA countries.

Dutse International Journal of Social and Economics Research Vol. 1, No. 1 June 2018
40
However, determining the factors accounting for high infant deaths in the region cannot be
measured without considering several factors some of which the consumer of healthcare
services cannot control, these includes children health infrastructure and facilities provision.
This implies that an efficient service delivery with adequate government expenditure on
children health system will be a significant factor in determining the success of reducing
infant mortality rate (IMR) in every country in SSA.
Therefore, this paper seeks to examine the drivers of infant mortality rate in eight SSA
countries (Angola, Cameroon, Chad, Cote d‘Ivoire, Equatorial Guinea, Gabon, Nigeria and
Congo Republic). The rest of the paper was organized as follow; section two reviewed
literature, while section three contained the methodology. Four presented the paper‘s analysis
of data and discuses results. And finally, five focused on summary of the findings and policy
recommendations.
2.0 Literature Reviews
2.1 Conceptual Issues
Infant mortality is mortality before the age of five of childhood. To Osawe (2014) infant
mortality refers to numbers of deaths of newborn baby under the age of one. Infant mortality
rate is also the number of infants dying before reaching one year of age, per 1,000 live births
in a given year (United Nations Children‘s Fund, 2012; United Nation Inter-Agency Group
for Child Mortality Estimation, 2013). But, Adedini (2013) defines infant mortality as the
probability of dying before the first birthday (that is, the probability of infants dying between
age zero and eleven months). This is similar to childhood (also known as under-five)
mortality rate which is the probability of a child born in a specified year dying before
reaching the age of five if subject to current age-specific mortality rate and expressed as a
rate per 1,000 live births (United Nations 2013).
This represents the probability of a child who survives to age one, dying between age one and
age five (WHO, 2011). To Adedini (2013), infant mortality is the probability of children
dying between the first and fifth birthdays (that is, the probability of dying between age 12
and 59 months). It is also referring to as the death of infants and children under the age of
five. Child mortality has remained a national and global concern and its importance in socio-
economic rating of country‘s development cannot be over-emphasized.
Figure 1: Infant Mortality Rate across Regions of the World
Source: Compiled from World Development Indicator dataset for various years
The infant mortality rate in Sub-Saharan Africa (SSA) region is the highest among all regions
of the world (as figure 1 above revealed) with an estimate of approximately 108 child-hood
020406080
100120140160180
Global Average SSANorth and Middle East AfricaOECD East Asia and PacificNorth America
pe
r 1
,00
0 li
ve b
irth
s
2000
2005
2011

Dutse International Journal of Social and Economics Research Vol. 1, No. 1 June 2018
41
deaths per every 1,000 live births in year 2011 compared to the global average of about 51 in
the same period. In Nigeria, like other nations in SSA region, the health systems are
performing far below average. The nation loses about 2,300 children in every single day,
which makes the country the second largest contributor to childhood mortalities worldwide.
Furthermore, there are three categories of general sources of threat to the life of the mother
during pregnancy and child birth. The first of the three, poor accessibility to health services in
supply due to poor health financing, is often the most immediate cause of death during child
birth. The second category includes a large number of indicators of health status including
woman‘s constitution, age, and parity. The last risk category is composed of several socio-
economic and environmental factors such as literacy status and income level. These
conditions contribute to high levels of morbidity resulting in maternal mortality; maternal
mortality research focuses on proximate causes of death such as lack of emergency medical
care for childbirth (Burchett and Mayhew, 2009). Most often, maternal mortality ratios are a
function of both economic and social developments. Of all the social indicators, one that
clearly discriminates between developing and developed countries is maternal mortality ratio.
Hence, adequate funding is paramount to reducing mortalities.
2.1.1 The Socio-Economic Determinants of Infant Mortality Rate in Sub-Saharan
Africa Childhood mortalities rates are important measure of the well-being of infants, children, and
pregnant women often the rateare also used for evaluating population and health programme,
intervention and policies. Therefore, unraveling the determinants of infant and childhood
mortalities in the developing world is rather a difficult task (Rodgers, 2002). Although, many
studies have identified various determinants of infants and child mortality, it has been
observed that recognizing the effects of various determinants is indeed a difficult task. It has
also been contended that the pathway of influence through which the various determinants
operate is rather a complex one (Adedini, 2013).
These complex determinants are also related to a variety of factors, including health status of
women, the quality of and access to healthcare services, socio-economic conditions, and
public health practices. By implication, high mortalities signify the lack of proper healthcare
owing to poverty, lack of education, and societal preferences (such as the affinity for a male
child), among others (Adetoro and Amoo, 2014). Household decisions shape health, but these
decisions are also inhibited by the income and education of household members. In sub-
Saharan Africa region, the common causes of mortalities and morbidities include malaria,
measles and acute respiratory infections; many children die mainly from malaria (Osawe,
2014and Adepoju, 2015). Ogunjuyigbe (2004) viewed morbidity and mortality of the child to
be influenced by the underlying factors of both biological and socio-economic that operates
through proximate determinants.
These diseases could be as a result of dirty feeding bottles and utensils, inadequate disposal
of household refuse and poor storage of drinking water which are also significantly related to
the high incidence of diarrhoea. But, there are various determinants of high mortalities rate in
sub-Saharan Africa countries which cannot be measured without considering several factors
some of which the users of healthcare services cannot control that has to do with service
delivery (inputs, knowledge, skills, and efforts of providers).In addition, basic infrastructure
and equipment availability are generally lacking at the frontlines of healthcare services
provision, and without these; effective services, proximity and presence of structures might
not translate into improved access to healthcare services (World Bank, 2017).

Dutse International Journal of Social and Economics Research Vol. 1, No. 1 June 2018
42
2.2 Theoretical Literature The principal-agent theory (also known as agency theory), which has its roots in information
economics, helped to explains the importance of health financing from agents to reduce
mortalities. The theory arises when two (or more) parties with one, designated as the agent,
acts on behalf of, or serve as representative for other, the principal (the public or the society),
in a particular domain of decisions, for instance, healthcare service delivery (Ross, 1973).
Principal-agent relationship can also be characterized by ill-informed and agent. Wagner
(1958) opined that increasing public financing of health activities. He postulated that there
are inherent tendencies for growth of the economy from the growth of government‘s
spending increases. Although, traditionally the government was limited to only defense,
justice, law and other maintenance of their economy; but with the growing awareness of its
responsibilities to their citizens, the government (agent of the society) was expanding its
activities in the fields of various welfare measures.
These measures include those financing to provide social security to the citizens. Similarly,
the state health financing increases on the account of its effort in redistributing income and
wealth among the citizens. The Wagner‘s public financing of 1958 also explains the
expanding state expenditure activities on health which has a definite long-term trend, though
in the short-run, financial difficulties could come in the way. However, in the long-run, the
desire for healthy societies in Africa and development of a progressive people will always
overcome these financial challenges. Romer (1986) developed the endogenous growth
models.
In 1986, Romer emphasizes investment (government spending) as an input in production
function (of children and mothers‘ healthcare services) of the following form:
Y = A (R) f (Ri, Ki, Li) 1
Where: represent aggregate output (or aggregate children and mothers‘ health outcomes in
Africa), A is innovation and new invention from research and development, R, such as an
advancement in healthcare research. Ri is the stock of results from expenditure on research
and development by country i; Ki are capital stock – investment on health infrastructure and
facilities. And Li are investment on healthcare providers. The assumption of the model was
based on three elements, namely externalities, increasing returns in the production of output
(children healthcare services), and diminishing returns in the production of new knowledge.
This implies that, it is the spill-over rom research efforts on healthcare services, and health
financing the ultimate determinants of infant mortality in SSA.
2.3 Empirical Reviews
A number of global studies have linked changes in infant mortality rate to low health care
financing, which results to inadequacy of health equipment, infrastructure, and resource use
at hospital, managed care; and educational status of mothers. Kotsadam et al. (2017) used
quasi-experimental approach to investigate the effects of developmental aid on infant
mortality in Nigeria. Their results indicate that geographical proximity to aid projects reduces
neonatal, infant, and child mortality. In particular, the study found that aid more effectively
reduces infant deaths in less privileged groups. Barenberg et al. (2015) used panel dataset of
Indian states between 1983 and 2012 to examine the effect of public health expenditure on
infant mortality in India. After controlling for other relevant covariates like per capita
income, female literacy, and urbanization; the authors found that an increase in public health
expenditure by 1 per cent is associated with a reduction in the infant mortality rate by about 8
infant deaths per 1,000 live births.

Dutse International Journal of Social and Economics Research Vol. 1, No. 1 June 2018
43
However, Hartwig et al. (2015) exploit the variation in the design of health care financing in
Indonesia to assess its effect on maternal care from 2004 to 2010. The analysis was based on
district pseudo-panel, combining data from a unique survey among District Health Offices in
Indonesia. Their finding show that district schemes contribute to a rise in antenatal care visits
and the probability of receiving basic recommended antenatal care services, and a fall in
home births, especially for citizens that fall outside the target group of the national health
insurance programs.
Issa and Ouattara (2005) disaggregate health care financing into public and private.
Employing a panel data on 160 countries their results show a strong negative relation
between health financing and infant mortality rates. Similarly, Alves and Belluzzo (2005)
investigate the determinants of mortality ratesin Brazil for the period 1970 to 2000. The study
estimate panel data models using census data and indicate that high mortality rates in Brazil
can be explained by the level of education, sanitation and poverty. Wagstaff and Cleason
(2004) show that government health expenditures are important determinants of infant and
maternal mortality. Their findings reveal that the impact of government health expenditures
on maternal mortality, under-weight children, under-five and tuberculosis mortalities
increases and is statistically significant. However, the study concludes that the impact of
government expenditures on under-five mortality not significantly different from zero.
Similarly, the effects of government financing of health expenditures, health insurance
coverage and other factors on children and mothers‘ health outcomes are examined by Berger
and Messer (2002) employing health production models estimated using 1960 to 1992 data
across 20 OECD countries. Their finding shows that increases in the publicly financed share
of health expenditures are associated with increases in mortality rates. The authors therefore
conclude that, as countries increase the level of their health spending, they may want to avoid
increasing the proportion of their expenditures that are government financed.
Furthermore, Or (2001) explores the determinants of variations in mortalities rates across 21
OECD countries between the period of 1970 and 1995, and found weak statistical significant
relationship between per capita health expenditure and mortalities rates. As he observes, the
absence of a strong statistical relationship may be due to model specification or may reflect
the fact that at high levels of population health, the returns to increase in health spending are
small. In Africa, a recent study by Adepoju (2015) examines the differentials in mortalities
rates across socio-economic, demographic and selected health characteristics. The study
employing the 2008 National Demographic and Health Survey (NDHS) data which were
collected using three well-structured questionnaires (household, women‘s and men‘s
questionnaires). Results show that child mortality rate was highest among illiterate mothers,
mothers without a source of income, under aged women (less than 20 years) and among
fathers whose primary livelihood lie in agriculture and fathers without means of incomes.
However, Osawe (2014) investigates factors that affect the rate of mortality among infants
under one year of age using panel data sets from the World Bank‘s World Development
Indicator database from 2000 to 2009 for 53 African countries. The results obtained after
correcting for endogeneity showed that fertility rate significantly affects infant mortality rate
in a positive way. Similarly, Gross Domestic Product (GDP) per capita as a proxy for income,
public health expenditure as a percentage of GDP, prevalence of HIV and the participation of
adult female in the labour force significantly affect infant mortality rate (IMR). In another
study, Adetoro and Amoo (2014) used data from Nigerian Demographic Health Survey
(NDHS) dataset to investigate the determinants of child (aged 0 – 4 years) mortality in
Dutse International Journal of Social and Economics Research Vol. 1, No. 1 June 2018
44
Nigeria. The binary logistic regression techniques employed reveals that education of both
parents and occupation of mothers were found statistically significant to reduction in
childhood mortalities rates.
Similarly, Godson and Mojekwu (2012) used data from the Nigerian Demographic and
Health Survey (NDHS) 2008 and the annual abstract of the National Bureau of Statistics
(NBS) to evaluated environmental determinants of child mortality in Nigeria. The study
employed multiple regression techniques, and the combination of the household
environmental factor significantly predicted infant mortality with the
immunization/household dwelling infrastructure/low polluting fuel factor significantly
contributing to high childhood mortalities. Mojekwu and Ajijola (2011) use multivariate
logistic regression techniques. Antai, (2010) employs the multilevel logistic regression
model, but Ozumba and Nwogu-Ikojo (2008) applied multiple regressions techniques with
autocorrelation adjustment to estimate mortality, while Ogunjuyigbe (2004) combine
univariate and bivariate analysis to calculate mortality indices for woman. All these studies
find demographic, socio-economic (age, sex, level of education, income level, and
occupation) and environmental factors (source of drinking water, and sanitation facilities) to
be significantly related to high infant and child mortalities rates in Nigeria.
Baird et al. (2009) investigated the relationship between health expenditures and children
mortality in developing countries. Their findings reveal that there is a large, negative
association between per capita GDP and infant mortality—on average, a one percent decrease
in per capita GDP is associated with an increase in mortality of between 0.24 and 0.40 infants
per 1,000 children born. Female infant mortality is more sensitive than male infant mortality
to economic fluctuations, especially during negative shocks to GDP. In developing countries,
approximately 30 percent of all deaths occur to children under the age of five, compared to
less than 1 percent in rich countries. Further empirical evidence on the relationship between
health care financing (proxy by per capita public health expenditure), under-five mortality
rates and crude death rates has provided by Azmat (2008) by using cross-country data from
seven Pacific Island countries, which argued that that per capita health expenditure is an
important factor in determining health outcomes. The results suggest that a 10 per cent
increase in per capita health expenditure would lead to an approximate 6.6 per cent reduction
in infant mortality rate.
Several studies on Africa have provide evidence to show different factors responsible for
high infant and maternal mortalities rates in the continent; however, these determinants
cannot be measured without considering those factors (adequate health infrastructure and
facilities) some of which the users of healthcare services cannot control. It could then be
concluded that several of the studies reviewed examine socio-economic determinants of
infant and maternal mortalities. However, in recent years, several efforts have been made to
identify which of service quality, service value and satisfaction has the most influence on
choice of a service provider – this might include healthcare financing and government
expenditure to enhance quality infrastructure and health facilities. Therefore, this paper seeks
to examine to investigates the drivers of infant mortality rate in sub-Saharan Africa countries
in recent years.

Dutse International Journal of Social and Economics Research Vol. 1, No. 1 June 2018
45
3.0 Methods
3.1 Model Specification The model specified in the paper is based on panel data regressions for infant health
outcomes. The paper model specification is consistent with Romer (1986) and empirical
literature reviewed. In accordance with these literature, quality and availability of water
supplies, sanitation facility, improved standard of living; and low level of pollution serves as
an indicator to improve infant health outcomes. Thus;
IMRit = αit+ β1IWSit + β2ISFit+ β3POLit+ β4RGDPit+ µit 2
where IMRit is Infant Health Outcomes (infant mortality rate); αit is regional/country-specific
effect; IWSit the improved water supplies; ISFit is improved sanitation facilities; POLit the
level of pollution; RGDPit is real gross domestic product per capita; and µit the error term.
As specified in equation 3.1 above, the equation examines the direct impact of major drivers
of infant mortality rate on infant health outcomes in sub-Saharan Africa region.The paper
expects these drivers to have inverse or negative effect on infant mortality rate except level of
pollution. However, an increase in per capita GDP implies a broader access to healthcare
services which could help to decrease infant mortality rate (see Osawe, 2014; Godson and
Mojekwu, 2012).
3.2 Data Source and Scope
A panel dataset for eight sub-Saharan African countries (Angola, Cameroon, Chad, Cote
d‘Ivoire, Equatorial Guinea, Gabon, Nigeria and Congo Republic) from 2000 to 2015 were
compiled for the study. The study sourced all variables from World Development Indicators
(2017) databases.
3.3 Method of Analysis
The study employed descriptive statistics, correlation matrix and Panel Regression analysis;
on both the dependent and independent variables selected from the dataset. The econometric
approach would be based on panel data regressions in equation (2). The study controlled for
country fixed-effects which control of unobserved factors that differ between the selected
SSA countries but are constant over time for each country. The study taken on the following
general form for the fixed effect of panel data model, where i represent a country and t
denotes year.
yit = g1Xit + vi + eit (3)
In this setting vi represents the effects of those variables particular to the ith
country which are
invariant over time. The advantage of fixed effects model (also called the analysis of
covariance model) allows for a very intuitive interpretation of the results. As a following step,
the study would compare the fixed-effect model to the random-effect model using Hausman
test. The test is often used to test for the difference in these models (pooled mean group and
mean group) with null hypothesis (Ho) of random effects and alternative (H1) of fixed effects.
4.0 Results
4.1 General Descriptive Results The study presents general descriptive statistics in Table 1 to provides information about the
means, minimum, maximum and standard deviations of variables used. Infant deaths are as

Dutse International Journal of Social and Economics Research Vol. 1, No. 1 June 2018
46
high as 80.2 per 1,000 children in Angola, Cameroon, Chad, Cote d‘Ivoire, Equatorial
Guinea, Gabon, Nigeria and Congo Republic from 2000 to 2015.
Table 1: Descriptive Statistics Table
Variable Observations Mean Standard Dev. Minimum Maximum
IMR 128 80.2 23.6 33.2 128.3
IWS 128 64.3 15.5 44.7 93.2
ISF 128 31.6 21.3 9.7 80.2
POL 128 63.1 28.7 4.6 100
EG 128 4004.2 5317.7 166.0 2334.7
Source: Author‘s computation from Stata 13.0
Furthermore, table 2 reveals correlation matrix; some with high correlation and some with
low correlation. For example, there is high inverse correlation between improved water
supply (IWS) with IMR. However, IMR is negative related to increase in pollution level.
Table 2: Correlation Matrix Table
IMR IWS ISF POL EG
IMR 1.00
IWS -0.78 1.00
ISF 0.30 -0.52 1.00
POL -0.44 0.42 -0.70 1.00
EG -0.41 0.27 0.11 -0.13 1.00
Source: Author‘s computation from Stata 13.0
4.2 Panel Regression Results Table 3 reveals the fixed effects regression findings of IMR in SSA countries. The estimation
results indicated supportive evidence that children‘ health outcomes in SSA nations is
dependent on water supply and its quality, living standard and citizens‘ ability to meet basic
needs; sanitation, access to toilet facilities and clean environment; and pollution. As table 3
also indicated, there is clear negative nexus between IMR, water supply and its quality,
sanitation, access to toilet facilities and clean environment in selected SSA countries; but it
was positively related to pollution level.
Table 3: Fixed Effects Results
Infant Mortality Rate (IMR)
Variable Coefficient t-statistics
Constant 275.42***
(13.76)
20.00
IWS -2.8637***
(0.2008)
-14.26
ISF -0.7626***
(0.2139)
-3.57
POL 0.2171***
(0.0617)
3.52
EG -0.0001
(0.0002)
-0.86
Adj. R2
0.7381
Nos of obs 128
Prob. 0.0000
Notes: 1. ***significance at 1%; **significance at 5%;*significance at 10% 2. Robust standard errors are
reported in parentheses
Source: Author‘s computation using Stata 13

Dutse International Journal of Social and Economics Research Vol. 1, No. 1 June 2018
47
In addition, the signs of the coefficients of IWS, ISF, POL and EG confirm the study a-priori
expectation. The coefficients of IWS, ISF, and POL (-2.8637, -0.7626, and 0.2171) were all
highly statistically significant at 1 per cent level. The pollution (POL) results were consistent
with the results obtained by McCord, et al, (2017) that temporal variation in ecology of
diseases which could leads to high child mortality increases as pollution rises. The result of
the random effects in table 4 further supported the fixed effects regression result with a slight
difference in magnitude. All the signs of the coefficients of IWS, ISF, and POL also confirm
the study a-priori expectation (+), (+), and (-) respectively. The coefficients of IWS, ISF, and
POL (-4.8921, -1.3861, and 0.3030) in table 4.2 were all statistically significant at 1 per cent
level.
Table 4: Random Effects Results
Infant Mortality Rates (IMR)
Variable Coefficient t-statistics
Constant 255.146***
(14.5197)
17.57
IWS -2.5572***
(0.1863)
-13.72
ISF -0.6289***
(0.1682)
-3.74
POL 0.1685***
(0.0621)
2.72
EG -0.00032
(0.00021)
-1.53
Adj. R2
0.73
Wald chi2 279.3
Prob. 0.0000
Notes: 1. ***significance at 1%; **significance at 5%; *significance at 10% 2. Robust standard errors are
reported in parentheses
Source: Author‘s computation using Stata 13
In general, the Hausman specification test is used to test for the best model (between Fixed
Effect and Random Effect models). The calculated Hausman specification statistic (as
presented in Table 5) and distributed chi-square are 66.66 and 0.0000 respectively.
Table 5: Hausman Test Summary
IMR
Chi-value 66.66
Prob. value 0.0000
Source: Author‘s computation from Stata 13.0
These reveals that the p-values<0.05 (5% level), therefore it is appropriate to interprets the
random effect models. From random effect regression results (see Table 4) suggest that
policy efforts that emphasizes on improving water supply and its quality (IWS); sanitation,
access to toilet facilities and clean environment (ISF); control of pollution (POL), and
improving the living standard and citizens‘ ability to meet basic needs (EG) are key to lower
infant mortality (IMR) in Angola, Cameroon, Chad, Cote d‘Ivoire, Equatorial Guinea,
Gabon, Nigeria and Congo Republic; because all of these determinants were theoretically
correct and highly significant with infant mortality.
Dutse International Journal of Social and Economics Research Vol. 1, No. 1 June 2018
48
5.0 Conclusion
5.1 Summary and Policy Implications This paper investigates major drivers of high infant mortality across eight SSA countries
(Angola, Cameroon, Chad, Cote d‘Ivoire, Equatorial Guinea, Gabon, Nigeria and Congo
Republic) from recent 2000 to 2015 employing panel model analysis (FE, RE and Hausman
tests). The findings suggest that improving water supply and its quality; sanitation, access to
toilet facilities and clean environment; control of pollution and improving the living standard
and citizens‘ ability to meet basic needs are key to lower infant mortality in these nations.
The findings therefore call for effective policy to be directed at providing water and
sanitation facilities, and reducing pollution to improve health outcomes of selected SSA
children. Finally, governments efforts should also be directed towards enhancing effective
child healthcare services and citizens‘ welfare.
References Adedini, S.A. (2013). Contextual Determinants of Infant and Child Mortality in Nigeria. A
Doctoral Thesis submitted to the Faculty of Humanities, University of the
Witwatersrand, Johannesburg, South Africa
Adepoju, A.O. (2015). Differential Pattern in Child Mortality Rate in Rural Nigeria. Annual
Research & Review in Biology, 7(5): 309-317
Adetoro, G.W., and E.O. Amoo (2014). A Statistical Analysis of Child Mortality: Evidence
from Nigeria. Journal of Demography and Social Statistics. Vol. 1, pp 110-120
Alves, D and W. Belluzzo (2005). Child Mortality and Socioeconomic Status in Sub-Saharan
Africa, African Population Studies, Vol 19 (1), 1-11
Antai, D. (2010). Migration and Child Immunization in Nigeria: Individual and Community-
level Contexts. British MedicalCare Public Health, 10 (1)
Anyanwu J.C. and A.E.O Erhijakpor (2007). Health Expenditure and Health Outcomes in
Africa, Economic Research Working Paper, No 91
Amiri A. and U.G. Gerdtham (2013). Impact of Maternal and Child Health on Economic
Growth: New Evidence based Granger Causality and DEA Analysis, Partnership for
Maternal Newborn and Child Health
Azmat G,( 2009), ―Health care financing and health outcomes in Pacific Island countries‖,
Health Policy and Planning 2009; 24:72–81
Baird, Friedman, Schady, (2009), Aggregate income shocks and infant mortality in the
developing world
Berger, M.C. and J. Messer (2002). Public financing of health expenditures, insurance, and
health outcomes, Applied Economics, Vol. 34 (1), 125-139
Burchett H.E. and S. H. Mayhew (2009). Maternal mortality in low-income countries: what
interventions have been evaluated and how should the evidence base be developed further?
International Journal of Gynecology and Obstetrics, Vol.105 (1), 78–81
Fagbamigbe, A.F. and O. Alabi (2014). Differentials and Correlates of Infants Mortality in
Nigeria: A Comparative Survival Analysis between North East and South West
Nigeria. International Journal of Tropical Disease and Health, 4(8): 869-886
Fiala, C. and J.H. Arthur (2014). ―Dishonorable Disobedience‘‘ -Why refusal to treat in
Reproductive healthcare is not conscientious objection. Women Psychosomatics
Gynecology and Obstetrics, 1, 12-23
Howlader M. R. (2014). An Estimation of Health Production Function of Bangladesh,
Directorate of Secondary and Higher Education, Dhaka
Issa, H and B. Ouattara (2005). The Effect of Private and Public Health on Infant Mortality
Rates: Does the Level of Development Matters, May 2005

Dutse International Journal of Social and Economics Research Vol. 1, No. 1 June 2018
49
Kotsadam A., G. Ostby, S.A. Rustad, A.F. Tollefsen, and H. Urdal (2017). Development Aid
and Infant Mortality, Working Paper 39
Jinadu, M. K., S.O. Olusi, J. I. Agun, and A. K. Fabiyi (1991). Childhood diarrhoea in rural
Nigeria: Studies on prevalence, mortality and socio-environmental factors. Journal of
Diarrhoea Diseases Research, 9 (4), 323-327.
Lavallee E., R. Mireille and F. Rouband (2008). Corruption and Trust in Political Institutions
in sub- Saharan Africa, Dial Development Institutions and Analysis de Long term DT/2008-
07
Mesike, C. G., and J. N. Mojekwu (2012). Environmental Determinants of Child Mortality in
Nigeria. Journal of Sustainable Development, 5 (1), 65 – 75
Mojekwu, J. N., and L. A. Ajijola (2011). Developing a Model for Estimating Infant
Mortality rate of Nigeria. Journal of Research in International Business and
Management, 1 (2), 164-170.
Morse, A.R. (2014). Definitions of Maternal Mortality, The Population Research Institute
Ogunjuyigbe, P. O. (2004). Under-Five Mortality in Nigeria: Perception and Attitude of the
Yoruba towards the Existence of Abiku. Demographic Research, 11 (2)
Or Z. (2001). Exploring the Effects of Health Care on Mortality across OECD Countries.
Labour Market and Social Policy Papers 46, OECD Directorate for Employment,
Labour and Social Affairs
Osawe, O. W. (2014). Determinant of Infant Mortality Rate: A Panel Data Analysis of
African Countries. Developing Country Studies, 4 (18), pp 111-115
Ozumba, B. C., and E. E. Nwogu-Ikojo (2008). Avoidable Maternal in Enugu, Nigeria.
Public Health, 122 (4), 354-360.
Pillai, V.K., A. Maleku, and F. Wei (2013). Maternal Mortality and Female Literacy Rates in
Developing Countries during 1970-2000: A Latent Growth Curve Analysis.
International Journal of Population Research, Vol. 2013
Rodgers, G.B. (2002). Income and inequality as determinants of mortality: an international
cross-section analysis. International Journal of Epidemiology, 31, 533-538
Romer, P.M. (1990). Human Capital and Growth: Theory and Evidence, Carnegie-Rochester
Conference Series on Public Policy, Vol 32, 251-286
Ross, D. S. and R. Venkatech (2015), An Empirical Study of the Factors Influencing Quality
of Healthcare and Its Effects on Patients‘ Satisfaction, International Journal of
Innovation Research in Science, Engineering and Technology, Vol. 4 (2), p. 54-59
Ross S.A. (1973). The Economic Theory of Agency: The Principal‘s Problem, National
Science Foundation, Vol. 63(2), 134-139
Sen, Amartya (1999), Development as Freedom (1st Ed) New York: Oxford University Press
Stidham, Hall K, Patton E.W, and Crissman H.P, (2015). A population-based study of U S
women‘s preferred versus usual sources of reproductive health care. Journal of
Obstet. Gynecol. 213:352
United Nations Children‘s Fund (2012). Levels and Trends in Child Mortality - Report
2012.Estimates Developed by the United Nations Inter-Agency Group for Child
Mortality Estimation.
United Nations Children‘s Fund (2014). State of the World‘s Children Report, United
Nations
United Nations Children‘s Fund (2015). The Inter-Agency Group for Child Mortality
Estimation
United Nations Inter-Agency Group for Child Mortality Estimation (2013). Levels and
Trends in Child Mortality - Report 2013. UN Inter-Agency Group for Child
Mortality Estimation. New York.

Dutse International Journal of Social and Economics Research Vol. 1, No. 1 June 2018
50
Wagstaff, A. and M. Cleason (2004). The Millennium Development Goals for Health: Rising
to the challenge, Washington, D.C. World Bank
UNICEF (2013) World Health Indicators
World Bank (1997), World Development Report, World Bank, Washington, DC
World Bank (2006), World Development Report, World Bank, Washington, DC
World Bank (2017), World Development Indicators, World Bank Washington, DC
Dutse International Journal of Social and Economics Research Vol. 1, No. 1 June 2018
51
Human Trafficking in Nigeria: NAPTIP
role and recent efforts in focus
*Izevbigie John Norense1
1Department of Economics, Faculty of Social Sciences, University of Benin,
Benin City, Edo State, Nigeria.
*Corresponding Author‘s Email: [email protected]
Abstract: This study examined the socio-economic factors influencing human trafficking and
the efforts of NAPTIP in combating this crime in Nigeria. Towards this end, descriptive
analysis of secondary data was carried out. An attempt was specifically made to bring to fore
the number of rescued victims and suspected/convicted traffickers by NAPTIP in recent times.
The study revealed that NAPTIP had not been able to stem this growing illicit act that has
assume frightening dimension in Nigeria because of some underline basic factors such as
high rate of unemployment, poor funding and lacuna in the existing legal framework. As a
result, some policy recommendations such as putting in place functional social insurance
policies, improved funding to relevant agencies and a sustain campaign that discourages the
illicit act were put forward.
Keywords: Migration, Nigeria.
JEL Classification: F20. O55
1.0. Introduction
Human trafficking can be viewed from different perspective. However, the most generally
accepted definition of human trafficking is as stated in the United Nations protocol to
prevent, suppress and punish trafficking in persons (2000). It states that:
―Trafficking or traffic in persons‖ means the recruitment, transportation, transfer, harboring
or receipt of persons by means of threat or use of force or other forms of coercion, abduction,
fraud, deception, the abuse of power of a position of vulnerability or the giving or receiving
of payments or benefits to achieve the consent of a person having control over another
person or debt bondage for the purpose of placing or holding the person whether for or not
in involuntary servitude (domestic, sexual or reproductive) in forced or bonded labor, or in
slavery-like conditions, the removal of organs or generally for exploitative purposes‖
Human trafficking can therefore be classified as a vice and not a virtue. In recent times, this
scourge has taking frightening dimensions resulting in increasing global attention. At the
initial stage, it was mainly in form of trafficking of women and girls for forced sex work and
domestic servitude, but today it has taking different forms including the trafficking of
children and men for labor and sexual exploitation. Trafficked persons are also forced to
work as beggars, soldiers or/and wives (UNICEF, 2016). This illicit act strives within a
strong and organized network. It is a demand-driven global business with a huge market for
cheap labor and commercial sex confronting often insufficient or unexercised policy
frameworks or trained personnel to prevent it (UN, 2016).

Dutse International Journal of Social and Economics Research Vol. 1, No. 1 June 2018
52
Available reports revealed that sub-Saharan Africa and indeed, the West Africa sub-region
accounts for huge proportion of the number of persons indulged in the act. Of this, Nigeria
accounts for a lion share due to a combination of widespread aspirations for migrating to
Europe and other developed regions of the world among its citizens (NAPTIP, 2016).
UNICEF (2016) place Nigeria as one of the leading African countries in human trafficking
and ranked as the third largest crime after economic fraud and the drug trade in the country.
Despite the apparent risk and dangers involved in this illicit act, it had being on a steady
increase over the years in Nigeria. Worthy to state here that promoters and victims of this
illicit act are often related in one way or the other, for example, through family ties, language,
ethnicity, gender and so on. This helps to build atmosphere of trust at the first point of contact
(UN, 2016). One of the factors believed to have contributed to this menace is the long period
of military regimes in Nigeria which resulted to the institutionalization of violation of human
rights and severe political, social and economic crises in the country. In addition, the oil
boom in the 1970s created opportunities for both internal migration as larger proportion of
the population decided to leave the rural communities due to the gradual dwindling
government interest in the agricultural sector. These created exploitative avenues for both
internal and international trafficking in persons for varied purposes such as sexual
exploitation, forced labor, organ harvesting and so on.
Despite global condemnation and some well thought out policies, the scourge seems to be
unabated in Nigeria. To this end, this paper takes a critical look at the nature of human
trafficking, the propelling socio-economic factors, the role of National Agency for
Prohibition of Traffic in Persons and Other Related Matters (NAPTIP) and the way forward
for Nigeria.
2.0. The Nature of Trafficking in Persons in Nigeria
Human trafficking in Nigeria is of varied forms and dimensions. This could be categorized
into internal and cross border trafficking. It can also be viewed as a source, destination or
transit point from the perspective of a country.
Internal trafficking involves the trafficking of persons from one location/place to another
within the same country for various illicit purposes. In particular, it involves the trafficking of
persons from a particular community, region or state to another predominantly for
exploitative domestic work, farm labor and prostitution within same country. For example,
NAPTIP (2016) reports stated that a huge number of persons are trafficked from communities
in some states in Nigeria such as Osun, Akwa-Ibom, Ebonyi, and Benue to cities such as
Lagos, Ibadan, Kano, Calabar and Port-Harcourt for various exploitative acts. On the other
hand, international trafficking in persons involves cross boarder trafficking of persons. It is
the trafficking of persons mainly from their home country to a foreign country for various
forms of dehumanizing act such as slavery and illicit sexual act. For example, Nigeria
Immigration Service (2016) revealed that most Nigerians are trafficked to Republic of Benin,
Togo, Cote d‘Ivoire, Equatorial Guinea, Cameroon, Gabon, Guinea and Libya to work mostly
as domestic servants, street hawkers and prostitutes. Also, common European destinations for
trafficked Nigerians were revealed to be Italy, Belgium, Spain, the Netherlands, Germany and
the United Kingdom. Daily Telegraph (2001) revealed that an increasing number of young
girls claiming asylum in the United Kingdom are trafficked persons. Akon (2000) revealed
also that the Middle East and South America such as Saudi Arabia, Venezuela and India have
become destination for trafficked Nigerians.
Dutse International Journal of Social and Economics Research Vol. 1, No. 1 June 2018
53
The International Criminal Police Organization (2000) revealed that Nigeria serves as a
source country for international trafficking though some states such as Akwa-Ibom, Edo,
Benue, Kano, Oyo, Imo, Enugu, Lagos accounts for more trafficked persons than others. The
report stated further that most of the trafficked persons are often lured to believe that as soon
as they get to their destination, things will automatically turn around for their good. Also,
Nigeria strategic location in Africa, especially within West Africa sub-region results in her
classification as a transit country. This is because in the movement of trafficked persons to
other Africa and foreign countries (especially through land borders) such as Republic of
Benin, Cameroon, Libya, Italy and Spain, Nigeria Immigration Service (NIS) (2013) reported
that Nigeria is often used as transit route. Some Togolese women and young girls recruited
from Dapaong (about 600 km from the capital Lome) and from Basser in the central region of
the country were trafficked to Europe mainly through Nigeria (NIS, 2013). This movement
takes days, months or years under arduous and deplorable conditions and in most cases
victims lack the necessary means during the waiting period and thus result to various illicit
acts for survival. Nigeria also serves as a destination for trafficking in persons. This means
that Nigeria serve as a veritable place for the illicit act of trafficking in persons. NIS (2013)
also had it that women, young girls and children from Benin, Togo, Liberia, Mali, Burkina
Faso and Ghana are often trafficked to Nigeria for varied illicit purposes. Traffickers over
the years have also leverage on the free movement of persons within ECOWAS sub-region to
perpetuate this act in addition to the porous border condition.
3.0. The Propelling Socio-economic factors of Human Trafficking in Nigeria
One of the root causes of human trafficking is poverty. Poverty is an economic condition
whose consequences include among others reduced health and life expectancy (Akinbobola
& Saibu, 2007). In Nigeria with about 170 million persons, over 112 million relatively live
below poverty (Akinbobola & Saibu, 2007). Poverty is often seen as the driving force that
makes victims vulnerable for various forms of trafficking. Poverty has been identified as a
causal root of human and sex trafficking. The quest to support family members makes victim
susceptible to traffickers who often promise them high return (Patterson, 2003). Similarly,
Yen (2008) opined that trafficked persons are either unemployed or earn meager
income/wages and as such are easily lured into the illicit act. High poverty rate motivates a
lot of victims to agree to embark on the dreaded journey which is often through desert and the
Mediterranean all in the quest for a better life and leaving condition. The continuous
increasing poverty rate in most parts of Nigeria contributes in a larger measure to the upsurge
in the number of persons indulging in this illicit act (Okojie, Okojie, Eghafona, Vincent-
Osaghae and Kalu, 2003). In corroboration, Ellis and Akpalla (2011) identify poverty as one
the factors that drives Nigerian migrants to seek the services of human traffickers.
Unemployment is another factor that promotes trafficking in persons in Nigeria. The
inadequacy of job opportunities and social benefits for the vulnerable and unemployed in
most third world country including Nigeria is also a major determining factor. Vergara (2007)
opined that just as in Nigeria, human trafficking for sexual exploitation exists in America and
that the category of person that mainly indulge in the illicit act are those that are unemployed.
Ikein, Alamieyeseigha and Azaiki (2008) see unemployment as a serious socio-economic
problem in Nigeria owing to its increasing rate between 2000 and 2007. In addition, the data
release by National Bureau of Statistics (2012) revealed that the number of new entrants per
year seeking for job opportunity in Nigeria has been on the increase over the years. Bakare
(2013) corroborated this when he stated that youth unemployment in Nigeria had risen to
about 80 percent comprising mainly of graduates from University, Polytechnics and Colleges.
A similar position was expressed by Awogbenle and Iwuamadi (2010) when they opined that
Dutse International Journal of Social and Economics Research Vol. 1, No. 1 June 2018
54
the estimated population of unemployed youth in Nigeria is about 80 million representing
about 60 percent of the total population in Nigeria. One major implication of this is that, most
of these unemployed are easily lured and/or forced to indulge in the illicit act.
Poor education and high illiteracy rate is another factor that enhances human trafficking in
Nigeria. Poor educational background makes one gullible and easily lured into the illicit act
of human trafficking. For example, Henrietta and Egbochuku (2009) revealed that there is
high rate of school dropout among female in Edo State as a result of poor parental
commitment to the girl child education amongst others. Also, on a general note, NBS (2012)
revealed that the number of persons that had no access to education or at best regarded as a
school dropout has been on the increase in Nigeria over the years. Odigie and Patience (2008)
further stated that Nigerians without formal education or those that dropped out of school
constitute bulk of the victim of human trafficking.
Another vital factor that influences human trafficking in Nigeria is the eroding values system.
The influence of globalization and telecommunication has made it difficult to regulate what
most individuals watched and listen to. This no doubt affects their thought and actions.
Arowolo (2010) argues that western culture and European mode of civilization has been
thriving and has outgrown Africa cultural heritage and that western culture is now regarded
as a frontline civilization in Africa. In time past, households in Nigeria were organized into
family bonds and cultural rules that emphasized male responsibility for provision and
protection of the entire family members. This family structure of male dominance and
protection had been weakened to the extent that parent now encourages their ward (male and
female) to fed for the family. The moral decadence in the country makes some household
heads to voluntary aid and abet their wards to indulge in various forms of human trafficking.
Parents readily give out their daughters and sons to traffickers or put pressure on them to
indulge in the act with the hope of using the expected financial gain arising from the act to
improve their lots. Thus, in some cases, most of the girls and woman that makes fortune from
this illicit act becomes the breadwinner of the family (Okojie, Okojie, Eghafona, Vincent-
Osaghae and Kalu, 2003). Cole and Booth (2007) asserted that parents who would have
refused giving their daughters to sex traffickers in the past now welcome the fact that their
daughters have become a source of income and are willingly giving them to traffickers.
Again, some unwholesome practice of traditional religion has also contributed to the
increasing rate of human trafficking in Nigeria. This is because one major traditional practice
employed by traffickers is the use of traditional fortune tellers, voodoo and diviners as well as
fetishism. This various activities are employed to assure the prospecting traffickers of
success. Bell (2011) stated that ‗Vodoo‘ (black magic) is a significant part of the West
African culture and it is also prevalent in most parts of Nigeria. as a result of its fear and
believe the people have on it. Due to the fear and believe the people have on it, it is usually
employed to convinced and assure victims. This practice often makes victim unwilling to
report their ordeal to relevant law enforcement agency as well as refuse to testify in courts
against suspected traffickers. Adams (2011) explains how sex traffickers employed the
services of traditional Juju priest to control their victims by giving him/her a box containing
the trafficked person‘s body parts such as fingernails or pubic hair and thereafter mandate the
victim to swear to an oath to abide by the terms of agreement. This further instills fear on the
victims as a result of the possible consequences that may befall them if they go out of the
agreement.

Dutse International Journal of Social and Economics Research Vol. 1, No. 1 June 2018
55
Closely related to the practice of traditional practice is the condemnable activities of some
‗Men of God/Religious Leaders‘ whose actions had directly promoted this illicit act over the
years. In most parts of Nigeria (especially in the southern part), some of these religious
leaders mindful of dangers and consequences of these illicit act embarked on spiritual
voyages on behalf of the victims in exchange for monetary reward. This no doubt serves as a
boost and encouragement to prospecting traffickers who often hold their so called ‗Man of
God‘ in high esteem. Corroborating this is the assertion by Kara (2009) when he opined that
before victim(s) embark on the illicit act, they often indulge in some spiritual rites by some
acclaimed ‗Men of God‘.
4.0. Methodology and Data Sources
Most countries including Nigeria do not have comprehensive data on trafficking in persons.
This may not be unconnected with the secrecy surrounding the manner the illicit act is carried
out. However, this study adopts the secondary data from NAPTIP. This is because NAPTIP is
more directly involved in efforts aimed at curtailing the increasing trend of trafficking in
persons in Nigeria. The study covers the period between 2004 and 2016.
4.1. NAPTIP Response So far
NAPTIP is one of the agencies of government given the mandate to stem the menace of
human trafficking in Nigeria. Other sister agencies includes; Nigerian Immigration Service,
Nigeria Police Force, National Drug Law Enforcement Agency and Nigeria Security and
Civil Defense Corps. The establishment of NAPTIP in 2003 by the Nigerian Government
empowers the agency to coordinate and implement all the mandates as it relates to trafficking
in persons in the country. In particular, NAPTIP carries out functions such as researches to
discover new and emerging trends in human trafficking, prevention and awareness campaigns
against trafficking, deterrent strategic arrests, investigation, court prosecution and conviction
of offenders. Others include team approach to complex, multi-dimensional, multi-faceted and
underground criminal activity, bilateral, multilateral collaboration with both local and
international agencies and counseling and rehabilitation of trafficked persons. Also, as one of
the core mandate of NAPTIP, the agency is expected to works closely with foreign embassies
and consulates in Nigeria and Nigerian embassies and consulates abroad, ECOWAS, Africa
Union and relevant agencies of United Nations Organization.

Dutse International Journal of Social and Economics Research Vol. 1, No. 1 June 2018
56
Figure 1: Gender Distribution of Rescued Victims between 2004 and 2014
Source: Authors Computation Using NAPTIP Data 2014
Figure 1 shows the gender distribution of victims of human trafficking in Nigeria for a period
of 10 years, that is, between 2004 and 2014. The figure revealed that the number of trafficked
victims that has been rescued by NAPTIP in the period under review has been on a stable
increase. With respect to gender, the figure shows that there was a stable increase in the
number of rescued female trafficked victims compared to male. This could be linked to the
renewed effort of the agency to curb this scourge by collaborating with relevant agencies
within and outside the country. There were some years such as 2010 and 2012 wherein the
agency recorded slumps in the number of rescued victims for females and year 2008 and
2012 for male. However on a general note, there was a tremendous improvement in the
number of rescued victims of human trafficking by NAPTIP in the period under review. This
is because the agency rescued a total of about 1030 victims of human trafficking in 2014
compared to 77, 336, 366, 907, 882, 1029, 1015, 976, 749 and 960 in 2004, 2005, 2006,
2007, 2008, 2009, 2010, 2011, 2012 and 2013 respectively. Of this number, child labor had
the highest; this was closely followed by external trafficking for sexual exploitation and
internal trafficking for labor exploitation, child kidnap, forced marriage and so on. External
trafficking for labor exploitation had always accounted for the lowest number of rescued
victims in Nigeria over the years (NIS and NAPTIP, 2015).
0
100
200
300
400
500
600
700
800
20
04
20
05
20
06
20
07
20
08
20
09
20
10
20
11
20
12
20
13
20
14
20
15
20
16
17Yrs & Below
18Yrs & Above
Unclassified
0
200
400
600
800
1000
1200
2004 2005 2006 2007 2008 2009 2010 2011 2012 2013 2014
Female
Male

Dutse International Journal of Social and Economics Research Vol. 1, No. 1 June 2018
57
Figure 2. Age Distribution of Rescued Victims of Human Trafficking between 2004 & 2016
Source: Authors Computation Using NAPTIP and Nigeria Immigration Service Data 2016
The major interest here is the categorization of the various age bracket that account for a
larger number of rescued victims by NAPTIP. Figure 2 shows that there was an increase in
the two major age bracket (17years & below and 18years above) employed in this study. The
age bracket of 17years and below accounted for the largest number of recued victims
compared to the age bracket of 18years and above between the period 2004 and 2016. The
number of children (17years and below) rescued within this same period showed a high level
of oscillation with its peak at 708 persons in 2014. Though, the age bracket of 18years and
above exhibited a similar pattern, there were reductions in the number of victims rescued
between the age ranges of 18-27years and 28 and above in the period under review. However,
individuals within the age range of 18-24years recorded the highest number of victims
rescued, followed by the age bracket of 12-17years. This could be connected with the fact
that most of the individuals within this age bracket are youthful. However, the lowest number
of rescued victims was accounted for by the age bracket of 11years and below (see figure 2
for details). It is also worth mentioning here that more underage male within the age bracket
of 17years and below fell victims of human trafficking compared to male adults between the
age brackets of 18-27years. There was also a little disparity between the number of trafficked
underage female (17years and below) and adult female within this period.
Worthy to state here that though Edo, Delta, Akwa-Ibom, Imo and Kano state had been
accounting for a high volume of rescued victims of human trafficking in the country over the
years, there was however significant reduction in the number of victims rescued from Edo,
Akwa Ibom and Kano States while Benue, Lagos and Borno States witnessed a considerable
level of increase in the number of rescued victims of human trafficking in most years in the
period under review. Also, state such as Gombe, Jigawa, Adamawa and Bauchi had been
recording the lowest number of rescued victims of human trafficking in the country
(NAPTIP, 2013). In a similar vein, some foreign countries whose citizens accounted for a
high volume of the number of rescued trafficked persons in Nigeria includes; Republic of
Benin, Togo, Niger, Burkina Faso and Ghana (NAPTIP, 2013).
0
100
200
300
400
500
600
700
800
2000 2005 2010 2015 2020
17Yrs & Below
18Yrs & Above
Unclassified

Dutse International Journal of Social and Economics Research Vol. 1, No. 1 June 2018
58
Figure 3: Trend in Number of Convicted Traffickers in Recent Times
Source: Authors Computation Using NAPTIP Data 2011-2016
Figure 3 shows the trend in the number of convicted victims of human traffickers in recent
times. In particular, the figure shows that there was a sustain increase in the number of
convicted human traffickers by NAPTIP in Nigeria between 2011 and 2013. However, this
increase was not sustained further as revealed in the number of convicted traffickers in 2014
and 2015. In other words, though there was a sustain increase in the number of convicted
human traffickers in 2012 and 2013 to the tune of about 25 and 44 convicted persons
respectively, there was a gradual fall/reduction in the number of convicted traffickers to about
39 and 23 persons in 2014 and 2015 respectively. A further breakdown of the total number
of conviction in 2012 shows that they comprises 12 males and 13 females with external
trafficking for sexual exploitation, child kidnapping, rape/sexual abuse and internal
trafficking for labor exploitation accounting for the highest volume of those convicted. Also,
in 2013 and 2014, the Agency witnessed an increase in the numbers of convicted traffickers
of child labor and external trafficking for sexual exploitation; however, there was a noticeable
reduction in the number of convicted traffickers for cases of internal trafficking for sexual
exploitation and rape/sexual abuse. Lastly, there was an increase in the number of convicted
offenders in 2016 to the tune of about 31 persons. This represents an increase of
approximately 39 percent in the number of convictions secured in 2016 compared to 2015.
5.0. What are the Problems?
The persistence harmful cultural practices, harsh economic condition, high rate of
unemployment, high cost of living, poor macroeconomic environment, non provision of basic
amenities, high level of moral decadence, lack of political will on the part of government
towards ameliorating the plight of the poor and vulnerable groups in the Nigeria state just to
mention a few has made this illicit act of human trafficking to be on the increase over the
years. These socio-economic problems which have remain unabated in the country inform the
decision of both human traffickers and victims to take the risk that could result in the lost of
their lives all in a bid to acquire economic power and resources to better their lots and those
of their love ones.
0
5
10
15
20
25
30
35
40
45
50
2011 2012 2013 2014 2015 2016 2017
Series1
Dutse International Journal of Social and Economics Research Vol. 1, No. 1 June 2018
59
Also, there exist no national rehabilitation programme for traffickers and victims and as such
must of these persons choose to continue in the illicit act rather than to be scorn and
stigmatize by the society if they voluntarily withdraw from the illicit act. Though some state
government, for example, Edo and Akwa-Ibom State has openly declare in several forum that
victims of human trafficking will be adequately rehabilitated and economically empowered,
however, an investigation into what has actually be down revealed that there is a huge gap
from what is expected.
It is also a basic fact that some commendable legal measures have been put in place to stem
the scourge of human trafficking in Nigeria. Noticeable among these measures includes;
adoption of the convention on domestic workers in 2011 which includes special measures to
protect vulnerable members in terms of employment (ILO, 2011), the Dhaka Principles which
is a guide for companies on responsible recruitment and employment of migrant workers
(IHRB, 2012). Others includes; the ratification of the UN Protocol to prevent, suppress and
punish trafficking in persons, especially women and children in 2001, enactment of national
law against trafficking in persons enforcement and administration act in 2003, and the child
rights act of 2003 which deals comprehensively with the issue of child trafficking. Of late,
there has also being increase in enlightenment campaign, economic empowerment,
reintegration and rehabilitation programmes to discourage this scourge.
However, despite the aforementioned initiatives, human trafficking has remained a critical
problem in Nigeria as a result of some underline issues. For example, the child rights act of
2003 deals comprehensively with the issue of child trafficking in Nigeria, unfortunately, this
‗Act‘ has not been adopted by all the federating units in the country, this no doubt sabotages
the lofty objectives of the ‗Act‘. Also, though trafficking in women was criminalized in
Nigeria by the criminal code of 1904 and the penal code of 1960, however, these two codes
failed to accurately define what constitutes trafficking and as such leaves its various forms
unaddressed. Again, Nigeria‘s trafficking law caption ‗Trafficking in Persons (Prohibition)
Law Enforcement and Administration Act 2003‘also seems narrow because it deals more
extensively with trafficking for prostitution and sexual exploitation with less emphasis on
other forms of trafficking in persons. In addition, there are observed lacuna in the Nigerian
trafficking law for the protection of trafficked persons (victims) and witnesses. This has
limited its scope and falls short of the recommended human rights standard approach (Global
Alliance against Traffic in Women, 2001). While the law criminalizes the transport of
trafficked persons by any commercial carrier with knowledge of the illicit act, it calls for a
concern that no commercial carrier has ever been charged, prosecuted or convicted over the
years. The sanctions against human trafficking offenders seem to be weak in Nigeria.
Offenders are frequently allowed to escape serious human rights abuses with impunity
(UNICEF 2001). The result is a distrust of the legal system and its punishments.
The successful conviction of human traffickers will no doubt serve as a deterrent to others,
but a cursory look at the various legal provisions as it relates to Nigeria shows that they are
defective in one area or the other and prospective human traffickers leverage on this to
perpetuate their illicit act. This no doubt has also negatively impacted on NAPTIP efforts in
meeting its core mandate of prevention and prosecution of trafficking in persons in the
country since its establishment. For example, in 2014 about 603 cases of human trafficking
and other related matters were reported to the agency, of this number, 298 cases were
successfully investigated while only 39 convictions were secured. Also, in 2016, out of the
721 cases that were reported to the Agency, 389 were successfully investigated while 332
cases reported were still under various stages of investigation with just 31 convictions thus

Dutse International Journal of Social and Economics Research Vol. 1, No. 1 June 2018
60
far. This brings the total number of cases of human trafficking reported to the Agency from
inception to about 4,620 (NAPTIP, 2016).
6.0. Conclusion and Recommendations
Human trafficking is an organized crime and curbing it requires concerted efforts by
concerned stakeholders. Combating human trafficking and its attendant damaging effects in
the Nigerian society requires interest and resources of government, international
organizations, non-governmental organization and civil society. This is because despite the
decisive steps taking thus far in the country, the illicit act is still on the upward trend.
Though, NAPTIP has succeeded in some areas such as public awareness and enlightenment,
arrests and prosecution of some traffickers and victims, collaboration with sister agencies and
establishment of offices across the country, however, there have been some observed short
comings since its inception occasioned by poor funding and weak legal provisions amongst
others. This has no doubt militated against the meeting of its core mandate.
Thus, to adequately control and fight this ravaging scourge in Nigeria, the followings are
recommended;
The government should ensure that there is adequate funding for NAPTIP and other
collaborating agencies such as Nigerian Immigration Service and Nigeria Police
Force.
The government should also make provision for basic amenities, social insurance
scheme and job opportunities for the growing unemployed population (especially the
youth).
A functional rehabilitation centre for both the victims and traffickers should be put in
place by relevant agency(s) of government. This could include the granting of
victim(s) rights to state-supported health services regardless of the ability to pay or
willingness to participate in criminal action against traffickers (Zimmerman, 2006).
Increase awareness of the risks of human trafficking, especially among individuals
intending to migrate (IOM, 2009). This will go a long way in deterring most persons
migrating illegally especially through the Desert and Mediterranean Sea.
Need for a strong institutional and all encompassing legal framework that will
identify, prosecute and punish human traffickers justly in the country.
Accurate data on various forms of human trafficking should be collected and made
available by relevant agencies of government in other to aid detail and reliable studies
for effective counter-trafficking strategies. Reliable data are also needed on
trafficking across the full range of labor sectors involved (ILO, 2008).
References
Adams, C. (2011). Re-trafficked victims: how a human rights approach can stop the cycle of
re-victimization of sex trafficking victims', Georgia Washington International Law
Review 43,220
Akinbobola, T.O & Saibu, O.O. (2004). Income inequality, unemployment, and poverty in
Nigeria: a vector autoregressive approach, The Journal of Policy Reforms, 7(3)
Akon, B. (2000). This Day News Paper, issue of 3rd August.
Alika, H. Egbochuku, O. (2009). Drop out from school among girls in Edo State:
implications for counseling. Journal of Counselling.
Arowolo, D. (2010). The effects of western civilization and culture on Africa. Asian Journal
of Social Sciences

Dutse International Journal of Social and Economics Research Vol. 1, No. 1 June 2018
61
Awogbenle, A.C. & Iwuamadi, K.C. (2010). Youth unemployment: entrepreneurship
development programme as an intervention mechanism. African Journal of
Management,4(6), 831-835.
Bell, S. (2013). Trafficked girls controlled by juju trafficked rituals.
http://www.bbc.co.uk/news/uk-14044205. [Accessed December, 2016]
Cole, J. & Booth, S. (2007). Dirty work: Immigrants in domestic service, agriculture, and
prostitution in Sicily. Lexington Books,123.
Daily Telegraph March 9, 2001.
Ellis, T. & Okpalla, J. (2011). Making sense of the relationship between trafficking in
persons, human smuggling and organized crime: The case of Nigeria. Police Journal
84(14).
Global Alliance Against Traffic in Women (2001). Human rights standards for the treatment
of trafficked persons, Third edition.
Ikein, A., Alamieyeseigha, D. & Azaiki, S. (2008). Oil, democracy, and the promise of true
federalism in Nigeria,University Press of America, 425.
International Criminal Police Organization, Nigerian Division, 25th August 2000.
Institute for Human Rights and Business, (2012). Dhaka principles for migration with
dignity. London.
International Organization for Migration, (2009).Working to prevent and address violence
against women migrant workers. Geneva.
International Organization for Migration, (2008). Human trafficking: new directions for
research. Geneva.
International Labour Organization, (2011). Convention concerning decent work for domestic
workers. C189-Domestic Workers Convention, 2011 (189). Geneva.
Kara, S. (2009). Sex trafficking: inside the business of modern slavery, Columbia University
Press, 90&91.
National Bureau of Statistics (2012). Statistical Bulletin and Reports.
National Bureau of Statistics (2013). Statistical Bulletin and Reports.
Nigeria Immigration Service (2016). Yearly Report.
National Agency for Prohibition of Traffic in Persons and Other Related Matters (2016).
Annual Report.
Odigie, D. & Patience, C (2008). Human trafficking trends in Nigeria and strategies for
combating the crime. Peace Studies Journal,68.
Okojie, C., Okojie, O., Eghafona, K., Vincent-Osaghae, G. & Kalu, V. (2003). Trafficking of
Nigerian girls to Italy. Report of field survey in Edo State, Nigeria
Okafor, E.E, (2011). Youth unemployment and implications for stability of democracy in
Nigeria. Journal of Sustainable Development in Africa 13(1), ISSN: 1520-5509
Clarion University of Pennsylvania, Clarion, Pennsylvania.
Patterson, K. (2003). Sex trafficking from Thailand to Japan: human beings or Illegal goods.
Dalhousie Journal of Legal Studies 12,183.
United Nations Office on Drugs and Crime, (2016). Global report on trafficking in persons,
New York
United Nations (2000). Protocol to prevent, suppress and punish trafficking in persons,
especially women and children, supplementing the United Nations convention against
transnational organized crime. General Assembly resolution 55/25. New York, NY.
UNICEF Report on Nigeria (2001). The Situation Assessment and Analysis Report,
234-245.
Vergara, V. (2007). Looking beneath the surface: Illinois response to human trafficking and
modern-day slavery. University of Toledo Law Review 38, 992.

Dutse International Journal of Social and Economics Research Vol. 1, No. 1 June 2018
62
Yen, I. (2008). Of vice and men: a new approach to eradicating sex trafficking by reducing
male demand through educational programs and abolitionist legislation, Journal of
criminal law and criminology, 656.
Zimmerman C. (2006). Stolen smiles: a summary report on the physical and psychological
health consequences of women and adolescents trafficked in Europe. London School
of Hygiene and Tropical Medicine.
Dutse International Journal of Social and Economics Research Vol. 1, No. 1 June 2018
63
An Examination of the Export –
Economic Growth Nexus in Cameroon:
An Empirical Analysis
*Dobdinga C. Fonchamnyo1, Afuge A. Ramsy
2 and Metuge W. Epie
3
1Department of Economics, Faculty of Economics and Management Sciences,
University of Bamenda, P.O. Box 39, Bambili, NW Region, 23
Department of Economics, Faculty of Social and Management Sciences,
University of Buea,
P.O. Box 63, Buea, S.W. Region, Cameroon.
*Corresponding Author‘s Email: [email protected]
Abstract: The paper aimed at testing for the direction of causality and co-integration
between exports and economic growth in Cameroon. Time series data mobilized from the
World Bank, World Development Indicators for the period 1980 to 2016 was used. The
techniques of analyses employed were; the Johansen Co-integration, Augmented Dickey-
Fuller, Granger causality Wald tests and Vector Error Correction Model (VECM). The
findings revealed that there exist a long-run relationship between exports and economic
growth and also that there exist a bi-directional causation between exports and growth. Thus,
both the Export-Led Growth (ELG) and Growth-Led Export (GLE) hypotheses are validated
in Cameroon. The paper therefore recommends that in implementing growth enhancing
policies, its implications on the export sector must be taken into consideration and also that
there is need for verification of the growth implications of export policies.
Keywords: Export, Economic Growth, Co-integration, Causality, Cameroon
JEL Classification: C32, F14, F43, O24.
1. Introduction
The discussion on the relationship between exports and economic growth has attracted many
researchers recently (Giles & Williams, 2000). According to Chen (2007) this relationship
can be grouped into four outcomes when investigating the export-growth relationship. First is
the export-led growth hypothesis, which means that export growth causes economic growth.
Export growth is typically considered one of the main determinants of an economy‘s growth
in production and employment. Empirically, it refers to unidirectional causality from exports
to gross domestic product (GDP). The second possible outcome could be referred to as the
growth-driven export hypothesis, which postulates that a rise in GDP generally leads to a
corresponding increase in exports, thereby empirically indicating unidirectional causality
from GDP to exports. The third possible outcome is a bidirectional relationship between
exports and economic growth. Finally, the fourth possible outcome is a neutral relationship
between exports and economic growth.
Theoretically, it has been argued that a change in export rates could change output.
Export growth, therefore, is often considered to be the main determinant of the production
and employment growth of an economy which is shown in Gross Domestic Product (GDP)
growth The most important and crucial aim of many countries in general is to achieve a
rapid economic growth and development and exports are generally perceived as a

Dutse International Journal of Social and Economics Research Vol. 1, No. 1 June 2018
64
motivating factor for economic growth. The desire for rapid economic growth in developing
countries is attained through more trade. Classical economists like Adam Smith and David
Ricardo have argued that international trade is the main source of economic growth and
more economic gain is attained from specialization. This argument also emerged within
the neoclassical economist due to the success of free trade and outward oriented policies of
the East Asian Tigers (World Bank, 1993).
In this perspective, the export led growth hypothesis has been given a number of theoretical
justifications. First, in Keynesian theory more exports generate more income growth through
foreign exchange multiplier in the short run. Second, export raises more foreign exchange
which is used to purchase commodities such.as machinery, electrical and transport
equipment, fuel and food which is motivating factors for the economic growth of any
nation. Third, exports indirectly promote growth via increased competition, economies of
scale, technological development, and increased capacity utilization. Fourth, many positive
externalities like more efficient management or reduction of organizational inefficiencies,
better production techniques, positive learning from foreign rivals and technical expertise,
about product design are accrued due to more exports, leading to economic growth.
On the empirical front many studies have been carried out to validate the hypotheses on the
nexus between export and economic (Kunst and Marin, 1989; Sung-Shen et al., 1990;
Bahmani-Oskooee and Alse, 1991; Ahmad and Kwan, 1991; Serletis, 1992; Khan and
Saqib,1993; Dodaro, 1993; Jin and Yu, 1995; Holman and Graves,1995; Abou-Stait, 2005;
Faridi, 2012; among others).These studies have focused on the impact of total exports on
growth. However, during the last thirty years, another group of literature affirms that
not exports per se matter for growth, but the composition of exports is also crucial
(Levin and Raut, 1997). This group of studies supports the view that success in manufactured
exports has been nearly synonymous with rapid economic growth.
The best-known examples of countries that have achieved the most rapid gains in economic
growth and income per capita have also recorded the fastest growth in manufactured exports
are the East Asian countries in which incomes grew by between four-fold (in Southeast Asia)
and seven-fold (in the four tigers) on the back of labor-intensive manufactured exports.
Several authors hypothesize that dynamic technological spillover effects are mainly
associated with manufactured exports rather than with the primary export. This is because
manufactured exports can promote high rates of investment into profitable economic
activities by fostering closer connections with international firms using leading-edge
technologies. In addition, export industries are likely to encourage economic specialization
and to provide foreign exchange to finance imports of capital goods that cannot be
produced locally. Exporters of manufactured goods are also more likely to demand high
standards of service from their suppliers and to exert pressure for improved infrastructure
provision, maintenance and management. In addition, manufactured export markets allow
labor and capital to move rapidly from low to high-productivity sectors without encountering
diminishing returns (Torayeh, 2011).
Cameroon‘s economy is predominantly agrarian and agriculture with the exploitation of
both renewable and exhaustible natural resources remaining the driving force for the
country‘s Economic growth. Cameroon‘s economy performed very well for the period
1961to1985, with agriculture supporting the economy from 1961to1977.This sector plays a
pivotal role in the economy and exerts important effects on other sectors. Before the
beginning of crude oil exports in 1978, statistics from the Ministry of Economic and Finance
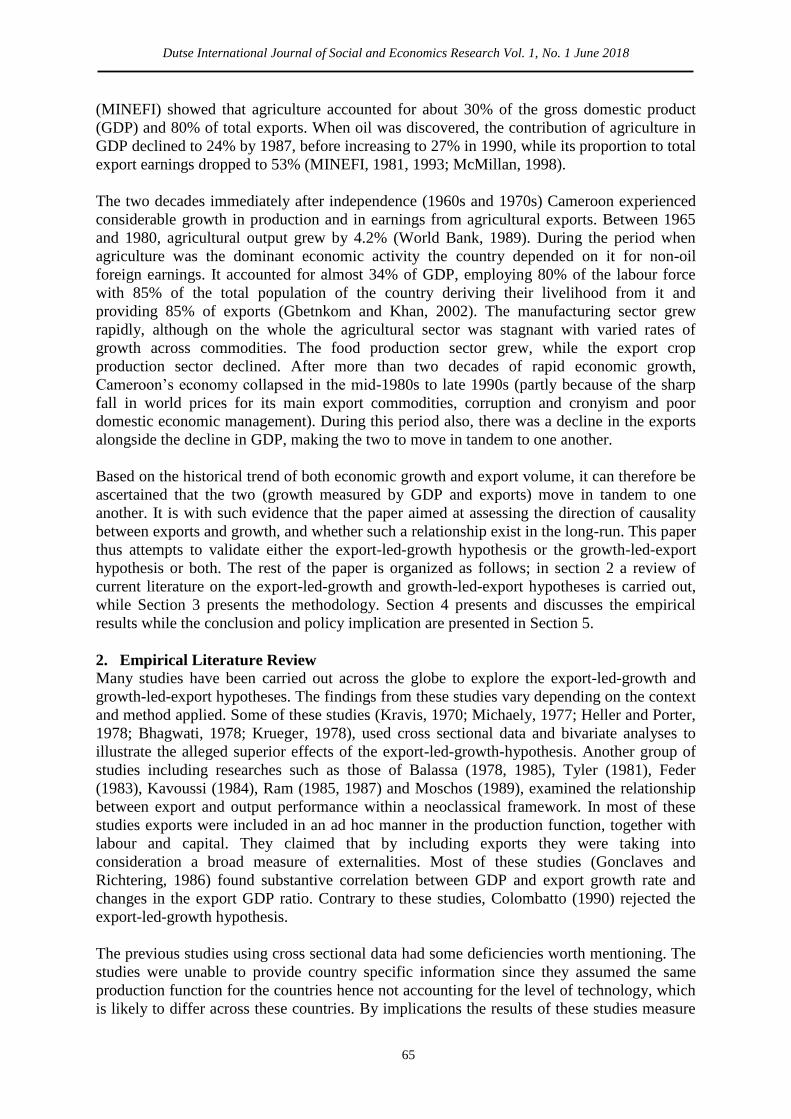
Dutse International Journal of Social and Economics Research Vol. 1, No. 1 June 2018
65
(MINEFI) showed that agriculture accounted for about 30% of the gross domestic product
(GDP) and 80% of total exports. When oil was discovered, the contribution of agriculture in
GDP declined to 24% by 1987, before increasing to 27% in 1990, while its proportion to total
export earnings dropped to 53% (MINEFI, 1981, 1993; McMillan, 1998).
The two decades immediately after independence (1960s and 1970s) Cameroon experienced
considerable growth in production and in earnings from agricultural exports. Between 1965
and 1980, agricultural output grew by 4.2% (World Bank, 1989). During the period when
agriculture was the dominant economic activity the country depended on it for non-oil
foreign earnings. It accounted for almost 34% of GDP, employing 80% of the labour force
with 85% of the total population of the country deriving their livelihood from it and
providing 85% of exports (Gbetnkom and Khan, 2002). The manufacturing sector grew
rapidly, although on the whole the agricultural sector was stagnant with varied rates of
growth across commodities. The food production sector grew, while the export crop
production sector declined. After more than two decades of rapid economic growth,
Cameroon‘s economy collapsed in the mid-1980s to late 1990s (partly because of the sharp
fall in world prices for its main export commodities, corruption and cronyism and poor
domestic economic management). During this period also, there was a decline in the exports
alongside the decline in GDP, making the two to move in tandem to one another.
Based on the historical trend of both economic growth and export volume, it can therefore be
ascertained that the two (growth measured by GDP and exports) move in tandem to one
another. It is with such evidence that the paper aimed at assessing the direction of causality
between exports and growth, and whether such a relationship exist in the long-run. This paper
thus attempts to validate either the export-led-growth hypothesis or the growth-led-export
hypothesis or both. The rest of the paper is organized as follows; in section 2 a review of
current literature on the export-led-growth and growth-led-export hypotheses is carried out,
while Section 3 presents the methodology. Section 4 presents and discusses the empirical
results while the conclusion and policy implication are presented in Section 5.
2. Empirical Literature Review
Many studies have been carried out across the globe to explore the export-led-growth and
growth-led-export hypotheses. The findings from these studies vary depending on the context
and method applied. Some of these studies (Kravis, 1970; Michaely, 1977; Heller and Porter,
1978; Bhagwati, 1978; Krueger, 1978), used cross sectional data and bivariate analyses to
illustrate the alleged superior effects of the export-led-growth-hypothesis. Another group of
studies including researches such as those of Balassa (1978, 1985), Tyler (1981), Feder
(1983), Kavoussi (1984), Ram (1985, 1987) and Moschos (1989), examined the relationship
between export and output performance within a neoclassical framework. In most of these
studies exports were included in an ad hoc manner in the production function, together with
labour and capital. They claimed that by including exports they were taking into
consideration a broad measure of externalities. Most of these studies (Gonclaves and
Richtering, 1986) found substantive correlation between GDP and export growth rate and
changes in the export GDP ratio. Contrary to these studies, Colombatto (1990) rejected the
export-led-growth hypothesis.
The previous studies using cross sectional data had some deficiencies worth mentioning. The
studies were unable to provide country specific information since they assumed the same
production function for the countries hence not accounting for the level of technology, which
is likely to differ across these countries. By implications the results of these studies measure

Dutse International Journal of Social and Economics Research Vol. 1, No. 1 June 2018
66
averages which cannot be peculiar to a particular country. In addition some of the studies
(such as Balassa, 1978; Bhagwati, 1978; Krueger, 1978 and Chow, 1989) used a same of less
than 12 countries in their analyses making it difficult to generalise the results. Studies using
two or more countries are limited to Developed Countries, mostly middle income countries at
the detriment of low-income countries and major oil exporters (Feder, 1983; Kavoussi, 1984).
Another strand of empirical literature examines the export and growth relationship by
examining the causality between these variables. These studies investigate the presence of
common trend in the long run for export and growth (Chow, 1989; Sephton, 1989). The
studies used time series data and employ techniques such as co-integration, granger causality,
VAR and VECM. A majority of these studies obtained results indicating that a long run
relationship existed between export and growth, while others rejected the hypothesis that
export cause growth in the long run. In fact, in most studies the results suggest that this arises
owing to a simple short-term relationship, a feature that is not surprising since many of these
studies focused on industrialized nations (Kugler, 1991). In an attempt to resolve some of the
weaknesses of previous studies Al-Yousif (1997) examined this relationship between export
and growth in four Arab Gulf countries namely; Saudi Arabia, Kuwait, the United Arab
Emirates and Oman, which are all members of OPEC. The result obtained showed the
absence of a long run relationship between exports and economic growth.
Other studies using time series data have been conducted in Latin American Countries
(LACs) using modern econometric techniques, and an augmented neoclassical production
function as a theoretical framework. Van den Berg and Schmidt (1994) found a long run co-
integration in 11 of the 16 LACs analysed. Although the results endorsed the export-led
hypothesis in general, Rodrik (1999) argued the results deviate from those recently reported
by the empirical literature A possible justification of the positive results obtained in the
investigation conducted by Van den Berg and Schmidt (1994) is that these researchers
employed population and investment as proxies for the appropriate aggregate inputs, i.e.
labour force and capital stock. Although they have been widely used in many cross-sectional
growth studies as well as time series analysis (see e.g. Al-Yousif, 1997), many researchers
have had serious doubts about them and thus expressed their suspicion regarding studies that
tested the export promotion hypothesis by using the investment-output ratio as opposed to
capital stock or population instead of labour force.
Some studies have focused on the effect of primary commodity and manufactured exports on
economic growth (Levin and Raut, 1997; Dawson, 2005; Sanjuan-Lopez and Dawson, 2010).
The exports of primary commodity included both agricultural products and others that are
metals and oil products. The results of some of these studies (Levin and Raut, 1997)
concluded that there was a bi – directional causality between export growth and economic
growth in all the developing countries included in the analysis except for Malaysia. The
results therefore showed strong evidence for causality in the developing countries used in the
study. Although, the study failed to show the contribution made by each agricultural product
exported for the different countries on economic growth, the results suggested that the poor
countries could attain high economic growth by promoting the agricultural exports.
Recently many studies (Rubina, 2001; Aurangzeb, 2006; Shirazi and Abdul Manap, 2005;
Tuck, 2006; Muhammed, 2010; Billah Dar et al., 2013; Bilas et al., 2015 and Gokmenoglu et
al., 2015) have also re-examined the linkage between export and growth. The results of these
studies are mixed. For instance, Aurangzeb (2006) showed that the export sector had a
significantly higher social marginal productivities leading to the conclusion that an export

Dutse International Journal of Social and Economics Research Vol. 1, No. 1 June 2018
67
oriented and outward looking approach was needed for high rates of economic growth in
Pakistan. Shirazi and Abdul Manap (2005) investigated the causality between export
expansion and economic growth in five South Asian countries using co-integration and
multivariate granger causality tests. They found mixed evidence supporting the ELG
hypothesis. In a similar study, Tuck (2006) investigated the causality between export
expansion and economic growth in China by adding the imports variable in a tri-variate
framework. The study found no long- and short-run causality, at least in the Granger's sense,
between export expansion and economic growth in China, but economic growth does
Granger-cause imports in the short run.
Billah Dar et al. (2013) reinvestigated the relationship between export and GDP using the
methodology of wavelets based correlation and cross correlation. Their results showed that
the relationship between export growth and output growth is not only positive in India but
that the relationship grows stronger as time horizons increases. Their results further showed
evidence of a bi-directional relationship at higher time scales. In a similar study, Bilas et al.
(2015) using the case of Croatia confirmed unidirectional granger causality from export to
GDP, while Gokmenoglu et al. (2015) obtained a unidirectional causality from economic
growth to export in the case of Costa Rico.
In a study on Cameroon, Gilbert et al. (2013) were interested in investigating whether
agricultural exports have a significant effect on economic growth in Cameroon from 1976 to
2009 using a generalized augmented neo-classical Cobb Douglas production function. They
applied the Augmented Dickey-Fuller unit root test to investigate the presence of stationarity
in the variables while the Engle and Granger co-integration analysis was used to determine
the long and short run relationships. The ARCH test and the Breusch-Godfrey serial
correlation LM test were equally used to test for model stability. Their results indicated that
the variables of agricultural export had a mix effect on domestic growth. Precisely, the results
showed that coffee and banana exports exerted a positive and significant effect on economic
growth while cocoa export showed a negative and insignificant effect on economic growth.
3. Methodology
Early literature on ELG have made use of simple regression by means of the OLS
regressions, where the establishment of the ELG hypothesis could either be verified as true or
nullified. Findings associated with such methodologies did not however, provide the direction
of the causality, which guides establish whether it is export-led-growth or growth-led-export.
In this study, the usage of dynamic time series data on export and GDP mobilized from the
World Bank World Development Indicators covering the period from 1980 to 2016 has been
employed to verify both the direction of causality and the magnitude of the effects of the two
variables on each other.
This paper uses the Johansen Cointegration procedure in a bivariate context, which provides
us with a very elegant way to ensure for stationarity. This constitutes a major pre-condition if
causality test is to be applied. The Granger (1969) causality test provides us with an
opportunity to check if by including past values of the variable X, it is possible to predict
better the present values of Y. If this occurs then it can be stated that X Granger-cause Y, or
if the opposite is true, then it implies that Y Granger-cause X. However, if both propositions
are true; then this signifies that a feedback effect occurs.

Dutse International Journal of Social and Economics Research Vol. 1, No. 1 June 2018
68
For an effective assessment of the nature of causality, it is imperative to verify the nature of
the stationarity and co-integration of the variables. The stationarity analysis is conducted
following the Augmented Dickey-Fuller (ADF) and Philip Perron test, while the co-
integration of the relationship is assessed using the Johansen Co-integration procedure. The
Vector Autoregression (VAR) model in first difference was utilized to perform the standard
Granger Causality test for export-led growth and growth-led export hypothesis implied in the
paper. The general form of the VAR model is specified as follows:
1 1 1 11 1
P P
t i t i i t i ti i
LGDP LGDP LEXP
(1)
2 2 2 21 1
P P
t i t i i t i ti i
LEXP LGDP LEXP
(2)
In addition to the Granger causality analyses, the Johansen Co-integration and Vector Error
Correction Model (VECM) were conducted to verify the existence of long run relationship
and the order of integration. The VECM is specified as;
1 1 1 1 1 11 1
P P
t i t i i t i t ti i
LGDP LGDP LEXP ECT
(3)
2 2 2 2 1 21 1
P P
t i t i i t i t ti i
LEXP LGDP LEXP ECT
(4)
Where LEXP represents the natural logarithm of exports, LGDP represents the natural
logarithm real Gross Domestic Product (GDP) used as a proxy for growth; 1t and
2t are
residuals in period t, which follows a normal distribution; and are the short run elasticity
coefficients; 1,2,3...,i P is the lag order; ECT is the Error Correction Termderived from
the long run relationship,.
The suitability of the above parameters are tested on the basis of three criteria namely; the
economic or a priori criteria, the statistical or first order test and the econometric or second
order test. The economic or a priori test is concerned with the magnitude (size) and direction
(sign) of the estimated parameters. Through this criterion, economic theories on the variables
and their relationship are made to confirm to the expected signs and sizes of the parameters in
question with respect to a priori expectation. The statistical criteria or test involves the use of
statistical tools of analyses to confirm the statistical significance and the explanatory power
of the parameters and estimates gotten, while econometric test includes; test for stationary of
variables, lag selection test, normality test, Lagrange-Multiplier Test and co-integration test.
The Lagrange-Multiplier is implemented to test for autocorrelation whereas the Johansen
Test is used to investigate the presence of co-integration making use of the Trace statistic and
the Maximum Eigen value criteria.
The above framework presented guided in the assessment of the following hypotheses:
Growth-led Export (GLE) Hypothesis (Growth Equation)
- H0: Growth does not granger cause exports
- H1: Growth granger causes exports.
-
Export-led Growth (ELG) Hypothesis (Export Equation)
- H0: Exports do not granger cause Growth
- H1: Exports granger cause Growth
Alternatively, to verify the possibility of bidirectional causality, we assert that:
- H0: There is no causality between exports and growth
- H1: There exist a bi-causality between exports and growth

Dutse International Journal of Social and Economics Research Vol. 1, No. 1 June 2018
69
4. Presentation and Discussion of Results
The results begin with an assessment of the stationarity condition of the variables used in the
estimation. This is because testing for causality and cointegration between GDP growth and
exports warrants that the variables be integrated of the same order. The results of this test
using the Philips Perron and Augmented Dickey-Fuller test are presented below.
Table 1: Unit Root Test Results
Philips Perron Unit Root Test Implied Order of integration
Levels First Difference
Variable Test Statistic P-value Test Statistic P-value
LGDP -0.993 0.7559 -5.195 0.0000 I(1)
LEXP -0.652 0.8587 -6.397 0.0000 I(1)
Augmented Dickey Fuller Unit Root Test
LGDP -0.953 0.7701 -5.203 0.0000 I(1)
LEXP -0.756 0.8316 -6.378 0.0000 I(1)
Source: Computed by Authors Using Stata 13.1
The results showed that the variables are all found to be non-stationary at levels using a 5%
level of significance. However, the variables turn to be stationary after the first difference at
1% level of significance using both the Philips Perron and Augmented Dickey Fuller unit root
test. Hence, the variables are denoted as I(1) meaning they are stationary after first difference
and thus the existence of a long run relationship among the variables can be verified.
In order to estimate the co-integrating vectors, it is essential to select an optimal lag length
that will give white noise residuals. The lag length has significant influence on the outcome
of the results. A trade-off exists when too many lags or too few lags are used. Using too many
lags can make the model less parsimonious, thereby reducing the degrees of freedom.
However, using very few lags can lead to correlation of the residuals. The work of
information criteria is to compromise between the numbers of parameters and lag length by
minimizing the linear combination of the residual sum of squares and the number of
parameters (Johansen, 1995). The optimal lag length in the VAR and VECM model was
tested through five lag selection criteria namely, Akaike Information Criteria (AIC), Schwarz
Bayesian Information Criteria (SBIC), Likelihood Ratio Tests (LR), Final Prediction Error
(FPE) and Hannan-Quinn Information Criteria (HQIC). The result of optimal lag selection is
presented below;
Table 2: Lag Length Select Test Results
Lag LL LR df p FPE AIC HQIC SBIC
0 15.2989 0.00128 -.985105 -.956563 -0.889117
1 63.7142 96.831 4 0.000 0.00005 -4.27513 -4.1895 -3.98716
2 72.7033 17.978 4 0.001 0.00003* -4.64469* -4.50198* -4.16475*
3 74.0017 2.5967 4 0.627 0.00004 -4.44457 -4.24477 -3.77265
4 77.2443 6.4851 4 0.166 0.00005 -4.38846 -4.13158 -3.52457
5 77.4923 0.49609 4 0.974 0.00006 -4.11054 -3.79658 -3.05467
6 80.2919 5.5992 4 0.231 0.00007 -4.02162 -3.65057 -2.77378
7 87.3357 14.088 4 0.007 0.00007 -4.24709 -3.81895 -2.80727
8 87.7522 0.83315 4 0.934 0.00012 -3.98165 -3.49643 -2.34985
Endogenous: LGDP LEXP
Exogenous: LGDP LEXP
Source: Computed by Authors Using Stata 13.1
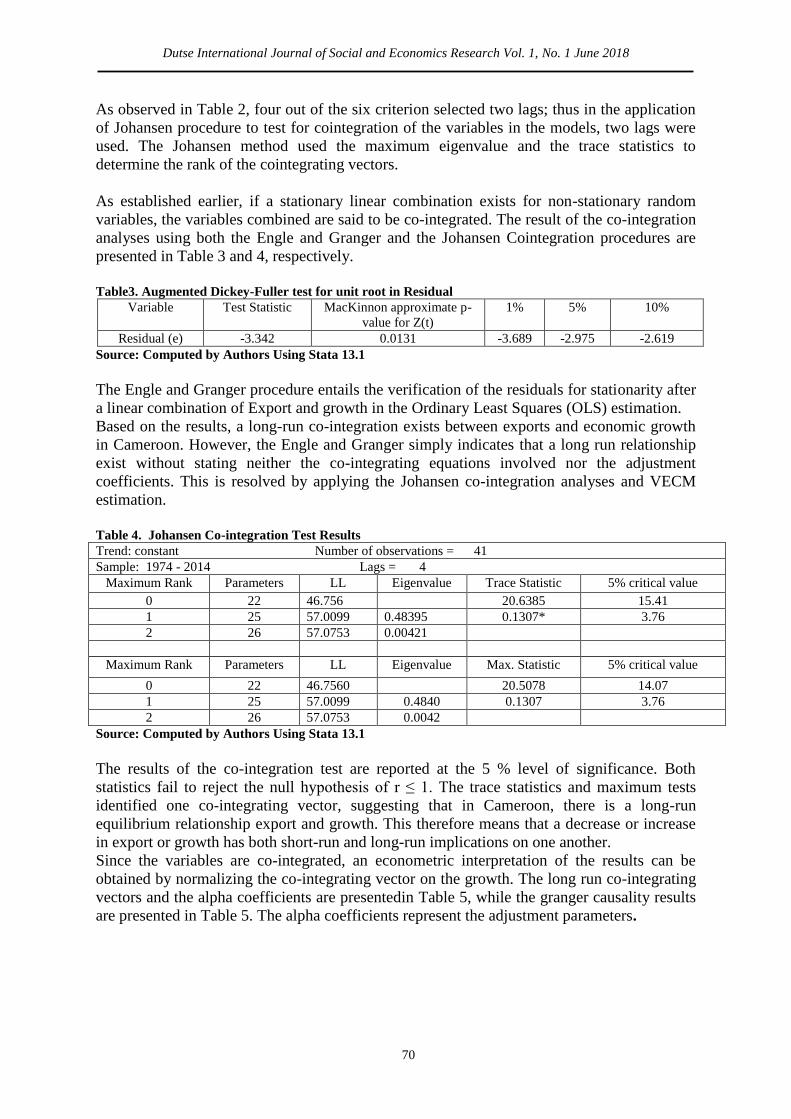
Dutse International Journal of Social and Economics Research Vol. 1, No. 1 June 2018
70
As observed in Table 2, four out of the six criterion selected two lags; thus in the application
of Johansen procedure to test for cointegration of the variables in the models, two lags were
used. The Johansen method used the maximum eigenvalue and the trace statistics to
determine the rank of the cointegrating vectors.
As established earlier, if a stationary linear combination exists for non-stationary random
variables, the variables combined are said to be co-integrated. The result of the co-integration
analyses using both the Engle and Granger and the Johansen Cointegration procedures are
presented in Table 3 and 4, respectively.
Table3. Augmented Dickey-Fuller test for unit root in Residual
Variable Test Statistic MacKinnon approximate p-
value for Z(t)
1% 5% 10%
Residual (e) -3.342 0.0131 -3.689 -2.975 -2.619
Source: Computed by Authors Using Stata 13.1
The Engle and Granger procedure entails the verification of the residuals for stationarity after
a linear combination of Export and growth in the Ordinary Least Squares (OLS) estimation.
Based on the results, a long-run co-integration exists between exports and economic growth
in Cameroon. However, the Engle and Granger simply indicates that a long run relationship
exist without stating neither the co-integrating equations involved nor the adjustment
coefficients. This is resolved by applying the Johansen co-integration analyses and VECM
estimation.
Table 4. Johansen Co-integration Test Results
Trend: constant Number of observations = 41
Sample: 1974 - 2014 Lags = 4
Maximum Rank Parameters LL Eigenvalue Trace Statistic 5% critical value
0 22 46.756 20.6385 15.41
1 25 57.0099 0.48395 0.1307* 3.76
2 26 57.0753 0.00421
Maximum Rank Parameters LL Eigenvalue Max. Statistic 5% critical value
0 22 46.7560 20.5078 14.07
1 25 57.0099 0.4840 0.1307 3.76
2 26 57.0753 0.0042
Source: Computed by Authors Using Stata 13.1
The results of the co-integration test are reported at the 5 % level of significance. Both
statistics fail to reject the null hypothesis of r ≤ 1. The trace statistics and maximum tests
identified one co-integrating vector, suggesting that in Cameroon, there is a long-run
equilibrium relationship export and growth. This therefore means that a decrease or increase
in export or growth has both short-run and long-run implications on one another.
Since the variables are co-integrated, an econometric interpretation of the results can be
obtained by normalizing the co-integrating vector on the growth. The long run co-integrating
vectors and the alpha coefficients are presentedin Table 5, while the granger causality results
are presented in Table 5. The alpha coefficients represent the adjustment parameters.

Dutse International Journal of Social and Economics Research Vol. 1, No. 1 June 2018
71
Table 5.Long Run Equilibrium Relationship
Variable Coefficient Standard Error Z P>|z|
Standardized β eigenvectors
LGDP 1 . . .
LEXP -0.7998 0.1043 -7.67 0.0000
CONSTANT 0.4449 . . .
Standardized Alpha ( ) Adjustment parameters
LGDP -0.0620 0.01584 -3.92 0.0000
LEXP -0.2701 0.05864 -4.61 0.0000
Source: Computed by Authors Using Stata 13.1
The result of the normalization yields an estimate of the long-run elasticities. The co-
integrating vector was normalized with respect to the trade balance in order to give economic
meanings to the estimated vectors. The coefficient of export has a positive sign and is
statistically significant at 1% level of significance suggesting export will stimulate the
volume of GDP and growth will improve in the long-run. The long run elasticity is 0.7998
between export and GDP. This is
Having established the long-run relationship between export and GDP, the Vector Error
Correction Model (VECM) was estimated. From the results one error correction term was
constructed and included in the estimation of the VECM, as shown in the equations below;
1 1 1(0.4124) (0.1224) (0.0773) (0.0158)
0.0531 0.3075 0.2993 0.062t t t tGDP GDP EXP ECT
1 1 1(1.5265) (0.4530) (0.2860) (0.0586)
0.1222 1.5197 0.6746 0.2701t t t tEXP GDP EXP ECT
NB: Coefficients in brackets are the standard errors
The coefficient of the ECT is negative for both the growth and the export equations. From the
growth equations the coefficient is -0.0.62 which shows that the actual value of growth at
time t-1is below its long run equilibrium. This implies therefore that if there is any shock that
causes any short run macroeconomic disequilibrium in growth performance, there is the
tendency for equilibrium to be restored in the long run. Quantitatively, if there is any
macroeconomic disequilibrium affecting growth performance in the short run, it will
automatically be self-corrected about 6.2% per year in the long run. Therefore, growth adjust
itself foreword to restore equilibrium in the next period.
From the export equation the coefficient of ECT is -0.2701 which shows that the actual value
of exports at time t-1is below its long run equilibrium. This implies therefore that if there is
any shock that causes any short run macroeconomic disequilibrium in the performance of
export, there is the tendency for equilibrium to be restored in the long run. Quantitatively, if
there is any macroeconomic disequilibrium affecting growth performance in the short run, it
will automatically be self-corrected at about 27.01% per year in the long run.
In order to assert the existence and thus the direction of causality between exports and growth
in Cameroon, the Granger causality Wald tests was employed. The result of the Granger
causality is presented in the table below.
Table 6: Granger causality Wald tests Results
Equation Excluded Chi2 Degree of freedom Probability > Chi
2
LGDP LEXP 4.936 2 0.085
LGDP ALL 4.936 2 0.085
LEXP LGDP 9.851 2 0.007
LEXP ALL 9.851 2 0.007
Source: Computed by Authors Using Stata 13.1

Dutse International Journal of Social and Economics Research Vol. 1, No. 1 June 2018
72
Based on the results, the significance level of the Probability> Chi2 both for the growth
(LGDP) and the export (LEXP) equations is in testimony of the fact that growth granger
causes export and exports granger cause growth. Thus, we establish a bi-causality or
feedback effect between exports and growth in the Cameroonian context. Thus, we reject the
null hypothesis for both ELG and GLE hypothesis and conclude that as much as growth
granger causes exports, so too do exports granger cause growth, implying the existence of bi-
causality between export growth and economic growth in Cameroon.
Other tests results to check for the stability and reliability of the results are presented in the
Appendix. The tests include the Eigenvalue stability condition (Figure A3), langrage
multiplier test for autocorrelation (Table A1) and Jarque Berra Normality test (Table A2).
The results all showed that there is no autocorrelation and that the variables individually and
jointly are normally distributed. The eigenvalue stability condition reported shows that the
coefficients of the variables of the model are stable since the imaginary effects lies within the
modulus of the companion matrix. This means that if we increase the period of the study, the
coefficients of the variables will not change significantly over time.
The findings of this study showed that both a short-run and long relationship exists between
export and economic growth. The results are consistent with previous studies such as Al-
Assaf and Al-Abdulrazag (2015), Billah et al. (2013), Bilas et al. (2015) and Gokmenoglu et
al. (2015). It however, contrast with the findings of Tuck (2006) who found no long-run and
short-run causality, at least in the Granger's sense, between export expansion and economic
growth in China. In addition, the findings support a bidirectional relationship exists between
export and growth, that is, both the Export-Led-Growth (ELG) and the Growth-Led-Export
(GLE) hypotheses are confirmed. This finding is consistent with the findings of Billah et al.
(2013) who obtained results for India indicating the presence of a long run cointegration and
validated the bidirectional hypotheses of ELG and GLE. Ekanayake (1999) used
cointegration and error-correction to show that a bidirectional relation exist between export
growth and economic growth in eight Asian developing countries for the 1960–1997 period.
A similar result of bidirectional relational has been obtained Biswal and Dhawan (1998)
while studying the relationship between export and growth in Taiwan.
5. Conclusion and Policy Recommendations
This study aimed at examining the nexus existing between export and economic growth in the
short and long run. In this respect a co-integration analysis was conducted using a two stage
Engle and Granger and Johansen Co-integration procedures. In addition, the granger causality
and Vector Error Correction techniques were employed. The findings showed that both a
short and long run relationship exist between export and economic growth. The results further
showed that both the Growth-Led-Export hypothesis and Export-Led-Growth hypothesis are
validated for Cameroon. Thus, there is bi-causation between exports and economic growth in
the case of Cameroon‘s economy in conformity with the situation of many other countries.
In the light of this, it is recommend that when implementing growth enhancing policies, it
effects and implications on the export sector must be taken into consideration. In addition, the
growth implications of export policies should also be taken into account when designing
export promotion policies.

Dutse International Journal of Social and Economics Research Vol. 1, No. 1 June 2018
73
References
Abou-Stait, F. (2005). Are Exports the Engine of Economic Growth? An Application of
Cointegration and Causality Analysis for Egypt, 1977-2003. Economic Research
Working Paper Series, No. 76. African Development Bank, Tunisia.
Ahmad, J. and Kwan, A. C. (1991). Causality Between Exports and Economic Growth.
Economics Letters, Vol. 37: 243-248.
Al-Assaf, G. and Al-Abdulrazag, B. (2015). The Validity of Export-Led Growth Hypothesis
for Jordan: A Bounds Testing Approach. International Journal of Economics and
Financial Issues, Vol. 5, No. 1, 199-211
Al-Yousif, Y. K. (1997). Exports and economic growth: Some empirical evidence from the
Arab Gulf countries. Applied Economics, 29, 6: 693-97.
Aurangzeb, A. (2006). Exports, Productivity and Economic Growth in Pakistan: a Time
Series Analysis. The Lahore Journal of Economics, Vol. 11(1), 1-18.
Bahmani-Oskooee, M. and Alse, J. (1993): Export Growth and Economic Growth: An
Application of Cointegration and Error-Correction Modelling. Journal of Developing
Areas. Vol. 27, No. 4: 535-542.
Balassa, B. (1978). Exports and Economic Growth: Further Evidence. Journal of
Development Economics, Vol. 5, 2: 181-89.
Balassa, B. (1985). Exports, Policy Choices and Economic Growth in Developing Countries
After the 1973 Oil Shock. Journal of Development Economics, Vol. 4, 1: 23-35.
Bhagwati, J. (1978). Anatomy and Consequences of Exchange Control Regimes:
Liberalization Attempts and Consequences. Cambridge, MA: Ballinger.
Bilas, V., Bošnjak, M. and Franc, S. (2015). Examining the Export-led Growth Hypothesis:
The Case of Croatia. NAŠE GOSPODARSTVO / OUR ECONOMY, Vol. 61, No. 3.
Billah Dar, A., Bhanja, N., Samantaraya, A. and Tiwari, A. (2013). Export Led Growth or
Growth Led Export Hypothesis in India: Evidence Based on Time-Frequency
Approach. Asian Economic and Financial Review, 3(7): 869-880
Biswal, B., and Dhawan, U. (1998). Export-led Growth Hypothesis: Cointegration and
Causality Analysis for Taiwan. Applied Economics Letters, Vol. 5: 699–701.
Chen, S. W. (2007). Exactly What is the Link Between Export and Growth in Taiwan? New
Evidence from the Granger Causality Test. Economics Bulletin, 6(7), 1–10.
Chow, P. C. Y. (1989). Causality Between Export Growth and Industrial Development:
Empirical evidence from the NICs - Reply, Journal of Development Economics, Vol.
31, 2: 413-15.
Colombatto, E. (1990). An analysis of exports and growth, Kyklos, Vol. 43, 4: 579-97.
Dawson, P. J. (2005), Agricultural Exports and Economic Growth in Less Developed
Countries. Agricultural Economics, No.33, pp. 145 - 152.
Dodaro, S. (1993). Exports and Growth a Reconsideration of Causality. The Journal of
Developing Areas, 27: 227-44.
Ekanayake, E., (1999). Exports and Economic Growth in Asian Developing Countries:
Cointegration and Error Correction Models. Journal of Economic Development,
24(2): 43-56.
Faridi, M.(2012). Contribution of Agricultural Exports to Economic Growth in Pakistan.
Pakistan Journal of Commerce & Social Sciences, No. 6(1): 133-146
Feder, G. (1983). On Exports and Economic Growth. Journal of Development Economics,
Vol. 12, 2: 59-73.
Heller, P. S. and Porter, R. C. (1978). Exports and Growth: An Empirical Re-investigation,
Journal of Development Economics, Vol. 5, 2: 191-93.
Holman, J. A. and Graves, P.E. (1995), Korean Exports Economic Growth: An Econometric
Reassessment. Journal of Economic Development, Vol. 20, No. 2, 45-56.

Dutse International Journal of Social and Economics Research Vol. 1, No. 1 June 2018
74
Kavoussi, R. M. (1984). Export Expansion and Economic Growth: Further Empirical
Evidence. Journal of Development Economics, 14, 1/2: 241-50.
Krueger, A. O. (1978). Foreign Trade Regimes and Economic Development: Liberalization
Attempts and Consequences. Cambridge, MA: Ballinger.
Kravis, I. B. (1970). Trade as a Handmaiden of Growth: Similarities Between the Nineteenth
and Twentieth Centuries. Economic Journal, 80, 320: 850-72.
Gbetnkom, D. and Khan, Sunday A. (2002). Determinants of Agricultural Exports: The Case
of Cameroon AERC research paper, Vol. 120
Gilbert, N., S. Linyong and Divine, G. (2013). Impact of Agricultural Exports on Economic
Growth in Cameroon: Case of Banana, Coffee and Cocoa. International Journal of
Business and Management Review, 1(1): 44-71.
Giles,A. J. and Williams, C.L. (2000).Export-led Growth: a Survey of the Empirical
Literature and Some Non-causality Results, Part 1. Journal of International Trade
and Economic Development, 9(3), 261-337.
Gokmenoglu, Korhan K., Sehnaz, Zehra and Taspinar, Nigar (2015). The Export-Led
Growth: A Case Study of Costa Rica. Procedia Economics and Finance, 25, 471 –
477
Jin, J.C., and E.S.U. Yu (1995). The Causal Relationship Between Exports and Income,
Journal of Economic Development, Vol. 20, No. 1, 131-140.
Johnston, B. F. and Mellor, J. W. (1961). The Role of Agriculture in Economic Development.
American Economic Review, 51: 566 - 593.
Khan, A. H. and N. Saqib (1993). Exports and Economic Growth: The Pakistan Experience.
International Economic Journal, Vol. 7, No. 3: 53-64.
Kugler, P. (1991). Growth, exports and Cointegration: An Empirical Investigation,
Weltwirtschaffliches Archiv, 127, 1: 73-82.
Kunst, R.M., and D. Marin (1989), On Exports and Productivity: A Causal Analysis. Review
of Economics and Statistics, Vol. 71: 699-703.
Levin, A. and Raut, L.K. (1997). Complementarities Between Exports and Human Capital in
Economic Growth: Evidence from the Semi-industrialized Countries. Economic
Development and Cultural Change, No. 46: 155 - 174.
McMillan, Margaret. (1998). A Dynamic Theory of Primary Export Taxation: Evidence from
Sub-Saharan Africa. Tufts University.
Michaely, M. (1977). Exports and growth: An Empirical Investigation. Journal of
Development Economics, 4, 1: 49-53.
MINEFI. (1993). Cameroon in Figures. Department of Statistics and National Accounts.
Yaounde, Cameroon
MINEFI. (1981). Cameroon in Figures. Department of Statistics and National Accounts.
Yaounde, Cameroon
Moschos, D. (1989). Export Expansion, Growth and the Level of Economic Development:
An Empirical Analysis, Journal of Development Economics, 30, 1: 93-102.
Muhammed N. Islam, (2010).Export Expansion and Economic Growth: Testing for
Cointegration and Causality. Journal of Applied Economics, Vol. 30, Issue 3: 415-425
Ram, R. (1985). Exports and Economic Growth: Some Additional Evidence. Economic
Development and Cultural Change, 33, 2: 15-25.
Ram, R. (1987). Exports and Economic Growth in Developing Countries: Evidence from
Time-Series and Cross-Section Data. Economic Development and Cultural Change,
36, 1: 51-63.
Rodrik, D. (1999). The New Global Economy and Developing Countries: Making Openness
Work. Washington D.C.: Overseas Development Council, Essay No. 24.
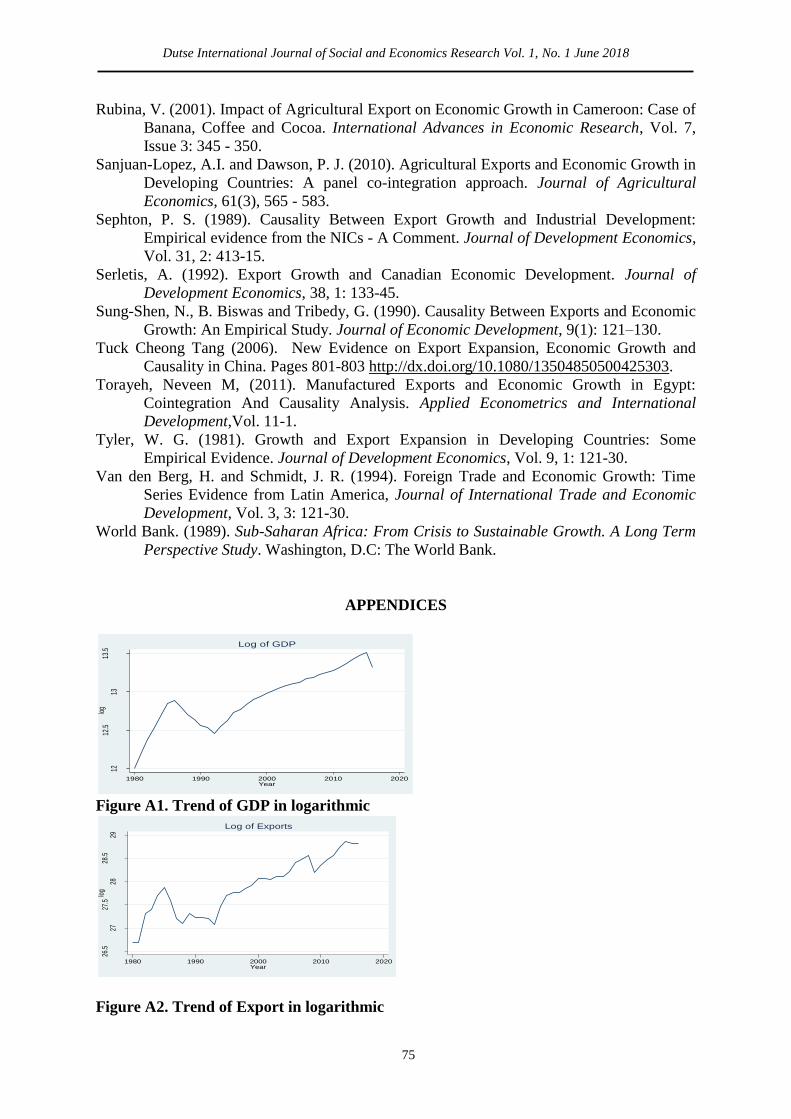
Dutse International Journal of Social and Economics Research Vol. 1, No. 1 June 2018
75
Rubina, V. (2001). Impact of Agricultural Export on Economic Growth in Cameroon: Case of
Banana, Coffee and Cocoa. International Advances in Economic Research, Vol. 7,
Issue 3: 345 - 350.
Sanjuan-Lopez, A.I. and Dawson, P. J. (2010). Agricultural Exports and Economic Growth in
Developing Countries: A panel co-integration approach. Journal of Agricultural
Economics, 61(3), 565 - 583.
Sephton, P. S. (1989). Causality Between Export Growth and Industrial Development:
Empirical evidence from the NICs - A Comment. Journal of Development Economics,
Vol. 31, 2: 413-15.
Serletis, A. (1992). Export Growth and Canadian Economic Development. Journal of
Development Economics, 38, 1: 133-45.
Sung-Shen, N., B. Biswas and Tribedy, G. (1990). Causality Between Exports and Economic
Growth: An Empirical Study. Journal of Economic Development, 9(1): 121–130.
Tuck Cheong Tang (2006). New Evidence on Export Expansion, Economic Growth and
Causality in China. Pages 801-803 http://dx.doi.org/10.1080/13504850500425303.
Torayeh, Neveen M, (2011). Manufactured Exports and Economic Growth in Egypt:
Cointegration And Causality Analysis. Applied Econometrics and International
Development,Vol. 11-1.
Tyler, W. G. (1981). Growth and Export Expansion in Developing Countries: Some
Empirical Evidence. Journal of Development Economics, Vol. 9, 1: 121-30.
Van den Berg, H. and Schmidt, J. R. (1994). Foreign Trade and Economic Growth: Time
Series Evidence from Latin America, Journal of International Trade and Economic
Development, Vol. 3, 3: 121-30.
World Bank. (1989). Sub-Saharan Africa: From Crisis to Sustainable Growth. A Long Term
Perspective Study. Washington, D.C: The World Bank.
APPENDICES
Figure A1. Trend of GDP in logarithmic
Figure A2. Trend of Export in logarithmic
1212
.513
13.5
log
1980 1990 2000 2010 2020Year
Log of GDP
26.5
2727
.528
28.5
29
log
1980 1990 2000 2010 2020Year
Log of Exports

Dutse International Journal of Social and Economics Research Vol. 1, No. 1 June 2018
76
Table A1. Lagrange-multiplier test
Lag
chi2 df Prob> chi2
1 3.4093 4 0.49181
2 0.3118 4 0.98904
H0: no autocorrelation at lag order
Computed by Authors Using Stata 13.1
Table A2. Normality Test
Jarque-Bera test
Equation chi2 df Prob> chi2
LEXP 0.664 2 0.71752
LRGDP 1.477 2 0.47788
ALL 2.141 4 0.70990
Skewness test
Equation Skewness chi2 df Prob> chi2
LEXP -0.18188 0.193 1 0.66046
LRGDP -0.48191 1.355 1 0.24446
ALL 1.548 2 0.46124
Kurtosis test
Equation Kurtosis chi2 df Prob> chi2
LEXP 3.5683 0.471 1 0.49255
LRGDP 3.2893 0.122 1 0.72679
ALL 0.593 2 0.74340
Computed by Authors Using Stata 13.1
Figure A3. Eigenvalue stability condition
-1-.
50
.51
Imag
inary
-1 -.5 0 .5 1Real
The VECM specification imposes 1 unit modulus
Roots of the companion matrix

Dutse International Journal of Social and Economics Research Vol. 1, No. 1 June 2018
77
Does Financial Integration Induce a
Higher Level of Public Debt?
Empirical Evidence from the MINT Countries
Muhammad Kabir, Salihu1 & *Abdulmalik Mohammed Yusuf
2
1Department of Economics, Lancaster University, United Kingdom
2 Department of Economics, Ahmadu Bello University, Zaria, Nigeria
*Corresponding Author‘s Email: [email protected]
Abstract: This study investigates the relevance of the Azzimonti, de Francisco & Quadrini‘s
(2012) theoretical model which suggests that as financial markets become internationally
integrated, governments chooses a higher level of public debt. The study evaluated these
predictions using a set of panel data from 1970-2011 for the MINT countries. The findings
from this study showed that indeed, there is a strong positive correlation between a change in
the index of financial integration and change in the level of real public debt, and this finding
is robust for both de jure and de facto measures of financial integration. This study also
found that financial integration has a positive impact on economic growth, while higher debt
to GDP ratio negatively affects growth. However, the study observed that financial
integration, tends to have a larger influence on growth than the debt to GDP ratio. Finally,
the study conducted a series of robustness check for the models used, and concluded that in
general, the models were robust to various specification and estimation techniques.
Keywords: Financial integration, public debt, economic growth.
JEL Codes: E62, F36, H63, O43
1.0 Introduction It is almost a decade since the last financial crisis that shook the health of the world‘s
economies. So far, one enduring lesson from the crisis accentuates the need for a more
sustainable financial integration that can enhance diversification of risks across borders.
Indeed, financial integration can positively benefit a country in several ways: first, it can
boost investment and economic growth (Michalopoulos, Laeven & Levine, 2009; Saito &
Osada, 2010; Kose, Prasad & Taylor, 2011). It may also facilitate the development of the
banking system and the efficiency of domestic equity markets (Chinn & Ito, 2005). Also,
financial integration, by providing access to global financial markets, may enhance efficient
risk sharing and smoothing of domestic consumption (Kose, Prasad & Terrones, 2007) and it
can improve the quality of market discipline and fiscal rules (Simone & Guido, 2009).
Financial integration, via its impacts on tax revenue (Genschel, 2001; Devereux, Lockwood
& Redoano, 2003) and government expenditure (Fatàs & Mihov, 2003; Liberati, 2006) can
stimulate the effectiveness of fiscal deficit policies. But with the ease of access to external
1Department of Economics, Lancaster University,U.K. [email protected]
2Department of Economics Ahmadu Bello University Zaria. [email protected]

Dutse International Journal of Social and Economics Research Vol. 1, No. 1 June 2018
78
financing, it may also spur excessive debt accumulation, particularly for countries with
fragile fiscal structures. If this is the case, the growth effects of financial integration can be
undermined in the short run (Ranciere, Tornell & Westermann, 2006). Moreover, countries
with a more integrated market economy, are more likely to be exposed to financial shocks or
crisis that may arise due to excessive credit growth and falling lending standards (Giovanni &
Marquez, 2006). This in turn have a tendency to heighten fiscal deficits, instead of reducing
it. Against this background, greater financial integration could have global systemic
consequences and strain the fiscal position of governments, when policies meant to address
the shock increases moral hazard.3 A relevant example of how financial integration could
undermine a country‘s fiscal policy choice is the sub-prime mortgage lending crisis, which
started in the U.S. before spreading to the Euro area and emerging market economies. The
crisis led to the bailout of some financial institutions that were termed as globally
systemically important and increased government contingent liabilities in terms of high debt
to GDP ratio (IMF, 2012).
The empirical evidence for the link between financial integration and fiscal policy choices,
however, remain inconclusive. For instance, whereas Kim (2003) finds that capital account
liberalization leads to fiscal tightening and hence, reduce budget deficits (the disciplinary
effects), Irina & Shang-Jin (2004) finds no strong causal effects of financial globalization on
public finance. More recently, Azzimonti, de Francisco & Quadrini (2012) developed a
theoretical political economy model in which higher level of public debt is positively related
to financial market liberalizations and inequality. Using a panel data analysis for the OECD
countries, the authors finds that empirical data supports the prediction of their model. My
research seeks to examine the relevance of the Azzimonti, de Francisco & Quadrini (2012)
theoretical model using empirical data for the MINT countries – Mexico, Indonesia, Nigeria
and Turkey.4 Although, these countries are disparate groups rather than a bloc, they share
certain common economic fundamentals such as young, growing and ambitious population;
advantageous geographical location, as well as being commodity producers (exclusive of
Turkey) 5
. Besides, based on the Chinn-Ito (2008) financial openness indicator, the levels of
capital account liberalization in these countries are similar, while data from the World Bank
development indicators revealed that the average level of debt to GDP ratio for the MINT
have been above the international threshold suggested for emerging economies (like theirs)
by the IMF. These considerations are what prompted us to ask whether financial integration
induces a higher level of public debt in the MINT countries (that is, Mexico, Indonesia,
Nigeria and Turkey).
The paper proceeds as follows. In section two, the study presents an overview of stylized
facts on the MINT countries‘ economy. Section three described the data and empirical
strategy used. Section four presented the analyses of the results, and section five presented
the conclusion and recommendations of the paper.
3 Although, empirical evidence in support of this claim is inconclusive. On the balance, panel data analysis suggests that
rapid financial integration increases the probability of financial crisis in the short run (see Kaminsky & Reinhart, 1999 and
Bonfiglioli & Mendicino, 2004). 4 The acronym MINT was coined by the famous Economist, Jim O‘Neil, who is known for coining acronyms for countries
with promising abilities to become next economic giants. 5 See: BBC news. (2014) The Mint countries: Next economic giants? 6th January. Available from:
http://www.bbc.co.uk/news/magazine-25548060 [Accessed: 04 March 2016]

Dutse International Journal of Social and Economics Research Vol. 1, No. 1 June 2018
79
2.0 An Overview of Stylized Facts on Debt to GDP Ratio and Real GDP Growth in
the Mint Countries
Data from World Bank development indicators showed that the MINT countries‘ public debt
to GDP ratio (i.e. total gross central government debt over GDP) has averaged between 16.27
and 26.48 percent in the 1970‘s and rose to between 44.04 and 80.83 percent in the 1980‘s.
However, in the 1990‘s and early 2000, the average public debt to GDP ratio for the MINT
countries hovered around 53.52 percent and 72.87 percent, respectively, but reduced to 31.53
percent in 2006 before rising to 48.14 percent in 2011 (see figure 1). Although, level of debt
intolerance threshold varies across each country, Reinhart, Rogoff & Savastano (2003),
observes that it is predominantly dependent on the history of default, level of financial
development and inflation. For instance, the IMF, in its 2011 World Economic Outlook
averred that the debt intolerance threshold for countries with highly industrial activities is 75
percent of GDP, while that of the emerging markets (like the MINT countries) is a little
above 25 percent. This means that, since the last decade, the MINT countries‘ debt to GDP
ratio has effectively been above the international threshold suggested by the IMF.
Despite these facts, the average real GDP growth for the MINT countries has oscillated
between 10.72 percent in 1970 and 4.93 percent in 1980, 2.16 percent in 1981 and 9.03
percent in 1990, 3.31 percent in 1991 and -0.85 percent in 1998. The average growth rate,
however, reached a peak of 13.11 percent in 2004, before declining to 0.51 percent in 2009
during the height of the global financial crisis. In 2010 and 2011, the growth rate averaged
7.07 percent and 5.97 percent, respectively (see figure 2). Of course, it can be easily noticed
that the higher debt to GDP ratio did not directly inhibit growth in the MINT countries. A
possible explanation for this is that financial globalization has increased significantly in the
past few years. Indeed, an analysis of the various indices of financial openness revealed that
the world financial markets have increasingly become less regulated in the last few decades.6
Consequently, important fiscal spill-over effects via international bond markets have been
reported in various studies, see, for example, Beetsma, Massimo & Klaassen (2005),
Quadrini, Mendoza & Rios-Rull (2009), and Peter, Rosina & Jordi, (2012).
3.0 Data and Empirical Strategy
This section describes the sources and definitions of the main variables used in the study; the
model specification and estimation techniques adopted.
3.1 Data Description
The sample consisted of annual observational data over the period covering 1970 – 2011, for
the MINT countries. The choice of this time period is due to the availability of data for the
index of financial liberalization variable.
To measure financial openness, we made use of two broad measures of financial integration
indices, i.e. de jure measure proxy by Chinn & Ito (2008) capital account openness indicator
and the de facto measure draw upon the work of Philip & Gian (2007).7 Fundamentally, this
study relates the change in the level of a country‘s real public debt to the change in the
financial integration indices. Other fiscal variables that were included in the data are the ratio
of public debt to GDP of a country, and the growth rate of GDP.
6 See Obstfeld & Taylor (2005) and Abiad, et al (2008)
7 The de jure measure as proposed by Chinn & Ito (2006, 2008) is an index of capital account openness based upon
disaggregated capital account restriction measures extracted from the IMF‘s Annual Report on Exchange Arrangements and
Exchange Restrictions, while the de facto measure as proposed by Philip & Gian (2007) is the share of the total stocks of
foreign assets and liabilities to GDP

Dutse International Journal of Social and Economics Research Vol. 1, No. 1 June 2018
80
Chinn & Ito (2008) capital account openness indicator is available from the database
constructed by Menzie Chinn & Hiro Ito (www.web.pdx.edu/~ito/Chinn-Ito_website.htm),
while data for de facto measure of financial integration can be sourced from the database
constructed by Philip Lane (www.philiplane.org/EWN.html). Data for fiscal variables were
sourced from World Bank databank.
3.2 Model Specification and Estimation Techniques
Since samples for the study are panel data models, we made use of the fixed effect
(regression) model structure [as in Azzimonti, de Francisco & Quadrini (2012)] because of its
ease of reducing time-invariant characteristics from the predictor variables or the threat of
omitted variable bias. The fixed effect regression equation model takes the form specified
below:
, (1)
, (2)
Where the dependent variable for the first regression equation, is a log-change in
the level of real public debt of country in period ; real debt is constructed by multiplying
country i‘s debt to GDP ratio by real GDP8. The regression coefficients include , , ,
, and , respectively, and is the residual error term, which captures the country and
year fixed effects.
A brief description of the explanatory variables used in the first regression equation is given
below:
: Country ‘s debt to GDP ratio at period . This variable captures the
relationship between the lagged stock of debt and its natural log.
: Country ‘s lag real GDP growth in period . The inclusion of this variable is
meant to elicit information on the business cycle effects of government debt. The justification
for the inclusion of this variable, is based on the Saito & Osada (2010) theoretical model
which assert that growth in a country‘s economy is capable of improving government
revenue base and decreasing automatic expenditures, and hence leads to a lower increase in
government debt in the next period.
: is a log-change in the financial integration index in period . This index is not country
specific but a weighted average of all the country indexes where weights are given by the
country‘s relative total GDP shares. The motivation for computing a weighted average of
financial integration for the four countries in the sample is to take into consideration the
capital controls imposed by other countries so as to determine the ease with which
government can sell its debt to foreign (private) investors.
: is the size times the lag change in financial integration (where size is the lagged
logarithm of real GDP) in period . The variable is to elicit the effect of size
heterogeneity on the debt issued by the financially integrated countries. Based on the
theoretical model by Azzimonti, de Francisco & Quadrini (2012), the effects of financial
liberalization are resilient for smaller countries because of their inability to influence the
world interest rate. However, given access to international financial market, government in
smaller countries have higher incentives to borrow.
8 Debt to GDP ratio as defined here is total gross central government debt over GDP
Dutse International Journal of Social and Economics Research Vol. 1, No. 1 June 2018
81
For the second regression equation, the dependent variable is , i.e. the real GDP
growth of country in period . This variable is regress on the lag change of real public debt,
, and , which is country ‘s debt to GDP ratio at period .
Thus, we estimated two fixed-effects regression equations. The first regression equation
analyses the effect of financial integration on public debt, while the second equation elicits
information on how growth is affected by debt and financial integration.
Finally, to check the robustness of the results, we estimated a generalized method of moments
(GMM) dynamic panel data model, developed by Arrellano & Bond (1991). The use of the
GMM estimator allows us to deal with potential endogeneity problems in the regressors by
generating instruments from the lags of the regressors.9
4.0 Empirical Analysis and Results
The first set of results is presented in table 1. The first column reports findings where the
explanatory variables include lag debt to GDP ratio, lag real GDP growth and lag change in
financial index, while in the second column, we added the interaction term between size and
the financial integration index. As evident in the four columns of the table, the coefficient of
financial integration index is positive and highly significant at 1 per cent level. This implied
that there is a positive correlation between a change in the index of financial integration and
change in the level of real public debt. Although, the regression does not imply causation, the
strong statistical significance level is an important indicator that a percentage change in the
index of financial integration (proxy by the de jure measure) accounts for 0.52 percent
increases in the level of real public debt (i.e. column 2). However, when the index of
financial integration was proxied by the de facto measure, a percentage change will account
for 0.48 percent increases in the level of real public debt (i.e. column 4).
The study also found that the business cycle effect (proxied by the change in GDP) was
statistically significant at 10 percent level for de jure measure, and not significant for the de
facto measure of financial integration. However, their coefficient was negative as
theoretically expected. This indicates that when the economy performs well, the revenue base
of government increases thereby leading to a less increase in the level of real public debt.
About the lagged debt to GDP ratio, the study found that the lagged stock of debt was
positively correlated with its change. This is what is expected in the short-term before it tends
to converge to negative in the long-term level.10
Finally, the coefficient of size heterogeneity was negative and statistically significant at 1 per
cent level for the de jure measure of financial integration, thereby supporting the assertion
that the effects of financial integration is stronger for countries with smaller economy relative
to the large world market which they face in a financially integrated environment. This
incentivize smaller countries to issue more debt as they tend to perceive a less sensitive world
interest rate compared to their own per-capita debt.
Table 2 reports the country fixed-effect regression result analysing the effect of real GDP
growth on the level of real debt, debt to GDP ratio and an index of financial liberalization.
9 We also conducted model specification tests using Hausman‘s specification test and a cross-validation method, to check the
robustness of our model. 10
Quadrini, et al (2009) explains this mechanism fully.

Dutse International Journal of Social and Economics Research Vol. 1, No. 1 June 2018
82
The first column of table 2 showed findings when the measure of financial integration was
based on the de jure, while in the second column, the de facto measure of financial
integration was used. Evidently, the coefficient of real public debt was statistical significant
at 5 per cent level for the de jure measure, and positively correlated with growth in real GDP.
This indicates that a percentage point increase in the level of real public debt increases GDP
growth by 0.057 percentage point. However, the coefficient of debt to GDP ratio was
negative and statistically significant at 5 per cent per cent level, for both measures of
financial integration. This implied that higher debt to GDP ratio have the tendency to slow
growth by 0.009 and 0.003 percentage points, respectively, depending on the measure of
financial integration. These findings are in line with previous studies11
that have analysed the
impact of debt on economic growth. Furthermore, the index of financial integration was
significant for both measures of financial integration and positively associated with real GDP
growth supporting the assertion that financial integration has the potentials to boost economic
growth.
Table 1: Public debt and financial integration – FE Estimates
(1) (2) (3) (4)
De Jure Measure of
FI
De Facto Measure of
FI
Dependent Variable: Real public debt
Debt to GDP ratio 0.0191*** 0.0160*** 0.0112* 0.0140***
(0.0015) (0.0003) (0.0039) (0.0024)
Real GDP growth -0.0155 -0.0167* -0.0006 -0.0104
(0.0105) (0.0059) (0.0173) (0.0072)
Financial index 0.3990*** 0.5243*** 1.0571*** 0.4754***
(0.0560) (0.0600) (0.1396) (0.0643)
Size X financial index
-0.5630*** -0.1362
(0.0484) (0.3286)
Country and Year FE Yes Yes Yes Yes
Observations 164 164 164 164
R-squared 0.615 0.837 0.671 0.848
F-statistics 83.62 200.091 289.783 218.076
Number of Countries 4 4 4 4
Notes: Robust standard errors in parentheses
All variables (except GDP growth rate) are transformed into log form
*** p<0.01, ** p<0.05, * p<0.1
11
See Patillo (2002); Reinhart & Rogoff (2009), and Checherita & Rother (2010).

Dutse International Journal of Social and Economics Research Vol. 1, No. 1 June 2018
83
Table 2: GDP growth and financial integration – FE Estimates
(1) (2)
De Jure Measure De Facto Measure
Dependent Variable: Real GDP growth
Real debt 0.5709** 0.0611
(0.1329) (0.1030)
Debt to GDP ratio -0.0090* -0.0030**
(0.0030) (0.0009)
Financial index 0.1408* 0.3538***
(0.0507) (0.0553)
Country and Year FE Yes Yes
Observations 164 164
R-squared 0.794 0.926
F-statistics 25.068 160.813
Number of Countries 4 4
Notes: Robust standard errors in parentheses
All variables (except GDP growth rate) are transformed into log form
*** p<0.01, ** p<0.05, * p<0.1
4.1 Robustness Checks
The study estimated a dynamic panel GMM estimator in order to confirm the robustness of
our result. Table 3 and 4 reports the one-step results of the GMM estimates. Clearly, our
results are robust to the dynamic panel GMM estimators as the estimates shows similarity to
those obtained from the country fixed-effects regression results.
Also, the study conducted a cross-validation of the model used to assess the accuracy and
validity of the model. This was done by dividing the dataset into two parts, and then,
estimating the model using only one part of the dataset. This model was then used to predict
the dependent variable to see if the model does a good work in terms of predicting something
that has not been used in the estimation. In addition to cross-validation, this study also carried
out a Hausman‘s model specification test to determine whether the coefficients of the fixed
effects estimators are significantly different from that of the random effect estimators. The
results showed that in general, our model is robust to these specification tests.12
12
Results are not included here, but can be made available upon request.

Dutse International Journal of Social and Economics Research Vol. 1, No. 1 June 2018
84
Table 3: Public debt and financial integration – GMM Estimates
(1) (2)
De Jure Measure De Facto Measure
Dependent Variable: Real public debt
Debt to GDP ratio 0.0159*** 0.0140***
(0.0004) (0.0020)
Real GDP growth -0.0166*** -0.0107*
(0.0047) (0.0064)
Financial index 0.5272*** 0.4794***
(0.0488) (0.0559)
Size X financial index -0.5663*** -0.1503
(0.0404) (0.2933)
Year FE Yes Yes
Country FE No No
Observations 160 160
Wald Chi-sq 689.527 366.724
Number of Countries 4 4
Notes: Robust standard errors in parentheses
All variables (except GDP growth rate) are transformed into log form
*** p<0.01, ** p<0.05, * p<0.1
Table 4: GDP growth and financial integration – GMM Estimates
(1) (2)
De Jure Measure of FI De Facto Measure of
FI
Dependent Variable: Real GDP growth
Real debt 0.5697*** 0.6443***
(0.1139) (0.0985)
Debt to GDP ratio -0.0089*** -0.0108***
(0.0025) (0.0022)
Financial index 0.1391*** 0.0413
(0.0426) (0.1270)
Year FE Yes Yes
Country FE No No
Observations 160 160
Wald Chi-sq 146.507 761.24
Number of Countries 4 4
Notes: Robust standard errors in parentheses
All variables (except GDP growth rate) are transformed into log form
*** p<0.01, ** p<0.05, * p<0.1
Dutse International Journal of Social and Economics Research Vol. 1, No. 1 June 2018
85
5.0 CONCLUSION AND RECOMMENDATIONS
There is much discussion about the impacts of financial integration. Recent developments in
the theoretical and empirical literatures suggests that financial integration can spur economic
growth, induce investments, and facilitate the development of domestic equity markets.
Despite these benefits, Kose, Prasad & Taylor (2011) have pointed out that, a country with
financial openness may face potential risks of negative growth if certain threshold conditions
are not attained. These threshold conditions include the fact that, financially integrated
economies should strive to achieve institutional quality and financial depth by maintaining a
low debt to GDP ratio. However, it has been observed that, the integration of financial
markets (especially in the Euro Area) comes with an attendant increase in the level of
government bonds held by foreigners (Elena, 2013). Consequently, Azzimonti, de Francisco
& Quadrini (2012) presented a multi-country political economy model in which
governments‘ incentive to issue bond increases, when financial markets are internationally
integrated.
In this case, the study reviewed the importance of their model, using empirical data for the
MINT countries. The result supports the theoretical model that financial integration induces
higher level of government debt. While the study did not claim that this implies causation, it
is important, however, to stress that the highly significant positive relationship between a
change in the index of financial integration and change in the level of real public debt for
both measures of financial integration is a useful guide to the direction of influence.
Based on the different measures of financial integration (i.e. de jure and de facto), this study
confirm that financial integration is positively correlated with growth. Although we found out
that higher debt to GDP ratio negatively affect growth, financial integration, however, has a
larger influence on growth than the debt to GDP ratio. Moreover, based on de jure measure of
financial integration, we found out that smaller countries tend to optimize agents‘ welfare by
issuing more debt, relative to larger countries, thus supporting the theoretical evidence in
Azzimonti, de Francisco & Quadrini (2012) that, size plays an important role in determining
the effectiveness of financial integration.
An important implication of this study is the need for an extensive research on the direction
of causality between rising level of public debt and change in the index of financial
integration. Understanding the path of causation will be an important step in evaluating
whether better access to external financing, induced by financial markets integration, helps
trigger sovereign debt crisis, as Azzimonti, de Francisco & Quadrini (2012) rightly observes,
if debt crisis is more likely to result from higher level of public debt, then financial
integration is a likely contributor to it.

Dutse International Journal of Social and Economics Research Vol. 1, No. 1 June 2018
86
References
Abiad, A., Detragiache, E. & Therry T. (2008). ―A New Database of Financial Reform.‖ IMF
Working Papers, 08/226.
Arrellano, M. & Bond, S. (1991). ―Some Tests of Specification in Panel Data: Monte Carlo
Evidence and an Application to Employment Relations,‖ Review of Economics and Statistics,
58, pp. 277-97.
Azzimonti, M., de Francisco, E. & Quadrini, V. (2012). ―Financial Globalization, Inequality
and the Rising of Public Debt,‖ Federal Reserve Bank of Philadelphia Working
Papers, 12-6.
Beetsma, R., Massimo, G., & Klaassen, F. (2005). ―Trade Spillovers of Fiscal Policy in the
European Union: A Panel Analysis,‖ CEPR Discussion Paper No. 5222.
Bonfiglioli, G. & Mendicino, C. (2004). ―Financial Liberalization, Banking Crises, and
Growth: Assessing the Links,‖ Working Paper Series in Economics and Finance, 567, SSE.
Checherita, C. & Rother, P. (2010). ―The Impact of High and Growing Government Debt on
Economic Growth: An Empirical Investigation for the Euro Area.‖ ECB Working
Papers, 1237.
Chinn, M. & Ito, H. (2005). ―What Matters for Financial Development? Capital, Institutions,
and Interactions,‖ NBER Working Papers, 11370.
Chinn, M. & Ito, H. (2008). ―A New Measure of Financial Openness,‖ Journal of
Comparative
Policy Analysis, 10 (3), pp. 309-322.
Devereux, M.B., Lockwood, B. & Redoano, M. (2003). ―Capital Account Liberalization and
Corporate Taxes,‖ IMF Working Papers, 03/180.
Elena, R. (2013). ―Financial Integration and Sovereign Default,‖ unpublished. Available
from:
http://www.bde.es/investigador/papers/sie1405.pdf [Accessed: 17th
March, 2016].
Fatàs, A. & Mihov, I. (2003). ―The Case for Restricting Fiscal Policy Discretion,‖ Quarterly
Journal of Economics, 118 (4), pp. 1419-1447.
Genschel, P. (2001). ―Globalization, Tax Competition, and the Fiscal Viability of the Welfare
State,‖ IMF Working Papers, 01/1.
Giovanni, D. & Marquez, R. (2006). ―Lending Booms and Lending Standards,‖ The Journal
of Finance, 61 (5), pp. 2511-2546.
IMF, (2012). Global Financial Stability Report October 2012. Washington: International
Monetary Fund.
Irina, T. & Shang-Jin, W. (2004). ―Does Financial Globalization Induce Better
Macroeconomic Policies,‖ IMF Working Papers, 04/84.
Kaminsky, G. & Reinhart, C. (1999). ―The Twin Crises: The Causes of Banking and
Balance-of-Payments Problems,‖ American Economic Review, 89 (3), pp. 473-500.
Kim, W. (2003). ―Does Capital Account Liberalization Discipline Budget Deficit?‖ Review of
International Economics, 11 (5), pp. 830-840.

Dutse International Journal of Social and Economics Research Vol. 1, No. 1 June 2018
87
Kose, M.A., Prasad, E. & Terrones, M.E. (2007). ―How Does Financial Globalization Affect
Risk Sharing? Patterns and Channels,‖ IMF Working Papers, 07/238.
Kose, M.A., Prasad, E. & Taylor, A.D. (2009). ―Financial Globalization: A Reappraisal,‖
Journal of International Money and Finance,
Kose, M.A., Prasad, E. & Taylor, A.D. (2011). ―Thresholds in the Process of International
Financial Integration,‖ Journal of International Money and Finance, 30, pp. 147-179.
Liberati, P. (2006). ―Trade Openness, Financial Openness and Government Size,‖
Universitià di Urbino Santa Po, Mimeo.
Michalopoulos, S., Laeven, L. & Levine, R. (2009). ―Financial Innovation and Endogenous
Growth,‖ NIBER Working Papers, 15356.
Obstfeld, M. & Taylor, A.M. (2005). ―Global Capital Markets Integration, Crisis, and
Growth.‖ Cambridge University Press, New York
Patillo, C., Poirson, H. & Ricci, R. (2002). ―External Debt and Growth‖, IMF Working Paper,
02/69.
Peter, C., Rosina, M. & Jordi, S. (2012). ―Debt, Interest Rates, and Integration of Financial
Markets,‖ Journal of Economic Modelling, 29 (1), pp. 48-59.
Philip, R.L. & Gian, M. M. (2007). ―The External Wealth of Nations Mark II: Revised
Extended Estimates of Foreign Assets and Liabilities, 1970-2004,‖ Journal of International
Economics, 73, pp. 223-250.
Prasad, E.S., Rogoff, K., Shang-Jin W., and Kose, M.A. (2003). ―Effects of Financial
Globalization on Developing Countries: Some Empirical Evidence,‖ IMF Occasional
Paper, 220.
Quadrini, V., Mendoza, E., & Rios-Rull, J. (2009). ―Financial Integration, Financial
Development and Global Imbalances.‖ Journal of Political Economy, 117(3), pp. 371-
416.
Ranciere, R., Tornell, A. & Westermann, F. (2006). ―Decomposing the Effects of Financial
Liberalization: Crises vs. Growth,‖ Journal of Banking and finance, 30, pp. 3331-
3348.
Reinhart, C.M., Rogoff, K. & Savastano, M.A. (2003). ―Debt Intolerance,‖ Brookings Paper
on Economic Activity, 34(1), pp. 1-74.
Reinhart, C. & Rogoff, K. (2010). ―Growth in a Time of Debt,‖ American Economic Review,
100(2), pp. 573-78.
Saito, M. & Osada, M. (2010). ―Financial Integration and Economic Growth: An Empirical
Analysis Using International Panel Data from 1974 – 2007,‖ Bank of Japan Working
Paper Series, 10-E-5.
Simone, M. & Guido, W. (2009). ―Market Discipline, Financial Integration and Fiscal Rules:
What Drives Spreads in the Euro Area Government Bond Market?‖ Economic Policy,
48, pp. 191-240.

Dutse International Journal of Social and Economics Research Vol. 1, No. 1 June 2018
88
Appendix
Figures
Figure 1: Average Public Debt to GDP Ratio in the MINT Countries
Source: Author‘s own calculation based on data from World Bank Development Indicator
0
15
30
45
60
75
90
Average Public Debt to GDP Ratio in MINT

Dutse International Journal of Social and Economics Research Vol. 1, No. 1 June 2018
89
Figure 2: Average Growth Rate of Real GDP in the MINT Countries
Source: Author‘s own calculation based on data from World Bank Development Indicator
-2
0
2
4
6
8
10
12
14
Average growth Rate of Real GDP in MINT
Dutse International Journal of Social and Economics Research Vol. 1, No. 1 June 2018
90
Trends, Drivers and Implications of
Irregular Migration in Nigeria
*Ayuba, Muhammad Ribadu1
1Department of Sociology, Faculty of Social Sciences,
Ahmadu Bello University, Zaria.
*Corresponding Author‘s Email: [email protected]
Abstract: Migration, as a visible feature of human existence, has affected the world tremendously in
many respects throughout years. Thus, migration by people from one location to another in search of
better livelihood is not a new phenomenon. However, the growing scope and changing trends of
irregular migration, particularly the perilous migratory flows of people into the European continents
via the Mediterranean and Saharan deserts, is what has gained currency. This article, therefore,
examines the trends, drivers and implications of such irregular migrations by, particularly Nigerians
into Europe through Libya as the major transit point. Todaro‘s Model of Migration was employed to
make cogent analyses of the problem under study. Also, the study utilized secondary data which
include, but not limited to, policy reports by International Organization for Migration, International
Labour Organisation, media reports, relevant academic literature in the field etc. Forced
displacements caused by conflicts, lack of adequate better job opportunities, and general impression
about living conditions in developed countries are some of the factors identified as drivers of irregular
migration. Similarly, travelling by road through the deserts of Agadez in Niger Republic, Mali and
Algeria through Libya and crossing of the Mediterranean from Libya to Italy via boats were identified
as regular routes for the irregular migrants. Based on the findings of the study, a more holistic
approach which entails tackling socioeconomic challenges facing the country such as high rate of
poverty, unemployment among the youths, increasing conflicts, humanitarian crises with their
attendant consequences of corruption and mismanagement of resources was recommended.
Key words: Trends, Desert crossing, Irregular Migration, Mediterranean.
JEL Classification: R23, C83, C93
1. Introduction
The growing scope and perilous nature of desert journeys and crossings of the Mediterranean
via boats by migrants, as new dimension of irregular migration, trend increasingly and attract
global attention overwhelmingly. The rising trends of irregular migration into European
countries via boats in the Mediterranean portend serious implications for socio-political and
economic development of, especially, countries of origin, destination and even transit.
The migratory flows from less developed countries towards Europe, America and some Asian
countries is characterized largely by voluntary migration as a corollary to pull factors in
destination countries, or forced migration as a result of push factors in countries of origin.
Either way, the movements comprised divergent social categories such as unemployed youths
seeking gainful employment outside their countries of origin, internally displaced persons
(IDPs), refugees-who are displaced by seemingly unending conflicts, commercial sex
workers usually young women, abused children among others (African Union, 2006).

Dutse International Journal of Social and Economics Research Vol. 1, No. 1 June 2018
91
According to the United Nations‘ estimates, there are 232 million international migrants
worldwide, representing 3.2 per cent of the world‘s total population of 7.2 billion (United
Nations, 2013); and that 28.2 million of the international migrants were aged 15 to 24 in the
world (GMG, 2014), thus, extending an amplified sense of youth vulnerability to
international migration.
African continents are mostly countries of origin as far as irregular migration is concerned. A
large number of Africans, comprising mostly Nigerians, Eritreans, Guineans, Ghanians
among others engage in irregular migration (Niyi, 2014). For instance, in October 2013, 366
Eritreans, trying to cross the Mediterranean, drowned in a shipwreck near the shores of the
Italian island of Lampedusa (Adepegba, Nwogu, Adeoye, and Alagbe, 2017). Thus,
Nigerians, Eritreans and Guineans have been identified as the largest groups entering Italy,
―illegally‖, on almost daily basis, because as at November 2016, figures from the Italian
ministry of interior estimated the record of Nigerian arrivals at 36,000 people (Daily Trust
Online, January 11, 2017). This revelation strongly indicates the desperation of Africans,
mainly the youths, to get to Europe by all means and at all cost even at the expense of their
lives. Several local and foreign media outlets have reported many cases of African youths
who have perished in the Mediterranean while trying to get to Europe without authorization.
In similar manner, the most recent IOM‘s report revealed that between January and March
2017 alone, 26,589 migrants and refugees entered Europe clandestinely, with over 80%
arriving in Italy and the rest in Spain and Greece (IOM, 2017). The population size of
Nigeria, perhaps, makes the number of its irregular migrants equally large. This could also
explain the reason for the European Union‘s (EU) disclosure that 22,500 Nigerian irregular
migrants crossed the Mediterranean Sea to Europe between January and September 2016
alone (Daily Trust Online, January 11, 2017).
2. Conceptual Review and Theoretical Framewotk
Conceptual Review of Irregular Migration A wide swath of scholars defines migration in different ways. It basically, however, involves
an art of movement within a country or across international border. According to IOM (2004)
migration refers to any kind of movement of people irrespective of its duration, composition
and causes; it includes refugees, Internally Displaced Persons (IDPs), uprooted people, and
economic migrants. Similarly, the United Nations (2013) defines migration as the movement
of individuals from one geographical location to another, involving permanent or temporary
residence or settlement due to natural disasters, physical conditions, security challenges,
differences in socioeconomic opportunities and change in standing such as high level of
education and wealth. Ebong and Animashaun (2006) cited in Eyo and Ogo (2013) define
migration as a ‗spatial interaction of people, involving a relatively permanent movement of
persons over significant distance from one geographic place to another‘. Migration, therefore,
can be inferred from the definitions above to refer to movement of people from one
geographical location to another for the purpose of social, economic and even political
reasons on a permanent or temporary basis.
Irregular Migration, on the other hand, is a rather new way of describing folks migrating
without any proper authorization. Thus, the use of the term ‗irregular‘ is preferred to ‗illegal‘
by migration experts especially international organizations which grapple with migration
issues due to the offensive meaning the latter connotes (Koser, 2005). For instance, the
Council of Europe, International Labour Organisation (ILO), International Organisation for
Migration (IOM), the Organisation for Security and Co-operation in Europe (OSCE) and
UNHCR all adopt the use of ‗irregular migration‘ instead of illegal migration (Koser, 2005).
Dutse International Journal of Social and Economics Research Vol. 1, No. 1 June 2018
92
The only international organization that persists in using the term ‗illegal migration‘ is the
European Union (EU) (CDMG, 2004:29).
However, irregular migration is one of the fastest growing forms of migration worldwide
which present serious challenges for many destination countries (Angenendt, 2008). Thus, it
includes people who enter a country without proper authorization such as clandestine entry
and/or entry with fake documents; people who remain in a country in contravention of their
authority or people moved by migrant smugglers or human trafficking, and those who
deliberately abuse the asylum system (Koser, 2005). The International Organization on
Migration (2014) describes irregular migration as movement that takes place outside the
regulatory norms of the sending, transit and receiving countries. It can, therefore, be inferred
from the definitions above that irregular migration is a clandestine movement of people from
one geographical location, usually less developed societies, to more developed societies with
the intention to work without authorization.
Theoretical Framework
The theory upon which this study is based is Todaro‘s Model of Migration. Although the
theory was originally propounded by Todaro (1969) to offer theoretical basis for proper
understanding of rural-urban migration, it is equally adapted to explain drivers of migration
from developing countries to developed countries. The theory is premised on the assumption
that migration is an economic choice where individuals or households decide to migrate from
rural to urban areas, provided there is a higher anticipated income in the urban areas. The
model equally suggests that migration occurs due to disparities in rural-urban development
resulting from urban bias in provision of basic social amenities.
The main thrust of the theory, therefore, is that either potential migrants calculate their
expected earnings in their place of origin in comparison to various places of destination or
that migration decisions are taken by the household as a whole as part of its survival strategy.
As a result, migrants deliberate and compare the prospects and accessibility to job
opportunities and improved living conditions between Nigeria and Europe, and make a
decision on the basis of cost-benefit analysis. The migrants from this perspective are assumed
to be rational actors who choose a course of action, in this case migration without proper
authorization (irregular migration), which they believe will lead to the accomplishment of
their goals.
3. Methodology
The study utilized secondary data obtained from academic journals, policy reports by the
International Organization for Migration (IOM), International Labour Organization (ILO),
print and online media reports, magazines etc.
4. Results and Discussions
This section consists of a review of relevant empitrical results on the trends, drivers and
implications of irregular migration in Nigeria.
Trends of Irregular Migration
Widely considered an insurance against poverty among the youths, irregular migration has
continued to trend increasingly. However, the migratory flows are often characterized by
tremendous dangers, the biggest of which is loss of lives in the Mediterranean or Sahara
deserts. Recently, about 10,000 Nigerians have died between January and May 2017 while

Dutse International Journal of Social and Economics Research Vol. 1, No. 1 June 2018
93
trying to illegally migrate to Europe through the Mediterranean Sea and Sub-Saharan desert
(Adepegba, et.al, 2017). Out of this figure, 4,900 Nigerians died in the Mediterranean Sea
while the rest died while going through the Saharan deserts in their bid to cross to Europe
(Adepegba, et. al, 2017)
Earlier, in April 2014, Italy rescued 896 migrants, most of whom were Nigerians trying to
cross the Mediterranean by boat over night (Niyi, 2014). The number of people travelling
illegally into Europe in 2014 was 280,000 people; in 2015 the figure rose to 1.8 million
people. Also, from these numbers, people coming from Nigeria (to Europe) in 2012 were
800; in 2013 the number was 2,900; in 2014 the number was 8,700; in 2015, the number was
23,000, and between January and September 2016, the number was 22,500 people (Richard,
2016). This trend indicates a continuous increase in the number of irregular migrants from
Nigeria.
Furthermore, statistics published by the Global Commission on International Migration
(GCIM, 2006) revealed that there were 191 million stocks (i.e people with migrants‘ status)
in the world. Out of this figure, 115 million were in developed countries and 75 million in
developing countries. In terms of percentage, Europe had 34%; America 23% and Asia 28%,
Africa had just 9% and Latin America and the Caribbean 4%. Out of these figures, 27 million
are young people who leave their countries of birth to seek employment abroad as
international migrants (ILO, 2014). This indicates the rising number of stocks in the
developed countries as well as the high rate of international migration to the developed
countries. Also, Africa, Latin America and the Caribbean are mainly countries of origin. It is
also clear that West Africa and Eastern Africa had the highest number of international
migrants than the other regions of the continents with 42% and 28% of the international
migrants respectively (GCIM, 2006). In essence, almost one in every ten persons living in a
more developed country is a migrant. In contrast, nearly one in every 70 persons in
developing countries is a migrant (Kawar, n.d:72).
However, of great concern to this study are the irregular migrants who make their ways
clandestinely into Europe via perilous means in search of better livelihood- a search that
continues to be significant driver of youth migration in particularly developing countries due
to, largely, high number of unemployed youths estimated to be 71 million people globally in
2016 (ILO, 2016). This figure coupled with the global estimate of 15.5 million refugees and
10.5 million Internally Displaced Persons (IDPs) in mid 2016 (IOM, 2016) make irregular
migration of men, women and even children inevitable. For instance, the IOM Displacement
Tracking Matrix (DTM) as at October 2016 estimated that more than 1.8 million Nigerians
are displaced and are living in camps and host communities (IOM, 2016). Thus, in recent
years, irregular migration to Europe through boat crossings of the Mediterranean, with Libya
being a key transit point has become a survival strategy for desperate young Africans.
According to the Frontex, the European Border Agency, about 181,000 migrants arrived in
Italy in 2016 from North Africa; the highest number ever recorded (Salau, 2017).
Another trend of migration in Africa is the growing number of women who have also started
to migrate in search for greater employment opportunities in overseas without proper
authorization. This assertion corroborates an earlier study by Adepoju (2005) who argued that
emigration of unaccompanied married females as a survival strategy had increased
particularly among the educated due to low family income. He further argued that the
‗traditional male-dominated short-to-long-distance migratory streams in West Africa are
increasingly feminised so much that it has become a major survival strategy in response to
the deepening poverty in the sub-region‘ (Adepoju, 2005). Similarly, in his study on female
Dutse International Journal of Social and Economics Research Vol. 1, No. 1 June 2018
94
illegal migrants, Mohammed (2006) found that females leave their countries of origin out of
their strong desire to help their families. He equally found that females were believed to send
more remittance than males even though they mainly engaged in menial jobs such as house
maids. However, the most disturbing aspect of this trend of female irregular migration is the
fact that they experience massive sexual exploitation and are extremely dehumanized during
desert crossing in the Niger, Mali and Algeria. Most of them, with their infants, lose their
lives in boat mishaps in the Mediterranean. Even among the stock, (that is people with
migrant status), women constitute 50% of the total stock (GCIM, 2006).
Drivers of Irregular Migration
Irregular migration as a global phenomenon is caused by many factors. Many studies have
identified social, economic, political, cultural factors as facilitators of irregular migration
among African youths. For instance, the United Nations‘ (2006) report stipulates that for
people to migrate, three factors must be present. These are: demand (pull), supply (push) and
network (links demand and supply) factors. In the absence of one of these, migration from
one place to another will not occur. Thus, economic and political conditions provide the
general context within which international migration occurs.
In their general meeting, the African Union (AU, 2006) identified various political and social
factors which induce migration. Among these are bad leadership style, corruption, social
unrest, human rights violations, political instability, environmental factors, ethno-religious
conflicts and civil discord in the countries of origin. On the other hand, the real or perceived
opportunity for a better life, high income, greater security of life and property, better quality
of health care facilities and quality education at the destinations induce migration. Other
factors identified were improved transportation system which invariably lowers the costs of
movements; improved communication system, greater information availability and the need
to join relatives are among the factors, which amplify push-pull factors (AU, 2006). Agreeing
with the AU‘s assertion, a more recent statistics by the UN (2013) identified employment,
education, marriage, and escape from poverty, violence, conflict and environmental change
as the key drivers of international migration, particularly among the youths.
Another key factor that facilitates irregular migration in Nigeria as identified in the literature
is pervasive poverty. Although there are divergent opinions as to whether or not irregular
migration is carried out by the poor people only. Ehirim, Onyeneke, Chidiebere-Mark, and
Nnabuihe (2012) posit that poverty may be the main cause of out migration in some parts of
the world and under certain conditions, whereas in other parts, under different conditions the
poor will be among the last to move. This finding suggests that migration, regardless of its
type, involves the ability to mobilize resources; and as such the poorest are not likely to
engage in irregular migration to Europe. An earlier study by Wouterse and Van den Berg
(2004) discovered that migration to other African countries from Burkina Faso was
undertaken by comparatively poor households in response to lack of work and insufficient
income, while migration to Europe was by more wealthy households in response to
opportunities for accumulation of wealth. This, therefore, indicates that migration to
European continents from Africa is usually undertaken by individuals with the support of
their families, perhaps in anticipation of remittances. For instance, a study of rural households
in four villages in Burkina Faso found that international migrants tend to come from the
highest-income group and to earn more in remittances than local migrants, while households
with intercontinental migrants have higher income and are better off in terms of land and
livestock than households with local migrants (Black, Natali and Skinner, 2005). For this
reason, some of the irregular migrants are being sponsored by their immediate families to

Dutse International Journal of Social and Economics Research Vol. 1, No. 1 June 2018
95
embark on such expedition considering the benefits that will accrue to them in terms of
remittances upon successful arrival of the migrant to his/her destination. Therefore,
remittance by migrant constitutes a major facilitator of irregular migration among the youths.
In his study, Ofuoku (2015) found that many rural households use remittances from their out-
migrants to support agricultural production, especially to hire labour, and for purchase of
other farm inputs. This discovery, thus, revealed that apart from the urge to get to the
developed countries in order to get a better life, the Nigerian youths are motivated by their
immediate families and even communities to which remittances are usually made. Thus, the
monetary remittances to rural households remain the common benefit of rural-urban
migration (Eze, 2015). A similar study conducted in India by Srivastava and Sasikumar
(2003) revealed that remittances are the main benefit of external migration, providing scarce
foreign exchange and scope for higher levels of savings and investments. They further argued
that remittances over the years have financed much of India‘s balance of trade deficit and
have thus reduced the country‘s account deficit. However, it should be noted that remittances
are privately earned transfers and should, therefore, not be confused with foreign official aid.
The table 1 below shows the top ten countries in the world benefitting from remittances by
international migrants from year 2000 to 2015:
Table 1: Top Countries Receiving Remittances in the World (2000 – 2015)
2000 USD
(Billion)
2005 USD
(Billion)
2010 USD
(Billion)
2015 USD
(Billion)
India (12.84) China (23.63) India (53.48) India (68.91)
France (8.61) Mexico (22.74) China (52.46) China (63.94)
Mexico (7.52) India (22.13) Mexico (22.08) Philippines (28.48)
Philippines (6.96) Nigeria (14.64) Philippines (20.56) Mexico (26.23)
Republic of
Korea
(4.86) France (14.21) France (19.90) France (23.35)
Spain (4.86) Philippine (13.73) Nigeria (19.75) Nigeria (18.96)
Turkey (4.56) Belgium (6.89) Germany (12.79) Pakistan (19.85)
USA (4.40) Germany (6.87) Egypt (12.45) Egypt (16.58)
Germany (3.64) Spain (6.66) Bangladesh (10.85) Bangladesh (15.38)
United
Kingdom
(3.61) Poland (6.47) Belgium (10.35) Germany (15.36)
Source: International Organization for Migration (2018), (Accessed January 2018)
From the table 1 above, it can be seen that Nigeria received remittances of 14.64, 19.75 and
18.96 billion US dollars (USD) in 2005, 2010 and 2015 respectively. The table also shows
that Nigeria ranked fourth in the world in terms of remittance receipt in the year 2005 but by
2010 and 2015 Nigeria was overtaken by other countries thereby making it the sixth in the
world. However, despite the drop in the ranking the remittances received have increased by
about 4 billion USD. Nigeria and Egypt are the only African countries on the list of the top
ten countries receiving remittances in the world with a total remittance of 18.96 and 16.58
billion USD in 2015 respectively. This implies that Nigeria receives the highest remittances
from migrants in Africa, and this is not unconnected with the population size of its migrants
across the world.
Looking at migration from a holistic dimension, Kainth (2009) and Kardulias and Hall (2006)
explain migration as a reaction of humans to economic, social, political and demographic
changes within a given society. Similarly, Srivastava and Sasikumar (2003) identified that the
process of migration is influenced by social, cultural and economic factors and outcomes can
be vastly different for men and women, for different groups and different locations.
Specifically, Gimba and Kumshe (n.d: 171) found that search for better wages, education,
Dutse International Journal of Social and Economics Research Vol. 1, No. 1 June 2018
96
political and social stability, better technologies, employment and business opportunities
were some of the factors predisposing Nigerian youths to engage in clandestine migration.
These are pull factors that stimulate the youths to migrate at all costs and by all means to
foreign lands in order to make a better livelihood. On the other hand, poverty, unemployment,
crop failures and famine, inadequate social amenities and facilities in the rural areas such as
pipe borne water, electricity, good roads, hospitals, schools, vocational centres were push
factors facilitating rural-urban migration (Gimba and Kumshe, n.d: 171). Nwajiuba (2005),
Ango, Ibrahim, Yakubu, and Usman (2014) also key into the view that youth migration has a
direct bearing with the socio-economics of the migrants due to migration of the energetic
group of the rural residents to urban areas due to lack of job opportunities, infrastructural
facilities in rural areas and also to make better livelihood more than that of their origin. This
view corroborates the UN‘s (2013) report that young people‘s motivations to migrate are
often linked to the search for decent livelihoods due to lack of employment and/or under-
employment, indecent working conditions and poor economic prospects in countries of
origin. The report also identified furthering education, family reunification (for those with
family members in overseas) and escaping from regions affected by war, persecution,
humanitarian crises or natural disasters, gender-based discrimination and violence or
restrictions on women‘s rights as important motives for migration.
However, The Point (2016) posits a rather radical view that the outflow of Africans from
their native lands to the Europe was exacerbated by past and current breed of African leaders
and governments through bad governance such as misplaced and wrong economic policies,
corruption and embezzlement of state resources, human rights violations, poor democratic
values, power struggle and ethno-religious conflicts, aggravated poverty through poor
policies on importation of essential goods and services, as well as aid. In addition to this we
can identify incapacity of African leaders to design and enforce laudable policies that will
encourage consumption of locally made products and promote export drive for locally
extracted resources, farm produce and finished products, has rendered the teeming youths
jobless and induced them to migrate to foreign lands.
A large number of the irregular migrants originate from the rural areas particularly in the
developing countries. For instance, the UN report (2013) revealed that despite the lack of
reliable data on internal migrants, it is assumed that 40% of the migrants originated from the
rural areas and many of them are youth with high propensity to migrate. The Nigerian rural
poor, particularly the youths, have been identified with using migration as a survival strategy
(Ajaero and Onokala, 2013). However, while these factors may be true reflections of
facilitators of rural-urban migration, irregular migration from developing countries to
developed countries tend to be the outcome of other more powerful forces such as wide gap
in the level of human security and socioeconomic development. Also, the high increase in
education and professional skills among young Africans have made them vulnerable to
migration to countries where opportunities abound for them to exhibit their skills and get
rewarded accordingly. Hence, many young African professionals, such as medical doctors,
nurses, accountants, engineers and academicians, are found practicing in the European and
American cities. Likewise, a lot of skilled individuals such as tailors, mechanics etc. engage
in active, rewarding business activities in foreign lands, most of who get there through illegal
journey. On the whole, this ‗brain drain‘ impedes rapid sustainable development in African
countries. Thus, many scholars and policy makers remain pessimist about the possible
reduction in scale of irregular migration due to powerful nature of forces that propel it. One
reason identified is that the forces that determine the scale of international migration, which
include growing disparities in the level of prosperity and human security experienced by
Dutse International Journal of Social and Economics Research Vol. 1, No. 1 June 2018
97
different societies are powerful (Koser, 2005). Also, the ability to change those forces is very
limited, and according to Koser (2005), even if there is impetus towards a degree of
liberalization in certain parts of the world to address demographic deficits, regular migration
channels will not be opened on a scale sufficient to satisfy total demand to move.
High level of education has also been related to the scourge of migration in Africa. A survey
data by Lichfield and Waddington (2003) shows that migrants from Ghana, particularly
international migrants, are more likely to be highly qualified than non-migrants; and that the
probability of migration rose with education (Tsegai and Plotnikova, 2004). A United
Nations‘ report supports the view that lack of quality jobs for large numbers of highly trained
graduates leads to a flight of some of West Africa‘s brightest hopes for the future from
Africa; most of whom become tempted to take the path of immigration to Europe and the US,
during which many may fall victim to criminal immigration syndicates (UN, 2013). Hein de
Haas (2017) equally supports this view where he argued that migrants are often relatively
well educated and from moderate socio-economic backgrounds. They move because of a
general lack of opportunities, fear of persecution and violence, or a combination of both.
These discoveries have, however, negated an earlier finding by Findley (1989) that there was
no evidence that migration rates from the Senegal River valley were higher for literate
individuals or communities with good educational facilities, and speculated that literacy
levels were generally too low to distinguish the effect.
Moreover, environmental factors such as drought, desertification and erosion in several parts
of Africa have been identified as causes of out-migration. For instance, Ezra and Kiros (2001)
examine migration outflows in the areas affected by drought in Ethiopia in the period 1984-
1994. High rates of migration were observed during the year of the drought (1984), which
suggests that migration was used as an adaptation and survival strategy by many households
in the region. Similar result was reported by Ezra (2001) for migration flows as a result of
environmental factors such as droughts in the hinterlands of Ethiopia. However, other
researches revealed opposite views on the influence of environmental hazards on migration.
For instance, Findley (1994), Henry et. al., (2003) and Grey (2009) shared the view that
negative environmental conditions do not necessarily increase migration.
Implications of Irregular Migration
As far back as 2006, there were over 50 million estimated African migrants out of 150
million global migrants (African Union, 2006). The figure has, since doubled due to
inadequate measures put in place by policy makers in the continent to curb the menace. In
other words, there is persistent lack of comprehensive and balanced approach to migration
considering realities, trends and linkages between migration and other major socioeconomic,
political and humanitarian issues. Consequently, irregular migration in the continents
continues unabated. Unlike the origin countries, the destination countries seem to make
efforts towards stemming the tide of the irregular migration. It is estimated, for example, that
in 2002 alone, Canada, Germany, the Netherlands, the United Kingdom (UK) and the USA
together spent about US$17 billion in trying to respond to the problem of irregular migration
(Martin, 2003).
The phenomenon of irregular migration poses serious implications for the socioeconomic and
even political development of origin, transit and destination countries. However, its direct
link to human security makes it a major source of concern to various governments of
developing countries. Human insecurity such as loss of lives, trafficking and/or smuggling in
persons have been identified as some of the most grave problems related to irregular

Dutse International Journal of Social and Economics Research Vol. 1, No. 1 June 2018
98
migration (Ezzarqui, n.d:6). Thus, the actual figure of migrants, made up of men, women and
even children, who perish at sea, remains unknown as most deaths go unreported and the
bodies of the deceased remain unidentified. Even less is known about those who lose their
lives during the desert crossing from sub-Saharan Africa to Libya. However, available
statistics reveal that globally, most of the migrants who lost their lives are from Africa and
the Middle East; 27% from sub-Saharan Africa, 19% from the Middle East and North Africa,
13% from the Horn of Africa, excluding migrants whose countries of origin remain unknown
(GCIM, 2014). This, therefore, implies that the existing figures may greatly underestimate the
real number of dead migrants, considering the number of people who go missing and are
never found. Studies have further shown that majority of irregular migrants die at the transit
points. For instance, IOM‘s (2014) estimate indicates that over 40,000 migrants have died in
transit since year 2000; and that based on The Migrant Files data, over 22,400 of them have
lost their lives trying to reach Europe.
These migratory trends have grave social consequences on the irregular migrants, their
countries of origin as well as the destination countries. One of such negative effects on the
migrants is the fact that, even when they succeed in getting to their desired destinations, most
of them fall victims of racial attacks as in Libya and xenophobic attacks as in South Africa.
Others get involved in criminal activities such as drug peddling, cyber crime, prostitution,
human trafficking etc. and consequently pay the ultimate price with their lives or simply get
jailed in European and Asian prisons (Jide, 2017). This in turn affects the national image of
their countries of origin. Even though this trend is not peculiar to the Nigerian migrants who
get to Europe or Asia via illegal routes, it is however, common among Nigerian migrants
abroad who might have entered legally but remained in their host countries after the
expiration of their visas. For instance, many sportsmen and women, musicians and even
pilgrims to Saudi Arabia and Israel have bolted away in their countries of destination with the
intention of making it in the foreign lands (Jide, 2017). Corroborating this view, Ezzarqui
(n.d:7) and Ango et al. (2014:224) have revealed the poor and dangerous conditions Nigerian
migrants find themselves in foreign lands. They posit that many of the migrants find
themselves trapped behind walls of discrimination, xenophobia and racism as a result of
rising cultural and religious tensions in foreign countries. Apart from being unable to benefit
from the same political, social and economic rights as other citizens, the irregular migrants
often find themselves in insecure, menial jobs, or become lumped in dangerous locations
such as slums and deprived other basic amenities, with high levels of criminality and
violence. However, most of them enjoy their families or communities‘ support as they still
help their households and/or communities to increase their income and consumption levels,
as well as their capabilities to face socio-economic shocks through the remittances sent home
(GSDRC, 2013). For Srivastava and Sasikumar (2003) the implications of migration could be
seen in reduction in population growth of the sending countries; enhancing the dependency
burden within households, even though it increases consumption expenditures and reduces
poverty levels of the migrants and their families at their origin through remittances they send
home periodically. However, reduction in population growth of sending countries is not
applicable to Nigeria and many other African countries which grapple with population
explosion.
The implications of irregular migration has been viwed from the angle of human trafficking;
where women and vulnerable children are smuggled into Europe where they are exploited
and exposed to different kinds of inhuman treatments. Thus, the United Nations Office on
Drugs and Crime (UNODC, 2006:20) observed that ‗the system of migrant smuggling has
become nothing more than a mechanism for robbing and murdering some of the poorest

Dutse International Journal of Social and Economics Research Vol. 1, No. 1 June 2018
99
people of the world‘. Similarly, Ezzarqui (2003:7) posits that majority of the victims of
irregular migration fall prey to the phenomenon having been lured with the idea of migrating
for the purpose of visa marriage, marrying a foreigner with the intention of getting residence
permit in the foreign land, domestic labour, or to work in the entertainment and sex
industries. The victims eventually become so vulnerable to exploitation, social isolation and
also face specific health-related risks such as exposure to HIV/AIDS. She further argued that
migrant children are particularly vulnerable as they are often separated from their parents and
in many cases exploited and trafficked into the sex industry. Thus, irregular migration
occurring from Sub-Saharan Africa and the Maghreb to Europe has increasingly been defined
as a security problem associated with international crime, trafficking and terrorism (Castles,
De Haas, and Miller, 2014; Cuttitta, 2007; Goldschmidt, 2006; Lutterbeck, 2006) cited in (de
Haas, 2006).
Describing the effects of migration on the sending region, Fasoranti (2009), Ofuoku and
Chukwuji (2012), Ofuoku et al., (2015), and Li, Sun, Tan, and Li, (2016) identified drastic
decrease in rural labour which in turn reduces total cropped area and quality of work, giving
rise to reduced food production and reduced household wealth; out-migration of youths in
search of employment in cities, which affects the labour force in their origin as some of the
consequences of external migration on the sending regions. However, these studies have
failed to take into cognizance the fact that irregular migration has taken a new dimension
where individual households sponsor or at least support a member of the family to embark on
the migration with a view of sending remittances upon succeeding to land in foreign lands.
These remittances are then used by their families at home to engage workers on their
farmlands and engage in other profitable ventures. Thus, both the migrants and their
households see migration as a survival strategy capable of raising their standards of living.
5. Conclusion and Recommendations
Conclusion
The high rate of irregular migration of Nigerian youths to Europe through the deserts and
perilous crossing of the Mediterranean is quite alarming. It poses a serious concern for policy
makers and governments, particularly, in the countries of origin, destination and even transit.
Local and international dailies are awash with sad news of boat irregular migrants who get
drowned in the Mediterranean in their quest to get to Europe-among whom are women,
children and infants. On the other hand, a large number of irregular migrants meet their
demise in the deserts between Niger, Mali, Algeria and Libya most often in the hands of
armed bandits and human traffickers. Factors predisposing the youths in Nigeria, and by
extension, West Africa to embark on irregular migration include humanitarian crisis, food
insecurity, lack of employment opportunities and paucity in infrastructural development
among others. Consequently, many young African lives have been lost to the dangerous
desert journeys and perilous Mediterranean crossing, in addition to the brain drain suffered in
the sending regions due to their poor socioeconomic conditions.
Recommendations Almost all European and other developed countries of the world, particularly those
confronted with the problem of irregular migration have enacted laws that criminalise illegal
entry or facilitation of the entry for illegal migrants into their countries. For instance, under
the Immigration Act of the UK 1971, illegal border crossings into the UK and staying in the
UK illegally are criminal offences but are generally dealt with using administrative powers of
removal. Similarly, aiding another individual to breach immigration law is also an offence
under the same Act (Toms and Thorps, 2012). Aware of the detrimental effects of migration,

Dutse International Journal of Social and Economics Research Vol. 1, No. 1 June 2018
100
leaders of African countries, also, in their various capacities have introduced measures to
reduce the departure of, particularly, people whose skills are needed, such as doctors, nurses
and other professionals. However, most of the policies are targeted at stemming the outflow
of professionals thereby neglecting the large chunk of unskilled migrants who engage in
irregular migration and who are the real obstacle to both sending and receiving countries.
Almost all the local and international bodies grappling with migration problems seem to
dwell more on tackling the root causes of irregular migration. For instance, the International
Organization for Migration (IOM, 2016) stressed the need to tackle the root causes of
conflicts which engenders displacement because if not addressed, it is bound to cause
frequent patterns of humanitarian crises; and that unless the displaced populations are
effectively stabilised through adequate protection and assistance, there can be little hope in
achieving sustainable peace and many people will continue to make desperate and perilous
journeys across the Mediterranean and the Sahara desert in search for safety and greener
pastures. Therefore, the Federal Government of Nigeria (FGN) must, as a matter of urgency,
ensure that displaced persons can restore peaceful and fruitful lives and do not remain in
lingering dislocation. This will drastically reduce the urge to embark on illegal migration by
the internally displaced persons.
It, therefore, behoves the FGN to improve on the provision of infrastructures and create
employment opportunities for teeming youths who flee the country at the slightest
opportunity due to near-absence of basic social amenities in the country. It is generally
believed that most of the irregular migrants leave the shores of Nigeria out of their desire to
run away from poverty and migrate to foreign lands where they anticipate having better life.
Thus, one of the surest ways of curbing such dangerous mission is to make life worth living
in the country of origin by creating equal educational and job opportunities to all citizens.
On the other hand, the migration sector could facilitate the process of curbing irregular
migration through the increased use of modern technological equipment at the borders;
regular training of border officials on document forgery and migrant profiling techniques; and
the provision of standard border management equipment such as mobile communication
devices and adequate patrol vehicles at border posts. Similarly, the agencies which are
saddled with the responsibility of managing the territorial borders of the country- the Nigeria
Immigration Service (NIS) and the Nigeria Customs Service (NCS)-must synergize their
operational strategies in order to succeed in confronting the problem of irregular migration.
Equally important is the need to provide Border officials with language courses so as to
enhance effective communication between the officials and the irregular migrants as well as
between the officials of the two countries, that Nigeria and Niger, at borders. Also, regular
border patrols must be strengthened as well as co-ordination of officials, particularly, in joint
patrols in order to tackle the phenomenon of clandestine entry points.
Furthermore, for effective Border management, officials of the Borders should engage in
regular meetings with a view to analysing and dissecting operations and consider new
national policies that will affect border operations. Also, in order to avoid cases of people
wandering across border lines, there is a need to erect fences, structures and sign posts at the
crossing points of Nigerian borders. It must however, be noted that addressing the migration
sector alone will not curb the problems of irregular migration. A more holistic approach
which entails tackling socioeconomic challenges, as earlier alluded, facing the country such
as high rate of poverty, unemployment among the youths, increasing conflicts, humanitarian
crises with their attendant consequences of corruption and mismanagement of resources
Dutse International Journal of Social and Economics Research Vol. 1, No. 1 June 2018
101
earmarked for resettling the internally displaced persons and re-integrating them into the
society among others.
References
Adepegba, P., Nwogu,S., Adeoye, G. and Alagbe, J. (2017): ‗Illegal migration: 10,000
Nigerians die in Mediterranean Sea, deserts‘. Nigerian Immigration Service in
The Punch May 20, 2017. Retrieved on 23 August 2017.
Adepoju, A. (2005): Migration in West Africa. A paper prepared for the Policy Analysis and
Research Programme of the Global Commission on International Migration (GCIM).
African Union (2006): ‗African Common Position on Migration and Development‘. The AU
Executive Council. Ninth Ordinary Session, 25 – 29 June, 2006. Banjul, The Gambia.
Ajaero, C. and Onokala P. (2013): The Effects of Rural- Urban Migration on Rural
Communities
of Southeastern Nigeria. International Journal of Population Research. From
<http://www. hindawi. com/journals/ijpr/2013/610193/> (Retrieved on 3 March
2013).
Angenendt, S. (2008): Irregular migration as an international problem: Risks and options.
German Institute for international and security affairs. The Point for freedom and
democracy. Retrieved in April 20, 2016.
Ango, A., Ibrahim, S., Yakubu, A. and Usman, T. (2014): Determination of Socio-economic
Factors Influencing Youth Rural-Urban Migration in Sokoto State, Nigeria. Journal of
Humanity and Ecology, 45(3): 223-231 (2014)
Black, R. Natali, C. and Skinner, J. (2005): ―Migration and Inequality.‖ Equity and
Development. Background paper for World Bank‘s World Development Report 2006.
Retrieved from www.worldbank/development.org
CDMG, (2004): Study on Obstacles to Effective Access of Irregular Migrants to Minimum
Social Rights, Strasbourg: Council of Europe
Daily Trust (2017): ―Illegal Migrants in Italy‖. Daily Trust Online. Retrieved on 23 August
2017.
de Haas, H. (2006): Trans-Saharan Migration To North Africa and the EU: Historical Roots
and
Current Trends. Migration Policy Institute. IMI working paper 2. Oxford:
International Migration Institute, University of Oxford.
Ehirim N.C., Onyeneke R.U., Chidiebere-Mark N.M. and Nnabuihe V.C. (2012): Effect and
Prospect of Rural to Urban Migration on the Poverty Status of Migrants in Abia State,
Nigeria. Agricultural Science Research Journal Vol. 2(4), pp. 145 – 153, April 2012
Available online http://www.resjournals.com/ARJ ISSN-L: 2026-6073
Eyo, E. O. and Ogo, U.I., (2013). Environmental Implication of over Population and Rural-
Urban Migration on Development in Nigeria, Academic Research International ISSN-
L: 2223-9553, ISSN: 2223-9944 Vol. 4 No. 6 November 2013
Ezzarqui, L. (n.d). Alliance of civilizations. Research Paper on Migration for the United
Nations.
(Retrieved in July 2017).
Eze, B.U. (2015): Rural-Urban Socio-Economic Links in Foron District of Jos Plateau, North
Central Nigeria. International Journal of Science, Environment and Technology. Vol,
4.
Ezra, M. (2001): ―Demographic responses to environmental stress in the drought- and Famine
prone areas of northern Ethiopia,‖ International Journal of Population Geography
7(4): 259–279.
Dutse International Journal of Social and Economics Research Vol. 1, No. 1 June 2018
102
Ezra, M. and Kiros, G.E. (2001): Rural Out-migration in the Drought Prone Areas of
Ethiopia:
A Multilevel Analysis. International Migration Review, 35(3): 749–771.
Fasoranti, O.O. (2009): Perception of rural-urban migration of selected rural communities in
Ondo State, Nigeria. Bangladesh e-journal of Sociology.6 (1) 96-105. Retrieved in
July 2017.
Findley S.E., (1989): "Choosing Between African and French Destinations: the Role of
Family
And Community Factors in Migration in the Senegal River Valley. Paper presented at
Department de Demographie, Universite de Montreal, March 14. Retrieved on 23 July
2017
Findley, S.E. (1994): ‗‗Does drought increase migration? A study of migration from rural
Mali
during the 1983-85 drought,‘‘ International Migration Review 28(3): 539–553.
Gimba, Z. and Kumshe, M.G. (n.d): Causes and Effects of Rural-Urban Migration in
Borno State: A Case Study of Maiduguri Metropolis. Asian Journal of Business and
Management Sciences. ISSN: 2047-2528 Vol. 1 No. 1 [168-172]
Global Commission on International Migration (2005): ―Migration in an Interconnected
World:
New Directions for Action‖, Available at http://www.gcim.org/attachements/gcim-
complete-report-2005.pdf. Retrieved in July, 2017.
Global Commission on International Migration (2006). Available at www.gcim.org (retrieved
in
June. 2017)
Global Commission on International Migration (2014). Available at www.gcim.org (retrieved
in
June. 2017)
GMG, (2014): Global Migration Group: Migration and Youth Report, 2014. An overview of
migration in India, its impacts and key issues Retrieved in July 2017
Gray, C.L. (2008): ―Environment, land and rural outmigration in the southern Ecuadorian
Andes,‖ World Development 37(2): 457–468.
GSDRC, (2013): Applied Knowledge Services: Governance, Social Development,
Humanitarian
and Conflict. From <<www. SDRC.org/go/topic-guides/social inclusion/causes- and-
forms-of-social inclusion- spatial-conflicts- and- migration>(Retrieved on the 15th
February 2014).
Henry, S., Boyle, P., and Lambin, E.F. (2003): ―Modelling Inter-provincial Migration in
Burkina
Faso, West Africa: The role of socio-demographic and environmental factors,‖
Applied Geography 23(1): 115–136.
ILO, (2016): World Employment and Social Outlook Trends for Youth 2016, International
Labour Organization http://www.ilo.org/global/research/globalreports/ youth/2016/lang--
en/index.htm
International Organization for Migration (2004): Glossary on Migration. Available online at
http://www.iom.int/jahia/webdav/site/myjahiasite/shared/shared/mainsite/publishddoc
s/serial_publications/Glossary_eng.pdf. Accessed on 23 July 2017.
International Organization for Migration (2014): Global Migration Trends: An Overview.
Available online at
http://www.iom.int/jahia/webdav/site/myjahiasite/shared/shared/mainsite/publishddoc
s/serial_publications/Global_migration_trends.pdf

Dutse International Journal of Social and Economics Research Vol. 1, No. 1 June 2018
103
International Organization for Migration (2016): Glossary on Migration. Available online at
http://www.iom.int/jahia/webdav/site/myjahiasite/shared/shared/mainsite/publishddoc
s/serial_publications/Glossary_eng.pdf. Accessed on 23 July 2017.
International Organization for Migration (2017): Glossary on Migration. Available online at
http://www.iom.int/jahia/webdav/site/myjahiasite/shared/shared/mainsite/publishddoc
s/serial_publications/Glossary_eng.pdf. Accessed on 23 July 2017.
International Organization for Migration (2017): ‗What Nigeria must do to stop dangerous
illegal
migration of citizens‘. in The Premium Times. 20 December, 2016. Retrieved: on 23
August 2017.
International Organization for Migration (2018): World Migration Report. Available online at
http://www.iom.int/jahia/webdav/site/myjahiasite/shared/shared/mainsite/publishddoc
s/serial_publications/Glossary_eng.pdf. Accessed on 23 January 2018.
Jide, O. (2017): ‗Checking illegal migration of Nigerians‘. The Punch 25 January, 2017.
Retrieved: 23 August 2017.
Kainth, S. (2009): Push and pull factors of migration: A Case brick kiln industry of Punjab
state. Asia-pacific Journal of Social Science, (1), pp.82-116.
Kardulias, N., and Hall, D. (2006): A World-systems view of human migration past and
present:
Providing a general model for understanding the movement of people. Published by
the
forum on public policy.
Kawar, M. (n.d): Gender and Migration: Why are Women more Vulnerable? Retrieved from
http://women-in-migration/ylle.328.j/l. Accessed on 23 July 2017
Koser, K. (2005): ‗Irregular migration, state security and human security‘ Global
Commission on
International Migration. Accessed online on 23 August 2017. Available at
www.gcim.org
Li, S., Sun, Z., Tan, M., and Li, X. (2016): Effects of rural–urban migration on vegetation
greenness in fragile areas: A case study of Inner Mongolia in China. Journal of
Geographical Sciences, 26(3), 313-324. Retrieved in July 2017.
Litchfield, J. and Waddington, H. (2003): ―Migration and Poverty in Ghana: Evidence from
the
Ghana Living Standards Survey.‖ Sussex Migration Working Paper No. 10. Sussex
Centre for Migration Research. Retrieved in July 2017.
Martin, P. (2003): Bordering on Control: Combating Irregular Migration in North America
and
Europe, IOM Migration Research Series No. 13, Geneva: IOM.
Mohammed, Y.A. (2016): Cause and Consequence of Cross Border Illegal Migration from
South
Wollo, Ethiopia. Arts Social Science Journal 7:188. doi:10.4172/2151-6200.1000188
Myburgh, A. (2004): "Explaining Emigration from South Africa." South African Journal of
Economics, 72 (1):122-148.
National Geographic Xpeditions (2013): Human Migration Guides (6-8). From <www.
national
geographic.c om/ ex ped i t i on s/ l ess on s/0 9 /g 6 8 /mi gr a t i on
guidestudents.pdf> (Retrieved on 23 July 2017).
Niyi, (2014): ‗Illegal Immigrants in Italy‘ in The Punch December, 2014. Retrieved on 24
August 2017.
Nwajiuba, C. U. (2005): Migration and Livelihood in Southeast Nigeria, Margraf Verlag,

Dutse International Journal of Social and Economics Research Vol. 1, No. 1 June 2018
104
Weikersheim, Germany.
Ofuoku, A. U. (2015): Effect of rural-urban migrants‘ remittances on arable crop production
in
Delta State, Nigeria. Journal of Agricultural Sciences, Belgrade, 60(1), 49-59.
Retrieved in July 2017.
Ofuoku, A.U., and Chukwuji, C. O. (2012): The impact of rural-urban migration on
plantation
Agriculture in the Niger Delta region, Nigeria. Journal of Rural Social Sciences,
27(1), 137. Retrieved in July 2017.
Ofuoku, A.U., Chukwuji, C. O., and Isiorhovoja, R. A. (2015): Influence of agricultural
service
provision on rural-urban migration in Delta State, Nigeria. Gaziosmanpas a
Üniversitesi Ziraat Fakültesi Dergisi, 32(3), 78-87. Retrieved in July 2017
Richard, Y. (2016): ‗Illegal Journey to Europe‘. The Punch May 20, 2017. Retrieved on 23
August 2017.
Salau, A. (2017): ‗FG to evacuate other Nigerians from Libya‘ in Daily Trust 24 January
2017.
Retrieved 0n 23 August 2017
Srivastava, R. and Sasikumar, S. (2003): An overview of migration in India, its impacts and
key
issues. Available at website: www.livelihoods.org. Retrieved in July 2017
The Point (2016): The Point for freedom and democracy. Accessed on Wednesday April 20,
2016. Retrieved from www.thepoint_online/123&hj
Todaro, M.P. (1969): ―A model of labour migration and urban unemployment in Less
Developed
Countries,‖ American Economic Review 59(1): 138-148.
Toms, H. and Thorpe, K. (2012): Practical Measures for Reducing Irregular Migration.
European migration network EMN, retrieved from www.emn.org/6358.1 in July2017.
Tsegai, D. Plotnikova, M. (2004): ―Migration and Household Income Differentials in the
Volta
Basin of Ghana: A Sample Selection Approach.‖ Paper presented at Canadian
Economics Association 38th Annual Meetings. June.
United Nations, (2006). ―Trends in Total Migrant Stock: the 2005 Revision‖
POP/DB/MIG/Rev.2005/Doc, February 2006, Department of Economic and Social
Affairs, Population Division
(http://www.un.org/esa/population/publications/migration/UN_Migrant_Stock_Docu
mentation 2005.pdf; retrieved in Nov. 2006)
United Nations (2013): Rural Youth and Internal Migration, 2013 Report Prepared by the
Decent
Employment Team, ESW, FAO. From <www.unworld.youthreport.org> (Retrieved on
13th February 2014)
UNODC, (2006): Organized Crime and Irregular Migration from Africa to Europe. United
Nations Office on Drugs and Crime
https://www.unodc.org/pdf/research/Migration_Africa.pdf
Wouterse, F. Van den Berg, M. (2004): ―Migration for Survival or Accumulation: Evidence
from
Burkina Faso.‖ Wageningen University and Research Center, Mansholt Graduate
School of Social Sciences.
Dutse International Journal of Social and Economics Research Vol. 1, No. 1 June 2018
105
Hybrid Maize Farmer’s Perception on
Extension Activities in Giwa Local
Government Area of Kaduna State, Nigeria:
An Analytical Approach
*H. A. Yusuf1, T. M. Titus
2 and H. O. Yusuf
3
123Department of Agricultural Economics and Rural Sociology, Faculty of Agriculture,
Ahmadu Bello University, Zaria.
*Corresponding Author‘s Email: [email protected]
Abstract: The study analysed maize farmer‘s perception on extension activities in Giwa Local
Government Area of Kaduna State. The study specifically identified farmers‘ sources of seeds
in the study area, assessed maize farmer‘s perception on extension activities and identified
the problems confronting maize farmers on extension activities in the study area. The data for
the study were obtained through structured questionnaire which was administered to 110
respondents. Descriptive statistics such as frequency distribution table, percentage and
ranges were used to analyse the data. The study revealed that, most of the respondents source
seeds from the market. The study also showed that majority of the respondents strongly agree
and agree that extension activities leads to; adoption of improved farm practice, increase in
farm output, improves livelihood, increases income, improves farmers literacy even though
the most of the farmers disagree that extension activities leads to acquisition of credit. The
result also showed that lack of access to credit was the prime constraint faced by maize
farmers, others were; high cost of inputs, lack of frequent contact with extension agents and
the least was storage facilities. It is recommended that farmers should be encouraged to form
cooperative groups so that they can have access to credit which will enable farmers to
borrow and invest into their farm business. Also extension services should be enhanced
through provision of necessary logistics by the Local government. Farmers should also be
encouraged to buy seeds from seed companies to avoid adulteration of seeds.
Keywords: Perception, hybrid maize, farmers, extension activities, constraints.
JEL Classifications: Q12, Q16, C93
Introduction
Generally, agriculture has been recognized as the key to the wellbeing and economic
development of any country. It has remained the dominant occupation of the vast majority of
Nigerians especially, those who live in the rural areas, sustaining 90% and 70% of the rural
and total labour force, respectively (Nwosu, 2011). Maize is a popular cereal crop, also
known as corn and botanically identified as Zea mays and belongs to the grass family. Maize
is one of the major cereal crops grown in the guinea savannah zones of Nigeria. It is a
popular cereal crop cultivated for food, feed and fodder. It grows within temperature range of
10 - 400◦C, the optimum temperature being around 300
◦C.
Nigeria is currently the tenth largest producer of maize in the world, and the largest maize
producer in Africa (IITA, 2012). It is estimated that seventy percent of farmers are
smallholders accounting for 90 percent of total farm output (Cadini and Angelucci, 2013).

Dutse International Journal of Social and Economics Research Vol. 1, No. 1 June 2018
106
Maize crop started as a subsistence crop in Nigeria and has gradually risen to a commercial
crop on which many agro-based industries depend on as raw materials (Iken, and Amusa,
2014).
In recent times, hybrid maize production has been given widespread support among farmers
in Nigeria. Although, hybrid maize is renowned for its high demand for plant nutrients as
well as additional production inputs (Ayinde et al., 2011). They further added that the yield of
hybrid maize, differ from species to species, place to place and besides, it relies on the
availability of crucial factors such as soil nutrient status and application of fertilizer. Nearly
all farmers in developing countries like Nigeria, usually depends on the natural soil fertility
for crop production.
In view of the technicalities involved in the production of hybrid maize, the need for
agricultural extension agent to sensitize and teach farmers practical applications cannot be
over emphasized. Agricultural extension refers to the application of scientific research and
new knowledge to agricultural practices through farmers‘ education. The field of extension
now encompasses a wider range of communication and learning activities organized for rural
people by professionals from different disciplines. Extension activities are one of the most
important issues facing extension providers. However, despite the predictable high yield
derivable from hybrid maize, the national average grain yields of maize have fallen short
consistently of the potential yields (Alamu, 2001).
Even though, hybrid maize is grown extensively in many countries of the world, the farmers
have been taught with the belief that all details crucial for maximum production of hybrid
maize must be fulfilled, before the realization of the best possible income. As a result, the
extra cost of production discourages, a good number farmers engaging in hybrid maize
production in the country (Ayinde et al., 2011). Most farmers lack incentives for the use of
improved technologies. They harvest and threshed their crops manually at high cost and uses
crude method of production. This constitutes to low productivity in the crop production.
Inadequate supply of agricultural inputs which discourages the farmers from expanding the
scale of crop production, likewise the removal of subsidy on fertilizer by the government also
resulted in the no attainment of target production. Therefore based on this background, the
study intends to identify farmers‘ sources of seeds, assess their perceptions on extension
activities and identify the constraints faced by hybrid maize farmers.
Literature Review
Maize (Zea mays) belongs to the grass family plants, originated from centered America and
Mexico (Peru, Ecuador, Bolivia), first seen by Christopher in Columbus and his crew on 15th
November, 1492, Cuba where it is consumed by Indians. 50% of the world maize is done in
United State of America (USA) but about 80-90% of which is use to feed livestock (Eckebil
1994). Maize, one of the major staples in Nigeria, is one of the vital concerns to agricultural
policy decisions. Current maize production is about 8 million tonnes and its average yield is
1.5 tonnes per hectare. The average yield is lower compared to the world average of 4.3
tonnes/ha and to that from other African countries such as South Africa with 2.5 tonnes/ha
(FAO, 2009). There has been a growing gap between the demand for maize and its supply.
The stronger force of demand for maize relative to supply is evidenced in frequent rise in
price of maize and therefore, has great implication for the food security status and economic
development of the Nigerian economy.

Dutse International Journal of Social and Economics Research Vol. 1, No. 1 June 2018
107
In Nigeria, between 2004 and 2007, the quantity of maize produced ranged from 5,567,000
tonnes to 7,800 tonnes (FAO, 2008). Maize production in Nigeria has not been sufficient
enough to meet the needs of people and livestock. Supply has not been able to meet demand
despite the introduction of improved packages (Babatunde et al., 2008). International Institute
of Tropical Agriculture(IITA), (2009) reported that, the major limitations to the rapid
dissemination of newly released varieties included the unavailability of seeds in a commercial
quantity, lack of awareness of available varieties and hybrids, lack of access to credit
facilities by farmers, and the high relative price of seed. Also, sometimes monopolistic
distribution of seeds through a single intermediary, slow reimbursement of seed credit sales,
difficulty in getting access to other maize seed buyers, and low demand from farmers‘ lack of
awareness were identified. The demand for improved seeds was also relatively low, due
mainly to poor promotion and marketing efforts, high prices, and the inability of farmers to
purchase complementary inputs, especially fertilizer. Most rural areas are inaccessible due
largely to the poor roads, which often prevent extension staff from getting to the rural
communities.
In addition, farmers have their limitations to the adoption of improved seeds. According to
Kudi et al. (2011) Problems faced by farmers in the adoption of the improved maize varieties
are: lack capital, high cost of fertilizer which prevented them from using some of the
improved maize varieties, lack of market for produce was a major constraint that hinders
them from adopting the improved maize varieties. The analysis also revealed that high cost of
labour hinders them from adopting the improved maize varieties. Similarly a little percentage
of the respondents admitted that they lack extension contact prevent them from adopting the
technology.
METHODOLOGY
The Study Area:
The study was carried out in Giwa Local Government Area of Kaduna state, Nigeria. Giwa
Local Government is located between Latitude 11 0 and 12
0N and Longitude 7
0 and 8
0 E of
the Prime Meridian (Oguntolu, 2005). It is located north west of Zaria in the Northern Guinea
Savannah and about 640m above sea level. The Local Government is bounded in the North
by Funtua and Malumfashi Local Government Areas of Katsina State and on the West and
South by BirninGwari and Igabi Local Government Areas of Kaduna State respectively.
It has mean annual rainfall varies between 1100 and 1520mm and mean maximum ambient
temperature varies from 27-35oC, depending on the season. The average relative humidity
during wet season is about 72% and during harmattan period is about 21%. The Local
Government has an estimated population of about 286,427 (National Population Commission,
2006). There are 20 villages with 11 wards which include Giwa, Gangara, Shika, Yakawada,
Idasu, Kakangi, Kidandan, Galadimawa, Kadaga, Panhauya and Danmahawayi and 11
districts. Majority of the population engage in farming activities practices under traditional
technology (Oguntolu, 2005).
Sampling Procedure and Sample Size:
Purposive sampling was used to select five wards based on the intensity of maize production
in the study area. The wards were; Giwa, Shika, Galadima, Yakawada and Kidandan. The
population of maize farmers as obtained from the ward heads (Maianguwa) was 551. This
constitutes 113 maize farmers from Giwa ward, 110 from Shika, 121 from Galadimawa, 105
from Yakawada and 102 from Kidandan. Random sampling was used to select 110

Dutse International Journal of Social and Economics Research Vol. 1, No. 1 June 2018
108
respondents from these wards representing 20% of the population of farmers in the five
wards.
Method of Data Collection and Analytical Techniques:
Primary data were used for this study. Data were collected through the use of structured
questionnaire administered to the selected sample. Information collected include; farmers‘
sources of seeds, their perceptions on extension activities in the study area and the constraints
faced by hybrid maize farmers in the study area.
Descriptive statistics such as; percentages, mean, ranges were used to achieve the objectives
of the study. Five point likert scales was employed to assess the perceptions of the farmers by
assigning scores to the responses of the respondent. For example strongly agree ═ 5, agree ═
4, undecided ═ 3, disagree ═ 2, strongly disagree ═ 1
Results and Discussions
Farmers’ Sources of Seed:
The study indicated that 38% of the respondents bought their seeds from the market, about
33% sourced from agricultural institutes, nearly 26% of the respondents sourced from
previous harvest, and about 4% of the respondents sourced from seed companies (Table 1).
This implies that market is the major source of seed for the farmers in the study area.
Table 1: Distribution of respondents according to their sources of seeds
Source Frequency Percentage (%)
Market 42 38.2
Previous harvest 28 25.5
Agricultural Institute 36 32.7
Seed companies 4 3.6
Total 110 100
Source: Field survey, 2014
Perceptions of Farmers on Extension Activities: The result presented in Table 2 showed some perceptional statements which were validated
and presented to the respondents for their responses against a likert scale ranging from
strongly agree, agree, undecided, disagree to strongly disagree.
The result revealed that about 88% of the respondents agree that extension activities leads to
adoption of improved farm practice and about 12% strongly agree. This implies that majority
of the respondents (88%) perceived that extension activities leads to adoption of improved
farm practice. This could be due to activities of extension agent such as demonstration farms
which shows clear difference between improved farm practice and the usual farm practice.
―Agricultural extension by its nature has an important role in promoting the adoption of new
technologies and innovations‖ (Jamilah et al., 2010).
About 61% agreed that extension activities leads to increase in farm output and 39% strongly
agreed. The result indicated the most farmers (61%) perceived extension activities leads to
increase in farm output. About 81% agreed that extension activities lead to improvement in
livelihood, about 11% strongly agreed and about 8% were undecided. Hence, result revealed
that most (81%) of the respondent perceived extension activities lead to improvement in
livelihood. This could be due to increase in farm output where farmer may have more
produce for consumption and surplus to sell.

Dutse International Journal of Social and Economics Research Vol. 1, No. 1 June 2018
109
Nearly 75% agreed that extension activities lead to increase in income, about 18% strongly
agreed, about 6% undecided. From the result, majority (75%) perceived that extension
activities lead to increase in income; this could be due to the increase in farm output.
―Agricultural extension is responsible for technology transfer and it plays significant role in
increasing productivity, income and profit‖ (Luqman et al., 2004).
In addition, 50% of the respondents disagreed that extension activities leads to acquisition of
household assets, about 23% undecided, about 10% agreed and about 2% strongly agreed.
Therefore the research shows that more of the respondents (50%) perceived that extension
activities do not lead to acquisition of household assets. The result also indicated that 85% of
the respondents agreed that extension activities improve farmers‘ literacy level while about
15% strongly agreed. The result shows most of the respondents (85%) perceived that
extension activities lead to improve in farmers‘ literacy level.
The result showed that 85% of the respondents disagreed that extension activities leads to
acquisition of credit while 15% strongly disagreed. This shows that most of the respondents
(85%) perceived that extension activities do not lead to credit acquisition. The result in Table
2 indicated that the mean score values for ―strongly agree‖ was 15, ―agree‖ was 65.3,
―undecided‖ was 5.9, disagree was 21.1, while ―strongly disagree‖ was 2.7. ―Agree‖ has the
highest mean score of 65.3. This implies that most of the respondents have favourable
perception towards extension activities.
Table 2: Distribution of respondents according to their perceptions on extension activities
(N=110)
Perception SA A U D SD
Leads to adoption
of improved farm practice 13(11.8%) 97(88.2%) - - -
Leads to increase in farm
output 43(39.1%) 67(60.9%) - - -
Leads to improvement
in livelihood 12(10.9% ) 89(80.9%) 9(8.2%) - -
Leads to increase in income 20(18.2) 83(75.4%) 7(6.4%) - -
Acquisition of household
Assets - 28(10%) 25(22.7%) 5(50%) 2(1.8%)
Improves farmers literacy
Level 17(15.4%) 93(84.5%) - - -
Acquisition of credit - - - 93(84.5%) 17(15.4%)
Total 105 457 41 148 19
Mean score 15 65.3 5.9 21.1 2.7
* Percentages in parentheses Note: Strongly agree ═ 5, Agree ═ 4, Undecided ═ 3, Disagree ═ 2, Strongly
disagree ═ 1
Source: Field Survey, 2014
Constraints faced by maize farmers:
The study revealed lack of credit facilities as the major (25%) constraint faced by maize
farmers and closely followed by high cost of farm inputs with about 23% and lack of frequent
contact with extension workers as indicated by 19% of the respondents, then lack of full
knowledge on recommended agronomic practice with about 17% while lack of storage
fertilities was the least (Table 3). This implies that credit is very much needed by these
farmers in other to enable them purchase farm inputs that will help boast their yield.
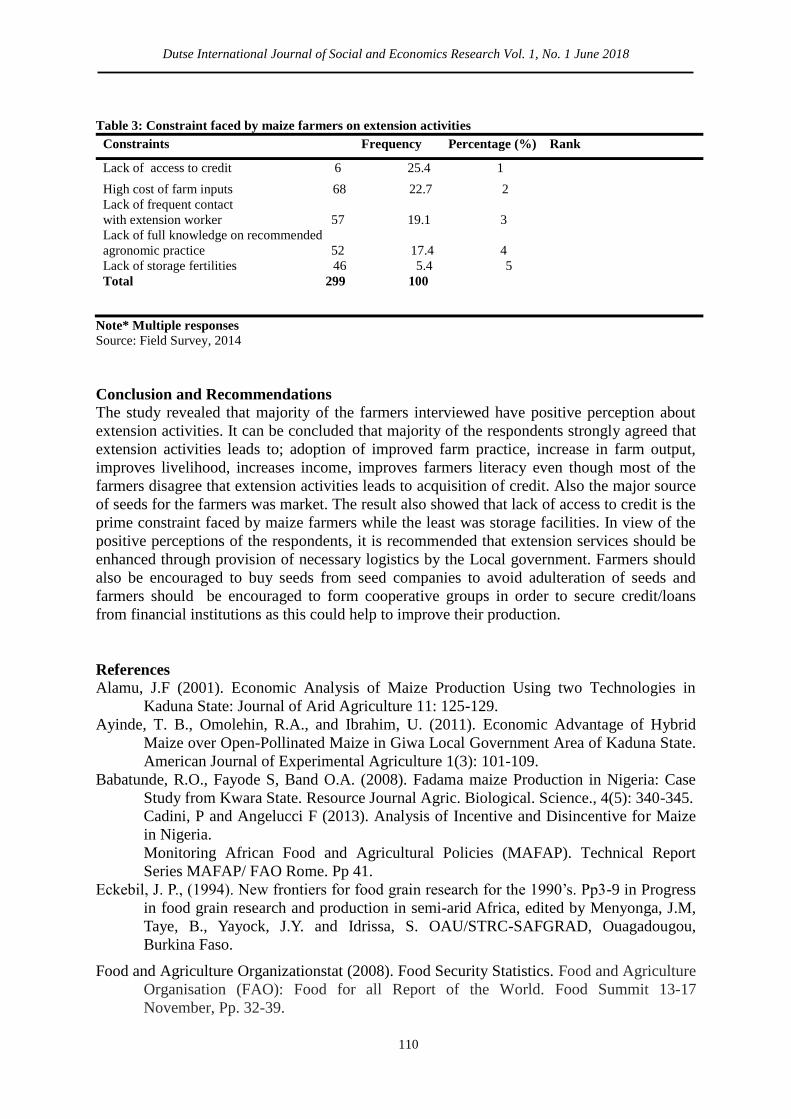
Dutse International Journal of Social and Economics Research Vol. 1, No. 1 June 2018
110
Table 3: Constraint faced by maize farmers on extension activities
Constraints Frequency Percentage (%) Rank
Lack of access to credit 6 25.4 1
High cost of farm inputs 68 22.7 2
Lack of frequent contact
with extension worker 57 19.1 3
Lack of full knowledge on recommended
agronomic practice 52 17.4 4
Lack of storage fertilities 46 5.4 5
Total 299 100
Note* Multiple responses
Source: Field Survey, 2014
Conclusion and Recommendations
The study revealed that majority of the farmers interviewed have positive perception about
extension activities. It can be concluded that majority of the respondents strongly agreed that
extension activities leads to; adoption of improved farm practice, increase in farm output,
improves livelihood, increases income, improves farmers literacy even though most of the
farmers disagree that extension activities leads to acquisition of credit. Also the major source
of seeds for the farmers was market. The result also showed that lack of access to credit is the
prime constraint faced by maize farmers while the least was storage facilities. In view of the
positive perceptions of the respondents, it is recommended that extension services should be
enhanced through provision of necessary logistics by the Local government. Farmers should
also be encouraged to buy seeds from seed companies to avoid adulteration of seeds and
farmers should be encouraged to form cooperative groups in order to secure credit/loans
from financial institutions as this could help to improve their production.
References Alamu, J.F (2001). Economic Analysis of Maize Production Using two Technologies in
Kaduna State: Journal of Arid Agriculture 11: 125-129.
Ayinde, T. B., Omolehin, R.A., and Ibrahim, U. (2011). Economic Advantage of Hybrid
Maize over Open-Pollinated Maize in Giwa Local Government Area of Kaduna State.
American Journal of Experimental Agriculture 1(3): 101-109.
Babatunde, R.O., Fayode S, Band O.A. (2008). Fadama maize Production in Nigeria: Case
Study from Kwara State. Resource Journal Agric. Biological. Science., 4(5): 340-345.
Cadini, P and Angelucci F (2013). Analysis of Incentive and Disincentive for Maize
in Nigeria.
Monitoring African Food and Agricultural Policies (MAFAP). Technical Report
Series MAFAP/ FAO Rome. Pp 41.
Eckebil, J. P., (1994). New frontiers for food grain research for the 1990‘s. Pp3-9 in Progress
in food grain research and production in semi-arid Africa, edited by Menyonga, J.M,
Taye, B., Yayock, J.Y. and Idrissa, S. OAU/STRC-SAFGRAD, Ouagadougou,
Burkina Faso.
Food and Agriculture Organizationstat (2008). Food Security Statistics. Food and Agriculture
Organisation (FAO): Food for all Report of the World. Food Summit 13-17
November, Pp. 32-39.

Dutse International Journal of Social and Economics Research Vol. 1, No. 1 June 2018
111
Food and Agriculture Organization (2009). FAOSTAT, Production
Statistics.http://faostat.fao.org/site/567/default.aspx#ancor (accessed April 2009).
Iken, J.E. and Amusa, N.A (2014) Maize research and production in Nigeria. Institute of
Agricultural Research and Training (IAR&T), Obafemi Awolowo University, PMB
5029, Moor Plantation, Ibadan. Nigeria. March 2004, PP 302-307.
Jamilah, O., Azril, S.H., Jegak, U., Asiah M. and Azman A.N. (2010). ―Can quality of
work life affect work performance among government agriculture extension officers?
A case from Malaysia‖. Journal of Social Sciences. 6: 64-73. DOI:
10.3844/jssp.2010.64.73.
Kudi, T. M., Bolaji, M., Akinola M. O. and Nasa‘I D. H. (2011). Analysis of adoption of
improved maize varieties among farmers in Kwara State, Nigeria. International
Journal of Peace and Development Studies Vol. 1(3), pp. 8-12, January
2011Available online at http://www.academicjournals.org/IJPDS.
Luqman, M., Ahmad, M. and, Javed, A. (2004). A Study into the effectiveness of public
sector extension after decentralization in district Muzaffargarh. Agric. Sci. J. Pakistan.
1: 68–70.
National Population Commission (NPC), (2006). National population Commission 2006.
Nwosu, I. E. (2011). ―Agricultural Development in Nigeria: A Conceptual Approach‖ In
Rural, Agricultural and Environmental Sociology in Nigeria. The Nigerian Rural
Sociology Association. Andkolad Publishers Nigeria Limited, Ibadan and Ile-Ife,
Nigeria. pp137
Oguntolu, O. W. (2005). Factors Affecting Participation of Out Growers in Certified
Hybrid Maize Seed Production in Giwa Local Government Area. Unpublished
M.sc Thesis, Ahmadu Bello University, Zaria, Nigeria.

Dutse International Journal of Social and Economics Research Vol. 1, No. 1 June 2018
112
An Assessment of Participation in “Gandu”
System of Farming in Giwa Local
Government Area of
Kaduna State, Nigeria.
1Shuaibu*, H.,
2Yakubu, D. H.,
3Oduehie, T. C.,
4Mamman, M.,
5Muhammad, M. B. and
1 Akor, R.
1Department of Agricultural Extension and Rural Development, Faculty of Agriculture,
Ahmadu Bello University/Institute for Agricultural Research, Zaria, Nigeria. 2Department of Agricultural Extension and Rural Development, Faculty of Agriculture,
Usmanu Danfodiyo University, Sokoto, Nigeria. 3National Agricultural Extension, Research and Liaison Services,
Ahmadu Bello University, Zaria, South-East Zonal Office, Umudike, Abia State, Nigeria. 4Department of Agricultural Economics and Extension, Faculty of Agriculture,
Federal University Dutsinma, Katsina State. 5Samaru College of Agriculture, Ahmadu Bello University, Zaria, Nigeria.
*Corresponding Author: [email protected]
Abstract: The study assessed participation in the Gandu system of Farming in Giwa Local
Government Area of Kaduna State, Nigeria. Simple random sampling was employed to select
five wards out of the 11 wards in the area. In each ward, two villages were randomly selected
and 12 farmers randomly selected from each village. Data were collected with the aid of
questionnaire randomly administered to the respondents and analysed using descriptive
statistics and logistic regression model. Results showed that a greater proportion (79.9%) of
the respondents were between age range of 20-49 years, about 84% married, and even
though 11.8% had no formal education up to 45.4% had tertiary level of education. About
70% of the respondents had household size above five members, high proportion (82%) had
no extension contact and majority (89.1%) are small scale farmers. Results further revealed
that about 72% of the farmer practice gandu system of farming and that age (β=0.050,
p<0.10), household size (β=0.098, p<0.10) and extension contact (β=3.712, p<0.10) were
the socioeconomic factors that influence farmers‘ participation in gandu system of farming.
Unwillingness of younger members of the family to participate in gandu farming and rural
urban migration were the major constrains that militate farmers participate in gandu system
of farming. It was therefore recommended that given the benefits of gandu system of reducing
cost incurred on hired labour and reducing land fragmentation, rural youths needs to be
enlightened and encouraged to remain in rural areas and assist their aging parents in
farming.
Keywords: participation, gandu, farmers.
JEL Classification: C83, Q12, Q24, Y1

Dutse International Journal of Social and Economics Research Vol. 1, No. 1 June 2018
113
Introduction
Agriculture is the main livelihood of the rural populace. It is the economic mainstay of the
majority of households in Nigeria and is significant in Nigeria‘s economy beyond oil, with
more than 70% of Nigerian‘s earning their living from agriculture and it provides among
others food, employment, income and foreign exchange, raw material for the manufacturing
sectors (FAO, 1999). It accounts for large share of the gross domestic product (GPD),
employs a large proportion of the economically active population, represents a major source
of foreign exchange and supplies the bulk of basic foods. The sector is also being transformed
by commercialization at the small, medium and large scale enterprise level (Olomola, 2007).
Nigeria‘s domestic economy is determined by agriculture which accounted for 40% of the
gross domestic product (GDP) in 2010 (CBN, 2011). Basically, it provides employment
opportunities for the teaming population, eradicates poverty and contribute to the growth of
the economy. Despite all these, the sector is characterized by low yield, low level of input
and limited area under cultivation (Izuchukwu, 2011).
According to the French Ministry of Agriculture, Agri-Food and Forestry (2014), gandu
farming is the most widespread form of agriculture, with 500 million family farms providing
the majority of jobs. Diarra and Monimart (2006) described gandu farming, also known as
Gandu (farm unit) as a system of farming in Northern Hausa communities of Nigeria which
is mostly practiced by crop farmers with the view of pooling resources together within a
farming unit for domestic production. Collective farm units known as Gandu are controlled
by the Mai Gandu, who organizes the agricultural work. The Gandu is a collective asset,
which is overseen by the Mai Gida (patriarch), who manages production so that everyone‘s
needs are met. Diarra and Monimart (2006) also posited that the gida has become a unit of
housing, production and consumption, which is the basic social unit in hausa communities: an
enclosure where one or more married men live with their households.
Family farms are operated units that derive most labor and enterprise from the farm family.
Gandu farming is different on account of the strong link between the family and the
production units.
The rural poor depends on agriculture for both their income and their food entitlement
(Blakeney, 2009). With 70% of the world‘s extremely poor and food insecure people living in
rural areas, the role of agriculture, which is predominant economic activity in rural areas, is
crucial in the eradication of poverty and food insecurity. Blakeney further stated that more
generally, in most countries with a high incidence of food insecurity, agriculture is the main
stay of the economy. In Nigeria and the world at large, there is increase in the demand for
food and other means of livelihood to meet up with the growing population. In a
predominantly agricultural society, the family unit has remained a fundamental element
underlying economic organization among the hausa. Large family groups appear traditionally
to have accorded high prestige throughout hausa land. But, evidence accumulating to suggest
that both their size and functions have declined. This tendency has been accompanied by a
more wisely recognized trend towards the individualization of lands tenure rights. Together,
these trends suggest a revolution in the social fabric of rural hausa land. It is therefore
imperative to assess participation in the gandu farming system in order to see possible ways
of revamping agriculture especially with falling oil prices worldwide. In view of this the
study set the following objectives;
i. Describe the socio-economic characteristics of farmers in the study area.
ii. Ascertain the rate of farmers‘ participation in Gandu system in the study area.
iii. Examine the factors influencing farmers in participation in Gandu system of farming.
iv. Identify the constraints to Gandu system of farming.
Dutse International Journal of Social and Economics Research Vol. 1, No. 1 June 2018
114
Literature Review
The ―gandu‖ system of farming is the earliest form of estate agriculture in hausa land and was
the basis of traditional agricultural production. The production process is carried out by all
members of the household within the extended family under the auspices of the ―Mai
Gandu‖. In other word it is a family farming unit whereby members of a kinship group
combine their farming operations under a common leadership and organization to form the
basis for a common unit of domestic economy (Yusuf, 2011). Mejia (2011) reported that the
gandu system of farming has three peculiar characteristics as follows:
i. Predominant use of labour,
ii. Limited access to land and capital, and
iii. Application of subsistence strategies based on multiple incomes.
The major farm-operating objectives of gandu farming are highlighted by FAO (1997) are:
household sustenance through production of food and fiber for household consumption; and
for profit maximization by producing as much as possible so that excesses are taken to the
market and sold for money.
Methodology
The study was carried out in Giwa local government area. It is situated in the plain of the
Northern part of Kaduna State. It lies between latitude 1102
1 and 11
050
1 North of the equator
and longitude 700
1and 7
05
1 East of Greenwich meridian. It is located in the transitional zone
between the Northern guinea and the Sudan savannah, and about 640m above sea level. Giwa
local government has an estimated projected population of about 286, 427 in 2015. Majority
of the population engage in farming activities practiced under traditional technology.
Examples of crops grown are Maize, Sorghum, Rice, Cowpea, Groundnut and vegetables.
Examples of animals reared include cattle, sheep, goat and chicken. The area is
predominantly rural and socio-politically made up of many ethnic groups mainly dominated
by Hausas. The farm economy of the area is characterized by small sized and fragmented
land holdings. Cultivation is done by traditional method using hoe, hand, cutlass, and
animals. Though tractor and other machines are used on large scale production. (Giwa Local
Government Secretarial, 2014).
Simple random sampling was employed in this study. Five wards were randomly selected
from of 11 wards in the area. The wards were Giwa, Shika, Yakawada, Kakangi and Gangara.
In each ward, two villages were randomly selected making a total of 10 villages. Twelve
respondents were randomly selected from each village to give a total sample size of 120
respondents. Primary data were collected with the aid of structured questionnaire. The
questionnaire was administered to the respondents in the study area with the help of
enumerators. Simple descriptive and inferential statistics were used to analyze the data
collected. Descriptive statistics such as frequencies, percentages and mean was used to
achieve objectives i, ii and iv and logistic regression model was used to analyze objective iii.
Logistic regression model:
A logistic regression model was used to analyze the determinants of participation i.e. factors
that influence the participation of the respondents in gandu farming in the study area. The
implicit form of the model is expressed below:
Zi = ß0 + ß1X1 + ß2X2 + ...... ßnXn + ųi............................................. (1)
Where;
ß0 = intercept

Dutse International Journal of Social and Economics Research Vol. 1, No. 1 June 2018
115
ß1, ß2 ……….. ßn = slopes of the equation
Xi = vector of relevant independent variable
ųi = error term
Z = participation (participant = 1, non-participant = 0)
Xi = Age (years)
X2 = Marital status (married = 2, Otherwise =1)
X3 = Educational qualification
X4 = Household size (Numbers)
X5 = Farm size (hectares)
X6 = Male children outside village (Numbers)
X7 = Extension contact (Number).
X8 = Average annual income
Results and Discussions
Socio Economic Characteristic of the Respondents:
The Socio-economic characteristics considered are age, marital status, educational
qualification, household size, main occupation, number of non-farm employment, number of
male children residing outside the village and number of extension contact. Table 1 shows
that majority (80%) of the respondent fall between the age range of 21-50 years, while 20%
were above 50 years of age. This result suggests that majority of the respondents were middle
aged and are within the age bracket in which people are innovative and active in work
(Asiabaka, 1998). Abdullahi et al. (2012) and Okwoche et al. (2012) also reported that age is
a factor that affects an individual‘s ability to make decisions and participate effectively in
farming operations. Table 1 also shows that 84% of the respondents are married while 16%
are not. According to Ugwoke et al. (2005) normally, young people in rural areas get married
earlier than their peers in urban zones and that rural youth become involved in adult
responsibilities before urban youths. Majority (88%) of the respondents had one form or the
other of formal education and could be considered as being educated (Table 1). This finding
agrees with the finding of Asogwa (2012) that majority of farmers have formal education.
Education plays a vital role in the economy of a society. According to Adegbola and
Gardebrock (2007), educated farmers are able to better process information, allocate input
more efficiently and more accurately assess the profitability of new technology, compared to
farmers with no education. Education enhances participation and helps to build confidence in
farmers (Odebode, 2012).
Still from Table 1, about 65% of the respondents had between 1-10 household members
while the remaining respondents had more than 10 members in the houses. The result could
positively influence participation in gandu as a reasonable percentage of the respondents have
large households (70% have more than five members per household). This is because
household constitute the labor force of the family and farmers with larger household size will
have less need for hired labor and by implication have less to borrow than farmers with
smaller household size (Ogungbile and Olukosi, 1999). Yusuf et al. (2011) also concluded in
their study that household size and participation are significantly related. The distribution of
the respondents by their farm size as shown in Table 1. The result show that 89% had farm
size 0.1-1.0 hectares, 8% had farm size between1.1-2.0 hectares 1% had farm size 2.1-
3.0hectares, and 2% has above 3hectares. The mean farm size from the result was 0.56
hectares indicating that most farmers have small farm land. This is expected, since most
farmers operate on relatively small scale (Ugwoke et al., 2005). These findings are similar to
the report of Mejia (2011) that Gandu farmers are known to be small scale farmers who

Dutse International Journal of Social and Economics Research Vol. 1, No. 1 June 2018
116
invest little in the way of capital into the farms. The main occupation of majority (85%) of
the respondents farming while 15% are into non-farming activities.
Table 1 further shows the number of male children of the respondents residing outside the
village. From the result, 49% of the respondents do not have male children away from home,
41% have 1-5 male children outside the village, and 8% have 6-10 while 0.2% have 11
above. This implies that majority of the respondents do not have male children residing
outside the village and this can therefore increase their participation in Gandu since more of
the labor is from the male members of the household. This is the line with the finding of Hill
(1972), that male adults contribute the bulk of the labor for the family unit. In terms of
extension contact, 82% had contact with extension agents and 19% did not have contact with
extension agents. This implies that a larger percentage (82%) of the respondents had contact
with extension agents and could be because of their proximity to many research institutes
(IAR, NAPRI, NAERLS) and therefore would have had the opportunity of being informed by
extension agents about improved agricultural technologies. This is in line with the findings of
Duflo and Udry (2004) that proximity to extension services appears to be correlated with the
farmers‘ adoption of productivity enhancing technologies. A major proportion (59%) of the
farmers have average annual income of ₦200,000 and below. Household income indicates
the ability of the household to purchase its basic needs for life.
Rate of Participation of Gandu System:
Table 2 below shows that majority (72%) of the respondents practice Gandu farming while
about 28% of the respondents do not practice Gandu farming. This implies that the most
prevalent system of farming in the study area is the Gandu farming system. Even though
young adults run away from faming, the result shows that there is still a high rate of
participation in Gandu farming in the study area. This could be because majority of the
farmers have farming as their main occupation and as such major source of livelihood and
also since labor is obtained from within the household there is less labour cost. Hazell et al.
(2007) describe small farms as those depending on household members for most of the labor
or those with a subsistence orientation, where the primary aim of the farm is to produce the
bulk of the household‘s consumption of staple foods.

Dutse International Journal of Social and Economics Research Vol. 1, No. 1 June 2018
117
Table 1: Socio-economic Characteristics of Farmers in the Study Area
Variables Frequency (n=119) Percentage
Age
20-29 41 34.5
30-39 31 26.1
40-49 23 19.2
50-59 12 10.1
60 and Above 12 10.1
Marital Status
Married 100 84.0
Otherwise 19 16.0
Educational Qualification
No formal education 14 11.8
Primary certificate 13 10.9
secondary certificate 38 31.9
Tertiary level 54 45.4
Household size
1-5 36 30.3
6-10 42 35.3
11-15 17 14.3
16-20 12 10.1
Above 20 12 10.1
Farm size
0.1-1.0 106 89.1
1.1-2.0 10 8.4
2.1-3.0 1 0.8
Above 3.0 2 1.7
Number of male children away from home
None 58 48.7
1-5 49 41.2
6-10 10 8.4
Above 10 2 0.2
Extension contact
Yes 97 81.5
No 22 18.5
Income level
<100,001 30 25.2
100,001-200,000 40 33.6
200,001-300,000 16 13.5
300,001-400,000 5 4.2
Above 400,000 28 23.5
Source: Field Survey, 2015
Table 2: Rate of Participation in Gandu System of Farming
Participation Frequency Percentage
Participant 73 71.6
Non-participant 29 28.4
Source: Field survey, 2015
Socio-Economic Factors Influencing participation in Gandu farming:
The result in Table 3 shows that eight variables were entered into the model, out of which
four variables (educational qualification, farm size, number of male children outside the
village and extension contact) were found to be negatively related to participation while the
remaining four variables (age, marital status, household size and average annual income)
were found to be positively related to participation. The implication is that a unit increase of
the variables with negative signs will lead to a reduction in the odds in favor of participating
in gandu farming activities while a unit increase of the variables with positive signs will

Dutse International Journal of Social and Economics Research Vol. 1, No. 1 June 2018
118
result in an increase of the odds in favor of participation. The findings further shows that age
(X1), household size (X4) and extension contact (X7) were the significant variables
influencing participation in Gandu. They were all significant at 10%. Age of the farmers was
significant and positively related to participation in gandu system of farming. This means that
an increase in age, will lead to an increase in the odds in favor of participation and vice-versa,
this is in line with the findings of Yusuf et al. (2011) that age is a factor that significantly
affect participation in gandu farming. Household size is also significant and shows positive or
direct relationship with participation in gandu. This implies that as household size increases,
the likelihood of participating in gandu also increases. This may be as a result of demand for
family labor in gandu system. Thus, the larger the household size, the more the family labor
is utilized. This is also similar to the findings of Yusuf et al. (2011) that household size
significantly affect participation in gandu farming.
Farm size is negatively related to participation in gandu, this means than an increase in size
of the farm land will result to a decrease in participation in gandu. This is contrary to
expectation. This may be attributed to the fact that almost half (45%) of the respondent have
been to tertiary institutions, and may have more opportunity for off-farm jobs/employment
which could translate to more income which the farmers could use for farm labour thereby
reducing the probability of engaging in gandu system of farming. Also, farmers with large
farm size are likely to adopt new technologies as they can afford to devote part of their land
to try new technologies unlike those with less farm size (Uaiene et al., 2009), thus adopting a
new technology can lead to deviation from gandu. The number of male children residing
outside the village is negatively related to participation in gandu, this implies that as more
male children or members of the family migrate out of the village, participation in gandu is
likely to decrease. This is because less number of male will remain and this will reduce the
labor available and hence reduce participation or practice of gandu as it depends largely on
family labor. Yusuf et al. (2011) had similar findings. Extension contact is negatively related
to participation in gandu, meaning that as extension contact increases, participation in gandu
is likely to decrease. This could be because the system is traditionally bound, therefore as
improved technologies are introduced, less people will be involved in gandu and may want to
practice a more mechanized form of agriculture on their individual farm lands, this is also in
line with findings of Yusuf et al. (2011).
Table 3: Factors Influencing Participation in Gandu System of Farming
Variables Coefficient Std. Error t-value
Age 0.050 0.028 1.786*
Marital status 0.854 0.635 1.345
Educational level -0.129 0.259 0.498
Household size 0.098 0.057 1.710*
Farm size -0.065 0.041 1.585
Number of male children away from home -0.123 0.121 1.017
Extension contact -1.100 0.571 1.926
Income level 0.000 0.000 0.000
Constant -3.737 1.512 2.472**
Source: Authors‘ computation
Constraints Militating against Participation in Gandu System of Farming:
Table 4 shows the distribution of constraints in descending order militating farmers‘
participation in gandu system of farming. About 66% of the farmers perceived that younger
members of the family have preference for autonomy to cultivate individual farms rather than
collective participation in gandu system. They believe that the younger farmers want
autonomy in deciding what to plant rather been imposed on them. This may encourage
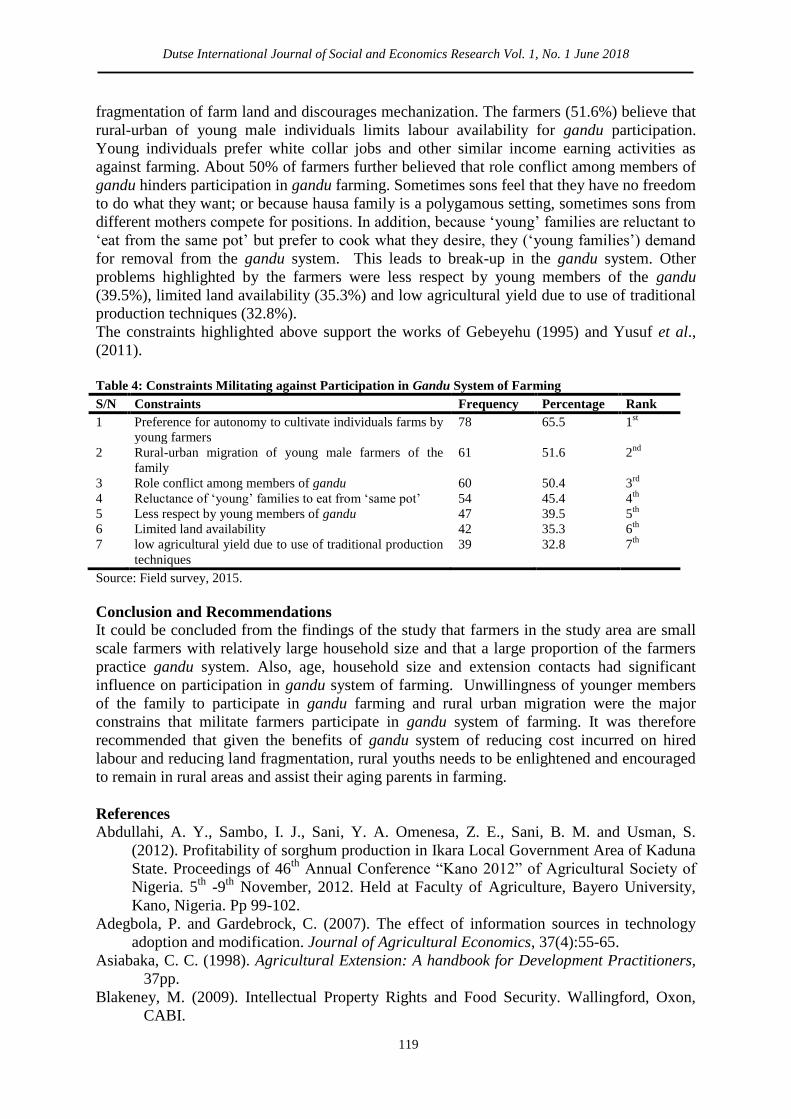
Dutse International Journal of Social and Economics Research Vol. 1, No. 1 June 2018
119
fragmentation of farm land and discourages mechanization. The farmers (51.6%) believe that
rural-urban of young male individuals limits labour availability for gandu participation.
Young individuals prefer white collar jobs and other similar income earning activities as
against farming. About 50% of farmers further believed that role conflict among members of
gandu hinders participation in gandu farming. Sometimes sons feel that they have no freedom
to do what they want; or because hausa family is a polygamous setting, sometimes sons from
different mothers compete for positions. In addition, because ‗young‘ families are reluctant to
‗eat from the same pot‘ but prefer to cook what they desire, they (‗young families‘) demand
for removal from the gandu system. This leads to break-up in the gandu system. Other
problems highlighted by the farmers were less respect by young members of the gandu
(39.5%), limited land availability (35.3%) and low agricultural yield due to use of traditional
production techniques (32.8%).
The constraints highlighted above support the works of Gebeyehu (1995) and Yusuf et al.,
(2011).
Table 4: Constraints Militating against Participation in Gandu System of Farming
S/N Constraints Frequency Percentage Rank
1 Preference for autonomy to cultivate individuals farms by
young farmers
78 65.5 1st
2 Rural-urban migration of young male farmers of the
family
61 51.6 2nd
3 Role conflict among members of gandu 60 50.4 3rd
4 Reluctance of ‗young‘ families to eat from ‗same pot‘ 54 45.4 4th
5 Less respect by young members of gandu 47 39.5 5th
6 Limited land availability 42 35.3 6th
7 low agricultural yield due to use of traditional production
techniques
39 32.8 7th
Source: Field survey, 2015.
Conclusion and Recommendations
It could be concluded from the findings of the study that farmers in the study area are small
scale farmers with relatively large household size and that a large proportion of the farmers
practice gandu system. Also, age, household size and extension contacts had significant
influence on participation in gandu system of farming. Unwillingness of younger members
of the family to participate in gandu farming and rural urban migration were the major
constrains that militate farmers participate in gandu system of farming. It was therefore
recommended that given the benefits of gandu system of reducing cost incurred on hired
labour and reducing land fragmentation, rural youths needs to be enlightened and encouraged
to remain in rural areas and assist their aging parents in farming.
References
Abdullahi, A. Y., Sambo, I. J., Sani, Y. A. Omenesa, Z. E., Sani, B. M. and Usman, S.
(2012). Profitability of sorghum production in Ikara Local Government Area of Kaduna
State. Proceedings of 46th
Annual Conference ―Kano 2012‖ of Agricultural Society of
Nigeria. 5th
-9th
November, 2012. Held at Faculty of Agriculture, Bayero University,
Kano, Nigeria. Pp 99-102.
Adegbola, P. and Gardebrock, C. (2007). The effect of information sources in technology
adoption and modification. Journal of Agricultural Economics, 37(4):55-65.
Asiabaka, C. C. (1998). Agricultural Extension: A handbook for Development Practitioners,
37pp.
Blakeney, M. (2009). Intellectual Property Rights and Food Security. Wallingford, Oxon,
CABI.

Dutse International Journal of Social and Economics Research Vol. 1, No. 1 June 2018
120
Central Bank of Nigeria (CBN) (2011). Agricultural Credit Guarantee Scheme Fund. Annual
Report and Statement of Accounts, CBN Publication. Abuja, Nigeria.
Diarra, M and Monimart, M. (2006). Landless women, hopeless women? Gender, land and
decentralization in Niger. Issue paper no. 143.
Duflo, E. and Udry, C. R. (2004). Intra-household Resource Allocation in Cote d‘Ivoire:
Social Norms Separate Accounts and Consumptions Choices, Working Paper.
Ellis, F. and Freeman, H. (2004). Rural livelihoods and poverty reduction strategies in four
African countries. Journal of Development Studies, 40(4):1-30.
Food and Agriculture Organisation (1997). Household Goals, Farm Planning Objectives
System and Performance Criteria. Food and Agriculture Organisation of the United
Nations.
Food and Agriculture Organisation (1999). North and South Gender Food Security
Assessment in parts of the Tekez River Watershed. United Nation Development
Programme, Emergencies Unit for Ethiopia Mission. 26th
May – 7th
June, 1999, Addis
Ababa, Ethiopia.
Gebeyehu, Y. (1995). Population pressure, agricultural land fragmentation and land use: A
case study of Dale and Shashemene Weredas, Southern Ethiopia. Proceedings of the
4th
Annual Conference on the Ethiopian Economy, Addis Ababa.
Hazell, P., Poulton, C., Wiggins, S. and Dorward, A. (2007). The future of small farms for
poverty reduction and growth. International Food Research Institute (IFPRI) 2020
Discussion Paper 42, May 2007. Washington D. C.: IFPRI.
Hill, P. (1972). Rural hausa: A village and a setting. Cambridge University Press.
Izuchukwu, O. (2011). Analysis of the contribution of agricultural sector on the Nigeria
economic development. World Review of Business Research, 1(1):191-200.
Mejia, R. (2011). Theory through practice: A Historical Cultural Studies. In: McCarthy, C.
Greenhalgh-Spencer, H. and Mejia, R. (Eds.), New Times: Making Sense of
Critical/Cultural Theory in a Digital Age. New York: Peter Lang. pp23-50.
Odebode, S. O. (2012). Gender Issues in Agricultural Extension and Rural Development in
Nigeria. Rural Development- Contemporary Issues and Practices. 139-156.
http://www.intechopen.com Ogunmefun, S. O. and Achike, A. I. (2015). Socioeconomic characteristics of rural farmers and
problems associated with the use of informal insurance measures in Odogbolu Local
Governemnt Area Ogun State, Nigeria. Researchers Department of Agricultural Economics,
University of Nigeria, Nsukka, Enugu State, Nigeria. RJOAS, 2:38-51.
Okwoche, V. A., Chukwudi, B. P. and Asegwa, O. C (2012). Agricultural information utilization
among rural sorghum farmers in Benue State of Nigeria. http://www.europeonjournalofscientificresearch.com
Olomila, U. (2007). Competition issues in the Agricultural sector in Nigeria. Invited paper presented
at the regional conference of the 7up project-capacity building on competition policy in
selected countries of Eastern and Southern Africa organized by the AHA Ethiopian consumer
protection association and consumer unity and Trust Society (CUTS), International, India,
Held in Hilton Hotel, Addis Ababa, Ethiopia.
Uaiene, R. N., Arndt, C.., Master, W. A. (2009). Determinant of Agricultural Technology Adoption in
Mozambique. Ministry of Planning and Development, Republic of Mozambique. Discussion
Paper No. 67E.
Ugwoke, F. O., Adesope, O. M. and Ibe, F. C. (2005). Youths‘ participation in Farming Activities in
Rural Areas of Imo State, Nigeria: Implications for Extension. Journal of Agricultural
Extension, 8
Yusuf, H. A., Omokore, D. F., Akinola, M. O. and Omolehin, R. A. (2011). Socio-economic
characteristics influencing farm household participation in gandu system in Charanchi L.G.A.
of Katsina State, Nigeria. Journal of Agricultural Extension and Rural Development.
3(12):220-223.

Dutse International Journal of Social and Economics Research Vol. 1, No. 1 June 2018
121
Modelling of Public Debt and its Impact
on Nigerian Economy
*Aminu M. Fagge1, Murtala Abdu
2 and Abdullahi D. Marmara
3
123Department of Economics and Development Studies,
Federal University Dutse.
*Corresponding Author‘s Email: [email protected]
Abstract: Public debt has become a crucial issue in recent times especially with the observed
instability in oil price (which account for 70% of governmental revenue in Nigeria), its
attendant consequences on the foreign reserve as well as the exchange rate. The main aim of
this study is to develop a small macro- econometric model of the Nigerian economy that will
serve as a scientific tool for examining the dynamic interrelationship between public debts,
debt services, interest rate and economic growth. In this regard, this study develops the small
macro- econometric model of the Nigerian economy which served as a scientific tool in
examining the dynamic interrelationship among the variables in the study.An Autoregressive
Distributed Lag (ARDL) model and its resultant Error Correction Model (ECM) were
employed to capture theeffect of domestic debt, external debt, interest rates (indicator of
monetary/stabilization policy) and total debt services on real GDP(the measure of economic
growth). The computed short-runelasticities indicatethat,while total debt servicinghas
negative effect on real GDP, both external and domestic debt have positive effect, thus,
indicating a crowding-in effect of domestic debt. However, interest rate which captures the
effectof monetary/stabilization policy in the model found to have a positive effect on real
GDP. The study recommends that government should put in place appropriate measures that
would help to lower the cost of debt servicing and keep the domestic borrowing (short-term
debt) at a required threshold and finally the borrowed funds should be used for productive
expenditure.
Keywords: Public Debt, ARDL, Debt Service, Nigerian Economy.
JEL Classifications: H63, C53, H69, H00
1.0 Introduction
Public debt has become a crucial issue in recent times especially with the observed instability
in oil price (which account for 70% of governmental revenue in Nigeria), its attendant
consequences on the foreign reserve as well as the exchange rate. The frequent attacks on oil
and gas installations often aggravate the problems resulting in drop of oil production and
eventually making it difficult for the country to meet its daily quota of 2.2 million barrel per
day (bpd)(National Bureau of Statistics, 2016)(NBS). This necessitated the need for
borrowing to meet the budgetary requirements by the policy makers.
The main objective of public debt management is to ensure that the Federal Government‘s
financing needs were met at minimal cost and risk, through sourcing of funds from both
external and domestic sources. Nigeria‘s total public debt outstanding as at the end of
December, 2015 stood at N12, 603,705.28 million (US$65,428.53 million) compared to N11,
243,120.22 million(US$67,726.28 million) in 2014, representing an increase of N1,
360,585.06 million or 12 percent. The external debt increased to N2,111,530.71 million
(US$10,718.43 millions), while domestic debt stood at N10,492,174.57 million
Dutse International Journal of Social and Economics Research Vol. 1, No. 1 June 2018
122
(US$54,710.10 millions).The domestic debt stock comprised securitized Federal Government
of Nigeria‘s debt of N8,836,995.86 million (US$44,857.85 millions) (Debt Management
Office, 2016. p. 11)(DMO).
The external debt service wasUS$331.06 million as at end of December, 2015, compared to
US$346.72 million as at end of December, 2014, representing a decrease of US$15.66
million or 4.52 percent. While the domestic debt service as at the end of December, 2015,
was N1, 018.13 billion compared to N865.81 billion in the corresponding period of 2014,
representing an increase of N152.32 billion or 17.59 percent (DMO, 2016).
Therehas been a view that repayment of domestic debt will not make much harm to the
economy in that it is mere transfer of fund to the local debtors. On the other hand, higher
interest rate (tight monetary policy) increases the cost of debt servicing as such the
economyfaced with the high risk ofbecoming more vulnerable (see Peter, 2005; Vieira,
2000). But Peter (2005) and Chowding (1994) viewed that theexternal debt servicing is
nothing more than a capital flight.
In Nigeria, most of the studies on foreign debt have largely focused on describing the causes,
magnitude and sustainability of the debt. Some of these studies include:(Adebiyi
&Olowookere, 2013; Akperan (n.d); Charles, 2012;Iyoha 1999; obadan, 2002; Olalekan,
2012;Ozurumba, Anayochukwu, & Success, 2014; Udoka&Ogege, 2012 ).
Nonetheless, the issue of concern is not the debt outstanding itself but also thepossible
effectsof the amount of resources and compounding interest rate required in servicing such
debts and their possible consequenceson general performance of the economy. For instance,
in Nigeria reports shows that the original loans from Paris Club creditors amounted to just
US$16.7 billion, accumulated by a succession of authoritarian regimes between 1964 and
1990. Since 1985, Nigeria has paid Paris Club creditors US$11.6 billion in debt service. Even
so, Paris Club debt stood at US$14 billion higher than the total original amount as of time of
the report, not because of new loans but because Nigeria was unable or unwilling, to meet
the full costs of servicing its debts over the years and therefore accumulated massive arrears
and penalties more especially during 1990s (DMO, 2005).Iyoha (1999) maintained similar
view when he observed that the accumulation of debt service arrears which is being
compounded by penalty interest has not permitted reduction in the debt stock, despite the fact
that government has been servicing it external debt annually. Such situation may adversely
affect the government‘s fiscal solvency and consequently macroeconomics stability which
justifies an argumentposed byPeter (2005).
The main aim of this study is to develop a small macro- econometric model of the Nigerian
economy that will serve as a scientific tool for examining the dynamic interrelationship
between public debts, debt services, interest rate and economic growth. This will be
accomplished byfinding out the impact of external and domestic debt, debt services and
interest rate on the real GDP as well as drawing the policy implications for thepublic debt.
The rest of the study structured as follows:Section 2 provides a brief review of the empirical
literature.Section 3 describes the econometric techniquesused to examine the dynamic
relationship among the variables under study. Adescription of the data used in this paper is
also provided in the section.Section 4 is devoted to the presentation and discussion of
empirical results.Finally, the conclusion and policy recommendations are made in section 5
of the paper.

Dutse International Journal of Social and Economics Research Vol. 1, No. 1 June 2018
123
2.0 Review of Related Literature
Many studies have been conducted on public debt and its impact on the economy of different
countries in Africa including Nigeria. More recently, the impact of different types of
domestic debt on economic growth of Nigeria was studied by Benedict and Success (2014),
using multiple regression technique, the outcome indicates that in the short run, FGN Bond
proved to have a positive significant relationship with economic growth, while Development
stock maintained a significant negative relationship. In the long run, Treasury Bills and the
lagged value of GDP (in the second year), taken as independent variables were found to be
positively significant. Result of the Granger causality test revealed that, while there is a
unidirectional relationship between economic growth and FGN Bonds on one hand, there is a
bidirectional relationship between Treasury bills and economic growth on the other hand. The
study, therefore recommends that, it is not a bad idea after all borrowing from within, since
debt could be deployed to good purposes. However, the rule of thumb is that the returns (for a
business) and societal welfare (in the case of a government) derivable from deploying the
funds generated from the loans mustsurpass the interest being paid on such loan. As a way
out of the woods, government must undertake an aggressive cut-down of her bogus /
burgeoning recurrent expenditure which is over 70% of the total expenditure profile. This
will help free up the much-needed savings for infrastructural development. The study further
recommends that the Nigerian government should stop accumulating unproductive debts that
have no positive multiplier effect. If at all she must borrow from within, then such loans must
be tied to some specific, viable and growth enhancing projects that could pay its way through.
Another study carried by Udoka and Ogege (2012), employed the error correction framework
and co-integration techniques to test the relationship between per-capita gross domestic
product and macroeconomics variables, and the study also examined the extent of public debt
crisis and its consequences on economic development using data from Nigerian economy for
the period 1970 to 2010. They concluded that in order to avoid the crisis of economic
development in Nigeria public debt should be reduced to a minimal level.
Charles (2012) investigates the relationship between domestic debt and economic growth in
Nigeria. Error Correction and parsimonious models were used to analyze quarterly data
between 1994 and 2008.The result shows that the domestic debt holding of government is far
above a healthy threshold of 35 percent of bank deposit as the average over the period of
study is 114.98 percent of bank deposit presenting evidence of crowding out of private
investments. The study also affirms that the level of debt has negative effect on economic
growth. Government should maintain a debt- bank deposit ratio below 35 percent, resort to
increase use of tax revenue to finance its projects and divest itself of all projects the private
sector can handle while providing enabling environment for private sector investors such as
tax holidays, subsidies, guarantees and most importantly improved infrastructure.
In his paper, Olalekan (2012), focuses on the impact of public debt on economic growth
using Nigeria as a case study. An analysis of the long-run relationship and impact of debt
from the perspective of the value impact and proportional impact was done. An augmented
Cobb Douglas model was used and subsequently a dynamic version of the functional
relationship was estimated using Co-integration technique to capture the long-run impact of
debt variables on economic growth. The result showed that the joint impact of debt on
economic growth is negative and quite significant in the long-run though in the short-run the
impact of borrowed funds and coefficient of budget deficit is positive. The conclusion from
the study was that, though in the short-run the impact of borrowed fund on the Nigerian
Dutse International Journal of Social and Economics Research Vol. 1, No. 1 June 2018
124
economy was positive, the impact of debt in the long-run depressed economic growth as a
result of incompetent debt management.
To investigates the implications of debt on the economic growth and development. The
Ordinary Least Squares Method (OLS) was used by Adebiyi and Olowookere (2013) in
analyzing the time series data extracted from CBN statistical bulletin and Debt Management
Office in Nigeria between 1990 and 2011. The result shows that the debt holding of
government far above certain healthy threshold has negative effect on economic growth and
recommended that the establishment of the Debt Management Office should be seen as a
positive step towards enhancing the efficiency of debt management and the effectiveness of
monetary policy.
Other pioneering studies like Akperan (n.d) used analytical method to examine the interaction
between external debt and economic growth, and analyses of the sustainability of Nigeria‘s
foreign debt. Their findings show that the effect of external debt on growth is negative. They
also viewed that the role of debt overhang in precipitating debt crisis is crucial and concluded
that Nigerian debt situation is highly unsustainable.
Iyoha (1999) examined the causes of Africa‘s debt problems and Nigeria in particular and
concluded that Nigeria, like most other less developed countries (LDCs) has been classified
by the World Bank among the severely indebted low income countries since 1992. The nation
inabilities to meets the entire debt servicing obligation constitute one of the factors that slow
the inflow of external resources into the economy. The accumulation of debt service arrears
which is being compounded with penalty interest has not permitted reduction in the debt
stock, despite the fact that government has been servicing it external debt annually.
According to Olukole (1991), a sustainable foreign borrowing is measured by several ratios,
such as debt to export, debt service to export, debt to GDP (or GNP), and external debt to
Gross National Income among others. However, the determination of the sustainable level of
these ratios is indeterminable and their usefulness is reduced to a warning of potential
explosive growth in the stock of foreign debt. He added that, if the acquisition of additional
foreign debt increases the debt servicing burden more than it increases the country‘s capacity
to bear the burden, such an acquisition becomes undesirable and the situation must be
reversed through export expansion. If export is not expanded, more borrowing will be
necessitated for servicing debt and external debt will pile up above the country‘s capacity to
bear.
Essien and Onwioduokit (2002) analyzed the African external debt problem with reference to
Nigeria and Morocco. They concluded that external debt has affected investment severely.
Other findings include the fact that fiscal expenditure, balance of payments, and global
interest rates are major factors explaining debt accumulation in the studied countries. He,
therefore, suggests measures that could alleviate the above problems (privatization, sustained
export promotion program, and restructuring and development of capital markets, among
others).
Fasipe and Akintayo (1989), the empirical study declared that there is a unidirectional and
positive causal relationship between foreign debt service and GDP growth after excluding
exports revenue growth for Africa and South of Saharan countries during 1983-1990.
In yet another study showing aninsight from cross-country regression analysis by Okonjo-
Iwela (2001) on the impact of aid and external debt in growth and investment the regression

Dutse International Journal of Social and Economics Research Vol. 1, No. 1 June 2018
125
result were suggestive of a series of interesting relationships. This then is to say as a result of
the explanatory regression there is quite strong evidence of positive impact of aid both on the
growth rate in GDP per capital and the investment rate.
Finally,Chowding (1994) argued that, external debt burden leads to bad management in
highly indebted countries such as exchange rate mismanagement. The expectation of
currency devaluation leads to speculative capital flight. Devaluation also causes the currency
cost of debt service obligations, deteriorates budget deficit and affect money supply and
inflation.
3.0 Methodology
Methodologically, most of the above studies including (Charles, 2012; Olalekan, 2012;
Udoka and Ogege, 2012)resorted to test for co-integration within VAR framework
(Johansson co-integration technique)and ended up estimatinga single equationeven
whenmore than one co-integrating vectors were discovered.Unless appropriate techniques
were considered, such results might have been suspected to havesuffered a feedback problem.
This study takes in to account such a problem in its analysis, likewise, the possibility of
structural break was also considered when conducting the unit root test.
3.1 Data Description and Source
This paper used annual time series data of Nigeria for the period of 1970-2015.Thus, data on
Real Gross Domestic Product (RGDP), external debt (ED), domestic debt (DD), external debt
services (EDS), domestic debt services (DDS) and rate of interest (R) were obtained from the
central bank of Nigeria (CBN) Statistical Bulletin (2016).
3.2 Model Specification
This study adopted the empirical model (model 2) of Olalekan (2012)where the augmented
production function has been adoptedbut in contrast the variables were not measured in
proportion to GDP. It had been observed that with large debt stock the sensitivity of
government‘s budget to change in interest rate affect macroeconomic stability. Peter (2012)
maintained that interest rate affects the economic performance negatively in that it restricts
the central bank from adopting a right stabilization policy (contractionary monetary policy) at
the time of inflation. This justified the inclusion of interest rate toto capture the effect of tight
monetary policy in the model. In addition, to avoid a misleading results as already mentioned
in preceding sections, this study has taken in to account the effect of structural break in the
series while testing for unit root. Thus, the study followsZivot and Andrews(1992), Banerjee
et al. (1992), Vogelsang and Perron(1998) and assume the break is determined endogenously
from the data.Of all the series however,LTDS found to be a stationary at level with a trend
break in 1994.
The summary statistics for all the variables were also observed (see appendix 1, table 1a) so
as to ensure the appropriate specification of the model.The mean for real GDP, total debt
service, external debt, domestic debt, and interest rate is 310737.5, 138749.0,
796821.4,1022950, and 0.111059respectively. This indicates that thevariables exhibit
significant variation in terms of magnitude, suggesting thatestimation in levels may result in
mis-specification vis-à-vis a wrong functional form. Also the Jarque-Berastatistic for all the
variables, except for real GDP and interest rateis also significant; hence we reject the null
hypothesis that the series are normally distributed. Therefore, the following model is
considered and expressed in semi- logarithmic multiple regression form:

Dutse International Journal of Social and Economics Research Vol. 1, No. 1 June 2018
126
lnRGDPt= α0 + α1lnTDSt + α2lnEDt+ α3lnDDt + α4Rt+ α5D94+ εt
……………………….(1) Where: lnRGDP is the log ofreal GDP per capita,lnTDS is the log of total debt servicing (due
to unavailability of disaggregated data on domestic debt service the total debt service is
consider),lnED is the log of external debt,lnDD is the log of domestic debt, R is the lending
rate(during inflation CBN is expected to adopt a contractionary monetary policy and rise
interest rate and higher interest rate accumulates the debt arrears as mentioned earlier, as a
result government will find it difficult to take the right decision for fear of fiscal insolvency,
therefore, high interest rate is expected to have negative impact on the economy) and D94 is
the dummy variable taken value of one at 94 and zeros elsewhere which is included to
account for break in the series. Thus, the expected signs of the parameters are as follows:
α1<0, α2> 0, α3> 0, α4<0.
3.3 ARDL Model Specifications
To examines the dynamic relationship among the variables of interest which include external
and domestic debt, debt services, interest rate and economic growth in Nigeria,
Autoregressive Distributed Lag,ARDL (p,q1,q2,q3,q4) approach to co-integration and its
associate bound-testing technique is adopted as proposed by Pesaran and Shin (1999) and
Pesaran et al. (2001).This choice becomes necessary because the variables in the model
aremixture of I(0) and I(1) data set.It is also extensively chosen over the Johansen Maximum
Likelihood (JML) in macroeconomics modellingmore in a more complicated situation where
some of the variable are fractionally integrated (Giles, 2013). Lastly, the ARDL approach is
acknowledged for its ability to incorporate both stationary and non-stationary series into a
data coherent equationas in case of this study.
Thus, the above model can be presented in the form of ARDL (p,q1,q2,q3,q4) as follows:
ΔlnRGDPt= α0 + Σα1ΔlnRGDPt-i+ Σα2Δln TDSt-i+ Σα3ΔlnEDt-i+ Σα4Δln DDt-i+ Σα5ΔRt-i
+ α6lnRGDPt-i+α7lnTDSt-i+α8lnDDSt-i+α9lnEDSt-i+α10Rt-
i+α11D94+……………………….…. (2)
From equation (2) above, the terms with the summation and difference notation capture the
short-run dynamics of the model, whereas other terms represent the long run relationship.
The ARDL process begins with a test of the presence of a long-run or level relationship
amongst the variables (irrespective of their order of integration) usingthe bounds testing
procedure of Pesaranet al (2001). The bounds testing procedure wasbased on the F-statistics
and is a joint significance test of the null hypothesis of noco-integration/long-run
relationship (Ho: α6 = α7 = α8 = α9= α10 = 0). If the F-calculatedstatistic exceeds the upper
critical value tabulated by Pesaranet al (2001), then the null hypothesis of no long-run
relationship can be rejected regardless of the order of integration of thevariables. If, however,
the test statistics falls within the bounds, then the test becomesinconclusive. A test statistic
that is below the lower critical bounds value would suggestthat there is no co-
integration/long-run relationship.
The appropriate model can be selected using model selection criteria like Schwartz-Bayesian
Criteria (SBC) and Akaike Information Criteria (AIC). AIC is known for selecting the
maximum relevant lag length and therefore adopted in this study so as to avoid the problem
of under fitting. Once there is a long-run relationship between the variables then there exists
an error correction representation. Therefore, in the third step, the error correction model is

Dutse International Journal of Social and Economics Research Vol. 1, No. 1 June 2018
127
estimated and it indicates the speed of adjustment back to the long-run equilibrium after a
short-run shock.Thus, ECM representation of Eq. (2) is formulated as follows:
ΔlnRGDPt= α0 + Σα1Δln RGDPt-i+ Σα2Δln TDSt-i+ Σα3Δln EDt-i+ Σα4Δln DDt-i+ Σα5ΔRt-i
+ α6ΔD94 + λECt-1 +
ut………………………………………………………………………….(3)
Where λ is the speed-of-adjustment parameter and EC represents the residuals that are
obtained from the estimated co-integration model of Eq. (3).
To ascertain the goodness of fit of the ARDL model, the diagnostic and stability test were
conducted. The diagnostic tests examine the serial correlation, normality and
Heteroscedasticity associated with the model. The stability test of thecoefficients of the
regression parameters is alsoundertaken using cumulative sum of recursive residuals
(CUSUM).
4.0 Findings and Discussion of Results
Using the Augmented Dickey-Fuller test, all the series are found to be integrated of order one
i.e.I(1), although some of the variables such as (interest rate (R) and log total debt service
(lnTDS)) show the tendency to be stationary at level, however, this is only possible at 10%
level of significance. It is argued that with structural break the ADF-test is misleadingPerron
(1998). In thisresearch one break point test is considered as the graphical examination of the
series shows the possibility of a single break if any; the small sample of the study also
justified the choice to consider a one break test. LTDS is found to be a stationary at level with
a break in trend in 1994(this means that ADF havebiased the result upward).All the results
from stationarity test presented in (Table 1, Appendix 1). The above unit root tests itis
ensured thatnone of the series is integrated of order two i.e.I(2), which is one of the
prerequisite for applying the bound-test approach ( see assumption one through four
inPesaran et al. (2001)) and therefore we conclude that ARDL is appropriate.
Equation (2) is estimated using an ARDL (4,2,2,0,4) procedures as selected by AIC(see
appendix1) and the result is presented along with its diagnostic test for both the statistical and
econometric criteria in table (1) and (2) below.
Table1: Autoregressive Distributed Lag ARDL(4,2,2,0,4) selected based on AIC
Dependent variable is lRGDP
R-Squared 0.99
F-stat. F(817.8530) [.000]
DW-statistic 1.89
AIC -0.86
Source: Authors’ computation using Eviews-9
Table 2: Diagnostic Tests
LM Test Statistics
A.Serial(1)=0.93031[0.335]B. Normality:3.159[0.2062]
C. HeteroscedasticityX^2(1)=11.62 [0.8664]
Source: Authors’ computation using Eviews-9
A: Lagrange multiplier test of residual serial correlation
B: Jarque-Bera
C: Breusch-Pagan-Godfrey
Based on statistical criterion, the model is satisfactory as R-square value of 0.99 means that
99% of the total variation of dependent variable is captured by explanatory variables in the
model. The F-statistics which measure the joint significance of all the regressors of the model

Dutse International Journal of Social and Economics Research Vol. 1, No. 1 June 2018
128
is also highly significance with 817.85 Chi-square values and 0.000 as probability.From the
econometrics point of view the model is also satisfactory as Durbin Watson statistics (DW) of
1.89 is approximatedto its conventional value of 2. Similarly, the model passes all the other
diagnostic tests for, normality with(3.159[0.2062] as chi-square and its corresponding
probability), autocorrelation with(0.93031[0.335] as chi-square and its corresponding
probability), and heterosdasticity with(11.62 [0.8664] as chi-square and its
correspondingprobability), all failed to reject the null hypothesis. The cumulative sum
(CUSUM) from a recursive estimation of the model also indicates stability in the coefficients
over the sample period for Nigeria(see figure 1 below):
-15
-10
-5
0
5
10
15
94 96 98 00 02 04 06 08 10 12
CUSUM 5% Significance
Figure 1: The cumulative sum (CUSUM) Stability test
However, it is important to note that an ARDL procedure is capable of containing only one
equation and hence a single co-integrating vector at a time(see assumption four fromPesaran
et al. (2001)), and therefore, it is necessary to ensure that only single co-integration do exist
before applying a procedure in question so as to avoid a feedback problem(see assumption
three Pesaran et al. (2001)). Consequently,each of the variables in equation 2 was treated as
dependent variable interchangeably while conducting a bound testing before it was eventually
found that only in lRGDP equation that the co-integrating vector do exist(Ahmad et al. 2008).
This furtherconfirmed that the ARDL approach is appropriate for the present study. The
results from bound testing are presented in table (3) below:
Table3: Results from bound Tests on Equation (2)
Dep, var. AIC F-stat.
Δ(lRGDP) -0.86 4.75
Δ(lTDS) -0.57 2.33
Δ(lDD) - 0.29 2.68
Δ(lED) 0.69 2.72
Δ(R) 0.26 2.32
Source: Authors Calculation Notes: Lower bound I(0) = 3.05 and Upper bound I(1) = .97 at 5% significance
level.
Source: Authors’ computation using Eviews-9
The findings using Δ(lRGDP) as dependent variable indicated the present ofco-integration at
5% level of significance as the null hypothesis of no long-run relationship was rejected given
the F-statistic of 4.75 is above the upper bound.

Dutse International Journal of Social and Economics Research Vol. 1, No. 1 June 2018
129
Source: Authors’ computation using Eviews-9. (**) indicate significant at 5%
Table 4 above, is the long-run model which present a level relationship (long-run elasticities
(
⁄ )) among the variables of the study. From the long-run relationship, LTDS shows the
opposite but insignificant relationship, but LED, LDD, and R show their expected signs,
however, LED is not statistically different from zero. Thus, 1% increase in domestic debt
(LDD) is associated with 1.43% increase in LRGDP and the effect is statistically significant
at 5%, this finding is in agreement with Umaru et.al (2013), Olalekan (2012) and Adebiyi and
Olowookere (2013). A unit increase in interest rate is associated with 100*(1.46) % decrease
in LRGDP and this effect is significant at 5% level this is in line with the claims by (Peter,
2005; Vieira, 2000). The coefficient of dummy variable (D94) and that of trend are not
significant at all conventional level, therefore, have not influence in the model.
Harris and Sollis (2013), suggested thatobtaining long-run estimates of the co-integration
relationships is only a first step to estimating the complete model. The short-run structure of
the model is also important in terms of the information it conveys on the short-run adjustment
behavior of economic variables, and this is likely to be at least as interesting from a policy
viewpoint as estimates of the long run. Therefore, only the short-run dynamics of the model
is considered andpresented in the form of Error-Correction Model (ECM)as in table (4)
below:
Table 5: Error Correction Representation for ARDL(4,2,2,0,4) selected based on AIC
Dependent variable is DlRGDP
Variable Coefficient Std. Error t-Statistic Prob.
Δ(LNRGDP(-1)) -0.451558 0.164716 -2.741435 0.0128*
Δ(LNRGDP(-2)) -0.458039 0.155000 -2.955099 0.0076*
Δ(LNRGDP(-3)) -0.705472 0.168137 -4.195825 0.0004*
Δ(LTDS) - 0.579375 0.142891 - 4.056662 0.0291**
Δ(LTDS(-1)) -0.077389 0.036693 -2.109091 0.0471**
Δ(LED) 0.188003 0.058396 3.219440 0.0041*
Δ(LED(-1)) 0.082872 0.060084 1.379277 0.1823
Δ(LDD) 0.382217 0.057277 6.673116 0.0000*
Δ(R) 0.271041 0.273665 0.990413 0.3332
Δ(R(-1)) 0.947050 0.367694 2.575644 0.0176**
Δ(R(-2)) 1.122326 0.357738 3.137281 0.0050*
Δ(R(-3)) 0.946807 0.281745 3.360509 0.0030*
Δ(D94) 0.153904 0.136924 1.124013 0.2737
C -1.198695 0.205191 -5.841856 0.0000*
Ecm(-1) -0.267203 0.041879 -6.380322 0.0000*
ECM = LNRGDP - (0.9485*LTDS + 0.3059*LED + 1.4288*LDD -1.4637 *R + 0.0943*DSAP -
0.4452*@TREND ) * Significant at 1% level * * Significant at 5% level * * * Significant at 10% level
Source: Authors’ computation using Eviews-9.
Table 4: Estimated long-run model (ARDL (4,2,2,0,4) selected based on AIC,Dependent variable is lRGDP
Variable Coeff. Std. Error t-Stat Prob.
LTDS 0.948510 0.690078 1.374497 0.1838
LED 0.305883 0.390955 0.782400 0.4427
LDD 1.428800 0.651114 2.194393 0.0396**
R -1.463726 0.665564 -2.19923 0.0087**
D94 0.094330 0.571826 0.164963 0.8706
@TREND -0.445166 0.363441 -1.224864 0.2342
Dutse International Journal of Social and Economics Research Vol. 1, No. 1 June 2018
130
From table (4) above, the coefficients of ΔlRGDP lagged one through three are statistically
significant at 1% level, the %change in Ltds has both contemporaneous and lagged
significantnegative effect on change in lRGDP, the result is consistent withOlalekan (2012)
thoughcontradicts the finding by Lawrence and Michael (2012), however, conform with the
view that external debt service is nothing more than capital flight (Peter, 2005).The %change
in lED has significant and contemporaneous positive effect on %change in lRGDP,
whichmatches the finding byAdebiyi and Olowookere (2013), yet, the effect is not
statistically significant at one period lag. In the same vein, %change LDD is associated with
the positive, contemporaneous and significant impact on %change in lRGDP, this is in line
with the study by Umaru et.al (2013), Olalekan (2012) and Adebiyi and Olowookere (2013),
no lagged effect is found. ThePositive effect of debt is what terms in literatures as crowding-
in effect.A unit change in R is significant only at lagged one through three, however, it
exhibited an opposite signs at a dead time (delay period) beginning from one period lag
which shows that the economy is stable in the short-run this shows that tight monetary policy
have no immediate effect in the model and the effect dies out at the rate of 0.267.The
implication is that if it is expected that government use of borrowed funds to finance fiscal
deficit willresulted in inflation, then the monetary authority should rise interest rate and then
short-term loan should be taken locally and any long term loan should be from external
sources this will helps to align the fiscal and monetary policies to achieve a desired result.
The coefficient of the dummy variable is not statistically significant and this implies that the
introduction of SAP has not significantly change the effect public debt services on Economic
growth.Finally, coefficient of ECM which is -0.267 is relatively small in magnitude and
highly significant. This is very interesting result as it indicates that only 27% of the current
deviation from the equilibrium will be found in next year. This will confirm aquick
convergence in the system and hence the existence of the long relationship between the
variables.
5.0 Conclusion and Recommendations
The study have successfully developed a small macro-econometric model of the Nigerian
economy within the ARDL frame work and which served as a scientific tool for examining
the dynamic interrelationship among the variables of interest. This modelling process is
employed to capture the effect of domestic debt, external debt, interest rates and debt services
on real GDP. Based on the outcome of the modelthe computed short-run elasticities indicated
that, while total debt serves has negative effect on real GDP, both external and domestic debt
have positive effect implying acrowding-in effect of domestic debt. However, interest rate
which represents the monetary policy shock in the model have been found to have a positive
but only lagged effect on real GDP in the short-run.Therefore, the study recommends
that:Government should use the borrowed funds to finance the productive expenditures like
infrastructure,education and health which can further help to generate income and
employment.Government should also try to avoid a crowding-out effect by keeping the
domestic borrowing at a minimal level and also avoid the use of borrowed funds to finance a
consumption expenditures such as stipend expenditure. Finally, Debt service may perhaps be
minimized only if the move is made to reduce debt burden. Thesewill involve the adoption of
appropriate stabilizations and structural reforms more especially in financial and labor market
(like reform in education, improving the job training and skills acquisition programs), which
will help to attract foreign resources in the form of FDI.

Dutse International Journal of Social and Economics Research Vol. 1, No. 1 June 2018
131
References:
Adebiyi, W. K. and Olowookere, J. K. (2013). Managing Nigerian Debt: The Practical
Solutions. Research Journal of Finance and Accounting.ISSN 2222-1697 (Paper)
ISSN 2222-2847 (Online). Vol.4, No.19, 2013
Adepoju, A.A., Salau, A.S., & Obayelu, A.E., (2007). The Effects of External Debt
Management on Sustainable Economic Growth and Development: Lessons from
Nigeria, MPRA. Paper No. 2147.
Adesola, W.A. (2009). Debt Servicing and Economic Growth in Nigeria: An Empirical
Investigation, Global Journal of Social Sciences, Vol. 8, No. 2, 1-11.
Afxention and Serletis, (1996): Indebtedness Impacts on the Economic Activity of Developing
Countries Ajayi, E.A. (1989): Nigeria Debt Management Experience C.B.N of
Nigeria Bullion April/June 1987 Vol 13 No 2 Pg 25 Ajayi L.B., (2005): Mathematics
of Finance; Abisco Press, Abuja Nigeria
Ahmad. A. Halim, Mohd. D. S. Narazira, and Marzuki, Ainulashikim (2008), Sovereign
credit ratings and macroeconomic variables: An empirical analysis on dynamic
linkages in Malaysia using bound test approach. The IUP Journal of Applied
Economics, 6: 29-39.
Akperan, J. A.(n.d),The Debt Servicing Capacity of Nigeria‘s Economy
Arikawe, Akin (2003). ―Nigeria‘s External Debt Management: Context, Challenges and
Initiatives‖, Paper Prepared for the Executive Management Seminar organized by the
Financial Institutions Training Centre, Kaduna, February 24 – 28.
Ayadi, F.S and Ayadi, F.O (2008). The Impact of External Debt on Economic Growth: A
Comparative Study of Nigeria and South Africa, Journal of Sustainable Development
in Africa, Vol. 10, No.3, 234-264.
Benedict, O. A. and Success, K. I. (2014). Domestic Debts and Economic growth in Nigeria
(1980-2011). Journal of Economics and Sustainable Development. ISSN 2222-1700
(Paper) ISSN 2222-2855 (Online). Vol.5, No.1, 2014.
Charles, O. (2012).Domestic Debt and the Growth of Nigerian Economy. Research Journal
of Finance and Accounting. ISSN 2222-1697 (Paper) ISSN 2222-2847 (Online).Vol
3, No 5.
Chowding (1994): Argued that External Debt Burden Lead to Bad Management in Highly
Indebted Countries such as Exchange Rate Mismanagement.
Cheung Y. W and Lai, K. S. (1993). Finite sample sizes of Johansens likelihood ratio tests
For co-integration. Oxford bulletin of Economics and Statistics, Vol. 55(3): 320-328.
Cook S. (2006). The power of single equation tests for cointegration. Applied Economics
Letters, 13:265-2.
Dave E. Giles (June 19, 2013), ARDL Models-Part II- Bound Test (Blog Post). Retrieved
from: davegiles.blospot.com.ng/2013/06/ardl-part-ii-bound-test.html.
Debt Management Office (DMO) (2006) ―Nigeria‘s Eternal Debt and the Economy‖, DMO
Publication, http:/Majorca.globat.com/dmo.gov.ng/debt stategy/extdebtstrat.htm
Debt Management Office (DMO) (2005). Annual Report and Statement of Accounts, Abuja.
Debt Management Office (DMO) (2002), DMO Publication, Abuja.
DMO, (2016) Report on Annual National Debt Sustainability Analysis: Retrieved
from:http://www.nigerianstat.gov.ng/report/397
Enders, Walter (2010) Applied Econometric Time Series. John Wiley and Sons, USA.
Engle, R.F and Granger, C.W.J (1987), Cointegration and Error Correction: Representation
Estimation and Testing Econometrica, (55) 2, pp.251-276.
Engle, R. F., and Granger, C. W. J. (1987). Co-integration and Error Correction:
Representation,
Estimation, and Testing. Econometrica, 55, 251–276.

Dutse International Journal of Social and Economics Research Vol. 1, No. 1 June 2018
132
Essien, E.A., and Onwioduokit, E.A. (2002). Foreign Debt and Economic Growth: An
Analytical Re-examination. CBN Economic and Financial Review, 36 (3).
Fosu, A. K. (2007). ‗Fiscal allocation for education in sub-Saharan Africa: implications of the
external debt service constraint,‘ World Development, 35 (4): 702-713.
Fasipe, Akintayo (1989) (ed), Nigeria‘s External Debt, Ile-Ife, Obafemi Awolowo University
Press.
Harris, R. and Sollis R.(2003). Applied Time Series Modelling and Forecasting.John Wiley
& Sons Ltd, the Atrium, Southern Gate. England.
Iyoha, M. A. (1999). External Debt and Economic Growth in Sub-Saharan African
Countries.Nairobi: African Economic Research Consortium. 1-59.
Karagol, E. (2002). The Causality Analysis of External Debt Service and GNP: The Case of
Turkey, Central Bank Review, 2(1), 39-64.
Lawrence, A. B. and Michael, O. O.(2012), Effect of External Debt on Economic Growth
and Development of Nigeria.International Journal of Business and Social Science.
Vol. 3 No. 12
Mandula (n.d) Nigeria‘s Debt Audit: Retrieved from:
http://en.youscribe.com/catalogue/tous/current-affairs-and-social-debate/politics/debt-
audit-nigeria-draft-3-512665.
NBS ( 2016) Nigeria‘s Growth Domestic Product Report, Quarter One, Issue(1). Rerieved
from:http://search.sosodesktop.com/search/web?fcoid=417&q=Nigerian+Gross+Dom
estic+Product+Report+Quarter+One+2016
Nuhu M. and Julius O.O. (2016), Exchange Rate, International Trade and Macroeconomic
Stabilization in Nigeria,‖ Dutse Journal of Economics and Developmental Studies
(DUJEDS). Vol.1 No. 1 July,2016.ISSN:2536-6130.PP.135-142.
Obadan M.I. (2003): ―Towards Nigeria‘s Sustainable Debt Strategy‖ The Debt Trap in
Nigeria. Towards a Sustainable Debt Strategy. Trenton, N.J., Africa World Press Inc.
Obadan, I. Mike (2004). Foreign Capital Flows and External Debt; Perspectives on Nigeria
and the LDCs Group, Lagos, Broadway Press Limited.
Okonjo-Iweala, Ngozi (2005) ―Debt Cancellation is Necessary for the Reform‖, DMO
Publication http:/majorca.globat.com/dmo.gov.ng/debtrelief/newspaper/index.php
Okonjo-Iweala, Ngozi (2001), ―Managing Nigeria‘s Debt: International and Governance
Aspects‖, Paper Prepared for the International Conference on Nigeria‘s Debt, Abuja,
May 17.
Okonjo-Iweala.(2011) Okonjo-Iweala frets over rising domestic liabilities, The Nation News
Paper of 25th
August, 2011.
Olalekan O. E. (2012).An Empirical Analysis of the Impact of Public Debt on Economic
Growth: Evidence from Nigeria 1975-2005. Canadian Social Science.Vol. 8, No. 4,
2012, pp. 154-161
Olukole, R(1991) Management of external debt of Nigeria, CBN Bullion,Vol.15, No 2.
Omotoye, O.R., Sharma, H.P., Ngassam, C. & Eseonu, M.C. (2006). Sub-Saharan Africa‘s
Debt Crisis: Analysis and Forecast Based on Nigeria, Managerial Finance, Vol. 32,
No.7, 606-602.
Omoruyi, S.E. (1995) ―Nigeria‘s Debt Management Control – Problems and Prospects‖,
paper
presented at the Seminar on Macroeconomic Policy for CBN Executive Staff, held in
Lagos, 15-19 November.
Pesaran, M.H (1997) The Role of Economic Theory in Modelling Long Run. Economic
Journal
107 Pp. 178 – 191.
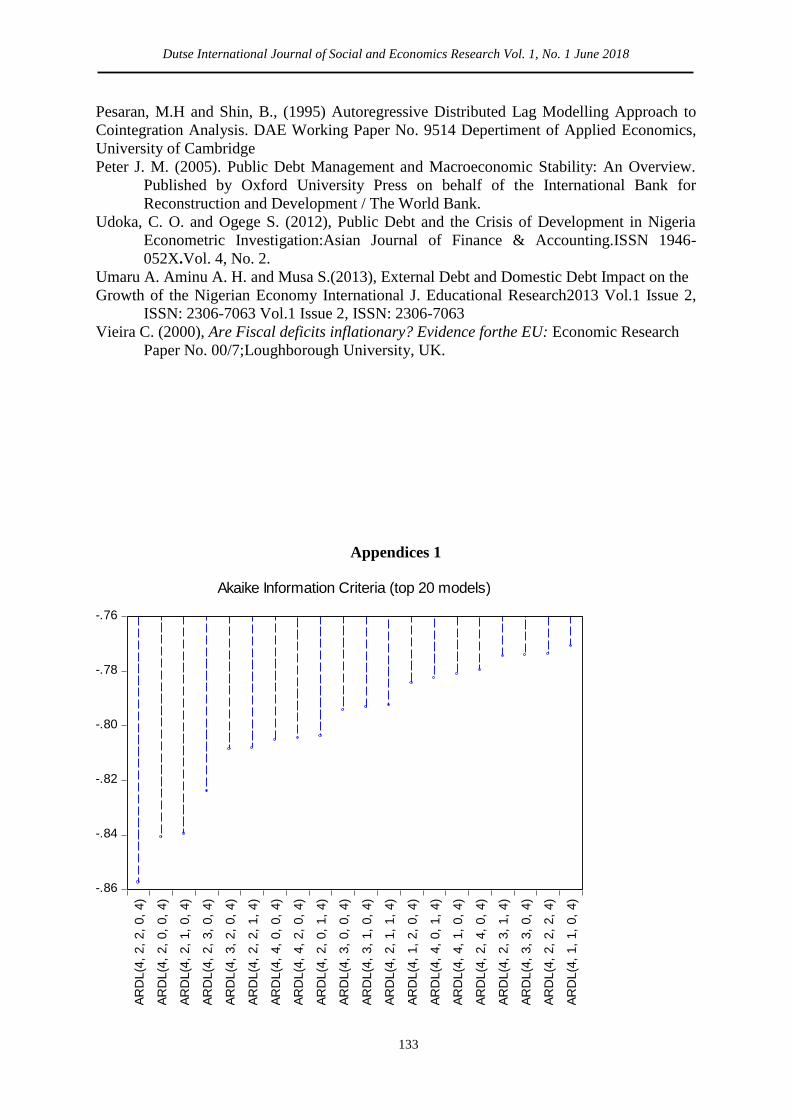
Dutse International Journal of Social and Economics Research Vol. 1, No. 1 June 2018
133
Pesaran, M.H and Shin, B., (1995) Autoregressive Distributed Lag Modelling Approach to
Cointegration Analysis. DAE Working Paper No. 9514 Depertiment of Applied Economics,
University of Cambridge
Peter J. M. (2005). Public Debt Management and Macroeconomic Stability: An Overview.
Published by Oxford University Press on behalf of the International Bank for
Reconstruction and Development / The World Bank.
Udoka, C. O. and Ogege S. (2012), Public Debt and the Crisis of Development in Nigeria
Econometric Investigation:Asian Journal of Finance & Accounting.ISSN 1946-
052X.Vol. 4, No. 2.
Umaru A. Aminu A. H. and Musa S.(2013), External Debt and Domestic Debt Impact on the
Growth of the Nigerian Economy International J. Educational Research2013 Vol.1 Issue 2,
ISSN: 2306-7063 Vol.1 Issue 2, ISSN: 2306-7063
Vieira C. (2000), Are Fiscal deficits inflationary? Evidence forthe EU: Economic Research
Paper No. 00/7;Loughborough University, UK.
Appendices 1
-.86
-.84
-.82
-.80
-.78
-.76
AR
DL
(4,
2,
2,
0,
4)
AR
DL
(4,
2,
0,
0,
4)
AR
DL
(4,
2,
1,
0,
4)
AR
DL
(4,
2,
3,
0,
4)
AR
DL
(4,
3,
2,
0,
4)
AR
DL
(4,
2,
2,
1,
4)
AR
DL
(4,
4,
0,
0,
4)
AR
DL
(4,
4,
2,
0,
4)
AR
DL
(4,
2,
0,
1,
4)
AR
DL
(4,
3,
0,
0,
4)
AR
DL
(4,
3,
1,
0,
4)
AR
DL
(4,
2,
1,
1,
4)
AR
DL
(4,
1,
2,
0,
4)
AR
DL
(4,
4,
0,
1,
4)
AR
DL
(4,
4,
1,
0,
4)
AR
DL
(4,
2,
4,
0,
4)
AR
DL
(4,
2,
3,
1,
4)
AR
DL
(4,
3,
3,
0,
4)
AR
DL
(4,
2,
2,
2,
4)
AR
DL
(4,
1,
1,
0,
4)
Akaike Information Criteria (top 20 models)
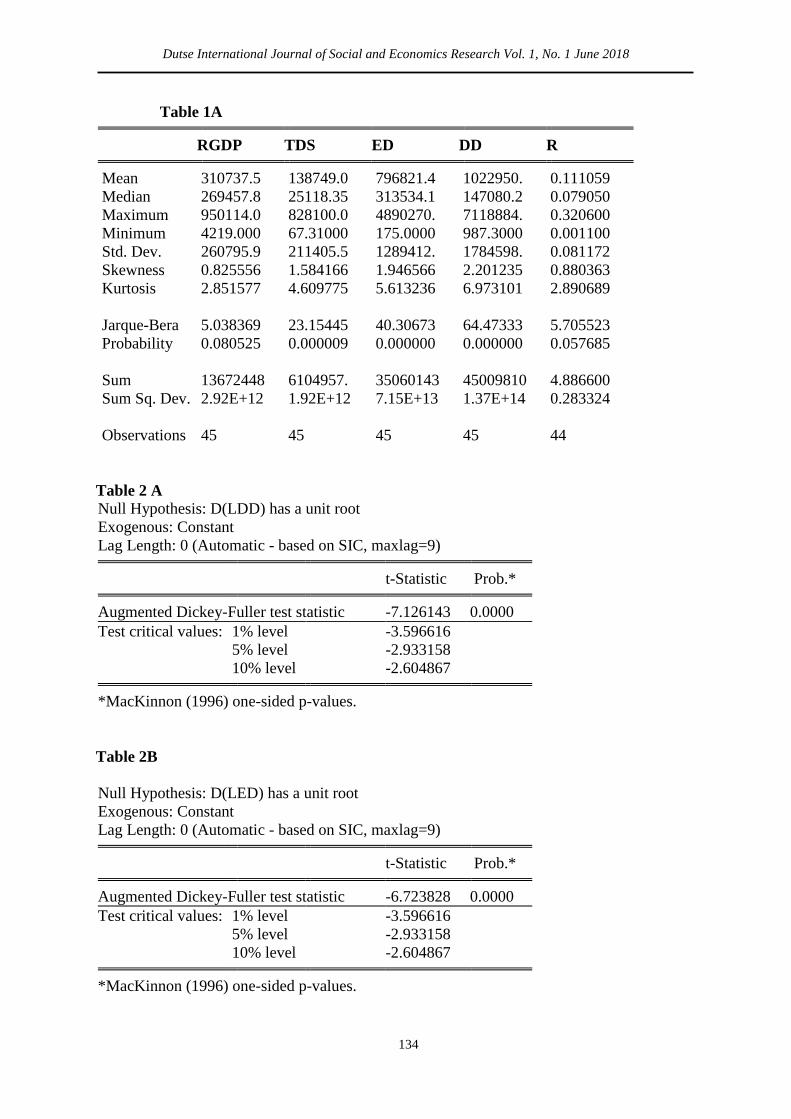
Dutse International Journal of Social and Economics Research Vol. 1, No. 1 June 2018
134
Table 1A
RGDP TDS ED DD R
Mean 310737.5 138749.0 796821.4 1022950. 0.111059
Median 269457.8 25118.35 313534.1 147080.2 0.079050
Maximum 950114.0 828100.0 4890270. 7118884. 0.320600
Minimum 4219.000 67.31000 175.0000 987.3000 0.001100
Std. Dev. 260795.9 211405.5 1289412. 1784598. 0.081172
Skewness 0.825556 1.584166 1.946566 2.201235 0.880363
Kurtosis 2.851577 4.609775 5.613236 6.973101 2.890689
Jarque-Bera 5.038369 23.15445 40.30673 64.47333 5.705523
Probability 0.080525 0.000009 0.000000 0.000000 0.057685
Sum 13672448 6104957. 35060143 45009810 4.886600
Sum Sq. Dev. 2.92E+12 1.92E+12 7.15E+13 1.37E+14 0.283324
Observations 45 45 45 45 44
Table 2 A
Null Hypothesis: D(LDD) has a unit root
Exogenous: Constant
Lag Length: 0 (Automatic - based on SIC, maxlag=9)
t-Statistic Prob.*
Augmented Dickey-Fuller test statistic -7.126143 0.0000
Test critical values: 1% level -3.596616
5% level -2.933158
10% level -2.604867
*MacKinnon (1996) one-sided p-values.
Table 2B
Null Hypothesis: D(LED) has a unit root
Exogenous: Constant
Lag Length: 0 (Automatic - based on SIC, maxlag=9)
t-Statistic Prob.*
Augmented Dickey-Fuller test statistic -6.723828 0.0000
Test critical values: 1% level -3.596616
5% level -2.933158
10% level -2.604867
*MacKinnon (1996) one-sided p-values.

Dutse International Journal of Social and Economics Research Vol. 1, No. 1 June 2018
135
Table 2C
Null Hypothesis: R has a unit root
Exogenous: Constant
Lag Length: 2 (Automatic - based on SIC, maxlag=9)
t-Statistic Prob.*
Augmented Dickey-Fuller test statistic -2.266660 0.0872
Test critical values: 1% level -3.600987
5% level -2.935001
10% level -2.105836
*MacKinnon (1996) one-sided p-values.
Table 2 C.i
Null Hypothesis: LTDS has a unit root
Exogenous: Constant, Linear Trend
Lag Length: 0 (Automatic - based on SIC, maxlag=9)
t-Statistic Prob.*
Augmented Dickey-Fuller test statistic -3.407957 0.0636
Test critical values: 1% level -4.186481
5% level -3.518090
10% level -3.189732
*MacKinnon (1996) one-sided p-values.
Table 2 C.ii
Null Hypothesis: LTDS has a unit root Trend Specification: Trend and intercept Break Specification: Trend only Break Type: Innovational outlier
Break Date: 1994
Break Selection: Minimize Dickey-Fuller t-statistic Lag Length: 0 (Automatic - based on Schwarz information criterion, maxlag=9)
t-Statistic Prob.* Augmented Dickey-Fuller test statistic -5.375045 < 0.01
Test critical values: 1% level -5.067425
5% level -4.524826 10% level -4.261048 *Vogelsang (1993) asymptotic one-sided p-values.

Dutse International Journal of Social and Economics Research Vol. 1, No. 1 June 2018
136
Table 2D
Null Hypothesis: D(LNRGDP) has a unit root
Exogenous: Constant
Lag Length: 0 (Automatic - based on SIC, maxlag=9)
t-Statistic Prob.*
Augmented Dickey-Fuller test statistic -4.291001 0.0015
Test critical values: 1% level -3.596616
5% level -2.933158
10% level -2.604867
*MacKinnon (1996) one-sided p-values.
Dutse International Journal of Social and Economics Research Vol. 1, No. 1 June 2018
137
Analysis of the Determinants of
Residential Willingness to Pay for
Electricity Tariff in Northwestern Nigeria.
*Prof. Ummu Ahmed Jalingo1 and Mamudu Abubakar
2
1Director, Centre for Social and Economic Research, Federal University, Dutse, Jigawa State.
2Research Fellow, Department of Economics, Bayero University Kano.
*Corresponding Author‘s Email: [email protected]
Abstract: The demand study and the residential willingness and ability to pay for electricity
tariff remain critical to the survival of the privatized electricity market in Nigeria considering
that fact that the residential customers consumes about 50% of the energy delivered to Discos
but contributes less than 15% of the total revenue generated. The study examined the
following specific objective, which are first to identify socio-demographic, economic and
behavioral factors that affects household‘s willingness to pay for electricity tariff in
Northwestern Nigeria, second is to ascertain the most preferred period of electricity supply in
Northwestern Nigeria and lastly to assess and determine the average WTP amount per kWh
of electricity in Northwestern Nigeria. To achieve these, contingent valuation method was
adopted consisting of Double Bounded Dichotomous Choice (DBDC) question format with a
closed-ended question consisting of a binary response of a ―yes‖ or ―no‖ answer to initial
and following question. The result of the logit regression model showed that Sex, Family Size,
Income of the Head of the Household, Number of Electrical Appliance in the Household,
Hours of Electricity Supply, WTP Amount, Household Ownership Status, Affiliation of the
Head of the Household, Percentage of Income Household are Willing to Pay from Income
were found to be statistically significant in experimenting residential WTP in Northwestern
Nigeria. Therefore, income was found to be the major driver of WTP for electricity tariff in
Northwestern Nigeria, thus we recommend that government at all levels should create an
enabling environment for business to strive so as to create more job opportunities, which
would lead to more income to the households.
Keywords: Households, Willingness and to Pay, Electricity Tariff, Contingent Valuation
Method.
JEL Classifications Codes: Q20, Q30, Q40
1.0 Introduction
The Nigerian electricity industry has been termed as an impossible sector of the economy
over the years. This is because the industry has defied all the interventions which are global
best practices in revitalizing electricity industries all over the world. Studies have shown that
(Norbert et al, 2017, Ojo et al, 2017 and Adenikinju and Olatokumbo, 2014), the industry is
where it is today partly due to poor demand studies to understand the demand pattern for
electricity in the country as well as the socio-economic characteristics of the individual
electricity user. The privatization in the Nigeria power sector is acclaimed to be the largest
privatization in the world, Misi, (2014) but without a proper demand study to understand the
willingness and ability to pay for electricity services, the objectives of the privatization could
soon be defeated and derailed. The objective of making the industry efficient and effective

Dutse International Journal of Social and Economics Research Vol. 1, No. 1 June 2018
138
cannot be achieved with the current cash flow challenges being experienced in the industry
which partly spring from low willingness to pay for electricity tariff in the country.
Pricing is the major signal for market clearance in a competitive environment which is the
basis for the privatization drive in the Nigerian power sector. An effective pricing ensures
that the market participants take advantage of the opportunities presented and thus promotes
market development. When considering efficient pricing and investment, the neoclassical
economists agree on one point, ―rate design matters‖. A strong case can be made for
regulators to allow some discretion in rate design, since firms have far greater information on
cost structures and demand patterns than is available to the regulatory. When cost allocation
manuals substitute for estimates of forward-looking incremental costs, inefficiencies arise. In
recognition of the important role of price signals, a wide range of rate designs has been
analyzed. In its effort to provide a robust tariff policy to support the long-term viability of the
Nigerian Electricity Supply Industry (NESI) and considering the fact that, the success of the
privatization drive is hitched on having a cost reflective tariff in place to guarantee free flow
of value addition across the electricity value chain. The Nigerian Electricity Regulatory
Commission (NERC)13
in keeping with this and its core mandate, introduced the Multi-Year
Tariff Order (MYTO) model in 2008 in an attempt to achieving cost reflective tariffs for the
industry and thus phases out subsidies.
The study was carried out in Northwestern Nigeria. The North West is one of the regions
curved out of the defunct Northern region which currently has seven states; Jigawa, Kaduna,
Kano, Katsina, Kebbi, Sokoto and Zamfara with a land mass of 223,150.39 km2
, covering
24.16% of the total land area of the country. It has a very vast arable land for subsistence
farming, Commercial farming, industrialization and trading. The inhabitants are mostly
farmers and traders with a sizable number of seasoned public servants and academies. The
region is blessed with wide range of natural resources, Arable land and Population14
just to
mention but a few. The poverty index of the region shows that about 80% of the population
earns an average of N20, 000 per month (National Bureau Statistics, 2015) which further
depicts that the majority of the households are living below poverty line.
This paper is organized in five sections with section one being the introduction and the
background to the study, which set the stage for the presentation of literature review in
section two and the methodology adopted in section three of the paper. Section four is the
presentation of result and discussion of the major findings while summary of major findings,
conclusion and recommendations were presented in section five of this paper.
1.1 Statement of the Problem
The discord between the two sides of the electricity market about the fairness and
sustainability of electricity pricing (Tariffs) is quite disturbing as the electricity supply value
chain15
argues that, the tariffs currently charged are not cost reflective while the demand side
(electricity users) argues that the same tariffs are not fair as it does not reflect the current
13
NERC was established in October, 2005 and officially inaugurated on 31st October, 2005 as an independent regulator of
the Nigerian Electricity Supply Industry with core functions of licensing operators and determination ofbalanced and fair
electricity tariffs. 14 The population of the region as at 2016, stood at 48,924,921 million people and 8,165,586 million households, NBS, 2012
projected to 2016.
15Nigerian Electricity Supply value chain comprises of the Gas suppliers, Electricity Generation companies, Transmission
Company, Electricity Distribution companies, Market Operator, System Operator, Bulk Trader and the Regulators.
Dutse International Journal of Social and Economics Research Vol. 1, No. 1 June 2018
139
economic reality of the country. This argument by the demand side particularly the residential
user may not be unconnected to the fact that the methodology used in setting electricity prices
(Tariffs) in Nigeria has been ill-defined and opaque since the Nigerian electricity sector was
established. Electricity was considered a public welfare service to be provided by the
government. Therefore, the electricity price had traditionally been subsidized. Prior to the
2008 when Multi-Year Tariff Order (MYTO)16
was first introduced, a uniform pricing
structure was used in which the electricity tariff remained fixed for years despite a continuous
rise in the price of natural gas. Interestingly, over 80 per cent of Nigeria‘s power is generated
from gas Olaoye, et al (2016). With an average collection efficiency of 50% recorded since
takeover after a successful privatization of the Generation companies (GENCOs) and
Distribution companies (DISCOs), DISCOs who are charged with the responsibility of
collecting revenue to finance the electricity value-chain have not been able to do so, due to
huge collection losses. It is quite worrisome to note that the residential customers are at the
heart of this problem, as the collection efficiency of the R Tariff Class (Residential
customers) that constitutes about 80% of postpaid customers billed is about 20%. It is even
more worrisome that the R class consumes at least 50% of total energy delivered to DISCOs
but contributed a paltry 14.7% of total postpaid collection (ANED, 2015)17
. This point is
collaborated by Prasad (2010) in a study; he discovered that, the residential share of the
customer base is about 60% of the total revenue share. However, in terms of revenue
collected, the share of residential customers is not proportionately couple with the fact that,
the residential customers bears the least tariff.
The implication of these huge collection losses threatens the sustainability of the privatization
drive in the power sector. This threat is glaring in the business performance of the DISCOs as
most DISCOs cannot support the electricity supply value-chain by paying up their financial
obligation to the market operators as and when due. This problem is further compounded by
the inability of the Discos to finance the shortfall in their revenue requirement which then
requires the customers to pay for the full cost of electricity supply.
1.2 Objectives of the Study
The main objective of this study is to estimate households demand for electricity in
Northwestern Nigeria. In addition, the following specific objectives were outlined;
i) To identify socio-demographic, economic and behavioral factors that affects household‘s
willingness to pay for electricity tariff in Northwestern Nigeria.
ii) To ascertain the most preferred period of electricity supply in Northwestern Nigeria.
iii) To assess and determine the average WTP amount per kWh of electricity in Northwestern
Nigeria.
1.3 Significance of the Study
The electricity distribution companies (DISCOs) are the life wire of the Nigerian Electricity
Supply Industry (NESI). They are the end point of the supply value chain and as such
interface with the electricity users directly. However, their ability to collect sufficient revenue
to service the supply value chain depends to a large extent on the tariff that is considered cost
reflective as well as fair to the customers, thus it is pertinent to assess the willingness to pay
ability of the residential customers so as to arrive at a cohesive and inclusive tariff design that
16
MYTO was first introduced in 2008 in an attempt to achieving cost reflective tariff by gradually phasing out subsidy.
MYTO model calculates the revenue required in the industry over a given period and set tariffs to recover such cost over
time while avoiding sudden spike in tariffs with an opportunity for minor/ major reviews to accommodate fluctuations in
macroeconomic parameters. 17
Association of Nigerian Electricity Distributors (ANED) is the body that coordinates the activities of electricity
distribution companies in Nigeria.
Dutse International Journal of Social and Economics Research Vol. 1, No. 1 June 2018
140
is bottom top. Moreover, one of the major challenges of the industry at the moment is cash
flow problem which springs from the fact that the tariff currently charge cannot generate
adequate cash flow for the industry which has led to huge liquidity shortfalls. Thus accessing
Household‘s willingness and ability to pay will go a long way in producing tariff that is
acceptable to electricity users as well as giving the DISCOs the necessary insight to the
shortfall financing requirement.
2.0 Literature Review
Estimating household‘s electricity demand in Northwestern Nigeria for a dynamic pricing
scheme requires knowledge about the consumer‘s willingness to pay (WTP) for electricity
services and associated infrastructure. Contingent Valuation (CV) techniques has been
identified as one of the most effective and efficient method of elucidating the WTP abilities
of household and users of electricity, Guncitilake et al (2012). The result from such studies
have shown that income is one of the major drivers of WTP for improved electricity supply
services, Brown et al (2014), Twerefou (2014), Ozbafli& Jenkins (2013), Gerpott&Paukert
(2014) and Abdullah &Jeanty (2011). Other associated determinants that shown significant
influences on WTP are Gender, Age, Educational qualification and Family size, Dinh et al
(2017), Tiruwork& Tewodros, (2017), Moira & David (2017) and Danlami, et al (2016).
Residential electricity users often times indicates their preferences in terms of the hours of
electricity supply to their premises. They tend to indicate the period of time of the day they
most preferred to be supplied with electricity in the event 24 hours supply is not feasible or
possible like in the cases of most African countries, Donna & Rahmatallah (2016).
Households WTP tends to increase when electricity is supplied to their premises when it is
needed, which goes to establish the basis for ―time of use‖ tariff design, Goutam
&Krishnendranath (2015) and Borenstein, (2013). Such dynamism in tariff design allows for
flexible cost recovery through the tariff which will be perceived to be fair and economically
correct and thus enhances the WTP for electricity tariff, Toby & Ahmad, (2014) and
Babawale&Awosanya (2014).
Other studies on willingness to pay are those of Brown, et al. (2014) in their study on general
household attitude towards the environment using choice modeling for selected OECD
countries, observed that there was significant unmet households demand for electricity
generated from renewable sources. 60% of the respondents are willing to pay extra for their
electricity to be generated from renewable sources. The study also showed that demand for
electricity decreased with the price of electricity and increases with household income, with
both effects relatively inelastic.
Aygül‘s (2011) estimating willingness to pay for a reliable electricity supply in Turkish
Republic of Northern Cyprus stated that WTP was estimated using choice experiments (CE),
contingent valuation methods (CVM) and approximated using the averting expenditure (AE)
method. These estimates relied on data collected from 350 in-person interviews conducted
during the period August 5-22, 2008. Using the Tobit model, an average household‘s averting
expenditures were estimated to be 3.13 YTL/month. In the CVM section, the spike model
with varying spike, varying mean and constant standard error specification resulted in a
median WTP of 23.03 YTL per month and a mean WTP of 29.14 YTL per month. Using CE,
compensating variation estimates for eliminating summer and winter outages were calculated
using parameter estimates from the mixed logit (ML) model with interactions. The
compensating variation was 6.65 YTL per month and 25.83 YTL per month, respectively.
Among the three valuation methodologies, WTP per hour unserved ranged from 0.13 YTL

Dutse International Journal of Social and Economics Research Vol. 1, No. 1 June 2018
141
(0.11 USD) to 1.22 YTL (1.03 USD). In order to avoid the cost of outages, households were
willing to incur a 1.5%-13.5% increase in their monthly electricity bill.
However, similar studies were conducted on the shores of Nigeria like the study by Oseni,
(2015), which explains that the ownership of a backup generator significantly increases the
WTP for a reliable grid supply in Nigeria. The author used event study methods and
discovered that the higher cost of backup generation with respect to the stated WTP amount
caused this behavior.
Otegbulu (2011) studied consumers‘ willingness to pay for improved electricity service in
some selected local government areas of Lagos State. Due to poor electricity supply in the
country, the study found that between 40-80% of households used generators daily. The study
also reported that more than 80% of the sampled households were willing to pay more for
electricity. However, the study did not examine whether WTP differed between households
owning a generator and those without. Moreover, the study could not offer clear and robust
estimates of how much people were willing to pay per unit improvement in supply. This
might be as a result of lack of clarity and cohesion in the questionnaire.
Ahenmen, et al. (2016), in their study on power supply and lighting pattern in North Central
Nigeria using household survey data from 1,637 households, revealed that majority showed a
predominant use of electricity in the study area to be lighting 60W incandescent bulbs instead
of energy efficient bulbs. They concluded that about 70% of the power supplied to the
residential customers could be saved, if energy efficient bulbs were adopted. Similarly, a
study by Bamiro & Ogunjobi (2015) examined household energy consumption in Ogun State,
Nigeria using a stratified random sampling technique to generate data, which was analyzed
using Multinomial Logit and Tobit regressions to examine the determinants of fuel choice
and energy consumption. The prices of wood and kerosene as well as family size had a
positive significant influence on energy consumption in the state.
3.0 Methodology
The study used primary source of data which was collected through the administration of
structured contingent valuation instrument to the sampled population. The administration of
the CV will be to elucidate households‘ views on the availability of electricity supply to the
research area and their willingness to pay abilities. The study was carried out in Northwestern
Nigeria comprising of seven states as listed in the introduction. However, one local
government area (LGA) each was chosen systematically at random from metropolitan area
and rural area, which brings the sample LGAs to Fourteen (14) based on set criteria. In order
to achieve unbiased estimators, these LGAs were further stratified into five groups according
to population density and income level of the households.
3.1 Population of the Study
The population of the study is made up of households in Northwestern Nigeria which is
approximately Eight (8) million housing units (NBS, 2012). This population figure is based
on 2006 Population census figures projected to 2016 with an average persons per household
of Six (6) persons. Table 1 shows the breakdown of the population of the region and the
number of household per state based on average person per households in the region.
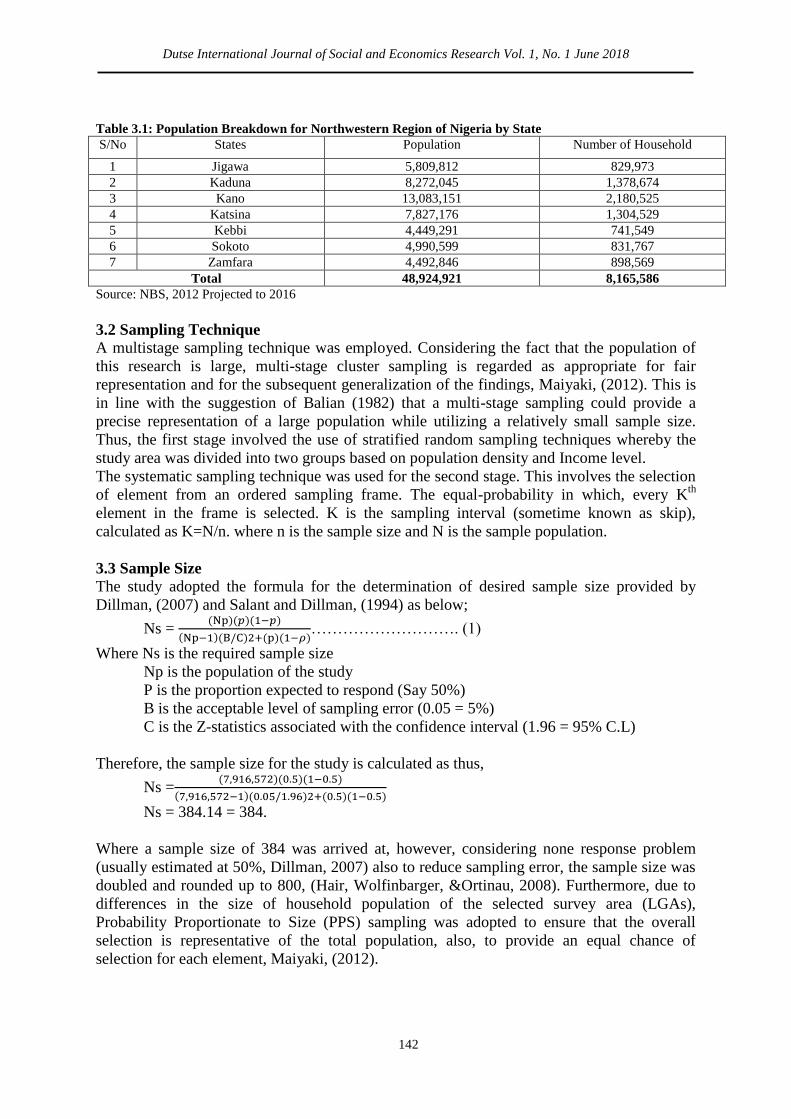
Dutse International Journal of Social and Economics Research Vol. 1, No. 1 June 2018
142
Table 3.1: Population Breakdown for Northwestern Region of Nigeria by State
S/No States Population Number of Household
1 Jigawa 5,809,812 829,973
2 Kaduna 8,272,045 1,378,674
3 Kano 13,083,151 2,180,525
4 Katsina 7,827,176 1,304,529
5 Kebbi 4,449,291 741,549
6 Sokoto 4,990,599 831,767
7 Zamfara 4,492,846 898,569
Total 48,924,921 8,165,586
Source: NBS, 2012 Projected to 2016
3.2 Sampling Technique
A multistage sampling technique was employed. Considering the fact that the population of
this research is large, multi-stage cluster sampling is regarded as appropriate for fair
representation and for the subsequent generalization of the findings, Maiyaki, (2012). This is
in line with the suggestion of Balian (1982) that a multi-stage sampling could provide a
precise representation of a large population while utilizing a relatively small sample size.
Thus, the first stage involved the use of stratified random sampling techniques whereby the
study area was divided into two groups based on population density and Income level.
The systematic sampling technique was used for the second stage. This involves the selection
of element from an ordered sampling frame. The equal-probability in which, every Kth
element in the frame is selected. K is the sampling interval (sometime known as skip),
calculated as K=N/n. where n is the sample size and N is the sample population.
3.3 Sample Size
The study adopted the formula for the determination of desired sample size provided by
Dillman, (2007) and Salant and Dillman, (1994) as below;
Ns =
………………………. (1)
Where Ns is the required sample size
Np is the population of the study
P is the proportion expected to respond (Say 50%)
B is the acceptable level of sampling error (0.05 = 5%)
C is the Z-statistics associated with the confidence interval (1.96 = 95% C.L)
Therefore, the sample size for the study is calculated as thus,
Ns =
Ns = 384.14 = 384.
Where a sample size of 384 was arrived at, however, considering none response problem
(usually estimated at 50%, Dillman, 2007) also to reduce sampling error, the sample size was
doubled and rounded up to 800, (Hair, Wolfinbarger, &Ortinau, 2008). Furthermore, due to
differences in the size of household population of the selected survey area (LGAs),
Probability Proportionate to Size (PPS) sampling was adopted to ensure that the overall
selection is representative of the total population, also, to provide an equal chance of
selection for each element, Maiyaki, (2012).

Dutse International Journal of Social and Economics Research Vol. 1, No. 1 June 2018
143
3.4 Model Specification
The model theoretically specified by Fair (1978) in his voting theory is modified and adopted
for this study as used by Whittington, Briscoe, Xinming and Barron (1990) in a study on
willingness to pay for improved conservation of environmental species in the USA. Also
Adepoju andOmonona (2009) and Mamudu, (2012) in the study of willingness to pay for
improved portable water supply in Nigeria. The model can be specified as:
1101
1X
ii
eXIYEp
…………………………………………………….. (2)
Where Pi is a probability that Yi = 1
Xi is a set of independent variables
Y is dependent variable
0 is the intercept which is constant
1 is the coefficient of the price (Tariff) that the households are willing to pay for electricity
tariff.
Thus, for the average WTP for electricity tariff, the model below will be used
Mean
//
111
1
0
en
WTP
……………………………………………………………… (3)
Where 0 and 1 are absolute coefficient estimates from the logistic regression and the Mean
WTP is the mean willingness to pay for electricity tariff by households.
However, the theoretical equation for the estimation of WTP is stated as thus:
zeY
1
1 ……………………………………………………………………………… (4)
Where Y = responses of household WTP which is either 1 for Yes and 0 for No
7722110 .............. XXXZ …………………….……………………… (5)
4.0 Data Analysis
The logit regression result is presented in three parts. The study looked at the regression
robust coefficients, the odd ratios and the marginal effects as detailed in the table below.

Dutse International Journal of Social and Economics Research Vol. 1, No. 1 June 2018
144
Table 4.1: Logit regression Model with Odd Ratios and Marginal Effects
VARIABLES Logit Coefficients Odd Ratios Marginal Effects
Gender -1.108* 0.330** 0.865**
(0.568) (0.175) (0.0590)
1.Q/Non Formal -0.239 0.787 0.963
(0.758) (0.656) (0.128)
2.Primary 0.194 1.214 1.029
(0.618) (0.822) (0.102)
3.Secondary 0.535 1.707 1.075
(0.584) (1.079) (0.0961)
4.Diploma/NCE 0.316 1.371 1.046
(0.637) (0.913) (0.101)
5.Degree/PG 0.665 1.945 1.091
(0.749) (1.491) (0.111)
Family Size -0.0441** 0.957* 0.994*
(0.0208) (0.0227) (0.00304)
Cost of Alternative Supply 0.196 1.217 1.026
(0.491) (0.531) (0.0587)
Monthly Expense on Elect 0.175 1.191 1.023
(0.241) (0.301) (0.0339)
% WTP from Income -0.0678* 0.934* 0.991*
(0.0386) (0.0378) (0.00518)
Income 1.052** 2.864** 1.148***
(0.438) (1.201) (0.0611)
Hours of Elect Supply 0.113*** 1.119*** 1.015***
(0.0438) (0.0438) (0.00502)
Location -0.308 0.735 0.960
(0.403) (0.298) (0.0510)
Number of Appliance -0.681** 0.506** 0.915**
(0.324) (0.156) (0.0360)
1.Owned Outright 0.241 1.272 1.020
(0.950) (1.513) (0.0952)
2.Owned Mortgage -1.134** 0.322** 0.870**
(0.484) (0.154) (0.0528)
3.Rented -1.340*** 0.262*** 0.841***
(0.460) (0.119) (0.0488)
4. Family House - - -
1.Managers/Professionals 0.583 1.791 1.081
(0.417) (0.741) (0.0573)
2.Manual Skilled 1.583*** 4.869** 1.186***
(0.584) (3.217) (0.0640)
3.Unskilled - - -
WTP Amount 0.0555** 1.057** 1.007***
(0.0217) (0.0229) (0.00277)
Constant -8.605** 0.000183**
(4.331) (0.000735)
Observations 283 283 283
Source: Survey Results, 2017
Robust standard errors in parentheses *** p<0.01, ** p<0.05, * p<0.1
4.1 Discussion of Results
Table 4.4 shows the estimated logistic regression model. It contains the odd ratios and
marginal effects. The result is explained in parts; first part shows the variables that are
statistically significant and positively related to the dependent variable (DV), second have
those that are statistically significant and negatively related to the DV and third are those that
are not statistically significant in explaining the behavior of the DV.
Dutse International Journal of Social and Economics Research Vol. 1, No. 1 June 2018
145
The logit regression result is presented in three parts. The study looked at the regression
robust coefficients, the odd ratios and the marginal effects as detailed in the table below. This
is a non-linear model with binary dependent variable (WTP which is recorded ―Yes‖ or
―No‖) and was regressed with Gender, Education, Family Size, Cost of Alternative Supply,
Monthly Expenditure, Percent WTP from Income, Income, Hours of Supply, Location,
Number of Electrical Appliance, House Ownership, Affiliation and WTP Amount.
Income: Is the average daily take home of head of the household which is continues variable
and denominated in Naira. The estimated result shows that the variable is positively related to
the log odd of willingness to pay (WTP) for electricity tariff and found to be statistically
significant at 5% level. This is in conformity with the a-priori expectation and conforms to
the study of Dinh, Thi and Nguyen (2017), Sara, Mad, Alias, Khalid and Mohd (2015), Liu,
Shuwen, Yanqin, Wendie, Renfei and Lili (2013) and Oliver, (2011). This direction of
causality can be linked to the principle of affordability as postulated in the studies of
Westerberg, Lifra and Olsen (2010); Ghosh and Mondal, (2013); Birol, Koundouri and
Koundoris (2011); Bliem, Getzner and Rodiga-Labning (2013) and Nuva, Shamsudin, Radam
and Shuib (2011). However, from the result, a one naira increase in income will increase the
log odd of WTP for electricity tariff by 1.052 units. This implies that respondents with higher
income are likely to have higher WTP for electricity tariff. This is so because; the higher the
level of income, the higher the tendency for the adoption of life style that employs modern
electrical appliances and thus the need for improved electricity supply. The average monthly
income of the region based on NBS report, 2012 was N20,000 but this figure has grown
based on the report of our study to N 45, 000 in 2017 (See descriptive statistics and
frequencies) which further explained the positive relationship between income and WTP for
electricity tariff in Northwestern Nigeria. Also on table 4.4, the Odd ratio result shows a 1
naira increase in income will increase the odd of WTP by 2.864 times while the marginal
effect of 14.8% is expected in the WTP resulting from 1% increase in income. This is also in
line with the ability to pay principle; the higher the income, the higher will be the ability to
pay which goes further to explain the direct relationship between income and WTP amount as
indicated by the respondents.
Hours of Supply: The variable hour of supply is the measure of hours of electricity supply
per day to the households (1-24 hours). It is found to be statistically significant at 1% level
and positively related to the log odd of WTP. This implies that for every hour increase in
electricity supply to the study area, the log odd of WTP increases by 0.113 units. In other
words, considering the odd ratio of the variable on table 4.4 shows, for every hour increase in
electricity supply increases the odds of WTP by 1.119 times. Likewise the marginal effect of
1.5% increase in the WTP for every hour increase in electricity supply to households. This
direction of causality cannot be unconnected to the fact that self-generation of electricity is
usually more expensive than the grid electricity couple with the fact that the voltage profile of
self-generators cannot be compared with the grid voltage profile. This variable conforms to
the a-priori expectation and in line with the studies of Ozbafli and Jenkins, (2016), David,
Nina and Kenneth (2014) and Abdullah and Mariel, (2010).
Affiliation: This variable looked at the characteristics of the affiliates of the head of the
households which is a categorical variable and found to be statistically significant at 1% level
also positively related to the log odd of WTP for electricity tariff. The result shows three
categories of associates of the head of the household; managers/professionals (Reference
category), manual skilled and unskilled. However, moving from the reference category to
manual skilled category depicts increase in the log odd of WTP for electricity tariff by 1.6

Dutse International Journal of Social and Economics Research Vol. 1, No. 1 June 2018
146
units also on table 4.4, the odd ratio result shows an odd increase of 4.9 times the odds of
managers/professionals, likewise, a marginal effect of 19% is recorded in the category and it
was found to be statistically significant at 1% level. This implies that household heads that
associates with artisans tends to have higher WTP for electricity tariff than household heads
who associates with managers and professionals. Artisans often use electricity for their
businesses and thus require stable electricity supply to be able to optimize their productivity
and profitability which in the event of power outage from the grid, they resort to self-
generation, an alternative that is more costly and thus eat into their profitability. It is
important to note that, the third category (Unskilled) is not significantly different from the
reference category and as such not statistically significant. The variable conforms to the a-
priori expectation.
WTP Amount: Willingness and ability is measured by the WTP amount (in Naira)
respondents offered for an improved electricity supply to their households. It is positively
related to the log odd of WTP for electricity tariff in Northwestern Nigeria and found to be
statistically significant at 5% level. The estimated result on table 4.6 shows a one naira
increase in the WTP amount will bring about an increase in the log odd of WTP by 0.06
units. Similarly, a one naira increase in the WTP amount will increase the odds of WTP by
1.06 times and a marginal effect of 1% is expected for every naira increase in the WTP
amount. This positive relation between WTP amount and WTP for electricity tariff explains
the optimism of the household heads and the need for stable electricity supply to their homes.
Furthermore, over 54% of the households in Northwestern Nigeria have and maintain a
generator to supplement power supply shortages and spend an average of thirteen thousand,
two hundred and thirty naira (N13, 230) monthly on fueling. WTP amount is in line with the
study of David et.al (2014) and has conformed to the a-priori expectation.
Gender: This is the sex of the head of the household, which is a binary variable (1 or 0). 1
represents male which is the reference category and 0 for female. The variable was found to
be negatively related to the log odds of WTP for electricity tariff also found to be statistically
significant at 95% confidence interval. A change in the gender of the household head from
male to female increases the log odd of WTP for electricity tariff by 1.108 units alternatively
decreases by the same units for male headed household, which shows that household headed
by a female, has higher WTP for electricity tariff compared to the household headed by a
male. This is because women in Northwestern Nigeria are predominantly house wives and
often stays at home and thus are the first to feel the impact of insufficient electricity supply
and therefore have higher WTP for improved electricity supply to the area. This finding is in
line with the work of Danlami, Shri-dewi and Rabiul (2016) and Dinh et.al (2017).
Furthermore, considering the odd ratio result on table 4.4 the variable (Gender) which shows
that female headed households have higher odd of WTP of about 0.330 times compared to a
male headed household in Northwestern Nigeria. While the marginal effect shows an 87%
increase in WTP for a change in the headship of household from a male to a female.
Family Size: Refers to the number of persons per head living under the same roof, that is, the
number of the member of the family. It is found to be statistically significant at 95%
confidence interval and negatively related to the log odd of WTP for electricity tariff. This
implies that an increase in family members by one person reduces the log odd of WTP by
0.044 units. Similarly, on table 4.4 the odd of additional family member by one person
reduces the odds of WTP by 0.957 times. In other words, household with fewer members
tend to have more odds of WTP by 0.957 times than the household with more family
members. Furthermore, the same trail is shown in the marginal effect estimation which

Dutse International Journal of Social and Economics Research Vol. 1, No. 1 June 2018
147
depicts 99% decrease in WTP resulting from addition of one person to the family. This is
basically so, because the income level of households in Northwestern Nigeria is relatively
low and therefore shows that additional family members imply additional responsibility on
the head of the household coupled with thecommunal system of family in the region imply
that, with relatively low/ stagnant income level, an increase in family size will naturally
change the priority of the head of the family and thus reduces the WTP for electricity
tariff.This relationship is in line with the a-priori expectation and conforms to the works of
Dinh et.al (2017) and Twerefou (2014).
Percentage WTP from Income: Represents the percentage of household income for which
the household heads are willing to devote for the payment of electricity tariff measured in
percentages. It is inversely associated with the log odd of WTP for electricity tariff and found
to be statistically significant at 10% level. The result depicts a 1% increase in the percentage
WTP from income will reduce the log odd of WTP for electricity tariff by 0.068 units.
Similarly, a 1% increase in the percentage willing to pay from income reduces the odds of
WTP for electricity tariff by 0.934 times also on table 4.4 the marginal effect shows a 1%
increase in the percentage WTP from income leads to a decrease in the WTP for electricity
tariff by 99%. This implies that household in Northwestern Nigeria have elastic income
elasticity for electricity tariff and as such, as the percentage of income devoted for the
payment of electricity tariff increases, the odds of WTP for electricity tariff reduces which
shows that with static income level in the region, increasing electricity tariff will reduce the
WTP of the households. This analogy goes on to show that the majority of the household
heads are either civil servants or farmers whose income may not be increasing
proportionately with the increase electricity tariff and thus lowered their WTP. The variable‘s
direction of causality conforms to the a-priori expectation and in line with the study of
Mamudu, (2012).
Number of Electrical Appliance: Refers to the number of electrical appliances like air
conditionals, refrigerators, water heaters, washing machines etcetera in the households. It is a
continues variable which was found to be statistically significant at 5% level and negatively
related to the log odd of WTP for electricity tariff. From table 4.4 it implies that an increase
in electrical appliance by one will reduce the log odds of WTP for electricity tariff by 0.681
units. Similarly, an addition of electrical appliance by one appliance in the household reduces
the odds of WTP by 0.506 times while an additional electrical appliance in the household
decreases the WTP for electricity tariff by 91.5%. The variable‘s direction of causality is in
line with the works of Hakinmul&Chumnong, (2015), and Zhou & Teng, (2013) but not in
conformity with the a-priori expectation. The a-priori expectation is for increase in the
number of electrical appliance to lead to an increase in electricity demand in the household
which increase both the willingness and the ability to pay. This is because number of
electrical appliance at home, willingness and ability are all the function of income.
House Ownership: This variable is a categorical variable, examining household ownership
status. It is statistically significant at 5% level and negatively related to the log odd of WTP
for electricity tariff. There are four categories of respondent‘s status (Owned outright, Owned
Mortgage, Rented and family House). Owned outright is the reference category which the
result have shown significant difference between owned outright and owned mortgage as well
as owned outright and rented house ownership status. This shows that, as household
ownership status move from owned outright to owned mortgage; the log odd of WTP for
electricity tariff reduces by 1.134 units. In the same vain the odds of WTP for electricity tariff
will decrease by 0.322 times while the marginal effect of a change in house ownership from
Dutse International Journal of Social and Economics Research Vol. 1, No. 1 June 2018
148
owned outright to owned mortgage will reduce the WTP for electricity tariff by 87%.
Similarly on Table 4.4 a change in household ownership status from owned outright to rented
reduces the log odds of WTP for electricity tariff by 1.340 units and the odds of WTP for
electricity tariff reduces by 0.262 times which is significant at 99% confidence interval.
While the result shows an invalid difference between the reference category and family house
status. This implies that, majority of the household heads in Northwestern Nigeria are living
in their own houses and thus expressed higher WTP than those household heads living in
rented apartments or having mortgage arrangement. It goes further to show that, household
heads with fewer obligations tend to have higher WTP that household heads with more
obligations in forms of rent and mortgage payments. This finding is in line with the a-priori
expectation but in conflict the study of Francis &Christain, (2015), Tiruwork& Tewodros,
(2017) and Moira & David (2017), of which the variable was not statistically significant in
explaining the household WTP for electricity tariff in their studies.
However, the following variables are not statistically significant but are equally important in
the understanding of the WTP of the respondents in the study area; Education, Cost of
alternative supply, Monthly expenditure on electricity and location (Rural or Urban) are not
statistically significant in explaining the WTP bahaviour of the respondents and as such do
not have predictive power in this study. It is pertinent to note that, empirical literature have
shown strong statistical inference power of the variables listed above (Oliver et.at, 2011) but
surprisingly turned out to be statistically insignificant in this study. This however, set the
grounds for further studies to investigate the causal relationship between the variables which
contrary to this study, other studies have shown a statistical significant relationship.
Tables 3 & 4 below are the descriptive statistics (Frequencies) focusing on the first two
specific objectives of the study while table 4 is the logit regression model examining the third
specific objective.
Table 4.2: Households Preferred Time of Electricity Supply
Prefered period of supply Freq Percent
6-12pm 58*** (10.05)
12-6pm 147*** (25.48)
6-12am 166*** (28.77)
12-6am 206*** (35.70)
Total 577
Source: Survey Result, 2017
The table 3 shows the preferences of households in the region with respect to 6 hourly supply
of electricity. Electricity generation in Nigeria stands at an average of 4,000 MW which put
the capita electricity consumption at 0.022 kWh (Energy Commission, 2017) and as such 24
hours supply is not possible in most parts of the region. However, 35.70% of the households
indicated preference for electricity to be supplied between 12 mid night to 6 am followed
those who preferred 6pm to 12 mid night (28.77%), then 12 noon to 6 pm (25.48%) and the
least preferred period is 6 am to 12 noon (10.05%). These are indicative of the fact that
respondents preferred to be supply with electricity when they are at home and mostly at night
when they are asleep.
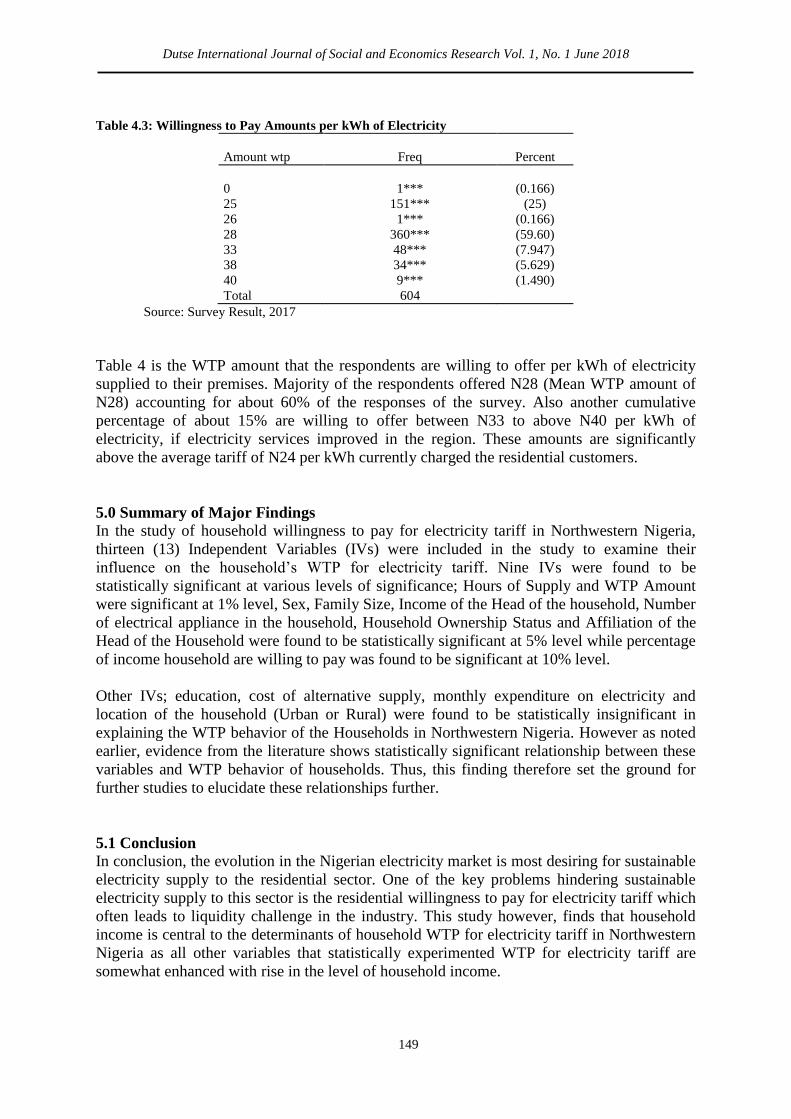
Dutse International Journal of Social and Economics Research Vol. 1, No. 1 June 2018
149
Table 4.3: Willingness to Pay Amounts per kWh of Electricity
Amount wtp Freq Percent
0 1*** (0.166)
25 151*** (25)
26 1*** (0.166)
28 360*** (59.60)
33 48*** (7.947)
38 34*** (5.629)
40 9*** (1.490)
Total 604
Source: Survey Result, 2017
Table 4 is the WTP amount that the respondents are willing to offer per kWh of electricity
supplied to their premises. Majority of the respondents offered N28 (Mean WTP amount of
N28) accounting for about 60% of the responses of the survey. Also another cumulative
percentage of about 15% are willing to offer between N33 to above N40 per kWh of
electricity, if electricity services improved in the region. These amounts are significantly
above the average tariff of N24 per kWh currently charged the residential customers.
5.0 Summary of Major Findings
In the study of household willingness to pay for electricity tariff in Northwestern Nigeria,
thirteen (13) Independent Variables (IVs) were included in the study to examine their
influence on the household‘s WTP for electricity tariff. Nine IVs were found to be
statistically significant at various levels of significance; Hours of Supply and WTP Amount
were significant at 1% level, Sex, Family Size, Income of the Head of the household, Number
of electrical appliance in the household, Household Ownership Status and Affiliation of the
Head of the Household were found to be statistically significant at 5% level while percentage
of income household are willing to pay was found to be significant at 10% level.
Other IVs; education, cost of alternative supply, monthly expenditure on electricity and
location of the household (Urban or Rural) were found to be statistically insignificant in
explaining the WTP behavior of the Households in Northwestern Nigeria. However as noted
earlier, evidence from the literature shows statistically significant relationship between these
variables and WTP behavior of households. Thus, this finding therefore set the ground for
further studies to elucidate these relationships further.
5.1 Conclusion
In conclusion, the evolution in the Nigerian electricity market is most desiring for sustainable
electricity supply to the residential sector. One of the key problems hindering sustainable
electricity supply to this sector is the residential willingness to pay for electricity tariff which
often leads to liquidity challenge in the industry. This study however, finds that household
income is central to the determinants of household WTP for electricity tariff in Northwestern
Nigeria as all other variables that statistically experimented WTP for electricity tariff are
somewhat enhanced with rise in the level of household income.

Dutse International Journal of Social and Economics Research Vol. 1, No. 1 June 2018
150
5.2 Recommendations
In view of the aforementioned, the following recommendations are forwarded;
i) Government should create an enabling environment for business to strive so as to
generate employment opportunities, which would lead to more income and more income
would lead to higher WTP for electricity tariff, which in turn would stabilize the
electricity market.
ii) Government should set aside funds to be used as subsidy for the low income group of the
residential sector (the vulnerable spectrum). The said subsidy should form the basis for
the calculation of the tariff for this group and the shortfalls from the group would then be
settled from the subsidy.
iii) The principle of affordability and fairness should be adhered to religiously to avoid the
disenchantment from the residential customers. This can be achieved when tariff setting
process is transparent and estimated billing reduced or stopped
References
Abdullah, S. &Jeanty, P.W., (2011). Willingness to pay for renewable energy: evidence from
a contingent valuation survey in Kenya. Renew. Sustain. Energy Rev. 15, 2974–2983.
Abdullah, S., & Mariel, P. (2010). Choice experiment study on the willingness to pay to
improve electricity services. Energy Policy, 38(8), 4570–4581.
Adepoju, A. A., &Omonona, B. T. (2009). Determinants of Willingness to Pay for Improved
Water Supply in Osogbo Metropolis ; Osun State, Nigeria. Research Journal of
Social Sciences, 4, 1–6.
Ahenmen, I., Amah, A.N. & Agada, P.O. (2016). A Survey of Power Supply and Lighting
Pattern In North Central Nigeria- The Energy Saving Potentials Through Efficient
Lighting Systems. Journal of Energy and Building, 133, 770-776.
ANED, (2016). West Africa Power Industry Convention (WAPIC) Lagos, Nigeria.
Aygül, ö. (2011), Estimating the Willingness to Pay for a Reliable Electricity Supply in the
Turkish Republic of Northern Cyprus. A Thesis submitted to the University Of
Birmingham for the degree of Doctor of Philosophy Department of Economics the
University of Birmingham.
Babawale, G. K. &Awosanya, A. O. (2014). Estimating Households Willingness to Pay for
Improved Electricity Supply in Lagos Metropolis. British Journal of Economics,
Management & Trade 4(5): 672-693.
Bamiro, O.M. & Ogunjobi, J.O. (2015). Determinants of Household Energy Consumption in
Nigeria: Evidence from Ogun State. Journal of Social Science and Management, Vol.
4, ISSN 2251 1571.
Bedir, M., Hasselaar, E. &Itard, L. (2013). Determinants of Electricity Consumption in Dutch
Dwellings, Energy Build. 58, 194-207.
Birol, E., Koundouri, P., &Koundouris, Y. (2011). Water resources management and wetland
conservation: The case of Akrotiri Wetland in Cyprus. In Water
Resources Allocation, pp. 141-155. Springer Netherlands.
http://dx.doi.org/10.1007/978-90-481-9825-2_10
Bliem, M., Getzner, M., &Rodiga-Laßnig, P. (2013). Temporal stability of individual
preferences for river restoration in Austria using a choice experiment. Journal of
environmental management, 103, 65-73.
http://dx.doi.org/10.1016/j.jenvman.2012.02.029

Dutse International Journal of Social and Economics Research Vol. 1, No. 1 June 2018
151
Brown, Z., Johnstone, N. and Serret-Itzicsohn Y. (2014) General household attitudes towards
the environment. Greening Household Behaviour: Overview of from the 2011 Survey,
OECD.
Chen, Y. (2017). The Factors Affecting Electricity Consumption and Consumption
Characteristics in the Residential Sector-A case example of Taiwan.
Sustainability,(MDPI), 9, 1484.
Danlami, A. H., Shri-Dewi, A. &Rabiul, I. (2016): From biomass cooking fuel source to
modern alternative for Bauchi State households: a preliminary analysis, Biofuels,
DOI: 10.1080/17597269.2016.1226724
David, A,H., Nina, S. & Kenneth, T. (2014). Willingness to Pay for Residential Electricity
Supply Quality and Reliability. Journal of Applied Energy, Vol. 115, Pages 280-292.
Dillman, Don A. (2007). Mail and Internet Surveys: The Tailored Design, Second Edition—
2007 Update. John Wiley: Hoboken, NJ. 565 pp. ISBN: 0-470-03856-x. 523 pp.
Dinh, Q. T., Thi, T. T. & Nguyen, T. X. H. (2017). Estimating Household Willingness to Pay
for Improved Solid Waste Management: A Case Study of Thu Dau Mot City, Binh
Duong. MATEC Web of Conferences 95, 18004.
Donna, P. and Rahmatallah, P. (2016). Sustainable Electricity Pricing for Tanzania, Oxford
Institute for Energy Studies, ISBN 978-1-78467-061-1.
Fair, R. C. (1978). Econometrics and Presidential Elections. Journal of Economic
Perspectives, Vol 10:3; 89-102.
Francis, T. &Christain, K. (2015). Households‘ Willingness to Pay for Reliable Electricity
Services in Ghana. Online at http://mpra.ub.uni-muenchen.de/65780/MRPA Paper No
65780..
Gerpott, J. T. and Paukert, M. (2013). Determinants of willingness to pay for smart meters:
An empirical analysis of household customers in Germany. Energy Policy 61, 2013,
483-495.
Ghosh, P. K., & Mondal, M. S. (2013). Economic valuation of the non-use attributes of a
south-western coastal wetland in Bangladesh. Journal of Environmental Planning and
Management, 56(9), 1403-1418. http://dx.doi.org/10.1080/09640568.2012.724667
Goutam, D. and Krishnendranath, M. (2015), Dynamic Pricing of Electricity: A Survey of
Related Research. Indian Institute of Management, Ahmedabad-380 015 India.
Gunatilake, H., Maddipati, N., &Patail, S. (2012). Willingness to Pay for Good Quality,
Uninterrupted Power Supply in Rural Madhya Pradesh, India. Mandaluyong City,
Philippines.
Liu, Y.,Shuwen, N., Yanqin, J., Wendie, W., Renfei, H. & Lili, H. (2013). Electricity
consumption and human development level: A comparative analysis based on panel
data for 50 countries. Electrical Power and Energy Systems 53, 338–347.
Maiyaki, A.A. (2012). Influence of Service Quality, Corporate Image, Perceived Value,
Switching Cost and Culture on Customer Behavioural Response in the Nigerian
Banks. An unpublished PhD Thesis.
Mamudu, A. (2012). Analysis of the Determinants of Willingness to Pay for Improved
Portable Water Supply in Kano metropolis. Unpublished M.sc Dissertation submitted
to the Department of Economics, Bayero University Kano, Nigeria.
Misi O. (2014). Power Sector Privatisation in Nigeria: Opportunities and Challenges. Global
Energy Industry Review Winter.
Moira, N. & David, S. (2017). Are Consumers Willing to Switch to Smart Time of Use
Electricity Tariff? The Importance of Loss-Aversion and Electric Vehicle Ownership.
Journal of Energy Research and Social Science, Vol. 23, Pages 82-96.
Dutse International Journal of Social and Economics Research Vol. 1, No. 1 June 2018
152
National Bureau of Statistics (NBS). (2012a). Basic Information Document: Nigeria General
Household Survey – Panel, March 2012 (pp. 1–38). Abuja, Nigeria. Retrieved from
http://www.nigerianstat.gov.ng/
Nuva, R., Shamsudin, M. N., Radam, A., &Shuib, A. (2011). Willingness to pay towards the
conservation of ecotourism resources at GunungGedePangrango National Park, West
Java, Indonesia. Journal of Sustainable Development, 2(2), 173.
Olaoye, T., Titilayo, A., Kunle A., Femi O., and Adelana A., (2016) ―Energy Crisis in
Nigeria: Need for Renewable Energy Mix.‖ American Journal of Electrical and
Electronic Engineering, vol. 4, no. 1: 1-8. doi: 10.12691/ajeee-4-1-1.
Oliver, H., Volschenk, J., & Smit, E. (2011). Residential Consumers in the Cape Peninsula‘s
willingness to pay for premium priced green electricity. Energy Policy, 39(2), 544–
550.
Otegbulu, A. C. (2011). A Contingent Valuation Model for Assessing Electricity Demand.
Journal of Financial Management of Property and Construction, 16(2), 126–146.
Ozbaafli, A. & Jenkins, G.P. (2016). Estimating the Willingness to Pay for Reliable
Electricity supply: A Choice Experiment Study. Journal of Energy Economics,
56/443-452.
Prasad, V.S.N.T. (2010), Nigeria‘s Electricity Sector- Electricity and Gas Pricing Barriers.
International Association of Energy Economics, First Quarter, P.30.
Salant, Priscilla and Don A. Dillman. (1994). How to Conduct Your Own Survey. John
Wiley Co.: New York, NY. 232 pp. (Alternate selection, Newbridge Book Club; The
Executive Program).
Sara K., Mad, N. S., Alias, R., Khalid, A. R. &Mohd, R. Y. (2015). Users and Non-users of
Wetland Area; Willingness to Pay and Demand Elasticity. Journal of Sustainable
Development; Vol. 8, No. 8; 2015 ISSN 1913-9063 E-ISSN 1913-9071 Published by
Canadian Center of Science and Education.
Tiruwork, A. & Tewodros, T. (2017). Household Willingness to Pay for Green Electricity in
Urban and Peri-Urban Tigray, Northern Ethiopia: Determinants and Welfare Effects.
Journal of Energy Policy, Vol. 100, Pages 292-300.
Toby, B. and Ahmad, F. (2014). Structure of Electricity Distribution Network Tariffs:
Recovery of Residual Costs. Australian Energy Market Commission. The Battle
Group.
Twerefou, D. K. (2014). Willingness to Pay for Improved Electricity Supply in Ghana.
Journal of Scientific Research; 5, 489-498.
Westerberg, V. H., Lifran, R., & Olsen, S. B. (2010). To restore or not? A valuation of social
and ecological functions of the Marais des Baux wetland in Southern
France. Ecological Economics, 69(12), 2383-2393.
http://dx.doi.org/10.1016/j.ecolecon.2010.07.005
Whittington, D., Briscoe, J., Mu, X. and Barron, W. (1990a), Estimating the Willingness to
Pay for Water Services in Developing Countries: A Case Study of the Use of
Contingent Valuation Surveys in Southern Haiti. Economic Development and
Cultural Change, 38(2): 293-311.
Zhou, S. & Teng, F. 2013. Estimation of urban residential electricity demand in China using
household survey data. Energy Policy 61, 394–402.

Dutse International Journal of Social and Economics Research Vol. 1, No. 1 June 2018
153

Dutse International Journal of Social and Economics Research Vol. 1, No. 1 June 2018
154
Electronic Surveillance as a Regulatory Tool:
Exploring the Role of CCTV in
Nigerian University Libraries
Medina Muhammad1, *Umar Faruk Dangida
2 Jamilu Ibrahim Mukhtar
3
& Adamu Abdullahi Muhammed
4
1, 2&4 J.D Amin Library, Federal University, Dutse- Jigawa State, Nigeria
3Sociology Department, Federal University, Dutse -Jigawa State Nigeria
*Corresponding author: [email protected]
Abstract: The main aim of this paper is to explore the role of electronic surveillance, CCTV
camera in particular, in preventing library regulations‘ violation in Nigerian universities.
The study used secondary data. Situational crime prevention theory was adopted to explain
the relevance of CCTV in regulating the behaviors of library users and ensuring the safety of
library materials. Situational crime prevention theory assumes that crime is possible when
two things are met: motivation and opportunity. Therefore, availability of CCTV in
monitoring activities of the library users will inhibit the violations of the rules governing the
use of library, as well as increasing the safety of the library staff and their clients. The paper
concluded that CCTV surveillance can serve as a useful tool for securing information and
tangible objects, as well as humans from criminal victimization.To achieve optimum usage of
CCTV in regulating the conduct of library users in Nigerian universities, the paper
recommended that government should incorporate its usage in libraries as part of
educational policy and universities to properly fund libraries. The paper also recommended
that CCTV should be combined with human surveillance and libraries should let users know
about the existence of the cameras, because the essence is prevention not reaction to library
rules‘ violation.
Keywords: CCTV, Electronic Surveillance, Nigeria, Surveillance, University Library.
JEL Classifications: L63, C93, N17
1.0 Introduction
Before considering some contemporary situations, this background remark should make it
clear thatsurveillance has a long history. However, its evolving functionality led to its
adoption in various bureaucratic settings, such as academic libraries. In line with this
observation, Omesekejimi, Ojeme&Eghworo (2015) stated that university libraries have
become busy information centres, where information is packaged in various formats to the
advantage of the users. In addition, university library has become user-centered as a result of
provision of Information and Communication Technology (ICT) facilities in Nigeria. This
requires close and painstaking monitoring in order to regulate the way and manner the library
users exploit the library materials.
Nigerian educational institutions should learn from other countries, such as the US whereby
not only universities, even elementary and secondary public school classrooms use CCTV for
classroom education. Nieto (1997: 28) reported that CCTV is used in 31 percent of the
Dutse International Journal of Social and Economics Research Vol. 1, No. 1 June 2018
155
elementary and secondary schools. In addition, 49 percent of all elementary and secondary
public school administrative offices rely on CCTV to monitor classroom activities. In a recent
nationwide telephone survey of public schools, 47 percent of the respondents indicated that
CCTV video surveillance is being used in some capacity in a school as a crime prevention
measure. According to the survey, most schools use the CCTV video surveillance to monitor
entranceways and parking lots, hallways, stairways, and cafeterias (Nieto, 1997).
Considering how such surveillance devices are becoming imbedded in law enforcement,Lyon
(2007) observed that, surveillance is moving towards the center of social order and
governance in many advanced societies. New technologies are implicated in this as they
facilitate and even drive some developments, but those technologies are also themselves
shaped by social, economic, and political factors. In the early twenty first century this is seen
clearly in the surveillance responses to security threats in the war on terror. The current of
much surveillance accompanies thrusts towards efficiency and safety in the modern world
and thus its effects may never be correctly viewed as only negative. This, however, does not
ignore the negative aspects of the electronic surveillance on the public, but its benefits are
immense that virtually all human organizations are expected to utilize the service of this
development for human and property‘s safety.
In view of this background, the paper is designed to explore the role of electronic surveillance
in controlling the conduct of library users in the Nigerian universities. Electronic surveillance
takes in many forms, but the paper narrow it to CCTV cameras, which is more affordable and
prevalent in Nigeria various government establishments in Nigeria.The paper is built on the
following research objectives: to identify the common library misconducts by student in
academic libraries; to examine the role of CCTV in combating misconducts in academic
libraries; to explore the relevance of CCTV in university libraries; and to provide some
measures for effective use of CCTV cameras in combating students‘ library misconducts in
Nigeria.
The paper is divided into eight sections. Section one represents this introduction, brief history
of surveillance and methodology; section two provides the literature review, where
clarification of concepts,theoretical frameworkand common library misconducts have been
discussed.Section three deals with the role of electronic surveillance in regulating library
conduct among users and section four concluded the paper and gives some recommendations.
1.1 Brief History of Surveillance
Ancient civilizations such as the Chinese and the Roman used censuses, for example, to keep
track of citizens for taxation or conscription purposes. And over seers of work projects have
always checked on their labor forces to ensure that the project is done correctly and on time.
The use of clocks, from the thirteenth century, aided this endeavor. The making of maps was
also a means of locating, in general terms, where people were. So both direct supervision
(another English word meaning ‗watching over‘) and record keeping are antique practices of
coordination and control. The coming of modernity made many such practices routine and
systematic (Lyon, 2007).
Modernity, according to Lyon (2007), is in part defined by the routinsation and
systematization in the scheme of things. Consequently, surveillance system has become
imbedded in electronic, and sometimes, wireless devices. This is what brought the emergence
of video surveillance, the common of which is known as closed circuit television (CCTV).
Video surveillance can be traced back to the 1950s with the expansion of information
andcommunications technology. At this time, cameras were mainly used for traffic

Dutse International Journal of Social and Economics Research Vol. 1, No. 1 June 2018
156
management, andin banks and shops. It was only in the 1960s that video technology began to
expand in cities,mainly in the United Kingdom and United States.
However, the implementation of CCTVin the world began in the United Kingdom,
wherebywith the growth of urban areas and consumer society in the 1970s, mass video
surveillance was adopted as a tool for monitoring shoplifting, mass events, private property,
public urban transport, hospitals and schools (Carli, 2008). Consequently, 500 CCTV
cameras wereinstalled every week since the 1980s by the UK government. In the UK, also,
videosurveillance cameras were installed in four major underground train stations and at the
same timebegan monitoring traffic flow on major highways. Following the UK, after store
owners and banks quickly understood the value of it at about 1980s, the use of
videosurveillance was becomes so prevalent for public areas in the United States. The mid-
1980s marked a move away from localauthority control over crime issues towards a more
state-led approach (Carli, 2008).
From the foregoing, it is clear that surveillance cameras systems, such as closed circuit
television (CCTV), were originally installed to deter burglary, assault and car theft but their
use has been extended to include combating anti socialbehaviour, such as littering, urinating
in public, traffic violations, obstruction, and drunkenness. CCTV systems are being used
increasingly to police public morals and public order (Isnard, 2001). But CCTV has been
diffusedand promoted to serveas a panacea for a wide range of socialand economic problems
by a variety of commercial organisations and state agencies including universities. In other
words, CCTV cameras helpgovernmental authorities to act on rising crime rates and it can
also be used as a regulatory tool in national, state, academic and/or university libraries.
1.2 Methodology
The study is exploratory research, because topic is original-trying to link library
operationwith Criminology. The study used many secondary qualitative and few quantitative
data. The method used in the study is therefore content analysis. The information collected
from the data sources are specifically based on the objectives of the study, i.e. to identify the
common library misconducts by student in academic libraries; to examine the role of CCTV
in combating misconducts in academic libraries; to explore the relevance of CCTV in
university libraries; and to provide some measures for effective use of CCTV cameras in
combating students‘ library misconducts in Nigeria.
2.0 Literature Review
2.1 The Concepts of Surveillance and CCTV
Surveillance may be defined as the focused and systematic attention to personal details for
the purposes of influence and management. Not all ‗watching‘ is focused and systematic, but
―watching over,‖ as in the French verb surveiller, is likely to be so. The watching may be
literal, as in daycare assistants ‗watching over‘ children, or street intersection cameras
‗watching out‘ for speeders who cross the line on a red light, but it may also be metaphorical.
Our activities may be ‗seen‘ in our telephone records or our credit card purchases. But the
watching is always purposeful-in these examples, to care for children or to catch out careless
drivers. Marketers may wish to influence consumers, employers to manage their workers, or
prison guards to control their inmates (Lyon, 2007).
Closed circuit television surveillance is a commonly used and commonly debated method for
preventing crime. Technological developments have also contributed to a constant growth in
the use of CCTV surveillance (Andersson, 2007). While surveillance can conducted by
humans, machines, or electronic devices, CCTV camera has now become one of the modern
Dutse International Journal of Social and Economics Research Vol. 1, No. 1 June 2018
157
means of electronic surveillance used in many parts of the world. It is usually installed to
complement human surveillance.
At its simplest, CCTV comprises a camera, coupled with a cable to a displaymonitor. It was
this type of system in the early days of CCTV monitoringthat was popular in many retail
establishments, since it was an ―affordable, do it yourself, self contained system‖ (Constant &
Turnbull, 1994:3, as quoted in Norris, 2010). These early systems were oft en extended to
connect up to four cameras tothe monitor, the images from which could be displayed
individually or in a preprogrammed sequence. The cameras were generally static and had a
fixed focal length.
The next innovation, according to Norris (2010), was to add a video recorder, enabling
theimage displayed on the monitor to be recorded on videotape and played back at a later
time. To this was added the ability to move the cameras in either the horizontal or vertical
plane, oft en coupled with the capability to zoom, by permitting variable camera focal length.
These fully functional cameras are oft en referred to as pan, tilt, and zoom (PTZ) cameras.
The recording of images has also undergone considerable change.
The sheer volume of tape requiredcapturing the images of, say, a four-camera system
recording in real time could be overwhelming. The solution has typically been to
―multiplex‖the monitoring and recording so that images from four or more cameras are
displayed on each screen and captured on a single tape. Doing this, of course, decreases the
quality of each individual image, but it lessens the number of tapes required. However, it still
requires the tapes to be changed every three hours. The solution to this problem has been to
install time lapse recordings, so that rather than recording each camera in real time, the
recording isupdated at a slower rate. As explained by Nieto (1997), CCTV video surveillance
systems can either passivelyrecord and play back video at certain intervals, be actively
monitored by security personnel, or use a combination of these methods. Law enforcement
personnel actively monitor most municipal operated systems, although volunteers and private
security are also involved in some related projects.
The library is a multipurpose establishment and a driving force in the realization of the aims
and objectives of any higher institution of learning. It can be regarded not only as a reading
centre but also a teaching and service agency (Nina-okpousung, 2011: 199). This is why stern
protection of the library materials and environment is paramount. Use of electronic
surveillance will enhance this sense of security, especially because of the increasing
challenges that ravage the various institutions of learning in Nigeria today.
2.2 Theoretical Framework
The use of electronic surveillance for regulation of behaviour would be explained within
purview of situational crime prevention approach. The situational crime prevention theory
was developed by Ronald Clarke (1983) and the theory provided the best-known strategies
and tactics for reducing criminal incidents. But it should be acknowledged that the Clarke‘s
work was predated by Oscar Newman‘s (1972) and Ray Jeffery‘s (1971, as cited in Siegel,
2010) works on crime prevention. Jeffery (1971, in Siegel, 2010) wrote Crime Prevention
through Environmental Design, which extended Newman‘s concepts and applied them to
nonresidential areas, such as schools and factories. According to this view, mechanisms such
as security systems, deadbolt locks, high-intensity street lighting, and neighborhood watch
patrols should reduce criminal opportunity (Siegel, 2010). Criminologists have suggested

Dutse International Journal of Social and Economics Research Vol. 1, No. 1 June 2018
158
using a number of situational crime prevention efforts that might reduce crime rates. One
approach is not to target specific crime but to create an environment that can reduce the
overall crime rate by limiting the access to tempting targets fora highly motivated offender
group (such as high school students).
Thus by reducing or removing the opportunity to the violation of laws, the commission of
crime will be difficult to the motivated potential criminal. For example, using burglar proofs
and alarms in doors, street lights, car securities, and availability of security personnel at the
gate or in public spaces will harden the target (i.e. target hardening). Situational crime
prevention is suitable for explaining CCTV surveillance cameras in library because the
cameras have serious impact on offenders‘ perceptions in the form of increasing risk of
apprehension by the librarians and library securities.
Having understood that situational crime prevention is about reducing the opportunity for
crime, it should also be noted that crime opportunities depend on the type of offence and
specifically on the type of offender. Therefore, Felson & Clarke (1998) warned that crime
analysts should not define offences in legal terms. This is because, in most cases, the
offenders do not consider legal rulings while making a decision about a crime. Thus: an
offender may walk down a street of bungalows looking for something to steal, leaving it open
whether to take from the garden, the drive, the carport or the house itself. Even when
committing a burglary, one offender may be interested mainly in cash, while others are
seeking electronic goods, and still others jewellery. Among the latter, some use what they
have stolen themselves, others sell it to an acquaintance, others find second-hand stores, and
yet others go to the pub or flea market to offload the stolen goods. (Felson & Clarke, 1998:
13).
In line with the above La Vigne, Lowry, Markman & Dwyer (2011) clarified that the
increased perception of risk is achieved when an offender is aware of the presence of the
camera(s) and thus be deterred from committing crime. As part of situational crime
prevention, routine activities theory is also instrumental in this paper. The major premise of
routine activities theory is that crime rates can be explained by the availability of suitable
targets, the absence of capable guardians, and the presence of motivated offenders (Siegel,
2010). The suitable target here can be any library material which is vulnerable to the
students‘ undue exploitation, such as stealing or mutilating library books, as well as
damaging or theft of electronic materials belonging to the library. A student motivated to
cause the damage to the library material is the motivated offender and the available
surveillance camera (CCTV) is the metaphor of capable guardian in the routine activities
theory.
Using the situational crime prevention, the CCTV camera can be seen a tool for surveillance
in all public spaces and it can ensure security against criminal tendencies. In the context of
this paper, the CCTV camera can also be used to prevent students‘ misconducts in the library
for they are quite aware of the existence of the unblinking eye of the camera, watching or
monitoring their activities inside the library. The situational crime prevention approach is
important for it can serve an end and a means for a variety of other unwanted behaviours in
the libraries. Apart from safeguarding the library materials the CCTV can also provide what
Siegel (2010) termed asdiffusion to other crime preventions.
The term diffusion refers above is used as similitude to latent function. For example,
Oregon‘sCentennial School District recently placed CCTV surveillance cameras at high

Dutse International Journal of Social and Economics Research Vol. 1, No. 1 June 2018
159
school and middle school campuses to curb thefts of school property, personal property, and
vandalism and to enhance after-school activity safety. The system is actively monitored by
school personnel (Nieto, 1997). In another instance, Nieto (1997) examined
howSantaFepublic schools use hidden video surveillance cameras on some school buses to
prevent vandals and graffiti artists from destroying or damaging school property. The video is
reviewed at the end of each day and after weekends and holidays. A proposal was recently
presented to the school board to extend CCTV surveillance to school sites but was defeated.
2.3 Common Library Misconducts by Studentsin Nigerian university libraries
Violating the rules and regulations of the library can cause disorder in the library
environment. Students are commonly indulging in unlawful conducts in the course of using
libraries in Nigeria. Nina-Okpousung (2011) stated that students in Nigerian higher
institutions are found to wrongly remove libraries materials from the shelves, refuse to return
the materials when they are due, disregard library due notices sent out, and refuse to pay due
fines. These and many more are done whileviolating the good order and library norms at all
times, such as placing of feet on the furniture; eating and drinking, smoking, sleeping etc. are
not condoned in all libraries. That is why the rules and regulations of all university and
college libraries are similar.
Fan Africa Christian University (2016) outlined some rules and regulations, violation of each
amounts to library misconduct. They include: noise making in the library and its environs at
all times; refusal by the library users to show their identity cards to security officer upon
entrance to the library; use of mobile phones in the library; not living all bags, cases, folders
and so on in the luggage area outside the library; leaving baggage overnight in the library by
the library users; users are logging in using their personal passwords at the search computers
or to access the internet from there; users‘ refusalto show all items to the security officer
before leaving the library; entering the circulation area by the student without the consent of
the library staff; defacing or mutilating books or any other library material.
In addition to the above rules, group discussions are only allowed in the discussion room and
the noise must be kept to a minimum and should not disturb any other user in the library; use
of sound equipments like radios, walkmans, cell phones etc. is strictly prohibited in the
library and its environs; users are not allowed to reshelf books after removing them from the
shelf. Leave the books on the table or on the trolley near the door; no library equipment may
be moved, modified or tampered with without permission from the librarian.
3.0 Role of CCTV in Combating Students’ Misconducts in the Library
In the present moment of rapid socio-economic and technological changes, the use of modern
information and communication technology is embraced anywhere in the world. This does
not signify that electronic devices are only needed for imparting knowledge or needed to be
used in the dissemination of information in Nigerian universities and colleges. Instead, it is an
indication that this technology should be incorporated in virtually all aspects of management
and security affairs of national infrastructures. To safeguard the lives and properties of
workers and visitors in banks, schools, and all other agencies, the use ofCCTV has become a
vital instrument. Similarly, university libraries are expected to use CCTV cameras for the
safety of the library materials and that of the library users and staff.
The relevance of CCTV cameras in combating all sorts of misconducts in academic libraries
cannot be overemphasized because many studies have been conducted to evaluateits
Dutse International Journal of Social and Economics Research Vol. 1, No. 1 June 2018
160
effectiveness (Norris &Amstrong, 1999; Isnard, 2001; Norris, 2010; La Vigneet al.
2011).Although these studies showed that the effects of CCTV varied, most of them
concluded that if CCTV was used correctly and under carefully favourable conditions,
criminal tendencies could be prevented (Andersson, 2007). From the beginning of its usage in
public places in the Western world, to the increase in its usage is a reason enough to conclude
that CCTV has some positive outcomes. First and foremost in the UK, CCTV surveillance
has been used extensively in public places. In Sweden, the use of CCTV for crime prevention
purposes has to date mainly been restricted to locations such as shops, parking garages and
other indoor environments (Andersson, 2007). In the recent years, the use of CCTV
surveillance for the purposes of crime prevention has become increasingly common on public
transport, in taxis and in schools. It has also become common to use CCTV surveillance in
bank entrances and near cash point machines. There are however still very few examples of
the use of CCTV for crime prevention purposes in larger public spaces where large numbers
of people gather and move around such as on the street, or in parks (Andersson, 2007).
CCTV is very important in academic libraries nowadays because schools are increasingly
becoming targets of burglaries due to the expensive computer equipment on site. That is why
some authorities are developing a model plan for school safety, emphasizing prevention and
interagency cooperation. This can be done between universities and other institutions to
promote security and safeguard information or between university library and other units
within the university. For instance, Nieto (1997) observes that school districts in some states
are experimenting with CCTV video surveillance as a principal security measure to reduce
campus violence and prevent crimes such as theft and graffiti. Similar method can be adopted
in Nigerian universities, libraries inclusive.
The CCTV surveillance systems either passively record activities and are played back at
certain intervals, or are actively monitored by personnel. According to a 1996 survey of
secondary school administrators conducted by the American Society for Industrial Security,
schools which use either passive or active CCTV surveillance systems, contend that the
systems have contributed to reduced property crimes such as break-ins, theft, and vandalism.
Advocates point out that schools are well designed for effective video surveillance since they
have a captive student population and staff in a restricted campus area (Nieto, 1997).
La Vigneet al. (2011) studied how surveillance cameras are used and acknowledged that
public surveillance program quickly grew, advancing well beyond the handful of portable
cameras to an integrated network of cameras that have become a benchmark for public
surveillance in the United States. One city in the UScan operate more than 8,000 cameras,
including public school cameras, and the vast majority of them can be accessed by the city‘s
Office of Emergency Management and Communications (OEMC).
Nieto (1997) adds that school-based CCTV surveillance systems employ active, passive, and
combined monitoring methods, depending on the financial resources and number and type of
personnel available. During the last decade, law enforcement agencies in Great Britain,
France, Monaco, Spain and other countries have increasingly relied on Close Circuit
Television (CCTV) surveillance to enhance public security. According to the survey
presented in this report, an increasing number of U.S. municipalities (mostly outside
California) have begun using CCTV public video surveillance as a law enforcement tool to
monitor public areas, schools, and residential districts.

Dutse International Journal of Social and Economics Research Vol. 1, No. 1 June 2018
161
Social changes relating to computers depend on the perceived needs for and benefits of
certain kinds of surveillance. The new technologies do have ‗effects,‘ but they are also
subject to social, economic, and political forces that give them their chance in the first place.
Thus some effects are intended. Some government agencies wish to reduce costs, including
fraud, and thus install systems to detect violators, for instance. But some effects are
unintended. Systems set up to increase production or distribution efficiency in manufacturing
may also have surveillance side effects in allowing workers to be monitored more closely.
Similarly, retail surveillance to prevent shoplifting may be expanded to check on staff
(Andersson, 2007). Using this scenario, university library users and library staff can be
monitored with the CCTV. That is why Andersson (2007) pointed out that the CCTV
technologies that facilitate surveillance have appeared at a snowballing pace, each adding
another dimension while maintaining previous capabilities. Because of recent terrorist
activity, the French government now permits electronic and CCTV surveillance in public
places, including monitoring major roads and city and urban public areas (Nieto, 1997).It
should be noted that attacks on Nigerian schools by Boko Harammade it obvious that Nigeria
is more plagued by terrorism than France, and therefore is in dire need for developing
security measures in all ramifications.
4.0 Conclusion
The paper consulted a body of literature and concluded that CCTV camera can serve as a
useful tool for securing information and tangible objects, as well as humans from
criminalvictimization. Though some evaluations of the role of CCTV camera in crime
prevention showed that the effects it has varied, but the paper agreed that if schools and
library authorities used the CCTV improperly and professionally, it will create a condition in
which violation library rules is drastically reduced. As observed in the previous section, there
were examinations of the effectiveness of CCTVcameras in many school districts in the
United States which operate passive or active CCTV video surveillance at universities,
middle and even elementary school campuses. Having testified its relevance, many schools
and city and county school boards considered installing video surveillance systems essential
for enhancing school safety and prevent crime and violence. Thussignifies that academic
libraries can equally enhance human and material safety within the library environment.
4.1 Recommendations
The paper made the following recommendations for proper and effective usage of the
electronic surveillance cameras in preventing students‘ misconduct in Nigerian university
libraries:
1. Giving that the use of CCTV can give intended (inducing proper conduct among
library users) and unintended (crime prevention and regulation of library staff‘s
conducts) consequences in academic libraries, government should make the use of
CCTV in academic libraries as part of educational policies in Nigerian tertiary
institutions.
2. Nigeria has long term problem of electricity which makes the use of many electric
appliances difficult. To achieve effective usage of CCTV for surveillance in
university libraries, there should be stable electricity supply.
3. CCTV cameras are very expensive. Thus, university authorities should also be
funding the library adequately for the librarians to afford to buy the surveillance
cameras for the safety of library environment, its materials, users and staff.
4. Library users are humans and they have rationality; they can dodge the eye of the
CCTV camera. The library personnel should not be carried away by the use of

Dutse International Journal of Social and Economics Research Vol. 1, No. 1 June 2018
162
electronic surveillance to downplay the role of human surveillance because the library
users may manipulate the camera, but they may not be able to deceive humans.
5. Lastly, the attention of the students and other university library users should be drawn
on the presence of the CCTV cameras in order to instill caution on any attempt to
violate library regulations. This might be done during orientation programmes.
References:
Carli, V. (2008). Assessing CCTV as an effective safety and management tool for crime-
solving, prevention and reduction. Montreal: International Centre for the
Prevention of Crime.
Clarke, R. V. (1983). ―Situational Crime Prevention: Its theoretical basis and practical
scope,‖ in M. Tonry& N. Morris (eds.) Annual Review of Criminal Justice
Research. Chicago: University of Chicago Press.
Fan Africa Christian University (2016). Library rules and regulations. PAC University.
Felson, M. & Clarke, R. V. (1998). Opportunity Makes the Thief Practical theory for crime
prevention. Police Research Series, Paper 98. London: Crown Copyright.
Isnard, A. (2001). Can surveillance cameras be successful in preventing crime and
controlling anti-social behaviours?Paper presented at the Character, Impact and
Prevention of Crime in Regional Australia Conference convened by the Australian
Institute of Criminologyand held in Townsville 2-3 August 200:Australian
Institute of Criminology.
La Vigne, N. G., Lowry, S. S., Markman, J. A. & Dwyer, A. M. (2011). Evaluating the Use
of Public Surveillance Cameras for Crime Control and Prevention.
Washington, DC: Urban Institute, Justice Policy Centre. e071112381.
Lyon,D. (2007). ―Surveillance‖. In G. Ritzer (ed.) The Blackwell Encyclopedia of Sociology
Oxford: Blackwell Publishing. P. 4903-4906.
Newman,O. (1972). Defensible space: People and design in the violent city. London:
Architectural Press.
Nieto, M. (1997). Public video surveillance: Is it an effective crime prevention tool?
Sacramento, CA: California Research Bureau, California State Library.
Nina-okpousung, M. O. (2011).Library policies and overdue materials inDelta State
Polytechnic Libraries, Nigeria. Journal of Research in Education and Society,
Vol.2, No. 1, pp. 199-207.
Norris, C.& Armstrong, G.(1999). The Maximum Surveillance Society: The Rise of CCTV.
Oxford: Oxford International Publishers Ltd.
Norris, C. (2010).―Closed-circuit television a review of itsdevelopment and its implications
for privacy‖.InS. G.Shoham, P. Knepper& M. Kett (eds.) International
Handbook of Criminology: Boca Raton, CRC Press.
Omesekejimi, A. F., Ojeme,T. N.&Eghworo, O. R. (2015). Undergraduate Students‘
Awareness and Compliance to Library Rules and Regulations in a Nigerian
University. Information and Knowledge Management.5 (10): 42-51.
Siegel, L. J. (2010). Criminology: Theories, Patterns, and Typology(10th
edn.). Belmont:
Wadsworth.

Dutse International Journal of Social and Economics Research Vol. 1, No. 1 June 2018
163

Dutse International Journal of Social and Economics Research Vol. 1, No. 1 June 2018
164
War or Conflict Sensitive Journalism:
A Linguistic Analysis of Newspaper
Reportage of Southern Kaduna
Conflicts in Nigeria
*Hassan Alhaji Ya‘u, Ph.D1
Faculty of Communication 1Department of Mass Communication, Bayero University, Kano
. *Corresponding Author‘s Email: [email protected]
Abstract: Peace is the most pressing challenge faced in the 21st century. On the other hand,
conflict is seen as the inevitable pursuit of incompatible interests and goals by different
groups. Armed conflict is the resort to the use of force/violence in the pursuit of incompatible
interests and goals. The search for causes of conflict, its management and resolution have led
to the use of such terms as peace-making, peace-keeping, peace-building, peace-education,
peace journalism and so on. In view of this, language, information and communication are
very essential in promoting, preventing and resolving conflict situations. Based on this
conceptual framework this paper used Descriptive Discourse Analysis as an approach of
Qualitative Content Analysis to describe the pattern of linguistic narrative employed in the
reportage of the southern Kaduna crisis as a means of resolving or aggravating the conflict.
The study found that 50% of the stories used labeling, 37.5% used incitement and 6.25% used
both exaggeration and false claim as the linguistic pattern of presentation of stories on
Southern Kaduna conflicts. The study recommends the effective socialization and orientation
of journalists into the principles and practices of conflict sensitive journalism in the coverage
of socio-economic and political conflicts.
Keywords: Conflict Sensitive Journalism, Exaggeration, Identification, Labeling
JEL Classification: C34, L82, Z11
Introduction
Language is considered to be an indispensable human endowment which is conceptualized
according to Crystal (1987), as having, perhaps, ‗magical and mystical‘ and ‗unique role in
capturing the breath of human thought and endeavors‘. Many studies derived from ‗linguistic
determinism‘ and ‗linguistic relativity‘ have shown that there exists a relationship between
language and thought. Such relationship clearly indicates that language is the vehicle for the
expression of thought.
Peace is a desirable condition but conflicts are inevitable in any society. In view of this,
language, information and communication are very essential in promoting, preventing and
resolving conflict situations. Negotiation or dialogue can only take place where exchanging
and sharing of information is possible. Communication, therefore, is the goal of language as
mutual agreement is the goal of conflict resolution. As a result of too many violent situations,
there is a desperate search for peace and conflict resolutions in our societies (Moulton, 1974).
Polemology – the study of the science of peace is concerned with the causes and resolution of
conflict. Peace is the most pressing challenge faced in the 21st century. On the other hand,
Dutse International Journal of Social and Economics Research Vol. 1, No. 1 June 2018
165
conflict is seen as the pursuit of incompatible interests and goals by different groups. Armed
conflict is the resort to the use of force and armed violence in the pursuit of incompatible and
particular interests and goals. The search for causes of conflict, its management and
resolution have led to the use of such terms as peace-making, peace-keeping, peace-building,
peace-education, peace journalism, conflict prevention, third party intervention, preventive
diplomacy, and peace-enforcement and so on. Peace, therefore, is the most pressing challenge
faced in the 21st century, without which, there will be no development (Galtung, 1998).
Problem Statement
Sapir (1963) argued that through language and communication we can see the heart of a
people. This implies that language makes it possible to express feelings, emotions, views,
ideas, opinions, perceptions as well as judgments about people, objects, places, things,
information and situations. Therefore, information about conflict and conflict situations can
be expressed in language. Communication relates to the presence and sharing of accurate
information about a conflict or conflict situation, being able to talk about feelings and
concerns of parties, speaking about what parties would like to change, and discussing the
nature and type of the conflict, touching on the positions, interests, needs and fears of the
parties. Communication, therefore, has come to represent a key strategy of conflict
prevention, resolution and aggravation.
There are no sacrosanct language strategies of settling disputes the world over. Experience,
cognitive abilities, unquestionable personalities, tolerance, transparency, demonstration of
understanding of the disputes, coupled with effective communicative skills are what many
conflict researchers consider to be foremost requirements of mediators and of conflict
resolution generally. However, some language and communicative strategies are practiced
during dialogue, negotiation, mediation, arbitration, adjudication etc. (Adejimola, 2009).
It is based on the above conceptual framework this paper seeks to examine the pattern of
newspaper linguistic narrative employed in the reportage of the southern Kaduna crisis as a
means of resolving or aggravating the conflict.
Literature
Conflict is one of the defining features of all human societies. Consequently, since the end of
the Cold War there have been countless conflicts that have involved the deaths of millions of
people and the suffering and displacement of millions more. It is impossible to accurately
quantify human suffering due to conflict. To take one indicator – it has been suggested that,
in the last ten years, over two million children have died in conflicts, more than one million
have been orphaned and more than six million have been disabled or seriously injured. One
striking factor is the growth in the number of conflicts which have fundamentally corroded
the ability of the state to care for its citizens (Shultz, R.; Godson, R.; Hanlon, Q. and Ravich,
S. 2011).
In many of these conflicts the media played a pernicious role – directly inciting genocide in
the case of some Rwandan media (and organizing it in the case of Radio Mille Collines)
while acting as a vehicle for virulent nationalism in former Yugoslavia. This is not just a
modern phenomenon – both the Nazis and the Soviet Union used the media to create a
hegemonic climate in which they could more easily exercise power. However, policy makers
have been slow to understand the importance of media in shaping modern conflict or how,
with proper support, it can help create the conditions for peace The growing recognition of
the crucial role the media can play in helping provoke conflict has led many to examine how

Dutse International Journal of Social and Economics Research Vol. 1, No. 1 June 2018
166
the media can play a constructive role in resolving conflict. This created considerable
controversy- should journalism stay detached, even from horrific events unfolding around
them, or should it take up the stance suggested by Martin Bell and become attached to a cause
– even that of peace (Shultz, Godson, Hanlon and Ravich, 2011).
The obvious problem with such an approach is that it might involve taking sides in a conflict
– after all, conflicts require a solution that addresses the underlying problems and this means
assessing the weight of the different claims in a conflict and seeking to resolve them. Peace is
something more than the absence of war. The dangers of journalists taking sides in a conflict
are obvious – professional independence is impossible to maintain, access to the other sides‘
combatants will disappear and journalists will become even more of a target than they already
are. Part of the problem with the debate about ―peace journalism‖ is confusion about the
different roles the media fulfills. The media is a place in which journalists convey ideas,
information and stories to the listener, viewer or reader – in this way they represent a version
of reality. It is sometimes said that the journalist acts as a vehicle, which conveys the
different views, outlooks and perspectives experienced in a society. In this capacity there is
fierce resistance to any attempt to encroach on the independence of the journalists carrying
out this function, or any attempt to impose an ideological purpose upon them, however
worthy. The media understood in this way is a structure that carries the debates of a society
(Crocker, 2007).
However, in addition to the representation of the groups they are reporting on – in this case
parties to the conflict – journalists also present their own views and interests. In this respect
the media itself becomes an actor in the conflict, for example when it takes an editorial
position or when the media focus on certain issues or aspects of the conflict leads to the
exclusion of others.
The idea that the journalist sits outside of the events they are covering, whatever their
perspective on ―peace journalism‖ is misleading. The media, in this sense, are themselves
actors or agents in the conflict and their behavior will have an effect on the way the conflict
develops. To use more abstract terms the media constitute a space in which the conflicts of a
society can be articulated and are inevitably themselves actors in that conflict. Moreover the
combatants in a conflict will usually relate to each other either on the battlefield or through
the way they are represented in the media (and this latter, as is evident in many recent
conflicts, may often be more important to them than the battlefield) (Crocker, 2007).
Too often unarmed men, women, and children are the targets of brutal unprovoked acts and
journalists find themselves reporting on events so horrific that observers describe them as
atrocities. These events tend to happen during periods of intense conflict and journalists will
continue to be called on to cover these internal conflagrations for many years to come.
International mediator and former United States assistant secretary of state for African affairs
Chester Crocker writes that ―the raw material for generating and sustaining violent conflict
remains plentiful (Crocker, 2007). This raw material, he suggests, includes:
(1) Large numbers of historically ―new states‖ with weak institutions and limited capacity
to carry out basic state functions in the areas of security, inclusive and responsive
governance (―delivery‖), and civil administration;
(2) The uneven pace of economic and political modernization within and between
regions, as well as dramatically increased inter-societal communication flows;
(3) The unresolved crises between militant Islamists and key western societies;
Dutse International Journal of Social and Economics Research Vol. 1, No. 1 June 2018
167
(4) The growing capacity of criminal and terrorist networks and other non-state actors to
utilize the instruments of globalization and asymmetric conflict to undermine peace
and security, exploit security vacuums, and cohabit profitably between states.
A foundation in journalism that is sensitive to the media‘s impact on conflict can help prepare
reporters to cover violent confrontations, to provide journalists with insights they can draw on
in
making a constructive contribution to the eventual peaceful management and resolution of
conflicts through their reporting. In doing so it recognizes that many professional journalists
have found that an approach to conflict coverage known as Conflict Sensitive Journalism
(CSJ) has enhanced their ability to cover conflict. Many have also noted that the CSJ
approach has raised their commitment to good journalism by helping them recognize how
they can make a positive contribution toward conflict transformation in their own
communities. In essence, conflict sensitive journalism involves journalists developing a more
sophisticated understanding of conflict and applying this knowledge in all aspects of their
reporting – from story conceptualization, to interviewing, to the final moments of production
(Howard, 2009).
Conflict Sensitive Journalism
In his UNESCO-sponsored curriculum for conflict sensitive reporting, Ross Howard
demonstrates how, over the past 30 years, there has been a growing recognition among media
support initiatives that journalists can contribute constructively in reporting on conflict
(Howard, 2009). Outlining a history of the emergence of conflict sensitive reporting, Howard
shows how these initiatives have shifted from a general focus on core professional
journalistic attributes of accuracy, neutrality and responsibility to one that more deliberately
recognizes the journalist‘s role in reporting on conflict. The shift, which began in the mid-
1990s, came in part because of the role played by Radio Télévision Libre des Mille Collines
(RTLM) in stoking and ultimately in facilitating the Rwandan genocide between July 1993
and July 1994 as well as the involvement of media in promoting ethnic cleansing in the
former Yugoslavia.
During the second half of the 1990s academics, journalists, development experts and peace
activists contributed toward a vibrant debate about the roles that news media can play when
covering conflict. Arguably the foremost voice was that of leading peace and conflict scholar
and practitioner Professor Johan Galtung who proposed that a distinction be drawn between
what he terms war/violence journalism and peace/conflict journalism. He suggests that, on
the one hand, war journalists see ―…conflict as a battle, as a sports arena or gladiator
circus… the zero-sum perspective draws on sports reporting where ‗winning is not
everything, it is the only thing‘‖ while peace journalists, on the other hand, recognize that
―…in conflict there is also a clear opportunity for human progress…transforming the conflict
creatively so that the opportunities take the upper hand — without violence (Galtung, 1998).
However, peace journalism has not escaped criticism. The approach has been critiqued for
advocating that journalists should ―play a more active role in bringing about peace‖ and
critics suggested that such a positioning could have an impact on traditional journalistic
values. The concept of conflict sensitive reporting emerged as an alternative approach which,
while recognizing the important role journalists can play in covering conflict, proposed that
this should not deviate from the core traditional values of journalism. The essential principles
of Conflict Sensitive Journalism (CSJ) were outlined in Ross Howard‘s 2003 handbook titled
Conflict Sensitive Journalism (Howard, 2003).

Dutse International Journal of Social and Economics Research Vol. 1, No. 1 June 2018
168
Understanding Conflict
Galtung (1998) and Howard (2003) observed that the question ‗What is conflict‘ is a question
more easily asked than answered and a survey of academic literature returns multiple
definitions. Galtung argued that the commonly held characteristics shared by most conflicts
are plausible template for comprehensive understanding of conflicts. Conflict exists in
relationships and interactions between individuals and groups. These actors (individuals and
groups) have, or at least believe they have, incompatible goals. Conflict becomes manifest or
recognizable in the actors‘ behavior toward each other. This behavior can range from
dialogue to threats and ultimately to violence. They can also include parties deliberately
refusing to engage with or even recognize each other.
Howard (2003) argued that behavior is driven by strategic objectives as parties mobilize the
power they have at their disposal to get what they want. Behavior will also be shaped by
emotions such as frustration, anger, and fear, which in turn are shaped by the attitudes of the
members of the different groups toward each other.
Journalists wanting to understand conflicts and to offer audiences a comprehensive narrative
that details what is happening need to consider all of these factors in their coverage. We need
to go beyond simply describing the conflict event — how the parties behaved toward each
other. We also need to question how prior relationships between the parties, and the broader
context in which the conflict happened, have shaped their relationships. For example, in
several countries people belonging to particular ethnic groups have felt marginalized by a
government dominated by people from another group. This sense of deprivation has caused
resentment toward those from the ruling tribe and this has contributed toward heightened
conflict during periods of instability, such as the aftermath of the 2007 elections in Kenya and
to some degree in Zimbabwe in 2008. To provide a comprehensive picture of what is taking
place in a conflict, journalists need to show how all of these issues — the parties‘ attitudes,
their behaviors and the social context (contradictions) — are impacting on each other. Too
often reporting focuses on behaviors without addressing the other two factors.
Sources of Conflict
Drawing broadly on conflict literature, South African conflict expert Professor Mark Anstey
outlines eight potential core sources of conflict which are summarized below (Pruit, and Kim,
2004). These sources can exist simultaneously and impact a conflict in different ways.
Conflicts can become manifest when:
1 Resources are scarce: Conflicts often take place when there are not enough resources
to go around. These can include physical goods such as land and control over mineral
and oil reserves, but they can also include employment opportunities and access to
political power and the wealth that people often accrue with power.
2 Identities are threatened: People form their identities by looking at the cultural,
ideological, and
religious beliefs they share with others of their group. They also define themselves in
terms of who they are not and in so doing highlight the differences that exist between
them and members of other groups. Conflicts can break out when groups feel that
they lack the same opportunities as members of other groups or when people feel their
symbols, cultures and languages are being threatened.
3 Structural imbalances exist in a society: Structural conflicts occur when actual or a
perceived inequality exists in the way a society is structured. These conflicts often
Dutse International Journal of Social and Economics Research Vol. 1, No. 1 June 2018
169
take on a class, ethnic, religious, or racial dimension because these inequalities tend to
follow these fault-lines in a society. Ending these conflicts can involve the
transformation of a political system from one that privileges certain groups over
others to one that reduces inequalities. Transformation of this type of conflict can be
complex as privileged groups generally resist change.
4 Groups have competing goals: Parties frequently find themselves in conflict because
of incompatible goals. Industrialists and environmentalists clash over waste disposal
methods, pastoralists and nomads clash over land utilization, and the decision by one
government to dam a river may place it in conflict with another state further
downstream. Importantly, the goals do not have to be incompatible; it is enough for
parties to believe this is the case.
5 People lack information: Conflict may occur if parties misread reach others‘ goals
and intentions and lack the information they need to correct their misperceptions.
Acting on incorrect or too little information they may unintentionally provoke hostile
responses, especially when there is a history of antagonistic relationships. For
example, if Party A fears an attack by Party B and deploys troops to a border, Party B
may interpret this as the prelude to an attack and respond as if Party A was the
aggressor.
6 Ambiguity exists in situations and in relationships that are in transition: Conflicts can
happen during times of transition when there is ambiguity about the rules of the
political game. People emerging from oppressive systems often have little experience
with democracy and democratic values. Confrontations can occur when people have
different expectations about what rights and Privileges a transition should have
brought about. For instance, civil society groups may expect greater tolerance from
the state toward questions of free speech, the right to protest and how the State
security apparatus can be deployed in a more open political system. These views may
not be shared by a newly invested government.
7 Tensions exist in independent relationships: It is not uncommon for conflicts between
groups to be influenced by leaders‘ personal antagonisms. Leaders will mobilize their
supporters in pursuit of their own more selfish interests, but as conflicts escalate and
more people are involved in clashes and confrontations, the conflict can become more
complex as animosities between groups extend beyond the leaders‘ antagonisms.
These potential sources of conflict provide us with useful lenses we can use when we
examine a conflict and try to identify the social, political, and economic factors at its roots.
By exploring which of these factors may have led to the outbreak of a conflict, we can begin
to develop theories about how conflicts began. We can then test these theories through our
observations and interviews with people involved.
Southern Kaduna Crisis: A Historical Perspective
Suberu (2013) has documented the historical antecedents and chronology of the southern
Kaduna crisis since the colonial period and argued that the ethnic minority tensions and
conflicts in the region have engendered serious violence than any other forms of communal
instability in recent Nigerian history. He observed that the present Kaduna State encompasses
the area of old Zaria emirate-cum province which Smith (1960) cited in Suberu (2013) argued
has two broad cultural segments. The first of which he referred to as the Muhammadan
Hausa-Fulani group and constitutes sixty per cent of the emirates population, occupies mainly
the northern part of the province and dominates the structure of traditional governance.
Dutse International Journal of Social and Economics Research Vol. 1, No. 1 June 2018
170
The second ethno cultural bloc of Zazzau kingdom comprises of a ‗Pagan population‘ of
about thirty tribes located in the south western half of the territory. However, throughout this
region half of it is dominated by the Hausa-Fulani in enclaves, walled towns or open villages
which are the foci of economic, political and administrative life in their respective areas. This
pattern of settlement has guaranteed the crystallization of the contours of socio-economic
conflicts between the Hausa population and the pagan communities (Smith, 1960).
Smith also observed the development of complex forms of clientage and vassalage between
the two groups. The pagan tribes were traditionally the legitimate targets for slave-raiding,
the exaction of tribute and other forms of domination by the Hausa-Fulani. He argued that the
political and military vulnerability of the pagan groups to Hausa-Fulani hegemony is a
consequence of their relative inferior technology, smaller settlements and decentralized
modes of political organization which rendered them defenseless of Hausa-Fulani
expansionism and imperialism.
He however noted that the pagan communities differ in their degree of penetration by or
subordination to the Fulani emirate system. Some communities have successfully resisted
conquest and incorporation by the Fulani power groups. Thus the Kagoro, Jaba and Maroa
have enjoyed some degree of independence from the emirate system. They have been able to
retain their integrity and autonomy as independent chiefdoms since the colonial era. These
communities have also been accorded higher status than pagan groups that are incorporated
and subordinated in to the emirate society.
The unequal historical political structure between the Hausa-Fulani and the pagan community
has been compounded by religious differences. Islam is the religion of the overwhelming
majority of the Hausa-Fulani and it has provided the doctrinal and ideological foundation for
the emirate system. On the contrary different forms of animistic worship have traditionally
dominated the pagan population. They are looked down upon as infidels by the emirate
population, arbitrarily and oppressively subjected to Muslim judicial and legal system as a
result of which they become receptive to Christian conversion and education. These ethnic
minority elites occupy a frontline position in the Christian Association of Nigeria which has
persistently and violently attacked the hegemony of Muslim Hausa-Fulani elites in the north
and the whole Nigeria (Yahaya, 1980 cited in Suberu, 2013).
The political, cultural and religious cleavages between the majority and minority groups in
the Zazzau emirate have been reinforced by economic imbalances. Although blessed with
heavier rainfall and denser woodland than the northern Zaria, southern Zaria is evidently
more underdeveloped than the northern section of the emirate. Moreover socio-economic
opportunities and infrastructure improvements have tended to be concentrated in areas or
enclaves inhabited by Hausa settlers (Smith, 1960, Yahaya; 1980 cited in Suberu, 2013).
The differences presented above over traditional political control, culture, religion and
resource distribution have often escalated into violent agitations and confrontations. Whitaker
(1970) noted that at different times between 1946-1966 riots were staged by the ‗Kataf‘ and
other related peoples in southern Zaria province over certain oppressive features of the
emirate system particularly the headship of the Fulani ruling families over predominantly non
Fulani districts.
Yahaya (1980) also observed that in 1942 and 1948 political protests developed among the
Kaje ethnic group of the Zangon Kataf district over perceived discrimination by the native
authority administration against the southern Zaria population. He argued that these protests
Dutse International Journal of Social and Economics Research Vol. 1, No. 1 June 2018
171
were in certain cases reinforced by violence and tensions and marked the beginning of what
became a continuous demand for political recognition and participation as well as frequent
tribal, ethinic and religious clashes in southern Zaria.
Any advocacy for peaceful coexistence, tolerance, and unity through the mass media and all
forms or approaches to conflict resolution must consciously and deliberately consider and
situate these historical antecedents into proper perspective so as not to frustrate the existing
relative peace and provoke conflict.
Methodology
The study adopts qualitative content analysis as the primary method of data inquiry. It is an
approach that focuses on the application of analytical tools from disciplines such as literary
criticism, film studies and linguistics to the investigation of texts structure and the production
of meaning (Gunter, 2000). The study espouses the approach of Discourse Analysis as the
principal means of data analysis. It is a mechanism for the assessment of the meaning of
language in terms of its implicit ideological assumptions. It assumes that text is a
representation of the world in language and that each linguistic expression in a text has a
structure of values; social, political, economic, cultural or ideological in origin on whatever is
represented. The method asserts that underlying ideological positions, perceptions of power
relation and level of interest and authority can be determined from the textual structure of
media content (Fowler, 1991 cited in Gunter, 2000).
The population of the study consists of all the daily national newspapers published in Nigeria
from May 2016 to March 2017. Purposive sampling is used to select some editions of Daily
Trust, Daily Post, The Vanguard and The Punch newspapers that covered stories on the
southern Kaduna crisis within the period under study. The study is qualitative and less
concern with generating an extensive perspective than providing an intensive insight into
complex social phenomenon in specific circumstance. Thus small samples generated more
informally and organically are used than those typically used in quantitative studies so as not
to preclude the intensive analysis needed in qualitative studies. The samples are therefore
illustrative.
The unit of analysis consists of all feature articles and news stories on the southern Kaduna
crisis in Daily Trust, Daily Post, The Vanguard and The Punch newspapers from May, 2016
to March, 2017.
The content categories include linguistic expressions that present exaggeration, identification,
labeling, false claim and incitement in the story.
Exaggeration: this is the description of any event, injury, killing, arson or crime related to
the southern Kaduna crisis beyond the actual magnitude established by official authorities.
Identification: this refers to the establishment or disclosure of the ethnic, tribal, religious or
political identity of the culprit or victim of a crime related to southern Kaduna crisis.
Labeling: this is a conclusive association of a particular person, tribe, religion, political party
or socio-economic group with a crime related to the southern Kaduna crisis.
False claim: this is an untrue, incorrect and spurious account of crime related to southern
Kaduna crisis that has not been validated by official authorities.
Incitement: this is an implicit or explicit call or encouragement to any of the parties in the
crisis to act in an illegal fashion on any matter related to the southern Kaduna crisis.

Dutse International Journal of Social and Economics Research Vol. 1, No. 1 June 2018
172
Data Presentation and Analysis
The study investigates the use of language in newspaper reports to resolve or aggravate the
southern Kaduna crises in Daily Trust, Daily Post, The Vanguard and The Punch newspapers
from May, 2016 to March, 2017. Purposive sampling was used to identify and examine 16
stories related to the crisis in the period under study out of which Daily trust reported 3
(18.6%), Daily Post reported 4 (25%), Vanguard reported 4 (25%) and The Punch reported 5
(31.9%). Moreover, 8 (50%) of the stories used labeling, 6 (37.5%) used incitement and 1
(6.25%) used both exaggeration and false claim as the linguistic pattern of presentation of
story.
For example on 26th
January, 2017 the Daily Post reported a story with the tittle ‗Crisis in
Southern Kaduna as Christians Attack Governor Elrufai‘. This linguistic expression is
conclusive that the attack on the governor on his visit to the southern Kaduna to assess the
crisis was perpetrated by people from Christian faith which suggests a religious bias as an
ideological or socio-cultural sympathy. It is obvious that a crowd is a composition of people
with divergent socio-cultural dispositions hence it is difficult to comprehensively establish
that the attack on the governor was responsibly executed by Christians.
Another example of a newspaper report on the southern Kaduna crisis which used labeling in
its presentation is evident in a news story reported by Daily Post on 6th
February, 2017 with
the caption ‗Fulani Herdsmen Attack Southern Kaduna Again‘. This suggests that of all the
different groups of herdsmen it is the ‗Fulani‘ that advanced and perpetrated attacks in
southern Kaduna even though herdsmen from within and outside the country graze in the
region and all herdsmen are Fulani as cattle grazing does not have ethnic or tribal frontier.
In another story from the same paper on 6th
March, 2017, labeling was clearly used to
identify and associate Hausa/Fulani with persistent killings in southern Kaduna. The story
title ‗Hausa/Fulani are the perpetrators of southern Kaduna massacre – CBCN’ has tagged
and categorized the responsibility of the ethnic killings in southern Kaduna to the
Hausa/Fulani clan. The story equally identified the Catholic Bishops Conference of Nigeria
as the source of the opinion. Each of the patterns suggests a socio-cultural value that is
evident in what is represented in the story.
Similarly in a story reported by Daily Post on 22nd
February, 2017 labeling was used to
suggest that the Fulani are victims of the crisis in southern Kaduna. The story title ‗Fulani
Herdsmen are the Victims of Injustices in Southern Kaduna‘ is therefore implicitly conclusive
that the crisis in southern Kaduna is perpetrated and sustained by the non-Fulani and non-
Muslims in the area. A linguistic analysis of this title reveals an explicit ethnic bias inherent
in the expression. Daily Trust newspaper also reported a story which labels the Hausa/Fulani
communities as the perpetrators of crisis in southern Kaduna on 29th
December, 2016 with
the title ‗southern Kaduna people reprisal attacks on Hausa/Muslim communities’.
The examples presented are clear examples of the use of language in newspaper reports
advance personal, cultural, ideological values and interests through labeling. In conflict or
crisis reporting this will results in inciting one party over the other and culminate in the
aggravation of the crisis as evident from the ongoing crisis in southern Kaduna.
In the aspect of using language in newspaper reports to incite one group over the other the
data shows that 37.5% of the stories reported on the southern Kaduna crisis in the period
under study used incitement as a linguistic pattern. For instance on 22nd
January, 2017

Dutse International Journal of Social and Economics Research Vol. 1, No. 1 June 2018
173
Vanguard newspaper reported a story with the headline ‗Southern Kaduna Killings:
Christians Are Not Scared of Fighting Back‘. This is a typical use of language to advance
religious interest and attempt to incite the Christians against the Muslim in the region. This is
also a clear example of War Journalism in which the media encourage unlawful engagements
and provocations in conflict situations. The media should provide a platform for the exchange
of ideas to facilitate agreement, understanding and integration.
In another story The Punch newspaper on 12th
February 2017, reported a story title ‗Southern
Kaduna Crisis: A Trail of Blood, Tears from Broken Communities’. The title is clearly
inciting as it deliberately created a horrible picture of the situation which will stimulate the
need for revenge in the opposing group and generate general sympathy and compassion from
the general public because blood and tears are evidence of suffering, sorrow or distress and
can easily motivate emotions.
Earlier in December 2016 the paper in a story on the Goska attack on 23rd
December, 2016
the paper wrote ‗On the Eve of the Christmas 19 People Were Killed in Goska While Tens of
Others Were Injured with Several Houses and Shops Razed Down in the Predominantly
Christian Community’.
In its 12th
December, 2016 edition The Punch created another picture which can incite one
party over the other in southern Kaduna conflict. The reporter narrated that ‗…the picture was
of charred bicycles, cars, burnt houses and hurriedly prepared graves as sign of the
destruction left in the wake of the Christian eve attack‘. Moreover on the 8th
January, 2017
Punch reported an opinion article tittle ‗As FG tackles the southern Kaduna crises where the
writer used linguistic devices that represent some socio-cultural values and which can incite
and aggravate the crisis in the region. The writer argued that ‗…the general consensus is that
the attacks allegedly visited upon them by the Fulani herdsmen are an attempt to drive
them off their land and Islamize the area’..
The highlighted linguistic expressions represent a bias and sympathy towards Christians and
Christianity. The expressions have the potential to incite Christians against Muslim in the
region or any part of the country for reprisal as the socio-political history of Nigeria is full of
similar instances.
The data generated also indicates that linguistic devices are used in newspaper reports on
southern Kaduna crisis for exaggeration. This represents an over statement or estimation of
the crisis by inflating the number of death, casualties and destructions beyond the magnitude
established by constitutional authorities. In its 14th
January, 2017 edition Vanguard reported a
story with the headline ‗Southern Kaduna Crisis: Church Puts Death to 808, Injuries 1422,
16 Churches, 19 Shops, and 1 Primary School’. However throughout the story no official
source was consulted to ascertain the claim of the magnitude of this destruction.
A week later Daily trust reported a story on the 20th
January, 2017 which officially disputed
the church‘s claim reported by Vanguard. The story tittle ‗Rumors, Fake News, Fake
Photographs Circulating about the Crisis in Southern Kaduna‘ has officially reported that
204 deaths were recorded by NEMA as at January, 2017. Moreover, on 18th
February, 2017
the paper reported that the crisis in southern Kaduna was exaggerated in a story tittle
‗Southern Kaduna Crisis: Exaggerated, Propaganda –CP
The data also reveals the use of language mechanisms to falsify facts, situations and claims in
the coverage of conflict or crisis situations. This is evident in a story reported by the
Vanguard on 24th
January, 2017 where the reporter said ‗Five Students of The Kaduna State
Dutse International Journal of Social and Economics Research Vol. 1, No. 1 June 2018
174
College of Education Gidan Waya Kafanchan Were Killed by Fulani’. The story attracted the
attention of both government and concerned Nigerians and was subsequently investigated and
verified to be a fabrication. The reporter was charged and prosecuted in court of law. The
deliberate and malicious use of students as victims and Fulani as culprits can inspire revenge
and attack by not only the non-Fulani people but also organize social groups.
Discussion
From the data analysed it is clear that linguistic approach to newspaper reportage of the
southern Kaduna crisis is a representation of socio-cultural and ideological values that are
intrinsic in the language used. The approach deviates substantially from the principles of
Conflict Sensitive Journalism which seeks to promote conflict resolution through
comprehensive reports about conflict or crisis by relating the socio-political and economic
antecedents of societies to existing experiences that result into crisis between groups. Conflict
sensitive journalism represent a shift from general focus on core professional journalistic
attributes of reporting accuracy, neutrality and responsibility to one that deliberately
recognizes the journalist‘s role in reporting conflict at the same time maintaining the
journalistic professional values so as to constructively contribute to conflict resolution and
peaceful coexistence.
The approach used in reporting the southern Kaduna conflicts inclines more to the tenets of
War Journalism, which is about reporting conflicts, crisis and disputes with value biased
towards violence and violent groups that leads audiences to overvalue violent responses and
ignore non-violent alternatives. It concentrated on reporting differences between parties
rather than similarities, previous agreements and common progress. It ignores causes and
consequences of crises and is zero sum (assuming that one group‘s benefit is a consequence
of the other‘s compromise or defeat).
Conclusion
The data analyzed have revealed the conscious and unconscious use of linguistic bias and
values to report the southern Kaduna crises which are predominantly labeling, exaggeration
and inciting capable of advancing and projecting violence and violent responses thereby
undermining non-violent alternatives. This calls for the urgent socialization and orientation of
journalists into the principles and practices of conflict sensitive reporting.
Conclusion
Whether journalists seek to influence a conflict or not, the moment we start reporting on a
conflict we become part of the event. How we behave, who we choose to speak to, what
questions we ask and what we write and broadcast influences how parties behave, how others
respond to us and how conflicts evolve. Conflict sensitive journalists share a heightened
awareness of this potential and this motivates us to produce quality journalism.
Recommendations
Journalists can make a constructive contribution through coverage of conflict without
compromising professional roles as providers of fair, accurate, and responsible reporting.
These principles are the building blocks of credibility without which the media‘s potential to
play a constructive role in conflict reporting can be severely compromised. Journalists can
contribute toward escalating conflict, interfere with peace processes, and derail negotiations
through inaccurate, insensitive, and sensational reporting journalists are not mediators, their

Dutse International Journal of Social and Economics Research Vol. 1, No. 1 June 2018
175
work can facilitate communication between parties, but this is not the same as sitting down
with antagonists and actively helping them reach solutions.
References
Adejimola, A.S. (2009) Language and communication in conflict resolution, Journal of Law
and Conflict Resolution Vol. 1(1), pp. 1-9, June, 2009
Crocker, C. (2007) Peacemaking and Mediation: Dynamics of a Changing Field.
International Peace Academy .Coping with Crises Working Paper Series,
www.ipacademy.org
Crystal, D. (1987), The Cambridge Encyclopedia of Linguistics. New York: Oxford
University Press.
Galtung, J. (1998) High Road: Low Road — Charting the course for peace journalism. 7(4).
http://reference.sabinet.
co.za/webx/access/electronic_journals/track2/track2_v7_n4_a4.htm
Gunter, B. (2000) Media Research Methods,.SAGE Publications, London.
Hoffman, F. (2007) Conflict in the 21st Century: The Rise of Hybrid Wars. Arlington:
Potomac Institute for Policy Studies
Howard, R. (2003), Conflict Sensitive Journalism: A handbook. IMPACS and IMS.
http://www.i-m-s.dk/ files/publications/IMS_CSJ_Handbook.pdf
Howard, R. (2009), Conflict Sensitive Reporting: State of the Art — A Course for Journalists
and Journalism Educators. Paris press
Moulton, W.O. (1974) The Nature of Language in Language as a Human Problem, ed. M.
Bloomfield and E. Haugen, 58-73. New York: W. W. Norton and Company.
Pruit, D.; & Kim, S. (2004) Social Conflict: Escalation, stalemate and settlement. Boston:
McGraw Hill: 9–11.
Sapir, E. (1963) Language – An Introduction to the Study of Speech, New York: W.W.
Norton and Company.
Suberu, R.T. (2013) Ethnic Minorities and Political Turbulence in Kaduna State, IFRA-
Nigeria
Shultz, R.; Godson, R.; Hanlon, Q. & Ravich, S. (2011), The Sources of Instability in the
Twenty-First Century: Weak States, Armed Groups, and Irregular Conflict. Strategic
StudiesQuarterly.
http://www.au.af.mil/au/ssq/2011/summer/shultzgodsonhanlonravich.pdf

Dutse International Journal of Social and Economics Research Vol. 1, No. 1 June 2018
176
Dutse International Journal of Social and Economics Research Vol. 1, No. 1 June 2018
177
An Assessment of Human Poverty –
Health Outcomes Nexus in Rural
Communities of Nasarawa State, Nigeria
*Abdul-Razaq Rilwan Itari1, Salihu Habibu Muhammad-Gani (Ph.D)
2,
& Muhammad Muazu Yusuf (Ph.D)3
1 Department of Economics & Development Studies, Faculty of Arts and Social Sciences,
Federal University, Dutse, Jigawa State, Nigeria. 2 Head, Department of Economics, Faculty of Social Sciences,
Nasarawa State University, Keffi, Nasarawa State, Nigeria. 3 Department of Economics & Development Studies, Faculty of Arts and Social Sciences,
Federal University, Birnin-Kebbi, Kebbi State, Nigeria.
*Corresponding Author‘s Email: [email protected]
Abstract: The study was set to explore the human poverty and health outcome nexus in rural
communities of Nasarawa State, Nigeria. The study relied solely on primary data collected
from 399 randomly selected rural community members in three rural communities from three
sample local government areas spread across the senatorial zones of the Nasarawa state. An
econometric model was specified and estimated using the Bivariate Correlation and the Logit
Regression techniques. Majority of the rural community dwellers i.e.76% are poor. The Logit
regression results reveal that state of health, the number of dependents , Education, Number
of times food is taken per day, poor utilization of health care facilities (and death of children
below the age of five are the major determinants of poverty and health relationships,
although the model has a good fit given the value of McFadden’s Pseudo – R2 coefficient
0.72, however, overall, the model is highly statistically significant according to the LR of
28.9 which is rejected at 1% level of significance. The model is very suitable as it passed the
econometric tests conducted. The study, therefore, recommends that poverty rate and health
conditions among the rural communities in Nasarawa State are greatly underpinned by the
deplorable state of infrastructures such as the roads linking the communities to the major
towns as well as to the healthcare facilities. The government should extend and intensify
community infrastructure projects to the rural communities.
Keywords: Poverty, Health, Rural Community, Nasarawa State, Nigeria
JEL Classification Codes: I32, I15
1.0 Introduction The perception that poverty and health as they relate to the comfort of people are strongly
interlinked. As an issue of reality, poverty insight is linked with a condition anywhere people
live in shallow comfort - occasionally substitute words are used, such as paucity of well-
being or the state of being ill. This relationship connecting the notions of poverty to health
entails that the outset of poverty is dependent on our thoughtful of well-being. Put differently,
the notions of well-being guides diverse ideas of poverty. In addition, when the idea of well-
being changes poverty conception changes too. This has penalty for the plan to create public
programs as well as policies aimed at reducing human poverty.

Dutse International Journal of Social and Economics Research Vol. 1, No. 1 June 2018
178
Poverty is understood as a situation where a community is experiencing low comfort (World
Health Organisation [WHO], 2001; Oshio& Khan, 2014). This implies that, poverty is
exceedingly an interesting thought that calls for urgent action to minimize it or at slightest to
alleviate its welfare effect as it concerns health. Understanding shallow well-being is not
understood easily by human beings; thus, there is importance in raising the populace’s well-
being, as such translating into a well-built yearning by governments, international
organizations, and private foundations to decrease poverty rate in the world. Consequently,
eliminating poverty from the global view is a widely established aspiration, and during the
preceding decades, a lot of poverty-reduction programs have been put into practice at the
local, countrywide and worldwide levels. Poverty in the rural district as aligned with riches in
the urban district echoes what we describe as disparity within a country.
Good health permits us to fully develop our capacities to stay out of poverty, which implies
having good wellbeing. As Aguayo-Rico, Guerra-Turrubiates& de Oca-Hernández, (2015)
observers, health on the whole is a significant resources a person has and to be considered
when eradicating poverty. If this resource crumble or it is not in optimal state, it can cause
physical and emotional weakening, creating a problem in the lives of individuals, in
particular, State and the Country at large. While high-quality health is indispensable to
human happiness and an essential goal of social and economic improvement, poor health
restraints human capital by reducing returns to learning and holds back growth and economic
development. Hence, diseases cause poverty and vice versa. Nearly in every countries of the
World, the foremost diseases causing poverty includes malaria, diarrhoea, HIV/AIDS,
cholera and measles among other infections/diseases (Olowa, 2012).
Most of the rural communities in Nigeria are largely characterized by unconditional poverty
and denial with inadequate access to educational amenities, pitiable shelter situation,
exhausted natural resources, imperfect job opportunities, unfortunate drinking water,
unhygienic conditions, meagre health and nutritional values as well as insufficient health
service amenities. Given the above account, the Gini coefficient of 0.68 (National Bureau of
Statistics [NBS], 2014) proves that the poor in Nasarawa State are more likely seen in the
relatively underprivileged rural districts and peri-urban slums, where first-class health
services are habitually missing.
Generally, several factors influence the health conditions of an individual or population of
rural communities. These include among many others, accessibility to healthy food, hygienic
water, sufficient clothes and housing, and the means for hygienic disposal of human wastes,
freedom from contamination by hazardous substances and environmental pollutants, as well
as relevant information and skills (Bloom & Lucas, 1999). Aside the aforementioned factors
affecting the general health conditions of rural communities, in Nasarawa state, rural
communities’ socio-economic status and the individuals living within them is one of
deprivation. It was observed during this study, that the social infrastructure in the study areas
is poorly developed. Roads are in poor shapes, like that of Massange community, it takes
about 1hour 45mins to drive on a motorcycle from Wamba town (Centre for Women, Youth
and Community Action [CWYCA], 2014). While, in Owena community, only one doctor at a
time serves the entire community, in Arusu community, education and literacy level is very
low. The poor level of education and ignorance deny the household heads the opportunity to
take positive actions for health and make sound health and behavioural choices that influence
their own health and that of their families as well as communities.

Dutse International Journal of Social and Economics Research Vol. 1, No. 1 June 2018
179
Since the creation of the state in 1996, succeeding regimes of Nasarawa State have made
efforts to undertake several of the most important troubling issues in the rural districts, that
include; healthiness crumble, complete poverty, deprived convenience to health care
prerequisite and education, unfortunate water provision and electrical energy as well as
pitiable road networks to these rural districts. Despite the trails made by the governments, the
intensity of poverty and pitiable health conditions persist to deepen through time. One of the
reasons for this outcome is that less rural-determined study has been done to scientifically
classify the inconveniences properly and recommend feasible approaches and programmes to
curtail the socio-economic trouble saddling the poor communities in Nasarawa State. Hence
the eradication or lessening of poverty is now one of the largely vital priorities of all the
major institutions that are disturbed with human improvement. For example, the (Nasarawa
State Economic Empowerment Development Scheme [NASEEDS], 2005) development goals
have it as one of its important policy thrust, to improve the performance of health sector by
strengthening the primary and secondary healthcare institutions in the state so as to decrease
the share of persons living in severe poverty by half.
Having noted the above assertion, the development goals, aspirations and yearnings of the
people of Nasarawa state involve statement in budget leaching but more succinctly expressed
in NASEEDS, (2005) with more reference to rural transformation. Rural transformation
cannot be achieved if labour and output productivity of rural communities in Nasarawa state
is not improved. However, improving the health situation of the rural community as well as
fighting poverty is key to achieving rural transformation. Any comprehensive rural
development programme at the state level must link this critical and the reality of health
factors as well as poverty together. But, unfortunately, little of this nexus between rural
poverty and health conditions, and how they affect productivity through household
consumption and production channel in rural communities of Nasarawa State is known.
Given the dimension of the problem, this paperexplores the nature of human poverty and
health outcome nexus in rural communities of Nasarawa State evidence for a connection
between the two conceptson rural dwellers, and also the use of the qualitative approach to
measuring the correlation between poverty and health of rural dwellers in Nasarawa State as
well as to make recommendations on improving their welfare. However, the overall objective
is to investigate the relationship between human poverty rate and health outcome of rural
communities in Nasarawa State. This study offered the opportunity to examine the problem
from within the rural setting, involving the rural poor to properly explain their problems.
This paper is categorized into five sections. Accordingly, section one is the introductory
aspect followed by section two which is mainly the review of literature in line with human
poverty and health-outcomes. Section three discusses the research methodology while section
four is the main thrust of this paper, it is concerned with the data analysis. Finally, section
five concludes the work by summarising the major findings and proffering recommendations
for policymakers.
2.0 Empirical Literature Review Over the years, research institutions and social scientists have delved deeply into poverty and
health issues. The majority of studies treated poverty and health issues separately and the
relationship connecting the two concepts is usually hidden (Peggy, 2003) and not linked to
economic wellbeing.

Dutse International Journal of Social and Economics Research Vol. 1, No. 1 June 2018
180
Poverty in its most general sense is the lack of necessities. Basic foodstuff, housing, health
care, and safety that are generally thought indispensable based on shared ethics of human
decorum. However, what is a requisite to one person is not consistently a requisite to others.
Needs may be relative to what is promising and are based on collective definition and past
understanding (Sen, 1999).Central Bank of Nigeria [CBN] (2003) asserts that poverty
concerns a person’s failure to provide sufficiently for the essential needs of foodstuff, clothes
and housing. It reveals the failure to meet social and economic responsibilities; lack of
profitable service, skills, assets and self respect. The place of CBN is attached on the limited
accessibility to social and economic infrastructures such as health, education, convenient
water and sanitation hence restraining the probability of advancing welfare to highest echelon
of potential. While Augère-Granier (2017) referred poverty ofrural areas as the existence of
exact weaknesses in rural districts that result in a advanced threat of poverty in contrast with
urban districts. The seclusion of rural districts, lessen access to education, health facilities,
weaker labour market, as well as dominance by an elderly population, among many.
According to Stuart, (2004), quoting the constitution of the World Health Organisation, as
defining health to mean “a state of complete physical, mental, and social well-being and not
merely the absence of disease or infirmity”. However, the definition of health by the WHO
has been described by some researchers into health issues as idealist. Also, Mosby (2013)
defined health as “a condition of physical, mental, and social well-being and the absence of
disease or other abnormal condition. It is not a static condition. Constant change and
adaptation to stress result in homeostasis”.
The study by Achia, Wangombe & Khadioli (2010) used a logistic regression technique to
identify major determinants of poverty with demographic and health assessment data in
Nairobi. The model was estimated based on the data amid the social and economic category
(i.e. underprivileged and privileged) as the unexplained variable and a set of demographic
variables (age of household head, household size, educational level of the household head,
type of settlement (rural or urban), ethnicity and religion) as the explained variables. The
results reveals that there are high echelon of poverty in settlements farther from the nation’s
capital, Nairobi. Their study suggest that the demographic and health surveys data can be
used to determine the correlates of poverty. However, their study did not incorporate the
determinants of health outcomes in their study, and the study was not conducted in Nigeria.
Using descriptive with multivariate logistic regression techniques on primary data obtained
from a national population assessment in Japan, Oshio& Khan (2014) focused their work on
four proportions of poverty (i.e. education, income, social protection, and housing situation)
and three health variables (self – rated health (SRH), psychological suffering, and status of
smoking). Unions as combined procedures of several poverty measures were more valuable
for discovering persons in deprived SRH or psychological suffering than one measurement,
for instance income. In evaluating, connection of poverty measures abridged the exposure of
those measured to be in poverty along with likelihood to be complicated in justifying with no
several unambiguous policy point.
In a study, Wagstaff (2002) also analyzed the correlation involving poverty with health. The
study found that poverty and sickness are knotted; poor nations are likely to contain poorer
health outcomes than wealthier nations. Significantly too, it was identified that inside a
nation, underprivileged citizens record poorer health outcomes than wealthier citizens
(Wagsaff, 2002). Globally, ill-health can also exacerbate and perpetuate poverty (WHO,
2001). Thus, poverty rears sickness and sickness holds back the underprivileged citizens to be

Dutse International Journal of Social and Economics Research Vol. 1, No. 1 June 2018
181
poorer. This association reinforces the evidence of causality running in both directions. Thus
disadvantaged nations and underprivileged citizens inside a nation are bedeviled with
diversity of dispossession that transform into higher susceptibility to diseases and death. The
measuring of socio-economic inequalities in health has been a long tradition in Europe.
However less empirical work has been undertaken on the subject in other regions most
especially in developing countries. In Europe it has been observed from empirical research
that inequalities in health are almost always to the disadvantage of the poor: the poor tend to
die earlier and to have higher levels of morbidity than the better-off.
Similarly, Nurudeen & Ibrahim (2014) used the bound testing approach, Co integration and
Granger causality test towards establishing the connection involving human poverty and
inequality as well as economic development of Nigeria. They used existing time series data
for period covering 2000 upto 2012. In their examination of the underlying connectives
between the variables under their study, their outcome demonstrates that a one way
directional connecting association exist in succession from real gross domestic product
(RGDP) to poverty, that meant a raise in RGDP of Nigeria will create higher echelon of
poverty. Their result further infers to facilitate the two ways directional contributory
association subsisted among literacy and poverty. Their study in addition revealed that
residents development Granger causes literacy with no comment. The policy implication of
their study was so as to demand supervision policies intend at plummeting the gap connecting
the wealthy and underprivileged ought to be energetically followed sequentially to minimize
the rate of persistent disparity within the nation.
Furthermore, Babatunde (2010) used a different method to analyze the annual time series data
between 1970 - 2008 in studying the association between growth and health in Nigeria. The
study used a simultaneous equation framework and found a quash causation among health
outcome and economic development within Nigeria as well as a guide through which this
connection transpire in human resources. Furthermore, economic development emerged to
guide to larger health achievements, predominantly at little echelon of economic growth.
Likewise, Adeniyi & Abiodun (2011) analyzed the effects of health expenditure on the
Nigerian economic growth, by means of data on life expectancy at birth (LE), fertility rate
(FR), capital and recurrent expenditures (CRE) from 1985 to 2009 argued that if finances are
prudently spent in the health division, the consequences of this spendings on the economic
development will be straight and significant. Consequently, the call for the progress on the
eminence and kind of health made available.
A robust study conducted by Riman & Akpan (2012) investigated the contributory path and
long run association among poverty, government health expenditure as well as health status,
in Nigeria .The study engaged the Granger Causality Test and Vector Error Correction Model
(VECM) in setting up a tough contributory two ways directional association in succession
amongst life expectation as well as poverty in Nigeria. Riman and Akpan’s findings as well
reveals the continuation of a long – run association involving human poverty as well as
health outcomes. Still, their study make known a non – important long – run association
involving health situation as well as government health spending. Their work ended by
initiating guidelines that could develop health outcome ought to be as such may encourage
grown person literacy level, minimize the poverty as well as income inequality since, rising
budgetary share to financially support health division only with no reduction in poverty level,
would not be adequate to develop the health situation of the nation.
Dutse International Journal of Social and Economics Research Vol. 1, No. 1 June 2018
182
Equally, Odubunmi, Saka & Oke (2012) studied the connection linking healthcare spending
and economic development in Nigeria used for a time frame of 1970 upto 2009. Their study
uses the Johansen cointegration method and establish the reality of at least one cointegrating
vector unfolding a long run connection amongst health expenditure, economic growth, total
saving, foreign aids as well as population. The cointegrating equations nevertheless reveals a
number of divergences in terms of the signs of the coefficients of health expenditure and
foreign aids that are pointed to several diversification of foreign aids to other uses or
insufficient share to health services.
Omonona (2010) contends that the key determinants of Nigeria’s poor quality go afar from
low incomes, savings, and development - which are frequently linked with the features of
developing countries poor. Reasons of poverty consist of high level of disparity pointing to
uneven access to income prospects, fundamental infrastructure, deprived education and health
condition. Moreover, it is an established fact that Nigeria is among the most endowed
countries in terms of human, material and mineral assets in the world but yet is graded as one
of the unfortunate nations globally (Omonona, 2010). In the words of Abiola & Olaopa
(2008) poverty is a scourge in Nigeria that is incontestable, and consequently leads to
ignorance, hunger, malnutrition, unemployment, disease, deprived access to credit facilities,
as well as low life expectancy and a common level of human despair.
A number of empirical researches to understand the nexus between poverty and health have
been conducted. These research works (Babatunde, 2010; Odubunmi et al, 2012) among
others are one sided in the sense that they particularly focused on how various government
policies affect poverty reduction and not if the wellbeing performance are health related.
However, none of such study to the extent of literature search by the author has been
published on the poverty and health nexus in rural communities of Nasarawa state, Nigeria.
This study is therefore designed to fill this gap.
3.0 Methodology 3.1 Population and Sampling Procedure This research was based on human poverty and health outcome nexus in rural areas of
Nasarawa State, Nigeria that constitutes the population of the study. This study made use of
survey design and as such gathers data mainly from the primary sources. Basically, the
structured questionnaire was the major method of data collection. The study adopted simple
random sampling technique by way of administrating a total of three hundred and ninety nine
(399) questionnaires to the three (3) sampled rural communities in the three (3) selected
LGAs ofNasarawa State. These sampled communities are Owena in Keana, Massange in
Wamba and Arusu in Kokona. Hence, the population of this study consists of one (1) Local
Government Area (LGA) per each senatorial districts of the State i.e. Keana in Nasarawa
South, Wamba in Nasarawa North and Kokona in Nasarawa West based on random sampling
with populations of 81,801; 72,687; 108,558 respectively (National Population Commission
[NPC], 2009).
3.2 Techniques of Data Analysis The research employed the use of two methods of data analysis including descriptive and
inferential statistics. The first method is basically descriptive statistics using frequency tables
and charts; while the second method is the employment of multiple regression analysis.
Before embarking on the analysis, the primary data obtained from the three hundred and
ninety nine (309) questionnaires administered were first cleaned and coded, then recorded
into Microsoft Excel spreadsheet application package. Thereafter, the empirical analysis was

Dutse International Journal of Social and Economics Research Vol. 1, No. 1 June 2018
183
carried out using the Statistical Package for Social Science (SPSS 20.0) and Eviews 9.0
econometric software application package.
3.3 Human Poverty – Health Outcome Model Specification A Logit model is developed to verify the strength of human poverty characteristics on the
health outcome of rural community populace. Several authors have used similar method of
the Logit regression technique (Rodriguez & Smith, 1994; Achia, Wangombe & Khadioli,
2010; Adjei, 2014).The model was based on INC, income of the respondent proxied by ( p
which is the probability that the individual was poor, that is INC = 1 if the individual is poor
and 0, otherwise); EDU is the highest educational attainment of the respondents; NDT is the
number of dependents of the respondents; PUH is the poor utilization of health care facilities;
SOH is the state of health of the respondents; NFD is the number of times food is taken per
day by the respondents’ household; MOR is the mortality rate of children who died before the
age of 5 of the respondents.
Adapting the work of Achia, Wangombe & Khadioli (2010), this study specifies the
following logit regression model:
(
) …
(3.1)
The above equation 3.1 is the econometric form for the human poverty – health outcome.
While is the constant parameter, are the parameter estimates of the explanatory
variables.The a priori expectation of the model is, and > 0 while < 0.
4.0 Results and Discussion This section focuses on the various formats used in presenting the data collected. It however
presents data by the use of tables and bar charts with its associated analysis. The study
assesses the human poverty – health outcomes nexus in rural communities of Nasarawa
State.
4.1 Descriptive Analysis The socio-economic characteristics of the rural community members considered include; age,
marital status, type of family, number of dependents, education occupation and monthly
income, of the respondents which are presented below.
1) Age
In table 4.1 below, out of the 399 rural community members under this study, 79 (19.8
percent) were aged 24 years and below, 80 (20.1 percent) falls within the age group of 25 –
29 years old, 67 (16.3 percent) are between the age brackets of 30 – 34 years while 43 (10.8
percent) are of the age 35 – 39 years old, and those with 40 and above years constituted the
largest number of 132 (33.1 percent). This implies that the study utilizes more of the adults in
these communities whom are in most cases the households heads and are responsible for the
wellbeing of the entire family.

Dutse International Journal of Social and Economics Research Vol. 1, No. 1 June 2018
184
Table 4.1: Age
Frequency Percent Cumulative Percent
Valid
24 years & below 79 19.8 19.8
25-29 years 80 20.1 39.9
30-34 years 67 16.3 56.1
35-39 years 43 10.8 67.9
40 years & above 132 33.1 100.0
Total 399 100.0
Source: Author’s Computation from SPSS 20.0, Nov. 2017
2) Marital Status The marital status of the respondents is revealed in table 4.2 below using frequencies and
percents. From the investigation, most of the respondents were married 269 (67.4 percent),
followed by the widow(ee) with 65 (16.3 percent), divorced and single has 35(8.8 percent)
and 30 (7.5 percent) respectively.
Table 4.2: Marital Status
Frequency Percent Cumulative percent
Valid
Single 30 7.5 7.5
Married 269 67.4 74.9
Divorced 35 8.8 83.7
Widow 65 16.3 100.0
Total 399 100.0
Source: Author’s Computation from SPSS 20.0, Nov. 2017
3) Type of Family In this study, we factor out the type of family in which these respondents found themselves.
Figure 4.1 below shows that most of the respondents are living in a polygamous family
compound 217 (representing about 54 percent) while the remaining 182 (representing about
46 percent) respondent’s lives in a monogamous family. The study of Adeniyi & Abiodun
(2011) infer that the type of family individuals found themselves in influences their health
status, this study also conforms to it.
Figure 4.1: Type of Family
Source: Author’s Computation from SPSS 20.0, Nov. 2017

Dutse International Journal of Social and Economics Research Vol. 1, No. 1 June 2018
185
4) Number of Dependents
At the time of this study, the number of dependents on the respondents is revealed in table
4.3, most of the respondents have in their households more than 6 dependents i.e. 167 (41.8
percent), next to it is the family size of 3 – 4 dependents with 130 (32.6 percent). The study
further reveals that 47 (11.8 percent) had 5 – 6 dependents whereas 22 (5.5 percent) had
between 1 – 2 dependents. Only 33 (8.8 percent) had none dependents on them partly due to
their marital status.
Table 4.3: Number of Dependents
Frequency Percent Cumulative percent
None 33 8.3 8.3
1 to 2 dependents 22 5.5 13.8
3 to 4 dependents 130 32.6 46.4
5 to 6 dependents 47 11.8 58.2
More than 6 dependents 167 41.8 100.0
Total 399 100.0
Source: Author’s Computation from SPSS 20.0, Nov. 2017
5) Education
The educational level of the respondents is revealed in table 4.4, it showed that, majority of
the respondents 205 (51.4 percent) had attended only primary school, while 84 (21.1 percent)
attained secondary education. A few proportion of them attended up to tertiary education 20
(5 percent), while 74 (18.5 percent) had no formal education and only 16 (i.e.4 percent) never
attended education. The study concludes that the rural folks in Nasarawa State are not
knowledgeable enough to easily understand how to prevent disease causing organisms if they
are exposed to preventive measure trainings by the government.
Table 4.4: Education
Frequency Percent Cumulative percent
Valid
Primary 205 51.4 96
Secondary 84 21.1 39.6
Tertiary 20 5.0 44.6
Non-formal 74 18.5 18.5
Never attended 16 4.0 100.0
Total 399 100.0
Source: Author’s Computation from SPSS 20.0, Nov. 2017
6) Occupation of the Respondent Majority of the respondents, about 76 percent are engaged in farming activities as their main
occupation, 10.3 percent are civil servants, while the remaining 13.8 percent are into various
business and trading such as petty cash crops sales. This result reveals that most of the
respondents in the selected rural communities are engaged in farming activities which could
have a positive effect on reducing the poverty rate but will influence on their health wellbeing
negatively.

Dutse International Journal of Social and Economics Research Vol. 1, No. 1 June 2018
186
Table 4.5: Occupation of the Respondent
Frequency Percent Cumulative Percent
Valid
Farmer 303 75.9 75.9
Civil Servant 41 10.3 86.2
Business/Trading 143 13.8 100
Total 399 100.0
Source: Author’s Computation from SPSS 20.0, Nov. 2017
7) Monthly Income
The income of the respondents as revealed in table 4.6 shows that 76.4 percent of the
communities members have an income of less than N18,000 per month while 23.6 percent
established that their earnings are well above N18,000 a month. This explains the low-income
status of the rural community members, as a result, many cannot afford to cater for the health
services they need for their wellbeing. This makes them vulnerable as well as their family
members and the general community in which they live. Hence, most of them fall below the
minimum wage. The findings here corrobates with the study conducted by Adjei (2014).
Table 4.6: Monthly Income
Frequency Percent Cumulative Percent
Valid
< 3,000 58 14.5 14.5
3,000 – 8,000 119 29.8 44.3
8,001 – 13,000 41 10.3 54.6
13,001 – 18,000 87 21.8 76.4
> 18,000 94 23.6 100
Total 399 100.0
Source: Author’s Computation from SPSS 20.0, Nov. 2017
8) Poor Socio-Economic Conditions Leading to Poor Health Conditions In table 4.7, majority of the rural dwellers 102 (25.6%) in Nasarawa were indifference in
determining whether or not socio-economic conditions lead to the poor health conditions
facing their communities. For those that agree that the poor socio-economic conditions lead
to the poor health conditions were 87(21.8%) and 61(15.3%) strongly agree to that. While
84(21.1%) disagree to that, 65(16.3%) strongly disagree. It can be concluded that poor socio-
economic conditions to some extent lead to the poor health conditions facing the rural
communities of Nasarawa State.
Table 4.7: Poor Socio-Economic Conditions Leading to Poor Health Conditions
Frequency Percent Cumulative Percent
Valid
Strongly Agree 61 15.3 15.3
Agree 87 21.8 37.1
Indifference 102 25.6 62.7
Disagree 84 21.1 83.7
Strongly
Disgree 65 16.3 100.0
Total 399 100.0
Source: Author’s Computation from SPSS 20.0, Nov. 2017
9) Income Poverty Leads to Poor Utilization of Healthcare Facilities
Similarly, table 4.8 reveals the respondents knowledge on how income poverty leads to the
rural community members not utilizing the existing healthcare facilities. 184(46.1%) agrees
that income poverty is a major contributing factors for the rural dwellers not been able to
patronize the healthcare facilities within their locality. 20(5%) strongly agrees to that while

Dutse International Journal of Social and Economics Research Vol. 1, No. 1 June 2018
187
141(35.3%) are indifference and 54(13.5%) disagree that income poverty led to poor
utilization of the existing healthcare facilities. It is concluded that income poverty leads to
poor utilization of the healthcare facilities. This is to say, that if they are been encouraged to
getting more income, they would utilize these facilities.
Table 4.8: Income Poverty Leads to Poor Utilization of Healthcare Facilities
Frequency Percent Cumulative Percent
Valid
Strongly Agree 20 5.0 5.0
Agree 184 46.1 51.1
Indifference 141 35.3 86.4
Disagree 54 13.5 100.0
Total 399 100.0
Source: Author’s Computation from SPSS 20.0, Nov. 2017
4.2 Logit Regression on Human Poverty and Health Outcome Correlate In order to evaluate the human poverty and health outcomes of rural communities of
Nasarawa State, the logit regression model was developed and tested as in table 4.9;
Table 4.9: Logit Regression on Human Poverty and Health Outcome Correlates
Variable Coefficient Std. Error Z-statistic Prob.
EDU 0.108185 0.081816 1.322302 0.0116**
NDT -0.305163 0.097775 -3.121060 0.0018*
PUH 0.080630 0.151970 0.530564 0.0457***
SOH 0.984510 0.270298 3.642317 0.0003*
NFD 0.093305 0.190340 0.490201 0.0062*
MOR 0.050144 0.169894 0.295146 0.7679
C 2.366721 0.643894 3.675637 0.0002*
Number of Observations
Log likelihood
LR Statistics
Prob (LR Statistics)
McFadden R2
399
-187.9820
28.9207
0.0001
0.7214
Significant level at 1% (*); 5% (**), 10% (***).
Source: Computation from EViews 9.0, 2018
The study estimated the factors that influence the health of rural community which causes
poverty and vice versa. From the logit regression above, it indicated that the coefficients of
education, state of health, number of times food is taken per day, number of dependents and
number of children that died before attain five years showed positive signs as expected.
While the poor utilization of health care facilities showed negative signs as expected
implying that poverty in rural communities of Nasarawa state does not take the poor
utilization of health care facilities as the major poverty and health correlates in rural
Nasarawa State.
In terms of magnitude, state of health in rural communities of Nasarawa State was very high
(4 = 0.9845), meaning that if the community members are healthy, their level of income will
increase by 98.5percent, hence the probability of moving out of the poverty line is high. This
was followed by the number of dependents (2 =0.3052), Education (1 =0.1082), Number of
times food is taken per day (5 = 0.0933), poor utilization of health care facilities (3 =0.0806)
and death of children below the age of five (6 = 0.0501). These took away a larger portion of
the income of the individuals in rural communities of Nasarawa State, leaving them with little
for saving and wealth creation.
Dutse International Journal of Social and Economics Research Vol. 1, No. 1 June 2018
188
Statistically, state of health, number of times food is taken per day and number of dependents
proved to be significant at one percent level of significance, and education at five percent
level of significance, poor utilization of health care facilities at ten percent level of
significance and death of children below the age of five is not statistically significant. These
results pointed out that whereas individuals in rural communities whose earnings are below
the minimum wage of N18,000 and with a larger number of dependents are more likely to be
poor, while individuals with larger per capita expenditures on education, health and who have
spent more years schooling are less likely to be poor. Similar conclusions were made by
Adjei, (2008).
To check for the model strength, the likelihood ratio (LR) test was used and it revealed that
the model is robust as the included variables were together statistically significant, this is
indicated by a 0.0001 probability of obtaining an LR value of 28.92. For all the analyzed
variables, the value of McFadden’s Pseudo – R2 coefficient was significant (0.72). This
proved the goodness of fit of the model for real data.
Previous studies such as Adjei (2008); Achia, Wangombe & Khadioli (2010); Woolf et al.
(2015) did not link rural poverty rate to health conditions. This work added value to empirical
research by treating linkage between rural human poverty and health outcome condition. The
model analysis revealed that, health conditions is affected by the rate of poverty of the
individuals in the study areas and vice versa. This showed that the poverty rate of these
communities and by inference, of Nasarawa State were highly tilted not in favour of their
welfare. The inference drawn from the above findings is that the health conditions of the rural
dwellers in Nasarawa State which is agrarian in nature, is different from the welfare
established by the other empirical works sighted from developed economies, which affects
the level of income of the rural dwellers.
The implication of the above finding for policy is that such patterns that dwell heavily on the
health conditions of the rural populace in Nasarawa State would impede economic growth
and development. This is because if a community is actually experiencing economic
development, health conditions should be seen improving, thereby improving the human
capital strength and hence moving away from poverty to prosperity. This would enhance
wealth creation, and eventually economic development. Therefore, necessary policy
framework is required towards addressing these issues of infrastructural development in rural
community of the State. Such policy actions should be targeted at increased welfare (that is
stable healthcare facilities, reducing poverty rate) of the citizenry in such localities.
5.0 Conclusion and Recommendations The question of whether human poverty and health outcome are related in rural communities
of Nasarawa State has been extensively investigated in this study. Based on the research
findings, it was concluded that health outcome and human poverty are closely related and
have a vice versa relationships among the rural communities found in Nasarawa State.
Having investigated the linkage between poverty and health in rural communities of
Nasarawa State, the study found out that educational attainment, number of dependents, poor
utilization of health care facilities, state of health, number of times food is taken per day and
number of children who died before attaining the age of five in the communities are essential
instruments for the poverty and health analysis in rural Nasarawa State. The results indicated
that there exist a strong relationship between the determinants of human poverty and health

Dutse International Journal of Social and Economics Research Vol. 1, No. 1 June 2018
189
outcome in the rural communities of Nasarawa State. This is consistent with the studies of
Adjei (2008) and Achia, Wangombe & Khadioli (2010).
Based on the research findings and suggestions made by the rural communities member,
which were identified as means of empowering the rural poor in order to reduce poverty and
improve their wellbeing. Since human poverty rate and health outcome conditions among the
rural communities in the Nasarawa State are greatly underpinned by the deplorable state of
infrastructures such as the roads linking the communities to the major towns as well as
healthcare facilities, it is recommended that government should extend and intensify
community infrastructure projects to the rural communities and properly implemented for the
benefit of the rural communities. This would lead to increased agricultural productivity and
effective marketing of farm produce. The scheme would further go a long way to
significantly reduce the out migration of the youth into the urban centres, avert the breeding
of disease causing organisms and also encourage access and utilization of healthcare facilities
in the communities.
References Abiola, A., & Olaopa, O. (2008). Economic Development and Democratic Sustenance in
Nigeria. In E. O. Ojo (ed), Challenges of Sustainable Democracy in Nigeria. Ibadan:
John Archers Publishers Limited.
Achia, T.N.O, Wangombe, A., & Khadioli, N. (2010). A Logistic Regression Model to
identify Key Determinants of Poverty using Demographic and Health Survey Data.
European Journal of Social Sciences, 13(1), 38 – 45.
Adeniyi, O., & Abiodun, N. (2011). Health Expenditure and Nigerian Economic Growth.
European Journal of Economics, Finance and Administrative Sciences, 3(1), 16 – 27.
Adjei, P. O. (2008). The Impact of Poverty on the Health of Rural Communities in Ghana: A
Case Study of the Amansie West District, Ashanti Region. Unpublished PhD Thesis,
Department of Geography and Rural Development. Kwame Nkrumah University of
Science and Technology, Ghana.
Aguayo-Rico, A., Guerra-Turrubiates, I. A., & de Oca-Hernández, R. M. (2015). Empirical
Evidence of the Impact of Health on Economic Growth. Issues in Political Economy,
14, 96 – 113.
Augère-Granier, M. (2017). Briefing on Rural Poverty in the European Union. Briefing
Report to European Parliamentary Research Service (EPRS).
Babatunde, M. A. (2010). An Analysis of the Growth-Health Relationship in Nigeria. A
Paper Presented at the Centre for the Study of African Economics –Economic
Development in Africa
Bloom, G., & Lucas, L. (1999). Health and Poverty in Sub-Saharan African. IDS Working
Paper
Central Bank of Nigeria (2003). CBN briefs 2002-2003 Edition. Abuja: CBN.
Centre for Women Youth and Community Action (2014). Progress Report on HAF-II
Programme in Rural Communities of Keana, Obi and Wamba LGAs, Nasaarawa State
Prepare for National Agency for the Control of Aids, Nigeria. Lafia: NACWYCA
Mosby (2013). Mosby’s Medical Dictionary 9th
Edition. UK: Elsevier Health Sciences.
Murgai, R., & Zaidi, S. (2005). Poverty Trends in Bangladesh during the 1990’s. Journal of
Developing Societies, 21(1), 7 – 32.
Dutse International Journal of Social and Economics Research Vol. 1, No. 1 June 2018
190
Nasarawa State Economic Empowerment and Development Strategy (2005). Nasarawa State
(Nigeria) Economic Empowerment and Development Strategy (NASEEDS).
NASEEDS Drafting Committee
National Bureau of Statistics (2014). The Nigeria Poverty Profile 2014 Report. Abuja:
National Bureau of Statistics.
National Population Commission (2009). Federal Republic of Nigeria Official Gazette: Legal
Notice of on Publication of 2006 Census Final Results. Abuja, Nigeria: The Federal
Government Printer.
Nurudeen, T., & Ibrahim, S. S. (2014). An Empirical Study on the Relationship Between
Poverty, Inequality and Economic Growth in Nigeria. Journal of Economics and
Sustainable Development, 5(26), 20 – 24.
Odubunmi, A. S., Saka, J. O., & Oke, M. D. (2012). Testing the Cointegrating Relationship
Between Health Care Expenditure and Economic Growth in Nigeria. International
Journal of Economics and Finance, 4(11), 20 – 32.
Olowa, W. A. (2012). Concept, Measurement and Causes of Poverty: Nigeria in Perspective.
American Journal of Economics, 2(1), 25-36
Omonona, B. (2010). Social capital and poverty reduction in Nigeria, Revised Report
Submitted to Africa Economic Research Consortium (AERC) Nairobi, Kenya.
Oshio, T., & Khan, M. (2014). Multidimensional Poverty and Health: Evidence from a
Nationwide Survey in Japan. International Journal for Equity in Health, 12, 128 –
137. doi.org/10.1186/s12939-014-0128-9
Peggy, M. (2003). Histories of Poverty and Self - Rated Health Trajectories. Journal of
Health and Social Behaviour, 44(2), 198 – 214.
Riman, H. B. & Akpan, E. S. (2012): Healthcare Financing and Health Outcomes in Nigeria:
A State Level Study Using Multivariate Analysis. International Journal of
Humanities and Social Science, 2(15), 296-309.
Rodriguez, A. G., & Smith, S. M. (1994). A Comparison of Determinants of Urban, rural and
Farm Poverty in Costa Rica. World Development, 22(3), 381 – 397.
Sen, A. (1999). Development as Freedom. New York: Anchor.
Stuart, F. (2004). Concept Paper on Poverty and Health. Stockholm: Stockholm
Environmental Institute.
Wagstaff, A. (2002). Poverty and Health Sector Inequalities. Bulletin of World Health
Organization, 80(2), 40 – 49.
Woolf, S. H., Aron, L., Dubay, L., Simon, S. M., Zimmerman, E., & Luk, K. X. (2015). How
are Income and Wealth Linked to Health and Longevity? Income and Health
Initiative: Brief ONE. A Publication of Center on Society and Health: USA: Urban
Institute.
World Health Organization (2001). Health Promotion in Developing Countries: Briefing
Book to the Sundvall Conference on Supportive Environment. Geneva: WHO
Division of Health Education.

Dutse International Journal of Social and Economics Research Vol. 1, No. 1 June 2018
191
Dutse International Journal of Social and Economics Research Vol. 1, No. 1 June 2018
192
Federal Government Expenditure and
Economic Growth in Nigeria:
Granger Causality Test Approach
*Asaolu, Taiwo Moses Ph.D1
1Department of Economics, School of Secondary Education Arts and Social Sciences,
Federal College of Education, Zaria
*Corresponding Author‘s Email: [email protected]
Abstract: This study empirically investigates the impact of Federal Government Expenditure
on Economic Growth in Nigeria from 1981 to 2015. Despite the rise in government
expenditure in Nigeria over the years, there are still public outcries over decaying
infrastructural facilities. Based on the above this main objective of this paper is to investigate
whether increasing federal government expenditure induces economic growth performance in
Nigeria. To achieve this goal, trend and descriptive analysis were carried out. Correlation
analysis and both aggregated and disaggregated regression analyses were also employed. In
addition, Granger Causality was conducted. The result of the regression analysis shows that:
There is a positive impact for both total government expenditure and recurrent government
expenditure on economic growth, which supports the Keynesian model. However, there is no
positive relationship between capital government expenditure and economic growth. This
concurs with Barro (1990), prediction that only those productive government expenditures
will positively affect the long run growth rate. Additionally, there is bi-directional causation
between Federal government total expenditure and economic growth supporting both
Wagner and Keynesian theory. Based on the findings of the empirical analysis, this study
provides the following recommendations. Capital government expenditure should be directed
mainly to current productive economic activities, in order to stimulate activity in the
economic sectors. Government should judiciously executes its capital expenditure and spend
more on current investments which will enhance the economic activities in the short-term.
This study also recommends that government should increase its spending on infrastructure,
social and economic activities. Also, budget implementation should be monitored for effective
performance.
Keywords: Economic Growth, Government Expenditure, Recurrent and Capital
Expenditure
JEL Classification: F43, H51, H59
1. Introduction
Government performs two major functions- protection and provisions of certain public good
Al-Yousif, (2000). Government spending in Nigeria has continued to rise due to the huge
receipts from production and sales of crude oil, and the increased demand for public (utilities)
goods like roads, communication, power, education and health. There is increasing need to
provide both internal and external security for the people and the nation. Available statistics
show that total federal government expenditure (capital and recurrent) and its components
have continued to rise in the last three decades. For instance, federal government total

Dutse International Journal of Social and Economics Research Vol. 1, No. 1 June 2018
193
recurrent expenditure increased from N4.85 billion in 1981 to N36.22 billion in 1990 by the
millennium in year 2000 it has tremendously increased to N461.6 billion and further to N3.1
trillion in 2010. By 2015 it has increased to N3.8 trillion. On the other hand government
capital expenditure rose from N6.57 billion in 1981 to N24.05 billion in 1990. Capital
expenditure stood at N239.45 billion and N883.87 billion in 2000 and 2010 respectively. By
2015 it has increased to N818.37 trillion; far below the recurrent expenditure (CBN Statistical
Bulletin 2015). The size of government expenditures and its effect on economic growth, and
vice versa, has been an issue of sustained interest for over decades now. The relationship
between government expenditure and economic growth has continued to generate series of
debate among scholars. Scholars argue that increase in government expenditure on socio-
economic and physical infrastructures encourage economic growth. For example, government
expenditure on health and education raises the productivity of labour and increase the growth
of national output. Similarly, expenditure on infrastructure such as roads, communications,
power, etc, reduces production costs, increases private sector investment and profitability of
firms, thus fostering economic growth. As observed by Al-Yusuf and Couray (2009),
Abdullah (2000), Ranjan, Sharma, (2008) and Cooray (2009) the expansion of government
expenditure contributes positively to economic growth. In Olukoye (2009) the general view is
that public expenditure either recurrent or capital expenditure, notably on social and
economic infrastructure can be growth-enhancing.
Over the past decades, the public sector expenditure has been increasing in geometric term
through government various activities and interactions with its Ministries, Departments and
Agencies (MDA‘s), (Niloy et al. 2003). Although, the general view is that public expenditure
either recurrent or capital expenditure, notably on social and economic infrastructure can be
growth-enhancing. However, the financing of such expenditure to provide essential
infrastructural facilities-including transport, electricity, telecommunications, water and
sanitation, waste disposal, education and health-can be growth-retarding, for example, due to
the negative effect associated with taxation and excessive debt.
Despite the rise in government expenditure in Nigeria over these years, there are still public
outcries over decaying infrastructural facilities. Also, merely few empirical studies have
taken holistic examination of the effect of government expenditure on economic growth
regardless of its importance for policy decisions. More so, for Nigeria to be ready in its quest
to become one of the largest economies in the world by the year 2020, determining the effect
of public expenditure on economic growth is a strategy to fast-track growth in the nation‘s
economy. A crucial question that requires an urgent answer is whether the government
aggregated, and disaggregated expenditures impact positively on economic growth of
Nigeria. This study attempts to provide an answer to this question by empirically estimating
the effects of aggregated and disaggregated federal government expenditure on economic
growth in Nigeria. Due to the mixed views on the above the debate has been inconclusive on
whether or not increasing government spending induces economic growth or not. Based on
the above this main objective of this paper is to investigate whether increasing federal
government expenditure induces economic growth performance in Nigeria. This study is
organized in five sections, section one contained the introduction, section two contained
review of literature, section three contained the methodology, section four contained data
presentation and discussion, and section five contained conclusion and recommendation.
Dutse International Journal of Social and Economics Research Vol. 1, No. 1 June 2018
194
2. Review of Literature
2.1 Theoretical literature
Public expenditure theory, traditionally, received only a scanty attention till recently. Partly,
this lop-sided interest in the theory of public finance is explained by a general acceptance of
the philosophy of laissez-faire and belief in the efficacy of free market mechanism. However,
with the advent of welfare economics the role of the state has expanded especially in the area
of infrastructural provision and theory of public expenditure is attracting increasing attention.
This tendency has been reinforced by the widening interest of economists in the problems of
economic growth, planning, regional disparities, distributive justice and the like (Bhatia,
2002).
This section highlights same basic theories that have been used to support the effects of
public expenditure on economic growth. Such theories amongst others are:
2.1.1 Musgrave Theory of Public Expenditure Growth This theory was propounded by Musgrave as he found changes in the income elasticity of
demand for public services in three ranges of per capita income. He posits that at low levels
of per capita income, demand for public services tends to be very low, this is so because
according to him such income is devoted to satisfying primary needs and that when per capita
income starts to rise above these levels of low income, the demand for services supplied by
the public sector such as health, education and transport starts to rise, thereby forcing
government to increase expenditure on them. He observes that at the high levels of per capita
income, typical of developed economics, the rate of public sector growth tends to fall as the
more basic wants are being satisfied.
2.1.2 The Wagner’s Law/ Theory of Increasing State Activities There are two important and well-known theories of increasing public expenditure. The first
one is connected with Wagner and the other with Wiseman and Peacock.
Wagner’s Law of Increasing State Activities - Adolph Wagner (1835-1917) was a German
economist who based his Law of Increasing State Activities on historical facts, primarily of
Germany. According to Wagner, there are inherent tendencies for the activities of different
layers of a government (such as central, state and local governments) to increase both
intensively and extensively. There is a functional relationship between the growth of an
economy and government activities with the result that the governmental sector grows faster
than the economy. From the original version of this theory it is not clear whether Wagner was
referring to an increase in (a) Absolute level of public expenditure; (b) The ratio of
government expenditure to GNP; or (c) Proportion of public sector in the economy.
Musgrave believes that Wagner was thinking of proportion of public sector in the economy.
Nitti (1903) not only supported Wagner‘s thesis but also concluded with empirical evidence
that it was equally applicable to several other governments which differed widely from each-
others (Nitti, 1903). All kinds of governments, irrespective of their levels (say, the central or
state government), intentions (peaceful or warlike), and size, etc., had exhibited the same
tendency of increasing public expenditure.
Wiseman-Peacock Hypothesis - The second thesis dealing with the growth of public
expenditure was put forth by Wiseman and Peacock in their study of public expenditure in
UK for the period 1890-1955. The main thesis is that public expenditure does not increase in
a smooth and continuous manner, but in jerks or step like fashion. At times, some social or
other disturbance takes place creating a need for increased public expenditure which the
existing public revenue cannot meet. While earlier, due to an insufficient pressure for public

Dutse International Journal of Social and Economics Research Vol. 1, No. 1 June 2018
195
expenditure, the revenue constraint was dominating and restraining an expansion in public
expenditure, now under changed requirements such a restraint gives way. The public
expenditure increases and makes the inadequacy of the present revenue quite clear to
everyone. The movement from the older level of expenditure and taxation to a new and
higher level is the displacement effect. The inadequacy of the revenue as compared with the
required public expenditure creates an inspection effect. The government and the people
review the revenue position and the need to find a solution of the important problems that
have come up and agree to the required adjustments to finance the increased expenditure.
They attain a new level of tax tolerance. They are now ready to tolerate a greater burden of
taxation and as a result the general level of expenditure and revenue goes up. In this way, the
public expenditure and revenue get stabilized at a new level till another disturbance occurs to
cause a displacement effect. Thus each major disturbance leads to the government assuming a
larger proportion of the total national activity. In other words, there is a concentration effect.
The concentration effect also refers to the apparent tendency for central government
economic activity to grow faster than that of the state and local level governments.
2.1.3 The Keynesian Theory Of all economists who discussed the relation between public expenditures and economic
growth, Keynes was among the most noted with his apparently contrasting viewpoint on this
relation. Keynes regards public expenditures as an exogenous factor which can be utilized as
a policy instruments promote economic growth. From the Keynesian thought, public
expenditure can contribute positively to economic growth. Hence, an increase in the
government consumption is likely to lead to an increase in employment, profitability and
investment through multiplier effects on aggregate demand. As a result, government
expenditure augments the aggregate demand, which provokes an increased output depending
on expenditure multipliers.
2.2 Empirical Literature
The seminal work of Barro, (1991) opened new ground for the investigation of the impact of
fiscal policy (government expenditure) on economic growth. According to Abdullah (2000)
the relationship between government expenditure and economic growth and reported that size
of government is very important in the performance of economy. He advised that government
should increase its spending on infrastructure, social and economic activities. In addition,
government should encourage and support the private sector to accelerate economic growth.
Researchers have attempted to examine the effect of government spending on economic
growth in different countries and periods. Ram (1986) studied the linkage between
government expenditure and economic growth for a group of 115 countries during the period
1950-1980. Using both cross section time series data in his analysis, and confirmed a positive
influence of government expenditure on economic growth. Olugbenga and Owoye (2007)
investigated the relationships between government expenditure and economic growth for a
group of 30 OECD countries during the period 1970-2005. The regression results showed the
existence of a long-run relationship between government expenditure and economic growth.
In addition, the authors observed a unidirectional causality from government expenditure to
growth for 16 out of the countries, thus supporting the Keynesian hypothesis. However,
causality runs from economic growth to government expenditure in 10 out of the countries,
confirming the Wagner‘s law. Finally, the authors found the existence of feedback
relationship between government expenditure and economic growth for a group of four
countries.

Dutse International Journal of Social and Economics Research Vol. 1, No. 1 June 2018
196
In Nigeria, many authors have also attempted to examine government expenditure - economic
growth relationship. Fajingbesi and Odusola (1999) empirically investigated the relationship
between government expenditure and economic growth in Nigeria. The econometric results
indicated that real government capital expenditure has a significant positive influence on real
output. However, the results showed that real government recurrent expenditure affects
growth only by little. Akpan (2005) used a disaggregated approach to determine the
components (that include capital, recurrent, administrative, economic service, social and
community service, and transfers) of government expenditure that enhances growth, and
those that do not. The author concluded that there was no significant association between
most components of government expenditure and economic growth in Nigeria. Ighodaro and
Okiakhi (2010) used time series data for the period 1961 to 2007 and applied Cointegration
Test and Granger Causality test to examine government expenditure disaggregated into
general administration and community and social services in Nigeria. The results revealed
negative impact of government on economic growth. Loto (2011) investigated the impact of
sectoral government expenditure on economic growth in Nigeria for the period 1980-2008
and applied Johansen cointegration technique and error correction model. The results inferred
that in the short run expenditures on agricultures and education were negatively related to
economic growth. However, expenditures on health, national security, transportation, and
communication were positively related to economic growth, though the impacts were not
statistically significant. Studies in Nigeria, like Nurudeen and Usman (2010) showed mixed
results.
The work of Abu and Abdullahi (2010) in their short-run analysis of recurrent and capital
expenditures, as well as government spending on agriculture, education, defence, health and
transport communication sectors of the Nigerian economy obtained results that revealed that
government total capital expenditure, total recurrent expenditure, and government
expenditure have negative effects on economic growth. On the contrary, the rising
government expenditure on transport, communication, and health results to an increase in
economic growth. Also Maku (2009) examined the link between government spending and
economic growth in Nigeria over the last three decades using time series data to analyse the
Ram (1986) model and regression real GDP on private investment, human capital investment.
He tested for the presence of stationary in the variables using the Augmented Dicker Fuller
(ADF) unit root test, and used the co-integration test to establish the long-run relationship
among variable, the Error Correction Model (ECM) was used. Empirical results showed that
public and private had insignificant effects economic growth during the review period.
Olulu et al., (2014) investigated the empirical relationship between government expenditure
and economic growth in Nigeria through the period between 1980 and 2010. The results
indicated that there is an inverse relationship between government expenditure and economic
growth in Nigeria. The results also revealed that government expenditure in Nigeria could
increase foreign and local investments. Torruam et al. (2014) used co-integration analysis to
find the impact of public expenditure on tertiary education and economic growth in Nigeria
during the period between 1990 and 2011. This study used time series data, with the results
indicating that public expenditure has a positive impact on each of tertiary education and
economic growth in Nigeria.
Olabisi and Funlayo (2012) examined the relationship between the composition of public
expenditure and economic growth in Nigeria during the period between 1960 and 2008. The
results indicated that public expenditure on education has a negative impact on economic
growth, because of the high rate of rent in the country and the rise in unemployment. Okoro,

Dutse International Journal of Social and Economics Research Vol. 1, No. 1 June 2018
197
(2013) using time series data of 32years period (1980- 2011), investigated the impact of
government spending on the Nigerian economic growth. Employing the ordinary least square
multiple regression analysis to estimate the model specified. Real Gross Domestic Product
(RGDP) was adopted as the dependent variable while government capital expenditure
(GCEXP) and government recurrent expenditure (GREXP) represents the independent
variables. With the application of Granger Causality test, Johansen Cointegration Test and
Error Correction Mechanism, the result shows that there exists a long-run equilibrium
relationship between government spending and economic growth in Nigeria. The short-run
dynamics adjusts to the long-run equilibrium at the rate of 60% per annum. The policy
implication is that that both the short-run and long-run expenditure has significant effect on
economic growth of Nigeria. In line with the findings, we recommend that Government
increase both capital expenditure (investment in roads, power supply, transport, and
communication) and recurrent expenditure mostly on issues that should attract economic
growth. Funds meant for development of the Nigerian economy should be properly managed
by the executive arm to boost employment as well as improve the wellbeing of citizens since
this will cause economic growth indirectly.
Chude, and Chude, (2013) investigate the effects of public expenditure in education on
economic growth in Nigeria over a period from 1977 to 2012, with particular focus on
disaggregated and sectoral expenditures analysis. Government expenditures are very crucial
instruments for economic growth at the disposal of policy makers in developing countries
like Nigeria. The objective of this study is to determine the effect of public expenditure on
economic growth in Nigeria using Error Correction Model (ECM). The study used Ex-post
facto research design and applied time series econometrics technique to examine the long and
short run effects of public expenditure on economic growth in Nigeria. The results indicate
that Total Expenditure Education is highly and statistically significant and have positive
relationship on economic growth in Nigeria in the long run. The result has an important
implication in terms of policy and budget implementation in Nigerian. The study concludes
that economic growth is clearly impacted by factors both exogenous and endogenous to the
public expenditure in Nigeria. It is therefore recommended that, there is need for government
to reduce its budgetary allocation to recurrent expenditure on education and place more
emphasis on the capital expenditures so as to accelerate economic growth of Nigeria and that
Government should direct its expenditure towards the productive sectors like education as it
would reduce the cost of doing business as well as raise the standard living of poor ones in
the country.
Egbetunde, and Fasanya, (2013) in their paper analyses the impact of public expenditure on
economic growth in Nigeria during the period 1970 to 2010 making use of annual time series
data. The study employs the bounds testing (ARDL) approach to examine the long run and
short run relationships between public expenditure and economic growth in Nigeria. The
bounds test suggested that the variables of interest put in the framework are bound together in
the long-run. The associated equilibrium correction was also significant confirming the
existence of long-run relationships. Their findings indicate the impact of total public
spending on growth to be negative which is consistent with other past studies. Recurrent
expenditure however was found to have little significant positive impact on growth.
Therefore, government should increase its spending on infrastructure, social and economic
activities.
Maku, (2014) examines the link between government spending and economic growth in
Nigeria over the last three decades (1977-2006) using time series data to analyze the Ram

Dutse International Journal of Social and Economics Research Vol. 1, No. 1 June 2018
198
(1986) model. Three variants of Ram (1986) model were developed-regressing Real GDP on
Private investment, Human capital investment, Government investment and Consumption
spending at absolute levels, regressing it as a share of real output and regressing the growth
rate real output to the explanatory variable as share of real GDP, in other to capture the
precise link between public investment spending and economic growth in Nigeria based on
different levels. Empirical result showed that private and public investments have
insignificant effect on economic growth during the period under review. The paper test for
presence of stationary using Augmented Dickey Fuller (ADF) unit root test result reveals that
all variables incorporated in the model were non-stationary at their levels. In an attempt to
establish long-run relationship between public expenditure and economic growth, the result
reveals that the variables are cointegrated at 5% and 10% critical level. With the use of error
correction model to detect short run behaviour of the variables, the result shows that for any
distortion in the short-run, the error term restore the relationship back to its original
equilibrium by a unit. The paper main policy recommendation was that government spending
should be channel in order to influence economic growth significantly and positively in
Nigeria especially on education and infrastructural facilities.
3. Methodology
3.1 Sources of Data
The data used in this research work are secondary in nature. They were collected from CBN
statistical bulletin. The scope covers from year 1981 to 2015 inclusive. That is a period of
thirty five (35) years.
3.2 Method of Data Analysis
The method that is employed to analyze the behaviour of the data is the use of both
descriptive and inferential statistics. The variable which were used to determine the effect of
Federal Government Total Expenditure (FGTE) on economic growth of Nigeria are;
dependent variable - proxy by Real Gross Domestic Product (RGDP), Independent variables -
Total Federal Government Expenditure (TFGE) and this is disaggregated to Federal
Government Recurrent Expenditure (FGRE) and Federal Government Capital Expenditure
(FGCE). The analyses involved; descriptive statistics, graph and trend analysis. Correlation
analysis was also conducted to determine the strength of the linear association between Real
Gross Domestic Product RGDP and Federal Government Total Expenditure (FGTE). In
addition, Granger Causality test was carried out to determine the direction of causation
between Federal Government Expenditure and Economic Growth. Then, the static long-run
model was derived, applying the Ordinary Least Square (OLS) technique. Subsequently, the
robustness of the model was established, using econometrics diagnostic tests of R2, adjusted
R2, F-statistic and Durbin Watson for Autocorrelation.
3.3 Model Specification
In an attempt to capture the essence of this study, and based on previous studies (Maku, 2014;
Okoro, 2013; Chude and Chude, 2013; Egbetunte and Fasanya; 2013 and Abdullah 2010),
The Real Gross Domestic Product (RGDP), Federal Government Total Expenditure (FGTE),
Federal Government Recurrent Expenditure (FGRE), and Federal Government Capital
Expenditure (FGCE) were used to formulate the model. Thus, the modified model is
represented in a functional form shown below:
The Aggregated model:
RGDPt = f (FGTEt), ……… ……………………….………..……….….. 3.1
Stating equation (3.1) in the linear explicit form yields:
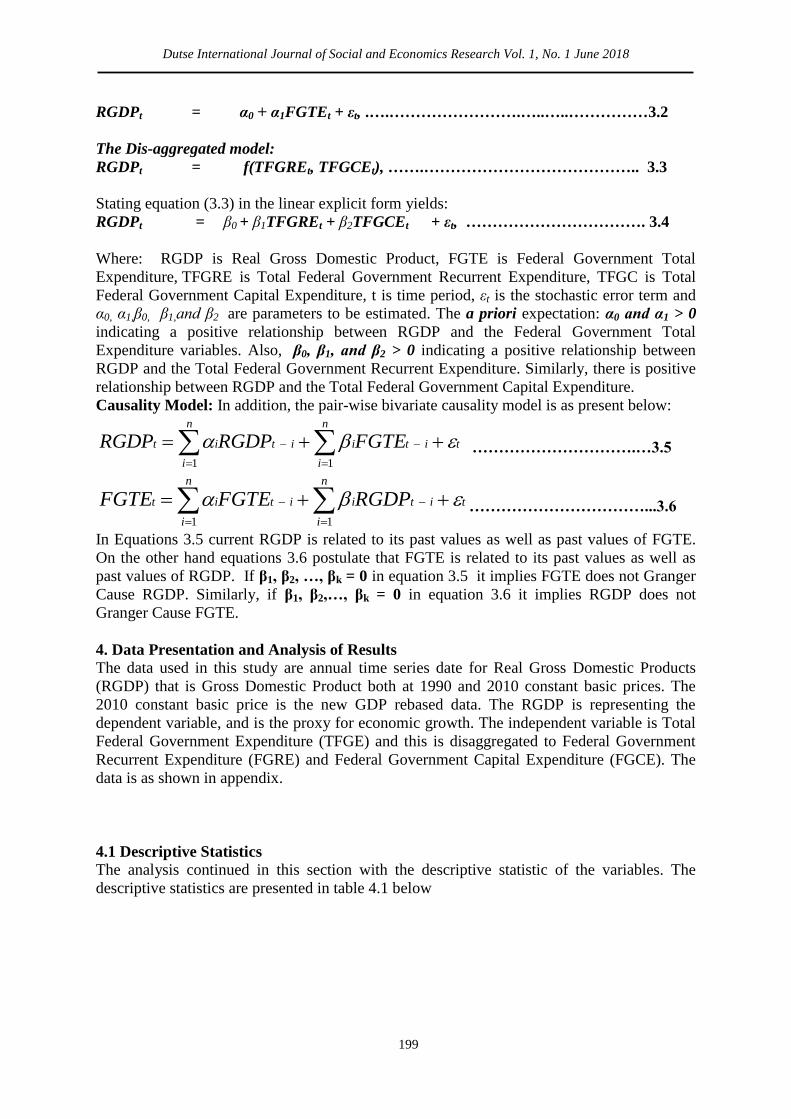
Dutse International Journal of Social and Economics Research Vol. 1, No. 1 June 2018
199
RGDPt = α0 + α1FGTEt + εt, .….…………………….…..…..……………3.2
The Dis-aggregated model:
RGDPt = f(TFGREt, TFGCEt), …….………………………………….. 3.3
Stating equation (3.3) in the linear explicit form yields:
RGDPt = β0 + β1TFGREt + β2TFGCEt + εt, ……………………………. 3.4
Where: RGDP is Real Gross Domestic Product, FGTE is Federal Government Total
Expenditure, TFGRE is Total Federal Government Recurrent Expenditure, TFGC is Total
Federal Government Capital Expenditure, t is time period, εt is the stochastic error term and
α0, α1,β0, β1,and β2 are parameters to be estimated. The a priori expectation: α0 and α1 > 0
indicating a positive relationship between RGDP and the Federal Government Total
Expenditure variables. Also, β0, β1, and β2 > 0 indicating a positive relationship between
RGDP and the Total Federal Government Recurrent Expenditure. Similarly, there is positive
relationship between RGDP and the Total Federal Government Capital Expenditure.
Causality Model: In addition, the pair-wise bivariate causality model is as present below:
titi
n
i
it
n
i
it FGTERGDPRGDP
11
………………………….…3.5
titi
n
i
it
n
i
it RGDPFGTEFGTE
11
……………………………...3.6
In Equations 3.5 current RGDP is related to its past values as well as past values of FGTE.
On the other hand equations 3.6 postulate that FGTE is related to its past values as well as
past values of RGDP. If β1, β2, …, βk = 0 in equation 3.5 it implies FGTE does not Granger
Cause RGDP. Similarly, if β1, β2,…, βk = 0 in equation 3.6 it implies RGDP does not
Granger Cause FGTE.
4. Data Presentation and Analysis of Results
The data used in this study are annual time series date for Real Gross Domestic Products
(RGDP) that is Gross Domestic Product both at 1990 and 2010 constant basic prices. The
2010 constant basic price is the new GDP rebased data. The RGDP is representing the
dependent variable, and is the proxy for economic growth. The independent variable is Total
Federal Government Expenditure (TFGE) and this is disaggregated to Federal Government
Recurrent Expenditure (FGRE) and Federal Government Capital Expenditure (FGCE). The
data is as shown in appendix.
4.1 Descriptive Statistics
The analysis continued in this section with the descriptive statistic of the variables. The
descriptive statistics are presented in table 4.1 below

Dutse International Journal of Social and Economics Research Vol. 1, No. 1 June 2018
200
Table 4.1: Descriptive Statistics
Descriptive Statistics
N Minimum Maximum Sum Mean Std. Deviation
Real Gross Domestic Products 35 227.25 69023.93 382804.59 10937.2740 23620.88144
Total Federal Government
Expenditure 35 9.64 5185.32 49751.57 1421.4734 1768.14351
Total Federal Government
Recurrent Expenditure 35 4.75 3831.98 33816.08 966.1737 1259.04405
Total Federal Government Capital
Expenditure 35 4.10 1152.80 12618.60 360.5314 374.90953
Valid N (listwise) 35
Source: Computed by the Researcher 2016 from table 4.1 employing IBM SPSS Statistics 20
From the table of descriptive statistic above, the highest value for Real Gross Domestic
Product (RGDP) during the period of study is N69, 023.93 billion. This occurred in 2015 as
shown in the table of data presentation. Also, peak value for Total Federal Government
Expenditure (TFGE) is N5185.32 billion. This occurred in 2013 as shown in the table of data
presentation. In addition the maximum values for Total Federal Government Recurrent
Expenditure (TFGRE) and Total Federal Government Capital Expenditure (TFGCE) are
N3831.98 and N1152.80 billion respectively. These occurred in year 2015 and 2009
respectively as shown by the peak period of their graph above.
However, the lowest value for Real Gross Domestic Product (RGDP) during the period of
study is N227.25 billion in the year 1984. Also, lowest value for Total Federal Government
Expenditure (TFGE) is N9.64 billion; this was in the year 1983. In the same vein, TFGRE
and TFGCE recorded a lowest value in of N4.75 and N4.10 in 1983 and 1984 respectively. It
is worthy of note that the minimum value for RGDP, TFGE TFGRE, and TFGCE all
occurred during the oil price slump of the early 1980s, indicating that there is link between
Oil price shock and RGDP and Total Federal Government Expenditure. It is also evident that
within the 35 year period of the study, the sum of Real Gross Domestic Product (RGDP) is
N382.80 trillion. Also, Total Federal Government Expenditure summed up to N49.75 trillion.
Out of which sum of N33.82 trillion was recurrent expenditure and N12.62 trillion was
capital expenditure. On the average, the value of RGDP is N10.94 trillion annually. Also the
average values of TFGE is N1.42 trillion annually. This gives an average of N966.17 billion
and N360.53 billion TFGRE and TFGCE respectively as indicated by their mean value
during the thirty five years period of the study.

Dutse International Journal of Social and Economics Research Vol. 1, No. 1 June 2018
201
4.2 Correlation Analysis Table 4.2: Correlation Matrix between the Variables
Covariance Analysis: Ordinary
Date: 03/18/17 Time: 07:41
Sample: 1981 2015
Included observations: 35
Correlation
Probability RGDP TFGE TFGRE TFGCE
RGDP 1.000000
-----
TFGE 0.862143 1.000000
0.0000 -----
TFGRE 0.885600 0.994309 1.000000
0.0000 0.0000 -----
TFGCE 0.659610 0.937612 0.903972 1.000000
0.0000 0.0000 0.0000 -----
Source: Computed by the Researcher (2017) employing E-Views 9
The above correlation analysis showed the strength and direction of the linear relationship
between the variables. The correlation coefficient between RGDP and TFGE is 0.862143
indicating a strong positive correlation between Real Gross Domestic Product and Total
federal Government Expenditure. This correlation is statistically significant at 1 percent. This
is because the probability value is 0.0000. Therefore, the null hypothesis which states that
―there is no significant relationship between RGDP and TFGE is rejected. We can therefore
conclude that there is a significant relationship between RGDP and TFGE. The same
situation holds for the association between RGDP, TFGRE and TFGCE.
4.3 Unit Root Test
Most time series variables are usually non-stationary and using non-stationary variables in the
model might lead to spurious regressions Granger and Newbold, (1977) or in Yule (1926)
term ‗nonsense‘ regression. The first or second difference terms of most variables will
usually be stationary Ramathan, (1992). Hence the variables were tested at levels, first and
second difference for stationarity using the Augmented Dickey-Fuller (ADF) test. In this
section, the analyses continue with a test of unit root to avoid ―spurious‖ or ―nonsense‖
regression results.

Dutse International Journal of Social and Economics Research Vol. 1, No. 1 June 2018
202
Table 4.3: Results of Augmented Dickey-Fuller Unit Root Tests
Variables
ADF Test Statistics
MacKinnon (1996) one-sided p-
values Order of
Integration
Level
1st
Difference
2nd
Difference Level
1st
Differenc
e
2nd
Difference
RGDP
0.18350
0 -3.751369* -6.528325 0.9673 0.0079 0.0000 I(1)
TFGE 1.876035 -2.006176 -7.891596* 0.9997 0.2828 0.0000 I(2)
TFGRE
2.15714
0 -2.705900 -5.737057* 0.9999 0.0841 0.0000 I(2)
TFGCE
-
0.552320 -3.620146* -6.126592 0.8679 0.0109 0.0000 I(1)
1% -
3.646342 -3.653730 -3.661661
5% -
2.954021 -2.957110 -2.960411
10% -
2.615817 -2.617434 -2.619160
Source: Computed by the Researcher (2017) employing E-Views 9 * Significant at 5 percent Level of Significance (LOS). ADF is calculated with intercept using one lagged period
Table 4.3 above presents the summary of the results of unit root test or test of stationarity.
The orders of integration of the variables were also indicated. The Augmented Dickey Fuller
(ADF) test for unit root was employed. The null hypothesis of non-stationarity is rejected if
the t-statistic is more negative than the critical t-value. The t-statistic here is the Augmented
Dickey-Fuller statistic. It is compared with the MacKinnon critical value and the decision is
for unit-root when ADF t-statistic is not more negative than t-critical value and for
stationarity when ADF t-statistic is more negative than t-critical value. Alternatively, the
decision for stationarity is when the MacKinnon (1996) one-sided p-values is less than 5
percent
ADF test shows that all the variables have unit root at level. This can be seen from the ADF
test statistics value of 0.183500, 1.876035, 2.157140, and -0.552320 for RGDP; TFGE;
TFGRE and TFGCE respectively which are not more negative than the Mackinnon Critical
Value of -3.646342, -2.954021, and -2.615817 at level with 1 percent, 5 percent and 10
percent level of significance respectively and at one period lag. Thus, they are integrated. It
should be noted that the value of ADF test statistics for RGDP; TFGE; TFGRE variables are
positive meaning they are explosive at level. First and Second difference of the integrated
variable were conducted so as to determine their order of integration. The result shows that
RGDP and TFGCE are integrated of order one, I(1), since they become stationary at first
difference, while TFGE and TFGRE are integrated of order two, I(2) since they are stationary
after second difference.
4.4 Granger Causality Test
A common problem in economics is determining whether changes in one variable are a cause
of change in another. For example, do changes in the money supply causes changes in
interest rate, or change in interest rates causes change in money supply. One approach to
questions like this is the test for causality introduced by Granger and Sims in 1969 and 1972
respectively. The basic idea is: If X causes Y; then in a regression of Y against past value of
Y, the addition of past values of X as independent (or explanatory) variables should
contribute significantly to the explanatory power of the regression. Employing E-views 9
statistical package, from the table 4.1 above, the pair-wise Granger causality test were
examined. This is to determine the direction of causation between Total Federal Government
Expenditure and Economic Growth. The results in respect of two lag, is as presented in table

Dutse International Journal of Social and Economics Research Vol. 1, No. 1 June 2018
203
4.5 below. The lags indicate the number of years the past behaviour of the variable takes to
have significant effect on the current period. Table 4.4: Granger Causality Test Results
Pairwise Granger Causality Tests
Date: 03/18/17 Time: 07:47
Sample: 1981 2015
Lags: 2
Null Hypothesis: Obs F-Statistic Prob.
RGDP does not Granger Cause TFGE 33 28.3462 2.E-07
TFGE does not Granger Cause RGDP 8.87188 0.0010
Source: Computed by the Researcher (2017) employing E-Views 9
From table 4.4 above the decision rule was obtained by considering the probability value.
From the above result, there is bi-directional (two way) causality between Real Gross
Domestic Products (RGDP) and Total Federal Government Expenditure (TFGE). The null
hypothesis TFGE does not Granger Cause RGDP was rejected since its p-value of 0.0010 is
less than 5 percent. Hence, the alternative hypothesis TFGE Granger Cause RGDP was
accepted. Similarly, the second null hypothesis, RGDP does not Granger Cause TFGE was
rejected as its p-value of 2.E-07 (0.0000002) is far less than 5 percent. The implication is that
based on the sample data the direction of causation between Total Federal Government
Expenditure (TFGE) and Economic Growth (proxy by RGDP) has a feedback mechanism,
with the strength of causation running more from RGDP to TFGE, meaning both Wagner and
Keynesian theory were upheld but more strength on Wagner theory. Thus the growth in the
economy lead to more Federal government expenditure
4.5 Regression Analysis Results
Table 4.5 Regression Results for the Aggregated Analysis
Dependent Variable: RGDP
Method: Least Squares
Date: 03/18/17 Time: 07:52
Sample: 1981 2015
Included observations: 35
Variable Coefficient Std. Error t-Statistic Prob.
C -5434.541 2649.805 -2.050921 0.0483
TFGE 11.51750 1.178262 9.774986 0.0000
R-squared 0.743291 Mean dependent var 10937.27
Adjusted R-squared 0.735512 S.D. dependent var 23620.88
S.E. of regression 12147.84 Akaike info criterion 21.70314
Sum squared resid 4.87E+09 Schwarz criterion 21.79201
Log likelihood -377.8049 Hannan-Quinn criter. 21.73382
F-statistic 95.55034 Durbin-Watson stat 0.498033
Prob(F-statistic) 0.000000
Source: Computed by the Researcher (2017) employing E-Views 9
The estimated regression equation for the aggregated analysis is as represented below:
RGDP = -5434.541 + 11.51750*TFGE …………………………………………4.1
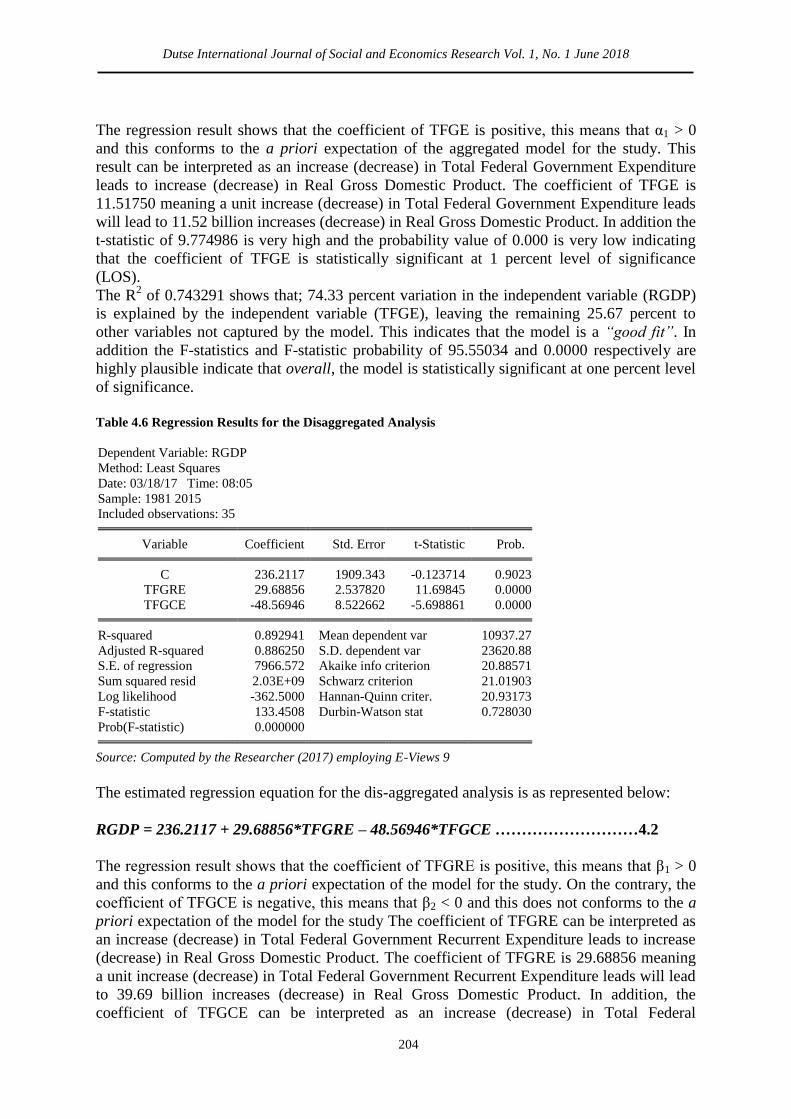
Dutse International Journal of Social and Economics Research Vol. 1, No. 1 June 2018
204
The regression result shows that the coefficient of TFGE is positive, this means that α1 > 0
and this conforms to the a priori expectation of the aggregated model for the study. This
result can be interpreted as an increase (decrease) in Total Federal Government Expenditure
leads to increase (decrease) in Real Gross Domestic Product. The coefficient of TFGE is
11.51750 meaning a unit increase (decrease) in Total Federal Government Expenditure leads
will lead to 11.52 billion increases (decrease) in Real Gross Domestic Product. In addition the
t-statistic of 9.774986 is very high and the probability value of 0.000 is very low indicating
that the coefficient of TFGE is statistically significant at 1 percent level of significance
(LOS).
The R2 of 0.743291 shows that; 74.33 percent variation in the independent variable (RGDP)
is explained by the independent variable (TFGE), leaving the remaining 25.67 percent to
other variables not captured by the model. This indicates that the model is a ―good fit‖. In
addition the F-statistics and F-statistic probability of 95.55034 and 0.0000 respectively are
highly plausible indicate that overall, the model is statistically significant at one percent level
of significance.
Table 4.6 Regression Results for the Disaggregated Analysis
Dependent Variable: RGDP
Method: Least Squares
Date: 03/18/17 Time: 08:05
Sample: 1981 2015
Included observations: 35
Variable Coefficient Std. Error t-Statistic Prob.
C 236.2117 1909.343 -0.123714 0.9023
TFGRE 29.68856 2.537820 11.69845 0.0000
TFGCE -48.56946 8.522662 -5.698861 0.0000
R-squared 0.892941 Mean dependent var 10937.27
Adjusted R-squared 0.886250 S.D. dependent var 23620.88
S.E. of regression 7966.572 Akaike info criterion 20.88571
Sum squared resid 2.03E+09 Schwarz criterion 21.01903
Log likelihood -362.5000 Hannan-Quinn criter. 20.93173
F-statistic 133.4508 Durbin-Watson stat 0.728030
Prob(F-statistic) 0.000000
Source: Computed by the Researcher (2017) employing E-Views 9
The estimated regression equation for the dis-aggregated analysis is as represented below:
RGDP = 236.2117 + 29.68856*TFGRE – 48.56946*TFGCE ………………………4.2
The regression result shows that the coefficient of TFGRE is positive, this means that β1 > 0
and this conforms to the a priori expectation of the model for the study. On the contrary, the
coefficient of TFGCE is negative, this means that β2 < 0 and this does not conforms to the a
priori expectation of the model for the study The coefficient of TFGRE can be interpreted as
an increase (decrease) in Total Federal Government Recurrent Expenditure leads to increase
(decrease) in Real Gross Domestic Product. The coefficient of TFGRE is 29.68856 meaning
a unit increase (decrease) in Total Federal Government Recurrent Expenditure leads will lead
to 39.69 billion increases (decrease) in Real Gross Domestic Product. In addition, the
coefficient of TFGCE can be interpreted as an increase (decrease) in Total Federal

Dutse International Journal of Social and Economics Research Vol. 1, No. 1 June 2018
205
Government Capital Expenditure leads to decrease (increase) in Real Gross Domestic
Product. The coefficient of TFGCE is -48.56946 meaning a unit increase (decrease) in Total
Federal Government Capital Expenditure leads will lead to 48.57 billion decreases (increase)
in Real Gross Domestic Product. Hence, the capital expenditure is not translating to growth.
This is contrary to the theoretical expectation, it may be due corruption, poor procurement of
capital project and abandoning of projects. In addition, it may be due to the small size of
capital expenditure to recurrent expenditure.
In addition the t-statistics of both TFGRE and TFGCE are very high and the probability
values of 0.000 are very low indicating that the coefficients of both TFGRE and TFGCE are
statistically significant at 1 percent level of significance (LOS).
The R2 of 0.892941 shows that; 89.29 percent variation in the independent variable (RGDP)
is explained by the independent variables (TFGRE and TFGCE), leaving the remaining 10.71
percent to other variables not captured by the model. This indicates that the model is a ―good
fit‖. In addition the F-statistics and F-statistic probability of 133.4508 and 0.0000
respectively are highly plausible indicate that overall, the model is statistically significant at
one percent level of significance.
4.6 Summary of Findings
This study empirically investigates the impact of Federal Government Expenditure on
Economic Growth in Nigeria from 1981 to 2015. The summary of the findings of the study
are: From the descriptive analysis, the Federal Government on the average spends over one
trillion naira annually during the period under review (1981-2015). In addition, the recurrent
expenditure on the average is more than twice that of capital expenditure. The result of the
regression analysis shows that: There is a positive impact for both total government
expenditure and recurrent government expenditure on economic growth, which supports the
Keynesian model. However, there is no positive relationship between capital government
expenditure and economic growth. This concurs with Barro (1990), predictiton that only
those productive government expenditures will positively affect the long run growth rate. The
first hypothesis that there is no significant positive impact of Federal government total
expenditure on economic growth in Nigeria was rejected. Hence, the alternative hypothesis
that there is significant positive impact of Federal government total expenditure on economic
growth in Nigeria was accepted. The second hypothesis that there is no significant positive
impact of Federal government recurrent expenditure on economic growth in Nigeria was also
rejected. Hence, the alternative hypothesis that there is significant positive impact of Federal
government recurrent expenditure on economic growth in Nigeria was accepted. On the other
hand, the federal government capital expenditure has significant negative impact on
economic growth in Nigeria. This decision is based on the fact that the value of the
coefficient of TFGCE does not meet the a priori expectation of positive relationship between
RGDP and TFGCE. This may be due to corruption and improper execution of capital
projects. Lastly the third hypothesis that Federal government total expenditure does not
Granger Cause economic growth in Nigeria was also rejected and the alternative accepted
based on the granger causality result. Additionally, there is bi-directional causation between
Federal government total expendituare and economic growth supporting both Wagner and
Keynesian theory.

Dutse International Journal of Social and Economics Research Vol. 1, No. 1 June 2018
206
5 Conclusion and Recommendation
5.1 Conclusion
On the basis of empirical results, this study concludes that public spending on capital project
does not stimulate economic growth for Nigeria which could be as a result of expenditure
fungibility, that is, spending more on recurrent than capital which is evident in Nigeria where
recurrent expenditure is almost three times the amount budgeted for capital expenditure.
Another factor that could be responsible for this is high cost of governance in Nigeria. The
result of this paper corroborates the findings of Laudau (1983), Liu et al. (2008), Abu and
Abdullahi (2010), Egbetunde and Fasanya (2013) and Maku (2009 & 2014) that government
expenditure has no substantial effect on growth.
5.2 Recommendations
Based on the findings of the empirical analysis, this study provides the following
recommendations.
i. Capital government expenditure should be directed mainly to current productive
economic activities, in order to stimulate activity in the economic sectors.
ii. Since the analysis showed that total and recurrent government expenditures have a
positive effect on economic growth, they require more favourable attention.
iii. Government should judiciously executes its capital expenditure and spend more on
current investments which will enhance the economic activities in the short-term.
iv. This study also recommends that government should increase its spending on
infrastructure, social and economic activities. Also, budget implementation should be
monitored for effective performance. In addition, government should encourage and
support the private sector initiative in accelerating economic growth.
References
Abdullah H.A, (2000) The relationship between government expenditure and economic
growth in Saudi Arabia. Journal of Administrative Science, 12(2): 173-191.
Abu N, and Abdullahi U (2010) Government Expenditure and Economic Growth in Nigeria,
1970- 2008: A Disaggregated Analysis. Business and Economics Journal, Vol.4.
Al-Yousif Y. (2000) Does government expenditure inhibit or promote economic growth:
Some empirical evidence from Saudi Arabia. Indian Economic Journal, 48(2)
Barro, R. J., (1991), ―Economic Growth in a Cross Section of Countries‖, Quarterly Journal
Economics, CVI, pp.407-444.
Bhatia H.L (2002): Public Finance, 25th Edition, Vikas Publishing House, PVT Ltd, India.
CBN Statistical Bulletin 2015
CBN Statistical Bulletin 2015
Chude, N. P. and Chude, D. I. (2013) Impact of government expenditure on economic growth
in Nigeria. International Journal of Business and Management Review Vol.1, No.4,
pp.64-71, December 2013 Published by European Centre for Research Training and
Development UK (www.ea-journals.org)
Cooray A, (2009), Government expenditure, governance and economic growth. Comparative
Economic Studies, 51(3):401-418.
Dutse International Journal of Social and Economics Research Vol. 1, No. 1 June 2018
207
Egbetunde, T. and Fasanya, I. O. (2013) Public expenditure and economic growth in Nigeria:
Evidence from auto-regressive distributed lag specification, Zagreb International
Review of Economics & Business,Vol. 16, No. 1, pp. 79-92, 2013Fajingbesi A. A,
Odusola A. F, (1999), Public expenditure and Ggrowth. A paper presented at a
training programme on Fiscal Policy Planning Management in Nigeria, Organized by
NCEMA, Ibadan, Oyo State, 137-179.
Ighodaro, C.A.U and Okiakhi, D.E. (2010): Does the relationship between government
expenditure and economic growth follow Wagner‘s law in Nigeria?. Annals of
University of Petrosani Economics, Vol. 10(2), pp.185-198
Loto, M. A. (2011): Impact of government Sectoral Expenditure on Economic Growth.
Journal of Economics and international Finance, Vol. 3(11), pp.646-652
Maku, O. E. (2009). ―Does Government Spending Spur Economic Growth in Nigeria?
Munich Personal RePEc Archive. http://mpra.ub.uni-muenchen.de/17941/MPRA Paper no. 17941.
Maku, O. E. (2014). Public expenditure and economic growth nexus in Nigeria: A time series
analysis; Public Policy and Administration Research www.iiste.org ISSN 2224-
5731(Paper) ISSN 2225- 972(Online) Vol.4, No.7, 2014
Niloy, B., Emranul. M.H and Denise. R.O (2003): Public Expenditure and Economic Growth:
A Disaggregated Analysis for Developing Countries, JEL, Publication
Okoro A. S. (2013) Government spending and economic growth in Nigeria (1980-2011)
Global Journal of Management and Business Research Economics and Commerce
Volume 13 Issue 5 Version 1.0 Year 2013
Olabisi, A., & Funlayo, O. (2012). Composition of Public Expenditure and Economic Growth
in Nigeria. Journal of Emerging Trends in Economics and Management Sciences,
3(4), 403-407.
Olugbenga A. O, Owoye O, (2007), Public Expenditure and Economic Growth, New
Evidence from OECD Countries.
Olulu, R., Erhieyovwe, E., & Andrew, U. (2014). Government Expenditures and Economic
Growth: The Nigerian Experience. Mediterranean Journal of Social Sciences, 5(10),
89-94. http://dx.doi.org/10.5901/mjss.2014.v5n10p89
Ram R, (1986), Government Size and Economic Growth: A New Framework and Some
evidence from Cross-Section and Time-Series Data. American Economic Review, 76:
191-203.
Ram, R. (1986) Causality between Income and Government Expenditure: A Broad
International Perspective. Public Finance Journal, 41: 393-413.
Ranjan K. D, Sharma C, (2008) Government Expenditure and Economic Growth: Evidence
from India. The ICFAI University Journal of Public Finance, 6(3): 60-69.
Torruam, J., Chiawa, M., & Abur, C. (2014). Cointegration Analysis of Public Expenditure
on Tertiary Education and Economic Growth in Nigeria. Journal of Applied Statistics,
5(2), 137-146.
Yule, G. U., (1926). Why do we sometimes get nonsense correlations between time series? A
study in sampling and the nature of time series, Journal of the Royal Statistical
Society, vol. 89, 1926, pp. 1–64

208