Evaluation in Malaysian Secondary Schools - Pertanika Journal
Upload
khangminh22Category
view
2download
0
Jou
rna
l of S
ocia
l Scie
nce
s & H
um
an
ities
Jo
urn
al o
f So
cial S
cien
ces &
Hu
ma
nitie
s Jo
urn
al o
f So
cial S
cien
ces &
Hu
ma
nitie
sPertanika Journal of Social Sciences & Humanities
VOL. 23 (S) SEPT. 2015
Vol. 23 (S) Sept. 2015
Pertanika Editorial O�ce, Journal DivisionO�ce of the Deputy Vice Chancellor (R&I) 1st Floor, IDEA Tower II UPM-MTDC Technology CentreUniversiti Putra Malaysia43400 UPM SerdangSelangor Darul EhsanMalaysia
http://www.pertanika.upm.edu.my/E-mail: [email protected]: +603 8947 1622 / 1619
A special edition devoted to issues in Accounting and Finance
Guest EditorsOng Tze San & Zariyawati Mohd Ashhari
Contents
Pertanika Journal of Social Sciences & HumanitiesVol. 23 (S) Sept. 2015
http://penerbit.upm.edu.my
Special Edition in Accounting and FinanceObjective of Accounting Education: Moral or Skills? 1
Haslinah Muhamad and Nor Aishah Sudin
Sustainable Performance Measurement (SPMs) Model: Effects of Product Tecnology and Process Technology
17
Boon Heng Teh, Tze San Ong, Nahariah Jaffar and Sayed Yousef Sheikh Abou Masoudi
Agency Problem, Managerial Incentive and Financial Controlling Instrument: A Brief Review for Agenda Study in Malaysia
39
Unethical Audit Behaviour among Malaysian Auditors: An Exploratory Study
59
Mohd Nazli Mohd Nor, Malcolm Smith, Zubaidah Ismail and Hairul Suhaimi Nahar
Corporate Internet Reporting in Emerging Economic Countries: The Malaysian Perspective
73
Siti Zaidah Turmin, Fatima Abdul Hamid and Nazli Anum Mohamad Ghazali
Auditors’ and PAC Members’ Views on Performance Auditing Practices in Malaysia: A Qualitative Approach
89
Zaidi Mat Daud and Ian Fraser
The State of Sustainability Disclosure and Effects on Companies’ Financial Performance
99
Ridzwana Mohd Said, Lim Theng Theng, Rosmila Senik, Yusniyati Yusri and Ong Tze San
Credit Card Practices: Knowledge, Attitude and Debt Management 119Maswati, A. T., Abdullah, A. and Wai Yee, C.
Accounting Undergraduates’ Learning Approaches: Case of a Malaysian Public University
143
Lau, Y. W., and Lim, S. Y
Identifying Multiple Structural Breaks in Exchange Rate Series in a Finance Research
155
Alireza Zarei, Mohamed Ariff, Law Siong Hook and Annuar Md Nassir
Jou
rna
l of
So
cia
l Sci
en
ces
& H
um
an
itie
s
Jou
rna
l of
So
cia
l Sci
en
ces
& H
um
an
itie
s Jo
urn
al o
f S
oci
al S
cie
nce
s &
Hu
ma
niti
es
Journal of Social Sciences & Humanities
About the JournalOverviewPertanika Journal of Social Sciences & Humanities (JSSH) is the official journal of Universiti Putra Malaysia published by UPM Press. It is an open-access online scientific journal which is free of charge. It publishes the scientific outputs. It neither accepts nor commissions third party content.
Recognized internationally as the leading peer-reviewed interdisciplinary journal devoted to the publication of original papers, it serves as a forum for practical approaches to improving quality in issues pertaining to social and behavioural sciences as well as the humanities.
JSSH is a quarterly (March, June, September and December) periodical that considers for publication original articles as per its scope. The journal publishes in English and it is open to authors around the world regardless of the nationality.
The Journal is available world-wide.
Aims and scopePertanika Journal of Social Sciences & Humanities aims to develop as a pioneer journal for the social sciences with a focus on emerging issues pertaining to the social and behavioural sciences as well as the humanities.
Areas relevant to the scope of the journal include Social Sciences—Accounting, anthropology, Archaeology and history, Architecture and habitat, Consumer and family economics, Economics, Education, Finance, Geography, Law, Management studies, Media and communication studies, Political sciences and public policy, Population studies, Psychology, Sociology, Technology management, Tourism; Humanities—Arts and culture, Dance, Historical and civilisation studies, Language and Linguistics, Literature, Music, Philosophy, Religious studies, Sports.
HistoryPertanika was founded in 1978. A decision was made in 1992 to streamline Pertanika into three journals as Journal of Tropical Agricultural Science, Journal of Science & Technology, and Journal of Social Sciences & Humanities to meet the need for specialised journals in areas of study aligned with the interdisciplinary strengths of the university.
After almost 25 years, as an interdisciplinary Journal of Social Sciences & Humanities, the revamped journal focuses on research in social and behavioural sciences as well as the humanities, particularly in the Asia Pacific region.
Goal of PertanikaOur goal is to bring the highest quality research to the widest possible audience.
Quality We aim for excellence, sustained by a responsible and professional approach to journal publishing. Submissions are guaranteed to receive a decision within 14 weeks. The elapsed time from submission to publication for the articles averages 5-6 months.
Abstracting and indexing of PertanikaPertanika is almost 40 years old; this accumulated knowledge has resulted in Pertanika JSSH being abstracted and indexed in SCOPUS (Elsevier), Thomson (ISI) Web of Knowledge [BIOSIS & CAB Abstracts], EBSCO & EBSCOhost, DOAJ, Cabell’s Directories, Google Scholar, MyAIS, ISC & Rubriq (Journal Guide).

Jou
rna
l of S
ocia
l Scie
nce
s & H
um
an
ities
Jo
urn
al o
f So
cial S
cien
ces &
Hu
ma
nitie
s Jo
urn
al o
f So
cial S
cien
ces &
Hu
ma
nitie
s
Future visionWe are continuously improving access to our journal archives, content, and research services. We have the drive to realise exciting new horizons that will benefit not only the academic community, but society itself.
Citing journal articlesThe abbreviation for Pertanika Journal of Social Sciences & Humanities is Pertanika J. Soc. Sci. Hum.
Publication policyPertanika policy prohibits an author from submitting the same manuscript for concurrent consideration by two or more publications. It prohibits as well publication of any manuscript that has already been published either in whole or substantial part elsewhere. It also does not permit publication of manuscript that has been published in full in Proceedings.
Code of EthicsThe Pertanika Journals and Universiti Putra Malaysia takes seriously the responsibility of all of its journal publications to reflect the highest in publication ethics. Thus all journals and journal editors are expected to abide by the Journal’s codes of ethics. Refer to Pertanika’s Code of Ethics for full details, or visit the Journal’s web link at http://www.pertanika.upm.edu.my/code_of_ethics.php
International Standard Serial Number (ISSN)An ISSN is an 8-digit code used to identify periodicals such as journals of all kinds and on all media–print and electronic. All Pertanika journals have ISSN as well as an e-ISSN.
Journal of Social Sciences & Humanities: ISSN 0128-7702 (Print); ISSN 2231-8534 (Online).
Lag time A decision on acceptance or rejection of a manuscript is reached in 3 to 4 months (average 14 weeks). The elapsed time from submission to publication for the articles averages 5-6 months.
AuthorshipAuthors are not permitted to add or remove any names from the authorship provided at the time of initial submission without the consent of the Journal’s Chief Executive Editor.
Manuscript preparationRefer to Pertanika’s Instructions to Authors at the back of this journal.
Most scientific papers are prepared according to a format called IMRAD. The term represents the first letters of the words Introduction, Materials and Methods, Results, And, Discussion. IMRAD is simply a more ‘defined’ version of the “IBC” [Introduction, Body, Conclusion] format used for all academic writing. IMRAD indicates a pattern or format rather than a complete list of headings or components of research papers; the missing parts of a paper are: Title, Authors, Keywords, Abstract, Conclusions, and References. Additionally, some papers include Acknowledgments and Appendices.
The Introduction explains the scope and objective of the study in the light of current knowledge on the subject; the Materials and Methods describes how the study was conducted; the Results section reports what was found in the study; and the Discussion section explains meaning and significance of the results and provides suggestions for future directions of research. The manuscript must be prepared according to the Journal’s Instructions to Authors.
Editorial processAuthors are notified with an acknowledgement containing a Manuscript ID on receipt of a manuscript, and upon the editorial decision regarding publication.

Jou
rna
l of
So
cia
l Sci
en
ces
& H
um
an
itie
s
Jou
rna
l of
So
cia
l Sci
en
ces
& H
um
an
itie
s Jo
urn
al o
f S
oci
al S
cie
nce
s &
Hu
ma
niti
es Pertanika follows a double-blind peer-review process. Manuscripts deemed suitable for publication
are usually sent to reviewers. Authors are encouraged to suggest names of at least three potential reviewers at the time of submission of their manuscript to Pertanika, but the editors will make the final choice. The editors are not, however, bound by these suggestions.
Notification of the editorial decision is usually provided within ten to fourteen weeks from the receipt of manuscript. Publication of solicited manuscripts is not guaranteed. In most cases, manuscripts are accepted conditionally, pending an author’s revision of the material.
As articles are double-blind reviewed, material that might identify authorship of the paper should be placed only on page 2 as described in the first-4 page format in Pertanika’s Instructions to Authors given at the back of this journal.
The Journal’s peer-reviewIn the peer-review process, three referees independently evaluate the scientific quality of the submitted manuscripts.
Peer reviewers are experts chosen by journal editors to provide written assessment of the strengths and weaknesses of written research, with the aim of improving the reporting of research and identifying the most appropriate and highest quality material for the journal.
Operating and review processWhat happens to a manuscript once it is submitted to Pertanika? Typically, there are seven steps to the editorial review process:
1. The Journal’s chief executive editor and the editorial board examine the paper to determine whether it is appropriate for the journal and should be reviewed. If not appropriate, the manuscript is rejected outright and the author is informed.
2. The chief executive editor sends the article-identifying information having been removed, to three reviewers. Typically, one of these is from the Journal’s editorial board. Others are specialists in the subject matter represented by the article. The chief executive editor asks them to complete the review in three weeks.
Comments to authors are about the appropriateness and adequacy of the theoretical or conceptual framework, literature review, method, results and discussion, and conclusions. Reviewers often include suggestions for strengthening of the manuscript. Comments to the editor are in the nature of the significance of the work and its potential contribution to the literature.
3. The chief executive editor, in consultation with the editor-in-chief, examines the reviews and decides whether to reject the manuscript, invite the author(s) to revise and resubmit the manuscript, or seek additional reviews. Final acceptance or rejection rests with the Edito-in-Chief, who reserves the right to refuse any material for publication. In rare instances, the manuscript is accepted with almost no revision. Almost without exception, reviewers’ comments (to the author) are forwarded to the author. If a revision is indicated, the editor provides guidelines for attending to the reviewers’ suggestions and perhaps additional advice about revising the manuscript.
4. The authors decide whether and how to address the reviewers’ comments and criticisms and the editor’s concerns. The authors return a revised version of the paper to the chief executive editor along with specific information describing how they have answered’ the concerns of the reviewers and the editor, usually in a tabular form. The author(s) may also submit a rebuttal if there is a need especially when the author disagrees with certain comments provided by reviewer(s).

Jou
rna
l of S
ocia
l Scie
nce
s & H
um
an
ities
Jo
urn
al o
f So
cial S
cien
ces &
Hu
ma
nitie
s Jo
urn
al o
f So
cial S
cien
ces &
Hu
ma
nitie
s
5. The chief executive editor sends the revised paper out for re-review. Typically, at least one of the original reviewers will be asked to examine the article.
6. When the reviewers have completed their work, the chief executive editor in consultation with the editorial board and the editor-in-chief examine their comments and decide whether the paper is ready to be published, needs another round of revisions, or should be rejected.
7. If the decision is to accept, an acceptance letter is sent to all the author(s), the paper is sent to the Press. The article should appear in print in approximately three months.
The Publisher ensures that the paper adheres to the correct style (in-text citations, the reference list, and tables are typical areas of concern, clarity, and grammar). The authors are asked to respond to any minor queries by the Publisher. Following these corrections, page proofs are mailed to the corresponding authors for their final approval. At this point, only essential changes are accepted. Finally, the article appears in the pages of the Journal and is posted on-line.


Vol. 23 (S) Sept. 2015(Special Edition)
A special edition devoted to issues in Accounting and Finance
A scientific journal published by Universiti Putra Malaysia Press
Guest EditorsOng Tze San & Zariyawati Mohd Ashhari
SOCIAL SCIENCES & HUMANITIES


JSSHJournal of Social Sciences & Humanities
AN INTERNATIONAL PEER-REVIEWED JOURNALEDITOR-IN-CHIEFMohd. Shahwahid Hj. OthmanEconomics, Natural Resource & Environmental Economics, Economics Valuation
CHIEF EXECUTIVE EDITORNayan Deep S. Kanwal Environmental Issues – Landscape Plant Modelling Applications
UNIVERSITY PUBLICATIONS COMMITTEEMohd Azmi Mohd Lila, Chair
EDITORIAL STAFFJournal Officers:Kwan Lee Yin, ScholarOne Kanagamalar Silvarajoo, ScholarOne
Lim Ee Leen, ScholarOne
Editorial Assistants:Siti Juridah Mat Arip Zulinaardawati Kamarudin Norhafizah Abd Rani
COPY EDITORSDoreen Dillah Crescentia Morais
PRODUCTION STAFFPre-press Officers:Nik Khairul Azizi Nik Ibrahim Kanagamalar Silvarajoo
Layout & Typeset:Sarwani Padzil Noor Sholihah Mohd Daud
WEBMASTERMohd Nazri Othman
PUBLICITY & PRESS RELEASEMagdalene Pokar (ResearchSEA)
EDITORIAL OFFICEJOURNAL DIVISION Office of the Deputy Vice Chancellor (R&I) 1st Floor, IDEA Tower II UPM-MTDC Technology Centre Universiti Putra Malaysia 43400 Serdang, Selangor Malaysia.Gen Enq.: +603 8947 1622 | 1619 | 1616E-mail: [email protected]: www.journals-jd.upm.edu.my
PUBLISHERKamariah Mohd SaidinUPM Press Universiti Putra Malaysia 43400 UPM, Serdang, Selangor, Malaysia.Tel: +603 8946 8855, 8946 8854 Fax: +603 8941 6172E-mail: [email protected] URL: http://penerbit.upm.edu.my
EDITORIAL BOARD2015-2017Abdul Mansur M. MasihEconomics, Econometrics, Finance, King Fahd University of Petroleum and Minerals, Saudi Arabia.
Alan Maley English Language Studies, Teaching of English Language and Literature, Leeds Metropolitan University, UK.
Ali Reza Kaldi Medical Sociology, Sociology of Development Ageing, Gerontology, University of Social Welfare and Rehabilitation, Tehran, Iran.
Aminah Ahmad Sociology, Gender and Development, Universiti Putra Malaysia, Malaysia.
Bee-Hoon Tan English Language Studies and Applied Linguistics, with Special Research Interest in e-learning and Learning Support, Universiti Putra Malaysia, Malaysia.
Brian Tomlinson English Language Studies, The Evaluation, Adaptation and Development, Leeds Metropolitan University, UK.
Deanna L. Sharpe Economics, Consumer and Family Economics, Personal Finance, The University of Missouri, Columbia, USA.
Dessy IrawatiInternational Business Management, Strategic Management, Economic Geography, Globalization and Development Studies, Industrial Dynamics and Knowledge Transfer, Radboud University, the Netherlands and EduPRIME the consulting, the Netherlands.
Elias @ Ilias SallehArchitectural Science, Sustainable Tropical Design, Thermal Comfort, Universiti Kebangsaan Malaysia, Malaysia.
Barbara WejnertPolitical Sociologist: Gender Studies, Macro Political and Social Changes, University at Buffalo, SUNY, USA.
Carolyn GrahamMusic, Jazz Chants, Harvard University, USA.
David NunanVice-President: Academic, Anaheim University, California, English Language Studies, Linguist, TESOL, University of Hong Kong, Hong Kong.
Faith Trent AM FACEEducation: Curriculum development, Flinders University, Adelaide, Australia.
Gary N. McleanExecutive Director, International Human Resource Development Programs, EAHR, Human Resource Development for National, Community and Social Development, International Human Resource Development, Organizational Development, Texas A&M University, USA.
Graham Thurgood English Language Studies, General Linguistics, Discourse and Syntax, California State University, Chico., USA.
Gong-Soog Hong Economics, Consumer and Family Sciences, The Ohio State University, USA.
Jacqueline Pugh-Kitingan Music, Ethnomusicology, Borneo and Papua New Guinea Studies, Universiti Malaysia Sabah, Malaysia.
James R. Stock Management Studies, Marketing, Logistics and Supply Chain Management, Quantitative Method, University of South Florida, USA.
Jayakaran Mukundan English Language Studies, Teaching English as a Second Language (TESL), English Language Studies, Universiti Putra Malaysia, Malaysia.
Jayum A. Jawan Sociology, Politics and Government, Civilization Studies, Universiti Putra Malaysia, Malaysia.
Jonathan Newton Classroom-based Second Language Acquisition, Language Teaching Methodology, the Interface of Culture and Language in Language Teaching and Learning, and Language/Communication Training and Material Design for the Multicultural Workplace, Victoria University of Wellington, New Zealand.
Marcus Bion GRIFFINHuman Ecology, Anthropology, Tropical Agriculture, Fisheries, Cultural Learning Solutions, USA.
Mary Susan PhilipEnglish Language Theatre in Malaysia and Singapore; Postcolonial Theatre, University of Malaya, Malaysia.
Muzafar Shah Habibullah Economics, Monetary Economics, Banking, Macroeconomics, Universiti Putra Malaysia, Malaysia.
Patricia Matusky Music, Ethnomusicology, Malay and Indonesian language, Literature and Culture, Grand Valley State University, USA.
Rohany Nasir Psychology-Career counseling, Counseling for Adolescents and Adults, Marriage and Family counseling, Counseling industry and Organization, Universiti Kebangsaan Malaysia, Malaysia.
Samsinar Md.Sidin Management Studies, Marketing, Consumer Behaviour, Universiti Putra Malaysia, Malaysia.
Shameem Rafik-GaleaEnglish Language Studies, Linguistics, Applied Linguistics, Language and Communication, Universiti Putra Malaysia, Malaysia.
Shamsher Mohamad Ramadili Mohd Finance, Corporate Governance, The Global University of Islamic Finance (INCEIF) Malaysia.
Stephen J. Hall English Language Studies, Linguist, Teacher Educator, TESOL, Sunway University College, Malaysia.
Stephen J. Thoma Phsycology, Educational Psychology, The University of Alabama, USA.
Swee-Heng Chan English Language Studies, Universiti Putra Malaysia, Malaysia.
Turiman Suandi Psychology, Youth Development and Volunteerism, Universiti Putra Malaysia, Malaysia.
Victor T. King Anthropology / Southeast Asian Studies White Rose East Asia Centre, University of Leeds, UK.
INTERNATIONAL ADVISORY BOARD2013-2016
Handoyo Puji Widodo English Language Studies, ESP, Language Curriculum-Materials Design and Development, and Language Methodology, Politeknik Negeri Jember, East Java-Indonesia.
John R. Schermerhorn Jr. Management Studies, Management and Organizational Behaviour, International Business, Ohio University, USA.
Kent Matthews Economics, Banking and Finance, Modelling and Forecasting the Macro Economy, Cardiff Business School, UK.
Lehman B. Fletcher Economics, Agricultural Development, Policy Analysis and Planning, Iowa State University, USA.
Mark P. Orbe Communication, Interpersonal Communication, Communication and Diversity, Intercultural Communication, Western Michigan University, USA.
Mohamed ARIFF Economics, Finance, Capital Market, Islamic Finance, Fiscal Policy, Bond University, Australia.
Pal Ahluwalia Pro Vice-Chancellor (Research and Innovation), African Studies, Social and Cultural Theory, Post-colonial Theory, Division of Education, Arts & Social Sciences, University of Portsmouth, United Kingdom.
Phillip Jones Architectural Science, Sustainability in the Built Environment, Welsh School of Architecture, Cardiff University, UK.
Rance P. L. Lee Sociology, The Chinese University of Hong Kong.
Royal D. Colle Communication, Cornell University, USA.
Shonda Buchanan Interim Chair, American Literature, Hampton University, USA.
Vijay K. Bhatia Education: Genre Analysis and Professional Communication, City University of Hong Kong
ABSTRACTING/INDEXINGPertanika is now over 35 years old; this accumulated knowledge has resulted the journals being indexed in SCOPUS (Elsevier), Thomson (ISI) Web of Knowledge [BIOSIS & CAB Abstracts], EBSCO, DOAJ, Google Scholar, AGRICOLA, ISC, Citefactor, Rubriq and MyAIS.
The publisher of Pertanika will not be responsible for the statements made by the authors in any articles published in the journal. Under no circumstances will the publisher of this publication be liable for any loss or damage caused by your reliance on the advice, opinion or information obtained either explicitly or implied through the contents of this publication.All rights of reproduction are reserved in respect of all papers, articles, illustrations, etc., published in Pertanika. Pertanika provides free access to the full text of research articles for anyone, web-wide. It does not charge either its authors or author-institution for refereeing/publishing outgoing articles or user-institution for accessing incoming articles.No material published in Pertanika may be reproduced or stored on microfilm or in electronic, optical or magnetic form without the written authorization of the Publisher.Copyright © 2015-16 Universiti Putra Malaysia Press. All Rights Reserved.


Preface
This idea of publishing an issue of Pertanika JSSH as “Special edition in Accounting and Finance” was mooted in the year 2014. The call for papers for the issue received an overwhelming response. To meet Pertanika’s stringent guidelines for peer-review, all the manuscripts for this particular issue were reviewed by a minimum of two reviewers.
The aim of this issue is to provide the knowledge derived from findings of accounting and finance related studies carried out both in the international and Malaysia contexts. It is compact and easy to use by undergraduate and postgraduate students. It is also suitable for business managers and practitioners to have understanding in related areas.
A total of seventeen articles are presented in this special edition, which incorporates various issues on Accounting, Accounting Education, Auditing, Banking, Corporate Finance, Corporate Governance, Corporate Reporting, Financial Economics and Investment.
We are indebted to all our contributors for their in-depth research works, as well as the reviewers and editors, who compiled, edited and prepared this special edition for publication. We would also like to thank the Dean, Prof. Dr. Zulkornain Bin Yusop, Deputy Dean, Assoc. Prof. Dr. Azmawani Binti Abd Rahman, and the Head of the Accounting and Finance Department, Dr Amalina Binti Abdullah, for their encouragement and guidance, numerous helpful suggestions and excellent coordination that contributed towards bringing this publication to reality.
We are equally thankful to Dr. Nayan Kanwal, the Chief Executive Editor, and his dedicated Pertanika team at the Journal Division, UPM, for rendering us their generous guidance and commitment in bringing this edition to print. Last but not least, we acknowledge all our anonymous reviewers for their hard work and dedication.
Guest Editors Ong Tze SanZariyawati Binti Mohd Ashhari
September 2015

Pertanika Journal of Social Sciences & Humanities Vol. 23 (S) Jul. 2015
Contents
Special Edition in Accounting and FinanceObjective of Accounting Education: Moral or Skills? 1
Haslinah Muhamad and Nor Aishah Sudin
Sustainable Performance Measurement (SPMs) Model: Effects of Product Tecnology and Process Technology
17
Boon Heng Teh, Tze San Ong, Nahariah Jaffar and Sayed Yousef Sheikh Abou Masoudi
Agency Problem, Managerial Incentive and Financial Controlling Instrument: A Brief Review for Agenda Study in Malaysia
39
M. Ghasemi, Nazrul Hisyam Ab Razak and Taufiq Hassan
Unethical Audit Behaviour among Malaysian Auditors: An Exploratory Study
59
Mohd Nazli Mohd Nor, Malcolm Smith, Zubaidah Ismail and Hairul Suhaimi Nahar
Corporate Internet Reporting in Emerging Economic Countries: The Malaysian Perspective
73
Siti Zaidah Turmin, Fatima Abdul Hamid and Nazli Anum Mohamad Ghazali
Auditors’ and PAC Members’ Views on Performance Auditing Practices in Malaysia: A Qualitative Approach
89
Zaidi Mat Daud and Ian Fraser
The State of Sustainability Disclosure and Effects on Companies’ Financial Performance
99
Ridzwana Mohd Said, Lim Theng Theng, Rosmila Senik, Yusniyati Yusri and Ong Tze San
Credit Card Practices: Knowledge, Attitude and Debt Management 119Maswati, A. T., Abdullah, A. and Wai Yee, C.
Accounting Undergraduates’ Learning Approaches: Case of a Malaysian Public University
143
Lau, Y. W., and Lim, S. Y
Identifying Multiple Structural Breaks in Exchange Rate Series in a Finance Research
155
Alireza Zarei, Mohamed Ariff, Law Siong Hook and Annuar Md Nassir

Key Determinants of German Banking Sector Performance 167A. Nasserinia, M. Ariff and Cheng Fan Fah
Wealth Effects Associated with Announcements of Hybrid Securities in an Emerging Country: Evidence from Malaysia
187
Abdul Rahim, N. and Abdul Rahman, F.
The Impact of Basel III on Malaysian Stock Performance 205J. L. Chia, Yahya, M. H. and Muhammad, J.
Technical Efficiency and Returns to Scale on Banking Sector: Empirical Evidence from GCC Countries
219
Fakarudin Kamarudin, Fadzlan Sufian, Annuar Md. Nassir and Nazratul Aina Mohamad Anwar
Stock Return, Currency and General Elections 237Tze San Ong, Wei Ni Soh, Boon Heng Teh and Sin Huei Ng
Identifying Factors Correlated with Corporate Cash Holdings in Korea and Malaysia
251
Soh Wei Ni, Annuar M. Nassir and Cheng Fan Fah

Pertanika J. Soc. Sci. & Hum. 23 (S): 1 – 16 (2015)
ISSN: 0128-7702 © Universiti Putra Malaysia Press
SOCIAL SCIENCES & HUMANITIESJournal homepage: http://www.pertanika.upm.edu.my/
ARTICLE INFOArticle history:Received: 30 March 2015Accepted: 10 September 2015
E-mail addresses:[email protected] / [email protected] (Haslinah Muhamad),[email protected] (Nor Aishah Sudin)* Corresponding author
Objective of Accounting Education: Moral or Skills?
Haslinah Muhamad* and Nor Aishah SudinDepartment of Accounting and Finance, Faculty of Economics and Management, University Putra Malaysia, 43400 UPM Serdang, Selangor, Malaysia
ABSTRACT
This study was carried out to identify the respondents’ preferred objective of accounting programme, especially for public universities as compared to National Philosophy of Education (NPE). This study also attempted to suggest the improvement needed in objective setting for undergraduate accounting programme. The study relied on primary data obtained from reviews of documents and interviews involving a total of 28 accounting lecturers from four (4) selected Malaysian public universities, namely, Universiti Putra Malaysia (UPM), National University of Malaysia (UKM), University of Malaya (UM) and International Islamic University of Malaysia (IIUM). The results suggested that most public universities involved in this study formally expressed their commitment towards academics excellent (material part) in their vision and mission. In contrast, the same universities did not seem to indicate formal commitment toward developing their students’ spiritual part as required by NPE. However, accounting lecturers at public universities involved in this study seemed to agree with NPE that the development of students’ moral should be set the as the primary objective of the accounting programme. Several respondents, especially Muslims, suggested that the objective of accounting programme should be based on the Islamic framework. In addition, they further suggested that the accounting programme for undergraduates should reduce the technical part and include more trainings that emphasise on the ability to be a thinker. This paper extends the accounting and education literature related to the accounting profession since it analyses the issues revolving around the objective of accounting programme, with specific reference to the Malaysian context.
Keywords: Objectives of accounting programme; Malaysian National Philosophy of Education (NPE), moral, ethics

Pertanika J. Soc. Sci. & Hum. 23 (S): 1 – 16 (2015)
Haslinah Muhamad and Nor Aishah Sudin
2
INTRODUCTION
National philosophy of education (NPE) in Malaysia states that “Education in Malaysia is a continuous effort towards enhancing potentials of individuals in a holistic and integrated manner in order to create individuals who are well-equipped intellectually, spiritually and emotionally”. This effort aims to produce knowledgeable, ethical and responsible Malaysian citizens who can contribute towards the harmony and prosperity of the community and nation (Ministry of Malaysia Education, 2013). This announced objective by NPE should be accepted as representative of all universities’ general objectives.
International Federation of Accountants (IFAC) released the Framework through International Education Standards for Professional Accountants (2009). It is outlined that the objective of accounting education is to develop competent professional accountants. In order to demonstrate competence in his or her role, a professional accountant must possess the necessary knowledge and skills including values, ethics and attitudes. Education, according to IFAC, is a systematic process aimed at acquiring and developing knowledge, skills and other capabilities within individuals; a process that is typically but not exclusively conducted in academic environment.
Even after the pronouncement of the relevant educational standard on ethics by IFAC, scholars continue to argue for the need to re-examine the type of educational system that produces accounting professionals
who, consciously or otherwise, appear to act unethically (Boyce, 2008; Low et al., 2008). This is because evidence that accounting education is largely guilty of failing to develop students’ intellectual and moral abilities abounds (see for instance, McPhail, 2001; Swanson & Frederick, 2003; Amernic & Craig, 2004). Low et al. (2008) argue that it is the lack of morals in ‘educated people’ that has contributed to the recent financial reporting scandals and corporate frauds. Only come to the question: are those existing objectives of accounting programme compatible with the education objectives setting by NPE? This research tries to answer the question.
This article is organised in the following manner. First, this paper presents literature review; second, it describes the research method and then followed by the analysis. The paper then concludes with discussion of the results and suggestions for future research.
LITERATURE REVIEW
Accountants face the pressure to show and demonstrate that accounting is a highly credible profession (IFAC, 2008). The infamous accounting scandals such as Enron, WorldCom and Tyco have already highlighted the failure of accountants to safeguard societal welfare. Given that professional conduct steeped in human values and ethics is the core to accounting professionalism, it is not surprising that the focus of attention has now shifted back to the manner in which accountants are trained and educated. It is based on

Pertanika J. Soc. Sci. & Hum. 23 (S): 1 – 16 (2015)
Objective of Accounting Education: Moral or Skills?
3
this premise that criticisms have been levelled at educators for contributing to the corporate reporting scandals by discharging poor quality professional education (see Lehman, 1988; Jackling, Leung, & Dellaportas, 2007; Low, Davey, & Hooper, 2008). Additionally, Amernic and Craig (2004, p. 343) stated that one of the causes of the seemingly never-ending parade of accounting scandals and unexpected company collapses is the inadequacy of university curricula and business education. The accounting programmes are said to be dominated by the learning of techniques and rules (Boyce, 2008; Low, Davey, & Hooper, 2008) and thus have very little attention given in instilling values, ethics and a sense of integrity (Armstrong, Ketz, & Owsen, 2003).
The ultimate aim of education based on the philosophy of NEP is to develop every aspect of individuals in a harmonious and balanced manner so as to preserve their well-being (Ministry of Malaysia Education, 2013). Knowledge and education should path the way to good ethics and moral values as responsible and learned members of the community and nation. A core concept of the NPE is the value and role of knowledge in the development of individuals and their role in the community. More importantly, the value of knowledge lies in the truth of the matter which serves not only to inform but also transform and shape individuals to serve the community. Education is a lifelong process and human beings are constantly in need to expand, explore and
verify existing knowledge. Experience does not only enrich and strengthen knowledge but also re-examine and increase the capacity of the existing knowledge possessed by individuals. Based on NPE, it is evident that the aim of all programmes, including accounting programme in higher education, should show the direction towards educating individuals for self-development in a holistic approach to serve their community and nation as learned and responsible not only to community but mainly as a God’s servant citizens.
Accounting Education in Malaysia
The summary of the report entitled, ‘East Asia Accounting Roundtable Country Presentation: Malaysia Summary’ published by American Accounting Association in 2000 claims that “in the current curriculum (referring to the year 2000), the majority of accountancy programmes in Malaysia tend to ‘over focus’ on core accounting subjects. There is an imperative need to review the education curriculum to give more weight to the learning of management, analytical skills and communication. These are necessary attributes in an information based and highly competitive business world” (East Asia Acounting Rountable Country Presentation: Malaysia Summary, 2000, p. 3).
Consequently, the accounting education in Public Institutes of Higher Learning is being revised to improve the quality of education and reduce the expectation gap relating to employers’ demands. Public universities in Malaysia have responded

Pertanika J. Soc. Sci. & Hum. 23 (S): 1 – 16 (2015)
Haslinah Muhamad and Nor Aishah Sudin
4
by developing and articulating coherent policies and frameworks called Hala Tuju 1 in 2001 to build accounting graduate attributes within and across the programmes. Malaysia Institute of Accountant (MIA), the accounting professional body in Malaysia, has also recognised the critical importance of the development of generic skills and attributes for accounting graduates. Beside compliance with the International Education Standard (IES 1-8) issued by the International Federation of Accountants (IFAC), MIA has also produced Accreditation Guidelines for universities making explicit of their expectations of the generic (cognitive and behavioural) skill level of graduates.
Consistent with the philosophy of IFAC, through the issuance of International Education Standards (IES) 4 in 2005 [1] on the role of accounting education in inculcating ethics, the Ministry of Education, Malaysia (formerly known as Ministry of Higher Education), revised the Reassessment Report on Accounting Programme offered by Malaysian Public Universities call Hala Tuju 2 in 2006. The Reassessment Report on Accounting Programme requires the Public Universities in Malaysia to incorporate twelve learning outcomes into their respective accounting degree curriculum, one of which is a demonstration of students’ ethical behaviour.
Even after the pronouncement of the relevant educational standard on ethics by IFAC, scholars continue to argue for the need to re-examine the type of educational system that produces accounting professionals who, consciously
or otherwise, appear to act unethically (Blanthorne, Kovar, & Fisher, 2007; Sikka, Haslam, Kyriacou, & Agrizzi, 2007). For example, Low et al. (2008) argued that it is the lack of moral in ‘educated people’ that has contributed to the recent financial reporting scandals and corporate frauds.
Graduate attributes being developed during accounting programmes should now going well beyond disciplinary or technical knowledge and expertise and include qualities that prepare graduates as lifelong learners, as ‘global citizens’, as agents for social good and for their personal development in light of an unknown future (Bowden & Marton, 1998; Barrie, 2004). However, the critiques on the inadequacy of accounting education continue. In fact, the claim that accountancy students are encouraged to learn rules and technique or the aim of ‘maximizing shareholder wealth’ sounds very familiar (Sikka, Haslam, Kyriacou, & Agrizzi, 2007).
METHODOLOGY
This study was based on interpretive of the ontological assumptions. These assumptions have led the researchers to choose the qualitative method through interview and document review approach and analysis by using Nvivo. Based on the general research questions, several sub-questions were formulated. These sub-questions constituted the main topics to guide the search for supporting documentary evidence and interviews, as summarised in Table 1.

Pertanika J. Soc. Sci. & Hum. 23 (S): 1 – 16 (2015)
Objective of Accounting Education: Moral or Skills?
5
TABLE 1Sub-questions and guided the search for supporting documentary evidence
Sub questions Main data source Support data sourceHow are the objectives of NEP being translated in the current vision and mission of university and faculty?
Document review
What should be the objectives of accounting education?i. What are the general objectives of education?ii. In your opinion, what should be the objectives of
accounting education?
Document review Educators’ interview
Educators’ interview Document review
The purpose is to understand the current requirements of Hala Tuju 2 on ethics accounting education.
Documents and Webpage
In this study, documents were intended as part of the strategy to ensure validity and reliability, namely, via triangulation of data sources. The contents of these documents were compared against some of the teaching educators’ claim on the integration of their own objectives they always emphasise to their students in class.
It was decided that a review must be made of the websites of the relevant faculty and department at each university. The websites were thought to contain useful background information about the institutions, especially on the ways in which each institution presents itself to the external public. Table 2 indicates the documents that had been reviewed and the information that was obtained from each of the documents. All the documents are considered as ‘public documents’ and thus have been made accessible to the researchers.
Data Collection and Sample of the Study
Due to limited time frame and financial budget, the collection of the data for this study concentrated at four (4) universities in Selangor, Malaysia, namely, Universiti Putra Malaysia (UPM), National University of Malaysia (UKM), University of Malaya (UM) and International Islamic University of Malaysia (IIUM). On several occasions, however, locations might have been visited on the same day due to scheduled interview appointments.
Respondents in the interviews were divided into two categories. The first category consisted of the main committee and subcommittee of business ethics and corporate governance in Hala Tuju 2. They participated in the development of accounting curriculum and education policies such as conceptual framework for accounting education, redesign of accounting programme curriculum and establishment of cooperative linkages with industry and accounting profession.

Pertanika J. Soc. Sci. & Hum. 23 (S): 1 – 16 (2015)
Haslinah Muhamad and Nor Aishah Sudin
6
TABLE 2Source of the documents
Documents PurposeUniversity/Department/UnitWebsiteUniversity Mission/ Vision
Background information on the universityDepartment/Unit, and staffIndication of the influence of human elements inUniversity vision and mission (if any)
DATA ANALYSIS
The generic steps of data analysis in qualitative inquiry proposed by Creswell (2003) are applied for the qualitative data. The steps involve generating opening code, assigning axial codes, identifying a story line representing qualitative narrative and making an interpretation or meaning of the data.
RESULTS AND DISCUSSION
Objective of Education in the Official Pronouncements
The vision and mission statements of each university contain unequivocal references to certain notions that could be associated with their identity. The opening paragraph of each vision statement in Table 3, for instance, attributes “the worldview of knowledge” as the source of inspiration for the universities’ overall educational direction.
Interview
In total, 28 face-to-face interviews were conducted and recorded. The general purpose of educator interviews was to obtain insights on the measures that are in place at the university to create individuals who are well-equipped intellectually, spiritually and emotionally. The order and structure of the questions were not fixed as they were exploratory, loosely-structured and open-ended in nature, as suggested by Rubin and Rubin (1995, cited in Yin, 2003, p. 89). For most of the duration of the interview, the researcher remained attentive and only probed for further clarification when necessary. Morse and Richards (2002) described this approach of interviewing as ‘interactive’. Such approach, which is common for qualitative research, is essential where the researcher would focus on listening and learning from the interviewees.
TABLE 3Vision Statement of the Four Public Institutions of Higher Learning (IHL)
University Vision StatementUniversity Putra Malaysia (UPM) To become a University of international repute.National University of Malaysia (UKM) To be ahead of society and time in leading the development if
a dynamic, learned and moral. University Malaya (UM) To be an internationally renowned institution of higher learning
in research, innovation, publication and teaching.International Islamic University of Malaysia (IIUM)
IIUM aims to become a leading international centre of educational excellence which seeks to restore the dynamic and progressive role of the Muslim Ummah in all branches of knowledge and intellectual discourse.

Pertanika J. Soc. Sci. & Hum. 23 (S): 1 – 16 (2015)
Objective of Accounting Education: Moral or Skills?
7
As with the pronouncements made at the university level, most of the pronouncements appear focusing on the challenges in the educational industry. These indicate the universities’ intention to become a ‘world class’ institution that focuses on research, publication and teaching activities. Nonetheless, these universities have not made any reference to any specific values or ideals to which they subscribe. Although those universities remain steadfast to educational excellence, there is a goal that is common to most universities. One of the university’s vision statements also lie out aims that are meant to distinguish the university from other institutions. In the explanations of the vision, they claimed that the university (IIUM)’s visions are inspired by the worldview of Tawhid (the concept of monotheism or asserting oneness) and the Islamic philosophy of the unity of knowledge, as well as its concept of holistic education. The aims also include restoration of intellectual vigour in the Muslim Ummah, integration of Islamic values into all disciplines of knowledge and re-establishing the place of Muslim Ummah at the forefront of knowledge and consequently improve the qualities of human life. Such belief may thus be contrasted with the educational mission of other universities that does not include the element of spiritual parts. Meanwhile, the values such as the concept of monotheism (Tawhid), the qualities of faith (iman), knowledge (`ilm), good character (akhlaq) and Islamic moral-spiritual values are also embedded in the vision or mission.
The promotion of the sovereignty of the Malay Language (Bahasa Melayu) as the first language and internationalises knowledge rooted in the national culture has been stipulated in UKM’s vision, potentially reflects the university’s endorsement of patriotisms spirit rather than Islamic or other values.
The vision statements discussed thus far are essentially formulated within the context of universities as a whole. In addition to these pronouncements, a review was also carried out on similar statements made by the faculty where the programme of accounting was conducted. This was thought to be useful in identifying the ethical values that are emphasised to undergraduate accounting students in Public universities.
The pronouncements, comprising statements on the Faculty’s philosophy, aims and quality of its graduates, are depicted in Table 4. The statements made by the faculty appeared to reflect the university’s emphasis on advancements in knowledge. For the faculty, however, such advancements are expressed within the context of business and management to meet the need of employability. As with the pronouncements made at the university level, the statements made by the faculty in the universities (except IIUM), in the researcher’s view, do not seem to indicate a commitment in developing the students’ moral character or spiritual and emotional part, as suggested by NPE. Instead, the pronouncements appear to focus on the challenges in the business environment,

Pertanika J. Soc. Sci. & Hum. 23 (S): 1 – 16 (2015)
Haslinah Muhamad and Nor Aishah Sudin
8
and the ways in which education at the faculty would enable the students to face those challenges. While such educational outcome is common to many business and management faculties, this, to a certain extent, would have also implied the
faculty’s endorsement of competitiveness. This, in turn, may well be associated with the university’s emphasis on the ‘world class’ reputation institution, as explicitly stated in its vision statement.
TABLE 4Faculty’s vision and mission
Faculty, University Faculty StatementsFaculty of Economics and Management,Universiti Putra Malaysia (UPM)
VISION To be a leading business school in Malaysia fulfilling global expectations.
MISSION• To produce business graduates who meet the needs of the business community
and to develop innovative and socially responsible leaders who are capable of dealing with changes in the global environment.
• To contribute to the advancement of knowledge in the area of business and management.
• To develop linkages and to collaborate with institutions, industries and communities at large.
Faculty of Economics and BusinessNational University of Malaysia (UKM)
VISIONTo be a distinguished faculty, which stimulates and generates knowledge for economics, business and professional development aimed at national and universal well-being.
MISSIONCommitted to strive towards excellence in the disciplines of business management, accounting, and economics through the integration of knowledge and ethical practices, high professionalism and current developments
Faculty of Business and AccountancyUniversity of Malaya (UM)
VISIONTo remain at the forefront of business and accounting education and continues to enjoy the reputation as an excellent knowledge-based institution.
MISSIONWe aspire to be the leader and preferred institution in businessand accounting education by:• Providing graduates with quality education and global perspective that meet the
evolving needs of various stakeholders.• Contributing to the advancement of knowledge in the area of business and
accounting through quality research and publication.Kulliyah of Economic and Management ScienceInternational Islamic University of Malaysia (IIUM)
VISIONTo be a leading faculty of international excellence for teaching, research and consulting services integrating conventional economics, accounting and business-related areas with Islamic values and ethics.
MISSION• To produce well-rounded professionals in economics, accounting and business
administration who are imbued with Islamic values and ethics.• To spearhead research and consultancy activities in Islamic economics,
accounting and business-related areas.• To promote publication activities in Islamic economics, accounting and business-
related areas

Pertanika J. Soc. Sci. & Hum. 23 (S): 1 – 16 (2015)
Objective of Accounting Education: Moral or Skills?
9
Faculty’s (Kulliyah of Economic and Management Science) statements at IIUM, as presented in Table 4, contain three major elements that could be associated with the pronouncements made at the university level. Firstly, the faculty aspires to excel as a centre of education, particularly in the areas of economics, accounting and business. Secondly, the faculty attaches itself to the idea of integrating religion values and ethics into each of the three disciplines of knowledge. Thirdly, in the first objective stated in its mission, the faculty has made specific reference to Islamic values and ethics in respect of the moral qualities that may be expected of integration of Islamic ideals into all branches of knowledge. The faculty may be seen as to have expressed a commitment to ethical development of accounting students at undergraduate levels through the use of terms that may be associated with Islam, that such development shall have a religious and spiritual bearing. Specific mentions are also made of other qualities that the faculty seeks to instil into the students, such as professional competence and the values of care and compassion.
Based on a review of pronouncements made by the university and the faculty in the four universities, some observations may be offered regarding values within the context of education in universities. First, most of the universities in this study (UPM, UKM, UM) seemed to affix themselves to the purpose of university education in the more conventional sense, that is, the pursuit of academic excellence. Second,
while these particular universities do not appear to make an explicit commitment to a certain set of values, the objectives found within their mission statements could be argued to imply an emphasis on certain matters such as the materialist worldview, social responsibility, competitiveness and the support for diversity (research, teaching and publication). Third, these universities have not made any indication of the importance of spiritual elements in their educational context. Fourth, the pronouncements made by the universities and the faculties do not explicitly indicate a commitment to develop the students’ spiritual and emotional part.
In the researcher’s view, the official pronouncements made at IIUM, faculty and departmental levels reflect university’s desire to make its Islamic identity and commitment to Islamic causes and ideals explicit to those within and outside the university. The statements also appear to signify the university’s endorsement of Islamic values and systems of morality. Therefore, these are the values that the university subscribes to and would have emphasised within its community. This, in effect, would have also reflected the university’s conceptualisation of the Islamic values and moral ideals as the right and most proper foundation for its attempt to develop the students’ moral character. It may also be suggested that by framing the values in such manner, values that are regarded incompatible with the Islamic ideals would have been discouraged.

Pertanika J. Soc. Sci. & Hum. 23 (S): 1 – 16 (2015)
Haslinah Muhamad and Nor Aishah Sudin
10
Objective of Accounting Education According to the Faculty Members
NPE has indicated the emphasis on moral conceptualisation of values. Yet, NPE’s statements seem to have made little elaboration on what should be the primary objective of education either moral or what they call the ‘intellectual skill’. Therefore, this topic was explored further with the faculty members (accounting educator) who teach accounting programme at Public Institution of Higher Learning (IHL).
The Primary Objective of Accounting Education from Educators’ Point of View
In elaborating the objective of accounting education, one senior educator argued that the objective of accounting education should put moral issue as the primary objective, as extracted from her statement that:
‘For me, I will put the moral issue in the first place then the technical ……’ (Assoc. Prof., aged 30-40).
According to her, this term should be representing the ideals which the university firmly subscribes and seeks to integrate into its educational aims. Another senior educator explained that accounting education in the university needs to integrate moral revealed knowledge and conventional knowledge. In summing up the expected outcome of accounting education in public university, which is structured around the mission, the educator member asserted and translated from Malay language as:
‘We want to produce graduates who are not only knowledgeable but act morally or ethically. They will bring the characteristics of students who excel, those who mean good character, not only physical but spiritual’. (Senior lecture, aged 40-45)
The Difference between Moral and Conventional Knowledge
Based on the western philosophy, educator members who viewed the conventional knowledge will basically devoid any element of religious or divine guidance. Since most of the educator members are Muslim, they looked at the objective of accounting education from the Islamic perspective and several educator members touched on this matter and emphasised that our education could not be departed from any element of ethics and morality, especially the divine guidance, the religious aspect. One of the educators emphasised that:
‘Of course, number one is our religion (Islam), our belief in our religion (believe in God) is important and the rest will fall accordingly’ (Lecturer, aged 43)
In a similar vein, another senior educator member asserted that the goal of accounting education based on the Islamic framework is expected to adequately address the objective of the life and the responsibility to divine guidance. He stated that:
‘I think to be human, students, workers; they have to think about their creator and the purpose of their life. (Assoc. Prof., aged 42)

Pertanika J. Soc. Sci. & Hum. 23 (S): 1 – 16 (2015)
Objective of Accounting Education: Moral or Skills?
11
One senior educator member, for instance, contended that the goal of the Islamic education and the notion of NPE should become the essence of universities’ idea of a holistic education, in which no separation is made between knowledge and ethics.
“Because we following western style education, we just focus on the marks, the grade and …… everything that can be measured. So here we are trying to make sure, when the student graduated from universities, they not just knowledgeable but also have the characters that following the eastern values” (Senior lecturer, aged 30-40).
A majority of the respondents agreed that public universities should embrace eastern moral values especially from the Islamic religion as the essence of the idea of a holistic education, in which no separation is made between knowledge and religion. The following quotes illustrate their shared sentiment in relation to the appropriateness of moral values.
“For me, the vision is to produce students who are not only knowledgeable (meaning know accounting terms and technical such as preparation of financial statements, interpretation, etc.) but they can also make decisions by weighing the pros and cons (the consequence) of ethical decisions and develop individuals who have self-integrity. Self – integrity means character (akhlaq).” (Senior lecturer, aged 43)
“It is important for our future accountant to have that’s kind of ethical behaviour (good relationship with environment). We would not suppose to give for only worldly knowledge but also the eternal knowledge (ukhrawi) or perennial knowledge.” (Senior lecturer, aged 35-40)
Discussion
Based on the vision of the universities, the missions of the faculty and department, accounting education at three universities out of four (UPM, UKM, UM) in this study do not emphasised on the development of moral character (spiritual and emotional development) as the main objective, as suggested by NPE. This is in line with some previous findings from the literature (e.g., Armstrong et al., 2003; Abdolmohammadi & Baker, 2006; McPhail & Walters, 2009). Only IIUM emphasises the development of moral character in its university’s vision and faculty’s mission. UKM did mention the moral development in the university level but not at the faculty level. Two other universities (UM and UPM) have be seen separating the curriculum from religion philosophy, which is parallel with the western style of educational framework.
Based on the universities’ vision and mission, it is possible that the accounting programme’s objectives have secular-based objective by putting academic excellence as the primary objective compared with moral development as a secondary. In fact, it is also seen as ‘outrageously stressed’ on technical skill and alleviates the other

Pertanika J. Soc. Sci. & Hum. 23 (S): 1 – 16 (2015)
Haslinah Muhamad and Nor Aishah Sudin
12
important things (besides moral) such as critical thinking skills. The technical skills, which need a lot of time and the syllabus, are too much to cover and may be part of the problems faced by accounting educators. The curriculum set up by professional body in Malaysia is also seen as too rigid and there is no room for creativity and the university does not have a chance to produce graduates according to their own unique set up.
Does this mean that in striving for this rather high sounding objective, the vocational aspect of training in accounting should be eliminated? Of course this is not the case. The technical aspects of accounting must be taken up as well. If the programme of professional accounting education ought to provide possible professional accountants with a construction of professional values, ethics and attitudes for exercising professional judgment and for acting in an ethical behaviour (IFAC, 2003), such judgement must be carried out beyond the narrow point of weighing the effects upon income or financial position. If this were not true, then accounting education could be approached almost entirely from the standpoint of limited vocational training, with no attention at all given to the moral or ethical viewpoint involved. The primary (technical skill) and secondary (values, ethics and moral) objectives may not only be compatible but mutually beneficial to students’ development (Amernic & Craig, 2004). As a language of business, accounting needs appropriate communication.
Communications of business situation need an awareness of the nature of the problem. Technical competence is necessary as a prerequisite to ability to communicate. Business situation is expressed in monetary terms. Accountants make contributions by communicating these financial facts orally and in writing. The report must be honest and show the real situation or without manipulation for own interest or that of particular parties. There must be transparency on the effect of the real situation to the society and environment as a whole. This is where moral and ethics (spiritual and emotional parts) will take place. It is personal fruitful of accountants because the individual who has achieved the primary objective feels he/she is making contribution to his society and the contribution is not bounded by monetary sign. Like a painter, he must know how to paint and will decide which colour to use, or either it is suitable or not.
As suggested from the results of the study, such commitment has not been made visible in the university’s mission and vision statements. It is possible that this has resulted in the differing views among public universities’ accounting educators on the nature and extent of their roles in relation to imparting values to their students. Hence, public universities, and in particular, the faculty and the Accounting department within it, need to consider incorporating the objective of instilling spiritual and emotional part such as moral character into their educational outcomes, and to make a formal expression on this

Pertanika J. Soc. Sci. & Hum. 23 (S): 1 – 16 (2015)
Objective of Accounting Education: Moral or Skills?
13
matter through official pronouncements. As asserted by Albrecht et al. (2006), the task of developing the students’ moral character requires an institution-wide involvement, in which the educational institution needs to set a highly visible ethical tone and solicit commitment and participation from within its community of staff. In some universities (such as UPM), however, there has been separate pronouncements about ethics and values.
Despite the differences in their general context of education, universities were highly concerned about meeting the accreditation requirements of the regulatory body, namely, MIA. Such requirements were viewed by some accounting educators in this study as a major obstacle in their efforts to impart spiritual part through the curriculum. This instance would signify the need for the regulatory body to consider some changes in their accreditation requirements. Ideally, such changes should allow more freedom for universities to instil values in ethics (one example of emotional part). In such manner, educational institutions that have set their sole focus on meeting the requirements of the regulatory body would have also sufficiently dealt with the matter of spiritual and emotional development of the students.
CONCLUSION
This study has developed the theme that the primary objective of accounting education should have to create individuals who are well-equipped intellectually, spiritually and
emotionally. This effort aims to produce knowledgeable, ethical and responsible Malaysian citizens who can contribute towards the harmony and prosperity of the community and nation. Through the pursuit of this primary objective of accounting education, the individual is encouraged to grow in technical accounting skill. Other than the technical skill, there is a need to improve the power of mind and strengthen the sense of responsibility both in professional and personal sense. In the end, the monetary evaluation should be tempered by accountability and strong sense of integrity.
REFERENCESAACSB. (2004). Report of the Ethics Education
Task Force. Retrieved September 24, 2009, from http://www.gfme.org/issues/pdfs/EthicsEducation.pdf
AACSB. (2006). AACSB Eligibility Procedures and Accreditation Standards for Business Accreditation. Retrieved September 21, 2009, from http://www.aacsb.edu/accreditation/standards.asp.
Abdolmohammadi, M. J., & Baker, C. R. (2006). Accountants’ Value Preferences and Moral Reasoning. Journal of Business Ethics, 69(1), 11-25.
Abdolmohammadi, M., Fedorowicz, J., & Davis, O. (2009). Accountants’ cognitive style and ethical reasoning: a comparison across 15 years. Journal of Accounting Education, 27(4), 185-196.
Al-Aidaros, A.-H., Shamsudin, F. M., & Idris, K. M. (2013). Ethics and Ethical Theories from Islamic Perspective. International Journal Of Islamic Thought (IJIT), 4, 1-13.
Pertanika J. Soc. Sci. & Hum. 23 (S): 1 – 16 (2015)
Haslinah Muhamad and Nor Aishah Sudin
14
Albrecht, W., Hill, N., & Albrecht, C. (2006). The ethics development model applied to declining ethics in accounting. . Australian Accounting Review 16(1), 30-40.
Amernic, J., & Craig, R. (2004). Reform of the accounting education in the post-enron era: moving accounting ‘out of the shadows. Abacus, 40(3), 342–78.
American Accounting Association. (2000). East Asia Acounting Rountable Country Presentation: Malaysia Summary. Singapore: AAA Globalization Initiatives Committee.
Apostolou, B., Dull, R. B., & Schleifer, L. L. (2013). A Framework for the Pedagogy of Accounting Ethics. Accounting Education: An International Journal, 22(1), 1-17.
Armstrong, M. B., Ketz, J. E., & Owsen., D. (2003). Ethics education in accounting: Moving toward ethical motivation and ethical behavior. Journal of Accounting Education, 21, 1-16.
Barrie, S. (2004). A research-based approach to generic attributes policy, Higher Education . Research and Development, 23(3), 261-275.
Blanthorne, C., Kovar, S. E., & Fisher, D. G. (2007). Accounting Educators’ Opinions about Ethics in the Curriculum: An Extensive View. Issues in Accounting Education, 22(3), 355-390.
Bowden, J., & Marton, F. (1998). The university of learning: Beyond quality and competence in higher education. London: Kogan Page.
Boyce, G. (2008). The social relevance of ethics education in global(ising) era: From invidual dilemmas to systemic crises. Critical Perspectives on Accounting 19, 255-290.
Bryman, A. (2006). Intergrating quantitative and qualitative research: How is it done? Qualitative Research, 6, 97-113.
Cooper, B. J., P. L., Stevendellaportas, Jackling, B., & Wong, G. ( 2008). Ethics Education for Accounting Students—a Toolkit Approach. Accounting Education: an International Journal, 17( 4), 405–430.
Creswell, J. W. (2003). Reseach Design Qualitative, Quantitative, and Mixed Methods Approaches (2nd Edition). Thousand Oaks, California: Sage Publication.
Dellaportas, S., Kanapathippillah, S., Khan, A., & Leung, P. E. (2014). Ethics Education in the Australian Accounting Curriculum: A Longitudinal Study Exam ining Barriers and Enablers. Accounting Education: An International Journal, 23(4), 362-382.
Faculty of Business and Accountancy, University Malaya. (2013). Mission And Vision. Retrieved November 2, 2013, from http://fba.um.edu.my/ ?modul=About_The_Faculty&pilihan=Mission _and_Vision
Faculty of Economics and Management, The National University of Malaysia. (2013). Vision, Mission & Goal. Retrieved November 1, 2013, from http://www.ukm.my/fep/index.php/about-us/vision
Fisher, D. G., Swanson, D. L., & Schmidt, J. (2007). Accounting Education Lags CPE Ethics Requirements: Implications for the Profession and a Call to Action. Accounting Education: an International Journal, 16(4), 345-365.
Glover, H. A. (1995). Changing the Model for Prevention and Detection of Fraud. Managerial Auditing Journal, 10(5), 3-9.
Gray, R., Bebbington, J., & McPhail, K. (1994). Teaching Ethics in Accounting and the Ethics of Accounting Teaching: Educating for Immorality and a Possible Case for Social and Environmental Accounting Education. Accounting Education 3(1), 51-75.

Pertanika J. Soc. Sci. & Hum. 23 (S): 1 – 16 (2015)
Objective of Accounting Education: Moral or Skills?
15
Haberman, L. (2003). Special Report: Sarbanes-Oxley Act Tops NASBA Meeting Agenda. Journal of Accounting, 195(2), 22-23.
IFAC. (2006c). Approaches to the Development and Maintenance of Professional Values, Ethics and Atitudes in Accounting Education Programs. New York: IFAC.
IFAC. (2008). Introduction to International Education Standards. Retrieved September 25, 2009, from http://www.ifac.org.
IFAC, I. F. (2006). IES 4 Professional Values, Ethics and Attitudes. Retrieved August 24, 2008, from http://www.ifac.org
International Islamic University of Malaysia. (2010). The IIUM Vision. Retrieved May 12, 2014, from http://www.iium.edu.my/about-iium/iium-vision
International Islamic University of Malaysia. (2013). About IIUM. Retrieved October 13, 2013, from http://www.iium.edu.my/about-iium/iium-vision
International Islamic University of Malaysia. (2013). Kulliyyah of Economics and Management Sciences. Retrieved November 2, 2013, from http://www.iium.edu.my/kenms
Jackling, B., Leung, P., & Dellaportas, S. (2007). Professional accounting bodies’ perceptions of ethical issues,causes of ethical failure and ethics education. Managerial Auditing Journal, 22(9), 928-944.
Lehman, C. (1988). Accounting Ethics: Surviving Survival of the Fittest. Advances in Public Interest in Accounting, 2, 71-82.
Lincoln, Y. S., & Guba, E. G. (1985). Naturalistic inquiry. Beverly Hills, California: Sage Publication.
Low, M., Davey, H., & Hooper, K. (2008). Accounting scandals, ethical dilemmas and educational challenges. Critical Perspectives on Accounting, 19, 222–254.
McPhail, K., & Walters, D. (2009). Accounting and business ethics. Abingdon, Oxon, UK: Routledge Taylor and Francis.
Merriam, S. B. (1998). Qualitative Research and Case Study Application in Education. San Francisco: Jossey-Bass.
Ministry of Domestic Trade, Co-operative and Consumerism, Malaysia. (n.d.). The Malaysian Business Code of Ethics. Retrieved November 20, 2009, from http://www.kpdnkk.gov.my/index.php?option=com_content&task=view&id=220&Itemid=214
Ministry of Education. (2006). The Assessment Report for Accounting Programme (Hala Tuju 2). Kuala Lumpur: Ministry of Higher Education of Malaysia.
MOHE. (2007). Hala Tuju 2 -Reassessment Report on Accounting Programme at Public Universities of Malaysia 2006. Shah Alam: Pusat Penerbitan Universiti (UPENA).
Morse, J. M., & Richards, L. (2002). Readme First for a User’s Guide to Qualitative Methods. Thousand Oaks, London, New Delhi:: Sage.
National Philosophy of Education, MOHE. (2007). 50 Years Higher Education Development in Malaysia (1957-2007) – USM Publisher, 2007. Retrieved May 13, 2013, from http://jpt.mohe.gov.my/eng/DASAR/falsafah.php
Pallant, J. (2001). SPSS Survival Manual, Step by Step Guide to Data Analysis using SPSS for Windows. New South Wales: Allen & Unwin.
Power, M. (1991). Educating Accountants: Towards a Critical Ethnography. Accounting, Organizations and Society, 16, 333-53.
Rizal, H. H. (2010). Top 18 local universities last year named. Putrajaya: The Malay Mail.
Pertanika J. Soc. Sci. & Hum. 23 (S): 1 – 16 (2015)
Haslinah Muhamad and Nor Aishah Sudin
16
Sikka, P., Haslam, C., Kyriacou, O., & Agrizzi, D. (2007). Professionalizing claim and the state of UK professional accounting education: Some evidence. Accounting Education: an International Journal, 16(1), 3-21.
Taylor, P. W. (1975). Principles of Ethics: An Introduction. Encino: Dickenson Publishing Company, Inc.
The National University of Malaysia. (2013). Motto, Vision, Mision & Philosophy Moto, Visi, Misi & Falsafah. Retrieved October 20, 2013, from http://www.ukm.my/v5/the-university/motto-vision-mision-philosophy/
Thomas, S. (2012). Ethics and accounting education. Issues in Accounting Education, 27(2), 399-418.
Universiti Kebangsaan Malaysia. (2010). Motto, Vission, Mission & Philosophy. Retrieved May 12, 2014, from http://www.upm.edu.my/v6/motto-vision-mission-philosophy/
University of Malaya. (2010). Our Vision & Mission. Retrieved May 12, 2014, from http://www.um.edu.my/about-um/vision-mission
University of Malaya. (2013). Discover University Malaya. Retrieved October 20, 2013, from http://www.um.edu.m y / m a i n p a g e . p h p ? m o d u l e = M a k l u m a t &kategori=51&id=195&papar=1
Universiti Putra Malaysia. (2010). Visi/misi/matlamatkami/dasar kualiti. Retrieved May 12, 2014, from http://www.upm.edu.my/tentang_kami/visimisimatlamat
Universiti Putra Malaysia. (2013). Visi/Misi/Matlamat Kami/Dasar Kualiti. Retrieved October 20, 2013, from http://www.upm.edu.my/tentang_kami/visimisimatlamat
Vidaver-Cohen, D. (2004). Fish starts to rot from head: the role of business school deans in curriculum planning for ethics. Journal of Business Ethics, 1(2), 213-238.
Woo, C. (2003, May-June 03). Personally responsible. Retrieved December 21, 2012, from http://www.aacsb.edu/publication/archives/mayjune03/p22-27.pdf
Yin, R. K. (2003). Case study research: Design and methods (3rd ed.). Thousand Oaks: CA: Sage.

Pertanika J. Soc. Sci. & Hum. 23 (S): 17 – 38 (2015)
ISSN: 0128-7702 © Universiti Putra Malaysia Press
SOCIAL SCIENCES & HUMANITIESJournal homepage: http://www.pertanika.upm.edu.my/
ARTICLE INFOArticle history:Received: 30 March 2015Accepted: 10 September 2015
E-mail addresses:[email protected] (Boon Heng Teh),[email protected] (Tze San Ong),[email protected] (Nahariah Jaffar),[email protected] (Sayed Yousef Sheikh Abou Masoudi)* Corresponding author
Sustainable Performance Measurement (SPMs) Model: Effects of Product Tecnology and Process Technology
Boon Heng Teh1*, Tze San Ong2, Nahariah Jaffar1 and Sayed Yousef Sheikh Abou Masoudi2
1Faculty of Management, Multimedia University, 63100 Cyberjaya, Malaysia2Faculty of Economics and Management, Universiti Putra Malaysia, 43400 UPM Serdang, Selanogr, Malaysia
ABSTRACT
Malaysia as a developing country is in the transformation process of becoming an industrialised nation, as stated in Vision 2020. Manufacturing industry significantly contributes to the national economic growth in Malaysia; however, the manufacturing industry consumes the most natural resources which cause degradation of natural resources. This is against the global efforts that put pressure on world organisations to carry out their business in a more responsible and sustainable manner. As an approach to improve sustainability performance, manufacturing companies should develop technologies that consume less material, while trying to adopt new technologies effectively. However, empirical studies in Malaysian manufacturing industry on technology and Sustainable Performance Measurements (SPMs) are still very limited. Thus, the main purpose of this study is to determine the relationship between technology and Sustainable Performance Measurements (SPMs) model among different sizes of Malaysian manufacturing companies. The target population in this research is 2500 manufacturing companies registered under Federation of Malaysian Manufacturers (FMM). The random sampling method is engaged in the sample selection. A total of 217 observations were collected over 600 sample size, with a response rate of 36.17%. The results of the analysis indicate that product technology does not have any significant effect on SPMs. In contrast,
process technology demonstrates a positive relationship with SPMs. In addition, business size does not affect SPMs. Overall, it can be concluded that Malaysian manufacturing companies consider more privilege for process technology implementation to achieve desirable SPMs performance in their business rather than product technology.

Pertanika J. Soc. Sci. & Hum. 23 (S): 17 – 38 (2015)
Boon Heng Teh, Tze San Ong, Nahariah Jaffar and Sayed Yousef Sheikh Abou Masoudi
18
Keywords: Sustainable performance measurement, product technology, process technology, Malaysia
INTRODUCTION
Over the recent years, global pressures dealing with issues such as global warming, scarcity of raw materials and deterioration of human rights have increased (Seuring, 2004; Porrit, 2006). Manufacturing companies are the main sources of producing natural resources consumption, depletion and degradation, along with making toxic by-products and wastes. Hence, environmental laws and regulations, customer demand for sustainable goods and services, and environmental interest groups have required manufacturers to perform their business in a more accountable and responsible manner toward all stakeholders including the environment.
This triggers the emergence of sustainability as an integral part of companies’ business strategies in order to obtain economic, environmental and social benefits (Sebhatu, 2009). Generally, sustainability is defined as fulfilling the current needs without jeopardising the ability of future generations to meet their requirements. That is why companies must be responsible for the impacts of their business activities on society and environment, while being accountable to stakeholders at the same time (ACCA, 2005). In order to respond to the increasing awareness of and demand for sustainability, Global Reporting Initiative (GRI), established in late 1997, provided generally accepted sustainability reporting
framework. The companies which adopt GRI standards are mandated to report their economic, environmental, social and governance compliance with the guidelines provided.
Some nations like Australia, China, Denmark and the USA have started to derive their own national sustainability standards from the whole or part of GRI guidelines. The stock exchanges of some Asia Pacific countries such as Singapore and Malaysia are also taking serious steps to require or recommend listed companies to disclose sustainability information (GRI, 2013). This geographical area deserves more consideration since about 25% of the global sustainability reports are originated from the Asia Pacific Region (ACCA, 2013). Although sustainability reporting is a voluntary exercise by each company in Malaysia, research on Bursa Malaysia revealed an increase number of listed companies reported over the environmental and social issues since 1999 to 2003, from 25 to 60 companies, respectively. The manufacturing sector had the greatest portion of environmental reports over this 5-year period, comprising 28% of the reporting companies in 1999 and reaching 32% in 2003 (ACCA, 2013).
In addition, the sustainability aspects of physical development of cities are aimed to be met in 10th Malaysia Plan from 2011 to 2015 (Prime Minister’s Department, 2010). In 2010, Bursa Malaysia announced Business Sustainability Programme to encourage public listed companies (PLCs) to integrate sustainable practices into their
Pertanika J. Soc. Sci. & Hum. 23 (S): 17 – 38 (2015)
Sustainable Performance Measurement (SPMs) Model: Effects of Product Tecnology and Process Technology
19
business strategy. This not only enables Malaysian companies to have a better understanding of sustainability but also assists PLCs to gain tangible and intangible benefits from sustainable processes.
It is assumed that observing sustainability guidelines assists manufacturers to gain a competitive advantage by reducing cost, increasing quality, managing risk and enhancing social image (Boons & Ludeke-Freund, 2013; Forsman, 2013). It is believed that sustainable development can be accomplished through technological innovation in conjunction with the measures to improve social and environmental impacts of the company’s operations (Manufacturing Skills Australia, MSA, 2008). This innovation comprises of process technology and product technology implementation in manufacturing processes.
To begin with process technology, manufacturing industries are required to be aware of newly available and emerging technologies in the market, while trying to develop technologies that generate more energy and consume less materials (Ball, 2013). For example, in 2012, Adidas introduced a new technology known as “DryDye” that uses no water, 50% less chemicals and 50% less energy than the traditional fabric dyeing process in manufacturing t-shirts. As a result of DryDye implementation, the financial expenses of Adidas decreased by 30%, while the net income attributable to shareholders increased by 6% just within
the first half of 2013 (Adidas, 2013). Thus, it can be concluded from Adidas case that new technology provides the company with a competitive advantage. Moreover, social and environmental responsibilities of the company with high technological process are met by reducing chemicals usage and increasing employees’ productivity. However, the fact that competitive advantage is resulted from the new technology does not last for a long time due to the quick imitation and thus, a continuous process innovation is a must for companies to be sustainable.
In addition, manufacturing companies play a vital role in sustainability if their product quality is improved and products with more environmental-friendly features are offered through using new technologies. For instance, UMW Toyota Motor recently launched a new product, Komatsu HB205-1 hybrid hydraulic excavator, with the function of saving fuel at an average of 25%, which is equivalent to the same reduction in carbon dioxide emissions (UMW, 2012). This new high technology product assisted Toyota to not only contribute to the environment preservation, but also capture a lot of customers’ attention. Nowadays, consumers are more interested in companies which produce environment-friendly products. This will motivate companies to invest more on product technologies that improve sustainability as well.
Although process technology and product technology seem to play a key role in sustainable performance measurement

Pertanika J. Soc. Sci. & Hum. 23 (S): 17 – 38 (2015)
Boon Heng Teh, Tze San Ong, Nahariah Jaffar and Sayed Yousef Sheikh Abou Masoudi
20
of manufacturing companies in developed context, this effect has not been investigated in an emerging market such as Malaysia. Hence, this research aims to find out the relationship between product and process technology and Sustainability Performance Measurements among manufacturing companies listed in Bursa Malaysia. Therefore, the effect of the size of manufacturing company on this possible relationship is also scrutinised in this study.
LITERATURE REVIEW
The concept of sustainability has been argued by a wide-range of international discussions. In 1972, the terms “sustainability” and “sustainable development” began to be commonly used in the literature (Harell, 2011). International Union for Conservation of Nature and Natural Resources (IUCN, 1991) explained that sustainability is the use of an organism, ecosystem, or other renewable resource at the rate within its capacity for renewal. In the subsequent year, this explanation is supported by Pronk, Jan and Haq (1992) who stated that sustainability involves economic growth that provides fairness and opportunity for the entire world’s people without further destroying the world’s finite natural resources.
In order to monitor the progress of sustainability performance of firms, Strategic performance measurement system (SPM) is introduced (Gadenne, Mia, Sands, Winata, & Hooi, 2012). Sustainability performance measurements have turned into a more competitive issue
in manufacturing industries. Feng and Joung (2011) proposed that sustainable manufacturing is the production process with the minimal level of negative impacts on the environment as well as the minimum energy, cost, and natural resources used throughout its entire lifecycle.
Although sustainable development is investigated internationally, Joseph (2013) indicates that there has been no research conducted in the Malaysian context. Until now, a number of theories have been developed by researchers globally to convey sustainability measurement; however, there is no perfect model that serves all elements of sustainability simultaneously.
Theoretical Framework
The three theories which seem to be relevant about sustainability measurement are discussed in the following subsection.
The first theory applied is called “Resource-Based Theory” (RBT). Resource-based view (RBV) is one of the main trends under (RTB) which discusses the relationship between firm’s resources and sustainable competitive advantage. Discussed for the first time in the late 1950s, RBV reflects the vitality of firm to manage resources to achieve sustainable competitive advantage (Alagoz & Akatay, 2008). According to Barney (1991), when firm implements a value creating strategy, which is not simultaneously taken by any other rivals, the firm gains competitive advantage. The potential resources of firm to achieve competitive advantage are

Pertanika J. Soc. Sci. & Hum. 23 (S): 17 – 38 (2015)
Sustainable Performance Measurement (SPMs) Model: Effects of Product Tecnology and Process Technology
21
represented by four empirical indicators of value, rareness, inimitability and substitutability (Barney, 1991). Another study by Hart (1995) stated that RBV of the firm is viewed based upon the relationship between the firm and natural environment. It explains that if a company attempts to manufacture products that are environmental responsible while constantly produce high level of production waste and emission, the firm is at risk of degrading its credibility and reputation.
“Institutional theory” is the second theory of study which emerged in the 1970s. This theory discusses over the implementation of organisation in social and cultural contexts. It comes to the concern of Delmas and Toffel (2004) that institutional pressures and organisational characteristics are influencing an organisation to adopt environmental management practices. In this study, the achievement of top management in implementing effective policy and culture to gain favourable sustainable performance measurement is identified.
The third is “Stakeholder Theory” discussed by Freeman (1988). Stakeholder theory defines stakeholders as groups and individuals that gain benefits or incur losses from corporate decision making. Stakeholder includes management, local community, suppliers, employees, customers, government, shareholders, financier and also investor. In the research done by Oruc and Sarikaya (2011), the stakeholder theory suggests that firm shall expand and have more sensitive
management approach towards benefit and interest of stakeholders in order to achieve long-term sustainability. However, there is little study to support sustainable performance measurement in the stakeholder theory. Another viewpoint by Ilinitch, Soderstrom and Thomas (1998) suggested that environmental issues are becoming substantially important to stakeholders. Phillips et al. (2003) further explained that managing stakeholder not only emphasises on maximising shareholders’ wealth but also concerns with the interest and well-being of people who are able to assist achievement of an organisation’s objectives. In a nutshell, the stakeholder theory argues about the role of stakeholders in managing a firm not only to achieve favourable prospect but also to consider environmental and social issues. Thereby, the impact of management’s decision making on the sustainability performance measurement is further determined in this study.
Technology and Sustainability
One way to improve sustainability performance of manufacturing companies is to take advantage of new technologies. As stated by Chakravarthy and Doz (1992), new technology is crucial in sustaining survival of industrial companies. The reason may be because manufacturing industry that implements new technology obtains competitive advantage (Milgrom & Roberts, 1990).
As an evidence, Malaysia’s economy expanded by 6.3% in 2007 because of the

Pertanika J. Soc. Sci. & Hum. 23 (S): 17 – 38 (2015)
Boon Heng Teh, Tze San Ong, Nahariah Jaffar and Sayed Yousef Sheikh Abou Masoudi
22
manufacturing industry being its strongest industrial sector (abed. Rahman, Bennet, & Sohal, 2009). Jabar et al. (2009) stated that technology advancement plays a key role in achieving Malaysia’s vision to become an industrialised nation by 2020.
According to the Malaysian Industrial Development Authority, MIDA (2008), the efforts have increased to improve Research & Development (R&D) and innovations in the manufacturing industries. After 2013, MIDA offered incentives for high technology companies with 100% income tax exemption of statutory income for a period of five years. Two types of technology called product technology and process technology have attracted a lot of attention recently.
Product Technology
Product technology is defined as the science and art of developing and producing performance products, either by improving existing or designing new products in order to meet the demands and requirements of society (Voncken et al., 2004).
Voncken et al. (2004) stated that product technology is increasingly important in manufacturing environment due to customers’ high demand for products with high levels of performance and functionality (Voncken et al., 2004). Rosen and Kishawy (2012) argued that designing new environmental friendly products contributes to firm’s success in terms of both introduction and mature lifecycle stages of products. However, there is little empirical study available on the impact of product technology on sustainability.
Based on the above discussion, the first hypothesis is suggested:H1: The product technology of manufacturing
industries in Malaysia has a positive relationship with sustainability performance measurement.
Process Technology
As opposed to product technology, where technology is embedded within a product, process technology facilitates the production and delivery of product to consumers (Slack, Chambers, & Johnston, 2013). In other words, process technology is the machinery, equipment and devices that assist manufacturer to transform materials into products which add values to customers (Dedhia, 2012). It is mentioned by Cramer and Zegveld (1991) that process technology requires less water, energy and raw material, and thus reduces waste discharges.
The introduction of both product technology and process technology in the late 1970s have eased firms to gain economies of scale and desired profitability. The concern on product technology is shifted toward process technology, where manufacturing firms are emphasising on even lower cost production as innovation rate in product technology has become slower (Slack et al., 2013). For instance, Samsung Foundry formed Semiconductor R&D Centre to offer process technology in order to meet its customers’ process specification and requirements. Another example is Semiconductor R&D Centre which emphasises on process technology

Pertanika J. Soc. Sci. & Hum. 23 (S): 17 – 38 (2015)
Sustainable Performance Measurement (SPMs) Model: Effects of Product Tecnology and Process Technology
23
development to produce mobile and information technology computing applications that consume energy more efficiently. Therefore, sustainable process technology is important to the current market as the raw materials of the earth are reducing at greater speed (Institute of Sustainable Process Technology, ISPT, 2011).
Having a look on the above-mentioned points, the second hypothesis of this research is proposed as: H2: The process technology of manufacturing
industries in Malaysia has a positive relationship with sustainability performance measurement.
Company Size as Control Variable
Firm size is one of the main characteristics of a firm in evaluating its performance. The size of a firm can be determined by using its total sales generated in monetary units and number of employees hired (Kitov, 2009).
In Malaysia, a guideline is issued by SME Corp Malaysia in judging the firm size. It states that SMEs engaging in manufacturing sectors have to employ full-time employees not more than 200 workers or generate sales turnover of less than RM50 million. More specifically, firms with sales turnover ranging from RM300,000 to less than RM15 million or with full-time employees from 5 to less than 75 persons are classified as small firms. Meanwhile, a firm with sales turnover ranging from RM15 million to less than RM50 million or full-time employees from 75 to not
exceeding 200 persons is known as a medium-sized firm [SME Cor. Malaysia, SME (M), 2013]. Therefore, the guideline issued by SME (M) is in line with the result in the research paper done by Kitov (2009) which listed out firm size as determined by firm’s sales turnover and number of employees employed.
The debate about the effect of firm size on sustainability practice is still open to discussion. Some studies supported the idea that small firms can perform better in sustainability through closed relationship with external parties (Ernst & Young, 1994; Condon, 2004; Spence, 2012), while other studies highlighted that large firms with abundant resources in terms of technology, labour and capital take advance in sustainability (Watson, Shrives & Martson, 2002; Zadeh & Eskandari, 2012; Hosey, 2013). To support the latter idea, it is proven by Burgess, Ong and Shaw (2007) that large companies engaging in high technology manufacturing industry tend to rely on performance measurement systems because of their advantage on resources to implement more innovation as compared to Small and Medium Enterprises. Therefore, this study aims to use a sample of companies with different sizes to investigate how process technology and product technology relation with social performance measures varies among them.
According to the above-mentioned literature and hypothesis, the research framework on technology and sustainability performance measurement is shown in Fig.1.

Pertanika J. Soc. Sci. & Hum. 23 (S): 17 – 38 (2015)
Boon Heng Teh, Tze San Ong, Nahariah Jaffar and Sayed Yousef Sheikh Abou Masoudi
24
Independent DependentVariables Variables
Product Technology Economic
Process EnvironmentalTechnology
Social
SPMs𝐻1
𝐻2
Fig.1: Research Framework on Technology and Sustainability Performance Measurement
company names were arranged alphabetically, and the sample was then chosen through simple random sampling method.
Research Instruments Development
In conducting the research, a closed-ended questionnaire that is also known as fixed-alternative questionnaire was designed and distributed to 600 selected companies through mail with a cover letter to selected companies. This research instrument was chosen because of its ability to provide objective and accurate data for hypothesis testing while it is cost-effective for the large sample sizes and wide geographical areas. Copy of the questionnaire used can be found in the appendix of this study.
This questionnaire is divided into four sections. The first part includes questions on the profile of company and the financial performance. This section requests details of the respondents, contact information, as well as the criteria possessed by
RESEARCH DESIGN
Population
The target population of this study comprises of the manufacturing companies of different sizes in Malaysia. The list of these companies was obtained from the Federation of Malaysian Manufacturers (FMM) database. FMM is an officially recognized economic organization which represents over 2,500 manufacturing companies of varying sizes in Malaysia. Since FMM’s vision is to assist Malaysian industries to become globally competitive, the FMM database is sufficiently reliable and valid to be used as the population.
Sample Size and Procedure
As suggested by Bolt (1999), minimum sample size of 100 observations is required to achieve adequate and valid results. In this study, a total of 600 manufacturing companies were randomly selected as the sample with an estimated response rate of 25%. Accordingly, the manufacturing

Pertanika J. Soc. Sci. & Hum. 23 (S): 17 – 38 (2015)
Sustainable Performance Measurement (SPMs) Model: Effects of Product Tecnology and Process Technology
25
technology in affecting sustainable performance measurement. The third part consists of the characteristic of company in relation to product technology and process technology. The questions in the final part of the questionnaire ask about the operation of company in relation to its achievement in economic, social and environmental areas. In designing the questionnaire, the five-point Likert scale was used and elaborated in sections three and four.
In order to ensure the relevancy of the questionnaire, it was submitted to two experienced university lecturers to evaluate the appropriateness of the questions. After amending the questionnaire by referring to the lecturers’ feedback, the next step was conducting a pilot test, where the questionnaire was distributed to ten manufacturing companies. The respondents included chief executive officer, chief financial officer and human resource manager who participated in the company’s sustainable performance measurement activities. When the comments received from these companies, changes to the questionnaire were made to improve the relevance of the questions. The final modified questionnaire was posted to selected companies with envelope provided for the convenience of the companies to return their responses to the researcher.
Data were analysed by using six statistical methods including descriptive analysis, validity test, reliability test, normality test, factor analysis, multicollinearity and regression analysis.
RESULTS AND DISCUSSION
In this study, there were 217 manufacturing companies participated out of the 600 samples selected, which constituted a response rate of 36.17%. The response rate was considered as high compared to the initial expected response rate of 25%. There were no missing data in the questionnaire due to the initiatives taken by researchers who had contacted every company representative to complete the questionnaire.
The guidelines provided by National SME Development Council (NSDC) are used as references in the classification of the size of companies. According to NSDC, small manufacturing companies consist of 5 to less than 75 full-time employees, whereas medium-sized companies have 75 to 200 full-time employees. Companies with more than 200 full-time employees are categorised as large companies. As shown in Table 1 below, the data consisted of small companies (50.7%), medium companies (17.5%) and large companies (31.8%).
TABLE 1Size of Companies
Frequency Percentage (%)
Small 110 50.7%
Medium 33 17.5%
Large 74 31.8%
Table 2 depicts the distribution of the 217 manufacturing companies which are mainly from the Klang Valley. The

Pertanika J. Soc. Sci. & Hum. 23 (S): 17 – 38 (2015)
Boon Heng Teh, Tze San Ong, Nahariah Jaffar and Sayed Yousef Sheikh Abou Masoudi
26
areas outside of the Klang Valley include several states of Perak and Sabah. For the purpose of this study, it is assumed that the Klang Valley includes Selangor state, Federal Governments of Kuala Lumpur and Putrajaya (Alatas, 2011).
TABLE 2Distribution of the Sample Size
Frequency Percentage (%)
Klang Valley 135 62.2%
Non-Klang Valley 82 37.8%
Descriptive Analysis
Table 3 below shows the value ranges of minimum, maximum, mean and standard deviation for the independent variables, dependent variables and control variable in the measurement model. The results are stated in value range because there are many statements which were initially designed in the questionnaire with the intention of achieving better understanding for each variable.
The minimum range value of 1 to 2 indicates the attitude of manufacturing companies towards the statements for each variable, where 1 is defined as strongly disagree and 2 is disagree. The maximum value of 5 for the independent variables and dependent variables is defined as strongly agree with the statements, in which the companies have implemented the measurement or concern as a particular statement stated.
Meanwhile, the control variable of business size distributed with a mean of 452.03 and standard deviation of 1,253.249. The result suggested that on average, the manufacturing companies involved are large companies comprising 452 employees. However, the result is not parallel with those in Table 3, which comprise 50.7% small companies that have 5 to less than 75 employees. The variance can be explained by the large standard deviation of 1253.249 along with a minimum value of 2 employees and the maximum value of 10,000 employees.
TABLE 3Descriptive Analysis of Value Range for All the Variables
Variables N Minimum Maximum Mean Standard Deviation
Independent Variables:Product Technology 217 1 5 3.65 - 3.74 1.112 - 1.198Process Technology 217 1 5 3.48 - 3.76 0.921 - 1.028
Dependent Variables:Economic 217 1 - 2 5 3.87 - 4.27 0.747 - 0.867Environmental 217 1 5 3.46 - 4.05 0.801 - 1.027Social 217 1 - 2 5 3.66 - 4.43 0.673 - 0.815
Control Variable:Business Size 217 2 10,000 452.03 1,253.249

Pertanika J. Soc. Sci. & Hum. 23 (S): 17 – 38 (2015)
Sustainable Performance Measurement (SPMs) Model: Effects of Product Tecnology and Process Technology
27
Modified Measurement Model
It is necessary to alter the initial measurement model to achieve the required model fit for this study. This is done by inspecting the factor loading of each indicator, where one with a value lower than 0.5 is eliminated from the construct (Awang, 2013). When
one indicator is deleted, the model fit analysis is performed to determine whether fit indexes are achieved. After repeating the analysis for several times, the model fit is achieved. The modifications conducted over the indicators of the variables are tabulated in Table 4.
TABLE 4Comparison of Factor Loadings between Initial and Modified Measurement Model
Initial Measurement Model
Modified Measurement Model
Construct Indicator Factor Loading (λ) Factor Loading (λ)Product Fp1 0.842 0.842Technology Fp2 0.891 0.892
Fp3 0.819 0.819Fp4 0.733 0.733
Process Fpr1* 0.063 DELETEDTechnology Fpr2 0.618 0.605
Fpr3 0.726 0.742SPMs Ec1* -0.333 DELETED
Ec2* 0.488 DELETEDEc3 0.500 0.416Ec4 0.603 0.550Enc1* -0.083 DELETEDEnc2 0.739 0.749Enc3 0.724 0.734Enc4 0.703 0.729Enc5 0.751 0.769Enc6 0.720 0.727Sc1* 0.446 DELETEDSc2* 0.407 DELETEDSc3* -0.064 DELETEDSc4 -0.325 0.346Sc5* 0.085 DELETED
In addition, the modification indices (MI) are also examined to determine results of every possible relationship that is not estimated in the model (Hair et al., 2010). Result of the MI for e1 and e2 is 47.077, which is higher than 15. This indicates
that Ec3 and Ec4 are correlated because it provides better results of model fit compared to deleting the indicators. Based on the above modifications, the Modified Measurement Model presented in Fig.2 is the fit model.

Pertanika J. Soc. Sci. & Hum. 23 (S): 17 – 38 (2015)
Boon Heng Teh, Tze San Ong, Nahariah Jaffar and Sayed Yousef Sheikh Abou Masoudi
28
Fig.2: Modified Measurement Model
In order to provide a clear view on the comparison of fit statistic between Initial and Modified Measurement Model, Table 6 is formed as follows. Therefore, the Modified Measurement Model is used to perform the following tests.
TABLE 6Comparison of Fit Statistic between Initial and Modified Measurement Model
Fit IndicesInitial
Measurement Model
Modified Measurement
ModelAbsolute Fit:- RMSEA 0.114 0.720- GFI 0.710 0.904Incremental Fit:- TLI 0.643 0.913- CFI 0.679 0.928Parsimonious Fit:- Chisq/df 3.820 2.135
Model Fit
Table 5 summarises the indices of Goodness-of-Fit (GOF) for the model used in this study. As it is clear, all absolute fit, incremental fit and parsimonious indices fall in either good or acceptable fit range.
TABLE 5Fit Indexes for Modified Measurement Model
Fit Indexes Value Model fitAbsolute fit- RMSEA- GFI
0.0720.904
< 0.08, Good fit> 0.9, Good fit
Incremental fit - TLI - CFI
0.9130.928
> 0.9, Good fit> 0.9 Good fit
Parsimonious fit- Chisq/df 2.135 < 5.0,
Acceptable

Pertanika J. Soc. Sci. & Hum. 23 (S): 17 – 38 (2015)
Sustainable Performance Measurement (SPMs) Model: Effects of Product Tecnology and Process Technology
29
Reliability and Validity Test
As stated in Table 7, Cronbach’s alpha for product technology is 0.890 (initial = 0.890), CR value of 0.981 (initial = 0.893) and AVE value of 0.678 (initial = 0.678). These values are above the acceptable cut-off value, thus, indicators in product technology are reliable and valid.
However, process technology improves significantly with Cronbach’s alpha value of 0.648 (initial = 0.401), CR value of 0.626 (initial = 0.487), and AVE value of 0.459 (initial = 0.304). Although the value of cronbach’s alpha is not greater than 0.7, it is supported by Hair et al. (2010) that the value of 0.6 is deemed the lower limit of acceptability. Meanwhile, the value of CR lower than 0.7 causes the data not to be highly reliable, but CR with the value higher than 0.5 can be considered as reliable enough (Bolt, 1999; Hair et al., 2010).
In spite of having AVE lower than 0.5, the process technology construct is sufficiently reliability because of the Cronbach’s alpha and CR values (Bolt, 1999). Moreover, the reliability and validity values for SPMs demonstrate remarkable improvement on the value in the Modified Measurement Model, making data for SPMs as both reliable and valid.
TABLE 7Reliability and Validity Test for the Modified Measurement Model
ConstructCronbach's
Alpha CR AVE
Product Technology 0.890 0.981 0.678Process Technology 0.648 0.626 0.459SPMs 0.783 0.836 0.418
Normality Test
In order to examine whether the data are normally distributed, two measures are used to determine the distribution of data: skewness and kurtosis. The acceptable range for both measures is +2 to -2. Based on the results of the skewness and kurtosis tests in this research, the data are found to be normally distributed (Table 8).
TABLE 8Normality Test for the Modified Measurement Model
Statements Skewness KurtosisIndependent Variables:Product TechnologyFp1 -0.779 0.277Fp2 -0.774 0.129Fp3 -0.835 0.091Fp4 -1.089 0.554Process TechnologyFpr2 -0.018 -0.690Fpr3 -0.791 -0.665
Dependent Variables:EconomicEc3 -0.499 -0.096Ec4 -0.457 -0.053Environmental Enc2 -0.018 -0.572Enc3 -0.453 -0.107Enc4 -0.251 -0.175Enc5 -0.344 0.046Enc6 -0.361 -0.206SocialSc4 -0.588 -0.464
Multicollinearity Analysis
Multicollinearity occurs when indicators are strongly correlated in the measurement model, with a coefficient correlation higher

Pertanika J. Soc. Sci. & Hum. 23 (S): 17 – 38 (2015)
Boon Heng Teh, Tze San Ong, Nahariah Jaffar and Sayed Yousef Sheikh Abou Masoudi
30
than 0.85 (Kline, 2011). As depicted in Table 9, the correlations between all the variables are less than 0.85, without considering the correlation between the same variable.
Therefore, the indicators in the study have the ability to provide a proper estimation for the relationship between the variables.
TABLE 9Coefficient Correlations of the Measurement Model
NoE
Fpr3
Fpr2
Fp4
Fp3
Fp2
Fp1
Sc4
Enc2
Enc3
Enc4
Enc5
Enc6
Ec3
Ec4
NoE
1.00
0
Fpr3
.070
1.00
0
Fpr2
.059
.448
1.00
0
Fp4
.031
.371
.301
1.00
0
Fp3
.022
.335
.260
.658
1.00
0
Fp2
.037
.257
.215
.613
.738
1.00
0
Fp1
.008
.337
.302
.599
.641
.782
1.00
0
Sc4
.047
-.294
-.317
-.175
-.078
-.183
-.210
1.00
0
Enc2
.017
.419
.303
.452
.330
.286
.351
-.294
1.00
0
Enc3
.121
.360
.266
.229
.183
.133
.093
-.254
.594
1.00
0
Enc4
.176
.296
.250
.347
.290
.236
.253
-.238
.503
.517
1.00
0
Enc5
.141
.314
.233
.315
.215
.124
.181
-.199
.566
.534
.630
1.00
0
Enc6
-.018
.368
.297
.342
.236
.201
.267
-.221
.524
.551
.547
.582
1.00
0
Ec3
.082
.196
.255
.271
.295
.250
.199
-.107
.315
.373
.282
.289
.264
1.00
0
Ec4
.115
.283
.328
.252
.138
.159
.174
-.246
.400
.418
.369
.461
.350
.591
1.00
0

Pertanika J. Soc. Sci. & Hum. 23 (S): 17 – 38 (2015)
Sustainable Performance Measurement (SPMs) Model: Effects of Product Tecnology and Process Technology
31
Regression Analysis
Regression analysis result for the framework of the study reveals of 0.42. This indicates that 42.4% of the dependent variable (SPMs) is affected by the independent variables, whereas the remaining 57.6% is represented by independent variables other than process technology and product technology.
Equation Model R2 Y = β0+ β1x1 + β2x2 + β3 NoE + ε 0.424
Y Dependent variableβ0 Axis interceptβn Regression coefficient, n = 1, 2x Independent variableNoE Control variableε Random non-observable error
The regression coefficients presented in Table 10 indicate that only process technology has a significant and positive effect on SPMs with β value of 0.491 at significant level, 0.01. However, product technology with β value of 0.041 and NoE with β value of 0.000 show non-significant effects on SPMs.
TABLE 10Summary of the Regression Coefficients
Dependent Variables β Standard error
SPMs Independent Variables- Product Technology 0.041ns 0.480- Process Technology 0.491*** 0.115Control Variable- NoE 0.000ns 0.000
Unstandardised CoefficientsVariables
*** represents P < 0.001ns represents non-significant
Results of Hypotheses Testing
Two hypotheses were formulated to predict the relationship between the dependent variable and independent variables while having a control variable. As presented in Table 11, hypothesis tested on the relationship between product technology
and SPMs is not supported at the significance level of 0.01. On the contrary, the test result on the second hypothesis reveals that process technology affects SPMs at the significance level of 0.01 with the regression weight of 0.601.
TABLE 11Results of Hypotheses Testing
HypothesisRelationship between
VariablesStandardised
Regression WeightLevel of
SignificanceHypothesis Test
OutcomeH1 : Product Technology SPMs 0.081 P > 0.001 Not supported
H2 : Process Technology SPMs 0.601 P < 0.001 Supported

Pertanika J. Soc. Sci. & Hum. 23 (S): 17 – 38 (2015)
Boon Heng Teh, Tze San Ong, Nahariah Jaffar and Sayed Yousef Sheikh Abou Masoudi
32
Discussion of Study Findings
Based on data presented in Table 4-11, it can be figured out that the first hypothesis of this study, which is about the relationship between product technology and SPMs, is rejected. The reason can be explained as the fact that majority of the observations participated in this survey comprises of small companies which suffer from scarcity of resources and capabilities in implementing product technology to enhance SPMs.
As indicated by Hosey (2013), large companies possess sufficient resources that offer them a privilege over the small and medium companies in the industry. As large companies are able to improve environmental characteristic by reducing carbon emission, and also social characteristic through enhancing employee productivity, it would therefore be a heavy burden for small companies to compete with medium and large firms in the manufacturing industry.
However, the results of testing the second hypothesis, revealed a significant and positive effect of process technology on SPMs. This means that the Malaysia manufacturing companies which have process technology in their production process are able to achieve better performance on SPMs. This result is relatively important to the growth and expansion of manufacturing companies, as majority of the small companies are involved in the survey.
CONCLUSION
The main purpose of this study is to investigate how technology influences Sustainable Performance Measurements adopted in Malaysia manufacturing industries. In specific, this study attempted to empirically test and explain the relationship between product and process technology on SPMs among Malaysia manufacturing companies.
The results of the study depict that product technology does not improve Malaysian manufacturing SPMs. This result contradicts with several research done in other countries. It was argued by Rosen and Kishawy (2012) that product technology improves the environmental performance of manufacturing companies while retaining their competitiveness. In addition, Drejer (2004) proposed that product technology has a positive relationship with social performance on the grounds that innovation applied in the performance of the product plays an important role in fulfilling customers’ demands.
Moreover, Voncken et al. (2004) claimed that product technology shortens the time to market of a new product and assists companies to gain first mover advantages. First mover advantages include superior positions in physical location, patent and customer perceptual (Lieberman & Montgomery, 1998). However, product technology requires continuous innovation and improvement in order to retain market share as the competitors would respond quickly by recognising the error made by the early entrant.

Pertanika J. Soc. Sci. & Hum. 23 (S): 17 – 38 (2015)
Sustainable Performance Measurement (SPMs) Model: Effects of Product Tecnology and Process Technology
33
Contrary to product technology, process technology does improve the SPMs of Malaysian manufacturing companies. Since small companies are able to gain advantages from the implementation of process technology, medium and large companies with higher capability are competent to place more comprehensive process technology to facilitate companies achieve higher performance on SPMs.
Other than that, this result is supported by Milgrom and Roberts (1990) who argued that process technology has a positive relationship with the economic and social aspects, which form the two elements of SPMs. Process technology would function well in profit-maximising company as it shortens the production cycles and lowers rejected orders. With shorter production cycles and lower goods return, the employees’ productivity and customers’ satisfaction will be improved.
Another study done by Cramer and Zegveld (1991) mentioned that process technology enables companies to reduce environmental pollution during the production process. Consequently, manufacturing companies can attain sustainable manufacturing. Having in mind the results of previous studies, it can be concluded that Malaysian manufacturing companies benefit from process technology since economic, social and environmental measurements outweigh the cost incurred from process technology implementation.
IMPLICATIONS OF STUDY
The results obtained from this study are particularly beneficial to researchers, manufacturing companies and policy makers. To begin with, this study provides a reference for researchers to further explore social performance measures in Malaysia due to the scarcity of research papers on this particular topic. As for manufacturing companies, the findings of this study suggest that these companies provide a budget for implementing process technology to boost their SPMs. Last but not least, evidences of this study encourage policy makers to motivate manufacturing companies with limited capital to have process technology in their activities. This can be achieved by offering tax incentives and low interest fund/loan to facilitate companies with this process.
REFERENCESAbd. Rahman, A., Bennet, D., & Sohal, A.
(2009). Transaction attributes and buyer-supplier relationships in AMT acquisitions and implementation: the case of Malaysia. International Journal of Production Research, 47(9), 2257-2278.
ACCA, (2005). Sustainability Reporting Guidelines for Malaysian Companies. Retrieved October 21, 2013, from http://www.accaglobal.com/en/research-insights/global-forums/sustainability.html
Adidas, (2013). Sustainability Progress Report 2012. Retrieved 9 October, 2013, from http://www.adidas-group.com/
Alatas, S.M. (2011). Governance and Freshwater in the Greater Kuala Lumpur Area/Klang Valley: Success or Failure? Akademika, 81(3), 95-102.

Pertanika J. Soc. Sci. & Hum. 23 (S): 17 – 38 (2015)
Boon Heng Teh, Tze San Ong, Nahariah Jaffar and Sayed Yousef Sheikh Abou Masoudi
34
Alagoz, S., & Akatay, A. (2008). Sustainable Competition and Resource-Based View in Global Markets. International Symposium Globalisation. Retrieved November 20, 2013, from www.gau.edu.tr/bildiriler/bildiri3.pdf
Awang, Z. (2013). Structural Equation Modelling Using Amos Graphic (2nd ed.). Subang Jaya, Selangor: Dee Sega Enterprise.
Ball, P. (2011, March). Sustainable manufacturing: industrial engineering and industrial ecology. A Journal of Sustainable Human Development, 7(3). Retrieved October 23, 2013 from http://www.pelicanweb.org/solisustv07n03 page4.html
Barney, J. (1991). Firm Resources and Sustained Competitive Advantage. Journal of Management, 17(1), 99-120.
Boettke, P.J. & Coyne, C.J. (2007). Context Matters: Institutions and Entrepreneurship. Foundations and Trends in Entrepreneurship, 5(3), 135–209.
Bolt, M.A. (1999). Chapter 6 Statistical Analysis. (Incomplete)
Boons, F. & Lu¨deke-Freund, F. (2013). Business models for sustainable innovation:state-of-the-art and steps towards a research agenda. Journal of Cleaner Production, 45, 9-19.
Branco, M.C. & Rodrigues, L.L. (2007). Positioning Stakeholder Theory within the Debate on Corporate Social Responsibility. Electronic Journal of Business Ethics and Organization Studies, 12(1), 5-15.
Bridoux, F. (2004). A Resource-Based Approach to Performance and Competition: An Overview of the Connections between Resources and Competition. Strategic Management Society Conference, USA.
Burgess, T.F., Ong, T.S., & Shaw, N.E. (2007). Traditional or Contemporary? The Prevalence of Performance Measurement System Types. International Journal of Productivity and Performance Management, 56(7), 583-602.
Charharbaghi, K., & Lynch, R. (1999). Sustainable Competitive Advantage: Towards a Dynamic Resource-Based Strategy. Management Decision, 37(1), 45-50.
Chakravarthy, B.S., & Doz, Y.L. (1992). A Practice-Centered Model of Organizational Renewal Through Product Innovation. Strategic Management Journal, 13, 5-14.
Condon, L. (2004). Sustainability and Small to Medium Sized Enterprises-How to engage them. Australian Journal of Environmental Education, 20(1), 57.
Cramer, J. & Zegveld, W.C.L. (1991). The Future Role of Technology in Environmental Management, Futures, 23(5), 461-462.
Daft, R. (1983). Organisational theory and design. New York: West.
Delmas, M., & Toffel, M.W. (2004). Stakeholders and Environmental Management Practices: An Institutional Framework. Business Strategy and the Environment, 13, 209-222. doi: 10.1002/bse.409
Drejer, A. (2000). Integrating Product and Technology Development. European Journal of Innovation Management, 3(3), 125-136.
Ernst & Young. (1994). Survey of environmental management in Canada. Toronto, ON: Author.
Epstein, M.J., & Roy, M.J. (2001). Sustainability in Action: Identifying and Measuring Key Performance Drivers. Long Range Planning Journal, 30, 585-604.
Forsman, H. (2013). Environmental innovations as a source of competitive advantage or vice versa? Business Strategy and the Environment, 22(5), 306-320.
Freeman, R. E. (1988). A stakeholder theory of the modern corporation. Perspectives in Bus Ethics Sie 3E, 144.

Pertanika J. Soc. Sci. & Hum. 23 (S): 17 – 38 (2015)
Sustainable Performance Measurement (SPMs) Model: Effects of Product Tecnology and Process Technology
35
Freeman, R.E., Wicks, A.C., & Parmar, B. (2004). Stakeholder Theory and The Corporate Objective Revisited. Organization Science, 15(3), 364-369.
Gadenne, D., Mia, L., Sands, J., Winata, L., & Hooi, G. (2012). The influence of sustainability performance management practices on organizational sustainability performance. Journal of Accounting & Organisational Change, 8(2), 210-235. doi:10.1108/18325911211230380
Global Reporting Initiatives. (2013). Sustainability Topics for Sectors: What do stakeholders want to know? Retrieved September 29, 2013 from https://www.globalreporting.org
Grant, R. M. (1991). The resource-based theory of competitive advantage: implications for strategy formulation (pp. 114-135). California Management Review, University of California.
Hair, J.J., Black, W.C., Babin, B.J., & Anderson, R.E. (2010). Multivariate Data Analysis (7th ed.). Pearson Prentice Hall.
Hart, S. L. (1995). A Natural Resource-Based of the Firm. Academy of Management Review, 20(4), 986-1014.
Hooper, D., Coughlan, J., & Mullen, M.R. (2008). Structural Equation Modelling: Guidelines for Determining Model Fit. Electronic Journal Business Research, 6(1), 53-60.
Hosey, L. (2013, January). The Big-Firm Advantage. The Magazine of Sustainable Design. Retrieved November 19, 2013 from http://greensource.construction. com/opinion/2013/1303-the-big-firm-advantage.asp
Ilinitich, A. Y., Soderstrom, N. S., & Thomas, T. E. (1998). Measuring Corporate Environmental Performance. Journal of Accounting and Public Policy, 17(4), 383-408.
Institute of Sustainable Process Technology (2011, September). A view of Sustainable Process Technology. Retrieved November 20, 2013, from ispt.eu/cusimages/Publications/5491-ISPT%20boek_Lage%20resolutie.pdf
Jabar, J., Soosay, C., & Santa, R. (2009). Organisational learning as an antecedent of technology transfer and new product development: A study of manufacturing firms in Malaysia. Journal of Manufacturing Technology, 22(1), 25-45. doi: 10.1108/17410381111099798
Kaen, F. R., & Baumann, H. D. (2003). Firm size, employees and profitability in US manufacturing industries. Employees and Profitability in US Manufacturing Industries (January 13, 2003).
Kaler, J. (2006). Evaluating Stakeholder Theory. Journal of Business Ethic, 69(3), 249-268. doi: 10.1007/s10551-006-9089-2
Kitov, I.O. (2009). What is the best size to invest? Journal of Economic Review. Available at SSRN 1395714.
Kline, R.B. (2011). Principles and Practice of Structural Equation Modeling (3rd ed.). New York, USA: A Division of Guilford Publications.
Kors, P. (2012). The role of institutional forces in unlocking successful sustainability-driven entrepreneurship in the Western Cape (Master Thesis). Faculty of Geosciences Thesis, Utrecht University.
Kumar, K., Rajan, R. G., & Zingales, L. (1999). What Determines Firm Sizes? Journal of Economic Review. (No. w7208). National Bureau of Economic Research.
Lieberman, M.B. & Montgomery, D.B. (1998). First-Mover (Dis)Advantages: Retrospective and Link with the Resource-Based View. Strategic Management Journal, 19, 1111-1125.
Lucas, H. C., Jr. (1975). Performance and the use of an Information System. Management Science, 20, 908-919.

Pertanika J. Soc. Sci. & Hum. 23 (S): 17 – 38 (2015)
Boon Heng Teh, Tze San Ong, Nahariah Jaffar and Sayed Yousef Sheikh Abou Masoudi
36
Malaysian Industrial Development Authority, (2008). Media Statement: MIDA Annual Media Conference on the Performance of the Manufacturing and Service Sectors in 2007, 19 February 2008. Retrieved November 7, 2013. from http://www.mida.gov.my/env3/uploads/PerformanceReport/2007/Media Statement.pdf
Malaysian Industrial Development Authority. (2013). Invest in Malaysia: Your Profit Centre in Asia. Retrieved November 7, 2013, from http://www.mida.gov.my/ env3/index.php?page=manufacturing-sector-2
Manufacturing Skills Australia. (2008). Sustainable Manufacturing: Manufacturing For Sustainability. Retrieved October 23, 2013 from http://www.mskills.com.au/DownloadManager/Downloads/Sustainable%20manufacturing%20report.pdf
Milgrom, P., & Roberts, J. (1990). The Economics of Modern Manufacturing: Technology, Strategy and Organisation. The American Economic Review, 80(3), 511-528.
Meyer, J. W. (2008). Reflections on institutional theories of organizations. The Sage handbook of organizational institutionalism, 790-811.
Oruc, L., & Sarikaya, M. (2011). Normative Stakeholder Theory in Relation to Ethics of Care. Social Responsibility Journal, 7(3), 381-392. doi: 10.1108/17471111111154527
Phillips, R., Freeman, R. E., & Wicks, A. C. (2003). What Stakeholder Theory Is Not. Business Ethic Quarterly, 13(4), 479-502.
Porrit, J. (2006). Capitalism as If the World Matters. Oxford: Earthscan.
Porter, M. E. (1980). Competitive Strategy. New York: Free Press.
Prime Minister’s Department (2010). Tenth Malaysia Plan 2011-2015. Retrieved October 26, 2013 from www.pmo.gov.my/dokumenattached/RMK/RMK10_ Eds.pdf
Pronk, J., & Haq, M. (1992). Sustainable Development: From Concept to Action. The Hague Report: United Nations Development Program. Ministry of Development Cooperation.
Rosen, M. A., & Kashawy, H. A. (2012). Sustainable Manufacturing and Design: Concepts, Practices and Needs. Sustainability, 4(2), 154-174. doi: 10.3390/su4020154
Samah, B.A. (2013). Multiple Linear Regression Prelude to SEM. Serdang: Selangor.
Samsung Semiconductor. (2013). Process Technology: Overview. Retrieved November 20, 2013, from http://www.samsung.com/global/business/semiconductor/foundry/process-technology/overview
Sautet, F. (2005). The Role of Institutions in Entrepreneurship: Implication for Development Policy. Mercatus Policy Primer No 1. Retrieved November 22, 2013, from http://papers.ssrn.com/sol3/papers.cfm?abstract_id=1264033
Sebhatu, S. P. (2009). Sustainability Performance Measurement for sustainable organizations: beyond compliance and reporting. Karlstad, Sweden.
Seuring, S. (2004). Industrial ecology, life cycles, supply chains – differences and interrelations. Business Strategy and the Environment, 3(5), 306-319.
Slack, N., Chambers, S., Johnston, R. (2013). Chapter 8: Process Technology. Pearson Education: Operation Management (4th Ed.). Retrieved November 19, 2013, from http://wps.pearsoned.co.uk/ema_uk_he_slack_opsman _4/17/4472/1144941.cw/index.html
SME Corp. Malaysia. (2013). Guideline for New SME Definition. Retrieved November 19, 2013, from http://www.smecorp.gov.my/vn2/

Pertanika J. Soc. Sci. & Hum. 23 (S): 17 – 38 (2015)
Sustainable Performance Measurement (SPMs) Model: Effects of Product Tecnology and Process Technology
37
Spence, L. (2012). Primer: Business Sustainability for Small and Medium Enterprises. Network for Business Sustainability. Retrieved November 18, 2013, from nbs.net/wp-content/uploads/SME-Primer.pdf
UMW. (2012). UMW Holdings Berhad Corporate Social Responsibility Report 2012. Retrieved October 16, 2013 from http://www.umw.com.my/
Voncken, R. M., Broekhuis, A. A., Heeres, H. J., & Jonker, G. H. (2004). The Many Facets of Product Technology. Chemical Engineering Research and Design, 82(A11), 1411-1424.
Watson, A., Shrives, P., & Marston, C. (2002). Voluntary disclosure of accounting ratios in the UK. The British Accounting Review, 34(4), 289-313.
Zadeh, F. O., & Eskandari, A. (2012). Firm Size As Company’s Characteristic and Level of Risk Disclosure: Review on Theories and Literatures. International Journal of business and Social Science, 3(17), 9-17.


Pertanika J. Soc. Sci. & Hum. 23 (S): 39 – 58 (2015)
ISSN: 0128-7702 © Universiti Putra Malaysia Press
SOCIAL SCIENCES & HUMANITIESJournal homepage: http://www.pertanika.upm.edu.my/
ARTICLE INFOArticle history:Received: 30 March 2015Accepted: 10 September 2015
E-mail addresses:[email protected] (M. Ghasemi),[email protected] (Nazrul Hisyam Ab Razak),[email protected] (Taufiq Hassan)* Corresponding author
Agency Problem, Managerial Incentive and Financial Controlling Instrument: A Brief Review for Agenda Study in Malaysia
M. Ghasemi1, Nazrul Hisyam Ab Razak2* and Taufiq Hassan3
1 Putra Business School, Universiti Putra Malaysia, 43400 Serdang, Selangor, Malaysia2Department of Accounting and Finance, Faculty of Economics and Management, Universiti Putra Malaysia, 43400 Serdang, Selangor, Malaysia
ABSTRACT
Although the agency theory has been widely used across a variety of corporate finance concepts for the past three decades, little work has been undertaken with regard to how the agency theory could be used to explain simultaneous interrelation among internal solutions for Agency problem. In addition, no general consensus has emerged after many years of investigation and scholars can often disagree about the same empirical evidence. Among other, potential endogeneity of the agency mechanisms, as well as cultural and structural differences between developed and developing markets, has been stated to cause the complexity of corporate governance around the world. This article reviews the theoretical and empirical literature addressing causal effects of managerial incentives and financial controlling instrument due to agency problem. At the same time, the article aims to improve the understanding of how these instruments affect each other. The main part of the discussion is related to the evaluation of theoretical aspects of internal Agency solution and their interrelations, as well as the experiential studies in different countries. As such, specification of Malaysian market is surveyed separately to highlight the need for multi-theoretic process and interrelation effects in future research on corporate agency problems in the Malaysian context.
Keywords: Agency Theory, Managerial Incentives, Leverage, Dividends, Simultaneous Equations Models
3Department of Economics Faculty of Economics and Management, Universiti Putra Malaysia, 43400 Serdang, Selangor, Malaysia
Pertanika J. Soc. Sci. & Hum. 23 (S): 39 – 58 (2015)
M. Ghasemi, Nazrul Hisyam Ab Razak and Taufiq Hassan
40
INTRODUCTION
Separation of corporate ownership may provide several benefits such as hierarchical decision making policy, firm size and developing investment strategies. However, it may bring harm in the sense that the managers have a lack of incentives to run the company efficiently and make it more profitable (Abdullah et al., 2011). Based on the agency theory, managerial incentives that include ownership and remuneration align the interest between managers and shareholders. On the other hand, it shows that some controlling approaches can resolve this dilemma, with leverage and dividends as two important financial solutions for this particular problem. However, managers are the ones who ultimately make decision about dividends and leverage. To be precise, these internal controlling instruments are methods that are impressed by managers. Conversely, dividends and leverage may affect the feasibility and attractiveness of managerial incentives.
As long as managers own only little portion of firms’ shares, they may pursue stock value maximisation due to the discipline of corporate control markets and managerial labour (Morck et al., 1988). However, as managers become large shareholders and have the supremacy to control the firms, they could divert the outside investors’ benefits to themselves (Jeelinek & Stuerke, 2009; Benson & Davidson, 2010). Thus, the relation between managerial ownership and other instrument of agency solution is assumed to be complicated. According to
risk–averse hypothesis, managers will be less motivated to have higher ownership at the presence of debt (Ahmed, 2008); therefore, debt is utilised as a monitoring substitute for managerial ownership. On the other hand, the entrenchment hypothesis postulates that owner-managers are liable to involve in actions that are detrimental to the benefits of debt issuers (Jensen & Meckling, 1976) and attempt to restructure capital based on own benefits. Therefore, rational lenders attempt to limit owner-manager with stricter contract. If managerial ownership and dividends are served as monitoring instrument substitutes in controlling agency matter of free cash flow, a negative causal relation from dividends to managerial ownership could therefore be expected. In contrast, with respect to dividend theories (e.g., signalling theory or Lintner model), management will be more motivated to distribute higher dividends to themselves as shareholders.
More than managerial ownership, managerial remuneration is another internal solution of agency problem although the relation between these two managerial incentive instrument on managerial ownership is ambiguous (Attaway, 2000; McConaughy, 2000); factors such as tax, regulation, culture and financial factors of firm (e.g., leverage, risk, dividends and performance) may influence this relation. The convergence of interest hypothesis (COI) posits that increasing share ownership by managers will increase their interest aligned with the shareholders (Ang et al., 2000; Fleming et al., 2005)

Pertanika J. Soc. Sci. & Hum. 23 (S): 39 – 58 (2015)
Agency theory, Manager Incentive, Dividends, Debt: Review for Agenda
41
although entrenchment hypothesis argues that owner-managers have more influence to derive more remuneration from firms without considering their performance (Allen, 1981; Holderness & Sheehan, 1988; Werner et al., 2005). Moreover, leverage and remuneration are two policies for reducing conflicts between shareholders and managers but applying each one will lead to distress for another (Agha, 2013). Besides, managers have to exercise debt for financing new projects. Managers also try to avoid the risk of leverage because they want to protect their career. Thus, shareholders have to compensate this problem by giving higher remuneration for managers. Firms with high debt, however, will likely have less free cash flow, and are thus less likely able to pay high remuneration. The relation between managerial remuneration and other controlling instruments (i.e., dividend) is indistinctive as well. Some studies have highlighted the association between various forms of executive compensation and the payout policies of a firm (Aboody & Kasznik, 2000; Kahle & Kathleen, 2002). As per the pecking order theory, firms prefer to rely more on internal funds or retained earnings; as a result, the firms will have a tendency to pay less dividend and hence have higher retained earnings. On the other hand, shareholders expect managers of highly profitable firms to pay higher dividends in order to reduce agency costs.
As elaborated earlier on, there are interrelations between managerial incentives and managerial controlling instrument. In other words, not only managerial incentives
affect leverage and dividend, leverage and dividend also have impacts on managerial incentives. In most mechanisms of corporate governance, endogeneity is not considered, and this ignorance of their interrelations leads to an incomprehensive interpretation of their empirical results. This paper aims at providing readers with a comprehensive understanding of simultaneous interrelations among the four mentioned internal instrument of agency problem by reviewing relevant empirical studies based on the original agency theory, Entrenchment hypothesis, Convergence interest hypothesis and pecking order theory.
In addition, this paper also contributes to the internal agency solutions in three ways. First, it describes how studies on internal agency solutions are interrelated and they are illustrated as integrated mechanisms. Second, the literature review of this paper focuses on the simultaneous interrelation between internal agency solutions. To the researchers’ understanding, this is the first work studying on this particular issue. Third, the paper highlights several avenues to advance the field of study, while providing useful and practical implications in the Malaysian context at the same time. The remainder of the paper is organised as follows: Section 2 provides theories that explain the interrelation between each pair of four instruments and relevant literature. Section 3 briefly discusses the traits of these instruments in the Malaysian market that may cause different reactions to agency problem compared to developed country. Finally, a brief conclusion is given in Section 4.

Pertanika J. Soc. Sci. & Hum. 23 (S): 39 – 58 (2015)
M. Ghasemi, Nazrul Hisyam Ab Razak and Taufiq Hassan
42
REVIEWING PROCESS
Research Methodology
The methodology used in this study is documentary research using electronic databases and data reduction procedures to collect information about the interrelations between managerial ownership, remuneration, dividends and leverage as internal instruments for agency problem. The initial reviews revealed several hundred published articles in every instrument and also their relations. Due to space constraint,
this paper focuses only on the most widely cited papers of each theoretical concept. This study also includes 21 articles that investigated the simultaneous interrelations of the four internal agency solutions. The variables, area of study and methods are illustrated in Table 1 below. The findings can be retrieved from the literature review. Finally, the empirical studies carried out in Malaysia are investigated. A brief review of the Original Agency Theory and two related hypotheses are explained in the subsequent paragraphs.
TABLE 1Selected studies of interrelation among managerial incentive and internal controlling instruments
Year Authors Country interrelated variables Methods2014 Persson Sweden Debt, Dividend and Managerial Ownership 3SLS(CMP),
3SLS, 2SLS2014 Gao and Li USA CEO Ownership and Compensation 2SLS2014 O’Callaghan et al. UK Ownership structure, compensation and
Performance2SLS
2014 Vo et al. Vietnam Debt, Dividend and Managerial Ownership 3SLS2014 Moussa and Chichti Tunisia Debt ratio and Managerial Ownership 3SLS2013 Shiyyab et al. EU Performance, Large Shareholder, Board Size,
Managerial Ownership, , Outside Directors and Executive Compensation
3SLS
2013 Bao and Yang China Dividends and Compensation Tobit regression2012 Nyonna USA Insider Ownership and Debt 2SLS2012 Lopez et al. 16 Countries Capital structure, Ownership structure and
Valuation3SLS
2011 Lee and Chen Taiwan CEO Compensation, Ownership and Firm Value
2SLS
2009 Zhang USA Debt and Executive Stock Options 2SLS2008 Bhattacharyya et al. Canada Dividend and Executive Compensation Tobit regression2007 Ghosh India, USA,
UK, IrelandLeverage, Managerial Ownership and Firm Valuation
3SLS
2007 Kim et al. Korea Debt, Dividend, Managerial Ownership 2SLS2007 Ortiz and Hernan USA Leverage and Compensation 2SLAD 2006 Hardjopranoto Indonesia Debt, Dividend, Managerial Ownership 3SLS2006 Joher et al. Malaysia Debt and Managerial Ownership 2SLS2006 Ghosh and Sirmans USA CEO ownership, Dividends, Compensation 2SLS2006 Faulkender et al. USA Dividends, Leverage 2SLS1999 Chen et al. USA Director Ownership, Leverage, Dividends, Risk Nonlinear 2SLS1992 Jensen et al. USA Debt, Dividend, Managerial Ownership 3SLS
2SLS: Two Stage Least Squares, 3SLS: Two Stage Least Squares, 2SLAD: two-stage least absolute deviation

Pertanika J. Soc. Sci. & Hum. 23 (S): 39 – 58 (2015)
Agency theory, Manager Incentive, Dividends, Debt: Review for Agenda
43
Econometrics Considerations of the Review
According to Gujarati and Porter (2009), “By combining time series of cross-section observations, panel data gives: more informative data, more variability, less collinearity among variables, more degrees of freedom, more efficiency, and better dynamic change.” Therefore, papers using panel data were chosen in this study to investigate the interrelations between the selected variables. In the presence of the simultaneously determined variables, the Ordinary Least Square (OLS) method will produce biased and inconsistent results (Hill et al., 2008). Hill et al. (2008) also offer Simultaneous Equation Model (SEM), which is an econometric model for data that is jointly determined by two or more economic relationships as an alternative to OLS. Two alternative approaches (namely, Single equation estimation and System estimation) can be used to estimate a simultaneous equation regression model. The Two Stage Least Squares (2SLS), used by Theil (1961), Basmann (1957) and Sargan (1958), was initially propounded as a method of estimation for a single equation’s parameters of a model. Similarly, the Tree stage least squares (3SLS) can also be used to estimate a model of simultaneous equations that includes endogenous independent variables with dependent variables’ role of other equations in the model (Zellner & Theil, 1962). The 3SLS technique consists of two different methods, namely, 2SLS and Seemingly Unrelated Regression (SUR).
This technique is used in a system of endogenous equations (Zellner, 1962). For a better understanding of the simultaneous interrelation between the agency instruments, this study also discusses the two-way causality between the variables based on the findings of papers that used the simultaneous equation models as their methodology. For instance, according to the finding by Kim Ph et al. (2007) who investigated the relation between leverage and managerial ownership or dividends and managerial ownership, the OLS methods indicated no relation between them; however, when the data were run by using the 2SLS method, the results showed significant relations between them. This finding has also been reported in most of the empirical papers.
The Agency Theory
The Original Agency Theory
The cornerstone of the agency theory is the assumption that the interest of principles and agents diverges (Hill & Jones, 1992). According to the traditional agency theory by Jensen and Meckling (1979), equity agency cost is zero when there is a 100 per cent ownership by the manager’s organisation, and there is a positive relationship between equity agency costs and the separation of ownership and control (Fleming et al., 2005). Jensen and Meckling (1979) hypothesised that managerial ownership is an important mechanism for aligning the interests of managers and shareholders. They also mentioned another way to reduce equity agency costs, i.e.

Pertanika J. Soc. Sci. & Hum. 23 (S): 39 – 58 (2015)
M. Ghasemi, Nazrul Hisyam Ab Razak and Taufiq Hassan
44
to use more debt financing. Using more debt reduces total equity financing and in return, this will lower the scope of the manager-stockholder conflict. The agency theory suggests that principals who find it difficult to observe or even monitor agents’ behaviour will use higher proportions of compensation (Baker et al., 1988; Jensen & Murphy, 1990). The payment of dividends may serve to align the interests and mitigate the agency problems between managers and shareholders by reducing the discretionary funds available to managers (Rozeff, 1982; Easterbrook, 1984).
Convergence-of-Interest and Entrenchment Hypotheses
There are two opposing viewpoints regarding managerial ownership in the modern agency theory; these being the convergence-of-interest hypothesis and the entrenchment hypothesis, Jensen and Meckling (1979) stated that minimal ownership might cause managers to work less vigorously and/or consume more perquisites. Consequently, increasing managerial ownership leads to a convergence of interests between and ownership, and reduces agency costs. On the other hand, too much managerial ownership leads to entrenchment, and thus an increase in agency costs (Morck et al., 1988). Dividend payments are expected to have a negative effect on debt if the convergence of interest theory is valid. Alternatively, dividends are expected to have positive impact on debt according to the entrenchment theory (Schooley & Barney, 1994). Meanwhile, dividend payout is expected to have a negative
effect on stock ownership if the convergence of interest theory is applicable, and to have a positive impact on stock ownership if the entrenchment theory holds (Chen & Steiner, 1999).
Theoretical and Empirical Debate on the Internal Agency Instrument
Interrelation between Managerial ownership and Dividends
The key idea behind the Agency theory is that the impossibility of perfect contracting inevitably and the existence of information asymmetry cause a conflict of interest between shareholders and management. Shareholders can mitigate this contradiction and also reduce agency costs by increasing dividends (Chen & Steiner, 1999).
Hence, based on the convergence interest hypothesis, managerial ownership and dividends may be considered as substitute mechanisms as they reduce agency costs, and thus, it is not effective to exercise two instruments at the same time to resolve the same problem. Lower dividend increases the likelihood that a company engages in managerial ownership programme and vice versa. Studies such as by Rozeff (1982), Jensen et al. (1992), Espen Eckbo and Verma (1994) and Peng et al. (2001) found a negative relation between them. On the other hand, the Entrenchment hypothesis claims that a company with higher levels of managerial ownership is intentionally presenting higher level of amount of payout due to the interest of managers (Schooley & Barney, 1994; Hu & Kumar, 2004).

Pertanika J. Soc. Sci. & Hum. 23 (S): 39 – 58 (2015)
Agency theory, Manager Incentive, Dividends, Debt: Review for Agenda
45
Besides, it has been recognised in the recent academic studies that dividend and managerial ownership policies are interrelated (Short et al., 2002). Jensen et al. (1992) used a simultaneous equations model (SEM) and found that inside ownership affects dividends in a negative way. Similarly, the results of the SEM research by Kim et al. (2007) showed that dividends are negatively related to inside ownership and vice versa. In contrast, Bao (2013) found that managerial shareholding has positive impact on corporate cash dividends. The results of the study by Vo and Nguyen (2014) indicate that companies with higher levels of managerial holdings deliberately choose higher level of dividends. The recent article by Persson (2014) highlights a two-way causal relation between dividend policies and inside ownership; dividends have a positive effect on inside ownership whereas inside ownership influences dividends in a negative way.
Interrelationship between Managerial Ownership and Leverage
The leverage has high magnitude to the predominant role of the ownership structure (Ezeoha & Okafor, 2010). Exercise of debt may lead to managerial discretion reduction and cause mitigate interest divergence between managers and fund contributors for the firm (Jensen & Meckling, 1976). The convergence of interest (COI) theory posits that leverage and insiders ownership can be assumed as substitutes. However, Bathala et al. (1994) argued that slathers
of managerial ownership can lead to entrenchment, and the outcome of the entrenchment hypothesis (ENT) is that owners cannot solve agency problem by presenting managers with more ownership stocks (Ahmed, 2008); this implies that owners will employ leverage instead. Thus, managerial shareholdings should be related to debt policy in a positive way. However, due to the fact that the entrenchment problem causes the controlling insiders to have more probability to make decisions that are harmful for the debt issuers’ interests, the debt issuers will strongly attempt to impose more influence on the managerial decision of firms (Short & Keasey, 1999; Demsetz & Villalonga, 2001). Debt holders also may envisage that an upper level of debt cost is linked to the risk of insider ownership. The studies of Anderson and Reeb (2003) and Fields Jr et al. (2010), on the other hand, showed that insider ownership is not related to the cost of debt.
The interrelation between inside ownership and leverage is acceptable in the recent academic literature. Givoly et al. (1992) found that high managerial ownership firms choose lower levels of debt. Meanwhile, Jensen et al. (1992) posited that the financial policies not affecting the levels of inside ownership, but inside ownership affects debt a negative way. The previous research by Chen and Steiner (1999) supports the convergence of interest theory and also suggests that inside ownership is negatively related to debt; this finding is consistent with the

Pertanika J. Soc. Sci. & Hum. 23 (S): 39 – 58 (2015)
M. Ghasemi, Nazrul Hisyam Ab Razak and Taufiq Hassan
46
study by Ghosh (2007). Moreover, Kim et al. (2007) expressed that inside ownership and debt have a negative interrelationship. Nyonna (2012) found a significant negative relation between them with a causality in both directions. Vo and Nguyen (2014) also indicated that managerial ownership has a negative relationship with leverage. Moussa and Chichti (2014) showed that the ownership structure affects the capital structure in a nonlinear way and vice versa. Persson (2014) argues that the effect from managerial ownership is directly imposed on debt policy in a negative way. In fact, debt policy does not affect inside ownership even though López-Iturriaga and Rodríguez-Sanz (2012) claimed that financial leverage and ownership structure are conditional based on the legal environment. Although both mechanisms work as complementary mechanisms in the civil law system, they seem to be substituting mechanisms in common law firms.
Interrelation between Managerial Ownership and Remuneration
The Traditional Agency theory predicts a negative relationship between managerial equity ownership and managerial remuneration since alignment between shareholders and executives is an increasing function of managerial ownership (Jensen & Meckling, 1976). In this view, researchers believe that managerial ownership eliminates managerial compensation requirement based on convergence interest hypothesis, that is, ownership and
compensation mechanisms may substitute one another and a higher level of ownership concentration may be associated with less necessity for incentive alignment (Mehran, 1995; Aggarwal & Samwick, 1996; Mat Nor & Sulong, 2007; Conyon et al., 2010; Fernandes et al., 2013).
Alternatively, entrenchment managerial ownership may allow managers to impose highly contingent compensation contracts on executives, leading to a positive relationship between managerial ownership and managerial remuneration (Allen, 1981; Holderness & Sheehan, 1988; Cheung et al., 2005; Werner et al., 2005). In other words, ownership and compensation mechanisms may complement each other. As a major explanation for executive compensation, the traditional agency theory has been challenged and criticised as under-socialised for its inability to explain cross country differences (Bruce & Buck, 2005; Mintzberg, 2009; Filatotchev & Allcock, 2010).
Lee and Chen (2011) discovered that CEO ownership and CEO compensation are interdependent and that ownership is positively associated with CEO compensation. Similarly, Gao and Li (2014) also argued that CEO’s annual compensation is more important than his equity ownership. That is, managers are interested to enhance compensation benefits in every level of ownership. Recently, O’Callaghan et al. (2014) reported sensitivity of executive remuneration to firm performance is associated with the degree of managerial equity ownership and

Pertanika J. Soc. Sci. & Hum. 23 (S): 39 – 58 (2015)
Agency theory, Manager Incentive, Dividends, Debt: Review for Agenda
47
ownership concentration in negative way. Their results indicated that in a firm where monitoring of managers activities is poorer and the separation of management and ownership is greater, the pay-performance sensitivity is more evident. In general, the impact of managerial ownership structure on managers’ pay is vague given the miscellaneous nature of the empirical findings.
The Interrelation between Managerial Remuneration and Dividends
Kahle and Kathleen (2002) suggested that amendments in compensation schemes have caused changes in firms’ payout policies. This means that if remuneration scheme achieves to align Managers and shareholders interest based on the convergence interest theory, then the role of dividends as a substitute alternative is mitigated. The study by Bhattacharyya et al. (2008) indicates that executive compensation is negatively associated with dividend payout.
Generally, dividend decisions reflect managerial motives and incentives (Tirole, 2010). If dividend payout is an effective tool for mitigating agency costs, efficient managerial compensation packages should then be designed to reward appropriate levels of dividend payout. A stock option compensation for CEOs leads to lower dividends but other kinds of remuneration should be positively related to dividends (Geiler & Renneboog, 2014). Otherwise, dividends may be used as a complement method to reduce the agent theory according
to the entrench hypothesis. In line with this notion, some scholars assigned a positive linkage between executive remuneration and dividend payment (Healy, 1985; Lewellen et al., 1987). Bao (2013) also reported that executive wage has a positive impact on corporate cash dividends, i.e., managers who are entrenched and receive a larger part of compensation through salary and bonus rather than long-term rewards linked to firm performance are less sensitive to shareholder values, and pay higher dividends (Ghosh & Sirmans, 2006). However, the other factors such as investment opportunity has an essential role between managerial remuneration and dividend (Chen, 2010).
The Interrelation between Managerial Remuneration and Leverage
The agency cost of equity hypothesis suggests that debt mitigates shareholder-manager agency problems by inducing lenders to monitor, reducing free cash flow available to managers and forcing managers to focus on value maximisation when facing the threat of bankruptcy (Grossman & Hart, 1982; Jensen, 1986). In addition, explaining the agency theory, Jensen and Meckling (1976) assumed that managers are risk averse and try to reduce the financial risk to protect their jobs and personal wealth (Fosberg, 2004; Hardjopranoto, 2006a). As a result, managers who run companies with higher level of risk should get higher remuneration than managers who handle companies with lower risk. In other words, managers who are willing to tolerate extra

Pertanika J. Soc. Sci. & Hum. 23 (S): 39 – 58 (2015)
M. Ghasemi, Nazrul Hisyam Ab Razak and Taufiq Hassan
48
risks and face uncertainty of returns should be compensated accordingly. Moreover, receiving debt by managers leads to more financial risks for firms. Based on this view, and because of the remunerations involved, managers take the financial risk of new projects.
Rational lenders price debt by considering executive incentive structure (Brander & Poitevin, 1992). When shareholders and managerial interests are strongly aligned, managers have the incentives to decide about investment plans that benefit shareholders at the cost of bondholders. Nonetheless, this may lead to higher cost level of debt finance. Since shareholder-bondholder arguments are more intense in more levered companies, these companies may find optimal to decrease agency costs of debt finance by inducing a lower incentive alignment with their executives, even though doing so may raise the agency costs of equity.
Zhang (2009) found that executive stock options and debt practice are substitutes to decrease free cash flow problem. In addition, he also posited his result as more pronounced in firms that tend to have much severe agency problem. Ortiz-Molina (2007) realised reduction in the condition of in direct-debt leverage for performance base payment sensitivity. However, the results of the study by Shiyyab et al. (2013) indicated that leverage has an insignificant negative impact on executive compensation levels.
The Interrelation between Dividends and Leverage
Easterbrook (1984) revealed that dividends might keep the firm in the capital market because they could monitor managers at a lower cost. Debt and dividends could be substitutes or complements in reducing the agency cost. The policies are substitutes if the convergence of interests is effective (Rozeff, 1982; Faccio et al., 2001) or complements if the entrenchment theory is effective (Hardjopranoto, 2006). If the entrenchment theory is effective, the shareholders could use a combination of debt and dividends to monitor managers because they cannot be monitored by offering them more ownership stakes. This finding suggests that dividends should be positively related to debt.
Meanwhile, Myers and Majluf (1984) explained that firms follow a hierarchy of financial decisions when establishing its capital structure. In fact, the Pecking Order Theory is based on the presence of asymmetric information between managers and outside investors and the assumption that managers act in the interest of existing shareholders (Shen, 2014). Initially, firms first finance projects with the retained earnings because this finance method incurs no flotation costs and requires no disclosure of the firm’s financial information (Bevan & Danbolt, 2002). If the retained earnings are not sufficient, the firms will go for debt (DeAngelo & DeAngelo, 2007), and if further financing is required, the last option for the firm is to issue equity. Therefore,

Pertanika J. Soc. Sci. & Hum. 23 (S): 39 – 58 (2015)
Agency theory, Manager Incentive, Dividends, Debt: Review for Agenda
49
higher level of dividends payout will lead to higher level of debt to finance new investment.
Leverage policy is not determined independently, but rather simultaneously with other factors such as firm’s dividend policy (Crutchley et al., 1999). Kim et al. (2007) and Faulkender et al. (2006) indicated a significant positive impact of leverage on dividend. Furthermore, the findings of Persson (2014) disclosed a positive two-way causal relation between total debt and dividends. Based on the finding by Vo and Nguyen (2014), however, there is a substitution relationship between leverage and dividend in the mechanism of controlling the agency conflicts.
Theoretical Framework
The theoretical discussion on the interrelationship between managerial ownership, compensation, dividend policy and debt policy is summarised in Fig.1 and Table 2 below. The general conclusions that follow from them are that causality may proceed in either direction between each pair of the variables. For instance, Table 2 indicates that the effects of dividends on managerial ownership can be explained based on two different hypotheses; from the Entrenchment hypothesis, the positive effect is expected, and from the convergence of interest view, the negative effect can be predicted (see Arrow 10). Moreover, the same predictions are also possible from the managerial ownership to dividends (see Arrow 9).
Fig.1: The interrelation framework between internal agency solutions

Pertanika J. Soc. Sci. & Hum. 23 (S): 39 – 58 (2015)
M. Ghasemi, Nazrul Hisyam Ab Razak and Taufiq Hassan
50
TABLE 2Expected Impact amongst the Variables
Arrow no. Effect prediction
1 Entrenchment hypothesis(+),convergence hypothesis(-), pecking Order Theory(+)
2 Entrenchment hypothesis(+), convergence hypothesis(-)
3 Entrenchment hypothesis(+), convergence hypothesis(-)4 Entrenchment hypothesis(+), convergence hypothesis(-)
5 Entrenchment hypothesis(+), convergence hypothesis(-)6 Entrenchment hypothesis(+), convergence hypothesis(-)
7 Entrenchment hypothesis(+), convergence hypothesis(-)8 Entrenchment hypothesis(+), convergence hypothesis(-)
9 Entrenchment hypothesis(+), convergence hypothesis(-)10 Entrenchment hypothesis(+), convergence hypothesis(-)11 Agency theory (-)
12 Agency theory (+)
and complexity in the use of corporate governance instruments. In this section, the specification of the four mentioned internal agency solutions are discussed.
In the case of Malaysia, capital structure is formed by the highest belonging of family businesses [almost 60% by Claessens et al. (2000) and 37% by Afza Amran and Che Ahmad (2009)] and the government properties. This means that the Government is involved in firms’ business, in which 22% Government Linked Companies (GLCs) in 1999 (Claessens et al., 1999) and this proportion increased to 36% in later years (Mokhtar, 2005). By adding a high proportion of managerial ownership, the issue becomes more complex [43%, as mentioned by Sulong et al. (2013), 27% as stated by Mustapha and Ahmad (2011b), 21% by Zunaidah and
INTERNAL AGENCY INSTRUMENTS IN THE MALAYSIAN CONTEXT
Malaysia is one of the fast growing economies that have successfully developed from a commodity-based economy to one that focused on manufacturing from the early 1980s through the mid-1990s. The origin of the 1997 financial crisis in Malaysia lies in the structural weaknesses in its domestic financial institutions which were supported by inaccurate macroeconomic policies and moral hazard (Corsetti et al., 1998). Thereafter, policymakers reformed corporate governance in Malaysia several times by codifying Malaysian Code on Corporate Governance, Capital Market Master Plan and Financial Sector Master Plan. However, some natures of the Malaysian capital structures cause difficulty

Pertanika J. Soc. Sci. & Hum. 23 (S): 39 – 58 (2015)
Agency theory, Manager Incentive, Dividends, Debt: Review for Agenda
51
Fauzias (2008) and 29 % by Kanapathy (2005)]. In addition, Ahmed (2008) also stated that among 100 blue-chip stocks, a higher level of managerial ownership could reduce the agency conflict between external equity claimholders and managers during the 1997-2001 period. Within these concentrated ownerships of companies, managers might have little influence on decision making policies. In addition, minority shareholders are doubtful to influence the decisions regarding how companies are run, whether qualified managers are running the firms or whether they are chosen based on Relationships or political connections. For this reason, how can agency problem be resolved or faded out by offering firm’s share to managers in the Malaysian context?
Other than that, executive compensations are vigorously debated in Malaysia (Wooi and Ming, 2009). Directors’ payment increased by 23% in six years (Kaur & Rahim, 2007). Moreover, total directors’ payout in top 20 companies increased by 22% in 2009 (Hamsawi, 2011). Family ownership and managerial ownership show uncertainty in relation to managers’ remuneration. For instance, Vicknes (2003) found that most owners-managed companies tend to have heftier payout to their managers. Conversely, Dogan and Smyth (2002) reported that board remuneration is negatively associated with ownership concentration for Malaysian listed firms. Likewise, directors’ payouts in GLCs have grown approximately 12% lower
compared to others (Minhat & Abdullah, 2014). Similarly, Salim and Wan-Hussin (2009) also found that among pay-without-performance firms, executives earn higher pay as managerial ownership increases, and this suggests that rent extraction through overcompensation is likely to be in tandem with the managerial power theory. Some studies, however, could not find any relation between debt and managerial remuneration in Malaysia (Yatim, 2013; Amin et al., 2014). Consequently, there are different remuneration policies among firms in Malaysia that cause difficulty to account executive remuneration as an instrument for the agency problem.
Mustapha and Ahmad (2011a) stated that debt structure has a significant and negative relationship with total monitoring costs in the firms listed on the Main and Second Boards of Bursa Malaysia. In addition, capital structure is argued as very much dependent on the dominant nature of the ownership structure (Ezeoha & Okafor, 2010). Ahmed (2008) posits that the debt policy, which serves as a positive monitoring substitute for agency conflict as positive and significant in explaining the level of ownership concentration. Mustapha et al. (2011) exclaimed that significant relationships exist between debt structure and ownership structure, specifically in the case of Malay executive directors’ shareholdings. Meanwhile, Appannan and Sim (2011) confirmed the positive correlation between current dividends with firms’ debt equity ratio in the food industry and stated if the debt equity ratio was low,

Pertanika J. Soc. Sci. & Hum. 23 (S): 39 – 58 (2015)
M. Ghasemi, Nazrul Hisyam Ab Razak and Taufiq Hassan
52
the dividend payment would be lower. The findings by Ling et al. (2008) showed that dividend-paying companies have lower firm leverage as compared to non dividend-paying companies that may be consistent with the agency theory.
As a developing country, Malaysia still lacks studies that look into the most important determinants of the dividend policy for the listed firms (Appannan & Sim, 2011). One of the conflicts about the dividend policy in Malaysian public listed companies is that due to personal tax exemption, managers are reluctant to cut or avoid omitting dividend even when the performance of the companies is deteriorating due to shareholders pressure (Ling et al., 2008). Furthermore, Ahmed (2008) also explains that dividend policies, which also serve as monitoring tools, substitute to reduce agency conflict between manager and external shareholders and do not appear to have any significant impact on managerial ownership. However, the manager-owner concentration strengthens the complicacy of the dividends policy as a financial instrument for the agency conflict.
Due to some characters mentioned in the Malaysian context, these instruments seem to be more complex to solve the agency problem compared to those of the developed country. Moreover, firms usually apply more than one method as a solution for their agency problem or use another method when carrying out their business activities. When the interrelation among them is considered, the agency solution mechanisms are found out be more intricate.
CONCLUSION
This paper reviews the interrelationships between debt policy, dividend policy, managerial ownership and managerial remuneration based on the original agency theory, convergence of interest and entrenchment hypotheses and pecking order theory. Taking COI, ENT and also explaining the variety of simultaneous system studies into consideration, this article has attempted to bridge the conceptual gap of relationship between the influences of individual internal agency instruments and their expected synchronised effects as an aggregated mechanism. For this purpose, three groups of articles were selected: the main theoretical and empirical article, the articles that use SEM, and the articles that identify the characters and related findings of these internal agency solutions in the Malaysian market. By considering the first two groups of articles, this paper has shown that as there was no particular attention given to the interrelationships between these instruments, the researchers were not able to infer the market mechanisms to mitigate agency problems. The interrelation framework and its expected impact table proposed the comprehensive perception to realise intricate agency solutions. In other words, understanding the condition of managers’ status based on the COI and ENT hypotheses, as well as considering the simultaneous two-way causality between instruments, leads to understanding of the market mechanism and also the ability to investigate the effectiveness of these instruments. Moreover, the concentrated
Pertanika J. Soc. Sci. & Hum. 23 (S): 39 – 58 (2015)
Agency theory, Manager Incentive, Dividends, Debt: Review for Agenda
53
ownership structure and some cultural and regulatory differences of the Malaysian market, compared to the developed country that was previously described, highlights the importance of exclusive and extensive studies of simultaneous interrelations among the internal agency instruments in this market. In particular, future survey carried out in Malaysia may enhance the knowledge about the agency theory in the concentrated ownership with sensible managerial ownership.
REFERENCESAbdullah, S. N., Mohamad, N. R., & Mokhtar, M.
Z. (2011). Board independence, ownership and CSR of Malaysian large firms. Corporate Ownership & Control, 8(3), 417-435.
Aboody, D., & Kasznik, R. (2000). CEO stock option awards and the timing of corporate voluntary disclosures. Journal of Accounting and Economics, 29(1), 73-100.
Afza Amran, N., & Che Ahmad, A. (2009). Family business, board dynamics and firm value: Evidence from Malaysia. Journal of Financial Reporting and Accounting, 7(1), 53-74.
Aggarwal, R. K., & Samwick, A. A. (1996). Executive compensation, strategic competition, and relative performance evaluation: Theory and evidence. The Journal of Finance, 54(6), 1999-2043.
Agha, M. (2013). Leverage, executive incentives and corporate governance. Accounting & Finance, 53(1), 1-30.
Ahmed, H. J. A. (2008). Managerial ownership concentration and agency conflict using logistic regression approach: Evidence from Bursa Malaysia. Journal of management research, 1(1), 1-10.
Allen, M. P. (1981). Power and privilege in the large corporation: corporate control and managerial compensation. American Journal of Sociology, 86(5), 1112-1123.
Amin, J. M., Kamarudin, K. A., & Ismail, W. A. W. (2014). What determines directors’ remuneration in Malaysia? In F. L. Gaol, S. Kadry, M. Taylor & P. S. Li (Eds.), Recent trends in Social and Behavioral Science (pp. 469-473). Taylor & Francis Group, London.
Anderson, R. C., & Reeb, D. M. (2003). Founding-family ownership and firm performance: evidence from the S&P 500. The journal of finance, 58(3), 1301-1327.
Ang, J. S., Cole, R. A., & Lin, J. W. (2000). Agency costs and ownership structure. the Journal of Finance, 55(1), 81-106.
Appannan, S., & Sim, L. W. (2011). A Study on Leading Determinants of Dividend Policy in Malaysia Listed Companies for Food Industry Under Consumer Product Sector. In 2nd International Conference on Business and Economic Research (Vol 2).
Attaway, M. (2000). A study of the relationship between company performance and Executive remuneration. American Business Review, 18(1), 77-85.
Baker, G. P., Jensen, M. C., & Murphy, K. J. (1988). Compensation and incentives: Practice vs. theory. The journal of Finance, 43(3), 593-616.
Bao, Y. (2013). Executive Compensation, Cash Dividend Policy and Compensation Contracts Design. Collected Essays on Finance and Economics, 3, 013.
Basmann, R. L. (1957). A generalized classical method of linear estimation of coefficients in a structural equation. Econometrica: Journal of the Econometric Society, 25(1), 77-83.

Pertanika J. Soc. Sci. & Hum. 23 (S): 39 – 58 (2015)
M. Ghasemi, Nazrul Hisyam Ab Razak and Taufiq Hassan
54
Bathala, C. T., Moon, K. P., & Rao, R. P. (1994). Managerial ownership, debt policy, and the impact of institutional holdings: an agency perspective. Financial Management, 23(3), 38-50.
Benson, B. W., & Davidson, W. N. (2010). The relation between stakeholder management, firm value, and CEO compensation: A test of enlightened value maximization. Financial Management, 39(3), 929-964.
Bevan, A. A., & Danbolt, J. (2002). Capital structure and its determinants in the UK-a decompositional analysis. Applied Financial Economics, 12(3), 159-170.
Bhattacharyya, N., Mawani, A., & Morrill, C. (2008). Dividend payout and executive compensation: theory and evidence. Accounting & Finance, 48(4), 521-541.
Brander, J. A., & Poitevin, M. (1992). Managerial compensation and the agency costs of debt finance. Managerial and Decision Economics, 13(1), 55-64.
Bruce, A., & Buck, T. (2005). Executive pay and UK corporate governance. In K. Keasey, S. Thompson, M. Wright (Eds.), Corporate Governance: Accountability, Enterprise and International Comparisons, (pp. 117-136). John Wiley & Sons, Chichester.
Chen, C. R., & Steiner, T. L. (1999). Managerial ownership and agency conflicts: A nonlinear simultaneous equation analysis of managerial ownership, risk taking, debt policy, and dividend policy. Financial Review, 34(1), 119-136.
Chen, M. Y. (2010). Managerial compensation and R&D investments: the role of the external managerial labour market. International Review of Applied Economics, 24(5), 553-572.
Cheung, Y.-L., Stouraitis, A., & Wong, A. W. (2005). Ownership concentration and executive compensation in closely held firms: Evidence from Hong Kong. Journal of Empirical Finance, 12(4), 511-532.
Claessens, S., Djankov, S., Fan, J. P., & Lang, L. H. (1999). Expropriation of minority shareholders: Evidence from East Asia: Citeseer.
Claessens, S., Djankov, S., & Lang, L. H. (2000). The separation of ownership and control in East Asian corporations. Journal of financial Economics, 58(1), 81-112.
Conyon, M. J., Core, J. E., & Guay, W. R. (2010). Are US CEOs paid more than UK CEOs? Inferences from risk-adjusted pay. Review of Financial Studies, 112.
Corsetti, G., Pesenti, P., & Roubini, N. (1998). What caused the Asian currency and financial crisis? Part II: The policy debate (No. w6834). National Bureau of Economic Research.
Crutchley, C. E., Jensen, M. R., Jahera Jr, J. S., & Raymond, J. E. (1999). Agency problems and the simultaneity of financial decision making: The role of institutional ownership. International Review of Financial Analysis, 8(2), 177-197.
DeAngelo, H., & DeAngelo, L. (2007). Capital structure, payout policy, and financial flexibility. Marshall School of Business Working Paper No. FBE, 02-06.
Demsetz, H., & Villalonga, B. (2001). Ownership structure and corporate performance. Journal of Corporate Finance, 7(3), 209-233.
Dogan, E., & Smyth, R. (2002). Board Remuneration, Company Performance, and Ownership Concentration: Evidence from Publicly Listed Malaysian Companies. ASEAN Economic Bulletin, 19(3), 319-347.
Easterbrook, F. H. (1984). Two agency-cost explanations of dividends. The American Economic Review, 74(4), 650-659.
Espen Eckbo, B., & Verma, S. (1994). Managerial shareownership, voting power, and cash dividend policy. Journal of Corporate Finance, 1(1), 33-62.

Pertanika J. Soc. Sci. & Hum. 23 (S): 39 – 58 (2015)
Agency theory, Manager Incentive, Dividends, Debt: Review for Agenda
55
Ezeoha, A. E., & Okafor, F. O. (2010). Local corporate ownership and capital structure decisions in Nigeria: a developing country perspective. Corporate Governance, 10(3), 249-260.
Faccio, M., Lang, L. H., & Young, L. (2001). Dividends and expropriation. American Economic Review, 91(1), 54-78.
Faulkender, M., Milbourn, T., & Thakor, A. (2006). Capital structure and dividend policy: two sides of the same coin. Washington University in St. Louis, working paper.
Fernandes, N., Ferreira, M. A., Matos, P., & Murphy, K. J. (2013). Are US CEOs paid more? New international evidence. Review of Financial Studies, 26(2), 323-367.
Fields Jr, J. S., Goodman, B. L., Guthrie, G. L., Starke, W. J., & Stuecheli, J. A. (2010). Protecting ownership transfer with non-uniform protection windows. Google Patents.
Filatotchev, I., & Allcock, D. (2010). Corporate governance and executive remuneration: A contingency framework. The Academy of Management Perspectives, 24(1), 20-33.
Fleming, G., Heaney, R., & McCosker, R. (2005). Agency costs and ownership structure in Australia. Pacific-Basin Finance Journal, 13(1), 29-52.
Fosberg, R. H. (2004). Agency problems and debt financing: leadership structure effects. Corporate Governance, 4(1), 31-38.
Gao, H., & Li, K. (2014). Large shareholders and CEO performance-based pay: New evidence from privately-held firms. Available at SSRN 2047997.
Geiler, P., & Renneboog, L. (2014, May 13). Executive Remuneration and the Payout Decision. Center Discussion Paper Series No. 2014-032; ECGI - Finance Working Paper No. 420/2014. Available at SSRN: http://ssrn.com/abstract=2436343 or http://dx.doi.org/10.2139/ssrn.2436343
Ghosh, C., & Sirmans, C. (2006). Do managerial motives impact dividend decisions in REITs? The Journal of Real Estate Finance and Economics, 32(3), 327-355.
Ghosh, S. (2007). Leverage, managerial monitoring and firm valuation: A simultaneous equation approach. Research in Economics, 61(2), 84-98.
Givoly, D., Hayn, C., Ofer, A. R., & Sarig, O. (1992). Taxes and capital structure: Evidence from firms’ response to the Tax Reform Act of 1986. Review of Financial Studies, 5(2), 331-355.
Grossman, S. J., & Hart, O. D. (1982). Corporate financial structure and managerial incentives. In The economics of information and uncertainty (pp. 107-140): University of Chicago Press.
Gujarati, D. N., & Porter, D. (2009). Basic Econometrics Mc Graw-Hill International Edition.
Hamsawi, R. (2011, 11 August). Top Ringgit for head honchos. Business Times.
Hardjopranoto, W. (2006). Interependent Analysis of Leverage, Dividend, and Managerial Ownership Policies. Gadjah Mada International Journal of Business, 8(2), 179-199.
Healy, P. M. (1985). The effect of bonus schemes on accounting decisions. Journal of accounting and economics, 7(1), 85-107.
Hill, C. W., & Jones, T. M. (1992). Stakeholder-agency theory. Journal of management studies, 29(2), 131-154.
Hill, R. C., Griffiths, W. E., & Lim, G. C. (2008). Principles of econometrics (Vol. 5): Wiley Hoboken, NJ.
Holderness, C. G., & Sheehan, D. P. (1988). The role of majority shareholders in publicly held corporations: An exploratory analysis. Journal of Financial Economics, 20, 317-346.

Pertanika J. Soc. Sci. & Hum. 23 (S): 39 – 58 (2015)
M. Ghasemi, Nazrul Hisyam Ab Razak and Taufiq Hassan
56
Hu, A., & Kumar, P. (2004). Managerial entrenchment and payout policy. Journal of Financial and Quantitative Analysis, 39(04), 759-790.
Jeelinek, K., & Stuerke, P. S. (2009). The non-linear relation between agency costs and managerial equity ownership. International Journal of Managerial Finance, 5(2), 156-178.
Jensen, G. R., Solberg, D. P., & Zorn, T. S. (1992). Simultaneous determination of insider ownership, debt, and dividend policies. Journal of Financial and Quantitative Analysis, 27(02), 247-263.
Jensen, M. C. (1986). Agency costs of free cash flow, corporate finance, and takeovers. The American Economic Review, 76(2), 323-329.
Jensen, M. C., & Meckling, W. H. (1976). Theory of the firm: managerial behavior, agency costs, and ownership structure. Journal of Financial Economics, 3(4), 78-79,305.
Jensen, M. C., & Meckling, W. H. (1979). Theory of the firm: Managerial behavior, agency costs, and ownership structure: Springer.
Jensen, M. C., & Murphy, K. J. (1990). Performance pay and top-management incentives. Journal of Political Economy, 98(2), 225-264.
Kahle & Kathleen. (2002). When a buyback isn’t a buyback: Open-market repurchases and employee options. Journal of Financial Economics, 63(2), 235–261.
Kanapathy, K. V. (2005). Independent Non-Executive Directors, Managerial Ownership And Firm Performance In Malaysian Public Listed Companies. (Doctoral dissertation), Universiti Sains Malaysia, Malaysia.
Kaur, G., & Rahim, N. (2007). Who gets the big money. Malaysian Business, 1, 16-17.
Kim Ph, Y. H., Rhim, J. C., & Friesner, D. L. (2007). Interrelationships among capital structure, dividends, and ownership: evidence from South Korea. Multinational Business Review, 15(3), 25-42.
Kim, Y. H., Rhim, J. C., & Friesner, D. L. (2007). Interrelationships among capital structure, dividends, and ownership: evidence from South Korea. Multinational Business Review, 15(3), 25-42.
Lee, S.-P., & Chen, H.-J. (2011). Corporate governance and firm value as determinants of CEO compensation in Taiwan: 2SLS for panel data model. Management Research Review, 34(3), 252-265.
Lewellen, W., Loderer, C., & Martin, K. (1987). Executive compensation and executive incentive problems: An empirical analysis. Journal of Accounting and Economics, 9(3), 287-310.
Ling, F. S., Abdull Mutalip, M., Shahrin, A. R., & Othman, M. S. (2008). Dividend policy: Evidence from public listed companies in Malaysia. In International Business Research Conference, 3-6 December 2007, Sydney, Australia.
López-Iturriaga, F. J., & Rodríguez-Sanz, J. A. (2012). Ownership structure, financial decisions, and institutional setting: an international analysis through simultaneous equations. Economics Research International, 2012, 1-12.
Mat Nor, F., and Sulong, Z. (2007). The interaction effect of ownership structure and board governance on dividends: Evidence from Malaysian listed firms. Capital Market Review, 15(1&2), 73-101.
McConaughy, D. L. (2000). Family CEO vs. Non-family CEOs in the familycontrolled firm: An examination of the level and sensitivity of pay to performance. Family Business Review, 13(2), 121-131.

Pertanika J. Soc. Sci. & Hum. 23 (S): 39 – 58 (2015)
Agency theory, Manager Incentive, Dividends, Debt: Review for Agenda
57
Mehran, H. (1995). Executive compensation structure, ownership, and firm performance. Journal of Financial Economics, 38(2), 163-184.
Minhat, M., & Abdullah, M. (2014). Executive compensation in government-linked companies: evidence from Malaysia. Applied Economics, 46(16), 1861-1872.
Mintzberg, H. (2009). No more executive bonuses! Wall Street Journal, 30, A17.
Mokhtar, A. (2005). The Malay Way of Business Change. Economist, 376(8440), 50.
Morck, R., Shleifer, A., & Vishny, R. W. (1988). Management ownership and market valuation: An empirical analysis. Journal of Financial Economics, 20, 293-315.
Moussa, F. B., & Chichti, J. (2014). A nonlinear simultaneous equation analysis of managerial ownership and debt policy: Evidence from Tunisian Stock Exchange. International Journal of Accounting and Financial Reporting, 3(2), 225-254.
Mustapha, M., & Ahmad, A.C. (2011a). Agency costs of debt and Monitoring. International Review of Business Research Papers, 7(4), 118-129.
Mustapha, M., & Ahmad, A. C. (2011b). Agency theory and managerial ownership: evidence from Malaysia. Managerial Auditing Journal, 26(5), 419-436.
Mustapha, M., Ismail, H., & Minai, B. (2011). Determinants of debt structure: empirical evidence from Malaysia. In Proceedings of the 2nd International Conference on Business and Economic Research (pp. 2523-254).
Myers, S. C., & Majluf, N. S. (1984). Corporate financing and investment decisions when firms have information that investors do not have. Journal of Financial Economics, 13(2), 187-221.
Nyonna, D. Y. (2012). Simultaneous Determination of Insider Ownership and Leverage: The Case of Small Businesses. Economics & Business Journal: Inquiries & Perspectives, 4(1), 9-20.
O’Callaghan, S., Ashton, J., & Hodgkinson, L. (2014). Executive compensation and ownership structure in private UK firms.Unpublished manuscript.
Ortiz-Molina, H. (2007). Executive compensation and capital structure: The effects of convertible debt and straight debt on CEO pay. Journal of Accounting and Economics, 43(1), 69-93.
Peng, M. W., Au, K. Y., & Wang, D. Y. (2001). Interlocking directorates as corporate governance in Third World multinationals: Theory and evidence from Thailand. Asia Pacific Journal of Management, 18(2), 161-181.
Persson, R. (2014). Simultaneous determination of Debt, Dividend, and Inside Ownership policies. Evidence from Sweden.
Rozeff, M. S. (1982). Growth, beta and agency costs as determinants of dividend payout ratios. Journal of Financial Research, 5(3), 249-259.
Salim, B., & Wan-Hussin, W. N. (2009, November 29). Remuneration committee, ownership structure and pay-for-performance: evidence from Malaysia. Available at SSRN 1515166.
Sargan, J. D. (1958). The estimation of economic relationships using instrumental variables. Econometrica: Journal of the Econometric Society, 26(3), 393-415.
Schooley, D. K., & Barney, L. D. (1994). Using dividend policy and managerial ownership to reduce agency costs. Journal of Financial Research, 17(3), 363-373.
Shen, C. H.-h. (2014). Pecking order, access to public debt market and information asymmetry. International Review of Economics & Finance, 29, 291-306.

Pertanika J. Soc. Sci. & Hum. 23 (S): 39 – 58 (2015)
M. Ghasemi, Nazrul Hisyam Ab Razak and Taufiq Hassan
58
Shiyyab, F., Girardone, C., & Zakaria, I. (2013). Pay for no performance? Executive pay and performance in EU banks. Essex Business School, University of Essex.
Short, H., & Keasey, K. (1999). Managerial Ownership and the Performance of Firms: Evidence from the UK. Journal of Corporate Finance, 5(1), 79-101.
Short, H., Zhang, H., & Keasey, K. (2002). The link between dividend policy and institutional ownership. Journal of Corporate Finance, 8(2), 105-122.
Sulong, Z., Gardner, J. C., Hussin, A. H., Sembilan, U. K. N., Sanusi, Z. M., & McGowan Jr, C. B. (2013). Managerial Ownership, Leverage and Audit Quality Impact on Firm Performance: Evidence from the Malaysian Ace Market. Accounting & Taxation, 5(1), 59-70.
Theil, H. (1961). Economic forecasts and policy.
Tirole, J. (2010). The theory of corporate finance: Princeton University Press.
Vicknes, S. (2003). Top earners in Malaysia. Accountants Today, 16(10), 12-15.
Vo, D. H., & Nguyen, V. T.-Y. (2014). Managerial Ownership, Leverage and Dividend Policies: Empirical Evidence from Vietnam’s Listed Firms. International Journal of Economics and Finance, 6(5), 274.
Werner, S., Tosi, H. L., & Gomez-Mejia, L. (2005). Organizational governance and employee pay: How ownership structure affects the firm’s compensation strategy. Strategic Management Journal, 26(4), 377-384.
Wooi, H. C., & Ming, M. T. C. (2009). Directors’ Pay-Performance: A Study on Malaysian Government Linked Companies. Centre for Policy Research and International Studies, 1-19.
Yatim, P. (2013). Directors’ Remuneration and Corporate Governance in Malaysia. In 7th Asia Pacific Interdisciplinary Research in Accounting Conference.
Zellner, A. (1962). An efficient method of estimating seemingly unrelated regressions and tests for aggregation bias. Journal of the American statistical Association, 57(298), 348-368.
Zhang, Y. (2009). Are debt and incentive compensation substitutes in controlling the free cash flow agency problem? Financial Management, 38(3), 507-541.
Zunaidah, S., & Fauzias, M. N. (2008). Dividends, ownership structure and board governance on firm value: Empirical evidence from Malaysian listed firms. Malaysian Accounting Review, 7(2), 55-94.

Pertanika J. Soc. Sci. & Hum. 23 (S): 59 – 72 (2015)
ISSN: 0128-7702 © Universiti Putra Malaysia Press
SOCIAL SCIENCES & HUMANITIESJournal homepage: http://www.pertanika.upm.edu.my/
ARTICLE INFOArticle history:Received: 30 March 2015Accepted: 10 September 2015
E-mail addresses:[email protected] (Mohd Nazli Mohd Nor),[email protected] (Malcolm Smith),[email protected] (Zubaidah Ismail),[email protected] (Hairul Suhaimi Nahar)* Corresponding author
Unethical Audit Behaviour among Malaysian Auditors: An Exploratory Study
Mohd Nazli Mohd Nor1*, Malcolm Smith2, Zubaidah Ismail3 and Hairul Suhaimi Nahar4
1School of Maritime Business and Management, Universiti Malaysia Terengganu, Malaysia2School of Commerce, University of South Australia, Australia3School of Business, Faculty of Business and Law, Edith Cowan University, Australia4Department of Accounting and Finance, Faculty of Economics and Management, Universiti Putra Malaysia, 43300 Serdang, Selangor, Malaysia
ABSTRACT
The purpose of this paper is to investigate the occurrence of unethical behaviours commonly known as Reduced Audit Quality Practices (RAQP) among auditors. The study employed a mail survey to collect data from auditors registered with the Malaysia Institute of Accountants. The results of this study indicated that RAQP did occur in the Malaysian auditing profession, especially among auditors with less auditing experience and practicing in non-big four audit firms.
Keywords: Unethical Behaviours, RAQP, Audit Quality, Dysfunctional Behaviour
public scrutiny whereby accountants were alleged to have breached their trust (Chan & Leung, 2006). Loosing the public trust may put the accountancy profession in a self destruct mode as proved by the case of Arthur Andersen, one of the then, big four audit firms. As a consequence, government intervention in regulating the profession were increased in quest of restoring public confidence (Chan & Leung, 2006).
One strategic effort was the introduction of a new quality control standard which is the International Standard on Quality Controls 1 (ISQC1). The purpose of
INTRODUCTION
Major corporate scandals such as Enron, WorldCom and Parmalat in the early 2000s have shed light on the status and credibility of the auditing profession. These scandals put the auditing profession under increasing

Pertanika J. Soc. Sci. & Hum. 23 (S): 59 – 72 (2015)
Mohd Nazli Mohd Nor, Malcolm Smith, Zubaidah Ismail and Hairul Suhaimi Nahar
60
this standard is to strengthen the ethical environment of the auditing profession by placing high emphasis on both, ethical and technical requirements. The standard recognises the importance of ethical behaviour among auditors when they audit the financial reports. Ethical behaviours among auditors are vital to produce high audit quality (Pflugrath, Martinov-Bennie & Chen, 2007), especially when ethical problems are inherent in the audit working environment (Finn, Chonko & Hunt, 1988). Auditors play a boundary-spanning role (Rebele & Michaels, 1990), a role requires extensive “interactions with many people, both inside and outside the organisation, with diverse needs and expectation” (Goolsby, 1992, p. 156). Such interactions, in many cases, may result in potential conflict of interest and lead to unethical behaviours among the auditors.
Previous studies indicate that auditors’ unethical behaviours such as reduced audit quality practices (RAQP) were common practices among the auditors. Such practices were identified in the published Cohen Commission report in 1978. The report discloses that majority of the auditors engaged in premature sign-off acts (Margheim & Pany, 1986) which constitutes one of the many RAQP practices. Subsequent studies showed relatively high number of auditors involved in RAQP, providing cogent evidence that auditors tend to compromise audit quality by engaging in unethical behaviours (Kelley & Margheim, 1990; Otley & Pierce, 1996; Coram, Ng & Woodliff, 2003; Paino, Ismail & Smith, 2010).
Present study examines the ethical problems among Malaysian auditors, especially after the code of ethics have mandated ISCQ1 on all accounting firms, which may give some insight into such regulatory initiative i.e. whether the introduction of ISCQ1 improves (or otherwise) auditors’ ethical environment in the auditing profession. Moreover, previous studies on RAQP have provided strong support on the occurrence of misbehaviour in the auditing work environment, however, none has considered the effect of auditors’ audit experience. The consequence of such misbehaviour is potentially detrimental, since it may lead to substandard audit quality and erroneous audit opinion thereof.
LITERATURE REVIEW
Audit Quality
Extant literature provide definitions of audit quality from multiple perspectives. The most prevalent definition of audit quality in the accounting literature is the market-assessed probability that the financial statements contain material errors and that the auditor will both detect and report errors and irregularities in financial statements (DeAngelo, 1981). Other definitions used in the accounting literature are the probability that an auditor will not issue an unqualified report for financial statements containing significant misstatements (Lee, Liu, & Wang, 1999), the accuracy of the information provided by auditors (Titman & Trueman, 1986; Krinsky & Rotenberg, 1989; Davidson & Neu, 1993) and the degree to which the auditors comply with

Pertanika J. Soc. Sci. & Hum. 23 (S): 59 – 72 (2015)
Unethical Audit Behaviour among Malaysian Auditors: An Exploratory Study
61
applicable legal and professional standards (Cook, 1987; McConnell & Banks, 1998; Tie, 1999; Krishnan & Schauer, 2001).
Despite the diverse definitions, they effectively share similar dimensions which are competence and independence. Fearnley and Beattie (2004) argued that these dimensions are necessary to avoid audit failure and hence they are mutually inclusive (Barnes & Huan, 1993). Pflugrath et al. (2007) defines auditor competency as the degree to which an auditor can apply and comply with the professional standards and professional’s code of ethics. They further suggest that auditors should “posses both technical and ethical dimensions, and audit quality is determined by both technical and ethical factors” (2007, p. 569).
Reduced Audit Quality Practices
In auditing, audit quality is the fundamental factor which explains the demand for auditing practice. The auditing profession serves as a middle-man to reduce information asymmetry between the preparer and users of financial statements. Therefore, in order to retain this role, auditors must maintain the trust and confidence of the public (Pasewark, Shockley & Wilkerson, 1995) which can only be achieved by providing high audit quality standards. Arguably, this stewardship function is systematically violated in the event of substandard audit quality. Lack of expertise and insufficient experience may lead the auditors to engage in unethical behaviours, such as improperly investigate errors or misstatements, or over relying on the information given by clients;
all of which will affect the findings of audit works. These unethical behaviours practically constitute RAQP.
RAQP is defined by Herrbach (2001, p. 790) as “…poor execution of an audit procedure that reduces the level of evidence gathered for the audit, so that the collected evidence is unreliable, false or inadequate quantitatively or qualitatively”. RAQP technically occurs when the auditors have not properly executed audit procedures required to complete their tasks. This behaviour will not only give a negative effect to individual auditors, but also threatens the outcome of the engagement and the validity of the audit opinion. The audit risk is increased if audit work is not properly performed and executed (Coram et al., 2003), causing the probability of auditing firms issuing wrong audit opinion is higher.
This research stream on RAQP originally emerges from the report issued by the American Institute of Certified Public Accountants’ (AICPA) Cohen Commission in 19781. The report provides some important insight on auditors’ behaviours and provides evidence that it is normal for auditors to sign-off an audit program without performing necessary audit procedures, not recording the omission of those audit procedures or not substituting it with other alternative audit procedures or steps (Alderman & Deitrick, 1982). The report also disclosed that approximately
1This report is not publicly available. References for this report has been obtained from other studies, e.g. Alderman and Deitrick (1982) and Margheim and Pany (1986).

Pertanika J. Soc. Sci. & Hum. 23 (S): 59 – 72 (2015)
Mohd Nazli Mohd Nor, Malcolm Smith, Zubaidah Ismail and Hairul Suhaimi Nahar
62
60% of the auditors engaged in premature sign-off acts (Margheim & Pany, 1986) and provides a platform for subsequent research to further investigate the RAQP among auditors.
RAQP have both, direct and indirect implications for audit quality. Underreporting of time is a behaviour engaged by auditors that indirectly affects audit quality (Kelley & Margheim, 1990; Otley & Pierce, 1996). On the other hand, behaviour that directly affect audit quality are premature sign-off (Donnelly, Quirin & O’Bryan, 2003; Pierce & Sweeney, 2004), accepting weak client explanations or doubtful evidence (Malone & Roberts, 1996; Coram et al., 2003; Gundry & Liyanarachchi, 2007), failing to research an accounting principle (Kelley & Margheim, 1990; Otley & Pierce, 1996), making superficial reviews of client documents (Kelley & Margheim, 1990; Malone & Roberts, 1996), reducing the amount of work performed on audit step (Otley & Pierce, 1996), rejecting awkward looking items from a sample and not testing all of the items in a selected sample (Coram et al., 2003).
Raghunathan (1991) found that 55% of the auditors had prematurely signed-off on audit program. Coram et al. (2003) who investigated auditors in Australia found that 63% of the auditors admitted “sometime” engaging in RAQP, while Paino et al. (2010) found 72% of the auditors admitted to engaging in one or more RAQP, at least “sometime”. The results of Otley and Pierce (1996) are more
disturbing as they found that 88% of the senior auditors in three of the Big 62 firms in Ireland admitted to have engaged in at least one of the RAQPs. Accordingly, the specific questions addressed in this study on RAQP is:RQ1. How extensive are the RAQP among
the Malaysian auditors?RQ2. What are the factors influencing the
occurrence of RAQP in Malaysia?
Prior studies have found that RAQP are most likely to occur at lower-level positions within the audit firm. Gundry and Liyanarachchi (2007) and Alderman and Deitrick (1982) found that lower level audit staffs and senior auditors were more likely to engage in RAQP than managers and partners. Similarly, most of prior studies examining lower level audit staffs and senior auditors found a high incidence of RAQP at these levels (Kelley & Margheim, 1990; Raghunathan, 1991; Otley & Pierce, 1996). One possible explanation for this may be that the auditors at lower level positions perceive meeting the budget as important for their performance evaluation and their evaluation is done by manager and partner. In addition, they may also think that budgets are more difficult to attain thus influencing them to engage in RAQP. On the other hand, Coram et al. (2003) found that there was no significant difference in terms of experience level in RAQP incidence. Malone and Roberts (1996) however did find experience level or “tenure effect” is associated with RAQP.
2Currently Big 6 firms are known as Big 4 firms

Pertanika J. Soc. Sci. & Hum. 23 (S): 59 – 72 (2015)
Unethical Audit Behaviour among Malaysian Auditors: An Exploratory Study
63
They found that senior auditors are more likely to have committed RAQP than staff auditors, in view that they have been in public accounting for quite some time and they were exposed to more chances to experience and respond to circumstances where RAQP were possible. With regards to gender, prior research suggests no significant difference between male and female auditors in the incidence of RAQP (Coram et al., 2003). Thus, research question 3 is stated as follows:RQ3. Do auditing experience, position
and gender affect RAQP behaviours among Malaysian auditors?
Majority of audit quality literature used firm differentiation approach as a basis for its research framework. This approach is used to explain the rationale of audit firms’ involvement in reducing the information gap. Previous studies that used such approach were conducted under the assumption that larger audit firms provide higher audit quality (Watkins, Hillison & Morecroft, 2004). This could be due to the fact that larger audit firms such as Big four auditing firms have stronger ethical environments through firm’s code of conduct and relevant ethical trainings (Pflugrath et al., 2007). However, the occurrences of recent scandals involving large audit firms suggest that this assumption is somewhat tenuous. Furthermore, there was also evidence that the incidence of RAQP does not only occurr in small and medium auditing firms (Margheim & Pany, 1986; Gundry & Liyanarachchi, 2007), but surprisingly, in Big four auditing firms too
(Kelley & Margheim, 1990; Raghunathan, 1991; Otley & Pierce, 1996; Donnelly et al., 2003). Thus, to investigate this issue in the Malaysian context, the following research question is proposed: R4. Do firm types affect the unethical
behaviours among the auditors?
METHODOLOGY
Participants
The respondents of this study consist of registered external auditors with the Malaysian Institute of Accountant (MIA). The questionnaire was posted together with a postage-paid pre-addressed envelope. In requesting their participation, respondents are also informed that their involvement is completely voluntary and that responses will be treated confidentially with results are reported in aggregate form.
Measurement
The questionnaire was divided into 3 sections of demographic information, RAQP and factors that lead to RAQP. Demographic information includes gender, age, year of audit experience, job position and type of audit firm. The RAQP was measured using items drawn from Kelley and Margheim (1990) and Otley and Pierce (1996). Five items, namely (1) prematurely signing-off on an audit program step; (2) reducing the amount of work performed on an audit step below what the audit would consider reasonable; (3) failing to research an accounting principle or technical issue; (4) making superficial reviews of client

Pertanika J. Soc. Sci. & Hum. 23 (S): 59 – 72 (2015)
Mohd Nazli Mohd Nor, Malcolm Smith, Zubaidah Ismail and Hairul Suhaimi Nahar
64
documents; and (5) accepting weak client explanations. These are selected mainly because Kelley and Margheim (1990) found that these audit misbehaviors are commonly engaged by auditors. Respondents were asked to indicate the frequency of each variable encountered in the previous year of audit work. The factors that lead to RAQP behaviours are drawn from Alderman and Deitrick (1982). A five-point Likert scale was employed in all of the questions in the questionnaire except for the demographic information.
RESULT
Response
Questionnaires were sent to 1,756 MIA members out of which 296 questionnaires were returned (16.9% response rate). Out of these, 7 incomplete questionnaires were received. 15 questionnaires were excluded
mainly because the respondents were not working as an external auditor. This leaves 274 usable questionnaires, representing 15.6% response rate. The low response rate is expected and well acknowledged in various mail survey studies across various research fields in Malaysia and developing countries in view that participants are typically reluctant to participate in mail surveys (Salleh & Dali, 2009; Shaari, 2010). In addition to that, the sensitive and confidential nature of the information requested may have contributed to the low response rate. The response rate obtained in this study is similar to prior studies conducted in Malaysia, with response rate ranging from only 12.3% to 22.7% (Othman, Abdul-Ghani & Arshad, 2001; Jusoh, Ibrahim & Zainuddin, 2008; Jusoh & Parnell, 2008; Lai, 2008; Salleh & Dali, 2009; Shaari, 2010).
TABLE 1Characteristics of Sample
No % No %Gender Firm’s SizeMale 110 40% Big Four 40 14.6%Female 164 60% Non-Big Four 234 85.4%
274 100% 274 100%
Auditing Experience Position in FirmBelow 3 years 0 0 Junior 0 03 – 5 years 92 33.6% Senior 125 45.6%6 – 10 years 120 43.8% Manager 126 46%11 years and above 62 22.6% Director 11 4%
Partner 12 4.4%274 100% 274 100%

Pertanika J. Soc. Sci. & Hum. 23 (S): 59 – 72 (2015)
Unethical Audit Behaviour among Malaysian Auditors: An Exploratory Study
65
Table 1 above summarizes the characteristics of respondents. A demographic assessment of the sample revealed that majority of the respondents were female (59.9%) and nearly half of the respondents (43.8%) had 6 to 10 years audit experience, followed by 3 to 5 years (33.6%) and more than 10 years of audit experience (22.6%). None of the respondents had audit experience of less than three years. This is not surprising as this study used MIA members as its respondents and MIA requires three years relevant experience to qualify for membership. The respondents were predominantly from non-Big Four firms (85%) and most of the respondents were either at senior (45.6%) or manager (46%) levels.
The survey questionnaire used five RAQP items similar to those used by Kelley and Margheim (1990) and Otley and Pierce (1996). Table 2 below presents the summary of respondents’ responses on specific RAQP. In general, the means for all RAQP items are close to “2”, which represented the “rarely”
category. The standard deviation suggests that the individual RAQP is not widely spread. The most common RAQPs engaged by respondents are “superficial reviews of client’s documents” followed by “reduced audit work below what they considered reasonable” with 24.1% and 16% of the respondents at least “often” involved in these kind of practices. Almost 13% of the respondents engaged in “premature sign-off”, whereas only 9.1% and 8% at least “often” engaging in the “accepted weak client explanation” and “failed to research an accounting principle”, respectively. 14.6% to 28.5% of the respondents indicated that they “never” involve in any of the RAQP. However, out of these, only 5.11% (14 respondents) indicated that they were “never” involved in all of five types of RAQP, thus suggesting that RAQP could be a normal practice among auditors during the auditing process.
TABLE 2The Frequencies of Specific RAQP Engaged by Auditors
RAQP Never Rarely Sometimes Often Always Mean Standard Deviation
Prematurely signing-off on audit program step
24.8% (68) 27.7% (76) 34.7% (95) 9.5% (26) 3.3% (9) 2.39 1.06
Reduced work below what you considered reasonable
14.6% (40) 31.4% (86) 38.0% (104) 14.2% (39) 1.8% (5) 2.57 0.97
Failed to research an accounting principle 28.5% (78) 35.4% (97) 28.1% (77) 6.9% (19) 1.1% (3) 2.17 0.96
Made superficial reviews of documents
24.1% (66) 21.2% (58) 30.7% (84) 16.8% (46) 7.3% (20) 2.62 1.22
Accepted weak client explanation 22.3% (61) 38.0% (104) 30.7% (84) 7.3% (20) 1.8% (5) 2.28 0.95

Pertanika J. Soc. Sci. & Hum. 23 (S): 59 – 72 (2015)
Mohd Nazli Mohd Nor, Malcolm Smith, Zubaidah Ismail and Hairul Suhaimi Nahar
66
Table 3 below presents means for RAQP items based on demographic information such as gender, firm size, position and year of auditing experience. It shows that male auditors involved in unprofessional behaviours more than female auditors. However, only “ reduced audit work below what they considered reasonable” is significant, t (272) = 2.71, p<0.01. Further analysis was conducted to compare total mean scores for RAQP for male and female respondents. The result indicates that there was no significant difference in scores for males (M = 2.49, SD = 0.78) and females (M = 2.35, SD = 0.76; t (272) = 1.52, p>0.5 (two-tailed).
The results also indicate that non-Big four firms have higher means in all RAQP items compared to Big-four firms, except for “reduced work below what auditor considered reasonable” which is significant at 0.01. The analysis of total mean scores for RAQP supports this assertion by indicating that non-Big four firms auditors (M = 2.50, SD = 0.76) had a significantly higher mean for engaging in RAQP than Big-four firm auditors (M = 1.88, SD = 0.64); t (272) = -4.86) at p<.01.
Table 3 futher shows that auditors with more auditing experience are associated with lower levels of engagement in RAQP. The mean score reflects the fact that all RAQP activities were engaged by those who had served in the profession for less than 5 years. The lowest is 2.41 (failed to research an accounting principle) and the highest is 2.86 (made superficial reviews of documents). ANOVA analysis was
conducted to further explore the impact of auditing experience on audit quality, as measured by the RAQP. There was a statistically significant difference at p<0.05 level in RAQP for the three experience groups: F (2, 271) = 7.39. A Tukey post-hoc test reveals that the unprofessional behaviours by the auditors with auditing experience 3 to 5 years (M = 2.63, SD = 0.77) was statistically significantly higher compared to auditors with 6 to 10 years (M = 2.35, SD = 0.74) and more than 11 years experience (M = 2.17, SD = 0.75). There is no statistically significant differences between the auditors with 6 to 10 years and more than 11 years experience.
As with the auditing experience, the results indicate that lower rank auditors have tendency to engage in RAQP except for “accepted weak client explanation”. ANOVA test examining the effect of positions (i.e. senior auditors, manager, director and partner) on RAQP provides resuls indicating that there is a significant effect of position on RAQP engagement, F (3, 270) = 8.55, p<0.01. Further analysis reveals that auditors at the “senior” level had a significantly higher mean for engaging in RAQP than those at “manager” level (senior auditor, M = 2.65, SD = 0.72; manager, M = 2.17, SD = 0.77).
With regards to possible reasons of engaging in RAQP, auditors indicate beliefs that this practice is most likely the result of (1) client or regulatory agency deadline, (2) time budget constraint, (3) work is low risk, and (4) inadequate supervision as shown in Table 4 below.

Pertanika J. Soc. Sci. & Hum. 23 (S): 59 – 72 (2015)
Unethical Audit Behaviour among Malaysian Auditors: An Exploratory Study
67
TABLE 3The Mean of Specific RAQP Based on Demographic Information
RAQPGender Firm size Auditing Experience
(years) Position
Male Female Big-four Non-Big four 3 to 5 6 to 10 above 11 Senior Auditor Manager Director Partner
Prematurely signing-off on a audit program step
2.46 2.34 1.80 2.49 2.54 2.48 1.98 2.61 2.18 2.18 2.42
Reduced work below what you considered reasonable
2.76 2.45 2.40 2.60 2.83 2.53 2.27 2.71
2.50
2.18
2.25
Failed to research an accounting principle 2.17 2.16 1.75 2.24 2.41 2.06 2.02
2.42
1.92
2.36 2.00
Made superficial reviews of documents 2.66 2.59 1.78 2.76 2.86 2.51 2.48 3.00
2.21 2.64
2.92
Accepted weak client explanation 2.40 2.21 1.68 2.39 2.52 2.19 2.11 2.50 2.06 2.18 2.58
Mean RAQP Score 2.49 2.34 1.88 2.50 2.63 2.35 2.17 2.65 2.17 2.31 2.43
TABLE 4The Cause for RAQP
RAQP MeanClient or regulatory agency imposed deadline 3.22Time budget constraint 3.19Work is low risk 2.96Inadequate supervision 2.84To obtain a favourable performance evaluation 2.82Lack of specific technical knowledge 2.80Inclination to readily accept client personnel explanations 2.76Unnecessary or immaterial audit step 2.69Dislike for the specific work required 2.43
Misunderstanding of professional responsibilities 2.34
DISCUSSION
The aim of this study is to examine the existence of RAQP among Malaysian auditors at various positions. This academic inquiry is motivated by several major financial scandals leading to public untrust
on auditing profession. This study provides fresh Malaysian evidence in relation to audit quality threatening behaviours specifically RAQP. In general the most RAQP engaged by auditors are “superficial reviews of client’s documents” followed

Pertanika J. Soc. Sci. & Hum. 23 (S): 59 – 72 (2015)
Mohd Nazli Mohd Nor, Malcolm Smith, Zubaidah Ismail and Hairul Suhaimi Nahar
68
by “reduced audit work” with 24% and 16% of the auditors at least being “often” involved in these practices, respectively. The least engaged RAQPs are “accepted weak client explanation” and “failed to research an accounting principle”. Almost 13% of the auditors involved in “premature sign-off”.
One major concern highlighted in this study is the high incidence of RAQP among auditors in Malaysia. This study found that almost 95% of the auditors engaged in some of the RAQP. The possible explanation for the high involvement of auditors with RAQP could be due to stress factors. The respondents in this study indicated that the reasons why they engaged in this unprofessional behaviours are mainly because of tight client deadline and time budget constraint; both are the sources of stress and need to be properly managed by audit firms. There is also evidence that these behaviours will be on an increasing trend as Otley and Pierce (1996) and Coram, Ng and Woodliff (2003) found that 12% and 37% of respondents indicated “never” for all types of RAQP. However, present research found that only 5% of respondents indicated that they “never” engaged in any type of RAQP. This provides evidence that RAQP is highly problematic in Malaysian auditing profession as the empirical results obtained point to the fact that the RAQP level is higher compared to those documented in other countries. The fact that almost 95% of the auditors engaged in at least one of the RAQPs in Malaysia provides evidence of the critical level of
this problem in the auditing environment, which could have a detrimental effect specifically on the audit opinion.
Consistent with previous studies (e.g., Margheim & Pany, 1986), the results indicate that auditors in non-Big four firms engaged in RAQP more compared to those in Big four firms. The Big four firms may have more effective quality control systems and review procedures to prevent any unprofessional behaviours. Furthermore, the presence of formal codes of conduct and relevant training create strong ethical environment in Big four firms (Pflugrath et al., 2007) and strong ethical culture reduces RAQP behaviours (Svanbergh & Ohman, 2013). These are true as Malone and Roberts (1996) found that auditors will be less likely to engage in RAQP if they perceived that their firm is able to detect and punish those who commit the RAQP. With regards to gender, there is no difference in terms of engaged RAQP between male and female auditors in Malaysia, although the number of female respondents is higher than male, and this is consistent with the previous study (e.g., Coram et al., 2003).
The results also revealed that those who have worked less than five years engaged more in RAQP. Therefore, it is not surprising that present study found auditors at senior position had a significantly higher mean of RAQP engagement compared to manager which supports findings in previous studies (e.g. Alderman & Deitrick, 1982; Gundry & Liyanarachchi, 2007). The possible explanation is that, senior auditors are responsible to directly supervise the

Pertanika J. Soc. Sci. & Hum. 23 (S): 59 – 72 (2015)
Unethical Audit Behaviour among Malaysian Auditors: An Exploratory Study
69
audit team and at the same time responsible to report to manager or partner. However, they are not directly supervised by the manager or partner while carrying out fieldwork, thus providing opportunities for dysfunctional behaviour to occur (Otley & Pierce, 1996). Furthermore, auditors at senior position are the most pressurized group in the firm, which could motivate them to engage in unethical behaviours (Kelley & Seller, 1982). The effectiveness of a firm’s code of ethics as a tool for ethical quidance may also contribute to the findings of this study. The presence of a code of ethics has a positive impact on auditors ethical behaviour (Adams, Malone & James, 1995; Pflugrath et al., 2007). Siegel, O’Shaughnessy and Rigsby (1995) suggests that auditors with greater auditing experience may familiar and have higher level of internalization of professional code of ethic, thus hinders them to behave unethically.
CONCLUSION
Overall, the results of the study provide persuasive evidence of the existence of unethical behaviours among Malaysian auditors at various positions. The fact that most of the RAQP engaged by auditors at lower position should be a concerned to the auditing profession. Accounting firms should consider formally exposing their auditors, especially at junior and senior rank to a professional code of ethic through formal training and close monitoring by more experienced auditors. The results of this study should be interpreted in light of
certain limitations inherent in the study. First, due to the relative small sample size, the auditors in the study may not be representative of the population of auditors in Malaysia; therefore, some caution should be exercised in extrapolating the results of this study to the auditors at large. Furthermore, the auditors who participated in the study are predominantly from non-Big four firms, which may also limit the generalisabiltiy of the results. Despite these limitations, the study improves our understanding of the current situation related to unethical behaviours in the Malaysian auditing profession.
REFERENCEAdams, B. L., Malone, F. L., & James, W. (1995).
Confidentiality decisions: The reasoning process of CPAs in resolving ethical dilemmas. Journal of Business Ethics, 14(12), 1015–1020.
Alderman, C. W., & Deitrick, J. W. (1982). Auditors’ perceptions of time budget pressures and premature sign-offs: A replication and extension. Auditing, 1(2), 54–68.
Barnes, P., & Huan, H. D. (1993). The auditor’s going concern decision: Some UK evidence concerning independence and competence. Journal of Business Finance & Accounting, 20(2), 213–228.
Chan, S. Y. S., & Leung, P. (2006). The effects of accounting students’ ethical reasoning and personal factors on their ethical sensitivity. Managerial Auditing Journal, 21(4), 436–457.
Cook, J. M. (1987). Two years of progress in financial accounting and reporting. Journal of Accountancy, 163(6), 96–108.

Pertanika J. Soc. Sci. & Hum. 23 (S): 59 – 72 (2015)
Mohd Nazli Mohd Nor, Malcolm Smith, Zubaidah Ismail and Hairul Suhaimi Nahar
70
Coram, P., Ng, J., & Woodliff, D. (2003). A Survey of Time Budget Pressure and Reduced Audit Quality Among Australian Auditors. Australian Accounting Review, 13(30), 38–44.
Davidson, R. A., & Neu, D. (1993). A note on the association between audit firm size and audit quality. Contemporary Accounting Research, 9(2), 479–488.
DeAngelo, L. E. (1981). Auditor size and audit quality. Journal of Accounting and Economics, 3(3), 183–199.
Donnelly, D. P., Quirin, J. J., & O’Bryan, D. (2003). Auditor acceptance of dysfunctional audit behavior: An explanatory model using auditors’ personal characteristics. Behavioral Research in Accounting, 15(1), 87–110.
Fearnley, S., & Beattie, V. (2004). The reform of the UK’s auditor independence framework after the Enron Collapse: An example of evidence-based policy making. International Journal of Auditing, 8(2), 117–138.
Finn, D. W., Chonko, L. B., & Hunt, S. D. (1988). Ethical problems in public accounting: The view from the top. Journal of Business Ethics, 7(8), 605–615.
Goolsby, J. R. (1992). A theory of role stress in boundary spanning positions of marketing organizations. Journal of the Academy of Marketing Science, 20(2), 155–164.
Gundry, L. C., & Liyanarachchi, G. A. (2007). Time budget pressure, auditors’ personality type, and the incidence of reduced audit quality practices. Pacific Accounting Review, 19(2), 125–152.
Herrbach, O. (2001). Audit quality, auditor behaviour and the psychological contract. The European Accounting Review, 10(4), 787–802.
Jusoh, R., Ibrahim, D. N., & Zainuddin, Y. (2008). The performance consequence of multiple performance measures usage. International Journal of Productivity and Performance Management, 57(2), 119–136.
Jusoh, R., & Parnell, J. A. (2008). Competitive strategy and performance measurement in the Malaysian context. Management Decision, 46(1), 5–31.
Kelley, T., & Margheim, L. (1990). The impact of time budget pressure, personality, and leadership variables on dysfunctional auditor behavior. Auditing, 9(2), 21–42.
Kelley, T., & Seller, R. E. (1982). Auditor stress and time budgets. The CPA Journal, 52(December), 24–34.
Krinsky, I., & Rotenberg, W. (1989). The valuation of initial public offerings. Contemporary Accounting Research, 5(2), 501–515.
Krishnan, J., & Schauer, P. C. (2001). Differences in quality among audit firms. Journal of Accountancy, 192(1), 85.
Lai, M. L. (2008). Technology readiness, internet self-efficacy and computing experience of professional accounting students. Campus-Wide Information Systems, 25(1), 18–29.
Lee, C. W. J., Liu, C., & Wang, T. (1999). The 150-hour rule. Journal of accounting and economics, 27(2), 203–228.
Malone, C. F., & Roberts, R. W. (1996). Factors associated with the incidence of reduced audit quality behaviors. Auditing, 15(2), 49–64.
Margheim, L., & Pany, K. (1986). Quality Control, premature signoff, and underreporting of time: Some empirical findings. Auditing: A Journal of Practice & Theory, 5(2), 56–63.
McConnell, D. K., & Banks, G. Y. (1998). A common peer review problem. Journal of Accountancy, 185(6), 39–44.
Othman, R., Abdul-Ghani, R., & Arshad, R. (2001). Great expectations - CEOs’ perception of the performance gap of the HRM function in the Malaysian manufacturing sector. Personnel Review, 30(1), 61-80.

Pertanika J. Soc. Sci. & Hum. 23 (S): 59 – 72 (2015)
Unethical Audit Behaviour among Malaysian Auditors: An Exploratory Study
71
Otley, D. T., & Pierce, B. J. (1996). The operation of control systems in large audit firms. Auditing, 15(2), 65–84.
Paino, H., Ismail, Z., & Smith, M. (2010). Dysfunctional audit behaviour: An exploratory study in Malaysia. Asian Review of Accounting, 18(2), 162–173.
Pasewark, W. R., Shockley, R. A., & Wilkerson, J. E. (1995). Legitimacy claims of the auditing profession vis-a-vis the behaviour of its members: An empirical examination. Critical Perspectives on Accounting, 6, 77–94.
Pflugrath, G., Martinov-Bennie, N., & Chen, L. (2007). The impact of codes of ethics and experience on auditor judgement. Managerial Auditing Journal, 22(6), 566–589.
Pierce, B., & Sweeney, B. (2004). Cost- quality conflict in audit firms: An empirical investigation. The European Accounting Review, 13(3), 415–441.
Raghunathan, B. (1991). Premature Signing-Off of Audit Procedures: An Analysis. Accounting Horizons, 5(2), 71–79.
Rebele, J. E., & Michaels, R. E. (1990). Independent auditors’ role stress: Antecedent, outcome, and moderating variables. Behavioral Research in Accounting, 2(1), 124–153.
Salleh, A. L., & Dali, A. (2009). Third party logistics service providers and logistics outsourcing in Malaysia. The Business Review, Cambridge, 13(1), 264–270.
Shaari, J. A. N. (2010). TQM: The Japanese way in Malaysian companies. IUP Journal of Operations Management, 9(1/2), 99–115.
Siegel, P. H., O’Shaughnessy, J., & Rigsby, J. T. (1995). A reexamination of the internal auditors’ code of ethics. Journal of Business Ethics, 14(11), 949–957.
Svanbergh, J., & Ohman, P. (2013). Auditors’ time pressure: Does ethical culture support audit quality. Managerial Auditing Journal, 28(7), 572–591.
Tie, R. (1999). Concerns over auditing quality complicate the future of accounting. Journal of Accountancy, 188(6), 14–15.
Titman, S., & Trueman, B. (1986). Information quality and the valuation of new issues. Journal of Accounting and Economics, 8(2), 159–172.
Watkins, A.L., Hillison, W., & Morecroft, S.E. (2004). Audit quality: A Synthesis of theory and empirical evidence. Journal of Accounting Literature, 23, 153.


Pertanika J. Soc. Sci. & Hum. 23 (S): 73 – 88 (2015)
ISSN: 0128-7702 © Universiti Putra Malaysia Press
SOCIAL SCIENCES & HUMANITIESJournal homepage: http://www.pertanika.upm.edu.my/
ARTICLE INFOArticle history:Received: 30 March 2015Accepted: 10 September 2015
E-mail addresses:[email protected] / [email protected] (Siti Zaidah Turmin),[email protected] (Fatima Abdul Hamid),[email protected] (Nazli Anum Mohamad Ghazali)* Corresponding author
Corporate Internet Reporting in Emerging Economic Countries: The Malaysian Perspective
Siti Zaidah Turmin1*, Fatima Abdul Hamid2 and Nazli Anum Mohamad Ghazali2
1Department of Accounting and Finance, Universiti Putra Malaysia, 43400 UPM Serdang, Selangor, Malaysia2Department of Accounting, Kuliyyah of Economics and Management Science, International Islamic University Malaysia, Malaysia
ABSTRACT
The increasing use of Internet technology in corporate world is undeniable. Corporate Internet Reporting (CIR) is the communication process between the corporate sectors and stakeholders via the medium of the Internet. CIR is a significant way for the corporate sectors in presenting and disseminating business information. The study is conducted with the objective to examine the practice of CIR by the Malaysian listed corporations. Sample of the study consisted of 380 listed corporations. In measuring the level of CIR practice by companies, a CIR index was used. Data for CIR practice were collected by observing the presence of CIR attributes in the websites of companies being investigated and analysed by using descriptive statistics. The findings show that 82 percent of the companies examined have websites and are practicing CIR. On average, Malaysian listed companies practiced around 28.9% of the overall CIR attributes. The results based on industry type showed that the plantation sector had the highest mean score for overall CIR, Investor Relations category and User Support category, whereas the finance sector had the highest mean score for the categories of Accounting and Finance and Technological Advantage, and the construction sector revealed the highest mean score for forward looking data. Furthermore, a comparison between the Main Market and ACE market companies did not show any significant difference in the mean score for the overall CIR attributes and specific CIR attributes. Findings of the study might be useful to the Malaysian listed corporations in
better understanding the level of CIR they practised so as to further increase the level of CIR in the near future. Finally, the study adds to the knowledge on the practice of CIR in Malaysia as one of the world’s emerging economic countries.

Pertanika J. Soc. Sci. & Hum. 23 (S): 73 – 88 (2015)
Siti Zaidah Turmin, Fatima Abdul Hamid and Nazli Anum Mohamad Ghazali
74
Keywords: Corporate Internet Reporting, practise, emerging economic, Malaysia
INTRODUCTION
Jones and Xiao (2004) define Corporate Internet Reporting (CIR) as traditional annual report together with additional financial and non-financial information in multiple formats through company websites. CIR is the new communication medium between corporate sector and stakeholders via the medium of the Internet. CIR is seen as an important way for the corporate sector in presenting and disseminating corporate information to the stakeholders. In recognising the significance of CIR in business activities, Beattie and Pratt (2003) mentioned that “Internet reporting improves users’ access to information by providing information that meet their specific needs, allowing non-sequential access to information through the use of hyperlinks, interactive and research facilities, and allowing the opportunity for providing more information than available in the annual reports. This improved accessibility of information results in more equitable dissemination among stakeholders.”
A substantial number of research on Internet reporting have been conducted in developed countries with advance capital markets, especially in the United States, United Kingdom and European countries (Bogdan, Pop, Popa, & Scorte, 2009). However, there are very limited studies on internet reporting in the emerging economic countries. According to Ally and Simon
(2008), findings of research on internet reporting conducted in the developed countries may not be generalisable to different countries at different stages of development, or with different business environment and cultures. In Malaysia, despite the noticeable internet usage growth highlighted in the Malaysian Internet Usage and Telecommunication Reports, research in the field of internet is still lacking. Hence, this study intends to fill this gap by providing insights into the level of CIR practised by public listed corporations in Malaysia.
The paper is organised as follows. The next section provides the prior international research of CIR. Research design is elaborated in the third section, followed by findings and discussions. The paper ends with a conclusion.
LITERATURE REVIEW
In general, past research on CIR has been classified into several different groups. Basically, CIR was examined based on the perspective of nature and the extent of CIR practice by companies, determinants of CIR, comparative CIR studies among different countries, as well as attitude and preference of CIR.
A study by Petravick and Gillet (1996) was among the earliest research conducted in the field of Internet reporting in the United States. Petravick and Gillet (1996) identified 69% or 103 companies of Fortune 150 as having corporate websites. Out of this number, 83 websites were found to have financial information.
Pertanika J. Soc. Sci. & Hum. 23 (S): 73 – 88 (2015)
Corporate Internet Reporting In Emerging Economic Countries: The Malaysian Perspective
75
Furthermore, Petravick and Gillet (1996) categorised these 83 websites into three different groups: advertisement, limited and comprehensive. The study identified three company websites that were under the classification of advertisement due to the fact that users need to make contact through e-mail or phone calls in order to obtain information from these companies. In other words, these companies did not provide any information on their websites. The websites of thirty-four companies were classified as limited on the grounds that users could access certain items for a limited and short period, whereas forty-six companies’ websites were classified as comprehensive because users could access to full annual reports, quarterly reports, current stock price, history of stock price, as well as audio and animated messages. This, according to Petravick and Gillet (1996), shows that the use of web goes beyond reporting purposes.
Besides accounting researchers, concern over the issue of CIR has also been raised by accounting organisations. In the year 2000, the Financial Accounting Standard Board (FASB) examined the practice of Internet reporting of Fortune 100 companies. This research was done to develop a comprehensive list of website attributes, as well as to determine the popularity of the attributes, or in other words, the frequencies of the attributes disclosed on the website. Due to the rapid advancement of Internet technology, the data for this research were collected on one specific day. Of the one hundred companies
examined, only one company did not have a website. Of the 99 companies with websites, 93 companies provided at least some form of investor relation or financial information on their websites. The study listed CIR attributes that were considered popular out of 325 total attributes developed by the FASB staff and academic members from prior studies. Graphics was used by all 99 companies’ websites; hence, it was the most popular attribute, followed by 80% to 90% use of table of contents, links to news releases and product advertisements. Chairman’s message, sales information, financial highlights and HTML format of financial information were provided by 70% to 80% of companies’ websites. Other popular attributes were used by at least fifty per cent of companies’ websites. The findings of this study were published for the Business Reporting Research Project’s (BRRP) report entitled, “Electronic Distribution of Business Reporting Information”. The study was also briefly discussed by Fitzsimons and Shoaf (2000) in their article entitled, “FASB Studies the Electronic Reporting of Business Information.”
In the European countries, In Greece, a study on Internet reporting was examined by Spanos (2006) by using a sample of 141 Greek companies listed on the Athens Exchange. The extent of Internet disclosure was investigated based on the developed Internet disclosure index. The index consisted of 50 items, classified under the categories of accounting and financial, corporate governance, corporate

Pertanika J. Soc. Sci. & Hum. 23 (S): 73 – 88 (2015)
Siti Zaidah Turmin, Fatima Abdul Hamid and Nazli Anum Mohamad Ghazali
76
social responsibility and contact details to investor relations that are associated with disclosure content and categories of processable formats and technological advantages associated with presentation format. The study found that majority of the companies (121 companies) had websites. For the disclosure content, the category of financial and accounting received the highest score with press releases, current financial statements and current annual reports being the most common items to be found. This implied the awareness of Greek companies concerning the importance of timely financial information. Nevertheless, corporate social responsibility was found to receive the lowest score. However, both categories of presentation format showed a similar score. A very low score was found with regards to the use of technological features of Internet reporting such as processable format of financial data, video and audio files, mailing list and link to related parties. Therefore, Spanos (2006) concluded that the potential of the Internet was not being fully utilised by Greek companies in practising Internet reporting. This is in line with the studies by Hedlin (1999) in Sweden, Gowthorpe and Amat (1999), and Larran and Giner (2002) in Spain.
Another study was conducted by Hossain Khan, Muzaffar and Nazmul (2008) by closely examining the extent of Internet reporting by Bangladeshi companies based on the attributes of financial reporting websites, which consisted of 27 items. In addition, the evaluation of Internet reporting
was also examined based on a focus group conducted with different experts and regulatory institutions. This differentiates this study from the previous one in 2006. A smaller sample of 30 companies listed on the categories of A and B of the Chittagong Stock Exchange were used. It was revealed by the study that 40% of the companies have websites with three quarters of them (9 companies, 75%) disclosing financial statements on the websites. Corporate information was the most frequently found item with all companies disclosing it, followed by vision statement (92%), chairman’s message and financial highlight summary (83%). Conversely, no company was found to have environmental reporting and quarterly statements on their websites. Despite the high percentage of disclosure, Hossain Khan et al. (2008) observed differences between annual reports in the digital version and the paper-based version. In addition, the auditors’ report and signatures in the digital annual reports were found to be copied from the printed version without the existence of the auditor’s digital signature on any website, thus, contributing to the issue of information security and manipulation of online corporate information.
In India, the first research on Internet reporting was conducted by Verma (2010). By using a sample of two hundred companies of BSE-200 Index from nineteen industry sectors, Verma (2010) examined the level and extent of financial and non-financial disclosure on corporate websites based on the Internet disclosure index of

Pertanika J. Soc. Sci. & Hum. 23 (S): 73 – 88 (2015)
Corporate Internet Reporting In Emerging Economic Countries: The Malaysian Perspective
77
135 items. The items were grouped into one category of financial reporting index and six categories of non-financial reporting index, namely, corporate governance information, corporate social responsibility and human resource information, marketing information, investor relations communication, right to information act, and technological aspects and user support. The results of the study indicated a wide variation of web disclosure of the companies without standardisation of the content and presentation of the disclosure. In general, disclosure of the non-financial reporting index received the mean score of 46.52, which was much higher than the mean score of 14.16 for the financial reporting index. Specifically, disclosure for the category of technological aspects and user support was the highest, followed by financial reporting index, corporate governance information, investor relations’ communication and corporate social responsibility and human resource information. However, the categories of marketing information and right to information act revealed the lowest score of disclosure. Looking at industry wise classification, it was found that companies in the sectors of information technology, diversified and transport service outperformed other sectors in average web disclosure. Companies in the diversified sector were the highest in the disclosure of financial reporting index, followed by the financial sector and chemical and petrochemical sector. However, the information technology sector was in
the first place with regards to the web disclosure of the non-financial reporting index, followed by the diversified sector and transport services sector. Furthermore, statistical analysis of ANOVA (sig. value of 0.001) confirmed the significant impact of industry sector upon the level of web disclosure of companies, thus, proving that the reporting practices by companies were determined by the industry standard and level of competition. Thus, Verma (2010) concluded that Internet reporting was used as a tool by corporations in India for the purpose of differentiation, image management and attracting stakeholders.
Besides looking at the extent of internet reporting by corporations, Aly, Simon and Hussainey (2010) made an attempt to examine the potential factors affecting CIR of 62 listed companies Egyptian Stock Exchange. Factors investigated include company size, profitability, leverage, liquidity, industry sectors, foreign listing and auditor size in examining the impacts of these factors on 62 companies listed on the Egyptian Stock Exchange. In measuring Internet reporting, the study used 82 items of Internet disclosure index, whereby the index consisted of 58 items of disclosure content and 24 items of presentation format and accessibility factors. The results of the OLS regression analysis showed that profitability, foreign listing and industry sectors through the communication and financial services sectors were positively significant in affecting both the amount and presentation formats of corporate Internet reporting of the Egyptian listed companies.

Pertanika J. Soc. Sci. & Hum. 23 (S): 73 – 88 (2015)
Siti Zaidah Turmin, Fatima Abdul Hamid and Nazli Anum Mohamad Ghazali
78
A comparative CIR study was conducted by Allam and Lymer (2003) who examined CIR practice by the largest companies in five countries around the world with advanced capital markets, namely, the US, UK, Canada, Australia and Hong Kong. In addition, the study examined the effects of firm size and country of origin against the level of CIR practice. The study was conducted on 50 largest companies from each of the five countries, whereby the companies were selected according to the value of market capitalisation. Thus, a total of 250 companies were examined in the study. The study examined the presence of corporate websites as well as the existence of CIR attributes and CIR scores for each company based on 36 CIR items. The study found that with an exception of one company in Hong Kong, almost all companies (99.6%, 249 companies) were revealed to have websites. All websites were found to have a section for investor relations. Looking specifically at general attributes, the study revealed differences with regards to the presence of webcast among companies in the five countries examined, whereby companies in the US and Canada were at the top in providing this attribute (84%) as compared to the UK (68%) and Australia (62%). Conversely, very few company websites in Hong Kong (4%) provided this attribute. A similar result was found pertaining to the attributes of e-mail alert and inside annual report techniques, whereby a very small number of company websites in Hong Kong companies have these attributes (14% for e-mail alerts,
6.1% for inside annual report techniques) compared to more than half of the company websites in the other four countries. As for the presentation style and format of annual reports, the results revealed differences in the practice of companies among the five countries with regards to the pdf format, as well as a mixed format of pdf and html. The use of pdf format in presenting financial information was higher among companies in Hong Kong (80%), Australia (66%) and Canada (58%) as compared to companies in the US (30%) and the UK (34%). However, the mixed format was less frequently used by most US companies (30%), followed by Australia (18%), Canada (14%), UK (8%) and Hong Kong (4%).
Another study was conducted by Hossain Khan, Muzaffar and Mahmood (2006) to examine the use of Internet corporate reporting by Bangladeshi companies. However, the study was done based on the attitudinal survey, which was aided by questionnaires and focus group discussion conducted with stakeholders. The study found that the majority of the stakeholders examined (60%) regularly browsed company websites. When asked about their opinion regarding CIR usage, including the variables of graphics, hyperlinking, downloadable data, press releases, financial trend data, non-financial information and data updating, the respondents revealed that such variables were important. Therefore, Hossain Khan et al. (2006) concluded that the Internet can be considered as a flourishing means of corporate reporting by the stakeholders.

Pertanika J. Soc. Sci. & Hum. 23 (S): 73 – 88 (2015)
Corporate Internet Reporting In Emerging Economic Countries: The Malaysian Perspective
79
In Malaysia, the issue of Internet technology transformation into corporations in Malaysia was investigated by Adham and Ahmad (2005). The study examined the rate of corporate website adoption and e-commerce technology by the population of the main board’s companies listed on the Kuala Lumpur Stock Exchange (KLSE), which consisted of thirteen activity sectors. The study was conducted based on the proposition of one hundred percent of companies having websites and most companies that serve end customers having e-commerce systems. It was found that more than half of the companies (62%, 351 companies) have operable websites. With regards to the remaining companies without functioning websites, the major concern of the study was on the deficiency in the level of information visibility of the companies in attracting investment from shareholders. Out of 351 operable websites, only 15 websites provided e-commerce transactions, with companies in the finance sector being at the top (8 companies), followed by trading and services (5 companies) and consumer products, as well as industrial products (1 company of each sector). As for corporate websites of other sectors, which include companies in the direct seller category (e.g., Cosway, Amway, Nestle), e-commerce application did not exist. A possible reason for not adopting e-commerce technology by these companies was to maintain the relationship of the companies and to avoid conflict with the stockists or intermediaries of the companies. The results indicated a
slow adoption of websites and e-commerce systems among the companies being examined, which is not in agreement with the developed research proposition.
The utilisation of Internet technology in disclosing corporate information by the Malaysian companies was also examined by Abdul Hamid (2005). However, the focus of his study was on investor relations information, whereby the research examined the presence of investor relations information on corporate websites and the content of the investor relations information. A study was conducted on one hundred Malaysian index-linked counters listed on the KLSE. It was found that nearly three quarters of the companies (74%, 74 companies) have websites. The majority of the websites (95%, 70 websites) contained investor related materials. For the purpose of examining the content of investor relations information of the 70 websites, six categories of checklist instruments for investor relations were used, namely, background of companies and financial data, share price and shareholder data, ratio analysis, press release and presentations, frequently asked questions and contact details, and online investor service. Based on the checklist, the investor relations disclosure level was examined by using a dichotomous score of 1 for the existence of items in the checklist and 0 for the non-existence of items. Based on the content analysis conducted, the study indicated that company’s background (93%), historical press releases (45%), current annual reports (47%), current press release (45%)

Pertanika J. Soc. Sci. & Hum. 23 (S): 73 – 88 (2015)
Siti Zaidah Turmin, Fatima Abdul Hamid and Nazli Anum Mohamad Ghazali
80
and earnings per share (31%) were the top five investor relations items disclosed by the companies through their websites. In contrast, information pertaining to frequently asked questions, names and addresses for investor enquiries and ratio of price earning, gearing, return on shareholder funds and both ROA and ROE was the least investor relations information disclosed, whereby this information was found on less than 10% of the websites examined. Based on the results, Abdul Hamid (2005) concluded that the full potential of the Internet was not fully utilised by the Malaysian corporations for investor relations purposes, especially in reaching foreign and public investors.
Furthermore, the findings on the variation in the use of the Internet for corporate reporting by the Malaysian corporations in terms of the type and extent of information disclosed motivated Hanifa and Abdul Rashid (2006) to investigate firm specific characteristics that influenced the practices of IFR by the Malaysian companies. The sample used in their study consisted of the 50 top and 50 bottom companies based on market capitalisation. The specific firm’s characteristics examined were size, leverage, performance, shareholders concentration, growth prospects, foreign ownership and industry type. The practice of IFR was measured through dummy variables of 1 for firms that have websites with latest annual reports and 0 for companies without websites or without the latest annual reports on the websites. Based on the binomial logistic regression conducted, the study
found that with the exception of profitability and industry type, the practice of IFR by Malaysian companies was positively and significantly influenced by all firms’ specific characteristics being examined.
RESEARCH DESIGN
The study examined 380 Malaysian listed companies which consist of eleven different sectors. Out of which, 332 companies are from the Main market and the remaining is listed under the ACE market. The companies were chosen based on the technique of systematic random sampling. Data for the study were collected from the companies’ websites from December 2008 to February 2009.
In searching for the website address of companies, multiple sources were used. First, for companies directly linked to Bursa Malaysia’s website, the companies’ homepage addresses were identified through the website of Bursa Malaysia. Second, identification of the homepage addresses for companies not directly linked to Bursa Malaysia’s website was done by using several meta search tools, which include AltaVista, Yahoo! and Google. Meanwhile, Internet Explorer was used in searching for the respective companies’ web addresses. Third, for the remaining website addresses that still could not be identified through the previously mentioned techniques, the companies were contacted directly through phone calls to confirm the existence of their website and the company web address.
In measuring the level of CIR practice by the companies, the study developed 41

Pertanika J. Soc. Sci. & Hum. 23 (S): 73 – 88 (2015)
Corporate Internet Reporting In Emerging Economic Countries: The Malaysian Perspective
81
attributes of CIR index. The development of CIR index is based on a review of the Web based business reporting framework by FASB (2000), as well as internet reporting index developed in the studies of Pirchegger and Wagenhofer (1999), Deller, Stubenrath and Weber (1999) and Marston and Polei (2004), but with some modification to provide better reflection of the web features available on the websites of Malaysian listed companies. The attributes were categorised into five groups, namely accounting and financial information, information of investor relations, forward looking data, technological advantage and user support.
Data for CIR practice were collected by observing the presence of each of the CIR attributes in the websites of companies being investigated. Specifically, the level of CIR practice by the company was measured by using the formulae of each company’s CIR score over total CIR
score. Data were analysed based on both individual companies and sectors by using descriptive statistics technique.
Out of 380 companies being examined, over three quarters were found to have websites and are practising CIR. With only 20 percent of the companies from the Main Market (do not have websites), the majority of companies with websites are from the Main Market. For the ACE Market, almost all companies were found to have corporate websites. With the high existence of corporate websites in both the Main market and the ACE market, it shows that the basic mechanism for corporate reporting over the Internet is in place. It also shows that CIR has been widely accepted and used by a significant number of listed companies in Malaysia as a means of communication to their stakeholders. The finding is depicted in Table 1.
TABLE 1The Existence of CIR in the Malaysian Market
Listing Practising CIR Non-practising CIR Total %No. of companies % No. of companies %
Main Board 266 80 66 20 332 100ACE Market 44 92 4 8.33 48 100
Total 310 82 70 18 380 100
Regarding the existence of CIR based on the Malaysian business sector, the findings revealed that companies in Malaysia vary in their frequency of having websites and practising CIR. Specifically, the hotel and infrastructure sectors revealed the highest percentage with all the sample companies in both sectors having corporate websites and practising CIR. Furthermore, the technology,
trading and services, properties, industrial product and finance sectors were found to have a high number of companies having websites and practicing CIR (93% for technology, 84% for trading and services, 83% for properties and 80% for both industrial product and finance). However, one company in the mining sector did not have a website. The result is depicted in Table 2.
FINDINGS AND DISCUSSION

Pertanika J. Soc. Sci. & Hum. 23 (S): 73 – 88 (2015)
Siti Zaidah Turmin, Fatima Abdul Hamid and Nazli Anum Mohamad Ghazali
82
TABLE 2CIR Existence by the Malaysian Business Sectors
Industry Type No. of companies having website / practicing CIR
Total no. of companies in the sector % of industry
Consumer Products 40 52 77%Industrial Products 86 108 80%Construction 15 19 79%Trading and Services 61 73 84%Finance 12 15 80%
Properties 30 36 83%Plantation 10 16 63%Technology 52 56 93%Infrastructure 2 2 100%Mining 0 1 0%Hotel 2 2 100%Total 310 380
As for the overall practice of CIR in Malaysia, findings are discussed based on the extent of overall CIR practice, as well as the extent of accounting and financial data disclosure, investor relation disclosure, forward looking data disclosure and practice of technological advantage and user support attributes. It is revealed that the overall mean of the extent of CIR is 0.289, with a standard deviation of 0.134. The overall practice ranges from 0.05 (minimum limit) to 0.63 (maximum limit), showing a large variation in the practice of CIR by companies. The mean score shows that Malaysian public listed companies practiced, on average, 29% or 12 attributes of the total 41 attributes of CIR index. Furthermore, the results on the Accounting and Financial data disclosure constitute the highest mean score of 0.49. This indicates that nearly half of the companies in the sample disclosed Accounting and Financial data in their corporate website. This is done
by either providing a link to their complete financial statements or a comprehensive set of financial statements in their corporate website. This is followed by the User Support attributes, Investor Relation disclosure and Technological Advantage attributes with the mean scores of 0.45, 0.33 and 0.20, respectively. These also indicate that, on average, the companies disclosed 45% or 2 attributes out of 5 attributes of the User Support’s category, 33% or 7 attributes out of 20 attributes of Investor Relation’s category and 20% or 2 attributes out of 11 attributes of the Technological Advantage’s category. In contrast to the category of Accounting and Finance, the category of Forward Looking is the lowest disclosure with a mean score of 0.04, revealing that, on average, companies only disclosed 4 percent or 0.16 attributes out of 4 attributes of the Forward Looking data category. The overall CIR practice is summarised in Table 3.

Pertanika J. Soc. Sci. & Hum. 23 (S): 73 – 88 (2015)
Corporate Internet Reporting In Emerging Economic Countries: The Malaysian Perspective
83
TABLE 3Descriptive Statistics of the Extent of CIR
Mean Rank Min Max Std. Dev Skewness Kurtosis
CIR(overall practice) 0.289 - 0.05 0.63 0.134 0.340 -0.904
Accounting and Financial data disclosure 0.490 1 0.00 1.00 0.501 0.039 -2.012Investor Relation disclosure 0.334 3 0.05 0.65 0.128 0.463 -0.302Forward Looking data disclosure 0.044 5 0.00 0.50 0.107 2.443 5.475Technological Advantage 0.202 4 0.00 0.64 0.177 0.435 -0.963User Support 0.453 2 0.00 1.00 0.221 0.183 -0.724
Looking at the practice of CIR by specific economic sectors in Malaysia, the results show that companies in the plantation sector held the top position with regards to the score of Investor Relations category (i.e.,0.415) and User Support category (i.e.,0.580). Companies in the plantation sector also scored the highest in the overall CIR score (0.371). Companies in the Finance sector scored the highest in the Accounting and Finance category (mean of 0.833) and technological advantage category (0.288), while the highest score for forward looking data (0.117) was
in construction companies. Industrial products companies were the lowest in the overall CIR score (0.253), as well as Investor Relations category (0.298) and technological advantage category (0.162). The sector of ‘others’, which constitutes hotel and infrastructure companies held the lowest position with regards to the score of forward looking category (0) and user support category (0.3). In addition, the lowest score for the category of accounting and finance was in consumer product companies (0.375). These findings are depicted in Table 4.
TABLE 4Means of the Extent of CIR based on Business Sectors in Malaysia
Mean/industry Overall Score
Accounting & Finance
Investor Relation
Forward Looking Tech. Adv User
SupportIndustrial (n= 86 ) 0.253 0.384 0.298 0.020 0.162 0.412Consumer (n= 40 ) 0.274 0.375 0.328 0.056 0.177 0.430Trading & Services (n= 61 ) 0.308 0.557 0.357 0.025 0.225 0.472Properties (n= 30 ) 0.334 0.633 0.368 0.083 0.273 0.473Plantation (n= 10 ) 0.371 0.800 0.415 0.050 0.273 0.580Technology (n= 52 ) 0.278 0.442 0.322 0.058 0.184 0.450Finance (n= 12 ) 0.337 0.833 0.350 0.021 0.288 0.550Construction (n= 15 ) 0.314 0.533 0.353 0.117 0.200 0.520Others (n= 4 ) 0.299 0.500 0.375 0 0.250 0.300
Note:The value in bold font is the highest disclosure mean.The value in italic bold font is the lowest disclosure mean.Others refer to hotel and infrastructure companies.

Pertanika J. Soc. Sci. & Hum. 23 (S): 73 – 88 (2015)
Siti Zaidah Turmin, Fatima Abdul Hamid and Nazli Anum Mohamad Ghazali
84
From the results, it can be concluded that the highest and the lowest scores of the overall CIR and specific categories of CIR were dominated by certain industries. There are several possible reasons to explain the findings. Malaysian listed companies under the plantation sector are mostly involved in exporting products (Basiron, 2009). Considering this, the future direction of those companies is very much dependent on the trade relation shared by those companies with buyers around the world (Basiron, 2009). In addition, due to the growing population, the plantation sector around the world is facing a shortage of plantation raw materials (Basiron, 2009). This reflects the need for market expansion by the plantation companies (Basiron, 2009). CIR is the modern tool for corporate reporting with the advantages of attracting a broader range of customers and an interactive two-way communication channel between corporations and investors. Therefore, relative to other sectors, there is a high possibility that CIR is greatly used by the Malaysian plantation sector to expand their market to buyers around the world, thus, reflecting the highest mean score for overall CIR score, as well as investor relation and user support categories.
For the financial sector, the government introduced the Financial Sector Master Plan in 2001 in order to build financial institutions that are resilient, efficient, competitive and responsive to the changes in economic requirements (Zamani, 2006). Accordingly, various initiatives were taken
by the financial companies to increase their capability to meet the growing demand of the economy. Among the initiatives taken were establishing an information website for the financial companies to provide useful information and facilitate customers in conducting transactions, as well as migrating users from a paper-based to an electronic payment system (Zamani, 2006). In undertaking these initiatives, there are needs for financial companies to not only have corporate websites, but also utilise elements of technological advantages in their websites. This could possibly be the reason behind the highest mean score of accounting and finance and technological advantage categories by the financial companies.
The industrial sector contributed the largest proportion of foreign direct investment in Malaysia (Masud, Mohd Yusoff, Abd Hamid, & Yahaya, 2008). Under the foreign direct investment, the non-resident direct investors of the home countries, which are mostly from Singapore, US and Japan, hold at least 10 percent of the total equity in a resident company in Malaysia (Masud et al., 2008). Companies in Malaysia function as production base and are controlled by companies in the home countries. Therefore, there is a possibility that CIR may be more actively practiced by companies in the home countries compared to companies in Malaysia, thus, contributing to the lowest CIR practice by the companies of the industrial sector in Malaysia compared to other sectors.
Pertanika J. Soc. Sci. & Hum. 23 (S): 73 – 88 (2015)
Corporate Internet Reporting In Emerging Economic Countries: The Malaysian Perspective
85
In addition, the industrial product sector is claimed to be the fastest growing sector with a continuous positive growth that is attributed to the growth of the export-oriented industries and robust performance of resource-based industries (Danavaindran, 2005). The government through the implementation of the Industrial MasterPlan (IMP) has provided a framework to establish a strong foundation for the sustained growth of this sector, as well as to ensure that this sector is more diversified and integrated. In addition, with the establishment of the ASEAN Free Trade Area (AFTA), the industrial sector’s companies are benefited by a tariff reduction, elimination of import duties, as well as quantitative restriction and removal of non-trade barriers (Danavaindran, 2005). As a result, industrial product companies are reported to have a wider market with an increase in the import and export activities (Danavaindran, 2005). As for the Malaysian consumer sector, it is well known to be a buoyant sector with relatively strong sales and earnings despite the high inflation and other changes in economic situations (Raj, 2008). In addition, the strong branding and good market positioning practiced by companies in this sector reflect the customers’ loyalty in their products (Raj, 2008). Furthermore, due to the attractive dividend offered by companies in the consumer sector to investors, shareholders’ investments in the companies are protected and secured (Raj, 2008). With these strong advantages of the industrial and consumer sectors
relative to other sectors, companies in both sectors may consider that efforts to expand the market and attract more customers and investors through CIR practice as not crucial. This possibly contributes to the results of the lowest mean score for overall CIR, investor relation category and technological advantage category by the industrial sector and the lowest mean score for accounting and finance category for the consumer product sector.
In addition, the result of the highest mean score of forward looking data category, which is revealed by the construction sector, is possibly due to the desire of the construction companies in promoting their future projects to potential buyers. Whereas a very small number of companies under the sector of ‘others’ possibly contribute to the result of the lowest mean score of the categories of forward looking data, technological advantage and user support.
PRACTICE OF CIR BY THE MALAYSIAN MARKET
Discussion follows with the findings of the extent of CIR practice by the Malaysian major market. As ACE Market comprises companies based on technology business activities and high growth, it is expected that those companies will practice CIR more than companies from the Main Market. However, a comparison of the mean scores for the overall CIR practice and specific CIR categories between the companies in the Main Market and the ACE Market did not reveal any significant

Pertanika J. Soc. Sci. & Hum. 23 (S): 73 – 88 (2015)
Siti Zaidah Turmin, Fatima Abdul Hamid and Nazli Anum Mohamad Ghazali
86
difference. This shows that companies in both markets have the same concentration in practising CIR in terms of overall CIR attributes and specific CIR attributes. Thus, it could be said that such a practice has not been dominated by any one of them. In
fact, the result suggests that companies in both markets have accepted CIR as a tool for corporate reporting but with a low level of CIR disclosure and practice for specific CIR categories. The result is depicted in Table 5.
TABLE 5Means of the extent of CIR based on listing status
CIR CATEGORY MAIN MARKET ACE MARKETOverall 0.291 0.278Accounting and finance 0.5 0.432Investor relation 0.335 0.326Forward looking 0.040 0.063Technological advantage 0.205 0.182User support 0.456 0.436
CONCLUSION
The widespread and increasing use of Internet technology, specifically CIR in the corporate world nowadays, is inevitable and undeniable. As one of the top ten Asian countries for Internet use, Malaysia is not lagging behind the significant influence of Internet technology in business activities. CIR is believed to provide a way for Malaysian companies to disseminate online corporate information in order to attract a wider range of national and international investors. The study provides insights into the practice of CIR in emerging economic countries by focusing on Malaysia. Discussions are based on the existence of CIR in the Malaysian market and economic sectors, overall CIR practice and specific CIR practice by Malaysian economic sectors and market.
Overall, the findings of this study revealed that 82 percent of the total companies examined have websites and are practicing CIR. In summary, the results of the analysis of the extent of CIR revealed that Malaysian listed companies practiced, on average, 28.9% of the overall CIR attributes in the period of two months between December 2008 and February 2009. The results based on industry type show that the plantation sector had the highest mean score for overall CIR, Investor Relations category and User Support category, while the finance sector had the highest mean score for the categories of Accounting and Finance and Technological Advantage. In addition, the construction sector revealed the highest mean score for forward looking data category, while the hotel and infrastructure, which constitute the sector of ‘others’ revealed the lowest

Pertanika J. Soc. Sci. & Hum. 23 (S): 73 – 88 (2015)
Corporate Internet Reporting In Emerging Economic Countries: The Malaysian Perspective
87
mean scores for the categories of forward looking data and user support. Furthermore, a comparison between the Main Market and ACE market companies did not show any significant difference in the mean score for the overall CIR attributes and specific CIR attributes.
This study contributes towards the perspective of knowledge and practise. With regards to the contribution towards knowledge, despite many studies on CIR at the international level, most of the studies have focused on the developed western countries. Indeed, research that examines issues of CIR practice in the emerging economic countries, particularly in Malaysia, is still very limited in number. Therefore, this study adds to the CIR literature by providing a comprehensive view of the CIR practice in Malaysia as an emerging economic country. As for the contribution towards practise, findings of this study are beneficial to the Malaysian listed corporations, both individuals and by sectors, to better understand their level of CIR practice to further improve and increase the practise in the near future.
REFERENCESAdham, K. A., & Ahmad, M. (2005). Adoption of
web site and e-commerce technology among Malaysian public companies. Industrial Management & Data Systems, 105(9), 1172-1187.
Allam, A., & Lymer, A. (2003). Developments in Internet Financial Reporting: Review and Analysis across Five Developed Countries. International Journal of Digital Accounting Research, 3(6), 165-199.
Aly, D., & Simon, J. (2008, April). Assessing the Development of Voluntary Internet Financial Reporting and Disclosure in Egypt. Paper presented at the British Accounting Association Annual Conference, Blackpool, UK.
Aly, D., Simon, J., & Hussainey, K. (2010). Determinants of corporate internet reporting: evidence from Egypt. Managerial Auditing Journal, 25(2), 182-202.
Basiron, Y. (2009). Trends and Potentials of Malaysia’s Plantation Sector. In A Presentation by Tan Sri Datuk Dr Yusof Basiron at the Perdana Leadership Foundation Seminar 2009 at Sime Darby Convention Centre, August 20.
Beattie, V., & Pratt, K. (2003). Issues concerning web-based business reporting: an analysis of the views of interested parties. The British Accounting Review, 35(2), 155-187.
Bogdan, V., Pop, C. S., Popa, D. N., & Scorte, C. (2009). Voluntary Internet Financial Reporting and Disclosure. A New Challenge for Romanian Companies. Annals of the University of Oradea: Economic Science, 3(1), 770-778.
Danavaindran, D. (2005). Manufacturing Sector in the Malaysian Economy – AFTA and its Implications on Employment. Paper presented at the National Statistics Conference.
Deller, D., Stubenrath, M., & Weber, C. (1999). A survey on the use of the Internet for investor relations in the USA, the UK and Germany. The European Accounting Review, 8(2), 351-364.
Financial Accounting Standard Board (FASB). (2000). Business Reporting Research Project. Electronic Distribution of Business Reporting Information.
Hanifa, M. H., & Abdul Rashid, H. M. (2006). The Determinants of Voluntary Disclosures in Malaysia: The Case of Internet Financial Reporting. Unitar E-Journal, 2(1), 22-42.

Pertanika J. Soc. Sci. & Hum. 23 (S): 73 – 88 (2015)
Siti Zaidah Turmin, Fatima Abdul Hamid and Nazli Anum Mohamad Ghazali
88
Jones, M. J., & Xiao, J. Z. (2004). Financial reporting on the Internet by 2010: a consensus view. Accounting Forum, 28(3), 237-263.
Khan, M. A. H., Muzaffar, A. T., & Mahmood, A. S. (2006). The Use of Internet for Corporate Reporting: A Discussion of the Issues and Surveys of Current Usage in Bangladesh (pp. 8-11). Working paper.
Khan, M.A. H, Muzaffar, A. T., & Nazmul, A. K. (2008). Corporate Financial Reporting on Internet: Global Developments and an Appraisal of Practices in Bangladesh. Office of Research and Publication, Working Paper No. AIUB-BUS-ECON-2008-25.
Marston, C., & Polei, A. (2004). Corporate reporting on the Internet by German companies. International Journal of Accounting Information Systems, 5(3), 285-311.
Masud, M. D., Yusoff, Z. M., Hamid, H. A., & Yahaya, N. (2008). Foreign Direct Investment in Malaysia - Findings of the Quarterly Survey of International Investment and Services. Journal of the Department of Statistics, Malaysia, 1, 1-9.
Petravick, S., & Gillet, J. (1996). Financial Reporting on the World Wide Web. Strategic Finance, 78(1), 26.
Pirchegger, B., & Wagenhofer, A. (1999). Financial information on the Internet: a survey of the homepages of Austrian companies. The European Accounting Review, 8(2), 383-395.
Raj, S. (2008, January 28). Consumer sector resilient. The Star. Retrieved January 15, 2011 from http://www.thestar.com.my/Story/?file=/2008/1/28/business/20081599&sec=business.
Spanos, L. (2006). Corporate reporting on the internet in a European emerging capital market: the Greek case. European Journal of Economics, Finance and Administrative Sciences, (7).
Verma, D. (2010). Web-based Business Reporting in Indian Corporate Sector. Journal of Knowledge Management Practice, 11(1).
Zakimi Abdul Hamid, F. (2005). Malaysian companies’ use of the internet for investor relations. Corporate Governance: The international journal of business in society, 5(1), 5-14.
Zamani, A. G. (2006). Re-engineering the Malaysian financial system to promote sustainable growth. Bank for International Settlements, 28, 269-275.

Pertanika J. Soc. Sci. & Hum. 23 (S): 89 – 98 (2015)
ISSN: 0128-7702 © Universiti Putra Malaysia Press
SOCIAL SCIENCES & HUMANITIESJournal homepage: http://www.pertanika.upm.edu.my/
ARTICLE INFOArticle history:Received: 30 March 2015Accepted: 10 September 2015
E-mail addresses:[email protected] (Zaidi Mat Daud),[email protected] (Ian Fraser)* Corresponding author
Auditors’ and PAC Members’ Views on Performance Auditing Practices in Malaysia: A Qualitative Approach
Zaidi Mat Daud1* and Ian Fraser2
1Department of Accounting and Finance, Faculty of Economics and Management, Universiti Putra Malaysia, 43400 UPM Serdang, Selangor, Malaysia2Accounting and Finance Division, School of Management, University of Stirling, U.K
ABSTRACT
This study explored the views of both auditors in the National Audit Department (NAD), and Public Accounts Committee (PAC) members toward the current performance-audit practices in the Malaysian public sector by interviewing selected members of each group. Results revealed that the views of these two groups diverged on several issues concerning auditor roles and responsibilities, auditor competence and independence, as well as the format, content and usefulness of the audit reports. The most significant divergence was in the respective views on the auditors’ responsibilities for fraud detection.
Keywords: Performance auditing, Auditor General, Public sector accounting, Malaysia
INTRODUCTION
Performance auditing has been recognised as an important management tool for monitoring the performance of government agencies (Driessen & Molenkamp, 1993; Rauum & Soniat, 1993; AGA, 2006). Generally, auditing is used to evaluate specific government programmes to determine their efficiency, effectiveness of
implementation and fiscal responsibility, as well as to decide on whether the programmes have achieved their goals.
The development of performance auditing in Malaysia can be traced back to 1978. The public (via Parliament) realised that audit reports based on financial information alone were not sufficient to hold government agencies accountable in carrying out their programmes and activities (Hazman, 1991). Consequently, the National Audit Department (NAD), as the institution responsible for auditing all government entities, was given the authority to amend the Audit Act of 1957.

Pertanika J. Soc. Sci. & Hum. 23 (S): 89 – 98 (2015)
Zaidi Mat Daud and Ian Fraser
90
Section 6(d) of the Act gave the Auditor General power to inquire whether the resources allocated by the parliament were being applied efficiently to selected governmental programmes and activities. Four years later, a second amendment was passed, expanding the audit scope to include performance auditing, giving the Auditor General the authority to question government agencies on the effectiveness of their programmes.
The major focus of this study was to investigate the current strengths and weaknesses of performance auditing and to determine the type of improvements to be done. Even though performance auditing has been in place in Malaysia for more than three decades, there is growing evidence that auditing recommendations are not consistently implemented (Daud, 2008), and there have been no studies on how the recipients actually use the audit reports. If performance auditing is to be a useful tool that can add value to the performance of government agencies, the audit reports must clearly understood and their recommendations implemented. There is, therefore, a clear need for a new research on users’ perceptions toward, and expectations of, audit reports. There is no point in providing audit services if they do not result in efficiency and productivity improvements.
This study contributes to these efforts in two ways. First, it adds to the literature on performance auditing in developing countries. Secondly, the findings can help auditors in these countries become more effective. The success or failure
of performance auditing needs to be measured not only from the perspective of the auditors, but also from the perspective of the users of audit reports, in this case, Public Accounts Committee (PAC) members. The findings of this study can be useful to NAD in their policy formulation and in developing programmes to optimise the value of performance auditing so that it can adequately fulfil the information needs of Malaysian users.
The remainder of this paper is organised as follows. The next section provides background on performance auditing in Malaysia and its relationship with NAD, which includes a brief discussion of some previous studies. The report then outlines the research method used and discusses the findings. The final section presents the conclusions.
LITERATURE REVIEW
Performance Auditing and National Audit Department (NAD)
National Audit Department (NAD) is the national agency in Malaysia that has been given the mandate to conduct various types of audits of public agencies throughout the country. NAD was originally empowered by two laws: the Malaysian Constitution and the Audit Act of 1957. According to Article 105 of the Constitution, the Auditor General is the head of NAD who is appointed by the Yang DiPertuan Agong (YDPA) on the advice of the Prime Minister after consultation with the Conference of Rulers. NAD assists the Auditor General in implementing the audit mandate to provide

Pertanika J. Soc. Sci. & Hum. 23 (S): 89 – 98 (2015)
Auditors’ and PAC Members’ Views on Performance Auditing Practices in Malaysia: A Qualitative Approach
91
an independent review of the performance and financial management of public sector agencies and bodies (NAD, 2006). Under Sections 9 (1) and 6 of the Audit Act of 1957, NAD is entrusted with the task of ensuring accountability in the administration and management of public funds through the audit of accounts and activities of the Federal government, State governments, statutory bodies, local authorities, and the Islamic Religious Councils, and a few other publicly funded organisations.
Prior Studies
A review of the literature shows that most studies of performance auditing have been confined to developed countries mainly in the U.K., New Zealand and Australia. Furthermore, many of these studies concentrated mainly on concepts rather than on the practical side of performance auditing. To date, only Pendlebury and Shreim (1990; 1991), Chowdhury and Innes (1998) and Johnsen et al. (2005) have undertaken research to investigate the divergence of views between auditors and users toward performance auditing practices in the public sector. An earlier empirical study was conducted in the U.K. by Pendlebury and Shreim (1990) with the objective of examining the attitudes of external auditors on the implementation effectiveness of audits in the public sector. The external auditors in that study included those from the Audit Commission, some from the National Audit Office, and others from private accounting firms. The findings revealed that there was consensus among
auditors that auditing is primarily concerned with economy and efficiency rather than effectiveness; effectiveness auditors rely more on personal judgment than on objective evidence; and audit teams should consist of auditors from several different disciplines.
A year later, Pendlebury and Shreim (1991) extended their previous study by examining the attitudes of public-sector managers and financial officers of local authorities in England and Wales from two sectors of environmental health and finance. The results of the study were then compared with those from the Audit Commission group in the earlier study. This second study found that there were divergent opinions on the objectives of effectiveness auditing, composition of audit teams, and suitability of auditors to conduct effectiveness auditing.
Another related study was undertaken by Johnsen et al. (2001) in Finland and Norway. They explored the perceptions of the auditors and auditees on the usefulness of audit reports and the efficiency of performance auditing. The researchers discovered that both groups of auditees had little faith in performance audit reports. In Finland, auditees regarded the reports as not useful because they lacked valuable information and were too complicated to understand, while those in Norway regarded the auditors as incompetent and the reports were therefore not trustworthy.
The current study differs from the above-mentioned prior research by focusing specifically on the practices of performance auditing in Malaysia. It aims

Pertanika J. Soc. Sci. & Hum. 23 (S): 89 – 98 (2015)
Zaidi Mat Daud and Ian Fraser
92
to furnish evidence of the divergent views on performance audit practices in the Malaysian public sector by soliciting the perceptions of both auditors in the National Audit Department (NAD) and Public Accounts Committee (PAC) members.
RESEARCH METHOD
This study was aimed at exploring whether there is any divergence of views toward performance audit practices in the public sector, and if so, in which areas such divergence exists. Thus, a qualitative approach to data analysis was taken to be the most suitable and appropriate for achieving the research objectives. A semi-structured interview approach was used because it was judged to provide more in-depth insights into the views of the study participants.
The interviews were conducted with 12 auditors of NAD and eight PAC members, using an interview schedule based on a review of the literature. A list of the interviewees by occupation is provided in Table 1. The PAC members were chosen mainly because they were the direct or main users of the Auditor General’s audit reports. Numerous measures were undertaken to minimise possible biases through preparation and careful design of the interview questions, and in the conduct of the interviews. The interview lasted from 45 minutes to one and half hours, and was undertaken at each interviewee’s office or in another location determined by the interviewee. The interviews were tape-recorded and transcribed, and summaries of the transcripts were subsequently verified by the original interviewees.
TABLE 1Interviewees and their occupations
Participant PositionAuditor 1 State Audit Director Auditor 2 State Audit Director Auditor 3 Deputy Audit Director Auditor 4 Deputy Audit DirectorAuditor 5 Deputy Audit DirectorAuditor 6 Deputy Audit DirectorAuditor 7 Deputy Audit DirectorAuditor 8 Senior AuditorAuditor 9 Senior AuditorAuditor 10 Senior AuditorAuditor 11 Senior AuditorAuditor 12 Junior AuditorPAC 1 Member of Parliament – Opposition PartyPAC 2 Member of Parliament – Opposition PartyPAC 3 Member of Parliament – Government PartyPAC 4 Member of Parliament – Government PartyPAC 5 Member of Parliament – Government PartyPAC 6 Member of Parliament – Opposition PartyPAC 7 Member of Parliament – Government PartyPAC 8 Member of Parliament – Government Party

Pertanika J. Soc. Sci. & Hum. 23 (S): 89 – 98 (2015)
Auditors’ and PAC Members’ Views on Performance Auditing Practices in Malaysia: A Qualitative Approach
93
FINDINGS
The research findings of this study are presented and discussed according to specific themes such as auditor roles and responsibilities, auditor independence, auditor competence and audit reporting. They show some intriguing outcomes.
Auditor Roles and Responsibilities
All the auditors agreed that it was not their duty to detect fraud, arguing that it is rather the management’s responsibility to detect fraud and suspicious activities. “Not many people are clear as to our role and management’s role relating to fraud. Many people believe that detecting fraud is the concern of auditors. This is incorrect. Our role is to evaluate the adequacy of the existing system of internal controls by analyzing and testing. In this case, if we suspect fraud, then we will report it. The management is responsible for detecting any suspected fraud.” (Auditor 9)
Another auditor concurred that the public always misunderstands the responsibility of auditors with regard to this role, often expecting auditors to discover fraudulent activities in government agencies. Similarly, all the auditors agreed that it was not their responsibility to report fraudulent activities to the relevant authorities.“We only bring matters to the attention of the relevant authority, normally the Anti-Corruption Agency (ACA) if the fraud is significant. Usually, we just inform the management if we come across any suspected fraud or irregularities.” (Auditor 2)
PAC members, on the other hand, were clearly disappointed with the auditors’ present efforts of detecting fraud. One PAC member reported that the lack of an audit mandate was the main reason auditors turned away from this particular role. Another PAC member felt that it was the absence of formal procedures for detecting fraud. She stated:“At the moment, no. There are so many things that have to be done by the Auditor General. As far as I am concerned, they do not go for fraud. They only investigate when they discover or suspect something is wrong, or any misappropriation exists during the audit; thus, this one aspect needs to be improved. What happens if they do not discover it during the audit? The procedures should be there to be followed by the auditors.” (PAC 6)
With regard to fraud reporting, all PAC members seemed to be pleased with the present practices of auditors. The auditors regularly inform them of any incidents referred to the respective authorities and adequately highlight these in the audit reports. The comment below summarises the PAC members’ perspectives on this role: “They did a good job in terms of reporting [fraud]. They highlighted in the report about their findings. Based on what they said [during a PAC meeting], sometimes, they also referred the case to the MACC [Malaysian Anti-Corruption Commission.” (PAC 6)

Pertanika J. Soc. Sci. & Hum. 23 (S): 89 – 98 (2015)
Zaidi Mat Daud and Ian Fraser
94
Auditor’s Independence
A general trend in the perceptions of the auditors is that they are free from external influence because the decisions they make are based on available facts and evidence. Nevertheless, a few auditors claimed that there were occasions where they received warnings and memoranda from certain parties requesting auditors not to disclose certain information in the audit report.“Usually, when it happens, they ask us not to disclose such information. It all depends on our top management. Usually we do not disclose reports like that to the public.” (Auditor 7)
PAC members showed mixed reactions on this issue. All the PAC members from the government parties perceived that the auditors were free of influence from any party. However, two PAC members from the opposition parties claimed that influence from outside parties is possible despite the guarantee of independence of the Auditor General required under the constitution and the Audit Act 1957, as claimed by one PAC member:“…the Auditor General is still under government control. If they are too aggressive, they might be subjected to actions by the Prime Minister. For example in the case of auditing the Finance Ministry, politicians would get involved. This is a sensitive issue.” (PAC 1)
In addition, the interviewees were asked about the suitability of the NAD in providing professional management advisory services (MAS) to the auditees. As
expected, the auditors did not perceive that this role would impair their independence. They argued that decision still rest with the management and auditors are there only to advice the agencies.“Let’s say the auditee comes to us and asks for help in developing the rules or procedures for a project….we will help them but in the context of advising them only. We might say that this procedure is against the Treasury guidelines… or accounting principles or whatever and ask them to consider other options. In some cases, we might suggest a few options… but at the end it is up to the auditee to decide.” (Auditor 2)
The PAC members generally agreed among themselves, however, that offering MAS to the auditees would indeed impair the auditors’ independence because they might be auditing their own work and establishing a close relationship with the auditees. However, they were quick to add that this provision is not an issue in the public sector as long as the auditors only offer help and provide advice or suggestions.
Auditor Competence
Auditors expressed satisfaction with their own level of competence. They perceived that their current level of qualification, which requires a minimum degree in accounting, is adequate. They also believe that they have the necessary skills to carry out performance auditing. However, they also noted that obtaining a reasonable level

Pertanika J. Soc. Sci. & Hum. 23 (S): 89 – 98 (2015)
Auditors’ and PAC Members’ Views on Performance Auditing Practices in Malaysia: A Qualitative Approach
95
of experience in professional financial work is essential. All, except for one of the PAC members, thought that the auditors have adequate qualifications and skills, and that the procedure for the appointment of auditors is proper. Furthermore, they believe that auditors are subjected to continuous performance monitoring and provided with proper training. On the issue of hiring auditors from disciplines other than accounting, not all auditors shared the same views. Most of them supported the idea of employing new auditors from other disciplines, arguing that the knowledge and views of these new auditors would lead to better processes and outcomes. However, two auditors were against the idea of hiring auditors from other academic backgrounds, fearing that this practice would result in overstaffing in the long term, and that the present practice of seeking assistance from other government agencies is more practical. All the PAC members were in favour of NAD’s employing people from different disciplines to conduct performance audits, averring that some projects would require individuals who are knowledgeable in fields other than accounting.
Audit Reporting
Most auditors held the view that the contents of audit reports are adequate and they are also confident that these contents meet the users’ information requirements. They also believe that audit reports are useful to users. Most of them cited the use of the ‘balanced reporting’ approach—addressing not only the weaknesses or
the problems of a programme but also its successes and strengths—to support this view. Furthermore, the auditors explained that NAD regularly reviews the contents of report in terms of its structure, language and graphics so as to assist users in understanding the report. Unexpectedly, one senior auditor perceived that the audit report is not effective because of its outdated information, dissuading the users from implementing any recommendations. She remarked:“I think the users do not use the information. Our audit report is not effective because the issues discussed are outdated.” (Auditor 2)
Audit reports were also thought to be limited in usefulness as they only describe what the auditors did and make impractical recommendations. Two PAC members concurred in this view, claiming that the present audit reports lack useful information such as expenditures, resources used and the impacts of audited programmes on the auditees and the public. Regarding the types of information that need to be included in the reports, the PAC members stressed that critical analyses on the performance and progress of programmes, including financial information, precise audit opinions and disagreements among the auditees on particular issues, need to be emphasised. One of the PAC members also expressed the need to include comments or statements from experts who have been involved with the audit. These comments may indicate that the auditors are not adequately addressing the users’ expectations in terms of programme performance.

Pertanika J. Soc. Sci. & Hum. 23 (S): 89 – 98 (2015)
Zaidi Mat Daud and Ian Fraser
96
In contrast to the opinions of the auditors, most PAC members expressed dissatisfaction with the information included in the reports. Three PAC members claimed that the issues in the reports were outdated and believed this to be the main reason the public is not interested to read them.“One of the big problems is that by the time certain problems are identified and put in the audit report, it’s possibly one or two years late. For instance, this happened two years ago but the report was produced last year. By the time the Auditor General identified the problem, it was already two or three years late, and it was another one or two years by the time it was presented to the parliament. Do you think people out there would be interested in this issue…maybe they already know by the time the audit report is published.” (PAC 3)
Other PAC members mentioned that audit reports are descriptive in nature and fail to critically analyse multiple aspects of programmes.“Actually, the auditors just record what the people did. They just list the problems, efficiencies, and delays…, such as why this money is not used and why so much money is used? ... they need to say what is the impact of the project.” (PAC 2)
As for the format of the audit report, the auditors indicated that the present format is adequate and very helpful to users reading the audit report. They also believe that no modification is required for the format. Although the auditors concurred that the
current audit reports are too voluminous for many users, they argued that this is unavoidable because of the nature of the audit, which involves non-financial information. Nonetheless, one auditor did not perceive the current format as the main factor in discouraging the public from reading the audit report.“It is not because the audit report looks so thick that makes the public reluctant to read. It has something to do with the attitude of our people. They do not care about what happens around them.” (Auditor 7)
The PAC members, however, believe that the format of audit reports needs to be improved. The present format was deemed inappropriate because it is standardised for all reports. Alternatively, they prefer to have a format that is more flexible and can be customised to the specific needs of an audit. One suggestion by the PAC members is to have an executive summary:“It would be helpful if the auditors can provide the executive summary in the front section of the audit report. It would be much easier for me as a PAC member to get straight to the problems. There are lots of reports that I need to look at.” (PAC 1)
Three PAC members considered the current format to be too long, believing that it would lead to important issues being overlooked in the audit opinion or that users might be discouraged from reading it. Nevertheless, many of them agreed that the current format provided some benefits in terms of outlining the methods employed and the objectives of the audits.
Pertanika J. Soc. Sci. & Hum. 23 (S): 89 – 98 (2015)
Auditors’ and PAC Members’ Views on Performance Auditing Practices in Malaysia: A Qualitative Approach
97
DISCUSSION AND CONCLUSIONS
The findings show that there is a significant divergence between auditors and PAC members about the duty of auditors to detect fraud. The present practice, certainly, is that the NAD auditors do not actively look for fraud and only report it if their suspicions are aroused during the course of the audit. The main reason for this approach is the absence of a specific mandate for fraud detection. PAC members, on the other hand, expect fraud detection to be a major reason for performing audits, while Chowdhury and Innes (1998) argued that fraud detection is an implied constitutional mandate. Clearly, the lack of a statutory requirement for fraud detection leads the auditors to believe that such detection is not a part of their duties, which contradicts with PAC members’ expectations.
As for the issue of auditors’ independence, most auditors claimed that they base their findings on the evidence, regardless of whether they have been subjected to any pressure from management or outside parties. Nevertheless, two auditors admitted that they were not allowed to include certain national-security-related or other controversial issues in their audit reports, and two out of eight PAC members believed that auditors could not always maintain their independence from external pressures, especially from politicians. They were convinced that the government administration still has at least a subtle indirect control over the NAD, primarily because the Auditor General is appointed on the recommendation of the Prime
Minister. The study found that some senior auditors did feel this influence, claiming that they are under pressure from their own managers and other governmental officers. This finding is in line with the work of McCrae and Vada (1997), which disclosed that the independence of the Auditor General is threatened by administrative forces who want to reduce audit operations and use their political leverage to influence audit results. This finding is also consistent with Chowdhury and Innes (1998), who found that, while auditors insisted that they are free from external influence, users perceived that the auditors are heavily influenced by their own management.
Another finding of this study is that, with the exception to two PAC members, auditors and PAC members agreed about the comprehensiveness of audit reports. Both groups considered the audit reports fair and balanced, incorporating sufficient information on the progress and impacts of the programmes audited. The reports include clear statements of the auditors’ opinions on particular issues, delineate management responsibility regarding those issues, and critique both strengths and weaknesses of the programmes. This finding is inconsistent, though, with Johnsen et al. (2001) who found that audit reports were overloaded with detailed information not actually useful to auditee management.
There was also a significant difference in the opinions of auditors and PAC members about the adequacy of the audit report format to meet users’ information requirements. All the auditors believe that

Pertanika J. Soc. Sci. & Hum. 23 (S): 89 – 98 (2015)
Zaidi Mat Daud and Ian Fraser
98
the present format and length of audit reports is appropriate because subjective matters and non-financial information require lengthy explanations. They also felt that the standardised format makes the report easy to comprehend as it includes sections on all the critical aspects of programmes: planning, implementation, and monitoring.
In conclusion, the findings of this study showed that auditors and PAC members held different views about auditors’ independence, roles and responsibilities, as well as about the audit reports’ timeliness, content and format. Furthermore, these differences were substantive, not mere misunderstandings or inconsistencies in methods or standards. The most critical disagreement was over auditors’ role in detecting fraud, with PAC members believing such detection to be a major part of the job and auditors demurring that they had no specific mandate for such an approach.
REFERENCESAGA. (2006). Challenges in performance auditing:
How a state auditor with intriguing new performance auditing authority is meeting them. AGA CPAG Research Series, Report No. 5
Chowdhury, R., & Innes, J. (1998). A qualitative analysis of the audit expectations gap in the public sector of Bangladesh. International Journal of Auditing, 2(3), 247-261.
Chowdhury, R., Innes, J., & Kouhy, R. (2005). The public sector audit expectations gap in Bangladesh. Managerial Auditing Journal, 20(8), 893-908.
Daud, Z. M. (2008). Performance auditing in the Malaysian public sector: Issues and challenge in promoting public accountability. Intergration & Dissemination, 3, 5-7.
Driessen, A. J. G., & Molenkamp, A. (1993). The perspective of operational auditing: A new management tool. Managerial Auditing Journal, 8(5), 19-25.
Hazman, S. (1991). Effectiveness of public accounts committee in ensuring public accountability. Journal of Malaysian Parliament, 2(2), 34-37.
McCrae, M., & Vada, H. (1997). Performance audit scope and the independence of the Australian Commonwealth Auditor-General. Financial Accountability and Management, 13(3), 203-223.
National Audit Department (2006). Laporan Hari Audit Se Malaysia 2006. Kuala Lumpur: National Audit Department.
Pendlebury, M., & Shreim, O. (1990). UK auditors’ attitudes to effectiveness auditing. Financial Accountability and Management, 6(3), 177-189.
Pendlebury, M., & Shreim, O. (1991). Attitudes to effectiveness auditing: Some further evidence. Financial Accountability and Management, 7(1), 57–63.
Pollitt, C., Girre, X., Lonsdale, J., Mul, R., Summa, H., & Waerness, M. (1999). Performance or Compliance? Performance Audit and Public Management Reform in Five Countries. Oxford: Oxford University Press.
Pollitt, C. (2003). Performance audit in Western Europe: Trends and choices. Critical Perspectives on Accounting, 14(1), 157-170.
Radcliffe, V. S. (1999). Knowing efficiency: the enactment of efficiency in efficiency auditing. Accounting, Organizations and Society, 24(4), 333-62.
Raaum, R. B., & Soniat, E. (1993). Measurement based performance audit: A tool for downsizing government. The Government Accountants Journal, 42(2), 61-72.

Pertanika J. Soc. Sci. & Hum. 23 (S): 99 – 118 (2015)
ISSN: 0128-7702 © Universiti Putra Malaysia Press
SOCIAL SCIENCES & HUMANITIESJournal homepage: http://www.pertanika.upm.edu.my/
ARTICLE INFOArticle history:Received: 30 March 2015Accepted: 10 September 2015
E-mail addresses:[email protected] / [email protected](Ridzwana Mohd Said),[email protected] (Lim Theng Theng),[email protected] (Rosmila Senik),[email protected] (Yusniyati Yusri),[email protected] (Ong Tze San)* Corresponding author
The State of Sustainability Disclosure and Effects on Companies’ Financial Performance
Ridzwana Mohd Said*, Lim Theng Theng, Rosmila Senik, Yusniyati Yusri and Ong Tze SanDepartment of Accounting and Finance, Faculty of Economics and Management, Universiti Putra Malaysia, 43400 Serdang, Selangor, Malaysia
ABSTRACT
In Malaysia, the disclosure of sustainability information is lacking since it is not a common practice for companies in this country compared to developed countries. Sustainability disclosure consists of three dimensions, namely, economic, environmental and social disclosure. This study examined the extensiveness of sustainability disclosure in terms of quality and quantity. In addition, the relationship between sustainability disclosure and financial performance, which was measured by return on assets (ROA) and earnings per share (EPS), was also investigated. The annual reports and stand-alone reports from 2007 to 2010 of 24 public companies listed on Bursa Malaysia (Malaysian Stock Exchange) participated in the ACCA Sustainability Reporting Awards (MaSRA) were analysed using content analysis. Meanwhile, the signalling hypothesis was used to address the relationships of the variables. It was found that the quantity of sustainability disclosure increased from year to year with the highest number of sentences of disclosure in the social dimension. In addition, companies provided comprehensive disclosure in the economic dimension in the forms of qualitative, monetary and non-monetary. Using multiple regression analysis, the results revealed no relationships between the sustainability dimensions and the financial performance of companies except for the economic
dimension and ROA with negative effect. The present study contributes to the current literature on sustainability, particularly inasmuch as prior studies mainly focus on corporate social reporting issues.
Keywords: Financial performance, Sustainability disclosure

Pertanika J. Soc. Sci. & Hum. 23 (S): 99 – 118 (2015)
Ridzwana Mohd Said, Lim Theng Theng, Rosmila Senik, Yusniyati Yusri and Ong Tze San
100
INTRODUCTION
The World Commission on Environment and Development defines sustainable development as “development that meets the needs of the present without compromising the ability of future generations to meet their own needs” (WCED, 1987). It is the idea of maintaining a better quality of life through using the natural resources prudently, enhancing social development and stabilising economic growth. Meanwhile, sustainability reporting is the practice of the management of companies in delivering accountability to the wider group of stakeholders through the disclosure of information for enhancing organisational performance to meet the goal of sustainable development (Global Reporting Initiative [GRI], 2011). The information can be reported as part of the corporate annual report or as a stand-alone report.
Many companies were found to continuously report sustainability information such as those in Germany, the United Kingdom, Japan, the United States and France (Burhan & Rahmanti, 2012). The information includes information concerning economic, environmental and social dimensions. However, according to the Chairman of the Environmental Quality Council Malaysia, Datuk Kok Wee Kiat, sustainability reporting in Malaysia is in a “poor shape”. Since sustainability reporting is not mandated in Malaysia, the information is hardly reported by companies listed on Bursa Malaysia (Sustainability Reporting in Poor Shape,
2009). Datuk Kok urged the government to make sustainability reporting compulsory for all companies in Malaysia. Besides that, Sumiani et al. (2007) found that the level of environmental and sustainability disclosure of 50 listed companies in Malaysia in 2003 was low and mainly qualitative term. Accordingly, this study examined the development of sustainability disclosure by companies in Malaysia through annual reports and sustainability reports between 2007 and 2010. It is interesting to determine the current state of the practice of corporate sustainability reporting in Malaysia in response to the statement of Datuk Kok. While it was found that many studies had examined the initiatives of corporate social responsibility and financial performance (such as Hillman & Keim, 2001; Saleh et al., 2011; Setiawan & Tjiang, 2012), literature examining sustainability initiatives and financial performance is lacking, particularly in the Malaysian context (Ramasamy et al., 2007). Thus, this study also examined the relationship between corporate sustainability reporting and financial performance.
This study makes several contributions. The results on the state of sustainability reporting of companies in Malaysia can be used as a benchmark by other companies in determining their position in sustainability reporting. The findings may also be used by policymakers or regulators in setting rules and regulations concerning sustainability disclosure, which is still voluntary in Malaysia. The empirical results may also be useful to companies concerning

Pertanika J. Soc. Sci. & Hum. 23 (S): 99 – 118 (2015)
The State of Sustainability Disclosure and Effects on Companies’ Financial Performance
101
the importance of extending the current financial reporting practices to non-financial information disclosure such as sustainability information.
Sustainability Reporting
Sustainability reports include disclosure of information concerning the economic, social and environment performance of a company and provide a useful tool to measure the sustainable performance of companies. The reports also act as a mechanism to show the commitment of companies in sustainability development (Tregidga & Milne, 2006). They can also be used to communicate the economic, social and environmental performance of a company and provide a benchmark of its compliance with the laws, codes of conduct, standards and voluntary initiatives (Global Reporting Initiative, 2000-2012).
Some countries such as Denmark and the Netherlands have made it mandatory for companies to disclose environmental information, albeit only for certain industrial sectors. However, Japan was the first country to adopt triple bottom line reports. In 2001, the government of France regulated listed companies to disclose environmental and social activities in their annual reports (Schadewitz & Niskala, 2010). In Malaysia, sustainability reporting is a voluntary practice. According to Amran and Haniffa (2011), the main motive for sustainability reporting by companies in Malaysia is for legitimate purposes relating to their public relations strategy for competitive advantage or government
institutionalisation. Companies such as Plus Highway Berhad, DRB-Hicom Berhad and Pharmaniaga Berhad depend on business contracts from the government. Thus, to secure such projects, they prepare reports to depict themselves as being socially responsible.
Sustainability reporting is still in its infancy in Malaysia. Siwar and Harizan (2009) found that one third of the companies in Malaysia are socially responsibly active, yet more than one tenth of the companies in Malaysia do not disclose information pertaining to their social responsibility activities. This is further supported by Low et al. (2012), who discovered that companies in Malaysia usually disclose their social responsibility activities in their annual reports but not as a stand-alone report, which is more comprehensive. Additionally, huge costs and unclear positive returns to companies relating to the disclosure of sustainability hinder the continuity of such disclosure practices. Indeed, although a number of prior studies revealed the existence of a positive relationship between social reporting and financial performance in developed countries, it is unclear in the Malaysian context (Ramasamy et al., 2007).
Sustainability Disclosure and Corporate Performance
The level of disclosure of the economic, social and environmental dimensions by companies in Malaysia is generally low in quantity and varies according to different business sectors. Sumiani et al. (2007)

Pertanika J. Soc. Sci. & Hum. 23 (S): 99 – 118 (2015)
Ridzwana Mohd Said, Lim Theng Theng, Rosmila Senik, Yusniyati Yusri and Ong Tze San
102
examined the environmental disclosure of 50 listed companies in Malaysia in the annual reports for 2003 and found that the disclosure level had low extensiveness. In addition, Aini and Sayce (2011) found that the level of disclosure of social information is low for the property investment sector and higher for information concerning corporate philanthropy than environmental information. Sustainability reporting by companies in Malaysia is far behind other countries such as New Zealand and Australia. The low level of social and environmental disclosure by companies in Malaysia may be because it is not required by law (Siwar & Harizan, 2009), the huge cost needed to disclose the information or because there is no guarantee of an immediate return (Low et al. 2012). While Raar (2002) found that environmental disclosure of firms listed in Australian Stock Exchange was extensive and in the forms of qualitative, quantitative and non-monetary, Sumiani et al. (2007) and Azim et al. (2009) studied companies in Bangladesh found otherwise. The quality of information disclosed is general and qualitative in nature.
The impact of social and environmental reporting on corporate financial performance has also been studied by researchers. However, prior findings indicated that such relationships are inconclusive (Wahba, 2008). Beurden and Gossling (2008) carried out a meta-analysis of prior studies on corporate social reporting and financial performance. They found that the majority of prior
studies obtained a positive relationship between corporate social performance and financial performance (68%), while only 26% showed an insignificant result and 6% indicated a negative relationship.
For example, Ameer and Othman (2012) found a positive relationship between sustainability disclosure of companies and financial performance. Using the sustainability reports of 100 companies, the results showed that environmental information represents 53.8% of the total sustainability information disclosed. In addition, companies with sustainability practices such as waste management and pollution control policy have higher financial performance than those without sustainability practices. Vijfvinkel et al. (2012) examined the relationship between environmental sustainability and the financial performance of 177 manufacturing firms in the Shanghai region and 180 companies in Rotterdam, Netherlands. The results showed that the revenue of the companies increased and their sustainable image improved after implementing the policy on reducing pollution. This is derived indirectly from the reduction of cost in manufacturing their product and the reuse of materials in production, which enable companies to save on the costs of the product and increase profit. Other studies that have found positive relationships between corporate sustainability disclosure and financial performance include those Saleh et al. (2011) and Burhan and Rahmanti (2012) in Malaysia and Indonesia, respectively. Such

Pertanika J. Soc. Sci. & Hum. 23 (S): 99 – 118 (2015)
The State of Sustainability Disclosure and Effects on Companies’ Financial Performance
103
positive relationships have been proven in the studies of companies in Singapore (Khaveh et al. 2012) and the United States (Lo, 2010).
In contrast, other studies also revealed a negative relationship between sustainability reporting and financial performance. Wagner et al. (2002) found a negative relationship between the environmental performance and economic performance of 37 European paper manufacturing companies. Consistently, Crisóstomo et al. (2011) found that 296 companies listed on the Brazilian stock market had a significant negative relationship between the employees and environmental activities, and the value of the firms. Makni et al. (2009) who also discovered a negative impact of corporate social performance and financial performance on Canadian firms, asserting that this might be due to the trade-off theory in which firms involved in corporate social responsibility would experience lower profit, and thus lower shareholders’ wealth. This is supported by Hillman and Keim (2001) who found that 308 firms participating in social issues had a negative influence on shareholders’ wealth. This result is consistent with the findings of Saleh et al. (2011).
Meanwhile, a number of studies found no relationship between social and environmental activities and corporate financial performance, such as those by Crisóstomo et al. (2011) in Brazil, and Mehar and Rahat (2007) in Pakistan. The results of a study by Adams et al. (2010) showed that corporate sustainability has
no impact on the financial performance of firms. In addition, short run sustainability efforts (i.e., less than 5 years) do not result in higher stock prices or enhance the return to shareholders. However, corporate sustainability efforts assist the firm to build brand loyalty and corporate reputation in the long term, which consequently maximises long-term shareholders’ wealth. They concluded that corporate sustainability has no impact on corporate financial performance in the short term but has an opposite effect if it is in the long term.
Since sustainability reporting is not mandated in Malaysia, it is interesting to identify the extensiveness of the disclosure level by companies in this country. Therefore, the present study was carried out to discover the quality and quantity of the sustainability disclosure by companies in Malaysia. In addition, mixed results were found in prior literature concerning the relationship between corporate social disclosure and financial performance. The present study was undertaken to provide further evidence, specifically on the relationship between sustainability disclosure and corporate financial performance.
Theoretical Framework
According to Ahmed et al. (2012), prior researchers view that corporate social and environmental initiative by companies is both a predictor and consequence of company’s financial performance. For example, corporate sustainability efforts by companies

Pertanika J. Soc. Sci. & Hum. 23 (S): 99 – 118 (2015)
Ridzwana Mohd Said, Lim Theng Theng, Rosmila Senik, Yusniyati Yusri and Ong Tze San
104
can signal the capital markets of the overall quality of companies’ products and services. Thus, based on signalling hypothesis, capital market participants may be expected to pay premium for the shares of companies that
emphasise sustainability efforts. This may allow firm to achieve high profitability and increased shareholders’ wealth maximisation (Adams et al., 2010). Accordingly, the following framework is developed.
Fig.1: Theoretical Framework
Deegan et al. (2002) found that managers are motivated to disclose social and environmental information as they wish to continue surviving within society and believe that it is their responsibility. They also perceive that by undertaking sustainable development, their financial performance will also increase. This means that the company can operate successfully as it remains within the boundaries of socially responsible behaviour (O’Donovan, 2002). Accordingly, the research framework drawn above inferred that the economic, environmental and social sustainability dimensions are expected to have a relationship with the financial performance of companies. The economic sustainability dimension disclosed in the report such
as financial growth, dividend policy and other economic conditions are essential information for the users of financial statements. The information is expected to contribute to the economic development of companies. Indeed, according to Burhan and Rahmanti (2012), the economic sustainability disclosure has a positive relationship with financial performance. Thus, the following null hypothesis is addressed:H1: There is no relationship between
economic sustainability disclosure and corporate financial performance.
The environmental sustainability dimension concerns the initiatives taken by a company such as to conserve the natural

Pertanika J. Soc. Sci. & Hum. 23 (S): 99 – 118 (2015)
The State of Sustainability Disclosure and Effects on Companies’ Financial Performance
105
environment and carry out energy saving programmes. The activities of companies may have a negative impact on the living and non-living features of the land, air and water. Thus, it is important for companies to carry out environmental activities to preserve the environment. Prior studies by Burhan and Rahmanti (2012), Khaveh et al. (2012) and Wibowo (2012) indicated that environmental sustainability disclosure has a positive relationship with financial performance. There are also several studies such as those Crisóstomo et al. (2011), Saleh et al. (2011) and Wagner et al. (2002) which found a negative relationship between environmental sustainability disclosure and financial performance. Therefore, the following null hypothesis is addressed:H2: There is no relationship between
environmental sustainability disclosure and corporate financial performance.
The social sustainability dimension is related to the contribution of the organisation of the society development. It is divided into five aspects, which consist of contribution to the community, human resource development, human rights, products responsibility and governance issues. A number of researchers, such as Lo (2010), Ameer and Othman (2012), and Ahmed et al. (2012), indicated that social sustainability disclosure has a positive relationship with financial performance. Therefore, the following null hypothesis is developed:H3: There is no relationship between social
sustainability disclosure and corporate financial performance.
RESEARCH METHODOLOGY
The sample frame was derived from among the 39 public- and non-public listed companies participating in the ACCA Malaysia Sustainability Reporting Awards (MaSRA) 2011. The award is given to companies that have carried out environmental and social performance, and contributed towards the advancement of sustainable development and performance (ACCA, 2011). However, since only the sustainability or annual reports of public-listed companies were available, the final number of the sample was 28. The reports from 2007 to 2010 were obtained, and, thus, 112 observations were included in the study. Since the number of companies in Malaysia that published stand-alone sustainability reports was limited, the sustainability information provided in the annual reports and corporate social responsibility (CSR) reports of companies was also considered.
Measurement of Variables and Regression Model
In this study, sustainability information disclosure has three dimensions – economic, social and environmental – as independent variables. The sustainability checklist items specified in the study by Sobhani et al. (2011) were adopted in collating sustainability information from the published reports of companies (the checklist can be obtained from the corresponding author). The economic dimension explains the organisation’s activities that can affect the wider

Pertanika J. Soc. Sci. & Hum. 23 (S): 99 – 118 (2015)
Ridzwana Mohd Said, Lim Theng Theng, Rosmila Senik, Yusniyati Yusri and Ong Tze San
106
stakeholders to enable them to understand the financial viability of companies. In addition, the social dimension reports on the social performance of companies and how this can influence the sustainability of companies in carrying out their business. Finally, the environmental dimension concerns the impact of the organisation on the living and non-living natural systems which include water, air, land and the ecosystem.
The dependent variable in this research is financial performance, which is measured by accounting returns. Two different accounting returns were used: return on assets (ROA) and earnings per share (EPS). ROA is a variable that can express economic performance effectively (Dincer, 2011). It explains how efficiently a company turns its assets into net income. The higher the ROA, the higher the profit earned by the company. The formula for ROA is:
ROA = Net Profit
Total Assets (average)
EPS is also used in the studies by Ahmed et al. (2012) and Lo (2010). EPS is one of the indicators of the profitability of companies, which indicates a portion of the company’s profit allocated to each outstanding share of common stock.
Meanwhile, firm size is used as a control variable as it can influence the level of sustainability disclosure in a company (Siwar & Harizan, 2009; Choi et al., 2010). Large firms are usually older firms that invest in CSR to gain greater economies of scale. In addition, having a better financial
position allows the larger organisations to undertake greater social responsibility activities to remain sustainable. Therefore, it is necessary to control firm size to determine its financial performance. Firm size is measured by the logarithm of total assets. In order to examine the relationships between the variables, the hierarchical multiple regression method was used. Thus, the following equation was developed:
Y = a + b1X1 + b2X2 + b3X3 + b4LTA + e
Where,Y = Return on Assets (ROA)/Earnings
per Share (EPS)a = Constantb = Regression coefficientX1 = Economic disclosure X2 = Social disclosureX3 = Environmental disclosure LTA = Logarithm of total assets (firm size)e = Error
Content Analysis
Content analysis is a method to systematically analyse the details of information content and other aspects of a message. Content analysis reads the message itself and creates a logical observation and records procedure for the quantitative illustration of the content of communication (Zinkmund, 2010). Content analysis is widely used in research on corporate social reporting (for example, Raar, 2002; Ameer & Othman, 2012; Setiawan & Tjiang, 2012). A number of approaches have been adopted by researchers. Among other, Ameer and

Pertanika J. Soc. Sci. & Hum. 23 (S): 99 – 118 (2015)
The State of Sustainability Disclosure and Effects on Companies’ Financial Performance
107
Othman (2012) assigned scores from +4 to 0 based on the wording of the sustainability report – a score of +4 is assigned if there is a major tangible positive contribution, a score of +1 for no contribution and a 0 score for the non-disclosure of information. After rating the items, they summed up the total scores for the events to obtain the precise index value of the company. Meanwhile, Setiawan and Tjiang (2012), and Raar (2002) used the number of sentences to determine the importance of the CSR items disclosed by companies. Prior studies proved that measuring sentences to examine the extent of disclosure is more reliable than measuring by the number of pages. The change in the number of pages may be due to the print size, column size and other reasons (Sobhani et al. 2012). The usage of sentences is easier for the coding method and it is comparative (Amran & Devi, 2008). As this study examines the quantity and quality of the sustainability of information, the measurement used by Raar (2002) is adopted (refer to Appendix 1). The higher the number of sentences, the more strongly the company emphasises the disclosure. Meanwhile, the quality of disclosure is assigned using different codes based on the form of the disclosure. The score ranges from 1 to 7, whereby 1 is assigned when the information is disclosed in monetary / currency term. The highest score 7 is given to a more detail disclosure which include descriptive prose, financial and numeric terms. The detail measurement of sustainability disclosure is attached in the Appendix 1.
ANALYSIS OF FINDINGS
Data collection process
The sustainability and social responsibility reports, and annual reports of 28 companies from 2007 to 2010 were examined. However, a thorough screening process led to the data of only 24 companies being obtained because three companies lacked prior stand-alone reports and annual reports, while one company was removed due to the existence of outliers when examining the relationship between sustainability disclosure and financial performance.
The collection of data began by reading the sentences from the front page to the last page of the reports line by line. The data were initially tabulated in Microsoft Excel before examining the relationships between the sustainability dimensions and corporate financial performance in SPSS. The data collected included the number of sentences related to each GRI item to measure the quantity of sustainability disclosure and the form of the information being disclosed to measure its quality. The data collection process took three months to complete.
RESULTS
Descriptive statisticsTABLE 1Total number of sentences for sustainability disclosure based on year
Year 2007 2008 2009 2010
Economic 192 180 202 236Environment 632 730 929 1299Social 4337 4735 5174 5847Total number of sentences 5161 5645 6305 7382

Pertanika J. Soc. Sci. & Hum. 23 (S): 99 – 118 (2015)
Ridzwana Mohd Said, Lim Theng Theng, Rosmila Senik, Yusniyati Yusri and Ong Tze San
108
Table 1 shows the disclosure level for each sustainability dimension between 2007 and 2010. The results showed that the environmental and social sustainability dimensions had an increasing trend of disclosure. This indicates that as companies move forward, they are more involved in sustainability activities, which are disclosed in their reports. Although the number of sentences for the economic dimension reduced in 2008 compared to 2007, the difference was small. The information being disclosed for economic dimension
included comparative financial growth and contribution to infrastructural and institutional development. Additionally, the companies concentrated more on the importance of environmental protection and invested in various programmes or initiatives to reduce environmental problems. Social information dominated the information being disclosed by companies within their reports, which might be due to the wider aspect of social issues defined by companies.
TABLE 2Total number of sentences for sustainability disclosure based on three dimensions
Number of Sentences %Economic dimension 810 3.31Environmental dimension1. Energy Consumption and Savings 559 2.282. Natural Environment 3031 12.37
3590 14.65Social dimension1. Contribution to the Community 3752 15.322. Human Resource Development 3104 12.673. Human Rights 1951 7.974. Product Responsibility 925 3.785. Governance Issue 10361 42.30
20093 82.04Total number of sentences for three dimensions 24493 100
Table 2 provides the sub-categories of the three sustainability dimensions. Within the 4 years, the highest level of disclosure was social dimension, which was approximately 82% of the total sustainability disclosure. The information included contribution to the society in terms of providing education, committing to human resource development, helping
the needy, establishing good corporate governance, establishing health and safety procedures in the workplace, organising social awareness programmes and many others. Public Bank Berhad contributed the highest level of social disclosure compared to the other corporations. The company offered training for its employees and there was also a high level of disclosure on

Pertanika J. Soc. Sci. & Hum. 23 (S): 99 – 118 (2015)
The State of Sustainability Disclosure and Effects on Companies’ Financial Performance
109
customer service information. In contrast, IJM Land Berhad disclosed the least sustainability information.
Economic sustainability only contributed 3.31% of the information being disclosed within the four-year period. This might be due to the limited items listed concerning the economic dimension. Most of the companies did not disclose their economic activities as stated in the GRI, and mainly reported information on comparative financial growth. Puncak Niaga Holdings Berhad had the highest disclosure while Guinness Anchor Berhad had the lowest disclosure on the economic dimension. Indeed, Guinness Anchor Berhad did not report any economic information related to GRI items since 2008, the year when the company adopted the CSR reporting system.
Fifteen per cent of the sustainability disclosure during the four-year period was related to the environmental dimension. One of the companies that made a significant environmental contribution was YTL Corporation, which had organized various environmental friendly programmes and many initiatives to reduce energy consumption. IJM Land Berhad had the least environmental disclosure. Surprisingly, the company did not disclose information related to energy which can conserve the environment.
Quality of sustainability disclosure
This study also analysed the quality of sustainability disclosure. As shown in Table 3, economic information
was disclosed mainly in the forms of qualitative, monetary and non-monetary. As for the environmental and social dimensions, the information was largely in qualitative form, which is descriptive in nature with no quantitative and monetary information.
Specifically, majority of the economic disclosure was in the monetary form with a percentage value and further elaboration of the issues concerned. It also gradually increased from one year to another. Meanwhile, the environmental information included information related to environmental initiatives, energy consumption and savings, which were briefly described in quantitative form such as kilowatt savings and so forth. Concerning the social sustainability dimension, the majority of the sentences were related to corporate governance such as directors’ profile and corporate profile. Therefore, the information was disclosed only in the qualitative form and the quantity of information continuously increased throughout the years. Additionally, the quantitative and monetary social information included the description about the number of people involved in social activities or the number of people who would gain benefits. The most common information was the employee benefit such as the number of annual leave days. The companies also reported information such as scholarship, education and donations to the community.

Pertanika J. Soc. Sci. & Hum. 23 (S): 99 – 118 (2015)
Ridzwana Mohd Said, Lim Theng Theng, Rosmila Senik, Yusniyati Yusri and Ong Tze San
110
TABLE 3Quality of sustainability disclosure based on three dimensions
Economic Environment SocialNumber of Sentences
% Number of Sentences
% Number of Sentences
%
Monetary 69 8.52 0 0 0 0Non-monetary 0 0 1 0.03 19 0.09Qualitative only 132 16.30 2672 74.43 14732 73.32Qualitative & monetary 198 24.44 111 3.09 610 3.04Qualitative & non-monetary 106 13.09 722 20.11 2625 13.06
Monetary & non-monetary 0 0 0 0 0 0
Qualitative, monetary & non-monetary 305 37.65 84 2.34 2107 10.49
Total 810 100 3590 100 20093 100
Firm size was entered at Step 1, explaining 8.5% and 4.4% of the variance in the dependent variables of ROA and EPS, respectively. After entering all the three sustainability dimensions in Step 2, the total variance explained by the models as a whole was 12.4% and 6.8%. The three sustainability dimensions further explained the variance in ROA and EPS.
TABLE 4Coefficient table
ROA EPSStandardized
coefficientSig Standardized
coefficientSig
Company size -0.261 0.014 0.304 0.006
Economic -0.278 0.012 -0.207 0.067Environment -0.004 0.969 0.013 0.906Social 0.113 0.298 -0.071 0.526
The coefficient table shows two variables that make a statistically significant contribution at a significant value less than 0.05. The size of the firm and economic
dimension influence ROA, but none of the sustainability dimensions affects EPS. Additionally, the results showed an inverse relationship between economic dimension
Inferential statistics
Hierarchical multiple regression was used to analyse the relationship between sustainability dimensions and financial performance, while company size was controlled. Preliminary analyses were conducted to ensure no violation of the assumptions of normality, linearity, multicollinearity and homoscedasticity.

Pertanika J. Soc. Sci. & Hum. 23 (S): 99 – 118 (2015)
The State of Sustainability Disclosure and Effects on Companies’ Financial Performance
111
and ROA, which means that higher economic sustainability disclosure leads to a low return on assets. Thus, hypothesis 1 is rejected.
The higher economic disclosures refer to the comparative financial growth, as well as the infrastructural and institutional development undertaken by companies. It will result in a lower return on assets as the investor has a different perception on the financial growth of the company. High disclosure on comparative financial growth provides details of the information of the company. Investors may refuse to invest in a company that has poor economic conditions, which then leads to poor financial performance. In addition, the infrastructural and institutional development established by the company incurs higher cost and results in low financial performance. For example, in 2008, MRCB Corporation contributed to the economic development by building roads, bus stops and other types of community infrastructure.
DISCUSSION AND CONCLUSION
The quantity of disclosure for the sustainability dimensions increased from one year to another. This is consistent with a study carried out by Aini and Sayce (2010), in which companies in Malaysia are currently emphasising the disclosure of sustainability and environmental practices in their reports. Sobhani et al. (2011) and Wibowo (2012), in their studies, also found that sustainability and CSR disclosure increased year by year. The
improvement of sustainability disclosure in terms of quality and quantity indicates that companies realise the importance of being socially responsible. Apart from meeting society’s expectations by being socially responsible, companies can boost their reputation and maintain successful businesses (O’Donovan, 2002).
In addition, the results showed that the social sustainability dimension had the highest disclosure among the three aspects of sustainability dimensions. This is consistent with a study conducted by Sobhani (2011) who found that the social theme, particularly the disclosure on human resource development, is the dominant disclosure for banks in Bangladesh. Indeed, according to Aini and Sayce (2010), companies in Malaysia emphasise on social sustainability such as corporate philanthropy compared to environmental issues. The economic sustainability disclosure had the least sentences being disclosed. This result is in contrast with Burhan and Rahmati (2012), who found that economic performance had the highest disclosure among the three sustainability dimensions among companies in Indonesia.
However, the economic information had been disclosed by companies comprehensively in the forms of qualitative, monetary and non-monetary, which might be due to the nature of the information. Economic disclosure, especially concerning the financial aspect, is an essential means for management to communicate firm performance to financial statement users and enable them to use

Pertanika J. Soc. Sci. & Hum. 23 (S): 99 – 118 (2015)
Ridzwana Mohd Said, Lim Theng Theng, Rosmila Senik, Yusniyati Yusri and Ong Tze San
112
the information for economic decisions. In contrast, the quality of environmental information disclosed in the reports was relatively low when companies mainly reported the environmental information in qualitative form. Similarly, Sumiani et al. (2007) also identified the low quality of environmental disclosure by companies in Malaysia. With regards to the social sustainability dimension, the results are supported by Azim et al. (2009) and Sobhani et al. (2011) who found that corporate social information is mainly disclosed in the qualitative form. Usually, the report briefly disclosed the social activities of the companies.
Further analysis on the relationships between sustainability dimensions and financial performance (measured by ROA and EPS) revealed that only the economic sustainability dimension affects the ROA of companies. There is an inverse relationship between the two variables, which means that higher economic disclosure leads to lower ROA. The majority of the companies disclosed their economic sustainability dimension pertaining to information on financial growth, dividend policy, institutional and infrastructure development. The inverse relationship might be due to the poor economic condition disclosed by the company that affected the investment decision of the investor, which then resulted in low financial performance, as measured by ROA. For example, Faber Group Berhad, which disclosed very detailed information concerning its review of financial
performance in its annual report for 2010, had a lower ROA. Risk adverse investors will not make investment decisions if there is uncertainty in the outcome. In addition, institutional and infrastructure development, as specified in the descriptive analysis, may also result in low financial performance as the developments require an output of substantial costs. The costs incurred for such development are usually huge and significant. The results of the present study contradict that of Burhan and Rahmanti (2012) who found no relationship between economic sustainability and ROA. According to Sitepu (2009), economic sustainability disclosure has a positive relationship with ROA. The other sustainability dimensions have no relationship with financial performance. Some prior studies such as those by Burhan and Rahmanti (2012), Aras et al. (2010), Mehar and Rahat (2007) and Adams et al. (2011) revealed similar results. The insignificant results in the present study may also be due to the small sample size. A smaller sample size may jeopardise the effect of the corporate sustainability dimensions on financial performance.
Nevertheless, the results of the descriptive analysis revealed in the present study demonstrated that companies in Malaysia should be more transparent and comprehensive in delivering sustainability information to the users of the reports. MaSRA and other similar rewards should continue to be offered to encourage corporate involvement in sustainability initiatives. The study also signals the regulators

Pertanika J. Soc. Sci. & Hum. 23 (S): 99 – 118 (2015)
The State of Sustainability Disclosure and Effects on Companies’ Financial Performance
113
to formulate policies on sustainability practices by companies. Due to the importance of sustainability development, the government has the responsibility to set the rules and regulations for the adoption of the disclosure. In addition, this study may also contribute to the extant literature on sustainability reporting.
The authors acknowledge that the present study has its share of limitations. First, the sample of 24 companies limits the generalisability of results. Nevertheless, the results still offer some insights into the state of companies’ sustainability disclosure participated in MaSRA in 2011 and effects of such disclosure upon companies’ financial performance. Second, the content analysis approach used in the study may subject to human error because the sentence is categorised and computed based on researchers’ judgments (Hackston & Milne, 1996; Thompson & Zakaria, 2004). This was mitigated through a second reader during pilot test of the study. Future research may increase the number of companies being investigated to resolve the issue of generalisation and use recent annual reports or stand-alone reports to have latest findings. Finally, a longer of five to ten years data may offer better results to gauge the impact of sustainability disclosure and companies’ financial performance.
REFERENCESACCA. (2011). Report of the Judges 2011. ACCA
Malaysia Sustainability Report Awards (MaSRA). Retrieved November 2, 2012, from http://ablemen.com/sustainability/lock/downloads/judges_report_ACCA-MaSRA2011.pdf
Adams, M., Thornton, B., & Sepehri, M. (2010). The impact of the pursuit of sustainability on the financial performance of the firm. Journal of Sustainability and Green Business, 1, 1-14.
Ahmed, S. U., Islam, M. Z., & Hasan, I. (2012). Corporate social responsibility and financial performance linkage-Evidence from the banking sector of Bangladesh. Journal of Organizational Management, 1(1), 14-21.
Ameer, R., & Othman, R. (2012). Sustainability practices and corporate financial performance: A study based on the top global corporations. Journal of Business Ethics, 108(1), 61-79.
Amran, A., & Devi, S. S. (2008). The impact of government and foreign affiliate influence on corporate social reporting: The case of Malaysia. Managerial Auditing Journal, 23(4), 386-404.
Amran, A., & Haniffa, R. (2011). Evidence in development of sustainability reporting: a case of a developing country. Business Strategy and the Environment, 20(3), 141-156.
Aras, G., Aybars, A., & Kutlu, O. (2010). Managing corporate performance: Investigating the relationship between corporate social responsibility and financial performance in emerging markets. International Journal of Productivity and Performance Management, 59(3), 229-254.
Azim, M. I., Ahmed, S., & Islam, M. S. (2009). Corporate Social Reporting Practice: Evidence from listed companies in Bangladesh. Journal of Asia-Pacific Business, 10(2), 130–145.
Burhan, A. H., & Rahmanti, W. (2012). The impact of sustainability reporting on company performance. Journal of Economics, Business, and Accountancy| Ventura, 15(2), 257-272.
Choi, J.S., Kwak, Y.M., & Choe, C. (2010). Corporate social responsibility and corporate financial performance:Evidence from Korea. Australian Journal of Management, 5(3), 291-311.
Pertanika J. Soc. Sci. & Hum. 23 (S): 99 – 118 (2015)
Ridzwana Mohd Said, Lim Theng Theng, Rosmila Senik, Yusniyati Yusri and Ong Tze San
114
Crisóstomo, V. L., Freire, F. S., & Vasconcellosde, F. C. (2011). Corporate social responsibility, firm value and financial performance in Brazil. Social Responsibility Journal, 7(2), 295 - 309.
Deegan, C., Rankin, M., & Tobin, J. (2002). An examination of the corporate social and environmental disclosures of BHP from 1983-1997: A test of legitimacy theory. Accounting, Auditing & Accountability Journal, 15(3), 312-343.
Dincer, B. (2011). Do the shareholders really care about corporate social responsibility? International Journal of Business and Social Science, 2(10), 71-76.
Global Reporting Initiative (GRI). (2011). Sustainability Reporting Guidelines. Retrieved November 2, 2012, from https://www.globalreporting.org/resourcelibrary/G3.1-Guidelines-Incl-Technical-Protocol.pdf
Global Reporting Initiative (GRI). (2000-2012). Sustainability Reporting Guidelines & Event Organizers Sector Supplement. Retrieved November 2, 2012, from https://www.globalreporting.org/resourcelibrary/EOSS-G3.1-Complete.pdf
Hackston, D., & Milne, M. J. (1996). Some determinants of social and environmental disclosures in New Zealand companies. Accounting, Auditing and Accountability Journal, 9(1), 77-108.
Hillman, A. J., & Keim, G. (2001). Shareholder value, stakeholder management and social issue: What’s the bottom line? Strategic Management Journal, 22(2), 125-139.
Khaveh, A., Nikhashemi, S. R., Yousefi, A., & Haque, A. (2012). Voluntary sustainability disclosure, revenue, and shareholders wealth - A perspective from Singaporean companies. Business Management Dynamics, 1(9), 6-12.
Lo, S. F. (2010). Performance evaluation for sustainable business:A profitability and marketability framework. Corporate Social Responsibility and Environmental Management, 17(6), 311-319.
Low, L. T., Ng, K. K., & Ong, S. F. (2012). Time to wake up! sustainable responsible business reporting in Malaysian companies. British Journal of Arts and Social Sciences, 7(11), 122-133.
Makni, R., Francoeur, C., & Bellavance, F. (2009). Causality Between Corporate Social Performance and Financial Performance:Evidence from Canadian Firms. Journal of Business Ethics 89(3), 409–422.
Mehar, A., & Rahat, F. (2007). Impact of Corporate Social Responsibility on Firm’s Financial Performance. South Asian Journal of Management Sciences, 1(1), 16-24.
Mohd Aini, A., & Sayce, S (2010). Disclosing environmental and sustainability practices and initiatives in the annual reporting process of property investors: Evidence from Malaysia. Paper presented at the 17th European Real Estate Society Conference, Milan, June 23-26.
Mohd Aini, A., & Sayce, S (2011). Informing responsible investors on the differences of sustainable building certification in Malaysia (No.eres2011_307). European Real Estate Society (ERES).
O’Donovan, G. (2002). Environmental disclosures in the annual report: extending the applicability and predictive power of legitimacy theory. Accounting, Auditing and Accountability Journal, 15(3), 344-371.
Raar, J. (2002). Environmental initiatives: towards triple-bottom line reporting. Corporate Communications: An International Journal, 7(3), 169-183.

Pertanika J. Soc. Sci. & Hum. 23 (S): 99 – 118 (2015)
The State of Sustainability Disclosure and Effects on Companies’ Financial Performance
115
Ramasamy, B., Ting, H. W., & Yeung, M. C. (2007). Does it pay to be good in developing countries? The relationship between CSR and financial performance in Malaysia. Asian Academy of Management Journal of Accounting and Finance, 3(1), 21-36.
Saleh, M., Zulkifli, N., & Muhamad, R. (2011). Looking for evidence of the relationship betweencorporate social responsibility and corporate financial performance in an emerging market. Asia-Pacific Journal of Business Administration, 3(2), 165-190.
Schadewitz, H., & Niskala, M. (2010). Communication via responsibility reporting and its effect on firm value in Finland. Corporate Social Responsibility and Environmental Management, 17(2), 96-106.
Setiawan, E., & Tjiang, G. J. (2012). Corporate Social Responsibility, Financial Performance, and Market Performance: Evidence from Indonesian Consumer Goods Industry. In 6th Asian Business Research Conference. World Business Institute Australia.
Sitepu, S. S. (2009). Pengaruh Pengungkapan Tanggung Jawab Sosial terhadap Kinerja Perusahaan. Skripsi S1, Universitas Gadjah Mada.
Siwar, C., & Harizan, S. H. (2009). A study on corporate social responibility practices amongst business organizations in Malaysia. Bangi:Institute for Environment and Development, University Kebangsaan Malaysia.
Sobhani, F. A., Zainuddin, Y., Amran, A., & Baten, A. (2011). Corporate sustainability disclosure practices of selected banks: A trend analysis approach. African Journal of Business Management, 5(7), 2794-2804.
Sobhani, F. A., Amran, A., & Zainuddin, Y. (2012). Sustainability disclosure in annual reports and websites: A study of the banking. Journal of Cleaner Production, 23(1), 75-85.
Sumiani, Y., Haslinda, Y. & Lehman, G. (2007). Environmental reporting in a developing country: a case study on status and implementation in Malaysia. Journal of Cleaner Production, 10(15) 895-901.
The Star Online. (2009, June 11). Sustainability reporting in ‘poor shape’. The Star. Retrieved November 2, 2012, from http://biz.thestar.com.my/news/story.asp?file=/2009/6/11/business/4092911&sec=business
Thompson, P., & Zakaria, Z. (2004). Corporate social responsibility reporting in Malaysia. Journal of Corporate Citizenship, 2004(13), 125-136.
Tregidga, H., & Milne, M. J. (2006). From sustainable management to sustainable development: A longitudinal analysis of a leading New Zealand environmental reporter. Business Strategy and the Environment, 15(4), 219-241.
Van Beurden, P., & Gossling, T. (2008). The worth of values – A literature review on the relation between corporate social and financial performance. Journal of Business Ethics, 82(2), 407–424.
Vijfvinkel, S., Bouman, N., & Hessels, J. (2012). Environmental sustainability and financial performance of SMEs. This research has been partly financed by SCALES, Scientific Analysis of Entrepreneurship and SMEs, 1-47.
Wagner, M., Phu, N. V., Azomahou, T., & Wehrmeyer, W. (2002). The relationship between the environmental and economic performance of firms: an empirical analysis of the European paper industry. Corporate Social Responsibility and Environmental Management, 9(3), 133-146.
Wahba, H. (2008). Does the market value corporate environmental responsibility? An empirical examination. Corporate Social Responsibility and Environmental Management, 15(2), 89-99.

Pertanika J. Soc. Sci. & Hum. 23 (S): 99 – 118 (2015)
Ridzwana Mohd Said, Lim Theng Theng, Rosmila Senik, Yusniyati Yusri and Ong Tze San
116
WCED - World Commission on Environment and Development (1987). Our Common Future. Oxford University Press: Oxford. Retrieved May 2, 2012, from http://www.un-documents.net/our-common-future.pdf
Wibowo, A. J. (2012). Interaction between corporate social responsibility disclosure and profitability of Indonesia firms. In UMT 11th International Annual Symposium on Sustainability Science and Management (pp. 378-380).
Zinkmund, W. G. (2010). Business Research Methods (8th Edition). Auckland: Thompson.
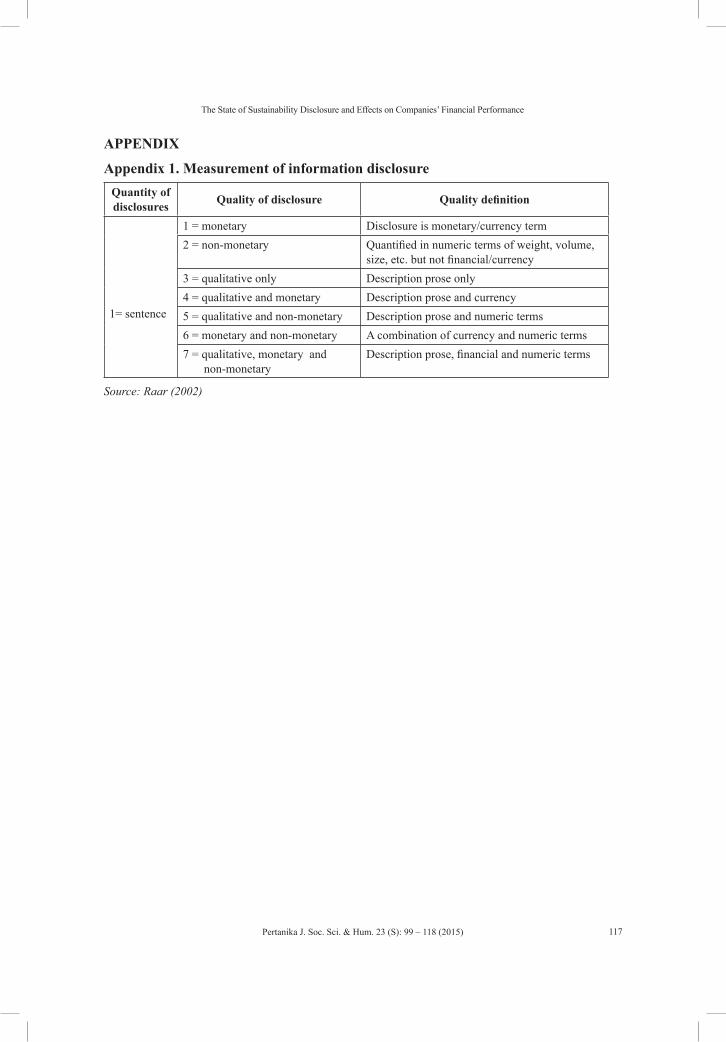
Pertanika J. Soc. Sci. & Hum. 23 (S): 99 – 118 (2015)
The State of Sustainability Disclosure and Effects on Companies’ Financial Performance
117
APPENDIX
Appendix 1. Measurement of information disclosureQuantity of disclosures Quality of disclosure Quality definition
1= sentence
1 = monetary Disclosure is monetary/currency term2 = non-monetary Quantified in numeric terms of weight, volume,
size, etc. but not financial/currency3 = qualitative only Description prose only4 = qualitative and monetary Description prose and currency5 = qualitative and non-monetary Description prose and numeric terms6 = monetary and non-monetary A combination of currency and numeric terms7 = qualitative, monetary and non-monetary
Description prose, financial and numeric terms
Source: Raar (2002)

Pertanika J. Soc. Sci. & Hum. 23 (S): 119 – 142 (2015)
ISSN: 0128-7702 © Universiti Putra Malaysia Press
SOCIAL SCIENCES & HUMANITIESJournal homepage: http://www.pertanika.upm.edu.my/
ARTICLE INFOArticle history:Received: 30 March 2015Accepted: 10 September 2015
E-mail addresses:[email protected] / [email protected] (Maswati A. T.),[email protected] / [email protected] (Abdullah, A.),[email protected] (Wai Yee, C.)* Corresponding author
Credit Card Practices: Knowledge, Attitude and Debt Management
Maswati A. T.*, Abdullah, A. and Wai Yee, C.Department of Accounting and Finance, Faculty of Economics and Management, Universiti Putra Malaysia, 43400 UPM Serdang, Selangor, Malaysia
ABSTRACT
The trend of accumulation of large credit card debt, especially among young adults, has certainly become a nationwide concern in Malaysia. Consequently, many youngsters have been declared as bankrupt due to credit card indebtedness. Even though these youngsters were those with a lack of essential skills to handle credit cards, it seems that credit cards were easily accessible by them (college students in particular). Therefore, as previous studies have indicated, the ability of these youngsters to manage their finances efficiently is being questioned. The purpose of this study is to examine the factors contributing to postgraduate students’ practices on credit card usage. The objectives of this study are: 1) to determine whether the understanding or knowledge of credit card usage can be used to minimise the impacts of credit card debt; 2) to examine whether the perceptions or attitudes on credit cards can affect its usage; and 3) to study the relationship between credit card debt management and credit card practices. Survey questionnaires were distributed and completed by a convenience sample of 100 postgraduate students at Universiti Putra Malaysia. After applying a chi-square test analysis, the results indicated three factors; knowledge of credit card usage, perceptions or attitudes of credit card usage, and credit card debt management have contributed as key determinants of the credit card practices and financial decisions among post-graduate students. The findings can assist the government in identifying suitable measures to reduce irresponsible credit card practices, especially amongst youngsters. It also offers practical information for administrators and counsellors
to address the challenges faced by students of higher learning institutions.
Keywords: Credit card practices, financial decisions, debt management, youngsters, personal bankruptcy

Pertanika J. Soc. Sci. & Hum. 23 (S): 119 – 142 (2015)
Maswati A. T., Abdullah, A. and Wai Yee, C.
120
INTRODUCTION
In 2012 alone, out of 19,575 bankruptcy cases, 11,134 (or 57%) cases were declared by individuals aged between 25 and 44 (Malaysia Department of Insolvency, 2015). Moreover, back in 2009, out of the 3,548 people declaring bankruptcy by credit cards, 1,774 (or 50%) were those aged 30 and below (Malaysia Department of Insolvency, 2015; AKPK, 2010). In brief, there exists a trend in which younger individuals are declaring bankruptcy. This phenomenon of accumulation of credit card debt, especially among young adults, has certainly become a nationwide concern.
There is a growing concern that, although college students lack the financial knowledge and skills to handle credit cards wisely, they have easy access to them (Chen & Volpe, 1998; Henry, Weber, & Yarbrough, 2001; Palmer, Pinto, & Parente, 2001). Consequently, many young people have accumulated large amounts of debt, and have basically mortgaged their futures by the time they graduate (Susswein, 1995; Blair, 1997; Quinn, 2001).
Questions regarding students’ abilities to efficiently manage their finances were raised by the prevalent usage of credit cards by college students. Several researchers have focused on the scope of credit card usage by students and concluded that the majority of college students use credit cards with some carrying substantial balances each month (Hayhoe, Leach, Turner, Bruin & Lawrence, 2000; Manning, 2000; Quinn, 2001; Joo, Grable & Bagwell, 2003).
Likewise, young people must be equipped with financial competencies before they are required to make decisions regarding money usage and management. Since it is the college and university administrators’ responsibility “to create the necessary support systems to encourage the academic and personal success of their students” (Pinto, Parente, & Palmer, 2001, p. 172), it is essential for them to offer students with financial literacy training opportunities. Therefore, there is an urgent need to educate young people in financial literacy. However, financial education and counselling usually take place after individuals have become so deeply involved in debt that it is impossible for them to be able to meet their financial obligations. This is the reverse of what should be done.
This study aimed to examine the selected factors contributing to the post graduates students’ financial decisions and practices on credit cards. For this purpose, the study adopted a revised theoretical framework of the Deacon and Firebaugh’s (1988) model of family resource management.
The objectives of this study are: 1) to determine whether the understanding or knowledge of credit card usage can be used to minimise the impacts of credit card debt; 2) to examine whether the perceptions or attitudes on credit cards can affect their usage; and 3) to study the relationship between credit card debt management and credit card practices.

Pertanika J. Soc. Sci. & Hum. 23 (S): 119 – 142 (2015)
Credit Card Practices: Knowledge, Attitude and Debt Management
121
Therefore, the significance of this study is that the findings on students’ credit card knowledge, attitudes, practices, and debt level can help the college or higher learning education’s administrators and counsellors to determine the best approaches to tackle the problem that college students face regarding irresponsible credit card behaviour. This study also offers practical information to government agencies related to youth development. This information can potentially help them address the challenges faced by youngsters by developing and delivering educational programmes and effective counselling approaches to instil awareness on credit cards, and eventually financial discipline to avoid indebtedness issues.
The next section reviews the related literature and discusses the hypotheses development. Next, the research methodology is explained, and the results are analysed. Finally, limitations and contributions of the study are discussed in the conclusion.
LITERATURE REVIEW
Credit Cards
The utilisation of credit cards has become common among Malaysians, especially amongst traders. The first recorded usage of credit actually can be traced back to the ancient Babylon and Egypt, nearly 3000 years ago (Evans & Schmalensee 2005). Later on, during the 20th century, John Biggins of the Flatbush National Bank of Brooklyn in New York invented the first bank-issued credit card.
Credit cards were first introduced in Malaysia in 1973, with the introduction of the Diners Club Card.
Recently, Awanis and Chi Chui (2014) presented a new concept and measure of susceptibility to the credit card misuse and indebtedness (SCCMI) on young credit card users (aged 18-25) from Malaysia, Singapore, and the UK, which applies confirmatory factor analysis and invariance tests to assess validity, reliability and parsimony of the proposed scale in these three countries. The results indicated that the SCCMI scale is valid, reliable and parsimonious across the multi-country context, as well as the prediction power of SCCMI on consumer tendency to become a revolving credit card debtor (Awanis & Chi Chui, 2014).
Knowledge of Credit Card Usage
Theoretically, knowledge plays an important role in the decision-making process. According to Liebermann and Flint-Goor (1996), one of the most important variables that influences the processing of information is the prior knowledge of an issue. This finding is consistent with that of Chen and Volpe (1998), who found that opinions and decisions tend to be influenced by one’s level of financial knowledge.
In addition, evidence implies that financial behaviour and knowledge are possibly positively interrelated in a common household decision-making behaviour analysis (Hilgert, Hogarth, & Beverly, 2003). Moreover, Sabri, MacDonald, Hira,

Pertanika J. Soc. Sci. & Hum. 23 (S): 119 – 142 (2015)
Maswati A. T., Abdullah, A. and Wai Yee, C.
122
and Masud’s (2010) study on financial literacy of college students in Malaysia is in line with the findings of Hilgert et al. (2003), which shows that discussing family finance with parents from an early age has an ample positive relationship with financial literacy.
Furthermore, prior studies indicate that knowledge may be a major factor in the development of credit attitudes (Zhu & Meeks, 1994; Chien & DeVaney, 2001; Hilgert et al., 2003). Generally, knowledge is often substituted using one’s education level. However, not many studies on determining whether actual financial knowledge is related to monitored credit behaviours among the student population. Jones (2005), and Borden, Lee and Serido (2008) did not find any significant relation between knowledge and usage of credit cards. Nevertheless, the exploratory nature and small sample size (n = 216) states that this question can be pursued further.
There are significant differences between those who are cautious with their credit card spending and those who are not. Students who are more likely to carry a revolving balance are the minorities, students on financial aid, and upper-level students who receive their cards after beginning college (Munro & Hirt, 1998). Lyons (2004) discovered that those who are more likely to have difficulties making credit card payments are female students and students who attained their cards after beginning college.
People’s financial decisions and opinions can be influenced by their level
of financial knowledge; individuals with higher level of financial knowledge are the ones who will be more likely to make good financial decisions in a hypothetical situation (Chen & Volpe, 1998). Furthermore, students who scored higher on a financial fitness test were more likely to report paying their balance in full each month, and were also less likely to own a credit card compared to students who had lower scores on the test (Cude, Lawrence, Lyons, Metzger, LeJeune et al., 2006). The results are consistent with Hussin, Kassim and Jamal’s (2013) recent study, which revealed that there are significant differences in credit card usage among credit card holders of different personal backgrounds.
There is strong evidence from two groups of financial knowledge studies that college students do not possess a high degree of financial knowledge, despite the consequences of how financial knowledge is operationalized, be it the introductory personal finance course, or specific financial knowledge (Joo et al., 2003; Braunsberger, Lucas, & Roach, 2004; Avard, Manton, English, & Walker, 2005; Jones, 2005).
Amin (2012) found that factors such as “financial recommendation”, “knowledge on Islamic credit cards”, “age (young)”, “marital status”, “religion”, and “education level” significantly affect Islamic credit card usage intention. However, Jusoh and Lin’s (2012) study showed no significant relationship between personal financial knowledge and credit card practice.

Pertanika J. Soc. Sci. & Hum. 23 (S): 119 – 142 (2015)
Credit Card Practices: Knowledge, Attitude and Debt Management
123
Prior studies indicated that evidence regarding the relationship between financial knowledge and financial behaviour has been mixed. Results differ depending on how financial knowledge has been measured, what behaviours have been studied, and what populations have been analysed (Mandell, 2004; Peng, Bartholomae, Fox, & Cravener, 2007). Yet, not all researchers agree that there is a significant relationship between financial knowledge and behaviour. Therefore, it is hypothesised that:H1: There is a significant relationship
between credit card knowledge and credit card practices of the postgraduate students.
Perception/ Attitude of Credit Card Usage
Prior studies demonstrated that perceived differences in payment attributes are important determinants of consumer payment behaviour (Jonker, 2005; Schuh & Stavins, 2008). The potential influence of consumer attitude towards credit on credit attainment and usage is one momentous issue that a number of studies have tackled (Durkin, 2000; Chien & DeVaney, 2001; Baum & O’Malley, 2003; Joo et al., 2003). To conclude, some broad trends can be distinguished, even if the method by which attitudes are measured, considerably differs from one study to another.
It is debatable on whether attitudes serve as an effective predictor of behaviour. An indication of the involvement of a more complicated series of interactions has
surfaced subsequent to research from the social psychology area, which suggests that behaviour and attitudes do not always concur (Ajzen, 1996). In addition, various research has suggested that attitudes revolutionise over time, which implies that the difficulty of assessing attitudes as the outcomes may only be strongly associated to the timing of the data collection (Godwin, 1997).
Generally, the literature provides evidence that individuals who are more liable to carry an outstanding balance are those with more positive attitudes toward credit (Canner & Cyrnak, 1986; Godwin, 1997; Chien & DeVaney, 2001; Kim & DeVaney, 2001). However, Canner and Cyrnak (1986) suggest that individuals that are more likely to utilise credit cards as a source of revolving credit rather than as a cash substitute are those with more positive attitudes toward borrowing. Another study demonstrates that the ability and willingness to borrow will influence the amount of debt held by a household (Godwin, 1997). Chien and DeVaney (2001), and Kim and DeVaney (2001), revealed that scores on a particular attitude index are found to be positively correlated to outstanding credit card balance in a study using the Survey of Consumer Finances (SCF, 2014).
However, there are other studies that do not universally support this line of thought. Other studies using SCF also suggest that, compared with individuals who use credit as a cash substitute, those who use credit cards as a borrowing medium also have the tendency to hold unfavourable views
Pertanika J. Soc. Sci. & Hum. 23 (S): 119 – 142 (2015)
Maswati A. T., Abdullah, A. and Wai Yee, C.
124
of credit (Durkin, 2000). Over a thirty-year period, Durkin (2000) analysed the responses and alter revealed that there was greater polarisation in the attitudes toward credit among consumers in 2000 compared with those in 1970.
Durkin (2000) discovered that less positive views toward credit cards are distinguished among those who “have three or more credit cards, have more than $1500 in revolving debt, have transferred a balance between cards, hardly ever pay their balance in full, and hardly ever pay the minimum payment in full” (Robb, 2007).
The potential origins of consumer attitudes are among the more interesting results from Durkin’s (2000) analysis, in which negative attitudes may influence individuals’ perceptions of consumers’ experiences than their own personal experiences. There is a widely held belief that, during the last half of the twentieth century, attitudes toward debt have changed radically. Amin’s (2012) study concludes that “attitude on Islamic credit card” appears to have no effect on the Islamic credit card usage intention.
In general, attitudes are appealing to the credit card behaviour analysis among consumers by means of the modern consumer generally accepting credit as a major constituent of their daily economic life (Lea, Webley, & Walker, 1995; Davies & Lea, 1995) using the Yamauchi and Templer’s (1982) Money Attitude Scale (MAS) to measure the role of attitudes in consumer credit behaviour.
Moreover, many studies have linked attitudes toward credit with credit card behaviour. Xiao, Noring and Anderson (1995) and Joo et al. (2003) found that there is a significant relationship between a positive attitude toward credit cards and card ownership, and usage.
Hayhoe, Leach, and Turner (1999) found a distinguished difference between students who have credit cards and those who do not have credit cards when comparing their scores in relation to money attitudes of obsession, retention and affective credit attitudes. Therefore, it is hypothesised that:H2: There is a significant relationship
between credit card perceptions or attitudes of credit card usage and credit card practices of the postgraduate students.
Credit Card Debt Management
Credit card spending and borrowing are particularly vulnerable to self-control problems due to the nature of the credit card. When using a credit card, payment is separated from the act of purchasing and can considerably occur later than the purchase or consumption. In other words, such chronological separation may psychologically encourage credit card spending, and consequently, credit card debt (Bar-Gill, 2004).
Meier and Sprenger (2007) show that self-control problems that are directly measured are strongly related with credit card debt. Ausubel (1991) explains that self-
Pertanika J. Soc. Sci. & Hum. 23 (S): 119 – 142 (2015)
Credit Card Practices: Knowledge, Attitude and Debt Management
125
control problems in credit card management play a major role in generating profits in the credit card industry. This indicates that self-control problems can clarify the success of teaser rates in the credit card markets (Shui & Ausubel, 2004).
Ming-Yen Teoh, Chong, and Mid Yong (2013) found that age, income, marital status, banks’ policies (benefits given and payment policies) and attitudes toward money (willingness to pay and awareness of the total debt owed) have a significant correlation with credit card holders’ spending behaviour among Malaysians.
Students are more inclined to go into personal debts due to the rise in tuition fees and the decrement in educational subsidising by the government (Bilski, 1991). As a result, students leave college with more debts than degrees. A recent study indicates that the average undergraduate student loan debt is $18,900 (Baum & O’Malley, 2003).
Credit card usage contributes the most to student debts. Mae’s (2002) study demonstrated that more than 80% of college students do own and use credit cards, in which each student owns an average of 4.25 credit cards. In terms of credit card balance, undergraduate students maintain an average account balance of $2,327 in debt (Mae, 2000). Furthermore, to shed some light on the intensity of student credit card debts, the median credit card debt for undergraduate students is $1,600 (Baum & O’Malley, 2003). Even though, in general, credit card debts are still under control, it does not
deny the fact that a considerable number of cases are indeed very serious. This raises an alarming concern to the financial habits of undergraduate students.
Since they are responsible for their own financial needs, college students find themselves trapped in a web of never ending debt. In considering credit card debt alone, two-fifths of the students maintain a balance that carries over from month-to-month on their credit cards (Jamba-Joyner, Howard-Hamilton, & Mamarchev, 2000). Thus, many students are identified as “revolving account holders” (i.e., those who do not pay their credit card bill in full each month), and this occurrence is actually evidence that students are unable to pay their debts constantly.
Being in such a condition of debt may adversely affect the students. Students with four to five credit cards are less likely to go to their friends or families in an event of a financial emergency (Hayhoe et al., 1999). These findings show that students are more willing to be in debt as they do not seek help from their friends or families, but turn to the profit seeking and interest raising credit companies.
A lack in financial management and strategy contributes considerably to the problem. Sixty-two percent of students were found not to have a specified monthly budget to govern their expenditures (Students in Free Enterprise, 2002). The notion that “if you fail to plan, you plan to fail” would be suitable to be imposed in this situation, as these students will face an inevitable financial ‘death’.

Pertanika J. Soc. Sci. & Hum. 23 (S): 119 – 142 (2015)
Maswati A. T., Abdullah, A. and Wai Yee, C.
126
When these students graduate, they face the financial burden of not only paying their educational loans, but also settling their formidable credit debts. Calculating the average income of fresh graduates, not more than eight percent should be used to repay debts. Any higher than the percentage used would result in a situation where the debts are unmanageable. Thus, it is estimated that 40% of students are not able to manage their debts (King & Bannon, 2002). These debts may burden the students not only in the immediate future, but will also be costly in the long run.
Furthermore, these students will have trouble in seeking for jobs, as their financial background is tainted with bad records of these debts (Consumer Federation of America, 1999). This highlights that bad management of credit debts will hinder the personal and professional developments of these graduates. Therefore, it is hypothesised that:H3: There is a significant relationship
between credit card management and credit card practices of the postgraduate students.
Overall, it is difficult to illustrate strong conclusions regarding the relationship among financial knowledge, perceptions or attitudes, as well as credit card debt management and behaviour due to the inconsistencies from the available literature. By directly comparing a theoretical measure of the factors to an observable financial behaviour, the present analysis utilised components of the previous measures that were built on prior research.
THEORETICAL FRAMEWORK
This study is based on the revised Deacon and Firebaugh’s (1988) framework model that has been strongly influenced by both Punjavat (1992) and Tucker (2000). It differs from Deacon and Firebaugh’s model in terms of its simplicity. The major components, which are input and output, remain the same as throughput is merged with input. This is because both the independent variables and mediating variables will eventually influence the dependent variables. This model is further simplified to accommodate the simplicity of this study (Fig.1) and has been adjusted and modified based on the literature review.
According to the theorists, management is a basic tool for achieving “meaningful, effective living of individuals and families” (Deacon & Firebaugh, 1988, p. 3) that helps organise the events of life and influences the resulting outcome. Individuals need to anticipate change and apply management processes in order to navigate their daily lives because living involves responding to continuous change. These management processes will differ accordingly depending on the individuals’ backgrounds.
Deacon and Firebaugh (1988) identified three components which are input, throughput and output. Input is defined as “matter, energy, and/or information entering a system in various forms to affect the throughput (transformation) processes resulting in output” (Deacon & Firebaugh, 1988, pp. 8-9), which consists of demands and resources that may originate from either inside or outside of the structure.

Pertanika J. Soc. Sci. & Hum. 23 (S): 119 – 142 (2015)
Credit Card Practices: Knowledge, Attitude and Debt Management
127
Tucker (2000) observed the relationships between the input (independent) variables, the throughput (mediating) variables, and the output (dependent) variables over the processes involved in baby boomers’ financial preparation for retirement. Input variables consisted of baby boomers’ demographic characteristics such as age, gender, ethnic background, marital status, household income, and educational achievement.
Tucker (2000) identified throughput variables such as anticipated age of retirement, confidence in social security and retirement savings calculation as personal and managerial responses that were estimated to arbitrate the effects of input on the output. These throughput variables “provide the functioning mechanism through which families and individuals can plan for retirement income” (Tucker, 2000, p. 17). Although the mediating variable acts as a dependent variable for the independent input variable, it also acts as an independent variable toward the dependent output variable (Tucker, 2000). In the revised model by Tucker, baby boomers’ current amount of retirement savings, expected sources of retirement income and post-retirement employment plans made up for the output variables.
Using the revised model of Deacon and Firebaugh’s (1988) conceptual framework, Punjavat (1992) based a study of international graduate students and credit cards. In Punjavat’s (1992) study, input consists of four independent variables which are socio-demographic
characteristics, credit card knowledge, credit card experiences or debt management, and credit card attitudes or perceptions. Socio-demographic characteristics may be categorised as input because they are known to be resources upon which students illustrate when making decisions about credit card practices (Punjavat, 1992). Internal (human) resources include knowledge regarding credit cards and experiences or management with credit cards. A higher level of credit card knowledge should result in more efficient credit card usage whereas positive or negative credit card management should make some impacts on the practices. Punjavat (1992) considered attitudes or perceptions toward credit cards to be a demand input that should influence the planning and implementation of the usage of credit card.
According to Punjavat (1992), throughput consists of credit card practices that involve both planning and implementation of credit card usage. Credit card practices are accountable for converting input to output (credit card satisfaction) and may be described as a mediating variable whereas output is the dependent variable.
Unlike Tucker’s (2000) study, Punjavat’s model includes a fourth component which is feedback. A high level of satisfaction would re-enter the system as a positive feedback whereas a low level of satisfaction would re-enter the system as a negative feedback. Even though there is negative feedback, it would help to promote the necessary changes to be made into constructing a better system.

Pertanika J. Soc. Sci. & Hum. 23 (S): 119 – 142 (2015)
Maswati A. T., Abdullah, A. and Wai Yee, C.
128
The external or internal demands and resources that enter the system are represented by the independent variable, college students’ socio-demographic characteristics. These are the inputs that consent to the transformation processes to fabricate output. In this study, the socio-demographic characteristics that influence postgraduate students’ credit card knowledge and credit card attitudes (throughput) were selected from the body of literature, which consisted of age, gender, ethnicity, marital status, grade point average, employment, income level, and socioeconomic background. The mediating variables (postgraduate students’ credit card knowledge, credit card attitudes, and credit card debt management) are managerial processes that affect output (credit card practices).
In this study, credit card practices involve the acquisition, possession and usage of credit cards. The term encompasses the reasons for using credit cards, the number of cards owned, and repayment practices. According to Moore (2004), “input represents factual and existing variables, throughput depicts the
change process that affects output, and output displays the final results of the framework from which the only change that can be realised is an alteration of the input component”.
The independent variable, such as socio-demographic characteristics, represents the input component. Postgraduate students’ credit card knowledge and credit card attitudes represent the throughput component. The throughput component consists of mediating variables because they indirectly explain the relationship between the independent variable and the dependent variable. Postgraduate students’ credit card practices represent the output component as the dependent variable.
Therefore, the revised Deacon and Firebaugh’s (1988) framework model would be the most suitable for the purpose of this study, subsequent to the indications of their thorough review on family resource management theory and its individual personal/managerial system. The possible sources for the revised model of Deacon and Firebaugh’s framework that were investigated are in two studies by Punjavat (1992) and Tucker (2000).
Fig.1: The Research Model

Pertanika J. Soc. Sci. & Hum. 23 (S): 119 – 142 (2015)
Credit Card Practices: Knowledge, Attitude and Debt Management
129
RESEARCH METHOD
Specifically, the study examined the interrelationships between postgraduate students’ credit card knowledge, credit card perceptions or attitudes and credit card debt management (independent variables), and postgraduate students’ credit card practices (dependent variable).
The study applies the single cross-sectional design, which involves the collection of information from any given sample of population elements only once. Only one sample of respondents was drawn from the target population and information was obtained from this particular one sample.
The researcher approached postgraduate students of various academic backgrounds in order to ensure that there is no discrimination that may alter the final results. The researcher had also ensured that the postgraduate students who were pursuing a range of different courses during the course of the research answered the questionnaire. This is to ensure that the data collected are as accurately as possible.
Furthermore, the researcher did a pilot test by distributing questionnaires to 30 respondents and receiving feedback regarding the difficulty in comprehending some of the questions. Therefore, the questionnaire was then tailored to be easily understood by the respondents, and the previous 30 samples were disregarded. After that, over a four-week period, beginning on 23 August 2010, the researcher distributed questionnaires to 100 postgraduate students
at Universiti Putra Malaysia. The survey was completed by a convenience sample of 100 postgraduate students from the Graduate School of Management and the School of Graduate Studies in Universiti Putra Malaysia.
The structured questionnaire was used in gathering data, which was adopted from Moore (2004) and Punjavat (1992). Moore (2004) examined the effects on financial knowledge and attitude of credit card practices, while Punjavat (1992) investigated the credit card debt management aspects. The survey questionnaire is divided into five sections. Section A represents the demographic profile, and consists of multiple choice questions about demographic information of the respondents. Meanwhile, in Sections B, C, D and E, the researcher constructed questions about various levels of perception by using a Likert Scale. Each part represents discussion on knowledge of credit card usage, perceptions or attitudes on credit card usage, and credit card debt management, respectively.
The Statistical Package for Social Science Version 16.0 software application was used by the researcher in order to analyse the data after the fieldwork process was done. The analyses included frequency distribution, descriptive statistics and a chi-Square test.
RESULTS AND DISCUSSION
Data were collected from 100 UPM post graduate students. The demographic profile of the respondents is shown in Table 1.

Pertanika J. Soc. Sci. & Hum. 23 (S): 119 – 142 (2015)
Maswati A. T., Abdullah, A. and Wai Yee, C.
130
TABLE 1Respondents’ Profile
Age Frequency %23-25 years 58 5826-30 years 35 3531 years and above 7 7
GenderMale 41 41Female 59 59
EthnicityMalay 48 48Chinese 40 40Indian 7 7Others 5 5
Monthly Income Less than RM1,000 54 54RM1,001-RM3,000 21 21RM3,001-RM5000 19 19RM5,001 and above 6 6
Having Finance/Business Related ProgrammeWITH Financial Background 57 57WITHOUT Financial Background 43 43
OccupationStudent 57 57Public Sector Employee 20 20Private Sector Employee 23 23
more than 31 years old. From the statistics, 48% of the respondents are Malay, 40% are Chinese, 7% are Indians, and the rest are from other ethnicity groups. Most of them (78%) are still single.
Moreover, the majority (57%) of the respondents have taken (or are currently taking) a finance/business-related programme. The other 43% are mostly postgraduate students from the School of Graduate Studies, and are
Female respondents (59%) are slightly more in number than male respondents (41%). The gap between female respondents and male respondents is 18%, which might be attributable to the trend of an increased number of females pursuing postgraduate studies. The majority (58%) of the respondents are from 23 to 25 years age groups. Thirty five percent of the respondents are from the age group of 26 to 30 years, and only 7% of the respondents are

Pertanika J. Soc. Sci. & Hum. 23 (S): 119 – 142 (2015)
Credit Card Practices: Knowledge, Attitude and Debt Management
131
taking non-finance or non–business related programmes such as Master’s of Pathology, Master’s of Veterinary Medicine, Master’s of Plantation Management, and Master’s of Corporate Communication (Refer Table 1).
Most (57%) of the respondents are full-time students, 23% are private sector employees, and 20% are public sector
employees. More than half (54%) of the respondents earn less than RM1,000 monthly. This could be due to their status as full-time students, where their monthly income is basically their allowance money. However, only 6% of the respondents earn more than RM5,000 per month. The results for the respondents’ credit card practices are presented in Table 2.
TABLE 2Respondents’ credit card practices
Respondents’ Credit Card Practices Frequency %
Number of Credit Card(s) Owned 1 53 53%2 or 3 32 32%4 and above 15 15%
First Time Acquiring a Credit Card Before College 16 16%First or Second Year of College 41 41%Third or Subsequent Years of College 37 37%Graduate School 6 6%
Average Payment MethodCredit Card
49 49%
Debit Card 6 6%Cash 45 45%
Ways Handling Credit Card BalancesPay them in full
15 15%
Pay more than the minimum 33 33%Pay the minimum 38 38%Behind on payments 14 14%
Reasons for Credit Card UsageTo get cash advances
37 37%
For convenience/ safety 32 32%To cover emergency needs 13 13%For the incentives 13 13%To keep up with friends 5 5%

Pertanika J. Soc. Sci. & Hum. 23 (S): 119 – 142 (2015)
Maswati A. T., Abdullah, A. and Wai Yee, C.
132
Table 2 shows that 49% of the respondents rely on credit cards as an average payment method in most of their transactions, while 45% use cash. Only six respondents use debit cards. Even though only 49% of the respondents use credit cards as an average payment method, 53% of them have at least one credit card. In fact, 32% of the respondents hold two or three credit cards, while 15% of them own more than three credit cards. Most of the respondents (41%) acquired their first credit card during their first or second year of postgraduate studies.
Furthermore, the respondents’ credit card balances payment was categorised into four groups, which are: Pay them in full, Pay more than the minimum, Pay the minimum, and Behind on payments. The result demonstrated a majority (38%) of the respondents pay their credit card balances by paying only the minimum. Only 15% of the respondents actually pay their credit card balances in full, whereas 14% of the respondents are behind on their credit card payments. Even though most of
the respondents pay the minimum of their credit card balances, they are still at risk of getting into debt as those who are behind on their credit card payments.
Moreover, the respondents’ reasons for credit card usage have been diversified into five groups, which are: to get cash advances, for convenience/safety, to cover emergency needs, for incentives and to keep up with friends. The results showed that 37% of the respondents use their credit card to get cash advances, 32% use it for convenience or safety, 13% use it to cover emergency needs such as unanticipated car repairs and 13% use it for incentives such as credit card membership discounts offered at certain outlets and bonus points for redemptions. Surprisingly, 5% of the respondents do use their credit card to keep up with their friends.
Reliability Analysis
Table 3 shows the results of the reliability of the independent variables using Cronbach’s Alpha.
TABLE 3Reliability analysis for knowledge, attitude of credit card usage and credit card debt Management
Independent Variables Cronbach’s Alpha N of ItemsKnowledge on Credit Card usage 0.793 6Attitude on Credit Card Usage 0.757 5Credit Card Debt Management 0.796 5
The Cronbach’s Alpha for six (6) items in knowledge of credit card usage (independent variables) measure is 0.793, whereas the Cronbach’s Alpha for five
(5) items in perceptions or attitude on credit card usage (independent variables) measure is 0.757, and the Cronbach’s Alpha for five (5) items in credit card

Pertanika J. Soc. Sci. & Hum. 23 (S): 119 – 142 (2015)
Credit Card Practices: Knowledge, Attitude and Debt Management
133
debt management (independent variables) measure is 0.796. The alpha coefficient shows that these independent variables are good (Hair, Babin, Money & Samouel, 2003) and acceptable.
Descriptive Analysis
Data screening was conducted in this study to check the normality of the data collected. For data to be normal, the value of the mean must be greater than the standard deviation, while the value of skewness must be between -2 to +2, and the value of kurtosis must be between -3 to +3.
Table 4 indicates that the value of the mean for all variables is greater than
the standard deviation. The results also show that the skewness values for the four variables fall within the range of -2 to +2, while the kurtosis of the four variables falls within the range of -3 to +3. A negative skew indicates that the tail on the left of the probability density function is longer than the one on the right, and the bulk of values including the median lie to the right of the mean. Meanwhile, a positive skew indicates that the tail on the right is longer than on the left, and the bulk of values lie to the left of the mean. Kurtosis is the measure of “peakness” of the probability distribution. Therefore, it is very appropriate to mention that the data collected are normal.
TABLE 4Descriptive statistics for all variables
Variables Mean Std Dev Skewness KurtosisCredit Card Practices 2.28 .58741 -.147 -.519Knowledge of Credit Card Usage 3.35 .55732 .263 -.345Perception/Attitude on Credit Card Usage 3.37 .64597 -.532 .839Credit Card Debt Management 3.11 .64971 .116 -.046
Hypotheses Testing
Chi-square tests were applied to determine the statistical significance of the relationship between credit card practices (dependent variables) with three independent variables, namely, knowledge of credit card usage, perception or attitude of credit card usage and credit card debt management. The significance level of α=0.05 was chosen, with a 95% confidence interval. The results of the chi-square test on hypotheses 1, 2, and 3 are summarised in Table 5.
Knowledge of Credit Card Usage
H1: There is a significant relationship between understanding or knowledge of credit card usage and credit card practices of postgraduate students.
Based on Table 5, the hypothesis testing for knowledge of credit card usage shows six degrees of freedom (df). The value for an upper tail of 0.05 is 56.479, which indicates that the probability

Pertanika J. Soc. Sci. & Hum. 23 (S): 119 – 142 (2015)
Maswati A. T., Abdullah, A. and Wai Yee, C.
134
of exceeding a chi-square value of 56.479 is 0.05. On the other hand, at a 0.05 level of significance with 6 df, the critical
value of the chi-square statistic is 12.592. Refer to the chi square distribution table in Appendix 1.
TABLE 5Chi-Square tests on hypothesis 1 (knowledge of credit card usage), hypothesis2 (perception/attitude of credit card usage), and hypothesis 3 (credit card debt management)
Hypothesis 1(Knowledge of credit card usage)
Hypothesis 2(Perception/Attitude of credit card usage)
Hypothesis 3(credit card debt management)
Value dfAsymp.
Sig. (2-sided)
Value df Asymp. Sig. (2-sided) Value df Asymp. Sig.
(2-sided)
Pearson Chi-Square 56.479(a) 6 .000 69.788(a) 8 .000 48.175(a) 6 .000
Likelihood Ratio 34.925 6 .000 54.719 8 .000 39.326 6 .000
Linear-by-Linear Association
27.734 1 .000 42.594 1 .000 30.351 1 .000
N of Valid Cases 100 100 100
The calculated chi-square statistic had a value of 56.749, which is more than the critical value of 12.592. Therefore, the null hypothesis is rejected, indicating that the association is statistically significant at the 0.05 level. Furthermore, the asymptotic value in this hypothesis is 0.000, which is lower than the alpha value of 0.05. The result shows that there is a strong relationship between knowledge of credit card usage and credit card practices. Thus, credit card practices do depend on the knowledge of credit card usage. Moreover, good credit card practices are not related to sufficient knowledge about credit card usage such as interest rates on debt payments.
Perception or Attitude of Credit Card Usage
H2: There is a significant relationship between perceptions or attitudes of credit card usage and credit card practices of postgraduate students
Table 5 demonstrates the hypothesis test for the perception or attitude on credit card practices. With eight degrees of freedom (df), the value for an upper tail of 0.05 is 69.788, which indicates that the probability of exceeding a chi-square value of 69.788 is 0.05. In other words, at the 0.05 level of significance with 8 df, the critical value of the chi-square statistic is 15.507i. Since the chi-square statistic holds a value of 69.788, which is more than the

Pertanika J. Soc. Sci. & Hum. 23 (S): 119 – 142 (2015)
Credit Card Practices: Knowledge, Attitude and Debt Management
135
critical value of 15.507; this indicates that the association is statistically significant at the 0.05 level. Furthermore, the asymptotic value in this hypothesis is 0.000, which is lower than the alpha value of 0.05. Thus, hypothesis 2 testing is accepted.
The result also shows a strong relationship between perception or attitude on credit card usage and credit card practices. Therefore, credit card practices do depend on the perception or attitude of credit card usage. Moreover, students will acquire good credit card practices if they have negative perceptions on credit card usage such as perceiving a credit card as a tool that will ultimately land them into greater financial trouble.
Credit Card Debt Management
H3: There is a significant relationship between credit card debt management and credit card practices of postgraduate students
Based on Table 5, the hypothesis test for credit card debt management indicates that for six degrees of freedom (df), the value for an upper tail of 0.05 is 48.175. This indicates that the probability of exceeding a chi-square value of 48.175 is 0.05. In other words, at a 0.05 level of significance with 6 df, the critical value of the chi-square statistic is 12.592i. Since the chi-square statistic has a value of 48.175, which is more than the critical value of 12.59, the association is statistically significant at the 0.05 level. Furthermore, the asymptotic value in this hypothesis is 0.000, which is lower than the alpha value of 0.05.
The result shows a strong relationship between credit card debt management and credit card practices. In other words, credit card practices do depend on credit card debt management. Moreover, postgraduate students will have good credit card practices if they manage their credit card debts well such as seeking new ways to reduce credit card debts and participating in workshops that deal with personal financial management and responsibilities.
CONCLUSION AND RECOMMENDATIONS
This study revealed a significant relationship between credit card knowledge and credit card practices of the postgraduate students. This finding is supported by Liebermann and Flint-Goor (1996) who claimed that one of the most important variables that influences the processing of information is the prior knowledge of an issue. In addition, Chen and Volpe’s (1998) supported this finding by explaining that opinions and decisions tend to be influenced by one’s level of financial knowledge. Moreover, according to Cude et al. (2006), students who scored higher on a financial fitness test were more likely to report paying their balance in full each month and these students were also less likely to own a credit card as compared with students who had lower scores on the test.
Moreover, this study also demonstrates a significant relationship between credit card perception or attitude and credit card practices of the postgraduate students. It

Pertanika J. Soc. Sci. & Hum. 23 (S): 119 – 142 (2015)
Maswati A. T., Abdullah, A. and Wai Yee, C.
136
has been found that perceptions, in this case the perceived differences in payment attributes, are important determinants of consumer payment behaviour (Hirschman, 1982; Jonker 2005; Schuh & Stavins 2008). The potential influence of consumers’ attitude towards credit on credit attainment and use is one momentous issue that a number of studies have tackled (Baum & O’Malley, 2003; Joo et al., 2003).
Furthermore, this study shows that there is a significant relationship between credit card debt management and credit card practices of the postgraduate students. Prior study showed that self-control problems that are directly measured are strongly related with credit card debt (Meier & Sprenger, 2007). In addition, Ausubel (1991) explains that self-control problems in credit card management do play a major role in generating profits in the credit card industry. Therefore, this indicates that self-control problems can explicate the success of teaser rates in the credit card markets (Shui & Ausubel, 2004).
From this research, it was found that the three factors (knowledge of credit card usage, perceptions or attitudes of credit card usage and credit card debt management) play significantly important roles in determining the credit card practices and financial decisions. Although this sample cannot be generalised for the whole population in Malaysia, it is a crucial step in understanding the depth and seriousness of the issues of bad credit card behaviours, which will eventually lead to bankruptcy.
This study demonstrates that there seems to be a worrying trend as some students are behind on their credit card balance payments. Unless something is done to mitigate or, at least, reduce the seriousness of the situation, more youths will likely be to succumb to such financial traps in the future.
Therefore, information should be made available and accessible to the public regarding the implications of unsettled debts as not all youngsters are aware of this particular aspect of credit card use since it is not easily available. Not many are aware that even applying for a telephone line is impossible when one is declared a bankrupt, according to National Consumer Complaints Centre chief executive officer Muhammad Sha’ani Abdullah (The Star, 2009).
Furthermore, project director of Muslim Consumer Association of Malaysia (PPIM), Noor Nirwandy Mat Noordin, is very concerned that the present module of credit card approval seems to be very effortless and easy. Youths who are not earning much income or do not even have jobs are even offered credit cards by banks. Consequently, the government must also regard this issue more seriously as more and more youths are getting entangled in the web of debts from credit card usage (Chang, 2009).
In general, youths must also take action in controlling their impulsive spending on their own. With e-shopping becoming more popular such as the likes of e-Bay, Amazon and iTunes Store, these eventually make

Pertanika J. Soc. Sci. & Hum. 23 (S): 119 – 142 (2015)
Credit Card Practices: Knowledge, Attitude and Debt Management
137
credit card usage become increasingly and indiscriminatingly widespread. Therefore, youths should consider the good credit card practices as a good habit as it can establish their financial future, whether intentionally or unintentionally.
REFERENCESAjzen, I. (1996). The social psychology of decision
making. In E. T. Higgins & A. W. Kruglanski (Eds.), Social Psychology: Handbook of Basic Principles (pp. 297-328). New York: Guilford.
AKPK. (2010). Agensi Kredit Pengurusan Kaunseling. Retrieved from http://www.akpk.org.my/happenings/news/press-release/id/27/swipe-what-you-can-afford-to-spend
Amin, H. (2012). Patronage factors of Malaysian local customers toward Islamic credit cards. Management Research Review 35(6), 512-530.
Ausubel, L. M. (1991). The failure of competition in the credit card market. The American Economic Review, 81(1), 50-81.
Avard, S., Manton, E., English, D., & Walker, J. (2005). The financial knowledge of college freshmen. College Student Journal, 39(2), 321.
Awanis, S., & Chi Cui, C. (2014). Consumer susceptibility to credit card misuse and indebtedness. Asia Pacific Journal of Marketing and Logistics, 26(3), 408-429.
Baum, S., & O’Malley, M. (2003). College on credit: How borrowers perceive their education debt. Journal of Student Financial Aid, 33(3), 7-19.
Bar-Gill, O. (2004). Seduction by Plastic. Northwestern University Law Review, 98(4), 1373-1375.
Bilski, A. (1991). The continuing indebtedness of our students... how deep can they get in debt. Credit World, 79(5), 24-28.
Blair, A. D. (1997). A high wire act: Balancing student loan and credit card debt. Credit World, 86, 15-17.
Borden, L. M., Lee, S. A., Serido, J., & Collins, D. (2008). Changing college students’ financial knowledge, attitudes, and behavior through seminar participation. Journal of Family and Economic Issues, 29(1), 23-40.
Braunsberger, K., Lucas, L. A., & Roach, D. (2004). The effectiveness of credit-card regulation for vulnerable consumers. Journal of Services Marketing, 18(5), 358-370.
Canner, G. B., & Cyrnak, A. W. (1986). Determinants of consumer credit card usage patterns. Journal of Retail Banking, 8(1), 9-18.
Chang. (2009). Credit card debt and you: Many unaware of effects of bankruptcy. Retrieved from http://www.lawyerment.com.my/boards/article-Malaysia_Business_Consumer_Bankruptcy_Law-570.htm
Chen, H., & Volpe, R. P. (1998). An analysis of personal financial literacy among college students. Financial services review, 7(2), 107-128.
Chien, Y. W., & Devaney, S. A. (2001). The effects of credit attitude and socioeconomic factors on credit card and installment debt. Journal of Consumer Affairs, 35(1), 162-179.
CFA. (1999, June 8). Credit card debt imposes huge costs on many college students. Consumer Federations of America, 1424 Sixteenth Street, N.W. Suite 604, Washington, D.C. 20036.
Cude, B., Lawrence, F., Lyons, A., Metzger, K., LeJeune, E., Marks, L., & Machtmes, K. (2006). College students and financial literacy: What they know and what we need to learn. Proceedings of the Eastern Family Economics and Resource Management Association, 102-109.

Pertanika J. Soc. Sci. & Hum. 23 (S): 119 – 142 (2015)
Maswati A. T., Abdullah, A. and Wai Yee, C.
138
Davies, E., & Lea, S. E. (1995). Student attitudes to student debt. Journal of Economic Psychology, 16(4), 663-679.
Deacon, R. E., & Firebaugh, F. M. (1988). Family resource management: Principle and applications (2nd Ed.). Needham Heights, MA: Allyn and Bacom.
Durkin, T. A. (2000). Credit cards: Use and consumer attitudes, 1970-2000. Fed. Res. Bull., 86, 623.
Evans, D. S., & Schmalensee, R. (2005). Paying with plastic: The digital revolution in buying and borrowing. Cambridge, Masachusetts: MIT Press.
Godwin, D. D. (1997). Dynamics of Households’ Income, Debt and Attitudes toward Credit, 1983–1989. Journal of Consumer Affairs, 31(2), 303-325.
Hair, J. F., Babin, B., Money, A. H., & Samouel, P. (2003). Essentials of Business Research Methods. New York: Wiley Publications.
Hayhoe, C. R., Leach, L., & Turner, P. R. (1999). Discriminating the number of credit cards held by college students using credit and money attitudes. Journal of Economic Psychology, 20(6), 643-656.
Hayhoe, C. R., Leach, L. J., Turner, P. R., Bruin, M. J., & Lawrence, F. C. (2000). Differences in spending habits and credit use of college students. Journal of Consumer Affairs, 34(1), 113-133.
Henry, R. A., Weber, J. G., & Yarbrough, D. (2001). Money management practices of college students. College Student Journal, 35(2), 244-249.
Hilgert, M. A., Hogarth, J. M., & Beverly, S. G. (2003). Household financial management: The connection between knowledge and behavior. Fed. Res. Bull., 89, 309.
Hirschman, E. C. (1982). Consumer payment systems: the relationship of attribute structure to preference and usage. Journal of Business, 55(4), 531-545.
Hussin, S. R., Kassim, S., & Jamal, N. (2013). Credit card holders in Malaysia: customer characteristics and credit card usage. International Journal of Economics and Management, 7(1), 108-122.
Jamba-Joyner, L. A., Howard-Hamilton, M., & Mamarchev, H. (2000). College Students and Credit Cards: Cause for Concern? Concern, 30(3), 2.
Jones, J. E. (2005). College Students’ Knowledge and Use of Credit. Financial Counseling and Planning, 16(2).
Jonker, N. (2005). Payment instruments as perceived by consumers-a public survey. De Nederlandsche Bank.
Joo, S. H., Grable, J. E., & Bagwell, D. C. (2003). Credit card attitudes and behaviors of college students. College Student Journal, 37(3), 405-419.
Jusoh, Z. M., & Lin, L. Y. (2012). Personal financial knowledge and attitude towards credit card practices among working adults in Malaysia. International Journal of Business and Social Science, 3(7), 176-185.
Kim, H., & DeVaney, S. A. (2001). The determinants of outstanding balances among credit card revolvers. Financial Counseling and Planning, 12(1), 67-77.
King, T., & Bannon, E. (2002). The burden of borrowing: A report on the rising rates of student loan debt. State PIRGs Higher Education Project.
Lea, S. E., Webley, P., & Walker, C. M. (1995). Psychological factors in consumer debt: Money management, economic socialization, and credit use. Journal of Economic Psychology, 16(4), 681-701.

Pertanika J. Soc. Sci. & Hum. 23 (S): 119 – 142 (2015)
Credit Card Practices: Knowledge, Attitude and Debt Management
139
Liebermann, Y., & Flint-Goor, A. (1996). Message strategy by product-class type: A matching model. International Journal of Research in Marketing, 13(3), 237-249.
Lyons, A. C. (2004). A Profile of Financially At-Risk College Students. Journal of Consumer Affairs, 38(1), 56-80.
Mae, N. (2002). Undergraduate students and credit cards. Braintree, MA.
Mae, N. (2000). Credit card usage analysis. Retrieved August 30, 2010, from http://www.nelliemae.com/library/ccstudy_2001.pdf
MDI. (2015). Malaysia Department of Insolvency. Retrived from http://www.insolvensi.gov.my/gallery/
MDI. (2009). Malaysia Department of Insolvency. Retrieved from http://www.insolvensi.gov.my/gallery/press-statement/the-malay-mail/91-the-malay-mail-15-06-09-credit-card-debt-trap
Mandell, L. (2004). Financial literacy: Are we improving? Washington, D.C.: Jumpstart coalition for Personal Financial Literacy.
Manning, R. D. (2000). Credit card nation. The Consequences of America’s Addiction to Credit, New York.
Meier, S., & Sprenger, C. (2007). Impatience and credit behavior: evidence from a field experiment (No. 07-3). Working paper series//Federal Reserve Bank of Boston.
Ming-Yen Teoh, W., Chong, S. C., & Mid Yong, S. (2013). Exploring the factors influencing credit card spending behavior among Malaysians. International Journal of Bank Marketing, 31(6), 481-500.
Moore, R. (2004). Credit Card Knowledge, Attitudes, and Practices of College Students. (Doctoral dissertation), Texas Tech University.
Munro, J., & Hirt, J. B. (1998). Credit Cards and College Students: Who Pays, Who Benefits? Journal of College Student Development, 39(1), 51-57.
Palmer, T. S., Pinto, M. B., & Parente, D. H. (2001). College students’ credit card debt and the role of parental involvement: implications for public policy. Journal of Public Policy & Marketing, 20(1), 105-113.
Peng, T. C. M., Bartholomae, S., Fox, J. J., & Cravener, G. (2007). The impact of personal finance education delivered in high school and college courses. Journal of Family and Economic Issues, 28(2), 265-284.
Pinto, M. B., Parente, D. H., & Palmer, T. S. (2001). Credit Card Solicitation Policies in Higher Education: Does” Protecting” Our Students Make a Difference? Journal of College Student Development, 42(2), 169-72.
Punjavat, T. (1992). Credit cards: understanding international graduate student consumers. (Unpublished doctoral dissertation), Oregon State University, Corvallis.
Quinn, L. R. (2001). Campus plastic. Mortgage Banking, 62(2), 26.
Robb, C. A. (2007). College students and Credit Card Use: The Effect of personal financial knowledge Debt behavior. (Doctoral dissertation), University of Missouri--Columbia.
Sabri, M. F., MacDonald, M., Hira, T. K., & Masud, J. (2010). Childhood consumer experience and the financial literacy of college students in Malaysia. Family and Consumer Sciences Research Journal, 38(4), 455-467.
Schuh, S., & Stavins, J. (2008). To Check or Not to Check: Why Are (Some) Consumers (Finally) Writing Fewer Checks? Mimeo.

Pertanika J. Soc. Sci. & Hum. 23 (S): 119 – 142 (2015)
Maswati A. T., Abdullah, A. and Wai Yee, C.
140
Shui, H., & Ausubel, L. M. (2004, May). Time Inconsistency in the Credit Card Market. In 14th Annual Utah Winter Finance Conference.
Students in Free Enterprise. (2002). SIFE Fiscal Fitness Survey.
SCF. (2014). Survey of Consumer Finances. Retrieved from http://www.federalreserve.gov/pubs/bulletin/2014/pdf/scf14.pdf
Susswein, R. (1995). College students and credit cards: A privilege earned. Credit World, 83(5), 21-23.
The Star Online. (2009, 16 October). Call for credit cards liability limit to be reduced or waived. The Star. Retrieved from http://www.nccc.org.my/v2/index.php/nccc-di-pentas-media/2009/1325-call-for-credit-cards-liability-limit-to-be-reduced-or-waived?format=pdf
Tucker, J. A. (2000). An examination of the babay boom generation’s financial preparations for retirement. (Doctoral dissertation), Lousiana State University, Baton Rouge.
Xiao, J. J., Noring, F. E., & Anderson, J. G. (1995). College students’ attitudes towards credit cards. Journal of Consumer Studies & Home Economics, 19(2), 155-174.
Yamauchi, K. T., & Templer, D. J. (1982). The development of a money attitude scale. Journal of Personality Assessment, 46(5), 522-528.
Zhu, L. Y., & Meeks, C. B. (1994). Effects of low income families’ ability and willingness to use consumer credit on subsequent outstanding credit balances. Journal of Consumer Affairs, 28(2), 403-422.

Pertanika J. Soc. Sci. & Hum. 23 (S): 119 – 142 (2015)
Credit Card Practices: Knowledge, Attitude and Debt Management
141
APPENDIX I
CHI-SQUARE DISTRIBUTION TABLE*
*Source: http://faculty.elgin.edu/dkernler/statistics/ch09/chi-square-table.pdf


Pertanika J. Soc. Sci. & Hum. 23 (S): 143 – 154 (2015)
ISSN: 0128-7702 © Universiti Putra Malaysia Press
SOCIAL SCIENCES & HUMANITIESJournal homepage: http://www.pertanika.upm.edu.my/
ARTICLE INFOArticle history:Received: 30 March 2015Accepted: 10 September 2015
E-mail addresses:[email protected] (Lau, Y. W.),[email protected] (Lim, S. Y)* Corresponding author
Accounting Undergraduates’ Learning Approaches: Case of a Malaysian Public University
Lau, Y. W.*, and Lim, S. Y Faculty of Economics and Management, Universiti Putra Malaysia, 43400 UPM Serdang, Selangor, Malaysia
ABSTRACT
Concerns about graduates’ employability are not new. Being burdened with accounting standards to be memorised and regurgitated in examinations does little to encourage learning with understanding, i.e. deep learning. Yet, deep learning is pertinent for development of generic employability skills such as problem solving and critical thinking. This study examines the extent to which accounting undergraduates at a public university in Malaysia adopt deep learning via a questionnaire survey. Results suggest that surface learning, which promotes rote memorisation and is often blamed for graduates’ incompetence, is the first step towards deep learning. Having a thirst for meanings has been found to be pertinent to motivate undergraduates to move from rote memorisation to seek meanings and thus deep learning. Female undergraduates have been found to be more inclined to adopt deep learning compared with their male counterparts. Nonetheless, much is still to be learned to promote deep learning, which is a complex process that is not constrained to the campus.
Keywords: Rote memorisation, learning with understanding, academic performance, gender, graduates’ employability
INTRODUCTION
Business schools are blamed for their increasing disconnection from practice as production and dissemination of research
and theory that bear little relevance to the real business world take centre stage (Bennis & O’Toole, 2005; Eckhardt & Wetherbe, 2014). Concerns about graduates’ poor interpersonal communication, critical thinking and problem solving skills, which do little to prepare graduates for the workforce, are not new (e.g., Pianin, 2014). Malaysia is not the only country grappling with the resultant graduate unemployment problem as graduates are ill-equipped with

Pertanika J. Soc. Sci. & Hum. 23 (S): 143 – 154 (2015)
Lau, Y. W. and Lim, S. Y
144
the relevant skills and competencies to be readily employable (e.g., Cleary et al., 2007; Kigotho, 2015).
To date, empirical findings on whether business schools equip graduates with the relevant skills and competencies to be employable have been inconclusive. While there is a general consensus that business schools need to contribute more in preparing graduates for the workforce, employers have been found to be satisfied with graduates’ employability skills to a certain extent (e.g., Lowden et al., 2011; Ismail et al., 2011). Further, what constitutes employability skills vary across culture and profession. For instance, ICT skills, values, ethics and proficiency in the Malay and English languages are considered important employability skills in a Malaysian study (Ismail et al., 2011) but not in the studies conducted in developed countries (Cleary et al., 2007; Oliver et al., 2007; Lowden et al., 2011). Development of employability skills is also believed to be a life-long process where graduates are expected to acquire employability skills not only through academic training on-campus but also via other off-campus life experiences such as industry placement, part-time employment and voluntary social and community work (Cleary et al., 2007).
While business schools are not solely responsible for the development of graduates’ employability skills, ongoing efforts aimed at improving and aligning academic curriculum with employability skills development continue worldwide (Cleary, 2007; Oliver et al., 2007). Though
employability skills vary across culture and profession, generic skills such as being able to understand and apply one’s understanding across contexts in a creative and critical manner and problem solving have been found to be most valuable (Cleary, 2007; Oliver et al., 2007).
This study contributes by exploring the learning approaches of accounting undergraduates at a public university in Malaysia. More specifically, this study examines the extent accounting undergraduates seek to understand (i.e., deep learning) versus memorise facts (i.e., surface learning). Reforms in accounting education in the early 1990s have already unravelled the need to move away from rote memorisation to learning with understanding, which is crucial for creative and critical thinking (Beattie et al., 1997). Recent studies suggest that accounting undergraduates’ tendency to resort to rote memorisation will continue to be unresolved for as long as the accounting profession is ridden with written standards (Sunder, 2010). Accounting education constitutes a rich context to ascertain to what extent undergraduates learn with understanding when confronted with volumes of written standards to be covered in lectures leaving little room for critical debates and discussions on the pros and cons of alternative accounting treatments for different classes of transaction.
This study conducted a questionnaire survey on accounting undergraduates’ learning approaches at a public university. Results demonstrate that deep learning is
Pertanika J. Soc. Sci. & Hum. 23 (S): 143 – 154 (2015)
Accounting Undergraduates’ Learning Approaches: Case of a Malaysian Public University
145
not readily attainable. Adoption of surface learning is required to ultimately attain deep learning. Having a preference for deep learning has been found to be important in undergraduates’ quest for meaning. Female undergraduates have been found to be more inclined to adopt deep learning.
The remainder of the paper is organised as follows. The second section develops the theory and hypotheses. The third section describes the method. The fourth section presents and discusses the results. The final section concludes the discussions.
THEORY AND DEVELOPMENT OF HYPOTHESES
Extant literature suggests that there are three predominant approaches to learning: deep, surface and strategic learning (see Richardson, 2005). Deep learning is characterised by quest for meanings, which involves vigorous interaction with the subject being studied, relating new ideas and concepts to existing knowledge and everyday experiences, and critical evaluation of evidences to conclusions and logic of arguments. Development of deep learning is desirable and becomes the aim of higher education (Beattie et al., 1997; Hayers et al., 1997). On the other hand, surface learning is characterised by passive, rote memorisation, where focus is on task completion. Surface learning entails little appreciation of the purposes of learning where learning is perceived as an imposition resulting in failure to distinguish principles from examples and inability to integrate new information with existing knowledge
to be applied in everyday life experiences. Strategic learning is characterised by concern to achieve the highest possible marks and/or grades. Strategic learning involves analysing structure and content of past examinations to predict examination questions, ensuring learning materials are appropriate, identifying cues about marking schemes, as well as organising time and effort to attain the highest possible marks and/or grades.
Ongoing calls for a greater degree of deep learning at the higher education level reflect that deep learning is desirable but not readily attainable (e.g., Beattie et al., 1997; Sunder, 2010). This study theorises that the three learning approaches facilitate one another. The psychology literature evidences that contextual information is required and desired to comprehend meanings that are often implicit (Goldstone & Barsalou, 1998). Implicit meanings emerge when the impact of one information item is considered in conjunction with the impact other contextual information (Lau, 2014). This study posits that adoption of surface learning which enables memorisation of accounting rules and procedures facilitates subsequent adoption of deep learning to discern the fundamental accounting principles that emerge when memorised rules and procedures are considered in conjunction with one another. Besides deep learning, this study posits that adoption of surface learning at the beginning also facilitates adoption of strategic learning where learners are better equipped to analyse past examinations,

Pertanika J. Soc. Sci. & Hum. 23 (S): 143 – 154 (2015)
Lau, Y. W. and Lim, S. Y
146
predict examination questions, as well as organise time and learning materials in a manner to attain the highest possible marks and/or grades. The goal of attaining the highest possible marks and/or grades is short-term and more readily attainable compared with quest for meanings. Furthermore, bad grades undermine learners’ mental and emotional well-being. Decreased mental and emotional well-being brings about a range of health concerns, from stress and anxiety to depression (Crocker et al., 2003). Quest for meanings and appreciation of the fundamental accounting principles becomes less of a concern when learners are grappling with stress, anxiety and depression. This study posits that surface learning first facilitates adoption of strategic learning. Subsequently, surface and strategic learning facilitate adoption of deep learning.
The hypothesised relationships between the three learning approaches, which are the dependent variables of this study, are stated in the alternative form, as follows:H1: Surface learning is positively related
to strategic learning.
H2: Surface learning is positively related to deep learning.
H3: Strategic learning is positively related to deep learning.
What affects the choice of learning approaches?
Extant literature suggests that learners’ perception of the learning context determines the learning approaches
adopted (Richardson, 2005). For instance, if learners perceive the learning task and subsequent assessment simply require acquisition and accurate reproduction of facts, they are likely to adopt surface learning. Similarly, if the learning task burden learners with heavy workload to the extent that learners become anxious, they tend to resort to surface learning (Cope & Staehr, 2005), consistent with the contention that having to cover expanding volumes of accounting standards merely drills memorisation of the specifics of the standards (Sunder, 2010). However, if learners perceive the learning task and subsequent assessment demands demonstration of a thorough understanding, integration and application of the fundamental concepts and principles, learners are more likely to adopt deep learning.
Learners with the same perception of the learning contexts adopt different learning approaches based on their conception of learning (Richardson, 2005). For instance, learners who see learning as contributing to their existing knowledge, as well as personal and career development in the long run, are more likely to adopt deep learning even when confronted with volumes of accounting standards to be digested compared with their counterparts who perceive learning as something they are compelled to do.
Female undergraduates at an institution of higher learning in Malaysia were found to possess a number of characteristics that contribute towards better academic
Pertanika J. Soc. Sci. & Hum. 23 (S): 143 – 154 (2015)
Accounting Undergraduates’ Learning Approaches: Case of a Malaysian Public University
147
performance (Ismail, 2014). More specifically, the study revealed that female undergraduates are more hardworking, more conscious of their goals in life and more determined in achieving their goals, have better self-discipline, give due priorities to their studies and are mentally more mature than their male counterparts (Ismail, 2014). Such characteristics among female students, especially being conscious of life goals and having the self-discipline, determination and mental maturity to attain their goals in life motivate adoption of deep learning for more effective learning and personal development. Further, while gender inequality is still an ongoing concern worldwide (Jacobs, 1996; Morley, 2005; Gunawardena et al., 2006), females have been found to have better access to institutions of higher learning in Malaysia, where females outnumber males in all disciplines except for engineering, manufacturing and construction (see Yusof et al., 2012; MOE, 2014). As of 2014, the overall ratio of male to female enrolled in public institutions of higher learning in Malaysia is 0.64:1, whereas the ratio for the social sciences and business discipline is 0.42:1 (MOE, 2014). Being more effective in learning, this study hypothesizes that females are more likely to adopt deep learning. The fourth hypothesis stated in the alternative form is as follows:H4: Female undergraduates are more
likely to adopt deep learning than male undergraduates.
METHOD
This study administered a questionnaire survey, which is the Approaches and Studies Skills Inventory for Students (ASSIST) questionnaire. The ASSIST questionnaire is an improved version of the Approaches to Studying Inventory (ASI) to measure learning approaches. The ASSIST questionnaire had been validated and found to be useful across countries and cultures (e.g., Richardson, 1994; Entwistle et al., 2000). A total of 153 accounting undergraduates at a public university in Malaysia completed the ASSIST questionnaire. Out of the total, 50 of them were the first year, 50 were the second year, three were the third year and 50 were the fourth year accounting undergraduates; the questionnaire survey were administered at the time where third year accounting undergraduates were off-campus for their industry placement.
Dependent Variables
The dependent variables—deep, strategic and surface learning—were measured using the questions in the ASSIST questionnaire. The extent to which undergraduates adopt each learning approach was assessed in terms of undergraduates’ perceptions of how they learn on a 5-point Likert-type scale, where 5 denotes “strongly agree” and 1 denotes “strongly disagree”, as follows:• Deep learning: Undergraduates’
perceptions of the extent to which they seek meanings, relate ideas, use evidence and are interested in the ideas are measured.

Pertanika J. Soc. Sci. & Hum. 23 (S): 143 – 154 (2015)
Lau, Y. W. and Lim, S. Y
148
• Surface learning: Undergraduates’ perceptions of the extent to which they memorise, lack purpose, are syllabus bounded and fear failure are measured.
• Strategic learning: Undergraduates’ perception of the extent to which they adopt organised studying, time management, are alert to assessment demands, are achievement-oriented and monitor their own studying effectiveness are measured.
Independent Variables
The key independent variable in this study is gender. Undergraduates were required to self-report gender in the questionnaire. Besides gender, the following variables were measured or captured:• Conception of learning: Undergraduates
were required to self-rate on a 5-point scale the extent to which they perceive learning as memorising, increase of knowledge, development as a person, acquisition of useful information, abstraction of meaning and for seeing things in a more meaningful way (e.g., Richardson, 2005).
• Preferences for deep and surface learning: Undergraduates were required to self-rate on a 5-point scale a list of items that measure their preferences for deep and surface learning, which are part of the ASSIST questionnaire.
• CGPA: Undergraduates were required to self-report CGPA in the questionnaire to be included as a control variable.
Data Analyses
In light of the hypothesised relationships between the three learning approaches (dependent variables), a Multivariate Analysis of Covariance (MANCOVA) which allows analysis of multiple dependent variables was conducted. Next, a Roy-Bargmann step-down procedure was conducted to enable test of the hypothesised sequential relationship between the three dependent variables, i.e. undergraduates proceed from surface to strategic and finally deep learning. Using the Roy-Bargmann step-down procedure, the effects of gender and other independent variables were first assessed on surface learning using an Analysis of Covariance (ANCOVA). Second, the effects of surface learning, gender and other independent variables were assessed on strategic learning using an ANCOVA. The second step of the Roy-Bargmann step-down procedure enables test of H1, i.e. the effect of surface learning on strategic learning. Finally, the effects of both surface and strategic learning, together with gender and other independent variables, were assessed on deep learning using an ANCOVA. The final step of the procedure enable test of H2 to H4, i.e. the effects of surface learning, strategic learning and gender, respectively, on deep learning.
A total of 32 male and 121 female accounting undergraduates participated in this study. The low male to female ratio is consistent with the overall enrolment
RESULTS AND DISCUSSION

Pertanika J. Soc. Sci. & Hum. 23 (S): 143 – 154 (2015)
Accounting Undergraduates’ Learning Approaches: Case of a Malaysian Public University
149
in public institutions of higher learning in Malaysia (see MOE, 2014). Table 1 provides a summary of the descriptive statistics, primarily means and standard deviations of the variables. Cronbach’s α value for each of the three dependent variables is greater than 0.7, which suggests a high level of internal consistency in measuring each learning approach. Female undergraduates appear to have higher mean scores and lower standard deviations for all the three learning approaches—surface, strategic and deep learning—compared with their male counterparts. Independent sample t-tests revealed that the three learning approaches are significantly
different between the two gender groups, p<0.05, which suggests that females are more inclined to adopt the three learning approaches. Male undergraduates appear to understand what learning is better than female undergraduates, as reflected by the slightly higher mean score for conception of learning (23.85 for males and 21.31 for females). Female undergraduates also have higher mean scores and lower standard deviations for their preferences for both deep and surface learning, respectively. Nonetheless, the mean CGPA for both gender groups do not appear to be significantly different.
TABLE 1Descriptive statistics - means and standard deviations (in parentheses) by gender
Total(N=153)
Male(N=32)
Female(N=121)
Independent sample t-test1
t pDEPENDENT VARIABLESSurface learningCronbach’s α = 0.798
51.86(13.306)
46.03(23.389)
53.41(8.453)
2.853 0.005
Strategic learningCronbach’s α = 0.880
66.32(17.117)
58.88(29.921)
68.29(11.007)
2.830 0.005
Deep learningCronbach’s α = 0.875 53.19
(13.785)48.44
(24.137)54.45
(9.087)
2.221 0.028
INDEPENDENT VARIABLESConception of learning 21.76
(4.748)23.85
(3.541)21.31
(4.865)Preference for deep learning 13.24
(4.056)11.88
(6.430)13.60
(3.086)Preference for surface learning
13.99(4.424)
12.09(6.468)
14.50(3.573)
CGPA 3.56(0.305)
3.54(0.338)
3.56(0.299)
1Note: Results are the same when equal variances are not assumed.
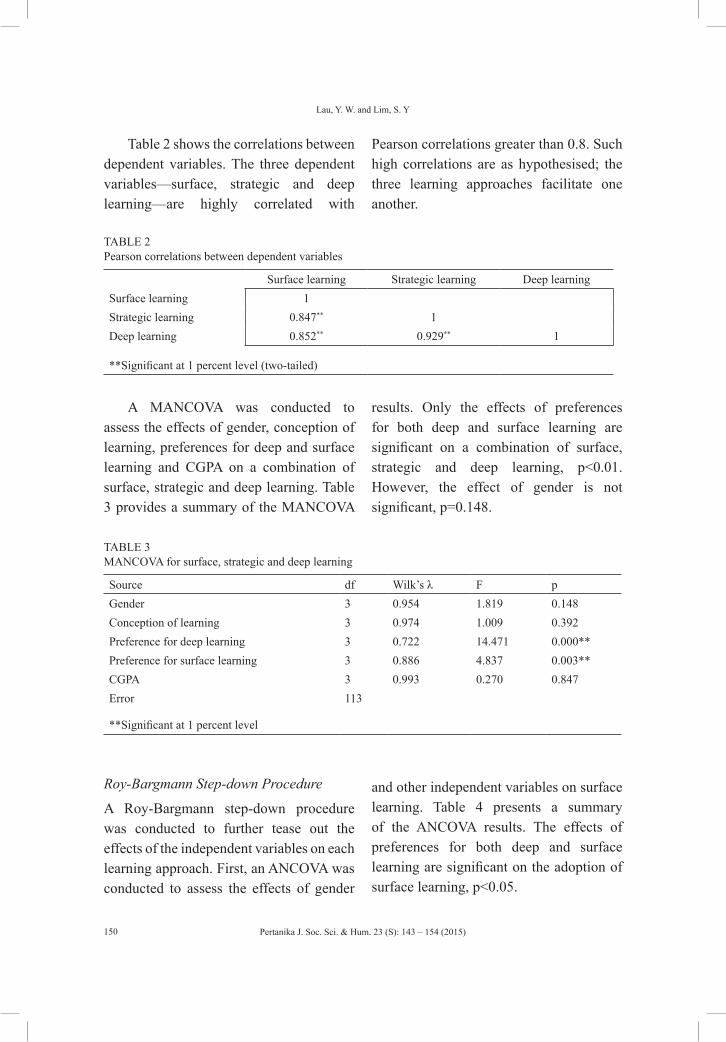
Pertanika J. Soc. Sci. & Hum. 23 (S): 143 – 154 (2015)
Lau, Y. W. and Lim, S. Y
150
Table 2 shows the correlations between dependent variables. The three dependent variables—surface, strategic and deep learning—are highly correlated with
Pearson correlations greater than 0.8. Such high correlations are as hypothesised; the three learning approaches facilitate one another.
TABLE 2Pearson correlations between dependent variables
Surface learning Strategic learning Deep learningSurface learning 1Strategic learning 0.847** 1Deep learning 0.852** 0.929** 1
**Significant at 1 percent level (two-tailed)
A MANCOVA was conducted to assess the effects of gender, conception of learning, preferences for deep and surface learning and CGPA on a combination of surface, strategic and deep learning. Table 3 provides a summary of the MANCOVA
results. Only the effects of preferences for both deep and surface learning are significant on a combination of surface, strategic and deep learning, p<0.01. However, the effect of gender is not significant, p=0.148.
TABLE 3MANCOVA for surface, strategic and deep learning
Source df Wilk’s λ F pGender 3 0.954 1.819 0.148Conception of learning 3 0.974 1.009 0.392Preference for deep learning 3 0.722 14.471 0.000**Preference for surface learning 3 0.886 4.837 0.003**CGPA 3 0.993 0.270 0.847Error 113
**Significant at 1 percent level
Roy-Bargmann Step-down Procedure
A Roy-Bargmann step-down procedure was conducted to further tease out the effects of the independent variables on each learning approach. First, an ANCOVA was conducted to assess the effects of gender
and other independent variables on surface learning. Table 4 presents a summary of the ANCOVA results. The effects of preferences for both deep and surface learning are significant on the adoption of surface learning, p<0.05.

Pertanika J. Soc. Sci. & Hum. 23 (S): 143 – 154 (2015)
Accounting Undergraduates’ Learning Approaches: Case of a Malaysian Public University
151
TABLE 4ANCOVA for surface learning
Source df MS F PGender 1 43.304 0.712 0.401Conception of learning 1 61.493 1.011 0.317Preference for deep learning 1 249.576 4.104 0.045*Preference for surface learning 1 850.325 13.981 0.000**CGPA 1 9.849 0.162 0.688Error 115
**Significant at 1 percent level*Significant at 5 percent level
rules of procedures facilitates adoption of strategic learning to attain highest possible marks and/or grades. Hence, H1 is supported. The effect of preference for deep learning on strategic learning is highly significant, p<0.01; having a preference to seek meanings positively affect adoption of strategic learning.
Second, an ANCOVA was conducted to assess the effects of surface learning, gender and other independent variables on strategic learning. Table 5 provides a summary of the ANCOVA results. The effect of surface learning on strategic learning is highly significant, p<0.01, which suggests that memorisation of accounting
TABLE 5
ANCOVA for strategic learning
Source df MS F PGender 1 35.711 0.526 0.470Conception of learning 1 91.935 1.354 0.247Preference for deep learning 1 1329.608 19.589 0.000**Preference for surface learning 1 5.929 0.087 0.768CGPA 1 40.440 0.596 0.442Surface learning 1 2648.010 39.012 0.000**Error 114
**Significant at 1 percent level
Finally, an ANCOVA was conducted to assess effects of both surface and strategic learning together with gender and other independent variables on deep learning. Table 6 provides a summary of the ANCOVA
results. The effect of surface learning is significant, p<0.05, while the effect of strategic learning is highly significant, p<0.01; memorisation of accounting rules and procedures, as well as organising

Pertanika J. Soc. Sci. & Hum. 23 (S): 143 – 154 (2015)
Lau, Y. W. and Lim, S. Y
152
learning materials and time in a manner to attain the highest possible marks and/or grades are useful in undergraduates’ quest for meanings. Therefore, both H2 and H3 are supported. The effect of preference for deep learning is highly significant, p<0.01.
The effect of gender is also significant, p<0.05. Parameter estimates reveal that female undergraduates are more inclined to adopt deep learning compared with their male counterparts; β=-2.320, SE=1.134, t=-2.046, p=0.043. H4 is supported.
TABLE 6ANCOVA for deep learning
Source df MS F pGender 1 93.909 4.186 0.043*Conception of learning 1 14.819 0.665 0.417Preference for deep learning 1 356.252 15.879 0.000**Preference for surface learning 1 13.504 0.602 0.439CGPA 1 1.334 0.059 0.808Surface learning 1 132.026 5.882 0.017*Strategic learning 1 1551.187 69.142 0.000**Error 113
**Significant at 1% level*Significant at 5% level
CONCLUSION
This study sheds light on the extent to which accounting undergraduates are in a position to equip themselves with the relevant skills and competencies to be employable, especially generic skills like being able to discern and apply fundamental principles across everyday life experiences. More specifically, this study examines the extent to which accounting undergraduates adopt deep learning, which is the aim of higher education. The results revealed that quests for meanings and being able to cope with new and complex situations in everyday life, which deep learning enables, are not easy to attain though
not impossible. Surface learning, though blamed for accounting undergraduates’ incompetence in exercising judgment, ensures rote memorisation which constitutes a stepping stone towards deep learning. Having memorised accounting rules and procedures enables the impact of each accounting rule and procedure to be considered in conjunction with the impact of other rules and procedures for better appreciation of the underlying accounting fundamentals. Accounting rules and procedures in learners’ memory also facilitate analyses of past examinations, prediction of examination questions and adoption of other strategic learning

Pertanika J. Soc. Sci. & Hum. 23 (S): 143 – 154 (2015)
Accounting Undergraduates’ Learning Approaches: Case of a Malaysian Public University
153
techniques to attain the highest possible grades. Having attained the highest possible grades promotes mental and emotional well-being, which facilitates adoption of deep learning to appreciate the meanings and fundamental accounting principles applicable across situational contexts.
This study helps to clarify concerns about accounting undergraduates’ incompetence in exercising judgment as syllabi become increasingly burdened with factual accounting standards, which promote rote memorisation and subsequent regurgitation of information in examinations (Beattie et al., 1997; Sunder, 2010). This study demonstrated that rote memorisation, and thus surface learning, is not completely useless as it constitutes the first step towards deep learning. However, having a preference for deep learning has been found to be important for undergraduates to proceed from surface to strategic learning, and ultimately deep learning.
Results of this study are consistent with the gender equality contention in Malaysian higher education (Yusof et al., 2012). More specifically, this study found that female undergraduates are more inclined to adopt deep learning, which is pertinent for development of generic skills to be employable. However, learning is a complex, life-long process where learning takes place every day regardless of whether undergraduates are on or off-campus (Cleary et al., 2007). Hence, future research can consider exploring the extent to which specific on and off campus experiences promote deep learning
for a better understanding of how best to encourage undergraduates to move from surface learning to strategic learning, and ultimately deep learning.
REFERENCESBeattie, V., Collins, B., & McInnes, B. (1997). Deep
and surface learning: A simple or simplistic dichotomy? Accounting Education: An International Journal, 6(1), 1-12.
Bennis, W., & O’Toole, J. (2005). How business schools lost their way. Education. Harvard Business Review (May). Retrieved April 17, 2015, from https://hbr.org.
Cleary, M., Flynn, R., Thomasson, S., Alexander, R., & McDonald, B. (2007). Graduate Employability Skills: Prepared for the Business, Industry and Higher Education Collaboration Council (August). Commonwealth of Australia. Retrieved April 17, 2015, from http://www.dest.gov.au/highered/bihecc.
Cope, C., & Staehr, L. (2005). Improving students’ learning approaches through intervention in an information systems. Studies in Higher Education, 30(2), 181-197.
Crocker, J., Karpinski, A., Quinn, D. M., & Chase, S. K. (2003). When grades determine self-worth: Consequences of contingent self-worth for male and female engineering and psychology majors. Journal of Personality and Social Psychology, 85(3), 507-516.
Eckhardt, J., & Wetherbe, J. C. (2014, December 24). Making business school research more relevant. Business Education. Harvard Business Review. Retrieved April 17, 2015, from https://hbr.org
Entwistle, N. J., Tait, H., & McCrune, V. (2000). Patterns of response to an approaches to studying inventory across contrasting groups and contexts. European Journal of Psychology of Education, 15(1), 33-48.

Pertanika J. Soc. Sci. & Hum. 23 (S): 143 – 154 (2015)
Lau, Y. W. and Lim, S. Y
154
Goldstone, R. L., & Barsalou, L. W. (1998). Reuniting perception and conception. Cognition, 65(2), 231-262.
Gunawardena, C., Rasanayagam, Y., Leitan, T., Bulumulle, K., & Abeyasekera-Van Dort, A. (2006). Quantitative and qualitative dimensions of gender equality in Sri Lankan higher education. Women’s Studies International Forum, 29(6), 562-571.
Hayers, K., King, E., & Richardson, J. T. E. (1997). Mature students in higher education: III, Approaches to studying in access students. Accounting Education, 22(1), 19-31.
Ismail, L. (2014). Factors influencing gender gap in higher education of Malaysia: A University of Malaya sample. Working paper, Faculty of Education, University of Malaya.
Ismail, R., Yussof, I., & Lai, W. S. (2011). Employers’ perceptions on graduates in Malaysian services sector. International Business Management, 5(3), 184-193.
Jacobs, J. A. (1996). Gender inequality and higher education. Annual Review of Sociology, 22, 135-185.
Kigotho, W. (2015). Graduate unemployment hits crisis level. University World News January 16 (350). Retrieved April 17, 2015, http://www.universityworldnews.com
Lau, Y. W. (2014). Aggregated or Disaggregated Information First? Journal of Business Research, 67(11), 2376-2384.
Lowden, K., Hall, S., Elliot, & Lewin, J. (2011). Employers’ perceptions of the employability skills of new graduates: Research commissioned by the Edge Foundation. Edge Foundation London. Retrieved April 21, 2015, from http://www.edge.co.uk
MOE. (2014). Quick facts 2014: Malaysia educational statistics. Educational Planning and Research Division, Ministry of Education. Ministry of Education, ISSN 1985-6407.
Morley, L. (2005). Gender equity in Commonwealth higher education. Women’s Studies International Forum, 28(2), 209-211.
Oliver, B., Jones, S., Tucker, B., & Ferns, S. (2007). Mapping curricula: ensuring work-ready graduates by mapping course learning outcomes and higher order thinking skills. Peer-reviewed paper presented at the Evaluations and Assessment Conference Brisbane. Retrieved April 16, 2015, from http://www.eac2007.qut.edu.au/proceedings/proceedings_ebook.pdf
Pianin, E. (2014). The surprising reason college grads can’t get a job. The Fiscal Times (January). Retrieved April 16, 2015, from http://www.thefiscaltimes.com.
Richardson, J. T. E. (1994). Cultural specificity of approaches to studying in higher education: A literature review. Higher Education, 27(4), 449-468.
Richardson, J. T. E. (2005). Students’ approaches to learning and teachers’ approaches to teaching in higher education. Educational Psychology, 25(6), 673-680.
Sunder, S. (2010). Adverse effects of uniform written reporting standards on accounting practice, education, and research. Journal of Accounting and Public Policy, 29(2), 99-114.
Yusof, A. M., Alias, R. A., & Habil, H. (2012). Stereotyping in graduate education: An insight of women’s participation in Malaysia. Journal of e-Learning and Higher Education. Retrieved April 17, 2015, from http://www.ibimapublishing.com/journals/JELHE/jelhe.html

Pertanika J. Soc. Sci. & Hum. 23 (S): 155 – 166 (2015)
ISSN: 0128-7702 © Universiti Putra Malaysia Press
SOCIAL SCIENCES & HUMANITIESJournal homepage: http://www.pertanika.upm.edu.my/
ARTICLE INFOArticle history:Received: 30 March 2015Accepted: 10 September 2015
E-mail addresses:[email protected] (Alireza Zarei),[email protected] (Mohamed Ariff),[email protected] (Law Siong Hook),[email protected] (Annuar Md Nassir)* Corresponding author
Identifying Multiple Structural Breaks in Exchange Rate Series in a Finance Research
Alireza Zarei1*, Mohamed Ariff2, Law Siong Hook2 and Annuar Md Nassir2
1Department of Financial Mathematics and Statistics, Sunway University, Malaysia2Faculty of Economics and Management, University Putra Malaysia, 43400 UPM Serdang, Selangor, Malaysia
ABSTRACT
This paper describes how to resolve a recurrent research problem in finance research, that is, how to identify and then take steps to correct structural breakpoints in time series data sets. A review of finance literature suggests that the familiar method of identifying breaks is by using news reports of events, which is not accurate in a formal sense, and will likely introduce estimation errors in research. There exist formal models, which are used to accurately identify breaks especially in long-time series to pre-test exchange rate data series as a pre-analysis step to accurately locate breaks that will help control estimation errors introduced from breakpoint impacts. The findings from testing four-country data series, using 651 months data of each country, suggested that the method described in this study identified breakpoints accurately, which was also verified using graphs. Therefore, it is suggested that this process is helpful for researchers to formally identify structural breakpoints as it greatly improves the robustness of estimation of exchange rate behaviour (apart from other financial variables).
Keywords: Multiple Structural breaks; Time series analysis; Exchange rates; Bai-Perron Model
INTRODUCTION
This paper reports new findings on an important empirical research problem of
how to identify structural breaks in exchange rate behaviour so that the impacts of serious disturbances, known as breakpoints in the series, could be designed to be controlled when time series data on exchange rates are used by finance or accounting researchers. For example, several studies identified breaks or disturbances based on newspaper reports: Asian Financial Crisis breakpoints were identified in the time series as the observations over July, 1997

Pertanika J. Soc. Sci. & Hum. 23 (S): 155 – 166 (2015)
Alireza Zarei, Mohamed Ariff, Law Siong Hook and Annuar Md Nassir
156
and October, 1998, and Global Financial Crisis breakpoints were specified for observations during April, 2007 to October, 2009 (Ariff et al., 2012). It is notable that there has been a great deal of attention in statistic and econometric research papers devoted to detecting structural breaks in long-length time series data sets, while most finance researchers use news reports of dates and then specify dummy variables to control the effect from major breaks. Hence, relying on event identification using a more rigorous method is better than to assume the breaks from newspaper reports.
Scholars in econometrics and statistics have suggested test models for analysing structural changes – call it disturbance that tweaks the data set substantially away from its normal path when such off-normal disturbances occur. Such tests could be routinely applied in finance research in order to statistically identify breaks. More importantly, there has been a growing improvement in developing multiple breakpoint tests (Andrews, Lee, & Ploberger, 1996; Garcia & Perron, 1996; Liu, Wu, & Zidek, 1997). Recent tests developed by Bai and Perron (1998; 2003) constitute an efficient algorithm based on dynamic programming method to obtain global minimisers of the sum of squared residuals in a simple regression test model under a very general framework that allows for both pure and partial structural changes. By imposing a common structure, the tests control for different serial correlations, data distributions and the errors across segments. That process is superior to using news reports to specify breaks.
This study provides an empirical implementation example by applying the method of Bai and Perron (1998; 2003) using exchange rate time series for a sample of four major countries with data stretching over a long length of 55 years of monthly observations. Our concern here is to identify all breaks in this long time series to ensure that the dates of breaks are not assumed from news reports but are quantitatively identified.
Researchers on exchange rates have obviously paid little attention to this aspect, so our continuing research on exchange rate effect (for example, Ariff & Zarei, 2015) is based on this method of identifying and then naming the crises periods embedded in the data set we use. Thus, we hope to add this method as a rigorous pre-analysis filtering procedure as shown in this paper to be used on exchange rates or other time series. This is our motivation for conducting and reporting the results in this paper.
The remainder of this paper is organised as follows: In Section 2, a brief review of some papers on this topic is given before describing the hypothesis and model development in Section 3. Findings are presented and discussed in Section 4 and conclusion is provided in Section 5.
LITERATURE ON STRUCTURAL BREAKS
The literature on structural change test development starting from the 1960s is substantial; the more important papers are reviewed in this paper. Prior to this date, it was customary to pre-identify the break
Pertanika J. Soc. Sci. & Hum. 23 (S): 155 – 166 (2015)
Identifying Multiple Structural Breaks in Exchange Rate Series in a Finance Research
157
using news reports and then specifying dummy variables to represent the break points, as was done in classic papers in the pre-1960s. A very preliminary test model of structural break was developed by Chow (1960). The testing procedure requires a priori known dates of pre- and post- break points to be tested for equality using a classic F-statistic: note that the initial anchor is on news reports.
The test gained huge popularity following over many decades despite the limitation of a method based on a priori identification of break dates. Quandt (1960) developed a modified version of Chow’s model taking the largest F-statistic over all possible break dates. In this way, the break dates can be identified without a need for a specific priori imposition of break dates. This method can be implemented by estimating the parameters in the sequence of Chow’s F-statistics as a function of candidate break dates so as to establish any systematic variation in the behaviour of sub-samples before and after the candidate break date.
Andrews (1993) and Andrews and Ploberger (1994) derived the limiting distribution of the Quandt results and developed related test statistics. The Quadnt-Andrew’s framework, as it was named later, was further extended in Bai (1997) and Bai and Perron (1998, 2003) to allow for multiple unknown breakpoints. In long time series, as in this research, the data series do have multiple breakpoints.
This method presents an efficient algorithm to obtain global minimisers of the sum of squared residuals. The issues
concerning the structure and distribution of errors, as well as the number of breaks, are addressed in their paper to provide a general framework that captures different levels of serial correlation in the errors and so the resulting different distributions of the data. Of advantages arising from this methodology, it can be noted that events which may foster any structural change can be identified accurately and quantitatively.
There are few other published works on this topic such as those by Sims (1980) and Gujarati (1978). Some papers suggest tests based on pre-identifying the disturbances, and are similar to the Chow’s (1960) suggestion. Bai-Perron test is considerably superior to all the previous suggestions, and is based on a rigorous statistical method of identifying disturbances.
HYPOTHESIS, MODEL DEVELOPMENT AND DATA SERIES
In this section, a test hypothesis was tested using the Bai-Perron model; there is a short discussion of the behaviour of the time series as we operationalised the method to identify multiple structural breaks in a long time series. The assumption is that there ought to be some breaks in a long length time series because of changes in monetary policy actions, or simply the effect of one or more crises that affects exchange rates periodically. The discussion has so far indicated the possible methods to identify breakpoints, and that Bai-Perron method is perhaps suitable. Consistent with the above discussions, therefore, the hypothesis of this study is:

Pertanika J. Soc. Sci. & Hum. 23 (S): 155 – 166 (2015)
Alireza Zarei, Mohamed Ariff, Law Siong Hook and Annuar Md Nassir
158
Hypothesis: There is no significant structural change or disturbance denoting instability in the behaviour of nominal exchange rate over the 55-year test period.
Bai and Perron (2003) proposed a multiple linear regression with m breaks as in:yt = x’ t β + z’ t δ1 + ut , t = 1,…,T1 ,yt = x’t β + z’t δ2 + ut , t = T1 + 1,…,T2 ,yt = x’t β + z’t δ(m+1) + ut , t = Tm+1 ,…,T.
(1)
where, m is the number of breaks in the m + 1 regimes, yt is the observed dependent variable at time t, while xt and zt are vectors of covariates and β and δ are the corresponding vectors of coefficients. ut is disturbance term at time t. The (T1…Tm) are the breakpoints or indices which are explicitly treated as unknown. The aim of this test is thus to estimate the unknown regression coefficients together with the break points when number of observations on the dependent and the vectors of
covariates (yt , xt , zt ) are available. “The problem of testing for multiple structural breaks is addressed by Sup Wald Type tests with null hypothesis of no break versus an alternative hypothesis of an arbitrary number of breaks, which allows for a specific to general modelling strategy in consistent determination of appropriate number of breaks” (Bai & Perron, 2003, p. 2).
This study applies Bai and Perron’s (2003) test to investigate structural changes by identifying parameter instability locations in our monthly exchange rates data set over 1960-14 (651 x 4 countries), which is a long time series as accessed from IMF CD-ROM database. The data series are month-end observations on each currency, where Eviews 8 is used. The countries included are Belgium, Canada, France and Japan. The analysis was conducted on each country separately so that the reliability of the results across similarly affected economies could be also verified.
Fig.1: Plots of Four Country Exchange Rate Behaviour over 55 years (Base=100 in 1960)

Pertanika J. Soc. Sci. & Hum. 23 (S): 155 – 166 (2015)
Identifying Multiple Structural Breaks in Exchange Rate Series in a Finance Research
159
We chose only four countries as a preliminary effort to find that the tests are suitable for application across many more countries. The exchange rates are against the US dollar since the currency is the most liquid trade currency; therefore, it is likely to have efficient market-clearing accuracy. The results are discussed in the next section.
Plots are of the exchange rates of four countries included in this study, as shown in Fig.1. For this purpose, an index (base year = 100) was constructed for respective exchange rates to examine the fluctuation of the time series. It is evident that Japanese
Yen is highly volatile; some large changes symptomatic of several structural break events, and this is possibly due to monetary policy actions, economic shocks and crises over the period.
In order to examine the normality assumption of data, a summary of descriptive statistics is provided in Table 1. The data used for this analysis are over the whole sampled period. The bilateral nominal exchange rates were used with US dollar being the denominator. The statistics can be verified from the table, i.e. from the mean value in column two of the table.
TABLE 1Descriptive Statistics on Exchange Rates of Four Countries, Percentage
Mean Median Std. Dev. Skewness Kurtosis Observations
Belgium 30.237 35.743 19.749 -0.543 1.816 651
Canada 1.183 1.156 0.166 0.668 2.432 651
France 4.179 4.937 2.283 -0.334 2.264 651
Japan 205.181 153.600 103.180 0.413 1.566 651Annual per cent change in exchange rates.
The statistics summarised in this table is meant to judge the means and standard deviations of the four time series. The series appear to be normally distributed as can be verified from the means and medians, which are close to one another. In addition, the skewness is close to 0, while the kurtosis is closer to 2 than far away from it.
The measure of dispersion, standard deviation in exchange rate for Japan, is larger than other exchange rates in view of the high exchange rate fluctuations in
Japan, whereas the Canadian dollar is the least fluctuating currency against the US dollar. The statistics on skewness and kurtosis fulfil the assumption of normal distribution of data.
Application of Eviews Software
The estimation procedure in Eviews 8 for this study is based on a simple regression equation under a least square specification; with the nominal exchange rate (NER) playing the role of dependent variable regressed against a single (constant)

Pertanika J. Soc. Sci. & Hum. 23 (S): 155 – 166 (2015)
Alireza Zarei, Mohamed Ariff, Law Siong Hook and Annuar Md Nassir
160
regressor. The modelling therefore can be represented as:NERt = constant + εt (2)
In order to allow for serial correlation in the errors, a quadratic spectral kernel was specified based on HAC covariance estimation with the use of pre-whitened residuals, whereby the kernel bandwidth is determined using the Andrews AR(1) method.
Eviews Version 8 satisfies the condition for such an implementation. In examining multiple breakpoint tests, three different methods are considered. As a priori requirement for all three methods, the distributions of errors are allowed to differ across breaks which in turn satisfy the heterogeneity of errors. The default method for investigation of multiple structural change, as outlined in the studies of Bai (1997) and Bai and Perron (1998), is known as sequential testing l + 1 of versus l breaks.
At the second stage, the global Bai-Perron break method is applied, which is meant to examine the alternative hypothesis of globally optimised breaks against the null of no structural breaks, along with the corresponding UDmax and WDmax tests, which are interpreted later on in discussing the findings. Finally, at the third stage, the method of global information criteria was applied, as it does not require computation of coefficient covariance compared to the previous two methods of break selection criteria.
This study applied the global information criteria to estimate breakpoints using global minimisers of the sum of
squared residuals. The LWZ criteria were chosen as the selection criterion for the optimum number of breaks after initial testing. The selection of optimum number of breaks was based on three different selection criteria, namely, sequential, Bayesian Information Criterion (BIC) and a modified Schwarz Criterion (LWZ). According to Bai and Perron (2003), LWZ performs better compared to the other two criteria under the no-break null hypothesis. The results on multiple structural break test the results from exchange rates over the 55-year test period, which are reported as obtained from joint model testing procedure developed in Bai and Perron (2003).
The discussion on the procedure using Eviews software indicates that it is feasible to adopt this as a pre-screening procedure when exchange rate series is used in the on-going research on monetary theory testing as in Ariff and Zarei (2015).
FINDINGS FROM THE STRUCTURAL BREAKPOINT TEST
A time-series analysis regarding multiple structural breakpoints is first described to facilitate the interpretation of results presented in this section. Results for each country from using monthly observations are reported in Table 2, in which model specification details and test statistics are given.
The estimation procedure is based on running a regression with a constant as regressor (Zt = [1]) that accounts for potential serial correlation via non-parametric adjustments; for each country,
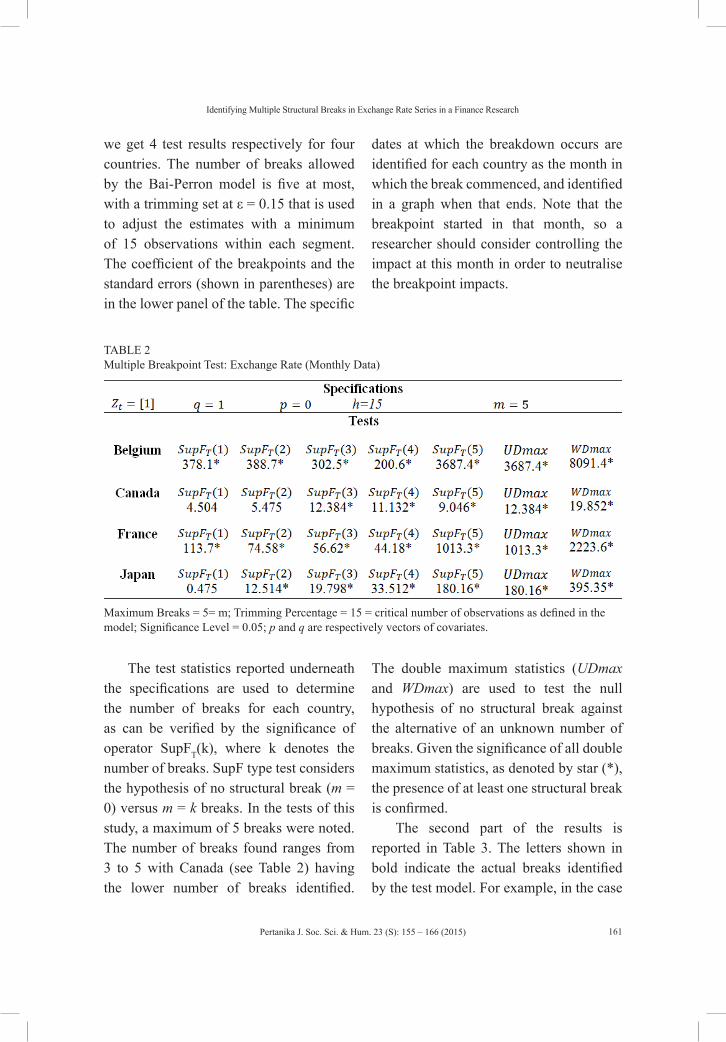
Pertanika J. Soc. Sci. & Hum. 23 (S): 155 – 166 (2015)
Identifying Multiple Structural Breaks in Exchange Rate Series in a Finance Research
161
we get 4 test results respectively for four countries. The number of breaks allowed by the Bai-Perron model is five at most, with a trimming set at ε = 0.15 that is used to adjust the estimates with a minimum of 15 observations within each segment. The coefficient of the breakpoints and the standard errors (shown in parentheses) are in the lower panel of the table. The specific
dates at which the breakdown occurs are identified for each country as the month in which the break commenced, and identified in a graph when that ends. Note that the breakpoint started in that month, so a researcher should consider controlling the impact at this month in order to neutralise the breakpoint impacts.
TABLE 2Multiple Breakpoint Test: Exchange Rate (Monthly Data)
Maximum Breaks = 5= m; Trimming Percentage = 15 = critical number of observations as defined in the model; Significance Level = 0.05; p and q are respectively vectors of covariates.
The double maximum statistics (UDmax and WDmax) are used to test the null hypothesis of no structural break against the alternative of an unknown number of breaks. Given the significance of all double maximum statistics, as denoted by star (*), the presence of at least one structural break is confirmed.
The second part of the results is reported in Table 3. The letters shown in bold indicate the actual breaks identified by the test model. For example, in the case
The test statistics reported underneath the specifications are used to determine the number of breaks for each country, as can be verified by the significance of operator SupFT(k), where k denotes the number of breaks. SupF type test considers the hypothesis of no structural break (m = 0) versus m = k breaks. In the tests of this study, a maximum of 5 breaks were noted. The number of breaks found ranges from 3 to 5 with Canada (see Table 2) having the lower number of breaks identified.

Pertanika J. Soc. Sci. & Hum. 23 (S): 155 – 166 (2015)
Alireza Zarei, Mohamed Ariff, Law Siong Hook and Annuar Md Nassir
162
of Belgium, four breaks are identified, which are in month-1 (1973), month-10 (1981), month-11 (1989), and month-12 (1998). Going back to the reported news, the 1973 breakpoint arose from the Smithsonian Agreement; 1989 is related to the announcement of Euro (€), while 1998 is the date of implementation of the Euro currency. Similar interpretations can be applied to France.
The test applies three break-selection criteria to identify the optimum number
of breaks, as specified in the upper half of Table 2. SupF(k) indicates the significance of k breaks. The final choice is made based on the LWZ criteria (Liu et al., 1997), which are robust to serial correlation problems and the test performs relatively well.
The statistics would have us believe that almost all the countries experienced a structural break at a date around the breakdown of Bretton Woods Agreement, that is, in 1971-1973 (Smithsonian Agreement was withdrawn in 1973).
TABLE 3Multiple Breakpoint Test and Exchange Rate (Monthly Data)
Canada is the only country which experienced breakdown at a later point than the actual breakdown of Bretton Woods, for reasons peculiar to that region:
1978 was a year of economic decline in the US, with which Canada had major connection.

Pertanika J. Soc. Sci. & Hum. 23 (S): 155 – 166 (2015)
Identifying Multiple Structural Breaks in Exchange Rate Series in a Finance Research
163
Fig.
2: M
ultip
le S
truct
ural
cha
nge
Gra
phs,
Bila
tera
l Exc
hang
e ra
tes
Fig.
2aFi
g.2c
Fig.
2bFi
g.2d

Pertanika J. Soc. Sci. & Hum. 23 (S): 155 – 166 (2015)
Alireza Zarei, Mohamed Ariff, Law Siong Hook and Annuar Md Nassir
164
The other important breakdown is related to late 1990s among European countries arising from the Euro currency leading to a change in those economies’ behaviour of exchange rates. The analysis was only conducted on monthly data to improve the precision of test results. If the annual data series were used, the years identified in this paper would prominently be identified as the years of the breakdown. Fig.2 provides four plots, one for each country, on how the data series can be depicted in terms of the breakpoints. For example, Belgium and France experienced the same breakpoints since both countries were affected by the introduction of the Euro currency in 1998-9.
In the case of Belgium (see Fig.2a), four breakpoints were identified in the plot, as shown at the top of that graph; 1973; 1981; 1989; 1998. The plot for France is identical to that of Belgium as both countries with common currency are within the EU region (since 1998) experiencing similar breakpoints. Canada (Fig.2c) had three breaks: 1978 due to tightening of monetary policy to contain high inflation; 1994 due to Mexican Peso Crisis; 2004 due to a sudden appreciation of Canadian dollar. In 1969, Japan experienced its first break due to the adoption of special drawing rights; 1977 witnessed the impact of the global high oil price crisis; 1994 coincided with the stock market crash in Japan; 1986 is the year when the implementation of Plaza Accord designed slowly appreciated the Yen against the US dollar; 2006 had a break ahead of the Global Financial Crisis.
The explanations for the breakpoints are sourced from accessing events in www.bbc.com; there are other event identifying databases, which anyone could also consult. The results presented in this section appear to verify what one sees in recorded events in the news from this source.
CONCLUSION
This paper started with the aim to identify and apply a formal research process to determine the structural breaks in the exchange rate time series data over 55 years relating to four OECD countries. This paper reports the results of this research for four countries so as to establish evidence on the applicability of a testing methodology described in this paper. This identification process could well be adopted for other time series analyses that require formally identifying structural breaks.
It is believed that a formal method to pinpoint the breakpoints will certainly be desirable to one that relies on specifying multiple dates based on newspaper reports, which is the most commonly followed practice in the research literature to resolve this important data problem. The Bai-Perron method, which we operationalised using standard software in this paper, is based on having no a priori reasoning, and is extracted from the correlation behaviour of the time series to identify when the breaks occur. The model identifies the date(s) accurately, so that this procedure, if followed as a pre-analysis step before subjecting the data set to analysis, could improve the accuracy of findings on

Pertanika J. Soc. Sci. & Hum. 23 (S): 155 – 166 (2015)
Identifying Multiple Structural Breaks in Exchange Rate Series in a Finance Research
165
exchange rate (or other) behaviour. Further tests with a larger sample of countries would help to generalise our findings to a greater number of countries.
REFERENCESAriff, M., Farrar, J., & Khalid, A. (Eds.). (2012).
Regulatory Failure and the Global Financial Crisis. Chetenham, UK and Northampton, NJ, USA: Edward Elgar Publishing.
Ariff, M., & Zarei, A. (2015). Parity Theorems Revisited: An Ardl Bound Test With Non-Parity Factors. Asian Academy of Management Journal of Accounting and Finance, 11(1), 1-26.
Andrews, D. W. (1993). Tests for parameter instability and structural change with unknown change point. Econometrica: Journal of the Econometric Society, 61(4), 821-856.
Andrews, D. W., Lee, I., & Ploberger, W. (1996). Optimal changepoint tests for normal linear regression. Journal of Econometrics, 70(1), 9-38.
Andrews, D. W., & Ploberger, W. (1994). Optimal tests when a nuisance parameter is present only under the alternative. Econometrica: Journal of the Econometric Society, 62(6), 1383-1414.
Bai, J. (1997). Estimating multiple breaks one at a time. Econometric Theory, 13(03), 315-352.
Bai, J., & Perron, P. (1998). Estimating and testing linear models with multiple structural changes. Econometrica, 66(1), 47-78.
Bai, J., & Perron, P. (2003). Computation and analysis of multiple structural change models. Journal of applied econometrics, 18(1), 1-22.
Chow, G. C. (1960). Tests of equality between sets of coefficients in two linear regressions. Econometrica: Journal of the Econometric Society, 28(3), 591-605.
Garcia, R., & Perron, P. (1996). An analysis of the real interest rate under regime shifts. The Review of Economics and Statistics, 78(1), 111-125.
Gujarati, D. (1978). N., 1995. Basic Econometrics. New York: McGraw Hill Inc.
Liu, J., Wu, S., & Zidek, J. V. (1997). On segmented multivariate regression. Statistica Sinica, 7(2), 497-525.
Quandt, R. E. (1960). Tests of the hypothesis that a linear regression system obeys two separate regimes. Journal of the American Statistical Association, 55(290), 324-330.
Sims, C. A. (1980). Macroeconomics and reality. Econometrica: Journal of the Econometric Society, 48(1), 1-48.


Pertanika J. Soc. Sci. & Hum. 23 (S): 167 – 186 (2015)
ISSN: 0128-7702 © Universiti Putra Malaysia Press
SOCIAL SCIENCES & HUMANITIESJournal homepage: http://www.pertanika.upm.edu.my/
ARTICLE INFOArticle history:Received: 30 March 2015Accepted: 10 September 2015
E-mail addresses:[email protected] (A. Nasserinia),[email protected] (M. Ariff),[email protected] (Cheng Fan Fah)* Corresponding author
Key Determinants of German Banking Sector Performance
A. Nasserinia*, M. Ariff and Cheng Fan FahFaculty of Economics and Management, University Putra Malaysia, 43400 UPM Serdang, Selangor, Malaysia
ABSTRACT
What drives banking performance is a little-explored research topic, despite the copious literature. This paper reports findings that offer new insights into what drives net interest margin, a key performance indicator (KPI) for the German banking sector. We consider the link between performance and a few carefully chosen critical bank-specific factors using the most up-to-date econometric methods such as panel regressions using a Generalized Method of Moments with data from 11 recent years. The results show that credit risk, income diversification and size have significant negative effects on net interest margin, as predicted by theory. Meanwhile, capital adequacy has a positive effect, as does the liquidity risk. The paper also finds that the effects of concentration and macroeconomic variables on net interest margin are weak and statistically insignificant. In this study, it was found that credit risk, income diversification, size, capital adequacy and liquidity risk are significant factors contributing to a new understanding of German banking performance.
Keywords: Net interest margin, credit risk, liquidity, capital, pooled regression, generalized moments method
INTRODUCTION
Net interest margin (NIM) is widely considered as a key performance measure for banks since it efficiently determines the intermediation between savers earning deposit rates and borrowers paying loan
rates, and thus determines how efficiently a bank operates. This study relies on a large number of key factors that correlate with banking performance in a major economy, Germany, in the most recent period that includes the years of the Global Financial Crisis. Data on NIM covering a period of over 11 years and ten theory-suggested factors were studied to identify the extent to which these factors correlate with Germany’s banking performance. To do this, the current econometric models were employed to obtain reliable findings
Pertanika J. Soc. Sci. & Hum. 23 (S): 167 – 186 (2015)
A. Nasserinia, M. Ariff and Cheng Fan Fah
168
on the linkage between performance and key factors for a large model-industrial economy.
A competitive banking sector promotes efficiency that is reflected in narrower interest margins between lending and borrowing. High margins are an obstacle for intermediary institutions since lower deposit rates under high-margin banking tend to discourage savings being entrusted to the banks, while also shrinking the investment opportunities for banks, as well as their borrowers, as this requires the banks to resort to high lending rates (Fungáčová & Poghosyan, 2011). Unlike variables such as the returns on assets (around 2 per cent) and equity (about 15 per cent), which are indicators of managed variables, as well as how the accounting treatment of earnings flows is treated, NIM is of more economic significance in that any narrowing of that variable indicates a bank’s high level of overall efficiency in order to be able to operate profitably with narrow margins. Hence, in this study, the use of this variable for performance is preferred over traditional ROI and ROE.
Ho and Saunders (1981) encapsulated the empirical studies carried out on determinants of bank margins in a theoretical framework referred to as the dealership model. The bank, in this model, is considered to be a risk-averse dealer in a credit market whose function as an intermediary between lenders and borrowers is to balance the asymmetry between loan demands and deposits by fixing interest rates for loans and deposits.
The model is then developed from the bid-ask prices of security-market traders. In this model, banks borrow (deposit interest) at one price and lend (loan interest) at a different price. Consequently, in an uncertain environment, banks have to bear the risks of fixing interest rates on loans and deposits, which they have to optimise in order to minimise the risk of interest-rate uncertainty when paying to borrow (deposits) while not dampening the demand for their deposits (loans) (Maudos & Fernandez de Guevara, 2004).
An alternative to the above model is Klein’s (1971) or Monti’s (1972) firm-theoretical models, which regard banking firms as playing an inactive role and simply allowing the supply and demand forces for deposits and loans to satisfy each market concurrently using the banking-firm micro-model approach (Zarruck & Madura, 1992; Wong, 1997).
Bank performance is assessed and understood using two broad approaches: non-structural and structural. The difference between them lies in the fact that the former employs a range of financial measures to assess different performance aspects, including factors such as the performance of the investment-strategies relationship while taking regulatory and governance features into account, and the latter is choice-theoretic that is dependent on a theoretical model of the banking firm and an optimization concept. For an example of that, see Panzar and Rosse (1987).

Pertanika J. Soc. Sci. & Hum. 23 (S): 167 – 186 (2015)
Key Determinants of German Banking Sector Performance
169
As the use of these theories is based on the motivation prompting investigations, there is no general theory of performance that can serve as a unifying framework. The structural approach, however, being such a narrowly focused theory of determinants, does not provide ample room to investigate the various suggestions in a single study as can be done when using potential determinants from a large number of theoretical papers on potential determinants. The literature is used to identify a set of ten variables as potential determinants of bank performance, narrowly defined as NIM.
Germany is an example of a country with universal banking that has experienced a relatively small number of banking crises in the past. Nevertheless, the global financial crisis has been far worse in Germany than in many of the advanced countries. Having the recent knowledge about the factors that affect net-interest margin are the most valuable, we can consider the efficiency trend of banks at the present time to devise a method for the determination of bank margin via the key variables identified in this study.
In this paper, the relevant literature to identify some determinants is briefly reviewed in Section 2, followed by a description of the data specification of the empirical model and methodology in Section 3, after which the results are presented and interpreted in Section 4, and then a conclusion is drawn at the end.
BANKING-PERFORMANCE LITERATURE
Internal Factors
Currently, there are a number of models developed in the attempt to explain the factors that can affect profit margins. Among these models are average operating costs, competition, market risk, credit risk and so on. Ho and Saunders (1981) considered assumed risk-averse intermediators to be involved in the financial market to collect deposits to provide loans. They demonstrated that pure-interest spread (NIM) is determined by factors such as the level to which bank managers seek to avoid risk; the magnitude of transaction operations undertaken; the structure of the bank market; and changes in interest rates. However, it should be noted that what precisely determines the NIM (i.e., whether these factors correlate with NIM) has not yet been studied thoroughly and systematically for any major economy, let alone for a group of countries.
The above model was extended by McShane and Sharpe (1985) by including operating costs and a measure for competition. Allen (1988) introduced various kinds of loans and deposits, while Angbazo (1997) added contained credit risk to the model and Maudos and De Guevara’s (2004) model incorporated operation costs. Furthermore, the results reported by Saunders and Schumacher (2000) showed that interest rates, cost of opportunity, market power, bank’s capital-to-assets ratio and fluctuations in interest rates have significant effects on NIM. It

Pertanika J. Soc. Sci. & Hum. 23 (S): 167 – 186 (2015)
A. Nasserinia, M. Ariff and Cheng Fan Fah
170
should be noted that these are not, in our view, the main factors driving NIM. Thus, we propose direct internal (individual bank) and external (bank industry and country) factors, as follows:
Liquidity risk: One potential risk of bank failure comes from liquidity risk. According to the Basel Committee on Banking Supervision (1997), liquidity risk arises when banks are unable to meet their funding needs due to a reduction in liabilities or an increase in assets. The literature on bank performance shows that the two main functions of a bank, called the creation of liquidity and risk transformation, do not move in the same direction. This means that the amount of liquidity created may differ as a certain amount of risk is transformed by the bank. Therefore, it is important both to examine the role of banks and to make a distinction between them.
Deep and Schaefer (2004) devised a measure of liquidity transformation known as the “liquidity transformation gap”, calculated by the difference between liquid liabilities and illiquid assets scaled by total assets. They argued that banks do not create much liquidity. Berger and Bouwman (2009) reported that capital is positively and significantly associated with liquidity in large banks but it is less important for average-sized banks and always negative for small-sized banks.
Distinguin, Roulet and Tarazi (2013) reported that European and American commercial banks decrease their regulatory capital coincidence as they create liquidity,
i.e. they finance their assets with their liabilities. Horváth et al. (2012) confirmed a negative Granger-causality relationship for capital and liquidity creation in the case of small banks, although this could have a positive effect on large banks. Finally, Shen et al. (2010) examined the association between the risk of bank liquidity and bank performance and reported that because of the higher cost of funds, a liquidity risk might reduce a bank’s profits but increase its net interest margin due to the higher interest income arising from the level of loans.
Credit risk: Credit risk plays an essential role in NIM because the major portion of a bank’s earnings arise from loans and bank loans contribute to the main portion of the bank’s assets. According to insolvency theory, if banks’ liabilities exceed their assets, they may face failure. In the majority of cases, non-performing loans lead to fall in asset values. Ahmad and Ariff (2007) stated that an increase in the provision for loan losses is a significant determinant of potential credit risk, which means that the credit risk is the main risk for a bank.
Athanasoglou et al. (2008) suggest that the risks for banks have important and broadly relevant effects on their profitability. Demirgüç-Kunt and Huizinga (1999) reported positive effects from credit risks for NIM, while Kasman et al. (2010) found that credit risk is positively and significantly linked to banks’ NIM. Poghosyan and Cihak (2011) highlighted the importance of other sources of bank risks, besides leverage such as asset quality and earning profile for a bank’s soundness. Poghosyan and

Pertanika J. Soc. Sci. & Hum. 23 (S): 167 – 186 (2015)
Key Determinants of German Banking Sector Performance
171
Cihak (2011) emphasised the importance of resources other than bank-leverage risk such as asset quality and earnings profile for the soundness of a bank.
Capital adequacy: Based on the recent capital theories, more capital makes for better bank performance and is more predictable. Some theories propound that banks with more capital tend to have secure and sound assets and strongly monitor their borrowers because they seek to reduce the probability of default. Demirguc-Kunt and Huizinga (1999) and Garcia-Herrero et al. (2009) suggested a positive correlation between bank performance and capital, while Ben Naceur and Goaied (2008) reported a positive association between capital, high NIM and profitability. Beltratti and Stulz (2009) found that banks with relatively superior Tier-1 capital and more deposit financing indicate higher returns in times of crisis.
Athanasoglou et al. (2008) confirmed that capital is a prominent factor of bank profitability. Naceur and Omran (2011) argued that a bank’s NIM and cost efficiency are affected by individual bank characteristics such as credit risk and capital. Berger and Bouwman (2013) cited evidence to support the importance of investing in small banks as this could help them to increase the probability of their continued existence and to maintain market share at all times, this being an important role played by investment banks in the performance of medium and large banks, mostly regarding the long banking crisis.
However, this approach is not without its flaws. It does not make active requests to take deposits, it is the least expensive source to finance the loans those banks can bear under different types of risk, while absorbing possible losses and keeping their debtors safe. It is also a strong individual bank factor in a time of crisis.
Asset quality: In some of the bank-performance literature, assets quality is proxied in the same way as credit risk or loan-loss provision, but asset quality is a factor which is achieved over time and through service. Thus, it is expected that older banks will have better-quality assets, resulting in a good reputation. Moreover, in some cases, loans are not key assets that create the main part of the income. A bank’s profits may be determined by the quality of its loan portfolio and the risks that it carries. Therefore, non-performing loans being outweighed by sound loans indicates the high quality of a portfolio, and one of the most obvious concerns for banks is to ensure a low level of impaired loans.
Managerial efficiency: In the last two decades, numerous bank failures have occurred around the world. The empirical literature identifies two main reasons for these bank failures: a large number of impaired loans, and an adverse situation regarding cost efficiency. A fundamental dispute concerns whether or not poor administration increases the chances of bank collapse. Based on the poor-management assumption, cost efficiency has an impact on impaired loans due to the

Pertanika J. Soc. Sci. & Hum. 23 (S): 167 – 186 (2015)
A. Nasserinia, M. Ariff and Cheng Fan Fah
172
lack of precise supervision of loans. In other words, low operational efficiency is a sign of poor management and this will affect credit decisions. In order to enhance bank’s efficiency, it is necessary to have efficient cost control, along with a change in the workplace culture. In other words, banks will benefit greatly if they meaningfully improve their managerial practices.
Williams (2004) supports poor-management theory and explains that a decline in efficiency is usually followed by a decline in loan quality. Rossi et al. (2005) also demonstrated similar results over a longer time period. Goddard et al. (2013) reported that managerial efficiency appears to be a more important determinant of performance. Athanasoglou et al. (2008) argued that bank profits are closely and negatively related to operating expenses.
Size: In some studies, size and performance are closely and inversely related to each other. Basically, it is anticipated that large banks will have a higher level of loan quality and be able to diversify their services more than smaller banks, which reduces their risk. In addition, they benefit from economies of scale. Therefore, a reduction in risk because of diversity and benefits from economy of scale due to a larger size can lead to enhanced performance of a bank. Moreover, the recent global financial crisis has shown that the size of a bank is connected to substantial risk regarding financing the activities of society. Conversely, once banks have become very large, it may lead to a negative relation to performance due to some reasons such as an increase in overhead costs.
Demirgüç-Kunt and Huizinga (2011) logarithmically measured the size of banks according to total assets called “absolute size” and liabilities over GDP called “systemic size”. They suggested that banks with a large absolute size are often much more profitable compared to banks with large systemic size profit less. Pasiouras and Kosmidou (2007) reported a negative association for size advantage, whereas Naceur and Goaied (2008) also mentioned similar findings. Others have suggested a weak or nonexistent correlation between size and bank performance (e.g., Goddard et al., 2004; Micco et al., 2007; Shih, Zhang, & Liu, 2007; Cornett et al., 2010).
Income diversification: As a definition of non-interest revenues, we refer to so-called non-traditional activities. Besides the changes in the banking industry and increased competition, non-interest income has been the centre of attention for banks. In most income-related studies, diversification is considered as a non-interest income that increases over time. Most importantly, it is assumed that income diversification can, logically, reduce bankruptcy. Busch and Kick (2009) analysed the determinants of non-interest income in Germany and argued for the impacts of the cross-subsidisation of interest and fee-based business activities. Williams and Rajaguru (2007) examined the relationship between fee-based income and interest margin in Australia, and suggested that report-fee business income could serve as an alternative if there is a decline in interest income. However, a negative correlation was expected between

Pertanika J. Soc. Sci. & Hum. 23 (S): 167 – 186 (2015)
Key Determinants of German Banking Sector Performance
173
NIM and non-interest income. It should be noted that most previous studies have tested only one or two factors connected to profitability, while this study aims to demonstrate a multifactor model.
External factors
There are many other determinants that affect the performance of a bank, such as taxes, quality of service and so on, that can be taken into account as an additional function. In our view, there are industrial and macroeconomic factors that have been studied (Demirguc-Kunt & Huizingha, 1999). For the study of a single country, such as this one, it would be irrelevant to include these factors in our test models. However, the model includes external variables as the control variables.
Market structure: There are two well-known theories regarding the relationship between bank concentration and net interest margin called “structure–conduct–performance (market power)” and “efficient-structure (ES)”. The first theory states that increased market power results in monopoly power, while the second theory attributes higher profit to superior efficiency. In support of the first theory, see Molyneux and Thornton (1992), Goddard et al. (2011) and Mirzaei et al. (2013). In contrast, studies by Staikouras and Wood (2004), Mamatzakis and Remoundos (2003), Athanasoglou et al. (2008), Ben Naceur and Goaied (2008) and Chortareas et al. (2012) did not find any evidence to support the market-power hypothesis.
GDP growth: There are no conclusive findings regarding the effects of economic growth on NIM. There are contrasting higher-growth scenarios indicating a greater demand for bank loans which can lead to higher charges by banks for their loans, increased competition and macroeconomic stability expectations for a lower spread associated with stronger growth. Again, in their study of Central and Eastern European countries (CEEC) and in comparison with Western European countries, Claeys and Vennet (2008) found higher economic growth to be associated with higher margins in the latter; however, no link was found for the former. Bank profitability being positively impacted upon by output growth has been reported by Kosmidou (2008) and Flamini et al. (2009), while an opposite negative effect is reported by Demirguc-Kunt et al. (2003), Sufian (2009), Liu and Wilson (2010) and Tan (2012).
Inflation: Empirical studies show that the effects of inflation on bank performance depend on whether operating expenses and revenue increase at a higher rate than inflation. In other words, the impacts of inflation on bank profitability depend on whether inflation is fully anticipated. Thus, inflation is one of the main ways in which it is possible to affect the operations and margins of banks through interest rates. Perry (1992) suggested that the effect of inflation on bank performance is positive if the rate of inflation is fully anticipated. This gives banks the opportunity to adjust interest rates accordingly and,

Pertanika J. Soc. Sci. & Hum. 23 (S): 167 – 186 (2015)
A. Nasserinia, M. Ariff and Cheng Fan Fah
174
consequently, to make higher profits. A positive relationship between inflation and NIM is reported by Demirgüç-Kunt and Huizinga (1999) in a study of 80 developed and developing countries by Staikouras and Wood (2004) for European banks, Athanasoglou et al. (2008) for Greek banks and by Albertazzi and Gambacorta (2009) for ten industrialised countries. An opposite negative effect is reported by Afanasieff et al. (2002) for Brazil and by Kosmidou (2008) and Ben Naceur and Kandil (2009) in their studies of Greece and Egypt.
DATA, HYPOTHESES AND METHODOLOGY
Econometric Specification
This study used a dynamic panel data and panel data with a large cross-sectional dimension and short time series, an approach for examining the determinants of NIM in a large sample of commercial banks since testing, as well as the fine-tuning methodology, pointed to it as the most appropriate method and one that is efficient for such a study. This method enables: (a) both time and cross-sectional variations to be located in the model, (b) lag-dependent variables and unobserved individual specific effects to be included, and (c) individual specific dynamics to be captured as allowing the dynamics of the relationship across subjects and over time permits this to be done. Consequently, any bias rising from either time-series dynamics influences was avoided in the results. The specific approach employed is the GMM
dynamic panel data approach (see Arellano & Bond, 1991; Arellano & Bover, 1995; Blundell & Bond, 1998).
Three potential sources of inconsistency (very persistent profits, endogeneity and omitted variables) arose in any empirical work were allowed for by using dynamic panel techniques in this study. As the literature shows panel data are not emendable by being treated with a fixed and/or random-effects model, a difficulty arises due to the influence of lagged dependent or independent variables, especially in cases of several periods or across a few banks.
As shown by Baltagi (1995), consistent estimates are not produced by estimators like Generalised Least Squares (GLS) or Fixed Effect in the presence of dynamic and endogenous influences. The following equation represents the linear dynamic-panel data model:
Where, is the one-period lag of the dependent variable; δ is the speed of adjustment to equilibrium; is the net interest margin of bank i at time t, with i=1...N, t=1,...,T, c is a constant term; Xit is bank-specific variables; Yit is industry-specific variables, Zit is macroeconomic variables, εit idisturbance, with vi the unobserved bank-specific effect and uit idiosyncratic error. This is a one-way

Pertanika J. Soc. Sci. & Hum. 23 (S): 167 – 186 (2015)
Key Determinants of German Banking Sector Performance
175
error-component regression model, where and independent of
.
Data
The data for this study comprise unbalanced panel data over a period of 11 years up to 2012, from 64 commercial banks, sourced from published and widely used financial information included in the Fitch-IBCA BankScope database of bank-specific observations, namely, bank balance sheets and income statements which are translated into 668 years of observations. The banks in the study sample, limited to
commercial banks, account for 95 per cent of the total assets of commercial banks for that particular period. World development indicators are the source for data on concentration, inflation, money supply and GDP growth, from which these are computed. Nonetheless, the sample of this study only includes commercial banks.
Descriptive statistics for the sample data is shown in Table 1. NIM, the proxy variable for interest-rate spread, shows a mean value of 2.044 per cent. The average inflation rate in the country over the period under study is 1.748 per cent and average GDP growth is 1.129 per cent.
TABLE 1Descriptive statistics for the Variables in the Model
Variables Mean Standard Deviation Minimum Maximum
NIM 2.044 2.048 -0.274 22.316
LR -0.016 0.478 -3.435 0.997
CR 0.096 0.796 -0.571 10.600
CA 1.138 5.314 0.034 69.231
ID 0.021 0.040 -0.013 0.289
LTA 14.969 1.972 11.918 21.843
CONCEN 85.745 1.448 83.880 89.270
GDPG 1.129 2.482 -5.145 4.012
M2 180.846 6.183 171.965 193.432
INF 1.748 0.663 0.840 3.116
Notes: NIM = (interest-rate income – interest-rate expenses)/average total-earning assets; LR is the financing gap (ban loans-customer deposits)/ total assets; CR = loan-loss provisions/ total loans; CA = equity capital/total loans; ID = is non-interest income/total assets; LTA = natural logarithm of total assets; CONCEN is 5-bank asset concentration for Germany (assets of the five largest banks /total commercial banking assets); GDPG is GDP growth (annual in %); M2 is money and quasi-money as % of GDP; and INF (inflation) is end-of-period consumer prices (% change).

Pertanika J. Soc. Sci. & Hum. 23 (S): 167 – 186 (2015)
A. Nasserinia, M. Ariff and Cheng Fan Fah
176
EMPIRICAL RESULTS
The first part of this study covers an OLS analysis that keeps NIM as the dependent variable, while LR, CR, CA, ID, LTA, CONCEN, GDPG, M2 and INF as the independent variables. Table 2 shows the preliminary OLS regression results. The results indicate that only LR, CR, CA, ID and LTA are significant determinants of net
interest income. Thus, NIM in the German banking sector is affected by each of these five bank-specific variables, with a positive relationship with liquidity risk (LR), capital adequacy (CR) and income diversification (ID), whereas bank performance is negatively influenced by credit risk (CR) and size (LTA) (see Table 2).
TABLE 2OLS regression (NIM as dependent variable)
Variables OLS VIF 1/VIF
Constant 11.091(1.21)
LR 1.419*** 1.01 0.9869(11.31)
CR -1.001*** 1.57 0.6366(-10.67)
CA 0.253*** 1.97 0.5067(16.06)
ID 3.33*** 1.33 0.7520(1.95)
LTA -0.152*** 1.09 0.7206(-4.83)
CONCEN -0.054 3.03 0.3297(-0.72)
GDPG 0.000 1.77 0.5347(-0.01)
M2 -0.013 3.05 0.3297(-0.78)
INF 0.007 1.87 0.5347
(0.06)
R2 0.4423Adjusted R2 0.4346F-statistic 57.98***
Note: VIF is the variance inflation factor. Mean VIF is 1.86

Pertanika J. Soc. Sci. & Hum. 23 (S): 167 – 186 (2015)
Key Determinants of German Banking Sector Performance
177
As LR is the difference between bank loan and customers deposit to total assets, the higher the ratio the higher should then be NIM because more loans are given out to earn interest. CA is equity capital to total loans; the higher the equity capital, the higher NIM will be because more equity is utilised to provide loanable funds. Similarly, as ID is non-interest income on total assets, it shows a positive correlation with NIM while we expect a negative one. In a competitive market, banks enhance their profit by matching between interest income and non-interest income and plan their profit structure with a view of usual or recession state of economic. The positive relationship can be interpreted that banks have more incentive carry out the activities of non-traditional banking with a recession state compared to the growing period. In situations of low economic growth, banks may be more interested in having non-traditional activities because they will be able to enjoy a variety of additional incomes. In addition, within low economic growth, banks may be affected on credit risk when they try to get a higher credit risk of traditional activities. This relationship will be further explained as time variance is taken in model condition.
In the opposite case, however, CR is defined as loan-loss provisions over total loans; the higher the loan-loss provision, the lower the net-interest
income. Finally, LTA is the logarithm of total assets and is used as an indication of bank size. Many studies have revealed that company profits are inversely related to size because large banks are more diversified and thus, they carry less risk than small banks. The OLS analysis carried out in this study yields consistent general findings with those of the literature, whereby the larger the bank, the lower NIM is, as observed for the German banking sector.
These OLS regression results are found to be reliable with an adjusted R-squared value of 0.4346 (43.46%), which provides a strong explanation for the variation in NIM. These five significant variables explained 44 per cent of the variations in NIM, a result which is seldom observed in the literature. The F-statistics of 57.98 shows that the model fit is significant. Finally, VIF (Table 2, column number 3) verification shows that there is no multicollinearity problem. White’s correction is used for the regression to ensure that heteroskedasticity is controlled in the results.
The next part of this study involves further analysis to determine the bank’s determinant by re-analysing the data with dynamic panel regression, as stated in Section 3 above. The results are given and explained below.

Pertanika J. Soc. Sci. & Hum. 23 (S): 167 – 186 (2015)
A. Nasserinia, M. Ariff and Cheng Fan Fah
178
TABLE 3GMM regression (NIM as the dependent variable)
Variable
Difference GMM System GMM
0ne step Two stepsTwo steps
with robust SE
One step Two stepsTwo steps
with robust SE
constant10.043 9.931*** 8.481 9.576 9.720*** 6.227(1.63) (11.64) (1.32) (1.58) (24.03) (0.98)
0.470*** 0.469*** 0.499*** 0.486*** 0.486*** 0.556***(14.38) (339.28) (16.14) (16.99) (486.05) (11.08)
LR0.148 0.187*** 0.138 0.422** 0.386*** 0.172(0.58) (4.60) (0.63) (1.75) (10.45) (0.69)
CR-0.920*** -0.921*** -0.751*** -0.993*** -0.996*** -0.890***
(-7.73) (-599.99) (-17.81) (-8.55) (-304.61) (-5.03)
CA0.264*** 0.264*** 0.227*** 0.273*** 0.273*** 0.246***(22.26) (936.45) (17.11) (23.50) (1138.81) (14.28)
ID-20.473*** -20.66*** -24.159 -10.870*** -11.00*** -11.76***
(-6.53) (-79.24) (-1.33) (-5.55) (-67.19) (-2.24)
LTA-0.462*** -0.46*** -0.594** -0.475*** -0.473*** -0.504**
(-3.90) (-24.84) (-1.76) (-4.53) (-46.91) (-1.68)
CONCEN-0.025 -0.02*** 0.024 -0.019 -0.021*** 0.033(-0.47) (-3.17) (0.89) (-0.35) (-5.61) (1.28)
GDPG0.001 0.003** 0.004 -0.006 -0.005*** -0.001(0.08) (1.91) (0.57) (-0.35) (-5.40) (-0.06)
M20.001 0.002** -0.002 0.001 0.001** -0.003(0.15) (1.71) (-0.34) (0.07) (1.61) (-0.29)
INF0.027 0.017*** 0.033 0.065 0.058*** 0.035(0.41) (2.41) (1.32) (0.99) (13.38) (0.99)
Wald χ2 1225.64*** 5160*** 1973.34*** 1891.46*** 49200*** 8170.18***Hansen p- value 0.000 0.155 0.000 0.31 AR(1) p-value 0.117 0.135 0.118 0.140 AR(2) p-value 0.308 0.364 0.313 0.351 Number of observations 604 604 604 604 604 604
Note: ***, ** and * indicate significance at 1, 5 and 10 per cent levels, respectively. Values in the parentheses are Z-statistics. The Hansen test is a test of overidentification restrictions. Arellano–Bond orders 1 and 2 are tests for first- and second-order correlation, respectively, which asymptotically N (0, 1), test first-difference residuals in the system’s GMM estimation. Two-step errors are computed according to Windmeijer’s (2005) finite-sample correction.

Pertanika J. Soc. Sci. & Hum. 23 (S): 167 – 186 (2015)
Key Determinants of German Banking Sector Performance
179
The findings from a dynamic-panel data-regression analysis are shown in Table 3. A two-step GMM panel-data procedure was used with a correction for the possibility of downward-biased estimated asymptotic standard errors in the two-step GMM estimator from Windmeijer (2005).
Some general comments about the test results are as follows. First, the most stable results are found in our regression. Second, the Wald chi2 test is statistically significant in different regression models at a 1 per cent probability. Third, the Hansen tests for over-identifying restrictions showed that at a 5 per cent significance level the instruments are appropriately orthogonal to the error. Arrelano–Bond AR (2) tests showed no second-order serial correlation was detected, which is important for GMM estimator consistency. Finally, the significance found for the lagged dependent variable validates the use of the dynamic-panel data model.
From the test statistics in Table 3, it is seen that the lagged dependent variable (NIM) is positive and significant, which can be inferred as proof of the persistence of NIM in commercial banks. The liquidity risk (LR) and net interest margin relationship, although not statistically significant, was found to be positive. These results, consistent with the literature, showed the propensity of banks to pass their liquidity risk on to consumers via an increase in the interest-rate margin. As the effect of credit risk (CR) is negative on net-interest margin, this is taken as an indication of banks having lower
profitability with higher credit risk. These results, therefore, indicate that German commercial banks need to focus on their credit-risk management.
Impaired assets pose a problem and are dealt with by creating a write-off reserve. The correct credit-risk measures improve banks’ efficiency and help to avoid or protect them from moral-hazard exposure. Capital adequacy (CA) is statistically significant, positive and related to NIM. Our findings are consistent with an entrenched belief in the banking sector that healthy capitalised banks have a lower risk of insolvency, thus reducing the financing cost. Saunders and Schumacher (2000a) explained that higher capital ratios might be interpreted as a form of tax on bank profits, thus forcing banks to charge an additional premium for NIM. Another possible reason is that well-capitalised banks have lower expected bankruptcy costs and lower financing costs.
In terms of managerial efficiency (ME), both variables were not put in our model at the same time because of a multicollinearity problem with income diversification (ID) in the data set. Instead, separate regressions were run by including the ME variable without the ID variable.
Although the results show that managerial efficiency, based on operating expenses to total assets and non-interest expenses to total asset, affects NIM negatively, these are not statistically significant. The finding is consistent with the bad-management hypothesis of Berger and DeYoung (1997), with low profitability being a signal of poor management
Pertanika J. Soc. Sci. & Hum. 23 (S): 167 – 186 (2015)
A. Nasserinia, M. Ariff and Cheng Fan Fah
180
practices. Obviously, proper management sees the need to improve the efficiency of the banking sector everywhere.
In relation to income diversification, previous research shows contrary results, DeYoung and Rice (2004) and Mercieca et al. (2007) suggested that better performing banks use less non-interest income. On the other hand, other research reports such as those by Baele et al. (2007) argue that non-interest income can increase the efficiency of a bank. The results of our study showed a negative and statistically significant relationship between income diversification (ID) and NIM. These results indicate that managed banks proceed to non-interest income more slowly and are consistent with the findings of many other studies. However, given our finding of a strong negative correlation, this might be interpreted as commercial banks pursuing purposes other than profits. However, given our findings, a strong negative correlation might be interpreted as commercial banks seeking higher than normal profits.
The relationship between the size and performance of banks is more complex, as found in the research, as many additional factors such as economic growth, market discipline, country etc. come into play. Although a recent study made a distinction between absolute size based upon the logarithm of total assets and systemic size based on the liabilities-to-GDP ratio, the empirical results of these studies are mixed. On the one hand, banks of large systemic size showed a tendency to be less profitable (Demirgüç-Kunt & Huizinga,
2011), and what are economies of scale and scope for smaller banks are diseconomies for larger financial institutions (Pasiouras & Kosmidou, 2007), with size impacting on profitability negatively (Ben Naceur & Goaied, 2008), while positive relationships by contrast found by Kosmidou (2008) and Beltratti and Stulz (2009).
In our study, bank size was computed as a logarithm of total assets. A negative and statistically significant relationship was found between bank size (LTA) and NIM for the commercial banks. One important reason for this might be that commercial banks are forced to increase their size in order to compete in the market, as this country is an example of universal banking. Another reason might relate to the level of consolidations through mergers and acquisitions in this region during the financial-crisis years.
As the concentration is not statistically significant and able to explain NIM, this does, in a sense, provide a rationalisation for rejecting both the Structure-Conduct-Performance (SCP) and Relative-Market-Power (RMP) hypotheses. The evidence for correlation between macroeconomic variables and net-interest margin is also very feeble. Macroeconomic control variables such as inflation undoubtedly affected the performance of the banking sector when, for instance, the 1990s interest-margin reduction in Europe correlated to economic growth that reduced costs (Maudos and Guevara, 2004). Angelini and Cetorelli (2003) are of the opinion that, in the case of European banks, GDP growth and NIM are negatively associated.

Pertanika J. Soc. Sci. & Hum. 23 (S): 167 – 186 (2015)
Key Determinants of German Banking Sector Performance
181
In addition, considering the effects of time as much as possible in our study, we included a dummy variable in the model and tested it. However, no time effect was found during the period of our study.
Confirmation of the dynamic character of the model specification is given by the significant coefficient for the lagged dependent variable. In this study, δ, with a value of about 0.55, indicates that the net-interest margin remains at a moderate level and paints a picture of a level of adjustment to an equilibrium appropriate for a perfectly competitive market structure in the German banking sector.
CONCLUSION
The net interest margins of German banks were studied to identify key determinants that correlate with banking performance as the dependent variable. Since the global financial crisis, structural reforms of banks have affected costs as well as interest income in different ways. Net-interest margin is the most significant indicator as it is a good proxy assessor of performance. This dropped by 41.7 per cent during the 11-year test period (see Fig.1). Interestingly, Fig.2 shows that the difference between total interest income and total interest expenses, as seen in 92 selected commercial banks in Germany, increased. There is a consensus that high intermediation costs hamper economic growth while low intermediation costs can contribute to it. Germany is a developed country that was affected by the financial crisis and has a universal banking industry.
This paper has investigated bank-specific and some macroeconomic determinants of interest in relation to NIM. This is the first study to model a large number of factors that are potentially correlated to performance (NIM). The results show that the most significant variables are bank-specific factors in multi-country tests using GMM. The results showed a negative association between credit risk, income diversification and size, while capital adequacy has a positive effect. Capital has a significant impact on a bank’s NIM. This is taken as substantiation of the role of capital in the financial system to reduce bank risk and keep the confidence of depositors. Liquidity risk and managerial efficiency have a positive and a negative impact, respectively; these are not statistically significant. The findings on concentration in this study support neither the structure-conduct-performance (SCP) hypothesis nor the relative-market-power (RMP) hypothesis.
A significant coefficient for the lagged dependent variable confirms the need to take into account the dynamic character of the model’s specification, as we did with GMM. In this study, δ takes a value of about 0.55, which means that the net-interest margin continues at moderate level in adjustments to the equilibrium of the sector to the level of an almost perfect competitive market structure in the German banking sector. Further research in a multi-country setting would reveal the industry and macroeconomic factors that are also important in banking performance.
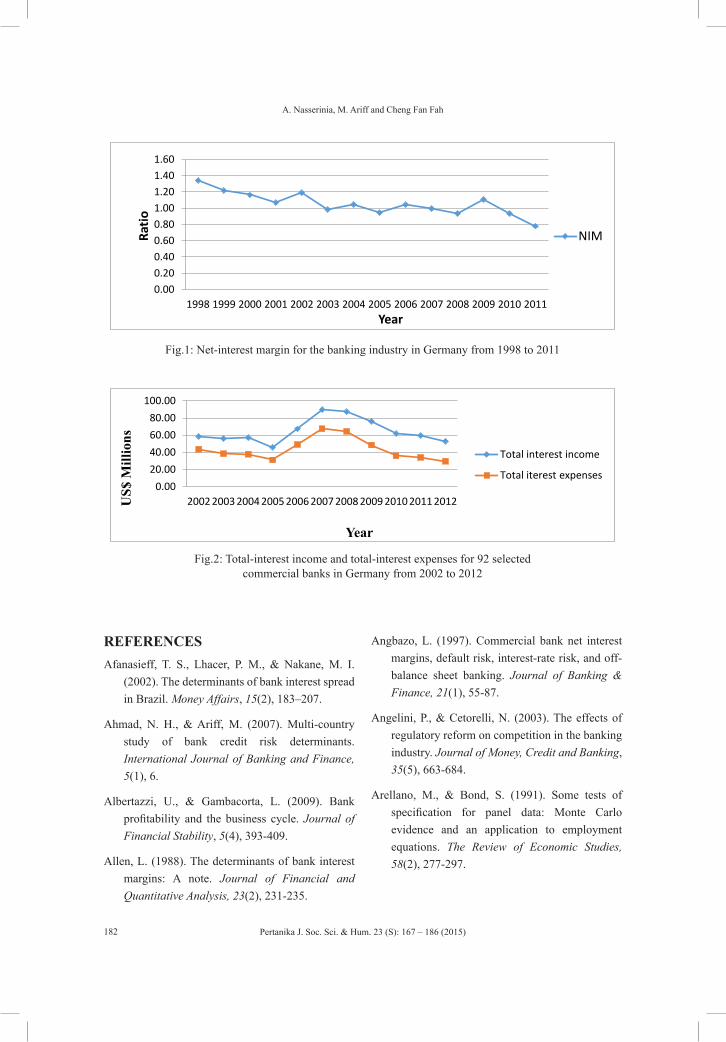
Pertanika J. Soc. Sci. & Hum. 23 (S): 167 – 186 (2015)
A. Nasserinia, M. Ariff and Cheng Fan Fah
182
28
moderate level in adjustments to the equilibrium of the sector to the level of an almost
perfect competitive market structure in the German banking sector. Further research in a
multi-country setting would reveal the industry and macroeconomic factors that are also
important in banking performance.
Figure 1. Net-interest margin for the banking industry in Germany from 1998 to 2011
Figure 2. Total-interest income and total-interest expenses for 92 selected commercial banks in Germany from 2002 to 2012
0.00 0.20 0.40 0.60 0.80 1.00 1.20 1.40 1.60
1998 1999 2000 2001 2002 2003 2004 2005 2006 2007 2008 2009 2010 2011
Ratio
Year
NIM
0.00 20.00 40.00 60.00 80.00
100.00
2002 2003 2004 2005 2006 2007 2008 2009 2010 2011 2012 US$
Mill
ions
Year
Total interest income
Total iterest expenses
Fig.1: Net-interest margin for the banking industry in Germany from 1998 to 2011
28
moderate level in adjustments to the equilibrium of the sector to the level of an almost
perfect competitive market structure in the German banking sector. Further research in a
multi-country setting would reveal the industry and macroeconomic factors that are also
important in banking performance.
Figure 1. Net-interest margin for the banking industry in Germany from 1998 to 2011
Figure 2. Total-interest income and total-interest expenses for 92 selected commercial banks in Germany from 2002 to 2012
0.00 0.20 0.40 0.60 0.80 1.00 1.20 1.40 1.60
1998 1999 2000 2001 2002 2003 2004 2005 2006 2007 2008 2009 2010 2011
Ratio
Year
NIM
0.00 20.00 40.00 60.00 80.00
100.00
2002 2003 2004 2005 2006 2007 2008 2009 2010 2011 2012 US$
Mill
ions
Year
Total interest income
Total iterest expenses
Fig.2: Total-interest income and total-interest expenses for 92 selected commercial banks in Germany from 2002 to 2012
Angbazo, L. (1997). Commercial bank net interest margins, default risk, interest-rate risk, and off-balance sheet banking. Journal of Banking & Finance, 21(1), 55-87.
Angelini, P., & Cetorelli, N. (2003). The effects of regulatory reform on competition in the banking industry. Journal of Money, Credit and Banking, 35(5), 663-684.
Arellano, M., & Bond, S. (1991). Some tests of specification for panel data: Monte Carlo evidence and an application to employment equations. The Review of Economic Studies, 58(2), 277-297.
REFERENCESAfanasieff, T. S., Lhacer, P. M., & Nakane, M. I.
(2002). The determinants of bank interest spread in Brazil. Money Affairs, 15(2), 183–207.
Ahmad, N. H., & Ariff, M. (2007). Multi-country study of bank credit risk determinants. International Journal of Banking and Finance, 5(1), 6.
Albertazzi, U., & Gambacorta, L. (2009). Bank profitability and the business cycle. Journal of Financial Stability, 5(4), 393-409.
Allen, L. (1988). The determinants of bank interest margins: A note. Journal of Financial and Quantitative Analysis, 23(2), 231-235.

Pertanika J. Soc. Sci. & Hum. 23 (S): 167 – 186 (2015)
Key Determinants of German Banking Sector Performance
183
Arellano, M., & Bover, O. (1995). Another look at the instrumental variable estimation of error-components models. Journal of Econometrics, 68(1), 29-51.
Athanasoglou, P. P., Brissimis, S. N., & Delis, M. D. (2008). Bank-specific, industry-specific and macroeconomic determinants of bank profitability. Journal of International Financial Markets, Institutions and Money, 18(2), 121-136.
Baele, L., De Jonghe, O., & Vander Vennet, R. (2007). Does the stock market value bank diversification? Journal of Banking & Finance, 31(7), 1999-2023.
Baltagi, B. H. (1995). The econometrics of panel data. Chichester: Wiley.
Beltratti, A., & Stulz, R. M. (2009). Why did some banks perform better during the credit crisis? A cross-country study of the impact of governance and regulation. National Bureau of Economic Research.
Ben Naceur, S., & Goaied, M. (2008). The determinants of commercial bank interest margin and profitability: evidence from Tunisia. Frontiers in Finance and Economics, 5(1), 106-130.
Ben Naceur, S., & Kandil, M. (2009). The impact of capital requirements on banks’ cost of intermediation and performance: The case of Egypt. Journal of Economics and Business, 61(1), 70-89.
Berger, A. N., & Bouwman, C. H. (2009). Bank liquidity creation. Review of Financial Studies, 22(9), 3779-3837.
Berger, A. N., & Bouwman, C. H. (2013). How does capital affect bank performance during financial crises? Journal of Financial Economics, 109(1), 146-176.
Berger, A. N., & DeYoung, R. (1997). Problem loans and cost efficiency in commercial banks. Journal of Banking & Finance, 21(6), 849-870.
Blundell, R., & Bond, S. (1998). Initial conditions and moment restrictions in dynamic panel data models. Journal of econometrics, 87(1), 115-143.
Busch, R., & Kick, T. (2009). Income diversification in the German banking industry (No. 2009, 09). Discussion Paper Series 2: Deutsche Bundesbank, Banking and Financial Studies.
Chortareas, G. E., Garza-García, J. G., & Girardone, C. (2012). Competition, efficiency and interest rate margins in Latin American banking. International Review of Financial Analysis, 24, 93-103.
Claeys, S., & Vander Vennet, R. (2008). Determinants of bank interest margins in Central and Eastern Europe: A comparison with the West. Economic Systems, 32(2), 197-216.
Cornett, M. M., McNutt, J. J., & Tehranian, H. (2010). The financial crisis, internal corporate governance, and the performance of publicly-traded US bank holding companies. Social Science Research Network (SSRN), 1476969.
Deep, A., & Schaefer, G. (2004). Are banks liquidity transformers? Social Science Research Network (SSRN), 556289.
Demirguc-Kunt, A., Laeven, L., & Levine, R. (2003). Regulations, market structure, institutions, and the cost of financial intermediation (Vol. w 9890). National Bureau of Economic Research.
Demirgüç-Kunt, A., & Huizinga, H. (1999). Determinants of commercial bank interest margins and profitability: Some international evidence. The World Bank Economic Review, 13(2), 379-408.

Pertanika J. Soc. Sci. & Hum. 23 (S): 167 – 186 (2015)
A. Nasserinia, M. Ariff and Cheng Fan Fah
184
Demirgüç-Kunt, A., & Huizinga, H. (2011). Do we need big banks? evidence on performance, strategy and market. Evidence on Performance, Strategy and Market, Social Science Research Network (SSRN), 1774423.
DeYoung, R., & Rice, T. (2004). Noninterest income and financial performance at US commercial banks. Financial Review, 39(1), 101-127.
Distinguin, I., Roulet, C., & Tarazi, A. (2013). Bank Regulatory Capital and Liquidity: Evidence from US and European publicly traded banks. Journal of Banking & Finance, 37(9), 3295–3317.
Flamini, V., McDonald, C. A., & Schumacher, L. (2009). The determinants of commercial bank profitability in Sub-Saharan Africa. International Monetary Fund.
Fungáčová, Z., & Poghosyan, T. (2011). Determinants of bank interest margins in Russia: Does bank ownership matter? Economic Systems, 35(4), 481-495.
García-Herrero, A., Gavilá, S., & Santabárbara, D. (2009). What explains the low profitability of Chinese banks? Journal of Banking & Finance, 33(11), 2080-2092.
Goddard, J., Liu, H., Molyneux, P., & Wilson, J. O. (2011). The persistence of bank profit. Journal of Banking & Finance, 35(11), 2881-2890.
Goddard, J., Liu, H., Molyneux, P., & Wilson, J. O. (2013). Do bank profits converge? European Financial Management, 19(2), 345-365.
Goddard, J., Molyneux, P., & Wilson, J. O. (2004). The profitability of european banks: a cross-sectional and dynamic panel analysis. The Manchester School, 72(3), 363-381.
Hansen, L. P. (1982). Large sample properties of generalized method of moments estimators. Econometrica: Journal of the Econometric Society, 50(4), 1029-1054.
Ho, T. S., & Saunders, A. (1981). The determinants of bank interest margins: theory and empirical evidence. Journal of Financial and Quantitative Analysis, 16(4), 581-600.
Horváth, R., Seidler, J., & Weill, L. (2012). Bank capital and liquidity creation: Granger-causality evidence. Springer, Journal of Financial Services Research. doi: 10.1007/s10693-013-0164-4, 1-21.
Kasman, A., Tunc, G., Vardar, G., & Okan, B. (2010). Consolidation and commercial bank net interest margins: Evidence from the old and new European Union members and candidate countries. Economic Modelling, 27(3), 648-655.
Klein, M. A. (1971). A theory of the banking firm. Journal of money, credit and banking, 3(2), 205-218.
Kosmidou, K. (2008). The determinants of banks’ profits in Greece during the period of EU financial integration. Managerial Finance, 34(3), 146-159.
Liu, H., & Wilson, J. O. (2010). The profitability of banks in Japan. Applied Financial Economics, 20(24), 1851-1866.
Mamatzakis, E., & Remoundos, P. (2003). Determinants of Greek commercial banks profitability, 1989-2000. Spoudai, 53(1), 84-94.
Maudos, J. n., & Fernandez de Guevara, J. (2004). Factors explaining the interest margin in the banking sectors of the European Union. Journal of Banking & Finance, 28(9), 2259-2281.
McShane, R., & Sharpe, I. G. (1985). A time series/cross section analysis of the determinants of Australian trading bank loan/deposit interest margins: 1962–1981. Journal of Banking & Finance, 9(1), 115-136.

Pertanika J. Soc. Sci. & Hum. 23 (S): 167 – 186 (2015)
Key Determinants of German Banking Sector Performance
185
Mercieca, S., Schaeck, K., & Wolfe, S. (2007). Small European banks: Benefits from diversification? Journal of Banking & Finance, 31(7), 1975-1998.
Micco, A., Panizza, U., & Yanez, M. (2007). Bank ownership and performance. Does politics matter? Journal of Banking & Finance, 31(1), 219-241.
Mirzaei, A., Liu, G., & Moore, T. (2011). Does market structure matter on banks’ profitability and stability? Emerging versus advanced economies. Brunel University London Economics and Finance, Working Paper Series, (11-12).
Molyneux, P., & Thornton, J. (1992). Determinants of European bank profitability: A note. Journal of Banking & Finance, 16(6), 1173-1178.
Monti, M. (1972). Deposit, credit, and interest rate determination under alternative bank objectives. Mathematical Methods in Investment and Finance, 431-454.
Naceur, S. B., & Omran, M. (2011). The effects of bank regulations, competition, and financial reforms on banks’ performance. Emerging Markets Review, 12(1), 1-20.
Panzar, J. C., & Rosse, J. N. (1987). Testing for “monopoly” equilibrium. The Journal of Industrial Economics, 35(4), 443-456.
Pasiouras, F., & Kosmidou, K. (2007). Factors influencing the profitability of domestic and foreign commercial banks in the European Union. Research in International Business and Finance, 21(2), 222-237.
Poghosyan, T., & Čihak, M. (2011). Determinants of bank distress in Europe: Evidence from a new data set. Journal of Financial Services Research, 40(3), 163-184.
Perry, P. (1992). Do banks gain or lose from inflation. Journal of Retail Banking, 14(2), 25-40.
Rossi, S. P., Schwaiger, M., Winkler, G., & Nationalbank, O. (2005). Managerial behavior and cost/profit efficiency in the banking sectors of Central and Eastern European countries: Oesterr. Nationalbank.
Saunders, A., & Schumacher, L. (2000). The determinants of bank interest rate margins: an international study. Journal of International Money and Finance, 19(6), 813-832.
Shih, V., Zhang, Q., & Liu, M. (2007). Comparing the performance of Chinese banks: a principal component approach. China Economic Review, 18(1), 15-34.
Staikouras, C. K., & Wood, G. E. (2004). The determinants of European bank profitability. International Business and Economics Research Journal, 3(6), 57-68.
Sufian, F. (2009). Determinants of bank efficiency during unstable macroeconomic environment: Empirical evidence from Malaysia. Research in International Business and Finance, 23(1), 54-77.
Supervision, E. B. (1997, September). Core Principles for Effective Banking Supervision. Bank for International Settlements.
Tan, Y., & Floros, C. (2012). Bank profitability and inflation: the case of China. Journal of Economic Studies, 39(6), 675-696.
Williams, J. (2004). Determining management behaviour in European banking. Journal of Banking & Finance, 28(10), 2427-2460.
Williams, B., & Rajaguru, G. (2007). The chicken or the egg? The trade-off between bank non interest income and net interest margins. In 20th Australasian Finance & Banking Conference.
Windmeijer, F. (2005). A finite sample correction for the variance of linear efficient two-step GMM estimators. Journal of econometrics, 126(1), 25-51.

Pertanika J. Soc. Sci. & Hum. 23 (S): 167 – 186 (2015)
A. Nasserinia, M. Ariff and Cheng Fan Fah
186
Wong, K. P. (1997). On the determinants of bank interest margins under credit and interest rate risks. Journal of Banking & Finance, 21(2), 251-271.
Zarruk, E. R., & Madura, J. (1992). Optimal bank interest margin under capital regulation and deposit insurance. Journal of Financial and Quantitative Analysis, 27(01), 143-149.
Pertanika J. Soc. Sci. & Hum. 23 (S): 187 – 204 (2015)
ISSN: 0128-7702 © Universiti Putra Malaysia Press
SOCIAL SCIENCES & HUMANITIESJournal homepage: http://www.pertanika.upm.edu.my/
ARTICLE INFOArticle history:Received: 30 March 2015Accepted: 10 September 2015
E-mail addresses:[email protected] / [email protected] (Abdul Rahim, N.),[email protected] (Abdul Rahman, F.)* Corresponding author
Wealth Effects Associated with Announcements of Hybrid Securities in an Emerging Country: Evidence from Malaysia
Abdul Rahim, N.* and Abdul Rahman, F.Department of Accounting and Finance, Faculty of Economics and Management, Universiti Putra Malaysia, 43400 Serdang, Malaysia.
ABSTRACT
This paper examines the market reaction to hybrid security announcements in an emerging country, specifically Malaysia, from January 1996 to December 2009. The results indicated that announcements of the intention to issue convertible bonds in Malaysia are significantly associated with negative abnormal returns of 1.10% (significant at the 10% level) on the event window of (-1, 1). On the other hand, announcements of the intention to issue warrant-bonds document significantly positive abnormal returns of 2.25% (significant at the 5% level) on the same event window. The ‘univariate’ test confirmed that the wealth effect associated with the announcement of the intention to issue warrant-bonds is larger (i.e., more positive) than convertible bonds, in line with a few studies conducted in different markets. The findings of this study highlight that listed firms with high risk uncertainty in Malaysia contribute to more negative abnormal returns in comparison to lower risk uncertainty firms.
Keywords: Event study, convertible bonds, warrant-bonds, emerging country
INTRODUCTION
Extensive research has been carried out on the wealth effects of security issues such as debt, equity, and hybrid securities such
as convertible bonds. Hybrid securities have been the centre of attention due to these securities being unique in terms of having characteristics of both debt and equity. Almost half of the studies on the announcement effects of hybrid securities focused on the United States, as they are the largest issuers of convertible bonds, followed by Japan. However, relatively few studies have been performed using data from emerging countries. For

Pertanika J. Soc. Sci. & Hum. 23 (S): 187 – 204 (2015)
Abdul Rahim, N. and Abdul Rahman, F.
188
example, Chang, Chen, and Liu (2004) used sample data from Taiwan, Li and Wang (2008) used data from China, and Mohd Ashhari and Sin-Chun (2009) used data from Malaysia.
Motivated by the limited literature available in this particular area in emerging countries, this study seeks to find the announcement effects associated with the intention to issue hybrid securities, namely, convertible bonds and warrant-bonds in Malaysia. Although one study of the market response associated with the intention to issue convertible bonds has been carried out in Malaysia (Mohd Ashhari & Sin-Chun, 2009), the present study expands the previous study sample period and compares the market response between two similar hybrid securities: convertible bonds and warrant-bonds. The current study also investigates whether or not the wealth effects of these hybrid securities announcements are the same. The wealth effects based on the sub-sample method of offerings (rights issue and private placements) of hybrid securities are also examined. An investigation into determinants of market response associated with these hybrid securities was also conducted. The justification for investigating Malaysian market is due to the important role that hybrid securities played during the Asian Financial Crisis (1997 to 1999) and during the recovery period (until the end of 2001). The issuance of convertible bonds and warrant-bonds increased significantly during the financial crisis and recovery
period (1997 until 2001), especially in 1999, in comparison to other alternative debt and equity.1
This study contributes to the literature by focusing on the wealth effects associated with announcements of hybrid securities in an emerging country. The uniqueness of this study is partially on hand collected dataset and testing a well-developed hypotheses, namely, ‘asymmetry information hypothesis’, ‘the risk uncertainty hypothesis’, ‘certification hypothesis’ and ‘signalling hypothesis’ in the different settings of the institutional and debt market structure. The research covers the announcements of the intention to issue hybrid securities in Malaysia from January 1996 to December 2009. The findings document that the wealth effects of the intention to issue convertible bonds in Malaysia induce significantly negative abnormal returns of 1.10% on the event window (-1, 1), whereas the warrant-bonds induce significantly positive abnormal returns of 2.25% on the same event window. There is a significant difference between the mean of these abnormal returns, confirming that the market perceived warrant-bonds as more advantageous than convertible bonds. However, when other factors are taken into accounts, there are no significant differences between convertible bonds and warrant-bonds.
1The issuance of bonds with warrants and convertible bonds constituted 12.17% of the private capital market (3.36% and 8.81%, respectively) in 1999.
Pertanika J. Soc. Sci. & Hum. 23 (S): 187 – 204 (2015)
Wealth Effects Associated with Announcements of Hybrid Securities in an Emerging Country: Evidence from Malaysia
189
The organisation of this paper is as follows: Section 2 considers various theoretical arguments about the factors that determine market reaction to the announcements of these hybrid securities and hypotheses construction. Research design and methods are discussed in Section 3, with empirical results and discussion presented in Section 4. Finally, this paper is concluded in Section 5.
THEORIES AND CONSTRUCTION OF THE HYPOTHESES
Asymmetry Information Hypothesis
A theory proposed by Myers and Majluf (1984), based on asymmetric information, notes that external financing signals negative market information to the outside investors. Investors perceive that announcements of equity may give a negative signal to the market, as investors know that managers have access to private information. Therefore, managers will issue equity when the share price is overvalued. With the existence of asymmetric information, Myers and Majluf (1984) suggested an order in issuing securities; first, use retained earnings, then use less risky assets such as straight debt, followed by issue hybrid securities. The final option is to issue external equity. This theory suggests that issuing securities is likely to have a negative impact on the share price.
In a similar fashion to other firms in emerging countries in Asia, Malaysian listed firms tend to have high concentrated family ownership with one controlling
owner, government or state ownership2, as well as affiliated groups that are also controlled by families (Claessens, Djankov, & Lang, 2000; Claessens, Fan, & Lang, 2006). These characteristics are different from developed countries such as Japan which tend to be controlled by banks or financial institutions. The institutional background of Malaysian firms is very similar to network-oriented countries in terms of concentration of ownership (family and group affiliation), except for the control aspect. Concentrated ownership suggests lower information asymmetry, leading to positive (or less negative) abnormal returns. Based on this argument, announcements of the intention to issue hybrid securities in Malaysia are hypothesised to be associated with positive abnormal returns.Hypothesis 1: Announcements of the intention to issue hybrid securities in Malaysia are associated with positive abnormal returns.
Risk Uncertainty Hypothesis
The ‘risk uncertainty hypothesis’ is first discussed by Brennan and Schwartz (1988). The basic idea of this hypothesis is that convertible bonds are suitable for a firm that has a risk uncertainty or disagreement about risk between investors and
2According to GLC Transformation Programme Progress Review 2011, as on 1st April 2011, Government-link companies constitute RM353 billion (approximately £70.60 billion) of the total market capitalization or 36% of the Bursa Malaysia.

Pertanika J. Soc. Sci. & Hum. 23 (S): 187 – 204 (2015)
Abdul Rahim, N. and Abdul Rahman, F.
190
shareholders. According to this hypothesis, companies that issue convertible debt have the largest risk uncertainty in which issuing straight debt can be very costly. While the value of the straight debt in a convertible bond might be low, this low values is offset by the increased value of the conversion. In other words, if investors perceive that the risk of a firm is high but firms perceive the risk as low, the value of the straight bond will decline, but the value of the ‘option’ or the conversion value will increase. Based on the risk uncertainty argument, the second hypothesis is:Hypothesis 2: Announcements of the intention to issue hybrid securities in Malaysia by firms with high risk uncertainty are associated with more positive abnormal returns than by firms with less risk uncertainty.
Method of Offering
The ‘certification hypothesis’ of Hertzel and Smith (1993) suggests that private placement investors have an opportunity to assess the firm’s value and the investment opportunities, thereby alleviating the asymmetric information in issuing securities suggested by Myers and Majluf (1984). According to Hertzel and Smith (1993), this ‘certification hypothesis’ is in agreement with the ‘ownership hypothesis’ that private placement improves managerial performance due to increased monitoring by the block-holders. Heinkel and Schwartz (1986), in their ‘signalling hypothesis’, suggest that rights offering of
equity convey more favourable information than non-rights equity offering, leading to a less negative stock price response during the announcement of security. Based on the ‘signalling hypothesis’ of Heinkel and Schwartz (1986) and the ‘certification hypothesis’ of Hertzel and Smith (1993), the rights issue and private placements of hybrid securities in Malaysia are expected to be associated with positive (or less negative) abnormal returns.Hypothesis 3: Announcements of the intention to issue hybrid securities in Malaysia by method of private placements are associated with positive abnormal returns.Hypothesis 4: Announcements of the intention to issue hybrid securities in Malaysia by method of rights offering are associated with positive abnormal returns.
RESEARCH DESIGN AND METHODOLOGY
Event Study Methodology
In order to investigate the wealth effects of the announcement of the intention to issue hybrid securities, the standard event-study methodology was used, as proposed by Brown and Warner (1985). The announcement dates were taken from two sources; the Investors’ Digest for the announcements from 1996 to 1999, and the Bursa Malaysia website for announcements from 2000 to 2009. The announcement date recorded in Investors’ Digest is the date that Kuala Lumpur Stock Exchange (currently known as Bursa Malaysia) received the announcement from listed companies.

Pertanika J. Soc. Sci. & Hum. 23 (S): 187 – 204 (2015)
Wealth Effects Associated with Announcements of Hybrid Securities in an Emerging Country: Evidence from Malaysia
191
Therefore, this date is treated as the event date, day 0. Announcements on the Bursa Malaysia website are received directly from public listed companies, merchant banks, or companies’ secretary through the Listing Information Network (LINK). Once again, the date that announcements are published on the website are treated as the event date (day 0).
The estimation period for market model is 171 days, starting at day 180 until day 10, before the announcement date (-180, -10). The test period is from 5 days before the announcement until 5 days after the announcement (-5, 5). The returns index (RI) series of the securities that are already adjusted for dividend are downloaded from Datastream. Logarithmic returns are computed as ln (Pi, t) – ln (Pi, t1). The logarithmic returns are used because they are more normally distributed than the discrete returns (Strong, 1992). The market model defined as Rit = αi+ βiRmt + eit is used to find the expected return, where Rit is return of security i in period t, Rmt is return of the market, αi is alpha or the intercept of the security i, βi is beta or the slope of the security i, and eit is the error term of security i in period t.
Before August 2009, public listed companies on Bursa Malaysia were segregated based on their market capitalisation, namely, the Main Board (at least RM60 million market capitalisation) and the Second Board (at least 40 million market capitalisations). On 3 August 2009, the Main Board and the Second Board were merged to form Bursa Malaysia
Main Market. This revamp required to use more than one benchmark of market index. Two benchmarks of the market index were used according to their listing board for announcements before August 2009; Exchange Main Board All Shares Index (EMAS) if the company listed in the Main Board, and the Second Board Index if the company listed in the Second Board. For announcements after August 2009, FTSE Bursa Malaysia EMAS index is used as the benchmark if the announcements are from the main market and ACE Index if the company is from the Access Certainty Efficiency (ACE) market, previously known as MESDAQ market. This approach has been used by Ahmad-Zaluki, Campbell, and Goodacre (2007) in their Malaysian IPOs study, in which they used the market index according to the listed companies’ board. All the indices are based on the market-capitalisation or a value-weighted index as it is available from Datastream.
To calculate the abnormal return, the return on a security is regressed against the market index to get the beta and the alpha. The beta is also adjusted according to Scholes and Williams (1977) for thin trading purpose. Then, the difference between the actual return on the security (as computed with the natural log) and expected return from the market model is computed as ARit = Rit – (αi+ βiRmt). The average abnormal return is computed by dividing the abnormal return by the number of sample or announcements as AAR = 1/n ∑ ARit .
The t-statistic presented by Brown and Warner (1985, p. 7) is used to test the

Pertanika J. Soc. Sci. & Hum. 23 (S): 187 – 204 (2015)
Abdul Rahim, N. and Abdul Rahman, F.
192
significance of the average abnormal return. The calculation of t-statistic for time t is t-stat = AAR/ SD (AAR), where AAR represents average abnormal return across securities in the sample. SD (AAR) is the standard deviation for average abnormal return for all securities in the sample calculated during the estimation period. The t-statistic for cumulative average abnormal return (CAR) is slightly different from the above. It is calculated by dividing CAR over the square root of the number of days in the event window multiplied by the estimated standard deviation. For example, the t-statistic for two-day event window of (1,0) is:
t-statistic = CAR(-1,0) / √2 * SD (AAR)
Sample Selection
The chosen sample consists of listed firms on Bursa Malaysia from 1996 to 2009. The list of convertible bonds and warrant-bonds issues was downloaded from Datastream, Fully Automated System and Tendering (FAST) and Security Commission websites. From the list, announcements of hybrid securities were tracked back from Investors’ Digest for the time period of 1996 to 1999. For the period of 2000 to 2009, announcements were collected from Bursa Malaysia’s website. The information about method of offerings is available on the Investors’ Digest, Bursa Malaysia’s website, the prospectus of offerings, and Annual Reports.
The final sample of convertible bonds consists of 105 announcements and 28 announcements for warrant-bonds, with a total of up to 133 announcements of hybrid securities altogether. Any package
announcement related to earnings and dividends, either actual or forecast in single day before and after the announcements of the hybrid securities (or in a three-day trading period), was excluded from the sample. However, package announcements other than that were included in the sample.
In the second part of this study, the determinants of the abnormal returns of hybrid securities in Malaysia were investigated using multivariate analysis. The sample dataset for this analysis consisted of 117 announcements, including announcements from financial companies which have characteristic data available from Datastream.
Variables and Measurement
The five-day cumulative abnormal return of the event window (1, 5) was used in this work as the dependent variable in multiple regression analysis. The justification of using the longer event window as dependent variable is because market in Malaysia is smaller compared to other developed country. Using a longer event window in this study is more appropriate as it is common in emerging market to either have insider trading or delay in market reaction (Salamudin, Ariff, & Nassir, 1999).
The first explanatory variable is company size, measured as a proxy of asymmetric information. As discussed before, listed firms in Malaysia are highly concentrated that suggests lower asymmetric information. However, the listed firms still have to disclose or report their earnings, investments and activities to the public in the Annual Report as one of

Pertanika J. Soc. Sci. & Hum. 23 (S): 187 – 204 (2015)
Wealth Effects Associated with Announcements of Hybrid Securities in an Emerging Country: Evidence from Malaysia
193
the compulsory requirements of Securities Commissions. Larger firms generally have lower asymmetric information than smaller firms. Thus, company size is hypothesised to have a positive relationship with abnormal returns. The proxy that is used to measure company size is market value (Datastream code: MV), defined as the market price at the fiscal year-end prior to the announcement multiplied by number of common shares outstanding at that time. This variable was taken from Datastream.
To test the ‘risk uncertainty hypothesis’, standard deviation of firm equity return was employed as the second explanatory variable. Firms with a higher standard deviation are hypothesised to have higher risk uncertainty. The standard deviation of firm’s equity return was calculated based on the raw return of the issuer over the window (-80, -6) (Lewis, Rogalski, & Seward, 2003; Dutordoir & Van de Gucht, 2007). This variable was expected to have a positive coefficient with the dependent variable.
The third variable is the Dummy rights variable is equal to 1 if the hybrid securities are offered by the method of rights offerings, 0 if not offered by method of rights offerings, and the Dummy placements variable is equal to 1 if the hybrid securities are offered by the method of private placements, and 0 otherwise are constructed. The omitted or based variable is the combination of 2 mixed announcements (a combination of private placement and rights offerings) and another 7 of unidentified announcements. To test whether there is a different relationship
between convertible bonds and warrant-bonds with regard to abnormal returns, a Dummy CB and WB is equal to 1 if the security is a convertible bond and 0 if the security is a warrant-bond is employed.
EMPIRICAL RESULTS AND DISCUSSION
The analysis and discussion of the empirical results of the study performed in this research are divided into three sub-sections. The first sub-section discusses the descriptive statistics of the firms that announced the intention to issue hybrid securities in Malaysia. The second sub-section contains the analysis of the market response towards the announcements of the intention to issue hybrid securities, and also focuses on the sub-samples based on method and purpose of offerings. Finally, the determinants of the abnormal returns are discussed on the third sub-section.
Descriptive Statistics
Table 1 contains descriptive statistics for announcements of the intention to issue hybrid securities and the characteristics of the issuance of hybrid securities in Malaysia. It shows that the highest numbers of announcements of hybrid securities in Malaysia were made in 1999 and 2000, with 22 announcements for each year. One possible factor that caused the higher numbers of hybrid securities announcements in these years was because at that time Malaysia was recovering from the Asian Financial Crisis that started in 1997 and ended at the end of 1999.

Pertanika J. Soc. Sci. & Hum. 23 (S): 187 – 204 (2015)
Abdul Rahim, N. and Abdul Rahman, F.
194
During this crisis, companies were forced to restructure in order to survive. There were 27 companies that announced their intention to issue hybrid securities during the financial crisis, and four of them were distressed companies. Four more companies were distressed in 2000, three in 2001, four companies in 2002, and one in 2004, 2005, 2007, and 2008, respectively, contributing to 19 distressed companies in total. The distressed companies were identified as they underwent the Scheme of Arrangement under Section 176 of the Company Act of Malaysia,
1965, or were listed in Practice Note 4 or Practice Note 17 of the Bursa Malaysia.
Private placements and rights issue are the preferable method of offering hybrid securities in Malaysia. During the study period, 33% of the announcements (44 announcements) used the rights issues and 59% (79 announcements) used private placements as their method of the offerings. The method of offerings is not able to be identified for 7 announcements, while 3 announcements used both rights and placements.
TABLE 1Descriptive statistics for the announcements of the intention to issue hybrid securities in Malaysia
Year of announcement
Securities Announcement per year Method of offeringCB WB Total Distress Firms RI PP Mixed Data not available
2009 7 1 8 0 4 4 0 02008 3 0 3 1 3 0 0 02007 3 4 7 1 1 6 0 02006 4 0 4 0 2 2 0 02005 6 0 6 1 3 3 0 02004 5 0 5 1 2 3 0 02003 10 0 10 0 0 9 1 02002 15 2 17 4 3 12 2 02001 11 0 11 3 5 6 0 02000 15 7 22 4 6 16 0 01999 16 6 22 4 5 17 0 01998 5 0 5 0 5 0 0 01997 0 0 0 0 0 0 0 01996 5 8 13 0 5 1 0 7Total 105 28 133 19 44 79 3 7
Total (%) 78.95 21.05 100 14.29 33.08 59.4 2.26 5.26
The sample consists of 133 announcements of the intention to issue hybrid securities by listed firms on Bursa Malaysia (formerly known as the Kuala Lumpur Security Exchange or KLSE) from 1996 to 2009. CB is convertible bonds, WB is warrant-bonds, RI is rights offering, PP is private placements, and Mixed is a combination of private placement and rights offerings.

Pertanika J. Soc. Sci. & Hum. 23 (S): 187 – 204 (2015)
Wealth Effects Associated with Announcements of Hybrid Securities in an Emerging Country: Evidence from Malaysia
195
Market Reaction to the Announcements of the Intention to Issue Hybrid Securities
Table 2 depicts average abnormal returns and t-statistics for the 5 days before and 5 days after the announcement of the intention to issue convertible bonds and warrant-bonds. Significant positive excess returns of 0.98% (significant at the 5% level) and 0.63% (significant at the 10% level) were documented on three and four day before the announcement, suggesting that companies announced their intention to issue convertible bonds after a positive stock run-up. A significant positive excess return of 0.77% (significant at the 5% level), and a non-significant positive abnormal return of 0.18% were revealed on the announcement day of convertible bonds and warrant-bonds, respectively. On the other hand, significant negative excess returns of 1.34% was reported (significant at the 1% level) on the day after the announcement of convertible bonds. As for warrant-bonds sample, a significant positive abnormal return of 1.66% (significant at the 1% level) was observed on the day after the announcement. Both results suggest that the market is delayed in responding to the announcements.
The cumulative average abnormal return (CAR) for the two-day event window is 0.23% for convertible bond sample and 0.59% for warrant-bonds sample (both are not significant). On the three-day event window, a significant negative CAR of -1.10% (significant at the 10% level) was reported for the convertible bonds sample and a significant positive CAR of 2.25% was
revealed (significant at the 5% level) for the warrant-bonds sample. For a longer event window of (1, 5), a significant negative CAR of 2.34% (significant at the 1% level) was documented for the convertible bonds sample and a non-significant negative CAR of 0.67% for the warrant-bonds sample.
Based on these results, two conclusions can be drawn. Firstly, on event window of (-1, 1), announcements of the intention to issue convertible bonds in Malaysia are associated with the significantly negative CAR of 1.10% suggesting that investors in Malaysia perceived the announcement of convertible bonds convey a negative signal. This result contradicts with Hypothesis 1 that the announcement of the intention to issue hybrid securities in Malaysia is associated with positive (or less negative) abnormal returns. However, this result is consistent with the empirical studies carried out using data from other countries that observe negative effects from the announcement of convertible bonds (Burlacu, 2000; Suchard, 2007; Mohd Ashhari & Sin-Chun, 2009; Duca et al., 2012). Secondly, the announcement of the intention to issue warrant-bonds in Malaysia on the three-day event window of (-1, 1) is associated with the significantly positive CAR of 2.25%. In this case, Hypothesis 1 that the announcement of the intention to issue hybrid securities in Malaysia is associated with positive (or less negative) abnormal returns is accepted.
To investigate that the announcement of warrant-bonds issued in Malaysia is associated with more positive or larger

Pertanika J. Soc. Sci. & Hum. 23 (S): 187 – 204 (2015)
Abdul Rahim, N. and Abdul Rahman, F.
196
abnormal returns compared to convertible bonds, the independent sample t-test, Mann-Whitney test. Table 3 presents the results of the differences in means and medians of CARs on a selective event window between convertible bonds and warrant-bonds. This table indicates that the one-tail test of differences in mean between the CARs of convertible bonds and warrant-bonds on the event window of (-1, 1) is significant at the 10% level (t =1.44). The equivalent non-parametric test (Wilcoxon rank-sum/Mann-Whitney) also confirms that the distributions of the means of convertible bonds and warrant-bonds on the same event window differ significantly (p = 0.01).
The significant difference in mean on event window (-1, 1) confirms that the
announcement of the intention to issue warrant-bonds is associated with larger abnormal returns than convertible bonds, which is in line with other empirical studies such as those presented by Billingsley et al. (1990), Jayamaran et al. (1990), Kang et al. (1995), De Roon and Veld (1998) and Gebhardt (2001). Similarly, Abdul Rahim et al. (2014), in their meta-analysis study, also found that warrant-bonds are associated with less negative abnormal returns compared to convertible bonds. This results suggest that in Malaysian market, investors perceive that the announcement of issuing warrant-bonds as a good news whereas the announcement of issuing convertible bonds as a bad news.
TABLE 2Average abnormal returns around announcements of the intention to issue convertible bonds and warrant-bonds in Malaysia
Convertible Bonds (n=105) Warrant-bonds (n=28)Event Day AAR% T-test AAR% T-test
-5 0.00 0.00 0.06 0.13-4 0.63 1.65* 0.33 0.67-3 0.98 2.58*** -0.14 -0.29-2 0.48 1.28 -0.09 -0.19-1 -0.54 -1.44 0.41 0.830 0.77 2.05** 0.18 0.361 -1.34 -3.53*** 1.66 3.34***
2 -0.62 -1.63 -0.24 -0.473 -0.50 -1.33 -0.57 -1.134 0.14 0.37 -0.41 -0.825 -0.02 -0.06 -1.12 -2.25
CAR(-1,0) 0.23 0.44 0.59 0.84CAR(-1,1) -1.10 -1.67* 2.25 2.61**
CAR(1, 5) -2.34 -2.77*** -0.67 -0.60
The sample consists of 105announcements of the intention to issue convertible bonds and 28 announcements of the intention to issue warrant-bonds by listed firms on Bursa Malaysia (formerly known as the Kuala Lumpur Security Exchange or KLSE) from 1996 to 2009. The AAR was calculated based on the market model.
* is significant at the 10% level, ** is significant at the 5% level and *** is significant at the 1% level. The significance is based on the two-tail test.

Pertanika J. Soc. Sci. & Hum. 23 (S): 187 – 204 (2015)
Wealth Effects Associated with Announcements of Hybrid Securities in an Emerging Country: Evidence from Malaysia
197
TABLE 3Cumulative abnormal returns for selective event windows around announcements of convertible bonds and warrant-bonds in Malaysia
Mean Test statistic for differences in mean
CAR(-1,0)
CB 0.23 t-test: p = 0.39
WB 0.59 Mann-Whitney: p = 0.39
CAR(-1,1)
CB -1.11 t-test: p = 0.08
WB 2.25 Mann-Whitney: p = 0.01
The sample of the announcement of the intention to issue convertible bonds (CB) consists of 105 announcements and 28 announcements for warrant-bonds. The one-tail test of differences between the mean of convertible bonds and warrants confirms that the mean CAR (-1, 1) for convertible bonds is significantly lower (more negative) than for warrant-bonds at 10% level (t = -1.44). The equivalent non-parametric test (Wilcoxon rank-sum/Mann-Whitney) confirms that the distributions of the mean CAR (-1, 1) of convertible bond and warrant-bond differ significantly (p = 0.01).
*is significant at the 10% level ** is significant at the 5% level and *** is significant at the 1% level.
Table 4 documents average abnormal returns and t-statistics across 5 days before and 5 days after the announcement of the intention to issue hybrid securities by the method of offerings, namely, private placements and rights offerings3. On the day of the announcement, the announcement of hybrid securities by means of rights issue revealed significant positive abnormal returns of 1.34% (significant at the 5% level). On the contrary, for the subsample of private placement, a non-significant positive abnormal return of 0.55% was observed. However, significant abnormal returns of 0.75% were reported on the fourth and fifth days before the announcements, indicating that the news
3 The event study for the announcements of the intention to issue hybrid securities for the mixed offerings (3 announcements) and the ‘unknown offerings’ (7 announcements) are not performed.
was already known by the public and the market reacted accordingly. Significant negative abnormal returns of 0.88% and 1.37% were also reported on the day after the announcement of private placements and second day of the announcement of rights issue.
On selective event window of (-1, 0) and (-1, 1), non-significant CARs were documented for both sub-samples. Nevertheless, the 5 day event window of (1, 5) revealed significant negative CARs of 2.65% and 1.99% (both CARs are significant at the 5% level) for both sub-samples. Based on the results on the longer event window of (1, 5), Hypothesis 3 and Hypothesis 4, that announcements of the intention to issue hybrid securities in Malaysia by private placements and rights offerings are associated with positive abnormal returns are both rejected. The results indicate that in Malaysian market

Pertanika J. Soc. Sci. & Hum. 23 (S): 187 – 204 (2015)
Abdul Rahim, N. and Abdul Rahman, F.
198
issuing hybrid securities by means of rights offering and private placement do not convey favourable information; in such, this information would mitigate asymmetry information. The results contradict with a study by Field and Mais (1991) which revealed significant positive abnormal returns of 1.80% on the two-day event window of (-1, 0) for the announcements
of convertible bonds by method of private placements in the United States. However, the results of rights offerings of hybrid security are consistent with the findings in a study by Abyhankar and Dunning (1999) that found significant abnormal returns of 0.95% for the rights offerings of convertible bonds in the UK.
TABLE 4Average abnormal returns around the announcements of the intention to issue hybrid securities in Malaysia for sub-samples method of offerings
Rights Issue (n=44) Placement (n=79)Event Day AAR% T-test AAR T-test
-5 0.99 1.71 -0.39 -0.98-4 -0.07 -0.11 0.75 1.89*-3 0.74 1.27 0.75 1.87*-2 0.21 0.37 0.64 1.62-1 -0.41 -0.70 -0.48 -1.210 1.34 2.31** 0.55 1.391 -0.69 -1.19 -0.88 -2.21**2 -1.37 -2.37** -0.07 -0.173 0.57 0.98 -1.31 -3.28***4 0.05 0.08 0.01 0.025 -1.20 -2.06** 0.26 0.65
CAR(-1,0) 0.93 1.14 0.07 0.13CAR(-1,1) 0.23 0.23 -0.81 -1.17CAR(1, 5) -2.65 -2.04** -1.99 -2.24**
The announcement of the intention to issue hybrid securities by listed firms on Bursa Malaysia (formerly known as the Kuala Lumpur Security Exchange or KLSE) from 1996 to 2009 for the sub-samples method of offerings consisted of 79 announcements of private placements and 44 announcements of rights offerings. However, the event study for the sub-samples of mix offerings (3 announcements) and unknown offerings (7 announcements) were not performed. The AAR was calculated based on the market model.
* is significant at the 10% level, ** is significant at the 5% level and *** is significant at the 1% level. The significance is based on the two-tail test.
Pertanika J. Soc. Sci. & Hum. 23 (S): 187 – 204 (2015)
Wealth Effects Associated with Announcements of Hybrid Securities in an Emerging Country: Evidence from Malaysia
199
Cross-sectional Regression Results and Discussion
Table 5 is an Ordinary Least Square (OLS) regression between cumulative abnormal returns for the five-day event window of (1, 5) for a total of 117 sample of hybrid securities issued in Malaysia. ‘Heteroskedasticity’ was corrected using the ‘Breusch-Pagan/ Cook-Weisberg’ test. The dependent variable is the CAR on the event window (1,5), while the independent variables are log of market value, standard deviation of the companies’ raw returns on the event window of (-80, -6), dummy rights, dummy private placements, as well as dummy convertible bonds and warrant-bond. The formula for the Multiple Regression is as follows:
CAR (1,5) = α + β1(Log Market value) + β2 (Standard deviation)+ β3 (Rights offering) + β4 (Private placements) + β8 (Dummy CB and WB) + β9 (Dummy clean) + β10 (Dummy economy) + eit
The significance of the results is based on the robust standard error. The rights offering variable was omitted in the regression because of the collinearity problem4. The Log Market value is not statistically significant in explaining or determining the CAR, and this is consistent with the findings of Kang and Stulz (1996) and Abhyankar and Dunning (1999).
4The average VIF for this model is 1.15 after eliminating the rights offering.
The Standard deviation of stock returns, a proxy for the ‘risk uncertainty hypothesis’, indicates a significant negative relationship (significant at the 5% level) with the CAR, which contradicts with Hypothesis 2. The coefficient for this variable is 1.97, suggesting that announcements of the intention to issue hybrid securities by high risk uncertainty companies are associated with 1.97% lower abnormal returns, contradicting with the ‘risk uncertainty’ theory. The possible reason for having significant but contradictory result is that the standard deviation might capture the effect of the financial crisis. The result is also in line with the findings of Dutordoir and Van de Gucht (2007), whereby a significant negative relationship was found between standard deviation and the abnormal returns in both hot and non-hot market issues of convertible bonds although the result is more pronounced in non-hot market issues.
Contrary to Hypothesis 4, the announcements of the hybrid securities issued through private placements reported a non-significant negative coefficient of 0.44 with abnormal returns. The results contradict with the ‘certification hypothesis’ of Hertzel and Smith (1993) that private placement conveys more information, and hence reduces asymmetric information. Thus, Hypothesis 4 that the announcement of hybrid securities by the method of private placements induces positive abnormal returns, is rejected.

Pertanika J. Soc. Sci. & Hum. 23 (S): 187 – 204 (2015)
Abdul Rahim, N. and Abdul Rahman, F.
200
With regard to the relationship with the CAR, the Dummy CB and WB variable reported a non-significant positive coefficient of 0.97, suggesting that convertible bonds or warrant-bonds are not determinants of abnormal returns. The R2 for the model is 6.94%, while the F-test is 2.63; statistically significant at the 5% level implying that this model can predict the cumulative abnormal returns on the event window (1, 5).
CONCLUSION
This study investigated the market reaction associated with announcements of convertible bonds and warrant-bonds between 1996 and 2009 in an emerging country, Malaysia. In addition, the announcement effects for sub-samples method of offerings of hybrid securities were also investigated in this market.
There are several conclusions that can be drawn from the findings of this study. Firstly, announcements of the intention to issue convertible bonds in Malaysia are associated with significantly negative abnormal returns of 1.10% (significant at the 10% level) on the event window of (-1, 1). Secondly, announcements of the intention to issue warrant-bonds document significantly yielded a positive abnormal return of 2.25% (significant at the 5% level) on the same event window. One finding that is of particular interest in this study is the finding of a significant difference
between mean CAR of convertible bonds and warrant-bonds on event window (1, 1). This result confirms that announcements of warrant-bonds in Malaysia are associated with more positive abnormal returns than convertible bonds announcements. The result is not consistent with the current trend, in which the statistics provided from the Bank Negara Malaysia stated that there were issuances of convertible bonds while the issuances of warrant-bonds is almost disappear.5
This paper leaves a gap for future research into the disappearance of warrant-bonds in Malaysia. Another potential research topic with regard to convertible bonds and warrant-bonds specifically in the Malaysia market is to compare the announcement effects of these hybrid securities with the Islamic bonds or ‘Sukuk’ that accompanied with warrants. This combination of ‘Sukuk’ and warrants is permissible in Islamic jurisprudence (or ‘Shariah’ law) as warrants itself are permissible security under one condition; the underlying security or the shares involved must be ‘Shariah’ approved. As with the case in Malaysia, the underlying shares must be listed in ‘Shariah Index’.
5 The latest statistics in 2014 indicated that the issuance of convertible bonds is RM214 millions (constituted of 4% of private capital market) but there were no issuance for warrant-bonds after 2004 (or maybe there were issuance of warrant-bonds but the amount is insignificant to report)

Pertanika J. Soc. Sci. & Hum. 23 (S): 187 – 204 (2015)
Wealth Effects Associated with Announcements of Hybrid Securities in an Emerging Country: Evidence from Malaysia
201
TABLE 5OLS regression for the determinants of abnormal returns
Independent variables Predicted sign Coefficient/T-statistic
Constant 6.92Asymmetric Information Hypothesis
Log Market value (+) -1.05 (-0.58)Risk Uncertainty Hypothesis
Standard deviation on (-80, -6) (+) -1.97 (-2.65)**
Method of offering Private placements (+) -0.44 (-0.17)
Other Variable Dummy CB and WB (-) 0.97 (0.57)
R2 (%) 6.94%
F-test 2.63**
The sample consists of 117 announcements (all announcements with available data in Datastream including financial companies) of the intention to issue hybrid securities by listed firms on Bursa Malaysia (formerly known as the Kuala Lumpur Security Exchange or KLSE) from 1996 to 2009. The dependent variable is a cumulative abnormal return for five-day event window (1, 5) and the independent variables are log of market value, standard deviation of the companies’ raw returns on the event window of (-80, -6), method of offerings, as well as dummy convertible bonds and warrant-bond. The figures in the parenthesis are the t-statistic based on the robust standard error.
** is significant at the 5% level. The significance is based on the two-tail test.
Billingsley, R. S., Lamy, R. E., & Smith, D. M. (1990). Units of debt with warrants: evidence of the ‘Penalty Free’ issuance of an equity-like security. The Journal of Financial Research, 13(3), 187-199.
Brown, S. J., & Warner J. B. (1985). Using daily stock returns: the case of event studies. Journal of Financial Economics, 14(1), 3-31.
Burlacu, R. (2000). New evidence on the pecking order hypothesis: the case of French convertible bonds. Journal of Multinational Financial Management, 10(3), 439-459.
Brennan, M., & Schwartz, E. (1988). The case of convertibles. Journal of Applied Corporate Finance, 1(2), 55-64.
REFERENCESAbdul Rahim N., Goodacre A., & Veld C. (2013).
Wealth effects of convertible bond loans versus warrant-bond loan: A meta-analysis. European Journal of Finance, 20(4), 380-398.
Abhyankar A., & Dunning, A. (1999). Wealth effects of convertible bond and convertible preference share issues: an empirical analysis of the UK market. Journal of Banking and Finance, 23(7), 1043-1065.
Ahmad-Zaluki, N. A., Campbell, K., & Goodacre, A. (2007). The long run share price performance of Malaysia Initial Public Offerings (IPO). Journal of Business and Accounting, 34(1-2), 78-110.

Pertanika J. Soc. Sci. & Hum. 23 (S): 187 – 204 (2015)
Abdul Rahim, N. and Abdul Rahman, F.
202
Chang, S. C., Chen, S. S., & Liu, Y. (2004). Why firms use convertibles: a further test of the sequential-financing hypothesis. Journal of Banking and Finance, 28(5), 1163-1183.
Claessens, S., Djankov, S., & Lang, L. H. P. (2000). The separation of ownership and control in East Asian corporations. Journal of Financial Economics, 58(1), 81-112.
Claessens, S., Fan, J. P. H., & Lang, L. H. P. (2006). The benefits and costs of group affiliation: evidence from East Asia. Emerging Markets Review, 7(1), 1-26.
De Roon, F., & Veld, C. (1998). Announcement effects of convertible bond loans: an empirical analysis for the Dutch market. Journal of Banking and Finance, 22(12), 1481-1506.
Duca, E., Dutordoir, M., Veld, C., & Verwijmeren, P. (2012). Why are convertible bond announcements associated with increasingly negative abnormal stock returns? An arbitrage-based explanation. Journal of Banking and Finance, 36(11), 2884-2899.
Dutordoir, M., & Van de Gucht, L. (2007). Are there windows of opportunity for convertible debt issuance? Evidence for Western Europe. Journal of Banking and Finance, 31(9), 2828-2846.
Fields, L. P. & Mais, E. L. (1991). The valuation effect of private placements of convertible debt. The Journal of Finance, 46(5), 1925-1932.
Gebhardt, G. (2001). Announcement effects of financing decisions by German companies: synthesis of an empirical research programme. Working Paper, Johann Wolfgang Goethe University Frankfurt (Germany).
Heinkel, R., & Schwartz, E. (1986). Rights versus underwritten offerings: an asymmetric information approach. The Journal of Finance, 41(1), 1-18.
Hertzel, M., & Smith, R.L. (1993). Market discounts and shareholder gains for placing equity privately. Journal of Finance, 48(2), 458-485.
Jayamaran, N., Shastri, K., & Tandon, K. (1990). Valuation effects of warrants in new security issues. Working Paper, Salomon Center, New York University.
Kang, J. K., Kim Y. C., Park J., & Stulz, R. M. (1995). An analysis of the wealth effects of Japanese offshore dollar-denominated convertible and warrant bond issues. Journal of Financial and Quantitative Analysis, 30(02), 257-270.
Kang, J. K., & Stulz, R. M. (1996). How different is Japanese corporate finance? An investigation of the information content of new security issues. Review of Financial Studies, 9(1), 109-139.
Lewis, C. M., Rogalski, R. J., & Seward, J. K. (2003). Industry conditions, growth opportunities and market reactions to convertible debt financing decisions. Journal of Banking and Finance, 27(1), 153-181.
Li, X. J., & Wang, P. X. (2008). Market reaction on convertible bonds offering: an agency cost of free cash flow perspective. China-USA Business Review, 7(2), 7-12.
Mohd Ashhari, Z., & Sin-Chun, L. (2009). The effect of debt announcements: straight bond vs convertible bond. In Universiti Teknologi Petronas, Regional Conference on the Humanities. Perak, Malaysia.
Myers, S. C., & Majluf, N. (1984). Corporate financing and investment decisions when firms have information that investors do not have. Journal of Financial Economics, 13(2), 187-221.
Salamudin, N., Ariff, M., & Nassir, A. M. (1999). Economic influence on rights issue announcement behaviour in Malaysia. Pacific-Basin Finance Journal, 7(3), 405-427.
Strong, N. (1992). Modelling abnormal returns: a review article. Journal of Business Finance and Accounting, 19(4), 533-553.

Pertanika J. Soc. Sci. & Hum. 23 (S): 187 – 204 (2015)
Wealth Effects Associated with Announcements of Hybrid Securities in an Emerging Country: Evidence from Malaysia
203
Scholes, M., & Williams, J. (1977). Estimating betas from nonsynchronous data. Journal of Financial Economics, 5(3), 309-327.
Suchard, J. A. (2007). The impact of right issued of convertible debt in Australian markets. Journal of Multinational Financial Management, 17(3), 187-202.


Pertanika J. Soc. Sci. & Hum. 23 (S): 205 – 218 (2015)
ISSN: 0128-7702 © Universiti Putra Malaysia Press
SOCIAL SCIENCES & HUMANITIESJournal homepage: http://www.pertanika.upm.edu.my/
ARTICLE INFOArticle history:Received: 30 March 2015Accepted: 10 September 2015
E-mail addresses:[email protected] (J. L. Chia),[email protected] (Yahya, M. H.),[email protected] / [email protected] (Muhammad, J.)* Corresponding author
The Impact of Basel III on Malaysian Stock Performance
J. L. Chia, Yahya, M. H. and Muhammad, J.*Department of Accounting and Finance, Faculty of Economics and Management, University Putra Malaysia
ABSTRACT
The introduction of new capital requirement by the Basel committee has positive and negative impacts on banking stock prices. Previous studies on Basel Accord’s minimum capital requirement on various countries have shown mixed results in the stock returns during the announcement date. This paper examines the impact of Basel III announcements on Malaysian banking stocks’ returns. Findings showed that investors viewed the implementation of new regulation as bad information and would reduce the banks’ stock prices.
Keywords: Basel III, Bank, Malaysia, Stock Returns
INTRODUCTION
Global financial crises have led to huge losses to the economy. Most economic recessions were mainly due to the crash of financial system. Most financial crises are associated with banking panics (early 1900’s), stock market crashes (1929), financial and asset bubbles (2008), and currency crises (1997), or a combination of these reasons.
Not only does the financial sector suffer a huge loss, it will also have a global consequence. The Basel Accord was designed with the primary goal of making capital requirements reflect bank risk exposures. More credit risks would require an appropriate amount of additional capital to keep the banks’ default probability low. The introduction of capital adequacy rules strengthens bank capital and improves banks’ resilience against negative shocks. This paper aims to explore whether Malaysian banks are influenced by the announcements of Basel Accord.
Banks are vital for a nation’s economy. Success of the banking sector contributes

Pertanika J. Soc. Sci. & Hum. 23 (S): 205 – 218 (2015)
J. L. Chia, Yahya, M. H. and Muhammad, J.
206
towards a country’s economic growth, financial stability and development. Nevertheless, the collapse of banks during financial crisis could worsen an economic recession. With the advent of globalisation, cross-border banking activities are increasing every day. The need to standardise the global bank regulations to provide guidance on banking rules and create a fair and competitive platform are crucial. The Basel Committee on Banking Supervision (BCBS) was established by the central bank governors of the Group of Ten (G10) countries in 1975. BCBS consists of representatives from Belgium, Canada, France, Germany, Italy, Japan, Luxembourg, the Netherlands, Sweden, Switzerland, the United Kingdom and the United States. The committee members set down a consensus on the common minimum capital standard for banking industries. Minimum capital requirements are put in place to ensure banking institutions have sufficient capacity to undertake the intermediation function necessary for the development of the economy. A bank that has a better control on their capital is able to allocate more resources to expand their business to compete in a global level.
Basel I & II
There were several bank failures from 1965 to 1981. Banks throughout the world were lending extensively, while countries’
external indebtedness was growing at an unsustainable rate. As a result, the potential for bankruptcy of major banks grew. In order to avert this, the Basel Committee on Banking Supervision drafted a document to set up an international minimum amount of capital that banks should hold. This minimum is a percentage of the total capital of a bank, which is also called the ‘minimum risk-based capital adequacy’. In 1988, the Basel I Capital Accord (agreement) was created. The accord contains a capital requirement of 8% based on the risk weighted assets and a minimal 4% high quality capital, which is also known as Tier-1. The accord was only focused and implemented on the credit risk. It took many years before the first accord was established. This was due to several factors such as, international political disagreements, different accounting standards and lack of necessity within the financial market for such an accord.
The introduction of risk-based Basel capital requirements for financial institutions is to protect the firms, their investor and customers and the economy as a whole. It intended to offer banks a space to avoid straightly regulation. If the risk exposure of the banks is reduced, they will able to reduce their cost of holding the capital sources of funds. Thereby, the main objective of Basel capital requirements is to control bank risk taking. The motivation behind the implementation of Basel I was described

Pertanika J. Soc. Sci. & Hum. 23 (S): 205 – 218 (2015)
The Impact of Basel III on Malaysian Stock Performance
207
as increasing the regulatory control over bank risk exposure and improve the safety of the banking system by encouraging the safe bank to grow faster and risky bank to grow slower (Keeton, 1989).
Quantitatively, Basel I did not reflect the true risk profile of a bank. Basel II is the second rendering of Basel accord. It was introduced in 2004 due to the inadequacies of Basel I. Basel I focused more on credit and market risks. In Basel II, BCBS have expanded the risk to include a specific operational risk component in banks’ capital ratio. The objectives of Basel II were to improve banks’ risk management system, ensure a better support of regulatory capital to underlying risk and enhancement of disclosure requirements, as well as ensure that the banks’ risk is quantified based on the approach provided. The Basel II framework focused on the three pillars concept: 1) minimum capital requirement, 2) supervisory review, and 3) market discipline. The first pillar required banks to maintain a minimum level of capital to cover the credit risk, market risk and operational risk. The second pillar was related to the control of banks’ capital relative to their risk, the supervisor review and corrective process. The last pillar aimed to improve the discipline in the marketplace by increasing the banks’ risk disclosure.
Basel III
Basel III is one of the most important reforms to have emerged from the 2008 financial crisis. It was introduced in September 2010 to promote: 1) bank capital adequacy, 2) stress testing, and 3) market liquidity. Basel III aims to: a) improve the banking sector’s ability to absorb shocks arising from the financial and economic stress, b) strengthen the risk management, and c) promote the banks’ transparency and disclosures. It is scheduled to be gradually introduced from 2013 until 2019. In addition to the capital requirement of former Basel II, Basel III introduces the short-term Liquidity Coverage Ratio (LCR) to maintain banks’ short term cash stability.
Basel III requires banks to hold 4.5% of common equity up from 2% of Basel II. It also requires banks to maintain 6% of Tier I capital (compared to 4% in Basel II), as well as a newly introduced buffer of 2.5 per cent. The purpose of the conservation buffer is to ensure that banks maintain a buffer of capital that can be used to absorb losses during periods of financial and economic stress. While banks are allowed to draw on the buffer during such periods of stress, the closer their regulatory capital ratios approach the minimum requirement, the greater the constraints on earnings distributions. The Basel Committee has outlined phase-in arrangements outlined as Table 1 below.

Pertanika J. Soc. Sci. & Hum. 23 (S): 205 – 218 (2015)
J. L. Chia, Yahya, M. H. and Muhammad, J.
208
TABLE 1Basel III Phase-in arrangement
Phases 2013 2014 2015 2016 2017 2018 2019
Capital
Leverage ratio Parallel run 2013 - 2017 Migration to Pillar 1
Minimum common equity capital ratio 3.50% 4.00% 4.50%
Capital conservation buffer 0.625% 1.25% 1.875% 2.50%Minimum common equity plus capital conservation buffer
3.50% 4% 4.50% 5.125% 5.75% 6.375% 7%
Phase-I of deduction from CET1* 20% 40% 60% 80% 100% 100%
Minimum Tier 1 Capital 4.50% 5.50% 6%
Minimum total Capital 8%Minimum Total Capital plus conservation buffer 8% 8.625% 9.25% 9.875% 10.50%
Capital instruments that no longer qualify as non core tier 1 capital or tier 2 capital
Phased out over 10 year horizon beginning 2013
LiquidityLiquidity coverage ratio - minimum requirement 60% 70% 80% 90% 100%
are not included in common equity tier-1). The tier-2 capital aims to provide loss absorption on a going-concern basis such as general provisions, revaluation reserves and undisclosed reserves. The liquidity coverage ratio (LCR) is an important part of the Basel III. It defines how many liquid assets have to be held by financial institutions so that they possess sufficient high-quality liquid assets to cover net liquidity outflows during a 30-day period of stress.
For the last two decades, Malaysian banking systems have experienced a deep transformation under the pressure of
The proposed changes in Basel III include a new definition in capital requirement to improve the quality, consistency, and transparency of capital. The three types of capital components in Basel III are: a) common equity tier-1, b) additional tier-1 capital, and c) tier-2 capital. To have a closer demarcation of capital, common equity tier-1 instruments should be predominantly in the form of common shares and retained earnings. The additional tier-1 capital should include instruments that are issued by banks that meet the criteria for inclusion in additional tier-1 capital (which

Pertanika J. Soc. Sci. & Hum. 23 (S): 205 – 218 (2015)
The Impact of Basel III on Malaysian Stock Performance
209
financial liberalisation, international capital flows, technological developments and financial innovations. The Asian financial crisis in 1997 played a meaningful role in the process. The Malaysian financial system has emerged stronger and more competitive since the Asian financial crisis. The Malaysian banking sector consists of Bank Negara Malaysia (the central bank of Malaysia), conventional banks, Islamic banks and investment banks. In Malaysia, conventional and Islamic banking systems coexist and operate together. In this study, commercial banks are the focus of the research as the Islamic and investment banks operate on a different set of rules of engagement and capital volume. The main functions of commercial banks are to provide credit facilities, trade finance services, treasury services, cross-border payment services, hire purchase and leasing activities. There are a total of 8 local commercial banks in Malaysia: Maybank, CIMB Bank, Public Bank, Hong Leong Bank, Am Bank, RHB bank, Affin Bank and Alliance Bank (in the increasing order of market capitalisation). This study examined the returns on stocks of Malaysia Banking Sector around the announcement period of Basel III. With the stringent requirement of Basel III, it is expected that the banks’ profitability would be affected as some funds would not be able to be used due to strict Basel III requirements. Even though the impact of Basel III is not immediate (i.e., banks will be given some time to implement Basel III requirement), it would be interesting to see its impact on banking stocks.
LITERATURE REVIEW
The minimum capital requirement was introduced by the Basel committee to ensure that banks would have sufficient resources to operate securely. However, it could be detrimental to the competitiveness of the banking industry. If banks are required to maintain an equity position in excess of what it would hold voluntarily, they might put constraints on their operations. It has been argued that the new regulations generally lead banks to set aside higher amounts of capital. Nevertheless, at least in the U.S., part of the increase seemed to be attributable to capital arbitrage (Juliusz, 2009). The implementation of Basel III strengthens the resilience of the global banking system. However, even with this new framework aimed to increase liquidity to improve the quality of capital to cover risks, the integrated risk approach cannot exclude the future emergence of other classes of vulnerabilities in the financial and banking systems (Vasile & Costin, 2012).
Several studies have examined the effects of announcements on banks’ share prices. The evidence from event studies on the stock market reaction to announcements of the introduction of Basel requirements is generally mixed and does not indicate an overwhelming reaction one way or the other regarding the expected effect on profitability. Using an event study methodology, Eyssell and Arshadi (1990) find significant negative abnormal returns for three events preceding the imposition of risk-based capital requirements. The announcement of regulatory changes is

Pertanika J. Soc. Sci. & Hum. 23 (S): 205 – 218 (2015)
J. L. Chia, Yahya, M. H. and Muhammad, J.
210
viewed by the capital market participants as generally unfavourable. Furthermore, those banks most likely to be affected are those whose capital ratios were deficient at the time of the announcements, suffered the greatest value losses (Eyssell & Arshadi, 1990). In their study, they analysed the effects of a series of announcements being made on the equity share prices of large banks in Canada, Japan, the UK, and the US. They found a significant decline in equity returns for U.S., Canadian and U.K. banks in response to news announcements, with U.S. bank stocks exhibiting the largest negative reaction. For Japanese banks, the equity return results are mixed. This may be due to uncertainty among investors regarding the handling of their sizeable hidden reserves under the new risk-adjusted capital rules. In another study on the period corresponding to the Basel conferences, evidence indicates that the market had already impounded information regarding risk-based capital requirements in bank stock prices (Cooper et al., 1991).
Typically, banks tend to use the least cost to meet the regulatory capital requirement (Jackson et al., 1999). During Credit crisis and economic recession, the cost of issuing an additional capital may become prohibitive. Hence, banker may meet their capital requirement by restricting lending. When the bank’s net interest margin is reduced by the implementation of tight regulation, the bank will likely hold less capital. This restricts the loan supply to the economy. This circumstance is called “bank capital financial accelerator”, which transmits
monetary policy to the banking sector’s level of credit creation (Chami & Cosimano, 2001). When regulatory capital requirement increases, banks are less likely to restructure the troubled loans, which will increase the cost of lending. This will eventually lead to a drop in the demand of bank loan (Thakor & Wilson, 1995). In a more recent study by Biase (2012), who examined the impact of Basel III on bank lending rates in Italian banks, it is concluded that the long-term impact of heightened capital requirements on bank loan rates is likely to be modest.
Chiuri et al. (2002) used international data from 15 emerging countries (Argentina, Brazil, Chile, Hungary, India, Korea, Malaysia, Mexico, Morocco, Paraguay, Poland, Slovenia, Thailand, Turkey and Venezuela) to test whether the implementation of Basel accord causes credit to contract. In their study, they found that for countries which have enforced the Basel accord capital requirements, retrenchment in the supply of bank loans has negative impacts on the aggregate level of its real economic activity. Al-Hares et al. (2013) conducted a more recent study on Gulf Cooperation Council (GCC) region to compare the financial performance of conventional and Islamic banks. The results revealed that Basel III capital standard requirements are on average have produced less efficient Islamic bank but more profitable, more liquid, more solvent and enjoyed higher internal growth rates than conventional banks.
Avery and Berger (1991) studied the impact of Basel I on the leverage

Pertanika J. Soc. Sci. & Hum. 23 (S): 205 – 218 (2015)
The Impact of Basel III on Malaysian Stock Performance
211
requirement in the US during the 1980s. They found that the introduction of risk based capital requirement had increased the capital standards for large banks more than small banks. Basel Accord minimum capital requirements are only one of the options used by the regulators to control bank risk taking. During the pre-Basel capital requirement, the bank’s profitability, risk preferences and initial capital position are the criteria to decide whether a bank should increase or decrease its incentive to hedge the risk exposure (Morgan & Smith, 1987). A study conducted by Jaseviciene and Jurksaityte (2014) in commercial bank of Lithuania suggested five statistically significant variables that have impacts on banks’ capital adequacy changes: the influence of management, the bank’s size, return on assets, assets weighted by risk assets ratio and all assets ratio and asset growth. Bank management decision factor by far has the largest impact (negative) on the capital adequacy in view of the conditions existing in the market. The influence of the size of the bank on the capital adequacy ratio once again proves how important in the Lithuanian banking sector is systemic risk management.
Except for Belgium and Scandinavia, the volatility of banks’ equity for most European countries is following on the introduction of Basel I in European countries (Ford & Weston, 2003). Before the implementation of Basel I, the risk adjusted return for these countries was very high. This suggests that these banks were originally undercapitalised relative to the risk exposure in the pre-Basel
Period. Before the introduction of the Basel Accord, a pre-Basel capital requirement was implemented by central bank to limit the bank risk taking. The cost of recapitalisation is one of the themes in the banking system’s feedback to risk based capital requirement (Stolz, 2002). A study by Krainer (2002) links the risk based capital requirements of Basel accord to the agency conflict between the bank creditor and depositors.
Minimum capital requirement is only one of the components of bank regulations. A study has been done on international banks to differentiate the impacts of capital requirements and individual country specific factors (Allen & Rai, 1996). Two opposing effects were found. One indicates a positive relationship between banks’ risk and capital levels while the other indicates a negative association. For banks with stronger safety nets, their risk increases as they reduce their capital levels. However, in countries with inadequate safety nets, banks normally increase their capital levels (thereby reducing risk) in order to maximise bank’s charter value. The increase in the cost of raising the capital could inhibit an already constrained bank from complying with the new capital requirement. Consequently, banks increase their capital ratio by lowering the size of the loan portfolio and moving towards lower risk securities such as government bond and treasury bills to lower the capital requirement (Laderman, 1994). On the contrary, Hancock and Wilcox (1994) found that capital deficient banks move their portfolio toward high risk assets. Calem and

Pertanika J. Soc. Sci. & Hum. 23 (S): 205 – 218 (2015)
J. L. Chia, Yahya, M. H. and Muhammad, J.
212
Rob (1996) discovered that the relationship between bank risk and capital requirements is a U-shaped function of the initial capital position of the bank. Reducing the risk will help the undercapitalised banks to avoid insolvency while well-capitalised banks tend to increase the value of their equity by taking on higher risk equity.
METHODOLOGY
This study investigated the effects of capital standards by examining the profitability or market reaction on the banking industry, following the imposition of new capital standard requirements, Basel III. The event study method was used to investigate the effects of the Basel accord on banks’ share prices. An event study is concerned with the impact of an event on corporations. If an
event has an impact on the value of a firm, it will be reflected in the firm’s security prices, manifesting it in abnormal security returns. In order to appraise the impact on the banking sector, the effects or abnormal return resulting from the Basel III announcement were measured via an event study.
The sample includes the common equity of all Malaysian banks which common shares are traded on Kuala Lumpur Stock Exchange Main Board. The daily stock prices of the banks, during the announcement period and a 120-day estimation period prior to the date (of the first public announcement), were selected. The banks which have at least one price missing is eliminated from the consideration. The final sample included 7 major local banks in Malaysia, as listed in Table 2 by order of asset size and market capital.
TABLE 2Sample of Malaysia Banks
Local Banks Asset Size (RM Bil) Market Cap (RM Bil)Malayan Banking Berhad 330.9 62.1CIMB Bank Berhad 264.9 58.5Public Bank Berhad 222.6 45.3AmBank Berhad 127.2 18.3RHB Bank Berhad 94.8 16.2Affin Bank Berhad 46.2 4.8Alliance Bank 31.2 4.5
The daily abnormal returns were calculated in the periods surrounding three regulatory announcements related to the imposition of higher global minimum capital requirements. The first event was on 12 September 2010, during which the announcements of a substantial strengthening of existing capital requirements and introduction of
global liquidity standard of Basel III were made. The second event was on 14 December 2012, when the report on the progress of Basel III implementation was presented. A large number of countries intended to introduce the new capital requirements in 2013. A brief description of these announcements is listed below.

Pertanika J. Soc. Sci. & Hum. 23 (S): 205 – 218 (2015)
The Impact of Basel III on Malaysian Stock Performance
213
TABLE 3Announcement dates of the important events on Capital requirement
Important event in the change of Capital requirement
Event no. Event Date Description1) 12-Sep-10 Group of Governors and Heads of Supervision announces higher
global minimum capital standards.
2) 14-Dec-12 Implementation of the Basel III Framework
A market model approach was used to obtain abnormal returns in the weeks surrounding these announcements. Abnormal return is a return over a period of time that is different from the expected rate of return under the consideration that the event had not taken place. Mathematically the abnormal return is expressed as:
ARit = Rit – E (Rit|Xt) 1)
where,i = ith bank t = date ARit = abnormal return Rit = actual return E (Rit|Xt) = normal return Xt = the conditioning information
for the normal model (in the market, model Xt is the
market return).
This model assumes that the relationship between the market and security returns is linear. It assumes that the return of the market portfolio Rmt is related to a stock return. The calculation for the actual return for stock i during time t for the market model is:
Rit = αt + βt Rmt 2)
where,Rit = return for share i
Rmt = return for the market portfolio m for time period t
αt = average return of the firm compared to the market average
βt = sensitivity of the firm’s return to the market return
The event window is divided into time periods. Each time period is divided into three categories: a) the period 120 days prior to the event window, b) a “moving window” which includes periods both before and after the event window, and c) the period after the event. Event studies are usually more effective when event windows are fairly short.
Residuals are aggregated over time, as well as across securities to cater for any delays in receiving the new information. These sums of the total residuals are known as Cumulative Average Residuals (CARt). These cumulative average residuals determine cumulative effects over time from the start of the testing period to any given event period date t:
FINDINGS
Table 4 shows the regression analysis results for the estimated coefficients for the market model (β).

Pertanika J. Soc. Sci. & Hum. 23 (S): 205 – 218 (2015)
J. L. Chia, Yahya, M. H. and Muhammad, J.
214
TABLE 4Beta and Alpha Analyses for the Sample Banks
Regression Analysis for Sample BanksLocal Banks α β
Malayan Banking Berhad -3.3361 0.0076
CIMB Bank Berhad -3.7081 0.0117
Public Bank Berhad 0.1512 0.0078
AmBank Berhad -1.8804 0.0048
RHB Bank Berhad 0.4710 0.0032
Affin Bank Berhad -0.0930 0.0016
Alliance Bank -0.3864 0.0023
The abnormal returns for announcements 1 and 2 are presented in Tables 5 and 6. The average abnormal returns on the banking stock price on days -7, -6, -5, -4, -3, -2, -1 related to the first announcement are -0.4078 percent, -0.4427 percent, -0.3370 percent, -0.3472 percent, -0.3721 percent, -0.3414 percent, and -0.3616 percent, respectively, all of
which are significantly different from zero. For days 1, 2, 3, 4, 5, 6, 7 for the first announcement, the abnormal returns are -0.4108 percent, -0.4040 percent, -0.3708 percent, -0.3844 percent, -0.4351 percent, -0.4325 percent and -0.3386 percent, respectively. Notice that most of the banks have positive abnormal returns, except for CIMB Bank and Alliance Bank.
TABLE 5Abnormal Return for Event 1
Time Line MaybankCIMB Bank
Public Bank AmBank RHB Bank Affin Bank
Alliance Bank Mean
7 0.2159 -5.3854 0.2982 0.3018 1.5266 0.7441 -0.0713 -0.33866 0.0798 -5.5898 0.1889 0.2516 1.4335 0.7181 -0.1099 -0.43255 0.1004 -5.5742 0.1893 0.2356 1.4195 0.6962 -0.1127 -0.43514 0.1081 -5.5408 0.2981 0.2659 1.4796 0.7660 -0.0681 -0.38443 0.0487 -5.5890 0.3192 0.3590 1.5283 0.7503 -0.0118 -0.37082 0.0034 -5.6588 0.2729 0.3303 1.5092 0.7409 -0.0257 -0.40401 -0.0079 -5.6762 0.1313 0.4131 1.5145 0.7386 0.0108 -0.41080 -0.0056 -5.6023 -0.0331 0.4972 1.5701 0.7359 -0.0587 -0.4138-1 0.0495 -5.4686 0.0957 0.5395 1.5912 0.7059 -0.0442 -0.3616-2 0.0770 -5.4262 0.1239 0.5571 1.6028 0.7116 -0.0358 -0.3414-3 0.0760 -5.4277 0.1129 0.4564 1.5224 0.7114 -0.0561 -0.3721-4 0.1229 -5.3825 0.0497 0.5545 1.5511 0.7107 -0.0370 -0.3472-5 0.1154 -5.3940 0.0420 0.5797 1.6279 0.7092 -0.0393 -0.3370-6 -0.0354 -5.5670 0.0201 0.4837 1.3307 0.7007 -0.0319 -0.4427-7 -0.0565 -5.5508 0.0908 0.5276 1.3797 0.7350 0.0193 -0.4078

Pertanika J. Soc. Sci. & Hum. 23 (S): 205 – 218 (2015)
The Impact of Basel III on Malaysian Stock Performance
215
For announcement 2, notice that the average abnormal stock return on -7, -6, -5, -4, -3, -2, -1 and 1, 2, 3, 4, 5, 6, 7 related to the second announcement are -.0444 percent, -0.0365 percent, -0.0437 percent, -0.1278 percent, -0.1415 percent, -0.1755
percent, -0.1707 percent, and -0.1504 percent, -0.2007 percent, -0.2180 percent, -0.2441 percent, -0.1503 percent, -0.2174 percent, -0.2010 percent, respectively. Maybank and CIMB bank demonstrated negative returns.
TABLE 6Abnormal Return for Event 2
Time Line Maybank CIMB
BankPublic Bank AmBank RHB Bank Affin Bank Alliance
Bank Mean
7 -0.2392 -8.1451 3.0620 0.4441 1.8768 0.8605 0.7342 -0.20106 -0.2527 -8.1297 2.9190 0.4346 1.8837 0.8639 0.7592 -0.21745 -0.1629 -7.9567 3.0208 0.4854 1.8873 0.8904 0.7837 -0.15034 -0.3118 -8.1237 2.8896 0.4089 1.8499 0.8320 0.7464 -0.24413 -0.2143 -8.0858 2.9281 0.3827 1.8457 0.8498 0.7679 -0.21802 -0.1774 -8.0435 2.9562 0.3926 1.8455 0.8394 0.7823 -0.20071 -0.1152 -7.9369 3.0005 0.4249 1.9200 0.8564 0.7975 -0.15040 -0.0909 -7.9865 2.9541 0.4185 1.9092 0.8711 0.7596 -0.1664-1 -0.0967 -7.9655 2.9281 0.4048 1.9068 0.8699 0.7578 -0.1707-2 -0.0941 -7.9305 2.8514 0.4392 1.9163 0.8746 0.7147 -0.1755-3 -0.0222 -7.8351 2.8948 0.4386 1.9124 0.8874 0.7337 -0.1415-4 0.0491 -7.7753 2.8279 0.4839 1.8824 0.8921 0.7455 -0.1278-5 0.1879 -7.6076 2.8995 0.5932 1.9281 0.9246 0.7688 -0.0437-6 0.1795 -7.5996 2.8714 0.6106 1.9730 0.9070 0.8024 -0.0365-7 0.1880 -7.6312 2.8903 0.5423 1.9108 1.0108 0.7780 -0.0444
A non-parametric Wilcoxon Rank Sum Test was performed to test for any significant differences of the abnormal returns before and after the event. The null hypothesis is that there is no difference in the abnormal return before and after the event. The result of the test is shown in Table 7. The result indicates that there is enough evidence to reject the null hypothesis due to high p-value. For the second announcement, the Wilcoxon test also showed significant evidence to reject the null hypothesis and prove that there is a significant difference
between the stock return before and after the announcement. However, some of the negative abnormal return on bank stock indicates that the market assumes that the announcement will lead to a reduction in profit gain.
TABLE 7Z, P Value & CAR for Announcements 1 & 2
Announcement 1 Announcement 2
Z -0.3194 -2.2361P Value 0.6249 0.9873CAR -5.7999 -2.2883

Pertanika J. Soc. Sci. & Hum. 23 (S): 205 – 218 (2015)
J. L. Chia, Yahya, M. H. and Muhammad, J.
216
CONCLUSION
The overall objective of this paper is to determine any abnormal stock return during the announcement of BASEL III on Malaysia Banking firms. The individual bank’s results for the event studies are inconsistent. Some banks like Am Bank, RHB bank and Affin Bank showed a positive return for both announcements. However, the returns for Maybank, CIMB Bank, Public Bank and Alliance bank are mixed. Looking at the average return for both the announcements, a negative return was obtained for both. The magnitude of negative return for most of the banks is higher than positive return. The results also suggested that market view the imposition of high capital requirement with disapproval. The market expects that with the introduction of the new Basel accord, the banking stock prices will drop. In general, the impact of Basel III is strongly dependent on its future implementation. For example, bond markets are likely to have a positive impact. This is because increase in the capital requirement by regulation will ultimately make bonds a safer investment. Even if the performance of economy is slow, the stability of financial system will be able to sustain the confidence level of investor towards bond market. It is undeniable that the implementation of Basel III will increase transparency, growth and financial strength of the banks. Eventually, it will lead to banks’ profitability and stability over the years.
REFERENCESAl-Hares, O. M., AbuGhazaleh, N. M., & El-Galfy,
A. M. (2013). Financial Performance and Compliance with Basel III Capital Standards: Conventional vs. Islamic Banks. The Journal of Applied Business Research (JABR), 29(4), 1031-1048.
Allen, L., & Rai, A. (1996). Bank Charter Values and Capital Levels: An International Comparison. Journal of Economics and Business, 48(3), 269-284.
Avery, R. B., & Berger, A. N. (1991). Risk-Based Capital and Deposit Insurance Reform. Journal of Banking and Finance, 15(4), 847-874.
Biase, P. D. (2012). The Impact of Basel III on Italian Banks’ Loan Rates: An Accounting-Based Approach. International Business & Economics Research Journal(IBER), 11(11), 1269-1280.
Calem, P. S., & Rob, R. (1996). The Impact of Capital-Based Regulation on Bank Risk-Taking: A Dynamic Model (pp. 96-107). Federal Reserve Board.
Chami, M. R., & Cosimano, M. T. F. (2001). Monetary Policy with a Touch of Basel (No. 1-151). International Monetary Fund.
Chiuri, M., Giovanni, F., & Majnoni, G. (2002). The Macroeconomic Impact of Bank Capital Requirements in Emerging Economies: Past Evidence to Assess the Future. Journal of Banking and Finance, 26(5), 881-904.
Cooper, K., Kolari, J., & Wagster, J. (1991). A Note on the Stock Market Effects of the Adoption of Risk-based Capital Requirements on International Banks in Different Countries. Journal of Banking and Finance, 15(2), 367-381.

Pertanika J. Soc. Sci. & Hum. 23 (S): 205 – 218 (2015)
The Impact of Basel III on Malaysian Stock Performance
217
Eyssell, T., & Arshadi, N. (1990). The Wealth Effects of the Risk-based Capital Requirement in Banking: The Evidence from the Capital Markets. Journal of Banking and Finance, 14(1), 179-197.
Ford, G., & Weston, R. (2003). Risk-Adjusted Performance of European Banks under the Basel Accord. EFMA 2003 Helsinki Meetings.
Hancock, D. & Wilcox, J. (1994). Bank Capital and the Credit Crunch: The Roles of Risk-Weighted and Unweighted Capital Regulations. Journal of American Real Estate and Urban Economics Association, 22(2), 59-94.
Jackson, P., Furfine, C., Groenveld, H., Hancock, D., Jones, D., Perraudin, W., Radecki, L., & Yoneyama, M. (1999). Capital Requiremetns and Bank Behavior: The Impact of the Basel Accord. Basel Committee on Banking Supervision Working Paper, Bank of International Settlements, April.
Jaseviciene, F. & Jurksaityte, D. (2014). The New Capital Adequacy Framework (Basel III) Options and Issues in Commercial Banks of Lithuania. Ekonomika, 93(4), 119-134.
Juliusz, J. (2009). The Impact of Basel I Capital Requirements on Bank Behavior and the Efficacy of Monetary Policy. International Journal of Economic Sciences and Applied Research, 2(1), 16-35.
Keeton, W. R. (1989). The New Risk-Based Capital Plan for Commercial Banks. Federal Reserve Bank of Kansas City Economic Review, 74(10), 40-60.
Kerry, C., James, K., & John, W. (1991). A note on the stock market effects of the adoption of risk-based capital requirements on international banks in different countries. Journal of Banking and Finance, 15(2), 367-381.
Kim, M. S., & Kross, W. (1998). The Impact of the 1989 Change in Bank Capital Standards on Loan Loss Provisions and Loan Write-offs. Journal of Accounting and Economics, 25(1), 69-99.
Krainer, R. E. (2002). Banking in a Theory of the Business Cycle: A Model and Critique of the Basel Accord on Risk-Based Capital Requirements for Banks. International Review of Law and Economics, 21(4), 413-433.
Laderman, E. S. (1994). Wealth Effects of Bank Holding Company Securities Issuance and Loan Growth under the Risk-Based Capital Requirements. Federal Reserve Bank of San Francisco Economic Review, 2, 30-41.
Morgan, G. E., & Smith, S. D. (1987). The Role of Capital Adequacy Regulation in the Hedging Decisions of Financial Intermediaries. Journal of Financial Research, X, Spring, 10(1), 33-46.
Stolz, S. (2002). The Relationship Between Bank Capital, Risk-Taking and Capital Regulation: A Review of the Literature. Kiel Institute for World Economics Working Paper (No. 1105), February.
Thakor, A. V., & Wilson, P. F. (1995). Capital Requirements, Loan Renegotiation and the Borrower’s Choice of Financing Source. Journal of Banking and Finance, 19(3), 693-711.
Vasile, D., & Costin, N. (2012). Basel III – Between Global Thinking and Local Acting. Theoretical and Applied Economics, 18(6), 5-12.


Pertanika J. Soc. Sci. & Hum. 23 (S): 219 – 236 (2015)
ISSN: 0128-7702 © Universiti Putra Malaysia Press
SOCIAL SCIENCES & HUMANITIESJournal homepage: http://www.pertanika.upm.edu.my/
ARTICLE INFOArticle history:Received: 30 March 2015Accepted: 10 September 2015
E-mail addresses:[email protected] / [email protected] (Fakarudin Kamarudin),[email protected] (Fadzlan Sufian),[email protected] (Annuar Md. Nassir),[email protected] (Nazratul Aina Mohamad Anwar)* Corresponding author
Technical Efficiency and Returns to Scale on Banking Sector: Empirical Evidence from GCC Countries
Fakarudin Kamarudin1*, Fadzlan Sufian2, Annuar Md. Nassir1,3 and Nazratul Aina Mohamad Anwar 1
1Department of Accounting and Finance, Faculty of Economics and Management, Universiti Putra Malaysia, 43400 Serdang, Selangor Darul Ehsan, Malaysia2Taylor’s University, Lakeside Campus, 1 Jalan Taylor’s, 50088, Subang Jaya, Selangor Darul Ehsan, Malaysia3Financial Economics Research Center, Faculty of Economics and Management, Universiti Putra Malaysia, 43400 UPM Serdang, Selangor, Malaysia
ABSTRACT
This paper investigates the efficiency level of Gulf Cooperation Council (GCC) banks on technical efficiency (TE), pure technical efficiency (PTE) and scale efficiency (SE). Both PTE and SE represent potential factors that influence the efficiency of GCC banks. This study investigates a total of 43 GCC banks over the time period of 2007 to 2011. Data Envelopment Analysis (DEA), a non-parametric method using variable returns to scale (VRTS) under the Banker, Charnes, and Cooper (BCC) model, was applied, with assets and deposit as input, and loan and income as output. On average, results revealed that GCC Banks operate with an optimal scale. Nevertheless, the results were contaminated by the managerial inefficiency in utilising the recourses, although TE, or managerial efficiency, increased to 83.6% in 2011. Furthermore, the results also indicated that, while larger banks (the 22 largest) tend to operate at constant returns to scale (CRS) or decreasing returns to scale (DRS), smaller banks (the 21 smallest) were susceptible to operate at either CRS or increasing returns to scale (IRS).
Keywords: Technical efficiency, pure technical efficiency, scale efficiency, returns to scale, bank, Gulf Cooperation Council
INTRODUCTION
The Gulf Cooperation Council (GCC) was established in an agreement that took place on May 25th, 1981, in Riyadh, Saudi Arabia. The GCC bloc comprises of Bahrain, Kuwait, Oman, Qatar, Saudi Arabia and the United Arab Emirates

Pertanika J. Soc. Sci. & Hum. 23 (S): 219 – 236 (2015)
Fakarudin Kamarudin, Fadzlan Sufian, Annuar Md. Nassir and Nazratul Aina Mohamad Anwar
220
(UAE). The six member countries declared that the aim of the GCC is to establish, in view of the special relations between them, joint destiny, common objectives and also similarity of political systems based on the Islamic belief.
The GCC has acquired remarkable financial wealth through their oil markets since the 1970’s, a period during which these markets have prospered. To enhance the economics of the GCC, the well-functioning financial system is an important one for economic growth. The links between financial intermediation and economic growth focus on the key functions of financial systems in the saving-investment-growth nexus. Nissanke and Stein (2003) asserted that these include effective channelling funds from surplus to deficit units, ensuring an efficient transformation of funds into real productive capital. According to Levine (1998), the efficiency of financial intermediation affects a country’s economic growth, and, at the same time, the bank (financial intermediation) insolvencies could result in systemic crises which have negative consequences on the economy as a whole. The financial intermediation also changes the maturity of the portfolios of savers and investors, while providing sufficient liquidity to the system as the need arises. In addition, the diversification and techniques of risk sharing and pooling affect the reduction of risks. The banking sector in GCC countries is one of the most important mechanisms of their financial system. In maintaining
the stability of the banking system, a sustainable and healthy profitability is significantly important.
Nevertheless, there are many challenges that may have a significant impact on their ability to grow and operate within a more competitive environment. First, the sector is heavily dependent on oil sector activities. Oil still represents a very large portion of their export earnings and budget revenues. As a result of the over-dependence on oil, and the dominance of the public sector, growth in the region remains vulnerable to the vagaries of world oil markets and fluctuation in oil prices. The investors uncover limited profitable investment opportunities offered by the scope, from a few sectors such as real estate, trade and stock market activities. Therefore, banks restricted to focus on bank lending mainly in consumer loans, real estate, construction and trade finance. Second, the GCC has reduced competitive pressure on domestic banks through over-protection from foreign competition. However, GCC banks are expected to face massive competitive pressure from foreign banks since their eventual commitment to liberalise many financial services including banking through their membership in the World Trade Organisation (WTO). Finally, GCC banks are experiencing pressure to fulfil the increasing demand of international standards in terms of risk management, capital adequacy and accounting practise.
The capability of the GCC banks to face all these challenges depends on how efficiently they are performing. However,

Pertanika J. Soc. Sci. & Hum. 23 (S): 219 – 236 (2015)
Technical Efficiency and Returns to Scale on Banking Sector: Empirical Evidence from GCC Countries
221
very few research works have been carried out on the efficiency of the GCC banking sector. This study aims to investigate the technical efficiency (TE), pure technical efficiency (PTE) and scale efficiency (SE) of GCC banks. Furthermore, the technical inefficiency (TIE) of the GCC banks could be discovered through pure technical inefficiency (PTIE) or scale inefficiency (SIE). PTE represents managerial efficiency, while SE refers to the scale or size of operational efficiency. TE measures the proportional reduction in input usage that can be attained if the bank operates on the efficient frontier, or if the effectiveness of the limited set of inputs is used to produce maximum outputs. TE is related to managerial factors (Isik & Hassan, 2002). Meanwhile, PTE is the measurement of TE devoid of the scale efficiency or firm’s SE effects (Coelli, 1998).
All this information is of value and benefit to investors, managers and consumers. This study also employed the non-parametric data envelopment analysis (DEA) method. Rickards (2003) discovered that, although widely employed to evaluate bank efficiency in the West, DEA is less known within the banking sector in developing countries, including the GCC countries. This study attempted to fill in this gap via several investigations on the efficiency of GCC banks using recent data (2007-2011). Additionally, this study also contributes in the methodology part by applying the DEA methods.
The study is set out as follows: the next section provides the related literature in
terms of the efficiency of banks throughout the world, and the use of the DEA method in evaluating a bank’s efficiency. Most of the works in the body of literature focus more on Islamic banking since most of the banks in GCC countries are also based on the Islamic banking system. Section 3 outlines the approach to the measurement of banks’ TE, PTE and SE, and data used to construct the efficiency frontiers. Section 4 discusses the results, and finally, the paper concludes in section 5.
LITERATURE REVIEW
Ramanthan (2007) examined the performance of banks operating in the six countries of the Gulf Cooperation Council (GCC). This study employed the DEA method on data recorded during the time period of 2000 to 2004. Only 15 of the 55 banks are rated as efficient under constant returns to scale (CRS), or TE. The number of efficient banks has nearly doubled to 27 under variable returns to scale (VRS), or PTE, and the additional 12 banks could not register unit CRS efficiencies due to size limitations (also known as scale inefficiency). Further analysis has shown that the selected banks in all six countries have registered the same efficiencies for a five-year period (2000 to 2004). There was a significant increase in the TE of selected banks in Bahrain, Kuwait, Oman, Qatar, Saudi Arabia and UAE during the time period of 2000 to 2004.
Srairi (2010) found that Islamic banks in GCC countries, on average, are less cost and profit efficient compared

Pertanika J. Soc. Sci. & Hum. 23 (S): 219 – 236 (2015)
Fakarudin Kamarudin, Fadzlan Sufian, Annuar Md. Nassir and Nazratul Aina Mohamad Anwar
222
to conventional banks. There are several reasons that may explain the lower cost and profit efficiencies of these Islamic banks. The main factor that leads to the lower efficiency in the Islamic banks is their size. They discover that the size of the average Islamic bank is smaller than that of a conventional bank. Olson and Zoubi (2008) examined the performance of Islamic and conventional banks in the GCC country banking sectors by using five different accounting ratios categories, namely, profitability, efficiency, credit risk, liquidity, and risk ratios. They concluded that Islamic banks are more profitable than their conventional counterparts.
Yudistira (2004) conducted an analysis of the efficiency levels of Islamic Banking in an empirical analysis of 18 Islamic banks during the period of 1997-2000, which were made available by the London-based International Bank Credit Analysis LTD’s BankScope database. The samples were grouped by total assets in which banks with assets worth over $600 million were categorised as large sized banks, and banks below this level were categorised as small-to-medium sized banks. Concentrating on SE, it is clear that the largest degrees of SIE come from large size Islamic banks (i.e., DRS). It is worthy to note that all but one of the large size Islamic banks in 1997 to 1998 exhibited DRS, whilst in 1999 to 2000, most large size banks showed CRS. The level of TIE in 1998 is more attributable to PTIE than SIE.
Size (SE) and technology are also important considerations. Research by
Ferrier and Lovell (1990) on a sample of 575 US commercial banks found that 88% exhibited IRS (a result which supports our choice of the VRTS variant of the DEA model). Somewhat surprisingly, the most efficient banks in the sample belonged to the smallest sized class. This was attributed to the successful application of technology, which allowed smaller banks to overcome capital cost disadvantages and distribute products more effectively. The results proved that the banks were higher in PTE compared to SE.
The earliest attempt to use DEA for banking was reported by Sherman and Gold (1985) in the context of evaluating different branches of a bank. Subsequently, there are several studies that have also applied the DEA method in measuring the banking sector’s efficiency. Due to the heavy concentration on the US, DEA has quickly become a popular method in evaluating the financial institutions’ efficiency among researchers in other nations. The DEA method was widely used to evaluate banking institutions during the late 1980s, and particularly in the 1990s. Berger and Humphrey (1997) discovered 130 studies on the efficiency of the banking sector in 21 countries; among them, 116 were published between 1992 and 1997.
The DEA method was used by Alirezaee et al. (1998) to examine a number of bank branches in Canada comprising data on 1,282 banks. They suggested that the average branch efficiency score varied inversely with the number of branches in the sample, and directly with the total number

Pertanika J. Soc. Sci. & Hum. 23 (S): 219 – 236 (2015)
Technical Efficiency and Returns to Scale on Banking Sector: Empirical Evidence from GCC Countries
223
of inputs and outputs. In fact, there are many studies that applied the DEA method to identify the efficiency of the banks (e.g., Vassiloglou & Giokas, 1990; Sherman & Ladino, 1995; Golany & Storbeck, 1999; Kantor & Maital, 1999) in the context of evaluating branches of a bank. Meanwhile, other studies compared the performance of different banks in various countries using the DEA method [e.g., Darrat et al. (2002) in Kuwait; Wheelock & Wilson (1999) in the USA; Saha & Ravisankar (2000) in India; Stanton (2002) in Canada; Brown (2001) in Australia; Mercana et al. (2003) in Turkey].
As a conclusion, based on the works mentioned above, most International Islamic banks face a similar problem, where their PTIE outweighs their SIE. In other words, although Islamic banks have been operating on a relatively optimal scale of operations, they were managerially inefficient to exploit their resources. On the other hand, the opposite is true for international conventional banks. Most of these studies have presented inefficiency from the scale side (wrong scale of operations). This indicates that large and small sized banks normally operated under IRS and DRS. However, the number of research works on the TE, PTE and SE in GCC banks is limited, since most of the literature covered focuses on developed countries. There is therefore a gap in the literature created by the majority of these studies, which have mainly concentrated on the TE, PTE, SE, cost efficiency and profit efficiency of the banking sectors
in developed countries. Meanwhile, few works have been devoted to investigate the technical efficiency concepts of the GCC banking sector, which presents the most important efficiency concept, since it may influence the profitability of the banks. In light of this gap in the related literature, this study seeks to provide the empirical evidence, particularly on TE, PTE and SE in the GCC banking sector.
METHODOLOGY
Sources of Data
The present study gathered data from a list of top 43 commercial GCC banks from 2007 to 2011. The primary source for financial data was obtained from the BankScope database produced by the Bureau van Dijk which provided the banks’ balance sheets and income statements. Bankscope database contains specific data on 25,800 banks world-wide, including commercial banks in GCC countries. Furthermore, BankScope database presents the original currencies’ data of the specific countries and provides the option to convert the data to any other currencies. The data are updated monthly. United States Dollar (USD) is used in this study since the study involved six countries in GCC bloc in order to maintain the homogeneity.
Data Envelopment Analysis (DEA)
This non-parametric efficiency measurement approach developed by Farrell (1957) defines a simple measure of firm efficiency which is capable to measure

Pertanika J. Soc. Sci. & Hum. 23 (S): 219 – 236 (2015)
Fakarudin Kamarudin, Fadzlan Sufian, Annuar Md. Nassir and Nazratul Aina Mohamad Anwar
224
for multiple inputs. Technical efficiency and allocative efficiency are two components proposed by Farell (1957) that consist in the firm’s efficiency components. The combination of both efficiency components produces the overall efficiency. Farrell’s (1957) concept can best be illustrated by a single output and two input case, in the unit isoquant diagram.
In this study, the GCC banks are modelled as multi-product firms producing two outputs and two outputs (Ariff & Can, 2008; Kamarudin et al., 2014a; 2014b; 2013; Sufian et al., 2014; 2013a; 2013b;
2012; Sufian & Kamarudin, 2014) using intermediation approach. Outputs consist of total loans (y1), which include short-term loan and long-term loan and income (y2), which include income derived from investment of depositors’ funds and other income from banking operations. Meanwhile, two inputs selected, namely, total asset (x1), which include cash and short-term funds and other assets and the last is deposit (x2) that include deposit from customers and other banks. All the variables were measured in United States Dollar (USD) (refer Table 1).
TABLE 1Summary statistics of the Variables input and output in the DEA model(in million USD)
Year Loan (y1) Income (y2) Asset (x1) Deposit (x2)2011 Min 30.700 5.950 322.507 125.913
Max 54017.420 2954.368 82954.757 69172.564Mean 15846.848 939.826 25779.872 20073.932SD 13424.152 783.064 21559.059 17405.487
2010 Min 34.212 1.426 231.290 86.244Max 38256.637 2739.780 75299.204 64931.177Mean 14573.653 920.431 23783.797 18420.388SD 11497.315 750.079 18876.693 15181.320
2009 Min 50.907 4.533 300.558 127.615Max 36736.773 2779.680 68653.924 58175.310Mean 13941.828 966.232 22489.905 17521.954SD 10753.566 735.521 17363.273 14074.479
2008 Min 7.800 9.784 344.628 131.183Max 37265.786 3178.320 59147.203 49215.469Mean 13770.485 1073.880 21959.831 17381.946SD 10368.568 801.027 15975.606 12880.195
2007 Min 50.916 8.059 413.553 158.608Max 27716.514 2817.517 55732.230 45744.299Mean 10673.287 980.716 18857.663 14800.455SD 7926.643 733.803 13723.864 11192.612
Sources: Bankscope database and authors’ own calculations.

Pertanika J. Soc. Sci. & Hum. 23 (S): 219 – 236 (2015)
Technical Efficiency and Returns to Scale on Banking Sector: Empirical Evidence from GCC Countries
225
Fig.1 is a conventional isoquant/ isocost graph for a single output being produced by two inputs. The unit isoquant (yy’) shows various combinations of the two inputs (x1, x2) which can be used to produce 1 unit of the single output (y). The Decision Making Unit (DMU) at E is productively (or overall) efficient in choosing the cost minimising production process given the relative input prices (represented by the slope of the isocost WW’). As illustrated in Figure 1, the ratio OQ/OR measures the technical efficiency of the production at point R, whereas OQ/OR compares the minimum input required for the production of one unit to the observed input usage in the firm. Thus, 1-OQ/OR measures the proportion of inputs that could be reduced without reducing output. Hence,
ROQOET =
The ratio OP/OQ measures allocative efficiency of the firms input usage. The costs in point P are equal to the costs in the overall productively efficient point E but lower than in point Q. The ratio of 1-OP/OQ then measures the possible input savings that could be reduced if the inputs were used in the right proportions. Hence,
QOPOEA =
A measure for overall efficiency (productively efficient) can be obtained by adding technical and allocative efficiency together. In Figure 1, the total efficiency is represented by the ratio of OP/OR. Total inefficiency reveals total waste of inputs, thus shows how much costs could be
reduced if the firm operates at the efficient point E instead of point R. Hence,
ROPOEO =
In short, a DMU at Q is allocatively inefficient in choosing an appropriate input mix, while a DMU at R is both allocatively (in the ratio of OP/OR) and technically inefficient (in the ratio of OQ/OR), resulted from excessive amount of both inputs usage (x1 and x2) compared to the DMU at Q in producing the same level of output (y).
W’
W
P
R
0
E
y'
x2
Q
S
y
x1
Fig.1: Farrell Technical Efficiency
The extensions to multiple inputs and/or outputs can easily be achieved through the use of parametric or non-parametric approaches. Bauer et al. (1998) pointed out that these approaches differ in terms of the assumptions made about the shape of the frontier, the treatment of random error and the distributions assumed for inefficiency and the random error.
The non-parametric Data Envelopment Analysis (DEA) method was employed

Pertanika J. Soc. Sci. & Hum. 23 (S): 219 – 236 (2015)
Fakarudin Kamarudin, Fadzlan Sufian, Annuar Md. Nassir and Nazratul Aina Mohamad Anwar
226
with the variable returns to scale (VRS) model to measure input-oriented technical efficiency of GCC banks. The VRS model was proposed by Banker, Charnes and Cooper (1984). The BCC model (VRS) extended the CCR model proposed by Charnes, Cooper and Rhodes (1978). The CCR model presupposes that there is no significant relationship between the scale of operations and efficiency by assuming CRS and it delivers OE or TE. The CRS assumption is only justifiable when all DMUs (decision making unit) are operating at an optimal scale. However, firms or DMUs in practice might face either economies or diseconomies of scale. Thus, if one makes the CRS assumption when not all DMUs are operating at the optimal scale, the computed measures of TE will be contaminated with SIE.
Banker, Charnes and Cooper (1984) extended the CCR model (CRS) by relaxing the CRS assumption. The resulting BCC model was used to assess the efficiency of DMUs characterised by VRTS. The VRTS assumption provides the measurement of PTE, which is the measurement of TE devoid of the SE effects. In fact, the TE measure the efficiency of the DMU’s managerial. The PTE measure the efficiency of the DMU’s pure managerial without contaminated by scale. Meanwhile, the SE measures the size of the DMU. If there is a difference between the TE and PTE scores of a particular DMU, it then indicates the existence of SIE (Coelli, 1996). The score of TE will take a value between zero and
one. If the score shows less than one, it indicates that DMU is relatively and technically inefficient and not operating at the efficiency frontier. On the other hand, DMU is considered as fully technically efficient if the TE’s score shows the value of one (i.e., operating at the efficiency frontier).
The Constant Returns to Scale Model (CRS) under the CCR model
Assume there are data on K inputs and M outputs on each of N firms or DMU’s. For the i-th firm or DMU, these are represented by the column vectors ix and iy , respectively. The K x N input matrix, X and the M x N output matrix, Y represent the data for all N firms or DMU’s. For each firm, all outputs were measured over all inputs in the form of ratios as ii xvyu ′′ / , where u is an M x 1 vector of output weights and v is a K x 1 vector of input weights. As such, the following mathematical programming is used to solve the optimal weight (Coelli et al., 1998):
( )
.0,
,,2,1,1/subject to,/max ,
≥
=≤′′
′′
vuNjxvyu
xvyu
jj
iivu
(1)
One problem with this particular ratio formulation is that it has infinite number of solutions as the original mathematical formulation is not linear. Thus, to avoid this, one can impose the constraint ixv′ , which provides:

Pertanika J. Soc. Sci. & Hum. 23 (S): 219 – 236 (2015)
Technical Efficiency and Returns to Scale on Banking Sector: Empirical Evidence from GCC Countries
227
( )
,0,
,,,2,1,0subject to
,1,max ,
≥
=≤′−′
=′′
vNjxvy
xvty
jj
iiv
µ
µ
µµ
(2)
Where the change of notation from u and v toµ and v is used to stress that this is a different linear programming problem. Using the dual form of the above problem, one can derive an equivalent envelopment form as:
,0,0,0- subject to
,min ,
≥≥−≥+
λλθλ
θλθ
XxYy
i
i
(3)
Where,θ is a scalar andλ is a 1×N vector of constant.
This envelopment form involves fewer constraints than the multiplier form( )1+<+ NMK , and hence is generally the preferred form to solve (Coelli et al., 1998).
The Variable Returns to Scale Model (VRS) and Scale Efficiency (SE) Under the BCC model
The Variable Returns to Scale Model (VRS)
The CSR linear programming problem could be simply modified to account for VRS by adding the convexity constraint: N
11 =′λ to equation 3 to provide (Coelli et al., 1998):
,min , θλθ
,011,0,0- subject to
≥=′≥−≥+
λλλθλ
NXxYy
i
i
Where,
N1 is a 1×N vector of ones (4)
This approach forms a convex hull of intersecting planes which envelope the data points more tightly than the CRS conical hull and thus provides technical efficiency scores greater than or equal to those obtained using the CRS model.
Calculation of Scale Efficiencies (SE)
TE scores obtained from a CRS DEA can be divided into two components; one due to SIE and one due to the PTIE. This may be completed by conducting both a CRS and a VRS DEA upon the same data. If there is a difference in two TE scores of DMU, it indicates that DMU has SIE and the SIE could be measured from the difference between the VRS TE (PTE) score and CRS TE (TE) score (Coelli et al., 1998). Although the SE measure will provide information concerning the degree of inefficiency resulting from the failure to operate with CRS, it cannot provide the information as to whether a DMU is operating in an area of increasing returns to scale (IRS) or decreasing returns to scale (DRS). This may be determined by

Pertanika J. Soc. Sci. & Hum. 23 (S): 219 – 236 (2015)
Fakarudin Kamarudin, Fadzlan Sufian, Annuar Md. Nassir and Nazratul Aina Mohamad Anwar
228
running an addition DEA problem with non-increasing returns to scale (NIRS) imposed. This can be done by altering the DEA model in equation 4 by substituting the N 11 =′λ restriction with N 11 ≤′λ , to provide:
,min , θλθ
,011,0,0- subject to
≥≤′≥−≥+
λλλθλ
NXxYy
i
i
(5)
Therefore, the nature of the scale inefficiencies, due to either IRS or DRS, could be determined by the difference between the NIRS TE and VRS TE score: if the VRS TE @ PTE ≠ NIRS TE, then DMU is operating at IRS; if the VRS TE @ PTE = NIRS TE, then DMU is operating at DRS.
RESULTS AND DISCUSSION
This section discusses the TE change of the GCC banks measured by the DEA method, and its decomposition into PTE and SE components. In the event of the existence of SIE, this study could potentially provide evidence on the nature of the returns to scale for each bank.
According to DeYoung and Hasan (1998), Bauer et al. (1998). and Isik and Hassan (2002), constructing an annual frontier specific to each year is more flexible and suitable than estimating a single multiyear frontier for the banks in the sample. Based on earlier studies and
for the purpose of the study, separating the annual efficiency frontier for each year is more preferable. Therefore, five separate frontiers were constructed for the study. According to Isik and Hassan (2002), the principal advantage of having panel data is the ability to observe each bank more than once over a period of time. The issue is also critical in a continuously changing business environment due to the fact that the technology of a bank that is most efficient in one period may not be the most efficient in another. In addition, it may also reduce the problems related to the lack of random error in DEA by allowing an efficient bank in one period to be inefficient in another, assuming that the errors due to luck or data problems are not consistent over time (Isik & Hassan, 2002).
Efficiency of the GCC banks
Table 2 illustrates the mean efficiency scores of the GCC banks for 2011 (Panel A), 2010 (Panel B), 2009 (Panel C), 2008 (Panel D), 2007 (Panel E) and all years (Panel F). The results suggested that the GCC banks’ mean TE had an increasing trend from 80.8% to 86.2% during the period of 2007 to 2008, and recorded a decrease of 81.6% to 81% during the period of 2009 to 2010, before rising again to 83.6% in 2011. The decomposition of TE into its PTE and SE components suggested that PTIE dominates SIE of GCC banks for all the years covered.
The results for all banks in all years (Panel F) have, in general, confirmed the earlier findings that the managerial factor

Pertanika J. Soc. Sci. & Hum. 23 (S): 219 – 236 (2015)
Technical Efficiency and Returns to Scale on Banking Sector: Empirical Evidence from GCC Countries
229
is the dominant one in influencing GCC banks’ efficiency. During the period of 2007 to 2011, the results from Panel F suggested that GCC banks exhibited a mean TE of 82.6%, with input waste of 17.4%. The decomposition of the TE into its PTE and SE components suggested that the inefficiency could be attributed mainly to PTIE (12.3%), rather than SIE (6.3%).
Thus, the results imply that GCC banks could have produced the same amount of
outputs with only 82.6% of the amount of inputs used. In other words, GCC banks could have reduced their inputs by 17.4%, and still produced the same amount of outputs. Overall, the results implied that, during the period of the study, although the banks had been operating on a relatively optimal scale, they were managerially inefficient to exploit their resources to the fullest.
TABLE 2Summary statistics of bank efficiency scores in GCC(2007 to 2011)Efficiency Measures No. DMUs Min Max Mean Std. Dev.Panel A : All Banks 2011Technical Efficiency 43 0.449 1.000 0.836 0.132Pure technical efficiency 43 0.471 1.000 0.899 0.127
Scale Efficiency 43 0.621 1.000 0.931 0.074
Panel B : All Banks 2010Technical Efficiency 43 0.361 1.000 0.810 0.152Pure technical efficiency 43 0.534 1.000 0.888 0.132Scale Efficiency 43 0.361 1.000 0.912 0.101
Panel C : All Banks 2009Technical Efficiency 43 0.283 1.000 0.816 0.169Pure technical efficiency 43 0.396 1.000 0.869 0.142Scale Efficiency 43 0.398 1.000 0.937 0.112
Panel D : All Banks 2008Technical Efficiency 43 0.274 1.000 0.862 0.148Pure technical efficiency 43 0.277 1.000 0.887 0.151Scale Efficiency 43 0.841 1.000 0.973 0.036
Panel E : All Banks 2007Technical Efficiency 43 0.308 1.000 0.808 0.134Pure technical efficiency 43 0.353 1.000 0.843 0.127Scale Efficiency 43 0.547 1.000 0.959 0.082
Panel F : All Bank All YearsTechnical Efficiency 215 0.274 1.000 0.826 0.148Pure technical efficiency 215 0.277 1.000 0.877 0.136Scale Efficiency 215 0.361 1.000 0.942 0.087
Sources: Bankscope database and authors’ own calculations.

Pertanika J. Soc. Sci. & Hum. 23 (S): 219 – 236 (2015)
Fakarudin Kamarudin, Fadzlan Sufian, Annuar Md. Nassir and Nazratul Aina Mohamad Anwar
230
Scale Inefficiency on Increase Returns to Scale (IRS) and Decrease Returns to Scale (DRS)
As previously mentioned, banks could operate at CRS or VRS, where CRS signifies that an increase in inputs results in a proportionate increase in outputs, while VRS means that a rise in inputs results in a disproportionate rise in outputs. Further, a bank operating at VRS could be either at DRS or IRS. Thus, DRS showed that an increase in inputs resulted in lesser output, while IRS indicated that an increase in inputs resulted in a higher increase in outputs.
During the period of the study, only Abu Dhabi Commercial Bank seemed to have dominated the efficiency frontier CRS at a 100% level compared to other GCC banks. In general, the results indicated that, while large banks (the 22 largest) tend to operate at 15.24% of CRS, or 67.62% of DRS, (refer to Table 3), small banks (the 21 smallest) tend to operate at 18.81% of CRS, or 42.57% of IRS (refer to Table 4). These findings are similar to several earlier studies (e.g., McAllister & McManus, 1993; Drake, 2001; Yudistira, 2004). To recap, Drake (2001) posited that a further increase in the size of bank would only result in a smaller increase of outputs for every proportionate increase in the inputs of large banks, resulting from the fact that the large banks were operating at DRS during these periods. Based on the results, the banks exposed to higher DRS and categorised under large sized banks (large on total assets) are the National
Commercial Bank and Emirates Bank International PJSC, since their DRS is at 100%.
According to McAllister and McManus (1993), on the other hand, small banks have generally exhibited IRS. The result is consistent with what has been discovered from this study, where small GCC banks faced IRS in their operations during the period of the study. The smaller banks, which have been operating at IRS, could achieve significant cost savings and efficiency gains by increasing their scale of operations, mainly because proportionate increases in inputs in small banks would result in more than proportionate increases in outputs. In other words, substantial gains could be attained from altering the scale via internal growth or through mergers and acquisitions in the sector. Therefore, the banks that experienced IRS should eliminate their SIE via internal expansion, or would become a prime target for acquiring banks because it could create value from underperforming banks, and in turn eliminate redundancies and inefficiencies (Evanoff & Israelvich, 1991). Based on the results, banks that were exposed to higher IRS and categorised under small size banks (small on total assets) are Arcapita, Investcorp and Bank of Kuwait & Middle East. Radam et al. (2008) discovered that small enterprises are relatively more technically efficient than medium enterprises due to the efficient use of inputs. Therefore, the efficient usage of resources (input) for the small and large sized firms could contribute to higher returns.

Pertanika J. Soc. Sci. & Hum. 23 (S): 219 – 236 (2015)
Technical Efficiency and Returns to Scale on Banking Sector: Empirical Evidence from GCC Countries
231
TAB
LE 3
Evol
utio
n of
effi
cien
cy sc
ore
for t
he la
rges
t GC
C b
anks
, 200
7 to
201
1
No
Ban
kTo
tal A
sset
s20
1120
1020
0920
0820
07C
ount
ban
k in
%C
ount
ban
k in
no.
USD
(mill
ion)
RT
SC
RS
IRS
DR
SC
RS
IRS
DR
S1
Nat
iona
l Com
mer
cial
Ban
k33
9152
.06
drs
drs
drs
drs
drs
0.00
0.00
100.
000
05
2Q
atar
Nat
iona
l Ban
k 26
6758
.53
drs
drs
drs
drs
irs0.
0020
.00
80.0
00
14
3N
atio
nal B
ank
of A
bu D
habi
26
3577
.12
drs
drs
drs
drs
crs
20.0
00.
0080
.00
10
44
SAM
BA
23
9791
.84
drs
drs
drs
drs
crs
20.0
00.
0080
.00
10
45
Al-R
ajhi
Ban
king
& In
vest
Cor
p 23
0616
.13
drs
drs
drs
crs
crs
40.0
00.
0060
.00
20
36
Emira
tes B
ank
Inte
rnat
iona
l PJS
C22
6324
.64
––
–dr
sdr
s0.
000.
0010
0.00
00
27
Nat
iona
l Ban
k of
Kuw
ait
2255
43.4
8dr
sdr
sdr
sdr
scr
s20
.00
0.00
80.0
01
04
8R
iyad
Ban
k 21
6535
.59
drs
drs
drs
drs
irs0.
0020
.00
80.0
00
14
9A
bu D
habi
Com
mer
cial
Ban
k 21
1531
.65
crs
crs
crs
crs
crs
100.
000.
000.
005
00
10K
uwai
t Fin
ance
Hou
se20
2837
.30
drs
drs
drs
crs
irs20
.00
20.0
060
.00
11
311
Saud
i Brit
ish
Ban
k 16
5566
.17
drs
drs
drs
drs
irs0.
0020
.00
80.0
00
14
12Fi
rst G
ulf B
ank
1645
82.7
3dr
sdr
sdr
sdr
sirs
0.00
20.0
080
.00
01
413
Ban
que
Saud
i Fra
nsi
1626
87.1
7dr
sdr
sdr
sdr
sirs
0.00
20.0
080
.00
01
414
Ara
b N
atio
nal B
ank
1492
81.9
3dr
sdr
sdr
sdr
sirs
0.00
20.0
080
.00
01
415
Nat
iona
l Ban
k of
Dub
ai
1408
67.6
6–
––
drs
irs0.
0033
.33
66.6
70
12
16A
rab
Ban
king
Cor
p14
0315
.00
drs
drs
drs
crs
irs20
.00
20.0
060
.00
11
317
Mas
hreq
bank
11
9695
.00
drs
drs
drs
crs
irs20
.00
20.0
060
.00
11
318
Dub
ai Is
lam
ic B
ank
1182
15.6
6dr
sdr
sdr
sdr
sirs
0.00
20.0
080
.00
01
419
Gul
f Int
erna
tiona
l Ban
k 10
3511
.80
irsirs
irscr
sirs
20.0
080
.00
0.00
14
020
Uni
on N
atio
nal B
ank
9820
4.55
drs
drs
drs
drs
irs0.
0020
.00
80.0
00
14
21G
ulf B
ank
8665
9.21
drs
drs
crs
crs
irs40
.00
20.0
040
.00
21
222
Abu
Dha
bi Is
lam
ic B
ank
8411
8.88
drs
drs
drs
drs
irs0.
0020
.00
80.0
00
14
15.2
417
.14
67.6
216
1871
CR
S =
cons
tant
retu
rns t
o sc
ale,
DR
S =
decr
easi
ng re
turn
s to
scal
e, IR
S =
incr
easi
ng re
turn
s to
scal
e. C
ount
Ban
k (C
RS)
= n
umbe
r of t
imes
a b
ank
has
appe
ared
on
the
effic
ienc
y fr
ontie
r dur
ing
the
perio
d of
stud
y. C
ount
Yea
r (C
RS)
= n
umbe
r of b
anks
app
earin
g on
the
effic
ienc
y fr
ontie
r dur
ing
the
year

Pertanika J. Soc. Sci. & Hum. 23 (S): 219 – 236 (2015)
Fakarudin Kamarudin, Fadzlan Sufian, Annuar Md. Nassir and Nazratul Aina Mohamad Anwar
232
TAB
LE 4
Ev
olut
ion
of e
ffici
ency
scor
e fo
r the
smal
lest
GC
C b
anks
, 200
7 to
201
1
No
Ban
kTo
tal A
sset
s20
1120
1020
0920
0820
07C
ount
ban
k %
Cou
nt b
ank
in n
o.
U
SD (m
illio
n)R
TS
CR
SIR
SD
RS
CR
SIR
SD
RS
1C
omm
erci
al B
ank
of Q
atar
8193
9.45
drs
crs
crs
irsirs
40.0
040
.00
20.0
02
21
2B
ank
Mus
cat
7587
9.58
drs
drs
drs
drs
irs0.
0020
.00
80.0
00
14
3Sa
udi H
olla
ndi B
ank
7532
1.55
drs
drs
drs
drs
irs0.
0020
.00
80.0
00
14
4B
urga
n B
ank
7463
7.15
–dr
sdr
scr
sirs
25.0
025
.00
50.0
01
12
5C
omm
erci
al B
ank
of K
uwai
t 70
096.
66dr
sdr
sdr
sdr
sirs
0.00
20.0
080
.00
01
46
Saud
i Inv
est B
ank
6767
6.04
drs
drs
crs
crs
irs40
.00
20.0
040
.00
21
27
Doh
a B
ank
5897
6.60
drs
drs
drs
crs
irs20
.00
20.0
060
.00
11
38
Qat
ar Is
lam
ic B
ank
5612
0.30
drs
drs
drs
irsirs
0.00
40.0
060
.00
02
39
Al-A
hli B
ank
of K
uwai
t 53
758.
38dr
sdr
sdr
scr
sirs
20.0
020
.00
60.0
01
13
10C
omm
erci
al B
ank
of D
ubai
48
939.
11cr
sdr
scr
scr
sirs
60.0
020
.00
20.0
03
11
11A
hli U
nite
d B
ank
KSC
4116
8.67
–dr
sdr
scr
sirs
25.0
025
.00
50.0
01
12
12B
ank
Al J
azira
40
268.
16dr
sdr
sirs
drs
irs0.
0040
.00
60.0
00
23
13N
atio
nal B
ank
of B
ahra
in
2850
6.38
drs
drs
irsirs
irs0.
0060
.00
40.0
00
32
14N
atio
nal B
ank
of O
man
24
169.
83cr
scr
scr
sirs
irs60
.00
40.0
00.
003
20
15B
ank
of S
harja
h23
478.
20dr
sdr
scr
sirs
irs20
.00
40.0
040
.00
12
216
Arc
apita
20
490.
60irs
irsirs
irsirs
0.00
100.
000.
000
50
17In
vest
corp
1896
9.50
irsirs
irsirs
irs0.
0010
0.00
0.00
05
018
Inve
stba
nk
1277
3.11
–cr
scr
scr
sirs
75.0
025
.00
0.00
31
019
Uni
ted
Gul
f Ban
k 11
595.
00irs
irsirs
irsirs
0.00
40.0
060
.00
02
320
Uni
ted
Ara
b B
ank
1070
5.00
irsirs
crs
irsirs
20.0
080
.00
0.00
14
021
Ban
k of
Kuw
ait &
Mid
dle
East
16
12.5
4–
irsirs
irsirs
0.00
100.
000.
000
40
18.8
142
.57
38.6
119
4339
CR
S =
cons
tant
retu
rns t
o sc
ale,
DR
S =
decr
easi
ng re
turn
s to
scal
e, IR
S =
incr
easi
ng re
turn
s to
scal
e. C
ount
Ban
k (C
RS)
= n
umbe
r of t
imes
a b
ank
has
appe
ared
on
the
effic
ienc
y fr
ontie
r dur
ing
the
perio
d of
stud
y. C
ount
Yea
r (C
RS)
= n
umbe
r of b
anks
app
earin
g on
the
effic
ienc
y fr
ontie
r dur
ing
the
year

Pertanika J. Soc. Sci. & Hum. 23 (S): 219 – 236 (2015)
Technical Efficiency and Returns to Scale on Banking Sector: Empirical Evidence from GCC Countries
233
CONCLUSION
This paper examined the relative efficiency of the banks in GCC countries by analysing the technical efficiency, pure technical efficiency and scale efficiency of GCC banks over the period of 2007-2011. The non-parametric Data Envelopment Analysis (DEA) approach was used to examine the efficiency of these banks. The empirical findings suggest that PTIE outweighs SIE in these GCC banks. During the period of 2007 to 2011, the results suggested that GCC banks exhibited a mean TE of 82.6%, with an input waste of 17.4%. The decomposition of TE into its PTE and SE components suggested that the inefficiency could mainly be attributed to PTIE (12.3%) rather than SIE (6.3%).
This may indicate that the overall results of the GCC banks imply that, during the period of study, although the banks had been operating on a relatively optimal scale, they were managerially inefficient to exploit their resources to the fullest. In addition, the empirical findings suggest that only Abu Dhabi Commercial Bank has dominated the efficiency frontier (CRS) compared with the other GCC banks. In general, the results indicate that, while large banks (the 22 largest) tend to operate at CRS or DRS, small banks (21 smallest banks) tend to operate at CRS or IRS. Therefore, the banks experiencing IRS (Arcapita, Investcorp and Bank of Kuwait & Middle East) should eliminate their SIE via internal expansion, or they would become a prime target for acquiring
banks because it could create value from underperforming banks and eliminate redundancies and inefficiencies (Evanoff & Israelvich, 1991). On the other hand, GCC banks operating at DRS (National Commercial Bank and Emirates Bank International PJSC) are advised not to increase their size or be involved with mergers and acquisitions events, mainly because a further increase in the size of the bank will only result in a smaller increase of outputs for every proportionate increase in inputs of the large banks.
These empirical findings are expected to contribute significantly to the existing knowledge on the operating performance of the GCC banking sector. Nevertheless, the study has also provided further insights into bank’s specific management, as well as to the policymakers, with regard to attaining optimal utilisation of capacities, improvement in managerial expertise, efficient allocation of scarce resources, and the most productive scale of operation of banks operating in GCC countries. Moreover, this study may also facilitate directions for sustainable competitiveness of the GCC banking sector operations in the future.
ACKNOWLEDGEMENTS
The authors would like to thank the editors and the anonymous referees of the journal for their constructive comments and suggestions, which have significantly helped to improve the contents of the paper. The usual caveats apply.

Pertanika J. Soc. Sci. & Hum. 23 (S): 219 – 236 (2015)
Fakarudin Kamarudin, Fadzlan Sufian, Annuar Md. Nassir and Nazratul Aina Mohamad Anwar
234
REFERENCESAlirezaee, M., Howland, M., & van de Panne, C.
(1998). Sampling size and efficiency bias in data envelopment analysis. Journal of Applied Mathematics and Decision Sciences, 2(1), 51-64.
Ariff, M., & Can, L. (2008). Cost and profit efficiency of Chinese banks: A non-parametric analysis. China Economic Review, 19(2), 260-273.
Banker, R. D., Charnes, A., & Cooper, W. W. (1984). Some models for estimating technical and scale inefficiencies in data envelopment analysis. Management Science, 30(10), 78-92.
Bauer, P. W., Berger, A. N., Ferrier, G. D., & Humphrey, D. B. (1998). Consistency conditions for regulatory analysis of financial institutions: A comparison of frontier efficiency methods. Journal of Economics and Business, 50(2), 85-114.
Berger, A., & Humphrey, D. (1997). Efficiency of financial institutions: international survey and directions for future research. European Journal of Operational Research, 98(2), 175-212.
Brown, R. (2001). Data envelopment analysis: application issues in the financial services sector (pp. 01-05). University of Melbourne, Melbourne.
Charnes, A., Cooper, W. W., & Rhodes, E. (1978). Measuring the efficiency of decision making units. European Journal of Operations Research, 2(6), 429-44.
Coelli, T. (1996). A guide to DEAP: Version 2.1: A data development analysis (computer program). Working Paper 96/08, CEPA, University of New England, Armidale (pp. 1-49).
Coelli, T., Prasada, R., & Battese, G. (1998). An introduction to efficiency and productivity analysis. Boston, MA: Kluwer Academic Publishers.
Darrat, A.F., Topuz, C., & Youzef, T. (2002). Assessing cost and technical efficiency of banks in Kuwait. Paper presented at the ERF’s 8th Annual Conference in Cairo, ERF, Cairo. Retrieved 9 August, 2005, from www.erf.org.eg
DeYoung, R. & Hasan, I. (1998). The performance of De Novo commercial banks: A profit efficiency approach. Journal of Banking and Finance, 22(5), 565-587.
Drake, L. (2001). Efficiency and Productivity Change in UK Banking. Applied Financial Economics, 11(5), 557–71.
Evanoff, D. D., & Israelvich, P. R. (1991). Productive efficiency in banking. Economic Perspectives, Federal Reserve Bank of Chicago, 15(4), 11-32.
Farrell, M. J. (1957). The measurement of productive efficiency. Journal of Royal Statistical Society Association, 120(3), 253-281.
Ferrier, G., & Lovell, C. A. K. (1990). Measuring cost efficiency in banking: econometric and linear programming evidence. Journal of Econometrics, 46(1), 229-45.
Golany, B. & Storbeck, J. (1999). A data envelopment analysis of the operational efficiency and bank branches. Interfaces, 29(3), 14-26.
Isik, I., & Hassan, M. K. (2002). Technical, scale and allocative efficiencies of Turkish banking industry. Journal of Banking and Finance, 26(4), 719-766.
Kamarudin, F., Nordin, B. A. A., & Nasir, A. M. (2013). Price efficiency and returns to scale of banking sector in gulf cooperative council countries: Empirical evidence from Islamic and conventional banks. Economic Computation and Economic Cybernetics Studies and Research, 47(3), 215-236.
Pertanika J. Soc. Sci. & Hum. 23 (S): 219 – 236 (2015)
Technical Efficiency and Returns to Scale on Banking Sector: Empirical Evidence from GCC Countries
235
Kamarudin, F., Nordin, B. A. A., Muhammad, J., & Hamid, M. A. A. (2014a). Cost, revenue and profit efficiency of Islamic and conventional banking sector: Empirical evidence from Gulf Cooperative Council countries. Global Business Review, 15(1), 1-24.
Kamarudin. F., Nasir, A. M., Yahya, M. H., Said, R. M., & Nordin, B. A. A. (2014b). Islamic banking sectors in Gulf Cooperative Council countries. Analysis on revenue, cost and profit efficiency concepts. Journal of Economic Cooperation and Development, 35(2), 1-42.
Kantor, J., & Maital, S. (1999). Measuring efficiency by product group: integrating DEA with activity-based accounting in a large Mideast Bank. Interfaces, 29(3), 27-36.
Levine, R., (1998). The legal environment, banks, and long-run economic growth, Journal of Money, Credit and Banking, 30(3), 596-613.
McAllister, P. H. & McManus, D. A. (1993). Resolving the scale efficiencies puzzle in banking. Journal of Banking and Finance, 17(2), 389-405.
Mercana, M., Reismanb, A., Yolaland, R., & Emel, A. B. (2003). The effect of scale and mode of ownership on the financial performance of the Turkish banking sector: results of a DEA-based analysis. Socio-Economic Planning Sciences, 37(3), 185-202.
Murillo-Zamorano, L. R. (2004). Economic efficiency and frontier techniques. Journal of Economic Surveys, 18(1), 33−77.
Nissanke, M., & Stein, H. (2003). Financial globalization and economic development: toward an institutional foundation. Eastern Economic Journal, 29(2), 287-308.
Olson, D. & Zoubi, T. A. (2008). Using accounting ratios to distinguish between Islamic and conventional banks in the GCC region. International Journal of Accounting, 43(1), 45-65.
Radam, A., Abu, M. L., & Abdullah, A. M. (2008). Technical efficiency of small and medium enterprise in Malaysia: a stochastic frontier production model. International Journal of Economics and Management, 2(2), 395-408.
Rickards, R. (2003). Setting benchmarks and evaluating balanced scorecards with data envelopment analysis. Benchmarking: An International Journal, 10(3), 226-45.
Saha, A., & Ravisankar, T. S. (2000). Rating of Indian commercial banks: a DEA approach. European Journal of Operational Research, 124(1), 187-203.
Sherman, H. D. & Gold, F. (1985). Bank branch operating efficiency: evaluation with data envelopment analysis. Journal of Banking and Finance, 9(2), 297-315.
Sherman, H. D., & Ladino, G. (1995). Managing bank productivity using data envelopment analysis (DEA). Interfaces, 25(2), 60-73.
Srairi, S.A. (2010). Cost and profit efficiency of conventional and Islamic banks in GCC countries. Journal of Productivity Analysis, 34(1), 45-62.
Stanton, K. R. (2002). Trends in relationship lending and factors affecting relationship lending efficiency. Journal of Banking & Finance, 26(1), 127-52.
Sufian, F., & Kamarudin, F. (2014). Efficiency and Returns to Scale in the Bangladesh Banking Sector: Empirical Evidence from the Slack-Based DEA Method. Inzinerine Ekonomika - Engineering Economics, 25(5), 549-557.
Sufian, F., Kamarudin, F., & Noor, N. H. H. M. (2012). Determinants of Revenue Efficiency in the Malaysian Islamic Banking Sector. Journal of King Abdulaziz: Islamic Economics, 25(2), 195-224.

Pertanika J. Soc. Sci. & Hum. 23 (S): 219 – 236 (2015)
Fakarudin Kamarudin, Fadzlan Sufian, Annuar Md. Nassir and Nazratul Aina Mohamad Anwar
236
Sufian, F., Kamarudin, F., & Noor, N. H. H. M. (2013a). Assessing the revenue efficiency of domestic and foreign Islamic banks: empirical evidence from. Jurnal Pengurusan, 37(1), 77-90.
Sufian, F., Kamarudin, F., & Noor, N. H. H. M. (2014). Revenue Efficiency and Returns to Scale in Islamic Banks: Empirical Evidence from Malaysia. Journal of Economic Cooperation and Development, 35(1), 47-80.
Sufian, F., Muhammad, J., Nordin, B. A. A., Yahya, M. H., & Kamarudin, F. (2013b). Assessing the Effect of Mergers and Acquisition on Revenue Efficiency: Evidence from Malaysian Banking Sector. International Journal of Economic Research, 10(2), 309-325.
Vassiloglou, M., & Giokas, D. (1990). A study of the relative efficiency of bank branches: an application of data envelopment analysis. Journal of Operational Research Society, 41(7), 591-7.
Wheelock, D. C., & Wilson, P. W. (1999). Technical progress, inefficiency, and productivity change in US banking 1984-1993. Journal of Money, Credit and Banking, 31(2), 212-34.
Yudistira, D. (2004). Efficiency in Islamic Banking: an Empirical Analysis of 18 Banks. Islamic Economic Studies, 12(1), 1-18.

Pertanika J. Soc. Sci. & Hum. 23 (S): 237 – 250 (2015)
ISSN: 0128-7702 © Universiti Putra Malaysia Press
SOCIAL SCIENCES & HUMANITIESJournal homepage: http://www.pertanika.upm.edu.my/
ARTICLE INFOArticle history:Received: 30 March 2015Accepted: 10 September 2015
E-mail addresses:[email protected] (Tze San Ong),[email protected] (Wei Ni Soh),[email protected] (Boon Heng Teh),[email protected] (Sin Huei Ng)* Corresponding author
Stock Return, Currency and General Elections
Tze San Ong1*, Wei Ni Soh1, Boon Heng Teh2 and Sin Huei Ng3
1Department of Accounting, Faculty of Economics and Management, Universiti Putra Malaysia, 43400 UPM Serdang, Selangor, Malaysia2Multimedia University (Cyberjaya), Jalan Multimedia, 63000 Cyberjaya, Selangor, Malaysia3Inti International University, Jalan BBN 12/1, Bandar Baru Nilai, 71800 Nilai, Negeri Sembilan, Malaysia
ABSTRACT
The association between political elections and stock market performance for Malaysia market is discussed in this paper. This study aims to investigate the impact of General Elections in Malaysia on stock market indices. To provide additional support of the impact of general elections on stock returns through other channels, currency changes were also included in this study so as to discover the mediation effect of the exchange rate on the relationship between general elections and stock returns. Since the exchange rate does, to some extent, influence stock return, the relationship between exchange rates and stock returns during different stages of a general election cannot be overlooked. The results showed that currency change is negatively related with stock returns in pre-election and post-election stages, but it is not significant during the election period. The impact of currency on stock return exists as a mediation effect during election period. In a nutshell, the currency change directly impacts stock return with a negative influence. However, the direct relationship between currency and stock return disappears during the election week. Thus, stock return is affected by currency change indirectly.
Keywords: General election, stock return, currency, mediation effect
INTRODUCTION
Stock is the most volatile financial instrument in a financial market; it is one of the most popular investment tools, especially for those interested in grabbing short-term increases in price to obtain attractive profit. General elections somehow generate an impact on the movement of

Pertanika J. Soc. Sci. & Hum. 23 (S): 237 – 250 (2015)
Tze San Ong, Wei Ni Soh, Boon Heng Teh and Sin Huei Ng
238
stock prices. The confidences of investors are usually adjusted according to the increase in uncertainty. The uncertainty factor will be taken into consideration when deciding the timing of involvement in the stock market.
According to Pantzalis, Stangeland and Turtle (2000), any political event is a key control variable on financial market. This is because the market is sensitive to new information regarding political decisions that may impact a nation’s fiscal and monetary policy. There are further studies that focused on the impacts of different types of elections on the stock market. For instance, Santa-Clara and Valkanov (2003) demonstrated that stock markets displayed significant abnormal returns around presidential elections, while Gemmill (1987) focused on the performance of FTSE 100 during the British General Elections in 1987.
Based on the studies above, the researchers showed that political elections might play an important role in affecting stock market performance. Similarly, this association may be reflected in a Malaysian context.
Stock market volatility usually portrays a significant increase around the time period of national elections, as mentioned by Bialkowski et al. (2008). Based on the historical facts during the previous General Elections, Bursa Malaysia displayed a high volatility during the General Elections held in Malaysia. Volatility of stock indices can also go up or down based on any serious incidents that happened during the course
of the year. For instance, the failure of the incumbent government to maintain super majority in the 2008 General Elections led to a much higher level of uncertainty, which was then reflected in the high volatility of the stock market.
Meanwhile, the study of Pantzalis et al. (2000) found a positive and significant market reaction in the two weeks leading up to the political elections. They further stated that the phenomenon was closely related to the political uncertainty that existed during that particular period. Another significant finding from the study documented that the volatility of equity prices was caused by the uncertainties that existed before an election.
According to Goodell and Vahamaa (2012), stock market volatility around US presidential elections was affected by political uncertainty. They found that the S&P 500 index increased when the probability of the eventual winner became higher. From a Malaysian perspective, there is no doubt that BN has been sustaining their win over the past 57 years. After 2008, the opposition parties such as Pakatan Rakyat have become stronger, with the number of their supporters increasing day by day. This condition has brought the political situation of Malaysia to a high level of uncertainty.
The awareness of citizens about the importance of general elections has contributed to the attention of both local and foreign investors. Consequently, the stock market will be affected, at least slightly, if there is any news or information about general elections released by the

Pertanika J. Soc. Sci. & Hum. 23 (S): 237 – 250 (2015)
Stock Return, Currency and General Elections
239
incumbent government. According to the statement of Bursa Malaysia on 3 April 2013, the announcement of the dissolution of the parliament dragged the index to sink by more than 52 points in the morning trading session. Yet, the index had returned to its positive territory before the market closed on the same day. It is important to note that the General Elections affected the movements of the investors. Hence, the volatility of the stock market necessitates that this research be carried out.
There are numerous studies indicating the effects of elections on stock markets in US (Jones & Banning, 2009), and Germany (Dopke & Pierdzioch, 2006). Therefore, this study aimed to investigate the impacts of general elections in Malaysia on stock market performance, especially a general election where the incumbent government fails to sustain their super majority seats in the parliament.
In a nutshell, various factors can affect the political situation in Malaysia, which in turn reflects on the stock market. Thus, it can be concluded that political situation is interrelated with the stock market. In order to provide additional support of the impacts of general elections on stock returns through other channels, currency changes were also included in this study and to discover the mediation effects of the exchange rate on the relationship between general elections and stock returns. Since the exchange rate does, to some extent, influence stock return, the relationship between exchange rates and stock returns during different stages of a general election cannot be overlooked.
This study is significant in at least three ways. First of all, stock market performance around general elections in Malaysia provides useful information for investor forecasting. Second, separating the effects of currency on stock returns into three different stages of the general elections enables the provision of additional evidence in supporting the relationship between currency and stock price; it is subject to political conditions. Last but not least, the inclusion of the mediation effect of currency change on general elections correspond to stock returns, thus enhancing the understanding of factors that impact stock return.
This paper is organised as follows: A brief introduction is given in the beginning, followed by a literature review on related studies. Data collection and the methods applied are elaborated in the methodology section, after which the findings and discussions of this study are interpreted and discussed. This paper ends with a conclusion and some limitations of this study.
LITERATURE REVIEW
In past literature, numerous studies have been carried out on the issue of stock changes responding to elections in three stages. However, the outcomes of the research vary and this is possibly due to the studies being conducted in different countries.
General elections and the stock market
Huang (1985), Gartner and Wellershoff (1995), and Wong and McAleer (2009)
Pertanika J. Soc. Sci. & Hum. 23 (S): 237 – 250 (2015)
Tze San Ong, Wei Ni Soh, Boon Heng Teh and Sin Huei Ng
240
figured out that the presidential election cycles play an important role in the US stock market. According to periodical studies, stock prices fell during the first half of the presidency, reached a trough in the second year, rose during the second half of the presidency, and reached a peak in the third or fourth year. Santa-Clara and Valkonox (2003) indicated that stock market returns were higher during the Democratic presidencies, compared to during the Republican presidencies. Hensel and Ziemba (1995) documented that small-cap stocks had significantly higher returns during Democratic administrations as opposed to during Republican administrations.
However, Dopke and Pierdzioch (2006) did not find that German stock market returns tended to be higher during left-wing than during right-wing governments. Dopke and Pierdzioch (2006) concluded that stylised facts that are well-established in the US cannot be confirmed by using the German data. In addition, the study of Chretien and Coggins (2009) also revealed no significant changes in the financial market returns, regardless of whether it was right-leaning Conservative or left-leaning Liberal governments. The finding of Powell et al. (2007) and Sy and Al Zaman (2011) suggested that the ruling of Democratic and Republican Presidencies did not bring significant difference in stock returns by controlling the estimation bias and systematic risk.
General election induced market uncertainty
Mei and Guo (2002) stated that elections have important implications for future political and economic course of a country. It also presented major uncertainty to both domestic and foreign investors; uncertainty caused by political elections has provided evidence that it tends to increase the volatility of emerging markets. When Nippani and Arize (2005) and Goodell and Bodey (2012) investigated the effects of the US presidential elections on stock markets, they documented that the stock prices were affected by the uncertainty caused by the elections. Nippani and Arize (2005) focused on 2000 presidential elections and reported that stock markets had a negative relationship with election uncertainty. On the other hand, Goodell and Bodey (2012) discovered that the election uncertainties around US presidential elections were negatively associated with price earning ratios. They further indicated that the decrease in stock market valuations was caused by the decrease of uncertainty on election outcomes.
The effects of election induced uncertainty on stock returns and volatility were also examined by Li and Born (2006). Their findings suggested that stock prices and market uncertainty increased before elections, even though candidates had gained higher support from voters. In other words, the uncertainty of an election’s outcome brings about a higher volatility on the stock market, especially

Pertanika J. Soc. Sci. & Hum. 23 (S): 237 – 250 (2015)
Stock Return, Currency and General Elections
241
before the US presidential elections. According Brown et al. (1988), price changes tend to be positive on average, if uncertainty is reduced. Therefore, positive price changes can be predicted when an election outcome draws nearer, as some of the uncertainty is resolved.
Currency change and stock return
The relationship between currency change and stock return has been investigated in past literature; findings suggested that the outcomes vary, and are subject to industry, period and the type of economy. Aggarwal (1981) showed a positive correlation between the changes in exchange rates and abnormal stock, whereas Solnik (1987) showed a negative relationship between monthly and quarterly real stock returns and real exchange rates, with the exception of a positive relationship only in the sub-period of 1979 to 1983.
Ma and Kao (1990) concluded that currency depreciation in an export-dominant economy was negatively related to stock prices, but positively related in an import-dominant economy. Soenen and Hennigar (1988) reported no significant relationship for three of the industries in their study, and a negative relationship for the other industries. Their results showed that exchange rates have little impact on stock returns of individual industries and sectors. They also suggested that exchange rates are able to affect stock prices to an even higher extent.
Election, currency change and rational partisan theory
Foreign investors inevitably seek out stable countries with strong economic performance in which to invest their capital. A country with such positive attributes will draw investment funds away from other countries that are perceived to have more political and economic risks. Political turmoil, for example, can cause loss of confidence in a currency, and thus a movement of capital to the currencies of more stable countries. Gartner (1986) found that elections significantly affect the spot rate.
Bachman (1992) found that electoral news significantly affects the forward bias. According to the rational partisan theory, if the election outcome is not perfectly anticipated, then elections can influence economic conditions even when expectations are rational. Ellis and Thoma (1995) found that the partisan theory affects real exchange rates. This is further supported by Blomberg and Hess (1997) and Lobo and Tufte (1998) who showed that policy-makers are opportunistic and largely concerned with remaining in power. An incumbent will tend to cut taxes to appear more competent before an election or whenever his approval rating falls, thereby enhancing the value of the domestic currency.
METHODOLOGY AND RESEARCH FRAMEWORK
Data Description and Sources
This paper is an event study that is integrated with econometric technique-

Pertanika J. Soc. Sci. & Hum. 23 (S): 237 – 250 (2015)
Tze San Ong, Wei Ni Soh, Boon Heng Teh and Sin Huei Ng
242
panel data analysis. The daily index data in this study are abstracts from the Bursa Malaysia. The stock price used here are in Ringgit Malaysia terms. The daily index data are available since January 1995.
Meanwhile, election information for Malaysia was obtained from the official website of the Malaysian Election Commission. Election information includes date of parliament dissolution, the period of the election campaign, date of polling day, and the election outcomes. The daily exchange rate is obtained from DataStream. Two currencies were tested in this study, including the U.S Dollar and the Singapore Dollar. Singapore Dollar was selected as Singapore is the top
trading partner for Malaysia in the import and export activities. Meanwhile, U.S. Dollar was selected in this study due to the importance of the major currency in the worth currency market. Changes in these two currencies on stock returns in several election stages strengthen the findings in this study.
This study only concentrated on the general elections of 2008 and 2013. Table 1 shows a summary of the election information in Malaysia for both the 12th and 13th General Elections. In the two elections, the Barisan Nasional party failed to maintain majority seats in the Parliament, which led to greater uncertainty among both foreign and domestic investors.
TABLE 1Information of General Elections in Malaysia
EditionYear of General Election
Date of Parliament Dissolution
Date of Nomination Day
Period of Election Campaign(No. of Days)
Date of Polling Day
12th 2008 13/2/2008 24/2/2008 24/2 -7/3/2008 (13) 8/3/200813th 2013 3/4/2013 20/4/2013 20/4 – 4/5/2013 (15) 5/5/2013
Sources: Official Website of Suruhanjaya PilihanRaya Malaysia
Event Study of Stock Indices’ Return around General Election
Dates
This study also examined an estimation window which refers to the four week pre-event period. Based on the history of General Elections in Malaysia, the dissolution of the parliament for the two observed general elections in this study happened on t=-4. In addition, a four-week post-event period was also under the observation of this study. The four-week post-event period is
examined to determine the magnitude of the uncertainty resolution that occurs after the announcement of the results; for instance, in the case where the vote was close and required coalition building, or if a runoff election was required.
Research Framework
This study tested the relationship between election stages and stock returns. It includes the currency change into this model as a mediation factor in influencing
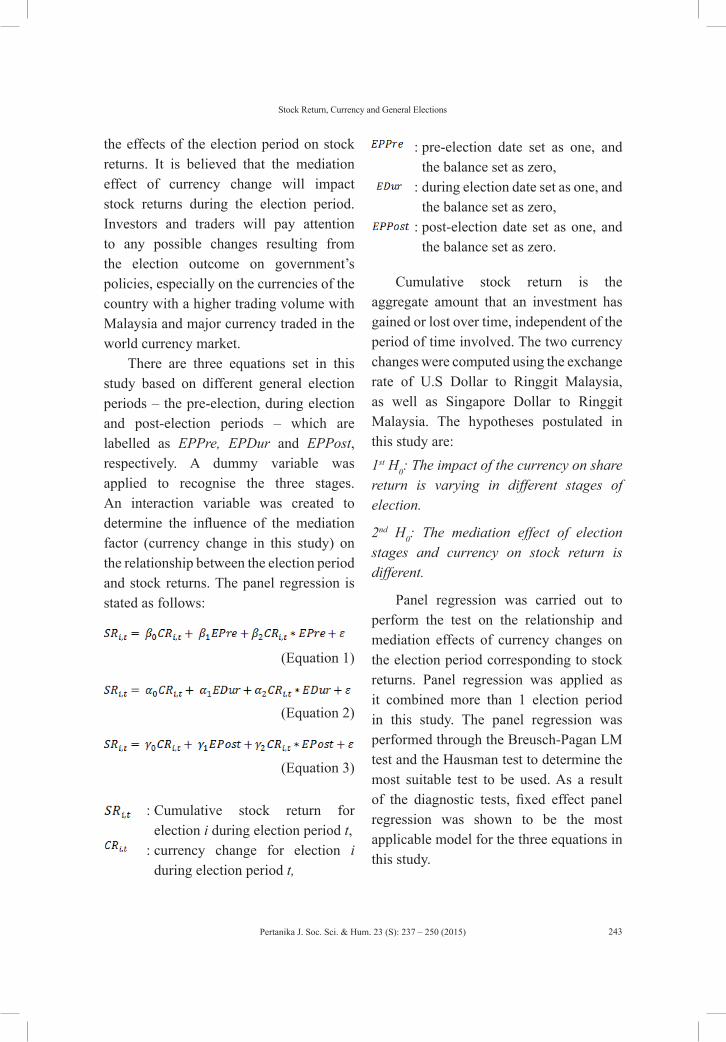
Pertanika J. Soc. Sci. & Hum. 23 (S): 237 – 250 (2015)
Stock Return, Currency and General Elections
243
the effects of the election period on stock returns. It is believed that the mediation effect of currency change will impact stock returns during the election period. Investors and traders will pay attention to any possible changes resulting from the election outcome on government’s policies, especially on the currencies of the country with a higher trading volume with Malaysia and major currency traded in the world currency market.
There are three equations set in this study based on different general election periods – the pre-election, during election and post-election periods – which are labelled as EPPre, EPDur and EPPost, respectively. A dummy variable was applied to recognise the three stages. An interaction variable was created to determine the influence of the mediation factor (currency change in this study) on the relationship between the election period and stock returns. The panel regression is stated as follows:
(Equation 1)
(Equation 2)
(Equation 3)
: Cumulative stock return for election i during election period t,
: currency change for election i during election period t,
: pre-election date set as one, and the balance set as zero,
: during election date set as one, and the balance set as zero,
: post-election date set as one, and the balance set as zero.
Cumulative stock return is the aggregate amount that an investment has gained or lost over time, independent of the period of time involved. The two currency changes were computed using the exchange rate of U.S Dollar to Ringgit Malaysia, as well as Singapore Dollar to Ringgit Malaysia. The hypotheses postulated in this study are:1st H0: The impact of the currency on share return is varying in different stages of election.
2nd H0: The mediation effect of election stages and currency on stock return is different.
Panel regression was carried out to perform the test on the relationship and mediation effects of currency changes on the election period corresponding to stock returns. Panel regression was applied as it combined more than 1 election period in this study. The panel regression was performed through the Breusch-Pagan LM test and the Hausman test to determine the most suitable test to be used. As a result of the diagnostic tests, fixed effect panel regression was shown to be the most applicable model for the three equations in this study.

Pertanika J. Soc. Sci. & Hum. 23 (S): 237 – 250 (2015)
Tze San Ong, Wei Ni Soh, Boon Heng Teh and Sin Huei Ng
244
TABLE 2Diagnostic and robustness checking report
Model BPL test Hausman testWooldridge
testModified Wald test VIF
Eq. 15.8200 38.6410 0.8460 150.0000
1.00 - 1.05(0.0158)** (0.0000)*** (0.3622) (0.0000)***
Eq. 29.2600 45.6460 1.5070 760.4450
1.03 - 2.34(0.0023)** (0.0000)*** (0.2254) (0.0000)***
Eq. 33.5800 48.6860 1.9740 400.4770
1.03 - 3.14(0.0585)* (0.0000)*** (0.1663) (0.0000)***
Note: The BPL test is to determine the method to be used between the OLS and random effect regression. The Hausman test is to determine the method to be used between random-effect and fixed-effect regressions. The Wooldridge test is to test the existence of an autocorrelation problem. The Modified Wald test is to identify the existence of heteroscedasticity problems, and the VIF is a collinearity diagnostic.*** Significance at 0.01 confidence level, ** significance at 0.05 confidence level, * significance at 0.1 confidence level, p-values are in parentheses.
shown in Table 2. Among the investigated weeks, week zero was found to have negative CARs. Similarly, this situation also happened in week-3. Generally, the announcement of political changes would cause the volatility of the stock market.1
DESCRIPTIVE STATISTICS, RESULTS AND DISCUSSION
Descriptive Statistics of CAR (-4, +4) by Weeks
Besides that, descriptive statistics from the four-week pre-event period until the four-week post event period (-4, +4) is also
TABLE 2Descriptive Statistics of CARs by Weeks (in percentages)
Week -4 -3 -2 -1 0 1 2 3 4Mean 0.019 -0.020 0.004 0.015 -0.082 0.017 0.107 -0.017 0.072Std Dev 0.012 0.017 0.008 0.019 0.047 0.012 0.048 0.025 0.035Min -0.005 -0.049 -0.012 -0.019 -0.171 -0.008 -0.005 -0.052 -0.002Max 0.037 0.015 0.017 0.052 -0.003 0.038 0.169 0.022 0.112
In addition, the fluctuation of CARs within the week was found to be different among the examined weeks – the highest fluctuation of CARs happened in week zero which ranged from -17.06 % to -0.28%. According to the study of NUS Students Investment Society (2013), the
1For instance, in the 13th General Elections, the FTSE Bursa Malaysia dropped by 52 points in the morning trading session after the Prime Minister of Malaysia, Dato’ Seri Haji Mohammad Najib bin Tun Haji Abdul Razak announced the dissolution of the parliament. This incident happened exactly in week-3 and caused the CARs to be negative.

Pertanika J. Soc. Sci. & Hum. 23 (S): 237 – 250 (2015)
Stock Return, Currency and General Elections
245
stock market tends to stay at a passive stage during the election week. This is due to the fact that corporate performance might be influenced by a potential new government’s policies such as on spending and tax changes. Therefore, investors might not take investment risks during that critical period. However, the stock market tends to move in a positive direction when there is no doubt of the
election result, and the newly formed government remains in a stable political situation.
Results and Discussion
The findings of this study are listed in Table 3. They are separated into three election stages, which comprise of pre-election, during election and post-election stages. The panel regression was tested on two different currencies (USD and SGD).
TABLE 3The effects of currency and election on stock returns in Bursa Malaysia for two elections
Dependent Variable: Stock returnVariable/ period Pre-election During Election Post-election
USD
Constant0.0005 -0.0005 -0.0038(0.7990) (0.7500) (0.0510*)
CR-1.2842 -0.3986 -1.4556(0.0000***) (0.3520) (0.0000***)
EP-0.0027 -0.0064 0.0054(0.3510) (0.1550) (0.0630*)
CR* EP0.9974 -1.5104 0.7915(0.2350) (0.0170**) (0.2410)
F-stat4.9300 6.5700 5.7800(0.0034***) (0.0005***) (0.0012***)
Adjusted R-square 14.34% 19.32% 17.05%
SGD
Constant0.0008 -0.0005 -0.0035(0.6870) (0.7170) (0.0650*)
CR-1.0917 0.1110 -2.3147(0.0100***) (0.7740) (0.0000***)
EP-0.0029 -0.0101 0.0046(0.3420) (0.0180**) (0.1140)
CR* EP0.9768 -4.0146 2.4082(0.3310) (0.0000***) (0.0010***)
F-stat2.5500 12.8400 6.9800(0.0615*) (0.0000***) (0.0003***)
Adjusted R-square 8.58% 32.68% 21.38%
The upper figure refers to coefficient, and figure in bracket is p-value. Note: significant at 0.01(*), 0.05(**), 0.001(***) level.

Pertanika J. Soc. Sci. & Hum. 23 (S): 237 – 250 (2015)
Tze San Ong, Wei Ni Soh, Boon Heng Teh and Sin Huei Ng
246
The results in Table 3 show that currency change is significantly and negatively related with stock returns in pre-election and post-election stages for both the currencies. This finding tallies with the existing evidence in a study by Solnik (1987). Investors might prefer investing in other financial instruments that become more valuable when a currency depreciates. Thus, the capitals invested in stock markets are perhaps pulled back by investors, who would rather invest in alternative financial instruments. Surprisingly, the currency change is not significantly related to stock returns during the election period.
According to the study of Pantzalis et al. (2000) and Li and Born (2006), political uncertainty may influence the returns of financial assets. The study of Bialkowski et al. (2008) also pointed out that stock market volatility significantly increased around the elections due to uncertainty. Furthermore, the study of Hirshleifer (2001) stated a negative relationship between the uncertainty of political elections and financial asset valuations. However, these findings are not found in this study. Even so, the negative coefficient of the period toward stock returns is revealed, but the coefficient is not significantly proven.
For U.S. Dollar, the effect of currency changes on stock returns is through the interaction variable (CR*EP) during the election period. In other words, foreign traders and investors will consider the political condition of a country before any significant decision is made. The mediation effect only occurs during the election and
is not affected by the stock return before and after the general election. The negative coefficient of the interaction variable shows that currency change will drop during the election period and the currency change additionally decreases the stock return during the election week. In a nutshell, the currency change directly impacts stock return with a negative influence. However, the direct relationship between currency and stock return disappears during the election week. Meanwhile, stock return is affected by currency change indirectly.
The election event is positively significant with stock returns for the US Dollar currency. This is supported by Pantzalis et al. (2000), who stated that it is possible that only partial uncertainty is resolved after the announcement of an election’s outcome. This is because the stock market needs time to assess an election’s impact following the announcement of the results. Hence, a post-election positive abnormal return should be expected if there is a significant amount of uncertainty resolution following the election date. The study of Bialkowski et al. (2008) revealed that a strong abnormal rise started on the Election Day and continued for a number of days thereafter. The market settled down when the cumulative abnormal volatility ceased to increase, which was after around 15 trading days following the event.
The findings for USD and SGD are similar for the pre-election period, and both currencies showed that the mediation effect is supported by evidence during the election week. Currency changes in

Pertanika J. Soc. Sci. & Hum. 23 (S): 237 – 250 (2015)
Stock Return, Currency and General Elections
247
USD impacted stock returns with a higher coefficient compared to SGD (1.284 > 1.0917). SGD was more sensitive to stock returns after the election week. According to Ma and Kao (1990), the impacts of currency depreciation to stock prices varied in export-dominant and import-dominant economies. Meanwhile, the volume of export and import can help in explaining the difference in coefficient for USD and SGD in influencing stock returns. The adjusted R-square for all models and currencies is in the range of 0.0858 to 0.3268. Overall, the adjusted R-square is very high and shows a high reliability of the data and models.
CONCLUSION
As stated in the previous study, stock prices tend to increase during the two weeks prior to an election as political uncertainty tends to decrease during that period. Nippani and Medlin (2002) also mentioned that the uncertainty of an election’s outcome has a direct impact on the stock market. The resolution of uncertainty when the election outcome draws nearer brings volatility to the stock market. Therefore, the rational partisan theory is supported in this study. The continued political power of the incumbent government convinces investors of the continuity of major projects endorsed and steered by them. This directly secures their investments in the said projects. As a result, a bullish market might be created after the announcement of an election’s results, as shown in the results of the USD.
Currency change is expected to be negatively related with stock returns for both currencies. However, the insignificant relationship between currency change and stock returns during the election week is seen to be unpredictable. The impacts of currency change on stock returns can only be explained through the interaction variable. During election week, the currency change will interactively add a supplementary effect on stock returns. Nonetheless, the supplementary effect of the currency change does not exist both before and after the election week.
The findings of this study can serve as a reference for investors of the stock market and traders involved in the movement of currency exchanges; investors will be able to have a better idea on when to get involved in the stock market. Timing is an important issue to consider in making decisions for portfolio investors, especially for foreign investors who are mostly impacted by the fluctuation in currency. As the results show that the currency is mediating the effects of election events on stock return, investors should pay attention to the political outcome and avoid making any decisions during the election event. The impacts of currency on stock returns are simply to make reasonable predictions before and after the election period. Trading companies that are involved in export and import activities are advised to closely monitor political outcomes to reduce any possibility of loss caused by any fluctuation in currency.

Pertanika J. Soc. Sci. & Hum. 23 (S): 237 – 250 (2015)
Tze San Ong, Wei Ni Soh, Boon Heng Teh and Sin Huei Ng
248
Limitations of the Study
One limitation of this study is the lack of available data, thus limiting the scope of the analysis. The exchange rate between Ringgit Malaysia to U.S. Dollar and Singapore Dollar is only available after the year 2005 due to the fixed currency regime set as an action to mitigate the impact of the financial crisis of 1997/98. Thus, this study only managed to include the latest two general elections. This study also attempted to increase the sample size by conducting the test using different currencies and comparing the results of the two currencies in order to avoid any bias results caused by a single currency. However, the adjusted R-square shows that the model is moderately reliable in explaining stock returns. Therefore, a high reliability level can serve as supportive evidence to cover the limitation of the short period in this study.
REFERENCESAggarwal, R. (1981). Exchange Rates and Stock
Prices: A Study of U.S. Capital Markets under Floating Exchange Rates. Akron Business and Economic Review, 12(3), 7-12.
Bachman, D. (1992). The effect of political risk on the forward exchange bias: the case of elections. Journal of international Money and Finance, 11(2), 208-219.
Bialkowski, J., Gottschalk, K., & Wisniewski, T. P. (2008). Stock market volatility around national elections. Journal of Banking and Finance, 32(9), 1941-1953.
Blomberg, S. B. & Hess, G. D. (1997). Politics and exchange rate forecasts for 25 currencies. Journal of International Economics, 52(1-3), 5-59.
Brown, K. C., Harlow, W. V., & Tinic, S. M. (1988). Risk aversion, uncertain information, and market efficiency. Journal of Financial Economics, 22(2), 355-385.
Chretien, S., & Coggins, F. (2009). Election outcomes and financial market returns in Canada. North American Journal of Economics and Finance, 20(1), 1-23.
Dopke, J., & Pierdzioch, C. (2006). Politics and the stock market: Evidence from Germany. European Journal of Political Economy, 22(4), 925-943.
Ellis, C. J., & Thoma, M. A. (1995). The implications for an open economy of partisan business cycles: theory and evidence. European Journal of Political Economy, 11(4), 635-651.
Gartner, M., & Wellershoff, K. W. (1995). Is there an election cycle in American stock returns? International Review of Economics and Finance, 4(4), 387– 410.
Gartner, M. (1986). Some political economy of flexible exchange rates. European Journal of Political Economy, 2(2), 153-168.
Gemmill, G. (1987). Political risk and market efficiency: tests based in British stock and options markets in the 1987 election. Journal of Banking and Finance, 16(1), 211–231.
Goodell, J. W., & Bodey, R. A. (2012). Price–earnings changes during US presidential election cycles: voter uncertainty and other determinants. Public Choice, 150(3-4), 633–650.
Goodell, J. W., & Vahamaa, S. (2013). US presidential elections and implied volatility: The role of political uncertainty. Journal of Banking and Finance, 37(3), 1108-1117.
Hensel, C. R., & Ziemba, W. T. (1995). United States investment returns during Democratic and Republican administrations 1928–1993. Financial Analysts Journal, 51(2), 61–69.
Pertanika J. Soc. Sci. & Hum. 23 (S): 237 – 250 (2015)
Stock Return, Currency and General Elections
249
Huang, R. D. (1985). Common stock returns and presidential elections. Financial Analyst Journal, 41(2), 58– 61.
Jones, S. T., & Banning, K. (2009). US elections and monthly stock market returns. Journal of Economics and Finance, 33(3), 273-287.
Li, J., & Born, J. A. (2006). Presidental election uncertainty and common stock returns in the United States. Journal of Financial Research, 29(4), 609–622.
Lobo, B. J., & Tufte, D. (1998). Exchange rate volatility: does politics matter? Journal of Macroeconomics, 20(2), 351-365.
Ma, C. K., & Kao, G. W. (1990). On Exchange Rate Changes and Stock Price Reactions. Journal of Business Finance and Accounting, 17(3), 441-449.
Mei, J., & Guo, L. (2002). Political uncertainty, financial crisis, and market volatility. Journal of International Business, 25, 325-345.
Nippani, S., & Arize, A. (2005). US presidential election impact on Canadian and Mexican stock markets. Journal of Economics and Finance, 29(2), 271–279.
Pantzalis, C., Stangeland, D. A., & Turtle, H. J. (2000). Political elections and the resolution of uncertainty: the international evidence. Journal of Banking and Finance, 24(10), 1575- 1604.
Powell, J. G., Shi, J., Smith, T., & Whaley, R. E. (2007). The persistent presidential dummy. Journal of Portfolio Management, 33, 133–143.
Santa-Clara, P., & Valkonov, R. (2003). The presidential puzzle: political cycles and the stock market. The Journal of Finance, 58, 1841– 1872.
Soenen, L. A., & Hennigar, E. S. (1988). An Analysis of Exchange Rates and Stock Prices í the U.S. Experience between 1980 and 1986. Akron Business and Economic Review (ABER), 19(4), 7-16.
Solnik, B. (1987). Using Financial Price to Test Exchange Rate Models: A Note. Journal of Finance, 42(18), 141-149.
Wooldridge, J. M. (2006). Introductory Econometrics, Mason. OH: Thomson South-Western.
Wong, W. K., & McAleer, M. (2009). Mapping the Presidential Election Cycle in US stock markets. Mathematics and Computers in Simulation, 79(11), 3267-3277.


Pertanika J. Soc. Sci. & Hum. 23 (S): 251 – 266 (2015)
ISSN: 0128-7702 © Universiti Putra Malaysia Press
SOCIAL SCIENCES & HUMANITIESJournal homepage: http://www.pertanika.upm.edu.my/
ARTICLE INFOArticle history:Received: 30 March 2015Accepted: 10 September 2015
E-mail addresses:[email protected] (Soh Wei Ni),[email protected] (Annuar M. Nassir),[email protected] (Cheng Fan Fah)* Corresponding author
Identifying Factors Correlated with Corporate Cash Holdings in Korea and Malaysia
Soh Wei Ni*, Annuar M. Nassir and Cheng Fan FahDepartment of Accounting & Finance, Faculty of Economics and Management, Universiti Putra Malaysia, 43400 UPM Serdang, Selangor, Malaysia
ABSTRACT
This paper reports new findings on how financial ratios and risk factors of corporations are correlated with cash holdings in Korea and Malaysia. Financial risk and risk factor effects of low cash holding firms and high cash holding firms are similar in both stock exchanges. The means of all variables are higher in high cash holdings firms. The significant results in the form of higher values of financial ratios and risk factors are related to the objective of meeting liquidity needs of firms by providing flexibility to meet uncertainties in the demand for cash flows in the future. The lagged cash flow variables have a significant impact on current cash holdings. Liquidity and repayment ability in Korea and low cash holdings firms in Malaysia have similar findings. These findings add new insights into how cash holding size is associated with key firm-specific and economic factors such as exchange rates and inflation factors.
Keywords: cash holdings, risk, exchange rates, inflation, liquidity
funds to meet cash demands on the firm is more likely technical bankruptcy. Some of the significant financial factors, such as liquidity and solvency factors, correspond to the liquidity conditions and financial health of firms in both short- and long-terms. Liquidity factor refers to the probability of facing losses when disposing of or selling assets to meet short-term obligations. Highly liquid assets can be sold easily and with little loss at no additional cost and with minimal chance
INTRODUCTION
This paper identifies the correlation of financial ratios and risk factors on cash holdings of firms in Korean and Malaysian stock exchanges. Firm has insufficient
Pertanika J. Soc. Sci. & Hum. 23 (S): 251 – 266 (2015)
Soh Wei Ni, Annuar M. Nassir and Cheng Fan Fah
252
of illiquidity. Besides, the management of funding sources, the overall monitoring of market conditions also plays an important role in affecting the ability to liquidate the assets of the firms with good value. Too little cash forces firms to liquidate productive assets; holding too much cash will reduce profitability. Nonetheless, long-term solvency factor concerns are not affected by external funding costs; therefore, cash holdings become moderately unimportant. Firms will become insolvent as they fail to meet maturing obligations on the due dates of long-term obligations (after disposal of their assets). Since cash holdings are the most liquidised assets in the short term, it is expected that the liquidity factor is significant in explaining the ratio of cash that a firm holds. However, the relationship between solvency factor and cash ratios is perceived to be weaker or not significant.
A compendium of work has been done on determinants of cash holdings. However, the elements related to cash holdings are unable to mitigate the exposure of a firm to certain risks and fail to contribute to a firm’s risk management, whether towards financial ratios and risk factors. Managing risk is one of the primary objectives of firms operating internationally (Ghoshal, 1987). Cash holdings might be affected by the changes in certain financial ratio and risk factors, and risk is the main issue that leads to varying outcomes of expected results. Therefore, this study tends to link cash, financial ratio and risk factors together as they are all related in determining firm’s cash holdings decision. Financial ratios
and risk factors more easy link with and understandable for investors. The links between financial ratios, risk factors and cash holdings, which are concerned by investors, give a clearer picture to investors on the judgement of the cash holding size. The findings could also serve as a reference for shareholders to understand the purpose of management so as to increase cash holdings.
The motivation for this research is to add findings relevant to the risk management literature by providing evidence of risk factors that influence the level of cash holdings in two yet studied economies, namely, Korea and Malaysia. Both economies have advanced institutional and regulatory frameworks in that the accounting standards are well developed, standards of supervision of securities markets are advanced, as are trading practices. Both economies are relatively affluent economies, although Korea had joined the ranks of developed economies some years back while Malaysia hopes to do so by the year 2020 with its current per capita income close to US$10,000, which is somewhat below the income level needed to be qualified as a developed economy. The similarity in the standards of regulations and supervision makes these two cases comparable in this paper.
The rest of the paper is organised into the following sections. In section 2, one could find a summary of review of literature on cash holdings. Section 3 provides a summary of discussion on how

Pertanika J. Soc. Sci. & Hum. 23 (S): 251 – 266 (2015)
Identifying Factors Correlated with Corporate Cash Holdings in Korea and Malaysia
253
an appropriate advanced methodology is selected to study this aspect. The findings are reported in Section 4, and the paper ends with a conclusion in Section 5.
LITERATURE REVIEW
Risk factors usually denote discrepancy in a firm’s performance or point to results that cannot be predicted before an incident occurs. The source of the risk could stem from external and internal factors impacting a firm’s performance such as profitability, management, liquidity, and etc., in which the firm’s operations could be exposed to certain indeterminate environmental components. This term of risk tallies with that used by researchers in strategy management that applies the variance or standard deviation of performance variables over the fiscal accounting year (Miller, 1992).
The decision on a cash-holding policy is based on several risk factors and the level of risk that corporations experience, especially credit risk that directly impacts a firm’s performance and market value. In general, the corporation with higher cash holdings should be safer and face lower credit risk. However, Acharya et al. (2011) remarked that the optimal cash reserves are actually significant and positively related to the risk spread. Their findings showed stronger evidence toward lower credit ratings.
Besides, as revealed in one of the latest studies by Arnold (2014) concerning the role of cash holdings and bankruptcy risk, cash can help in deferring bankruptcy by
providing a firm with sufficient liquidity to buffer against insolvency during difficult periods. Other than bankruptcy risk, the cash-holding level is influenced by cost of capital that is incurred when there are insufficient liquid assets to finance a firm’s obligations. The increase in the cost of capital burdens cash flow, and may lead to a higher liquidity risk due to the uncertainty of cash outflow in the future. Therefore the rise in liquidity risk will lead to a higher need for holding more cash (Guldimann, 1994).
Mamdouh (2014) concluded that leveraged firms tend to minimise liquidity factor by controlling their cash holdings; default caused by liquidity risk is due to lack of liquidity in covering coupon payments that were due. Nonetheless, there is no study investigating on the external and internal risk factors on cash holdings. Some other research focused on financial ratios with cash holdings which related with interest factor. A firm with an interest coverage ratio of less than one is assumed to be financially distressed (Desai & Jain, 1999). Firms will increase cash on hand to ensure that there is sufficient cash to meet interest obligations in order to avoid becoming financially distressed.
Macroeconomic risk factors are a broad concept encompassing fluctuations in the level of economic activity and prices (Oxelheim & Wihlborg, 1987). Inflation will increase the general price, including the prices of inputs (such as raw materials or labour) and consumer goods. The movements in inflation and

Pertanika J. Soc. Sci. & Hum. 23 (S): 251 – 266 (2015)
Soh Wei Ni, Annuar M. Nassir and Cheng Fan Fah
254
exchange rate will affect the purchasing power of firms, thus, resulting in aggregate production and general costing on daily business transactions. As firm’s value and market capitalisation are closely tied up with the movements in stock exchanges, fluctuations in the stock market will affect a firm’s decision on investment, financing and performance.
Inflation risk is predicted to have a negative relationship with cash holdings for low-cash-firms, but is positively related with high-cash firms. Firms with exposure to relatively high inflation rates in their cost base might find it tougher to contest on price, thus increasing the challenge of business with a higher chance of defaulting. Higher inflation risk will lead to greater volatility in all financial markets. Therefore, firms might hold on to more cash to makes it easier to perform current investments and buy other investments at declining prices (Refer to Chang et al., 2000; Dotsey & Sarte, 2000). However, some firms may prefer to invest in valuable property that continues to appreciate rather than holding on to cash, in order to reduce the loss of value in cash during periods of high inflation.
DATA AND METHODOLOGY
This study analysed the secondary and quantitative data of listed firms in the Korean Stock Exchange (Korea Exchange) and Bursa Malaysia. The time period of this study started from 2000 to 2012; therefore, the listed firms in these two selected Asian countries operating during the study period
and fulfilling certain criteria were taken as part of the sample. The financial and utility industries were excluded from the sample as the role and value of cash in these industries differed from other industries. Financial firms were excluded from the sample because of the unique role that cash plays for financial institutions and banks. Utilities were also excluded because they are regulated and should have a small differential between the costs of internal and external funds. The financial data and market data of each listed firm were collected from the Data stream database and the S&P capital IQ dataset. In the meantime, the macroeconomic variables’ data were collected from the Department of Statistics and the World Bank’s database. In addition, data of firms that are outliers and those that are missing were excluded from the study. The outlier is estimated as the 5 per cent of the bottom and top of the sample. Any listed firms that failed to offer continuous data that are less than 5 years were also deleted from the sample. This tight screening process reduced the sample sizes of Korea Exchange (from three thousands plus to around eight hundreds firms) and Bursa Malaysia (from one thousand plus to around 5 hundreds firms).
Panel regression is separated into two models which indicate the effects of financial ratio and risk factors on cash holdings over the fiscal year. The equation in Model 1 regresses cash holdings on internal factors, including liquidity factor (LF), repayment ability factor (RAF) and solvency factor (SF). The macroeconomic

Pertanika J. Soc. Sci. & Hum. 23 (S): 251 – 266 (2015)
Identifying Factors Correlated with Corporate Cash Holdings in Korea and Malaysia
255
risk factors such as inflation risk (InfR) and currency risk (CR) are added into Model 2. The function of cash holdings and control variables can be written in simple general forms, as follows:
Cash ratio = f (LF, RAF, SF) (Model 1)
Cash ratio = f (LF, RAF, SF, InfR, CR) (Model 2)
The use of the GMM estimator by Arellano and Bond (1991) is practical, and a general method used in solving the dilemma related to the dynamic panel data model, where some precise estimation problems exist due to the presence of lagged dependent variables on the right hand side of the equation. This problem has a high probability of occurring when examining the objectives of this study. The potential problems might lead to an upward bias of the estimates of the OLS regression analysis, where the error term by definition is corrected with one of the regressors (Bond, 2002).
The cash level is measured by cash and its equivalents over total assets minus cash. The average of firm’s cash ratio more than 25% is considered as high cash holdings firm and otherwise (Mikkelson & Partch, 2003). The justification and expected signs of each financial ratio and risk factor are clarified in subsections 3.1 and 3.2, respectively.
Financial Ratio Factors
Liquidity factor is measured by liquid assets over total assets ratio, which is also known as justification for short-term liquidity or daily
transaction. Solvency factor is estimated using equity over total assets, which is also known as long-term liquidity for long-term debt obligations. The two measurements were used in the study by Ariff et al. (2013) who expected positive regression with cumulative abnormal return. Since cash holdings aid in reducing the pressure of increased liquidity risk, it is believed that liquidity and solvency risk factors are positively related to cash holdings.
The repayment ability factor is calculated to measure the ability of a firm to repay the interest on debt. Therefore, the proxy for this factor is estimated by earnings before interest, taxes and depreciation (EBITD), divided by interest expenses, which are also known as the interest coverage ratio. Hence, the repayment ability factor is expected to be positively significant with cash holdings.
Macroeconomic Risk Factors
Inflation and currency risk factors are measured by the standard deviation of changes in monthly data for a particular fiscal year. Firms are exposed to macroeconomic risks. These corporate risk exposures tend to be multifaceted as to challenge any attempt at analytical modelling in a pro-forma statement (Bartram, 2000). Rita (1980) concluded that the appreciation in currencies will lead to an increase in cash holdings and marketable securities. Thus, currency risk and cash holdings are expected to move in the same direction and positively related to cash holdings.
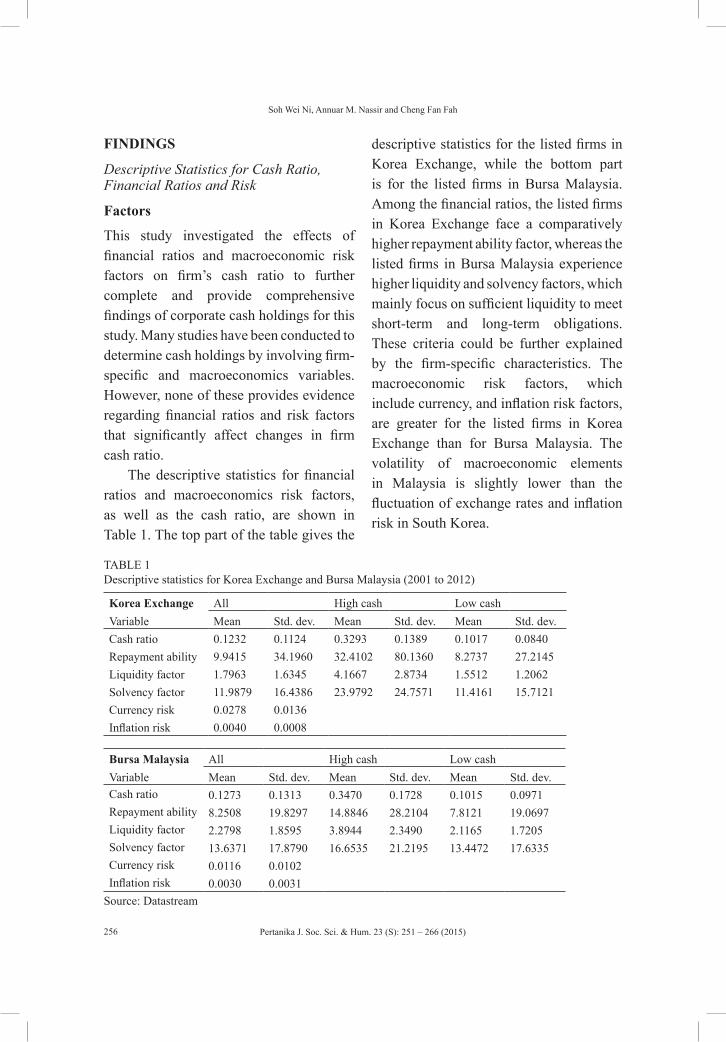
Pertanika J. Soc. Sci. & Hum. 23 (S): 251 – 266 (2015)
Soh Wei Ni, Annuar M. Nassir and Cheng Fan Fah
256
FINDINGS
Descriptive Statistics for Cash Ratio, Financial Ratios and Risk
Factors
This study investigated the effects of financial ratios and macroeconomic risk factors on firm’s cash ratio to further complete and provide comprehensive findings of corporate cash holdings for this study. Many studies have been conducted to determine cash holdings by involving firm-specific and macroeconomics variables. However, none of these provides evidence regarding financial ratios and risk factors that significantly affect changes in firm cash ratio.
The descriptive statistics for financial ratios and macroeconomics risk factors, as well as the cash ratio, are shown in Table 1. The top part of the table gives the
descriptive statistics for the listed firms in Korea Exchange, while the bottom part is for the listed firms in Bursa Malaysia. Among the financial ratios, the listed firms in Korea Exchange face a comparatively higher repayment ability factor, whereas the listed firms in Bursa Malaysia experience higher liquidity and solvency factors, which mainly focus on sufficient liquidity to meet short-term and long-term obligations. These criteria could be further explained by the firm-specific characteristics. The macroeconomic risk factors, which include currency, and inflation risk factors, are greater for the listed firms in Korea Exchange than for Bursa Malaysia. The volatility of macroeconomic elements in Malaysia is slightly lower than the fluctuation of exchange rates and inflation risk in South Korea.
TABLE 1Descriptive statistics for Korea Exchange and Bursa Malaysia (2001 to 2012)
Korea Exchange All High cash Low cashVariable Mean Std. dev. Mean Std. dev. Mean Std. dev.Cash ratio 0.1232 0.1124 0.3293 0.1389 0.1017 0.0840Repayment ability 9.9415 34.1960 32.4102 80.1360 8.2737 27.2145Liquidity factor 1.7963 1.6345 4.1667 2.8734 1.5512 1.2062Solvency factor 11.9879 16.4386 23.9792 24.7571 11.4161 15.7121Currency risk 0.0278 0.0136Inflation risk 0.0040 0.0008
Bursa Malaysia All High cash Low cashVariable Mean Std. dev. Mean Std. dev. Mean Std. dev.Cash ratio 0.1273 0.1313 0.3470 0.1728 0.1015 0.0971Repayment ability 8.2508 19.8297 14.8846 28.2104 7.8121 19.0697Liquidity factor 2.2798 1.8595 3.8944 2.3490 2.1165 1.7205Solvency factor 13.6371 17.8790 16.6535 21.2195 13.4472 17.6335Currency risk 0.0116 0.0102Inflation risk 0.0030 0.0031
Source: Datastream

Pertanika J. Soc. Sci. & Hum. 23 (S): 251 – 266 (2015)
Identifying Factors Correlated with Corporate Cash Holdings in Korea and Malaysia
257
The mean and standard deviation of cash ratio are about the same for both the stock exchanges, which showed a mean of 0.1232 and a standard deviation of 0.1124 for the listed firms in Korea Exchange, and a mean of 0.1273 and a standard deviation of 0.1313 for the listed firms in Bursa Malaysia. The previous section reports on a higher standard deviation of the change in interest expenses for Korea Exchange relative to the listed firms in Bursa Malaysia. The higher mean and standard deviation of the change in interest expenses showed that the listed firms in Korea Exchange are paying a relatively higher payment on interest charges. As a result, the interest risk for the listed firms in Korea Exchange is greater than in Bursa Malaysia.
These two financial ratios are lower for the listed firms in Korea Exchange, which eventually portray the weakness of these firms in terms of liquidity and solvency management. Financial risk and risk factor trends of low cash holding firms and high cash holding firms are similar for both the stock exchanges. High cash holding firms experience higher means of all variables. Overall, the status of financial ratios and higher risk factors might be the key motives to encourage firms to hold more cash in order to have sufficient liquidity and flexibility to overcome the uncertainties of the future.
(i) Diagnostic Check for GMM Estimation for Korea Exchange and Bursa Malaysia
There are two diagnostics that are part of the GMM in testing the appropriateness of the instruments used. The Sargan test is used to identify the restrictions under the null hypothesis on the validity of the instruments (Arellano et al., 1991; 2003). The test concludes with the null hypothesis that mentions that all IVs are uncorrelated or that the model is not over-identifying restrictions. If the statistical value shows enough evidence to reject the null hypothesis, then at least some of the IVs are not exogenous. In order to continue with the GMM estimations, the Sargan test must show that the model is not over-identifying restrictions. The results for the Sargan test in Table 2 show that they are not statistically significant. With respect to the Sargan test of over-identifying restrictions, the high p-value suggests insufficient data in rejecting the null hypothesis that the set of instruments are appropriate. The second diagnostic test is a check of the first-order and second-order serial correlations in the first different residuals, stated as asymptotically standard normal distribution values. As required, the test for the first-order correlation AR (1) in the GMM estimation must reject the null hypothesis that the autocorrelation exists in the data set, and the second-order correlation AR (2) must fail to reject the null hypothesis. The statistical reports of the p-value of AR (1) and AR (2) are fulfilling the requirement. Thus, the validity of GMM is supported in this model.

Pertanika J. Soc. Sci. & Hum. 23 (S): 251 – 266 (2015)
Soh Wei Ni, Annuar M. Nassir and Cheng Fan Fah
258
TABLE 2GMM post-estimation diagnostic checking for Korea Exchange and Bursa Malaysia
Variable/ model Sargan test AR 1 AR 2
Korea Exchange
All
Model 1 65.0768 -5.3324 0.9870(0.1235) (0.0000)*** (0.3237)
Model 2 63.5036 -5.3067 1.0369(0.2887) (0.0000)*** (0.2998)
High cash Model 1 23.6004 -2.5851 0.7974
(0.8860) (0.0097)*** (0.4252)
Model 2 30.8503 -2.5316 0.8390(0.9742) (0.0114)*** (0.4015)
Low cashModel 1 63.3947 -6.5809 0.3507
(0.1553) (0.0000)*** (0.7259)
Model 2 63.8806 -6.5234 0.4049(0.2776) (0.0000)*** (0.6856)
Bursa Malaysia
All
Model 169.8309 -6.4058 0.4916(0.1373) (0.0000)*** (0.6230)
Model 250.9692 -6.2191 0.9167(0.0778) (0.0000)*** (0.3593)
High cash Model 1
34.6623 -2.0164 -0.5695(0.3885) (0.0438)** (0.5690)
Model 237.9771 -1.9844 -0.6060(0.4705) (0.0472)** (0.5445)
Low cashModel 1
61.0121 -6.4094 0.9566(0.2101) (0.0000)*** (0.3388)
Model 286.3219 -6.6833 1.1798(0.0662) (0.0000)*** (0.2381)
Note: Sargan test was used to test over-identifying restrictions in a statistical mode. Arellano-bond tests 1 and 2 were used to detect the existence of autocorrelation.*** Significant at 0.01 confidence level, ** Significant at 0.05 confidence level, * Significant at 0.1 confidence level, p-values are in parenthesesFindings of GMM Estimation for Korea Exchange
(ii) Findings of GMM Estimation for Korea Exchange
As mentioned earlier, a GMM estimation consisting of lagged variables as the regressors can aid in improving results by allowing the significance of the previous exogenous variables to be reflected in the current adjustments. Therefore, the findings of the dynamic relationship of corporate cash holdings with the financial ratios and risk factors might be improved by including
the effects of lagged variables. The results for the GMM estimation for the listed firms in Korea Exchange are presented in Table 3.
The total number of the listed firms is 864, out of which, 10.8% are high cash holding firms, and there are 770 low cash holding firms. The horizontal arrangement makes it easy to compare the findings from row to row across each category. The data were estimated using a two-year moving average as the number of years for

Pertanika J. Soc. Sci. & Hum. 23 (S): 251 – 266 (2015)
Identifying Factors Correlated with Corporate Cash Holdings in Korea and Malaysia
259
the sample is not long enough to conduct a 3-year or 5-year moving average. The results for Korea Exchange are presented in Table 3. The statistics indicates that the coefficient of lagged cash ratio is positively significant to dependent variables in that it supports the dynamic relationship of the dependent variable existing in this model. The cash-holding level relative to total assets in previous periods do generate a positive impact on the current cash ratio, while the impact of the lagged cash reserves has more of an effect on low cash holding firms than high cash holding firms, as shown by the coefficient of 0.3228 compared to 0.1304 in model 2.
The listed firms in Korea Exchange, including high cash holding firms and low cash holding firms, the liquidity (tally with the finding in Mamdouh, 2014) and repayment ability factors are positively significant to cash holdings. The coefficients for the results of the GMM estimation showed that low cash holding firms have a higher coefficient for liquidity factor, while the coefficient for the repayment ability factor is almost the same for both the high cash holding firms and low cash holding firms. Low cash holding firms have a higher coefficient of 0.0321 for the liquidity risk factor, which is almost double compared with the coefficient of 0.0147 for the high cash holding firms. This finding shows that the cash ratio of low cash holding firms is greatly responsive to the changes in liquidity risk. Firms have access to two types of external financing: debt and equity. When internal cash holdings are insufficient to
cover a firm’s daily payments, the firm might need to issue equity to cover the deficit. If shareholders are no longer keen to pump in additional capital, the firm defaults (Chen, 2010). Therefore, low cash holding firms with relatively weak internal cash reserves are more sensitive to the changes in the liquidity risk factor. As firms need more cash to pay off the increase in daily transactional needs and short-term obligations, the cash ratio of a particular firm has to be adjusted to a higher proportion. Since high cash holding firms always have a higher amount of ready funds on hand, the response of the cash ratio towards the rise in liquidity risk is lower.
The coefficients of the repayment ability factor are quite similar for high cash holding firms and low cash holding firms, which are 0.0010 and 0.0007 in model 1, respectively. The coefficient of repayment ability factor for high cash holding firms decreased to 0.0005 in Model 2, after including the effect of macroeconomic risk factors. Therefore, the significance of the repayment ability factor in explaining the cash ratio in high cash holding firms is subject to the changes in macroeconomic risk factors. High cash holding firms would be concerned about the changes in interest rate, and the amount of interest payments might burden their cash flow when they experienced an unexpected need for cash reserves during bad economic times, a situation that is out of their control.
The change of macroeconomic risk factors might increase the probability of high cash holding firms to increase their debt and leverage. Furthermore, the

Pertanika J. Soc. Sci. & Hum. 23 (S): 251 – 266 (2015)
Soh Wei Ni, Annuar M. Nassir and Cheng Fan Fah
260
uncertainties in inflation and currency risk factors might negatively impact on the revenue of the firms which is used in serving the interest payment. However, the cash ratio of low cash holding firms is always sensitive to interest rate, no matter how bad the economic conditions may be. As they rely on debt in financing their short-
term and long-term obligations, cash ratio of low cash holding firms is adjusted according to a certain level of repayment ability. Any changes in interest payment will turn them into default when they fail to cover their interest payments. Therefore, the awareness of cash ratio on interest expenses obligation is very strong for low cash holding firms.
TABLE 3GMM estimation of the impacts of firm-level and macroeconomic factors on cash holdings ratio for the listed firms in Korea Exchange from 2001 to 2012 using two-year moving average
This table presents the results of the dynamic effects of cash ratio in the entire sample and the two subsamples of high cash holding firms and low cash holding firms. Model 1 regresses the cash ratio with lagged cash ratio and financial ratio factors; macroeconomic risk factors were added to Model 2. Liquidity factor was measured by liquid assets over total assets ratio, solvency factor was estimated using equity over total assets, and repayment ability factor was calculated using EBITD over interest expenses. Inflation and currency risk factors were measured by the standard deviation of changes in monthly data for particular fiscal year.
Dependent variable: cash ratioAll High cash Low cash
Variable Model 1 Model 2 Model 1 Model 2 Model 1 Model 2Constant a -0.0056 0.0205 0.3519 0.0778 -0.0070 0.0124
b (-0.5000) (1.1200) (4.1800***) (0.9100) (-0.6600) (0.7100)c (0.6190) (0.2620) (0.0000) (0.3610) (0.5100) (0.4760)
L. Cash Ratio 0.3164 0.3110 0.2737 0.1304 0.3413 0.3228(5.8300***) (5.7500***) (2.6900**) (2.2200**) (6.7700***) (6.4200***)
(0.0000) (0.0000) (0.0070) (0.0270) (0.0000) (0.0000)Liquidity Risk 0.0185 0.0190 0.0053 0.0091 0.0200 0.0213
(5.9200***) (5.5300***) (2.3400**) (1.9600**) (7.1100***) (6.7400***)(0.0000) (0.0000) (0.0190) (0.0500) (0.0000) (0.0000)
Repayment ability factor(3.2400***)
0.0006 0.0006 0.0010 0.0005 0.0007 0.0007(3.2300***) (1.8100*) (2.2200**) (4.5500***) (4.5500***)
(0.0010) (0.0010) (0.0700) (0.0260) (0.0000) (0.0000)Solvency factor 0.0003 0.0003 0.0007 0.0004 0.0005 0.0004
(1.4100) (1.5200) (2.4500**) (1.4800) (1.9800**) (1.8800*)(0.1580) (0.1290) (0.0140) (0.1390) (0.0470) (0.0600)
Inflation Risk -5.5697 -13.4356 -3.7371(-1.9900**) (-2.4000**) (-1.4400)
(0.0470) (0.0160) (0.1510)Currency Risk -0.2597 4.3455 -0.0976
(-1.1600) (5.9100***) (-0.4600)(0.2470) (0.0000) (0.6450)
Wald chi 158.3100 163.9600 389.0200 382.3000 217.6400 232.2300p-value (0.0000***) (0.0000***) (0.0000***) (0.0000***) (0.0000***) (0.0000***)
Note: a =coefficients, b = t-statistics, c = p-values, significant at 0.01(*), 0.05(**), 0.001(***) level.

Pertanika J. Soc. Sci. & Hum. 23 (S): 251 – 266 (2015)
Identifying Factors Correlated with Corporate Cash Holdings in Korea and Malaysia
261
The solvency factor is significantly related with cash ratio. As mentioned in the previous portion, since solvency risk is measured by long-term assets and liability, cash holdings, which are seen as part of current liquid assets, hardly contribute to any explanation of the cash ratio. Thus, the significance of solvency risk in the GMM estimation shows that solvency risks do provide some explanations of cash ratio and the impacts of the lagged cash ratio play an important role in enhancing this evidence. Solvency factor is measured by equity over-total-assets, issuance new equity which is seen as a source of external funding has a stronger explanation of cash holding for low cash holding firms. However, the significance of solvency factor is very weak for high cash holding firms that are less likely to obtain the external funding through equity issuance.
High cash holding firms are more likely to be explained by macroeconomic risk factors, which are currency and inflation risk factors. This evidence shows that high cash holding firms in Korea Exchange are likely to be greatly exposed to changes in macroeconomic risk. The coefficient of inflation risk, which is 13.4356 with a negative sign, shows that high cash holding firms will keep less cash reserves when inflation risk increases in order to avoid depreciation on cash holding value. High inflation erodes the purchasing power of the cash on hand. Firms with high cash holding prefer investing on assets or investment to shelter cash reserve from inflation. This finding tallies with those of Kim et al.
(1998) and Natke (2001). The cash ratio of low cash holding firms is unexplainable by inflation risk because the cash on hand is only sufficient for daily transactions. Therefore, the need of adjusting cash ratio according to the change in inflation risk does not exist for low cash holding firms.
Generally, firms with high cash holding have higher efficiency in internal management than in firms with low cash holding. A better internal control of assets for firms with high cash holding aids in accumulating cash holding. Therefore, firms with high cash can easily increase cash on hand compared to firms with low-cash holding. This finding is consistent with the capital flight theory, indicating that the appreciation in currency will increase the holdings of cash and marketable securities. The currency risk is significant with a positive coefficient of 4.3455 for high cash holding firms shows that firms are keeping more cash holding when the currency risk increases. As mentioned in the study of Rita (1980), the liquid fund will move in the same direction as the trends in the exchange markets. However, the currency risk is insignificant for low cash holding firms due to restrictions in liquidity management. Firms with low cash holding are unable to increase and adjust the cash ratio immediately as their liquidity is tied up with other components such as inventory and account receivables.
Macroeconomic risk factors might be the main reasons or sources of risk that encourage high cash holding firms to hold higher liquidity in order to

Pertanika J. Soc. Sci. & Hum. 23 (S): 251 – 266 (2015)
Soh Wei Ni, Annuar M. Nassir and Cheng Fan Fah
262
manage unexpected changes; however, macroeconomic risk is usually out of their control.1 Yet, the effects of those risk factors have been restricted in the fixed-effect regression; the explanation of the variables in the previous period on the current exogenous variable has been ignored. Therefore, it can only reflect that it is significant after including the effect of lagged exogenous variables. The F-statistics for all models in Table 3 are significant at 0.01.
(iii) Findings of GMM Estimation for Bursa Malaysia
The results in Table 4 summarise all the findings of the GMM estimation for the listed firms in Bursa Malaysia, which show that the lagged cash ratio is part of the endogenous variables in this model, and is statistically significant at 0.1 with a positive sign. It shows that a dynamic relationship exists in this model. Therefore, the GMM estimation aids in enhancing the estimation of this regression. The coefficient of the lagged cash ratio for the listed firms in Bursa Malaysia is slightly higher compared to the listed firms in Korea Exchange, exhibiting that the cash ratios for the listed firms in Bursa Malaysia are more
1The importance of macroeconomic risk factors in explaining the cash ratio of high cash holding firms is hinted in the fixed-effect regression shown by the increase in the adjusted R-square in the results of fixed-effect regression from Model 1 to Model 2 after including macroeconomic risk factors; it is available whenever required.
likely to be affected by the lagged cash ratio, and in a relatively higher proportion.
The liquidity and interest risk factors of the listed firms in Bursa Malaysia are statistically significant for all the categories with a positive sign. Higher-cash firms have a higher coefficient of 0.0334 for the liquidity risk factor compared with the coefficient of low cash holding firms at 0.0055 in Bursa Malaysia. High cash holding firms in Bursa Malaysia behave relatively in a more risk-adverse manner than high cash holding firms in Korea Exchange; the conservatism practice leads to higher response towards the increase of liquidity risk. As discussed in the earlier section, the coefficient of the liquidity factor indicates the firms’ response towards the adjustment on cash ratio. The sensitivities of high cash holding firms and low cash holding firms towards liquidity factor are dissimilar with firms in Korea Exchange. Somehow, high cash holding firms are seen as more capable in increasing cash by supportive cash management practices in their organisations. Thus, the coefficient of the liquidity factor is higher for high cash holding firms that act conservative towards any possible damage for firms with high cash holding in Bursa Malaysia.

Pertanika J. Soc. Sci. & Hum. 23 (S): 251 – 266 (2015)
Identifying Factors Correlated with Corporate Cash Holdings in Korea and Malaysia
263
TABLE 4GMM estimation of the impacts of firm-level and macroeconomic factors on cash holdings ratio for the listed firms in Bursa Malaysia from 2001 to 2012 using two-year moving average
This table presents the results of the dynamic effects of cash ratio in the entire sample and the two subsamples of high cash holding firms and low cash holding firms. Model 1 regresses the cash ratio with lagged cash ratio and financial ratio factors; macroeconomic risk factors were added to Model 2. Liquidity factor was measured by liquid assets over total assets ratio, solvency factor was estimated using equity over total assets, and repayment ability factor was calculated using EBITD over interest expenses. Inflation and currency risk factors were measured by the standard deviation of changes in the monthly data for particular fiscal year.
Dependent variable: cash ratio
All High cash Low cash
Variable Model 1 Model 2 Model 1 Model 2 Model 1 Model 2
Constant a 0.0014 0.0112 0.1045 0.1044 0.0754 0.0160
b (0.1400) (1.0300) (7.0400***) (0.4700) (6.0600***) (1.5800)
c (0.8910) (0.3010) (0.0000) (0.6410) (0.0000) (0.1130)
L. cash ratio 0.5742 0.5082 0.3265 0.3200 0.4567 0.4646
(3.7200***) (3.3000***) (5.8500***) (4.9200***) (3.7100***) (4.3300***)
(0.0000) (0.0000) (0.0000) (0.0000) (0.0000) (0.0000)
Liquidity factor 0.0083 0.0056 0.0293 0.0334 0.0066 0.0055
(2.4900**) (1.8200*) (5.3400***) (3.4300***) (2.0200**) (1.8200*)
(0.0130) (0.0690) (0.0000) (0.0000) (0.0430) (0.0690)
Repayment ability factor(3.0600**)(1.0400)
0.0012 0.0004 0.0014 0.0014 0.0004 0.0007
(4.1600***) (3.7600***) (0.8500) (1.7700*)
(0.0020) (0.2970) (0.0000) (0.0000) (0.3950) (0.0760)
Solvency factor 0.0000 0.0001 0.0001 0.0002 0.0005 0.0001
(0.0200) (0.4600) (0.3400) (0.4300) (1.7500*) (0.4600)
(0.9840) (0.6490) (0.7340) (0.6680) (0.0800) (0.6420)
Inflation risk -2.258 -1.4907 -2.3637
(-4.5200***) (-1.2600) (-4.7800***)
(0.0000) (0.2090) (0.0000)
Currency risk 1.1034 0.0648 1.1436
(3.5000***) (0.0900) (3.0300***)
(0.0000) (0.9290) (0.0000)
Wald chi 295.5300 347.8500 396.4300 414.8700 263.6300 306.8700
p-value (0.0000***) (0.0000***) (0.0000***) (0.0000***) (0.0000***) (0.0000***)
Note: a =coefficients, b = t-statistics, c = p-values, significant at 0.01(*), 0.05(**), 0.001(***) level.

Pertanika J. Soc. Sci. & Hum. 23 (S): 251 – 266 (2015)
Soh Wei Ni, Annuar M. Nassir and Cheng Fan Fah
264
Repayment ability is positively significant with cash ratio of the listed firms in Bursa Malaysia, which is consistent with the finding in the Korea Exchange sample. The trends of the coefficients for repayment ability factor of high cash holding firms and low cash holding firms in Bursa Malaysia are not similar to those of the listed firms in Korea Exchange. In more specific, the coefficient of repayment ability for firms with low cash holding was found to decrease from 0.0004 (model 1) to 0.0007 (model 2) after including the effect of macroeconomic risk factors. The changes of the cash ratio in low cash holding firms might be due to the risk-adverse and conservatism practices in the listed firms of Bursa Malaysia. Generally, the fluctuations of inflation and currency are associated with interest rate changes. Firms with low cash holding are adjusting their repayment ability according to the changes in inflation and currency risk factors to avoid failure in fulfilling interest expenses obligations which might turn them into default. Meanwhile, the coefficients of repayment ability factor are consistent in model 1 and model 2 for firms with high cash holding in Bursa Malaysia. The unchanged coefficients for the repayment ability factor in high cash holing firms in model 1 and model 2 might be explained by sufficient liquid to meet the interest expenses obligations. Furthermore, firms with high cash holding are usually involved in lesser debt and low interest payments, and therefore, they do not need to adjust according to the changes in the macroeconomic risk factors.
Unlike the findings in Korea Exchange, low-cash holding firms are statistically significant to macroeconomic risk factors, inflation and currency risk factors. However, there is no evidence found for high cash holding firms. The cash ratio of high cash holding firms in Bursa Malaysia is less likely to be affected by its macroeconomic risk factors as the listed firms in Bursa Malaysia practice conservatism in their cash management. The coefficient of 1.2102 for inflation risk is significant with a negative sign at 0.01 for low cash holding firms that showed the same sign compared with the inflation risk factors for the high cash holding firms in Korea Exchange. When the inflation risk is greater, low cash holding firms will further reduce the cash holdings to mitigate the loss of a drop in the value of cash and purchasing power.
The coefficient of 1.0299 with a positive sign for the currency risk of low cash holding firms indicates that firms will hold more cash when the volatility of the exchange rate or the change of value in the local currency is greater. Also, low cash holding firms expect local currency to depreciate; thus, the conversion of payment for import from other countries in foreign currency will be relatively expensive. Thus, low cash holding firms will keep more cash holdings as a preparation for the unanticipated increase in their daily transactions and obligations. The F-statistics is significant at 0.0001 for all models (see Table 4).

Pertanika J. Soc. Sci. & Hum. 23 (S): 251 – 266 (2015)
Identifying Factors Correlated with Corporate Cash Holdings in Korea and Malaysia
265
CONCLUSION
This study was an attempt to identify the impacts of financial ratios and risk factors on cash holdings, which are similar between Korea Exchange and Bursa Malaysia. The results of the panel regression, without considering the lagged effects of exogenous variables on the current stage, showed that the liquidity ratio and repayment ability factor significantly impacted the cash-holding decision. The results of this objective reported that most external risk factors are significant for low cash holding firms in Bursa Malaysia (in fixed-effect regression and GMM estimation) and high cash holding firms in Korea Exchange (in GMM estimation).
The limitation of this study lies in the method used in testing the data. The reliability of GMM applied in this study is still under debate. The criticism is on the homogenous of the number of company; one of the assumptions of GMM is not valid. A new method called Pool Mean Group is introduced to overcome this issue. However, the latest method was not utilised in this study due to the unavailability of this method at the time when this study was conducted.
A preliminary research on the relationship among financial ratio, risk factors and firm-specific elements (cash holdings) was conducted in this study. Financial ratio and risk factors are usually linked with stock returns and management in past literature. The results of the study showed that financial ratios and external risk factors (such as currency and inflation risk
factors) that were often been overlooked in existing studies are significant with cash holdings. By connecting the risk factors to other significant variables in firm’s management such as working capital, a better explanation could be given for the relationship between risk factors and important firm-specific elements. This is because a good understanding of risk and firm-specific elements aids in enhancing the risk management.
ACKNOWLEDGEMENTS
The first author wishes to record her sincere appreciation to the Doctoral Committee members for their guidance of her research. This paper is based on part of the findings reported in the thesis.
REFERENCESAcharya, V. V., Davydenko, S. A., & Strebulaev,
A. A. (2011). Cash holdings and credit risk (No. w16995). National Bureau of Economic Research.
Arellano, M., & Bond, S. (1991). Some tests of specification for panel data: Monte Carlo evidence and an application to employment equations. Review of Economic Studies, 8(2), 277 - 297.
Ariff, M., Cheng, F. F., & Soh, W. N. (2013). Earnings response coefficients of OECD banks: test extended to include bank risk factors. Advances in Accounting, 29(1), 97-107.
Arnold, M. (2014). Managerial cash use, default, and corporate financial policies. Journal of Corporate Finance, 27, 305-325.

Pertanika J. Soc. Sci. & Hum. 23 (S): 251 – 266 (2015)
Soh Wei Ni, Annuar M. Nassir and Cheng Fan Fah
266
Bartram, S. M. (2000). Corporate risk management as a lever for shareholder value creation. Financial Markets, Institutions & Instruments, 9(5), 279-324. doi: 10.1111/1468-0416.00038
Bond, S. R. (2002). Dynamic panel data model: A guide to micro data methods and practice. Portuguese Economic Journal, 1(2), 141-162.
Chang, W. Y, Hsieh, Y. N., & Lai, C. C. (2000). Social Status, Inflation and Endogenous Growth in a Cash-in-Advance Economy. European Journal of Political Economy, 16(3), 535-545.
Chen, N., & Mahajan, A. (2010). Effects of macroeconomic conditions on corporate liquidity - international evidence. International Research Journal of Finance and Economics, 35, 112-129.
Desai, H., & Jain, P. (1999). Firm performance and focus: Long run stock market performance following spinoffs. Journal of Financial Economics, 54(1), 75-101.
Dotsey, M., & Sarte, P. D. (2000). Inflation uncertainty and growth in a cash-in-advance economy. Journal of Monetary Economics, 45(3), 631-655.
Ghoshal, S. (1987). Global strategy: an organizing framework. Strategic Management Journal, 8(5), 425-40.
Guldimann, T. (1994). Introduction. In risk metrics technical document (2nd Edition). New York: Morgan Guarantee.
Kim, C. S., Mauer, D. C., & Sherman, A. E. (1998). The determinants of corporate liquidity: theory and evidence. Journal of Financial and Quantitative Analysis, 33(03), 335-359.
Mamdouh, M. (2014, October). Liquidity risk and distressed equity. Job Market Paper for the 2015 Academic Job Market.
Miller, K. D. (1992). A framework for integrated risk management in international business. Journal of International Business Studies, 23(2), 311-331.
Mikkelson, W. H., & Partch, M. M. (2003). Do persistent large cash reserve hinder performance? Journal of Financial and Quantitative Analysis, 38(02), 275-294.
Natke, P. (2001). The firm demand for liquid assets in an inflationary environment. Applied Economics, 33(4), 427-436.
Oxelheim, L., & Clas, G. W. (1987). Macroeconomic Uncertainty: International Risks and Opportunities for the Corporation. New York: John Wiley & Sons.
Rodriguez, R. M. (1980). Corporate Exchange Risk Management: Theme and Aberrations. The Journal of Finance, 36(2), 427-439.

REFEREES FOR THE PERTANIKA JOURNAL OF SOCIAL SCIENCES AND HUMANITIES
VOL. 23(S) SEPT. 2015Special Edition
Special Edition in Accounting and Finance
The Editorial Board of the Journal of Social Sciences and Humanities wishes to thank the following:
Aslam Izah Selamat (UPM, Malaysia)
Chong Lee-Lee (MMU, Malaysia)
Chung Tin Fah (Taylor’s University, Malaysia)
Mohd Hassan Che Haat (UMT, Malaysia)
Hirnissa Mohd Tahir (Kolej Poly-Tech MARA, Malaysia)
Mazrah Malik @ Malek (UUM, Malaysia)
Meysam Safari (SEGi University, Malaysia)
Mohd Halim Kadri (UiTM, Malaysia)
Mohd Rizal Palil (UKM, Malaysia)
Nor Aziah Abu Kasim (UPM, Malaysia)
Ong Hway Boon (MMU, Malaysia)
Sabarina Mohammed Shah (UPM, Malaysia)
Syahrul Ahmar Ahmad (UiTM, Malaysia)
Tan Siow Hooi (MMU, Malaysia)
Yusuf Karbhari (Cardiff University, UK)
Zamzulaila Zakaria (IIUM, Malaysia)
While every effort has been made to include a complete list of referees for the period stated above, however if any name(s) have been omitted unintentionally or spelt incorrectly, please notify the Chief Executive Editor, Pertanika Journals at [email protected].
Any inclusion or exclusion of name(s) on this page does not commit the Pertanika Editorial Office, nor the UPM Press or the University to provide any liability for whatsoever reason.
UPM - Universiti Putra MalaysiaUKM - Universiti Kebangsaan MalaysiaMMU - Multimedia University of MalaysiaUMT - Universiti Malaysia Terengganu
UUM - Universiti Utara MalaysiaIIUM - International Islamic University MalaysiaIUKL - Infrastructure University Kuala Lumpur


Pertanika JournalsOur goal is to bring high quality research to the widest possible audience
INSTRUCTIONS TO AUTHORS(Manuscript Preparation & Submission Guidelines)
Revised: August 2015
We aim for excellence, sustained by a responsible and professional approach to journal publishing. We value and support our authors in the research community.
Please read the Pertanika guidelines and follow these instructions carefully. Manuscripts not adhering to the instructions will be returned for revision without review. The Chief Executive Editor reserves the right to return manuscripts that are not prepared in accordance with these guidelines.
MANUSCRIPT PREPARATION
Manuscript Types Pertanika accepts submission of mainly four types of manuscripts for peer-review.
1. RegulaR aRticle
Regular articles are full-length original empirical investigations, consisting of introduction, materials and methods, results and discussion, conclusions. Original work must provide references and an explanation on research findings that contain new and significant findings.
Size: Generally, these are expected to be between 6 and 12 journal pages (excluding the abstract, references, tables and/or figures), a maximum of 80 references, and an abstract of 100–200 words.
2. Review aRticle
These report critical evaluation of materials about current research that has already been published by organizing, integrating, and evaluating previously published materials. It summarizes the status of knowledge and outline future directions of research within the journal scope. Review articles should aim to provide systemic overviews, evaluations and interpretations of research in a given field. Re-analyses as meta-analysis and systemic reviews are encouraged. The manuscript title must start with “Review Article:”.
Size: These articles do not have an expected page limit or maximum number of references, should include appropriate figures and/or tables, and an abstract of 100–200 words. Ideally, a review article should be of 7 to 8 printed pages.
3. ShoRt communicationS They are timely, peer-reviewed and brief. These are suitable for the publication of significant technical advances and may be used to:
(a) report new developments, significant advances and novel aspects of experimental and theoretical methods and techniques which are relevant for scientific investigations within the journal scope;
(b) report/discuss on significant matters of policy and perspective related to the science of the journal, including ‘personal’ commentary;
(c) disseminate information and data on topical events of significant scientific and/or social interest within the scope of the journal.
The manuscript title must start with “Brief Communication:”.
Size: These are usually between 2 and 4 journal pages and have a maximum of three figures and/or tables, from 8 to 20 references, and an abstract length not exceeding 100 words. Information must be in short but complete form and it is not intended to publish preliminary results or to be a reduced version of Regular or Rapid Papers.

4. otheRS
Brief reports, case studies, comments, concept papers, Letters to the Editor, and replies on previously published articles may be considered.
PLEASE NOTE: NO EXCEPTIONS WILL BE MADE FOR PAGE LENGTH.
Language Accuracy Pertanika emphasizes on the linguistic accuracy of every manuscript published. Articles must be in English and they must be competently written and argued in clear and concise grammatical English. Contributors are strongly advised to have the manuscript checked by a colleague with ample experience in writing English manuscripts or a competent English language editor.
Author(s) must provide a certificate confirming that their manuscripts have been adequately edited. A proof from a recognised editing service should be submitted together with the cover letter at the time of submitting a manuscript to Pertanika. All editing costs must be borne by the author(s). This step, taken by authors before submission, will greatly facilitate reviewing, and thus publication if the content is acceptable.
Linguistically hopeless manuscripts will be rejected straightaway (e.g., when the language is so poor that one cannot be sure of what the authors really mean). This process, taken by authors before submission, will greatly facilitate reviewing, and thus publication if the content is acceptable.
MANUSCRIPT FORMAT The paper should be submitted in one column format with at least 4cm margins and 1.5 line spacing throughout. Authors are advised to use Times New Roman 12-point font and MS Word format.
1. Manuscript StructureManuscripts in general should be organised in the following order:
Page 1: Running titleThis page should only contain the running title of your paper. The running title is an abbreviated title used as the running head on every page of the manuscript. The running title should not exceed 60 characters, counting letters and spaces.
Page 2: Author(s) and Corresponding author information. This page should contain the full title of your paper not exceeding 25 words, with name(s) of all the authors, institutions and corresponding author’s name, institution and full address (Street address, telephone number (including extension), hand phone number, and e-mail address) for editorial correspondence. First and corresponding authors must be clearly indicated.
The names of the authors may be abbreviated following the international naming convention. e.g. Salleh, A.B.1, Tan, S.G2*., and Sapuan, S.M3.
Authors’ addresses. Multiple authors with different addresses must indicate their respective addresses separately by superscript numbers:
George Swan1 and Nayan Kanwal2 1Department of Biology, Faculty of Science, Duke University, Durham, North Carolina, USA., 2Office of the Deputy Vice Chancellor (R&I), Universiti Putra Malaysia, Serdang, Malaysia.
A list of number of black and white / colour figures and tables should also be indicated on this page. Figures submitted in color will be printed in colour. See “5. Figures & Photographs” for details.
Page 3: AbstractThis page should repeat the full title of your paper with only the Abstract (the abstract should be less than 250 words for a Regular Paper and up to 100 words for a Short Communication), and Keywords.
Keywords: Not more than eight keywords in alphabetical order must be provided to describe the contents of the manuscript.

Page 4: IntroductionThis page should begin with the Introduction of your article and followed by the rest of your paper.
2. TextRegular Papers should be prepared with the headings Introduction, Materials and Methods, Results and Discussion, Conclusions, Acknowledgements, References, and Supplementary data (if avavailble) in this order.
3. Equations and Formulae These must be set up clearly and should be typed double spaced. Numbers identifying equations should be in square brackets and placed on the right margin of the text.
4. Tables All tables should be prepared in a form consistent with recent issues of Pertanika and should be numbered consecutively with Roman numerals. Explanatory material should be given in the table legends and footnotes. Each table should be prepared on a new page, embedded in the manuscript. When a manuscript is submitted for publication, tables must also be submitted separately as data - .doc, .rtf, Excel or PowerPoint files- because tables submitted as image data cannot be edited for publication and are usually in low-resolution.
5. Figures & PhotographsSubmit an original figure or photograph. Line drawings must be clear, with high black and white contrast. Each figure or photograph should be prepared on a new page, embedded in the manuscript for reviewing to keep the file of the manuscript under 5 MB. These should be numbered consecutively with Roman numerals.
Figures or photographs must also be submitted separately as TIFF, JPEG, or Excel files- because figures or photographs submitted in low-resolution embedded in the manuscript cannot be accepted for publication. For electronic figures, create your figures using applications that are capable of preparing high resolution TIFF files. In general, we require 300 dpi or higher resolution for coloured and half-tone artwork, and 1200 dpi or higher for line drawings are required.
Failure to comply with these specifications will require new figures and delay in publication. NOTE: Illustrations may be produced in colour at no extra cost at the discretion of the Publisher; the author could be charged Malaysian Ringgit 50 for each colour page.
Make your articles as concise as possible
Most scientific papers are prepared according to a format called IMRAD. The term represents the first letters of the words Introduction, Materials and Methods, Results, And, Discussion. It indicates a pattern or format rather than a complete list of headings or components of research papers; the missing parts of a paper are: Title, Authors, Keywords, Abstract, Conclusions, and References. Additionally, some papers include Acknowledgments and Appendices.
The Introduction explains the scope and objective of the study in the light of current knowledge on the subject; the Materials and Methods describes how the study was conducted; the Results section reports what was found in the study; and the Discussion section explains meaning and significance of the results and provides suggestions for future directions of research. The manuscript must be prepared according to the Journal’s instructions to authors.

6. References References begin on their own page and are listed in alphabetical order by the first author’s last name. Only references cited within the text should be included. All references should be in 12-point font and double-spaced.
NOTE: When formatting your references, please follow the APA reference style (6th Edition). Ensure that the references are strictly in the journal’s prescribed style, failing which your article will not be accepted for peer-review. You may refer to the Publication Manual of the American Psychological Association for further details (http://www.apastyle.org/).
7. General GuidelinesAbbreviations: Define alphabetically, other than abbreviations that can be used without definition. Words or phrases that are abbreviated in the introduction and following text should be written out in full the first time that they appear in the text, with each abbreviated form in parenthesis. Include the common name or scientific name, or both, of animal and plant materials.
Acknowledgements: Individuals and entities that have provided essential support such as research grants and fellowships and other sources of funding should be acknowledged. Contributions that do not involve researching (clerical assistance or personal acknowledgements) should not appear in acknowledgements.
Authors’ Affiliation: The primary affiliation for each author should be the institution where the majority of their work was done. If an author has subsequently moved to another institution, the current address may also be stated in the footer.
Co-Authors: The commonly accepted guideline for authorship is that one must have substantially contributed to the development of the paper and share accountability for the results. Researchers should decide who will be an author and what order they will be listed depending upon their order of importance to the study. Other contributions should be cited in the manuscript’s Acknowledgements.
Copyright Permissions: Authors should seek necessary permissions for quotations, artwork, boxes or tables taken from other publications or from other freely available sources on the Internet before submission to Pertanika. Acknowledgement must be given to the original source in the illustration legend, in a table footnote, or at the end of the quotation.
Footnotes: Current addresses of authors if different from heading may be inserted here.
Page Numbering: Every page of the manuscript, including the title page, references, tables, etc. should be numbered.
Spelling: The journal uses American or British spelling and authors may follow the latest edition of the Oxford Advanced Learner’s Dictionary for British spellings.
SUBMISSION OF MANUSCRIPTSOwing to the volume of manuscripts we receive, we must insist that all submissions be made electronically using the online submission system ScholarOne™, a web-based portal by Thomson Reuters. For more information, go to our web page and click “Online Submission”.
Submission Checklist
1. MANUSCRIPT: Ensure your MS has followed the Pertanika style particularly the first four pages as explained earlier. The article should be written in a good academic style and provide an accurate and succinct description of the contents ensuring that grammar and spelling errors have been corrected before submission. It should also not exceed the suggested length.
2. COVER LETTER: All submissions must be accompanied by a cover letter detailing what you
are submitting. Papers are accepted for publication in the journal on the understanding that the article is original and the content has not been published or submitted for publication elsewhere. This must be stated in the cover letter. Submission of your manuscript will not be

accepted until a signed cover letter (original pen-to-paper signature) has been received.The cover letter must also contain an acknowledgement that all authors have contributed significantly, and that all authors are in agreement with the content of the manuscript.The cover letter of the paper should contain (i) the title; (ii) the full names of the authors; (iii) the addresses of the institutions at which the work was carried out together with (iv) the full postal and email address, plus telephone numbers and emails of all the authors. The current address of any author, if different from that where the work was carried out, should be supplied in a footnote.
3. COPYRIGHT: Authors publishing the Journal will be asked to sign a copyright form. In signing the form, it is assumed that authors have obtained permission to use any copyrighted or previously published material. All authors must read and agree to the conditions outlined in the form, and must sign the form or agree that the corresponding author can sign on their behalf. Articles cannot be published until a signed form (original pen-to-paper signature) has been received.
Please do not submit manuscripts to the editor-in-chief or to any other office directly. Any queries must be directed to the Chief Executive Editor’s office via email to [email protected].
Visit our Journal’s website for more details at http://www.pertanika.upm.edu.my/home.php.
HARDCOPIES OF THE JOURNALS AND OFF PRINTSUnder the Journal’s open access initiative, authors can choose to download free material (via PDF link) from any of the journal issues from Pertanika’s website. Under “Browse Journals” you will see a link, “Current Issues” or “Archives”. Here you will get access to all current and back-issues from 1978 onwards.
The corresponding author for all articles will receive one complimentary hardcopy of the journal in which his/her articles is published. In addition, 20 off prints of the full text of their article will also be provided. Additional copies of the journals may be purchased by writing to the Chief Executive Editor.


Why should you publish in Pertanika?
BENEFITS TO AUTHORS
PROFILE: Our journals are circulated in large numbers all over Malaysia, and beyond in Southeast Asia. Our circulation covers other overseas countries as well. We ensure that your work reaches the widest possible audience in print and online, through our wide publicity campaigns held frequently, and through our constantly developing electronic initiatives such as Web of Science Author Connect backed by Thomson Reuters.
QUALITY: Our journals’ reputation for quality is unsurpassed ensuring that the originality, authority and accuracy of your work is fully recognised. Each manuscript submitted to Pertanika undergoes a rigid originality check. Our double-blind peer refereeing procedures are fair and open, and we aim to help authors develop and improve their scientific work. Pertanika is now over 35 years old; this accumulated knowledge has resulted in our journals being indexed in SCOPUS (Elsevier), Thomson (ISI) Web of Knowledge [BIOSIS & CAB Abstracts], EBSCO, DOAJ, Google Scholar, AGRICOLA, ERA, ISC, Citefactor, Rubriq and MyAIS.
AUTHOR SERVICES: We provide a rapid response service to all our authors, with dedicated support staff for each journal, and a point of contact throughout the refereeing and production processes. Our aim is to ensure that the production process is as smooth as possible, is borne out by the high number of authors who prefer to publish with us.
CODE OF ETHICS: Our Journal has adopted a Code of Ethics to ensure that its commitment to integrity is recognized and adhered to by contributors, editors and reviewers. It warns against plagiarism and self-plagiarism, and provides guidelines on authorship, copyright and submission, among others.
PRESS RELEASES: Landmark academic papers that are published in Pertanika journals are converted into press releases as a unique strategy for increasing visibility of the journal as well as to make major findings accessible to non-specialist readers. These press releases are then featured in the university’s UK-based research portal, ResearchSEA, for the perusal of journalists all over the world.
LAG TIME: The elapsed time from submission to publication for the articles averages 4 to 5 months. A decision on acceptance of a manuscript is reached in 3 to 4 months (average 14 weeks).
About the JournalPertanika is an international multidisciplinary peer-reviewed leading journal in Malaysia which began publication in 1978. The journal publishes in three different areas — Journal of Tropical Agricultural Science (JTAS); Journal of Science and Technology (JST); and Journal of Social Sciences and Humanities (JSSH).
JTAS is devoted to the publication of original papers that serves as a forum for practical approaches to improving quality in issues pertaining to tropical agricultural research- or related fields of study. It is published four times a year in February, May, August and November.
JST caters for science and engineering research- or related fields of study. It is published twice a year in January and July.
JSSH deals in research or theories in social sciences and humanities research. It aims to develop as a flagship journal with a focus on emerging issues pertaining to the social and behavioural sciences as well as the humanities, particularly in the Asia Pacific region. It is published four times a year in March, June, September and December.
now accepting submmissions...
Pertanika invites you to explore frontiers from all key areas of agriculture, science and technology to social sciences and humanities.
Original research and review articles are invited from scholars, scientists, professors, post-docs, and university students who are seeking publishing opportunities for their research papers through the Journal’s three titles; JTAS, JST & JSSH. Preference is given to the work on leading and innovative research approaches.
Pertanika is a fast track peer-reviewed and open-access academic journal published by Universiti Putra Malaysia. To date, Pertanika Journals have been indexed by many important databases. Authors may contribute their scientific work by publishing in UPM’s hallmark SCOPUS & ISI indexed journals.
Our journals are open access - international journals. Researchers worldwide will have full access to all the articles published online and be able to download them with zero subscription fee.
Pertanika uses online article submission, review and tracking system for quality and quick review processing backed by Thomson Reuter’s ScholarOne™. Journals provide rapid publication of research articles through this system.
For details on the Guide to Online Submissions, visit http://www.pertanika.upm.edu.my/guide_online_submission.php
Questions regarding submissions should only be directed to the Chief Executive Editor, Pertanika Journals.
Remember, Pertanika is the resource to support you in strengthening research and research management capacity.
An Award-Winning
International-Malaysian Journal
—MAY 2014
Address your submissions to: The Chief Executive EditorTel: +603 8947 1622 [email protected]
Journal’s profile: www.pertanika.upm.edu.my
Call for Papers 2015-16


Key Determinants of German Banking Sector Performance 167A. Nasserinia, M. Ariff and Cheng Fan Fah
Wealth Effects Associated with Announcements of Hybrid Securities in an Emerging Country: Evidence from Malaysia
187
Abdul Rahim, N. and Abdul Rahman, F.
The Impact of Basel III on Malaysian Stock Performance 205J. L. Chia, Yahya, M. H. and Muhammad, J.
Technical Efficiency and Returns to Scale on Banking Sector: Empirical Evidence from GCC Countries
219
Fakarudin Kamarudin, Fadzlan Sufian, Annuar Md. Nassir and Nazratul Aina Mohamad Anwar
Stock Return, Currency and General Elections 237Tze San Ong, Wei Ni Soh, Boon Heng Teh and Sin Huei Ng
Identifying Factors Correlated with Corporate Cash Holdings in Korea and Malaysia
251
Soh Wei Ni, Annuar M. Nassir and Cheng Fan Fah

Pertanika Journal of Social Sciences & Humanities
VOL. 23 (S) SEPT. 2015
Vol. 23 (S) Sept. 2015
Pertanika Editorial O�ce, Journal DivisionO�ce of the Deputy Vice Chancellor (R&I) 1st Floor, IDEA Tower II UPM-MTDC Technology CentreUniversiti Putra Malaysia43400 UPM SerdangSelangor Darul EhsanMalaysia
http://www.pertanika.upm.edu.my/E-mail: [email protected]: +603 8947 1622 / 1619
A special edition devoted to issues in Accounting and Finance
Guest EditorsOng Tze San & Zariyawati Mohd Ashhari
Contents
Pertanika Journal of Social Sciences & HumanitiesVol. 23 (S) Sept. 2015
http://penerbit.upm.edu.my
Special Edition in Accounting and FinanceObjective of Accounting Education: Moral or Skills? 1
Haslinah Muhamad and Nor Aishah Sudin
Sustainable Performance Measurement (SPMs) Model: Effects of Product Tecnology and Process Technology
17
Boon Heng Teh, Tze San Ong, Nahariah Jaffar and Sayed Yousef Sheikh Abou Masoudi
Agency Problem, Managerial Incentive and Financial Controlling Instrument: A Brief Review for Agenda Study in Malaysia
39
Unethical Audit Behaviour among Malaysian Auditors: An Exploratory Study
59
Mohd Nazli Mohd Nor, Malcolm Smith, Zubaidah Ismail and Hairul Suhaimi Nahar
Corporate Internet Reporting in Emerging Economic Countries: The Malaysian Perspective
73
Siti Zaidah Turmin, Fatima Abdul Hamid and Nazli Anum Mohamad Ghazali
Auditors’ and PAC Members’ Views on Performance Auditing Practices in Malaysia: A Qualitative Approach
89
Zaidi Mat Daud and Ian Fraser
The State of Sustainability Disclosure and Effects on Companies’ Financial Performance
99
Ridzwana Mohd Said, Lim Theng Theng, Rosmila Senik, Yusniyati Yusri and Ong Tze San
Credit Card Practices: Knowledge, Attitude and Debt Management 119Maswati, A. T., Abdullah, A. and Wai Yee, C.
Accounting Undergraduates’ Learning Approaches: Case of a Malaysian Public University
143
Lau, Y. W., and Lim, S. Y
Identifying Multiple Structural Breaks in Exchange Rate Series in a Finance Research
155
Alireza Zarei, Mohamed Ariff, Law Siong Hook and Annuar Md Nassir
Copyright © 2022 FDOKUMEN