
Vol 13 No 3 - CiteSeerX
327
Vol 13 No 3 June 2012
-
Upload
khangminh22 -
Category
Documents
-
view
2 -
download
0
Transcript of Vol 13 No 3 - CiteSeerX

Vol 13No 3
June 2012
Editorial - Volume 13, Issue Number 3
Here in the Northern Hemisphere, most of us are about to break our formal studies and work activities for a summer holiday. At Athabasca University, our graduate-paced courses are mostly finished for the term and convocation is over for another year, but like an in-creasing number of global workers, some parts of our organization continue 365 days a year, which includes our 25,000 undergraduate students (and their diligent teachers) who work throughout the summer, allowing formal education to provide not only physical ac-cessibility, but temporal flexibility as well. However flexibility comes at a cost, and thus we thank the families, the work mates, and the supporting friends of all distance education students, those taking the summer off and those using the summer break to accelerate their studies.
For those who just can’t leave a good research article unread, this issue will be very useful to meet your summer reading quota and expectations. It contains 16 research articles and two book reviews. My review will be short and I highlight the research articles.
The first article “Odyssey of the Mind: Social Networking in a Cyberschool” is especially rel-evant to those interested in either the growing number of distance programs designed for school-age children and youth or those interested in the use of new social media and Web 2.0 networked applications. This USA-based study asks, how can social media be used to reduce the loneliness of the distance learner and begin to bring us closer to the rich social interaction that can flourish in campus-based education?
There are many reasons for the generally lower completion rates of distance compared to campus-based learners. In the second article of this issue, the researchers investigate “Mo-tivation Levels among Traditional and Open Learning Undergraduate Students in India.”
Terry AndersonEditor, IRRODL
Editorial - Volume 13, Number 3Anderson
Vol 13 | No 3 Editorial June 2012 ii
They find significant differences between campus and distance students and suggest that the absence of extrinsic motivation may explain these differences.
We turn to a study from Turkey in which the “Development and Validation of the Online Student Connectedness Survey” is explored in order to measure distance students’ percep-tions of connectivity in an online program. The instrument has four scales: (1) community, (2) comfort, (3) facilitation, and (4) interaction and collaboration. The development and more importantly the reuse of prevalidated instruments is important work that allows us to develop a coherent and consistent approach to research in distance education.
Next from China we learn of “Quality Assurance in E-Learning: PDPP Evaluation Model and its Application,” which explains the development of another instrument, this time de-signed to evaluate the planning, development, process, and product (PDPP) outcomes of a distance education program. The authors hope that the “PDPP evaluation model and its application can provide a benchmark for establishing a wider e-learning quality assurance mechanism in educational institutions.”
The increasing emphasis on accountability and quality control in both campus and distance education focuses attention on evaluation of distance education teachers. However evalua-tion can sometimes be destructive to productive mentoring and improvement. In this USA study, “Creating a Sustainable Online Instructor Observation System: A Case Study High-lighting Flaws when Blending Mentoring and Evaluation” the authors demonstrate how an evaluation system “provides a useful tool but no panacea for increasing quality in online teaching and learning!
Our next research article covers a familiar but unresolved issue when educational program-ming spans context and culture through international delivery. From South Africa, “Map-ping the Interplay between Open Distance Learning and Internationalisation Principles” reminds us that transporting educational programming across national and cultural barri-ers is easy, but making it work effectively is much harder.
You’ve likely heard how long summer holidays can cause us to forget how to do complex tasks, notably mathematics. So to insure this doesn’t happen to IRRODL readers, we pres-ent a study from China, “Economies of Scope in Distance Education: The Case of Chinese Research Universities,” which features extensive mathematical analysis to investigate the contentious relationship between teaching and research and the costs of both.
One of the greatest sources of contention and fear among teachers is the time it takes to teach online. Research to date has been inconclusive with a host of factors, notably the in-structional design and the experience of the teacher, confounding simple answers. In this USA study, researchers study “Teaching Time Investment: Does Online Really Take More Time than Face-to-Face?” They conclude that “overall, face-to-face teaching required more time per student, but certain aspects of online teaching take considerably more time per student than in the face-to-face classroom.”
Editorial - Volume 13, Number 3Anderson
Vol 13 | No 3 Editorial June 2012 iii
Our next study, from Pakistan, studies “M-Learning Adoption: A Perspective from a Devel-oping Country.” We all know how pervasive mobile technologies are becoming, even in the poorest regions of the world, but this does not mean they are, can, or even should be adopt-ed for quality delivery of distance education programming. This study finds that adoption of m-learning is not that much different from adoption of earlier technologies. “Perceived usefulness, ease of use, and facilitating conditions significantly affect the students’ inten-tion to adopt m-learning.”
Faithful readers of IRRODL probably have read articles from almost every region and most countries of the world (OK, still no article from Antarctica). But they may be surprised that this is only our second article from Russia in 13 years of publication. This is not because distance education is an unimportant means of education in Russia – one institution alone enrolls over 110,000 students – but as you see in “The Development of Distance Education in the Russian Federation and the Former Soviet Union,” research has rarely surfaced in scholarly media. We hope this is the first of many more articles from this important region.
Jumping around the world in our global exposition, we turn back to Africa to study the “De-livery of Open, Distance, and E-Learning in Kenya.” We learn “that efficient and optimal delivery of ODeL in Kenya faces both economic and infrastructural challenges,” but still distance education promises a solution to the shortages of opportunity for African students.
The use of games to increase motivation has been championed by many educational pun-dits, but empirically studied much less. In this article from Germany, researchers study “Learning in Educational Computer Games for Novices: The Impact of Support Provision Types on Virtual Presence, Cognitive Load, and Learning Outcomes.” The study looked at different support services that can be integrated with games and found that “the game equipped with support devices enhances learning outcomes, although no differences in cognitive load were found.”
My first research study in distance education involved audio teleconference. In those days students had to travel (sometimes many kilometers) to a community learning centre, and still the delivery network I directed (Contact North) had an annual telephone bill of $600,000. Today both video and audio teleconferencing are approaching negligible costs at least when using home computers and free services such as Skype. In this study from the USA, “Examining Interactivity in Synchronous Virtual Classrooms,” the authors demon-strate the enhanced quality of interaction and feedback that this technology supports.
In a follow-up study, our friends and former guest editors from Utah, USA provide more data on the compelling case for the use of open textbooks in both distance and campus-based education. In “A Preliminary Examination of the Cost Savings and Learning Impacts of Using Open Textbooks in Middle and High School Science Classes,” the authors demon-strate 50% cost savings with no significant differences in measured student learning out-comes.
Editorial - Volume 13, Number 3Anderson
Vol 13 | No 3 Editorial June 2012 iv
Our second last article (at last one from Canada!!) focuses on mobile learning adoption: “Using Self-Efficacy to Assess the Readiness of Nursing Educators and Students for Mobile Learning.” This article also presents a new instrument, this time to measure self-efficacy in regard to using mobile devices. It is also unique in that it focuses on learning in the work-place as opposed to classroom or home distance education study.
We end this issue with an article from Greece that deals with adaptive testing, that seem-ingly always ‘just around the corner’ technology that allows tests to be revised in real time in response to individual student behaviour. In “Identification of Conflicting Questions in the PARES System,” the authors demonstrate sophisticated algorithms to bring us one step closer to truly adaptive learning and testing.
We end this issue with two book reviews. The first review of Quality Assurance and Accred-itation in Distance Education and E-Learning: Models, Policies and Research overviews the increasing importance, the techniques, and the challenges of quality control in distance education. The second targets an equally challenging topic of measuring the quality of re-search and of individual researchers through the use of citation analysis in The Publish or Perish Book: Your Guide to Effective and Responsible Citation Analysis.

Odyssey of the Mind: Social Networking in Cyberschool
AbstractK-12 online learning and cyber charter schools have grown at a tremendous rate over the past decade. At the same time, these online programs have struggled to provide the social spaces where students can interact that K-12 schools are traditionally able to provide. Social networking presents a unique opportunity to provide these kinds of social interactions in an online environment. In this article, we trace the development and use of social networking at one cyber charter school to extend the space for online instruction and provide opportu-nities for social interaction that online schools are often unable to provide.
Keywords: K-12 online learning; virtual school; cyberschool; social networking
K-12 online learning in the United States, both supplemental and full-time, has it roots in the 1990s (Barbour, 2010; Clark, 2003; Darrow, 2010). Approximately a decade after K-12 online learning first began, Clark (2001) reported there were at least 14 states with existing or planned virtual schools and approximately 40,000 students enrolled. Watson, Murin, Vashaw, Gemin, and Rapp (2011) stated that there is now significant K-12 online learning activity in all 50 states, while Wicks (2010) estimated the overall number of K-12 students engaged in online courses to be approximately two million. Participation in cyber charter schools has also increased during this time. Huerta and González (2004) estimated that there were approximately 60 cyber charter schools in 15 states serving over 16,000 students. More recently, Watson et al. (2011) reported there were over 250,000 students learning online full-time in 30 states.
In their review of the literature, Barbour and Reeves (2009) described five challenges of K-12 online learning. These included the high start-up costs associated with virtual schools, access issues surrounding the digital divide, approval or accreditation of virtual schools,
Michael K. BarbourWayne State University, USA
Cory PloughOdyssey Charter High School, USA
Odyssey of the Mind: Social Networking in a CyberschoolBarbour and Plough
Vol 13 | No 3 Research Articles June 2012 2
student readiness issues, and retention issues. Not included in the list of challenges was the issue of transactional or perceived distance that may be experienced by the students due to a potential lack of social interaction and socialization. K-12 schools are traditionally so-cial spaces often with time built into the school schedule for student interaction outside of class, student participation in extracurricular activities, and student involvement in formal activities such as school dances and other planned social events (Merrell, 2002; Tasma-jian, 2002). All of these social opportunities are difficult to replicate in an online setting, presenting a unique challenge for K-12 online schools as they attempt to serve the needs of their students.
In this article, we discuss one online school’s attempt to address the social aspect of their students’ experience by using social networking. Specifically, we begin by briefly describing the theory of transactional distance and discussing the role of the school as an agent for the socialization of children. Next, we describe the methodology for this action research proj-ect, beginning with the online school in question, that is the Odyssey Charter High School (OCHS) in Nevada, USA. We then trace the development of social networking at OCHS. Using these experiences, we discuss some of the lessons learned by the staff at OCHS. Fi-nally, we examine the use of this social network to provide the out-of-class interaction that online schools are often unable to provide, which should decrease the sense of transactional distance experienced by students.
Theory of Transactional DistanceOne of the most widely accepted theories of distance education at present is the theory of transactional distance (Moore, 1972, 1973, 1983, 1993; Moore & Kearsley, 1996). Like most other theories of distance education, this theory was based on adult learners in a distance environment. Based upon the work of Malcolm Knowles, one of the founders of the field of adult education, Moore conjectured that it was natural for an adult learner to exhibit autonomous behavior, which was why distance education programs should seek to have a low level of transactional distance (i.e., a high level of dialogue and a low level of structure) to maximize the opportunities for the autonomous adult learner.
Knowles (1970) stated that there were four assumptions about adult learners that were dif-ferent from assumptions about child learners:
1) his self-concept moves from one of being a dependent personality toward one of being a self-directing human being; 2) he accumulates a growing reservoir of experience that becomes an increasing resource for learning; 3) his readiness to learn becomes oriented increasingly to the developmental tasks of his social roles; and 4) his time perspective changes from one of postponed application of knowledge to immediacy of application, and accordingly his orientation toward learning shifts from one of subject-
Odyssey of the Mind: Social Networking in a CyberschoolBarbour and Plough
Vol 13 | No 3 Research Articles June 2012 3
centeredness to one of problem-centeredness. (p. 39)
Moore (1973) himself also speculated that even though the quality of autonomy, based upon Erikson’s stages of development, emerges in infancy, that this ego quality may not be the same as autonomy of learning and that “it may well be that, as learners, people are struggling in an ‘autonomy versus shame and doubt’ crisis in grade school, high school, or university” (p. 667). Even Bright (1989), in his critique of adult learning theory, stated “it is not being suggested that there are no differences between adults and children. On the contrary, there are probably many…” (p. 55). All of these individuals agree that there are fundamental differences in the orientation that adults have to learning compared to the way in which children and adolescents learn.
Vygotsky (1962) observed that, unlike the education of adult learners, learning for a child was a social process that focused upon interaction within a zone of proximal development. The zone of proximal development “is the distance between the actual developmental level as determined by independent problem solving and the level of potential development as determined through problem solving under adult guidance or in collaboration with more capable peers” (Vygotsky, 1978, p. 86). Cavanaugh et al. (2004) suggested, “since adults have progressed through these stages of cognitive development, delivery of web based edu-cation at the adult level need not concentrate on methods that help the learner develop these cognitive skills” (p. 7). The methods designed to help the child learner develop cogni-tive skills are intended as guidance provided to these learners to ensure that they remain in the zone of proximal development.
Moore (1973) noted that typically in K-12 education teachers were expected to maintain control of the content and method of delivery within the classroom. These students “should not be compelled to assume a degree of autonomy they are not ready to handle, and so it is customary in child education for the preparatory and evaluation processes to rest en-tirely in the hands of the teacher” (p. 84). According to adult education experts, children are not ready to assume high degrees of autonomy, and thus child and adolescent learners require more structure in their educational settings, particularly in distance education set-tings (such as online schools) where the lack of proximity to the teacher decreases one of the main sources of guidance to the learners in their zone of proximal development. The addition of structure, along with the continued high level of dialogue, to support the child learner in a virtual school environment may serve to replace some of that guidance.
Role of the School as an Agent for SocializationDurkin (1995) defined socialization as “the process whereby people acquire the rules of behavior and systems of beliefs and attitudes that equip a person to function effectively as a member of a particular society” (p. 614). Similarly, Giddens, Duneier, and Appelbaum (2005) defined socialization as “the process by which, through contact with other human beings, one becomes a self-aware, knowledgeable human being, skilled in the ways of a given culture and environment” (p. 7). Within the educational context, Irwin and Berge
Odyssey of the Mind: Social Networking in a CyberschoolBarbour and Plough
Vol 13 | No 3 Research Articles June 2012 4
(2006) wrote that “socialization [was] about people being able to mingle and establish con-nections on one or more levels. They speak [with] one another; share ideas and information and confirm the connections made through an agreed upon means” (¶ 3). Essentially, it is how children learn the social norms that will be expected of them as adults in society.
In many instances, it is the K-12 school environment that is the primary “agency responsible for socializing groups of young people in particular skills and values in our society” (Long, 2007, ¶ 9). Tasmajian (2002) argued that schools serve this function because “school is the first agency that encourages children to develop loyalties and sentiments that go be-yond the family and link them to a wider social order” (p. ¶ 9). Watson and Gemin (2008) further argued that it was “because a child or teenager spends so much time in school, the educational environment is clearly a key part of the student’s socialization” (p. 4). While the use of K-12 online learning has grown substantially in the past two decades, there has been concern that a lack of face-to-face contact might hinder the process of socialization for these students. As Sivin-Kachala and Bialo (2009) have indicated, “there is a lack of research addressing the effects of online schooling on socialization and the development of social skills” (p. 5). In en effort to address this deficit, we provide the OCHS and its social networking site as a descriptive example of one way an online school has attempted to pro-vide this socialization function.
MethodologyThe purpose of this project was to examine the effectiveness of a closed social network as a way to increase socialization in a full-time online school and to decrease transactional distance. This project used a multiphase, action research methodology (Mills, 2011). Action research was an appropriate methodological approach for this study because it is “insider research, in the sense of practitioners researching their own professional action” (McNiff, Lomax, & Whitehead, 1996, p. 14). The practitioners in question were teachers and admin-istrators at OCHS in Clark County School District (CCSD) in the U.S. state of Nevada.
While this action research project occurred in three phases, systematic data was only col-lected during the second semester of the second phase. Phase 1 and the first semester of Phase 2 served as an orientation for the practitioners involved and included smaller num-bers of students. The second semester of Phase 2, the implementation of the social net-work, was opened to all students and data was collected. The primary researcher used a look-think-act model (Stringer, 2004), which involves collecting relevant information and then using that information to undertake actions designed to improve upon that which is being studied. The data that were collected included interviews with the students, teachers, and administrators; observations of students, teachers, and administrators, using the social network; and usage statistics maintained within the social network system. Finally, Phase 3 included revisions to the use and polices of the social network based on the results of the study described here. Phase 3 is also the manner in which the social network is currently operating.
Odyssey of the Mind: Social Networking in a CyberschoolBarbour and Plough
Vol 13 | No 3 Research Articles June 2012 5
Setting: Odyssey Charter High School (OCHS)OCHS began as a sponsored online, public charter school of the Clark County School Dis-trict (CCSD) in 1999 using a hybrid model. The majority of courses are taught online, but there is a face-to-face component in which students attend class one day a week for four hours. During those four face-to-face hours, students take a Core Values class that re-sembles a traditional, direct instruction course. For the remainder of the time on campus (known as homeroom), they meet with a series of mentor teachers who help them organize their coursework, check their progress, and address their academic needs. Students remain in one room and while at school usually only interact with the other 10-20 students in that room.
Online teachers work full-time on campus. Teachers are responsible for mentoring approx-imately 40 students along with their online teaching course loads. In most cases, teachers meet their online students by seeking them out during homerooms. However, there are instances where the teacher may never meet all of their online students. Because students only interact with about 20 other students and have limited physical interaction with their online teachers, a small group of teachers at the OCHS decided in 2006 to create a social network for the school. The following sections describe the social network at OCHS, which is called Odyssey of the Mind.
Intervention: Odyssey of the MindThe evolution of the social networking site currently utilized by the OCHS (i.e., Odyssey of the Mind) began with frustrations two teachers had with the limited interaction, particular-ly social interaction, between themselves and their students (see boyd & Ellison, 2007, for a general description and history of social network sites). Their efforts led to experimenta-tion with various social networking sites and, eventually, the creation of a single NING (see http://www.ning.com/) network for students enrolled in the online high school.
Phase 1: Early attempts at social networking.
Due to the nature of teaching at an online school and the difficulty of teacher to student communication, a teacher at OCHS decided to begin using social networking during the 2006-2007 school year. The initial attempts began with one teacher using private or closed Facebook (see http://www.facebook.com) groups for each of his online courses and invit-ing students to join voluntarily. The purpose was to meet students where they were hang-ing out online (Lenhart & Madden, 2007), and the teacher was pleased with some of the discussion that occurred in those groups. However, there were limitations to the Facebook groups. They didn’t provide enough incentive for students to join or to participate. There were also structural constraints on the kind of networking that could be done within these groups (e.g., the teacher was limited to discussions and wall board comments within the group page, not wanting to utilize other aspects of Facebook due to his concerns over pri-vacy). Finally, while the teacher was pleased with some of the discussion, there was not as much socialization as he had hoped.
Odyssey of the Mind: Social Networking in a CyberschoolBarbour and Plough
Vol 13 | No 3 Research Articles June 2012 6
Ultimately, safety concerns were the main issue with the Facebook groups (see Dwyer, Hiltz, & Passerini, 2007 for an overview of this issue). While the teacher was able to make these groups private, students still had profile pages in which they controlled the secu-rity settings. Like many teenagers and young adults (Stutzman, 2006), the OCHS students chose to make their profiles public, which opened the door for anyone to communicate with them. Thus, the teacher began looking for alternatives to Facebook and discovered the NING social networking system.
Phase 2: The creation of Odyssey of the Mind.
The NING platform provided the ability to create and administer one’s own network. This addressed many of the problems that had been experienced with Facebook as students would be able to have all the functions of a social network (e.g., picture and music up-loads, group formations, discussion forums, blogging, and profile sharing) while in a setting where the creator could choose to exclude anyone not associated with the courses. During the 2007-2008 school year, the teacher created Odyssey of the Mind as a social network in NING for students in his online courses. Initially there were approximately 60 students who joined during the first semester.
The teacher perceived that everything had gone very well, and no safety issues arose; yet there was still not a lot of activity. Like many participatory sites, social networks need participants to keep them active. Sixty students were not enough to keep participation at a consistent, sustained level. This teacher began to collaborate with the OCHS assistant principal, who had been piloting a similar NING network with his own course, to create a network that involved students from both of their courses. The networks of the assistant principal were combined with this teacher’s, and students from the courses taught by five other teachers were invited. This expanded the Odyssey of the Mind NING network and it ran as a pilot program for the second semester of the 2007-2008 school year.
Phase 3: Current Odyssey of the Mind.
At the beginning of the 2008-2009 school year the Odyssey of the Mind NING network was opened to all OCHS students and staff. All 750 students, along with 27 teachers and admin-istrators, were sent an invitation to join the network. At the end of the first quarter, there were 321 students and approximately a dozen teachers involved. The same teacher and assistant principal who began experimenting with social networks at OCHS administered the new NING network. To assist in this monitoring process, a program has been written to search for language violations, and six of the most active students have been recruited to help monitor music, group discussions, and blogging for violations and safety and behav-ioral issues. Finally, there is an RSS feed of latest activity sent to OCHS aggregators, which helps keep track of student activity.

Odyssey of the Mind: Social Networking in a CyberschoolBarbour and Plough
Vol 13 | No 3 Research Articles June 2012 7
Results and DiscussionThe results presented below were based solely on the data collected during the second se-mester of Phase 2. These results are organized into two main themes: administrative les-sons from the pilot project and the nature of interaction observed in the social network.
Lessons from the Pilot ProjectThe OCHS pilot program, which occurred during the spring of 2008 for one semester, in-tended for each teacher to be responsible for leading projects with their online students and monitoring their students’ activities. However, there were some limitations in this area. The pilot had approximately 200 students in the network, many of whom had two or more teachers who were participating. While teachers were successful in completing projects and discussions with their classes in the network, the monitoring for safety and behavioral is-sues fell on the two administrators. OCHS learned in the pilot program that there needed to be a more systematic method for monitoring student behavior, and that if teachers were to be involved there had to be very specific and well-defined roles for each educator.
Curricular and cocurricular activities in a social network. All seven teaching staff involved in the pilot program led curricular-related projects or dis-cussions in the social network with their students. Students felt that the social network provided a more relaxed environment to work with teachers and somewhere that they were already spending significant time for social reasons. This was consistent with Mazer, Mur-phy, and Simonds (2007), who found that students appreciated their teachers’ efforts to use a social networking site. One teacher had students collaborating on their final quarter proj-ect within their NING group by reviewing peers’ ideas and offering suggestions on sample work. The social network also allowed students from different classes to more easily be involved in joint or cross-course projects, such as a global “Save Darfur” student campaign.
In addition to teacher-driven activities, students also used the social network for academic purposes. While the teachers created groups for each of their courses, the students chose to use these groups for course planning and participation; for example, in one of the physical education classes the teacher provided students a chance to decide on which sports they would play in the class. The students also created and operated their own tutorial groups. This allowed them to answer each other’s questions, point out specific resources, and help each other navigate lessons. In his study of high school students learning online, Barbour (2007) found that students would seek help from their student colleagues before seeking help from their teachers or from curricular materials (e.g., textbooks and online course materials). Barbour described these as learning communities that develop in the online environment because there are “like-minded groups of people [who gather] together in the spirit of shared goals” (Conrad, 2002, p. 4), in this instance the goal of understanding or completing course material.
The social network also provided students a place to discuss their problems regarding on-line teachers or courses. As a school that primarily caters to a population of at-risk stu-
Odyssey of the Mind: Social Networking in a CyberschoolBarbour and Plough
Vol 13 | No 3 Research Articles June 2012 8
dents (i.e., Clark and Berge [2005] described at-risk students as remedial and alternative, while Rapp, Eckes, and Plurker (2006) described them as students who might otherwise drop out of traditional schools), concerns or issues students have with their teachers and courses (e.g., organization, lessons, assignments, and grading) have the potential to create roadblocks to success. The social network gave students a forum to discuss those concerns with other students. The sharing of problems allowed students to determine if they were experiencing similar issues, and when there was a collective concern (e.g., a student posted a concern about unfair grading in one course to a discussion forum and found that others had the same concern) the students were able to report it to OCHS administration through the social network. In another discussion, students gave suggestions about what the school could do to improve. There was a lengthy set of comments on this topic during the pilot program, which was then shared with the high school administration and the school im-provement committee. Cross (1998) indicated that a learning community was intended to foster “active learning over passive learning, cooperation over competition, and community over isolation” (p. 5). As the students began to create an online learning community in the social network, they began to take a more active, cooperative role in their overall schooling experience.
Students responded well to the freedom of open discussion and idea sharing. They even created groups that became active on campus. For example, during the pilot program there was a student group formed to raise money for the World Wildlife Fund (WWF). The initial five students organized some meetings at school, developed a product, sold that product, and wrote their first check to the WWF in little more than a month after the group was first created. This group has continued to be active since the pilot program has become a school-wide social network.
One of the main limitations of the OCHS learning management system was that there was no easy way for students to meet each other or work together with students outside of their individual courses. As evidenced by these examples, the social network provided both the platform and the opportunity for students to collaborate beyond the confines of their own class. The learning management system also did not provide a resource for students to seek real-time assistance from teachers when they needed help with their online coursework. Barbour (2007) found that the two most important factors high school students learning online took into account when making decisions about where to turn for assistance were the availability of the source (i.e., being able to reach that person quickly) and the deadline (i.e., when the project was due). The social network provided a mechanism that allowed students to see whenever teachers were logged onto the network.
Safety and behavioral concerns and teaching opportunities. The most important aspect of running a social network for any school is student safety. The reason OCHS decided to use a NING social network for their pilot program, and later their main school network, was because it gave the administrators the ability to operate a walled garden. This meant that no one could join the network that was not invited to join. Since no one outside of the school could communicate with the students inside the walled garden,
Odyssey of the Mind: Social Networking in a CyberschoolBarbour and Plough
Vol 13 | No 3 Research Articles June 2012 9
parents were more comfortable with the idea of allowing their children to join. In order to further accommodate parent safety concerns, all students who are under the age of 18 must have a parent sign a permission form before they can join.
Another issue was the publishing of offensive and inappropriate material. In MySpace or Facebook, the school was not able to control what students saw or heard while using those networks (Ofcom, 2008). However, using a private NING network allowed OCHS to moni-tor uploaded pictures, music playlists, and published videos. It also allowed them to moni-tor student discussions and comments on profile pages. The main rule for the network has been, “Keep it clean, this is an extension of the classroom.” However, OCHS also has par-ents and students sign off on an acceptable use policy (AUP), which forbids publishing any explicit material or the use of offensive language in the network.
OCHS understood students were going to make mistakes when using a social network at school. Given the nature of the network, which allowed students to be in charge of most of the content creation, the network creators knew this could lead to some inappropriate behavior. Students were used to operating in MySpace and/or Facebook with little concern about oversight or behavioral consequences. A goal of OCHS was to create a space where young people could learn how to act professionally online. The teachers and administra-tors use student mistakes, such as explicit playlists or offensive language in the forums, as teachable moments. As well, the NING network provides an opportunity for teachers to help students become aware of the potential consequences of publishing personal or sensi-tive information online.
Interaction in an Online School through Social NetworkingVarious kinds of interaction have occurred in the social network. Some have been planned interactions by the teachers and administrators of OCHS, but most have been student gen-erated. The staff-led and student-led interactions can be grouped in two ways: pedagogical and social.
Pedagogical interaction.
As a hybrid school, OCHS requires students to be on campus for four hours one day a week. Beyond those four hours, there is no opportunity for face-to-face time between students and teachers or students and other students. During the four hours each week when the students are on campus, most of them work the entire time and there is often little interac-tion. The social network offered an opportunity for students to make connections to peers in an otherwise isolated learning environment. This was an important feature as Barbour (2009) found that getting to know their online classmates was one of the main challenges students identified in their online learning experience. The social network also gave them the opportunity to connect with others who were sharing similar experiences.
One of the goals of the network was to offer a place for students to discuss and partici-pate in their own learning. For example, the Principles of Leadership course had students design their social network home page for an early semester ‘About Me’ project and turn
Odyssey of the Mind: Social Networking in a CyberschoolBarbour and Plough
Vol 13 | No 3 Research Articles June 2012 10
the assignment in through their NING group. In another case, students created a course area for the Algebra 1B class where they offered assistance to other students in that course. Karabenick and Knapp (1991) found that students seeking help was negatively related to the students’ sense of the risk to their perceived social standing for seeking help. As the social network is a place where students can interact and seek the academic assistance they need without having to physically face their colleagues, this may have served to increase the frequency of this kind of activity (along with the number of students who participated).
Another goal of the social network was to provide students with a more profound sense of connection to the school, which could lead to greater motivation and academic achieve-ment. Communication at an online school is typically very formal with teachers sending e-mails and making telephone calls to students regarding schoolwork. There was often little opportunity to get to know students on a more personal level in the same way teachers are able to in a traditional school. The social network provided a casual environment that helped teachers to build stronger personal relationships with their online students (Hewitt & Forte, 2006) and to create opportunities to increase student motivation (Cayanus, 2004). In addition, students had an easier method to reach teachers and other students at all hours of the day if they needed help on an assignment or just someone to speak with. Golder, Wilkinson, and Huberman (2007) found that school-based users of social networks typi-cally interact with each other outside of traditional school hours. The immediacy of these communications could also serve to increase student motivation (Christophel, 1990).
As many of the OCHS students were considered to be at-risk students, the staff at OCHS used the social network to create an atmosphere where students could gain confidence be-cause they were given an opportunity to make friends, locate a source of help when they needed content-based assistance, and engage in open and safe discussions, which may have provided some students with the needed belief that they could succeed in school. Berge and Clark (2005) identified the potential to provide opportunities for at-risk students to be successful as one of their five benefits of K-12 online learning. The social network has also given students a resource for self-expression and identity development, which might not otherwise exist in an online education environment.
Social interaction.
In a traditional school environment, students often have the opportunity to become in-volved in a variety of extracurricular activities. As a hybrid school with a significant online component, OCHS did not have clubs or other activities available to students. However, with the introduction of the social network, students started forming interest groups. At the end of the first semester, there were 119 groups in the social network, only a dozen of which had been created by teachers. Students have created all of the other groups on topics such as theater, web design, mixed martial arts, comic books, anime, teen documentary, film and acting, and writing.
Along with the groups, there have been numerous discussions about nonacademic topics that are important to the development of youth adults (Fraser, 1992). Students have talked
Odyssey of the Mind: Social Networking in a CyberschoolBarbour and Plough
Vol 13 | No 3 Research Articles June 2012 11
about politics and the presidential election. There were blog and discussion posts about career goals. There was a robotics get-together planned, and several other nonacademic projects have also developed. Students created public service announcements about soci-etal concerns such as school violence and dropout rates. Finally, there was an acting group that was attempting to produce a comedy sketch to perform for the entire school.
Using the social network, students recently organized prom and talent show committees. OCHS has never had a prom or a talent show so creating these from scratch was quite an endeavor. The prom committee was raising money, planning the theme, researching the fa-cility, and organizing all of the intricate details at the time of writing. They had even created a new NING social network branching off from the Odyssey of the Mind network in order to conduct all of the necessary planning. The talent show committee was accepting proposals with hope of the event occurring in spring 2009. Essentially, the social network has been the public space that has allowed the students a sphere for their social development (boyd, 2007), similar to the kind of public space they would have experienced in the traditional school environment.
In addition to student-centered cocurricular and extracurricular groups, there were several groups that focused on students offering emotional support to others. “Unite the Outcasts,” “Gay/Straight Alliance,” and “Special Ed Kids” were all groups specifically started so stu-dents could talk about teen social problems. Each one had a distinct theme, yet they were all examples of students reaching out to fellow students to speak about topics they would nor-mally have hidden from others throughout their school careers. In their research on peer networks that develop in adolescence, Steinberg, Brown, and Dornbusch (1996) identified three groups: best friends, clique, and crowd. They defined the crowd as being composed of individuals who shared things in common but were not necessarily friends. While all of the students enrolled at OCHS shared some common contexts (i.e., they were all students en-rolled at OCHS), these groups provided a space for them to come together around specific interests, attitudes, and/or desired activities.
There were also over 15 active bloggers in the social network community. These were all students who were voicing their ideas about numerous topics that concerned them. Some of their posts focused on their online courses, others on music and the arts, but many of them related specifically to the emotional and psychological difficulties of adolescence. What made this surprising to the staff of the OCHS was the fact that these teenagers felt comfort-able enough to reveal themselves to an online viewership of nearly half of the school popu-lation. A very small portion faced ridicule for their posts (something that often provided an opportunity for a teachable moment), but most students have reacted very positively and great conversations ensued. Modeling has been a useful tool during these teachable mo-ments. Bandura (1997) described modeling as an effective teaching tool because it has the potential to provide information about how tasks should be performed.
One of the most active forms of interaction has come from the student-led discussions about teen problems. As of the writing of this article there were 64 active discussions in the forums, with approximately one quarter of them focused on social issues, teen problems,
Odyssey of the Mind: Social Networking in a CyberschoolBarbour and Plough
Vol 13 | No 3 Research Articles June 2012 12
or ethical dilemmas. In his stages of human development, Erikson (1958, 1968, 1982) de-scribed adolescence as a stage where humans must achieve their identity, as opposed to identity diffusion. Many of the conflicts during this stage of achieving identity focus upon resolving one’s beliefs about major personal and social issues. For example, in the social network there were discussions about depression, boyfriends/girlfriend problems, parent issues, interracial relationships, religion, and life after death. All of these topics are in-cluded in the kinds of issues that adolescents must come to terms with to develop their own identity. In this instance, Schunk’s (1991) finding that peer modeling was more effective than teacher modeling is relevant. Thus, allowing students to discuss issues that are re-lated to the formation of their own identity and allowing them to model for each other how to conduct a serious, empathetic, and thoughtful discussion can facilitate their personal development.
It has been difficult for the staff at OCHS to imagine many of these student-led groups and discussions occurring in a public manner at a traditional high school. Many students came to OCHS because of social problems or problems they were experiencing at their large high schools. The social network has provided a place to form groups and discussions with like-minded individuals, many of whom often felt that they had to hide their voices. Enochsson (2007) speculated that social networks might provide an accessible medium to give shy students a voice. The fact that there was still a measure of anonymity because there was a high likelihood that these students would not meet each other in person may have also contributed to this phenomenon, allowing students to be more revealing about themselves without fear of facing the people they are talking to at a later date.
Recently, OCHS added rules for using their forums. Since they gave students the oppor-tunity to create the majority of the network content, students had the ability to have very frank discussions about difficult material. There was no way a teacher could moderate every discussion, so there were periodic violations of the OCHS AUP. In some instances, students got overly passionate about a topic, which led to insults of other students. In an attempt to create a more respectful environment and mediate concerns over possible cyber-bullying, OCHS instituted a new set of guidelines for public discussions that prohibited insults and offensive or derogatory commentary. As participation in peer networks has been found to influence academic motivation in adolescents (Dweck & Goetz, 1978; Ryan, 2000), and re-search has also indicated that students who are more academically motivated tend to have larger peer networks (Kindermann, McCollam, & Gibson, 1996), there is a strong desire by the staff at OCHS to keep students participating and engaged in the social network.
Conclusions and ImplicationsOne main goal of the social network was to provide a safe place for students to collaborate with peers they would likely never meet and teachers they rarely had the opportunity to see face-to-face. Learning in an online environment can be a socially isolating experience; as such, the network creators also hoped to provide a platform for students to discuss their personal and schooling experiences with their peers. The final goal was to help motivate

Odyssey of the Mind: Social Networking in a CyberschoolBarbour and Plough
Vol 13 | No 3 Research Articles June 2012 13
students by making their educational and social experiences more dynamic. It was hoped that theses three goals would serve to decrease the transactional distance that students experienced.
The pilot program demonstrated some of the beliefs the creators had about socialization at an online school. For example, they believed that although many students had come to OCHS because of social hardships, they still had a desire to interact with their peers. It also reinforced the idea that students could benefit by having other students to discuss course-work with or, at the very least, by making contacts so they could get help when needed. As many students never met their classmates during the face-to-face school sessions, the so-cial network provided a medium to allow these meetings to occur. Educators at OCHS also witnessed students engaging in ways they had not envisioned or even experienced before in the OCHS environment. This engagement included social interaction, sharing personal histories, and connecting with classmates about important course curriculum.
The main concern during both the pilot program and the eventual school-wide NING net-work was student safety. Choosing a walled garden through NING, rather than an open platform (such as Facebook), allowed the network creators to take responsibility for the content of the network as well as those the students were able to interact with. Network administration determined who was allowed to access the social network by using a system of security checks, which included such things as signing up using a school email, hav-ing parents sign a permission form, and matching the names of the network applicants to a master student list. Network administrators also employed students and staff to help monitor the appropriateness of music, language, and pictures uploaded into the network. Although there was always fear of students harassing each other, the administrators have only seen a small amount of this kind of behavior. And there was no concern about stranger sfrom outside of the OCHS school system gaining access to the student population.
For administrators considering the creation of a social network for their online schools, there are four issues to consider. First, at OCHS maintaining children’s safety and security was at the forefront of every decision. Letters, which detailed the reasons behind starting the network and highlighted the positive aspects of social networking at an online school, were sent to parents/guardians of those who wished to join. In addition, parents/guardians signed consent letters to give their children permission to join the network and to agree to an acceptable use policy. Second, OCHS made the social network a volunteer activity. This meant that students did not have to join the network. It also meant that those who did join were more interested in maintaining a positive environment and helped monitor the hundreds of pages on the site. Third, OCHS used a simple software program that searched the private Ning network for keywords and flagged pages that violated the acceptable use policy. Finally, the school asked for teacher volunteers to log in daily and monitor different groups, conversations, and student interactions in order to maintain a safe and positive en-vironment. Based on our experiences, we would recommend that online school administra-tors consider these issues when exploring the implementation of their own social networks.
Odyssey of the Mind: Social Networking in a CyberschoolBarbour and Plough
Vol 13 | No 3 Research Articles June 2012 14
ReferencesBarbour, M. K. (2007). What are they doing and how are they doing it? Rural student
experiences in virtual schooling (Unpublished doctoral dissertation). University of Georgia, Athens, GA.
Barbour, M. K., (2009). Useful and challenging characteristics of virtual schooling: Second-ary student experiences. Quarterly Review of Distance Education, 4(9), 357–372.
Barbour, M. K. (2010). Researching K-12 online learning: What do we know and what should we examine? Distance Education, 7(2), 7-12.
Barbour, M. K., & Reeves, T. C. (2009). The reality of virtual schools: A review of the litera-ture. Computers and Education, 52(2), 402-416.
Bandura, A. (1997). Self-efficacy: The exercise of control. New York: Freeman.
Berge, Z. L., & Clark, T. (2005). Virtual schools: Planning for success. New York, NY: Teachers College Press.
boyd, d., & Ellison, N. (2007). Social network sites: Definition, history, and scholarship. Journal of Computer-Mediated Communication, 13(1). Retrieved from http://jcmc.indiana.edu/vol13/issue1/boyd.ellison.html
boyd, d. (2007). Social network sites: Public, private, or what? Knowledge Tree, 13. Re-trieved from http://kt.flexiblelearning.net.au/tkt2007/edition-13/social-network-sites-public-private-or-what/
Bright, B. P. (1989). Epistemological vandalism: Psychology in the study of adult education. In B. P. Bright (Ed.), Theory and practice in the study of adult education: The epistemological debate (pp. 34-64). London, U.K.: Routledge.
Cavanaugh, C., Gillan, K. J., Kromrey, J., Hess, M., & Blomeyer, R. (2004). The effects of distance education on K–12 student outcomes: A meta-analysis. Naperville, IL: Learning Point Associates. Retrieved from http://www.eric.ed.gov/ERICWebPor-tal/detail?accno=ED489533
Cayanus, J. L. (2004). Effective instructional practice: Using teacher self-disclosure as an instructional tool. Communication Teacher, 18, 6-9.
Christophel, D. M. (1990). The relationships among teacher immediacy behaviors, student motivation, and learning. Communication Education, 39, 323-340.
Clark, T. (2001). Virtual schools: Trends and issues – A study of virtual schools in the United States. San Francisco, CA: Western Regional Educational Laboratories. Re-trieved from http://www.wested.org/online_pubs/virtualschools.pdf
Odyssey of the Mind: Social Networking in a CyberschoolBarbour and Plough
Vol 13 | No 3 Research Articles June 2012 15
Clark, T. (2003). Virtual and distance education in American schools. In M. G. Moore & W. G. Anderson (Ed.), Handbook of distance education (pp. 673–699). Mahwah, NJ: Lawrence Erlbaum Associates.
Clark, T., & Berge, Z. L. (2005). Perspectives on virtual schools. In Z. L. Berge & T. Clark (Eds.), Virtual schools: Planning for success (pp. 9-19). New York, NY: Teachers College Press.
Conrad, D. (2002). Deep in the hearts of learners: Insights into the nature of online com-munity. Journal of Distance Education, 17(1), 1-19.
Cross, K. P. (1998). Why learning communities? Why now? About Campus, 3(3), 4-11.
Darrow, R. W. (2010). A comparative study between online charter high schools and tra-ditional high schools in California (Unpublished doctoral dissertation). California State University, Fresno, CA.
Durkin, K. (1995). Socialization. In A. Manstead & M Hewstone (Eds.), The Blackwell ency-clopedia of social psychology. Cambridge, MA: Basil Blackwell.
Dweck, C. S. & Goetz, T. (1978). Attributions and learning helplessness. In J. Harvey, W. Ickes, & R. Kidd (Eds.), New direction in attribution research (pp. 157-179). Hill-sdale, NJ: Erlbaum.
Dwyer, C., Hiltz, S. R., & Passerini, K. (2007). Trust and privacy concern within social net-working sites: A comparison of Facebook and MySpace. Proceedings of the Thir-teenth Americas Conference on Information Systems, Keystone, CO. Retrieved from http://csis.pace.edu/~dwyer/research/DwyerAMCIS2007.pdf
Enochsson, A. B. (2007). Tweens on the Internet: Communication in virtual guest books. Seminar.net, 3(2). Retrieved from http://www.seminar.net/images/stories/vol3-issue2/enochsson-tweens_on_the_internet.pdf
Erikson, E. H. (1950). Childhood and society. New York: W. W. Norton & Co.
Erikson, E. H. (1968). Identity and the life cycle. New York: W. W. Norton & Co.
Erikson, E. H. (1982). The lifecycle completed. New York: W. W. Norton & Co.
Fraser, N. (1992). Rethinking the public sphere: A contribution to the critique of actually existing democracy. In C. Calhoun (Ed.), Habermas and the public sphere (pp. 109-142). Cambridge, MA: MIT Press.
Giddens, A., Duneier, M., & Appelbaum, R. (2005). Introduction to sociology (5th edition). New York: W.W. Norton & Company, Inc.
Golder, S., Wilkinson, D., & Huberman, B. (2007). Rhythms of social interaction: Messag-
Odyssey of the Mind: Social Networking in a CyberschoolBarbour and Plough
Vol 13 | No 3 Research Articles June 2012 16
ing within a massive online network. In C. Steinfield, B. Pentland, M. Ackerman, & N. Contractor (Eds.), Proceedings of Third International Conference on Com-munities and Technologies (pp. 41-66). London: Springer. Retrieved from http://www.hpl.hp.com/research/idl/papers/facebook/index.html
Hewitt, A., & Forte, A. (2006, November). Crossing boundaries: Identity management and student/faculty relationships on the Facebook. A poster presentation at the annual Computer Supported Cooperative Work conference, Banff, AB. Retrieved from http://www.cc.gatech.edu/~aforte/HewittForteCSCWPoster2006.pdf
Huerta, L. A., & González, M. F. (2004). Cyber and home school charter schools: How states are defining new forms of public schooling. Tempe, AZ: Education Poli-cy Research Unit, Arizona State University. Retrieved from http://epsl.asu.edu/epru/articles/EPRU-0401-49-OWI.htm
Irwin C., & Berge, Z. (2006). Socialization in the online classroom. E-Journal of Instruc-tional Science and Technology, 9(1). Retrieved from http://www.ascilite.org.au/ajet/e-jist/docs/vol9_no1/papers/full_papers/irwin_berge.htm
Karabenick, S. A., & Knapp, J. R. (1991). Relationship of academic help seeking to the use of learning strategies and other instrument achievement behavior in college students. Journal of Educational Psychology, 88, 260-271.
Kindermann, T.A., McCollam, T. L., & Gibson, E. Jr. (1996). Peer networks and students’ classroom engagement during childhood and adolescences. In J. Juvonen & K. R. Wentzel (Eds.), Social motivation: Understanding children’s school adjustment (pp. 279-312). Cambridge, England: Cambridge University Press.
Knowles, M. S. (1970). The modern practice of adult education: Andragogy vs. pedagogy. New York, NY: Association Press.
Lenhart, A., & Madden, M. (2007). Social networking websites and teens: An overview. Washington, DC: Pew Internet & American Life Project. Retrieved from http://www.pewinternet.org/pdfs/PIP_SNS_Data_Memo_Jan_2007.pdf
Long, R. (2007). Socialization. Bern, Switzerland: Lumrix.net GmbH. Retrieved from http://www.lumrix.net/medical/sociology/socialization.html
McNiff, J., Lomax, P., & Whitehead, J. (1996). You and your action research project. Lon-don: Routledge.
Mazer, J. P., Murphy, R. E., & Simonds, C. J. (2007). I’ll see you on “Facebook”: The ef-fects of computer-mediated teacher self-disclosure on student motivation, affec-tive learning, and classroom climate. Communication Education, 56 (1), 1-17.
Merrell, K. W. (2002). Assessment of children’s social skills: Recent developments, best
Odyssey of the Mind: Social Networking in a CyberschoolBarbour and Plough
Vol 13 | No 3 Research Articles June 2012 17
practices and new directions. Exceptionality, 9, 3-18.
Mills, G. E. (2011). Action research: A guide for the teacher researcher (4th ed.). Boston, MA: Pearson Education, Inc..
Moore, M. G. (1972). Learner autonomy: The second dimension of independent learning. Convergence, Fall, 76-88.
Moore, M. G. (1973). Toward a theory of independent learning and teaching. Journal of Higher Education, 44(12), 661-679.
Moore, M. G. (1983). The individual adult learner. In M. Tight (Ed.), Education for adults: Volume 1 - Adult learning and education (pp. 153-168). London, U.K.: Croom Helm Ltd.
Moore, M. G. (1993). Theory of transactional distance. In D. Keegan (Ed.), Theoretical principles of distance education (pp. 22-38). London: Routledge.
Moore, M. G., & Kearsley, G. (1996). The theoretical basis for distance education. In Dis-tance education: A systems view (pp. 197-212). Belmont, CA: Wadsworth.
Ofcom. (2007). Social networking: A quantitative and qualitative research report into attitudes, behaviors and use. London: Author. Retrieved from http://www.ofcom.org.uk/advice/media_literacy/medlitpub/medlitpubrss/socialnetworking/report.pdf
Picciano, A. G., & Seaman, J. (2007). K-12 online learning: A survey of US school dis-trict administrators. Needham, MA: Alfred P. Sloan Foundation. Retrieved from http://www.sloan-c.org/publications/survey/K-12_06.asp
Rapp, K. E., Eckes, S. E., & Plurker, J. A. (2006). Cyber charter schools in Indiana: Policy implications of the current statutory language. Education Policy Brief, 4(3). Re-trieved from http://ceep.indiana.edu/projects/PDF/PB_V4N3_Winter_2006_CyberCharter.pdf
Ryan, A. (2000). Peer groups as a context for the socialization of adolescent’s motivation, engagement, and achievement in school. Educational Psychologist, 35, 101-111.
Schunk, D. H. (1991). Learning theories: An educational perspective. New York: Macmil-lan.
Sivin-Kachala, J., & Bialo, E. (2009). IESD Comprehensive technical report: Evaluation of the social skills of full-time, online public school students. New York: Interactive Educational Systems Design, Inc. Retrieved from http://www.k12.com/educators/research__results/reports__white_papers/socialization-study/
Steinberg, L., Brown, B. B., & Dornbusch, S. M. (1996). Beyond the classroom: Why school
Odyssey of the Mind: Social Networking in a CyberschoolBarbour and Plough
Vol 13 | No 3 Research Articles June 2012 18
reform has failed and what parents need to do. New York: Simon & Schuster.
Stringer, E. (2004). Action research in education. Upper Saddle River, NJ: Pearson Educa-tion, Inc..
Stutzman, F. (2006). An evaluation of identity-sharing behavior in social network com-munities. Journal of the International Digital Media and Arts Association, 3(1), 10-18. Retrieved from http://www.ibiblio.org/fred/pubs/stutzman_pub4.pdf
Tasmajian, D. (2002). Socialization skills acquired by elementary school children. Under-graduate Research Journal for the Human Sciences, 1. Retrieved from http://www.kon.org/urc/tasmajian.html
Tucker, B. (2007). Laboratories of reform: Virtual high schools and innovation in public education. Washington, DC: Education Sector. Retrieved from http://www.educa-tionsector.org/research/research_show.htm?doc_id=502307
Vygotsky, L. S. (1962). Thought and language (E. Hanfmann & G. Vakar, Trans.). Cam-bridge, MA: The M.I.T. Press.
Vygotsky, L. S. (1978). Mind in society: The development of higher psychologist processes. Cambridge, MA: Harvard University Press.
Watson, J. F., & Gemin, B. (2008). Promising practices in online learning: Socialization in online programs. Vienna, VA: North American Council for Online Learning. Re-trieved from http://www.inacol.org/research/promisingpractices/NACOL_PP_Socialization.pdf
Watson, J., Murin, A., Vashaw, L., Gemin, B., & Rapp, C. (2011). Keeping pace with K-12 online learning: An annual review of policy and practice. Evergreen, CO: Ever-green Education Group. Retrieved from http://kpk12.com/cms/wp-content/up-loads/KeepingPace2011.pdf
Wicks, M. (2010). A national primer on K–12 online learning, Version 2. Vienna, VA: In-ternational Association for K-12 Online Learning. Retrieved from http://www.ina-col.org/research/bookstore/detail.php?id=22
Motivation Levels among Traditional and Open Learning Undergraduate Students in India
AbstractMotivation plays a crucial role in learning. Motivation energizes the behavior of the individ-ual. It also directs the behavior towards specific goals. It helps students acquire knowledge, develop social qualities, increase initiation, persist in activities, improve performance, and develop a sense of discipline. This paper aims to compare the levels of motivation between students in the open education system (OES) and in the traditional education system (TES) in India. The study further investigates the motivation levels of male and female students in the two systems. An Academic Motivation Scale (AMS) was prepared and administered on the students of TES (n = 200) and OES (n = 151). Results show that there exist signifi-cant differences in the level of motivation between the students of TES and OES. The study concludes that it is the presence or absence of extrinsic motivation which is predominantly responsible for this difference.
Keywords: Traditional education system; open education system; academic motivation; survey
Shashi Singh and Ajay SinghMeerut Institute of Engineering & Technology, India
Kiran SinghUniversity of Allahabad, India

Motivation Levels among Traditional and Open Learning Undergraduate Students in IndiaSingh, Singh, and Singh
Vol 13 | No 3 Research Articles June 2012 20
IntroductionMotivation is typically defined as the force that accounts for the arousal, selection, direc-tion, and continuation of behavior. Motivation means the desire and willingness to do something. It is a drive that compels an individual to act towards the attainment of some goal. As defined by Daft (1977, p. 526), “Motivation refers to the forces either within or external to a person that arouse enthusiasm and persistence to pursue a certain course of action.” Motivation plays a crucial role in learning. It not only sets in motion the activity resulting in learning, but also sustains and directs it. It is “the central factor in the effec-tive management of the process of learning” (Kelley, 2002, as cited in Aggarwal, 2004).
Academic motivation has been found to be positively associated with academic achieve-ment, academic performance, and the “will to learn” (McCelland et al., 1953; Entwistle, 1968; Frymier et al., 1975). Various studies have found that classroom competition (Bolo-cofsky, 1980), family culture and environment (Tseng, 1998; Satyanandam, 1969; Hussain, 1977; Salunke, 1979; Nagalakshmi, 1982; Singh, 1984), personal aspiration factors (Yeung & Yeung; 2001, Banerjee; 1974, Siddiqui; 1979), and study habits (Tiwari, 1982) positively motivate students to do better.
Open learning has afforded opportunities for education outside the realm of the conven-tional system by providing flexibility in pursuing courses and taking examinations (Gau-tam, 1990; Indradevi, 1985). Studies have further stated that the popularity and accep-tance of open education systems is on the rise (Bhattacharya, 1991; Khan, 1991). Freedom from constraint may also be seen as a defining feature of distance learning, for example freedom of content, space, medium, access (Paulsen, 1993), and relationship development (Anderson, 2006, as cited in Hartnett et al., 2011). Other than flexibility, job-related goals (Wanieweicz, 1981) and improvement of social status (McIntosh, 1978) are the main mo-tivation to join the open education system. It has also been revealed that the chances of students successfully completing their open education studies is generally linked to their personal concept (Gibson, 1996), capacity for self-management (Atman, 1988), and famil-iarity with technology (Schifter & Monolescu, 2000). Notwithstanding the advantages that distance education offer, retention of students has been a major area of concern in open education. Dropout rates reported by open and distance learning (ODL) institutions are typically higher than those reported by conventional universities (Pierrakeas et al., 2004). Pierrakeas et al. (2004) further report the following:
In Europe, dropout rates in distance education programs typically range from 20 percent to 30 percent (Rumble, 1992) or even higher in Northern America (Schlosser & Anderson, 1994). Asian countries have recorded rates as high as 50 percent (Shin & Kim, 1999; Narasimharao, 1999). (p.1)
Various reasons such as family (related to childbirth, child rearing, marriage, pregnancy, travel problems, death of a family member), personal, or health reasons (Pierrakeas et al., 2004), distance to the study center, insufficient academic support from study centers, ab-
Motivation Levels among Traditional and Open Learning Undergraduate Students in IndiaSingh, Singh, and Singh
Vol 13 | No 3 Research Articles June 2012 21
sence of interaction with other students, and insufficient counseling sessions (Fozdar et al., 2006) have been found to contribute to higher dropouts in the open education system. Apart from these explicit factors, poor motivation has been identified as a decisive factor in contributing to the high dropout rates from online courses (Muilenburg & Berge, 2005). Against this backdrop of poor retention rates, the diverse characteristics of distance learn-ers and the importance of motivation in the learning process prompted our study. This study explores whether the level of motivation in OES students compared to TES students is low enough to raise apprehension among distance education administrators. Issues have been raised and explored regarding the motivation of students of TES and OES. Further, motivation has been explored from extrinsic and intrinsic points of view. While intrinsic motivation is important to influence the learning habits of students, particularly in OES (Shroff, Vogel, & Coombes, 2008; Rovai, Ponton, Wighting, & Baker, 2007; Wighting et al., 2008), this study also examines the importance of extrinsic motivation in the formation of the overall motivation level of students.
Objectives of this StudyThough it may not seem logical to compare the pupils of the two types of education sys-tems, which differ so widely in their characteristics and functioning, the researchers have undertaken this study to explore the reasons, if any, for the differences in motivation levels. The study aims to discover the learning motivations of OES and TES students. The study compares academic motivation between the two education systems. It also incorporates a comparison between male and female students studying under the two systems. The vari-ous dimensions that have influence on the motivation level of students are discussed.
The objective of this study is also to apply the theories of motivation to explore the reasons for any significant differences in the motivation levels of the two types of pupil. This study will present suggestions which may be beneficial for policy makers. It will also raise ques-tions which may be the subject matter of future research. To achieve the above stated objec-tives and after reviewing the related literature the following hypotheses have been framed and tested.
Hypothesis 1: There is no significant difference in the academic motivation of students studying in the two systems of education.
Hypothesis 2: There is no significant difference in the academic motivation of male and female students studying in the two systems of education.
Hypothesis 2 has further been subdivided into the following hypotheses.
Hypothesis 2(a): There is no significant difference in the academic motivation of the male and female students studying in the traditional education system.
Hypothesis 2(b): There is no significant difference in the academic motivation of the male and female students studying in the open education system.
Motivation Levels among Traditional and Open Learning Undergraduate Students in IndiaSingh, Singh, and Singh
Vol 13 | No 3 Research Articles June 2012 22
Hypothesis 2(c): There is no significant difference in the academic motivation of the male students studying in the traditional education system and in the open education system.
Hypothesis 2(d): There is no significant difference in the academic motivation of the female
students studying in the traditional education system and in the open education system.
Delimitations of this Study
The present study has the following delimitations:
• It is confined to undergraduate students only.
• It is confined to two faculties, namely the arts and science faculties.
• The population under study is limited to the municipal limits of Allahabad Municipal Area (Uttar Pradesh, India).
• The sample size of the present study is limited to 351 students.
• The present study is limited in its design, method, measuring devices, and statistical
techniques.
MethodThe present study is closely connected with the normative survey method of research. The population for the present study has been defined as all B.A. and B.Sc. students (male and female) of session 2009-2010 studying in the degree colleges affiliated to Allahabad Uni-versity and Allahabad study centre of U.P. Rajarshi Tandon Open University who have gone through the process of examination and evaluation of their respective educational system at least once.
The population for the traditional education system has been defined as the number of students studying in the degree colleges offering B.Sc. and B.A. courses in Allahabad city region; these degree colleges are affiliated to the University of Allahabad. Only second and third year undergraduate students have been considered as members of the population as they have gone through the examination and evaluation process of their education system. At the time of the study, a total population of 13,748 students from nine colleges was eli-gible to participate.
The population for the open education system has been defined as the number of students enrolled with Uttar Pradesh Rajarshi Tandon Open University, Allahabad, for the courses in the arts and science streams. Their study centers are based in Allahabad. This university conducts examinations each semester, which is why the population constitutes all the stu-dents studying in the first, second, and third years of their respective stream (n = 305 from
Motivation Levels among Traditional and Open Learning Undergraduate Students in IndiaSingh, Singh, and Singh
Vol 13 | No 3 Research Articles June 2012 23
five study centers). Those first year students considered to be part of the population have appeared and cleared their first-semester examination, thus fulfilling the criterion of “going through the examination and evaluation process.”
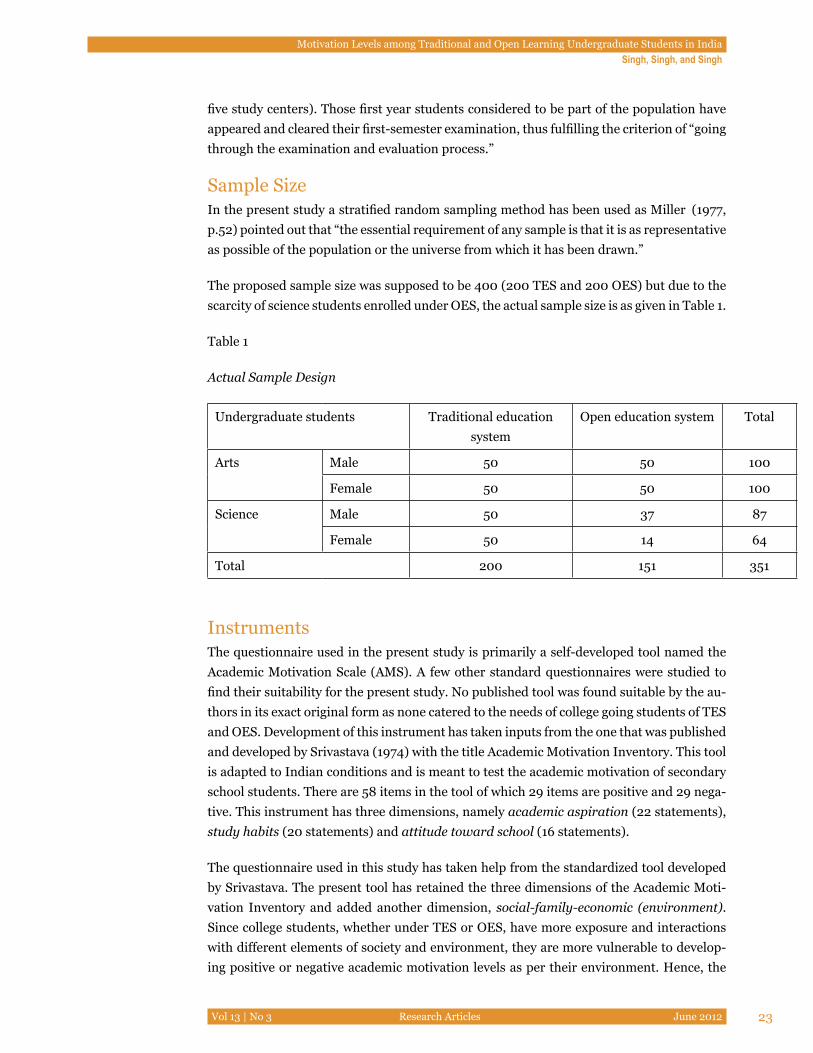
Sample SizeIn the present study a stratified random sampling method has been used as Miller (1977, p.52) pointed out that “the essential requirement of any sample is that it is as representative as possible of the population or the universe from which it has been drawn.”
The proposed sample size was supposed to be 400 (200 TES and 200 OES) but due to the scarcity of science students enrolled under OES, the actual sample size is as given in Table 1.
Table 1
Actual Sample Design
Undergraduate students Traditional education system
Open education system Total
Arts Male 50 50 100
Female 50 50 100
Science Male 50 37 87
Female 50 14 64
Total 200 151 351
InstrumentsThe questionnaire used in the present study is primarily a self-developed tool named the Academic Motivation Scale (AMS). A few other standard questionnaires were studied to find their suitability for the present study. No published tool was found suitable by the au-thors in its exact original form as none catered to the needs of college going students of TES and OES. Development of this instrument has taken inputs from the one that was published and developed by Srivastava (1974) with the title Academic Motivation Inventory. This tool is adapted to Indian conditions and is meant to test the academic motivation of secondary school students. There are 58 items in the tool of which 29 items are positive and 29 nega-tive. This instrument has three dimensions, namely academic aspiration (22 statements), study habits (20 statements) and attitude toward school (16 statements).
The questionnaire used in this study has taken help from the standardized tool developed by Srivastava. The present tool has retained the three dimensions of the Academic Moti-vation Inventory and added another dimension, social-family-economic (environment). Since college students, whether under TES or OES, have more exposure and interactions with different elements of society and environment, they are more vulnerable to develop-ing positive or negative academic motivation levels as per their environment. Hence, the
Motivation Levels among Traditional and Open Learning Undergraduate Students in IndiaSingh, Singh, and Singh
Vol 13 | No 3 Research Articles June 2012 24
dimensions used in the questionnaire are as follows:
• personal aspiration,
• study habits,
• social-family-economic (environment) factors, and
• attitude towards college/ study centre.
A five-point rating scale was prepared by the researcher with the following alternatives: strongly agree, agree, undecided, disagree, and strongly disagree. Having identified the items, the preliminary tool was tested on 40 students consisting of 20 students from TES and 20 students from OES belonging to the science stream or the arts stream. Emphasis was laid upon the inclusion of male, female, rural, and urban students in the proper ratio. The tool was administered to examine the gross language mistakes and identify the defects, if any. After making the necessary corrections AMS was administered on 150 students.
Final Form of QuestionnaireNine items due to t-value and five items due to item validity and item difficulty were re-jected. Therefore 46 items remained. These 46 items or statements can be deemed as com-pletely fit and appropriate for further use. In the final form of the AMS, there were 15 items for measuring the first dimension (i.e., personal aspiration), 15 items for the second dimen-sion (i.e., study habits), 8 items for the third dimension (i.e., socioeconomic factors), and 8 items for the fourth dimension (i.e., attitude towards college/study centers). The final scale (AMS) contained 22 favorable and 24 unfavorable statements. The tool was standardized by judging reliability using the split half method (the correlation coefficient was found to be 0.87 and when corrected it was 0.93) and test-reset method (moment product correlation coefficient was 0.97) and incorporating suggestions from students, educationists, psycholo-gists, and specialists working in the field of education (traditional as well as open).
Brief Description of Dimensions of AMSThe following four dimensions have been taken in designing AMS to analyze the academic motivation of students, keeping in mind the characteristics of the research population.
Personal aspiration.
This is an intrinsic motivation that energizes an individual to perform certain tasks. It is the main driving force that guides a student through the process of learning. A stronger feeling of self-determination and competence will have a positive impact on the development of a student’s academic motivation, whereas the opposite will have a negative impact (Deci & Ryan, 1991, cited in Karsenti, 1999).
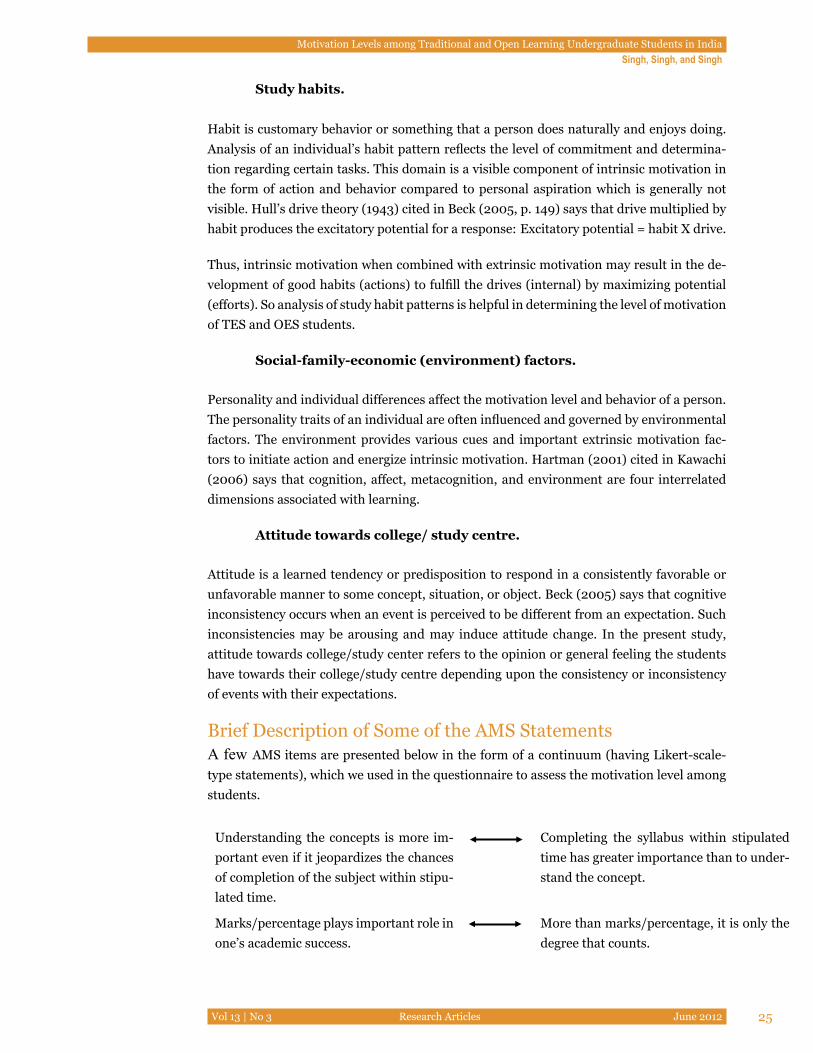
Motivation Levels among Traditional and Open Learning Undergraduate Students in IndiaSingh, Singh, and Singh
Vol 13 | No 3 Research Articles June 2012 25
Study habits.
Habit is customary behavior or something that a person does naturally and enjoys doing. Analysis of an individual’s habit pattern reflects the level of commitment and determina-tion regarding certain tasks. This domain is a visible component of intrinsic motivation in the form of action and behavior compared to personal aspiration which is generally not visible. Hull’s drive theory (1943) cited in Beck (2005, p. 149) says that drive multiplied by habit produces the excitatory potential for a response: Excitatory potential = habit X drive.
Thus, intrinsic motivation when combined with extrinsic motivation may result in the de-velopment of good habits (actions) to fulfill the drives (internal) by maximizing potential (efforts). So analysis of study habit patterns is helpful in determining the level of motivation of TES and OES students.
Social-family-economic (environment) factors.
Personality and individual differences affect the motivation level and behavior of a person. The personality traits of an individual are often influenced and governed by environmental factors. The environment provides various cues and important extrinsic motivation fac-tors to initiate action and energize intrinsic motivation. Hartman (2001) cited in Kawachi (2006) says that cognition, affect, metacognition, and environment are four interrelated dimensions associated with learning.
Attitude towards college/ study centre.
Attitude is a learned tendency or predisposition to respond in a consistently favorable or unfavorable manner to some concept, situation, or object. Beck (2005) says that cognitive inconsistency occurs when an event is perceived to be different from an expectation. Such inconsistencies may be arousing and may induce attitude change. In the present study, attitude towards college/study center refers to the opinion or general feeling the students have towards their college/study centre depending upon the consistency or inconsistency of events with their expectations.
Brief Description of Some of the AMS StatementsA few AMS items are presented below in the form of a continuum (having Likert-scale-type statements), which we used in the questionnaire to assess the motivation level among students.
Understanding the concepts is more im-portant even if it jeopardizes the chances of completion of the subject within stipu-lated time.
Completing the syllabus within stipulated time has greater importance than to under-stand the concept.
Marks/percentage plays important role in one’s academic success.
More than marks/percentage, it is only the degree that counts.
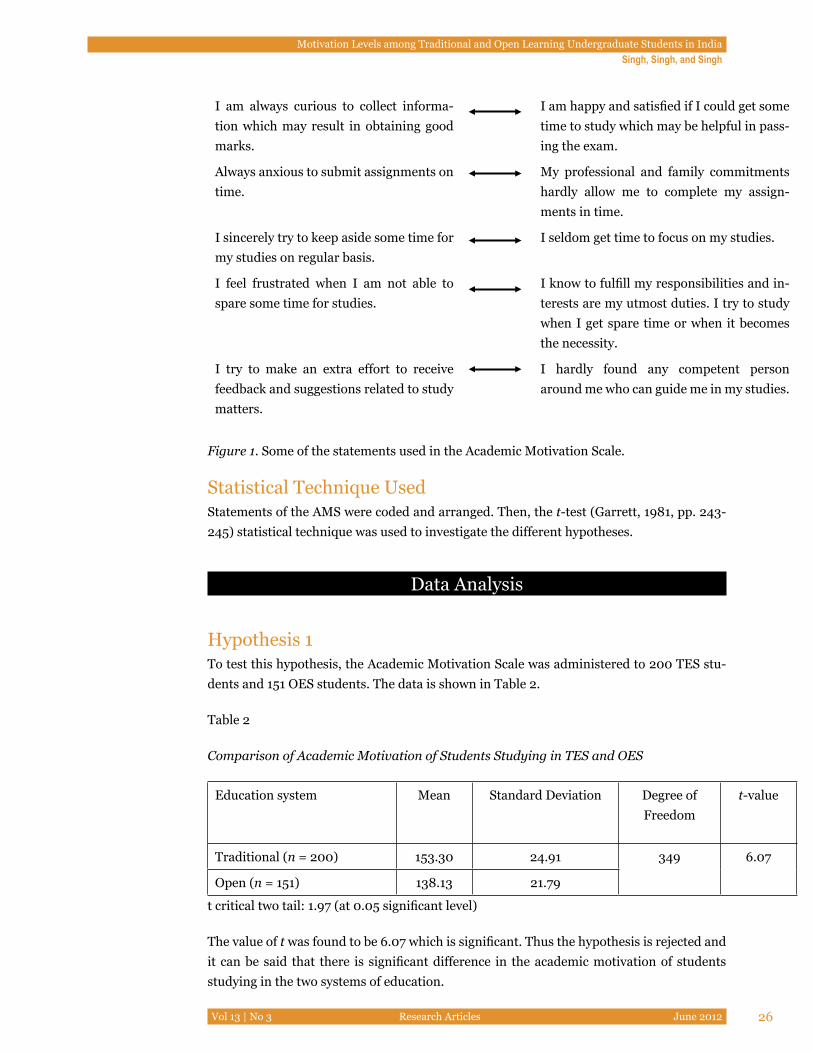
Motivation Levels among Traditional and Open Learning Undergraduate Students in IndiaSingh, Singh, and Singh
Vol 13 | No 3 Research Articles June 2012 26
I am always curious to collect informa-tion which may result in obtaining good marks.
I am happy and satisfied if I could get some time to study which may be helpful in pass-ing the exam.
Always anxious to submit assignments on time.
My professional and family commitments hardly allow me to complete my assign-ments in time.
I sincerely try to keep aside some time for my studies on regular basis.
I seldom get time to focus on my studies.
I feel frustrated when I am not able to spare some time for studies.
I know to fulfill my responsibilities and in-terests are my utmost duties. I try to study when I get spare time or when it becomes the necessity.
I try to make an extra effort to receive feedback and suggestions related to study matters.
I hardly found any competent person around me who can guide me in my studies.
Figure 1. Some of the statements used in the Academic Motivation Scale.
Statistical Technique UsedStatements of the AMS were coded and arranged. Then, the t-test (Garrett, 1981, pp. 243-245) statistical technique was used to investigate the different hypotheses.
Data Analysis
Hypothesis 1To test this hypothesis, the Academic Motivation Scale was administered to 200 TES stu-dents and 151 OES students. The data is shown in Table 2.
Table 2
Comparison of Academic Motivation of Students Studying in TES and OES
Education system Mean Standard Deviation Degree of Freedom
t-value
Traditional (n = 200) 153.30 24.91 349 6.07
Open (n = 151) 138.13 21.79
t critical two tail: 1.97 (at 0.05 significant level)
The value of t was found to be 6.07 which is significant. Thus the hypothesis is rejected and it can be said that there is significant difference in the academic motivation of students studying in the two systems of education.
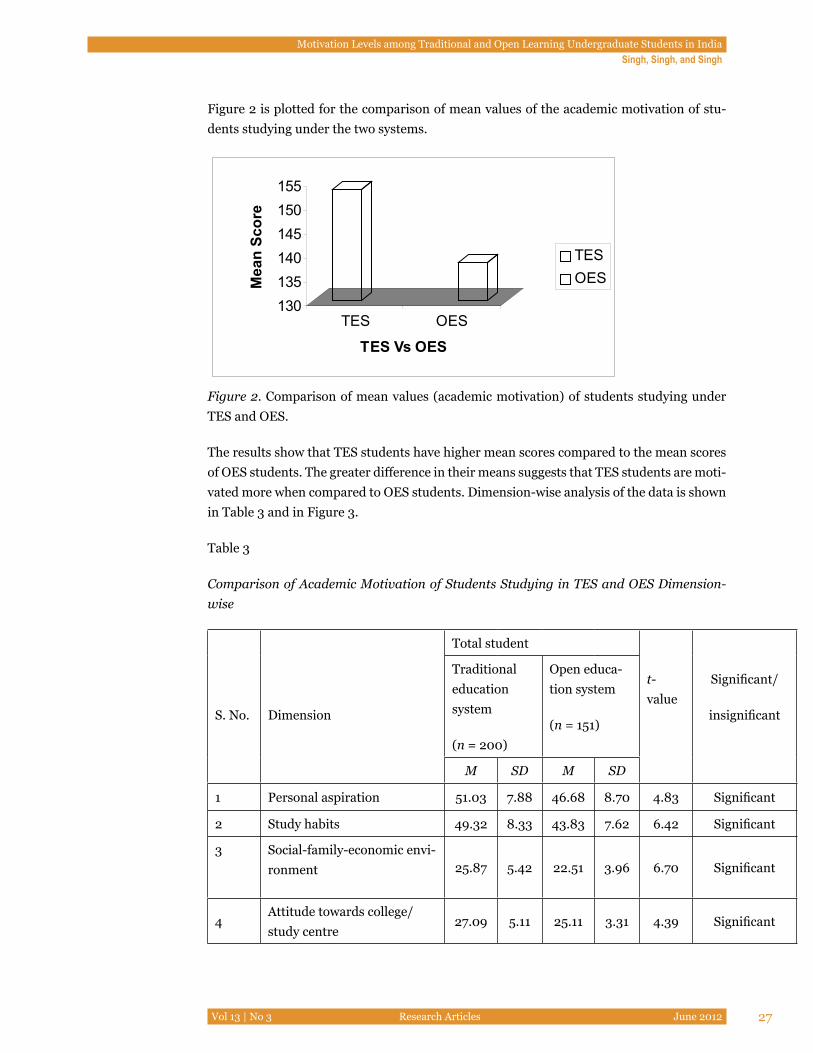
Motivation Levels among Traditional and Open Learning Undergraduate Students in IndiaSingh, Singh, and Singh
Vol 13 | No 3 Research Articles June 2012 27
Figure 2 is plotted for the comparison of mean values of the academic motivation of stu-dents studying under the two systems.
130135140145150155
Mea
n Sc
ore
TES OES
TES Vs OES
TESOES
Figure 2. Comparison of mean values (academic motivation) of students studying under TES and OES.
The results show that TES students have higher mean scores compared to the mean scores of OES students. The greater difference in their means suggests that TES students are moti-vated more when compared to OES students. Dimension-wise analysis of the data is shown in Table 3 and in Figure 3.
Table 3
Comparison of Academic Motivation of Students Studying in TES and OES Dimension-wise
S. No. Dimension
Total student
t-value
Significant/
insignificant
Traditional education system
(n = 200)
Open educa-tion system
(n = 151)
M SD M SD
1 Personal aspiration 51.03 7.88 46.68 8.70 4.83 Significant
2 Study habits 49.32 8.33 43.83 7.62 6.42 Significant
3 Social-family-economic envi-ronment 25.87 5.42 22.51 3.96 6.70 Significant
4Attitude towards college/study centre
27.09 5.11 25.11 3.31 4.39 Significant
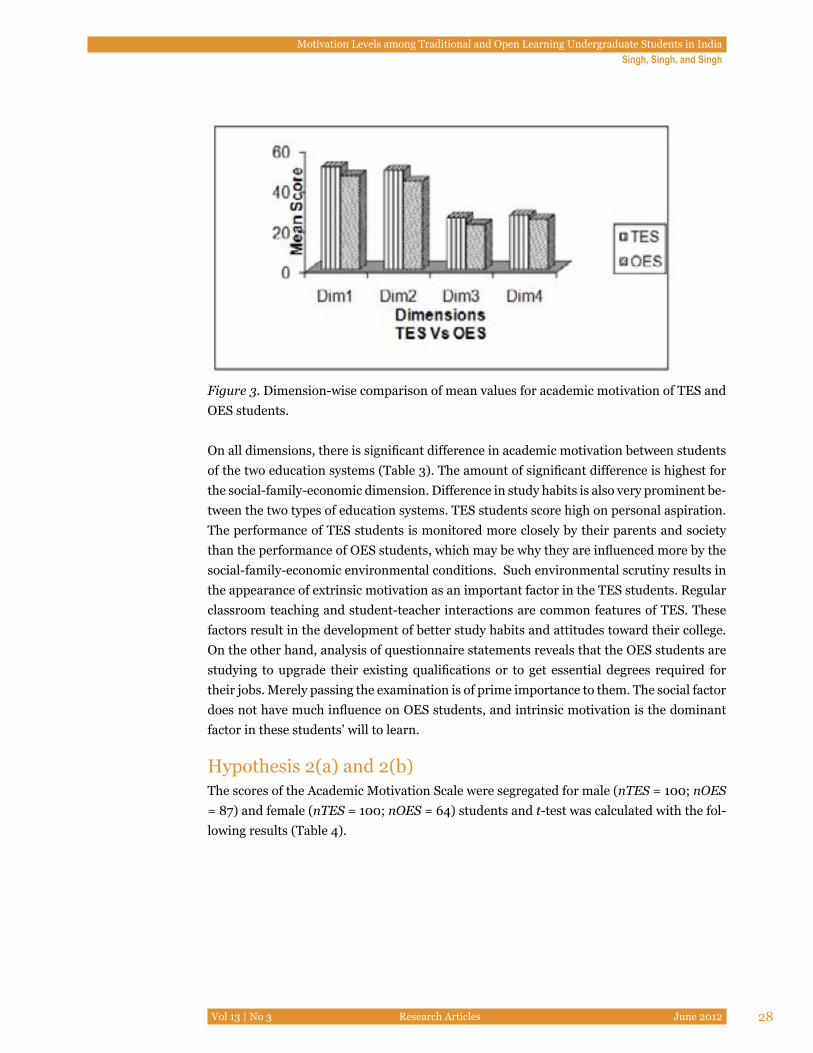
Motivation Levels among Traditional and Open Learning Undergraduate Students in IndiaSingh, Singh, and Singh
Vol 13 | No 3 Research Articles June 2012 28
Figure 3. Dimension-wise comparison of mean values for academic motivation of TES and OES students.
On all dimensions, there is significant difference in academic motivation between students of the two education systems (Table 3). The amount of significant difference is highest for the social-family-economic dimension. Difference in study habits is also very prominent be-tween the two types of education systems. TES students score high on personal aspiration. The performance of TES students is monitored more closely by their parents and society than the performance of OES students, which may be why they are influenced more by the social-family-economic environmental conditions. Such environmental scrutiny results in the appearance of extrinsic motivation as an important factor in the TES students. Regular classroom teaching and student-teacher interactions are common features of TES. These factors result in the development of better study habits and attitudes toward their college. On the other hand, analysis of questionnaire statements reveals that the OES students are studying to upgrade their existing qualifications or to get essential degrees required for their jobs. Merely passing the examination is of prime importance to them. The social factor does not have much influence on OES students, and intrinsic motivation is the dominant factor in these students’ will to learn.
Hypothesis 2(a) and 2(b) The scores of the Academic Motivation Scale were segregated for male (nTES = 100; nOES = 87) and female (nTES = 100; nOES = 64) students and t-test was calculated with the fol-lowing results (Table 4).
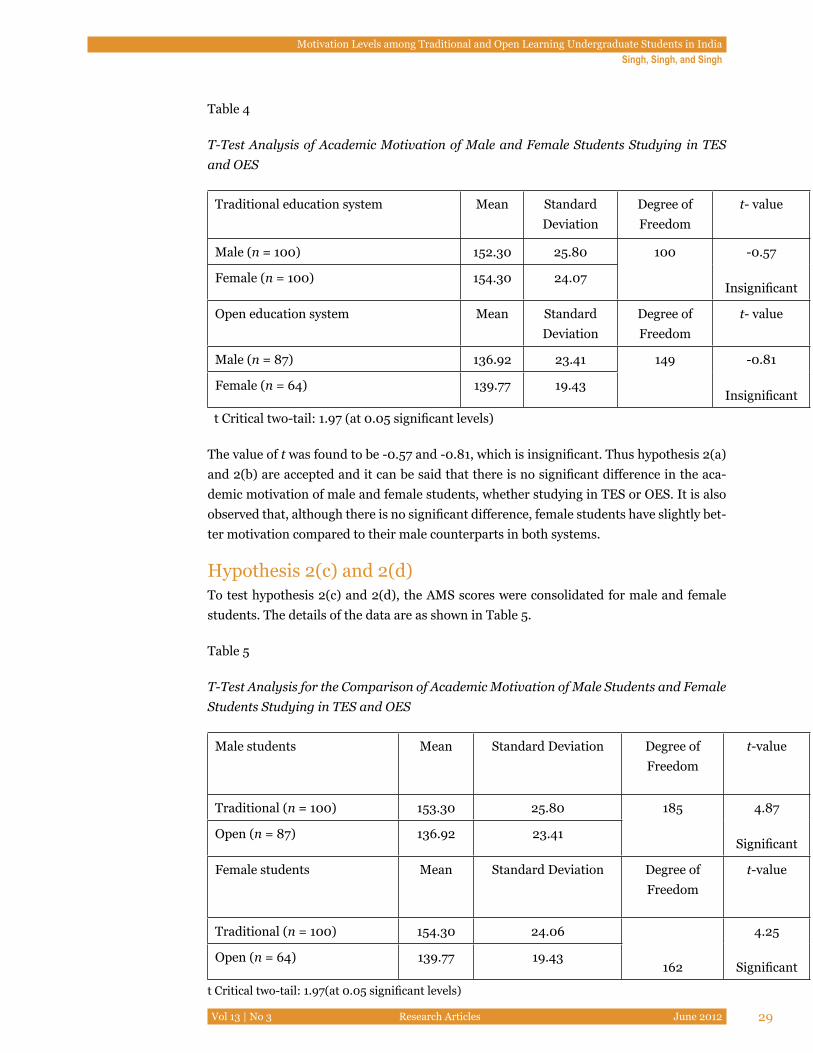
Motivation Levels among Traditional and Open Learning Undergraduate Students in IndiaSingh, Singh, and Singh
Vol 13 | No 3 Research Articles June 2012 29
Table 4
T-Test Analysis of Academic Motivation of Male and Female Students Studying in TES and OES
Traditional education system Mean Standard Deviation
Degree of Freedom
t- value
Male (n = 100) 152.30 25.80 100 -0.57
InsignificantFemale (n = 100) 154.30 24.07
Open education system Mean Standard Deviation
Degree of Freedom
t- value
Male (n = 87) 136.92 23.41 149 -0.81
InsignificantFemale (n = 64) 139.77 19.43
t Critical two-tail: 1.97 (at 0.05 significant levels)
The value of t was found to be -0.57 and -0.81, which is insignificant. Thus hypothesis 2(a) and 2(b) are accepted and it can be said that there is no significant difference in the aca-demic motivation of male and female students, whether studying in TES or OES. It is also observed that, although there is no significant difference, female students have slightly bet-ter motivation compared to their male counterparts in both systems.
Hypothesis 2(c) and 2(d)To test hypothesis 2(c) and 2(d), the AMS scores were consolidated for male and female students. The details of the data are as shown in Table 5.
Table 5
T-Test Analysis for the Comparison of Academic Motivation of Male Students and Female Students Studying in TES and OES
Male students Mean Standard Deviation Degree of Freedom
t-value
Traditional (n = 100) 153.30 25.80 185 4.87
SignificantOpen (n = 87) 136.92 23.41
Female students Mean Standard Deviation Degree of Freedom
t-value
Traditional (n = 100) 154.30 24.06
162
4.25
SignificantOpen (n = 64) 139.77 19.43
t Critical two-tail: 1.97(at 0.05 significant levels)
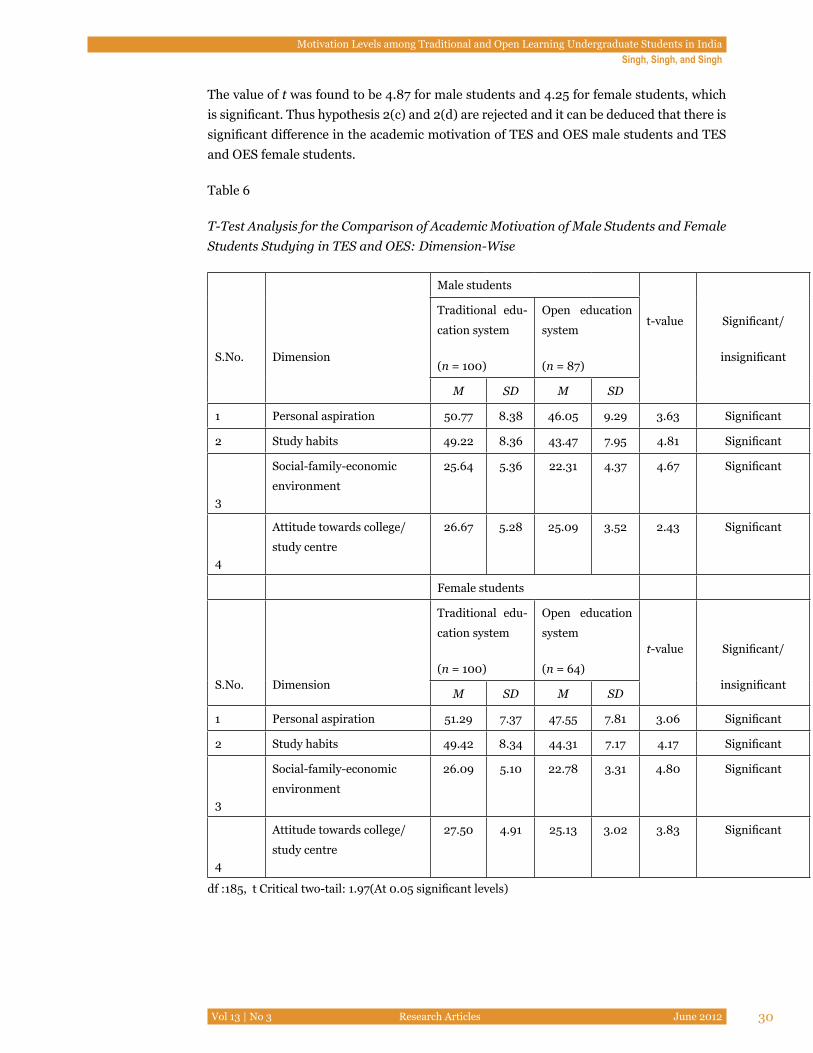
Motivation Levels among Traditional and Open Learning Undergraduate Students in IndiaSingh, Singh, and Singh
Vol 13 | No 3 Research Articles June 2012 30
The value of t was found to be 4.87 for male students and 4.25 for female students, which is significant. Thus hypothesis 2(c) and 2(d) are rejected and it can be deduced that there is significant difference in the academic motivation of TES and OES male students and TES and OES female students.
Table 6
T-Test Analysis for the Comparison of Academic Motivation of Male Students and Female Students Studying in TES and OES: Dimension-Wise
S.No. Dimension
Male students
t-value Significant/
insignificant
Traditional edu-
cation system
(n = 100)
Open education
system
(n = 87)
M SD M SD
1 Personal aspiration 50.77 8.38 46.05 9.29 3.63 Significant
2 Study habits 49.22 8.36 43.47 7.95 4.81 Significant
3
Social-family-economic
environment
25.64 5.36 22.31 4.37 4.67 Significant
4
Attitude towards college/
study centre
26.67 5.28 25.09 3.52 2.43 Significant
Female students
S.No. Dimension
Traditional edu-
cation system
(n = 100)
Open education
system
(n = 64)
t-value Significant/
insignificantM SD M SD
1 Personal aspiration 51.29 7.37 47.55 7.81 3.06 Significant
2 Study habits 49.42 8.34 44.31 7.17 4.17 Significant
3
Social-family-economic
environment
26.09 5.10 22.78 3.31 4.80 Significant
4
Attitude towards college/
study centre
27.50 4.91 25.13 3.02 3.83 Significant
df :185, t Critical two-tail: 1.97(At 0.05 significant levels)
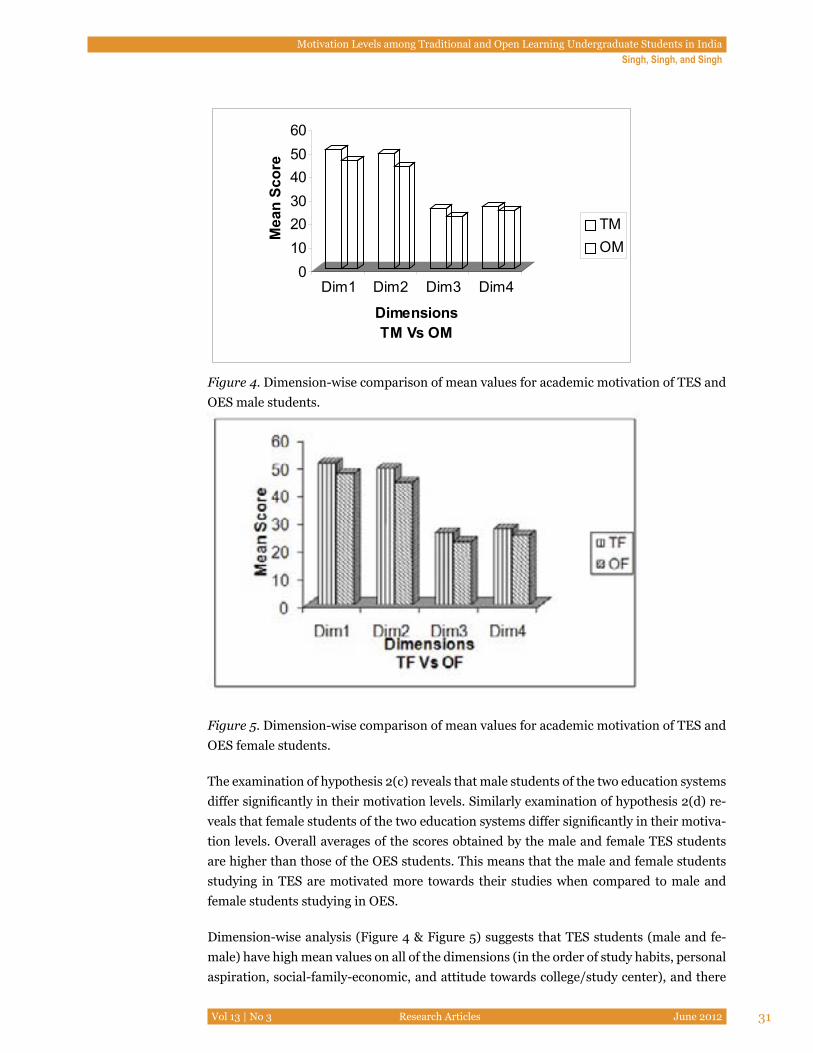
Motivation Levels among Traditional and Open Learning Undergraduate Students in IndiaSingh, Singh, and Singh
Vol 13 | No 3 Research Articles June 2012 31
0102030405060
Mea
n Sc
ore
Dim1 Dim2 Dim3 Dim4
DimensionsTM Vs OM
TMOM
Figure 4. Dimension-wise comparison of mean values for academic motivation of TES and OES male students.
Figure 5. Dimension-wise comparison of mean values for academic motivation of TES and OES female students.
The examination of hypothesis 2(c) reveals that male students of the two education systems differ significantly in their motivation levels. Similarly examination of hypothesis 2(d) re-veals that female students of the two education systems differ significantly in their motiva-tion levels. Overall averages of the scores obtained by the male and female TES students are higher than those of the OES students. This means that the male and female students studying in TES are motivated more towards their studies when compared to male and female students studying in OES.
Dimension-wise analysis (Figure 4 & Figure 5) suggests that TES students (male and fe-male) have high mean values on all of the dimensions (in the order of study habits, personal aspiration, social-family-economic, and attitude towards college/study center), and there
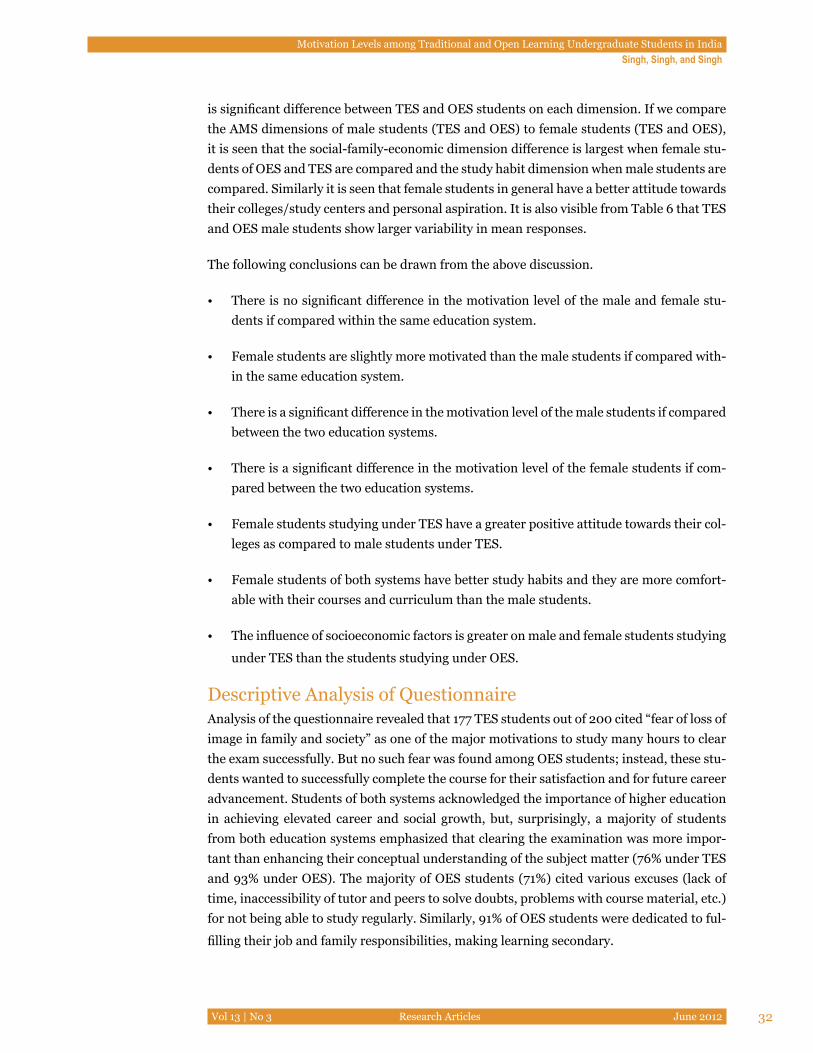
Motivation Levels among Traditional and Open Learning Undergraduate Students in IndiaSingh, Singh, and Singh
Vol 13 | No 3 Research Articles June 2012 32
is significant difference between TES and OES students on each dimension. If we compare the AMS dimensions of male students (TES and OES) to female students (TES and OES), it is seen that the social-family-economic dimension difference is largest when female stu-dents of OES and TES are compared and the study habit dimension when male students are compared. Similarly it is seen that female students in general have a better attitude towards their colleges/study centers and personal aspiration. It is also visible from Table 6 that TES and OES male students show larger variability in mean responses.
The following conclusions can be drawn from the above discussion.
• There is no significant difference in the motivation level of the male and female stu-dents if compared within the same education system.
• Female students are slightly more motivated than the male students if compared with-in the same education system.
• There is a significant difference in the motivation level of the male students if compared between the two education systems.
• There is a significant difference in the motivation level of the female students if com-pared between the two education systems.
• Female students studying under TES have a greater positive attitude towards their col-leges as compared to male students under TES.
• Female students of both systems have better study habits and they are more comfort-able with their courses and curriculum than the male students.
• The influence of socioeconomic factors is greater on male and female students studying
under TES than the students studying under OES.
Descriptive Analysis of QuestionnaireAnalysis of the questionnaire revealed that 177 TES students out of 200 cited “fear of loss of image in family and society” as one of the major motivations to study many hours to clear the exam successfully. But no such fear was found among OES students; instead, these stu-dents wanted to successfully complete the course for their satisfaction and for future career advancement. Students of both systems acknowledged the importance of higher education in achieving elevated career and social growth, but, surprisingly, a majority of students from both education systems emphasized that clearing the examination was more impor-tant than enhancing their conceptual understanding of the subject matter (76% under TES and 93% under OES). The majority of OES students (71%) cited various excuses (lack of time, inaccessibility of tutor and peers to solve doubts, problems with course material, etc.) for not being able to study regularly. Similarly, 91% of OES students were dedicated to ful-
filling their job and family responsibilities, making learning secondary.
Motivation Levels among Traditional and Open Learning Undergraduate Students in IndiaSingh, Singh, and Singh
Vol 13 | No 3 Research Articles June 2012 33
Results and DiscussionOverall, the present study concludes that there is significant difference in the levels of academic motivation between TES and OES students. The results further show that TES students are more motivated than OES students. On all dimensions, TES students have scored higher means compared to OES students. Students of OES are found to be low on personal aspiration and study habits and less motivated, and they do not have much of a positive attitude towards their study centers. Differences in the means of the two types of students is greater in the study habits and personal aspiration dimensions. This suggests that regular classroom studies, regular teacher-student interaction, regular discussions among students, availability of library facilities, and so on help develop better study habits in TES students. Further, it can be concluded that due to the different social environment settings of the students, there are differences in motivation levels. TES students generally are more conscious about their family and society. Analysis of different statements suggests that parents and society play a major role in the academic decision-making process of these students. They feel it is important and prestigious to attain a good position in their studies.
On the other hand, OES students are self-reliant and are generally engaged in some other occupation. Their first priorities may be job, family, or other things rather than devoting regular time towards studies. Their personal aspiration extends merely to passing the ex-amination and obtaining the degree. This results in poor study habits. It is the intrinsic motivation which drives the students’ will to learn in OES. It is also seen from the descrip-tive analysis of the questionnaire that a majority of students (in both TES and OES) have a superficial approach to learning habits.
Kawachi (2006, p.3) in his research on the learning of distance education pupils has identi-fied four motivations that are helpful to the will to learn: vocational, academic, personal, and social. The intrinsic and extrinsic motivation factors to learn are summarized in Figure 6.
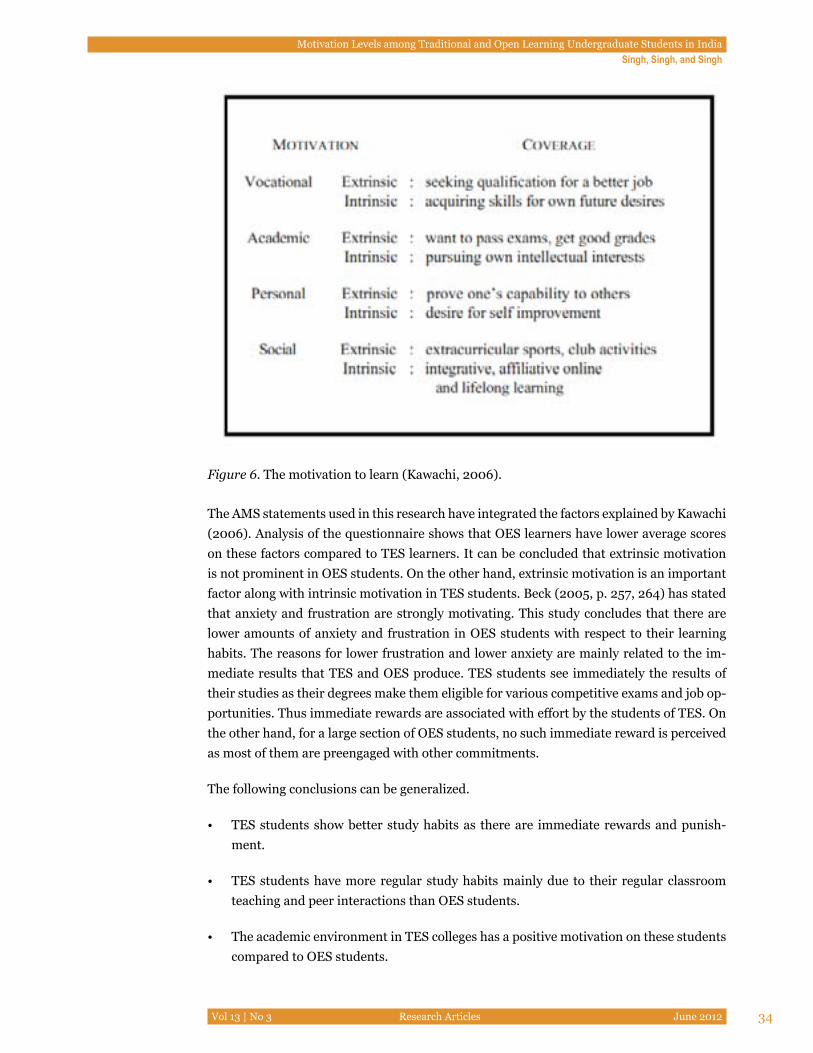
Motivation Levels among Traditional and Open Learning Undergraduate Students in IndiaSingh, Singh, and Singh
Vol 13 | No 3 Research Articles June 2012 34
Figure 6. The motivation to learn (Kawachi, 2006).
The AMS statements used in this research have integrated the factors explained by Kawachi (2006). Analysis of the questionnaire shows that OES learners have lower average scores on these factors compared to TES learners. It can be concluded that extrinsic motivation is not prominent in OES students. On the other hand, extrinsic motivation is an important factor along with intrinsic motivation in TES students. Beck (2005, p. 257, 264) has stated that anxiety and frustration are strongly motivating. This study concludes that there are lower amounts of anxiety and frustration in OES students with respect to their learning habits. The reasons for lower frustration and lower anxiety are mainly related to the im-mediate results that TES and OES produce. TES students see immediately the results of their studies as their degrees make them eligible for various competitive exams and job op-portunities. Thus immediate rewards are associated with effort by the students of TES. On the other hand, for a large section of OES students, no such immediate reward is perceived as most of them are preengaged with other commitments.
The following conclusions can be generalized.
• TES students show better study habits as there are immediate rewards and punish-ment.
• TES students have more regular study habits mainly due to their regular classroom teaching and peer interactions than OES students.
• The academic environment in TES colleges has a positive motivation on these students compared to OES students.
Motivation Levels among Traditional and Open Learning Undergraduate Students in IndiaSingh, Singh, and Singh
Vol 13 | No 3 Research Articles June 2012 35
• Extrinsic motivation has a greater and immediate effect on the motivation level of TES students. Intrinsic motivation is a governing factor in the accomplishments in OES. Since extrinsic motivation is not as valuable for the students of OES, their overall mo-tivation level is low.
• Gender-wise analysis shows that the motivation levels of male and female students of one system compared to the levels of male and female students of the other system dif-fer significantly.
ConclusionsWe see that OES students are low in extrinsic motivation, which results in an overall lower motivation level. The difference in the levels of motivation between students of TES and OES is significant. To increase the extrinsic motivation level, recognition and worth of the degrees obtained from OES should be increased. The importance of extrinsic motivation has also been acknowledged by Hartnett et al. (2011) in their recent research: “While in-trinsic motivation constituted an important part of students’ motivation to learn in the contexts described here, identified regulation (i.e., recognising the value and importance of the activity) was also important.”
Policy makers are gradually increasing the worth of degrees procured under OES by making these degrees eligible for students to appear for job interviews and write various competi-tive examinations. This trend is also evident from the fact that, these days, various adver-tisements published by institutions/universities offering courses through distance learning are highlighting the equivalence of these degrees to the degrees of TES as far as eligibility for competitive examinations. This can be said to be a step in the right direction but it is also true that such degree holders must be capable to stand at par in knowledge and skills with the students of the traditional education system, which is why the evaluation process of OES becomes important to assure quality.
Facilities at the study centers should be improved and involvement of students in the aca-demic process should be increased under OES to develop positive attitudes towards their education system. The role and intervention of tutors along with peer interaction are of par-amount importance (Kawachi, 2006) in developing motivation among students to learn.
The basic natures of the two systems are different and so require altogether different ap-proaches to run and manage the education process. The traditional education system de-pends more on verbal communication and methodologies to impart education thus making it quick and having an immediate effect (in the form of immediate rewards and feedback). On the other hand, the education process of OES is largely completed through written or other media communication involving distances and depends upon many intermediaries. Consequently, the types of skills required in faculty members, students, and administrative personnel are significantly different in the two types of education systems. Administrators and faculty members of OES should be able to design study materials in a way that is ef-fective and easy to comprehend by the students. The importance of administrative roles
Motivation Levels among Traditional and Open Learning Undergraduate Students in IndiaSingh, Singh, and Singh
Vol 13 | No 3 Research Articles June 2012 36
increases in OES so that course materials and feedback/evaluation are available to students on time and records are updated continuously and correctly. The role of administrators and tutors can also be stretched to keep track of failing students and to guide them towards suc-cessful completion of the course by sending motivating letters.
Research can be undertaken to investigate if there is a positive relationship between the personality traits of students pursuing education through OES and successful course com-pletion. Such traits, if any, can be identified and used to formulate policies and strategies for effective governance of OES. Registration and entrance tests may contain a few ques-tions or statements designed to help judge the personality traits of prospective candidates seeking admission to OES courses. This may help in formulating strategies and policies to reduce the dropout rates. The time required to complete a syllabus should be known to OES students beforehand to make them aware of the time and energy they need to put in for suc-cessful completion of the course.
In summary, enhancing infrastructure facilities, increasing the worth of degrees, increasing the roles of tutors, and increasing familiarity with technology and administrative correct-ness and innovation are paramount in OES to lessen the motivation differences between the students of the two systems.
Motivation Levels among Traditional and Open Learning Undergraduate Students in IndiaSingh, Singh, and Singh
Vol 13 | No 3 Research Articles June 2012 37
ReferencesAggarwal, J.C. (2004). Essentials of educational psychology. New Delhi: Vikas Publishing
House Pvt. Ltd.
Anderson, T. (2006). Higher education evolution: Individual freedom afforded by educa-tional social software. In M. Beaudoin (Ed.), Perspectives on the future of higher education in the digital age (pp. 77-90). New York: Nova Science Publishers.
Atman, K. (1988). Psychological type elements and goal accomplishment style: Implica-tions for distance education. The American Distance Journal of Education, 2(3). Retrieved from http://www.ajde.com/Contents/vol2_3.htm
Banerjee, T. (1974). Academic motivation-development of a questionnaire. The Bureau of Educational and Psychological Research, Govt. of West Bengal, Calcutta. In M.B. Buch (1986) (Ed.), Third survey of research in education. NewDelhi: NCERT.
Bhattacharya, S. (1991). Open University-Its scope and possibilities: An analysis of Tago-re’s educational thoughts in evolving a conceptual framework of open university in India. In M.B. Buch (2000) (Ed.), Fifth survey of research in education (Vol.1, pp. 1572-1573). New Delhi: NCERT.
Beck, R.C. (2005). Motivation: Theories and principles. (4th ed.). Pearson Education, Delhi.
Bolocofsky, D.N. (1980). Motivational effect of classroom competition as a function of field dependence. The Journal of Educational Research, 73(4), 213.
Daft, R. L. (1977). Management (4th ed.). Orlando, Fl.: Harcourt Brace.
Entwistle, N.J. (1968). Academic motivation and school attainment. British Journal of Ed-ucational Psychology, 38(2), 181-188.
Fozdar, B.I., Kumar, L.S., & Kannan, S. (2006). A survey of a study on the reasons re-sponsible for student dropout from the bachelor of science programme at Indira Gandhi National Open University. International Review of Research in Open and Distance Learning, 7(3). Retrieved from http://www.irrodl.org/index.php/irrodl/article/view/291/755
Frymier, J.R., Norris, L., Henning, M. J., Henning, W. Jr., & West, S. C. (1975). A longitu-dinal study of academic motivation. The Journal of Educational Research, 69(2).
Garrett, H.E. (1981). Statistics in psychology and education. Kalyani Publishers Ludhiana Pb.
Gautam, R. (1990). A study of success in distance learning system in relation to some key learned and institutional variables. In M.B. Buch (2000) (Ed), Fifth survey of re-search in education (pp. 1573-1574). New Delhi: NCERT.

Motivation Levels among Traditional and Open Learning Undergraduate Students in IndiaSingh, Singh, and Singh
Vol 13 | No 3 Research Articles June 2012 38
Gibson, C. C. (1996). Toward an understanding of academic self-concept in distance educa-tion. American Journal of Distance Education, 10(1). Retrieved from http://www.ajde.com/Contents/vol10_1.htm
Hartnett, M., George, St. A., & Dron. J. (2011). Examining motivation in online distance learning environments: Complex, multifaceted, and situation-dependent. Interna-tional Review of Research in Open and Distance Learning, 12(6). Retrieved from http://www.irrodl.org/index.php/irrodl/article/view/1030/1954.
Hussain, M.Q. (1977). A study of academic attainment in relation to level of aspiration and anxiety. In M.B. Buch (1986) (Ed.). Third survey of research in education (pp. 667-668). NewDelhi: NCERT.
Indradevi, V. (1985). Philosophical analysis of the concept of distance education and its implication on the emerging non-formal systems of education with special refer-ence to teacher education. In M.B. Buch (1991), (Ed.), Fourth survey of research in Education (Vol. 1, pp. 944-945). New Delhi: NCERT.
Karsenti, T. (1999). StudentmotivationanddistanceeducationontheWeb:Loveatfirstsight? Retrieved from http://www.unb.ca/naweb/proceedings/1999/karsenti/karsenti.html
Kawachi, P. (2006). The will to learn: Tutor’s role. In P.R. Ramanujam (Ed.) Globalisation, education and open distance learning (pp. 197-221). New Delhi, India: Shipra. Retrieved from http://www.open-ed.net/library/R3107.pdf
Khan, N. (1991). Effectivity of distance education programme with reference to the teach-ers’ training course. In M.B. Buch, (2000) (Ed.), Fifth survey of research in educa-tion (Vol.1, p. 532). New Delhi: NCERT.
McClelland et al. (1953). The achievement motive. Princton, N.J.:D. Van Nostrand.
McIntosh, N.E. (1978). What do we know about our students? Recent research on women in adult education: The Open University experience. International Council for CorrespondenceEducation:DynamicandDiversified, Vol.2, New Delhi.
Miller, D. C. (1977). Handbook of research design and social measurement. New York: David Mc Kay Company, Inc.
Muilenburg, L. Y., & Berge, Z. L. (2005). Student barriers to online learning: A factor ana-lytic study. Distance Education, 26(1), 29-48. doi: 10.1080/01587910500081269
Nagalakshmi, B. (1982). A study of perceived behaviour and the level of academic motiva-tion of class IX students. In M.B. Buch (1986) (Ed.), Third survey of research in education (p. 382). NewDelhi: NCERT.
Motivation Levels among Traditional and Open Learning Undergraduate Students in IndiaSingh, Singh, and Singh
Vol 13 | No 3 Research Articles June 2012 39
Paulsen, M. F. (1993). The hexagon of cooperative freedom: A distance education theory attuned to computer conferencing. DEOSNEWS, 3(2).
Pierrakeas, C., & Xenos, M. (2004). A comparative study of dropout rates and causes for two different distance education courses. International Review of Research in Open and Distance Learning, 5(2). Retrieved from http://www.irrodl.org/index.php/irrodl/article/view/183/804
Rovai, A. P., Ponton, M., Wighting, M., & Baker, J. (2007). A comparative analysis of stu-dent motivation in traditional classroom and e-learning courses. International Journal on E-Learning, 6(3), 413-432.
Salunke, R.B. (1979). A study of the home environment, socio-economic status and eco-nomic management in relation to the academic achievement of the first year col-lege students. In M.B. Buch (1986) (Ed.), Third survey of research in education (pp. 685-686). NewDelhi: NCERT.
Satyanandam, B.D. (1969). A study of socio-economic status and academic achievement. In M. B. Buch (1986) (Ed.), Third survey of research in education (p. 686). NewD-elhi: NCERT.
Schifter, C. & Monolescu, D. (2000). Evaluating students online course experiences. The virtual focus group. Retrieved from http://www.ed.psu.edu/acsde/deos/deos-news/deosnews10_9.asp
Siddiqui, B.B. (1979). Effects of achievement motivation and personality on academic suc-cess. In M.B. Buch (1986) (Ed.). Third survey of research in education (pp. 690-691). NewDelhi: NCERT.
Singh, S. (1984). Relationship of home environment need for achievement and academic motivation with academic achievement. In M.B. Buch (1991) (Ed.), Fourth survey of research in education (Vol.1, pp. 856-857). New Delhi: NCERT.
Shroff, R. H., Vogel, D. R., & Coombes, J. (2008). Assessing individual-level factors sup-porting student intrinsic motivation in online discussions: A qualitative study. Journal of Information Systems Education, 19(1), 111-125.
Tiwari, G.N. (1982). Study habits and scholastic performance at three levels of education. In M.B. Buch (1991) (Ed.). Fourth survey of research in education (Vol.1, pp. 862-863). New Delhi: NCERT.
Tseng, V. (1998). Academic motivation, achievement and decision among students from immigrant and U.S born families. Retrieved from http://tigger.uic.edu/~thork/Trust/Tseng.htm
Waniewicz, G. (1986). The adult learners: Who are they, why and where do they learn?
Motivation Levels among Traditional and Open Learning Undergraduate Students in IndiaSingh, Singh, and Singh
Vol 13 | No 3 Research Articles June 2012 40
ICDE Conference Paper.
Wighting, M. J., Liu, J., & Rovai, A. P. (2008). Distinguishing sense of community and mo-tivation characteristics between online and traditional college students. Quarterly Review of Distance Education, 9(3), 285-295.
Yeung, N. T. Y., & Yeung, A, S. (2001). Does school motivation change over secondary school years? Paper presented at AARE, the University of Notre Dame, Fremantle, Western Australia. Retrieved from http://www.aare.edu.au/01pap/yeu01019.htm
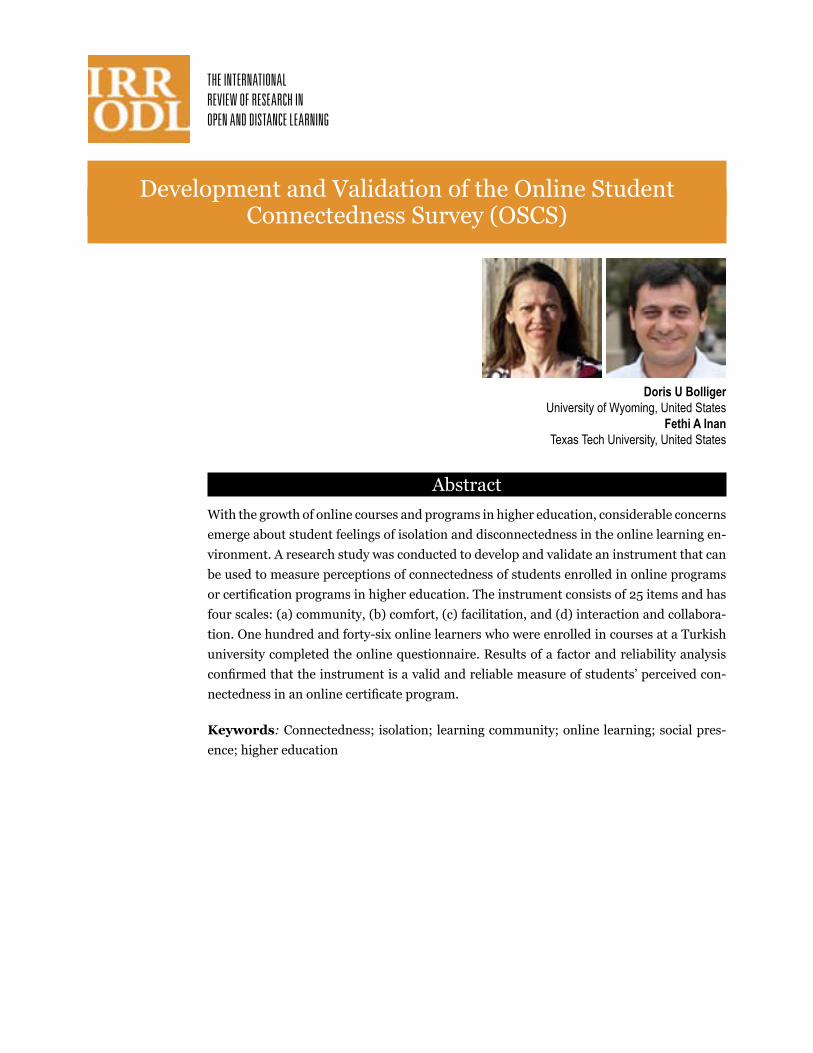
Development and Validation of the Online StudentConnectedness Survey (OSCS)
AbstractWith the growth of online courses and programs in higher education, considerable concerns emerge about student feelings of isolation and disconnectedness in the online learning en-vironment. A research study was conducted to develop and validate an instrument that can be used to measure perceptions of connectedness of students enrolled in online programs or certification programs in higher education. The instrument consists of 25 items and has four scales: (a) community, (b) comfort, (c) facilitation, and (d) interaction and collabora-tion. One hundred and forty-six online learners who were enrolled in courses at a Turkish university completed the online questionnaire. Results of a factor and reliability analysis confirmed that the instrument is a valid and reliable measure of students’ perceived con-nectedness in an online certificate program.
Keywords: Connectedness; isolation; learning community; online learning; social pres-ence; higher education
Doris U BolligerUniversity of Wyoming, United States
Fethi A InanTexas Tech University, United States
Development and Validation of the Online Student Connectedness Survey Bolliger and Inan
Vol 13 | No 3 Research Articles June 2012 42
IntroductionThe number of students who enroll in online courses offered by institutions of higher edu-cation in the United States has seen a dramatic growth over the past years. In fall 2008, 4.6 million students were enrolled in at least one online course; this marked a 17% increase from the number reported the previous year and was much higher than the 1.2% increase in higher education student body growth (Allen & Seaman, 2010b). The growth continued in the fall of 2009 when the number of online students enrolled in online courses increased by almost 1 million – to 5.6 million – which marks a 21% increase. During that time almost 30% of students in higher education took one online course. The growth rate for enroll-ment in online courses is not expected to drop off in the foreseeable future (Allen & Sea-man, 2010a). Similar to the U.S., the demand for online learning has increased worldwide (Demiray, 2010). Turkey, a country with a population of over 74 million, is considered a developing nation and faces several challenges. The country experienced a high increase in population in recent years, and approximately half of the population was under the age of 29 in 2011. The unemployment rate was 9.8% in 2011 but the unemployment rate for youth was much higher (18.4%) (Turkish Statistical Institute, 2011).
Turkish universities served 3 million students in 2010 (Akguner, 2011). According to Ya-mamoto and Aydin (2010), the country has had high demand for opportunities in higher education and has experienced growth in online learning. In order to address the demand, Turkish higher education institutions have started offering more online courses and pro-grams (Askar, 2009; Gursoy, 2005). For example, Anadolu University, one of the country’s larger institutions, has 930,000 students enrolled in distance education offerings (Anadolu University, 2010).
There are several advantages of enrolling in online courses such as convenience, flexibil-ity, and accessibility. Online students can easily access programs and experts without the need for relocation. As the courses are accessible from anywhere, students can structure their study time around other job or family-related responsibilities. Other possible advan-tages are streamlined courses; condensed, accelerated degree programs; diversity of peer groups; student-centered teaching approaches; and integration of innovative instructional technologies (Belanger & Jordan, 2000; Hara & Kling, 2000; Moore & Kearsley, 1996). However, there are several challenges with online learning due to limited face-to-face per-sonal interaction between students and instructors. Many sources attribute high student attrition in online courses to the lack of interaction between participants in courses taught in the distance education environment (Carr, 2000). They believe that isolation and discon-nectedness of students in the online environment are two main factors in student dropout (Angelino, Williams, & Natvig, 2007; Kanuka & Jugdev, 2006).
Development and Validation of the Online Student Connectedness Survey Bolliger and Inan
Vol 13 | No 3 Research Articles June 2012 43
Literature Review
The Social Dimension in Online ProgramsResearchers suggest that students in distance learning programs should be socially and ac-ademically integrated in order to provide meaningful learning experiences (Kanuka & Jug-dev, 2006). Shin (2003) reports that “the perceptions of psychological presence a distance student holds on the part of teachers, student peers, and the institution can be significant predictors of their success in distance learning” (p. 79). Yet not much attention has been given to the academic integration of students in distance programs. In one study, research-ers concluded students had limited “opportunities for connecting to the larger community outside of what is provided in individual courses” (Exter, Korkmaz, Harlin, & Bichelmeyer, 2009, p. 190). Angelino et al. (2007) point out the importance of the formation of “relation-ships with cohorts” (p. 8). Furthermore, Shin (2003) supports the notion that interaction between peers is important to online students and suggests that “the psychological pres-ence of peer students can also bring a positive effect on various aspects of distance learning” (p. 80). Shin’s findings show that there was a statistically significant relationship between peer presence and student satisfaction and persistence.
Students in distance education may experience limited contact with academic staff at the university and department which can contribute to a feeling of disconnectedness. Exter et al. (2009) found distant learners did not participate as often in departmental activities as residential students, and distance students “did not generally have any way to connect to faculty who do not teach their courses, especially fulltime professors on campus” (p. 190). Additionally, distance students had less frequent contact with their advisors compared to residential students. The importance of the relationship between teacher presence and stu-dents’ learning achievement was confirmed by results in a study conducted by Shin (2003). Quality student-teacher relationships and informal contact in a campus-based learning environment have been tied to higher student achievement and ‘college outcomes’ in the literature (Pascarella, 1980).
Isolation and ConnectednessConnectedness is the sense of belonging and acceptance. It refers to a person’s belief that a relationship exists between him or her and at least one other individual. When individuals feel connected they feel less isolation (Lee & Robbins, 1998; Rovai, 2002b; Shin, 2003). However, when students feel isolated, they may feel alone or disconnected from their social world. The impact of social isolation and connectedness in online courses is widely docu-mented and many researchers argue that student isolation is one of the major problems for online learners (Kanuka & Jugdev, 2006; Haythonthwaite, Kazmer, Robins, & Shoemaker, 2000; Motteram & Forrester, 2005; Rovai, 2002a; Shaw & Polovina, 1999; Shieh, Gum-mer, & Niess, 2008; Wegerif, 1998). For example, Lee and Robbins (1998) asserted that “people with high levels of connectedness are better able to manage their own needs and emotions through cognitive processes” (p. 338). Those individuals who feel connected are more willing and able to engage with others and participate in activities. Zembylas, The-
Development and Validation of the Online Student Connectedness Survey Bolliger and Inan
Vol 13 | No 3 Research Articles June 2012 44
odorou, and Pavlakis (2008), who investigated emotions of 92 online learners in a qualita-tive study, found that one of the major categories associated with negative emotions was loneliness and isolation. Students used words such as alone, desperation, hopelessness, distress, stress, and anxiety to describe their states of emotion in diary entries, interviews, final reports, phone conversations, and e-mails.
According to Stelzer and Vogelzangs (1994) isolation has two dimensions. These dimen-sions are physiological (physical and temporal) and psychological. Distance education students experience physiological isolation because they are physically separated by space and/or time. Social constructivists believe that learning is a social process. These beliefs are based on Vygotsky’s (1934, 1962, 1978) sociocultural theory which emphasized that cogni-tive development and learning takes place through communication and social interaction with others. But the Internet can be a medium of social isolation for some (Bibeau, 2001). Shin (2003) argues that “psychological distance is more important than physical distance” (p. 69). Terms such as human contact, interaction, and relationship have been associated with psychological distance (Shin, 2003). Interpersonal contact can be diminished in the online environment because most interaction and communication in which online learn-ers engage is via computer-mediated communication (Aragon, 2003). Therefore, online teaching and learning can result in feelings of psychological isolation, sense of loneliness, or disconnectedness according to researchers (Motteram & Forrester, 2005; Rovai, 2002a). However, researchers concluded students were positive about the use of computer-mediat-ed communication and that those technologies helped combat isolation to a degree (John-son & Huff, 2000).
Factors Pertaining to Student Connectedness
Community and social presence.
Wegerif (1998) points out learners who do not feel part of a community “are on their own, likely to be anxious, defensive and unwilling to take the risks involved in learning” (p. 48). Online courses and programs have become more prevalent in higher education; therefore, online learners’ sense of community is an important consideration (Rovai, 2002a). A learn-ing community is defined as “groups of people engaged in intellectual interaction for the purpose of learning” (Cross, 1998, p. 4). McMillan and Chavis (1986) include four elements in their definition of sense of community: (a) membership, (b) influence, (c) integration and fulfillment of needs, and (d) shared emotional connection. The authors propose that in essence it is “a feeling that members have of belonging, a feeling that members matter to one another and to the group, and a shared faith that members’ needs will be met through their commitment to be together” (p. 9). Rovai (2002a) identifies trust as an important characteristic of a community and stipulates that learners in strong learning communities feel connected.
The physical separation of online learners can reduce their sense of community (Rovai, 2002a). In order to combat student isolation, individuals suggest the integration of learn-
Development and Validation of the Online Student Connectedness Survey Bolliger and Inan
Vol 13 | No 3 Research Articles June 2012 45
ing communities in online courses (Bibeau, 2001; DiRamio & Wolveton, 2006; Northrup, 2002; Palloff & Pratt, 2007). Northrup (2002) found the majority of research participants agreed that it is important to create a community in online courses. There have been posi-tive outcomes for students in learning communities (Haythornthwaite et al., 2000). DiRa-mio and Wolverton (2006) imply that the integration of online communities in the online environment can reduce student dropout rates and “can help meet the quality challenge” (p. 111). Online communities, however, must be fostered in order to be sustainable and successful (Palloff & Pratt, 2007) and are not the answer to all challenges. Some students do not feel part of a community in online courses (Motteram & Forrester, 2005). Other stu-dents may feel part of a community but may still experience high levels of isolation because they have limited opportunities to participate in those learning communities. While many students’ feeling of community contributes to student satisfaction, not all students expect, need, or value a sense of community in online courses according to Drouin (2008).
The community of inquiry model (Rourke, Anderson, Garrison, & Archer, 1999) is based on the belief that “deep and meaningful learning takes place in a community of inquiry” (¶2) that consists of instructors and learners. The model includes three independent im-portant elements or types of presences: social, teaching, and cognitive. According to Shin (2003), presence “refers to the degree to which a distance student perceives the availability of, and connectedness with, people in his/her educational setting” (p. 71). Social presence, according to Short, Williams, and Christie (1976) contributes to the feeling of intimacy. Social presence is considered an important factor in student satisfaction and success (Bi-beau, 2001; Swan & Shih, 2005). Teachers create social presence so that learners can feel at ease in the learning environment and feel comfortable interacting with their peers and the instructor (Aragon, 2003). Tu (2002) confirmed several factors that influence perceived student levels of social presence: social context, privacy, online communication, and inter-action.
Individuals who feel socially connected believe that they have close relationships with oth-ers (Lee & Robbins, 1998). Research on interpersonal relationships in distance education environments are limited (Shin, 2003). However, it is possible that distance students have fewer opportunities to form close working relationships with program faculty, advisors, or peers. Furthermore, establishing educational relationships with learners “is more difficult when using computer-mediated conferencing” (Wikeley & Muschamp, 2004, p. 138). When individuals do not feel connected, they may experience loneliness, an emotional distressing condition based on individuals’ perceptions of isolation from or rejection by others and the lack of social networks and other support systems. Persons can experience loneliness when their relationships with others do not measure up in terms of anticipated or needed levels of quality. Loneliness is complex and can lead to anxiety and depression (McWirther, 1990).
Comfort.
Comfort is defined as experiencing contentment and security, and comfort with either in-tegrated technologies or the learning environment is mentioned by researchers as an im-portant aspect for distance students (Aragon, 2003; Haythornwaite et al., 2000; Kanuka
Development and Validation of the Online Student Connectedness Survey Bolliger and Inan
Vol 13 | No 3 Research Articles June 2012 46
& Jugdev, 2006; Shin, 2003; Tu & McIsaac, 2002; Wikeley & Muschamp, 2004). Depart-ments and instructors need to create safe learning environments (Stelzer & Vogelzangs, 1994) in which learners feel comfortable and are encouraged to participate without fear of persecution. When students do not feel comfortable or safe in the learning environment, they are more likely to limit their interactions with an instructor and peers or less likely to ask for support (Shin, 2003); this can result in missed learning opportunities.
Facilitation of learning.
Instructors are central in creating learning communities and establishing teaching pres-ence (Rouke et al., 1999). Shea, Li, and Pickett (2006) found a positive relationship be-tween students’ perceived learning and community and teaching presence. Swan and Shih (2005) found that teaching presence may be even more important than social presence. Young (2006) measured effective online teaching and found that one important element of good online teaching is the effective facilitation of a course. “The instructor’s role and responsibilities in an online course involve carefully designed, primarily written communi-cations with the learners” (p. 73). Therefore, instructors need to ensure that students have the opportunity to communicate, interact, and collaborate with course participants. “On-line communication between distance students is purported by some authors as lessening student’s feelings of isolation” (Motteram & Forrester, 2005, p. 283).
Aragon (2003) believes that the use of formal titles creates a distance between students and instructors, hence he suggests giving students options in how to address the instruc-tor. Tu and McIsaac (2002) found “the level of formality influenced the students’ willing-ness to respond” (p. 144) in an online graduate-level course because participants felt closer to one another due to the fact that the psychological distance was reduced. Rovai (2003) who investigated relationships between communication styles, community, and learning styles in online courses found “friendly and open communication styles correlated with connectedness” (p. 360). Norton (1983, 1986) developed a communicator style inventory. He includes several styles such as the open and friendly style. Open communicators share accurate information about themselves by using a conversational and an approachable tone (Johnson & Evans, 1997; Norton, 1983). They are willing to share their thoughts and emo-tions openly. Friendly communicators are tactful; they tend to encourage individuals and acknowledge others’ contributions (Johnson & Evans, 1997).
Engaged learners are active participants in the learning process. Involved learners actively participate in their construction of knowledge and acquisition of skills. By actively engag-ing students in an active learning environment we encourage them “to read, speak, listen, think deeply, and to write” (Berge, 2002, p. 184). Learners engage in the construction of meaningful or relevant knowledge and skills through collaboration, interaction, and indi-vidual activities (Jonassen, Howland, Marra, & Crismond, 2008). In most instances, learn-ers should not be engaged with course content in isolation. Rather, they should be engaged in creating meaning by interacting with peers and the instructor and collaborating with classmates. Walker and Fraser (2005) created an instrument to assess distance education learning environments in higher education and included a subscale on interaction and col-
Development and Validation of the Online Student Connectedness Survey Bolliger and Inan
Vol 13 | No 3 Research Articles June 2012 47
laboration.
Collaboration and interaction.
Projects that require students to work together collaboratively can reduce levels of student isolation (Wikeley & Muschamp, 2004). Interaction is a two-way communication process that involves two or more individuals (Berge, 2002). By using the process of interaction, data, information, and ideas are manipulated and enhanced, and transformed into newly acquired knowledge.
One important factor in student satisfaction and learning in the online environment is in-teraction (Bolliger & Martindale, 2004). Moore (1989) classifies interaction into three cat-egories: interaction with content, interaction with instructors, and interaction with peers. Social interaction is an essential component of learning in the online environment (Gar-rison, 2000; Rovai, 2002a). Students need to process information provided via commu-nication in order to generate their own knowledge. At times, students can accomplish the transformation from information to knowledge by themselves, and sometimes they require assistance from instructors or peers. Brown and Duguid (2000) write “the resources for learning lie not simply in information, but in the practice that allows people to make sense of and use that information and the practitioners who know how to use that information” (p. 133).
Purpose of the Study Although the importance of the isolation and connectedness in online learning has been acknowledged by previous research, there have only been a limited number of initiatives to design and develop instruments to measure the underlying concept of student connected-ness. Unfortunately, those existing instruments do not specifically measure connectedness of students enrolled in online degree or certificate programs and are not applicable to dif-ferent student populations (e.g., undergraduates, postgraduates, etc). A literature review yielded three validated instruments that attempt to measure factors closely related to com-munity, social presence, or connectedness in specific settings or targeted specific student populations. Rovai’s (2002a) Classroom Community Scale (CCS) has been a frequently used instrument that includes two subscales: connectedness and learning. The instrument, however, aims to measure only students’ perceptions of the sense of community in a learn-ing environment in broad scale. Barnard-Brak and Shui (2010) tested the CCS’s psycho-metric properties with students enrolled in a blended undergraduate course and point out that its use may be limited to a population of graduate students; the instrument’s construct validity was not supported in their review.
Another instrument, the Social Presence and Privacy Questionnaire, was developed by Tu (2002) to assess social presence in computer-mediated communication. The author pro-posed that social presence includes three constructs: interactivity and online communi-cation, social context, and online privacy. Some of the elements identified by Tu may be related to students’ sense of connectedness; however, those elements are not specifically targeted to measure connectedness.
Development and Validation of the Online Student Connectedness Survey Bolliger and Inan
Vol 13 | No 3 Research Articles June 2012 48
An instrument developed by Terrell, Snyder, and Dringus (2009) measures sense of con-nectedness of doctoral students who are in the dissertation writing phase in order to iden-tify students who may consider dropping out of the program. The validated scale includes items pertaining to two elements: learners’ “sense of community and research competency” (p. 113). However, the need of doctoral students for connectedness with faculty and peers is much different from students who do not seek terminal degrees. Doctoral students are engaged in independent research and need faculty mentors who not only train, support, advise, sponsor, and encourage them but who provide opportunities for networking and funding (Walker, Golde, Jones, Bueschel, & Hutchings, 2008).
Therefore, it was the purpose of this research study to identify and confirm factors spe-cifically influencing student connectedness in online programs in higher education and to develop and validate a reliable instrument to measure perceived feelings of connectedness of students enrolled in online degree or certificate programs.
Methodology
Initial Development of the OSCSThe initial item development process included (a) an in-depth review of the literature, (b) an expert-panel review, and (c) a pilot questionnaire. Items were developed based on the literature associated with students’ academic environments and sense of isolation. The lit-erature suggests four important elements are associated with student connectedness: (a) comfort, (b) community, (c) facilitation, and (d) interaction and collaboration. Initially, 78 Likert-scale items were developed to address the identified dimensions and elements. Five slightly modified items from the interaction and collaboration subscale developed by Walker and Fraser (2005) were included after obtaining permission from the authors. The final version of the instrument consists of 25 Likert-scale items ranging from 1, strongly disagree to 5, strongly agree.
Validity and reliability.
In order to ensure the construct validity of the original survey, the questionnaire was re-viewed by a panel of experts involved in distance education and instructional technology at three public research universities in the United States. Four reviewers, three faculty members, and one distance education administrator with extensive experience in the de-livery of online courses and programs were invited to evaluate all Likert-scale items on their representation of the construct they were purported to measure and on their clarity. Experts were provided with scale items, operational definitions, and instructions on rating the items. Reviewers were instructed to (a) indicate the items’ relevance and to rate the degree to which each item corresponded with the construct and subconstruct; (b) evaluate the clarity of each item; (c) recommend changes for any items they felt were unclear; (d) recommend any addition or deletion of items; and (e) evaluate the structure and definition of each construct and subconstruct. The expert review resulted in the revision, deletion, and addition of several items. Several closely related items were removed in order to reduce
Development and Validation of the Online Student Connectedness Survey Bolliger and Inan
Vol 13 | No 3 Research Articles June 2012 49
the number of scale items before administering the survey to students in a pilot study.
The revised version of the scale included 48 Likert-scale items. After the validation study, items with high factor loadings were selected for the administration to students in this re-search study. The final version of the instrument included 25 items. An internal reliability coefficient was calculated for the instrument and its subscales after the questionnaire was administered during the study to students enrolled in three online programs (education, business, and nursing) at a research university in the western United States. The instru-ment’s reliability was found to be very high (a = .98).
Turkish Version of the OSCSThe English version of the instrument was translated into Turkish by a team of faculty and graduate students including one professor, three online instructors, and three graduate students who have high competency in both the English and Turkish languages. The team worked collaboratively to ensure that the instrument had semantic equivalence across lan-guages and conceptual equivalence across cultures (Cha, Kim, & Erlen, 2007). The devel-oped Turkish version of the instrument was then distributed to one Turkish professional in the field of distance education to gather his views regarding the content validity (e.g., evalu-ating the item clarity and the relevance of items) (Ozkok, Walker, & Buyukozturk, 2009).
Setting and ParticipantsAfter the development process, the finalized Turkish version of the instrument was admin-istered to students enrolled in an online information technologies certificate program of-fered by a computer engineering department at a university in Turkey in spring 2010. The certificate consists of eight sequenced online courses that are completed in four semesters. Students are grouped into cohorts and can complete the certificate in nine months. The certificate attracts not only currently enrolled university students (at the undergraduate and graduate level) but also postgraduates who desire to learn about computer engineering and information technology.
At the beginning of the semester, 175 students were enrolled in two courses that utilize asynchronous and synchronous delivery methods. One hundred and forty-six individuals (83%) completed the online questionnaire. Over 70% of respondents were male (73.3%), and the majority (59.2%) was classified as current undergraduate or graduate students, whereas 40.8% had already graduated from college. Their ages ranged from 19 to 47 (M = 27.62). Half of the students were currently employed (53.4%) and resided in the capitol city (50.4%). Only 10.3% had previously taken an online course.
Data AnalysisAs a preliminary exploration of the factor, a principal components factor analysis with ob-limin rotation was performed on the 25 questionnaire items. Prior to conducting the analy-sis, assumptions (adequacy of sample size, factorability, presence of outliers, linearity, and multicollinearity) were checked. In order to interpret factor structure, the pattern matrix and structure matrix were examined for item loadings to determine the number of factors
Development and Validation of the Online Student Connectedness Survey Bolliger and Inan
Vol 13 | No 3 Research Articles June 2012 50
to retain; several methods including Kaiser’s (1960) eignvalues greater than one rule, Cat-tel’s (1966) scree test, total variance, and residuals (the difference between the empirical and reproduced correlations) were utilized (Mertler & Vannatta, 2010; Stevens, 2010).
Sample size and factorability.
The data set included 146 completed response sets. This is considered adequate because all communalities were greater than .60, items per factor ratio was about 5:1, and all fac-tor loadings were above .60 in absolute value (Stevens, 2010). Bartlett’s test of sphericity (Bartlett, 1950) and Kaiser-Myer-Olkin measure (Mertler & Vannatta, 2010) was checked to see if the data were appropriate for a factor analysis. Both the Kaiser-Myer-Olkin measure of sampling adequacy (.935) and the Bartlett’s test of sphericity (χ2 = 4694.87, p = .000) suggested that the dataset was suitable for factor analysis. Furthermore, Kaiser’s measure of sampling adequacy (MSA) for all items was greater than .90 which is considered very good (Pett, Lackey, & Sullivan, 2003).
Outliers.
The data was screened for univariate and multivariate outliers. Initially, an examination of z scores revealed two potential outliers within the range of z ± 3.00. Leverage values were examined to detect multivariate outliers. Thirteen additional possible outliers were detected by using the cutoff value (.37) calculated by the formula provided by Tabachnick and Fidell (2007). However, the examination of those cases did not indicate any obvious reasons to exclude those data sets from the analysis. Factor analyses were performed with and without outliers to see whether those data sets significantly impacted the results. Ex-amination of factor structure, communalities, and percentage of variance explained clearly indicated that results were consistent with or without those outliers. Therefore, all data sets were included in the analysis.
Linearity and multicollinearity.
In order to examine for linearity, several bivariate scatterplots were generated and exam-ined. A scatterplot matrix revealed fairly normal distributions and linear relationships among variables. In order to determine if multicollinearity existed, squared multiple cor-relations (SMCs) for each variable were examined. Only one of the SMC values (.903) was close to 1. The correlation coefficients among variables were high but only two of the cor-relations were just above .90.
Results
Factor AnalysisThe construct validity was examined using a confirmatory analysis with oblim rotation. An initial examination revealed four dimensions with eigenvalues greater than 1. Inspection of
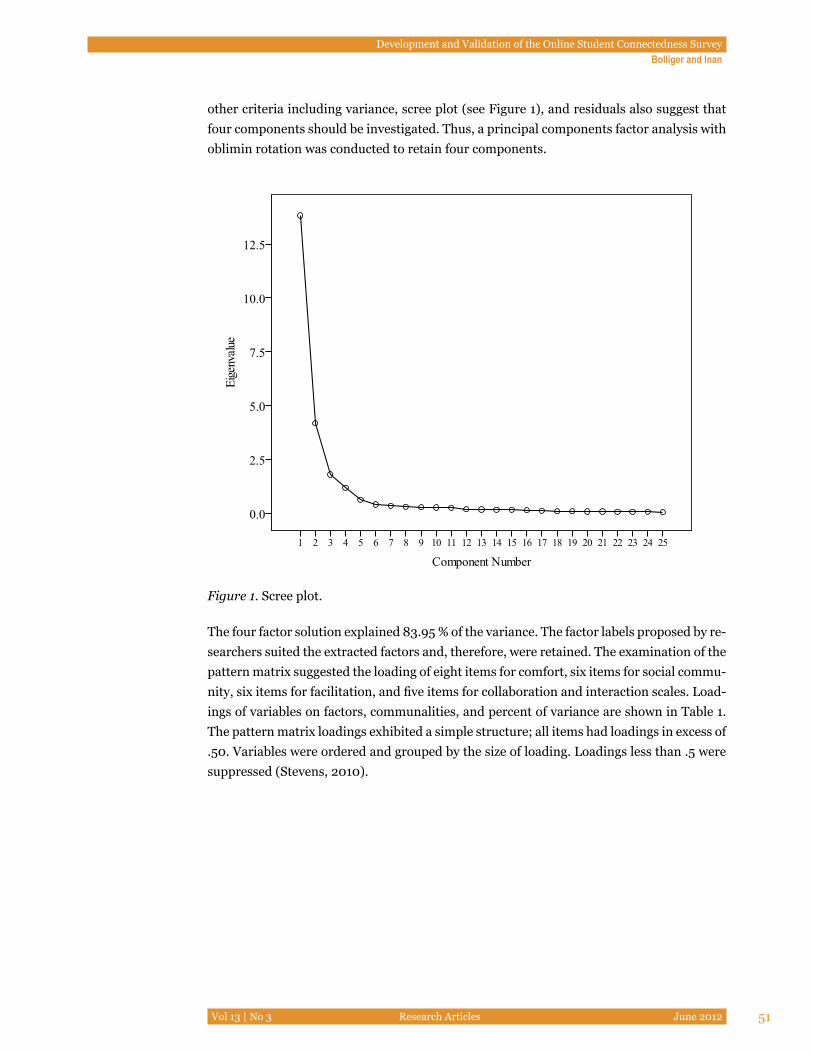
Development and Validation of the Online Student Connectedness Survey Bolliger and Inan
Vol 13 | No 3 Research Articles June 2012 51
other criteria including variance, scree plot (see Figure 1), and residuals also suggest that four components should be investigated. Thus, a principal components factor analysis with oblimin rotation was conducted to retain four components.
Figure 1. Scree plot.
The four factor solution explained 83.95 % of the variance. The factor labels proposed by re-searchers suited the extracted factors and, therefore, were retained. The examination of the pattern matrix suggested the loading of eight items for comfort, six items for social commu-nity, six items for facilitation, and five items for collaboration and interaction scales. Load-ings of variables on factors, communalities, and percent of variance are shown in Table 1. The pattern matrix loadings exhibited a simple structure; all items had loadings in excess of .50. Variables were ordered and grouped by the size of loading. Loadings less than .5 were suppressed (Stevens, 2010).
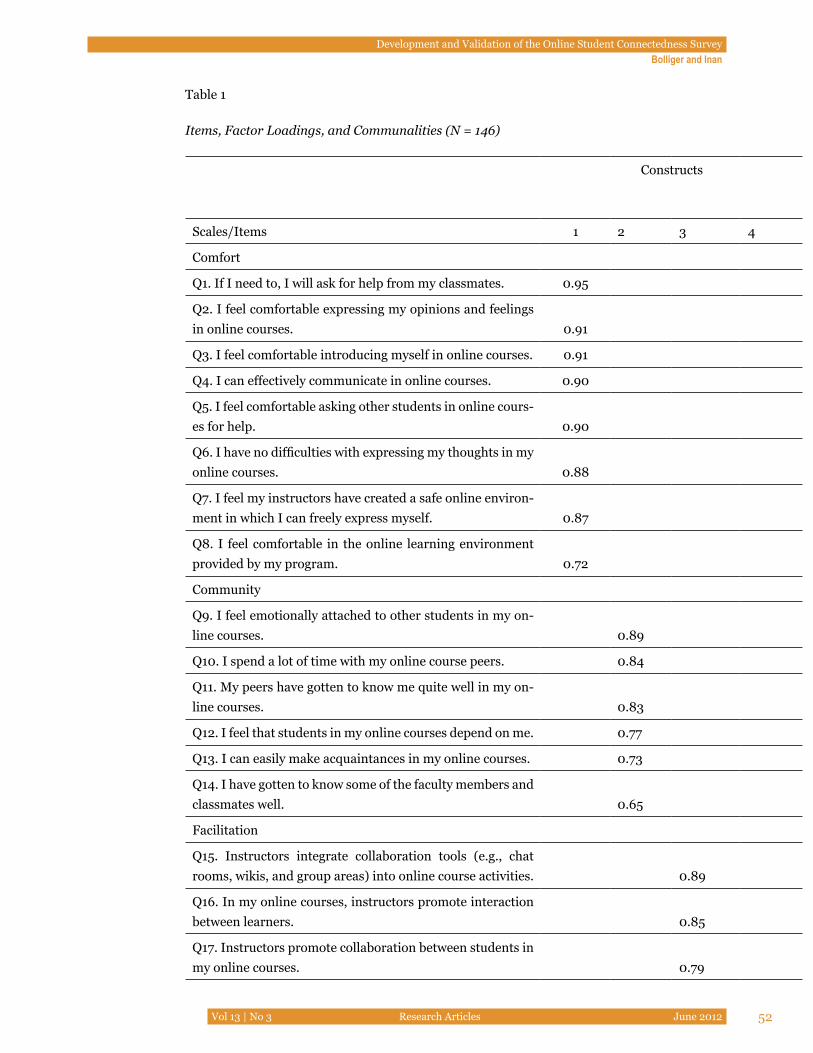
Development and Validation of the Online Student Connectedness Survey Bolliger and Inan
Vol 13 | No 3 Research Articles June 2012 52
Table 1
Items, Factor Loadings, and Communalities (N = 146)
Constructs
Scales/Items 1 2 3 4
Comfort
Q1. If I need to, I will ask for help from my classmates. 0.95
Q2. I feel comfortable expressing my opinions and feelings in online courses. 0.91
Q3. I feel comfortable introducing myself in online courses. 0.91
Q4. I can effectively communicate in online courses. 0.90
Q5. I feel comfortable asking other students in online cours-es for help. 0.90
Q6. I have no difficulties with expressing my thoughts in my online courses. 0.88
Q7. I feel my instructors have created a safe online environ-ment in which I can freely express myself. 0.87
Q8. I feel comfortable in the online learning environment provided by my program. 0.72
Community
Q9. I feel emotionally attached to other students in my on-line courses. 0.89
Q10. I spend a lot of time with my online course peers. 0.84
Q11. My peers have gotten to know me quite well in my on-line courses. 0.83
Q12. I feel that students in my online courses depend on me. 0.77
Q13. I can easily make acquaintances in my online courses. 0.73
Q14. I have gotten to know some of the faculty members and classmates well. 0.65
Facilitation
Q15. Instructors integrate collaboration tools (e.g., chat rooms, wikis, and group areas) into online course activities. 0.89
Q16. In my online courses, instructors promote interaction between learners. 0.85
Q17. Instructors promote collaboration between students in my online courses. 0.79
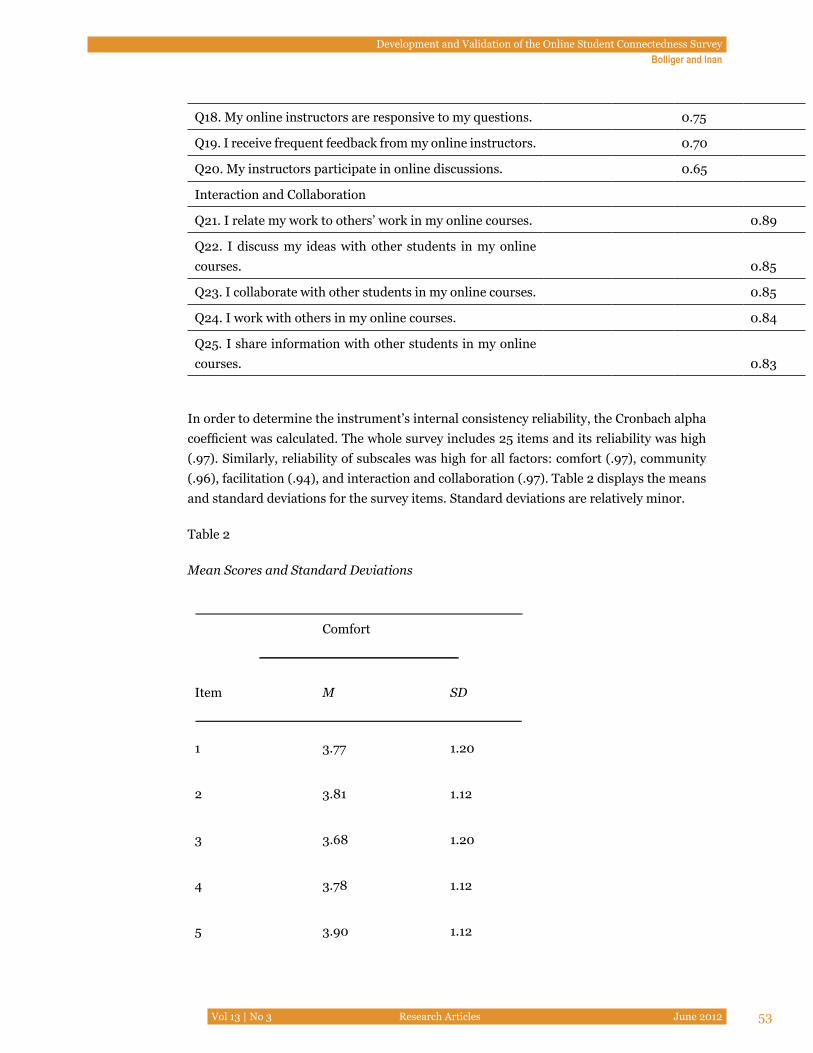
Development and Validation of the Online Student Connectedness Survey Bolliger and Inan
Vol 13 | No 3 Research Articles June 2012 53
Q18. My online instructors are responsive to my questions. 0.75
Q19. I receive frequent feedback from my online instructors. 0.70
Q20. My instructors participate in online discussions. 0.65
Interaction and Collaboration
Q21. I relate my work to others’ work in my online courses. 0.89
Q22. I discuss my ideas with other students in my online courses. 0.85
Q23. I collaborate with other students in my online courses. 0.85
Q24. I work with others in my online courses. 0.84
Q25. I share information with other students in my online courses. 0.83
In order to determine the instrument’s internal consistency reliability, the Cronbach alpha coefficient was calculated. The whole survey includes 25 items and its reliability was high (.97). Similarly, reliability of subscales was high for all factors: comfort (.97), community (.96), facilitation (.94), and interaction and collaboration (.97). Table 2 displays the means and standard deviations for the survey items. Standard deviations are relatively minor.
Table 2
Mean Scores and Standard Deviations
Comfort
Item M SD
1 3.77 1.20
2 3.81 1.12
3 3.68 1.20
4 3.78 1.12
5 3.90 1.12

Development and Validation of the Online Student Connectedness Survey Bolliger and Inan
Vol 13 | No 3 Research Articles June 2012 54
6 3.81 1.15
7 3.85 1.14
8 3.81 1.16
Community
Item M SD
9 2.99 1.27
10 2.45 1.23
11 2.86 1.21
12 2.29 1.30
13 2.48 1.30
14 2.70 1.32
Facilitation
Item M SD
15 3.28 1.19
16 3.33 1.15
17 3.62 1.13
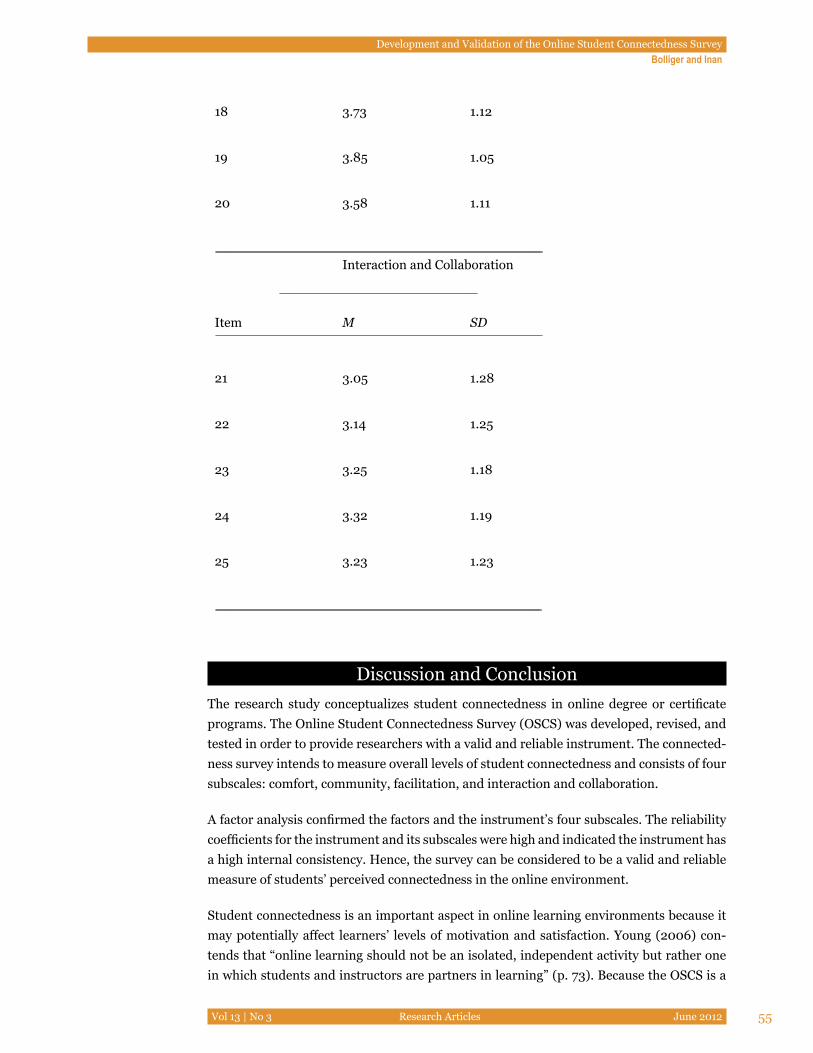
Development and Validation of the Online Student Connectedness Survey Bolliger and Inan
Vol 13 | No 3 Research Articles June 2012 55
18 3.73 1.12
19 3.85 1.05
20 3.58 1.11
Interaction and Collaboration
Item M SD
21 3.05 1.28
22 3.14 1.25
23 3.25 1.18
24 3.32 1.19
25 3.23 1.23
Discussion and ConclusionThe research study conceptualizes student connectedness in online degree or certificate programs. The Online Student Connectedness Survey (OSCS) was developed, revised, and tested in order to provide researchers with a valid and reliable instrument. The connected-ness survey intends to measure overall levels of student connectedness and consists of four subscales: comfort, community, facilitation, and interaction and collaboration.
A factor analysis confirmed the factors and the instrument’s four subscales. The reliability coefficients for the instrument and its subscales were high and indicated the instrument has a high internal consistency. Hence, the survey can be considered to be a valid and reliable measure of students’ perceived connectedness in the online environment.
Student connectedness is an important aspect in online learning environments because it may potentially affect learners’ levels of motivation and satisfaction. Young (2006) con-tends that “online learning should not be an isolated, independent activity but rather one in which students and instructors are partners in learning” (p. 73). Because the OSCS is a

Development and Validation of the Online Student Connectedness Survey Bolliger and Inan
Vol 13 | No 3 Research Articles June 2012 56
valid and reliable measure of student connectedness in online programs, it can be used in future studies to ascertain different levels of connectedness. The instrument can be used to evaluate the effectiveness of planned instructional events and integrated strategies for fostering students’ perceptions of connectedness in online degree or certificate programs and, if needed, assist in the revisions of online programs.
LimitationsSome limitations need to be pointed out. First, the geographical area was limited and participants were recruited from only one university. Second, all study participants were enrolled in courses in one subject area, computer engineering. The sample is somewhat unique because over 70% were male. Therefore, the results should be interpreted with cau-tion as their generalizability may be limited. Future research could include a replication of the study with the inclusion of multiple institutions and the solicitation of students with different majors.
AcknowledgmentThe authors would like to thank all colleagues and students who contributed to this study. We are grateful to Scott Walker, Steven Crooks, Landra Rezabek, Larry Jansen, Erman Yukselturk, Fatih Ari, Ismahan Arslan-Ari, and Gul Durukan for their contributions and help during the instrument development process.
Development and Validation of the Online Student Connectedness Survey Bolliger and Inan
Vol 13 | No 3 Research Articles June 2012 57
ReferencesAkguner, P. (2011, May 11). Turkey: Education market (Market Research Library). Wash-
ington, DC: United Sates Department of Commerce. Retrieved from http://www.buyusainfo.net/docs/x_678799.pdf
Allen, I. E., & Seaman, J. (2010a, November). Class differences: Online education in the United States, 2010. Babson Park, MA: Babson Survey Research Group. Retrieved from http://www.usdla.org/assets/pdf_files/2010%20Sloan-C%20Report%20on%20Online%20Education%20Enrollment.pdf
Allen, I. E., & Seaman, J. (2010b, January). Learning on demand: Online education in the United States, 2009. Babson Park, MA: Babson Survey Research Group. Retrieved from http://sloanconsortium.org/sites/default/files/pages/learningondemand-7.pdf
Anadolu University. (2010, December 30). About. Retrieved from http://www.anadolu.edu.tr/en/universitemiz/hakkinda.aspx
Angelino, L. M., Williams, F. K., & Natvig, D. (2007). Strategies to engage online students and reduce attrition rates. Journal of Educators Online, 4(2), 1-14.
Aragon, S. R. (2003). Creating social presence in online environments. In S. R. Aragon (Ed.), Facilitating learning in online environments (pp. 57-68). San Francisco: Jossey-Bass.
Askar, P. (2009). Distance education in Turkey. In P. L. Rogers et al. (Eds.), Encyclopedia of distance learning (2nd ed., pp. 671-675). Hershey, PA: Idea Group Reference.
Barnard-Brak, L., & Shiu, W. (2010). Classroom community scale in the blended learning environment: A psychometric review. International Journal on E-Learning, 9(3), 303-311.
Bartlett, M. S. (1950). Tests of significance in factor analysis. British Journal of Statistical Psychology, 3, 77-85.
Belanger, F., & Jordan, D. H. (2000). Evaluation and implementation of distance learn-ing: Technologies, tools and techniques. Hershey, PA: Idea Publishing Group.
Berge, Z. L. (2002). Active, interactive, and reflective elearning. The Quarterly Review of Distance Education, 3(2), 181-190.
Bibeau, S. (2001). Social presence, isolation and connectedness in online teaching and learning: From the literature to real life. Journal of Instruction Delivery Systems, 15(3), 35-39.
Development and Validation of the Online Student Connectedness Survey Bolliger and Inan
Vol 13 | No 3 Research Articles June 2012 58
Bolliger, D. U., & Martindale, T. (2004). Key factors influencing student satisfaction with online courses. International Journal on E-Learning, 3(1), 61-67.
Brown, J. S., & Duguid, P. (2000). Social life of information. Boston, MA: Harvard Busi-ness School Press.
Carr, S. (2000, February 11). As distance education comes of age, the challenge is keeping the students. Chronicle of Higher Education, 46(23), A39. Retrieved from Aca-demic Search Premier database.
Cattell, R. B. (1966). The scree test for the number of factors. Multivariate Behavioral Re-search, 1(2), 245-276.
Cha, E. S., Kim, K. H., & Erlen, J. A. (2007). Translation of scales in crosscultural research: issues and techniques. Journal of Advanced Nursing, 58(4), 386-395.
Cross, K. P. (1998). Why learning communities? Why now? About Campus, 3(3), 4-11. Retrieved from Academic Search Premier database.
Exter, M. E., Korkmaz, N., Harlin, N. M., & Bichelmeyer, B. A. (2009). Sense of community within a fully online program: Perspective of graduate students. The Quarterly Re-view of Distance Education, 10(2), 177-194.
Demiray, U. (Ed.). (2010). e-Learning practices: Cases and challenges facing e-learning and national development: Institutional studies and practices, Vol. 1. Eskisehir, Turkey: Anadolu University. Retrieved from http://www.midasebook.com/dosya-lar/FINAL_ELEARN_EBOOK_VOL1.pdf
DiRamio, D., & Wolverton, M. (2006). Integrating learning communities and distance edu-cation: Possibility or pipedream? Innovative Higher Education, 31(2), 99-113.
Drouin, M. A. (2008). The relationship between students’ perceived sense of community and satisfaction, achievement, and retention in online courses. Quarterly Review of Distance Education, 9(3), 267-284.
Garrison, R. (2000). Theoretical challenges for distance education in the 21st century: A shift from structural to transactional issues. International Review of Research in Open and Distance Learning, 1(1), 1-17.
Gursoy, H. (2005). A critical look at distance education in Turkey. In A. A. Carr-Chellman (Ed.), Global perspectives on e-learning: Rhetoric and reality (pp. 115-126).Thou-sand Oaks, CA: Sage.
Hara, N., & Kling, R. (2000). Student distress in a Web-based distance education course. Information, Communication, and Society, 3(4), 557-579.
Haythornthwaite, C., Kazmer, M. M., Robins, J., & Shoemaker, S. (2000). Community
Development and Validation of the Online Student Connectedness Survey Bolliger and Inan
Vol 13 | No 3 Research Articles June 2012 59
development among distance learners: Temporal and technological dimensions. Journal of Computer-Mediated Communication, 6(1). Retrieved from http://jcmc.indiana.edu/vol6/issue1/haythornthwaite.html
Johnson, P. E., & Evans, J. P. (1997). Power, communicator styles, and conflict manage-ment styles: A web of interpersonal constructs for the school principal. Interna-tional Journal of Educational Reform, 6(1), 40-53.
Johnson, M. M., & & Huff, M. T. (2000). Students’ use of computer-mediated communi-cation in a distance education course. Research on Social Work Practice, 10(4), 519-532.
Jonassen, D. H., Howland, J., Marra, R. M., & Crismond, D. P. (2008). Meaningful learn-ing with technology (3rd ed.). Upper Saddle River, NJ: Pearson/Merrill Prentice Hall.
Kaiser, H. F. (1960). The application of electronic computers to factor analysis. Educa-tional and Psychological Measurement, 20, 141-151.
Kanuka, H., & Jugdev, K. (2006). Distance education MBA students: An investigation into the use of an orientation course to address academic and social integration issues. Open Learning, 21(2), 153-166.
Lee, R. M., & Robbins, S. B. (1998). The relationship between social connectedness and anxiety, self-esteem, and social identity. Journal of Counseling Psychology, 45(3), 338-345.
McMillan, D. W., & Chavis, D. M. (1986). Sense of community: A definition and theory. Journal of Community Psychology, 14(1), 6-23.
McWirther, B. T. (1990). Loneliness: A review of the current literature, with implications for counseling and research. Journal of Counseling and Development, 68(4), 417-422.
Mertler, C. A., & Vannatta, R. A. (2010). Advanced and multivariate statistical methods: Practical application and interpretation (4th ed.). Los Angeles, CA: Pyrczak.
Moore, M. G. (1989). Three types of interaction. The American Journal of Distance Educa-tion, 3(2). Retrieved from http://www.ajde.com/Contents/vol3_2.htm#editorial
Moore, M. G., & Kearsley, G. (1996). Distance education: A systems view. Belmont, CA: Wadsworth Publishing Company.
Motteram, G., & Forrester, G. (2005). Becoming an online distance learner: What can be learned from students’ experiences of induction to distance programmes. Distance Education, 26(3), 281-298.
Development and Validation of the Online Student Connectedness Survey Bolliger and Inan
Vol 13 | No 3 Research Articles June 2012 60
Northrup, P. T. (2002). Online learners’ preferences for interaction. The Quarterly Review of Distance Education, 3(2), 219-226.
Norton, R. (1983). Communicator style: Theory, application, and measures. Beverly Hills, CA: Sage.
Norton, R. W. (1986). Communicator style in teaching: Giving good form to content. In J. M. Civikly (Ed.), Communicating in college classrooms (pp. 33-40). New Direc-tions for Teaching and Learning, no. 26. San Francisco: Jossey-Bass.
Ozkok, A., Walker, S. L., & Buyukozturk, S. (2009). Reliability and validity of a Turkish ver-sion of the DELES. Learning Environments Research, 12(3), 175-190.
Palloff, R. M., & Pratt, K. (2007). Building online learning communities: Effective strate-gies for the virtual classroom (2nd ed.). San Francisco: Jossey-Bass.
Pascarella, E. T. (1980). Student-faculty informal contact and college outcomes. Review of Educational Research, 50(4), 545-595.
Pett, M. A., Lackey, N. R., & Sullivan, J. J. (2003). Making sense of factor analysis: The use of factor analysis for instrument development in health care research. Thousand Oaks, CA: Sage.
Rouke, L., Anderson, T., Garrison, D. R., & Archer, W. (1999). Assessing social presence in asynchronous text-based computer conferencing. Journal of Distance Education, 14(2), 50-71.
Rovai, A. P. (2002a). Development of an instrument to measure classroom community. The Internet and Higher Education, 5(3), 197-211. doi:10.1016/S1096-7516(02)00102-1
Rovai, A. P. (2002b). Sense of community, perceived cognitive learning, and persistence in asynchronous learning networks. The Internet and Higher Education, 5(4), 319-332. doi:10.1016/S1096-7516(02)00130-6
Rovai, A. P. (2003). The relationship of communicator style, personality based learning style, and classroom community among online graduate students. The Internet and Higher Education, 6, 347-363. doi:10.1016/j.iheduc.2003.07.004
Shaw, S., & Polovina, S. (1999). Practical experiences of, and lessons learnt from, Internet technologies in higher education. Educational Technology & Society, 2(2). Re-trieved from http://ifets.ieee.og/periodical/vol._3_99/stephen_shaw.html
Shea, P., Li, C. S., & Pickett, A. (2006). A study of teaching presence and student sense of learning community in fully online and web-enhanced college courses. The Inter-net and Higher Education, 9(3), 175-190.
Development and Validation of the Online Student Connectedness Survey Bolliger and Inan
Vol 13 | No 3 Research Articles June 2012 61
Shieh, R. S., Gummer, E., & Niess, M. (2008). Perspectives of the instructor and the stu-dents. TechTrends, 52(6), 61-68.
Shin, N. (2003). Transactional presence as a critical predictor of success in distance learn-ing. Distance Education, 24(1), 69-86.
Short, J., Williams, E., & Christie, B. (1976). The social psychology of telecommunications. New York: Wiley.
Stelzer, M, & Vogelzangs, I. (1994). Isolation and motivation in on-line and distance learn-ing courses. In B. Collins (Ed.), On-line and distance education courses: A reader. Enschede, Netherlands: University of Twente. Retrieved from http://projects.edte.utwente.nl/ism/Online/chap8/chap8.htm
Stevens, J. (2010). Applied multivariate statistics for the social sciences. Mahwah, NJ: Lawrence Erlbaum.
Swan, K., & Shih, L. F. (2005). On the nature and development of social presence in online course discussions. Journal of Asynchronous Learning Network, 9(3), 115-136.
Tabachnick, B. G., & Fidell, L. S. (2007). Using multivariate statistics (5th ed.). Boston, MA: Allyn and Bacon.
Terrell, S. R., Snyder, M. M., & Dringus, L. P. (2009). The development, validation, and application of the Doctoral Student Connectedness Scale. The Internet and Higher Education, 12(2), 112-116. doi:10.1016/j.iheduc.2009.06.004
Tu, C. (2002). The measurement of social presence in an online learning environment. In-ternational Journal on E-Learning, 1(2), 34-45.
Tu, C., & McIsaac, M. (2002). The relationship between social presence and interaction in online classes. The American Journal of Distance Education, 16(3), 131-150.
Turkish Statistical Institute. (2010). Welcome to Turkish Statistical Institute (TurkStat). Retrieved from http://www.turkstat.gov.tr
Vygotsky, L. S. (1962). Thought and language (E. Hanfmann & G. Vakar [Eds.] Trans.). Cambridge, MA: The Massachusetts Institute of Technology. (Original work pub-lished 1934)
Vygotsky, L. S. (1978). Mind in society: The development of higher psychological process-es. Cambridge, MA: Harvard University Press.
Walker, G. E., Golde, C. M., Jones, L., Bueschel, A. C., & Hutchings, P. (2008). The forma-tion of scholars: Rethinking doctoral education for the twenty-first century. The
Development and Validation of the Online Student Connectedness Survey Bolliger and Inan
Vol 13 | No 3 Research Articles June 2012 62
Carnegie Foundation for the Advancement of Teaching. San Francisco, CA: Jossey-Bass.
Walker, S. L., & Fraser, B. J. (2005). Development and validation of an instrument for assessing distance education learning environments in higher education: The dis-tance learning environments survey (DELES). Learning Environments Research, 8(3), 289-308. doi:10.1007/s10984-005-1568-3
Wegerif, R. (1998). The social dimensions of asynchronous learning networks. Journal of Asynchronous Learning Networks, 2(1), 34-49. Retrieved from http://www.sloan-c.org/publications/jaln/v2n1/pdf/v2n1_wegerif.pdf
Wikeley, F., & Muschamp, Y. (2004). Pedagogical implications of working with doctoral students at a distance. Distance Education, 25(1), 125-142.
Young, S. (2006). Student views of effective online teaching in higher education. The Amer-ican Journal of Distance Education, 20(2), 65-77.
Zembylas, M., Theodorou, M., & Pavlakis, A. (2008). The role of emotion in the experience of online learning: Challenges and opportunities. Education Media International, 45(2), 107-117.
Yamamoto, G. T., & Aydin, C. H. (2010). eLearning in Turkey: Past, present and future. In U. Demiray, L. Vainio, M. C. Sahin, G. Kurubacak, P. T. Lounaskorpi, S. R. Rao, & C. Machado (Eds.), e-Learning practices: Volume II: Cases and challenges fac-ing e-learning and national development: Institutional studies and practices (pp. 961-987). Retrieved from http://www.midasebook.com/dosyalar/FINAL_EL-EARN_EBOOK_VOL2.pdf
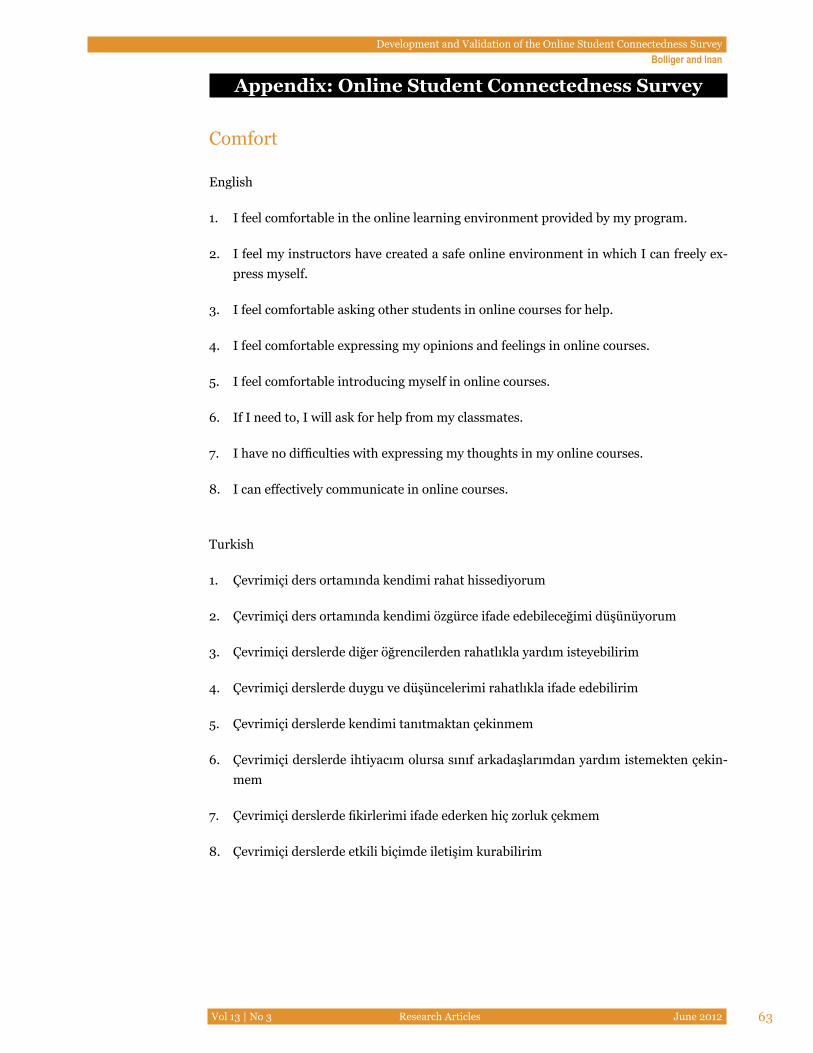
Development and Validation of the Online Student Connectedness Survey Bolliger and Inan
Vol 13 | No 3 Research Articles June 2012 63
Appendix: Online Student Connectedness Survey (OSCS)
Comfort
English
1. I feel comfortable in the online learning environment provided by my program.
2. I feel my instructors have created a safe online environment in which I can freely ex-press myself.
3. I feel comfortable asking other students in online courses for help.
4. I feel comfortable expressing my opinions and feelings in online courses.
5. I feel comfortable introducing myself in online courses.
6. If I need to, I will ask for help from my classmates.
7. I have no difficulties with expressing my thoughts in my online courses.
8. I can effectively communicate in online courses.
Turkish
1. Çevrimiçi ders ortamında kendimi rahat hissediyorum
2. Çevrimiçi ders ortamında kendimi özgürce ifade edebileceğimi düşünüyorum
3. Çevrimiçi derslerde diğer öğrencilerden rahatlıkla yardım isteyebilirim
4. Çevrimiçi derslerde duygu ve düşüncelerimi rahatlıkla ifade edebilirim
5. Çevrimiçi derslerde kendimi tanıtmaktan çekinmem
6. Çevrimiçi derslerde ihtiyacım olursa sınıf arkadaşlarımdan yardım istemekten çekin-mem
7. Çevrimiçi derslerde fikirlerimi ifade ederken hiç zorluk çekmem
8. Çevrimiçi derslerde etkili biçimde iletişim kurabilirim
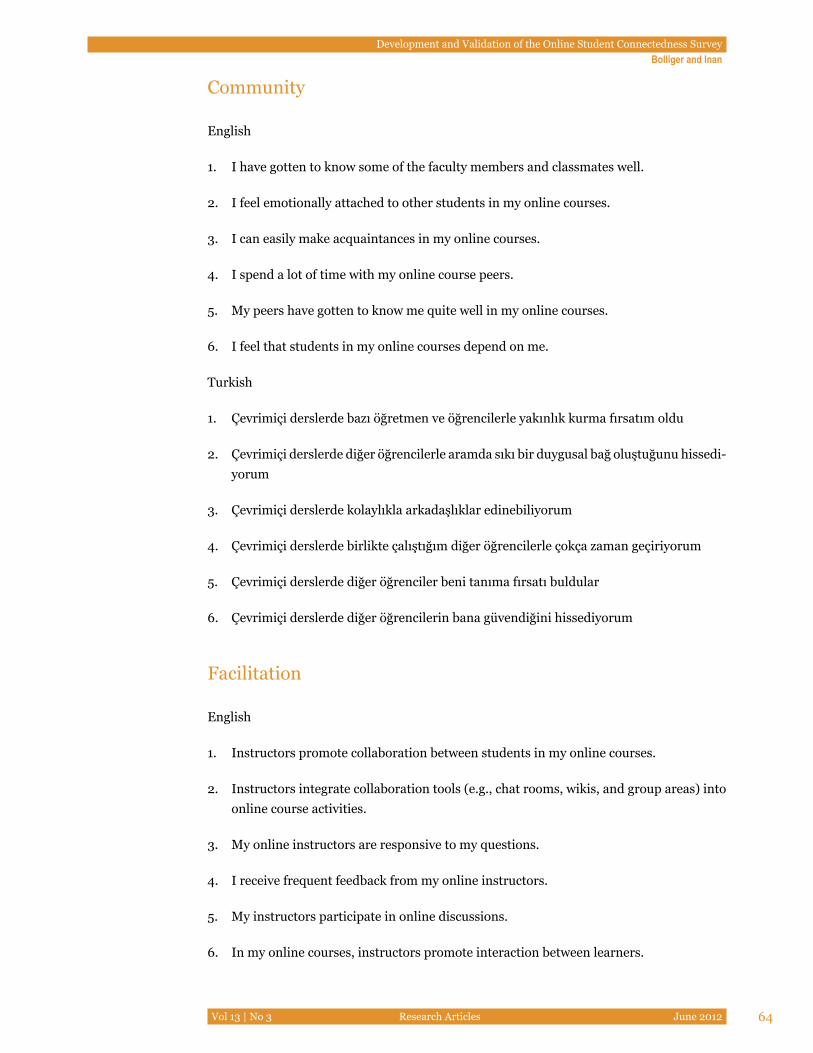
Development and Validation of the Online Student Connectedness Survey Bolliger and Inan
Vol 13 | No 3 Research Articles June 2012 64
Community
English
1. I have gotten to know some of the faculty members and classmates well.
2. I feel emotionally attached to other students in my online courses.
3. I can easily make acquaintances in my online courses.
4. I spend a lot of time with my online course peers.
5. My peers have gotten to know me quite well in my online courses.
6. I feel that students in my online courses depend on me.
Turkish
1. Çevrimiçi derslerde bazı öğretmen ve öğrencilerle yakınlık kurma fırsatım oldu
2. Çevrimiçi derslerde diğer öğrencilerle aramda sıkı bir duygusal bağ oluştuğunu hissedi-yorum
3. Çevrimiçi derslerde kolaylıkla arkadaşlıklar edinebiliyorum
4. Çevrimiçi derslerde birlikte çalıştığım diğer öğrencilerle çokça zaman geçiriyorum
5. Çevrimiçi derslerde diğer öğrenciler beni tanıma fırsatı buldular
6. Çevrimiçi derslerde diğer öğrencilerin bana güvendiğini hissediyorum
Facilitation
English
1. Instructors promote collaboration between students in my online courses.
2. Instructors integrate collaboration tools (e.g., chat rooms, wikis, and group areas) into online course activities.
3. My online instructors are responsive to my questions.
4. I receive frequent feedback from my online instructors.
5. My instructors participate in online discussions.
6. In my online courses, instructors promote interaction between learners.
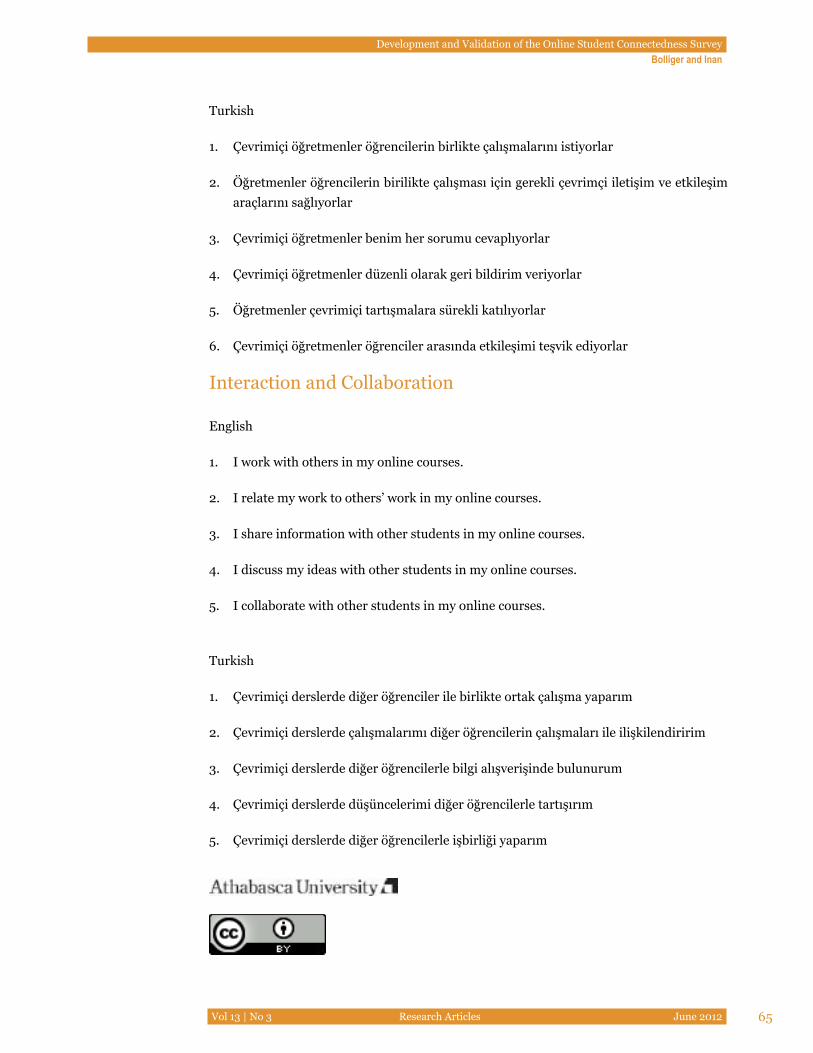
Development and Validation of the Online Student Connectedness Survey Bolliger and Inan
Vol 13 | No 3 Research Articles June 2012 65
Turkish
1. Çevrimiçi öğretmenler öğrencilerin birlikte çalışmalarını istiyorlar
2. Öğretmenler öğrencilerin birilikte çalışması için gerekli çevrimçi iletişim ve etkileşim araçlarını sağlıyorlar
3. Çevrimiçi öğretmenler benim her sorumu cevaplıyorlar
4. Çevrimiçi öğretmenler düzenli olarak geri bildirim veriyorlar
5. Öğretmenler çevrimiçi tartışmalara sürekli katılıyorlar
6. Çevrimiçi öğretmenler öğrenciler arasında etkileşimi teşvik ediyorlar
Interaction and Collaboration
English
1. I work with others in my online courses.
2. I relate my work to others’ work in my online courses.
3. I share information with other students in my online courses.
4. I discuss my ideas with other students in my online courses.
5. I collaborate with other students in my online courses.
Turkish
1. Çevrimiçi derslerde diğer öğrenciler ile birlikte ortak çalışma yaparım
2. Çevrimiçi derslerde çalışmalarımı diğer öğrencilerin çalışmaları ile ilişkilendiririm
3. Çevrimiçi derslerde diğer öğrencilerle bilgi alışverişinde bulunurum
4. Çevrimiçi derslerde düşüncelerimi diğer öğrencilerle tartışırım
5. Çevrimiçi derslerde diğer öğrencilerle işbirliği yaparım
Quality Assurance in E-Learning: PDPP Evaluation Model and its Application
AbstractE-learning has become an increasingly important teaching and learning mode in educational institutions and corporate training. The evaluation of e-learning, however, is essential for the quality assurance of e-learning courses. This paper constructs a four-phase evaluation model for e-learning courses, which includes planning, development, process, and product evaluation, called the PDPP evaluation model. Planning evaluation includes market demand, feasibility, target student group, course objectives, and finance. Development evaluation includes instructional design, course material design, course Web site design, flexibility, student-student interaction, teacher/tutor support, technical support, and assessment. Process evaluation includes technical support, Web site utilization, learning interaction, learning evaluation, learning support, and flexibility. Product evaluation includes student satisfaction, teaching effectiveness, learning effectiveness, and sustainability. Using the PDPP model as a research framework, a purely e-learning course on Research Methods in Distance Education, developed by the School of Professional and Continuing Education at the University of Hong Kong (HKU SPACE) and jointly offered with the School of Dis-tance Learning for Medical Education of Peking University (SDLME, PKU) was used as a case study. Sixty students from mainland China, Hong Kong, Macau, and Malaysia were recruited for this course. According to summative evaluation through a student e-learning experience survey, the majority of students were very satisfied/satisfied on all e-learning di-mensions of this course. The majority of students thought that the learning effectiveness of this course was equivalent, even better, than face-to-face learning because of cross-border collaborative learning, student-centred learning, sufficient learning support, and learning flexibility. This study shows that a high quality of teaching and learning might be assured by using the systematic PDPP evaluation procedure. It is hoped that the PDPP evaluation model and its application can provide a benchmark for establishing a wider e-learning qual-ity assurance mechanism in educational institutions.
Keywords: E-learning; quality assurance; evaluation; PDPP model
Weiyuan Zhang and Y L Cheng The University of Hong Kong
Quality Assurance in E-Learning: PDPP Evaluation Model and its ApplicationZhang and Cheng
Vol 13 | No 3 Research Articles June 2012 67
IntroductionE-learning has become widely used in conventional education, continuing education, adult education, and corporate training because of its flexibility, richness, resource-sharing, and cost-effectiveness. United Nations Educational, Scientific and Cultural Organization (UNESCO) statistics show that over 455 million people around the world received educa-tion and training through the Internet in 2008. Over 70% of universities in the USA were providing e-learning courses, and more than 6.1 million university students were taking at least one e-learning course during the fall 2010 term, which accounted for over 31% of the total number of university students in the USA (Allen & Seaman, 2011).
The financial crisis in 2009 led to a significant increase in student enrollment in e-learn-ing colleges in mainland China, some of which even had increases of 20%. The continu-ing education departments in China’s universities are gradually merging with e-learning colleges and providing continuing education programmes to their adult students through e-learning. With the rapid development of information and communication technology, student attitudes towards e-learning are becoming more positive. For example, according to the Survey on the Demand for Continuing Education in Hong Kong 2007-2008, 40.4% of the respondents showed positive attitudes to e-learning when they considered pursuing a continuing education programme, while 83.9% of them hoped to try the blended learning approach.
The economic benefits of e-learning are also becoming visible. For example, China Distance Education Holdings Limited in Beijing launched its first e-learning accounting course about 10 years ago in the name of China E-learning Accounting Website. Now with millions of students enrolled across the country every year, it generates a huge profit for the company, and about a year ago it was listed on the New York Stock Exchange (Chinaacc, 2009). An-other example is that The Hong Kong and Shanghai Banking Corporation Limited (HSBC) transformed 30% of its training programmes into e-learning programmes in 2008, which cut its annual training expenditure by 15%; in 2009, HSBC planned to raise the percentage of e-learning training to 50 (Hu, 2009).
With the rapid development of e-learning, there is also an increasing interest in e-learning research. Among all the research topics, quality assurance of e-learning has attracted the greatest concern. Jung et al. (2011) found that various national, regional, and international initiatives have been undertaken with regard to quality assurance in e-learning. Endean et al. (2010) stated that those concerned about online learning have been developing and pub-lishing ideas for over a decade about how to manage the quality of the learning experience of those trying to study through the Internet.
However, Jung and Latchem (2007) found that most institutions apply the same quality criteria for e-learning as for the other modes of delivery. Endean et al. (2010) pointed that new entrants to the e-learning field were unlikely to have existing internal procedures to cover quality assurance of this new mode of operation. The adoption of a set of quality stan-dards that carry some wider recognition addresses the need for internal processes.
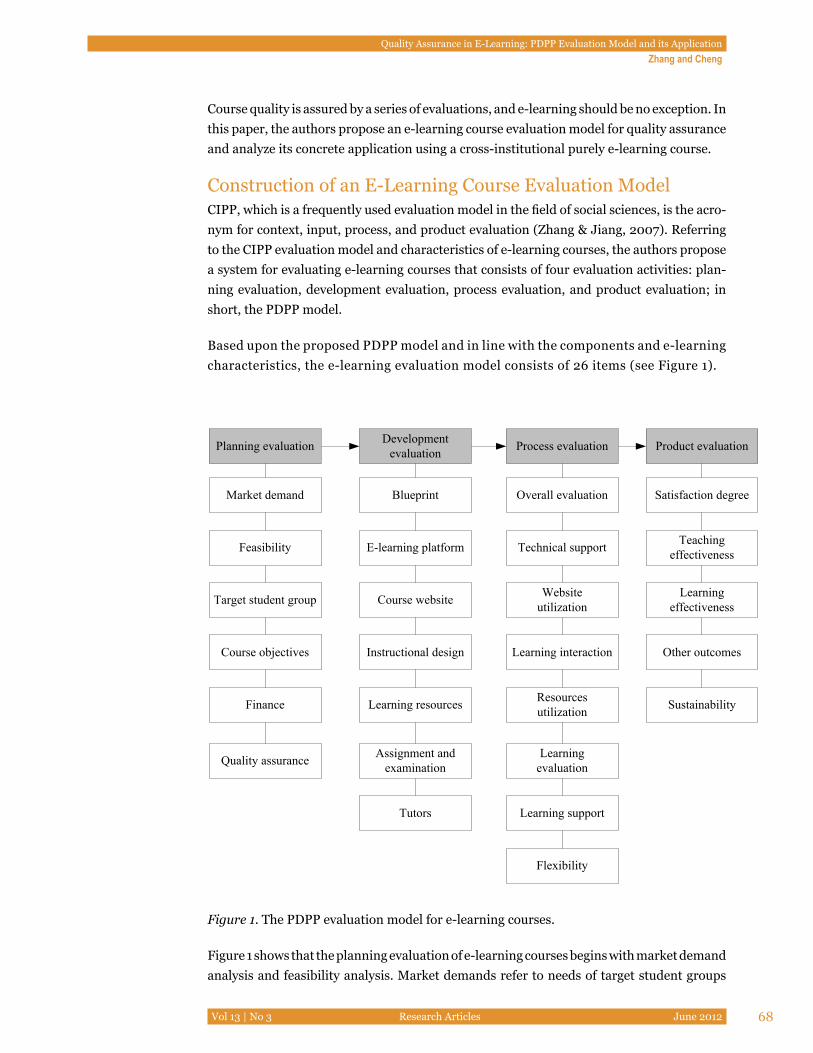
Quality Assurance in E-Learning: PDPP Evaluation Model and its ApplicationZhang and Cheng
Vol 13 | No 3 Research Articles June 2012 68
Course quality is assured by a series of evaluations, and e-learning should be no exception. In this paper, the authors propose an e-learning course evaluation model for quality assurance and analyze its concrete application using a cross-institutional purely e-learning course.
Construction of an E-Learning Course Evaluation ModelCIPP, which is a frequently used evaluation model in the field of social sciences, is the acro-nym for context, input, process, and product evaluation (Zhang & Jiang, 2007). Referring to the CIPP evaluation model and characteristics of e-learning courses, the authors propose a system for evaluating e-learning courses that consists of four evaluation activities: plan-ning evaluation, development evaluation, process evaluation, and product evaluation; in short, the PDPP model.
Based upon the proposed PDPP model and in line with the components and e-learning characteristics, the e-learning evaluation model consists of 26 items (see Figure 1).
Planning evaluation
Teaching effectivenessTechnical supportE-learning platformFeasibility
Satisfaction degreeOverall evaluationBlueprintMarket demand
Product evaluationProcess evaluationDevelopment evaluation
Learning effectiveness
Website utilizationCourse websiteTarget student group
Learning interactionInstructional designCourse objectives Other outcomes
Sustainability ResourcesutilizationLearning resourcesFinance
Flexibility
Learning supportTutors
Learningevaluation
Assignment and examinationQuality assurance
Figure 1. The PDPP evaluation model for e-learning courses.
Figure 1 shows that the planning evaluation of e-learning courses begins with market demand analysis and feasibility analysis. Market demands refer to needs of target student groups
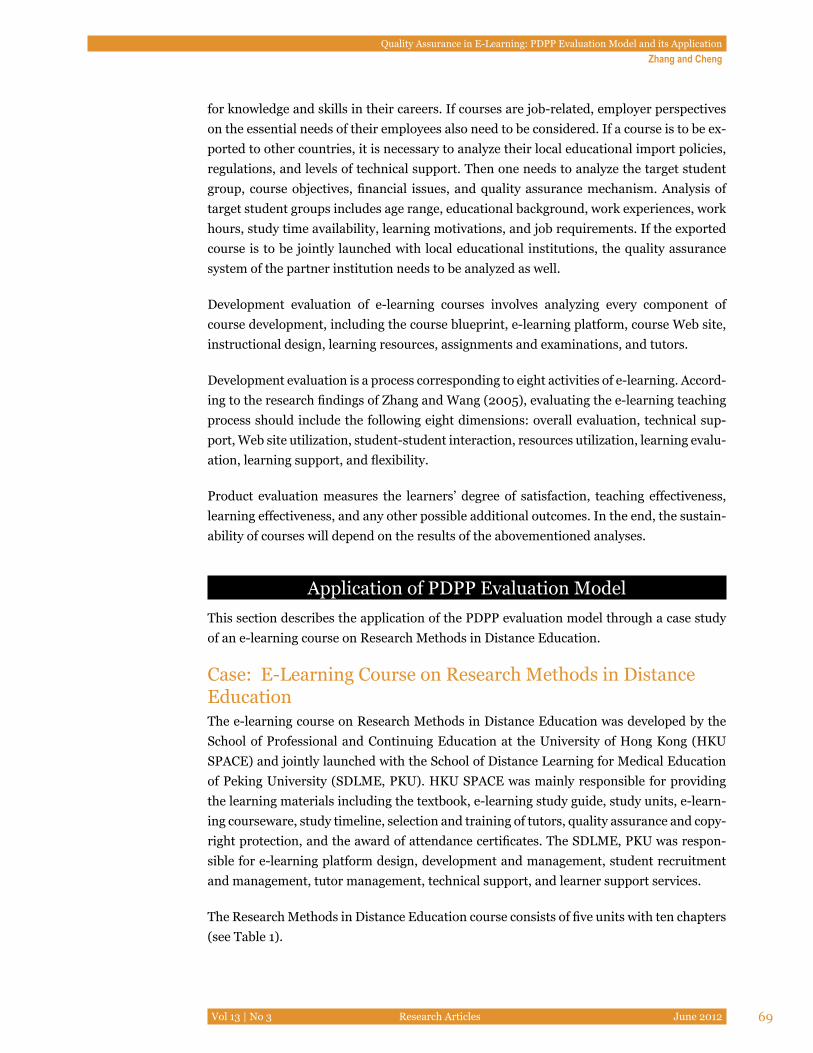
Quality Assurance in E-Learning: PDPP Evaluation Model and its ApplicationZhang and Cheng
Vol 13 | No 3 Research Articles June 2012 69
for knowledge and skills in their careers. If courses are job-related, employer perspectives on the essential needs of their employees also need to be considered. If a course is to be ex-ported to other countries, it is necessary to analyze their local educational import policies, regulations, and levels of technical support. Then one needs to analyze the target student group, course objectives, financial issues, and quality assurance mechanism. Analysis of target student groups includes age range, educational background, work experiences, work hours, study time availability, learning motivations, and job requirements. If the exported course is to be jointly launched with local educational institutions, the quality assurance system of the partner institution needs to be analyzed as well.
Development evaluation of e-learning courses involves analyzing every component of course development, including the course blueprint, e-learning platform, course Web site, instructional design, learning resources, assignments and examinations, and tutors.
Development evaluation is a process corresponding to eight activities of e-learning. Accord-ing to the research findings of Zhang and Wang (2005), evaluating the e-learning teaching process should include the following eight dimensions: overall evaluation, technical sup-port, Web site utilization, student-student interaction, resources utilization, learning evalu-ation, learning support, and flexibility.
Product evaluation measures the learners’ degree of satisfaction, teaching effectiveness, learning effectiveness, and any other possible additional outcomes. In the end, the sustain-ability of courses will depend on the results of the abovementioned analyses.
Application of PDPP Evaluation ModelThis section describes the application of the PDPP evaluation model through a case study of an e-learning course on Research Methods in Distance Education.
Case: E-Learning Course on Research Methods in Distance EducationThe e-learning course on Research Methods in Distance Education was developed by the School of Professional and Continuing Education at the University of Hong Kong (HKU SPACE) and jointly launched with the School of Distance Learning for Medical Education of Peking University (SDLME, PKU). HKU SPACE was mainly responsible for providing the learning materials including the textbook, e-learning study guide, study units, e-learn-ing courseware, study timeline, selection and training of tutors, quality assurance and copy-right protection, and the award of attendance certificates. The SDLME, PKU was respon-sible for e-learning platform design, development and management, student recruitment and management, tutor management, technical support, and learner support services.
The Research Methods in Distance Education course consists of five units with ten chapters (see Table 1).
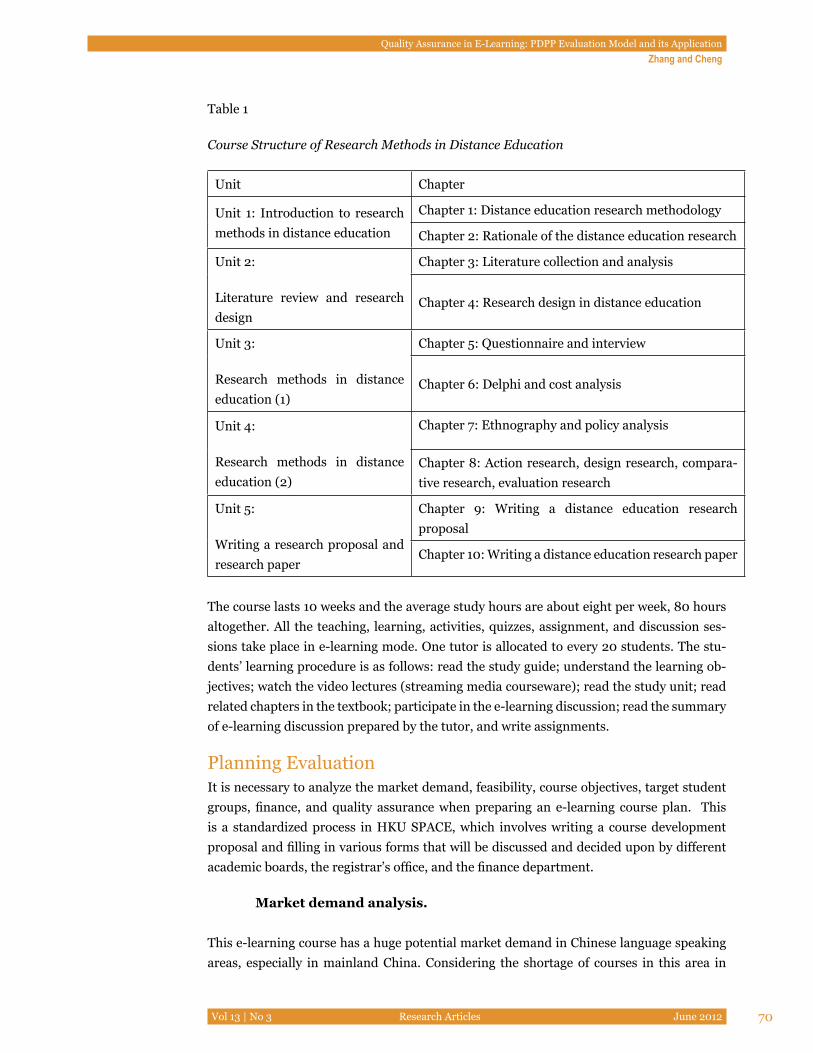
Quality Assurance in E-Learning: PDPP Evaluation Model and its ApplicationZhang and Cheng
Vol 13 | No 3 Research Articles June 2012 70
Table 1
Course Structure of Research Methods in Distance Education
Unit Chapter
Unit 1: Introduction to research methods in distance education
Chapter 1: Distance education research methodology
Chapter 2: Rationale of the distance education research
Unit 2:
Literature review and research design
Chapter 3: Literature collection and analysis
Chapter 4: Research design in distance education
Unit 3:
Research methods in distance education (1)
Chapter 5: Questionnaire and interview
Chapter 6: Delphi and cost analysis
Unit 4:
Research methods in distance education (2)
Chapter 7: Ethnography and policy analysis
Chapter 8: Action research, design research, compara-tive research, evaluation research
Unit 5:
Writing a research proposal and research paper
Chapter 9: Writing a distance education research proposal
Chapter 10: Writing a distance education research paper
The course lasts 10 weeks and the average study hours are about eight per week, 80 hours altogether. All the teaching, learning, activities, quizzes, assignment, and discussion ses-sions take place in e-learning mode. One tutor is allocated to every 20 students. The stu-dents’ learning procedure is as follows: read the study guide; understand the learning ob-jectives; watch the video lectures (streaming media courseware); read the study unit; read related chapters in the textbook; participate in the e-learning discussion; read the summary of e-learning discussion prepared by the tutor, and write assignments.
Planning Evaluation It is necessary to analyze the market demand, feasibility, course objectives, target student groups, finance, and quality assurance when preparing an e-learning course plan. This is a standardized process in HKU SPACE, which involves writing a course development proposal and filling in various forms that will be discussed and decided upon by different academic boards, the registrar’s office, and the finance department.
Market demand analysis.
This e-learning course has a huge potential market demand in Chinese language speaking areas, especially in mainland China. Considering the shortage of courses in this area in
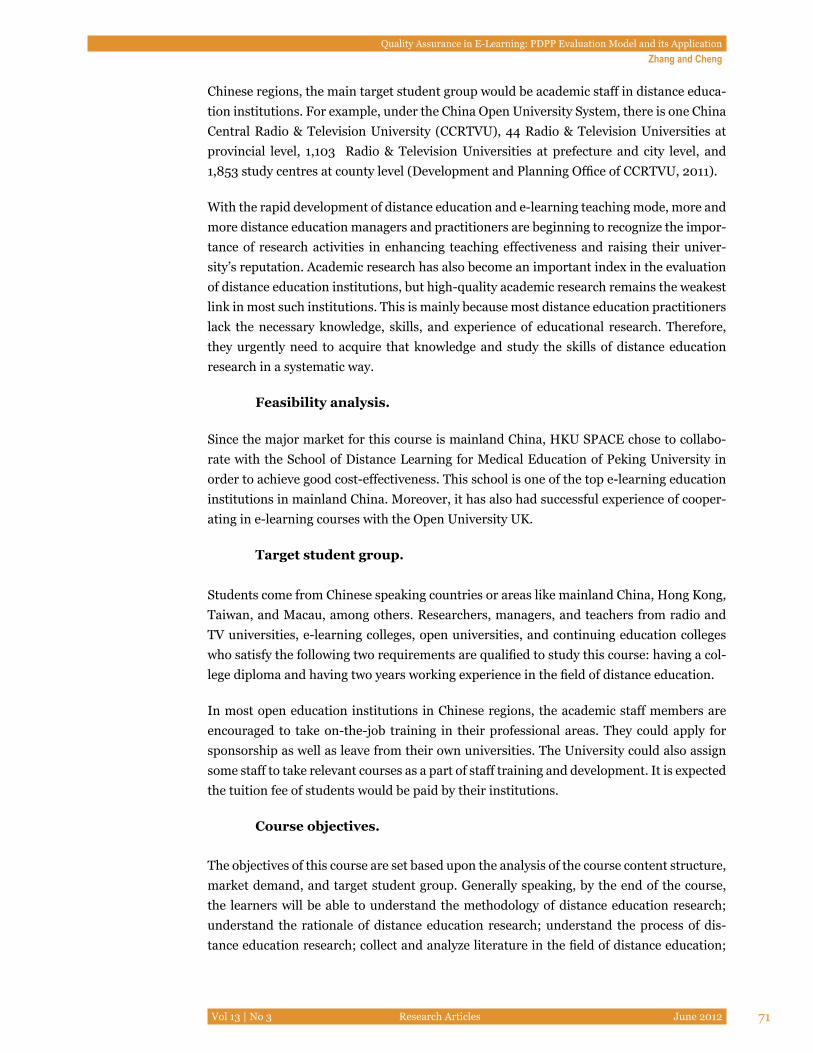
Quality Assurance in E-Learning: PDPP Evaluation Model and its ApplicationZhang and Cheng
Vol 13 | No 3 Research Articles June 2012 71
Chinese regions, the main target student group would be academic staff in distance educa-tion institutions. For example, under the China Open University System, there is one China Central Radio & Television University (CCRTVU), 44 Radio & Television Universities at provincial level, 1,103 Radio & Television Universities at prefecture and city level, and 1,853 study centres at county level (Development and Planning Office of CCRTVU, 2011).
With the rapid development of distance education and e-learning teaching mode, more and more distance education managers and practitioners are beginning to recognize the impor-tance of research activities in enhancing teaching effectiveness and raising their univer-sity’s reputation. Academic research has also become an important index in the evaluation of distance education institutions, but high-quality academic research remains the weakest link in most such institutions. This is mainly because most distance education practitioners lack the necessary knowledge, skills, and experience of educational research. Therefore, they urgently need to acquire that knowledge and study the skills of distance education research in a systematic way.
Feasibility analysis.
Since the major market for this course is mainland China, HKU SPACE chose to collabo-rate with the School of Distance Learning for Medical Education of Peking University in order to achieve good cost-effectiveness. This school is one of the top e-learning education institutions in mainland China. Moreover, it has also had successful experience of cooper-ating in e-learning courses with the Open University UK.
Target student group. Students come from Chinese speaking countries or areas like mainland China, Hong Kong, Taiwan, and Macau, among others. Researchers, managers, and teachers from radio and TV universities, e-learning colleges, open universities, and continuing education colleges who satisfy the following two requirements are qualified to study this course: having a col-lege diploma and having two years working experience in the field of distance education.
In most open education institutions in Chinese regions, the academic staff members are encouraged to take on-the-job training in their professional areas. They could apply for sponsorship as well as leave from their own universities. The University could also assign some staff to take relevant courses as a part of staff training and development. It is expected the tuition fee of students would be paid by their institutions.
Course objectives.
The objectives of this course are set based upon the analysis of the course content structure, market demand, and target student group. Generally speaking, by the end of the course, the learners will be able to understand the methodology of distance education research; understand the rationale of distance education research; understand the process of dis-tance education research; collect and analyze literature in the field of distance education;
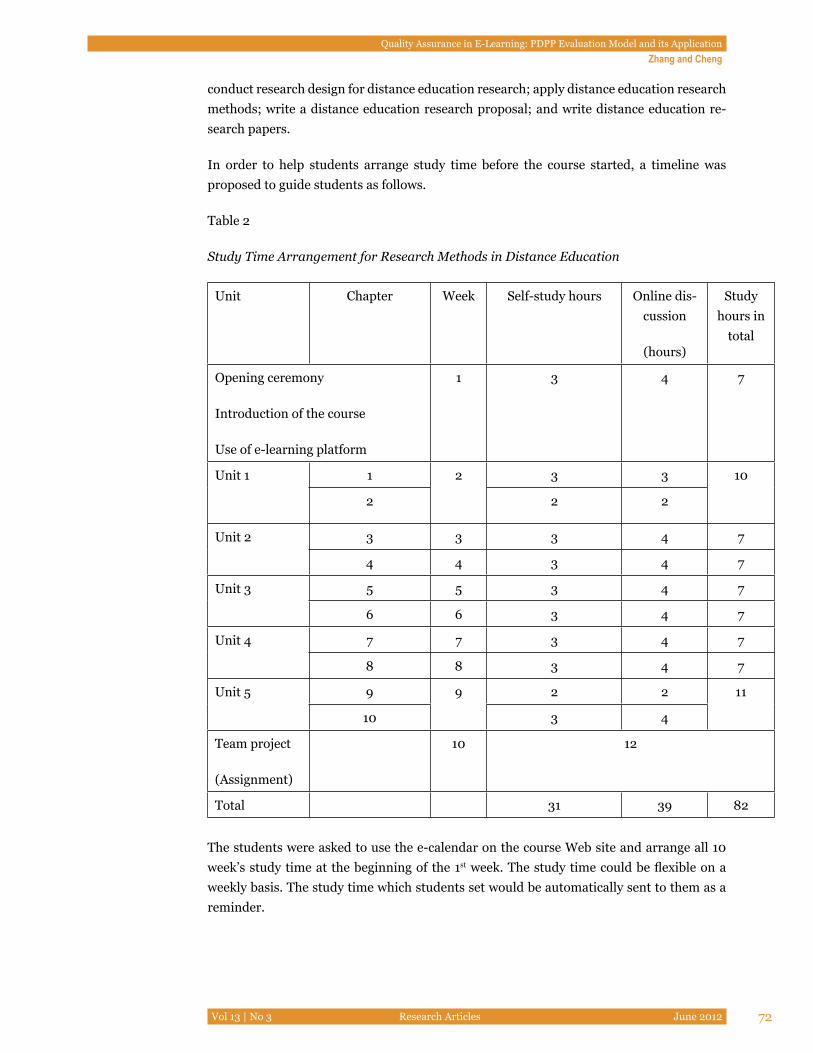
Quality Assurance in E-Learning: PDPP Evaluation Model and its ApplicationZhang and Cheng
Vol 13 | No 3 Research Articles June 2012 72
conduct research design for distance education research; apply distance education research methods; write a distance education research proposal; and write distance education re-search papers.
In order to help students arrange study time before the course started, a timeline was proposed to guide students as follows.
Table 2
Study Time Arrangement for Research Methods in Distance Education
Unit Chapter Week Self-study hours Online dis-cussion
(hours)
Study hours in
total
Opening ceremony
Introduction of the course
Use of e-learning platform
1 3 4 7
Unit 1 1 2 3 3 10
2 2 2
Unit 2 3 3 3 4 7
4 4 3 4 7
Unit 3 5 5 3 4 7
6 6 3 4 7
Unit 4 7 7 3 4 7
8 8 3 4 7
Unit 5 9 9 2 2 11
10 3 4
Team project
(Assignment)
10 12
Total 31 39 82
The students were asked to use the e-calendar on the course Web site and arrange all 10 week’s study time at the beginning of the 1st week. The study time could be flexible on a weekly basis. The study time which students set would be automatically sent to them as a reminder.
Quality Assurance in E-Learning: PDPP Evaluation Model and its ApplicationZhang and Cheng
Vol 13 | No 3 Research Articles June 2012 73
Financial analysis.
This involves budgeting various expenditures and income. The expenditures consist of five categories, which are course materials development (course content writing, editing, use of copyright materials, translation); e-learning instructional design (working hours of instructional and graphic designers); multimedia design and production (expert teaching, video programme shooting, offline editing, dubbing, use of DV); interactive courseware development; technical development (setting up the e-course platform, designing the course Web site, upload learning resources); and textbook and tutor fees. The income is tuition fees from students. It was estimated that the tuition fee from 60 students of the 1st intake could cover all course design and development expenditures.
Internal quality assurance analysis.
This follows the quality assurance systems of HKU SPACE. For a short course, the internal quality assurance includes six parts: course development and approval, course monitoring, course review, quality process review, teaching quality, and teaching and learning support (HKU SPACE, 2009).
Development EvaluationThe first step in e-learning development evaluation is to analyze the course blueprint, which is compiled and prepared by the programme director. The blueprint deals with the forma-tion of the course team and its members’ roles, course background, course introduction, course objectives, learner analysis, requirements for learning facilities and skills, course modules/units, learning materials, assessment and examination, communication and col-laboration in learning, learner support services, teaching model(s), course materials writ-ing schedule, quality assurance, and copyright issues.
When the course blueprint evaluation has been completed, it is followed by analyzing the construction of the e-learning platform and course Web site, instructional design, learning resources, assignment and examination arrangements, and the recruitment and training of tutorial staff. Table 3 lists the e-learning course development and evaluation steps.
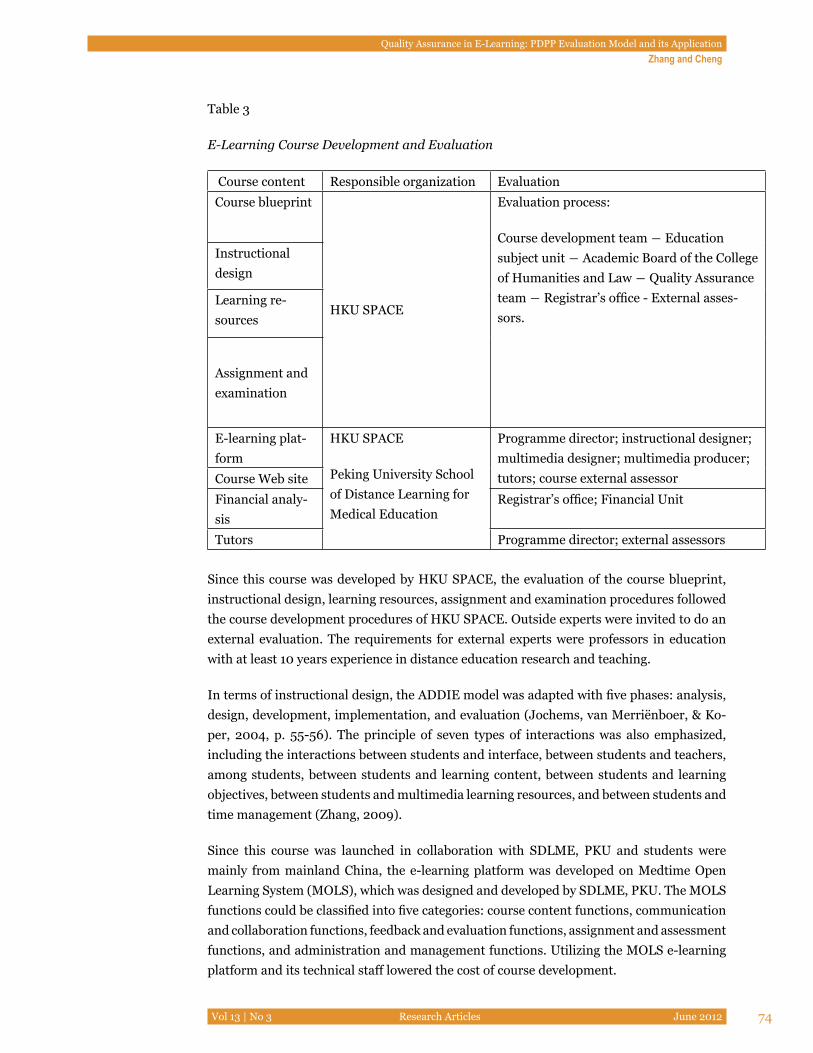
Quality Assurance in E-Learning: PDPP Evaluation Model and its ApplicationZhang and Cheng
Vol 13 | No 3 Research Articles June 2012 74
Table 3
E-Learning Course Development and Evaluation
Course content Responsible organization Evaluation
Course blueprint
HKU SPACE
Evaluation process:
Course development team ― Education subject unit ― Academic Board of the College of Humanities and Law ― Quality Assurance team ― Registrar’s office - External asses-sors.
Instructional design
Learning re-sources
Assignment and examination
E-learning plat-form
HKU SPACE
Peking University School of Distance Learning for Medical Education
Programme director; instructional designer; multimedia designer; multimedia producer; tutors; course external assessorCourse Web site
Financial analy-sis
Registrar’s office; Financial Unit
Tutors Programme director; external assessors
Since this course was developed by HKU SPACE, the evaluation of the course blueprint, instructional design, learning resources, assignment and examination procedures followed the course development procedures of HKU SPACE. Outside experts were invited to do an external evaluation. The requirements for external experts were professors in education with at least 10 years experience in distance education research and teaching.
In terms of instructional design, the ADDIE model was adapted with five phases: analysis, design, development, implementation, and evaluation (Jochems, van Merriënboer, & Ko-per, 2004, p. 55-56). The principle of seven types of interactions was also emphasized, including the interactions between students and interface, between students and teachers, among students, between students and learning content, between students and learning objectives, between students and multimedia learning resources, and between students and time management (Zhang, 2009).
Since this course was launched in collaboration with SDLME, PKU and students were mainly from mainland China, the e-learning platform was developed on Medtime Open Learning System (MOLS), which was designed and developed by SDLME, PKU. The MOLS functions could be classified into five categories: course content functions, communication and collaboration functions, feedback and evaluation functions, assignment and assessment functions, and administration and management functions. Utilizing the MOLS e-learning platform and its technical staff lowered the cost of course development.
Quality Assurance in E-Learning: PDPP Evaluation Model and its ApplicationZhang and Cheng
Vol 13 | No 3 Research Articles June 2012 75
Tutors were recruited from mainland China, but HKU SPACE assessed their qualifications.
Process Evaluation Process evaluation refers to evaluating the process of course delivery, including the overall evaluation, technical support, Web site utilization, learning interaction, resource utilization, learner support, assessment, and flexibility. Process evaluation mainly uses three approaches: survey of students’ learning experience and feedback; survey of tutors’ opinions; and programme director’s monitoring of the e-learning tutorials.
The approach to understanding students’ learning experience and feedback is as follows: establishing a special feedback area on the course Web site, establishing email communica-tion between tutors and students, and internal reviewer or programme director’s interviews with tutors and students. For example, the students were asked to familiarize themselves with various functions of the e-learning platform in the first week, referring to the course Web site guidance. The students needed to report to their tutor their degree of familiarity and time spent for this purpose. It was found that all the students learnt to use this course platform in two to four hours.
In the middle of this course, the reviewers and the programme director conducted forma-tive evaluation. For example, at the sixth week of this course, individual interviews were conducted and a virtual classroom was organized for evaluators to gather students’ learning feedback, including overall evaluation, learning experiences, difficulties, and suggestions so that timely adjustments could be made. For example, in the original course schedule, students were required to study 10 research methods within two weeks’ time, which was very difficult for most of them on a part-time study basis. The students suggested “select and master a few research methods in detail that were closely related to the work require-ment while achieving general understanding of the other research methods.”
Considering that this was a short on-the-job training course without study credits, the change was made by the course team. Instead of applying each research method in general, the students were asked to choose two research methods in writing a research proposal as a group project. The assignments were revised accordingly for the 2nd intake of students. However, for credit courses, changes must be approved by the quality assurance committees of HKU SPACE.
Monitoring e-learning tutorials is one of the most important tasks for the programme di-rector, who needs to log into the course Web site at least once every two days to observe stu-dents’ learning progress and difficulties. If students’ questions are not answered promptly or only ambiguous answers are provided, or if there are not many posts in the discussion forum area, the programme director would take immediate action to contact the tutors and solve the problem and inspire student’s learning enthusiasm.
Process evaluation is a meticulous process which involves continuous evaluation through-out the course. The programme director and tutors need to plan carefully to maintain stu-dents’ learning enthusiasm and help them achieve the final learning objectives.
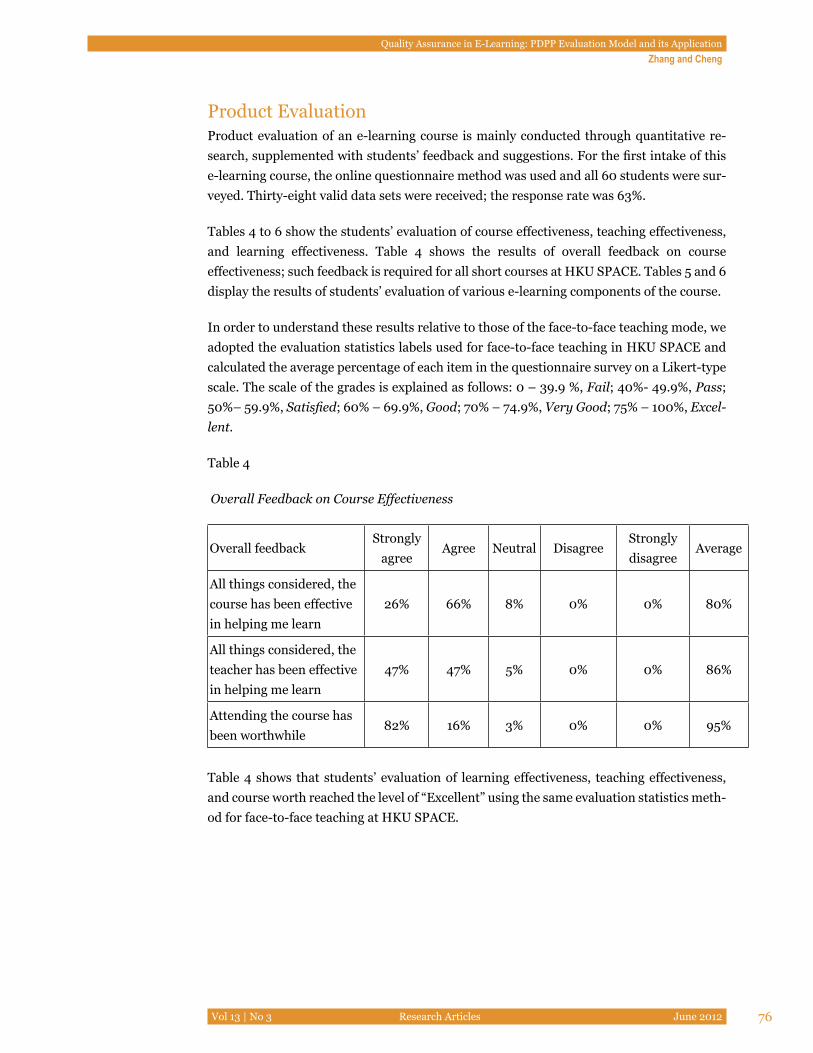
Quality Assurance in E-Learning: PDPP Evaluation Model and its ApplicationZhang and Cheng
Vol 13 | No 3 Research Articles June 2012 76
Product Evaluation Product evaluation of an e-learning course is mainly conducted through quantitative re-search, supplemented with students’ feedback and suggestions. For the first intake of this e-learning course, the online questionnaire method was used and all 60 students were sur-veyed. Thirty-eight valid data sets were received; the response rate was 63%.
Tables 4 to 6 show the students’ evaluation of course effectiveness, teaching effectiveness, and learning effectiveness. Table 4 shows the results of overall feedback on course effectiveness; such feedback is required for all short courses at HKU SPACE. Tables 5 and 6 display the results of students’ evaluation of various e-learning components of the course.
In order to understand these results relative to those of the face-to-face teaching mode, we adopted the evaluation statistics labels used for face-to-face teaching in HKU SPACE and calculated the average percentage of each item in the questionnaire survey on a Likert-type scale. The scale of the grades is explained as follows: 0 – 39.9 %, Fail; 40%- 49.9%, Pass; 50%– 59.9%, Satisfied; 60% – 69.9%, Good; 70% – 74.9%, Very Good; 75% – 100%, Excel-lent.
Table 4
Overall Feedback on Course Effectiveness
Overall feedback Strongly
agreeAgree Neutral Disagree
Strongly disagree
Average
All things considered, the course has been effective in helping me learn
26% 66% 8% 0% 0% 80%
All things considered, the teacher has been effective in helping me learn
47% 47% 5% 0% 0% 86%
Attending the course has been worthwhile
82% 16% 3% 0% 0% 95%
Table 4 shows that students’ evaluation of learning effectiveness, teaching effectiveness, and course worth reached the level of “Excellent” using the same evaluation statistics meth-od for face-to-face teaching at HKU SPACE.
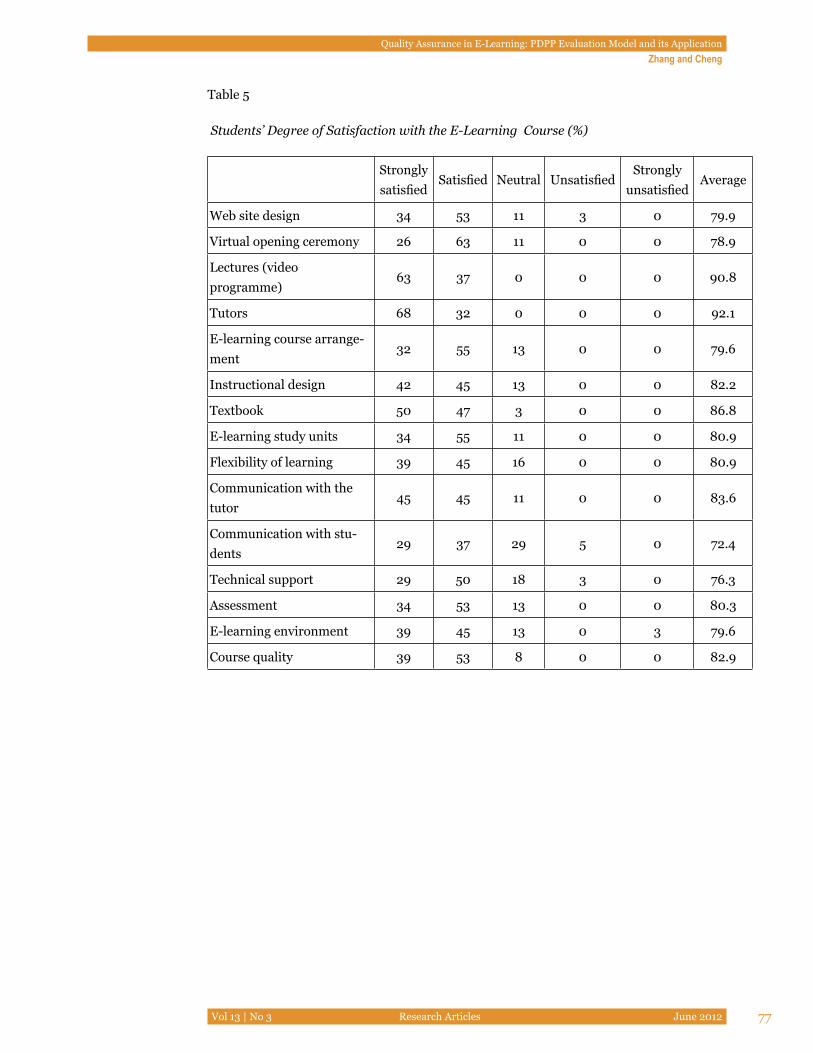
Quality Assurance in E-Learning: PDPP Evaluation Model and its ApplicationZhang and Cheng
Vol 13 | No 3 Research Articles June 2012 77
Table 5
Students’ Degree of Satisfaction with the E-Learning Course (%)
Strongly satisfied
Satisfied Neutral UnsatisfiedStrongly
unsatisfiedAverage
Web site design 34 53 11 3 0 79.9
Virtual opening ceremony 26 63 11 0 0 78.9
Lectures (video programme)
63 37 0 0 0 90.8
Tutors 68 32 0 0 0 92.1
E-learning course arrange-ment
32 55 13 0 0 79.6
Instructional design 42 45 13 0 0 82.2
Textbook 50 47 3 0 0 86.8
E-learning study units 34 55 11 0 0 80.9
Flexibility of learning 39 45 16 0 0 80.9
Communication with the tutor
45 45 11 0 0 83.6
Communication with stu-dents
29 37 29 5 0 72.4
Technical support 29 50 18 3 0 76.3
Assessment 34 53 13 0 0 80.3
E-learning environment 39 45 13 0 3 79.6
Course quality 39 53 8 0 0 82.9
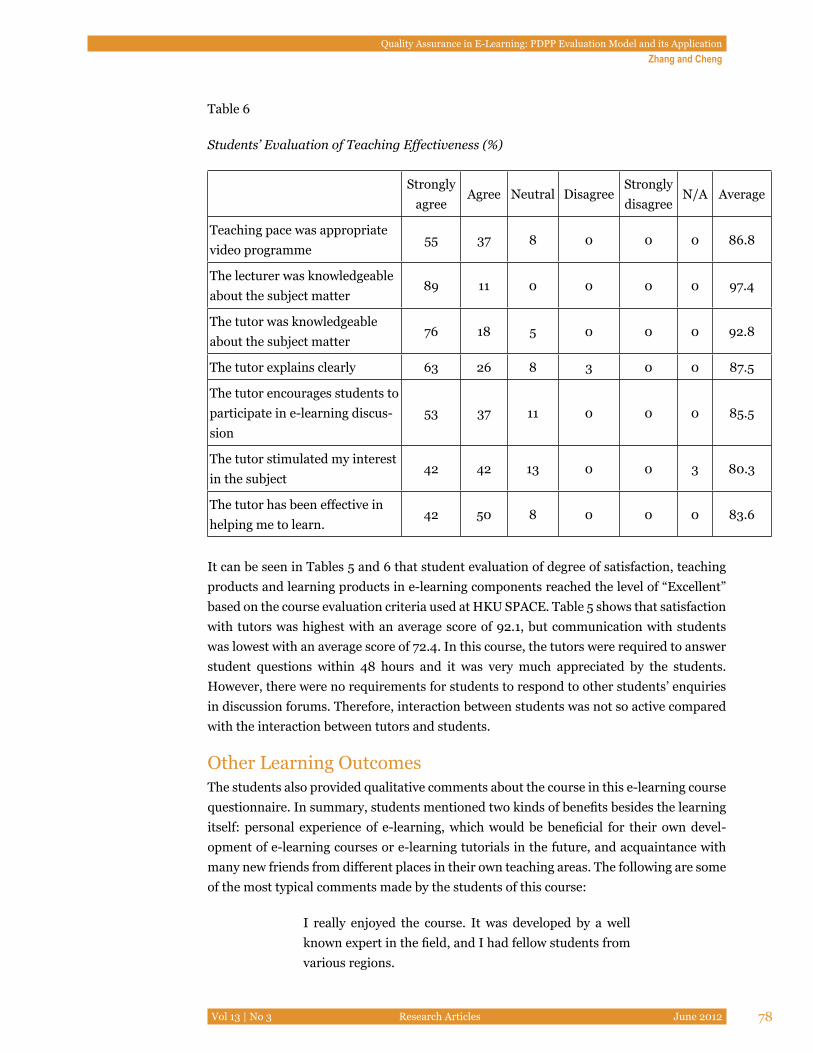
Quality Assurance in E-Learning: PDPP Evaluation Model and its ApplicationZhang and Cheng
Vol 13 | No 3 Research Articles June 2012 78
Table 6
Students’ Evaluation of Teaching Effectiveness (%)
Strongly agree
Agree Neutral DisagreeStrongly disagree
N/A Average
Teaching pace was appropriate video programme
55 37 8 0 0 0 86.8
The lecturer was knowledgeable about the subject matter
89 11 0 0 0 0 97.4
The tutor was knowledgeable about the subject matter
76 18 5 0 0 0 92.8
The tutor explains clearly 63 26 8 3 0 0 87.5
The tutor encourages students to participate in e-learning discus-sion
53 37 11 0 0 0 85.5
The tutor stimulated my interest in the subject
42 42 13 0 0 3 80.3
The tutor has been effective in helping me to learn.
42 50 8 0 0 0 83.6
It can be seen in Tables 5 and 6 that student evaluation of degree of satisfaction, teaching products and learning products in e-learning components reached the level of “Excellent” based on the course evaluation criteria used at HKU SPACE. Table 5 shows that satisfaction with tutors was highest with an average score of 92.1, but communication with students was lowest with an average score of 72.4. In this course, the tutors were required to answer student questions within 48 hours and it was very much appreciated by the students. However, there were no requirements for students to respond to other students’ enquiries in discussion forums. Therefore, interaction between students was not so active compared with the interaction between tutors and students.
Other Learning OutcomesThe students also provided qualitative comments about the course in this e-learning course questionnaire. In summary, students mentioned two kinds of benefits besides the learning itself: personal experience of e-learning, which would be beneficial for their own devel-opment of e-learning courses or e-learning tutorials in the future, and acquaintance with many new friends from different places in their own teaching areas. The following are some of the most typical comments made by the students of this course:
I really enjoyed the course. It was developed by a well known expert in the field, and I had fellow students from various regions.
Quality Assurance in E-Learning: PDPP Evaluation Model and its ApplicationZhang and Cheng
Vol 13 | No 3 Research Articles June 2012 79
The knowledge and skills I learnt from this course could improve my research quality greatly. Although I learnt courses on education research methods in Australia, only from this course can I really understand how to conduct educational research properly.
I feel so lucky that I can study this course. Students are from different places. We can share our experiences with each other in the course website, with no restriction of time and place.
I met some of my classmates from Inner Mongolia and Malaysia at the AAOU (Asian Association of Open Universities) conference. We had had a lot of discussions on the internet, but the first sight of the real person was still so exciting, just like seeing old friends after a long time.
The e-learning study materials are so clear and interactive. It can serve as a good example for my own e-learning course development.
Thanks to the enthusiasm and good examples of the staff tutor and tutors, I really enjoyed the e-learning learning environment of this course.
Besides studying different research methods, I have also learned a lot about how to develop quality e-course materials and how to facilitate discussion forums effectively.
Many thanks for Professor to develop and chair this course. Also thanks a lot for the passion and hard work of the tutors and other staff. This course has achieved better teaching and learning effectiveness than face to face instruction. In addition to those different research methods, I have also learned a lot about how to develop quality e-course materials and how to facilitate e-learning discussion effectively. Meanwhile, I also got to know many friends in the same field from different places. This e-learning course is definitely a good model and worthy of studying.
Quality Assurance in E-Learning: PDPP Evaluation Model and its ApplicationZhang and Cheng
Vol 13 | No 3 Research Articles June 2012 80
Sustainability.
The success of this e-learning course has built up a good reputation. Many institutions have reserved places for their staff, and the long waiting list of potential students shows the course’s success, which ensures its sustainability.
ConclusionThe PDPP model for evaluating e-learning courses was designed and proposed based upon the CIPP evaluation model (i.e., planning evaluation, development evaluation, process eval-uation, and product evaluation.) In line with the characteristics and process of e-learning teaching and learning, 26 evaluation items were identified within the PDPP model. Using the PDPP model, the authors took the e-learning course on Research Methods in Distance Education as a case study to describe and analyze the series of evaluation activities. The research results show that this PDPP evaluation model could effectively ensure the qual-ity of the e-learning course in terms of both teaching and learning effectiveness. However, the use of the PDPP model in this study measures only one purely e-learning course and further studies are needed. The authors hope that this model could contribute to the e-learning quality assurance literature in the Chinese context and could be one reference in establishing e-learning quality assurance models for other educational institutions.
AcknowledgementThis article is based on the paper presented at the 24th ICDE World Conference on Open and Distance Learning held on 2-5 October, 2011, on Bali, Indonesia. Some of the revisions made in the production of this article are based on discussions at the conference, for which I am very grateful to the participants.
Quality Assurance in E-Learning: PDPP Evaluation Model and its ApplicationZhang and Cheng
Vol 13 | No 3 Research Articles June 2012 81
ReferencesAllen, I. E., & J. Seaman. (2011). Going the distance: Online education in the United States,
2011. Retrieved from http://www.onlinelearningsurvey.com/reports/goingthe-distance.pdf.
Chinaacc (2009). About us. Retrieved from http://www.chinaacc.com/
Development and Planning Office of CCRTVU (2011). Education statistics communiqué of Radio & Television Universities in China. Journal of China Distance Education, 3, 72-76.
Education Life Website (2009). Economic crisis couldn’t prevent people from pursuing further education: E-learning education is blooming. Retrieved from http://www.yuloo.com/wangyuan/jyzc/2009-07-16/270066.html
Endean, M., Bai, B., & Du, R. (2010). Quality standards in online distance education. In-ternational Journal of Continuing Education and Lifelong Learning, 3(1), 53-73.
HKU SPACE (2010). Quality assurance manual, Retrieved from http://www.hkuspace.hku.hk/files/about-us/governance/quality-assurance/qa-in-hku-space/CoverP-age_eng.pdf.
Hu, Xiaohong (2009). E-learning application: 50% of HSBC courses will be provided e-learning in 2009. Journal of China Distance Education, 6, 77.
Jochems, W., van Merriënboer, J., & Koper, R. (2004). Integrated e-learning: Implica-tions for pedagogy, technology and organization. London: RoutledgeFalmer.
Jung, I., & Latchem, C. (2007). Assuring quality in Asian open and distance learning. Open Learning, 22(3), 235-250.
Jung, I, Wong, T.M., Chen, L., Baigaltugs, S., & Belawati, T. (2011). Quality assurance in Asian distance education: Diverse approaches and common culture. International Review of Research in Open and Distance Learning, 12(6), 63-83.
Zhang, W., & Jiang, G. (2007). Evaluation research in distance education. In W. Zhang, & G. Jiang (Eds.), Distance education research methods (pp. 184-197). Beijing: Higher Education Press.
Zhang, W., & Wang, L. (2005). International cooperation in the development of e-learning learning environment inventory. In W. Zhang (Ed.). Management and learner support in modern distance education (pp. 1-18). Beijing: Beijing Radio and TV University Press.
Quality Assurance in E-Learning: PDPP Evaluation Model and its ApplicationZhang and Cheng
Vol 13 | No 3 Research Articles June 2012 82
Zhang, W. Y. (2009). The theory and application of interaction-centered online interaction (in Chinese). Modern Distance Education Research, 2009(5), 10–13.
Young, E., Zhang, W., Chan, A., & Cheung, D. (2009). Survey on the demand for continu-ing education in Hong Kong. International Journal of Continuing Education and Lifelong Learning, 1(2), 103-118.
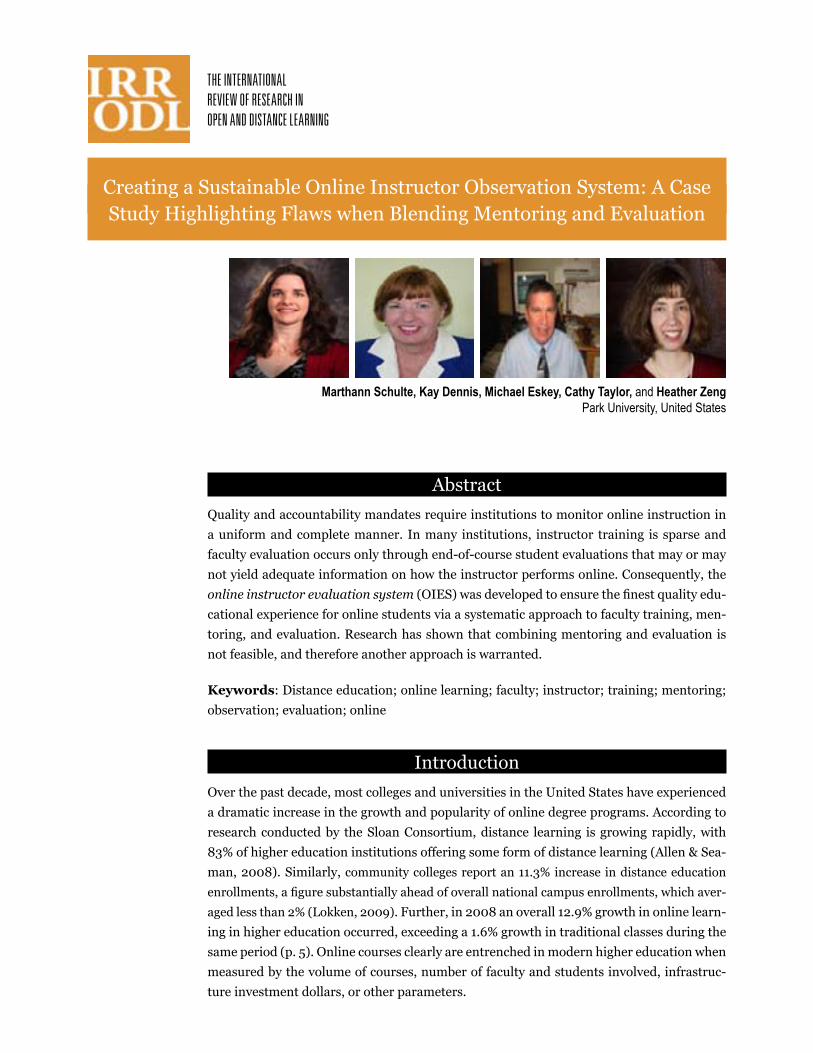
Creating a Sustainable Online Instructor Observation System: A Case Study Highlighting Flaws when Blending Mentoring and Evaluation
AbstractQuality and accountability mandates require institutions to monitor online instruction in a uniform and complete manner. In many institutions, instructor training is sparse and faculty evaluation occurs only through end-of-course student evaluations that may or may not yield adequate information on how the instructor performs online. Consequently, the online instructor evaluation system (OIES) was developed to ensure the finest quality edu-cational experience for online students via a systematic approach to faculty training, men-toring, and evaluation. Research has shown that combining mentoring and evaluation is not feasible, and therefore another approach is warranted.
Keywords: Distance education; online learning; faculty; instructor; training; mentoring; observation; evaluation; online
IntroductionOver the past decade, most colleges and universities in the United States have experienced a dramatic increase in the growth and popularity of online degree programs. According to research conducted by the Sloan Consortium, distance learning is growing rapidly, with 83% of higher education institutions offering some form of distance learning (Allen & Sea-man, 2008). Similarly, community colleges report an 11.3% increase in distance education
enrollments, a figure substantially ahead of overall national campus enrollments, which aver-
aged less than 2% (Lokken, 2009). Further, in 2008 an overall 12.9% growth in online learn-ing in higher education occurred, exceeding a 1.6% growth in traditional classes during the same period (p. 5). Online courses clearly are entrenched in modern higher education when measured by the volume of courses, number of faculty and students involved, infrastruc-ture investment dollars, or other parameters.
Marthann Schulte, Kay Dennis, Michael Eskey, Cathy Taylor, and Heather Zeng Park University, United States
Creating a Sustainable Online Instructor Evaluation System: A Case Study Highlighting Flaws when Blending Mentoring and EvaluationSchulte, Dennis, Eskey, Taylor, and Zeng
Vol 13 | No 3 Research Articles June 2012 84
Students cite convenience and flexibility as dominant reasons to enroll in online courses (Northrup, 2009). Faculty also benefit from online course flexibility and convenience as it provides more professional options such as teaching part-time at one or more institutions, an option to supplement academic retirement, and professional development opportuni-ties. Institutions benefit from enhanced access and revenue from students who reside a great distance from the institution’s geographic location. Employers appreciate the avail-ability of workers with additional qualifications, attained with less absenteeism or career interruption.
As institutions of higher learning strengthen their infrastructures to accommodate the de-mand for online courses and programs, urgent needs for trained and properly motivated faculty emerge. Through proactive measures to train, mentor, evaluate, and remediate on-line faculty, colleges and universities can limit potential student problems and complaints. It is not sufficient merely to train instructors without conducting follow-up administrative or peer scrutiny of their performance. Quality and accountability mandates obligate in-stitutions to monitor online instruction in a uniform and complete manner. Institutional circumstances require that such monitoring be conducted efficiently.
Park University, with a historic campus located in Parkville, Missouri (near Kansas City) and 40 campus centers in 21 states, has developed and implemented a quality management system to ensure that students are taught by trained, mentored, and evaluated faculty. Park has experienced a surge in distance education enrollments, with a student enrollment full-time equivalent (FTE) of 20,000 and over 50,000 total enrollments annually. The univer-sity employs approximately 350 online instructors to teach more than 450 course sections each eight-week term in order to accommodate student demand. Because Park is commit-ted to high standards, academic integrity, course content consistency, and effective mea-sures of learning outcomes, the transition to the online course delivery mode has necessi-tated new approaches to monitoring and evaluating academic quality.
In many institutions, instructor training is sparse and faculty evaluation occurs only through end-of-course student evaluations that may or may not yield adequate information on how the instructor performs online. However, Park promotes academic rigor by fun-neling substantial resources into faculty training and evaluation. Consequently, the online instructor evaluation system (OIES) was developed to ensure the finest quality educational experience for online students via a systematic approach to faculty training, mentoring, and evaluation (Mandernach, Donnelli, Dailey, & Schulte, 2005). Using a case study approach, the OIES was created based upon institutional need, existing research on online learning, and resources available for instructor mentoring and evaluation.
Creating a Sustainable Online Instructor Evaluation System: A Case Study Highlighting Flaws when Blending Mentoring and EvaluationSchulte, Dennis, Eskey, Taylor, and Zeng
Vol 13 | No 3 Research Articles June 2012 85
Literature Review
BackgroundInstitutions with online learning courses and programs are understandably interested in best practices and empirical information that can strengthen their distance learning opera-tions. Consequently, evaluation of online courses is a popular topic in the research litera-ture (Dykman & David, 2008; Lord, 2009; Mandernach et.al., 2005; Weschke & Canipe, 2010; Villar Angulo & Alegre de la Rosa, 2007; Avery, Bryant, Mathios, Kang, & Bell, 2006). Distance learning practitioners have struggled to create effective models for designing, assessing, and evaluating online courses. Observation of the Web sites of online and/or higher education associations reveals various references to guidelines and best practices that encourage excellence in online learning. Individual authors also add to the depth and breadth of online learning interest. The oft-cited seven principles (Chickering & Ehrmann, 1996) and subsequent application of the principles to online course evaluation (Graham, Cagiltay, Lim, Craner, & Duffy, 2001) are but two examples. Such seminal works, with their learning-focused criteria, provide the theoretical background of adult learning theory that guides this research. Additionally, these adult learning principles have guided the develop-ment of many online programs.
The system described herein incorporates an array of best practices for teaching online, notably the seven principles (Chickering & Ehrmann, 1996; Graham et.al., 2001). Through our initial review of the literature, coupled with an analysis of key components of the Park course platform and course layout, an evaluation process was established using a case study approach. As the OIES is a dynamic system, this section presents some of the research that influenced this process. By implementing various versions of the document over a period of time and analyzing the outcomes, improvements were made to the evaluation tool and the overall process. While thematically the coverage areas remain the same, the evaluation tool process has been refined to clarify what the institution expects from instructors. The fol-lowing sections provide an overview of focal areas that emerged from the OIES and which contributed to the present streamlined model used at the university.
Community in the ClassroomAs noted above, the seven principles (Chickering & Ehrmann,1996; Graham et al., 2001) provided the basis for the criteria established for the review. The importance of establish-ing community in the classroom has been confirmed by a number of writings. Dykman and Davis (2008) affirm the use of a personal profile as the first real opportunity to set the tone for the course with students. Moreover, it is an important early opportunity to con-nect with the students and therefore warrants careful consideration and preparation. The authors conclude that “Consistent interaction, steady participation, and timely reinforce-ment are the keys to keeping the students in an online course involved and active” (p. 287). Malbrito (2001) aligns with the preceding authors in recognizing the importance of student introductions in the course. Inducing students to post meaningful profiles is well worth the effort for the overall success of the virtual classroom experience. The OIES emphasizes the
Creating a Sustainable Online Instructor Evaluation System: A Case Study Highlighting Flaws when Blending Mentoring and EvaluationSchulte, Dennis, Eskey, Taylor, and Zeng
Vol 13 | No 3 Research Articles June 2012 86
importance of encouraging all students to post an introduction and suggests that instruc-tors should reach out to students who may be late in posting their introductions. The OIES also reminds instructors to acknowledge the presence of students in the online classroom and to comment in an authentic way on the student’s sharing of personal information.
Discussion Facilitation in Online InstructionAnother area of the OIES that emerged from the literature is effective discussion facilita-tion in online instruction. The OIES examines both policy compliance and level of engage-ment by the online instructor. Instructors are required to participate a specific number of days each week and to engage in critical thinking dialogue with students to promote quality postings. In support of this emphasis area, Dietz-Uhler, Fisher, and Han (2007) reviewed a study of retention rates in online education. Some students reported that their reasons for dropping out of a course included a lack of instructor participation, feedback, and replies to student e-mails. Barnard, Paton, and Lan (2008) suggest that instructors of online courses should be especially concerned with creating learning environments where positive percep-tions toward online course communication and collaboration can be informed and fostered. This latter qualitative study revealed that while positive instructor feedback and interest in their work elicited pleasure and pride in students, failure by the instructor to acknowledge their potential produced shame. These findings bear clear andragogic implications for on-line teaching. Ultimately the instructor must be willing to re-evaluate and to revise teacher-learner roles and relationships. Thus, through analyzing the relevant literature the evalu-ation team realized that discussion facilitation distinctly differentiates the online course from an independent study. Therefore, acknowledgement by instructor and peers is central to the learning success of each student and poses a unique opportunity for instructors.
Mann (2005) describes discussion as an essential dimension of the online course. The dis-cussion feature should resemble a conversation that allows each participant a voice in the learning group and its workings. Responsibility is reciprocal. Mann suggests that instruc-tor withdrawal from the discussion will lead to stagnation. To avoid this, instructors must be fully cognizant of their privilege and power and use them judiciously to engage learners with their classmates and the content. This vital classroom communication dynamic is re-flected in the tone, engagement, and guidance provided in the online instructor observa-tion. It seeks to eliminate stagnation in favor of ongoing instructor presence and to prompt feedback to students throughout the course. These critical points are precisely captured in the OIES.
Assessment, Grading, and FeedbackOther areas of emphasis in the OIES include a focus on the instructor’s approach to course assessments, grading, and feedback. Dykman and Davis (2008) address this issue in their dialogue on efficacy in the online classroom. These authors confirm that students are al-ways very concerned about grades and that too much ambiguity about grading in an on-line course can destroy the instructor’s credibility with the students. The authors posit that without the normal contact found in a conventional classroom, students seldom know what to expect from an instructor. Ambiguity or inconsistency in grading quickly destroys trust.
Creating a Sustainable Online Instructor Evaluation System: A Case Study Highlighting Flaws when Blending Mentoring and EvaluationSchulte, Dennis, Eskey, Taylor, and Zeng
Vol 13 | No 3 Research Articles June 2012 87
The OIES provides a rigorous analysis of the instructor’s progress in grading, use of rubrics, and providing individualized feedback to students on their performance.
Some key findings that relate to the development of the OIES involve a 2010 survey of more than 550 higher education faculty and students in the United States and Canada. More than a third of the faculty in the sample said they were not proficient with their institution’s course management system. Students reported being either “pretty much lost” or that they “know a little, a few basics” (Primary Research Group, 2010). These findings support claims that it is essential for instructors to be supported in using the tools in order to provide feed-back and grading and also that students must be provided guidance that help them learn and to assimilate into the online culture. Through the self-assessment feature of the OIES, reflection and metacognition enable our instructors to consider how effective they are at providing feedback and assigning grades. Through this process instructors build their ca-pacity for integrating best practices in their work.
Course Climate and Learning Environment A final best practice to be discussed here is one of the most critical focal areas of the OIES, course climate and learning environment. Over the years of implementing the OIES, our team has strived to assure that the learning climate in our online courses is conducive to the academic success of a diverse group of adult learners. Our experience with observing courses over the past several years affirms the research of Gilmore and Warren (2007). The findings of their qualitative study of online seminars confirm that when an instructor is absent or provides limited interaction in the online classroom, students feel isolated in their learning. Students are then forced to navigate the curriculum alone or to bond with classmates, who are not content experts. The OIES evaluators have recognized that ample clarification, addressing students by name, and timely follow-up to questions and concerns are beneficial in establishing student/instructor respect and trust in the classroom. Dyk-man and Davis (2008) attest similarly that consistent interaction, steady participation, and timely reinforcement are the keys to keeping online students involved and active. The OIES process affirms that quality online teaching requires extensive interaction and a substantial commitment of the instructor’s time and effort.
This section highlighted some of the supportive literature and lessons learned as related to the OIES development. It should be emphasized that this OIES process was integrated in tandem with an academic institutional examination to assure a seamless investment in in-structor efficacy and engagement in the online classroom. Aspects of traditional and online evaluation processes in the field of faculty development were used to provide additional insights into the model, strategy, and implementation that would work well at the univer-sity and at the same time also provide a unique learning context. The OIES offers a rigorous evaluation system for instructors who may require extensive support in transitioning to the online instructional environment.
Creating a Sustainable Online Instructor Evaluation System: A Case Study Highlighting Flaws when Blending Mentoring and EvaluationSchulte, Dennis, Eskey, Taylor, and Zeng
Vol 13 | No 3 Research Articles June 2012 88
Effective Methods of Performance Management (Faculty Devel-opment)Lord (2009) suggests that professors should develop delicate ways to identify weaknesses and praise strengths. Weschke and Canipe (2010) describe an evaluation model similar to the OIES which is conducted peer-to-peer and is not derived from administrative leader-ship. This similar model identifies collaborations among instructors that lead to construc-tive faculty development. After several years of implementation, the results of many obser-vations suggest that our emphasis on carefully worded, concrete checklists has yielded less ambiguity and confusion about the performance level expected of online instructors.
The strength of the OIES lies in its futuristic element of embedding opportunities for self-guided reflection and learning by the instructor being evaluated. According to Ciezki and Kharé (2010), these types of self-directed reflections and participative reviews benefit both employers and employees as they build a sense of ownership and motivation through com-munication and negotiation. In many ways, self-directed learning allows employees to as-sume responsibility and a certain level of personal investment. This unique combination of reflection, dialogue, review of professional development topics, and final summary in the OIES provides a robust quality assurance process. It also provides a tier of support in work-ing with a faculty evaluator, thus humanizing the evaluation process and helping to align the instructor’s self-assessment with the actual criteria established on the OIES. Further-more, it provides an objective observation with rationale for best practices.
A range of sensitive topics are addressed in the faculty evaluation. The OIES model bal-ances objectivity with a tightly written checklist and rubric that eliminate subjectivity. It has also fostered a broad-brush professional development approach for acquiring skills at teaching online.
Case Study: An Overview of the OIES MethodFirst implemented in 2004, the online instructor evaluation system aided the Park Uni-versity Distance Learning division in the areas of online instructor mentoring, evaluation, course scheduling priority, and professional development. A total of 437 separate OIES evaluations have been conducted on online instructors up to the present day. The number of evaluators has fluctuated from term to term depending upon evaluator availability and course numbers needed. For example, one evaluator might have conducted evaluations in one eight-week accelerated term, followed by a term in which five or six evaluators per-formed OIES evaluations. Over the years of use, 12 OIES evaluators have been trained and utilized. The current cadre of six evaluators includes members who have followed the pro-cess from its inception to the present. The materials that follow in this case study are based on the cumulative experiences of this author and evaluator workgroup.
The robust and comprehensive nature of the OIES is one of its strengths. The OISE includes both formative and summative evaluation components. The formative reviews, a total of five, are completed by the instructor evaluators at the beginning of the term and continue

Creating a Sustainable Online Instructor Evaluation System: A Case Study Highlighting Flaws when Blending Mentoring and EvaluationSchulte, Dennis, Eskey, Taylor, and Zeng
Vol 13 | No 3 Research Articles June 2012 89
every two weeks during the eight-week term. Each review focuses on specific online best practices and/or Park University online learning policy. The reviews provide boxes for each criterion, the evaluator rating of the level to which the instructor has met the criterion, and comments. The comment box provides the most useful formative/mentoring feedback for online instructors. Evaluators have compiled banks of commonly used comments to facili-tate the completion of each review, but often it is necessary to customize the comments for the needs and idiosyncrasies of each instructor.
The intended result of each formative review is to spark a mentoring dialogue between instructor and evaluator. Each formative review is posted to a secure online portal. An au-tomated email notifies the instructor that the review is available. Frequently, questions, suggestions, and guidance on best online teaching practices dominate the subsequent men-toring discussions. The OIES team has found that reactions to the formative reviews are as unique as the instructors. Some instructors become very involved in the “back and forth” discussions (via phone, email, or both) of the reviews and possible modifications of their teaching practices. Other instructors mistakenly view the formative reviews as “judgments” on their teaching. Dispelling these misperceptions quickly and efficiently is important so that mentoring discussions can prevail.
In an effort to maximize the benefits of mentoring, the OIES includes an instructor self-review component during the formative stages. Self-reviews, which are completed every two weeks, mirror the corresponding weeks’ formative reviews. Criteria for the self-reviews and formative reviews are complementary so that both instructor and evaluator focus on the same items at once. While the self-reviews are not mandatory, they are strongly encour-aged for reasons of professional development, rich instructor input, and acknowledgement of areas of strength or weakness. The self-reviews are not viewed by the evaluator during the term, although the instructor can choose to share the self-reviews with the evaluator if deemed appropriate to enhance understanding or meet mentoring needs. The self-reviews are compiled via a secure online portal and shared with the academic department at the end of the term.
The summative component of the OIES includes a summative review and end-of-term student evaluations of the course and instructor. The summative review is completed by the same evaluator who conducted the formative/mentoring process during the term. The summative review is designed to encapsulate the formative review process and to stress changes (either positive or negative) in the instructor’s facilitation of the course during the formative/mentoring phase. Ultimately, the evaluator makes a recommendation of wheth-er the instructor should be a) retained, b) retained with contingencies, or c) not retained as an online instructor at the university. A fourth level, probation, was used briefly, but this category was difficult to distinguish from retain with contingencies. For this reason the two ratings were merged. As remediation and retraining are desirable for most online instruc-tors having difficulty, the merged category used the label retain with contingencies to con-note a more mentoring, developmental stance by the university. While the overall rating levels provide categorization and overall feedback, instructors and evaluators suggest that it is the comments (in both formative and summative reviews) that provide the most helpful
Creating a Sustainable Online Instructor Evaluation System: A Case Study Highlighting Flaws when Blending Mentoring and EvaluationSchulte, Dennis, Eskey, Taylor, and Zeng
Vol 13 | No 3 Research Articles June 2012 90
guidance to online instructors.
The summative components of the OIES and instructor self-reviews are delivered to the instructor’s academic department online program coordinator. Based upon the summative review, instructor self-reviews, and student evaluations, the program coordinator deter-mines which individual courses the instructor may be assigned to teach in the future or if the instructor no longer will be given departmental teaching assignments. Online admin-istrators also use the summative components of the OIES to determine if the instructor is adept at handling online instruction and the particular policies of online learning. In this way, both the academic and administrative areas utilize the OIES when making instructor retention decisions.
Outcomes of the OIESOf the 437 OIES evaluations conducted to date, 379 (86%) bore the final rating of retain.Thirty-eight reviews were rated retain with contingencies, nine were probation (a term which is not currently used), and 11 were in the category of do not retain. These statistics support the overall intent of the OIES as a mentoring mechanism to retain and retrain online instructors. Because so few instructors received negative ratings, we concluded that the OIES either reinforced existing positive online facilitation or that instructors who may have been struggling in their online facilitation were properly guided and mentored via the formative reviews so as to result in acceptable improvement by the end of the process. One cannot assume that the OIES itself leads to good online facilitation, but the data and outcomes of the OIES do enhance instructor awareness of and adherence to policy and best practices in online learning.
After implementing the OIES, the team found numerous strengths and some weaknesses. These strengths and weaknesses fell into two main categories: administration-oriented and instructor-oriented. Administrative issues included a) the time involved in completing each formative review, b) standardizing the nomenclature and comments that passed between the instructor evaluators, and c) managing the list of current and future reviewees for the OIES. Instructor-oriented issues included a) explaining and allowing for differences in the instructional strategies used across courses (that is, the instructor presentation of devel-oped course content) and b) the notable differences between new instructors and experi-enced instructors regarding their perceptions of the OIES.
Time Early in the implementation of the OIES, the instructor evaluators discovered that the for-mative reviews (which were completed and delivered to instructors every two weeks) were very time-consuming. Each criterion on the reviews required the instructor evaluator to access the online course via the learning management system and to scrutinize multiple areas in which the instructor facilitated student learning. This process became even more time-consuminG as the instructor evaluators often had to compare instructor facilitation of course content to the master course developed content. If they found instructor deviations from the master course content (which could be either beneficial or detrimental depending upon the deviation), the evaluator had to spend additional time consulting with adminis-
Creating a Sustainable Online Instructor Evaluation System: A Case Study Highlighting Flaws when Blending Mentoring and EvaluationSchulte, Dennis, Eskey, Taylor, and Zeng
Vol 13 | No 3 Research Articles June 2012 91
trators or the academic department concerning the content changes. It was not uncommon for a normal formative review to take 30–50 minutes to complete. One strategy to address this time factor was for each evaluator to evaluate a group of instructors teaching differ-ent sections of the same course. This strategy allowed the instructor evaluator to become very familiar with the developed content and to then discern efficiently the differences each instructor used in the facilitation of their course section. Consequently, evaluating several sections of the same course reduced the time required to approximately 20–35 minutes per review.
Standard LanguageAnother administrative issue involved standardizing the language used by the instructor evaluators. This element was a natural extension of the criterion-based nature of the for-mative reviews. The instructor evaluators had to ensure that their interpretation of the cri-teria was consistent not only among themselves, but also with the policies of the online operations unit and academic departments. Each instructor evaluator spent much time in telephonic and email communication with the other instructor evaluators to ensure that a uniform message would be conveyed to online instructors. Building on this desire for uniformity of interpretation, the OIES team developed comment banks for each review. The comment banks were shared with each instructor evaluator and helped ensure that each online instructor received the same information about Park policies and online in-structor facilitation expectations. Instructor evaluators did have the latitude to customize their comments for each review and for each instructor, but the comment banks increased continuity and equity in the formative reviews. The comment banks were also time-efficient as the same comment, if warranted, could be quickly cut and pasted into several formative reviews. Another strategy for achieving standard language among the evaluators would be interrater reliability research. Interrater reliability has not yet been assessed for the OIES, but it would be an appropriate way to gauge standardization and equitable treatment in reviews.
ManagementA final administrative consideration was managing a list of current and future OIES re-viewees. To meet this need, a spreadsheet was created and archived by the lead instructor evaluator. The spreadsheet included all the pertinent administrative information as well as OIES term, evaluator, and summative evaluation information. In addition, this archival system provided a plan for future OIES terms by anticipating instructor teaching assign-ments and evaluator availability. The lead instructor evaluator kept track of online instruc-tors who received retain with contingencies summative evaluation ratings and planned for these instructors to be evaluated again during the next term. A system of OIES referral was also created in which operations staff and department program coordinators could suggest instructors for OIES evaluation. Referrals could be made on the grounds of administrative infractions (failure to follow university policies) or facilitation concerns (improper interac-tion with students in their online classroom). While it was a sufficient administrative tool, the master spreadsheet and working versions became unwieldy and prone to input error. Attempts were made to create a database and online portal entry for administrative needs,
Creating a Sustainable Online Instructor Evaluation System: A Case Study Highlighting Flaws when Blending Mentoring and EvaluationSchulte, Dennis, Eskey, Taylor, and Zeng
Vol 13 | No 3 Research Articles June 2012 92
but these needs were not met due to a lack of computer programming personnel and/or funding resources.
Course/Instructor DifferencesInstructor-oriented issues with the OIES were more revealing, arguably, than the admin-istrative issues. A perennial online instructor issue related to the difference between an instructor and a course developer. According to university policy, course developers cre-ate the course content, following university and operations guidelines; and this content is subject to approval by the academic department. The developed material is then provided to the various online instructors for individual course sections. Instructors are encouraged to add supplemental course content to provide for their own instructional differences and preferences. This policy was confusing to online instructors; therefore, the OIES served as a reinforcement of this guideline. Some instructors felt their creativity was stifled by the policy, but the mentoring exchanges with the instructor evaluators provided suggestions for taking the developed course content and enhancing the material with their own facili-tation methods. Through the formative reviews and mentoring early in the term, instruc-tors received guidance and tips from the evaluator to enhance the later weeks of the term. Evaluators were able to explain university policy and expectations in a real course context. In some instances, evaluators served as a peer bridge between content developers and indi-vidual section instructors. The presence of an intermediary was also beneficial when misin-terpretations occurred between administrative needs and instructor intentions.
New versus Experienced InstructorsOne striking difference was the perception of the OIES among new instructors compared to existing instructors. The OIES was envisioned primarily as an efficient mentoring tool to aid new online instructors on the grounds that new instructors, unfamiliar to university policies and/or online instruction, would be the greatest beneficiaries of the OIES forma-tive reviews. It was also believed that these new instructors would be suspect of the OIES as a “judgment” of their online facilitation ability. In actuality, the instructor evaluators observed that new instructors were among the most receptive to the formative, mentoring reviews. They appreciated the guidance and even the way in which the formative reviews provided them with a measure of their online facilitation performance during the term. The early formative reviews were timed so that corrections could be made within the ac-tive term in order to benefit current students. One new instructor commented, “I love the constructive criticism and since this is my first time teaching online courses, it is greatly appreciated.” Another instructor echoed, “This being my first course online has been a great experience, learning as I go as well as generating ideas for me on how to make changes in the course materials, supplements, etc.”
Experienced Park online instructors were equally appreciative of the OIES, but the in-structor evaluators witnessed an initial suspicion from these instructors. These suspicions ranged from questions about a) why they were being evaluated, b) how the information would be reported to their department, and c) the credentials of the instructor evaluators. The instructor evaluators found that it was best to quell these concerns by underscoring the
Creating a Sustainable Online Instructor Evaluation System: A Case Study Highlighting Flaws when Blending Mentoring and EvaluationSchulte, Dennis, Eskey, Taylor, and Zeng
Vol 13 | No 3 Research Articles June 2012 93
fact that the OIES was primarily a formative, mentoring evaluation system. The reviews were designed to guide and suggest, not judge and dictate. As these existing instructors became familiar with the review process and the mentoring discussions with the instructor evaluator, they too became appreciative of the OIES and looked to the instructor evaluators for new ideas to enhance their teaching. The following is a good example of this mentality of sharing, fostered by the OIES. “Are there examples to share from other instructors as to how they might be embellishing the rubric, grading system if that’s what you want us to do?” A common culminating comment to an instructor evaluator from an experienced instructor was, “Thanks for your excellent suggestions and mentoring. They were very ben-eficial.” This was the predominant sentiment from existing and new instructors after expe-riencing the OIES.
ConclusionsEvaluation is a human process. As such, the OIES promotes the evaluator’s ability to work effectively to positively guide an instructor during the course. Cognizant of issues that can arise (i.e., instructor illness, course room development issues, technological challenges, natural disasters, or other life issues) the evaluator also must provide some room for flex-ibility. The instructor stands central in this evaluation process and is assessed distinctly with a final observation rating or outcome level. Regardless of the outcome of the OIES evaluation in terms of the instructor’s rating, the continual conversation centers on estab-lishing the ideal environmental conditions online for students to forge learning and criti-cal thinking. Through integrated support, a learning community online, and ongoing pro-fessional development resources with examples that identify best practices, the instructor finds collegial support.
Overall, the instructor evaluation team was encouraged by the instructor reactions to the OIES. The team realized that clarification and emphasis on the formative/mentoring na-ture of the reviews was extremely important. It was equally important to spend as much time as necessary in the mentoring dialogues between the instructor and instructor evalu-ator. The reviews proved to be an excellent guide for these mentoring exchanges, which occur within a context of guidance and mutual benefit. However, at times the evaluators experienced frustration when their mentoring advice was ignored.
The evaluation component became problematic for in the final analysis, at close of term, the instructors’ skills, progress, and potential must be categorized in a final recommendation in order to meet administrative needs of the institution. Evaluators experienced conflict of interest when shifting from a mentoring role to that of evaluator. Rendering these de-terminations often severed the mentoring relationship permanently. The team concluded that mixing mentoring with a high-stakes judgment is illogical. Therefore, future evaluative mechanisms at Park University separated the mentoring and evaluation functions.
Another charge from the university pertained to an annual teaching evaluation. The thor-ough, nurturing nature of the OIES reviews placed severe constraints on the number of on-line instructors who could be evaluated annually by the limited pool of available evaluators.
Creating a Sustainable Online Instructor Evaluation System: A Case Study Highlighting Flaws when Blending Mentoring and EvaluationSchulte, Dennis, Eskey, Taylor, and Zeng
Vol 13 | No 3 Research Articles June 2012 94
There were simply too many instructors and too few evaluators. Fulfilling the annual evalu-ation requirement for all online adjunct instructors was unsustainable given the mentor-ing nature of the reviews. Knowing that no more evaluators were available, a streamlined evaluation model was sought.
A shorter instrument was devised that focused only on evaluation. The faculty online ob-servation (FOO) reflected the lessons learned from implementing the OIES. The FOO con-sists of fewer evaluation criteria, observes an instructor during a short, finite span of time, and yet retains the necessary online evaluation components stressed in the research litera-ture and found to be paramount in the OIES experience. The FOO continues to emphasize the same critical areas, thereby ensuring that student learning needs are still met via proper online instructor facilitation. The FOO uses the same retrievable archive as the OIES for university administrative use and instructor feedback.
Every aspect of online education at Park University occurs collaboratively. From situat-ing a course within a curriculum, through syllabus formation, course design, development, delivery, approvals, to faculty training, we anticipate and solve problems relative to qual-ity. Every online instructor is welcomed to Park with the understanding that providing the best educational experience available is our top priority. The next logical step is to ensure that the instructor possesses the proper skills, mindset, and expertise to facilitate student learning. The OIES provided valuable insight into the hazards of blending mentoring and evaluations. The FOO brings to fruition these high standards and the demands of modern distance education.
Creating a Sustainable Online Instructor Evaluation System: A Case Study Highlighting Flaws when Blending Mentoring and EvaluationSchulte, Dennis, Eskey, Taylor, and Zeng
Vol 13 | No 3 Research Articles June 2012 95
ReferencesAllen, E. I., & Seaman, J. (2008, November). Staying the course: Online education in the
United States. The Sloan Consortium. Retrieved from http://www.sloan-c.org/publications/survey/pdf/staying_the_course.pdf
Avery, R., Bryant, W., Mathios, A., Kang, H., & Bell, D. (2006). Electronic course evalua-tions: Does online delivery system influence student evaluations? Journal of Eco-nomic Education, 37(1), 21–37.
Barnard, L., Paton, V., Lan, W. (2008). Online self-regulatory learning behaviors as a me-diator in the relationship between online course perceptions with achievement. In-ternational Review of Research in Open & Distance Learning, 9(2), 1–11.
Chickering, A., & Ehrmann, S. (1996). Implementing the seven principles: Technology as lever. AHHE Bulletin, October 3–6. Retrieved from http://www.tltgroup.org/pro-grams/seven.html.
Ciezki, C., & Kharé, N. (2010). Personal learning plans: A tool for engaging and retaining talent. National Career Development Association’s Career Convergence Newslet-ter. Retrieved from http://associationdatabase.com/aws/NCDA/pt/sd/news_ar-ticle/28851/_PARENT/layout_details_cc/false
Dietz-Uhler, B., Fisher, A., & Han, A. (2007). Designing online courses to promote student retention. Journal of Educational Technology Systems, 36(1), 105–112.
Dykman, C., & Davis, C. (2008) Online education forum – Part three: A quality online edu-cational experience. Journal of Information Systems Education, 19(3), 281–289.
Gilmore, S., & Warren, S. (2007). Emotion online: Experiences of teaching in a virtual learning environment. Human Relations, 60(4), 581–608.
Graham, C., Cagiltay, K., Lim, B., Craner, J., & Duffy, T. M. (2001, March/April). Seven principles of effective teaching: A practical lens for evaluating online courses. http://technologysource.org/article/seven_principles_of_effective_teaching/
Lokken, F. (2009). 2008 distance education survey results: Tracking the impact of e-learning at community colleges. Washington, DC: Instructional Technical Coun-cil. Retrieved from http://www.itcnetwork.org/file.php?file=%2F1%2FITCAnnualSurveyMarch2009Final.pdf
Lord, T. (2009). “But I thought we were colleagues?” Professors evaluating professors. Journal of College Science Teaching, 38(3), 62–66.
Malbrito, M. (2001), Facilitating interactivity in an online business writing course. Busi-ness Communication Quarterly, 64(3), 81–86.
Creating a Sustainable Online Instructor Evaluation System: A Case Study Highlighting Flaws when Blending Mentoring and EvaluationSchulte, Dennis, Eskey, Taylor, and Zeng
Vol 13 | No 3 Research Articles June 2012 96
Mandernach, B. J., Donnelli, E., Dailey, A., & Schulte, M. (2005). A faculty evaluation mod-el for online instructors: Mentoring and evaluation in the online classroom. Online Journal of Distance Learning Administration, 8(3). Retrieved from http://www.westga.edu/~distance/ojdla/fall83/mandernach83.htm
Mann, S. (2005). Alienation in the learning environment: A failure of community. Studies in Higher Education, 30(1), 43–55.
Northrup, P. (2009). Online learners’ preferences for interaction. In A. Orellana, T. Hudgins, & M. Simonson (Eds.), The perfect online course: Best practices for de-signing and teaching (pp. 463–473). Information Age Publishing.
Primary Research Group. (2010). The survey of higher education faculty: Use of educa-tional technology. New York, NY: Primary Research Group.
Villar Angulo, L., & Alegre de la Rosa, O. (2007). Online faculty development and assess-ment systems (OFDAS): A study of academic learning. Journal of Personnel Eval-uation in Education, 20, 21–41.
Weschke, B., & Canipe, S. (2010). The faculty evaluation process: The first step in fostering professional development in an online university. Journal of College Teaching and Learning, 7(1), 45–55.
Mapping the Interplay between Open Distance Learning and Internationalisation Principles
AbstractOpen distance learning is viewed as a system of learning that blends student support, cur-riculum and instruction design, flexibility of learning provision, removal of barriers to ac-cess, credit of prior learning, and other academic activities such as programme delivery and assessment for the purpose of meeting the diverse needs of students. Internationalisation, on the other hand, is viewed as a process that blends intercultural international dimensions into different academic activities, such as teaching, learning, and research, into the purpose and functions of higher education. The common feature in the narratives that define open distance learning and internationalisation is the blending of university services to achieve specific outcomes. This blending feature has instigated an inquiry into identifying the inter-play between the two concepts in as far as how the concepts are defined and what their goals and rationale are in the context of higher education institutions. While there are a breadth and variety of interpretations of the two concepts, there are differences and common fea-tures. The purpose of such an analysis is to open a new window through which institutions of higher learning can be viewed.
Keywords: Curriculum design; higher education institutions; South Africa; internation-alisation; student support; teaching and learning
IntroductionBoth open distance learning (ODL) and internationalisation of higher education convey a variety of understandings, interpretations, and applications. For example, ODL is viewed as a system of meeting multiple and diverse learning needs of students through course design, administrative processes, and learner support (O’Rourke, 2009). Another view that is more nuanced towards promoting flexibility in learning provision is propounded by a number of
Pumela Msweli University of South Africa
Mapping the Interplay between Open Distance Learning and Internationalisation PrinciplesMsweli
Vol 13 | No 3 Research Articles June 2012 98
scholars such as Braimoh (2003) and Sonnekus, Louw, and Wilson (2006). There is also a view of ODL that emphasises acquiring, creating, and sharing knowledge by interacting asynchronously or synchronously without the constraints of space and time (De Beer & Be-zuidenhout, 2006; Monk, 2001; Littlejohn & Margaryan, 2010; De Beer, 2010; Heydenrych & Prinsloo, 2010). While these views are not necessarily mutually exclusive, they portray a system of learning that weaves together student support, curriculum and instructional design, and other academic activities such as programme delivery and assessment for the purpose of meeting the diverse needs of students.
It is not only the variety of interpretations that lend ODL comparable to internationalisa-tion, but it is also the interplay between the meaning and definitions of these concepts, es-pecially the blending or integrative characteristics of certain features of these concepts. For instance, a view of internationalisation as a process of integrating an international dimen-sion into the research, teaching, and services function of higher education, as propounded by Knight (2004), depicts the blending feature in the process of internationalisation that is similar to one of the key features of ODL.
Internationalisation literature also presents divergent views about the dimensionality of the construct. For example, Krause, Coates, and James (2005) see internationalisation as a five-dimensional concept including (1) teaching and curriculum issues, (2) faculty, (3) research, (4) student issues, and (5) strategy; whereas Elkin, Farnsworth, and Templer (2008) present a nine-dimensional measure of internationalisation in their study that ex-plores the relationship between strategy and the extent of externalisation. These include (1) undergraduate international students, (2) postgraduate international students, (3) stu-dent exchange programmes, (4) staff exchange programmes, (5) staff interaction in inter-national contexts at international conferences, (6) internationally focused programmes of study, (7) international research collaboration, (8) support for international students, and (9) international institutional links.
The integrative feature of the concepts of internationalisation and ODL has raised a ques-tion of how the two concepts converge in a manner that enhances the outputs and outcomes of higher education. The purpose of this article is to map out the interplay between these two concepts, with a special focus on how the concepts are defined as well as on the goals and rationale of the two concepts. Shedding light on the interconnectedness of the con-cepts is likely to strengthen the ability of higher education institutions to design offerings and systems that are more customer focused. This discourse is organised into four parts. The first part paints in broad brush strokes the context of ODL and internationalisation in South Africa. The second part of the paper is an explication of the meaning and definition of the two concepts. The third part looks into the rationale and goals of the two concepts then maps out how the two concepts are related. This is followed by a discussion on implications for higher education institutions.
ContextGlobalisation has posed many challenges to the South African economy. The 2008 global economic downturn, which was characterised by a fall in gross domestic product (GDP)
Mapping the Interplay between Open Distance Learning and Internationalisation PrinciplesMsweli
Vol 13 | No 3 Research Articles June 2012 99
and severe job losses, is a clarion call for higher education institutions to create new global competencies. The message is quite clear: Those who are skilled will secure the benefits of the global economy and thrive in the 21st century. The pressure is mounting with the New Growth Path Framework (Patel, 2011) to seek ways of creating 5 million jobs by 2020. The compelling pressure from all angles has opened up a space in the higher education sector to interrogate the employability of graduates for the new economy. At the regional level, the Higher Education and Training protocol for the nations of Southern Africa calls for harmonisation of the regional education systems and stresses maintenance of acceptable quality standards (SAUVCA, 2004). The quality imperative is being driven at the national policy level and it is at this level where strong messages are being sent for internationali-sation of education systems in the region. The Council on Higher Education (CHE, 2009) entrenches the idea of increasing recruitment of students from the Southern African Devel-opment Community (SADC) as a process of internationalisation. The outcome of attracting SADC students is not only to enrich the experience of South African students, but also to add to enrolment and graduation subsidies of host institutions (CHE, 2009).
In a comprehensive study on internationalisation in South Africa, McLellan (2008) argues for the importance of developing a broad framework for internationalisation that clarifies the government’s position on issues such as
• the role of South African higher education in guiding the internationalisation process;
• student mobility and government policy on harmonisation;
• the role of internationalisation in regional and continental development; and
• the redress and equity in relation to internationalisation.
Notwithstanding the lack of a framework that clarifies the government’s position, the CHE (2009) encourages South African institutions to engage with internationalisation because the country enjoys a leading position in research output and the number of foreign students it attracts to its shores in comparison to other African countries.
ODL is envisaged by the CHE (2009) to be the mechanism for opening access to people who would not have been able to study in face-to-face instructional situations or at a traditional institution. Out of the 23 public higher education institutions in South Africa, the highest proportion of enrolments (37.6%) in 2007 was in distance programmes (CHE, 2009). The 2004 merger between the University of South Africa, Technikon SA, and the distance learn-ing element of Vista marked a significant development in distance and open education in South Africa (CHE, 2009). University of South Africa is the dominant player in the provi-sion of distance education.
Mapping the Interplay between Open Distance Learning and Internationalisation PrinciplesMsweli
Vol 13 | No 3 Research Articles June 2012 100
Definitions: ODL versus Internationalisatoin
Defining ODLAs suggested by Heydenrych and Prinsloo (2010) there is no homogeneity in terms when it comes to describing ODL. Heydenrych and Prinsloo (2010) point out that even though open distance learning is used interchangeably with distance learning, not all distance edu-cation institutions embrace ODL, but all ODL institutions offer distance education. The terms used to describe ODL have differed across different geographical areas and institu-tions. The Commonwealth of Learning suggests that there is no single phrase that captures the essence of ODL. The rather different approaches and different terms that can be used to describe the concept may include “learner-centred education, open learning, open ac-cess, flexible learning and distributed learning” (Commonwealth of Learning, 2000, p. 2). To elucidate the point about the variants of distance education, the Commonwealth of Learning maps out four scenarios for ODL and points out that most ODL institutions use a combination of the four scenarios.
Scenario 1 – Same time, same place: Classroom teaching, face-to-face tutorials, seminars, workshops, and residential schools
Scenario 2 – Same time, different place: Audio conferences and video conferences, televi-sion, one-way or two-way videos etc.
Scenario 3 – Different time, same place: Learning resource centres which learners visit at their leisure
Scenario 4 – Different time, different place: Home study, computer conferencing, tutorial support by e-mail and fax communication
Table 1 presents a sample of ODL definitions. The definition offered by the CHE (2009) seems to be comprehensive enough to include key elements of distance learning featured in most ODL literature: (1) learner centredness, (2) lifelong learning, (3) flexibility, (4) provi-sion of learner support, and (5) removal of barriers to access. What makes the definition particularly relevant for South Africa is an addition of the recognition of prior learning (RPL) element which espouses a more inclusive approach to education. The principle of learner centredness in the CHE definition of ODL takes into account that learners come from different socioeconomic backgrounds with different needs that should be catered for in an open distance learning system.
A descriptive definition that portrays ODL from a European perspective was put forward by the Open and Distance Learning Quality Council of the European Association for Distance Learning (2010) as a form of learning that includes
any provision in which a significant element of the management of the provision is at the discretion of the
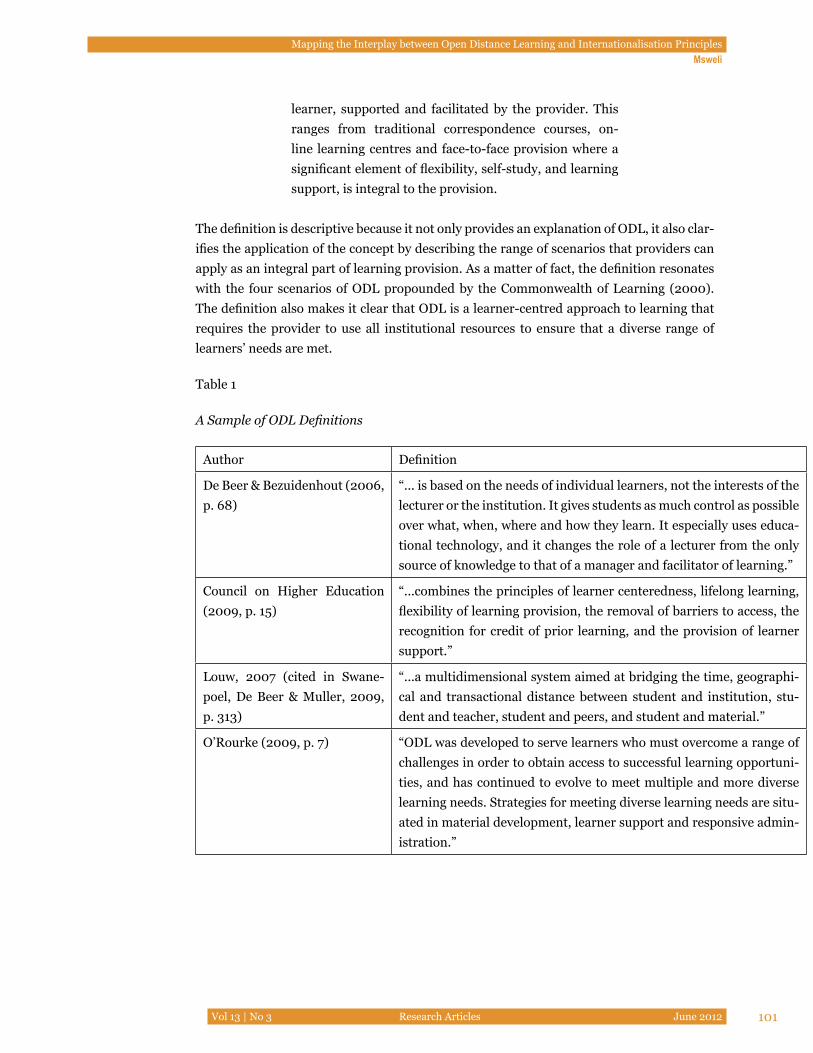
Mapping the Interplay between Open Distance Learning and Internationalisation PrinciplesMsweli
Vol 13 | No 3 Research Articles June 2012 101
learner, supported and facilitated by the provider. This ranges from traditional correspondence courses, on-line learning centres and face-to-face provision where a significant element of flexibility, self-study, and learning support, is integral to the provision.
The definition is descriptive because it not only provides an explanation of ODL, it also clar-ifies the application of the concept by describing the range of scenarios that providers can apply as an integral part of learning provision. As a matter of fact, the definition resonates with the four scenarios of ODL propounded by the Commonwealth of Learning (2000). The definition also makes it clear that ODL is a learner-centred approach to learning that requires the provider to use all institutional resources to ensure that a diverse range of learners’ needs are met.
Table 1
A Sample of ODL Definitions
Author Definition
De Beer & Bezuidenhout (2006, p. 68)
“... is based on the needs of individual learners, not the interests of the lecturer or the institution. It gives students as much control as possible over what, when, where and how they learn. It especially uses educa-tional technology, and it changes the role of a lecturer from the only source of knowledge to that of a manager and facilitator of learning.”
Council on Higher Education (2009, p. 15)
“...combines the principles of learner centeredness, lifelong learning, flexibility of learning provision, the removal of barriers to access, the recognition for credit of prior learning, and the provision of learner support.”
Louw, 2007 (cited in Swane-poel, De Beer & Muller, 2009, p. 313)
“...a multidimensional system aimed at bridging the time, geographi-cal and transactional distance between student and institution, stu-dent and teacher, student and peers, and student and material.”
O’Rourke (2009, p. 7) “ODL was developed to serve learners who must overcome a range of challenges in order to obtain access to successful learning opportuni-ties, and has continued to evolve to meet multiple and more diverse learning needs. Strategies for meeting diverse learning needs are situ-ated in material development, learner support and responsive admin-istration.”
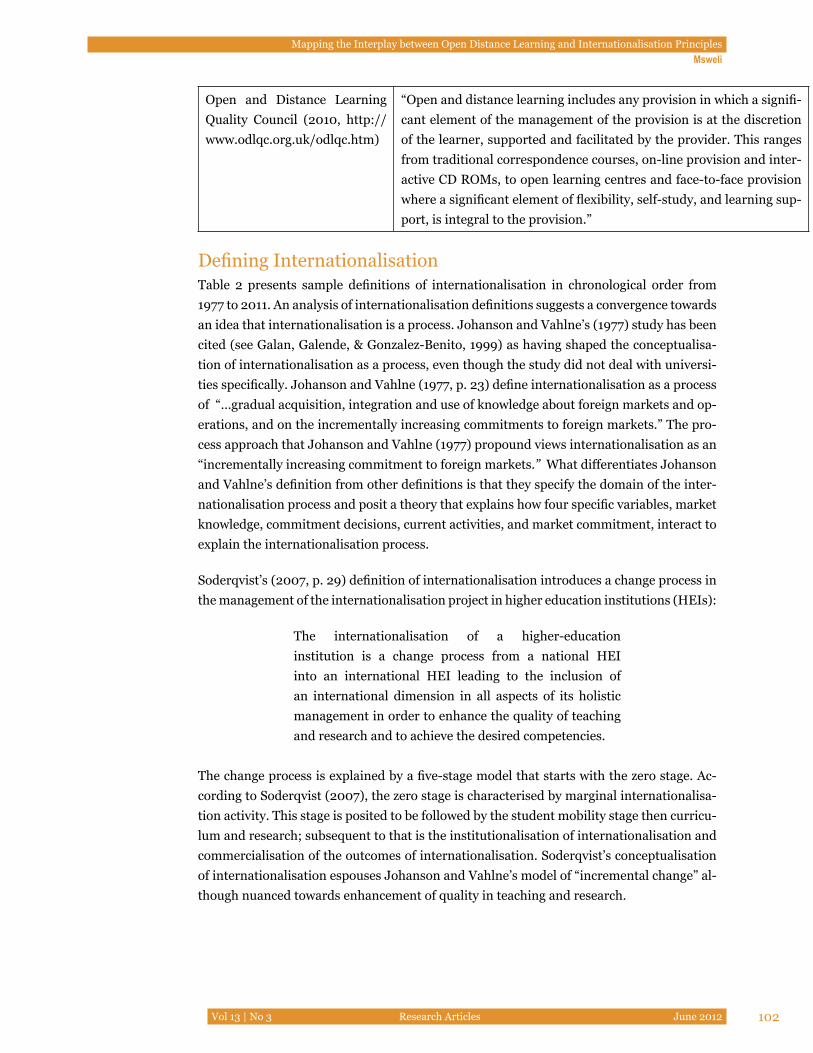
Mapping the Interplay between Open Distance Learning and Internationalisation PrinciplesMsweli
Vol 13 | No 3 Research Articles June 2012 102
Open and Distance Learning Quality Council (2010, http://www.odlqc.org.uk/odlqc.htm)
“Open and distance learning includes any provision in which a signifi-cant element of the management of the provision is at the discretion of the learner, supported and facilitated by the provider. This ranges from traditional correspondence courses, on-line provision and inter-active CD ROMs, to open learning centres and face-to-face provision where a significant element of flexibility, self-study, and learning sup-port, is integral to the provision.”
Defining InternationalisationTable 2 presents sample definitions of internationalisation in chronological order from 1977 to 2011. An analysis of internationalisation definitions suggests a convergence towards an idea that internationalisation is a process. Johanson and Vahlne’s (1977) study has been cited (see Galan, Galende, & Gonzalez-Benito, 1999) as having shaped the conceptualisa-tion of internationalisation as a process, even though the study did not deal with universi-ties specifically. Johanson and Vahlne (1977, p. 23) define internationalisation as a process of “…gradual acquisition, integration and use of knowledge about foreign markets and op-erations, and on the incrementally increasing commitments to foreign markets.” The pro-cess approach that Johanson and Vahlne (1977) propound views internationalisation as an “incrementally increasing commitment to foreign markets.” What differentiates Johanson and Vahlne’s definition from other definitions is that they specify the domain of the inter-nationalisation process and posit a theory that explains how four specific variables, market knowledge, commitment decisions, current activities, and market commitment, interact to explain the internationalisation process.
Soderqvist’s (2007, p. 29) definition of internationalisation introduces a change process in the management of the internationalisation project in higher education institutions (HEIs):
The internationalisation of a higher-education institution is a change process from a national HEI into an international HEI leading to the inclusion of an international dimension in all aspects of its holistic management in order to enhance the quality of teaching and research and to achieve the desired competencies.
The change process is explained by a five-stage model that starts with the zero stage. Ac-cording to Soderqvist (2007), the zero stage is characterised by marginal internationalisa-tion activity. This stage is posited to be followed by the student mobility stage then curricu-lum and research; subsequent to that is the institutionalisation of internationalisation and commercialisation of the outcomes of internationalisation. Soderqvist’s conceptualisation of internationalisation espouses Johanson and Vahlne’s model of “incremental change” al-though nuanced towards enhancement of quality in teaching and research.
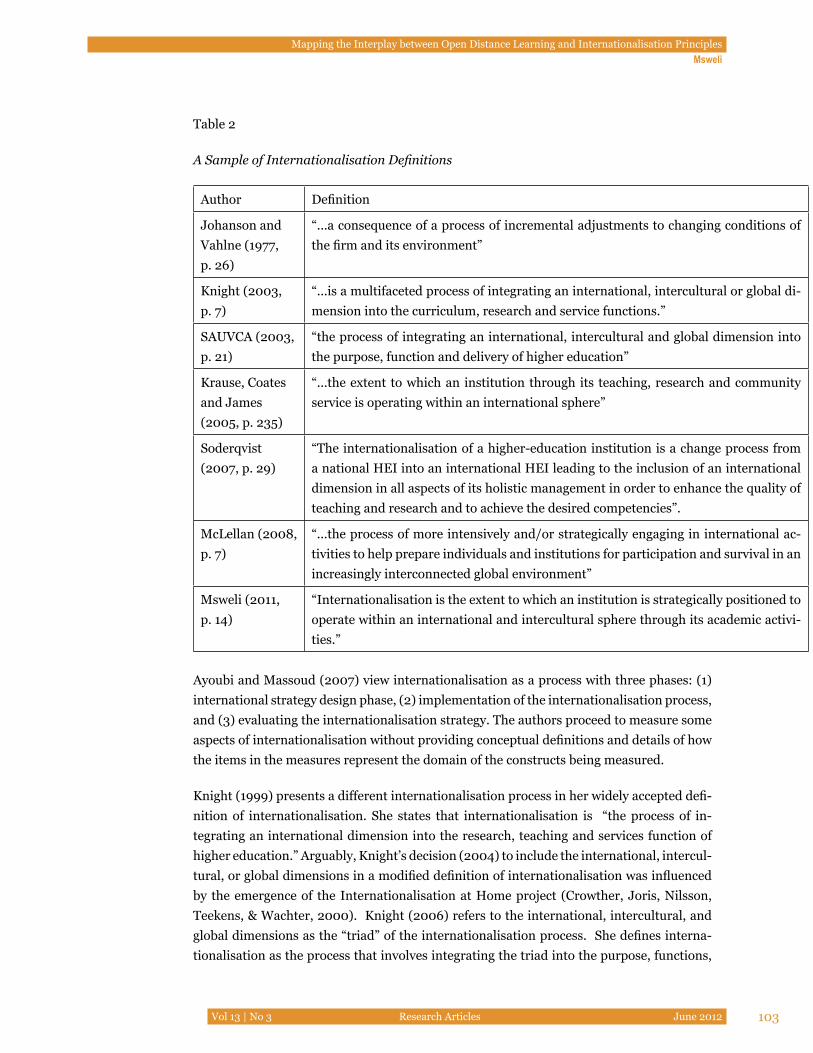
Mapping the Interplay between Open Distance Learning and Internationalisation PrinciplesMsweli
Vol 13 | No 3 Research Articles June 2012 103
Table 2
A Sample of Internationalisation Definitions
Author Definition
Johanson and Vahlne (1977, p. 26)
“...a consequence of a process of incremental adjustments to changing conditions of the firm and its environment”
Knight (2003, p. 7)
“...is a multifaceted process of integrating an international, intercultural or global di-mension into the curriculum, research and service functions.”
SAUVCA (2003, p. 21)
“the process of integrating an international, intercultural and global dimension into the purpose, function and delivery of higher education”
Krause, Coates and James (2005, p. 235)
“...the extent to which an institution through its teaching, research and community service is operating within an international sphere”
Soderqvist (2007, p. 29)
“The internationalisation of a higher-education institution is a change process from a national HEI into an international HEI leading to the inclusion of an international dimension in all aspects of its holistic management in order to enhance the quality of teaching and research and to achieve the desired competencies”.
McLellan (2008, p. 7)
“...the process of more intensively and/or strategically engaging in international ac-tivities to help prepare individuals and institutions for participation and survival in an increasingly interconnected global environment”
Msweli (2011, p. 14)
“Internationalisation is the extent to which an institution is strategically positioned to operate within an international and intercultural sphere through its academic activi-ties.”
Ayoubi and Massoud (2007) view internationalisation as a process with three phases: (1) international strategy design phase, (2) implementation of the internationalisation process, and (3) evaluating the internationalisation strategy. The authors proceed to measure some aspects of internationalisation without providing conceptual definitions and details of how the items in the measures represent the domain of the constructs being measured.
Knight (1999) presents a different internationalisation process in her widely accepted defi-nition of internationalisation. She states that internationalisation is “the process of in-tegrating an international dimension into the research, teaching and services function of higher education.” Arguably, Knight’s decision (2004) to include the international, intercul-tural, or global dimensions in a modified definition of internationalisation was influenced by the emergence of the Internationalisation at Home project (Crowther, Joris, Nilsson, Teekens, & Wachter, 2000). Knight (2006) refers to the international, intercultural, and global dimensions as the “triad” of the internationalisation process. She defines interna-tionalisation as the process that involves integrating the triad into the purpose, functions,
Mapping the Interplay between Open Distance Learning and Internationalisation PrinciplesMsweli
Vol 13 | No 3 Research Articles June 2012 104
or delivery of postsecondary education (Knight, 2004). In Europe, internationalisation has become a strategic issue as pointed out by Crowther (2000, p. 37) in this statement: “In-ternationalisation has become central to universities’ mission, and the focus is on ‘systemic internationalisation’ more than on mobility.”
Literature shows that internationalisation definitions have widened to include strategies on teaching and learning, quality assurance, governance, human resource development, and resource mobilisation (see Bartell, 2003; Soderqvist, 2007; Ayoubi & Massoud, 2007; Elkin, Farnsworth, & Templer, 2008; McLellan, 2008).
A number of internationalisation definitions offered by different authors illustrate the fact that, similar to ODL, there is not a single definition of internationalisation that satisfies all legitimate actions or applications of internationalisation. Scheffler (1960) suggests that when there is a myriad of definitions offered in literature, it is better to adopt a definition that suits a particular context. Following that line of argument, this study adopts the fol-lowing definition of internationalisation: “Internationalisation is the extent to which an institution is strategically positioned to operate within an international and intercultural sphere through its academic activities” (Msweli, 2011, p. 14).
Goals and Rationale: ODL versus InternationalisationA careful look at the goals of ODL as depicted in Table 3 shows that ODL is a way of re-sponding to a global environment characterised by significant political and socioeconomic trends as well as by technological advances. Undeniably, the most significant trend in the world is the rate of population growth. By 1960 the world population had reached 3 billion and almost doubled in 1974 with approximately 5.3 billion people (Hutchinson, 1996). Ac-cording to the United States Census Bureau (2012) there are about 7.01 billion people in the world. The sharp rise in the number of people calls for more flexible ways of accessing education.
As pointed out by Banathy (1996), it is an ‘old story’ to attribute changes just to technol-ogy and globalisation. As environmental, socioeconomic, legislative, and ethical issues gain more prominence, the demands for governments to respond to the pressures of democra-tising economic institutions have increased. The dynamics of the new world environment requires institutions to embrace not only new technologies but new value systems in order to remain relevant and to survive in the global economic environment. Table 3 shows that ODL espouses the values of more autonomous ways of studying and working, accessible education for all, and continuous professional development.
Access to learning and the goal to meet the needs of learners are the two most prized goals of ODL. This is because ODL extends access to those who would have been excluded on the basis of physical distance, personal constraints, or because of full-time employment or fam-ily responsibilities. The goal of access is also identified as one of the key goals of the National Plan for Higher Education (Ministry of Education, 2001) in South Africa. Linked to the goal of access is the requirement to provide educational opportunities to “an expanding range of population irrespective of race, gender, age, creed or class or other forms of discrimina-tion” (Ministry of Education, 2001). ODL has been recognised by a number of scholars as
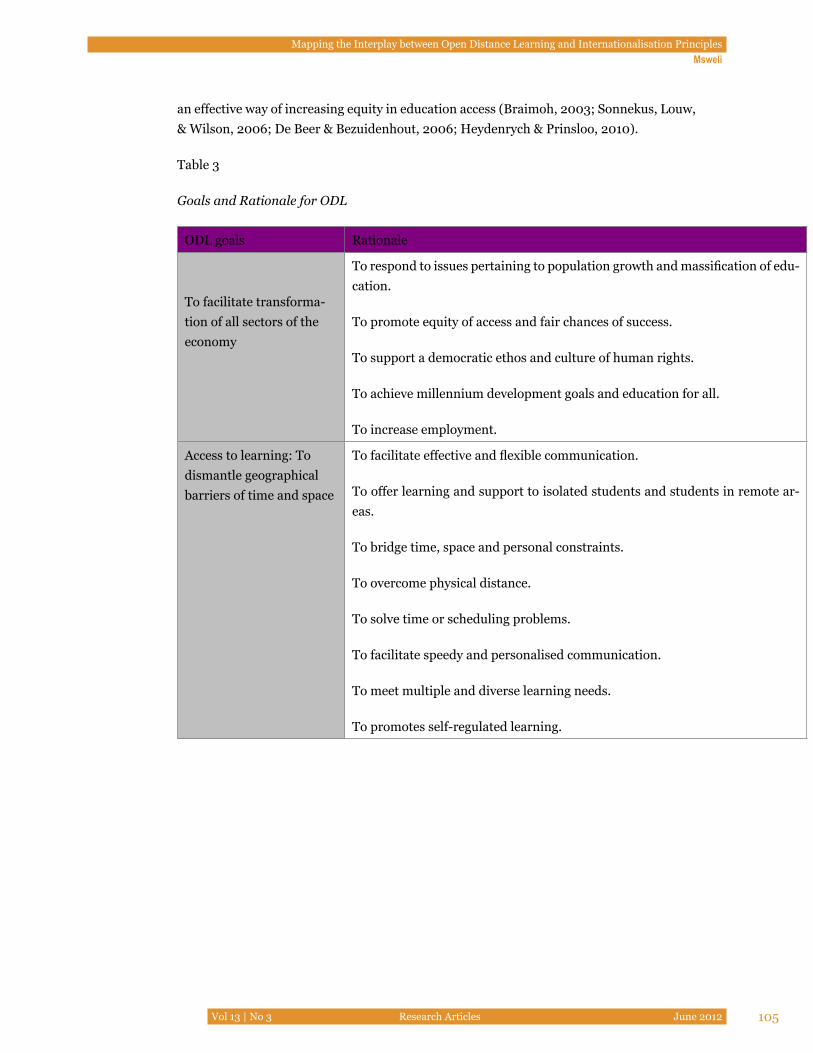
Mapping the Interplay between Open Distance Learning and Internationalisation PrinciplesMsweli
Vol 13 | No 3 Research Articles June 2012 105
an effective way of increasing equity in education access (Braimoh, 2003; Sonnekus, Louw, & Wilson, 2006; De Beer & Bezuidenhout, 2006; Heydenrych & Prinsloo, 2010).
Table 3
Goals and Rationale for ODL
ODL goals Rationale
To facilitate transforma-tion of all sectors of the economy
To respond to issues pertaining to population growth and massification of edu-cation.
To promote equity of access and fair chances of success.
To support a democratic ethos and culture of human rights.
To achieve millennium development goals and education for all.
To increase employment.
Access to learning: To dismantle geographical barriers of time and space
To facilitate effective and flexible communication.
To offer learning and support to isolated students and students in remote ar-eas.
To bridge time, space and personal constraints.
To overcome physical distance.
To solve time or scheduling problems.
To facilitate speedy and personalised communication.
To meet multiple and diverse learning needs.
To promotes self-regulated learning.
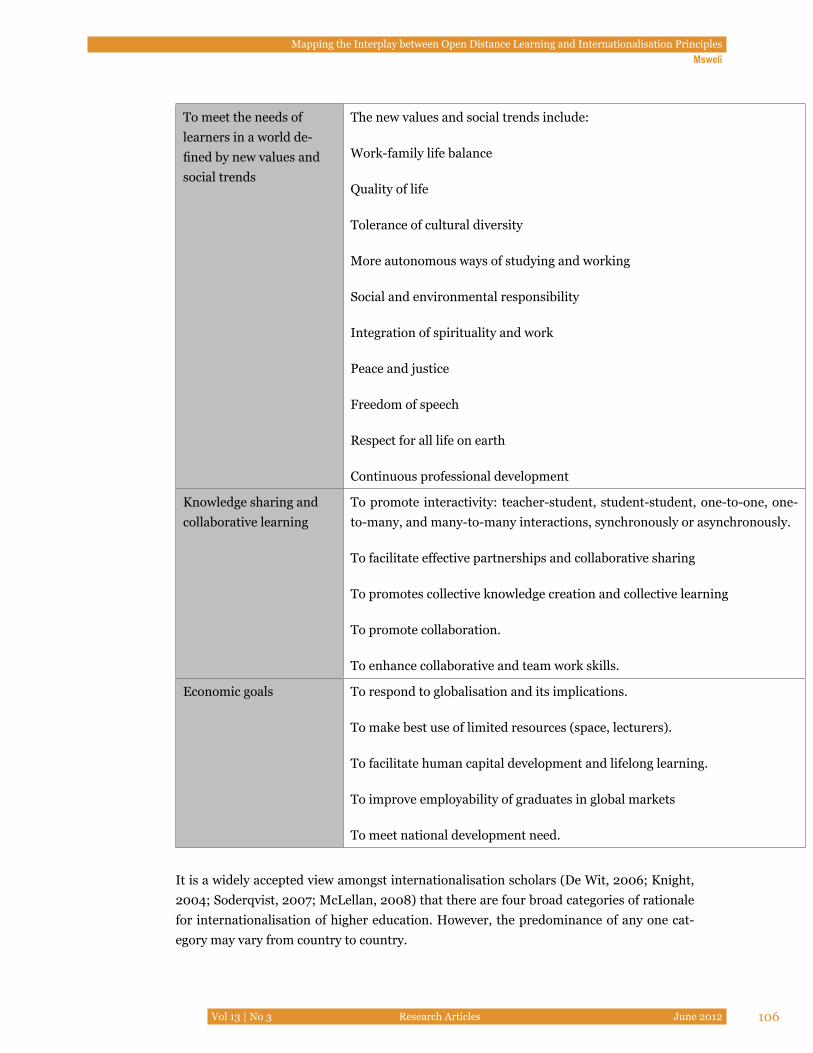
Mapping the Interplay between Open Distance Learning and Internationalisation PrinciplesMsweli
Vol 13 | No 3 Research Articles June 2012 106
To meet the needs of learners in a world de-fined by new values and social trends
The new values and social trends include:
Work-family life balance
Quality of life
Tolerance of cultural diversity
More autonomous ways of studying and working
Social and environmental responsibility
Integration of spirituality and work
Peace and justice
Freedom of speech
Respect for all life on earth
Continuous professional development
Knowledge sharing and collaborative learning
To promote interactivity: teacher-student, student-student, one-to-one, one-to-many, and many-to-many interactions, synchronously or asynchronously.
To facilitate effective partnerships and collaborative sharing
To promotes collective knowledge creation and collective learning
To promote collaboration.
To enhance collaborative and team work skills.
Economic goals To respond to globalisation and its implications.
To make best use of limited resources (space, lecturers).
To facilitate human capital development and lifelong learning.
To improve employability of graduates in global markets
To meet national development need.
It is a widely accepted view amongst internationalisation scholars (De Wit, 2006; Knight, 2004; Soderqvist, 2007; McLellan, 2008) that there are four broad categories of rationale for internationalisation of higher education. However, the predominance of any one cat-egory may vary from country to country.
Mapping the Interplay between Open Distance Learning and Internationalisation PrinciplesMsweli
Vol 13 | No 3 Research Articles June 2012 107
1. Economic rationale, which includes economic growth, national education demand, competitiveness, the labour market, human capital, and financial incentives, is one cat-egory. Economic growth in most cases sets the scene in how other economic variables play out. Those who are hardest hit by the recession are usually the majority of citizens who have the greatest need to acquire critical skills to participate in the global econo-my. Income to fund higher education has become one of the key drivers of internation-alisation because institutions can no longer rely on fee income from local students. The declining state budgets to finance higher education have forced institutions to look into international students’ fees as a lucrative option to increase revenue. Many countries require international students to pay significantly more than local students for higher education. All these factors, including mobility of the labour market and commodifica-tion of education, make a strong case for internationalisation.
2. Academic rationale, which includes international ranking and international research collaboration, is one factor that drives internationalisation. It is inconceivable to of-fer education that meets the needs of the globalised labour market without attracting students and academics from the international pool. International research collabora-tion, which could be considered one of the key drivers of internationalisation, ensures that institutions allocate resources for international activities such as student and staff exchanges and collaborative projects that support international research. International collaborations and partnerships require universities to prepare for international re-quirements in its offerings and in its teaching, learning, and administrative processes. As pointed out by Wächter (2000, p. 10), an internationalised institution that seeks to prepare graduates to perform successfully in an international arena will be character-ised by a “multiplicity of cultural styles, with concomitant demands on teaching and learning strategies” employed in a physical or virtual teaching environment. The aca-demic rationale for internationalisation is also connected to the international standing of an institution; as such, most universities place a greater emphasis on developing the image of their institutions to make them attractive to the international market.
3. Social and cultural rationale, as pointed out by De Wit (2006, p. 34), has much to do with the role universities play in promoting intercultural competence and social cohe-sion. Intercultural competence, or in other words the ability to work effectively within various cultures, can be enhanced when academic units and faculties infuse intercul-tural dimensions in teaching, learning, research, and community outreach activities (Msweli, 2011).
4. Political rationale relevant to internationalisation of higher education institutions in-cludes foreign policy as well as regional and international trade agreements that pro-mote interregional cooperation. For example, international trade policies, notably the General Agreement on Trade in Services (GATS), have fuelled fierce debates about the sustainability of universities in their domestic countries.
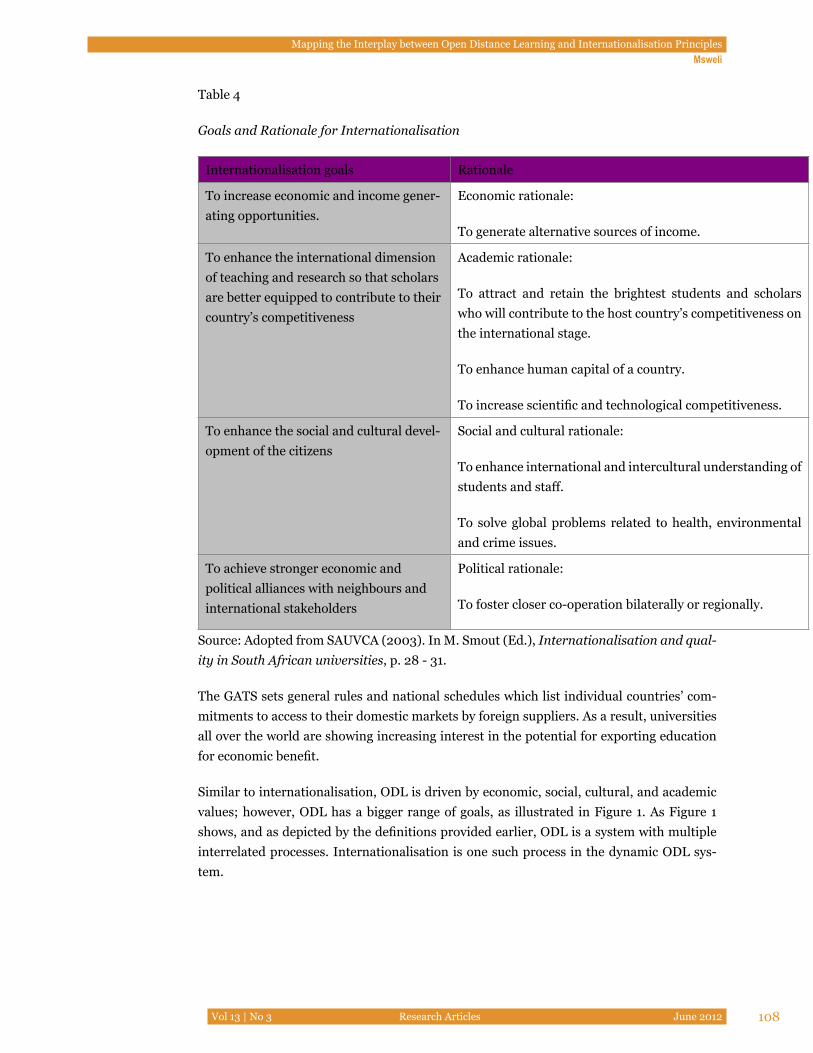
Mapping the Interplay between Open Distance Learning and Internationalisation PrinciplesMsweli
Vol 13 | No 3 Research Articles June 2012 108
Table 4
Goals and Rationale for Internationalisation
Internationalisation goals Rationale
To increase economic and income gener-ating opportunities.
Economic rationale:
To generate alternative sources of income.
To enhance the international dimension of teaching and research so that scholars are better equipped to contribute to their country’s competitiveness
Academic rationale:
To attract and retain the brightest students and scholars who will contribute to the host country’s competitiveness on the international stage.
To enhance human capital of a country.
To increase scientific and technological competitiveness.
To enhance the social and cultural devel-opment of the citizens
Social and cultural rationale:
To enhance international and intercultural understanding of students and staff.
To solve global problems related to health, environmental and crime issues.
To achieve stronger economic and political alliances with neighbours and international stakeholders
Political rationale:
To foster closer co-operation bilaterally or regionally.
Source: Adopted from SAUVCA (2003). In M. Smout (Ed.), Internationalisation and qual-ity in South African universities, p. 28 - 31.
The GATS sets general rules and national schedules which list individual countries’ com-mitments to access to their domestic markets by foreign suppliers. As a result, universities all over the world are showing increasing interest in the potential for exporting education for economic benefit.
Similar to internationalisation, ODL is driven by economic, social, cultural, and academic values; however, ODL has a bigger range of goals, as illustrated in Figure 1. As Figure 1 shows, and as depicted by the definitions provided earlier, ODL is a system with multiple interrelated processes. Internationalisation is one such process in the dynamic ODL sys-tem.
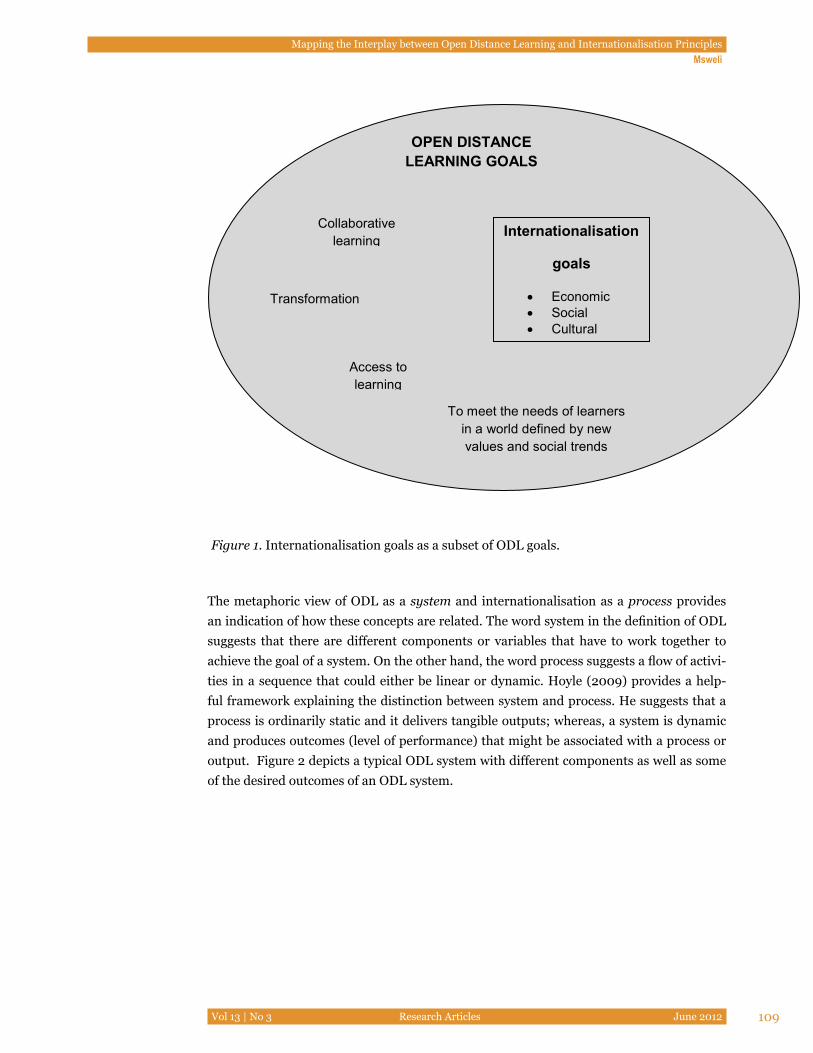
Mapping the Interplay between Open Distance Learning and Internationalisation PrinciplesMsweli
Vol 13 | No 3 Research Articles June 2012 109
Transformation
OPEN DISTANCE LEARNING GOALS
Access to learning
To meet the needs of learners in a world defined by new values and social trends
Collaborative learning
Internationalisation
goals
• Economic • Social • Cultural • Academic
Figure 1. Internationalisation goals as a subset of ODL goals.
The metaphoric view of ODL as a system and internationalisation as a process provides an indication of how these concepts are related. The word system in the definition of ODL suggests that there are different components or variables that have to work together to achieve the goal of a system. On the other hand, the word process suggests a flow of activi-ties in a sequence that could either be linear or dynamic. Hoyle (2009) provides a help-ful framework explaining the distinction between system and process. He suggests that a process is ordinarily static and it delivers tangible outputs; whereas, a system is dynamic and produces outcomes (level of performance) that might be associated with a process or output. Figure 2 depicts a typical ODL system with different components as well as some of the desired outcomes of an ODL system.
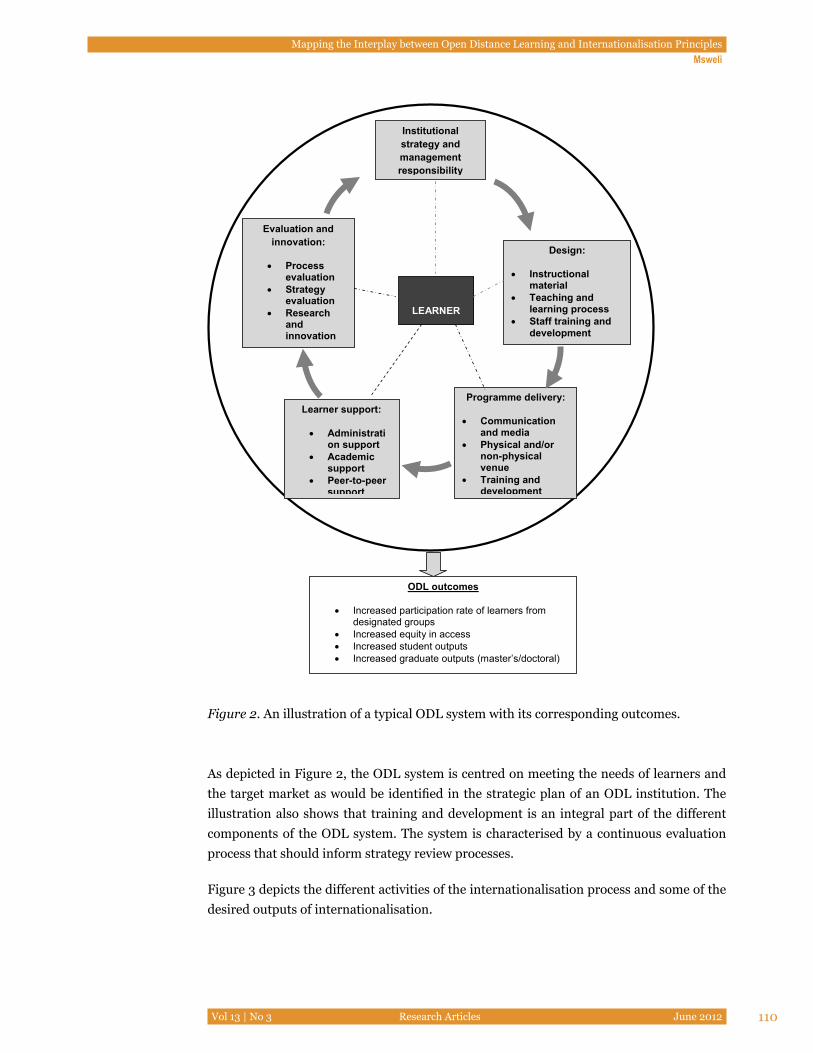
Mapping the Interplay between Open Distance Learning and Internationalisation PrinciplesMsweli
Vol 13 | No 3 Research Articles June 2012 110
ODL outcomes
• Increased participation rate of learners from designated groups
• Increased equity in access • Increased student outputs • Increased graduate outputs (master’s/doctoral)
OUTCOMES
LEARNER
Institutional strategy and management responsibility
Evaluation and innovation:
• Process evaluation
• Strategy evaluation
• Research and innovation
• Student assessment
Design:
• Instructional material
• Teaching and learning process
• Staff training and development
Learner support:
• Administration support
• Academic support
• Peer-to-peer support
Programme delivery:
• Communication and media
• Physical and/or non-physical venue
• Training and development
Figure 2. An illustration of a typical ODL system with its corresponding outcomes.
As depicted in Figure 2, the ODL system is centred on meeting the needs of learners and the target market as would be identified in the strategic plan of an ODL institution. The illustration also shows that training and development is an integral part of the different components of the ODL system. The system is characterised by a continuous evaluation process that should inform strategy review processes.
Figure 3 depicts the different activities of the internationalisation process and some of the desired outputs of internationalisation.
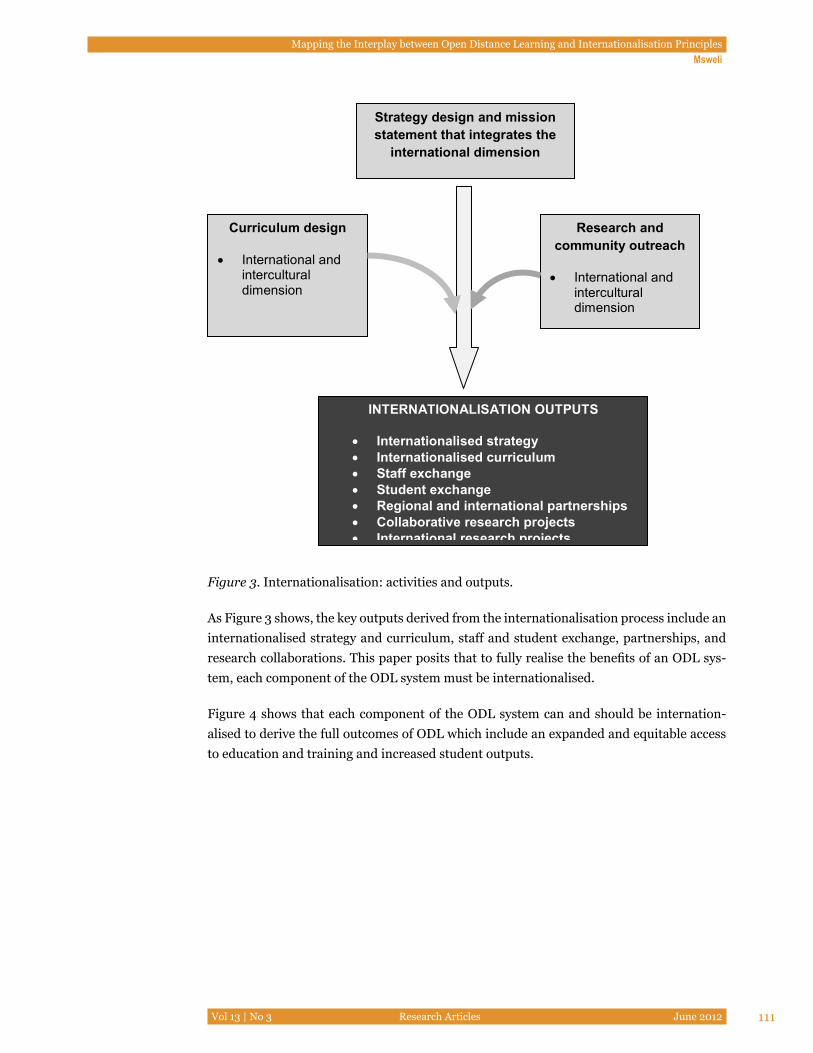
Mapping the Interplay between Open Distance Learning and Internationalisation PrinciplesMsweli
Vol 13 | No 3 Research Articles June 2012 111
Strategy design and mission statement that integrates the
international dimension
Curriculum design
• International and intercultural dimension
Research and community outreach
• International and intercultural dimension
INTERNATIONALISATION OUTPUTS
• Internationalised strategy • Internationalised curriculum • Staff exchange • Student exchange • Regional and international partnerships • Collaborative research projects • International research projects
Figure 3. Internationalisation: activities and outputs.
As Figure 3 shows, the key outputs derived from the internationalisation process include an internationalised strategy and curriculum, staff and student exchange, partnerships, and research collaborations. This paper posits that to fully realise the benefits of an ODL sys-tem, each component of the ODL system must be internationalised.
Figure 4 shows that each component of the ODL system can and should be internation-alised to derive the full outcomes of ODL which include an expanded and equitable access to education and training and increased student outputs.
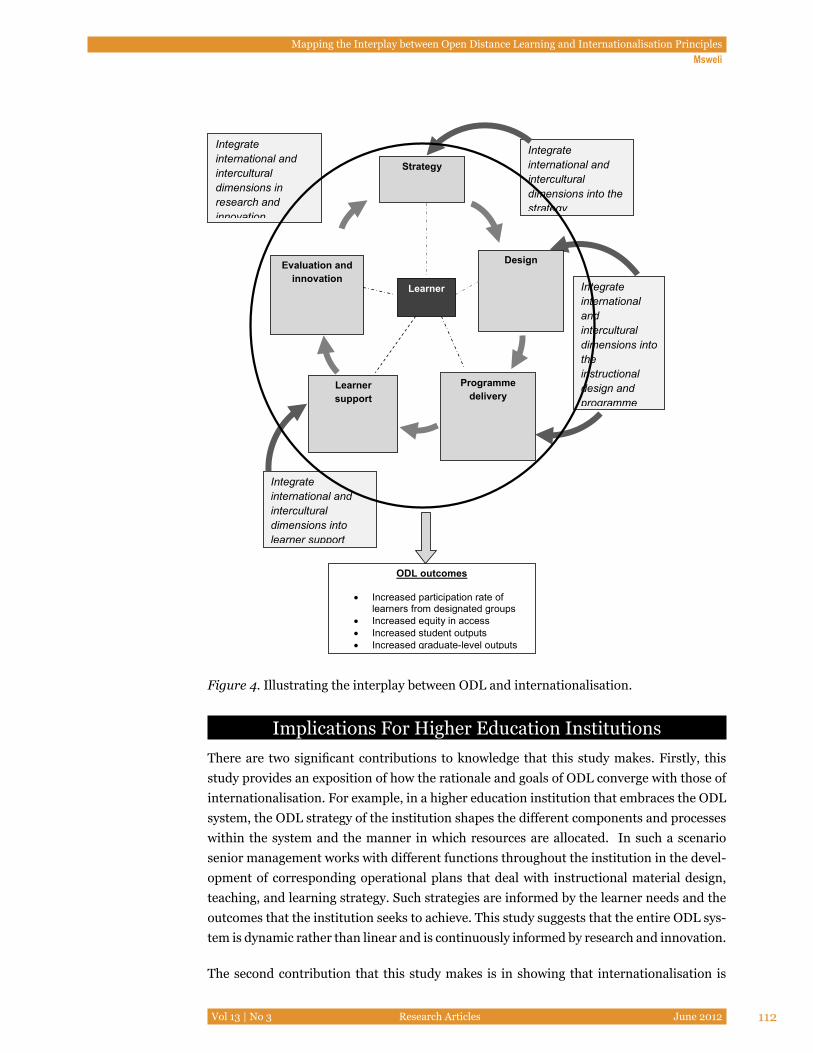
Mapping the Interplay between Open Distance Learning and Internationalisation PrinciplesMsweli
Vol 13 | No 3 Research Articles June 2012 112
Integrate international and intercultural dimensions into the strategy
Integrate international and intercultural dimensions into the instructional design and programme delivery
Integrate international and intercultural dimensions into learner support
Integrate international and intercultural dimensions in research and innovation
Strategy
Evaluation and innovation
Design
Learner support
Programme delivery
ODL outcomes
• Increased participation rate of learners from designated groups
• Increased equity in access • Increased student outputs • Increased graduate-level outputs
OUTCOMES
Learner
Figure 4. Illustrating the interplay between ODL and internationalisation.
Implications For Higher Education InstitutionsThere are two significant contributions to knowledge that this study makes. Firstly, this study provides an exposition of how the rationale and goals of ODL converge with those of internationalisation. For example, in a higher education institution that embraces the ODL system, the ODL strategy of the institution shapes the different components and processes within the system and the manner in which resources are allocated. In such a scenario senior management works with different functions throughout the institution in the devel-opment of corresponding operational plans that deal with instructional material design, teaching, and learning strategy. Such strategies are informed by the learner needs and the outcomes that the institution seeks to achieve. This study suggests that the entire ODL sys-tem is dynamic rather than linear and is continuously informed by research and innovation.
The second contribution that this study makes is in showing that internationalisation is
Mapping the Interplay between Open Distance Learning and Internationalisation PrinciplesMsweli
Vol 13 | No 3 Research Articles June 2012 113
a process embedded in each component of the ODL system. The manner in which inter-nationalisation is linked to ODL, as illustrated in Figure 4, suggests that internationalisa-tion is as dynamic as ODL. As Figure 4 shows, there are internationalisation dimensions in each component of the ODL system. This study puts forward an argument that for an ODL institution to derive the fullest benefit of resources deployed to implement ODL it has to be perfectly internationalised at all levels. Arguably, all higher education institutions, whether they embrace distance learning or open distance learning, are national institutions operating in international spaces locally, regionally, and abroad. As such, internationalisa-tion has to feature at the very least in the teaching, learning, and research processes of all higher learning institutions. Expanding on the same logic, an ODL institution that seeks to increase equitable access and to increase graduation rates of students who have relevant skills for the globalised world would want to ensure that all elements of the ODL system are internationalised.
Further research is needed, firstly, to look into the factors that explain each of the five com-ponents of the ODL system as delineated in Figure 2, and, secondly, to test the empirical validity of the proposition that a combination of internationalisation dimensions with com-ponents of ODL is likely to yield better outcomes in terms of equitable access, increased participation rates of students from designated groups, increased student outputs, and increased graduate outputs at master’s and doctoral levels. Although it is apparent that the distinction between ODL and internationalisation is somewhat diffused with respect to economic, social, and cultural rationales, it is critical to understand the process of in-ternationalisation as it affects ODL institutions in South Africa. In South Africa, the higher education sector is still engaged in debates on how to internationalise while simultaneously dealing with local, regional, and global environmental factors shaping higher education. An opportunity exists for further research to explore the levels of internationalisation and how internationalisation is linked to the strategic focus of ODL institutions in South Africa.
AcknowledgementThe author thanks the editor and reviewers of IRRODL for their helpful comments, which have enhanced the quality of this paper.
Mapping the Interplay between Open Distance Learning and Internationalisation PrinciplesMsweli
Vol 13 | No 3 Research Articles June 2012 114
ReferencesAyoubi, R.M., & Massoud, H.K. (2007). The strategy of internationalisation in universities
– a quantitative evaluation of the intent and implementation in UK universities. International Journal of Educational Management, 21(4), 329-349.
Banathy, B.H. (1996). Designing social systems in a changing world. New York, Plenum.
Bartell, M. (2003). Internationalisation of universities: A university culture-based frame-work. Higher Education, 45(1), 43-70.
Braimoh, D. (2003). Transforming tertiary institutions for mass higher education through distance and open learning approaches in Africa: A telescopic view. South African Journal of Higher Education, 17(3), 13-25.
Commonwealth of Learning. (2000). An introduction to open and distance learning. Re-trieved from http://www.col.org/resources/publications/trainingresources/Pag-es/intro.aspx
Council on Higher Education (CHE) (2009). The state of higher education in South Africa. Higher Education Monitor, 8 (October).
Crowther, P., Joris M., Nilsson B., Teekens, H., & Wachter B. (2000). Internationalisation at Home position paper. European Association for International Education.
Crowther, P. (2000). Internationalisation at home – institutional implications. In Inter-nationalisation at Home position paper. European Association for International Education.
De Beer, K.J. (2010). Open and distance e-learning at the Central University of Technology. Progressio, 9(2), 41-58.
De Beer, K., & Bezuidenhout, J. (2006). A preliminary literature overview of open learning at the Central University of Technology, Free State, South Africa. Progressio, 28(1 & 2), 64-81.
De Wit, H. (2006). Changing dynamics in the internationalisation of higher education. In R. Kishun (Ed.), The internationalisation of higher education in South Africa (pp. 29-39). Durban: IEASA.
Elkin, G., Farnsworth, J., & Templer, A. (2008). Strategy and the internationalisation of universities. International Journal of Educational Management, 22(3), 239-250.
Galan, J.I., Galende, J., & Gonalez-Benito, J. (1999). Determinant factors of international development: Some empirical evidence. Management Decision, 37(10), 778-785.
Heydenrych, J.F., & Prinsloo, P. (2010). Revisiting the five generations of distance educa-
Mapping the Interplay between Open Distance Learning and Internationalisation PrinciplesMsweli
Vol 13 | No 3 Research Articles June 2012 115
tion: Quo vadis? Progressio, 32(1), 5-26.
Hoyle, D.D. (2009). Systems and processes – Is t here a difference? Retrieved from http://www.thecqi.org/Documents/community/South%20Western/Wessex%20Branch/ Systems%20and%20Processes%20article%20by%20David%20Hoyle%20Oct09%20(2).pdf
Hutchinson, F. (1996). Educating beyond violent futures. Routledge: London.
Johanson, J., & Vahlne, J. (1977). The internationalization process of the firm – a model of knowledge development and increasing foreign market commitments. Journal of International Business Studies, 8(1), 23-32.
Knight, J. (2003). Internationalisation of higher education: Practices and priorities. In-ternational Association of Universities.
Knight, J. (2006). Internationalisation in the 21st century: Evolution and revolution. In R. Kishun (Ed.), The internationalisation of higher education in South Africa (pp. 41-58). Durban: IEASA.
Krause, K., Coates, H., & James, R. (2005). Monitoring the internationalisation of higher education: Are there useful quantitative performance indicators? International Perspectives on Higher Education Research, 3, 233-253.
Littlejohn, A. (2011). Change 11 position paper: Connected learning, collective learning. Retrieved from http://littlebylittlejohn.com/change11-position-paper/
Littlejohn, A., & Margaryan, A. (2010). Sharing resources in educational communities. International Journal of Emerging Technologies in Learning, 5(2). Doi:10.3001/ijet.v5i2.857.
McLellan, C.E. (2008). Speaking of internationalisation: An analysis policy of discourses on internationalisation of higher education in post-apartheid South Africa. Jour-nal of Studies in International Education, 12(2), 131-147.
Ministry of Education. (2001). National plan for higher education in South Africa. Preto-ria.
Monk, D. (2001). Open/distance learning in the United Kingdom. Why do people do it here (and elsewhere)? Perspective in Education, 19(3), 53-65.
Msweli, P. (2011, August/September). Internationalisation in higher education institu-tions in South Africa: Scale development and measurement. Paper presented at 15th Annual IEASA Conference, Durban.
Mapping the Interplay between Open Distance Learning and Internationalisation PrinciplesMsweli
Vol 13 | No 3 Research Articles June 2012 116
Open and Distance Learning Quality Council. (2010). Open and distance learning – a for-mal definition. Retrieved from http://www.odlqc.org.uk/odl.htm
O’Rourke, J. (2009). Meeting diverse learning needs. Progressio, 31(1 & 2), 5-16.
Patel E. (2011). The New Growth Path: The framework. Retrieved from http://www.info.gov.za/view/DownloadFileAction?id=135748
Smout, M (Ed.) (2003). Internationalisation and quality in South African universities. South African Universities’ Vice-Chancellors’ Association (SAUVCA).
Soderqvist, M. (2007). Internationalisation and its management at higher-education in-stitutions – applying conceptual, content and discourse analysis. Helsinki: Hel-sinki School of Economics.
Sonnekus, P., Louw, W., & Wilson, H. (2006). Emergent learner support at University of South Africa: An informal report. Progressio, 28(1 & 20), 44-53.
Swanepoel, E., De Beer, A., & Muller, H. (2009). Using satellite classes to optimise ac-cess to and participation in first-year business management: A case at an open and distance-learning university in South Africa. Perspectives in Education, 27(3), September, 311-319.
United States Census Bureau (2012). US & world population clocks. Retrieved from http://www.census.gov/main/www/popclock.html
United States Distance Learning Association. (2010). Home. Retrieved from http://www.usdla.org/
Wächter, B. (2000). Internationalisation at home – the context. Internationalisation at Home position paper. European Association for International Education.
Economies of Scope in Distance Education: The Caseof Chinese Research Universities
AbstractWith the rapid development of information technologies, distance education has become “another form of product differentiation in the output mix produced by the multi-product university or college” (Cohn & Cooper, 2004, p. 607). This article aims at analyzing the economies of scope of distance education (as an educational output) in Chinese research universities. The empirical results show that a) product-specific economies of scope do ex-ist in distance education programs offered by Chinese research universities; b) there are economies of scale in distance education; and c) there are weak cost complementarities between distance education and research output, meaning that distance education and aca-demic research can promote each other to reduce the costs in Chinese research universities.
Keywords: Distance education; economies of scope; multiproduct organization; Chinese research universities
IntroductionBefore the 1960s, distance education had been on the margin of the contemporary educa-tion system around the world. Distance education was provided by private, profit-oriented institutions to disadvantaged populations as a means to support their desire for achieving greater equity and equality of opportunity to access education. Since then, distance educa-tion has been popularized by various governments with unprecedented passion. Advocates firmly believe that distance education will not only achieve greater equity and equality in higher education, but also take control of the cost of education and maintain it at a manage-able level. In particular, the development of information technologies has revolutionarily expanded the range of distance education, resulting in a general improvement in its attrac-tiveness, quality, effectiveness, and efficiency (Siaciwena, 2008).
Fengliang Li and Xinlei Chen Tsinghua University, Beijing, PR China

Economies of Scope in Distance Education: The Case of Chinese Research Universities Li and Chen
Vol 13 | No 3 Research Articles June 2012 118
In recent years, some researchers have argued that the development of information tech-nologies, especially the Internet, has enabled Internet-based distance education to become “another form of product differentiation in the output mix produced by the multi-product university or college” (Cohn & Cooper, 2004, p. 607) and allowed research-intensive uni-versities to benefit from distance education (Garrison & Anderson, 1999). However, pre-vailing current studies on the input and output of distance higher education have focused on their economies of scale1 (Rumble, 1976, 1997; Wagner, 1977; Abrioux & Ferreira, 2009) rather than their economies of scope2 which regards distance higher education as part of a multiproduct3. In response, Cohn and Cooper (2004, p. 609) suggest it is necessary to study distance education as a “product mix of the typical university and college.” Two recent stud-ies also investigate the economies of scope in distance education through theoretical analy-ses and discussions4 (Bramble & Panda, 2008; Morris, 2008). However, these researchers do not seem to have conducted the empirical analyses of the economies of scope of distance education by higher education institutions (HEIs hereafter) as one of multiple outputs; although, they acknowledge the importance of distance education as an educational output and the necessity of inquiring into the cost relations of distance education with other edu-cational outputs5 as well as research outputs of HEIs. With an objective to fill this research gap, this article adopts the methodology of Cohn et al. (1989) and focuses on an empirical study on the economies of scope of distance education in research universities in China6.
The paper is structured in the following way: introduction of distance higher education in China, methodology (multiproduct cost function), data, results, and conclusions.
1 Economy of scale, in microeconomics, refers to the decrease in average cost (cost per unit) due to
expansion of the scale for a single product type in an organization.
2 Economy of scope is conceptually similar to economy of scale. It refers to cost advantages for an
organization in producing two or more products. Economy of scope can arise from the sharing or joint utiliza-
tion of inputs and lead to reductions in unit costs. An example would be the benefits of teaching from academic
research in universities.
3 According to economics of education, universities are typical multi-product organizations since uni-
versities usually tend to have a broader set of products, such as teaching and academic research.
4 These two studies focus on the economies of scale and scope of online learning or e-learning. How-
ever, according to Siaciwena (2008), although distance education has been widely carried out, it does not have a
unified definition of consensus because of the multiplicity of service purposes and the variety of media utilized.
In fact, terms such as opening learning, flexible learning, and online or e-learning have been used as substitu-
tions. In this article, online learning or e-learning is regarded as equivalent to distance education if there is no
special explanation.
5 The distance education studied in this article refers to degree programmes, which should be regarded
as an educational output of HIEs, instead of nondegree programmes, (i.e., training programs which should be
regarded as a public service output).
6 If there is no special explanation, China in this article refers to mainland China which does not in-
clude Hong Kong, Taiwan, and Macau.
Economies of Scope in Distance Education: The Case of Chinese Research Universities Li and Chen
Vol 13 | No 3 Research Articles June 2012 119
Distance Higher Education in ChinaDistance higher education in China is a later initiation than that of the developed coun-tries; yet, it has been paid close attention by the Chinese government since the establish-ment of P.R. China in 1949. In the early 1950s, Renmin University of China and Northeast Normal University began to provide distance higher education. By the early 1960s, dif-ferent provinces nationwide had witnessed the establishment of specific distance educa-tion institutions and the Radio and Television Universities (Ding, 2001, p. 91). During the Cultural Revolution (1966-1976), the contemporary education system in China was almost destroyed. In the years after the Cultural Revolution, the Chinese government realized the importance of quickly recovering and upgrading the shattered education system. One of the benchmarks is the establishment of the Central Radio and Television University of China in 1979, leading the development of distance education nationwide. The Central Radio and Television University of China, directly led by the Ministry of Education (MOE hereafter), is dedicated to distance higher education, whose main role is to
provide opportunities of higher education for professionals in different industries and enterprises as well as for other members of the society…to plan overall and comprehensive usage of open universities’ educational resources from all over the country and to establish a distance education system of public services to provide support for distance education to colleges, universities, and other educational institutions.7
From 1979 to 1998, the task of providing distance higher education was mainly shared with-in the national Radio and Television University system, that is the specific institutions for distance higher education, including the Central Radio and Television University of China and other provincial or municipal Radio and Television Universities.
In the year 1998, the MOE decided to allow general HEIs to become involved in distance higher education, with Tsinghua University8, Zhejiang University, Beijing University of Posts and Telecommunications, and Hunan University as the first four institutions piloting the scheme. In April 2000, the MOE decided to further enlarge the scale of general HEIs providing distance education due to the information technology boom in China at that time. Thirty more general HEIs were added to the list of distance higher education providers of degree programs (Ding, 2001, p. 100). By 2009, sixty-eight HEIs had been approved as degree program providers by means of distance education by the Ministry of Education (MOE, 2009).
7 For more information about the Central Radio and Television University of China, please refer to its
homepage http://en.crtvu.edu.cn/about/general-information. Now it will be renamed National Open Univer-
sity.
8 Tsinghua University announced in the year 2004 that it would no longer provide degree programmes
by means of distance education.
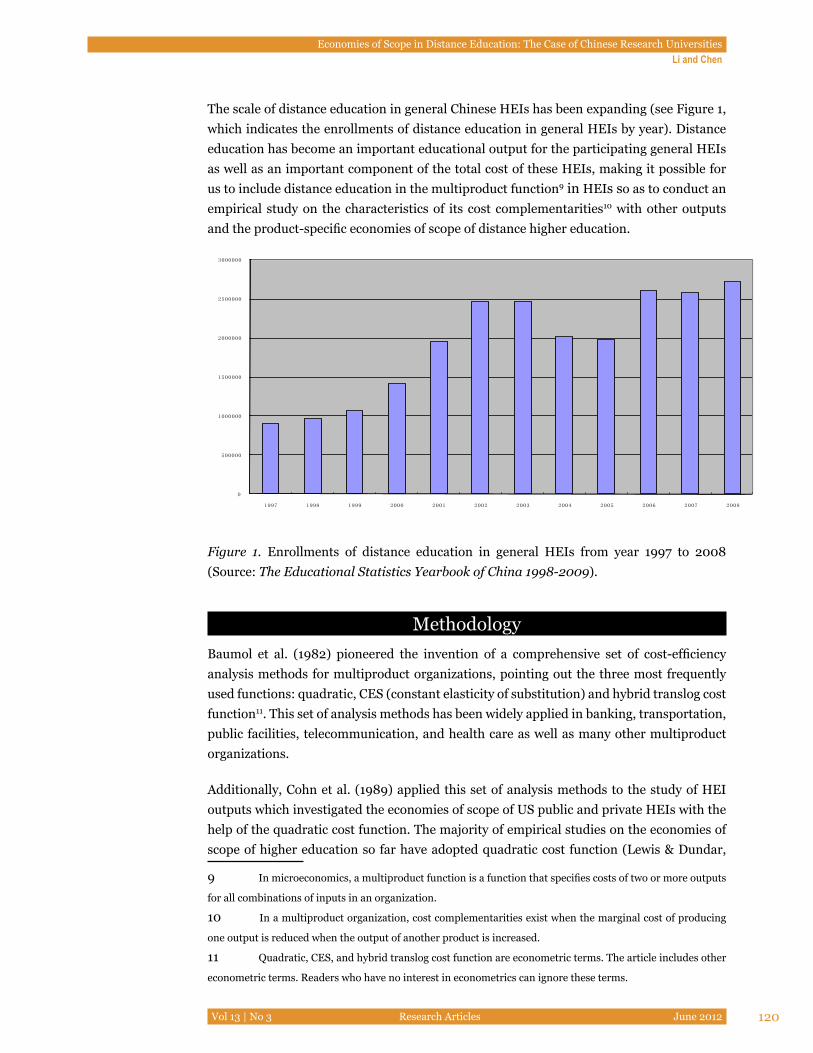
Economies of Scope in Distance Education: The Case of Chinese Research Universities Li and Chen
Vol 13 | No 3 Research Articles June 2012 120
The scale of distance education in general Chinese HEIs has been expanding (see Figure 1, which indicates the enrollments of distance education in general HEIs by year). Distance education has become an important educational output for the participating general HEIs as well as an important component of the total cost of these HEIs, making it possible for us to include distance education in the multiproduct function9 in HEIs so as to conduct an empirical study on the characteristics of its cost complementarities10 with other outputs and the product-specific economies of scope of distance higher education.
0
500000
1000000
1500000
2000000
2500000
3000000
1997 1998 1999 2000 2001 2002 2003 2004 2005 2006 2007 2008
Figure 1. Enrollments of distance education in general HEIs from year 1997 to 2008 (Source: The Educational Statistics Yearbook of China 1998-2009).
MethodologyBaumol et al. (1982) pioneered the invention of a comprehensive set of cost-efficiency analysis methods for multiproduct organizations, pointing out the three most frequently used functions: quadratic, CES (constant elasticity of substitution) and hybrid translog cost function11. This set of analysis methods has been widely applied in banking, transportation, public facilities, telecommunication, and health care as well as many other multiproduct organizations.
Additionally, Cohn et al. (1989) applied this set of analysis methods to the study of HEI outputs which investigated the economies of scope of US public and private HEIs with the help of the quadratic cost function. The majority of empirical studies on the economies of scope of higher education so far have adopted quadratic cost function (Lewis & Dundar,
9 In microeconomics, a multiproduct function is a function that specifies costs of two or more outputs
for all combinations of inputs in an organization.
10 In a multiproduct organization, cost complementarities exist when the marginal cost of producing
one output is reduced when the output of another product is increased.
11 Quadratic, CES, and hybrid translog cost function are econometric terms. The article includes other
econometric terms. Readers who have no interest in econometrics can ignore these terms.
Economies of Scope in Distance Education: The Case of Chinese Research Universities Li and Chen
Vol 13 | No 3 Research Articles June 2012 121
1995; Koshal et al., 2001; Laband & Lentz, 2003; Sav, 2004; Cesar, 2006; Hou et al., 2009), with only a few exceptions adopting CES (Johnes, 1997; Izadi et al., 2002) and hybrid trans-log cost function (de Groot et al., 1991; Glass et al., 1995; Nelson & Hevert, 1992; Stevens, 2005), while in more recent literature SFA (stochastic frontier analysis) has been adopted (Johnes, 1996; Izadi et al., 2002; Stevens, 2005; Johnes et al., 2008).
The primary objective of this research is to study the economies of scope of distance educa-tion provided by general HEIs rather than to compare the advantages and disadvantages of the various functions mentioned above. In light of this point, this article adopts the qua-dratic cost function due to its wide application.
Thus, the cost function is as follows:
01 1 1
1( , )2
k k k
i i ij i ji i j
C q W a a q b q q= = =
= + +∑ ∑∑ (1)
, , 1, 2, ,ij jib b i j k= =
where C is the total cost of producing k products, and qi is the output of the ith product.
Generally economies of scope are divided into global and product-specific economies of scope12. Global economies of scope measure how much can be saved from joint production of multiple products compared with a separate process, which means that a certain HEI can produce all products more cheaply than a combination of separate HEIs can.
Global economies of scope are defined as follows:
( ) ( )
( )
n
kk
G
C q C qS
C q
− =∑ (2)
Global economies of scope exist if GS is greater than zero.
Product-specific economies of scope are also to be examined since scales of all products may not increase (or decrease) proportionally. Product-specific economies of scope are given by:
[ ]-( ) ( ) ( )( )
k n kk
C q C q C qSC
C q+ −
= (3)
Product-specific economies of scope associated with product k exist if kSC is greater than zero, which means a certain HEI can produce product k more cheaply with other products than a combination of separate HEIs can.
12 The product-specific economy of scope exists when the product can bring cost advantages for the
multiproduct organization.
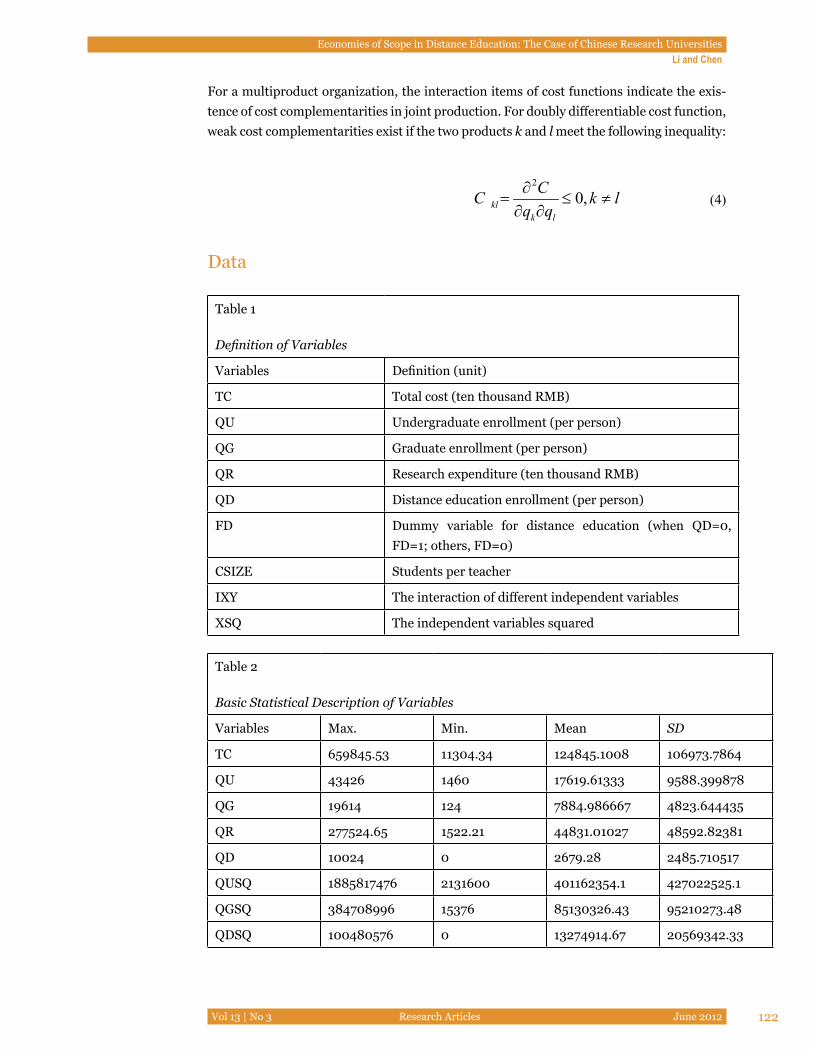
Economies of Scope in Distance Education: The Case of Chinese Research Universities Li and Chen
Vol 13 | No 3 Research Articles June 2012 122
For a multiproduct organization, the interaction items of cost functions indicate the exis-tence of cost complementarities in joint production. For doubly differentiable cost function, weak cost complementarities exist if the two products k and l meet the following inequality:
2
0,klk l
CC k lq q∂
= ≤ ≠∂ ∂
(4)
Data
Table 1
Definition of Variables
Variables Definition (unit)
TC Total cost (ten thousand RMB)
QU Undergraduate enrollment (per person)
QG Graduate enrollment (per person)
QR Research expenditure (ten thousand RMB)
QD Distance education enrollment (per person)
FD Dummy variable for distance education (when QD=0, FD=1; others, FD=0)
CSIZE Students per teacher
IXY The interaction of different independent variables
XSQ The independent variables squared
Table 2
Basic Statistical Description of Variables
Variables Max. Min. Mean SD
TC 659845.53 11304.34 124845.1008 106973.7864
QU 43426 1460 17619.61333 9588.399878
QG 19614 124 7884.986667 4823.644435
QR 277524.65 1522.21 44831.01027 48592.82381
QD 10024 0 2679.28 2485.710517
QUSQ 1885817476 2131600 401162354.1 427022525.1
QGSQ 384708996 15376 85130326.43 95210273.48
QDSQ 100480576 0 13274914.67 20569342.33
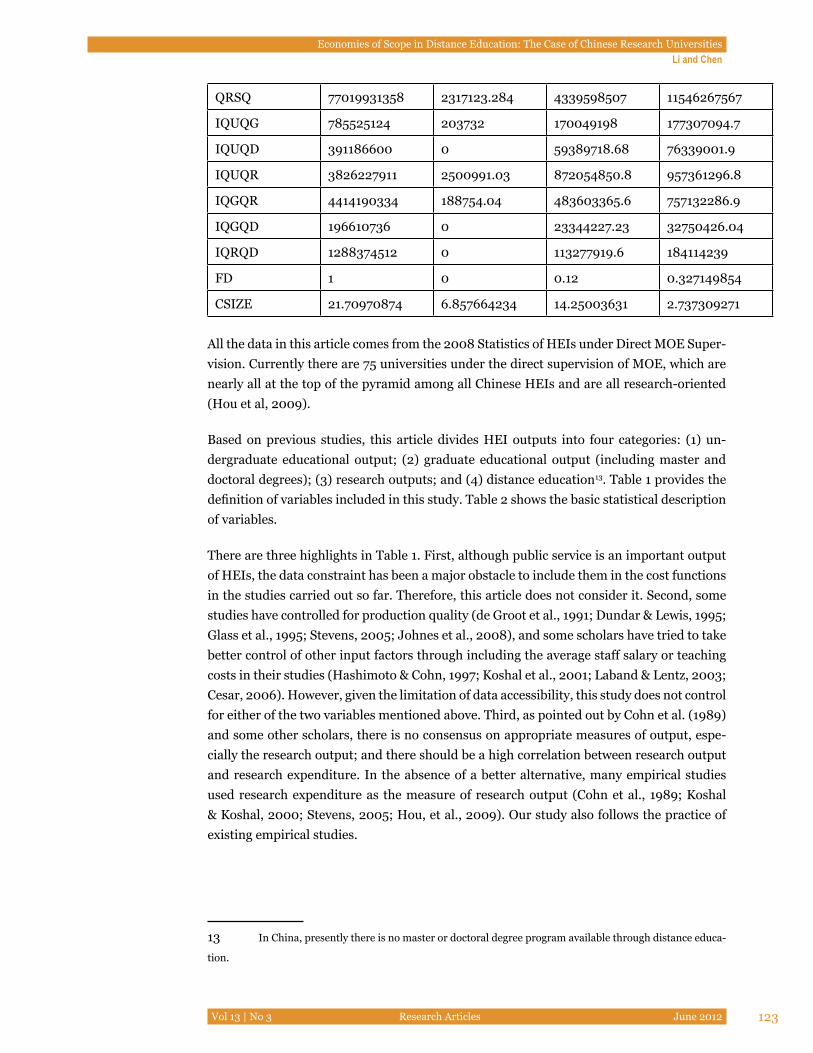
Economies of Scope in Distance Education: The Case of Chinese Research Universities Li and Chen
Vol 13 | No 3 Research Articles June 2012 123
QRSQ 77019931358 2317123.284 4339598507 11546267567
IQUQG 785525124 203732 170049198 177307094.7
IQUQD 391186600 0 59389718.68 76339001.9
IQUQR 3826227911 2500991.03 872054850.8 957361296.8
IQGQR 4414190334 188754.04 483603365.6 757132286.9
IQGQD 196610736 0 23344227.23 32750426.04
IQRQD 1288374512 0 113277919.6 184114239
FD 1 0 0.12 0.327149854
CSIZE 21.70970874 6.857664234 14.25003631 2.737309271
All the data in this article comes from the 2008 Statistics of HEIs under Direct MOE Super-vision. Currently there are 75 universities under the direct supervision of MOE, which are nearly all at the top of the pyramid among all Chinese HEIs and are all research-oriented (Hou et al, 2009).
Based on previous studies, this article divides HEI outputs into four categories: (1) un-dergraduate educational output; (2) graduate educational output (including master and doctoral degrees); (3) research outputs; and (4) distance education13. Table 1 provides the definition of variables included in this study. Table 2 shows the basic statistical description of variables.
There are three highlights in Table 1. First, although public service is an important output of HEIs, the data constraint has been a major obstacle to include them in the cost functions in the studies carried out so far. Therefore, this article does not consider it. Second, some studies have controlled for production quality (de Groot et al., 1991; Dundar & Lewis, 1995; Glass et al., 1995; Stevens, 2005; Johnes et al., 2008), and some scholars have tried to take better control of other input factors through including the average staff salary or teaching costs in their studies (Hashimoto & Cohn, 1997; Koshal et al., 2001; Laband & Lentz, 2003; Cesar, 2006). However, given the limitation of data accessibility, this study does not control for either of the two variables mentioned above. Third, as pointed out by Cohn et al. (1989) and some other scholars, there is no consensus on appropriate measures of output, espe-cially the research output; and there should be a high correlation between research output and research expenditure. In the absence of a better alternative, many empirical studies used research expenditure as the measure of research output (Cohn et al., 1989; Koshal & Koshal, 2000; Stevens, 2005; Hou, et al., 2009). Our study also follows the practice of existing empirical studies.
13 In China, presently there is no master or doctoral degree program available through distance educa-
tion.
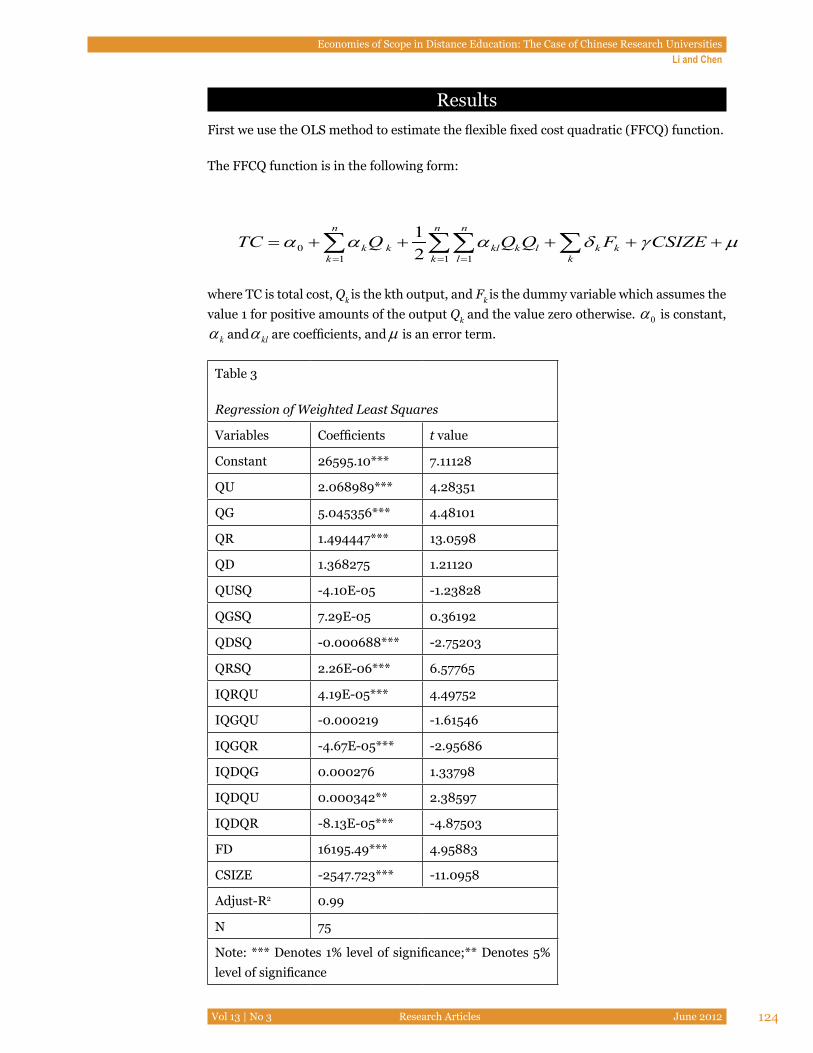
Economies of Scope in Distance Education: The Case of Chinese Research Universities Li and Chen
Vol 13 | No 3 Research Articles June 2012 124
ResultsFirst we use the OLS method to estimate the flexible fixed cost quadratic (FFCQ) function.
The FFCQ function is in the following form:
01 1 1
12
n n n
k k kl k l k kk k l k
TC Q Q Q F CSIZEα α α δ γ µ= = =
= + + + + +∑ ∑∑ ∑
where TC is total cost, Qk is the kth output, and Fk is the dummy variable which assumes the value 1 for positive amounts of the output Qk and the value zero otherwise. 0α is constant,
kα and klα are coefficients, andµ is an error term.
Table 3
Regression of Weighted Least Squares
Variables Coefficients t value
Constant 26595.10*** 7.11128
QU 2.068989*** 4.28351
QG 5.045356*** 4.48101
QR 1.494447*** 13.0598
QD 1.368275 1.21120
QUSQ -4.10E-05 -1.23828
QGSQ 7.29E-05 0.36192
QDSQ -0.000688*** -2.75203
QRSQ 2.26E-06*** 6.57765
IQRQU 4.19E-05*** 4.49752
IQGQU -0.000219 -1.61546
IQGQR -4.67E-05*** -2.95686
IQDQG 0.000276 1.33798
IQDQU 0.000342** 2.38597
IQDQR -8.13E-05*** -4.87503
FD 16195.49*** 4.95883
CSIZE -2547.723*** -11.0958
Adjust-R2 0.99
N 75
Note: *** Denotes 1% level of significance;** Denotes 5% level of significance
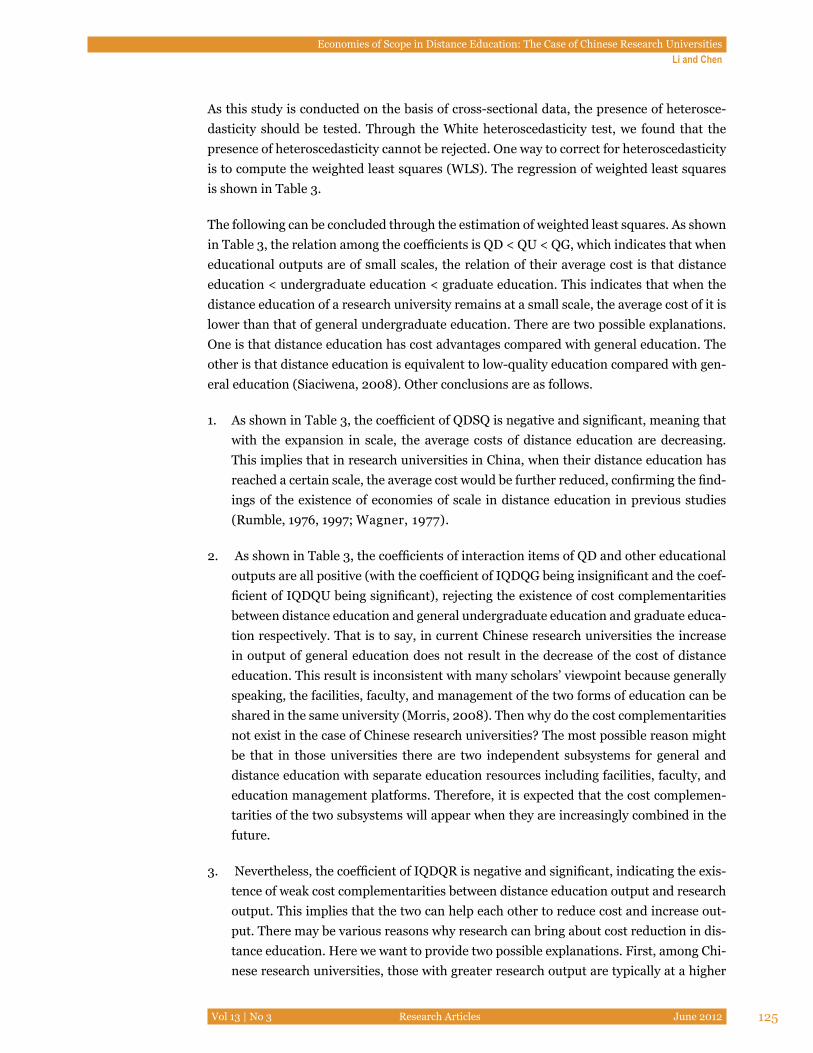
Economies of Scope in Distance Education: The Case of Chinese Research Universities Li and Chen
Vol 13 | No 3 Research Articles June 2012 125
As this study is conducted on the basis of cross-sectional data, the presence of heterosce-dasticity should be tested. Through the White heteroscedasticity test, we found that the presence of heteroscedasticity cannot be rejected. One way to correct for heteroscedasticity is to compute the weighted least squares (WLS). The regression of weighted least squares is shown in Table 3.
The following can be concluded through the estimation of weighted least squares. As shown in Table 3, the relation among the coefficients is QD < QU < QG, which indicates that when educational outputs are of small scales, the relation of their average cost is that distance education < undergraduate education < graduate education. This indicates that when the distance education of a research university remains at a small scale, the average cost of it is lower than that of general undergraduate education. There are two possible explanations. One is that distance education has cost advantages compared with general education. The other is that distance education is equivalent to low-quality education compared with gen-eral education (Siaciwena, 2008). Other conclusions are as follows.
1. As shown in Table 3, the coefficient of QDSQ is negative and significant, meaning that with the expansion in scale, the average costs of distance education are decreasing. This implies that in research universities in China, when their distance education has reached a certain scale, the average cost would be further reduced, confirming the find-ings of the existence of economies of scale in distance education in previous studies (Rumble, 1976, 1997; Wagner, 1977).
2. As shown in Table 3, the coefficients of interaction items of QD and other educational outputs are all positive (with the coefficient of IQDQG being insignificant and the coef-ficient of IQDQU being significant), rejecting the existence of cost complementarities between distance education and general undergraduate education and graduate educa-tion respectively. That is to say, in current Chinese research universities the increase in output of general education does not result in the decrease of the cost of distance education. This result is inconsistent with many scholars’ viewpoint because generally speaking, the facilities, faculty, and management of the two forms of education can be shared in the same university (Morris, 2008). Then why do the cost complementarities not exist in the case of Chinese research universities? The most possible reason might be that in those universities there are two independent subsystems for general and distance education with separate education resources including facilities, faculty, and education management platforms. Therefore, it is expected that the cost complemen-tarities of the two subsystems will appear when they are increasingly combined in the future.
3. Nevertheless, the coefficient of IQDQR is negative and significant, indicating the exis-tence of weak cost complementarities between distance education output and research output. This implies that the two can help each other to reduce cost and increase out-put. There may be various reasons why research can bring about cost reduction in dis-tance education. Here we want to provide two possible explanations. First, among Chi-nese research universities, those with greater research output are typically at a higher
Economies of Scope in Distance Education: The Case of Chinese Research Universities Li and Chen
Vol 13 | No 3 Research Articles June 2012 126
academic and research level. Although research and distance education are of different subsystems, the higher the research level, the higher the level of information technol-ogy, providing high-quality technical support from the subsystem of research to the subsystem of distance education at a relatively low cost. Second, universities of higher academic level usually have highly qualified faculty who can teach distance courses, reducing the cost of hiring high-quality faculty outside the school because it would cost the universities much more to do so due to the salary system of higher education in China. Meanwhile, since distance education brings considerable tuition to the universi-ties, this money can be used to boost research output.
4. As shown in Table 3, the coefficient of CSIZE is significantly negative, which can be interpreted as the significant influence over cost by the student-teacher ratio, and the higher the ratio, the lower the cost, which indicates the intrinsic economies of scale in teaching.
Now the question is whether specific-product economies (hereafter PSE) of scope in dis-tance education exist when provided by Chinese research universities. The formula is as follows:
( , , ,0) (0,0,0, ) ( , , , )( , , , )D
TC QU QP QR TC QD TC QU QP QR QDPSETC QU QP QR QD+ −
= (5)
Firstly, we conduct the calculation under the 100% output level14, which results in PSED = 0.0933. Thus it can be concluded that presently the product-specific economies of scope for distance education exist in Chinese research universities and that providing distance education, on top of general education and research output, is conducive to reducing the cost and increasing the total output of a university.
Secondly, we analyze the PSED for different levels of output. Calculations have been con-ducted based on two different scenarios: 1) HEIs only make changes to the scale of their distance education; and 2) the scale of every HEI output changes by the same proportion. The results are shown in Table 4.
From Table 4 we can see that at the output level from 50% to 140%, PSE of scope do exist in the output of distance education among the Chinese research universities, which shall disappear either when the output of distance education reaches a 220% level of its present scale in scenario 1 or when all outputs reach a 150 % level of their present scale in scenario 2. Therefore, research universities should consider the subsystems of general education and research when planning distance education, or they may wrongly estimate the reason-able boundary of economies of scope so that diseconomies of scope may arise.
14 Those who are interested in the detailed calculation process may contact the author.
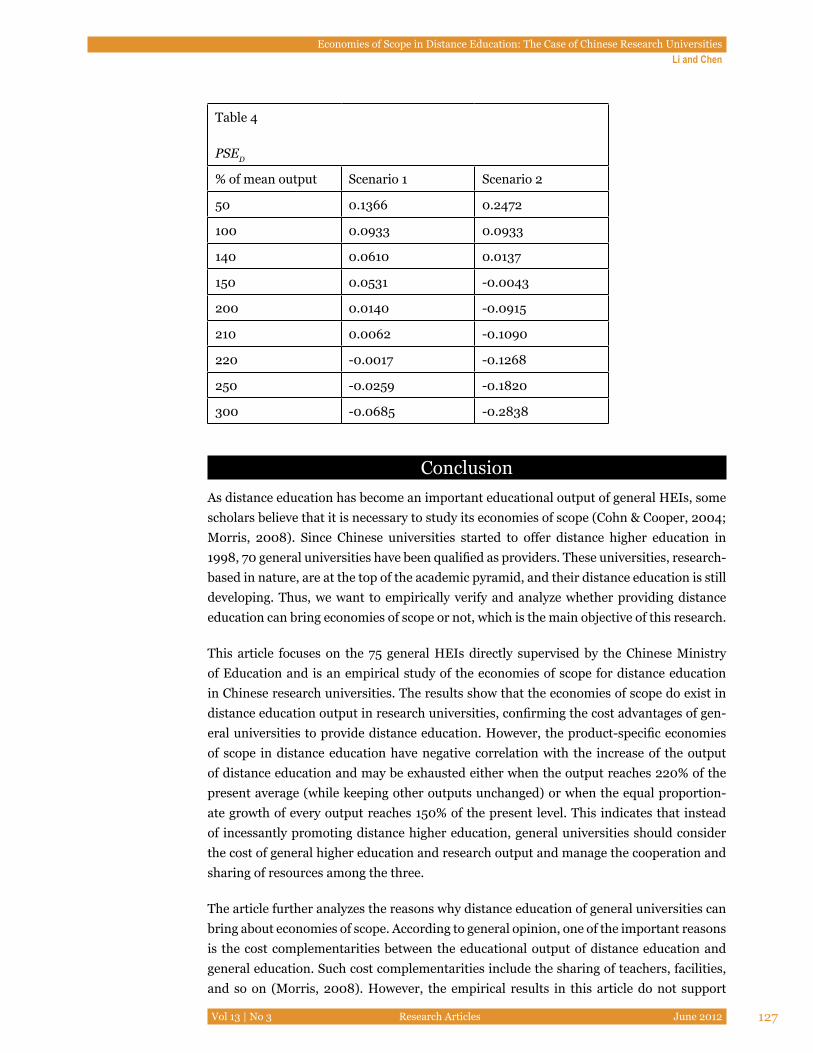
Economies of Scope in Distance Education: The Case of Chinese Research Universities Li and Chen
Vol 13 | No 3 Research Articles June 2012 127
Table 4
PSED
% of mean output Scenario 1 Scenario 2
50 0.1366 0.2472
100 0.0933 0.0933
140 0.0610 0.0137
150 0.0531 -0.0043
200 0.0140 -0.0915
210 0.0062 -0.1090
220 -0.0017 -0.1268
250 -0.0259 -0.1820
300 -0.0685 -0.2838
ConclusionAs distance education has become an important educational output of general HEIs, some scholars believe that it is necessary to study its economies of scope (Cohn & Cooper, 2004; Morris, 2008). Since Chinese universities started to offer distance higher education in 1998, 70 general universities have been qualified as providers. These universities, research-based in nature, are at the top of the academic pyramid, and their distance education is still developing. Thus, we want to empirically verify and analyze whether providing distance education can bring economies of scope or not, which is the main objective of this research.
This article focuses on the 75 general HEIs directly supervised by the Chinese Ministry of Education and is an empirical study of the economies of scope for distance education in Chinese research universities. The results show that the economies of scope do exist in distance education output in research universities, confirming the cost advantages of gen-eral universities to provide distance education. However, the product-specific economies of scope in distance education have negative correlation with the increase of the output of distance education and may be exhausted either when the output reaches 220% of the present average (while keeping other outputs unchanged) or when the equal proportion-ate growth of every output reaches 150% of the present level. This indicates that instead of incessantly promoting distance higher education, general universities should consider the cost of general higher education and research output and manage the cooperation and sharing of resources among the three.
The article further analyzes the reasons why distance education of general universities can bring about economies of scope. According to general opinion, one of the important reasons is the cost complementarities between the educational output of distance education and general education. Such cost complementarities include the sharing of teachers, facilities, and so on (Morris, 2008). However, the empirical results in this article do not support
Economies of Scope in Distance Education: The Case of Chinese Research Universities Li and Chen
Vol 13 | No 3 Research Articles June 2012 128
such general opinion, which we believe is due to the operational mechanism of distance education in research universities. There are essentially two independent subsystems for general and distance education with separate facilities, faculty, and education management platforms and little communication and interaction between them.
If economies of scope do not result from the cost complementarities of distance and gen-eral education, what do they come from? What we have found is the existence of weak cost complementarities between distance education and research output, meaning that research output can reduce the average cost per student of distance education, enabling the univer-sity to produce more output with the same cost. As stated above, we find that distance edu-cation and academic research can promote each other, which has rarely been mentioned in previous studies and discussions on the economic issues of distance education. Such phenomenon evinces the feasibility of providing a new type of output (i.e., distance educa-tion on top of general education and research output). It also verifies that as multiproduct organizations, general research universities have been suitable institutions for the pilot programs of distance higher education launched by the Chinese Ministry of Education.
Furthermore, the results show that the average cost of distance education is lower than that of undergraduate or graduate education and is negatively correlated with the increase of its output. Therefore, scale production is economic for distance education, confirming the conclusion of the existence of economies of scale in distance education by previous studies (Rumble, 1976, 1997; Wagner, 1977).
In conclusion, there are economies of scope in distance education due to the weak cost com-plementarities between distance education and research output. However, the boundary of economies of scope does exist, and research universities therefore should avoid excess growth in distance education so as not to cross the boundary. We also find that there is no complementarity between general and distance education. The most possible reason might be that the universities have two independent subsystems for general and distance educa-tion. Therefore, we suggest that universities should promote the integration and resource-sharing of the two systems so as to lower the cost, increase the output, and achieve greater economies of scope.
AcknowledgementsResearch for this article received support from the Beijing 11th Five-Year Plan of Educa-tional Science, Youth Issues, Research on the cost-efficiency of teaching, academic research and social service in Beijing’s Research Universities Project (No. CDA10104).
The author wishes to thank the reviewers for their helpful comments on earlier drafts. The author is also grateful to Miss Fan Yueqian, Miss Gong Jingtian, and Dr. Zhang Yu who have made many useful suggestions and modifications to this article’s wording.

Economies of Scope in Distance Education: The Case of Chinese Research Universities Li and Chen
Vol 13 | No 3 Research Articles June 2012 129
ReferencesAbrioux, D., & Ferreira, F (2009). Perspectives on distance education: Open schooling in
the 21st Century. Vancouver: Commonwealth of Learning.
Baumol, W. J., Panzar, J. C., & Willig, R. D.(1982). Contestable markets and the theory of industry structure. New York: Harcourt Brace Jovanovich.
Cesar C. R. (2006). Estimating the degree cost functions of the Philippines public and pri-vate higher educational institutions. Asia Pacific Education Review, 7(1), 32-40.
Cohn, E., & Cooper, S.T. (2004). Mulit-product cost functions for universities: Economies of scale and scope. In G. Johnes & J. Johnes (Eds.), The International handbook on the economics of education. Cheltenham: Edward Elgar.
Cohn, E., Rhine, S. L. W., & Santos, M. C.(1989). Institutions of higher education as multi-product firms: Economies of scale and scope. Review of Economics and Statistics, 71(2), 284-290.
Curran, C. (2008). Online learning and the university. In W.J. Bramble & S.K. Panda (Eds.) Economics of distance and online learning: Theory, practice, and research. New York: Routledge.
De Groot, H., McMahon, W. W., & Volkwein, J. F.(1991). The cost structure of American research universities. Review of Economics and Statistics, 73(3), 424-431.
Ding, X.F. (2001) The research in distance education (in Chinese). Beijing: Beijing Normal University Press.
Dundar, H., & Lewis, D. R. (1995). Departmental productivity in American universities: Economies of scale and scope. Economics of Education Review, 14(2), 199-244.
Glass, J.C., McKillop, D.G., & Hyndman, N.S.(1995) The achievement of scale efficiency in UK universities: A multiple-input multiple-output analysis. Education Economics, 3(3), 249-263.
Hashimoto, K., & Cohn, E. (1997). Economies of scale and scope in Japanese private uni-versities. Education Economics, 5(2),107-115.
Hou L., Li F., & Min W.(2009). Multiproduct total cost functions for higher education: The case of Chinese research universities. Economics of Education Review, 29(4),374–381.
Izadi, H., Johnes, G., Oskrochi, R., & Crouchley, R.(2002). Stochastic frontier estimation of a CES cost function: The case of higher education in Britain. Economics of Educa-tion Review, 21(1), 63-71.
Economies of Scope in Distance Education: The Case of Chinese Research Universities Li and Chen
Vol 13 | No 3 Research Articles June 2012 130
Johnes, G. (1996). Multi-product cost functions and the funding of tuition in UK Universi-ties. Applied Economics Letters, 3(9), 557-561.
Johnes, G. (1997). Costs and industrial structure in contemporary British higher educa-tion. Economic Journal, 107(442), 727-37
Johnes, G., Johnes, J., & Thanassoulis, E.(2008). An analysis of costs in institutions of higher education in England. Studies in Higher Education, 33(5), 527-549.
Koshal, R. K., & Koshal, M. (2000). Do liberal arts colleges exhibit economies of scale and scope? Education Economics, 8(3), 209-220.
Koshal, R. K., Koshal, M., & Gupta, A. (2001). Multi-product total cost function for higher education: A Case of Bible colleges. Economics of Education Review, 20(3), 297-303.
Laband, D. N., & Lentz, B. F. (2003). New estimates of economies of scale and scope in higher education. Southern Economic Journal, 70(1), 172-183.
Lewis, D. R., & Dundar, H. (1995). Economics of scale and scope in Turkish universities. Education Economics, 3(2), 133-157.
MOE (2009). The notice of Ministry of Education on the enrollment in distance higher education for degree programmes (in Chinese). Beijing: Department of Higher Education, MOE).
Morris, D. (2008). Economies of scale and scope in e-learning. Studies in Higher Educa-tion, 33(3), 331-343.
Nelson, R., & Hevert, K. T. (1992). Effect of class size on economies of scale and marginal costs in higher education. Applied Economics, 24(5), 473-482.
Randy, D. G., & Anderson D. T. (1999). Avoiding the industrialization of research universi-ties: Big and little distance education. American Journal of Distance Education, 13(2), 48-63.
Rumble, G. (1976). The economics of the Open University. Milton Keynes: OU.
Rumble, G. (1997). The costs and economics of open and distance learning. New York: RoutledgeFalmer.
Sav, G. T.(2004). Higher education costs and scale and scope economies. Applied Econom-ics, 36(6), 607–614
Siaciwena, R. (2008). Distance education/learning. In G. McCulloch & D. Crook (Eds.) The Routledge international encyclopedia of education. New York: Routledge.
Economies of Scope in Distance Education: The Case of Chinese Research Universities Li and Chen
Vol 13 | No 3 Research Articles June 2012 131
Stevens, P.A.( 2005). A stochastic frontier analysis of English and Welsh universities. Edu-cation Economics, 13(4),355-374.
The Department of Development and Planning, MOE.(1998-2009). The educational statis-tics yearbook of China (in Chinese). Beijing: People’s Education Press.
Wagner , L. (1972). The economics of the Open University. Higher Education, 1(2), 150-83.
Teaching Time Investment: Does Online Really Take More Time than Face-to-Face?
AbstractEnrollments in online programs are growing, increasing demand for online courses. The perception that teaching online takes more time than teaching face-to-face creates con-cerns related to faculty workload. To date, the research on teaching time does not provide a clear answer as to the accuracy of this perception. This study was designed to investigate which aspects, if any, are more time consuming for instructors teaching in the online envi-ronment. Time logs were kept by four online instructors (eight classes) and six on-campus instructors (six classes) through six weeks of the 15-week semester. Results indicated that, overall, face-to-face teaching required more time per student, but certain aspects of online teaching take considerably more time per student than in the face-to-face classroom.
Keywords: Time; online; teaching
As online delivery of higher education programs has grown over the past decade, research-ers have asked, “does it take more time to teach online?” The perception of faculty con-sistently seems to indicate that it does. This is a critical concern with economic strains negatively impacting faculty numbers in many academic departments, while at the same time demand for online programs is rapidly increasing. Online enrollments are growing at a rate of 10%, considerably greater than the less than 1% seen in higher education overall (Allen & Seaman 2011).
The research results are not definitive one way or the other, suggesting more studies are required. In addition, the rapid changes in technology, mainstreaming of online education, and increased user experience will most likely impact the answer to this question. Most
Rebecca Van de Vord and Korolyn Pogue Washington State University, USA

Teaching Time Investment: Does Online Really Take More Time than Face-to-Face?Van de Vord and Pogue
Vol 13 | No 3 Research Articles June 2012 133
important is the ability to understand where faculty spend their time in online instruction. This understanding can inform the development of processes and tools that can facilitate greater efficiency in online teaching.
Review of the LiteratureResearchers employed the university libraries’ online education database to search for all articles related to the keywords online teaching time, eLearning teaching time, and dis-tance teaching time and captured all articles available. Further investigation was complet-ed through Google Scholar resulting in no additional articles related to the research topic.
Survey and qualitative interview studies consistently suggest that faculty perceive online teaching as far more onerous than in the face-to-face classroom (Bolliger & Waslik, 2009; Concieção, 2006; Harber & Mills, 2008; Lee & Busch, 2005). Concieção (2006) quotes participants as noting the “intense work involved in designing and delivering an online course because of the length of engagement before and during and the depth of engagement during course delivery” (p. 35). Participants in the study indicated they perceived more time was involved with all aspects of teaching an online class.
Results of studies comparing time spent teaching online with that spent teaching face-to-face are not as clear as the survey and interview research noted earlier. Some research sug-gests that time spent is approximately equal (Hislop & Ellis, 2004). Other results suggest more time is involved in teaching online when time is calculated per student enrollment (Bender, Wood, & Vredevoogd, 2004; Cavanaugh, 2005; Hislop, 2001; Spector, 2005; To-mei, 2006; Worley & Tesdell, 2009). Yet others indicate the time to teach online is actually less than face-to-face (DiBiase, 2000; McKenney, Peffley, & Teolis, 2010). On the surface these studies provide very conflicting results. It is important, then, to review the prior work more carefully.
Bender et al. (2004) compared a single face-to-face course, with 111 enrolled students and 38 teaching assistants, to an online version with 18 students and five teaching assistants. The online version was a new course and the students and teaching assistants associated with this version were new to the online environment. According to the findings, instruc-tion time was approximately equivalent, but the time required for grading and email com-munication for the online course was significantly greater than required for the face-to-face version. The time recorded for the online course, however, included training time for the teaching assistants as well as time for the instructors and two teaching assistants to travel to the distance location to sort through technology problems. Additionally, the authors note that the grading was more time consuming in the online course because “lack of a com-puterized grading process in the distance course resulted in more work” (p. 110). The class-room course was able to “utilize university facilities to electronically grade assignments and e-mail students, the instructor assumed this responsibility in the distance course” (p. 110). In other words, conditions for grading were not equivalent. Furthermore, the fact that the students and teaching assistants were new to the online environment created a variety of
Teaching Time Investment: Does Online Really Take More Time than Face-to-Face?Van de Vord and Pogue
Vol 13 | No 3 Research Articles June 2012 134
time-consuming issues that did not relate to actual instruction.
In a similar study, Cavanaugh (2005) logged the time required to teach an economics course, comparing an online version with 15 students to the face-to-face version with 40 students. Initial design time for the online course was not included, but updating the online portion of the course, contacting the students to get them started, and final tasks related to miscellaneous administrative-type duties performed at the end of the course for the online version only were counted. There is no indication that grading time for the two courses was examined in the study. Overall, time per student for the online version was greater.
The Hislop (2001) study involved four pairs of course sections taught in the same or suc-cessive terms by the same instructor. The pairs included three different courses and three different instructors. This study included only time expended during delivery of the course, excluding course preparation time. In this study, two of the online versions took more time, and two took less time to deliver than the face-to-face versions. In all cases, however, the online courses took more time per student, but in three of the four cases the differences were “not all that large” (p. 26). Enrollment numbers for each of the courses is not men-tioned in the article. Of interest, the authors note that online instructors logged time spent on the course more days per week than for the face-to-face version suggesting that “online courses clearly have a different rhythm to them” (p. 26).
Spector (2005) focused on communication methods, comparing different forms of e-col-laboration and the effects on time demands placed on teachers and students in three online and one face-to-face course. Results suggested that email is less efficient than threaded dis-cussions or chat sessions for instructors. The instructor teaching the one course in both the online and face-to-face environments spent significantly more time in the online course. In addition, the authors note that two instructors teaching online reported they spent about twice as much time in their online course as face-to-face “but no data were collected to cor-roborate these reports” (p. 17). The conclusion was based on instructor perceptions rather than the time logs.
Tomei (2006) compared a traditional evening class, 11 students enrolled, with a distance course of the same content and also with 11 students, two with prior online experience. Distance students communicated with the instructor through “weekly e-mails, end of ses-sion posts, and periodic online chat sessions” (p. 534). The author found that instructing via discussion, e-mail, and chat increased time demands of the online course a minimum of 14%.
Worley and Tesdell (2009) each taught an online version and a face-to-face version of the same course at their respective universities. The authors kept “a time log of every minute we spent teaching” (p. 141). Enrollment of the online courses was 30 and 26, and the face-to-face 43 in each case. The courses had previously been taught in both online and face-to-face versions, and the instructors were experienced in both delivery venues. Time spent in each of the following categories was recorded: tool training time and effort, preparation time and effort, teaching time and effort, and technical time and effort. Results indicate
Teaching Time Investment: Does Online Really Take More Time than Face-to-Face?Van de Vord and Pogue
Vol 13 | No 3 Research Articles June 2012 135
approximately 20% more time was spent per student in the online course. Significant time differences were found, with time required for online being greater in time spent setting up the online environment, record keeping, and miscellaneous. Significantly more time was spent in the face-to-face class than in the comparable synchronous chat held for the online course. The authors’ conclusions echo those of Cavanaugh, finding that overall time spent on the online course was not greater, but that time per student is greater.
Similar to an earlier study, the Hislop and Ellis (2004) study employed seven pairs of grad-uate classes. Class size for the online versions averaged 19.3 and for the face-to-face 26. As with most of the prior studies noted in this review, the instructors were experienced in both the face-to-face and online environments and focused on time required to deliver the course, excluding development time. The authors conclude that when class size is taken into account, the average time spent per student was “nearly equivalent for online and face-to-face” (p. 15). They note, however, that time spent in the online course was more frag-mented and involved a greater number of days, suggesting that teaching online requires more effort, but not necessarily more time. Further, according to the authors, “the data appear to be internally consistent, where different instructors expended similar efforts for the same courses and the same instructors exhibited the same effort pattern across differ-ent courses” (p. 29).
Finally, at least two research studies suggest that time spent teaching online is less than teaching face-to-face. McKenney and colleagues (2010) compared a completely online course with 47 students in two sections to two Web-facilitated face-to-face sections with a total of 192 students, finding the fully online sections take less time. Only actual instruction time was measured. Teaching included “lecturing, releasing modules, or posting assign-ments” (p. 247). Initial course preparation was not included, but ongoing preparation, such as reviewing modules or copying handouts, was included. It appears that communica-tion time with individual students was not considered to be instruction time. Instead, the authors analyzed the number of student contacts, finding them to be significantly greater in the fully online sections, as would be expected. In an online course it is this individual communication that in part replaces the classroom sessions.
DiBiase (2000) conducted a comparison of two geography courses. The online versions (four sections) were offered to adult professionals, enrollment averaging 18 per section. The two face-to-face sections were offered on campus to college undergraduate students with a total enrollment of 223. During the period of the study, the instructor and his teaching assistants recorded any teaching episode lasting longer than five minutes. Consistent with most of the other studies noted here, course development time was not included. The find-ings indicated that time per student in the online classroom was less than time per student required in the face-to-face classroom. Similar to the Hislop and Ellis (2004) findings, the author notes that the number of days during which the instructor engaged in activities related to the online classroom was greater for the online course (5) than the face-to-face course (4).
A multitude of factors influence the amount of instructor time required to teach either
Teaching Time Investment: Does Online Really Take More Time than Face-to-Face?Van de Vord and Pogue
Vol 13 | No 3 Research Articles June 2012 136
a face-to-face or an online course. Class sizes in these studies were consistently smaller for the online versions than the face-to-face versions. Exploring the scalability of distance learning courses, DiBiase and Rademacher (2005) note that as the course enrollment in-creased by a factor of 2.7, time required by the course increased by a factor of 2.5. In other words, as enrollment increases teaching time does not also increase at the same rate, sug-gesting that smaller courses require more time per student making larger courses more efficient to teach. This would be true in the face-to-face environment as well with required hours of class meetings held constant despite enrollment size.
Second, DiBiase (2000) argues that “the amount of effort required to teach a distance course may be inversely proportional to the effort invested in instructional design and de-velopment” (p. 19). The studies noted above do not indicate to what extent online instruc-tional design expertise was employed.
Third, some administrative items noted in the studies above are handled differently for online and on-campus courses, or were in the early days of online delivery. As online in-struction becomes more a part of the norm, the instructor may spend less time explaining to students how to access their course spaces and other technical issues, for example. In addition, universities are developing systems for orienting online students and providing other services which more closely replicate the on-campus experience. As we see these changes occur, how is online teaching time impacted?
MethodThere is great variety in the way that online courses are developed and delivered across institutions of higher education. At the university where the current study was conducted, there is a center which supports the development and delivery of online courses, including student and faculty support services. All courses are developed by faculty in conjunction with an instructional designer and all employ the same template, creating consistent navi-gation across all courses.
Initially a pilot group of nine online instructors was asked to maintain a daily time log, recording start and end times for all activities related to the course for three of the final four weeks of the semester. The instructors were selected solely on their willingness to participate. It was thought that this information then would provide a foundation for de-veloping categories of instructional processes for use with a greater number of instructors in the following semester. By starting without preset categories researchers hoped not to bias the reporting but instead explore the categories that emerged. The group also agreed to continue the record-keeping the following semester and suggested that maintaining data from seven weeks would provide a sound representation of the full semester’s work (15 weeks plus final exams.)
Of the nine instructors, six completed the original task. From the time logs each main-tained, spreadsheets were created to categorize the time spent related to teaching. These categories included interacting with students, evaluating students’ work, lecture prepara-
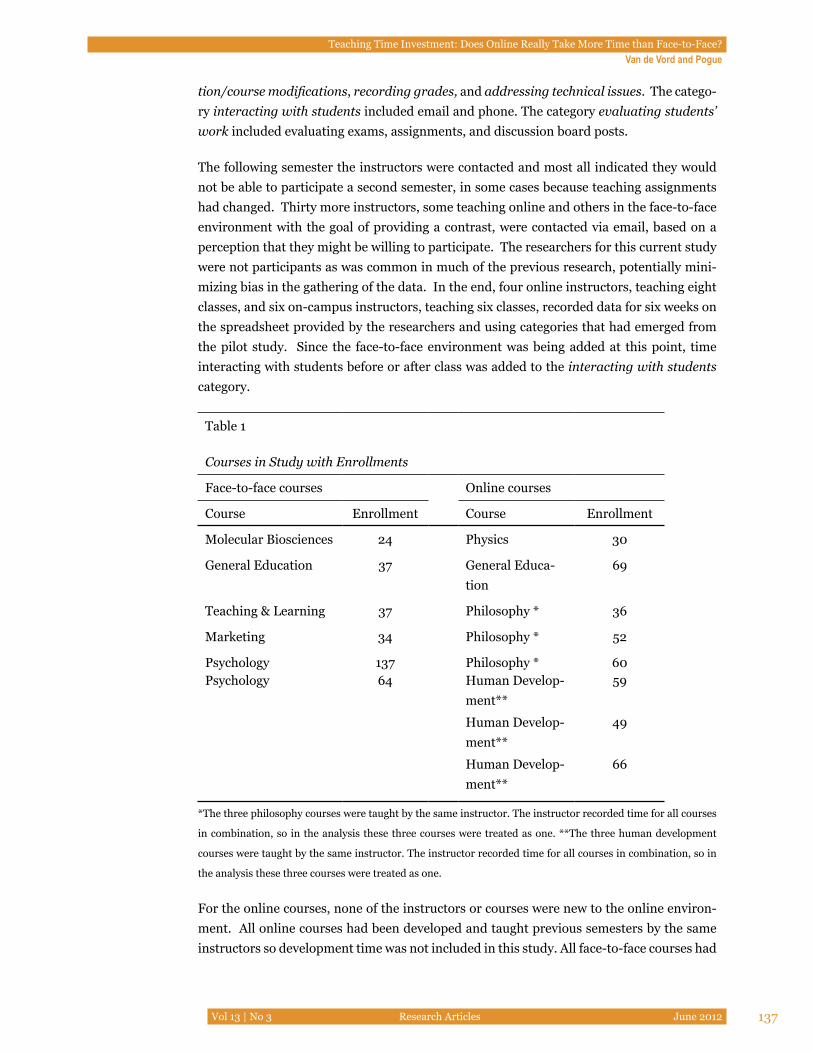
Teaching Time Investment: Does Online Really Take More Time than Face-to-Face?Van de Vord and Pogue
Vol 13 | No 3 Research Articles June 2012 137
tion/course modifications, recording grades, and addressing technical issues. The catego-ry interacting with students included email and phone. The category evaluating students’ work included evaluating exams, assignments, and discussion board posts.
The following semester the instructors were contacted and most all indicated they would not be able to participate a second semester, in some cases because teaching assignments had changed. Thirty more instructors, some teaching online and others in the face-to-face environment with the goal of providing a contrast, were contacted via email, based on a perception that they might be willing to participate. The researchers for this current study were not participants as was common in much of the previous research, potentially mini-mizing bias in the gathering of the data. In the end, four online instructors, teaching eight classes, and six on-campus instructors, teaching six classes, recorded data for six weeks on the spreadsheet provided by the researchers and using categories that had emerged from the pilot study. Since the face-to-face environment was being added at this point, time interacting with students before or after class was added to the interacting with students category.
Table 1
Courses in Study with Enrollments
Face-to-face courses Online courses
Course Enrollment Course Enrollment
Molecular Biosciences 24 Physics 30
General Education 37 General Educa-tion
69
Teaching & Learning 37 Philosophy * 36
Marketing 34 Philosophy * 52
Psychology 137 Philosophy * 60Psychology 64 Human Develop-
ment**59
Human Develop-ment**
49
Human Develop-ment**
66
*The three philosophy courses were taught by the same instructor. The instructor recorded time for all courses
in combination, so in the analysis these three courses were treated as one. **The three human development
courses were taught by the same instructor. The instructor recorded time for all courses in combination, so in
the analysis these three courses were treated as one.
For the online courses, none of the instructors or courses were new to the online environ-ment. All online courses had been developed and taught previous semesters by the same instructors so development time was not included in this study. All face-to-face courses had
Teaching Time Investment: Does Online Really Take More Time than Face-to-Face?Van de Vord and Pogue
Vol 13 | No 3 Research Articles June 2012 138
also been taught by the instructors before with the exception of a face-to-face psychology course which was being taught by the instructor for the first time and therefore took more effort than would be typical. A full semester is 15 weeks plus a final exam week during which regular classes are not held and only final exams take place. Instructors were asked to record their time for weeks 5, 6, 9, 10, and 14 through submission of final grades. It was perceived after the feedback from the pilot that instructors would not be willing to keep track for the full 16-week semester. The weeks chosen to provide a sample representative of a semester’s work were identified as generally heavy grading weeks by the researchers and instructors involved in the pilot. In fact, not all instructors maintained accurate data through the seven weeks of the study and those teaching multiple courses had difficulty separating their data accordingly.
Therefore, the following adjustments were made: the teaching and learning, human devel-opment, and marketing courses did not have final tests and were thus completed in week 15. For these five courses, weeks 14 and 15 were counted as the final two weeks of work of the semester. The online general education course was missing data for weeks 14 and 15. It was determined that with two courses completing early and one missing data, week 14 would be removed from all of the other courses. None of those courses with data in that week had anything remarkable so removing the data did not change their outcome. Overall, six weeks of data, then, instead of seven, were used to assess differences between online and on-cam-pus teaching time. Additionally, the three philosophy and the three human development courses were taught by the same instructor. In both instances the instructors recorded the combined time spent teaching all three courses, rather than by individual course.
For this study, rather than using pairs of courses, that is the same course taught face-to-face and online, or a single instructor teaching both online and face-to-face, a selection of courses across disciplines was thought to provide a broader perspective than has been dis-cussed in previous research. The goal was to provide data across a range of fields, moving beyond the limits of single instructors or disciplines. The minutes spent teaching onsite in the classroom was included in the grand total and as a component of student interaction. No initial course development time for either online or face-to-face courses was included in the study, consistent with prior research (Cavanaugh, 2005; Hislop & Ellis, 2004; McKen-ney, Peffley, & Teolis, 2010).
ResultsTotal teaching time, per week, per student in the face-to-face course ranged from 3.83 minutes to 36.32 minutes, with a mean of 14.98 and a median of 13.88. In the online courses the range was 11.21 minutes to 16.72, with a mean of 12.7 and a median of 12.32. The range in the data for face-to-face categories was large when compared to the range in online courses, making the median rather than mean a better comparison between the two delivery systems.
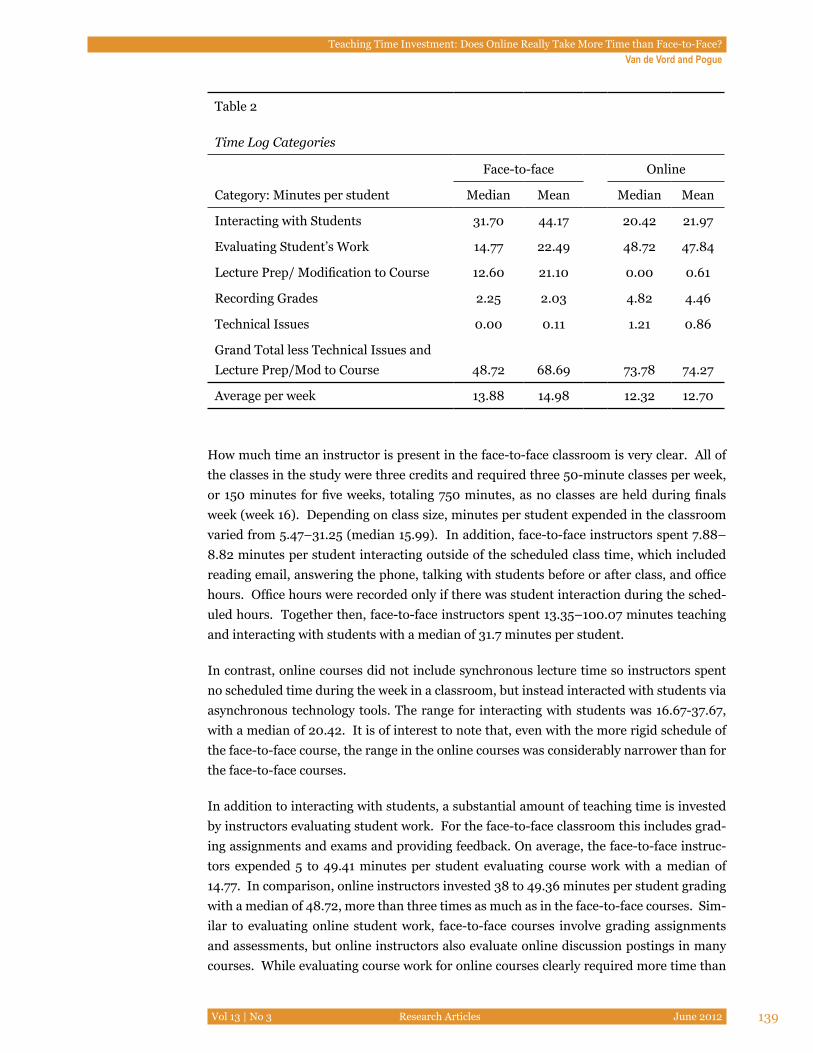
Teaching Time Investment: Does Online Really Take More Time than Face-to-Face?Van de Vord and Pogue
Vol 13 | No 3 Research Articles June 2012 139
Table 2
Time Log Categories
Face-to-face Online
Category: Minutes per student Median Mean Median Mean
Interacting with Students 31.70 44.17 20.42 21.97
Evaluating Student’s Work 14.77 22.49 48.72 47.84
Lecture Prep/ Modification to Course 12.60 21.10 0.00 0.61
Recording Grades 2.25 2.03 4.82 4.46
Technical Issues 0.00 0.11 1.21 0.86
Grand Total less Technical Issues and Lecture Prep/Mod to Course 48.72 68.69 73.78 74.27
Average per week 13.88 14.98 12.32 12.70
How much time an instructor is present in the face-to-face classroom is very clear. All of the classes in the study were three credits and required three 50-minute classes per week, or 150 minutes for five weeks, totaling 750 minutes, as no classes are held during finals week (week 16). Depending on class size, minutes per student expended in the classroom varied from 5.47–31.25 (median 15.99). In addition, face-to-face instructors spent 7.88–8.82 minutes per student interacting outside of the scheduled class time, which included reading email, answering the phone, talking with students before or after class, and office hours. Office hours were recorded only if there was student interaction during the sched-uled hours. Together then, face-to-face instructors spent 13.35–100.07 minutes teaching and interacting with students with a median of 31.7 minutes per student.
In contrast, online courses did not include synchronous lecture time so instructors spent no scheduled time during the week in a classroom, but instead interacted with students via asynchronous technology tools. The range for interacting with students was 16.67-37.67, with a median of 20.42. It is of interest to note that, even with the more rigid schedule of the face-to-face course, the range in the online courses was considerably narrower than for the face-to-face courses.
In addition to interacting with students, a substantial amount of teaching time is invested by instructors evaluating student work. For the face-to-face classroom this includes grad-ing assignments and exams and providing feedback. On average, the face-to-face instruc-tors expended 5 to 49.41 minutes per student evaluating course work with a median of 14.77. In comparison, online instructors invested 38 to 49.36 minutes per student grading with a median of 48.72, more than three times as much as in the face-to-face courses. Sim-ilar to evaluating online student work, face-to-face courses involve grading assignments and assessments, but online instructors also evaluate online discussion postings in many courses. While evaluating course work for online courses clearly required more time than
Teaching Time Investment: Does Online Really Take More Time than Face-to-Face?Van de Vord and Pogue
Vol 13 | No 3 Research Articles June 2012 140
in the face-to-face classroom, there was less variation in the range than in the face-to-face courses.
This study also examined the amount of time instructors spent modifying their courses while teaching them. For face-to-face courses, ongoing lecture preparation required a me-dian of 12.6 minutes per student compared with .00 minutes per student in online course modification because the preparation for the online course is completed before the first day of the semester in most cases.
Lastly, time required by the instructor for addressing technical support issues was minimal in the face-to-face course at .00 median minutes/student and greater in the online course at an average of 1.21 minutes per student, as would be expected.
DiscussionThe perception amongst the academic community is that it takes more time to teach an online class than one face-to-face. Researchers have been investigating this question and so far have come to no clear conclusions. At the same time, the technology has been advanc-ing, along with increased mainstreaming of online education which brings with it more experience and better institutional support structures. The current study explored time re-cords kept by online and on-campus instructors for six weeks during a 16-week semester. According to the data, overall the time spent by face-to-face instructors was greater (me-dian 14.98) than online (median 12.70), suggesting, on the surface, more time was spent teaching face-to-face. This surface level finding, however, does not tell the whole story.
Comparisons such as this are difficult. Comparing one individual course to another, it is difficult at best to account for differences between instructors, content, and students. A course which one semester seems fairly easy to teach can the next semester be much more time consuming due to the particular group of students. Comparing face-to-face and online courses increases the challenge because there are considerable differences between the en-vironments, which are in many ways like comparing apples to oranges. For example, there is the more traditional process of creating course materials “as you go” in the face-to-face environment versus creating the online course in its entirety prior to delivery. Further, there are variations across universities in the processes related to development and delivery of online courses. Since there is a perception that online courses take more time, however, it is important to continue to investigate and understand the workload differences inherent in the two environments.
To put the data of this study in perspective one must understand the online teaching envi-ronment at the university where the research took place. A center has been established to work with departments to deliver all online courses. The center provides student services including advising, instructional design, technology, and faculty support. These support services include 24/7 technical support for both students and instructors. Further, the one-to-one instructional design support provided during course development, training of instructors, assistance in the ongoing updating and maintenance of courses, and the appli-
Teaching Time Investment: Does Online Really Take More Time than Face-to-Face?Van de Vord and Pogue
Vol 13 | No 3 Research Articles June 2012 141
cation of a consistent course template are all intended to minimize student and instructor support needs and workload demands.
Lecture preparation was included in the data recorded. Since online courses are set up prior to the first day of class, there is no equivalent task for the online instructor during the peri-od of delivery. It was thought that lecture preparation time in the face-to-face course might be offset by technical support demands of the online course. Findings from other studies have suggested that the online instructor spends significant time providing student techni-cal support (e.g., Bender, Wood, & Vredegood, 2004; Lee & Busch, 2005; Santilli & Beck, 2005 ). Technical support time (1.21 minutes per student), however, was considerably less than the lecture preparation time (12.6 minutes per student) required in the face-to-face course, perhaps owing to the 24/7 technical support described above, suggesting one does not offset the other. If lecture preparation and technical support were both eliminated from the data, face-to-face instructors would have invested less time overall during the period of delivery than online instructors in this study. Subtracting out the lecture preparation and technical support time, face-to-face instructors invested a median time of 11.45 minutes per week (mean 8.12) compared to the online median time of 12.30 minutes per week (mean 12.38), suggesting that these online instructors are spending about a minute per week per student more in their online course.
The aspects of teaching that include interaction with students, whether in the physical or online classroom, before or after class, or via email, phone or during office hours is not more time consuming in the online environment than the face-to-face environment, according to the results of this study. In fact, more time was recorded as interacting per student in the face-to-face environment. In part, this may be due to the fact that no matter how many students enroll in a face-to-face course, the instructor must spend the requisite three hours per week (for a 3-credit class) in the classroom. An online course does not have similar requirements as course materials are preprepared and available to students, rather than be-ing presented in a “Carnegie Hour” format. On the other hand, one of the previous findings related to teaching online is that the communication style of the online environment causes instructors to feel that they are working 24/7 (Concieção, 2006; DiBiase, 2000; Hislop & Ellis, 2004). It is possible that this communication style is beginning to infiltrate the face-to-face environment as well, increasing the amount of time or frequency that instructors spend interacting with students who use email instead of office hours for communication.
According to the data in this study, evaluating student work is much more time intensive for online instructors, including the uploading of grades. Further research is required to determine exactly where this time is being spent, but it is likely due in large part to online courses depending on text-based discussion, which requires thorough reading not only to evaluate student learning, but to facilitate that learning as well. In fact, instructors partici-pating in this study commented on the extensive time invested in grading. One instructor stated, “Grading these 8-10 page papers also takes a very long time. Trying to read and grade these papers in a timely manner and keep up with weekly posts is where most of my time goes.” A second instructor commented,
Teaching Time Investment: Does Online Really Take More Time than Face-to-Face?Van de Vord and Pogue
Vol 13 | No 3 Research Articles June 2012 142
I think my biggest surprise is that it takes longer to grade papers on the computer than it does with a pile of them in hard copy form in front of you. Also giving feedback is much more time consuming, because it must be done for every student individually, whereas in a classroom an instructor may give general feedback to the whole class at the same time. Thirdly, as papers are graded students ask questions, which is an excellent thing, but more students actually ask for more feedback than in the classroom. This again takes more time.
These comments suggest that strategies are needed to assist instructors in online grad-ing and efficiently facilitating and evaluating discussion. These strategies can range from randomized grading of a select number of discussion postings, implementing peer review of fellow students’ postings, and exploring posting of audio discussion and audio feedback which might be less time consuming to create and critique. Furthermore, personal ex-perience with learning management systems leads to the observation that uploading and downloading of documents to grade and then return to the student is less efficient than the traditional handing in and handing back of assignments and assessments, as also noted in the second quote above. Technology developers need to investigate more efficient grading processes. Lastly, ensuring that instructors have the appropriate training with the learning management tools is critical.
There appears to be a larger variation in the time commitment of face-to-face instructors than online instructors. The total minutes per week per student in the face-to-face environ-ment ranged from 3.83–36.32 while in the online environment the range was 11.01–16.72. This is possibly due to a larger variation in enrollment, although there is not a clear cor-relation between enrollment numbers and time spent teaching in either environment. This finding may suggest that the similar structure of these online courses minimizes the varia-tion, and perhaps flexibility, of online instructors. This may relate to the use of a consistent template and systematic development of the online courses that were a part of this study. In addition, as mentioned previously, the university maintains a center which supports these online instructors and their students, possibly relieving them of greater time require-ments that teaching in other online programs might demand
As in this study, most research has focused on time spent during course delivery. Future research should explore the time required to prepare the online course versus creating a new face-to-face course. For both environments, development of a new course takes time.
This research has a number of limitations. In the field of education it is very difficult to con-duct controlled experiments. Students self-select into courses and course environments. Of greater concern in this study, researchers were dependent on the instructors keeping ac-curate, detailed records over a period of time. Researchers were not able to offer incentives to participate in this study so had to rely on the generosity of the faculty who volunteered. To make this task somewhat less onerous, and potentially increase the accuracy and num-
Teaching Time Investment: Does Online Really Take More Time than Face-to-Face?Van de Vord and Pogue
Vol 13 | No 3 Research Articles June 2012 143
ber of participants, the number of weeks instructors were asked to keep data was limited to seven (with six completed). This was a tradeoff, however, in that it is then only a sample of time across the semester. It would be worthwhile, based on these data, to further investigate with a full semester of data. It is worth noting that the two most similar courses, the general education face-to-face and online course, followed the same pattern of results as has been reported for the groups of courses on the whole, suggesting external validity of the data. Fi-nally, the study did not compare exact pairs of courses, online and face-to-face, taught by the same instructor as many courses at this university are taught either online or face-to-face but not necessarily both.
The intent of this study was to provide a broader picture and to move beyond factors related solely to individual instructors or individual courses. This study was able to include more of a cross section of instructors and courses than previous research. The pilot study provided in-formation that enabled the targeting of specific activities where instructors spend significant time in both course delivery formats. Our findings conclude that interaction time with stu-dents is greater in the face-to-face courses while evaluating students and their work is greater in the online courses. The importance of these data is not whether time demand, overall, is greater in one environment or the other but where and how that time is spent, which will point to possible strategies for supporting instructors teaching online.
First, the data suggest that online instructors are spending three times more time than face-to-face instructors evaluating student work. This is a difficult task and suggests that teaching online is perhaps more difficult, rather than more time consuming, than teaching face-to-face. The greater investment of face-to-face teachers is time in the classroom lecturing or facilitating. These are activities with which face-to-face instructors are very comfortable and are not likely to define as challenging. Considering the findings of the current study, com-bined with the research of Hislop and colleagues, that teaching online is more demanding in frequency of interaction, it is no surprise that instructors are concerned when asked to teach online. It behooves those who are looking to grow their online programs to invest in techno-logical solutions that will ease the burden on online faculty.
Second, there was far less variation in the amount of time spent teaching online than in the face-to-face environment, yet it seems that one could assume that instructors and course con-tent vary as much online. This may suggest that the learning management system, the struc-ture of the online courses, or other unidentified factors play a role in determining amount of time spent teaching online. This finding requires further investigation to determine how this information can best serve online instructors in managing their teaching time.
Ongoing research is required to capture the continually changing environment of technology in course delivery, for both online and face-to-face courses, and how these changes effect faculty teaching time in the classroom.
AcknowledgementsKathryn Baldwin, Linda Cook, Ken Faunce, Mary Garcia, Lydia Gerber, Sally Horton, Ioan-

Teaching Time Investment: Does Online Really Take More Time than Face-to-Face?Van de Vord and Pogue
Vol 13 | No 3 Research Articles June 2012 144
nis Kareklas, Janet Kendall, Richard Kouzes, Phil Longstreet, Norah McCabe, Valeria Pietz, Jeannie Pittman, Nori Porter, Brigit Schneider, Carole-Anne Seeley, Rob Snyder, Saman-tha Swindell, Steve Ullrich.
Teaching Time Investment: Does Online Really Take More Time than Face-to-Face?Van de Vord and Pogue
Vol 13 | No 3 Research Articles June 2012 145
References
Allen, E., & Seaman, J. (2011). Going the distance: Online education in the United States, 2011. Babson Survey Research Group. Retrieved from http://sloanconsortium.org/publications/survey/going_distance_2011
Bender, D. M., Wood, J.B., & Vredevoogd, J. D. (2004). Teaching time: Distance educa-tion versus classroom instruction. The American Journal of Distance Education, 18(2), 103-114.
Bolliger, D., & Waslik, O. (2009). Factors influencing faculty satisfaction with online teach-ing and learning in higher education. Distance Education, 30, 103-116.
Cavanaugh, J., (2005). Teaching online-A time comparison. Online Journal of Distance Learning Administration Content, 8(1). Retrieved from http://www.westga.edu/~distance/ojdla/spring_81/cavanaugh81.htm.
Concieção, S. C. (2006). Faculty lived experiences in the online environment. Adult Educa-tion Quarterly, 5, 26-45.
DiBiase, D. (2000). Is distance teaching more work or less work? The American Journal of Distance Education, 14(3), 6-20.
DiBiase, D., & Rademacher, H. (2005). Scaling up: Faculty workload, class size and student satisfaction in a distance learning course on geographic information science. Jour-nal of Geography in Higher Education, 29, 139-158.
Harber, J., & Mills, M. (2008). Perceptions of barriers concerning effective online teaching and policies: Florida Community College Faculty. Community College Journal of Research and Practice, 3, 266-283.
Hislop, G. (2001). Does teaching online take more time? Paper presented at 31st ASEE/IEEE Frontiers in Education Conference, October 10-13, Reno, NV.
Hislop, G., & Ellis, H. J. C. (2004). A study of faculty effort in online teaching. Internet and Higher Education, 7, 15- 31.
Lee, J. A., & Busch, P. E. (2005). Factors related to instructors’ willingness to participate in distance education. Journal of Education Research, 99(2), 109-115.
Lonn, S., & Teasley, S. D. (2009). Saving time or innovating practice: Investigating per-ceptions and uses of learning management systems. Computers & Education, 53, 686-694.
McKenney, C., Peffley, E., & Teolis, I. (2010). Comparison of time investment in common teaching practices among three instructional methods. Teaching Methods, 20,

Teaching Time Investment: Does Online Really Take More Time than Face-to-Face?Van de Vord and Pogue
Vol 13 | No 3 Research Articles June 2012 146
245-249.
Mital, M. (2007). Integrating technology into the teaching-learning transaction: Pedagogi-cal and technological perceptions of management faculty. International Journal of Educational Development Using Information Communication Technology, 3(1). Retrieved from http://vnweb.hwwilsonweb.com/hww/results/results_single_ftPES.jhtml.
Santilli, S., & Beck, V. (2005). Graduate faculty perceptions of online teaching. The Quar-terly Review of Distance Education, 6(2), 155-160.
Spector, M. (2005). Time demands in online instruction. Distance Education, 26, 5-27.
Tomei, L. A., (2006). The impact of online teaching on faculty load: Computing the ideal class size for online courses. Journal of Technology and Teacher Education, 14(3), 531-541.
Worley, W., & Tesdell, L. (2009). Instructor time and effort in online and face-to-face teaching: Lessons learned. IEEE Transactions on Professional Communication, 52, 138-151.
Wang, M., MacArthur, D. A., & Crosby, B. (2003). A descriptive study of community college teachers’ attitudes toward online learning. Tech Trends, 47(5), 28-31.
M-Learning Adoption: A Perspective from a Developing Country
AbstractM-learning is the style of learning for the new millennium. Decreases in cost and increases in capabilities of mobile devices have made this medium attractive for the dissemination of knowledge. Mobile engineers, software developers, and educationists represent the supply side of this technology, whereas students represent the demand side. In order to further develop and improve this medium of learning it is imperative to find out students’ percep-tions about m-learning adoption. To achieve this objective a survey was conducted among the students of 10 chartered universities operating in the twin cities of Rawalpindi and Is-lamabad in Pakistan. The results indicate that perceived usefulness, ease of use, and facili-tating conditions significantly affect the students’ intention to adopt m-learning, whereas perceived playfulness is found to have less influence. Social influence is found to have a negative impact on adoption of m-learning. The findings of this study are useful in provid-ing guidance to developers and educators for designing m-learning courses specifically in the context of developing countries.
Keywords: M-learning; mobile learning; technology adoption; technology acceptance
model
IntroductionThe concept of distance learning during the 1960s mostly involved distributing learning material to help educate the geographically scattered masses through prerecorded lectures on audio/video tapes or live lectures delivered via radio or television. With the emergence of the World Wide Web, e-learning, which is learning supported by digital electronic tools and media, became popular (Peng et al., 2009). In the last decade the number of mobile
Shakeel Iqbal and Ijaz A. QureshiIqra University, Pakistan
M-Learning Adoption: A Perspective from a Developing CountryIqbal and Qureshi
Vol 13 | No 3 Research Articles June 2012 148
devices (e.g., mobile phones, personal data assistants [PDAs], laptop computers, and pen tablet computers) increased drastically (Wali et al., 2008). This increase in the number of mobile devices led researchers to focus on using these devices as a medium of learning (Koszalka & Ntloedibe-Kuswani, 2010).
Various research studies were conducted in developed countries to find out the factors af-fecting acceptance of e-learning and m-learning among students (see Concannon et al., 2005; Davies & Graff, 2005; Huang et al., 2007; Wang et al., 2009). However, limited re-search is available on the issue from the perspective of developing countries. The state of technology and the social structure of developing countries are different from developed countries. Therefore research specifically identifying motivating factors for m-learning in developing countries is needed. The present study was conducted to fill this research gap. The outcomes of this study are likely to be useful for the developers and designers of m-learning.
Literature ReviewMobile learning or m-learning has been defined differently in different studies, which in-dicates that m-learning is still in an evolving phase (Peng et al., 2009). M-learning has been defined as “e-learning using mobile devices and wireless transmission” (Hoppe et al., 2003; Chang et al., 2003). Two important aspects of m-learning are its ubiquity and mo-bility. Ubiquitous computing is access to computing technologies whenever and wherever they are needed and mobility can be defined as learning on the go (Peng et al., 2009). While e-learning is mostly dependent upon desktop personal computing (PC) technology, m-learning is dependent upon mobile devices (Orr, 2010).
One of the main reasons for increased attention paid towards m-learning is the increase in the number of mobile devices (such as mobile phones, PDAs, laptops, and iPads) as well as enhancements in the technological capabilities of these devices. With decreasing costs these mobile devices are becoming accessible to more people. These mobile devices offer multiple features and capabilities such as making phone calls, recording audio/video, cap-turing pictures, storing data, and accessing the Internet. All of these functionalities can be used in an educational context (Maccallam & Jeffery, 2009). A review of the literature on m-learning reveals several initiatives, such as the implementation of m-portals (Mitchell, 2003), classrooms of the future (Dawabi et al., 2003), and practical scientific experimenta-tion and teaching (Milrad et al., 2004).
Learners can create and share their own knowledge through the use of interactive games installed on their mobile devices. M-learning provides a tool for brainstorming, quizzing, and voting through integration with online management systems in classrooms (Goh & Kinshuk, 2006), while in the laboratory it bridges individual and collaborative learning. It helps users take graphic and textual data on field trips and supports the delivery of learning, whether the users are sitting in the same place at the same time or not; this access to infor-mation anytime and all the time is the greatest advantage of m-learning. M-learning can be
M-Learning Adoption: A Perspective from a Developing CountryIqbal and Qureshi
Vol 13 | No 3 Research Articles June 2012 149
seen as a further extension of its predecessor, e-learning (Wang et al., 2009).
Engines of M-LearningThere are four key-players in m-learning: hardware developers (engineers), software devel-opers, educators, and students. There are many challenges for all the key players to make m-learning a preferred mode of transmitting and acquiring information. From a technology perspective, there are many technical restrictions that may cause resistance to m-learning adoption (Wang et al., 2009).
Technological challenges faced by software developers are mainly due to the limitations of commonly used mobile devices as compared to personal computers (Wang et al., 2009). Unless these developers are well versed in the capabilities as well as the limitations of spe-cific mobile devices, they will not be able to develop something of value for the users (Geor-giev et al., 2006). Software developers need to realize that mobile devices have less process-ing speed, less memory, no keyboard (in most cases), and smaller displays when compared to PCs; though every new product being introduced to the market is superior compared to its predecessors in these aspects.
Educators will be interested in m-learning only if they are comfortable using mobile de-vices. If they are well versed in using mobile devices they can provide valuable input to the m-learning software developers. Knowledge about the capabilities and limitations of mobile devices and their frequent usage by educationists is a prerequisite for developing m-learning content (Georgiev et al., 2006). Mobile engineers, developers, and educationists work on the supply side while students represent the demand side of m-learning. As men-tioned earlier more students can access mobile devices mainly due to their decreasing costs. At present, these devices are mostly being used for gaming, music sharing, and connecting to social Web sites like Facebook, YouTube, and MySpace. If students are provided with educational content in an appropriate manner which is exciting and novel they will be more inclined to use these devices. However, designing a device compatible with m-learning and making it affordable for students and educators is a challenging task.
Successful measurement of m-learning depends upon three factors: technical-level success, semantic-level success, and effectiveness-level success of the information system. Separate success measures are used to measure each level (DeLone & McLean, 1992). Technical-level success can be measured by system quality, semantic-level success can be measured by information quality, and effectiveness-level success can be measured by user satisfaction.
Different factors have been studied in previous research, which are considered to be impor-tant from the adoption point of view. In one of the studies on this topic, Phuangthong and Malisawan (2005) presented a model of m-learning adoption and concluded that people’s attitude towards m-learning was influenced by perceived enjoyment. In another study, Ju et al. (2007) pointed out that perceived usefulness has a significant impact on users’ atti-tudes, which further affects the users’ intention to adopt m-learning. In their study, Wang et al. (2009 indicated the following factors as important determinants of users’ intentions to adopt m-learning: learning at a self-managed pace, perceived usefulness, social influ-
M-Learning Adoption: A Perspective from a Developing CountryIqbal and Qureshi
Vol 13 | No 3 Research Articles June 2012 150
ence, performance expectancy, and effort expectancy.
Perceived Usefulness, Perceived Ease of Use, and Intention to UseThe technology acceptance model (TAM) was first proposed by Davis (1989) and consists of two major constructs: perceived ease of use (PEOU) and perceived usefulness (PU). Later, Venkatesh et al. (2003) proposed a unified model based on the two TAM constructs, the unified theory of acceptance and use of technology (UTAUT). Several other studies have used these two concepts to demonstrate their impact on intention; for example, studies conducted on e-commerce (Gefen & Straub, 2000), Web 2.0 (Shin & Kim, 2008), broad-band Internet (Oh et al., 2003), digital libraries (Hong, 2002), and virtual communities (Lin, 2006) can be considered. In some recent studies PEOU and PU have been demon-strated to have an impact on intention to adopt e-learning. Based on the relevance of these two variables to the adoption of new technology we propose our first two hypotheses as follows.
H1: Perceived usefulness (PU) positively influences intention to adopt m-learning.
H2: Perceived ease of use (PEOU) positively influences intention to adopt m-learning.
Facilitating ConditionsAcceptance of any new technology largely depends upon the supporting conditions/envi-ronment. Venkatesh et al. (2003) defined facilitating conditions as “the degree to which an individual believes that an organizational and technical infrastructure exists to support use of the system.” In the context of m-learning these facilitating conditions include factors which can contribute to the adoption of m-learning, such as resources, knowledge, Internet speed, and support personnel.
There are many technical challenges that make adaptation of the present e-learning ser-vices to m-learning difficult, and due to these technical restrictions users will be reluctant to adopt m-learning (Wang et al., 2009). Some of these restrictions as noted by Maniar and Bennett (2002) are a lack of standardization, low bandwidth, limited processor speed, small screen size, low storage, short battery life, lack of data input capability, and software issues and interoperability. In addition to these, other limitations of the mobile devices have been pointed out by Shiau, Lim, and Shen (2001): unfriendly user interfaces, lower display resolution, limited memory and disk capacity, less surf-ability, and less computa-tional power. Due to the importance of facilitating conditions, we propose our third hypoth-esis as follows.
H3: Facilitating conditions positively influences intention to adopt m-learning.
Perceived PlayfulnessIn previous studies, perceived playfulness was found to have positively influenced the adop-tion of IT-based innovations (e.g., mobile Internet and Internet-based learning media) (Lee
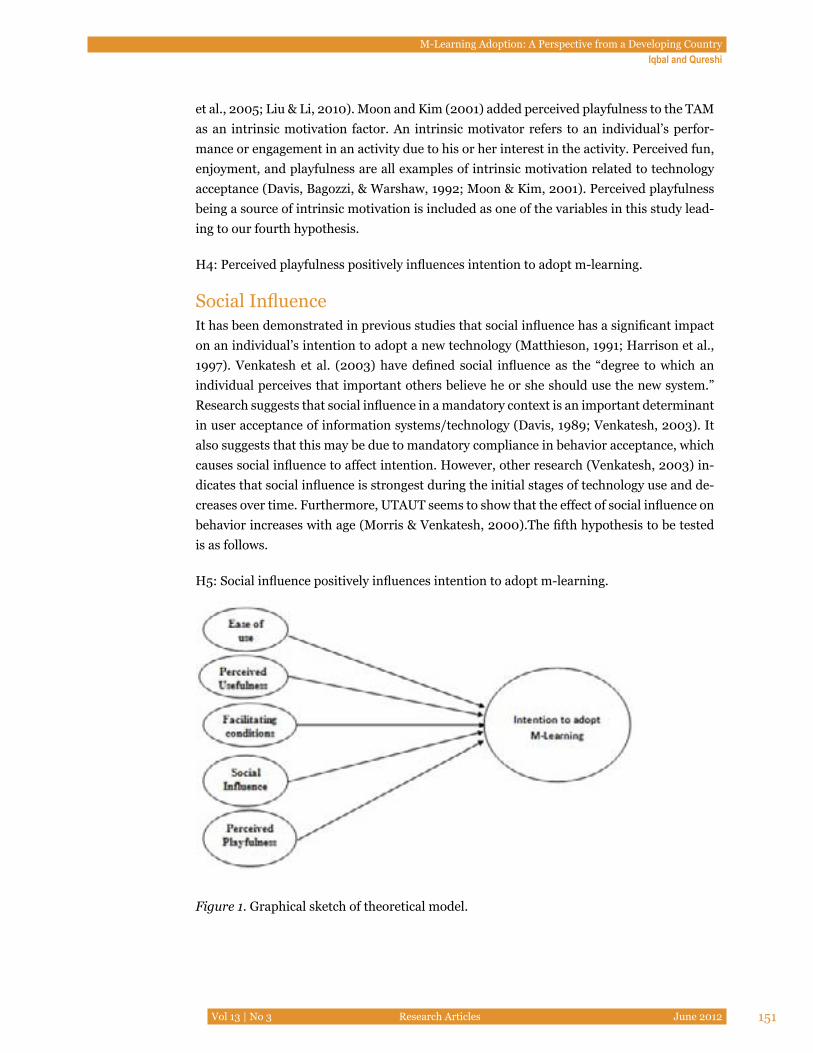
M-Learning Adoption: A Perspective from a Developing CountryIqbal and Qureshi
Vol 13 | No 3 Research Articles June 2012 151
et al., 2005; Liu & Li, 2010). Moon and Kim (2001) added perceived playfulness to the TAM as an intrinsic motivation factor. An intrinsic motivator refers to an individual’s perfor-mance or engagement in an activity due to his or her interest in the activity. Perceived fun, enjoyment, and playfulness are all examples of intrinsic motivation related to technology acceptance (Davis, Bagozzi, & Warshaw, 1992; Moon & Kim, 2001). Perceived playfulness being a source of intrinsic motivation is included as one of the variables in this study lead-ing to our fourth hypothesis.
H4: Perceived playfulness positively influences intention to adopt m-learning.
Social InfluenceIt has been demonstrated in previous studies that social influence has a significant impact on an individual’s intention to adopt a new technology (Matthieson, 1991; Harrison et al., 1997). Venkatesh et al. (2003) have defined social influence as the “degree to which an individual perceives that important others believe he or she should use the new system.” Research suggests that social influence in a mandatory context is an important determinant in user acceptance of information systems/technology (Davis, 1989; Venkatesh, 2003). It also suggests that this may be due to mandatory compliance in behavior acceptance, which causes social influence to affect intention. However, other research (Venkatesh, 2003) in-dicates that social influence is strongest during the initial stages of technology use and de-creases over time. Furthermore, UTAUT seems to show that the effect of social influence on behavior increases with age (Morris & Venkatesh, 2000).The fifth hypothesis to be tested is as follows.
H5: Social influence positively influences intention to adopt m-learning.
Figure 1. Graphical sketch of theoretical model.
M-Learning Adoption: A Perspective from a Developing CountryIqbal and Qureshi
Vol 13 | No 3 Research Articles June 2012 152
Method This is a survey-based study conducted through a structured questionnaire. The target population for this survey is the students of chartered universities operating in the twin cities of Rawalpindi and Islamabad in Pakistan. Ten universities were selected based on a convenient sampling technique. Both public and private universities were included in this survey since public universities outnumber the private universities in the twin city area; six of the selected universities belong to the public sector. The questionnaires were personally administered and distributed among the students of management sciences in the selected universities. The reason for conducting this survey among the students is that they repre-sent the user side of m-learning and it is a commonly used approach in a distance learning context (see Biner, 1993; Roberts et al., 2005; Abbad et al., 2009). Before asking students to fill in the questionnaire, the researchers ensured that they were familiar with Internet usage on mobile phones.
A total of 300 questionnaires were distributed since a sample size of 200 is considered to be reasonable for structural equation model (SEM) research (Kenny, 2011), and ordinary least square (OLS) multiple regression is a special case of SEM (Kelley & Maxwell, 2003). Two hundred and sixty-one questionnaires were received, out of which 250 were found to be complete and useful for the purpose of further analysis. The response rate was 83%.
The questionnaire was divided into two parts: demographic information of the participants and responses regarding the five predictors, that is perceived usefulness (PU), perceived ease of use (PEOU), social influence (SI), perceived playfulness (PP), and facilitating con-ditions (FC), and one dependant variable, the intention to adopt m-learning (IML). PU consisted of four items (adapted from Venkatesh et al., 2003), which mainly focused on increases in productivity and effectiveness. PEOU consisted of five items (adapted from Venkatesh et al., 2003) and enquired about ease of access and learning. FC was measured using four items (adapted from Hung et al., 2003), mainly focusing on hardware and soft-ware support and Internet speed. PP was measured using three items (adapted from Moon and Kim, 2001) and focused on the enjoyability of the experience of learning through mo-bile devices. SI consisted of three items (adapted from Park et al., 2007) and focused on peer/superior and organizational pressures in adopting m-learning. IML was measured us-ing four items, which mainly focused on the respondent’s intention to use m-learning as a medium of learning (adopted from Venkatesh et al., 2003).
All the retrieved questionnaires were entered in the Statistical Package for Social Sciences (SPSS) version 17.0 for carrying out the statistical analysis. The data was screened to find outliers and missing values. All the out coded variables were rectified and data normality was checked by means of skewness and kurtosis (DeCarlo, 1997). Data reliability for each variable was checked by means of Cronbach’s Alpha (Cronbach, 1951), which was found to be as follows: PU = .819, PEOU = .865, FC = .918, PP = .873, SI = .852, and IML = .807. Since all of these values are greater than 0.70 they fall in an acceptable range (Nunnally, 1978).

M-Learning Adoption: A Perspective from a Developing CountryIqbal and Qureshi
Vol 13 | No 3 Research Articles June 2012 153
Results and DiscussionThe demographic profile of the respondents is given in Table 1.
Table 1
Demographic Profiles of Respondents
Frequency Percent
Program enrolled Undergraduate 50 20
Graduate 125 50
Postgraduate 75 30
Total 250 100
Mobile device Mobile phone 175 70
PDA/palmtop 50 20
Both mobile phone and PDA/palmtop 25 10
Total 250 100
Mobile capabili-ties
Large screen display 50 20
External memory card 50 20
Internet browsing 100 40
Edge technology 50 20
Total 250 100
Internet sub-scriber
Yes 175 70
No 75 30
Total 250 100
Internet plan Prepaid 175 70
Postpaid 75 30
Total 250 100
Descriptive statistics for all the items used in this study are given in Table 2.
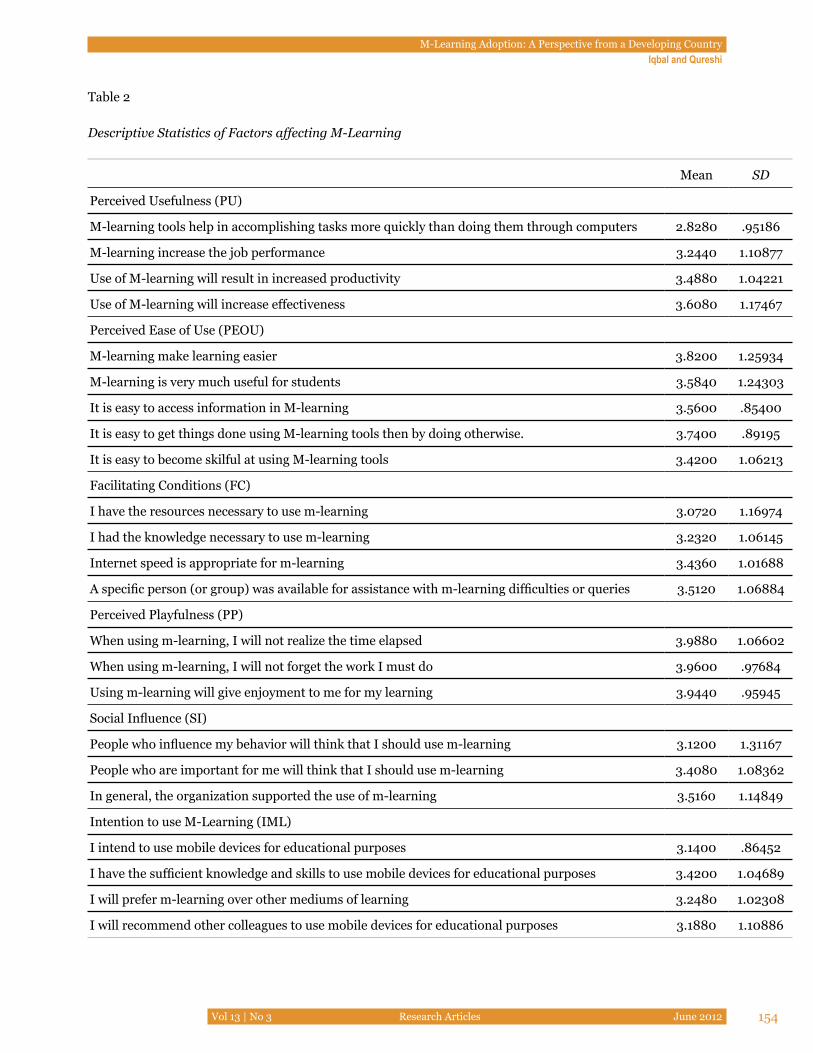
M-Learning Adoption: A Perspective from a Developing CountryIqbal and Qureshi
Vol 13 | No 3 Research Articles June 2012 154
Table 2
Descriptive Statistics of Factors affecting M-Learning
Mean SD
Perceived Usefulness (PU)
M-learning tools help in accomplishing tasks more quickly than doing them through computers 2.8280 .95186
M-learning increase the job performance 3.2440 1.10877
Use of M-learning will result in increased productivity 3.4880 1.04221
Use of M-learning will increase effectiveness 3.6080 1.17467
Perceived Ease of Use (PEOU)
M-learning make learning easier 3.8200 1.25934
M-learning is very much useful for students 3.5840 1.24303
It is easy to access information in M-learning 3.5600 .85400
It is easy to get things done using M-learning tools then by doing otherwise. 3.7400 .89195
It is easy to become skilful at using M-learning tools 3.4200 1.06213
Facilitating Conditions (FC)
I have the resources necessary to use m-learning 3.0720 1.16974
I had the knowledge necessary to use m-learning 3.2320 1.06145
Internet speed is appropriate for m-learning 3.4360 1.01688
A specific person (or group) was available for assistance with m-learning difficulties or queries 3.5120 1.06884
Perceived Playfulness (PP)
When using m-learning, I will not realize the time elapsed 3.9880 1.06602
When using m-learning, I will not forget the work I must do 3.9600 .97684
Using m-learning will give enjoyment to me for my learning 3.9440 .95945
Social Influence (SI)
People who influence my behavior will think that I should use m-learning 3.1200 1.31167
People who are important for me will think that I should use m-learning 3.4080 1.08362
In general, the organization supported the use of m-learning 3.5160 1.14849
Intention to use M-Learning (IML)
I intend to use mobile devices for educational purposes 3.1400 .86452
I have the sufficient knowledge and skills to use mobile devices for educational purposes 3.4200 1.04689
I will prefer m-learning over other mediums of learning 3.2480 1.02308
I will recommend other colleagues to use mobile devices for educational purposes 3.1880 1.10886
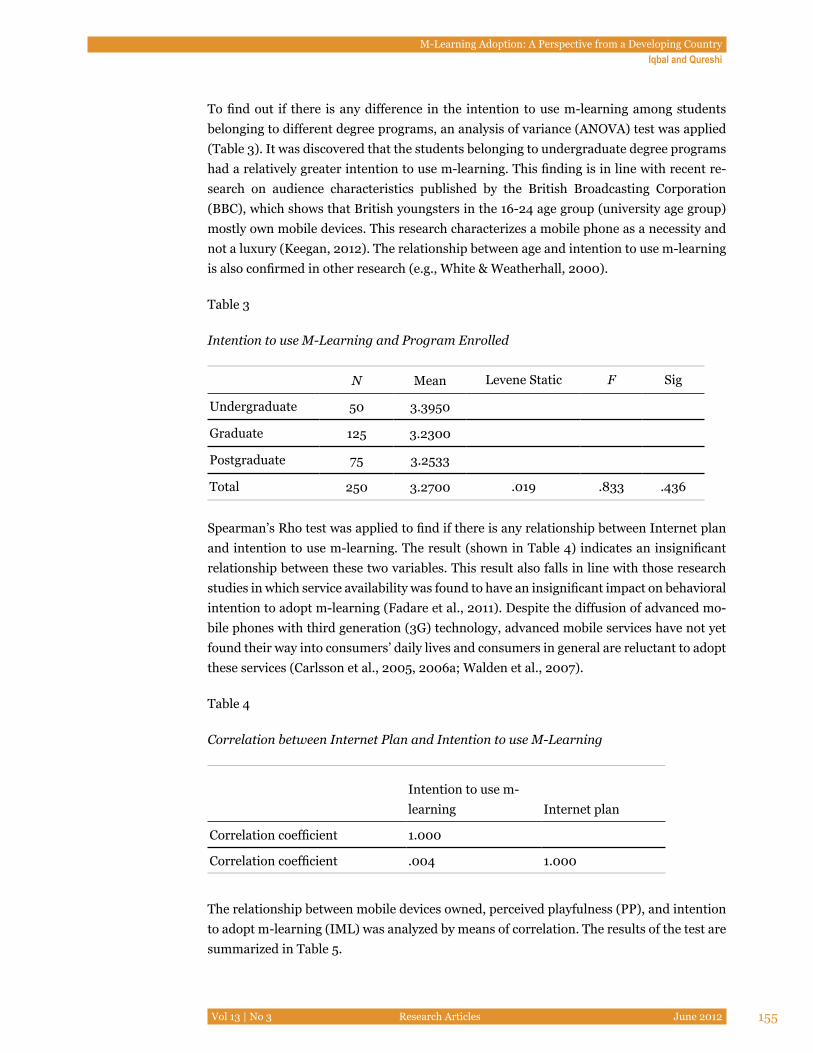
M-Learning Adoption: A Perspective from a Developing CountryIqbal and Qureshi
Vol 13 | No 3 Research Articles June 2012 155
To find out if there is any difference in the intention to use m-learning among students belonging to different degree programs, an analysis of variance (ANOVA) test was applied (Table 3). It was discovered that the students belonging to undergraduate degree programs had a relatively greater intention to use m-learning. This finding is in line with recent re-search on audience characteristics published by the British Broadcasting Corporation (BBC), which shows that British youngsters in the 16-24 age group (university age group) mostly own mobile devices. This research characterizes a mobile phone as a necessity and not a luxury (Keegan, 2012). The relationship between age and intention to use m-learning is also confirmed in other research (e.g., White & Weatherhall, 2000).
Table 3
Intention to use M-Learning and Program Enrolled
N Mean Levene Static F Sig
Undergraduate 50 3.3950
Graduate 125 3.2300
Postgraduate 75 3.2533
Total 250 3.2700 .019 .833 .436
Spearman’s Rho test was applied to find if there is any relationship between Internet plan and intention to use m-learning. The result (shown in Table 4) indicates an insignificant relationship between these two variables. This result also falls in line with those research studies in which service availability was found to have an insignificant impact on behavioral intention to adopt m-learning (Fadare et al., 2011). Despite the diffusion of advanced mo-bile phones with third generation (3G) technology, advanced mobile services have not yet found their way into consumers’ daily lives and consumers in general are reluctant to adopt these services (Carlsson et al., 2005, 2006a; Walden et al., 2007).
Table 4
Correlation between Internet Plan and Intention to use M-Learning
Intention to use m-learning Internet plan
Correlation coefficient 1.000
Correlation coefficient .004 1.000
The relationship between mobile devices owned, perceived playfulness (PP), and intention to adopt m-learning (IML) was analyzed by means of correlation. The results of the test are summarized in Table 5.
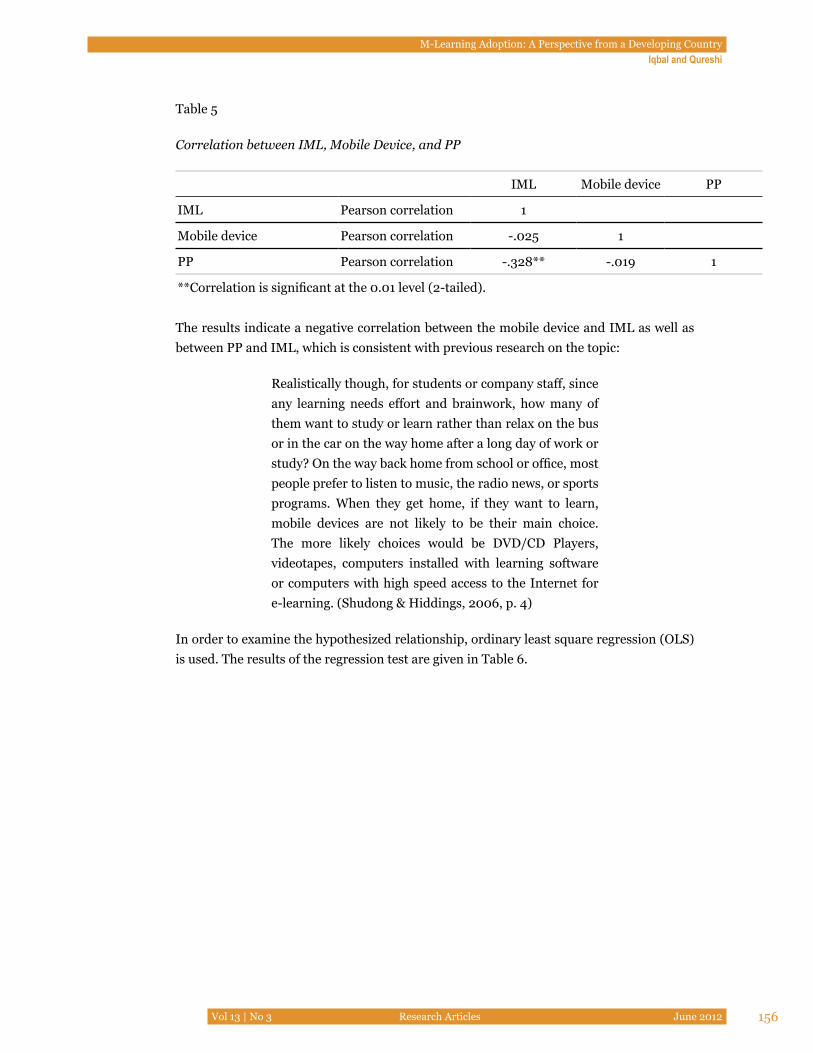
M-Learning Adoption: A Perspective from a Developing CountryIqbal and Qureshi
Vol 13 | No 3 Research Articles June 2012 156
Table 5
Correlation between IML, Mobile Device, and PP
IML Mobile device PP
IML Pearson correlation 1
Mobile device Pearson correlation -.025 1
PP Pearson correlation -.328** -.019 1
**Correlation is significant at the 0.01 level (2-tailed).
The results indicate a negative correlation between the mobile device and IML as well as between PP and IML, which is consistent with previous research on the topic:
Realistically though, for students or company staff, since any learning needs effort and brainwork, how many of them want to study or learn rather than relax on the bus or in the car on the way home after a long day of work or study? On the way back home from school or office, most people prefer to listen to music, the radio news, or sports programs. When they get home, if they want to learn, mobile devices are not likely to be their main choice. The more likely choices would be DVD/CD Players, videotapes, computers installed with learning software or computers with high speed access to the Internet for e-learning. (Shudong & Hiddings, 2006, p. 4)
In order to examine the hypothesized relationship, ordinary least square regression (OLS) is used. The results of the regression test are given in Table 6.
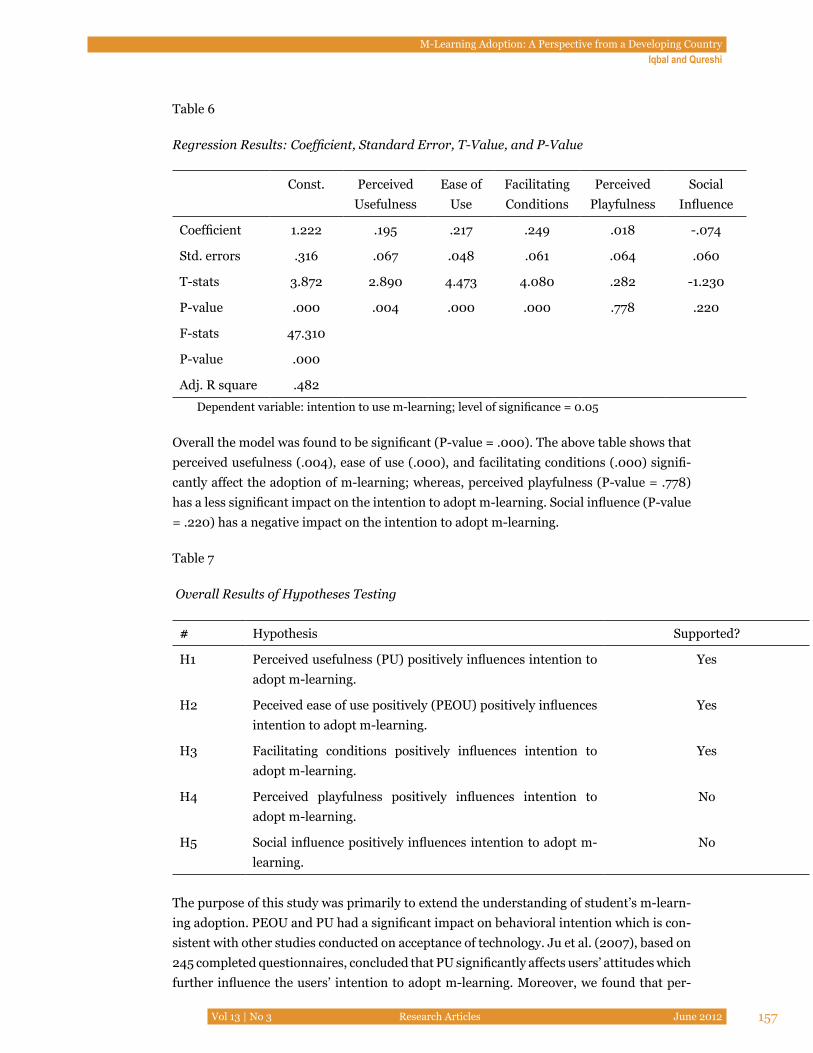
M-Learning Adoption: A Perspective from a Developing CountryIqbal and Qureshi
Vol 13 | No 3 Research Articles June 2012 157
Table 6
Regression Results: Coefficient, Standard Error, T-Value, and P-Value
Const. Perceived Usefulness
Ease of Use
Facilitating Conditions
Perceived Playfulness
Social Influence
Coefficient 1.222 .195 .217 .249 .018 -.074
Std. errors .316 .067 .048 .061 .064 .060
T-stats 3.872 2.890 4.473 4.080 .282 -1.230
P-value .000 .004 .000 .000 .778 .220
F-stats 47.310
P-value .000
Adj. R square .482
Dependent variable: intention to use m-learning; level of significance = 0.05
Overall the model was found to be significant (P-value = .000). The above table shows that perceived usefulness (.004), ease of use (.000), and facilitating conditions (.000) signifi-cantly affect the adoption of m-learning; whereas, perceived playfulness (P-value = .778) has a less significant impact on the intention to adopt m-learning. Social influence (P-value = .220) has a negative impact on the intention to adopt m-learning.
Table 7
Overall Results of Hypotheses Testing
# Hypothesis Supported?
H1 Perceived usefulness (PU) positively influences intention to adopt m-learning.
Yes
H2 Peceived ease of use positively (PEOU) positively influences intention to adopt m-learning.
Yes
H3 Facilitating conditions positively influences intention to adopt m-learning.
Yes
H4 Perceived playfulness positively influences intention to adopt m-learning.
No
H5 Social influence positively influences intention to adopt m-learning.
No
The purpose of this study was primarily to extend the understanding of student’s m-learn-ing adoption. PEOU and PU had a significant impact on behavioral intention which is con-sistent with other studies conducted on acceptance of technology. Ju et al. (2007), based on 245 completed questionnaires, concluded that PU significantly affects users’ attitudes which further influence the users’ intention to adopt m-learning. Moreover, we found that per-
M-Learning Adoption: A Perspective from a Developing CountryIqbal and Qureshi
Vol 13 | No 3 Research Articles June 2012 158
ceived playfulness had no significant impact on adoption behavior, which is not in line with some of the previous studies (Huang et al., 2007; Wang et al., 2009). The main reason for this difference could be unfamiliarity with smart phones. As indicated in the demographic profile data only a small percentage of students owned smart phones. Once a greater pro-portion of the student population owns mobile phones with advanced technology features the impact of this variable is likely to change. Also in Pakistan most of the telecommunica-tion networks are still operating on 2G (second generation) mobile technology, which is far inferior to 3G technology. This can also be a limiting factor for the perceived playfulness of m-learning. System quality depends a lot on the underlying mobile technology and with 3G technology (third generation mobile communication) becoming popular the possibility of bringing new function modules for m-learning has increased. The transmission speed as well as presentation of multimedia content is much superior in 3G as compared to the pre-vious two generations. This technology enables the users to see images more fluently and hear voices more clearly and browse the Internet more quickly (Zhuang & Xiaoyan, 2009). With widespread usage of 3G the scope of m-learning would further expand.
The negative but insignificant impact of social influence on student intention is somewhat inconsistent with those studies that emphasize the role of social influence in adoption of technology (McInerney, 2005). In the context of students’ perceptions these findings look into the role of schools, teachers, and peers. It can be concluded that in developing coun-tries such as Pakistan where m-learning is still in an embryonic stage the influence of peers, teachers, and schools on m-learning adoption is insignificant. The main impediments could be the high cost of smart phones and nonavailability of supporting technology.
Facilitating conditions, such as Internet speed, hardware, and software support, are very important for m-learning adoption. This suggests that students will not be inclined to-wards m-learning adoption in the absence of these facilitating conditions. Limited access to broadband wireless may prohibit ready access to mobile content (Lawrence et al., 2008). Students’ perceptions about m-learning usefulness and ease of use as well as facilitating conditions to support m-learning are the main driving forces; whereas, social influence and perceived playfulness will play their part in motivating students once the smart phones as well as 3G technology become easily accessible to the vast majority.
The TAM and unified theory of acceptance and use of technology (UTAUT) model were developed to describe IT innovation adoption in organizational contexts, “but the mobile technology adoption is more individual, more personalized and focused on the services made available by the technology” (Carlsson et al., 2006b, p. 8). While applying TAM and UTAUT to m-learning, certain points need to be considered. Firstly, the users are the learn-ers and not employees, and, secondly, m-learning is an education service which is differ-ent from traditional services. Based on an extensive review of the literature, the proposed model extends the well-established technology acceptance model for m-learning adoption. The model addresses the weakness of TAM to include social contexts where technology us-ers are treated as learners and not employees.

M-Learning Adoption: A Perspective from a Developing CountryIqbal and Qureshi
Vol 13 | No 3 Research Articles June 2012 159
Conclusion and RecommendationsM-learning has the potential to become an effective partner for providing education along with traditional methods. Particularly, it can be a medium of interest in developing coun-tries where the number of mobile users is far greater than the number of wire users (Yu, Wang, & Chen, 2007). If any student fails to attend a class and he does not have access to an Internet-enabled PC, he can access the information delivered in the class using his mobile device. M-learning can be used to leap-frog over existing e-learning in developing countries (Motlik, 2008).
The concepts and instructional issues related to m-learning are evolving (Kukulska-Hulme, 2007). This research adds to the existing literature on student acceptance and intention to adopt m-learning. Understanding the factors affecting mobile learning will help the stake-holders (i.e., educators, software developers, and technicians) to incorporate these factors in their design and implementation of m-learning initiatives. This medium can become successful only if there is a positive contribution from all stakeholders. Students’ interest in mobile devices and m-learning is clear from the findings of this study; the educationists and software developers can attract more users by providing content and information on resources formatted for mobile devices and by educating students on its benefits. The key is to understand students’ needs and concerns and the factors affecting their acceptance.
Limitations of the Research and Future DirectionFuture studies can focus on specific disciplines such as engineering, medicine, humanities, and arts to figure out the ideal disciplines for adoption of this medium of education. Effec-tiveness of m-learning programs depends on the field of study. For example, courses related to business and liberal arts require a limited set of software, which can either be acquired free of cost or at a very low price; whereas, courses related to information technology (IT) and engineering require a much larger set of applications, which generally are expensive and require frequent updating (Percival & Percival, 2008). Moreover, the types of students that will be more comfortable with this medium can be identified in future research.
AcknowledgementsThe authors are thankful to the editor and anonymous reviewers who provided useful feed-back to improve the quality of this paper.
M-Learning Adoption: A Perspective from a Developing CountryIqbal and Qureshi
Vol 13 | No 3 Research Articles June 2012 160
ReferencesAbbad, M.M., Morris, D., & Nahlik, C. (2009). Looking under the bonnet: Factors affecting
student adoption of e-learning systems in Jordan. The International Review of Re-search in Open and Distance Learning, 10(2). Retrieved from http://www.irrodl.org/index.php/irrodl/article/view/596/1218
Biner, P. M. (1993). The development of an instrument to measure student attitudes to-wards television course. The American Journal of Distance Education, 7(1), 62-73.
Carlsson, C., Carlsson, J., Puhakainen, J. & Walden, P. (2006a). Nice mobile services do not fly. Observations of mobile services and the Finnish consumers. Proceedings of the 19th Bled eCommerce Conference, Bled, Slovenia.
Carlsson, C., Carlsson, J., Hyvonen, K., Puhakainen, J., & Walden, P. (2006b). Adoption of mobile devices/services – searching for answers with the UTAUT. Proceedings of the 39th Annual Hawaii International Conference on System Sciences (HIC-SS’06), Track 6, p. 132a.
Carlsson, C., Hyvonen, K., Repo, P., & Walden, P. (2005), Asynchronous adoption patterns of mobile services. In R.H. Sprague (Ed.), Proceedings of the 38th Annual Hawaii International Conference on System Sciences, IEEE Computer Society Press, Los Alamitos, CA.
Chang, C.Y., Sheu, J.P., & Chan, T.W. (2003). Concept and design of ad hoc and mobile classrooms. Journal of Computer Assisted Learning, 19(3), 336-346.
Concannon, F., Flynn, A., & Campbell, M. (2005). What campus-based students think about the quality and benefits of e-learning. British Journal of Educational Tech-nology, 36(3), 501-512.
Cronbach, L.J. (1951). Coefficient alpha and the internal structure of tests. Psychometrika, 16(3), 297-333.
Davis, F.D. (1989). Perceived usefulness, perceived ease of use, and user acceptance of in-formation technology. MIS Quarterly, 13(3), 318-39.
Davis, F. D., Bagozzi, R. P., & Warshaw, P. R. (1989). User acceptance of computer technol-ogy: A comparison of two theoretical models. Management Science, 35(8), 982-1003.
Davies, J., & Graff, M. (2005). Performance in e-learning: Online participation and student grades. British Journal of Educational Technology, 36(4), 657-663.
Dawabi, P., Wessner, M., & Neuhold, E. (2003). Using mobile devices for the classroom of the future. In J. Attewell & C. Savill-Smith (Eds), Learning with mobile devices. London: Research and Development, Learning and Skills Development Agency.
M-Learning Adoption: A Perspective from a Developing CountryIqbal and Qureshi
Vol 13 | No 3 Research Articles June 2012 161
DeCarlo, L.T. (1997). On the meaning and use of kurtosis. Psychological Methods, 2(3), 292-307.
DeLone, W.H., & McLean, E.R. (1992). Information systems success: The quest for the de-pendent variable. Information Systems Research, 3(1), 60-95.
Fadare, O.G., Babatunde, O.H., Akomolafe, D.T., & Lawal, O.O. (2011) Behavioral intention for m- learning on 3G mobile Internet technology. World Journal of Engineering and Pure and Applied Sci. 1(2). Retrieved from http://www.rrpjournals.com/wj-epas/WJEPAS%202011;1%282%29pg19-28.pdf
Gefen, D., & Straub, D.W. (2000). The relative importance of perceived ease of use in IS adoption: A study of e-commerce adoption. Journal of the Association for Infor-mation Systems, 1(8), 1-30.
Georgiev, T., Georgieva, E., & Trajkovski, G. (2006, June). Transitioning from e-learning to m-learning: Present issues and future challenges. Proceedings of the Seventh ACIS International Conference on Software Engineering, Artificial Intelligence, Networking, and Parallel/Distributed Computing (SNPD’06), Las Vegas, Nevada, 349-353.
Goh, T., & Kinshuk (2006). Getting ready For mobile learning-adaptation perspective. Journal of Educational Multimedia and Hypermedia, 15(2), 175-198.
Harrison, D. A., Mykytyn, P. P., & Riemenschneider, C. K. (1997). Executive decisions about adoption of information technology in small business: Theory and empirical tests. Information Systems Research, 8(2), 171-195.
Hong, W. (2002). Determinants of user acceptance of digital libraries: An empirical exami-nation of individual differences and system characteristics. Journal of Manage-ment Information Systems, 18(3), 97-124.
Hoppe, H.U., Joiner, R., Milrad, M., & Sharples, M. (2003). Guest editorial: Wireless and mobile technologies in education. Journal of Computer Assisted Learning, 19, 255-259.
Huang, J.H., Lin, Y.R., & Chuang, S.T. (2007). Elucidating user behavior of mobile learn-ing: A perspective of the extended technology acceptance model. The Electronic Library, 25(5), 586-99.
Hung, S., Ku, C., & Chang, C. (2003). Critical factors of WAP services adoption: An empiri-cal study. Electronic Commerce Research and Applications, 2(1), 42-60.
Ju, T.L., Sriprapaipong, W., & Minh, D.N. (2007). On the success factors of mobile learn-ing. Paper presented at 5th International Conference on ICT and Higher Educa-tion, Bangkok. Retrieved from http://www.mendeley.com/research/success-fac-
M-Learning Adoption: A Perspective from a Developing CountryIqbal and Qureshi
Vol 13 | No 3 Research Articles June 2012 162
tors-mobile-learning/
Keegan, D. (2012). Mobile learning: A practical guide. Retrieved from http://www.er-icsson.com/ericsson/corpinfo/programs/incorporating_mobile_learning_into_mainstream_education/products/book/introduction.pdf
Kelley, K. & Maxwell, S. E. (2003). Sample size for multiple regression: Obtaining regres-sion coefficients that are accurate, not simply significant. Psychological Methods, 8, 305-321.
Kenny, D.A. (2011) Measuring model fit. Retrieved from http://davidakenny.net/cm/fit.htm
Koszalka, T. A., & Ntloedibe-Kuswani, G. S.(2010). Literature on the safe and disruptive learning potential of mobile technologies. Distance Education, 31(2), 139-157.
Kukulska-Hulme, A. (2007). Mobile usability in educational contexts: What have we learnt. International Review of Research in Open and Distance Learning, 8(2).
Lee, M.K.O., Cheung, C.M.K. & Chen, Z. (2005). Acceptance of internet-based learning me-dium: The role of extrinsic and intrinsic motivation. Information Management, 42(8), 1095-104.
Lawrence, E., Bachfischer, A., Dyson, L. E., & Litchfield, A. (2008). Mobile learning and student perspectives: A reality check! Paper presented at the 7th International Con-ference on Mobile Business.
Liu, Y. & Li, H. (2010). Mobile Internet diffusion in China: An empirical study. Industrial Management & Data Systems, 110(3), 309-324.
Lin, H.-F. (2006). Understanding behavioral intention to participate in virtual communi-ties. CyberPsychology & Behavior, 9(5), 540-7.
MacCallum, K., & Jeffrey, L (2009). Identifying discriminating variables that determine mobile learning adoption by educators: An initial study. In Same places, different spaces. Proceedings ascilite Auckland 2009. Retrieved from http://www.ascilite.org.au/conferences/auckland09/procs/maccallum.pdf.
Maniar, N., & Bennett, E. (2007). Media influence on m-learning? Proceedings of VideoFu-net Conference, Tampere, Finland.
Mathieson, K. (1991). Predicting user intentions: Comparing the technology acceptance model with the theory of planned behavior. Information Systems Research, 2(3), 173-191.
McInerney, C. (2005). Knowledge management: Lessons learned, what works and what doesn’t. Information Processing & Management, 41(2), 408-410.
M-Learning Adoption: A Perspective from a Developing CountryIqbal and Qureshi
Vol 13 | No 3 Research Articles June 2012 163
Milrad, M., Hoppe, U., Gottdenker, J., & Jansen, M. (2004, March). In J. Roschelle, Kin-shuk, & S.J.H. Yang, (Eds), Exploring the use of mobile devices to facilitate edu-cational interoperability around digitally enhanced experiments. Proceedings of the 2nd IEEE International Workshop on Wireless and Mobile Technologies in Education (WMTE 2004), Mobile Support for Learning Communities, Taoyuan, Taiwan.
Mitchell, A. (2003). Exploring the potential of a games-oriented implementation for m-portal. In J. Attewell & C. Savill-Smith (Eds), Learning with mobile devices. Lon-don: Research and Development, Learning and Skills Development Agency.
Moon, J. & Kim, Y. (2001). Extending the TAM for World-Wide-Web context. Information and Management, 38(4), 217-30.
Morris, M. G., & Venkatesh, V. (2000). Age differences in technology adoption decisions: Implications for a changing workforce. Personnel Psychology, 53(2), 375-403.
Motlik, S. (2008). Mobile learning in developing nations. International Review of Re-search in Open and Distance Learning, 9(3). Retrieved from http://www.irrodl.org/index.php/irrodl/article/view/582/1105.
Nunnally, J. (1978). Psychometric theory. New York: McGraw-Hill.
Oh, S., Ahn, J., & Kim, B. (2003). Adoption of broadband internet in Korea: The role of experience in building attitudes. Journal of Information Technology Theory and Application, 18(4), 267-80.
Orr, G. (2010, April). Review of literature in mobile learning: Affordances and constraints. The 6th IEEE International Conference on Wireless, Mobile, and Ubiquitous Technologies in Education, Taiwan, 107-111.
Park,J., Yang, S., & Lehto, X. (2007). Adoption of mobile technologies for Chinese consum-ers. Journal of Electronic Commerce Research, 8(3), 196-206.
Percival, J., & Percival, N. (2008, October). Engineering Students’ Perceptions of Mobile Learning. Proceedings of the World Congress on Engineering and Computer Sci-ence WCECS 2008, San Francisco, USA
Peng, H., Su, Y., Chou, C. & Tsai, C. (2009). Ubiquitous knowledge construction: Mobile learning re-defined and a conceptual framework. Innovations in Education and Teaching International, 46(2), 171-183.
Phuangthong, D., & Malisawan, S.A. (2005). Study of behavioral intention for 3G mobile technology: preliminary research on mobile learning. Paper presented at the 2nd International Conference on eLearning for Knowledge-Based Society, Bangkok.
M-Learning Adoption: A Perspective from a Developing CountryIqbal and Qureshi
Vol 13 | No 3 Research Articles June 2012 164
Roberts, T. G., Irani, T. A., Telg, W., & Lundy, L. K. (2005). The development of an instru-ment to evaluate distance education courses using student attitudes. The American Journal of Distance Education, 19(1), 51-64.
Shin, D.-H., & Kim, W.-Y. (2008). Applying the technology acceptance model and flow theory to cyworld user behavior: Implication of the Web 2.0 user acceptance. Cy-berPsychology & Behavior, 11(3), 378-82.
Shudong, W., & Higgins, M. (2006). Limitations of mobile phone learning. The JALT CALL Journal, 2(1), 3-14.
Siau, K., Lim, E. -P. & Shen, Z. (2001). Mobile commerce: Promises, challenges, and re-search agenda. Journal of Database Management, 12(3), 4-13.
Venkatesh, V., Morris, M.G., Davis, G.B., & Davis, F.D. (2003). User acceptance of informa-tion technology: Toward a unified view. MIS Quarterly, 27(3), 425-78.
Walden, P., Han, S., Carlsson, C., & Majlender, P. (2007). The sleeping giant – a longitudi-nal study surveying the mobile service market in Finland. Proceedings of the 15th European Conference on Information Systems, University of St Gallen, St Gallen, Switzerland, 1885-95.
Wali, E. , Winters, N., & Oliver, M. (2008). Maintaining, changing and crossing contexts: An activity theoretic reinterpretation of mobile learning. ALT-J, 16(1), 41-57.
Wang, Y.-S., Wu, M.-C. & Wang, H.-Y. (2009). Investigating the determinants and age and gender differences in the acceptance of mobile learning. British Journal of Educa-tional Technology, 40(1), 92-118.
White, J., & Weatherall, A. (2000). A grounded theory analysis of older adults and informa-tion technology. Educational Gerontology, 26(4), 1-22.
Yu, S., Wang, M., & Che, H. (2007). An exposition of the crucial issues in China’s edu-cational informatization. Educational Technology Research & Development, 53, 177-196.
Zhuang, L., & Xiaoyan,C.D. (2009). Mobile learning applied research based on 3G tech-nology. Paper presented at Seventh ACIS International Conference on Software Engineering Research, Management and Applications.
The Development of Distance Education in the Russian Federation and the Former Soviet Union
AbstractDistance education in the present Russian Federation and former Soviet Union has a long tradition that prevails to this day. The majority of students in Russia are enrolled in dis-tance learning programs. The numbers indicate the existence of a well-established system for distance education, of which little is known in Western literature. A review of distance education research in the Anglo-American sphere showed that within the past 10 years not a single article dealing with the Russian system was published. Consequently, within inter-national DE research Russia remains uncharted territory. The following explorative study introduces the educational and tertiary educational system and presents current statistical data while emphasizing the historical perspective to further describe how the distance edu-cation system is embedded therein. In order to discuss current practice in this field, one of the biggest higher distance education institutions in Moscow with approximately 110,000 students is used as an example.
Keywords: Distance education; history; Russia
Olaf Zawacki-RichterCarl von Ossietzky University of Oldenburg, Germany
Anna KourotchkinaSt. Petersburg State University of Economics and Finance, Russian Federation
The Development of Distance Education in the Russian Federation and the Former Soviet UnionZawacki-Richter and Kourotchkina
Vol 13 | No 3 Research Articles June 2012 166
IntroductionThe Russian Federation has developed an elaborate distance education system with a long tradition dating back to the October Revolution. More than half of the total number of ap-proximately 7.4 million enrolled students is registered in distance education programs. The history of the Russian higher education system is characterized by an enormous structural change, which has been procured by ideological ambitions directed towards the qualifica-tion of citizens who enjoyed only little access to higher education, yet at the same time it has led to problems regarding the quality of educational opportunities within distance edu-cation. Today universities invest in the development of modern online distance education, allowing for flexible study, independent of time and place.
Throughout the Western world, particularly among Anglo-American and European scien-tists, only little is known about this system. One reason might be the language barrier; Russian scientists rarely publish papers written in English and thus remain internationally isolated. A bibliographical analysis of 695 articles published between 2000 and 2008 in five leading journals of e-learning and distance education research confirms that not a single article originated from Russia (Zawacki-Richter, Bäcker, & Vogt, 2009).
This article aims at shedding light on the Russian higher education system in general and the distance education system in particular. The first part of this paper deals with the his-torical development of distance education in Russia and provides some background knowl-edge. The second part then explores the Russian higher education system, focusing on its particular structures, including the different forms of higher education institutions and modes of study in reference to current statistics.
In order to assess the different forms of study, the different types of distance education, the regulatory framework, and higher education statistics as well as various databases of the Russian government were analyzed in addition to internet-based research. Further in-formation predicates on interviews, which have been conducted throughout the summer of 2010 at a large distance education institution counting more than 110,000 students: The Moscow State University for Economics, Statistics and Informatics in Moscow (MESI, МЭСИ). Selected results from the case study of MESI were used to illustrate the structure of the Russian higher education system and its current practices regarding distance edu-cation services. Following thorough research on the leading Russian distance education institutions, which possess a long tradition in distance education and e-learning and thus also become internationally visible, MESI was selected as an example for good practice in this field.
MESI was founded in 1932 and is a member of the European Association of Distance Teach-ing Universities (EADTU). MESI further represents Russia in the European Foundation for Quality in E-Learning (EFQUEL) and holds international importance as it is intercon-nected with universities in France, Italy, and the Netherlands via double-degree-programs. MESI also publishes one of the leading journals of e-learning and distance education re-search in Russia. In the ranking of Russia’s best business schools, MESI takes 5th place.
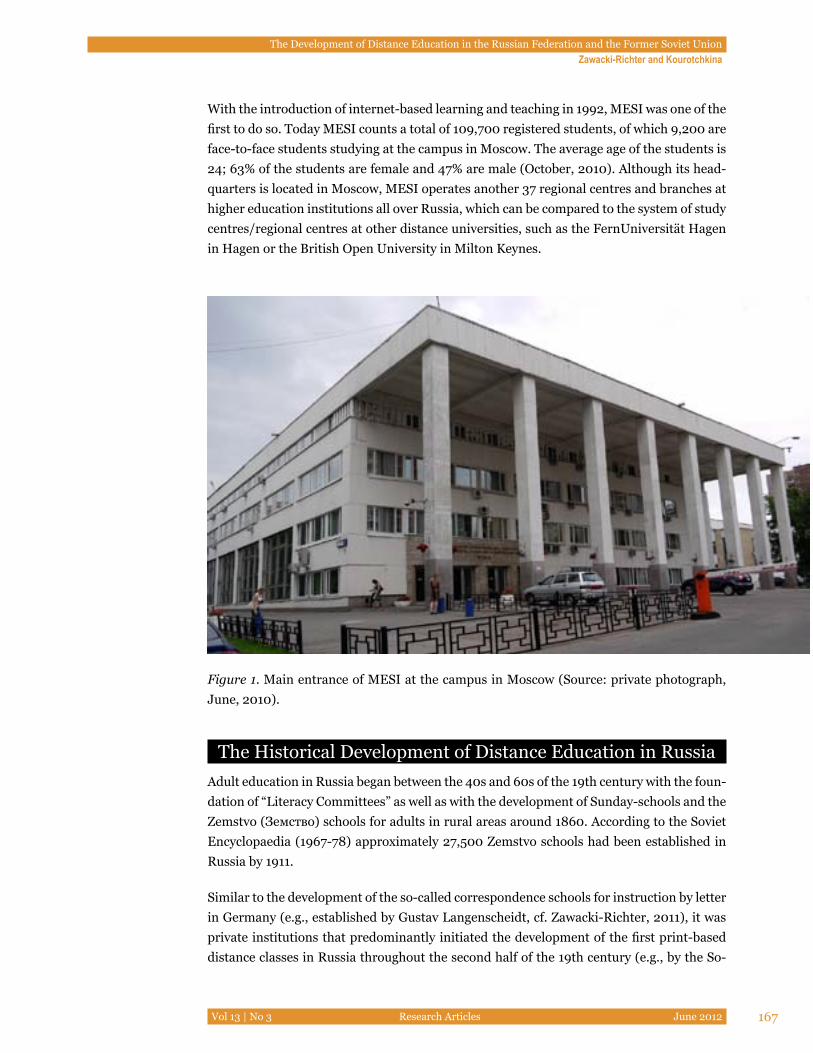
The Development of Distance Education in the Russian Federation and the Former Soviet UnionZawacki-Richter and Kourotchkina
Vol 13 | No 3 Research Articles June 2012 167
With the introduction of internet-based learning and teaching in 1992, MESI was one of the first to do so. Today MESI counts a total of 109,700 registered students, of which 9,200 are face-to-face students studying at the campus in Moscow. The average age of the students is 24; 63% of the students are female and 47% are male (October, 2010). Although its head-quarters is located in Moscow, MESI operates another 37 regional centres and branches at higher education institutions all over Russia, which can be compared to the system of study centres/regional centres at other distance universities, such as the FernUniversität Hagen in Hagen or the British Open University in Milton Keynes.
Figure 1. Main entrance of MESI at the campus in Moscow (Source: private photograph, June, 2010).
The Historical Development of Distance Education in RussiaAdult education in Russia began between the 40s and 60s of the 19th century with the foun-dation of “Literacy Committees” as well as with the development of Sunday-schools and the Zemstvo (Земство) schools for adults in rural areas around 1860. According to the Soviet Encyclopaedia (1967-78) approximately 27,500 Zemstvo schools had been established in Russia by 1911.
Similar to the development of the so-called correspondence schools for instruction by letter in Germany (e.g., established by Gustav Langenscheidt, cf. Zawacki-Richter, 2011), it was private institutions that predominantly initiated the development of the first print-based distance classes in Russia throughout the second half of the 19th century (e.g., by the So-
The Development of Distance Education in the Russian Federation and the Former Soviet UnionZawacki-Richter and Kourotchkina
Vol 13 | No 3 Research Articles June 2012 168
ciety for the Advancement of Technical Sciences and the Society of Community Colleges). Many evening schools (“evening education”) were founded around the same time (Rosen, Gardner, & Keppel, 1965, p. 3).
During Soviet times, the correspondence and evening schools were incorporated into the public educational system and expanded nationwide. Shortly after the October Revolution, the Communist Party demanded in its manifesto from 1919 financial support from the gov-ernment to promote the “self-education and self-development” of workers and peasants, following its ideological ambitions to elevate the educational standards of the proletariat. Three years later in 1922, a government committee for the advancement of self-education was established, which was also responsible for organizing a nationwide correspondence education system.
Various educational institutions for self-education were established thereafter, including the “Labour Faculty” (рабочий факультет, abbreviated as Рабфак - Rabfak), in which workers and peasants ages 16 and up were prepared for higher education studies:
[…] hundreds of Rabfaks enrolled several hundred thousand adults. Rabfaks were preparatory faculties or departments, located in higher educational institutions, providing accelerated day, evening, and correspondence courses for workers and peasants lacking sufficient learning to benefit from higher education. (Rosen, Gardner, & Keppel, 1965, p.4)
These higher education opportunities can be regarded as a preliminary stage of distance education. As full-time study the schooling lasted three years; part-time or evening stu-dents studied four years. The participants received a national stipend and their study time was partly credited for the hours they worked in the company. During the academic year of 1925-26, 40% of all freshmen were graduates from Rabfaks (Soviet Encyclopaedia, 1967-78). However, with the development of the general education system during the 1930s the Rabfaks were quickly dissolved (cf. Egorov, Vendrovsky, & Nikandrow, 2000).
In 1924, several broadcast universities for workers and peasants were established. The courses were broadcast via radio (e.g., in science of education, social sciences, engineer-ing, radio technologies, agricultural sciences) and contained lessons ranging from 20 to 30 hours. After the students had listened to the lessons, they could participate in a written examination, which had to be turned in to the broadcast university for grading. However, the educational standards did not reach those of regular universities. Consequently, the broadcast universities never became part of the officially accredited educational system.
The development of print-based distance education (correspondence education) as a regu-lar part of higher education began in the 1920s:
Substantial, large scale development in Soviet distance

The Development of Distance Education in the Russian Federation and the Former Soviet UnionZawacki-Richter and Kourotchkina
Vol 13 | No 3 Research Articles June 2012 169
education has taken place since a decree of the USSR. In August 1926, the Councils of People’s Commissars made correspondence education a regular part of the higher education system. In 1927, a Central Institute for Correspondence Education was established and correspondence preparatory departments prepared young people for entering Communist universities. (Rosen, Gardner, & Keppel, 1965, p. 6)
The five-year-plans for the economic development of the USSR, which started in 1926, de-manded a high number of qualified specialists, which the common education system failed to “produce.” Therefore, the correspondence study opportunities were greatly expanded. With the beginning of the 1930s, a network of correspondence education institutions and technical schools (professional schools) was established, particularly with regard to heavy industry workers and their education on factory sites.
While prior to 1929, distance education programs had been designed as mere self-study courses, in which the students had only little or irregular contact with teachers, the devel-opment of distance education in the following years was characterized by alternating dis-tance and presence phases, which can be compared to today’s format of blended learning. Nickolas de Witt, member of the Russian Research Centre at Harvard University, described the system of the different study forms as follows:
The three basic types of instruction programs offered by Soviet higher educational establishments are: regular day, or full-time study; part-time evening; and part-time extension-correspondence programs. Attempts to equate these programs with particular institutes produce a good deal of confusion. (de Witt, 1961, p. 229)
In addition to that, a fourth form, the so-called “Externat” was established, in which stu-dents are not obligated to attend the university at all; instead, they “merely” have to pass the final exams. In 1951, the Externat was abrogated, only to be reintroduced shortly thereafter. The structure of these various study modes has essentially remained the same to this day.
Between 1940 and 1959, the number of part-time students enrolled in distance education courses increased by 4.5 times, while the number of on-campus students doubled. More than half of all students studied part time: “In the fall of 1960, of the total 2,396,000 higher education students, 1,240,000, or 51.7%, were enrolled in evening or extension-correspon-dence programs” (de Witt, 1961, p. 231). In 1959, article 121 of the Russian constitution was changed and the new version emphasized the right of the Russian population to education. In order to secure that right, evening and distance education courses had to be further de-veloped.
Against the background of these developments, Otto Peters, founding president of the Fer-
The Development of Distance Education in the Russian Federation and the Former Soviet UnionZawacki-Richter and Kourotchkina
Vol 13 | No 3 Research Articles June 2012 170
nUniversität in Hagen, Germany, presented a study in 1967, dealing with “Distance Edu-cation at Higher Education Institutions in the Soviet Union.” He declares that “the high percentage of distance education students allows for the conclusion that higher education in the Soviet Union underwent structural changes, which are unprecedented in the history of higher education” (Peters, 1967, p. 9).
Unfortunately, the enormous expansion of distance education proceeded at the expense of its quality: “In their resolution from September 10th, 1966, the CPSU central committee and the USSR’s Council of Ministers listed the distance education system among prob-lems, which have been solved insufficiently so far” (Peters, 1967, p.11). Despite the efforts to prevent distance education institutions from becoming second-class schools (e.g., equal appointments to professorships), the general problem of lacking quality within distance ed-ucation could not be solved. The OECD report (1999) Tertiary Education and Research in the Russian Federation criticizes the suitability of the study material for self-study: “There is little evidence of any kind of instructional design and, in some cases, the material pro-vided is barely readable because of poor quality reproduction“ (p. 76). It is further stated: “Much of the material as it stands does not really enable independent study by the student” (p.79).
Due to the development of online education, many higher education institutions distance themselves from traditional correspondence studies and invest in modern distance educa-tion. The following section illustrates these latest developments in more detail after the Russian higher education system is described in general.
Higher Education in the Russian Federation
Organization of the Educational SystemThe educational system of the Russian Federation is divided into four segments:1
• preschool education (дошкольное образование);
• general education (общее образование);
• professional education (профессиональное образование); and
• continuing education (дополнительное образование).
1 ФЗ «Об образовании» №3266-1. от 10.07.1992 (с изм. 1993, 1996, 1997, 2000, 2001, 2002, 2003,
2004, 2006, 2007, 2008) [Federal Law “On Education” No. 3266-1 of July 10, 1992]. http://mon.gov.ru/dok/
fz/obr/3986/ (Retrieved Feb. 25, 2011)
The Development of Distance Education in the Russian Federation and the Former Soviet UnionZawacki-Richter and Kourotchkina
Vol 13 | No 3 Research Articles June 2012 171
Higher education falls into line with the branch of professional education, which is struc-tured as follows:
• primary/beginning professional education (начальное профессиональное образование);
• mid-level professional education (среднее профессиональное образование);
• higher professional education (высшее профессиональное образование); and
• postgraduate professional education (послевузовское профессиональное образование).
The primary professional education corresponds with the vocational education on level 3B as defined by the ISCED (International Standard Classification of Education) of UNESCO. The mid-level professional education is classified as mixed secondary and tertiary educa-tion, which can also include practice-related study courses at academies and institutions (level 3B through 5B).
The higher professional education equals tertiary higher education below the doctorate (level 5A), and the postgraduate professional education equals tertiary education as a re-search qualification (doctorate, habilitation; level 6).
Upon completion of a two-year upper school (level 3A), students receive university en-trance qualification after passing the national examination (EGE) (ЕГЭ – единый государственный экзамен), the general national examination which is since 2009 count-ed at the same time as the final examination for middle schools and as the entrance exami-nation for higher education institutions in the whole of Russia, the mid-level (full) general education (среднее (полное) общее образование). The university entrance qualification can alternatively be received upon completion of the mid-level professional education (level 5B). In the latter case, students study fewer semesters if they enrol in comparable study courses.
Like many other countries Russia joined the Bologna Accord and has started to adapt to bachelor and master degrees2. However, some fields of study, especially the natural, tech-nical, and medical sciences maintained the traditional diploma study courses. Within hu-manities, similar transitional regulations apply and at some universities students still enrol in traditional diploma study courses. Students also have the possibility to receive an “in-complete higher education” (неполное высшее образование) degree after a minimum of two years of study.
2 ФЗ «О высшем и послевузовском профессиональном образовании» №125 от 22.08.1996 (с изм.
2000, 2001, 2002, 2003, 2004, 2005, 2006, 2007, 2008). [Federal Law “On higher and postgraduate professional educa-
tion”]. http://mon.gov.ru/dok/fz/obr/3993/ (Retrieved Jan. 24, 2011)

The Development of Distance Education in the Russian Federation and the Former Soviet UnionZawacki-Richter and Kourotchkina
Vol 13 | No 3 Research Articles June 2012 172
For the past 20 years, the Russian higher education system has undergone continuous ref-ormation, which is reflected in the way new forms of higher education have been developed.
Figure 2. Structure of the Russian higher education system.
Forms of Higher Education InstitutionsIn conformity with higher school laws, the following forms exist: National research institu-tions with special status, universities, academies, and institutes.
National research universities/institutions with special status.
In 2009, the Lomonosov State University Moscow and the State University St. Petersburg were granted special status as elite-universities.3 Such a nomination entails that the nomi-nation of the presidents for these universities is reserved for the president of the Russian Federation alone. Also, the universities organize their study programs independently and
3 ФЗ «О Московском государственном университете им. М.В. Ломоносова и Санкт-Петербургском
государственном университете» №259. от 10.11.09 [Federal Law “On Lomonosov State University Moscow and
State University St. Petersburg“ No. 259 of Nov. 10, 2009]. http://mon.gov.ru/dok/fz/obr/6368/ (Retrieved Jan. 3, 2011)
The Development of Distance Education in the Russian Federation and the Former Soviet UnionZawacki-Richter and Kourotchkina
Vol 13 | No 3 Research Articles June 2012 173
they are exempt from obligatory educational standards that otherwise apply. They are fur-ther authorized to conduct entry examinations in order to select their students.
In 2008, an additional status of higher education was introduced: the national research university.4 This status can be awarded for a time period of 5 years (extensions are possible) to national universities that are particularly committed to intense research and innovation. The election is based on a contest in which all national universities can compete. The se-lected universities then receive special financial support (approximately 1.8 billion RUB/45 million EUR for the time period 2009-2013) for the realization of their projects. In the first two rounds of the competition (2009 and 2010), 29 universities were awarded the status of national research universities among them,
• Novosibirsk State University (Новосибирский государственный университет);
• National Research Tomsk Polytechnic University (Национальный исследовательский Томский политехнический университет);
• National Research University St. Petersburg State Polytechnical Universi-ty (Национальный исследовательский университет Санкт-Петербургский государственный политехнический университет); and
• National Research University N.I. Lobachevsky State University Nizhniy Novgorod (Национальный исследовательский университет Нижегородский государственный университет им. Н.И. Лобачевского).
Federal universities.
The program for the formation of federal universities in “remote territories” began in 2006.5 In 2007, the first two federal universities were established: The Southern Federal University in Rostov-on-Don and the Siberian Federal University in Krasnojarsk (in both cases, three or four regional higher education institutions merged in order to form the new universities). The main purpose of the federal universities is to provide innovative and in-ternational study programs and to optimize the transfer of knowledge within the region (the university as a center for innovation). Each federal university thus concentrates on five to six specific fields of research and instruction, which contribute most to the development of the particular region they are located in. The new universities aspire to achieve a place among Russia’s top ten higher education institutions and anticipate a place among the 100 best universities worldwide by 2020.6
4 Сайт Министерства образования и науки РФ. проект «национальные исследовательские
университеты» [Ministry of Education and Science of the Russian Federation, Project «National Research
Universities»]. http://mon.gov.ru/pro/niu/ (Retrieved Jan. 3, 2011)
5 Сайт Министерства образования и науки РФ. национальный проект «Образование»/
федеральные университеты [Ministry of Education and Science of the Russian Federation National Project
“Education,” Federal Universities]. http://mon.gov.ru/pro/pnpo/fed/ (Retrieved Jan. 3, 2011)
6 Сайт Министерства образования и науки РФ. национальный проект «Образование»/
The Development of Distance Education in the Russian Federation and the Former Soviet UnionZawacki-Richter and Kourotchkina
Vol 13 | No 3 Research Articles June 2012 174
Federal universities as of 2010 are
• Southern Federal University, Rostov-on-Don (2006)/Южный федеральный университет;
• Siberian Federal University, Krasnoyarsk (2006)/Сибирский федеральный университет;
• M.V. Lomonosov Northern (Arctic) Federal University, Arkhangelsk (2009)/Северный (Арктический) федеральный университет им. М.В. Ломоносова;
• Kazan (Volga) Federal University (2009)/Казанский (Приволжский) федеральный университет;
• B.N. Yeltsin Ural Federal University, Ekaternburg (2009)/Уральский федеральный университет им. первого президента России Б.Н. Ельцина;
• Far Eastern Federal University, Vladivostok (2009)/Дальневосточный федеральный университет;
• K.M. Ammosov North Eastern Federal University, Yakutsk (2009)/Северо-Восточ-ный федеральный университет им. К.М. Аммосова; and
• Kant Baltic Federal University, Kaliningrad (2010)/Балтийский федеральный уни-верситет им. И. Канта.
Academies and institutes.
These forms of higher education offer studies and continuing education courses in a specific professional field (e.g., academies for art or architecture, institutes for foreign languages etc.).
Modes of StudyThe current modes of study within the Russian Federation are statutory regulated and di-vided into four forms.
• On-campus/contact study (очное обучение): Students attend mandatory face-to-face seminars, usually 27-36 hours a week; the maximum workload does not exceed 54 hours a week (including face-to-face seminars, independent study, papers etc.).
• Evening study (очно-заочное обучение): combination of face-to-face and distance study; students attend evening classes (after 6.00 pm) at the university three or four times a week, usually 16 hours a week.
федеральные университеты [Ministry of Education and Science of the RF. National Project “Education.” Fed-
eral Universities]. http://mon.gov.ru/pro/pnpo/fed/ (Retrieved Jan. 3, 2011)
The Development of Distance Education in the Russian Federation and the Former Soviet UnionZawacki-Richter and Kourotchkina
Vol 13 | No 3 Research Articles June 2012 175
• Correspondence study (заочное обучение): independent study including face-to-face study periods. Over the course of the academic year the students attend a face-to-face period (max. 200 hours), which is usually divided into two periods. Evening and cor-respondence students can prolong the standard period of study for one year.
• Externat (экстернат): independent study. The students independently control their learning process and the period of study. They merely take examinations at the uni-versities.
The different Russian definitions of the concept of distance education and its various forms complicate the methodological discussion at this point since they do not transfer to the definitions that dominate the German or Anglo-American literature.
Rosen, Gardner, and Keppel (1965) use the term part-time education as a broader term to describe extra occupational qualification, continuing education, adult education, and dis-tance education in Russia and the USSR.
Part-time education in the Soviet Union encompasses general education and specialized training of urban and rural youth and adults, ‘without interruption of production’. The term, ‘part-time education’, as applied to the Soviet system may be related to educational programs in the United States known as work-study programs. continuing education, evening correspondence, and part-time study. (p. I)
Within the Russian context, the term distance education (дистанционное образование) is used to describe the modern version of distance education which employs new informa-tion and communication technologies (cf. e-learning, blended learning, flexible learning); whereas, the term correspondence education represents the traditional Soviet system of distance education and carries a rather negative connotation. For instance, the State Uni-versity St. Petersburg presidency classified correspondence education as an obsolete form of lower quality education. Thus, beginning with the academic year of 2010-2011, corre-spondence education courses will cease to be offered while distance education is planned to further expand.
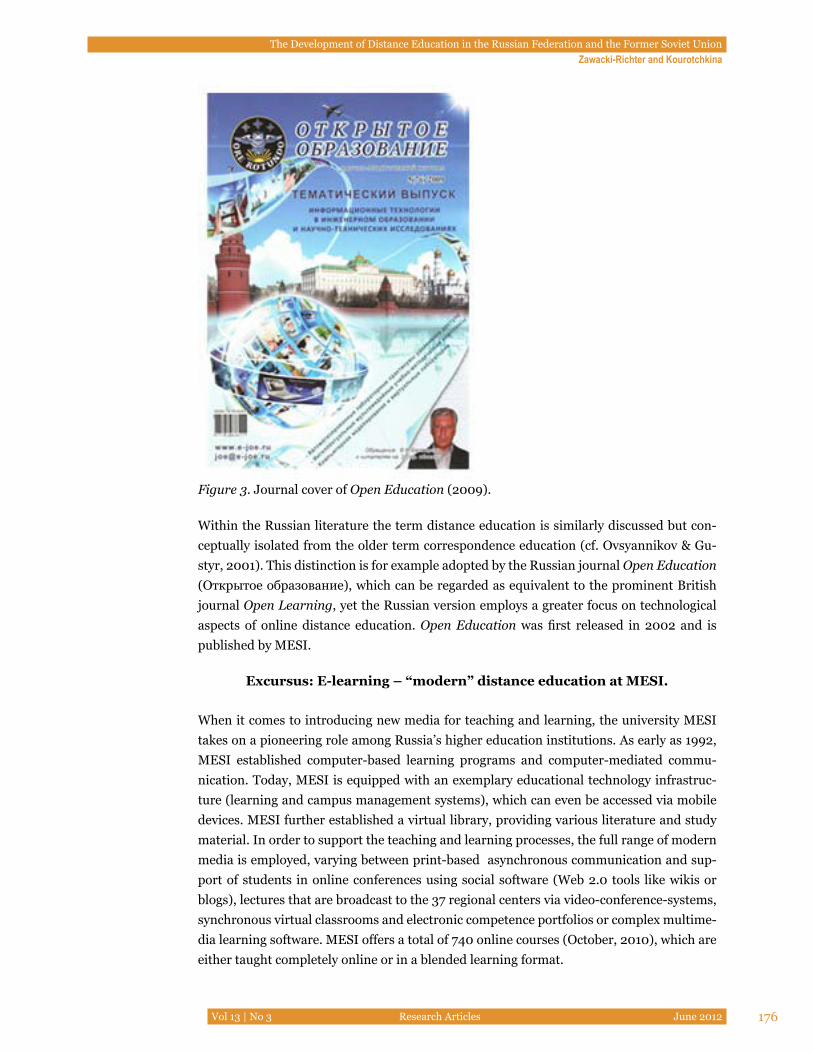
The Development of Distance Education in the Russian Federation and the Former Soviet UnionZawacki-Richter and Kourotchkina
Vol 13 | No 3 Research Articles June 2012 176
Figure 3. Journal cover of Open Education (2009).
Within the Russian literature the term distance education is similarly discussed but con-ceptually isolated from the older term correspondence education (cf. Ovsyannikov & Gu-styr, 2001). This distinction is for example adopted by the Russian journal Open Education (Открытое образование), which can be regarded as equivalent to the prominent British journal Open Learning, yet the Russian version employs a greater focus on technological aspects of online distance education. Open Education was first released in 2002 and is published by MESI.
Excursus: E-learning – “modern” distance education at MESI.
When it comes to introducing new media for teaching and learning, the university MESI takes on a pioneering role among Russia’s higher education institutions. As early as 1992, MESI established computer-based learning programs and computer-mediated commu-nication. Today, MESI is equipped with an exemplary educational technology infrastruc-ture (learning and campus management systems), which can even be accessed via mobile devices. MESI further established a virtual library, providing various literature and study material. In order to support the teaching and learning processes, the full range of modern media is employed, varying between print-based asynchronous communication and sup-port of students in online conferences using social software (Web 2.0 tools like wikis or blogs), lectures that are broadcast to the 37 regional centers via video-conference-systems, synchronous virtual classrooms and electronic competence portfolios or complex multime-dia learning software. MESI offers a total of 740 online courses (October, 2010), which are either taught completely online or in a blended learning format.
The Development of Distance Education in the Russian Federation and the Former Soviet UnionZawacki-Richter and Kourotchkina
Vol 13 | No 3 Research Articles June 2012 177
In order to further promote innovative processes as well as the development, implementa-tion, and effective embedding of e-learning, MESI has invested in respective support in-frastructures from the beginning. This institutional e-learning infrastructure involves nu-merous central service departments and scientific centers: the Department for e-Learning Support and the Research Institute for Knowledge Management, the IT Department, the Institute for Continuing Education, and the Institute for Computer Technologies as well as the Department for Instructional Research. External agencies in Moscow are charged with the development and programming of multimedia applications.
This specific support infrastructure simultaneously serves as a tool for teachers and tutors to design and perform online courses. In addition to that, MESI introduced an incentive system that encourages teachers to use a variety of internet-based communication tools, thus enforcing the participation of tutors in online teaching. Those who pursue the afore-mentioned teaching methods on a regular basis receive up to 30% pay improvement. Other bonus programs apply to research and its affiliation with research results in the field of e-learning and distance education research, especially with regard to its practical usability in online instruction.
Higher Education Statistics In 2006, the Russian Federation invested 3.9% of its gross national product in its educa-tional system, 0.8% thereof was invested in the system of tertiary education (OECD, 2009). By way of comparison, the average investment in the educational system within the OECD amounts to 5.3%, the EU 1.9 to 5.4% and 1.3% per higher educational branch respectively.
In the academic year of 2009-2010, the Russian Federation included 1,114 higher education institutions, of which 662 were state-owned and 452 independently operated. The first pri-vate higher education institutions were founded in accordance to the liberal reform policies at the beginning of the 1990s. Figure 4 shows the development since 1914.
The higher education institutions are spaced out very unevenly throughout Russia. More than a third of all institutions are located in the greater areas of Moscow (264 institutions) and St. Petersburg (82 institutions). A further increase of educational and scientific poten-tial is anticipated by establishing federal universities in neglected regions (see Organization of the Educational System section).
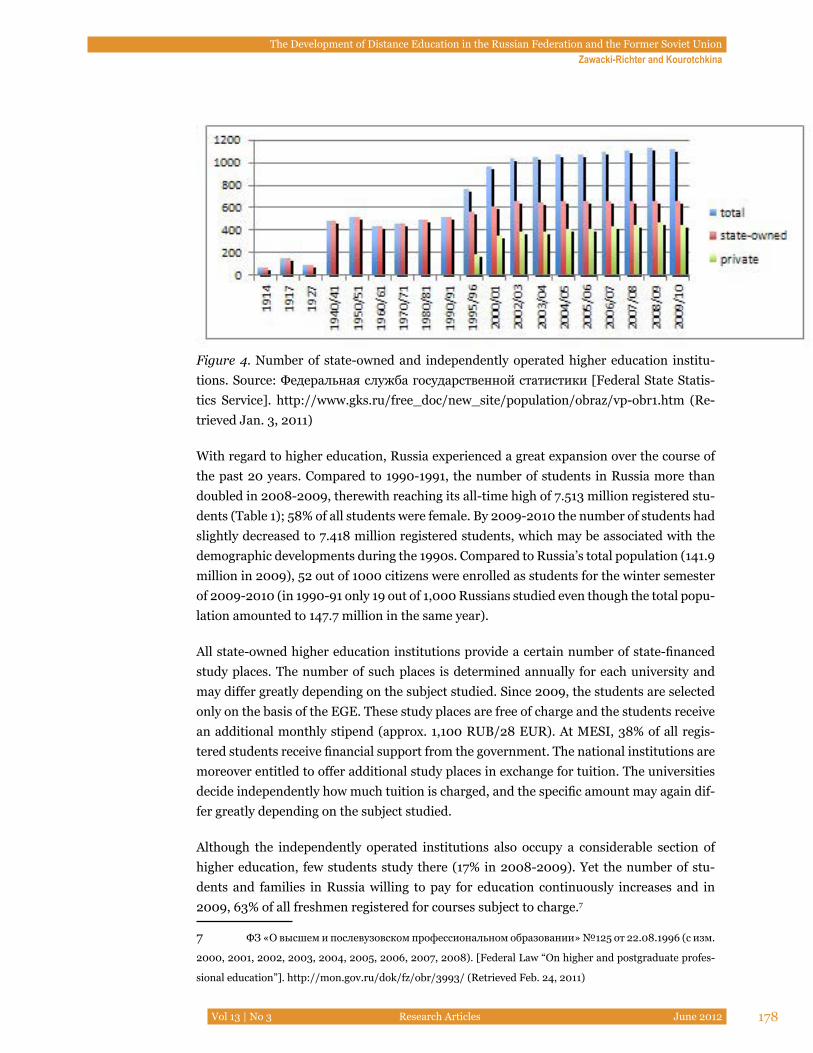
The Development of Distance Education in the Russian Federation and the Former Soviet UnionZawacki-Richter and Kourotchkina
Vol 13 | No 3 Research Articles June 2012 178
Figure 4. Number of state-owned and independently operated higher education institu-tions. Source: Федеральная служба государственной статистики [Federal State Statis-tics Service]. http://www.gks.ru/free_doc/new_site/population/obraz/vp-obr1.htm (Re-trieved Jan. 3, 2011)
With regard to higher education, Russia experienced a great expansion over the course of the past 20 years. Compared to 1990-1991, the number of students in Russia more than doubled in 2008-2009, therewith reaching its all-time high of 7.513 million registered stu-dents (Table 1); 58% of all students were female. By 2009-2010 the number of students had slightly decreased to 7.418 million registered students, which may be associated with the demographic developments during the 1990s. Compared to Russia’s total population (141.9 million in 2009), 52 out of 1000 citizens were enrolled as students for the winter semester of 2009-2010 (in 1990-91 only 19 out of 1,000 Russians studied even though the total popu-lation amounted to 147.7 million in the same year).
All state-owned higher education institutions provide a certain number of state-financed study places. The number of such places is determined annually for each university and may differ greatly depending on the subject studied. Since 2009, the students are selected only on the basis of the EGE. These study places are free of charge and the students receive an additional monthly stipend (approx. 1,100 RUB/28 EUR). At MESI, 38% of all regis-tered students receive financial support from the government. The national institutions are moreover entitled to offer additional study places in exchange for tuition. The universities decide independently how much tuition is charged, and the specific amount may again dif-fer greatly depending on the subject studied.
Although the independently operated institutions also occupy a considerable section of higher education, few students study there (17% in 2008-2009). Yet the number of stu-dents and families in Russia willing to pay for education continuously increases and in 2009, 63% of all freshmen registered for courses subject to charge.7
7 ФЗ «О высшем и послевузовском профессиональном образовании» №125 от 22.08.1996 (с изм.
2000, 2001, 2002, 2003, 2004, 2005, 2006, 2007, 2008). [Federal Law “On higher and postgraduate profes-
sional education”]. http://mon.gov.ru/dok/fz/obr/3993/ (Retrieved Feb. 24, 2011)
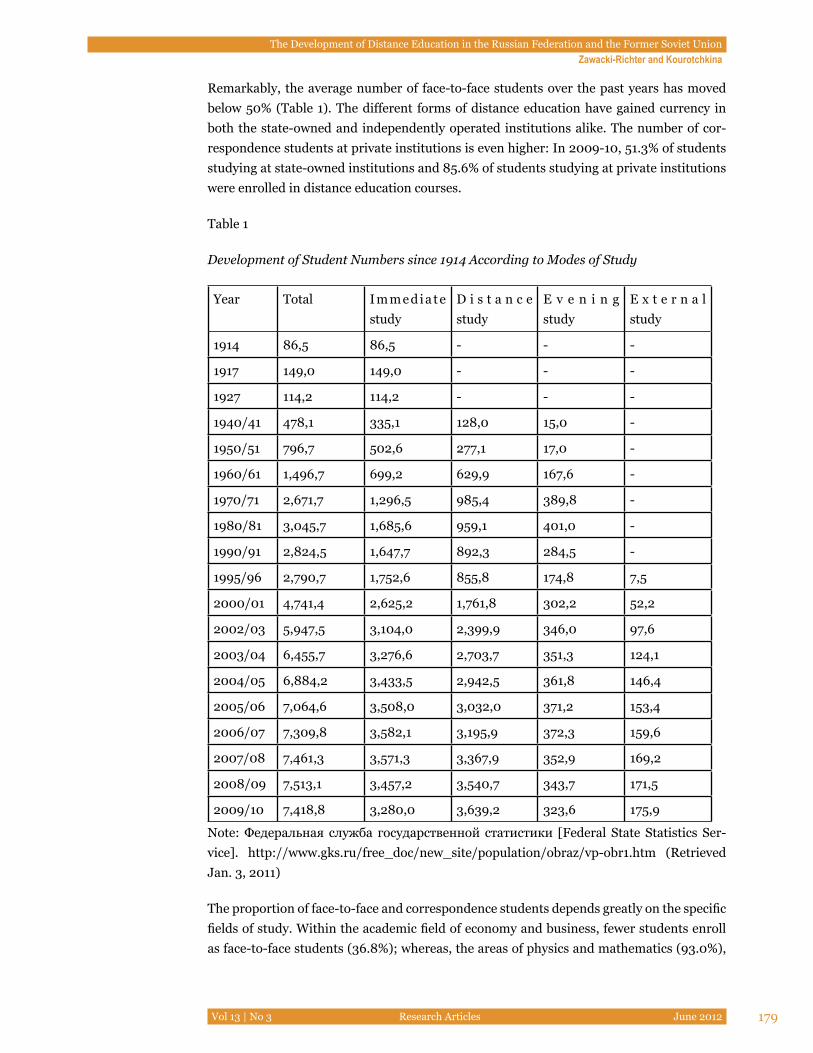
The Development of Distance Education in the Russian Federation and the Former Soviet UnionZawacki-Richter and Kourotchkina
Vol 13 | No 3 Research Articles June 2012 179
Remarkably, the average number of face-to-face students over the past years has moved below 50% (Table 1). The different forms of distance education have gained currency in both the state-owned and independently operated institutions alike. The number of cor-respondence students at private institutions is even higher: In 2009-10, 51.3% of students studying at state-owned institutions and 85.6% of students studying at private institutions were enrolled in distance education courses.
Table 1
Development of Student Numbers since 1914 According to Modes of Study
Year Total I m m e d i a t e study
D i s t a n c e study
E v e n i n g study
E x t e r n a l study
1914 86,5 86,5 - - -
1917 149,0 149,0 - - -
1927 114,2 114,2 - - -
1940/41 478,1 335,1 128,0 15,0 -
1950/51 796,7 502,6 277,1 17,0 -
1960/61 1,496,7 699,2 629,9 167,6 -
1970/71 2,671,7 1,296,5 985,4 389,8 -
1980/81 3,045,7 1,685,6 959,1 401,0 -
1990/91 2,824,5 1,647,7 892,3 284,5 -
1995/96 2,790,7 1,752,6 855,8 174,8 7,5
2000/01 4,741,4 2,625,2 1,761,8 302,2 52,2
2002/03 5,947,5 3,104,0 2,399,9 346,0 97,6
2003/04 6,455,7 3,276,6 2,703,7 351,3 124,1
2004/05 6,884,2 3,433,5 2,942,5 361,8 146,4
2005/06 7,064,6 3,508,0 3,032,0 371,2 153,4
2006/07 7,309,8 3,582,1 3,195,9 372,3 159,6
2007/08 7,461,3 3,571,3 3,367,9 352,9 169,2
2008/09 7,513,1 3,457,2 3,540,7 343,7 171,5
2009/10 7,418,8 3,280,0 3,639,2 323,6 175,9
Note: Федеральная служба государственной статистики [Federal State Statistics Ser-vice]. http://www.gks.ru/free_doc/new_site/population/obraz/vp-obr1.htm (Retrieved Jan. 3, 2011)
The proportion of face-to-face and correspondence students depends greatly on the specific fields of study. Within the academic field of economy and business, fewer students enroll as face-to-face students (36.8%); whereas, the areas of physics and mathematics (93.0%),
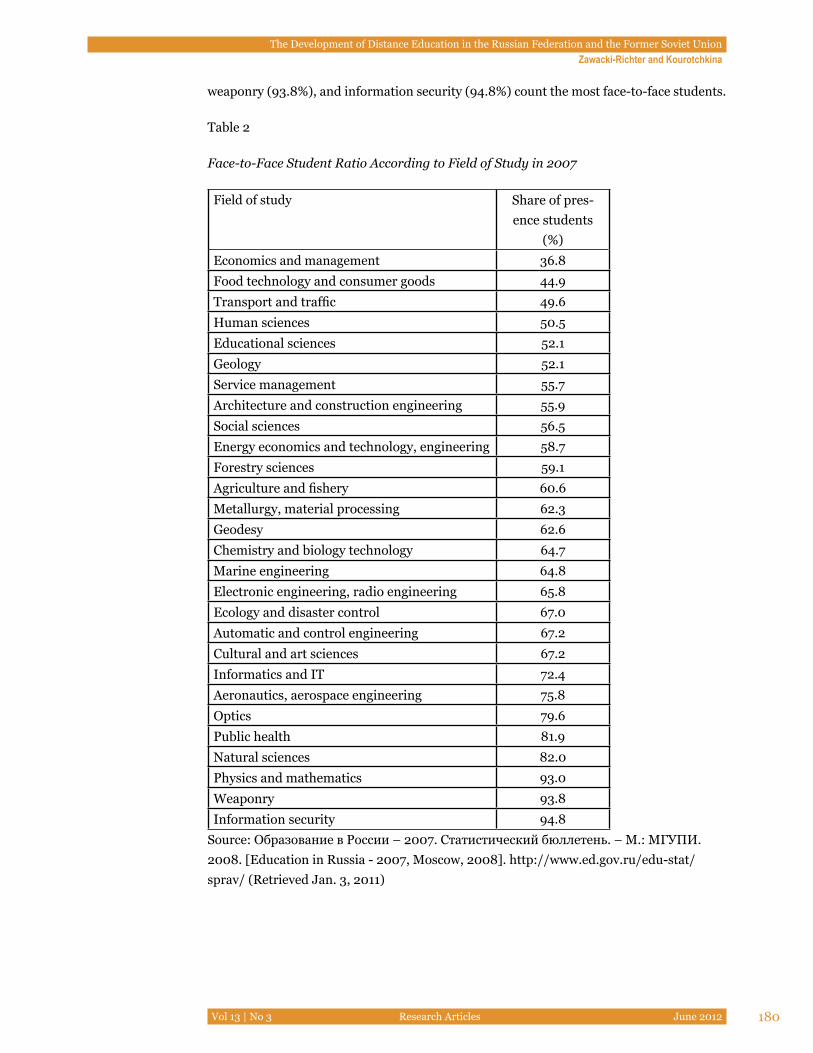
The Development of Distance Education in the Russian Federation and the Former Soviet UnionZawacki-Richter and Kourotchkina
Vol 13 | No 3 Research Articles June 2012 180
weaponry (93.8%), and information security (94.8%) count the most face-to-face students.
Table 2
Face-to-Face Student Ratio According to Field of Study in 2007
Field of study Share of pres-ence students
(%)Economics and management 36.8
Food technology and consumer goods 44.9
Transport and traffic 49.6
Human sciences 50.5
Educational sciences 52.1
Geology 52.1
Service management 55.7
Architecture and construction engineering 55.9
Social sciences 56.5
Energy economics and technology, engineering 58.7
Forestry sciences 59.1
Agriculture and fishery 60.6
Metallurgy, material processing 62.3
Geodesy 62.6
Chemistry and biology technology 64.7
Marine engineering 64.8
Electronic engineering, radio engineering 65.8
Ecology and disaster control 67.0
Automatic and control engineering 67.2
Cultural and art sciences 67.2
Informatics and IT 72.4
Aeronautics, aerospace engineering 75.8
Optics 79.6
Public health 81.9
Natural sciences 82.0
Physics and mathematics 93.0
Weaponry 93.8
Information security 94.8
Source: Образование в России – 2007. Статистический бюллетень. – М.: МГУПИ. 2008. [Education in Russia - 2007, Moscow, 2008]. http://www.ed.gov.ru/edu-stat/sprav/ (Retrieved Jan. 3, 2011)
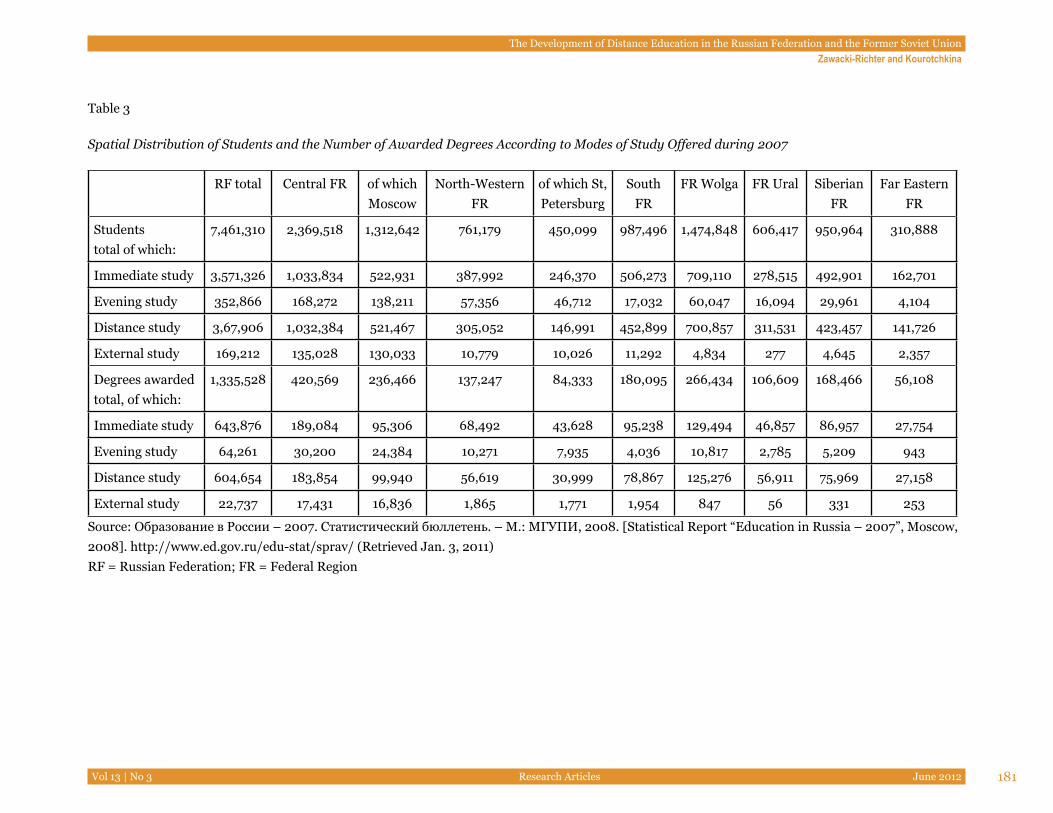
The Development of Distance Education in the Russian Federation and the Former Soviet UnionZawacki-Richter and Kourotchkina
Vol 13 | No 3 Research Articles June 2012 181
Table 3
Spatial Distribution of Students and the Number of Awarded Degrees According to Modes of Study Offered during 2007
RF total Central FR of which Moscow
North-Western FR
of which St, Petersburg
South FR
FR Wolga FR Ural Siberian FR
Far Eastern FR
Students total of which:
7,461,310 2,369,518 1,312,642 761,179 450,099 987,496 1,474,848 606,417 950,964 310,888
Immediate study 3,571,326 1,033,834 522,931 387,992 246,370 506,273 709,110 278,515 492,901 162,701
Evening study 352,866 168,272 138,211 57,356 46,712 17,032 60,047 16,094 29,961 4,104
Distance study 3,67,906 1,032,384 521,467 305,052 146,991 452,899 700,857 311,531 423,457 141,726
External study 169,212 135,028 130,033 10,779 10,026 11,292 4,834 277 4,645 2,357
Degrees awarded total, of which:
1,335,528 420,569 236,466 137,247 84,333 180,095 266,434 106,609 168,466 56,108
Immediate study 643,876 189,084 95,306 68,492 43,628 95,238 129,494 46,857 86,957 27,754
Evening study 64,261 30,200 24,384 10,271 7,935 4,036 10,817 2,785 5,209 943
Distance study 604,654 183,854 99,940 56,619 30,999 78,867 125,276 56,911 75,969 27,158
External study 22,737 17,431 16,836 1,865 1,771 1,954 847 56 331 253
Source: Образование в России – 2007. Статистический бюллетень. – М.: МГУПИ, 2008. [Statistical Report “Education in Russia – 2007”, Moscow, 2008]. http://www.ed.gov.ru/edu-stat/sprav/ (Retrieved Jan. 3, 2011) RF = Russian Federation; FR = Federal Region
The Development of Distance Education in the Russian Federation and the Former Soviet UnionZawacki-Richter and Kourotchkina
Vol 13 | No 3 Research Articles June 2012 182
Summary and OutlookHistorically and presently, distance education has played and plays a prominent role in the Russian educational system. Due to the different modes in distance education, a disparate picture is created which is corroborated by the different terminologies used: the traditional correspondence education on the one hand and “the modern distance education” employ-ing new media (e-learning) on the other.
In the Anglo-American sphere, the terms e-learning and distance education are often used synonymously: “The distinction of eLearning from distance education is difficult: In the USA both forms […] are subsumed under the term Distance Education” (Schulmeister, 2006, p. 5). It is to be observed that in line with the development of internet-based learning and teaching, the originally existing boundaries between distance universities and brick and mortar universities blur. The usage of new media leads to a convergence: Single-mode universities develop into dual-mode universities (Mills & Tait, 1999). In Russia, this has been the case for a long time. Almost all higher education institutions operate distance de-partments next to their direct departments.
As was shown in the OECD report (1999), traditional print-based distance education lacked quality. Kruglov (1997) points out that the instructional design is not
laid out for the specific needs of correspondence students and the study materials are often not suitable for self-study. Today, universities operating as providers of E-Learning distance themselves deliberately against this distance education of low quality, correspondence education departments are shut down, while new distance education programs are established.
Kruglov (1997) observes that in terms of the development of distance education, that is web-based e-learning, two fundamental points of view are represented in Russia: the tech-nocratic and the system developing. Representatives of the first advocate a radical break with traditional distance education and intend to newly develop modern online distance learning. This point of view is widespread in Russia, which also shows in the technological orientation in the journals. In contrast, representatives of the system developing approach support a further development of distance education.
The Russian government is pushing the implementation and application of e-learning and information and communication technologies (ICT) for teaching and learning in schools and universities by providing project funds for example in the Federal Program for the Advancement of Education 2011-2015 (see http://www.fcpro.ru). The aim of this pro-gram is that 85 % of all teachers use ICTs effectively in their classes. Furthermore, vari-ous portals that provide access to over 100,000 electronic educational resources have been launched: the Federal Portal “Russian Education” (Федеральный портал «Российской образование“, http://www.edu.ru/db/portal/sites/res_page.htm), the Federal Center
The Development of Distance Education in the Russian Federation and the Former Soviet UnionZawacki-Richter and Kourotchkina
Vol 13 | No 3 Research Articles June 2012 183
for Educational Resources (Федеральный центр информационно-образовательных ресурсов, http://fcior.edu.ru/), and the Russian General Education Portal (Российский общеобразовательный портал, http://www.school.edu.ru/default.asp).
The aim of this paper was an exploration of the Russian distance education system, its historical roots and recent developments in modern distance education and e-learning. By uniting sources that are scattered and already due to linguistic barriers difficult to access, the authors of this article hope to have composed a picture of the Russian educational sys-tem with special consideration of distance education.
The example of MESI University in Moscow shows distance education as being an impor-tant factor in the development of e-learning. The future needs an understanding of its ori-gins. Looking at the wider picture and directing one’s gaze to the East can indeed be fruitful.
The Development of Distance Education in the Russian Federation and the Former Soviet UnionZawacki-Richter and Kourotchkina
Vol 13 | No 3 Research Articles June 2012 184
Referencesde Witt, N. (1961). Education and professional employment in the U.S.S.R. Boston: Rus-
sian Research Center, Harvard University.
Egorov, S., Vendrovsky, R., & Nikandrov, N. (2000). Russia. In K. Salimova & N.L. Dodde (Eds.), International handbook on history of education (S. 355-386). Moscow: Orbita-M.
Kruglov, J.G. (1997). Ergebnisse und Perspektiven des pädagogischen Fernstudiums in Rußland. Pädagogische Rundschau, 51, 191-200.
OECD (1999). Tertiary education and research in the Russian Federation. Paris: OECD Publications.
Peters, O. (1967). Das Fernstudium an den Hochschulen der Sowjetunion. Hamburg: Wal-ter Schultz Verlag KG.
Rosen, S.M., Gardner, J.W., & Keppel, F. (1965). Part-time education in the USSR. U.S. Department of Health Education and Welfare, Office of Education.
Sovietische Enzyklopädie (1967-1978). Große Sovietische Enzyklopädie / Большая Советская Энциклопедия (3. Aufl.). Verlag Sovietische Enzyklopädie.
Zawacki-Richter, O. (2011). Geschichte des Fernunterrichts - Vom brieflichen Unterricht zum gemeinsamen Lernen im Web 2.0. In S. Schön & Ebner (Hrsg.), L3T - Lehrbu-ch für Lernen und Lehren mit Technologien. Retrieved from http://l3t.tugraz.at/
Zawacki-Richter, O., Bäcker, E.M., & Vogt. S. (2009). Review of distance education research (2000 to 2008) – analysis of research areas, methods, and authorship patterns. International Review of Research in Open and Distance Learning, 10(6), 21-50.
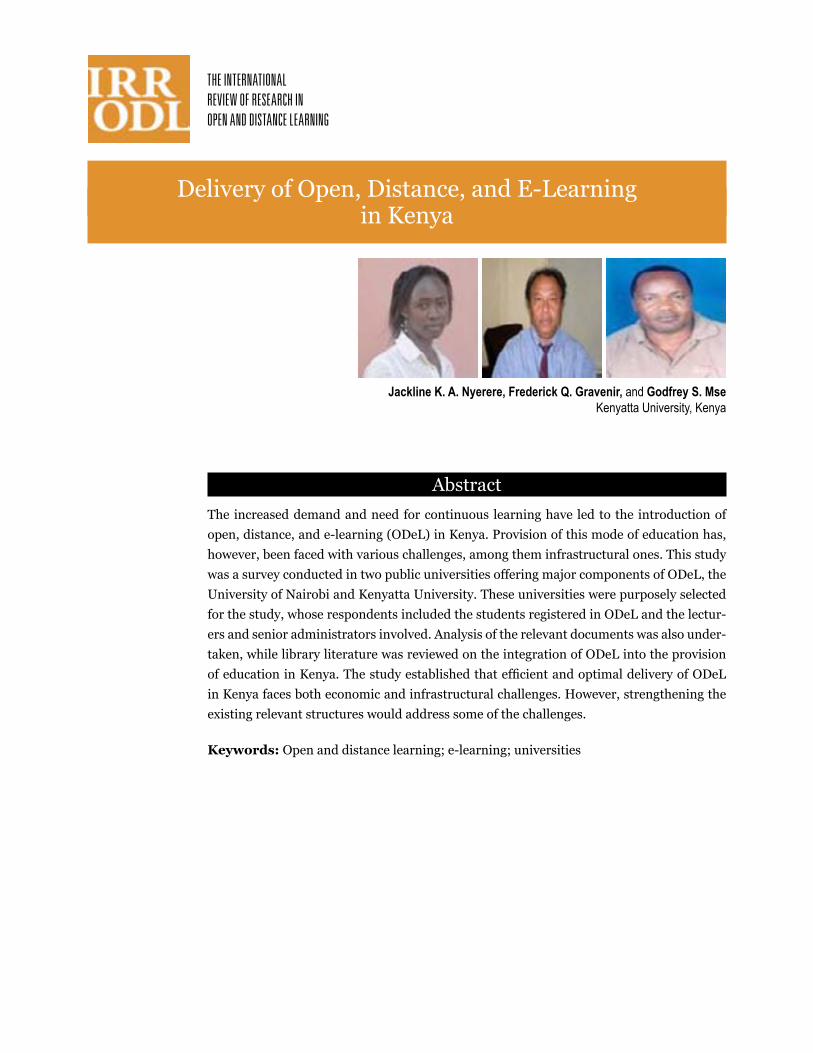
Delivery of Open, Distance, and E-Learning in Kenya
AbstractThe increased demand and need for continuous learning have led to the introduction of open, distance, and e-learning (ODeL) in Kenya. Provision of this mode of education has, however, been faced with various challenges, among them infrastructural ones. This study was a survey conducted in two public universities offering major components of ODeL, the University of Nairobi and Kenyatta University. These universities were purposely selected for the study, whose respondents included the students registered in ODeL and the lectur-ers and senior administrators involved. Analysis of the relevant documents was also under-taken, while library literature was reviewed on the integration of ODeL into the provision of education in Kenya. The study established that efficient and optimal delivery of ODeL in Kenya faces both economic and infrastructural challenges. However, strengthening the existing relevant structures would address some of the challenges.
Keywords: Open and distance learning; e-learning; universities
Jackline K. A. Nyerere, Frederick Q. Gravenir, and Godfrey S. Mse Kenyatta University, Kenya
Delivery of Open, Distance, and E-Learning in KenyaNyerere, Gravenir, and Mse
Vol 13 | No 3 Research Articles June 2012 186
Background and Literature ReviewThe last few decades have witnessed rapid expansion of higher education institutions in Ke-nya. This can be attributed to increased demand for higher education, partly as a result of increased awareness of the positive benefits of education (Khan, 2001). Education, learn-ing, and acquisition of knowledge and skills have never been of more central importance than they are today. It is becoming increasingly clear that our ability to cope with rapid changes will become the primary measure of success at both macro and micro levels (Khan, 1997). This increased demand has seen ODeL fast becoming an accepted and indispensable part of the mainstream educational platforms in both developed and developing countries, with particular emphasis in the latter (UNESCO, 2002).
Several factors have led to an increasing interest in distance learning. Family commitments, especially among women, is one such factor. Women, especially in the developing coun-tries, must deal with various constraints compared to men in terms of time and resources. The advent of ODeL, however, has widened the opportunities for women and has helped to make education and training more accessible to them as they can now study within their homes. It allows them to study at an individual pace and seek and acquire skills for individ-ual development while, at the same time, fulfilling family responsibilities (Brunner, 1991). We have to recognize that we are living in an age of unprecedented societal change. Tech-nological, cultural, and social upheavals have impacted upon us with regularity, radically changing the way we live, work, and learn (Wheeler, 2000; Edwards, 1997). Accelerating change has often overtaken even the most stable of our social institutions, including educa-tion, and the rate of change will no doubt increase in the years ahead. Conflict is another factor. While the risk of war among developed countries will be low, the developing coun-tries will face both internal conflicts and regional interstate wars stemming from religious, ethnic, economic, or political disputes. The number of refugees and homeless or displaced people may increase significantly, necessitating flexible educational provision.
Additionally, there is a growing need for continued skills upgrading and retraining, and technological advances have made it possible to teach more and more subjects at a distance. The new technologies have served to push knowledge acquisition into the domain of the individual. Concomitant with individualization comes the growing autonomy of learners. Technology, and particularly its application in flexible ODeL situations, can be considered vital for increasing and widening access to learning and autonomy for the learner (Lauril-lard, 1993). The flexibility of open, distance, and e-learning methodologies is the key factor in their emergence as the primary mode for lifelong learning.
ODEL in AfricaPrior to the emergence of distance learning providers in Africa, many African students ob-tained various qualifications through ODeL providers in Europe and North America. One of the first distance education universities that emerged in the African continent is the Univer-sity of South Africa (UNISA), which has been offering correspondence courses since 1946. UNISA’s success has spurred the establishment of other ODeL providers in the African continent. Examples of these are the open universities in Nigeria, Tanzania, and Zimbabwe,
Delivery of Open, Distance, and E-Learning in KenyaNyerere, Gravenir, and Mse
Vol 13 | No 3 Research Articles June 2012 187
which started out as providers of residential programmes and have now diversified into providing ODeL as well (Juma, 2003).
ODeL techniques are increasingly being employed by a growing number of higher educa-tion institutions in Africa. While most of the ongoing distance education initiatives on the continent have been used to upgrade the quality of basic education (Association for the De-velopment of Education in Africa [ADEA], 1999), some countries are taking bold initiatives in implementing Internet-based and satellite-linked distance educational programmes in selected courses. An example is the African Virtual University (AVU), which used to run programmes in Francophone and Anglophone Africa but has since changed its mandate from providing distance learning directly to the learners to providing training to staff in institutions offering ODeL programmes.
Challenges of ODeL in AfricaFor the developing world, and in particular Africa, ODeL is a promising and practical strat-egy to address the challenge of widening access to, and thus increasing participation in, higher education. It is increasingly being seen as an educational delivery model that is cost-effective without sacrificing quality. On the African continent, where resources are scarce and higher education provision is poor, ODeL is viewed as a viable, cost-effective means of expanding provision without costly outlay in infrastructure (Pityana, 2009). As it holds the promise of economies of scale and expanded geographical reach, it is not surprising that many African governments are starting to explore this potential.
While distance education holds promises, a number of obstacles have to be addressed be-fore it can be fully utilized in Africa. There are a number of technological constraints that hinder distance education. Infrastructures outside of major cities remain inadequate. Con-nectivity beyond major capital cities poses a potential problem in creating a national dis-tance education strategy. Another challenge is the lack of a trained cadre of professionals to support the implementation of distance education. A study conducted in Zimbabwe showed that a majority of the lecturers (97.5%) facilitating ODeL have no experience in distance education (Mpofu et al., 2012). Effective use of distance learning technologies demands that teaching staff be properly trained in using distance education as a delivery mode. To date, few African scholars are familiar with teaching in an online environment. This situa-tion poses a major challenge in introducing distance education on the continent. A National Education Association (NEA) survey in the United States reported that teaching staff mem-bers’ top concern about distance education was that they would do more work for the same amount of pay, apparently a merited concern. The NEA (2000) found that most teaching staff members do spend more time on their distance courses than they do on traditional courses, and 84% of them do not get a reduced workload. Similarly, 63% of distance teach-ing staff members receive no extra compensation for their distance courses.
The absence of clearly defined national distance education policies in most African coun-tries poses another challenge. Policies are needed to provide a framework for the develop-ment of distance education. With the exception of South Africa, few African countries have clearly defined national policies to guide the development of distance education in their
Delivery of Open, Distance, and E-Learning in KenyaNyerere, Gravenir, and Mse
Vol 13 | No 3 Research Articles June 2012 188
respective countries. The absence of such policies is a clear obstacle to the development of distance education. For instance, there are challenges when it comes to learner support services as evidenced by a study carried out in Botswana which revealed that the greatest challenge facing the ODeL tutors was the minimal learner support (Sikwibele & Mungoo, 2009). This can, however, be resolved through mediation and creation of various ties and connections between the university and the student. The students’ main support can be achieved through strong connection with their individual tutors (Macintyre & Macdonald, 2011). This could also be enhanced through provision of Internet connectivity, which still remains one of the major challenges in Africa, especially in rural areas.
The knowledge gap between the North and South is evident in Sub-Saharan Africa. Here, ODeL has been mainly used to widen access to basic education and to maintain and im-prove quality in the conventional education system, particularly through in-service train-ing of teachers (UNESCO, 2003). There is a growing attempt by countries in the South to adopt ODeL platforms in order to widen access to education and training. As a Sub-Saharan African country, Kenya has perceived the potential of ODeL. It is thus essential for its edu-cational planning that the opportunities offered by the new mode of learning be realistically examined within the framework of national development plans in general and educational policies in particular.
The first Kenyan Government policy to address ODeL in higher education was the Act of Parliament of 1966, which established the Board of Adult Education. Since independence, however, a number of commissions and reports have highlighted ODeL as an alternative mode of education provision. The latest government initiative, as contained in Sessional Paper No. 1 of 2005 (Republic of Kenya, 2005), recommends the establishment of an open university and the use of ODeL in human resource development at all levels. The practice of ODeL in the country has been at all levels of education and has been provided by different institutions each governed by their own institutional policies (Juma, 2003).
Kenya adopted a National ICT Policy in January 2006. This policy aims at ensuring the availability of accessible, efficient, reliable, and affordable ICT services. The relevant objec-tive in this section on information technology states that government will encourage the use of ICT in schools, colleges, universities, and other educational institutions in the country so as to improve the quality of teaching and learning. According to Farrell (2007), the related strategies are to promote the development of e-learning resources; facilitate public-pri-vate partnerships to mobilize resources in order to support e-learning initiatives; promote the development of an integrated e-learning curriculum to support ICT in education; and promote distance education and virtual institutions, particularly in higher education and training, among others. Equally, the Kenya Education Sector Support Program (KESSP), developed in 2005 by the Ministry of Education, prioritizes mainstreaming ICTs into the teaching and learning process.
These efforts notwithstanding, there are a large number of qualified Kenyans who cannot secure places in the existing internal faculties of the national universities. The need for an educated workforce and the opportunity to maximize the use of limited educational re-
Delivery of Open, Distance, and E-Learning in KenyaNyerere, Gravenir, and Mse
Vol 13 | No 3 Research Articles June 2012 189
sources, both human and material, call for alternative and innovative methods of learning, which can make university education available beyond lecture halls in Kenya, not limited to a particular time, pace, or space. There is also the need to incorporate ICT in education to improve access to quality education and respond to the challenges of globalization. This study was conducted against this background. It aimed at bringing out the status of and the various challenges that hinder realization of the full potential of ODeL in Kenya.
Specific ObjectivesThe specific objectives of the study were to
1. establish access and equity in ODeL delivery in Kenya;
2. establish the adequacy and appropriateness of resources used in ODeL programme de-livery; and
3. analyze the challenges of ODeL in Kenya and propose appropriate strategies of over-coming them.
Study QuestionsThis study was undertaken to provide information on the following questions:
1. What are the main models of ODeL programme organization and delivery?
2. How equitable is ODeL programme delivery across geographical locations?
3. What is the level of ODeL programme staffing in Kenya?
4. What are the sources of funding for ODeL programmes in Kenya?
5. What are the resources used in ODeL?
6. What are the levels of satisfaction of ODeL participants?
Theoretical FrameworkThis study was based on the industrial production model of Otto Peters. This model, which, according to Garrison (2000), was conceived in the mid-1960s, analyzes the structure of distance education and acknowledges the possibility of adopting industrial production tech-niques such as a division of labor, mass production, and organization to realize economies of scale and reduce unit costs (Peters, 1994). This model is about organizing the educational process to realize economies of scale. The context of this study being a developing country, the resource constraints have hindered adequate provision of higher education to match demand. There is a need, therefore, to look for alternative ways of providing higher educa-tion such as ODeL, a mode that is capable of increasing access without necessarily expand-ing the existing facilities. This mode of delivery thus benefits from the economies of scale.
Peters notes that this model, which has had a considerable influence and to this day domi-
Delivery of Open, Distance, and E-Learning in KenyaNyerere, Gravenir, and Mse
Vol 13 | No 3 Research Articles June 2012 190
nates the field of distance education, is ideal because of the structural constraints and the reliance on self-instructional print packages. The model is not, however, a theory of teach-ing or learning, according to Garrison (2000), but a contribution to clear thought about the organization of distance education. Peters (1994) also describes the industrial approach as “objectification of the teaching process,” which reduces the forms of shared learning and keeps learners away from personal interactions and critical discourse.
Methodology
Study DesignDescriptive survey was adopted because it is concerned with describing, recording, ana-lyzing, and reporting conditions that exist or existed (Kothari, 1985). The survey would describe the status of ODeL and analyze the challenges of this type of education. Engelhart (1972) further asserts that survey methods are widely used to obtain data useful in evaluat-ing present practices and in providing the basis for decision making.
Sample and Sampling ProceduresPurposive sampling was used to select two public universities with major components of ODeL, namely the University of Nairobi and Kenyatta University, with the University of Nairobi being the pioneer institution in ODeL. The purposive sampling method was also used to select the study centres used in the study. Six, three from each of the two universi-ties, were selected for the study. The centres included Nairobi, Kisumu, and Garissa for both the University of Nairobi and Kenyatta University. Nairobi was selected to represent the urban setup, Kisumu to represent the rural setup, and Garissa to represent the hardship areas setup. Purposive sampling was also used to select two senior university administra-tors in ODeL programmes. These are the managers who are directly involved in the provi-sion of ODeL in the two universities. These administrators, the directors of ODeL, one from each of the universities, are more versed with the challenges they face in the delivery of ODeL and are therefore in a position to suggest areas that need improvement.
Randomly, the teaching staff and students enrolled in ODeL were selected to participate in the study. The study sample was arrived at using tables instituted by Krejcie and Morgan (1990). These are tables which help the researcher determine, with 95% certainty, what the results would have been had the entire population been surveyed.
Research InstrumentsData was collected through questionnaires for students and lecturers, interview schedules for administrators, and document analysis. A survey was carried out in two universities with major components of ODeL in Kenya, the University of Nairobi and Kenyatta Uni-versity, to establish the status and challenges of ODeL. Senior university administrators in charge of ODeL, staff, and students participated in the study, which utilized questionnaires for students and staff as well as interviews for senior administrators.
Delivery of Open, Distance, and E-Learning in KenyaNyerere, Gravenir, and Mse
Vol 13 | No 3 Research Articles June 2012 191
The students’ questionnaire was structured to seek information on their reasons for enroll-ing in ODeL as opposed to the residential mode of education; whether they are satisfied with the delivery of the programmes; the challenges they face in pursuing the programmes; and their suggestions on ways of improving the programmes.
The questionnaire for the teaching staff was structured to seek information on the train-ing they have had on the delivery of ODeL; the mode of delivery they employ in ODeL; the type of technology they use to reach their distributed students; the challenges they face in provision of the programmes; and their suggestions as to how the programmes could be improved.
Information sought from the directors of ODeL in the two universities included the policy guidelines for ODeL; the facilities employed in ODeL; adequacy of resources for ODeL; the challenges the institutions encounter in provision of the programmes; and what they feel should be done to address the challenges.
Analysis of the relevant documents was also undertaken to capture information on the sta-tus of open, distance, and e-learning and the policies guiding this type of education in the two universities under study. Library literature was reviewed on the integration of ODeL into the provision of primary, secondary, and tertiary education in Kenya.
Pretesting of the Instruments Before the actual study, pretesting of the instruments was carried out in one of the univer-sities offering ODeL, Strathmore University. Strathmore University was selected because it was the third most developed in provision of ODeL in Kenya after the two participating institutions, the University of Nairobi and Kenyatta University. This was to determine reli-ability, which is a measure of the degree to which a research instrument yields consistent results or is influenced by random error, which is the deviation from a true measurement (Mugenda & Mugenda, 1999).
For pretesting purposes, questionnaires were administered to twenty students and ten teaching staff. The open-ended questions were scored by giving a mark for a relevant re-sponse and a zero for irrelevant and blank responses. The questions selected were divided into two equal halves for both the students and the teaching staff, dividing the odd against the even numbered items. The scores of the halves were then correlated using the split half measure of reliability. The Pearson product moment correlation coefficient was calculated between the scores obtained for each person on the odd items and the scores obtained on the even items. The student questionnaire yielded a half test coefficient of 0.79 while the teaching staff questionnaire yielded a half test coefficient of 0.81. The subjects’ scores were then corrected using the Spearman-Brown prophecy formula for the full test, and total test coefficients of 0.88 and 0.89 were obtained for the student and teaching staff question-naires respectively. The instruments were therefore considered reliable since the general rule of thumb in research, a rule that allows one to estimate quickly whenever a large calcu-lation is required, is that reliability should be at least 0.70 (Orodho, 2005).
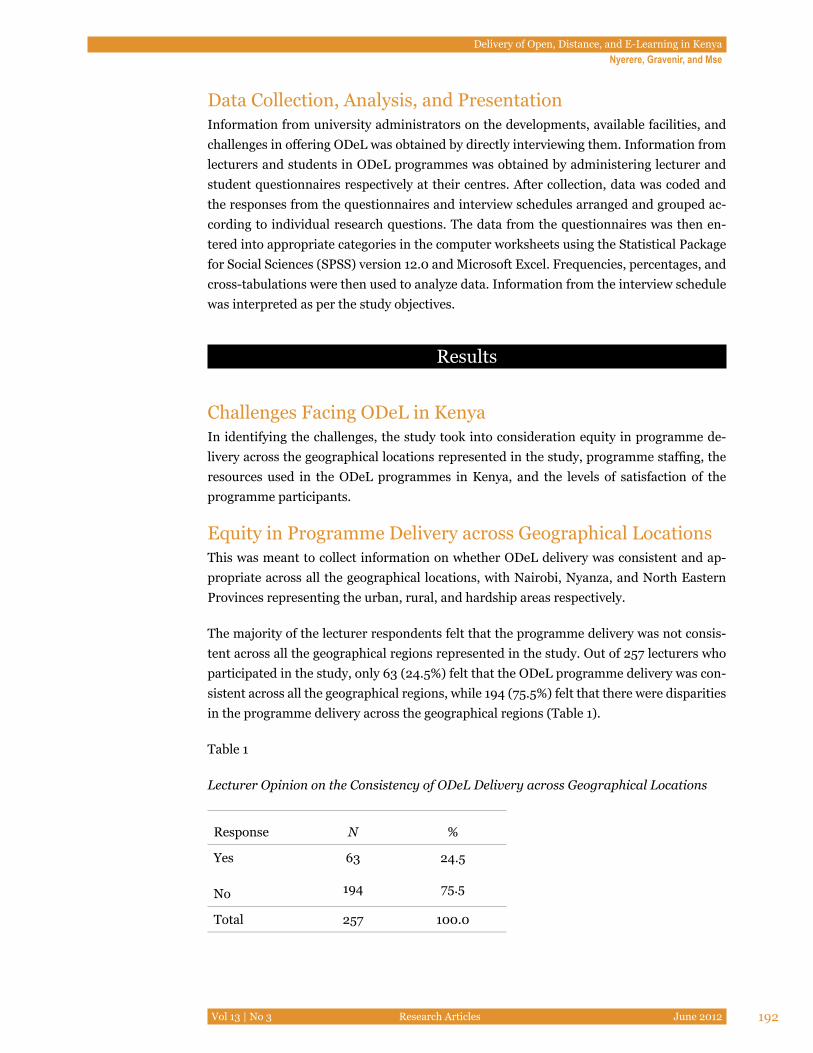
Delivery of Open, Distance, and E-Learning in KenyaNyerere, Gravenir, and Mse
Vol 13 | No 3 Research Articles June 2012 192
Data Collection, Analysis, and Presentation Information from university administrators on the developments, available facilities, and challenges in offering ODeL was obtained by directly interviewing them. Information from lecturers and students in ODeL programmes was obtained by administering lecturer and student questionnaires respectively at their centres. After collection, data was coded and the responses from the questionnaires and interview schedules arranged and grouped ac-cording to individual research questions. The data from the questionnaires was then en-tered into appropriate categories in the computer worksheets using the Statistical Package for Social Sciences (SPSS) version 12.0 and Microsoft Excel. Frequencies, percentages, and cross-tabulations were then used to analyze data. Information from the interview schedule was interpreted as per the study objectives.
Results
Challenges Facing ODeL in Kenya In identifying the challenges, the study took into consideration equity in programme de-livery across the geographical locations represented in the study, programme staffing, the resources used in the ODeL programmes in Kenya, and the levels of satisfaction of the programme participants.
Equity in Programme Delivery across Geographical LocationsThis was meant to collect information on whether ODeL delivery was consistent and ap-propriate across all the geographical locations, with Nairobi, Nyanza, and North Eastern Provinces representing the urban, rural, and hardship areas respectively.
The majority of the lecturer respondents felt that the programme delivery was not consis-tent across all the geographical regions represented in the study. Out of 257 lecturers who participated in the study, only 63 (24.5%) felt that the ODeL programme delivery was con-sistent across all the geographical regions, while 194 (75.5%) felt that there were disparities in the programme delivery across the geographical regions (Table 1).
Table 1
Lecturer Opinion on the Consistency of ODeL Delivery across Geographical Locations
Response N %
Yes
No
63 24.5
194 75.5
Total 257 100.0
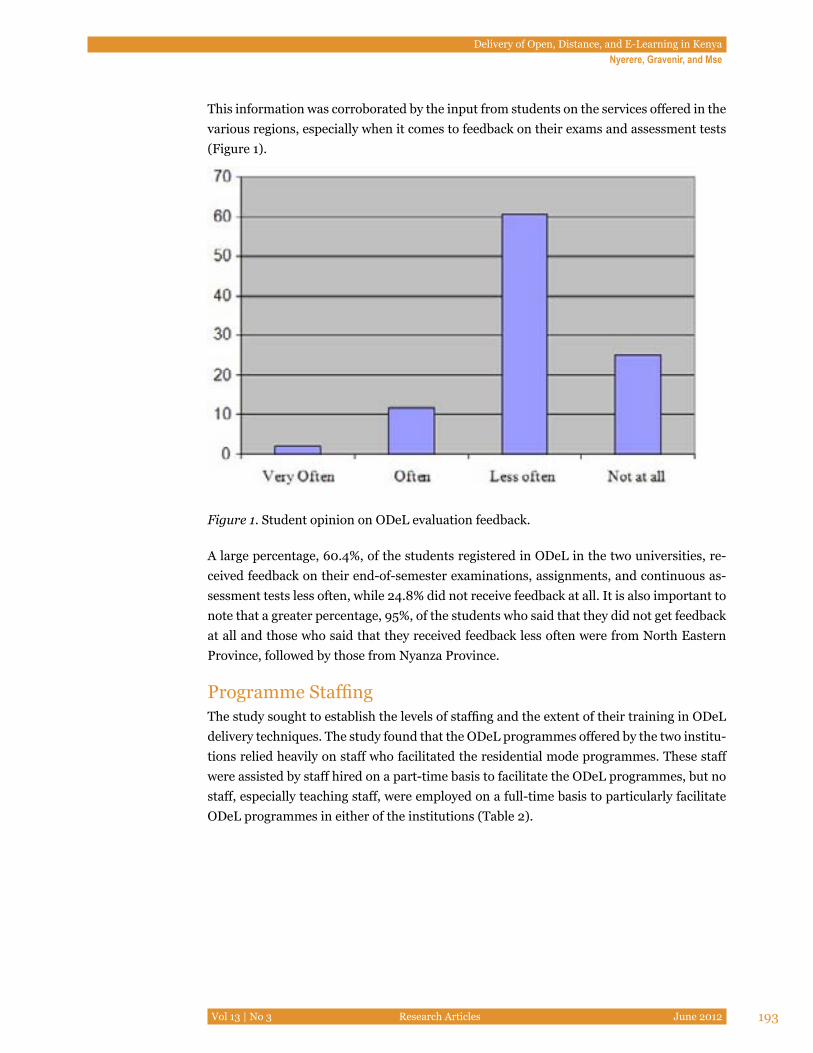
Delivery of Open, Distance, and E-Learning in KenyaNyerere, Gravenir, and Mse
Vol 13 | No 3 Research Articles June 2012 193
This information was corroborated by the input from students on the services offered in the various regions, especially when it comes to feedback on their exams and assessment tests (Figure 1).
Figure 1. Student opinion on ODeL evaluation feedback.
A large percentage, 60.4%, of the students registered in ODeL in the two universities, re-ceived feedback on their end-of-semester examinations, assignments, and continuous as-sessment tests less often, while 24.8% did not receive feedback at all. It is also important to note that a greater percentage, 95%, of the students who said that they did not get feedback at all and those who said that they received feedback less often were from North Eastern Province, followed by those from Nyanza Province.
Programme StaffingThe study sought to establish the levels of staffing and the extent of their training in ODeL delivery techniques. The study found that the ODeL programmes offered by the two institu-tions relied heavily on staff who facilitated the residential mode programmes. These staff were assisted by staff hired on a part-time basis to facilitate the ODeL programmes, but no staff, especially teaching staff, were employed on a full-time basis to particularly facilitate ODeL programmes in either of the institutions (Table 2).
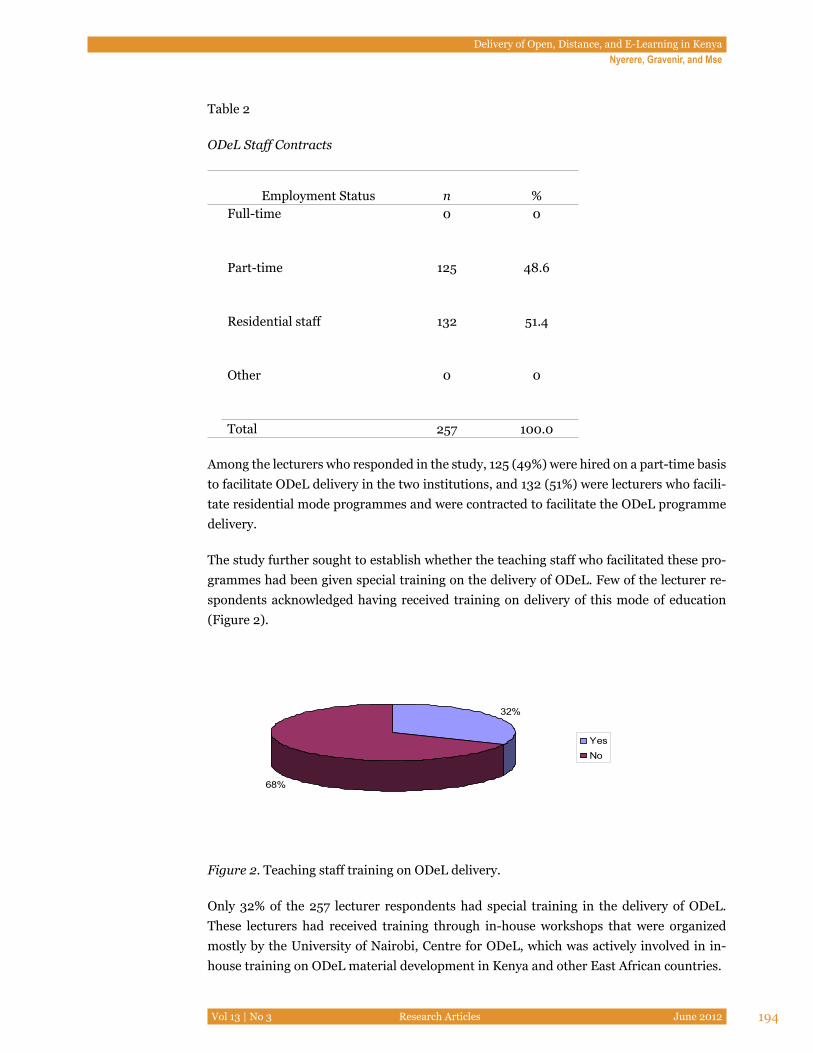
Delivery of Open, Distance, and E-Learning in KenyaNyerere, Gravenir, and Mse
Vol 13 | No 3 Research Articles June 2012 194
Table 2
ODeL Staff Contracts
Employment Status n %
Full-time 0 0
Part-time 125 48.6
Residential staff 132 51.4
Other 0 0
Total 257 100.0
Among the lecturers who responded in the study, 125 (49%) were hired on a part-time basis to facilitate ODeL delivery in the two institutions, and 132 (51%) were lecturers who facili-tate residential mode programmes and were contracted to facilitate the ODeL programme delivery.
The study further sought to establish whether the teaching staff who facilitated these pro-grammes had been given special training on the delivery of ODeL. Few of the lecturer re-spondents acknowledged having received training on delivery of this mode of education (Figure 2).
32%
68%
YesNo
Figure 2. Teaching staff training on ODeL delivery.
Only 32% of the 257 lecturer respondents had special training in the delivery of ODeL. These lecturers had received training through in-house workshops that were organized mostly by the University of Nairobi, Centre for ODeL, which was actively involved in in-house training on ODeL material development in Kenya and other East African countries.
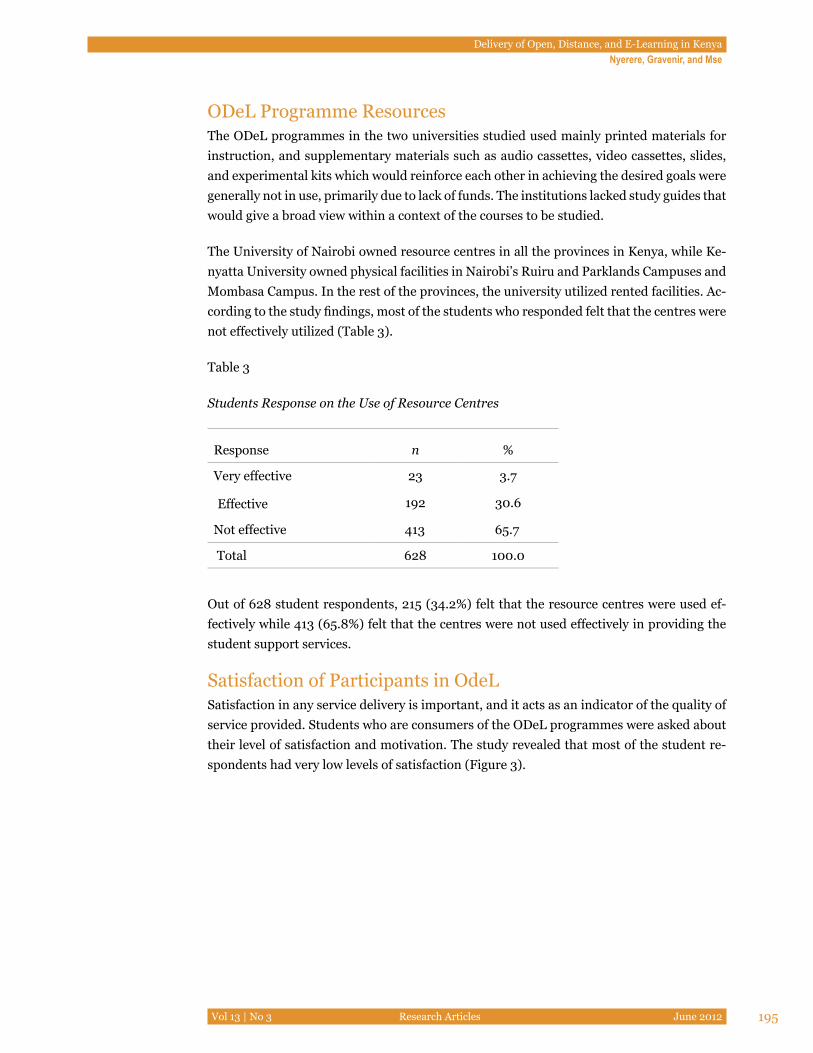
Delivery of Open, Distance, and E-Learning in KenyaNyerere, Gravenir, and Mse
Vol 13 | No 3 Research Articles June 2012 195
ODeL Programme ResourcesThe ODeL programmes in the two universities studied used mainly printed materials for instruction, and supplementary materials such as audio cassettes, video cassettes, slides, and experimental kits which would reinforce each other in achieving the desired goals were generally not in use, primarily due to lack of funds. The institutions lacked study guides that would give a broad view within a context of the courses to be studied.
The University of Nairobi owned resource centres in all the provinces in Kenya, while Ke-nyatta University owned physical facilities in Nairobi’s Ruiru and Parklands Campuses and Mombasa Campus. In the rest of the provinces, the university utilized rented facilities. Ac-cording to the study findings, most of the students who responded felt that the centres were not effectively utilized (Table 3).
Table 3
Students Response on the Use of Resource Centres
Response n %
Very effective 23 3.7
Effective 192 30.6
Not effective 413 65.7
Total 628 100.0
Out of 628 student respondents, 215 (34.2%) felt that the resource centres were used ef-fectively while 413 (65.8%) felt that the centres were not used effectively in providing the student support services.
Satisfaction of Participants in OdeLSatisfaction in any service delivery is important, and it acts as an indicator of the quality of service provided. Students who are consumers of the ODeL programmes were asked about their level of satisfaction and motivation. The study revealed that most of the student re-spondents had very low levels of satisfaction (Figure 3).
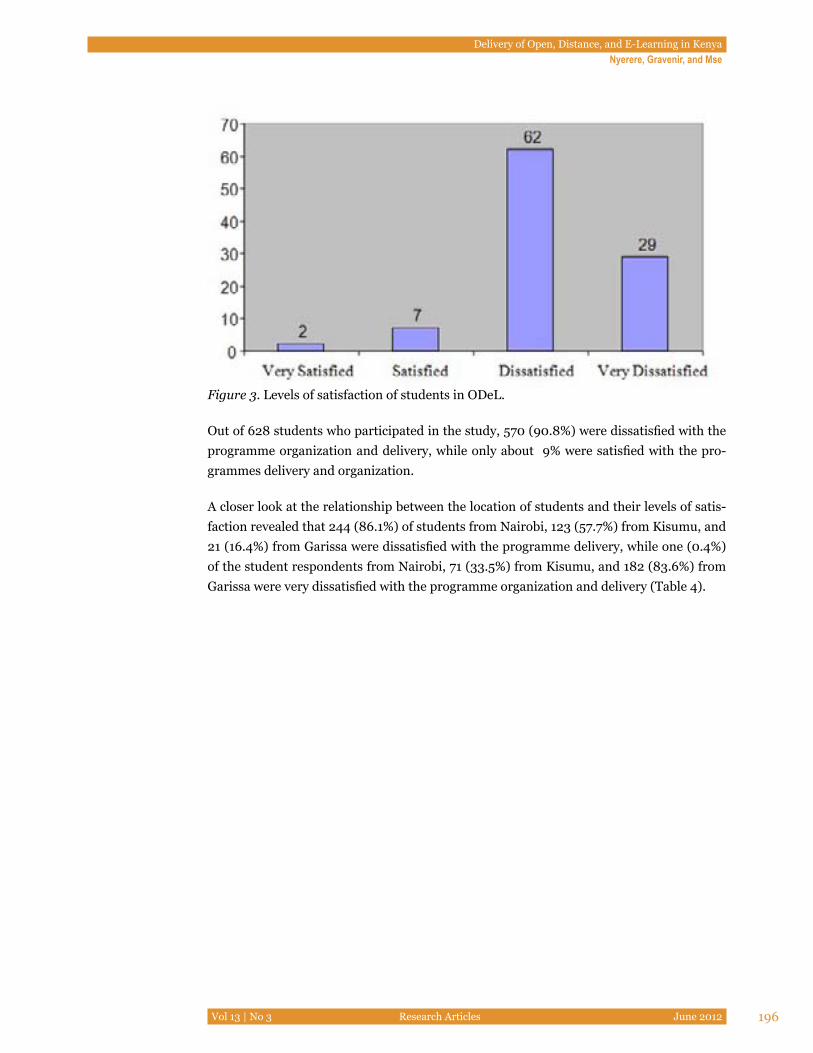
Delivery of Open, Distance, and E-Learning in KenyaNyerere, Gravenir, and Mse
Vol 13 | No 3 Research Articles June 2012 196
Figure 3. Levels of satisfaction of students in ODeL.
Out of 628 students who participated in the study, 570 (90.8%) were dissatisfied with the programme organization and delivery, while only about 9% were satisfied with the pro-grammes delivery and organization.
A closer look at the relationship between the location of students and their levels of satis-faction revealed that 244 (86.1%) of students from Nairobi, 123 (57.7%) from Kisumu, and 21 (16.4%) from Garissa were dissatisfied with the programme delivery, while one (0.4%) of the student respondents from Nairobi, 71 (33.5%) from Kisumu, and 182 (83.6%) from Garissa were very dissatisfied with the programme organization and delivery (Table 4).
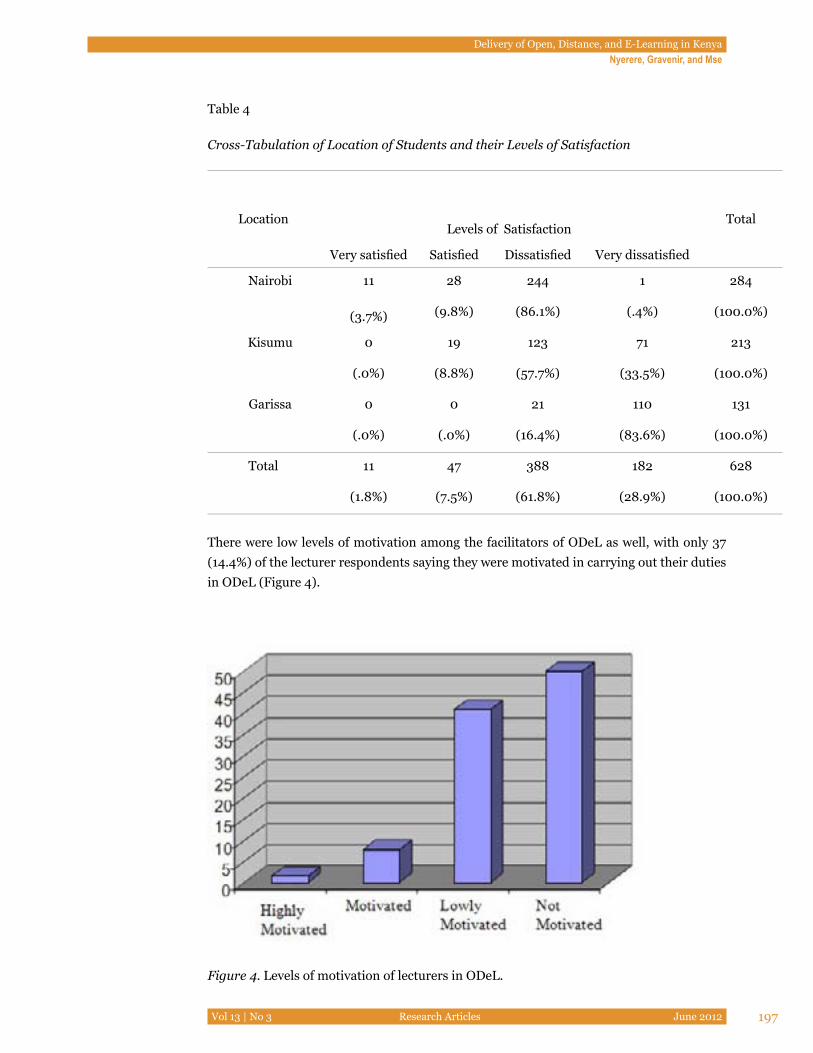
Delivery of Open, Distance, and E-Learning in KenyaNyerere, Gravenir, and Mse
Vol 13 | No 3 Research Articles June 2012 197
Table 4
Cross-Tabulation of Location of Students and their Levels of Satisfaction
LocationLevels of Satisfaction
Total
Very satisfied Satisfied Dissatisfied Very dissatisfied
Nairobi 11
(3.7%)
28 244 1 284
(9.8%) (86.1%) (.4%) (100.0%)
Kisumu 0 19 123 71 213
(.0%) (8.8%) (57.7%) (33.5%) (100.0%)
Garissa 0 0 21 110 131
(.0%) (.0%) (16.4%) (83.6%) (100.0%)
Total 11 47 388 182 628
(1.8%) (7.5%) (61.8%) (28.9%) (100.0%)
There were low levels of motivation among the facilitators of ODeL as well, with only 37 (14.4%) of the lecturer respondents saying they were motivated in carrying out their duties in ODeL (Figure 4).
Figure 4. Levels of motivation of lecturers in ODeL.
0 Highly Motivated
MotivatedNot Motivated
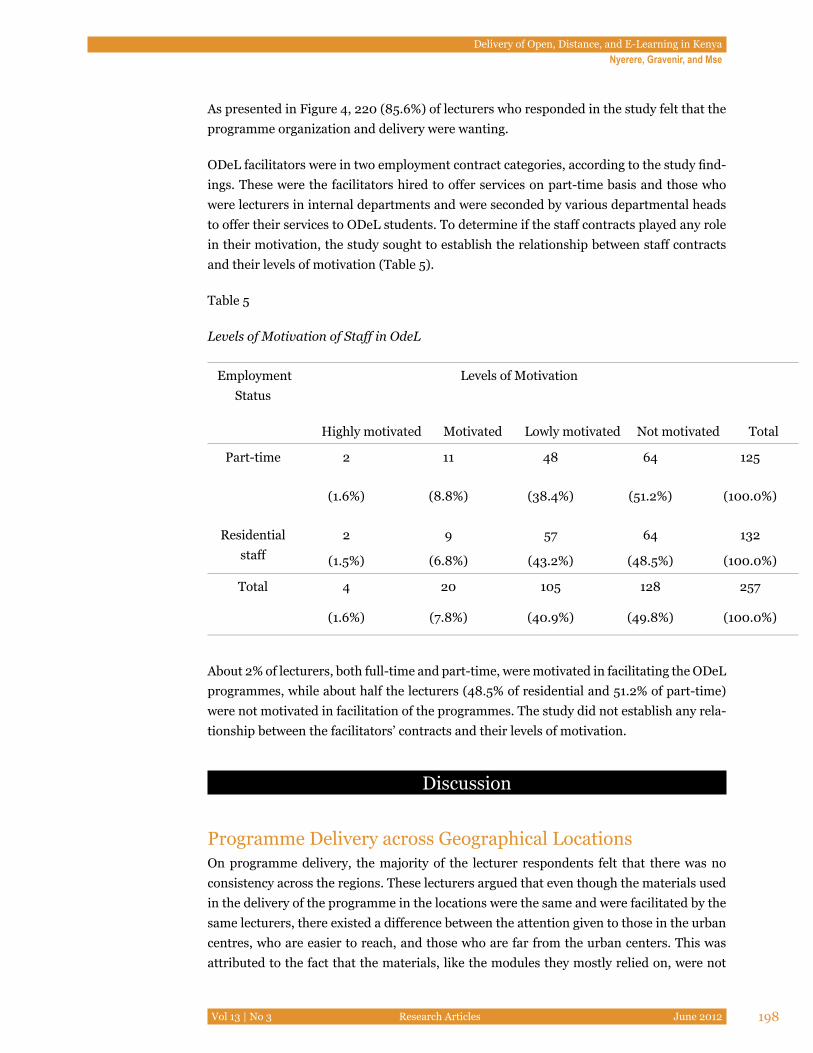
Delivery of Open, Distance, and E-Learning in KenyaNyerere, Gravenir, and Mse
Vol 13 | No 3 Research Articles June 2012 198
As presented in Figure 4, 220 (85.6%) of lecturers who responded in the study felt that the programme organization and delivery were wanting.
ODeL facilitators were in two employment contract categories, according to the study find-ings. These were the facilitators hired to offer services on part-time basis and those who were lecturers in internal departments and were seconded by various departmental heads to offer their services to ODeL students. To determine if the staff contracts played any role in their motivation, the study sought to establish the relationship between staff contracts and their levels of motivation (Table 5).
Table 5
Levels of Motivation of Staff in OdeL
Employment Status
Levels of Motivation
Highly motivated Motivated Lowly motivated Not motivated Total
Part-time 2 11 48 64 125
(1.6%) (8.8%) (38.4%) (51.2%) (100.0%)
Residential staff
2 9 57 64 132
(1.5%) (6.8%) (43.2%) (48.5%) (100.0%)
Total
4 20 105 128 257
(1.6%) (7.8%) (40.9%) (49.8%) (100.0%)
About 2% of lecturers, both full-time and part-time, were motivated in facilitating the ODeL programmes, while about half the lecturers (48.5% of residential and 51.2% of part-time) were not motivated in facilitation of the programmes. The study did not establish any rela-tionship between the facilitators’ contracts and their levels of motivation.
Discussion
Programme Delivery across Geographical LocationsOn programme delivery, the majority of the lecturer respondents felt that there was no consistency across the regions. These lecturers argued that even though the materials used in the delivery of the programme in the locations were the same and were facilitated by the same lecturers, there existed a difference between the attention given to those in the urban centres, who are easier to reach, and those who are far from the urban centers. This was attributed to the fact that the materials, like the modules they mostly relied on, were not

Delivery of Open, Distance, and E-Learning in KenyaNyerere, Gravenir, and Mse
Vol 13 | No 3 Research Articles June 2012 199
prepared on time, which necessitated checking regularly with the programme administra-tion to find out when they were ready. This, in essence, means that those in the urban cen-tres, who have no problem with infrastructure like the road and communication network, accessed the materials early enough and had enough time to study before the examinations, which usually took place at the same time in all the regional centres. Students from the oth-er areas, few of whom got timely access to the materials, were left with little time for study-ing the materials, which put them at a disadvantage. This was also noted by Macintyre and Macdonald (2011), who, in their study carried out in Scotland, recommend that a possible solution could be through mediation and creation of various ties and connections between the university and the student, especially through strong connections between students and their individual tutors.
The other problem cited is in connection with evaluation of the students of ODeL. The lec-turer respondents also argued that the continuous assessment tests and the assignments given to the students in the rural and especially the hardship regions took quite a long time to reach the facilitators. This was also attributed to the poor communication and road net-work. This information was corroborated by the opinions of ODeL students on the evalua-tion process. These students also indicated that there were disparities, mostly in receiving feedback on their tests and assignments, since most of those who received feedback on assignments more regularly were from the urban centres (Figure 4).
ODeL Programme StaffingOn staffing, the study established that the ODeL programmes offered by the two institutions that participated in the study rely heavily on staff in the residential mode programmes. The dual-mode approach that makes use of existing academic staff and facilities as in the case of universities in Kenya has been recommended by some studies as it reduces the competi-tion for scarce resources often associated with the establishment of a new institution and erodes staff resistance by offering opportunities for direct participation (Saint, 2000). The study established that most (68%) of the teaching staff who facilitated these programmes had not been given special training on the delivery of ODeL techniques. These findings are similar to those by Mpofu et al. (2012), where they noted that 97.5% of the ODeL facilitators in Zimbabwe had not received relevant training. Having well-trained and competent staff is important in providing quality ODeL, yet in the effort to get ODeL programmes into opera-tion in Kenya, insufficient preparation, time, and funding had been given to staff training. Few of the lecturer respondents acknowledged having received training on delivery of this mode of education, which was provided mostly through in-house sessions conducted by the University of Nairobi Centre for ODeL. The majority of these lecturers felt that it would be important for them to receive training on the ODeL delivery techniques.
Given that ODeL is generally based on an indirect teaching relationship, using fundamen-tally self-teaching methods with the tutor acting as a facilitator to activate the skills and sit-uations needed for self-education, the relatively small percentage of staff trained on ODeL would encourage most of the existing ODeL programmes to adopt patterns of traditional education delivery.
Delivery of Open, Distance, and E-Learning in KenyaNyerere, Gravenir, and Mse
Vol 13 | No 3 Research Articles June 2012 200
Additionally, most of the lecturer respondents felt that the number of staff facilitating these programmes was not adequate and that additional staff were required in order to run the programmes effectively. According to the study findings, 90% of these lecturers felt that the level of staffing was inadequate. This, they said, contributed to overloading and hence lack of adequate attention to the students in the ODeL, a factor that had a bearing on the qual-ity of services offered to the students. The lecturers said that they were heavily burdened with many duties because the majority of them were from internal faculties and were also engaged in teaching the residential programmes.
ODeL Programme ResourcesThe universities that participated in the study used mainly print material in delivery of ODeL programmes. Computing resources, both hardware and software, which are crucial in ODeL, are difficult to afford in reasonable quantities and quality. Production of high-quality ODeL materials for the country’s university programmes appears far more expen-sive because the cost would include the design of the curriculum and the course authors’ fee, remuneration of reviewers and assessors, and the tremendous effort devoted to the pre-sentation of the final product using graphics language and layout style. Staff members were thus forced to use curriculum and study materials meant for the residential model of edu-cation, which cannot effectively communicate to learners separated from their tutors. In addition, teaching staff members did not have access to modern libraries. The institutions were faced with a lack of current journals and publications in distance learning and were unable to adequately subscribe to publications due to the limited funds available in univer-sities. The programmes also failed to benefit from economies of scale because of the rela-tively small numbers (8,215) of students enrolled in the programmes, and yet the fact that many African governments are exploring provision of education through ODeL, according to Pityana (2009), is due to resource constraints. This is because resources are scarce and higher education provision is poor on the African continent, and ODeL is viewed as a viable, cost-effective means of expanding provision without costly outlay in infrastructure.
Technology being very dynamic, universities in Kenya cannot cope with the changes in terms of cost and relevancy (Juma, 2003). Quality ODeL could be achieved through effec-tive application of information technology, and as Hooper and Rieber (1995) note, quality can be enhanced when teachers create environments in which students actively engage in cognitive partnerships with technology. Hooper and Rieber (1995) point out, however, that where technology is not appropriately applied, it is unlikely to improve educational quality and may perpetuate or even exacerbate existing problems instead. The Internet represents a technological breakthrough in ODeL tools, and advances with respect to access and qual-ity of information are essential for making ODeL efficient and effective as an innovation in higher education in Kenya. Adequate Internet connectivity throughout the country has not yet been achieved, and the ODeL programmes in Kenya supplement printed materials largely with audio cassettes.
The resource centres constitute an important base for transmitting content. They are meant to provide facilities for individual and group tutoring and academic guidance and counseling. The ODeL students who responded in the study felt that the centres were not adequately utilized since they had to travel to the head offices to get study materials, which
Delivery of Open, Distance, and E-Learning in KenyaNyerere, Gravenir, and Mse
Vol 13 | No 3 Research Articles June 2012 201
were not prepared and dispatched to the centers in time. They also felt that the centers did not do enough to facilitate individual or group tutoring and academic guidance and coun-seling (Table 4).
Satisfaction of Participants in ODeLSatisfaction in delivery of any service is important, and it acts as an indicator of the qual-ity of service provided. Most of the study respondent group, which included the students as consumers of the ODeL programmes and the teaching staff who facilitate ODeL pro-grammes, however, had very low levels of satisfaction. Some of the student respondents felt that their study centres were not adequately utilized in providing them with study materials as they had to travel to the main centres for the materials. They also felt that they did not receive adequate student support services, and they did not receive feedback on their as-signments and examinations on time. This agrees with a study in Botswana by Sikwibele and Mungoo (2009), which revealed that the greatest challenge in ODeL was the minimal learner support. Most of the teaching staff respondents attributed their low levels of moti-vation to inadequate resources, especially the modules used in the programmes. They also felt that the workload was too heavy, given that they were the same lecturers who facilitated the residential mode of education in addition to other responsibilities such as research and publications. The facilitators also raised the issue of compensation, with the majority feel-ing that it was too low compared to the workload and the time they put into provision of these services. These sentiments by ODeL teaching staff were also established by a survey by NEA (2000).
ConclusionThe study established that provision of ODeL by Kenyatta University and the University of Nairobi is faced with various challenges that hinder its fully effective implementation. Various challenges touching on nonoptimal utilization of programme facilities, delays in production of study materials, inadequate funding, and low teaching staff levels were iden-tified. Efforts of the ODeL providers in Kenya were also not guided by national policies, pos-ing a challenge in resource mobilization and programme quality issues. These institutions, being dual mode, were overwhelmed and were not able to meet demand for university edu-cation. The integration of ICT in education in Kenya, on the other hand, is more recent and on a smaller scale. This is due to resource and infrastructural constraints.
Study ImplicationThe major implication of the study is that there is a lot of potential in implementation of ODeL programmes in Kenya which, if fully exploited, could provide the much-needed access to quality education in the country. This could be achieved through, among other things, adequate budgetary and resource provision, proper infrastructure development, training of adequate staff in ODel, and provision of student support services.
For the government, it would be important to develop and articulate national policies on ODeL to facilitate mobilization of resources for ODeL programmes; develop a budgetary
Delivery of Open, Distance, and E-Learning in KenyaNyerere, Gravenir, and Mse
Vol 13 | No 3 Research Articles June 2012 202
provision structure for ODeL programmes; and establish proper infrastructure, especially ICT, to support ODeL programmes in the country. Institutions, on the other hand, should, among other things recognize the fact that ODeL is fundamentally different from residen-tial programmes and provide relevant resources; increase the level of trained staff in ODeL delivery techniques; and strengthen the student support services through optimal utiliza-tion of the resource centres.
Recommendation for Further ResearchA study should be carried out to investigate why ODeL student support services have not been realized in dual mode institutions.
Delivery of Open, Distance, and E-Learning in KenyaNyerere, Gravenir, and Mse
Vol 13 | No 3 Research Articles June 2012 203
ReferencesAssociation for the Development of Education in Africa (ADEA). (1999). Tertiary distance
learning in Sub-Saharan Africa. ADEA Newsletter, 11(1).
Brunner, C. (1991). Gender and distance learning. Annals of the American Academy of Political and Social Science, 514(1), 133–145.
Edwards, R. (1997). Changing places? Flexibility, lifelong learning and a learning society. London: Routledge.
Engelhart, M. D. (1972). Methods of educational research. Chicago: Rand McNally.
Farrell, G. (2007). ICT in education in Kenya. A survey of ICT and education in Africa: Ke-nya country report. Retrieved from http://www.infodev.org/en/Publication.409.html
Garrison, R. (2000). Theoretical challenges for distance education in the 21st century: A shift from structural to transactional issues. International Review of Research in Open and Distance Learning, 1(1).
Hooper, S., & Rieber, L. P. (1995). Teaching with technology. In A. C. Ornstein (Ed.), Teach-ing: Theory into practice (pp. 154–170). Needham Heights, MA: Allyn and Bacon.
Juma, M. N. (2003). The establishment of a higher education open and distance learning knowledge base for decision makers in Kenya. Nairobi: UNESCO.
Khan, A. W. (1997). Introduction in educational technology 2000: A global vision for open and distance learning. Conference Papers. Vancouver: Commonwealth of Learn-ing.
Khan, A. W. (2001, April). The future of learning – Learning for the future: Shaping the transition. 20th ICDE World Conference on Open Learning and Distance Educa-tion, Düsseldorf, Germany.
Kothari, C. R. (1985). Research methodology: Methods and techniques. New Delhi: Wiley Eastern.
Krejcie, R. V., & Morgan, D. W. (1990). Determining sample size for research activities. Educational and Psychological Measurement, 30, 609–616.
Laurillard, D. (1993). Rethinking university teaching: A framework for the effective use of educational technology. London: Routledge.
Macintyre, R., & Macdonald, J. (2011). Remote from what? Perspectives of distance learn-ing students in remote rural areas of Scotland. International Review of Research in Open and Distance Learning, 12(4).
Delivery of Open, Distance, and E-Learning in KenyaNyerere, Gravenir, and Mse
Vol 13 | No 3 Research Articles June 2012 204
Mpofu, V., Samukange, T., Kusure, L. M., Zinyandu, T. M., Denhere, C., Huggins, N., Wise-man, C., Ndlovu, S., Chiveya, R., Matavire, M., Mukavhi, L., Gwizangwe, I., Ma-gombe, E., Magomelo, M., & Sithole, F. (2012). Challenges of virtual and open dis-tance science teacher education in Zimbabwe. International Review of Research in Open and Distance Learning, 13(1).
Mugenda, O., & Mugenda, A. (1999). Research methods: Qualitative and quantitative ap-proaches. Nairobi: Acts Press.
National Education Association (NEA). (2000). A survey of traditional and distance learn-ing higher education members. Washington, DC: NEA.
Orodho, J. A. (2005). Elements of education and social science research methods. Nairobi: Masola Publishers.
Peters, O. (1994). Distance education and industrial production: A comparative interpreta-tion in outline (1973). In D. Keegan (Ed.), Otto Peters on distance education: The industrialization of teaching and learning (pp. 107–127). London: Routledge.
Pityana, B. (2009). Open and distance learning in the developing world: Trends, progress and challenges. Keynote speech at the 2009 23rd ICDE World Conference, Maas-tricht, Netherlands.
Republic of Kenya (2005). A policy framework for education, training and research: Meeting the challenges of education, training and research in Kenya in the 21st century. Nairobi: Government Printers.
Saint, W. (2000). Implementation of tertiary distance education: Choices and decisions. World Bank: Knowledge Enterprise, Inc.
Sikwibele, A. L., & Mungoo, J. K. (2009). Distance learning and teacher education in Bo-tswana: Opportunities and challenges. International Review of Research in Open and Distance Learning, 10(4).
UNESCO (2003). Africa: A survey of distance education 1991. New Papers on Higher Edu-cation Studies and Research, No. 4.
UNESCO. (2002). Open and distance learning: Trends, policy and strategy consider-ations. Retrieved from unesdoc.unesco.org/images/0012/001284/128463e.pdf
Wheeler, S. (2000, May). The traditional university is dead – Long live the distributed university! Keynote Presentation to the European Universities Continuing Educa-tion Network Conference, University of Bergen, Norway.

Delivery of Open, Distance, and E-Learning in KenyaNyerere, Gravenir, and Mse
Vol 13 | No 3 Research Articles June 2012 205
Learning in Educational Computer Games for Novices: The Impact of
Support Provision Types on Virtual Presence, Cognitive Load, and Learning Outcomes
AbstractEmbedding support devices in educational computer games has been asserted to positively affect learning outcomes. However, there is only limited direct empirical evidence on which design variations of support provision influence learning. In order to better understand the impact of support design on novices’ learning, the current study investigates how support devices and their type of provision (intrinsic vs. extrinsic) determine games’ effectiveness on learning outcomes. This effectiveness is also related to how the design-type of provi-sion influences learners’ virtual presence and cognitive load. Compared to an educational adventure game without additional support, the results indicate that the game equipped with support devices enhances learning outcomes, although no differences in cognitive load were found. A variation in the design of provision shows no effect. In order to gain a more thorough understanding of support devices and their design for games, additional learner characteristics (e.g., interest) should be considered in future research.
Keywords: Open learning; e-learning; educational computer games
Claudia Schrader and Theo BastiaensFernUniversität in Hagen, Germany
Learning in Educational Computer Games for NovicesSchrader and Bastiaens
Vol 13 | No 3 Research Articles June 2012 207
IntroductionInstructional approaches based on discovery (Bruner, 1961), experiential (Kolb, 1983), or problem-based learning (Barrows & Tamblyn, 1980) as well as constructivist ideas (Jo-nassen, 1991) stress the importance of learning environments such as educational com-puter games. They are seen as opportunities to enhance learning and motivation by of-fering learners open-ended, autonomous learning. As they permit learners to discover or construct learning information themselves, theorists consider them to be a promising al-ternative to the presently more common approach of presenting learners with informa-tion for example by listening to a teacher (Kirschner, Sweller, & Clark, 2006). Although the beneficial effects of autonomous learning in educational games are supported from a theoretical perspective, empirical research shows both beneficial and detrimental effects on learning outcomes (e.g., Beale et al., 2007; Dede et al., 1997, 2005; Parchman et al., 2000; Wong et al., 2007). While some learners benefit from learning in educational computer games, for other learners, especially those with little prior knowledge, educational games have proven no more effective than traditional media (for an overview on games’ learning effectiveness see Schrader, 2010; Schrader & Bastiaens, in press). According to Kirschner et al. (2006), one of the potential threats not only of educational computer games but of all discovery-based, problem-based, or experiential learning environments is that they make heavy demands on learners’ working memory capacity by requiring unnecessary cognitive load that exceeds the limitation of working memory. In this case, learning will be inhib-ited (Sweller, 1993). Following the line of cognitive load theory (Chandler & Sweller, 1991; Sweller, 1994, 1999), the total cognitive load imposed on working memory during learning is additively composed of three load types: intrinsic cognitive load, extraneous cognitive load, and germane cognitive load. Intrinsic cognitive load depends on the complexity of the given task in relation to learners’ level of expertise. Extraneous cognitive load depends on the instructional design of learning material; whereas, germane cognitive load results from learners’ engagement in the learning activity. During learning with games, an example of intrinsic and extraneous factors that overload learners’ processing resources is the amount and complexity of information that needs to be processed, combined with simultaneous actions of cognitive and motor activities (Kalyuga & Plass, 2009; Kerres, Bormann, & Ver-venne, 2009; Lim, Nonis, & Hedberg, 2006; Whitton, 2010). Learners have to give high attention to how to manipulate the game and control experimental tasks through motor actions. In addition, they have to search for the tasks that perhaps are delayed in space and time in the gaming environment. These are often more complex than simply chatting, shooting, or regulating experimental simulations, and the completion of the objective may involve several or all of these. The learning objectives of tasks are not obviously given, but gradually unfold while learners interact with the game to complete them. They have to dis-cover and analyze what the learning objectives behind these tasks are. They have to draw hypothetical conclusions from the result of their attempts to solve the task, especially when they have failed to reach their goal and need to repeat the attempt.
Thus, learning with games seems to pose a challenge even to learners with a high level of expertise in the learning topic, and more so to novices. Martens et al. (1997) suggest that learners with higher developed prior knowledge on the learning topic have a better base for
Learning in Educational Computer Games for NovicesSchrader and Bastiaens
Vol 13 | No 3 Research Articles June 2012 208
compensating for complexity, intransparency, and incoherence within information. They have knowledge structures in long-term memory available, which help to organize and link relevant information. In contrast, novices have no sufficient prior knowledge and corre-sponding knowledge structures in their long-term memory to compensate for ineffective activity. The provided tasks in games are often too difficult and mentally too demanding for novices. They prevent them from accurately processing the necessary information. As a result, novices might experience a total cognitive load that exceeds their limited working memory capacity and leaves them with insufficient cognitive resources for successful learn-ing. Novices could also revert to less meaningful learning to keep their cognitive load within the threshold limit (Aleven et al., 2003). This attempt to avoid cognitive overload through unselective, explorative modes of information processing is as detrimental to learning as a cognitive overload itself.
For novices, providing support devices might be one possible approach to reducing cogni-tive stress in terms of task complexity and difficulty. The effectiveness of this approach is supported by research in the field of cognitive load theory (e.g., Chall, 2000; Kirschner, Sweller, & Clark, 2006; Klahr & Nigam, 2004; Tuovinen & Sweller, 1999) but also by theo-retical frameworks of classroom teaching (e.g., Klauer, 1985). Moreno (2004) concluded from a literature review of studies comparing pure discovery learning with guided forms of learning that “the debate about discovery has been replayed many times in education but each time, the evidence has favored a guided approach to learning” (p. 18). Game research-ers (e.g., Cobb & Fraser, 2005; Leemkuil, 2006; Leutner, 1993; Rieber, Tzeng, & Tribble, 2004; Salzman et al., 1999; Standen et al., 2001) therefore stress the importance of support devices. They may overcome difficulties of task complexity by presenting essential informa-tion. They help make the uncovering of relations between the provided learning objects more explicit and transparent (de Jong, 2005). Also, they aim at cognitive processes of learners by directing learners’ attention to the essential learning information. Therefore, combined with an adequate game design, they may reduce information search and, con-sequently, cognitive load in order to enhance the learning outcomes (de Jong, 2005), that is the successful restructuring and integration of new information in existing knowledge structures (Krapp & Weidenmann, 2001). But support devices not only seem to enhance learning outcomes through preventing cognitive overload, they may also strengthen the re-lation between learners’ experience of virtual presence and their learning. Virtual presence is defined as an actual subjective emotion-related state in which a user is fully immersed in a virtual activity provided by technological means. For games, their positive impact on virtual presence was affirmed in several studies (e.g., Heers, 2005; Welch et al., 1996). Further-more, in the study carried out by Schrader and Bastiaens (2012), it was demonstrated that virtual presence is positively associated with learning success. Adapted from research on emotions in the fields of psychology, education and computer science (e.g., Dweck, 2002; Lepper & Henderlong, 2000) and education (e.g., Ainley, Corrigan, & Richardson, 2005; Meinhardt & Pekrun, 2003; Meyer & Turner, 2002; Pekrun et al., 2002), it was argued that this result is based on virtual presence’s function to motivate and stimulate learners to in-vest mental effort in learning with games. Also, virtual presence guides learners’ attention away from the interface towards the gaming content. This increases the cognitive capacity
Learning in Educational Computer Games for NovicesSchrader and Bastiaens
Vol 13 | No 3 Research Articles June 2012 209
actually allocated to the learning task. However, the findings of the study also showed that virtual presence does not guarantee better learning outcomes. Besides learners’ individu-al tendency to invest in virtual presence, it was shown that a heavy cognitive load, which might be due to inadequate game design and complexity of tasks, reduced virtual presence and its positive impact on learning (Schrader & Bastiaens, in press).
Because of the described benefits of support devices on cognitive load, virtual presence, and learning outcomes, game designers do not always ignore the role of support. An analysis of current support devices in educational computer games reveals a variety of designs (e.g., direct vs. non-direct, game-extrinsic vs. game-intrinsic, before vs. during game-playing, learner-requested vs. automatically system-initiated). All are based on the idea of support-ing learners by giving information on the learning topic or gaming behaviour. However, the few existing studies on support devices and their relation to learning outcomes (e.g., Leem-kuil, 2006; Leutner, 1993; Nelson, 2007) show that even if support is provided it does not always improve learning outcomes, especially not if learners have a low level of expertise (Nelson, 2007). In accordance with these results, this article argues that support devices are more effective predictors of learning success if they are designed to reduce cognitive load while also enabling virtual presence. Hence, the current article focuses on support devices designed to mediate the embedded learning topic effectively rather than to instruct the learner on how to interact with the gaming environment.
Considering this background, the area of particular interest in this study is on the design of support devices in terms of their types of provision, more specifically on two different types: intrinsic versus extrinsic support. In particular, this study investigates which one of these two types is most capable of maximizing virtual presence and minimizing cognitive load to advance learning outcomes. The type of provision is interesting since advocates of pure discovery learning oppose not only integrating content support into the gaming envi-ronment but also take different stances on this issue (e.g., Hofer et al., 1996; Nelson, 2007; Renkl, 2002; Wood, 2001). Besides, especially in the field of educational computer games, consolidated findings are rare.
Therefore, the following section discusses the advantages and disadvantages of the dif-ferent methodological approaches in the areas of support provision with regard to virtual presence, cognitive load, and learning outcomes.
The Provision of Support Devices: Intrinsic versus ExtrinsicBased on the basic support categories of Gery (1995), an analysis of current support devices in computer games shows that support can be presented in an intrinsic or in an extrinsic way. Intrinsic support automatically provides learning information during game-playing that is adequate to the learners’ actual needs, that is when learners make a mistake (e.g., in Winterfest [Alphabit, 2012]). In contrast, extrinsic support is not part of the gaming world. It offers domain-specific background information such as definitions, basic facts, and con-cepts mostly presented in the form of a hyperlinked textbook (e.g., in Bioscopia [Heureka-

Learning in Educational Computer Games for NovicesSchrader and Bastiaens
Vol 13 | No 3 Research Articles June 2012 210
Klett, 2011]; River City [Dede, Ketelhut, & Reuss, 2003]).
Hofer et al. (1996) suggest that the intrinsic type of support provision – if it is adequately designed (for an overview of design see e.g., Narciss, 2006) – may be more effective for learning compared to an extrinsic hyperlinked textbook. While the authors did not elabo-rate on possible causes for the learning ineffectiveness of extrinsic support, the effects they observed can be explained with a decrease in virtual presence and an excessive cognitive load. It can be argued that switching between the gaming environment and the extrinsic hyperlinked textbook not only causes a break in the experience in terms of virtual presence. It also requires additional working memory resources unrelated to learning and thereby overloads the limited working memory capacity. Whereas the intrinsic support provides explicit information that helps to continue solving a gaming task, information given in the extrinsic type of support does not necessarily help to make judgements about the actual task in the game. Here, learners have to pause their game-playing for searching of suitable information and have to adapt it to the current task inside the game. Especially for novices, who may not understand or misinterpret the learning purpose of the tasks, it is practically impossible to select the relevant information for a specific learning task at hand. Conse-quently, they are not likely to profit from extrinsic support in terms of learning.
Besides their difference in spatial presentation and alignment on given tasks, both types also differ in their degree to which the control of support is given to the learners. Whereas intrinsic support is volunteered by the game-system, extrinsic support has to be invoked from the learner. This influences not only virtual presence, cognitive load, and learning outcomes but also the use of help. As highlighted in several studies (e.g., Hofer et al., 1996; Jiang, Elen, & Clarebout, 2009; Nelson, 2007; Wood, 2001), the effect learners’ control of support has on learning outcomes may not always be materialized as some researchers stat-ed (Hofer et al., 1996; Leutner, 1993; Renkl, 2002). Nelson (2007), for example, evaluated the influence of learner-requested access to support in a learning simulation, but found no measurable impact on learning. He notes that an important feature of support is that learners are given the choice of whether or not to use it. When support devices are offered for optional use, as in the type of extrinsic support, learners reported lower learning out-comes because instead of using the support device they tried to guess the right answer. In addition, Wood (2001) found that novices are the least likely to use support appropriately when it is under their own control. It was argued that novices have weaker help-seeking behaviour or that they might be unable to cope with the demands of searching for help. They are faced with tasks, which are, given their low prior knowledge, subjectively already difficult enough. Thus, the learning effectiveness of extrinsic support is minimal especially for novices because they do not actively use help as appropriate. Hence, novices have to be provided automatically with intrinsic support, continuously added as learners repeatedly fail at solving a task. This strategy of information delivery would guarantee the appropriate use of the help function by offering the novices assistance tailored to their actual need in a specific situation and, at the same time, prevent overloading the learners’ cognitive re-sources and preserve learners’ virtual presence by allowing them to continue concentrating on the current task.
Learning in Educational Computer Games for NovicesSchrader and Bastiaens
Vol 13 | No 3 Research Articles June 2012 211
Research QuestionsFor support devices to be effective in games, the above review suggests that they must be designed to optimize virtual presence, cognitive load, and learning outcomes. Otherwise, support devices may hamper learning. The design of support in terms of their provision should help to meet these requirements. The present research therefore investigates under which type of provision support is most effective in relation to learners’ low prior knowl-edge of the learning topic. In particular, this study addresses the following two research questions.
(1) Are virtual presence, cognitive load, and learning outcomes different for novices who use educational computer games with support devices compared to novices who use an educational computer game without support?
According to this first research question, for virtual presence it is expected that a game without additional support devices generates a higher degree of virtual presence in contrast to both gaming variations with support because game-playing is not interrupted due to offering any kind of help. For cognitive load, it is assumed that both game versions with support decrease cognitive load by providing essential learning information in compari-son to an educational computer game without support. Support in general might reduce the search for information and directing working-memory resources to the actual intended learning activity. As a result, both versions with support should increase learning outcomes more than a conventional game version without any support.
(2) Are virtual presence, cognitive load, and learning outcomes different for novices who have access to intrinsic support from those of novices who have access to extrinsic support?
With respect to this second research question, it is expected that intrinsic support enables a more intensive feeling of virtual presence and avoids high cognitive load in contrast to extrinsic support. As discussed in the theoretical part of this article, this assumption is due to the spatial split-attention effect brought about by switching between the game and the hyperlinked-textbook. Moreover, it is expected that game-internal support presents infor-mation immediately required to deal with the current task in the game. As a result, intrinsic support is expected to promote learning outcomes more than extrinsic support. The differ-ence in learning outcomes between both support conditions is not only based on the fact that extrinsic support causes a heavy cognitive load when used. Also, lower learning out-comes can be the result of underusing them by learners, even if they require help.
To sum up, the effectiveness of support in games for learning outcomes is hypothesized since it encourage learners to use it and preserves, rather than disrupts, learners’ experi-ence of virtual presence. In addition, support devices should reduce cognitive load by im-plicitly providing help that is adaptive to learners’ needs.
Learning in Educational Computer Games for NovicesSchrader and Bastiaens
Vol 13 | No 3 Research Articles June 2012 212
Method
ParticipantsOne hundred and thirty-five 8th graders (65 male and 73 female; mean age = 13.44 years, SD = .57) of the preparatory high school Ricarda-Huch Gymnasium in Hagen, Germany par-ticipated in this study. As this study examines the effect of support devices on novices, the researchers intentionally selected only learners that were not familiar with the embedded learning topic in the game. Thus, none of the participants had prior knowledge of the learn-ing topic. In addition, participants were not familiar with the educational computer game used in the study. Learners were randomly assigned to one of the following three versions of an educational computer game: (1) without additional support (G) (n = 43), (2) with ex-trinsic support (G_ES) (n = 47), and (3) with intrinsic support (G_IS) (n = 45).
The Gaming EnvironmentThe computer-based educational game Elektra (European commission, 2009) was adapt-ed for this experiment. It offers a coloured, three-dimensional (3D) single-user adventure game for learning physics content for 8th graders. The gaming scenario takes place in an old house in Florence. From a first-person view, learners can move freely through the house’s rooms, explore, and manipulate objects to solve learning problems presented to them. They gather information and perform a series of three interactive experimental tasks, through which they can learn, for example, about the concept of light refraction.
For the study, three versions of Elektra were developed: (1) without support (G), (2) with extrinsic support (G_ES), and (3) with intrinsic support (G_IS).
The first design condition, used as the control condition, is the conventional design of a gaming environment. This design follows the tenet that learners should construct knowl-edge completely on their own by discovery learning, a situation that requires learners to solve the provided tasks without any support. Learners have to learn about light refraction, that is that light consists of rays and how it can be focused. The learner has to send a strong beam of light through the keyhole of a door in order to open it. Behind the door, the beam has to hit a light cell but not anything else. The learner can use a virtual lab with a flashlight and blinds to learn how to create a narrow beam of light and transfer it to the light cell to open the door. If the learner fails in solving the given tasks, no prompts on how to proceed are presented. The learner has to keep trying until the correct solution is discovered (see Figure 1).
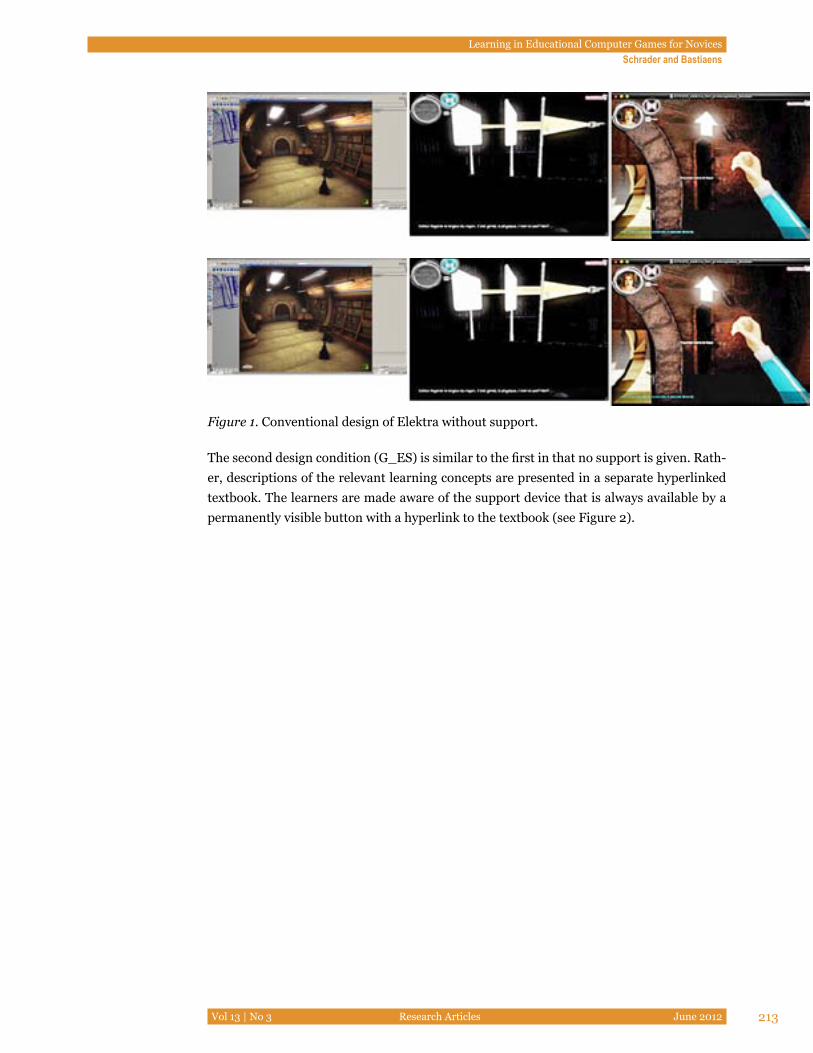
Learning in Educational Computer Games for NovicesSchrader and Bastiaens
Vol 13 | No 3 Research Articles June 2012 213
Figure 1. Conventional design of Elektra without support.
The second design condition (G_ES) is similar to the first in that no support is given. Rath-er, descriptions of the relevant learning concepts are presented in a separate hyperlinked textbook. The learners are made aware of the support device that is always available by a permanently visible button with a hyperlink to the textbook (see Figure 2).
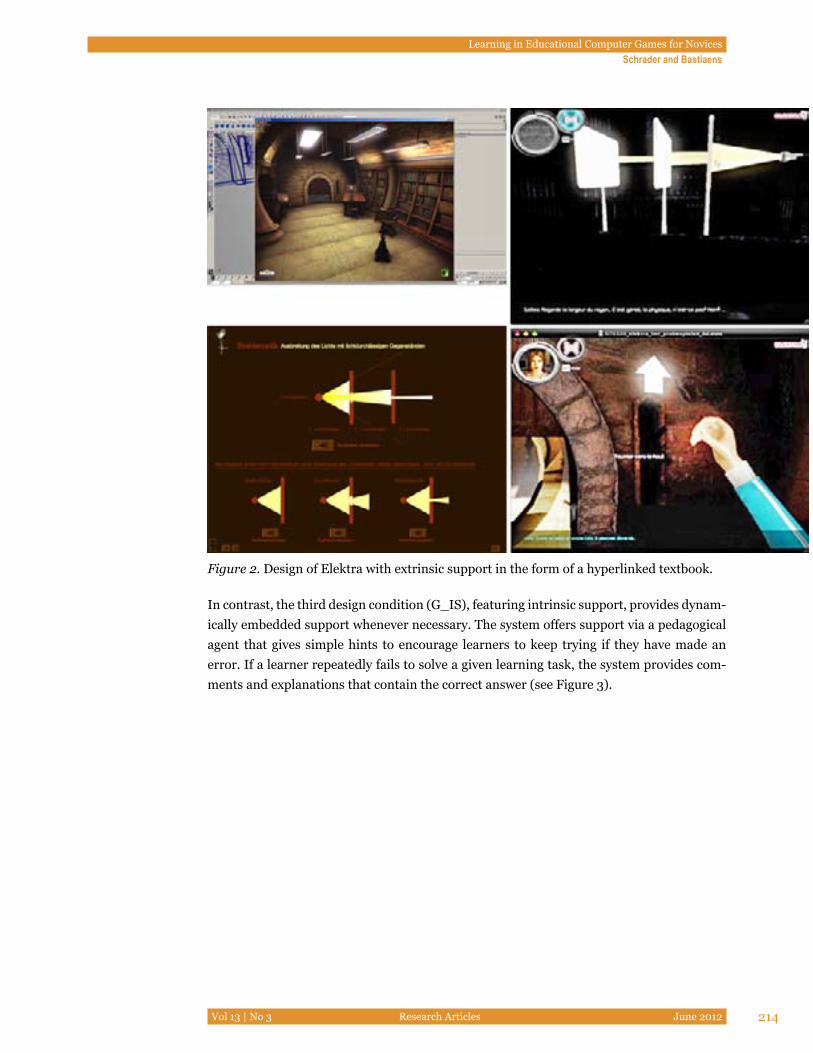
Learning in Educational Computer Games for NovicesSchrader and Bastiaens
Vol 13 | No 3 Research Articles June 2012 214
Figure 2. Design of Elektra with extrinsic support in the form of a hyperlinked textbook.
In contrast, the third design condition (G_IS), featuring intrinsic support, provides dynam-ically embedded support whenever necessary. The system offers support via a pedagogical agent that gives simple hints to encourage learners to keep trying if they have made an error. If a learner repeatedly fails to solve a given learning task, the system provides com-ments and explanations that contain the correct answer (see Figure 3).
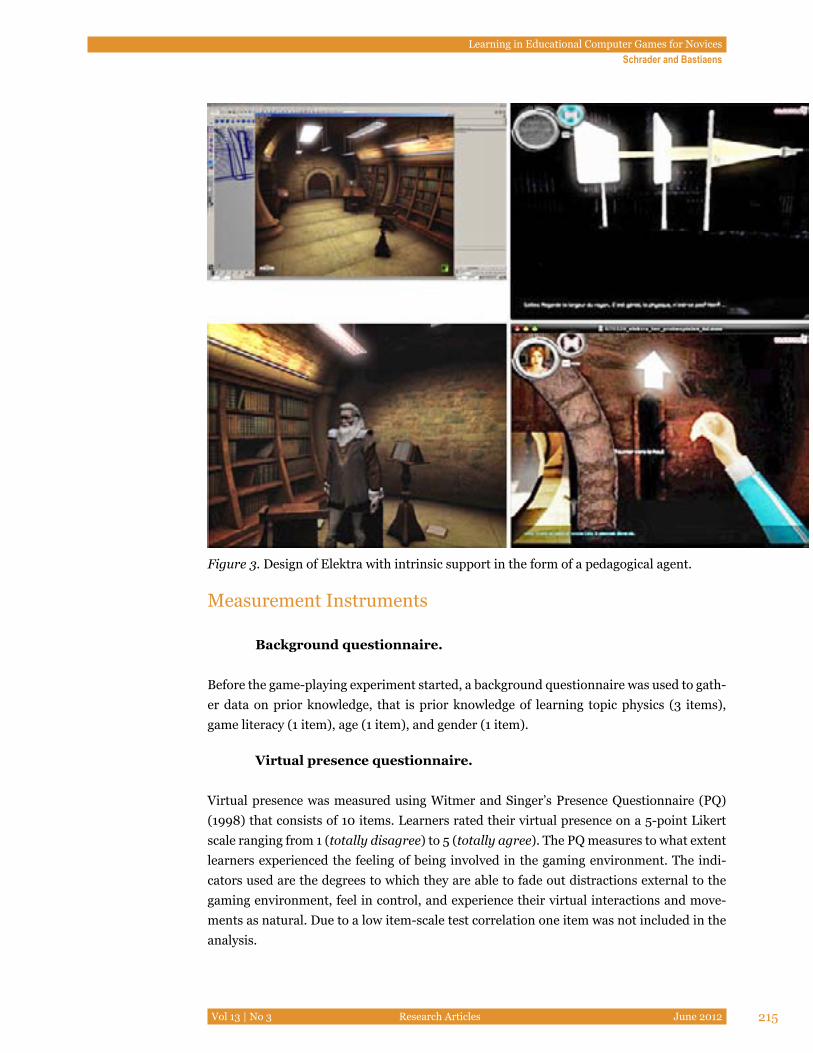
Learning in Educational Computer Games for NovicesSchrader and Bastiaens
Vol 13 | No 3 Research Articles June 2012 215
Figure 3. Design of Elektra with intrinsic support in the form of a pedagogical agent.
Measurement Instruments
Background questionnaire.
Before the game-playing experiment started, a background questionnaire was used to gath-er data on prior knowledge, that is prior knowledge of learning topic physics (3 items), game literacy (1 item), age (1 item), and gender (1 item).
Virtual presence questionnaire.
Virtual presence was measured using Witmer and Singer’s Presence Questionnaire (PQ) (1998) that consists of 10 items. Learners rated their virtual presence on a 5-point Likert scale ranging from 1 (totally disagree) to 5 (totally agree). The PQ measures to what extent learners experienced the feeling of being involved in the gaming environment. The indi-cators used are the degrees to which they are able to fade out distractions external to the gaming environment, feel in control, and experience their virtual interactions and move-ments as natural. Due to a low item-scale test correlation one item was not included in the analysis.
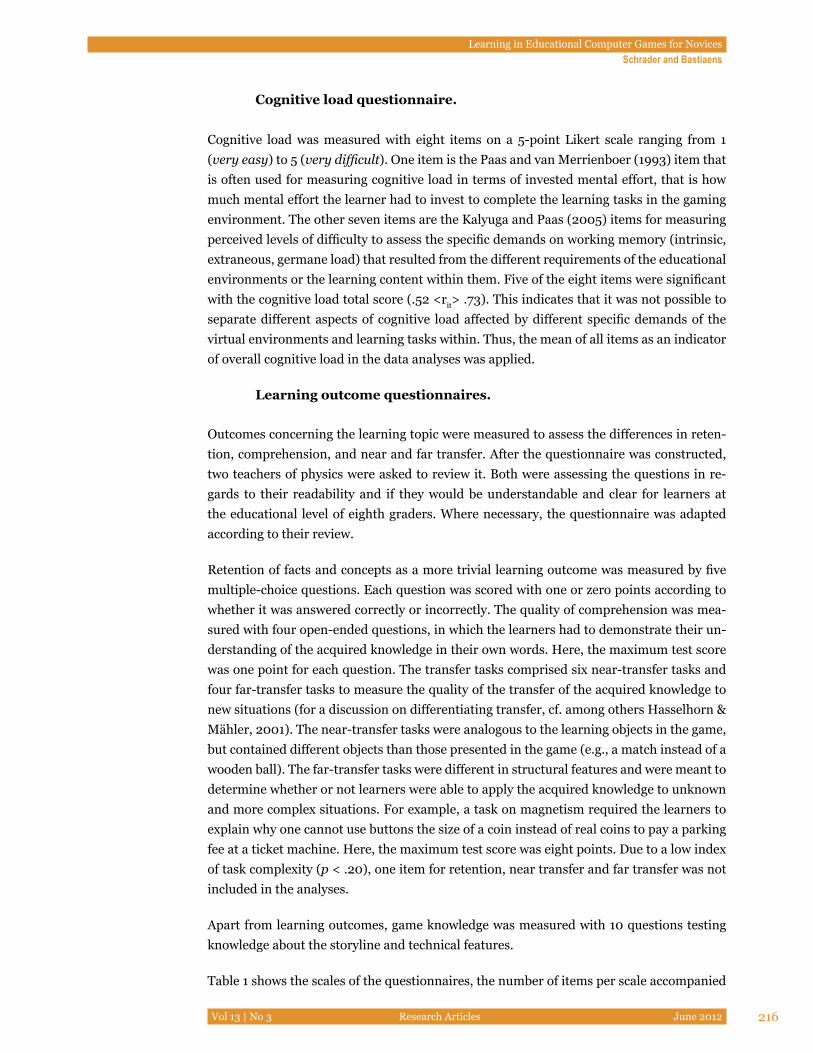
Learning in Educational Computer Games for NovicesSchrader and Bastiaens
Vol 13 | No 3 Research Articles June 2012 216
Cognitive load questionnaire.
Cognitive load was measured with eight items on a 5-point Likert scale ranging from 1 (very easy) to 5 (very difficult). One item is the Paas and van Merrienboer (1993) item that is often used for measuring cognitive load in terms of invested mental effort, that is how much mental effort the learner had to invest to complete the learning tasks in the gaming environment. The other seven items are the Kalyuga and Paas (2005) items for measuring perceived levels of difficulty to assess the specific demands on working memory (intrinsic, extraneous, germane load) that resulted from the different requirements of the educational environments or the learning content within them. Five of the eight items were significant with the cognitive load total score (.52 <rit> .73). This indicates that it was not possible to separate different aspects of cognitive load affected by different specific demands of the virtual environments and learning tasks within. Thus, the mean of all items as an indicator of overall cognitive load in the data analyses was applied.
Learning outcome questionnaires.
Outcomes concerning the learning topic were measured to assess the differences in reten-tion, comprehension, and near and far transfer. After the questionnaire was constructed, two teachers of physics were asked to review it. Both were assessing the questions in re-gards to their readability and if they would be understandable and clear for learners at the educational level of eighth graders. Where necessary, the questionnaire was adapted according to their review.
Retention of facts and concepts as a more trivial learning outcome was measured by five multiple-choice questions. Each question was scored with one or zero points according to whether it was answered correctly or incorrectly. The quality of comprehension was mea-sured with four open-ended questions, in which the learners had to demonstrate their un-derstanding of the acquired knowledge in their own words. Here, the maximum test score was one point for each question. The transfer tasks comprised six near-transfer tasks and four far-transfer tasks to measure the quality of the transfer of the acquired knowledge to new situations (for a discussion on differentiating transfer, cf. among others Hasselhorn & Mähler, 2001). The near-transfer tasks were analogous to the learning objects in the game, but contained different objects than those presented in the game (e.g., a match instead of a wooden ball). The far-transfer tasks were different in structural features and were meant to determine whether or not learners were able to apply the acquired knowledge to unknown and more complex situations. For example, a task on magnetism required the learners to explain why one cannot use buttons the size of a coin instead of real coins to pay a parking fee at a ticket machine. Here, the maximum test score was eight points. Due to a low index of task complexity (p < .20), one item for retention, near transfer and far transfer was not included in the analyses.
Apart from learning outcomes, game knowledge was measured with 10 questions testing knowledge about the storyline and technical features.
Table 1 shows the scales of the questionnaires, the number of items per scale accompanied
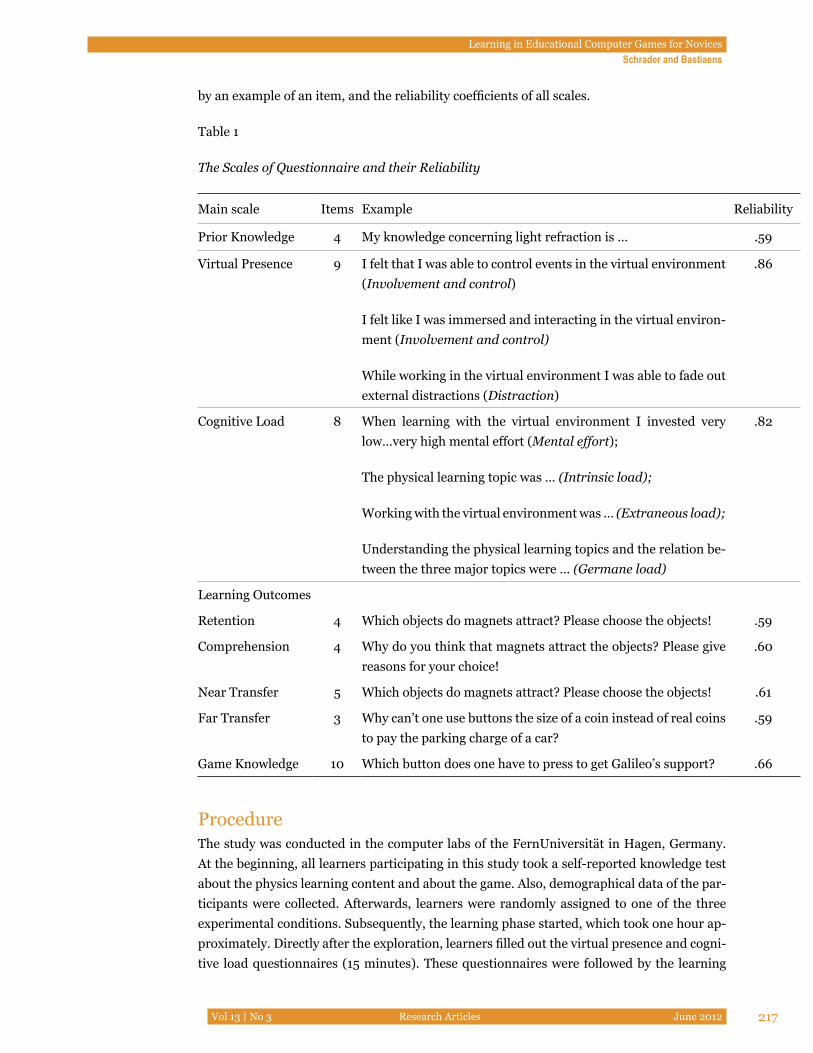
Learning in Educational Computer Games for NovicesSchrader and Bastiaens
Vol 13 | No 3 Research Articles June 2012 217
by an example of an item, and the reliability coefficients of all scales.
Table 1
The Scales of Questionnaire and their Reliability
Main scale Items Example Reliability
Prior Knowledge 4 My knowledge concerning light refraction is … .59
Virtual Presence 9 I felt that I was able to control events in the virtual environment (Involvement and control)
I felt like I was immersed and interacting in the virtual environ-ment (Involvement and control)
While working in the virtual environment I was able to fade out external distractions (Distraction)
.86
Cognitive Load 8 When learning with the virtual environment I invested very low…very high mental effort (Mental effort);
The physical learning topic was … (Intrinsic load);
Working with the virtual environment was … (Extraneous load);
Understanding the physical learning topics and the relation be-tween the three major topics were … (Germane load)
.82
Learning Outcomes
Retention 4 Which objects do magnets attract? Please choose the objects! .59
Comprehension 4 Why do you think that magnets attract the objects? Please give reasons for your choice!
.60
Near Transfer 5 Which objects do magnets attract? Please choose the objects! .61
Far Transfer 3 Why can’t one use buttons the size of a coin instead of real coins to pay the parking charge of a car?
.59
Game Knowledge 10 Which button does one have to press to get Galileo’s support? .66
ProcedureThe study was conducted in the computer labs of the FernUniversität in Hagen, Germany. At the beginning, all learners participating in this study took a self-reported knowledge test about the physics learning content and about the game. Also, demographical data of the par-ticipants were collected. Afterwards, learners were randomly assigned to one of the three experimental conditions. Subsequently, the learning phase started, which took one hour ap-proximately. Directly after the exploration, learners filled out the virtual presence and cogni-tive load questionnaires (15 minutes). These questionnaires were followed by the learning
Learning in Educational Computer Games for NovicesSchrader and Bastiaens
Vol 13 | No 3 Research Articles June 2012 218
tests (40 minutes).
AnalysisOne-factorial analyses of variance (ANOVA) were performed to measure the overall differ-ence in the mean level of virtual presence, cognitive load, and learning outcomes between the groups presented with three different design conditions of the same educational com-puter game (G, G_ES, G_IS).
As the overall differences between the three groups was significant, analyses of contrasts were conducted to carry out two comparisons: first, between the group who learned with the G version on the one hand and both groups who learned with the support versions (G_ES, G_IS) on the other hand and, second, between both groups with support (G_ES, G_IS). Analyses of homogeneity of variances indicated that for all groups the population variances were equal. Also, all scores were normally distributed. Thus, it was shown that the use of ANOVA and contrast analyses was justified. For all statistical tests, a significance level of .05 was maintained. In addition to the statistical significance, for ANOVA Eta2 and for contrast analyses rcontrast was used as the degree of the effect size showing the practical significance.
ResultsThe additional analysis of the G_ES group’s utilization of the hyperlinked textbook indi-cates, as was hypothesized, that the textbook was accessed infrequently. Only 30 learners used the linked textbook for help during game-playing, whereas 17 learners reported that they had ignored it. In order not to adulterate the results concerning the effectiveness of support devices on virtual presence and cognitive load, the analysis for the G_ES group in-cludes only the data of the 30 learners who used the textbook. The number of learners that dropped out was evenly distributed over the conditions (X2 = .29, p = .95). This resulted in the following group composition: (1) game without additional support (G) (n = 30), (2) game with extrinsic support (G_ES) (n = 30), and (3) game with intrinsic support (G_IS) (n = 31).
There was no statistically significant difference between the three groups concerning gen-der: (1) male = 13, female = 17; (2) male = 15, female = 15; (3) male = 14, female = 17; X2 = .10, p = .94. Also, the collected data for determining learners’ prior knowledge showed no differences between learners (F(2, 88) = .33, p = .71). As well, participant comparability with respect to the learning topic was assured because the presented learning topic of phys-ics is embedded in the school curriculum for eight graders of Gymnasium – the German equivalent of the British grammar school or US preparatory high school – and all partici-pants were only at the beginning of their eighth year. In addition, learners had no previous experience of the used educational computer game Elektra. Thus, these results ruled out the possibility of a prior knowledge effect connected to the given learning topic or the game.
The mean results for virtual presence, cognitive load, and learning outcomes are summa-
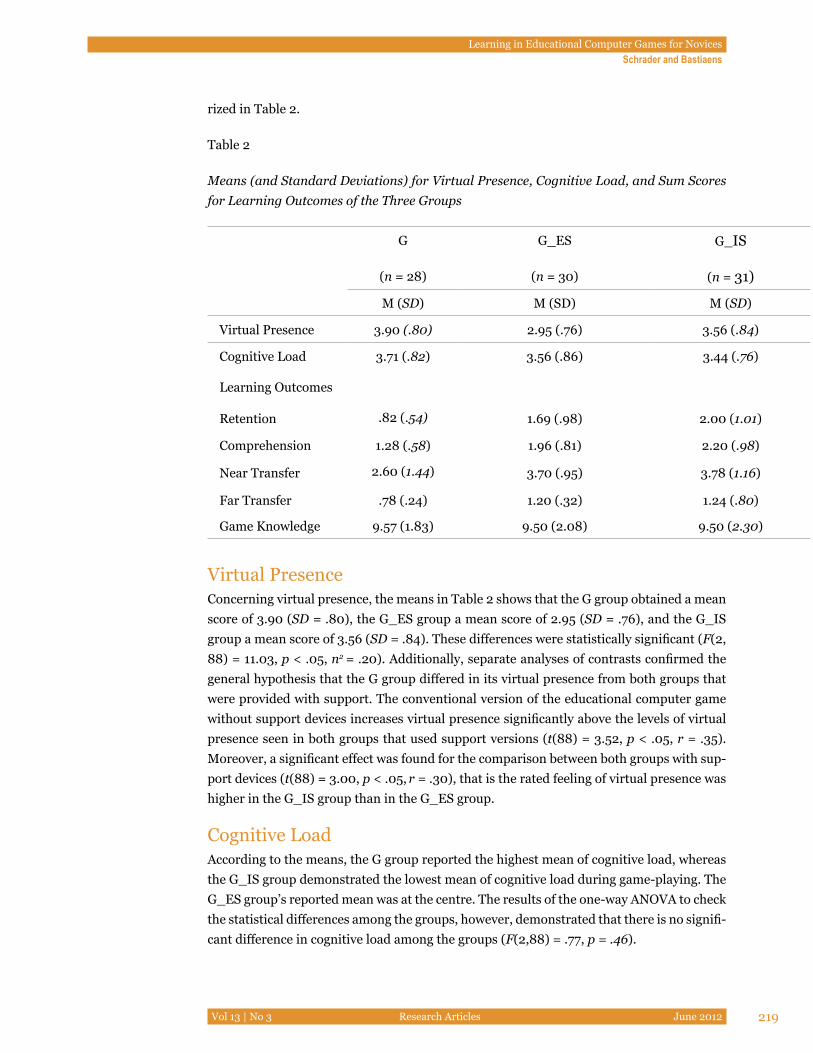
Learning in Educational Computer Games for NovicesSchrader and Bastiaens
Vol 13 | No 3 Research Articles June 2012 219
rized in Table 2.
Table 2
Means (and Standard Deviations) for Virtual Presence, Cognitive Load, and Sum Scores for Learning Outcomes of the Three Groups
G
(n = 28)
G_ES
(n = 30)
G_IS
(n = 31)
M (SD) M (SD) M (SD)
Virtual Presence 3.90 (.80) 2.95 (.76) 3.56 (.84)
Cognitive Load 3.71 (.82) 3.56 (.86) 3.44 (.76)
Learning Outcomes
Retention .82 (.54) 1.69 (.98) 2.00 (1.01)
Comprehension 1.28 (.58) 1.96 (.81) 2.20 (.98)
Near Transfer 2.60 (1.44) 3.70 (.95) 3.78 (1.16)
Far Transfer .78 (.24) 1.20 (.32) 1.24 (.80)
Game Knowledge 9.57 (1.83) 9.50 (2.08) 9.50 (2.30)
Virtual PresenceConcerning virtual presence, the means in Table 2 shows that the G group obtained a mean score of 3.90 (SD = .80), the G_ES group a mean score of 2.95 (SD = .76), and the G_IS group a mean score of 3.56 (SD = .84). These differences were statistically significant (F(2, 88) = 11.03, p < .05, n2 = .20). Additionally, separate analyses of contrasts confirmed the general hypothesis that the G group differed in its virtual presence from both groups that were provided with support. The conventional version of the educational computer game without support devices increases virtual presence significantly above the levels of virtual presence seen in both groups that used support versions (t(88) = 3.52, p < .05, r = .35). Moreover, a significant effect was found for the comparison between both groups with sup-port devices (t(88) = 3.00, p < .05, r = .30), that is the rated feeling of virtual presence was higher in the G_IS group than in the G_ES group.
Cognitive LoadAccording to the means, the G group reported the highest mean of cognitive load, whereas the G_IS group demonstrated the lowest mean of cognitive load during game-playing. The G_ES group’s reported mean was at the centre. The results of the one-way ANOVA to check the statistical differences among the groups, however, demonstrated that there is no signifi-cant difference in cognitive load among the groups (F(2,88) = .77, p = .46).
Learning in Educational Computer Games for NovicesSchrader and Bastiaens
Vol 13 | No 3 Research Articles June 2012 220
Learning OutcomesDifferentiating the learning outcomes for the learning topic of physics in terms of reten-tion, comprehension, and near and far transfer, the G group reported the lowest sum scores in learning outcomes compared to the G_ES group and the G_IS group. The difference in sum scores between all three groups was statistically significant for retention, comprehen-sion, and near transfer (for retention: F(2,88) = 11.17, p < .05, n2 = .20; for comprehension: F(2,88) = 5.65, p < .05, n2 = .11; for near transfer: F(2,88) = 8.78, p < .05, n2 = .16), but not for far transfer (F(2,88) = 1.44, p =.24). In addition, analyses of contrasts showed that the G group differed in these learning outcomes from both groups that were provided with sup-port (for retention: t(88) = 4.59, p < .05, r = .43; for comprehension: t(88) = 3.27, p < .05, r = .32; for near transfer: t(88) =4.17, p < .05, r = .40). The contrast analysis of the compari-son between the G_ES group and the G_IS group demonstrated nonsignificant effects (for retention: t(88) = 1.20, p = .22; for comprehension: t(88) = .85, p = .39; for near transfer: t(88) = .29, p = .77; for far transfer: t(88) = 2.74, p = .07).
For game knowledge, the results reported a contrary effect than for the outcomes of the learning topic: Although the difference in sum scores of gaming knowledge was not signifi-cant between groups (F(2,88) = .01, p =.98), the differences in the sum scores nevertheless demonstrated that learners in the G group reported higher game knowledge than did learn-ers who learned with the G_ES version and learners who learned with the G_IS version.
Discussion and ConclusionBased on criticism of tenets of pure discovery, problem-based, and experiential learning, this study compared the effects of educational computer games with different designs of support devices. The study focussed on computer games with intrinsic or with extrinsic support. The study measured the influence the type of support system has on virtual pres-ence, cognitive load, and learning outcomes and compared these results to the influence of conventional educational computer games without any support devices.
Results show that the effectiveness in terms of virtual presence was influenced both by the presence of support devices in educational computer games and their design as well. As expected, learners who learned with the conventional educational computer game re-ported the most intense experience of virtual presence because they were not interrupted in game-playing by support devices. The comparison of both groups using support devices demonstrates that the group who learned with the educational computer game with intrin-sic support reported a more intensive virtual presence than the group provided with the support device in the form of an extrinsic hyperlinked textbook. This result confirms the hypothesis that virtual presence is diminished by the break in learners’ game-playing in order to search for support in the hyperlinked textbook. According to these results, support devices are more effective in terms of virtual presence if they are intrinsic, that is integrated into the gaming environment.
Moreover, intrinsic support was hypothesized to have a positive influence on learning out-
Learning in Educational Computer Games for NovicesSchrader and Bastiaens
Vol 13 | No 3 Research Articles June 2012 221
comes not only by enhancing virtual presence, but also by avoiding heavy cognitive load. However, for cognitive load, the theoretical hypothesis was not confirmed. All three game conditions do not significantly differ in affecting cognitive load. This result shows that sup-port devices can affect the demand on cognitive processes not only in a positive, but also in a detrimental way. This might support the idea that even if support provides useful in-formation for solving the given task, it also causes cognitive effort for novices, who have to deal with both the task and the help simultaneously. This explanation, in addition to the fact that cognitive load is neither affected by the use of support devices nor by their imple-mentation, also accounts for the observation that not all learners used learner-requested extrinsic support. In accordance with the theoretical assumption that especially novices do not use support devices because they might be unable to cope with additional information (Wood, 2001), the additional analyses show that 17 of 47 learners ignored the extrinsic support device. It can be argued that these learners refrain from requesting support in or-der to avoid cognitive load and to preserve their virtual presence and involvement in the gaming environment. Whereas Aleven et al. (2003) suggest that an appropriate design of support might compensate for the cognitive load of its use, in our study the cognitive load was not reduced by the support device designed to eliminate additional cognitive load by integrating the help into the gaming environment. A reason for this finding could be due to the design characteristics of the given extrinsic support. The possibility of stopping the game to search for help outside (i.e., not doing game-playing and help-searching simul-taneously) might have prevented the expected cognitive load. While the results discussed suggest no significant difference in cognitive load between all three game-design versions, support seems to be effective in terms of learning outcomes. Based on this result, a straight-forward practical implication of this study is that support should be provided within edu-cational computer games. Learners with access to support, regardless of its design, showed significantly greater gains in test scores for retention, comprehension, and near transfer compared to those with no access to support in the conventional gaming condition. For far transfer as a nontrivial and more complex learning outcome, the hypothesis of improved learning outcomes due to support in general could not be confirmed. Nevertheless, given the low test score for learning outcomes in terms of retention, comprehension, near and far transfer, any interpretation on the basis of learning effects should be considered with cau-tion. Contrary to the significant differences between the group presented with the conven-tional educational computer game on the one hand and both groups with support devices on the other, the differences in design between both support devices did not have any mea-surable effect on learning outcomes in terms of retention, comprehension, and near trans-fer. Dochy and Segers (1997) provide a possible explanation for this finding. The authors hold that in classroom practice a high level of interest strengthens the relation between prior knowledge, the use of support, and learners’ mental effort. Adapting this result to our study, it can be assumed that the group using the extrinsic support device had a higher level of interest in the given learning topic and/or in learning through gaming than the other two groups. This assumption can be supported by the fact that only the results of subjects who used this type of support provision, thereby showing a high level of motivation, were taken into account. Thus, this group may have used support in a more adaptive way because its members wanted to master the tasks. They may also have invested more mental effort, that
Learning in Educational Computer Games for NovicesSchrader and Bastiaens
Vol 13 | No 3 Research Articles June 2012 222
is they may have allocated more cognitive capacity to the task and may therefore have had improved learning outcomes.
In summary, educational computer games with support devices enhance learning outcomes compared to educational computer games without additional support. However, depen-dent on the level of learners’ interest, the type of support provision may or may not have an influence on learning outcomes. In order to gain a thorough understanding of the impact of learners’ level of interest on the effectiveness of types of support provision, more research needs to be conducted. In order to learn more about the effect of learners’ characteristics on the effectiveness of support in games, subjects need to be not only selected in such a way as to ensure sufficient variation in their levels of interest (e.g., in the learning topic, in learning with games). Also the differences between novices and experts should be studied since experts are better able than novices to compensate for design flaws of support devices and to integrate new knowledge. Such studies should be conducted with respect to novices’ and experts’ respective experience of virtual presence and cognitive load and to the learning effectiveness of different support designs. Since it was not possible to differentiate between the three cognitive-load types in measuring them, which is the first limitation of this study, future research on cognitive load needs to use instruments that distinguish the three cogni-tive load types, instruments that were not available to the researchers of the present study (see, for discussion, e.g. Domagk, 2009). This is not only necessary to gain insight into the influence of differently designed support on cognitive processes, but also to investigate more thoroughly whether or not cognitive load regulates the relation between support, vir-tual presence, and learning outcomes. Another limitation of this study is the relatively low number of participants, which may have had a negative effect on the statistical power. Thus, future research should use larger samples. Furthermore, the reliability of the retention and far-transfer tasks was slightly below the accepted consistency of measurement (i.e., Cron-bach’s α = .59). This seems to indicate that not all tasks assessed learners’ knowledge and understanding of the given physics material. Based on the fact that the average correlation between items for retention and transfer was as respectable (r > .300, see Field, 2009), however, data from both questionnaires were used. Finally, it was not possible to determine how frequently and for how long learners used the extrinsic support in the G_ES group. Therefore, it cannot be excluded that some learners did not follow the instruction to use the hyperlinked textbook when needed, although they said so in the questionnaire. It may be possible that they gathered no additional information similar to learners provided with no additional support. Further studies should include log-file data of the use of extrinsic sup-port (e.g., when and how learners use certain support-options during learning with games) combined with direct observations (e.g., eye-movement, think aloud-interviews) that could provide useful information on whether and how often support devices were properly used.
Learning in Educational Computer Games for NovicesSchrader and Bastiaens
Vol 13 | No 3 Research Articles June 2012 223
ReferencesAinley, M., Corrigan, M., & Richardson, N. (2005). Students, tasks and emotions: Iden-
tifying the contribution of emotions to students’ reading of popular culture and popular science texts. Learning and Instruction, 15, 433-447.
Aleven, V., Stahl, E., Schworm, S., Fischer, F., & Wallace, R. (2003). Help seeking and help design in interactive learning environments. Review of Educational Research, 73(3), 277-320.
Alphabit (2010). Winterfest - Das Lernadventure [Computer Game]. Retrieved 30.11.2011, from http://www.lernspiel-winterfest.de/
Barrows, H. S., & Tamblyn, R. M. (1980). Problem-based learning: An approach to medi-cal education. New York: Springer Publishing Company.
Beale, I. L., Kato, P. M., Marin-Bowling, V. M., Guthrie, N., & Cole, S. W. (2007). Improve-ment in cancer-related knowledge following use of a psychoeducational video game for adolescents and young adults with cancer. Journal of Adolescent Health, 41(3), 263-270.
Bioscopia: Where Science Conquers Evil (2001). HEUREKA-Klett Softwareverlag GmbH, Stuttgart.
Bruner, J. S. (1961). The act of discovery. Harvard Educational Review, 31, 21-32.
Capt’n Sharky (2010). Coppenrath Verlag GmbH & Co. KG, Münster.
Chall, J. S. (2000). The academic achievement challenge. New York: Guilford.
Cobb, S., & Fraser, D. S. (2005). Multimedia learning in games, simulations, and micro-worlds. In R. E. Mayer (Ed.), The Cambridge handbook of multimedia learning (pp. 525-547). Cambridge, New York, Melbourne: Cambridge University Press.
Dede, C., Clarke, J., Ketelhut, D. J., Nelson, B., & Bowman, C. (2005, April). Students’ motivation and learning of science in a multi-user virtual environment. Paper presented at the meeting of the American Educational Research Association, Mon-tréal, Quebec. Retrieved from http://muve.gse.harvard.edu/rivercityproject/doc-uments/motivation_muves_aera_2005.pdf
Dede, C., Ketelhut, D. J., & Reuss, K. (2003). Motivation, usability, and learning outco-mes in a prototype museum-based multi-user virtual environment. In P. Bell, R. Stevens, & T. Stawicz (Eds.), Proceedings of Fifth International Conference of the Learning Sciences (ICLS). Mahwah, NJ: Erlbaum.
Learning in Educational Computer Games for NovicesSchrader and Bastiaens
Vol 13 | No 3 Research Articles June 2012 224
Dede, C., Salzman, M., Loftin, R. B., & Ash, K. (1997). Using virtual reality technology to convey abstract scientific concepts. In M. J. Jacobson & R. B. Kozma (Eds.), Learning the sciences of the 21st century: Research, design, and implementing advanced technology learning environments. Hillsdale, NJ: Lawrence Erlbaum.
de Jong, T. (2005). The guided-discovery principle in multimedia learning. In R. E. May-er (Ed.), The Cambridge handbook of multimedia learning (pp. 215-228). Cam-bridge, New York, Melbourne: Cambridge University Press.
Dochy, F. J. R. C., & Segers, M. S. R. (1997). The effect of prior knowledge and its assess-ment on learning in classroom practice. Keynote address presented at the Deut-sche Gesellschaft für Psychologie Conference on the Role of Prior Knowledge in Learning, Frankfurt, Germany.
Dweck, C. S. (2002). Messages that motivate: How praise molds students‘ beliefs, motiva-tion, and performance (in surprising ways). In J. Aronson (Ed.), Improving aca-demic achievement: Impact of psychological factors on education. Orlando, FL: Academic Press.
European Commission’s IST-Programme (2009). ELEKTRA [Computer Game]. Retrieved 09.11.2011, from http://www.elektra-project.org/
Field, A. (2009). Discovering statistics using SPSS (3rd ed.). London: SAGE Publications.
Hasselhorn, M., & Mähler, C. (2001). Transfer. In D. Rost (Ed.), Handwörterbuch pädago-gische psychologie (pp. 721-730). Weinheim: PVU.
Heers, R. (2005). Being there. Untersuchungen zum wissenserwerb in virtuellen um-gebungen. Tübingen: Eberhard-Karls-Universität Tübingen. Retrieved from http://deposit.d-nb.de/cgi-bin/dokserv?idn=974321664&dok_var=d1&dok_ext=pdf&filename=974321664.pdf
Hofer, M., Niegemann, H. M., Eckert, A., & Rinn, U. (1996). Pädagogische hilfen für in-teraktive selbstgesteuerte lernprozesse und konstruktion eines neuen verfahrens zur wissensdiagnose. Zeitschrift für Berufs- und Wirtschaftspädagogik Beiheft, 13, 53-67.
Jiang, L., Elen, J., & Clarebout, G. (2009). The relationships between learner variables, tool-usage behaviour and performance. Computers in Human Behavior, 25(2), 501-509.
Jonassen, D. (1991). Objectivism vs. constructivism. Educational Technology Research and Development, 39(3), 5-14.
Learning in Educational Computer Games for NovicesSchrader and Bastiaens
Vol 13 | No 3 Research Articles June 2012 225
Kalyuga, S., & Paas, F. (2005, August). Cognitive measurement to design effective learning environments. Paper presented at JURE workshop, Nicosia, Cyprus.
Kalyuga, S., & Plass, J. (2009). Evaluating and managing cognitive load in games. In R. E. Ferdig (Ed.), Handbook of research on effective electronic gaming in education (pp. 719-737). Hershey, PA: Information Science Reference.
Kerres, M., Bormann, M., & Vervenne, M. (2009). Didaktische konzeption von seri-ous games: Zur verknüpfung von spiel- und lernangeboten. MedienPädagogik. Zeitschrift für theorie und praxis der medienbildung.
Kirschner, P. A., Sweller, J., & Clark, R. E. (2006). Why minimal guidance during instruc-tion does not work: An analysis of the failure of constructivist, discovery, problem-based, experiential, and inquiry-based teaching. Educational Psychologist, 46, 75-86.
Klahr, D., & Nigam, M. (2004). The equivalence of learning paths in early science instruc-tion: Effects of direct instruction and discovery learning. Psychological Science, 15, 661-667.
Klauer, K. J. (1985). Framework for a theory of teaching. Teaching and Teacher Education, 1, 5-17.
Kolb, D. A. (1983). Experiential learning: Experience as the source of learning and devel-opment. Upper Saddle River, NJ: Prentice Hall.
Krapp, A., & Weidenmann, B. (2001). Pädagogische psychologie (4th ed.). Weinheim: Beltz.
Leemkuil, H. (2006). Is it all in the game? Learner support in an educational knoweldge management simulation game (Unpublished doctoral thesis). University of Twen-te, Enschede, The Netherlands.
Lepper, M. R., & Henderlong, J. (2000). Turning “play” into “work” and “work” into “play”: 25 years of research on intrinsic versus extrinsic motivation. In C. Sansone & J. M. Harackiewicz (Eds.), Intrinsic and extrinsic motivation: The search for optimal motivation and performance (pp. 257-307). San Diego, CA: Academic Press.
Leutner, D. (1993). Guided discovery learning with computer-based simulation games: Ef-fects of adaptive and non-adaptive instructional support. Learning and Instruc-tion, 3(2), 113-132.
Lim, C. P., Nonis, D., & Hedberg, J. (2006). Gaming in a 3D multiuser virtual environment: Engaging students in Science lessons. British Journal of Educational Technology, 37(2), 211–231.
Learning in Educational Computer Games for NovicesSchrader and Bastiaens
Vol 13 | No 3 Research Articles June 2012 226
Martens, R. L., Valcke, M. M., & Portier, S. J. (1997). Interactive learning environments to support independent learning: The impact of discernability of embedded support devices. Computers & Education, 28, 185-197.
Mayer, R. E. (2001). Multimedia learning. Cambridge: Cambridge University Press.
Meinhardt, J., & Pekrun, R. (2003). Attentional resource allocation to emotional events: An ERP study. Cognition and Emotion, 17(3), 477-500.
Meyer, D. K., & Turner, J. C. (2002). Discovering emotion in classroom motivation re-search. Educational Psychologist, 37, 107-114.
Moreno, R. (2004). Decreasing cognitive load for novice students: Effects of explanatory versus corrective feedback on discovery-based multimedia. Instructional Science, 32, 99-113.
Nelson, B. C. (2007). Exploring the use of individualized, reflective guidance in an educa-tional multi-user virtual environment. Journal of Science Education and Technol-ogy, 16, 83-97.
Paas, F., & van Merriënboer, J. J. G. (1993). The efficiency of instructional conditions: An approach to combine mental effort and performance measures. Human Factors: The Journal of the Human Factors and Ergonomics Society, 35, 737-743.
Parchman, S. W., Ellis, J. A., Christinaz, D., & Vogel, M. (2000). An evaluation of three computer-based instructional strategies in basic electricity and electronics train-ing. Military Psychology, 12(1), 73-87.
Pekrun, R., Goetz, T., Titz, W., & Perry, R. P. (2002). Academic emotions in students’ self-regulated learning and achievement: A program of qualitive and quantitative re-search. Educational Psychologist, 37, 91-106.
Renkl, A. (2002). Worked-out examples: Instructional explanations support learning by self-explanations. Learning and Instruction, 12(5), 529-556.
Rieber, L. P., Tzeng, S., & Tribble, K. (2004). Discovery learning, representation, and expla-nation within a computer-based simulation: Finding the right mix. Learning and Instruction, 14, 307-323.
Salzman, M. C., Dede, C., Loftin, R. B., & Chen, J. (1999). A model for understanding how virtual reality aids complex conceptual learning. Presence: Teleoperators and Vir-tual Environments, 8(3), 293-316.
Schrader, C. (2010). Computerbasierte lernspiele - Stand der forschung. In S. Ganguin & B. Hoffmann (Eds.), Digitale spielkultur. München: Schriftenreihe zur Medienpäda-
Learning in Educational Computer Games for NovicesSchrader and Bastiaens
Vol 13 | No 3 Research Articles June 2012 227
gogik.
Schrader, C., & Bastiaens, T. J. (in press). Educational computer games and learning: The relationship between design, cognitive load, emotions and outcomes. Manuscript accepted for publication in Journal of Interactive Learning Environments.
Schrader, C., & Bastiaens, T. J. (2012). The influence of virtual presence: Effects on ex-perienced cognitive load and learning outcomes in educational computer games. Journal of Computers in Human Behavior, 28, 648-658.
Standen, P. J., Brown, D. J., & Cromby, J. J. (2001). The effective use of virtual environ-ments in the education and rehabilitation of students with intellectual disabilities. British Journal of Educational Technology, 32(3), 289-299.
Tuovinen, J. E., & Sweller, J. (1999). A comparison of cognitive load associated with dis-covery learning and worked examples. Journal of Educational Psychology, 91(2), 334-341.
Welch, R. B., Blackmon, T. T., Liu, A., Mellers, B. A., & Stark, L. W. (1996). The effects of pictorial realism, delay of visual feedback, and observer interactivity on the subjec-tive sense of presence. Presence: Teleoperators and Virtual Environments, 5(3), 263-273.
Whitton, N. (2010). Learning with digital games: A practical guide to engage students in higher education. New York: Routledge.
Witmer, B. G., & Singer, M. J. (1998). Measuring presence in virtual environments: A pre-sence questionnaire. Presence: Teleoperators and Virtual Environments, 7(3), 225-240.
Wong, W. L., Shen, C., Nocera, L., Carriazo, E., Tang, F., Bugga, S., & Narayanan, H. (2007). Serious video game effectiveness. Proceedings of the International Conference on Advances in Computer Entertainment Technology (pp. 49-55). Salzburg, Austria.
Wood, D. (2001). Scaffolding, contingent tutoring, and computer-supported learning. In-ternational Journal of Artificial Intelligence in Education, 12, 153-169.
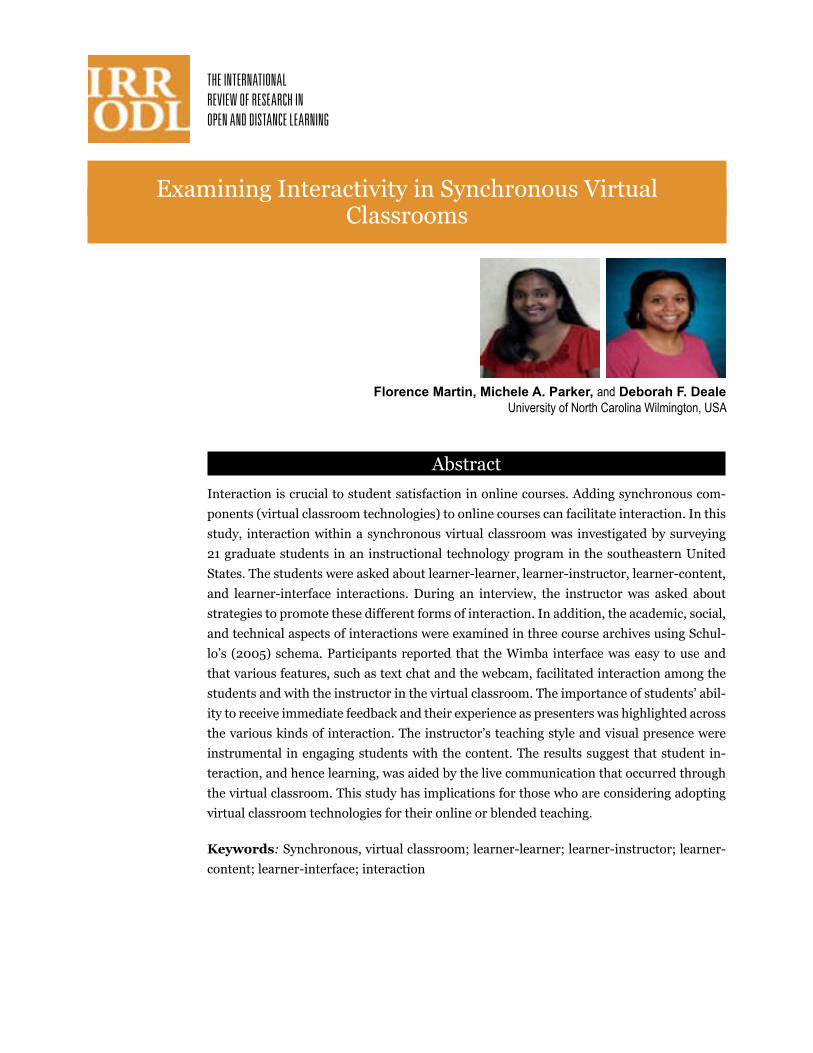
Examining Interactivity in Synchronous VirtualClassrooms
AbstractInteraction is crucial to student satisfaction in online courses. Adding synchronous com-ponents (virtual classroom technologies) to online courses can facilitate interaction. In this study, interaction within a synchronous virtual classroom was investigated by surveying 21 graduate students in an instructional technology program in the southeastern United States. The students were asked about learner-learner, learner-instructor, learner-content, and learner-interface interactions. During an interview, the instructor was asked about strategies to promote these different forms of interaction. In addition, the academic, social, and technical aspects of interactions were examined in three course archives using Schul-lo’s (2005) schema. Participants reported that the Wimba interface was easy to use and that various features, such as text chat and the webcam, facilitated interaction among the students and with the instructor in the virtual classroom. The importance of students’ abil-ity to receive immediate feedback and their experience as presenters was highlighted across the various kinds of interaction. The instructor’s teaching style and visual presence were instrumental in engaging students with the content. The results suggest that student in-teraction, and hence learning, was aided by the live communication that occurred through the virtual classroom. This study has implications for those who are considering adopting virtual classroom technologies for their online or blended teaching.
Keywords: Synchronous, virtual classroom; learner-learner; learner-instructor; learner-content; learner-interface; interaction
Florence Martin, Michele A. Parker, and Deborah F. DealeUniversity of North Carolina Wilmington, USA
Examining Interactivity in Synchronous Virtual Classrooms Martin, Parker, and Deale
Vol 13 | No 3 Research Articles June 2012 228
IntroductionSloan Consortium reports that over 6.1 million students were enrolled in at least one online course in the fall of 2010 (Allen & Seaman, 2011). Online instruction is rapidly gaining ac-ceptance as an alternative and a supplement to traditional classroom instruction (Arbaugh, 2000). According to Coleman (2012), students enroll in online courses for a variety of rea-sons, which include anywhere/anytime learning, increased student interaction, acquiring skills in using technology, and instructors being more approachable. Asynchronous online courses offer anytime/anywhere learning to the students; whereas, in synchronous online courses, students have the freedom of place but have to login at a specific time. Studies have shown that students succeed in online courses when they are active participants (Verneil & Berge, 2000), and therefore interaction is crucial to student satisfaction and engagement in online courses (Mandernach, 2005).
Kearsley (1995) states that a high level of interaction is desirable and enhances the effec-tiveness of any distance education course. This need for interaction has resulted in the de-velopment of guidelines for designing effective online courses (Roblyer & Ekhaml, 2000). While asynchronous courses provide interaction primarily through discussion forums, synchronous courses provide real-time interactions. Adding synchronous components to online courses can enrich meaningful interactions (Repman, Zinskie, & Carlson, 2005). Virtual classroom technologies are a cost-effective method for synchronous delivery in on-line courses, which were initially made possible through video conferencing technologies.
Synchronous Virtual ClassroomsVirtual classrooms allow instructors and students to interact online synchronously. The best advantages of synchronous online instruction are that faculty and students can talk to each other using text, audio, and video and express emotion using emoticons. Synchronous virtual classrooms provide the instructors with the ability to poll students instantly and af-ford the students the chance to participate in group activities in the breakout rooms, while having the feeling that they can still interact as if they were face-to-face (Wimba, 2011). These interactive elements are unavailable in an asynchronous course.
The features available in the synchronous virtual classroom play an important role in main-taining interaction. Most of the virtual classroom technologies have a content frame to share the instructor’s PowerPoints, an eboard where an instructor can write, breakout rooms for group activities, text chat so the instructor and other students in the class can interact using words and emoticons, and audio chat to talk via microphone or telephone with the instruc-tor and other students. Instructors can administer student polls, share their desktop, or have the students share their own desktops through application sharing. Web sites can be displayed for students, and with a stable Internet bandwidth webcams can be used so stu-dents and instructors can see each other. Some of the common virtual classrooms available in the market today are Elluminate, Adobe Connect, Webex, and Horizon Wimba.
Cao, Griffin, and Bai (2009) suggest that synchronous interaction effectively increases stu-dent satisfaction. Synchronous tools are also helpful in the social aspects of education (Mot-
Examining Interactivity in Synchronous Virtual Classrooms Martin, Parker, and Deale
Vol 13 | No 3 Research Articles June 2012 229
teram, 2001). Park and Bonk (2007) list the major benefits of using a synchronous virtual classroom as follows: providing immediate feedback, encouraging the exchange of multiple perspectives, enhancing dynamic interactions among participants, strengthening social presence, fostering the exchange of emotional supports, and supplying verbal elements. When comparing asynchronous and synchronous interaction, Chou (2002) found that there were more socioemotional interactions in the synchronous communication mode, which enhanced interpersonal connections. Chou also found that there was more one-way communication in the asynchronous mode as students seemed to be more interested in expressing opinions than challenging each other’s views; whereas, in synchronous mode, there were more questions and answers. Students were more engaged in the synchronous discussions.
Defining InteractionEarly definitions of interaction were considered human-to-human, where two people were involved. Daniel and Marquis (1988) defined interaction as activity in which a student is in two-way contact with one or more persons. Later, Gilbert and Moore (1998) defined interactivity in computer-mediated instruction as the reciprocal exchange between the technology and the learner. Wagner (1994) differentiates between interaction and inter-activity. Wagner suggests that “interaction functions as an attribute of effective instruction while interactivity functions as an attribute of instructional delivery systems” (p. 6). She further defines instructional interaction as “an event that takes place between a learner and learner’s environment and its purpose is to respond to the learner in a way intended to change his or her behavior toward an educational goal” (p. 9). In this study, we accept Wagner’s differentiation of interactivity as a machine attribute and interaction as an out-come of using interactive instructional delivery systems. However, we agree with Roblyer and Ekhaml (2000), who state that there is also a relationship between these two terms in online courses. Technologies that are considered highly interactive permit learner-learner, learner-group, and learner-system interaction, which occurs in synchronous virtual class-rooms. Thurmond and Wambach (2004) describe interaction in distance education as “the learner’s engagement with the course content, other learners, the instructor, and the tech-nological medium used in the course” (p. 4). This description best explains interaction in the synchronous virtual classroom.
Types of InteractionMoore (1993) identified three types of interaction inherent in effective online courses: 1) learner-to-content interaction, 2) learner-to-instructor interaction, and 3) learner-to-learner interaction. Learner-content interaction is the process of intellectually interacting with the content, which changes the understanding, perspectives, and cognitive structures of a learner’s mind. Learner-instructor interaction is highly desirable as the instructor seeks to stimulate, or at least maintain, student interest in what is to be taught and to moti-vate the student to learn. Learner-learner interaction is an extremely valuable resource for learning, and Moore (1993) emphasized the importance of students’ interaction with their peers in his work.
Examining Interactivity in Synchronous Virtual Classrooms Martin, Parker, and Deale
Vol 13 | No 3 Research Articles June 2012 230
Hillman, Willis, and Gunawardena (1994) introduce a fourth type of interaction, inter-action with technologies. They present the concept of learner-interface interaction and recommend instructional design strategies that will facilitate students’ acquisition of the skills needed to participate effectively in the online classroom. Hillman et al. (1994) define learner-interface interaction as “a process of manipulating tools to accomplish a task” (p. 34). The learner must understand not only the procedures of working with the interface but also why these procedures obtain results. Later, Anderson and Garrison (1998) introduced three other types of interaction: teacher-teacher, teacher-content, and content-content. They suggest that teacher-teacher interaction usually occurs in the context of professional development, where teachers interact with each other to develop their teaching compe-tencies. Teacher-content interaction is considered essential and is the form of interaction expected from most teachers in higher education. However, Anderson and Garrison ques-tion whether this occurs while using computer technologies that combine content and com-munication. Content-content interaction is made possible by the use of intelligent agents, who search for updated content information. Not all types of interaction have educational value. Anderson (2003) concludes that “deep and meaningful formal learning is supported as long as one of the three forms of interaction (student-teacher; student-student; student-content) is at a high level” (p. 4). Having one or more of the three interaction types at a high level results in a satisfying educational experience.
Interaction FrameworkAlly (2004) proposes a framework of lower level to higher level interactions based on be-haviorist, cognitivist, and constructivist schools of learning (see Figure 1). The learner-in-terface interaction is considered the lowest level of interaction and is represented at the top of the flowchart. This learner-interface interaction allows the learner to access the informa-tion, and it is here that the learners use their senses to register the information in sensory storage. The learner-content interaction is the next level in the flowchart. This is where learners navigate through the content to access the various components of the lesson. In this interaction, the learners process the information to transform it from short-term to long-term memory. The higher the level of processing, the more associations that are made in long-term memory, which results in higher-level learning. As the flowchart progress-es and as the learners work through the content, the type of learner support needed can change (e.g., learner-learner, learner-instructor, and learner-expert). Finally, at the highest level is the learner-context interaction, which allows learners to apply what they learn in real life so that they can contextualize the information.
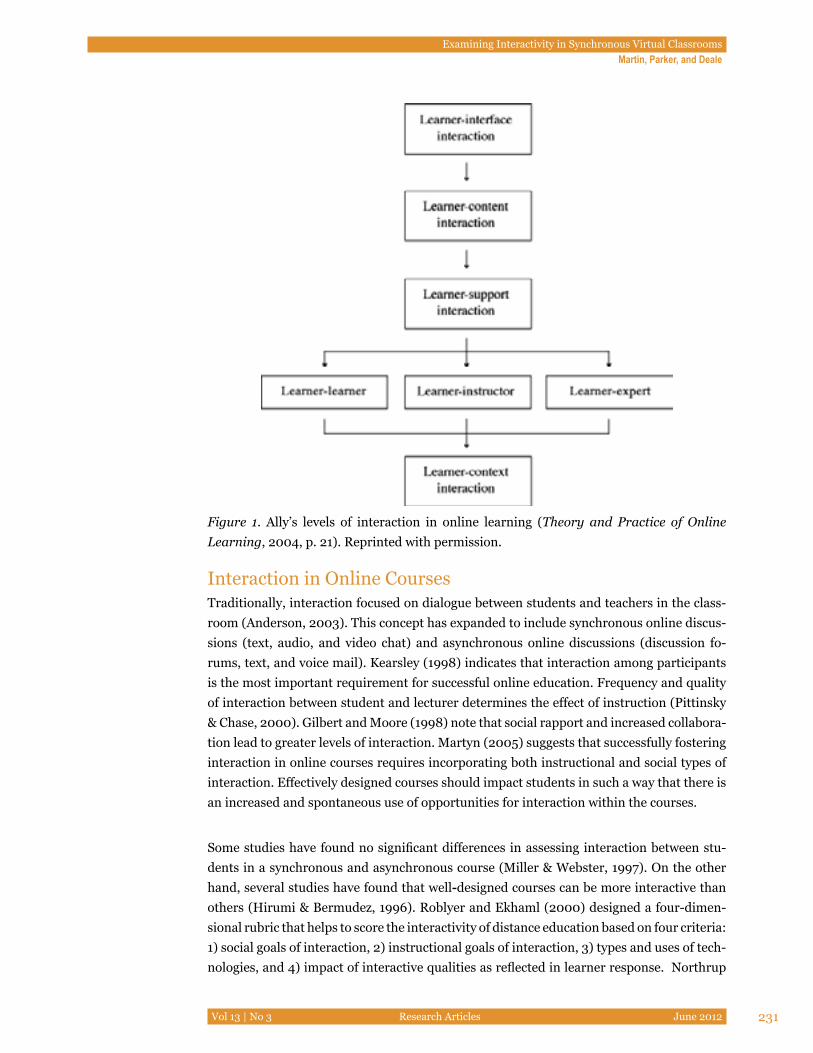
Examining Interactivity in Synchronous Virtual Classrooms Martin, Parker, and Deale
Vol 13 | No 3 Research Articles June 2012 231
Figure 1. Ally’s levels of interaction in online learning (Theory and Practice of Online Learning, 2004, p. 21). Reprinted with permission.
Interaction in Online CoursesTraditionally, interaction focused on dialogue between students and teachers in the class-room (Anderson, 2003). This concept has expanded to include synchronous online discus-sions (text, audio, and video chat) and asynchronous online discussions (discussion fo-rums, text, and voice mail). Kearsley (1998) indicates that interaction among participants is the most important requirement for successful online education. Frequency and quality of interaction between student and lecturer determines the effect of instruction (Pittinsky & Chase, 2000). Gilbert and Moore (1998) note that social rapport and increased collabora-tion lead to greater levels of interaction. Martyn (2005) suggests that successfully fostering interaction in online courses requires incorporating both instructional and social types of interaction. Effectively designed courses should impact students in such a way that there is an increased and spontaneous use of opportunities for interaction within the courses.
Some studies have found no significant differences in assessing interaction between stu-dents in a synchronous and asynchronous course (Miller & Webster, 1997). On the other hand, several studies have found that well-designed courses can be more interactive than others (Hirumi & Bermudez, 1996). Roblyer and Ekhaml (2000) designed a four-dimen-sional rubric that helps to score the interactivity of distance education based on four criteria: 1) social goals of interaction, 2) instructional goals of interaction, 3) types and uses of tech-nologies, and 4) impact of interactive qualities as reflected in learner response. Northrup

Examining Interactivity in Synchronous Virtual Classrooms Martin, Parker, and Deale
Vol 13 | No 3 Research Articles June 2012 232
(2001) proposed five different purposes for interaction: to interact with content, to col-laborate, to converse, to help monitor and regulate learning, and to support performance.
The researchers reviewed the extant literature on interaction and synchronous systems. The appendix provides details of eight current studies. McBrien and Jones (2009) found that dialogue, structure, and learner autonomy enhanced learner interaction in a synchro-nous online setting. Meanwhile, LaPointe and Gunawardena (2004) stated that computer-mediated conferencing experience had a moderate direct effect on self-reported peer in-teraction and had a strong direct effect on self-reported learning outcomes. Aydin (2008) recommended that an e-class (a synchronous virtual classroom) might increase interaction among students because such an application motivates learners and encourages them to develop positive attitudes towards the course. Wang (2004) supported the use of video con-ferencing in distance learning for the provision of oral-visual interaction. Abdous and Yen (2010) found that delivery mode (face-to-face, satellite broadcast, and live video stream-ing) was not a useful predictor for self-perceived learner-to-teacher interaction. Although a number of studies have been conducted on interaction and synchronous systems, few stud-ies analyzed the four types of interaction in the virtual classroom. Of these studies, none has examined this from the student and instructor perspective.
Online Interaction Analysis ModelsA number of interaction analysis models have been developed to account for different as-pects of interaction. Most of these models have been developed to analyze interaction in asynchronous communication. Henri (1992) developed a model for content analysis which included five dimensions (participation, social, interactivity, cognitive skills, and meta-cognitive knowledge and skills). Gunawardena, Lowe, and Anderson (1997) developed an interaction analysis model to examine meaning negotiation and co-construction of knowl-edge. Their model contained five progressive phases of knowledge co-construction which included sharing and comparing of information, discovery of dissonance, negotiation of meaning/co-construction of knowledge, testing and modification of proposed synthesis, and agreement/application of newly constructed meaning. Veldhuis-Diermanse (2002) and Lockhorst, Admiraal, Pilot, and Veen (2003) focused their interaction models on a constructivist framework. Veldhuis-Diermanse’s method consists of three steps: 1) analyz-ing the participation and interaction; 2) focusing on different learning activities; and 3) focusing on the quality of constructed knowledge, which is based on the structure of the ob-served learning outcome. Lockhorst et al. (2003) focus on online cooperation, specifically on the learning strategies leading to in-depth levels of information exchange. DeWever, Schellens, Valcke, and Van Keer (2006) reviewed the different content analysis schemes to analyze transcripts of online asynchronous discussion groups. They reviewed 14 different interaction analysis models, but all of them attempted to identify both cognitive and social features of online interaction.
Chou (2002) used Bales’s (1950) interaction process analysis model to compare interaction patterns between synchronous and asynchronous communication. This model analyzes socioemotional and task interactions. Schullo’s (2005) synchronous interaction analysis
Examining Interactivity in Synchronous Virtual Classrooms Martin, Parker, and Deale
Vol 13 | No 3 Research Articles June 2012 233
model had 57 different interaction elements and was specifically designed for synchronous virtual classroom interaction. It includes the option to review audio, text chat, and the use of other features in the virtual classroom and classify them into one of the six categories of interactions. The interactions are also classified as academic, social, or technical.
Purpose of this StudyAs more and more instructors have begun to integrate synchronous communication in their online courses, seeing the need for immediacy, socioemotional interaction, and engage-ment (Chou, 2002), it is essential that we look at how the different types of interaction can be promoted using the synchronous virtual classroom. It is important that all the types of interaction (learner-learner, learner-instructor, learner-content, and learner-interface) oc-cur so that they enhance academic, social, and technical communication.
The purpose of the study was to understand the interaction capability of the synchronous virtual classroom. The research questions that are answered are as follows:
1. What perceptions do students have about learner-learner, learner-instructor, learner-content, and learner-interface interaction within the virtual classroom?
2. What strategies and tools can an instructor use to enhance learner-learner, learner-instructor, learner-content, and learner-interface interaction in the virtual classroom?
MethodologyThe study was conducted at a university in the southeastern United States. Instructors at this institution have been using a synchronous virtual classroom, Horizon Wimba, for the past five years. In this research, a multiple case study design was employed. Each course was considered a single case with similarities and differences explored across the cases (Schullo, 2005; Stake, 2006). This was considered a valuable method of answering the re-search questions due to our interest in the process rather than the outcome in this context (Merriam, 1998). Also, cross-case analysis can facilitate generalizations across cases and the development of sophisticated descriptions and explanations (Miles & Huberman, 1994).
As in many case studies, various research methods were implemented (Stake, 2006; Yin, 2003). Open-ended surveys and an interview were used to obtain detailed accounts (Dill-man, 1999; Kvale, 1996) of interaction in the virtual classroom from students and the in-structor. The researchers also used archived course sessions to systematically review and describe the events and behaviors under investigation (Marshall & Rossman, 1989; Schullo, 2005). Methodological triangulation (using more than one method to collect data) and the-ory triangulation (using more than one theoretical scheme to interpret the phenomenon) were used to validate the findings (Denzin, 2006; Stake, 2006; Yin, 2003).
Survey on Interaction in the Synchronous Virtual ClassroomsWe surveyed graduate students in an instructional technology program about their interac-tions within the synchronous virtual classroom. In the spring and summer of 2010, an on-
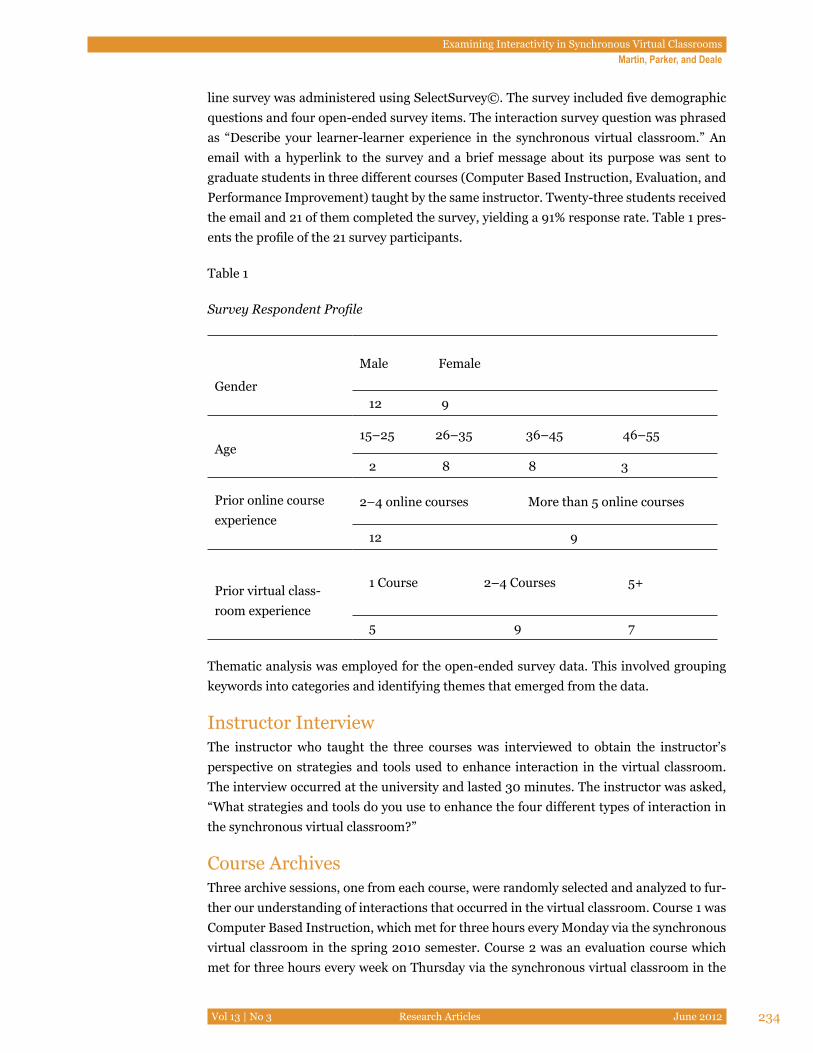
Examining Interactivity in Synchronous Virtual Classrooms Martin, Parker, and Deale
Vol 13 | No 3 Research Articles June 2012 234
line survey was administered using SelectSurvey©. The survey included five demographic questions and four open-ended survey items. The interaction survey question was phrased as “Describe your learner-learner experience in the synchronous virtual classroom.” An email with a hyperlink to the survey and a brief message about its purpose was sent to graduate students in three different courses (Computer Based Instruction, Evaluation, and Performance Improvement) taught by the same instructor. Twenty-three students received the email and 21 of them completed the survey, yielding a 91% response rate. Table 1 pres-ents the profile of the 21 survey participants.
Table 1
Survey Respondent Profile
Gender
Male Female
12 9
Age 15–25 26–35 36–45 46–55
2 8 8 3
Prior online course experience
2–4 online courses More than 5 online courses
12 9
Prior virtual class-room experience
1 Course 2–4 Courses 5+
5 9 7
Thematic analysis was employed for the open-ended survey data. This involved grouping keywords into categories and identifying themes that emerged from the data.
Instructor InterviewThe instructor who taught the three courses was interviewed to obtain the instructor’s perspective on strategies and tools used to enhance interaction in the virtual classroom. The interview occurred at the university and lasted 30 minutes. The instructor was asked, “What strategies and tools do you use to enhance the four different types of interaction in the synchronous virtual classroom?”
Course ArchivesThree archive sessions, one from each course, were randomly selected and analyzed to fur-ther our understanding of interactions that occurred in the virtual classroom. Course 1 was Computer Based Instruction, which met for three hours every Monday via the synchronous virtual classroom in the spring 2010 semester. Course 2 was an evaluation course which met for three hours every week on Thursday via the synchronous virtual classroom in the
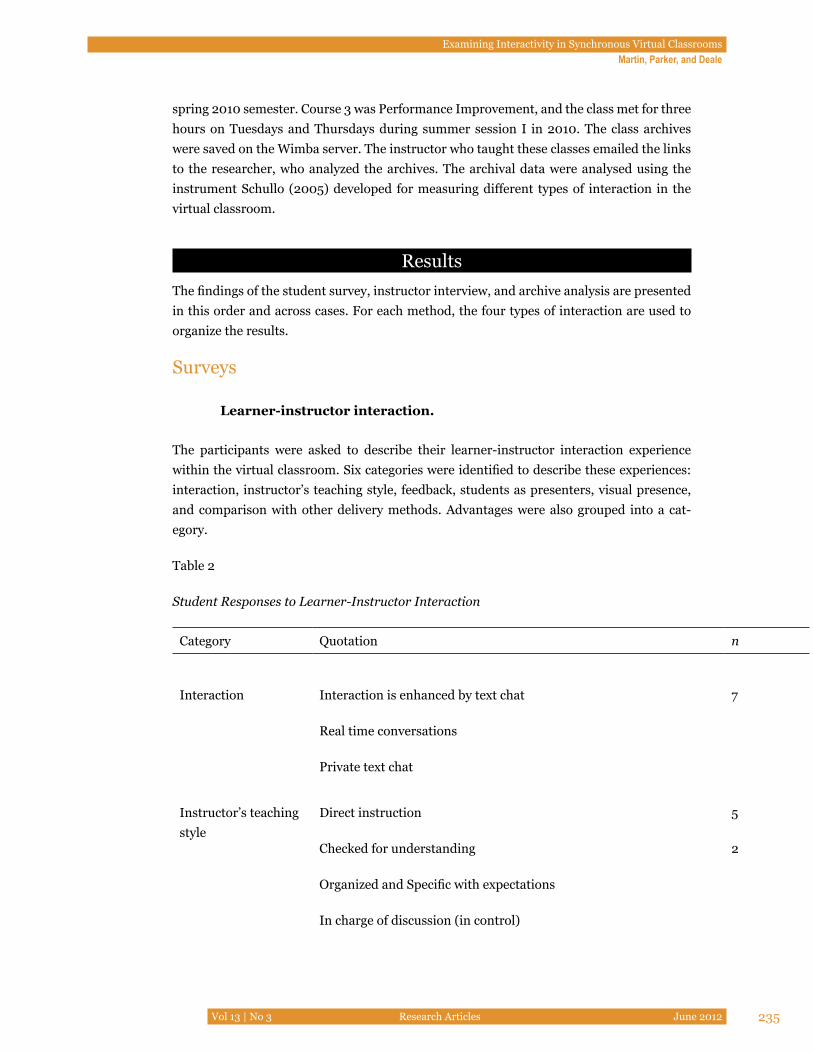
Examining Interactivity in Synchronous Virtual Classrooms Martin, Parker, and Deale
Vol 13 | No 3 Research Articles June 2012 235
spring 2010 semester. Course 3 was Performance Improvement, and the class met for three hours on Tuesdays and Thursdays during summer session I in 2010. The class archives were saved on the Wimba server. The instructor who taught these classes emailed the links to the researcher, who analyzed the archives. The archival data were analysed using the instrument Schullo (2005) developed for measuring different types of interaction in the virtual classroom.
ResultsThe findings of the student survey, instructor interview, and archive analysis are presented in this order and across cases. For each method, the four types of interaction are used to organize the results.
Surveys
Learner-instructor interaction.
The participants were asked to describe their learner-instructor interaction experience within the virtual classroom. Six categories were identified to describe these experiences: interaction, instructor’s teaching style, feedback, students as presenters, visual presence, and comparison with other delivery methods. Advantages were also grouped into a cat-egory.
Table 2
Student Responses to Learner-Instructor Interaction
Category Quotation n
Interaction Interaction is enhanced by text chat
Real time conversations
Private text chat
7
Instructor’s teaching style
Direct instruction
Checked for understanding
Organized and Specific with expectations
In charge of discussion (in control)
5
2
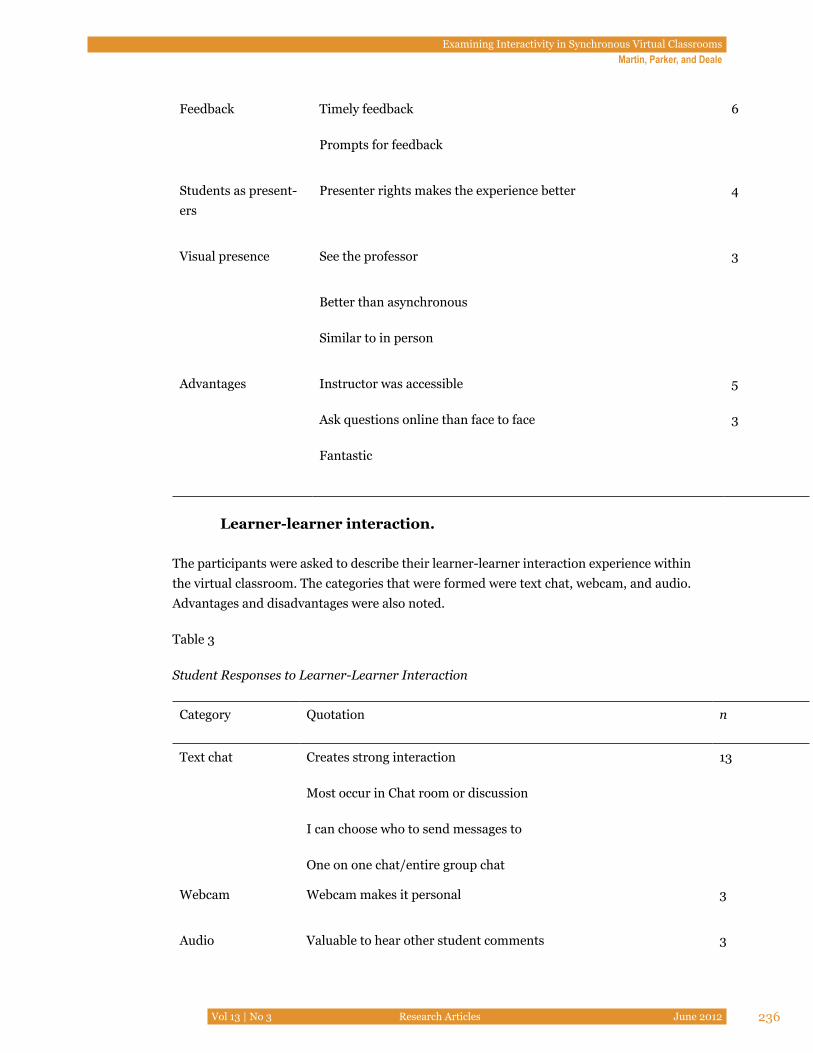
Examining Interactivity in Synchronous Virtual Classrooms Martin, Parker, and Deale
Vol 13 | No 3 Research Articles June 2012 236
Feedback Timely feedback
Prompts for feedback
6
Students as present-ers
Presenter rights makes the experience better 4
Visual presence See the professor 3
Better than asynchronous
Similar to in person
Advantages Instructor was accessible
Ask questions online than face to face
Fantastic
5
3
Learner-learner interaction.
The participants were asked to describe their learner-learner interaction experience within the virtual classroom. The categories that were formed were text chat, webcam, and audio. Advantages and disadvantages were also noted.
Table 3
Student Responses to Learner-Learner Interaction
Category Quotation n
Text chat Creates strong interaction
Most occur in Chat room or discussion
I can choose who to send messages to
One on one chat/entire group chat
13
Webcam Webcam makes it personal 3
Audio Valuable to hear other student comments 3
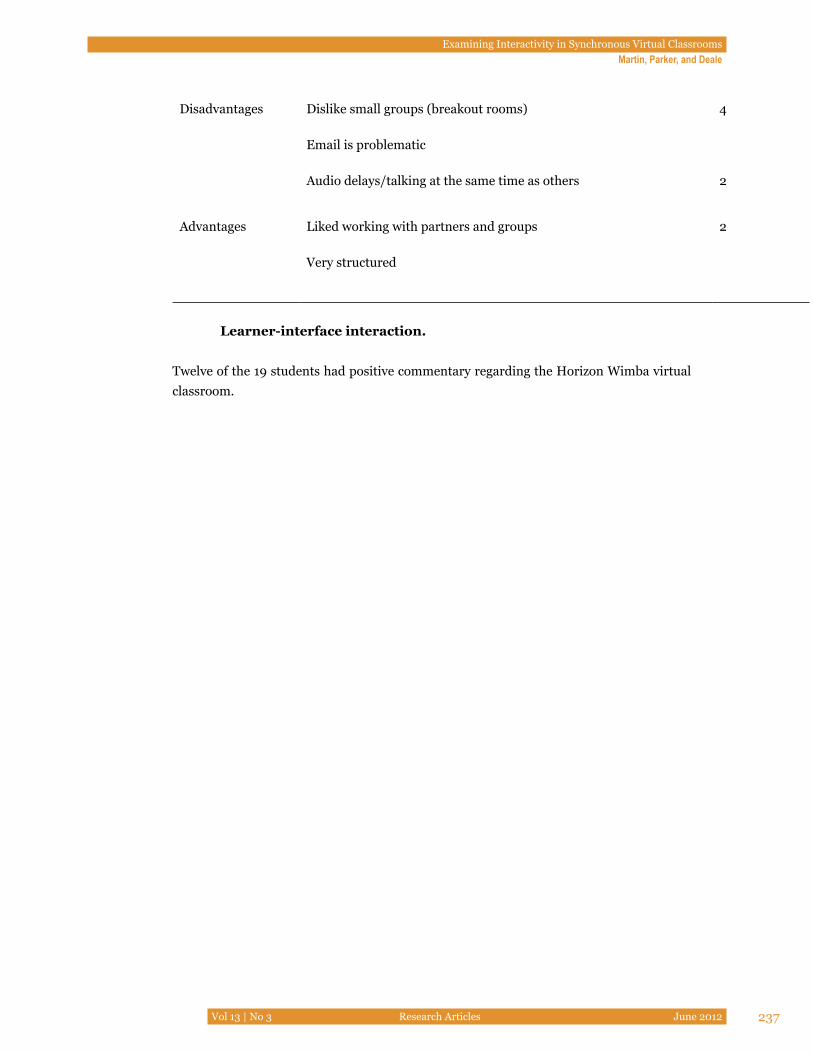
Examining Interactivity in Synchronous Virtual Classrooms Martin, Parker, and Deale
Vol 13 | No 3 Research Articles June 2012 237
Disadvantages Dislike small groups (breakout rooms)
Email is problematic
Audio delays/talking at the same time as others
4
2
Advantages Liked working with partners and groups
Very structured
2
Learner-interface interaction.
Twelve of the 19 students had positive commentary regarding the Horizon Wimba virtual classroom.
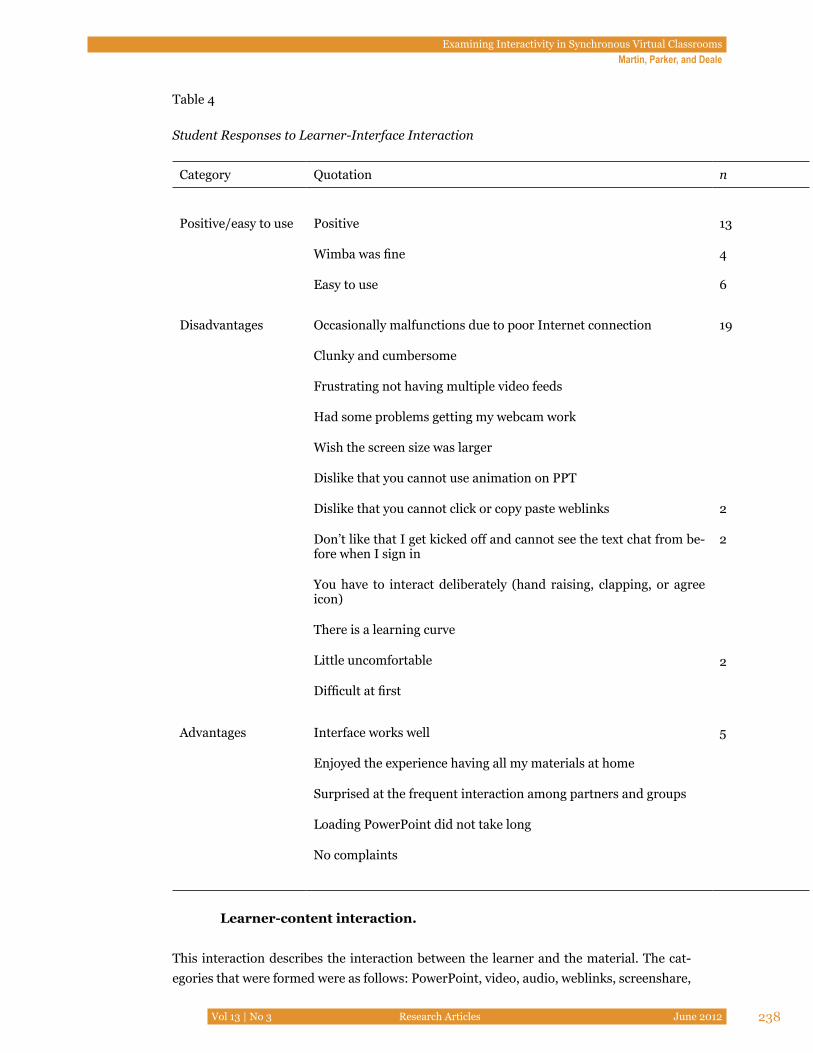
Examining Interactivity in Synchronous Virtual Classrooms Martin, Parker, and Deale
Vol 13 | No 3 Research Articles June 2012 238
Table 4
Student Responses to Learner-Interface Interaction
Category Quotation n
Positive/easy to use Positive
Wimba was fine
Easy to use
13
4
6
Disadvantages Occasionally malfunctions due to poor Internet connection
Clunky and cumbersome
Frustrating not having multiple video feeds
Had some problems getting my webcam work
Wish the screen size was larger
Dislike that you cannot use animation on PPT
Dislike that you cannot click or copy paste weblinks
Don’t like that I get kicked off and cannot see the text chat from be-fore when I sign in
You have to interact deliberately (hand raising, clapping, or agree icon)
There is a learning curve
Little uncomfortable
Difficult at first
19
2
2
2
Advantages Interface works well
Enjoyed the experience having all my materials at home
Surprised at the frequent interaction among partners and groups
Loading PowerPoint did not take long
No complaints
5
Learner-content interaction.
This interaction describes the interaction between the learner and the material. The cat-egories that were formed were as follows: PowerPoint, video, audio, weblinks, screenshare,
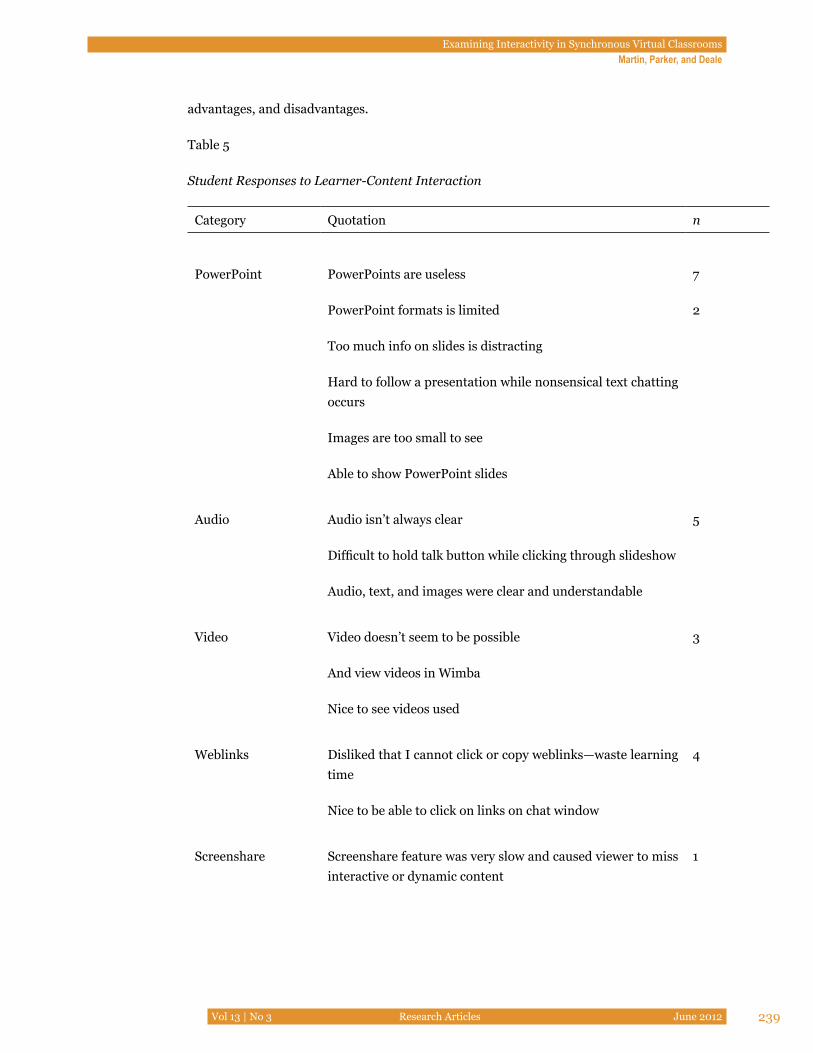
Examining Interactivity in Synchronous Virtual Classrooms Martin, Parker, and Deale
Vol 13 | No 3 Research Articles June 2012 239
advantages, and disadvantages.
Table 5
Student Responses to Learner-Content Interaction
Category Quotation n
PowerPoint PowerPoints are useless
PowerPoint formats is limited
Too much info on slides is distracting
Hard to follow a presentation while nonsensical text chatting occurs
Images are too small to see
Able to show PowerPoint slides
7
2
Audio Audio isn’t always clear
Difficult to hold talk button while clicking through slideshow
Audio, text, and images were clear and understandable
5
Video Video doesn’t seem to be possible
And view videos in Wimba
Nice to see videos used
3
Weblinks Disliked that I cannot click or copy weblinks—waste learning time
Nice to be able to click on links on chat window
4
Screenshare Screenshare feature was very slow and caused viewer to miss interactive or dynamic content
1
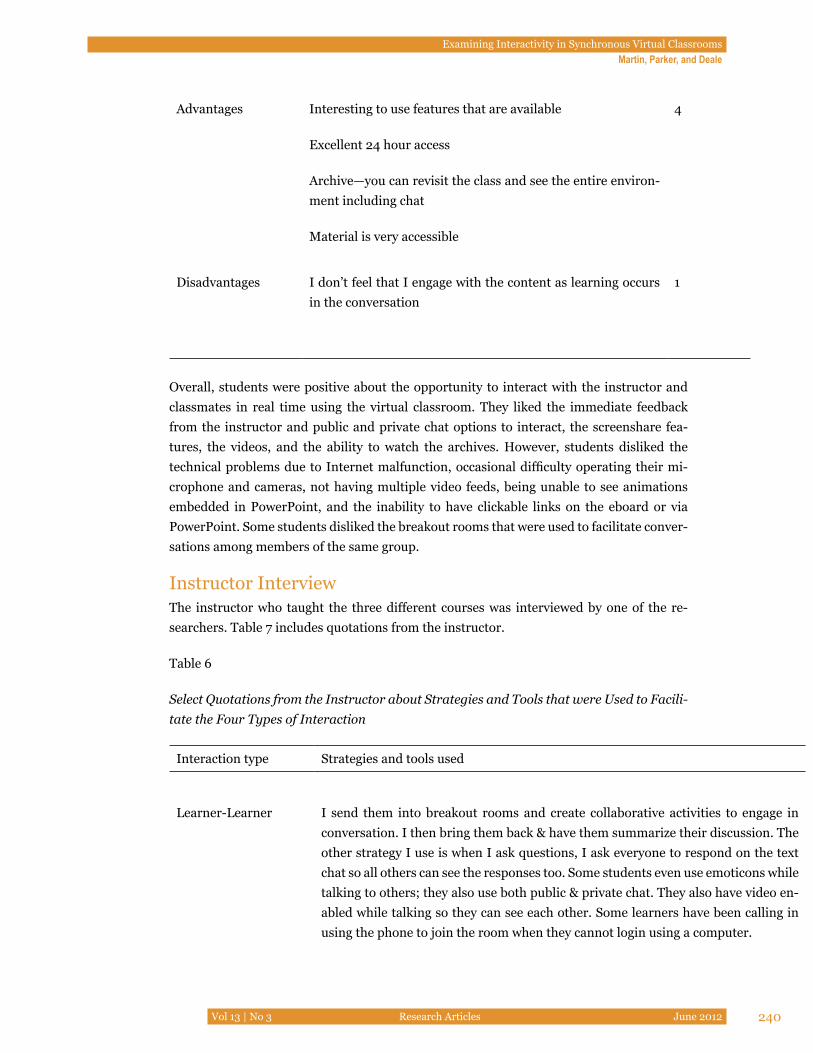
Examining Interactivity in Synchronous Virtual Classrooms Martin, Parker, and Deale
Vol 13 | No 3 Research Articles June 2012 240
Advantages Interesting to use features that are available
Excellent 24 hour access
Archive—you can revisit the class and see the entire environ-ment including chat
Material is very accessible
4
Disadvantages I don’t feel that I engage with the content as learning occurs in the conversation
1
Overall, students were positive about the opportunity to interact with the instructor and classmates in real time using the virtual classroom. They liked the immediate feedback from the instructor and public and private chat options to interact, the screenshare fea-tures, the videos, and the ability to watch the archives. However, students disliked the technical problems due to Internet malfunction, occasional difficulty operating their mi-crophone and cameras, not having multiple video feeds, being unable to see animations embedded in PowerPoint, and the inability to have clickable links on the eboard or via PowerPoint. Some students disliked the breakout rooms that were used to facilitate conver-sations among members of the same group.
Instructor InterviewThe instructor who taught the three different courses was interviewed by one of the re-searchers. Table 7 includes quotations from the instructor.
Table 6
Select Quotations from the Instructor about Strategies and Tools that were Used to Facili-tate the Four Types of Interaction
Interaction type Strategies and tools used
Learner-Learner I send them into breakout rooms and create collaborative activities to engage in conversation. I then bring them back & have them summarize their discussion. The other strategy I use is when I ask questions, I ask everyone to respond on the text chat so all others can see the responses too. Some students even use emoticons while talking to others; they also use both public & private chat. They also have video en-abled while talking so they can see each other. Some learners have been calling in using the phone to join the room when they cannot login using a computer.
Examining Interactivity in Synchronous Virtual Classrooms Martin, Parker, and Deale
Vol 13 | No 3 Research Articles June 2012 241
Learner-Instructor I let the students ask questions to clarify something. They can raise their hand, or type in text chat. They use audio, text, and video chat to talk to me. I do different activities, where they have to respond using text chat or audio chat or polling. I also do a lot of demonstrations using application share, and students interact with me, especially if they don’t understand what I am showing them. I ask them to use the step-away feature so I can see if they are out, especially during breaks.
Learner-Content I have a PowerPoint every time I teach using the virtual classroom. I load this to the eboard. This helps me to get them to focus their attention to the content. I also take them on web tours, or share web links. To introduce them to other content on the web. Again, for the development courses, I demonstrate the tools using application sharing. The different practice activities help them with the content too. I give them group activities, which gets them to interact with content and other learners. I think there is a lot of learning happening in the virtual classroom just from interacting via text chat with other classmates. I also use audio chat all the time to explain the content.
Learner-Interface I use the different features of the virtual classroom to enhance learner-interface in-teraction. I use the eboard, application sharing, all three types of chat – audio video & text, hand raising, polling, break out rooms, step away feature, sharing we blinks, emoticons. I give a chance for students to present using the eboard; this gives them a chance to interact with the system and I provide feedback on their presentation.
Archival Analysis of Classroom InteractionSchullo’s (2005) instrument with 57 items on different interaction elements in the virtual classroom was used to analyze three archived sessions. One researcher reviewed audio, text chat, and use of other features in the virtual classroom in order to classify six categories of interactions. The interactions were also classified as academic, social, or technical. Interac-tions related to the course content were considered academic, interactions that related to the virtual classroom system were technical (e.g., audio issues, how to use a feature), and interactions that were not academic or technical were considered social. The archive from the third course, Human Performance Improvement, was the most interactive course with 705 interactions. Among the three courses, there were 815 total academic interactions, 352 total technical interactions, and 143 total social interactions.
This data revealed that most of the interactions were academic in nature; however, there were also a number of interactions related to technical issues and fewer social interactions. The archive analysis illuminated the different strategies and tools that were used to en-hance interaction in the synchronous virtual classroom. Text chat, the microphone, and the hand-raising tool were used most often. Text chat was employed in various interactions,
Examining Interactivity in Synchronous Virtual Classrooms Martin, Parker, and Deale
Vol 13 | No 3 Research Articles June 2012 242
and academically related interactions were well supported by this tool.
Course 1 – Computer Based Instruction (CBI)This class contained nine students, and the class session consisted of roughly 50 minutes of student presentations using PowerPoint within the virtual classroom. This was followed by lecture and 10 minutes for small group discussions in the breakout rooms. Students re-turned to the main room and reported on their discussions. During breakout sessions, the researcher was unable to track interactions. The webcam was on the professor during the entire class time. There was a lot of conversation in the chat room, and the researcher states that the level of learner-learner interaction was probably higher in the text chat than audio chat. Questions about the course content were addressed within the chat room without in-terrupting the lecture. There were lots of learner-learner and learner-instructor comments throughout the lecture. Everything was on topic or social in nature. The researcher was unable to examine the “step away” feature or the interactions in the breakout room because they are not archived. In the instructor-interface category, the microphone and application share feature were used the entire time.
Course 2 – Evaluation and Change ManagementThis class consisted of seven students. The instructor started the virtual classroom session by reviewing the learning objectives and checking with students regarding the status of their projects. The remaining time was used for lecture and students’ response to readings. The last five to seven minutes were about the upcoming class and the necessary software. The instructor used lots of rhetorical questions such as “right?” or “yes?” Students seemed comfortable speaking even though they often paused. The instructor responded directly to each student who posed a question.
Course 3 – Human Performance Improvement (HPI)This class had more interactions and more students (17) than the other two courses. Many of the students knew each other, which seemed to encourage more text chatting. This vir-tual classroom session was discussion focused. The instructor gave each student time to respond to the topic, and there was minimal lecture. The instructor affirmed student re-sponses by nodding, which was visible via the webcam. In the instructor-interface category, the video and microphone were turned on the entire time.
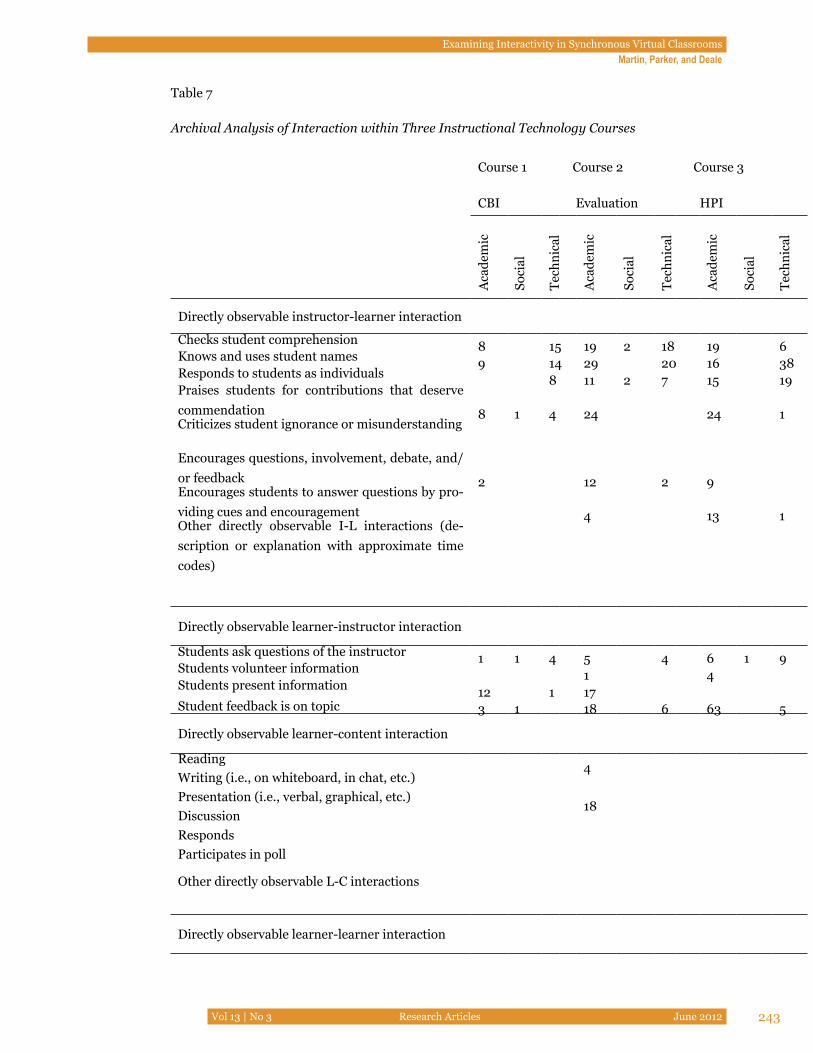
Examining Interactivity in Synchronous Virtual Classrooms Martin, Parker, and Deale
Vol 13 | No 3 Research Articles June 2012 243
Table 7
Archival Analysis of Interaction within Three Instructional Technology Courses
Course 1
CBI
Course 2
Evaluation
Course 3
HPI
Aca
dem
ic
Soci
al
Tech
nica
l
Aca
dem
ic
Soci
al
Tech
nica
l
Aca
dem
ic
Soci
al
Tech
nica
l
Directly observable instructor-learner interaction
Checks student comprehension 8 15 19 2 18 19 6Knows and uses student names 9 14 29 20 16 38Responds to students as individuals 8 11 2 7 15 19Praises students for contributions that deserve commendation 8 1 4 24 24 1Criticizes student ignorance or misunderstanding
Encourages questions, involvement, debate, and/or feedback 2 12 2 9Encourages students to answer questions by pro-viding cues and encouragement 4 13 1Other directly observable I-L interactions (de-scription or explanation with approximate time codes)
Directly observable learner-instructor interaction
Students ask questions of the instructor 1 1 4 5 4 6 1 9Students volunteer information 1 4Students present information 12 1 17Student feedback is on topic 3 1 18 6 63 5
Directly observable learner-content interaction
Reading4
Writing (i.e., on whiteboard, in chat, etc.) Presentation (i.e., verbal, graphical, etc.)
18DiscussionRespondsParticipates in poll
Other directly observable L-C interactions
Directly observable learner-learner interaction
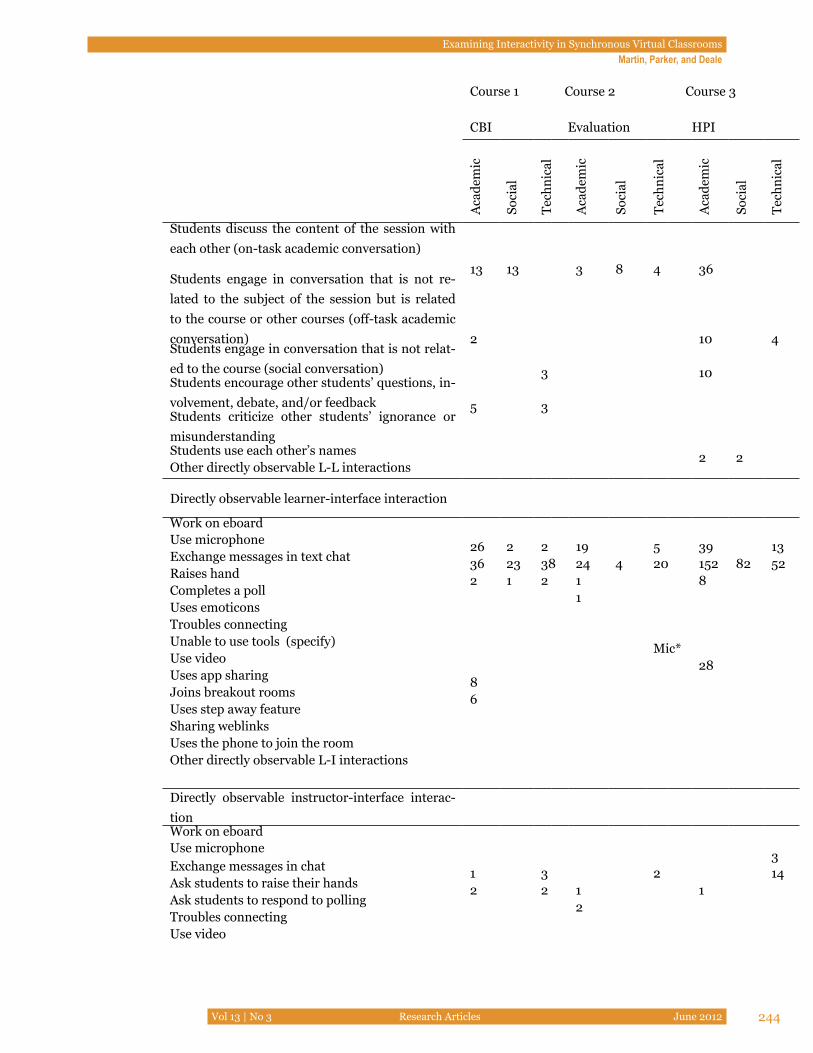
Examining Interactivity in Synchronous Virtual Classrooms Martin, Parker, and Deale
Vol 13 | No 3 Research Articles June 2012 244
Course 1
CBI
Course 2
Evaluation
Course 3
HPI
Aca
dem
ic
Soci
al
Tech
nica
l
Aca
dem
ic
Soci
al
Tech
nica
l
Aca
dem
ic
Soci
al
Tech
nica
l
Students discuss the content of the session with each other (on-task academic conversation)
13 13 3 8 4 36Students engage in conversation that is not re-lated to the subject of the session but is related to the course or other courses (off-task academic conversation) 2 10 4Students engage in conversation that is not relat-ed to the course (social conversation) 3 10Students encourage other students’ questions, in-volvement, debate, and/or feedback 5 3Students criticize other students’ ignorance or misunderstandingStudents use each other’s names 2 2Other directly observable L-L interactions
Directly observable learner-interface interaction
Work on eboard Use microphone 26 2 2 19 5 39 13Exchange messages in text chat 36 23 38 24 4 20 152 82 52Raises hand 2 1 2 1 8Completes a poll 1Uses emoticons Troubles connectingUnable to use tools (specify) Mic*Use video 28Uses app sharing 8Joins breakout rooms 6Uses step away featureSharing weblinksUses the phone to join the roomOther directly observable L-I interactions
Directly observable instructor-interface interac-tion Work on eboard Use microphone
3Exchange messages in chat 1 3 2 14Ask students to raise their hands 2 2 1 1Ask students to respond to polling 2Troubles connectingUse video
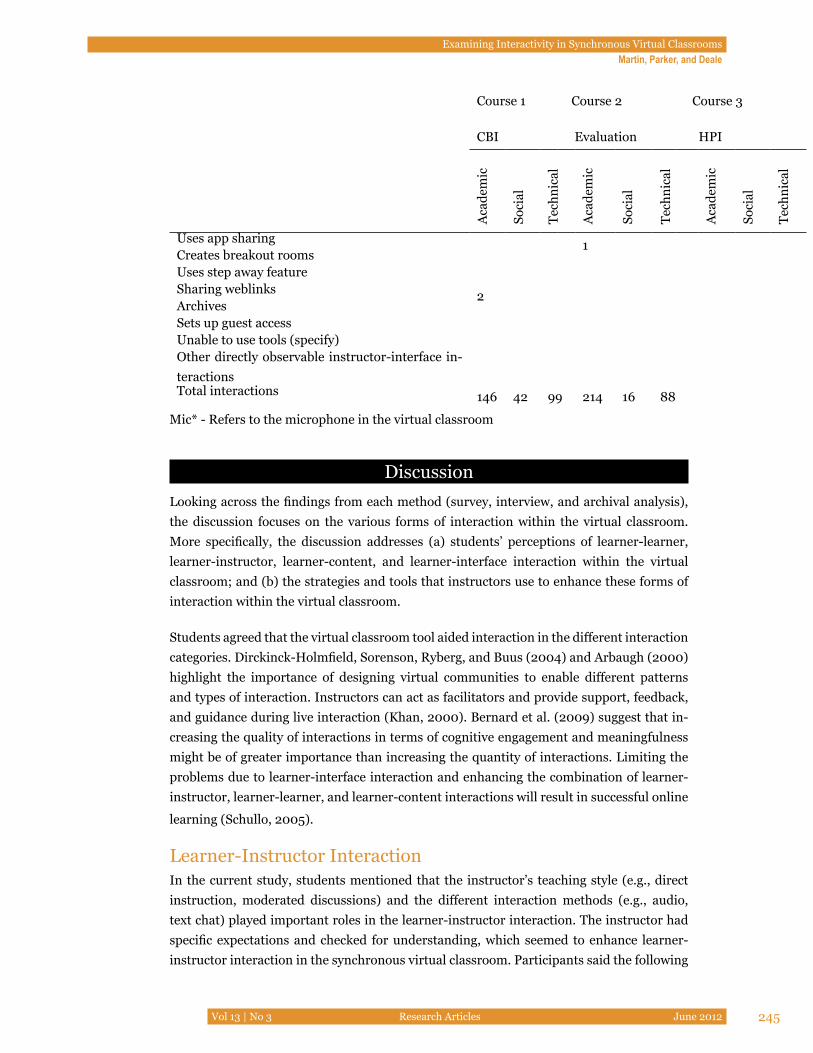
Examining Interactivity in Synchronous Virtual Classrooms Martin, Parker, and Deale
Vol 13 | No 3 Research Articles June 2012 245
Course 1
CBI
Course 2
Evaluation
Course 3
HPI
Aca
dem
ic
Soci
al
Tech
nica
l
Aca
dem
ic
Soci
al
Tech
nica
l
Aca
dem
ic
Soci
al
Tech
nica
l
Uses app sharing 1Creates breakout roomsUses step away featureSharing weblinks 2ArchivesSets up guest accessUnable to use tools (specify)Other directly observable instructor-interface in-teractions Total interactions 146 42 99 214 16 88
Mic* - Refers to the microphone in the virtual classroom
DiscussionLooking across the findings from each method (survey, interview, and archival analysis), the discussion focuses on the various forms of interaction within the virtual classroom. More specifically, the discussion addresses (a) students’ perceptions of learner-learner, learner-instructor, learner-content, and learner-interface interaction within the virtual classroom; and (b) the strategies and tools that instructors use to enhance these forms of interaction within the virtual classroom.
Students agreed that the virtual classroom tool aided interaction in the different interaction categories. Dirckinck-Holmfield, Sorenson, Ryberg, and Buus (2004) and Arbaugh (2000) highlight the importance of designing virtual communities to enable different patterns and types of interaction. Instructors can act as facilitators and provide support, feedback, and guidance during live interaction (Khan, 2000). Bernard et al. (2009) suggest that in-creasing the quality of interactions in terms of cognitive engagement and meaningfulness might be of greater importance than increasing the quantity of interactions. Limiting the problems due to learner-interface interaction and enhancing the combination of learner-instructor, learner-learner, and learner-content interactions will result in successful online
learning (Schullo, 2005).
Learner-Instructor InteractionIn the current study, students mentioned that the instructor’s teaching style (e.g., direct instruction, moderated discussions) and the different interaction methods (e.g., audio, text chat) played important roles in the learner-instructor interaction. The instructor had specific expectations and checked for understanding, which seemed to enhance learner-instructor interaction in the synchronous virtual classroom. Participants said the following
Examining Interactivity in Synchronous Virtual Classrooms Martin, Parker, and Deale
Vol 13 | No 3 Research Articles June 2012 246
about the virtual classroom: a) that it helped them receive immediate feedback, b) that the presenter rights made the virtual experience better, c) that the visual presence of the in-structor was beneficial, and (d) that they considered the experience positive overall. Chen, Ko, Kinshuk, and Lin (2005) demonstrated that the most promising aspect of the synchro-nous classroom is the provision of immediate feedback, which allows the participants to correct themselves immediately and strengthen their learning. The low-quality audio/video makes interaction difficult in a virtual classroom (Anderson, Beavers, VanDeGrift, & Vid-eon, 2003). Nevertheless, participants preferred viewing the live video to a prerecorded video of the instructor. The instructor in this study used the breakout rooms and text chat area as the major feature to enhance learner-learner interaction. While studies have found breakout rooms to be effective, they also found audio with video to be more effective in enhancing learner-learner interaction (Baker, 2002).
The archive analysis revealed that learners were able to express ideas or ask questions through text chat to the instructor without interrupting another speaker. The text chat tool provided a much-needed way to communicate technical difficulties when they arose, espe-cially as other tools (such as the microphone) presented technical difficulties for the user. The microphone was frequently used during learner-instructor interactions. These interac-tions consisted of academic and technical topics but were rarely used for social interactions.
The instructor-learner interactions employed the microphone tool the most. Both the hand-raising and polling tools provided an organized method of interaction. The hand-raising tool was employed by the instructor for organizing class discussion, offering an effective way to ensure that all students’ ideas, questions, and concerns were addressed.
Learner-Learner InteractionScholl, McCarthy, and Harr (2006) discovered that chat has advantages in informal com-munication when used in conjunction with the webcam. Seeing the students through the webcam made the learner-learner interaction more personal. Text chat seemed to pro-mote the most learner-learner interaction in the synchronous virtual classroom. The stu-dents perceived both private chat and group communication as beneficial to all the stu-dents. Breakout rooms provided another vehicle for small group communication. Text chat helped overcome the audio delays and prevented students from talking at the same time during audio communication. Listening to other classmates and hearing their comments were valuable factors in the learner-learner interaction. Chou (2002) reported that syn-chronous message exchanges encouraged more socioemotional interactions. Linebarger, Scholand, Ehlen, and Procopio (2005) found that synchronous collaboration improved the formation of common mental models in terms of both time and quality. This idea was evi-denced in this study as students were able to benefit from interacting with their peers in the breakout rooms. A virtual classroom increases interaction among students because it motivates learners and helps them develop positive attitudes towards the course (Aydin, 2008). According to the instructor, the majority of the learner-instructor interaction oc-curred through the three types of chat (audio, video, and text), and through application sharing, which was primarily used for demonstration.
Examining Interactivity in Synchronous Virtual Classrooms Martin, Parker, and Deale
Vol 13 | No 3 Research Articles June 2012 247
The archive analysis revealed that when learners had questions, other learners frequently chimed in with their thoughts and answers. This greatly enhanced the learning experience and supported learner-learner learning. Learners were able to present their work and par-ticipate in group sessions using the microphone. This tool was often used in combination with the text chat, which provided a seemingly effective method for learner-learner interac-tion. When the class format contained large amounts of lecture, many of the learner-learner interaction tools were used infrequently; whereas, learner-learner interactions increased with class discussions and when students presented course material.
Learner-Interface InteractionSome students mentioned the initial learning curve when using the tool. Overall, the vir-tual classroom interface was considered easy to use, and it facilitated frequent interaction among the students. Ease of use seems to be a key feature in the adoption of this technology by both faculty and students (DuFrene, Lehman, Kellermanns, & Pearson, 2009; Lehner, Nösekabel, & Lehmann, 2003; Schullo, 2005; Van Raaij & Schepers, 2008). Students in-dicated three disadvantages of the virtual classroom, which are the lack of multiple video feeds, the lack of animation capability when viewing a PowerPoint in the virtual classroom, and the inability to access Web sites from a PowerPoint. Similar to the findings of Thur-mond and Wambach (2004), computer experience, perceptions about the technology be-ing used, and access to technology were linked with learner-interface interactions. Wang’s study (2004) indicated that desktop video conferencing also enhances oral-visual interac-tion. This study mentioned the importance of having a video feed in synchronous virtual sessions. According to the instructor, all features used to enhance the different types of interaction (eboard, application sharing, all three types of chat, audio, video, and text, hand raising, polling, breakout rooms, sharing weblinks, emoticons), enhance learner-interface interaction.
Learner-Content InteractionAlthough students were engaged with the content and learning occurred through conversa-tion, they described features that inhibited them from interacting with the content. For in-stance, the small-sized graphics were hard to see and content-related Web sites embedded in PowerPoints were inactive. Audio was unclear and the students did not like to hold the “talk” button while speaking. One way to solve this would have been to have the students raise their hands and give the opportunity for one person to speak at a time so that the speaker is audible. Students can also be instructed to use lock-talk, which frees them from having to hold the “talk” button while speaking. Students also noted that the video from the webcam was unclear and the screenshare was slow. The issues that the students described were directly related to the virtual classroom system that was used; whereas, other virtual classrooms have addressed some of these drawbacks by upgrading their interface. Despite the limitations with the virtual classroom that was used, the students listed features that helped them interact more with the content. For instance, they liked the ability to access the archive at any time, the ability to click on the weblinks from the chat room, and the text, audio, and video chat options. Finally, presenter control made the virtual classroom experi-ence engaging for students. Presenter control provides students with access to the presen-

Examining Interactivity in Synchronous Virtual Classrooms Martin, Parker, and Deale
Vol 13 | No 3 Research Articles June 2012 248
tation tools, which enables them to present material to the class. This allowed the gradu-ate students to take ownership of and responsibility for their learning. According to the instructor, the learner-content interaction primarily occurred through direct instruction by the use of PowerPoint, sharing weblinks, demonstrations through application sharing, and different chat options. This reinforces the view that sharing visuals and demonstrations along with the chat options enhances learner-context interaction.
Best PracticesBelow is a list of best practices in conducting an interactive virtual classroom session.
A. Before the Virtual Session
• Send participants a reminder to run the wizard before the session.
• Provide the direct link to enter the virtual classroom (VC), especially for the first meet-ing if they are still unable to access the VC through the learning management system.
• Provide alternate phone numbers in case they are away from a computer and wish to connect to the class or have difficulty with audio.
• The above three steps will reduce the time the instructor has to spend on handling technical issues in the class.
B. Introduction
• Introduce yourself as the instructor for the session.
• Use a webcam if possible; if not, include a picture of yourself. Students prefer seeing the video instead of just hearing the instructor’s voice.
• Set VC session rules regarding hand-raising as well as when and how to ask questions.
C. Limiting Access/Guest Access
• Provide only the access students need. (e.g., do not give eboard access unless they need it. Students love to draw on it during class.)
• The private chat option can be disabled if you do not see the need for it. Graduate stu-dents prefer to use the private chat option to talk to their classmates/teammates.
• Enable guest access if you plan on inviting guest speakers.
D. Features
• The text chat feature is very important as it provides feedback to the instructor regard-ing technical issues that can be resolved quickly with little disruption.
Examining Interactivity in Synchronous Virtual Classrooms Martin, Parker, and Deale
Vol 13 | No 3 Research Articles June 2012 249
• Text chat provides learner-learner and learner-instructor interactions for both social and content knowledge.
• Text chat provides immediate feedback for knowledge checks for learner-instructor in-teractions.
• The web camera provides a visual presence to instructor and students.
• Presenter control allows students to use their desktops to present and share their knowledge. This allows students to take ownership of and responsibility for their own learning as they must present their work.
• PowerPoint presentations used by the instructor are easily shared with the students through the eboard or content window and provide guidance for instructional flow.
• Share weblinks with the students in the course. PowerPoint slides are converted to im-ages in Wimba. Therefore we recommend typing Web site links into the text chat area and/or sharing links via the Web site sharing feature.
• Breakout rooms facilitate small group discussion and increase learner-learner interac-tion as well as learner-content interaction.
E. How to avoid audio and video delays?
• Use an ethernet (network) connection always.
• Avoid using a wireless network connection. This could cause a delay in audio.
• As a presenter, you can see everyone’s network statistics and help guide them in order to be successful.
• If a student complains about audio difficulty, do not wait for him/her to start the class. Tell him/her to watch the archive for the missed portion. A system reboot generally fixes these issues.
• Tell students not to run too many other applications when they are logged into the virtual classroom.
F. Archiving
• Remember to archive each session. It is very helpful for those who have missed class and also for the instructor in improving his/her teaching using VC.
• Archive accessibility provides students with the ability to review course content and a means for obtaining clarification about course content and/or assignments at a later date.
Examining Interactivity in Synchronous Virtual Classrooms Martin, Parker, and Deale
Vol 13 | No 3 Research Articles June 2012 250
Limitations and Future ResearchThis study was conducted with students in one graduate program in a specific region of the United States. The students were also instructional technology students and experienced virtual learners. The data were based on students’ open-ended survey responses, which were short in nature and thus prevented us from using Schullo’s (2005) framework for the analysis. Future research can use Schullo’s (2005) framework for the various data collection modalities. We also suggest that researchers examine archival data for the same class mul-tiple times and interview students to gain more in-depth responses. Additional suggestions include examining interaction in different types of courses (e.g., history, computer science), programs (e.g., higher education, curriculum, and instruction), settings (e.g., kinds of insti-tutions), and subgroup (e.g., gender, age, race/ethnicity) in the virtual classroom. Based on these findings, instruction can be tailored to promote learning and student satisfaction in courses, programs, or institutions that use the virtual classroom.
ImplicationsStudents perceived the virtual classroom as a means of enhancing learner-learner, learn-er-instructor, learner-content, and learner-interface interaction. The tools and strategies recommended by the students, instructor, and the archive analysis have implications for those who are considering teaching synchronously using the virtual classroom or adding synchronous components to asynchronous courses. The synchronous virtual classroom tools support authentic forms of interaction with reduced cost of travel and added flex-ibility. Instructors who use synchronous systems to teach are able to immediately address student understanding of the instructional concepts in an online setting. The best practices recommended in this study can help instructors conduct effective synchronous class ses-sions with enhanced interaction. This study recommends using different features such as text, audio, and video chat, polling, emoticons, application sharing, eboard, and breakout rooms to enhance interaction. The technical difficulties and disadvantages can be mini-mized by a) training the students ahead of time to use the applications, b) asking students to use the setup wizard before each class session, c) having students login ahead of time to help troubleshoot any potential technical difficulties, and d) providing a reference guide to address technical difficulties.
The virtual classroom tools are helpful in providing instant demonstration of hands-on skills such as learning an Adobe Photoshop application. These tools can also be adopted by faculty for office hours, where students can interact with the instructor remotely. Other im-plications for universities include using these synchronous systems to provide interactive professional development opportunities. Finally, this study has implications for distance education theory and research.
Examining Interactivity in Synchronous Virtual Classrooms Martin, Parker, and Deale
Vol 13 | No 3 Research Articles June 2012 251
ReferencesAbdous, M., & Yen, C. (2010). A predictive study of learner satisfaction and outcomes in face-
to-face, satellite broadcast, and live video-streaming learning environments. Inter-net and Higher Education, 13(4), 248–257. doi:10.1016/j.iheduc.2010.04.005
Allen, E. I., & Seaman, J. (2011). Going the distance: Online education in the United States 2011. Retrieved from http://www.onlinelearningsurvey.com/reports/goingthedis-tance.pdf
Ally, M. (2004). Foundations of educational theory for online learning. In T. Anderson & F. Elloumi (Eds.), Theory and practice of online learning (pp. 3–31). Athabasca, AB: AU Press.
Anderson, R. J., Beavers, J., VanDeGrift, T., & Videon, F. (2003). Videoconferencing and presentation support for synchronous distance learning. 33rd ASEE/IEEE Fron-tiers in Education Conference, Boulder, CO.
Anderson, T. (2003). Getting the mix right again: An updated and theoretical rationale for interaction. International Review of Research in Open and Distance Learning, 4(2), 1–14.
Anderson, T., & Garrison, D. R. (1998). Learning in a networked world: New roles and responsibilities. In C. Gibson (Ed.), Distance learners in higher education (pp. 97–112). Madison, WI: Atwood Publishing.
Arbaugh, J. B. (2000). Virtual classroom characteristics and student satisfaction with online MBA courses. Journal of Management Education, 24(1), 32–54. doi:10.1177/105256290002400104
Aydin, B. (2008). An e-class application in a distance English language teacher training program (DELTT): Turkish learners’ perceptions. Interactive Learning Environ-ments, 16(2), 157–168. doi:10.1080/10494820701343900
Baker, G. (2002). The effects of synchronous collaborative technologies on decision making: A study of virtual teams. Information Resources Management Journal (IRMJ), 15(4), 79–93. doi:10.4018/irmj.2002100106
Bales, R. F. (1950). Interaction process analysis: A method for the study of small groups. Cambridge, MA: Addison-Wesley Press.
Bernard, R. M., Abrami, P. C., Borokhovski, E., Wade, C. A., Tamin, R. M., Surkes, M. A., & Bethel, E. C. (2009). A meta-analysis of three types of interaction treatments in distance education. Review of Education Research, 79(3), 1243–1289.
Cao, Q., Griffin, T. E., & Bai, X. (2009). The importance of synchronous interaction for student satisfaction with course Web sites. Journal of Information Systems Edu-
Examining Interactivity in Synchronous Virtual Classrooms Martin, Parker, and Deale
Vol 13 | No 3 Research Articles June 2012 252
cation, 20(3), 331–339.
Chen, N. S., Ko, H. C., Kinshuk, & Lin, T. (2005). A model for synchronous learning us-ing the internet. Innovations in Education and Teaching International, 42(2), 181–194.
Chou, C. (2002). A comparative content analysis of student interaction in synchronous and asynchronous learning networks. Proceedings of the 35th Hawaii International Conference on System Sciences, 5, 134.2. Retrieved from http://courseweb.sttho-mas.edu/ccchou/triennial/Publications/HICSS35.pdf
Coleman, S. (2012). Why do students learn online? Retrieved from http://www.worldwide-learn.com/education-articles/benefits-of-online-learning.htm
Daniel, J., & Marquis, C. (1988). Interaction and independence: Getting the mix right. In D. Sewart, D. Keegan, & B. Holmberg (Eds.), Distance education: International perspectives (pp. 339–359). London: Routledge.
Denzin, N. (2006). Sociological methods: A sourcebook (5th ed.). New Brunswick, NJ: Transaction.
DeWever, B., Schellens, T., Valcke, M., & Van Keer, H. (2006). Content analysis schemes toanalyze transcripts of online asynchronous discussion groups: A review. Com puters & Education, 46(1), 6–28.
Dillman, D. A. (1999). Mail and Internet surveys: The tailed design method. New York: John Wiley and Sons.
Dirckinck-Holmfield, L., Sorensen, E. K., Ryberg, T., & Buus, L. (2004). A theoretical framework for designing online master communities of practice. In S. Banks et al. (Eds.), Networked learning (pp. 267–73). Lancaster, UK: University of Lancaster.
DuFrene, D. D., Lehman, C. M., Kellermanns, F. W., & Pearson, R. A. (2009). Do business communication technology tools meet learner needs? Business Communication Quarterly, 72(2), 146–162.
Gilbert, L., & Moore, D. R. (1998). Building interactivity into web courses: Tools for social and instructional interaction. Educational Technology, 38(3), 29–35.
Goussal, D. M., & Udrízar Lezcano, M. S. (2003). Synchronous distance learning and vir-tual classrooms: A case study on student expectations and conditioning factors. Australian Journal of Educational Technology, 19(3), 388–404.
Gunawardena, C., Lowe, C., & Anderson, T. (1997). Analysis of a global online debate and the development of an interaction analysis model for examining social construc-tion of knowledge in computer conferencing. Journal of Educational Computing
Examining Interactivity in Synchronous Virtual Classrooms Martin, Parker, and Deale
Vol 13 | No 3 Research Articles June 2012 253
Research, 17(4), 397–431.
Henri, F. (1992). Computer conferencing and content analysis. In A. R. Kaye (Ed.), Col-laborative learning through computer conferencing (pp. 117–136). Heidelberg: Springer..
Hillman, D. C. A, Willis, D. J., & Gunawardena, C. N. (1994). Learner-interface interac-tion in distance education: An extension of contemporary models and strategies for practitioners. American Journal of Distance Education, 8(2), 30–42.
Hirumi, A., & Bermudez, A. (1996). Interactivity, distance education, and instructional sys-tems design converge on the information superhighway. Journal of Research on Computing in Education, 29(1), 1-16.
Hrastinski, S. (2006). Introducing an informal synchronous medium in a distance learning course: How is participation affected? The Internet and Higher Education, 9(2), 117–131.
Kearsley, G. (1995, May). The nature and value of interaction in distance learning. Paper prepared for the Third Distance Education Research Symposium, University Park: Pennsylvania State University.
Kearsley, G. (1998). A guide to online education. Retrieved from http://home.sprynet.eom/~gkearsley/online.htm
Khan, B. H. (2000). Discussion of resources and attributes of the web for the creation of meaningful learning environments. CyberPyschology and Behavior, 3(1), 17–23.
Kvale, S. (1996). Interviews: An introduction to qualitative research interviewing. Thou-sand Oaks, CA: Sage.
LaPointe, D. K., & Gunawardena, C. N. (2004). Developing, testing and refining of a model to understand the relationship between peer interaction and learning out-comes in computer-mediated conferencing. Distance Education, 25(1), 83–106. doi:10.1080/0158791042000212477
Lehner, F., Nösekabel, H., & Lehmann, H. (2003). Wireless e-learning and communication environment. In Z. Maamar, W. Mansoor, and W.-J. van den Heuvel (Eds.), Pro-ceedings of the Workshop at ISMIS ’02, Lyon.
Linebarger, J. M., Scholand, A. J., Ehlen, M. A., & Procopio, M. J. (2005). Benefits of syn-chronous collaboration support for an application-centered analysis team work-ing on complex problems: A case study. Proceedings of the 2005 International ACM SIGGROUP Conference on Supporting Group Work, New York, NY, USA, pp. 51–60.
Examining Interactivity in Synchronous Virtual Classrooms Martin, Parker, and Deale
Vol 13 | No 3 Research Articles June 2012 254
Lockhorst, D., Admiraal, W., Pilot, A., & Veen, W. (2003). Analysis of electronic commu-nication using 5 different perspectives. Paper presented at ORD 2003, Heerlen, Netherlands.
Mandernach, B. J. (2005). A faculty evaluation model for online instructors: Mentoring and evaluation in the online classroom. Online Journal of Distance Learning Ad-ministration, 8(3), 1–10.
Marshall, C., & Rossman, G. B. (1989). Designing qualitative research. Newbury Park, CA: Sage.
Martyn, M. A. (2005). Using interaction in online discussion boards. Educause Quarterly, 4, 61–62.
McBrien, J. L., & Jones, P. (2009). Virtual spaces: Employing a synchronous online class-room to facilitate student engagement in online learning. International Review of Research in Open and Distance Learning, 10(3). Retrieved from http://www.irrodl.org/index.php/irrodl/article/view/605/1264
Merriam, S. (1998). Qualitative research and case study applications in education. San Francisco: Jossey-Bass.
Miles, M. B., & Huberman, A. M. (1994). An expanded sourcebook: Qualitative data analy-sis. Thousand Oaks, CA: Sage.
Miller, W. W., & Webster, J. (1997, December). A comparison of interaction needs and per-formances of distance learners in synchronous and a synchronous classes. Paper presented at the American Vocational Association Convention, Las Vegas, NV.
Moore, M. J. (1993). Three types of interaction. In K. Harry, M. John, & D. Keegan (Eds.), Distance education theory (pp. 19–24). New York: Routledge.
Motteram, G. (2001). The role of synchronous communication in fully distance education. Australian Journal of Educational Technology, 17(2), 131–149.
Northrup, P. (2001). A framework for designing interactivity into web-based instruction. Educational Technology, 41(2), 31–39.
Repman, J., Zinskie, C., & Carlson, R. (2005). Effective use of CMC tools in interactive on-line learning. Computers in the Schools, 22(1–2), 57–69.
Roblyer, M., & Ekhaml, L. (2000). How interactive are YOUR distance courses? A rubric for assessing interaction in distance learning. Online Journal of Distance Learning Administration. Retrieved from http://www.westga.edu/distance/roblyer32.html
Park, Y. J., & Bonk, C. J. (2007). Is life a breeze?: A case study for promoting synchronous learning in a blended graduate course. Journal of Online Learning and Teaching,
Examining Interactivity in Synchronous Virtual Classrooms Martin, Parker, and Deale
Vol 13 | No 3 Research Articles June 2012 255
3(3), 307–323.
Pittinsky, M., & Chase, B. (2000). Quality on the line: Benchmarks for success in internet–based distance education. Washington, DC: Institute for Higher Education Policy.
Scholl, J., McCarthy, J., & Harr, R. (2006). A comparison of chat and audio in media richen-vironments. In Proceedings of CSCW ’06. ACM Press, 323–332.
Schullo, S. (2005). An analysis of pedagogical strategies: Using synchronous web-based course systems in the online classroom (Unpublished dissertation). University of South Florida.
Shi, S. (2010). Teacher moderating and student engagement in synchronous computer con-ferences. Journal of Online Learning and Teaching, 6(2). Retrieved from http://jolt.merlot.org/vol6no2/shi_0610.htm
Stake, R. E. (2006). Multiple case study analysis. New York: Guilford Press.
Thurmond, V. A., & Wambach, K. (2004). Understanding interactions in distance educa-tion: A review of the literature. International Journal of Instructional Technol-ogy and Distance Learning, 1(1). Retrieved from http://itdl.org/journal/Jan_04/article02.htm
Van Raaij, E. M., & Schepers, J. L. (2008). The acceptance and use of a virtual learning environment in China. Computers & Education, 50(3), 838–852.
Veldhuis-Diermanse, A. E. (2002). CSCLearning? Participation, learning activities and knowledge construction in computer-supported collaborative learning in higher education (Unpublished doctoral dissertation). Wageningen Universiteit, Neder-land.
Verneil, M., & Berge, Z. (2000). Going online: Guidelines for faculty in higher education. Educational Technology Review, 6(3), 13–18.
Wagner, E. D. (1994). In support of a functional definition of interaction. American Jour-nal of Distance Education, 8(2), 6–29.
Wang, Y. (2004). Supporting synchronous distance language learning with desktop video-conferencing. Language Learning & Technology, 8(3), 90–121.
Wimba (2011). Wimba Classroom 6.1. Retrieved online from http://www.wimba.com/products/wimba_classroom/
Yin, R. K. (2003). Case study research: Design and methods. Thousand Oaks, CA: Sage.
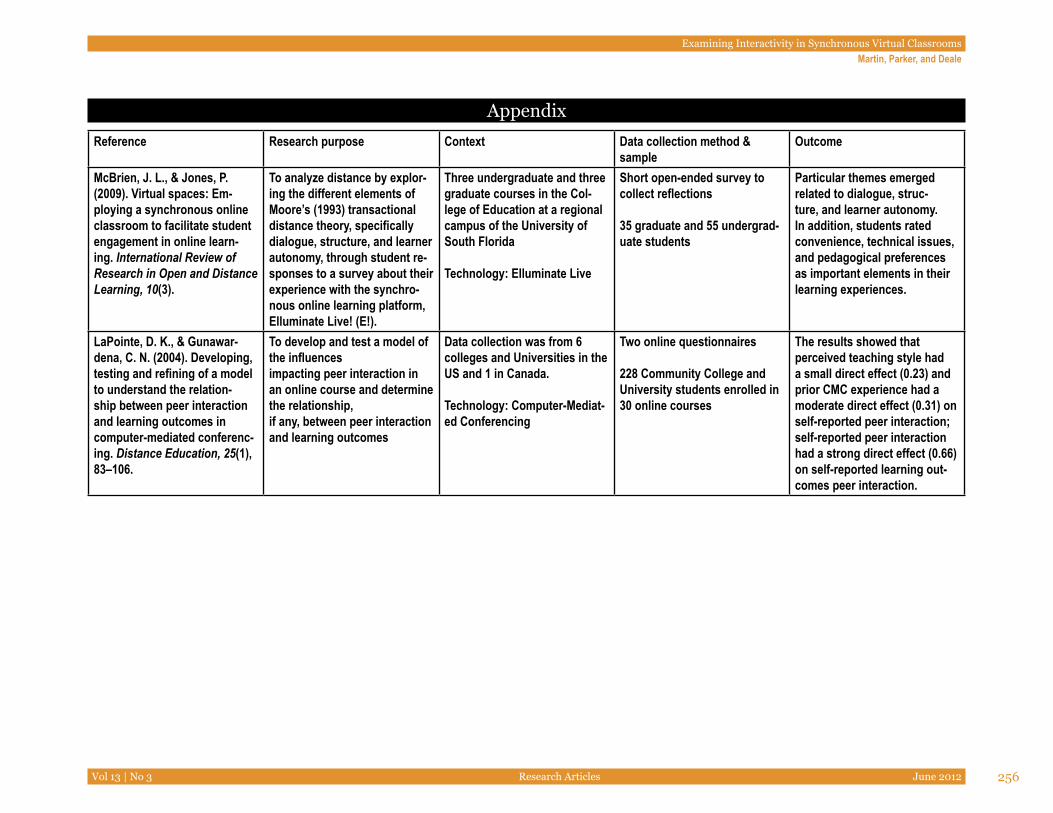
Examining Interactivity in Synchronous Virtual ClassroomsMartin, Parker, and Deale
Vol 13 | No 3 Research Articles June 2012 256
AppendixReference
Research purpose Context Data collection method & sample
Outcome
McBrien, J. L., & Jones, P. (2009). Virtual spaces: Em-ploying a synchronous online classroom to facilitate student engagement in online learn-ing. International Review of Research in Open and Distance Learning, 10(3).
To analyze distance by explor-ing the different elements of Moore’s (1993) transactional distance theory, specifically dialogue, structure, and learner autonomy, through student re-sponses to a survey about their experience with the synchro-nous online learning platform, Elluminate Live! (E!).
Three undergraduate and three graduate courses in the Col-lege of Education at a regional campus of the University of South Florida
Technology: Elluminate Live
Short open-ended survey to collect reflections
35 graduate and 55 undergrad-uate students
Particular themes emerged related to dialogue, struc-ture, and learner autonomy. In addition, students rated convenience, technical issues, and pedagogical preferences as important elements in their learning experiences.
LaPointe, D. K., & Gunawar-dena, C. N. (2004). Developing, testing and refining of a model to understand the relation-ship between peer interaction and learning outcomes in computer-mediated conferenc-ing. Distance Education, 25(1), 83–106.
To develop and test a model of the influencesimpacting peer interaction in an online course and determine the relationship,if any, between peer interaction and learning outcomes
Data collection was from 6 colleges and Universities in the US and 1 in Canada.
Technology: Computer-Mediat-ed Conferencing
Two online questionnaires
228 Community College and University students enrolled in 30 online courses
The results showed that perceived teaching style had a small direct effect (0.23) and prior CMC experience had a moderate direct effect (0.31) on self-reported peer interaction; self-reported peer interaction had a strong direct effect (0.66) on self-reported learning out-comes peer interaction.
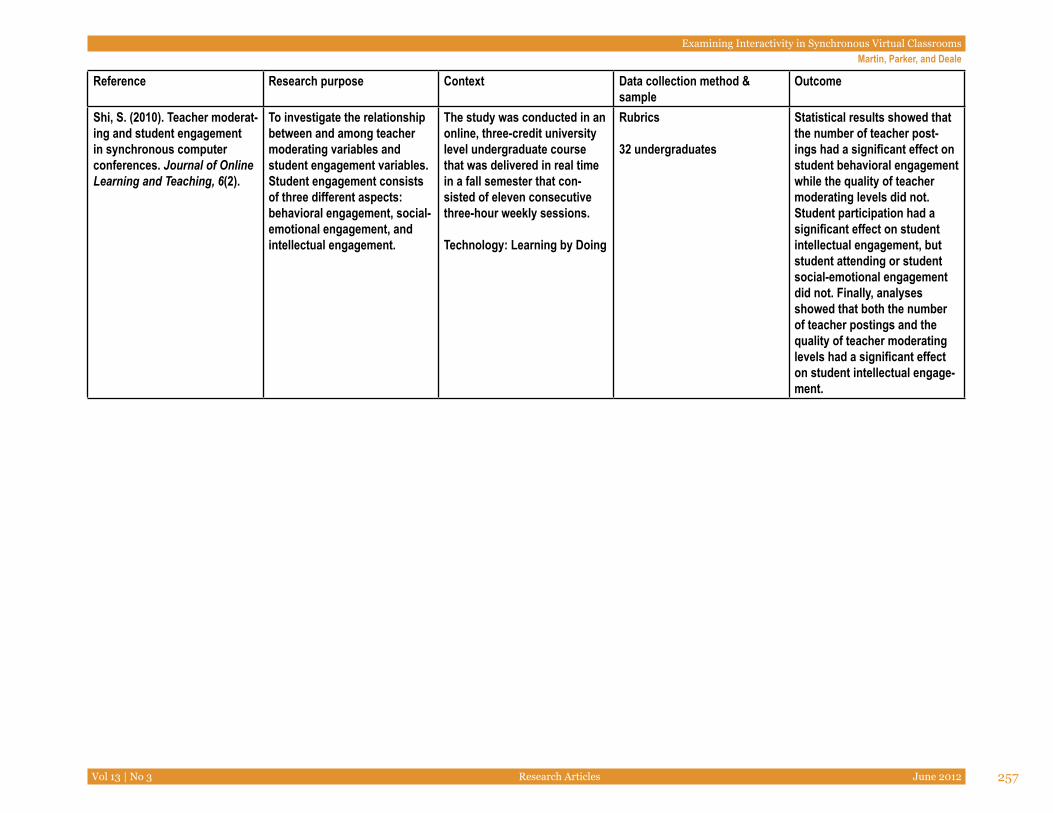
Examining Interactivity in Synchronous Virtual ClassroomsMartin, Parker, and Deale
Vol 13 | No 3 Research Articles June 2012 257
Reference
Research purpose Context Data collection method & sample
Outcome
Shi, S. (2010). Teacher moderat-ing and student engagement in synchronous computer conferences. Journal of Online Learning and Teaching, 6(2).
To investigate the relationship between and among teacher moderating variables and student engagement variables. Student engagement consists of three different aspects: behavioral engagement, social-emotional engagement, and intellectual engagement.
The study was conducted in an online, three-credit university level undergraduate course that was delivered in real time in a fall semester that con-sisted of eleven consecutive three-hour weekly sessions.
Technology: Learning by Doing
Rubrics
32 undergraduates
Statistical results showed that the number of teacher post-ings had a significant effect on student behavioral engagement while the quality of teacher moderating levels did not. Student participation had a significant effect on student intellectual engagement, but student attending or student social-emotional engagement did not. Finally, analyses showed that both the number of teacher postings and the quality of teacher moderating levels had a significant effect on student intellectual engage-ment.
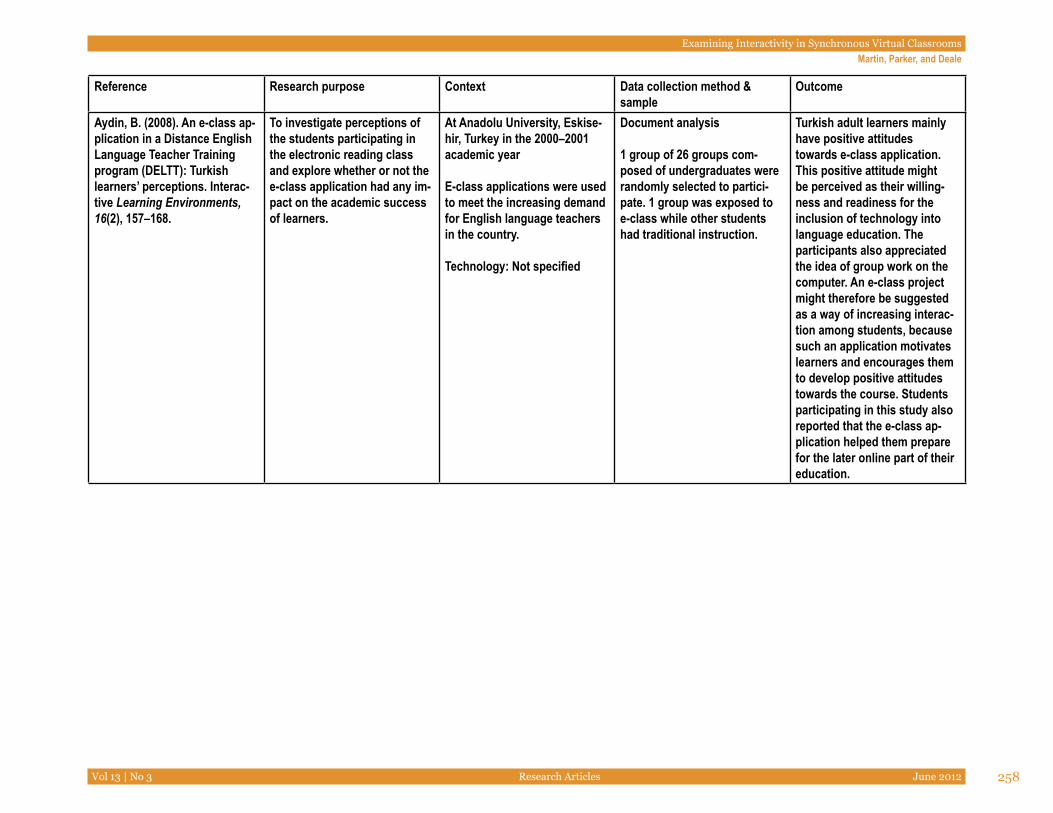
Examining Interactivity in Synchronous Virtual ClassroomsMartin, Parker, and Deale
Vol 13 | No 3 Research Articles June 2012 258
Reference
Research purpose Context Data collection method & sample
Outcome
Aydin, B. (2008). An e-class ap-plication in a Distance English Language Teacher Training program (DELTT): Turkish learners’ perceptions. Interac-tive Learning Environments, 16(2), 157–168.
To investigate perceptions of the students participating in the electronic reading class and explore whether or not the e-class application had any im-pact on the academic success of learners.
At Anadolu University, Eskise-hir, Turkey in the 2000–2001 academic year
E-class applications were used to meet the increasing demand for English language teachers in the country.
Technology: Not specified
Document analysis
1 group of 26 groups com-posed of undergraduates were randomly selected to partici-pate. 1 group was exposed to e-class while other students had traditional instruction.
Turkish adult learners mainly have positive attitudes towards e-class application. This positive attitude might be perceived as their willing-ness and readiness for the inclusion of technology into language education. The participants also appreciated the idea of group work on the computer. An e-class project might therefore be suggested as a way of increasing interac-tion among students, because such an application motivates learners and encourages them to develop positive attitudes towards the course. Students participating in this study also reported that the e-class ap-plication helped them prepare for the later online part of their education.
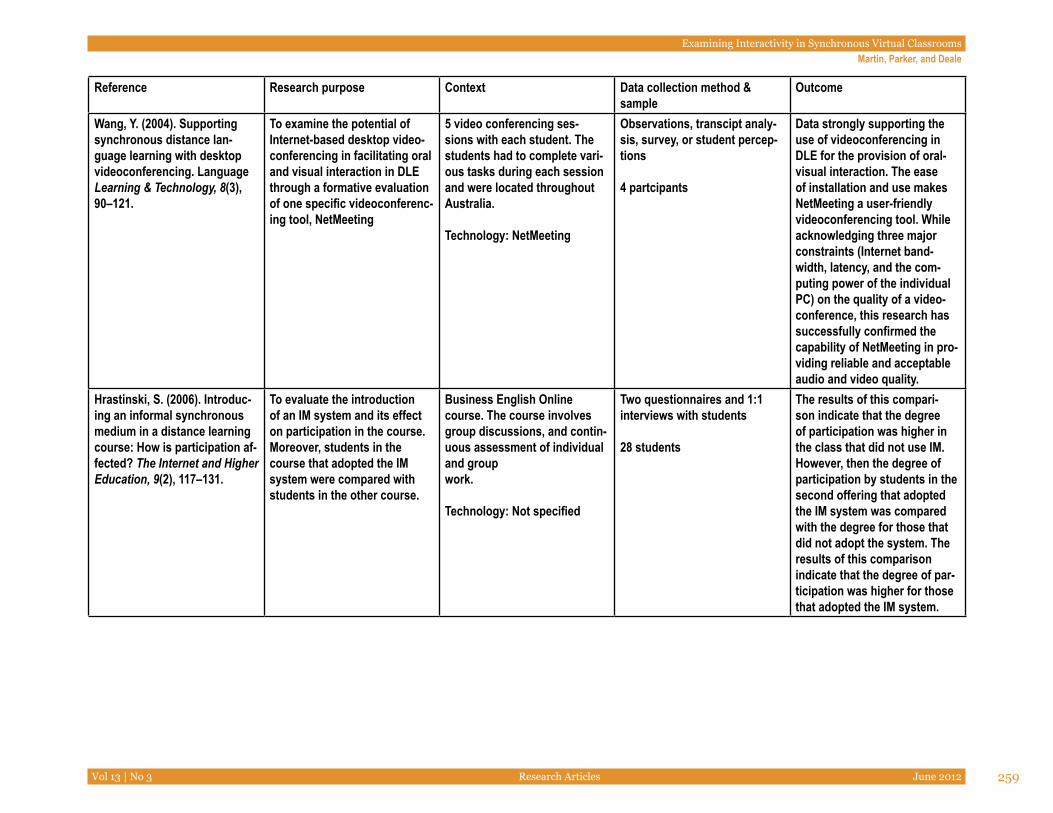
Examining Interactivity in Synchronous Virtual ClassroomsMartin, Parker, and Deale
Vol 13 | No 3 Research Articles June 2012 259
Reference
Research purpose Context Data collection method & sample
Outcome
Wang, Y. (2004). Supporting synchronous distance lan-guage learning with desktop videoconferencing. Language Learning & Technology, 8(3), 90–121.
To examine the potential of Internet-based desktop video-conferencing in facilitating oral and visual interaction in DLE through a formative evaluation of one specific videoconferenc-ing tool, NetMeeting
5 video conferencing ses-sions with each student. The students had to complete vari-ous tasks during each session and were located throughout Australia.
Technology: NetMeeting
Observations, transcipt analy-sis, survey, or student percep-tions
4 partcipants
Data strongly supporting the use of videoconferencing in DLE for the provision of oral-visual interaction. The ease of installation and use makes NetMeeting a user-friendly videoconferencing tool. While acknowledging three major constraints (Internet band-width, latency, and the com-puting power of the individual PC) on the quality of a video-conference, this research has successfully confirmed the capability of NetMeeting in pro-viding reliable and acceptable audio and video quality.
Hrastinski, S. (2006). Introduc-ing an informal synchronous medium in a distance learning course: How is participation af-fected? The Internet and Higher Education, 9(2), 117–131.
To evaluate the introduction of an IM system and its effect on participation in the course. Moreover, students in the course that adopted the IM system were compared with students in the other course.
Business English Online course. The course involves group discussions, and contin-uous assessment of individual and group work.
Technology: Not specified
Two questionnaires and 1:1 interviews with students
28 students
The results of this compari-son indicate that the degree of participation was higher in the class that did not use IM. However, then the degree of participation by students in the second offering that adopted the IM system was compared with the degree for those that did not adopt the system. The results of this comparison indicate that the degree of par-ticipation was higher for those that adopted the IM system.
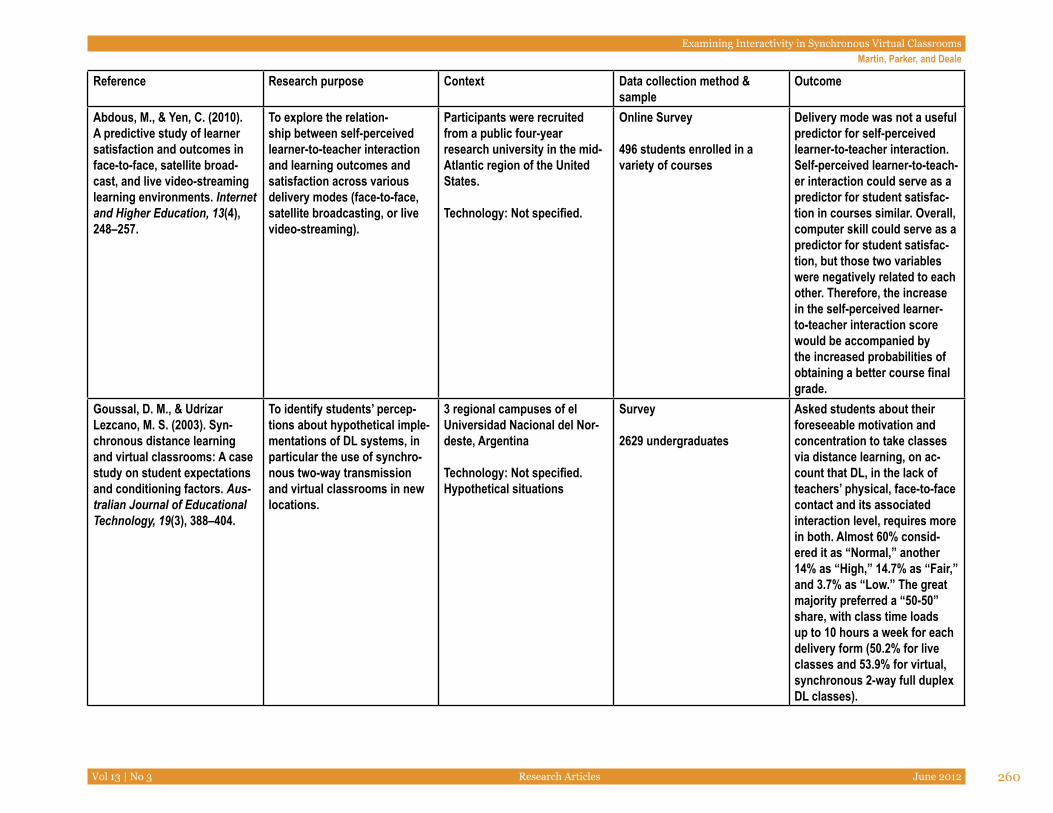
Examining Interactivity in Synchronous Virtual ClassroomsMartin, Parker, and Deale
Vol 13 | No 3 Research Articles June 2012 260
Reference
Research purpose Context Data collection method & sample
Outcome
Abdous, M., & Yen, C. (2010). A predictive study of learner satisfaction and outcomes in face-to-face, satellite broad-cast, and live video-streaming learning environments. Internet and Higher Education, 13(4), 248–257.
To explore the relation-ship between self-perceived learner-to-teacher interaction and learning outcomes and satisfaction across various delivery modes (face-to-face, satellite broadcasting, or live video-streaming).
Participants were recruited from a public four-yearresearch university in the mid-Atlantic region of the United States.
Technology: Not specified.
Online Survey
496 students enrolled in a variety of courses
Delivery mode was not a useful predictor for self-perceived learner-to-teacher interaction. Self-perceived learner-to-teach-er interaction could serve as a predictor for student satisfac-tion in courses similar. Overall, computer skill could serve as a predictor for student satisfac-tion, but those two variables were negatively related to each other. Therefore, the increase in the self-perceived learner-to-teacher interaction score would be accompanied by the increased probabilities of obtaining a better course final grade.
Goussal, D. M., & Udrízar Lezcano, M. S. (2003). Syn-chronous distance learning and virtual classrooms: A case study on student expectations and conditioning factors. Aus-tralian Journal of Educational Technology, 19(3), 388–404.
To identify students’ percep-tions about hypothetical imple-mentations of DL systems, in particular the use of synchro-nous two-way transmission and virtual classrooms in new locations.
3 regional campuses of el Universidad Nacional del Nor-deste, Argentina
Technology: Not specified. Hypothetical situations
Survey
2629 undergraduates
Asked students about their foreseeable motivation and concentration to take classes via distance learning, on ac-count that DL, in the lack of teachers’ physical, face-to-face contact and its associated interaction level, requires more in both. Almost 60% consid-ered it as “Normal,” another 14% as “High,” 14.7% as “Fair,” and 3.7% as “Low.” The great majority preferred a “50-50” share, with class time loads up to 10 hours a week for each delivery form (50.2% for live classes and 53.9% for virtual, synchronous 2-way full duplex DL classes).

Examining Interactivity in Synchronous Virtual Classrooms Martin, Parker, and Deale
Vol 13 | No 3 Research Articles June 2012 261
A Preliminary Examination of the Cost Savings and Learning Impacts of Using Open Textbooks in Middle and High School Science Classes
AbstractProponents of open educational resources claim that significant cost savings are possible when open textbooks displace traditional textbooks in the classroom. Over a period of two years, we worked with 20 middle and high school science teachers (collectively teaching approximately 3,900 students) who adopted open textbooks to understand the process and determine the overall cost of such an adoption. The teachers deployed open textbooks in multiple ways. Some of these methods cost more than traditional textbooks; however, we did identify and implement a successful model of open textbook adoption that reduces costs by over 50% compared to the cost of adopting traditional textbooks. In addition, we examined the standardized test scores of students using the open textbooks and found no apparent differences in the results of students who used open textbooks compared with previous years when the same teachers’ students used traditional textbooks. However, giv-en the limited sample of participating teachers, further investigation is needed.
Keywords: Cost; open educational resources; remix; reuse; open textbooks; electronic textbooks; open access
IntroductionPublic education budgets continue to shrink while the public’s expectations for the perfor-mance of its educational institutes continue to increase. This tension places many school districts in a difficult position as they attempt to find ways to do more with less (Odden et al., 2007). Over the last two decades, textbooks and other educational resources have re-peatedly undergone scrutiny in an effort to determine whether the amount of learning they facilitate justifies their costs (Card & Krueger, 1996; Chaudhary, 2009; Hanushek, 2002). Open education resources (OER), educational materials that are available at no cost and
David Wiley and John Levi Hilton IIIBrigham Young University, USA
Shelley Ellington and Tiffany Hall
A Preliminary Examination of the Costs Savings and Learning Impacts of Using Open Textbooks in Middle and High School Science Classes
Wiley, Hilton, Ellington, and Hall
Vol 13 | No 3 Research Articles June 2012 263
under open copyright licenses or in the public domain, offer an alternative to traditional textbooks and resources. According to the Organization for Economic Co-operation and Development (OECD), “the definition of OER currently most often used is ‘digitized mate-rials offered freely and openly for educators, students, and self-learners to use and reuse for teaching, learning, and research’” (OECD, 2007, p.10). In addition to potentially saving school and district resources, OER can also be adapted to individual circumstances, printed on demand or used in digital formats, and leveraged to enable new pedagogical practices.
Background and LiteratureDespite over a decade of research, development, foundation funding, and other efforts, open educational resources (OER) have yet to show a discernable impact on public education in the United States. Open education resources are often used in distance education programs in a supplementary fashion alongside traditionally copyrighted materials (Butcher & Wil-son-Strydom, 2008). However, open textbooks can also be used in classrooms to replace expensive, proprietary textbooks. Several teachers in higher-education settings have exam-ined the possibility of substituting open textbooks for proprietary textbooks (e.g., Baker, 2008; Baker, Thierstein, Fletcher, Kaur, & Emmons, 2009), but K–12 education has been slower to respond to the open textbook opportunity. This delay is partly attributable to text-book selection processes that are typically slow and bureaucratic (Armstrong & Bray, 1986; Watt, 2009; Frydenberg, Matkin, & Center, 2007).
As public education budgets have tightened, open educational resources have become part of the educational conversation as a potential source of cost savings (Odden et al., 2007). However, in addition to bureaucratic adoption hurdles, educators lack appropriate re-search data to support a decision to use or reject open textbooks. But a small and growing body of research about OER effectiveness does exist. For example, OER allow teachers and students to remix content in locally meaningful ways (D’Antoni, 2009), to share a variety of types of learning resources (Downes, 2007), and to enable the best resources for teaching a specific topic to be more easily found (Gurrell & Wiley, 2008). OER have received consider-able attention in higher education (Baker, 2005; Koch, 2006), and researchers are exam-ining the question of how students are receiving open textbooks and how these textbooks affect student learning (Frith, 2009). Petrides, Jimes, Middleton-Detzner, Walling, and Weiss (2011) have begun a study examining how using an open textbook affects teacher and student experience. Nevertheless, no existing research empirically validates the arguments that (1) open educational resources can save K–12 public schools money, or (2) that open educational resources can promote deeper learning for students in K–12 public schools.
Curriculum materials are an important part of student learning and represent a significant, recurring cost to public schools (Ansari, 2004). In the United States, core high-school sci-ence textbooks (without supplemental materials) from commercial publishers available on Amazon.com cost $80–$120 per copy, and teacher editions typically cost over $100 per copy. More problematically, the economic difficulties presented by the rising cost of text-books can translate directly into pedagogical challenges. In the best cases, where schools/
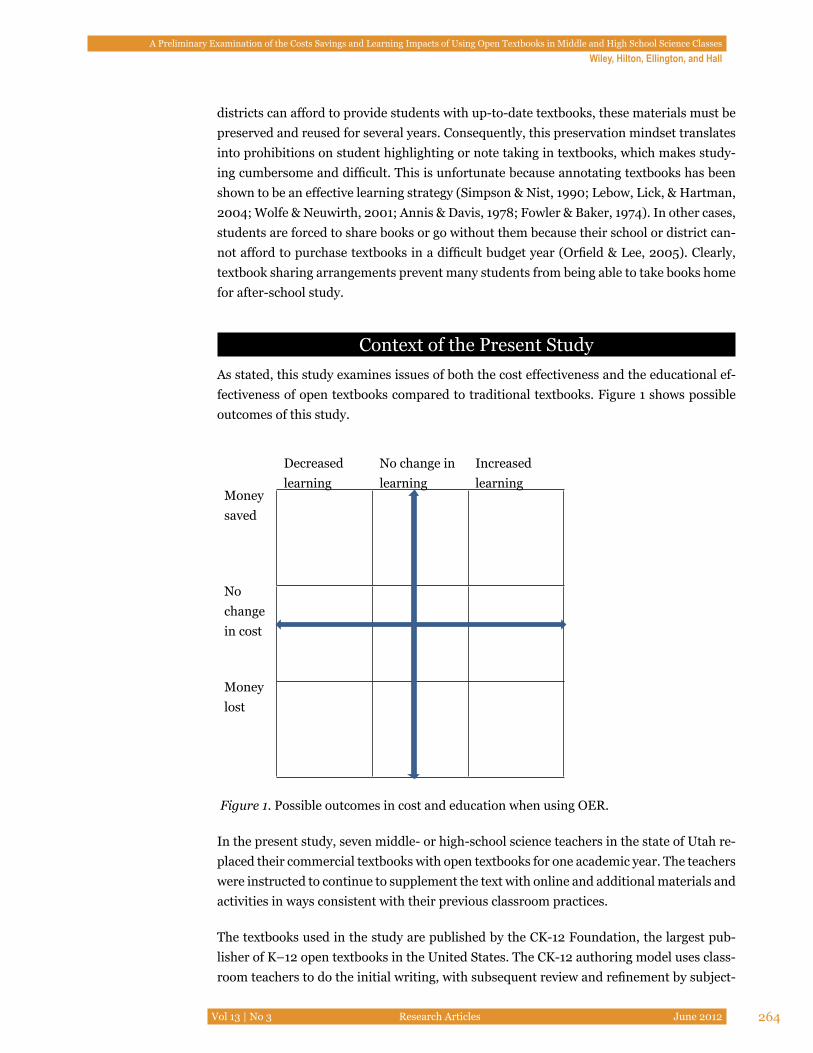
A Preliminary Examination of the Costs Savings and Learning Impacts of Using Open Textbooks in Middle and High School Science Classes
Wiley, Hilton, Ellington, and Hall
Vol 13 | No 3 Research Articles June 2012 264
districts can afford to provide students with up-to-date textbooks, these materials must be preserved and reused for several years. Consequently, this preservation mindset translates into prohibitions on student highlighting or note taking in textbooks, which makes study-ing cumbersome and difficult. This is unfortunate because annotating textbooks has been shown to be an effective learning strategy (Simpson & Nist, 1990; Lebow, Lick, & Hartman, 2004; Wolfe & Neuwirth, 2001; Annis & Davis, 1978; Fowler & Baker, 1974). In other cases, students are forced to share books or go without them because their school or district can-not afford to purchase textbooks in a difficult budget year (Orfield & Lee, 2005). Clearly, textbook sharing arrangements prevent many students from being able to take books home for after-school study.
Context of the Present StudyAs stated, this study examines issues of both the cost effectiveness and the educational ef-fectiveness of open textbooks compared to traditional textbooks. Figure 1 shows possible outcomes of this study.
Decreased learning
No change in learning
Increased learning
Money saved
No change in cost
Money lost
Figure 1. Possible outcomes in cost and education when using OER.
In the present study, seven middle- or high-school science teachers in the state of Utah re-placed their commercial textbooks with open textbooks for one academic year. The teachers were instructed to continue to supplement the text with online and additional materials and activities in ways consistent with their previous classroom practices.
The textbooks used in the study are published by the CK-12 Foundation, the largest pub-lisher of K–12 open textbooks in the United States. The CK-12 authoring model uses class-room teachers to do the initial writing, with subsequent review and refinement by subject-
A Preliminary Examination of the Costs Savings and Learning Impacts of Using Open Textbooks in Middle and High School Science Classes
Wiley, Hilton, Ellington, and Hall
Vol 13 | No 3 Research Articles June 2012 265
matter experts (e.g., university faculty with PhDs in the content areas).
In this article, we report three key findings from the study. First, we describe the costs of printing books during the 2010–2011 school year. Second, we explain how we applied les-sons learned from the 2010–2011 experience that significantly reduced the costs of print-ing books for the 2011–2012 school year. Finally, we discuss how students who used the open textbooks performed on the state’s standardized test for the 2011–2012 school year compared with students who studied the same subject under the same teachers in previous years using commercial textbooks.
Participants Teacher participants were drawn from three of the largest public-school districts in Utah. These districts educate about one fourth of all Utah’s school children (approximately 120,000) and employ over 4,000 teachers. Each teacher customized his/her open textbook to a different degree (editing, adding, and removing material), which drastically impacted the costs of the books, as described below. As instructed, teachers continued to supplement the open textbooks with additional resources and activities in exactly the same manner that they have historically supplemented traditional textbooks.
Approximately 1,200 students used open textbooks during the 2010–2011 portion of this study. Most used printed versions of the open textbooks, while approximately 300 used online versions of the books on netbooks or iPads.
At the beginning of the study, researchers and representatives from CK-12 met with par-ticipating teachers and provided one day of training regarding open educational resources, CK-12 textbooks, and the technical platform provided by CK-12 for adapting books; another full day of training was dedicated to hands-on practice in adapting textbooks with support provided directly by CK-12 personnel and researchers.
Methodology: 2010–2011In order to determine whether a cost savings was associated with using open textbooks, we compared the price of adopting open textbooks to the price of adopting traditional text-books. Although significant effort can go into locating, vetting, and selecting open text-books, there is also significant effort put into locating, vetting, and selecting traditional textbooks. Consequently, we do not factor these costs into our comparison.
Because open textbooks are designed to be adapted and modified for the local context in which they are used, the time spent in the adaptation process can be a significant factor in the cost of adopting such textbooks. Consequently, we explicitly accounted for the time teachers spent modifying open textbooks when comparing these costs to the market price of a comparable traditional textbook. The amount of time participating teachers spent modi-fying the open textbooks varied widely (see Table 1).

A Preliminary Examination of the Costs Savings and Learning Impacts of Using Open Textbooks in Middle and High School Science Classes
Wiley, Hilton, Ellington, and Hall
Vol 13 | No 3 Research Articles June 2012 266
Table 1
Summary of Teacher Efforts to Modify Open Textbooks 2010–2011
Teacher identifier% of book modified
(self-report)Hours spent modi-fying (self-report)
Estimated modifi-cation cost
Teacher A 10% 20 $600.00
Teacher B 50% 4 $120.00
Teacher C 40% 24 $720.00
Teacher D 1% 6 $180.00
Teacher E 0% 0 $0.00
Teacher F 75% 60 $1,800.00
Teacher G 17% 10 $300.00 The reader may note that the amount of time spent does not correlate with the amount of modification (e.g., Teacher B spent 4 hours modifying 50% of the book, but Teacher C spent 24 hours modifying 40% of the book). This is true because some quick modifications can result in large changes to a book (e.g., removing chapters), while other changes that require a significant investment of time may only result in small percentage modifications (e.g., rewriting an example). Teacher E reported no modification because s/he adopted the modified textbook adapted by Teacher F. Teacher D made essentially no changes to his/her book.
Once teachers had modified and adapted the textbooks according to their needs, CK-12 personnel reviewed the textbooks for clarity and accuracy. (Because CK-12 provides these and other services freely to everyone, we do not factor these costs into our comparison.) Each teacher then chose the way he/she wanted the textbook to be bound and distributed to his/her students. Of the seven teachers, three (Teachers B, C, and D) chose a loose-leaf option (printed on three-hole-punched paper and assembled in a three-ring binder), two (Teachers E and F) chose to print with a perfect-bind option (a print-on-demand, paper-back format), and two chose to go completely digital with no printing.
In calculating the total cost of implementing the open textbooks in classrooms, we (1) summed the money paid to teachers for participating in professional development/training activities, (2) estimated the monetary value of the unpaid time teachers spent making their adaptations (at a rate of $30 per hour), and (3) added these to the printing costs (including printing, binding, tax, and shipping or delivery costs). In calculating the total cost of tradi-tional textbooks, we obtained from the school district offices that handle textbook selection and purchasing the amounts that schools in our study typically spend on comparable tra-ditional textbooks. While shipping and other costs are certainly incurred when traditional textbooks are purchased, we do not account for these costs. Consequently, the cost of tradi-
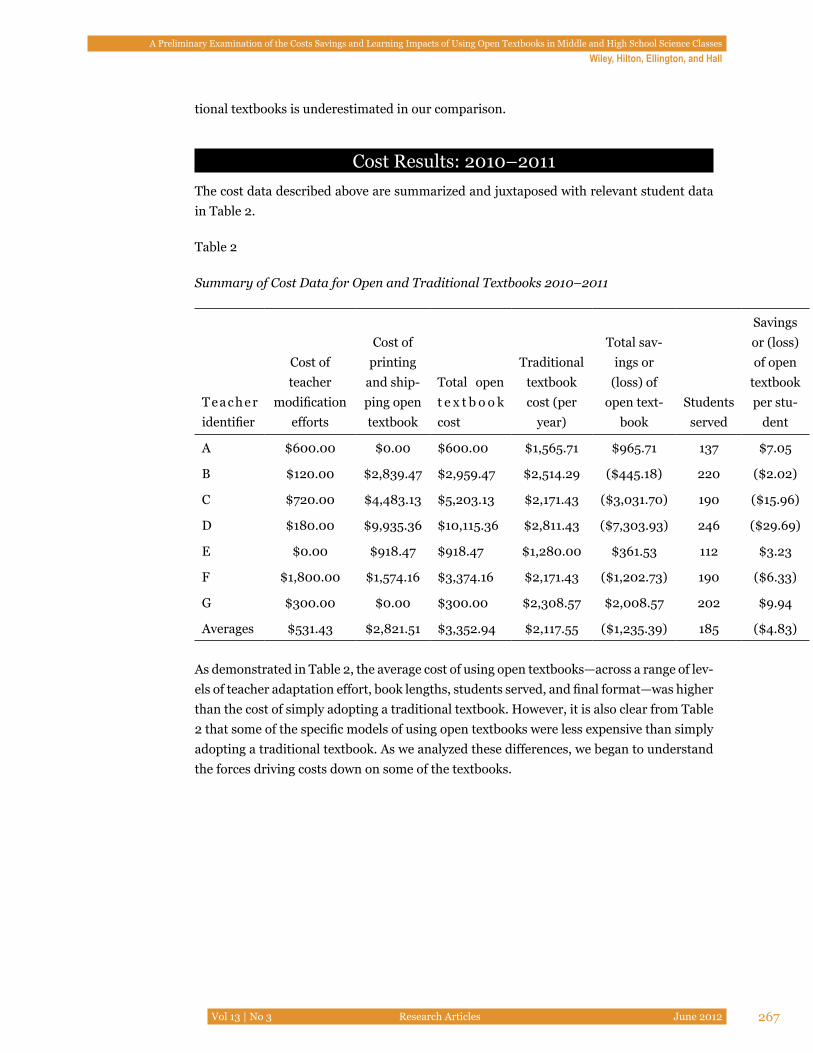
A Preliminary Examination of the Costs Savings and Learning Impacts of Using Open Textbooks in Middle and High School Science Classes
Wiley, Hilton, Ellington, and Hall
Vol 13 | No 3 Research Articles June 2012 267
tional textbooks is underestimated in our comparison.
Cost Results: 2010–2011The cost data described above are summarized and juxtaposed with relevant student data in Table 2.
Table 2
Summary of Cost Data for Open and Traditional Textbooks 2010–2011
T e a c h e r identifier
Cost of teacher
modification efforts
Cost of printing
and ship-ping open textbook
Total open t e x t b o o k cost
Traditional textbook cost (per
year)
Total sav-ings or
(loss) of open text-
bookStudents
served
Savings or (loss) of open
textbook per stu-
dent
A $600.00 $0.00 $600.00 $1,565.71 $965.71 137 $7.05
B $120.00 $2,839.47 $2,959.47 $2,514.29 ($445.18) 220 ($2.02)
C $720.00 $4,483.13 $5,203.13 $2,171.43 ($3,031.70) 190 ($15.96)
D $180.00 $9,935.36 $10,115.36 $2,811.43 ($7,303.93) 246 ($29.69)
E $0.00 $918.47 $918.47 $1,280.00 $361.53 112 $3.23
F $1,800.00 $1,574.16 $3,374.16 $2,171.43 ($1,202.73) 190 ($6.33)
G $300.00 $0.00 $300.00 $2,308.57 $2,008.57 202 $9.94
Averages $531.43 $2,821.51 $3,352.94 $2,117.55 ($1,235.39) 185 ($4.83)
As demonstrated in Table 2, the average cost of using open textbooks—across a range of lev-els of teacher adaptation effort, book lengths, students served, and final format—was higher than the cost of simply adopting a traditional textbook. However, it is also clear from Table 2 that some of the specific models of using open textbooks were less expensive than simply adopting a traditional textbook. As we analyzed these differences, we began to understand the forces driving costs down on some of the textbooks.
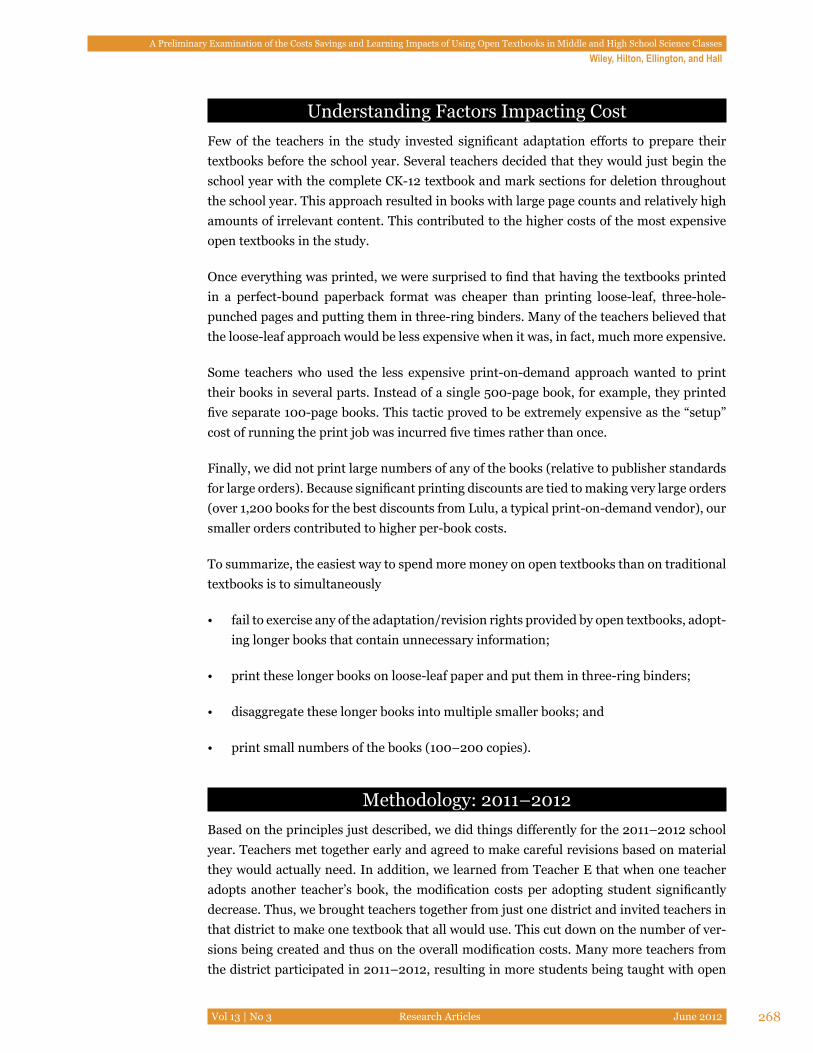
A Preliminary Examination of the Costs Savings and Learning Impacts of Using Open Textbooks in Middle and High School Science Classes
Wiley, Hilton, Ellington, and Hall
Vol 13 | No 3 Research Articles June 2012 268
Understanding Factors Impacting CostFew of the teachers in the study invested significant adaptation efforts to prepare their textbooks before the school year. Several teachers decided that they would just begin the school year with the complete CK-12 textbook and mark sections for deletion throughout the school year. This approach resulted in books with large page counts and relatively high amounts of irrelevant content. This contributed to the higher costs of the most expensive open textbooks in the study.
Once everything was printed, we were surprised to find that having the textbooks printed in a perfect-bound paperback format was cheaper than printing loose-leaf, three-hole-punched pages and putting them in three-ring binders. Many of the teachers believed that the loose-leaf approach would be less expensive when it was, in fact, much more expensive.
Some teachers who used the less expensive print-on-demand approach wanted to print their books in several parts. Instead of a single 500-page book, for example, they printed five separate 100-page books. This tactic proved to be extremely expensive as the “setup” cost of running the print job was incurred five times rather than once.
Finally, we did not print large numbers of any of the books (relative to publisher standards for large orders). Because significant printing discounts are tied to making very large orders (over 1,200 books for the best discounts from Lulu, a typical print-on-demand vendor), our smaller orders contributed to higher per-book costs.
To summarize, the easiest way to spend more money on open textbooks than on traditional textbooks is to simultaneously
• fail to exercise any of the adaptation/revision rights provided by open textbooks, adopt-ing longer books that contain unnecessary information;
• print these longer books on loose-leaf paper and put them in three-ring binders;
• disaggregate these longer books into multiple smaller books; and
• print small numbers of the books (100–200 copies).
Methodology: 2011–2012Based on the principles just described, we did things differently for the 2011–2012 school year. Teachers met together early and agreed to make careful revisions based on material they would actually need. In addition, we learned from Teacher E that when one teacher adopts another teacher’s book, the modification costs per adopting student significantly decrease. Thus, we brought teachers together from just one district and invited teachers in that district to make one textbook that all would use. This cut down on the number of ver-sions being created and thus on the overall modification costs. Many more teachers from the district participated in 2011–2012, resulting in more students being taught with open
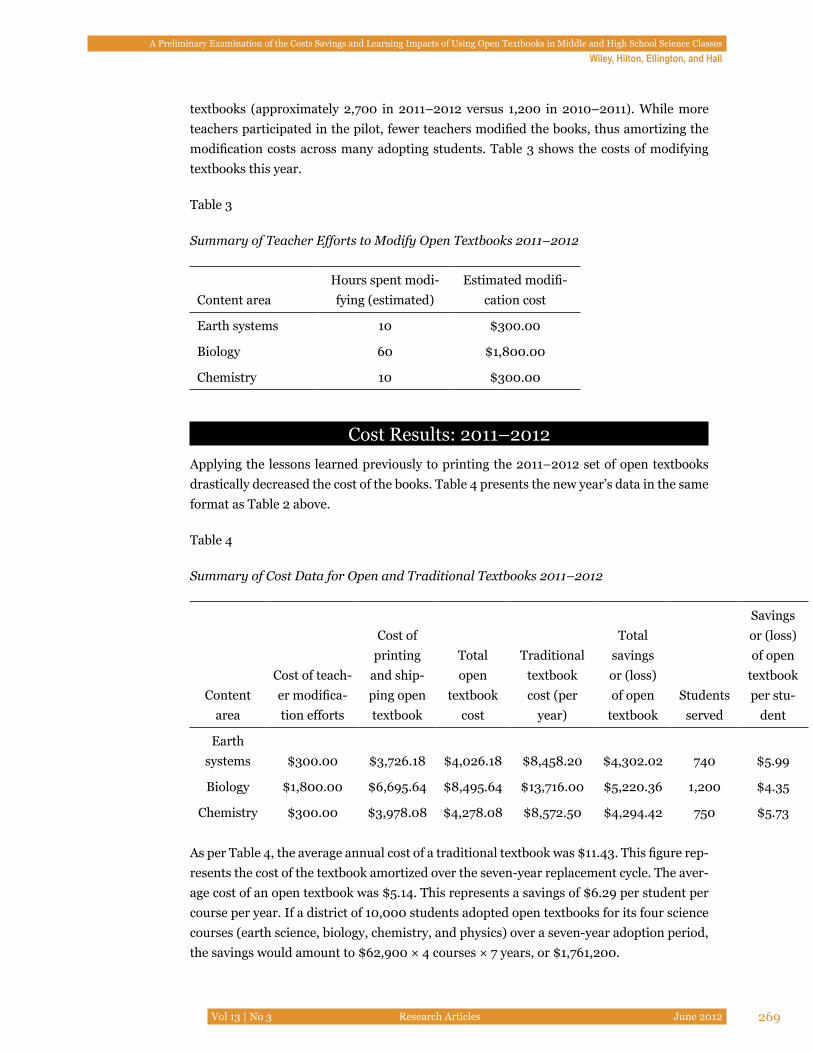
A Preliminary Examination of the Costs Savings and Learning Impacts of Using Open Textbooks in Middle and High School Science Classes
Wiley, Hilton, Ellington, and Hall
Vol 13 | No 3 Research Articles June 2012 269
textbooks (approximately 2,700 in 2011–2012 versus 1,200 in 2010–2011). While more teachers participated in the pilot, fewer teachers modified the books, thus amortizing the modification costs across many adopting students. Table 3 shows the costs of modifying textbooks this year.
Table 3
Summary of Teacher Efforts to Modify Open Textbooks 2011–2012
Content areaHours spent modi-fying (estimated)
Estimated modifi-cation cost
Earth systems 10 $300.00
Biology 60 $1,800.00
Chemistry 10 $300.00
Cost Results: 2011–2012Applying the lessons learned previously to printing the 2011–2012 set of open textbooks drastically decreased the cost of the books. Table 4 presents the new year’s data in the same format as Table 2 above.
Table 4
Summary of Cost Data for Open and Traditional Textbooks 2011–2012
Content area
Cost of teach-er modifica-tion efforts
Cost of printing
and ship-ping open textbook
Total open
textbook cost
Traditional textbook cost (per
year)
Total savings or (loss) of open
textbookStudents
served
Savings or (loss) of open
textbook per stu-
dent
Earth systems $300.00 $3,726.18 $4,026.18 $8,458.20 $4,302.02 740 $5.99
Biology $1,800.00 $6,695.64 $8,495.64 $13,716.00 $5,220.36 1,200 $4.35
Chemistry $300.00 $3,978.08 $4,278.08 $8,572.50 $4,294.42 750 $5.73
As per Table 4, the average annual cost of a traditional textbook was $11.43. This figure rep-resents the cost of the textbook amortized over the seven-year replacement cycle. The aver-age cost of an open textbook was $5.14. This represents a savings of $6.29 per student per course per year. If a district of 10,000 students adopted open textbooks for its four science courses (earth science, biology, chemistry, and physics) over a seven-year adoption period, the savings would amount to $62,900 × 4 courses × 7 years, or $1,761,200.
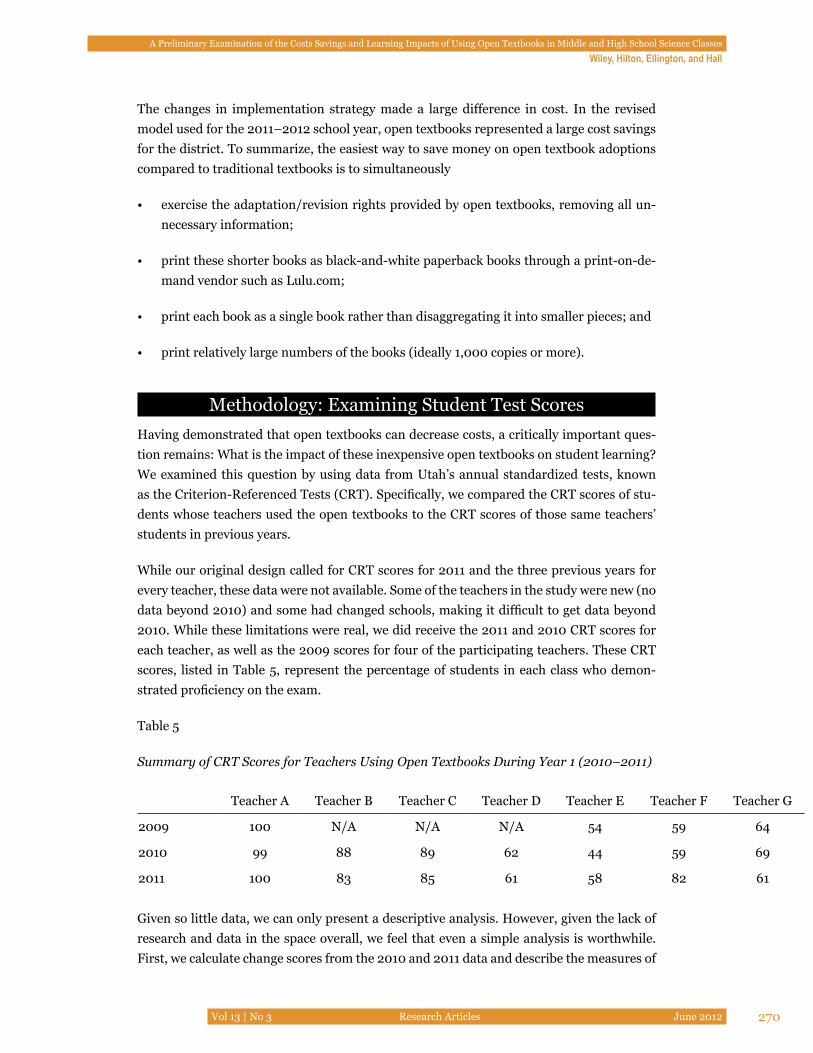
A Preliminary Examination of the Costs Savings and Learning Impacts of Using Open Textbooks in Middle and High School Science Classes
Wiley, Hilton, Ellington, and Hall
Vol 13 | No 3 Research Articles June 2012 270
The changes in implementation strategy made a large difference in cost. In the revised model used for the 2011–2012 school year, open textbooks represented a large cost savings for the district. To summarize, the easiest way to save money on open textbook adoptions compared to traditional textbooks is to simultaneously
• exercise the adaptation/revision rights provided by open textbooks, removing all un-necessary information;
• print these shorter books as black-and-white paperback books through a print-on-de-mand vendor such as Lulu.com;
• print each book as a single book rather than disaggregating it into smaller pieces; and
• print relatively large numbers of the books (ideally 1,000 copies or more).
Methodology: Examining Student Test ScoresHaving demonstrated that open textbooks can decrease costs, a critically important ques-tion remains: What is the impact of these inexpensive open textbooks on student learning? We examined this question by using data from Utah’s annual standardized tests, known as the Criterion-Referenced Tests (CRT). Specifically, we compared the CRT scores of stu-dents whose teachers used the open textbooks to the CRT scores of those same teachers’ students in previous years.
While our original design called for CRT scores for 2011 and the three previous years for every teacher, these data were not available. Some of the teachers in the study were new (no data beyond 2010) and some had changed schools, making it difficult to get data beyond 2010. While these limitations were real, we did receive the 2011 and 2010 CRT scores for each teacher, as well as the 2009 scores for four of the participating teachers. These CRT scores, listed in Table 5, represent the percentage of students in each class who demon-strated proficiency on the exam.
Table 5
Summary of CRT Scores for Teachers Using Open Textbooks During Year 1 (2010–2011)
Teacher A Teacher B Teacher C Teacher D Teacher E Teacher F Teacher G
2009 100 N/A N/A N/A 54 59 64
2010 99 88 89 62 44 59 69
2011 100 83 85 61 58 82 61
Given so little data, we can only present a descriptive analysis. However, given the lack of research and data in the space overall, we feel that even a simple analysis is worthwhile. First, we calculate change scores from the 2010 and 2011 data and describe the measures of
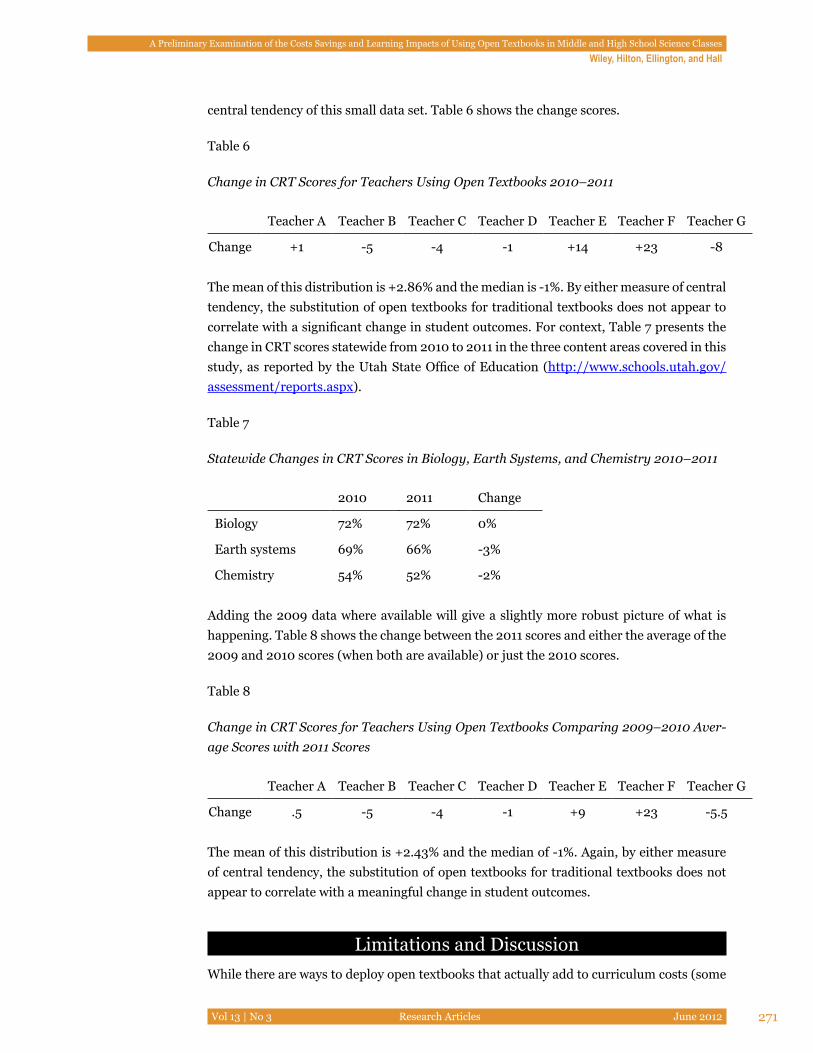
A Preliminary Examination of the Costs Savings and Learning Impacts of Using Open Textbooks in Middle and High School Science Classes
Wiley, Hilton, Ellington, and Hall
Vol 13 | No 3 Research Articles June 2012 271
central tendency of this small data set. Table 6 shows the change scores.
Table 6
Change in CRT Scores for Teachers Using Open Textbooks 2010–2011
Teacher A Teacher B Teacher C Teacher D Teacher E Teacher F Teacher G
Change +1 -5 -4 -1 +14 +23 -8
The mean of this distribution is +2.86% and the median is -1%. By either measure of central tendency, the substitution of open textbooks for traditional textbooks does not appear to correlate with a significant change in student outcomes. For context, Table 7 presents the change in CRT scores statewide from 2010 to 2011 in the three content areas covered in this study, as reported by the Utah State Office of Education (http://www.schools.utah.gov/assessment/reports.aspx).
Table 7
Statewide Changes in CRT Scores in Biology, Earth Systems, and Chemistry 2010–2011
2010 2011 Change
Biology 72% 72% 0%
Earth systems 69% 66% -3%
Chemistry 54% 52% -2%
Adding the 2009 data where available will give a slightly more robust picture of what is happening. Table 8 shows the change between the 2011 scores and either the average of the 2009 and 2010 scores (when both are available) or just the 2010 scores.
Table 8
Change in CRT Scores for Teachers Using Open Textbooks Comparing 2009–2010 Aver-age Scores with 2011 Scores
Teacher A Teacher B Teacher C Teacher D Teacher E Teacher F Teacher G
Change .5 -5 -4 -1 +9 +23 -5.5
The mean of this distribution is +2.43% and the median of -1%. Again, by either measure of central tendency, the substitution of open textbooks for traditional textbooks does not appear to correlate with a meaningful change in student outcomes.
Limitations and DiscussionWhile there are ways to deploy open textbooks that actually add to curriculum costs (some
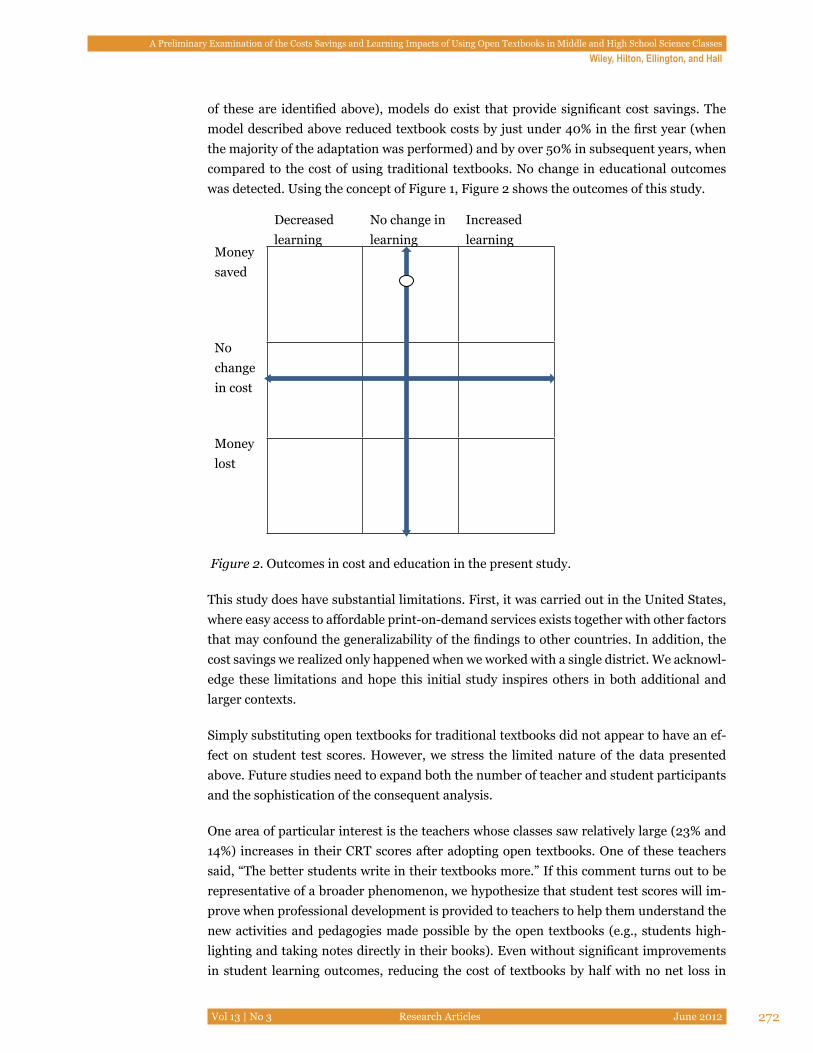
A Preliminary Examination of the Costs Savings and Learning Impacts of Using Open Textbooks in Middle and High School Science Classes
Wiley, Hilton, Ellington, and Hall
Vol 13 | No 3 Research Articles June 2012 272
of these are identified above), models do exist that provide significant cost savings. The model described above reduced textbook costs by just under 40% in the first year (when the majority of the adaptation was performed) and by over 50% in subsequent years, when compared to the cost of using traditional textbooks. No change in educational outcomes was detected. Using the concept of Figure 1, Figure 2 shows the outcomes of this study.
Decreased learning
No change in learning
Increased learning
Money saved
No change in cost
Money lost
Figure 2. Outcomes in cost and education in the present study.
This study does have substantial limitations. First, it was carried out in the United States, where easy access to affordable print-on-demand services exists together with other factors that may confound the generalizability of the findings to other countries. In addition, the cost savings we realized only happened when we worked with a single district. We acknowl-edge these limitations and hope this initial study inspires others in both additional and larger contexts.
Simply substituting open textbooks for traditional textbooks did not appear to have an ef-fect on student test scores. However, we stress the limited nature of the data presented above. Future studies need to expand both the number of teacher and student participants and the sophistication of the consequent analysis.
One area of particular interest is the teachers whose classes saw relatively large (23% and 14%) increases in their CRT scores after adopting open textbooks. One of these teachers said, “The better students write in their textbooks more.” If this comment turns out to be representative of a broader phenomenon, we hypothesize that student test scores will im-prove when professional development is provided to teachers to help them understand the new activities and pedagogies made possible by the open textbooks (e.g., students high-lighting and taking notes directly in their books). Even without significant improvements in student learning outcomes, reducing the cost of textbooks by half with no net loss in

A Preliminary Examination of the Costs Savings and Learning Impacts of Using Open Textbooks in Middle and High School Science Classes
Wiley, Hilton, Ellington, and Hall
Vol 13 | No 3 Research Articles June 2012 273
learning appears to be a result of tremendous practical significance given the state of the global economy.
A Preliminary Examination of the Costs Savings and Learning Impacts of Using Open Textbooks in Middle and High School Science Classes
Wiley, Hilton, Ellington, and Hall
Vol 13 | No 3 Research Articles June 2012 274
ReferencesAnnis, L., & Davis, J. K. (1978). Study techniques and cognitive style: Their effect on recall
and recognition. Journal of Educational Research, 71(3), 175–178.
El Ansari, W., & Phillips, C. J. (2004). The costs and benefits to participants in com-munity partnerships: A paradox? Health Promotion Practice, 5(1), 35–48. doi:10.1177/1524839903258066
Armstrong, J., & Bray, J. (1986). How can we improve textbooks? Publications, ECS Dis-tribution Center, CO. Retrieved from http://www.eric.ed.gov/ERICWebPortal/contentdelivery/servlet/ERICServlet?accno=ED292208
Baker, D. (2005). Are copyrights a textbook scam? Alternatives for financing textbook pro-duction in the 21st century. CEPR Reports and Issue Briefs.
Baker, J. (2008). Culture of shared knowledge: Developing a strategy for low-cost textbook alternatives. New England Journal of Higher Education, 21(1), 30.
Baker, J., Thierstein, J., Fletcher, K., Kaur, M., & Emmons, J. (2009). Open textbook proof-of-concept via Connexions. The International Review of Research in Open and Distance Learning, 10(5).
Butcher, N., & Wilson-Strydom, M. (2008). Technology and open learning: The potential of open education resources for K–12 education. International Handbook of Infor-mation Technology in Primary and Secondary Education (pp. 725–745).
Card, D., & Krueger, A. B. (1996). School resources and student outcomes: An overview of the literature and new evidence from North and South Carolina. The Journal of Economic Perspectives, 10(4), 31–50.
Chaudhary, L. (2009). Education inputs, student performance, and school finance reform in Michigan. Economics of Education Review, 28(1), 90–98.
D’Antoni, S. (2009). Open educational resources: Reviewing initiatives and issues. Open Learning: The Journal of Open and Distance Learning, 24(1), 3-10. doi: 10.1080/02680510802625443
Downes, S. (2007). Models for sustainable open educational resources. Interdisciplinary Journal of Knowledge and Learning Objects, 3 29-44. http://www.ijello.org/Vol-ume3/IJKLOv3p029-044Downes.pdf
Fowler, R. L., & Barker, A. S. (1974). Effectiveness of highlighting for retention of text mate-rial. Journal of Applied Psychology, 59(3), 358–364.
Frith, J. (2009). Open revolution: An environmental scan of the open textbook landscape. Raleigh: North Carolina State University Digital Scholarship & Publishing Center. Retrieved from http://web.archive.org/web/20100707162707/http://www.lib.

A Preliminary Examination of the Costs Savings and Learning Impacts of Using Open Textbooks in Middle and High School Science Classes
Wiley, Hilton, Ellington, and Hall
Vol 13 | No 3 Research Articles June 2012 275
ncsu.edu/dspc/opentextbookswhitepaper.pdf
Frydenberg, J., Matkin, G., & Center, D. L. (2007). Open textbooks: Why? What? How? When? Menlo Park, CA: The William and Flora Hewlett Foundation. Retrieved from http://www.hewlett.org/uploads/files/OpenTextbooks.pdf
Gurell, S., & Wiley, D. (2008). OER handbook for educators (pp. 1-284). Retrieved from http://wikieducator.org/OER_Handbook/educator_version_one
Hanushek, E. A. (2002). Publicly provided education. Handbook of Public Economics, 4, 2045–2141.
Koch, J. V. (2006). An economic analysis of textbook pricing and textbook markets. ACF-SA college textbook cost study plan proposal. Washington, DC: Advisory Commit-tee on Student Financial Assistance.
Lebow, D., Lick, D., & Hartman, H. (2004). Interactive annotation for teaching and learn-ing. In R. Ferdig et al. (Eds.), Proceedings of Society for Information Technology & Teacher Education International Conference 2004 (pp. 1781–1786). Chesa-peake, VA: AACE.
OECD. (2007). Giving knowledge for free: The emergence of open educational resources. Retrieved from http://www.oecd.org/dataoecd/35/7/38654317.pdf
Odden, A., Picus, L. O., Archibald, S., Goetz, M., Mangan, M. T., & Aportela, A. (2007). Moving from good to great in Wisconsin: Funding schools adequately and dou-bling student performance. Madison: University of Wisconsin, Wisconsin Center for Education Research, Consortium for Policy Research in Education. Retrieved from http://cpre.wceruw.org/finance/WI%20March%201%202007%20Adequa-cy%20Report1.pdf
Orfield, G., & Lee, C. (2005). Why segregation matters: Poverty and educational inequal-ity. Civil Rights Project, Harvard University.
Petrides, L., Jimes, C., Middleton-Detzner, C., Walling, J., & Weiss, S. (2011). Open text-book adoption and use: Implications for teachers and learners. Open Learning: The Journal of Open, Distance, and e-Learning, 26(1).
Simpson, M., & Nist, S. (1990). An effective and efficient study strategy for college students. Journal of Reading, 34(2), 122–129.
Watt, M. G. (2009). Research on the textbook selection orocess in the United States of America. Retrieved from http://www.eric.ed.gov/ERICWebPortal/contentdeliv-ery/servlet/ERICServlet?accno=ED506523
Wolfe, J. L., & Neuwirth, C. M. (2001). From the margins to the center: The future of an-

A Preliminary Examination of the Costs Savings and Learning Impacts of Using Open Textbooks in Middle and High School Science Classes
Wiley, Hilton, Ellington, and Hall
Vol 13 | No 3 Research Articles June 2012 276
notation. Journal of Business and Technical Communication, 15(3), 333–71.
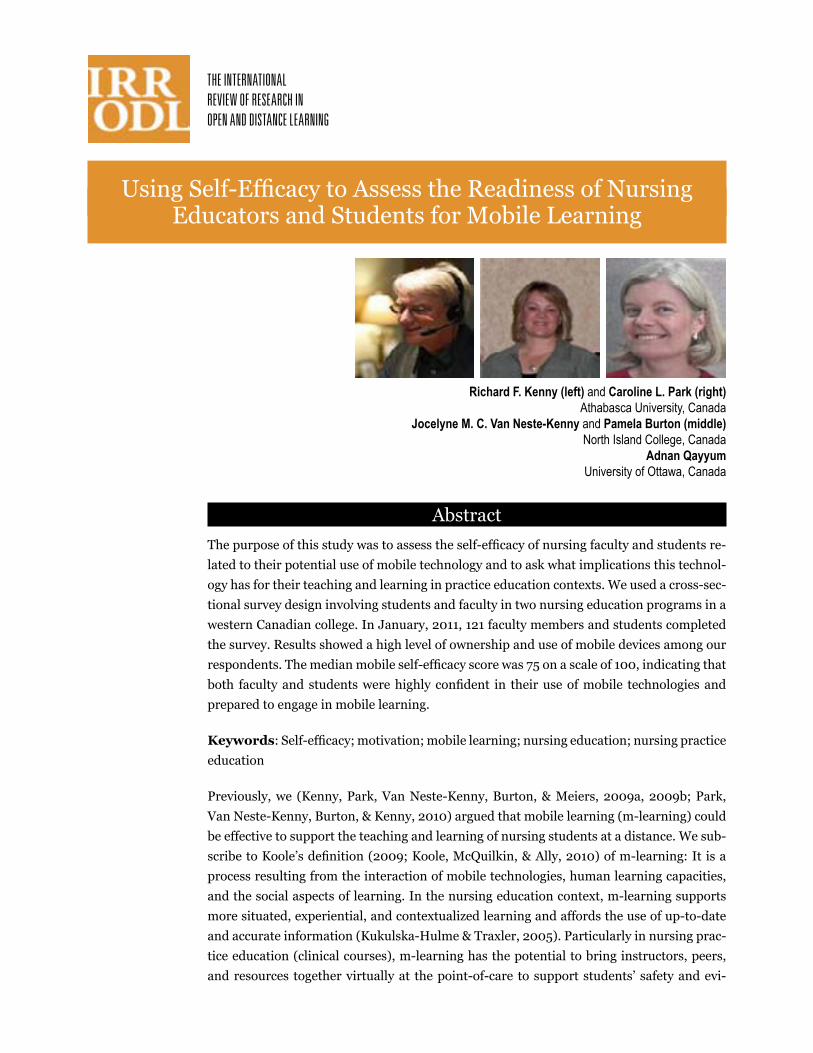
Using Self-Efficacy to Assess the Readiness of Nursing Educators and Students for Mobile Learning
AbstractThe purpose of this study was to assess the self-efficacy of nursing faculty and students re-lated to their potential use of mobile technology and to ask what implications this technol-ogy has for their teaching and learning in practice education contexts. We used a cross-sec-tional survey design involving students and faculty in two nursing education programs in a western Canadian college. In January, 2011, 121 faculty members and students completed the survey. Results showed a high level of ownership and use of mobile devices among our respondents. The median mobile self-efficacy score was 75 on a scale of 100, indicating that both faculty and students were highly confident in their use of mobile technologies and prepared to engage in mobile learning.
Keywords: Self-efficacy; motivation; mobile learning; nursing education; nursing practice education
Previously, we (Kenny, Park, Van Neste-Kenny, Burton, & Meiers, 2009a, 2009b; Park, Van Neste-Kenny, Burton, & Kenny, 2010) argued that mobile learning (m-learning) could be effective to support the teaching and learning of nursing students at a distance. We sub-scribe to Koole’s definition (2009; Koole, McQuilkin, & Ally, 2010) of m-learning: It is a process resulting from the interaction of mobile technologies, human learning capacities, and the social aspects of learning. In the nursing education context, m-learning supports more situated, experiential, and contextualized learning and affords the use of up-to-date and accurate information (Kukulska-Hulme & Traxler, 2005). Particularly in nursing prac-tice education (clinical courses), m-learning has the potential to bring instructors, peers, and resources together virtually at the point-of-care to support students’ safety and evi-
Richard F. Kenny (left) and Caroline L. Park (right)Athabasca University, Canada
Jocelyne M. C. Van Neste-Kenny and Pamela Burton (middle) North Island College, Canada
Adnan Qayyum University of Ottawa, Canada
Using Self-Efficacy to Assess the Readiness of Nursing Educators and Students for Mobile Learning Kenny, Van Neste-Kenny, Burton, Park, and Qayyum
Vol 13 | No 3 Research Articles June 2012 278
dence-informed practice (Park et al., 2010).
The purpose of this study was to gauge nursing faculty and students’ current use of mobile devices in their teaching and learning and to measure their mobile self-efficacy as an indi-cator of their readiness to engage in m-learning in the future. As such, this is a replication, on a larger scale, of a previous study (Kenny, Park, Van Neste-Kenny, & Burton, 2010). As before, we were interested in our respondents’ level of motivation to engage in m-learning and, specifically, in the concept of self-efficacy (Bandura, 1997) as applied to mobile learn-ing in nursing education.
Self-efficacy refers to the personal beliefs individuals have that they are capable of learn-ing and performing particular behaviors and is domain-specific (Bandura, 1997; Schunk, 2008). Students’ perceptions of self-efficacy have been found to influence their decisions about the choice of activity in which they engage , their emotional responses (e.g., stress and anxiety) when performing the behaviors, and their persistence in carrying out these actions (Bandura, 1997; Compeau & Higgins, 1995; Schunk, 2008). In the m-learning domain, mobile use is both enabled and constrained by the physical and functional components of the specific devices. They are the medium through which learners interact and therefore impact their physical and psychological comfort levels (Koole, 2009). These components directly impact device usability and therefore an individual’s ability to use her mobile de-vice to engage in cognitive tasks, locate and manipulate information, and communicate and collaborate using social technologies (e.g., text messaging, email, or audio conferencing). In an m-learning context, these applications allow learners to interact in social and learning communities where they can acquire information and negotiate meaning. The ensemble of these components then defines the m-learning process and domain.
Individuals’ self-efficacy judgments differ on three interrelated dimensions: magnitude, strength, and generalizability (Bandura, 1997, 2006; Compeau & Higgins, 1995). Magni-tude refers to the level of task difficulty individuals believe they can attain. Those with high mobile self-efficacy would believe they were able to use their mobiles to accomplish difficult and sophisticated tasks, while those with low mobile self-efficacy would think they were only able to use them for limited and simple tasks. Self-efficacy strength refers to the level of confidence individuals have in their ability to perform specific tasks (e.g., their level of confidence in their ability to easily learn and use the various features of, and applications provided by, mobile devices). Finally, self-efficacy generalizability reflects how much an individual’s judgment is limited to a particular domain of activity. Individuals with high mobile self-efficacy generalizability expect to be able to competently use a variety of dif-ferent devices, while those with low computer self-efficacy generalizability may perceive their capabilities as limited to particular devices, especially those with which they have had experience.
While a significant body of research exists on learners’ feelings of self-efficacy concern-ing computer technology, online learning, and even podcasting (e.g., Compeau & Higgins, 1995; Hodges, Stackpole-Hodges, & Cox, 2008; Johnson, 2005; Kao & Tsai, 2009; Koh & Frick, 2009; Liang & Wu, 2010; Loftus, 2009), this concept does not appear to have been
Using Self-Efficacy to Assess the Readiness of Nursing Educators and Students for Mobile Learning Kenny, Van Neste-Kenny, Burton, Park, and Qayyum
Vol 13 | No 3 Research Articles June 2012 279
examined in any detail in a mobile learning context.
MethodThis study then replicates and extends our previous research (Kenny, Park, Van Neste-Ken-ny, & Burton 2010) to gauge the current use of mobile devices by nursing faculty and stu-dents in their teaching and learning and to assess their readiness to engage in m-learning by measuring their mobile self-efficacy. Our research questions were as follows:
• In what ways are faculty and students currently using personal mobile devices in their teaching and learning?
• How do they foresee using personal mobile devices in teaching and learning in the future?
• To what degree is the level of mobile self-efficacy of nursing faculty and students re-lated to their potential use of m-technology in teaching and learning?
To investigate these questions, we used a cross-sectional survey design involving students and faculty in two separate nursing education programs at a community college in western Canada: a one-year Practical Nurse (PN) program and a four-year Bachelor of Science in Nursing (BSN) program. At the time of the survey, there were 55 students and 9 faculty members in the PN program and 134 students and 18 faculty members in the BSN Program, for a total of 216 potential participants.
We used an online survey to gather demographic information and mobile use data (see Ap-pendix A) and to administer the mobile use self-efficacy questionnaire (see Appendix B). The demographics and mobile use questions were both quantitative and qualitative in na-ture. Questions 3 to 6 afforded respondents the opportunity to provide open-ended written comments in addition to the scaled items, while questions 7 to 9 asked only for open-ended responses.
Bandura (1997, 2006) stresses that self-efficacy should measure judgments of capability that may vary across specific realms of activity. Our mobile self-efficacy questionnaire was based on a computer self-efficacy instrument (Compeau & Higgins, 1995) modified for a mobile learning context. This consisted of changing the question stem for students from “I could complete the job using the software package . . .” to “If I had a mobile device such as a smartphone or 3G phone (e.g., iPhone), I could use it in my Nursing program . . .” For instance, the wording for students in question 1 was, “If I had a mobile device such as a smartphone or 3G phone (e.g., iPhone), I could use it in my Nursing program if there was no one around to tell me what to do as I go.” See Appendix A for the full set of questions. Bandura (2006) describes the assessment of self-efficacy as follows:
In the standard methodology for measuring self-efficacy beliefs, individuals are presented with items portraying
Using Self-Efficacy to Assess the Readiness of Nursing Educators and Students for Mobile Learning Kenny, Van Neste-Kenny, Burton, Park, and Qayyum
Vol 13 | No 3 Research Articles June 2012 280
different levels of task demands, and they rate the strength of their belief in their ability to execute the requisite activities. They record the strength of their efficacy beliefs on a 100-point scale, ranging in 10-unit intervals from 0 (“Cannot do”); through intermediate degrees of assurance, 50 (“Moderately certain can do”); to complete assurance, 100 (“Highly certain can do”). (p. 312)
As stipulated by Bandura, we asked our respondents to express their confidence about mo-bile use behavior by answering 10 questions, each rated from 0 to 10. If their answer was “No” (“Could not do”), they selected “0.” If their answer was “Yes,” they chose between 1 and 10, with “1” indicating only slight confidence and “10” showing total confidence (“High-ly certain could do”). Therefore, the scale ranges from a minimum of 0 to a maximum of 100. Nursing students and instructors scoring 0 believe that they are essentially incapable of learning and using mobile devices in their teaching and learning, and those scoring 100 believe they are highly certain of their ability to learn and use mobile devices for this pur-pose. Bandura (2006) also stresses the need for item homogeneity within a domain-rele-vant scale. Cronbach’s alpha was 0.941, indicating that the mobile version of the scale could be considered strongly internally consistent.
Factor AnalysisAn exploratory factor analysis was also conducted to see if the mobile self-efficacy questions as modified for this study might be grouped together and, if so, in what way. An oblique rotation was chosen to ensure that only the unique relationship between each factor and observed item was included in the model. The resulting pattern matrix yielded two factors with eigenvalues greater than 0.7 (ranging from 6.65 to 0.92) and before the scree plot flat-lined (see Table 1). The two factors were “external resources” and “using the mobile device alone”; they accounted for over three-quarters of variance in the measure (75.64%). These factors can be interpreted as aspects of our participants’ perceived strength of self-efficacy about mobile device use in their teaching and learning. Both reflect their self-confidence in the use of the various feature applications provided by their mobile devices. However, it is reasonable to assume that participants might feel more self-confident if they received some support in their learning from others or external sources on their devices, rather than rely-ing solely on themselves.
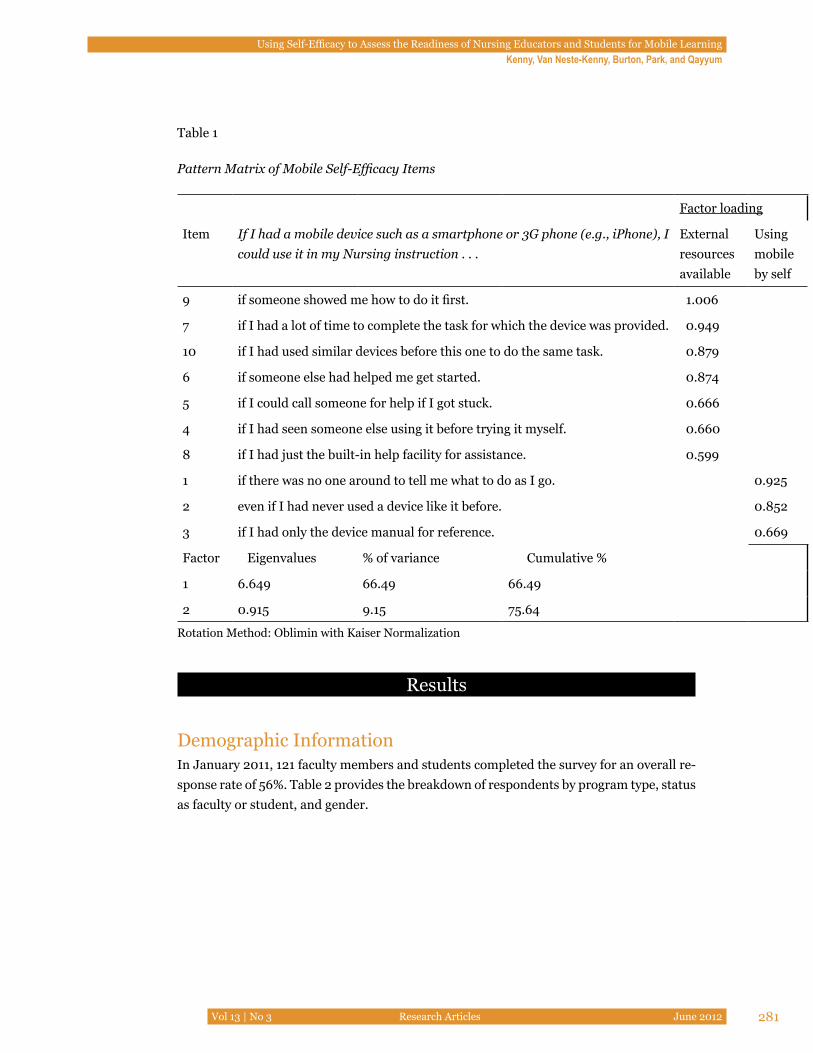
Using Self-Efficacy to Assess the Readiness of Nursing Educators and Students for Mobile Learning Kenny, Van Neste-Kenny, Burton, Park, and Qayyum
Vol 13 | No 3 Research Articles June 2012 281
Table 1
Pattern Matrix of Mobile Self-Efficacy Items
Factor loading
Item If I had a mobile device such as a smartphone or 3G phone (e.g., iPhone), I could use it in my Nursing instruction . . .
External resources available
Using mobile by self
9 if someone showed me how to do it first. 1.006
7 if I had a lot of time to complete the task for which the device was provided. 0.949
10 if I had used similar devices before this one to do the same task. 0.879
6 if someone else had helped me get started. 0.874
5 if I could call someone for help if I got stuck. 0.666
4 if I had seen someone else using it before trying it myself. 0.660
8 if I had just the built-in help facility for assistance. 0.599
1 if there was no one around to tell me what to do as I go. 0.925
2 even if I had never used a device like it before. 0.852
3 if I had only the device manual for reference. 0.669
Factor Eigenvalues % of variance Cumulative %
1 6.649 66.49 66.49
2 0.915 9.15 75.64
Rotation Method: Oblimin with Kaiser Normalization
Results
Demographic InformationIn January 2011, 121 faculty members and students completed the survey for an overall re-sponse rate of 56%. Table 2 provides the breakdown of respondents by program type, status as faculty or student, and gender.
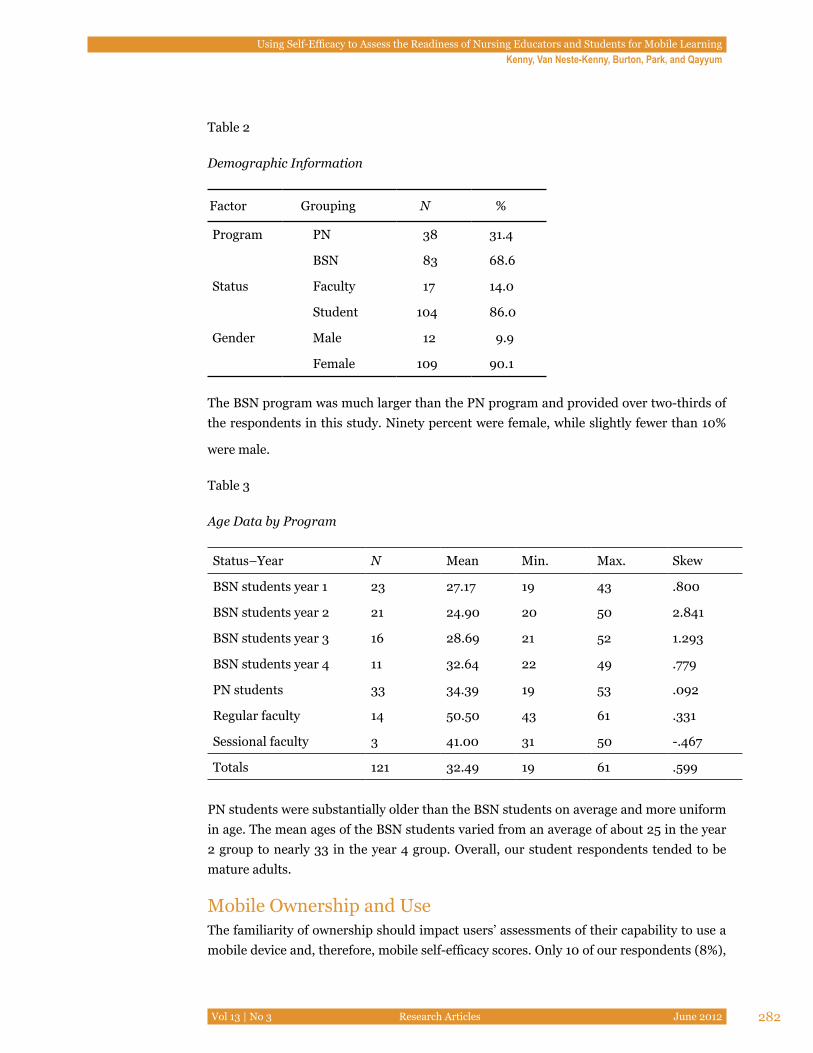
Using Self-Efficacy to Assess the Readiness of Nursing Educators and Students for Mobile Learning Kenny, Van Neste-Kenny, Burton, Park, and Qayyum
Vol 13 | No 3 Research Articles June 2012 282
Table 2
Demographic Information
Factor Grouping N %
Program PN 38 31.4
BSN 83 68.6
Status Faculty 17 14.0
Student 104 86.0
Gender Male 12 9.9
Female 109 90.1
The BSN program was much larger than the PN program and provided over two-thirds of the respondents in this study. Ninety percent were female, while slightly fewer than 10%
were male.
Table 3
Age Data by Program
Status–Year N Mean Min. Max. Skew
BSN students year 1 23 27.17 19 43 .800
BSN students year 2 21 24.90 20 50 2.841
BSN students year 3 16 28.69 21 52 1.293
BSN students year 4 11 32.64 22 49 .779
PN students 33 34.39 19 53 .092
Regular faculty 14 50.50 43 61 .331
Sessional faculty 3 41.00 31 50 -.467
Totals 121 32.49 19 61 .599
PN students were substantially older than the BSN students on average and more uniform in age. The mean ages of the BSN students varied from an average of about 25 in the year 2 group to nearly 33 in the year 4 group. Overall, our student respondents tended to be mature adults.
Mobile Ownership and UseThe familiarity of ownership should impact users’ assessments of their capability to use a mobile device and, therefore, mobile self-efficacy scores. Only 10 of our respondents (8%),
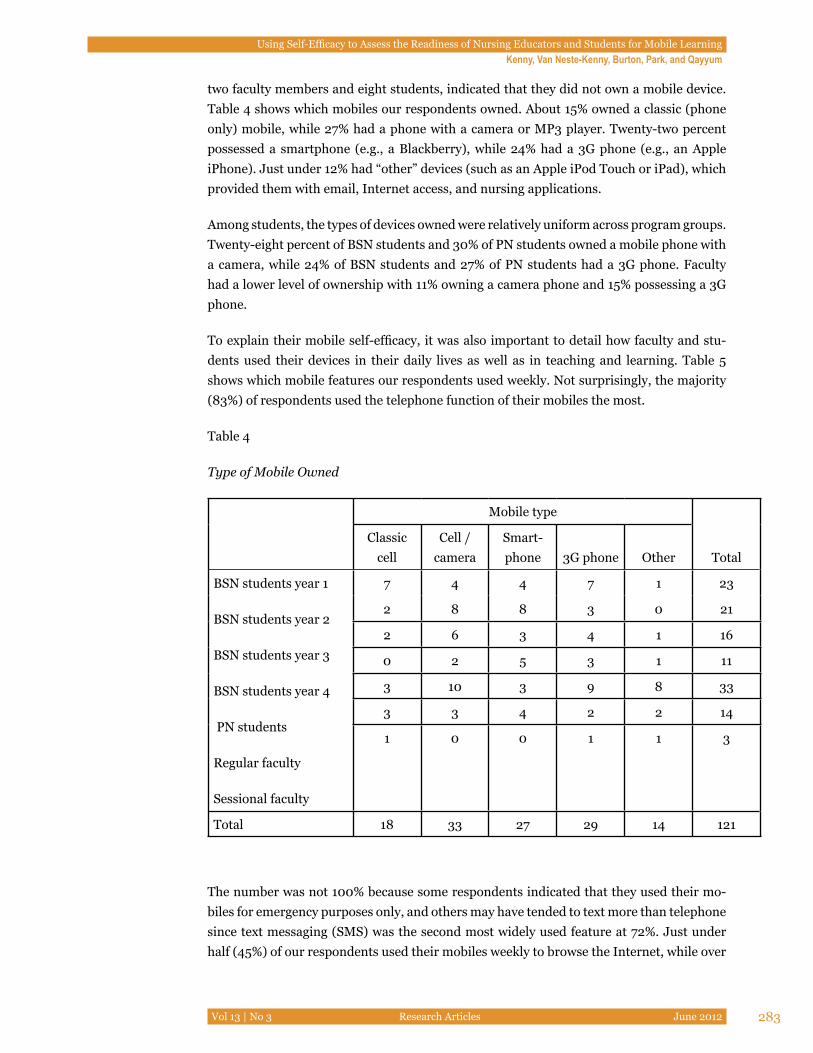
Using Self-Efficacy to Assess the Readiness of Nursing Educators and Students for Mobile Learning Kenny, Van Neste-Kenny, Burton, Park, and Qayyum
Vol 13 | No 3 Research Articles June 2012 283
two faculty members and eight students, indicated that they did not own a mobile device. Table 4 shows which mobiles our respondents owned. About 15% owned a classic (phone only) mobile, while 27% had a phone with a camera or MP3 player. Twenty-two percent possessed a smartphone (e.g., a Blackberry), while 24% had a 3G phone (e.g., an Apple iPhone). Just under 12% had “other” devices (such as an Apple iPod Touch or iPad), which provided them with email, Internet access, and nursing applications.
Among students, the types of devices owned were relatively uniform across program groups. Twenty-eight percent of BSN students and 30% of PN students owned a mobile phone with a camera, while 24% of BSN students and 27% of PN students had a 3G phone. Faculty had a lower level of ownership with 11% owning a camera phone and 15% possessing a 3G phone.
To explain their mobile self-efficacy, it was also important to detail how faculty and stu-dents used their devices in their daily lives as well as in teaching and learning. Table 5 shows which mobile features our respondents used weekly. Not surprisingly, the majority (83%) of respondents used the telephone function of their mobiles the most.
Table 4
Type of Mobile Owned
Mobile type
TotalClassic
cellCell /
cameraSmart-phone 3G phone Other
BSN students year 1
BSN students year 2
BSN students year 3
BSN students year 4
PN students
Regular faculty
Sessional faculty
7 4 4 7 1 23
2 8 8 3 0 21
2 6 3 4 1 16
0 2 5 3 1 11
3 10 3 9 8 33
3 3 4 2 2 14
1 0 0 1 1 3
Total 18 33 27 29 14 121
The number was not 100% because some respondents indicated that they used their mo-biles for emergency purposes only, and others may have tended to text more than telephone since text messaging (SMS) was the second most widely used feature at 72%. Just under half (45%) of our respondents used their mobiles weekly to browse the Internet, while over
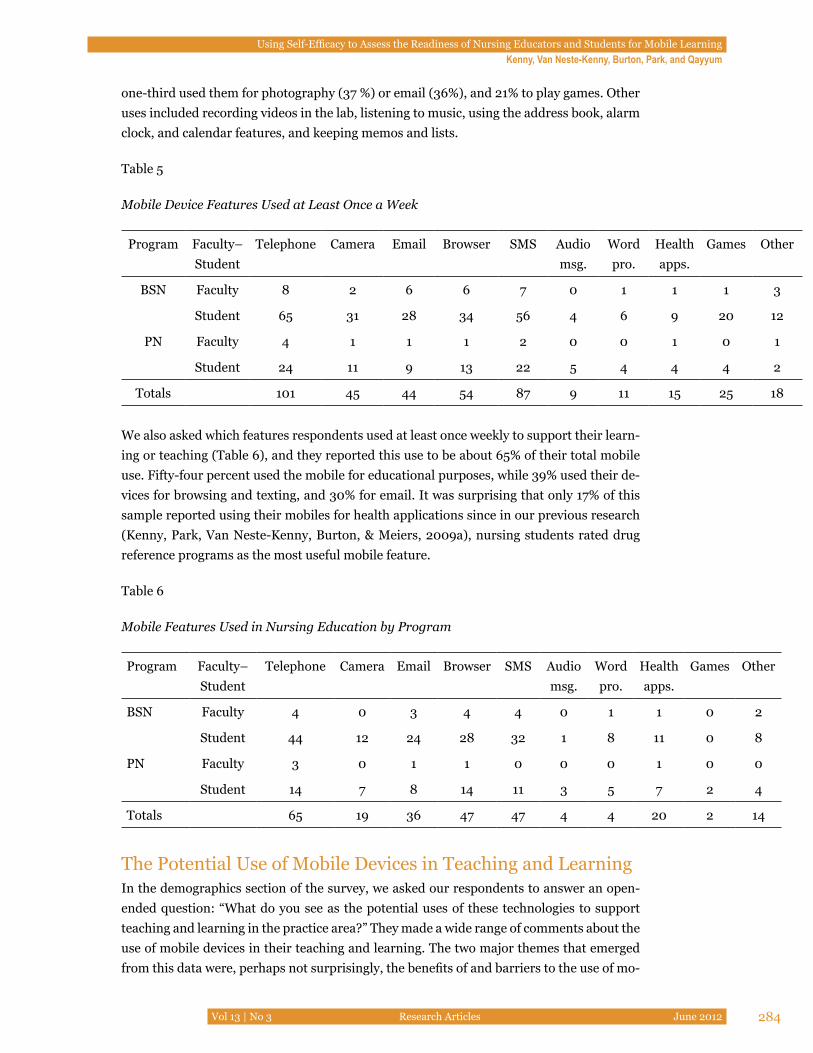
Using Self-Efficacy to Assess the Readiness of Nursing Educators and Students for Mobile Learning Kenny, Van Neste-Kenny, Burton, Park, and Qayyum
Vol 13 | No 3 Research Articles June 2012 284
one-third used them for photography (37 %) or email (36%), and 21% to play games. Other uses included recording videos in the lab, listening to music, using the address book, alarm clock, and calendar features, and keeping memos and lists.
Table 5
Mobile Device Features Used at Least Once a Week
Program Faculty–Student
Telephone Camera Email Browser SMS Audio msg.
Word pro.
Health apps.
Games Other
BSN Faculty 8 2 6 6 7 0 1 1 1 3
Student 65 31 28 34 56 4 6 9 20 12
PN Faculty 4 1 1 1 2 0 0 1 0 1
Student 24 11 9 13 22 5 4 4 4 2
Totals 101 45 44 54 87 9 11 15 25 18
We also asked which features respondents used at least once weekly to support their learn-ing or teaching (Table 6), and they reported this use to be about 65% of their total mobile use. Fifty-four percent used the mobile for educational purposes, while 39% used their de-vices for browsing and texting, and 30% for email. It was surprising that only 17% of this sample reported using their mobiles for health applications since in our previous research (Kenny, Park, Van Neste-Kenny, Burton, & Meiers, 2009a), nursing students rated drug reference programs as the most useful mobile feature.
Table 6
Mobile Features Used in Nursing Education by Program
Program Faculty–Student
Telephone Camera Email Browser SMS Audio msg.
Word pro.
Health apps.
Games Other
BSN Faculty 4 0 3 4 4 0 1 1 0 2
Student 44 12 24 28 32 1 8 11 0 8
PN Faculty 3 0 1 1 0 0 0 1 0 0
Student 14 7 8 14 11 3 5 7 2 4
Totals 65 19 36 47 47 4 4 20 2 14
The Potential Use of Mobile Devices in Teaching and LearningIn the demographics section of the survey, we asked our respondents to answer an open-ended question: “What do you see as the potential uses of these technologies to support teaching and learning in the practice area?” They made a wide range of comments about the use of mobile devices in their teaching and learning. The two major themes that emerged from this data were, perhaps not surprisingly, the benefits of and barriers to the use of mo-
Using Self-Efficacy to Assess the Readiness of Nursing Educators and Students for Mobile Learning Kenny, Van Neste-Kenny, Burton, Park, and Qayyum
Vol 13 | No 3 Research Articles June 2012 285
bile devices perceived by the faculty and students in both nursing programs.
Benefits.
One major benefit noted by faculty and students for their teaching and learning was the use of mobile devices to provide quick, easy, and anytime access to current professional information at the point-of-care. This included both the use of nursing resource applica-tions such as drug guides and access to the Internet. This perceived importance of mobiles as a way to access resources is also supported by past research and our own studies (Kenny, Park, Van Neste-Kenny, Burton, & Meiers, 2009a, 2009b). These comments by BSN stu-dents typify the comments made in this regard: “Technology can support nursing practice, such as accessing current information quickly to support practice decisions, reducing er-rors (i.e., using programs to check drugs and calculate doses).”
And, as another student said,
If downloading is time effective, it can allow for faster access to information without having to track down books or hardcopy resources. The information will be up-to-date. It can be accessed from the patient’s bedside for teaching and learning based on specific questions by the patient.
The following comment by a PN student corroborated these views:
I think they will help because there is so much that technology like phones are capable of nowadays; Websites, questions we may have, being able to talk to somebody somewhere else quickly without leaving the room, I think there is so much potential to it. Faster responses, and if someone does not know the answer, they can find it.
The other main benefit cited by our respondents was the use of mobile devices to improve communications between faculty and students who are off campus on practice placements, thereby affording students greater access to their instructors. In this regard, one instructor noted that mobile devices could provide
instant communication with students (i.e., texting/emails) - texting re “checking in” with students who are in indirect supervision (i.e., community placements) - using blackboard to send messages to students, receive documents from them (i.e., domains of practice) - use of nursing resource software to support myself and students in the practice setting (i.e., medication software, psychomotor skills, nursing assessment) - access best
Using Self-Efficacy to Assess the Readiness of Nursing Educators and Students for Mobile Learning Kenny, Van Neste-Kenny, Burton, Park, and Qayyum
Vol 13 | No 3 Research Articles June 2012 286
evidence to support practice (i.e., databases to search for information related to practice).
And a BSN student noted that mobile devices could provide “support from teachers, we have two towns primarily that we are sent to for placements, and our instructors may not be immediately available. We could get quick responses and support from them if we had communication on these devices.”
Barriers.
Our respondents also reported on barriers to the use of mobile devices in their teaching and learning. The barriers most widely discussed were the cost of both mobile devices and of wireless connectivity and who should pay for it. For instance, one BSN student stated,
Not all people have these types of devices—they can be costly with roaming time as well—will VIHA [Vancouver Island Health Authority, which runs the local hospitals and clinics] help in paying these bills? Will everyone be expected to have one?
A PN student made a similar observation:
As indicated previously, my only concern is the cost associated. I currently do not maximize the potential of my smartphone simply because the fees to do so are a lot, which is not in the budget of a student.
Our respondents also noted potential barriers pertaining to mobile use in the hospitals. One was a concern about infection control. One BSN faculty member commented, “[I] just wonder about infection control issues with these devices in the clinical setting, I can see this as being an issue, and also wonder if the cleaning products required by the agency would damage the devices?” and a PN student agreed, commenting that, “The word ‘sanitary’ comes to mind . . . if using the phone in the nursing practice, we would have to be aware and practice asepsis technique.”
Another concern was about current hospital policies related to mobile use. A BSN faculty member raised this issue as follows:
Hmmmm . . . I think we need to inform and educate our colleagues in the agencies about the use of technology, that in fact using a cell phone near a cardiac monitor is not going to upset the monitor, nor will it upset communications, etc., within the hospital particularly. I think this is true, and I think there is a need to assure people that it is not going to get in the way of their practice.
Using Self-Efficacy to Assess the Readiness of Nursing Educators and Students for Mobile Learning Kenny, Van Neste-Kenny, Burton, Park, and Qayyum
Vol 13 | No 3 Research Articles June 2012 287
And, finally, while not a benefit or barrier per se, some faculty members discussed the over-all need to adjust their teaching to take into account the mobile technology that students are using in their daily lives. For instance, one BSN faculty member stated that
students are very comfortable with technology these days, and it is very much the norm at breaks and meal times to see them pull out their phones or mobile device and start to text, and so forth. Many students have pointed out applications to me in these settings which they frequently use to support their learning, such as drug guides or “apps” which quickly remind them of vital sign norms, and so forth. I want to understand them and be able to relate on their level. I want to be able to communicate with them and not appear that I don’t know. I also want to maintain a sense of where they are at, and without understanding the technology that they use and how this influences their learning, I would feel somewhat of a disconnect. I am not saying that it surpasses other ways of teaching, but for them it is the new “normal,” and I must adjust to it to help support/understand them as well as using other teaching/learning techniques.
The last word in this regard went to a PN student, who also expressed the importance of nurses keeping up with emerging technologies in a rapidly changing world. “Since we do live in a technology age that is progressing and changing all the time, we need to keep up with it to provide fast and better care for our clients.”
Self-Efficacy The demographics data and analysis of the comments made by our participants indicated that they had adopted mobile technologies in their personal lives and appeared to foresee the potential for their use in teaching and learning. Most of our respondents reported own-ing a mobile device, and most used it at least weekly to make telephone calls. But did this translate into the confidence to use mobile devices in their professional lives? Did their familiarity with mobile use translate into feelings of self-efficacy (SE)?
The average mobile self-efficacy score (Table 7) was 68 out of a possible score of 100. How-ever, these scores were negatively skewed, indicating a tendency toward higher scores with individual low scores affecting the average. Therefore, the median score of 75 is likely more reflective of the group as a whole.
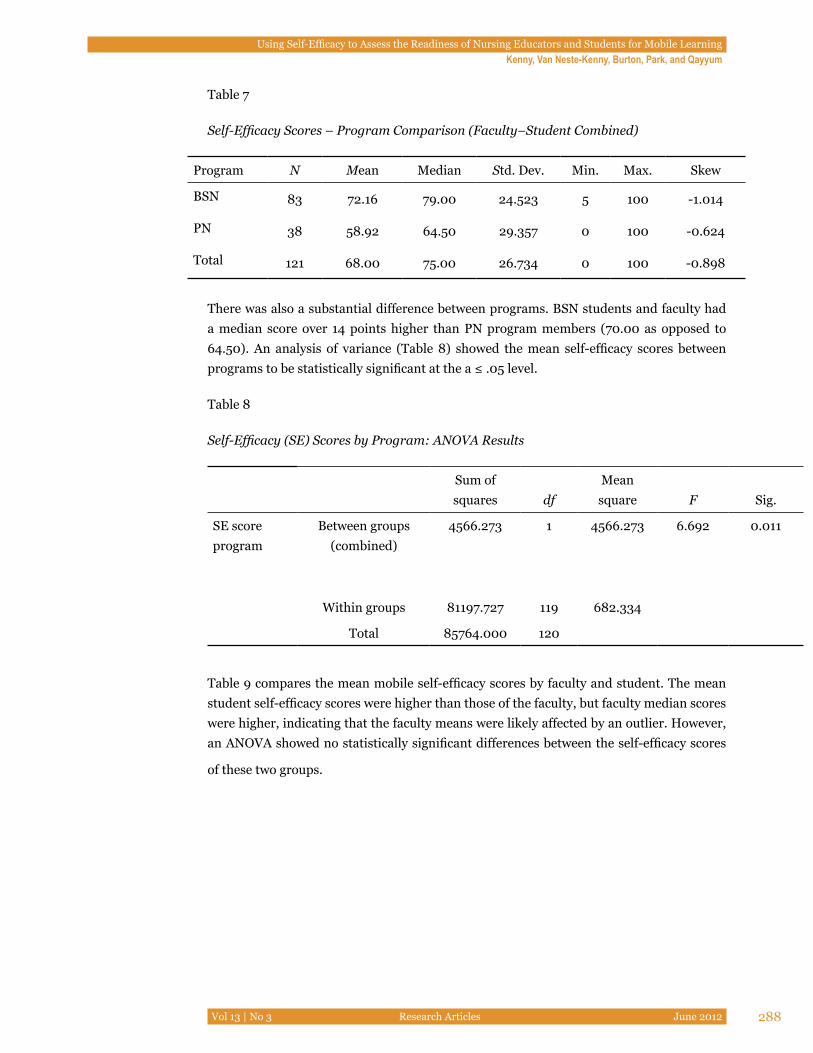
Using Self-Efficacy to Assess the Readiness of Nursing Educators and Students for Mobile Learning Kenny, Van Neste-Kenny, Burton, Park, and Qayyum
Vol 13 | No 3 Research Articles June 2012 288
Table 7
Self-Efficacy Scores – Program Comparison (Faculty–Student Combined)
Program N Mean Median Std. Dev. Min. Max. Skew
BSN 83 72.16 79.00 24.523 5 100 -1.014
PN 38 58.92 64.50 29.357 0 100 -0.624
Total 121 68.00 75.00 26.734 0 100 -0.898
There was also a substantial difference between programs. BSN students and faculty had a median score over 14 points higher than PN program members (70.00 as opposed to 64.50). An analysis of variance (Table 8) showed the mean self-efficacy scores between programs to be statistically significant at the a ≤ .05 level.
Table 8
Self-Efficacy (SE) Scores by Program: ANOVA Results
Sum of squares df
Mean square F Sig.
SE score program
Between groups (combined)
4566.273 1 4566.273 6.692 0.011
Within groups 81197.727 119 682.334
Total 85764.000 120
Table 9 compares the mean mobile self-efficacy scores by faculty and student. The mean student self-efficacy scores were higher than those of the faculty, but faculty median scores were higher, indicating that the faculty means were likely affected by an outlier. However, an ANOVA showed no statistically significant differences between the self-efficacy scores
of these two groups.
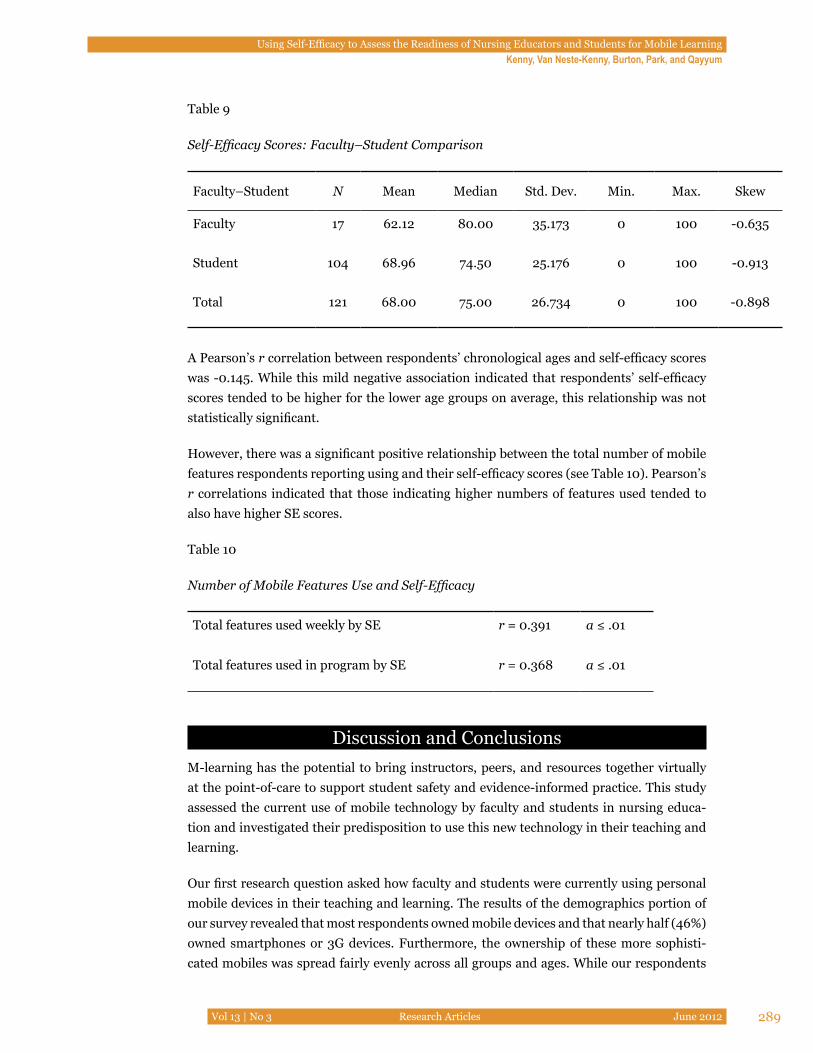
Using Self-Efficacy to Assess the Readiness of Nursing Educators and Students for Mobile Learning Kenny, Van Neste-Kenny, Burton, Park, and Qayyum
Vol 13 | No 3 Research Articles June 2012 289
Table 9
Self-Efficacy Scores: Faculty–Student Comparison
Faculty–Student N Mean Median Std. Dev. Min. Max. Skew
Faculty 17 62.12 80.00 35.173 0 100 -0.635
Student 104 68.96 74.50 25.176 0 100 -0.913
Total 121 68.00 75.00 26.734 0 100 -0.898
A Pearson’s r correlation between respondents’ chronological ages and self-efficacy scores was -0.145. While this mild negative association indicated that respondents’ self-efficacy scores tended to be higher for the lower age groups on average, this relationship was not statistically significant.
However, there was a significant positive relationship between the total number of mobile features respondents reporting using and their self-efficacy scores (see Table 10). Pearson’s r correlations indicated that those indicating higher numbers of features used tended to also have higher SE scores.
Table 10
Number of Mobile Features Use and Self-Efficacy
Total features used weekly by SE r = 0.391 a ≤ .01
Total features used in program by SE r = 0.368 a ≤ .01
Discussion and ConclusionsM-learning has the potential to bring instructors, peers, and resources together virtually at the point-of-care to support student safety and evidence-informed practice. This study assessed the current use of mobile technology by faculty and students in nursing educa-tion and investigated their predisposition to use this new technology in their teaching and learning.
Our first research question asked how faculty and students were currently using personal mobile devices in their teaching and learning. The results of the demographics portion of our survey revealed that most respondents owned mobile devices and that nearly half (46%) owned smartphones or 3G devices. Furthermore, the ownership of these more sophisti-cated mobiles was spread fairly evenly across all groups and ages. While our respondents
Using Self-Efficacy to Assess the Readiness of Nursing Educators and Students for Mobile Learning Kenny, Van Neste-Kenny, Burton, Park, and Qayyum
Vol 13 | No 3 Research Articles June 2012 290
used their mobiles weekly and predominantly for communications (cell phone, texting, and email), they also used them regularly for a range of other activities, including Web brows-ing, photography, word processing, and health applications. More importantly, nearly two-thirds (65%) of the time, our respondents used their mobiles in their teaching and learn-ing. This data alone indicates that our respondents are not only predisposed to use mobile devices in nursing education, they have already begun to do so.
Our second research question queried our respondents about their views on using mobile devices in their teaching and learning in the future. If nursing faculty and students are al-ready using these devices in a substantive way, will this use increase? In what ways? This question was addressed most specifically by our respondents’ replies to the open-ended question asking for their views about the potential uses of these technologies to support teaching and learning in the practice area. They pointed out both benefits and barriers to such use. Among the benefits were just-in-time access to current, professional information at the point-of-care and improved communications between students and faculty, espe-cially while students are in clinical practice placements. Among the barriers were the cost of purchasing a device and high wireless connectivity costs as well as issues of infection control and adhering to current hospital policies. The implication of these findings is that, despite some significant barriers to use, nursing faculty and students do foresee an increas-ing use of mobile devices in their practice and strong reasons for their presence.
Finally, we asked, To what degree is the level of mobile self-efficacy among nursing faculty and students related to their potential use of m-technology in teaching and learning? Self-efficacy refers to individuals’ personal beliefs that they are capable of learning and perform-ing particular behaviors. The stronger the sense of personal efficacy they possess, the great-er their perseverance will be, and the likelihood increases that they will perform the chosen activity successfully (Bandura, 1997; Compeau & Higgins, 1995). Our results provide some support for this relationship. The mean self-efficacy score for our respondents was 75, a rat-ing that reflects a high level of confidence in their ability to use mobile technology, that is a strong sense of personal mobile self-efficacy. Moreover, there were strong positive correla-tions between the magnitude of our respondents’ use of mobile device features and their self-efficacy scores. While this data is based on self-report scores rather than independent observations, it does provide support for the conclusion that the more individuals (at least as represented by our respondents) use mobile devices, the more self-confidence they de-velop in use, resulting in the increased likelihood that they will use the devices even more, forming a positive feedback system.
These self-efficacy levels, however, were significantly different between program groups, with BSN students and faculty having a median difference that was 14 points higher than PN students and faculty. Since the PN students engage in a one-year certificate program while the BSN students are involved in a four-year baccalaureate program, it is possible that higher levels of education and experience could contribute strongly to an individual’s sense of mobile self-efficacy in learning contexts. No other comparisons resulted in signifi-cant differences. There was no discernible difference in mobile self-efficacy between faculty and students. While there was a slight relationship between age and self-efficacy in favor of
Using Self-Efficacy to Assess the Readiness of Nursing Educators and Students for Mobile Learning Kenny, Van Neste-Kenny, Burton, Park, and Qayyum
Vol 13 | No 3 Research Articles June 2012 291
younger respondents, this correlation was not statistically significant.
Despite the difference between nursing programs, at a median rating of nearly 65 out of 100, even PN students and faculty are demonstrating a strong sense of mobile self-efficacy. While the BSN students and faculty in this institution had a higher level of mobile self-efficacy, the vast majority of our respondents indicated a strong sense of self-confidence in using their mobile devices, and their use of these devices clearly carried over into their teaching and learning.
It appears, then, that nursing faculty and students are quite familiar with the use of mobile technology, and a substantial proportion of them are very comfortable using the various functionalities these devices afford. Therefore, it is reasonable to conclude that nursing students and faculty, as represented by our respondents, are well prepared and strongly motivated to engage in mobile learning. The implication for nursing programs is that there is a substantive reason for them to consider the integration of mobile device use in their curricula, if they have not already done so. Nursing faculty and students are already using such devices in their teaching and learning informally on a regular basis, and this use is only likely to increase.
Future ResearchWhile the results from this study appear to provide strong evidence that nursing students and faculty are well-disposed to m-learning, these results are from two nursing programs in one rural community college and, as such, need to be corroborated in different settings and at different levels of nursing study. Our research team is currently implementing a replica-tion of this study in baccalaureate and graduate specialty nursing programs in a large urban setting in western Canada.
In addition, while our mobile self-efficacy scale was based on a previously validated com-puter self-efficacy scale (Compeau & Higgins, 1995) and its validity is also supported by the results of an exploratory factor analysis, the psychometrics of our current instrument require further assessment. We will carry out a confirmatory factor analysis as a component of our planned replication study.

Using Self-Efficacy to Assess the Readiness of Nursing Educators and Students for Mobile Learning Kenny, Van Neste-Kenny, Burton, Park, and Qayyum
Vol 13 | No 3 Research Articles June 2012 292
ReferencesBandura, A. (1997). Self-efficacy: The exercise of control. New York, NY: W. H. Freeman
and Company.
Bandura, A. (2006). Guide for constructing self-efficacy scales. In F. Pajares & T. Urdan (Eds.), Self-efficacy beliefs of adolescents (pp. 307–337). Greenwich, CT: Informa-tion Age Publishing.
Compeau, D. R., & Higgins, C. A. (1995). Computer self-efficacy: Development of a measure and initial test. MIS Quarterly, 19(2), 189–211.
Hodges, C. B., Stackpole-Hodges, C. L., & Cox, K. M. (2008). Self-efficacy, self-regulation, and cognitive style as predictors of achievement with podcast instruction. Journal of Educational Computing Research, 38(2), 139–153.
Johnson, R. D. (2005). An empirical investigation of sources of application-specific com-puter-self-efficacy and mediators of the efficacy: Performance relationship. Inter-national Journal of Human-Computer Studies, 62(6), 737–758.
Kao, C.-P., & Tsai, C.-C. (2009). Teachers’ attitudes toward web-based professional devel-opment, with relation to internet self-efficacy and beliefs about web-based learn-ing. Computers and Education, 53, 66–73.
Kenny, R. F., Park, C. L., Van Neste-Kenny, J. M. C., Burton, P. A., & Meiers, J. (2009a). Using mobile learning to enhance the quality of nursing practice education. In M. Ally (Ed.), Mobile learning: Transforming the delivery of education and training (pp. 75–98). Edmonton, AB: Athabasca University Press. Retrieved from http://www.aupress.ca/index.php/books/120155
Kenny, R. F., Park, C. L, Van Neste-Kenny, J. M. C., Burton, P. A., & Meiers, J. (2009b). Mobile learning in nursing practice education: Applying Koole’s FRAME model. Journal of Distance Education, 23(3), 75–96. Retrieved from http://www.jofde.ca/index.php/jde/article/view/599
Kenny, R. F., Park, C. L., Van Neste-Kenny, J. M. C., & Burton, P. A. (2010). Mobile self-efficacy in Canadian nursing education programs. In M. Montebello, V. Camilleri, & A. Dingli (Eds.), Proceedings of mLearn 2010, the 9th World Conference on Mobile Learning, Valletta, Malta.
Koh, J. L., & Frick, T. W. (2009). Instructor and student classroom interactions during technology skills instruction for facilitating preservice teachers’ computer self-effi-cacy. Journal of Educational Computing Research, 40(2), 211–228.
Koole, M. L. (2009). A model for framing mobile learning. In M. Ally (Ed.), Mobile learn-ing: Transforming the delivery of education and training (pp. 25–47). Edmonton,

Using Self-Efficacy to Assess the Readiness of Nursing Educators and Students for Mobile Learning Kenny, Van Neste-Kenny, Burton, Park, and Qayyum
Vol 13 | No 3 Research Articles June 2012 293
AB: Athabasca University Press. Retrieved from http://www.aupress.ca/index.php/books/120155
Koole, M. L., McQuilkin, J. L., & Ally, M. (2010). Mobile learning in distance education: Utility or futility? Journal of Distance Education, 24(2), 59–82. Retrieved from http://www.jofde.ca/index.php/jde/article/view/644
Kukulska-Hulme, A., & Traxler, J. (2005). Mobile teaching and learning. In A. Kukulska-Hulme & J. Traxler (Eds.), Mobile learning: A handbook for educators and train-ers (pp. 25–44). London: Routledge.
Liang, J-C., & Wu, S-H. (2010). Nurses’ motivations for web-based learning and the role of internet self-efficacy. Innovations in Education and Teaching International, 47(1), 25–37.
Loftus, J. (2009). Factors affecting implementation of educational media casting as an instructional resource in distance education (Unpublished master’s thesis). Atha-basca University, Athabasca, AB. Retrieved from http://library.athabascau.ca/drr/searchdtr.php?textfield=Loftus&Submit=Find&subj=45&cnum=205
Park, C. L., Van Neste-Kenny, J. M. C., Burton, P. A. & Kenny, R. F. (2010). A model of mo-bile faculty presence in nursing education practice. Canadian Journal of Nursing Informatics, 5(3), 21–42. Retrieved from http://cjni.net/Journal_original/Sum-mer2010/Park.pdf
Schunk, D.H. (2008) Learning theories: An educational perspective (5th ed.). Upper Sad-dle Hill, NJ: Pearson Education.
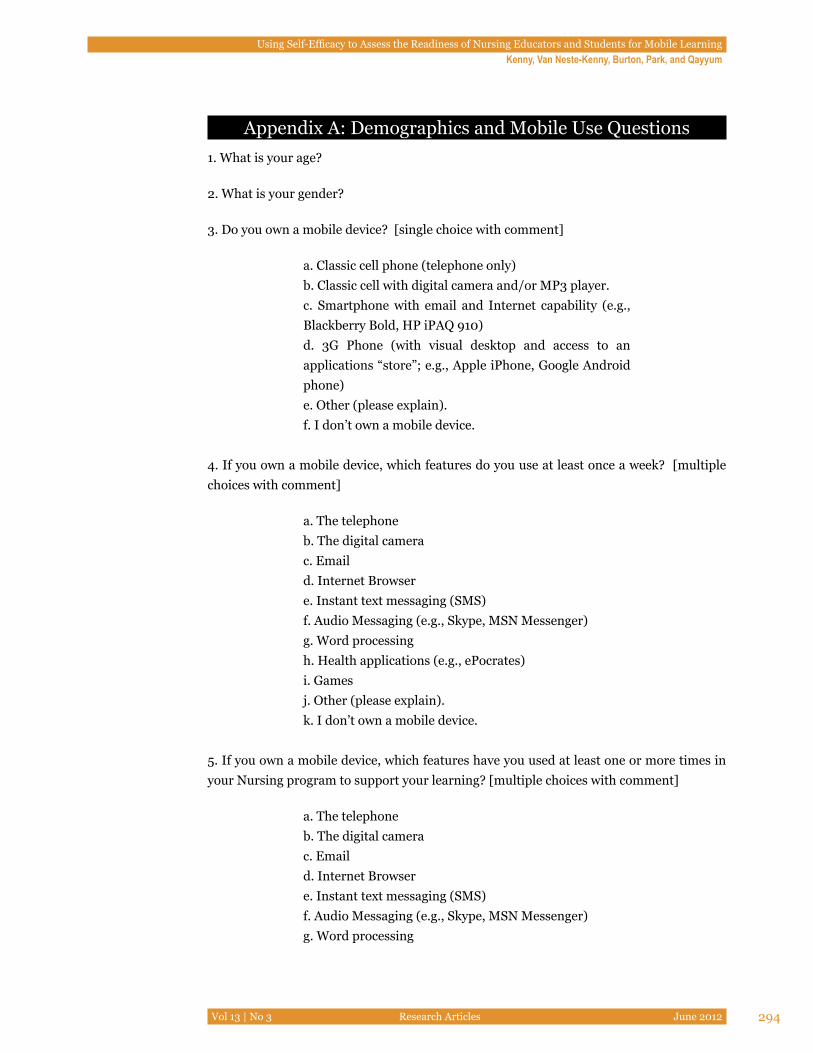
Using Self-Efficacy to Assess the Readiness of Nursing Educators and Students for Mobile Learning Kenny, Van Neste-Kenny, Burton, Park, and Qayyum
Vol 13 | No 3 Research Articles June 2012 294
Appendix A: Demographics and Mobile Use Questions1. What is your age?
2. What is your gender?
3. Do you own a mobile device? [single choice with comment]
a. Classic cell phone (telephone only)b. Classic cell with digital camera and/or MP3 player.c. Smartphone with email and Internet capability (e.g., Blackberry Bold, HP iPAQ 910)d. 3G Phone (with visual desktop and access to an applications “store”; e.g., Apple iPhone, Google Android phone)e. Other (please explain).f. I don’t own a mobile device.
4. If you own a mobile device, which features do you use at least once a week? [multiple choices with comment]
a. The telephone b. The digital camerac. Emaild. Internet Browser e. Instant text messaging (SMS)f. Audio Messaging (e.g., Skype, MSN Messenger) g. Word processing h. Health applications (e.g., ePocrates) i. Gamesj. Other (please explain).k. I don’t own a mobile device.
5. If you own a mobile device, which features have you used at least one or more times in your Nursing program to support your learning? [multiple choices with comment]
a. The telephone b. The digital camerac. Emaild. Internet Browser e. Instant text messaging (SMS)f. Audio Messaging (e.g., Skype, MSN Messenger) g. Word processing

Using Self-Efficacy to Assess the Readiness of Nursing Educators and Students for Mobile Learning Kenny, Van Neste-Kenny, Burton, Park, and Qayyum
Vol 13 | No 3 Research Articles June 2012 295
h. Health applications (e.g., ePocrates)i. Games? j. Other (please explain).k. I have never used my mobile device in my Nursing program.
6. Which kinds of information would you like to be able to share with your students or other instructors via mobile? [multiple choices with comment]
a. Course administration (i.e., meeting times, assignments, absences, etc.)b. Motivational messagesc. Evaluatory commentsd. Care planning decisions e. Sharing practice informationf. Sharing interesting Internet linksg. Other
7. What do you see as the potential uses of these technologies to support nursing practice? [open comment]
8. What do you see as the potential uses of these technologies to support teaching and learning in the practice area? [open comment]
9. Please add any further comments or observations about your use of cell phones and other mobile devices that you would like to bring to our attention. [open comment]
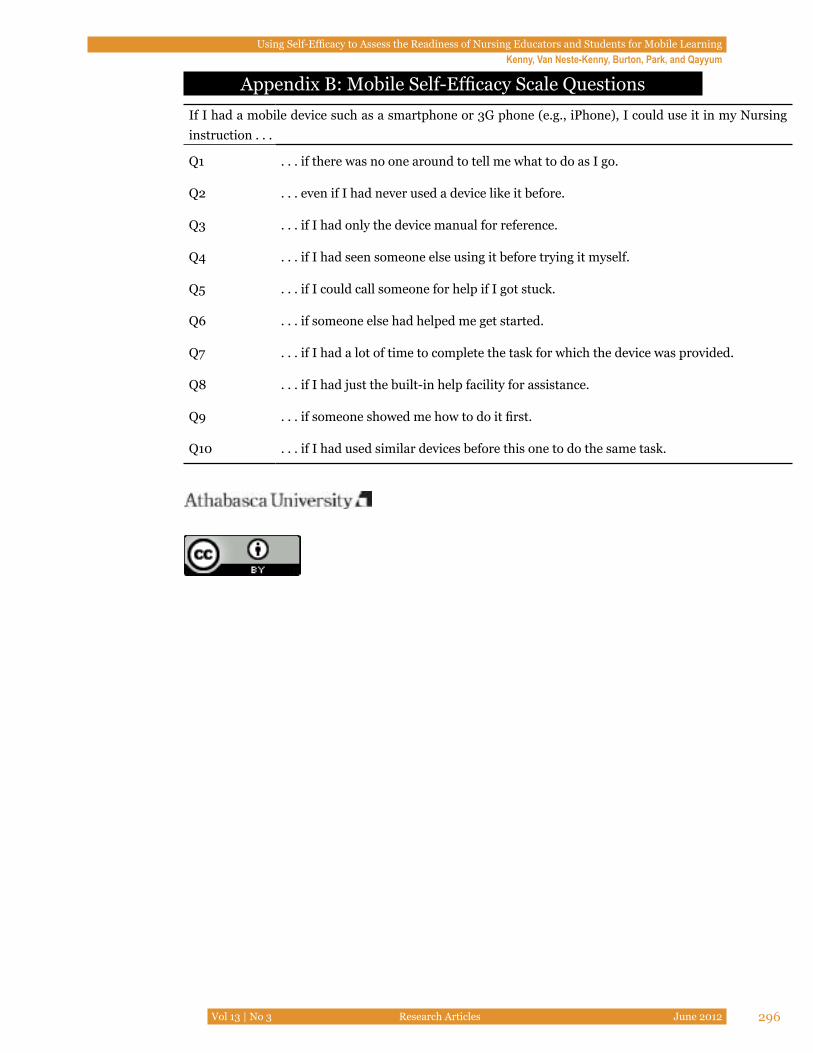
Using Self-Efficacy to Assess the Readiness of Nursing Educators and Students for Mobile Learning Kenny, Van Neste-Kenny, Burton, Park, and Qayyum
Vol 13 | No 3 Research Articles June 2012 296
Appendix B: Mobile Self-Efficacy Scale QuestionsIf I had a mobile device such as a smartphone or 3G phone (e.g., iPhone), I could use it in my Nursing instruction . . .
Q1 . . . if there was no one around to tell me what to do as I go.
Q2 . . . even if I had never used a device like it before.
Q3 . . . if I had only the device manual for reference.
Q4 . . . if I had seen someone else using it before trying it myself.
Q5 . . . if I could call someone for help if I got stuck.
Q6 . . . if someone else had helped me get started.
Q7 . . . if I had a lot of time to complete the task for which the device was provided.
Q8 . . . if I had just the built-in help facility for assistance.
Q9 . . . if someone showed me how to do it first.
Q10 . . . if I had used similar devices before this one to do the same task.

Identification of Conflicting Questions in the PARES System
AbstractStudent testing and knowledge assessment is a significant aspect of the learning process. In a number of cases, it is expedient not to present the exact same test to all learners all the time (Pritchett, 1999). This may be desired so that cheating in the exam is made harder to carry out or so that the learners can take several practice tests on the same subject as part of the course.
This study presents an e-testing platform, namely PARES, which aims to provide assess-ment services to academic staff by facilitating the creation and management of question banks and powering the delivery of nondeterministically generated test suites. PARES uses a conflict detection algorithm based on the vector space model to compute the similarity between questions and exclude questions which are deemed to have an unacceptably large similarity from appearing in the same test suite. The conflict detection algorithm and a sta-tistical evaluation of its accuracy are presented. Evaluation results show that PARES suc-ceeds in detecting question types at about 90% and its efficiency can be further increased through continuing education and enrichment of the system’s correlation vocabulary.
Keywords: Computer adaptive testing; CAT; conflict detection algorithm
IntroductionIn recent years, e-learning has made significant progress in every way that can be mea-sured. Multiple e-learning platforms exist, both open source (Moodle, ILIAS, ATutor) and commercial (BlackBoard), and these have matured considerably over the years, offering
Avgoustos Tsinakos and Ioannis KazanidisKavala Institute of Technology, Greece
Identification of Conflicting Questions in the PARES SystemTsinakos and Kazanidis
Vol 13 | No 3 Research Articles June 2012 298
comprehensive and powerful tools with which to facilitate the learning process.
Even though e-learning platforms and tools have displayed significant progress as outlined above, there still remain several aspects of the learning process that are not quite adequate-ly provided for. One such significant aspect is student testing and knowledge assessment, more concisely known as e-testing. Most of the times platform’s teaching staff has to main-tain and administer large question banks covering a multitude of subjects, an endeavor which requires advanced software features that are still being discussed, refined, and devel-oped. An especially thorny problem arises when question banks are exported and merged together with other, previously existing testing material. It is quite possible that these suites may not be altogether effective, fair, and without conflicts.
Effectiveness is a quality that cannot be objectively measured a priori, but we can make several effectiveness-related objective observations based on practical situations. One such observation is that in a sizable number of cases, it is expedient to not present the exact same test suite to all learners all the time (Pritchett, 1999). This may be desired so that cheating in the exam is made harder to carry out or so that the learners can take several practice tests on the same subject as part of the course. In any case, this aim can be achieved by randomly selecting questions from a question bank according to some predefined algorithm (Kiku-sawa et al., 2006).
The same inability to provide a waterproof objective definition is also encountered when discussing fairness, but in this case also we can constrain ourselves to a single aspect of it. Specifically, we would like to assert that each of these randomly generated test suites pro-vides in each case a more or less constant (within some acceptable bounds) balance among the subjects it covers.
The final of these testing system requirements is today the most difficult to achieve. A con-flict in a test suite is defined as the simultaneous presence of two or more questions that are redundant in content and/or one of their number provides a part or the whole of the answer for another (Hage & Aimeur, 2006).
This paper introduces PARES, a platform that is being developed in our institution to pro-vide learning assessment tools closely tailored to our teachers’ and professors’ needs. The latest improvement in PARES, which is the main subject of this paper, concerns the in-tegration of information retrieval (IR) techniques to identify conflicting questions in the question banks and prevent their mutual inclusion in the same test instance. This func-tionality is a specialized case of the search problem and uses keywords for each question to compute the similarities between questions using the cosine function in the vector space model (Salton et al., 1975). For additional efficiency, term frequency/inverse document frequency (tf-idf) weighting is applied to keywords when constructing question vectors.
The present paper is organized as follows: a brief description of basic information retrieval methods; a presentation of some related work; a presentation of PARES; details about the specific methodology used in PARES to generate random test suites with no conflicting
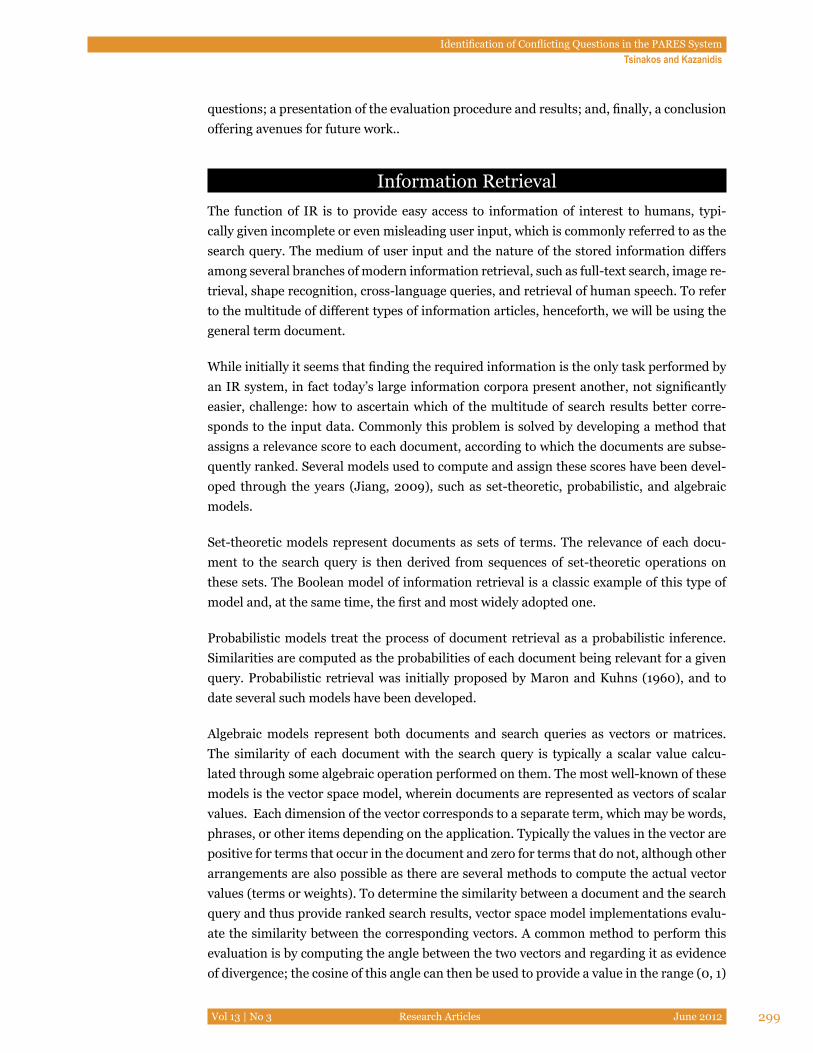
Identification of Conflicting Questions in the PARES SystemTsinakos and Kazanidis
Vol 13 | No 3 Research Articles June 2012 299
questions; a presentation of the evaluation procedure and results; and, finally, a conclusion offering avenues for future work..
Information RetrievalThe function of IR is to provide easy access to information of interest to humans, typi-cally given incomplete or even misleading user input, which is commonly referred to as the search query. The medium of user input and the nature of the stored information differs among several branches of modern information retrieval, such as full-text search, image re-trieval, shape recognition, cross-language queries, and retrieval of human speech. To refer to the multitude of different types of information articles, henceforth, we will be using the general term document.
While initially it seems that finding the required information is the only task performed by an IR system, in fact today’s large information corpora present another, not significantly easier, challenge: how to ascertain which of the multitude of search results better corre-sponds to the input data. Commonly this problem is solved by developing a method that assigns a relevance score to each document, according to which the documents are subse-quently ranked. Several models used to compute and assign these scores have been devel-oped through the years (Jiang, 2009), such as set-theoretic, probabilistic, and algebraic models.
Set-theoretic models represent documents as sets of terms. The relevance of each docu-ment to the search query is then derived from sequences of set-theoretic operations on these sets. The Boolean model of information retrieval is a classic example of this type of model and, at the same time, the first and most widely adopted one.
Probabilistic models treat the process of document retrieval as a probabilistic inference. Similarities are computed as the probabilities of each document being relevant for a given query. Probabilistic retrieval was initially proposed by Maron and Kuhns (1960), and to date several such models have been developed.
Algebraic models represent both documents and search queries as vectors or matrices. The similarity of each document with the search query is typically a scalar value calcu-lated through some algebraic operation performed on them. The most well-known of these models is the vector space model, wherein documents are represented as vectors of scalar values. Each dimension of the vector corresponds to a separate term, which may be words, phrases, or other items depending on the application. Typically the values in the vector are positive for terms that occur in the document and zero for terms that do not, although other arrangements are also possible as there are several methods to compute the actual vector values (terms or weights). To determine the similarity between a document and the search query and thus provide ranked search results, vector space model implementations evalu-ate the similarity between the corresponding vectors. A common method to perform this evaluation is by computing the angle between the two vectors and regarding it as evidence of divergence; the cosine of this angle can then be used to provide a value in the range (0, 1)
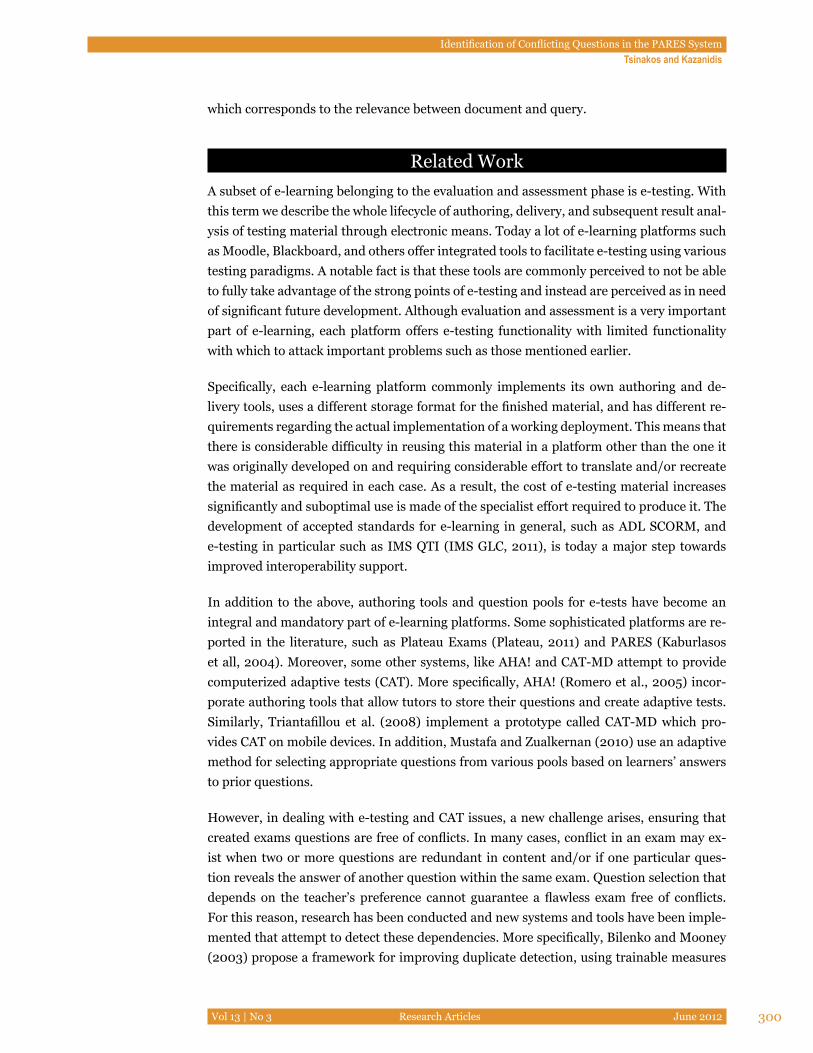
Identification of Conflicting Questions in the PARES SystemTsinakos and Kazanidis
Vol 13 | No 3 Research Articles June 2012 300
which corresponds to the relevance between document and query.
Related WorkA subset of e-learning belonging to the evaluation and assessment phase is e-testing. With this term we describe the whole lifecycle of authoring, delivery, and subsequent result anal-ysis of testing material through electronic means. Today a lot of e-learning platforms such as Moodle, Blackboard, and others offer integrated tools to facilitate e-testing using various testing paradigms. A notable fact is that these tools are commonly perceived to not be able to fully take advantage of the strong points of e-testing and instead are perceived as in need of significant future development. Although evaluation and assessment is a very important part of e-learning, each platform offers e-testing functionality with limited functionality with which to attack important problems such as those mentioned earlier.
Specifically, each e-learning platform commonly implements its own authoring and de-livery tools, uses a different storage format for the finished material, and has different re-quirements regarding the actual implementation of a working deployment. This means that there is considerable difficulty in reusing this material in a platform other than the one it was originally developed on and requiring considerable effort to translate and/or recreate the material as required in each case. As a result, the cost of e-testing material increases significantly and suboptimal use is made of the specialist effort required to produce it. The development of accepted standards for e-learning in general, such as ADL SCORM, and e-testing in particular such as IMS QTI (IMS GLC, 2011), is today a major step towards improved interoperability support.
In addition to the above, authoring tools and question pools for e-tests have become an integral and mandatory part of e-learning platforms. Some sophisticated platforms are re-ported in the literature, such as Plateau Exams (Plateau, 2011) and PARES (Kaburlasos et all, 2004). Moreover, some other systems, like AHA! and CAT-MD attempt to provide computerized adaptive tests (CAT). More specifically, AHA! (Romero et al., 2005) incor-porate authoring tools that allow tutors to store their questions and create adaptive tests. Similarly, Triantafillou et al. (2008) implement a prototype called CAT-MD which pro-vides CAT on mobile devices. In addition, Mustafa and Zualkernan (2010) use an adaptive method for selecting appropriate questions from various pools based on learners’ answers to prior questions.
However, in dealing with e-testing and CAT issues, a new challenge arises, ensuring that created exams questions are free of conflicts. In many cases, conflict in an exam may ex-ist when two or more questions are redundant in content and/or if one particular ques-tion reveals the answer of another question within the same exam. Question selection that depends on the teacher’s preference cannot guarantee a flawless exam free of conflicts. For this reason, research has been conducted and new systems and tools have been imple-mented that attempt to detect these dependencies. More specifically, Bilenko and Mooney (2003) propose a framework for improving duplicate detection, using trainable measures

Identification of Conflicting Questions in the PARES SystemTsinakos and Kazanidis
Vol 13 | No 3 Research Articles June 2012 301
of textual similarity, and Cadmus (Hage & Aimeru, 2006) uses information retrieval tech-niques to detect conflicts within an exam. For this reason, a module called ICE (Identifica-tion of Conflicts in Exams) is appended to the system, which is based on the vector space model relying on tf-idf weighing and the cosine function to calculate the similarity between questions.
PARESPARES is an e-testing system that offers a comprehensive feature set targeted to managing testing and assessment in an academic environment. It includes tools to manage teachers and students, create logical courses and assign users to participate in or facilitate them, de-velop suitable testing material for each course, and administer tests to students according to a variety of testing paradigms. The results are then stored and made available in a variety of forms for further perusal. The platform is divided in three distinct modules, each one of which corresponds to a user role.
The administrator module in PARES allows the creation of user accounts and courses and the assignment of the former to the latter. The functions of this module are quite straight-forward and commonly used in virtually all e-learning systems today; therefore, we shall not present it in greater detail here.
At the other end of the user spectrum is the PARES student module, which is used by learn-ers to take tests electronically. Initially, these tests are constrained to multiple choice ques-tions organized in question banks, from which tests are assembled. Learners may be al-lowed to take multiple tests, the significance of which is determined by the course teacher.
Finally, the most important module in PARES is used by teachers to develop testing mate-rial and determine the various test parameters.
Testing Material Development and DeliveryPARES offers teachers several tools to organize and develop testing material. Initially teachers submit new questions. The system prompts the teacher to provide a summary of the question and a description and to define the corresponded topic.
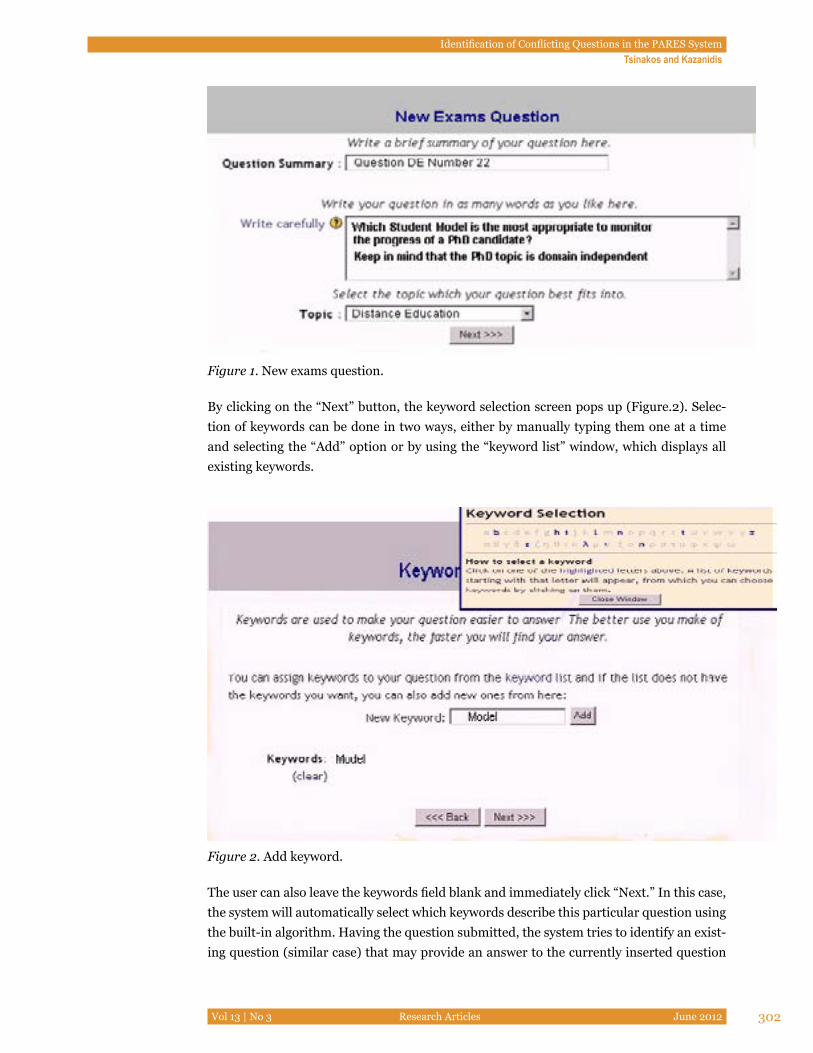
Identification of Conflicting Questions in the PARES SystemTsinakos and Kazanidis
Vol 13 | No 3 Research Articles June 2012 302
Figure 1. New exams question.
By clicking on the “Next” button, the keyword selection screen pops up (Figure.2). Selec-tion of keywords can be done in two ways, either by manually typing them one at a time and selecting the “Add” option or by using the “keyword list” window, which displays all existing keywords.
Figure 2. Add keyword.
The user can also leave the keywords field blank and immediately click “Next.” In this case, the system will automatically select which keywords describe this particular question using the built-in algorithm. Having the question submitted, the system tries to identify an exist-ing question (similar case) that may provide an answer to the currently inserted question
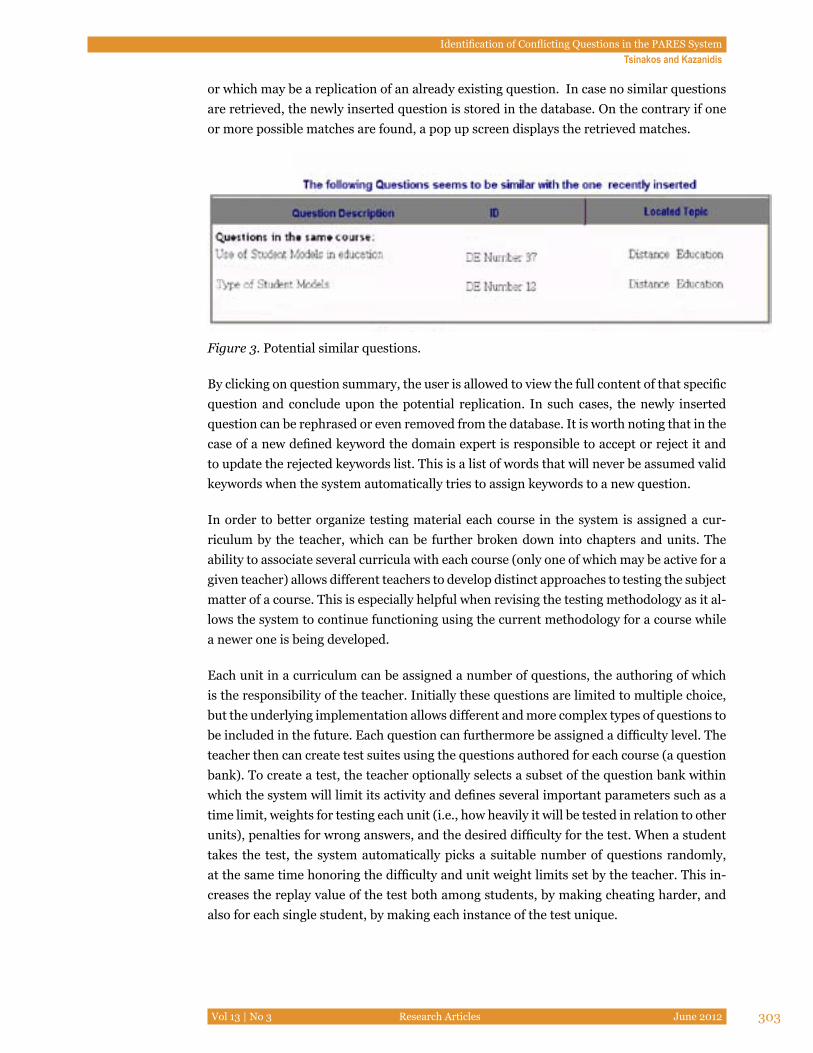
Identification of Conflicting Questions in the PARES SystemTsinakos and Kazanidis
Vol 13 | No 3 Research Articles June 2012 303
or which may be a replication of an already existing question. In case no similar questions are retrieved, the newly inserted question is stored in the database. On the contrary if one or more possible matches are found, a pop up screen displays the retrieved matches.
Figure 3. Potential similar questions.
By clicking on question summary, the user is allowed to view the full content of that specific question and conclude upon the potential replication. In such cases, the newly inserted question can be rephrased or even removed from the database. It is worth noting that in the case of a new defined keyword the domain expert is responsible to accept or reject it and to update the rejected keywords list. This is a list of words that will never be assumed valid keywords when the system automatically tries to assign keywords to a new question.
In order to better organize testing material each course in the system is assigned a cur-riculum by the teacher, which can be further broken down into chapters and units. The ability to associate several curricula with each course (only one of which may be active for a given teacher) allows different teachers to develop distinct approaches to testing the subject matter of a course. This is especially helpful when revising the testing methodology as it al-lows the system to continue functioning using the current methodology for a course while a newer one is being developed.
Each unit in a curriculum can be assigned a number of questions, the authoring of which is the responsibility of the teacher. Initially these questions are limited to multiple choice, but the underlying implementation allows different and more complex types of questions to be included in the future. Each question can furthermore be assigned a difficulty level. The teacher then can create test suites using the questions authored for each course (a question bank). To create a test, the teacher optionally selects a subset of the question bank within which the system will limit its activity and defines several important parameters such as a time limit, weights for testing each unit (i.e., how heavily it will be tested in relation to other units), penalties for wrong answers, and the desired difficulty for the test. When a student takes the test, the system automatically picks a suitable number of questions randomly, at the same time honoring the difficulty and unit weight limits set by the teacher. This in-creases the replay value of the test both among students, by making cheating harder, and also for each single student, by making each instance of the test unique.
Identification of Conflicting Questions in the PARES SystemTsinakos and Kazanidis
Vol 13 | No 3 Research Articles June 2012 304
Conflicts in TestsAn inherent problem with generating tests by randomly selecting questions within a ques-tion bank is that there will typically be several questions that are designed to assess the learner’s knowledge on a single item. This state of affairs is practically guaranteed in PARES as it follows from the requirements of all test instances a) covering the same curriculum and b) being distinct. Therefore, for items belonging to a single unit we would like to avoid the possibility of including at the same time questions that are redundant or provide the answer to another included question in direct or indirect fashion. It can be argued that this is even a requirement from the system instead of a valuable feature. As a consequence, PARES con-tains logic specifically designed to avoid the inclusion of conflicting questions in the same exam. In order to detect such questions, the relevant subsystem uses IR techniques based on the vector space model. Within each set of interchangeable questions in the question bank, the similarities between questions are computed and constraints are placed on the maximum similarity between questions that can be chosen together.
Conflict Detection AlgorithmThe conflict detection algorithm in PARES operates in two distinct phases: question au-thoring time and test generation time. During question authoring, each question is charac-terized according to teacher input by a set of keywords and/or keyphrases which must be present in the question body. The number of occurrences of each term in each question is calculated whenever a question is created or updated and stored in the system.
At test generation time, for each course unit the system retrieves the questions belonging to the union of two sets, these being a) the questions relevant to the unit and b) the questions that the teacher designated as usable in the current test. Since it is highly probable that there will be conflicting questions within this set, a document vector is computed for each question and the similarities between each pair are calculated according to these vectors. Question pairs with similarity above a certain threshold are deemed mutually exclusive and are treated by the system as such. Therefore, assuming satisfactory performance and a minimum number of questions in the bank, the resulting test is both randomized and free of conflicting questions.
Weight CalculationThe document vector for each question is multidimensional and contains the weights for each keyword or phrase (the word term will be used for these two kinds of text) that appears in at least one question in each course. The notation wn,d represents the weight for keyword n in the vector of document d, therefore:
[ ]TdNddd wwwV ,,2,1 ...=
These weights are calculated according to the tf-idf weighting method. This method relies on term frequency and inverted document frequency to calculate each weight in turn as the product of these two factors. Term frequency (tf) represents the importance of term n
Identification of Conflicting Questions in the PARES SystemTsinakos and Kazanidis
Vol 13 | No 3 Research Articles June 2012 305
in document d and is calculated as the quotient of the term n’s frequency in document d divided by the maximum frequency among all terms appearing in said document. This is given in the next equation.
)max(,
,d
dndn f
ftf =
The inverted document frequency (idf) serves as a metric of the discriminatory power of each term and is determined by an operation among all questions in a course. Higher val-ues of idf therefore correspond to terms which characterize a question more distinctly than others. The idf is computed as the logarithm of the total number of questions divided by the number of questions in which term n appears:
{ }dnD
idfn ∈= log
After the tf and idf have been calculated for each term in a question, the question’s vector Vd can now be computed as follows:
ndndn idftfw ⋅= ,,
Similarity FunctionThe similarity function used to measure the similarities between questions considered for mutual inclusion to the test being generated in PARES is based on the convergence of those questions’ document vectors. The angle between the vectors is calculated and its cosine is then taken into account. Question pairs where the cosine is equal to 0 are deemed to have no similarity at all, while pairs where the cosine is equal to 1 should be deemed extremely redundant. The following equation highlights the method of similarity calculation:
21
21cosVV
VV⋅⋅
=θ
The vector dot products and magnitudes in the above equation are calculated as follows:
∑ =×=⋅
N
n nn wwVV1 2,1,21
∑∑ ==×=⋅
N
n nN
n n wwVV1
22,1
21,21
Test Generation ProcessWe can now comprehensively summarize the conflict detection process built into PARES.
Identification of Conflicting Questions in the PARES SystemTsinakos and Kazanidis
Vol 13 | No 3 Research Articles June 2012 306
There are three distinct phases in the test generation process. In the first phase, preliminary calculations are made after any question is created or edited in order to compute the docu-ment vector for all questions. This is necessary as the inverted document frequency for any term may change after any one document is edited, and therefore a change in any document may result in alterations to possibly all document vectors.
Phase 1 (question authoring):Calculate term frequency and inverted document frequency for each term and document. Calculate document vector for all questions.
In the second phase, teachers select the parameters for a test template they wish to make available to students. A key parameter for the test is the number of questions from each teaching unit that should be included in the test; the system must therefore confirm that there are a sufficient number of nonconflicting questions to satisfy this requirement. In order to achieve this, conflicting questions are assigned to a number of bins. It is evident that at most one question from each bin can be used in a conflict-free test; therefore, if the number of bins is smaller than the number of questions to include the test is not viable with the given parameters. PARES also provides support for questions of varying difficulty and creating tests with a specified difficulty level, a feature which we have not addressed in this discussion because it is not related to the conflict detection algorithm. This feature can be implemented by creating sub-bins for each similarity group where questions with differing difficulty are placed.
Phase 2 (test creation):Accept test configuration data from teacherFor each course unit { Retrieve S (set of questions pertaining to the unit)Calculate similarity (vector angle cosine) for each pair of questions in SLet bin number B = 1While S is not empty {Assign any one question Q in S to bin BRemove Q from SAssign all questions Q’ with similarity(Q, Q’) > threshold to bin BRemove all Q’ from SLet B = B + 1}If B – 1 < N (number of questions to be included) {Not enough material to create test for this N}}
Identification of Conflicting Questions in the PARES SystemTsinakos and Kazanidis
Vol 13 | No 3 Research Articles June 2012 307
In the final phase, triggered when a student has elected to take the test, the questions are again assigned to bins as above and a random question is selected from each bin for inclu-sion until enough questions have been selected.
Phase 3 (test generation):For each course unit {Retrieve S (set of questions pertaining to the unit)Calculate similarity values (cosines) for each pair of questions in SLet bin number B = 1While S is not empty {Assign any one question Q in S to bin BRemove Q from SAssign all questions Q’ with similarity(Q, Q’) > threshold to bin BRemove all Q’ from SLet B = B + 1}For i = 1 to N (number of questions to be included) { Randomly pick a bin P where 1 <= P < B Randomly pick a question assigned to B and include it in the test Remove bin P from bin list Let B = B – 1}}
Present test to student
EvaluationTo evaluate the PARES efficiency of finding conflicting questions, 103 exam questions were submitted for three higher education courses: 45 on Telematics, 32 on Distance Education, and 26 on Teaching Information Technology. These questions were either original and had concept dependencies or they were similar to other questions. Since these questions had been previously classified into one of the above subjects, according to their type, the goal of the evaluation was to find the rate of successful question classification per course as well as in total so as to measure the conflict algorithm efficiency. Evaluation results are sum-marized in Table 1 and Figure 4.

Identification of Conflicting Questions in the PARES SystemTsinakos and Kazanidis
Vol 13 | No 3 Research Articles June 2012 308
Table 1
Evaluation Results
Telematics
Similar Concept dependencies Original Total
Submitted 28 7 10 45
Successfully identified 27 7 10 44
Percentage 96.43% 100.00% 100.00% 97.78%
Distance Education
Similar Concept dependencies Original Total
Submitted 20 9 3 32
Successfully identified 18 8 3 29
Percentage 90.00% 88.89% 100.00% 90.63%
Teaching Information Technology
Similar Concept dependencies Original Total
Submitted 16 6 4 26
Successfully identified 12 4 4 20
Percentage 75.00% 66.67% 100.00% 76.92%
All Courses
Similar Concept dependencies Original Total
Submitted 64 22 17 103
Successfully identified 57 19 17 93
Percentage 89.06% 86.36% 100.00% 90.29%
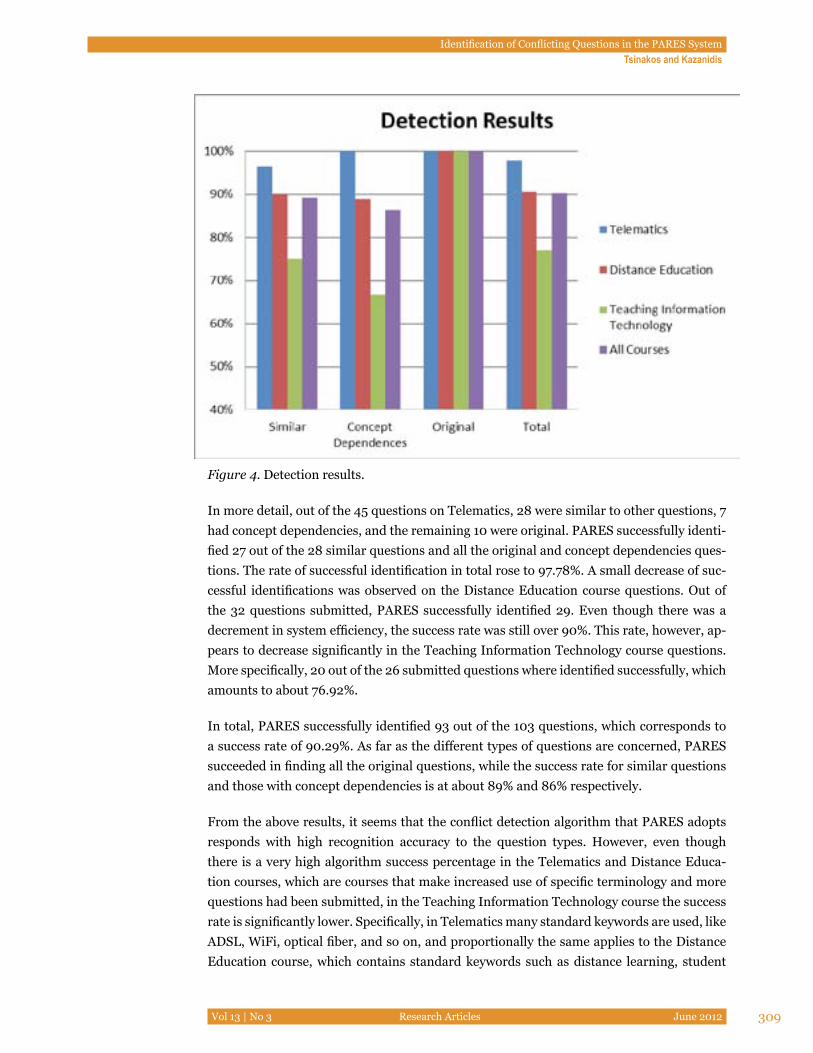
Identification of Conflicting Questions in the PARES SystemTsinakos and Kazanidis
Vol 13 | No 3 Research Articles June 2012 309
Figure 4. Detection results.
In more detail, out of the 45 questions on Telematics, 28 were similar to other questions, 7 had concept dependencies, and the remaining 10 were original. PARES successfully identi-fied 27 out of the 28 similar questions and all the original and concept dependencies ques-tions. The rate of successful identification in total rose to 97.78%. A small decrease of suc-cessful identifications was observed on the Distance Education course questions. Out of the 32 questions submitted, PARES successfully identified 29. Even though there was a decrement in system efficiency, the success rate was still over 90%. This rate, however, ap-pears to decrease significantly in the Teaching Information Technology course questions. More specifically, 20 out of the 26 submitted questions where identified successfully, which amounts to about 76.92%.
In total, PARES successfully identified 93 out of the 103 questions, which corresponds to a success rate of 90.29%. As far as the different types of questions are concerned, PARES succeeded in finding all the original questions, while the success rate for similar questions and those with concept dependencies is at about 89% and 86% respectively.
From the above results, it seems that the conflict detection algorithm that PARES adopts responds with high recognition accuracy to the question types. However, even though there is a very high algorithm success percentage in the Telematics and Distance Educa-tion courses, which are courses that make increased use of specific terminology and more questions had been submitted, in the Teaching Information Technology course the success rate is significantly lower. Specifically, in Telematics many standard keywords are used, like ADSL, WiFi, optical fiber, and so on, and proportionally the same applies to the Distance Education course, which contains standard keywords such as distance learning, student
Identification of Conflicting Questions in the PARES SystemTsinakos and Kazanidis
Vol 13 | No 3 Research Articles June 2012 310
model, and so on. It seems, therefore, that the identification of conflicting questions de-creases in those cases where the wording of the questions is descriptive and lacks termi-nology or where limited use of terminology is made. In addition the number of submitted questions in the Telematics course, in which system detection accuracy was the highest, is also at a high level (45) and almost double from the Teaching Information Technology course submitted questions (26). Thus, the number of submitted questions affects the per-formance of the algorithm.
Fortunately, algorithm efficiency may be further increased through continuing education and the enrichment of the system’s correlation vocabulary. This may be achieved either through the submission of more questions related to a particular topic or through the inter-vention of an expert who correlates the specific keywords and key phrases used in specific topic questions. These actions lead to a higher success rate of the algorithm as there is in-creased terminology awareness on a particular topic.
ConclusionSeveral established e-learning platforms today offer e-testing tools to facilitate evaluation and assessment of the learning process. These tools are still being developed as there are many opportunities for the inclusion of features that will greatly increase the testing mate-rial’s potential for reuse both in space (by reusing material developed in other platforms or deployments) and time (by combining the same material in different ways for each as-sessment). These opportunities however present certain problems that must be addressed before such features are ready for productive use.
PARES is an e-testing platform that aims to provide assessment services to academic staff by facilitating the creation and management of question banks and powering the delivery of nondeterministically generated test suites. This capability is very important in cases where teachers wish to provide students with the option of testing their subject knowledge several times during the learning process, a scenario which would require immense amounts of effort if implemented with pre-engineered tests. The platform augments this feature with additional parameters that enable the generation of tests with a specified difficulty level. Therefore PARES may help both teachers and students assess learning performance more efficiently. Consequently this will allow teachers to improve their courses and provide ap-propriate responses to their students. On the other hand students can readjust their study according to the online tests outcomes.
In order to provide tests that are effective and free of conflicting questions, PARES uses an algorithm based on the vector space model to compute the similarity between questions and exclude questions which are deemed to have an unacceptably large similarity from ap-pearing in the same test suite. Furthermore, teachers can be warned in advance that their question banks are not populated enough to create tests with certain characteristics.
Since the performance of the system depends on its ability to accurately calculate question similarity, further work will naturally focus on improving these calculations. The vector
Identification of Conflicting Questions in the PARES SystemTsinakos and Kazanidis
Vol 13 | No 3 Research Articles June 2012 311
space model used has certain known deficiencies, only some of which may be offset by mak-ing larger question banks available. In particular, the use of keywords can be made more effective if they are internally processed to a more computer-friendly form before they are used as input to the algorithm. Stripping words which belong in the rejected keywords list (list of words devoid of specific meaning) from key phrases and stemming keywords (so that grammatical rules do not hinder the operation of the algorithm) are two such obvious improvements, after the implementation of which the term weighting function can be fur-ther profiled and improved.
Identification of Conflicting Questions in the PARES SystemTsinakos and Kazanidis
Vol 13 | No 3 Research Articles June 2012 312
ReferencesBilenko M, & Mooney RJ. (2003). Adaptive duplicate detection using learnable string simi-
larity measures. Proceedings of the Ninth ACM SIGKDD International Conference on Knowledge Discovery and Data Mining (KDD-2003) (pp. 39-48).
Hage, H., & Aimeru, E. (2006). ICE: A system for identification of conflicts in exams. Pro-ceedings of IEEE International Conference on Computer Systems and Applica-tions (pp. 980-987).
IMS GLC (2011). IMS question & test interoperability specification. Retrieved from http://www.imsglobal.org/question/
Jiang, H. (2009). Study on the performance measure of information retrieval models. Pro-ceedings of IEEE International Symposium on Intelligent Ubiquitous Computing and Education (pp.436-439).
Kaburlasos, V.,G., Marinagi, C.,C., & Tsoukalas, V.,T. (2004). PARES: A software tool for computer-based testing and evaluation used in the Greek higher education system. In Kinshuk et al. (Eds), Proceedings of 4th International Conference of Advanced Learning Technologies (pp.771-773), Joensuu, Finland: IEEE.
Kikusawa, M., Yamakawa, O., & Tanaka, T. (2006). The method and role of CBT in a class-room lecture of higher education. In T. Reeves & S. Yamashita (Eds.), Proceedings of World Conference on E-Learning in Corporate, Government, Healthcare, and Higher Education (pp. 661-666).
Maron, M. E., & Kuhns J. L. (1960). On relevance, probabilistic indexing and information retrieval. Journal of the ACM, 7(3), 216-244.
Plateau (2011). Plateau Talent Management System. Retrieved from http://www.plateau.com/prod/exams.htm at April 2011
Pritchett, N. (1999). Effective question design. In S. Brown, P. Race, & J. Bull (Eds.), Com-puter-assisted assessment in higher education (pp. 29-37). London: Kogan Page.
Romero C., Ventura S., Hervás C., & De Bra. P. (2005). Extending AHA!: Adding levels, data mining, tests and SCORM to AHA!. Proceedings of Fifth International Con-ference Human Systems Learning (pp. 21-40).
Salton, G., Wong, A., & Yang C. S. (1975). A vector space model for automatic indexing. Communications of the ACM, 18(11), 613–620.
Seet, A.M., & Zualkernan I.A. (2010). An adaptive method for selecting question pools us-ing C4.5. Proceedings of 10th International Conference of Advanced Learning Technologies (pp. 86-88), Sousse, Tunisia: IEEE.
Identification of Conflicting Questions in the PARES SystemTsinakos and Kazanidis
Vol 13 | No 3 Research Articles June 2012 313
Triantafillou, E., Georgiadou, E., & Economides, A. A. (2008). The design and evaluation of a computerized adaptive test on mobile devices. Computers & Education, 50(4), 1319-1330.

Book Review - Quality Assurance and Accreditation in Distance Education and e-Learning: Models, Policies and Research
Reviewer: Kay Shattuck, Quality Matters, USA
Open and distance learning providers who have enjoyed freedom from external scrutiny may resist attempts at external regulation and auditing and look upon QA as yet another imposition of corporatization and bureaucracy on education. Others see it as a means of establishing a culture of quality, self-reflection and self-improvement.
Thus, Insung Jung and Colin Latchem, open the book for all students and practitioners of open and distance learning. Jung is a professor of Education, Media and Society at the International Christian University in Tokyo, and Colin Latchem is an Australian researcher, writer, and consultant in open and distance learning. As editors of the book they contrib-uted a number of the 23 chapters; other chapters are provided by invited knowledgeable practitioners in various topics related to quality assurance.
Although the book is presented in chapters, I find it separates naturally into themes.
Three chapters (1, 2, 3) provide an overview of issues that impact quality assurance and accreditation in open and distance education following the foreword from Sir John Daniel, president of the Commonwealth of Learning, and two concluding chapters (21 and 23) pro-vide specific QA competencies and guidelines.
Ten chapters from invited authors present information on quality assurance efforts, includ-ing regional policies and guidelines:
Editors: Insung Jung and Colin Latchem (2012)Routledge, New York, 285 pp.ISBN: 978-1-60752-120-4
Book Review - Quality Assurance and Accreditation in Distance Education and e-Learning: Models, Policies and ResearchShattuck
Vol 13 | No 3 Book Notes June 2012 315
• Asia open and distance learning,• Sub-Saharan Africa distance education,• United Kingdom QA and accreditation,• Palestine Open University,• Australian and New Zealand distance education
institutions and open education consortia policies and guidelines (two chapters),
• South Korean QM in corporate e-Learning, • South Pacific and West Indies QA in dual-mode
universities,• North America overview of QA and accreditation,• European QA policies and guidelines.
Six chapters focus on various educational modes:
• Models and case studies of QA in the rising number of open universities,
• Lessons learned from QA efforts in a mega-university (Indonesia Open University) and global telecentres (two chapters),
• Attempts suggested by Commonwealth of Learning’s review and improvement model at lowering cost and increasing effectiveness of QA for developing countries,
• QA issues and challenges in secondary schooling for remote and socially disadvantaged communities in India and Indonesia,
• QA challenges for European small-to-medium enterprises (training).
Two chapters look at the impact of digital technologies on transforming relationships be-tween teachers and learners and learners’ perceptions of quality.
To readers who do not have a grounding in open education, I suggest, after reading the foreword and preface, begin with Latchem and Jung’s chapter on “Quality Assurance and Accreditation in Open and Distance Learning” (Chapter 2); proceed to Chalmers and John-ston’s chapter on “Quality Assurance and Accreditation in Higher Education” (Chapter 1); move on to Latchem and Ali’s chapter on “International and Regional Quality Assurance and Accreditation” (Chapter 3); read on to Jung and Latchem’s chapter on “Competencies and Quality Assurance in Distance and E-Learning” (Chapter 21); and next read Jung and Latchem’s “Concluding Remarks” (Chapter 23). Then, treat yourself to the other chapters that provide rich information, including lessons learned about how well established open and distance institutions in Asia, Europe, Africa, Australia, and the Pacific address qual-
Book Review - Quality Assurance and Accreditation in Distance Education and e-Learning: Models, Policies and ResearchShattuck
Vol 13 | No 3 Book Notes June 2012 316
ity assurance. Please do not be tempted to skip these chapters. To those readers who are familiar with the concept of open and distance education as a well-established mode of regionally and nationally based education openly available to citizens, I say read from cover to cover, making sure not to miss the final chapters on competencies, learners’ perceptions, and concluding remarks. Then hand the book over to an e-learning manager or administra-tor.
Some interesting themes that run through many of the chapters include the following.
• Although distance education continues to have an image problem, as Sir Daniel pointed out, “Active QA is a necessary, if not a sufficient condition for improving its reputation, and those institutions that have engaged most intensely with QA processes, such as Open University Malaysia and the UK Open University, have derived clear benefit from doing so” (p. xiii). So QA efforts can have positive impact with shareholders.
• For-profit institutions and online technologies are playing a role in the need for open and distance education institutions to address quality assurance and the complications “enterprising” entities can create for cross-border education.
• There is discussion on whether e-learning should have specific QA criteria and accredi-tation or be included as a subset of the educational delivery system and even whether there should be internationalization of QA. Arguments are presented for treating open and distance learning, especially e-learning, as requiring special quality assurance pro-cedures and reporting.
• There is an increasing learner-centered focus in e-learning and on student learners as key stakeholders in the QA process; in fact, Jung provides a conceptual framework for learner-oriented QA for e-learning that includes cultural variables for cross-cultural learning situations. This cultural issue is raised elsewhere in the book as it becomes important for today’s and tomorrow’s technologies that allow educational reach well beyond national borders. (An interesting point is made elsewhere by Lockee, Perkins, Potter, Burton, and Kreb when they recently reviewed 17 national and international or-ganizations’ quality standards. They noted different emphasis on standards regarding course design issues and instructor preparation [cited in Irele, in press]).
Currently, quality assurance is a phrase frequently associated with e-learning, perhaps, often as a handy platitude from lack of familiarity with systemic approaches to distance education and lack of awareness of the importance of recognizing the various sharehold-ers of education, which often have been invisible (I dare say even ignored). As suggested throughout the book, the growth and popularity of e-learning, along with the emergence of new “enterprising” organizations into the mix, has drawn attention and resulted in un-precedented demands for accountability. As Sir John Daniel writes in the Foreword, “We face the paradox that while open and distance education is growing rapidly in popularity with students and institutions, thanks in part to online technologies, hostility to it is also growing” (p. xvi).
Book Review - Quality Assurance and Accreditation in Distance Education and e-Learning: Models, Policies and ResearchShattuck
Vol 13 | No 3 Book Notes June 2012 317
And the book’s authors point out,
There is little research-based literature to guide policymakers, managers and practitioners in applying Quality Assurance (QA) in education and training to ensure the right balance is found between accountability and autonomy, as well as assuring quality for the time and costs involved.
The book that Jung and Latchem pulled together provides much-needed discussion on just what quality assurance in distance education is. It also provides conceptual organizational models and practical strategies for continually working towards quality improvement and for transparently tracking and documenting outcomes. Most importantly, this book finally brings quality assurance from being a lofty ideal into the realm of practical discussion.
On a personal (and professional) note, I smiled when I first read the title of the final chapter, “Concluding Remarks: Quality Matters.” Since 2000, I’ve been involved with a program called just that: Quality Matters1. It began as a small group of distance education practitio-ners who were affiliated with a state-wide distance learning consortium collaborating to im-prove the quality of course design for shared e-learning courses. We quickly discovered that we were not the only instructors, designers, and program directors wrestling with trying to find a workable process for applying what the research and best practices were reporting about quality assurance in the design of an online course. While Quality Matters is focused on course design issues, we continue to receive questions about myriad other dimensions of quality assurance for e-learning. Practitioners are obviously searching for information and workable models. This book serves as a reference guide for a systems approach to QA by providing example cases (although many are not focused on e-learning) and including multiple models that can be adapted into discussion on a local level, for example “means of gathering data for QA audits and self-reviews” and “an analytic rubric for judging the achievement of KPIs (key performance indicators) or critical success factors” presented in the final chapter.
Even while building a case for QA standards, the authors conclude with the warning to distance education leaders not to succumb to rote technical application of benchmarks, that we must move from external control (which distance education, especially e-learning is faced with now and for the unforeseeable future) to a culture of quality. They remind us that in our rush to respond to external demands for QA in e-learning we should not give up the culture of innovative solutions to continually improve the quality of learning. Tony Bates reviewed of this book on his Web site2 and indicates that a big missing piece is a per-spective on traditional campus-based universities and colleges, which have unique issues in establishing QA in their e-learning programs that single-mode or virtual open and distance education institutions do not have. Although I agree, I think this book goes a long way to provide a foundation from the experience of others that can be the basis for creativity in quality assurance. It will be useful for those who need models and strategies right now.
Book Review - Quality Assurance and Accreditation in Distance Education and e-Learning: Models, Policies and ResearchShattuck
Vol 13 | No 3 Book Notes June 2012 318
Notes 1http://www.qmprogram.org/
2http://www.tonybates.ca/2012/02/08/book-review-quality-assurance-in-distance-edu-cation-and-e-learning/
ReferenceIrele, M. E. (in press). Evaluating distance education in an era of internationalization. In
M. G. Moore (Ed.), Handbook of distance education (3rd ed.). Mahwah, N.J.: Law-rence Erlbaum Associates.
Book Review - The Publish or Perish Book: Your Guide to Effective and Responsible Citation Analysis
Reviewer: Michael Barbour, Wayne State University, USA
Regular readers of the International Review of Research in Open and Distance Learning (IRRODL) will be familiar with the issues facing the field of distance education, the high number of online and open access journals in our field, and the difficulties getting indexed in traditional citation databases such as the Thomson ISI Web of Science and the Elsevier SciVerse Scopus. Terry Anderson, the editor of IRRODL, has even spoken of the trouble he has had getting IRRODL listed in these closed databases. It was with interest that I took the opportunity to review The Publish or Perish Book by Anne-Wil Harzing; it is a self-pub-lished book that is designed to accompany the use of her Google Scholar citation analysis tool of the same name. As such, the book is structured in a manner to introduce readers to the topic of citation analysis and to orient them to the Publish or Perish tool, providing a de-tailed guide on how the tool can be used. This is followed by an interesting discussion that is specific to academics on ways in which the tool can be used and to a lesser extent the ways in which citation analysis can be used by different types of individuals in the academy (e.g., faculty up for promotion and tenure, academic administrators) for a variety of purposes (e.g., judging someone’s scholarly record or the quality of a journal, making decisions about where to submit an academic paper, assisting in the preparation of a literature review). The book concludes with an examination of the strengths and weaknesses of Google Scholar and the Thomson ISI Web of Science as measures of scholarly rigour in the academy.
The book begins with an introduction to the topic of citation analysis. As a junior faculty member at Wayne State University and a fairly recent graduate of a PhD program at the University of Georgia, I found that this introduction provided substance to information that I had an awareness of but not a firm understanding. For example, I knew of the Web of Science and had a general understanding of things like impact factors and h-indexes.
Author: Harzing, A-W. (2010-11)Melbourne, Australia: Tarma Software Research Pty Ltd.ISBN: 978-1-60752-120-4
Book Review - The Publish or Perish Book: Your Guide to Effective and Responsible Citation AnalysisBarbour
Vol 13 | No 3 Book Notes June 2012 320
However, over the first 15 pages I felt as if I had taken a short course in all of the different ways in which one’s scholarly impact can be measured, the history of each measure, and the strengths and shortcomings of each. As someone with a general understanding of how I could quantify the perceived value of my scholarship, I was quite surprised by how little I actually knew and how much I learned from Harzing’s first chapter alone.
The next five chapters provide a very detailed, step-by-step guide to using the Publish or Perish tool. For those unfamiliar with this tool, it is a free PC-based program that interfaces with Google Scholar to conduct citation analysis (although the tool can be used on a Mac by using Bootcamp, Parallels, or Wine and on a Linux-based machine using a Wine compat-ibility layer), which can be found at http://www.harzing.com/pop.htm . The step-by-step guides provided in these five chapters walk the user through conducting searches based on author name, journal title, specific citation, or multiple citations, along with a number of other general features (e.g., exporting the results, merging duplicate entries, removing self-citations). These guides are quite well done with images of what the user sees on-screen as well as bolded words or phrases that the user should see or be looking for. Each action that Harzing guides the user through is accompanied by a worked example that she has completed using herself or one of her colleagues. Throughout these five chapters, Harzing regularly outlines some of the limitations that users will experience with the tools, often based on the limitations of Google Scholar itself. However, in conversations with some quantitative faculty members, I get the impression that Harzing underemphasizes some of the limitations of the Google Scholar database (largely through the strategy of pointing out inclusion and geographic limitations in the other databases available for citation analysis). For example, if I count my own journal articles, book chapters, books, conference proceed-ings, and so on, I have a total of 110 publications as of the end of 2011. While Google Scholar only finds 69 of those publications, it is also true that the Web of Science only in-cludes 4 of those publications and SciVerse Scopus only includes 12 publications. Does that make Google Scholar a more reliable and accurate source for measuring the impact of my scholarship? The impression that Harzing gives the reader is that it is as effective or more effective, which may or may not be the case depending on one’s discipline and one’s own feelings about the nature of scholarship and the kinds of material included in the Google Scholar database.
Following the chapters that show readers how to use the Publish or Perish tool are six chapters on how specific individuals in the academy might use the tool in their everyday academic endeavours. For example, the first of these six chapters is entitled “Making Your Case for Promotion and Tenure.” As a junior faculty member who will be submitting my own promotion and tenure package in the next year, this was a chapter that I read with in-terest. For example, Harzing makes the suggestion that faculty members getting ready for promotion and tenure should consider comparing their own scholarship with other mem-bers of the department at the time they were granted promotion and tenure or with promi-nent faculty in the field at the time they received their promotion and tenure. Another strategy that Harzing suggests is to compare one’s own best papers with the journal average or to compare more recent articles with other articles published in that same year. There is
Book Review - The Publish or Perish Book: Your Guide to Effective and Responsible Citation AnalysisBarbour
Vol 13 | No 3 Book Notes June 2012 321
also a series of arguments presented that faculty can use in favour of using Google Scholar as a measure in their promotion and tenure package. Harzing also provides this level of suggested use for deans and academic administrators, authors deciding on which journal to submit a manuscript, writers conducting literature reviews, and individuals conducting bibliometric research.
The next two chapters provide a more detailed analysis of the advantages of Google Scholar (approximately 1 page in length), the disadvantages of Google Scholar (approximately 7 pages in length), the advantages of the Thomson ISI Web of Science (approximately 1 page in length), and the disadvantages of the Thomson ISI Web of Science (approximately 17 pages in length). I include the length of coverage of each of these four topics to give you a sense of how much time Harzing invests in her discussion of each database and how my effort appears to highlight the limitations of the Thomson ISI Web of Science. This is understandable given that this book is in support of a tool that uses Google Scholar (a database that has been called into question by many academics, particularly quantitative faculty members). This is not to say that the limitations that Harzing discusses aren’t valid or shouldn’t be cause for concern. Rather, it is to remind readers of the main purpose of Harzing’s book and allow readers of her book to draw their own conclusions.
The final two chapters of the book provide a revised version of a scholarly article that ex-amines the effectiveness of the h-index (and by extension Google Scholar) in the field of marketing that was written by Harzing and a colleague and then an analysis of the number of authors and citations across disciplines in each of the three main citation databases. The book concludes with appendices that provide specific help guidelines for using the Publish or Perish tool.
Overall, this is a book that I would strongly recommend to faculty members who are a part of the promotion and tenure process or who have an interest in their potential scholarly impact. Further, regardless of whether you are a user of the Publish or Perish tool or of how you feel about the Thomson ISI Web of Science and/or Google Scholar, The Publish or Perish Book: Your Guide to Effective and Responsible Citation Analysis is useful for understanding the issue of citation analysis, how it works, and some of the shortcomings of each of the measures.