Vitamin D and Hospital Admission in Older Adults - MDPI
11
nutrients Article Vitamin D and Hospital Admission in Older Adults: A Prospective Association Avril Beirne 1, *, Kevin McCarroll 2 , James Bernard Walsh 2 , Miriam Casey 2 , Eamon Laird 3 , Helene McNulty 4 , Mary Ward 4 , Leane Hoey 4 , Anne M. Molloy 3 , Martin Healy 5 , Catherine Hughes 4 , Sean Strain 4 and Conal Cunningham 2 Citation: Beirne, A.; McCarroll, K.; Walsh, J.B.; Casey, M.; Laird, E.; McNulty, H.; Ward, M.; Hoey, L.; Molloy, A.M.; Healy, M.; et al. Vitamin D and Hospital Admission in Older Adults: A Prospective Association. Nutrients 2021, 13, 616. https://doi.org/10.3390/nu13020616 Academic Editor: Etienne Cavalier Received: 28 January 2021 Accepted: 8 February 2021 Published: 14 February 2021 Publisher’s Note: MDPI stays neutral with regard to jurisdictional claims in published maps and institutional affil- iations. Copyright: © 2021 by the authors. Licensee MDPI, Basel, Switzerland. This article is an open access article distributed under the terms and conditions of the Creative Commons Attribution (CC BY) license (https:// creativecommons.org/licenses/by/ 4.0/). 1 Mercers Institute for Research on Ageing, St James’s Hospital, D08 NYH1 Dublin, Ireland 2 Department of Gerontology, St James’s Hospital, D08 NYH1 Dublin, Ireland; [email protected] (K.M.); [email protected] (J.B.W.); [email protected] (M.C.); [email protected] (C.C.) 3 School of Medicine, Trinity College, D02PN40 Dublin, Ireland; [email protected] (E.L.); [email protected] (A.M.M.) 4 Nutrition Innovation Centre for Food and Health, School of Biomedical Sciences, University of Ulster, Coleraine, Northern Ireland BT52 1SA, UK; [email protected] (H.M.); [email protected] (M.W.); [email protected] (L.H.); [email protected] (C.H.); [email protected] (S.S.) 5 Department of Biochemistry, St James’s Hospital, D08 NYH1 Dublin, Ireland; [email protected] * Correspondence: [email protected] Abstract: The health effects of vitamin D are well documented, with increasing evidence of its roles beyond bone. There is, however, little evidence of the effects of vitamin D on hospitalisation among older adults. This study aimed to prospectively determine the relationship of vitamin D status in older adults with hospital admission and emergency department (ED) attendance. Trinity University of Ulster Department of Agriculture (TUDA) is a large cross-sectional study of older adults with a community population from three disease-defined cohorts (cognitive dysfunction, hypertension, and osteoporosis). Participants included in this analysis were recruited between 2008 and 2012. ED and hospital admission data were gathered from the date of TUDA participation until June 2013, with a mean follow up of 3.6 years. Of the 3093 participants, 1577 (50.9%) attended the ED during the period of follow-up. Attendees had lower mean serum 25(OH)D concentrations than non-attendees (59.1 vs. 70.6 nmol/L). Fully adjusted models showed an inverse association between vitamin D and ED attendance (Hazard Ratio (HR) 0.996; 95% Confidence Interval (CI) 0.995–0.998; p < 0.001). A total of 1269 participants (41%) were admitted to hospital during the follow-up. Those admitted had lower mean vitamin D concentrations (58.4 vs. 69.3 nmol/L, p < 0.001). In fully adjusted models, higher vitamin D was inversely associated with hospital admission (HR 0.996; 95% CI 0.994–0.998; p < 0.001) and length of stay (LOS) (β = -0.95, p = 0.006). This study showed independent prospective associations between vitamin D deficiency and increased hospitalisation by older adults. The need for further evaluation of current recommendations in relation to vitamin D supplementation, with consideration beyond bone health, is warranted and should focus on randomised controlled trials. Keywords: vitamin D; vitamin D deficiency; hospitalisation; hospital admission; emergency depart- ment attendance; resource utilisation 1. Introduction Increased use of healthcare resources by older populations is a complex issue in modern healthcare, associated with negative outcomes in relation to function, independent living, and quality of life. Presentation to the emergency department (ED) for older adults can be associated with poorer outcomes of functional decline, institutionalisation, and mortality. Hospital admission rates and length of stay (LOS) are other measures used to quantify resource use. Reduction in LOS is considered a potential strategy to optimise resource consumption and reduce health care costs. Nutrients 2021, 13, 616. https://doi.org/10.3390/nu13020616 https://www.mdpi.com/journal/nutrients
-
Upload
khangminh22 -
Category
Documents
-
view
4 -
download
0
Transcript of Vitamin D and Hospital Admission in Older Adults - MDPI

nutrients
Article
Vitamin D and Hospital Admission in Older Adults:A Prospective Association
Avril Beirne 1,*, Kevin McCarroll 2, James Bernard Walsh 2, Miriam Casey 2, Eamon Laird 3 , Helene McNulty 4 ,Mary Ward 4 , Leane Hoey 4, Anne M. Molloy 3, Martin Healy 5, Catherine Hughes 4, Sean Strain 4 andConal Cunningham 2
�����������������
Citation: Beirne, A.; McCarroll, K.;
Walsh, J.B.; Casey, M.; Laird, E.;
McNulty, H.; Ward, M.; Hoey, L.;
Molloy, A.M.; Healy, M.; et al.
Vitamin D and Hospital Admission in
Older Adults: A Prospective
Association. Nutrients 2021, 13, 616.
https://doi.org/10.3390/nu13020616
Academic Editor: Etienne Cavalier
Received: 28 January 2021
Accepted: 8 February 2021
Published: 14 February 2021
Publisher’s Note: MDPI stays neutral
with regard to jurisdictional claims in
published maps and institutional affil-
iations.
Copyright: © 2021 by the authors.
Licensee MDPI, Basel, Switzerland.
This article is an open access article
distributed under the terms and
conditions of the Creative Commons
Attribution (CC BY) license (https://
creativecommons.org/licenses/by/
4.0/).
1 Mercers Institute for Research on Ageing, St James’s Hospital, D08 NYH1 Dublin, Ireland2 Department of Gerontology, St James’s Hospital, D08 NYH1 Dublin, Ireland; [email protected] (K.M.);
[email protected] (J.B.W.); [email protected] (M.C.); [email protected] (C.C.)3 School of Medicine, Trinity College, D02PN40 Dublin, Ireland; [email protected] (E.L.);
[email protected] (A.M.M.)4 Nutrition Innovation Centre for Food and Health, School of Biomedical Sciences, University of Ulster,
Coleraine, Northern Ireland BT52 1SA, UK; [email protected] (H.M.); [email protected] (M.W.);[email protected] (L.H.); [email protected] (C.H.); [email protected] (S.S.)
5 Department of Biochemistry, St James’s Hospital, D08 NYH1 Dublin, Ireland; [email protected]* Correspondence: [email protected]
Abstract: The health effects of vitamin D are well documented, with increasing evidence of its rolesbeyond bone. There is, however, little evidence of the effects of vitamin D on hospitalisation amongolder adults. This study aimed to prospectively determine the relationship of vitamin D status inolder adults with hospital admission and emergency department (ED) attendance. Trinity Universityof Ulster Department of Agriculture (TUDA) is a large cross-sectional study of older adults with acommunity population from three disease-defined cohorts (cognitive dysfunction, hypertension, andosteoporosis). Participants included in this analysis were recruited between 2008 and 2012. ED andhospital admission data were gathered from the date of TUDA participation until June 2013, witha mean follow up of 3.6 years. Of the 3093 participants, 1577 (50.9%) attended the ED during theperiod of follow-up. Attendees had lower mean serum 25(OH)D concentrations than non-attendees(59.1 vs. 70.6 nmol/L). Fully adjusted models showed an inverse association between vitamin D andED attendance (Hazard Ratio (HR) 0.996; 95% Confidence Interval (CI) 0.995–0.998; p < 0.001). Atotal of 1269 participants (41%) were admitted to hospital during the follow-up. Those admitted hadlower mean vitamin D concentrations (58.4 vs. 69.3 nmol/L, p < 0.001). In fully adjusted models,higher vitamin D was inversely associated with hospital admission (HR 0.996; 95% CI 0.994–0.998;p < 0.001) and length of stay (LOS) (β = −0.95, p = 0.006). This study showed independent prospectiveassociations between vitamin D deficiency and increased hospitalisation by older adults. The needfor further evaluation of current recommendations in relation to vitamin D supplementation, withconsideration beyond bone health, is warranted and should focus on randomised controlled trials.
Keywords: vitamin D; vitamin D deficiency; hospitalisation; hospital admission; emergency depart-ment attendance; resource utilisation
1. Introduction
Increased use of healthcare resources by older populations is a complex issue inmodern healthcare, associated with negative outcomes in relation to function, independentliving, and quality of life. Presentation to the emergency department (ED) for older adultscan be associated with poorer outcomes of functional decline, institutionalisation, andmortality. Hospital admission rates and length of stay (LOS) are other measures used toquantify resource use. Reduction in LOS is considered a potential strategy to optimiseresource consumption and reduce health care costs.
Nutrients 2021, 13, 616. https://doi.org/10.3390/nu13020616 https://www.mdpi.com/journal/nutrients

Nutrients 2021, 13, 616 2 of 11
Many studies have tried to identify those at increased risk of ED attendance and hospi-talisation. The effects of vitamin D deficiency on bone are well-established, causing ricketsand osteomalacia, osteoporosis, falls [1], and fractures [2]. Given postulated multisystemeffects of vitamin D beyond bone, studies have analysed the association between vitaminD and specific conditions such as infections, sepsis [3–6], exacerbations of chronic illnesses,and functional outcomes following falls and fractures [7–10]. Vitamin D also appears to beassociated with cardiovascular risk through promoting atherosclerosis [11] and has beenlinked to inflammation, increased platelet volume, and vascular stiffness [12,13]. VitaminD deficiency stimulates systemic and vascular inflammation, enabling atherogenesis [14].Hypertension is also associated with lack of vitamin D, due to activation of the ReninAngiotensin Aldosterone (RAA) system, causing endothelial dysfunction. Evidence alsosupports a role of 25-hydroxyvitamin D (25(OH)D) in cognitive function, with a numberof studies assessing the association between cognition and vitamin D [15–17]. The effectsof vitamin D on the brain and on cognition are potentially mediated through a number ofmechanisms, including effects on neurotransmitters, neuro-inflammation, the vitamin Dreceptor, and genetic effects [18–22].
Associations between vitamin D deficiency and adverse outcomes have been conflict-ing, depending on study populations.
Previous studies demonstrated that frailty is associated with increased ED attendanceand increased rates of hospitalisation and with higher healthcare costs [10,11]. A numberof studies have evaluated the relationship between vitamin D and frailty and have foundan association between deficient levels and frailty measures. [12–14].
Given the paucity of evidence for an association between serum 25(OH)D and hos-pitalisation, the aim of this study was to evaluate the prospective relationship betweenserum vitamin D and resource use including ED attendances, hospital admission, and LOSin older Irish community-dwelling adults.
2. Materials and Methods
This analysis was conducted in 3093 participants recruited to the Trinity-Ulster, De-partment of Agriculture (TUDA) study through St James’s Hospital (SJH), Dublin. TheTUDA study comprised a community-dwelling population of Irish adults aged 60 yearsand older. It was a cross-sectional study designed to create a genotype/phenotype databasefor three population cohorts based on three disease states: cognition, bone health, andhypertension. This current study examined the cognition and bone health cohorts as theywere originally recruited from SJH. The full methodology is published elsewhere [23].
2.1. Vitamin D Measurements
Samples for 25(OH)D analysis (the recognised marker for the nutritional status of vita-min D) included total serum 25(OH)D (D2 and D3) concentrations, which were quantifiedby a fully validated method (Chromsystems Instruments and Chemicals GmbH, Grafelfing,Germany; MassCrom25-OH-VitaminD3/D2) using liquid chromatography–tandem massspectrometry (API 4000; AB SCIEX, Chesire, United Kingdom) and batch-analysed in theBiochemistry Department of St. James’s Hospital (accredited to International Organisationfor Standardisation (ISO) 15,189 standard). The quality and accuracy of the method werecontinuously monitored by the use of internal quality controls, participation in the vitaminD external quality assessment scheme (DEQAS), and the use of the National Institute ofStandards and Technology (NIST)972 D standard reference material.
The recognised cut-offs for vitamin D, as defined by the Institute of Medicine (IOM)of deficiency: <30 nmol/L, insufficiency: 30–50 nmol/L, and sufficiency: >50 nmol/L wereadopted in this analysis.
2.2. ED Attendance
Details relating to ED attendance were accessed through the SJH Therefore system, anelectronic record of all ED attendance. Information was gathered from the date of TUDA
Nutrients 2021, 13, 616 3 of 11
participation until June 2013, including the number of and reason for ED attendance. Thereason for ED attendance was established from individual records, extracting diagnosisthrough predefined keywords: falls, fracture, cardiopulmonary, stroke/transient ischaemicattack (TIA), gastrointestinal bleed, other/unclear, planned.
2.3. Hospital Admissions
Details of hospitalisation were accessed through the SJH Electronic Patient Record(EPR) system, which includes clinical, cardiac, radiology, and laboratory information, aswell as discharge summaries. Information was gathered from date of TUDA participationuntil study completion in June 2013. No exclusion criteria were applied. Informationcollected included LOS and reason for admission, which was established by extractingrelevant information and diagnosis through predefined keywords as outlined above.
Two researchers, Rosaleen Lannon (RL) and Avril Beirne (AB), independently investi-gated a review of records for reason for ED attendance and hospital admission. Overall,thirty cases were initially reviewed for standardisation of keyword analysis and reasonfor ED attendance and a further thirty for reason for admission. This review was achievedwith a kappa score of greater than 0.8 for inter-rater reliability [24].
Attendance at emergency departments and admissions to other institutions werenot captured in this study. Only 1% of the TUDA population studied lived outside thecatchment area of SJH; therefore, our data collection captured events for 99% of the studypopulation.
Ethical approval was granted for this study from the St. James’s Hospital/Tallaght Uni-versity Hospital Joint Research Ethics Committee (REC Reference 5 May 2013 Chairman’sAction).
2.4. Statistical Analysis
All parameters were inspected for normality and, if significantly skewed, were appro-priately transformed. Normal assumptions for linear regression analysis were observed.Descriptive and comparative analyses were performed for all included participants and fora priori determined subgroups.
Continuous variables are expressed as mean and standard deviations for normallydistributed and median and inter-quartiles for non-normally distributed data. Categoricalvariables are expressed as number of cases and percentages. Nominal or dichotomousvariables were compared using chi-squared test, non-normally distributed variables werecompared with the Mann–Whitney U-test, and normally distributed continuous variableswere compared using Student’s t-test. These analyses were run using SPSS v22.0 (SPSS,Inc., Chicago, IL, USA). Statistical significance was accepted when p < 0.05.
Survival analysis was performed using R (Bell Technologies, New Jersey, USA) [25].Cox proportional hazard models were generated for vitamin D as a continuous variableand as a categorical variable based on defined vitamin D concentrations, and were usedto evaluate the proposed relationship between vitamin D and ED attendance and hos-pitalisation. The vitamin D cut-off of >50 nmol/L, defined as sufficient, was based onrecommendations from the Institute of Medicine (IOM) [26]. Missing data were dealt withusing multiple imputation modelling in multivariate imputation by chained equations(MICE) using R [25].
Interaction terms for cohort and ED attendance and admission status were examinedbut were not found to be significant in regression analysis.
2.5. Covariates
The basic model (Model 1) considered covariates known to effect serum 25(OH)Dconcentrations, ED attendance, and hospital admission including age, sex, and total numberof years in education, Body Mass Index (BMI), vitamin D supplementation and global solarradiation (GSR). The GSR in the month and preceding two months of subject recruitmentwas used as a surrogate marker of Ultraviolet B (UVB) exposure, which is known to effect
Nutrients 2021, 13, 616 4 of 11
serum vitamin D concentrations. GSR represents the total amount of solar radiation (directbeam plus the diffuse component on a horizontal surface) received per unit area per month(MJm−2), (http://www.met.ie/about/valentiaobservatory/solarradiation.asp). GSR datawere obtained by request from the Irish Meteorological Service.
Model 2 included all variables in Model 1 and variables that were confounders forboth physical and cognitive frailty, which are known to affect ED attendance and admissionrates: timed up and go (TUG) [27], which is a frequently used screening tool to measurepatients gait speed and is associated with a potential risk of falling; Mini Mental StateExamination (MMSE) [28], which is a screening tool for cognition and can be used as amarker of cognitive frailty; and finally Instrumental Activity of Daily Living (IADL) [29],a score reflecting a patient’s ability to function independently in their activities of dailyliving.
Model 3 included all variables from Models 1 and 2 and pre-specified diseases/conditionsthat might account for ED attendance and admission (i.e., fall in the past year, chronickidney disease, and history of cancer).
3. Results3.1. Baseline Characteristics
Over the mean follow-up of 3.6 years, 1577 (50.9%) TUDA participants attendedthe ED (Table 1). The median time to first ED attendance was 10.0 months (range 0–51 months) and the median number of attendances was 2.0 (range 1–39 visits). Thoseparticipants who attended the ED were older (79.2 vs. 73.7 years), less educated (10.0 vs.12.0 years), and more likely to be living alone. They also had lower vitamin D concentrations(59.1 vs. 70.6 nmol/L). Those who attended ED were less likely to be taking vitamin Dsupplementation (62.8%) compared with those who did not attend the ED (67.3%).
The 1269 participants (41%) admitted to hospital were older (80.0 vs. 74.1 years) andmore likely to be less educated. Those participants admitted had lower mean vitamin Dat baseline, 58.4 nmol/L vs. 69.3 nmol/L. Of those participants admitted, 584 (46%) had25(OH)D concentration <50 nmol/L and were deemed to have insufficient levels. Again,those who were admitted were less likely to be taking vitamin D supplementation (62.4%compared with those who were not admitted to hospital (66.9%)).
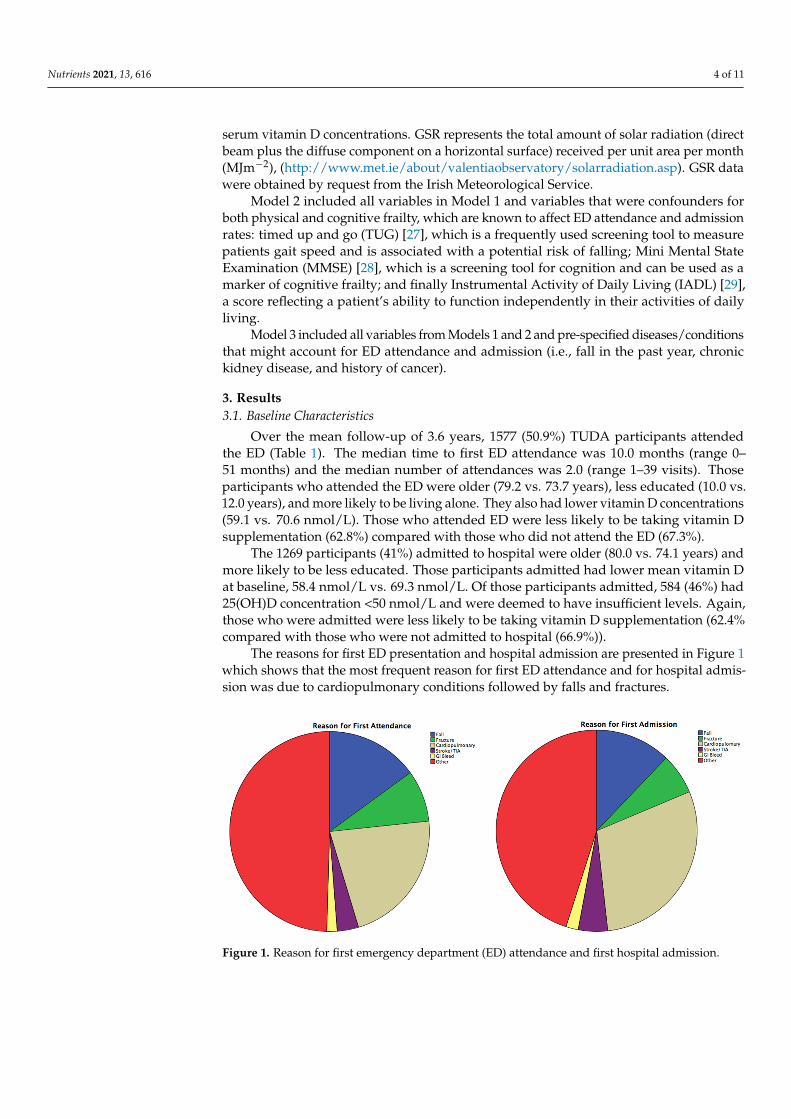
The reasons for first ED presentation and hospital admission are presented in Figure 1which shows that the most frequent reason for first ED attendance and for hospital admis-sion was due to cardiopulmonary conditions followed by falls and fractures.
Nutrients 2021, 13, x FOR PEER REVIEW 5 of 12
MMSE, Median (Range) 27.0 (6.0–30.0) 27.0 (5.0–30.0) 0.074c 27.0 (6.0–30.0) 27.0 (5.0–30.0) 0.033c HADS, Median (Range) 2.0 (0–21.0) 2.0 (0–21.0) 0.574c 2.0 (0–21.0) 2.0 (0–21.0) 0.309c
CES-D, Mean (SD) 6.6 (±7.4) 5.9 (±7.1) 0.014*,a 6.5 (±7.3) 6.0 (±7.2) 0.056a TUG (seconds), Median
(Range) 16.0 (4.0–140.0) 12.0 (3.0–68.0) <0.001*,c 16.0 (4.0–140.0) 12.0 (3.0–68.0) <0.001*,c
BMI (kg/m2), Mean (SD) 26.9 (±5.3) 26.6 (±5.3) 0.109a 26.9 (±5.4) 26.6 (±5.3) 0.875a Waist–Hip Ratio, Mean (SD) 0.9 (±0.1) 0.9 (±0.1) 0.022a 0.9 (±0.1) 0.9 (±0.1) 0.68a
IADL, Mean (SD) 22.3 (±4.6) 23.1 (±4.6) <0.001*,a 22.4 (±4.7) 23.0 (±4.6) <0.001*,a PSMS, Median (Range) 24.0 (10.0–24.0) 24.0 (9.0–24.0) 0.292c 24.0 (10.0–24.0) 24.0 (9.0–24.0) 0.203c
Hypertension (%)** 83.1 75.5 <0.001*,b 83.2 76.6 <0.001*,b Vascular Disease (%)^ 30.4 26.6 0.019*,b 29.6 27.8 0.267b
Diabetes (%) 11.5 8.4 0.003*,b 11.4 9.0 0.026*,b Atrial Fibrillation (%) 16.0 14.6 0.270b 15.7 15.0 0.602b
a Independent t-test; b Chi-Square Test; c Mann–Whiney U-Test; * Statistically significant result; ^ Vascular disease: self-reported history of stroke, transient ischaemic attack, peripheral vascular disease and/or myocardial infraction; ** Hypertension: self-reported history, medication or Blood Pressure (BP) >140/90 mmHg; BMI: Body Mass Index, CES-D: Centre for Epidemiologic Studies Depression Scale, HADS: Hospital Anxiety and Depression Scale, IADL: Instrumental Activities of Daily Living Scale, MMSE: Mini Mental State Examination, PSMS: Physical Self-Maintenance Scale, SD: Standard Deviation, TUG: Timed up and Go.
The 1269 participants (41%) admitted to hospital were older (80.0 vs. 74.1 years) and more likely to be less educated. Those participants admitted had lower mean vitamin D at baseline, 58.4 nmol/L vs. 69.3 nmol/L. Of those participants admitted, 584 (46%) had 25(OH)D concentration <50 nmol/L and were deemed to have insufficient levels. Again, those who were admitted were less likely to be taking vitamin D supplementation (62.4% compared with those who were not admitted to hospital (66.9%)).
The reasons for first ED presentation and hospital admission are presented in Figure 1 which shows that the most frequent reason for first ED attendance and for hos-pital admission was due to cardiopulmonary conditions followed by falls and fractures.
Nutrients 2021, 13, x FOR PEER REVIEW 6 of 12
Figure 1. Reason for first emergency department (ED) attendance and first hospital admission.
3.2. Survival Analysis: ED Attendance Fully adjusted Cox proportional hazard models with vitamin D as the continuous
variable showed an inverse association between vitamin D and ED attendances (HR 0.996, 95% CI 0.995–0.998, p < 0.001; Table 2). For every 1 nmol/L increase in serum 25(OH)D concentrations, there was a 0.4% reduction in the risk of ED attendance.
Table 2. Cox proportional hazard 25 hydroxyvitamin D and emergency department (ED) attend-ance (vitamin D as a continuous time dependent variable).
ED Attendance β Coefficient HR 95% CI p Value
Model 1 −3.570 0.996 0.995–0.998 <0.001*
Model 2 −3.644 0.996 0.994–0.998 <0.001*
Model 3 −3.868 0.996 0.994–0.998 <0.001*
Hospital Admission β Coefficient HR 95% CI p Value
Model 1 −3.485 0.997 0.995–0.998 <0.001*
Model 2 −3.768 0.996 0.994–0.998 <0.001*
Model 3 −4.035 0.996 0.994–0.998 <0.001*
Model 1: Age, sex, living alone, total education, vitamin D supplementation, GSR, and BMI; Model 2: Model 1 and TUG, MMSE, and IADL; Model 3 ED: Model 2 and fall in the last year and history of cancer; Model 3 admission: Model 2 and history of cancer, CKD, and fall in the past year; * Statis-tically significant value; BMI: Body Mass Index, CKD: Chronic Kidney Disease, GSR: Global Solar Radiation, HR: Hazard Ratio, IADL: Instrumental Activities of Daily Living Scale, MMSE: Mini Mental State Examination, TUG: Timed Up and Go, CI: Confidence Interval.
Further modelling with vitamin D concentrations presented as a dependent cate-gorical variable continued to show the inverse association between vitamin D and ED attendance. Vitamin D sufficiency (defined as ≥50 nmol/L) was associated with a reduced risk of ED attendance over the follow up period (Relative Risk (RR) 0.76, p < 0.001). Models were adjusted for variables known to be associated with vitamin D deficiency and frailty markers.
3.3. Survival Analysis: Hospital Admission In multivariate survival analysis, with Cox proportional hazard modelling, vitamin
D, considered as a continuous variable (Table 2), was found to be inversely associated
Figure 1. Reason for first emergency department (ED) attendance and first hospital admission.

Nutrients 2021, 13, 616 5 of 11
Table 1. Baseline characteristics by emergency department (ED) and admission status.
Baseline Characteristic ED Attenders(n = 1557)
ED Non-Attenders(n = 1536) p-Value Admitted
(n = 1269)Not Admitted
(n = 1824) p-Value
Cognitive Cohort (%) 72.7 37.0 <0.001 *,b 76.6 39.9 <0.001 *,b
Bone Cohort (%) 27.3 63.0 <0.001 *,b 23.4 60.1 <0.001 *,b
Age (years), Mean (SD) 79.2 (±7.8) 73.7 (±8.2) <0.001 *,a 80.0 (±7.6) 74.1 (±8.3) <0.001 *,a
Sex, female (%) 70.0 79.9 <0.001 *,b 68.5 79.8 <0.001 *,b
Education (years),Mean (SD) 10.0 (±2.5) 12.0 (±3.5) <0.001 *,c 10.0 (±2.5) 11.0 (±3.4) <0.001 *,c
Living Alone (%) 43.7 36.1 <0.001 *,b 45.0 36.4 <0.001 *,b
Current Smoker (%) 13.0 12.6 0.747 b 12.9 12.8 0.912 b
Previous Smoker (%) 43.9 37.7 <0.001 *,b 44.5 38.2 <0.001 *,b
Current Alcohol (%) 52.7 61.4 <0.001 *,b 51.0 61.2 <0.001 *,b
Previous Alcohol (%) 22.9 14.6 <0.001 *,b 24.2 15.0 <0.001 *,b
25(OH)D (nmol/L), Mean (SD) 59.1 (±33.3) 70.6 (±31.9) <0.001 *,c 58.4 (±33.6) 69.3 (±32.0) <0.001 *,c
25(OH)D (nmol/L),Median (Range) 55.0 (2.2–185.0) 71.9 (3.7–288.0) <0.001 *,c 53.9 (2.2–185.0) 70.4 (3.7–288.0) <0.001 *,c
Vitamin Dsupplementation (%) 62.8 67.3 0.012 *,b 62.4 66.9 0.012 *,b
MMSE, Median (Range) 27.0 (6.0–30.0) 27.0 (5.0–30.0) 0.074 c 27.0 (6.0–30.0) 27.0 (5.0–30.0) 0.033 c
HADS, Median (Range) 2.0 (0–21.0) 2.0 (0–21.0) 0.574 c 2.0 (0–21.0) 2.0 (0–21.0) 0.309 c
CES-D, Mean (SD) 6.6 (±7.4) 5.9 (±7.1) 0.014 *,a 6.5 (±7.3) 6.0 (±7.2) 0.056 a
TUG (seconds), Median (Range) 16.0 (4.0–140.0) 12.0 (3.0–68.0) <0.001 *,c 16.0 (4.0–140.0) 12.0 (3.0–68.0) <0.001 *,c
BMI (kg/m2), Mean (SD) 26.9 (±5.3) 26.6 (±5.3) 0.109 a 26.9 (±5.4) 26.6 (±5.3) 0.875 a
Waist–Hip Ratio, Mean (SD) 0.9 (±0.1) 0.9 (±0.1) 0.022 a 0.9 (±0.1) 0.9 (±0.1) 0.68 a
IADL, Mean (SD) 22.3 (±4.6) 23.1 (±4.6) <0.001 *,a 22.4 (±4.7) 23.0 (±4.6) <0.001 *,a
PSMS, Median (Range) 24.0 (10.0–24.0) 24.0 (9.0–24.0) 0.292 c 24.0 (10.0–24.0) 24.0 (9.0–24.0) 0.203 c
Hypertension (%) ** 83.1 75.5 <0.001 *,b 83.2 76.6 <0.001 *,b
Vascular Disease (%) ˆ 30.4 26.6 0.019 *,b 29.6 27.8 0.267 b
Diabetes (%) 11.5 8.4 0.003 *,b 11.4 9.0 0.026 *,b
Atrial Fibrillation (%) 16.0 14.6 0.270 b 15.7 15.0 0.602 b
a Independent t-test; b Chi-Square Test; c Mann–Whiney U-Test; * Statistically significant result; ˆ Vascular disease: self-reported history of stroke, transient ischaemic attack, peripheral vascular disease and/ormyocardial infraction; ** Hypertension: self-reported history, medication or Blood Pressure (BP) >140/90 mmHg; BMI: Body Mass Index, CES-D: Centre for Epidemiologic Studies Depression Scale, HADS:Hospital Anxiety and Depression Scale, IADL: Instrumental Activities of Daily Living Scale, MMSE: Mini Mental State Examination, PSMS: Physical Self-Maintenance Scale, SD: Standard Deviation, TUG: Timedup and Go.

Nutrients 2021, 13, 616 6 of 11
3.2. Survival Analysis: ED Attendance
Fully adjusted Cox proportional hazard models with vitamin D as the continuousvariable showed an inverse association between vitamin D and ED attendances (HR 0.996,95% CI 0.995–0.998, p < 0.001; Table 2). For every 1 nmol/L increase in serum 25(OH)Dconcentrations, there was a 0.4% reduction in the risk of ED attendance.
Table 2. Cox proportional hazard 25 hydroxyvitamin D and emergency department (ED) attendance(vitamin D as a continuous time dependent variable).
ED Attendance β Coefficient HR 95% CI pValue
Model 1 −3.570 0.996 0.995–0.998 <0.001 *Model 2 −3.644 0.996 0.994–0.998 <0.001 *Model 3 −3.868 0.996 0.994–0.998 <0.001 *
HospitalAdmission β Coefficient HR 95% CI pValue
Model 1 −3.485 0.997 0.995–0.998 <0.001 *Model 2 −3.768 0.996 0.994–0.998 <0.001 *Model 3 −4.035 0.996 0.994–0.998 <0.001 *
Model 1: Age, sex, living alone, total education, vitamin D supplementation, GSR, and BMI; Model 2: Model 1 andTUG, MMSE, and IADL; Model 3 ED: Model 2 and fall in the last year and history of cancer; Model 3 admission:Model 2 and history of cancer, CKD, and fall in the past year; * Statistically significant value; BMI: Body Mass Index,CKD: Chronic Kidney Disease, GSR: Global Solar Radiation, HR: Hazard Ratio, IADL: Instrumental Activities ofDaily Living Scale, MMSE: Mini Mental State Examination, TUG: Timed Up and Go, CI: Confidence Interval.
Further modelling with vitamin D concentrations presented as a dependent categoricalvariable continued to show the inverse association between vitamin D and ED attendance.Vitamin D sufficiency (defined as ≥50 nmol/L) was associated with a reduced risk of EDattendance over the follow up period (Relative Risk (RR) 0.76, p < 0.001). Models wereadjusted for variables known to be associated with vitamin D deficiency and frailty markers.
3.3. Survival Analysis: Hospital Admission
In multivariate survival analysis, with Cox proportional hazard modelling, vitamin D,considered as a continuous variable (Table 2), was found to be inversely associated withhospital admission (HR 0.997, 95% CI 0.995–0.998, p < 0.001). This association remained infully adjusted models (HR 0.996, 95% CI 0.994–0.998, p < 0.001). Thus, for every 1 nmol/Lincrease in 25(OH)D, the relative risk of hospital admission was reduced by 0.4%.
Further analysis considering vitamin D as a categorical variable (Table 3) revealed anassociation between hospital admission and participants with insufficient (<50 nmol/L)vitamin D. Once again, this association was present in fully adjusted models with covariatesfor both physical and cognitive frailty considered. Thus, for an individual with 25(OH)Dconcentrations above 50 nmol/L, the relative risk of hospital admission was lower, i.e., 0.77times that of those with concentrations <50 nmol/L (Figure 2 and Table 3).
Table 3. Cox proportional hazards 25 hydroxyvitamin D >/<50nmol/L: ED attendance and hospitaladmission (vitamin D as a categorical variable).
ED Attendance β Coefficient RR pValue
Model 1 −0.2519 0.77 <0.001 *Model 2 −0.2667 0.77 <0.001 *Model 3 −0.2740 0.76 <0.001 *
Hospital Admission β Coefficient RR pValue
Model 1 −0.2521 0.77 <0.0001 *Model 2 −0.2574 0.77 0.0004 *Model 3 −0.2638 0.77 0.0003 *
Model 1: Age, sex, living alone, total education, vitamin D supplementation, GSR, and BMI; Model 2: Model1 and TUG, MMSE, and IADL; Model 3: Model 2 and fall in the last year and history of cancer; * Statisticallysignificant value; BMI: Body Mass Index, GSR: Global Solar Radiation, IADL: Instrumental Activities of DailyLiving Scale, MMSE: Mini Mental State Examination, TUG: Timed Up and Go, RR: Relative Risk.

Nutrients 2021, 13, 616 7 of 11
Nutrients 2021, 13, x FOR PEER REVIEW 7 of 12
with hospital admission (HR 0.997, 95% CI 0.995–0.998, p < 0.001). This association re-mained in fully adjusted models (HR 0.996, 95% CI 0.994–0.998, p < 0.001). Thus, for every 1 nmol/L increase in 25(OH)D, the relative risk of hospital admission was reduced by 0.4%.
Further analysis considering vitamin D as a categorical variable (Table 3) revealed an association between hospital admission and participants with insufficient (<50 nmol/L) vitamin D. Once again, this association was present in fully adjusted models with covariates for both physical and cognitive frailty considered. Thus, for an individual with 25(OH)D concentrations above 50 nmol/L, the relative risk of hospital admission was lower, i.e., 0.77 times that of those with concentrations <50 nmol/L (Figure 2 and Table 3).
Figure 2. Survival curve 25 hydroxyvitamin D >/< 50 nmol/L: ED attendance and hospital admissions.
Table 3. Cox proportional hazards 25 hydroxyvitamin D >/<50nmol/L: ED attendance and hospital admission (vitamin D as a categorical variable).
ED Attendance β Coefficient RR p Value
Model 1 −0.2519 0.77 <0.001*
Model 2 −0.2667 0.77 <0.001*
Model 3 −0.2740 0.76 <0.001*
Hospital Admission β Coefficient RR p Value
Model 1 −0.2521 0.77 <0.0001*
Model 2 −0.2574 0.77 0.0004*
Figure 2. Survival curve 25 hydroxyvitamin D >/< 50 nmol/L: ED attendance and hospital admis-sions.
Vitamin D concentration was inversely associated with overall (accumulated overallhospital admissions) hospital LOS throughout the study period (β = −0.95, p = 0.006),(Table 4 and Figure 3).
Table 4. Association between total hospital length of stay (LOS) (log transformed) and 25(OH)Dconcentration (log transformed).
Length of Stay β Coefficient 95% CI p Value
Model 1 −0.74 −0.27–−0.03 0.015 *Model 2 −0.95 −0.33–−0.56 0.006 *
Model 1: Age, sex, living alone (Y/N), education, GSR, vitamin D supplementation, BMI, and time to assessment;Model 2: Model 1 and TUG, MMSE, and IADL; * Statistically significant value; IADL: Instrumental Activities ofDaily Living Scale, MMSE: Mini Mental State Examination, TUG: Timed Up and Go

Nutrients 2021, 13, 616 8 of 11
Nutrients 2021, 13, x FOR PEER REVIEW 8 of 12
Model 3 −0.2638 0.77 0.0003*
Model 1: Age, sex, living alone, total education, vitamin D supplementation, GSR, and BMI; Model 2: Model 1 and TUG, MMSE, and IADL; Model 3: Model 2 and fall in the last year and history of cancer; * Statistically significant value; BMI: Body Mass Index, GSR: Global Solar Radiation, IADL: Instrumental Activities of Daily Living Scale, MMSE: Mini Mental State Examination, TUG: Timed Up and Go, RR: Relative Risk.
Vitamin D concentration was inversely associated with overall (accumulated overall hospital admissions) hospital LOS throughout the study period (β = −0.95, p = 0.006), (Table 4 and Figure 3).
Table 4. Association between total hospital length of stay (LOS) (log transformed) and 25(OH)D concentration (log transformed).
Length of Stay β Coefficient 95% CI p Value
Model 1 −0.74 −0.27–−0.03 0.015*
Model 2 −0.95 −0.33–−0.56 0.006*
Model 1: Age, sex, living alone (Y/N), education, GSR, vitamin D supplementation, BMI, and time to assessment; Model 2: Model 1 and TUG, MMSE, and IADL; * Statistically significant value; IADL: Instrumental Activities of Daily Living Scale, MMSE: Mini Mental State Examination, TUG: Timed Up and Go
Figure 3. Scatter plot of the association between total hospital length of stay (LOS) and 25(OH)D concentration.
4. Discussion This study demonstrated an inverse relationship between vitamin D deficiency and
ED attendance, hospital admission rate, and LOS in an older population of communi-ty-dwelling adults.
Participants with concentrations of 25(OH)D < 50nmol/L were more likely to attend the ED and be admitted. This relationship remained robust in fully adjusted models ac-counting for multiple cofounders for vitamin D status, measures of physical and cogni-
Figure 3. Scatter plot of the association between total hospital length of stay (LOS) and 25(OH)Dconcentration.
4. Discussion
This study demonstrated an inverse relationship between vitamin D deficiency andED attendance, hospital admission rate, and LOS in an older population of community-dwelling adults.
Participants with concentrations of 25(OH)D < 50nmol/L were more likely to attendthe ED and be admitted. This relationship remained robust in fully adjusted modelsaccounting for multiple cofounders for vitamin D status, measures of physical and cognitivefrailty, and for a number of chronic conditions. Those participants with lower vitamin Dwho were admitted to hospital were also more likely to have longer hospital LOS comparedwith vitamin-D-replete participants.
To the best of our knowledge, this is the first study to examine the prospectiveassociation between vitamin D deficiency and hospitalisation in a large population ofolder adults. Earlier studies suggested an association between vitamin D and certainconditions associated with increased resource use, such as chronic conditions, falls [1],frailty [30,31], and fractures [32,33]. Prior studies have suggested that vitamin D deficiencyis associated with increased risk of hospital re-admission, nursing home admission, andincreased hospital LOS [34–37].
Whereas some studies have shown an association between vitamin D and conditionsleading to admission such as multiple sclerosis and Chronic Obstructive Pulmonary Dis-ease (COPD) [7,38], and infections [4,6,39], this is the only study to date evaluating therelationship between vitamin D and hospital admission rather than specific diseases orillnesses.
A number of reports indicate a high prevalence of vitamin D deficiency in Europeancountries, leading to concerns about the associated health risks [40]. An Irish study reportedthe prevalence of vitamin D deficiency (<30nmol/L) as 13% and deficiency status wasmore prevalent in those aged over 80 years [41]. Older compared to younger adults areat higher risk of vitamin D deficiency due to reduced sun exposure, lower capacity tosynthesise vitamin D in skin, and lower dietary intakes of dietary vitamin D. Our previousresearch from the TUDA study showed that vitamin D supplement use was the most

Nutrients 2021, 13, 616 9 of 11
important determinant of vitamin D status in the TUDA cohort, whilst vitamin-D-fortifiedfood and spending time in the sun, even in the oldest, were effective in improving 25(OH)Dconcentrations [23]. We also previously showed that vitamin D deficiency was associatedwith a more pronounced pro-inflammatory status, including higher Interleukin (IL)-6 andC-reactive protein (CRP) in older Irish adults [42].
Vitamin D deficiency occurs commonly in older adults and, given its adverse effectson immune functioning, has received increased attention during the time of the COVID-19 pandemic. Although to date there are no published intervention trials in relation toSARS-CoV-2, it is possible that better vitamin D status may be beneficial in terms of thehost response to initial infection or in determining health outcomes should an older personbecome infected with corona virus [43,44].
Although a large population of older adults was included in this analysis, with a3.6 year follow-up, and multiple potential confounders were considered, there are somepotential limitations to our study. Participants were originally recruited to cohorts withunderlying diseases of cognition and bone health and, therefore, the results may not befully representative of a general older population. Data were only available for our owninstitution so it is possible that participants could have attended another facility and thesedata were not available for this study. As only approximately 1% of participants livedoutside our catchment area, this possibility is unlikely.
Finally, frailty is an important factor potentially contributing to the reason for EDattendance. While we did not use a specific frailty score or tool in this study, as there is noconsensus on the best frailty index at present, frailty was considered and measured usingmarkers of physical and cognitive frailty as previously outlined and which were includedas confounders in this study’s analysis.
5. Conclusions
Our study’s findings suggest vitamin D deficiency is associated with increased hospi-talisation by older adults independent of markers of physical and cognitive frailty. Thisprospective association strengthens the need to consider vitamin D as an independentmodifiable factor in ED attendance and hospital admission rates and the potential need forsupplementation in older adults deficient in vitamin D to bring concentrations >50 nmol/L.The need for further evaluation of current recommendations in relation to vitamin Dsupplementation, with consideration of the effects of deficiency beyond bone health, iswarranted and should focus on randomised controlled trials.
Author Contributions: Conceptualization, M.W. A.M.M. S.S. and H.M.; methodology, M.C. J.B.W.L.H. and C.H.; formal analysis, A.B.; investigation, M.H.; data curation E.L. and K.M.; writing—original draft preparation, A.B.; writing—review and editing, A.B.; supervision C.C. All authors haveread and agreed to the published version of the manuscript.
Funding: This research received no external funding.
Institutional Review Board Statement: Ethical approval was granted for this study from the StJames’s Hospital/Tallaght University Hospital Joint Research Ethics Committee (REC Reference2013/05/05 Chairman’s Action).
Informed Consent Statement: Informed consent was obtained from all subjects involved in thestudy.
Data Availability Statement: Publicly available datasets were analysed in this study. This data canbe found here: https://www.ucd.ie/jingo/database/tuda/.
Conflicts of Interest: The authors declare no conflict of interest.
References1. Bischoff-Ferrari, H.A.; Dawson-Hughes, B.; Willett, W.C.; Staehelin, H.B.; Bazemore, M.G.; Zee, R.Y.; Wong, J.B. Effect of Vitamin
D on falls: A meta-analysis. JAMA 2004, 291, 1999–2006. [CrossRef]

Nutrients 2021, 13, 616 10 of 11
2. Bischoff-Ferrari, H.A.; Willett, W.C.; Wong, J.B.; Giovannucci, E.; Dietrich, T.; Dawson-Hughes, B. Fracture prevention withvitamin D supplementation: A meta-analysis of randomized controlled trials. JAMA 2005, 293, 2257–2264. [CrossRef]
3. Ginde, A.A.; Camargo, C.A., Jr.; Shapiro, N.I. Vitamin D insufficiency and sepsis severity in emergency department patients withsuspected infection. Acad. Emerg. Med. Off. J. Soc. Acad. Emerg. Med. 2011, 18, 551–554. [CrossRef]
4. Jovanovich, A.J.; Ginde, A.A.; Holmen, J.; Jablonski, K.; Allyn, R.L.; Kendrick, J.; Chonchol, M. Vitamin D level and risk ofcommunity-acquired pneumonia and sepsis. Nutrients 2014, 6, 2196–2205. [CrossRef]
5. Leow, L.; Simpson, T.; Cursons, R.; Karalus, N.; Hancox, R.J. Vitamin D, innate immunity and outcomes in community acquiredpneumonia. Respirology 2011, 16, 611–616. [CrossRef] [PubMed]
6. Pletz, M.W.; Terkamp, C.; Schumacher, U.; Rohde, G.; Schutte, H.; Welte, T.; Bals, R. Vitamin D deficiency in community-acquiredpneumonia: Low levels of 1,25(OH)2 D are associated with disease severity. Respir. Res. 2014, 15, 53. [CrossRef] [PubMed]
7. Dhesi, J.K.; Jackson, S.H.; Bearne, L.M.; Moniz, C.; Hurley, M.V.; Swift, C.G.; Allain, T.J. Vitamin D supplementation improvesneuromuscular function in older people who fall. Age Ageing 2004, 33, 589–595. [CrossRef] [PubMed]
8. Ghafouri, H.B.; Zare, M.; Bazrafshan, A.; Modirian, E.; Mousavi, A.; Abazarian, N. The association between serum 25-hydroxyvitamin D level and recurrent falls in the elderly population: A cohort study. Electron. Physician 2016, 8, 2707–2712.[CrossRef]
9. Scragg, R.; Waayer, D.; Stewart, A.W.; Lawes, C.M.; Toop, L.; Murphy, J.; Khaw, K.T.; Camargo, C.A., Jr. The Vitamin D Assessment(ViDA) Study: Design of a randomized controlled trial of vitamin D supplementation for the prevention of cardiovascular disease,acute respiratory infection, falls and non-vertebral fractures. J. Steroid Biochem. Mol. Biol. 2015. [CrossRef]
10. Snijder, M.B.; Van Schoor, N.M.; Pluijm, S.M.; Van Dam, R.M.; Visser, M.; Lips, P. Vitamin D status in relation to one-year risk ofrecurrent falling in older men and women. J. Clin. Endocrinol. Metab. 2006, 91, 2980–2985. [CrossRef] [PubMed]
11. Wang, T.J.; Pencina, M.J.; Booth, S.L.; Jacques, P.F.; Ingelsson, E.; Lanier, K.; Benjamin, E.J.; D’Agostino, R.B.; Wolf, M.; Vasan, R.S.Vitamin D deficiency and risk of cardiovascular disease. Circulation 2008, 117, 503–511. [CrossRef] [PubMed]
12. Kunadian, V.; Ford, G.A.; Bawamia, B.; Qiu, W.; Manson, J.E. Vitamin D deficiency and coronary artery disease: A review of theevidence. Am. Heart J. 2014, 167, 283–291. [CrossRef] [PubMed]
13. Cumhur Cure, M.; Cure, E.; Yuce, S.; Yazici, T.; Karakoyun, I.; Efe, H. Mean platelet volume and vitamin D level. Ann. Lab. Med.2014, 34, 98–103. [CrossRef]
14. Lee, J.H.; O’Keefe, J.H.; Bell, D.; Hensrud, D.D.; Holick, M.F. Vitamin D deficiency an important, common, and easily treatablecardiovascular risk factor? J. Am. Coll. Cardiol. 2008, 52, 1949–1956. [CrossRef] [PubMed]
15. Feart, C.; Helmer, C.; Merle, B.; Herrmann, F.R.; Annweiler, C.; Dartigues, J.F.; Delcourt, C.; Samieri, C. Associations of lowervitamin D concentrations with cognitive decline and long-term risk of dementia and Alzheimer’s disease in older adults. AlzheimerDement. J. Alzheimer Assoc. 2017. [CrossRef] [PubMed]
16. Licher, S.; De Bruijn, R.; Wolters, F.J.; Zillikens, M.C.; Ikram, M.A.; Ikram, M.K. Vitamin D and the Risk of Dementia: TheRotterdam Study. J. Alzheimer Dis. JAD 2017, 60, 989–997. [CrossRef] [PubMed]
17. Olsson, E.; Byberg, L.; Karlstrom, B.; Cederholm, T.; Melhus, H.; Sjogren, P.; Kilander, L. Vitamin D is not associated with incidentdementia or cognitive impairment: An 18-y follow-up study in community-living old men. Am. J. Clin. Nutr. 2017, 105, 936–943.[CrossRef]
18. Alley, D.E.; Crimmins, E.M.; Karlamangla, A.; Hu, P.; Seeman, T.E. Inflammation and rate of cognitive change in high-functioningolder adults. J. Gerontol. A Biol. Sci. Med. Sci. 2008, 63, 50–55. [CrossRef] [PubMed]
19. Brewer, L.D.; Thibault, V.; Chen, K.C.; Langub, M.C.; Landfield, P.W.; Porter, N.M. Vitamin D hormone confers neuroprotectionin parallel with downregulation of L-type calcium channel expression in hippocampal neurons. J. Neurosci. 2001, 21, 98–108.[CrossRef]
20. Eyles, D.W.; Smith, S.; Kinobe, R.; Hewison, M.; McGrath, J.J. Distribution of the vitamin D receptor and 1 alpha-hydroxylase inhuman brain. J. Chem. Neuroanat. 2005, 29, 21–30. [CrossRef]
21. Hayes, C.E.; Nashold, F.E.; Spach, K.M.; Pedersen, L.B. The immunological functions of the vitamin D endocrine system. Cell Mol.Biol. 2003, 49, 277–300.
22. Korsching, S.; Auburger, G.; Heumann, R.; Scott, J.; Thoenen, H. Levels of nerve growth factor and its mRNA in the centralnervous system of the rat correlate with cholinergic innervation. EMBO J. 1985, 4, 1389–1393. [CrossRef]
23. McCarroll, K.; Beirne, A.; Casey, M.; McNulty, H.; Ward, M.; Hoey, L.; Molloy, A.; Laird, E.; Healy, M.; Strain, J.J.; et al.Determinants of 25-hydroxyvitamin D in older Irish adults. Age Ageing 2015, 44, 847–853. [CrossRef]
24. Viera, A.J.; Garrett, J.M. Understanding interobserver agreement: The kappa statistic. Fam. Med. 2005, 37, 360–363. [PubMed]25. R Devlopment Core Team. R: A Language and Environment for Statistical Computing; R Foundation for Statistical Computing:
Vienna, Austria, 2013.26. Del Valle, H.B.; Yaktine, A.L.; Taylor, C.L.; Ross, A.C. Dietary Reference Intakes for Calcium and Vitamin D; Institute of Medicine The
National Academic Press: Washington, DC, USA, 2011; p. 1132.27. Podsiadlo, D.; Richardson, S. The timed “Up & Go”: A test of basic functional mobility for frail elderly persons. J. Am. Geriatr.
Soc. 1991, 39, 142–148.28. Folstein, M.F.; Folstein, S.E.; McHugh, P.R. “Mini-mental state”. A practical method for grading the cognitive state of patients for
the clinician. J. Psychiatr. Res. 1975, 12, 189–198. [CrossRef]

Nutrients 2021, 13, 616 11 of 11
29. Lawton, M.P.; Brody, E.M. Assessment of older people: Self-maintaining and instrumental activities of daily living. Gerontologist1969, 9, 179–186. [CrossRef] [PubMed]
30. Rosendahl-Riise, H.; Spielau, U.; Ranhoff, A.H.; Gudbrandsen, O.A.; Dierkes, J. Vitamin D supplementation and its influence onmuscle strength and mobility in community-dwelling older persons: A systematic review and meta-analysis. J. Hum. Nutr. Diet.Off. J. Br. Diet. Assoc. 2017, 30, 3–15. [CrossRef]
31. Zhou, J.; Huang, P.; Liu, P.; Hao, Q.; Chen, S.; Dong, B.; Wang, J. Association of vitamin D deficiency and frailty: A systematicreview and meta-analysis. Maturitas 2016, 94, 70–76. [CrossRef]
32. Avenell, A.; Mak, J.C.; O’Connell, D. Vitamin D and vitamin D analogues for preventing fractures in post-menopausal womenand older men. Cochrane Database Syst. Rev. 2014, 4, CD000227. [CrossRef] [PubMed]
33. Boonen, S.; Lips, P.; Bouillon, R.; Bischoff-Ferrari, H.A.; Vanderschueren, D.; Haentjens, P. Need for additional calcium to reducethe risk of hip fracture with vitamin d supplementation: Evidence from a comparative metaanalysis of randomized controlledtrials. J. Clin. Endocrinol. Metab. 2007, 92, 1415–1423. [CrossRef] [PubMed]
34. Amrein, K.; Litonjua, A.A.; Moromizato, T.; Quraishi, S.A.; Gibbons, F.K.; Pieber, T.R.; Camargo, C.A., Jr.; Giovannucci, E.;Christopher, K.B. Increases in pre-hospitalization serum 25(OH)D concentrations are associated with improved 30-day mortalityafter hospital admission: A cohort study. Clin. Nutr. 2016, 35, 514–521. [CrossRef]
35. Beauchet, O.; Launay, C.; De Decker, L.; Fantino, B.; Kabeshova, A.; Annweiler, C. Who is at risk of long hospital stay amongpatients admitted to geriatric acute care unit? Results from a prospective cohort study. J. Nutr. Health Aging 2013, 17, 695–699.[CrossRef] [PubMed]
36. Graedel, L.; Merker, M.; Felder, S.; Kutz, A.; Haubitz, S.; Faessler, L.; Kaeslin, M.; Huber, A.; Mueller, B.; Schuetz, P. VitaminD Deficiency Strongly Predicts Adverse Medical Outcome Across Different Medical Inpatient Populations: Results from aProspective Study. Medicine 2016, 95, e3533. [CrossRef]
37. Visser, M.; Deeg, D.J.; Puts, M.T.; Seidell, J.C.; Lips, P. Low serum concentrations of 25-hydroxyvitamin D in older persons and therisk of nursing home admission. Am. J. Clin. Nutr. 2006, 84, 616–622. [CrossRef] [PubMed]
38. Malinovschi, A.; Masoero, M.; Bellocchia, M.; Ciuffreda, A.; Solidoro, P.; Mattei, A.; Mercante, L.; Heffler, E.; Rolla, G.; Bucca, C.Severe vitamin D deficiency is associated with frequent exacerbations and hospitalization in COPD patients. Respir. Res. 2014, 15,131. [CrossRef]
39. Aregbesola, A.; Voutilainen, S.; Nurmi, T.; Virtanen, J.K.; Ronkainen, K.; Tuomainen, T.P. Serum 25-hydroxyvitamin D3 and therisk of pneumonia in an ageing general population. J. Epidemiol. Community Health 2013, 67, 533–536. [CrossRef] [PubMed]
40. Spiro, A.; Buttriss, J.L. Vitamin D: An overview of vitamin D status and intake in Europe. Nutr. Bull. 2014, 39, 322–350. [CrossRef][PubMed]
41. Laird, E.; O’Halloran, A.M.; Carey, D.; Healy, M.; O’Connor, D.; Moore, P.; Shannon, T.; Molloy, A.M.; Kenny, R.A. The Prevalenceof Vitamin D Deficiency and the Determinants of 25(OH)D Concentration in Older Irish Adults: Data From The Irish LongitudinalStudy on Ageing (TILDA). J. Gerontol. A Biol. Sci. Med. Sci. 2018, 73, 519–525. [CrossRef]
42. Laird, E.; McNulty, H.; Ward, M.; Hoey, L.; McSorley, E.; Wallace, J.M.; Carson, E.; Molloy, A.M.; Healy, M.; Casey, M.C.; et al.Vitamin D deficiency is associated with inflammation in older Irish adults. J. Clin. Endocrinol. Metab. 2014, 99, 1807–1815.[CrossRef] [PubMed]
43. Laird, E.; Rhodes, J.; Kenny, R.A. Vitamin D and Inflammation: Potential Implications for Severity of Covid-19. Ir. Med. J. 2020,113, 81. [PubMed]
44. McCartney, D.M.; O’Shea, P.M.; Faul, J.L.; Healy, M.J.; Byrne, G.; Griffin, T.P.; Walsh, J.B.; Byrne, D.G.; Kenny, R.A. Vitamin D andSARS-CoV-2 infection-evolution of evidence supporting clinical practice and policy development: A position statement from theCovit-D Consortium. Ir. J. Med. Sci. 2020. [CrossRef] [PubMed]