Visualizing the Evolution of Compound Digraphs with TimeArcTrees
8
Eurographics/ IEEE-VGTC Symposium on Visualization 2009 H.-C. Hege, I. Hotz, and T. Munzner (Guest Editors) Volume 28 (2009), Number 3 Visualizing the Evolution of Compound Digraphs with TimeArcTrees M. Greilich 1 , M. Burch 1 and S. Diehl 1 1 University of Trier, Germany Abstract Compound digraphs are a widely used model in computer science. In many application domains these models evolve over time. Only few approaches to visualize such dynamic compound digraphs exist and mostly use anima- tion to show the dynamics. In this paper we present a new visualization tool called TimeArcTrees that visualizes weighted, dynamic compound digraphs by drawing a sequence of node-link diagrams in a single view. Compact- ness is achieved by aligning the nodes of a graph vertically. Edge crossings are reduced by drawing upward and downward edges separately as colored arcs. Horizontal alignment of the instances of the same node in different graphs facilitates comparison of the graphs in the sequence. Many interaction techniques allow to explore the given graphs. Smooth animation supports the user to better track the transitions between views and to preserve his or her mental map. We illustrate the usefulness of the tool by looking at the particular problem of how shortest paths evolve over time. To this end, we applied the system to an evolving graph representing the German Autobahn and its traffic jams. Categories and Subject Descriptors (according to ACM CCS): Data Structures [E.1]: Graphs and Networks— 1. Introduction Graphs are a mathematical method to express relations or de- pendencies between a set of objects. Compound graphs addi- tionally encapsulate a hierarchical order on the graph nodes. Many layout algorithms have been developed to better un- derstand interesting structures or substructures of a given compound graph by producing node-link diagrams. In many cases these algorithms can only deal with static graphs that do not change their structure over time. Only few algorithms can deal with changing relations [PB08]. Information hierarchies occur in many application do- mains such as the hierarchical organization of companies, news topics and subtopics, file/directory systems, products and product groups of a department store, or phylogenetic trees in biology. The evolution of dependencies in such in- formation hierarchies can be modeled by sequences of com- pound digraphs with edge weights. While there has been a lot of work on visualizing in- formation hierarchies [RT81, YFDH01, JS91, AH98, SZ00], only few researchers have developed methods to visualize dependencies between elements in the hierarchy [NSC05, FWD * 03, ZMC05, Hol06, PvW06], see Section 4 for a more detailed discussion. The TimeArcTrees approach shows a sequence of com- pound digraphs in a traditional node-link representation. Based on the order of the nodes in the hierarchy the nodes of the graph are placed on a vertical line from top to bot- tom for each graph of the sequence. The hierarchy is repre- sented as a node-link diagram on the left hand side of the whole view and can be expanded or collapsed to an inter- actively selectable level. The visualization of the graph se- quence automatically adapts to the current expansion level of the hierarchy. The frontier of the current hierarchy tree forms the nodes of the graph sequence. By frontier we mean the currently visible leaf nodes of the hierarchy which are either real leaf nodes or collapsed nodes of the underlying hierarchy. The mental map is preserved by smooth anima- tion making the transitions between different views easier to understand. The graphs of the sequence are drawn from left to right as separate node-link diagrams. In these diagrams we use the following conventions. First, all nodes of a graph are aligned vertically above each other. Edges are not drawn as straight c 2010 The Author(s) Journal compilation c 2010 The Eurographics Association and Blackwell Publishing Ltd. Published by Blackwell Publishing, 9600 Garsington Road, Oxford OX4 2DQ, UK and 350 Main Street, Malden, MA 02148, USA.
Transcript of Visualizing the Evolution of Compound Digraphs with TimeArcTrees

Eurographics/ IEEE-VGTC Symposium on Visualization 2009H.-C. Hege, I. Hotz, and T. Munzner(Guest Editors)
Volume 28 (2009), Number 3
Visualizing the Evolution of Compound Digraphs withTimeArcTrees
M. Greilich1, M. Burch1 and S. Diehl11University of Trier, Germany
Abstract
Compound digraphs are a widely used model in computer science. In many application domains these modelsevolve over time. Only few approaches to visualize such dynamic compound digraphs exist and mostly use anima-tion to show the dynamics. In this paper we present a new visualization tool called TimeArcTrees that visualizesweighted, dynamic compound digraphs by drawing a sequence of node-link diagrams in a single view. Compact-ness is achieved by aligning the nodes of a graph vertically. Edge crossings are reduced by drawing upward anddownward edges separately as colored arcs. Horizontal alignment of the instances of the same node in differentgraphs facilitates comparison of the graphs in the sequence. Many interaction techniques allow to explore thegiven graphs. Smooth animation supports the user to better track the transitions between views and to preservehis or her mental map. We illustrate the usefulness of the tool by looking at the particular problem of how shortestpaths evolve over time. To this end, we applied the system to an evolving graph representing the German Autobahnand its traffic jams.
Categories and Subject Descriptors (according to ACM CCS): Data Structures [E.1]: Graphs and Networks—
1. Introduction
Graphs are a mathematical method to express relations or de-pendencies between a set of objects. Compound graphs addi-tionally encapsulate a hierarchical order on the graph nodes.Many layout algorithms have been developed to better un-derstand interesting structures or substructures of a givencompound graph by producing node-link diagrams. In manycases these algorithms can only deal with static graphs thatdo not change their structure over time. Only few algorithmscan deal with changing relations [PB08].
Information hierarchies occur in many application do-mains such as the hierarchical organization of companies,news topics and subtopics, file/directory systems, productsand product groups of a department store, or phylogenetictrees in biology. The evolution of dependencies in such in-formation hierarchies can be modeled by sequences of com-pound digraphs with edge weights.
While there has been a lot of work on visualizing in-formation hierarchies [RT81, YFDH01, JS91, AH98, SZ00],only few researchers have developed methods to visualizedependencies between elements in the hierarchy [NSC05,
FWD∗03,ZMC05,Hol06,PvW06], see Section 4 for a moredetailed discussion.
The TimeArcTrees approach shows a sequence of com-pound digraphs in a traditional node-link representation.Based on the order of the nodes in the hierarchy the nodesof the graph are placed on a vertical line from top to bot-tom for each graph of the sequence. The hierarchy is repre-sented as a node-link diagram on the left hand side of thewhole view and can be expanded or collapsed to an inter-actively selectable level. The visualization of the graph se-quence automatically adapts to the current expansion levelof the hierarchy. The frontier of the current hierarchy treeforms the nodes of the graph sequence. By frontier we meanthe currently visible leaf nodes of the hierarchy which areeither real leaf nodes or collapsed nodes of the underlyinghierarchy. The mental map is preserved by smooth anima-tion making the transitions between different views easier tounderstand.
The graphs of the sequence are drawn from left to right asseparate node-link diagrams. In these diagrams we use thefollowing conventions. First, all nodes of a graph are alignedvertically above each other. Edges are not drawn as straight
c© 2010 The Author(s)Journal compilation c© 2010 The Eurographics Association and Blackwell Publishing Ltd.Published by Blackwell Publishing, 9600 Garsington Road, Oxford OX4 2DQ, UK and350 Main Street, Malden, MA 02148, USA.
Martin Greilich, Michael Burch & Stephan Diehl / TimeArcTrees
lines with bends, but as arcs to make it easier for the hu-man eye to follow a path. Furthermore, we show three kindsof edges. For upward edges the starting node is located be-low the target node in the visualization, whereas the remain-ing edges are either downward edges or self-edges. Upwardedges as well as self-edges are shown on the left hand sideof the corresponding graph. All other edges are visualized onthe right hand side of each graph. This layout reduces visualclutter but does not avoid it completely.
Moreover edges can be weighted. These weights are indi-cated by color using one of many color scales provided bythe system.
We have developed several interaction techniques that al-low the users to explore the data. On top of each graph onecan find a time slider that is used to aggregate a graph sub-sequence, for example. These and other features will be ex-plained in more detail later on.
The rest of this paper is organized as follows: In Section 2we introduce the different constituents of the TimeArcTreesvisualization by means of examples. In Section 3 we showhow TimeArcTrees can be used to explore shortest paths in asequence of graphs. Related work is discussed in Section 4.Finally, Section 5 gives some conclusions and possible di-rections for future work.
2. TimeArcTrees – step by step
We illustrate our visualization technique by means of a smallexample. Assume the graph sequence S = (G1, . . . ,Gk) thatconsists of k graphs Gi = (V,Ei) , 1 ≤ i ≤ k with V the setof nodes and Ei ⊆ V ×V ×N the set of directed weightededges between pairs of nodes. In the context of this paperwe denote an edge (u,v,w) ∈ Ei of graph Gi with
u w→Gi
v
We call w the edge weight. A path
u c→Gi
∗v
is a possibly empty sequence of edges such that
u w1→Gi
v1w2→Gi
. . .wn−1→
Givn−1
wn→Gi
v
and c = ∑nj=1 w j are the accumulated costs along the path.
A cycle or loop is a nonempty path
u c→Gi
∗u
.
In the following example we assume that the nodes ofthe graph sequence correspond to IP-addresses and the edgeweights represent network delays. The graph can be obtainedby merging the information of multiple invocations of thetraceroute program. Table 1 shows the nodes of the
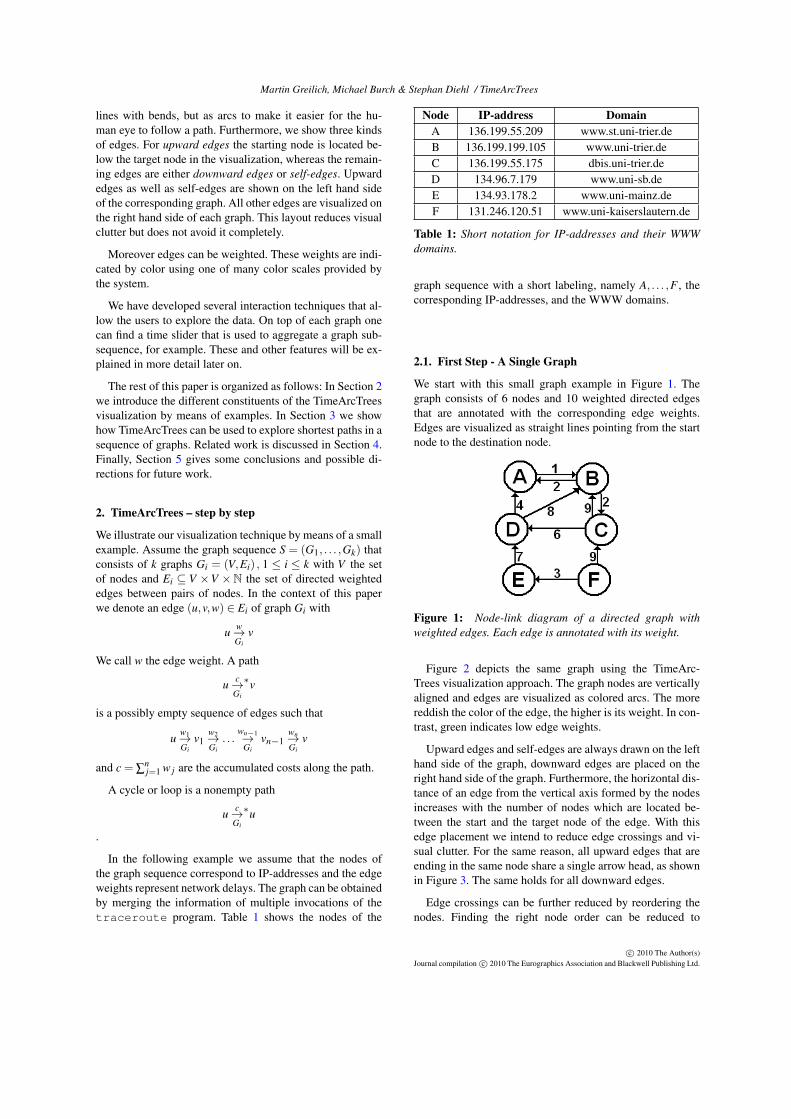
Node IP-address DomainA 136.199.55.209 www.st.uni-trier.deB 136.199.199.105 www.uni-trier.deC 136.199.55.175 dbis.uni-trier.deD 134.96.7.179 www.uni-sb.deE 134.93.178.2 www.uni-mainz.deF 131.246.120.51 www.uni-kaiserslautern.de
Table 1: Short notation for IP-addresses and their WWWdomains.
graph sequence with a short labeling, namely A, . . . ,F , thecorresponding IP-addresses, and the WWW domains.
2.1. First Step - A Single Graph
We start with this small graph example in Figure 1. Thegraph consists of 6 nodes and 10 weighted directed edgesthat are annotated with the corresponding edge weights.Edges are visualized as straight lines pointing from the startnode to the destination node.
Figure 1: Node-link diagram of a directed graph withweighted edges. Each edge is annotated with its weight.
Figure 2 depicts the same graph using the TimeArc-Trees visualization approach. The graph nodes are verticallyaligned and edges are visualized as colored arcs. The morereddish the color of the edge, the higher is its weight. In con-trast, green indicates low edge weights.
Upward edges and self-edges are always drawn on the lefthand side of the graph, downward edges are placed on theright hand side of the graph. Furthermore, the horizontal dis-tance of an edge from the vertical axis formed by the nodesincreases with the number of nodes which are located be-tween the start and the target node of the edge. With thisedge placement we intend to reduce edge crossings and vi-sual clutter. For the same reason, all upward edges that areending in the same node share a single arrow head, as shownin Figure 3. The same holds for all downward edges.
Edge crossings can be further reduced by reordering thenodes. Finding the right node order can be reduced to
c© 2010 The Author(s)Journal compilation c© 2010 The Eurographics Association and Blackwell Publishing Ltd.

Martin Greilich, Michael Burch & Stephan Diehl / TimeArcTrees
Figure 2: Node-link diagram of a directed weighted graphin a TimeArcTrees representation. The weighted edges arerepresented by colored arcs.
Figure 3: Incoming and outgoing edge ports
the NP-complete problem of Optimal Linear Arrangement(OLA) [GJ79]. As a consequence, we first reorder the leafnodes to reduce the edge crossings between sibling nodes,then we recurse to the parent nodes and reorder these to fur-ther reduce the edge crossings.
2.2. Second Step - Hierarchy Levels
As we have to deal with compound digraphs we have to vi-sualize the hierarchical ordering of the graph nodes as well.Figure 4 shows how the information hierarchy could be rep-resented. We also use a traditional node-link diagram that islocated on the left side of the whole graph view to give anoverview of the hierarchical information of the compounddigraph. Subtrees can be collapsed into a single node or ex-panded. The size of a collapsed subtree is indicated by thecolor of its root node. Large subtrees are represented bywhite hierarchy nodes, whereas small subtrees are visualizedas dark blue nodes.
The hierarchy can be transformed by clicking on a node.If the subtree of the node is expanded, it will be collapsed,and vice versa. The graph is automatically updated to showonly nodes of the current frontier of the hierarchy. Smoothanimations to get from the old view to the new one help theuser to keep track of what is going on and to preserve his orher mental map of the graphs.
2.3. Third Step - Aggregation of Edges
If the hierarchy is transformed by clicking on an interme-diate node, the graph is adjusted as shown in Figure 5. The
Figure 4: A graph in a TimeArcTrees representation: Thehierarchy is shown on the left hand side. In this example, thehierarchy is completely expanded.
corresponding nodes of a collapsed subtree are replaced by asingle node and all edges to and from nodes within the sub-tree are shown as edges to and from the new node. If thereare several edges to or from the same node, they are onlyrepresented by a single edge. The weight of this edge is ei-ther computed as the sum or average of the individual edgeweights depending on the user’s preferences.
Figure 5: Parts of the hierarchy can be expanded or col-lapsed to an interactively selectable level. In this example,the complete subtree with root 136 is collapsed and all in-coming, outgoing and inner edges of this subtree are aggre-gated.
For example, the edge from D to 136 in Figure 5 aggre-gates the edge from D to B and the edge from D to A in Fig-ure 4 and its color indicates the sum of the individual edgeweights.
2.4. Fourth Step - Graph Sequence
The TimeArcTrees tool is at its best if we have to deal withsequences of graphs. Dependencies and relations are chang-ing over time. The graph structure could be a completelynew one or just subgraphs are evolving. The node-link dia-grams in Figure 6 show a sequence of small graphs. For ex-ample, the edge D→B in the first graph disappears in the sec-
c© 2010 The Author(s)Journal compilation c© 2010 The Eurographics Association and Blackwell Publishing Ltd.

Martin Greilich, Michael Burch & Stephan Diehl / TimeArcTrees
ond graph and reappears in the third one, but with a smallerweight than before. The node E in the last graph has neitherincoming nor outgoing edges and thus is not shown at all.
Figure 6: A sequence of graphs in a traditional node-linkrepresentation.
The same scenario as in Figure 6 is represented in Fig-ure 7, but here we use our new TimeArcTrees approach.Edges are colored and the hierarchy is added on the left sideof the graph sequence view.
Figure 7: The TimeArcTrees visualization for a sequenceof three graphs with the information hierarchy. Graph sep-arators are interactive widgets that can be used to changethe horizontal space for each graph, as well as to aggregateseveral subsequent graphs.
2.5. Fifth Step - Aggregation of Graphs over Time
Subsequent graphs can be aggregated into a single graph. Inthe example shown in Figure 8 the second and third graph ofFigure 7 are aggregated. To indicate this, there is no graphseparator between the two bullets representing the two orig-inal graphs.
In the aggregated graph the edge from E to D stems fromthe second graph and the edge from D to B from the thirdgraph. The color of the edge from F to C represents the aver-age of the weights of the same edge in both original graphs.Alternatively, the TimeArcTrees tool can use the sum of the
Figure 8: The second and third graph are aggregated to asingle graph. The graph separator between the two originalgraphs was removed.
weights for aggregated edges. It goes without saying thatTimeArcTrees also allows to expand aggregated graphs byreinserting graph separators.
2.6. Interactive Features
The TimeArcTrees tool has many additional interactive fea-tures that help the user to explore the given graphs. In thissection we will explain some of them in more detail.
Expanding/Collapsing of the HierarchyThe information hierarchy can be expanded or collapsedby clicking on the corresponding node. This has the pos-itive effect that subgraphs can be combined to one singlenode and the graphs become much smaller.
Graph AggregationSubsequent graphs can be aggregated by dissolving thegraph separator between two or more subsequent graphs.The edge weights of the aggregated edges are either com-puted as the sum or the average of the weights of the indi-vidual edges.
Node Activation and DeactivationNodes in the hierarchy can be activated and deactivated. Ifa node is deactivated only those edges are visible that arenot incoming or outgoing edges of this deactivated node.
Filtering FunctionsIn order to reduce visual clutter, edges can be filtered outby applying a threshold to their edge weights. In otherwords, if the weight of an edge is below a given threshold,it is not drawn on the screen.
Detail on DemandDetailed information can be obtained in form of a tooltipwhen moving the mouse cursor over a node or edge posi-tion.
Color CodingThe tool provides a set of predefined color scales fromwhich the user can select an adequate one.
c© 2010 The Author(s)Journal compilation c© 2010 The Eurographics Association and Blackwell Publishing Ltd.

Martin Greilich, Michael Burch & Stephan Diehl / TimeArcTrees
Figure 9: Excerpt of the German Autobahn map: The mapis divided into four regions. The start node for our shortestpath example is indicated by a green flag. The target node bya red one.
3. Shortest Paths
So far, we have shown how TimeArcTrees can be used toexplore a sequence of graphs. In addition, the tool is able tocompute shortest paths using the Bellmann-Ford algorithm.TimeArcTrees can also visualize some other graph proper-ties like maximum flows that we do not further discuss inthis paper. To this end, the user has to select start and tar-get nodes as shown in Figure 10. By clicking at the greencircle sector the node is marked as the start node, whereasby clicking at the red circle sector it is marked as the targetnode.
Figure 10: The start node for shortest path visualization isselected by clicking at the green circle sector of a node. Thetarget node can be selected with the red circle sector.
A shortest path in a graph G from node u to node v is thepath u c→
G∗v with the minimal costs c. To visualize a shortest
path, only those edges along the path are drawn in color,while the remaining edges are drawn in light grey. At eachnode along the path, the accumulated cost relative to the costof the longest shortest path are indicated by a circular bar, asshown in Figure 11. For each graph of the sequence we mayhave a different shortest path. Of these shortest paths, thelongest shortest path is the one with the highest cost.
To illustrate our approach, we look at the question ofhow the fastest way to get home on the German Autobahnchanges during the day. Or more precisely, how to get fromthe junction "Kreuz Meerbusch" to the junction "Kamener
Figure 11: The costs accumulated along the shortest pathfrom the start node up to this node are represented by a cir-cular bar.
Kreuz". Figure 9 shows an excerpt of a German Autobahnmap that we will consider in the following. We divided themap into four regions: South, North, West, and East.
From this map we derived an Autobahn graph consistingof 27 nodes and 78 edges, in which the nodes represent thejunctions and the edge weights represent the time to get bycar from one junction to another. These times change duringthe day due to traffic jams. In the example, we used real datarecorded on a typical day.
Figure 12: A sequence of maps showing the shortest pathsat different points of time. In the lower right map all pathsare shown at once.
c© 2010 The Author(s)Journal compilation c© 2010 The Eurographics Association and Blackwell Publishing Ltd.

Martin Greilich, Michael Burch & Stephan Diehl / TimeArcTrees
In Figure 12 the shortest paths are drawn into the map topreserve geographic information. For each of seven differenttimes of day a separate map is shown. Finally, the map at thelower right shows all shortest paths in a single map. Visual-izing the paths using separate maps requires a lot of screenspace, showing the maps one after another using animationleads to high cognitive load, and integrating the paths into asingle map produces a lot of visual clutter and makes it hardto show additional information. By visualizing the Autobahngraph instead of the map, we lose the geographic informa-tion, but it allows us to apply the TimeArcTrees approachto explore the data in a space efficient and highly interactiveway.
In the example in Figure 13 the shortest paths are shownfor 8 different points of time of the same day. Actually, thegraphs for 12:00 and 14:00 are aggregated in this example tosave screen space, and because there was no difference be-tween the shortest paths in both graphs. As can be seen bythe closed circular bar around the target node in the graph for16:00, this graph contains the longest shortest path. Whenmoving the cursor onto the circular bar, the tooltip showsthat this path takes 102 minutes. In contrast, the shortestshortest path only takes 62 minutes. Surprisingly, the longestshortest path and the shortest shortest path are along thesame nodes. Whereas, most of the other shortest paths havedifferent intermediate nodes. Thus, in this case we found outthat it does not pay off to use alternative routes during therush hour because these are also jammed.
Although we found the Autobahn example very intuitive,there is a risk that by removing the spatial information andaligning all junctions vertically, the user might misinterpretthe length and direction of edges as the geographical dis-tance and orientation.
4. Related Work
Many approaches for visualizing dependencies in informa-tion hierarchies encode dependencies between objects as di-rected or undirected edges in node-link diagrams. In particu-lar, specialized graph-drawing algorithms for compound di-graphs have been developed [FT04, SM91, BM99]. In theserepresentations the appearance of edges, for example, theircolor, shape, orientation, thickness or connection, can rep-resent the weights of edges. There are several approachesthat extend Treemaps [JS91] to also show different kindsof graphs on top of the treemap [FWD∗03, ZMC05, BD06].For example, ArcTrees [NSC05] is an interactive visualiza-tion tool for hierarchical and non-hierarchical relations. Itextends the hierarchical view of the Treemap approach witharc diagrams [Wat02] to present relations. Hierarchical EdgeBundles [Hol06] show relations by bundled edges betweenthe nodes of a radial icicle view, treemap or balloon layout.None of these approaches is able to show the evolution ofthe graphs.
Several researchers have developed animated node-link
representations of dynamic compound digraphs [FT07,PB08]. In contrast, the TimeRadarTrees approach [BD08]visualizes a sequence of weighted, compound digraphs ina single view. This radial and space-filling visualizationtechnique uses colored circle sectors to represent weightededges. TimeArcTrees can be seen as an extension of theTimeline Trees approach [BBD08] which shows transitionsinstead of digraphs, i.e., no edges are drawn, instead the par-ticipation in a transition is indicated by color. The TimeArc-Trees tool provides many of the interaction features of theTimeline Trees tool like collapsing and expanding of treenodes, but extends these by graph aggregation, node activa-tion and filtering functions, see Sections 2.5 and 2.6.
Discussion While one can certainly think of possible exten-sions of the approaches discussed above, to the best of ourknowledge none of the existing approaches has so far beenextended and applied to visualize dynamic, weighted com-pound digraphs in a single, static image using a node-linkrepresentation. Timeline Trees [BBD08] and TimeRadar-Trees [BD08] provide a compact, crossing free representa-tion of dynamic graphs, but it is still difficult for the humaneye to follow paths in these representations. TimeArcTreesare a compromise. They are a relatively compact representa-tion of dynamic compound digraphs which allows the humaneye to follow paths more easily.
As can be seen in Figure 13 up to 10 graphs with about 30expanded or collapsed nodes and about 100 edges per graphcan be displayed simultaneously without a significant lossof readability on a computer screen (1680x1080 resolution),i.e., a total of 30.000 edges. For the horizontal dimensionthere is a tradeoff between the number of edges per graphand the number of graphs which can be readably shown atthe same time. Thus, the interaction features provided by thetool are very crucial for inspecting larger data sets.
5. Conclusions and Future Work
In this paper we have presented the TimeArcTrees visual-ization tool for exploring dynamic, weighted compound di-graphs. To illustrate the usefulness of our tool and some ofits interaction techniques, we focussed on how shortest pathsevolve in these dynamic graphs. To this end, we appliedit to a sequence of graphs representing the German Auto-bahn and its traffic jams at different times of the day. Thecompact and clear representation facilitated comparison ofthe graphs. The horizontal alignment of the instances of thesame node in different graphs helped us to detect where theshortest paths diverged.
As part of our future work we plan to improve the sys-tem by adding an interactive street map and allowing "link-ing and brushing" in both the TimeArcTrees and the streetmap view. Furthermore, we intend to use the system to ex-plore the evolution of other graph properties like maximumflow, strongly connected components and the like. Finally,
c© 2010 The Author(s)Journal compilation c© 2010 The Eurographics Association and Blackwell Publishing Ltd.

Martin Greilich, Michael Burch & Stephan Diehl / TimeArcTrees
Figu
re13
:Scr
eens
hoto
fthe
Tim
eArc
Tree
sto
olsh
owin
gth
esh
orte
stpa
ths
betw
een
the
node
s"K
reuz
Mee
rbus
ch"
and
"Kam
ener
Kre
uz"
for
diffe
rent
poin
tsof
time.
The
grap
hin
the
mid
dle
isac
tual
lyan
aggr
egat
ion
oftw
ogr
aphs
.The
edge
sar
eco
lore
dw
itha
blue
tore
dco
lor
scal
e.
c© 2010 The Author(s)Journal compilation c© 2010 The Eurographics Association and Blackwell Publishing Ltd.

Martin Greilich, Michael Burch & Stephan Diehl / TimeArcTrees
we want to perform a user study to compare it with other ex-isting approaches with respect to different tasks like count-ing and correlation problems [BBBD08], and in particular,tasks related to the evolution of shortest paths. To this end,we will have to extend the other tools to also compute andvisualize shortest paths.
References[AH98] ANDREWS K., HEIDEGGER H.: Information slices: Vi-
sualising and exploring large hierarchies using cascading, semi-circular discs (late breaking hot topic paper). In Proceedings ofthe IEEE Symposium on Information Visualization (INFOVIS’98)(Research Triangle Park, NC, 1998), pp. 9–12. 1
[BBBD08] BURCH M., BOTT F., BECK F., DIEHL S.: Cartesianvs. radial – a comparative evaluation of two visualization tools.In Proceedings of 4th International Symposium on Visual Com-puting (ISVC08), Las Vegas, Nevada (2008). 8
[BBD08] BURCH M., BECK F., DIEHL S.: Timeline trees: Vi-sualizing sequences of transactions in information hierarchies.In Proceedings of 9th International Working Conference on Ad-vanced Visual Interfaces (AVI2008) (Naples, Italy, 2008). 6
[BD06] BURCH M., DIEHL S.: Trees in a treemap. In Proceed-ings of 13th Conference on Visualization and Data Analysis (VDA2006) (San Jose, California, 2006). 6
[BD08] BURCH M., DIEHL S.: Timeradartrees: Visualizingdynamic compound digraphs. In Proceedings of Tenth JointEurographics/IEEE-VGTC Symposium on Visualization (Euro-Vis’2008), Eindhoven, The Netherlands (2008), EurographicsAssociation. 6
[BM99] BERTAULT F., MILLER M.: An Algorithm for DrawingCompound Graphs. In Proceedings of 7th International Sympo-sium on Graphdrawing, GD (1999), vol. 1731 of LNCS, Springer,pp. 197–204. 6
[FT04] FRISHMAN Y., TAL A.: Dynamic Drawing of ClusteredGraphs. In Proceedings of 10th IEEE Symposium on Infor-mation Visualization, INFOVIS (2004), IEEE Computer Society,pp. 191–198. 6
[FT07] FRISHMAN Y., TAL A.: Online dynamic graph draw-ing. In Proceedings of Nineth Joint Eurographics/IEEE-VGTCSymposium on Visualization (EuroVis’2007), Norrköping, Swe-den (2007), Eurographics Association. 6
[FWD∗03] FEKETE J.-D., WAND D., DANG N., ARIS A.,PLAISANT C.: Overlaying graph links on treemaps. In PosterCompendium of the IEEE Symposium on Information Visualiza-tion (INFOVIS’03), Los Alamitos, CA, USA (2003), IEEE. 1, 6
[GJ79] GAREY M. R., JOHNSON D. S.: Computers and In-tractability A guide to the Theory of NP-Completeness. W.HFreeman Publ., 1979. 3
[Hol06] HOLTEN D.: Hierarchical edge bundles: Visualizing ofadjacency relations in hierarchical data. In Proceedings of theIEEE Transactions on Visualization and Computer Graphics, 12,741-748 (2006), IEEE. 1, 6
[JS91] JOHNSON B., SHNEIDERMAN B.: Tree-maps: A space-filling approach to the visualization of hierarchical informationstructures. In Proceedings of IEEE Visualization Conference(San Diego, CA, 1991), pp. 284–291. 1, 6
[NSC05] NEUMANN P., SCHLECHTWEG S., CARPENDALE S.:Arctrees: Visualizing relations in hierarchical data. In DataVisualization, Eurographics/IEEE VGTC Symposium on Visual-ization (Aire-la-Ville, Switzerland, 2005), Brodlie K. W., DukeD. J., Joy K. I., (Eds.). 1, 6
[PB08] POHL M., BIRKE P.: Interactive exploration of large dy-namic networks. In Proceedings of International Conference onVisual Information Systems (Visual 2008), Salerno, Italy (2008),Springer Verlag. 1, 6
[PvW06] PRETORIUS A., VAN WIJK J.: Visual analysis of mul-tivariate state transition graphs. In Proceedings of IEEE Sympo-sium on Information Visualization (InfoVis 2006), IEEE CS Press(2006). 1
[RT81] REINGOLD E. M., TILFORD J. S.: Tidier drawing oftrees. IEEE Transactions on Software Engineering 7, 2 (1981),223–228. 1
[SM91] SUGIYAMA K., MISUE K.: Visualization of StructuralInformation: Automatic Drawing of Compound Digraphs. IEEETransactions on Systems, Man and Cybernetics 21, 4 (1991),876–892. 6
[SZ00] STASKO J., ZHANG E.: Focus+context display and nav-igation techniques for enhancing radial, space-filling hierarchyvisualizations. In Proceedings of the Symposium on Informa-tion Visualization (InfoVis’00), Salt Lake City, UT (2000), IEEEComputer Society Press, pp. 57–65. 1
[Wat02] WATTENBERG M.: Arc diagrams: Visualizing structurein strings. In Proceedings of IEEE Symposium on InformationVisualization (2002). 6
[YFDH01] YEE K.-P., FISHER D., DHAMIJA R., HEARST M.:Animated exploration of dynamic graphs with radial layout. InProceedings of the IEEE Symposium on Information Visualiza-tion, San Diego, CA, USA (2001). 1
[ZMC05] ZHAO S., MCGUFFIN M. J., CHIGNELL M. H.: Elas-tic hierarchies: Combining treemaps and node-link diagrams. InProceedings of the IEEE Symposium on Information Visualiza-tion (INFOVIS’05), Minneapolis, MN, USA (2005), IEEE. 1, 6
c© 2010 The Author(s)Journal compilation c© 2010 The Eurographics Association and Blackwell Publishing Ltd.