Visual Analytics: Empowering Humans for Knowledge Discovery in Big Data
36
Visual Analytics: Empowering Humans for Knowledge Discovery in Big Data Dr. Nikola S. Nikolov Department of CSIS, UL 3 rd December 2014
Transcript of Visual Analytics: Empowering Humans for Knowledge Discovery in Big Data
Visual Analytics: Empowering Humans for
Knowledge Discovery in Big Data
Dr. Nikola S. NikolovDepartment of CSIS, UL
3rd December 2014
Information Retrieval
Data Mining
Statistical Modelling
Knowledge Discovery
Machine Learning
Information Visualisatio
n
Data Analytics Data
Visualisation
Predictive Analytics
2
OutlineO Visual Analytics Overview
O What is visual analytics?O The visual analytics process and method
O Visual Analytics at CSISO Network VisualisationO Geospatial Visual AnalysisO Visual Text Mining
O Discussion3
I. Visual Analytics
4
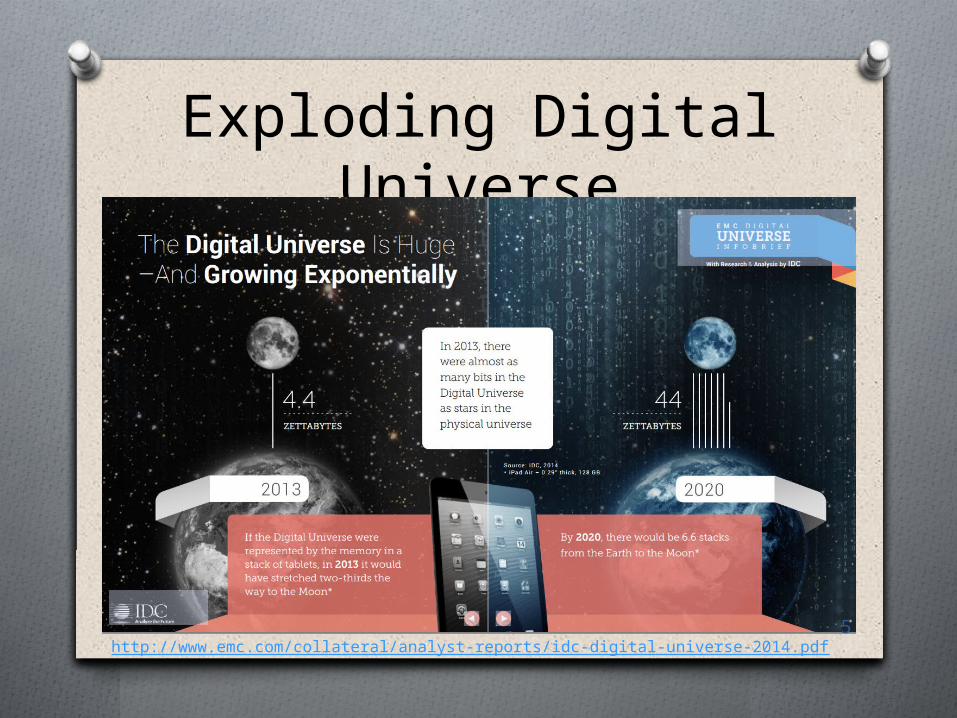
Exploding Digital Universe
http://www.emc.com/collateral/analyst-reports/idc-digital-universe-2014.pdf5
Exploding Digital Universe
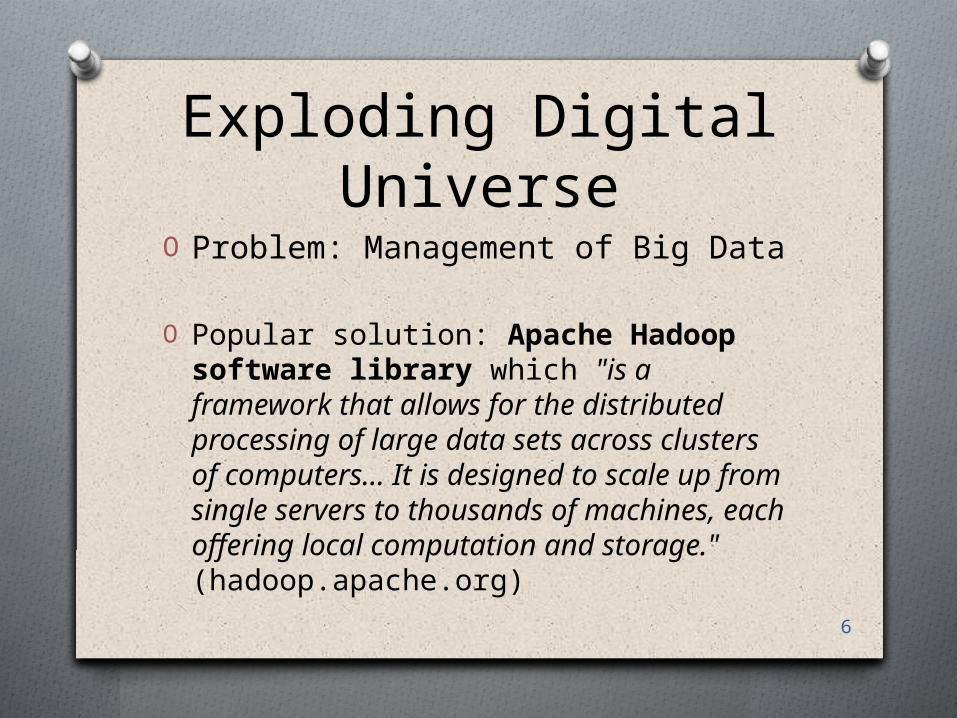
O Problem: Management of Big Data
O Popular solution: Apache Hadoop software library which "is a framework that allows for the distributed processing of large data sets across clusters of computers… It is designed to scale up from single servers to thousands of machines, each offering local computation and storage." (hadoop.apache.org)
6
Exploding Digital Universe
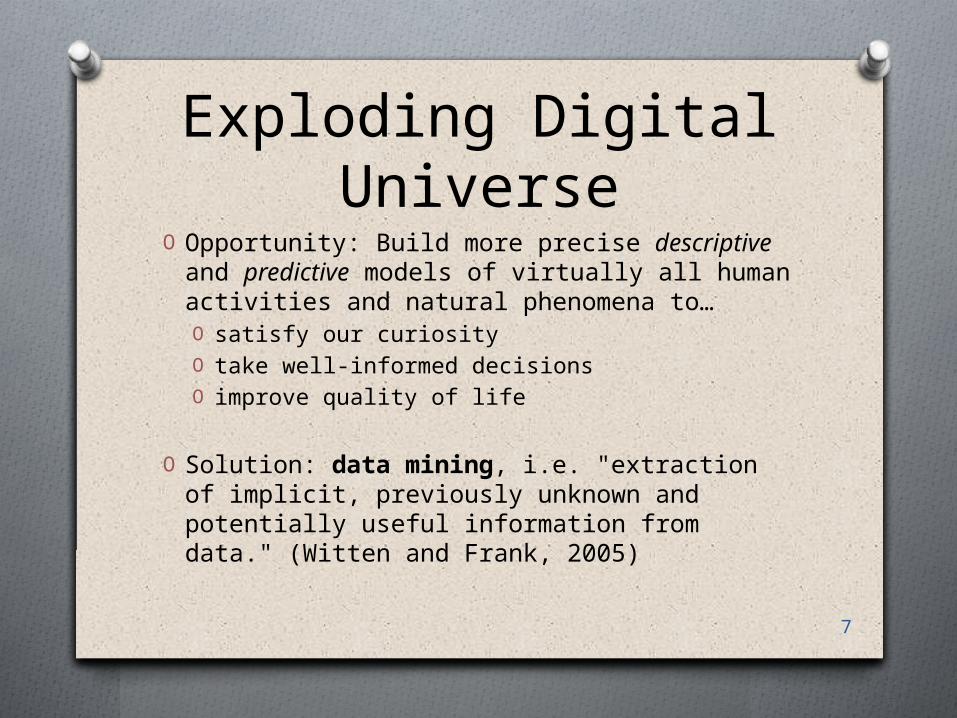
O Opportunity: Build more precise descriptive and predictive models of virtually all human activities and natural phenomena to…O satisfy our curiosityO take well-informed decisionsO improve quality of life
O Solution: data mining, i.e. "extraction of implicit, previously unknown and potentially useful information from data." (Witten and Frank, 2005)
7

Data MiningO Methods:
O Statistical modellingO Machine learning algorithms
O Statistics vs. Machine Learning discussion:O http://stats.stackexchange.com/questions/6/the-two-cultures-statistics-vs-machine-learning
O http://brenocon.com/blog/2008/12/statistics-vs-machine-learning-fight/
O http://projecteuclid.org/euclid.ss/1009213726
8
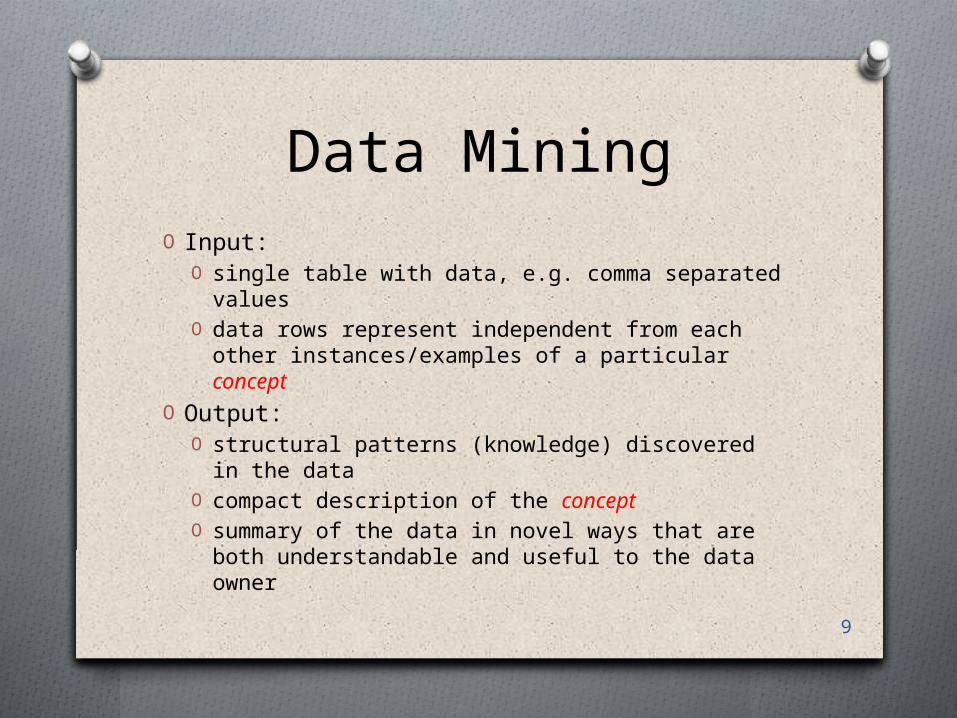
Data MiningO Input:
O single table with data, e.g. comma separated values
O data rows represent independent from each other instances/examples of a particular concept
O Output:O structural patterns (knowledge) discovered in the data
O compact description of the conceptO summary of the data in novel ways that are both understandable and useful to the data owner
9
Data Mining
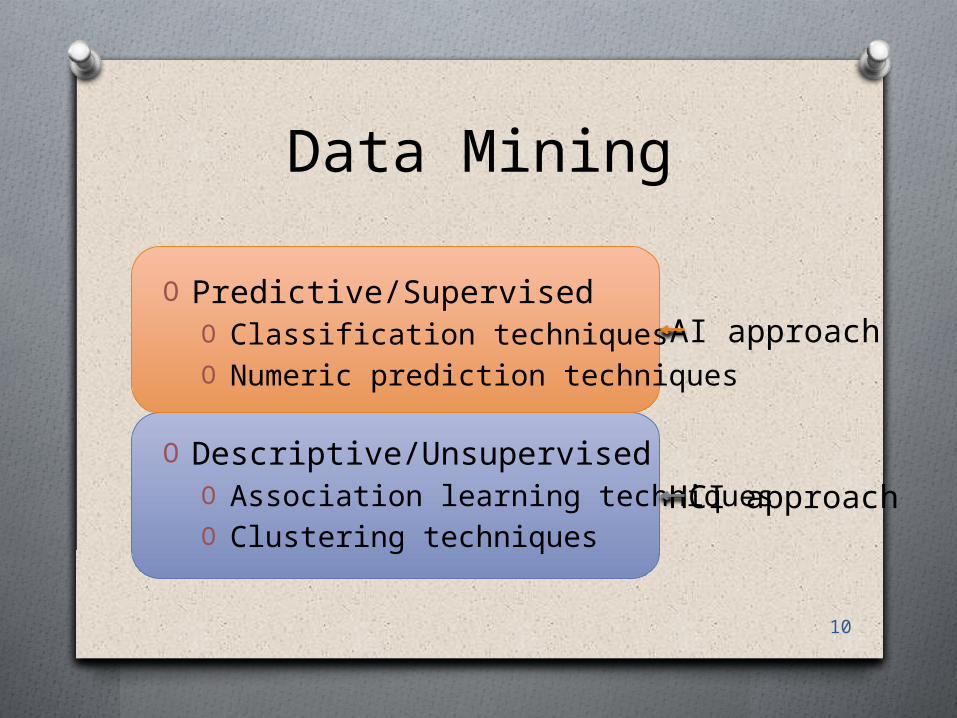
O Predictive/SupervisedO Classification techniquesO Numeric prediction techniques
O Descriptive/UnsupervisedO Association learning techniquesO Clustering techniques
AI approach
HCI approach
10
Data Mining
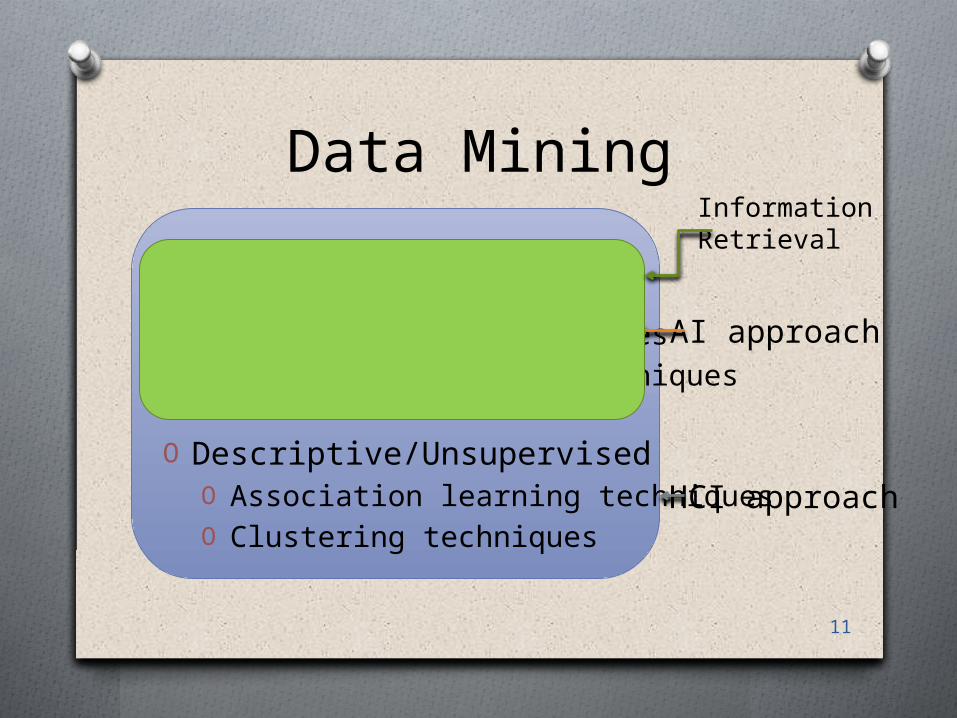
O Predictive/SupervisedO Classification techniquesO Numeric prediction techniques
O Descriptive/UnsupervisedO Association learning techniquesO Clustering techniques
AI approach
HCI approach
InformationRetrieval
11

Visual AnalyticsO Visual Analytics is the science of analytical reasoning supported by a highly interactive visual interface (Thomas & Cook, 2005)
Minority Report, 2002 (Twentieth Century Fox)12

Visual AnalyticsO Visual Analytics is the science of analytical reasoning supported by a highly interactive visual interface (Thomas & Cook, 2005)
Data Knowledge
Visualisation
Models
transformation
feedback loop
user interaction
refine13
Visualisation Problems
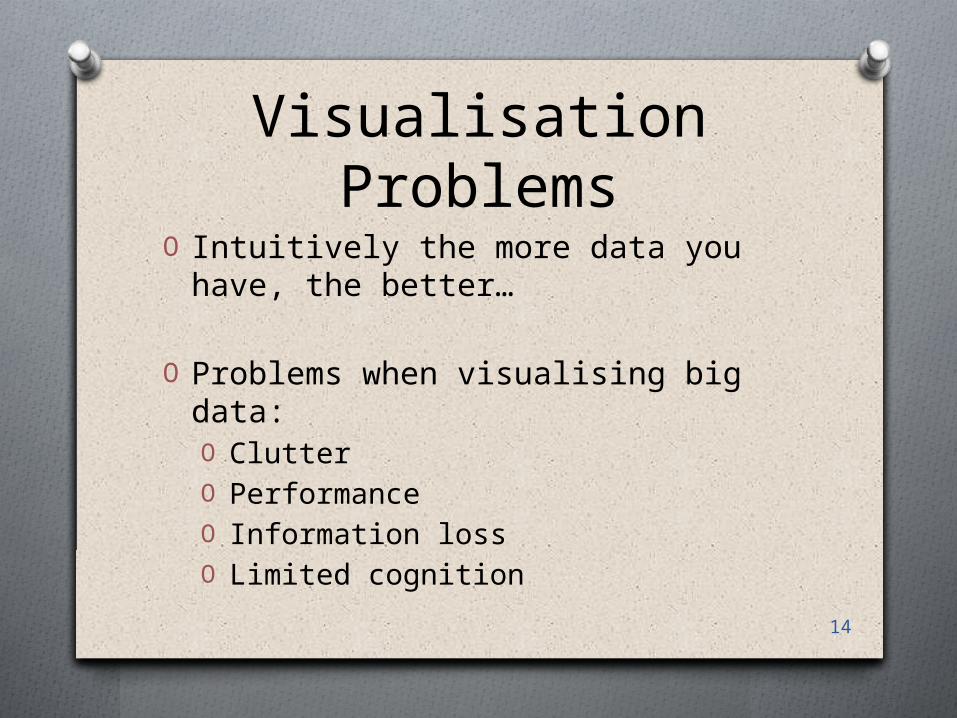
O Intuitively the more data you have, the better…
O Problems when visualising big data:O ClutterO PerformanceO Information lossO Limited cognition
14
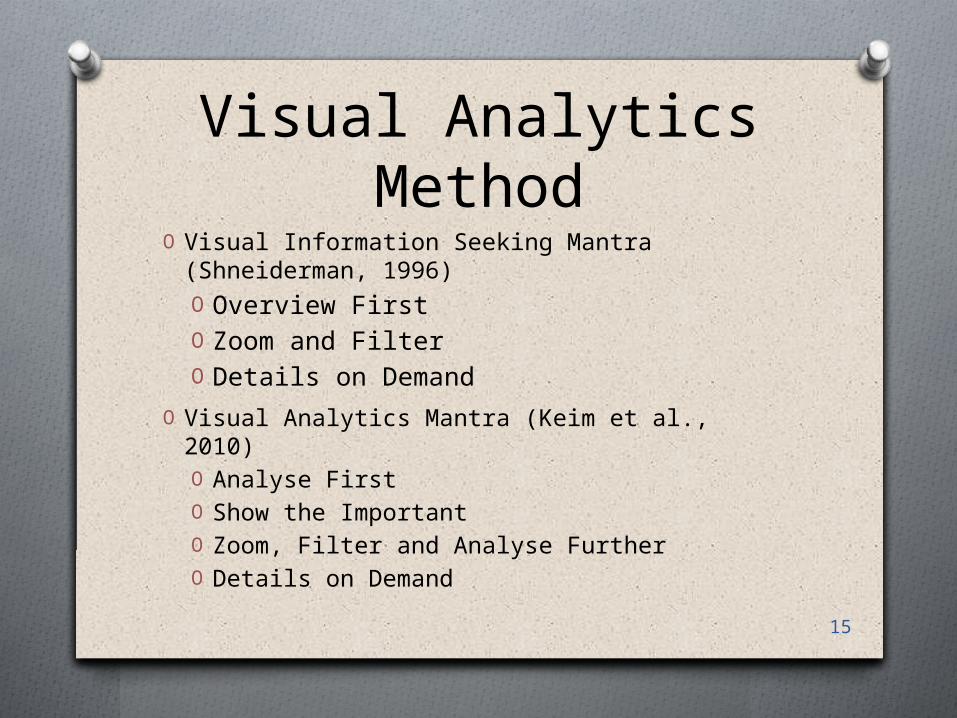
Visual Analytics Method
O Visual Information Seeking Mantra (Shneiderman, 1996)O Overview FirstO Zoom and FilterO Details on Demand
O Visual Analytics Mantra (Keim et al., 2010)O Analyse FirstO Show the ImportantO Zoom, Filter and Analyse FurtherO Details on Demand
15
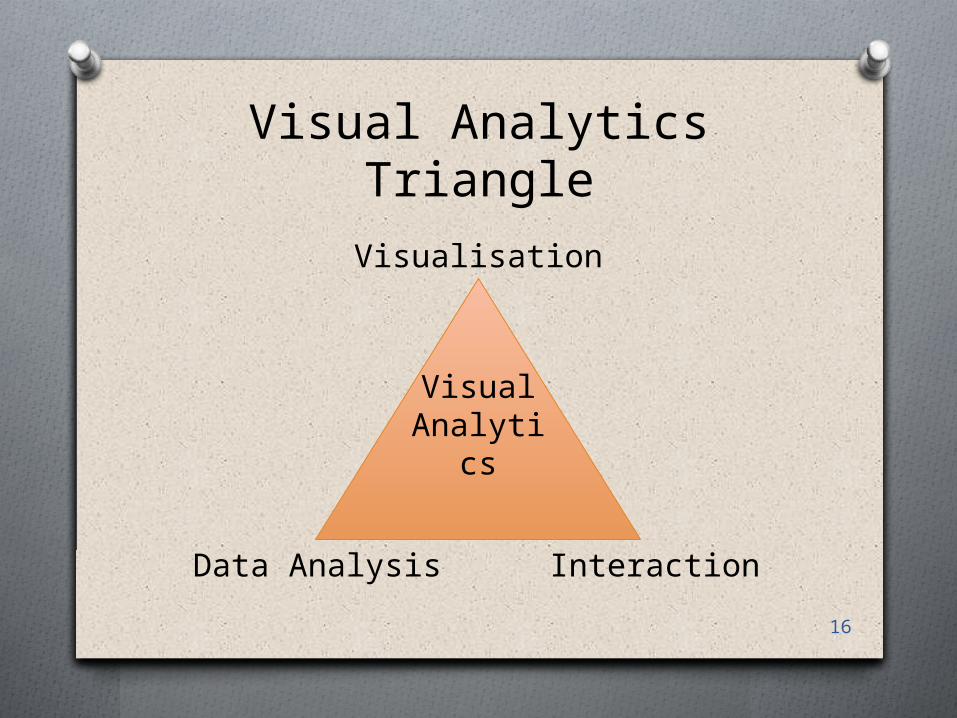
Visual Analytics Triangle
VisualAnalyti
cs
Visualisation
InteractionData Analysis16
II. Our Work
17
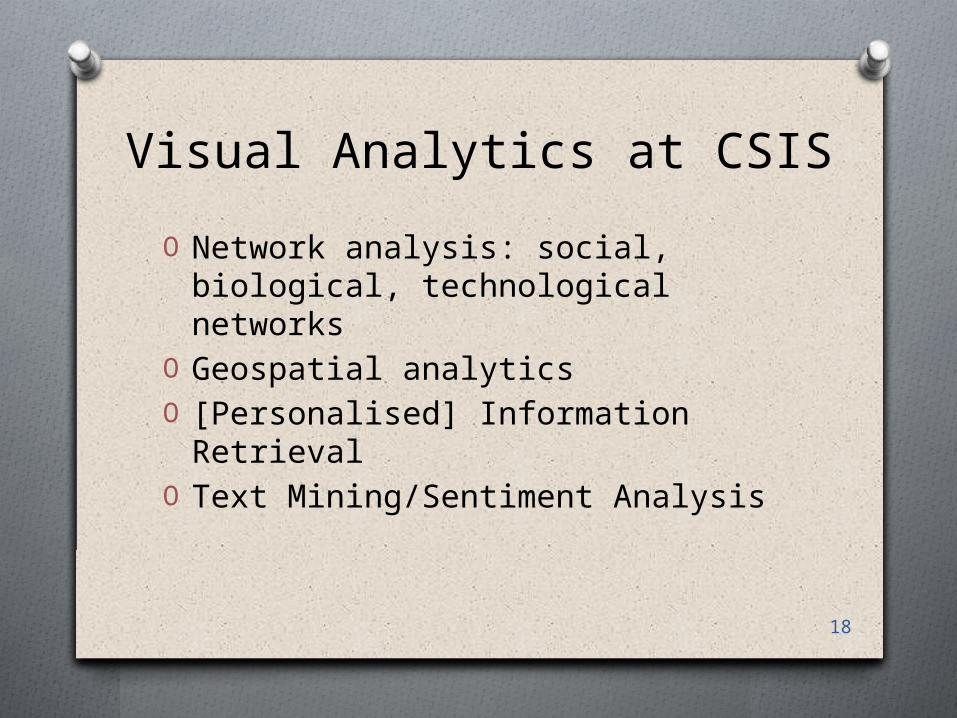
Visual Analytics at CSISO Network analysis: social, biological, technological networks
O Geospatial analyticsO [Personalised] Information Retrieval
O Text Mining/Sentiment Analysis
18
Network Visualisation
O Also known as Graph DrawingO Probably the earliest and most successful branch of Information Visualisation to be scientifically researched (since the 1980s).
O The Information Visualisation community appeared a bit laterO emerged "from research in human-computer interaction, computer science, graphics, visual design, psychology and business methods". (Bederson and Shneiderman, 2003)
19
Network Visualisation
O Methods (two very successful among many):O Force-directed drawing
O the graph modelled as a mechanical system of particles with forces of attraction and repulsion between them
O let the vertices/particles move so that the system reaches mechanical equilibrium
O Hierarchical drawing (Sugiyama method)O distribute vertices among multiple levelsO order vertices within each levelO finely tune the positions of the vertices
20
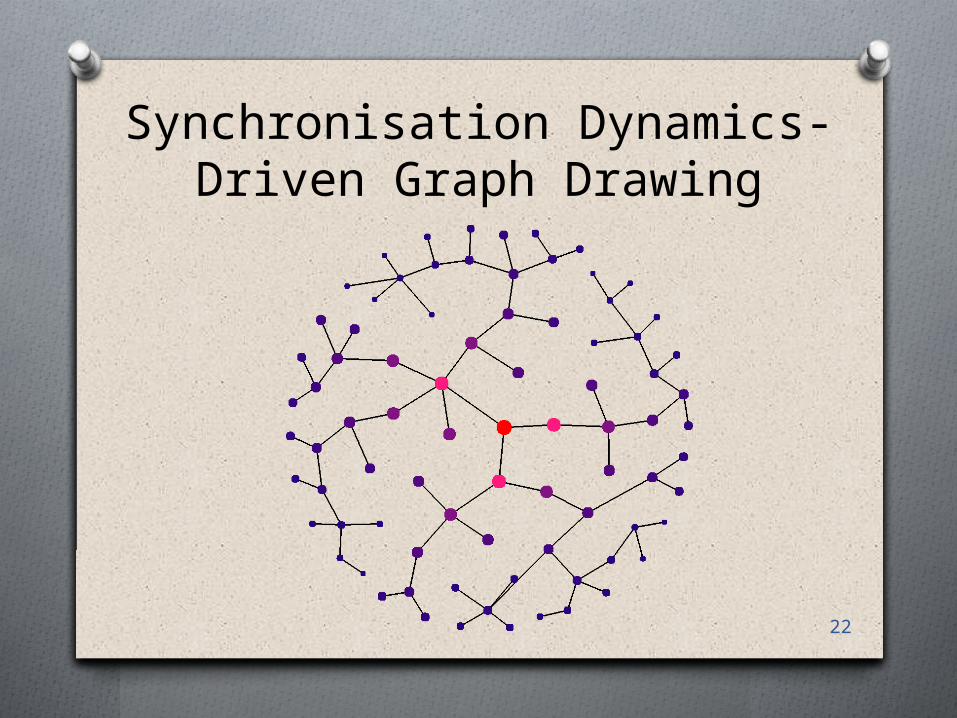
Synchronisation Dynamics-Driven Graph Drawing
O Work of Farshad Ghassemi Toosi (started PhD in May 2013)
O General idea:O Assign random scalar values (dynamic values) to all vertices of a graph
O Simulate synchronisation dynamics on the graph according to a variation of the Kuramoto model
O Use the evolution of the dynamic values to compute a layout of the graph
O Initial results published in the proceedings of the international symposium of Graph Drawing 2014
21
Synchronisation Dynamics-Driven Graph Drawing
22
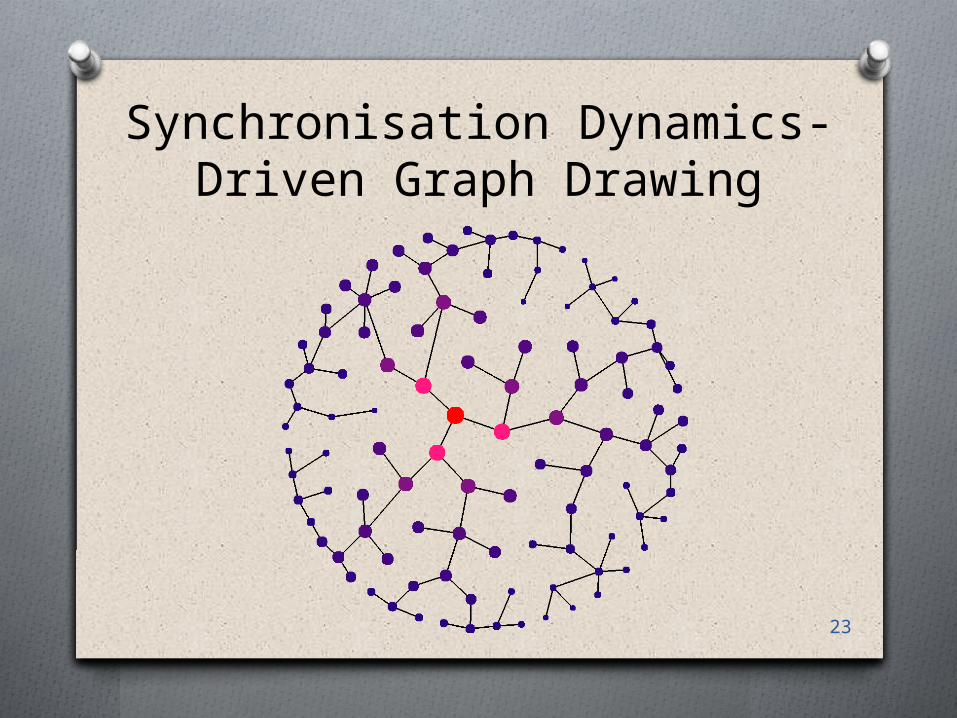
Synchronisation Dynamics-Driven Graph Drawing
23
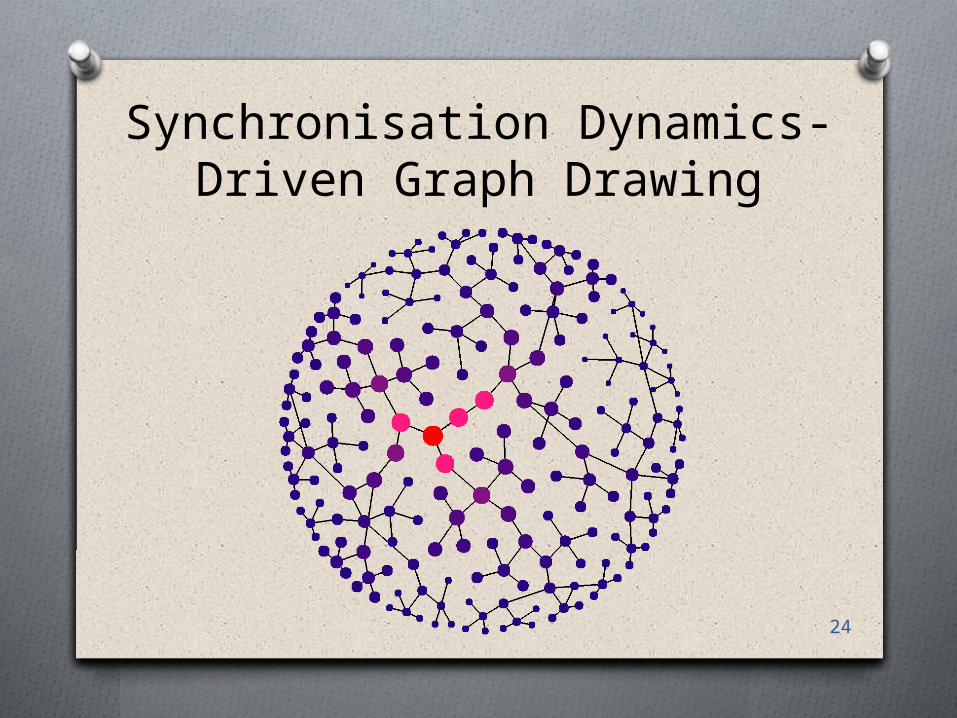
Synchronisation Dynamics-Driven Graph Drawing
24
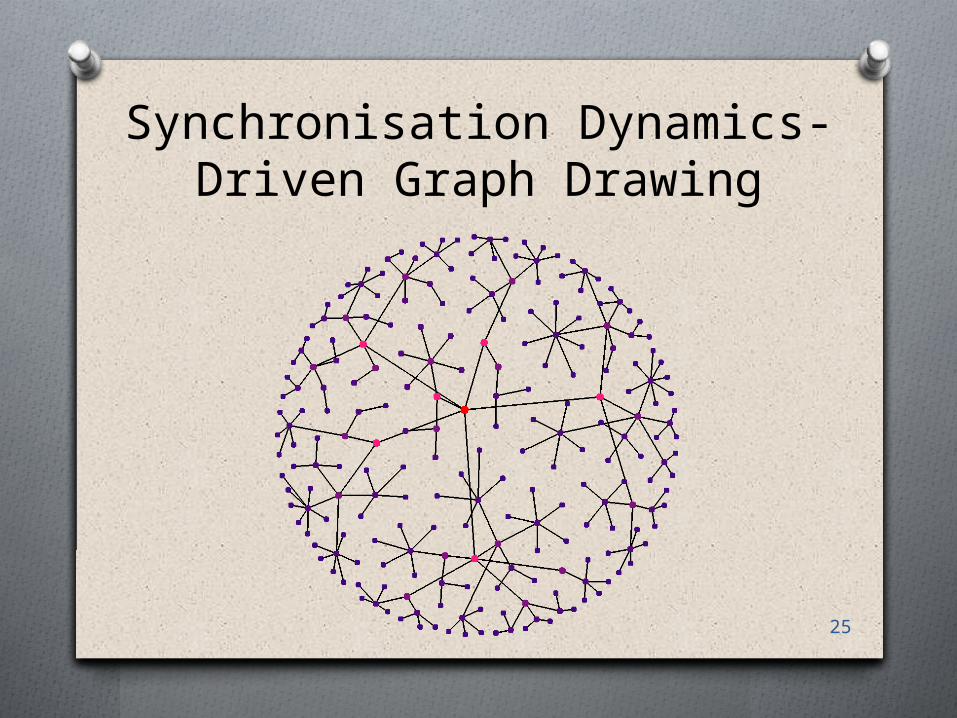
Synchronisation Dynamics-Driven Graph Drawing
25
Synchronisation Dynamics-Driven Graph Drawing
O Properties of our layouts:O Exact Circular shapeO Even distribution of vertices over the drawing area
O Synchronisation reveals the structure of a complex network at various scales (Arenas, 2006)O Thus, synchronisation-driven visualisation can be particularly suitable for visual analytics
26
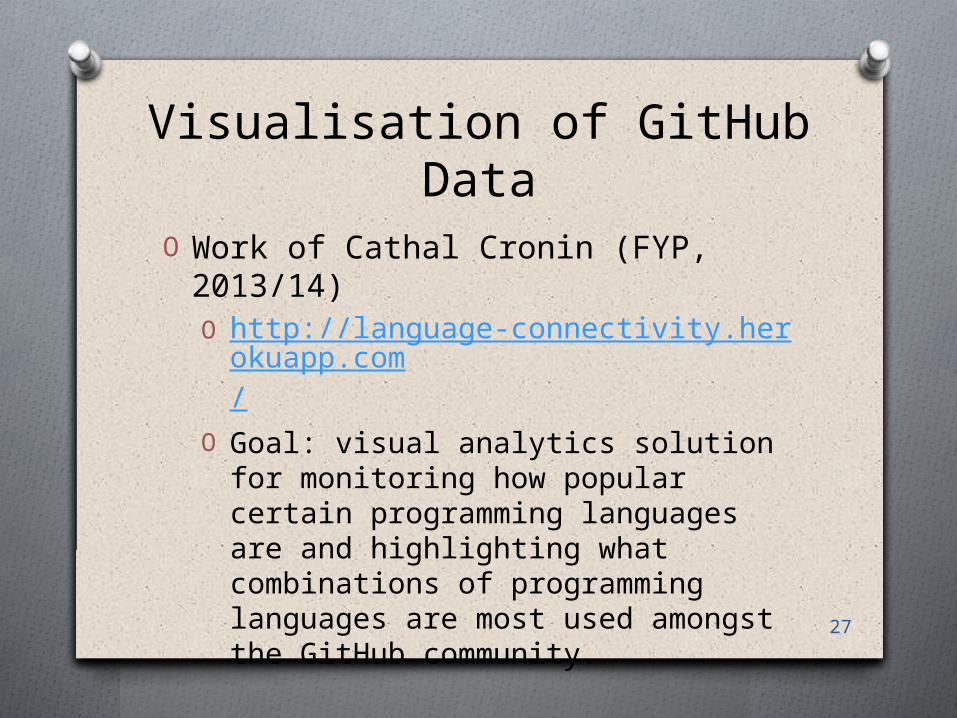
Visualisation of GitHub Data
O Work of Cathal Cronin (FYP, 2013/14)O http://language-connectivity.herokuapp.com/
O Goal: visual analytics solution for monitoring how popular certain programming languages are and highlighting what combinations of programming languages are most used amongst the GitHub community.
27

Geospatial Visual Analytics
O Work of Eimhear O'Brien (started PhD in October 2013)
O GIS analysis is a process for looking at geographic patterns in your data and at the relationships between features (Mitchel, 2005)
O Goal: Novel visual analytics solution for geospatial data
28
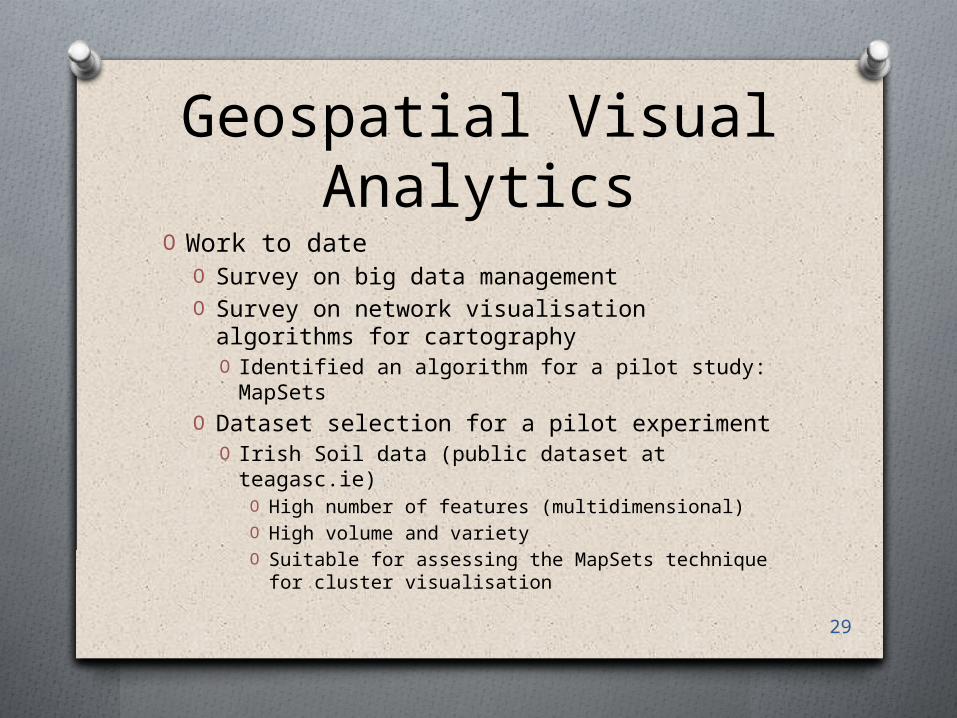
Geospatial Visual Analytics
O Work to dateO Survey on big data managementO Survey on network visualisation algorithms for cartographyO Identified an algorithm for a pilot study: MapSets
O Dataset selection for a pilot experimentO Irish Soil data (public dataset at teagasc.ie)O High number of features (multidimensional)O High volume and varietyO Suitable for assessing the MapSets technique for cluster visualisation
29

MapSet Steps
Algorithmic pipeline of MapSets (Efrat et al., 2014)http://www.cs.arizona.edu/~kobourov/mapsets.pdf 30
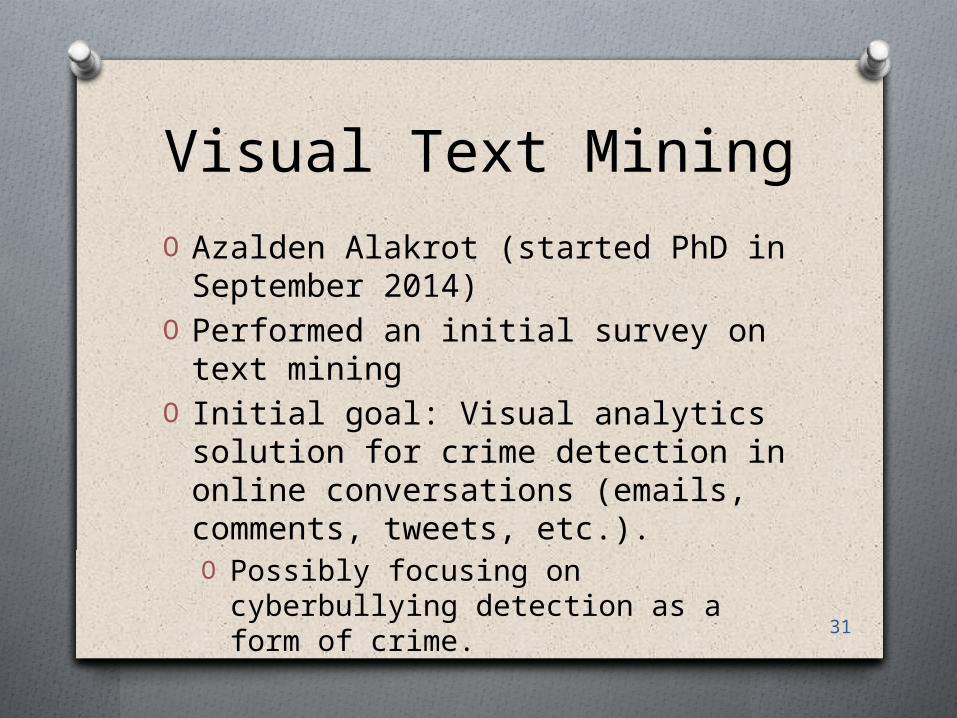
Visual Text MiningO Azalden Alakrot (started PhD in September 2014)
O Performed an initial survey on text mining
O Initial goal: Visual analytics solution for crime detection in online conversations (emails, comments, tweets, etc.).O Possibly focusing on cyberbullying detection as a form of crime. 31
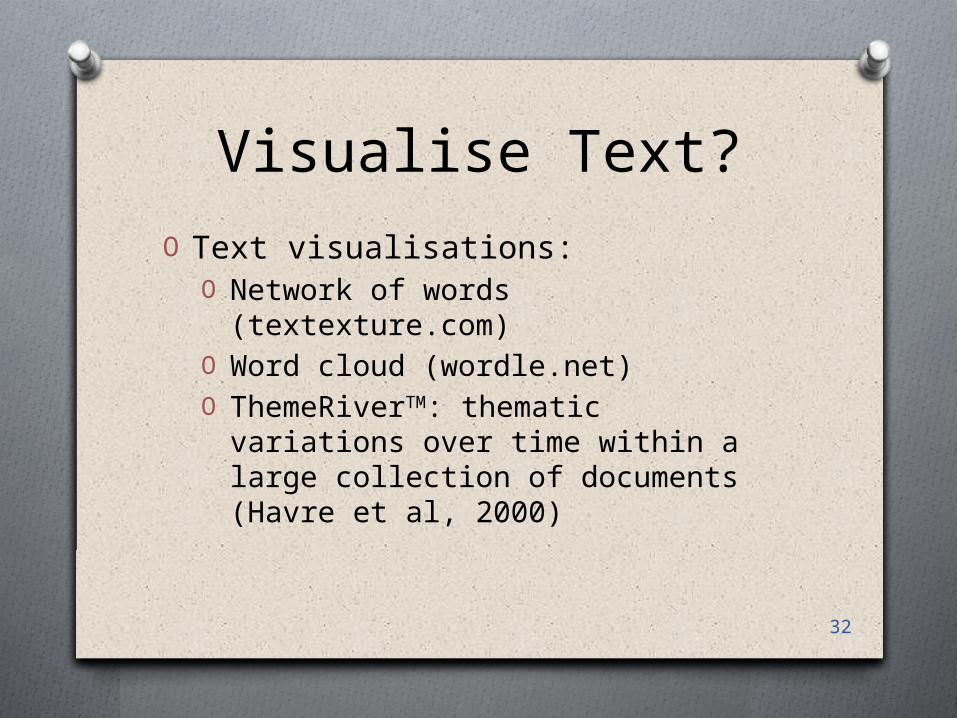
Visualise Text?O Text visualisations:
O Network of words (textexture.com)
O Word cloud (wordle.net)O ThemeRiverTM: thematic variations over time within a large collection of documents (Havre et al, 2000)
32
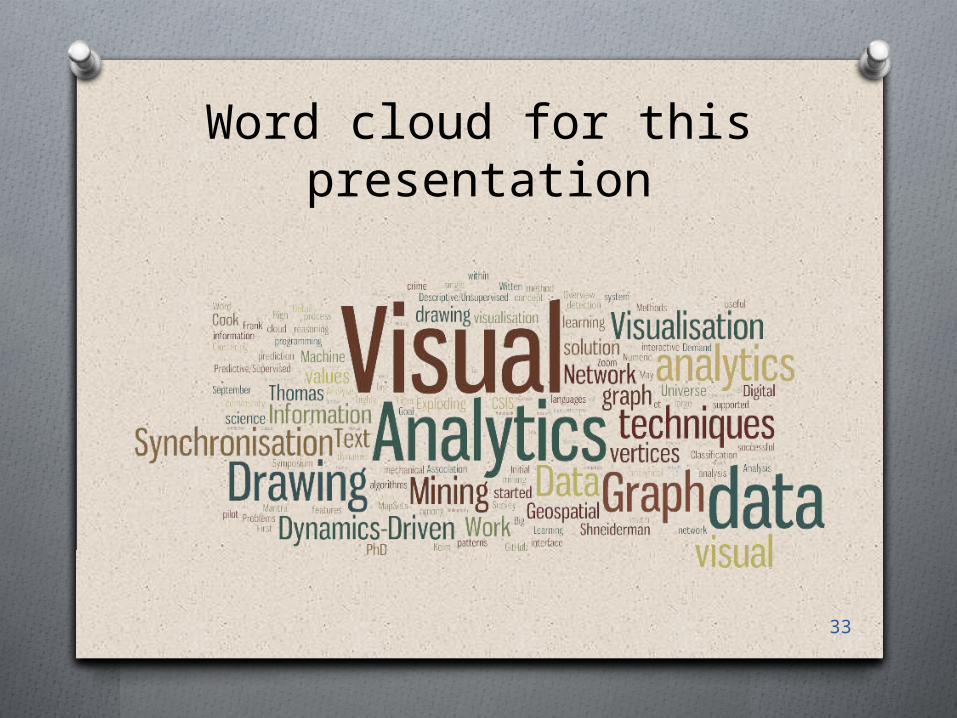
Word cloud for this presentation
33
Web ReferencesO http://www.visual-analytics.eu/faq/
O http://fellinlovewithdata.com/guides/how-do-you-visualize-too-much-data
O http://www3.cs.stonybrook.edu/~mueller/teaching/cse564/visualAnalytics.pdf
O https://blogs.princeton.edu/etc/2012/08/16/see-text-in-whole-new-waytext-visualization-tools/
34
BibliographyO Eades. P: On the future of graph drawing. Invited talk at the 18th International Symposium on Graph Drawing (September 24 2010), http://www.graphdrawing.org/gd2010/invited.html.
O Keim, D., Mansmann, F. and Thomas, J.: Visual analytics: how much visualization and how much analytics?. SIGKDD Explor. Newsl. 11, 2 (May 2010), pp. 5 - 8.
O Shneiderman, B.: The eyes have it: a task by data type taxonomy for information visualizations, Visual Languages, 1996. Proceedings., IEEE Symposium on (1996), pp.336 - 343,
O Roberto Tamassia, editor. Handbook of Graph Drawing and Visualization, vol. 81 of Discrete Mathematics and Its Applications. Chapman and Hall/CRC (2013).
O Thomas, J., Cook, K.: Illuminating the Path: Research and Development Agenda for Visual Analytics. IEEE-Press (2005).
O Witten, I. H., Frank, E. and Hall, M. A., Data Mining: Practical Machine Learning Tools and Techniques, Morgan Kaufmann (2011).
35
ContactO Email: [email protected] Twitter: @NikNiko101vO LinkedIn: ie.linkedin.com/in/niknikolov/
O Pinterest: nikniko101v/visual-analytics/
36