
Vision Statement - Central Bank of Nigeria
90
i Vision Statement To be one of the most effective central bank financial markets franchise in the world. Mission Statement To deepen the Nigerian financial markets by ensuring that they are global, organised, liquid, diversified and transparent. Mandate To intervene effectively in the money and foreign exchange markets in order to achieve monetary policy objectives To conduct auctions in government securities, Central Bank of Nigeria securities and foreign exchange for effective liquidity management To obtain timely market intelligence reports on the impact of monetary policy decisions and promote the development of efficient markets To develop instruments to deepen the financial markets To monitor activities in the financial markets
-
Upload
khangminh22 -
Category
Documents
-
view
1 -
download
0
Transcript of Vision Statement - Central Bank of Nigeria
i
Vision Statement
To be one of the most effective central bank financial markets franchise in
the world.
Mission Statement
To deepen the Nigerian financial markets by ensuring that they are global,
organised, liquid, diversified and transparent.
Mandate
To intervene effectively in the money and foreign exchange markets in order
to achieve monetary policy objectives
To conduct auctions in government securities, Central Bank of Nigeria
securities and foreign exchange for effective liquidity management
To obtain timely market intelligence reports on the impact of monetary
policy decisions and promote the development of efficient markets
To develop instruments to deepen the financial markets
To monitor activities in the financial markets
ii
Table of Contents
Financial Markets Department Vision, Mission and Mandate i
Table of Contents ii
List of Abbreviations v
Foreword viii
Preface ix
1.0 OVERVIEW 1
1.1 Global Economy 1
1.2 Domestic Economy 2
1.3 Monetary Policy 3
1.4 Nigerian Financial Markets Operations 3
1.4.1 Money Market 3
1.4.2 Foreign Exchange Market 4
1.4.3 Capital Market Developments 4
1.5 Federal Government Domestic Debt 4
1.6 Committee Activities and Stakeholder Collaboration 5
1.7 Other Developments in the Nigerian Financial Markets 5
1.8 Guidelines and Circulars 5
2.0 DOMESTIC MONEY MARKET OPERATIONS 6
2.1 Liquidity Management 6
2.1.1 Open Market Operations 7
2.1.1.1 Open Market Operations Auctions 7
2.1.1.2 Two-Way Quote Trading in Nigerian Treasury Bills 9
2.1.2 Discount Window Operations 9
2.1.2.1 Repurchase Transactions 9
2.1.2.2 Central Bank of Nigeria Standing Facilities 9
(i) Standing Lending Facility 9
(ii) Standing Deposit Facility 10
2.1.2.3 Rediscounting of Nigerian Treasury Bills 10
2.2 Inter-Bank Funds Market 10
2.3 Interest Rates Movement 11
2.4 Central Bank of Nigeria Promissory Notes 14
3.0 FOREIGN EXCHANGE MARKET OPERATIONS 15
3.1 Developments in the Foreign Exchange Market 15
3.2 Retail Dutch Auction System Spot 16
3.3 Inter-Bank Foreign Exchange Market 17

iii
3.4 Bureaux-de-Change 18
3.5 Foreign Exchange Rate Premium 18
4.0 CAPITAL MARKET DEVELOPMENTS 22
4.1 Nigerian Stock Market 22
4.1.1 All Share Index and Market Capitalisation 24
4.1.2 Market Turnover 25
4.1.3 New and Supplementary Listings and Delisting 25
5.0 FEDERAL GOVERNMENT DOMESTIC DEBT 27
5.1 Nigerian Treasury Bills 27
5.1.1 Structure of Nigerian Treasury Bills Holdings 29
5.2 Federal Republic of Nigeria Treasury Bonds 29
5.3 Federal Government of Nigeria Bonds 29
5.4 Domestic Debt Charges 30
6.0 ACTIVITIES OF INTERNAL AND INTER-AGENCY COMMITTEES 31
6.1 Liquidity Assessment Group 31
6.2 Non-Interest Financial Institutions Product Development Committee 31
6.3 Treasury Dealing Room Project Committee 32
6.4 Fiscal and Liquidity Assessment Committee 32
6.5 Financial Stability Report Committee 32
6.6 Financial Services Regulation Coordinating Committee Subcommittee on
Financial Markets 33
6.7 Financial System Strategy (FSS) 2020 Secretariat Financial Markets Working
Committee 34
7.0 MAJOR DEVELOPMENTS IN THE NIGERIAN FINANCIAL MARKETS 35
7.1 Bank Verification Number 35
7.2 Review of Cash Reserve Requirement 35
7.3 Review of Foreign Currency Trading Position Limit 36
7.4 Modification in Foreign Exchange Sale Strategy 36
7.5 Establishment of Industry Fraud Desk 37
7.6 Redesign of the Credit Risk Management System 38
7.7 Establishment of Advisory Committee of Experts for Non-Interest
(Islamic) Financial Institutions in Nigeria 39
7.8 Time Bar for the Resolution of Customer Complaints 39

iv
7.9 Implementation of Treasury Single Account 39
7.10 Revision of Prudential Guidelines for Deposit Money Banks 40
7.11 Establishment of Monitoring System for Global Mobile Payment
System 40
7.12 Guidelines on Mobile Money Services in Nigeria 40
APPENDICES
Appendix 1
Index of Financial Markets Regulatory Circulars/Guidelines Issue in 2013 42
Appendix 2
Non-Interest Financial Institutions Format for Submission of Request 51
LIST OF TABLES
Page 2.1 Open Market Operations Subscription and Sales 52
2.2 Repurchase Transactions 53
2.3 Daily Average Standing Lending Facility (N) 54
2.4 Daily Average Standing Deposit Facility (N) 55
2.5 Inter-Bank Placement and Securities Trading (N’Billion) 56
2.6 Monthly Money Market Rates (Per cent per Annum) 57
2.7 Promissory Notes 59
2.8 Rediscounting 60 3.1 Retail Dutch Auction System (US$’Million) 61
3.2 Average RDAS-SPT, Inter-bank and BDC Rates (N/US$) 62
4.1 Nigerian Stock Exchange Monthly Opening and Closing Transactions 63
4.2 Quarterly Distribution of Transactions on the Nigerian Stock Exchange 64
4.3 Sectoral Distribution of Transactions on the Nigerian Stock Exchange 65
4.4 Foreign Portfolio Participation in Equity Trading 66
4.5 New Listing, Supplementary Listing and Delisting 67
5.1 Nigerian Domestic Debt: Class of Holders 70
5.2 Primary Market: Nigerian Treasury Bills Transactions (N’Billion) 71
5.3 Nigerian Treasury Bills: Class of Holders 72
5.4 Federal Republic of Nigeria Treasury Bonds: Class of Holders 73
5.5 Federal Government of Nigeria Bonds Issued 74
5.6 Federal Government of Nigeria Bonds Outstanding 76
5.7 Federal Government of Nigeria Bond Issues: Class of Holders (N’Billion) 77
5.8 Domestic Debt Charges (N’Billion) 79
5.9 Federal Government's Domestic Debt Stock 81
5.10 Marginal Rates and Range of Successful Bids Schedule 82
v
LIST OF CHARTS
2.1 OMO Transactions, 2015 8
2.2 OMO Transactions, 2014 8
2.3 Money Market Rates, 2015 13
2.4 Money Market Rates, 2014 13
3.1 Retail Dutch Auction System Transactions, 2015 16
3.2 Retail Dutch Auction System Transactions, 2014 17
3.3 RDAS-SPT, Inter-Bank and BDC Rates, 2015 19
3.4 RDAS-SPT, Inter-Bank and BDC Rates, 2014 19
3.5 Average Rate Premium from Inter-bank and BDC, 2015 20
3.6 Average Rate Premium from RDAS-SPT, 2014 20
5.1 Primary Market Auction, 2015 28
5.2 Primary Market Auction, 2014 28
Box Information Currency Devaluation and Its Implication 21
List of Abbreviations AASCE- Abuja Securities and Commodity Exchange
ASeM- Alternative Securities Market
ASI- All Share Index
BDCs- Bureau-de-Change
BOF- Budget Office of the Federation
BVN- Bank Verification Number
CAC- Corporate Affairs Commission
CBI- Convention on Business Integrity
CBN- Central Bank of Nigeria
CGRS- Corporate Governance Rating System
CoG- Committee of Governors
CRR- Cash Reserve Ratio
DHs- Discount Houses
DMBs- Deposit Money Bank
DMO- Debt Management Office

vi
ETF- Exchange Traded Funds
e-WRS- electronic-Warehouse Receipt System
FACAN- Federation of Agricultural Commodity Association of Nigeria
FCT- Federal Capital Territory
FED- Federal Reserve Bank
FIRS- Federal Inland Revenue Service
FLAC- Fiscal and Liquidity Assessment Committee
FMD- Financial Markets Department
FMDA- Financial Markets Dealers Association
FMDQ- Financial Markets Dealers Quotation
FMF- Federal Ministry of Finance
FRN- Federal Republic of Nigeria
FSR- Financial Stability Report
FSS- Financial Markets, Financial System Strategy
GDP- Gross Domestic Product
ICPC- Independent Corrupt Practices and other offences Commission
ILF- Intraday Liquidity Facility
JVC- Joint Venture Cash
LAG- Liquidity Assessment Group
LSEG- London Stock Exchange Group
MC- Market Capitalisation
MPIC- Monetary Policy Implementation Committee
MPR- Monetary Policy Rate
MPTC- Monetary Policy Technical Committee
MSC- Market Support Committee
NAICOM- National Insurance Commission
NBS- National Bureau of Statistics
NCS- Nigeria Customs Service
NCX- Nigeria Commodity Exchange
NEFT- Nigeria Electronic Funds Transfer

vii
NIBOR- Nigerian Interbank Offered Rate
NIBSS- Nigerian Inter Bank Settlement System
NIP- NIBSS Instant Payment
NNPC- Nigerian National Petroleum Corporation
NSE- Nigerian Stock Exchange
NTBs- Nigerian Treasury Bills
OMO- Open Market Operations
OTC- Over-the-Counter
PENCOM- Pension Commission
PSV- Payments System Vision 2020
QE- Quantitative Easing
RDAS- Retail Dutch Auction System
SDF- Standing Deposit Facility
SEC- Security Exchange Commission
SLF- Standing Lending Facility

viii
FOREWARD
In 2015, activities in the Nigerian financial markets were largely influenced by
developments in the global and domestic economy and the political landscape.
Some of these included declining price of crude oil at the international market,
sluggish global economic growth, the normalisation of monetary policy in the
United States, delisting of Nigeria from JP Morgan Government Bond Index-
Emerging Market, insurgencies in the North-Eastern part of the country and
anxieties surrounding the outcome of the general elections in the first half of the
year.
Following a fragile macro-economic environment, slow growth in the economy,
increased capital flow reversals and the dwindling foreign reserves, pressures in
the markets mounted. As a result, the monetary authority adopted measures to
moderate the adverse effects. They included the downward review of the Monetary
Policy Rate by 200 basis points to 11.00 percent, with an asymmetric corridor of
+200/-700 basis points, the Cash Reserve Ratio by 500 basis points to 20 per cent
and the exchange rate from N168/US$ to N197/US$. In addition, relevant
guidelines and circulars were issued to guide the conduct of certain financial
transactions.
This edition of the Activity Report, therefore, presents some of the developments
in the global and domestic economy and actions taken by the Financial Markets
Department towards the implementation of monetary policy decisions and
achieving the objectives of the Bank, especially in ensuring price and exchange
rate stability.
I commend the staff of the FMD for their unwavering commitment to the
realisation of the Bank's mandate.
Dr. (Mrs.) Sarah Omotunde Alade
Deputy Governor, Economic Policy

ix
PREFACE
The Financial Markets Department 2015 Annual Activity Report is the sixth in the
series that will continue to provide members of the general public with
developments in the financial markets under the purview of the monetary
authority.
To this end, the report is structured into eight chapters. Chapter one provides an
overview, while chapter two appraises the operations of the domestic money
market. Chapter three presents salient developments in the foreign exchange
markets, while chapter four focuses on developments in the capital market. The
Federal Government domestic debt issues, internal and inter-agency committee
activities are considered in chapters five and six, respectively. Major developments
in the Nigerian financial markets is covered in chapter seven, while guidelines and
circulars issued during the period are highlighted in chapter eight and tabulated in
the appendix for reference.
I hereby wish to thank the Management of the Bank for providing the needed
support throughout the review period. In the same vein, I commend the staff of the
Department for their loyalty, diligence and commitment to towards achieving set
goals.
Emmanuel Uzodinma Ukeje
Director, Financial Markets Department
1
1.0 OVERVIEW
1.1 Global Economy
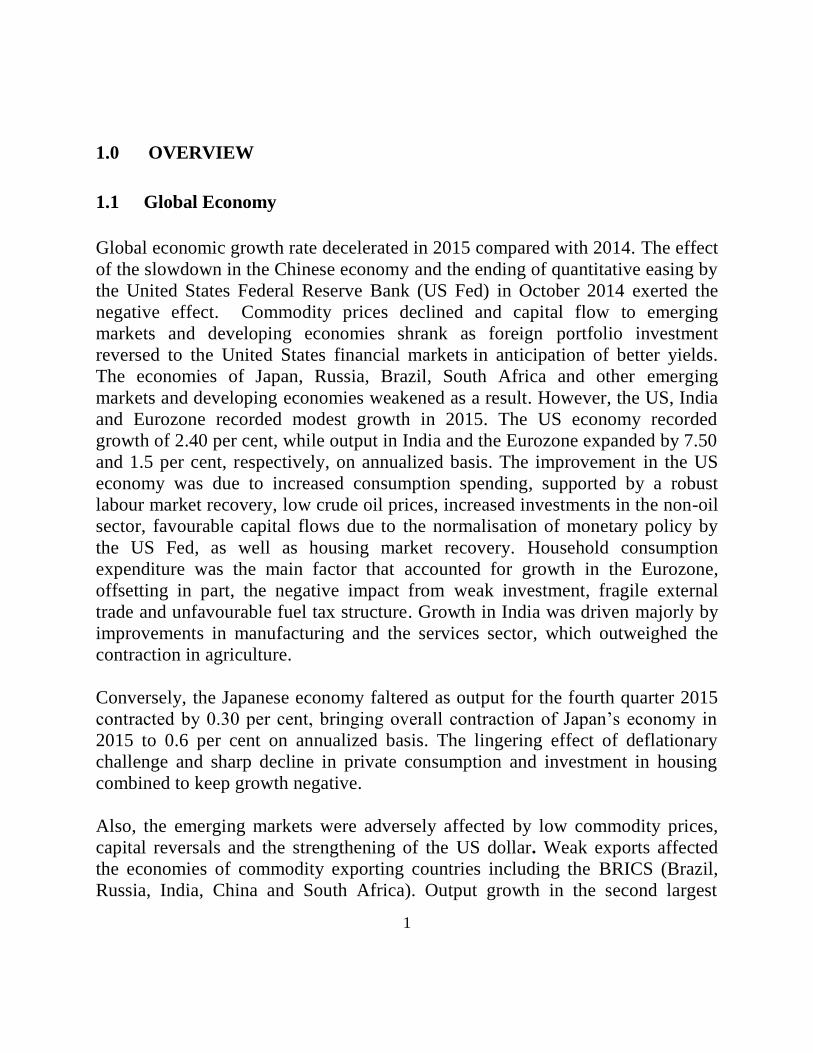
Global economic growth rate decelerated in 2015 compared with 2014. The effect
of the slowdown in the Chinese economy and the ending of quantitative easing by
the United States Federal Reserve Bank (US Fed) in October 2014 exerted the
negative effect. Commodity prices declined and capital flow to emerging
markets and developing economies shrank as foreign portfolio investment
reversed to the United States financial markets in anticipation of better yields.
The economies of Japan, Russia, Brazil, South Africa and other emerging
markets and developing economies weakened as a result. However, the US, India
and Eurozone recorded modest growth in 2015. The US economy recorded
growth of 2.40 per cent, while output in India and the Eurozone expanded by 7.50
and 1.5 per cent, respectively, on annualized basis. The improvement in the US
economy was due to increased consumption spending, supported by a robust
labour market recovery, low crude oil prices, increased investments in the non-oil
sector, favourable capital flows due to the normalisation of monetary policy by
the US Fed, as well as housing market recovery. Household consumption
expenditure was the main factor that accounted for growth in the Eurozone,
offsetting in part, the negative impact from weak investment, fragile external
trade and unfavourable fuel tax structure. Growth in India was driven majorly by
improvements in manufacturing and the services sector, which outweighed the
contraction in agriculture.
Conversely, the Japanese economy faltered as output for the fourth quarter 2015
contracted by 0.30 per cent, bringing overall contraction of Japan’s economy in
2015 to 0.6 per cent on annualized basis. The lingering effect of deflationary
challenge and sharp decline in private consumption and investment in housing
combined to keep growth negative.
Also, the emerging markets were adversely affected by low commodity prices,
capital reversals and the strengthening of the US dollar. Weak exports affected
the economies of commodity exporting countries including the BRICS (Brazil,
Russia, India, China and South Africa). Output growth in the second largest
2
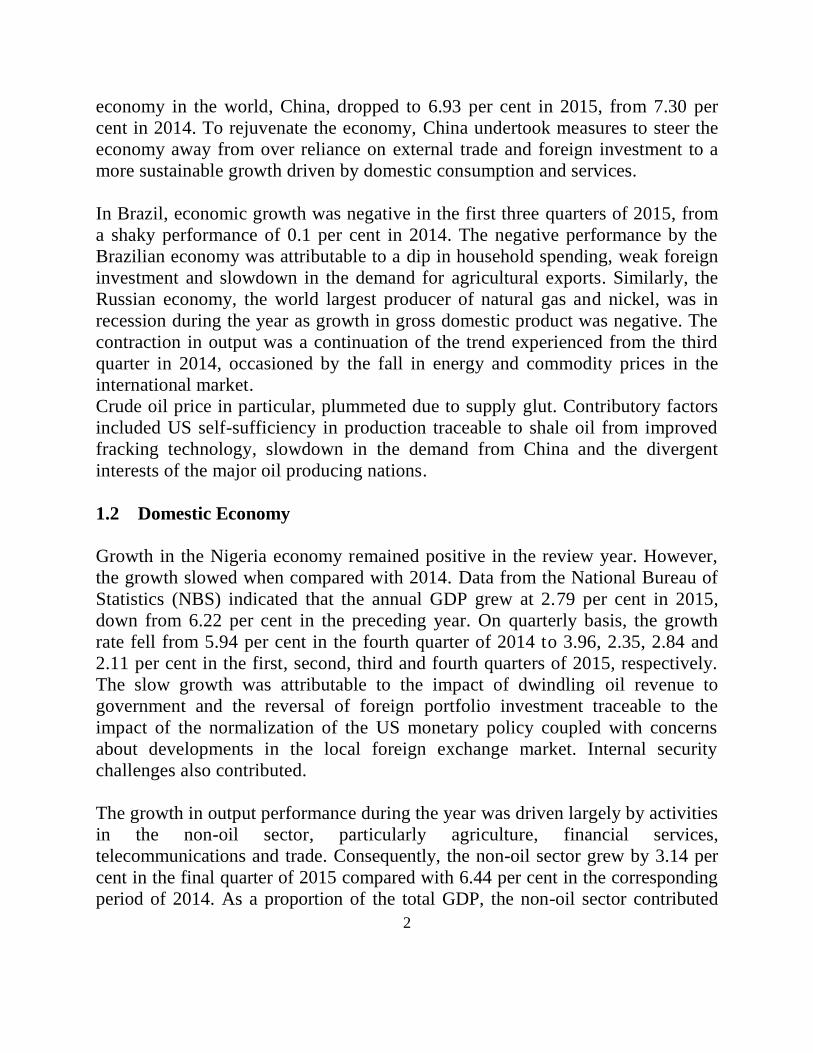
economy in the world, China, dropped to 6.93 per cent in 2015, from 7.30 per
cent in 2014. To rejuvenate the economy, China undertook measures to steer the
economy away from over reliance on external trade and foreign investment to a
more sustainable growth driven by domestic consumption and services.
In Brazil, economic growth was negative in the first three quarters of 2015, from
a shaky performance of 0.1 per cent in 2014. The negative performance by the
Brazilian economy was attributable to a dip in household spending, weak foreign
investment and slowdown in the demand for agricultural exports. Similarly, the
Russian economy, the world largest producer of natural gas and nickel, was in
recession during the year as growth in gross domestic product was negative. The
contraction in output was a continuation of the trend experienced from the third
quarter in 2014, occasioned by the fall in energy and commodity prices in the
international market.
Crude oil price in particular, plummeted due to supply glut. Contributory factors
included US self-sufficiency in production traceable to shale oil from improved
fracking technology, slowdown in the demand from China and the divergent
interests of the major oil producing nations.
1.2 Domestic Economy
Growth in the Nigeria economy remained positive in the review year. However,
the growth slowed when compared with 2014. Data from the National Bureau of
Statistics (NBS) indicated that the annual GDP grew at 2.79 per cent in 2015,
down from 6.22 per cent in the preceding year. On quarterly basis, the growth
rate fell from 5.94 per cent in the fourth quarter of 2014 to 3.96, 2.35, 2.84 and
2.11 per cent in the first, second, third and fourth quarters of 2015, respectively.
The slow growth was attributable to the impact of dwindling oil revenue to
government and the reversal of foreign portfolio investment traceable to the
impact of the normalization of the US monetary policy coupled with concerns
about developments in the local foreign exchange market. Internal security
challenges also contributed.
The growth in output performance during the year was driven largely by activities
in the non-oil sector, particularly agriculture, financial services,
telecommunications and trade. Consequently, the non-oil sector grew by 3.14 per
cent in the final quarter of 2015 compared with 6.44 per cent in the corresponding
period of 2014. As a proportion of the total GDP, the non-oil sector contributed

3
91.94 per cent in the fourth quarter of 2015, representing an increase of 0.91
percentage point when compared with 91.03 per cent contributed by the sector in
the corresponding period of 2014.
Inflationary pressures persisted during the year. Inflation rose persistently from 8.0
per cent in the last quarter of 2014 to 9.55 per cent in the final quarter of 2015. The
rise in inflation rate was traceable to electioneering expenditures, foreign exchange
rate adjustment, paucity of petroleum products across the country and insecurity
that affected both the production and distribution of agricultural produce, amongst
others. Other contributory factors included the expansion of aggregate domestic
credit from N19,273.76 billion to N20,470.80 billion.
1.3 Monetary Policy
Monetary policy applied majorly the use of indirect instruments for the
management of banking system structural liquidity. This included the adjustment
of the Monetary Policy Rate (MPR) and conduct of open market operations
(OMO), complemented by standing facilities, reserve requirement ratios, discount
window operations and interventions in the foreign exchange market. Assessment
of financial system stability, the management of external reserves and
collaboration with relevant stakeholders were also carried out to foster the
achievements of monetary policy objectives.
1.4 Nigerian Financial Markets Operations
1.4.1 Money Markets
The money market was largely influenced by developments in the local and
international environment. Policy adjustments at both monetary and fiscal spheres
of the economy impacted on liquidity changes, while the effect of global economic
slowdown affected the revenue and expenditure profile of the government at both
the national and sub-national levels. The transition in government during the year
brought about a new focus in both political and economic spheres, impacting the
money market as well. The Bank responded to these developments by adopting
measures to sustain monetary and financial system stability to promote economic
growth and development.
1.4.2 Foreign Exchange Market
Pressures in the foreign exchange market mounted throughout the year following
adverse development at the international market with respect to commodity price

4
decline and weak demand for the Nigerian crude oil in the international oil market.
This resulted in the adoption of various measures by the monetary and fiscal
authorities to defend the local currency and to stem the decline in the external
reserves. These included the closure of the Retail Dutch Auction System (RDAS)
segment, suspension of two-way quote trades, restriction of some imported items
from accessing the official foreign exchange market, reduction of foreign exchange
sales to the bureaux-de-change (BDCs) and adjustments in the net foreign
exchange trading position limit, amongst other. The aim of these measures
included the promotion of domestic production and re-orientation of domestic
consumption away from imports and towards locally produced goods and services.
1.4.3 Capital Market Developments
The general slowdown in economic activities during the year was reflected in the
performance of the capital market. The Nigerian Stock Exchange (NSE) All Share
Index (ASI) and Market Capitalisation (MC) fell by 15.62 and 12.37 per cent,
respectively, below the levels achieved in the preceding year. Similarly, the
volume, value and number of deals declined by 32.11, 29.80 and 17.76 per cent,
respectively. The trend was attributable to share price losses, precipitated by
domestic and international economic developments, influenced by foreign portfolio
investment outflow and local investor caution. Regulatory actions were
nevertheless sustained to strengthen market efficiency, effectiveness, and depth.
1.5 Federal Government Domestic Debt
The Federal Government of Nigeria (FGN) continued to patronise the fixed income
market to finance fiscal deficits. As a result, the stock of the FGN domestic debt at
end-December 2015 was N8,837.00 billion, an increase of N932.97 billion or
11.80 per cent over the N7,904.03 billion recorded at end-December 2014. The
increase was attributed to the issuance of new debt instruments to bridge the
budgetary gap. The composition of the stock of domestic debt showed a
preponderance of FGN Bonds. The stock of domestic debt comprised FGN Bonds,
N5,808.14 billion or 65.73 per cent, NTBs, N2,772.87 billion or 31.38 per cent,
and Federal Republic of Nigeria (FRN) Treasury Bonds, N255.99 billion or 2.90
per cent. The CBN remained the registrar and issuing house for all the instruments,
while the DMO ensures the effective and efficient management of Nigeria’s public
debt portfolio.
5
1.6 Committee Activities and Stakeholder Collaboration
Consistent with the objective of having an all-inclusive process for decision
making, the FMD constituted and participated in various intra- and inter-
department committees assigned to handle specific tasks for the sustenance of
financial system stability and monetary policy implementation. It also collaborated
with internal and external stakeholders to further develop the financial markets.
1.7 Other Developments in the Nigerian Financial Markets Various actions were taken by other regulatory authorities, which impacted on the
Nigerian financial markets and influenced the conduct of transactions. These
included policies aimed at enhancing financial intermediation, money supply to
impact economic development, developing the payments system, deepening the
capital and commodities markets and ensuring effective management of foreign
exchange, amongst others.
1.8 Guidelines and Circulars
The CBN issued new guidelines and circulars to operators in the financial markets,
to guide activities in the market. In addition, some of the existing guidelines and
circulars were revised. The details of the releases can be accessed on the CBN
website, www.cbn.gov.ng. Appendix 1 contains a list of the documents.
6
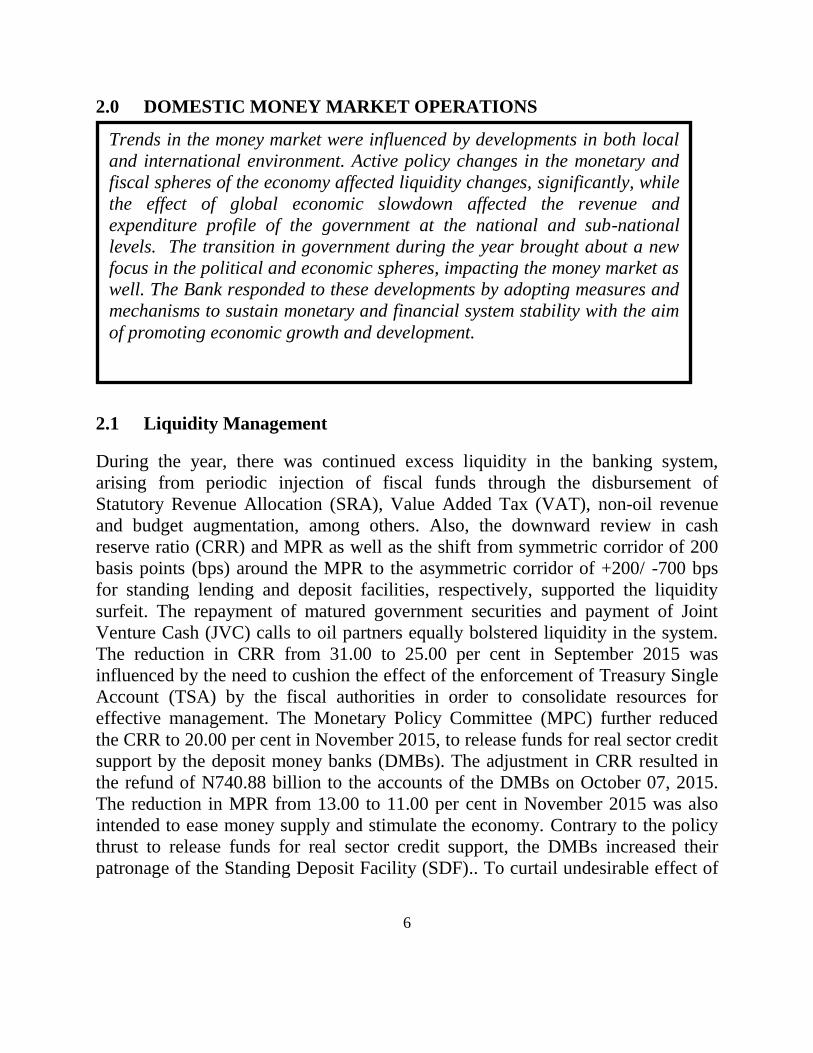
2.0 DOMESTIC MONEY MARKET OPERATIONS
2.1 Liquidity Management
During the year, there was continued excess liquidity in the banking system,
arising from periodic injection of fiscal funds through the disbursement of
Statutory Revenue Allocation (SRA), Value Added Tax (VAT), non-oil revenue
and budget augmentation, among others. Also, the downward review in cash
reserve ratio (CRR) and MPR as well as the shift from symmetric corridor of 200
basis points (bps) around the MPR to the asymmetric corridor of +200/ -700 bps
for standing lending and deposit facilities, respectively, supported the liquidity
surfeit. The repayment of matured government securities and payment of Joint
Venture Cash (JVC) calls to oil partners equally bolstered liquidity in the system.
The reduction in CRR from 31.00 to 25.00 per cent in September 2015 was
influenced by the need to cushion the effect of the enforcement of Treasury Single
Account (TSA) by the fiscal authorities in order to consolidate resources for
effective management. The Monetary Policy Committee (MPC) further reduced
the CRR to 20.00 per cent in November 2015, to release funds for real sector credit
support by the deposit money banks (DMBs). The adjustment in CRR resulted in
the refund of N740.88 billion to the accounts of the DMBs on October 07, 2015.
The reduction in MPR from 13.00 to 11.00 per cent in November 2015 was also
intended to ease money supply and stimulate the economy. Contrary to the policy
thrust to release funds for real sector credit support, the DMBs increased their
patronage of the Standing Deposit Facility (SDF).. To curtail undesirable effect of
Trends in the money market were influenced by developments in both local
and international environment. Active policy changes in the monetary and
fiscal spheres of the economy affected liquidity changes, significantly, while
the effect of global economic slowdown affected the revenue and
expenditure profile of the government at the national and sub-national
levels. The transition in government during the year brought about a new
focus in the political and economic spheres, impacting the money market as
well. The Bank responded to these developments by adopting measures and
mechanisms to sustain monetary and financial system stability with the aim
of promoting economic growth and development.

7
monetary growth on prices, the Bank conducted OMO to mop up the excess
liquidity in the system.
Furthermore, the Bank intervened in the interbank foreign exchange market in
addition to sales of foreign exchange at the RDAS, before it was closed on
February 18, 2015. The discontinuation of the RDAS resulted in funding of all
imports and payment for invisibles through the interbank foreign exchange market,
while the BDCs provided foreign exchange for retail users.
2.1.1 Open Market Operations
In line with the objective of maintaining monetary and financial system stability,
OMO was carried out as the major instrument for liquidity management and to
boost tradable securities and activities in the secondary market.
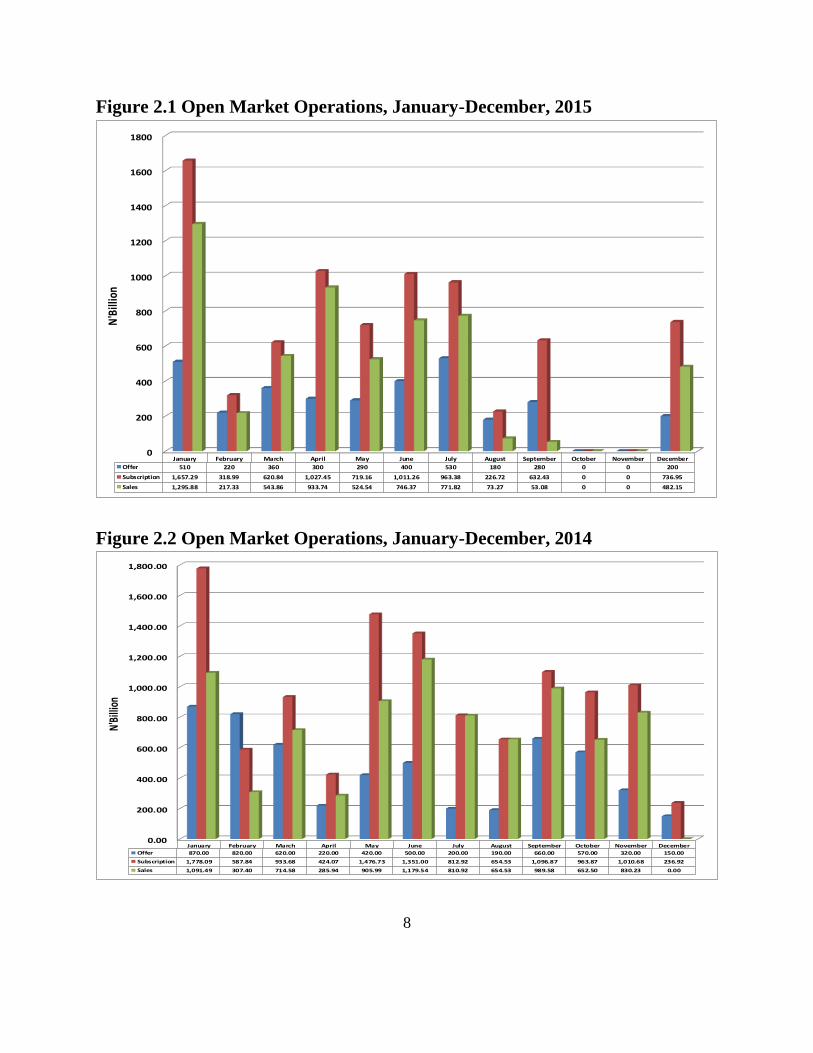
2.1.1.1 Open Market Operations Auctions
Total CBN Bills offered was N3,270.00 billion, while total public subscription and
sale amounted to N7,914.47 billion and N5,642.04 billion, respectively (Table 2.1),
compared with N5,540.00 billion, N11,329.20 billion and N8,422.69 billion
offered, subscribed and sold, respectively, in 2014 (Figure 2.1 and 2.2). No OMO
was conducted in October and November in order to ease monetary conditions in
the wake of the full implementation of the TSA and also to forestall the negative
impact of the delisting of the Federal Government of Nigeria (FGN) Bonds from
the JP Morgan Government Bond Index (GBI)-Emerging Markets (EM). The sum
of N441.32 billion was incurred as the cost of liquidity management. The stop rates
ranged from 7.4800 to 14.8500 per cent. This compared with N353.38 billion
incurred in 2014 at stop rates that ranged from 10.5500 to 13.1000 per cent.
8
Figure 2.1 Open Market Operations, January-December, 2015
Figure 2.2 Open Market Operations, January-December, 2014
0
200
400
600
800
1000
1200
1400
1600
1800
January February March April May June July August September October November December
Offer 510 220 360 300 290 400 530 180 280 0 0 200
Subscription 1,657.29 318.99 620.84 1,027.45 719.16 1,011.26 963.38 226.72 632.43 0 0 736.95
Sales 1,295.88 217.33 543.86 933.74 524.54 746.37 771.82 73.27 53.08 0 0 482.15
N'B
illio
n
0.00
200.00
400.00
600.00
800.00
1,000.00
1,200.00
1,400.00
1,600.00
1,800.00
January February March April May June July August September October November December
Offer 870.00 820.00 620.00 220.00 420.00 500.00 200.00 190.00 660.00 570.00 320.00 150.00
Subscription 1,778.09 587.84 933.68 424.07 1,476.73 1,351.00 812.92 654.53 1,096.87 963.87 1,010.68 236.92
Sales 1,091.49 307.40 714.58 285.94 905.99 1,179.54 810.92 654.53 989.58 652.50 830.23 0.00
N'Bi
llion
9
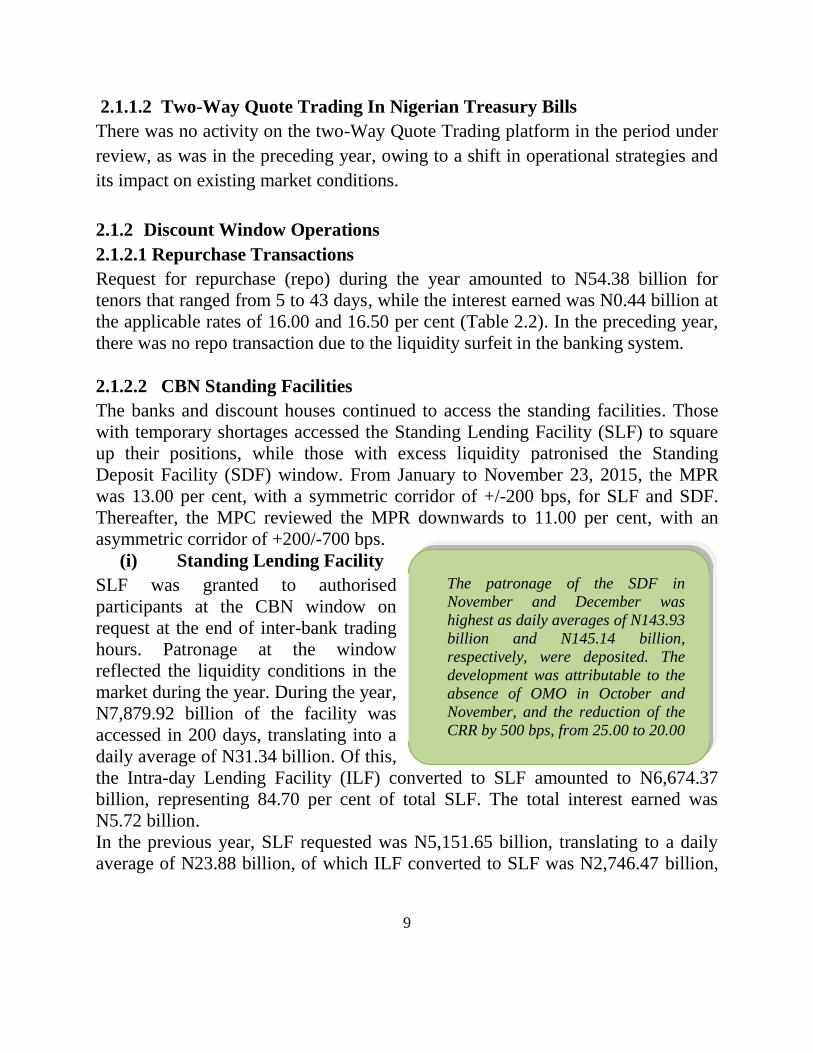
2.1.1.2 Two-Way Quote Trading In Nigerian Treasury Bills
There was no activity on the two-Way Quote Trading platform in the period under
review, as was in the preceding year, owing to a shift in operational strategies and
its impact on existing market conditions.
2.1.2 Discount Window Operations
2.1.2.1 Repurchase Transactions
Request for repurchase (repo) during the year amounted to N54.38 billion for
tenors that ranged from 5 to 43 days, while the interest earned was N0.44 billion at
the applicable rates of 16.00 and 16.50 per cent (Table 2.2). In the preceding year,
there was no repo transaction due to the liquidity surfeit in the banking system.
2.1.2.2 CBN Standing Facilities
The banks and discount houses continued to access the standing facilities. Those
with temporary shortages accessed the Standing Lending Facility (SLF) to square
up their positions, while those with excess liquidity patronised the Standing
Deposit Facility (SDF) window. From January to November 23, 2015, the MPR
was 13.00 per cent, with a symmetric corridor of +/-200 bps, for SLF and SDF.
Thereafter, the MPC reviewed the MPR downwards to 11.00 per cent, with an
asymmetric corridor of +200/-700 bps.
(i) Standing Lending Facility
SLF was granted to authorised
participants at the CBN window on
request at the end of inter-bank trading
hours. Patronage at the window
reflected the liquidity conditions in the
market during the year. During the year,
N7,879.92 billion of the facility was
accessed in 200 days, translating into a
daily average of N31.34 billion. Of this,
the Intra-day Lending Facility (ILF) converted to SLF amounted to N6,674.37
billion, representing 84.70 per cent of total SLF. The total interest earned was
N5.72 billion.
In the previous year, SLF requested was N5,151.65 billion, translating to a daily
average of N23.88 billion, of which ILF converted to SLF was N2,746.47 billion,
The patronage of the SDF in
November and December was
highest as daily averages of N143.93
billion and N145.14 billion,
respectively, were deposited. The
development was attributable to the
absence of OMO in October and
November, and the reduction of the
CRR by 500 bps, from 25.00 to 20.00
per cent.
10
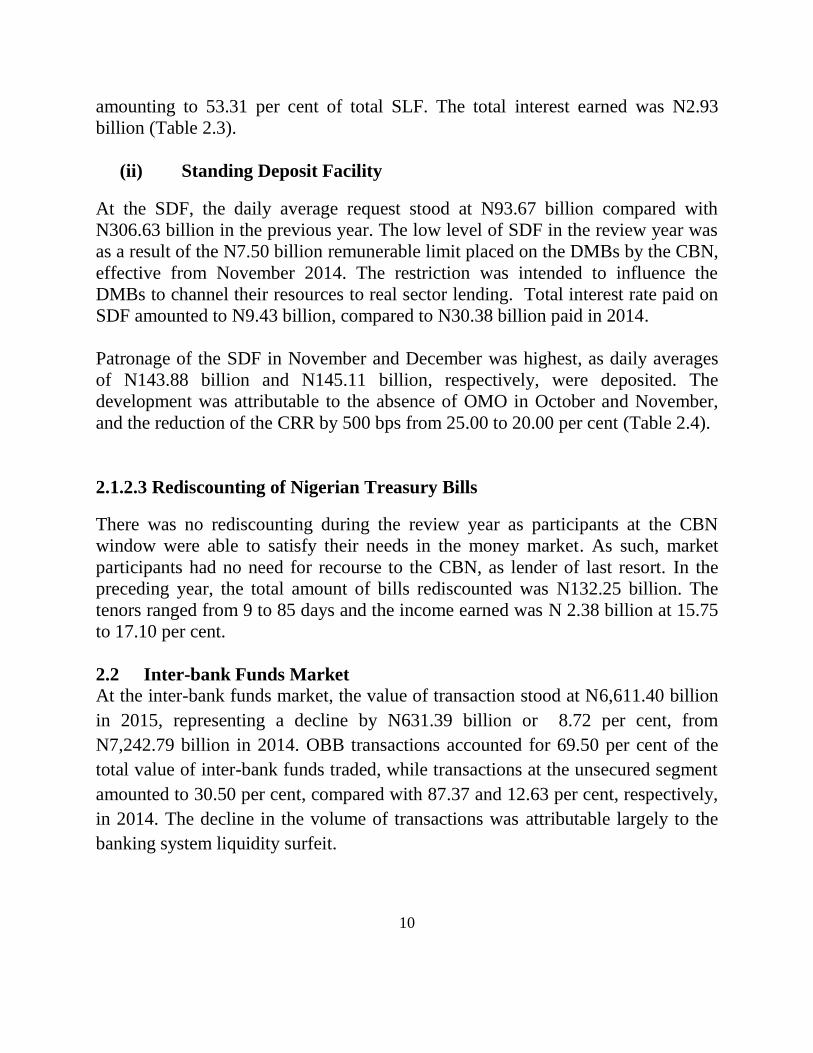
amounting to 53.31 per cent of total SLF. The total interest earned was N2.93
billion (Table 2.3).
(ii) Standing Deposit Facility
At the SDF, the daily average request stood at N93.67 billion compared with
N306.63 billion in the previous year. The low level of SDF in the review year was
as a result of the N7.50 billion remunerable limit placed on the DMBs by the CBN,
effective from November 2014. The restriction was intended to influence the
DMBs to channel their resources to real sector lending. Total interest rate paid on
SDF amounted to N9.43 billion, compared to N30.38 billion paid in 2014.
Patronage of the SDF in November and December was highest, as daily averages
of N143.88 billion and N145.11 billion, respectively, were deposited. The
development was attributable to the absence of OMO in October and November,
and the reduction of the CRR by 500 bps from 25.00 to 20.00 per cent (Table 2.4).
2.1.2.3 Rediscounting of Nigerian Treasury Bills
There was no rediscounting during the review year as participants at the CBN
window were able to satisfy their needs in the money market. As such, market
participants had no need for recourse to the CBN, as lender of last resort. In the
preceding year, the total amount of bills rediscounted was N132.25 billion. The
tenors ranged from 9 to 85 days and the income earned was N 2.38 billion at 15.75
to 17.10 per cent.
2.2 Inter-bank Funds Market
At the inter-bank funds market, the value of transaction stood at N6,611.40 billion
in 2015, representing a decline by N631.39 billion or 8.72 per cent, from
N7,242.79 billion in 2014. OBB transactions accounted for 69.50 per cent of the
total value of inter-bank funds traded, while transactions at the unsecured segment
amounted to 30.50 per cent, compared with 87.37 and 12.63 per cent, respectively,
in 2014. The decline in the volume of transactions was attributable largely to the
banking system liquidity surfeit.
11
The CRR on public and private sector
deposits were at 75.00 and 20.00 percent,
respectively, until they were harmonised at
31.00 per cent on May 19, by the MPC, and
later reduced to 25.00 and 20.00 per cent on
September 22 and November 24, 2015,
respectively.
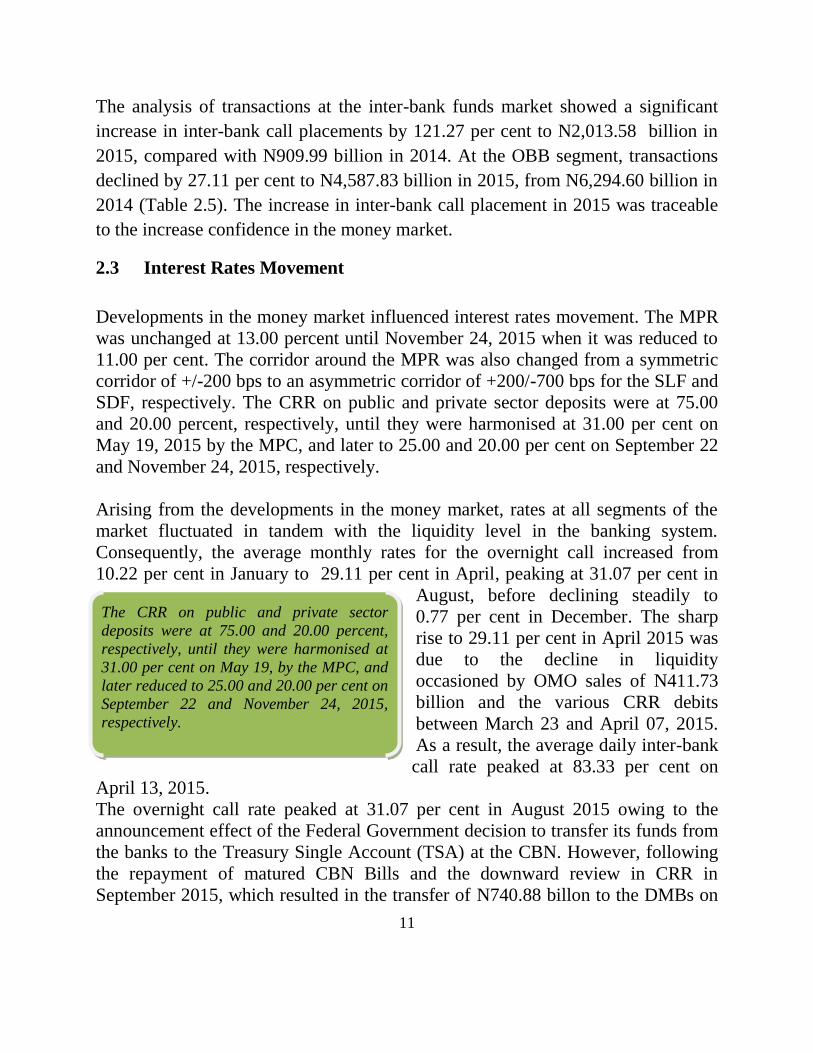
The analysis of transactions at the inter-bank funds market showed a significant
increase in inter-bank call placements by 121.27 per cent to N2,013.58 billion in
2015, compared with N909.99 billion in 2014. At the OBB segment, transactions
declined by 27.11 per cent to N4,587.83 billion in 2015, from N6,294.60 billion in
2014 (Table 2.5). The increase in inter-bank call placement in 2015 was traceable
to the increase confidence in the money market.
2.3 Interest Rates Movement
Developments in the money market influenced interest rates movement. The MPR
was unchanged at 13.00 percent until November 24, 2015 when it was reduced to
11.00 per cent. The corridor around the MPR was also changed from a symmetric
corridor of +/-200 bps to an asymmetric corridor of +200/-700 bps for the SLF and
SDF, respectively. The CRR on public and private sector deposits were at 75.00
and 20.00 percent, respectively, until they were harmonised at 31.00 per cent on
May 19, 2015 by the MPC, and later to 25.00 and 20.00 per cent on September 22
and November 24, 2015, respectively.
Arising from the developments in the money market, rates at all segments of the
market fluctuated in tandem with the liquidity level in the banking system.
Consequently, the average monthly rates for the overnight call increased from
10.22 per cent in January to 29.11 per cent in April, peaking at 31.07 per cent in
August, before declining steadily to
0.77 per cent in December. The sharp
rise to 29.11 per cent in April 2015 was
due to the decline in liquidity
occasioned by OMO sales of N411.73
billion and the various CRR debits
between March 23 and April 07, 2015.
As a result, the average daily inter-bank
call rate peaked at 83.33 per cent on
April 13, 2015.
The overnight call rate peaked at 31.07 per cent in August 2015 owing to the
announcement effect of the Federal Government decision to transfer its funds from
the banks to the Treasury Single Account (TSA) at the CBN. However, following
the repayment of matured CBN Bills and the downward review in CRR in
September 2015, which resulted in the transfer of N740.88 billon to the DMBs on

12
October 7, 2015, rates decelerated sharply and closed at 0.77 per cent in December
2015 (Figure 2.3).
Similarly, the Open Buy Back (OBB) rate followed the same trend as the inter-
bank call rate. Thus, the OBB rate increased from 9.06 per cent in January to
23.20 per cent in April, and peaked at 28.10 per cent in August, before declining to
0.87 per cent in December 2015.
Overall, both Call and OBB rates were relatively less stable in 2015 than in
2014(Figure 2.4) owing to a more volatile economic environment in 2015 that
necessitated salient policy changes.
In a related development, the benchmark Nigerian Inter-bank Offered Rate
(NIBOR) for call and 30-day tenors averaged 14.05 and 14.29 per cent,
respectively, in 2015, compared with 12.51 and 12.67 per cent for the same tenors
in 2014 (Table 2.6)
.

13
Figure 2.3 Average Monthly Money Market Rates, 2015
*There was no inter-bank tenured transaction in 2015
Figure 2.4 Average Monthly Money Market Rates, 2014
-
5.00
10.00
15.00
20.00
25.00
30.00
35.00
Perc
ent
Inter-Bank Call Inter-Bank Tenored NIBOR (7-Day) NIBOR (30-Day) OBB MPR
0.00
5.00
10.00
15.00
20.00
25.00
30.00
Perc
ent
Inter-bank Call Inter-Bank Tenored NIBOR (7-Day) NIBOR (30-Day) OBB MPR

14
2.4 Central Bank of Nigeria Promissory Notes
Promissory notes worth N90.89 million were issued in 2015 compared with
N23.54 million in 2014. The increase was due to the requests received and
approved by the Bank from the Purchase and Assumption arrangement associated
with the banking system consolidation (Table 2.7).

15
3.0 FOREIGN EXCHANGE MARKET OPERATIONS
3.1 Developments in the Foreign Exchange Market
Weak commodity prices at the international market affected the economic fortunes
of primary product exporting countries like Nigeria, whose major foreign exchange
earnings come from crude oil. The preponderance of oil glut at the international
market that negatively impacted the price of oil, which plummeted from a peak of
US$114.77 per barrel in June 2014 to US$55.88 per barrel at end-December 2014,
and further down to US$36.57 per barrel at end-December 2015. This resulted in a
slowdown in accretion to and eventual depletion of the external reserves. The
reserves, which stood at US$34.25 billion at end-December 2014 declined to
US$28.29 billion at end-December 2015. The normalisation of monetary policy by
the US Fed in late 2014 encouraged capital flow reversals from emerging markets
and developing economies. As such, the strengthening of the US dollar translated
to additional pressures on the naira. These developments necessitated a variety of
actions by the CBN, including the closure of RDAS, suspension of two-way quote
trades, restriction of some items from accessing the foreign exchange market,
reduction of the amount sold to the BDCs and adjustments in the net foreign
exchange trading position limit. The ongoing objective was to promote domestic
production and expenditure switching in order to conserve scarce foreign exchange
earnings.
Pressures mounted in the foreign exchange market throughout the year following
the adverse developments in the international market, characterised by
commodity price decline and reduced demand for Nigeria’s crude oil. This
resulted in the adoption of various measures by the monetary authority to defend
the local currency and reverse the depletion of the external reserves. Among these
were the closure of the RDAS, suspension of two-way quote trades, restriction of
some items from accessing the official foreign exchange market, reduction in the
amount of foreign exchange sold to the BDCs and adjustments in the net foreign
exchange trading position limit. The overall objective was to promote domestic
production and expenditure switching in order to conserve scarce foreign
exchange earnings.
16
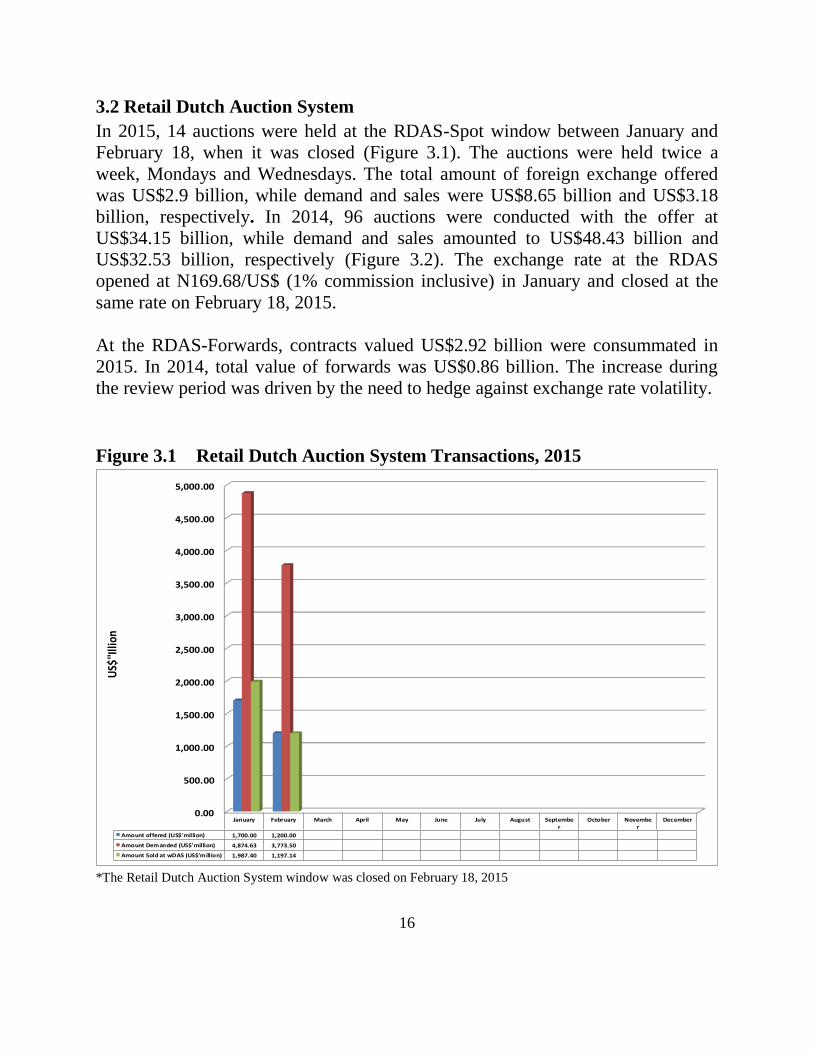
3.2 Retail Dutch Auction System
In 2015, 14 auctions were held at the RDAS-Spot window between January and
February 18, when it was closed (Figure 3.1). The auctions were held twice a
week, Mondays and Wednesdays. The total amount of foreign exchange offered
was US$2.9 billion, while demand and sales were US$8.65 billion and US$3.18
billion, respectively. In 2014, 96 auctions were conducted with the offer at
US$34.15 billion, while demand and sales amounted to US$48.43 billion and
US$32.53 billion, respectively (Figure 3.2). The exchange rate at the RDAS
opened at N169.68/US$ (1% commission inclusive) in January and closed at the
same rate on February 18, 2015.
At the RDAS-Forwards, contracts valued US$2.92 billion were consummated in
2015. In 2014, total value of forwards was US$0.86 billion. The increase during
the review period was driven by the need to hedge against exchange rate volatility.
Figure 3.1 Retail Dutch Auction System Transactions, 2015
*The Retail Dutch Auction System window was closed on February 18, 2015
0.00
500.00
1,000.00
1,500.00
2,000.00
2,500.00
3,000.00
3,500.00
4,000.00
4,500.00
5,000.00
January February March April May June July August September
October November
December
Amount offered (US$'million) 1,700.00 1,200.00
Amount Demanded (US$'million) 4,874.63 3,773.50
Amount Sold at wDAS (US$'million) 1,987.40 1,197.14
US$
''Illi
on
17
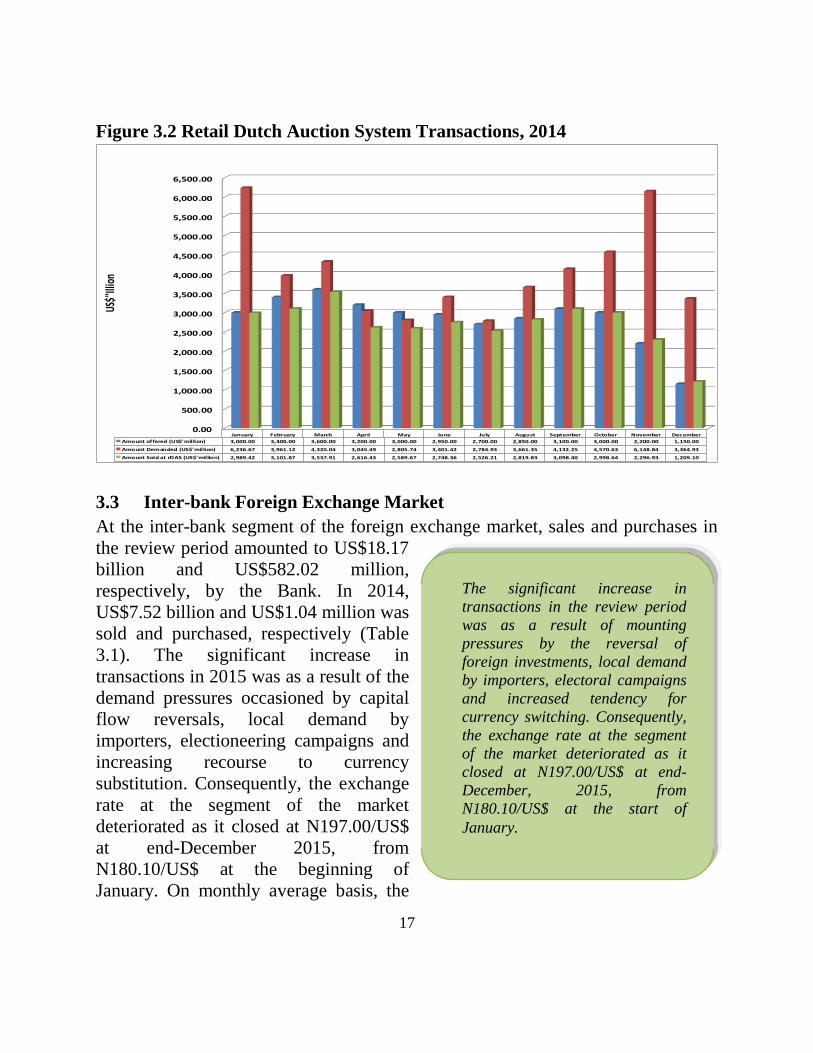
Figure 3.2 Retail Dutch Auction System Transactions, 2014
3.3 Inter-bank Foreign Exchange Market
At the inter-bank segment of the foreign exchange market, sales and purchases in
the review period amounted to US$18.17
billion and US$582.02 million,
respectively, by the Bank. In 2014,
US$7.52 billion and US$1.04 million was
sold and purchased, respectively (Table
3.1). The significant increase in
transactions in 2015 was as a result of the
demand pressures occasioned by capital
flow reversals, local demand by
importers, electioneering campaigns and
increasing recourse to currency
substitution. Consequently, the exchange
rate at the segment of the market
deteriorated as it closed at N197.00/US$
at end-December 2015, from
N180.10/US$ at the beginning of
January. On monthly average basis, the
0.00
500.00
1,000.00
1,500.00
2,000.00
2,500.00
3,000.00
3,500.00
4,000.00
4,500.00
5,000.00
5,500.00
6,000.00
6,500.00
January February March April May June July August September October November December
Amount offered (US$'million) 3,000.00 3,400.00 3,600.00 3,200.00 3,000.00 2,950.00 2,700.00 2,850.00 3,100.00 3,000.00 2,200.00 1,150.00
Amount Demanded (US$'million) 6,236.67 3,961.12 4,320.04 3,045.49 2,805.74 3,401.42 2,784.93 3,661.35 4,132.25 4,570.63 6,148.84 3,364.93
Amount Sold at rDAS (US$'million) 2,989.42 3,101.87 3,537.91 2,616.43 2,589.67 2,748.36 2,526.21 2,819.83 3,098.40 2,998.64 2,296.93 1,209.10
US$'
'Illio
n
The significant increase in
transactions in the review period
was as a result of mounting
pressures by the reversal of
foreign investments, local demand
by importers, electoral campaigns
and increased tendency for
currency switching. Consequently,
the exchange rate at the segment
of the market deteriorated as it
closed at N197.00/US$ at end-
December, 2015, from
N180.10/US$ at the start of
January.

18
exchange rate stood at N181.78/US$ in January, while it depreciated to
N196.99/US$ in December 2015 (Table 3.2 and Figure 3.3).
At the inter-bank forwards, new contracts worth US$1.71 billion were executed,
while US$2.92 billion matured in 2015. In 2014, the value of new contracts
executed were US$3.78 billion, while US$2.65 billion matured.
3.4 Bureaux-de-Change
The direct sale of foreign exchange through the CBN branches to the BDCs
amounted to US$3.96 billion in 2015 (Table 3.1).
The exchange rate in the segment of the market opened at N191.50/US$ in January
and closed at N267.00/US$ at end-December 2015. On monthly average basis, the
exchange rate stood at N196.13/US$ in January, while it depreciated to
N258.30/US$ in December 2015 (Table 3.2 and Figure 3.3). The depreciation of
the naira in 2015 was traceable to increased demand pressures in the BDC
segment. In 2014, sales to the BDCs amounted to US$4.36 billion, while the
exchange rate opened at N172.00/US$ in January and closed at N191.50/US$ at
end-December. In January, the rate at the BDC segment averaged N171.71/US$,
while it depreciated to N188.45/US$ in December 2014 (Figure 3.4).
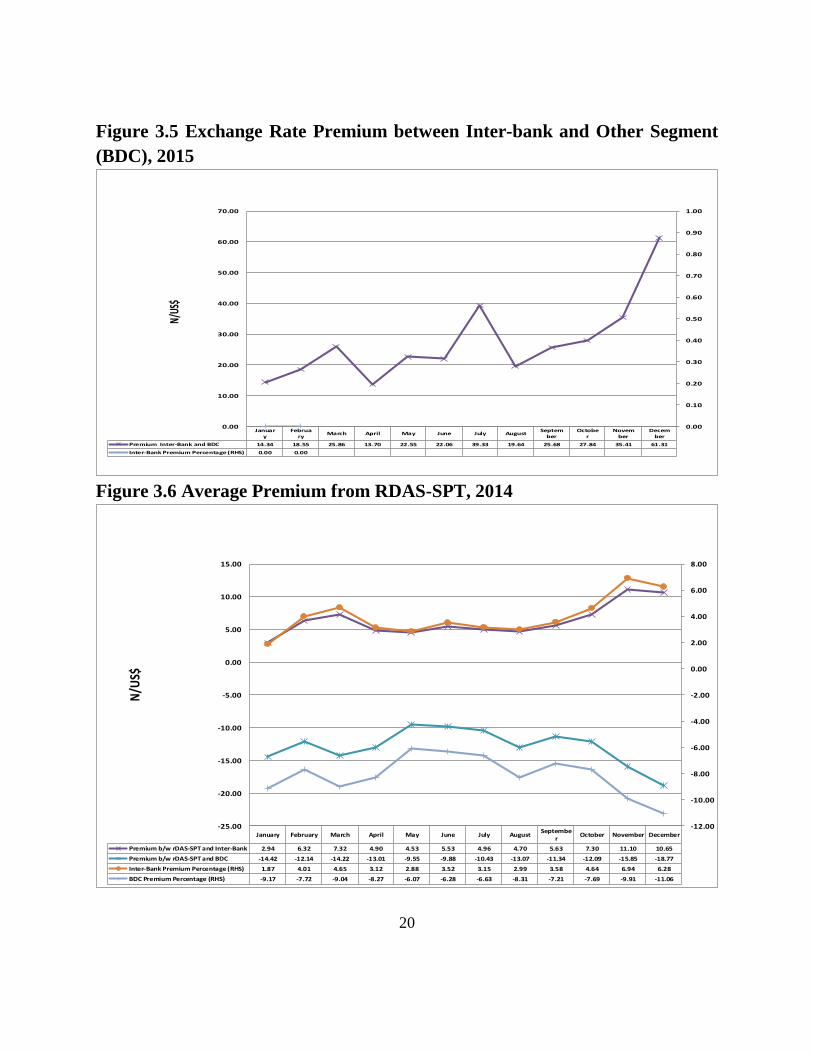
3.5 Foreign Exchange Rate Premium
The exchange rate premium between the interbank and BDC closing rates of
N197.00/US$ and N267.00/US$, respectively, at end-December 2015 stood at
N70.00/US$ or 35.53 per cent. On average monthly basis, the premium between
the interbank and BDC stood at N14.34/US$ in January, while it widened to
N61.31/US$ in December (Figure 3.5). In December 2014, the premium between
the average RDAS and BDC rates of N169.68/US$ and N188.45/US$,
respectively, was N18.77/US$ (Figure 3.6). The higher premium in 2015 was
attributable to reduced supply of foreign exchange in the economy, coupled with
increased demand pressures at the BDC segment. Please note that the RDAS
segment was closed on February 18, 2015 and the inter-bank rate became the
effective official rate.

19
Figure 3.3 RDAS-SPT, Inter-Bank and BDC Rates, 2015
*The Retail Dutch Auction System window was closed on February 18, 2015
Figure 3.4 RDAS-SPT, Inter-Bank and BDC Rates, 2014
January February March April May June July August September October November December
wDAS-SPT (incl. 1% comm.) 169.68 169.68
Inter-Bank 181.78 194.48 197.07 197.00 197.00 196.92 196.97 197.00 197.00 196.99 196.99 196.99
BDC 196.13 213.03 222.93 210.70 219.55 218.98 236.30 216.64 222.68 224.83 232.40 258.30
0.00
50.00
100.00
150.00
200.00
250.00
300.00
N/U
S$
January February March April May June July August September October November December
rDAS-SPT (incl. 1% comm.) 157.29 157.31 157.30 157.29 157.29 157.29 157.29 157.29 157.30 157.31 160.00 169.68
Inter-Bank 160.23 163.62 164.62 162.19 161.81 162.82 162.25 161.99 162.93 164.62 171.10 180.33
BDC 171.71 169.45 171.52 170.30 166.84 167.17 167.71 170.36 168.64 169.40 175.85 188.45
141.00
144.00
147.00
150.00
153.00
156.00
159.00
162.00
165.00
168.00
171.00
174.00
177.00
180.00
183.00
186.00
189.00
192.00
N/U
S$
20
Figure 3.5 Exchange Rate Premium between Inter-bank and Other Segment
(BDC), 2015
Figure 3.6 Average Premium from RDAS-SPT, 2014
January
February
March April May June July AugustSeptem
berOctobe
rNovem
berDecem
ber
Premium Inter-Bank and BDC 14.34 18.55 25.86 13.70 22.55 22.06 39.33 19.64 25.68 27.84 35.41 61.31
Inter-Bank Premium Percentage (RHS) 0.00 0.00
0.00
0.10
0.20
0.30
0.40
0.50
0.60
0.70
0.80
0.90
1.00
0.00
10.00
20.00
30.00
40.00
50.00
60.00
70.00
N/US
$
January February March April May June July AugustSeptembe
rOctober November December
Premium b/w rDAS-SPT and Inter-Bank 2.94 6.32 7.32 4.90 4.53 5.53 4.96 4.70 5.63 7.30 11.10 10.65
Premium b/w rDAS-SPT and BDC -14.42 -12.14 -14.22 -13.01 -9.55 -9.88 -10.43 -13.07 -11.34 -12.09 -15.85 -18.77
Inter-Bank Premium Percentage (RHS) 1.87 4.01 4.65 3.12 2.88 3.52 3.15 2.99 3.58 4.64 6.94 6.28
BDC Premium Percentage (RHS) -9.17 -7.72 -9.04 -8.27 -6.07 -6.28 -6.63 -8.31 -7.21 -7.69 -9.91 -11.06
-12.00
-10.00
-8.00
-6.00
-4.00
-2.00
0.00
2.00
4.00
6.00
8.00
-25.00
-20.00
-15.00
-10.00
-5.00
0.00
5.00
10.00
15.00
N/U
S$

21
Box Information: Currency Devaluation and Its Implications
The challenge of exchange rate management in Nigeria has become more intense in
recent times as the economy experiences external shocks from adverse crude-oil price
movements. The effect of the external shocks also impacted on the current account of the
balance of payment and exchange rate arrangements.
To address the current account challenges, either of the following actions may be
adopted: the monetary authority may allow the market to determine the exchange rate, or
it may apply foreign exchange controls and import restrictions. The former action would
lead to depreciation in exchange rate, while the latter may result in a slowdown in
economic activities. Both actions have the tendency to reduce pressures on the current
account balance and preserve the stock of external reserves. However, the choice of
measure is dependent on the aim of the monetary authority, bearing in mind the general
direction of the economy.
A market-determined exchange rate would almost instantly lead to an increase in the
prices of imported goods with a pass-through to inflation. It would also exert pressures
on the external debt service burden of both government and corporates. Notwithstanding,
the market-determined exchange rate offers inherent gains. The changes in the prices
would engender expenditure switching in favour of locally made products.
The increase in demand for these products may stimulate productive activities in the
medium-to-long term and increase employment opportunities, as producers expand their
capacities to fill the demand – supply gap. However this strategy may not be seamless for
an import dependent economy like Nigeria, with a relatively less diversified export
sector. Experience from previous devaluations show that gains were minimal due to non-
diversification and supply inelasticity of our primary export products, coupled with other
well-known structural rigidities that have rendered local demand for imports inelastic.
Besides, the increase in price pass-through, the effects of devaluation usually engender
economic agent outcry and pitch labour against the government, as trade unions intensify
agitation for wage increase to offset the erosion of workers real income.
Another downside of devaluation is the unknown actual market equilibrium. The biggest
challenge is the stifling of foreign currency supply. Therefore, as long as the supply of
foreign exchange does not improve, even if the official exchange rate is depreciated,
there is no guarantee that rates at the parallel market will not react to the devaluation
and move farther away from the new equilibrium.
To ensure lasting economic stability, over-reliance on limited source of foreign exchange
earnings is unsustainable. As a result, diversifying the Nigerian economy with active
private sector participation and increasing its exports through the primary and
manufacturing sectors are undebateable ways of promoting exchange rate stability and
enhancing economic growth and prosperity. However, if the exchange rate strays too far
away from the level consistent with the nation’s economic fundamentals, it will be
counterproductive for the economy.

22
4.0 CAPITAL MARKET DEVELOPMENTS
4.1 Nigerian Stock Market
Transactions on the floor of the NSE were bearish during the year as both the NSE
ASI and MC trended downwards. The decline was due largely to the fall in asset
prices owing to divestments by foreign portfolio and marginal local investors as a
consequence of strained macro-economic indicators and international economic
developments. These led to the delisting of FGN Bonds from the JP Morgan GBI-
EM and further weakening in foreign portfolio investment that constituted a
significant portion of the market.
In view of the slide in the capital market, the regulators continued efforts that
deepened the market by
entrenching market discipline
through ensuring compliance with
rules and regulations and
enhancing integration within the
sub-region and the wider international community as well as attracting new
participants to the market. These efforts included the following:
The general slowdown in economic activities during the year reflected in the
performance of the capital market. Indicators on the floor of the Nigerian
Stock Exchange showed that the ASI and MC declined by 15.62 and 12.37 per
cent, respectively, over the levels achieved in the preceding year. Similarly,
the volume, value and number of deals declined in varying degrees by 32.11,
29.80 and 17.76 per cent, respectively. The development was attributable to
share price losses of listed companies, precipitated by domestic and
international economic developments that led foreign investors to divest and
local investors to be more cautious. Regulatory actions were nevertheless,
sustained throughout the year to strengthen market efficiency, effectiveness
and depth.
Transactions on the floor of the NSE were
bearish during the year as both ASI and
MC trended downwards.

23
Carrying out feasibility studies for the introduction of derivatives, to
determine the preparedness of market operators, level of infrastructure and
other requirements, as well as the sequence for the launch of risk management
products in the market.
The adoption of Direct Cash Settlement (DCS) system by the Capital Market
Committee (CMC), to ensure cash proceeds from trades settle directly into
investors’ bank account. The DCS also aimed at improving transparency,
entrenching investor confidence, reducing market infractions and improving
trading velocity.
Consequently, on December 30, 2015, all capital market operators were
mandated to adopt the DCS system with effect from January 2, 2016.
The conclusion, in September 2015, of the recapitalization exercise for capital
market operators, which was initiated in 2014. The upward review in capital
base was aimed at enhancing the ability of the operators to improve service
delivery, acquire appropriate equipment and technology, and hire necessary
manpower and enhance corporate governance.
The release of six new rules to the capital market. These are the: Code of
Conduct for Rating Agencies; Code of Conduct for Underwriters; Code of
Conduct for Trustees; Rules on Securitisation; Rules on National Investors
Protection Fund and Rules on Trading Unlisted Securities in Over the Counter
(OTC) markets in Nigeria.
The signing of Capital Markets Agreement with the London Stock Exchange
Group (LSEG) to strengthen cooperation and promote mutual development
between the two exchanges. The agreement also supports companies seeking
dual listings.

24
Introduction of Corporate Governance Rating System (CGRS) by the NSE, in
partnership with the Convention on Business Integrity (CBI). Using a holistic
multi-stakeholder approach and a diverse set of information collection and
verification processes, the CGRS was designed to rate companies listed on the
Exchange based on corporate governance practices. This was aimed at
improving the overall perception of and trust in the capital market.
Participation by listed companies was made mandatory in 2015.
Newly listed companies were also granted tax reduction in the second half of
2015.
4.1.1 All Share Index and Market Capitalisation
The NSE ASI decreased by 5,301.04 points or 15.62 per cent to 28,642.25 at end-
December 2015 from 33,943.29 at the beginning of January 2015. Similarly, the
MC of equities decreased by N1.39 trillion or 12.37 per cent, from N11.24 trillion
at the beginning of January to N9.85 trillion by end-December 2015. The decline
in the ASI and MC was attributable to the
predominance of share price losses, due to
adverse domestic and international
economic developments that led to capital
flow reversals and increased caution by
local investors.
In 2014, the ASI decreased by 8,721.30
points to 32,786.00 at end-December, from
41,507.30 at the beginning of the year.
Similarly, the MC of listed equities
decreased by 18.52 per cent, from N13.28
trillion to N10.82 trillion by end-December (Table 4.1).
The decline in the ASI and MC
was attributable to the
predominance of share price
losses, precipitated by domestic
and international economic
developments that led to capital
reversal by foreign investors
and increased caution by local
investors.

25
Eight corporate, two state
government and one FGN Bonds as
well as one new company equity and
two Exchange Traded Funds (ETF)
were admitted on the floor of the
NSE in 2015.
4.1.2 Market Turnover
The turnover of activities in the market during the year reflected a decrease below
the level in 2014, as the volume of deals traded, stood at 73.64 billion shares as
against 108.47 billion in the preceding year
(Table 4.2). Correspondingly, the value of
shares traded stood at N940.00 billion as
against N1,338.62 billion in 2014. Similarly,
the number of deals decreased to 999,985,
compared to 1,216,069 in 2014. The
decrease in the turnover and number of
deals was traceable to slowdown in trading
activities compared with the preceding year and the cautious stance by market
participants (Table 4.5).
The Financial Services sector was the most active during the review year,
accounting for 79.63 per cent of the volume of equities traded, while the remaining
sectors accounted for 20.37 per cent (Table 4.3).
Foreign investment inflows amounted to N470.63 billion, while outflows
amounted to N554.24 billion, reflecting a net outflow of N83.61 billion. In 2014,
Foreign investment inflows amounted to N692.39 billion, while outflows
amounted to N846.53 billion, reflecting a net outflow of N154.14 billion (Table
4.4). Concerns over oil price shocks, declining foreign reserves and exchange rate
volatility and the monetary policy normalisation in the US influenced the outflows
by foreign investors. In 2015, the percentage of foreign investment in the stock
market averaged 53.79 per cent, compared with 57.52 per cent in 2014. The
dominance of foreign investors in the market indicates that changes in the direction
of foreign portfolio investment would have effect on price movement.
4.1.3 New and Supplementary Listings and Delisting
The NSE admitted one new company, two state government bonds, eight corporate
bonds, one FGN Bond and two Exchange Traded Funds (ETF) on the floor in
2015. In addition, there were thirty-seven supplementary listings on the NSE
owing to bonus issues, special placements and convertible preference shares.
Conversely, the NSE delisted six companies, three of which were on account of

26
failure to comply with post listing requirements, and the remainder on voluntary
basis (Table 4.5).

27
The stock of domestic debt
comprised FGN Bonds, N5,808.14
billion or 65.73 per cent, NTBs,
N2,772.87 billion or 31.38 per
cent, and Federal Republic of
Nigeria (FRN) Treasury Bonds,
N255.99 billion or 2.90 per cent.
5.0 FEDERAL GOVERNMENT DOMESTIC DEBT
5.1 Nigerian Treasury Bills
Total NTBs worth N3,845.32 billion were offered and allotted, representing a
marginal decrease of N34.15 billion or 0.88 per cent when compared with
N3,879.47 billion in 2014. The decline was traceable to the Federal Government’s
preference for longer tenor debt, vis-à-vis FGN Bonds and the redemption of
N100.00 billion NTB in 2015. The total public subscription, however, stood at
N9,302.32 billion, an increase of N1,258.76
billion or 15.65 per cent when compared with
N8,043.56 billion in the preceding year
(Figure 5.1 and 5.2). The tenors were 91-,
182- and 364-day. The increase in
subscription was attributed to the attractive
yields experienced in the review period
(Table 5.2).
The structure of investment (allotment)
indicated that banks and discount houses took up N2,765.62 billion or 71.92 per
cent, mandate and internal funds customers (including CBN branches) N1,079.70
billion or 28.08 per cent (Table 5.2). The successful bid rates in the market ranged
from 3.63 to 11.20 per cent for the 91-day, 6.19 to 14.85 per cent for the 182-day
and 7.45 to 15.90 per cent for the 364-day tenors. In comparison, the successful bid
rates in 2014 were from 9.58 to 11.95 per cent for the 91-day, 10.02 to 14.48 per
The Federal Government of Nigeria (FGN) continued to patronize domestic market for
funds to finance its fiscal deficits and also provide benchmark prices for corporate bonds.
As a result, the stock of the FGN domestic debt at end-December 2015 was N8,837.00
billion, an increase of N932.97 billion or 11.80 per cent over the N7,904.03 billion
recorded at end-December 2014. The increase was attributed to the issuance of new debt
instruments, particularly FGN Bonds and NTBs to bridge budgetary gap. The stock of
domestic debt comprised FGN Bonds, N5,808.14 billion or 65.73 per cent, NTBs,
N2,772.87 billion or 31.38 per cent, and Federal Republic of Nigeria (FRN) Treasury
Bonds, N255.99 billion or 2.90 per cent.
.

28
cent for the 182-day and 10.13 to 15.99 per cent for the 364-day tenor (Table 5.10).
Generally, the rates were lower towards the end of 2015 traceable to the CBN
expansionary monetary policy stance.
Figure 5.1 NTB Primary Market Auction, 2015
Figure 5.2 NTB Primary Market Auction, 2014
0.00
200.00
400.00
600.00
800.00
1,000.00
1,200.00
N'Bi
llion
Issues Subscription Allotment
-
200.00
400.00
600.00
800.00
1,000.00
1,200.00
1,400.00
N''B
illio
n
Primary Market Auction, 2014
Issues Subscription Allotment

29
5.1.1 Structure of Nigerian Treasury Bills Holdings
At end-December 2015, banks accounted for 37.75 per cent of NTBs outstanding,
non-bank investors 53.85 per cent, while the CBN held the balance of 8.40 per
cent, as against 69.94, 30.00 and 0.06 per cent in 2014, respectively (Table 5.3).
The shift in holdings from banks to non-bank public was as a result of increased
patronage by pension funds and other government agencies.
5.2 Federal Republic of Nigeria Treasury Bonds
There was no new issue of the Federal Republic of Nigeria (FRN) Treasury Bonds
in 2015, same as in 2014. Thus, the stock of the instrument at end-December 2015
stood at N255.99 billion, compared with N296.22 billion at end-December 2014.
The decline was attributed to the redemption of N40.23 billion FRN Treasury
Bonds during the year. A breakdown of the amount outstanding showed that the
CBN held N93.79 billion, while N162.20 billion was held in the sinking fund
(Table 5.4).
5.3 Federal Government of Nigeria Bonds
New issues and re-openings of FGN Bonds series 1 and 2 were auctioned in 2015.
Total FGN Bonds offered for sale was N853.22 billion while public subscription
and sales stood at N1,751.97 billion and N788.72 billion, respectively (Table 5.5).
The lower sale in comparison to amount offered was due to the speculative bids by
investors. The huge subscription was attributed to the level of liquidity in the
banking system and attractive coupon
yields. Thus, the total value of FGN
Bonds outstanding at end-December 2015
was N6,488.56 billion (of this amount,
N680.42 billion was restructured
commercial loans by the Federal
Government on behalf of the state
governments), compared to N4,792.28 billion at end-December 2014, indicating an
increase of N1,696.28 billion or 35.40 per cent (Table 5.6).
The level of subscription was due
to the liquidity surfeit in the
banking system and attractive
coupon yields.

30
On the structure of holdings in 2015, banks (inclusive of merchant banks) held
N2,693.51 billion or 41.51 per cent, pension funds N1,214.70 billion or 18.72 per
cent, corporate bodies N590.57 billion or 9.10 per cent and parastatals N687.36
billion or 10.59 per cent. The balance of N1,302.42 billion or 20.07 per cent was
accounted for by brokers, trust funds, CBN, insurance companies, and individuals.
In 2014, banks accounted for the highest, N1,801.13 billion or 37.58 per cent,
while individuals accounted for the lowest, N3.70 billion or 0.08 percent (Table
5.7).
5.4 Domestic Debt Charges
At end-December 2015, the stock of the FGN domestic debt was N8,837.00
billion, an increase of N932.97 billion or 11.80 per cent over the N7,904.03 billion
recorded at end-December 2014 (Table 5.9). The increase in the stock of the FGN
domestic debt during the year resulted in a corresponding increase in domestic debt
servicing to N996.80 billion in 2015, from N852.07 billion in 2014. However, in
2015, debt servicing as a percentage of recurrent expenditure fell slightly to 39.09
percent compared with 39.71 percent in 2014. The FGN Bonds coupon payments
accounted for N635.43 billion or 63.75 per cent, while interest on NTBs stood at
N324.06 billion or 32.51 per cent and FRN Treasury Bonds, N37.30 billion or 3.74
per cent (Table 5.8).
31
6.0 ACTIVITIES OF INTERNAL AND INTER-AGENCY COMMITTEES
6.1 Liquidity Assessment Group
The Liquidity Assessment Group (LAG) continued to meet to assess the liquidity
levels in the banking system on a daily basis, and advise on intervention measures
by the Bank. The membership of the committee includes Heads of Division and
Office in the Financial Markets Department.
6.2 Non-Interest Financial Institutions Product Development Committee
The Committee developed Draft Guidelines for the Granting of Liquidity Status to
Sukuk Issued by State Governments for Management consideration. The
Committee, in collaboration with the Non-Interest Capital Market Advocacy
Committee of the Securities and Exchange Commission, also initiated discussion
on the need for the issuance of sovereign Sukuk and decided to include other
critical stakeholders in the process. This was considered expedient to expand
sources of finance available to government for infrastructure development,
especially at a time the revenue to government was weak.
The Committee comprises representatives from Financial Policy and Regulation,
Banking Supervision, Consumer Protection, Banking and Payments System,
Governors’, Reserve Management, Monetary Policy, Development Finance, Risk
Management, Legal Services and Financial Markets Departments.
.
Consistent with the objective of having an all-inclusive decision making
process, the FMD constituted and participated in various intra- and inter-
department committees assigned to handle specific tasks for the
sustenance of financial system stability. It also collaborated with internal
and external stakeholders to further develop the Nigerian financial
markets.
32
6.3 Dealing Room Project Committee
The Dealing Room project was concluded delivered and is being operated by the
staff of the Financial Markets and Reserve Management Departments for effective
and efficient management of treasury and external reserves by the Bank.
6.4 Fiscal and Liquidity Assessment Committee
Activities of the inter-agency Committee continued to focus on the examination of
funds flow in the economy to determine its effects on interest, exchange and
inflation rates and proffer measures to keep them at desirable levels.
The membership of the Committee comprises the Nigerian National Petroleum
Corporation (NNPC), Office of the Accountant General of the Federation (OAGF),
Federal Ministry of Finance (FMF), Federal Inland Revenue Service (FIRS),
Nigeria Customs Service (NCS), Debt Management Office (DMO), Budget Office
of the Federation (BOF), and the CBN.
6.5 Financial Stability Report Committee
In 2015, the Committee produced reports on the Nigerian financial system for the
periods ended December 31, 2014 and June 30, 2015. The reports reviewed the
soundness of the financial system, potential risks and efforts made at sustaining its
safety and stability. It also provided a six-month outlook on developments that
might impact the Nigerian financial system and probable actions to mitigate any
threats.
The membership of the Committee comprises the Financial Markets, Financial
Policy and Regulation, Statistics, Trade and Exchange, Research, Monetary Policy,
Banking and Payments System, Reserve Management, Strategy Management, Risk
Management, Banking Supervision, Other Financial Institutions Supervision and
Development Finance Departments.

33
6.6 Financial Services Regulation Coordinating Committee (Sub-
Committee on Financial Markets)
The Financial Services Regulation Coordinating Committee (FSRCC) continued to
meet to engender harmonious collaboration among regulators and foster a safe,
sound and resilient Nigerian financial system. To facilitate its activities, the Sub-
Committee on Financial Markets undertook the following responsibilities:
Identified the challenges facing the financial markets and the role to be played
by member agencies;
Served as a technical support group for the FSRCC on financial markets
development and other related matters;
Provided members, other agencies and the general public with information
that assisted in strengthening the Nigerian financial markets;
Monitored and analysed developments in the financial markets and explored
ways to deepen the markets;
Made recommendations on how to improve market liquidity management; and
Deliberated on such other issues as may be specified from time to time by the
FSRCC.
The membership of the Committee comprises the SEC, Debt Management Office
(DMO), National Pension Commission (PENCOM), National Insurance
Commission (NAICOM), Corporate Affairs Commission (CAC), FIRS, FMF,
Abuja Securities and Commodity Exchange (ASCE), NSE and the CBN (Financial
Policy and Regulation Department and FMD).

34
6.7 Financial System Strategy 2020 Secretariat: Financial Markets
Working Committee
Two of the bills promoted by the FSS 2020 Secretariat, namely, the Nigerian
International Financial Centre (NIFC) Bill and the Nigerian Financial Ombudsman
Bill were passed by the National Assembly in June 2015 and awaiting the assent of
the President. In that regard, the Committee developed implementation strategies
for the Bills for the consideration of the CBN Management that sponsored them.
The strategies provided for country experiences, main driver for the
implementation, governance structure, funding, phases of implementation, re-
alignment of processes, likely risks and mitigants as well as recommendations.
The committee comprised SEC, DMO, National Pension Commission, National
Insurance Commission, Corporate Affairs Commission, Federal Inland Revenue
Service, Federal Ministry of Finance, Nigeria Commodity Exchange Commission,
NSE, Independent Corrupt Practices and other offences Commission (ICPC),
Small and Medium Enterprises Development Agency (SMEDAN), and the CBN.

35
7.0 MAJOR DEVELOPMENTS IN THE NIGERIAN FINANCIAL
MARKETS
7.1 Bank Verification Number
The Bank Verification Number (BVN) project, which the CBN launched on
February 14, 2014, became fully operational on October 30, 2015. Its
implementation aims at enhancing financial services by providing unique customer
identifier, eliminating identity theft, preventing fraudulent transactions in the
banking industry, ensuring the safety of depositors' funds, reducing losses
associated with the compromise of personal identification numbers, promoting
financial inclusion and enhancing financial system stability.
Drawing from the objectives of the BVN, all licensed BDCs in Nigeria were
mandated to indicate the BVN of their customers in every transaction, with effect
from August 1, 2015. The CBN directive further provided that in the event of a
corporate customer, the BVN of a director or any authorized signatory was
required. In addition, all the BDCs were required to provide the BVN of all their
directors, latest by August 15, 2015. More so, the DMBs were directed to use BVN
in all foreign exchange transactions from November 1, 2015. The provision of
BVN in foreign exchange transactions contributed to sanitizing the retail segment
of the foreign exchange market and forestalling incidences of multiple purchases,
round tripping, illicit transfer of funds as well as facilitating the enforcement of
limits on foreign exchange sales to end users.
7.2 Review of Cash Reserve Requirement Following observed developments in the financial markets, the MPC reviewed the
CRR thrice in the year. First, in May 2015 the CRR on private and public sector
deposits, which was at 20.00 and 75.00 per cent, respectively, was harmonized to
31.00 per cent. The action was aimed at eliminating the possibility of infraction
Various actions taken by the various regulatory authorities impacted the
Nigerian financial markets and influenced the conduct of transactions. These
included policies aimed at enhancing financial intermediation, developing the
payments system, deepening the capital and commodities markets and ensuring
effective management of foreign exchange.

36
through misclassification of deposits liabilities by the DMBs. Secondly, in
September 2015, the CRR was reduced to 25.00 per cent, in order to cushion the
effect of the adoption of Treasury Single Account by the fiscal authority. Thirdly,
in November 2015, it was further reduced to 20 per cent, in order to incentivize the
DMBs to lend to the real sector in a bid to diversify the economy.
7.3 Review of Foreign Currency Trading Position Limit The net foreign currency trading position limit was reviewed from 0.1 to 0.5 per
cent of shareholders’ funds un-impaired by losses, on January 21, 2015. This
supported increased liquidity in the inter-bank market.
7.4 Modifications in Foreign Exchange Management
In 2015, in line with the need to adjust to the dynamics of the developments in the
domestic and global economy, the Bank modified its foreign exchange
management practice. On February 18, 2015 the Bank closed the RDAS and
channeled all demand for foreign exchange to the interbank segment. The decision
was dictated by the need to eliminate multiple foreign exchange rates, moderate
persistent pressures in the market, preserve the external reserves, curtail round-
tripping, arbitrage and speculation, amongst others.
Also, following the commitment to sustain stability in the foreign exchange
market, the Bank increased sale of foreign exchange to each of the BDCs in the
early part of the year, from $15,000 to $30,000 weekly and through special
intervention sales of $30,000 to any interested BDC. Onward sale by the BDCs to
their customers was restricted to a margin of 3.5 per cent above the Bank exchange
rate.
In April 2015, the Bank reviewed the existing limit on the usage of naira
denominated cards for transaction overseas, from $150,000 to $50,000 per
individual, per annum, while cash withdrawal was pegged at $300 per card per
day. In the last quarter of 2015, in view of further developments in the external
sector, the banks stopped the use of naira denominated debit and credit cards
abroad.

37
The foreign exchange management thrusts stemmed the volatility in the market, to
a large extent.
7.5 Establishment of Industry Fraud Desk
In furtherance of efforts at combating fraud and attending to challenges associated
with the increased usage of electronic payment channels in the banking system, the
Bank, in consultation with the banks and e-payment service providers, identified
the need for a mechanism for handling fraud cases promptly in the banking
industry. To this end, all banks, money market operators (MMOs), switches and all
payment service providers were mandated to maintain a dedicated fraud desk in
their respective organisations with the requisite manpower to provide the following
services, amongst others:
Provide support to customers on electronic fraud with a minimum of 10
dedicated phone lines, manned and available to customers at all times;
Make available the option for calls to contact center, in respect of fraud alerts
or complaints, to be redirected to fraud desk;
Block and/or Place No Debit restrictions on accounts upon receipt of fraud
complaint;
Receive customers’ stop-transaction instructions to block their accounts
through short codes service provided to customers by the banks;
Log all customer frauds alert and/or complaint and escalate in line with
internally predefined escalation path;
Submit reports to the Nigeria Inter-Bank Settlement System (NIBSS) Plc on
fraud information logged by the fraud desk;

38
Honour “hold” instructions from NIBSS with respect to fraud matters and
grant NIBSS permission to view details on logged transactions;
Sensitise customers on e-Fraud and fraud desk services;
Manage/resolve all intra-bank fraud issues leveraging on enterprise fraud
management system; and
Maintain a mail group mapped to members of the fraud desk system.
The Bank further mandated NIBSS Plc to act as Coordinator of the Fraud Desks
across all banks, MMOs, switches and all payments service providers. NIBSS also
has the responsibility to provide the necessary support for the effective and
efficient running of the fraud desks, and make monthly reports to the Bank. The
objective of the directive was to ensure that issues associated with electronic
payments were adequately and promptly attended to in order to prevent loss and
sustain the confidence of users of the financial services and foster the attainment of
the cash-less policy. The Bank has recorded high level of compliance from all
stakeholders since the inception for the fraud desk.
7.6 Redesign of the Credit Risk Management System
To support the credit administration system and promote the safety and soundness
of the Nigerian financial system, the Bank commenced the redesign of the existing
Credit Risk Management System (CRMS). The Bank engaged all the banks to
participate in the process towards developing a robust framework that would cater
for the banking industry credit administration information super-structure. The
redesign is now at the rebuilding stage at the Information Technology Department
of the Bank. The programme is expected to take off effectively by the end of
second quarter, 2016.

39
7.7 Establishment of Advisory Committee of Experts for Non-Interest
(Islamic) Financial Institutions in Nigeria
In compliance with the principles of non-interest (Islamic) banking and finance,
guidelines were developed for all institutions offering non-interest financial
services, under the purview of the Bank, to establish an “Advisory Committee of
Experts (ACE)”. The guidelines stipulate the ACE’s independence, appointment/
discontinuation of members, duties and responsibilities as well as its working
relationship with non-interest financial institutions. The ACE has been established,
accordingly.
7.8 Time Bar for the Resolution of Customer Complaints
Against the background of attending to the needs of consumers of financial
services, the Bank collaborated with stakeholders on the need for a time bar policy,
for the management of consumer complaints in the financial services industry.
Arising from this development, and the provisions of various legislations, the Bank
stipulated a time limit of six years for the resolution of consumer complaints,
effective from the date of transaction. Notwithstanding, the time limit will not
apply to:
fraud cases,
complaints already lodged with the financial institutions and the CBN, and
international electronic payment transactions whose records are not retained
beyond 180 days on the dispute resolution application (Arbiter).
7.9 Implementation of Treasury Single Account
To consolidate all financial resources, revenue generation and promote proper
financial management in the public sector, the Federal Government stipulated the
deadline of September 15, 2015 for full compliance with the Treasury Single
Account initiative by ministries, department and agencies. The implementation of
the TSA aimed at enabling the FGN to have:

40
Unification of all its accounts and eliminate duplication or multiple
accounts,
Comprehensive monitoring of all sources of revenue,
Access to aggregate account balance, on real time basis,
Enhanced public finance accountability and transparency, and avoid
unapproved withdrawals,
Effective audit trail of transactions,
Reduced waste and minimize/block sources of leakages, and
Enhanced optimal investment of government idle funds and save cost of
borrowing.
7.10 Revision of Prudential Guidelines for Deposit Money Banks
In November 2015, the prudential guidelines Section 12.14 of 2010, for deposit
money banks was revised to allow for an increase in general provision on
performing loans to 2 per cent. The review was borne out of the need to avail
adequate buffers against unexpected loan losses.
7.11 Establishment of Monitoring System for Global Mobile Payments
System
The Global Mobile Payments Monitoring and Regulation System (GMPMS) was
implemented by the CBN at the NIBSS to process the daily transaction data of all
licensed MMOs.
7.12 Guidelines on Mobile Money Services in Nigeria
Following the growth of mobile telephony in Nigeria and the need to foster
financial inclusion and an orderly development, guidelines for mobile money
services were released. The guidelines provide for the operation, participation,
41
minimum requirements and functionalities expected of a mobile payment service
or solution in the country.
The guidelines identify two models for the implementation of mobile money
services namely:
Bank-Led Model - involves a bank, either alone or a consortium of banks that
seek to deliver banking services, leveraging on the mobile payments system.
Non-Bank Led Model - involves a corporate organisation (other than a deposit
money bank or a telecommunication company) that has been duly licensed by the
CBN to deliver mobile money services to customers.
The provisions of the guidelines for the regulation of agent banking and agent
banking relationships in Nigeria applied to Mobile Money Agent Network.
The lead initiator will be responsible for the provision of enabling infrastructure
that will facilitate transaction processing, clearing, settlement and management.
Appropriate guide for risk management, business continuity plan, know your
customer (KYC), customer due diligence (CDD) and Consumer protection
measures are also clearly articulated in the guidelines. Mobile money services are
expected to address the financial needs of the unbanked Nigerians in rural areas,
improve savings, provide jobs, create wealth and drive the nation’s economy by
increasing business activities. It should also reduce the huge costs associated with
cash transactions.

42
APPENDIX 1
Index of Financial Markets Regulatory Circulars / Guidelines Issued January – December 2015 S/N Date Issued REFERENCE NO. Title Department Remark
1. 19-01-15 BPS/DIR/GEN/CIR/06/002 Circular on Nigerian Issued Card Present Fraud in non- Environments
BPS New
2. 19-01-15 BPS/DIR/GEN/CIR/06/001 Circular on Implementation of two Factor Authentication for Internal Banking Processes
BPS New
3. 21-01-15 TED/FEM/FPC/GEN/01/002 Utilization of RDAS and Inter-bank
Funds/Review of the foreign Exchange trading positions of banks
TED New
4. 22-01-15 FPR/DIR/GEN/CIR/04/004 Circular to all Banks, Discount Houses and other Financial Institutions on Compliance with the United States of America’s Foreign Accounts Tax Compliance Act
FPR New
5. 23-01-15 TED/FEM/FPC/GEN/01/003 Review of Weekly Foreign Exchange Cash
Sales to Bureau De change (BDC) Operators
TED Revised
6. 29-01-15 BPS/DIR/GEN/CIR/06/002 Circular on Nigerian Issued Card Present Fraud in Non-Environments
BPS New
7. 03-02-15 TED/FEM/FPC/GEN/01/004 Special Intervention in the Bureau De Change (BDC) Segment of the Foreign Exchange Market
TED New
8. 09-02-15 BPS/DIR/GEN/CIR/02/004 Exposure Draft on the Guidelines for Banking Operations in the Free Trade Zones in
Nigeria
BPS New
9. 13-02-15 FPR/DIR/GUI/NIB/01/002 Guideline on the Governance of Advisory Council of Experts for Non-Interest (Islamic)
FPR New

43
Financial Institution in Nigeria
10. 16-02-15 FPR/DIR/CIR/GEN/01/003 Circular to all Deposit Taking Financial
Institutions and Stakeholders in the Financial Services Industry: Exposure Draft Guidelines for the Management of Dormant Accounts by Banks in Nigeria
FPR New
11. 16-02-15 FPR/DIR/GEN/CIR/01/045 Circular to all Banks, Discount Houses and
Other Financial Institution, Time Bar for Resolution of Customers’ Complains
FPR New
12. 19-02-15 TED/FEM/FPC/GEN/01/005 Repatriation of Exports Proceeds (Oil and Non-Oil)
TED Revised
13. 20-02-15 FPR/DIR/GUI/NIB/01/001 Guideline on the Governance of Advisory
Council of Experts for Non-Interest (Islamic) Financial Institution in Nigeria
FPR New
14. 20-02-15 TED/FEM/FPC/GEN/01/006 RE: Unfettered Access to Funds in Export Proceeds Domiciliary Accounts.
TED Revised
15. 25-02-15 BPS/CSO/CON/DIR/01/079 Commencement of Federal Government’s
Independent Revenue E-Collection Scheme under the Treasury Single Account (TSA) Initiative
BPS New
16. 11-03-15 FPR/DIR/GEN/CIR/01/004 Terms and Conditions for Participation by Deposit Money Banks (DMBs) in the
Implementation and Execution of Nigeria Electricity Market Stabilization Facility (CBN-NEMSF)
FPR New
17. 01-04-15 BPS/DIR/GEN/CIR/02/010 Regulatory Framework for Licensing Super
Agents in Nigeria
BPS New
18. 01-04-15 BPS/DIR/GEN/CIR/02/008 Guidelines on Mobile Money Services in BPS New

44
Nigeria
19. 13-04-15 TED/FEM/FPC/GEN/01/007 Usage of Naira Denominated Cards Overseas TED Revised
20. 18-05-15 FPR/DIR/CIR/GEN/05/005 Amendment to Pricing of Commercial Agricultural Credit Scheme (CACS) and Guidelines.
FPR Revised
21. 20-05-15 FPR/DIR/CIR/GEN/05/004 Circular to all Non-Interest (Islamic)
Financial Institutions on the treatment of Hamish Al Jiddiya (Earnest Deposit)
FPR New
22. 26-05-15 BPS/DIR/GEN/05/008 Re: Process for Linking the BVN with Customers Account on the Core banking Applications by Banks
BPS Revised
23. 10-06-15 FPR/DIR/BDC/GEN/05/011 Updated List of Confirmed Bureau de Change in Compliance with New Requirement
FPR Revised
24. 12-06-15 BPS/DIR/GEN/CIR/02/004 Establishment of Industry Fraud Desks BPS New
25. 23-06-15 TED/FEM/FPC/01/010 Inclusion of Some Imported Goods and
Services on the list of Items not valid for Foreign Exchange in the Nigerian Foreign Exchange Market
TED New
26. 24-06-15 FPR/DIR/CIR/GEN/05/007 Circular to all Banks on the Redesign of the Credit Risk Management System
FPR New
27. 24-06-15 TED/FEM/FPC/GEN/01/010 Inclusion of Some Imported Goods and Services on the List of Items Not Valid for Foreign Exchange in the Nigerian Foreign Exchange Market - UPDATED
TED Revised
28. 26-06-15 TED/FEM/FPC/GEN/01/010 Inclusion of Some Imported Goods and
Services on the List of Items Not Valid for Foreign Exchange in the Nigerian Foreign
TED Revised
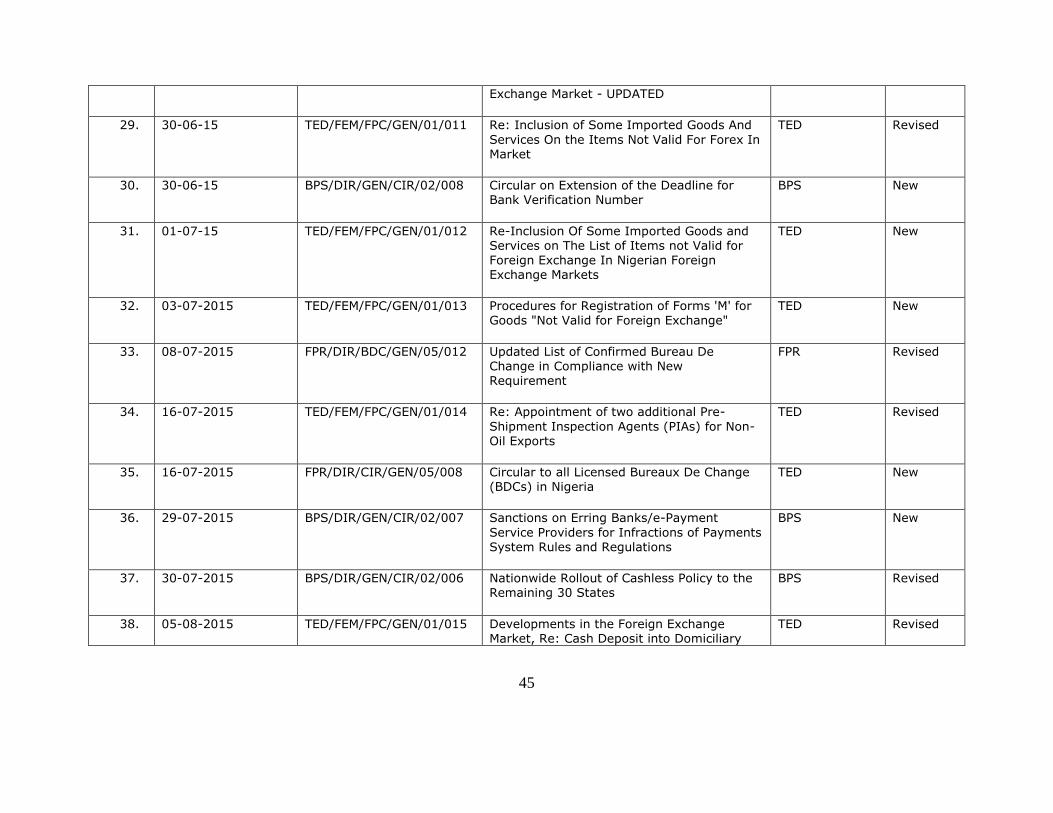
45
Exchange Market - UPDATED
29. 30-06-15 TED/FEM/FPC/GEN/01/011 Re: Inclusion of Some Imported Goods And
Services On the Items Not Valid For Forex In Market
TED Revised
30. 30-06-15 BPS/DIR/GEN/CIR/02/008 Circular on Extension of the Deadline for Bank Verification Number
BPS New
31. 01-07-15 TED/FEM/FPC/GEN/01/012 Re-Inclusion Of Some Imported Goods and Services on The List of Items not Valid for
Foreign Exchange In Nigerian Foreign Exchange Markets
TED New
32. 03-07-2015 TED/FEM/FPC/GEN/01/013 Procedures for Registration of Forms 'M' for Goods "Not Valid for Foreign Exchange"
TED New
33. 08-07-2015 FPR/DIR/BDC/GEN/05/012 Updated List of Confirmed Bureau De Change in Compliance with New Requirement
FPR Revised
34. 16-07-2015 TED/FEM/FPC/GEN/01/014 Re: Appointment of two additional Pre-
Shipment Inspection Agents (PIAs) for Non-
Oil Exports
TED Revised
35. 16-07-2015 FPR/DIR/CIR/GEN/05/008 Circular to all Licensed Bureaux De Change (BDCs) in Nigeria
TED New
36. 29-07-2015 BPS/DIR/GEN/CIR/02/007 Sanctions on Erring Banks/e-Payment
Service Providers for Infractions of Payments System Rules and Regulations
BPS New
37. 30-07-2015 BPS/DIR/GEN/CIR/02/006 Nationwide Rollout of Cashless Policy to the Remaining 30 States
BPS Revised
38. 05-08-2015 TED/FEM/FPC/GEN/01/015 Developments in the Foreign Exchange Market, Re: Cash Deposit into Domiciliary
TED Revised
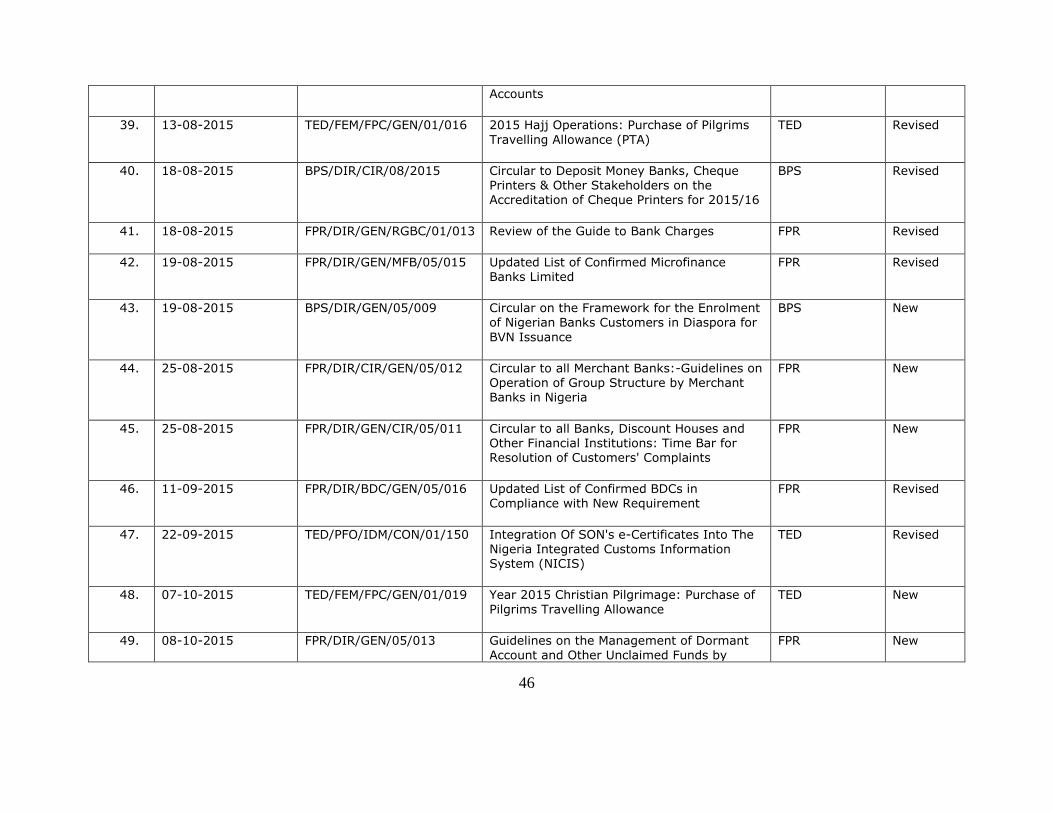
46
Accounts
39. 13-08-2015 TED/FEM/FPC/GEN/01/016 2015 Hajj Operations: Purchase of Pilgrims
Travelling Allowance (PTA)
TED Revised
40. 18-08-2015 BPS/DIR/CIR/08/2015 Circular to Deposit Money Banks, Cheque Printers & Other Stakeholders on the Accreditation of Cheque Printers for 2015/16
BPS Revised
41. 18-08-2015 FPR/DIR/GEN/RGBC/01/013 Review of the Guide to Bank Charges FPR Revised
42. 19-08-2015 FPR/DIR/GEN/MFB/05/015 Updated List of Confirmed Microfinance Banks Limited
FPR Revised
43. 19-08-2015 BPS/DIR/GEN/05/009 Circular on the Framework for the Enrolment of Nigerian Banks Customers in Diaspora for
BVN Issuance
BPS New
44. 25-08-2015 FPR/DIR/CIR/GEN/05/012 Circular to all Merchant Banks:-Guidelines on Operation of Group Structure by Merchant Banks in Nigeria
FPR New
45. 25-08-2015 FPR/DIR/GEN/CIR/05/011 Circular to all Banks, Discount Houses and Other Financial Institutions: Time Bar for Resolution of Customers' Complaints
FPR New
46. 11-09-2015 FPR/DIR/BDC/GEN/05/016 Updated List of Confirmed BDCs in Compliance with New Requirement
FPR Revised
47. 22-09-2015 TED/PFO/IDM/CON/01/150 Integration Of SON's e-Certificates Into The Nigeria Integrated Customs Information System (NICIS)
TED Revised
48. 07-10-2015 TED/FEM/FPC/GEN/01/019 Year 2015 Christian Pilgrimage: Purchase of
Pilgrims Travelling Allowance
TED New
49. 08-10-2015 FPR/DIR/GEN/05/013 Guidelines on the Management of Dormant Account and Other Unclaimed Funds by
FPR New

47
Banks and Other Financial Institutions in Nigeria
50. 12-10-2015 TED/FEM/FPC/GEN/01/020 Re: 2015 Christian Pilgrimage: Purchase of Pilgrims Travelling Allowance
TED Revised
51. 14-10-2015 FPR/DIR/BDC/GEN/05/017 Updated List of Confirmed BDCs in Compliance with new Requirement
FPR Revised
52. 21-10-2015 FPR/DIR/CIR/GEN/05/014 Circular to All Banks and Other Financial Institutions: Revised Assessment criteria for
Approved Persons' Regime For Financial Institutions
FPR Revised
53. 21-10-2015 FPR/DIR/CIR/GEN/05/013 Circular to All Banks and Licensed Bureaux De Change (BDCs) on the use of Bank
Verification Number
TED New
54. 23-10-2015 TED/FEM/FPC/GEN/01/021 Re: Inclusion of Some Imported Goods and Services on the List of Items Not Valid for Foreign Exchange in the Nigerian Foreign Exchange Markets
TED Revised
55. 02-11-2015 BPS/DIR/GEN/CIR/02/033 Extension Of BVN For Nigeria Bank Customers In Diaspora And Other Related Matters
BPS Revised
56. 04-11-2015 BPS/DIR/GEN/CIR/02/011 Circular on the Implementation of the Global Mobile Payments Monitoring & Regulation
System
BPS New
57. 18-11-2015 TED/FEM/FPC/GEN/01/022 Guidelines on International Mobile Money Remittance Service in Nigeria
TED New
58. 11-12-2015 FPR/DIR/CIR/GEN/01/030 Circular to all Bureaux De Change: Revised
Operational Guidelines for Bureaux De Change in Nigeria
FPR Revised

48
59. 31-12-2015 FPR/DIR/MFB/GEN/05/020 Licensed Microfinance Banks (MFBs) in Nigeria as at December 31, 2015
FPR New
60. 31-12-2015 FPR/DIR/BDC/GEN/05/019 Confirmed Bureaux De Change in Compliance with the New Requirements for the Operation of BDCs in Nigeria as at December 31, 2015
FPR Revised
61. 31-12-2015 FPR/DIR/GEN/CIR/01/035 Payment of Annual License Renewal Fee
Through Electronic Channels
FPR New
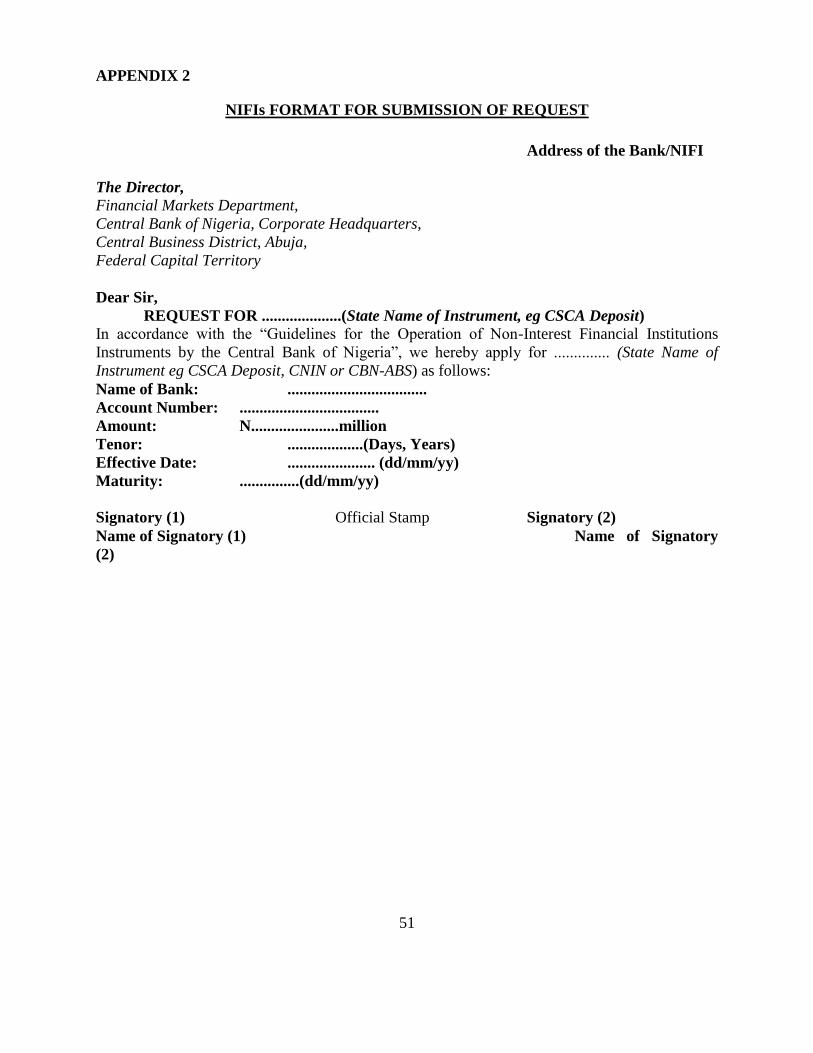
51
APPENDIX 2
NIFIs FORMAT FOR SUBMISSION OF REQUEST
Address of the Bank/NIFI
The Director,
Financial Markets Department,
Central Bank of Nigeria, Corporate Headquarters,
Central Business District, Abuja,
Federal Capital Territory
Dear Sir,
REQUEST FOR ....................(State Name of Instrument, eg CSCA Deposit)
In accordance with the “Guidelines for the Operation of Non-Interest Financial Institutions
Instruments by the Central Bank of Nigeria”, we hereby apply for .............. (State Name of
Instrument eg CSCA Deposit, CNIN or CBN-ABS) as follows:
Name of Bank: ...................................
Account Number: ...................................
Amount: N......................million
Tenor: ...................(Days, Years)
Effective Date: ...................... (dd/mm/yy)
Maturity: ...............(dd/mm/yy)
Signatory (1) Official Stamp Signatory (2)
Name of Signatory (1) Name of Signatory
(2)

52
2014
January 870.00 1,778.09 1,091.49 10.0500-16.6000 11.2000-12.1000 115 45.79
February 820.00 587.84 307.40 12.0000-16.5000 12.1000-13.1000 129 13.68
March 620.00 933.68 714.57 12.8000-14.0000 13.0400-13.1000 133 35
April 220.00 424.07 285.94 11.5000-13.4000 12.0000-13.1000 122 12.1
May 420.00 1,476.73 905.99 9.9500-12.0000 10.8000-11.0000 116 31.8
June 500.00 1,351.00 1,179.54 10.5500-12.0000 10.7500-10.8000 122 42.99
July 200.00 812.92 810.92 10.6000-11.2500 10.8000-10.8000 129 30.54
August 190.00 654.53 654.53 10.75000-10.8000 10.8000-10.8000 133 25.79
September 660.00 1,096.87 989.58 10.5500-11.0000 10.5500-10.8800 141 42.52
October 570.00 963.87 652.50 10.5000-14.0000 10.8000-11.0000 158 31.9
November 320.00 1,012.68 830.23 10.5000-15.0000 10.8000-13.0000 163 41.27
December 150.00 236.92 0.00 14.3000-19.0000 NIL 137 0
Total 5,540.00 11,329.20 8,422.69 353.38
2015
January 510 1,657.29 1,295.88 14.0000-18.0000 14.2000-14.3000 168 80.42
February 220 318.99 217.33 13.9000-17.0000 14.5000-14.8400 192 16.55
March 360 620.84 543.86 14.7500-16.0000 14.8400-14.8500 188 41.91
April 300 1,027.45 933.74 13.2000-14.8500 14.0000-14.8400 261 98.17
May 290 719.16 524.54 13.7500-14.0000 13.9000-14.0000 202 42.64
June 400 1,011.26 746.37 10.5000-13.9000 11.4500-13.8000 148 43.86
July 530 963.38 771.82 13.3700-14.0000 13.7000-14.0000 235 73.64
August 180 226.72 73.27 14.0000-16.5000 14.0000-14.0000 329 9.69
September 280 632.43 53.08 13.2500-17.0000 13.5 300 5.36
October 0 0 0 0 0 0 0
November 0 0 0 0 0 0 0
December 200 736.95 482.15 7.0000-13.500 7.4800-8.0000 273 29.07
Total 3,270.00 7,914.47 5,645.04 441.31
COST OF
LIQUIDITY
MANAGEMENT(
N'BILLION)
PeriodSubscription
(N’Billion)
Average Tenor
(Days)
Table 2.1
OMO Subscription and Sales
Offer
(N’Billion)
Sales
(N’Billion)Bid Rate (%) Stop Rate (%)
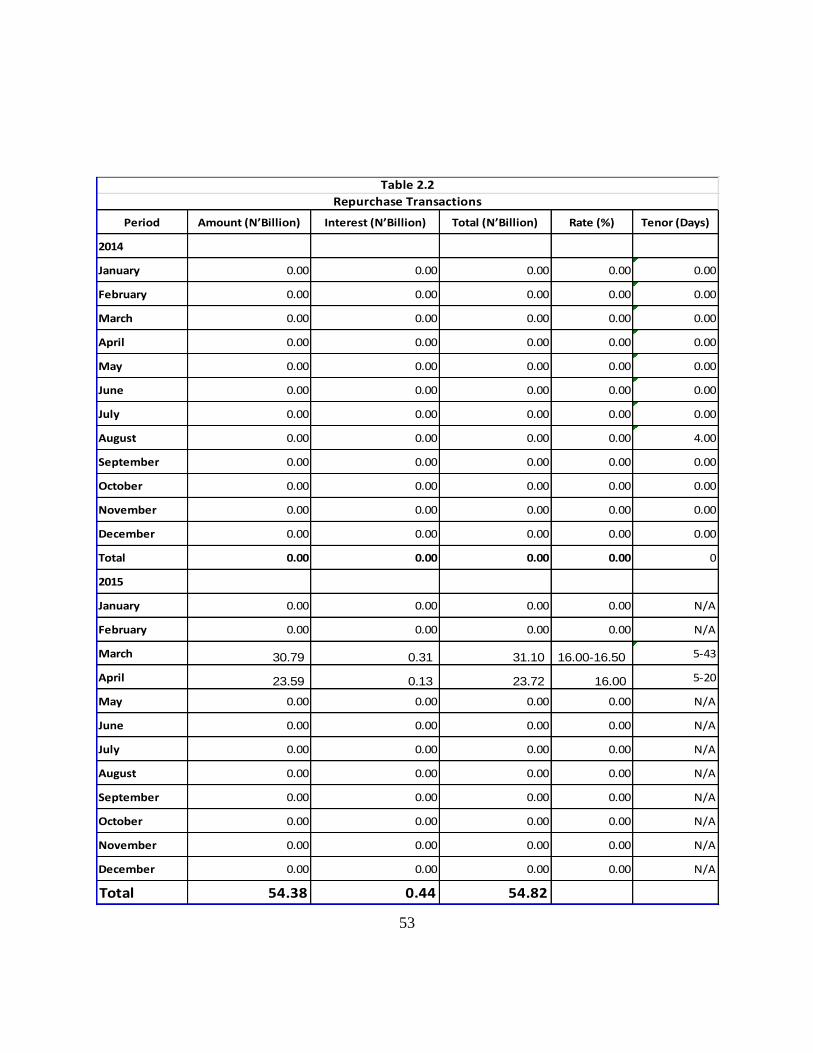
53
Period Amount (N’Billion) Interest (N’Billion) Total (N’Billion) Rate (%) Tenor (Days)
2014
January 0.00 0.00 0.00 0.00 0.00
February 0.00 0.00 0.00 0.00 0.00
March 0.00 0.00 0.00 0.00 0.00
April 0.00 0.00 0.00 0.00 0.00
May 0.00 0.00 0.00 0.00 0.00
June 0.00 0.00 0.00 0.00 0.00
July 0.00 0.00 0.00 0.00 0.00
August 0.00 0.00 0.00 0.00 4.00
September 0.00 0.00 0.00 0.00 0.00
October 0.00 0.00 0.00 0.00 0.00
November 0.00 0.00 0.00 0.00 0.00
December 0.00 0.00 0.00 0.00 0.00
Total 0.00 0.00 0.00 0.00 0
2015
January 0.00 0.00 0.00 0.00 N/A
February 0.00 0.00 0.00 0.00 N/A
March 30.79 0.31 31.10 16.00-16.50 5-43
April 23.59 0.13 23.72 16.00 5-20
May 0.00 0.00 0.00 0.00 N/A
June 0.00 0.00 0.00 0.00 N/A
July 0.00 0.00 0.00 0.00 N/A
August 0.00 0.00 0.00 0.00 N/A
September 0.00 0.00 0.00 0.00 N/A
October 0.00 0.00 0.00 0.00 N/A
November 0.00 0.00 0.00 0.00 N/A
December 0.00 0.00 0.00 0.00 N/A
Total 54.38 0.44 54.82
Table 2.2
Repurchase Transactions
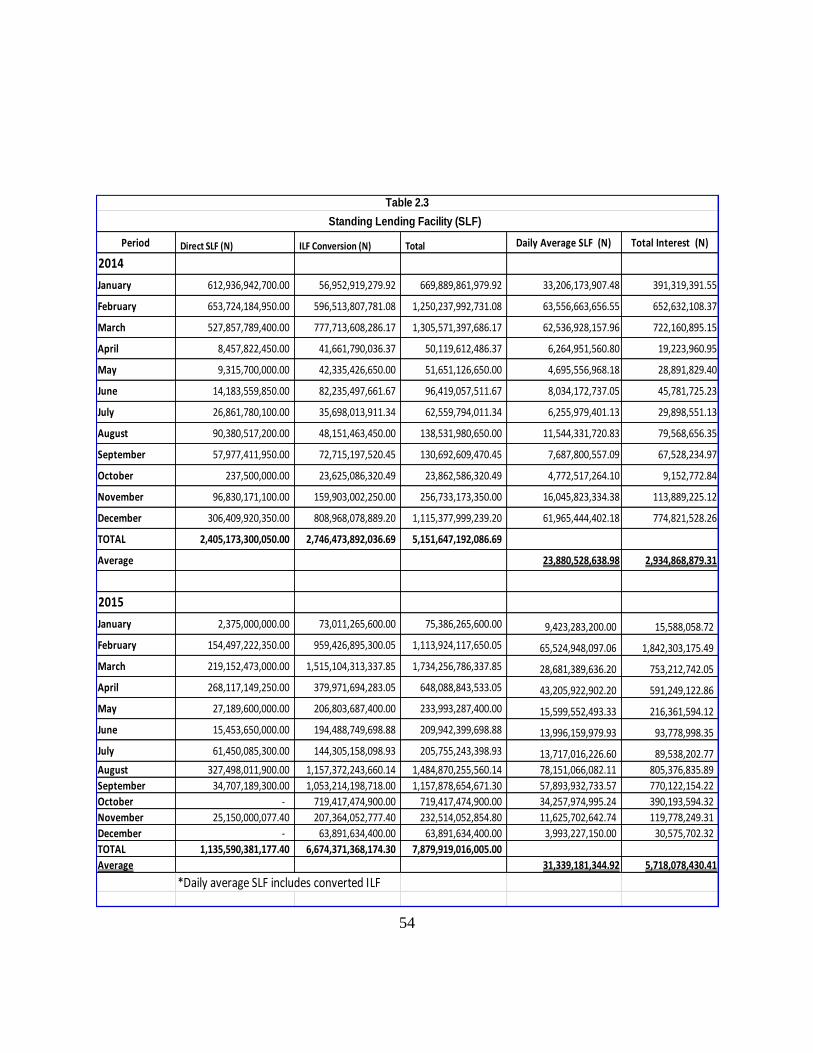
54
Period Direct SLF (N) ILF Conversion (N) Total Daily Average SLF (N) Total Interest (N)
2014
January 612,936,942,700.00 56,952,919,279.92 669,889,861,979.92 33,206,173,907.48 391,319,391.55
February 653,724,184,950.00 596,513,807,781.08 1,250,237,992,731.08 63,556,663,656.55 652,632,108.37
March 527,857,789,400.00 777,713,608,286.17 1,305,571,397,686.17 62,536,928,157.96 722,160,895.15
April 8,457,822,450.00 41,661,790,036.37 50,119,612,486.37 6,264,951,560.80 19,223,960.95
May 9,315,700,000.00 42,335,426,650.00 51,651,126,650.00 4,695,556,968.18 28,891,829.40
June 14,183,559,850.00 82,235,497,661.67 96,419,057,511.67 8,034,172,737.05 45,781,725.23
July 26,861,780,100.00 35,698,013,911.34 62,559,794,011.34 6,255,979,401.13 29,898,551.13
August 90,380,517,200.00 48,151,463,450.00 138,531,980,650.00 11,544,331,720.83 79,568,656.35
September 57,977,411,950.00 72,715,197,520.45 130,692,609,470.45 7,687,800,557.09 67,528,234.97
October 237,500,000.00 23,625,086,320.49 23,862,586,320.49 4,772,517,264.10 9,152,772.84
November 96,830,171,100.00 159,903,002,250.00 256,733,173,350.00 16,045,823,334.38 113,889,225.12
December 306,409,920,350.00 808,968,078,889.20 1,115,377,999,239.20 61,965,444,402.18 774,821,528.26
TOTAL 2,405,173,300,050.00 2,746,473,892,036.69 5,151,647,192,086.69
Average 23,880,528,638.98 2,934,868,879.31
2015
January 2,375,000,000.00 73,011,265,600.00 75,386,265,600.00 9,423,283,200.00 15,588,058.72
February 154,497,222,350.00 959,426,895,300.05 1,113,924,117,650.05 65,524,948,097.06 1,842,303,175.49
March 219,152,473,000.00 1,515,104,313,337.85 1,734,256,786,337.85 28,681,389,636.20 753,212,742.05
April 268,117,149,250.00 379,971,694,283.05 648,088,843,533.05 43,205,922,902.20 591,249,122.86
May 27,189,600,000.00 206,803,687,400.00 233,993,287,400.00 15,599,552,493.33 216,361,594.12
June 15,453,650,000.00 194,488,749,698.88 209,942,399,698.88 13,996,159,979.93 93,778,998.35
July 61,450,085,300.00 144,305,158,098.93 205,755,243,398.93 13,717,016,226.60 89,538,202.77
August 327,498,011,900.00 1,157,372,243,660.14 1,484,870,255,560.14 78,151,066,082.11 805,376,835.89
September 34,707,189,300.00 1,053,214,198,718.00 1,157,878,654,671.30 57,893,932,733.57 770,122,154.22
October - 719,417,474,900.00 719,417,474,900.00 34,257,974,995.24 390,193,594.32
November 25,150,000,077.40 207,364,052,777.40 232,514,052,854.80 11,625,702,642.74 119,778,249.31
December - 63,891,634,400.00 63,891,634,400.00 3,993,227,150.00 30,575,702.32
TOTAL 1,135,590,381,177.40 6,674,371,368,174.30 7,879,919,016,005.00
Average 31,339,181,344.92 5,718,078,430.41
*Daily average SLF includes converted ILF
Table 2.3
Standing Lending Facility (SLF)

55
Period TOTAL SDF (N) Daily Average SDF (N) Total Interest (N)
2014
January 13,540,580,000,000.00 644,789,523,809.52 5,451,013,698.63
February 4,651,920,000,000.00 232,596,000,000.00 1,736,580,821.92
March 5,844,759,600,000.00 278,321,885,714.29 2,236,838,246.58
April 8,311,782,000,000.00 415,589,100,000.00 3,442,840,000.00
May 8,069,625,080,000.00 403,481,254,000.00 3,535,743,309.59
June 5,912,500,000,000.00 281,547,619,047.62 2,346,908,493.15
July 7,412,590,500,000.00 352,980,500,000.00 2,949,038,493.15
August 4,314,596,090,000.00 205,456,956,666.67 1,939,361,668.49
September 6,745,550,000,000.00 306,615,909,090.91 2,742,729,863.01
October 7,493,190,000,000.00 374,659,500,000.00 2,634,843,561.64
November 2,818,957,000,000.00 140,947,850,000.00 1,002,315,342.47
December 809,663,000,000.00 42,613,842,105.26 365,839,808.22
TOTAL 75,925,713,270,000.00
Average 306,633,328,369.52 30,384,053,306.85
2015
January 2,574,076,199,880.40 128,703,809,994.02 1,287,293,232.77
February 879,151,000,000.00 48,841,722,222.22 377,376,246.58
March 1,380,829,000,000.00 62,764,954,545.45 621,438,219.18
April 901,191,000,000.00 53,011,235,294.12 559,651,972.60
May 1,990,062,000,000.00 104,740,105,263.26 907,732,356.16
June 1,745,854,000,000.00 79,357,000,000.00 771,442,958.90
July 2,036,488,000,000.00 96,975,619,047.62 1,026,550,739.73
August 773,215,000,000.00 38,660,750,000.00 221,335,369.86
September 1,917,079,000,000.00 95,853,950,000.00 901,494,000.00
October 2,647,980,900,000.00 126,094,328,571.43 1,179,651,723.29
November 3,021,528,800,000.00 143,882,323,809.52 1,086,301,473.97
December 2,902,293,000,000.00 145,114,650,000.00 493,510,684.93
TOTAL 22,769,747,899,880.40
Average 93,666,704,062.30 9,433,778,977.97
Table 2.4
Daily Average Standing Deposit Facility (N)
Standing Deposit Facility (SDF)
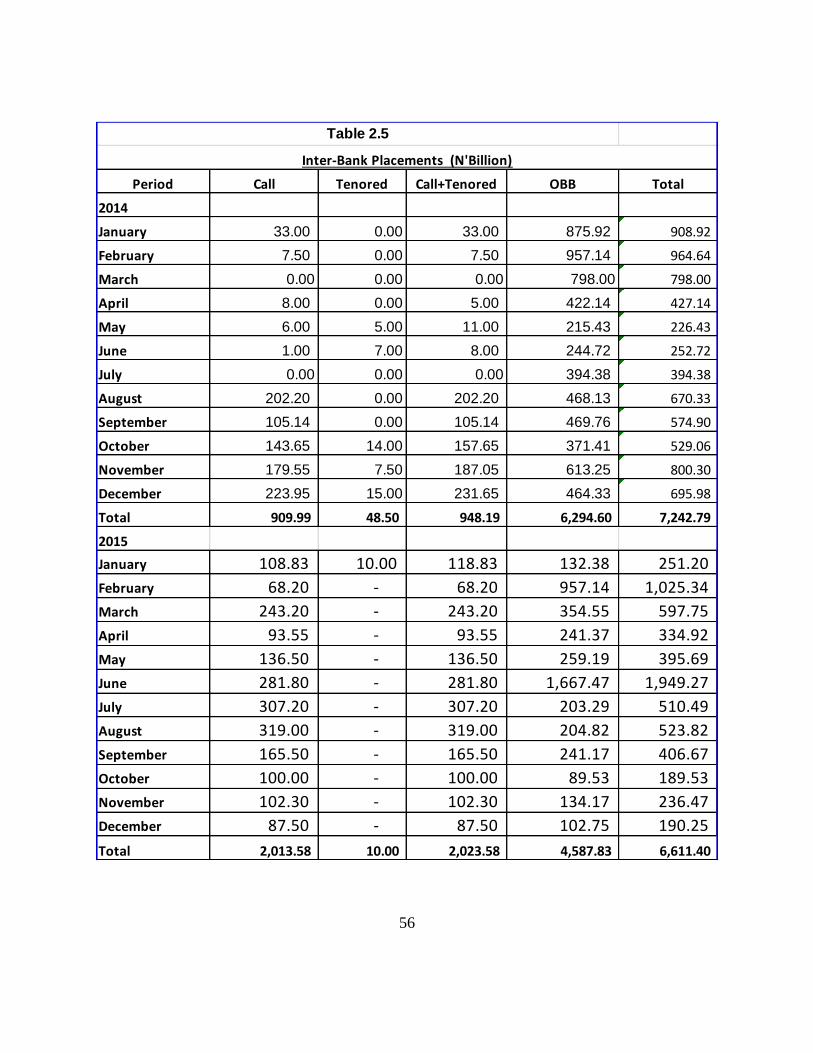
56
Period Call Tenored Call+Tenored OBB Total
2014
January 33.00 0.00 33.00 875.92 908.92
February 7.50 0.00 7.50 957.14 964.64
March 0.00 0.00 0.00 798.00 798.00
April 8.00 0.00 5.00 422.14 427.14
May 6.00 5.00 11.00 215.43 226.43
June 1.00 7.00 8.00 244.72 252.72
July 0.00 0.00 0.00 394.38 394.38
August 202.20 0.00 202.20 468.13 670.33
September 105.14 0.00 105.14 469.76 574.90
October 143.65 14.00 157.65 371.41 529.06
November 179.55 7.50 187.05 613.25 800.30
December 223.95 15.00 231.65 464.33 695.98
Total 909.99 48.50 948.19 6,294.60 7,242.79
2015
January 108.83 10.00 118.83 132.38 251.20
February 68.20 - 68.20 957.14 1,025.34
March 243.20 - 243.20 354.55 597.75
April 93.55 - 93.55 241.37 334.92
May 136.50 - 136.50 259.19 395.69
June 281.80 - 281.80 1,667.47 1,949.27
July 307.20 - 307.20 203.29 510.49
August 319.00 - 319.00 204.82 523.82
September 165.50 - 165.50 241.17 406.67
October 100.00 - 100.00 89.53 189.53
November 102.30 - 102.30 134.17 236.47
December 87.50 - 87.50 102.75 190.25
Total 2,013.58 10.00 2,023.58 4,587.83 6,611.40
Table 2.5
Inter-Bank Placements (N'Billion)
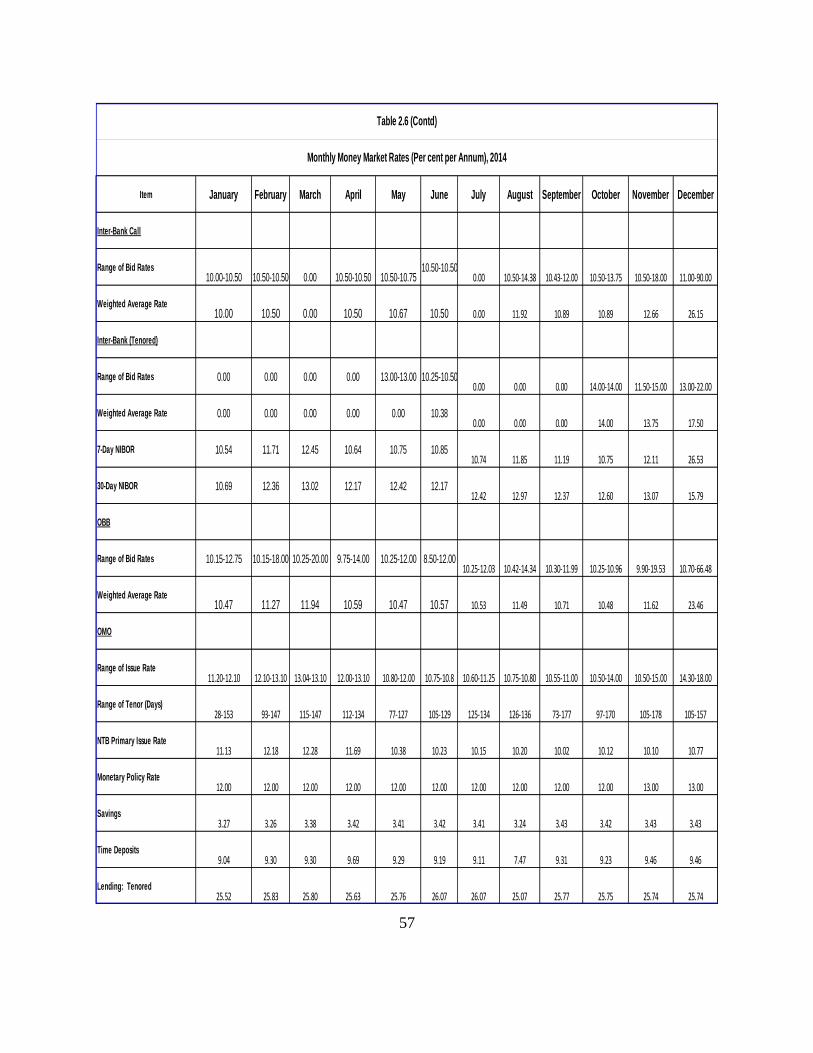
57
Item January February March April May June July August September October November December
Inter-Bank Call
Range of Bid Rates10.00-10.50 10.50-10.50 0.00 10.50-10.50 10.50-10.75
10.50-10.500.00 10.50-14.38 10.43-12.00 10.50-13.75 10.50-18.00 11.00-90.00
Weighted Average Rate10.00 10.50 0.00 10.50 10.67 10.50 0.00 11.92 10.89 10.89 12.66 26.15
Inter-Bank (Tenored)
Range of Bid Rates 0.00 0.00 0.00 0.00 13.00-13.00 10.25-10.500.00 0.00 0.00 14.00-14.00 11.50-15.00 13.00-22.00
Weighted Average Rate 0.00 0.00 0.00 0.00 0.00 10.380.00 0.00 0.00 14.00 13.75 17.50
7-Day NIBOR 10.54 11.71 12.45 10.64 10.75 10.8510.74 11.85 11.19 10.75 12.11 26.53
30-Day NIBOR 10.69 12.36 13.02 12.17 12.42 12.1712.42 12.97 12.37 12.60 13.07 15.79
OBB
Range of Bid Rates 10.15-12.75 10.15-18.00 10.25-20.00 9.75-14.00 10.25-12.00 8.50-12.0010.25-12.03 10.42-14.34 10.30-11.99 10.25-10.96 9.90-19.53 10.70-66.48
Weighted Average Rate10.47 11.27 11.94 10.59 10.47 10.57 10.53 11.49 10.71 10.48 11.62 23.46
OMO
Range of Issue Rate11.20-12.10 12.10-13.10 13.04-13.10 12.00-13.10 10.80-12.00 10.75-10.8 10.60-11.25 10.75-10.80 10.55-11.00 10.50-14.00 10.50-15.00 14.30-18.00
Range of Tenor (Days)28-153 93-147 115-147 112-134 77-127 105-129 125-134 126-136 73-177 97-170 105-178 105-157
NTB Primary Issue Rate11.13 12.18 12.28 11.69 10.38 10.23 10.15 10.20 10.02 10.12 10.10 10.77
Monetary Policy Rate12.00 12.00 12.00 12.00 12.00 12.00 12.00 12.00 12.00 12.00 13.00 13.00
Savings3.27 3.26 3.38 3.42 3.41 3.42 3.41 3.24 3.43 3.42 3.43 3.43
Time Deposits9.04 9.30 9.30 9.69 9.29 9.19 9.11 7.47 9.31 9.23 9.46 9.46
Lending: Tenored25.52 25.83 25.80 25.63 25.76 26.07 26.07 25.07 25.77 25.75 25.74 25.74
Table 2.6 (Contd)
Monthly Money Market Rates (Per cent per Annum), 2014
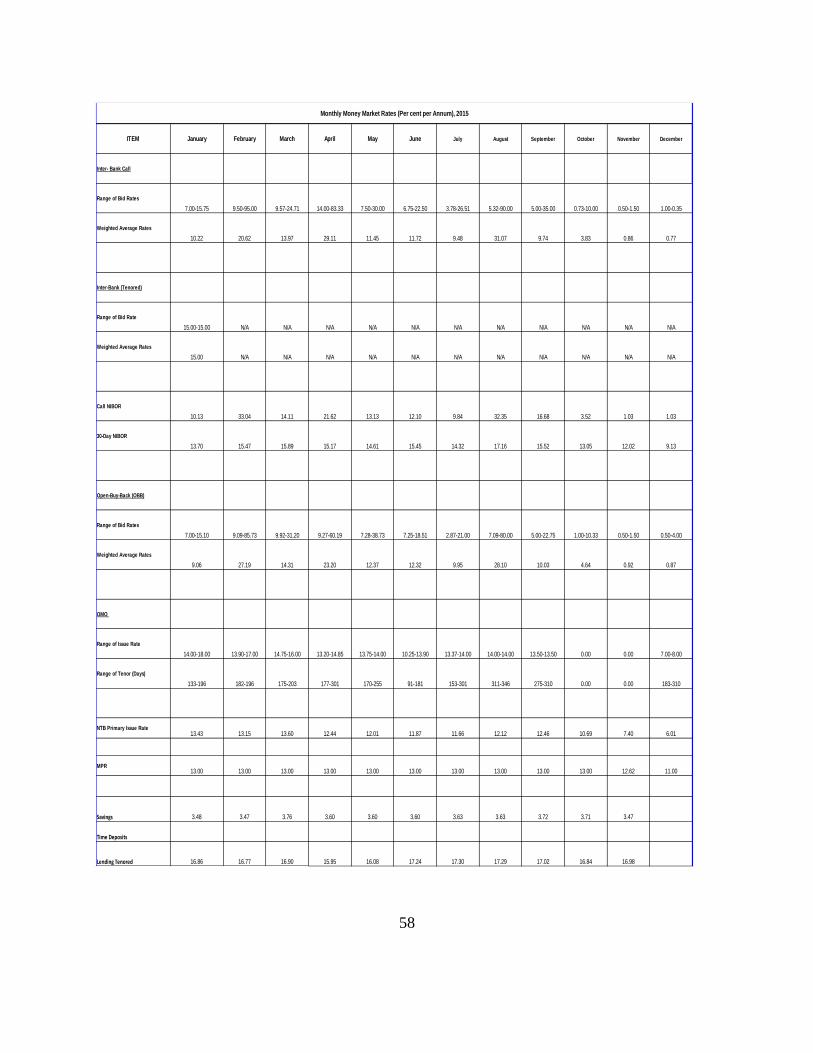
58
ITEM January February March April May June July August September October November December
Inter- Bank Call
Range of Bid Rates
7.00-15.75 9.50-95.00 9.57-24.71 14.00-83.33 7.50-30.00 6.75-22.50 3.78-26.51 5.32-90.00 5.00-35.00 0.73-10.00 0.50-1.50 1.00-0.35
Weighted Average Rates
10.22 20.62 13.97 29.11 11.45 11.72 9.48 31.07 9.74 3.83 0.86 0.77
Inter-Bank (Tenored)
Range of Bid Rate
15.00-15.00 N/A N/A N/A N/A N/A N/A N/A N/A N/A N/A N/A
Weighted Average Rates
15.00 N/A N/A N/A N/A N/A N/A N/A N/A N/A N/A N/A
Call NIBOR
10.13 33.04 14.11 21.62 13.13 12.10 9.84 32.35 16.68 3.52 1.03 1.03
30-Day NIBOR
13.70 15.47 15.89 15.17 14.61 15.45 14.32 17.16 15.52 13.05 12.02 9.13
Open-Buy-Back (OBB)
Range of Bid Rates
7.00-15.10 9.09-85.73 9.92-31.20 9.27-60.19 7.28-38.73 7.25-18.51 2.87-21.00 7.09-80.00 5.00-22.75 1.00-10.33 0.50-1.50 0.50-4.00
Weighted Average Rates
9.06 27.19 14.31 23.20 12.37 12.32 9.95 28.10 10.03 4.64 0.92 0.87
OMO
Range of Issue Rate
14.00-18.00 13.90-17.00 14.75-16.00 13.20-14.85 13.75-14.00 10.25-13.90 13.37-14.00 14.00-14.00 13.50-13.50 0.00 0.00 7.00-8.00
Range of Tenor (Days)
133-196 182-196 175-203 177-301 170-255 91-181 153-301 311-346 275-310 0.00 0.00 183-310
NTB Primary Issue Rate13.43 13.15 13.60 12.44 12.01 11.87 11.66 12.12 12.46 10.69 7.40 6.01
MPR13.00 13.00 13.00 13.00 13.00 13.00 13.00 13.00 13.00 13.00 12.62 11.00
Savings 3.48 3.47 3.76 3.60 3.60 3.60 3.63 3.63 3.72 3.71 3.47
Time Deposits
Lending Tenored 16.86 16.77 16.90 15.95 16.08 17.24 17.30 17.29 17.02 16.84 16.98
Monthly Money Market Rates (Per cent per Annum), 2015

59
Beneficiary Assumed Bank Tranche Issue DateIssue Amount
(N)Applicable Rate (%)
Redemption
DateInterest Pay Date
2014
UBA Plc
Trade Bank, City Ex press Metropolitan, AFEX and Gulf
BanksOne Year
23/01/2014 23,530,750.00, 11.66% 31/12/2014 1 JUN & 31 JAN
2/1/2014 23,540,750.00,
2015
ECO Bank Plc ECO Bank One Year 9/9/2015 90,891,528.50 14.69% 12/8/2016 12 FEB & 12 AUG 2016
Table 2.7
Promissory Notes

60
Period Amount (N’Billion) Interest (N’Billion) Rate (%) Tenor (Days)
2014January 0.00 0.00 0.00 N/AFebruary 0.00 0.00 0.00 N/AMarch 0.00 0.00 0.00 N/AApril 45.00 0.25 15.75 9-16May 0.00 0.00 0.00 N/AJune 0.00 0.00 0.00 N/AJuly 0.00 0.00 0.00 N/AAugust 0.00 0.00 0.00 N/ASeptember 0.00 0.00 0.00 N/AOctober 0.00 0.00 0.00 N/ANovember 0.00 0.00 0.00 N/ADecember 0.00 0.00 0.00 N/A
Total 45.00 0.25 0.00 N/A
2015January 0.00 0.00 0.00 N/AFebruary 0.00 0.00 0.00 N/AMarch 0.00 0.00 0.00 N/AApril 0.00 0.00 0.00 N/AMay 0.00 0.00 0.00 N/AJune 0.00 0.00 0.00 N/AJuly 0.00 0.00 0.00 N/AAugust 0.00 0.00 0.00 N/ASeptember 0.00 0.00 0.00 N/AOctober 0.00 0.00 0.00 N/ANovember 0.00 0.00 0.00 N/ADecember 0.00 0.00 0.00 N/A
Total 0.00 0.00 0.00 N/A
Table 2.8 Rediscounting
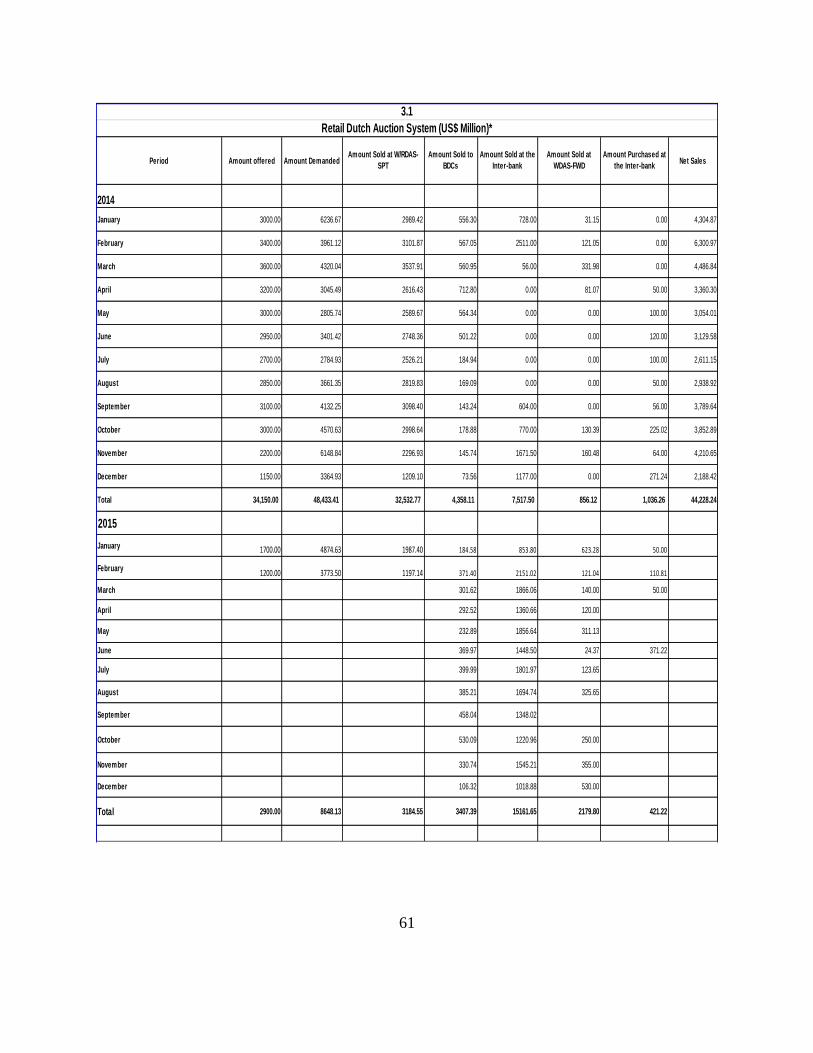
61
Period Amount offered Amount DemandedAmount Sold at W/RDAS-
SPT
Amount Sold to
BDCs
Amount Sold at the
Inter-bank
Amount Sold at
WDAS-FWD
Amount Purchased at
the Inter-bankNet Sales
2014
January 3000.00 6236.67 2989.42 556.30 728.00 31.15 0.00 4,304.87
February 3400.00 3961.12 3101.87 567.05 2511.00 121.05 0.00 6,300.97
March 3600.00 4320.04 3537.91 560.95 56.00 331.98 0.00 4,486.84
April 3200.00 3045.49 2616.43 712.80 0.00 81.07 50.00 3,360.30
May 3000.00 2805.74 2589.67 564.34 0.00 0.00 100.00 3,054.01
June 2950.00 3401.42 2748.36 501.22 0.00 0.00 120.00 3,129.58
July 2700.00 2784.93 2526.21 184.94 0.00 0.00 100.00 2,611.15
August 2850.00 3661.35 2819.83 169.09 0.00 0.00 50.00 2,938.92
September 3100.00 4132.25 3098.40 143.24 604.00 0.00 56.00 3,789.64
October 3000.00 4570.63 2998.64 178.88 770.00 130.39 225.02 3,852.89
November 2200.00 6148.84 2296.93 145.74 1671.50 160.48 64.00 4,210.65
December 1150.00 3364.93 1209.10 73.56 1177.00 0.00 271.24 2,188.42
Total 34,150.00 48,433.41 32,532.77 4,358.11 7,517.50 856.12 1,036.26 44,228.24
2015
January 1700.00 4874.63 1987.40 184.58 853.80 623.28 50.00
February 1200.00 3773.50 1197.14 371.40 2151.02 121.04 110.81
March 301.62 1866.06 140.00 50.00
April 292.52 1360.66 120.00
May 232.89 1856.64 311.13
June 369.97 1448.50 24.37 371.22
July 399.99 1801.97 123.65
August 385.21 1694.74 325.65
September 458.04 1348.02
October 530.09 1220.96 250.00
November 330.74 1545.21 355.00
December 106.32 1018.88 530.00
Total 2900.00 8648.13 3184.55 3407.39 15161.65 2179.80 421.22
3.1
Retail Dutch Auction System (US$ Million)*

62
Period
w/rDAS-SPT
(incl. 1%
comm.)
Inter-Bank BDC
Premium
b/w w/rDAS-
SPT and
Inter-Bank
Premium
b/w w/rDAS-
SPT and
BDC
2014
January 157.29 160.23 171.71 2.94 14.42
February 157.31 163.62 169.45 6.32 12.14
March 157.30 164.62 171.52 7.32 14.22
April 157.29 162.19 170.30 4.90 13.01
May 157.29 161.81 166.84 4.53 9.55
June 157.29 162.82 167.17 5.53 9.88
July 157.29 162.25 167.71 4.96 10.43
August 157.29 161.99 170.36 4.70 13.07
September 157.30 162.93 168.64 5.63 11.34
October 157.31 164.62 169.40 7.30 12.09
November 160.00 171.10 175.85 11.10 15.85
December 169.68 180.33 188.45 10.65 18.77
Average 158.55 164.88 171.45 6.32 12.90
2015
Premium
b/w
Interbank
and BDC
January 169.68 181.78 196.13 0.00 14.34
February 169.68 194.48 213.03 0.00 18.55
March * 197.07 222.93 0.00 25.86
April * 197.00 210.70 0.00 13.70
May * 197.00 219.55 0.00 22.55
June * 196.92 218.98 0.00 22.06
July * 196.97 236.30 0.00 39.33
August * 197.00 216.64 0.00 19.64
September * 197.00 222.68 0.00 25.68
October * 196.99 224.83 0.00 27.84
November * 196.99 232.40 0.00 35.41
December * 196.99 258.30 0.00 61.31
Average 169.68 195.52 222.71 0.00 27.19
*The RDAS was closed on February 18, 2015.
Table 3.2
Average w/rDAS-SPT, Inter-Bank and BDC Rates*
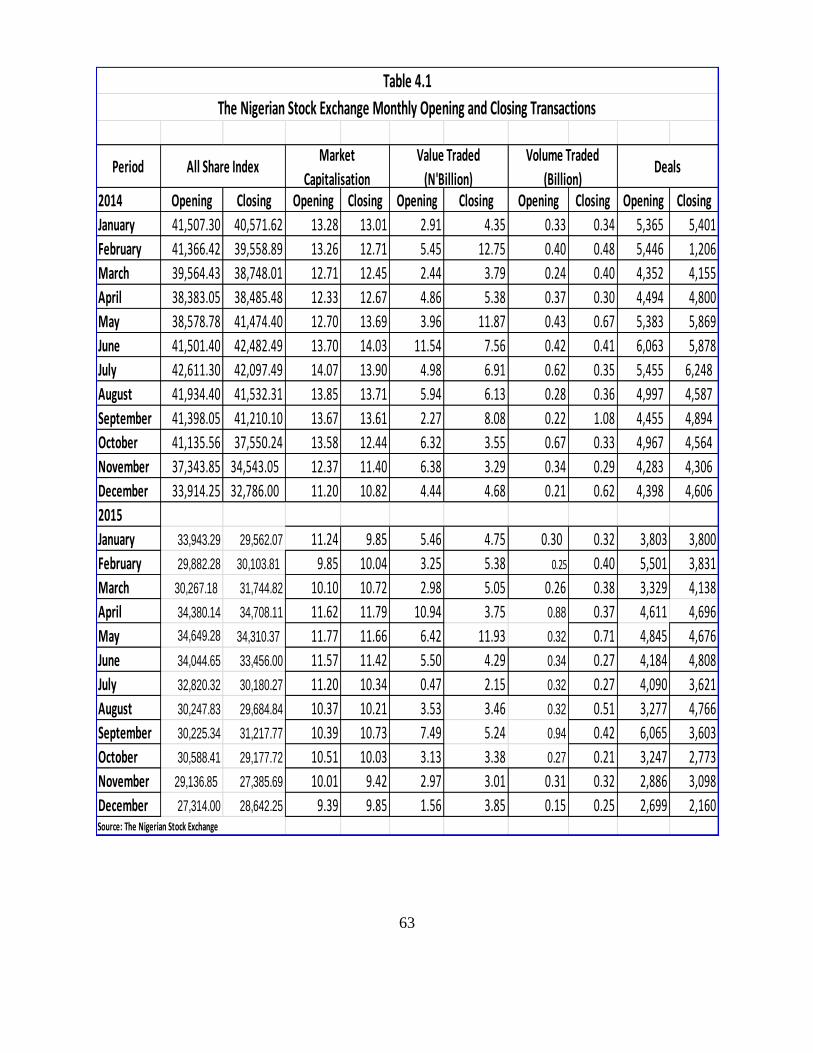
63
Period
2014 Opening Closing Opening Closing Opening Closing Opening Closing Opening Closing
January 41,507.30 40,571.62 13.28 13.01 2.91 4.35 0.33 0.34 5,365 5,401
February 41,366.42 39,558.89 13.26 12.71 5.45 12.75 0.40 0.48 5,446 1,206
March 39,564.43 38,748.01 12.71 12.45 2.44 3.79 0.24 0.40 4,352 4,155
April 38,383.05 38,485.48 12.33 12.67 4.86 5.38 0.37 0.30 4,494 4,800
May 38,578.78 41,474.40 12.70 13.69 3.96 11.87 0.43 0.67 5,383 5,869
June 41,501.40 42,482.49 13.70 14.03 11.54 7.56 0.42 0.41 6,063 5,878
July 42,611.30 42,097.49 14.07 13.90 4.98 6.91 0.62 0.35 5,455 6,248
August 41,934.40 41,532.31 13.85 13.71 5.94 6.13 0.28 0.36 4,997 4,587
September 41,398.05 41,210.10 13.67 13.61 2.27 8.08 0.22 1.08 4,455 4,894
October 41,135.56 37,550.24 13.58 12.44 6.32 3.55 0.67 0.33 4,967 4,564
November 37,343.85 34,543.05 12.37 11.40 6.38 3.29 0.34 0.29 4,283 4,306
December 33,914.25 32,786.00 11.20 10.82 4.44 4.68 0.21 0.62 4,398 4,606
2015
January 33,943.29 29,562.07 11.24 9.85 5.46 4.75 0.30 0.32 3,803 3,800
February 29,882.28 30,103.81 9.85 10.04 3.25 5.38 0.25 0.40 5,501 3,831
March 30,267.18 31,744.82 10.10 10.72 2.98 5.05 0.26 0.38 3,329 4,138
April 34,380.14 34,708.11 11.62 11.79 10.94 3.75 0.88 0.37 4,611 4,696
May 34,649.28 34,310.37 11.77 11.66 6.42 11.93 0.32 0.71 4,845 4,676
June 34,044.65 33,456.00 11.57 11.42 5.50 4.29 0.34 0.27 4,184 4,808
July 32,820.32 30,180.27 11.20 10.34 0.47 2.15 0.32 0.27 4,090 3,621
August 30,247.83 29,684.84 10.37 10.21 3.53 3.46 0.32 0.51 3,277 4,766
September 30,225.34 31,217.77 10.39 10.73 7.49 5.24 0.94 0.42 6,065 3,603
October 30,588.41 29,177.72 10.51 10.03 3.13 3.38 0.27 0.21 3,247 2,773
November 29,136.85 27,385.69 10.01 9.42 2.97 3.01 0.31 0.32 2,886 3,098
December 27,314.00 28,642.25 9.39 9.85 1.56 3.85 0.15 0.25 2,699 2,160Source: The Nigerian Stock Exchange
Table 4.1
The Nigerian Stock Exchange Monthly Opening and Closing Transactions
All Share IndexMarket
Capitalisation
Value Traded
(N'Billion)
Volume Traded
(Billion)Deals
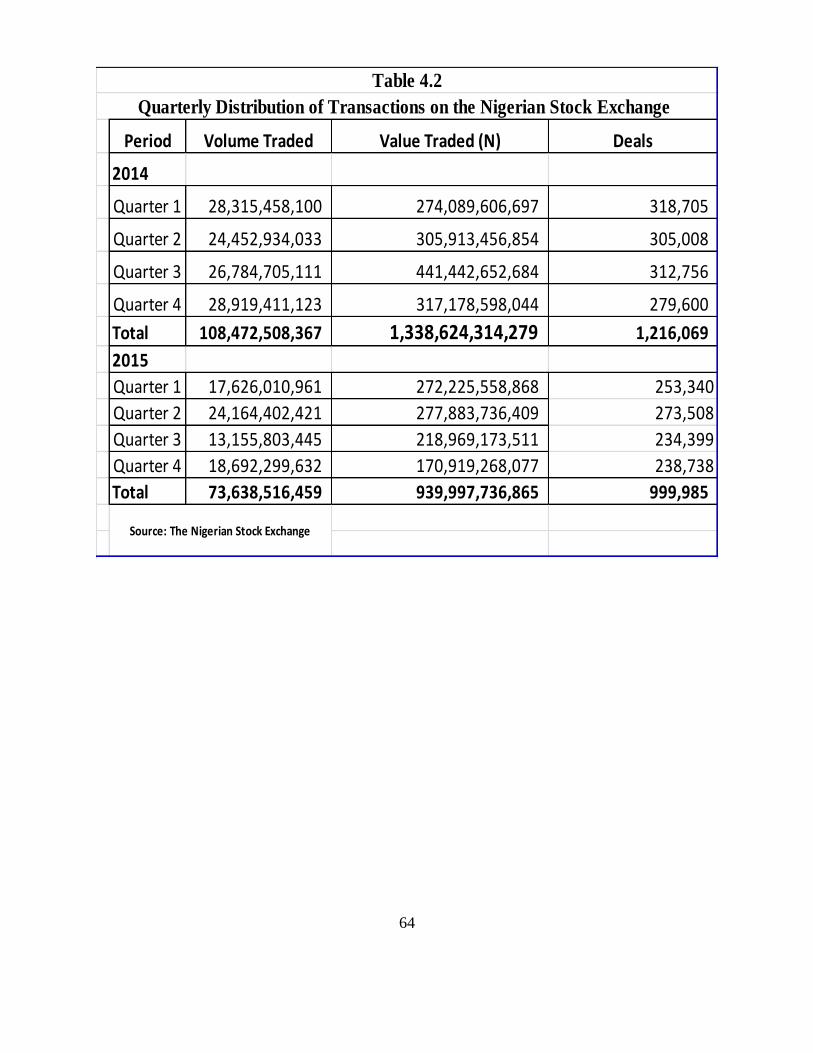
64
Period Volume Traded Value Traded (N) Deals
2014
Quarter 1 28,315,458,100 274,089,606,697 318,705
Quarter 2 24,452,934,033 305,913,456,854 305,008
Quarter 3 26,784,705,111 441,442,652,684 312,756
Quarter 4 28,919,411,123 317,178,598,044 279,600
Total 108,472,508,367 1,338,624,314,279 1,216,069
2015
Quarter 1 17,626,010,961 272,225,558,868 253,340
Quarter 2 24,164,402,421 277,883,736,409 273,508
Quarter 3 13,155,803,445 218,969,173,511 234,399
Quarter 4 18,692,299,632 170,919,268,077 238,738
Total 73,638,516,459 939,997,736,865 999,985
Table 4.2
Quarterly Distribution of Transactions on the Nigerian Stock Exchange
Source: The Nigerian Stock Exchange

65
Sector Volume Value (N) No. of Deals Percentage
2014
Financial Services 81,258,894,063 693,089,273,130.56 640,615 74.93
Consumer Goods 4,248,567,960 251,648,421,493.22 182,190 3.92
Conglomerates 9,666,353,578 57,796,360,700.24 85,244 8.91
Oil & Gas 3,867,029,107 101,240,474,853.90 146,437 3.57
Industrial Goods 3,010,333,831 206,875,773,088.10 63,537 2.78
Others 6,401,265,954 27,304,516,864.22 96,887 5.90
Total 108,452,444,493 1,337,954,820,130.24 1,214,910 100.002015
Financial Services 78,148,025,974.06 472,164,822,839.04 577,620.24 79.63
Consumer Goods 5,025,113,221.59 248,457,097,869.75 166,672.79 5.12
Conglomerates 5,012,131,247.61 31,963,298,909.21 55,377.99 5.11
Oil & Gas 3,943,234,814.07 89,526,076,437.84 89,510.05 4.02
Industrial Goods 943,348,503.90 64,350,693,198.27 44,052.80 0.96
Others 5,073,176,980.77 33,535,747,612.91 66,751.14 5.17
Total 98,145,030,742 939,997,736,867.03 999,985 100.00
Table 4.3
Sectoral Distribution of Equities Transactions on the Nigerian Stock Exchange
Source: The Nigerian Stock Exchange

66
Month
Total
Transactions
(N' billion)
Total
Foreign
Inflow (N'
billion)
Total
Foreign
Outflow (N'
billion)
Total
Domestic
Transaction
(N' billion)
Foreign
Transactions
%
January 189.72 48.03 51.08 90.61 52.24February 184.49 52.35 81.60 50.54 72.61March 184.02 50.15 52.41 81.46 55.73April 206.86 54.20 49.75 102.91 50.25
May 145.45 38.00 41.77 65.68 54.84
June 203.45 42.67 26.98 133.80 34.24
July 170.83 48.64 58.83 63.36 62.91
August 145.69 33.06 48.07 64.56 55.69
September 129.92 29.06 40.07 60.59 53.36
October 106.84 25.56 28.64 52.64 50.73
November 127.80 31.87 40.73 55.20 56.81
December 110.56 17.04 34.31 59.21 46.45
Total 1,905.63 470.63 554.24 880.56
Table 4.4
Foreign Portfolio Participation in Equities Trading 2015
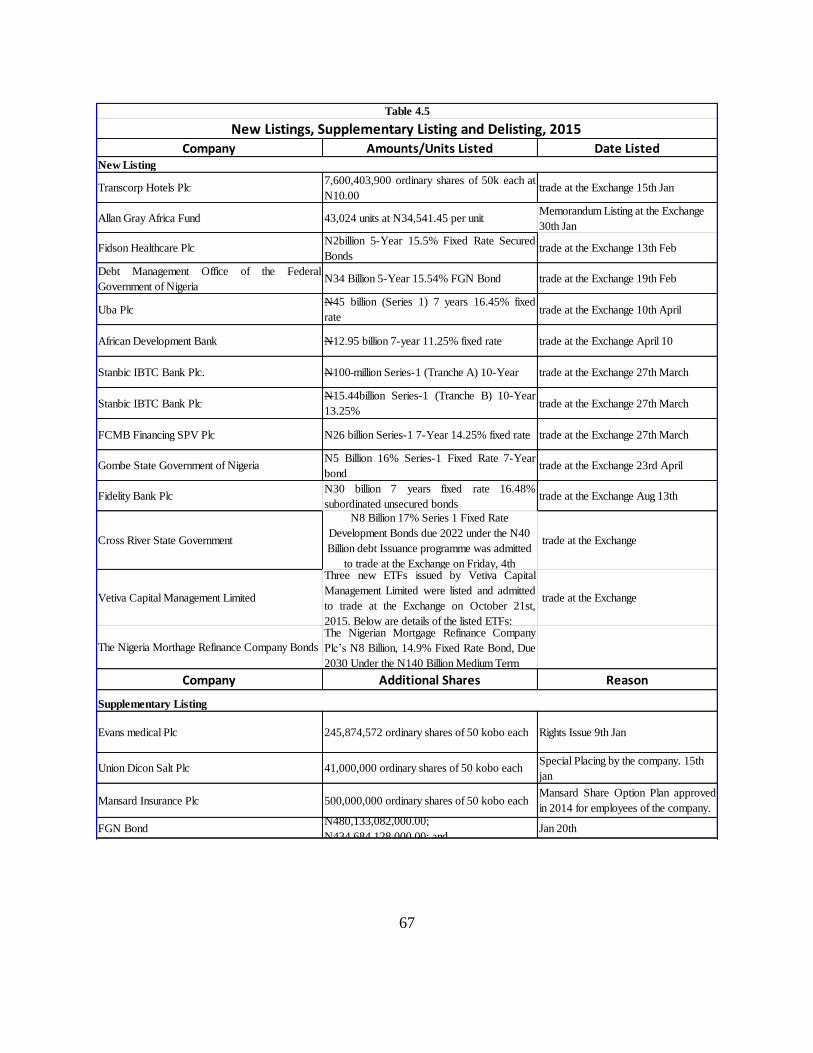
67
Company Amounts/Units Listed Date Listed
Transcorp Hotels Plc7,600,403,900 ordinary shares of 50k each at
N10.00trade at the Exchange 15th Jan
Allan Gray Africa Fund 43,024 units at N34,541.45 per unitMemorandum Listing at the Exchange
30th Jan
Fidson Healthcare PlcN2billion 5-Year 15.5% Fixed Rate Secured
Bondstrade at the Exchange 13th Feb
Debt Management Office of the Federal
Government of NigeriaN34 Billion 5-Year 15.54% FGN Bond trade at the Exchange 19th Feb
Uba PlcN45 billion (Series 1) 7 years 16.45% fixed
ratetrade at the Exchange 10th April
African Development Bank N12.95 billion 7-year 11.25% fixed rate trade at the Exchange April 10
Stanbic IBTC Bank Plc. N100 million Series-1 (Tranche A) 10-Year trade at the Exchange 27th March
Stanbic IBTC Bank PlcN15.44billion Series-1 (Tranche B) 10-Year
13.25%trade at the Exchange 27th March
FCMB Financing SPV Plc N26 billion Series-1 7-Year 14.25% fixed rate trade at the Exchange 27th March
Gombe State Government of NigeriaN5 Billion 16% Series-1 Fixed Rate 7-Year
bondtrade at the Exchange 23rd April
Fidelity Bank PlcN30 billion 7 years fixed rate 16.48%
subordinated unsecured bondstrade at the Exchange Aug 13th
Cross River State Government
N8 Billion 17% Series 1 Fixed Rate
Development Bonds due 2022 under the N40
Billion debt Issuance programme was admitted
to trade at the Exchange on Friday, 4th
trade at the Exchange
Vetiva Capital Management Limited
Three new ETFs issued by Vetiva Capital
Management Limited were listed and admitted
to trade at the Exchange on October 21st,
2015. Below are details of the listed ETFs:
trade at the Exchange
The Nigeria Morthage Refinance Company Bonds
The Nigerian Mortgage Refinance Company
Plc’s N8 Billion, 14.9% Fixed Rate Bond, Due
2030 Under the N140 Billion Medium Term
Company Additional Shares Reason
Evans medical Plc 245,874,572 ordinary shares of 50 kobo each Rights Issue 9th Jan
Union Dicon Salt Plc 41,000,000 ordinary shares of 50 kobo eachSpecial Placing by the company. 15th
jan
Mansard Insurance Plc 500,000,000 ordinary shares of 50 kobo eachMansard Share Option Plan approved
in 2014 for employees of the company.
FGN BondN480,133,082,000.00;
N434,684,128,000.00; and Jan 20th
Table 4.5
New Listings, Supplementary Listing and Delisting, 2015
New Listing
Supplementary Listing
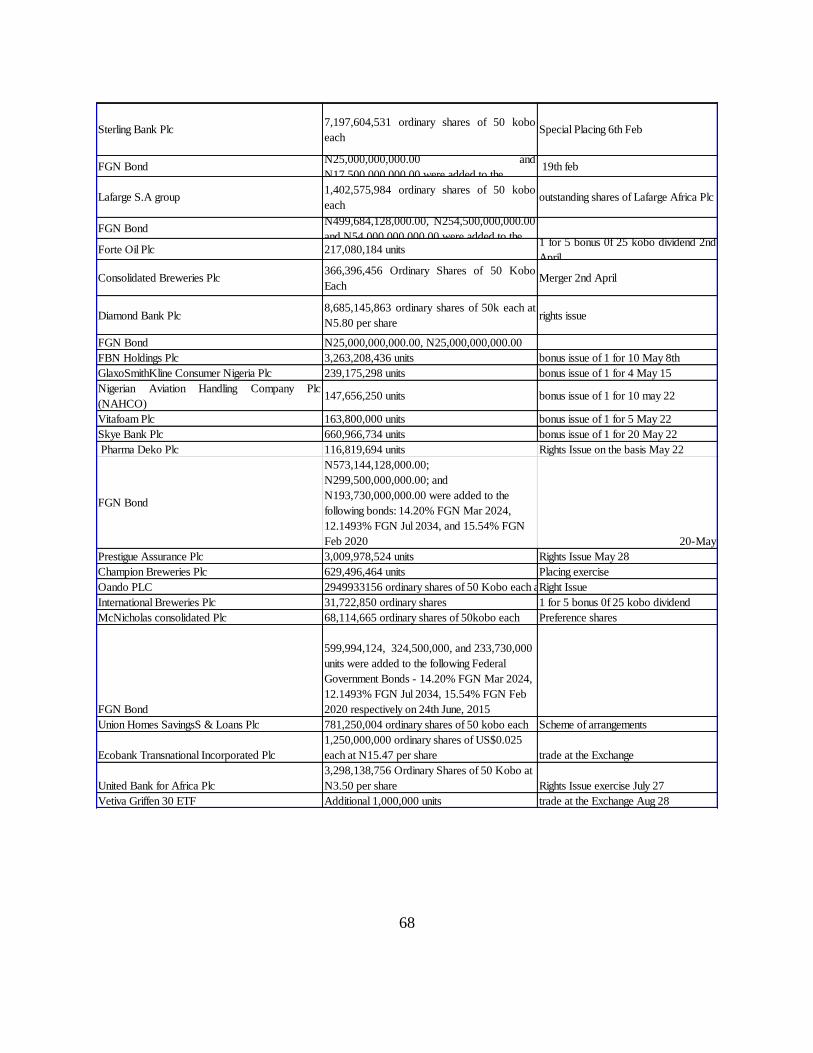
68
Sterling Bank Plc7,197,604,531 ordinary shares of 50 kobo
eachSpecial Placing 6th Feb
FGN BondN25,000,000,000.00 and
N17,500,000,000.00 were added to the 19th feb
Lafarge S.A group1,402,575,984 ordinary shares of 50 kobo
eachoutstanding shares of Lafarge Africa Plc
FGN BondN499,684,128,000.00, N254,500,000,000.00
and N54,000,000,000.00 were added to the Forte Oil Plc 217,080,184 units
1 for 5 bonus 0f 25 kobo dividend 2nd
April
Consolidated Breweries Plc366,396,456 Ordinary Shares of 50 Kobo
EachMerger 2nd April
Diamond Bank Plc8,685,145,863 ordinary shares of 50k each at
N5.80 per sharerights issue
FGN Bond N25,000,000,000.00, N25,000,000,000.00
FBN Holdings Plc 3,263,208,436 units bonus issue of 1 for 10 May 8th
GlaxoSmithKline Consumer Nigeria Plc 239,175,298 units bonus issue of 1 for 4 May 15
Nigerian Aviation Handling Company Plc
(NAHCO)147,656,250 units bonus issue of 1 for 10 may 22
Vitafoam Plc 163,800,000 units bonus issue of 1 for 5 May 22
Skye Bank Plc 660,966,734 units bonus issue of 1 for 20 May 22
Pharma Deko Plc 116,819,694 units Rights Issue on the basis May 22
FGN Bond
N573,144,128,000.00;
N299,500,000,000.00; and
N193,730,000,000.00 were added to the
following bonds: 14.20% FGN Mar 2024,
12.1493% FGN Jul 2034, and 15.54% FGN
Feb 2020 20-May
Prestigue Assurance Plc 3,009,978,524 units Rights Issue May 28
Champion Breweries Plc 629,496,464 units Placing exercise
Oando PLC 2949933156 ordinary shares of 50 Kobo each at N16.50 per shareRight Issue
International Breweries Plc 31,722,850 ordinary shares 1 for 5 bonus 0f 25 kobo dividend
McNicholas consolidated Plc 68,114,665 ordinary shares of 50kobo each Preference shares
FGN Bond
599,994,124, 324,500,000, and 233,730,000
units were added to the following Federal
Government Bonds - 14.20% FGN Mar 2024,
12.1493% FGN Jul 2034, 15.54% FGN Feb
2020 respectively on 24th June, 2015
Union Homes SavingsS & Loans Plc 781,250,004 ordinary shares of 50 kobo each Scheme of arrangements
Ecobank Transnational Incorporated Plc
1,250,000,000 ordinary shares of US$0.025
each at N15.47 per share trade at the Exchange
United Bank for Africa Plc
3,298,138,756 Ordinary Shares of 50 Kobo at
N3.50 per share Rights Issue exercise July 27
Vetiva Griffen 30 ETF Additional 1,000,000 units trade at the Exchange Aug 28

69
Academy Press Plc, 100,800,000 units outstanding shares
FGN Bond
370,500,000 and 311,930,000 units were
added to the following Federal Government
Bonds -12.1493% FGN Jul 2034 and 15.54%
FGN Feb 2020 respectively on 20th August,
2015. Aug 20th
Access Bank Plc
6,045,052,723 ordinary shares of 50 kobo
each one new ordinary share Aug 28
FGN BOND
A total volume of 705,420,115 and 20,000,000
units were added to the following bonds
12.1493% FGN Jul 2034 and 15.54% FGN
Feb 2020 respectively on the 29th of
September, 2015.
FGN BOND
A total volume of 679,994,128 and
371,930,000 units were added to 14.20%
FGN MAR 2024 and 15.54% FGN Feb 2020
respectively on 19th of October, 2015.
Seplat Plc,
Additional ordinary shares of 10,134,248 units
of Seplat Petroleum Development Company
Plc. (Seplat) which arose from a Long-Term
Incentive Scheme of the company, were
admitted to trading on 5th November, 2015.
This brings the total outstanding shares of the
company to 563,444,561 units. admitted to trading
FGN Bond Bonds
A total volume of 20 million and 50 million units
were added to the following bonds: 14.20%
FGN Mar 2024 and 15.54% FGN Feb 2020
respectively on Friday 20th November, 2015.
Standard Alliance Insurance
A total volume of 3,500,000,000 were added to
the shares of Standard Alliance Insurance Plc.
This arose from its convertible preference shares
which was done in December 2009 at N0.50k
per share. By this action, the outstanding volume
of shares of the company is now 11,993,173,450.
Was as a result of its convertible
Preference shares
Bond
A total volume of 20 million and 30 million units
were added to the following bonds: 14.20%
FGN Mar 2024 and 15.54% FGN Feb 2020
respectively on Thursday 17th December,
2015.
Company
Oasis Insurance Plc
Cappa & D’Alberto Plc
IHS Nigerian Plc voluntary delisting 28th April
Nigerian Sewing Machine Manufacturing
Company Plc.
Stokvis Nigeria Plc.
Nigerian Wire & Cable Plc.
not complying with the post listing requirements
Reason
DeListingvoluntary 9th Jan
not complying with the post listing requirements
voluntary 15th Jan
not complying with the post listing requirements

70
InstrumentAmount
OutstandingCBN
Banks and
Discount
Non-
Bank
Sinking
Fund
2014
FRN Treasury Bonds 296.22 115.80 0.00 0.00 180.42
4TH FGN BOND 120.00 2.18 95.33 22.49 0.00
5TH FGN BOND 375.00 2.30 200.24 172.46 0.00
6TH FGN BOND 583.90 31.87 342.38 209.64 0.00
7TH FGN BOND 1,126.57 22.60 472.72 631.25 0.00
9TH FGN BOND 1,412.74 0.00 548.28 864.46 0.00
10TH FGN BOND 581.39 0.00 203.87 377.51 0.00
11TH FGN BOND 592.68 0.00 150.78 441.91 0.00
Nigerian Treasury Bills 2,815.52 1.81 1,969.12 844.59 0.00
Total7,904.02 176.56 3,982.73 3,564.31 180.42
2015
FRN Treasury Bonds 255.99 93.79 0.00 0.00 162.20
4TH FGN BOND 120.00 2.18 95.33 22.49 0.00
5TH FGN BOND 375.00 2.30 200.24 172.46 0.00
6TH FGN BOND 583.90 31.87 342.38 209.64 0.00
7TH FGN BOND 591.57 12.10 177.76 401.71 0.00
9TH FGN BOND 1,436.74 0.00 558.96 877.79 0.00
10TH FGN BOND 581.39 0.00 203.87 377.51 0.00
11TH FGN BOND 1,795.91 0.00 963.04 832.87 0.00
12TH FGN BOND 1,004.05 502.31 151.92 349.82 0.00
Nigerian Treasury Bills 4.52 2.77 1.51 0.23 0.00
Total 6,749.07 647.32 2,695.02 3,244.52 162.20
Table 5.1
Nigerian Domestic Debt: Class of Holders (N'Billion)
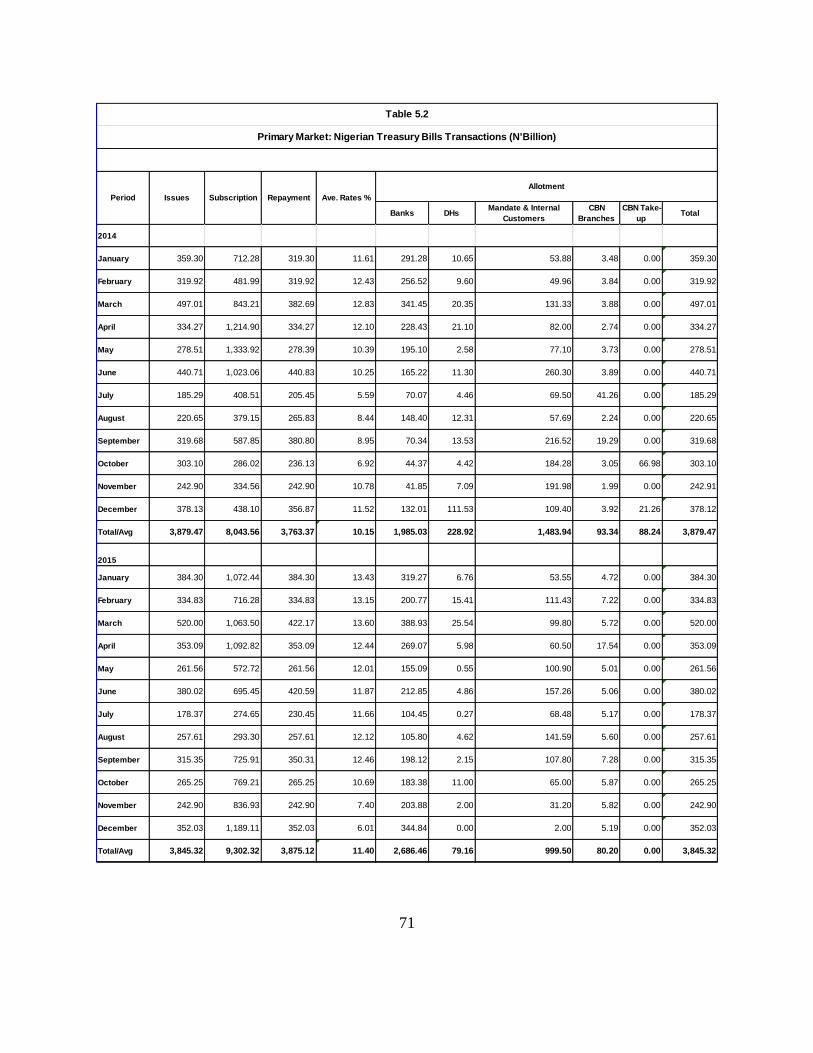
71
Banks DHsMandate & Internal
Customers
CBN
Branches
CBN Take-
upTotal
2014
January 359.30 712.28 319.30 11.61 291.28 10.65 53.88 3.48 0.00 359.30
February 319.92 481.99 319.92 12.43 256.52 9.60 49.96 3.84 0.00 319.92
March 497.01 843.21 382.69 12.83 341.45 20.35 131.33 3.88 0.00 497.01
April 334.27 1,214.90 334.27 12.10 228.43 21.10 82.00 2.74 0.00 334.27
May 278.51 1,333.92 278.39 10.39 195.10 2.58 77.10 3.73 0.00 278.51
June 440.71 1,023.06 440.83 10.25 165.22 11.30 260.30 3.89 0.00 440.71
July 185.29 408.51 205.45 5.59 70.07 4.46 69.50 41.26 0.00 185.29
August 220.65 379.15 265.83 8.44 148.40 12.31 57.69 2.24 0.00 220.65
September 319.68 587.85 380.80 8.95 70.34 13.53 216.52 19.29 0.00 319.68
October 303.10 286.02 236.13 6.92 44.37 4.42 184.28 3.05 66.98 303.10
November 242.90 334.56 242.90 10.78 41.85 7.09 191.98 1.99 0.00 242.91
December 378.13 438.10 356.87 11.52 132.01 111.53 109.40 3.92 21.26 378.12
Total/Avg 3,879.47 8,043.56 3,763.37 10.15 1,985.03 228.92 1,483.94 93.34 88.24 3,879.47
2015
January 384.30 1,072.44 384.30 13.43 319.27 6.76 53.55 4.72 0.00 384.30
February 334.83 716.28 334.83 13.15 200.77 15.41 111.43 7.22 0.00 334.83
March 520.00 1,063.50 422.17 13.60 388.93 25.54 99.80 5.72 0.00 520.00
April 353.09 1,092.82 353.09 12.44 269.07 5.98 60.50 17.54 0.00 353.09
May 261.56 572.72 261.56 12.01 155.09 0.55 100.90 5.01 0.00 261.56
June 380.02 695.45 420.59 11.87 212.85 4.86 157.26 5.06 0.00 380.02
July 178.37 274.65 230.45 11.66 104.45 0.27 68.48 5.17 0.00 178.37
August 257.61 293.30 257.61 12.12 105.80 4.62 141.59 5.60 0.00 257.61
September 315.35 725.91 350.31 12.46 198.12 2.15 107.80 7.28 0.00 315.35
October 265.25 769.21 265.25 10.69 183.38 11.00 65.00 5.87 0.00 265.25
November 242.90 836.93 242.90 7.40 203.88 2.00 31.20 5.82 0.00 242.90
December 352.03 1,189.11 352.03 6.01 344.84 0.00 2.00 5.19 0.00 352.03
Total/Avg 3,845.32 9,302.32 3,875.12 11.40 2,686.46 79.16 999.50 80.20 0.00 3,845.32
Issues Subscription Repayment Ave. Rates %
Allotment
Table 5.2
Primary Market: Nigerian Treasury Bills Transactions (N'Billion)
Period

72
N’Million % N’Million % N’Million % N’Million % N’Million % N’Million %
Banks 2,029,572.32 77.42 1,874,523.14 71.50 1,937,860.76 70.83 2,009,188.77 73.44 1,655,347.12 60.51 1,495,264.32 54.65
Merchant Banks 26,922.30 1.03 42,229.65 1.61 54,200.51 1.98 63,416.88 2.32 30,877.74 1.13 31,019.51 1.13
Parastatals 547,416.82 20.88 698,806.36 26.66 740,322.69 27.06 659,498.60 24.11 1,047,389.41 38.28 1,207,995.71 44.15
CBN 17,639.21 0.67 5,991.50 0.23 3,364.58 0.12 3,644.29 0.13 2,254.83 0.08 1,589.55 0.06
Total 2,621,550.64 100.00 2,621,550.64 100.00 2,735,748.54 100.00 2,735,748.54 100.00 2,735,869.09 100.00 2,735,869.09 100.00
N’Million % N’Million % N’Million % N’Million % N’Million % N’Million %
Banks 1,924,314.59 70.34 1,925,344.16 70.37 1,928,284.72 70.48 1,908,344.16 67.89 1,928,244.72 68.60 1,927,690.00 68.47
Merchant Banks 35,808.43 1.31 85,997.08 3.14 38,433.88 1.40 84,997.08 3.02 38,433.88 1.37 41,430.00 1.47
Parastatals 774,166.08 28.30 722,947.86 26.42 767,570.50 28.06 815,920.00 29.03 842,570.00 29.98 844,590.00 30.00
CBN 1,580.00 0.06 1,580.00 0.06 1,580.00 0.06 1,610.00 0.06 1,620.00 0.06 1,810.00 0.06
Total 2,735,869.09 100.00 2,735,869.09 100.00 2,735,869.09 100.00 2,810,871.23 100.00 2,810,868.60 100.00 2,815,520.00 100.00
N’Million % N’Million % N’Million % N’Million % N’Million % N’Million %
Banks 1,014,620.37 36.04 987,294.09 35.07 1,038,385.89 36.24 1,025,293.89 35.78 1,035,293.89 36.13 1,020,108.60 36.11
Merchant Banks 30,247.54 1.07 25,488.77 0.91 22,488.07 0.78 26,230.07 0.92 23,232.81 0.81 24,238.07 0.86
Parastatals 1,556,160.68 55.27 1,559,900.10 55.40 1,561,809.00 54.50 1,571,159.00 54.83 1,564,156.26 54.59 1,537,764.78 54.44
CBN 214,495.16 7.62 242,840.80 8.63 242,840.80 8.47 242,840.80 8.47 242,840.80 8.47 242,840.80 8.60
Total 2,815,523.75 100.00 2,815,523.75 100.00 2,865,523.75 100.00 2,865,523.75 100.00 2,865,523.75 100.00 2,824,952.25 100.00
N’Million % N’Million % N’Million % N’Million % N’Million % N’Million %
Banks 841,126.75 30.33 829,336.74 29.91 1,095,515.17 39.51 1,017,338.22 36.69 1,062,739.07 38.33 1,027,385.89 37.05
Merchant Banks 10,631.04 0.38 9,081.04 0.33 11,103.19 0.40 27,247.54 0.98 23,140.07 0.83 19,488.07 0.70
Parastatals 1,143,945.71 41.25 1,109,504.46 40.01 906,676.31 32.70 1,513,786.12 54.59 1,502,226.02 54.18 1,493,152.28 53.85
CBN 777,163.55 28.03 824,944.80 29.75 759,572.36 27.39 214,495.16 7.74 184,761.88 6.66 232,840.80 8.40
Total 2,772,867.04 100.00 2,772,867.04 100.00 2,772,867.04 100.00 2,772,867.04 100.00 2,772,867.04 100.00 2,772,867.04 100.00
NovemberJuly August September
October
Customer ClassApril
JuneFebruary May
June
2015
September
2014
Customer Class
May
Customer ClassJuly August November
January February March
January
October December
TABLE 5.3
Nigerian Treasury Bills Outstanding: Class of Holders
Customer Class
December
March April
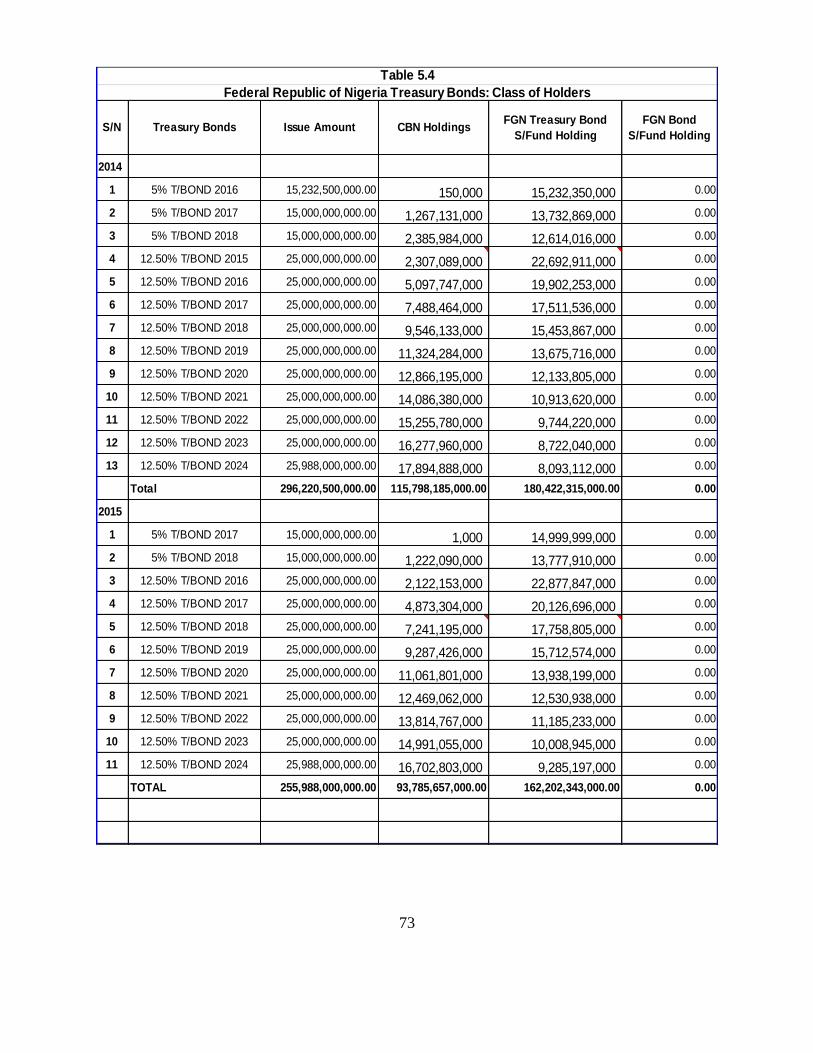
73
2014
1 5% T/BOND 2016 15,232,500,000.00 150,000 15,232,350,000 0.00
2 5% T/BOND 2017 15,000,000,000.00 1,267,131,000 13,732,869,000 0.00
3 5% T/BOND 2018 15,000,000,000.00 2,385,984,000 12,614,016,000 0.00
4 12.50% T/BOND 2015 25,000,000,000.00 2,307,089,000 22,692,911,000 0.00
5 12.50% T/BOND 2016 25,000,000,000.00 5,097,747,000 19,902,253,000 0.00
6 12.50% T/BOND 2017 25,000,000,000.00 7,488,464,000 17,511,536,000 0.00
7 12.50% T/BOND 2018 25,000,000,000.00 9,546,133,000 15,453,867,000 0.00
8 12.50% T/BOND 2019 25,000,000,000.00 11,324,284,000 13,675,716,000 0.00
9 12.50% T/BOND 2020 25,000,000,000.00 12,866,195,000 12,133,805,000 0.00
10 12.50% T/BOND 2021 25,000,000,000.00 14,086,380,000 10,913,620,000 0.00
11 12.50% T/BOND 2022 25,000,000,000.00 15,255,780,000 9,744,220,000 0.00
12 12.50% T/BOND 2023 25,000,000,000.00 16,277,960,000 8,722,040,000 0.00
13 12.50% T/BOND 2024 25,988,000,000.00 17,894,888,000 8,093,112,000 0.00
Total 296,220,500,000.00 115,798,185,000.00 180,422,315,000.00 0.00
2015
1 5% T/BOND 2017 15,000,000,000.00 1,000 14,999,999,000 0.00
2 5% T/BOND 2018 15,000,000,000.00 1,222,090,000 13,777,910,000 0.00
3 12.50% T/BOND 2016 25,000,000,000.00 2,122,153,000 22,877,847,000 0.00
4 12.50% T/BOND 2017 25,000,000,000.00 4,873,304,000 20,126,696,000 0.00
5 12.50% T/BOND 2018 25,000,000,000.00 7,241,195,000 17,758,805,000 0.00
6 12.50% T/BOND 2019 25,000,000,000.00 9,287,426,000 15,712,574,000 0.00
7 12.50% T/BOND 2020 25,000,000,000.00 11,061,801,000 13,938,199,000 0.00
8 12.50% T/BOND 2021 25,000,000,000.00 12,469,062,000 12,530,938,000 0.00
9 12.50% T/BOND 2022 25,000,000,000.00 13,814,767,000 11,185,233,000 0.00
10 12.50% T/BOND 2023 25,000,000,000.00 14,991,055,000 10,008,945,000 0.00
11 12.50% T/BOND 2024 25,988,000,000.00 16,702,803,000 9,285,197,000 0.00
TOTAL 255,988,000,000.00 93,785,657,000.00 162,202,343,000.00 0.00
Table 5.4
Treasury Bonds Issue Amount CBN HoldingsFGN Treasury Bond
S/Fund Holding
FGN Bond
S/Fund Holding
Federal Republic of Nigeria Treasury Bonds: Class of Holders
S/N

74
Tranche Tenor Issue (N'Billion)Subscription
(N'Billion)
Allotment
(N'Billion)
JANUARY 14 ,2015
15.1.05% FGN APR 2017 5 YEAR 24.00 56.65 24.00
14.20% FGN MAR 2024 10 YEAR 25.00 32.24 20.00
12.1493% FGN JUL 2034 20 YEAR 24.00 40.61 28.00
Sub-Total 73.00 129.50 72.00
FEBRUARY 11,2015
15.54% FGN FEB 2020 5 YEAR 35.00 60.1 34.00
14.20% FGN MAR 2024 10 YEAR 30.00 35.37 25.00
12.1493% FGN JUL 2034 20 YEAR 25.00 28.14 17.50
Sub-Total 90.00 123.61 76.50
MARCH 11,2015
15.54% FGN FEB 2020 5 YEAR 35.00 31.61 20.00
14.20% FGN MAR 2024 10 YEAR 30.00 49.01 40.00
12.1493% FGN JUL 2034 20 YEAR 30.00 38.53 31.00
Sub-Total 95.00 119.15 91.00
April 15, 2015
15.54% FGN FEB 2020 5 YEAR 30.00 45.93 20.00
14.20% FGN MAR 2024 10 YEAR 20.00 69.48 25.00
12.1493% FGN JUL 2034 20 YEAR 20.00 70.21 25.00
Sub-Total 70.00 185.62 70.00
May 13, 2015
15.54% FGN FEB 2020 5 YEAR 20.00 42.55 20.00
14.20% FGN MAR 2024 10 YEAR 20.00 81.68 20.00
12.1493% FGN JUL 2034 20 YEAR 20.00 59.14 20.00
Sub-Total 60.00 183.37 60.00
June 17, 2015
15.54% FGN FEB 2020 5 YEAR 40.00 50.55 40.00
14.20% FGN MAR 2024 10 YEAR 15.22 36.32 15.22
12.1493% FGN JUL 2034 20 YEAR 25.00 44.01 25.00
Sub-Total 80.22 130.87 80.22
July 15, 2015
15.54% FGN FEB 2020 5 YEAR 40.00 77.07 28.00
12.1493% FGN JUL 2034 20 YEAR 25.00 42.48 16.00
Sub-Total 65.00 119.55 44.00
August 12, 2015
15.54% FGN FEB 2020 5 YEAR 40.00 88.33 40.00
12.1493% FGN JUL 2034 20 YEAR 30.00 65.16 30.00
Sub-Total 70.00 153.49 70.00
September 16, 2015
15.54% FGN FEB 2020 5 YEAR 40.00 67.10 20.00
12.1493% FGN JUL 2034 20 YEAR 30.00 54.11 25.00
Sub-Total 70.00 121.21 45.00
October 14, 2015
15.54% FGN FEB 2020 5 YEAR 40.00 102.71 40.00
14.20% FGN MAR 2024 10 YEAR 40.00 82.17 40.00
Sub-Total 80.00 184.88 80.00
November 11, 2015
15.54% FGN FEB 2020 5 YEAR 30.00 71.05 30.00
14.20% FGN MAR 2024 10 YEAR 20.00 83.90 20.00
Sub-Total 50.00 154.95 50.00
December 9, 2015
15.54% FGN FEB 2020 5 YEAR 30.00 86.81 30.00
14.20% FGN MAR 2024 10 YEAR 20.00 58.97 20.00
Sub-Total 50.00 145.78 50.00
Grand Total 853.22 1,751.97 788.72
FGN Bonds Issue, 2015
Table 5.5 (Contd)
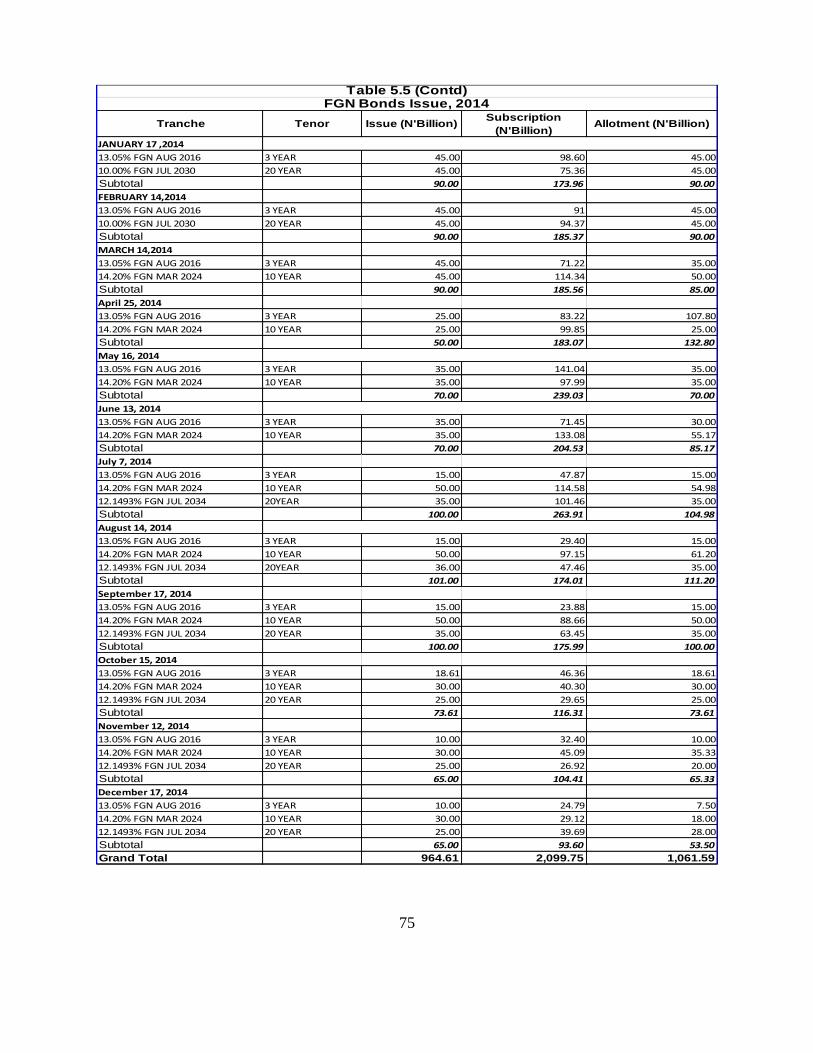
75
Tranche Tenor Issue (N'Billion)Subscription
(N'Billion)Allotment (N'Billion)
JANUARY 17 ,2014
13.05% FGN AUG 2016 3 YEAR 45.00 98.60 45.00
10.00% FGN JUL 2030 20 YEAR 45.00 75.36 45.00
Subtotal 90.00 173.96 90.00
FEBRUARY 14,2014
13.05% FGN AUG 2016 3 YEAR 45.00 91 45.00
10.00% FGN JUL 2030 20 YEAR 45.00 94.37 45.00
Subtotal 90.00 185.37 90.00
MARCH 14,2014
13.05% FGN AUG 2016 3 YEAR 45.00 71.22 35.00
14.20% FGN MAR 2024 10 YEAR 45.00 114.34 50.00
Subtotal 90.00 185.56 85.00
April 25, 2014
13.05% FGN AUG 2016 3 YEAR 25.00 83.22 107.80
14.20% FGN MAR 2024 10 YEAR 25.00 99.85 25.00
Subtotal 50.00 183.07 132.80
May 16, 2014
13.05% FGN AUG 2016 3 YEAR 35.00 141.04 35.00
14.20% FGN MAR 2024 10 YEAR 35.00 97.99 35.00
Subtotal 70.00 239.03 70.00
June 13, 2014
13.05% FGN AUG 2016 3 YEAR 35.00 71.45 30.00
14.20% FGN MAR 2024 10 YEAR 35.00 133.08 55.17
Subtotal 70.00 204.53 85.17
July 7, 2014
13.05% FGN AUG 2016 3 YEAR 15.00 47.87 15.00
14.20% FGN MAR 2024 10 YEAR 50.00 114.58 54.98
12.1493% FGN JUL 2034 20YEAR 35.00 101.46 35.00
Subtotal 100.00 263.91 104.98
August 14, 2014
13.05% FGN AUG 2016 3 YEAR 15.00 29.40 15.00
14.20% FGN MAR 2024 10 YEAR 50.00 97.15 61.20
12.1493% FGN JUL 2034 20YEAR 36.00 47.46 35.00
Subtotal 101.00 174.01 111.20
September 17, 2014
13.05% FGN AUG 2016 3 YEAR 15.00 23.88 15.00
14.20% FGN MAR 2024 10 YEAR 50.00 88.66 50.00
12.1493% FGN JUL 2034 20 YEAR 35.00 63.45 35.00
Subtotal 100.00 175.99 100.00
October 15, 2014
13.05% FGN AUG 2016 3 YEAR 18.61 46.36 18.61
14.20% FGN MAR 2024 10 YEAR 30.00 40.30 30.00
12.1493% FGN JUL 2034 20 YEAR 25.00 29.65 25.00
Subtotal 73.61 116.31 73.61
November 12, 2014
13.05% FGN AUG 2016 3 YEAR 10.00 32.40 10.00
14.20% FGN MAR 2024 10 YEAR 30.00 45.09 35.33
12.1493% FGN JUL 2034 20 YEAR 25.00 26.92 20.00
Subtotal 65.00 104.41 65.33
December 17, 2014
13.05% FGN AUG 2016 3 YEAR 10.00 24.79 7.50
14.20% FGN MAR 2024 10 YEAR 30.00 29.12 18.00
12.1493% FGN JUL 2034 20 YEAR 25.00 39.69 28.00
Subtotal 65.00 93.60 53.50
Grand Total 964.61 2,099.75 1,061.59
Table 5.5 (Contd)FGN Bonds Issue, 2014
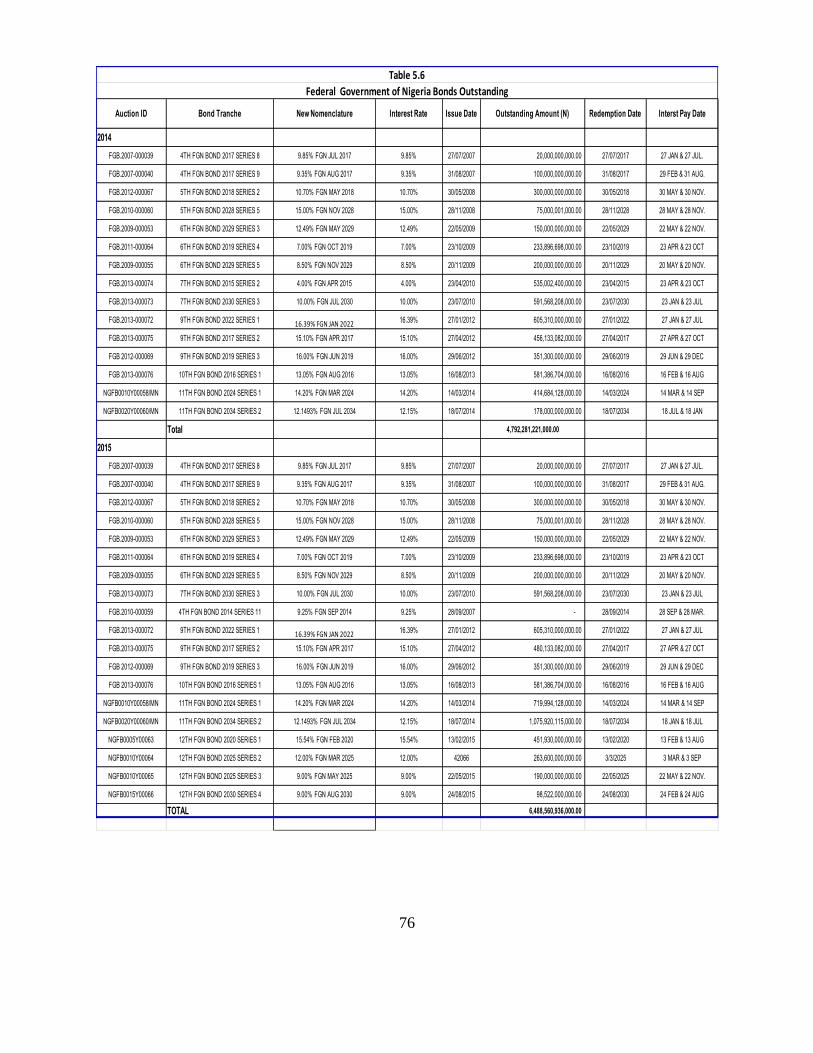
76
Auction ID Bond Tranche New Nomenclature Interest Rate Issue Date Outstanding Amount (N) Redemption Date Interst Pay Date
2014
FGB.2007-000039 4TH FGN BOND 2017 SERIES 8 9.85% FGN JUL 2017 9.85% 27/07/2007 20,000,000,000.00 27/07/2017 27 JAN & 27 JUL.
FGB.2007-000040 4TH FGN BOND 2017 SERIES 9 9.35% FGN AUG 2017 9.35% 31/08/2007 100,000,000,000.00 31/08/2017 29 FEB & 31 AUG.
FGB.2012-000067 5TH FGN BOND 2018 SERIES 2 10.70% FGN MAY 2018 10.70% 30/05/2008 300,000,000,000.00 30/05/2018 30 MAY & 30 NOV.
FGB.2010-000060 5TH FGN BOND 2028 SERIES 5 15.00% FGN NOV 2028 15.00% 28/11/2008 75,000,001,000.00 28/11/2028 28 MAY & 28 NOV.
FGB.2009-000053 6TH FGN BOND 2029 SERIES 3 12.49% FGN MAY 2029 12.49% 22/05/2009 150,000,000,000.00 22/05/2029 22 MAY & 22 NOV.
FGB.2011-000064 6TH FGN BOND 2019 SERIES 4 7.00% FGN OCT 2019 7.00% 23/10/2009 233,896,698,000.00 23/10/2019 23 APR & 23 OCT
FGB.2009-000055 6TH FGN BOND 2029 SERIES 5 8.50% FGN NOV 2029 8.50% 20/11/2009 200,000,000,000.00 20/11/2029 20 MAY & 20 NOV.
FGB.2013-000074 7TH FGN BOND 2015 SERIES 2 4.00% FGN APR 2015 4.00% 23/04/2010 535,002,400,000.00 23/04/2015 23 APR & 23 OCT
FGB.2013-000073 7TH FGN BOND 2030 SERIES 3 10.00% FGN JUL 2030 10.00% 23/07/2010 591,568,208,000.00 23/07/2030 23 JAN & 23 JUL
FGB.2013-000072 9TH FGN BOND 2022 SERIES 1 16.39% FGN JAN 2022 16.39% 27/01/2012 605,310,000,000.00 27/01/2022 27 JAN & 27 JUL
FGB.2013-000075 9TH FGN BOND 2017 SERIES 2 15.10% FGN APR 2017 15.10% 27/04/2012 456,133,082,000.00 27/04/2017 27 APR & 27 OCT
FGB 2012-000069 9TH FGN BOND 2019 SERIES 3 16.00% FGN JUN 2019 16.00% 29/06/2012 351,300,000,000.00 29/06/2019 29 JUN & 29 DEC
FGB 2013-000076 10TH FGN BOND 2016 SERIES 1 13.05% FGN AUG 2016 13.05% 16/08/2013 581,386,704,000.00 16/08/2016 16 FEB & 16 AUG
NGFB0010Y00058/MN 11TH FGN BOND 2024 SERIES 1 14.20% FGN MAR 2024 14.20% 14/03/2014 414,684,128,000.00 14/03/2024 14 MAR & 14 SEP
NGFB0020Y00060/MN 11TH FGN BOND 2034 SERIES 2 12.1493% FGN JUL 2034 12.15% 18/07/2014 178,000,000,000.00 18/07/2034 18 JUL & 18 JAN
Total 4,792,281,221,000.00
2015
FGB.2007-000039 4TH FGN BOND 2017 SERIES 8 9.85% FGN JUL 2017 9.85% 27/07/2007 20,000,000,000.00 27/07/2017 27 JAN & 27 JUL.
FGB.2007-000040 4TH FGN BOND 2017 SERIES 9 9.35% FGN AUG 2017 9.35% 31/08/2007 100,000,000,000.00 31/08/2017 29 FEB & 31 AUG.
FGB.2012-000067 5TH FGN BOND 2018 SERIES 2 10.70% FGN MAY 2018 10.70% 30/05/2008 300,000,000,000.00 30/05/2018 30 MAY & 30 NOV.
FGB.2010-000060 5TH FGN BOND 2028 SERIES 5 15.00% FGN NOV 2028 15.00% 28/11/2008 75,000,001,000.00 28/11/2028 28 MAY & 28 NOV.
FGB.2009-000053 6TH FGN BOND 2029 SERIES 3 12.49% FGN MAY 2029 12.49% 22/05/2009 150,000,000,000.00 22/05/2029 22 MAY & 22 NOV.
FGB.2011-000064 6TH FGN BOND 2019 SERIES 4 7.00% FGN OCT 2019 7.00% 23/10/2009 233,896,698,000.00 23/10/2019 23 APR & 23 OCT
FGB.2009-000055 6TH FGN BOND 2029 SERIES 5 8.50% FGN NOV 2029 8.50% 20/11/2009 200,000,000,000.00 20/11/2029 20 MAY & 20 NOV.
FGB.2013-000073 7TH FGN BOND 2030 SERIES 3 10.00% FGN JUL 2030 10.00% 23/07/2010 591,568,208,000.00 23/07/2030 23 JAN & 23 JUL
FGB.2010-000059 4TH FGN BOND 2014 SERIES 11 9.25% FGN SEP 2014 9.25% 28/09/2007 - 28/09/2014 28 SEP & 28 MAR.
FGB.2013-000072 9TH FGN BOND 2022 SERIES 1 16.39% FGN JAN 2022 16.39% 27/01/2012 605,310,000,000.00 27/01/2022 27 JAN & 27 JUL
FGB.2013-000075 9TH FGN BOND 2017 SERIES 2 15.10% FGN APR 2017 15.10% 27/04/2012 480,133,082,000.00 27/04/2017 27 APR & 27 OCT
FGB 2012-000069 9TH FGN BOND 2019 SERIES 3 16.00% FGN JUN 2019 16.00% 29/06/2012 351,300,000,000.00 29/06/2019 29 JUN & 29 DEC
FGB 2013-000076 10TH FGN BOND 2016 SERIES 1 13.05% FGN AUG 2016 13.05% 16/08/2013 581,386,704,000.00 16/08/2016 16 FEB & 16 AUG
NGFB0010Y00058/MN 11TH FGN BOND 2024 SERIES 1 14.20% FGN MAR 2024 14.20% 14/03/2014 719,994,128,000.00 14/03/2024 14 MAR & 14 SEP
NGFB0020Y00060/MN 11TH FGN BOND 2034 SERIES 2 12.1493% FGN JUL 2034 12.15% 18/07/2014 1,075,920,115,000.00 18/07/2034 18 JAN & 18 JUL
NGFB0005Y00063 12TH FGN BOND 2020 SERIES 1 15.54% FGN FEB 2020 15.54% 13/02/2015 451,930,000,000.00 13/02/2020 13 FEB & 13 AUG
NGFB0010Y00064 12TH FGN BOND 2025 SERIES 2 12.00% FGN MAR 2025 12.00% 42066 263,600,000,000.00 3/3/2025 3 MAR & 3 SEP
NGFB0010Y00065 12TH FGN BOND 2025 SERIES 3 9.00% FGN MAY 2025 9.00% 22/05/2015 190,000,000,000.00 22/05/2025 22 MAY & 22 NOV.
NGFB0015Y00066 12TH FGN BOND 2030 SERIES 4 9.00% FGN AUG 2030 9.00% 24/08/2015 98,522,000,000.00 24/08/2030 24 FEB & 24 AUG
TOTAL 6,488,560,936,000.00
Table 5.6
Federal Government of Nigeria Bonds Outstanding

77
9.85% FGN JUL 2017 14,402.20 200.00 0.00 2,005.40 0.00 3,392.40 0.00 0.00 0.00 20,000.00
9.35% FGN AUG 2017 73,500.07 7,230.88 0.00 7,087.20 0.00 9,800.85 200.00 0.00 2,180.00 1.00 100,000.00
Subtotal 87,902.27 7,430.88 0.00 9,092.60 0.00 13,193.25 200.00 0.00 2,180.00 1.00 120,000.00
10.70% FGN MAY 2018 50,163.65 14,476.34 13,605.00 99,941.00 0.00 7,754.93 895.00 10,259.87 2,300.00 604.20 300,000.00
15.00% FGN NOV 2028 29,341.74 6,258.91 0.00 37,462.19 0.00 1,305.90 0.00 557.40 0.00 73.86 75,000.00
Subtotal 179,505.39 20,735.25 13,605.00 137,403.19 0.00 9,060.83 895.00 10,817.28 2,300.00 678.06 375,000.00
12.49% FGN MAY 2029 50,421.44 29,851.50 6,200.00 53,707.48 0.00 2,600.00 0.00 0.00 7,218.22 1.36 150,000.00
7.00% FGN OCT 2019 89,069.76 17,147.84 24,797.03 62,852.39 0.00 19,271.09 700.00 11,878.50 8,150.00 30.09 233,896.70
8.50% FGN NOV 2029 109,448.70 46,444.45 2,000.00 12,604.51 0.00 4,750.01 100.00 8,100.00 16,500.00 52.33 200,000.00
Subtotal 248,939.89 93,443.79 32,997.03 129,164.38 0.00 26,621.11 800.00 19,978.50 31,868.22 83.78 583,896.70
4.00% FGN APR 2015 270,470.85 24,495.65 24,520.54 96,356.10 30,000.00 53,563.93 1,900.00 23,055.40 10,500.00 139.93 535,002.40
10.00% FGN JUL 2030 169,137.22 8,620.00 23,159.74 255,343.25 0.00 100,122.26 8,450.00 14,456.95 12,100.00 178.80 591,568.21
Subtotal 439,608.06 33,115.65 47,680.28 351,699.35 30,000.00 153,686.19 10,350.00 37,512.34 22,600.00 318.73 1,126,570.61
16.39% FGN JAN 2022 195,305.18 14,013.48 54,992.35 99,860.94 130,613.48 81,778.86 12,605.00 15,929.25 0.00 211.48 605,310.00
15.10% FGN APR 2017 171,483.47 9,311.00 43,032.29 68,391.13 90,000.00 60,128.17 9,625.00 3,959.16 0.00 202.87 456,133.08
16.00% FGN JUN 2019 150,816.78 7,351.00 24,893.12 56,175.48 38,800.00 62,964.00 7,776.87 1,892.00 0.00 630.74 351,300.00
Subtotal 517,605.43 30,675.48 122,917.76 224,427.54 259,413.48 204,871.03 30,006.87 21,780.41 0.00 1,045.09 1,412,743.08
13.05% FGN AUG 2016 200,465.04 3,409.00 54,762.79 113,305.89 124,800.00 62,996.40 6,231.71 14,041.76 0.00 1,374.12 581,386.70
Subtotal 200,465.04 3,409.00 54,762.79 113,305.89 124,800.00 62,996.40 6,231.71 14,041.76 0.00 1,374.12 581,386.70
14.20% FGN MAR 2024 93,146.36 15,856.69 68,304.04 83,427.12 31,684.09 85,956.28 3,100.00 33,031.66 177.89 414,684.13
12.1493% FGN JUL 2034 33,960.23 7,814.97 30,950.97 61,702.78 0.00 21,973.00 6,900.00 14,680.00 18.06 178,000.00
Subtotal 127,106.59 23,671.65 99,255.01 145,129.90 31,684.09 107,929.28 10,000.00 47,711.66 0.00 195.95 592,684.13
Grand Total 1,801,132.68 212,481.70 371,217.87 1,110,222.85 445,897.57 578,358.08 58,483.58 151,841.94 58,948.22 3,696.74 4,792,281.22
Bond Tranche Banks
Table 5.7
FGN Bonds Outstanding: Class of Holders, 2014 (N'Million)
Brokers Pension Fund ParastatalsDiscount HousesCorporate
Bodies
Insurance
Companies
Trust/INV/Tax
FundCBN Individuals Total

78
4TH FGN BOND 2017 SERIES 8 14,402.20 200.00 14,602.20 0.00 2,005.40 0.00 3,392.40 0.00 0.00 0.00 0.00 20,000.00
4TH FGN BOND 2017 SERIES 9 73,500.07 7,230.88 80,730.95 0.00 7,087.20 0.00 9,800.85 200.00 0.00 2,180.00 1.00 100,000.00
SUB TOTAL 87,902.27 7,430.88 95,333.15 0.00 9,092.60 0.00 13,193.25 200.00 0.00 2,180.00 1.00 120,000.00
5TH FGN BOND 2018 SERIES 2 150,163.65 14,476.34 164,639.99 13,605.00 99,941.00 0.00 7,754.93 895.00 10,259.87 2,300.00 604.20 300,000.00
5TH FGN BOND 2028 SERIES 5 29,341.74 6,258.91 35,600.65 0.00 37,462.19 0.00 1,305.90 0.00 557.40 0.00 73.86 75,000.00
SUB TOTAL 179,505.39 20,735.25 200,240.64 13,605.00 137,403.19 0.00 9,060.83 895.00 10,817.28 2,300.00 678.06 375,000.00
6TH FGN BOND 2029 SERIES 3 50,421.44 29,851.50 80,272.94 6,200.00 53,707.48 0.00 2,600.00 0.00 0.00 7,218.22 1.36 150,000.00
6TH FGN BOND 2019 SERIES 4 89,069.76 17,147.84 106,217.60 24,797.03 62,852.39 0.00 19,271.09 700.00 11,878.50 8,150.00 30.09 233,896.70
6TH FGN BOND 2029 SERIES 5 109,448.70 46,444.45 155,893.15 2,000.00 12,604.51 0.00 4,750.01 100.00 8,100.00 16,500.00 52.33 200,000.00
SUB TOTAL 248,939.89 93,443.79 342,383.69 32,997.03 129,164.38 0.00 26,621.11 800.00 19,978.50 31,868.22 83.78 583,896.70
7TH FGN BOND 2030 SERIES 3 169,137.22 8,620.00 177,757.22 23,159.74 255,343.25 0.00 100,122.26 8,450.00 14,456.95 12,100.00 178.80 591,568.21
SUB TOTAL 169,137.22 8,620.00 177,757.22 23,159.74 255,343.25 0.00 100,122.26 8,450.00 14,456.95 12,100.00 178.80 591,568.21
9TH FGN BOND 2022 SERIES 1 195,305.18 14,013.48 209,318.66 54,992.35 99,860.94 130,613.48 81,778.86 12,605.00 15,929.25 0.00 211.48 605,310.00
9TH FGN BOND 2017 SERIES 2 182,158.56 9,311.00 191,469.56 46,128.91 73,937.00 90,000.00 64,487.19 9,925.00 3,959.16 0.00 226.26 480,133.08
9TH FGN BOND 2019 SERIES 3 150,816.78 7,351.00 158,167.78 24,893.12 56,175.48 38,800.00 62,964.00 7,776.87 1,892.00 0.00 630.74 351,300.00
SUB TOTAL 528,280.52 30,675.48 558,956.00 126,014.37 229,973.42 259,413.48 209,230.06 30,306.87 21,780.41 0.00 1,068.48 1,436,743.08
10TH FGN BOND 2016 SERIES 1 200,465.04 3,409.00 203,874.04 54,762.79 113,305.89 124,800.00 62,996.40 6,231.71 14,041.76 0.00 1,374.12 581,386.70
SUB TOTAL 200,465.04 3,409.00 203,874.04 54,762.79 113,305.89 124,800.00 62,996.40 6,231.71 14,041.76 0.00 1,374.12 581,386.70
11TH FGN BOND 2024 SERIES 1 161,554.04 16,356.69 177,910.73 119,847.31 122,810.17 133,604.09 108,790.36 19,133.57 34,531.66 0.00 3,366.24 719,994.13
11TH FGN BOND 2034 SERIES 2 775,145.69 9,988.47 785,134.16 73,827.02 130,723.23 45,185.30 15,207.50 16,680.00 0.00 9,162.91 1,075,920.12
SUB TOTAL 936,699.73 26,345.15 963,044.89 193,674.34 253,533.39 133,604.09 153,975.66 34,341.07 51,211.66 0.00 12,529.15 1,795,914.24
12TH FGN BOND 2020 SERIES 1 145,873.56 6,045.80 151,919.36 53,018.00 86,881.97 119,730.00 15,368.10 11,455.24 1,025.98 0.00 12,531.35 451,930.00
12TH FGN BOND 2025 SERIES 2 0.00 0.00 0.00 0.00 0.00 49,810.00 0.00 0.00 0.00 213,790.00 0.00 263,600.00
12TH FGN BOND 2025 SERIES 3 0.00 0.00 0.00 0.00 0.00 0.00 0.00 0.00 0.00 190,000.00 0.00 190,000.00
12TH FGN BOND 2030 SERIES 4 0.00 0.00 0.00 0.00 0.00 0.00 0.00 0.00 0.00 98,522.00 0.00 98,522.00
SUB TOTAL 145,873.56 6,045.80 151,919.36 53,018.00 86,881.97 169,540.00 15,368.10 11,455.24 1,025.98 502,312.00 12,531.35 1,004,052.00
GRAND TOTAL 2,496,803.63 196,705.35 2,693,508.98 497,231.27 1,214,698.09 687,357.57 590,567.66 92,679.89 133,312.52 550,760.22 28,444.75 6,488,560.94
Total
Table 5.7 (Contd)
FGN Bonds Outstanding: Class of Holders, 2015 (N'Million)
Bond Tranche Banks Merchant Banks Brokers Pension Fund Parastatals Corporate Bodies Insurance Companies Trust/INV/Tax Fund CBNBanks +
Merchant BanksIndividuals

79
Interest and
Sinking F und
C harges
January F ebruary M arch A pril M ay June July A ugust September Octo ber N o vember D ecember T o tal
N igerian T reasury
B ills:
{i} Interest 91-D ay 1.42 1.14 2.56 1.47 1.22 2.29 1.54 2.05 2.03 1.35 2.11 1.99 21.17
{ii} Interest 182-
D ay5.10 4.97 6.45 4.23 3.15 7.20 5.73 4.92 9.77 4.52 2.82 5.76 64.62
{iii} Interest 1
year20.75 19.79 18.01 22.40 20.83 30.11 6.89 12.99 18.11 11.56 11.83 21.20 214.48
T reasury B o nds
( Interest)3.13 3.13 3.13 3.13 3.13 3.13 3.13 3.13 3.13 3.25 0.96 2.26 34.59
Sinking F und o n
T reasury B o nds0.56 0.49 0.43 0.37 0.33 0.29 0.25 0.22 0.20 0.18 0.36 1.76 5.43
1st F GN B o nds 0.00 0.00 0.00 0.00 0.00 0.00 0.00 0.00 0.00 0.00 0.00 0.00 0.00
Sinking F und o n
1st F GN B o nds0.99 4.64 6.45 0.00 0.00 2.06 0.98 4.71 4.66 0.00 0.00 0.00 24.50
3rd F GN B o nds 0.00 0.00 0.00 0.00 21.50 0.00 0.00 0.00 0.00 0.00 21.85 0.00 43.35
4th F GN B o nds 0.00 0.00 0.00 8.16 17.72 0.00 0.00 0.00 0.00 8.21 18.01 0.00 52.11
5th F GN B o nds 27.55 0.00 0.00 10.67 0.00 0.00 29.34 0.00 0.00 10.73 0.00 0.00 78.29
6th F GN B o nds 0.00 0.00 16.66 0.00 0.00 0.00 0.00 0.00 0.00 0.00 0.00 0.00 16.66
7th F GN B o nds 49.57 0.00 0.00 34.09 0.00 28.03 48.77 0.00 0.00 34.53 0.00 28.18 223.17
8th F GN B o nds 0.00 19.24 0.00 0.00 0.00 0.00 0.00 34.32 0.00 0.00 0.00 0.00 53.56
9th F GN B o nds 0.00 0.00 0.00 0.00 0.00 0.00 0.00 0.00 20.14 0.00 0.00 0.00 20.14
T o tal 109.07 53.39 53.69 84.52 67.88 73.10 96.62 62.34 58.04 74.33 57.95 61.16 852.07
C ummulat ive
T o tal 109.07 162.45 216.14 300.66 368.54 441.64 538.26 600.60 658.64 732.96 790.92 852.07
Table 5.8Domestic Debt Charges, 2014 (N'Billion)

80
Interest and
Sinking F und
C harges
January F ebruary M arch A pril M ay June July A ugust September Octo ber N o vember D ecember T o tal
N igerian T reasury
B ills:
{i} 91 1.96 1.90 1.71 1.64 2.10 1.76 1.48 1.93 1.84 1.54 1.92 1.66 21.43
{ii} 182 4.98 3.03 6.79 4.52 2.45 7.34 8.41 4.12 5.50 4.53 2.91 5.19 59.77
{iii} 364 24.56 24.48 35.74 25.86 14.79 25.44 5.23 12.20 16.88 14.67 14.01 29.00 242.87
T R EA SUR Y
B ON D S3.13 3.13 3.13 3.13 3.13 3.13 3.13 3.13 3.13 3.25 0.00 2.26 33.64
S/ F UN D ON
T R EA SUR Y
B ON D S
0.56 0.49 0.43 0.37 0.33 0.29 0.25 0.22 0.20 0.18 0.00 0.35 3.67
3R D F GN B ON D S 0.00 0.00 0.00 0.00 0.00 0.00 0.00 0.00 0.00 0.00 0.00 0.00 0.00
4T H F GN B ON D S 0.99 4.64 0.00 0.00 0.00 0.00 0.98 4.71 0.00 0.00 0.00 0.00 11.32
5T H F GN B ON D S 0.00 0.00 0.00 0.00 21.50 0.00 0.00 0.00 0.00 0.00 21.85 0.00 43.35
6T H F GN B ON D S 0.00 0.00 0.00 8.16 17.72 0.00 0.00 0.00 0.00 8.21 18.01 0.00 52.11
7T H F GN B ON D S 29.82 0.00 0.00 10.67 0.00 0.00 29.34 0.00 0.00 0.00 0.00 0.00 69.83
8T H F GN B ON D S 0.00 0.00 0.00 0.00 0.00 0.00 0.00 0.00 0.00 0.00 0.00 0.00 0.00
9T H F GN B ON D S 50.01 0.00 0.00 36.15 0.00 28.03 49.20 0.00 0.00 36.35 0.00 28.18 227.92
10T H F GN B ON D S 0.00 38.25 0.00 0.00 0.00 0.00 0.00 37.62 0.00 0.00 0.00 0.00 75.87
11T H F GN B ON D S 12.62 0.00 35.19 0.00 0.00 0.00 19.55 0.00 42.95 0.00 0.00 0.00 110.30
12T H F GN B ON D S 0.00 0.00 0.00 0.00 0.00 0.00 0.00 20.17 15.95 0.00 8.62 0.00 44.74
T OT A L 128.62 75.91 82.98 90.50 62.01 65.98 117.57 84.10 86.43 68.71 67.33 66.66 996.80
C UM M ULA T IVE
T OT A L 128.62 204.53 287.51 378.00 440.02 506.00 623.57 707.67 794.10 862.81 930.14 996.80
Table 5.8Domestic Debt Charges, 2015 (N'Billion)

81
Outstanding by Instrument as at December 31, 2015
S/N Instrument
N'billion
Percentage
Share N'billion
Percentage
Share
1 FGN Bonds 4,792.28 60.63 5,808.14 65.73
2 Nigerian Treasury Bills 2,815.52 35.62 2,772.87 31.38
3 Nigerian Treasury Bonds 296.22 3.75 255.99 2.90
Total 7,904.02 100.00 8,837.00 100.00
Federal Government Domestic Debt Stock
Table 5.9
2014 2015

82
Range of Bids
Stop
Rates Range of Bids
Stop
Rates Range of Bids
Stop
Rates
10.0000-12.0000 10.9000 10.0000-12.1000 11.8500 10.0000-13.9219 12.0000
10.0000-12.1000 10.7500 10.5000-12.7500 11.9400 11.0000-15.4990 12.2200
10.0000-12.5000 11.7500 11.0000-13.1990 12.2200 10.0000-13.5990 12.3400
10.0000-14.1001 11.9000 10.0000-13.1921 13.1418 10.5000-14.0000 13.1992
10.5000-13.0357 11.8900 11.0000-14.4990 13.3581 10.0000-16.9990 13.5094
10.2500-13.3776 11.9500 11.0000-14.3159 13.2490 12.0000-15.2990 13.5990
11.0000-14.0000 11.9000 11.5000-14.0000 13.1800
10.5500-15.0000 11.7140 11.5000-13.6990 12.8400 12.2000-15.0000 13.0400
10.4000-15.0000 11.0000 11.0000-13.0000 11.7700 11.7500-13.3385 12.2490
9.5000-15.0000 10.2400 10.2000-12.7500 10.6500 10.6000-13.5119 11.2800
8.5000-12.0000 10.0000 9.2000-12.0000 10.0150 9.7000-13.0000 10.1250
9.0000-12.0000 10.0000 9.4600-12.2100 10.4500 9.0000-13.0000 10.4900
9.0000-11.5000 9.9900 9.4600-12.1198 10.3800 9.0000-12.6898 10.3973
9.0000-12.0000 9.9500 10.0000-11.9519 10.2500 10.0000-12.5189 10.3490
8.5000-11.0000 9.9500 9.0000-12.6189 10.2445
9.0000-10.7000 9.8400 9.8000-11.9519 10.1000 9.9992-12.6189 10.1400
8.0000-11.2500 10.0000 9.0000-11.9519 10.2000 9.8000-12.5189 10.3190
8.5000-15.0000 9.9000 9.5000-12.5189 10.2000
9.0000 - 14.0000 9.7900 9.0000 - 12.1752 10.1700 9.9900 - 12.5189 10.3519
9.0000 - 12.1752 9.5800 9.7500 - 12.5189 10.2400
9.0000 - 10.6000 9.9500 9.8500 - 12.3452 10.1000 9.8500 - 12.7189 10.3500
8.0000 - 11.0000 9.9500 9.0000 - 12.3452 10.3000 9.8000 - 12.7189 10.7890
8.5000 - 10.5000 9.8000 9.0000 - 12.2200 10.2000 9.5000 - 12.1450 11.2500
8.5000-11.0000 9.7000 9.5000-11.9336 10.5000 10.5000-12.9900 11.2000
9.0000-13.0000 9.9980 9.6500-16.0000 10.8000 10.0000-16.0000 12.4850
9.0000-12.0000 10.0500 9.0000-12.0000 13.4900 10.0000-15.0000 13.5800
9.5000-13.5000 11.0000 9.7500-15.5000 13.8490 10.0000-17.4490 15.9900
9.8500-13.0000 11.2490 12.5000-18.1999 14.4800
August
September
October
November
December
February
March
April
May
June
July
Table 5.10 Marginal Rates and Range of Successful Bids Schedule for 201491 182 364
January

83
Range of Bids
Stop
Rates Range of Bids Stop Rates Range of Bids
Stop
Rates
Date
1/8/2015 10.0000-14.5000 11.2000 11.0000-16.0000 14.4000 10.9000-19.0000 15.0000
1/22/2015 10.0000-13.0900 11.2000 11.0000-14.9915 14.1900 11.2500-16.9980 14.5616
2/5/2015 9.5000-15.0000 10.9800 9.5000-14.9999 13.9000 13.0000-18.0000 14.3000
2/19/2015 9.5000-15.0000 10.7500 10.0000-16.4915 13.7000 12.5000-19.9800 15.2500
3/5/2015 9.0000-14.5000 10.8000 10.2500-15.6915 14.8500 12.0000-17.6185 15.8990
3/19/2015 10.0000-14.5000 10.7900 10.0000-15.8000 14.7000 14.0000-18.9800 15.3500
3/26/2015 10.0000-15.6915 10.6999 14.0000-15.6915 14.5000 14.0000-15.6915 14.8500
4/9/2015 9.5000 – 15.0000 10.5000 13.0000 – 15.6915 14.1000 11.0000 – 16.3185 14.1500
4/23/2015 9.2000 – 15.0000 10.0900 11.3500 – 15.0000 12.8000 12.0000 – 16.3185 12.9999
5/7/2015 9.2500-14.0000 10.0900 10.0000-15.0000 12.8900 10.0000-16.3185 13.3990
5/21/2015 9.0000-13.6000 9.9500 10.0000-15.4300 12.7500 11.4300-16.5549 13.0000
6/3/2015 7.5000-15.0000 9.7990 10.0000-14.6432 12.7000 11.0000-16.2832 12.9999
6/17/2015 7.5000-15.0000 10.0000 10.0000-14.6432 12.7000 11.4300-16.5549 12.8000
6/24/2015 9.0000 – 14.0000 10.0000 12.0000 – 14.6432 12.8000 12.0000 – 16.2832 13.0000
7/9/2015 9.0000-12.5000 10.0000 10.0000-14.6432 12.6250
7/23/2015 8.0000-12.5000 10.0000 12.0000-14.8200 12.6500 12.5000-16.0000 13.0000
8/6/2015 9.0000-12.8000 10.0000 11.0000-15.0000 12.9000 12.0000-16.0189 14.7118
8/20/2015 9.0000-14.3000 10.0000 10.0000-16.3145 13.0000
9/3/2015 9.0000-14.0000 10.0000 12.0000-15.2900 13.5000 12.5000-17.2490 14.6900
9/17/2015 9.5000-15.0000 10.5000 12.5000-18.0000 13.4900
9/24/2015 9.9800-14.0000 10.5000 12.4000-14.5000 13.1900 12.8000-15.9990 13.8012
10/8/2015 9.0000-13.8000 10.0000 10.0000-14.5000 12.2000 11.8025-14.9990 12.5000
10/22/2015 6.9000-12.5000 8.4990 8.9000-13.5000 10.1500 10.0000-15.2066 10.8170
11/5/2015 4.9500-13.0000 5.8269 6.9100-12.3400 7.9880 7.4800-13.0000 9.4800
11/19/2015 3.9900-12.5000 5.3424 5.0000-12.0000 7.2500 6.4400-9.3448 8.5000
12/3/2015 3.0000-10.0000 5.6125 4.0000-12.5000 7.0000 5.0000-13.3869 8.0000
12/17/2015 2.0000-10.5000 4.0000 5.0000-12.5000 6.1900 6.0251-12.1211 7.4500
12/24/2015 2.0000-9.0245 3.6250 4.5000-13.5000 6.1990
July
August
September
October
November
December
March
April
May
June
Table 5.10 Marginal Rates and Range of Successful Bids Schedule, December 201591 182 364
January
February