Visibility path-finding in relation to hybrid strategy-based models in distributed interactive...
10
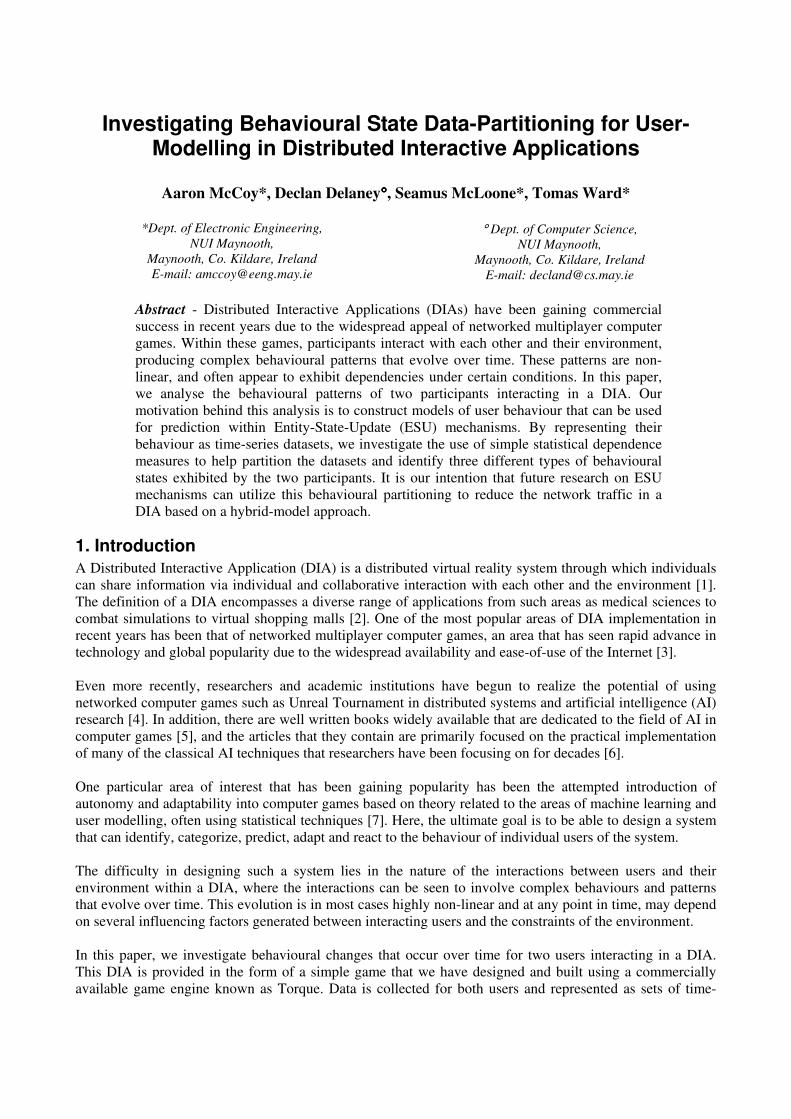
Investigating Behavioural State Data-Partitioning for User- Modelling in Distributed Interactive Applications Aaron McCoy*, Declan Delaney°, Seamus McLoone*, Tomas Ward* *Dept. of Electronic Engineering, NUI Maynooth, Maynooth, Co. Kildare, Ireland E-mail: [email protected] ° Dept. of Computer Science, NUI Maynooth, Maynooth, Co. Kildare, Ireland E-mail: [email protected] Abstract - Distributed Interactive Applications (DIAs) have been gaining commercial success in recent years due to the widespread appeal of networked multiplayer computer games. Within these games, participants interact with each other and their environment, producing complex behavioural patterns that evolve over time. These patterns are non- linear, and often appear to exhibit dependencies under certain conditions. In this paper, we analyse the behavioural patterns of two participants interacting in a DIA. Our motivation behind this analysis is to construct models of user behaviour that can be used for prediction within Entity-State-Update (ESU) mechanisms. By representing their behaviour as time-series datasets, we investigate the use of simple statistical dependence measures to help partition the datasets and identify three different types of behavioural states exhibited by the two participants. It is our intention that future research on ESU mechanisms can utilize this behavioural partitioning to reduce the network traffic in a DIA based on a hybrid-model approach. 1. Introduction A Distributed Interactive Application (DIA) is a distributed virtual reality system through which individuals can share information via individual and collaborative interaction with each other and the environment [1]. The definition of a DIA encompasses a diverse range of applications from such areas as medical sciences to combat simulations to virtual shopping malls [2]. One of the most popular areas of DIA implementation in recent years has been that of networked multiplayer computer games, an area that has seen rapid advance in technology and global popularity due to the widespread availability and ease-of-use of the Internet [3]. Even more recently, researchers and academic institutions have begun to realize the potential of using networked computer games such as Unreal Tournament in distributed systems and artificial intelligence (AI) research [4]. In addition, there are well written books widely available that are dedicated to the field of AI in computer games [5], and the articles that they contain are primarily focused on the practical implementation of many of the classical AI techniques that researchers have been focusing on for decades [6]. One particular area of interest that has been gaining popularity has been the attempted introduction of autonomy and adaptability into computer games based on theory related to the areas of machine learning and user modelling, often using statistical techniques [7]. Here, the ultimate goal is to be able to design a system that can identify, categorize, predict, adapt and react to the behaviour of individual users of the system. The difficulty in designing such a system lies in the nature of the interactions between users and their environment within a DIA, where the interactions can be seen to involve complex behaviours and patterns that evolve over time. This evolution is in most cases highly non-linear and at any point in time, may depend on several influencing factors generated between interacting users and the constraints of the environment. In this paper, we investigate behavioural changes that occur over time for two users interacting in a DIA. This DIA is provided in the form of a simple game that we have designed and built using a commercially available game engine known as Torque. Data is collected for both users and represented as sets of time-
-
Upload
univfianar -
Category
Documents
-
view
5 -
download
0
Transcript of Visibility path-finding in relation to hybrid strategy-based models in distributed interactive...
Investigating Behavioural State Data-Partitioning for User-Modelling in Distributed Interactive Applications
Aaron McCoy*, Declan Delaney°°°°, Seamus McLoone*, Tomas Ward*
*Dept. of Electronic Engineering,
NUI Maynooth, Maynooth, Co. Kildare, Ireland E-mail: [email protected]
° Dept. of Computer Science, NUI Maynooth,
Maynooth, Co. Kildare, Ireland E-mail: [email protected]
Abstract - Distributed Interactive Applications (DIAs) have been gaining commercial success in recent years due to the widespread appeal of networked multiplayer computer games. Within these games, participants interact with each other and their environment, producing complex behavioural patterns that evolve over time. These patterns are non-linear, and often appear to exhibit dependencies under certain conditions. In this paper, we analyse the behavioural patterns of two participants interacting in a DIA. Our motivation behind this analysis is to construct models of user behaviour that can be used for prediction within Entity-State-Update (ESU) mechanisms. By representing their behaviour as time-series datasets, we investigate the use of simple statistical dependence measures to help partition the datasets and identify three different types of behavioural states exhibited by the two participants. It is our intention that future research on ESU mechanisms can utilize this behavioural partitioning to reduce the network traffic in a DIA based on a hybrid-model approach.
1. Introduction A Distributed Interactive Application (DIA) is a distributed virtual reality system through which individuals can share information via individual and collaborative interaction with each other and the environment [1]. The definition of a DIA encompasses a diverse range of applications from such areas as medical sciences to combat simulations to virtual shopping malls [2]. One of the most popular areas of DIA implementation in recent years has been that of networked multiplayer computer games, an area that has seen rapid advance in technology and global popularity due to the widespread availability and ease-of-use of the Internet [3]. Even more recently, researchers and academic institutions have begun to realize the potential of using networked computer games such as Unreal Tournament in distributed systems and artificial intelligence (AI) research [4]. In addition, there are well written books widely available that are dedicated to the field of AI in computer games [5], and the articles that they contain are primarily focused on the practical implementation of many of the classical AI techniques that researchers have been focusing on for decades [6]. One particular area of interest that has been gaining popularity has been the attempted introduction of autonomy and adaptability into computer games based on theory related to the areas of machine learning and user modelling, often using statistical techniques [7]. Here, the ultimate goal is to be able to design a system that can identify, categorize, predict, adapt and react to the behaviour of individual users of the system. The difficulty in designing such a system lies in the nature of the interactions between users and their environment within a DIA, where the interactions can be seen to involve complex behaviours and patterns that evolve over time. This evolution is in most cases highly non-linear and at any point in time, may depend on several influencing factors generated between interacting users and the constraints of the environment. In this paper, we investigate behavioural changes that occur over time for two users interacting in a DIA. This DIA is provided in the form of a simple game that we have designed and built using a commercially available game engine known as Torque. Data is collected for both users and represented as sets of time-
series data. Three high-level behavioural states are defined, and we present a preliminary analysis of standard statistical dependence measures on some of the collected datasets. The ability to partition the datasets and recognize behavioural states has ramifications for our current research in Entity-State-Update (ESU) mechanisms within DIAs in three ways. Firstly, it allows hybrid models of user behaviour to be developed that can be used as behavioural extrapolation guides in the absence of client updates. Secondly, it allows recognition of user behaviour that may signal perceived latency effects that can be used to adjust the ESU update mechanism. Finally, it also plays an important role for the general use of AI in DIAs, and in particular networked multiplayer computer games. The rest of this paper is organized as follows. In section 2, we give a brief overview of the Torque game engine, along with a description of our test environment and data collection methods. Section 3 provides a Visual Data Analysis (VDA) of some of the collected data sets. Section 4 provides an overview of the statistical dependence measures used for analysis. In section 5, we present and discuss the results of our analysis on the collected data. Finally, section 6 offers a conclusion as well as directions for future work.
2. Data Collection and the Torque Game Engine In order to collect the type of data that one would expect to observe in a real world DIA application, we have chosen to utilize the Torque Game Engine [8] as a research platform to enable us to perform experiments and data analysis. Torque is a powerful all-in-one game engine that has been used as the technology behind several commercially released games, and by purchasing a copy of the engine, we have full access to all of the source code as well as a built-in easy-to-use scripting language. The test environment that we developed using Torque to enable us to gather data was a simple First-Person-Shooter (FPS) style game that was designed to allow two or more players to play against each other in opposition towards a specific goal. The rules that govern the game are fairly typical of the type of scenarios used in most FPS games, and yield data that can be considered a fair representation of the type of data one would expect to see in networked multiplayer computer games (which dominate the commercial DIA market). The rules of the game are as follows:
��At the beginning of a game, each player is placed randomly into the game world at one of several ‘spawn-points’ located around the map.
��The goal of the game is to be the player holding the special ‘tag’ when the game ends. ��Each game lasts for a predetermined amount of time that counts down when a player is in
possession of the tag. ��Each player is equipped with a weapon that they may use to disable their opponent by inflicting
sufficient damage on them. A player can only use their weapon when they are not in possession of the tag.
��When a player is disabled, they are re-placed randomly at one of the spawn-points. ��Each player has a radar that shows the position of an opponent within a certain range. ��There are four ‘health-houses’ located in the game world, only one of which is active at any one
time. A health-house will replenish the energy of a player if they go inside while it is active. The active health-house is determined randomly at fixed intervals, and a notification is sent to each player to inform them when it changes.
For data collection purposes, each player connects as a client to a server that is running a copy of the game and records data locally for both themselves and their local representations of other participants in the game. This enables us to reconstruct each player’s local game-state at any point in time during data analysis. This is important because the local game-state is what a player reacts to when they are playing the game and is a representation of their approximation to the authoritative game-state that is kept on the server. The quality of this approximation varies from one player to the next, and is dependent on the latency and bandwidth restrictions for each player’s connection from client to server. Movement data is recorded for each player in the form of x, y and z spatial co-ordinates, along with movement action events and firing events. Movement action events are triggered when a user presses a
button to perform a movement action, such as move forward or jump, and firing events are triggered whenever a user presses a button to fire their weapon. All recordings are time-stamped using a clock that is synchronized between clients at the very start of a game session (that may contain one or more individual games).
(a)
(b)
(c)
(d)
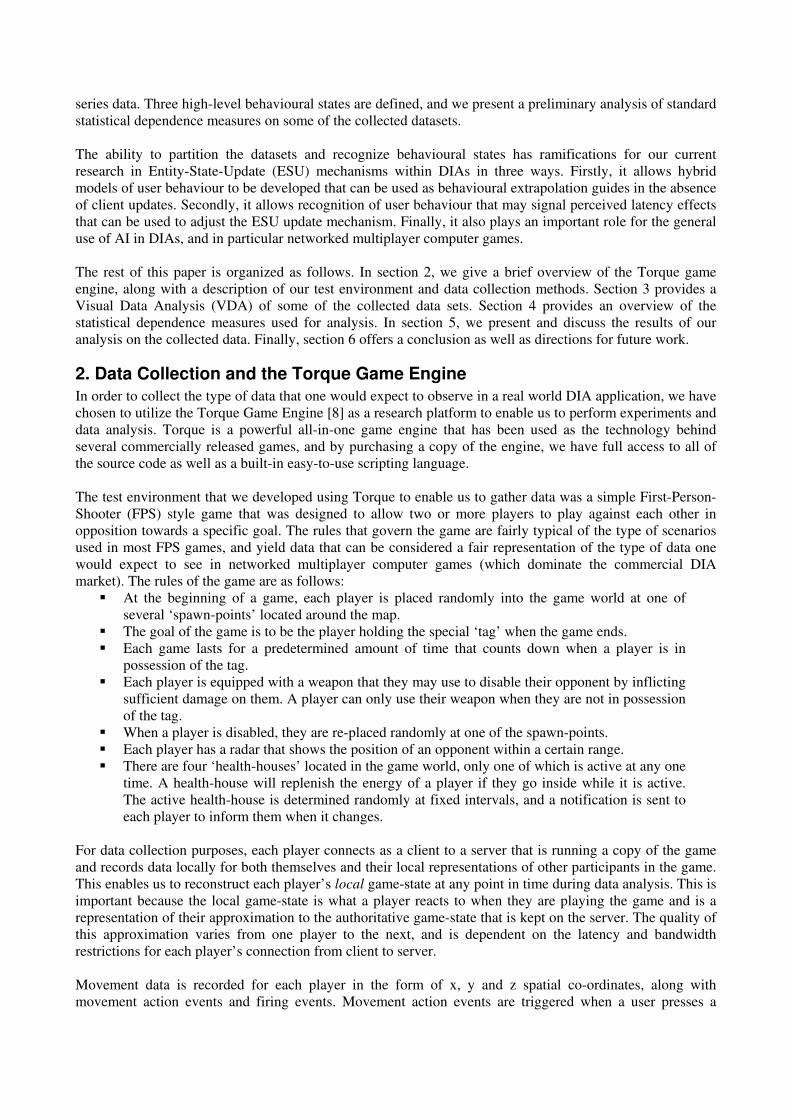
Figure 1: (a) Top-down view of the test environment. (b) First-person view showing components of the Heads-Up-Display (HUD). (c) 2D spatial plot showing two players' movements over time.
(d) Corresponding time-series dataset representations.
Figure 1(a) shows a top-down ‘birds eye’ view of the test environment, showing the location of the tag and the four health-houses. Figure 1(b) shows a screenshot of the game in action – this is what a user sees when they are playing the game. Figure 1(c) illustrates how we can reconstruct two players’ movements over time in visual relation to several of the landmarks in the environment, such as the tag and the health-houses (marked on the spatial plot as a black circle and black squares respectively). More importantly, we have the ability to represent this movement data in the form of time-series datasets, as shown in Figure 1(d). This allows for increased temporal analysis of the data using exploratory data analysis (EDA) techniques [9].
3. Visual Data Analysis In this section, we present a visual data analysis (VDA) of several datasets that have been recorded using our test environment. The datasets have been partitioned into fuzzy regions by hand based on simple visual inspection, and the partitioning is governed by our definition of three high-level types of behaviour that we expect to see exhibited by players during a game. These high-level behaviours are defined in terms of the goal that a player is attempting to satisfy when observed to exhibit the behaviour in question, and our choice of the three is based primarily on our own experience with multiplayer games and DIAs in general. A qualitative visual analysis would suggest that they provide a satisfactory encompassing of most subsets of behaviour that one would expect to see being exhibited by participants in this type of game, and as such,
offer a broad categorization of more complex behavioural interactions that may actually be occurring between players. The three high-level behaviours are defined as follows:
1) Attack: The goal of a player in this behavioural state is to disable their opponent, possibly to gain possession of the tag. Players in this state will typically exhibit forceful and aggressive tendencies, such as pursuit of an opponent and a high amount of weapon firing.
2) Defend: The goal of a player in this behavioural state is to remain alive for the maximum amount of time possible. Players in this state will typically exhibit a tendency for passive tactics, such as attempting to run away and escape an opponent or possibly hiding for long periods of time.
3) Wander: The goal of a player in this behavioural state is exploration of their environment, either in search of an item of interest (typically the tag or another player) or to familiarize themselves with the environment’s layout.
(a)
(b)
(c)
(d)
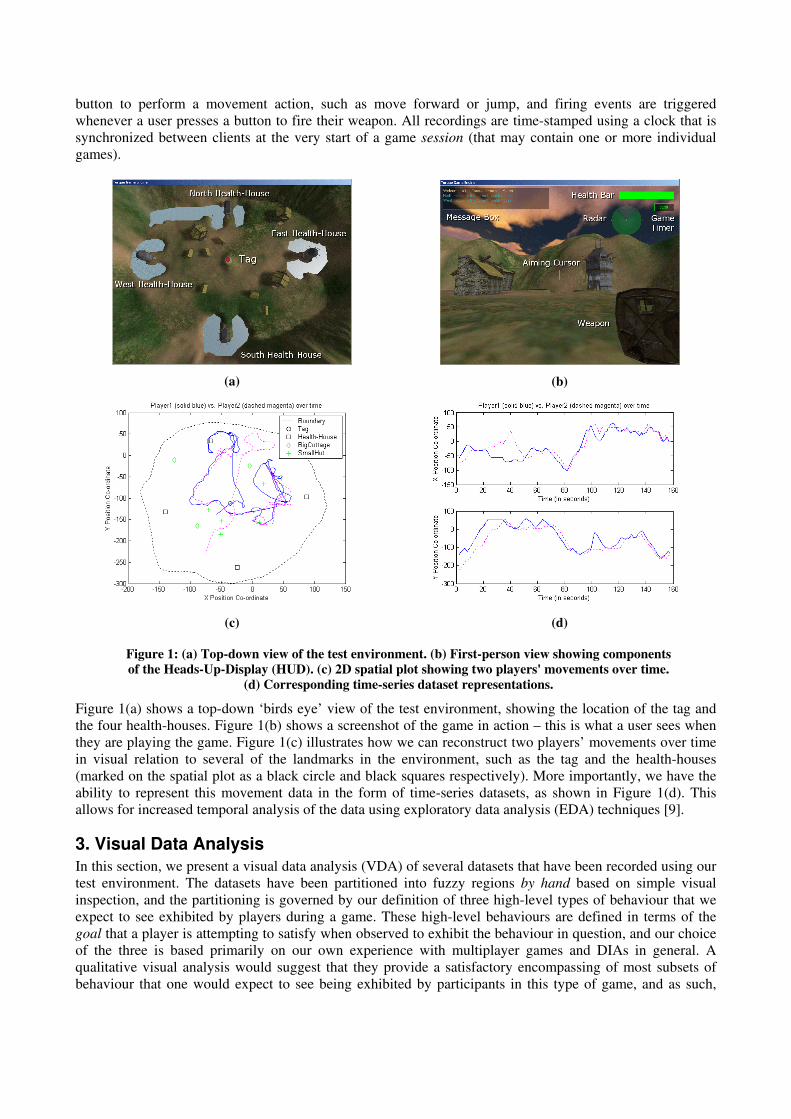
Figure 2: (a-d) Four representative datasets that have been partitioned by hand into regions of behaviour based on visual observation.
Figure 2(a-d) presents four representative datasets that have been partitioned by hand based on visual observation. These datasets were collected between three pairs of different players of varying ability and experience interacting within the test environment during separate games. For each dataset, the x and y movement data for both players is plotted. Here we can intuitively partition possible regions of behaviour that may be identified between both players. The first important point to note is that several of the datasets contain discontinuities as a result of players being disabled during a game. When this happens, they are randomly replaced into the game world at one of the spawn-points (as per the rules of the game), and hence a jump in the data occurs and a natural partition of the dataset is the result. The second important point to note is that the boundaries between several of the behavioural regions are illustrated as being slightly fuzzy, indicating that the change from one behavioural region to another is ill defined in some cases. The discontinuities described
previously are the exception to this rule, whereby a discontinuity represents a crisp boundary between one behavioural region and another. Finally, we have not included any of the additional state information that is available for both players in the form of movement action events and firing events (as described in section 2) in this initial VDA of the datasets. As a consequence, the partitions are based exclusively on our intuitive notion of the correlation between the movements of the players and where we feel a change in behavioural state was likely to have occurred. Typically the attack and defend behaviours are seen to occur between two players in a coupled fashion, implying that when one player is exhibiting patterns of either attack or defend type behaviour, there is a high degree of probability that the other player will be exhibiting patterns of the opposite behavioural state. This assumption is due in part to our definition of the goal of the game, namely to be the player in possession of the tag when the game ends. When a player is in possession of the tag, they are unable to disable their opponent as they cannot fire their weapon. Naturally a player in this situation will adopt a defend-type behavioural state as they attempt to avoid confrontation. By the same token, a player not in possession of the tag will naturally adopt an attack-type behavioural state as they attempt to disable their opponent and gain possession of the tag. Coupled behaviour presents an obvious advantage when attempting to identify and classify behavioural changes because if we can identify one player’s behavioural state, we can then make strong assumptions about the other player’s behavioural state without having to look at any of their data. It is important to note however that this assumption may not hold as strongly under a condition of more than two players participating in any one game, but we are primarily concerned here with interactions between only two players, so this assumption is sufficiently valid for our purposes.
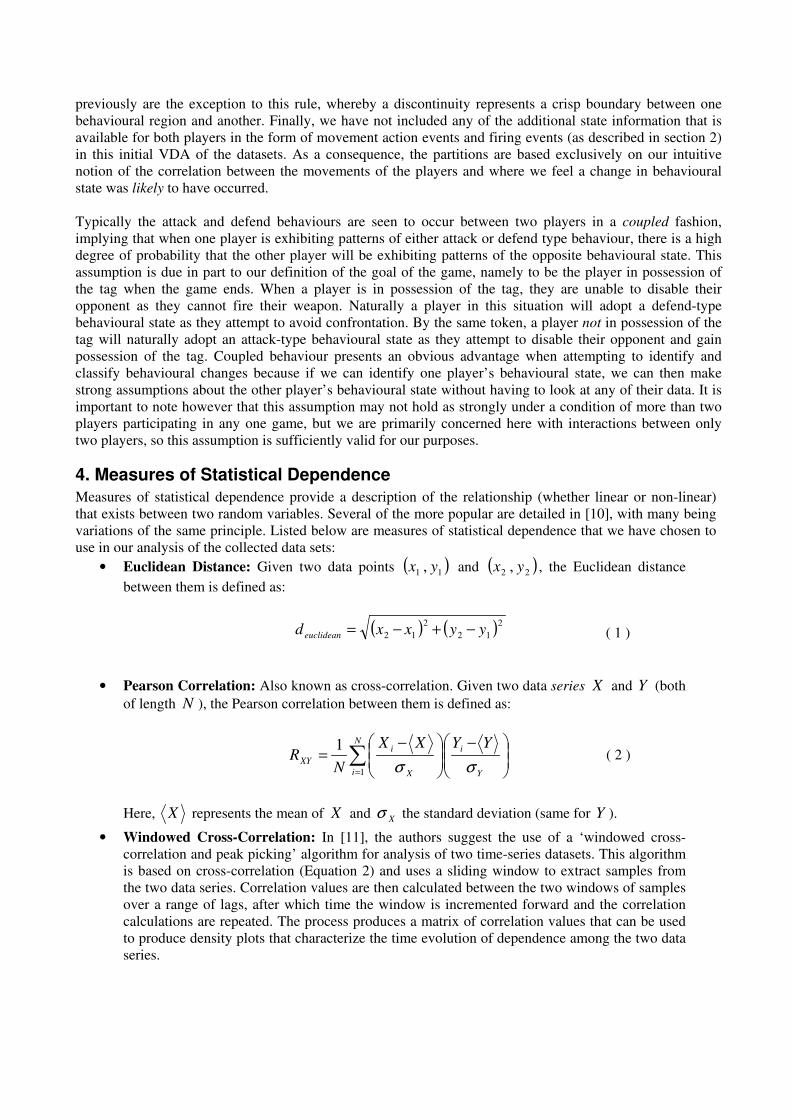
4. Measures of Statistical Dependence Measures of statistical dependence provide a description of the relationship (whether linear or non-linear) that exists between two random variables. Several of the more popular are detailed in [10], with many being variations of the same principle. Listed below are measures of statistical dependence that we have chosen to use in our analysis of the collected data sets:
• Euclidean Distance: Given two data points ( )11 , yx and ( )22 , yx , the Euclidean distance between them is defined as:
( ) ( )2
122
12 yyxxd euclidean −+−=
( 1 )
• Pearson Correlation: Also known as cross-correlation. Given two data series X and Y (both
of length N ), the Pearson correlation between them is defined as:
���
����
� −���
����
� −= �
= Y
iN
i X
iXY
YYXX
NR
σσ1
1
( 2 )
Here, X represents the mean of X and Xσ the standard deviation (same for Y ).
• Windowed Cross-Correlation: In [11], the authors suggest the use of a ‘windowed cross-correlation and peak picking’ algorithm for analysis of two time-series datasets. This algorithm is based on cross-correlation (Equation 2) and uses a sliding window to extract samples from the two data series. Correlation values are then calculated between the two windows of samples over a range of lags, after which time the window is incremented forward and the correlation calculations are repeated. The process produces a matrix of correlation values that can be used to produce density plots that characterize the time evolution of dependence among the two data series.
5. Results In this section, we will present the results of our analysis on two representative datasets using the measures of statistical dependence described in the previous section along with the state information that is collected for each player during a game. We will discuss the results as they are presented. 5.1 State Descriptions
(a)
(b)
(c)
(d)
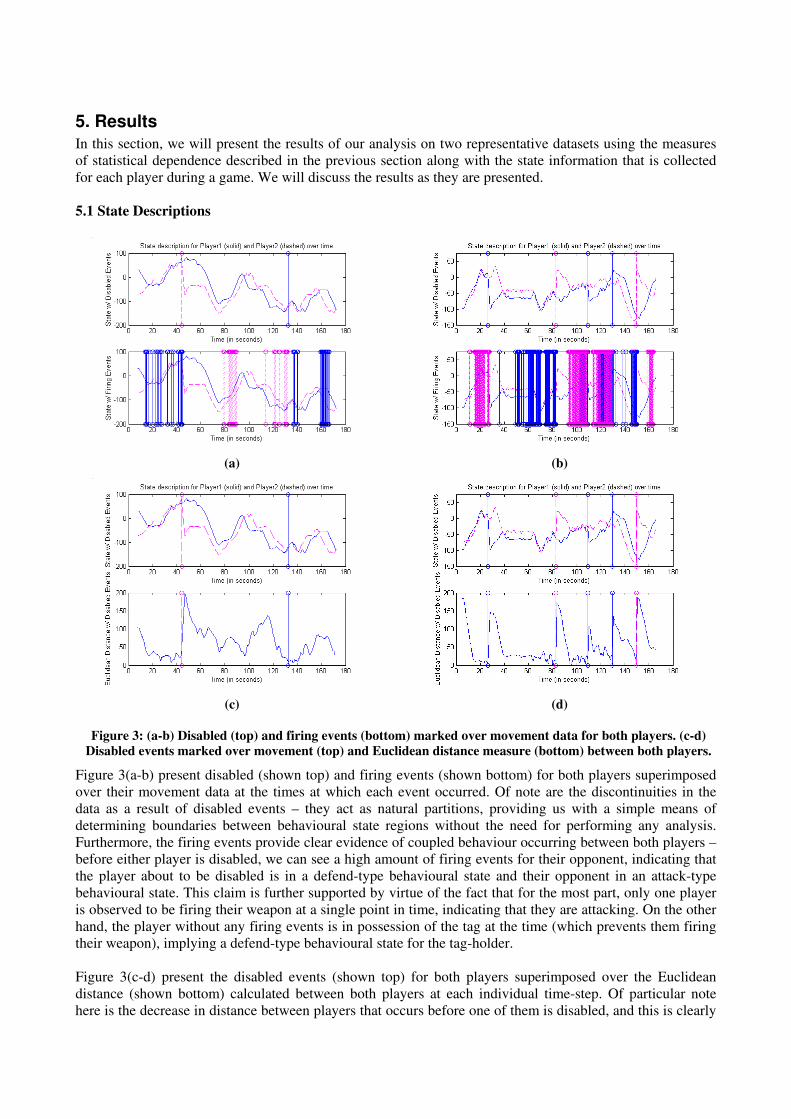
Figure 3: (a-b) Disabled (top) and firing events (bottom) marked over movement data for both players. (c-d) Disabled events marked over movement (top) and Euclidean distance measure (bottom) between both players.
Figure 3(a-b) present disabled (shown top) and firing events (shown bottom) for both players superimposed over their movement data at the times at which each event occurred. Of note are the discontinuities in the data as a result of disabled events – they act as natural partitions, providing us with a simple means of determining boundaries between behavioural state regions without the need for performing any analysis. Furthermore, the firing events provide clear evidence of coupled behaviour occurring between both players – before either player is disabled, we can see a high amount of firing events for their opponent, indicating that the player about to be disabled is in a defend-type behavioural state and their opponent in an attack-type behavioural state. This claim is further supported by virtue of the fact that for the most part, only one player is observed to be firing their weapon at a single point in time, indicating that they are attacking. On the other hand, the player without any firing events is in possession of the tag at the time (which prevents them firing their weapon), implying a defend-type behavioural state for the tag-holder. Figure 3(c-d) present the disabled events (shown top) for both players superimposed over the Euclidean distance (shown bottom) calculated between both players at each individual time-step. Of particular note here is the decrease in distance between players that occurs before one of them is disabled, and this is clearly

evident from both plots, where we observe the dips followed by large spikes in the data. This agrees with our intuitive notion of how players play the game, with the player in the attack-type behavioural state (attacker) attempting to pursue and get close to the defender (tag holder) in order to make disabling them easier and quicker. The use of a simple cut-off (threshold) function in this case would be one technique for discerning changes in behavioural state not caused by disabled events, such as the transition that occurs between players when they are both in the wandering state and when they switch to a coupled attack-defend state (or possibly attack-attack, if neither player has yet picked up the tag). A suitable threshold value would have to be estimated (perhaps on a case-by-case basis) and a smoothing technique employed to reduce the number of spikes contained within the data. 5.2 Fourier Analysis and State Partitions
(a)
(b)
Figure 4: (a) DFT for both players' movement data. (b) Original and filtered datasets.
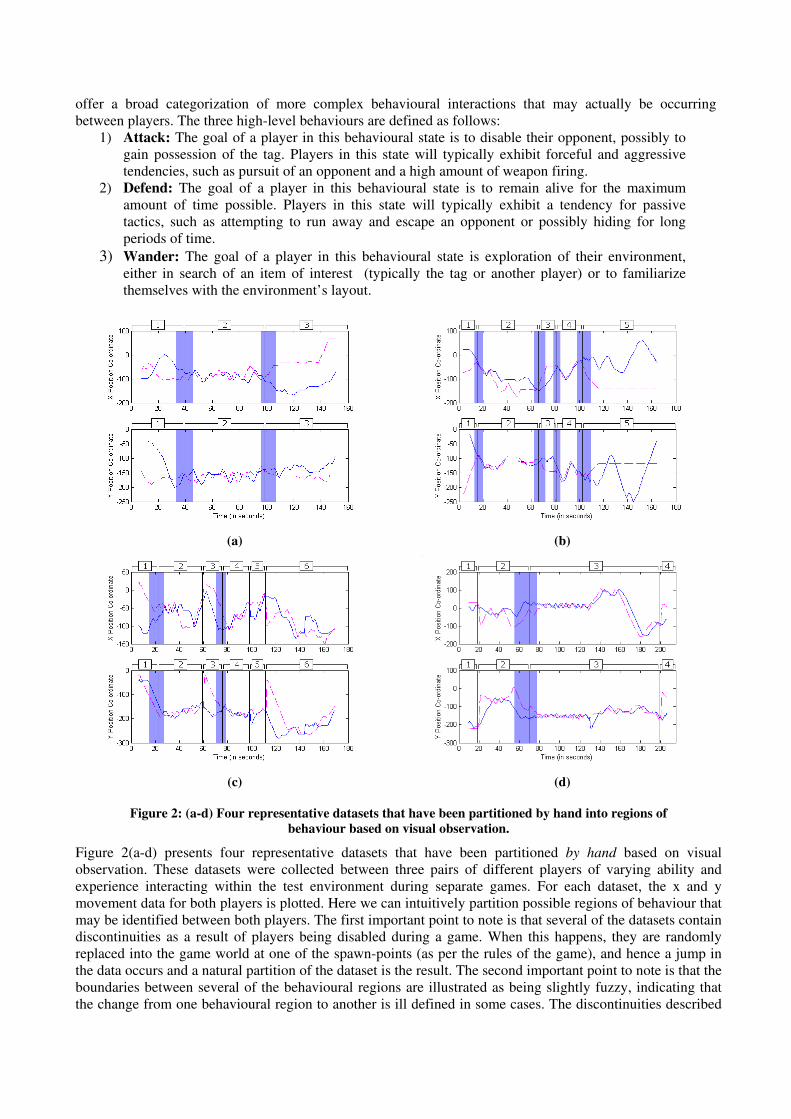
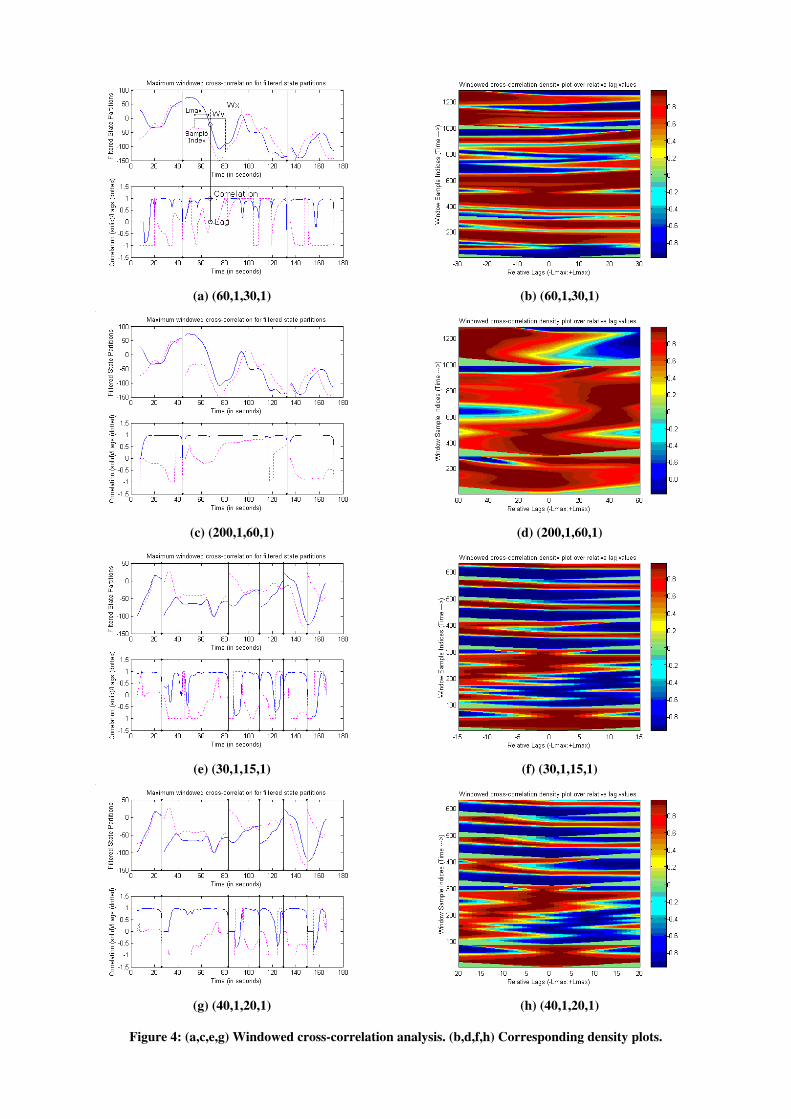
Figure 4(a) shows the results of a discrete Fourier transform (DFT) applied to one of the representative datasets, while Figure 4(b) presents both the original data split into natural partitions (based on the discontinuities where each disabled event occurs) (shown left), and filtered through a low-pass digital filter that smoothes the data and removes high-frequency spikes (shown right). The reason for splitting and filtering the data in this manner is to improve the accuracy of the cross-correlation analysis performed in the next section, where calculating a cross-correlation coefficient either across a discontinuity in the data or in the presence of numerous data spikes would produce inconsistent measures. 5.3 Windowed Cross-Correlation Analysis Figure 5(a,c,e,g) present the results of a windowed cross-correlation analysis performed on both representative datasets for a variety of values for the various required algorithm parameters, namely window-size, window-increment, maximum lag and lag increment ( maxW , incW , maxτ , incτ ) (the actual values used for each parameter are indicated below each plot). Movement data for both players is plotted on top, along with the maximum correlation and maximum lag values at each sample index (for visual presentation, the lags have been normalized by maxτ to the interval [-1,1]). In addition, Figure 5(a) illustrates graphically the
method of selecting two windows separated by a relative lag value of maxτ . Figure 5(b,d,f,h) present the density plots that characterize the time evolution of dependence between the corresponding datasets shown in Figure 5(a,c,e,g) respectively. In each of these graphs, the abscissa plots the relative lag between the two windows XW and YW , the ordinate plots the elapsed time during the game (in terms of samples) and the colour tone of each point represents the value of the cross-correlation calculated between the two windows starting at that particular sample and for that particular relative lag value.
(a) (60,1,30,1)
(b) (60,1,30,1)
(c) (200,1,60,1)
(d) (200,1,60,1)
(e) (30,1,15,1)
(f) (30,1,15,1)
(g) (40,1,20,1)
(h) (40,1,20,1)
Figure 4: (a,c,e,g) Windowed cross-correlation analysis. (b,d,f,h) Corresponding density plots.

From inspection of the above graphs, we can make several observations. Firstly, we notice large and often abrupt changes between certain subsequent horizontal slices of the graphs, indicating that the correlation in these areas does not remain stable over time. This indicates rapid change in the cross-correlation between the two players as time progresses, implying that the association between the time-series is clearly non-stationary in parts, confirming our initial intuition. If the association between the time-series were stable, then we should observe vertical slices running through the density graphs. Secondly, we notice several large areas of zero-correlation at the extremities of each graph that resemble spikes starting near the centre and ‘growing’ out towards the edge, increasing in size as they do so. These spikes are caused by edge effects that occur at the extremities of our datasets, where calculations of correlation coefficients become difficult and unreliable due to the cut-off points at the edge of the data. At the beginning of the dataset, this problem manifests itself as an inability to lag windows back in time because we have no data before the first sample. At the end of the dataset, we no longer have the problem of lagging windows back in time, but now we face the difficulty of having to reduce our window size as we get close to the end due to the lack of data after the terminating sample of our dataset. The solution that we have utilized for the results in this paper is to lag windows back in time by a gradually increasing amount of lag from the beginning of the dataset (starting at zero), until we reach a point where we have a sufficient number of previous samples, allowing us to calculate the cross-correlation for each lag value up to the requested maximum. At the end of the dataset, we gradually decrease the window size until we reach the second last sample and then stop, leaving the final value at zero. The reason that we choose to do this is so that we can calculate a correlation coefficient value at every sample index for our datasets, even if the value obtained is not completely reliable (in the sense of comparing it to calculations made on the centre of the dataset, where window and lag size are not a problem). As a direct consequence, a spike of zero-correlations will appear for every natural partition that results from a disabled event occurring for one of the players. Another observation that we can make from the density plots is that there are several areas of constant high correlation that occur fairly often, and these are indicated by adjacent horizontal sections of the graph with similar colour tone. The interesting feature about these regions is that the correlation values are relatively constant over all lags, implying some sort of close dependence between the time-series that is continuing for an extended period of time. These results correlate well with what we observe from the state descriptions shown for both players in Figure 3, where there are obviously periods in the game where both players are involved in some sort of coupled behavioural state, perhaps with one player attacking and one defending. One final point of note is that the size of the datasets are very important, as this places restrictions on the size of window and lag values that we can use for windowed cross-correlation analysis, particularly as certain partitions of the data will contain a significantly smaller number of elements than others. One possible option for increasing the size of the datasets would be to sample at a higher rate in our test environment, producing more data points. Another possibility for smaller datasets would be to utilize some sort of dynamic window-size, perhaps based on wavelets [12] or dynamic time warping [13], and this is something that we will be investigating in future research.
6. Conclusion and Future Work In this paper we have investigated the use of simple statistical dependence measures for partitioning time-series datasets representing behavioural states for two users interacting in a DIA. This DIA is implemented on a proven commercially available game engine, allowing us to analyse the type of data that we would expect to see in real-world applications. Our motivation for partitioning these datasets is to allow us to recognise when users within a DIA switch behavioural states, allowing us to employ models of behaviour to predict user intentions within their environment and towards other users. Our intention would be to integrate this into the framework of Entity-State-Update (ESU) mechanisms within DIAs. Our results on state descriptions for players show that by utilizing measures such as Euclidean distance, and by taking advantage of additionally available state information (in the form of disabled and firing events), heuristic methods such as simple threshold functions could potentially be developed that allow us to accurately partition the datasets and recognise user behavioural state changes. In addition, analysis of two representative datasets using windowed cross-correlation techniques have validated several of our intuitive theories about the nature of the interactions between users, namely the existence of regions of non-stationary association coupled with regions of extended close dependence.

Although the results obtained so-far using cross-correlation are promising, we are limited in our ability to capture the dependencies that clearly exist between players by using a technique that is essentially linear in nature. Our future work in this area will involve the investigation of more advanced techniques for dependency measures among the datasets, including generalized information theoretic approaches such as entropy and mutual information [14]. In addition, we will also be focusing on the development of actual models of user-behaviour that can be used for modelling and prediction purposes for reducing network traffic within ESU mechanisms.
References [1] Churchill, E.F., D.N. Snowdon, and A.J. Munro, Collaborative Virtual Environments: Digital Places
and Spaces for Interaction. First ed, ed. D. Diaper and C. Sanger. 2001: Springer Verlag. 336. [2] Singhal, S. and M. Zyda, Networked Virtual Environments: Design and Implementation. First ed.
1999: Addison-Wesley. 331. [3] McCoy, A., D. Delaney, and T. Ward, Game-State Fidelity Across Distributed Interactive Games.
ACM Crossroads, 2003(9.4): p. 4-9. [4] Laird, J.E., Research in human-level AI using computer games. Communications of the ACM, 2002.
45(1): p. 32-35. [5] Rabin, S., AI Game Programming Wisdom 2. First ed. Vol. 2. 2004: Charles River Media. 732. [6] Russell, S.J. and P. Norvig, Artificial Intelligence: A Modern Approach. Second ed. 2002: Prentice
Hall. 1132. [7] Zukerman, I. and D.W. Albrecht, Predictive Statistical Models for User Modeling. User Modeling
and User-Adapted Interaction, 2001. 11: p. 5-18. [8] Marshall, D., A. McCoy, D. Delaney, S. McLoone and T. Ward, A Realistic Distributed Interactive
Application Testbed for Static and Dynamic Entity State Data Acquisition. in ISSC. 2004. Belfast, Ireland.
[9] Brillinger, D.R., H. K. Preisler, A. A. Ager and J. G. Kie, An exploratory data analysis (EDA) of the paths of moving animals. Journal of Statistical Planning and Inference, 2004. 122(1-2): p. 43-63.
[10] Webb, A., Statistical Pattern Recognition. Second ed. 2002: Wiley. 534. [11] Boker, S.M., M. Xu, J. L. Rotondo and K. King, Windowed cross-correlation and peak picking for
the analysis of variability in the association between behavioral time series. Psychological Methods, 2002. 7(1): p. 338-355.
[12] Mallat, S.G., A theory for multiresolution signal decomposition: the wavelet representation. Pattern Analysis and Machine Intelligence, IEEE Transactions on, 1989. 11(7): p. 674-693.
[13] Oates, T., L. Firoiu, and P.R. Cohen. Clustering Time Series with Hidden Markov Models and Dynamic Time Warping. in IJCAI-99 Workshop on Sequence Learning. 1999.
[14] Steuer, R., J. Kurths, C. O. Daub, J. Weise and J. Selbig, The mutual information: Detecting and evaluating dependencies between variables. Bioinformatics, 2002. 18(2): p. S231-S240.