Designing Virtual Environments for Brain Injury Rehabilitation
Virtual Redlining for Civil Engineering in Real Environments
Gerhard Schall Erick Mendez Dieter Schmalstieg
Graz University of Technology
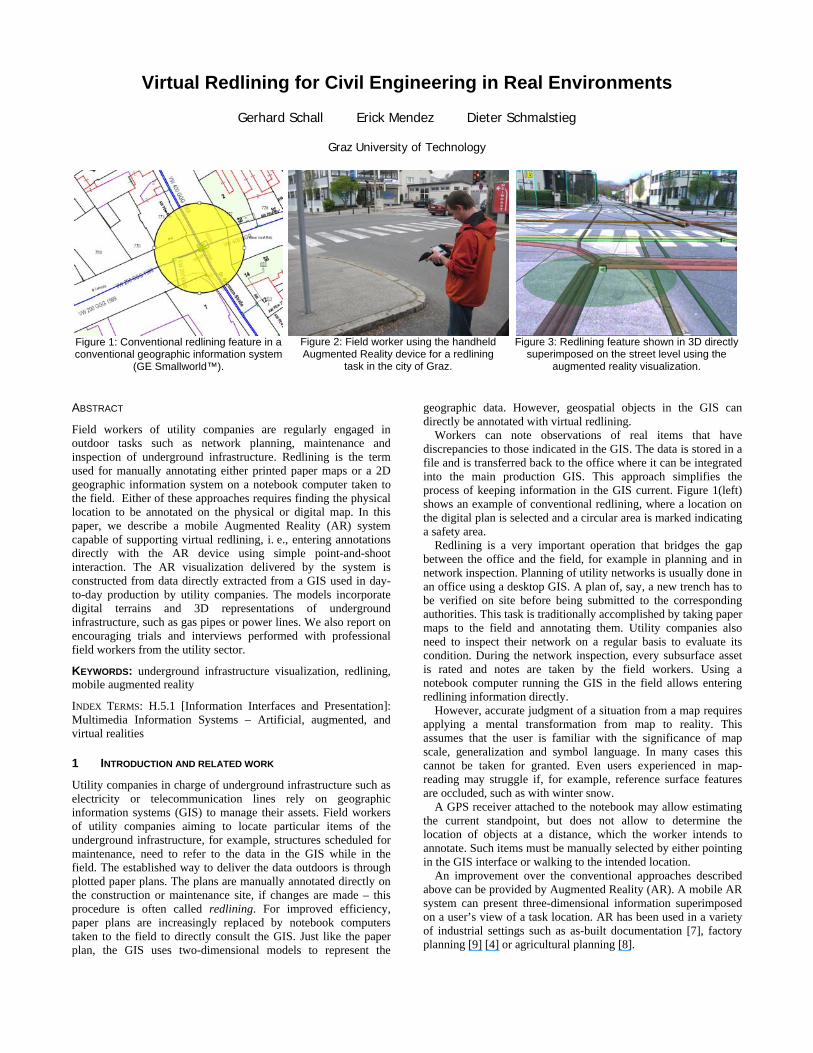
Figure 1: Conventional redlining feature in a conventional geographic information system
(GE Smallworld™).
Figure 2: Field worker using the handheld Augmented Reality device for a redlining
task in the city of Graz.
Figure 3: Redlining feature shown in 3D directly
superimposed on the street level using the augmented reality visualization.
ABSTRACT
Field workers of utility companies are regularly engaged in outdoor tasks such as network planning, maintenance and inspection of underground infrastructure. Redlining is the term used for manually annotating either printed paper maps or a 2D geographic information system on a notebook computer taken to the field. Either of these approaches requires finding the physical location to be annotated on the physical or digital map. In this paper, we describe a mobile Augmented Reality (AR) system capable of supporting virtual redlining, i. e., entering annotations directly with the AR device using simple point-and-shoot interaction. The AR visualization delivered by the system is constructed from data directly extracted from a GIS used in day-to-day production by utility companies. The models incorporate digital terrains and 3D representations of underground infrastructure, such as gas pipes or power lines. We also report on encouraging trials and interviews performed with professional field workers from the utility sector.
KEYWORDS: underground infrastructure visualization, redlining, mobile augmented reality
INDEX TERMS: H.5.1 [Information Interfaces and Presentation]: Multimedia Information Systems – Artificial, augmented, and virtual realities
1 INTRODUCTION AND RELATED WORK
Utility companies in charge of underground infrastructure such as electricity or telecommunication lines rely on geographic information systems (GIS) to manage their assets. Field workers of utility companies aiming to locate particular items of the underground infrastructure, for example, structures scheduled for maintenance, need to refer to the data in the GIS while in the field. The established way to deliver the data outdoors is through plotted paper plans. The plans are manually annotated directly on the construction or maintenance site, if changes are made – this procedure is often called redlining. For improved efficiency, paper plans are increasingly replaced by notebook computers taken to the field to directly consult the GIS. Just like the paper plan, the GIS uses two-dimensional models to represent the
geographic data. However, geospatial objects in the GIS can directly be annotated with virtual redlining.
Workers can note observations of real items that have discrepancies to those indicated in the GIS. The data is stored in a file and is transferred back to the office where it can be integrated into the main production GIS. This approach simplifies the process of keeping information in the GIS current. Figure 1(left) shows an example of conventional redlining, where a location on the digital plan is selected and a circular area is marked indicating a safety area.
Redlining is a very important operation that bridges the gap between the office and the field, for example in planning and in network inspection. Planning of utility networks is usually done in an office using a desktop GIS. A plan of, say, a new trench has to be verified on site before being submitted to the corresponding authorities. This task is traditionally accomplished by taking paper maps to the field and annotating them. Utility companies also need to inspect their network on a regular basis to evaluate its condition. During the network inspection, every subsurface asset is rated and notes are taken by the field workers. Using a notebook computer running the GIS in the field allows entering redlining information directly.
However, accurate judgment of a situation from a map requires applying a mental transformation from map to reality. This assumes that the user is familiar with the significance of map scale, generalization and symbol language. In many cases this cannot be taken for granted. Even users experienced in map-reading may struggle if, for example, reference surface features are occluded, such as with winter snow.
A GPS receiver attached to the notebook may allow estimating the current standpoint, but does not allow to determine the location of objects at a distance, which the worker intends to annotate. Such items must be manually selected by either pointing in the GIS interface or walking to the intended location.
An improvement over the conventional approaches described above can be provided by Augmented Reality (AR). A mobile AR system can present three-dimensional information superimposed on a user’s view of a task location. AR has been used in a variety of industrial settings such as as-built documentation [7], factory planning [9] [4] or agricultural planning [8].

Figure 4: Cadastral plan of urban area (courtesy of Salzburg AG).
Another recurring theme of AR research are world-registered (augmentable) annotations, of which redlining can be seen as a special case. Finally, our work is influenced by the potential of AR for simulated looking through solid objects, often called “X-ray vision”, which has been a steady motivation for research on AR in civil engineering [10], [11]. The work in [5] seems to be the only AR application that is explicitly concerned with underground infrastructure.
However, all the approaches mentioned above assume that the 3D models for visualization are available at the required level of detail and accuracy. In contrast, in this work we are also considering how the 3D model used for AR can be created from the legacy data, and how the results of the AR interaction – the virtual redlining – are transferred back to the GIS. This approach is summarized in section 2, more details can be found in [7].
Besides the visualization, another essential aspect of outdoor AR are the ergonomic properties of the AR device and its user interface. We use a handheld AR device briefly presented in [13], which has been designed to be used for longer periods of time by a civil engineer in the field. While most outdoor AR systems described in literature use a “backpack” design [2], [6], our handheld device can be seen as a descendent of the NaviCam [1], adapted for outdoor operation. Background on the handheld AR device is given in section 3.1.
The most important aspect of the work reported here is the user interface for interaction in the field, described in section 3.2 and for redlining, described in section 3.3. We also performed trials and interviews with experienced field workers, to assess the suitability of the proposed techniques. A summary of these evaluations is given in section 4.
2 THREE-DIMENSIONAL MODELS
Many of the key data requirements for AR are available in GIS data managed by government and industry, such as underground infrastructure (Figure 4) and digital terrain models (DTM).
2.1 Data extraction and conversion from GIS To obtain and manage complex 3D models for AR we use a multi-stage pipeline [3]. First, geospatial data is extracted from a proprietary GIS and exported in the standardized Geography Markup Language (GML1). The GML dataset is then translated into the 3D file format of the scene-graph engine Coin3D2.
1 http://www.opengeospatial.org 2 http://www.coin3d.org
Figure 5: Urban geospatial 3D model consisting of underground infrastructure (gas pipes, electricity lines and water mains) plus above surface features (buildings). (data transcoded from data
courtesy of Salzburg AG). Inset: Digital terrain model.
Figure 6: Export of data from the GIS server to the mobile AR client through a Web Feature Service. The service delivers XML encoded Geography Markup Language documents, which are translated into
3D scene graph on the client side.
This two-step process allows a clean separation of concerns. Data from multiple sources can be aggregated at the GML level, which is readily supported by many GIS vendors. For example, the underground infrastructure and the DTM come from different sources. Moreover, with the Web Feature Service3 there exists a standardized interface for online query and retrieval of GML documents. Compared to a 3D file format, GML is a very compact XML representation.
The translation from GML to a scene graph model is performed on the client side. This allows to easily enforce client-side constraints such as geometric level of detail, user preferences in supported visualization parameters or device hardware capabilites. In this step, a mechanism similar to style sheets can be applied to turn the abstract feature attributes data into visualization styles. For example, a curved pipe can be represented as a tubular extrusion shape or as a multi-segment line [3].
The translation can be performed on the fly after an online query for a particular area given by a GPS coordinate (Figure 6). However, current practice often is to load the relevant data on the client device in the morning before going out to the field, so that a wireless online connection is not required. Figure 5 gives an example of a resulting geospatial 3D model. Currently we are able to automatically create both above-surface and underground models of structures relevant for utility management from GML data sources.
3 http://www.opengeospatial.org/standards/wfs

Figure 7: AR device called Vesp´R designed for outdoor use and
delivering field workers an augmented view with geospatial content.
Figure 8: The excavation lens implements a virtual excavation in
which the buried assets perceived in all three dimensions.
All attributes from the GIS are preserved and stored in the parameterized scene graph. Such attributes allow for flexible rendering of the elements of the scene graph during runtime. Hence, features that have the same attributes (e.g., pipes of type electricity and the owner type of Salzburg AG) can be rendered in a specific color. The user is able to augment his view with such geospatial 3D models using a handheld AR device. During the operation of the AR device, the 3D data must be appropriately filtered to avoid display clutter and incomprehensive results. This is done using the scene graph filtering described in [12].
2.2 Integration of Digital Terrain Models Geospatial databases traditionally store only 2D information. Consequently, assets can only be presented relative to a plane surface unless specific depth information is present. This situation involves major registration errors when the terrain is uneven. To overcome this shortcoming we included a DTM into our geospatial model, which is also translated from a geospatial data source (see inset of Figure 5). All above-surface and underground infrastructures use the DTM as reference for calculating the appropriate depth values that the buried assets follow the terrain. Consequently, the integration of a DTM improves the visualization significantly since all features are shown with the correct reference to the terrain.
Figure 9: Metadata query tool to select and view meta information
of geospatial content.
Figure 10: Snapshot of the augmented live video.
3 PLATFORM AND USER INTERFACE
In this section we briefly describe the handheld AR platform developed for the field work, and the user interface functions of the software that was developed to visualize and interact with geo-data in the field. We distinguish general inspection functions from redlining tools.
3.1 Handheld Augmented Reality device An AR device intended to be used outdoors at an unprepared location must be completely self-contained. The system must provide sufficient computing capabilities for real-time 3D graphics and allows for several hours of battery-powered operation. It is also necessary have an ergonomic form factor that allows to holding the AR device for extended periods, and a real-time tracker with six degrees of freedom operating without preparing a tracking model first – GPS is used in practice. A handheld AR device – as opposed to an HMD – can also be viewed collaboratively. Unlike body worn equipment, a handheld device is less intimidating and can be more easily shared by multiple workers.
Considering the above requirements, a two-handed shell was designed around an Ultra Mobile PC (Sony Vaio UX1) [13]. The shell was manufactured from lightweight ABS plastic, and holds the sensors.

Figure 11: Surveyed locations of a planned pipe with the point-and-
shoot metaphor of the handheld AR device.
A GPS receiver with EGNOS corrections, inertial orientation tracker and a high quality industrial camera are connected to the UMPC. The handlebars contain joystick controls that can be operated by thumb and index finger. All peripherals are connected and powered via USB. The total weight of the device is ~1200g. The UMPC is operated under Windows XP and runs the Studierstube4 software framework developed at our research group.
3.2 Inspection toolset Excavation tool Indiscriminately overlaying hidden information on top of visible real-world entities introduces depth perception problems. Virtual objects appear to float on top of the real ones because of overdraw. Therefore we employ an excavation tool resembling a hole in the ground, thereby providing plausible interpretation of depth through partial object occlusion as well as motion parallax. (see Figure 8) The excavation tool is implemented using a magic lens technique, filtering the content based on contextual information [12] derived from the attribute data in the GIS. The lens is initially positioned in front of the user, but can be adjusted using controls on the AR device. Metadata Querying tool We have also implemented a metadata querying tool, which helps the user to visualize the meta information of the infrastructure, such as part number, ownership etc. This meta information is obtained from the original geo-data and stored as non-geometrical attributes on the 3D model. As depicted in Figure 9 a crosshair target can be positioned on top of an asset, revealing associated meta-information. Filtering tool Desktop GIS systems offer advanced possibilities for filtering and selecting information to avoid cluttering. Such detailed attribute selection tends to be too complicated for interaction in handheld AR. Instead, as shown in Figure 8 we let the user select a region of interest with the excavation tool first, and then turn on 3D features based on pre-grouping into asset categories (gas, water, buildings and so on). This two-step filtering approach reduces clutter to a manageable amount with only a minimum of interaction.
4 http://www.studierstube.org
Snapshot toolFor documentation, field workers like to freeze an image at any point in time and take a snapshot, to be analyzed later in the planning office. A dedicated button on the AR device triggers such a snapshot (see Figure 10).
3.3 Redlining toolset Annotating the geospatial model We implemented a redlining tool in an augmented reality style for providing field workers redlining capabilities. The redlining tool enables the outdoor user to annotate and interact with geospatial objects. The user can choose a symbol from a predefined palette of symbols (e.g., damage, safety area, or maintenance area), that can be placed in the geospatial model. Using the point-and-shoot metaphor of the AR device, the user can place the selected symbol at the point of intersection with the geospatial model.
Furthermore, the tool enables the user to mark areas on the terrain. This is done by choosing the center of an area to be marked with the handheld AR device again using the same metaphor. The radius of the area to be marked can be changed by varying the pitch and yaw of the device (see Figure 3). Interactive validation of object placement Some applications demand to inspect, validate or modify the placement of specific structures in the environment. This can be necessary if either the GIS is known to be incomplete, so that planning exclusively in the office is not feasible, or if plans from contractors are obtained without geo-referencing. In this case, surveying in the field and planning the actual location of the asset can be integrated in one interactive feature of the AR system, assuming that a 3D representation of the inspected structure is already available.
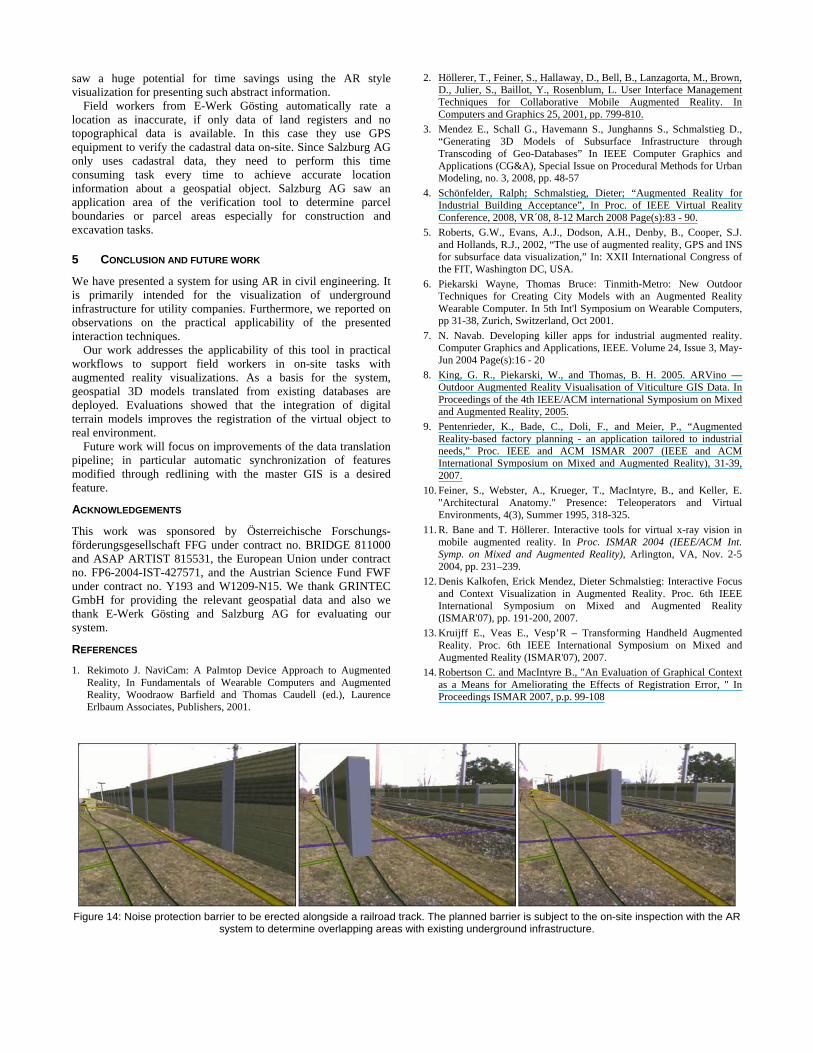
For example, Figure 14 shows a noise protection barrier to be erected alongside a railroad track. The barrier has been planned by a contractor, while the exact placement of the barrier is subject to the on-site inspection with the AR system. The barrier must not be built on top of existing underground utility infrastructure, to assure that maintenance of the utilities is not affected. In order to do that, the field workers determine various possible placements in an on-site planning discussion. Surveying locations in the geospatial model Besides placing an annotation to a location in the geospatial 3D model the user also has the possibility to survey locations by intersecting his pose with the geospatial model (underground infrastructure, DTM or buildings). This enables a field worker for example to survey a single spot or the location of a trench. Furthermore the user can draw a freehand polygon on the DTM and store its location. Small cubes indicate the surveyed locations by the field worker.
Redlining information can be stored in a separate file (e.g. each location and symbol), for later analysis in the office.
3.4 Verification toolset Visualization of abstract information
Field workers from utility companies that are only using land-register data and no topographic data in their GIS have the strong need to localize the geospatial objects directly on-site. Typically this is done by using a real-time kinematics GPS device to obtain references to the real topography. Undoubtedly, this is a time consuming task.
Visualization of legally binding land-register data is an important task for utility suppliers, since this information is usually difficult to find on-site. A wide range of abstract information, such as parcel borders, parcel areas, ownership and servitude rights (see Figure 12) are relevant for this task.

Figure 12: Conventional visualization of parcel areas in 2D based
on land-register (cadastral) data (Graz Geodatenserver).
Superimposing that data with our AR device does not need any further measurement steps, since the user knows his pose in relation to the real world topography due to tracking anyway. Especially utility companies that only employ land-register data need to determine and find the land-register data in the real environment. To do so, they have the need to transfer the parcel border or trench border from the land-register data to the real on-site environment. Consequently they survey the borders, because borders in the real world are not necessarily on the right place. For example, it cannot be assumed that a fence is exactly located at the parcel border. The mobile AR device provides the possibility to fulfill the positioning requirements by having an integrated GPS receiver.
Figure 13 shows green marked areas indicating land-register data superimposed on the real environment. In contrast, compare this 3D visualization with the one in 2D usually done on office PCs (Figure 12). Using the augmented reality style visualization the user sees the parcels in an egocentric view directly superimposed on the environment. Verification of abstract information
Often field workers from utility companies need to verify data from the GIS on-site at construction or surveying sites. For example, in an excavation or digging task it is essential to not dig on wrong parcels. The verification toolset can support the field workers in the verification of land-register and cadastral data.
4 EVALUATION
In order to assess the applicability of the virtual redlining toolset, we performed a series of field trials and interviews, analyzing a range of aspects. These factors included the general quality of the redlining method, the matching of industrial requirements obtained in the system requirement phase, and the actual operation by end-users. The main focus was on the practical relevance of our prototype. By conducting an interview with field workers from industrial utility companies (two employees from the local power supplier E-Werk Gösting Stromversorgungs-GmbH and five employees from Salzburg AG operating gas, water, electricity and heating networks), we obtained valuable feedback from experts with several years of experience.
After introducing the hardware setup and the application to the field workers, they used the setup to visualize the underground infrastructure at the outdoor site and interacted with the application (see Figure 2).
Figure 13: Land-register (cadastral) data superimposed on the real
environment in employing AR visualization techniques.
A semi-structured interview was performed evaluating the practical applicability of the virtual redlining tool and the usefulness of terrain models for their tasks. Next, results from the evaluations are presented.
4.1 First field worker interview An early trial and interview was performed with 5 experienced field workers. All field workers confirmed the high potential of AR for time savings and error avoidance in tasks like construction instruction, outage management and planning.
The most significant advantage of using AR is an improved spatial overview of the construction site through the egocentric visualization of the underground infrastructure. The field workers want to see all assets buried in one spot at once, and clearly preferred a 3D visualization over one in only 2D. Especially, the depth perception of the pipes is beneficial, which reconfirmed our expectations that conventional 2D GIS does not fully address the worker’s needs.
Color coding for different bands – voltage bands for electricity or pressure bands for gas pipes – is important, since it helps a lot in classifying the assets. The field workers also mentioned that a positional accuracy of 30cm for asset location is sufficient, and that photorealistic graphics are not important.
Communication between utility companies and construction companies is conventionally done by spraying markers on the ground. This can be seen as another form of redlining. Using our application, spraying is no longer necessary. The snapshot tool is very relevant, when a certain situation concerning underground infrastructure needs to be discussed, documented or presented.
E-Werk Gösting usually needs to locate 50-100 meters of trench length a day. Thus, the AR device would be operated in a discontinuously mode, using it for ~5-10 seconds, and then walking further. The overall time of usage at one construction site is around 15-20 minutes. The AR system can alleviate their work by carrying less measurement devices with them. It can even be used to digitize of a trench by walking along its course and recording GPS positions. Overall, a smaller workload and fewer erroneous excavations are expected.
4.2 Digital Terrain Model Including a DTM into the geospatial model was rated very helpful for visualization. As expected, the visualized terrain especially was found useful in uneven areas, since the pipes need to follow the terrain. Without a DTM the registration in uneven terrain would only be correct in the near view (looking down onto the

street). Additionally the DTM improves the reference of both underground features and above surface features like buildings.
Furthermore, two field workers from Salzburg AG mentioned when they only see the underground infrastructure without other assets superimposed on the real world they feel unsure if the registration is correct. Both DTM and buildings help people to rate the registration as reliable, because they first search for building lines in the model that are correlating to real building lines. After having found such references the location of underground infrastructure is trusted. This is consistent with the findings of [14].
4.3 Virtual Redlining E-Werk Gösting currently works with analog plans in the field and work with both land-registers and topography data in the GIS. Their field workers need such redlining functions every day whereas the GIS is updated with redlining information on a weekly basis. Currently the field workers do all redlining on plotted paper plans. In contrast, employees of Salzburg AG use Tablet PCs in many processes, where redlining is a widely used technique. They currently use a mobile application from SAP for asset management and redlining purposes. Business processes of utility companies Field workers from Salzburg AG saw a practical application of our redlining tool in the network inspection process. The utility network is inspected on a regular basis, where a field worker needs to describe the condition of the single assets. Usually each asset is rated using a scale from 1 to 5. In this task redlining allows the field worker to assign the appropriate redlining symbols (1-5) to the assets. Furthermore, the redlining symbols with the according assets are then stored to a file and can be used for further tasks.
A second application area that was identified by the field workers is archiving of data. Utility suppliers have the need to archive all relevant information concerning each geospatial object. This is a time consuming task since the database must be kept up-to-date manually in the office. With our virtual redlining tool, it is easy to take snapshots of redlined geospatial objects, store and connect them to the according object. Salzburg AG stated that such a procedure would safe a massive amount of work.
Experts from both companies mentioned the task of planning new geospatial objects or trenches as very useful for our redlining tool. As shown in Figure 11,a field worker from Salzburg AG had the task of surveying the locations of a newly planned pipe (in red color). The small cubes in the image represent the locations the field worker has surveyed using the AR device with the redlining tool. Additionally, the coordinates of these surveyed locations could be used for further processing.
Field workers from Salzburg AG have a demand in localizing street features, such as manhole covers or water openings. They often need to find the features again even if they have been covered (e.g., by a new thin layer of asphalt). By surveying such features on the street using the redlining tool takes advantage of the point-and-shoot metaphor they can easier find the features again. Rating of redlining modes We also asked the field workers to rate the various modes of the redlining tool. Drawing of circular or rectangular areas with variable radius or size, as depicted in Figure 3, was rated mediocre, despite the fact that it directly mimics a function available in the GIS. Interestingly, drawing rectangular areas received better feedback than circular areas, since many geospatial objects have rectangular shape (e.g. a trench).
Using a palette of predefined symbols was found very useful by all participants. This way they only need to place a specific symbol to a location instead of writing a description every time. For example, this mode simplifies the network inspection task in which the conditions of geospatial assets are determined and described with a number from 1 to 5. In this case a palette of symbols is sufficient allowing the user to place a symbol onto a geospatial object using the point-and-shoot metaphor.
For the task of describing and annotating assets (e.g., a damaged pipe) a palette of symbols gives too little information. In this case textboxes and the like need to be connected with the asset and additionally also a catalog of measures describing how to fix the damage.
Freehand drawing of polygons got excellent feedback. This allows flexibility and is similar to what is also available in 2D-GIS systems today. How accurate need the redlining symbols be placed Symbols from a predefined palette do not need to be set precisely because the redlined objects will not be directly transferred into the GIS. An example would be placing a safety symbol indicating a safety area. In contrast when surveying a geospatial object or planning a new trench, the locations need to be determined precisely since the coordinates will be used to create an object in the GIS. Spatial interaction The spatial interaction method using the point-and-shoot metaphor for placing symbols in the geospatial model was rated high. Also, when marking a circular area on the ground, the variation of the radius with orientation changes got high scores. Salzburg AG workers were very enthusiastic about the interaction techniques and handling in general. Overall advantage of redlining As a major difference to conventional procedures, field workers mentioned plotted plans would be redundant for processes agreed before. The Tablet PC systems they already use do not need paper prints, but only show data in 2D. Field workers also found it necessary to store and use large data sets with redlined objects. They mentioned that the main strength of the virtual redlining tool is the integration of functions for annotating geospatial objects and surveying of locations. The evaluations showed that the virtual redlining tool has the potential to improve the workflow of a variety of tasks such as planning, network inspection, network documentation and surveying street features.
4.4 Verification of abstract information Field workers from E-Werk Gösting don’t have a strong need to
visualize such abstract information in the field because they also use topographic data next to land-register data in their GIS. Already before going on-site they prepare and measure the land-register data in the main GIS in the office. For example, virtual semantic information, such as parcel areas can be visualized in a 2D GIS (see Figure 12). Employees from E-Werk Gösting rated 3D visualization most useful, where no borders can be seen, like in fields or woods. This verification tool was also rated helpful in a planning task when a new object, e.g. trench or pipe needs to be placed. In contrast for Salzburg AG it is vital to determine and find land-register data in the real environment, since they do not use topological data in their GIS.
Generally companies that only use land-register data can benefit from on-site visualizations. The visualization of parcel borders in an AR manner was found useful and timesaving by field workers from Salzburg AG and was rated to have a huge potential to simplify their work. Additionally, all field workers
saw a huge potential for time savings using the AR style visualization for presenting such abstract information.
Field workers from E-Werk Gösting automatically rate a location as inaccurate, if only data of land registers and no topographical data is available. In this case they use GPS equipment to verify the cadastral data on-site. Since Salzburg AG only uses cadastral data, they need to perform this time consuming task every time to achieve accurate location information about a geospatial object. Salzburg AG saw an application area of the verification tool to determine parcel boundaries or parcel areas especially for construction and excavation tasks.
2. Höllerer, T., Feiner, S., Hallaway, D., Bell, B., Lanzagorta, M., Brown, D., Julier, S., Baillot, Y., Rosenblum, L. User Interface Management Techniques for Collaborative Mobile Augmented Reality. In Computers and Graphics 25, 2001, pp. 799-810.
3. Mendez E., Schall G., Havemann S., Junghanns S., Schmalstieg D., “Generating 3D Models of Subsurface Infrastructure through Transcoding of Geo-Databases” In IEEE Computer Graphics and Applications (CG&A), Special Issue on Procedural Methods for Urban Modeling, no. 3, 2008, pp. 48-57
4. Schönfelder, Ralph; Schmalstieg, Dieter; “Augmented Reality for Industrial Building Acceptance”, In Proc. of IEEE Virtual Reality Conference, 2008, VR´08, 8-12 March 2008 Page(s):83 - 90.
5. Roberts, G.W., Evans, A.J., Dodson, A.H., Denby, B., Cooper, S.J. and Hollands, R.J., 2002, “The use of augmented reality, GPS and INS for subsurface data visualization,” In: XXII International Congress of the FIT, Washington DC, USA.
5 CONCLUSION AND FUTURE WORK
We have presented a system for using AR in civil engineering. It is primarily intended for the visualization of underground infrastructure for utility companies. Furthermore, we reported on observations on the practical applicability of the presented interaction techniques.
6. Piekarski Wayne, Thomas Bruce: Tinmith-Metro: New Outdoor Techniques for Creating City Models with an Augmented Reality Wearable Computer. In 5th Int'l Symposium on Wearable Computers, pp 31-38, Zurich, Switzerland, Oct 2001.
7. N. Navab. Developing killer apps for industrial augmented reality. Computer Graphics and Applications, IEEE. Volume 24, Issue 3, May-Jun 2004 Page(s):16 - 20
Our work addresses the applicability of this tool in practical workflows to support field workers in on-site tasks with augmented reality visualizations. As a basis for the system, geospatial 3D models translated from existing databases are deployed. Evaluations showed that the integration of digital terrain models improves the registration of the virtual object to real environment.
8. King, G. R., Piekarski, W., and Thomas, B. H. 2005. ARVino — Outdoor Augmented Reality Visualisation of Viticulture GIS Data. In Proceedings of the 4th IEEE/ACM international Symposium on Mixed and Augmented Reality, 2005.
9. Pentenrieder, K., Bade, C., Doli, F., and Meier, P., “Augmented Reality-based factory planning - an application tailored to industrial needs,” Proc. IEEE and ACM ISMAR 2007 (IEEE and ACM International Symposium on Mixed and Augmented Reality), 31-39, 2007.
Future work will focus on improvements of the data translation pipeline; in particular automatic synchronization of features modified through redlining with the master GIS is a desired feature. 10. Feiner, S., Webster, A., Krueger, T., MacIntyre, B., and Keller, E.
"Architectural Anatomy." Presence: Teleoperators and Virtual Environments, 4(3), Summer 1995, 318-325. ACKNOWLEDGEMENTS
11. R. Bane and T. Höllerer. Interactive tools for virtual x-ray vision in mobile augmented reality. In Proc. ISMAR 2004 (IEEE/ACM Int. Symp. on Mixed and Augmented Reality), Arlington, VA, Nov. 2-5 2004, pp. 231–239.
This work was sponsored by Österreichische Forschungs-förderungsgesellschaft FFG under contract no. BRIDGE 811000 and ASAP ARTIST 815531, the European Union under contract no. FP6-2004-IST-427571, and the Austrian Science Fund FWF under contract no. Y193 and W1209-N15. We thank GRINTEC GmbH for providing the relevant geospatial data and also we thank E-Werk Gösting and Salzburg AG for evaluating our system.
12. Denis Kalkofen, Erick Mendez, Dieter Schmalstieg: Interactive Focus and Context Visualization in Augmented Reality. Proc. 6th IEEE International Symposium on Mixed and Augmented Reality (ISMAR'07), pp. 191-200, 2007.
13. Kruijff E., Veas E., Vesp’R – Transforming Handheld Augmented Reality. Proc. 6th IEEE International Symposium on Mixed and Augmented Reality (ISMAR'07), 2007.
REFERENCES 1. Rekimoto J. NaviCam: A Palmtop Device Approach to Augmented
Reality, In Fundamentals of Wearable Computers and Augmented Reality, Woodraow Barfield and Thomas Caudell (ed.), Laurence Erlbaum Associates, Publishers, 2001.
14. Robertson C. and MacIntyre B., "An Evaluation of Graphical Context as a Means for Ameliorating the Effects of Registration Error, " In Proceedings ISMAR 2007, p.p. 99-108
Figure 14: Noise protection barrier to be erected alongside a railroad track. The planned barrier is subject to the on-site inspection with the AR
system to determine overlapping areas with existing underground infrastructure.
Copyright © 2022 FDOKUMEN