Designing and Using Virtual Field Environments to Enhance ...
225
Portland State University PDXScholar Dissertations and eses Dissertations and eses 1-1-2011 Designing and Using Virtual Field Environments to Enhance and Extend Field Experience in Professional Development Programs in Geology for K-12 Teachers Frank D. Granshaw Portland State University Let us know how access to this document benefits you. Follow this and additional works at: hp://pdxscholar.library.pdx.edu/open_access_etds is Dissertation is brought to you for free and open access. It has been accepted for inclusion in Dissertations and eses by an authorized administrator of PDXScholar. For more information, please contact [email protected]. Recommended Citation Granshaw, Frank D., "Designing and Using Virtual Field Environments to Enhance and Extend Field Experience in Professional Development Programs in Geology for K-12 Teachers" (2011). Dissertations and eses. Paper 280. 10.15760/etd.280
-
Upload
khangminh22 -
Category
Documents
-
view
0 -
download
0
Transcript of Designing and Using Virtual Field Environments to Enhance ...

Portland State UniversityPDXScholar
Dissertations and Theses Dissertations and Theses
1-1-2011
Designing and Using Virtual Field Environments to Enhance andExtend Field Experience in Professional Development Programs inGeology for K-12 TeachersFrank D. GranshawPortland State University
Let us know how access to this document benefits you.Follow this and additional works at: http://pdxscholar.library.pdx.edu/open_access_etds
This Dissertation is brought to you for free and open access. It has been accepted for inclusion in Dissertations and Theses by an authorizedadministrator of PDXScholar. For more information, please contact [email protected].
Recommended CitationGranshaw, Frank D., "Designing and Using Virtual Field Environments to Enhance and Extend Field Experience in ProfessionalDevelopment Programs in Geology for K-12 Teachers" (2011). Dissertations and Theses. Paper 280.
10.15760/etd.280

Designing and Using Virtual Field Environments to Enhance and Extend Field
Experience in Professional Development Programs in Geology for
K-12 Teachers
by
Frank Douglas Granshaw
A dissertation in partial fulfillment of the requirements for the degree of
Doctor of Philosophy in
Environmental Sciences and Resources: Geology
Dissertation Committee: Michael L. Cummings, Chair
Richard C. Hugo Eric J. Pyle
Carl C. Wamser Eric Mankowski
Portland State University ©2011

i
ABSTRACT
Virtual reality (VR) is increasingly used to acquaint geoscience novices with
some of the observation, data gathering, and problem solving done in actual field
situations by geoscientists. VR environments in a variety of forms are used to prepare
students for doing geologic fieldwork, as well as to provide proxies for such experience
when venturing into the field is not possible. However, despite increased use of VR for
these purposes, there is little research on how students learn using these environments,
how using them impacts student field experience, or what constitutes effective design in
light of emerging theories of geocognition.
To address these questions, I investigated the design and use of a virtual reality
environment in a professional development program for middle school Earth science
teachers called Teachers on the Leading Edge (TOTLE). This environment, called a
virtual field environment, or VFE, was based largely on the field sites visited by the
participants during summer workshops. It was designed as a tool to prepare the
participants for workshop field activities and as a vehicle for taking elements of that
experience back to their students. I assessed how effectively the VFE accomplished these
goals using a quasi-experimental, mixed method study that involved a series of teaching
experiments, interviews, participant surveys, and focus groups. The principle
conclusions reached in this study are as follows:
1. In a field trip orientation experiment involving 35 middle school teachers, 90.6% of the
participants stated a preference for VFE enhanced orientation over an alternative

ii
orientation that used photographs and static maps to complete a practice field activity.
When asked about how the VFE prepared them for their field experience, the
participants ranked it as most helpful for visualize the location and geography of the
field sites. They ranked it lower for helping them visualize structural and geomorphic
patterns, and ranked it as least helpful in developing conceptual links between the
geology at individual field sites and regional geologic structure and processes.
2. According to workshop follow-up surveys, 23% of the first year participants and 40%
of the second year participants used the VFE with their own classes. While factors
cited for not using the VFE provided some information relevant to the larger question
of technology use in classroom, individual reports of how teachers used the VFE in
their classes provided limited information about student interaction with the virtual
environment.
3. Interviews with 85 community college students (novices), geologists (experts), and
middle school Earth science instructors (teachers) revealed no significant difference in
the features of interest selected from a virtual field site. Though experts tended to ask
slightly more complicated and higher order questions than the other two groups, there
was no statistically significant difference in the questions asked about these features in
regards to topical characteristics, cognitive outcome, or cognitive type. In addition to
some insights into cognitive differences between these groups, the interviews also
provided information about visual selection, perception, and processing which are
valuable to VFE scene design.

iii
Acknowledgements
This research and the accompanying development were possible only because of
the support and encouragement of a great many people. Chief among them are the
following…
• My dissertation adviser, Michael Cummings and the other members of the
committee (Richard Hugo, Eric Pyle, Eric Mankowsi, and Carl Wamser) whose
comments, conversations, and support where invaluable in guiding this work.
• The staff of TOTLE (Teachers on the Leading Edge) who made this project
possible. Special thanks go to Robert Butler who invited me to be part of the
team, joined me for related fieldwork, and read over a great many drafts
associated with this project.
• Brian Atwater and William Scott of the U.S. Geological Survey, as well as Patrick
Pringle (Centralia College) who provided technical support and guidance on the
virtual field environment (VFE).
• Shelly Olds (UNAVCO) who provided technical information related to
Earthscope and reviewed parts of the VFE and the accompanying teacher guide.
• Barbara Samora (Mt. Rainier National Park) who made extended field time on
Mt. Rainier a possibility.
• All the students, teachers, and geologists who participated in this research.
• The National Science Foundation who provided financial support for TOTLE and
this research.
iv
• Finally, special thanks go to my wife, who participated in fieldwork, read through
numerous drafts, and lovingly put up with me through almost half a decade of
decision making, research, development, and writing.

v
Table of Contents
Abstract……………………………………………………………………………..i
Acknowledgements ....................................................................................................iii
List of Figures ............................................................................................................viii
List of Tables .............................................................................................................x
Chapter 1 - Introduction .............................................................................................1
The purpose and context of this research: ..............................................................2
The theoretical and empirical framework of this problem: ...................................3
The significance of this research: ..........................................................................5
Chapter 2 - Field experience in geoscience education ...............................................7
The role of fieldwork in geoscience research ........................................................7
The role and status of field experience in geoscience education ...........................9
The nature of field experience in geoscience education ........................................12
Field experience in K-12 teacher education ...........................................................14
Chapter 3 - Virtual reality in geoscience education ..................................................17
Virtual reality defined: ...........................................................................................17
The role of virtual reality in geoscience research: .................................................17
Virtual reality in geoscience education ..................................................................19
Chapter 4 - TOTLE, the professional development context .....................................30
Chapter 5 - Developing the Virtual Field Environment ............................................36

vi
VFE design and pedagogical rationale ..................................................................37
VFE development within the TOTLE program .....................................................52
Chapter 6 - Evaluating Enhancement: VFE augmented orientation and participants’
sense of preparedness .................................................................................................58
Research question ..................................................................................................58
Hypothesis..............................................................................................................58
Methodology ..........................................................................................................59
Results ....................................................................................................................62
Discussion ..............................................................................................................67
Chapter 7 – Evaluating Extension: The impact of VFEs on teacher classroom
practice .......................................................................................................................76
Research question ..................................................................................................76
Methodology ..........................................................................................................76
Results ....................................................................................................................78
Discussion ..............................................................................................................83
Chapter 8 – Design Experiment: Feature identification and questions for a virtual field
site ..............................................................................................................................88
Research question ..................................................................................................88
Hypothesis..............................................................................................................88
Methodology ..........................................................................................................89
Results ....................................................................................................................99
Discussion ..............................................................................................................111
vii
Chapter 9 – Conclusions ............................................................................................120
Chapter 10 – Future Work .........................................................................................123
Expansion of the TOTLE VFE project ..................................................................123
Additional VFE projects and alternative development strategies: .........................126
References Cited ........................................................................................................131
Appendix A – Survey and test forms .........................................................................148
Form 1 - TOTLE 2008, VFE prototype assessment - Breakout session activity ...149
Form 2 - TOTLE 2008, VFE prototype assessment - Post Activity Survey ..........150
Form 3 – Enhancement experiment - Consent letter .............................................151
Form 4 – Enhancement experiment - Pre-activity survey .....................................153
Form 5 – Copalis River field trip orientation activity ............................................156
Form 6 – Mt. Rainier field trip orientation activity ...............................................157
Form 7 – Enhancement experiment - Post-activity survey ....................................159
Form 8 – Design experiment - Consent form .......................................................161
Form 9 – Design experiment - Background survey ...............................................163
Form 10 – Design experiment - Interview script ...................................................167
Form 11 – Design experiment - Interview recording form ....................................169
Appendix B – Survey and Experimental Data ...........................................................171
Appendix C – Contents of the Companion CD .........................................................207
viii
List of Figures
Figure 3. 1 – The ADVISOR system in action. .........................................................18
Figure 3. 2 – Scene from a Burgess Shale virtual field environment. .......................21
Figure 5. 1 - Spatially hierarchical views from the TOTLE VFE .............................40
Figure 5. 2 - Aerial view with associated map views ................................................41
Figure 5. 3 - Panorama with enhancement overlay active. ........................................42
Figure 5. 4 - Measuring tools built into the TOTLE VFE .........................................43
Figure 5. 5 - Sediment sequence from the TOTLE VFE ..........................................45
Figure 5. 6 - Screens from the regional map module .................................................46
Figure 5. 7 - Inundation extent of the tsunami related to Cascadia megathrust
earthquake ..........................................................................................................48
Figure 5. 8 - Possible flooding from a tsunami generated by a near shore
magnitude 9 earthquake. ....................................................................................48
Figure 5. 9 - Volcanic hazard map for Mt. Rainier ....................................................49
Figure 5. 10 - Probable depth of an Osceola scale debris flow behind Mud
Mountain Dam, Washington ..............................................................................49
Figure 6. 1 - Conceptual diagram of the relationship between learners, pictures,
texts, and the learning tasks. From Whitmeyer et. al. (2007) ...........................71

ix
Figure 8. 1 - Scene from the digital panorama used in this experiment ....................91
Figure 8. 2 - Academic background in geology .........................................................101
Figure 8. 3 – Experience with scientific fieldwork ....................................................102
Figure 8. 4 - Interviewees' teaching experience .........................................................102
Figure 8. 5 - Interviewees' computer usage ...............................................................103
Figure 8. 6 - Feature location .....................................................................................105
Figure 8. 7 - Feature selection by group ....................................................................106
Figure 8. 8 - Interviewee questions classified by topical operational characteristics 109
Figure 8. 9 - Interviewee questions classified by cognitive outcome ........................110
Figure 8. 10 - Interviewee questions classified by cognitive type .............................110

x
List of Tables
Table 6. 1 - Academic Background in geoscience ....................................................62
Table 6. 2 - Experience with scientific fieldwork. ....................................................63
Table 6. 3 - Participant computer experience ...........................................................64
Table 6. 4 - Participant response to the VFE augmented field trip orientation. .......66
Table 6. 5 - Participant response to how the VFE prepared them for workshop field
trips. ...................................................................................................................67
Table 7. 1 - Intended versus actual use of the VFE for instruction. .........................79
Table 7. 2 - Reported uses of the VFE. Cited from the 2010 workshop follow-up
survey. ................................................................................................................80
Table 7. 3 - Factors cited for not using the VFE in instruction.. ..............................82

Page 1
Chapter 1 - Introduction
Virtual reality used to aid or substitute for educational field experience is
increasingly being discussed in geoscience education literature, as well as appearing with
greater frequency in Earth science curricula. However, despite this escalating popularity,
there is little research about how and what students learn from such environments, and
how what they learn compares to learning in actual field situations. This research
examines the development and assessment of a virtual reality environment for a teacher
professional development, in an effort to address some of this lack of information.
This dissertation consists of two principle components: This document which
describes the development and assessment process, and an accompanying computer CD
that contains the virtual environment and teacher and student guides to environment.
The general structure of this document is as follows:
• Chapters 2 and 3 provide background on the nature of fieldwork in geoscience
research and education, as well as the use of virtual reality in those venues.
• Chapter 4 describes the program in which this research and development took
place.
• Chapter 5 explains the structure and development of the virtual environment for
this program, as well as the geocognitive issues associated with its design.
• Chapters 6 through 8 explain three experiments created to guide the design of the
virtual environment and evaluate its use.

Page 2
• The final two chapters (9 and 10) are a general discussion of the findings of these
experiments, the nature and impact of the development process on the program it
was designed for, and potential follow-ups to this type of research and
development.
The purpose and context of this research:
The purpose of this research is to determine the impact of virtual reality
environments (VRE) on professional development programs for secondary level Earth
science teachers. The chief questions in evaluating this impact are:
1) Does using these environments prepare teachers for actual field experience?
If so, how do these environments prepare them?
2) Does using these environments in teacher education impact the classroom
practice of the teachers who use them? If so, what impact does it have?
3) How does the design of these environments influence their effectiveness?
Presently there has been little research on these questions. One possible reason
for this is that until recently the technology has been beyond the reach of most secondary
science teachers and teacher education programs. The few studies that have been done
(Tretinjak and Riggs, 2008; Tretinjak, 2004) focus on virtual environments as a substitute
experience rather than a preparative tool.
To address these questions, this research involves identifying and examining key
issues entailed in designing educational virtual field environments (VFEs). To date I have
found very little literature discussing what creates an effective educational virtual field
environment. Addressing design issues associated with these environments is particularly
Page 3
important for two reasons. First, virtual environments are used extensively in geoscience
research for data visualization, collaborative analysis, and research planning (Clegg et al.,
2005; Head et al., 2005; Dorn et al., 2001; Rasmussen et al., 2000; Xu and Aiken, 2000;
Stoker et al., 1997; Xu et al., 1999; Robinson and Richers, 1992). Second, virtual reality
is rapidly gaining popularity with geoscience educators as a means of visualization and
training (Kelly and Riggs, 2006; Browne, 2005; Boundy and Condit, 2004; Kerridge et
al., 2003; Nix, 2002; Hatch and Leggitt, 1998; Beller et al., 1997).
The theoretical and empirical framework of this problem:
Virtual reality is increasingly used in both geoscience education and research. In
geoscience research, virtual reality environments (VREs) are used for a wide variety of
tasks. These include archiving large amounts of visual data; displaying and analyzing
remote sensing, geophysical, and geographic data; linking these data with visual human
scale data; displaying these data across multiple spatial and temporal scales; and
promoting collaborative research (Clegg et al., 2005; Head et al., 2005; Thurmond et al.,
2005; Dorn et al., 2001; Rasmussen et al., 2000; Xu and Aiken, 2000; Xu et al., 1999;
Robinson and Stoker et al., 1997; Richers, 1992). In geoscience education, VREs are
used to prepare students for conducting fieldwork and provide proxy experiences when it
is not possible for students to actually visit a particular field site (Kelly and Riggs, 2006;
Browne, 2005; Boundy and Condit, 2004; Kerridge et al., 2003; Nix, 2002; Hatch and
Leggitt, 1998; Beller et al., 1997).
Until recently, the principle limiting factor to using VR technology in
introductory geoscience courses has been the expense and the technical complexity of VR

Page 4
systems. Nearly a decade ago, VR was limited to personal viewing systems such as
bulky display visors and control gloves, or group viewing systems such as stereoscopic
viewing “caves” and theaters (Pimentel and Teixeira, 1993). In each case, the technology
was generally too expensive and unwieldy to be used in K-12 and lower division
collegiate Earth science courses. However, with improvements in desktop computer
technology, the increasing prevalence of computers in classrooms, the rapid expansion of
the Internet, and the explosive growth of geospatial viewers, relatively complex VREs are
possible even for classrooms and home users having modest computer technology.
This rapid technological growth has coincided with two conflicting trends;
tightening educational budgets and continued interest in hands-on, inquiry-based science
curricula (AAAS, 2008; Bransford and Donovan, 2005; Minstrell and Kraus, 2005). In
terms of the latter, an emphasis on inquiry in geoscience education should mean an
increased emphasis on having students do fieldwork, since fieldwork plays such a
significant role in constructing geoscience knowledge. However, tightening educational
budgets make it increasingly difficult for teachers to arrange field experiences for their
students. Even in those instances where it is possible to arrange field experiences for
most students, disabilities may make it difficult for some students to participate in these
experiences. A result of this conflict is that field experience is frequently absent from
introductory geoscience curricula. It is also important to note that even when field
experience is present, that experience tends to be a “Cook’s tour” (direct instruction) type
field trip, rather than being inquiry-based fieldwork (Orion, 1989). This latter trend

Page 5
means that even when students do get the opportunity to go into the field, they do so
without getting the opportunity to engage in authentic fieldwork.
Other factors that could influence the inclusion of inquiry-based fieldwork in a
geoscience curriculum include the academic backgrounds of the instructors, their
familiarity with the geophysical character of the area in which they teach, their
experience doing fieldwork, and their experience with inquiry based instruction. Teachers
on the Leading Edge or TOTLE, the professional development program of which this
research is a part, was designed to address these issues by helping middle school teachers
become familiar with their own local (Oregon and Washington) geology. During
summer workshops they heard from and talked to researchers investigating this geology.
They also became familiar with hands-on inquiry based strategies for teaching about
Northwest geology, earthquakes, and volcanoes, and experience some of this geology in
the field (See chapter 4 for additional detail about this program). The purpose of the VFE
development for this program was to support these goals by providing the teachers with a
virtual environment that enables students to investigate some of the geology and geologic
hazards research the teachers experienced during the summer field workshops. It was
also designed to prepare the teachers in this program for their field experience by
familiarizing them with the sites they visited and the activities they engaged in during the
visits.
The significance of this research:
The first major benefit of the research described in this dissertation is that it
provides insight into the design of virtual reality environments used for geoscience

Page 6
education. An important aspect of this investigation is that it entails looking beyond the
technical issues of creating virtual environments to examine some of the cognitive and
instructional issues involved in their design and construction.
Another benefit is that this research contributes to teacher education by
demonstrating how virtual reality can augment the field component of field-based
professional development programs. Since the stated purpose of the TOTLE VFEs is to
enhance and extend the impact of the summer workshops, understanding how these
environments influence teacher learning and practice provides teacher educators with a
tool for influencing pedagogy.
Finally, this research provides insight into student learning in field and virtual
environments, as well as the cognitive aspects of educational visualization. Throughout
this project, my working assumption has been that building an effective instructional
VFE requires examining how geologic novices learn and solve problems in the field.
Building an effective VFE also involves examining how geologic novices and experts
interact with various visualizations. In other words, effective VFE design hinges on
gaining a fuller understanding of student and expert geocognition. Geocognition is a
rapidly emerging field of study that looks at cognition and metacognition as it relates to
geoscience learning and research (King et al., 2008; Petovic et al., 2009).

Page 7
Chapter 2 - Field experience in geoscience education
A critical step in designing and implementing virtual field environments for
geoscience education is to first understand what fieldwork is, the role that it plays in the
geosciences, its status in geoscience education, and effective models for field education.
To do so, it is important to begin with the case for including field experience, whether
real or virtual, in the geoscience curriculum. It is also important to understand what
happens in professional and educational field experiences as a means of devising
guidelines for developing effective virtual experiences. Finally, in order to determine
how virtual experiences can be used to enhance actual field experience, it is important to
identify the characteristics of an effective educational field experience.
The role of fieldwork in geoscience research
According to a 2009 workforce report published by American Geological Institute
(Gonzales et al., 2009), geoscience is the study of the composition, structure, and
physical dynamics of the Earth. This definition implies that observing, measuring, and
interpreting Earth structures and processes in their natural context is the means by which

Page 8
much of geoscience knowledge is constructed1. In one of the classic texts for field
geology, Geology in the Field (1985), Compton describes fieldwork as having three
central components. The first of these is the gathering of data by direct observation and
measurement. The second entails organizing these data into representations such as maps
and diagrams that enable us to generalize and interpret what we are seeing. The third
component involves constructing histories of and proposing causal mechanisms for the
structures and processes that are observed. Compton (1985) also states that fieldwork is
both operational and philosophical. In other words, fieldwork, like other scientific
activities, involves both observation and interpretation. This essential difference is that
unlike laboratory or theoretical science, in field science much of the observation and
interpretation takes place in a much more expansive, complicated, and fluid arena.
1 One of the challenges to this argument is that there are specialties within the geosciences within which
researchers may do little or no fieldwork (e.g. geochemists, geochronologists, or theoretical geophysicists).
Furthermore, with the increasing use of remote sensing technology, some researchers might argue that
fieldwork is becoming progressively less important to geoscience research. While the validity of this claim
is difficult to determine because no significant research exists detailing the activities of research
geoscientists, there does exist significant anecdotal evidence to support the importance of fieldwork in both
classic geologic literature (Compton 1985) and geoscience education literature (Butler
2008).geophysicists). Furthermore, with the increasing use of remote sensing technology, some researchers
might argue that fieldwork is becoming progressively less important to geoscience research. While the
validity of this claim is difficult to determine because no significant research exists detailing the activities
of research geoscientists, there does exist significant anecdotal evidence to support the importance of
fieldwork in both classic geologic literature (Compton 1985) and geoscience education literature (Butler
2008).

Page 9
The role and status of field experience in geoscience education
In addition to its importance in geoscience research, fieldwork provides students
with a series of cognitive, social, and affective benefits that are best outlined in the
Centre for Excellence in Active and Interactive Learning (CEAIL) report on fieldwork
(Quinn, 2009). In this report, Quinn (2009) argues that the benefits and value of field
courses have been well documented. The report notes that field experience:
• Provides students with opportunities to acquire a variety of procedural skills and
work effectively in a team (Moore, 2001).
• Has positive impact on long-term memory due to the memorable nature of the
fieldwork setting (Rickinson et al., 2004).
• Provides students with a platform for individual growth and improvements in
social skills (Quinn, 2009).
• Reinforces the affective and the cognitive, with each influencing the other and
providing a bridge to higher order learning (Nundy, 2001).
• Provides opportunities for instructors to experiment with a wide variety of course
delivery methods and the integration of theoretical and practical concepts (Kent et
al., 1997). Field experience reinforces abstract topics and higher-level concepts,
by connecting theory with practice (Haigh, 1986; Wiley and Humphreys, 1985;
Kern and Carpenter, 1986; McElroy, 1981).
• Provides opportunities for instructors to practice techniques that cannot be carried
out elsewhere. Field experience can demonstrate phenomena that are not
accessible in other settings, can stimulate a high level of understanding and an

Page 10
attitude of appreciation of different environments (Lonergan and Andresen,
1988).
• Provides learning in the field, offers originality, holism, integration, and
contextualization (Lonergan and Andresen, 1988). It also promotes particular
cognitive aspects, such as an appreciation of scale (e.g. micro to macro),
intellectual application, an appreciation of complexity, and the ability to
synthesize and evaluate information (Hawley, 1997).
• Promotes key organizational, personal, interpersonal skills (Thompson, 1982).
Boyle et al. (2007) argue that when field activities are included in the curriculum,
students tend to be more positive about their academic work, more confident in working
with others and coping with challenges, and they tend to attach greater importance to
their work. From this line of reasoning, Quinn concludes in that since successful learning
is dependent on motivation, which is in turn dependent on affective response (Biggs,
1999; Kern and Carpenter, 1986), engaging in fieldwork has cognitive as well as
affective benefits.
One issue not discussed in the CEAIL report is how field experience might help
students develop strategies for dealing with ambiguity. Scientific uncertainty is an
integral part of scientific inquiry (St. John, 2010; Kastens, 1995). Paradoxically,
uncertainty in science frequently leads to public skepticism about science. This in turn
can result in uninformed negative public opinion towards critical fields such as climate
science or evolutionary studies. In the classroom, discomfort with uncertainty can
translate into debilitating frustration or other negative affect (Margolis and McCabe,

Page 11
2006). Because of the unconstrained nature of many field situations, fieldwork requires
investigators to contend with incomplete data to solve problems having multiple
solutions. Consequently, field experience can be a rich venue for teaching students how
to deal with uncertainty when solving problems, provided they receive help in developing
strategies for dealing with the ambiguity that they confront.
Despite the importance of fieldwork in geoscience research, most K-16 students
taking geoscience tend to receive little or no field experience (Gonzales et al., 2009).
One potential contributing factor is that here in the United States, geoscience tends to be
a relatively minor part of both K-12 and community college curricula (Gonzales et al.,
2009). Additional reasons include budgetary restrictions, concerns about safety and
insurance liability, effective use of instructional time, the time constraints of working
students, and the difficulty of accommodating students with physical disabilities. Several
publications from the United Kingdom and Israel, suggest that a lack of field experience
in general geoscience education is an international issue that is influenced by many of the
same factors that impact field education in the United States (Cook et al., 2006; Smith,
2004; Fisher, 2001; Orion, 1993).
Given this state of affairs, the principle question that advocates for stronger field
education must address is “how do students benefit from doing fieldwork?” While
indentifying these benefits for geoscience majors tends to be straightforward, identifying
them for K-12 students and college non-science majors tends to be more difficult. For
many geoscience career track students, field experience is part of their training.
However, for students not in this career track, learning to do fieldwork appears to be
Page 12
irrelevant to their education. Add to this the practical and administrative obstacles to
field education mentioned in the previous paragraph, and it is tempting to argue that
limited educational resources are best allocated to those students having the “greatest
need”, namely the career track students.
The fundamental problem with limiting field experience to career track students is
that it runs counter to an emerging emphasis on geoscience literacy for all students.
Geoscience literacy, as defined by the Earth Science Literacy Initiative (Wyesession et
al., 2010), is a set of basic ideas and skills that characterize an Earth science literate
person. Chief among these is that an Earth science literate person has a fundamental
understanding of how scientific inquiry works and is able to “do science” in some basic
way. “Doing science” (Bransford and Donovan, 2005) means learning and practicing the
construction of scientific knowledge rather than simply assimilating a canonical body of
knowledge. Since fieldwork is one of the principle ways that geoscience knowledge is
constructed, having K-12 and undergraduate non-science students engage in some kind of
field experience is critical to their gaining a fundamental appreciation of how geoscience
is done, and in getting direct experience with the phenomena that they are studying.
The nature of field experience in geoscience education
Whether or not students benefit from field experience depends largely on the
nature of that experience (Orion and Hofstein, 1991). Likewise, whether or not they
benefit from virtual field experience should depend on how that virtual experience
captures the character of effective physical field experiences. One of the more common
modes of field instruction is the “Cook’s tour” field trip, which is an excursion

Page 13
characterized by field-based lecture with student activity limited to listening, note-taking,
and occasional questions (Hawley, 1997). The digital parallel to this is the type of virtual
field trip that takes the form of web-based narrative and/or traditional “road logs” (Nix,
1999). While “Cook’s tour” field trips are sometimes regarded as an efficient means of
relaying information, they often fail to involve students in doing authentic fieldwork.
Furthermore, in a review by Kent et al. (1997), the authors argue that students tend to
respond better to fieldwork based on active learning and project-based strategies than
they do the “Cook’s tour” approach. The implication of this argument is that virtual field
experiences should engage students in something resembling authentic fieldwork, rather
than simply being a digital narrative. The underlying important question is “what does
instruction involving authentic fieldwork look like?”
In contrast to the “Cook’s tour” approach, Hawley (1997) outlines what he calls
an “investigative fieldwork” approach. In this approach, students are encouraged to make
independent observations and interpretations. At the same time, instructors must assume
greater responsibility for knowing and stating the objectives of the fieldwork, helping
students learn the necessary skills for doing the work, structuring the learning experience,
and encouraging a sense of student involvement. Accomplishing these objectives means
identifying the purpose of an educational field experience and tailoring instruction to that
purpose. A scheme that provides insight into this task is the following classification of
instructional fieldwork from Compiani and Carneiro (1996):
• Motivational fieldwork designed to stimulate and generate interest in students.
• Illustrative fieldwork designed to show and reinforce particular concepts.
Page 14
• Training fieldwork to help students develop and practice specific skills and
techniques.
• Inducing fieldwork that promotes structured problem solving, scientific method
and logical reasoning.
• Investigative fieldwork that stimulates students to carry out their own research.
Field experience in K-12 teacher education
One of the principle factors impacting K-12 geoscience education is the amount
and type of Earth science education received by K-12 teachers (NSTA, 2003; NRC,
2000). Teachers generally receive this training in three ways; during their pre-service
training, during in-service workshops, and informally as they teach themselves what they
need to know. How they learn in each of these venues has significant impact on how and
what they teach (NRC, 2000). Consequently, their experience with fieldwork during
their pre-service and in-service education should impact whether and how field
experience is included in their classes. So the principle questions at this point are as
follows:
1. How much is field experience included in K-12 teacher education?
2. What kinds of field experiences take place in pre-service and in-service
programs?
3. What kinds of instruction take place during these experiences?
4. What role might virtual field environments play in strengthening field experience
in teacher education?

Page 15
Regarding question 1, no research has been found that provides statistical insight
into the number of teacher education opportunities in geoscience in the United States or
any other country, let alone the percentage of these programs having a significant field
component. Given this lack of basic information, it is extremely difficult to reach any
conclusions about how much experience K-12 teachers have with scientific fieldwork
(question 2). However, given some of the factors that limit field experience that were
discussed in the previous section, there is a strong likelihood that field experiences in pre-
service and in-service programs are infrequent and brief. Furthermore, given the lack of
statistical information about teacher preparation in geoscience, the nature of field
experience is also uncertain (question 3). Though there are numerous references to field-
based teacher education programs (Bishop et al., 2009; Kitts et al., 2009; Lee et al., 2009;
St. John et al., 2009) where investigative fieldwork is central part of the program, it is
highly uncertain whether such experiences are the norm or exceptions in geoscience
teacher education. Given the cost and time commitments of these programs, there is a
strong possibility that they not common.
Given this state of affairs, the question of the role of virtual reality in teacher
education is particularly germane. If in fact, K-12 teachers generally have little or no
background in scientific fieldwork, preparing them for field experiences that are part of
their education is critically important to increasing the efficiency of what for them is a
rare and unusual learning experience. As indicated by research done by Kelly and Riggs
(2006), virtual reality could be useful in helping teachers and prospective teachers
become familiar with a site before visiting it, thus mitigating a number of novelty effects.

Page 16
As implied by Quinn (2009), virtual reality based on teachers’ field experience could
provide them with a way of reviewing their experience thus reinforcing it. Likewise,
virtual reality could provide teachers with a way of transferring their field learning to
their own classroom by having their students interact with a virtual representation of the
field sites they visited. Though the use of virtual reality in these ways is largely
unexplored, one group that is actively using virtual reality in teacher education is
virtualfieldwork.org (PRI, 2010), an education and outreach project of the
Paleontological Research Institute. One of its goals is to create a network of virtual field
experiences created by teachers. To accomplish this, the project conducts field-based
workshops in which teacher participants are instructed on how to create simple virtual
environments and then given time during the workshop to create these environments.
This model suggests that creating simple virtual reality environments and/or instructional
activities to accompany them could be used to support field-based learning and increase
the likelihood that that learning makes its way back into the classroom. At present PRI
has yet to conduct follow-up research to test this claim.

Page 17
Chapter 3 - Virtual reality in geoscience education
Virtual reality defined:
Bowman et al. (2003) define a virtual environment (VE) as a synthetic, spatial
world seen from a first-person point of view. One of its chief characteristics is that it is
under the real-time control of the user. While VEs are often models of physical places,
they can also be representations of abstract data or some combination of the two. A
defining characteristic of all VEs is they immerse the user in an environment within
which they can freely navigate and in which they have tools to collect and compare data
presented by the environment (Rosenblum and Cross, 1997). Though most VEs tend to
be limited to visual and textual information, some fully immersible environments also
provide users with auditory, tactile, and even kinesthetic information.
The role of virtual reality in geoscience research:
In the geosciences VEs are used to plan field investigations or related
development, archive field data, enhance the analysis of field data, or analyze abstract
geophysical data sets. An example of a VE used for research is the ADVISER system
based in the planetary geology department at Brown University (Head et al., 2005). This
system is a walk-in theater used for projecting digital models of planetary landscapes.
The theater (Figure 3.1) surrounds users with a continuous stereoscopic image that is
located in front, below, above, and to both sides of them. Because the models are
interactive, researchers can “fly over” or “walk through” these landscapes, while being

Page 18
able to measure major topographic characteristics. Head et al. (2005) describe the system
as a way that planetary geologists can interact with extraterrestrial landscapes in a way
that is similar to how terrestrial geologists interact with outcrops. They make the claim
that the system provides a more efficient and flexible means of analyzing data than if the
same data were presented on a desktop computer.
Figure 3. 1 – The ADVISOR system
in action.
The visualization cave with an
interactive stereographic image of
Victoria Crater on Mars appearing on
two walls and the floor. The person
on the left (visible as a silhouette) is
holding a calculator like controller.
The control features of the controller
are superimposed on the image on
the left wall.
Another example of a VE used in research is the Cybermapping Lab (University
of Texas Dallas) virtual theater that is used to project digital models of terrestrial
outcrops (Xu and Aiken, 2000). Like the ADVISER system, the Cybermapping Lab
(CmL) Theater allows multiple researchers to navigate through and analyze a selected
landscape. Also like ADVISER, the CmL system projects models in polarized stereo on
multiple walls so users see visual data in 3-D that surrounds them on several sides. A

Page 19
distinguishing characteristic of this system is that the models are photorealistic and
incorporate data for subsurface structure. Systems of this type are used by both research
and exploration geologists to connect surface with subsurface geology.
Virtual reality in geoscience education
Virtual reality and other types of computer simulations are increasingly being
used in science education to familiarize students with places and situations, enabling
them to experiment with theory, or understand physical systems. Because virtual reality
is a type of computer simulation, it is important to discuss its role in geoscience education
in conjunction with the use of the other types of simulations in Earth science instruction.
Generically, a computer simulation is a mathematical model of a system that
allows users to visualize and predict the structure and behavior of that system over time
(Kozma and Russell, 2005). Simulations used for geoscience instruction model Earth
systems in such a way that students can watch and manipulate the behavior of those
systems with the aim of understanding how natural processes work, and how those
processes shape present day structures. Like any computer program, a simulator has an
interface that allows users to interact with the model (the input), and has a means of
displaying the state of the modeled system. For many simulators, user input consists of
data (numbers or words) typed on a keyboard or entered via virtual controls (sliders,
buttons, etc.) in a graphical user interface (Jern, 1997). Likewise, the output of these
simulators often consists of calculated values shown via tables, graphs, maps, or
diagrams.

Page 20
In the case of a VE, since it is a dynamic representation of 3-D space, the
environment itself is both the input and output for the simulator (Pimentel and Teixeira,
1993). Being dynamic, users interact with this virtual space in much the same way that
they would a real physical space. In other words, they can move from place to place
within it, look in different directions from a single location, measure dimensions, collect
samples, and so on. In some instances, these virtual spaces are tied to mathematical
models of geophysical systems that cause the virtual space to change over time (Li and
Liu, 2003). For example some high-end computer models of thunderstorms involve
display systems that immerse the user in the model and given him/her tools to move
within the simulation while gathering data such as wind velocity, temperature
(Wilhelmson et al., 1990). Traditionally, VEs of this type are synthetic environments,
meaning that their representation of a physical space is highly simplified or cartoonish.
However, as the speed of computers available to the general educational community
continues to increase, this will undoubtedly change.
In the case of Virtual Field Environments (VFE) the virtual space is generated
using extensive photography, remote sensing imagery, and other geospatial data. Using
this imagery and data means that the virtual space is photorealistic and therefore highly
detailed (Figure 3.2). It also means that the virtual space is temporally static, meaning
that it tends not to show changes in the physical environments that it represents. But
again, with advances in the computing technology available to the educational
community, this will likely change in the near future.
Page 21
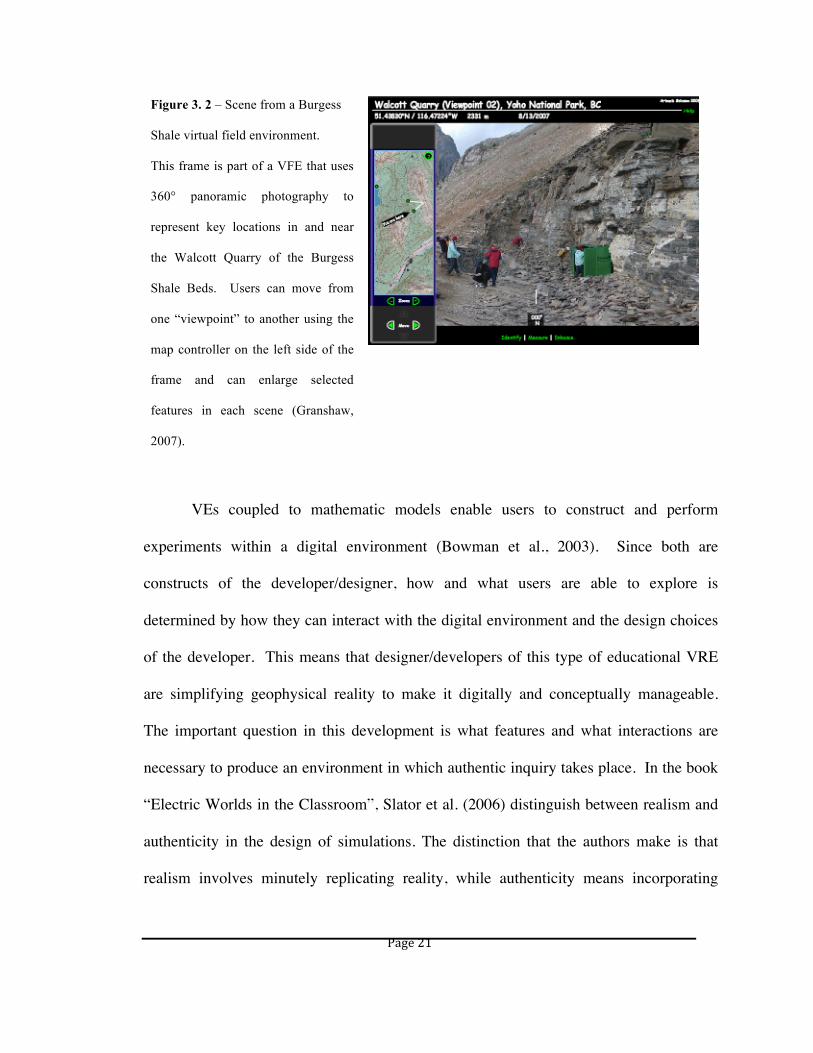
Figure 3. 2 – Scene from a Burgess
Shale virtual field environment.
This frame is part of a VFE that uses
360° panoramic photography to
represent key locations in and near
the Walcott Quarry of the Burgess
Shale Beds. Users can move from
one “viewpoint” to another using the
map controller on the left side of the
frame and can enlarge selected
features in each scene (Granshaw,
2007).
VEs coupled to mathematic models enable users to construct and perform
experiments within a digital environment (Bowman et al., 2003). Since both are
constructs of the developer/designer, how and what users are able to explore is
determined by how they can interact with the digital environment and the design choices
of the developer. This means that designer/developers of this type of educational VRE
are simplifying geophysical reality to make it digitally and conceptually manageable.
The important question in this development is what features and what interactions are
necessary to produce an environment in which authentic inquiry takes place. In the book
“Electric Worlds in the Classroom”, Slator et al. (2006) distinguish between realism and
authenticity in the design of simulations. The distinction that the authors make is that
realism involves minutely replicating reality, while authenticity means incorporating

Page 22
significant details and activities in a simulation or VR, while excluding what is
extraneous to what is being taught.
One measure of the educational effectiveness of any simulation is how engaged
students are in solving problems while using them. In part, this is an issue of graphic
layout or navigational design. If the control structure of the package is cumbersome or
media is visually unappealing, student engagement will most likely be low. However, an
equally important issue is how they perceive the task that they are being asked to
accomplish with the environment. Key here is if they are asked to play a role, or if they
are engaging in open exploration. The former is a major theme in the environments
developed by Slator et al. (2006). Their group, the World Wide Web Instructional
Consortium, has developed a series of web-based science simulations that cast users in
the role of geologists, biologists, archeologists, and other researchers. In doing so, they
embrace the concept of situated cognition, which is the idea that in the world beyond the
traditional classroom ideas, skills, and facts are learned within an environmental context
based on their utility and their relationship to other knowledge. By constructing
environments in which students play roles, they are striving to provide an authentic
context in which learning takes place. An example is Geology Explorer (Slator et al.
2006), an educational game that cast students in the role of geologist/explorers assigned
to survey an imaginary Earth-like planet. Other programs developed by this group
challenge users to play other roles such as archeologists and economists. In each case,
students gather information and solve problems within a pre-defined context. To support

Page 23
this activity, the programs are integrated with on-line tutorials that provide the user with
relevant background information.
In designing virtual environments from a situated cognitive perspective, a
comprehensive set of guidelines could be adapted from the textbook evaluation procedure
outlined by Project 2061 (AAAS, 2006). This procedure is built around seven categories
of questions.
Category I - How does the resource convey an overall sense of purpose and
direction that is understandable and motivating to students? Applied to virtual
experiences (VE), an effective VE is one in which students have a clear sense about what
they are investigating within it, and they can see how the individual tasks they perform
within that environment relate to a more global goal.
Category II – How does the resource take into account the background and ideas
of the students? Applied to VEs, this relates to how students and teachers are alerted to
ideas, skills, or experiences needed to accomplish specific tasks within the VE. Because
it is still an emerging technology, assessing previous knowledge is a largely undeveloped
aspect of VE use in education. One approach to this might be to provide users with pre-
task questionnaires framed as “equipment lists” or “pre-flight checklists”. Such
questionnaires could assess students’ content knowledge related to the task they are about
to perform, and suggest information files to read, list, or view before proceeding.
Category III – How does the resource engage students with relevant phenomena?
The implication of this question for VE design and use is that the choice of what the
virtual environment represents and how it represents it, is critical to creating an

Page 24
environment that is meaningful to the students it is designed for. For instance, a virtual
environment based on familiar local sites could prove to be more effective for
introducing stream erosion to urban high school students, than an environment
representing a distant remote site. Likewise, including virtual data gathering tools (e.g.
stream gages) based on familiar technology, rather than technology used by professional
fieldworkers, could prove to be more meaningful to these students.
Category IV – How does the resource help students develop and use scientific
ideas? In particular how does it include the following?
• The introduction of terminology within a meaningful context.
• The accurate and comprehensible representation of key ideas.
• The inclusion of opportunities to demonstrate knowledge
• The inclusion of opportunities for using that knowledge in a variety of
contexts.
A sufficiently flexible, and robust simulation or virtual environment could
provide students with a variety of options for doing hypothesis construction, experimental
design, data collection and analysis, and hypothesis evaluation and revision. It could also
provide them with abundant opportunity to demonstrate and use new knowledge. Finally,
it has the potential for introducing new terminology by using the terminology as a
navigational tool within the environment. For example, in a plate tectonic simulation, the
directory to select a tectonic setting to experiment could be a list of names for the major
settings.

Page 25
Category V – How does the resource promote student thinking about phenomena,
experiences and knowledge? Does it encourage students to explain their ideas? Do it
guide student interpretation and reasoning? Does it encourage students to think about
what they have learned? One digital environment that is neither a simulation nor a
virtual environment is a collaborative research environment called Dynamic Planet
(Prothero, 1995). This environment is an ocean data display and analysis system
combined with a sophisticated report publishing system. The former takes the form of a
series of interactive maps with which students can access physical data related to the
global ocean. The latter component is a report writing/editing/publishing system that
encourages on-line peer review of student reports. In this way, Dynamic Planet
encourages students to think about what they are learning within that environment in a
collaborative context.
Category VI – Does the resource include assessment tasks that require
application of ideas? Are some assessments embedded in the curriculum along the way?
One of the interesting aspects of virtual environments in which role-playing is involved,
is that accomplishing specific tasks is often necessary to progress within the environment.
In Geology Explorer (Slator et al., 2006) users progress to different levels of the game by
successfully completing designated tasks. For instance to progress to the geologic
mapping portion of the game, students must first complete a field survey in which they
successfully collect and identify a given number of rocks.
Category VII – Does the resource enhance the science-learning environment by
providing teacher content support, and encouraging curiosity and questioning. A strong

Page 26
point of virtual environments is that they give students the opportunity to “play with”
theory and vicariously explore unfamiliar locations or phenomena. If the tasks involved
in this exploration are scaled to the abilities of the intended user, and the environment is
built with a suitable complexity and flexibility, there is a strong probability that students
will be curious about what they can do and see in that environment. The question,
however, is how much this curiosity is carried over to the actual locations and
phenomena. In other words, is the environment helping students appreciate and
understand the place or phenomena that it is representing, or are the students viewing the
environment as an end in itself and simply learning computer skills. One possibility for
helping students make the connection between the real and the virtual is to design into the
environment tasks in the “real world” that parallel tasks done in the “virtual world” of the
environment. A slightly different variation of this strategy would be to design “real
world” activities that are done in conjunction with “virtual world” activities. For
instance, students can use a geologic cycle simulator to identify actual hand specimens,
and then use the simulator to determine the relationship between the specimens
(Granshaw, 2008).
The issue of providing teachers with content support is probably best addressed
by including supplemental background targeted at the level of the teachers of the
intended users. Again, because of the relative “newness” of simulators and virtual
environments designed for geoscience education, this is a largely undeveloped or absent
aspect of what is available. In some instances, the environments are accompanied by a
physical / digital teachers manual that contain both additional background and extension
Page 27
activities. In other cases, developers provide teachers with web-based information that
centers on how their environment or simulator corresponds to various state or federal
education standards (EdGCM, 2010). Finally, some developers provide no such support,
leaving it to instructors to design activities relevant to their students and curriculum
topics. Sometimes developers may create and manage a web-based forum where teachers
post their instructional ideas as a type of “do-it-yourself” support system.
Virtual reality and field based learning
Commonly in science education literature, virtual reality is characterized as either
augmenting or replacing actual field experience. In those cases where it augments field
studies, virtual environments are used to prepare students for a field experience or
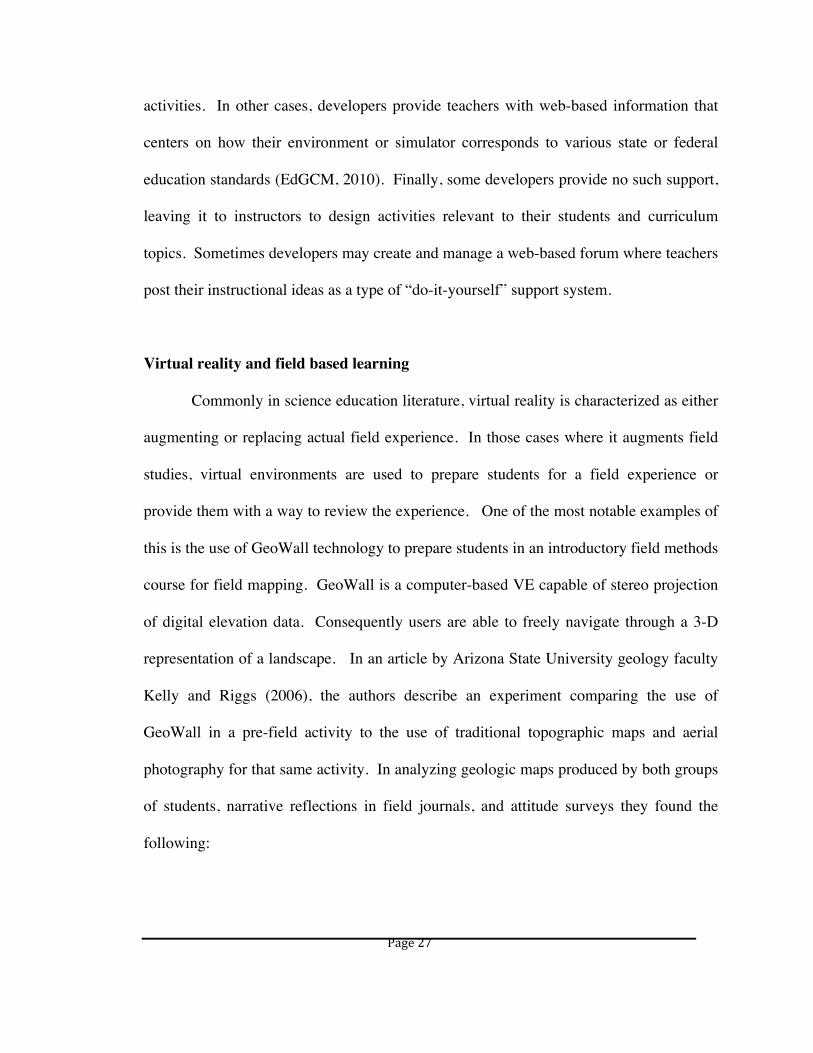
provide them with a way to review the experience. One of the most notable examples of
this is the use of GeoWall technology to prepare students in an introductory field methods
course for field mapping. GeoWall is a computer-based VE capable of stereo projection
of digital elevation data. Consequently users are able to freely navigate through a 3-D
representation of a landscape. In an article by Arizona State University geology faculty
Kelly and Riggs (2006), the authors describe an experiment comparing the use of
GeoWall in a pre-field activity to the use of traditional topographic maps and aerial
photography for that same activity. In analyzing geologic maps produced by both groups
of students, narrative reflections in field journals, and attitude surveys they found the
following:

Page 28
• The group of students who used GeoWall for the pre-field activity in general
scored higher on their geologic maps (n = 27, Median = 80) than did the group
who used the more traditional tools (n = 35, Median = 60) . At an alpha level of
0.05 the mean ranks of these two groups were found to be statistically different (z
= 3.67).
• Narratives and attitude surveys from the group who had used the GeoWall system
indicated that they found the GeoWall system easier to use and that it gave them a
more complete understanding of the site than stereo imagery or topographic maps.
In their discussion of the experiment, Kelly and Riggs point out that the small sample size
and other constraints severely limited the generalizability of their results. However,
despite these limitations they felt that the GeoWall proved to be a useful tool for
increasing student confidence and efficiency in the field.
One of the significant limitations of the GeoWall system is its expense and
complexity. Though the system is characterized as being more affordable than many
commercial stereo viewing systems (Johnson et al., 2007) it remains beyond the financial
and technical resources of a great many high schools and community colleges. Much
more affordable alternatives are geospatial viewers such as Google EarthTM, NASA’s
World Wind (NASA, 2010), or Lamont-Doherty Earth Observatory’s Virtual Ocean
(MGDS, 2010). Because they operate on desk-top and mobile computers, are
inexpensive, and becuause they are able to access and display a variety of geospatial data
in 3-D, these viewers have become quite popular in both college and pre-college
geoscience courses. This popularity is seen in the number of Google EarthTM based lab
Page 29
manuals published by major textbook companies (Kluge, 2009; Wilkerson et al., 2009)
and the prevalence of web sites dedicated to using geospatial viewers to teach geology
(SDSU, 2010; Selkin, 2006).

Page 30
Chapter 4 - TOTLE, the professional development context
TOTLE is a professional development program focused on familiarizing K-12
teachers with the Geology and geologic hazards of the Pacific Northwest. Most recently,
TOTLE completed a three years (2008-2010) of summer workshops for middle school
Earth science teachers in Oregon and Washington. These workshops were part of a
collaborative research project that was funded by the National Science Foundation
through the Earthscope program. The following is a list of the participating colleges and
universities and the principal investigators in this collaboration.
• University of Portland (Portland Oregon)
NSF Grant #0745692 / Principal investigator – Dr. Robert Butler
• Pacific Lutheran University
NSF Grant #0745681 / Principal investigator – Dr. Jill Whitman
• Central Washington University
NSF Grant #0745526 / Principal investigator – Dr. Beth Pratt-Sitaula
• Portland Community College
NSF Grant # 0745570 / Principal investigator - Frank D. Granshaw
In addition to the principal investigators, the TOTLE core staff consisted of four
master teachers and a media developer. The four master teachers were experienced
middle and high school Earth science teachers who were involved in planning and
conducting the workshops and related events. The media developer was instrumental in

Page 31
creating a variety of animations, maps, and other visualizations used to present basic
volcanic and seismic processes.
Each year the program engaged approximately 35 K-12 teachers (largely middle
school) in a weeklong workshop focusing on regional tectonics, earthquake and tsunami
hazards, and the research activities of EarthScope in the region. EarthScope is an NSF
funded Earth science project that is using geological and geophysical techniques to
ascertain the structure and evolution of the North American continent as well as the
processes controlling earthquakes and volcanoes (Earthscope, 2009). In addition to
attending sessions on these topics and inquiry-based strategies for presenting them to
students, the participants engaged in two days of field activities designed to give them
first-hand experience with the geology being discussed.
To increase the likelihood that teachers would integrate what they learn into their
curriculum, participants were divided into work groups based on geography. During the
summer workshop each group was given the task of developing an implementation plan
and presenting it on the final day of the workshop. To aid this process, a community
college geology or university instructor from their area facilitated each group. In addition
to being group facilitators, the team leaders acted as content resource specialists who
could help the group members adapt their implementation plan to the geology of the area
in which they taught. The instructors were assigned to groups from areas with which
they were familiar.
During the three years of the program, all but four of the participants were from
public middle schools in Oregon and Washington. The remaining participants taught
Page 32
upper elementary and high school science, or taught middle school science in private
schools. The TOTLE program staff (the four PIs and the Master teachers) selected these
participants on the basis of the following criteria:
• Geography – Since the first year (2008-2009) was centered in Oregon, preference
was given to teachers from Oregon and southwestern Washington. During the
following years the program was centered in Washington, meaning that
preference was given to Washington state teachers.
• Grade level – Though some high and upper elementary school teachers were
selected, most of the participants selected were middle school teachers. The
rationale for this is that in the Northwest, Earth science is much more common in
the middle school curriculum, and involves a greater percentage of the school
population.
• Potential impact of participants on their local school system - Since maximizing
the impact of the program is a high priority for TOTLE, identifying teachers who
would have a significant influence on their co-workers and administrators was a
major selection criterion. For this reason practicing teachers with at least three
years experience teaching Earth science were preferred over less experienced
teachers. Other important criteria included relevant professional and community
involvement.
• The Earth science curriculum used by participants - This was used as a selection
criterion since many of the participants came from school systems using district-
adopted curricula. Having two or more participants using the same curricula in
Page 33
the workshop was intended to make it easier for participants to collaborate when
implementing ideas from the workshop into their curriculum. Also having
knowledge of the curricula used by participants helped the TOTLE team tailor
workshop activities to the curricular needs of the teachers.
TOTLE PIs and Master Teachers cooperatively assembled workshop evaluation
instruments with an external program evaluator (Steven Ryder – Pacific Research and
Evaluation - PRE). These instruments included pre- and post tests given during the
summer workshop and participant surveys given at the end of the workshop and during
the 2008-2009 and 2009-2010 academic years. While in most cases these instruments
were administered on-line, some data were collected via focus groups at the end of the
workshop and telephone interviews during the academic year by PRE. Data collected
from the pre- and post- tests included knowledge questions about plate tectonics,
earthquakes, and Pacific Northwest volcanism, as well as questions about frequency,
confidence levels, and strategies for teaching these topics. Surveys and focus groups
conducted at the end of the workshop centered on participant reaction to workshop
activities, while surveys and telephone conferences conducted during the school year
focused on how participants implemented what they learned in the summer workshop.
During the first year of the project evaluators from two cooperating agencies, IRIS2 and
UNAVCO3, conducted additional program evaluation.
2 IRIS is Incorporated Research Institutions for Seismology. 3 UNAVCO is a non-profit consortium that facilitates geoscience research and education using geodesy.
Page 34
A key characteristic of TOTLE was that the region in which the participants
taught was used to teach geology. This place-based approach made the inclusion of field
experience an essential part of the program. During the summer workshop this
experience took the form of two daylong field outings. The first of these involved sites
that illustrated seismic hazards, while the second trip involved areas that illustrated
volcanic hazards and processes. Each trip was lead by researchers familiar with the
locations, as well as the processes and hazards associated with them. During the 2008
summer workshop the seismic hazards day focused on tsunamis on the northern Oregon
coast (led by Brian Atwater - University of Washington/USGS and James Roddy -
Oregon Department of Geology and Mineral Industries), while the volcanic hazards trip
centered on Mount Hood Oregon (lead by William Scott - Cascade Volcanic
Observatory/USGS). During the first year the instructional format of these trips was
largely a traditional “Cooks tour” venue.
During the 2009 and 2010 summer workshops, the theme and general format of
the trips remained the same as that of first year. However, with the change in the location
of the workshop, new sites were selected. One of the field days involved investigating
tsunami hazards on the central Washington coast (Copalis Beach Washington), while the
other day focused on volcanic hazards on Mt. Rainier and surrounding communities
(Orting Washington). Furthermore, given feedback from the first year, the instructional
format of the field experiences evolved to become more guided inquiry based making use
of community college team leaders to guide the inquiry
Page 35
The current TOTLE program is a follow-up to an earlier program by the same
name (TOTLE 2005 – NSF# 0533168). Like the more recent program, TOTLE 2005
focused on both regional geology and middle school Earth science. A major difference is
that the summer workshop in the earlier program was twice as long and was largely field-
based. While TOTLE 2005 was successful at giving the participants a broad overview of
the regional geology and first hand experience doing field geology, it had significant
limitations in terms of the number of teachers impacted, the expense of the program, and
the question of how the participants could transfer their summer field experience back to
their classrooms. To address the first two issues, the length of the summer workshops in
the most recent program was reduced to a week. In addition, the number of participants
was increased and the percentage of the workshop spent in the field reduced to two days.
With these changes have come two issues. 1) How to prepare the participants for their
field experience so they derive the maximum benefit given its brevity. 2) Providing the
participants with a mechanism for bringing something of this experience back to their
own students. It was to address these two issues that the TOTLE VFE was developed
and tested.

Page 36
Chapter 5 - Developing the Virtual Field Environment
The structure of TOTLE VFE:
The TOTLE VFE is a collection of virtual field sites representing all the locations
that were visited by each year’s participants during the three years of the TOTLE
program. Each virtual field site is a set of ground views or “viewpoints” that enable users
to move from one point to another in much the same way that they would walk from
place to place in the actual setting. Each of the viewpoints are 360° panoramas equipped
with overlays for locating and identifying surface features, measuring distances, angles,
and compass orientations, viewing stratigraphic interpretations, highlighting indistinct
features, and magnifying, measuring, and identifying the components of outcrops and
individual hand samples. Each viewpoint can be accessed from a high-resolution aerial
view or by clicking on “sign posts” seen from a nearby vantage point.
All the sites contained within the VFE are linked via a series of oblique aerial and
satellite views. The views are linked in such a way that they give the user the impression
that they are flying to a field location from a near Earth orbit. Each of the aerial views is
equipped with a map module having a GIS-like interface that enables the user to locate
and identify major features and regions, make comparisons between various types of
geographic and geophysical information, and measure distances, compass orientations,
and elevations.
The entire environment was built using Adobe Flash. The decision of the
platform was made on the basis of the platform’s widespread use and its flexibility. In

Page 37
addition to being a common means of creating web-deliverable interactive content, Flash
is a robust tool for creating “data-rich” media. To increase flexibility, the VFE was
constructed as a series of interlocking modules that could be accessed from standard web
pages or geospatial viewers such as Google EarthTM.
VFE design and pedagogical rationale
The design goal of the TOTLE VFE was to create an exploratory digital
environment that possesses some of the visual/spatial characteristics of the actual sites on
which it is based and enables novice users to practice some of the observation,
measurement, and problem solving skills practiced by field geologists. The key to
accomplishing this goal was to address several basic questions related to field-based
education. Chief among these are the following:
• What constitutes a field study?
• What makes field study an effective means of geologic problem solving?
• What kinds of information are gathered in such a study?
• What principle cognitive processes are involved in geologic observation and problem
solving?
Beginning with the first question, geologic field study is the process of observing
and interpreting geologic phenomena in their natural context. So while as a form of
investigation it does not provide the degree of control over variables that laboratory
modeling or analysis does, it does provide a more holistic and complete view of the
phenomenon in question. Compton (1985) makes the claim that field studies have
several unique advantages in solving geologic problems. The first of these is that Earth
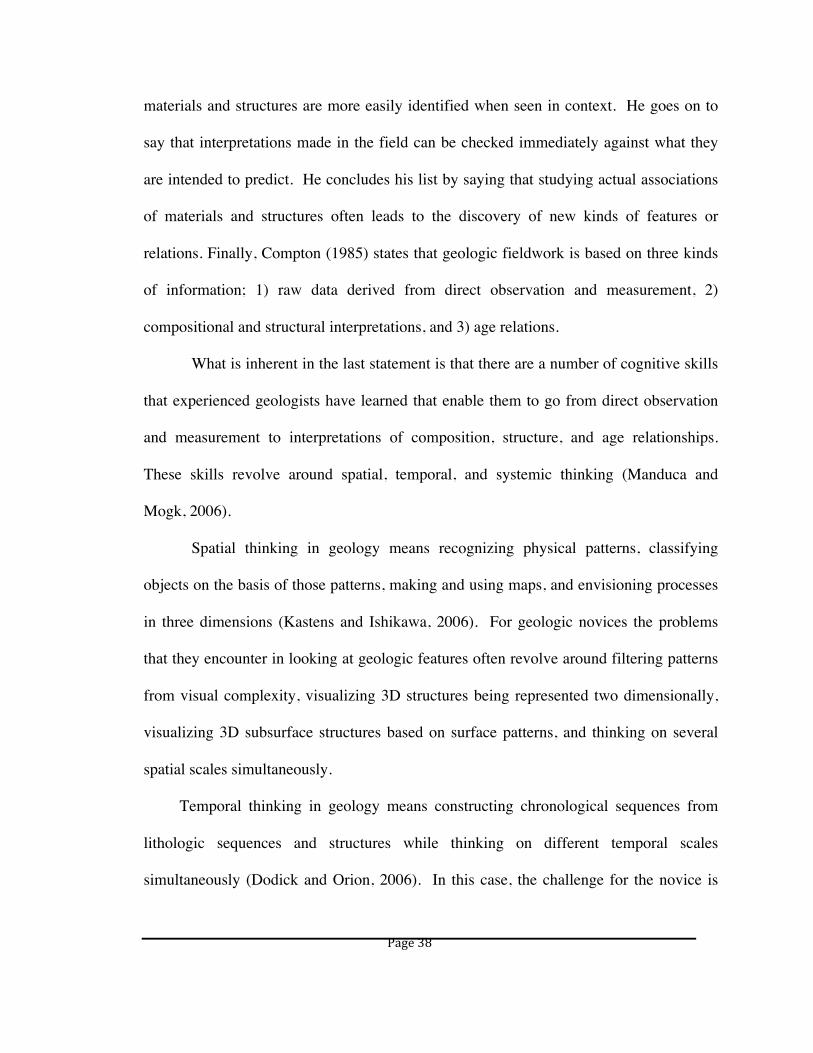
Page 38
materials and structures are more easily identified when seen in context. He goes on to
say that interpretations made in the field can be checked immediately against what they
are intended to predict. He concludes his list by saying that studying actual associations
of materials and structures often leads to the discovery of new kinds of features or
relations. Finally, Compton (1985) states that geologic fieldwork is based on three kinds
of information; 1) raw data derived from direct observation and measurement, 2)
compositional and structural interpretations, and 3) age relations.
What is inherent in the last statement is that there are a number of cognitive skills
that experienced geologists have learned that enable them to go from direct observation
and measurement to interpretations of composition, structure, and age relationships.
These skills revolve around spatial, temporal, and systemic thinking (Manduca and
Mogk, 2006).
Spatial thinking in geology means recognizing physical patterns, classifying
objects on the basis of those patterns, making and using maps, and envisioning processes
in three dimensions (Kastens and Ishikawa, 2006). For geologic novices the problems
that they encounter in looking at geologic features often revolve around filtering patterns
from visual complexity, visualizing 3D structures being represented two dimensionally,
visualizing 3D subsurface structures based on surface patterns, and thinking on several
spatial scales simultaneously.
Temporal thinking in geology means constructing chronological sequences from
lithologic sequences and structures while thinking on different temporal scales
simultaneously (Dodick and Orion, 2006). In this case, the challenge for the novice is

Page 39
threefold: connecting geologic events and chronologies to visible geologic features,
developing a sense of the large time spans involved in these chronologies, and linking
these time spans to the much shorter time spans of directly observable processes.
Finally, systemic thinking means seeing the dynamic and structural relationship
between individual, directly observable materials, structures, and processes (Herbert,
2006). While such relationships are often apparent to trained geologists, geologic
novices tend to be more immediate and isolated in their thinking.
How these three geocognitive skills were incorporated into the TOTLE VFE design
• Spatial thinking: Linking spatial scales – One of the major challenges in a field study
is helping students see local settings in a regional and sometimes a global context.
This is important not only for helping students understand where they are, but also for
helping them understand how processes visible at the human scale are linked to
regional and global processes. In the TOTLE VFE users are helped to make these
connections by navigating through a series of aerial and ground views arranged to
create the impression of flying from a global to a human level. In several of the
ground views users can magnify hand samples linking the human level to the
microscope (Figure 5.1).

Page 40
(a)
(b)
(c)
Figure 5. 1 - Spatially hierarchical views from the TOTLE VFE
These views proceed from larger to smaller areas as you move from left to right. Figure
5.1a is an oblique view of Mt. Hood Oregon looking north. Figure 5.1b is a ground view of a
location marked on Figure 5.1a. Finally, Figure 5.1c is a close-‐up of a hand sample of red
andesite visible in the previous view.
• Spatial thinking: Creating spatial maps – Another challenge for novices in the field is
being able to relate what they see on a map to the landscape before them. One aspect
of this is being able to translate a two-dimensional representation into a three
dimensional environment. Another is being able to recognize and use landmarks to
find one’s self on a map. Several features of the TOTLE VFE were designed to help
students learn to read and create maps. A principle feature of the environment is the
map module that accompanies each of the aerial views (Figure 5.2). Each module is
built in the form of a simple geospatial viewer that enables the user to identify
landmarks, measure elevation, distance, and bearing, and overlay and compare major
geographic and geophysical aspects of an area. Since the module is linked to oblique
views of a landscape, the user can compare 2D map views of that landscape to 3D
renderings of it. Furthermore each of the vantage points contains a local-scale map
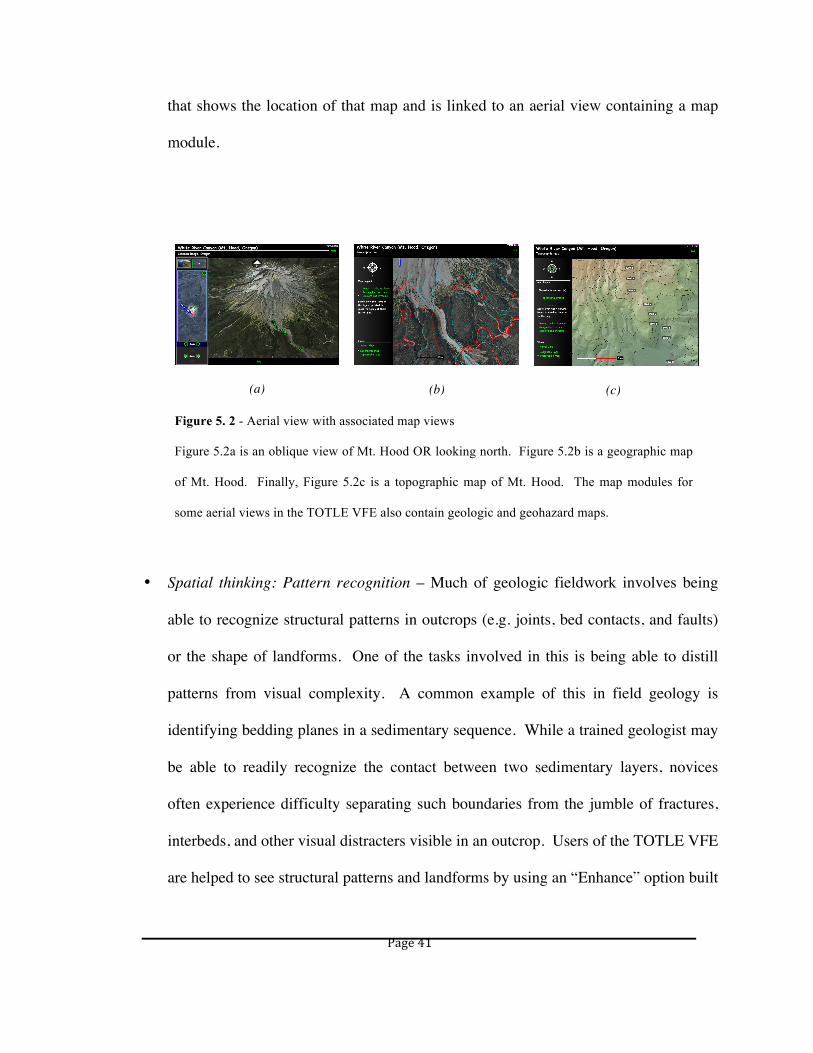
Page 41
that shows the location of that map and is linked to an aerial view containing a map
module.
(a)
(b)
(c)
Figure 5. 2 - Aerial view with associated map views
Figure 5.2a is an oblique view of Mt. Hood OR looking north. Figure 5.2b is a geographic map
of Mt. Hood. Finally, Figure 5.2c is a topographic map of Mt. Hood. The map modules for
some aerial views in the TOTLE VFE also contain geologic and geohazard maps.
• Spatial thinking: Pattern recognition – Much of geologic fieldwork involves being
able to recognize structural patterns in outcrops (e.g. joints, bed contacts, and faults)
or the shape of landforms. One of the tasks involved in this is being able to distill
patterns from visual complexity. A common example of this in field geology is
identifying bedding planes in a sedimentary sequence. While a trained geologist may
be able to readily recognize the contact between two sedimentary layers, novices
often experience difficulty separating such boundaries from the jumble of fractures,
interbeds, and other visual distracters visible in an outcrop. Users of the TOTLE VFE
are helped to see structural patterns and landforms by using an “Enhance” option built
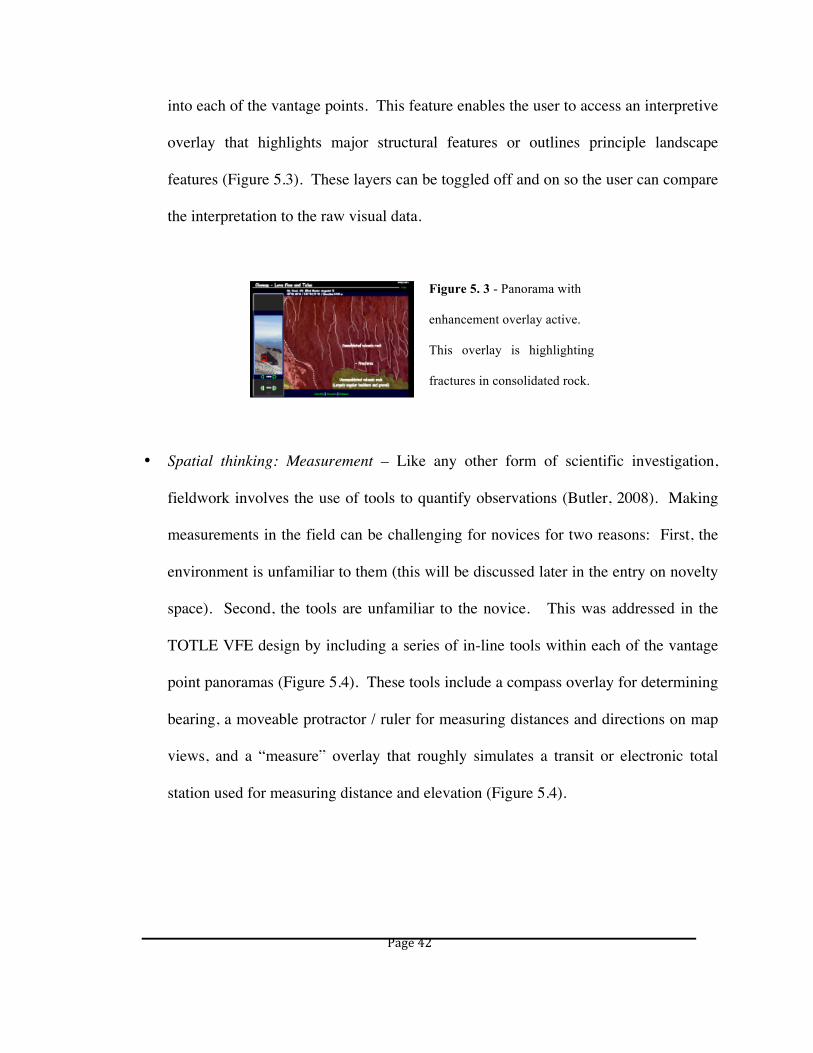
Page 42
into each of the vantage points. This feature enables the user to access an interpretive
overlay that highlights major structural features or outlines principle landscape
features (Figure 5.3). These layers can be toggled off and on so the user can compare
the interpretation to the raw visual data.
Figure 5. 3 - Panorama with
enhancement overlay active.
This overlay is highlighting
fractures in consolidated rock.
• Spatial thinking: Measurement – Like any other form of scientific investigation,
fieldwork involves the use of tools to quantify observations (Butler, 2008). Making
measurements in the field can be challenging for novices for two reasons: First, the
environment is unfamiliar to them (this will be discussed later in the entry on novelty
space). Second, the tools are unfamiliar to the novice. This was addressed in the
TOTLE VFE design by including a series of in-line tools within each of the vantage
point panoramas (Figure 5.4). These tools include a compass overlay for determining
bearing, a moveable protractor / ruler for measuring distances and directions on map
views, and a “measure” overlay that roughly simulates a transit or electronic total
station used for measuring distance and elevation (Figure 5.4).
Page 43
(a)
(b)
(c)
Figure 5. 4 - Measuring tools built into the TOTLE VFE
Figure 5.4a – Compass-bearing overlay at the base of a panoramic ground scene (viewpoint).
Figure 5.4b – Radial ruler overlay for a map view of the Young’s Bay site near Astoria Oregon.
The ruler is used for measuring both distance and direction from selected points.
Figure 5.4c – Distance / elevation overlays on a viewpoint.
• Temporal thinking: Correlating contemporary environments with stratigraphic
sequences – A major challenge for novices in field situations is to infer from geologic
structures the processes that formed them and environments in which those processes
took place. A prime example of this is constructing a geologic history from a
sedimentary sequence. Accomplishing this when presented with an outcrop involves
several tasks. The first of these is recognizing structural and compositional patterns
within an outcrop (discussed earlier). The next task involves correlating discreet
elements of the sequence with contemporary processes and environments. The third
task is arranging those events and environments in their order of occurrence. The
final task is constructing the chronology to include not only the order and nature of
the events forming the stratigraphic sequence, but also to explain the transition from
one event to the next. The TOTLE VFE contains several vantage points showing

Page 44
prominent volcanic and sedimentary sequences. In addition to the “enhance” feature
included in the VFE, there are several vantage points in which modern analogs (plants
and depositional environments) are visible within the same scene as a sedimentary
sequence (Figure 5.5).

Page 45
Figure 5. 5 - Sediment sequence from
the TOTLE VFE
This sequence is located in a bank of the
Niawiakum River of southwestern
Washington. Figure 5.5a is a close-up of
tsunami related sands sandwiched
between a layer of peat and a layer of
gray to reddish mud. Figure 5.5b is the
same outcrop seen from several meters
distant. The green plus sign on the bank
marks where the sequence shown is
located. In addition to showing the
location of the sequence, this image also
shows type of environments in which the
peat and mud layers were deposited. In
other words, the marsh corresponds to the
peat layer, while the stream corresponds
to the sediment in the upper mud layer.
The sand it foreign to this environment,
since the nearest source of sand is several
kilometers to the west.
Figure 5.5a
Figure 5.5b
• Systemic thinking: Linking human-scale settings to regional structure and processes –
Another significant challenge in field education is helping novices understand a field
site in terms of the structure and dynamics of the region that it is a part of. While

Page 46
similar to the issue of linking spatial scales, this task goes beyond geographic location
and sense of scale to include visualizing subsurface structure and the geophysical
processes active at a site, and understanding that structure and process within a
regional context. In the TOTLE VFE this issue was addressed by several of the map
modules accompanying the aerial views in the environment. The most extensive of
these, the module accompanying the satellite view of the Pacific Northwest, includes
a sequence of interactive maps displaying the lithology, tectonic structure, and
seismic and volcanic activity of the region (Figure 5.6). By locating one of the field
sites in the VFE on these regional maps the user can see where the site fits into a
regional geologic context (e.g. the predominant type of rock in the area, the proximity
of the site to major faults or plate boundaries, and nearby volcanic activity).
(a)
(b)
(c)
Figure 5. 6 - Screens from the regional map module
Figure 5.6a – Geologic map showing both lithology and structure (distribution of faults)
Figure 5.6b – Tectonic map showing plate boundaries and movement.
Figure 5.6c – Volcanic map showing the distribution of active, dormant, and identifiable
extinct volcanoes.
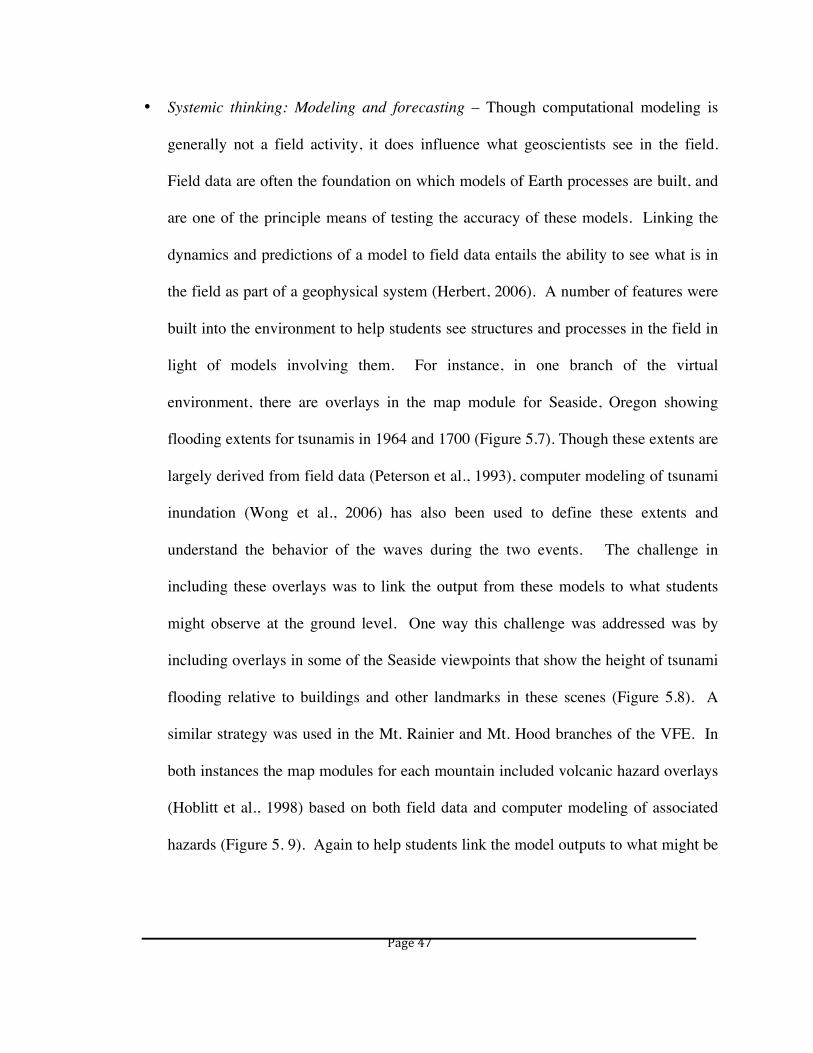
Page 47
• Systemic thinking: Modeling and forecasting – Though computational modeling is
generally not a field activity, it does influence what geoscientists see in the field.
Field data are often the foundation on which models of Earth processes are built, and
are one of the principle means of testing the accuracy of these models. Linking the
dynamics and predictions of a model to field data entails the ability to see what is in
the field as part of a geophysical system (Herbert, 2006). A number of features were
built into the environment to help students see structures and processes in the field in
light of models involving them. For instance, in one branch of the virtual
environment, there are overlays in the map module for Seaside, Oregon showing
flooding extents for tsunamis in 1964 and 1700 (Figure 5.7). Though these extents are
largely derived from field data (Peterson et al., 1993), computer modeling of tsunami
inundation (Wong et al., 2006) has also been used to define these extents and
understand the behavior of the waves during the two events. The challenge in
including these overlays was to link the output from these models to what students
might observe at the ground level. One way this challenge was addressed was by
including overlays in some of the Seaside viewpoints that show the height of tsunami
flooding relative to buildings and other landmarks in these scenes (Figure 5.8). A
similar strategy was used in the Mt. Rainier and Mt. Hood branches of the VFE. In
both instances the map modules for each mountain included volcanic hazard overlays
(Hoblitt et al., 1998) based on both field data and computer modeling of associated
hazards (Figure 5. 9). Again to help students link the model outputs to what might be
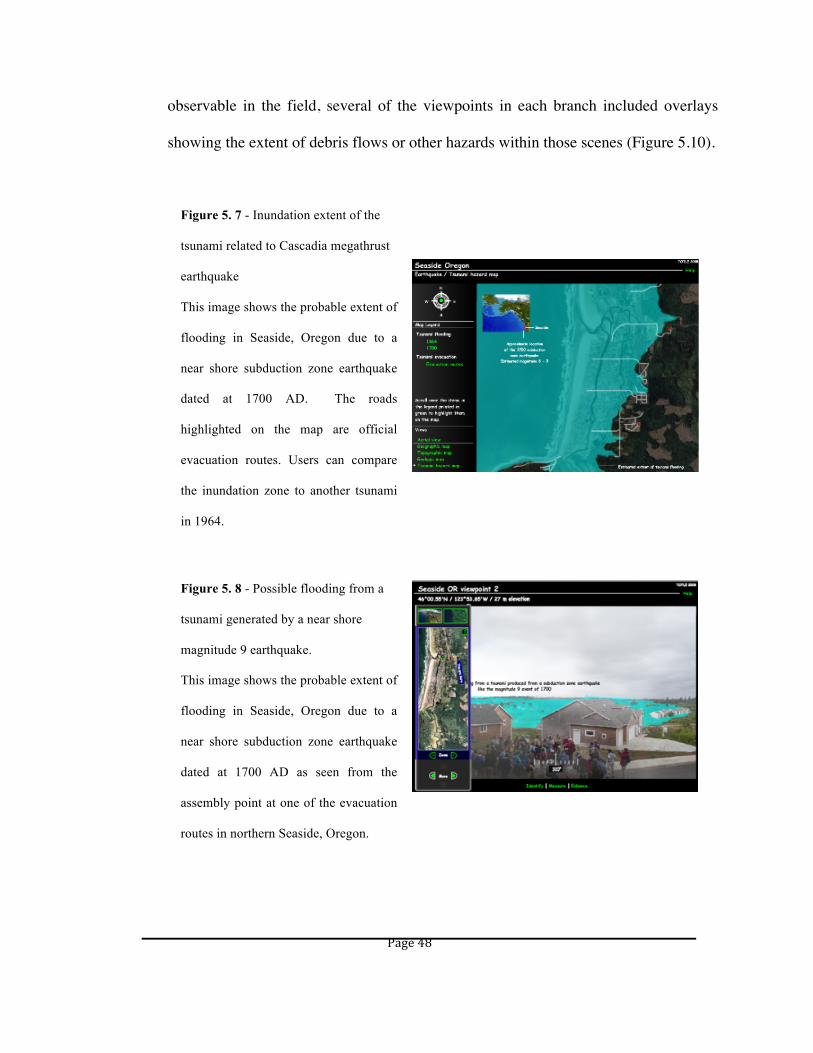
Page 48
observable in the field, several of the viewpoints in each branch included overlays
showing the extent of debris flows or other hazards within those scenes (Figure 5.10).
Figure 5. 7 - Inundation extent of the
tsunami related to Cascadia megathrust
earthquake
This image shows the probable extent of
flooding in Seaside, Oregon due to a
near shore subduction zone earthquake
dated at 1700 AD. The roads
highlighted on the map are official
evacuation routes. Users can compare
the inundation zone to another tsunami
in 1964.
Figure 5. 8 - Possible flooding from a
tsunami generated by a near shore
magnitude 9 earthquake.
This image shows the probable extent of
flooding in Seaside, Oregon due to a
near shore subduction zone earthquake
dated at 1700 AD as seen from the
assembly point at one of the evacuation
routes in northern Seaside, Oregon.
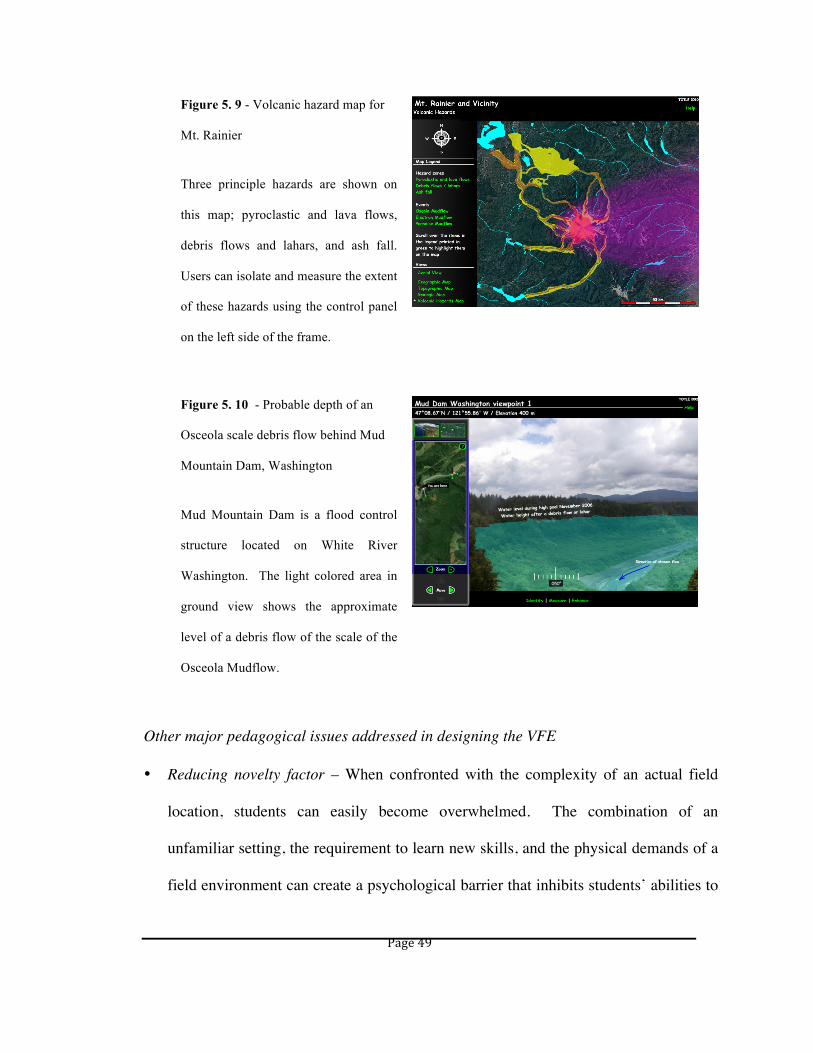
Page 49
Figure 5. 9 - Volcanic hazard map for
Mt. Rainier
Three principle hazards are shown on
this map; pyroclastic and lava flows,
debris flows and lahars, and ash fall.
Users can isolate and measure the extent
of these hazards using the control panel
on the left side of the frame.
Figure 5. 10 - Probable depth of an
Osceola scale debris flow behind Mud
Mountain Dam, Washington
Mud Mountain Dam is a flood control
structure located on White River
Washington. The light colored area in
ground view shows the approximate
level of a debris flow of the scale of the
Osceola Mudflow.
Other major pedagogical issues addressed in designing the VFE
• Reducing novelty factor – When confronted with the complexity of an actual field
location, students can easily become overwhelmed. The combination of an
unfamiliar setting, the requirement to learn new skills, and the physical demands of a
field environment can create a psychological barrier that inhibits students’ abilities to
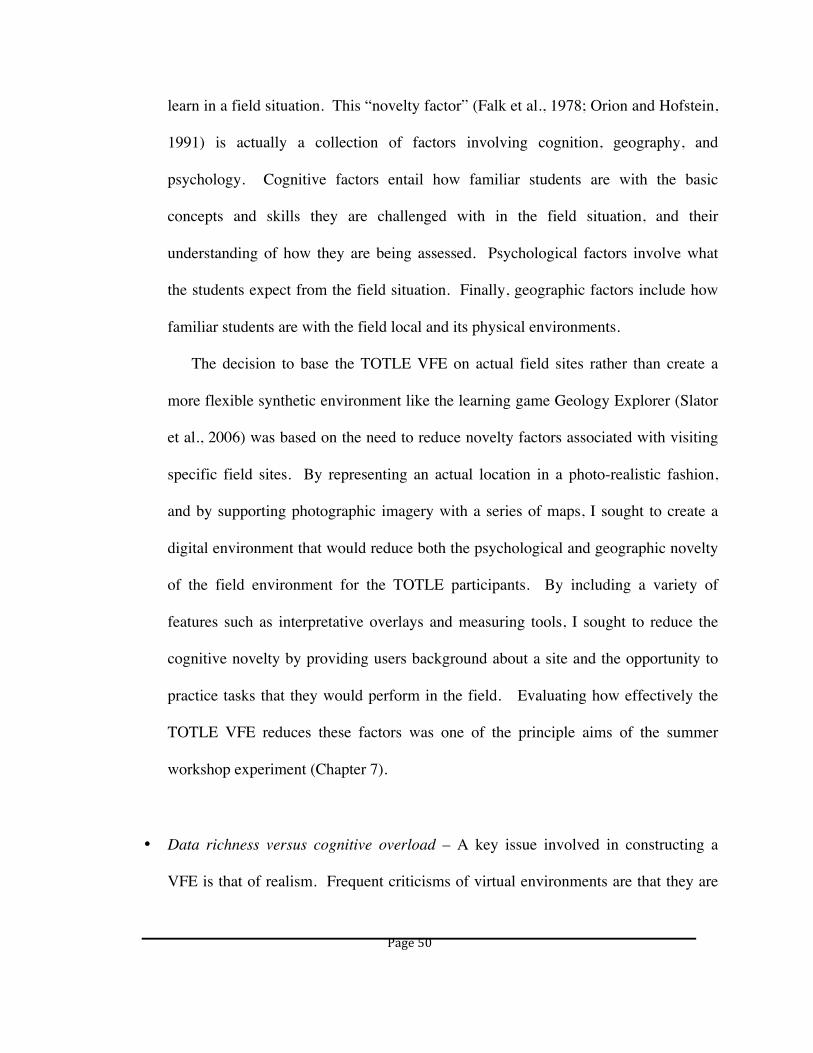
Page 50
learn in a field situation. This “novelty factor” (Falk et al., 1978; Orion and Hofstein,
1991) is actually a collection of factors involving cognition, geography, and
psychology. Cognitive factors entail how familiar students are with the basic
concepts and skills they are challenged with in the field situation, and their
understanding of how they are being assessed. Psychological factors involve what
the students expect from the field situation. Finally, geographic factors include how
familiar students are with the field local and its physical environments.
The decision to base the TOTLE VFE on actual field sites rather than create a
more flexible synthetic environment like the learning game Geology Explorer (Slator
et al., 2006) was based on the need to reduce novelty factors associated with visiting
specific field sites. By representing an actual location in a photo-realistic fashion,
and by supporting photographic imagery with a series of maps, I sought to create a
digital environment that would reduce both the psychological and geographic novelty
of the field environment for the TOTLE participants. By including a variety of
features such as interpretative overlays and measuring tools, I sought to reduce the
cognitive novelty by providing users background about a site and the opportunity to
practice tasks that they would perform in the field. Evaluating how effectively the
TOTLE VFE reduces these factors was one of the principle aims of the summer
workshop experiment (Chapter 7).
• Data richness versus cognitive overload – A key issue involved in constructing a
VFE is that of realism. Frequent criticisms of virtual environments are that they are
Page 51
too controlled, and that virtual materials cannot replicate real objects such as rocks
(Butler, 2008). Ignoring for a moment the accuracy of these criticisms, they raise an
important question about VFE design, this being “What kind of data should be in a
VFE and how much should be there?” This is an important question on both a
practical and pedagogical level. On a practical level, the more realistic the virtual
environment, the more costly it is to build, the longer it takes to build it, and the more
sophisticated the computer hardware must be to support it. On a pedagogical level,
the issue is one of learning objectives. If students are being asked to accomplish a
certain task, what kinds of data do they need to accomplish that task? Another
question that harkens back to one of the previously mentioned criticisms is “How
much do you want to limit the data contained in a VFE to alleviate some of the
‘cognitive overload’ that many novices experience in field situations?”
Virtual environments such as Geology Explorer (GE) have addressed some of
these issues by creating synthetic environments that are not photo-realistic and do not
represent particular locations. In the case of GE, this means that a great many
landscapes can be represented in the same environment giving it curriculum
flexibility and user focus. User focus means that the student’s attention is directed
towards specific tasks or concepts rather than being diverted by extraneous detail. In
the case of GE and many photo-realistic VFEs, the data contained in the environment
are generally limited to visual information, though non-visual data is often included
in the form of text describing smells, tactile sensations, or sounds. An additional
feature that may be present in these environments is video that illustrates dynamic

Page 52
processes such as stream flow or rock fall or activities such as scratching a mineral
across a streak plate.
The decision to build the TOTLE VFE as a photo-realistic environment was
based largely on its purpose, to prepare teachers going into the field and provide them
with a vehicle for bringing something of that experience back to their students. The
decision of what kinds of visual and non-visual data to include in the environment
was rooted in part on the core concepts discussed in the TOTLE summer workshops;
these being regional geology and tectonics, Cascadian volcanism and volcanic
hazards, and earthquakes and tsunami hazards. These decisions were also based on
discussions with field trip leaders as to what imagery and features that they would
like to see to support what they are presenting in the field. The challenge in making
these decisions was to provide sufficient data in the environment to give it enough
curricular flexibility that teachers could devise their own activities and adapt it to a
multitude of different teaching situations while avoiding the cognitive overload
associated with an exceedingly complex environment. To address this challenge the
VFE design process included evaluation of a prototype VFE by 2008 TOTLE
participants. A similar evaluation, as well as interviews and curriculum-use surveys
was conducted during the 2009 summer workshop.
VFE development within the TOTLE program
The TOTLE VFE was developed during the three years of the TOTLE program.
As such, it evolved as the workshop field experiences evolved. It also evolved in

Page 53
response to feedback from each year’s workshop participants as well as input from
program staff. The following is a brief history of this development.
• Year 1 (2008) – The first prototype was developed which included sites in Oregon
related to the summer 2008 workshop field trips. The workshop participants were
introduced to this version of the VFE in a focus group, where they were given time to
explore the VFE, and asked to suggest potential uses, feature additions, or
architectural changes to the package (Appendix A – Forms 1 and 2). This input was
used to modify the Oregon prototype and create the Washington prototype. All the
participants were given a copy of the VFE on CD and asked to rank its usefulness in
their classroom during the spring 2009 follow-up survey.
• Year 2 (2009) – A second prototype was developed that included sites in Washington
related to the summer 2009 workshop field trips. This time the participants were
introduced to the VFE in the field trip orientations. Here it was used to familiarize
the participants with the sites that they would be visiting. These orientations were
designed as an experiment to evaluate the effectiveness of the VFE as a tool for field
trip preparation. Again, the participants were given a copy of the VFE on CD and
asked to rank its usefulness in their classroom during the spring 2010 follow-up
survey.
• Year 3 (2010) – A final version of the VFE was produced by merging and modifying
both the Oregon and Washington prototypes. This final version also included a
teacher guide and student activity page for the VFE, all of which were included on the

Page 54
program DVD and website. TOTLE 2010 participants were introduced to the VFE as
part of the field trip orientations, as well as during a separate breakout session. All
the participants received a copy of the VFE and associated resources on the TOTLE
DVD.
While developing the VFE in this manner meant that it became a resource directly
related to the goals and activities of the TOTLE program, there were significant
challenges to this process. Chief among these were eliciting sufficient feedback on VFE
development and assessment from other TOTLE staff, and scheduling sufficient time
during summer workshops for conducting evaluations and experiments related to the
VFE. Since one of our goals as a teacher education project was to develop a model for
future similar efforts associated with the Earthscope program, it is important to
understand the impact of these challenges on the development and evaluation of the VFE,
as well as their impact on the professional development program of which it was a part.
To gain a more complete understanding of these challenges I met with four
members of the TOTLE team to discuss their impressions of the VFE, its development
process, and the impact of that development on the larger program. Here are some of the
significant ideas derived from those conversations:
• Participants from the first two years experienced the VFE in process (in-line
development), while the participants in the final year of the program received a final
product (pre-workshop development).
Page 55
• The in-line development model was advantageous for several reasons. It was tailored
to the teachers’ field experiences, and it provided them with a model for doing action
research. Also, it was engaging to teachers interested in the technology, and it gave
them a sense of “ownership” of the final product. This model had disadvantages in
that it added to the complexity of the workshop schedule. Furthermore, the
development and research activities were sometimes confusing to the workshop
participants, and the incompleteness of the VFE was a limiting factor in it use.
• The pre-workshop development model was advantageous in that participants were
presented with a complete package that could instantly be utilized. Consequently, the
participants could see the full potential of the package, and they could focus on
learning using the package rather than being confused by the gaps in it. One of the
disadvantages of this model is that there was a lack of room for creativity and
contribution. As a result, the participants missed out on potentially instructive aspects
of the research and development process, and the developer received no feedback in
the development process.
In discussing the advantages and disadvantages of these two development models
no consensus emerged in terms of which was optimal. One person preferred the in-line
development, while a second person would have preferred a pre-workshop development.
The other two staff members suggested that a hybrid approach, where much of the
environment development would have been completed prior to the workshop, but that
Page 56
activity development and associated evaluation and educational research could take place
during the workshop.
A potential model for the hybrid development is that of the “Using data in the
classroom workshop 2008” held in Portland Oregon (Ledley et al., 2008b). This event
was part of the Access Data project (Ledley et al., 2008a) that consisted of a series of
workshops that brought together educators with geoscientists, data providers, curriculum
developers, and software developers to discuss and develop strategies for using data sets
and visualization tools in geoscience classrooms. In addition to participating in plenary
and workshop sessions discussing these issues, participants worked together in
development teams to design curricula around selected data management, analysis, and
visualization tools, as well as providing software developers with input on the continued
development of these tools.
An alternate model for the in-line development is that of virtualfieldwork.org
(PRI, 2010). This project, previously discussed in Chapter 3, engages K-12 teachers in
the design and construction of virtual field environments using low-cost, readily
accessible, and simple to use software. The organizers of this effort argue that having the
teachers construct these environments not only provides them with a valuable resource,
but it also provides valuable professional development experience. Most importantly, the
act of VFE creation requires that educators study their local environment with an eye
towards engaging students in fieldwork. Furthermore, the VFE documents what they
have done towards that end (Duggan-Haas, 2010). To accomplish this, the project
conducts several workshops each year at different locations throughout the United States

Page 57
in which they introduce workshop participants to the geology of selected sites, the
pedagogical principles of VFE design, and the technical aspects of design and
construction. Participants are also guided through the process of producing their own
VFE and supporting activities. The project disseminates the work done by the
participants by maintaining a web-based database of virtual field environments.
Page 58
Chapter 6 - Evaluating Enhancement: VFE augmented orientation and
participants’ sense of preparedness
Research question
How does the use of the VFE in a field trip orientation impact the participant’s
sense of preparedness for a field trip?
This question involves the use of the TOTLE VFE to prepare teacher workshop
participants for a field experience. Of particular concern is whether using the VFE in
field trip orientations reduces the participants’ sense of geographic, cognitive, and
psychological novelty once they go into the field.
Hypothesis
This experiment centered on providing parallel orientation sessions for the same
field trip to two different groups of teachers. In both orientations, participants were
introduced to the field site and field trip logistics, and guided through a sample field
activity. In the case of one of these groups, participants used the VFE to work their way
through the activity, while the other group used paper maps and photographs of the field
site to complete the activity. The goal of this experiment was to test the following
hypothesis.
Participants who are introduced to a field site using the VFE during an
orientation will experience a stronger sense of preparedness during the field trip than
those who did not use it in a parallel orientation.
Page 59
Methodology
This experiment involved providing parallel field trip orientations to two groups
of teachers to assess how the pre-trip use of the TOTLE VFE impacted their sense of
preparation for the workshop field trips. The experiment was conducted twice during the
2009 summer workshop at Pacific Lutheran University (Tacoma, Washington), once for
each of the field trips occurring during the week. During the first day of the workshop,
all the participants were asked to submit a consent form and complete a background
survey (Appendix A - Forms 3 and 4) to determine their background in geology,
scientific fieldwork, and computer usage.
During the week of the workshop the participants attended two field trips. One of
these trips was to the Copalis River on the central Washington coast to examine evidence
for recent subduction zone earthquakes. The second trip was to Orting and Electronic,
Washington, as well as the White River near Enunclaw Washington to examine evidence
for recent debris flows originating on Mt. Rainier and civil preparedness for future flows.
The evening prior to each trip the participants received an hour-long field trip
orientation. Each evening two different versions of the orientation were conducted
concurrently. In both versions, the agenda included a power-point presentation providing
background on the field site and logistics of the trip, followed by an activity modeling the
type of inquiry activities scheduled for the next day’s experience. In one version of the
orientation, the teachers in the control group completed the activity using a color
photograph of an outcrop that is characteristic of the area that they would visit the
following day. The outcrop was either one at the field site they would be visiting the next
Page 60
day or one that was similar to outcrops appearing at that site. In the other version of the
orientation, teachers in the experimental group completed the activity using the TOTLE
VFE prepared for that year. In both versions, the activity included a brief introduction to
a problem and the tools that could be used to solve it. This was followed by an
exploration phase; where participants worked in small groups to address the problem
(Appendix A – Forms 5 and 6). The activity was concluded with a whole-group
debriefing session during which the participants discussed their results and the activity.
At the end of the session, each participant in the experimental group received a CD
containing the entire TOTLE VFE. This gave them the opportunity to continue exploring
the virtual version of the site that they would be visiting the next day.
Prior to the first session, the teachers in the workshop were divided into two
groups. Each group experienced both types of orientation but on alternating days. In
other words, the experimental group for the Copalis orientation became the control group
for the Orting trip orientation, and visa versa. This was done to ensure that all the
workshop participants could compare the two orientation types.
To create the two groups for this experiment two or more working teams were
combined. A working team is a group of seven to eight teachers who work together
throughout the workshop to produce a curriculum implementation plan for their
classrooms. Working teams were assigned at the onset of the workshop based on
geography and workshop scheduling factors. The groups were created in this way to
minimize the impact of the experiment on the workshop schedule. Though the
Page 61
participants had contact with one another before and after the orientation, they had no
contact with one another during the session.
At the end of the workshop week, all the participants completed a post-activity
survey asking them to identify which type of orientation they found most helpful for
preparing them for the field trip. This survey also asked them to rank the VFEs
usefulness in terms of the following:
a. Showing them where they were going.
b. Providing them with a geographic sense of the field site.
c. Connecting the “big picture” geologic concepts with the geology they saw at the
field locations.
d. Helping them see patterns in the rocks and landscapes observed during the field
trip.
e. Helping them visualize the processes that shaped the landscapes observed during
the field trip.
The experiment produced two data clusters, comprised of information on the
background of the participants, and measures of their responses to using the VFE for field
trip orientation. Analysis of the first data cluster consisted of constructing simple
descriptive statistics for participant background which was divided into three categories;
academic background in geology, experience with scientific fieldwork, and computer
usage. Analysis of the second data cluster involved creating descriptive statistics for
orientation version preference and task specific rankings of VFE use in the orientation.
While evaluation of the second data cluster was the process most germane to testing the

Page 62
initial hypothesis, evaluating the first data cluster was critical to testing the validity of
these conclusions. Analysis of participant background was necessary to determine the
degree of similarity within the entire sample.
Results
Participant background
With a sample size of 35, 28.6% of the sample had a degree in geology or a
related science. Of these ten people, two had graduate degrees, with the remainder
having completed undergraduate degrees. The majority (57.1%) of the participants had
only one or two geology courses in college. A small percentage (14.3%) had no college
courses in geology (Table 6. 1).
Table 6. 1 - Academic Background in geoscience
The college coursework of the TOTLE 2009 participants divided into four
categories. “r” is the number of participants in each category, while “%n” is the
percentage of the total group in each category (n = 35).
r %n
None 5 14.3%
One or two courses in college 20 57.1%
I have an undergraduate degree in geology or a related science 8 22.9%
I have a graduate degree in geology or a related science 2 5.7%
When asked about experience with scientific fieldwork (Table 6.2) the majority
(51.4%) had only introductory field experience in college courses. A minority (8.6%)
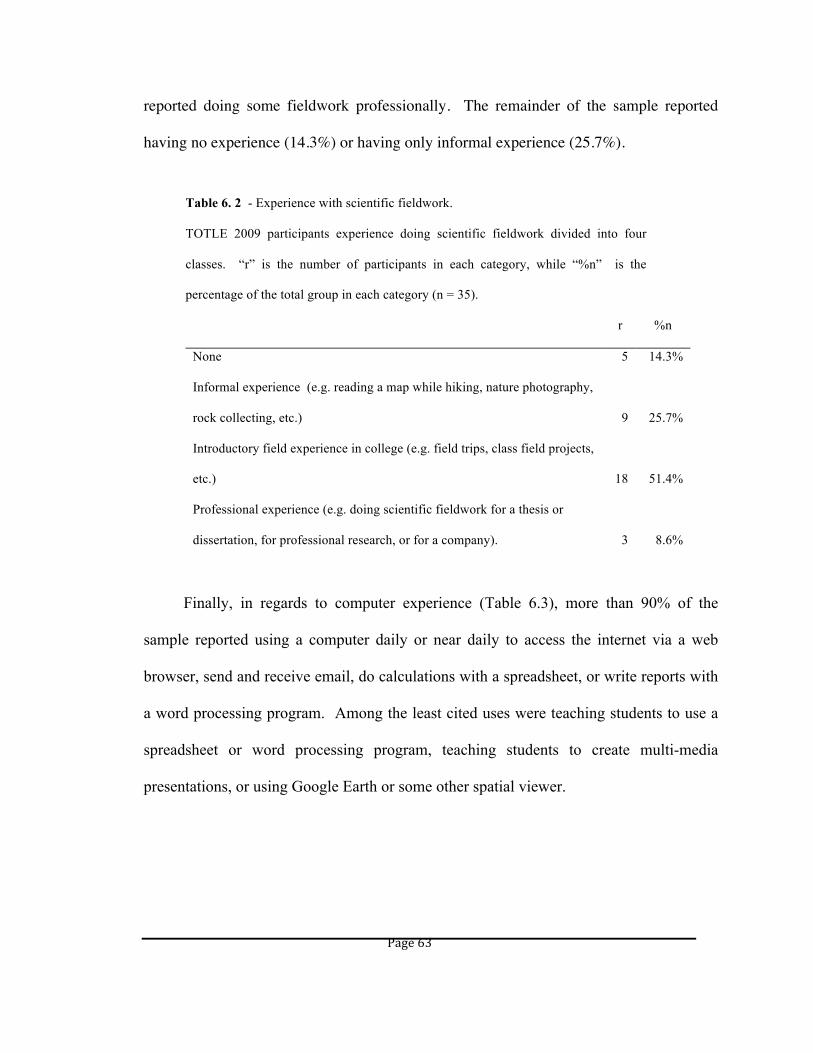
Page 63
reported doing some fieldwork professionally. The remainder of the sample reported
having no experience (14.3%) or having only informal experience (25.7%).
Table 6. 2 - Experience with scientific fieldwork.
TOTLE 2009 participants experience doing scientific fieldwork divided into four
classes. “r” is the number of participants in each category, while “%n” is the
percentage of the total group in each category (n = 35).
r %n
None 5 14.3%
Informal experience (e.g. reading a map while hiking, nature photography,
rock collecting, etc.) 9 25.7%
Introductory field experience in college (e.g. field trips, class field projects,
etc.) 18 51.4%
Professional experience (e.g. doing scientific fieldwork for a thesis or
dissertation, for professional research, or for a company). 3 8.6%
Finally, in regards to computer experience (Table 6.3), more than 90% of the
sample reported using a computer daily or near daily to access the internet via a web
browser, send and receive email, do calculations with a spreadsheet, or write reports with
a word processing program. Among the least cited uses were teaching students to use a
spreadsheet or word processing program, teaching students to create multi-media
presentations, or using Google Earth or some other spatial viewer.
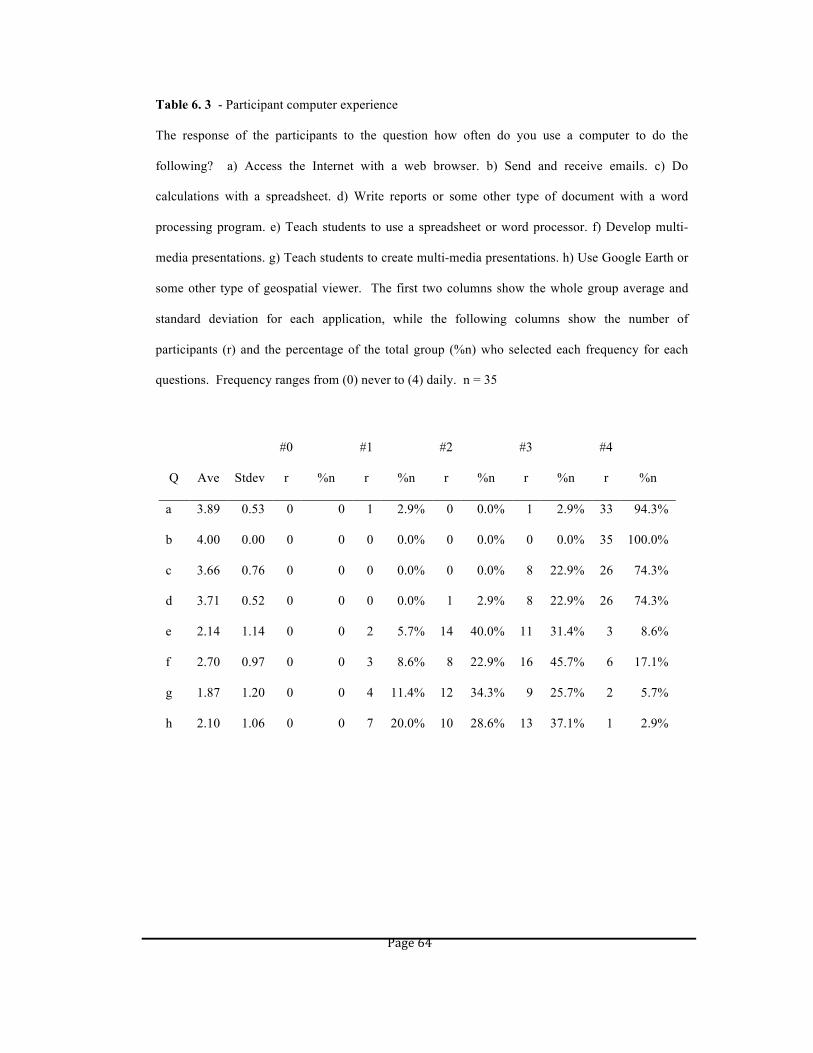
Page 64
Table 6. 3 - Participant computer experience
The response of the participants to the question how often do you use a computer to do the
following? a) Access the Internet with a web browser. b) Send and receive emails. c) Do
calculations with a spreadsheet. d) Write reports or some other type of document with a word
processing program. e) Teach students to use a spreadsheet or word processor. f) Develop multi-
media presentations. g) Teach students to create multi-media presentations. h) Use Google Earth or
some other type of geospatial viewer. The first two columns show the whole group average and
standard deviation for each application, while the following columns show the number of
participants (r) and the percentage of the total group (%n) who selected each frequency for each
questions. Frequency ranges from (0) never to (4) daily. n = 35
Q Ave Stdev
#0
r %n
#1
r %n
#2
r %n
#3
r %n
#4
r %n
a 3.89 0.53 0 0 1 2.9% 0 0.0% 1 2.9% 33 94.3%
b 4.00 0.00 0 0 0 0.0% 0 0.0% 0 0.0% 35 100.0%
c 3.66 0.76 0 0 0 0.0% 0 0.0% 8 22.9% 26 74.3%
d 3.71 0.52 0 0 0 0.0% 1 2.9% 8 22.9% 26 74.3%
e 2.14 1.14 0 0 2 5.7% 14 40.0% 11 31.4% 3 8.6%
f 2.70 0.97 0 0 3 8.6% 8 22.9% 16 45.7% 6 17.1%
g 1.87 1.20 0 0 4 11.4% 12 34.3% 9 25.7% 2 5.7%
h 2.10 1.06 0 0 7 20.0% 10 28.6% 13 37.1% 1 2.9%

Page 65
Results of the post-activity survey
When asked which type of orientation was most helpful in terms of preparing
them for the field trips, 90.6% of the sample identified the version that included using the
VFE (Table 6.4). When asked to evaluate the VFE in terms of helping them with key
geocognitive tasks the participants ranked it highest in terms of geographic tasks.
More than 80% of the participants rated it as either 3 or 4 (Table 6.5) in showing them
where they were going and helping them see patterns in the rocks and landscapes
observed during the field trip. The ranking range was from 0 to 4, with 0 being not
helpful and 4 being extremely helpful. They rated the environment as least useful in
helping them visualize the geologic processes shaping the landscapes observed during the
field trips. Over 6% of the sample claimed that the VFE either was not helpful (0) or was
only marginally helpful (1) in helping them visualize geologic processes, with 75%
ranking it as either a 3 or 4. This was the only task receiving a rating of 0 from any of
the participants, and it had the lowest percentage of the participants ranking it as either a
3 or 4.

Page 66
Table 6. 4 - Participant response to the VFE augmented field trip orientation.
The number of participants (r) receiving the VFE augmented field trip orientation for each
of the two field trips during the 2009 summer workshop. The third table shows the
participant preference for style of workshop. %n is the percentage of the total sample (n =
33) represented by each “r”.
What type of orientation did you receive for the Mt. Rainier field trip? r %n
The orientation that included the VFE. 16 48.5%
The orientation that didn't include the VFE. 17 51.5%
What type of orientation did you receive for the Copalis Beach field
trip? r %n
The orientation that included the VFE. 17 51.5%
The orientation that didn't include the VFE. 16 48.5%
Which type of orientation was the most helpful in terms of preparing
you for the field trip? r %n
The orientation that included the VFE. 29 90.6%
The orientation that didn't include the VFE. 3 9.4%
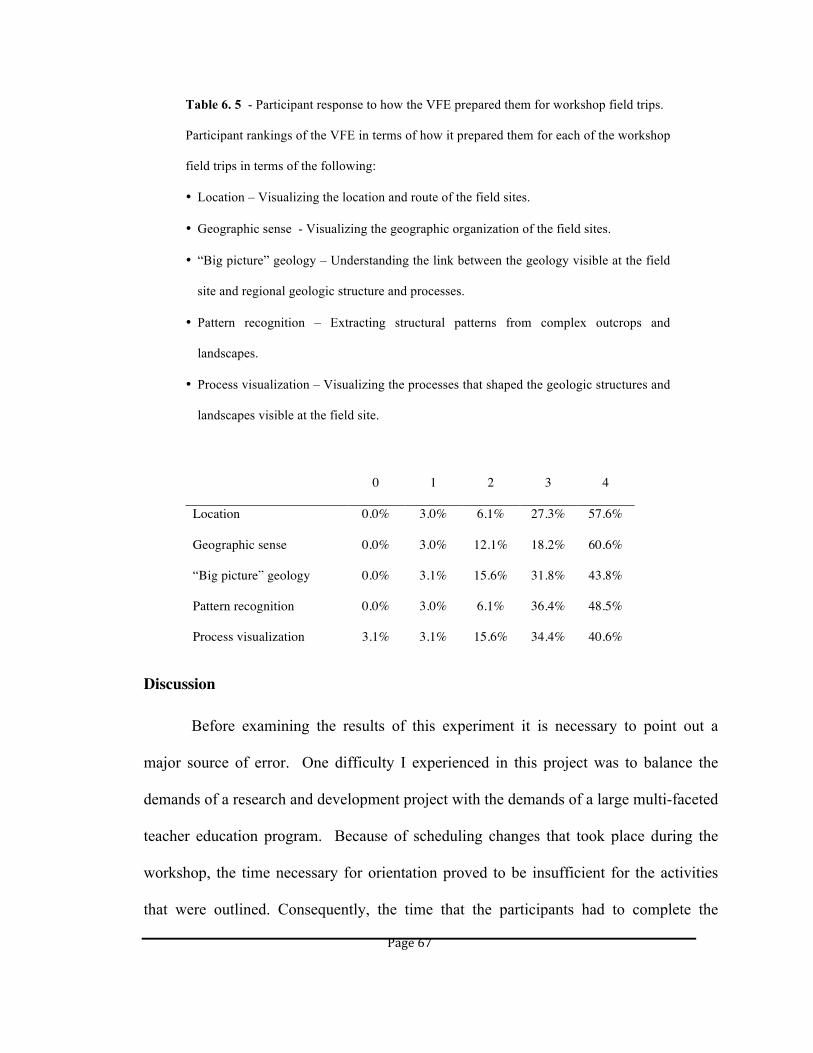
Page 67
Table 6. 5 - Participant response to how the VFE prepared them for workshop field trips.
Participant rankings of the VFE in terms of how it prepared them for each of the workshop
field trips in terms of the following:
• Location – Visualizing the location and route of the field sites.
• Geographic sense - Visualizing the geographic organization of the field sites.
• “Big picture” geology – Understanding the link between the geology visible at the field
site and regional geologic structure and processes.
• Pattern recognition – Extracting structural patterns from complex outcrops and
landscapes.
• Process visualization – Visualizing the processes that shaped the geologic structures and
landscapes visible at the field site.
0 1 2 3 4
Location 0.0% 3.0% 6.1% 27.3% 57.6%
Geographic sense 0.0% 3.0% 12.1% 18.2% 60.6%
“Big picture” geology 0.0% 3.1% 15.6% 31.8% 43.8%
Pattern recognition 0.0% 3.0% 6.1% 36.4% 48.5%
Process visualization 3.1% 3.1% 15.6% 34.4% 40.6%
Discussion
Before examining the results of this experiment it is necessary to point out a
major source of error. One difficulty I experienced in this project was to balance the
demands of a research and development project with the demands of a large multi-faceted
teacher education program. Because of scheduling changes that took place during the
workshop, the time necessary for orientation proved to be insufficient for the activities
that were outlined. Consequently, the time that the participants had to complete the
Page 68
assigned practice activity using the VFE was significantly abbreviated. Participants were
asked to compensate for this by taking time later that evening to individually explore on
the VFE branch that included the field site that they would be visiting the following day.
It is uncertain how many of the participants availed themselves of this option.
Hypothesis
Participants who are introduced to a field site using the VFE during an
orientation will experience a stronger sense of preparedness during the field trip than
those who did not use it in a parallel orientation.
A significant majority of the workshop participants (90.6%) stated a preference
for the VFE-augmented version of the orientation. When asked how the VFE prepared
them for their field experience, they ranked it highest in terms of providing them with a
sense of location (where they were going) and the geography of the field site. They
ranked it lowest in terms of helping them visualize processes. Based on these results, the
use of the VFE to prepare for field trips was most useful in reducing geographic novelty.
The lower ranking for process visualization indicates that using the VFE was less helpful
in reducing cognitive novelty. What is uncertain is the degree to which its use reduced
psychological novelty since the experiment included no mechanism for assessing this.
Implications of these results for VFE design and geocognition
The results of this experiment provide insight into the design features described in
Chapter 5 in terms of how effectively they support the geocognitive skills outlined in that
same chapter. Based on these results (Table 6.5), the VFE was ranked most effective in

Page 69
supporting spatial thinking and least effective in terms of encouraging systemic thinking.
The participants gave the lowest ranking to process visualization and linking “big
picture” to local geology (both regarded as systemic thinking skills). No data regarding
temporal thinking were derived from the survey since there were no related questions
asked in the post-activity survey.
The extent to which the VFE supported each type of thinking is understood by
looking at three factors; the complexity of each geocognitive skill, how it was supported
by the environment, and the amount of experience the participants had with the
environment specific to each skill.
Complexity
Regarding the questions about task-specific usefulness that were asked in the post
workshop survey, those that involved systems thinking4 are the most complex. This is in
large part because spatial thinking and pattern recognition involve immediate, visual, and
static phenomena (Kastens and Ishikawa, 2006), while understanding Earth systems
involves visualizing both complex spatial characteristics and dynamics (Herbert, 2006).
Spatial thinking is complex in that it includes the translation of two-dimensional
representations or the visualization of internal structure (Kastens et al., 2009; Kastens and
Ishikawa, 2006; Piburn et al., 2002), and pattern recognition can be difficult where
patterns have poor resolution or complex (Kastens and Ishikawa, 2006). However,
learning systemic thinking provides an even larger challenge for novices since it 4 The systems thinking related questions are those involving “Big picture” geology and process
visualization.
Page 70
incorporates both spatial and temporal thinking to understand the elements and the
relationships between the elements of a geophysical system (Bice, 2006; Ben-Zvi and
Orion, 2005). Given the difference in the complexity of these two skills, it is reasonable
to assume that the design features that would support systemic thinking would need to be
more complex than those supporting spatial thinking, and would require more time to
master.
Support by the virtual environment
The VFE was designed to support spatial thinking in two ways. First, individual
viewpoints were all accessed from a set of spatially hierarchical aerial and satellite
images. Second, movement between one viewpoint and another was possible via a GPS-
like navigation panel accompanying each viewpoint. In some instances, users could
move between viewpoints using “signposts” included in the scene, while simultaneously
watching their position change on the navigation panel. These features were designed to
provide users with a link between the regional and local context (linking spatial scales) as
well as a sense of location (creating spatial maps).
The principle way that the TOTLE VFE supported pattern recognition was
through the use of overlays, in particular what is referred to as the “enhance” layer. This
layer is a translucent mask that can be superimposed onto each viewpoint, highlighting
materials, structural features, and fluid levels. One of the challenges of building these
layers was addressing a question asked about educational geoscience visualizations by
Rapp and Uttal (2006), “Does a particular visualization improve (or hurt) learning?”
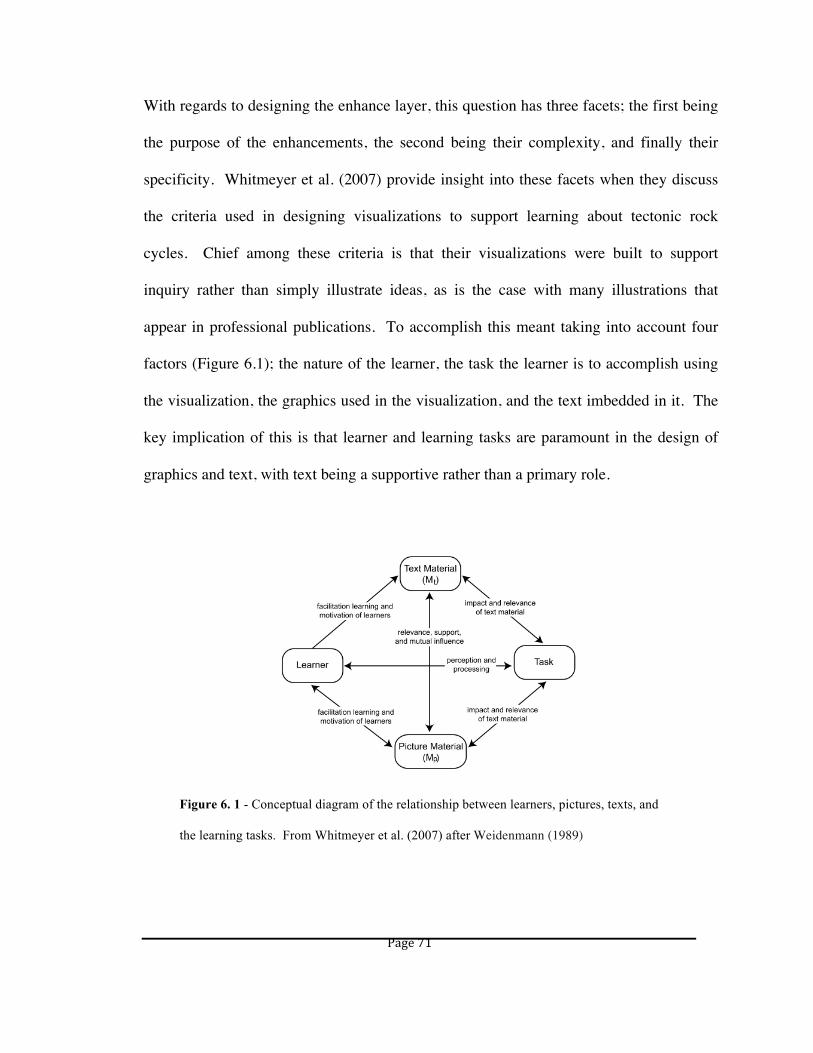
Page 71
With regards to designing the enhance layer, this question has three facets; the first being
the purpose of the enhancements, the second being their complexity, and finally their
specificity. Whitmeyer et al. (2007) provide insight into these facets when they discuss
the criteria used in designing visualizations to support learning about tectonic rock
cycles. Chief among these criteria is that their visualizations were built to support
inquiry rather than simply illustrate ideas, as is the case with many illustrations that
appear in professional publications. To accomplish this meant taking into account four
factors (Figure 6.1); the nature of the learner, the task the learner is to accomplish using
the visualization, the graphics used in the visualization, and the text imbedded in it. The
key implication of this is that learner and learning tasks are paramount in the design of
graphics and text, with text being a supportive rather than a primary role.
Figure 6. 1 - Conceptual diagram of the relationship between learners, pictures, texts, and
the learning tasks. From Whitmeyer et al. (2007) after Weidenmann (1989)

Page 72
Like the animations developed by Whitmeyer et al. (2007) the TOTLE VFE was
built to support inquiry instruction5. This meant that scene enhancements were designed
to provide data to help users interpret the geology of the scene rather than presenting
them with a completed interpretation devised by a professional geologist. It also meant
that the complexity of the overlays is significantly less than what might appear in a
professional interpretation. Consequently, overlays frequently delineate general types of
material (e.g. consolidated rock vs. unconsolidated rock and sediment) rather than
specific formation names. Finally, like their visualizations, text included in the
enhancements was designed to support graphics, rather than the graphics illustrating the
text.
The task of incorporating systems thinking into the TOTLE VFE was
considerably more complex. There are two aspects of the environment that are important
here. First is the inclusion of simple geospatial viewers with both aerial and satellite
views. Second is the inclusion of modeled results in (e.g. Tsunami inundation extents
and volcanic hazard ranges) in several of these viewers. Both aspects enabled users to
isolate, compare, and analyze specific characteristics of an area across multiple spatial
scales. In essence, these aspects allowed them to distinguish the structural elements of
geologic systems and to examine the dynamics of the relationship between them.
Theoretically, this should have aided the TOTLE 2008-2009 participants in visualizing 5 Though the VFE was built to be flexible enough to support open constructivism in which students define
both the questions and methodology for an investigation, it was created primarily for guided inquiry in
which a set of questions are given and a constrained data set is provided, but the solution for the inquiry is
not defined. Additional discussion of this issue is included in the teacher’s guide accompanying the VFE (
http://multimedia2.up.edu/Physics/TOLE/VFEs/ ).

Page 73
the processes shaping the geology of the sites that they visited. However, the results of
the post-activity survey indicate that this was one of the areas where the VFE was least
effective. Though there are a number potential factors involved this outcome (see the
following section), one important structural issue is how the VFE presented dynamic
relationships and model results.
Though the photography for the TOTLE VFE was accumulated over a period of
four years, there was no attempt to create time-lapse sequences representing changes in
areas or specific locations. Consequently, despite its spatial interactivity the VFE is a
temporal “snap-shot” rather than a dynamic representation. Even in those places where
geospatial viewers include modeled tsunami inundation and volcanic hazard extents,
these are single frame outputs from other models (Hoblitt et al., 1998; Scott et al., 1997;
Wong et al., 2006) rather than the outcome of a model that the user is able to manipulate.
Consequently, the VFE gives an incomplete view of the geophysical dynamics it is
representing. This severely limits its utility as a tool for teaching about systems from an
inquiry approach, as does the fact that users view model results rather than manipulate
models and then observe the results.
A possible solution to this dilemma would be to incorporate the code for simple
mathematical models into the appropriate geospatial viewers within the VFE, or replace
static model results with a few selected animation sequences derived from research
models. In the latter case, users would be working with a pseudo-model that gives them
the impression that they are controlling an actual mathematical model. The principle
advantages of such a feature are as follows:
Page 74
1) It incorporates the manipulation of variables into the VFE. This is one of the
hallmarks of model-based systems education (Gilbert et al., 2000; Herbert, 2006).
2) Integrating simple mathematical models into the VFE links modeling with physical
locations, thus reducing the level of abstraction inherent in common educational
modeling programs such as STELLA (Bice, 2006; Bice, 2001).
Experience specific to each skill
The final factor influencing the outcome of the alternative orientation experiment
is the type and amount of experience that the participants had using the VFE in ways
related to spatial thinking, pattern recognition, and systems thinking. Changes in the
2008-2009 workshop schedule reduced the time available for the practice field activity
from 30 to 15 minutes. This time limitation occurred in both version of the orientation.
To compensate for this, the participants were provided with a copy of the VFE on CD
and encouraged to independently explore the parts relevant to next day’s field trip.
Again, it is uncertain how many of the participants completed this assignment.
The impact of this time restriction should vary with the complexity of the
geospatial skill supported by the VFE. Based on the assumption that tasks involving
more complex skills are more time-consuming, it is highly probable that tasks involving
systems thinking will take more time than those involving spatial thinking or pattern
recognition. Consequently, one reason for the lower ranking of the VFE in terms of
systems thinking skills is that the participants either did not have sufficient time to
investigate relevant aspects of the VFE, or to engage in activities utilizing them. Upon

Page 75
reexamining the practice field activities in which the VFE was used (Appendix A - Forms
5 and 6), another factor became apparent, namely which skills were involved in each
activity. Though the activities involved different locations, they were parallel in that that
they focused largely on observation, description, and pattern recognition. Spatial
thinking was involved in the VFE version of the activity in that participants had to
navigate to the target field site to complete the activity. Following the activity they were
briefly introduced to the geospatial viewers included with each of the aerial views. This,
in addition to a Power-Point-aided lecture, were the principle direct ways in which they
were introduced to the systemic aspects of Northwest geology.
Page 76
Chapter 7 – Evaluating Extension: The impact of VFEs on teacher classroom
practice
Research question
The process described in this chapter entailed evaluating the impact of the VFE
on the participants’ classroom practice. Performing this evaluation meant addressing the
three following questions:
1. Were the VFE’s used in the participants classrooms?
2. If so how were they used, how frequently were they used, and how did the students
react to them?
3. If not, why not? What technical, institutional, or pedagogical issues prevented
the participants from using the VFEs.
Methodology
These three questions were addressed using post activity and post-workshop
surveys given to the 2008 and 2009 workshop participants. The results of the post
activity surveys, given at the end of each summer workshop, were used to determine if
and how participants intended to use the VFE in their classrooms. The post-activity
surveys (Appendix A – Form 7) were instruments specific to the VFE that were
administered during the last day of each workshop. The results of the post-workshop
Page 77
survey were used to determine if and how the participants actually used the VFE with
their students or colleagues, as well as factors affecting this use.
The post-workshop survey for the VFE was a set of questions that were imbedded
in a program survey that was sent to each year’s participants between six and eight
months after the summer workshop. The program surveys were compiled and
administered by Pacific Research Inc., an external evaluator hired by TOTLE to provide
both formative and summative evaluation (Pacific Research and Evaluation, 2009, 2010).
During both years, the questionnaires asked teachers to rate each educational resource
provided to them in terms of how frequently they used it. If they did not use a particular
resource they were asked why they did not do so. In the 2008-2009 survey, participants
were simply asked how frequently they used the VFEs and then asked for comments. In
the 2009-2010 survey, the participants were asked these same questions. However, they
were also asked to elaborate on how they used the VFE if they did use it, what they used
it for, what the students’ reactions were to using it, and what factors prevented them from
using it if they did not use it with students. Questions about frequency of use and
students’ reactions were structured as a Likart scale, while the remaining questions were
formatted as multiple-choice questions. With each question, participants were
encouraged to elaborate via a brief narrative.
Page 78
Results
Table 7.1 is a summary comparison of intended to actual use of the VFE by the
2008 and 2009 workshop participants. In both years more than 50% of the teachers
stated that they intended to use the environment in their classrooms, meaning that more
participants said they intended to use the VFE than said they might or did not intend to
use it. Though no one in the first year said they would / could not use it with their
students, in the second year (2009) approximately 9% stated that they did not intend to
use the package with their students. These three participants stated that they either were
not teaching a course where they could use the VFE or they did not have technology
necessary for their students to use it.
In contrast to the intended use, approximately 23% of the 2008 participants stated
that they used the VFE at least once with their students. In 2009 the percentage reporting
that they had actually used the environment had risen to 40%. A significant characteristic
of these data sets is the number of participants who failed to complete either the post
activity or workshop follow-up surveys. In 2008-2009 and 2009-2010 there were 34 and
35 participants respectively. During 2008-2009, 70% of the participants completed the
post-activity survey and 85% responded to the follow-up survey. In 2009-2010, 94%
completed the post-activity survey, while 57% responded to the workshop follow-up
survey.

Page 79
Table 7. 1 - Intended versus actual use of the VFE for instruction.
Yes No Maybe
Intended use n r %n r %n r %n
2008 24 14 58.3% 0 0% 10 41.7%
2009 33 17 51.5% 3 9.1% 13 39.4%
Actual use n r %n r %n r %n
2008 29 7 23% 22 77%
2009 20 8 40% 12 60%
Table 7.2 summarizes how the 2009-2010 participants used the VFE in their
classrooms. Questions asking the participants to describe how they used the environment
were not included in the 2008-2009 follow-up survey for reasons mentioned in the
methods section of this chapter. Of the seven teachers who reported using the
environment, six used it with students, either as a lecture / presentation tool (86%), a
replacement for a field trip (43%), or for specific lab activities (14%). Three of these
teachers used it as presentation tool with colleagues, parent groups, or administrators.

Page 80
Table 7. 2 - Reported uses of the VFE. Cited from the 2010 workshop follow-up survey.
r is the number of respondents citing each use, while %n is the percentage of the total number of
respondents (n=20) represented by each r.
Reported use r %n
As a presentation during a lesson / lecture 6 86%
As a replacement for a field trip 3 43%
To show colleagues, parent groups, or administrators where
you went during the TOTLE workshop
3 43%
For specific lab activities 1 14%
When asked about the level of engagement the students exhibited when using the
VFE, 67% (n = 4) of the teachers who used it with their students said they were
enthusiastic and engaged, one (17%) said they were mildly interested, and one said that
they were unable to determine their level of engagement. When asked about the
problems that the students seemed to encounter, these same teachers reported the
following:
• The student had problems getting a sense of scale or location as they moved from
one view to the next (33%, n=2);
• I was unable to determine (33%, n=2);
• The students had problems seeing the links between ground view and regional
geology (17%, n=1);
• The terminology or images in the VFE were too complicated (17%, n=1);
• Other problems (17%, n=1).

Page 81
In both years, a significant majority (60% to 70%) of those completing the follow-
up survey reported not using the VFE with their students. During both years participants
were asked to identify the factors that prevented them from using the environment with
their students. In 2008-2009 lack of time in the curriculum was reported as the major
impediment, while lack of time to review / learn the background necessary to use the
VFE was the major reason cited in 2009-2010. The complexity of the environment and
its fit in the teachers’ curriculum were cited to a lesser degree during both years. The
2009-2010 participants did not mention lack of time in the curriculum as a factor.

Page 82
Table 7. 3 - Factors cited for not using the VFE in instruction. Cited from the 2009
and 2010 workshop follow-up surveys. n is the total number of respondents to the
survey, while n’ is the number of respondents who said they did not use the VFE
who cited reasons for not using it.
Factors cited
2008
n = 29
n’ = 22
2009
n = 20
n’ = 12
Lack of time in the curriculum 41%
75%
Lack of time to review/learn needed background
knowledge
7%
10%
31%
Too complex 21%
14%
15%
Does not fit subjects our curriculum covers 7%
3%
8%
No response selected 31%
35%

Page 83
Discussion
Information about the impact of the VFEs on classroom instruction (rate of use
and student reaction) was derived primarily from post workshop surveys conducted
during 2008-2009 and 2009-2010. Based on this information, the following can be
surmised in response to the central questions outlined at the beginning of this chapter.
1. Were the VFE’s used in the participant’s classrooms?
For 2008-2009, 23% of the teachers who completed the workshop follow-up
survey reported using the environment at least once with their students. For the 2009-
2010 survey this percentage had increased to 40%. One obstacle to accurately
assessing VFE use was the percentage of the participants in each year who did not
complete the follow-up survey for that year. In 2008-2009, 82% of the participants
completed the survey. This percentage decreased to 57% in 2009-20106. Using the
completion rates for each year, I estimate that actual use for 2008-2009 could have
been between 20% and 35% for 2008-2009, while use for 2009-2010 could have been
between 23% and 63%. The low estimates for VFE use are based on the assumption
that none of the participants who failed to report used the VFE with their students.
6 A brief survey of literature related to teacher professional development (Young and LaFollette,2009;
Stefanich. 2002; and Wiecha et al.. 2002) revealed post program survey return rates of between 25 and
76%. No research was found specifically addressing the issue of survey return rates in teacher education
programs, consequently the three cases studies in this survey were compared to the TOTLE post work-
shop rates to assess their significance. The 2008-2009 rates were higher than any of these three studies,
while the 2009-2010 rates fell in the mid-range of these cases.
Page 84
The high estimates are based on the assumption that all of those who failed to report
used the VFE at least once.
2. If so how were they used, how frequently were they used, and how did the students
react to them?
2009-2010 workshop participants who used the VFE in their classrooms used
it primarily as a presentation tool. Approximately a third of those reporting that they
had used it with students stated that they had used it in lieu of a field trip. Whether
they had used it as a substitute for a “Cooks tour” type field trip, or to do some type
of inquiry-based “fieldwork” is not known. Further, one of the participants reported
using the VFE for specific lab activities. Here again, no information was given about
what types of lab activities the students were engaged in.
3. If the VFEs were not used, why not? What technical, institutional, or pedagogical
issues prevented the participants from using the VFEs?
In both 2008-2009 and 2009-2010, workshop participants who did not use the
VFE in their classroom identified the principle reason why they did not do so as a
lack of time. During 2008-2009, 75% of those who did not use the environment said
it was because of a lack of time in their curriculum. During 2009-2010, 31% of the
non-users stated a lack of time to review the environment or the background needed
to use it. Other factors that were identified include complexity of the environment
(21% for 2008-2009 and 15% for 2009-2010); and “it did not fit into my curriculum”
(7% for 2008-2009 and 8% for 2009-2010). Thirty-one percent (31%) of the 2008-
2009 non-users and 42% of the 2009-2010 non-users gave no response.
Page 85
In addition to the factors identified by the surveys, there are several other
factors that may have had significant impact on whether or not the environment was
used. One of these is that during the first two years of the TOTLE program,
participants received an incomplete environment. Though not mentioned by any of
the workshop participants, this factor was mentioned in interviews with several of the
program’s master teachers and principle investigators. These interviews were
discussed in Chapter 5. Another factor discussed by one of the master teachers is the
technology infrastructure and policies of various schools. Throughout the program,
the TOTLE VFE was available to the participants in two forms, the program website
and on a CD that they received during the workshop. This posed a problem for some
participants for two reasons; Internet connectivity problems and/or school
information technology restrictions. In several instances, participants mentioned in
informal discussions that their school Internet connections were either too slow or too
narrow (bandwidth) for a group of students to access simultaneously. In other
instances where the infrastructure was capable of having groups of students use a
single web site simultaneously, teachers were limited by having to have all web-sites
accessed by students pre-approved by district technology administrators. Such
problems were the principle reason that CDs containing the entire environment were
provided to all the participants. This, however, was accompanied by yet another
problem. Some teachers reported that no type of portable media could be used with
their computers. In their situations, all programs and other media had to be both
approved and installed by district technology administrators. Some of these issues

Page 86
and other factors are cited in various studies of the frequency of use of instructional
technology in secondary classrooms (Cuban et al., 2001; Becker, 1999). Among the
additional factors cited by these studies is that of pedagogy. One study of teacher and
student use of the Internet for classroom work and administration (Becker, 1999)
found a strong correlation between the degree of constructivism7 in a teacher’s
curriculum and his or her use of the Internet. Though with changes in technology and
culture this correlation may no longer be accurate, it does raise an interesting question
about the use of virtual reality in classrooms. Many virtual reality environments,
including the TOTLE VFE, are flexible, exploratory environments built to support
constructivist pedagogy, rather than direct instruction. Consequently, another factor
affecting the degree of use of the TOTLE VFE may be the participants’ comfort and
experience with inquiry instruction, as well as their school’s curricular policies.
Another factor that could have had a significant impact on the frequency with
which the VFE was used are the number of other resources that were presented to
participants. In the 2009-2010 follow-up survey the participants were asked to rate
20 instructional tools to which introduced during a weeklong summer workshop.
7 Degree of constructivism refers to the extent to which students define the focus, questions,
methodology, and outcome for a lesson (Pyle, 2008). On one end of this spectrum, open
constructivism, students define all aspects of a learning project. On the opposite end, the instructor
defines direct instruction, the questions, methods, and outcomes of a lesson. Between these
extremes are guided inquiry in which instructors or curriculum designers define the questions and
the data set, but leave methodology and outcome to be determined by students (Thomas, 2000).
Another intermediary method are forms of project based learning in which instructors define an
overarching project, but assist rather than provide the students with identifying principle questions,
formulating a methodology, and producing a final product (Eberlin et al., 2008)

Page 87
This is slightly less than the number of tools (24) to which the previous year’s
participants were introduced. This meant that in both years an incomplete product
was competing with a large number of complete products for the teacher’s attention.
The large number of resources made available to the participants also put severe
restrictions on the amount of time available to introduce any one resource.
Page 88
Chapter 8 – Design Experiment: Feature identification and questions for a virtual
field site
Research question
Given the same virtual field site, what do geoscience novices, experts, and grade
6-12 teachers select as features of interest from the site, why do they select these features,
and what questions do they ask about them?
There are two principle reasons for investigating this question. The first is that
addressing it provides insight into what geologic experts, teachers, and novices interpret
what they see at a field site. The second is that these responses can be useful in
developing interpretive overlays for the virtual environments such as the TOTLE VFE, as
well as the guided inquiry activities (question sets) designed to accompany them. These
activities are designed to help students develop observational and interpretive skills
related to the geology represented in the environment.
Hypothesis
This experiment involved three groups: undergraduates in introductory Earth
science courses, instructors of Earth science (grades 6-12), and professional geologists.
Based on assumed differences in expertise between the three groups the following results
are anticipated:
1. Given the situational context of being on a geology field trip, the questions asked
by novices will tend to be more generalized. In other words, their questions will
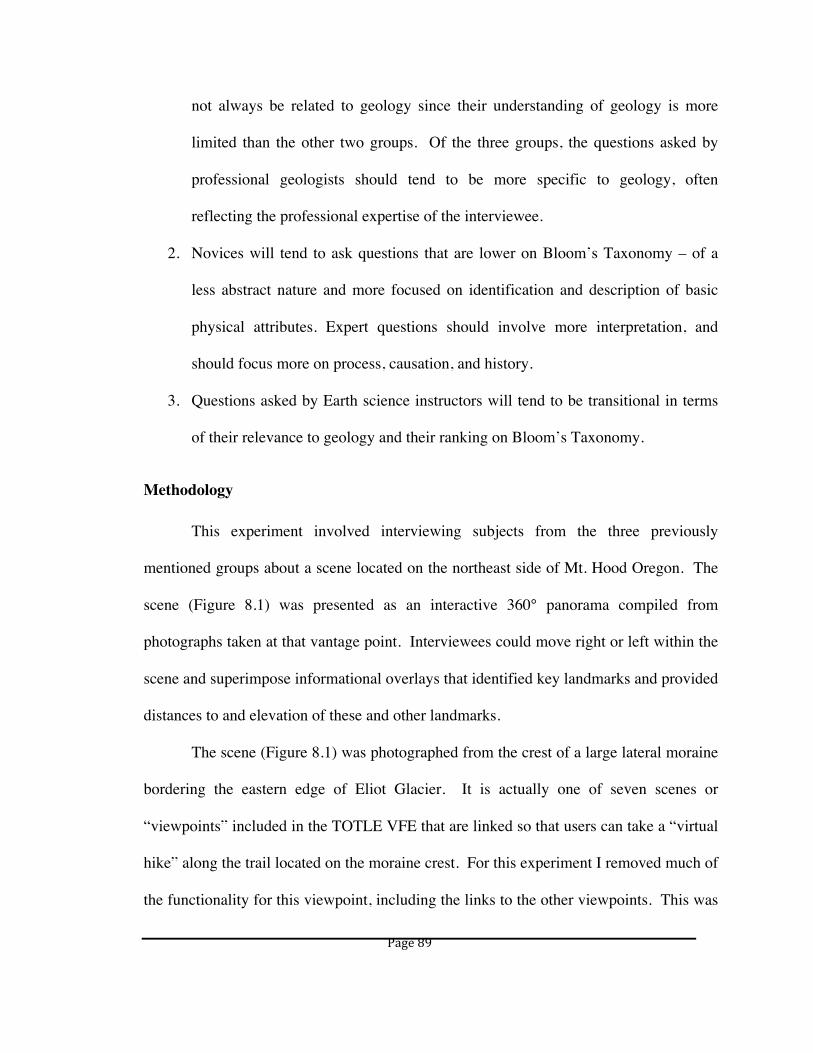
Page 89
not always be related to geology since their understanding of geology is more
limited than the other two groups. Of the three groups, the questions asked by
professional geologists should tend to be more specific to geology, often
reflecting the professional expertise of the interviewee.
2. Novices will tend to ask questions that are lower on Bloom’s Taxonomy – of a
less abstract nature and more focused on identification and description of basic
physical attributes. Expert questions should involve more interpretation, and
should focus more on process, causation, and history.
3. Questions asked by Earth science instructors will tend to be transitional in terms
of their relevance to geology and their ranking on Bloom’s Taxonomy.
Methodology
This experiment involved interviewing subjects from the three previously
mentioned groups about a scene located on the northeast side of Mt. Hood Oregon. The
scene (Figure 8.1) was presented as an interactive 360° panorama compiled from
photographs taken at that vantage point. Interviewees could move right or left within the
scene and superimpose informational overlays that identified key landmarks and provided
distances to and elevation of these and other landmarks.
The scene (Figure 8.1) was photographed from the crest of a large lateral moraine
bordering the eastern edge of Eliot Glacier. It is actually one of seven scenes or
“viewpoints” included in the TOTLE VFE that are linked so that users can take a “virtual
hike” along the trail located on the moraine crest. For this experiment I removed much of
the functionality for this viewpoint, including the links to the other viewpoints. This was
Page 90
done to remove distractions from the experiment such as interpretations provided by
scene overlays and program navigational features that were extraneous to the
experimental tasks. Geologic background for this area is provided in the teacher guide
contained in the CD accompanying this dissertation. The location is listed as viewpoint 6
on Eliot Glacier. The entire panorama and a scene from the panorama are shown in
Figure 8.1. The lower image shows the panorama, as the viewer would see it. Central to
this scene is the glacial valley bordered by two prominent lateral moraines. The glacier is
visible further up valley, occupying a cirque below the summit of the mountain. An
icefall and lateral moraine mark a transition between the largely debris-free upper reaches
of the glacier and a debris-covered ablation zone (Jackson and Fountain, 2007). The
view moving right from the northwest to the east is largely of the Cascade Range.
Several volcanic features (e.g. Mt. Adams) and a large north-south trending river valley
(Hood River Valley) are prominently visible in the distance.
Page 91
| | | |
(E) (S) (W) (N)
Figure 8. 1 - Scene from the digital panorama used in this experiment
The image at the top of the figure is the full 360° panorama with principle cardinal points marked
below it. The image below is a screen shot of one of the frames of the digital panorama as the
user sees it. The controls for this panorama have been reduced to pan-right and pan-left keys
(green arrows), overlays for measuring elevations and distances and identifying features, and a
simple help file providing the user with navigational assistance.
Page 92
For this experiment the interviewees were divided into three groups (novices,
experts, and teachers) on the basis of results from a participant background survey
(Appendix A – Form 9). Novices were defined as undergraduates having two or less
geology courses and no formal training in scientific fieldwork. Experts were defined as
instructors or working geologists, have at least a master’s degree in geology or a related
science, and experience doing scientific fieldwork as part of research or employment.
The final group consists of grade 6-12 teachers who have some part of their teaching load
being Earth science. Subjects in the novice group were volunteers from Earth science
and chemistry courses at Portland Community College (PCC), Portland State University
(PSU), and University of British Columbia (UBC). Subjects in the expert group were
instructors from PCC, PSU, UBC, staff at Cascade Volcanic Observatory (Vancouver,
Washington) and USGS water resources division (Portland, Oregon), and participants in
the 2010 Geo2YC planning workshop in Fairfax Virginia. Participants from the final
group (grades 6-12) were instructors from Oregon and Washington middle schools and
high schools. In most cases these teachers were recruited from teacher workshops in
geology. In all cases interviewees were volunteers responding to a general invitation.
Consequently, the sample was a convenience rather than an intentionally designed
random sample.
Prior to each interview, the participant was asked to complete a background
survey assessing his or her background in geology, scientific fieldwork, and computer
use. The first two question categories in the survey were used to assign a grouping to
each participant (novice, expert, or 6-12 teacher). The last question category was used to
Page 93
assess each participant’s comfort with various computer applications. This information
was used to determine if and how using the virtual field site might have been complicated
by interviewee discomfort or unfamiliarity with basic computer technology.
At the beginning of each interview, each interviewee was introduced by the
interviewer to the scene and how to navigate through it. They were instructed to imagine
themselves standing at this location with a group of other people, all on a geology field
trip. They were finally instructed to look over the scene and select four features of
interest to them. Once they had selected the features of interest, they pointed out each to
the interviewer and were asked why they had selected each feature and asked for one
question that they had about that feature or a question that they might have about it for a
group of students. To insure that all the participants were asked the same three questions,
the interviewer read the questions to the interviewees from a printed script that was
clearly visible to both the interviewer and interviewee. During this latter part of the
interview, computer screen activity and audio was recorded using the program
Camtasia™ for later analysis. At this same time the interviewer recorded features, the
location of each feature within the scene (azimuth), the stated significance of each
feature, and question about it on a standardized report form (Appendix A – Form 11).
From this experiment two principle data clusters were produced. The first,
derived from the background survey, describes the subjects’ geologic background,
fieldwork experience, and computer experience. This consists primarily of responses to
multiple choice questions and rankings. The second cluster, derived from the interviews,
identifies what the participants found to be of interest in the given scene and the

Page 94
questions they had about it. This cluster consists of feature and question lists organized
by participant groupings, and frequency counts and rankings derived by coding narrative
responses from each interview.
The goal of analyzing the first data cluster was to establish subject groupings
based on background. From this analysis, each participant was placed in one of three
groups; novices, experts, and teachers. However, given overlapping roles (e.g. teacher
and professional geologists) and the variability of computer and field experience among
members of all three groups, some overlap did emerge between the latter expert and
teacher groups. To minimize this ambiguity, community college instructors and other
teaching geologists were classified as experts, while the teacher designation was reserved
for grades 6-12 teachers. In the last portion of the survey, interviewees were asked to
identify how frequently they performed various tasks with a computer. These tasks
include using a computer to access the internet, send and receive email, write reports with
a word processor, use a spreadsheet program for calculation and graphing, create graphics
and multi-media presentations, use geospatial viewers, and write computer programs. To
establish frequency each participant ranked their use for doing each task on a 0 to 4
rating, 0 being never and 4 being daily. The principle reason for analyzing computer
usage was to ascertain where technological discomfort might influence interview results.
The first step in analyzing the second data cluster was to list the features selected
by the participants and determine the frequency that each was selected. Listing was done
for the entire sample pool, as well as each of the participant groups. Once lists had been
constructed for each group, the frequency that each feature was selected was determined
Page 95
and then normalized by dividing the frequency by the total number of features selected by
each group. For instance, of the 180 feature selections made by novices, Eliot Glacier
was selected 45 times giving it a normalized frequency of 26.8%.
The next step in analyzing the second data cluster was to list the questions asked
about each feature by the interviewees. Lists were constructed for groups only. The
questions in each list were then categorized according to three schemas; topical /
operational characteristics, cognitive skills, and cognitive type. A definition of these
schemas begins in the following paragraph. To minimize investigator bias in this part of
the analysis, two graduate students in psychology conducted the principle coding for two
of the three categories (cognitive skills and type). Their rankings were then reconciled8
to produce common skill and type rankings for all three groups.
Both the coders were given the following schemas to use in coding each question.
Topical / operational characteristics
These are the basic science concepts and/or activities involved in the question. These
categories were designed to be generic enough that they could be applied to non-
geoscience questions (e.g. questions about vegetation or cloud formations). This list was
8 To reconcile the coders’ rankings I defaulted to the lower rank in the event of a disagreement. This was
deemed an acceptable strategy because between 83% and 98.2% of the ranking pairs in the six data clusters
either matched or had a difference of 1. kappa statistic for these clusters varied from 0.42 to 0.71. Because
these statistics for topical / operational characteristics rankings were significantly lower (0.07 to 0.47) I
took a more interactive approach in which I compared the rankings done by the coders to rankings I had
completed prior to examining their coding worksheets. In the event of disagreement I reconciled the
rankings based on my own professional judgment as a geologist and geosicence educator. This was
deemed necessary since neither of the coders had a significant background in geoscience, and both
expressed uncertainty about judging the topical/operational character of the questions.
Page 96
extrapolated from various themes discussed in introductory undergraduate geology
textbooks (Reynolds et al. 2008, Smith and Pun, 2010).
• Identification – The question is about what a feature is, what its name is, or why it
is named what it is.
• Orientation – The question is about the size, location, distance, or elevation of a
feature.
• External form – The question involves the visible form of the feature.
• Internal structure – The question involves the architecture of the feature that is not
visible.
• Composition – The question is about what a feature is made of.
• Classification – The question is about what class or group a feature belongs to.
• Comparison - The question involves comparing one feature to another feature.
• Dynamics – The question is about how a feature operates.
• Process – The question is about the physical processes that have shaped a feature.
• History – The question is about when a feature was formed or when the processes
that shaped it occurred.
• Technique – The question is about how information about a feature is derived.
• Other – Questions that fail to fit into any of the previous categories.
Cognitive outcomes:
In this instance questions were coded according to Anderson and Krathwohl’s
taxonomy of cognitive outcomes (2001). This meant tagging each question with one or
more of the skills listed in the Anderson /Krathwohl hierarchy. The numbers and the
Page 97
corresponding outcomes are as follows and are listed from lower to higher order thinking
skills.
1. Remembering (knowledge) - Retrieving, recalling, or recognizing knowledge
from memory. Remembering is when memory is used to produce definitions,
lists, or facts, or recite or retrieve materials.
2. Understanding (comprehension) – Constructing meaning from written or
graphic messages. Understanding involves interpreting, exemplifying,
classifying, summarizing, inferring, comparing, or explaining these messages.
3. Applying (application) – Using abstraction, rules, principles and other
information in concrete situations.
4. Analyzing (analysis) – Breaking down material into its constituent parts,
determining how these parts relate to each other or to an overall structure or
purpose.
5. Evaluating (evaluation) – Making judgments based on criteria and standards
through checking and critiquing.
6. Creating (synthesis) – Combining elements, pieces, or parts to form a whole
or produce a new pattern or structure.
Note – The Anderson / Krathwohl taxonomy is a revision of Bloom’s taxonomy
(Bloom, 1956). The label that Bloom used for each level appears in parenthesis, and
levels 5 and 6 are reversed in Bloom’s scheme.
Cognitive type:
Page 98
This classification scheme is based on a conceptual framework is used by guided
inquiry curriculum projects to design activities for science education. Since one of the
goals of this investigation is to provide information used to design guided inquiry
activities to accompany the VFE, it seemed appropriate to analyze the questions
interviewees asked about the scene from this framework. In general each of these
question types are defined as follows:
• A directed question points to obvious, immediate information about the feature.
• A convergent question has a unique answer, but requires people to synthesize
information about relationships to develop new concepts or reach deeper
conceptual understanding.
• A divergent question is open-ended and does not have a unique answer.
Divergent questions require people to generalize and consider the relevance or
applicability of concepts.
The purpose of coding these questions was to compare the type of questions asked
by each group. To accomplish this, the normalized frequency that each type of question
was asked by each group was determined using raw frequency counts and the total
number of distinct questions asked by each group. The notion of distinct questions arose
because some participants asked more than one question about a single feature or asked
questions that were compound questions. These multiple and compound questions were
separated into single questions to produce discrete or distinct questions. The statistical
significance of between-group differences in normalized frequencies was determined

Page 99
using a chi-squared test of raw frequencies. The success of each test was based on a
probability of 0.05.
Results
Participant background
For this experiment, 85 geoscientists, teachers, and students were interviewed.
Based on results of a background survey (Figures 8.2, 8.3, 8.4, and 8.5) 46 of these
participants were classified as novices, 23 as experts, and 17 as teachers. Two groups,
teachers and experts, had considerable overlap since 69.5% of the geologists who were
interviewed taught undergraduates and/or graduates. To clarify this distinction, teachers
with an advanced degree in geology, professional field experience, and who taught
community college or university geology were considered experts.
For the novice group, the most significant percentage had no background in
geology (35.6%) or only one or two geology courses during college (44.4%). The
remainder (22.2%) reported having had some Earth science in middle or high school, or
were amateurs with no formal background. Likewise, 42.2% of this group had only
informal field experience. The second largest percentage (31.1%) responded that they
had had some introductory experience as part of a college course. The remainder
(28.9%) reported having no field experience. No one in this group claimed to have done
any professional fieldwork.
By contrast, all of the participants in the expert group possessed at least a master’s
degree in geology or a related field, and all but one had done fieldwork as part of a
research project or for a company. Of this group 69.5% are currently teaching

Page 100
undergraduate and/or graduate courses. The remainder of this group were research
geologists. With n = 23, 8.7% of this group are structural geologists, 21.7% are
engineering, environmental, or hydro-geologists, 39.1% are geophysics, 8.7% have an
expertise in geochemistry, mineralogy, or petrology, 17.4% identified themselves as
volcanologists, and 26.1% claimed other fields of expertise9. None of this group claimed
an expertise in stratigraphy, paleontology, or economic geology. Several of the
respondents claimed two or more areas of expertise.
The third group, grade 6-12 Earth science teachers, showed the widest range in
academic background. For an n = 17, 43.8% had one or two geology courses in college.
The next largest subgroup (23.5%) had a geology or Earth science course in middle or
high school. While one of the participants (5.9%) had an undergraduate degree in
geology, the remaining two subgroups had no geology (11.8%) or claimed to be amateur
geologists with no formal experience. Given that both of these latter subgroups taught
Earth science, it would be reasonable to combine them since the individuals in both
subgroups developed their geologic knowledge informally. In terms of fieldwork
experience, all the members of the teacher group reported having some field experience.
The majority (64.7%) identified this experience as field trips and other introductory work
in college course. The remaining 29.4% identified this experience as informal, and one
individual stated that he/she had done professional fieldwork.
Finally, with regards to computer usage, nearly all of the participants in all three
groups reported regular use of web browsers and mail programs. Average ranking is 9 The percentages listed here add up to greater than 100% since several of the expert participants had
multiple areas of expertise.

Page 101
between 3.98 and 4.00 for the former, and 3.84 and 4.00 for the latter. A 4.00 signifies
daily use. Writing computer programs received the lowest ranking, between 0.40 and
1.45. A 0.00 signifies never, 1.00 once or twice during their life, and 2.00 once or twice
a year. Of the three groups, the expert group had significantly higher average rankings in
terms performing calculations or producing graphs with a spreadsheet and writing
computer programs (Figure 8.4). The average ranking for geospatial viewer use is higher
among experts (3.18) than it is for teachers (2.41) and novices (2.18). This same trend
appears in the rankings for developing multimedia presentations. The average expert
ranking for this activity is 3.00, while the average for teachers is 2.71, and 1.67 for
novices. All three groups were similar with regard to using word processors for writing
some type of document.
Figure 8. 2 - Academic background in geology
This figure summarizes the interviewees’ academic background in geology by group. A tabular form of
these data appears in Table B2.1 (Appendix B).

Page 102
Figure 8. 3 – Experience with scientific fieldwork
This figure summarizes the interviewees’ experience doing scientific fieldwork by group. A tabular form
of these data appears in Table B2.1 (Appendix B).
Figure 8. 4 - Interviewees' teaching experience
This figure summarizes the interviewees’ teaching experience by group. A tabular form of these data
appears in Table B2.1 (Appendix B).

Page 103
Figure 8. 5 - Interviewees' computer usage
This figure summarizes interviewee response to the questions “How often do you use a computer to
do the following?” Interviewees ranked each use on a scale from 0 to 4, 0 being never and 4 being
daily. A tabular form of these data appears in Table B2.1 (Appendix B).
Feature identification
In total, the 85 participants in these interviews made 323 feature selections.
Based on commonalities identified during analysis, these selections involve 29 distinct
features. Because several of these features are aspects of larger features (e.g. crevassing
in Eliot Glacier) this number was reduced to 18. A list of these 18 features and the
frequency that each group selected them appear in Figure 8.1.

Page 104
The frequency with which each feature was identified was highly similar for all
three groups (Figure 8.6). Chi-squared tests performed assuming ρ = 0.05, showed no
significant difference in selection. For all the groups, Eliot Glacier (g) being the most
frequently selected feature in the panorama (Figure 8.2). The percentage of each group
selecting the glacier is 25.3% (experts), 20.9% (teachers), and 26.8% (novices). The next
most popular features were nearby ridges, Cooper Spur (e) and the western lateral
moraine (i). Teachers and novices tended to select Cooper Spur more frequently than the
western moraine (i), while experts tended to focus more on the western moraine.
Features having the lowest frequency included several sky features (contrails, clear sky,
and clouds), a large rockslide (d) in a stream valley, and various hills and ridges between
5 and 20 kilometers from the viewpoint location. Some features selected with a
significantly higher frequency include several structural and volcanic features in the near
and distant background. Most notable of these is Mt. Adams (l), a large stratovolcano
approximately 90 km from Mt. Hood. The selection frequency for all three groups
ranked fourth in the list of 18 features. All three groups selected Languille Crags (h), a
remnant of lava flow from Mt. Hood, with a lower frequency, while all but the expert
group selected Butcher Knife Ridge (k) with a still lower frequency. The frequencies for
Butcher Knife Ridge are 10.4% for teachers and 4.8% for novices.

Page 105
(a) (b) (c) (d) (e) (f) (g) (h) (i) (j) (k) (l)
| | | |
(E) (S) (W) (N)
Figure 8. 6 - Feature location
The 360° panorama for the target location with selected features marked on it. Marked features include (a)
Hood River Valley and the Columbia River Gorge, (b) Survey Ridge, (c) Shell Rock Mountain, (d) Hwy 35
Rock Slide, (e) Cooper Spur, (f) Mt. Hood summit, (g) Eliot Glacier, (h) Languille Crags, (i) West
Moraines, and (j) contrails. (k) Butcher Knife Ridge, and (l) Mt. Adams and Mt. Defiance.

Page 106
Figure 8. 7 - Feature selection by group
This figure is a bar graph showing the frequency that the three groups selected each of 18 features.
The frequency for each feature (shown at the top of the graph) is the percentage of the total selections
for each group that it was selected.
Page 107
Questions about the selected features
Figures 8.8, 8.9, and 8.10 summarize the coding of the questions asked by the
interviewees. The specific questions that were asked are listed in tables B2.2, B2.3, and
B2.4 in appendix B. These questions are summarized in terms of their topical /
operational character (Figure 8.8), cognitive outcomes (Figure 8.9), and cognitive type
(Figure 8.10).
Based on the data summarized in Figure 8.8 and Table B2.5 (appendix B), three
basic trends were observable in regards to the topical / operational character of the
questions asked by the interviewees. These are as follows:
1) The questions asked most frequently if at all (%dq > 13) involved process (novices
36.6%, teachers 34.9%, experts 30.0%), orientation (novices 14.6%, teachers 19.8%,
experts 13.3%), and identification (novices 15.1%, teachers 15.1%, experts 16.7%).
2) The questions asked least frequently (%dq < 2) involved technique (novices 0.5%,
teachers 0.0%), internal structure (teachers 1.2%), comparison (teachers 1.2%) and
dynamics (teachers 1.2%, experts 0.0%).
3) At ρ = 0.05 no statistically significant differences were observed between the groups.
Based on the data summarized in Figure 8.9 and Table B2.6 (appendix B), three
basic trends were observable with regard to the cognitive outcome of the questions asked
by the interviewees. These are as follows:

Page 108
1) The questions asked most frequently (%dq > 25) called for remembering (novices
61.5%, teachers 61.6%, and experts 42.5%) and understanding (novices 33.2%,
teachers 29.1%, and experts 40.8%).
2) The questions asked least frequently (%dq < 2) called for analysis (novices 0.5%, and
experts 1.7%) evaluation (novices 0.0%, and teachers 0.0%), and creation (0% for all
three groups
3) At ρ = 0.05 no statistically significant differences were observed between the groups.
Based on the data summarized in Figure 8.10 and Table B2.7 (appendix B), three
basic trends were observable with regard to the cognitive type of the questions asked by
the interviewees. These are as follows:
1) Directed questions were the most frequently asked (rank = 1) type of questions by all
three groups (novices 64.4%, teachers 66.3%, and experts 50.8%).
2) Divergent questions were the least frequently asked (rank = 3) questions by all three
groups (novices 2.4%, teachers 0.0%, and experts 3.3%).
3) At ρ = 0.05 no statistically significant differences were observed between the groups.

Page 109
Figure 8. 8 - Interviewee questions classified by topical operational characteristics
Percentage of distinct questions asked by each group classified by the 13 topical operational categories.
The number of participants in each group are novices (45), teachers (17), and experts (23), while the
number of distinct questions asks by each are novices (205), teachers (17), and experts (120).

Page 110
Figure 8. 9 - Interviewee questions classified by cognitive outcome
Percentage of distinct questions asked by each group classified by the 6 cognitive outcome categories. The
number of participants in each group are novices (45), teachers (17), and experts (23), while the number of
distinct questions asks by each are novices (205), teachers (17), and experts (120).
Figure 8. 10 - Interviewee questions classified by cognitive type
Percentage of distinct questions asked by each group classified by the 3 cognitive type categories. The
number of participants in each group are novices (45), teachers (17), and experts (23), while the number of
distinct questions asks by each are novices (205), teachers (17), and experts (120).

Page 111
Discussion
This experiment was designed to identify cognitive differences between novices,
teachers, and experts that could be used to guide the development of the VFE and inquiry
activities associated with it. These included differences in the features selected from a
virtual field scene, as well as the questions the interviewees asked about these features.
Comparison of the frequencies of selection (Figure 8.8) revealed no significant difference
between the groups in the frequency of the features selected. In terms of how the types of
questions asked by each of these groups compare, I revisit the three hypotheses outlined
at the beginning of this chapter.
Hypothesis #1:
Given the situational context of being on a geology field trip, the questions asked
by novices will tend to be more generalized. In other words, their questions will not
always be related to geology since their understanding of geology is more limited than
the other two groups. Of the three groups, the questions asked by professional geologists
should tend to be more specific to geology, often reflecting the professional expertise of
the interviewee.
Though the data (Figure 8.8) suggest novices asked questions about external form
more frequently than teachers did, and experts asked questions involving technique more
frequently than novices or teachers, no significant difference was found in the topical /
operational character of the questions asked by each group. In the one category that
would shed light on this hypothesis, “Other”, no significant difference was found
between any of the groups. These trends reveal that novice questions were no more

Page 112
generalized than the other two groups. Furthermore, the low percentage of questions
asked by each group that were classified as “Other” reveals that all three groups tended to
ask questions that were specific to geology. Because the professional expertise of the
geoscientists interviewed was exceptionally wide-ranging and the size of this group was
small, no attempt was made to link questions with professional expertise.
Hypothesis #2:
Novices will tend to ask questions that are lower on Bloom’s Taxonomy. In other words,
novice questions should tend to be less abstract and more focused on identification and
description of basic physical attributes, while expert questions should involve more
interpretation and focus more on process, causation, and history.
Based on an inter-group comparison of the cognitive outcome of the questions
(Figure 8.9), teachers and experts asked questions calling for analysis more frequently
than novices did, while experts asked questions calling for evaluation more frequently
than novices did. Furthermore, novices asked directed questions more frequently than
experts did, while experts asked proportionally more divergent questions. Though these
trends appear to support the hypothesis, the observed differences were not statistically
significant.
Hypothesis #3:
Questions asked by Earth science instructors will tend to be transitional in terms of their
relevance to geology and their ranking on Bloom’s Taxonomy.
There is little direct evidence to support this hypothesis. While both teachers and
experts asked questions calling for analysis more frequently than novices, the same was
Page 113
not true for evaluation or application. Furthermore, there was no statistically significant
difference between the rate at which teachers ask questions involving analysis and the
rate at which experts did. Finally, this analysis was complicated by the result that there
was no significant difference between the rate at which experts asked questions calling
for recall and the rate at which novices asked this type of question.
Implications of these results for VFE design and geocognition
A principle goal of this feature identification / question experiment was to derive
guidelines that could be used in the design of future VFEs and instructional activities
involving them. In terms of VFE design, the feature selection aspect of this experiment
was intended to help devise guidelines for completing the fieldwork phase of VFE
construction. These guidelines involve the selection of areas of concentrated
photography (areas of interest) within panoramic scenes (viewpoints), as well as the
selection of viewpoints within a field site. This part of the experiment was also intended
to help devise guidelines for assembling interpretative overlays and points of interest.
Both the feature identification and question selection portions of the experiment were
designed to devise guidelines for developing questions for guided inquiry activities
involving the VFE.
Though the small sample size of this experiment and the major discrepancies
between the sizes of the groups makes it difficult to produce any meaningful
generalizations from the results, it did generate several significant insights that are
useable for future VFE and VFE activity design. Chief among these are the following:
Page 114
• The feature selection portion of this experiment produced a profile of features of
interest for a single scene based on a significant number of individuals. What is
needed to make this kind of experiment more useful for VFE development is to
correlate key visual characteristics (e.g. its spatial prominence in the scene, its shape,
its color and contrast, etc.) of individual characteristics with the frequency that it was
selected. What is also needed is to repeat this experiment using a variety of scenes.
The fact that this experiment was conducted using a single scene may have had
significant influence on the outcome of the cross-group comparison of feature
selection.
• Together with the features selected, the types of questions asked by the interviewees
provided some unexpected insights into the perspectives users are given on features
and how non-visual information impacts their perception. In several instances,
interviewees asked questions about features that indicated that they misidentified
features. For instance, in one case, interviewees identified a dark area on a cliff face
as cave, when it was in fact a shadow. In another instance, they asked why the rocks
close “at their feet” were so much larger than the material on an adjacent ridge, when
in fact the material at both locations were the same size. In the first case, the fact that
the user was limited to a single two-dimensional representation of the cliff face may
have had impact on his/her perspective. Quite likely the issue was the same in the
second instance. Both problems might have been overcome if the user had been able
to view a feature from at least one other perspective. This possibility indicates that a
repeat of this experiment could include multiple viewpoints containing the same

Page 115
features, to determine how having multiple views impacts the frequency with which
users make these same misidentifications.
Another major goal of this experiment was to examine what novices perceive in
selected field situations versus what experts perceive. While the use of virtual reality to
assess these differences is unique, there are several related studies that involve geologic
novices and experts in actual field settings (Choi, 2010; Petcovic et al., 2009; Riggs,
2009; Turner et al., 2009; Manduca et al., 2008). Two of these studies (Choi, 2010;
Riggs, 2009) involved outfitting geology students and geologists with eye tracking
goggles to create visual/auditory records of what they focused their attention on during
field site discussions. Other work (Callahan et al., 2009; Petcovic et al., 2009; Riggs,
2009) involved tracking students’ and geologists’ movements during a field mapping
exercise. Additional related research is that of Wiebe and Anneta (2007). In this work,
the investigators used eye tracking to assess how narration impacted the visual attention
of students viewing several different types of graphic media. Their research provides
considerable insight into how eye tracking could be adapted to viewing digital
panoramas, to compare novice and expert perception of those scenes.

Page 116
In terms of the findings of the feature identification / questions experiment,
principle issues impacting the outcome of the experiment include the character of the
expert group, and the nature and scope of the tasks given to the interviewees.
Character of the expert group
While all the members of the expert group have a graduate degree in geology or a
related field and experience with professional fieldwork, this group was heavily
populated with teaching geoscientists. Since many of these instructors frequently work
with novices, they have considerable experience asking geologic questions in ways that
are understandable to that population. So this may have influenced how they posed
questions about the features they selected. To test this idea, a useful follow-up
experiment would be to conduct the same interviews with a group of research
geoscientists having little or no teaching experience, and compare their questions to those
of the other experts, as well as the teachers and novices.
Nature of the interview tasks
The character of the expert group is particularly significant given one of the
interview tasks. In this experiment all of the interviewees were specifically asked “What
is one question you have about this feature or a question that you would pose to student?”
Since the latter half of this instruction gives the interviewee the alternative of posing their
questions in a way that is understandable to a novice, there is a strong possibility that
many of the experts and teachers posed their questions as a novice would, thus artificially
Page 117
closing the gap between their questions and the questions the novices asked. A more
accurate assessment of the cognitive level of the three groups would have been to limit
the task to identifying “What is one question you have about this feature”.
Scope of the interview tasks
In research similar to the feature identification / questions experiment, Manduca et
al. (2008) compared how undergraduates in introductory geology courses divided
landscapes into general categories with how geologists completed the same task. They
concluded that the two groups divided landscapes into similar common categories (e.g.
lakes, mountains, and dunes). They did, however, hypothesize that only geoscientists
would further subdivide them into geologically significant categories. This raises the
question of whether the interview task in my design experiment went sufficiently far
enough to discern where expert perception diverged from novice perception. The
indication from the post-survey results and the work of Manduca et al. (2008) is that it
did not, in that their hypothesis points to additional factors to be examined.
Some of these additional factors can be seen in the work of Riggs (2009) and
Petcovic et al. (2009). In both instances the researchers analyzed GPS track logs from
students and geologists during field mapping exercises to determine how the quality of
fieldwork products (e.g. geologic maps and field notes) corresponded with various types
of travel patterns. What they found is that more efficient travel within a field area
resulted in more accurate and detailed maps. They qualified this by saying that more
efficient travel did not necessarily mean speedy and direct movement through a field

Page 118
area, and that travel patterns tended to vary with the complexity of the field area. The
primary implication of their work is that while experts and novices may notice the same
features in a field setting and ask similar questions about them, how they answer those
questions should be significantly different. Consequently, an extension of the design
experiment would be to include two additional questions in the interviews. These being;
“What would you look for in this scene to address your question?” and “What would you
do with this information?”
Finally, the techniques discussed in these studies have several implications for
VFE design, as well as for geocognition research. In substance, the eye tracking studies
(Choi, 2010; Riggs, 2009) are similar to the design experiment in that the key question is
what attracts novice and expert attention. One of the principle advantages of eye-tracking
experiments is that they can generate an extensive and candid record of student and
expert activity in the field. Among the principle challenges of these experiments is the
current expense of eye-tracking equipment and the logistical difficulties of field trips.
Consequently, well-crafted virtual field environments that are deliverable over the
Internet could provide a cost-effective means of conducting such experiments with larger
sample sizes. By contrast, the results of field movement tracking experiments could
prove valuable in the design of virtual field sites. Currently, technological limitations
(e.g. limited memory space and the time required to do necessary photography) restrict
the detail of virtual field sites. However, even as these limitations are overcome, the
results of field movement experiments indicate that it may be preferable to limit the detail
of a virtual site to reduce the perceptual / cognitive overload novices often experience in

Page 119
field situations. In either case, such experiments could be used to produce blueprints for
virtual field sites that could help bridge expert and novice geocognition. Based on such
blueprints, virtual field sites could be designed that encourage students to develop
increasingly more effective data gathering strategies.

Page 120
Chapter 9 – Conclusions
The work described in this dissertation is a research and development project that
was part of a teacher education program (TOTLE) that took place between 2008 and
2010. The development portion of the project involved creating a virtual reality tool for
geoscience education. The research portion entailed investigating geocognitive and
procedural issues relevant to designing and using this tool. The major conclusions of
this research are as follows:
1) A significant percentage of the TOTLE 2009 workshop participants reported finding
the VFE useful for helping orient them to field sites that they would be visiting. They
found it most useful in overcoming geographic novelty (e.g. knowing where they
were going and the geography of the site). However, they found it less useful in
dealing with several other geocognitive tasks (e.g. discerning patterns in outcrops,
linking ground-level geology to larger regional geologic processes).
2) The VFE had little impact on classroom practice, in the sense that even when
provided with the virtual environment in a readily accessible form, a majority of the
workshop participants did not use the environment in their classrooms. A majority of
those reporting that they did not use it stated that lack of time and curriculum miss-
match were limiting factors. Informal discussions with workshop participants and
other TOTLE staff indicated that other significant limiting factors included the
technology infrastructure and policies of the individual schools and school districts,
the incomplete nature of the prototypes available to the 2008 and 2009 participants,

Page 121
and various other technical difficulties. Some of these difficulties were alluded to in
the responses to the 2009 workshop follow-up survey. Teachers who did use the VFE
reported that they used it either for presentation, as a substitute for a field trip, or with
laboratory activities that they had designed or adapted. Of those that reported using
the VFE with their students, a significant majority ranked the experience high in
terms of student engagement and interest.
3) The scene feature experiment (described in chapter 8) revealed no significant
differences in the types and frequency of the features selected by the three groups,
novice, expert, and teacher. Likewise, no significant differences were found between
the groups in the frequency of the types of questions they asked about these features.
Questions were classified according to topical operational characteristics, cognitive
outcome, and cognitive type. These results and work done by others in expert/novice
geocognition (Petcovic et al., 2009; Riggs, 2009; Turner et al., 2009; Manduca et al.,
2008) indicate that the experiment was insufficient to discern any significant
geocognitive differences between the groups.
4) A significant byproduct of the scene feature experiment is the insight into how
novices process visual information in virtual reality scenes, specifically in terms of
the importance of visual cues and multiple viewpoints in determining the size and
shape of distant features.
5) Another outcome of the feature scene feature experiment is that it provides an
example of how geocognitive research can be integrated into the development of an

Page 122
educational virtual field environment, and alternately how these environments can be
used to investigate geocognitive issues having to do with field education.
6) The model for VFE development and research outlined in this dissertation had the
advantage of evolving with the teacher education program in which it was imbedded,
and giving the participants direct experience with an educational research project.
This model, however, presented challenges that impacted both the project itself and
the program of which it was a part. Developing and evaluating other models of VFE
development and teacher education are needed to find the balance between these
advantages and challenges.

Page 123
Chapter 10 – Future Work
Expansion of the TOTLE VFE project
With the completion of the third and final year of TOTLE, a major question is
“What is next?” This is a question relevant to both TOTLE and continued development
of the VFE. Given that the VFE is readily available from the program web site, it can be
used to present some of the program field experience to a much wider group of educators
than the 130 teachers who participated in the program. A logical next step will be to
determine how frequently the VFE is used and for what purpose. This could be
accomplished by periodically surveying principle users (participants in the TOTLE
summer workshops), or by implementing a continuous, on-line feedback mechanism via
the program website. Some of these data will be gathered during the final post workshop
survey in Spring 2011.
In terms of continued development of the TOTLE VFE, the TOTLE staff and
others have discussed three major possibilities. These are as follows:
1) Refining and/or expanding the virtual environment - In conversations with various
personnel in natural resource agencies, it is apparent that the virtual environment
has significant utility for public education. Likewise, in talking with other
undergraduate geoscience educators, an expanded version of the environment
could help with providing more of an “on-the-ground” sense of regional geology,
especially in cases where factors such as diminishing school budgets, time

Page 124
constraints, long distances, and physical disabilities limit student participation in
field experiences.
2) Creating additional instructional activities to accompany the environment - As
mentioned earlier in this dissertation, the TOTLE VFE was constructed as an
exploratory educational environment rather than a digital narrative. This means
that it is primarily designed for inquiry-based / constructivist learning, rather than
direct instruction. To support this goal, a series of guided inquiry activities are
included in the teacher’s manual described in appendix C. These activities are
question sets focusing on individual scenes within the VFE. Each set seeks to
move students from observation to interpretation, thus guiding them through the
same type of data gathering and problem-solving that they might engage in during
actual fieldwork. These activities, however, are few in number and preliminary.
To increase the utility of the current VFE, additional activities should be
developed and the existing activities evaluated with the use of demonstrated
guided inquiry techniques.
A major effort in guided inquiry instruction is POGIL (Process Oriented
Guided Inquiry Learning). POGIL is a pedagogical method devised to teach
process skills (such as collaboration, writing, and hypothesis formation) as well as
content using an inquiry-based approach. Though it was originally devised for
improving student performance in chemistry courses at Franklin and Marshall
College and the State University of New, Stony Brook, it has been expanded and
used in a number of other disciplines, most notably biology and physics. POGIL
Page 125
would provide a strong framework for developing and evaluating additional
activities to accompany the TOTLE VFE or similar environments, because of the
POGIL organization’s considerable experience developing guided inquiry
activities (Moog et al., 2009; Moog and Spencer, 2008; and Moog et al., 2006)
and their interest in expanding into the Earth sciences.
3) Using VFEs as platforms for conducting geocognitive research - One of the major
insights derived from this work is that the development of educational virtual
reality environments and research into novice and expert cognition and
metacognition in geoscience are symbiotic activities. The third experiment
presented in this dissertation is a clear example of this interdependence. Chapter
8 outlines an experiment using a scene from a virtual reality environment to
examine how feature selection and questioning differs between novices and
experts for the same field environment. One extension of this experiment would
be to repeat the same experiment with students from various cultural groups. This
approach could be particularly useful in looking at cultural differences between
geoscience novices, thus providing some insight into equity issues associated with
our national geoscience workforce (e.g. why are most geologists in the United
States Caucasians?).
Another unexplored line of inquiry is how using virtual reality
environments impacts student performance in accomplishing many of the
laboratory activities typical of introductory geoscience courses. For instance, in
introductory historical geology courses students are often given the task of
Page 126
identifying and interpreting stratigraphic sequences using line sketches, color
cartoons, and/or photographs. These are frequently presented with little or no
geographic context other than a location map. Furthermore, students are often
limited to a single two-dimensional view of the sequence in the form of a
photograph or highly simplified sketch of an outcrop. Virtual field environments,
by contrast, could overcome some of these limitations by providing a graduated
spatial context and multiple views of the same structure. This statement,
however, is a hypothesis and not a tested statement. One way to test this
hypothesis would be to conduct an experiment in which two student groups
interpret the same stratigraphic sequence. One group, the control group, would
use a line drawing and photograph of a stratigraphic sequence (e.g. a canyon wall)
and a topographic map of the area in which the sequence is found. The other
group, the experimental group, would use a VFE that shows the sequence from
multiple angles. To assess the impact of the different treatments, investigators
would evaluate and compare the interpretations produced by the students in both
groups, as well as compare responses to surveys that ask students to assess the
data they were given and identify data they felt were missing.
Additional VFE projects and alternative development strategies:
During both the 2008 and 2009 TOTLE summer workshops, a significant number
of participants expressed interest in having students build their own VFEs. In response to
this interest, I pursued two informal experiments in student-built VFEs during late spring
Page 127
and summer 2009. These projects were completed in conjunction with faculty from
Portland Community College and Portland State University. In both instances, the
principle questions being investigated were as follows:
1) Could students having minimal field experience successfully gather the
photographic and other data needed to construct a VFE?
2) When given the opportunity to design their own viewpoint, what points of interest
do students choose that is related to either biology or geology?
3) What is their reaction to the activity in terms of levels of engagement?
4) What is the reaction of the instructors in terms of their level of engagement and the
value of the activity?
May 2009:
In the first experiment, students and faculty in a field course offered through
Portland Community College built a VFE of a cove at Shore Acres State Park. This
course, G160/B160 – Geology/Biology of the Oregon coast, is a field experience course
for both majors and non-majors taught by both geology (Frank Granshaw) and biology
(Ed DeGrau) staff. The format for this experiment included a site/activity orientation
conducted the evening before the site visit. During this time, I used a previously
prepared framework for the VFE to introduce the students to the site and to the VFE that
they would be producing. During the visit, the students worked in teams at selected sites
to acquire the photography and other data needed to compile viewpoints. Following the
visit, I met with each team to incorporate their data into the VFE. Finally, during the
Page 128
concluding session of the course, students presented their viewpoint and area of interest
to their classmates. The product of this experiment can be seen at
< http://www.artemis-science.com/ShoreAcres_VFE/ShoreAcresBIG160.swf >
July 2009:
The second experiment involved students in a geology field course at
Yellowstone National Park. Students constructed a VFE for a system of hot springs in
the park’s Lower Geyser Basin. The course, G410/510 – Astrobiology in Yellowstone, is
a field course in geomicrobiology that is offered through Portland State and taught by
Sherry Cady and Rick Hugo (geology). In this project, field data collection took place
over three days and was considerably more focused than that which was done in the
previous experiment. Data collection was generally confined to photography of the hot
springs and the bacterial mats within it, physical conditions of the water, and mapping of
the springs. Though some sites were selected for instructor-specified data collection, at
the remainder of the sites, student groups were given considerable flexibility as to the
data that they would collect and the problems they would address with those data.
Because data collection took place over several days, students periodically met as a
whole class to discuss their data and data collection procedures. Like the previous
experiment, the follow-up to this data collection was to incorporate the student
photography into a pre-existing framework and make it available to the students via the
Internet. At this time this phase of the project is still in process, though a prototype can
be seen at:

Page 129
< http://www.artemis-science.com/YNP_VFE/YNP_LGB.swf >
These two experiments are regarded as informal, because no surveys or tests were
developed to collect data relevant to the four questions listed at the beginning of this
section. These experiments were pilot studies aimed at testing the feasibility of having
students build VFEs. Based on conversations with the students and other faculty, student
journals and papers, and the photography produced by the students, here are some
preliminary conclusions:
1) It is technically viable for students with little or no field experience and limited
photographic skills to collect photography and other data needed to construct a
VFE. This conclusion was based on the quality of the photography and data
collected by the students. Principle questions in this determination included “Did
they produce a viable 360° panorama and set of nested images?” and “What kinds
of non-photographic data did they collect, and how was it related to their
viewpoint?”
2) The VFE construction was an activity that a majority of the students found highly
engaging. This was gauged by students’ responses during debriefing with
individual teams, questions and comments they shared with me in the field, and
the types and detail of the data they collected.
3) The construction of the VFE provided a focus for fieldwork in that students could
produce a tangible product that would provide a virtual reality archive of the site.
In other words, the VFE that they helped produce is something that could be used
by other students in the same class or classes taught subsequent seasons/years.
Page 130
This conclusion is based on discussions with instructors and the high school
teachers who were enrolled in the course.
4) The response of the instructors of the class was highly positive. In both instances,
these experiments led to lengthy discussion about how to continue these
experiments with other classes. These conversations also included discussion of
how student-built VFEs could be used both for field trip orientations and
producing time-lapse records of research sites.

Page 131
References Cited
AAAS, 2006, Project 2061 Textbook Evaluations, America Association for the
Advancement of Science.
AAAS, 2008, The Nature of Science, Benchmarks On-line (Project 2061): Washington
D.C., AAAS.
Anderson, L. W., and Krathwohl, D. R., 2001, A Taxonomy for learning, teaching, and
assessing: A revision of Bloom's Taxonomy of educational objectives: New York,
Longman.
Becker, H. J., 1999, Internet Use by Teachers: Conditions of Professional Use and
Teacher-Directed Student Use: Center for Research on Information Technology
and Organizations The University of California, Irvine and The University of
Minnesota.
Beller, C., Giardino John, R., Gardner, P., Giardino Mary, F., and Vitek John, D., 1997,
Rocks, pic(k)s and jpegs; a virtual reality geology field trip on the Internet, in
Geological Society of America, 1997 annual meeting. Salt Lake City, UT, United
States. Oct.
Ben-Zvi, O., and Orion, N., 2005, Development of System Thinking Skills in the Context
of Earth System Education: Journal of Research in Science Teaching, v. 42, no. 5,
p. 518-560.

Page 132
Bice, D., 2006, STELLA modeling as a tool for understanding the dynamics of Earth
systems, in Manduca, C., and Mogk, D. W., eds., Earth and Mind: How
Geologists Think and Learn about the Earth: Boulder CO, Geological Society of
America, p. 171-185.
Bice, D. M., 2001, Using STELLA models to explore the dynamics of Earth systems;
experimenting with Earth's climate system using a simple computer model:
Journal of Geoscience Education, v. 49, no. 2, p. 170-181.
Biggs, J., 1999, Teaching ro Quality Learning at University: Buckingham, Open
University.
Bishop, G. A., Vance, R. K., Rich, F. J., Meyer, B. K., Davis, E. J., Hayes, R. H., and
Marsh, N. B., 2009, Evolution of geology field education for K-12 teachers from
field education for geology majors at Georgia Southern University: Historical and
Modern Perspective, in Whitmeyer, S. J., Mogk, D. W., and Pyle, E. J., eds., Field
Geology Education: Historical Perspectives and Modern Approaches: Boulder,
CO., Geological Society of America, p. 356.
Bloom, B. S., 1956, Taxonomy of Educational Objectives: New York, David McKay.
Boundy, T. M., and Condit, C., 2004, Bringing the Field into the Classroom by Using
Dynamic Digital Maps to Engage Undergraduate Students in Petrology Research:
Journal of Geoscience Education, v. 52, no. 4, p. 313-319.
Bowman, D. A., North, C., Chen, J., Polys, N. F., Pyla, P. S., and Umar, Y., 2003,
Information-Rich Virtual Environments: Theory, Tools, and Research Agenda, in

Page 133
Proceedings of the ACM symposium on Virtual reality software and technology
Osaka, Japan, p. 235.
Bransford, J. D., and Donovan, M. S., 2005, Scientific Inquiry and How People Learn, in
Bransford, J. D., and Donovan, M. S., eds., How Students Learn, Science in the
Classroom: Washington D.C., National Academies Press, p. 397-420.
Browne, J. D., 2005, LEARNING OUTCOMES OF VIRTUAL FIELD TRIPS USED
FOR GEOSCIENCE EDUCATION: San Diego State University, 43 p.
Butler, R., 2008, Teaching Geoscience through Fieldwork, GEES Learning and Teaching
Guide: Plymouth UK, The Higher Education Academy Subject Centre for
Geography, Earth, and Environmental Science, University of Plymouth, 56 p.
Callahan, C. N., Petcovic, H., Baker, K., M., and Libarkin, J., 2009, TRACKING
EXPERT AND NOVICE GEOCOGNITION DURING FIELD MAPPING,
Geological Society of America Annual Meeting: Portland, OR, Geological
Society of America.
Choi, C., 2010, Expert Education - A field study tries to see how expertise can be taught
to novices, Scientific American, Nature America.
Clegg, P., Trinks, I., McCaffery, K., Holdsworth, B., Jones, R., Hobbs, R., and Waggott,
S., 2005, Towards the Virtual Outcrop: Geoscientist, v. 15, no. 1, p. 8-9.
Compiani, M., and Carneiro, C. D. R., 1996, The Didactic Roles Played by Geological
Excursions, in Stow, D. A. V., and McCall, G. H. J., eds., Geoscience Education
and Training: in schools, University, for Industry and Public Awareness:
Rotterdam, A.A. Balkema.

Page 134
Compton, R. R., 1985, Geology in the Field: New York, Chichester, Brisbane, Toronto,
Singapore, John Wiles & Sons, 398 p.
Cook, V. A., Phillips, D., and Holden, J., 2006, Geography fieldwork in a ‘risk society’:
Area, v. 38, no. 4, p. 413-420.
Cuban, L., Kirkpatrick, H., and Peck, C., 2001, High Access and Low Use of
Technologies in High School Classrooms: Explaining an Apparent Paradox:
American Educational Research Journal, v. 38, no. 4, p. 813-834.
Dodick, J., and Orion, N., 2006, Building and understanding of geologic time: A
cognitive synthesis of the "macro" and "micro" scales of time, in Manduca, C.,
and Mogk, D. W., eds., Earth and Mind: How Geologists Think and Learn about
the Earth: Boulder CO, Geological Society of America, p. 77-93.
Dorn, G., Touysinhthiphonexay, K., Bradley, H., and Jamieson, A., 2001, Immersive 3-D
visualization applied to drilling planning: The Leading Edge, v. 20, no. 12, p.
1389-1392.
Duggan-Haas, D., 2010, Personal communication
Earthscope, 2009, Earthscope, http://www.earthscope.org, last accessed 12/14/2010.
Eberlein, T., Kampmeier, J., Minderhout, V., Moog, R. S., Platt, T., Varma-‐Nelson, P.,
and White, H. B., 2008, Pedagogies of Engagement in Science -‐ A comparison
of PBL, POGIL, and PLTL: Biochemistry and Molecular Biology Education, v.
36, no. 4, p. 262-‐273.
EdGCM, 2010, EdGCM - Educational Global Climate Modeling, Columbia University.

Page 135
Falk, J. H., Martin, W. W., and Balling, J. D., 1978, The novel field-trip phenomenon:
Adjustment novel settings interferes with task learning: Journal of Research in
Science Teaching, v. 15, p. 127-134.
Fisher, J. A., 2001, The demise of fieldwork as an integral part of science education in
United Kingdom schools: a victim of cultural change and political pressure? :
Padgogy, Culture, and Society, v. 9, no. 1, p. 75-96.
Gilbert, J. K., Boulter, C. J., and Elmer, R., 2000, Positioning models in science
education and in design and technology education, in Gilbert, J. K., and Boulter,
C. J., eds., Developing models in science education: Netherlands, Kluwer
Academic Publishing, p. 3-17.
Gonzales, L., Keane, C., and Martinez, C., 2009, Status of Geoscience Workforce 2009,
American Geological Institute, p. 136.
Granshaw, F. D., 2007, A Virtual Field Environment - Walcott Quarry, Yoho National
Park, British Columbia: Portland, OR., Artemis Science.
Granshaw, F. D., 2008, GeoCycle: Portland, OR., Artemis Science.
Haigh, M. J., 1986, The evaluation of an experiment in physical geology teaching:
Journal of Geography in Higher Education, v. 10, p. 133-147.
Hatch, K., Scott, and Leggitt, V. L., 1998, Quicktime virtual reality (QTVR); an aid to
teaching geologic mapping, in Geological Society of America, 1998 annual
meeting. Toronto, ON, Canada. Oct.
Hawley, D., 1997, Being There: A Short Review of Field-Based Teaching and Learning,
in UK Geoscience Fieldwork Symposium.

Page 136
Head, J. W., van Dam, A., Fulcomer, S. G., Forsberg, A., Prabhat, Rosser, G., and
Milkovich, 2005, Adviser: Immersive Scientific Visualization Applied to Mars
Research and Exploration: Photogrammetric Engineering and Remote Sensing, v.
71, no. 10, p. 1219-1225.
Herbert, B. E., 2006, Student understanding of complex Earth systems, in Manduca, C.,
and Mogk, D. W., eds., Earth and Mind: How Geologists Think and Understand
about the Earth: Boulder CO, Geological Society of America, p. 95-104.
Hoblitt, R. P., Walder, J. S., Driedger, C. L., Scott, K. M., Pringle, P. T., and Vallance, J.
W., 1998, Volcano Hazards from Mount Rainier, Washington, Revised 1998:
Open-File Report 98-428: U.S. Geological Survey.
Jackson, K. M., and Fountain, A. G., 2007, Spatial and morphological change on Eliot
Glacier, Mount Hood, Oregon, USA: Annals of Glaciology, v. 46, no. 1, p. 222-
226.
Jern, M., 1997, Visual User Interface - A Third Generation GUI Paradigm, in Earnshaw,
R., Vince, J., and Jones, H., eds., Visualization and Modeling: San Diego,
London, Boston, New Yor, Sydney, Tokyo, and Toronto, p. 439-459.
Johnson, A., Leigh, J., Morin, P., and Van Keken, P., 2007, The GeoWall: Low-cost
Stereoscopic Visualization for Geoscience Research and Education.
Kastens, K. A., 1995, Earth science as a vehicle for illuminating the boundary between
the known and the unknown: Journal of Geological Education, v. 43, no. 2, p.
138-140.
Page 137
Kastens, K. A., Agrawal, S., and Liben, L. S., 2009, How Students and Field Geologists
Reason in Integrating Spatial Observations from Outcrops to Visualize a 3-D
Geological Structure International Journal of Science Education, v. 31, no. 3, p.
365-393.
Kastens, K. A., and Ishikawa, T., 2006, Spatial thinking in the geosciences and cognitive
sciences: A cross-disciplinary look at the intersection of the two fields., in
Manduca, C., and Mogk, D. W., eds., Earth and Mind: How Geologists Think and
Learn about the Earth: Boulder CO, Geological Society of America, p. 53-76.
Kelly, M. M., and Riggs, N. R., 2006, Use of a Virtual Environment in the Geowall to
Increase Student Confidence and Performance During Field Mapping: An
Example from an Introductory-Level Field Class Journal of Geoscience
Education, v. 54, no. 2, p. 158-164.
Kent, M., Gilbertson, D. D., and Hunt, C. O., 1997, Fieldwork in Geography Teaching: A
critical review of the literature and approaches: Journal of Geography in Higher
Education, v. 21, p. 313-332.
Kern, E. L., and Carpenter, J. R., 1986, Effect of field activities on student learning:
Journal of Geoloq, v. 34, p. 180-183.
Kerridge, A., Kizil, M., and Howarth, D., 2003, Use of virtual reality in mining
education, in AusIMM young leaders' conference. Brisbane, Queensl., Australia.
King, H. L., Clark, S., Libarkin, J., and Stokes, A., 2008, The Emerging Field of
Geocognition, Geological Society of America National Conference: Houston
Texas, Geological Society of America.
Page 138
Kitts, K., Perry, E., Leal-Bautista, R. M., and Velazquez-Oliman, G., 2009, Geological
field experiences in Mexico: An effective and efficient model for enabiling
middle and high school science teachers to connect with their burgeoning
Hispanic populations, in Whitmeyer, S. J., Mogk, D. W., and Pyle, E. J., eds.,
Field Geology Education: Historical Perspectives and Modern Approaches:
Boulder, CO., Geological Society of America, p. 356.
Kluge, S., 2009, Encounter Earth: Interactive Geoscience Explorations: Upper Saddle
River, NJ, Pearson Prentice Hall, 64 p.
Kozma, R., and Russell, J., 2005, Students Becoming Chemists: Developing
Representational Competence, in Gilbert, J. K., ed., Visualization in Science
Education: Dordrecht, the Netherlands, Springer, p. 121-145.
Ledley, T., Domenico, B., Taber, M., and Dahlman, L., 2008a, AccessData workshops, in
Data, A., ed., SERC.
Ledley, T., Domenico, B., Taber, M., and Dahlman, L., 2008b, Using Data in the
Classroom workshop 2008, in Data, A., ed., SERC.
Lee, M., Wolf, L., Hardesty, K., Beasley, L., Smith, J., Adams, L., Stone, K., and Block,
D., 2009, Water education (Wet) for Alabama's black belt: A hands-on field
experience for middle school students and teachers, in Whitmeyer, S. J., Mogk, D.
W., and Pyle, E. J., eds., Field Geology Education: Historical Perspectives and
Modern Approaches: Boulder, CO., Geological Society of America, p. 356.
Page 139
Li, S.-G., and Liu, Q., 2003, Interactive Groundwater (IGW): An innovative digital
laboratory for groundwater education and research: Computer Applications in
Engineering Education, v. 11, no. 4, p. 179-202.
Lonergan, N., and Andresen, L. W., 1988, Field-based Education: Some Theoretical
Considerations: Higher Education Research and Development, v. 7, no. 1, p. 63-
77.
Manduca, C., Gentner, D., Holden, M. P., Ormand, C. H., Jee, B., Sageman, B. B.,
Shipley, T. F., Tikoff, B., and Uttal, D. H., 2008, Geoscience Perception: Expert
and Novice Experience of Graphs, Outcrops, and Landscapes, Joint Meeting of
The Geological Society of America, Soil Science Society of America, American
Society of Agronomy, Crop Science Society of America, Gulf Coast Association
of Geological Societies with the Gulf Coast Section of SEPM: Houston, TX.
Manduca, C., and Mogk, D. W., 2006, Earth and Mind: How Geologists Think and Learn
about the Earth: Boulder CO, Geologic Society of America, p. 188.
Margolis, H., and McCabe, P., 2006, Improving Self-Efficacy and Motivation: What to
Do, What to Say: Intervention in School and Clinic, v. 41, no. 4, p. 218-227.
McElroy, B., 1981, Models and reality: Integrating practical work and fieldwork in
geography, The Geography Teacher's Guide to the Classroom, p. 95-103.
MGDS, 2010, Virtual Ocean, Marine Geoscience Data System - Lamont Doherty Earth
Observatory - Columbia University.
Page 140
Minstrell, J., and Kraus, P., 2005, Guided Inquiry in the Classroom, in Bransford, J. D.,
and Donovan, M. S., eds., How Students Learn: Science in the Classroom:
Washington D.C., National Academies Press, p. 475-514.
Moog, R. S., Creegan, F. J., Hanson, D. M., Spencer, J. N., and Straumanis, A., 2006,
Process-Oriented Guided Inquiry Learning: POGIL and the POGIL Projecty:
Metropolitan Universities Journal, v. 17, p. 41-45.
Moog, R. S., Creegan, F. J., Hanson, D. M., Spencer, J. N., Straumanis, A., Bunce, D.
M., and Wolfskill, T., 2009, POGI: Process-Oriented Guided-Inquiry Learning, in
Pienta, N. J., Cooper, M. M., and Greenbowe, T. J., eds., Chemists' Guide to
Effective Teaching: Upper Saddle River NJ, Prentice Hall, p. 90-107.
Moog, R. S., and Spencer, J. N., 2008, Process-Oriented Guided Inquiry Learning: ACS
Symposium Series 994: Washington D.C., American Chemical Society.
Moore, G., 2001, A Cost-Benefit Analysis of Marine Fieldwork, in Proceedings:
Developing and sharing best practice in marine-related fieldwork, p. 2-8.
NASA, 2010, World Wind, National Aeronautics and Space Administration.
Nix, R. K., 1999, A Critical Evaluation of Science-Related Virtual Field Trips Available
on the World Wide Web, Curtin University of Technology.
Nix, R.K., 2002, Virtual Field Trips: Using Information Technology to Create as
Integrated Science Learning Environment: Curtin University of Technology.
NRC, 2000, Educating Teachers of Science, Mathematics, and Technology: New
Practices for the New Millennium, Committee on Science and Mathematics
Teacher Preparation, National Research Council.
Page 141
NSTA, 2003, Standards for Teacher Preparation: National Science Teachers Association.
Nundy, S., 2001, Raising Achievement through the Environment: The Case for
Fieldwork and Field Centres: National Association of Field Studies Officiers.
Orion, N., 1989, Development of a high-school geology course based on field trips:
Journal of Geological Education, v. 37, no. 1, p. 13-17.
Orion, N., 1993, A Model for the Development and Implementation of Field Trips as an
Integral Part of the Science Curriculum: School Science and Mathematics, v. 93,
no. 6, p. 325-331.
Orion, N., and Hofstein, A., 1991, Measurment of Students' Attitudes Towards Scientific
Field Trips.: Science Education, v. 75, no. 5, p. 513-523.
Pacific Research and Evaluation, 2009, Teachers on the Leading Edge: Winter 2009 -
Teacher Follow Up Survey Report.
Pacific Research and Evaluation, 2010, Teachers on the Leading Edge: April 2010 -
Teacher Follow Up Survey Report.
Petcovic, H., Libarkin, J., Hambrick, D. Z., Baker, K., M., Callahan, C. N., Rench, T. A.,
Turner, S. P., and Wisnikewski, M. K., 2009, GEOLOGY EXPERTISE:
EVIDENCE FROM FIELD AND LABORATORY GEOCOGNITION
RESEARCH, Geological Society of America Annual Meeting: Portland, OR,
Geological Society of America.
Peterson, C. D., Darienzo, M. E., Burns, S. F., and Burris, W. K., 1993, Field trip guide
to Cascadia paleoseismic evidence along the northern Oregon coast: Evidence of

Page 142
subduction zone seismicity in the central Cascadia margin: Oregon Geology, v.
55, no. 5, p. 99-114.
Petovic, H. L., Libarkin, J. C., and Baker, K. M., 2009, An Empirical Methodology for
Investigating Geocognition in the Field: Journal of Geoscience Education, v. 57,
no. 4, p. 316-328.
Piburn, M. D., Reynolds, S. J., Leedy, D. E., McAuliffe, C. M., Birk, J. P., and Johnson,
J. K., 2002, The Hidden Earth: Visualization of Geologic Features and their
Subsurface Geometry.
NSF/Johnson Foundation Workshop: Bringing Research on Learning to the Geosciences:
Wingspread conference center, Racine Wisconsin.
Pimentel, K., and Teixeira, K., 1993, Virtual Reality, Through the New Looking Glass:
New York, TAB Books - McGraw-Hill, Inc., 301 p.
PRI, 2010, Why does the Earth look the way it does?, Paleontological Research Institute,
http://www.virtualfieldwork.org/Welcome.html, date of last access 5 March 2011
Prothero, W. A., Jr., 1995, Using technology to tame the large oceanography class:
Journal of Geological Education, v. 43, no. 5, p. 497-506.
Pyle, E. J., 2008, A Model of Inquiry for Teaching Earth Science: Electronic Journal of
Science Education, v. 12, no. 2, p. 3-‐21.
Quinn, J., 2009, CEAIL Report on Fieldwork: Queen's University, Belfast - Centre for
Excellence in Active and Interactive Learning.
Rapp, D. N., and Uttal, D. H., 2006, Understanding and enhancing visualizations: Two
models of collaboration between Earth science and cognitive science, in
Page 143
Manduca, C., and Mogk, D. W., eds., Earth and Mind: How Geologists Think and
Learn about the Earth: Boulder CO, Geological Society of America, p. 121-127.
Rasmussen, B., Helland, R., and Finnstrom, E., 2000, Virtual reality in exploration and
production, in Geoluanda 2000. Luanda, Angola.
Reynolds, S.J., Johnson, J.K., Kelly, M.M., Morin, P.J., Carter, C.M., 2008, Exploring
Geology, 590 p.
Rickinson, M., Dillon, J., Tearney, K., Morris, M., Choi, M. Y., Sander, D., and
Benefield, P., 2004, A review of research on outdoor learning: National
Foundation for Educational Research and King's College London.
Riggs, E. M., 2009, Assessing Learning Outcomes in Field Geology Instruction, GSA
Annual Meeting: Portland, OR.
Robinson, J., E., and Richers, D., M., 1992, Geological applications of computerized
virtual reality, in American Association of Petroleum Geologists, 1992 annual
convention. Calgary, AB, Canada.
Rosenblum, L. J., and Cross, R. A., 1997, The Challenge of Virtual Reality, in Earnshaw,
R., Vince, J., and Jones, H., eds., Visualization and Modeling: San Diego,
London, Boston, New York, Sydney, Tokyo,Toronto, Academic Press.
Scott, W. E., Pierson, T. C., Schilling, S. P., Costa, J. E., Gardner, C. A., Vallance, J. W.,
and Major, J. J., 1997, Volcanic Hazards in the Mt. Hood Region, Oregon; Open-
File Report 97-89: U.S. Geological Survey.
SDSU, 2010, KML Geology, Using Google in Geology, Department of Geological
Science - San Diego State University.
Page 144
Selkin, P., 2006, Google Earth and Geoscience Education, Teaching Geoscience with
Visualizations: Using Images, Animations, and Models Effectively, Science
Education Resource Center.
Slator, B. M., Beckwith, R. T., Chaput, H., McClean, P., Saini-Eidukat, B., Vender, B.,
Brandt, L., Clark, J. T., Hill, C., Opgrande, J., Schwert, D. P., and White, A.,
2006, Electric Worlds in the Classroom, Technology, Education-Connections -
The TEC Series: New York and Londan, Teachers College, Columbia University,
182 p.
Smith, D., 2004, Issues and trends in higher education biology fieldwork: Journal of
Biological Education, v. 39, no. 1, p. 6-10.
Smith, G.A., Pun, A., 2010, How Does the Earth Work?, Prentice Hall, 600 p.
St. John, K., 2010, Editorial: Uncertainty is Part of Inquiry: Journal of Geoscience
Education, v. 58, no. 2
St. John, K., Lecki, R. M., Slough, S., Peart, L., Niemitz, M., and Klaus, A., 2009, The
Integrated Ocean Drilling Program "School of Rock": Lesson learned from an
ocean-going research expedition for Earth and ocean science educators, in
Whitmeyer, S. J., Mogk, D. W., and Pyle, E. J., eds., Field Geology Education:
Historical Perspectives and Modern Approaches: Boulder, CO., Geological
Society of America, p. 356.
Stefanich, G. P., 2002, The Impact of Dissemination Workshops on Educator Attitudes
Toward Teaching Science to Students with Disabilities: Don't Discount Short
Page 145
Term Interventions?, in Jeffery, P. L., ed., International Education Research
Conference : Brisbane
Stoker, C., Blackmon, T., Hagan, J., Kanefsky, B., Neveu, C., Schwehr, K., Sims, M.,
and Zbinden, E., 1997, MarsMap; analyzing Pathfinder data using virtual reality,
in American Geophysical Union, 1997 fall meeting. San Francisco, CA, United
States. Dec.
Thomas, J. W., 2000, A REVIEW OF RESEARCH ON PROJECT-‐BASED LEARNING:
Autodesk Foundation.
Thompson, D. B., 1982, On discerning the purposes of Geological Fieldwork: Geology
Teaching, v. 7, no. 2, p. 59-65.
Thurmond, J., B., Drzewiecki, P., A., and Xu, X., 2005, Building simple multiscale
visualizations of outcrop geology using virtual reality modeling language
(VRML): Computers and Geosciences, v. 31, no. 7, p. 913-919.
Tretinjak, C., 2004, Enhancement of Preservice Teachers' Geological Content Knowledge
as a Result of Fieldwork: San Diego State University, 101 p.
Tretinjak, C., and Riggs, E., 2008, Enhancement of Geology Content Knowledge
Through Field-Based Instruction for Pre-Service Elementary Teachers: Journal of
Geoscience Education, v. 56, no. 5, p. 422-433.
Turner A, S., W., and Conchie, S., 2007, Fieldwork is good: the student perception and
the affective domain: Journal of Geography in Higher Education, v. 31, no. 2, p.
19.

Page 146
Turner, S. P., Libarkin, J., Hambrick, D. Z., and Petcovic, H., 2009, ANALYZING
GEOSCIENTIFIC EXPERTISE THROUGH NOVEL APPLICATION OF
COMMON TECHNOLOGIES, Geological Society of America Annual Meeting:
Portland, OR, Geological Society of America.
Young, R. M., and LaFollette, S., 2009, Assessing the Status of Environmental Education
in Illinois Elementary Schools: Environmental Health Insights, v. 3, p. 95-103.
Whitmeyer, S. J., Fichter, L., and Pyle, E. J., 2007, New directions in Wilson Cycle
concepts: Supercontinent and Tectonic Rock Cycles: Geosphere, v. 3, no. 6, p.
511-526.
Weidenmann, B., 1989, When good pictures fail: An infor- mation-processing approach
to the effect of illustra- tions, in Mandl, H., and Levin, J., eds., Knowledge
acquisition from text and pictures: Elsevier Science, p. 157–170.
Wiebe, E.N. and Annetta, L.A., 2007, Animation and Narration: Using Eye Tracking to
Understand Visual Attention Distribution. Presented at the Annual meeting of the
American Educational Research Association, Chicago, IL.,
www4.ncsu.edu/~wiebe/articles/AERA-PPTN2-2007.pdf, last accessed 5 March
2011
Wiecha, J. L., El Ayadi, A. M., Fuemmeler, B. F., Carter, J. E., Handler, S., Johnson, S.,
Strunk, N., Korzec-Ramirez, D., and Gortmaker, S. L., 2010, Diffusion of an
Integrated Health Education Program in an Urban School System: Planet Health:
Journal of Pediatric Psychology, v. 35, no. 10, p. 467-474.

Page 147
Wiley, D. A., and Humphreys, D. w., 1985, The geology field trip in Ninth Grade Earth
Science: Journal of Geologic Education, v. 33, p. 126-127.
Wilhelmson, R. B., Jewett, B. F., Shaw, C., Wicker, L. J., Arrot, M., Bushell, C., Bajuk,
M., Thingvold, J., and Yost, J. B., 1990, A Study of the Evolution of a
Numerically Modeled Severe Storm: International Journal of High Performance
Computing Applications, v. 24, no. 3, p. 16.
Wilkerson, M. S., Marshak, S., and Wilkerson, M. B., 2009, GeoTours Workbook to
accompany Essentials of Geology of Geology, Third Edition: New York, London,
W.W. Norton & Company.
Wong, F. L., Venturato, A. J., and Geist, E. L., 2006, Seaside, Oregon, Tsunami Pilot
Study—Modernization of FEMA Flood Hazard Maps: GIS Data: Menlo Park,
California, U.S. Geological Survey.
Wyesession, M., Taber, J., Budd, D., Cambell, K., Conklin, M., LaDue, N., Lewis, G.,
Reynolds, R., Ridky, R., Ross, R., Tewksbury, B., and Tuddenham, P., 2010,
Earth Science Literacy Principles: Earth Science Literacy Initiative.
Xu, X., and Aiken, C., 2000, Digital field mapping and the virtual outcrop at UTD, in
Geological Society of America, 2000 annual meeting. Reno, NV, United States.
Nov.
Xu, X., Aiken Carlos, L. V., and Nielsen Kent, C., 1999, Real time and the virtual
outcrop improve geological field mapping: Eos, Transactions, American
Geophysical Union, v. 80, no. 29, p. 317, 322, 323-324.
Page 148
Appendix A – Survey and test forms
Form 1 - TOTLE 2008, VFE prototype assessment - Breakout session activity
Form 2 – TOTLE 2008, VFE prototype assessment - Post-activity survey
Form 3 - Enhancement experiment – Consent form
Form 4 - Enhancement experiment – Pre-activity survey
Form 5 – Enhancement experiment – Copalis River field trip orientation activity
Form 6 - Enhancement experiment – Mt. Rainier field trip orientation activity
Form 7 – Enhancement – Post-activity survey
Form 8 – Design experiment – Consent form
Form 9 – Design experiment – Background survey
Form 10 – Design experiment – Interview script
Form 11 – Design experiment – Coding scheme

Page 149
Form 1 - TOTLE 2008, VFE prototype assessment - Breakout session activity
These questions were given to participant teams during summer workshop
breakout sessions dedicated to introducing the VFE prototype for 2008 (Chapter 5).
These questions were presented prior to a “free exploration” time during the session.
Near the end of these sessions the facilitator debriefed with the entire session and
recorded team responses to these questions.
1) How could you use this VFE with your students?
2) What would you add to it to make it more useful?
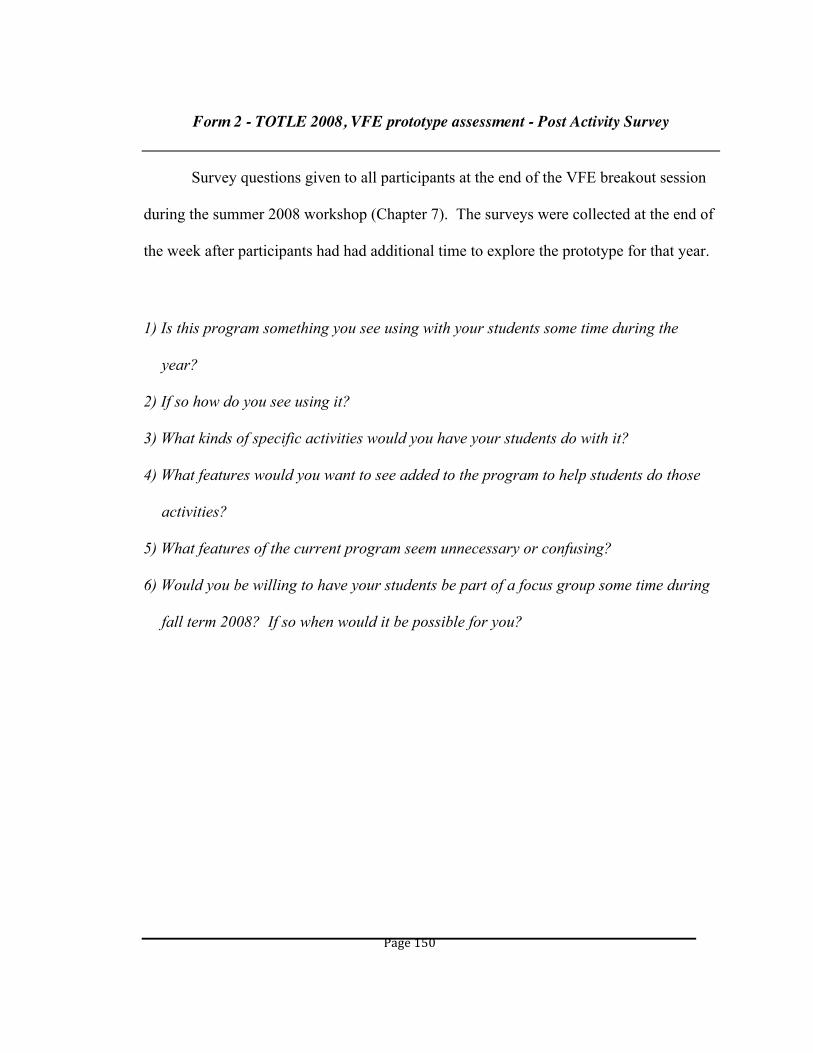
Page 150
Form 2 - TOTLE 2008, VFE prototype assessment - Post Activity Survey
Survey questions given to all participants at the end of the VFE breakout session
during the summer 2008 workshop (Chapter 7). The surveys were collected at the end of
the week after participants had had additional time to explore the prototype for that year.
1) Is this program something you see using with your students some time during the
year?
2) If so how do you see using it?
3) What kinds of specific activities would you have your students do with it?
4) What features would you want to see added to the program to help students do those
activities?
5) What features of the current program seem unnecessary or confusing?
6) Would you be willing to have your students be part of a focus group some time during
fall term 2008? If so when would it be possible for you?

Page 151
Form 3 – Enhancement experiment - Consent letter
The following is the letter of consent presented to the participants in the field trip
orientation experiment during TOTLE 2009
From: Frank D. Granshaw – TOTLE / Portland Community College
To: Prospective workshop participants TOTLE 2009 summer workshop
One of the learning tools that you will be receiving as part of your participation
in the TOTLE (Teachers on the Leading Edge) summer workshop is a CD containing a
virtual field environment (VFE) designed specifically for the program. A virtual field
environment is a digital representation of a real place designed to allow the user to
explore that place by freely moving around in it, taking samples, making measurements,
etc. As part of your participation in TOTLE you will be part of a study on the use of
these environments for enhancing field activities in teacher professional development in
geoscience. This research is part of my doctoral work and involves an experiment to be
conducted during the summer workshop, as well as a follow-up survey to be conducted
during following school year. The experiment will be accompanied by a brief pre- and
post-test, as well as a pre- and post-activity survey. My goal with the tests and the
Page 152
surveys is to evaluate the usefulness of the VFE. For that reason all your responses will
be anonymous and kept in confidence.
By signing this form you are consenting to be part of this study and giving your
permission for me to use your test scores and survey responses as data in this study.
_____________________________________________ ______________
Participant name Date

Page 153
Form 4 – Enhancement experiment - Pre-activity survey
The following is the background survey that was given to the participants in the
field trip orientation experiment conducted during the TOTLE 2009 summer workshop
(chapter 6).
Your ID# _____________
1. What is your background do you have in geology?
a. None
b. One or two courses during my college career.
c. I have an undergraduate degree in geology or a related science.
d. I have a graduate degree in geology or a related science.
2. What experience do you have doing scientific fieldwork?
a. None
b. Informal field experience like reading a map while hiking, collecting
rocks, or doing nature photography.
c. Introductory field work in college.
d. Professional fieldwork (e.g. for a company or as part of a thesis or
dissertation).

Page 154
3. How often do you use a computer to do the following? Rank each use from 0-4
0 = Never
1 = Once or twice in my life
2 = Once or twice a year
3 = Once or twice a month
4 = Daily
a. Use a web browser to access the Internet.
b. Use an email program to send and receive email.
c. Use a spreadsheet program to record grades or
do calculations.
d. Use a word processor to write lesson plans or
some other type of document
e. Teach students how to use spreadsheets and
word processors.
f. Develop multimedia presentations.
g. Teach students how to create multi-media
presentations.
h. Use Google Earth or some other type of
geospatial viewer.
0…1…2…3…4
0…1…2…3…4
0…1…2…3…4
0…1…2…3…4
0…1…2…3…4
0…1…2…3…4
0…1…2…3…4
0…1…2…3…4

Page 155
Forms 5 and 6
The participants in the TOTLE 2009 summer workshop completed the activities
described in forms 8 and 9 as part of their orientation for the field trips for that
workshop. During each orientation approximately half the participants used the VFE
prepared for that year to complete the activity relevant to that orientation (experimental
group), while the other half used only this photograph and the field guide provided to
them (control group). The purpose of each activity was to introduce the participants to
inquiry style field activities, as well as the structure and use of the VFE.

Page 156
Form 5 – Copalis River field trip orientation activity
Building Geologic Observation Skills
TOTLE 2009 - Copalis River field trip orientation activity
Photograph of a stream bank
along the Niawiakum River.
Each of the red and white
divisions on the shovel handle
is 10 cm long. Use this
photograph to answer the
following questions.
1) Look for layers with different colors and textures. Feel free to label the photograph
indicating your observations.
2) Where are the boundaries between layers? Mark major boundaries and other
features on the photograph.
3) Are there layers within layers? Mark any features of note on the photograph.

Page 157
Form 6 – Mt. Rainier field trip orientation activity
Mt. Rainier Lahar Deposits
TOTLE 2009 – Mt. Rainier field trip orientation activity
Photograph of a cliff side
along the White River near
Orting Washington. Use
this photograph to answer
the following questions.
1) What is the material – Texture and composition?
a. When you describe texture of sedimentary material, what are we describing?
(Hint: three S’s)
b. What can you say about the texture of the material in this photograph?
c. What additional information could we collect in the field to answer this question
(b) more effectively?
d. How would you determine composition using this photograph?

Page 158
e. What additional information could we collect in the field to answer this question
(d) more effectively?
2) Do you see changes vertically or laterally in texture and/or composition? Describe
them. (Use back of sheet as needed).

Page 159
Form 7 – Enhancement experiment - Post-activity survey
The following is the post-activity survey given to the participants in the field trip
orientation activity conducted during the 2009 TOTLE summer workshop.
Your ID# _______________
1. What type of orientation did you receive for the Mt. Rainier field trip?
f. The orientation that included the VFE.
g. The orientation that did not include VFE.
2. What type of orientation did you receive for the Copalis River field trip?
a. The orientation that included the VFE.
b. The orientation that did not include VFE.
3. Which type of orientation was the most helpful in terms of preparing you for the
fieldtrip?
a. The orientation that included the VFE.
b. The orientation that did not include VFE.
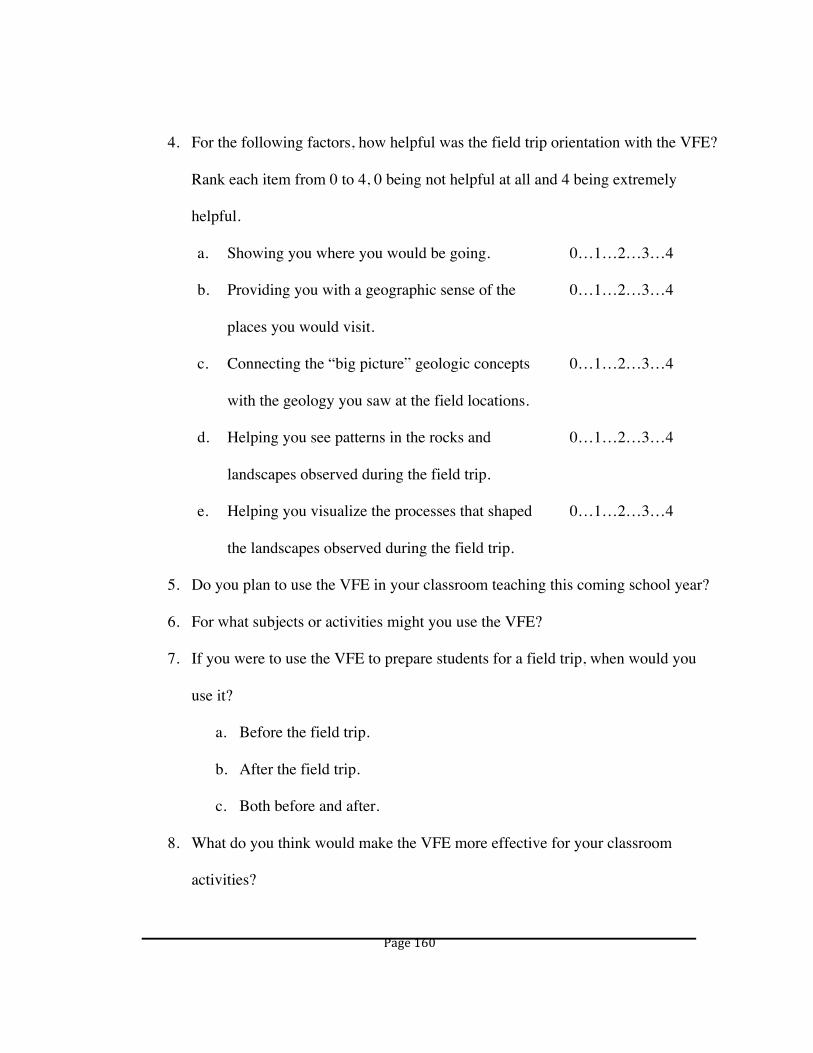
Page 160
4. For the following factors, how helpful was the field trip orientation with the VFE?
Rank each item from 0 to 4, 0 being not helpful at all and 4 being extremely
helpful.
a. Showing you where you would be going.
b. Providing you with a geographic sense of the
places you would visit.
c. Connecting the “big picture” geologic concepts
with the geology you saw at the field locations.
d. Helping you see patterns in the rocks and
landscapes observed during the field trip.
e. Helping you visualize the processes that shaped
the landscapes observed during the field trip.
0…1…2…3…4
0…1…2…3…4
0…1…2…3…4
0…1…2…3…4
0…1…2…3…4
5. Do you plan to use the VFE in your classroom teaching this coming school year?
6. For what subjects or activities might you use the VFE?
7. If you were to use the VFE to prepare students for a field trip, when would you
use it?
a. Before the field trip.
b. After the field trip.
c. Both before and after.
8. What do you think would make the VFE more effective for your classroom
activities?

Page 161
Form 8 – Design experiment - Consent form
This experiment is part of a project developing a virtual reality environment
(VRE) to support field geology education. The VRE being developed in this project is
used for field trip orientations in teacher workshops and for classroom use by Earth
science educators. Your participation in this experiment will be immensely valuable in
guiding the development of this tool and will contribute to research that will help
improve how Earth science is taught.
This experiment involves looking at a single scene or “viewpoint” from this VR
environment. The purpose of this experiment is to compare the kinds of observations and
questions professional geologists would make and ask in such a setting with the
observations and questions Earth science students (novices) and middle school teachers
would make and ask in the same setting. Understanding the difference between how
novices and experts think about what they see in the field is critical to improving Earth
science instruction. In the case of this experiment, the results from it will be used to
build activities involving the VRE.
The experiment is estimated to take approximately 45 minutes of your time and
will have two parts. Part one is a pre-activity survey designed to assess your geologic
background, your experience doing scientific fieldwork, and your experience using
computers. This part is a written survey that you will be asked to complete before
proceeding onto the next part of the experiment. Part two, the activity, asks you to
examine a single viewpoint from the VRE. At this point you will be asked to identify

Page 162
four features of interest to you in the scene. During a recorded interview you will be
asked several questions about why you selected those features and questions that you
might have about them. During this interview only our conversations and activities on a
computer screen will be recorded. No names will be used and you will not appear in the
video portion of the recording.
Since my intention is to publish the results of this experiment in my doctoral
dissertation and other professional publications, you will be asked to signify your
cooperation in this experiment by clicking on “I agree” in the consent form at the bottom
of this page. Please be assured that your identity will not be divulged in any of those
publications or associated presentations.
Frank D. Granshaw TOTLE virtual field environment developer
Earth Science Instructor – Portland Community College
Consent
I agree to be part of this experiment.
Your signature
Date

Page 163
Form 9 – Design experiment - Background survey
This form is the background survey given to each of the participants in the design
experiment described in Chapter 8.
Your ID number
The purpose of this survey is to determine your experience with geology, scientific
fieldwork, and computer usage. Whether you are a student, a teacher, or a professional
geologist please answer all eight questions before proceeding onto the experimental
activity.
1. Which are you? Check all that apply
a. An undergraduate student in an introductory geology course.
b. A graduate student in geology
c. A teacher
d. A professional geologist
e. A professional scientist other than a geologist
2. What background do you have in geology?
a. None
b. One or two classes in middle school or high school
c. I’m an amateur geologist with no formal background
d. One or two courses in college.
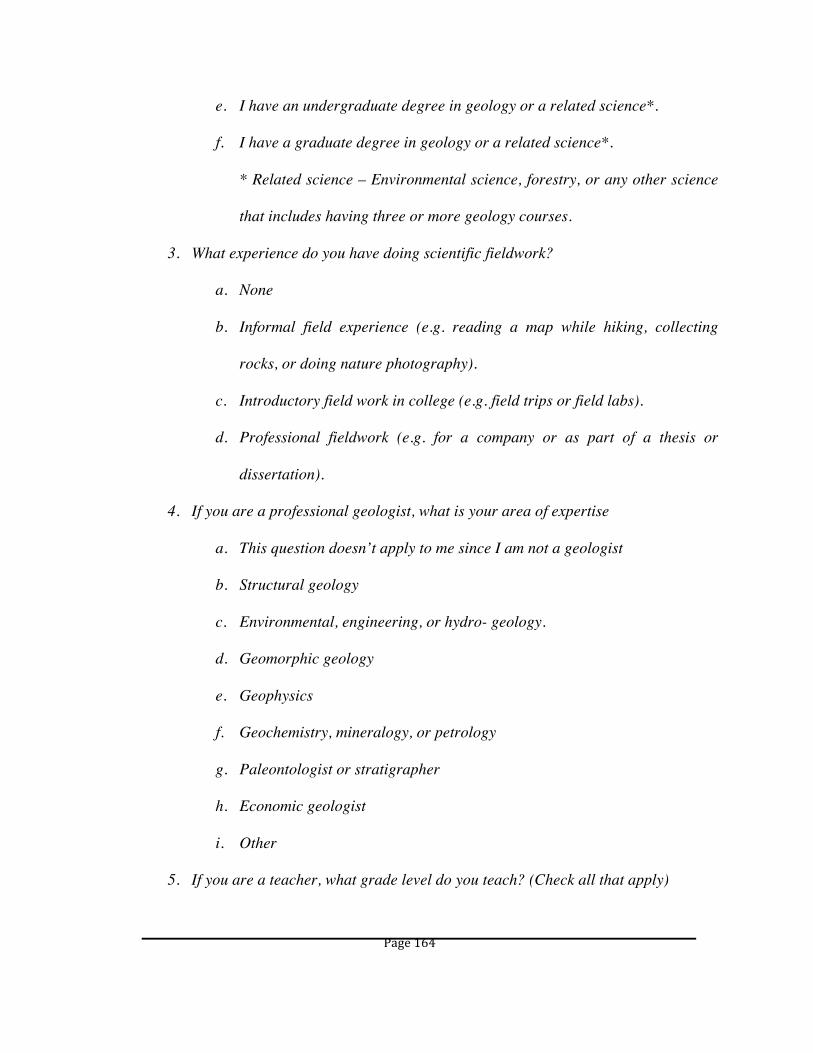
Page 164
e. I have an undergraduate degree in geology or a related science*.
f. I have a graduate degree in geology or a related science*.
* Related science – Environmental science, forestry, or any other science
that includes having three or more geology courses.
3. What experience do you have doing scientific fieldwork?
a. None
b. Informal field experience (e.g. reading a map while hiking, collecting
rocks, or doing nature photography).
c. Introductory field work in college (e.g. field trips or field labs).
d. Professional fieldwork (e.g. for a company or as part of a thesis or
dissertation).
4. If you are a professional geologist, what is your area of expertise
a. This question doesn’t apply to me since I am not a geologist
b. Structural geology
c. Environmental, engineering, or hydro- geology.
d. Geomorphic geology
e. Geophysics
f. Geochemistry, mineralogy, or petrology
g. Paleontologist or stratigrapher
h. Economic geologist
i. Other
5. If you are a teacher, what grade level do you teach? (Check all that apply)
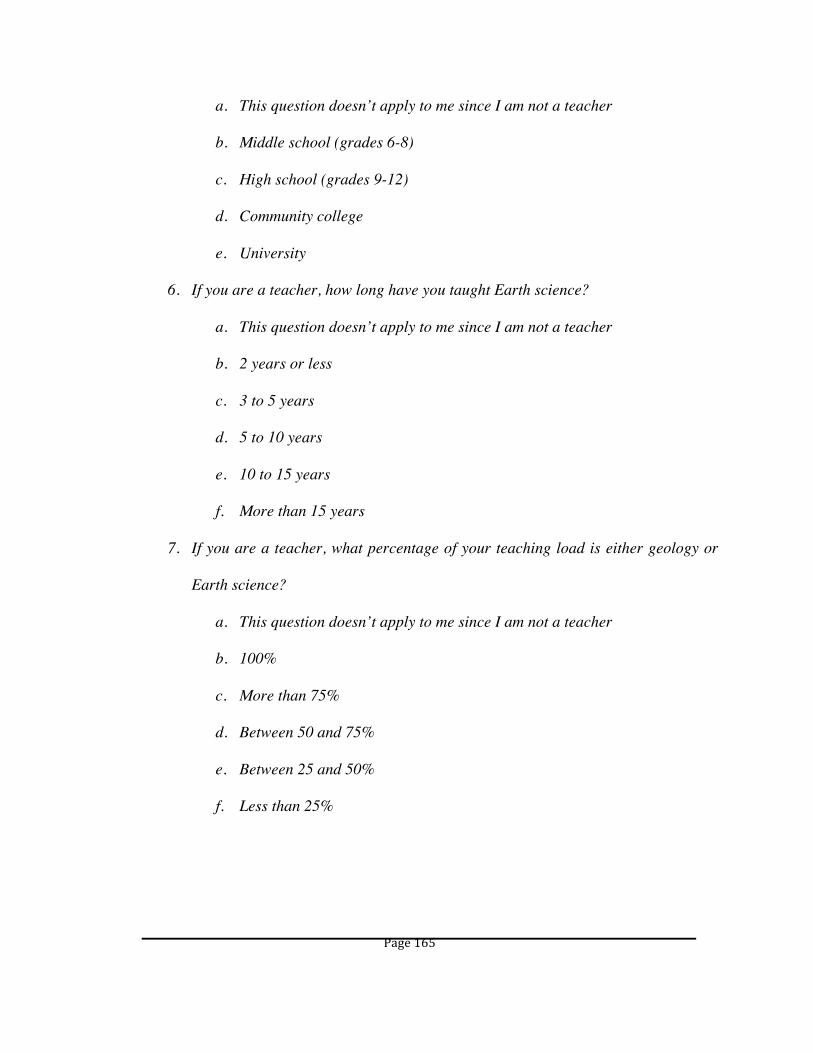
Page 165
a. This question doesn’t apply to me since I am not a teacher
b. Middle school (grades 6-8)
c. High school (grades 9-12)
d. Community college
e. University
6. If you are a teacher, how long have you taught Earth science?
a. This question doesn’t apply to me since I am not a teacher
b. 2 years or less
c. 3 to 5 years
d. 5 to 10 years
e. 10 to 15 years
f. More than 15 years
7. If you are a teacher, what percentage of your teaching load is either geology or
Earth science?
a. This question doesn’t apply to me since I am not a teacher
b. 100%
c. More than 75%
d. Between 50 and 75%
e. Between 25 and 50%
f. Less than 25%

Page 166
8. How often do you use a computer to do the following?
Rank each use from 0 to 4.
0 = Never
1 = Once or twice in my life
2 = Once or twice a year
3 = Once or twice a month
4 = Daily
a. Access the Internet.
b. Send and receive emails.
c. Do calculations with a spreadsheet program.
d. Produce graphs with a spreadsheet program.
e. Write reports or some other type of document
with a word processing program.
f. Use Google Earth or some other type of
geospatial viewer.
g. Develop multimedia presentations.
h. Write computer programs
0…1…2…3…4
0…1…2…3…4
0…1…2…3…4
0…1…2…3…4
0…1…2…3…4
0…1…2…3…4
0…1…2…3…4
0…1…2…3…4
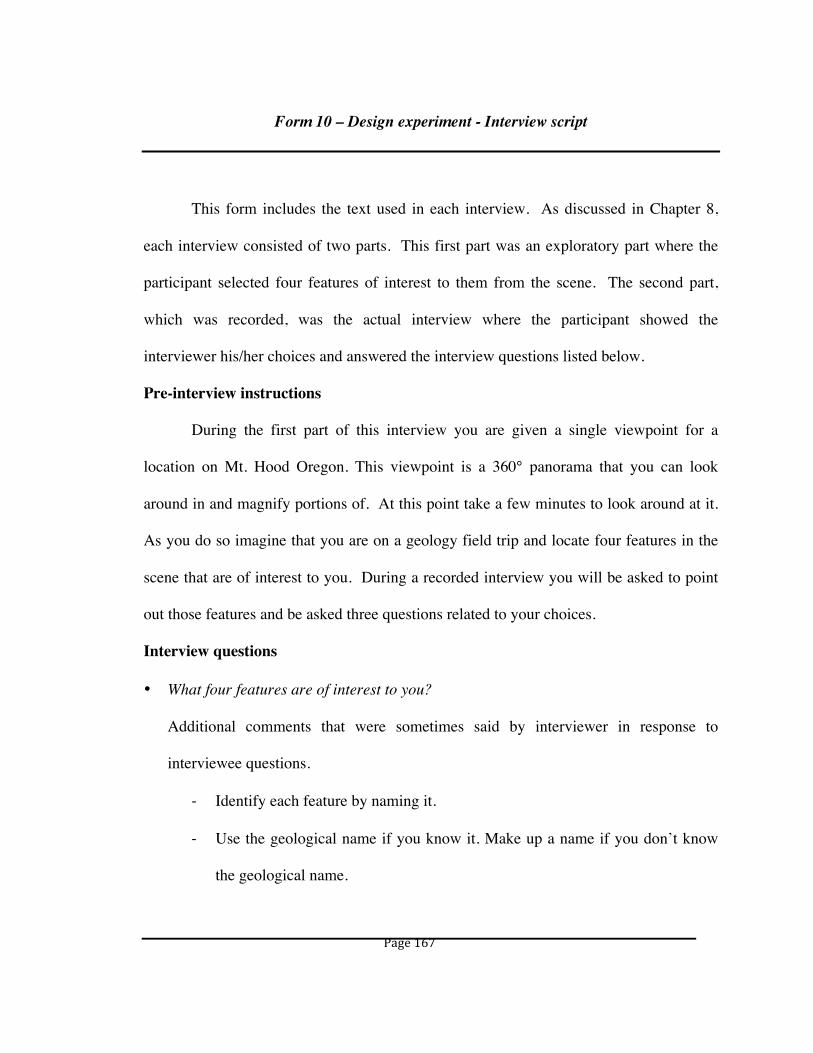
Page 167
Form 10 – Design experiment - Interview script
This form includes the text used in each interview. As discussed in Chapter 8,
each interview consisted of two parts. This first part was an exploratory part where the
participant selected four features of interest to them from the scene. The second part,
which was recorded, was the actual interview where the participant showed the
interviewer his/her choices and answered the interview questions listed below.
Pre-interview instructions
During the first part of this interview you are given a single viewpoint for a
location on Mt. Hood Oregon. This viewpoint is a 360° panorama that you can look
around in and magnify portions of. At this point take a few minutes to look around at it.
As you do so imagine that you are on a geology field trip and locate four features in the
scene that are of interest to you. During a recorded interview you will be asked to point
out those features and be asked three questions related to your choices.
Interview questions
• What four features are of interest to you?
Additional comments that were sometimes said by interviewer in response to
interviewee questions.
-‐ Identify each feature by naming it.
-‐ Use the geological name if you know it. Make up a name if you don’t know
the geological name.

Page 168
• Why is this feature is of interest to you? Do you think that there is anything
interesting behind, underneath, or inside the feature?
• What is one question you have about this feature or a question that you would pose to
student?

Page 169
Form 11 – Design experiment - Interview recording form
This form is part of a worksheet used by the interviewer to record interviewee
responses to the interview questions listed in the previous form.
Feature #
Description
Narrative
Azimuth
Significance
Narrative
Question
Narrative
Feature #
Description Narrative
Azimuth
Significance
Narrative
Question
Narrative
Page 170
Feature #
Description Narrative
Azimuth
Significance
Narrative
Question
Narrative
Feature #
Description
Narrative
Azimuth
Significance
Narrative
Question
Narrative

Page 171
Appendix B – Survey and Experimental Data
Page 172
Table B1. 1 - Enhancement experiment – Background survey questions
The following are questions taken from the enhancement experiment (chapter 7) pre-activity survey.
This survey was designed to assess participant background in geology, scientific fieldwork, and
computer usage. The results of this survey are summarized in table B2.2. This survey was given to
the 2009 TOTLE workshop participants, a group of 35 middle school Earth science teachers from
Washington State.
1 What background do you have in geology?
1a None
1b One or two courses in college
1c I have an undergraduate degree in geology or a related science
1d I have a graduate degree in geology or a related science
2 What experience do you have doing scientific fieldwork?
2a None
2b Informal experience
2c Intro experience in college
2d Professional experience
3 How often do you use a computer to do the following
3a Browse the web
3b Send/ receive email
3c Use a spreadsheet
3d Use a word processor
3e Teach students to use ss or wp
3f Develop multi-media presentations
3g Teach student how to create m-m presentations
3h Use Google Earth or some other type of geospatial viewer
Table B1. 2 - Enhancement experiment - Background survey results

Page 173
This table summarizes the responses to the survey questions in Table B3.1. R is number of
responses to each item; Raw # is the number of respondents selecting each option; and %R is
percentage of respondents selecting each option. Column 1 contains codes for cross-referencing the
data with the questions (Table B2.1).
1 R Raw# %R
1a 35 5 14.3%
1b 35 20 57.1%
1c 35 8 22.9%
1d 35 2 5.7%
2 R Raw# %R
2a 35 5 14.3%
2b 35 9 25.7%
2c 35 18 51.4%
2d 35 3 8.6%

Page 174
Table B1. 3 - Enhancement experiment - Background survey results
R is number of responses to each item; Raw # is the number of respondents selecting each options;
and %R is percentage of respondents selecting each option. R0 through R4 are rankings for
response options 3a through 3h. Column 1 is the code for cross-referencing the data with the
questions (Table B2.1).
3 R Ave Stdev R0 %R R1 %R R2 %R R3 %R R4 %Resp
3a 35 3.89 0.53 0 0 1 2.9% 0 0.0% 1 2.9% 33 94.3%
3b 35 4.00 0.00 0 0 0 0.0% 0 0.0% 0 0.0% 35 100.0%
3c 35 3.66 0.76 0 0 0 0.0% 0 0.0% 8 22.9% 26 74.3%
3d 35 3.71 0.52 0 0 0 0.0% 1 2.9% 8 22.9% 26 74.3%
3e 35 2.14 1.14 0 0 2 5.7% 14 40.0% 11 31.4% 3 8.6%
3f 35 2.70 0.97 0 0 3 8.6% 8 22.9% 16 45.7% 6 17.1%
3g 35 1.87 1.20 0 0 4 11.4% 12 34.3% 9 25.7% 2 5.7%
3h 35 2.10 1.06 0 0 7 20.0% 10 28.6% 13 37.1% 1 2.9%
Page 175
Table B1. 4 - Enhancement experiment - Post-activity survey questions
The following are questions taken from the enhancement experiment (chapter 7) post-activity
survey. This survey was designed to assess the impact of using the VFE on their sense of
preparation for the field workshop field trips. The results of this survey are summarized in table
B2.4. This survey was given to the 2009 TOTLE workshop participants, a group of 35 middle
school Earth science teachers from Washington State. The first column of the table contains
codes cross-referencing the questions with the survey results (Table B2.4).
1 What type of orientation did you receive for the Mt. Rainier field trip?
1a The orientation that included the VFE.
1b The orientation that didn't include the VFE.
2 What type of orientation did you receive for the Mt. Rainier field trip?
2a The orientation that included the VFE.
2b The orientation that didn't include the VFE.
3 Which type of orientation was the most helpful in terms of preparing you for the field trip?
3a The orientation that included the VFE.
3b The orientation that didn't include the VFE.
4
4a Showing you where you would be going.
4b Providing you with a geographic sense of the places that you would visit.
4c Connecting "big picture" geologic concepts with the geology you saw at the field locations.
4d Helping you see patterns in the rocks and landscapes observed during the field trip.
4e
Helping you visualize the processes that shaped the landscaped observed during the field
trip.

Page 176
Table B1.4 (continued)
5 Do you plan to use the VFE in your classroom teaching this coming year?
Yes
No
Maybe
6 For what subjects or activities might you use the VFE?
7 If you were to use the VFE to prepare students for a field trip when would you use it?
a Before the field trip.
b After the field trip.
c Both before and after.
In place of a field trip
8 What do you think would make the the VFE more effective for your classroom activities.
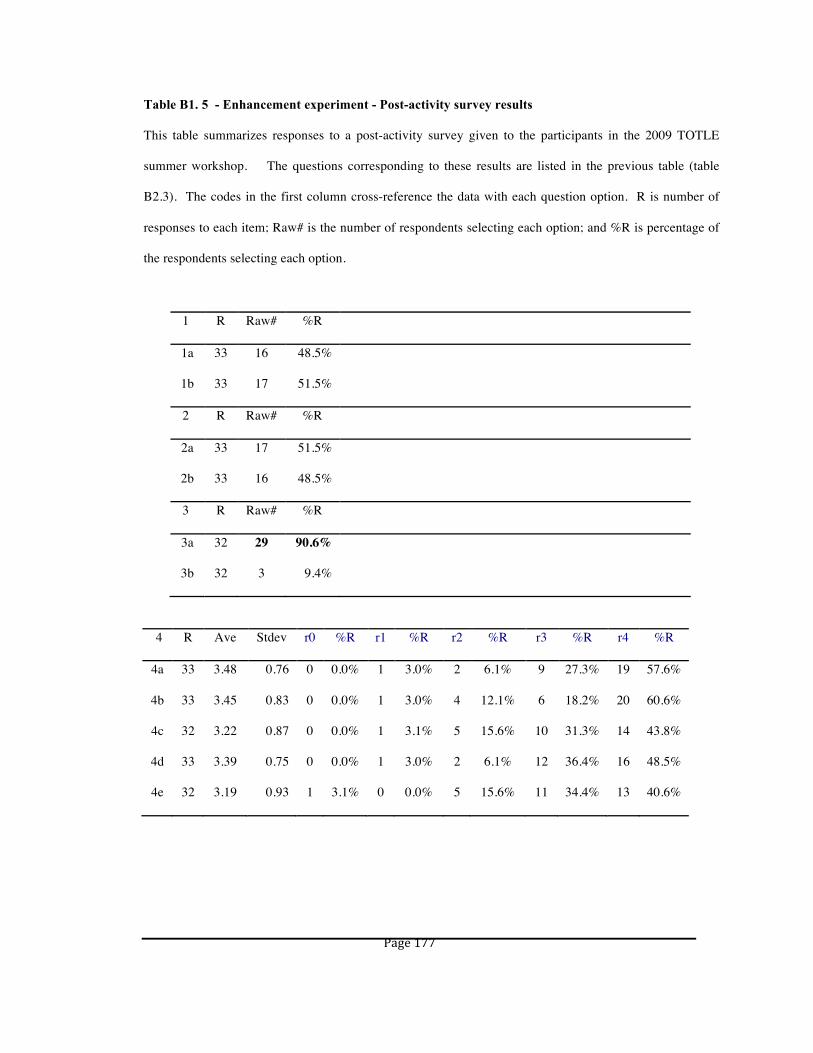
Page 177
Table B1. 5 - Enhancement experiment - Post-activity survey results This table summarizes responses to a post-activity survey given to the participants in the 2009 TOTLE
summer workshop. The questions corresponding to these results are listed in the previous table (table
B2.3). The codes in the first column cross-reference the data with each question option. R is number of
responses to each item; Raw# is the number of respondents selecting each option; and %R is percentage of
the respondents selecting each option.
1 R Raw# %R
1a 33 16 48.5%
1b 33 17 51.5%
2 R Raw# %R
2a 33 17 51.5%
2b 33 16 48.5%
3 R Raw# %R
3a 32 29 90.6%
3b 32 3 9.4%
4 R Ave Stdev r0 %R r1 %R r2 %R r3 %R r4 %R
4a 33 3.48 0.76 0 0.0% 1 3.0% 2 6.1% 9 27.3% 19 57.6%
4b 33 3.45 0.83 0 0.0% 1 3.0% 4 12.1% 6 18.2% 20 60.6%
4c 32 3.22 0.87 0 0.0% 1 3.1% 5 15.6% 10 31.3% 14 43.8%
4d 33 3.39 0.75 0 0.0% 1 3.0% 2 6.1% 12 36.4% 16 48.5%
4e 32 3.19 0.93 1 3.1% 0 0.0% 5 15.6% 11 34.4% 13 40.6%
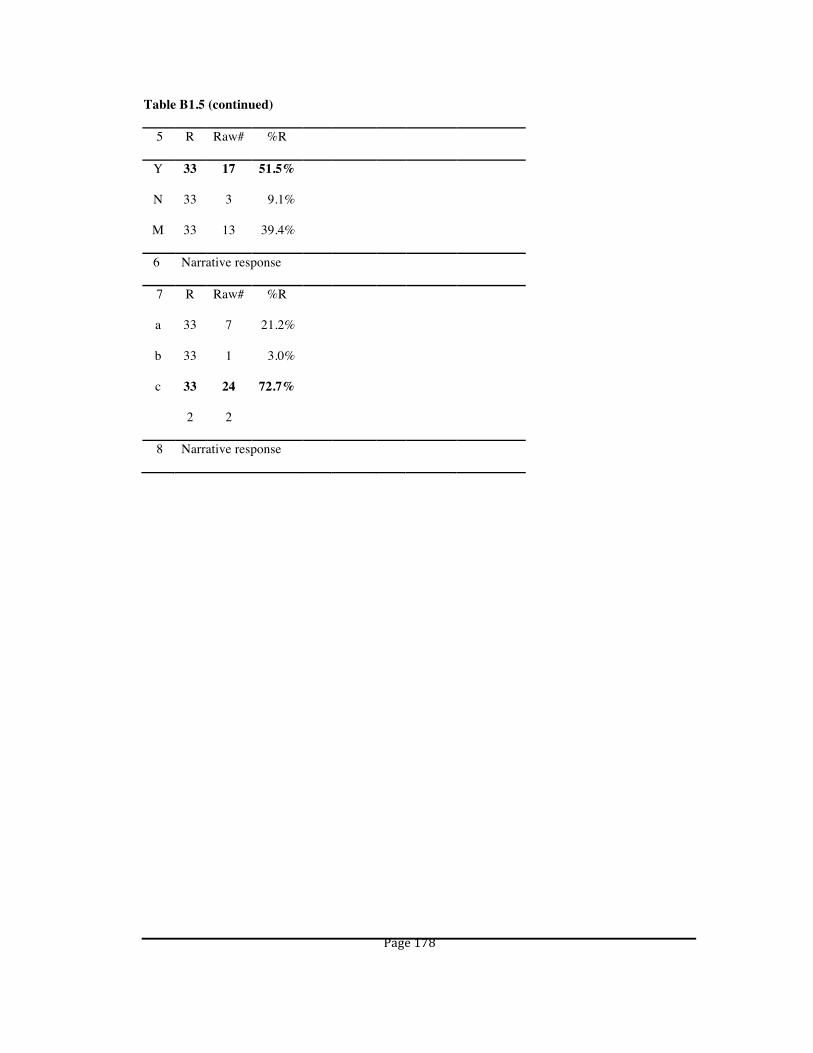
Page 178
Table B1.5 (continued)
5 R Raw# %R
Y 33 17 51.5%
N 33 3 9.1%
M 33 13 39.4%
6 Narrative response
7 R Raw# %R
a 33 7 21.2%
b 33 1 3.0%
c 33 24 72.7%
2 2
8 Narrative response

Page 179
Table B1. 6 - Enhancement experiment - Narrative responses to the post-activity survey
Questions 6 and 8 required narrative responses. This table lists those responses. See table B2.3 for the text
of the questions.
6 For what subjects or activities might you use the VFE?
Catastrophic events (Earth Science)
Examining regional geology and processes
Landforms (Earth science)
Volcanoes / Earthquakes
To connect my students to local geology
Field trips that kids can not make
Intro / extensions of class subject
Copalis River
When we study tsunamis
Use where field trips are not necessarily feasible but want the kids to "get the experience"
(Science)
Going to Mt. St. Helens
Trips to Mt. St. Helens, Hawaii volcanoes, Yellowstone, and Mt. Rainier
Mt. Rainier Volcanic Hazards
Tsunami story
Earthquakes / tsunamis / erosion-deposition
Tsunami story, maybe lahars
Showing students where the geology is.
Rock layering
Tsunamis, earthquakes, and plate tectonics
Properties of matter (chemistry) and catastrophic events (Earth science)
Toejam Hill Fault
Table 1.6 (Continued)

Page 180
8 What do you think would make the VFE more effective for your classroom activities?
Have East side of Washington "stuff" too.
A little more of Eastern Washington and Northern Idaho
Being able to make my own
More VFE sites
More information on it. Being more in depth.
Template to build my own trips.
Paints the Big Picture for the students.
More teacher explanation.
Do the field trip more like the VFE.
Video and more internet links.
Worksheet directing students to areas I want them to explore or answer questions about.
More practice going to the website.
Link some relevant teaching concepts (animations and Powerpoints) to the trip pictures.
If we actually took the field trip.
I would want the ability to author my own VFEs.
More links for them to click on. Maybe videos of Brian discussing his findings.
Local site.
Local VFEs for where I would take students on field trips.
Have the (?) visible in more than one view.
Have links to animations about geologic processes.
More locations, pictures.
I could use more practice / instruction
Allowing students to add photos, videos, observations, data, and conclusion.
Unfortunately I don't have the means for field trips. I could use it in place of the actual trip.

Page 181
Table B2. 1 - Design experiment - Interviewee background
This table is a summary of interviewee responses to the following questions from the background
survey. Responses are summarized for the Total sample (n) and each group (n’). R is the number of
responses to each question option and %n is the percentage of the total sample (n), %n’ is the
percentage of each group (n’) represented by each R.
Total
sample Novice Teacher Expert
84 n 45 n’ 17 n’ 23 n’
R %n R %n’ R %n’ R %n’
Which are you? Check all that apply.
An undergraduate student in
an introductory geology
course. 40
47.6
% 40 88.9% 0 0.0% 0 0.0%
A graduate student in
geology. 0 0.0% 0 0.0% 0 0.0% 0 0.0%
A teacher. 29
34.5
% 0 0.0% 17
100.0
% 13
56.5
%
A professional geologist. 20
23.8
% 0 0.0% 0 0.0% 20
87.0
%
A professional scientist
other than a geologist. 2 2.4% 0 0.0% 0 0.0% 2 8.7%
Other (please specify) 3 3.6% 5 11.1% 0 0.0% 0 0.0%
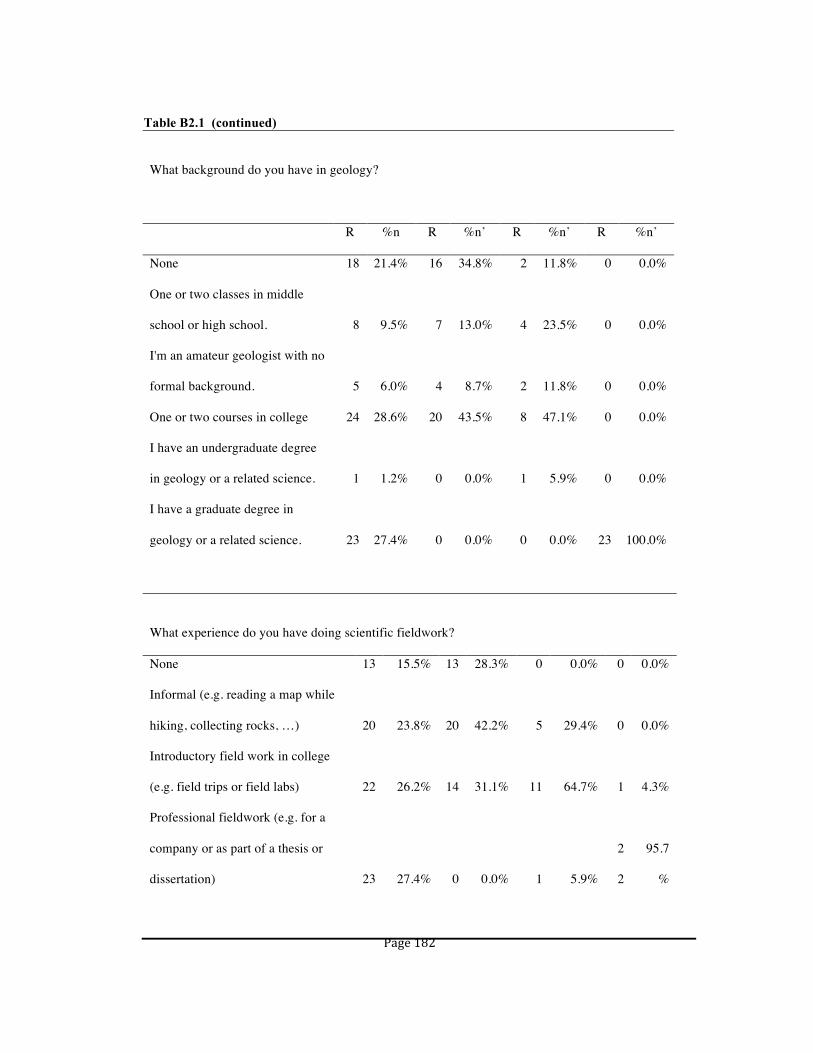
Page 182
Table B2.1 (continued)
What background do you have in geology?
R %n R %n’ R %n’ R %n’
None 18 21.4% 16 34.8% 2 11.8% 0 0.0%
One or two classes in middle
school or high school. 8 9.5% 7 13.0% 4 23.5% 0 0.0%
I'm an amateur geologist with no
formal background. 5 6.0% 4 8.7% 2 11.8% 0 0.0%
One or two courses in college 24 28.6% 20 43.5% 8 47.1% 0 0.0%
I have an undergraduate degree
in geology or a related science. 1 1.2% 0 0.0% 1 5.9% 0 0.0%
I have a graduate degree in
geology or a related science. 23 27.4% 0 0.0% 0 0.0% 23 100.0%
What experience do you have doing scientific fieldwork?
None 13 15.5% 13 28.3% 0 0.0% 0 0.0%
Informal (e.g. reading a map while
hiking, collecting rocks, …) 20 23.8% 20 42.2% 5 29.4% 0 0.0%
Introductory field work in college
(e.g. field trips or field labs) 22 26.2% 14 31.1% 11 64.7% 1 4.3%
Professional fieldwork (e.g. for a
company or as part of a thesis or
dissertation) 23 27.4% 0 0.0% 1 5.9%
2
2
95.7
%

Page 183
Table B2.1 (continued)
If you are a professional geologist, what is your area of expertise?
R %n R %n’ R %n’ R %n’
This question doesn't apply to
me since I am not a geologist.
6
1 72.6% 44 97.8% 17
100.0
% 0 0.0%
Structural geologist 2 2.4% 0 0.0% 0 0.0% 2 8.7%
Environmental, engineering, or
hydro- geology 5 6.0% 0 0.0% 0 0.0% 5 21.7%
Geomorphic geology 9 10.7% 0 0.0% 0 0.0% 9 39.1%
Geophysics 2 2.4% 0 0.0% 0 0.0% 2 8.7%
Geochemistry, minerology, or
petrology 4 4.8% 0 0.0% 0 0.0% 4 17.4%
Paleontologist or stratigrapher 0 0.0% 0 0.0% 0 0.0% 0 0.0%
Economic geologist 0 0.0% 0 0.0% 0 0.0% 0 0.0%
Other (please specify) 6 7.1% 0 0.0% 0 0.0% 6 26.1%
Vulcanology 4 4.8% 0 0.0% 0 0.0% 4 17.4%

Page 184
Table B2.1 (continued)
Total
sample Novice Teacher Expert
If you are a teacher, what grade level do you teach?
R %n R %n’ R %n’ R %n’
This question doesn't apply to me
since I am not a teacher 53 61.9% 46 100.0% 0 0.0% 7 30.4%
Middle school (grades 6-8) 11 13.1% 0 0.0% 12 70.6% 0 0.0%
High school (grades 9-12) 5 6.0% 0 0.0% 6 35.3% 0 0.0%
Community college 9 10.7% 0 0.0% 0 0.0% 9 39.1%
University 7 8.3% 0 0.0% 0 0.0% 7 30.4%
If you are a teacher, how long have you taught Earth science?
This question doesn't apply to me
since I am not a teacher 53 63.1% 45 100.0% 0 0.0% 8 34.8%
2 years or less 6 7.1% 0 0.0% 5 29.4% 2 8.7%
3 to 5 years 4 4.8% 0 0.0% 3 17.6% 1 4.3%
5 to 10 years 3 3.6% 0 0.0% 3 17.6% 0 0.0%
10 to 15 years 9 10.7% 0 0.0% 3 17.6% 6 26.1%
More than 15 years 7 8.3% 0 0.0% 2 11.8% 5 21.7%
I don't teach es (please specify what
you do teach and how long you have
taught it.) 1 1.2% 0 0.0% 1 5.9% 0 0.0%
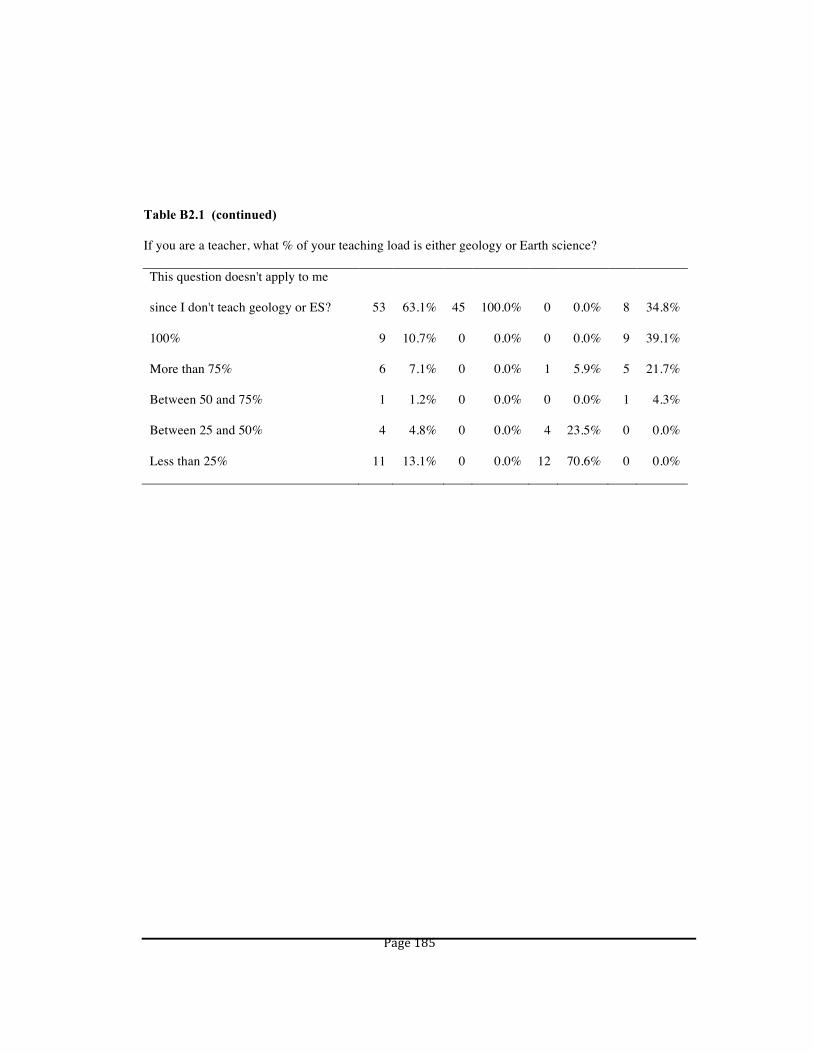
Page 185
Table B2.1 (continued)
If you are a teacher, what % of your teaching load is either geology or Earth science?
This question doesn't apply to me
since I don't teach geology or ES? 53 63.1% 45 100.0% 0 0.0% 8 34.8%
100% 9 10.7% 0 0.0% 0 0.0% 9 39.1%
More than 75% 6 7.1% 0 0.0% 1 5.9% 5 21.7%
Between 50 and 75% 1 1.2% 0 0.0% 0 0.0% 1 4.3%
Between 25 and 50% 4 4.8% 0 0.0% 4 23.5% 0 0.0%
Less than 25% 11 13.1% 0 0.0% 12 70.6% 0 0.0%
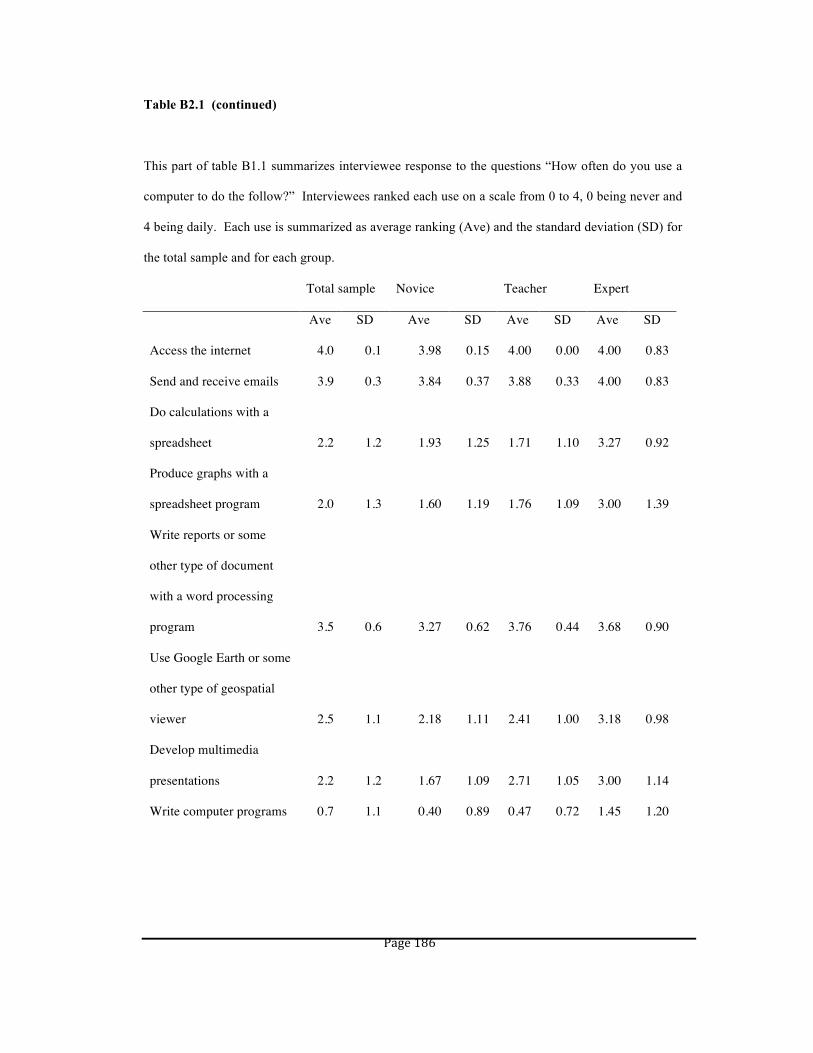
Page 186
Table B2.1 (continued)
This part of table B1.1 summarizes interviewee response to the questions “How often do you use a
computer to do the follow?” Interviewees ranked each use on a scale from 0 to 4, 0 being never and
4 being daily. Each use is summarized as average ranking (Ave) and the standard deviation (SD) for
the total sample and for each group.
Total sample Novice Teacher Expert
Ave SD Ave SD Ave SD Ave SD
Access the internet 4.0 0.1 3.98 0.15 4.00 0.00 4.00 0.83
Send and receive emails 3.9 0.3 3.84 0.37 3.88 0.33 4.00 0.83
Do calculations with a
spreadsheet 2.2 1.2 1.93 1.25 1.71 1.10 3.27 0.92
Produce graphs with a
spreadsheet program 2.0 1.3 1.60 1.19 1.76 1.09 3.00 1.39
Write reports or some
other type of document
with a word processing
program 3.5 0.6 3.27 0.62 3.76 0.44 3.68 0.90
Use Google Earth or some
other type of geospatial
viewer 2.5 1.1 2.18 1.11 2.41 1.00 3.18 0.98
Develop multimedia
presentations 2.2 1.2 1.67 1.09 2.71 1.05 3.00 1.14
Write computer programs 0.7 1.1 0.40 0.89 0.47 0.72 1.45 1.20

Page 187
Table B2. 2 - Design experiment - Questions from the expert group
This table lists questions about features visible in a panoramic scene from Mt. Hood, Oregon.
Questions asked by experts (professional geoscientists) in response to the question “What is one
question you have about each feature that you selected, or a question that you would ask students
about that feature?”
Feature Question
Cloud Cap Inn
Columbia Gorge Why did the Columbia River cut across the Cascade Mountains?
Cooper Spur
Boulders What's the texture of the rock?
What is its origin?
How does the rock relate to the volcanic construction?
Is it a jumble of rock or one rock? What about the other rocks?
What is the deposition mechanism?
Do you notice anyting about the rocks? What's your hypothesis about this?
Why are the boulders smooth on the mountain side of the rock? Why do you
think this?
Is this (the rock shape) the result of weathering, exfoliation, or glaciation.
Can we ascertain what caused the fracturing in this rock?
How did they get there?
Why are these (the rocks) so different?
Why are these so different (smooth rocks at 195° and jagged rocks at 325°)?
Vegetation What's going on (with the vegetation)?

Page 188
Table B2.2 (Continued)
Feature Question
Eliot Glacier What is it?
What's the relationship of the glacier to its bedrock?
Why is there snow here and no where else?
Can you tell where the glacier is?
Why is this one moving downslope?
What can we do to test this?
Where does the glacier end?
Is this an advancing or a retreating glacier?
How is the glacier changing through time?
What's its future?
Does this (the changes in the glacier) represent seasonal variation or past
extend?
Why is there a big stripe of rock on the glacier?
What is a glacier?
How does it (the glacier) form?
How does a glacier work?
What would Eliot Glacier have to look like to create a moraine on either
side?
Crevassed ice
Based on what you think you know about brittle and ductile deformation,
how deep do you think the crevasses are?
Page 189
Table B2.2 (Continued)
Feature Question
Ice fall What is the feature we're looking at?
What's the material?
Is this part of the glacier?
Medial moraine What does this say to you about the history of the rock?
What is the thickness of the debris?
What is it?
Am I looking at volcanic material deposited during an eruption or
material that's been reworked by erosion?
What happened here? What's the timeline for what happened?
What's the origin of this medial moraine?
What's the material?
Is that a glacial landform or does it have other sources?
How do we sort out time and history here?
Can you tell me about the sequence of events that happened (to form
this band)?
Are these debris flows or rock glaciers?
Rock masses What is this? Refering to the dark spot in the photo.
To which sequences do they (the rock masses) belong?
Hood River Valley In the process of drawing a sketch what processes are you looking at?
Languille Crags Do they look like they have been glaciated?
Lava Flow Why is there a change in the structure of the outcrop?
How thick is the basal breccia?
Table B2.2 (Continued)
Page 190
Feature Question
Lava flow Would the layering that you can see be a reasonable dip for a lava flow?
Mt. Adams Why are the two volcanoes close to each other?
Without having visited it, what would you expect to see on the distant
mountain in terms of rock?
Compare the mountain you are standing on to the two in the distance (Mt.
Adams / Mt. Defiance). Which is similar?
How is it similar or different from Mt. Hood?
How do we know that we are on a subduction zone?
What's is the relative orientation of Mt. Adams and Mt. Hood?
Mt. Adams What does this alignment mean?
What's its history? How long did it take to form?
Mt. Hood
(Summit)
How many different sorts of processes are we talking about here? How many
deposits?
Why is the mountain here?
Cirque What would happen as that ice volume starts up?
Lava flows Is this a debris flow or a lava flow?
What's going on here in terms of geologic time?
How do you get the orientation of the lava flows?
What is the rock type?
What caused the jointing?
Is the contact (on the north cirque wall ) a potential zone of detachment?
What's the significance of the bedding (in the north cirque wall)?
Is it bedding?
Page 191
Table B2.2 (Continued)
Feature Question
Mt. Defiance Is this a Boring Lava vent?
Compare the mountain you are standing on to the two in the distance
(Mt. Adams / Mt. Defiance). Which is similar?
What do you think this is? Is it a volcano or something else?
Rock slide (Hwy 35) Can you see that?
Why can you see it from so far away?
When did it happen?
Shellrock Mtn. What are they? Let's speculate on what they are?
Surveyor Ridge What is the ridge made of?
Is it a landslide or volcanic in origin?
What is it?
Is it structural?
What is its extent?
How is this feature related to the structure of the area
West Moraine What is that material?
What does this tell you about the volcanic history?
How recently was it formed?
How did it form?
Where did the rock come from?
What is it made of?
What is it called? What are thoses features?
What's the relationship to the previous moraine?
Table B2.2 (Continued)

Page 192
Feature Question
West Morine Is there a lithologic transition or is it just fresh surface?
How are they (the moraines) similar? How are they different?
What's implied about advance and retreat?
How would you find the ages of the moriaines?
How could you use your modern observation to make a case for past
observations?
How old is it (the lateral moraine)?
What's the orientation of the moraine
How does this (the moraine) relate to the rest of the landscape?
What are the processes here?
What's underneath?
What's the significance of this landform? What does it tell you about the
history of the glacier?
Is this (light / dark transition on moraine slope) evidence of high pct and
runoff that generated the
incision of the valley floor?
Why is it there? How did it get there?
What's the sequence of events here that instigated the November 2006
debris flow?
View How does the sky make it look like its underwater?
Contrails What are they?
What are the atmospheric conditions producing them?
Table B2. 3 - Design experiment - Questions from the teacher group

Page 193
This table lists questions about features visible in a panoramic scene from Mt. Hood OR. Questions
asked by middle school and high school Earth science teachers in response to the question “What is
one question you have about each feature that you selected, or a question that you would ask
students about that feature?”
Feature Question
Butcher knife Ridge Is the ridge the result of glacial activity?
How did it form?
Why is it called Butcher Knife Ridge?
Was it formed by ice or eroded by water?
Is it glacially deposited or is it part of a lava flow?
Is the ridge geologically related to the glacier?
Is that a lava flow?
What's it made of?
Columbia Gorge How wide is the gorge?
How far away is it in this picture?
Cooper Spur Why is it called Cooper Spur?
What's a spur?
How old is it?
What kind of rock is there?
What is it made up of?
Do all spurs look like this one (have an indentation in the ridge)?
Is it dangerous? Why is it dangerous?
Is it visible from populated places
How did it (the peak on Cooper Spur) get there?
Table B2.3 (Continued)

Page 194
Feature Question
Boulders How did the scree get here?
Are the rocks flat and slick looking because of glaciation?
Why are the rocks flat?
How big is it (a rise composed of fracture rock) in relation to my
body?
Where did the rocks come from? How did they get here?
Is this erosion or the product of an eruption?
What would produce this (the rock) vs. what we saw at azimuth
220°?
Vegetation Why is there no vegetation?
How far down do we have to go to find vegetation?
How does elevation affect plant growth and species variation?
Why is there plant life starting here?
Eliot Glacier Do you think that the glacier has always been like this?
Is the glacier getting smaller, holding steady, or getting larger?
Has it changed size in response to climate?
How far has it receded?
Does the glacier have anything to do with the formation of the
spur?
At what rate is it moving?
What defines a glacier on Mt. Hood?
Is it the headwaters of a significant stream system?
Crevassed ice How deep is the ice?
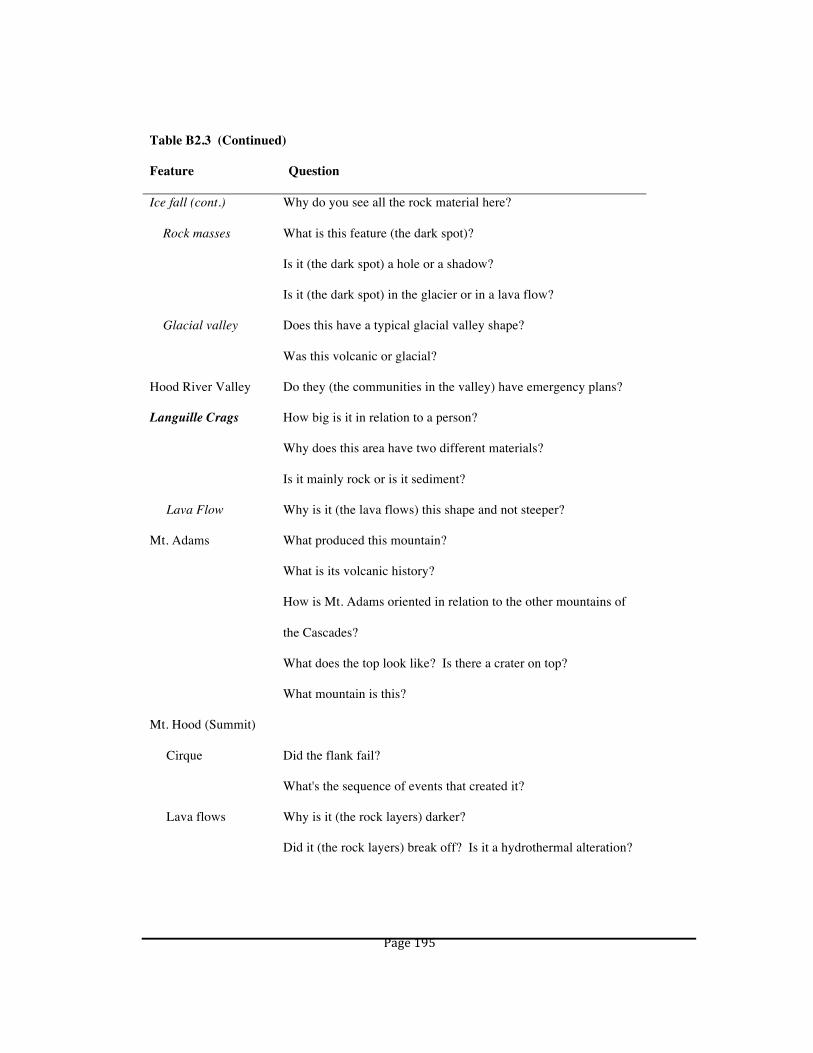
Page 195
Table B2.3 (Continued)
Feature Question
Ice fall (cont.) Why do you see all the rock material here?
Rock masses What is this feature (the dark spot)?
Is it (the dark spot) a hole or a shadow?
Is it (the dark spot) in the glacier or in a lava flow?
Glacial valley Does this have a typical glacial valley shape?
Was this volcanic or glacial?
Hood River Valley Do they (the communities in the valley) have emergency plans?
Languille Crags How big is it in relation to a person?
Why does this area have two different materials?
Is it mainly rock or is it sediment?
Lava Flow Why is it (the lava flows) this shape and not steeper?
Mt. Adams What produced this mountain?
What is its volcanic history?
How is Mt. Adams oriented in relation to the other mountains of
the Cascades?
What does the top look like? Is there a crater on top?
What mountain is this?
Mt. Hood (Summit)
Cirque Did the flank fail?
What's the sequence of events that created it?
Lava flows Why is it (the rock layers) darker?
Did it (the rock layers) break off? Is it a hydrothermal alteration?

Page 196
Table B2.3 (Continued)
Feature Question
Mt. Defiance What produced this mountain? / How did it form?
What is its elevation?
Where is it in relation to the Gorge?
Surveyor Ridge What is it?
What created it?
West Moraine Where did the ice go? How long did it take to disappear?
Why is it (the moraine) able to stay solid?
How long has it been there?
Why is there no vegetation on it?
Where is the end of the moraine? E.g. the terminal moraine.
Is there a body of water nearby?
What makes up the West Moraine?
Which volcanoes contributed to this ash*? Interviewee assumed
the till was ash.
What is this feature?
What's a moraine?
How was it made?
What's it made up of?
View
Which mountains* are those? Interviewee assumed clouds on the
horizon were mountains.
Weather How high is the smoke layer in the distance?
How large is the fire producing it and where is the fire?

Page 197
Table B2. 4 - Design experiment - Questions from the novice group
This table lists questions about features visible in a panoramic scene from Mt. Hood OR. Questions
asked by novices (community college Earth students with less than two courses in earth science) in
response to the question “What is one question you have about each feature that you selected, or a
question that you would ask students about that feature?”
Feature Question
Butcher knife Ridge What kind of geologic forces created this ridge?
How tall is it?
What type of rock is it?
How is this feature related to the structure of this area?
How did it get its name?
How did it form?
Is there a fault? Is there uplift?
Butcher knife Ridge What are the layers?
What's the river at the base of the ridge?
Cloud Cap Inn What is it (CCI)?
Why is it named that?
Why is it so much wider?
Columbia Gorge Where is the river?
Does it form a divder? Is it a boundary?
What's the depth of the Gorge? How far away is it?
How did it form?
What's its human history?

Page 198
Table B2.4 (Continued)
Feature Question
Cooper Spur
How was it formed? What went on with the mountain to make it look like it
does?
Why is it such a prominent feature?
Why is the erosion on this ridge less than the erosion on the other ridge (west
moraine)?
What rock is in it?
How does this igneous rock differ from other volcanic mountains?
What's behind it?
Is this (Cooper Spur) the name of the ridge or an actual formation?
What is a spur?
How did it (the change in slope at azimuth 260°) happen?
Is it related to any previous volcanic activity?
Boulders Did erosion or something else happen in this area?
Why are they (pinkish rocks on the moraine) a different color?
Why are they (a stack of rocks) like this, while everything else is broken down?
Why is it like this? (referring to the coarseness of the surface)
What causes the lines (fracturing visible at azimuth 100°)?
Have the rocks (large boulders) moved down the mountain?
Was there once an earthquake that produced all the gravel?
What's on the plaque? One of the boulders has a commerative plaque on it.
Snowfiled What made the white spot near the peak?

Page 199
Table B2.4 (Continued)
Feature Question
Vegetation
Why do you think plants can grow beside the rocks (and not in other
places)?
How do you go from solid ground with vegetation to barren steep slopes?
How is it that there is plant life where there is no soil?
Is there soil underneath?
Eliot Glacier Why is snow melted in one place and not in another?
How long has it been there? What changes have occurred over time?
Is it receding or getting bigger?
What is its rate of recession?
How can you tell?
How old is the glacier?
Is it the remnant of a larger glacier?
How does this glacier impact the landscape?
Do you think that's hard or soft snow?
How deep is it? How big is it?
Is it there year round?
Does it melt throuhgout the year?
Why are glaciers able to sustain throughout the year?
Is it pillow basalt with snow on it? If so how did it get there?
How does this glacier work?
How did the glacier form there? What makes the glacier?
How is the glacier related to the other features around it?

Page 200
Table B2.4 (Continued)
Feature Question
Eliot Glacier Why is the ice where it is, and not lower?
Is it snow or is it sand? Why is it colored differently?
What are the snowfall statistics?
Was the glacier involved in the Hwy 35 closure in 12/2007?
How is it ranked or classified?
Ice fall What do you think that (the ice fall) is?
What's the difference in elevation (between the bottom and the top)?
Medial moraine Why is there soil in this one spot?
Is this dirt?
Why is it like this? (Referring to the coarseness of the surface)
What's it made of?
Is the ice responsible for this?
Noonatack How did the "hole" (the dark spot on outcrop) get there?
Did the glacier have anything to do with its (the "hole's") formation?
What is it (the dark spot)? Is it a cave? Is it a shadow?
Do you think that anything is in there (the dark spot interpreted as a
cave)?
Can I go in it?
Glacial valley How long does it take form this valley?
Hood River Valley What defines a valley?
What is there?
Why is tree cover missing in places?

Page 201
Table B2.4 (Continued)
Feature Question
Languille Crags Is this the name of the ridge or an actual formation?
What is it?
How did it form? Why is it there?
How far is it?
Can you distinguish it on a map?
Mt. Adams Is it (Mt. Adams) like Mt. Hood or Mt. St. Helens? Is it a volcano?
Is there a possibility of it erupting?
When was the last eruption?
How high is it?
Mt. Adams (cont.) Is it volcanic or something that pushed up?
What is its volcanic activity relative to the surrounding Cascades?
How did the mountain get there?
What's the composition of the mountain?
Is the topography (landscape?) between the two mountains changing?
What mountain is it?
Where am I relative to it?
Were they* once connected by other mountains?
* Mt. Adams and Mt. Hood.
Mt. Adams (cont.) How come it is a single mountain?
Mt. Hood What does the top look like?
Cirque
How did it get the fracturing that it did?
How did it (the layering) form?

Page 202
Table B2.4 (Continued)
Feature Question
Mt. Defiance What makes it a mountain?
What do you think this is? Is it a volcano or something else?
How big is it?
How was it formed?
Why is it called Mt. Defiance?
River Is it a river? If so which river is it?
What is it connected to?
Shellrock Mtn. What are they?
Are the two peaks two mountains or an erosional remnant?`
Surveyor Ridge How far is it? How high is it?
How is this feature related to the structure of the area
Is this the name of the ridge or a survey point?
Where does the ridge end?
What is that?
Is it similar in shape to the ridge in the foreground?
West Moraine
Why is the rock on the ridge different from the rocks on the other ridge
different?
Is it (the light area on the moraine) erosion?
Is it (the light area on the moraine) a landslide? If so, what caused it?
Why is it (the moraine) in that spot? How did it form?
What is it?
What is the surface?
What is it made of?

Page 203
Table B2.4 (Continued)
Feature Question
West Moraine How is it layered?
Is this a glacial moraine for Eliot Glacier?
Why is there gravel?
Why are there small channels on the slope?
How big is it?
How is it flowing? (What's its orientation).
Did the ground shift to create the moraine?
Why is it devoid of vegetation?
Is this part of the mountain or something else?
Is it possible it was once underwater?
View How high am I at this place?
What's the distance to the mountains?
Do glaciers affect the other mountains?
Contrails Does anyone see the plane that created the streamer?
Weather What's the temperature up here?
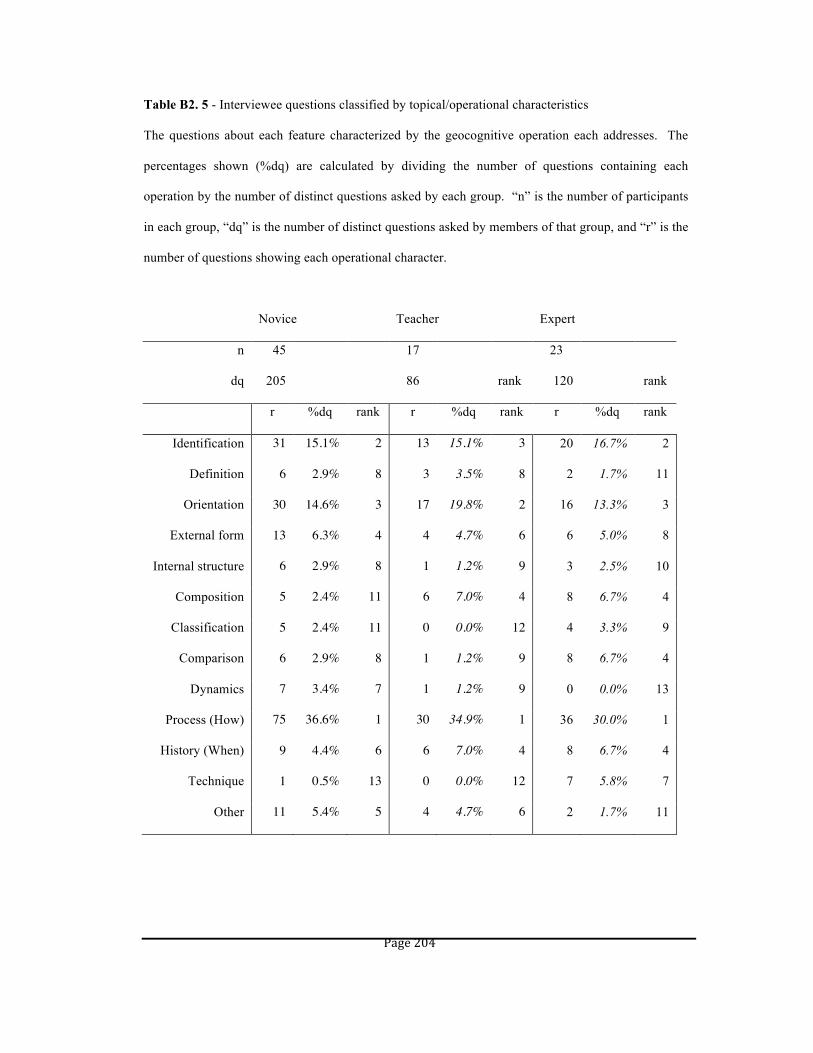
Page 204
Table B2. 5 - Interviewee questions classified by topical/operational characteristics
The questions about each feature characterized by the geocognitive operation each addresses. The
percentages shown (%dq) are calculated by dividing the number of questions containing each
operation by the number of distinct questions asked by each group. “n” is the number of participants
in each group, “dq” is the number of distinct questions asked by members of that group, and “r” is the
number of questions showing each operational character.
Novice Teacher Expert
n 45 17 23
dq 205 86 rank 120 rank
r %dq rank r %dq rank r %dq rank
Identification 31 15.1% 2 13 15.1% 3 20 16.7% 2
Definition 6 2.9% 8 3 3.5% 8 2 1.7% 11
Orientation 30 14.6% 3 17 19.8% 2 16 13.3% 3
External form 13 6.3% 4 4 4.7% 6 6 5.0% 8
Internal structure 6 2.9% 8 1 1.2% 9 3 2.5% 10
Composition 5 2.4% 11 6 7.0% 4 8 6.7% 4
Classification 5 2.4% 11 0 0.0% 12 4 3.3% 9
Comparison 6 2.9% 8 1 1.2% 9 8 6.7% 4
Dynamics 7 3.4% 7 1 1.2% 9 0 0.0% 13
Process (How) 75 36.6% 1 30 34.9% 1 36 30.0% 1
History (When) 9 4.4% 6 6 7.0% 4 8 6.7% 4
Technique 1 0.5% 13 0 0.0% 12 7 5.8% 7
Other 11 5.4% 5 4 4.7% 6 2 1.7% 11

Page 205
Table B2. 6 - Interviewee questions classified by cognitive outcome
Questions about the features selected characterized by cognitive outcomes. The percentages shown
(%dq) are calculated by dividing the number of questions containing each operation by the number
of distinct questions asked by each group. “n” is the number of participants in each group, “dq” is
the number of distinct questions asked by members of that that group, and “r” is the number of
questions showing each operational character.
Novice Teacher Expert
n 45 17 23
dq 205 86 120
r %dq r %dq r %dq
Remembering 126 61.5% 53 61.6% 51 42.5%
Understanding 68 33.2% 25 29.1% 49 40.8%
Applying 10 4.9% 5 5.8% 14 11.7%
Analyzing 1 0.5% 3 3.5% 2 1.7%
Evaluating 0 0.0% 0 0.0% 4 3.3%
Creating 0 0.0% 0 0.0% 0 0.0%
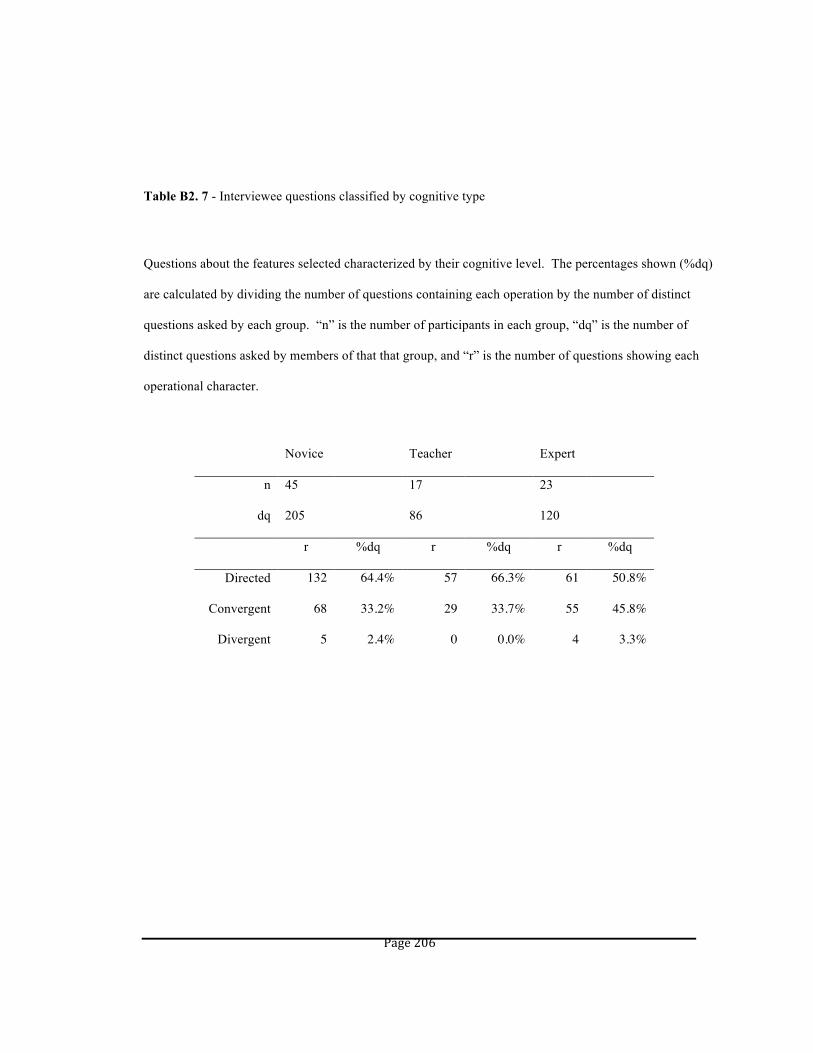
Page 206
Table B2. 7 - Interviewee questions classified by cognitive type
Questions about the features selected characterized by their cognitive level. The percentages shown (%dq)
are calculated by dividing the number of questions containing each operation by the number of distinct
questions asked by each group. “n” is the number of participants in each group, “dq” is the number of
distinct questions asked by members of that that group, and “r” is the number of questions showing each
operational character.
Novice Teacher Expert
n 45 17 23
dq 205 86 120
r %dq r %dq r %dq
Directed 132 64.4% 57 66.3% 61 50.8%
Convergent 68 33.2% 29 33.7% 55 45.8%
Divergent 5 2.4% 0 0.0% 4 3.3%

Page 207
Appendix C – Contents of the Companion CD
The CD accompanying the paper version of this dissertation is readable by
both Windows and Mac OSX based computers. It includes the complete contents of
the TOTLE VFE website and the virtual field site used for the design experiment
discussed in Chapter 8. On-line these resources can be accessed at the following
addresses
< http://multimedia2.up.edu/Physics/TOLE/VFEs/ >
< http://www.artemis-science.com/Dissertation / Scene.swf >
To access the VFE, open the folder “TOTLE_VFE” on the disc. Once you
have done so, find and launch the file “index.html” by double clicking on it. On most
computers the file will open using one of its web browsers. If this does not happen
open the file using one of your computer’s web browsers. To view the virtual field
site described in Chapter 8, use your browser to open the file “scene.swf” on the CD.
Contents of the disc:
From the index / gateway page of the website the user can access three
resources; the virtual field environment, the teacher’s guide that accompanies the
environments, and a student activities page that links the various student activities
found in the guide with the parts of the VFE that are relevant to each activity.
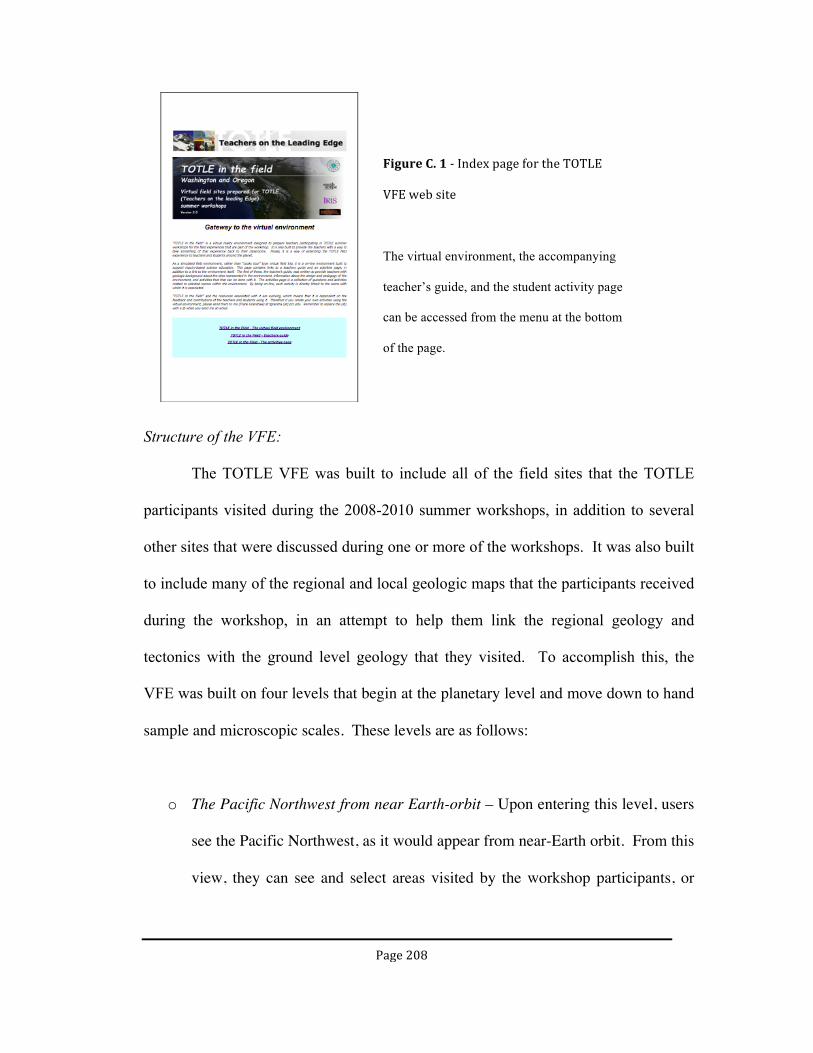
Page 208
Structure of the VFE:
The TOTLE VFE was built to include all of the field sites that the TOTLE
participants visited during the 2008-2010 summer workshops, in addition to several
other sites that were discussed during one or more of the workshops. It was also built
to include many of the regional and local geologic maps that the participants received
during the workshop, in an attempt to help them link the regional geology and
tectonics with the ground level geology that they visited. To accomplish this, the
VFE was built on four levels that begin at the planetary level and move down to hand
sample and microscopic scales. These levels are as follows:
o The Pacific Northwest from near Earth-orbit – Upon entering this level, users
see the Pacific Northwest, as it would appear from near-Earth orbit. From this
view, they can see and select areas visited by the workshop participants, or
Figure C. 1 -‐ Index page for the TOTLE
VFE web site
The virtual environment, the accompanying
teacher’s guide, and the student activity page
can be accessed from the menu at the bottom
of the page.
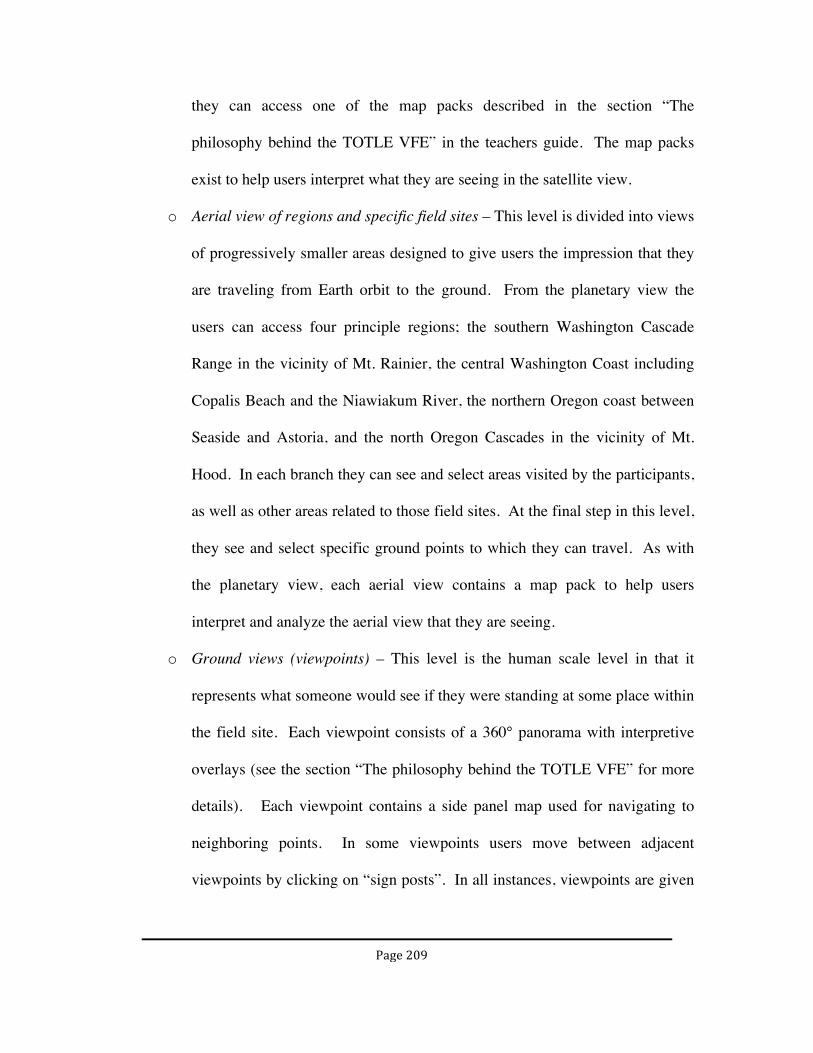
Page 209
they can access one of the map packs described in the section “The
philosophy behind the TOTLE VFE” in the teachers guide. The map packs
exist to help users interpret what they are seeing in the satellite view.
o Aerial view of regions and specific field sites – This level is divided into views
of progressively smaller areas designed to give users the impression that they
are traveling from Earth orbit to the ground. From the planetary view the
users can access four principle regions; the southern Washington Cascade
Range in the vicinity of Mt. Rainier, the central Washington Coast including
Copalis Beach and the Niawiakum River, the northern Oregon coast between
Seaside and Astoria, and the north Oregon Cascades in the vicinity of Mt.
Hood. In each branch they can see and select areas visited by the participants,
as well as other areas related to those field sites. At the final step in this level,
they see and select specific ground points to which they can travel. As with
the planetary view, each aerial view contains a map pack to help users
interpret and analyze the aerial view that they are seeing.
o Ground views (viewpoints) – This level is the human scale level in that it
represents what someone would see if they were standing at some place within
the field site. Each viewpoint consists of a 360° panorama with interpretive
overlays (see the section “The philosophy behind the TOTLE VFE” for more
details). Each viewpoint contains a side panel map used for navigating to
neighboring points. In some viewpoints users move between adjacent
viewpoints by clicking on “sign posts”. In all instances, viewpoints are given
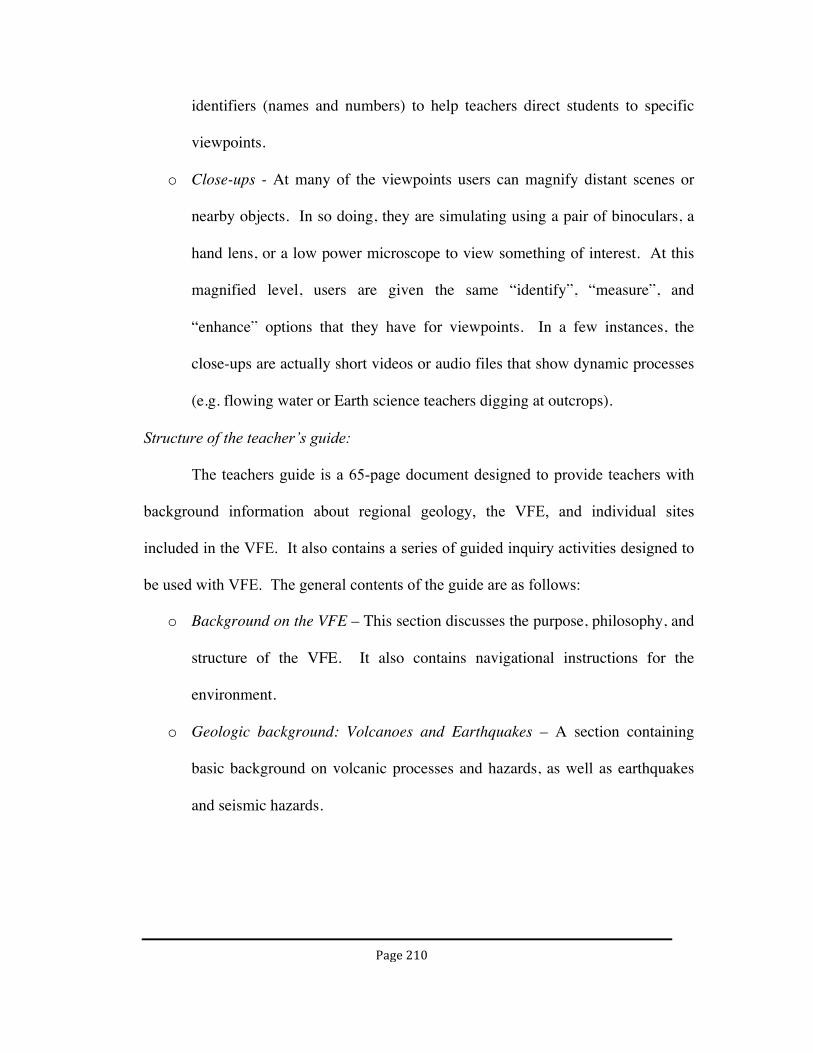
Page 210
identifiers (names and numbers) to help teachers direct students to specific
viewpoints.
o Close-ups - At many of the viewpoints users can magnify distant scenes or
nearby objects. In so doing, they are simulating using a pair of binoculars, a
hand lens, or a low power microscope to view something of interest. At this
magnified level, users are given the same “identify”, “measure”, and
“enhance” options that they have for viewpoints. In a few instances, the
close-ups are actually short videos or audio files that show dynamic processes
(e.g. flowing water or Earth science teachers digging at outcrops).
Structure of the teacher’s guide:
The teachers guide is a 65-page document designed to provide teachers with
background information about regional geology, the VFE, and individual sites
included in the VFE. It also contains a series of guided inquiry activities designed to
be used with VFE. The general contents of the guide are as follows:
o Background on the VFE – This section discusses the purpose, philosophy, and
structure of the VFE. It also contains navigational instructions for the
environment.
o Geologic background: Volcanoes and Earthquakes – A section containing
basic background on volcanic processes and hazards, as well as earthquakes
and seismic hazards.

Page 211
o Geologic background: The Regional picture – A section outlining the
geography, tectonics, volcanic activity, geologic structure, and seismic
activity of the region.
o The Pacific Northwest Coast: Earthquakes and tsunamis – This section
outlines history and mechanics of subduction zone earthquakes, and discusses
their impact on the Oregon and Washington coast in terms of tsunamis and
crustal subsidence. It also contains background on specific areas contained in
the VFE. These areas include the Copalis and Niawiakum Rivers of
Washington, Elma Washington, and Young’s Bay and the city of Seaside in
northwestern Oregon. Many of the viewpoint descriptions are accompanied
by student activities.
o The Cascades: Volcanoes and volcanic hazards – This final section provides
the reader with general background about Cascade volcanism, as well as
background about specific area. These areas include White River Canyon,
Eliot Glacier, and Heather Canyon on Mt. Hood, Oregon; the Hood and Sandy
Rivers in the vicinity of Mt. Hood; White River, the Sunrise area, Tahoma
Creek, and the Nisqually River area on Mt. Rainier, Washington; and the
communities of Electron and Orting in the vicinity of Mt. Rainier. Like the
previous section, many of the viewpoint descriptions in this section contain
student activities.
Structure of the student activity page:
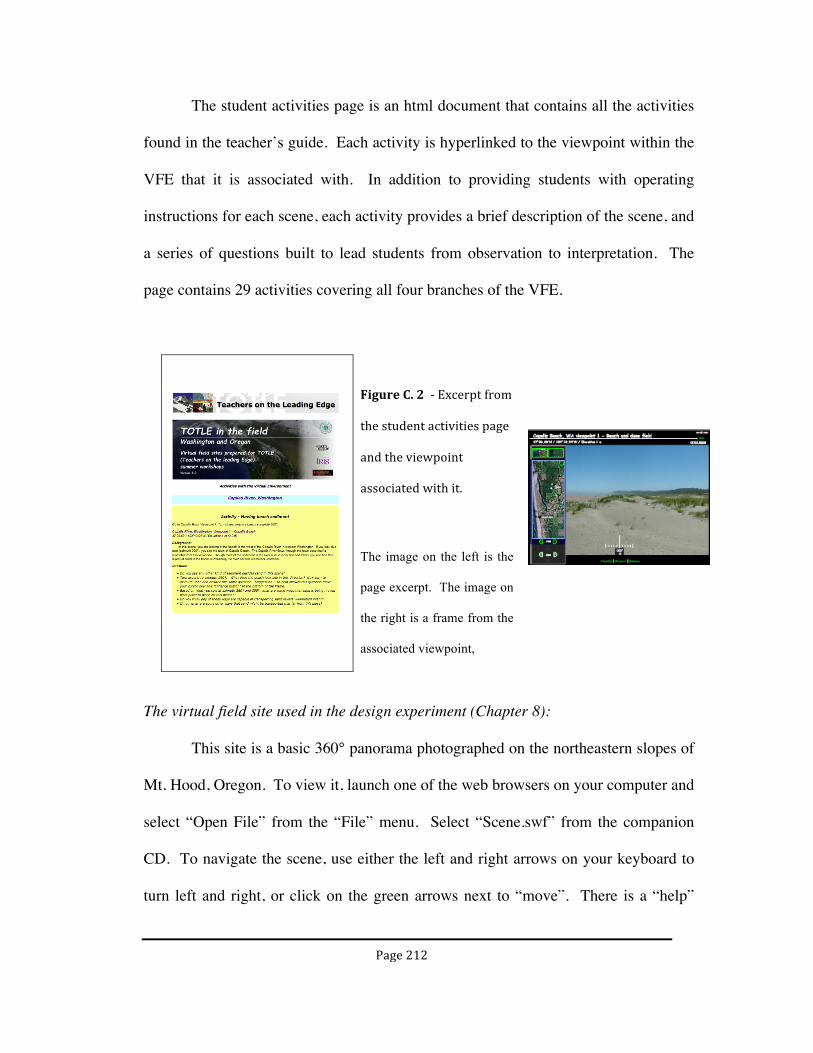
Page 212
The student activities page is an html document that contains all the activities
found in the teacher’s guide. Each activity is hyperlinked to the viewpoint within the
VFE that it is associated with. In addition to providing students with operating
instructions for each scene, each activity provides a brief description of the scene, and
a series of questions built to lead students from observation to interpretation. The
page contains 29 activities covering all four branches of the VFE.
Figure C. 2 -‐ Excerpt from
the student activities page
and the viewpoint
associated with it.
The image on the left is the
page excerpt. The image on
the right is a frame from the
associated viewpoint,
The virtual field site used in the design experiment (Chapter 8):
This site is a basic 360° panorama photographed on the northeastern slopes of
Mt. Hood, Oregon. To view it, launch one of the web browsers on your computer and
select “Open File” from the “File” menu. Select “Scene.swf” from the companion
CD. To navigate the scene, use either the left and right arrows on your keyboard to
turn left and right, or click on the green arrows next to “move”. There is a “help”

Page 213
button in the upper right hand corner of the screen to provide additional navigational
instructions.