1.3.2. Average percentage of courses that include experiential

This article appeared in a journal published by Elsevier. The attachedcopy is furnished to the author for internal non-commercial researchand education use, including for instruction at the authors institution
and sharing with colleagues.
Other uses, including reproduction and distribution, or selling orlicensing copies, or posting to personal, institutional or third party
websites are prohibited.
In most cases authors are permitted to post their version of thearticle (e.g. in Word or Tex form) to their personal website orinstitutional repository. Authors requiring further information
regarding Elsevier’s archiving and manuscript policies areencouraged to visit:
http://www.elsevier.com/copyright

Author's personal copy
Int. J. Human-Computer Studies 67 (2009) 787–799
The movement patterns and the experiential componentsof virtual environments
Heikki Sarkelaa,�, Jari Takataloa, Patrick Mayb, Mikko Laaksoc, Gote Nymana
aPsychology of Evolving Media and Technology (POEM), Faculty of Behavioral Sciences, University of Helsinki, PO Box 9, FIN-00014, FinlandbDepartment of Biomedical Engineering and Computational Science, Helsinki University of Technology, PO Box 3310, FIN-02015 TKK, Finland
cDepartment of Media Technology, Helsinki University of Technology, PO Box 5400, FIN-02015 TKK, Finland
Received 3 July 2007; received in revised form 7 February 2009; accepted 18 May 2009
Communicated by e. motta
Available online 27 May 2009
Abstract
Human movement in virtual environments (VEs) is a largely unstudied area, and there are no well-established methods of measuring it
in VEs. Consequently, it is unclear how movement affects the experiential side of VEs. We introduce a novel method of measuring and
modelling human movement. A specific information entropy-based modelling method enabled us to identify different movement patterns
and analyse the experiential components related to them. The data was collected by registering the movement patterns of 68 participants
who were in a virtual house doing a search task. The experiential side of the VE was measured with the Experimental Virtual
Environment Questionnaire (EVEQ). Four movement patterns were identified. In addition, fluent movement in VEs was related to a high
sense of presence. Moreover, the participants who moved fluently in the environment assessed their skills high. The results show how
movement is related the way in which people experience the VE. The movement analysis method introduced here is applicable to other
related research areas as well.
r 2009 Elsevier Ltd. All rights reserved.
Keywords: Virtual environments; Movement modelling; Entropy; Experiences; Presence; Flow
1. Introduction
Picture yourself driving a bumper car in an amusementpark with your friend. Your friend manoeuvres her carwith a big smile on her face, while despite your best effort,your car does not move in a direction that you wantit to move, making the whole experience unpleasant.The fluency of movement affects how both you andyour friend experience the situation. But, how should westudy this experience and, especially, how should we studymovement? According to Hilgard (1980), experiencesshould be analysed by considering simultaneously thecognitive (thoughts), emotional (feelings), and conative
(motivation) sides of them. The problem with thisapproach is operationalization of experience and difficultyof conducting experimental research in laboratory condi-tions on such a complex subject. One solution is the use ofvirtual environments (VEs) as a research setting.VEs have high ecological validity when studying human
perception (Waller, 2005), motor functions (Zacharias,2006), or experiences and emotions (Germanchis et al.,2004; Wiederhold and Wiederhold, 2003). It is fairly easyto build realistic yet controllable experimental settingsby using VEs. This has led to a large spectrum ofapplications in different areas, such as using VEs topractise surgical operations (Delp et al., 1997), trainingastronauts (Loftin and Kenney, 1995), and, in ever growingnumbers, in the entertainment industry (Zyda, 2005).However, despite the numerous VE applications, there isrelatively little information about the experiential compo-nents of VEs. An exception is presence, an illusion of beingin a virtual world, which is one of the most commonly used
ARTICLE IN PRESS
www.elsevier.com/locate/ijhcs
1071-5819/$ - see front matter r 2009 Elsevier Ltd. All rights reserved.
doi:10.1016/j.ijhcs.2009.05.003
Abbreviations: EVE, experimental virtual environment; EVEQ, Experi-
mental Virtual Environment Questionnaire; VE, virtual environment.�Corresponding author. Tel.: +358 919 129 461; fax: +358 919 129 542.
E-mail addresses: [email protected] (H. Sarkela),[email protected] (J. Takatalo), [email protected] (P. May),
[email protected] (M. Laakso), [email protected] (G. Nyman).

Author's personal copy
concepts when studying VEs (Lombard and Ditton, 1997;Sanchez-Vives and Slater, 2005; Schubert et al., 1999;Takatalo et al., 2008; Witmer and Singer, 1998).
Conversely, movement in VE and its effects on subjectiveexperiences is not well studied. The reason for this issimple: there are no well-established methods of measuringmovement in VE. However, part of the experiences usersattain from VEs could be best explained by their ability(or inability) to move fluently. We introduce a novelinformation theory-based method of measuring andmodelling movement. It allows us to identify and comparedifferent movement patterns, that is, different ways of howusers move in VEs, and the background variables related tothem. In addition, this entropy-based movement modelallows us to make statistical comparisons between move-ment patterns, which, in turn, enables us to examine theexperiential components related to them.
1.1. Movement in virtual environments
Movement in VEs is basically only visual movementwhich users steer with an interface. In practice, this meansthat the user is standing still in front of a display device andwith the help of control devices the picture, and thereby,the VE around him/her moves. There are numerousinterfaces, which are especially developed for VEs. Themost common interface for moving is mouse and buttons(Burdea and Coiffet, 2003). Other possible interfaces are,for example, a tracking camera, speech recognition input,and walking on a special treadmill (Hand, 1997). Althoughsteering with a mouse is admittedly far from actualwalking, it has been shown that the basic movementstrategy in well-built VE is similar to the movementstrategy used in natural environment (Zacharias, 2006).Therefore, findings from movement in VE can, withcertain restrictions, be generalized to movement in the realenvironment.
1.1.1. Movement modelling
Movement is a dynamic process, where both the task andthe environment where it is done, affect how a personmoves. This, in turn, makes mathematical modellingdifficult. Partly because of the complexity of it, so far,there have been only a few studies that analyse movementin VEs. These studies have analysed movement in VEsmostly by using qualitative measures (Lathrop and Kaiser,2005; Ruddle and Jones, 2001). In contrast, there are nowell-established methods of measuring which give quanti-tative information about how users move in VEs, not tomention any standard measures which would allowcomparison between previous studies. However, quantita-tive data is essential to most statistical analysis methods.One way of studying movement quantitatively is the use ofdistributions that are based on movement speed androtations (Slater et al., 1998). However, previous researchhas shown that there are experimental and theoreticallimitations when using distributional statistics in move-
ment analysis (Kim et al., 1999). As a solution, informationentropy analysis has been suggested as a sound method ofmovement modelling (Lai et al., 2005).
1.1.2. Information entropy and movement
Entropy is originally a concept of classical thermodynamics,which measures the increase of disorder in a physicalsystem, that is, a change toward thermodynamic equilibrium(Clausius, 1865). Entropy has been applied, for example, inchemistry, statistical mechanics, bioinformatics, and informa-tion theory (Sethna, 2006). In information theory, entropymeasures the amount of information that a data sourcecontains (Weaver, 1963). A data source can be any signal,event, or any other result of measurement, which containsinformation. When calculating entropy from the measure-ment, the following rule can be applied: the more often youget a specific result, the less new information it gives you. Inthis case the entropy of the result is also small. To clarify,think of a biased dice which gives you six every time it is cast.In this case the result of a measurement gives you no newinformation, that is, its uncertainty, and hence entropy, iszero. In contrast, the less frequently you get a specific result,the more information it contains and the bigger the entropy.In our dice example, this would represent a normal unbiaseddice. In other words, the bigger the entropy of the result ofmeasurement, the more randomness and new information itcontains. In short, the entropy of the result of measurementtells howmuch information the result contains. In informationtheory entropy H is calculated as follows:
HðX Þ ¼ �X
pðxiÞ log pðxiÞ
where X indicates the result of measurement, ranging from x1,x2, x3, y, xj, while the probability of an individual result ofmeasurement xj is indicated with a p(xj).In movement studies entropy measures have been applied
only to rather simple tasks, such as muscle control or aimingmovements (Lai et al., 2005; Stergiou et al., 2004). Move-ment in VEs has not been previously studied with entropymeasures. What are the advantages of entropy measuresthen? Entropy measures reveal the regularity and smoothnessof the movement, which helps to discriminate, for instance,those who move with a fluctuating speed from those whotravel at a steady pace. In addition, the entropy measures arecalculated by using the true occurrence of information in thedata, unlike many other estimators which make assumptionsabout the distributional properties of the data. To conclude,by using information entropy it is possible to quantifymovement, and thus identify different movement patterns.Furthermore, this approach can be used to show howdifferent movement patterns are related to how usersexperience the VE.
1.2. Experiences and virtual environments
With the help of modern technology, realistic VEs areeasier and cheaper to create than ever before (Lanier,
ARTICLE IN PRESSH. Sarkela et al. / Int. J. Human-Computer Studies 67 (2009) 787–799788

Author's personal copy
2001). As VE applications are becoming more popular,there is a growing need to understand what psychologicallyrelevant factors are associated with them. First, it is knownthat VEs can create a state of presence where a user doesnot perceive her/his immediate surroundings, but insteadfeels like being inside the world created by the computer(Lombard and Ditton, 1997; Sanchez-Vives and Slater,2005). These perceptual and cognitive processes are studiedwith the concept of presence. This approach emphasizesthe active role of perception (Gibson, 1979). Secondly,cognitive and affective factors are studied with the conceptof flow, according to which the cognitive evaluationof skills and challenges has an effect on the quality of theaffective appraisal of the situation (Csikszentmihalyi,1975). The study of flow is parallel to the cognitive-motivational theory of emotion as formulated by Lazarus(1991). While the main experiential components that arerelated to VEs are recognised, the role of movement onthese experiences is mainly unknown.
1.2.1. Presence
Presence is a psychological state, which is thought to be adefining factor in what makes VEs unique experientialenvironments (Sanchez-Vives and Slater, 2005; Schubertet al., 1999). The definition of presence is still acontroversial issue, which has led to a wide range ofdifferent operationalizations (e.g. Friedman et al., 2006;Sas and O’Hare, 2003; Schuemie et al., 2001). Despite thedifferences, it is a widely accepted fact that in order toachieve the state of presence, the VE should be immersiveand easy to use, so that the user must not consciously payattention to the equipment she/he is using. That is, the stateof presence is defined as a perceptual illusion of non-mediation (Lombard and Ditton, 1997). For example,when playing a driving simulator game the player may feellike really driving a car instead of playing a simulator.
The most common way to measure presence is the use ofself-report questionnaires. In practice, a group of compo-nent variables is being measured, which when combinedtells something about presence. The most salient compo-nents of presence are realness and the perceived spatialityof the VE and the possibility to explore it freely (Fontaine,1992; Lessiter et al., 2001; Schubert et al., 2001; Witmerand Singer, 1998). In addition, the speed and the range ofinteractivity and the shift of attention to the VE are centralcomponents (Lessiter et al., 2001; Schubert et al., 2001;Slater et al., 1998). A common term for all of thesecomponents is physical presence. However, why tryto maximise presence when designing applications? Firstof all, high presence is related to pleasant user experience(Novak et al., 2000). Furthermore, high presence isrelated to better task performance and a smaller numberof simulator sickness symptoms (Rice, 1992; Witmer andSinger, 1998). Overall, applications that elicit high presenceare more efficient to use and users are keener to use them.
The controllability of the VE and the ease of use areimportant in order to achieve high presence (Schuemie et
al., 2001). If the interface is distracting or it requires a lot ofeffort to concentrate on the using of VE, it is difficult to beimmersed in a virtual world (Lombard and Ditton, 1997).It is reasonable to assume that fluent movement is aprerequisite for a high presence. Previous research hasshown that highest presence is achieved when movement inVE is carried out by actual walking by using, for example,a treadmill interface (Usoh et al., 1999). Nevertheless, thereis no previous research that addresses how the fluencyof the movement affects presence evaluations. All in all,the effects of the control factors and the ease of use onpresence have been analysed only on a theoretical level(Novak et al., 2000; Schubert et al., 2001; Witmer andSinger, 1998).
1.2.2. Flow
Flow is a concept that refers to a psychological state ofenjoyment and concentration (Csikszentmihalyi, 1975).In addition, in a state of flow a person is fully absorbedinto her/his current action and feels motivated, happy, andcognitively efficient. Although originally flow was appliedin the analysis of such activities as rock climbing anddancing, later on it has been successfully used whenstudying computer use (Ghani and Deshpande, 1994),web activities (Chen et al., 1999; Novak et al., 2000), andcomputer games (Hsu and Lu, 2004; Takatalo et al., 2004).While there is still some debate concerning the definitionof flow, it is widely accepted that subjective evaluationof skills and challenges, and a sufficient level of controland playfulness, are the main antecedents of flow(Csikszentmihalyi and Csikszentmihalyi, 1988; Finneranand Zhang, 2005; Novak et al., 2000).The flow experience itself is a pleasant experience, and
hence the action where flow is attained is seen as mean-ingful, fluent, and efficient. Previous studies concerning theexperiential factors of computer use have shown that flowis related to more efficient learning (Hoffman and Novak,1996), positive affect (Chen et al., 1999; Hoffman andNovak, 1996), and more frequent computer use (Ghani andDeshpande, 1994). It seems that when attained, flow leadsto better results, faster learning, and happier users.Despite the inconsistencies and discrepancies in the
definition of flow, there is a strong consensus that skill andchallenge and the balance between them is vital in orderto experience flow (Finneran and Zhang, 2005). Often theproblems with the interface are the main reason thathinders users from experiencing flow in computer settings(Pilke, 2004). In order to be able to move fluently in a VE,the interface cannot be highly distracting. Research-wise,the trouble is the lack of proper objective measuringmethods for skills and challenges. This study introducesa novel method of measuring movement, which offers apossibility to use objective evaluation of movement as askill measure. While skills and challenges are essential toflow, it has been shown that both skills and challenges haveto reach a certain level and maintain a balance in order toexperience flow (Csikszentmihalyi and Csikszentmihalyi,
ARTICLE IN PRESSH. Sarkela et al. / Int. J. Human-Computer Studies 67 (2009) 787–799 789

Author's personal copy
1988). Based on this notion, Massimini and Carli (1988)have presented a four-channel flow model (see Fig. 1).According to this model, too easy a task or lack of skillsprevents the users from experiencing flow, even though thebalance between the skills and challenges would beappropriate. Consequently, it is assumed that fluentmovement in VE is related to flow, but only when usersevaluate their skills and challenges of the situation as high.
1.3. Aim of the study
The aim of this study is to analyse movement in VEs andto examine the role of movement on how users experienceVEs. Movement in the VE is modelled by combiningtraditional movement data, such as the amount of stops,with information-entropy-based measures. With the move-ment model, we try to identify characteristics of fluentmovement and compare fluently moving users with lessfluently moving ones. Due to the lack of previous researchon the role of movement in VE, this is an exploratorystudy. Consequently, first it is necessary to find out whetherthere are movement patterns that can be identified.Secondly, we analyse how different background variablesare related to movement patterns. Thirdly, we hypothesize
that fluent movement in VEs is related to a high sense ofpresence. Finally, we expect fluent movement to be relatedto high evaluations of skill and challenge. In addition,we draw a few tentative conclusions whether our move-ment modelling method could work as an objective skillmeasure.
2. Methods
2.1. Participants
Volunteers were sought through announcements postedon university mailing lists. In addition, mailing list sub-scribers were encouraged forwarding the announcementto people who might be interested in participating. Thesample consisted of 68 participants, with 43 (63.2%)of them men and 25 (36.8%) women. The mean age ofthe sample was 28.15 (SD ¼ 5.50), with a range from 18 to45 years. The majority of the participants were highlyeducated, with high school degree (n ¼ 32, 47.1%) ora university degree (n ¼ 31, 45.6%). All participantshad at least basic skills in using computers. Their weeklycomputer use ranged from 0 to 60 h per week (M ¼ 28.51,SD ¼ 16.78). Only nine participants (13.2%) had pre-viously used VEs. Twenty-two participants (32.4%) re-ported never playing computers games, while only threeparticipants (4.4%) reported playing on a daily basis.
2.2. Technology
The experiment took place in the experimental virtualenvironment (EVE) hosted by Department of MediaTechnology at the Helsinki University of Technology.EVE is a rear-projection-based virtual reality system,where the user is surrounded by three 3� 3m2 screens(see Fig. 2a and b). In order to view the environment in 3D,shutter glasses were worn. The participants were able tointeract with the environment by a custom-made wand,consisting of a wireless mouse and a magnetic 3D tracker(Laakso, 2001) (see Fig. 2c). For travel technique, we chosethrottle and steering-metaphor. In this technique, the userpushes a button in the wand and moves the device in adirection he wishes to move. This results in (continuous)movement to that direction. The distance from the origin
ARTICLE IN PRESS
Skill
Cha
lleng
e
Anxiety
Apathy
Flow
Boredom
Fig. 1. A four-channel flow model (adapted from Massimini and Carli,
1988).
Fig. 2. (a) The stereoscopic images from the projectors are reflected into 3� 3m2 screens with the help of mirrors, (b) a view of the EVE and (c) the
custom-made wand device that was used to move in the VE.
H. Sarkela et al. / Int. J. Human-Computer Studies 67 (2009) 787–799790

Author's personal copy
(point where the button was pressed down) determinesthe speed and releasing the button stops the movement.The rotation is handled by pressing another button androtating the wand in a desired direction. The rotation anglefrom the origin determines the rotation speed and releasingthe button stops it. The software that we used was amodified version of HCNav by Laakso (2001). Theparticipants heard all the sounds through EVE’s 3D-audiosystem with a volume of approximately 65 dB. For a morecomprehensive description of the software and hardwareused, see Jalkanen (2000) and Laakso (2001).
2.3. Test procedure
The procedure started with a rehearsing period. Theinstructions on how to use the Wand and move in the VEwere available to the participants on the test informationpages in the Web. In addition, the participants werefamiliarised with the instructions before entering the EVE.If necessary, the participants were instructed in finding aneffective way to move around the EVE. Movement wasrestricted so that the participants could move only at ahorizontal level. The actual task was to go into a virtualfive-bedroom house and explore it in order to find objectsthat do not belong into a normal house. There was onlyone ‘‘wrong’’ object at each point in time and when itwas found the participants were instructed to collide it.The collision made the object disappear and produced asmall sound. At the same time, another object turned upsomewhere else in the house. In total, there were 11 targetobjects in EVE. After the participant found all the objectsor reached the limit of 15min the task was aborted. Therewas no overall collision detection, so the participants wereable to move through walls and furniture. However, theywere encouraged to avoid it. The idea of the task was toprovide the participants a meaningful and quite neutralactivity for 10–15min in EVE. The whole procedure tookapproximately 20–25min. Afterwards, the participants
were asked to fill in the Experimental Virtual EnvironmentQuestionnaire (EVEQ) (Takatalo et al., 2008).
2.4. Movement analysis
The participants’ movement in the VE was recorded on acomputer as a two-dimensional (x, y) path (Fig. 3a).The sampling rate for the movement was set on 17 timesper second. In order to analyse movement statistically,we needed a way to quantify it. First, we calculated foreach participant the total time, the amount of stops, timespent being stationary and mean acceleration. Next, threeentropy measures were calculated by using a custom-madealgorithm in MatLab R13. We calculated location entropy,the entropy of turning, and speed entropy for eachparticipant individually. All entropy measures were con-tinuous variables.
Location entropy was calculated by dividing the areawhere the participant was moving in equal sections, whichfor the sake of clarity are called tiles. Next, we calculatedthe frequency for how often the participant had visitedeach tile. Consequently, a 3D histogram was made showingboth the movement path of the participant and the numberof visits on each tile (Fig. 3b). By using the frequencyinformation, a probability of visit for each tile wascalculated, which, in turn, was used to calculate thelocation entropy. Hence, low location entropy illustratesthat the participant has moved most of the time in a fairlylimited part of the VE. In contrast, high location entropyshows that the participant has moved evenly in all the partsof the VE.
The entropy of turning was formed by calculating achange in angle for each consecutive point of measurement.Next, a full circle was divided into equal segments (11) andeach change in angle was categorised belonging to asegment based on the size of the angle. By this procedure,we were able to calculate the probability for each change inangle, and thereby, to determine the entropy of turning. In
ARTICLE IN PRESS
2010
20
40
60
80
4000
30
Fig. 3. (a) Two-dimensional movement path of one participant and (b) movement path of the same participant on a 3D histogram. The height of the
histogram illustrates the amount of visits on a certain location.
H. Sarkela et al. / Int. J. Human-Computer Studies 67 (2009) 787–799 791
Author's personal copy
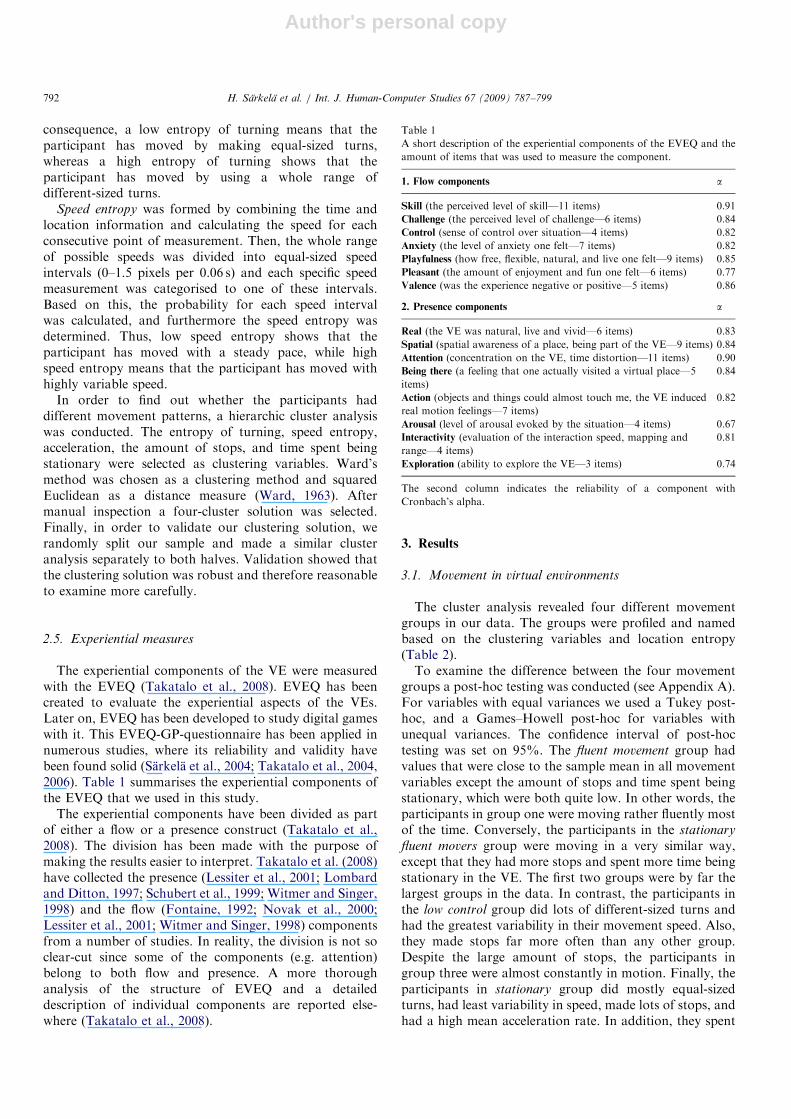
consequence, a low entropy of turning means that theparticipant has moved by making equal-sized turns,whereas a high entropy of turning shows that theparticipant has moved by using a whole range ofdifferent-sized turns.
Speed entropy was formed by combining the time andlocation information and calculating the speed for eachconsecutive point of measurement. Then, the whole rangeof possible speeds was divided into equal-sized speedintervals (0–1.5 pixels per 0.06 s) and each specific speedmeasurement was categorised to one of these intervals.Based on this, the probability for each speed intervalwas calculated, and furthermore the speed entropy wasdetermined. Thus, low speed entropy shows that theparticipant has moved with a steady pace, while highspeed entropy means that the participant has moved withhighly variable speed.
In order to find out whether the participants haddifferent movement patterns, a hierarchic cluster analysiswas conducted. The entropy of turning, speed entropy,acceleration, the amount of stops, and time spent beingstationary were selected as clustering variables. Ward’smethod was chosen as a clustering method and squaredEuclidean as a distance measure (Ward, 1963). Aftermanual inspection a four-cluster solution was selected.Finally, in order to validate our clustering solution, werandomly split our sample and made a similar clusteranalysis separately to both halves. Validation showed thatthe clustering solution was robust and therefore reasonableto examine more carefully.
2.5. Experiential measures
The experiential components of the VE were measuredwith the EVEQ (Takatalo et al., 2008). EVEQ has beencreated to evaluate the experiential aspects of the VEs.Later on, EVEQ has been developed to study digital gameswith it. This EVEQ-GP-questionnaire has been applied innumerous studies, where its reliability and validity havebeen found solid (Sarkela et al., 2004; Takatalo et al., 2004,2006). Table 1 summarises the experiential components ofthe EVEQ that we used in this study.
The experiential components have been divided as partof either a flow or a presence construct (Takatalo et al.,2008). The division has been made with the purpose ofmaking the results easier to interpret. Takatalo et al. (2008)have collected the presence (Lessiter et al., 2001; Lombardand Ditton, 1997; Schubert et al., 1999; Witmer and Singer,1998) and the flow (Fontaine, 1992; Novak et al., 2000;Lessiter et al., 2001; Witmer and Singer, 1998) componentsfrom a number of studies. In reality, the division is not soclear-cut since some of the components (e.g. attention)belong to both flow and presence. A more thoroughanalysis of the structure of EVEQ and a detaileddescription of individual components are reported else-where (Takatalo et al., 2008).
3. Results
3.1. Movement in virtual environments
The cluster analysis revealed four different movementgroups in our data. The groups were profiled and namedbased on the clustering variables and location entropy(Table 2).To examine the difference between the four movement
groups a post-hoc testing was conducted (see Appendix A).For variables with equal variances we used a Tukey post-hoc, and a Games–Howell post-hoc for variables withunequal variances. The confidence interval of post-hoctesting was set on 95%. The fluent movement group hadvalues that were close to the sample mean in all movementvariables except the amount of stops and time spent beingstationary, which were both quite low. In other words, theparticipants in group one were moving rather fluently mostof the time. Conversely, the participants in the stationary
fluent movers group were moving in a very similar way,except that they had more stops and spent more time beingstationary in the VE. The first two groups were by far thelargest groups in the data. In contrast, the participants inthe low control group did lots of different-sized turns andhad the greatest variability in their movement speed. Also,they made stops far more often than any other group.Despite the large amount of stops, the participants ingroup three were almost constantly in motion. Finally, theparticipants in stationary group did mostly equal-sizedturns, had least variability in speed, made lots of stops, andhad a high mean acceleration rate. In addition, they spent
ARTICLE IN PRESS
Table 1
A short description of the experiential components of the EVEQ and the
amount of items that was used to measure the component.
1. Flow components a
Skill (the perceived level of skill—11 items) 0.91
Challenge (the perceived level of challenge—6 items) 0.84
Control (sense of control over situation—4 items) 0.82
Anxiety (the level of anxiety one felt—7 items) 0.82
Playfulness (how free, flexible, natural, and live one felt—9 items) 0.85
Pleasant (the amount of enjoyment and fun one felt—6 items) 0.77
Valence (was the experience negative or positive—5 items) 0.86
2. Presence components a
Real (the VE was natural, live and vivid—6 items) 0.83
Spatial (spatial awareness of a place, being part of the VE—9 items) 0.84
Attention (concentration on the VE, time distortion—11 items) 0.90
Being there (a feeling that one actually visited a virtual place—5
items)
0.84
Action (objects and things could almost touch me, the VE induced
real motion feelings—7 items)
0.82
Arousal (level of arousal evoked by the situation—4 items) 0.67
Interactivity (evaluation of the interaction speed, mapping and
range—4 items)
0.81
Exploration (ability to explore the VE—3 items) 0.74
The second column indicates the reliability of a component with
Cronbach’s alpha.
H. Sarkela et al. / Int. J. Human-Computer Studies 67 (2009) 787–799792
Author's personal copy
ARTICLE IN PRESS
Table 2
Four different movement patterns were identified in our data.
Movement measures Groups df1, df2 F
1 2 3 4
Fluent movers Stationary fluent movers Low control Stationary
n ¼ 20 n ¼ 24 n ¼ 10 n ¼ 14
Entropy of turninga 2.76 (0.25) 2.55 (0.13) 3.04 (0.27) 2.34 (0.13) 3,26 26.05***
Speed entropyb 2.60 (0.30) 2.22 (0.20) 2.74 (0.31) 1.95 (0.24) 3,64 26.98***
Amount of stopsa 54.65 (25.16) 75.75 (22.91) 155.50 (35.02) 101.29 (36.82) 3,37 25.44***
Stationary (%)a 23.09 (11.72) 46.21 (4.73) 26.90 (13.05) 58.62 (5.04) 3,26 47.55***
Accelerationa 0.13 (0.04) 0.15 (0.03) 0.22 (0.11) 0.23 (0.06) 3,19 8.22**
Location entropyb 5.54 (0.43) 5.16 (0.22) 5.67 (0.25) 5.06 (0.22) 3,64 13.58***
The table shows the cross-tabulation of movement measures (standard deviations in brackets). Location entropy was not used as a clustering variable.
***p o 0.001, **p o 0.01, *p o 0.05,+p o 0.10.aBrown–Forsythe test.bOne-way analysis of variance.
-2
-1
0
1
2Location entropy
Entropy of turning
Speed entropy
Amount of stops
Stationary (%)
Acceleration
Fluent movers
-2
-1
0
1
2Location entropy
Entropy of turning
Speed entropy
Amount of stops
Stationary (%)
Acceleration
Stationary fluent movers
-2
-1
0
1
2Location entropy
Entropy of turning
Speed entropy
Amount of stops
Stationary (%)
Acceleration
Low control
-2
-1
0
1
2Location entropy
Entropy of turning
Speed entropy
Amount of stops
Stationary (%)
Acceleration
Stationary
Fig. 4. An illustration of differences in movement measures in the four movement patterns which we were able to identify. In the picture, the mean values
of each variable are shown. All the variables have been scaled on a commensurate standardized scale.
H. Sarkela et al. / Int. J. Human-Computer Studies 67 (2009) 787–799 793

Author's personal copy
more time being stationary than participants in othergroups. The characteristics and the differences between thegroups are illustrated in Fig. 4.
Next, we wanted to examine how the movement patternsare associated with task completion and backgroundvariables. The background variables were age, gender,computer experience, average weekly computer usage, anddigital gaming experience. The search task was relativelysimple, as three-quarters of our participants found at least10 objects, and half of the participants found all 11 targetobjects. Movement groups did not differ with respect to theamount of objects found (Kruskal–Wallis, w2[3] ¼ 3.85,p ¼ 0.28). In addition, there were only minor differenceswith respect to background variables. Only average weeklycomputer usage was related to different movement patterns(one-way ANOVA, F[3,63] ¼ 3.50, po0.05), so that fluent
movers and stationary participants used computers moreoften than the participants in other two groups. There wereno other statistically significant differences between themovement patterns with respect to other backgroundvariables.
3.2. Movement and the experiential components of virtual
environments
3.2.1. Experiences in all movement groups
After identifying four distinct movement patterns, weexamined how they are related to experiential components(Table 3). Furthermore, a Tukey post-hoc testing, with
confidence interval set on 95%, was conducted to examinethe experiential differences between the movement groups(see Appendix A). First, the fluent movers experienced VEas a realistic and believable space while the low control
and the stationary group experienced it as artificial andunconvincing. Furthermore, the participants in the fluent
movers group and stationary group assessed themselves asskilled in VE use, while the participants in two othergroups did not. In addition, the post-hoc analysis indicatedthat the participants in the low control group felt moreanxiety than other users, although the effect on analysis ofvariance testing was merely marginally significant. Finally,the fluent movers evaluated the interactivity of the VE asfast and natural but the post-hoc testing failed to identifysignificant differences between the movement groups.
3.2.2. Experiences in fluent movers and low control groups
Next, we compared the two most diverging groups: thefluent movers and the low control group. This approachallowed us to compare how the fluent movement in VE,or the lack of it, is related to how people experience theVE. The comparison was made by using contrasts in theanalysis of variance. The contrast analysis is used fortesting specific hypotheses of interest as an alternativeto traditional pair-wise comparisons. The results of thecontrast analysis are illustrated in Fig. 5.The low control group differed from the fluent movers
with regard to almost all of the experiential components.The using of the VE was easier and more positive
ARTICLE IN PRESS
Table 3
Presence and flow components in different movement patterns.
Experiential components Groups F (3,64)
1 2 3 4
Fluent movers Stationary fluent movers Low control Stationary
n ¼ 20 N ¼ 24 n ¼ 10 n ¼ 14
Flow components
Skill 0.26 (0.90) �0.24 (0.89) �0.53 (0.88) 0.45 (0.99) 3.32*
Challenge 0.04 (1.04) 0.12 (0.88) 0.09 (1.07) �0.33 (0.75) 0.78
Control 0.20 (0.72) �0.05 (0.91) �0.43 (0.88) 0.22 (0.82) 1.60
Anxiety �0.38 (0.82) 0.04 (0.86) 0.38 (0.82) �0.02 (0.55) 2.27+
Playfulness 0.22 (0.97) 0.06 (0.92) �0.48 (0.87) �0.08 (0.76) 1.45
Pleasant 0.19 (0.89) 0.05 (1.06) �0.49 (0.63) 0.02 (0.73) 1.34
Valence 0.31 (0.99) �0.02 (1.01) �0.47 (0.61) �0.07 (0.86) 1.63
Presence components
Real 0.47 (0.96) �0.07 (0.82) �0.40 (0.61) �0.34 (0.81) 3.70*
Spatial 0.27 (1.03) �0.06 (0.84) �0.41 (0.86) 0.07 (0.84) 1.31
Attention 0.24 (0.87) �0.02 (0.95) �0.21 (0.98) �0.16 (1.10) 0.67
Being there 0.25 (0.92) 0.09 (0.75) �0.34 (1.19) �0.26 (1.05) 1.34
Action 0.33 (1.03) �0.10 (0.82) �0.40 (0.92) �0.01 (0.83) 1.66
Arousal 0.23 (0.67) �0.01 (0.77) �0.33 (0.67) 0.17 (0.74) 1.50
Interactivity 0.51 (0.79) �0.18 (0.96) �0.24 (0.52) �0.24 (0.97) 3.34*
Explorationa 0.14 (1.02) 0.13 (0.75) �0.24 (0.51) �0.07 (0.73) 0.77
The table shows means and standard deviations (in brackets) in each component. In addition the results of the between-group analysis of variance are
shown in the table.
***p o 0.001, **p o 0.01, *p o 0.05, +p o 0.10.aBrown–Forsythe test.
H. Sarkela et al. / Int. J. Human-Computer Studies 67 (2009) 787–799794
Author's personal copy
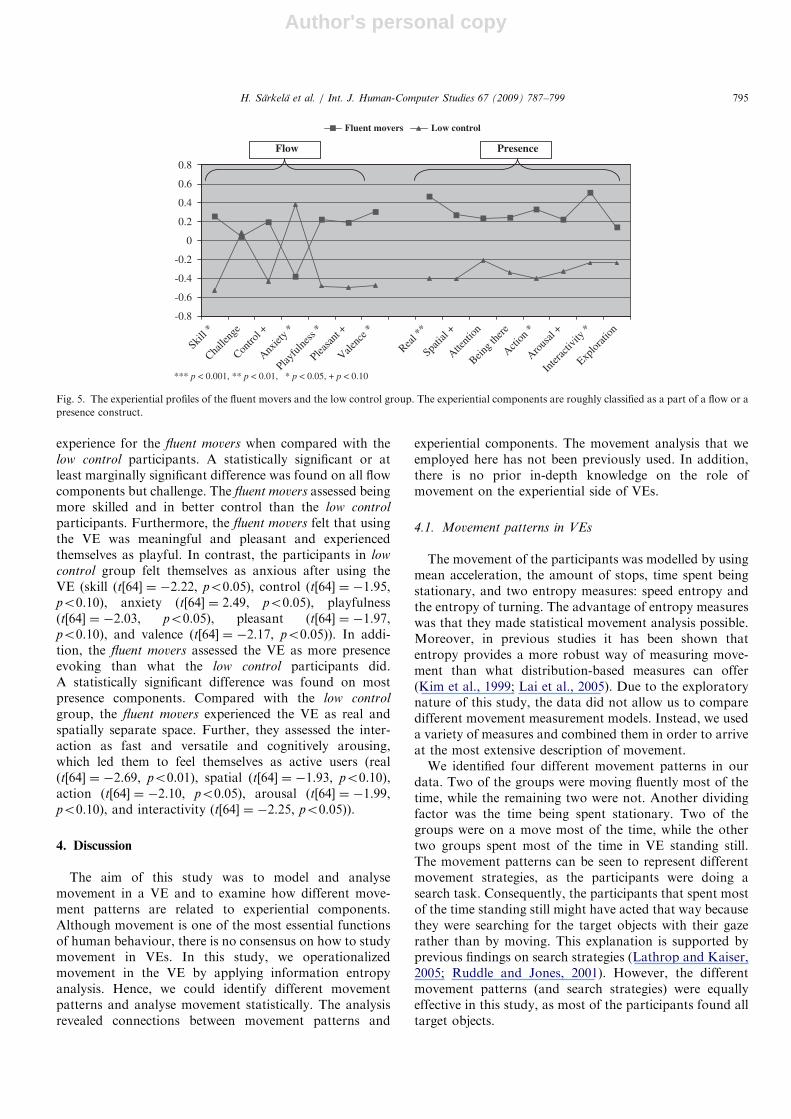
experience for the fluent movers when compared with thelow control participants. A statistically significant or atleast marginally significant difference was found on all flowcomponents but challenge. The fluent movers assessed beingmore skilled and in better control than the low control
participants. Furthermore, the fluent movers felt that usingthe VE was meaningful and pleasant and experiencedthemselves as playful. In contrast, the participants in low
control group felt themselves as anxious after using theVE (skill (t[64] ¼ �2.22, po0.05), control (t[64] ¼ �1.95,po0.10), anxiety (t[64] ¼ 2.49, po0.05), playfulness(t[64] ¼ �2.03, po0.05), pleasant (t[64] ¼ �1.97,po0.10), and valence (t[64] ¼ �2.17, po0.05)). In addi-tion, the fluent movers assessed the VE as more presenceevoking than what the low control participants did.A statistically significant difference was found on mostpresence components. Compared with the low control
group, the fluent movers experienced the VE as real andspatially separate space. Further, they assessed the inter-action as fast and versatile and cognitively arousing,which led them to feel themselves as active users (real(t[64] ¼ �2.69, po0.01), spatial (t[64] ¼ �1.93, po0.10),action (t[64] ¼ �2.10, po0.05), arousal (t[64] ¼ �1.99,po0.10), and interactivity (t[64] ¼ �2.25, po0.05)).
4. Discussion
The aim of this study was to model and analysemovement in a VE and to examine how different move-ment patterns are related to experiential components.Although movement is one of the most essential functionsof human behaviour, there is no consensus on how to studymovement in VEs. In this study, we operationalizedmovement in the VE by applying information entropyanalysis. Hence, we could identify different movementpatterns and analyse movement statistically. The analysisrevealed connections between movement patterns and
experiential components. The movement analysis that weemployed here has not been previously used. In addition,there is no prior in-depth knowledge on the role ofmovement on the experiential side of VEs.
4.1. Movement patterns in VEs
The movement of the participants was modelled by usingmean acceleration, the amount of stops, time spent beingstationary, and two entropy measures: speed entropy andthe entropy of turning. The advantage of entropy measureswas that they made statistical movement analysis possible.Moreover, in previous studies it has been shown thatentropy provides a more robust way of measuring move-ment than what distribution-based measures can offer(Kim et al., 1999; Lai et al., 2005). Due to the exploratorynature of this study, the data did not allow us to comparedifferent movement measurement models. Instead, we useda variety of measures and combined them in order to arriveat the most extensive description of movement.We identified four different movement patterns in our
data. Two of the groups were moving fluently most of thetime, while the remaining two were not. Another dividingfactor was the time being spent stationary. Two of thegroups were on a move most of the time, while the othertwo groups spent most of the time in VE standing still.The movement patterns can be seen to represent differentmovement strategies, as the participants were doing asearch task. Consequently, the participants that spent mostof the time standing still might have acted that way becausethey were searching for the target objects with their gazerather than by moving. This explanation is supported byprevious findings on search strategies (Lathrop and Kaiser,2005; Ruddle and Jones, 2001). However, the differentmovement patterns (and search strategies) were equallyeffective in this study, as most of the participants found alltarget objects.
ARTICLE IN PRESS
-0.8
-0.6
-0.4
-0.2
0
0.2
0.4
0.6
0.8
Skill *
Challe
nge
Contro
l +
Anxiet
y *
Play
fulne
ss *
Pleasa
nt +
Valenc
e *
Real *
*
Spatia
l +
Attenti
on
Being t
here
Action
*
Arous
al +
Inter
activ
ity *
Explor
ation
Fluent movers Low control
Flow Presence
*** p < 0.001, ** p < 0.01, * p < 0.05, + p < 0.10
Fig. 5. The experiential profiles of the fluent movers and the low control group. The experiential components are roughly classified as a part of a flow or a
presence construct.
H. Sarkela et al. / Int. J. Human-Computer Studies 67 (2009) 787–799 795

Author's personal copy
Next, we analysed how background variables are relatedto different movement patterns. Weekly computer usagewas the only background variable that had statisticallysignificant differences between the movement patterns. Theparticipants in fluent movers group and stationary groupused computers more frequently than the participants intwo other groups. In consequence, active computer use didnot necessarily ensure fluent movement in the VE. The VEused in this study was novel to most participants and usingit was different from typical computer use, which is whyhigh computer use did not help users move more fluently.This finding supports the earlier recommendations, whichsuggests that all users should get structured movingpractice before entering a VE (Sayers, 2004). In this study,all participants got such practice session before the taskwas begun although admittedly this was not sufficient forthe participants in the low control group.
4.2. Movement patterns and the experiential components of
VEs
As was hypothesized, fluent movement in the VE wasrelated to a high sense of presence. Fluently moving usersexperienced the VE as more realistic environment com-pared with non-fluently moving ones. In addition, com-pared with the low control participants, the fluent moversexperienced the VE as more presence evoking environmentoverall. This finding lends support to, and expands, theprevious findings in the literature that the ease of use andcontrollability are related to high presence (Novak et al.,2000; Schubert et al., 2001; Schuemie et al., 2001; Witmerand Singer, 1998). Furthermore, fluent movement in theVE verified that there were no major problems with regardto the interface. Naturally, the connection between fluentmovement and high presence would not be possible,if a user had difficulties with the interface (Lombard andDitton, 1997).
The second hypothesis was that fluent movement isrelated to users’ evaluations of high skills and challenges.This notion was also partially supported by our data: theparticipants from both fluent movers and stationary groupevaluated themselves as being more skilled than other twomovement groups. In addition to high skill evaluation,fluently moving participants felt themselves as playful andthought that the VE was a pleasant environment. Thus, allthese components combined suggest that fluently movingparticipants were in a flow state (Csikszentmihalyi, 1975).However, there were no statistically significant differencesin challenge, although the participants in stationary grouphad a tendency to assess the environment as less challen-ging compared with the participants in the other groups.Therefore, the participants in the stationary groupevaluated as being skilled, but the VE did not seem to bechallenging enough for them to achieve a flow state.Instead, they were feeling more or less bored. Thesefindings are in line with the four-channel flow model(Massimini and Carli, 1988).
As a secondary interest, we wanted to examine whethermovement modelling would work as an alternative skillmeasure. Evidently, the low control movement pattern wasa clear marker of insufficient skills. This was an importantfinding, because obviously it is essential to recognise thoseusers who need further practice and guidance in VE use(Sayers, 2004). However, fluent movement in the VE didnot necessary mean that the participant evaluated her/hisskills as high. For example, the participants in stationaryfluent movers group assessed their skills as insufficient,regardless of the fact that their movement was fluent.Furthermore, the movement pattern analysis can beconsidered as a more objective measure of movement skillsthan the participants’ subjective evaluation. Consequently,movement fluency could be applied as an alternative skillmeasure (Finneran and Zhang, 2005).
4.3. Limitations and future research
The most evident limitation of this study is that thesample size was rather small. In addition, the search taskthat we used was easy and resulted in minimal differencesin task performance. Admittedly, a bigger sample sizewould strengthen the reliability of the questionnaire and aharder task would have resulted in clearer differencesin task performance. Lately, there have been discussions ofthe limitations of studying presence with questionnaires(e.g. Slater, 2004). Although some of this discussion hasbeen made in a provocative manner, it has been a necessaryreminder that both validity and reliability are essentialwhen using questionnaires. Our EVEQ meets theserequirements well and further refinement of the question-naire is being made (Sarkela et al., 2004; Takatalo et al.,2004, 2006, 2008). The critique can also be pointed on ourmovement modelling method, particularly since informa-tion entropy measures have not been studied sufficiently incomplex movement modelling. Nevertheless, this studyshowed that combining traditional movement data, such asthe amount of stops and mean acceleration, with informa-tion entropy measures leads to rather simple but extremelymultifaceted movement modelling method. However, it isout of the scope of this study to further analyse andcompare this modelling method with other possiblemethods. In the future, there is a clear need for systematicanalysis of different measurement models and methods.Furthermore, in future the movement modelling method
introduced in this study could be applied in a numberof other research areas which lack a proper movementmodelling method. For instance, eye-tracking camera datacould easily be quantified with the help of location entropy.In addition, eye-tracking data could help us analysemovement patterns in a VE by comparing, for example,the eye movement paths of the participants who spendmost of the time being stationary with those that areconstantly on the move. Furthermore, speed entropyand the entropy of turning values of VE users could beregistered online and if a certain pre-determined limit
ARTICLE IN PRESSH. Sarkela et al. / Int. J. Human-Computer Studies 67 (2009) 787–799796

Author's personal copy
would be reached the system would notify that additionalguidance is probably needed. Alternatively, when afore-mentioned limits would be reached, the system could start‘‘softening’’ the steering commands, in order to help usersmove more fluently. Finally, our movement analysismethod could be applied to study movement in computergames, since many games already have a possibility toregister player movement in a log file in a similar way aswas done in this study.
4.4. Conclusions
To sum up, different movement patterns were related todifferent experiences. Moreover, the differences were seenon the level of perceptions, cognitions, and affectivefactors, which are also the fundamental elements of allexperiences as such (Hilgard, 1980). The fact that move-ment patterns were related to presence evaluations is in linewith the conception of perception as an active process(Gibson, 1979). After all, all the participants had a similar
background (e.g. educational level and age), they were allusing the same VE and were all performing the same task.Furthermore, most of them used a VE for the first time.Therefore, the differences in the way that the participantsmoved had an effect on how they perceived the environ-ment. In addition, part of the users evaluated as havinginsufficient skills regardless of the fact that they movedfluently, and felt the use of the VE as anxiety provoking.For these users, the cognitive evaluation of skill andchallenge level had an effect on the affective appraisalof the situation, which is in line with the propositionsabout the important role of the cognitive appraisal of thesituation on emotion process as suggested in the cognitive-motivational emotion theory (Lazarus, 1991).In conclusion, there is a growing need to understand
what psychologically relevant factors are related to VEs, asthey are becoming more and more common. Obviously,room-sized VEs will hardly ever reach average consumermarkets, but instead head mounted displays and augmen-ted reality-based VEs are becoming more popular (Lanier,
ARTICLE IN PRESS
Table A1
Speed entropy a Amount of stops b Stationary (%)b
Subset 1 Subset 2 Subset 3 Subset 1 Subset 2 Subset 3 Subset 1 Subset 2 Subset 3
Fluentmovers
Fluent movers
Fluent movers
Stationary fluent
movers
Stationary fluent
movers
Stationary fluent
moversLow
control Low
controlLow
control
Stationary Stationary Stationary
Entropy of turning b Acceleration b Location entropy a
Subset 1 Subset 2 Subset 3 Subset 4 Subset 1 Subset 2 Subset 1 Subset 2
Fluent movers
Fluentmovers
Fluent movers
Stationary fluent
movers
Stationary fluent movers
Stationary fluent
movers
Low
control Low control Low control
Low control
Stationary Stationary Stationary
Real a Anxiety a Skill a
Subset 1 Subset 2 Subset 1 Subset 2 Subset 1 Subset 2
Fluent movers
Fluent movers
Fluent movers
Stationary fluent
movers
Stationary fluent
movers
Stationary fluent
movers
Stationary fluent
movers
Low control Low
control Low control
Stationary Stationary Stationary
a Tukey post-hocb Games-Howell post-hoc
H. Sarkela et al. / Int. J. Human-Computer Studies 67 (2009) 787–799 797

Author's personal copy
2001). While VEs are an interesting research topic as such,one should also keep in mind that the phenomena seen inVE studies cannot and should not be seen as separate fromreal-world. We do not yet know why some people havemore fun in an amusement park than other people do, butif it has anything to do with movement, this study showsthat we can measure it and model it.
Acknowledgements
This project was conducted in co-operation betweenthe CSC-Finnish IT Center for Science, the Department ofMedia Technology at the Helsinki University of Technol-ogy, and the Psychology of Evolving Media and Technol-ogy-group at the University of Helsinki. The authorswould like to thank Jyrki Hokkanen, Leif Laaksonen andJarmo Pirhonen from CSC and Matti Grhn and TommiIlmonen from Department of Media Technology. Specialthanks to Jukka Hkkinen and Jeppe Komulainen fromUniversity of Helsinki.
Appendix A
A post-hoc testing was conducted to examine thedifferences between the four movement groups. The tableshows the subsets that were formed in the post-hoc testing(see Table A1). There is a statistically significant differencebetween the subsets. Note that two movement groupsbelonging to a same subset do not necessarily have samemean value.
References
Burdea, G.C., Coiffet, P., 2003. Virtual Reality Technology, second ed.
Wiley, New Jersey.
Chen, H., Wigand, R.T., Nilan, M.S., 1999. Optimal experience of web
activities. Computers in Human Behavior 15, 585–608.
Clausius, R., 1865. Ueber verschiedene fur die Anwendung bequeme
Formen der Hauptgleichungen der mechanischen Warmetheorie.
Annalen der Physik und Chemie 201, 353–400 (Electronic version).
Csikszentmihalyi, M., 1975. Beyond Boredom and Anxiety. Jossey-Bass
Publishers, San Francisco.
Csikszentmihalyi, M., Csikszentmihalyi, I.S., 1988. Introduction to part
IV. In: Csikszentmihalyi, M., Csikszentmihalyi, I.S. (Eds.), Optimal
Experience: Psychological Studies of Flow in Consciousness. Cam-
bridge University Press, New York, pp. 251–265.
Delp, S.L., Loan, P., Basdogan, C., Rosen, J.M., 1997. Surgical
simulation: an emerging technology for training in emergency
medicine. Presence 6, 147–159.
Finneran, C.M., Zhang, P., 2005. Flow in computer-mediated environ-
ments: promises and challenges. Communications of the Association
for Information Systems 15, 82–101.
Friedman, D., Brogni, A., Guger, C., Antley, A., Steed, A., Slater, M.,
2006. Sharing and analyzing data from presence experiments. Presence
15, 599–610.
Fontaine, G., 1992. The experience of a sense of presence in intercultural
and international encounters. Presence 1, 482–490.
Germanchis, T., Pettit, C., Cartwright, W., 2004. Building a three-
dimensional geospatial virtual environment on games technology.
Journal of Spatial Science 49, 89–96.
Ghani, J.A., Deshpande, S.P., 1994. Task characteristics and the
experience of optimal flow in human–computer interaction. The
Journal of Psychology 128, 381–391.
Gibson, J.J., 1979. The Ecological Approach to Visual Perception.
Houghton Mifflin, Boston.
Hand, C., 1997. A survey of 3D interaction techniques. Computer
Graphics Forum 16, 269–281.
Hilgard, E.R., 1980. The trilogy of mind: cognition, affection, and
conation. Journal of the History of the Behavioral Sciences 16,
107–117.
Hoffman, D.L., Novak, T.P., 1996. Marketing in hypermedia computer-
mediated environments: conceptual foundations. Journal of Marketing
60, 50–68.
Hsu, C., Lu, H., 2004. Why do people play on-line games? An extended
TAM with social influences and flow experience. Information &
Management 41, 853–868.
Jalkanen, J., 2000. Building a spatially immersive display-HUTCAVE.
Computer Sciences Licentiate’s Thesis, Helsinki University of Tech-
nology.
Kim, S., Carlton, L.G., Liu, Y.-T., Newell, K.M., 1999. Impulse and
movement space–time variability. Journal of Motor Behavior 31,
341–357.
Laakso, M., 2001. Practical navigation in virtual architectural environ-
ments. Telecommunication Software and Multimedia Laboratory
Master’s Thesis, Helsinki University of Technology.
Lai, S., Mayer-Kress, G., Sosnoff, J.J., Newell, K.M., 2005. Information
entropy analysis of discrete aiming movements. Acta Psychologica 119,
283–304.
Lanier, J., 2001. Virtually there. Scientific American 284, 66–75.
Lathrop, W.B., Kaiser, M.K., 2005. Acquiring spatial knowledge while
travelling simple and complex paths with immersive and non-
immersive interfaces. Presence 14, 249–263.
Lazarus, R.S., 1991. Progress on a cognitive-motivational-relational
theory of emotion. American Psychologist 46, 819–834.
Lessiter, J., Freeman, J., Keogh, E., Davidoff, J., 2001. A cross-media
presence questionnaire: the ITC-sense of presence inventory. Presence
10, 282–297.
Loftin, R.B., Kenney, P., 1995. Training the hubble space telescope flight
team. Computer Graphics and Applications 15, 31–37.
Lombard, M., Ditton, T., 1997. At the heart of it all: the concept of
presence. Journal of Computer-Mediated Communication 3.
Massimini, F., Carli, M., 1988. The systematic assessment
of flow in daily experience. In: Csikszentmihalyi, M., Csikszentmihalyi,
I.S. (Eds.), Optimal Experience: Psychological Studies of Flow
in Consciousness. Cambridge University Press, New York,
pp. 288–306.
Novak, T.P., Hoffman, D.L., Yung, Y.F., 2000. Measuring the customer
experience in online environments: a structural modelling approach.
Marketing Science 19, 22–42.
Pilke, E.M., 2004. Flow experiences in information technology use.
International Journal of Human–Computer Studies 61, 347–357.
Rice, R.E., 1992. Task analyzability, use of new media, and effectiveness:
a multi-site exploration of media richness. Organization Science 3,
475–500.
Ruddle, R.A., Jones, D.M., 2001. Movement in cluttered virtual
environments. Presence 10, 511–524.
Sanchez-Vives, M.V., Slater, M., 2005. From presence to consciousness
through virtual reality. Nature Reviews Neuroscience 6, 332–339.
Sas, C., O’Hare, G.M.P., 2003. Presence equation: an investigation into
cognitive factors underlying presence. Presence 12, 523–537.
Sayers, H., 2004. Desktop virtual environments: a study of navigation and
age. Interacting with Computers 16, 939–956.
Schubert, T., Friedmann, F., Regenbrecht, H., 1999. Embodied
presence in virtual environments. In: Paton, R., Neilson, I. (Eds.),
Visual Representations and Interpretations. Springer, London,
pp. 269–278.
Schubert, T., Friedmann, F., Regenbrecht, H., 2001. The experience of
presence: factor analytic insights. Presence 10, 266–281.
ARTICLE IN PRESSH. Sarkela et al. / Int. J. Human-Computer Studies 67 (2009) 787–799798

Author's personal copy
Schuemie, M.J., van der Straaten, P., Krijn, M., van der Mast, C.A.P.G.,
2001. Research on presence in virtual reality: a survey. Cyber
Psychology & Behavior 4, 183–201.
Sethna, J.P., 2006. Entropy, Order Parameters and Complexity. Clar-
endon Press, Oxford.
Slater, M., Steed, A., McCarthy, J., Maringelli, F., 1998. The influence of
body movement on subjective presence in virtual environments.
Human Factors 40, 469–477.
Slater, M., 2004. How colorful was your day? Why questionnaires cannot
assess presence in virtual environments. Presence 13, 484–493.
Stergiou, N., Buzzi, U.H., Kurz, M.J., Heidel, J., 2004. Nonlinear tools in
human movement. In: Stergiou, N. (Ed.), Innovative Analyses of
Human Movement. Human Kinetics, Champaign, IL, pp. 76–84.
Sarkela, H., Takatalo, J., Komulainen, J., Nyman, G., Hakkinen, J., 2004.Attitudes to new technology and experiential dimensions of two
different digital games. In: Proceedings of the NordiCHI 2004,
Tampere, Finland, pp. 349–352.
Takatalo, J., Hakkinen, J., Komulainen, J., Sarkela, H., Nyman, G., 2006.
Involvement and presence in digital gaming. In: Proceedings of the
NordiCHI 2006, Oslo, Norway, pp. 393–396.
Takatalo, J., Hakkinen, J., Sarkela, H., Komulainen, J., Nyman, G., 2004.
The experiential dimensions of two different digital games. In:
Proceedings of the PRESENCE 2004, Valencia, Spain, pp. 274–278.
Takatalo, J., Nyman, G., Laaksonen, L., 2008. Components of human ex-
perience in virtual environments. Computers in Human Behavior 24, 1–15.
Usoh, M., Arthur, K., Whitton, M.C., Bastos, R., Steed, A., Slater, M.,
1999. Walking 4walking-in-place 4flying, in virtual environments.
In: Proceedings of the 26th Annual Conference on Computer Graphics
and Interactive Techniques, Los Angeles, USA, pp. 359–364.
Ward, J.H., 1963. Hierarchical grouping to optimize an objective function.
Journal of the American Statistical Association 58, 236–244.
Waller, D., 2005. The WALKABOUT: using virtual environments to assess
large-scale spatial abilities. Computers in Human Behavior 21, 243–253.
Weaver, W., 1963. Some recent contributions to the mathematical theory
of communication. In: Shannon, C.E., Weaver, W. (Eds.), Mathema-
tical Theory of Communication. University of Illinois Press, Cham-
paign, IL, pp. 1–29.
Wiederhold, B.K., Wiederhold, M.D., 2003. Three-year follow-up
for virtual reality exposure for fear of flying. Cyber Psychology &
Behavior 6, 441–445.
Witmer, B.G., Singer, M.J., 1998. Measuring presence in virtual
environments: a presence questionnaire. Presence 7, 225–240.
Zacharias, J., 2006. Exploratory spatial behaviour in real and virtual
environments. Landscape and Urban Planning 78, 1–13.
Zyda, M., 2005. From visual simulation to virtual reality to games.
Computer 38, 25–32.
ARTICLE IN PRESSH. Sarkela et al. / Int. J. Human-Computer Studies 67 (2009) 787–799 799
Copyright © 2022 FDOKUMEN