
VIPoE SHARE Center Update – - THE-ICE
52
Source: STR 2020 © CoStar Realty Information, Inc. VIPoE SHARE Center Update – New Data, Research, Certifications, Internships and Competitions Supporting Hotel-related Academic Research and Education
-
Upload
khangminh22 -
Category
Documents
-
view
0 -
download
0
Transcript of VIPoE SHARE Center Update – - THE-ICE
Source: STR2020 © CoStar Realty Information, Inc.
VIPoE SHARE Center Update –New Data, Research, Certifications,
Internships and Competitions
Supporting Hotel-related Academic Research and Education

Source: STR2020 © CoStar Realty Information, Inc.
Introduction to STR and the SHARE Center
Source: STR2020 © CoStar Realty Information, Inc.
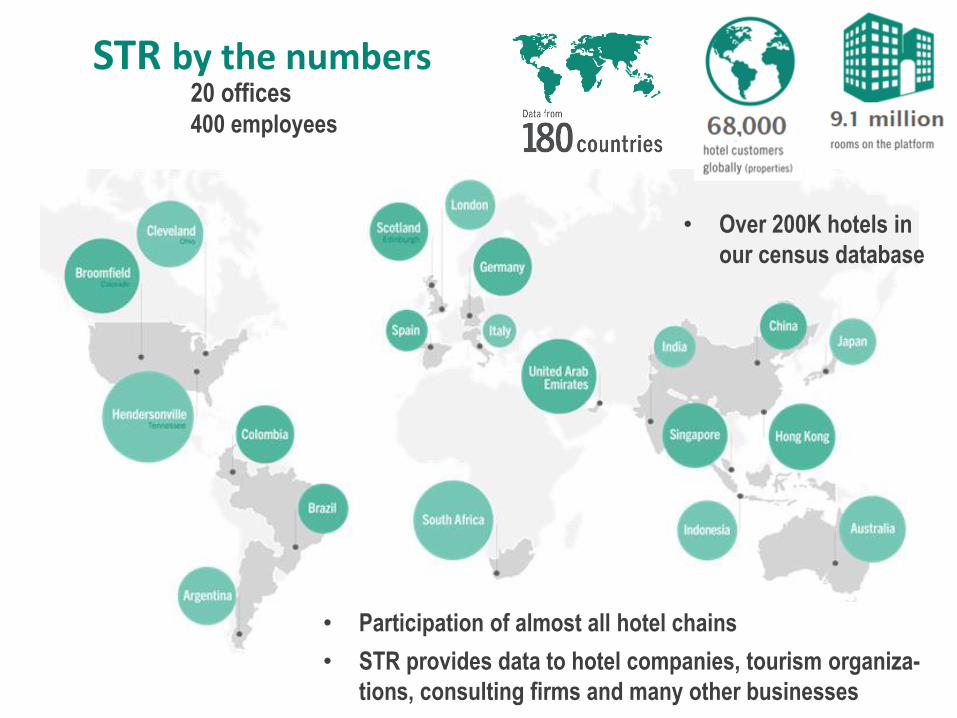
STR by the numbers20 offices400 employees
• Participation of almost all hotel chains
• STR provides data to hotel companies, tourism organiza-
tions, consulting firms and many other businesses
• Over 200K hotels in
our census database
Source: STR2020 © CoStar Realty Information, Inc.
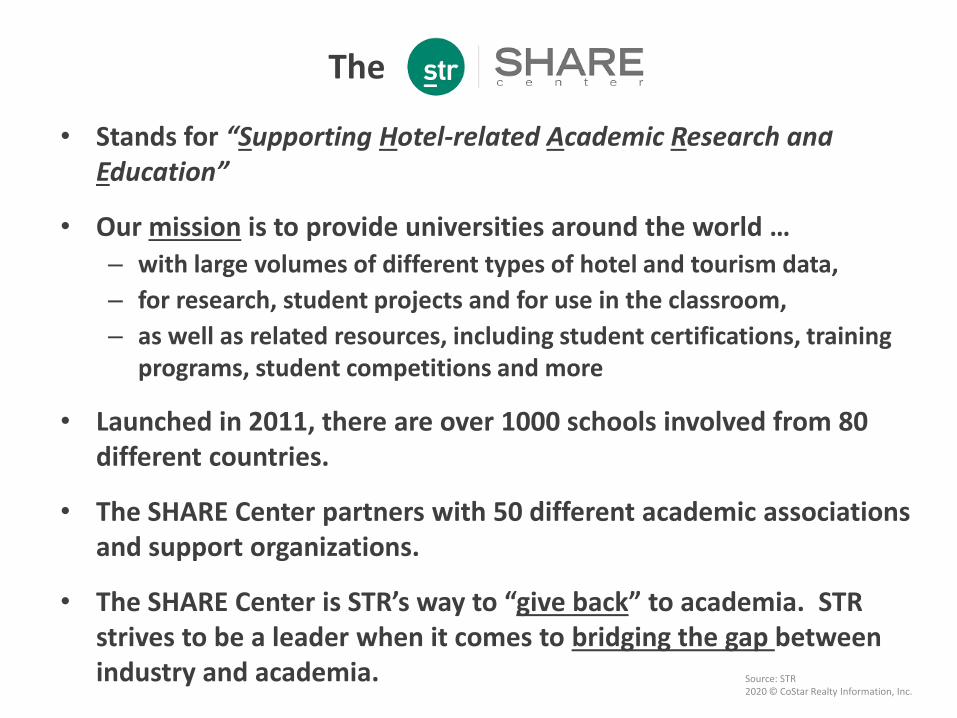
• Stands for “Supporting Hotel-related Academic Research and Education”
• Our mission is to provide universities around the world …
– with large volumes of different types of hotel and tourism data,
– for research, student projects and for use in the classroom,
– as well as related resources, including student certifications, training programs, student competitions and more
• Launched in 2011, there are over 1000 schools involved from 80 different countries.
• The SHARE Center partners with 50 different academic associations and support organizations.
• The SHARE Center is STR’s way to “give back” to academia. STR strives to be a leader when it comes to bridging the gap between industry and academia.
The

Source: STR2020 © CoStar Realty Information, Inc.
Data Available for Research
Source: STR2020 © CoStar Realty Information, Inc.
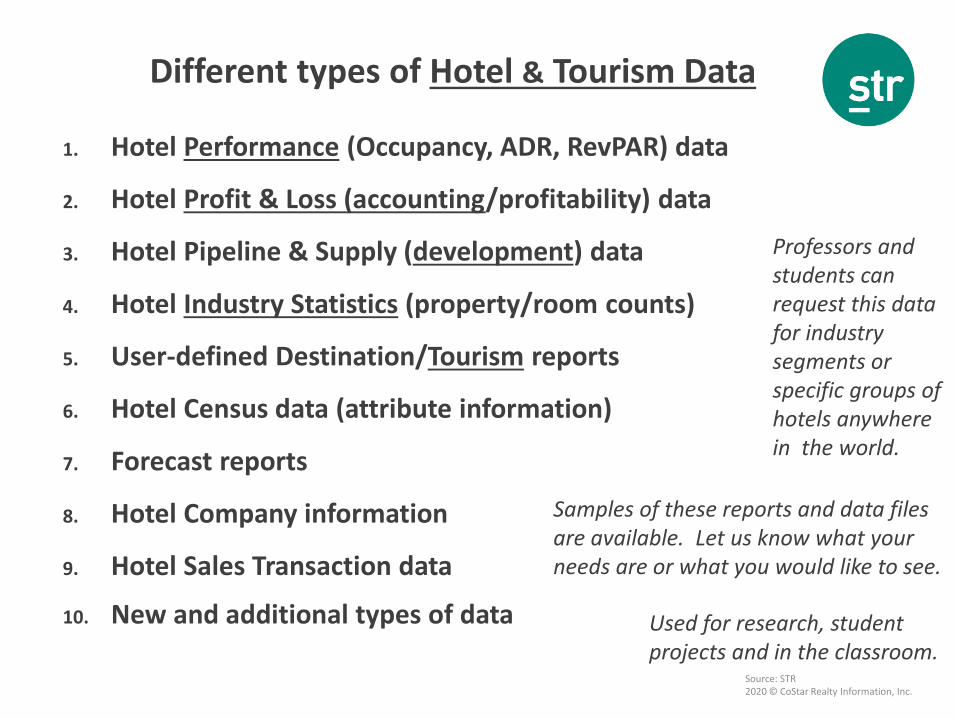
Different types of Hotel & Tourism Data
1. Hotel Performance (Occupancy, ADR, RevPAR) data
2. Hotel Profit & Loss (accounting/profitability) data
3. Hotel Pipeline & Supply (development) data
4. Hotel Industry Statistics (property/room counts)
5. User-defined Destination/Tourism reports
6. Hotel Census data (attribute information)
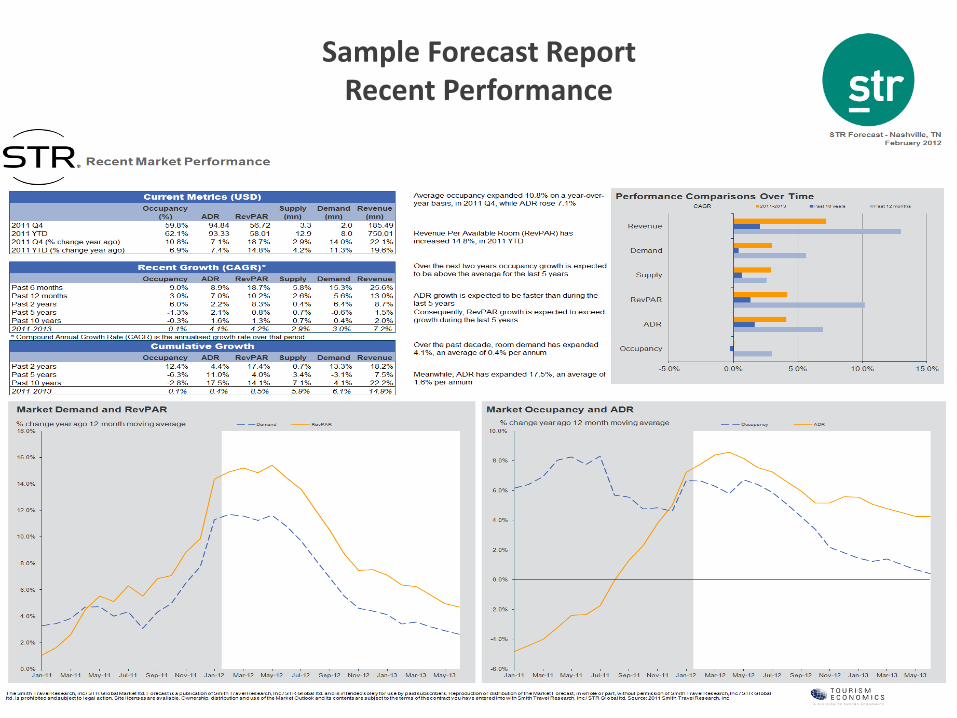
7. Forecast reports
8. Hotel Company information
9. Hotel Sales Transaction data
10. New and additional types of data
Samples of these reports and data files are available. Let us know what your needs are or what you would like to see.
Professors and students can request this data for industry segments or specific groups of hotels anywhere in the world.
Used for research, student projects and in the classroom.
Source: STR2020 © CoStar Realty Information, Inc.
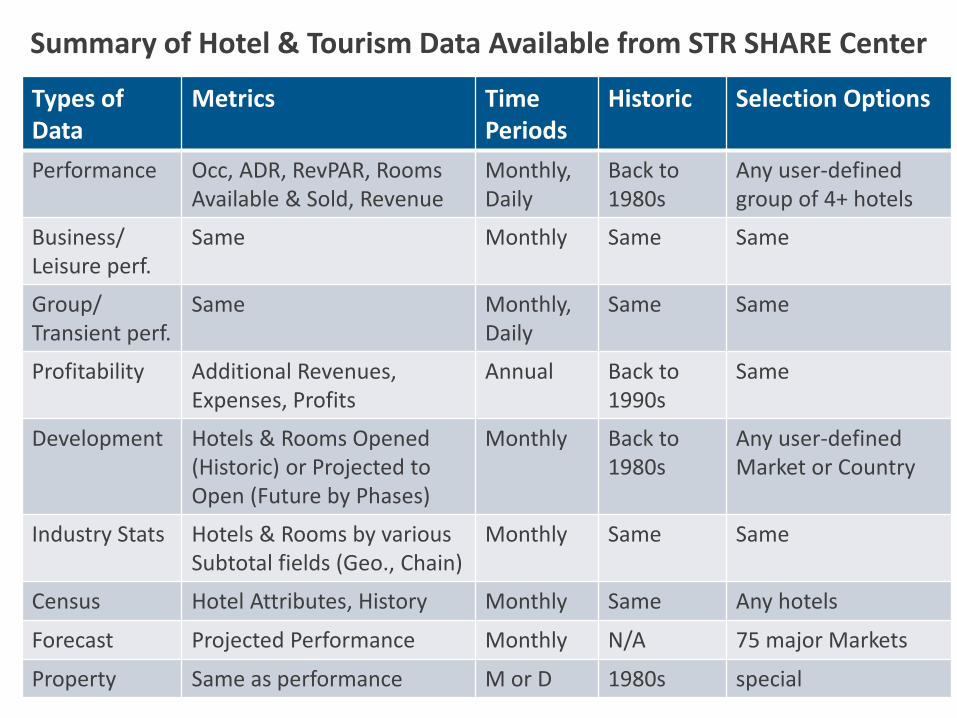
Summary of Hotel & Tourism Data Available from STR SHARE Center
Types of Data
Metrics Time Periods
Historic Selection Options
Performance Occ, ADR, RevPAR, Rooms Available & Sold, Revenue
Monthly, Daily
Back to 1980s
Any user-defined group of 4+ hotels
Business/ Leisure perf.
Same Monthly Same Same
Group/ Transient perf.
Same Monthly, Daily
Same Same
Profitability Additional Revenues, Expenses, Profits
Annual Back to 1990s
Same
Development Hotels & Rooms Opened (Historic) or Projected to Open (Future by Phases)
Monthly Back to 1980s
Any user-defined Market or Country
Industry Stats Hotels & Rooms by various Subtotal fields (Geo., Chain)
Monthly Same Same
Census Hotel Attributes, History Monthly Same Any hotels
Forecast Projected Performance Monthly N/A 75 major Markets
Property Same as performance M or D 1980s special
Source: STR2020 © CoStar Realty Information, Inc.
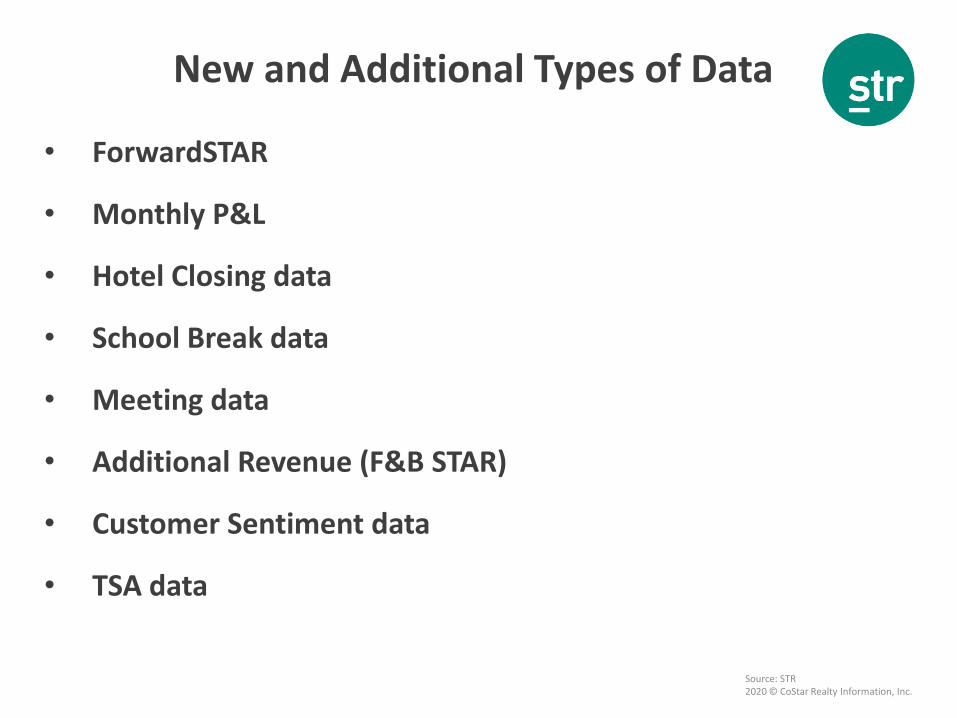
• ForwardSTAR
• Monthly P&L
• Hotel Closing data
• School Break data
• Meeting data
• Additional Revenue (F&B STAR)
• Customer Sentiment data
• TSA data
New and Additional Types of Data

Source: STR2020 © CoStar Realty Information, Inc.
The benefits of live industry data and
how it can help academic research
• Data is easy to access, 2-day turnaround, email [email protected]
• Data provided in Excel with raw data, easy to work with.
• Professors have access to current/latest data for any area of the world and for any group of hotels, totally user-defined
• Helps increase the industry relevance of academic research; address hot topics, today’s questions and future challenges
• This can help determine if your findings impact the bottom line. (If you tried to sell your research findings to an industry practitioner, who would buy and for how much?)
Source: STR2020 © CoStar Realty Information, Inc.
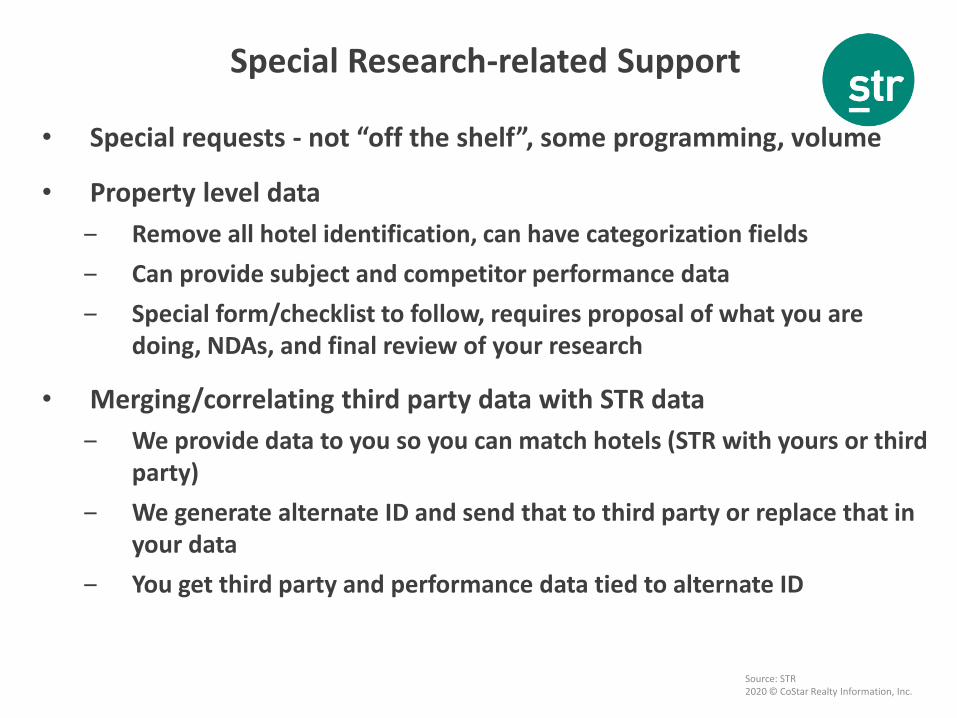
Special Research-related Support
• Special requests - not “off the shelf”, some programming, volume
• Property level data
‒ Remove all hotel identification, can have categorization fields
‒ Can provide subject and competitor performance data
‒ Special form/checklist to follow, requires proposal of what you are doing, NDAs, and final review of your research
• Merging/correlating third party data with STR data
‒ We provide data to you so you can match hotels (STR with yours or third party)
‒ We generate alternate ID and send that to third party or replace that in your data
‒ You get third party and performance data tied to alternate ID
Source: STR2020 © CoStar Realty Information, Inc.
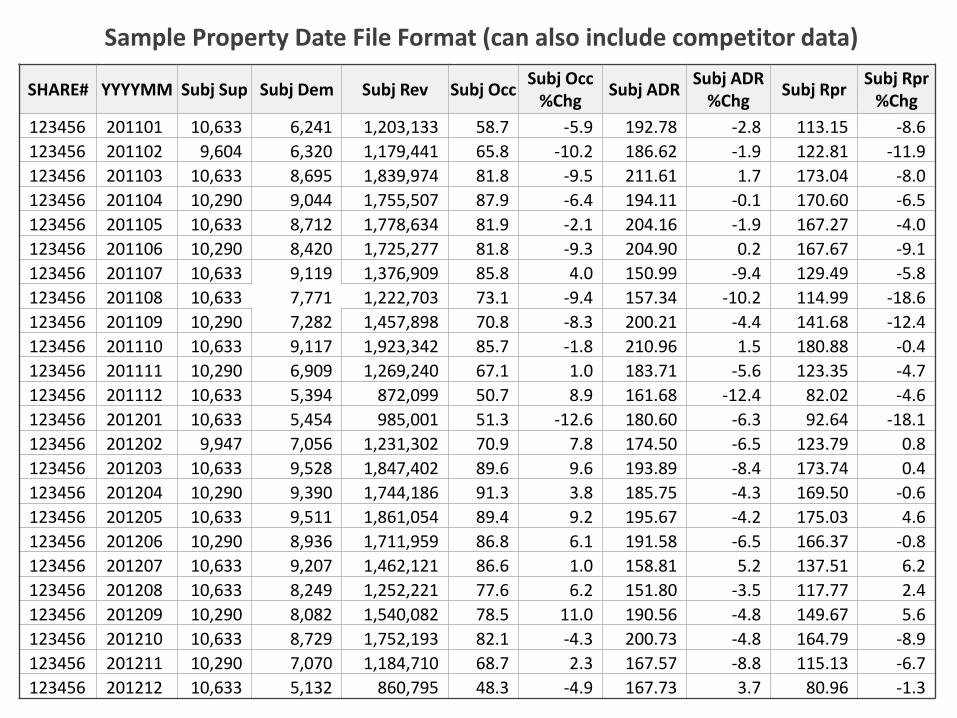
Sample Property Date File Format (can also include competitor data)
SHARE# YYYYMM Subj Sup Subj Dem Subj Rev Subj OccSubj Occ
%ChgSubj ADR
Subj ADR %Chg
Subj RprSubj Rpr
%Chg
123456 201101 10,633 6,241 1,203,133 58.7 -5.9 192.78 -2.8 113.15 -8.6
123456 201102 9,604 6,320 1,179,441 65.8 -10.2 186.62 -1.9 122.81 -11.9
123456 201103 10,633 8,695 1,839,974 81.8 -9.5 211.61 1.7 173.04 -8.0
123456 201104 10,290 9,044 1,755,507 87.9 -6.4 194.11 -0.1 170.60 -6.5
123456 201105 10,633 8,712 1,778,634 81.9 -2.1 204.16 -1.9 167.27 -4.0
123456 201106 10,290 8,420 1,725,277 81.8 -9.3 204.90 0.2 167.67 -9.1
123456 201107 10,633 9,119 1,376,909 85.8 4.0 150.99 -9.4 129.49 -5.8
123456 201108 10,633 7,771 1,222,703 73.1 -9.4 157.34 -10.2 114.99 -18.6
123456 201109 10,290 7,282 1,457,898 70.8 -8.3 200.21 -4.4 141.68 -12.4
123456 201110 10,633 9,117 1,923,342 85.7 -1.8 210.96 1.5 180.88 -0.4
123456 201111 10,290 6,909 1,269,240 67.1 1.0 183.71 -5.6 123.35 -4.7
123456 201112 10,633 5,394 872,099 50.7 8.9 161.68 -12.4 82.02 -4.6
123456 201201 10,633 5,454 985,001 51.3 -12.6 180.60 -6.3 92.64 -18.1
123456 201202 9,947 7,056 1,231,302 70.9 7.8 174.50 -6.5 123.79 0.8
123456 201203 10,633 9,528 1,847,402 89.6 9.6 193.89 -8.4 173.74 0.4
123456 201204 10,290 9,390 1,744,186 91.3 3.8 185.75 -4.3 169.50 -0.6
123456 201205 10,633 9,511 1,861,054 89.4 9.2 195.67 -4.2 175.03 4.6
123456 201206 10,290 8,936 1,711,959 86.8 6.1 191.58 -6.5 166.37 -0.8
123456 201207 10,633 9,207 1,462,121 86.6 1.0 158.81 5.2 137.51 6.2
123456 201208 10,633 8,249 1,252,221 77.6 6.2 151.80 -3.5 117.77 2.4
123456 201209 10,290 8,082 1,540,082 78.5 11.0 190.56 -4.8 149.67 5.6
123456 201210 10,633 8,729 1,752,193 82.1 -4.3 200.73 -4.8 164.79 -8.9
123456 201211 10,290 7,070 1,184,710 68.7 2.3 167.57 -8.8 115.13 -6.7
123456 201212 10,633 5,132 860,795 48.3 -4.9 167.73 3.7 80.96 -1.3
Source: STR2020 © CoStar Realty Information, Inc.
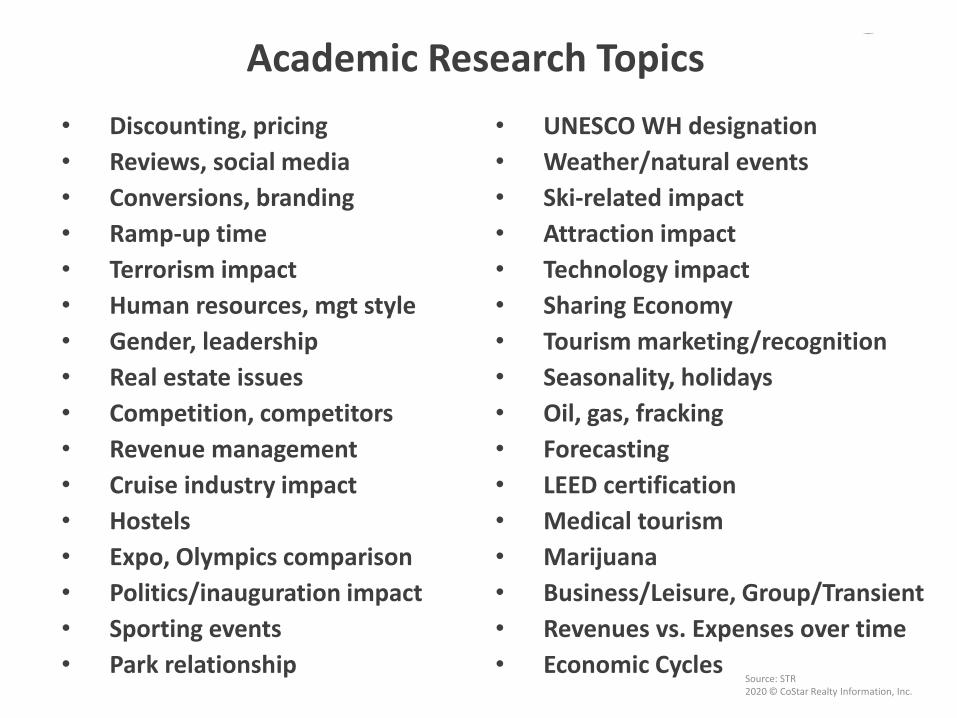
Academic Research Topics
• Discounting, pricing
• Reviews, social media
• Conversions, branding
• Ramp-up time
• Terrorism impact
• Human resources, mgt style
• Gender, leadership
• Real estate issues
• Competition, competitors
• Revenue management
• Cruise industry impact
• Hostels
• Expo, Olympics comparison
• Politics/inauguration impact
• Sporting events
• Park relationship
• UNESCO WH designation
• Weather/natural events
• Ski-related impact
• Attraction impact
• Technology impact
• Sharing Economy
• Tourism marketing/recognition
• Seasonality, holidays
• Oil, gas, fracking
• Forecasting
• LEED certification
• Medical tourism
• Marijuana
• Business/Leisure, Group/Transient
• Revenues vs. Expenses over time
• Economic Cycles
Source: STR2020 © CoStar Realty Information, Inc.
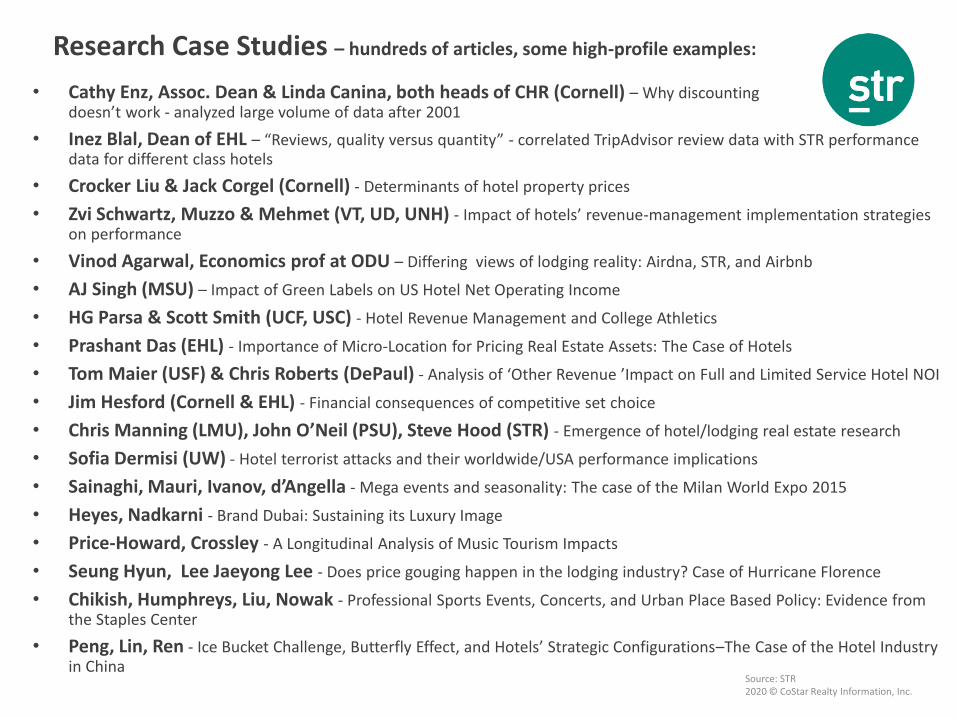
Research Case Studies – hundreds of articles, some high-profile examples:
• Cathy Enz, Assoc. Dean & Linda Canina, both heads of CHR (Cornell) – Why discounting doesn’t work - analyzed large volume of data after 2001
• Inez Blal, Dean of EHL – “Reviews, quality versus quantity” - correlated TripAdvisor review data with STR performance data for different class hotels
• Crocker Liu & Jack Corgel (Cornell) - Determinants of hotel property prices
• Zvi Schwartz, Muzzo & Mehmet (VT, UD, UNH) - Impact of hotels’ revenue-management implementation strategies on performance
• Vinod Agarwal, Economics prof at ODU – Differing views of lodging reality: Airdna, STR, and Airbnb
• AJ Singh (MSU) – Impact of Green Labels on US Hotel Net Operating Income
• HG Parsa & Scott Smith (UCF, USC) - Hotel Revenue Management and College Athletics
• Prashant Das (EHL) - Importance of Micro-Location for Pricing Real Estate Assets: The Case of Hotels
• Tom Maier (USF) & Chris Roberts (DePaul) - Analysis of ‘Other Revenue ’Impact on Full and Limited Service Hotel NOI
• Jim Hesford (Cornell & EHL) - Financial consequences of competitive set choice
• Chris Manning (LMU), John O’Neil (PSU), Steve Hood (STR) - Emergence of hotel/lodging real estate research
• Sofia Dermisi (UW) - Hotel terrorist attacks and their worldwide/USA performance implications
• Sainaghi, Mauri, Ivanov, d’Angella - Mega events and seasonality: The case of the Milan World Expo 2015
• Heyes, Nadkarni - Brand Dubai: Sustaining its Luxury Image
• Price-Howard, Crossley - A Longitudinal Analysis of Music Tourism Impacts
• Seung Hyun, Lee Jaeyong Lee - Does price gouging happen in the lodging industry? Case of Hurricane Florence
• Chikish, Humphreys, Liu, Nowak - Professional Sports Events, Concerts, and Urban Place Based Policy: Evidence from the Staples Center
• Peng, Lin, Ren - Ice Bucket Challenge, Butterfly Effect, and Hotels’ Strategic Configurations–The Case of the Hotel Industry in China

Source: STR2020 © CoStar Realty Information, Inc.
Certifications, Internships and Competitions

Source: STR2020 © CoStar Realty Information, Inc.
STR Certification Training
• Analytics certifications from STR
– Industry recognized stamps of approval
– Endorsed by many organizations
– Students add credentials (CHIA or CAHTA) to their resume or business card
– Help students stand out
– Students bring their projects to their interviews
– Countless testimonials from students
– Full training package and support provided to professors
– Free train-the-trainer sessions offered regularly
• Certification in Hotel Industry Analytics (CHIA)
• Certification in Advanced Hospitality and Tourism Analytics (CAHTA)
Source: STR2020 © CoStar Realty Information, Inc.
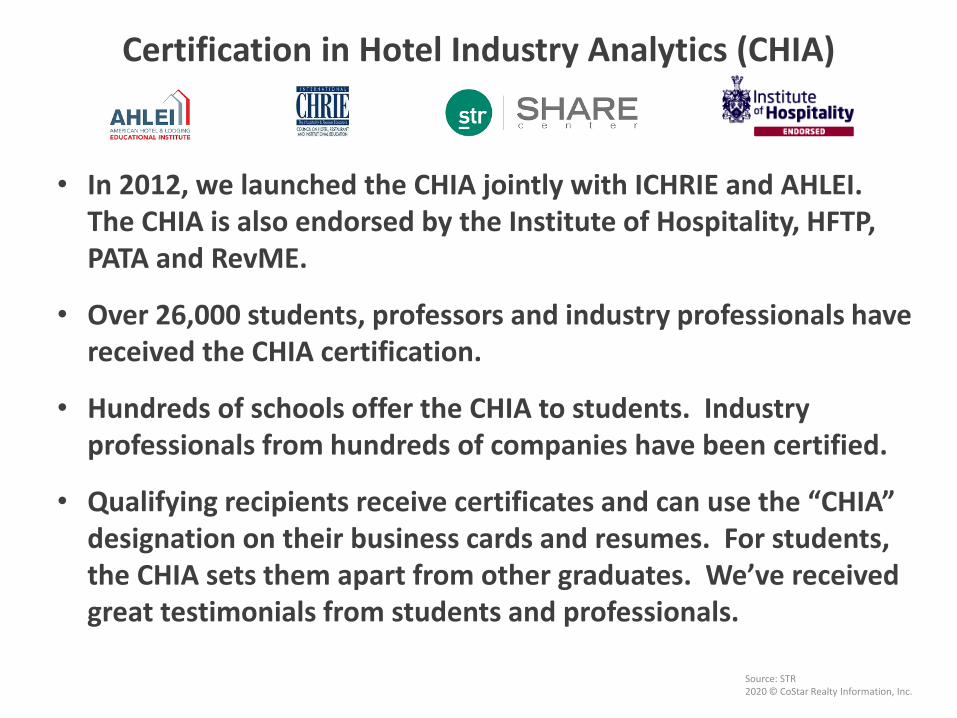
Certification in Hotel Industry Analytics (CHIA)
• In 2012, we launched the CHIA jointly with ICHRIE and AHLEI. The CHIA is also endorsed by the Institute of Hospitality, HFTP, PATA and RevME.
• Over 26,000 students, professors and industry professionals have received the CHIA certification.
• Hundreds of schools offer the CHIA to students. Industry professionals from hundreds of companies have been certified.
• Qualifying recipients receive certificates and can use the “CHIA” designation on their business cards and resumes. For students, the CHIA sets them apart from other graduates. We’ve received great testimonials from students and professionals.
Source: STR2020 © CoStar Realty Information, Inc.
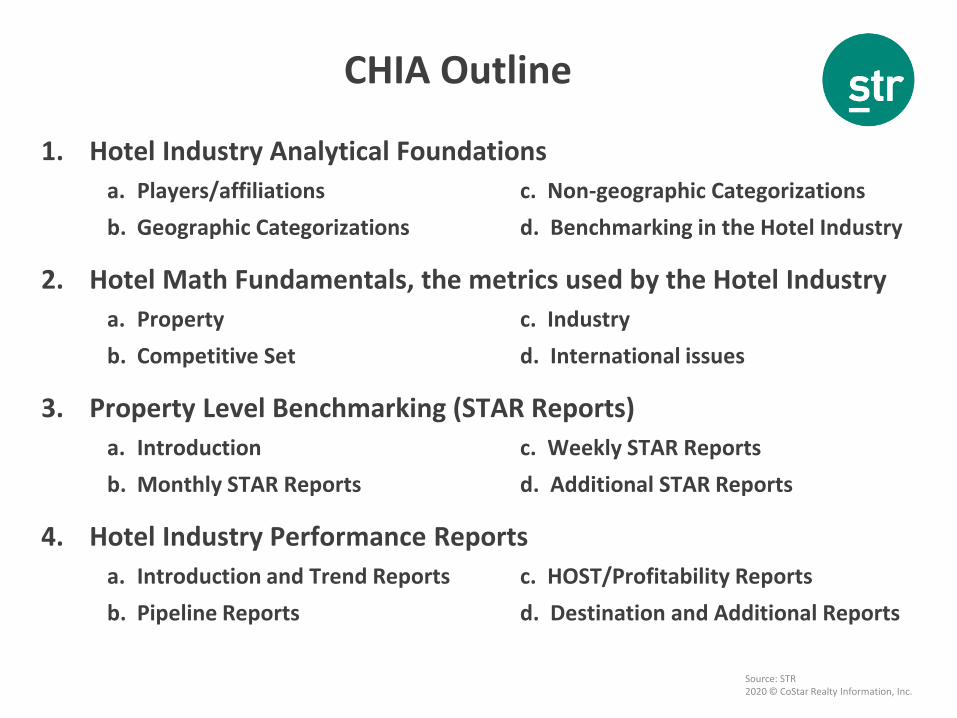
CHIA Outline
1. Hotel Industry Analytical Foundations
a. Players/affiliations c. Non-geographic Categorizations
b. Geographic Categorizations d. Benchmarking in the Hotel Industry
2. Hotel Math Fundamentals, the metrics used by the Hotel Industry
a. Property c. Industry
b. Competitive Set d. International issues
3. Property Level Benchmarking (STAR Reports)
a. Introduction c. Weekly STAR Reports
b. Monthly STAR Reports d. Additional STAR Reports
4. Hotel Industry Performance Reports
a. Introduction and Trend Reports c. HOST/Profitability Reports
b. Pipeline Reports d. Destination and Additional Reports
Source: STR2020 © CoStar Realty Information, Inc.
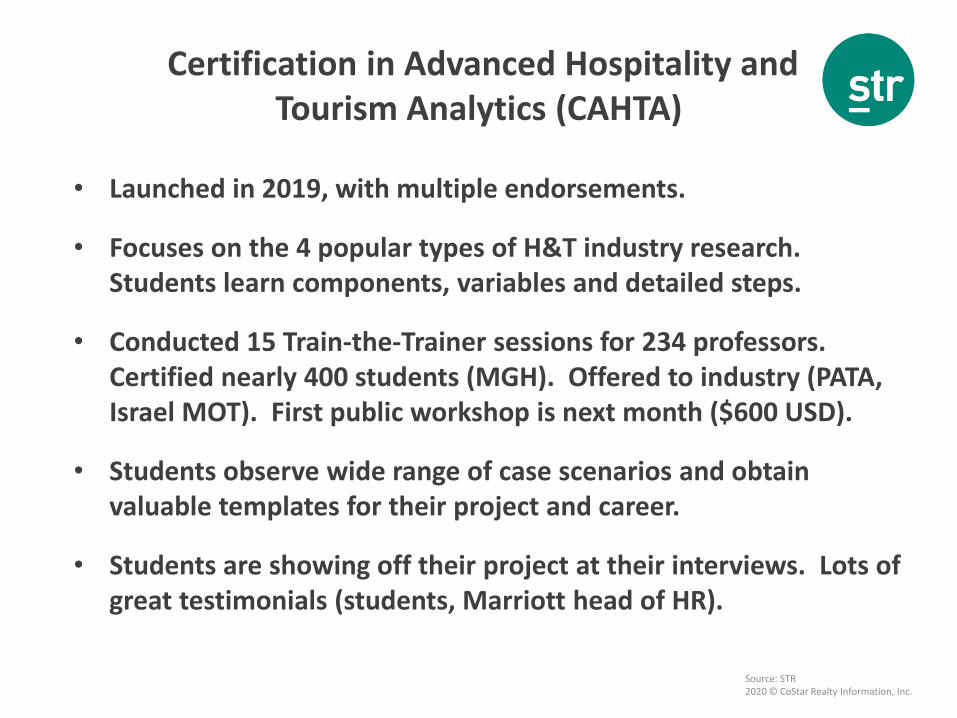
• Launched in 2019, with multiple endorsements.
• Focuses on the 4 popular types of H&T industry research. Students learn components, variables and detailed steps.
• Conducted 15 Train-the-Trainer sessions for 234 professors. Certified nearly 400 students (MGH). Offered to industry (PATA, Israel MOT). First public workshop is next month ($600 USD).
• Students observe wide range of case scenarios and obtain valuable templates for their project and career.
• Students are showing off their project at their interviews. Lots of great testimonials (students, Marriott head of HR).
Certification in Advanced Hospitality and Tourism Analytics (CAHTA)
Source: STR2020 © CoStar Realty Information, Inc.
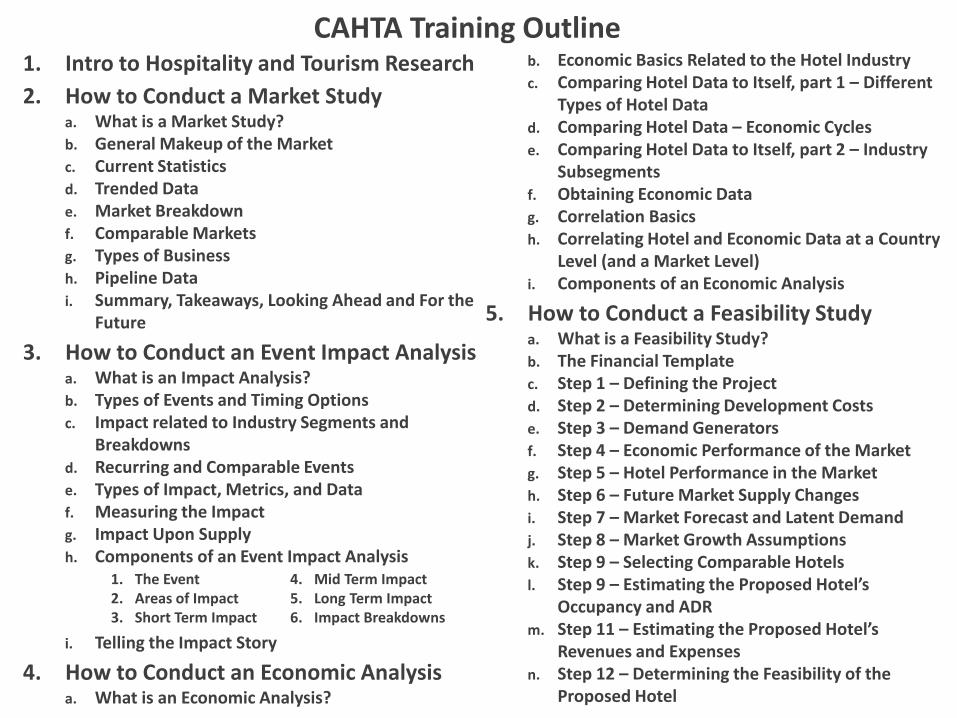
CAHTA Training Outline1. Intro to Hospitality and Tourism Research
2. How to Conduct a Market Studya. What is a Market Study?b. General Makeup of the Marketc. Current Statisticsd. Trended Datae. Market Breakdownf. Comparable Marketsg. Types of Businessh. Pipeline Datai. Summary, Takeaways, Looking Ahead and For the
Future
3. How to Conduct an Event Impact Analysisa. What is an Impact Analysis?b. Types of Events and Timing Optionsc. Impact related to Industry Segments and
Breakdownsd. Recurring and Comparable Eventse. Types of Impact, Metrics, and Dataf. Measuring the Impactg. Impact Upon Supplyh. Components of an Event Impact Analysis
i. Telling the Impact Story
4. How to Conduct an Economic Analysisa. What is an Economic Analysis?
b. Economic Basics Related to the Hotel Industryc. Comparing Hotel Data to Itself, part 1 – Different
Types of Hotel Datad. Comparing Hotel Data – Economic Cyclese. Comparing Hotel Data to Itself, part 2 – Industry
Subsegmentsf. Obtaining Economic Datag. Correlation Basicsh. Correlating Hotel and Economic Data at a Country
Level (and a Market Level)i. Components of an Economic Analysis
5. How to Conduct a Feasibility Studya. What is a Feasibility Study?b. The Financial Templatec. Step 1 – Defining the Projectd. Step 2 – Determining Development Costse. Step 3 – Demand Generatorsf. Step 4 – Economic Performance of the Marketg. Step 5 – Hotel Performance in the Marketh. Step 6 – Future Market Supply Changesi. Step 7 – Market Forecast and Latent Demandj. Step 8 – Market Growth Assumptionsk. Step 9 – Selecting Comparable Hotelsl. Step 9 – Estimating the Proposed Hotel’s
Occupancy and ADRm. Step 11 – Estimating the Proposed Hotel’s
Revenues and Expensesn. Step 12 – Determining the Feasibility of the
Proposed Hotel
1. The Event2. Areas of Impact3. Short Term Impact
4. Mid Term Impact5. Long Term Impact6. Impact Breakdowns
Source: STR2020 © CoStar Realty Information, Inc.
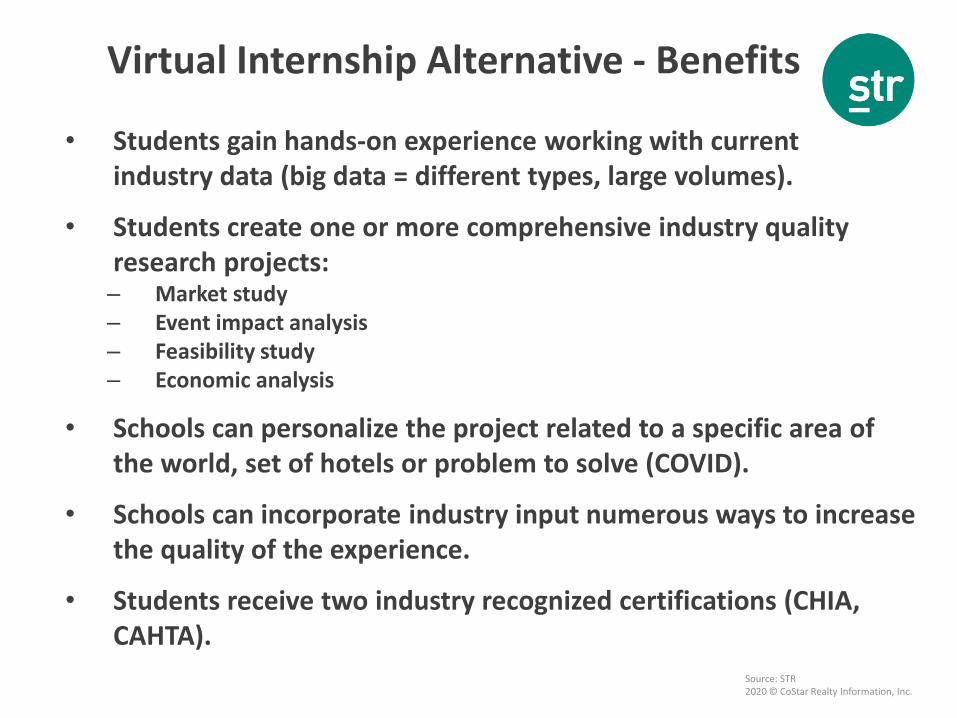
Virtual Internship Alternative - Benefits
• Students gain hands-on experience working with current industry data (big data = different types, large volumes).
• Students create one or more comprehensive industry quality research projects: – Market study– Event impact analysis– Feasibility study– Economic analysis
• Schools can personalize the project related to a specific area of the world, set of hotels or problem to solve (COVID).
• Schools can incorporate industry input numerous ways to increase the quality of the experience.
• Students receive two industry recognized certifications (CHIA, CAHTA).
Source: STR2020 © CoStar Realty Information, Inc.
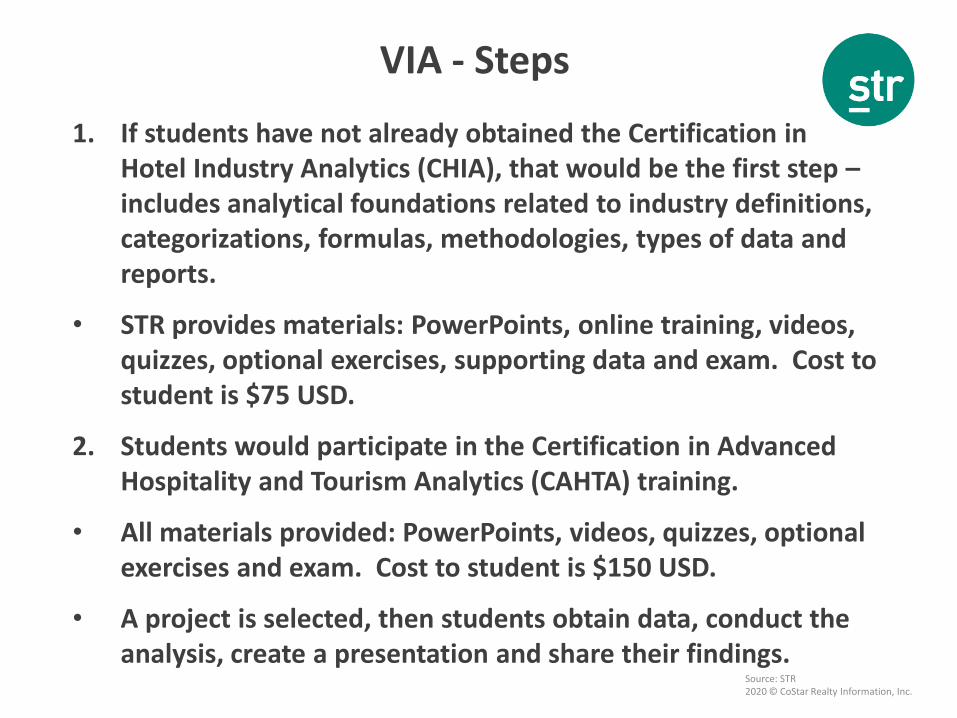
VIA - Steps
1. If students have not already obtained the Certification in Hotel Industry Analytics (CHIA), that would be the first step –includes analytical foundations related to industry definitions, categorizations, formulas, methodologies, types of data and reports.
• STR provides materials: PowerPoints, online training, videos, quizzes, optional exercises, supporting data and exam. Cost to student is $75 USD.
2. Students would participate in the Certification in Advanced Hospitality and Tourism Analytics (CAHTA) training.
• All materials provided: PowerPoints, videos, quizzes, optional exercises and exam. Cost to student is $150 USD.
• A project is selected, then students obtain data, conduct the analysis, create a presentation and share their findings.
Source: STR2020 © CoStar Realty Information, Inc.
Incorporating Industry Input
• Schools are involving alumnus, advisory board members, friends of the universities and neighboring hotels, companies and tourism organizations.
• During the training, schools can invite industry professionals to share their testimonials.
• Students can interview hotel or tourism staff or business owners during the projects.
• Field trips could be incorporated related to the project.
• Students can present preliminary versions of their analyses to industry professionals for input.
• Students can present the final version of their projects to industry professionals who can assume the role of investor or contractor.
Source: STR2020 © CoStar Realty Information, Inc.
VIA - Details
• Schools need to have someone to facilitate the VIA.
• STR will be glad to support the facilitator. Free train-the-trainer sessions are available for the CHIA and CAHTA.
• Students will obtain two certifications ($75 and $150 USD).
• Unfortunately, there is no payment or salary for the students.
• STR would be glad to be involved via webinar (industry update, hot topics, combined sessions).
• Timing is flexible:
– CHIA training and optional exercises: 10-20 hours
– CAHTA training and optional exercises: 10-20 hours
– Single CAHTA project: 10-40 hours
– Additional projects: 10-40 hours each
Source: STR2020 © CoStar Realty Information, Inc.
Student Competitions
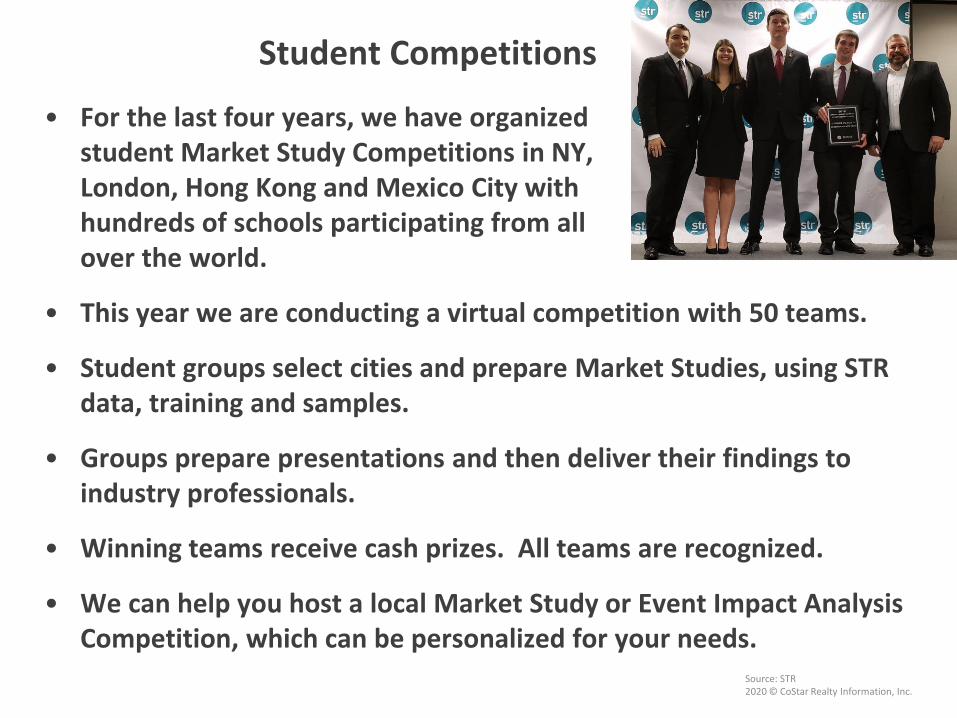
• For the last four years, we have organizedstudent Market Study Competitions in NY, London, Hong Kong and Mexico City with hundreds of schools participating from all over the world.
• This year we are conducting a virtual competition with 50 teams.
• Student groups select cities and prepare Market Studies, using STR data, training and samples.
• Groups prepare presentations and then deliver their findings to industry professionals.
• Winning teams receive cash prizes. All teams are recognized.
• We can help you host a local Market Study or Event Impact Analysis Competition, which can be personalized for your needs.

Source: STR2020 © CoStar Realty Information, Inc.
Thank you
Source: STR2020 © CoStar Realty Information, Inc.
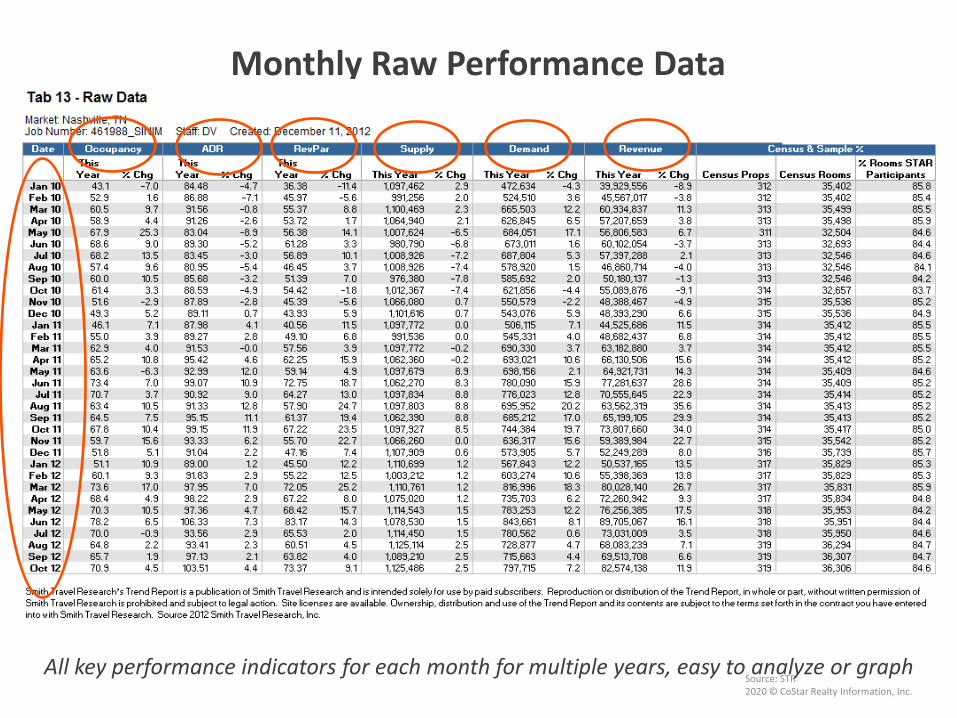
Hotel Performance Data (Trend Report)
• Performance data includes Occupancy, Average Daily Rate (ADR), RevPAR, Supply (Rooms Available), Demand (Rooms Sold), and Revenue
• Several different types: Monthly, Daily, Weekday/Weekend, Running 12-month, and Group/Transient
• Historic data back to as early as 1987 for any area of the world
• You can select a geographic area (city, county), a type of hotel (luxury, resort), or even select specific individual hotels
• Provided in Excel file with raw data, easy to graph/analyze
• “Trend Report” is the most popular report used by professors. Used for market studies and impact analyses.
Source: STR2020 © CoStar Realty Information, Inc.
Monthly Raw Performance Data
All key performance indicators for each month for multiple years, easy to analyze or graph
Source: STR2020 © CoStar Realty Information, Inc.
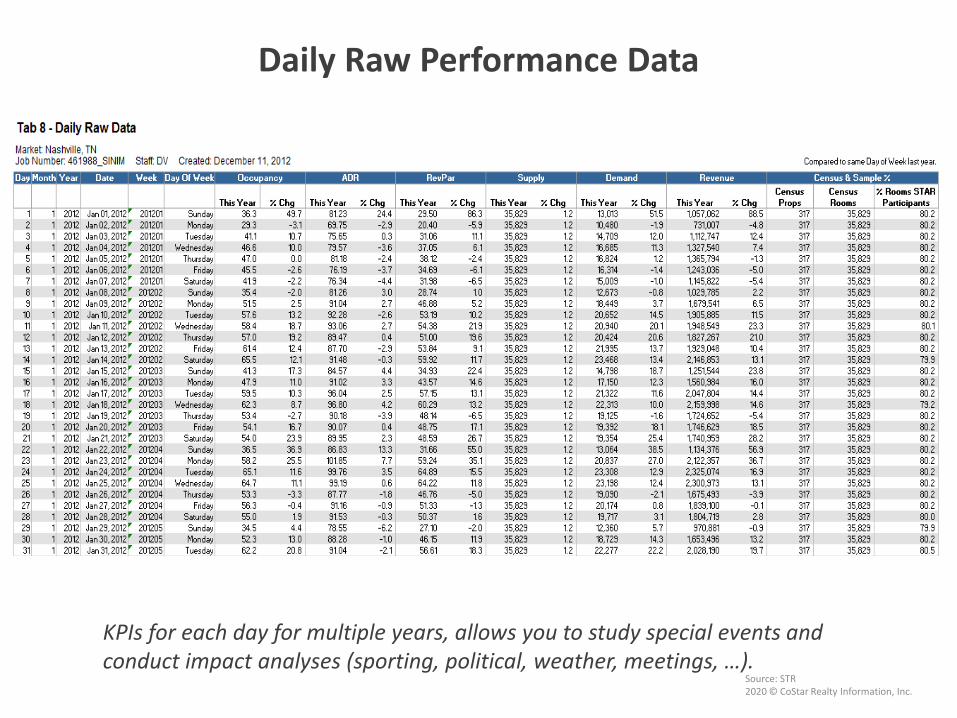
Daily Raw Performance Data
KPIs for each day for multiple years, allows you to study special events and conduct impact analyses (sporting, political, weather, meetings, …).
Source: STR2020 © CoStar Realty Information, Inc.
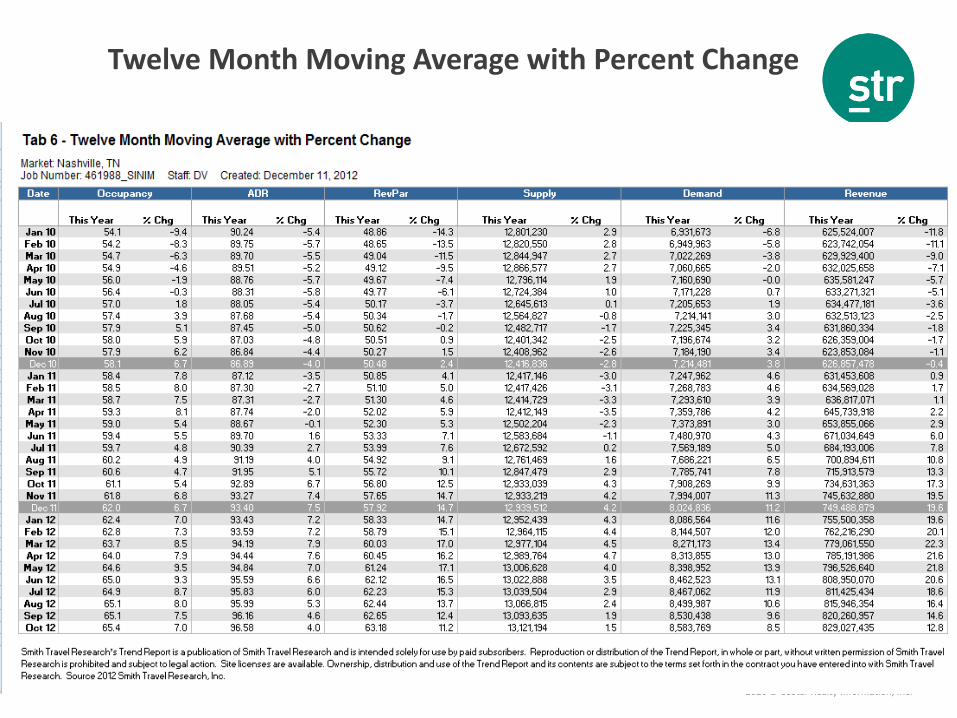
Twelve Month Moving Average with Percent Change
Source: STR2020 © CoStar Realty Information, Inc.
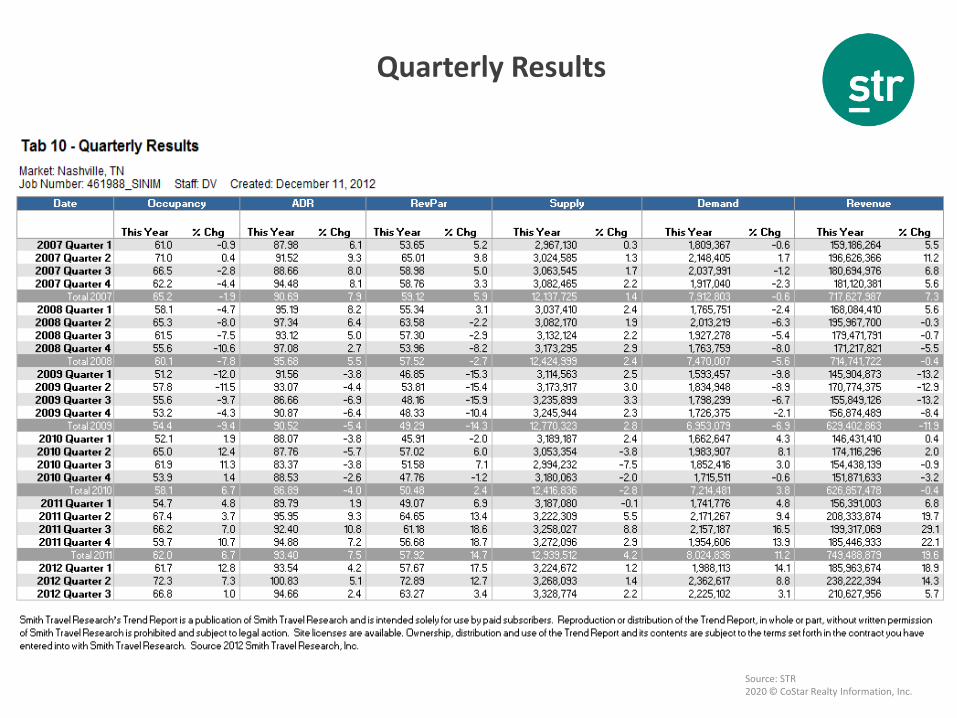
Quarterly Results
Source: STR2020 © CoStar Realty Information, Inc.
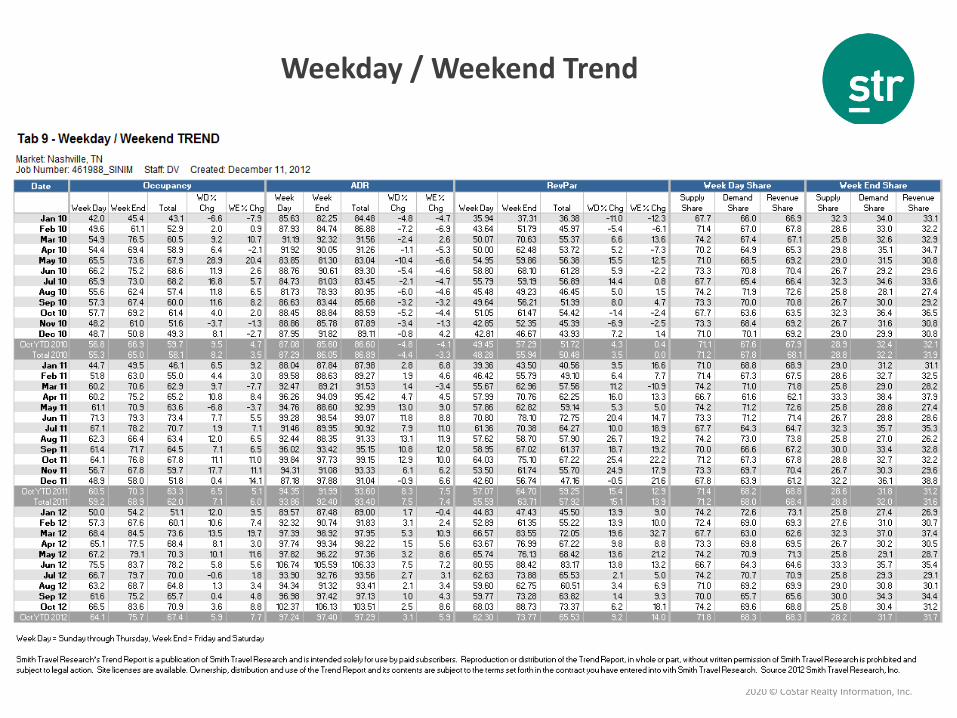
Weekday / Weekend Trend
Source: STR2020 © CoStar Realty Information, Inc.
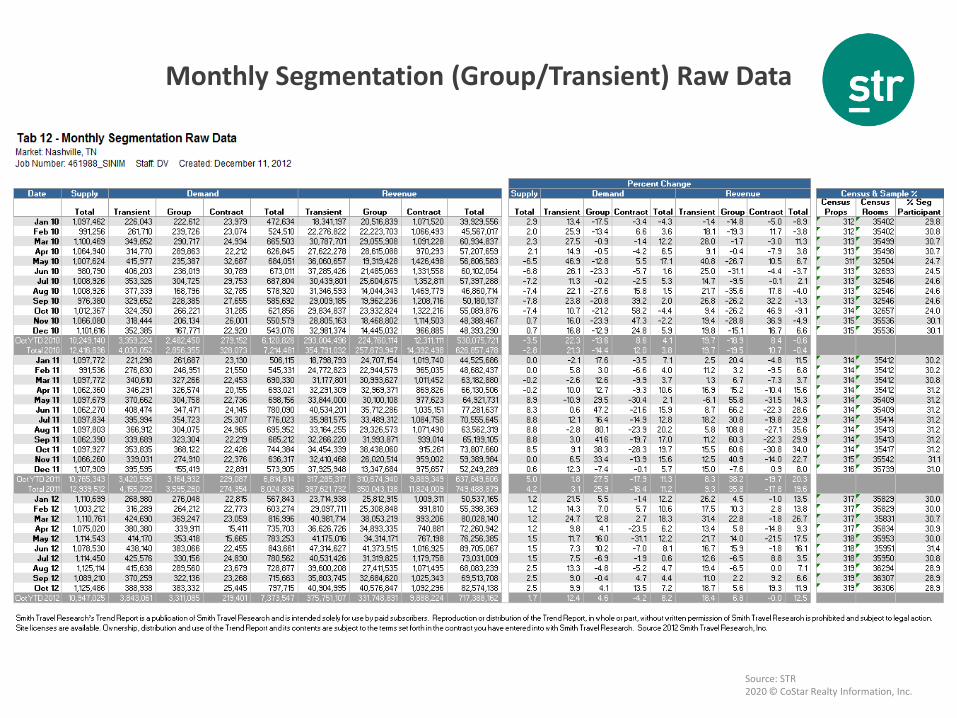
Monthly Segmentation (Group/Transient) Raw Data
Source: STR2020 © CoStar Realty Information, Inc.
Hotel Development Data (Pipeline Report)
• Includes “Historic Supply” data, what hotels have opened in the last 5 years, as well as conversion activity
• Includes future “Pipeline” information – hotels under constructionand in various phases of planning
• Also detailed data on existing hotels and pipeline projects
• You can select a geographic area (city, state, country) anywhere in the world
• Professors can use for feasibility/development studies, supply analyses, market studies, or to help with forecasting.
• You can see what brands and markets have been popular in an area and which ones will be popular in the future.
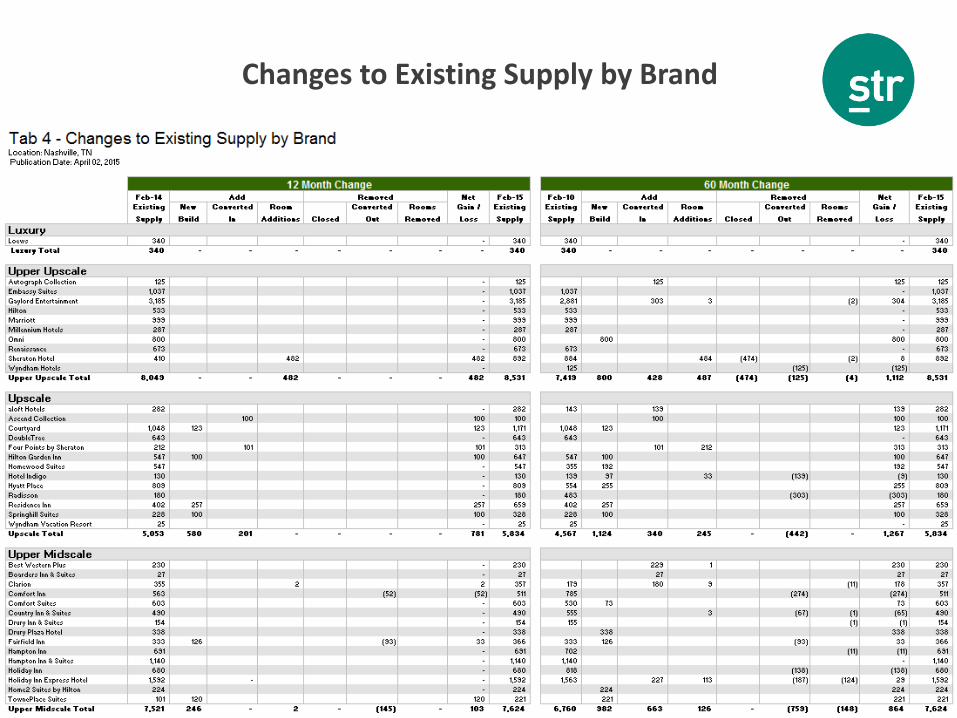
• Prior year Pipeline data available via a “Changes to Existing Supply Report”
Source: STR2020 © CoStar Realty Information, Inc.
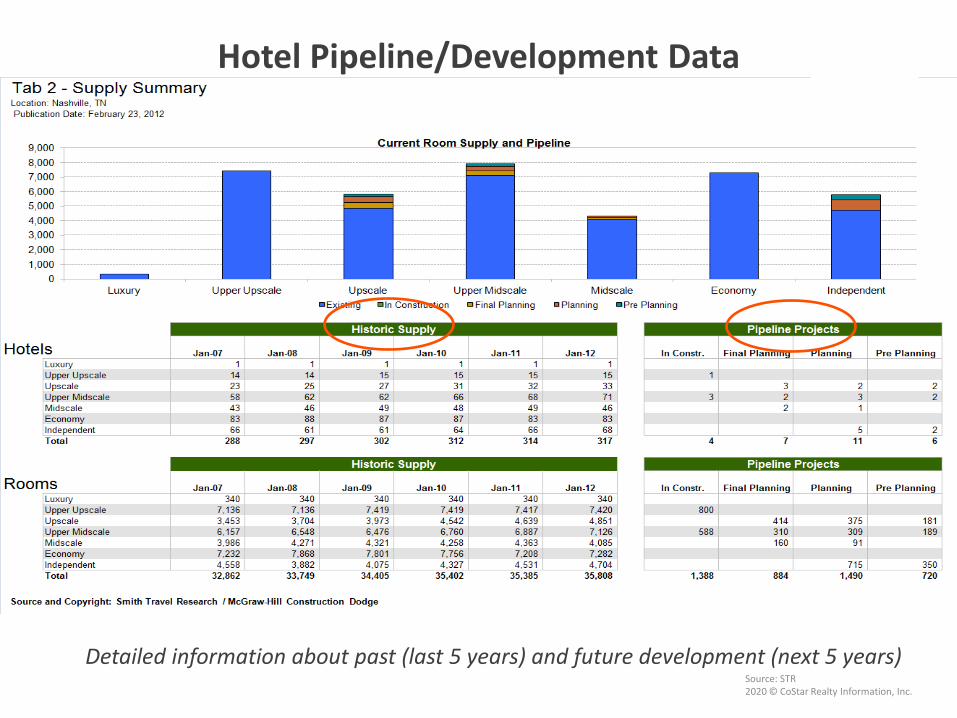
Hotel Pipeline/Development Data
Detailed information about past (last 5 years) and future development (next 5 years)
Source: STR2020 © CoStar Realty Information, Inc.
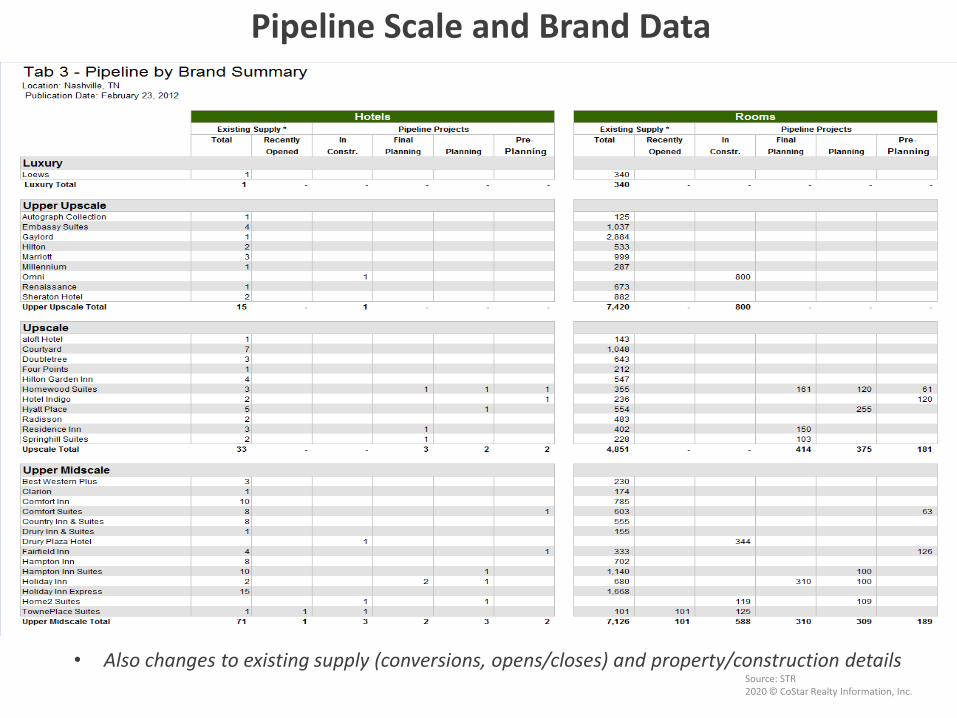
Pipeline Scale and Brand Data
• Also changes to existing supply (conversions, opens/closes) and property/construction details
Source: STR2020 © CoStar Realty Information, Inc.
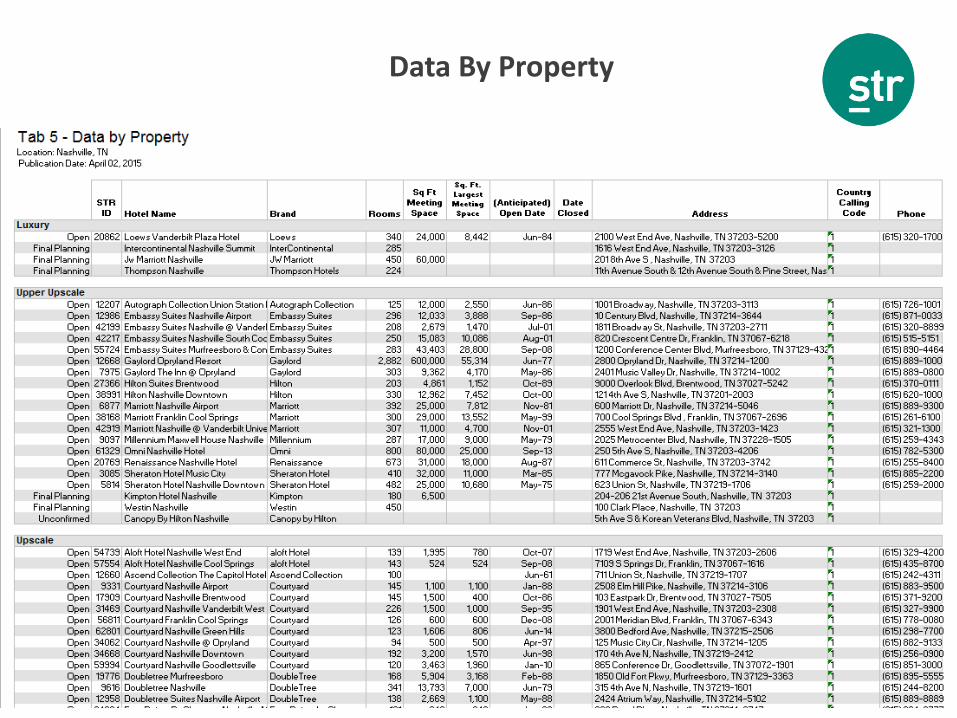
Data By Property
Source: STR2020 © CoStar Realty Information, Inc.
Changes to Existing Supply by Brand
Source: STR2020 © CoStar Realty Information, Inc.
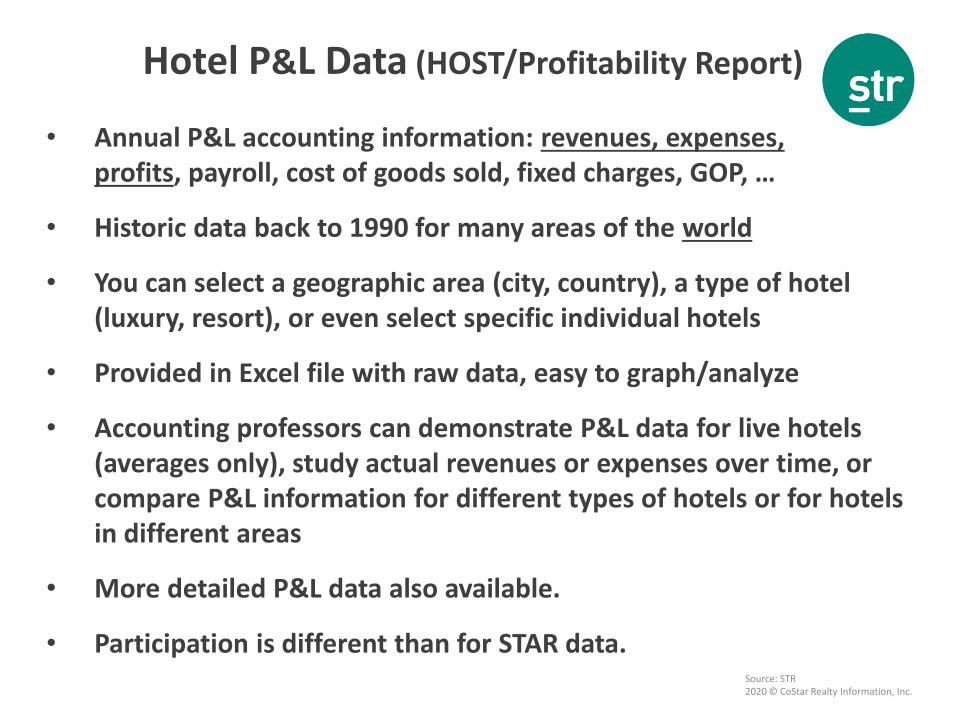
Hotel P&L Data (HOST/Profitability Report)
• Annual P&L accounting information: revenues, expenses, profits, payroll, cost of goods sold, fixed charges, GOP, …
• Historic data back to 1990 for many areas of the world
• You can select a geographic area (city, country), a type of hotel (luxury, resort), or even select specific individual hotels
• Provided in Excel file with raw data, easy to graph/analyze
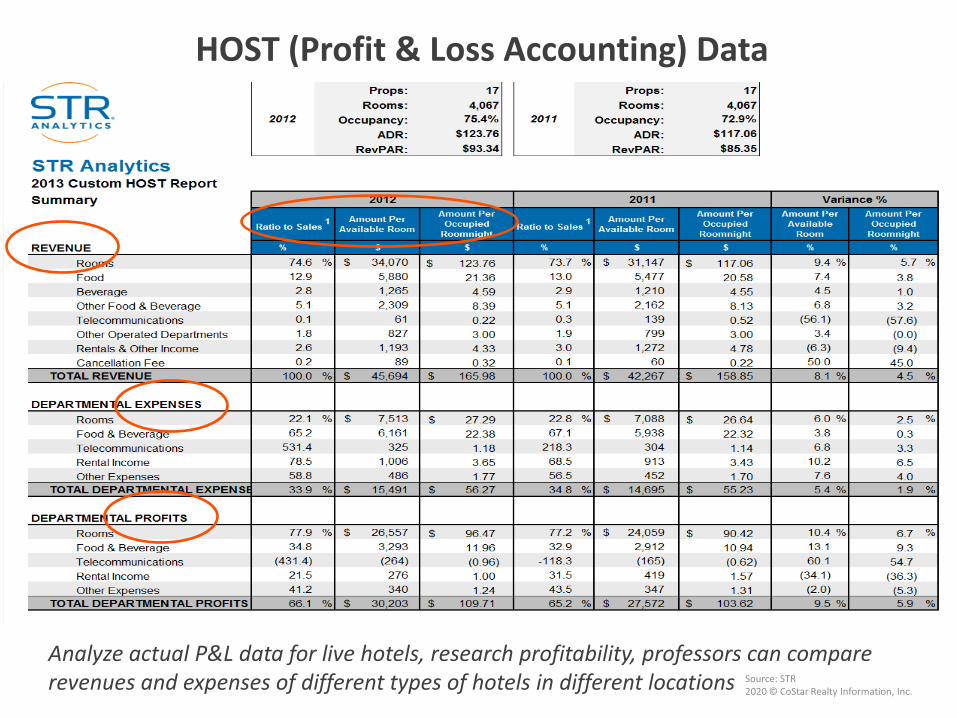
• Accounting professors can demonstrate P&L data for live hotels (averages only), study actual revenues or expenses over time, or compare P&L information for different types of hotels or for hotels in different areas
• More detailed P&L data also available.
• Participation is different than for STAR data.
Source: STR2020 © CoStar Realty Information, Inc.
HOST (Profit & Loss Accounting) Data
Analyze actual P&L data for live hotels, research profitability, professors can compare revenues and expenses of different types of hotels in different locations
Source: STR2020 © CoStar Realty Information, Inc.
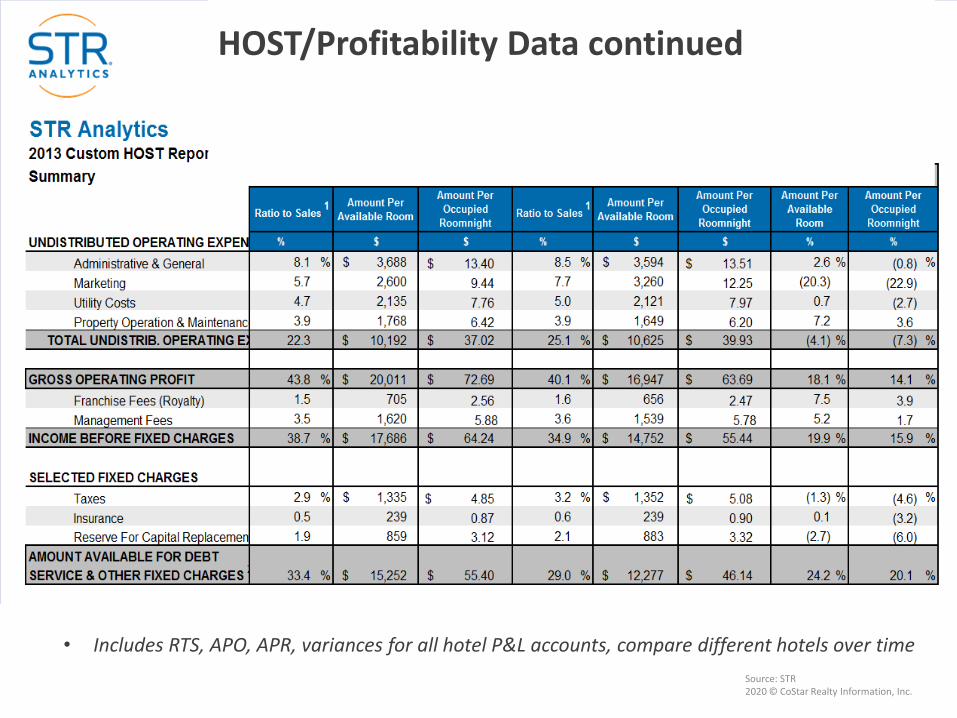
• Includes RTS, APO, APR, variances for all hotel P&L accounts, compare different hotels over time
HOST/Profitability Data continued
Source: STR2020 © CoStar Realty Information, Inc.
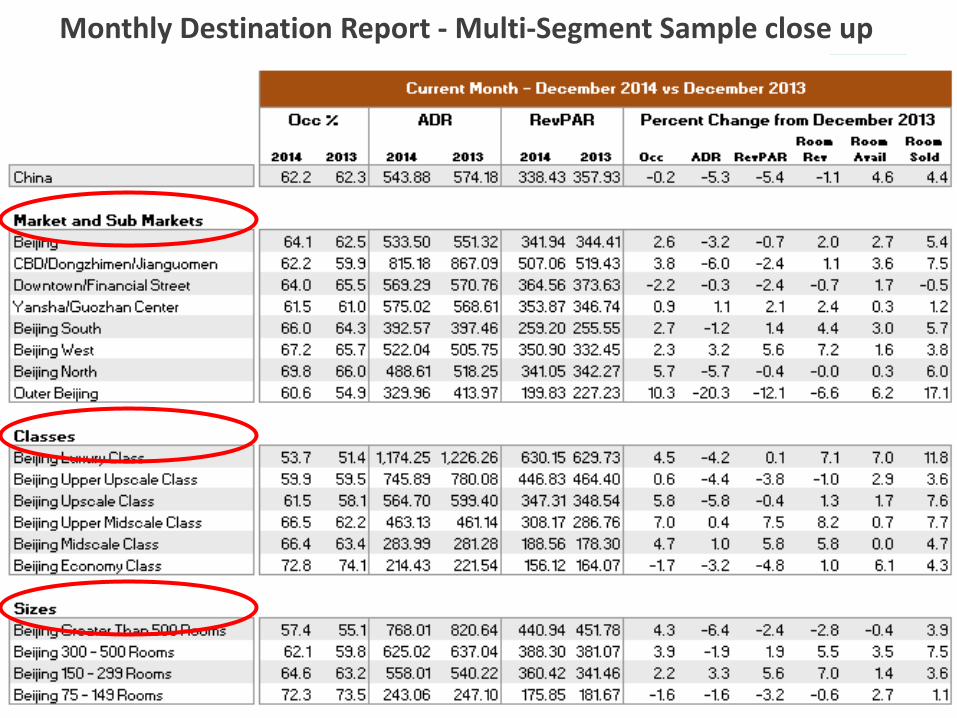
Destination Report/Tourism Data
• Same reports and data received by thousands of tourism organizations all over the world.
• They provide ongoing hotel performance data (Occupancy, ADR, …) for multiple time periods (Current Month, YTD, Weekly also).
• User-definable - a professor can select destinations of interest, such as cities or groups of hotels around your campus, or any other geographic areas around the world
• Weekly and/or monthly reports will be emailed to you with updates on the hotel performance in these areas
• Tourism and lodging operations professors can track performance of user-defined groups of hotels, observe how special events affect metrics, simulate a tourism organization, and teach forecasting
Source: STR2020 © CoStar Realty Information, Inc.
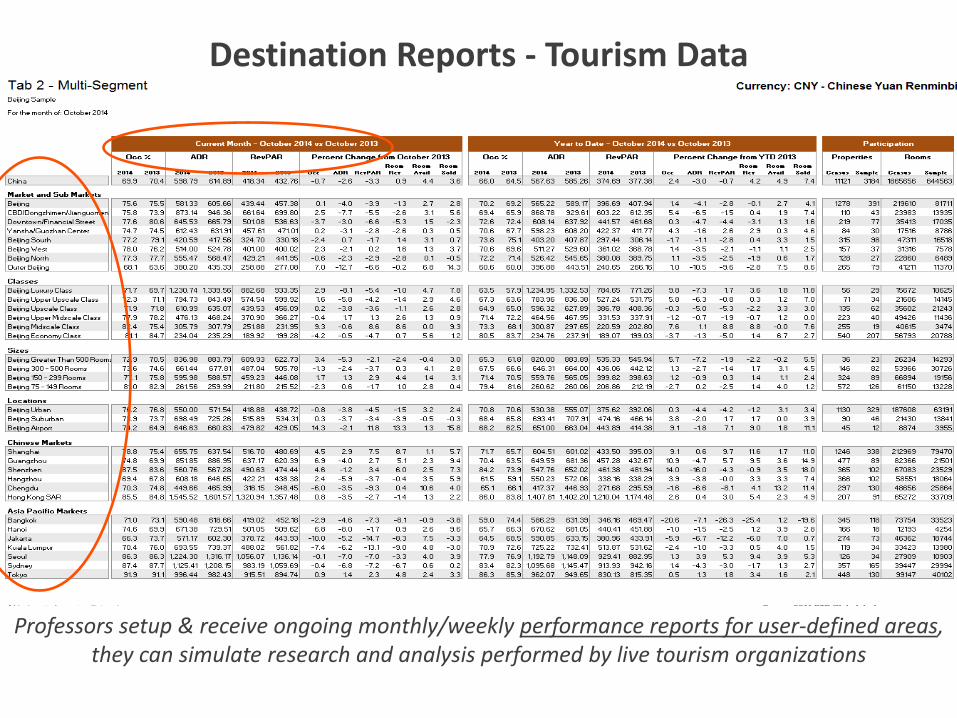
Destination Reports - Tourism Data
Professors setup & receive ongoing monthly/weekly performance reports for user-defined areas, they can simulate research and analysis performed by live tourism organizations
Source: STR2020 © CoStar Realty Information, Inc.
Monthly Destination Report - Multi-Segment Sample close up
Source: STR2020 © CoStar Realty Information, Inc.
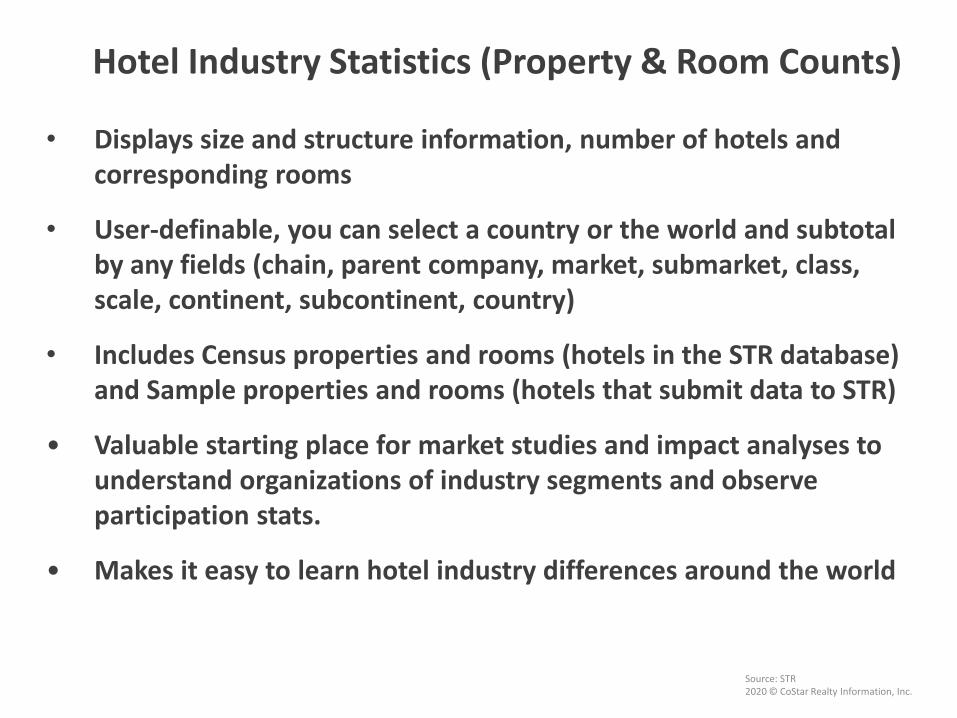
Hotel Industry Statistics (Property & Room Counts)
• Displays size and structure information, number of hotels and corresponding rooms
• User-definable, you can select a country or the world and subtotal by any fields (chain, parent company, market, submarket, class, scale, continent, subcontinent, country)
• Includes Census properties and rooms (hotels in the STR database) and Sample properties and rooms (hotels that submit data to STR)
• Valuable starting place for market studies and impact analyses to understand organizations of industry segments and observe participation stats.
• Makes it easy to learn hotel industry differences around the world
Source: STR2020 © CoStar Realty Information, Inc.
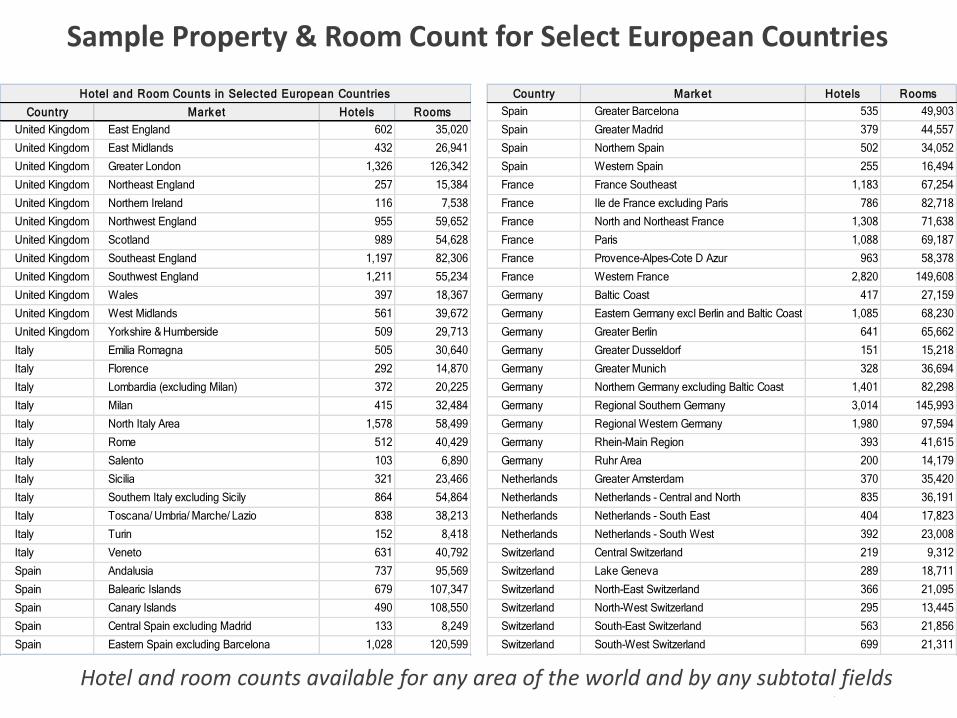
Hotel and room counts available for any area of the world and by any subtotal fields
Sample Property & Room Count for Select European Countries
Country Market Hotels Rooms
United Kingdom East England 602 35,020
United Kingdom East Midlands 432 26,941
United Kingdom Greater London 1,326 126,342
United Kingdom Northeast England 257 15,384
United Kingdom Northern Ireland 116 7,538
United Kingdom Northwest England 955 59,652
United Kingdom Scotland 989 54,628
United Kingdom Southeast England 1,197 82,306
United Kingdom Southwest England 1,211 55,234
United Kingdom Wales 397 18,367
United Kingdom West Midlands 561 39,672
United Kingdom Yorkshire & Humberside 509 29,713
Italy Emilia Romagna 505 30,640
Italy Florence 292 14,870
Italy Lombardia (excluding Milan) 372 20,225
Italy Milan 415 32,484
Italy North Italy Area 1,578 58,499
Italy Rome 512 40,429
Italy Salento 103 6,890
Italy Sicilia 321 23,466
Italy Southern Italy excluding Sicily 864 54,864
Italy Toscana/ Umbria/ Marche/ Lazio 838 38,213
Italy Turin 152 8,418
Italy Veneto 631 40,792
Spain Andalusia 737 95,569
Spain Balearic Islands 679 107,347
Spain Canary Islands 490 108,550
Spain Central Spain excluding Madrid 133 8,249
Spain Eastern Spain excluding Barcelona 1,028 120,599
Hotel and Room Counts in Selec ted European Countries Country Market Hotels Rooms
Spain Greater Barcelona 535 49,903
Spain Greater Madrid 379 44,557
Spain Northern Spain 502 34,052
Spain Western Spain 255 16,494
France France Southeast 1,183 67,254
France Ile de France excluding Paris 786 82,718
France North and Northeast France 1,308 71,638
France Paris 1,088 69,187
France Provence-Alpes-Cote D Azur 963 58,378
France Western France 2,820 149,608
Germany Baltic Coast 417 27,159
Germany Eastern Germany excl Berlin and Baltic Coast 1,085 68,230
Germany Greater Berlin 641 65,662
Germany Greater Dusseldorf 151 15,218
Germany Greater Munich 328 36,694
Germany Northern Germany excluding Baltic Coast 1,401 82,298
Germany Regional Southern Germany 3,014 145,993
Germany Regional Western Germany 1,980 97,594
Germany Rhein-Main Region 393 41,615
Germany Ruhr Area 200 14,179
Netherlands Greater Amsterdam 370 35,420
Netherlands Netherlands - Central and North 835 36,191
Netherlands Netherlands - South East 404 17,823
Netherlands Netherlands - South West 392 23,008
Switzerland Central Switzerland 219 9,312
Switzerland Lake Geneva 289 18,711
Switzerland North-East Switzerland 366 21,095
Switzerland North-West Switzerland 295 13,445
Switzerland South-East Switzerland 563 21,856
Switzerland South-West Switzerland 699 21,311
Source: STR2020 © CoStar Realty Information, Inc.
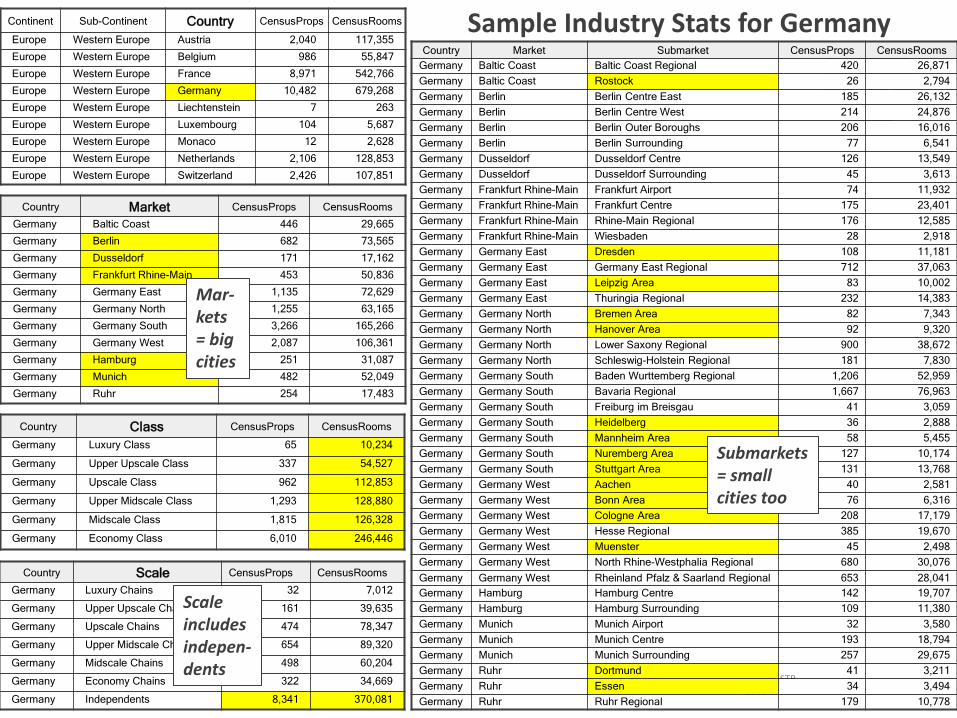
Sample Industry Stats for GermanyContinent Sub-Continent Country CensusProps CensusRooms
Europe Western Europe Austria 2,040 117,355
Europe Western Europe Belgium 986 55,847
Europe Western Europe France 8,971 542,766
Europe Western Europe Germany 10,482 679,268
Europe Western Europe Liechtenstein 7 263
Europe Western Europe Luxembourg 104 5,687
Europe Western Europe Monaco 12 2,628
Europe Western Europe Netherlands 2,106 128,853
Europe Western Europe Switzerland 2,426 107,851
Country Market CensusProps CensusRooms
Germany Baltic Coast 446 29,665
Germany Berlin 682 73,565
Germany Dusseldorf 171 17,162
Germany Frankfurt Rhine-Main 453 50,836
Germany Germany East 1,135 72,629
Germany Germany North 1,255 63,165
Germany Germany South 3,266 165,266
Germany Germany West 2,087 106,361
Germany Hamburg 251 31,087
Germany Munich 482 52,049
Germany Ruhr 254 17,483
Mar-kets= big cities
Country Class CensusProps CensusRooms
Germany Luxury Class 65 10,234
Germany Upper Upscale Class 337 54,527
Germany Upscale Class 962 112,853
Germany Upper Midscale Class 1,293 128,880
Germany Midscale Class 1,815 126,328
Germany Economy Class 6,010 246,446
Country Scale CensusProps CensusRooms
Germany Luxury Chains 32 7,012
Germany Upper Upscale Chains 161 39,635
Germany Upscale Chains 474 78,347
Germany Upper Midscale Chains 654 89,320
Germany Midscale Chains 498 60,204
Germany Economy Chains 322 34,669
Germany Independents 8,341 370,081
Scale includes indepen-dents
Country Market Submarket CensusProps CensusRooms
Germany Baltic Coast Baltic Coast Regional 420 26,871
Germany Baltic Coast Rostock 26 2,794
Germany Berlin Berlin Centre East 185 26,132
Germany Berlin Berlin Centre West 214 24,876
Germany Berlin Berlin Outer Boroughs 206 16,016
Germany Berlin Berlin Surrounding 77 6,541
Germany Dusseldorf Dusseldorf Centre 126 13,549
Germany Dusseldorf Dusseldorf Surrounding 45 3,613
Germany Frankfurt Rhine-Main Frankfurt Airport 74 11,932
Germany Frankfurt Rhine-Main Frankfurt Centre 175 23,401
Germany Frankfurt Rhine-Main Rhine-Main Regional 176 12,585
Germany Frankfurt Rhine-Main Wiesbaden 28 2,918
Germany Germany East Dresden 108 11,181
Germany Germany East Germany East Regional 712 37,063
Germany Germany East Leipzig Area 83 10,002
Germany Germany East Thuringia Regional 232 14,383
Germany Germany North Bremen Area 82 7,343
Germany Germany North Hanover Area 92 9,320
Germany Germany North Lower Saxony Regional 900 38,672
Germany Germany North Schleswig-Holstein Regional 181 7,830
Germany Germany South Baden Wurttemberg Regional 1,206 52,959
Germany Germany South Bavaria Regional 1,667 76,963
Germany Germany South Freiburg im Breisgau 41 3,059
Germany Germany South Heidelberg 36 2,888
Germany Germany South Mannheim Area 58 5,455
Germany Germany South Nuremberg Area 127 10,174
Germany Germany South Stuttgart Area 131 13,768
Germany Germany West Aachen 40 2,581
Germany Germany West Bonn Area 76 6,316
Germany Germany West Cologne Area 208 17,179
Germany Germany West Hesse Regional 385 19,670
Germany Germany West Muenster 45 2,498
Germany Germany West North Rhine-Westphalia Regional 680 30,076
Germany Germany West Rheinland Pfalz & Saarland Regional 653 28,041
Germany Hamburg Hamburg Centre 142 19,707
Germany Hamburg Hamburg Surrounding 109 11,380
Germany Munich Munich Airport 32 3,580
Germany Munich Munich Centre 193 18,794
Germany Munich Munich Surrounding 257 29,675
Germany Ruhr Dortmund 41 3,211
Germany Ruhr Essen 34 3,494
Germany Ruhr Ruhr Regional 179 10,778
Submarkets = small cities too
Source: STR2020 © CoStar Realty Information, Inc.
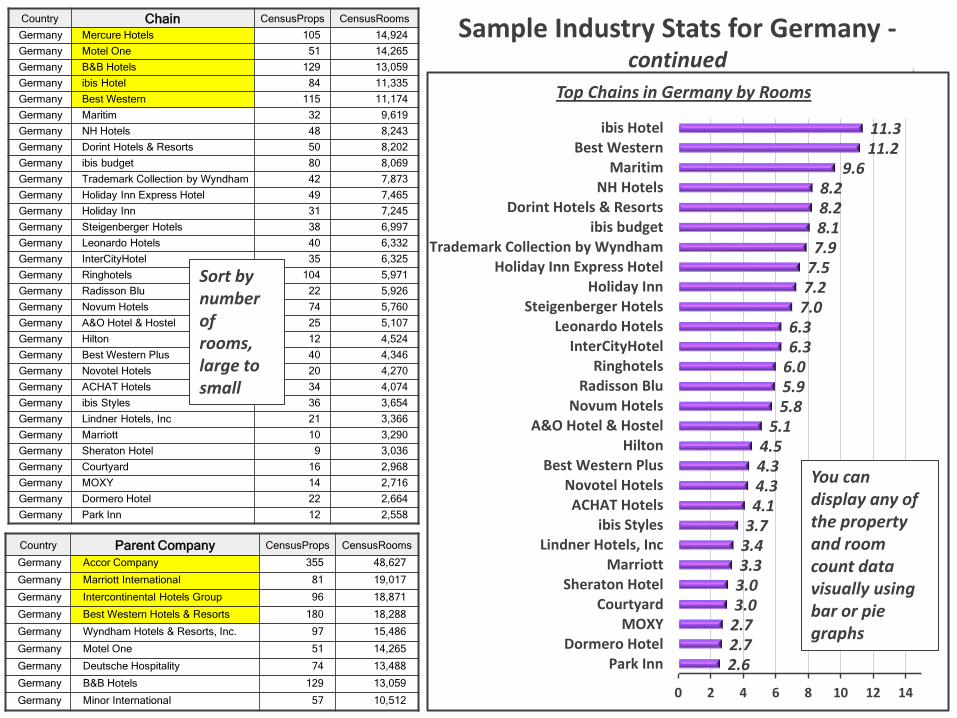
Sample Industry Stats for Germany -continued
2.62.72.73.03.03.33.43.74.14.34.34.5
5.15.85.96.06.36.3
7.07.27.57.98.18.28.2
9.611.211.3
0 2 4 6 8 10 12 14
Park InnDormero Hotel
MOXYCourtyard
Sheraton HotelMarriott
Lindner Hotels, Incibis Styles
ACHAT HotelsNovotel Hotels
Best Western PlusHilton
A&O Hotel & HostelNovum Hotels
Radisson BluRinghotels
InterCityHotelLeonardo Hotels
Steigenberger HotelsHoliday Inn
Holiday Inn Express HotelTrademark Collection by Wyndham
ibis budgetDorint Hotels & Resorts
NH HotelsMaritim
Best Westernibis Hotel
Thousands
Top Chains in Germany by Rooms
You can display any of the property and room count data visually using bar or pie graphs
Country Chain CensusProps CensusRooms
Germany Mercure Hotels 105 14,924
Germany Motel One 51 14,265
Germany B&B Hotels 129 13,059
Germany ibis Hotel 84 11,335
Germany Best Western 115 11,174
Germany Maritim 32 9,619
Germany NH Hotels 48 8,243
Germany Dorint Hotels & Resorts 50 8,202
Germany ibis budget 80 8,069
Germany Trademark Collection by Wyndham 42 7,873
Germany Holiday Inn Express Hotel 49 7,465
Germany Holiday Inn 31 7,245
Germany Steigenberger Hotels 38 6,997
Germany Leonardo Hotels 40 6,332
Germany InterCityHotel 35 6,325
Germany Ringhotels 104 5,971
Germany Radisson Blu 22 5,926
Germany Novum Hotels 74 5,760
Germany A&O Hotel & Hostel 25 5,107
Germany Hilton 12 4,524
Germany Best Western Plus 40 4,346
Germany Novotel Hotels 20 4,270
Germany ACHAT Hotels 34 4,074
Germany ibis Styles 36 3,654
Germany Lindner Hotels, Inc 21 3,366
Germany Marriott 10 3,290
Germany Sheraton Hotel 9 3,036
Germany Courtyard 16 2,968
Germany MOXY 14 2,716
Germany Dormero Hotel 22 2,664
Germany Park Inn 12 2,558
Country Parent Company CensusProps CensusRooms
Germany Accor Company 355 48,627
Germany Marriott International 81 19,017
Germany Intercontinental Hotels Group 96 18,871
Germany Best Western Hotels & Resorts 180 18,288
Germany Wyndham Hotels & Resorts, Inc. 97 15,486
Germany Motel One 51 14,265
Germany Deutsche Hospitality 74 13,488
Germany B&B Hotels 129 13,059
Germany Minor International 57 10,512
Sort by number of rooms, large to small

Source: STR2020 © CoStar Realty Information, Inc.
Hotel Sales Transaction Data
• Detailed information on hotel sales back to 2000
• You can select a geographic area or specific transactions
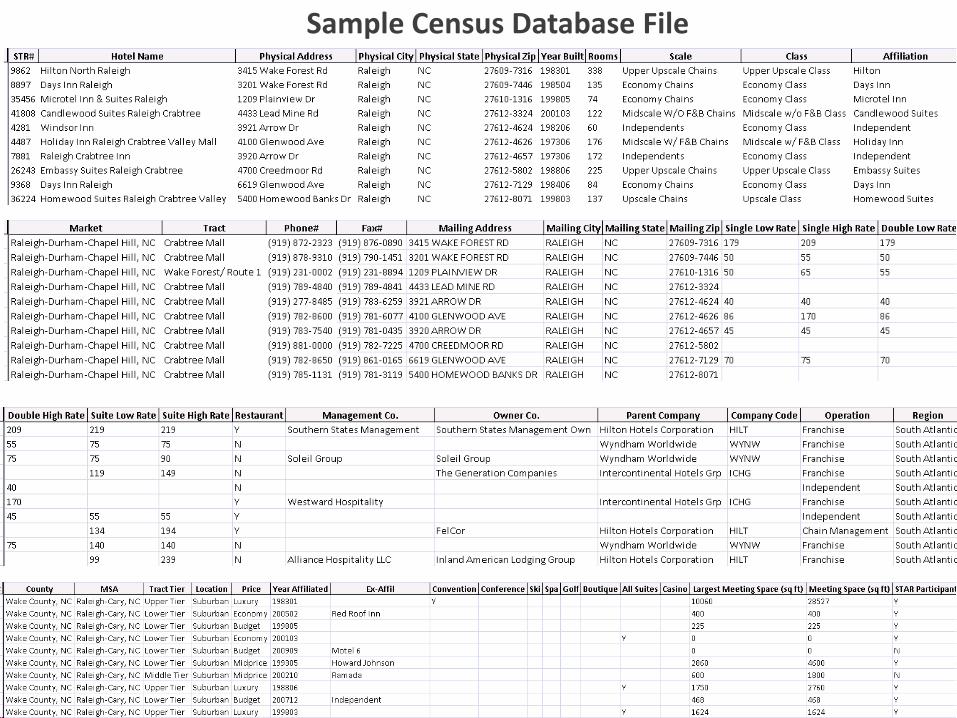
Hotel Census Data
• Attribute information on hotels any where in the world
• Over 100 fields of data including categorizations, features, amenities, history, meeting space info, latitude/longitude, generic email address; see sample on next slide
Professors can use hotel census data for market analyses or competitor studies
Source: STR2020 © CoStar Realty Information, Inc.
Sample Census Database File
Source: STR2020 © CoStar Realty Information, Inc.
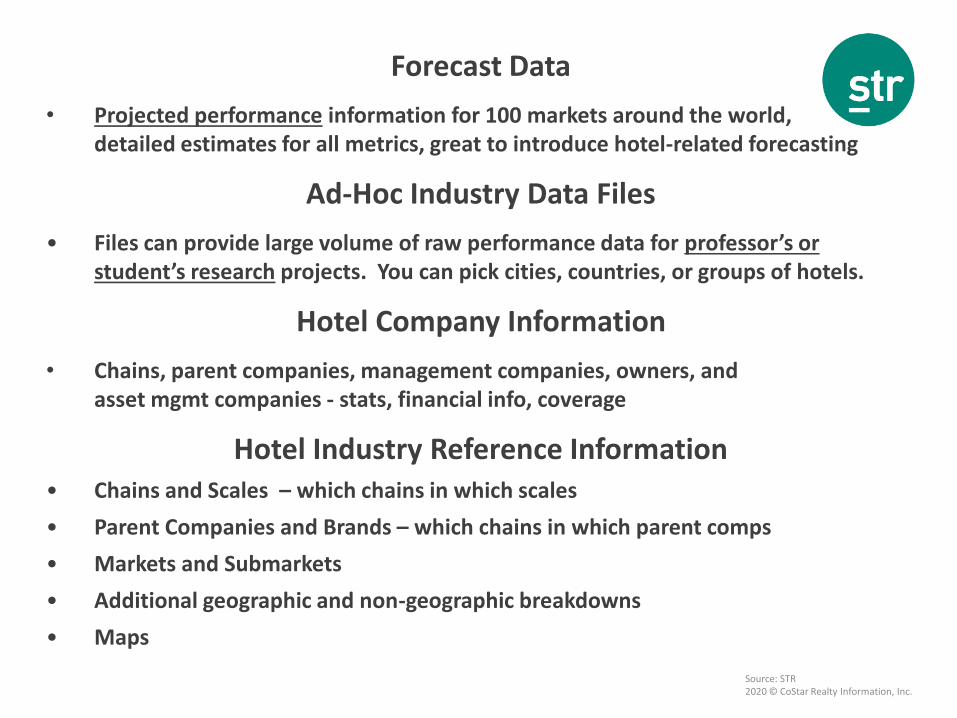
Forecast Data
• Projected performance information for 100 markets around the world, detailed estimates for all metrics, great to introduce hotel-related forecasting
Ad-Hoc Industry Data Files
• Files can provide large volume of raw performance data for professor’s or student’s research projects. You can pick cities, countries, or groups of hotels.
Hotel Company Information
• Chains, parent companies, management companies, owners, and asset mgmt companies - stats, financial info, coverage
Hotel Industry Reference Information• Chains and Scales – which chains in which scales
• Parent Companies and Brands – which chains in which parent comps
• Markets and Submarkets
• Additional geographic and non-geographic breakdowns
• Maps
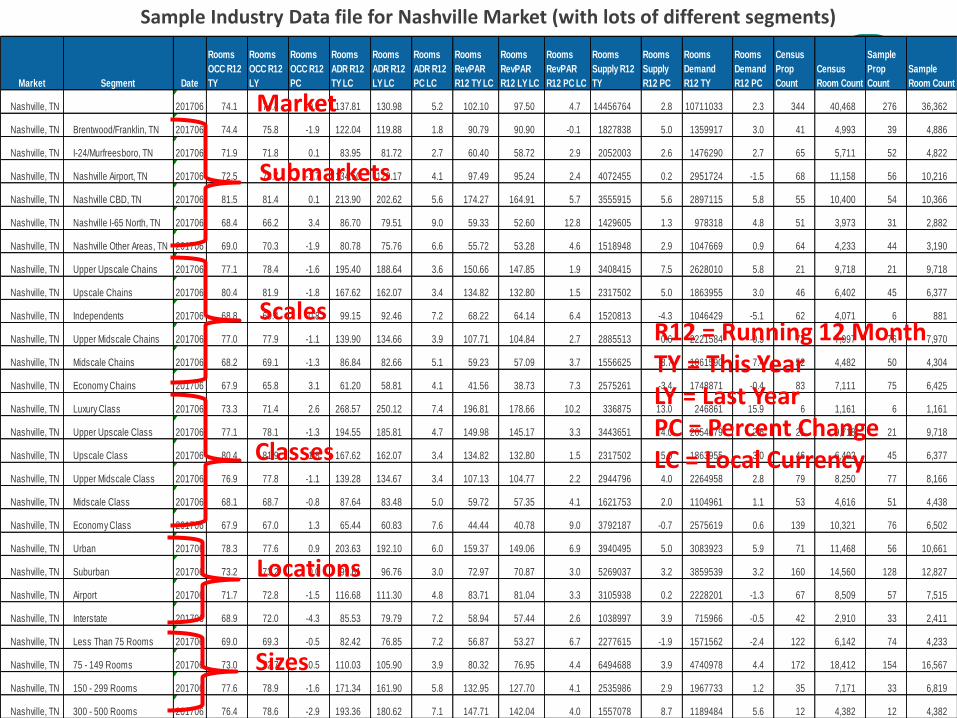
Sample Industry Data file for Nashville Market (with lots of different segments)
Market Segment Date
Rooms
OCC R12
TY
Rooms
OCC R12
LY
Rooms
OCC R12
PC
Rooms
ADR R12
TY LC
Rooms
ADR R12
LY LC
Rooms
ADR R12
PC LC
Rooms
RevPAR
R12 TY LC
Rooms
RevPAR
R12 LY LC
Rooms
RevPAR
R12 PC LC
Rooms
Supply R12
TY
Rooms
Supply
R12 PC
Rooms
Demand
R12 TY
Rooms
Demand
R12 PC
Census
Prop
Count
Census
Room Count
Sample
Prop
Count
Sample
Room Count
Nashville, TN 201706 74.1 74.4 -0.5 137.81 130.98 5.2 102.10 97.50 4.7 14456764 2.8 10711033 2.3 344 40,468 276 36,362
Nashville, TN Brentwood/Franklin, TN 201706 74.4 75.8 -1.9 122.04 119.88 1.8 90.79 90.90 -0.1 1827838 5.0 1359917 3.0 41 4,993 39 4,886
Nashville, TN I-24/Murfreesboro, TN 201706 71.9 71.8 0.1 83.95 81.72 2.7 60.40 58.72 2.9 2052003 2.6 1476290 2.7 65 5,711 52 4,822
Nashville, TN Nashville Airport, TN 201706 72.5 73.7 -1.7 134.50 129.17 4.1 97.49 95.24 2.4 4072455 0.2 2951724 -1.5 68 11,158 56 10,216
Nashville, TN Nashville CBD, TN 201706 81.5 81.4 0.1 213.90 202.62 5.6 174.27 164.91 5.7 3555915 5.6 2897115 5.8 55 10,400 54 10,366
Nashville, TN Nashville I-65 North, TN 201706 68.4 66.2 3.4 86.70 79.51 9.0 59.33 52.60 12.8 1429605 1.3 978318 4.8 51 3,973 31 2,882
Nashville, TN Nashville Other Areas, TN 201706 69.0 70.3 -1.9 80.78 75.76 6.6 55.72 53.28 4.6 1518948 2.9 1047669 0.9 64 4,233 44 3,190
Nashville, TN Upper Upscale Chains 201706 77.1 78.4 -1.6 195.40 188.64 3.6 150.66 147.85 1.9 3408415 7.5 2628010 5.8 21 9,718 21 9,718
Nashville, TN Upscale Chains 201706 80.4 81.9 -1.8 167.62 162.07 3.4 134.82 132.80 1.5 2317502 5.0 1863955 3.0 46 6,402 45 6,377
Nashville, TN Independents 201706 68.8 69.4 -0.8 99.15 92.46 7.2 68.22 64.14 6.4 1520813 -4.3 1046429 -5.1 62 4,071 6 881
Nashville, TN Upper Midscale Chains 201706 77.0 77.9 -1.1 139.90 134.66 3.9 107.71 104.84 2.7 2885513 0.6 2221584 -0.5 77 7,997 76 7,970
Nashville, TN Midscale Chains 201706 68.2 69.1 -1.3 86.84 82.66 5.1 59.23 57.09 3.7 1556625 8.7 1061590 7.4 52 4,482 50 4,304
Nashville, TN Economy Chains 201706 67.9 65.8 3.1 61.20 58.81 4.1 41.56 38.73 7.3 2575261 -3.4 1748871 -0.4 83 7,111 75 6,425
Nashville, TN Luxury Class 201706 73.3 71.4 2.6 268.57 250.12 7.4 196.81 178.66 10.2 336875 13.0 246861 15.9 6 1,161 6 1,161
Nashville, TN Upper Upscale Class 201706 77.1 78.1 -1.3 194.55 185.81 4.7 149.98 145.17 3.3 3443651 4.0 2654679 2.6 21 9,718 21 9,718
Nashville, TN Upscale Class 201706 80.4 81.9 -1.8 167.62 162.07 3.4 134.82 132.80 1.5 2317502 5.0 1863955 3.0 46 6,402 45 6,377
Nashville, TN Upper Midscale Class 201706 76.9 77.8 -1.1 139.28 134.67 3.4 107.13 104.77 2.2 2944796 4.0 2264958 2.8 79 8,250 77 8,166
Nashville, TN Midscale Class 201706 68.1 68.7 -0.8 87.64 83.48 5.0 59.72 57.35 4.1 1621753 2.0 1104961 1.1 53 4,616 51 4,438
Nashville, TN Economy Class 201706 67.9 67.0 1.3 65.44 60.83 7.6 44.44 40.78 9.0 3792187 -0.7 2575619 0.6 139 10,321 76 6,502
Nashville, TN Urban 201706 78.3 77.6 0.9 203.63 192.10 6.0 159.37 149.06 6.9 3940495 5.0 3083923 5.9 71 11,468 56 10,661
Nashville, TN Suburban 201706 73.2 73.2 0.0 99.61 96.76 3.0 72.97 70.87 3.0 5269037 3.2 3859539 3.2 160 14,560 128 12,827
Nashville, TN Airport 201706 71.7 72.8 -1.5 116.68 111.30 4.8 83.71 81.04 3.3 3105938 0.2 2228201 -1.3 67 8,509 57 7,515
Nashville, TN Interstate 201706 68.9 72.0 -4.3 85.53 79.79 7.2 58.94 57.44 2.6 1038997 3.9 715966 -0.5 42 2,910 33 2,411
Nashville, TN Less Than 75 Rooms 201706 69.0 69.3 -0.5 82.42 76.85 7.2 56.87 53.27 6.7 2277615 -1.9 1571562 -2.4 122 6,142 74 4,233
Nashville, TN 75 - 149 Rooms 201706 73.0 72.7 0.5 110.03 105.90 3.9 80.32 76.95 4.4 6494688 3.9 4740978 4.4 172 18,412 154 16,567
Nashville, TN 150 - 299 Rooms 201706 77.6 78.9 -1.6 171.34 161.90 5.8 132.95 127.70 4.1 2535986 2.9 1967733 1.2 35 7,171 33 6,819
Nashville, TN 300 - 500 Rooms 201706 76.4 78.6 -2.9 193.36 180.62 7.1 147.71 142.04 4.0 1557078 8.7 1189484 5.6 12 4,382 12 4,382
Market
Submarkets
Scales
Classes
Locations
Sizes
R12 = Running 12 MonthTY = This YearLY = Last YearPC = Percent ChangeLC = Local Currency
Source: STR2020 © CoStar Realty Information, Inc.
Sample Forecast ReportRecent Performance