Village & Townwise Primary Census Abstract, Jalpalguri, Part ...
215
CENSUS OF _INDIA 1981 SERmS ·23 WEST BENGAL DISTRICT CENSUS HANDBOOK PART XIII-B VILLAGE & TOWNWISE PRIMARY CENSUS ABSTRACT JALPAIGURI DISTRICT S.N. GHOSH of the Indian Administrative Service DIRECTOR OF CENSUS OPERATIONS WEST BENGAL
-
Upload
khangminh22 -
Category
Documents
-
view
1 -
download
0
Transcript of Village & Townwise Primary Census Abstract, Jalpalguri, Part ...

~0IlI'it
CENSUS OF _INDIA 1981 SERmS ·23
WEST BENGAL
DISTRICT CENSUS HANDBOOK
PART XIII-B
VILLAGE & TOWNWISE PRIMARY CENSUS
ABSTRACT
JALPAIGURI DISTRICT
S.N. GHOSH of the Indian Administrative Service
DIRECTOR OF CENSUS OPERATIONS
WEST BENGAL

Price: (Inland) Rs. 15.00 Paise: (Foreign) £ 1.?S -OJ! S $ 40 CeDfs.
PUBLISHED BY .THE CONTROLLER.
GOVERNMENT PRINTING, WEST BENGAL AND
PRINTED BY MILl ART PRESS,
36, IMDAD ALI LANE, CALCUTTA-700 016
1987

Foreword
Preface
Acknowledgements
Map of the District
Important Statistics
Analytical Note and Analysis of Data
District Primary Census Abstract
CONTENTS
(Police Station-wise Total, Rural, Urban)
Police Station-wise Primary Census Absn:act
1. Rajganj Police Station (a) Alphabetical list of villages (b) Village-wise Primary Census Abstract (c) Town-wise Primary Census Abstract
(For Statutory Town ward-wise)
2. Jalpaiguri Police Station (a) Alphabeticallist of villages (b) Village-wise Primary Census Abstract (c) Town-wise Primary'Census Abstract
(For Statutory Town ward-wise)
3. Mal Police Station (a) Alphabetical list of villages (b) Village>wise Primary Census Abstract (c) Town-wise Primary Census Abstract
(For Statutory Town ward-wise)
4. Mitiali Police Station (a) Alphabetical list of villages (b) Village-wise Primary. Census Abstract
5. Maynaguri Police Station (a) Alphabetical list of villages (b) Village-wise Primary Census Abstract (c) Town-wise Primary Census Abstract
(For Statutory Town ward-wise)
6. Nagrakata Police Station (a) Alphabetical list of villages (b) Village-wise Primary Census Abstract
VII
IX
XI
XIII
XV
1-19
22
37
38 38
41
42 44
46 48
54
57 58
60
62 66
(}9 70

, IV I
~ag~
7. Banarhat Police Station (a) Alphabetical list of villages 73 (b) Village-wise Primary Census Abstract 74-(cI Town-wise Primary Censes Abstract 7('
(For Statutory Town'ward-wise)
8. Dhubguri Police Station (a) ~ Alpbabeticallist of villages 71 (b) Village-wise Primary Census Abstract "0 (c) Town-wise Primary Census Abstract ·84
(For Statutory Town ward-wise)
9. Birpara Police Station (a) Alphabetical list of villages ·87 (b) Village-wise Primary Census Abstract ·88
10. Falakata Police Station (a) Alphabetical list of villages 91 (b) Village-wise Primary Census Abstract 92 (c) Town-wise Primary Census Abstract 96
(For Staturory Town ward-wise)
11. Madarihat Police Station (a) Alphabetical list of villages '9 (b) Village-wise Primary Census Abstract ·100
12. Alipurduar Police Station
(a) Alphabetical list of villages 102 (b) Village-wise Primary Census Abstract ,104-(c) Town-wise Primary Census Abstract 114
I For Statutory Town ward-wise)
13. Kalcbini Police Station (a) Al phabetical list of villages U7 (b) Village-wise Primary Census Abstract 111 (c) Town-wise Primary Census Abstract 120
(For Statutory Town ward-Wise)
14. Kumargram Police Station (a) Alphabetical list of villages 123 (b) Village-wise Primary Census Abstrac t 124

v
Appendix
Total Population, Scheduled Caste Popul;tion .and Scheduled Tribe Population-Urban Block-wise
District Primary Census Abstract of Scheduled Castes
District Primary Census Abstract of Scheduled Tribes
List of Scheduled Castes and Scheduled Tribes-West Bengal
Maps
1. Rajganj Police Station
2. Jalpaiguri Police Station
3. Mal "Police Statio"n
4. Mitiali Police Station
5. Maynaguri Police Station
6. Nagrakata Police Station
7. Banarhat Police Sta.tion
8. Dhubguri Police Station
9. Birpara Police Station
10. Falakata Police Station
11. Madarihat Police Station
12. Alipurduar Police Station
13. Kalchini Police Station
14. Kurnargram Police Station
"ages
130
142
154
q,69-170
173
l75
f.l77
H9
ll'il
U3
iJ.8S
,187
189
lUl
~193
195
197
,..199


FOREWORD
-The district census handbook (DCH). compiled by the Census Organisatio~ on behalf of the State Government8t is one of the most valuable products of the Census. The DCH is constantly referred to by planners, administrators,
.academicians and researchers. It is inter alia used for delimitation of constituencies, formulation of local level andregional plans and as an aid to District administration. The district censlis handbook is the only publication which provides Primary Census Abstract (PCA) data upto village level for the rural areas and wardwise for eaca
.city or town. I! also provides data on infrastructure and amenities in villages and towns, etc.
The district census handbook series was initiated during the 1951 Census. It contained important cenlus tables and PCA for each village and town of the district: During 1961 Census the scope of the DCH was -enlarged and it contained a de~criptive account of thc district, administrative statistics, census tables and a vi1Iag~ and town directory, inc1udi~ PCA. The 1971 DCH series wa~ planned in three parts. Part-A related t() village and town directory, Part-B to village and town PCA and Part-C comprised analytical report • .administrative statistics, district census tables and certain analytical tables based on PCA and amenity data in respect of villages. However, in some states it was confined to district census tables and in a few cases .altogether given up due to delay in compilation and printing.
While designing the format of 1981 DCH series some new features along with the restructuring of the formata of village and town directory have been attempted. At the same time, comparability with the 1971 data -has also been kept in view. All the amenities except power supply in the village have been brought together in ·the village directory with the instruction tbat in case an amenity is not available in the referrent village .the distance in broad ranges from the nearest place where the amenity is available may be given. Tho restructuring of the format of the village directory and incorporating more exhaustive data on infrastructure .aspect particularly in relation to amenities and land-use pattern is expected to further meet the need of micro level planning for rural areas. It is expected to help not only in local area planning but regulating the provision of goods and services as well so as to minimise the regional imbalances in the process of .development. A few new items of information have also been introduced to meet some of the requirements of the Revised Minimum Needs Programme. Such new items of information as adult literacy centres, primary health sub-centres, and community health workers in the village have been introduced in the village directory with this objective in mind. The new item on approach to the village is to have an idea about the villages in the district which are inaccessible. A new column, "total population and number of nouseholds" has been introduced to examine the correlation of the amenities with the population and number of households they serve. Addition of two more appendices listing the villages where no amenities are available and according to the proportion of scheduled caste and scheduled trib~ population to the total population bas also been made with this view in mind.
The formats of the town directory have also been modified to meet the requirements of the Minimum Needs Programme by providing information on a few new items. A new ·statement on civic and other amenities in slums in Class-I and Class-II towns (State,ment IV-A) has been introduced with tbis objective in mind. It is expected that this will help the planners to chalk out programmes on provision of civic amenities for tho improvement of slums. The columns on Scheduled Castes and Scheduled Tribes population in statement IV relating to civic and other amenities and adult literacy classes/centres under educational facilities in statement Vare also added inter alia with this view. A significant addition is class of town in all the seven statements of the town directory. The infrastructure of amenities in urban areas of the country can be best analysed by taking the class of towns into consideration. The addition of the columns on civic administration status and population in -a few stlftements alsc> serves this purpose.

E VIII 1
~e format or tlie primary eensus abstract for the villages and towns has been formulated in the iight of changes in the economic and other questions canvassed through the individual-slip of 1981 Census.
In order to av()id delay in publication of 1981 DCH series it has been so designed tliat Part-A of thevotume contains village and town directory and Part-B, the PCA of villages and towns including the Scheduled Castes and Scheduled Tribes PCA upto Police Stationl/Town lavels. At the beginning of the DeH a detailed analytical note supported -by a number of inset tables based on PCA and non censps data in relation to th~ infrastructure has been introduced to enhance 'its value. The district and' Police Station level maps depicting the boundaries and other important features have been insert~d at appropriate places, to further enhance the value of the publication.
fThis publication is a joint venture of the State Government and the Census Organisation. The data , have been collected and compiled in the state under the direction of Sbri S. N. Ghosh, lAS, the Director of Census Operations, West Bengal on behalf of State Government which has borne the cost of' printing. The task of. planning, designing and co-ordin~tion of this publication was carried out by Shri N. G. Nag, Deputy Registrar General (Social Studies) of my office. Dr. 'B. -K. Roy., Deputy Registrat:General (Map) provided the; technical guidance in the preparation of the maps. Data received from Census Direcrorates have been scrutinised in the Social studies Division at the head quarters under the guidance: ()f Shri M. M. Dua, Senior Research Officer. I am thankful to all who have <;ontributed in this project.
New Delhi the 26th April, 1982
P. PADMANABHA Registrar General, India.

PREFACE
The District Cenllus Handbook compiled by the Cemms' Directorate, West Bengal, on behalf of the Govt. of West Bengal containing Census Statistics besides other invaluable data of' importance for use by the State Govt., district administration, research scholars and various other data-users owes its origin to 1951 Census. The present-publication of 1981 Census is fourth in the series.
The Census of 1981 was conducted in February, 1981 with sunrise of ht March, 1981 as reference date under the stewardship of Shri S: N. Ghosh, Director of Census Operations, West Bengal. The credit for the success of the operation goes entirely to Shri Ghosh. However, before the report could be finalised, Shri Chosh bad to resu£ his duties und_er the Govt. of West Bengal in pUblic' interest. The present publication is the product of his dedicated labour, immaculate planning and sterling administrative capabilities. Without the active involvement and inspiring leadership of Shri Ghosh, the present publication would have been a still birth.
The Census statistics in the form of Primary Census Abstract ineluded in the publication relate to the district of Jalpaiguri. A brief analytical note with a number of inset tables based on Census data, included in this publication, will hopefully meet the requirements o'f the readers.
As mentioned earlier, the 1981 Census Operations in West Bengal was conducted by Shri S. N. Ghosh, as Director of Census Operations under the inspiring captaincy of Shri P: Padmanabha, former Registrar General and ex-officio Census Commissioner of India, whose imaginative planning enthusiastic support and electrifying gllidance led us to successful completion of an undovbtedly difficun: operation. We silently recall the contribution of Sri Padmanabha.
Shri V. S. Verma, the present Registrar General, India has been guiding us soon after his assumption of office in 1983 to oversee the timely completion of the project. Without his active support, deep understanding and mature guidance, the publication would not have progressed much. We are grateful to Shri Verma.
We gratefully recall the help, guidance and advice received from Shri V. P. Pandey, Joint Registrar General, India in technical and administrative matters relating to this project.
Dr. N. G. Nag, Deputy Registrar General (Social Studies) and his colleagues had provided us technical guidance and scholarly assistances right from the start of the project. We acknowledge our debt to him and his colleagues.
We are also indebted to Shri K. K. Chakraborty former Deputy Registrar General (C & T) and Shri N. Rama Rao, Asstt. Registrar General for their helpful suggestions. Dr. B. K. Roy, Deputy R~istrar General (Map) had provided us excellent support and guidance in cartographic matters. We are indebted to him.
The data presented in the volume were collected at grass-root level by the District Magistrate, Jalpaiguri (Principal Census Officer.) and his innumerable colleagues including the Charge Superintendent, Census Supervisors, Census Enumerators. The data were processed under ~he Deputy Director-in-Charge of the
--Regiona( Tabulation ,office by a host of Coders, Checkers, Tabulators, Supervisors etc. We acknowledge their contributions to the preparation of this- volume.

[ x ] , \
'fhe final tabulation and compilation of the data have been done by the Central Tabulation Unit of thill, office under the supervision of Shri S. K. Guha, Investigator, first under the guidance and supervision of Shri M. N. Sarkar, Asstt. Director of Census Operations (since retired) and lat~r unde.r Sri A. K. Dutta, Deputy Director of Census Operations, West Bengal. Without their sincere efforts the data could not have been finalised. The analytical note was prepared by Shri S. K. Guha, Investigator and scrutinised, edited and finalised by Shri A. K. Dutta, Deputy Director of Census Operations, West Bengal. The publication is a silent testimony to their labOur and love.
The credit for ,preparation of the maps goes to the Map unit of this, directorate under the technical and administrative gUidance and supervision of Shri A. K. Dutta, Deputy Director of Census Operations, West Bengal, who was ably assisted by Shri Chourajit SiIJ'gh, Senior Geographer, Sri T. S. Khadatkar, Geographer and their colleagues.
The printing work was supervised very efficiently by Shri S. K Guha, Investigator, under the able guidance of Sri A. K. Dutta, Deputy Director. )-Vithout whose direct involvement the publication could not have seen the light of the day. We recall Sri Datta's effective contribution with admiration.
There were also officials who had contributed to the project from behind the curtain. Among the officials of the State Govt. who had helped us in various stages of the publication are Shri K. J. Basu Roy Choudhury, WBCS., and Shri B. Bhattacharyya, WBCS., both Deputy Secretaries to the Govt. of West Bengal, Home
"-( C & E) Department, Writers' Bulidings, Calcutta and their colleagues to whom we pay our tribute. Mention should also be made of the Controller of Stationery, Govt. of West Bengal, for kindly providing us the necessary, printing materials.
La.stIy, we must express our appreciation to Mis. Mili Art Press, 36, Imdad Ali L~ne, Calcutta-700 016 for the printing of this publication.
Calcutta
SUKUMAR SINHA Joint Director of Census Operations,
West Bengal

ACKNOWLEDGEMENTS No. Name
1. Shri Afzaluddin Ahmed
2. " Pratap &ingh
3. Shrimati AnjaJi Das
4. "
Sucheta Dutta
5. Smi Kamal Dutta
6. "
Sudhin Ghosh
7. "
Nikhil Kumar Bagchi
8. "
Manash Mitra
9. "
Ashok Kumar Sarkar
10. Shrimati Banani Ghosh
11. "
Nira Chakraborty
J2. "
Mira Banerjee
13. "
Kalpana Chowdhury
14. "
Dipti Chatterjee
15. "
Sabita Banetjee
16. " Namita Chatterjee
17. " Ranu Indra J
r8~" Nandita Outta
19. 'J Shefali Bose
20. "
Atashi Das Gupta
21. Shri Pra~anta Kumar :Burman
22. "
Gouri Sankar Chatterjee
23. Shrimati Supti Chatterjee
24. Sbri R. K. Chourajit Singh
25. "
T. S. Khadatkar
26. "
Bimalesb Das
27. Birendranath MaHick
28. " Ramchandra Kaib;trttaIDas
29. "
J. B. Dasgupta
30. A. R. Halder
31. "
Pradip Das
32. C. K. Ghosh
33. " H. R. Banerjee
34. " B' K. Majumder
35. "
A. K. Paul
36. " S. K. Chatterjee
Dc\\ignation
Statistical As&istant
"
" " "
Computor
" " .. "
"
"
" "
" " "
Proof Reader
" "
Senior Geograpner
Geographer
Senior Artist (Since Retired, 1986)
Senior Artist
" , Artist
Sen i or Dra Ugll tsml'lD
.. Artist
Drauglltsman
" " "


--------~~--------~r i,l 11
11
\:J' '" - a, l' a:
~. Ii
_, ~o <C
C) _. g z <C ~ -' .. 2!~ cq
cCl JI' fl, _,,___. -.
So S .4 Itt
,. ::- -.
tii f-~o 0 I.AJ
3: a: .; ti.
el ~
" f!.
, l:J J. S , 0


IMPORTANT STATISTICS
WEST BBNGA[' ..JALPAIGURI
Population Total Persons 54,580,647 2,214,8711 -Males ~,560,901 1,159.843
Females 26,019,746 1,055,028
Rural Persons 40,133.926 1~903,650
Males 20,617,489 994.747
Females 19,516.437 908,903
Urban Persons 14,446.721 311.221
Males 7,943.412 165,096
Females (i,503,309 ,146.125
Decennial-Popula tion Total +23.17 +26.55
Growth Rates 1971-81 Rural +20.36 +20.33
Urban +31.73 +85.16
Area (Sq. kms.) .88,752.0 .6.227.0 , Density of Population (per sq. kms.) 615 356
Sex Ratio (Number of Females per 1,000 Males) Total 911 '910
Rural 947 914
Urban '819 885
Literacy Rate Persons 40.94 '29.19
Males 30.67 37.30
Females 30.25 2J!J.27
Percentage of Urban Population to Total Population 26.47 14.05
'Percentage to Total Population
(i) Main Workers Persons 28.26 ·:31.75
Males <48.71 50.53
Females 5.81 .11.10
(ii) Marginal Workers Persons 1.91 .1.85
Males 1.58 1,47
Females 2.26 .2.28
(iii) Non-Workers Persons <69..83 60.40
Males 49.70 48.00
Females '9.1.93 '86.62

[ XVI
Break-up of Main Workers:
(i) Cultivators Persons 29.76 33.3I
Males 31.40 38.36
Females 14.67 8.05
(ii) Agricultural Labourers Persons 25.23 16.28
Males 23.69 17.04
Females 39.43 12.53
(iii) Household Industry Persons 3.52 1.22
Males 3.09 1.19
Females 7.50 1.33
(iv>, Other Workers Penons 41.49 49.19
Males 41.82 43.42
Females 38.40 78.08
Percentage of Scheduled Castes
Population to Total Population: Persons 21.99 34.61
Males 21.82 34.40
Females 22.17 34.84
Percentage of Scheduled Tribes
Population to Total Popula tion ; Persons 5.63 22.20
Males 5.46 21.80
Females 5.81 22.65
Number of Occupied Residential Houses : 91591,501 409,697
Number of Villages: Total 41.112 756
Inhabited 38,024 73&
Uninhabited 3.088 20
NJlmber of Towns: 291 12.

ANALYTICAL NOTE


ANALYTICAL NOTE
It has been the tradition of tlie Indlan Census to present the census data uader the two broad divisj,q~; termed urban and rural.
The definition of an urban unit at the 1981 Census is as follows:
(a) All places with a Corporation, Municipality, Town Committee r Notified Area, Canto_nment.
(b) All other places which satisfied the following criteria:
(i) A population of 5,000 as the minimum,
(ii) Density per....square kilometre would be a minimum of 400, and
(iii) At least 75% of the male working force should be engaged in non-agricultural pursu~ts.
Apart from town/city the 1971 concept of urban agglomeration is also adopted for the 1981 Census. An urban agglomeration means a stretch of urban area covering more than one municipality/town/urban outgrowth within a geographically contiguous urban continuum. An urban agglomeration shows how a particular area has had geographically continuous urbanisation.
Mention may be made in this connection of urban outgrowths. The concept of urban outgrowth has come into force for the first time in 1981 Census. 'The outgrowth, which must necessarily be contiguous to an urban area, is itself an urban area in so far as it fulfills the last two criteria of being an urban unit, but it falls short on the population front, i.e. it would have a population of less than 5,000 but more than 600.
All other areas which are not covered by the definition of urban as stated above will be treated as Rural.
CENSUS HOUSE
We defined the census houses in the following manner: "A census house is a building or part of a building havil,1g a separate main entrance from the road or common courtyard or staircase etc., used or recognised as a separate unit. It may be occupied or vacant. It may be used for a residential or non-resid~ntial purposes or both". Actually to make the concept understandable and applicable in field we had to introduce the concept of singleness of use. What, as per the above definition, would be a census house otherwise might not be so if there is no singleness of use" .
HOUSEHOLD
We defined household as follows: "The household is a group of persons who commonly live together and would take their meals from a common kitchen unless the exigencies of work prevented any of them from doing so. There may be a household of persons related by blood or household of unrelated. persons or having a mix of both" •
SCHEDULED CASTES/SCHEDULED TRIBES
We have OUT own list of scheduled castes and scheduled tribes notified for our state only. If the person belonging to a scheduled caste or scheduled tribe returns his caste or tribe by a synonym or generic name of a caste or a tribe, the information was noted if it found place in the notified list. All,efforts were given'to

[4 ]
ascertain the correct name of the scheduled caste or tribe as found in the notified list. For a household belonging to scheduled castes or scheduled tribes, religion of the head of household was also examined. Scheduled caste population are found only among the population belonging to Hindu and Sikh religions but the
'scBg'd\{ded tribe population may belong to any religion.
LITERATES
In the census terminology, a person who can both read and write with understanding in any language is to be taken as literate. A man who can merely read but cannot write is not a literate. It is not necessary that a person who is literate should have received any formal education or should have passed any mininum education standard. All the children of the age of four years. or less were treated as illiterate even if the child was attending a school or might have picked up reading and writing.
Careful attention was also given while collecting inforffiltion on educational attainment of individuals. The highest education level attained by the person ~llumerated was recorded. This information is vital for
manpower planning.
MAIN WORKER
The definition of worker difference between 1971 and 1981 and the system of dividing the entir~ population by application of the concept of worker has also undergone a very important change. Earlier in 1961 and then in 1971, the total population was divided into two categories mutually exclusive of each other. They were workers and nori-workers respectively. But in 1981, this dichotomy has been replaced by a trichotomy with three categories mutually exclusive of each other, viz. main workers, marginal workers and non-workers.
The 1961 Census definition of worker was as follows:
"The·basis of work will be satisfied in the case of seasonal work like cultivation, livestock, dairying, household industry etc., if the person has had some regular work of more than one hour a day throughout the greater part of the working season. In the case of regular employment in any trade, profession, services, business or commerce the basis of work will be satisfied if the person was employed during any of the fifteen days precedinR the day.Qn which you (Enumerator) visited the Household". In 1971, the following definition was applied = "A worker is a person whose main activity is participation in any economically productive work by his physical or mental activity. Work involves not only actual work but effective supervision and direction of work. 'the reference period is one week prior to the date of enumeration in the case of regular work in trade, profession. service or business. If a person had any such regular work on anyone of the days during this reference period and this has been returned as his main activity the gerson will be categorised accordingly... ... There are certain types of work which are not carried on throughout the year such as cultivation, livestock keeping, plantation work, some types of household industry etc. A person's main activity should be ascertained with reference to such "York in last one year even if he was not economically active in the week prior to enumeration."
Further, those who did not do any work in the manner described above, yet did sdme work to come under the category of secondary worker. As per 1971 definition, it was to cover "cases like 'Persons performing household duties or students who may not be engaged in any other economically productive work at all, as also those who, though basically are performing household duties or students etc., for the purpose of their main activity. still participated in some other economic activity such as h,elping the household in several items of work, as in cultivation, or in household industay, or in looking after the cattle, in attending to family business etc., but not to the extent as a full time work. Such participation will be cOlil.sidoced as secondary work of those persons ..... .

[ 5
!,participation of work that goes to augm.ent the income of the household will only ,be treated as economic activity."
In 1981 Census anyone who has done any work at all during the last one year is a worker. The definition of work as participation in any economically productive activity either in physical or mental way remain rpore or less the same as in 1971. But this time the population has been classified into three main groups, each mutually exclusive of the others. rhe main worker, are those who have worked major part of the year preceding the enumeration. In other words, the main worker is som~body who has done economically productive work for at least 183 days during the year preceding enumeration. All workers have been categorised in four distinct parts viz. (i) Cultivators, (ii) Agricultural Labourers, (iii) Household Indllstries and (iv) Other Workers in 1981 Census. This is a major departure from the 1971 categories of workers. In 1971 Census the workers were divided in nine categories.
MARGINAL WORKER
'The marginal workers are those who have worked any tim;: at all in the y~ar preceding enumeration but have not worked for a major part of the year.. In other words, mlrginal workers are those who participated ill economically productive work for less than 183 days during the year preceding enumeration.
NON-WORKERS
Non-workers are those who have not done any economically productive work at all during the last one year. All non-workers have been divided into seven categories in 1981 Census. They are (i) Students, (ii) Household
.duties, (iii) Rentiers/Retired persons, (iv) Beggers etc., (v) Inmates of Institutions, (vi) Dependents and (vii) Others.
SCOPE OF PRIMARY CENSUS ABSTRACT
The primary Census Ab~tract is the basic table prepared from the total couat of cenSU3. It has b;!en presented at .three levels, viz. (1) District Primary Census Abstract, (2) Urb::m/Village Primlry Census Abstract and
(3) Primary Census Abstract of Scheduled Castes and Scheduled Tribes-District level showing towns and police stations. The District Primary Census Abstract presented here corresponds the 1971 pattern and contains the 'following items :-Area of the police stations/towns in sq. km, _number of occupied residential houses, number of household.>, total population and its division into sexes, scheduled castes population a~d its division into males and females, scheduled tribes population and its division into males and feml1es, the sex--1ivision of the literate. total male main worker and total female main worker, total male cultivators and total female cultivators.
similar sex division of agricultural labourers, household industries, other workers, marginal workers and non-workers. All these information have been covered in 39 columns.
'The urban/village PCA contains 28 cols. which depicted viz. occupied residential houses, number of households, population, scheduled castes popUlation, scheduled tribes population, literates, main workers showing its four broad divisions, marginal workars and non-workers. All these data have been shown with breakdown by sex. The urban/village PCA represents data wardwise for statutory towns and as a whole for non-statutory towus
and for the rest mouzawise.

[ 6 ]
The primary census abstracts of scheduled castes and scheduled tribes represent-separately information such aiJ scheduled castes and scheduled tribes population, literates, main-workers with broad categories, marginal workers and non-workers by sex breakdown of males and females covered in 31 columns.
The 1981 Census classified workers into four major categories. The first and second categories i.e. cultivatorsand agricultural labourers correspond the. categories as follows in 1971. The third category however represent!>
workers corresponding to category V(a) of 1971. Whereas all other remaining workers have been groupecf together in category IV of 1981. This category includes the workers as categories ill, IV, V(b),VI, VII, vnr and IX in 1971. . ANA.LYSIS OF DATA
It is a Census tradition to analyse certain data on social and demographic information collected during censU~ .
enumeration and from ancillary projects like Town Directory and Village Directory. The District censu&> Handbook 1951 arid 1961 weIe decorated with such analysis which were most attractive to the scholars. The District Census "'Handbook 1981 follows the same manner as in 1951, 1961. A large number of inset tables has been prepared on Town Directory, Village Directory and Primary Census Abstract to make the..
analysis more scientific and acceptable.

TABLB 1

S!.No.
1
2
3
4
5
6
7
10
11
12
13
14
Name of Police Station
2
Rajganj
Jalpaiguri
Mal
Mitiali
Maynaguri
Nagrakata
Banarhat
Dhubguri
Birpara
Falakata
Madarihat
Alipurduar
Kalchini
Kumargram
TOTAL
[ 8
r--
,-Persons
3
197,090
266,925
205,644
74,649
199,509
70,148
149,729
145,243
70,190
169,011
53,196
333.265
160,615
119.657
2,214,871
]
TABLE--) POPULATION, NUMBER OP'
Population
Total
Males Females
4 5
104,524 92,566
139,426 127,499
109.074 95,570
38,738 35.911
104,647 94,862
36,714 33,434
77,393 72,336
76.209 69,034
36.798 33.392
88,513 80,498
27,654 25,542
174,305 158,960
83,532 77,083-
62,316 57,341
1,159,843 1,055,028
The population of the district of Jalpaiguri is spread over in 14 police stations with rural-urban break
down as well as the number of villages and towns in each police station of the district are shown in. Table 1. According to 1981 Census, the district is inbabited by 2,214,871 persons of which 311,221 live in urban areas i.e. 14.05% of the total population, The district has altogether 756 rural mouzas of which 736 (i.e. 97.35%) are inhabited. The district h2S 12 towns. Except the district headquarters town of Jalpaiguri and the subdivisional headquarters towa of Alipurduar which are administered by the Board of Municipal Commissioners, all the other towns of the distfict are non-municipal urban areas.

[ 9 1
VILLAGES AND TOWNS 1981
Population ---,
Rural Urban No. of Villages , ___ -----A--__ ___!_.____, .--- , ___ ...A. ___ --,
No. of Persons Males Females Persons Males Females Total Inhabited Towns
6 7 8 9 10 II 12 13 14
120,688 63,521 57,167 76,402 41,003 35,39j 28 28
205.182 107,222 97,960 61,743 32,204 29,539 29 29
183,766 96,907 86,859 21,878 12,167 9,711 106 101 2
74,649 38,738 35.9l1 31 30
169,602 89.000 80.602 29,907 15,647 14,260 82 77 2
70,148 36,7[4 33.434 23 23
143,774 74,145 69,629 5,955 3,248 2,707 53 50
122,145 63,992 58,153 23,098 12,217 10,881 62 62
70,190 36,798 33.392 21 21
157,Q13 82,334 74,679 11,998 6,179 5,819 63 63
53.196 27.654 25,542 29 28
261,692 136,463 125,229 71,537 37,842 33,731 129 129 2
f5J,948 78,943 73,005 8,667 4,589 4,078 44 43
119,657 62,316 57,341 56 52
1,903,650 994,747 908,903 311,221 165,096 146,125 756 736 12

[ 10 ]
TABLE 2-DECADAL CHANGE IN DISTRIBUTION OF POPULATION
51. No. Police Station
2
Rajganj
2 Jalpaiguri
3 Mal
4 Mitiali
5 Maynaguri
6 ~grakata
7 Baoarhat
8 Dhubguri
9 Birpara
10 Falakata
11 Madarihat
12 AIipurduar
13 Kalchini
14 Kumargram
TOTAL
Population _____ -----A-
1971 1981
Percentage decadal variation (1971-81)
, ___ .A. __ ----, r------A-- r--------"-
Total Rural Urban Total Rural Urban Total Rural Urban
3 4 5 6 7 8 9 10 11
128,744 128.744 197.090 120,688 76.402 53.09 16.26
217,410 162,251 55,159 266,925 205,182 61.743 "
22.77 26.46 11.94
166,142 155.191 10,951 205.644 183.766 21.878 23.78 18.41 99.78
61,045 61,045 74,649 74.649 22.29 22.29
158.230 144,716 23,514 199,509 169.602 29,907 26.90 25.90 27.19
53,694 53,694 70,148 70,148 30.64 30.64
114.767 114,767 149,729 143.774 5.955 30.46 25.27
98.597 98,597 16,808 145.243 122.145 23,098 47.31 23.88 37.42
57.942 57,942 70,190 70,190 21.14 21.14
130.5i9 123,335 7.195 169,Oll 157,013 11,998 29.4S 27.31 66.78
42,807 42,807 53,196 53,196 24.27 24.27
271,766 217,312 54,454 333,265 261.692 71.573 22.63 20.42 31.44
134,467 134,467 160,615 151,948 8.667 19.45 13.00
97.211 97.2II 119.657 119.657 23.09 23.09
1,750,159 1,582,079 168,080 2,214,871 1,903.650 311,221 Z6.55 20.33 85.16
A decade ago (1971) the district was inhabited by 1,750,159 persons. Over the decade, the population of the district has increased by 464,712, i.e. 26.55 percent. The decadal increase of population in rural and urban' areas of the district are 20.33 and 85.16 percent respectively. The steep increase in population in the urban sector of the district can be explained by the fact that as many as 4 new towns have since emerged during this decade. The towns are Dabgram (NM), Gairkata (NM). Odlabari (NM) and Uttar Latabari (NM). There has been a net addition of 97,911 persons in the urban areas during the decade.
In the state of West Bengal as a whole the population increased by 23.17 percent during the decade 1971·81. The rural population has shown a.steady growth of 20.36 percent in the state while the urban population have shown an increase of 31.73 percent during the period 1971-81. Among the police stations of the district, the intercensal growth of popUlation is found highest in Rajganj police station with 53.09 percent followed chiefly by Dhubguri police station with 43.31 percent. In the rural sector of' the district, Kalchini has recorded a significantly low growth rate compared to other areas of the district. The reason of such a low rate in Kalchini rural is·attributable with fact that the village Uttar Latabari of 1971 bas become a town in 1981 with a popUlation of 8,667. The urban growth of Mal police station to the extent of 99.78 percent is quite Significant. This rise in population of the urban sector of Mal police station is due to the reason that a Odlabari with a population of 6,887 has been declared a non-municipal town in 1981.

[ 11 ]
TABLE 3-DISTRIBUTION OF VILLAGES BY POPULATION RANGES
Ranges of Population
200
2()0 -- 499
500 - 1,999
2,000 - 4,999
5,000 - 9,999
10,000 +
TOTAL
No. of Villages in each range
2
24
39
315
296
45
17
736
Percen tage of villages in each range
3
3.26
5.30
42.80
40.22
6.11
2.31
100.00
The variation in number of villages according to the range of population is evident from the table 3. Out of
736 inhabited villages in the district, the highest number -"of villages num1Jering 315 was 42.80 percent
belong to the population range of 500-1999. It is interestin·g to note that there are as many as 17
villages in the distriet of Jalpaiguri having 10,000 or plus.
TABLE 4-DISTRIBUTION OF VILLAGES BY DENSITY
Range of density Total No. of villages Percentage of villages (per sq. km) in each density range in each density range
2 3~
10 7 0.95
11- 20 6 0.82
21 ~ 50 13 1.77
51 - 100 23 3.12
101 - 200 32 4.35
201 - 300 70 9.51
301 - 500 374 50.82
501 + 210 28.53
Not Known 0.13
TOTAL 736 100.00
,."
Table 4 presents variations in .density in the villages of the district. The district as a whole is a very
'- thinly populated area. In 1981 Census the density of population per sq. km. in the rural area of the district ~
works out to 313 per sq. km. only. The table 4 reveals thaUhe majority of the villages (i.e. 374 in number or
50.82 percent) belong to the density range of 301-500 per sq. km. There are seven villages' in the district which
have a density range upto 10 only.

( 12 1
TABLE 5-PROPORTION OF SCHEDULED CASTES POPULATION TO TOTAL POPUL1\.TION IN THE VILLAGES
Percentage range of Scheduled Castes No. of villages Percentage of villages Population to Total Population in each range in each range
2 3
0- 5 lOS 16,39
6 - 10 74 11.23
11 - 15 57 S.65
16 - 20 27 4.10
21 - 30 47 7.13
31 and above 346 52.50
TOTAL 659 100.00
Table 5 gives the proportion of scheduled caste to total population at villages of the district of Jalpaiguri. Out
of 736 inhabited villages of the distnct, the scheduled caste p:>pulation lrq.ve been found as many as, in 659
vHiages. Among those villages 346 villages have scheduled caste population to the extent of 31 percent and
above whereas the scheduled caste population to the extent of 5 percent are found in 108 villages
of the district.
TABLE 6-PROPORTION OF SCHEDULED TRIBE POPULATION TO TOTAL POPULATION IN THE VIL~AGES
Percentage range of Scheduled Tribe No. of villages Percentage of villages Population to TotalPopulation in each range in each range
2 3
0- 5 152 24.63
6 - 15 110 17.S3
16 - 25 66 10.70
26 - 35 47 7.62
36 - 50 73 11.83
51 and above 169 27.39
Total 617 100.00
An acoount of the scheduled tribe population in the villages of Jalpaiguri district is available in table 6.
The scheduled tribe pOQulation are found in six hundred seventeen villages of the district. In majority
df the villages (i.e. 169 or 27.39 percent), the scheduled tribe population accounts for 51 I?erce-nt and
above. The second largest number of villages (i.e. 152 or 24:63%) have scheduled tribe population in
the percentage range upto 5 only. Rest of the villages have scheduled tribe population between 6-50%.,

[ 13 ] ,
'TABLE 7-PROPORTION OF SCHEDULED CASTES/SCHEDULED TRIBES
POPULATION IN TOWNS
Percentage of Percentage of Total Total Scheduled Scheduled Tribes
Scheduled Sehcduled Castes Popu- Population Sl. Total Castes Tribes lation to Total to Total No. Name of the Town Population Population Population Population Population
2 3 4 5 6 7
Alipurduar 48,605 5,369 157 11.05 0.32
2 Alipurduar Rly. Junc. 22.968 3,006 560 13.09 2.44
3 Dabgram 76,402 18,710 979 24.49 1.28 I
4 Dhupguri 23,098 6,560 2" 28.40 0.b9
• 5 Domohani 10,339 6,113 98 59.13 0.95
6 Falakata 11,998 1,802 79 15.02 'b.66
7 Gairkata 5,955 1.366 777 22.94 13.05
8 Jalpaiguri 61,743 8,440 567 13.67 0.92
9 Maynaguri 19,568 6,145 67 31 .• 40 0.34 ,
10 Mal 14,991 635 583 4.24 3.89
11 Odlabari 6.887 777 661 11.28 9.60
12 Uttar Latabari 8.667 856 1;004 9.88 11.58
All Towns 311,221 59,779 5,552 19.21 1.78
Table 7 deals with the proportion of schequled caste and scheduled tribe population in towns.
The scheduled caste and scheduled tribe population inhabiting the 12 towns of the district of JaJpaiguri comprise J 9.21 percent and 1.78 percent respectively. These percentages, are much above the state average in these regards. In the state of West Bengal for instance, 10.31 percent of the total urban population is scheduled caste and 0.80 percent the scheduled tribe. Amongst the towns of the district of Jalpaiguri, highest concentration of scheduled castes i.e. 59.13% is found in Domohani town whereas Goirkata town has the highest concentration of scheduled tribe population in the district. The scheduled tribe populatio~ comprises 13.05 percent of the total pOp'ulation of the town.

[ 14 ]
TABLE 8-LlTERACY RATES BY POPULATION RANGES OF VILLAGFS·
Range of No. of villages Population in each range Literacy rate
2 3
- 200 24 24.07
100 - 499 39 18.77
!l00 -1,999 315 22.25
2,000 -4,999 296 23.67
5,000 -9,999 45 24.98
10,000 + 17 28.53
Total 736 24.28
Table 8 shows the rate of literacy by population ranges of villages in the district. In the rural are&' of the district 24.28 percent of the population are literateS. This is much below the state rural average of 33.12 percent. The highest rate of literacy is observed in the villages ha.ving population more than 10,000 plus. The small villages with a population less 200 are not far behind the district rural average with regard to the rate of literacy. 24.07 percent of the population of the villages with less than 200 inhabitants are literates in the district. The lowest rate (18.77%) in connection with literacy has
been recorded among the population living in the villages 200-499.
TABLE 9-LITERAey RATES FOR TOWN
SI. No. Name of the ToWll Literacy Rate
2 3
1 Alipurduar 67.26
2 AlipUIduar Railway Junction 73.18
3 Dabgram 50.48
4 Dhupguri 52.55
5 Domohani 35.40
6 Palakata 57.29
7 Gairkata 51.17
8 Jalpaiguri .7.94
9 Maynaguri 58.76
10 Mal 64.23
1l Odlabari 47.05
12 Uttar Latabari 52.53 )
All Towns 59.17
The literacy rate in respect of each town of the district can be seen from table 9. The literates form 59.17 percent in the urban sector of tbe district. In the state as a whole, the urban rates of Literacy
is 62.66 percent.
Amongst the towns, Alipurduar RaiI'way Junction has recorded a highest literacy figure in the district where 73.18 percent are literates. Jalpaiguri, the headquarters town of the district has the literate population to the extent of 67.94 percent. Every where else in the district except for towns viz. Alipurduar, Alipurduar Railway Junction, Jalpaiguri and Mal, literac~ rate is below the district average.
TABLE to

[ 16 ]
TABLE 10-LITERATES, WORKERS, NON-WORKERS,
Percentage of r- ~------
S.C. S.T. Total Total Population Population Population Literate to Total Population
Nameo! Rural ..A.--___ -, to Total to Total ,--__J,__ .......
Police Station Urban Persons Males Females Population 1'opulati,?n Persons Males Females
1 2 3 4 5 6 7 8 9 10
II. Rajganj T 197,090 •
104,524 92,566 40.24 4.18 35.23 44.43 24.84
R 120,688 63,521 57,167 50.22 6.02 25.57 35.32, 14.75
U 76,402 41,003 35,399 24.49 1.28 50.48 58.54 41.14
2 Jalpaiguri T 266,925 139,426 127,499 47.74 5.18 39.03 46.99 30.33
R 205,182 107.222 97,960 57.99 6.46 30.34 39.33 20.49
U 61,743 32,204 29,539 13.67 0.92 67.94 72.52 62.94
3 Mal T 205,644 109,074 96,570 21.49 3"5.49 21.87 28.77 14.11
R 183,766 96,907 86,859 23.28 39.03 18.42 25.36 10.6&
U 21,878 12,167 9,711 6.45 5.69 64.23 68.35 59.03
4 MitiaH T 74,649 38,738 35.911 11.59 51.83 22.28 31.64 12.19
R 74,649 38,738 35,911 11.59 '"' 51.83 22.28 31.64 12.19
U
5 Maynaguri T 199,509 104,647 94,862 68.02 1.87 23.33 28.68 17.42
R 169.602 89,000 80,602 72.79 2.10 19.24 24.51 13.42
U 29,907 15,647 14,260 40.99 0.55 58.76 64.90 52.01
6 Nagrakata T 70,148 36,714 33,434 5.1g 55.68 p.88 24.99 10.07
R 70,148 36,714 33,434 5.18 55.68 17.88 24.99 10.07
U .1
7 Banarhat T 149.729 77,393 72,336 18.99 41.'31 22.62 30.64 14.05
R 143,774 74,145 69,629 18.82 42.84 21.44 29.46 12.90
U 5,955 3,248 2,707 22.94 13.05 51.17 57.45 43.63
8 Dhubguri T 145,243 7o,209 69,034 60.15 2.55 28.54 38.92 17.08
R 122,145 63,992 58,1 <) 66.15 3.01 24.00 34.86 12.05
U 23.098 12,217 10,b81 28,40 0.09 52.35 60.21 43.95
9 Birpam T 70,190 36,798 -33,392 8.53 40.04 21.41 28.71 13.37
R 70,190 36,798 33,392 8.53 40.04 21.41 28.71 13.37
U
10 Falakata T 169,OB 88,513 80,498 38.03 1"9.02 27.91 36.99 17.91
R 157,013 82,334 74,679 39.79 QO.42 25.66 35.05 15.31
U 11,998 6,179 5,819 15.02 0.66 57.29 62.91 51.33

[ 17 J
SCHEDULED CASTES/TRIBES POPULATION IN THE DISTRICT
Main Workers to Total Population
~------~~------~ Persons Males Females
11
29.18
30.25
27.49
29.52
29.68
28.98
35.67
36~32
27.78
38.67
38.67
29.87
30.27
26.43
34.27
34.27
34.24
34.41
30.10
29.89
30.12
28.69
34.12
34.12
31.43
31.70
27.85
12
51.33
52.13
41.94
51.44
52.35
48.40
51.53
51.92
46.95
48.69
48.69
54.37
55.23
46.86
45.25
45.25
46.36
46.11
52.06
54.60
55.30
50.94
44.56
44.56
53.93
54.28
49.23
13
4.17
5.11
2.65
5.55
4.86
7.81
17.82
18.91
3.61
27.87
27.87
2.83
2.70
3.96
22:~1
22.21
21.27
21.95
3.73
2.61
2.41
3.70
12.61
22.61
6.69
6.81
5.16
Percentage of
Marginal Workers to Total Population
.----~---,
Persons Males Females
14
1.69
2.37
0.37
0.79
0.95
0.29
2.01
2.14
0.45
4.83
4.83
0.68
0.69
0.54
2.88
2.88
3.36
3.50
0.15
0.79
0.i7
0.39
1.76
1.76
1.35
I.~O
0.74
15
1.68
2.24
0.82
0.65
0.75
0.34
1.71
1.81
0.61
4.22
4.22
0.65
0.67
0.18
2.48
2.48
2.61
2.72
0.22
0.65
0.69
0.46
1.02
1.62
0.90
0.90
0.84
16
1.71
2.51
0.41
0.95
1.16
0.24
2.34
2.50
0.26
5.49
5.49
'0.71
0.72
1.61
33.17
33.17
4.17
4.33
0.07
0.94
1.86
0.30
2.58
2.58
1.85
1.95
0.64
Total Workers to Total Population
~ _____ ..A. __ ---,
Persons Males Females
17
30.88
32.62
28.12
30.31
30.63
29.27
37.68
38.45
28.23
43.50
43.50
30.55
30.96
26.97
37.15
37.15
37.60
37.91
30.24
30.68
30.99
29.07
35.88
35.83
32.78
33.10
28.60
18
53.02
55.12
49.76
52.10
53.10
48.74
53.24
53.73
47.56
52.91
52.91
55.02
55.90
47.34
47.73
47.73
48.97
48.83
52.28
55.26
55.99
51.40
45.59
45.59
54.82
55.18
50.07
19
5.87
7.61
30.62
6.49
6.02
8.05
20.16
21.41
3.86
33.36
33.36
3.54
3.42
4.57
25.52
25.52
25.44
26.28
3.80
3.56
3.47
4.'1
25.19
25.19
8.55
8.76
5.79
Non-workers to Total Population
~ ____ ..A._-'--_--..
Persons Males
20
69.12
67.38
71.88
69.69
69.37
70.73
62.32
61.55
71.77
56.50
56.50
69.45
69.04
73.03
62.85
'62.85
62.46
62.09
69.76
(i9.32
69.01
70.93
64.12
64.12
67.22
66.90
71AO
21
46.98
44.88
50.24
47.90
46.90
51.26
46.76
46.27
52.44
47.09
47.09
44.98
44.10
52.66
52.27
52.27
5],03
51.17
47.72
44.74
44.01
48.60
54.41
54.41
45.18
44.82
49.93
Females
22
94.13
92.39
96.94
93.51
93.98
91.95
79.84
78.59
96.14
66.64
66.64
96.46
96.58
95.43
74.48
74.48.
74.56
73.72
96.20
96.44
96.53
95.99
74.81
74.81
91.45
91.24-
94.21

Name of Police Station
H Madarihat
12 Alipurduar
13 Kalchini
14 Kumargram
District Jalpaiguri
[ ]8 ]
TABLE lO-LITERATES, WORKERS, NON-WORKERS~
Percentage of r--- ------ ----
S.C. S.T. Total Total Population Population Population Literate to Total Population. Rural r--- -------::-------- -, to Total to Total r-- -- _.A._ -- ---,
Population Population Persons Males Females Urban Persons
2 3
T 53,196
R 53,196
U
T 333,265
R 261,692
U 71,573
T 160,615
R 151.948
U 8,667
T 119,657
R 119,657
U
T 2,214,871
R 1,903,650
U 311,221
Males
4
-27,654
27,654
174,305
136.463
37,842
83,532
7R,943
4,589
62,316
62,316
1,159,843
994,747
165,096
Females
5
25,542
25,542
158,960
125,229
33,731
77.083
73,005
4,078
57,341
57,341
1,055,028
908,903
146,125
6
14.12
14.12
35.92
42.54
11.70
8.78
8.71
9.88
33.59
33.59
34.61
37.12
H.il
7
35.93
35.93
17.33
21.80
1.00
45.90
47.86
11.58
32.48
32.48
22.20
25.54
1.78
8
23.64
23.64
35.92
30.49
67.26
23.21
21.53
52.53
27.56
27.56
29.19
24.28
59.17
9
31.34
31.34
44.4~
39.46
72.74
31.39
29.81
58.55
36.39
36.39
37.30
32.64
65.32
to
15.30
15.30
26.64
20.70
61.20
1434
12.58
45.76
17.96
17.96
20.27,
15.13
5:1.22
The percentage distribution of scheduled castes and scheduled tribes, literale~, workers and nOIT-w;Hkers in
each police station of the district Jalpaiguri has been shown il1 table 10. Scheduled caste population
comprise 34.61 percent of the total population of the district. In rural areas they constituted 37.12 percent
and in tIle urban areas 19.21 percent. Among the police stations, the high(':st concentration of scheduled castes
i.e. 68.02 pt rcent of the total popUlation of the police station is found in Maynaguri. Dhubguri police station
'comfS next in order of habitatIon of the scheduled castes in the police stations. Dhubguri accounts for
60.15 percent scheduled castes population to total population of the police station.
In the -district of Jalpaiguri 22.20 percent of the total population of the district belongs to scheduleJ
tribe. Rural and urban distributions in this regard are 25.54 percent and 1.78 percent respectively.
Among the police stations Nagrakata has the highest p~rcentage )f th] scheduled tribe i.e. 55.68 percent.
Mitiali, com~s close second in this connection with 51.83 percent.

[ 19 ]
SCHEDULED CASTES/TRIBES POPULATION IN THE DISTRICT
Main Workers to Total Population
,---___ --A-___ .........
Persons Males
11 12
34.83 50.84
34.83 50.84
30.34 50.85
31.02 51.71
26.44 45.89
33.90 45.84
34.46 23.90
25.14" 43.04
31.01 49.36
31.01 49.36
31.75 50.53
32.44 50.97
27.54 47.87
Females
13
17.50
17.50
7.95
8.47
4.93
20.96
21.86
5.00
11.07
11.07
11.10
12.15
4.58
Percentage of -----
Marginal Workers to Total Population
,----- -------"-- -------, Persons
14
4.47
4.47
2.20
2.50
0.47
1.43
1.51
0.03
2.84
2.84
1.85
2.08
0.44
Males
15
3.67
3.67
1.50
1.67
0.55
1.12
1.18
0.07
1.94
1.94
1.47
1.62
0.54
Females
16
5.34
5.34
2.97
3.41
0.38
1.77
1.87
3.83
3.83
2.28
2.59
0.33
Total Workers to Total Population
r-------A--Persons
17
39.30
39.30
32.55
33.5:?
26.90
35.33
35.91
25.18
33.85
33.85
33.60
34.52
27.98
Males
18
54.50
54.50
52.35
53.38
46.44
46.96
47.18
43.10
51.30
51.30
52.00
52.59
48.41
-----, Females
19
22.84
22.84
10.92
l.IS
5.31
22.74
23.73
5.00
14.90
14.90
13.38
14.74
4.91
- --""' Non-workers to Total Population
,---- ----'---. --~ Persons Malcs Females
20
60.70
60.70
67.45
66.48
73.10
64.67
64.09
74.82
66.15
66.15
66.40
65.48
72.02
21
45.50
'45.50
47.65
46.62
53.56
53.04
'2.82
56.90
48.70
48.70
18.00
47.41
51.59
22
77.16
77.16
89.08
88.11
94.69
77.26
76.27
9).00
85.10
W:i,lO
86.62
85.26
95.09
The percentage of literates in Jalpaiguri district is 29.l9. These figures in respect of rural and urban
areas work out tL 24.28 and 59.17 percent respectively. The highellt percentage ot literates is found in
Jalpaiguri police station i.e. 39.03 percent.
The labour participation ratio in JaJpaiguri is higher than the state average. In the stale of West
Bengal as a Whole 28.26 percent of the total population are main worKers. In the distriI.L of JaJpaiguri
31 75 percent of the total population have been recorded as main workers. The proportion of main
\"orkers at the rural area of the state accounts for 28.04 percenL whereas in the rural areas of the
district Jalpaiguri lhis figure is 32.44 percent. The urban laboUl participation rate in JaJpaiguri is
found lower than the corresponding st, te figure. Whereas the state urban w:_th regard to main worKers
acco!1nt~ for 2R.87 percent. There have be~n lesser number non-work..:rs in the district of Jall-'uiguri
in corresponcence to state figurf's in this rC30ect.


DISTRICT PRIMARY CENSDs ABSTRACT

[ 22 J
PRIMARY
Districtl Total Population (including Institutional and Houseless
Police Station/ Total Area Occllpied No. of Population) 51. U. A.ICitYI Rural in Residential House·
,.--___ ------A.. ... No. Town Urban Sq. KIllS. Houses bolds Persons Males Females 2 3 4 5 6 7 -8 9
13 JALPAIGURI DISTRICT T 6,227 .• 0 4G9,697 416,936 2,214,87J 1,159,843 1,055,028
R 6,07\).5 353,706 359,014 1,903,650 994,747 908,903 U 147.5 55,991 57,922 311,2Z1 165,096 146,125
Sadar T 3,373.7 242,521 249,065 1,308,937 686,725 622,212
Subdivision R 3,257.3 202,605 207,490 1,089,954 570,239 519,715
U 116.4 39,916 41,575 218,983 116,486 102,497
1 Rajganj T 636.6 32, 795 37,355 197,090 l(H.,24 92,566
R 590.7 17,788 22,325 120,688 63,521 57,167
U 45.9 IS,O{}7 15,030 76,402 41,003 35,399
Dabgram (NM) U 45.86 15.007 15,030 76,402 41,003 35,399
2 Jalpaiguri T 503.0 48,914 49,170 266,925 139,426 127,499
R 492.9 37,898 37,973 205,182 107,222 97,960-
U 10.1 11,016 11,197 61,743 32,204 29,539
Jalpaipuri (M) U 10.08 11,016 11 ,197 61,743 32.204 29,539
3 1>lal T 543.6 38,624 39,922 205,644 109,074 96,570
R. 53I.8 35,602 35,671 183,766 96,907 86,859
U 11.8 3,022 4,251 21,878 12167 9,711
Mal(NM) U 2.56 1,721 2,853 14,9<;1 8,360 6,631
Odlaba,ri (N~1) U 9.27 1,301 1,398 6,881 3,~ " 3030-
4 Mitiali T 206.2 14,979 14,998 74,649 38,1 1 3 35 <,>11
R 206.2 14.979 14,998 14,64') 38,7J3 3:'.';111 U .,
5 Maynaguri T 525.2 37,181 37,3 ,9 199,50<) 1Q4,647 94,862
R 494.2 31,561 31,539 119,602 89,000 130,602 U 31.0 5,620 5,720 29,'}O7 1. ,647 1,,260
Mainagllri (UA) U 30.9) 5,620 \"'20 29,907 1',647 )4,260
ca) Domohani (NM) U 18.57 2,047 4,074 10,33<) 5,398 4,941
(b) Mainaguri (NM) U 12.38 3,573 3,646 19,568 10,249 9,319
6 Nagrakata T 284.0 13,887 13,903 70,148 36,714 33.~34
R 284.0 13,887 13,903 70,148 %,714 33,434
U

[ 23 ]
CENSUS ABSTRACT
MAIN WORKERS
Total Scheduled Scheduled Main Workers Castes Tribes Literates (I-IX)
r------------"-- -----, ,--------"------.. ,------"- ---....... ,--------'-------. P M F P M F P M F P M F
10
766,498
'706,719
59,779
514,729
1/65,983
48,746
79,317
'{i0,607
18,710
18,710
117;423
118,983
8,440
8,440
44,194
42,782
1,412
635
777
8,652
8,652
135,713
123,455
12,258
12,258
6,113
6,145
3,637
3,637
11
398,945
367,396
31,549
267,364
241,662
25,702
41,483
31,603
9,l80
9,880
66,3 ~9
'(il,\lS2
4.407
4,407
23,365
22,565
800
375
425
4,519
4,519
71,392
65,006
6,3tl6
6,186
3.146
3,240
1,911
1,911
12
367,553
339,323
28,230
247,365
224,J21 ,
23,044
37,834
'!9,004
8,830
8.830
61,034
57,001
4,033
4,033
20,g29
20,217
612
260
352
4,133
4,133
64,321
58,449
5,872
5,872
2,967
2,Cl05
1,726
1.726
13
491,791
486,239
5,552
242,072
2'iR, ~20
3,752
8.240
7.261
979
979
13,821
13,254
567
567
72,977
71,733
1,244
583
661
38,691
38,691
3,728
3,563
165
165
98
67
39,058
39,058
14
252,842
249,660
3,182
123,089
121,013
2,076
4,284
3,74')
535
535
7,174
6,847
327
327
36,554
35,864
690
357
333
20,294
20,294
1,991
1,890
101
101
65
36
20,050
20.050
15
238,949
236,579
2,370
JlB,083
116.407
1,676
3,956
3,512
444
444
6,674
6,407
240
240
36,423
35,869
554
328
18,397
18,397
1,737
1,673
64
64
33
31
19,008
19,008
16
646,432
462,280
184,152
372,636
248,908
123,728
69,434
30,805
38,569
38,569
104,191
62,244
41,947
41,947
46.718
33,850_
12,868
9,628
3,240
16,635
16,635
47.790
32,l3l
15,159
15,159
3,660
11,499
12,541
12,541
17
432,566
32.4,721
107,845
249,902
]76,569
73,333
46.439
22,434
24,005
24,005
65,523
42,169
23,354
23,354
32,325
24,571
7,'754
5,714
2.040
12,257
12,257
30,810
21,812
8,998
8,998
2,346
6,652
9,173
9,173
18
213,866
137,559
76,307
122,734
72,339
50,395
22,995
8,431
14,564
14,564
38,663
20,075
18,593
18,593
14,393
9,279
5,114
3,914
1,200
4,378
4,378
16.980
10,819
6,161
6.161
1,314
4,847
3,368
3,368
19_ 20
703,180 586,071
617,45'8 507,042
85,722 79,029
416,316 351,286
354,651 294,251
61,665 57,035
57,514 53,657
36,509 33,590
21,005 20,067
21,005 20,067
78,793 71,722
60,099 56,135
17,894 15,587
17,89~ 15.587
72,819 56,070
66,738 50,315
6,081 5,755
4,164 2,925
1,917 1,830
28,869 18,860
28.869 18,860
59,606 56,871
51,333 49,159
8,267 7,712
8,267 7,712
3,095 2,909
5,152 4,803
24,039 16,614
24,039 16,614
21
117,109
110,416
6,693
65,030
60,400.
4,630
3,857
2,919
938
838
7,071
4,764
2.307
2,307
16,749
16,423
326
239
87
10,009
10.009
2,729
2,174-
555
555
186
369
7,425.
7,425

51. No.
Districtl Police SlationJ
U. A.jCity/ Town
1 2
13 JALPAIGURI DISTRICT
Sodar SubtiivisiolJ
Dabgram (NM)
2 Jalpaiguri
Jalpaiguri (M)
3 Mal
Mal (NM)
Odlabari (NM)
4 Mitiali
5 Maynaguri
Mainaquri (UA)
(a) Domohani (NM)
(b) Mainllquri (NM)
(i Nagrakata
Total Rural Urban
3
T
R
U
T
R
U
T
R
U
U
T
R
U
U
T
R
U
u
u
T
R
U
T
R
U
u
u
u
T
R
U
[ 24 ].
Cultivators (1)
P M F
22 23 24
MAIN WORKERS
PRIMARY-
---. Household
Industry-Manufacturing. Processing, •
Agricultural Servicing and Rep'airs Labourers (II) [V(a)]
,-------"--,----. ,.. ___ _..A.. ___ __
P
25
M F P M F
26 27 28 29 30
234,226 224,795 9,431 114,519 99,842 14,677 8,549 6,988 1,557
1,267
290
228,107 218,839 9,268 109,747
6,119 5.956 163 4,772
95,306
~536
14,441
236
6,509
2,036
5,242
1,746
136,153 133,136 3.017 68,177 61,555 6,622 5,387 4,405
131,229
4,924
128,260 2,969
4,876 48
64,085
4.092
57,650
3,905
6,435
187
19.128 18,636 492 12,636 11,186 1,450
17,826
1.302
17,346
1.290
1,302 1,2~0
28,929 28.451
28,602 28,126
327 325 I
327 325
16,660 16.178
16,446 15,965
214 213
34 33
180 180
3,006 2,756
3,006 2.759
33.681 33,060
31,871 31,275
1.810 1,785
1,810 1,785
1,100 1,077
710 708
2,452 2,347
2,452 2,347
480
12
11,075
1,561
9,674
1,512
12 1,561 1,512
478 15,068 13,658
476 14,817 13,413
2 251 245
2 251 245
482 10,023 9,078
481 9,750 8,833
273 245
64 59
209 186
250 1,472 1,229
250 1,472 1,229
621 13,980 13.130
596 12,782 11,982
25 1,198 1,148
25 1,198 1.148
23 620 579
2 578 569
105 1,619 1,33i
105 1,619 1.335
1,401
49
49
1,410
1,404
6
6
945
917
28
5
23
243
243
850
800
50
50
41
9'
284
284
3,916
1,471
879
282
597
597
1,509
1,293
21S
216
476
402
74
37
37
207
,207
932
694
238
238
145
93
347
347
3,123
1,282
776
235
541
541
1,219
1,Q21
198
198
383
314
69
33
36
185
185
663
482
181
181
100
81
317
317
982
793
189
103
47
56
56
290
272
18
18
93
88
5
4
22
22
269
212
57
57
45
12
30
30

[ 25 1
CENSUS ABSTRACI'
MAIN WORKERS "7>
Other Workers
[III, IV, V(b) & Marginal Non-Workers VI to IXJ Workers
r- .A.. • r-.A. ______ • , ________ .A.. ______ ~
P M F P M F P M F
31 32 33 34 35 36 37 38 39
345,890 254,446 91,444 41,043 17,009 24,034 1,470,648 556,763 913,885
273,095 187,655 85,440 39,673 16,119 23,554 1,246,519 471,586 774,933
72,795 66,791 6,004 1,370 890 480 224,129 85,177 138,952
206,599 152,190 54,409 22,653 10,258 12,395 869,968 325,181 544,787
155,421 105,218 50,203 21,611 9,573 12,038 713,692 266,415 447,277
51,178 46,972 4,206 1,042 685 357 156,276 58,766 97,510
24,871 23,059 1,812 3,338 1,758 1,580 136,238 49,109 87,129
7,326 6,335 991 ~,857 1,423 1,434 81,322 28,508 52,814
17,545 16,724 821 481 335 146 54,916 20,601 34,315
17,545 16,724 821 481 335 146 54,916 20,601 34,315·
33,287 28,394 4,893- _ 2,119 912 1,207 186,013 66,792 119.221
16,187 13,575 2,612 1,939 802 1,137 142,344 50,285 92,059
17,100 14,819 2,281 180 110 70 43,6~9 16,507 27,162
17,100 14,819 2,281 180 110 70 43,669 16,507 27,162
45,660 3Q,431 15,229 4,066 1,866 2,200 128,759 51,138 77,621
'40,140 25,203 14,937 3,925 1,753 2,172 113,103 44,839 68,264-
5,520 5,228 292 141 113 28 15,656 6,299 9,357
4,029 3,800 22' 68 51 17 10,759 4,384 6,375-
1,491 1,428 63 73 62 11 4,897 1,915 2,982
24,184 14,690 9,494 3,606 1,636 1,970 42,174 18,242 23,932
24,184 14,690 9,494 3,606 1,636 1,970 42,174 18,242 23,932
11,007 10,018 989 1,319 658 661 138,590 47,118 91,472
5,986 5,420 566 1,177 594 533 117,092 39,247 77,845.
5,021 4,598 423 142 64 78 21,498 7,871 13,627
5,021 4,598 423 142 64 78 21,498 7,871 13,627
1,230 1,153 77 36 15 21 7,208 2,474 4,734-
3,791 3,445 346 106 49 57 14,29(9 5,397 8,893
19,621 1%,6(5 7,006 2,018 909 1,109 44,091 19,191 24,900
19,621 12,615 7,006 2,01S 909 1,109 44,091 19,191 24,900

[ 26 ]
PRIMARY
Dishictt Total Population (including Institutional and Houseless
Police Sta tionl Total Area Occupied No. of Population) ·Sl. U. A./City/ Rural in Residential House- r--No. Town Urban Sq. Kms. Houses holds Persons Males Females
·1 2 3 4 5 6 "- 7 8 9
7 Banarhat T 395.6 29,699 29,823 149,729 77,393 72,336 ~
R 392.6 28,~28 28,704 143,774 74,145 69,626
U 3.0 1,071 1,1l9 5,955 3,248 2 .. 707
Gairkata (NM) U 2.96 1,071 1,119 5,955 3,248 2,707
8 Dhubguri T 279.5 26,442 26,535 145,243 76,209 69,034
R 264.9 22,262 22,277 122,145 63,992 58,153
U 14.6 4,180 4,258 23,098 12,217 10,881
Dhubguri (NM) U 14.55 4,180 4,258 23,098 12,217 10,881
Alipurdilar Subdirision T 2787.5 167,176 167,871 905,934 473,118 432,816
R 2756.4 151,101 151,524 813,696 424,508 38~,188
U 31.1 16,075 16,347 92,238, 48.610 43,628
9 Birpara T 190.8 13,305 13,371 70,190 36,79& 33,392
R 190.8 13,305 13,371 70,190 36,798 33,392
U
10 Falakata T 317.5 30,420 30,572 169,011 88,513 80,498
R. 312.6 28,292 28,365 157,013 82,334 74,679
J) 4.9 2,128 2,207 11,998 6,179 5,819
Falakata (i\M) U 4.92 2,128 2,207 11,998 6,179 5,819
11 Madarihat T 189.7 9,987 10,051 53,196 27,654 25,542
it 189.7 9,987 10,051 53,196 27,654 25,542
U
12 Alipurduar T 693.5 60,634 60.852 333,265 174,305 158,960
R 674.0 48,345 48,419 261,692 136,463 125,229
U 19.5 12,289 12,433 71,573 37,842 33,73l
Alipurduar (UA) U 19.53 1<2,289 12,433 71,573 37,842' 33,731
(a) Alipurduar U 10.89 8,100 8,244 48,605 25,517 23,088
(i) Alipurduar (M) U 9.36 7.543 7,684 45,324 23,798 21.526
(ii) Sobhaganj (OG) U 1.53 557 560 3.281 1,719 1.562
(b) Alipurduar Rly. Jun. U 8.64 4,189 ,4,189 22,968 12,325 10,643
(i) Alipurduar Rly. Jun.(NM)U 7.20 3,391 3.391 17,774 9,448 8,326
(ii) Chechakhata (OG) U 1.44 798 798 5,194 2,877· .1,317

CENSUS ABSTRACT
Scheduled Castes ,-____ A _____ -,
P M F
10
28,430
27,064
1.366
1,366
87,363
80,803
6.560
,6,560
251.769
240.736
11,033
5.987
5,987
64,282
62,480
1,802
1,802
7.513
7,513
119,694
111.319
" 8,375
8,375
5.369
4.859
510
3.006
2,478
528
11
14,792
14.057
735
735
• 43,5.13
40,019
3.494
3,494
131.581
125,734
5,847
3,134
3.134
33,605
32.649
956
956
3,861
3,861
63,057
58.592
4.465
4.465
2,804
2,527
277
1,661
1,365
296
12
13,638
13.007
631
631
43,850
40,784
3.066
3,066
120,188
llf.002
5,186
2,853
2.853
30.677
19,831
846
846
3.652
3.652"
56,637
52.272
3,910
3,910
2.565
2,332
233
1,345
r.l13
232
[ 27 J
Scheduled Tribes ,.-------_ ....... _-----,
P M F
13
61.858
61.081
777
777
3,699
3,679
20
20
249,719
247,919
1,800
28,105
28,105
32,145
32.066
79
79
19.115
19.115
57,771
57.054
717
717
157
153
4
560
122
438
14
31.555
31,141
414
414
2,087
'2,078
9
9
128.853
127,747
1,106
14,366
14,366
16,731
16,684
47
47
9,668
'9,668
30,303
29,790
513
513
89
88 • I
424
64
360
15
30,303
29,940
363
363
1,612
1,601
11
11
120,866
120.172
694
13,739
13.739
15,414
15,382
32
32
9,447
9,447
27,468
27.264
204
204
68
65
3
136
58
78
Literates ,.-_____ .A. _____ -,
P M F
16
33,874
30.827
3.047
3,047
41,45.3
,29.315
12,Q8
12,138
273.796
213.372
60,424
15,029
15,029
47,163
40,289
6.874
6,874
12.576
12.576
128,779 I
79,782
48,997
48.997
32.271
30,485
1,786
16,726
13,007
3,719
17
23,712
21,846
1,866
1,866
29.663
22,307
7,356
7,356
182,664
148,152
34,512
10,565
10,565
32,743
28,856
3.887
3,887
8,667
8,667
'81,793
53,855
27,938
27,938
18,376
17,311
1,065
9,562
7,334
2,228
18
10,1,62
8,981
1,181
1,181
11,790
7,008
4,782
4,782
91,132
65,220
25,912
4,464
4,464
14,420
1),433
2,987
2,987
3,909
3,909
46.986
25.927
21,059
21,059
13,895
13,174
721
7,164
5,673
1,491
MAIN WORKERS ,-----------
Total Main Workers
(I-IX) ,------"------....,
P M F
19 20 21
51,266
49,474
1,792
1,792
43,416
36.790
6,626
6,626
286,864
262,807
24,057
23.950
23,950
53,120
49,778
3,342
3,342
18.527
18.527
99.713
81,177
18,536
18,536
12,908
11,9?3
~25'
5,628
4.562
1.066
35,879 15,387
34,188 15,286
1,691- 101
1,691 101
41,613 1,803
35,390 1,400
6,223 403
6,223 403
234.785 52,079-
212.791 _50,016'
21,924 2,063
16,399 7,551
16.399 7,551
47,733 5.~87
44,691 5,087
3,042 30()
3.042 300
14,058 4,469
14,058 4,469
87,546 12,167
70,569 10,608
16,977 1.559
16,977 1,559
1)'765 1,143
10,922 1,061
843 82
5,212 416
4,205 357
1,007 59

'81. No.
t
District! Poliee Stationl U. A.{Cityl
Town
2
7 Baoarhat
Gairkata (NM)
8 Dhubguri
Dhubguri (NM)
Alipurduar Subdivision
9 Birpara
10 J;alakata
Falakata (M)
11 Madarihat
12 Alipurduar
Alipurduar (U.A.)
(a) Alipurduar
(i) Alipllrduar (M)
(ii) Sobhaganj (O.G.)
Total Rural Urban
3
T
R
U
U
T
R
U
u
T
R
U
T
R
U
T
R
U
u
T
R
V
T
R
U
U
U
U
U
(b) Alipurdllar Rly. Jan. U
(i) Alipurdllar R!y. Jan.(NM)U
(ii). Checbakhata (O.G.' V
( 28 ]
Cultivators (1)
P M F
22
7,349
7,213
136
136
24,948
23,813
1,135
1,135
98,073
96,878
1,195
3,181
3,18!
23
7,070
6,939
131
24
279
274
5
131 5
24,638 310
23,506 307
1.132 3
1,132 3
91,659 6.414
90,579 6,299
1,080 115
2,675 506
2,675 506
MAIN WORKERS
Agricultural Labourers (II)
,-----"-------.. P M F
25 26
3,569 I 2,900
3,391 2,736
178
178
9,810
9,179
631
631
46,342
45,662-
680
697
697
164
164
9,039
8,448
591
591
38.287
37,656
631
539
539
27
669
655
14
14
771
731
40
40
8,055
8,006
49
158
158
26,170 25,602 562 11,577 9,585 1,992
25,816 25,254 562 11,421
354 348 6 156
354
6 •• 26
(1,626
39.639
39,233
406
406
346
259
87
60
60
348
5,790
5,790
6
836
836
36,660 2,979
36,258 2,975
462 4
402 4
342 4
255 4
87
60
60
156
2,128
2,128
22,335
21,993
342
342
213
140
73
129
16
113
9,445 1,976
140 16
140
1,923
1,923
18,455
18,126
329
329
204
131
73
125
15
110
16
205
205
3,880
3,867
13
13
9
9
4
1
3
PRIMARY
Household Industry-Manufacturing,
Processing. Servicing and Repairs
[ V Ca) ] r-----"-----,
P M F
28
461
427
34
29
409
377
32
34 32
576 453
264 192
312 261
312 261
3.158 2,583
2,593 2.119
565 464
152 146
152 146
518
450
68
68
160
160
1,615
1,163
452
452
405
351
'54
47
26
21
4'38
390
48
48
122
122
374
328
296
32
46
26 20
30
52
50
2
2
123
72
51
51
575
474
10)
6
6
80
60
20
20
38
3&
386
308
78
78
77
55
22
1
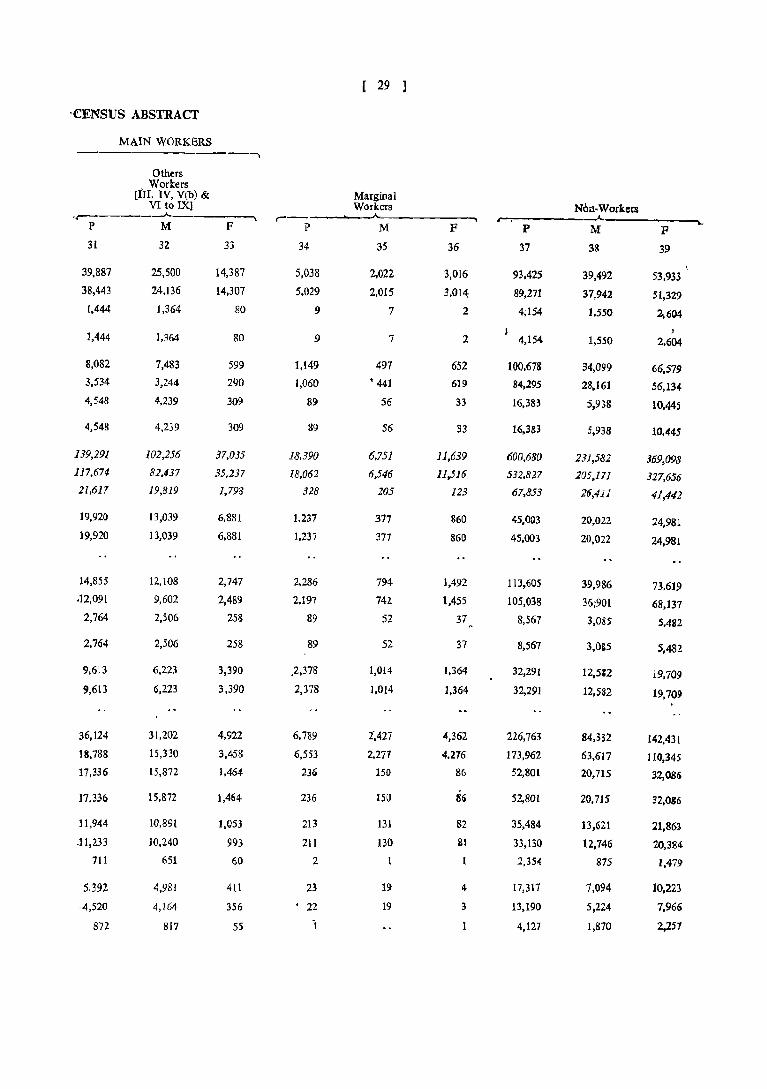
[ 29 ]
'£ENSUS ABSTRACT
MAIN WORKERS -,
Others Workers
[III. IV, V(b) & Marginal Non-Workers VI to IX] Workers
.-A. r"
P M F P M F p M F 31 32 33 34 35 36 37 38 39
39,887 25,500 14,387 5,038 2,022 3,016 93,425 39,492 53,933 38,443 24.136 14,307 5,029 2,015 3,014; 89,271 37,942 51,329 1,444 1,364 SO 9 7 2 4;154 1.550 2;604
J 1,444 1,364 80 9 7 2 4,154 1,550 2,604
tl,082 7,483 599 1,149 497 652 100,678 34,099 66,579 3,534 3,244 290 1,060 • 441 619 8.,295 28,161 56,134 4,548 4,239 309 89 56 33 16,383 5,938 10,445
4,548 4,239 309 89 56 33 16,383 5,938 10,445
139,29] 102,256 37,035 18,390 6,751 11,639 600,680 231,582 369,098 117,674 81,437 35,237 18,062 6,546 11,516 532,827 205,171 327,656 21,617 19,819 1,798 328 205 123 67,853 26,411 41,442
19,920 13,039 6,881 1.237 377 860 45,003 20,022 24,981 19,910 13,039 6,881 1,237 377 860 45,003 20,022 24,981
14,855 12,108 2,747 2,286 794- ],492 ] 13,605 39,986 73,619 -12,091 9,602 2,489 2,197 742. 1,455 105,038 35;901 68,137
2,764 2,506 258 89 52 37 8,567 3,085 5,482
2,764 2,506 253 89 52 37 8,567 3,OS5 5,482
9,613 6,223 3,390 ,2,378 1,014 1,364 32,291 12,582 19,709 9,613 6,223 3,390 2,378 1,014 1,364 32,291 12,582 19,709
36,124- 3[,202 4,922 6,789 2",427 4,362 226,763 84,332 142,431 18,788 15,330 3,45B 6,553 2,277 4,276 173,962 63,617 110,345 17,336 15,872 1,464 236 150 86 52,801 20,715 32,086
17,336 15,872 1,464 236 150 86 52,801 20,715 32,036
11,944 10,891 1,053 213 13l 82 35,484 13,621 21,863
.11,233 10,240 993 211 )30 21 33,130 12,146 20,384
711 651 60 2 2,354 875 1,479
5.392 4,9Bl 411 23 19 4 17,317 7,094 10,223
-4,520 4,164 356 22 19 3 13,190 5,224 7,966
872 817 55 i 4,127 1,870 2,257

, 30 1
PRIMARY:
Total Population (including District/ Institutional and Houscless
Police Stationl Tota] Area Occupied No. of Population) St. U. A.{CitYI Rlllal in Residential . House- r-------A-------~ No. Town Urban Sq. Kms. Houses bolds Persons Males Females
2 3 4 5 6 7 8 9
13 Kalchini . T 892.0 31,014 31,164 160.6lS 83,532 77,083·
R 885.3 29,356 29,457 151,948 , n,943 73,005
U 6.7 1,658 1,707 8,667 4,589 4,078
Uttar Latabari (NMJ U 6.68 1,65& 1,707 8,667 4,589 4,078.
14 Kumargram T 504.0 21,816 2],861 119,657 62,316 57,341 f
R 504.0 21,816 21,861 119,657 62,316 57,341
)U

[ 31 1
CENSUS ABSTRACT
MAIN WORKERS
Total Scheduled Scheduled Main Workers
Castes Tribes Literates (I-IX) r-------"-----~
,. __ ---A.------, ,..... ___ ---A.- _
• r- -A.
p M F P M F P M P P M F
10 11 12 13 14 1; 16 17 1& 19 20 21
14,097 7,031 7,066 73.721 37,710 3fi,dtl ! 37,274 26,218 l1,051i 54.450 38,290 16,160
13,24[ 6,605 6,636 72.717 37,[64 35,553 32.721 23.531 9,190 52,271 36.315 15,956
856 426 430 , 1,004 546 458 4,553 2,687 1,866 2.179 1,975 204·
856 426 430 1,004 546 45il 4,553 2,687 '1,865 2,179 '1.975 204
40,196 20,893 19,303 38.862 20,075 1S:7S·, 32,975 .22,678 10,297 37,104 30.759 6,345 '"
40,196 20,893 19,303 38,862 20,075 18,787 32,975 22,678 10,297 J7.104 30,759 6,345

I 32 ]
PRIMARY CENSUS ABSTRACf
MAIN WORKERS
Household Industry-Manufacturing.
Processing, ,District/ Agricultural !' Servicing &
Police Station! Total Cultivators ~I) "Labourers (II) Repairs [V(a)] Sl. U. A./City/ Rural -. r- ---. r-Np. Town Urban P M F P M F P M F
1 2 3 22 23 24 25 26 27 28 29 30
13 Kalchini T 9,139 7,'24 1,215 3,149 2,251 8" 162 151 11
R 8,704 7,594 1,110 2,967 2,089 878 117 109 3
U 435 330 105 132 162 20 45 42 3 "-
Uttar Lataba ri (NM) IU 435 330 105 182 162 20 45 42 3
14. Kumararam T 13,318 13,008 318 6,45,6 5,534 922 551 497 54-
R 13,318 13,002 310 6,456 5,534 922 551 497 5.
U

r 33 )
CENSUS ABSTRAC1'
MAIN WORKERS
Others WorkeI'll
[III. IV, V(b) &; Marginal VI~vIX] WorkeI'll Non-Workers
1" M. F P M P P M F
42,000 27,'64 14,036 2,29& '33 1,365 103,867 44,309 59,558 040,483 2 •• 52) 13,960 2,29S 930 1,365 97,382 41,6'8 55,684 1.517 1.441 76 3 3 6.485 2,611 3,874
1,517 1,441 7. 3 3 ',485 2,611 3,874
1',77' 1l.72Q 5,OS' 3,.0102 1,206 2,196 7',151 30,351 48.800
1',77' 11,72i S,OS' 3,41il2 1,206 201" 79,151 30,351 418,800


URBAN/VILLAGE PRIMARY CENSUS ABSTRACT


-sL No.
1
1
2
3
4
5
6
7
8
9
'10
11
12
13
14
15
Name of Villages
2
Araji Bhelakoba-I
Araji Bhelakoba-II
Araji Bhelakoba-III
Araji Binoaguri
Ambari Falakata
Badlagac~
Balaigachh
Binoaguri
Chakiabhita
Chhat Guzrimari
Chhat Sikarpur
Dabgram
Gadbeagaoj
Guzrimari
Jungle Mohal
Saraswatipur T. E.
1.L. No.
3
11
13
14
Ii
22
25
2a
3
17
9
15
2
23
8
1
1
I 31 ]
ALPHABETICAL LIS1' OF VILLAGES
1 P.S. RAJGANJ
Population ,-__ .A-__ ,
1971 1981
4
173
939
92
928
855
644
518
12,712
1,906
3,50()
136
38,859
1.044
4,730
1,8191 r
1,554 )
5
178
592
156
1,416
1,207
827
643
20.053
2,851
3,664
307
* 1,689
3,195
4,754
SI. No.
1
16
17
18
19
20
21
22
23
24
25
26
27
28
29
Nam~ofViU~
.£
Jugibhita
Kamarbbita
Kismat Sukaoi
Kukurjan
Lalitabati
Mahaobbita
Maotadari
Mebeodigachb
Panikauri
Patbarghata
Sanoyasikata
Sikarpur
Sikarpur T.E.
SimuIguri
Sukani
Total
* Included in Dabgram (NM)
,.f). No..
a
it IS
10
29
5
21
6 ., 12
7Jj
rD
7
7
4
28
I -1,201
2.40~
2,3J8
6,620
\542
1,782
2,811
3!91S
7,150
842
823 i,077
2,246 '3;129
782 -1,471
3,989. '5,275
69. 4,085
H,625 '11'/540
.7.3f:l}. 14:763
2;206
172
14.794
1,062
20,251

Area of Mouza (Village)
in Name of Hectares
Mouza (Village)/ and of TownJWard (in absence Town!
of name repeat Ward in
[ 38 1
URBAN/VILLAGE PRlMA)tY
ToUtI Population (including Institutional
and Houseless PopUlation)
,------"-----.......
Scheduled Castes
,-_ ...... _-----,
Scheduled Tribes
,-__.._---.~
Location Code
Number I.e.
1.L.No. of
Mauia (Village) I
Ward No . • Ward No.) Sq. Kms
No. of Occupied ~Residen·
tial Hocses
No. of House
Doldi- Persons Males Females M F M F
1 2
1 P. S. Rajganj
I Gungle Mohal
2,
.!
4
5
6
1 , 9
10
:l1
12
13
14
15 t6 17
Dabgram
Binnaguri
Simulguri
Lalitabari
Mantadari
, Sikarf;JlJl'
G1IZl'irnari . ' Ch?at Guttirnari
Klsmat Sukani
Araji Bhelakoba-I
PaniKauri
Araji Bhelakoba-IT
Araji Bhelakoba-III
Cbhat Sikarpur
Araji Binnaguri
Cbakiabbita
1S Kamarbhita
19 Mehendigachb
20 Balaigachh
21 Mahanbhita
22 Ambari Falakata
23 Gadheaganj
24 Jugibhita
2S Badlagachh
26 Patharghata
27 Sannyasikata
28 Sukani
29 Kukurjan
Dabgram (Non-Municipality)
Rural
Urban
Grand Tota.
3
25,305.76
.5,892.60
2S8.6~
273.54
1,1112.49
3,380.55
793.01
1,194.62
849.66
81.97
1,272.34
165.)1
49.17
118.25
677.22
383.92
362.65
481.08
297.16
460.08
337.86
541.12
453.68
272.81
316.07
5,671.12
5,580.59
2,392.02
45.86
590.7
45.9
634i.Ci
4
851
2,803
155
129
482
2.037
553
652
660
36
902
106
33
51
224
490
522
220
115
170
189
249
294
120
162
I,S53
2,8()2
9l!8
15,C07
17,78S
15,007
32,71JS
5
903
3,806
186,
129
528
2.643,
603
702
710
36
962
106
33
51
244
520
542
240
125
190
210
279
325
140
192
2,761
3,809
1,350
15,030
22,325
15,030
37,355
6 7 8
4,754 2,458 2,296 755
Included in Dabgram (NM)
20,053 10,695 9,358 6,047
1,062
842
3,129
14.763
3.195
3,664
3,918
178
5,275
592
156
307
1,416
2.851
2,811'
1,471
643
1,077
1,207
1,6~
1,782
827
1,085
f4,540
20,251
7,150
556
554
1,70B
7,68(i
1,675
1,8?5
2,026
85
2,716-
316
, 91
154
763
1,465
1.483
778
312
562
658
900
926
422
557
7,640
10,689
3,771
76,402 41,003
120,6S8 '63,321
76,402 -fl,OD3
197,090 104,524
506
288
1.421
7,077
1,520
1,789
1,892
93
2,559
276
6~
153
653
1.386
1,nS
693
331
5J5
549
7&9
8S6
405
528
6,900
9,562
3,379
35.399
57,167
35,399
92,566
466
J 303
1,069
,3,490
583
1,250
1,~1
84
1.750
307
,N 139
6;'9
981
1,008
401
274
ISS
98
?5 279
41
198
3,508
4,694
1,829
9,880
31,603
9,880
41,483
10
698
5,705
425
21'7
939
3,281
529
'1.187
989
93
].624-
27f
49
139
546
922
956
333
281
181
75
191
249
S5
193
3.123
4,08(1
1,782
8,830
29,004
8,830
37,834
11
935
153
86
32
242
f,755
235
12
18
4
25
15
9
19
96
5
17
11
9
535
3,749
535
4,184
12
911
120-
78
24,
223,
~,600-
237
21
'.,
6
15
It2
3
17
7
II
45
B
2
444-
l,512
44.4
3,956

CENSUS ABSTRACT
Literates ,~
Total Main
Workers (I-IX)
.----"-~ M F M F
13
735
-3.404
182
149
542
-2,783
756
865
884
46
<1,126
128
25
55
270
S81
S84
373
133
'221
238
264
401
120
187
2,886
3,160
1,336
15 16
231 1,089 226
242 6,009 437
27 320 3
30 204 22
135 954 146
1,324
359
481
410
9
422
38
2
12
62
330
235
109
20 41
63
86
188
32
51
899
1,589
404
3,781 561
878 143
1.001 122
978 90
57
1,470 102
182 10
33
82
3
2
448 11
776 96
823 61
344 142
196 8
370 62
370 31
526 19
546 25
235 4
338 6
4,322 320
5,405 244
1,853 22
39 ]
MAIN WORKERS
Household Industry
Manufacturing, Processing,' Other
Agricultural Servicing, Workers Cultivators Labourers and-Repairing [III, IV, V(b) &
(1)" (II) [V (a)] VI to IX] .-_..A.. __ , ..-_ __..A..~ ....-----"---- ,.....----A._---. M F M F M F M F
17 18 19 20 21 '!2 23 24
446 8. 161 3 479 218
Included in Dabgram (NM)
2,910 77 1,638 270
225 2 77 1
132 5 64 17
611 69 218 66
1,614
391
376
442
38
844"
119
19
61
368
313
262
130
106
249
229
262
314
157
239
2,435
2,902
1,152
42 787 75
11 258 100
10 326 71
4" 299 77
16
4 474 45
45 10
12
19 2
4 76 5
11 151 39
167 47
18 188 123
2 80 6
38 90 21
14 111 16
3 2ilO 16
9 169 14
76 4
59 3
93 1,520 213
51 1,758 147
3 595 12
33
3
24
18
39
10
4
39
5
7
31
5
8 1,428
17
8
5 122
1,356
8 211
5 260
227
3
3 139
9
5
2
1
18
2
2
4
308
355
26
10
31
25
"24
63
2
40
360
714-
101
82
6
443
24
36
9
50
2
37
8
1
1
2
3
13
46
7
-24,005 14,564 20,067 938" 1,290 12 1,512 49 541 56 16,724 821
22,434
24.005
\8,431
14,564
33,590 2,919
20,067 938
17,146
1,290
480 9,674 1,401
12 1,512 49
235
541
47 6,335
56 16,724
9~1
821
Marginal , Workers Non-Workers .--~ .--~
M F M F
25
75
74
183
7Q
194
75
29
137
18
16
6
2
8
23
85
217
211
335
1,42.3
335
26 27 21
14 1,294 2,05'
45 4,612
1 236
167
77 684
391
128
73
99
1
213
7
16
3.711
722
845
911
28
1,228
134
42
66
1 313
30 6&1
56 637
434
116
192
288
3:74
380
187
219
240 3,233
12 5,067
30 1,707
8,876
502
266
1,198
6,125
1,249
1.594
1,703
91
2,244
266
S5
135
641
1,26()
1,211
551
323
453 518
77c)
; 831
401
522
6,34G
9,30'
3,327
146, 20,601 34,315
1,434 28,508
146 20,601
52,814
34,31'5
46,43? 22,995 53,657 3,857 18,636 492 11,186 1,450 ,776 103 23,059 1,812 1,758 1,580 49,109 87,tD


[ 41
ALPHABETICAL LIST OF VILLAGES
2. P.S. JALPAIGURI
Population Population 81. J.L. ,...----"-----, 81. J.L. ,.-__ .A. __ ,""
No. Name of Villages No. 1971 1981 No. Name of Villages No. 1971 1981
1 Amarakhana 10 186 259 16 Garalbari 9 12,361 15,706
2 AI1Iji Amrakhana 12 240 184 17 Kachua 28 1,640 889
3 Araji Garalbari 25 1,170 1,194 18 Kharia 7 34.262 44,736
4 Araji Maria Kall}ala Pukharil4 1,200 2,166 19 Kbarija BerubaR 27 5,832 7,21~
5 Bahadur 4 8,129 10,861 20 MandaIghat 8 8.474 10,267
6 Banskanthia 24 1.043 1,281 21 Maria Kamala Pukhari 16 * 319
7 Barapatia Nutunbas 6.250, 16,195 22 Nandanpur 26 4,012 4,456
Bhandarpur T.E. " 793 I 23 Paharpur 6 8,411 10,467
Bhandigurite r
Patkata 5 10,817, 21,281 988, 24
Jaipur T.E. ,
Karatavalley T.E. 5 1,221 I 742) r
8 Berubari 23 22,633 28.11.6 Rangamaty T.E. 5 3.380 I I
9 Berubari Nagar 19 654 730 Raypur·T.E. 5 1,293) . ... 10 Bhelakoba 2 8,931 10,043, 25 Rarmmadeb 13 402 218
11 Biunaguri 21 773 931 26 Satkhama,r 3 5,015 6,453
12 Boalmari 29 6,156 5,1-61 27 Shakati 20 1,167 2,427 r
13 Chhitland'of Singimari 18 179 14 28 Singimari Prathankhanda 17 1,458 894
14 Daikhata 22 1,668 1.720 29 Singimari Dwitiyakhanda 15 604 701
15 Dharmmadeb 11 167 295 Total 162,251 205,182

" Location Area of Code Mouza
Number (Village) i. e. in
J. L. No. Name of Hectares of Mouza (Village)! and of
Mouza Town/Ward (in absence Town/ (Village)/ of name repeat Ward in Ward No. Ward No.) Sq. Kms
2
2 P. S. Ja/paiguri
2
3
4
5
6
7
8
9
10
Barapatm Nutunbas
Bhelakoba
Satkhamar
Bahadur
Patkata
Paharpur
Kharia
Mandalghat
Garalbari
Amarkhana
11 Dharmmadeb
12 Araji Amarkhana
13 Rarmmadeb
3
4.622.71
2500.38
1.839.40
3,373.54
7.192.39
2,417.04
6.044,55
2,232.63
4,521.02
61.12
85.30
103.86 ~
122.75
14 Araji Maria Kamala Pukhan 556.74
15 Singimari bwitiyakhanda
16 Maria Kamala Pukhari
214.89
104.4l
17 Singimari Prathamkhanda 460.94
18 Chhit Land of Siogimari 9.31
19
20
21
22
23
24
25
26
27
28
29
Beruban Nagar
ShakatJ
Binnagun
Daikhata
BerubtMi
Banskanthia
Arajl GaraIbari
Naodanpur
Kharija Berubari
Kachua
Boalmari
33.55
567.98
308.78
680.28
6,424.09
250.47
190.30
1,023.45
1,383.09
1,277.22
1,704.37
No. of Occupied Residen
tial Houses
4
2,995
1,898
1,128
2.002
4,002
1,902
1,871
1,891
2,941
44
65
36
47
442
147
69
169
3
131
444
198
359
5,439
255
243
791
1,265
159
956
No. of Households_
5
2,999
1,903
1,130·
2,002
4,009
1.906
7.876
1.893
2,947
44
65
36
47
442
147
69
169
3
142
449
198
359
5,448
256
243
791
1,285
159
956
[ 42 ]
Total Population (including Institutional
and Houseless Population)
,--------"-----, Persons Males Females
6
)6,195
10,043'\
6,453
10,861
21,281
10,467
44.736
10.267
15,706
259
295
184
218
2,166
101
319
894
14
730
2,427
931
1,720
28,116
1,281
1,194
4,455
7,219
889
5,161
7
8,452
5,213 '
3,44S
5,661
11,128
5,515
23,208
5,475
8,257
131
152
98
118
1,139
372
169
476
8
383
1,261
473
908
14,579
686
637
2,348
3,728
473
2,729
8
7,743
4,830'
3,008
5,200
10,153
4,952
21,528
4,792
7,449
128
143
86
100
1,027
329
150
418
6
347
1,166
458
812
13,537
595
557
2,107
3.491
416
2,432
URBAN/VILLAGE PRIMARY
Scheduled Castes ,--__ .A.-,
M F
9
3,683
2,807
2,509
3,270
6,491
2.438
8,816
3,548
3,439
29
148
97
109
1,013
174
73
308
164
1,085
305
422
11,677
555
384
2,219
3,203
442
2.574
10
3,295
2,646
2,186
3,080
5,986
2,211
7,625
3,085
2,971
37
138
86
94
911
160
65
274
154
1,009
311
376
11,764
497
344
2,001
2,991
401
2,303
Scheduled Tribes
r----'---, M F
3,898
31
5
69
1,6/5
65
160
3
177
22
15
4
13
372
391
2
3
12
3,724
34
55
1,568
58
109
1
160
21
10
2
12
323
310

CENSUS ABSTRACT
Literates r-__......~
M F
13 14
Total Main
Workers (I-IX)
r------"------. M F
15 16
[ 43 1
MAIN WORKERS
Agricultural Cultivators Labourers
(I) (II) ,-_.A..-_, ,---A..~
M F M F
.n 18 19 20
Houusehold Indstry
Manufacturing, Processina. Other Servicing Workers
and Repairing [III. IV, V(b) & [V (a)] VI to IX]
,-_ __...._~ .--A-~
M P M F
21 22 23 24
1,697
1,826
1,033
1,801
3,894
2,220
13,281
2,291
3,046
429 4,150 1,225 1,540 15 649 110 172 25 1,789 1,075
31
36
28
39
372
181
63
123-
1
188
374
154
2f.6 5,401
227
321
772
1,460
122
961
849
384
.p19
1,603
1.003
9.254
1,080
1,123
8
6
10
20
122
91
13
39
127
125
2,964 248
1,859 45
3,052 146
5,793 913
2,861 101
10,986 771
2,880 170
4,673 137
85
94
55
70
4
3
2
616 25
192 12
91 1
295 4
3
200 12
671 9
52 269 18
12 562 84 • 1.605 8,119 598
67 389 12
165 335 30
295 1,297 44
633 1,915 77
28 281
3[2 1,414 72
1,596
1,191
1,688
2,736
1,499
2,30.f'
1,598
2,734
54
72
25
32
430
119
55
230
2
41
483
16 893 134
8 544 34
22 1,035 85
103 1.348
9 625
21 1,918
32 734
25 1,495
1
30
22
28
29
7 163
7 59
34
4 23
1
39
166
176
52
75
90
76
3
3
2
17
5
4
196 7 67 11
472 12 71 71
5,351 154 2,071' 339
218 2 134 6
153 4 61 7
932 6 264 26
1,129 12 545 46
200 48
1,046 8 312 31
50
38
41
184
20
328
34
57
2
7
2
37
4
7
29
7
45
26
425
86
288
59 1,525
5 717
37 6,436
20 514
3 387.
" ..
1
9
6
3
27
2
9
21
14
2
6
113
21
6
17
655
36
117
94
212
33
49
53
2
13
575
35
638
28
33
11
3
96
3
18
6
J6
6
Marginal Workers ~~
M F
Non.Workers ,-__ ..A.._..l...,
M F
25
113
28
12
39
207
62
98
4
87
28
70
5
34
2
.11
26 27 28
215 4,189 6,303
15 2,221
17 1,574
53 2,570
308 5,128
6 2,592
164 12.124
32 2,591
103 3,497
46
58
43
48
4,567
2,946
5,001
~,932
4,845
20,593
4,590
7,209
127
139
83
98
522 1,002
180 317
78 149
217 414
5 6
183 335
56 562 1,IO!
204 440
345 728
133 6,390 12,806
297 583
14 297 513
2 J ,051 2,Oul
9 J ,779 3,405
190 416
10 1,304 2,350

[ 44 ]
URBAN/VILLAGE PRIMARY
Location Area of Code Mouza
Numebr (V~llage) i. e. 10 Total Population
J. L. No. Na-me of Hectares NQ. of (including Institutional of' Meuza (Villagel and of Occupied and Houseless Scheduled Scheduled
Mouza Town/Ward in absence TownJ . Residen- No. of P,?pulatien) Castes Tribes (Village)1 of npme repeat Ward in tial House-
~ ____ ..A.. __ • ___ -, ...-___ ..A.. __ -, ...-__ ..A.._~
Ward No. Ward No.) Sq. Kms Houses holds Persons Males Females M F M F
2. 3 4 5 6 7 ~ 9 10 11 12
2 P. S. Jalpaiguri-concld.
Jalpaiguri (Municipality) 10.08 11,016 11,197 61,743 32,204 29,539 4,407 4,033 327 240
Ward No. 1 595 595 3,275 1,813 1,462 421 355 16 11
.. 2 605 605 3,749 1,925 1,824 356 315 71 28
3 427 427 2,499 1,287 1,212 305 268 2 3
" 4 494 494 '2,326 1,250 1,076 139 120 2
5 9'20 921 5,127 2,619" 2,508 156 139 2 4
.. 6 515 515 2,885 1,5!! 1,374 104 77
7 767 776 4,167 2,144 2,023 298 257 19 8
" 8 '435 450 2,439 1,233 1,206 37 64
9 33'1 373 2,313 1,218 1,095 102 116 1
10 513 548 2.970 1,628 1,342 51 45 1
" 11 334 355 2,251 1,257 994 53 46
o' 12 1,026 1.055 4,954 2.557 2,397 399 380 82 83-
" 13 322 326 1,956 1.074 932 12 13 'I 2
I" 14 514 517 2,726 1,414 1,312 241 220 6 1
" 15 628 628 '3,422 1,737 1.685' 557 537 3 3
16 560 578 3.136 1.641 1.495 419 380 2 1
17 473 475 2,951 1,515 1,436 200 188 1 1 "
18 631 63! 3.699 1.937 1,762 111 93 3 2
., 19 926 928 4.898 2.494 2,404 446 420 114 103
Rural 492.9 37,898 37.973 205,182 107,222 97,960 61.982 57,001 6.847 6.407
Urban 10.1 11,016 11,197 61,743 32,204 29.539 4,407 4,033 327 240
Grand Total ,503.0 48,914 49,170 266,925 139,426 127,499 66,389 61,O~4 7,174 6,647

[ 45 ]
.cENSUS ABSTRACT
MAIN WORKERS ~'--~------------------~------------------------,
Other Workers
Total Main
Workers (I-IX)
Household Industry
Manufacturing, Processing,
Agricultural Servicing Cultivators Ljlbourers and Repairing [Ul, lV, V(b) &
VI to IX] Marginal
(1) -- (JI) [V (a)] Workers Non-Workers Literates ,.,.--------'-----. ,--_.A.._......., ,-_ __.._____, ,-__ .A. __ , ~ __ .A. __ .......,
~----"-----... ,.~r--~ M F M F M F M F M F M F M F M F
13
:'23,354
] ,165
1,461
713
896
.2,069
1,191
1,690
1,007
918
964
806
1,751
863
905
1,184
1,114
1,207
"1,567
1,883
42,[69
23'354
",,5,523
14 15 16
1?,593 15,587 2,307
763 ,904 89
1,308 908 212
508 617 53
586 511 85
1,775 1,118 140
965 742 98
1,439
930
802
523
577
1',391
741
743
?14
867
993 136
650 183
683 127
940
701
80
57
1,336 252
490 57
700 '163
807 218
774 62
697
822
78
67
17 18 19 20
325.
31
106
lOS
10
20
8
2
6
3
5
4
13
2 245
58
52
54
27
2
1
2
4
3
5
27
6
4
2
~ .
21
198
13
6-
14
4
7
10
9
_10
11
15
12
24 5
9
26
19
1,052
)'270
1,439 1,094 150 10 9 3
20,075
[8,593
38,668
56,135 4,764 28,126 476 13,413 1,404 1,021
15,587 2,307 325 2 245 6 [98
71,722 7,071 28,451 478 ]3,658.1,410 1,219
22 23
18 14,819
2 802
2 744
4
444
570
1,089
-924
981
637
666
939
685
1,317
489
3 676
794
2 765
2 662
7<53
1 1,072
272 13,575
[8 [4,8[9
290 28,394
24 25
2,281 110
82 2
208 24
51 2
'85 20
140 9
98 7
136
t79
127
80
56
252
P 160
218
60
76
67 -
149
2,612
2,28[
4,893
3
2
1
9
3
28
802
[10
912
26 27 28
70 16,507 27,162
1,372
1,602
1,158
1 907
10 993
7
3
l:i
668
619
1",492
762
1,148
583
535
984
2,3'65
1,275 J
1,887
1,02~ 967
686 1,261 555 923
3 ),221 2,14~
534 875
714 1,14"9
921 1,466
17 864 1,416
12
1,137
818 1,358
1,115
1,372
50,285
1.695
2,242
92,059
70 16,507 27,16,2
1,207 66,792 119,221

[ 46
ALPHABETICAL LIST OF V~LAGES
3 P.S. MAL
81. No.
POIlula tion I.L. ~
Name of ViUages No. 1971 1981
1 2
1 Adal:lari
2 Anandapur
3 Anandapur Tea Garden
4 Apalchand
3
90
58
59
64
5 Apa1chand Forest 16
6 13agrakote Tea Garden 11
7 Baintguri Tea Garden 49
8 Baragharia 57
9 Basusuba t07
10 Betbari Tea Garden 38
11 Bidurerdanga 106
11 Chak MauJani 93 j
11 Cbap_adanga 96
14 Chengmari Qangapara 68
IS Che:lgmari Forest 67
16 ChcugwaIi Hat 87
h Chikanmati 83
18 Dakshin Chak Maulani 94
l' Dakshin Cbangmari 98
10 Dakshin Hanskhali 61
21 Dakshin Kantadighi Kumarp~ra 82
22 Dakshin Khalpara 88
23 Dakshin Majbgram 85
24" Dakshin Matiali 105
25 Dakshn Odlabari 19
26 Dakshin Phulbari 13
4
945
1,247
2,225
158
1,382
5,'136
4,266
1,981
1,299
832
929
1,326
783
791
24
583
638
828
845
3,180
1,062
486
1,218
1,'734
1,l1O
357
'i1' " "Dakshh~ Saripukhuri
~g Dalingkote Tea Garden
95" ;,5:'8
29 Damdim Hat
30 Damdim Tca Garden
31 Demkajhora
12 Dhalabari
33 Ellenbury Tea Garden
34 Gochimari
as Gojaldoba Tea Garden
26 1,828
37 1,426
40
48
75
4
62
15
5,156
1,117
1,641
1.526
1,023
1,049
5
1.247
1,176
2,966
14
1,280
6,491
4,620
2,257
1,541
932
1,122
(939
1,157
400
14
799
635
2,062
* 3,505
1.065
3.940
1,691
2,454
2,478
427
U6>
1,515
1,3 J3
6,574
1.276
2.050
1,980
1,409
6,618
Population SI. No.
J. L. r-------"-----ro Name of Villages No. 1971 1981
2 3 4 5
36 Golabari 66 385 607
37 Gurjangjhora Tea Garden 28 591 1,711
38 Haihai Pathar 47 2,465 3,309
39 Haihai Patbar Tea Ga~den.I,II 43 2,089 2,181
40
41
42
43
44
45
46
47
48
49
50
S1
52
53
54
55
56
57
58
59
60
f I
Haihai Pathar Tea c;Jarden-II 45
Hans.khali 14
Jogesh Chandra Tea Garden 72
Jhar Majhgram 76
Jhar Matiali 92
Kalagaity 6
Kaiagaity Tea GardeIl 7
Kaotadighi Kumarpara 34
Khasjangal·I 32
Khasjangal·1I 35
Kodalkati 77
Krami 84
Kumlai 55
Kumlai Tea Garden 41
Lataguri 81
Ush River Tea Garden 10
Mal 44
Malnadi Tea Gardan 27
Malbati Forest 71
Manabari --22
Manabari Tea Garden 21
. Menglass Tea Garden 25
832
389
3,213
1,058
3,478
151
1,599
},184
(a)
240
1,280
3,159
1,470
2,606
3,287
3,661
*" 1,442
(a)
576
1.769
2,568
720
2,706,
3,861
1,205
'3,421
301
750·
1,865.
21
971
1,548
3.327
1,814
3,101
3,757
4,352
** 7S}
2
910
1,800
3,250
62 Neola basH 65 567 728
63 Neora 78 894 914
64 Neora Nadi Tea Garden 79 2,648 3,289
6S Newglenco Tea Garden 42
66 Nichchalsa 53
67 Nidamjhora Tea Garden 30
I 68 Nipuehhapur 5 \
69 Nipucbbapur Tea Garden 52
70 Odlabari 20
2.216
1,521
1,388
1,295
1.733
4,773
2,717
1,961
1.731
1,61(}
2,107
+

[ 41 ]
ALPHABETICAL LIST OF VILLAGES
3 P.S. M AL-Concld.
'" Population Population
:51. J. L. r-~ 51. J. L. .. ~ 'No. N arne of Villages No. 1971 1981 No. Name of Villages No. 1971 1981 '. 1 2 3 4 5 1 2 3 4 5
71 Odlabari Tea Garden 18 2,386 2,615 90 Saogaon 8 474 435
72 Paschim Damdirn 39 903 584 91 Saogaon Tea Garden 9 1,507 1.631
73 Paschim Dolaigaon 70 787 1,101 92 Sidabari 63 428 600
74 Pascbim Mauamari 100 74- * 93 Sisubari Tea Garden 36 1,746 1,890
75 Paschim Prernganj 101 88 * 94 Sunderibasti 3 212- 92
76 Paschim Sangapara 97 742 363 95 Syli Tea Garden 33 3,467 3,366
77 Pascbim Totgaon * 92 96 Targhera 17 539 745
78 Patharjbora Tea Garden 24 2,938 3,270 97 Tesimala 46 2,102 2,254
79 Purbba Damdim 50 1,051 1,238 98 Tunbari Tea Garden 29 661 800
80 Purbba Dolaigaon 69 754 1,397 99 Turibari 23 1,155 1.174
81 Purbba Kantadigbi Kumarpara 80 115 226 100 Uttar Chengmari 73 386 4q3
82 Purbba Mauamari 99 694 341 101 - Uttar Hanskhali 60 1.255 2,082
83 Purbba Premganj 103 97 306 102 Uttar KlIalpara 86 1,730 1,87~
84 Purbba Sangapara 104 725 1,IS0 103 Uttar Majbgram 74 1,489 1,7D.1
85 Purbba Totgaon 2 (a) * 104 Uttar Matiali 91 1,990 2,54q
86 Premganj Majhiali 102 496 3'45 105 Uttar Phulbari 21 591 *; 87 Rajadanga 56 881 894 106 Uttar Saripakuri 89 2,384 2,71,3
88 Rangamati Tea Garden 31 5,254 6,573 107 Washabari Tea Garden 5 2,622 3,24J j
89 Ranichera Tea Garden 34 3,621 4,539 Total, 155,191 183,766
* Uninhabited
** Included in Mal (NM)
+ Included in Odlabari (NM)

Location Area of Code Mouza
Number (Village) i. e. in
J. L. No. Name of Hectares of Mouza (Village)! and of
Mouza Town/Ward (in absence Town! (Village)! of name repeat Ward in Ward No. Ward No.) Sq. Kms
1 2 3
3 P. S. Mal
1 Paschim Totgaon
2 Purbba Totgaon
31qil
482.39
452.36 3 Sunda'ribasti
4 Ellenbury Tea Garden 406.28
~ Washabari Tea Garden 511.41
6 Kalagaity 4i9.66
7 Kalagaity Tea Garden 209.87
8 Saogaon 1,003.22
9 Saogaon Tea Garden 475.11
10 Lish River Tea Garden 940.52
11 Bagrakot Tea Garden 909.22
12 Uttar Phulbari 279.80
13 Dakshin Phulbari 526.00
14 Hanskhali 724.49
15 Gojaldoba Tea Garden 208.04
16 Apalchand Forest 5,231.79
17 Targhera 444.26
18
19
20
,21
22
23
24
125
26
27
28
29
30
31
32
Odlabari Tea Garden
Dakshin Odlabari
Odlabari
272.93
601.17
Manabari Tea Garden 492.61
Manabari 607.84
Turibari 591.25
Patharjhora Tea Garden 878.99
Menglass Tea Garden 683.52
Dalingkote Tea Garden 414.00
Malnadi Tea Garden 146.50
Gurjangjhora Tea Garden 330.26
Tunbari Tea Garden 298.25
Nidamjhora Tea Garden 360.12
Rangamati Tea Garden 1,475.09
Khas Jangal I 6,\7
[ 4? )
URBAN/VILLAGE PRIMARY
No. of Occupied Residen
tial Houses
4
17
17
No. of Households
5
17
17'
386 386
603 603
54 54
136 136
70 70
305 305
917 918
1,257 1,257
Total Population (including Institutional
and Houseless Population)
,.....--------"-----""\ Persons. Males Females
6
92
92
1,980
3,241
301
750
435
1,631
4,352
6,491
7
48
49
1,033
1,627
161
395
240
821
2,274
3,325
8
44
Uninhabited
43
947
1,614
140
355
195
810
2,078
3,166 /
Uninhabited
94
749
534
181
158
552
489
94 427 222
1,638
3,219
676
402
1,374
205
749 .2,706
534 3,930
181 1,280
158 745
552
489
2,615
2,478 1,287
1,068
711
604-
343
1,241
1,191
Scheduled Castes
,-----'----.,
Scheduled Tribes
,---A.. ~
M F M F
9
199
294
89
29
11
59
365
9
554
820
4
299
176 356
10 11 12
22 21'
23
164 513 517
286 730 743.
66 16 16
34 310 299"
143 140
9 744 769
44 1,433 1,471
408 693, 751
4
448
600
5
207
58
46
4& 556
35
118 1,002
350 358
56
43
38
555
31
1,001
355·
Included in Odlabari (NM)
342
184
195
640
675
302
159
351
176
356
1,291
4
342
188
195
640
675
30r
159
351
176
356
1,291
4
1,800
910
1,174
3,270
3,250
1,515
751
1,711
800
1,73l
6,573
21
924
514
615
1,648
1,644
753
378
879
413
884
3,357
10
876
396
559
1,622
1,606
762
373
832
387·
847
3,216
11
18S
43
7
322
89
27
77
24
223
210
2
167 638
34 128
8 86
331 537
90 1,145
18 2n 79 139
16 425
350
196 582
196 1,741
3
632
129
86
537
r,168
295·
138
440>
349
585
1,738

( 49 I
CENSUS ABSTRACT
MAIN WORKERS ______ . ___________ ------A---______ _
Literates ...-----'----..
M F
13
9
9
219
633
36
83
26
76
618
1,451
72
731
531
100
117
231
330
269
140
98
14
8
9
47
200
9
11
3
9
102
525
21
291
19
21
46
54
129
43
55
37
517 / 180
111
39
13
50
Total Main
Workers (I-IX)
,----"----, . M F
15 16
27 2
27 2
538 244
692 484
100 7
184 145
132 28
269 154
1.302 978
1,533 903
128
1,105
2.833
346
9
i 2
6
231 46
695 511
751 143
383 237
326 31
354 52
747 606
872 773
436 401
187 176
397 175
458
148
82
240
13
154
766
2
5 2~5 196
47 363 260
228 1,629 1.320
5
Agricultural Cultivators Labourers
(1) (II) ,..----"------.. ,.----'------.
M F M..-F
Household Industry
Manufacturing, Processing. Servicing
and Repairjng [V (a)]
,..----"---, M F
Other Workers
[III, IV, V{b) & Marglnai VI to IX] Workers
.----'---, .---'----, M F M F
17 18 19 20 21 22 • 23 25 26
26
26
3
23
95
53
119
3
329
627
248
8
3
116
Uninhabited
212
3 21
2
3 3
5 1
2
42
90
12
3
2
2
I
13
.. '---- .. 3
6 2
4 1
6
17 5
Uninhabited
49
84
1,348
76
4
4
123 39
21 3
6 408 89
3
13
Included in Odlabari (NM)
1
323
645
4
122
12
263
1.254
1.425
73
691
858
22
I
231
477
3
138
22
153
978
885
5
7
2
100 7
671 568
214 - 47
37 13 1 345
83 2 73 4 170
224
25
307 50 39 8
8
5
4
5
3 740
863
431
181
397
606
773
401
176
175
225 196
12
2
20
7
43
9
11
2
42
12
5
2
28
12
9
4
27
4
20
34
N OB-WorkerSo ,--_-A. __ -,.
M F
27
21
22
495
923
61
209
108
532
965
1,749
94
533
377
330
28
42
41'
7031
1.125-
133-
20S:
167
628
1,088.
2,254-
196
1,061.
709
598
171 296
679 670
536 1,041
540
187
261
901
639-
365
503-
1.016
761 806·
315 357
149 177
470 623'
188
362 260 107
30
15§) 414
191
428
1,863-
a 1.627 1.320 33 1,698
5 5

Location Area of Code Mouza
Number (Village) ~~ ~
J. L. No. Nam<.: of Hectares of 1'V1nuza (Village), and of
Mouza Town Ward (in absence Town (Village)/ of name repeat Ward in
Ward No. Ward No.) Sq. Kms
2
3 P. S. Mal-contd.
Syli Tea Garden 760.75 33
34 Ranichera Tea Garden 1,226.21
35 Khasjangal-II 5(.08
36 Sisubari Tea Garden 651.14
37 Damdim Hat 24.18
38 Bctbat T a Garden 273.38
39 Paschim Damdim 685.54
40 Damd:m Tea Garden ]'401.84
41 Kumlai Tea Garden 61J6.911
42 Newglenco Tea Garden 'if 8.11
43 Haihaipathar Too Garden-I & II 565.35
44 Mal
45 Haihaipathar .lea Garden-III
46 Tesimala
47 Haihaipd!har
48 D.::mkajhora
49 Paintguri Tea Garden
50 Purhha Damdim
Nipuchhapur
136.34
5: 5.42
8 8.06
438.18
1,068.92
498.21
528.1 ? 51
52 NipuC1·ltl.;ur Tea Garden 356.53
S3 Nichchal~a 424.35
S4 Kantadighi Kumarpara 446.27
S5 Kumlai 406.28
56 Rajadanga 358.92
Baragharia
An8ndapur
472.98
415.10
57
58
59
60
Anandapur Tea Garden 371.10
Uttar Hanskhali
61 Dakshin Hanskhali
62 Gochimari
63 Sidabari
64 Apalchand
235.12
663.24
431.42
353.78
184.38
No. of Occupled Residen
tial Houses
4
698
902
11\9
398
267
176
105
1,327
624
561
498
144
408
623
214
737
218
320
390
384
362
384
171
410
210
657
418
687
278
123
4
No. of Households
5
698
919
1')0
398
268
176
105
1,327
624
561
498
144
409
629
21;t.
737
218
320
390
398
362
384
171
410
210
657
418
687
279
123
4
[ 50
URBAN/VILLAGE PRIMARY
Total Population (including Institutional
and Houseless PopulaLion
,-________ ..A.. ____ ......
Persons Males Females
6
3,366
4,539
971
1,890
1,313
932
584
6,574
3,101
2,717
2,181
720
2,254
3,309
1,276
4,620
1,238
1,610
2.107
1,961
1.865
1,8[4
894
2,257
1,176
2,966
2,088
3,505
1,409
600
14
7
1,686
2,361
567
969
720
491
306
3,36~
1,620
1,355
1,201
8
1,680
2,178
404
921
593
441
278
3,209
1,481
1,362
980
Included in Mal (NM)
358
1,224
1,715
661
2,389
642
816
1,069
1,064
970
948
462
1,IS9
629
1,500
1,.075
1,808
730
335
9
362
1,030
1,594
615
2,231
596
794
1,038
8Y7
895
866
432
1,068
547
1,466
1,013
1,697
679
265
5
Scheduled Castes
r-----'""'----l M F
10
Scheduled Tribes
,-- -_.....__----.. M F
11 12
139
252
84
60
30
106 1,254 1,256.
1,386
15
671
12
396
214
2,617 45
65
66
48
83
141
9
154
46
200
14
290
214
130
125
375
356
95
50
436
447
178
5
219 1,391
62 ]6
77 673
34 25
2 419
244
39 2,6?5
46 ],254
56 1,124
32 374
75
130
15
139 51
222
18
243
182
[17
133
347
362
408
:30
2,007
123
341
784
136
258
401
79
329 246
296 145
8[ 1,[96
55 821
408
416
141
5
220
133
45
3
1,229
1,182
371
353
352
397
231
1,984
123
355
802
135
257
397
82
248
145
1,211
820
216
131
14

CENSUS ABSTRACT
Total Main
Workers Literates (I-IX)
,---"- ---., ,---"----. M F M F
13
364
507
328
145
302
51
9
42"7
416
365
304
78
290
320
126
247
168
242
163
361
267
192
104
173
172
222
163
442
206
95
2
14
113
223
145
47
229
16
1
144
149
273
152
15
142
113
30
51
115
104
48
190
95
34
35
59
22
95
46
194
61
13
2
15 16
837 639
1,054 539
271 10
492 296
341 15
234 205
183 4
1,334 897
749 552
640 395
545 216
133 98
745 164
891 49
37'4 71
1,129 887
370 6
432 108'
545 454
546 13
428 12
524 31
247
686 13
336 21
793 705
378 243,
987 ! 18
307
125
7
4
1
[ 51 1
MAIN WORKERS ~---------------~
Household Industry
Manufacturing, Processing, Other
Agricultural Servicing, Workers Cultivators Labourers and Repairing [III. IV, V(b) & Marginal
(1) (II) [V (a)] VI to IX] Workers Non-Workers ,----A.-..--., ,--___j",.-- ,-- --"-- ---.,,-- _A. --, ,-__ .A._ , ,-__ ..A. _,
M F M F M F M F M F M F
17 18 19 20
152
4
66
104
4
6
24
11
II
38
7 13
17
73
13
10
3
2
3
4
4
21
18
56
4
2
10
22 23
836
873
173
413
319
234
6
1,315
733
616
524
Included in Mal (NM)
398 114 217 29
540 10 254 15
245 16 114 54
3 3
217 149 5
344 13 81 77
8 2 5
287 76
306 5 116 7
398 13117 18
185 44
516 141 10
253 14 76 6
2 6
341 3 411 37
246
114
5
40
3
7
23
·27
~
133
10 123
13 74
15
1,123
4
7
532
156
6
9
18
29
7
784
378
234
21
8
2
24
639
538
6
287
12
205
893
552
395
216
98
11
11
886
18
452
13
3
705
243
78
3
25
16
196
4
3
4
118
3
99
3
42
17
15
6
151
62
113
76
26 27
46 813
I ~4 1,111
296
5 4"73
376
257
3 119
240 1,913
4 Illi8
100 616
6'i6
28
995
1,485
393
620
578
236
271
2,072
925
867
764"
225- 264
479 866
8 281 1,537
3 L87 541
48 1,21~ 1.296
16
22
1
63
3
191
29
25
9
272 590
367
509
512
541
424
215
503
293
707
546
759
310
134
2
670
561
883"
883
835
369
1052
526
761
579-
1,550
650
255
5

Location Area of Code Mouza
Number (Village) i. e. in
J. L. No. Name of Hectares of Mouza (Village)! and of
Mouza Town/Ward (in absence Town! (Village)! of name repeat Ward in Ward No. Ward No.) Sq. Kms
f 2
3 P. S. Mal-Contd.
65 Neolabasti
66 Golabari
67 Chengmari Forest
3
545.91
344.30
371.66
158 Chengmari D_lngapar~ 335.56
,69 Purbba Dolaigaon 469.87
70 Paschim Dolaigaon 311.22
71 Malbati Forest 129.50
72 Jogesh Chandra Tea_ Garden 522.71
73 Uttar Chengmari 151.47
, 74 Uttar Majbgram
75 Dbalabari
76 Jhar Majhgram
77 Kodalkati
78 Neora
450.53
453.74
251.83
390.66
330.05
79 Neora Nadi Tea Garden 654.80
80 Purbba Kantadighi Kumarpara 77.26
81 La taguri 302.68
82 Dakshin Kantadighi Kumarpara 303.45
83 Chikanmati
84 Kranii
85 Dakshin Majhgram
86 Uttar Khalpara
87 Chengmari Hat
88 Dakshin Khalpara
89 Uttar Saripakuri
90 Adabari
91 Uttar Matiali
91. Jhar Matiali
93 Chak Maulani
94. Dakshin Chak Maulani
95 Dakshin Saripakuri
96 Chapadanga
287.96
669.51
343.82
546.11
320.71
449.12
582.19
297.23
562.11
742.96
443.14
374.84
445.48
429.70
No. of Occupied Residen
tial Houses
4
129
102
4
79
261
238
2
756
82
317
391
220
292
186
628
44
688
213
99
617
326
407
151
825
485
205
434
666
344
399
298
203
[ 52 ]
URBAN/VILLAGE PRIMARY
No. of House
holds
5
129
102
4
79
1,61
238
2
756
82
317
391
220
292
186
628
44
697
213
99
617
326
407
151
825
485
205
434
666
345
403
298
210
Total Population (including Institutional
and Houseless Population)
,-____ --A. . __ ~
Persons Males Females
6
728
607
14
400
1,~97
1,101
2
3,861
463
1,701
2,050
1,205
1,548
914
3,289
226
3.757
1,065
635
3,327
1.691
1,879
799
3,940
2.713
1,247
2,540
3,421
1,939
2.062
1,563
1.157
7
379
312
6
202
751
581
2
1,955
240
861
1;055
624
812
505
1,727
125
2,032
550
329
1,753
879
972
410
2,000
1,403
700
1.323
1,760
1,035
1,103
844
603
g
349
295
8
198
646
520
1.906
223
840
995
581
736
409_
1,562
101
1,725
515
306
1.574
812
907
389
1,940
1,310
547
1.217
1,661
904
959
719
554
Scheduled Scheduled Castes Tribes
.-~~--.., M F M F I
9
204
160
185
76
176
119
127
352
136
187
350
224
26
33
364
313
166
667
278
656
173
585
785
150
624
1,507
797
713
691
446
10
190
162
2
184
11
69
5.1
79 109
163 43
116 1496
123 60
355 92
128 155
157 61
320 135
176 84.
31 1,347
31 92
321 128
296 162
148 68
582
248
6q
169\
558
614
117
575
1,432
701
627
585
394
97
124
169
25
140
82
16
229
130
18
38
45
17
12
62
51
109
49
1.494
56
87
153
54
137
85
1,346
70
127
159
67
98
124
166
30
141
77
17
227
130
13
3g
46
17

~ENSUS ABSTRACT
Total Main
Workers Literates
'Q""'"---"------. (I-IX)
~----. M F M F
13
109
.21
6
48
168
,130
2
352
99'
270
234
1~2
218
160
204
17
·1,027
179
95
720
337
232
109
384
418
296
361
, 482
252
346
251 I
,168
14
36
13
1
12
44
36
150
40
114
71
55
64
44
65
3
807
51
30
492
155
62
15 16
189 2
169 12
5
105 16
461 56
307
2
762 479
133
486
588
370
492
249
656
46
357
307
187
7
28
6
50
2
9
293
62
56
4
924 32
493 39
582 13
36 187 - 31
181 1,104 81
256 I 746 29
94 425 17
123' 742 10
235 1,055 146
122 604 45
136
58
48
594 31
468 27
353 6
[ 53 }
MAIN WORKERS
Household Industry
Manufacturing, Processing,
Agricultural Servicing Cultivators Labourers and Repairing
(I) (II) [V (an r---A.--, r----A------. ~
M F M F M F
17
136
109,
18 19 20
44
58 10
71 .• ' 18
287
207
22
93
313
414
277
426
179
3
43
132
141
129
442
252
329
9 170 57
8S.
2
1
2
18
9
2
5
37
132
152
71
63
53
2
157
77
51
5
24
32
6
5
46
3
3 214 10
7 175 25
3 241 10
21
1
1
2
14
3
22
I'·
"
2
2
Other Workers)
[III. IV, V(b & VI mIX}
M F
9
2.
4
10
4
14
2
735
3
4()
21
20
3
17
651
2
654
86
1
249
6:l
6
2
2
16
419
2
290
ss S
1
19
5
96 12 63 9
19
3
6
2
23
4 26 6
20
7
349 2 613 25
404 2 236 20
211 3 63
509 2 187 4
716 82 211 57
406 21 150 21
304
355
263
227 21
7 100 18
81 4
8
2
1
5
·35 119
98
.149
45
128
47
58
13
8
U
4
7
3
10
2
I
Margina1 Workers
M F
26
24
9
1
S
7
217
16
14 , '
S
2
26
J08
89 208
12 15
9
20 34
Non-Workers r----"--~
M F
27
166
134
96
285
267
976
101
371,
467
254
320
256
982
79
1,063
243
142
23
'. 33~
27~
P 182
588
494
., 1,1'1.0, .1"1'1 i
2!6 s,,~,
989
531 1,1
727 il,j'
400
1,061
101
1,648
459
302
820 1,542
366 - 739
390 894
3
13
21
4
1 220 35'1
1
1
2
1
108 883 1,751
3 636 1,278
2 271 528
581 1,207
705 1,515
2 430 857
.... 508
374
249
928
692
548

[ 54 ]
DBAN/VILLAGE PRIMARY ,.
Location Area of Code Mouza
Number (Village) i .. e in Total Population
1. L. No. Name of Hectares No. of tincluding Institutional of Mouzl1 (Village)1 and of Occupied and Houseless Scheduled Scheduled
.. Mouza Town/Ward (in absence Town/ Residen- No. of Population) Castes Tribes (Village)! of name repeat Ward in tial House-
___ ..A. _____ ~ r----"-------, r---"-----,.
Ward No. Ward No.) Sq. Kms Houses bolds Persons Males Females M F M F
1 2 3 4 5 6 7 8 9 10 11 12
3 P. S. M al-concld.
97 Paschim Sangapara 380.65 67 67 363 191 172 191 172
98 Dakshin Chengmari 486.16 Uninhabited
99 Purbba Mauamari 282.90 64 64 341 179 162 179 162
100 Paschim Mauamari 28.9.35 Uninhabited
101 Pashim Premganj 329.94 Uninhabited
102 Premganj Majhiali 354.33 71 71 345 189 156 189 156
103 Purbba Premganj 270.43 90 90 306 134 172 28 41
104 • Purbba Sangapara 323.75 193 194 1,150 625 525' 248 '205
lOS Daksbin Matiali 567.45 437 438 2,454 1,30.4 1,150 1,070 962 88 70'
106 Bidurerdanga 230.17 211 211 1.122 582 540 234 218 14 12
107 Basusuba 62i.80 297 297 1,541 826 715 590 498 3 1
Mal (Non-Municipality) 2.56 1,721 2,853 14,991 8,360 6,631 -375 260 357 226
Odlabari (Non-Municipality) 9.27 1,301 ],398 6,887 3,807 3,080 425 352 333 328
Rural 531.8 ' 35,602 35,671 183,766 96,907 86,859 22,565 20,217 35,864 35,869
Urban 11.8 3,022 4,251 21,878 12,167 9,711 800 612 690 55'{
Grand Total 543.6 38,624 39,922 205,644 109,074 96,570 23,365 20,829 36,554 36,423

CENSUS ABSTRACT
Literates ,r-----"--___,,
:M F
13 14
61 18
47
32 3
73 72
134 31
509 117
232 50
256 85
5,714 3,914
2,040 1,200
'24,571 9,2~9
7,754 5,114
32,325 14,393
Total Main
Workers (I-IX)
,.-----.--A---, M F
15 16
89
102
100 3
53 4
321 3
644 35
345 26
433 31
3,925 239
t,830 87
50,315 16,423
5,755 326
56,070 16,749
[ 55 ]
MAIN WORKERS ~,------------------------~
Household Industry
Manufacturing. Processing, Other
Agricultural Servicing, Workers Cultivators Labourers and Repairing [III, IV, Vel»~ &
(I) (II) [V (a)] VI to IX] ,-_--"-----, , __ .A. __ --. ,------"-__ ., ~
M F M F M PM P'
17 18 19 20 21 22 23 24
82 3 4 1
Uninhabited
97 5
Uninhabited
Uninhabited ~
93 5 3 2
5 48 3
259 49 13 3
446 2 153 16 9 18 36 7
233 7 66 12 2 44 7
261 6 142 17 30 8
33 59 5 33 4 3,800 229
130 186 23 36 ],428 63
15,965 481 8/'33 917 314 88 25,203 14.937
213 1 245 28 69 5 5,228 292
16,178 482 9,078 945 383 93 30,431 15,229
Marginal Workers Non-Worken .-------"------, >------"------,
M P M F
25 27 28
102 171
77 162
89 153
81 168
303 522
31 55 629 1.060
8 32 229 482
46 47 347 '37
51 17 4,384 6,375
{;2 11 1,915 2,982
1,753 2,172 44,839 68,264
113 j28 (i,299 9,357
L866 2.200 .51,138 77,621


[ 57
ALPHABETICAL LIST OF VILLAGES
4 P.S. MITI~I
Population Population 81. J. L. ~ Sl. J. L. r---...A._--~
No. Name of Villages No. 1971 1981 No. Name of Villages No. 1971 1981.
2 3 4 5 2 3 4 5
. 1 Aibhil Tea Garden 5 2,a40 3,142 n MatlaU Hat 12 3,\)\\) 3,42()'
2 Baradighi 23 859 330 18 MatiaJi Tea Garden 10 4,108 4,511
3 Baradighi Tea Garden 29 3,541 4,445 19 Mathachulka 22 1,985 2,017
4 Bhatabari Tea Garden 25 1,691 1,805 20 ,Nagaisuri Tea Garden 6 2,969 3,492'
5 Chalauni Tea Garden 7 2,554 3,450 21 Nakhati Tea Garden 3 1,524 1,874
6 Cbalsa Mahabari 16 2,071 2,763 22 NeDra Majhiali 20 1,016 1,010
7 Chalsa Tea Garden 13 2,949 3,398 23 Nimma Tandu Forest 31 555 330
8 Chhaoaphali 30 t 465 24 Pa,schim Batabari 24 t 221
9 Chhut 11 '" 25 Purbba Batabari 26 1,297 2,011
10 Dakshin Dhupjhora 28 1,451 2,008 26 Salbari 21 1,821 2,564-
11 Engo Tea Garden 1 717 716 27 Samsing Tea Garden 8 4,232 5,118
12 Indong Tea Garden 14 3,239 4,073 28 Sathkaya Tea Garden 18 2,760 3,203·
13 Jurant Tea Garden 2 3,599 3,983 29 Sonagachhi Tea Garden 4 2,715 3,495
14 Khariarbandar 19 582 523 30 Uttar Dhupjhora 27 1,365 2,229
IS Kilkote Tea Garden 15 2,573 2,924 31 Y onglong Tea Garden 9 2,016 2,381
16 Mangalbari 17 906 2,748 Total 61,045 74,649
* Uninhabited

Location Area of Code Mouza
Number (Village) ~~ ~
J. L. No. l\jame of Hectares of Mouza (Village)! and ot
Mouza Town/Ward (in absence Town! (Village)! of name repeat Ward in Ward No. Ward No.) Sq. Kms
2
4 P. S. Miliali
1
2
3
4
5
6
7
11
9
10
11
12
13
14
15
16
17
18
19
20
21
22
23
24
25
26
27
28
29
30
31
Engo Tea Garden
Juranti Tea Garden
Nakhati Ter Garden
.Sonagac~hl Tea Garden
Aibhil T< a arden
Nagaisuri Tea Garden
Chalauni Tpa Garden
Samsing Tea Garden
Y'1Dgttong Tea Garden
Matiali Tea Garden
Chhut
Matiali Hat
Chalsa Tea Garden
Indonl! T'- a Garden
Kilkolo 'T'ea Garden
Chalsa Mahahari
Mangalba"i
S,.thkava Teil Garden
:<harbrhandar
-JeoJa \1ail,jali
Saibari
Mathachulka
Baradighi
Paschim Batabari
3ntabari Tea Garden
Purbba Batahari
l Itar Dhupjhof'l
kshin Dhupjhora
Ilaradighi Tea Garden
Chhaoaphali
" imna Tandu Fore,t
3
161.81
779.09
502.42
963.1"6
'728.23
952.84
718.94
773.76
523.26
1,0 ;0.89
31.18
621'i.86
i$62.17
670.28
2,8.40
650.95
97<1.49
224 gO
40099
830.32
588.92
237 .85
132.30
393.15
51914
405 ·0
566. 3
743.82
274.58
3,812.56
No. of. Occupied Residen
tial Houses
4
154
835
379
667
647
773
703
960
447
941
685
703
897
547
593
560
646
95
184
476
354
71
38
391
376
411
375
908
92
71
No. of Households
5
154
835
379
66'7
647
773
703
960
447
948
692
703
897
548
593
563
6"6
95
184
476
354
71
38
391
376
376
908
92
71
[ 58 J
URBAN/VILLAGE PRIMARY
Total Population (including Institutional
and .clouseless.. Scheduled C.astes
r----"---......
Scheuuled Tribes
Persons
6
716
3,983
1,874
3,495
3,142
3,492
3,450
'i,l18
2,381
ASll
3,420
3,398
4,0'3
2,92&
2,763
2,748
3.203
523
1,010
",564
2017
330
2~1
1,805
2,011
1,'29
2,0015
4.4'15
465
330
PopulatIOn) --A. _._-...... r- .--:A----..,
Males Females M F M F
7
367
2,001
968
1,781
1,614
1,769
1,760
2,510
1,180
2,353
8
349
1,982
906
1,714
1,501
1,723
1,690
2,601
1,201
2,15!S
9
19
100
47
9
41
156
312
316
143
233
Uninhabited
1,934
1,735
2,O~8
1,51 ~
1,493
1,482
J,(i64
290
506
1.343
1,076
1"2
122
9 .. .)
1,\ 8)
1,168
I,O)~
2,355
239
191
1,486 72
1,663 • 229
2,005 86
1,40~ 24
1,27 0 167
1,2t 6 451
1,539 105
233 3
504 51
1,221 467
941 221
168
~9
880
925
1.061
953
2,090
226
139
58
347
318
473
37
9
25
10
14
84
10
47
167
294
46
129
172
234
1,271
n,5
1,346
1,31'1
1,239
604
250
508
1,3'70
49 60
232 911
81 1,50:
25 1,219
14'7 348
402 596
102 1,206
4 222
40 165
41'i 539
1" 471
45
2b4
108
348
50 (
Hil'
I 837
174
138
234
1,306
691
1.332
1,226
1,240
609
2511
576
1,277
45
7P.5
1,~120
1,162
253
430
1,114
162
175
408
313
112
73
634
209
346
128
1,606
11]8
109
Total 206.2 14,979 14,998 '74,649 38,738 35,911 4,519 4,133 20,294 18,397 (Entirely Rural) Sq. Kms.

l 59 1
-CENSUS ABSTRACT
MAIN WORKERS r-- ----- ---"-- -- ------------ -
Total Main
Workers Literates (I-IX)
r---A..·......!--.. r-- --A...,____--. M F M F-
13
193
397
213
427
378
454
682
1.320
325
758
1,213
502
418
287
673
511
337
36
156
348
259
54
37
367
380
372
321
752
42
4~
14
23
137
42
179
130
96
230
15 16
187 157
844 675
493 261
681 374
812 610
1,020 901
9?7 782
578 924 792
87 405 289
197 1,026 866
760
156
134
79
359
222
97
-10
41
81
1'05
15
3
88
128
81
104
198
12
6
1,l_D9 80
1,009 840
991.) 663
758 584
711 86
831 157
'171 628
lSI
312 45
817 n 615 64
95 41
63 11
466 353
637 43
391 26
562 35
1,010 550
119 24
93
Household Industry
Manufacturing, Processing, Other
Agricultural Servicing Workers Cultivators Labourers and Repairing OIl, IV, V(b) & Marginal
(1) (II) [V (a») VI to IX] Workers Non-Worken ,----"--__ ,-_..A ____ ,--__ -'-__ ...... r- __ -A.___ , ___ A_ r -'----,
M F M F M F M P M F M F
17 18
87 8
29 8
19_ 31
2
19 20
4 3
19
7 4
21
4
11
4
8
3
2
Uninhabited
2
3 8 3
45
6
87 27 23 11
16R 41 100 27
6
90 56
61 4 156 _ 24
559 18 179 49
430 23 177 41
78 23 13 11
47 4 10 6
308 7 216 3}
190 4 104 15
369 14 159 18
5
107 24 1
57
43
11
4
20
7
9
2
3
11
14
2
2
22
4
23
183
833
402
633
808
993
956
2 914
402
1,023
1,063
5 992
946
748
578
543
758
5
86
78
8
2
6
463
102
3 83
2 32
1.003
11
36
24
157
670
.49
365
609,
866
78t
790
289
865
80·
835
653
584
47
88
628
17
5
2
353
5
4
549
25
36
164
30
239
179
/5
4
2
40
65
54
33
204
5
7
5
239
28
213
14
180
52 1,121
3 4;5
21 8, 936
829
32 719
803
28
192
1,255
642
1,062
891
79Q·
908
322 J ,347 1,494-
219 596 693
101 1,252 1,19i
821
4 724
49 1,037
71' 69,2
56 7~g
24 6 8
226 oWl
139
I9~
50 521
461
10 67
9 52
454
448
l2l 538
31
8 465
283 1,132
20 106
98
1,406
819
1,293
754
1,12S
),085
685
233
459
1,099-
876.
117
7f)
496-
883.
911\..
910.
1,257
182
139.
12,257 4,378 18,860 10,009 2,756 250 1,229 243 185 22 14,690 9,494 1,636 1,970 18,242 23,932

51. 'No.
1
2
3
4
5
6
7
8
9
10
11
12
13
14
15
16
17
18
19
20
21
22
23
,24
25
26
27
28
29
30
31
32
33
34
35
Name of Villages
Amguri
Bagjan
Baikur Gaurgram
Balasan
BangJajhar
Barakamat
Barnes
Basilardan ga
Baulbari
Bengkandi
Betgara
Bhangamali
Bhangarhat
Bhotpatti
Brahmapur
Chapgar
Char Churabhahdar
Charerbari
Chatrarpar
Chengmari
Churabhandar , Dakshin Baragila
Dakshin Bhuskadanga
Dakshin Dangapara
Dakshin Kalamati
Dakshin Khagrabari
Dakshin Madhabdanga
Dakshin Marichbari
Dakshin Mauamari
Dakshin Putimari
Dakshin Sisuabari
Dakshin Ulladabari
Dhaola~uri
Dharmmapur
Dobbari
[ 60 ]
ALPHABETICAL LIST OF VILLAGES
5 P. S. MAYNAGURI
Population J. L. .-----'------... No. 1971 1981
49
39
90 63
43
58
31
71
17
38
48
79
82
62
88
46
83
75
18
15
78
44
66
56
14
52
55
23
36
30
24
34
76
28
4
3,305
1,064
6,196
905
1,199
2,031,
1,811
1,649
2,074
+ 2,736
1,764
1,559
2,370
+ 1,692
2,940
1,773
1,024
1,510
1,204
1,435
1.465
1,645
698
2,323
1,955
1.177
+ ],000
348
2,322
1,400
4,962
*
3:323
1,335
6,632
1,338
1,525
2,550
2,121
2,211
2,824
t 3,258
2,067
1,881
2,916
1,569
2,048
2,690
2,336
987
1.865
2.100
1,667
1,726
2,168
929
3,165
1,023
* t
],062
* ;,433
1,737
4,790
*
51. No.
36
87
38
39
40
4i
42
43
44
45
46
47
48
49
50
51
52
53
54
55
56
57
58
59
60
61
62
63
64
65
66
67
68
'9 70
Name of Villages
Domohani
Dwarikamari
Forest Ramsai
Gartali Jalpes
Gopalganj
Gaurgram
Rasludanga
Jabar Amli
Jadabpur Tea Garden
Jhar Baragila
Rajaldighi
Raoagap
Rathalbari
Rhaerkhal
Rumarpara . Madhabdanga
Madhya Khagrabari
Mainaguri
Nimna Tandu Forest
Nirendrapur
I>adamati
I>iharpur
I>aitkakh,ocha
Panbari
I>anisala
I>aschim Baragharia
I>aschim Baragila
I>aschim Harmati
I>aschim 5albari
l'enchahati
I>urbba Baragaria
~rbba Baragila
Purbba Dehar
Purbba Dobbari
Purbba Harmati
J.L. No.
19
74
3
68
2S
29
81
'- 84
10
7
13
8
20
61
16
54
51
37
11
72
60
89
42
5
87
27
45
65
69
59
86
47
80
2
64
Population r--_A_"",
1971 1981
+ 1,198·
* 999
125
f,219
1,444
3,575
tt 622
969
874
+ 1.239
2,050
733
1,129
487
944
4.638
1.157
1,204
2,245
N.A.
914
],342
2,033
719
1,967
1,107
1,844
1,872
381
1,019
+ 2,616
591
990
174
1,856
1,758
4,331
926
1,761
1,084
1,655
+ 1,530
3.316
1,580
1,249
t 779
1,499
4,882
1,565
],319
2,963
...
1,370
1,669
2,807
1,105
3,37J'
2.472
2,026
2,501
566
1,139

L 61
ALPHABETICAL LIST OF VILLAGES
5 P.S. MAYNAGUR[-concld.
Population PopulatioB SI. J. L. i-_--A.~ SI.\ J. L. ..-~
'No. Name of Villages No. 1971 1981 No. N:une of Villages No. 1971 1981
1 2 3 4 5 2 3 4 S
71 Purbba Sa1bari 70 1,544 1.691 82 Uttar Bhuskadanga 67 1,728 2,291
72 purbba Sisuabari 57 343 431 83 Uttar Dangapara 33 1,703 2,058
73 Ramsai (T. E.) 9 1,184 1,496 84 Uttar Kalamati 12 993 1,200
74 Rahterhat 77 1,416 1,647 85 Uttar Khagrabari 50 1,847 2,645
75 Saptibari 85 11,584 14,526 86 Uttar Madhabdanga 53 2,546 2,900
76 Satvendi 6 1,311 1.852 87 Uttar Marichbari 21 t + 77 Singimari 41 2,050 2,382 88 Uttar Mauamari 40 t + 78 Sisuabari 26 594 765 89 Uttar Putimari 32 81,3 1,282
79 Tekatali 73 1,988 2,471 90 Uttar Sisuabari 22 ++ * 80 Ulladabari 35 2.887 3.209"
81 Upar Tandu Forest 1.534 ** Total 136,250 169,602
* Uninhabited
** J. L. No.1 Transferred to Nagrakata P. S.
+ Ipcluded in Domohani (NM)
t Included in Mainaguri (NM)

Location Area of Code Mouza
Number (Village) i. e. in
J. L. No. Name of Hectares of Mouza (Village)! and of
Mouza Town/Ward (in absence Town/ ~ilIage)1 of name repeat Ward in
Ward No. (Ward No.) Sq. Kms
1
2
3
2
5' P. S. Maynaguri
Upar Tandu Forest
Purbba Dobbari
Forest Ramsai
4' Dobbari
5 Pabbari
6' Satvendi
7 Jhar Baragila
8 Kaoagap
9 Ramsai
10
11
12
13
14
15
16
17
18
19
20
21
22
23
24
25
26
27
28
29
SO
Jadabpur Tea Garden
Nimna Tando Forest
Uttar Kalamati
Kajaldighi
Dakshin Kalama ti
Cben~mari
Kumarpara
Baulbari
Chatrarpar
Domohani
Kathalbari
Uttar Marichbari
Uttar Sisuabari
Dakshin Marichbari
Dakshin Sisuabari
Gopalganj
Sisuabari
Paschim Baragharia
Dhafmmapur
Gaurgram
Dakshin Putimari
61 Barnes
82 Uttar Putimari
3
77.27
1,008.52
141.65
1,151.95
439.90
649.56
479.01
639.01
221.67
3.885.00
403.27
341.92
282.09
493.17
634.11
655.37
301.58
273.18
493.39
547.20
152.51
150.10
223.83
399.78
197.26
520.94
2,802.47
419.63
424.48
468.38
109.12
No. of Occupied Residen
tial Houses
4
100
69
544
365
308
302
286
142
110
227
198
173
374
618
528
173
37
134
261
942
352
190
403
230
( 62 I
No. of House
. bolds
5
Total Population· (including Institutional
and Houseless Population) ,,-____ ..A. _____ ,
Persons Males Females
6 7 8
Transfer to Nagrakata P. S.
100
69
544
)75
308
302
286
142
110
227
198
173
374
619
528
173
37
134 261
943
353
190
408
234
566
591
299
306
Uninhabited
2.963 1,561
1·,852 949
1,761 917
1,655 858
1.496 783
926
779
1.200
1.084
929
1.865
3.316
2.824
987
487
405
617
558
478
957
1.699
1,518
519
267
285
1,402
903
844
797
713
439;10
374
583
526
451
908
1,617
1,306
468
Included in Domohani (NM)
Included in Domohani (NM)
included in Domohani (NM) \
Uninhabited
Uninhabited
174
765
1;370
4,790
1,856
1.062
2,121
1,282
93
368
714
2,494
979
568
1,091
678
81
397
656
2,296
877
494
1,030
604
URBAN/VILLAGE PRIMAR~'
Scheduled Castes .----_ ...... _-,
M F
9
27
13
780
793
476
666
277
27
4
559
537
395
667
1,381
1,309
397
77
307
458
1,259
801
459
539
530
10
32
11
687
757
459
632
265
18
4
516
508
377
640
1,293
1,129
367
69
338
423
1.171
730
413
527
467
Scheduled Tribes
r---..A.--""'I'
M F
223
247
226
49
68
161
126
259
15f
40
3
2
66
3
16
12
224
239-
196
4fr
57'
95
177
232
129
46
3
2
53
7
15.

[ 63
.cENSUS ABSTRACT
MAIN WORKERS , _____________ ..A..___ _ ______ '~
Literates .r----'----,
M F
13
53
80
503
228 154
141
110
115
71
112
,140
106
120
254
278
100
37
117
143
729
156
113
165
119
14
50
81
244
97
82
21
71
72
9
29
34
25
83
71
104
25
15
80
67
289 66
38
140
123
Total Main
Workers (I-JX)
(---------A..----., M F
15
220
149
857
524
472·
454
495
175
141
372
298
255
461
966
790
285
33
197
377
1,342
568
330
585
379
16
13
13
67
21
1
5
7
60 7
6
7
7
18
3
15
6
54
28
6
9
26
Household Industry
Manufacturing. '" Processing. Other
Agricultural Servicing, Workers Cultivators Labourers and Repairing [III. IV. V(b) &
(1) (II) [V (a)J VI to IX] Marginal Workers Non-Workers
,-_--A.----., ,-_..A.._---., ,-----"-__ ~ ~~ .-~ ...----'--~ M F M F M F 'M F M F M F
17
120
25
18
12
19 20 21 . 22
2
Uninhabited
6
Uninhabited
702 2 101 58 11 4
341 .. ' 158 20
421 45
306
268
39
5
313
218
209
318
752
468
175
19
122
265
881
365
263
267
232
2
141
104
9
4
55
14
44
127
147
155
97
4
6
6
6
2
8
4
4
8
Included in DOffiohani (NM)
Included in Domohani (NM)
Included in Domobani (NM)
Uninhabited
Uninba?ited
Uninhabited
6
6 45
86
8 319
4 172
2 50
2 256
122,
3
7
7
2
7
26
2
II
19
15
2
23
100
116
43
25
6
3
119
24 25
12'
3
4
127 60
132 6
4
6
2
16
59 , 4
166
13
8
30
26
116
29
17
61
14
8 59
4
12
8, 24
2.t 2
20 ~l 23
2:. 12
4 • ... 3
18
26
6
27
79
157
703
425
444
403
284
312
264
245
260
223
496
733
23
254
272
1,335,
882
843
792
700
379
367
576
526
451
90t·
1,610
3S 669' 1,25)
230
48
147
I, 335
10 1.129
25 399
1 238
6 506
299
8,0
381
649
2,232
824
487
1,015
578

Location Area of Code Mouza
Number (Village) i. e. in
J. L. No. Name of· Hectares of Mouza (Village)! and of
Mouza Town/Ward (in absence Town! (Village)! of name repeat Ward in Ward No. Ward No.) Sq. Kms
2 3
5 P. S. Maynaguri-contd.
33
34
35
36
37
Uttar Dangapara
Dakshin UlJadabad
Ulladabari
Dakshin Mauamari
Mainaguri
a8 Bengkandi
39 Bagjan
-40
41
42
43
44
45
46
47
4& 49
50
51
52
S3
54
S5
56
57
58
59
'0 61
62
63
64
Uttar Mauamari
Singimari
Paitkakhocha
Banglajhar
Dakshin Baragila
Paschim BaragiIa
Chapgar
Purbba Baragila
Betgara
Amguri
Uttar Khagrabari
Madhya Khagrabari
Dakshin Khagrabari
Uttar Madhabdanga
Madbabdanga
Dakshin Madhabdanga
Dakshin Dangapara
Purbba Sisuabari
Barakamat
Penchahati
Padamati
Khaerkhal
Bhotpatti
Balasan
Purbba Harmati
348.61.
548.63
541.15
229.98
461.45
427.45
496.53
444.99
535.94
535.81
856.73
946.62
667.98
607.97
276.44
495.98
552.58
351.86
496.65
438.86
92.14
522.54
423.93
1,843,52
442.84
498.73
421.08
318.21
No. of Occupied Residen
tial Houses
4
286
448
572
209
448
252
264
314
319
356
384
623
688
454
232
604
511
297
393
413
89
453
681
894
290
537
236
172
[ 64 ]
URBAN/VILLAGE PRIMAR'V
No. of House
holds
5
290
449
572
209
450
252
264
.314
319
356
387
623
689
454
232
604
511
297
398
4J4
89
453
692
894
290
537
236
172
Total Population (including Institutional
and Houseless Population)
..... ------"---------., Scheduled
Castes ,...----"------.
Persons Males Females M F
6
2,068
2,433
3,209
1,335
2,382
1,319
1,525
1,667
1.669
2.048
2.026
3,258
3,323
2.645
1.249
3,165
2,900
1,580
'2,041
2,168
431
2,550
3,373
4,882
1,530
2,916
1,338
1,139
7
1,081
1,293
1,664
g
987
1.140
1.545
9
978
1,085
1,362
Included in Mainaguri (N~
Included in Mainaguri (NM)
Included in Mainaguri (NM)
691 644 400
Included in Domohani (NM)
1,245< 1,137 1,608-
731 588 425
802
866
837
1,105
1,078
1,715
1,730
1,404
672
1,637
1,537
8d8
1.059
1,143
229
1,362
1,805
2.534
793 1,547
742
603
723
801
832
943
948
1,543
),593
1,241
577
1,528
1,363
772
982
1.025
202
1,188
1,568
2,348
737
1,367
596
536
575
578
543
1,038 .
I.Oi7
1,630
668
1,261
280
884
1,047
746
902
768
222
970
1,045
1,801
736
742
617
597
10
886
967
1,223
397
664
419
519
532
560
888
898
1,466
1,219
1,094
281
765
916
716
843
689
194
820
884
1,677
691
699
494
530
Scheduled Tribes
r----A-_ M F
11
27
31
19
25
41
2
2
12
18:
15
23
21
34-
1
6.

[ 65 ]
CENSUS ABSTRA.CT
Literates r----"-----,
M F
13
212
296
345
148
14 "
113
169
177
86
MAIN WORKERS ---------------~ --------------~
Total Main
Workers (I-IX)
..---'-~ M F
15 16
573 53
675 76
876 43
378 31
Agricultural Cultivators Labourers
(I) (II) r----'----., ..-_..A._ .......
M F M F
17 18 19 20
343 15 152 30
345 4 137 2
563 184 13
Houusehold Indstry
Manufacturing. Processing, Other Servicing Workers
and Repairing [III, IV. V(b) & [V (a)] VI to IX]
,-__ ..A. __ ....... ,...._..A. __ .......
M P M P
'2.1
46
27
22 23
78
• 147
28 102
24
8
69
2
Included in Mainaguri (NM)
~Included in Mainaguri (NM)
Included in Mainaguri (NM)
200 11 106 15 7 65 4
Included'in Domohani (NM)
273
103
119
212
207
'353
277
431
455
271
240
411
518
213
307
299
158 694 50 317
226
292
310
350
512
438
717
210 22 41 18" 126 9
87
457
642
579
105
438
154
220
53' 385 2
64 429 4
166
58
168
75
135
287
164
173
387
426
60
120
111
29
213
381
233
42
279
56
120
483 18
496 6
636 ).9
617 5
976 4
1,006
765
359
877
831
478
594
631
131
709
918
1,466
460
867
402
291
55 560
8 486
2 155
42 297
17 391
318
9 383
4 431
10 72
42 375
83 407
56 1,096
3 370
51 347
1 303
5 243
118 10 1 31
118 4 I 18
7 159 10
2 139 4
5 lit! 21-
3 157 2
230
2 289 45
176 4
98
4 158 4
189 3
133
179
171 4
36 3
2 293 39
4 226 16
(5 272 31
85
252 13
61
29 2
23
18
16
1
2
2
52
8
4
2
5
6
6
38
13
7
8
22
28
134
103
106
404
235
26
32
29
.21
39-
233
90
5
264
'38
17
4
3
4
2
28
13
8
25
10
3
36
2
Marginal Workors
,.....--....... _---; Noo-Worken ..--_ ....... _-.......
M P M F
25
43
8
36·
2
4
10
41
9
3
35
19
30
6
26
58
24
48
8
21
27
465
610
787
313
515
346
371
383
341
469
457
739
714
17 598
4 313
23 751
706
330
<165
509
98
•. 653
9 852
43 1.049
333
4 65Q
340
4. 306
28
876
1,040
1,502
613
1,039
586
719
775
826
91:4
922
1,539
1,537
1,216
571
1,463
1,346
772'
973
1021
191
1,146
1,476
2,249
734
1,314
595
527

Location Area of Code Mouza
Number (Village) ~~ ~
J. L. No. Name of Hectares of Mouza (Village)! and of
Mouza Town/Ward (in absence Townl (VilIage)1 of name repeat Ward in Ward No. Ward No.) Sq. Kms
2 3
5 P. S. Maynagu.ri-conc1d.
65 Paschim Harmati
66 Dakshin Bhu'kadanga
c7 Uttar Bhusl< qnga
68 Garf ,Ii JaJj,.es
69 Pascr-im leari
70 Purbba S n .. tri
71 Basilarc1a- ga
72 Nirend-dpur
73 Tckatali
74 .Jwarikanari
75
76
77
Charerbari
Dhaoaguri
Ratherhat
78 Churabhandar
79 Bhangamll!i
80 Purbba r)"har
81 Hasludahba
82 Bhanr"rhf
83 Char '1. :lbh mdar
84 Jabara dl
85 Saptibar
86 Purbba J:M a,;haria
87 Panisala
88 Brahmapur
89 Paharpur
SO Baikurgourgram
479.28
474.71
511.08
229.94
32277
498.96
468.06
367.29
406.44
575.06
447.90
48R.57
.:P9.d4
449.75
551.01
527.40
362.71
539.05
1,004.98
1,045.84
3,93"'.23
373.32
500.53
382.51
2,149.71
No. of Occupied Residen
tial Houses
4
500
305
463
174
195
325
428
288
454
486
462
343
310
383
387
448
336
364
541
850
2,736
458
28'
302
1.246
MA YNAGURI (U.A.) 30.95 5,620
Domohani ('!'1M) 18.57 2,047
Mainaguri (NM) 12.38 3,573
Rural 494.2 31,561
Urban 31.0 5,620
Grand Total 525.2 37,181
No. of Households
5
500
305
463
189
195
326
428
288
454
486
462
343
315
3113
388
448
337
364
541
850
2.741
459
287
302
1,250
5,720
2,074
3,646
31,639
5,720
37,359
I 66
URBAN/VILLAGE PRIMARY
Total Population (including Institutional
ana Houseless Sr:heduled Population Castes
r---,----_,\",~------_. ,-___ A ____ -,
Persons Males Females M F
6
2.807
1,7::6
2,291
990
1.105
1,691
2,211
1,499
2,471
2.616
2,330
1,737
1,647
2,100
2,067
2,501
1,758
I,Rlll
2,690
4,331
14,526
2,471..
1.569
1.565
6,632
29,907
10,339
19,568
169,602
29,907
199,509
7
1,499
893
1,207
544
607
866
1,199
7~1
1,339
1,324
1,243
896
865
1,086
1,09'0)
1,36 8
930
991
1,432
2,281
7,616
1,283
8
1,308
833
1,Ot4
446
498
825
1,OD
708
1,132
1,292
1,093
841
782
1,014
968
1, 153
828
890
1,258
2,050
6,910
1,1~9
Unmbabited
933
725
868
502
676
192.
7"9
",7 1,2'lS
1,164
64~
626
916
909
1,073
762
979
1,289
1,503
4,786
1.2;3
11,13 726 560
786 77' 703
3,423 3·, -.19 2,479
15,647
5.3'Jts
10,249
89,000
15,647
104,647
14,260 6,186
4,941 3,146
9,319 3,240
80,602 65,006
14,260 6,3:J6
94,862 71,3~2
10
799
659
779
30'
406
672
7'0
1.179
721
·793
745
~q9
798
701
77
1,132
lY4
4,252
1,176
48?
708
2,-,62
5,872
2,967
2,905
58,449
5,872
64,321
Scheduled Tribes ,-___ .A. __ -,
M F
11
.'.
7
7
2
10
11
2
101
65
36
1.890
101
1,991
12
3
7
10
13
2
64
33
31
1,673
64
1,737

I 67
CENSUS ABSTRACT
MAINWOR~RS _J.._ _____________ --..
Totdl Main
Worki!rs Agricultural
Cultivators Labourers Literates (I-IX) (1) (II)
,--~ ---., ,-_ _ _.A. __ -----. .-__ _.A..____.., ,--.A._-,
M F M F M F M F
13
498
25i)
267
207
138
250
259
2~O
487
2?4
257
300
264
217
293
413
237
346
359
686
1,561
36~
14
274
179
119
117
59
121
97
102
303
117
126
119
115
168
103
162
160
175
107
322
75
15
851
488
668
280
306
510
604
511
71S
666
495
480
607
625
734
469
561
825
1.253
4,331
738
16
15
85
6
9
5
8
21
.14
3
14
15
32
6
14
17 18 19 20
372 301
319 147
312 13 208 6
107 84
194 94
327 161 4
391 2 195 6
364 18 lOS 2
373 5 170 6
548 151 3
5!0 5 124 6
385
367
.106
415
489
105
102
150
193
3 165
14
4
6
2
13 246 103 5
6 369 143
4 520 213
39 918 14 285 P'l9
683 2,87 1 387 .171 254
7 147 167 ,7
Household Industry-
Manufacturing, Processing, Servicing
and Repairing [V (a)]
.-__ .A._
M
.21
49
25
4
2
23
5
6
20
2
p
22
4
7
27
21
Uninhabited
165
7:'
~30
8,998
6,6:'2
21,812
R,998
33
73
314
6.161
1,314
4,847
10,819
6,161
534 472
'i12
1,,184 65 1,241
7.712 555 1 78
2,909 186 1,077
4.8(13 .joY 708
49159 ",1" 3.,:>75
7,712 555 1.785
2 101
7 101
17 438 24
25 1,148 50
. .'.3 5" 41
i. )b9 9
596 11,982 800
25 1,148 50
5
181
100
81
482
181
57
45
12
212
57
Other Worke,
LIIl,IV.V( )& VI to IX]
r- ___.
M
,23
129
22
123
88
18
22
18
35
173
60
30
5
II
118
80
115
49
92
44
269
22
II
10
200
4.598
1,153
3,445
5,470
4,50 8
F
24
11
65
'i
8
6
9
6
6
4
6
21
24
423
30,IHO 16,9S{) 56,S'71 2,'729 33,060 62113,130 SS0 663 269 10,018
77
346
566
423
989
Murgl11aJ Workers Nun- \\ orker~
25
21
18
46
2
2
18
86
5
18
4
11
20
17
64
15
49
594
64
658
5
6
14
13
6
19
93
3
--, p
27 28
627 1,288
404 826
5d 985
263 440
255 476
354 814
594 1.004.
280 68',
623 1.10~
560 1,28'}
5/5 1,060
400
3G7
463
~74
826
689
981
962
6 443
1,136
809
884 42{)
60',
1,027
40 3.2·!4
19 525
309
254
7 1,522
78 7,871
21 2,474
57 5,397
583 39,247
78 7,871
2.011
6,187
1,163
723
3,137
13,627
4,734
8,893
77,845
13.627
661 47,118 91,472


'Sl. No.
1
2
3
4
5
6
7
8
9
10
11
12
13
14
15
16
.17
J.L • Name of Villages No.
2 3
Angrabhasa 3L
Bamandanga Tea Garden 22
Bhagatpur Tea Garden 9
Caron Tea Garden 13
Chhar Tandu 17
Cbengmari Tea Garden 14
Dhondasimla 32
Dhumpara 26
Dina Forest 23
Gatia Tea Garden 11
Ghasmari 16
Grassmore Tea Garden 15
Hila 5
Hila Tea Garden 4
Pope Tea Garden 2
Hridaypur 30
Jaldhaka Altadanga Tea
Garden 24
[ 69
ALPHABETICAL LIST OF VILLAGES
6 P.S. NAGRAKATA
PopuLation ..-~ SI.
1971 1981 No. Name of Villages
4 5 2
2,067 .. 18 Jiti Tea Garden
3,489 3,554 19 Kalabari
5.540 7,867 20 Kalabari Tea Garden
1,488 2,435 21 Kharibari \
922 1,592 22 Kbairkata
7,812 9,943 23 Kurti Tea Garden
1,419 .. 24 Luksan Tea Garden
1,142 *" 25 Nagrakata
t '" 26 Nagrakata Tea Garden
2,801- 3,943 27 Nayasaili Tea Garden
693 963 28 Sukhani Bastl
3,312 3,793 29 Sulkapara
+ 600 30 Tandu
2,041 2,025 31 Tandu Tea Garden
2,703 3,695 32 Upar Kalabari
1,378 .. 33 UUar Nunkbawadanga
34 Upar Tanqu Forest
1,016
t J. ,L. No.1 (M) Transferred from Maynaguri P. S. in 1981 .. J. L. Nos. 23 to 33 Transferred_ to Banarhat P. S. in 1911
Population J.L. ,---.-A-------. No. 1971 1981
3 4 5
1 3,149 3,738
28 1,535 .. 27 2,053 .. 19 1,179 1,866
25 1,344 .. 10 2,550 2,932
12 3,892 5,281
7 331 335
6 2,772 3,8~6
3 3,228 4,422
8 1,524 1,562
18 1,~5i. 2,571
20 525 418
21 358 S30
29 822 .. 33 1,066 ..
1 (M) t 1,897

Location Area of Code Mouza
Number (Village) t~ ~
J L. No. Name of Hectares of Mouza (Village)! and of
Mouza To"n/Ward (in absence Town! (\. iIlage)! of name repeat Ward in \'\ aid No. Ward No.) Sq. Kms
2
6 P. S. Nagrakata
1
2
3
4
5
(;
7
8
9
10
11
12
13
I;
16
17
Jiti Tea Garden
Hope Tea Ga~den
N ayasaili Tea, Garden
Hila Tea Ga~den
Hila
Nagrakata Tea Garden
Nagrakata
Sukhani Basti
Bhagatpur T,~a Garden
Kurti Tea Garden
Gatia Tea Garden
Luksan Tea Garden
Caron Tea Garden
Chengmari Tea Garden
Grassmore Tea Garden
Ghasmari
Chhar Tandu
18 Sulkapara
19 Khairbari
20 Tandu
21 Tandu Tea Garden
3
1055.23
729.57
811.50
618.04
47.67
941.32
69.25
356.04
1389.67
790.70
865.99
938.15
592.05
2539.80
1036.45
317.82
432.64
419.23
691.23
424.41
259.41
n Bamandanga Tea Garden 94'1.99
J tM) Upar Tandu Forest d.119.97
No. of Occupied Residen
tial Houses
4
728
792
786
528
120
810
83
292
1,580
556
706
1,018
469
2. 63
713
161
294
531
374
84
141
661
2,978
No. of House
holds
5
nil"
792
795
528
120
810
83
292
1,580
560
706
1.018
469
2,163
7 13
161
294
532
374
84
141
662
298
Total 284.0 13,887 13,903
(Entirely Rural) Sq. Kms.
URBAN/VILLAGE PRIMAR1r
Total Population (including Institutional
and Houseless Population)
.------"-------""" Persons Males Females
6
3,738
3,695
4,422
2,025
600
3,886
335
1,562
'7,867"
2,932
3,943
';,281 J
2,435
9,943
3. '93
963
1,592
2,571
1,866
418
830
3,5 4
1,81;
7
1,975
1,943
2,219
1,026
350
2,035
181
860
4,209
1,511
2,047
2,779
].203
5,197
1,922
501
850
1,374
1,023
261
431
1,7R4
1,033
1,763
1,752,
2,203.
999
250
1,851
154
702
3,658
1,421
1,896
2,502
1,232
4,746
1,8/1
462
742
1,197
843
157
399
1,770
864
Scheduled Castes
Scheduled Tribes
r--_..A.._-""". r---..A..--""" M F M p,
9
105
210
56
117
149
6
17
112
66
26
116
72
380
18
36
55 43
25
" 2
30
113
157
10
88
183
55
105
121
4
14
116
78
24
113
76
319
i4 33
52
11
1,342
807
1,360
600
46
959
156
405
2,695
917
1,242
1,091
574
2,943
1,427
292
329
12
1,267
750
1,457
500
87
897
136
336
2,545
840
1,205
1,053
567
2,737
1,429
271
290
30 482 420
20 306 224
40 36
36 297 27 6
IO? 1,316 1,321
139 424 364-
70,148 36714 33,434 1,911 1,726 20,050 11) 008

l 71
CENSUS ABSTRACT
MAIN WORKERS ,..---------------'-_ ._-.....,
Literates r----"----,
M F
13
520
689
566
300
76
287
16
384
1,150
409
357
92
237
1.448
351
90
258
263
204
20
103
327
191
14
206
217
482
102
40
95
134
41i2
96
115
396
76
437
112
30
67
III
69
9
8
.52
51
Total Main
Wor _l!fS
(1- -IX) r- -"-- -..
M F
15 16
991 772
992 747
901 465
439 300
101 83
896 500
114
493 48
1,874 ( 812
599 356
7"2 444
1,428 228
;69 452
1.9~4 967
779 3' 7
251 17
443 25
735 96
624 62
98 18
167 67
630 471
534 108
Household Industry
Manllfadunng, Pmces ng,
Agricultural St:'vi, ng' Cultivators LatJo~rers and Repar ng
(1) ~II) LV (a' r-___.A... ... ~-1 .,--_ .. A_ ---.. c- A -~
M F M F M F
17 18 19 20
2
2
21
12
38
21
22
2
·ther Hkels
[1 , V(O) & toIXj
, __ .A-_ .......
M F
23
991
980
860
437
100
860
24
772
747
463
300
83
500 4
59
11
43
179 23 147 11
28
30
80 18
12
106
2 1,646
14
792
353
443
191
452
927
3tli
~ 3
536 lil 45 23
97 4 192 36
42 1 13
173 3 " 13
277 106 20
349 6 146 42
383 10 169 52
48 14 19 4
27 2 3 1
45 18 64 18
66 221 43
14
9
2
29 2
560
761
833
1,69)
T!4
13
uO
171
70
31
137
721
218
4
26
54
435
63
9,173 3,368 16,614 7,425 2,367 105 1,235 28<1 317 30. 12,615 7,006
Marginal Workers Non-Workers
25
21
30
35
70
16
I
13
6
85
23
186
20
226
1
23
4
46
10
21
70
2
26 27
57 963
25 921
50 1,283
60 517
8 233
1 1,138
1 54
4
28
934
-980
1,688
639
159
1,350
153
55 2,ljO 2,791
4 ~89 J,Ofil
1,2 S 1,452
322 1,165 1,952
24 614 75fl
338 .:.,977 3.441
1,142
25 227
2 403
30 593
399
,53
28 243
73 884
1 497
7
1,071
781)
jJ
~04
1,2 !J
909 I, t09 19,191 24,!lO{


S1. No.
2
3
4
5
6
7
8
9
10
11
12
13
14
15
16
17
18
19
20
21
22
23
24
25
26
27
28
1. L. Name of Villages No.
Ambari Tea Garden 3(D)
Angra Bhasa 31(N)
Banarhat Tea Garden 17(0)
Binaguri Tea Garden 19(D)
Bhatiapara 41(D)
Chamti Mukbi 43(0)
Chana Dipa 34(D)
[ 73 J
ALPHABETlCAL LIST OF VILLAGES
7 P. S. BANARHAT
Population r--_.A..---~ Sl. 1971 1981 No. Name of Villages
3,193 29 Kalabari Tea Garden
1,067 30 Kalabari
8,403 31 Karbala Tea Garden
5,184 32 Katha1guri Tea Garden
2,111 33 Khairkata
2,258 34 Lakshmikantapur
1.599 Tea Garden
J. t. No.
28(N)
28(N)
1!l(0)
6(D)
2S(N)
44(D)
Chapaguri 13(D) * 35 Lakshmipara Tea Garden 14(0)
Chapaguri Khanda 32(0) 2,006 36 Madhyasalbari 36(0)
Chhamurchi Tea Garden 4(D) 6,708 37 Maraghat Forest 28(0)
Chunanbhati Tea Garden 5(0) 3.916 38 Maraghat Tea Garden 16(D)
Oakshin Nunkhawadanga 40(D) 1,158 39 Mogalkata Tea Garden 31(D)
Oakshin Salbari 35(0) 2,306 40 Palasbari Tea Garden 8(0)
Deana forest 23(N) * 41 Paschim Duramari 38(0)
Oebpara Tea Garden 11(0) 3,314 42 PrayagplIr '12(0)
Ohondasimla 32(N) 419 43 PlIrbba Dumamari 37(0)
Dhumpara 26(N) 137 44 Redbank 1(0)
Dinan Tea Garden 10(D) 2,520 45 Redbank Tea Garden 2(0)
Fatak Tari 42(D) 2,231 46 Riabari Tea Garden 7(D)
Gairkata 25(D) t 47 Sako J~ora 21(D)
Gairkata Tea Garden 26(0) 5.949 48 Telipara Tea Garden 20(D)
Gendrapara Tea Garden 15(D) 6.235 49 Totopara Tea Garden 29(D)
Gosairhat Forest 58(0) 2,779 50 Upar: Kalabari 29(N)
Haritalguri T. G. 9(D) 5,206 51 Uttar Nunkhawadanga 33(N)
Haldiba.ri Tea Garden 27(D) 6,436 52 Uttar Salbari 33(D)
Hridaypur 30(N) 300 53 Uttar Tharalta Gram 39(0)
Jalapara 30(D)\ 2,298.
Jaldhaka Altadanga 24(N) 1.873 Total
N.B.-New P. S. of 1981
D Mouzas Transferred from Ohupguri P. S. N Mouzas Transferred from Nagrakata P. S.
* Uninhabited
t Included in Gairkata (NM)
Population r----A----,. 1971 1981
~,624
535
5,347
5,046
344
1,479
4,482
1,379
2,404
3,172
5,906-
2,478
2,148'
", 379
2,252
* 2,822
3,258
3,027
6.428-
3570
827
1,066
2.558 ..... 634.
1.43,774-

Location Area of Code Mouza
Number (Village) i. e. in
1. L. No. Name of Hectares No. of of Mouza (Village)! and of Occupied
Mouza Town/Ward (in absence Town! Residen-{Village)! of name repeat Ward in tial Ward No'. Ward No.) Sq. Kms Houses
2 3
7 P. S. Banarhat
(D) Redbank 26.80
2 (D) Redbank Tea Garden 769.45
3 (D) Amblui Tea Garden 714.07
4 (D) Cphamurcni Tea Garden 9Q3.09
5 (D)' Chunubbati Tea Garden 792.78
6 (D) Kathaigun Tea Garden 973.33
'i (D) Riabari Tea Garden 527.3L
8 (Dj Palasbari Tea Garden 429.73
9 (D) daritalguri Tea Garden 1,000.27
to (D) Dinan Tea Garden 433.40
11 (D) Debpara Tea Garden 642.24
12 (D) Prayagpur 511.33
13 (D) Chapaguri 80.84
14 (D) Lakshmipara Tea
yarden 605.77
IS (D) Gendrapara Tea
Garden
t6 (D) Maraghat Tea
Garden
17 (D) Banarhat Tea Garden
18 (D) Karba1a Tea Garden
19 (D) Binaguri Tea Garden
20 (D) Telipara Tca ,?arden
21 (0) Sako Jhora
24 (N) Ialdhaka Altadanga
982.74
697.38
883.13
1,096.09
1,59J.65
1,554.07
467.41
571.24
25 (D) Guirkala 296.31
26 (D) Gairkata Tea Garden 1,190.57
27 (D) Haldibari Tea Garden 1,135.95
28 (D) Maraghat Tea Garden 4,600.03
29 (D) Totopara Tep Garden 482.73
30 (D) Jalapara 350.65
"31 (D) Mogalkata Tea Garden 612.07
4
584
693
1,179
641
1,061
649
476
995.
513
725
63
884
1,178
655
1,705
1,113
1,011
1,236
558
384
1,054
1, 196
413
704
427
1,145
[ 74
URBAN/VILLAGE PRIMARY
No. of Households
584
693
1,194
643
1,061
651
Total Population (including Institutional
and Houseless Population)
,---__ • __ .A. __ -----,
PersOns Males Females
6
2,822
3',193
, ~9&-
3,916
5,04'6
3,2)8
7
476 2,47'8
1,471
1,583
3,549
1,980
2,548
1,664
1,269
2.594
1,270
1,695
Uninhabited
1,351
1,610
3,159
1,936
2,498
1,594
1,209
2,612
1,250
1,619
995 5,206 I
513 , 2,520
725 3,314
63" 379
884
1.178
655
1,722
1,113
1,013
1,237
558
384
4,482
6,235
3,172
8.403
5,347;
5,184
6,428
3,027
1,873
198
2,294
3,165
1,627
4,770
2,647 , 2,623
3,373
1,610
1,021
181
Uninhabited
2,188
3,070
1,545
3.633
2,700
2,561
3,055
1,417
852
Scheduled Castes
,...--'---. M ~
9
144
35
644
330
277
175
208
274
6
12
4
353
99
198
258
259
272
159
294
157
10
113
46
634
343
248
175
207
288
5
11
3
320
93
202
201
290
272
110
206
139
Scheduled Tribes
,.-----.A.---. M F
11
940
566
7:1.8
805
1,647
715
390
1,799
494
911
45
893
1.060
1,121
1,199
1,094
1,515
1,995
349
424
12
864
585
671
735
1.667
638
378
1,808
503
896
30
849
1,054
1,070
1,030
1,311
1,536
2,009
312
364
Included in Gairkata (NM)
1,057
1,196
422
704
430
1,147
5.949
6.436
2,404
3,57.0
2.298
5,906
3,050 2,899 246
3,251 3,185 430
1,249
1,867
1,231
3,006
1,155
1,703
1,067
2,900
164
139
229
355
230 2,213 2,095
401 2,397 2,38i
146 816 766
122 904 879
191 506 418
354 1,191 1.829

r 75 )
'CENSUS ABSTRACT
MAIN WORKERS ,.--_________ --A. ______________ -,
Household Industry
Manufacturing, Total Processing, Other Main Agricultural Servicing Workt'rs)
Workers Cultivators Labourers and Repairing [III. IV. V(b) & Marginal Literates (I-IX) (J) (II) [V (al] VI to IX] Workers Non-Workers
,-_-"---, ,-_ __A.._-, ,-_...A-__ --, ,-__ ~-, ,-__ A __ , ,-_..A. __ , ,-__ ..A. __ , ,-__ ..A. __ ,
Mi F M F M F M F M 'F M F M F M F
13
416
288
1,325
555
610
438
382 •
546
236
370
9
499
815
524
2;353
642
733
933
587
193
741
585
195
481
181
486
14
151
89
484
145
180
297
135
161
168
193
126
183
15 16
742 617
6'Z4 583
1,690 '817
687 570
949 621
814 762
467 361
1,050 751
488 369
764 581
82 20
969 816
1,779 1,520
137 825 714
1.269 2,412. b22
200 1,0(11 ).79
176 1,029 532
419
2RO
51
272
213
51
III
41
121
1.502 520
886 28
534 108
r,280' '576
1.279 911
593 185
961 471
718
1,331 639
17 18 19 20 21
Uninhabited
2 13
2
4
."
60
Uninhabited
22 23
742
674
1.675
684
949
814
467
1,050
484
764
22
969
24
617
583
816
569
621
762
361
751
369
581
20
816
81 26 2 2 1,696 1.492
10 4
45 5
348 362 23
I
197
7
3
2j
824
6 2.204
1,061
1,021
2 1,453
153
534
Tncludetl in Gairkata (NM)
357 98 4 825
351 26 90 96-
236 14
541 130
418 78 174 65
3
2
10
6 2
1,276
150
710
37
733
714
612
779
532
513
4
108
571
911
63
471
494
25
2
37
123
166
206
173
6
233
222
106
58
2
18
136
82
114
101
78
26 27
727
909
26 1.822
133 1.170
312 1.433
850
285 596
353 1,371
776
931
116
281 1,092
1,385
28
734
1.027
2,3'16.
1,233
1,565
832
563
1,508
gsa-
1.03'7' '~
161
1.091
1,550
802 831
360 2.136 2,651
204 1,480 1,71T
29 1,536 2,000
24
166
92
163
1.869
760
487
1,634
1,890
542
l,.o5 805
513
132 1,597
2,534-
1,365
744
2.157
2,18!
807
1.127
1,066
2,129

Location Area of Code Mouza
Number (Village) ~~ ~
1. L. No. Name of Hec tar·: s of Mouza (Village)! and of
Mouza Town/Ward (in absence Town, (Village)! of name repeat Ward in
Ward No. (Ward No.) Sq. Kms
2 3
7 P. S. Banarhat-concld.
32 (D) Chapaguri Khanda
33 (D) Uttar Salbari
34 t D) Chanadipa
35 (D) Dakshin S~dl;ari
36 (D) Madhya Salbari
37 (D) Purba Du amari
38 (D) Paschim Juramari
39 (D) Uttar ,horaltagram
f9.99
422.59
362.90
428.16
274.33
41:8.56
253.08
205.48
40 (D) Dakshin Nunkhawadanga 228.'10
41 (D) Bhalipara 1 Q7.43
42 (D' Fataktari "l)~.59
43 (D) Chamtimukhi 4 RS
*44 (D) Lakshmi Kantapur
Tea Garden 365.49
*58 (D) Gosairhat Forest "1 :) 20
23 (N) Deana Forcst 6221.30
25 (N) KMirkata 366.v4
26 (N) ~h llnpara 514"'6
27 (N) Kala :lri Tea Garden 566.56
28 (;'l) Kal ;.. ,ri 765.67
29 (N) Upar Kalabari 464.38
30 (N) Haridaypur 488.26
31 (N) Angrabhasa 629.'!9
32 (N) Dhoudasimla 482.::9
33 (N) {Tttar Nunkhawadanga 284.90
Galrkata (NM) 2.' 6
Rural
Urban
Grand Total
3/J
395.6
No. of Occupied ResIden
tial Houses
4
367
491
306
446
244
399
378
115
214
~28
408
418
2118
505
100
40
513
200
226
1,110
,10
40
4'i0
1,0'71
No. of Households
5
367
492
306
448
245
399
378
115
214
335
418
268
514
100
40
513
200
220
IQO
~40
L40
450
1,119
I 76 I
Total Population (including Institutional
and Houseless Population)
,Persons
6
2,006
2,558
1,599
2,309
1,379
2,252
2,148
634
1.158
2,111
2,231
2,258
1,479
2,779
344
137
2,624
535
827
300
1,067
419
1,066
5,955
-----, Males Females
7
1,047
1,369
851
1.206
129
1,1~7
1,107
320
609
1,208
1,168
1,168
8
959
1,189
748
1,103
650
1,085
1,041
314
549
903
1,063
1,090
779 700
1,461 1,318
Uninhabited
154 190
50 87
1,325 1,299
252 283
336 491
(09 191
4H7 580
258
,j 17 589
3,7~8 2,707
URBAN/VILLAGE PRIMAR~
Scheduled Castes
r----A.-, M P
9
578
496
390
592
344
947
1,014
225
300
400
786
891
366
789
5
4
97
fO
5
12
30
25
30
735
10
507
471
350
586
312
877
925
239
266
314
723
833
329
688
5
2
98
12
5
20
40
25
30
631
Sch.:duled Tribes
,-__ .A. __ ,
M F
11
181
339
194
280
~4
124
81
31
67
124
239
90
370
534
900
5
30
30
'1-14
12
158
281
163
232
78
106
62
20
60
14
214
83
333
512
900
5
20
20
343
2f"I\ .... ~ ?8,704 I 13,7'74 74,11)
3, ?4i5
69,629 14,057 13.0()7 3 ,141 29,940
],[71 1,/19 .),9.5 2,707 7j5 631 414 363
29,699 29,823 149,729 77,393' 72,336 ]4,792 13,638 31,555 30,303
D Mouzas transferred from Dhupguri P. S. N Mouzas transferred from Nagrakata P. S. * Mouzas shown in this P. S. according to the record supplied by the B.D.O.
Actually they ar.:: located in Dhupguri P. S.

CENSUS ABSTRACT
Total Main
Workers Literates (I-IX) ...-----A--_, ,--_Jo....--"'I
M F M F
13
238
438
284
314
258
501
478
88
247
792
371
391
246
398
53
50
576
100
200
50
300
150
200
1,866
21,846
1,866
23,712
14
61
160
92
137
102
203
116
48
99
404
84
92
113
121
50
40
563
90
190
43
270
100
150
1,181
8,98 1
1,18.1
10,162
15
577
700
482
674
381
682
485
176
291
463
619
616
428
805
50
20
477
46
100
200
101
200
16
116
23
20
14
38
107
12
27
37
12
31
76
106
75
3:c.
10
27
50
1,691 10i
3l, I R8 15,29,1)
1,6,'7 101
35,879 I5,3!!7
( ?7 1
MAIN WORKERS • ____ __.A.
.----------------~ Household Industry
Manufacfuring, Processing, Other
Agricultural Servicing, VI' orkers Cultivators Labourers and Repairing [III, , V(b) &
(1) (II) [V (a)] VI to IX] r---.A.--~ ,-.. _..A------. r-- _.A.._ - ..._ r---..A.--~
M F M F M F M F
17
408
452
18
19
349 2
411
256 23
475 52
276
117
19 20
141 95
157 4
122 II
lll7 4
IOj 13
I'.. 52
80 6
47 25'
120 10 64 24
141 10i
416 4 131 21
351 14 230 60
209
551
3 1J 2 97
10 1/3 46
21
29
27
5
2
2
5
4
43
Uninhabited
131 5 164 14
6,939 "74 2.736 655
131 5 104 14
7,070 279 2,1)00 669
32
377
32
409
22
15
4
8
3
8
23
'28
62
11
69
17
28
127
12
105
216
68
34
107
38
'i0
20
477
46
100
50
20Q
100
200
24
2
4
3
2
2
3
2
2
3
11
5
2
6
11
32
10
2
50
2 1,364 80
50 2'1,136 14.307
2 1,364 80
52 25,53:> 14,387
Marginal Workers Non-Workers .-~ .----J'--~
M F M F
25
10
3
5
5
22
10
5
23
20
3
6
37
2
7
2,015
7
2,022
26
26
2
13
119
18
10
3
150
2
27
460
669
366
527
343
463
612
13)
295
725
546
546
351
619
104
30
848
206
234
59
287
61
277
2 1,550
3,014 37,942
2 1,550
3,016 39,492
28
Sl7
1,164
728
1,076
611
859
1,011
287
502
891
1,031
1,011
594
1,093
190
87
1,26"1
283
4"19
9!
553
258
539
2.604
51,329
2,604
53,9J]

[ 18 }
ALPHABETICAL LIST OF VILLAGES
8 P.S. DHUBGURI
SI. No.
Population 1; L. r-----"----...
Name of Villages
2
No. 1971 1981
,Ambari Tea Garden
2 Bagribari
3 Bairatiguri
4 Bamantari
5 Banarhat Tea Garden
6 Baragharia
7 Bhandani
8 Bhatiapara
9 Bhemtia
10 Bhotpara
11 Binnaguri Tea Garden
12 Chamtimukhi
13 Chamurchi Tea Garden
14 Chanadipa
15 Chapaguri
1 ~ Chapaguri Khanda
! 7 Char Charabari
III Chaubaddi
1'1 Chaunabhati Tea Garden
20 -Dakshin Alta gram
21
22
23
Dakhin Dangapara
Dakshin Gosairhat
Dakshin Jhar Altagram
Dakshin Kathulia
3 4
3 2,860
69 1,425
98 t 47 1,322
17 8.171
88 2,645
71 1,579
41 1,736
90 1,122
84 1,091
19 4,136
43 1,946
4 3,980
34 1,494
13 * 32 631
67 1,464
51 1.033
5 2,982
78 1,676
81
97
66
65
2'5 Dakshin Khairbari 83
1,435
1,913
1,724
1,572
3,043
1,057
1,147
26 Dakshio Khuttimari 56
12" Dakshio Nunkhawadanga 40
28 Dakshin Sakojhora 60
"29 Dakshin Salbari 35
30 Dhambari 82
31 Debpara Tea Garden 11
32 Dhupguri 89
33 Diana Tea Garden 10
34 Fataktari 42
35 Gadang 99
427
1,786
1.711
3,235
t 2,152
1,867
1.559
5
* (~667
t 1,479
* 3.400
1.845
* 1,590
1,431
* * * * * * 1.936
1,258
* 1.865
1.599
2,107
2,192
2.036
3,320
1,282
* 5,151
* 1,734
* t * * 1,659
SI. No. Name 9f Villages
2
36 Gadhear Kuti
37 Gairkata
38 Gairkata Tea Gardea
39 Garakhuta
40 Garailtari
41 Gendrapara Tea Garden
42 Gosairhat Forest
43 Haldibari Tea Garden
44 Haritalguri Tea Garden
45- lakhalikona
46 Jalapara
47 Jharmagurmari
48 Ihar Salbari
49 Jurapani
50 Kalirbat
-S1 Karbala Tea Garden
52 Kathalguri Tea Garden
53 Kathapara
54 Kazipara
55 Khalaigram
KUTsamari
J.L No.
Population r--- ....... --~. 1971 19&1
3 4
68 1,379
25 4.479
26 3,744
57 801
49 1.456
15 4,589
58 t 27 5,637
9 3,954
79 369
30 212
63 1,536
106 3,021
107 1,797.
64 1,849
18 4,602
6 4,179
100 1.340
101 !,920
85 2.087
70 1.289
5
1,435
* * 1.124-
1,808
* * * * 399
* 1,961
3,764
2,405
2,219
* * 1.488
2.157
2,681
1,523 56
57
58
59
Lakshmikantapur Tea Garden44 682
3,.061
3.350
1.534
2,675
1,065
2,223
2,064
1,705
2,369
3.i90
1,562
1,999
1,604
* * 4,440
Lakshmipara Tea Garden 14
Madhya Baragari 86
r, 1 ,Madhya Daukimari
(, I Madhya Kbuttimari
62 Madhya Salbari
63 Mainatali
64 Malliksobha
65 Maraghat Forest
66 Maraghat Tea Garden
67 MOt1galkata Tea Garden
68 Niranjanpat
69 Palasbari Tea Garden
70 Parkumlai
53
46
36
77
61
28
16
31
62
8
73
1,801
3,372
* 2,665
2,485
* * * 2,105
* 1,828

·S1. No.
1
71
72
73
74
75
76
77
78
79
80
81
82
83
84
85
86
-87
38
[ 79 ]
ALPHABETICAL LIST OF VILLAGES
8 P.S. DHUBGURI-concld.
Population J. L.- ....---"------- SI.
Name of Villages No. 1971 1981 No. Name of Villages
2 3 4 5 2
Paschin Dangapara 48 940 1.024 89 Redbank Tea Garden
Paschim Daukimari 52 1,237 1.640 90 Raibari Tea Garden
Paschim Duramari 38 1,379 * 91 Sajnapara
Paschim Murgamari 91 2,016 2,417 92 Sakojhora
Paschim MaIlikpara 74 1,598 2,217 93 Sonakli~ii Paschim Salbari 104 2,154 2,348 94 TeJipara Tea- Garden
Patkidaha 80 921 1,036 95 Totapara Tea Garden
Pradhanpara 22 1.980 2,807 96 Tuklimari
Prayagpur 12 313 * 97 Uttar Altagram
Pundibari 108 776 913 98 Uttar Boragari
Purbba Altagram 76 1,557 2,077 99 Uttar Dangapara
Purbba Dangapara )03 1,415 1.686 100 Uttar Gosairhat
Purbba Daukimari 54 3,007 3,806 101 Uttar Jhar Altagram
Purbba Magurmari 93 2,504 2,854 102 Uttar Kathulia
Purbba Mallikpara 96 2,369 2,773 103 Uttar Khuttimari
Purbba Salbari 105 2,180 2,724 104 U (tar Salbari
Rarnsai Forest 2nd 50 * * Redbank * * Teta!
* J. L. Nos. are Transferred tQ Banarhat P. S.
t Included in l)hupguri (NM)
'" Uninhabited
I.L. Population
r---"----, No. 1971 1981
3 " S
2 2,157 * 7 2,152 * 24 1,247 2,322
21 2,152 * -59 698 830
20 4,196 * 29 2,017 * 72 1,272 1,697
75 1,468 1,792
87 t t 23 2,176 ),191
94 1,330 1,842
39 602 * 55 1,386 1,818
45 2,030 1,733
33 1,269 * 199,5~2 122,145

Locatioll Area of Code Mouza
Number (Village) j. e. iIr
J. L. No. Name of Hectares of Mouza (VilIage)( and of
Mouza Town/Ward (in absence Town! (Village)! of. name repeat Ward in
Ward No. Ward No.) " Sq. Kms
2
8 P. S. Dhubguri
22 Pradhanpara
23 Uttar Dangapara
24 Sajnapara
45 Uttar,Killtimari
46 Madhya Kultimari
47 Bamantari
48 Paschim Dangapara
~ Garialtari
50 Rarnsai Forest
3
52).39
645.07
290.65
546.41
652.69
377.38
252.20
383.36
485.63
51 Chauhaddl 311.04
52 Paschim Daukirnari 350.66
53 Madhya Daukirnari 429.30
54 Purbba Daukimari 657.67
55 Uttar Kathulia 414.21
56 Dakshin Khuttirnari 243.85
57 Garakhuta 246.07
59 Sanakhuli 188.60
60 Dakshirn Sakojhora 161.28
61 Malliksobha 487.85
62 Nirajanpat <430.96
63 Jharmagurmari 468.80
64 KaIirhat 418.23
65 Dakshin Kathulia 342.19
66 Dakshin Jhar Altagram 361.75
67 Char·Cbarabari 364.09
68 Gadhear Kuti 357.23
69 Bagribari 43'.62
70 Kursarnari 342.58
71 Bhandani 402.18
72 TukIirnari 321.27
73 Parkurnlai 403.85
74 Paschirn Mallikpara 578.98
No. of Occupied Residen-
tial Houses
4
572
635
440
334
605
256
203
333
228
332'
320
647
345
251
222
147
103
437
397
341
423
3,4
395
367
270
291
244
337
310
356
394
[ 80 ]
URBAN/VILLAGE PRIMARY·
No. of Households
572
Total Population (including Institutional
and HouseJess Population)
r-----..A.----~ Persons Males Females
6 7 8
2,807
635 3,191
441 , 2,322
335 1,733
1,461
1,669
1;203
911
1,346
1,522
1,119
822
605
256
204
333
3,372
1,479
1,024
1,808
1,784
764
517
938
1,588
715
507
870
Scheduled Castes
~_..A.------,
M F
9 . 10
816 'B09
809
465
748
1,099
538
434
658
834
490
778
1,107
553
436
663
Reserved Forest Area (Uninhabited)
228
332
322
947
345
251
222
147
103
437
397
341
423
394
395
368
270·
291
244
337
310
356
395
1,258
1,640
1,801
3,806
1,818
1,282
1,124
830
515
2,485
2,105
1,961
2,219
2,036
2,192
1,936
1,435
1,667
1,523
1,845
1,697
1,828
2,217
636
862
950
2,017
930
660
569
443
255
1,321
1,079
1,035
1,149
1,060
1,130
1.004
742
877
788
955
872
984'
1,172
622
778
851
1.789
888
622
555
387
260
1,164
1,026
926
1,070
976
1,062
932.
693
790
735
890
825
844
1,045
269
525
794
1,477
786
505
546
6
225
662
904'
464
715
833
985
886
446
589
719
837
5QI
698
1,021
297
564
798
1,490
798
544
538
4
227
663
955
497
717
833
989
881
461
626
725
828
555
695
1,019
Scheduled Tribes
,..-~ M P
11
230
475
253
52
219
108
39
85
27
11
58
49
36
l3
50
27
J5
17
30
38
9
31
19
1
1
42
12'
182
239
157
39
181
91
55
74
23
7
53
40
25
10
44
31
5
18
30
23-
7
39
20
2
35-

CENSUS ABSTRACT
Literates
Total Main
Workers (I-IX)
r--_..A...---, M F M F
13
523
579
416
340
543
~12
172
287
147
245
432
548
262
317
236
83
67
414
394
428
546
341
509
417
232
334
199
337
396
333
498
151
166
174
110
129
110
51
120
26
53
15 16
937
900
649
497
1,008
417
291
535
368
417
65
114
63 , 27
16
15
40
39
7
S.
129 546 22
209 1,076 101
82 528 15
76 391 26
30 347 2
29 244 15
25 166 8
156 740 28
107 640 21
174
200
114
190
52
64
87
49
100
135
77
140
587 2
685 135
571 11
647
571
399
472
436
533
517
563
566
18
9
12
10
14
14
[ 81 ]
MAIN WORKERS
Household Industry~
Manufacturing. Processing.
Agricultural Servicing Cultivators Labourers and Repairing
(I) (II) [V (a)] ,-.-A----, ,-__ ....... __ • ,-___ .A...---,
M F M F M F
17 18 19 20
581 15 307 48
512 3 230 93
318 16 101 30
278 5 .167 19
781 171 8
293 2 98 11
149 ·5 108 31
321 192 13
21
11
15
12
2
22
2
4
3
8
Other Workers
[III, IV. V(b) & VI to IX]
,----"--. M F
23
49
147
215
51
44
26
33
20
24
2
16
13
4
20
Reserved Forest Area_ (Uninhabited)
243
268
5 103
97
337 172 II
649 14 274 30
389 6 109 3
250 9 100 12
237 99
136 88 13
144 17 8
551 11 152 14
404 2 224 15
411 167
448 88 139 38
406 .5 130 4
510
434
285
317
393
347
469
374
437
115
129
91
117
36
173
46
2 128
15
8
7
8
98 12
8
7
2
21
1
2
. 1
2
2
2 9
45
'35
8 132
29
2, 40
11
20
5
36
2 10
2
5
1
9
97
35
21
8
21
36
7
13
2
61
30
...
7
10
49
6
3
2
3
2
9
2
3
4
Marginal Workers
,----"----., M F
25
57
14
68
5
3
83
2
20
8
26
24
30
103
179
14
20
6
9
9
Non-Workers ,-___ .A.. __ ~
M F
27
524
712
540
346
771
347
226
400
267
362
28
1,257
1,378
953
616'
1.558
699
467
811
615
764
404 82&
941 1.688
402 833
267 S96
222 553-
199 372
89 252
580 1,131
439 1,005
448
464
489
924
934
965-
483 1,044
433 932
343 684
385 758
352 734
422
355
420
598
871
824-
830
1,021

Location Code
Number i. e.
Area of Mouza
(Village) in
J. L. No. of
Mouza (Village)!
Ward No.
!', arne of Hectares Mouza (Village)! and of
Town 'Waw (m absence Townj of name repeat Ward in
Ward No.) Sq. Kms
2 3
-8 p, S, Dhubguri-contd.
7i lmar Altagram
76 Purbt a Altag.am
77 Mainatali
78 Dakshin AltJgtam
79 Jakha1;1'Jna
80 Patkidaha
81 Dakshin Dangapara
82 Dambari
83 Dakshin Khairbari
84 Bhotp3ra
85 Khalaigram
86 Ma,dhya Boragari
88 Baragharia
90 Bhemtia
'1 Paschim Magurmari
92 Magurmari
93 Purbba Magllrmari
94 Uttar Gosairbat
95 Gosail h:.n Chhits
96 Purbba Mallikpara
97 Dakshin Gosairhat
99 Gadang
100
101
102
103
104
105
106
107
108
Kathapara
Kazipara
Gadang Dwitia Khand!l
Purbba Dangapara
Paschim Salbari
Purbba Salbari
Jhar Salbri
Jurapani
Pundibari
398.80
422.58
595.67
509.08
99.19
343.65
380.17
470.44
713.06
290.76
573.26
882.02
646.48
281.29
453.43
62.11
377.67
356.99
183.32
596.61
460.53
331.43
328.89
450.92
159.45
370.15
463.76
526.87
673.61
316.45
214.96
No. of Occupied Residen
tial Houses
4
317
371
485
348
71
175
256
312
592
241
468
840
584
311
461
89
562
351
119
493
357
302
252
377
139
282
433
475
663
441
166
[ 82 1
URBAN/VILLAGE PRIMARY
No. of House
hoids
5
317
371
487
348
73
175
256
312
592
242
468
840
584
311
461
89
563
351
119
493
357
302
252
377
139
282
433
475
665
441
166
Total Population (including Institutional
and Houseless Population)
r----- -"-- ------, Persons Males Females
6
1,794 2,077
2,665
1,865
399
1,036
1,599
1,734
3,320
1,431
2,681
4,440
3,400
1,590
2,417
519
2,854
1,842
687
2,773
2,107
1,659
1,488
2,157
817
1,686
2,348
2,724
3,764
2;405
913
7
970
1,070
1,433
983
207
529
875
901
1,741 '
754
1,432
2,366
1,766
839
1,290
281
1,543
955
372
1,482
1,088
845
814
1,100
430
879
2,213
1,419
1,911
1,280
487
8
822
1,007
1,232
882
192
507
724
833
1,579
677
1,249
2,074
1,634
751
1,127
238
1,311
887
315
1,291
1,019
814
674
1,057
387
807
1,135
1,305
1,853
1,125
426
Scheduled Castes
r-- --'------, M F
9
690
282
817
318
26
196
470
660
1,315
391
615
1,596
731
320
649
128
797
796
170
982
645
440
446
531.1
189
530
920
892
1,363
734
355
10
718
319
821
318
27
198
476
664'
1,366
920
616
1,627
733
3io 649
141
795
798
169
1,018
656
449
457
560
182
581
969
895
1,367
774
357
Scheduled Tribes
,-__ ..A. __ ---,
M F
11
21
5
3
11
7
6
S4
32
3
12
11
5
3
I
9
4
48
33

[ 83 ]
CENSUS ABSTRACT
MAIN WORKERS ,..----
__________ --A-_____ . ----.......
Literates r---A.----,
M F
13
419
284
577
355 ..
63
169
287
268
~50
316
483
999
540
228
400
14
107
50
217
115
22
54
73
118
174
107
184
297
195
77
145
51
209
153
46
106
126
58
81
56
30
94
96
Total Main
Workers (I-IX)
15
567
624
179
510
116
302
481
400
891
387
776
1,302
1,023
495
730
138
901
513
192
833
619
415
438
616
713
493
702
16
2
16
9
2
6
10
41
9
9
66
89
15
29
43
12
9
6
24
21
16
34
89
480
434
103
354
380
325
332
341
130
342
389
548
517
510
208
216 695
4
2
19
6
159 1,030
174 638
53r 247
19
4
24
Agricultural Cultivators Labourers
(l) (II) ..-__ ..A.. __ , ,--..-A-__ ._
M F M F
Household Industry-
Manufacturing, Processing, Other Servicing, Workers
and Repairing [III, IV, V(b) & [V (a)] VI to IX]
'-"- _..A.. __ -", r-~ ~- _.A._ -~
M P ~ F
17 18 19 20 21 22 23
494
349
60
249 2
48? 5 195 7 4
339 3 129 2
86
190
358
312
672
304
437
850
074
222
20 2
80
84
2
4 148 5
3 172 32
3 5' 3
3 251 5
7 ~81 19
9 2(j0 7
144
7 239
10
11
60 29
381 13 239 2
233 3 172 5
106 2 30 4
615 155 1
473 4 114 10
281 4~ 11
302 3 113 9
461 17 138 17
141 57 4
409 71 2
492 3 152 II
176 2 426
729
350
206
3 252 11
t.6
122
35 6
.3
3
2
4
10
2
3
24
1
4
2
2
1
5
14
5
-7
2
6
2
2
2
2
4
1
4
...
13
26
98
42
9
31
39
17
44
26
84
161
87
129
93
48
257
107
52
63
30
84
22
17
15
8
58
79
44
159
5
3
4
6
3
34
9
2
4
26
2
4
9
9
5
2
4
Marginal Workers Non-Workers
,.. ___ .A.._ -..... r _..A.. __ ~
M P M F
25
14
54
14
18
4
3
2l
16
18
15
26
6
59
41i
2-'
403
446
640
419
91
227
394
421
836
367
656
42 1,0!h
8
8
4
5
2
12
743
34J
'i
3
fi39
44:.:.
180
649
469
409
360
466
217
385
'ill
724
881
642
225
28
821
1,005
1,710
14
190
501
24
8~3
1,490
hb8
1,239
1,966
1,544
728
I .04
238
1,267
874
306
1,285
995
785
654-
1,018
383
805
1,116.
1,297
1,834
I, 21
39(}

[ 84' )
URBAN/VILLAGE PRIMARY
Location Area of Code Mouza
Number (Village) i. e. in Total Population
J.L. No. Name of Hectares No. of (including Institutional of Mouza (Village)! and of Occupied and Houseless Scheduled Scheduled
Mouza Town!Ward (in absence Town! Residen- No. of Population Castes Tribes (Village)! of name repeat _ Ward in tial House- ,--------"-------. ,-----"------, r---'---...... Ward No. Ward No.) Sq. Kms Houses holds Persons Males Females M F M F
• 2 3 4 5 6 7 8 ~ 10 11 12
8 P. S. Dhubguri-concld.
Dhupguri (NM) 14:55 4,180 4,2$8 23,098 12,217 10,8S1 3,4'4 3,066 9 11
Rural 264.9 22,262 22,277 122,145 63,993 58,153 40,019 40,784 2.07& 1,601
Urban 14.6 4,180 4,258 23,098 12,217 10,881 3,494 3,066 9 11 , Grand Total J.79.5 26,442 26,535 145,243 76,209 69,034 43,513 43,850 2,087 1,612

CENSUS ABSTRACT
Literates ,....~
M F
13 14
7.356 4.782
22.~07 7.008
7.356 4,782
~9,663 11,790
Total Maio
Workers (I-IX)
,...---A-~
M F
15 16
6.223 403
35,390 1,400
6,223 403
41,613 1,803
[ 85 1
MAIN WORKERS ..,-__ ----A. __ _
Household Indtlstry-t:
Manuf~cturing, Processing. Other
Agricultural Servicing. Workers Cultivator~ Labourers and Repairing [Ill. IV. V(b) &
(J) (II) IV (a)] VI to IX] ,.----A------, ,..-_..-A_-. ,..-__ ....____, ,..-__ ..A..---,
M F M F M F M F
17 IS 19 20 21 22 23 24
1.132 3 591 40 261 51 4.239 309
23,506 307 8,448 -731 192 72 3,244 290
1.132 3 591 40' 261 51 4,239 309
24,638 310 9,039 771 453 123 7,483 599
Marginal Workers
,...----"----, M F
25 26
56 33
Non-Workers r---~
M P
27 28
5.938 10,445
441 ~19 28,161 56.134
56 33 5,938 10.445
497 652 34,099 66,579


[ 87
ALPHABETICAL LIST OF VILLAGES
9 P.S. BIRP ARA
Population. Population "SI. J.L. .....------A------. SI. J.,J.. ,......--...-A--, 'No. Name of Villages No. 1971 1981 No. Name of Villages No. 1971 1981
2 3 4 5 2 3 4 5
1 Bandapani Tea Garden 12 5.526 4,108 12 Lankapara Tea Garden 30 7,259 1,954 2 Birpara Tea Garden , 11,850 19,509 13 Lankapara Hat it 451 655
3 Dalmora Tea Garden 15 3,49, 5.731 14 Makrapara Tea Garden 14 2,468 2,256
4 Dangapara 7 101 96 IS Nangdala Tea Garden 10 3,258 3,726
5 Dheklapara Tea Garden 3 2,531 1,852 16 Nepania 1 299 679
'6 Dim Dirna Tea Garden .. 4,389 4,975 17 Rahimpur Tea Garden 5 941 1,274
7 Dumchi 1& 262 565 18 Rarnjhora Tea Garden 26 3,136 3,771
8 Garochera Bandapani 13 1,674 188 19 Riti Forest 2 478 1,139
9 Gopalpur Tea Garde.D • • 17 3,767 4,473 20 Sarugaon 4 558 621
·10 Hosainabad Tea Garden 16 1,132 1,963 21 Sisha Jhumrha {; 1,002 1,626
11 Joybirpara Tea Garaon 11 3,364 2,029 Total 57,942 70,19J)

[ ~8 ]
URBAN/VILLAGE PRIMARY'
LGcatioD Area of Code Mouza
Numcbr (Village) i.e. in
No:of Total Population
J.L.No. Name of Hectares (inclu-ding Institutional of Mouza (Village! and of Occupied and Houseless Scheduled Scheduled
Mouza Town/Ward in absence Townl Residen- No. of Population) Castes Tribes (Village)1 of name repeat Ward in tial House- r-----..A.--_--_~ ..--__ ..A._---,
r----"--_ Ward No. Ward No.) Sq. Kms HouJes holds Persons Males Females M F M F
2 3 4 5 6 7 3 9. 10 11 12
9 P.S, Birpa~a
Nepflinia 38~.02 126 126 679 352 327- 90 84 62 41
2 Rati Forest 1.269.11 201 201 1.139 597 542 9 6 124 113
3 Dbeklapara Tea Garden 580.32 447 447 1,852 ~97 85, 44 41 647 538
4 Sarugaon 213.67 166 166 621 350 271: 41 19 7 9
51. Rahimpur Tea Garden 294.61 215 229 1,274 688 I 586 I 29 16 364 343
6 Sisha Jumrha' 426.54 281 281 1,626 898 723\ I 7 7 368 305
7 Dangapara 140.83 24 24 96 48 481 I 18 25
8 J)imdima Tea Garden 813.42 1.015 1,015 4,975 2,545 2,430 I 75 64 2.04'0 1,967
9 Birpara Tea Garden 2,607.41 3,416 3,467 19,509 10,517 8,992 678 535 2,900 2,754-
10 Nangdala Tea Garden 933.62 733 733 3,726 1,868 • 1,858 126 121 1,573 1,598
11 Joybirpara Tea Garden 435.04 441 441 2,029 1,048 981 23 22 647 600
12 Bandapani Tea Garden 2,354.89 840 840 4,108 2,079 2,029 104 82 1,047 1.054
13 'Garo Chera Bandapani 195.06 35 35 183 97 91 9 7
14 Makrapara Tea Garden 1,161.05 409 409 2.256 1,203 1,053 140 156 118 89
15 Dalmore Tea Garden 2,376,74 1,144 1,144 5,731 2,998 2,733 495 477 703 699
16 Hoasinbad Tea Garden 268.11 304 305 1,l}63 1,020 943 211 174 \
483 449
17 Gopalpur Tea Garden 621.20 821 821 4,473 2,273 2,200 160 108" 1,863 1,818 , 18 Dumchi 345.61 109 109 565 285 280 6 2 156 142_
26 Ramjbora Tea Garden 620.31) 829 829 3,771 1,947 1,824 267 276 483 488.
30 Lanka para Tea Garden 2,'68.93 1.603 1,603 8,954 4,627 4,327 593 582 716 681
31 Lankaparahat 9.31 146 146 655 361 294 27 27 47 26
Total 190.8 13,305 13,371 70,190 36,798 ' 33,392 3,134 2,853 14,366 13,739 (Entirely Rural) Sq. Kms,

I 89 )
CENSUS ABSTRACT
MAIN WORKERS ,..----------------"----------------,
Household Industry-·
Manufacturing, Total Processing. Other Main Agricultural Servicing Workers
Workers Cultivators Labourers and Repairing [III, IV, V(b) & MargInal Literates (I-IX) (I) (II) [V (a)] VI to IX] Workers Non-Wo.rkera
,.._......__. ,..-_--"-__ ---, ,-__ ....... __ ---, ,..-_.A._. ,---....... --. ,--_ ....... --. r--.A.-_-., r----.A.-:--, M F M F M F M F M F M F M F M F
13
10
73
289
169
175
241
6
417
4,222
533
328
534
17
272
514
223
503
58
791
1,024
166
14 15 16 17 18 19 20
14
82
117
222 6
279 29
439 255
224 4
27 192 102
110 536 46
29 6
193 1,000 667
2,233 5,252 1,466
226 872 707
107 436 241
160 529
213 5 3
228 ·25 43
32 4 9
16 6
217 13 130
15 14
31 17 5
930 322 53
5 2 18
10
3
58
117
too 198
19
851
58
398
9 52 9
45
6
26
22
314
329
56
1,363
431
839
152
8i2
.1,85'6
14'8
J 250
467 512
245 24
486
62
495
1,476
3
4
137
247
4
50
48
15
93
56
4
3
14
5
10
8
6
107
.10,565 .. ,464 16,399 7,551 2,675 506 539 158
21
3
5
9
103
4
4
3
5
5
4
146
22 23
6
8
;t98 220
24
248
4
176 96
184 19
955 650
4 4,166 1,130
848 705
2 432 239
792
372
826
4.06
815
15
816
1,512
92
521
250
463
245
486_
6
495
1,321
3
, 13,039 6,881
25
2
2
125
6
21"
92
3
23
2
23
ts
60
3
377
26 27
130
316
558
124
7 371
362
19
7 1,539
7 5,2H
115 904
609
88 r.205
46 37
1'05
475 1,612
4 574
39
2
69
1.374
133
1,122
2,771
213
28
321
513
599
267
,477
G82
42
1,756
7.Sl\)
1,036
740
1,412
36
803
1.791
694
1.675
218
1,327
2,782
291
860 20,022 24,981


SI. No.
1
N arne of Villages
2
1 Alinagar
2 Badaitari
3 Baganbari
4 Balasundar
5 Bangsidharpur
6 Batadoba
7 Beltali Bhandani
8 Bengkandi
9 Bhutnirgbat
10 Chengrnaritari
11 Chhota Salkurnar
12 Chuakhola
13 Dakshin Deogaon
14_ Dakshin Parangarpar
15' DaIgaon
16 DaIgaon Forest
17-' DaIgaon Tea Garden
18 Dalirnpur
19 Dalrnoney Tea Garden
20 Deomali
21 Dhan-irampur
22 Dhulagaon
23 Ethelbari Tea. Garden
24 Falakata
25 Ghatpar Sarugram
26 Gokulnagar
27 Gua barnagar
28 Harinathpur
29 Hedaitnagar
30 Jateswar
31 Jay Chandpur
32 lharhbdltali
33 J~gendrapur
( 91 ]
ALPHABETICAL LIST OF VILLAGES
10 P.S. FALAKAT A
Population J.L . ..---...... ~ No. 1971 1981
SI. No. 1'IClillC of'lillages
J. L. No.
3
30
55
23
17
62
20
44
31
19
6
51
59
38
60
34
8
33
25
7
4
11
40
4
2,081
1,712
1,607
1,782
1,073
900
1,566
1,495
1,754
1,347
1,875
3,33'0
1,376
1,170
1,547
225
2,827
2,451
813
2,298
2,541
1,887
1,508
t-1,556
5
2,265
2,033
2,152
2,157
1,335
1,579
1,473
1,751
2,279,
1,796
2,319
4,229
1,860
},741
1,816
238
3,610
2,949
980
3,148
3,441
2,571
1.765
t 1,604
2
34 Jogijbora Barabak
35 Kadambini Tea Garden 61
64
35
26
10
54
24
58
57
36 Kalipur
37 Karibari
38 Kathalbari
39 Khagenhat
40 Khau Chandpara
41 Kshirarkot
42 Kunjanagar
43 Lochhmandabri
44
45
46
47
48
49
50
51
52
53
54
-55
56
57
58
59
60
61
62
63
64
Madhya Deogaon 39
Mairadanga 49
Malsagaon 14
Mechhuadhura Bala Bathan 3
Nabanagar 45
NarSlngpur 2
Parangarpar 22
Paschim Deogaon 41
Paschim Salkumar 52
Pramodenagar" 15
Pui'bba Deogaon 37
Purbba Jharhbeltali 43
Raichenga 63
Sarugaon Tea Garden 13
Satpukuria 48
Sibnathpur 56
Sisa bari Sarugaon 9
Talukertari 50
Tasati Tea Garden 32
Uma Charanpur 53
Uttar Deogauo 36
3
Population ,----A.. __ -.,
1971 1981
4
,2,210
2,688
1,718
925
2,013
2,4[6
2,783
1,138
2,117
2,141
),004
2,587
),735
),389
2,265
1,516
3, ~26
731
1,586
2,445
1,051
1,529
5,358
2,661
2,202
2,375
1,053
2,460
3,288
2,346
1,585
5
2,228
2,974
3,174
1,164
2,366
3,211
3,114
1,644
3,005
2.820
1,259
,3,535
2,343
1,858
3,030
2.170
4,984
1.409
1,931
2,868
1,299
2,144
7,427
2,692
2,918
2,778
1,222
2,992
4~375
2,838
2,079
5
21
12
16
27
46
29
28
18
42
47
1,964
1,498
2,069
2,977
3,799
1,818
1,407
1,817
2,599
1,715
2,460
3,995
4,449
2,210
1,762
2,521 Total 123,335 157,013
t Included in Falakata (NM)

Location Area of Code Mouza
Number (Village) i. e. in
J. L.No. j'~dme of Hectares of Mouza (Village)! and of
Mouza Town/Ward (in absence TOWil! (VilIage)/ of name repeat Ward in Ward No. Ward No.) Sq. Kms
1 2 3
10 P. S. Falakata
Jagijhora Barabak 519.91
2 Narsingpur 625.81
3 MechhuadhUl, Bala
Bathan 52).57
4 Deomal! 664.33
5 Ethelban Tea Garden 321.53
6 Chengmaritall 460.58
7 Dalmoney Tea Garden 291.12
S Dalgaon Forest 4,237.51
9 Sishabari Sarugaon 348.22
10 Khagenbat 621.35
11 Dbanirampur 7~0.48
12 Ghatpar Sarugram <il b.27
13 Sarugaon Tea Garden 17.92
14 Malsagarlll 4159.68
15 Pramodenagar 5)8.15
16 Gokulnagar 464.39
17 Balasundar 466.01
18 Jay Ch, ndpur
19 Bhutnilgnat
20 Baradoba
22 Parangarpar
23 Baganbari
24 Ksbirarkot
25 Dalimpur
26 Kathalbari
27 Guabarnagar
2: Jateswar
29 Hedaitnagar
30 A-linagar
31 Bengkandi
32 Tasti Tea Garden
410.56
347.50
250.38
570.41
345.82
273.64
575.72
488.17
372.13
428.8l
609.46
468.15
458.64
605.69
No. of Occupied Residen
tial Houses
4
389
365
340
576
330
317
193
38
225
558
623
310
496
460
511
498
380
451
434
271
894
423
307
538
442
326
852
702
401
312
924
No.ot House. holds
5
413
376
342
576
333
317
193
39
225
562
623
314
496
460
511
498
380
452
437
271
895
424
307
538
442
326
862
702
404
312
925
r 92 )
Total Population (including Institutional
and Houseless Population) ,..-____ --A---- _--,
Persons Males Females
6
2,288
2,170
1,858
3,148
1,765
1,796
980
238
1,222
3,211
3,441
1,604
2,692
2,343
2,868
2,599
2,157
2,210
2,279
1,579
4,n4
2,15::'
1,644
2,949
2,166
1,715
4.749
3,995
2,265
1,751
'4,375
7
1,336
1,189
993
1,671
918
962
484
116
630
1,671
1,810
822
1,372
1,214
1,492,
1,361
1,115
1,131
1,11l8
811
2,582
1,114
~59
1,559
1,230
910
2,544
2,100
1,182
913
2,202
8
952
981
865
1,477
847
834
496
122
592
1,540
1,631
782
1,320
1,129
1,376
1,238
1,042
1,079
1,0;11
768
2.402
1,G.31!
785
1,390
1,136
805
2,205
1,895
1,083
838
2,173
URBAN/VILLAGE PRIMARY
Scheduled Castes .-~
Scheduled Tribes
,..--.A._---. M F M F
9
84
276
460
690
14
130
2
136
817
1,312
355
64
868
726
595
945
78!
366
652
298
318
333
1,004
864
692
850
1,134
929
657
72
lO
64
2~3
406
480
5057
492
12
411
479
418
623 231 186
7 816 791
117 333 264
476 486
103 113
123 259 228
742 393 396
1, 194 55 42
• 345 147 125
51 1, 166 1,143
835 107 95
676 84 71
543 110 ,105
879 11 11
737
346 18 12
629
300 184 179
302 90 80
286 38 28
926 6 10
814
606 5 2
714 8 7
1~48 22 21
846 13 8
623 192 162
77 1,845 1,849

CENSUS ABSTRACT
Literates ..-_..A._~
Total Main
Workers (I-IX)
r-- _..A._""",
M F M F
13
404
161
234
502
131
257
86
30
186
616
~88
272
244
311
475
559
'441
485
·485
311
1,559
511
263
608
407
309
1,438
1,020
507
408
486
14 15 16
146 861 230
48 796 121
57 532 ·21
135 1,034 51
23
65
19
7
62
169
123
92
37,
73.
205
137
118
197
220
89
1,103
281
115
196
105
96
924
468
215
152
127
325 248
552 6
181 la6
68 4.
395 2
861 22
1,068 27
490 24
568 321
6i5 30
793 40
733 61
592 31
714 117
632
447
1,182
570
470
876
703
10
26
130
55
12
47
16
52l 23
1.267 122
1,146 35
642 4
497 77
858 376
[ 93 )
MAIN WORKERS
Agricultural Cultivators Labourers
(I) (II) ,-_..A.._ .-~ r--!"---__
M F M F
17 III 19 20
395 55 143 147
508 10 185 58
-379 120 12
892 II 124 39
17
358
53
289
561
784
327
24
448
553
524
407
6 5
2 144
5
2 101
3 208 18
9 233 18
4 137 19
127 59
153 28
6 194 31
2 IR5 59
4 100 '24
464 32 204 84
384
351
290
298
271
573
419
342
419
637
364
6
8
2
6
123
39
I3S
94
117
216
9
5
2S
31
9
34
4 280 12
~ 161 18
227 74
278 it
200 4
313 29 137 47
51 12
Houusehold Indstry
Manufacturing,
--------
Processing, Other' Servicing \\ lrkers
and Repairing [Ill, 1 ,T, V(b) &: [V (a)] VI to IX]
,--_"""---.. r-- -----"----.. M F M F
21
8I
S
3
5
8
2
2
6
7
26
15
15
7
32
18
8
2
7
23
)42
95
30
18
303
45
181
10
5
84
51
26
415
46
24
23
40
118
31
739
178
82
72
4
1,8
614
199
78
42
794
24
28
53
2
242
3
136
2
262
3
2
1
2
91
16
5
3
4? 16
375
Marginal Workers ~
M P
2S
19
39
150
3
9
5
25
14
1
4
17
6
26
6
202
88
2
148
7
55
12
36
1
15
3
4
1
,34
NOll-Wor_ril ~'"'\ M F
28
475 116
374 658
422. 756
631 1.424
44J
407
303
48
451
S2f>
36Q
118
235 590
810 1,511
133 1,.549
.,21
804
574
746
999
1,063
685 J,335
627 ,1,16l
523 1.01'
417
556
363
1.39~
5'1:1
389
671
521
370
961
,1.08
13'"
2,27t
979
m 1,309
1.120
- 19
7
6
4
4 '1,270
170
,2,019
1,857
1.04J
3 948
36 536
1 416 "150
95 68 1,249

Location Area of Code Mouza
Number (Village) i. e. in
1. L. No. Name of Hectares of Mouza.(VilJage)/ and of
Mouza Town/Ward (in absence Townl '(Village)1 of name repeat Ward in V'.ard Ne. Ward No.) Sq. Kms
2 3
10 P. S. Falakata-contd.
33 Dalgaon Tea Garden
34 Dalgaon
35 Karaibari
36 Uttar DeogaQn
37 Purbba Deogaon
3l.l Dakshin Deogaon
39 Madhya Deogaon
40 Dhulagaon
41 Pa.schim Deogaon
42 Jharhbeltali
43 Purbba Jharhbeltali
<I i Beltali Bhandani
4) Nabanagar
4) Harinathpur
47 Jogendrapur
4 Satpukuria
4':1 'Mairadanga
5{) Talukertari
51 Chfiota Salkumar
52 Paschim Salkum.Jlr
51 Uma Charanpur
5 ~ Khau Chandpara
55 Badaitari
5 1 Sibnatbpur
57 Lochhmandabari
58 Kunjanagar
59 Chuakhola
(JO Dakshin Parangarpar
f,\ Kadambini Tea Garden
1,2 Bangsidharpur
1,3 Raichenga
t4 Kalipur
615.61
663.33
319.95
464.30
336.73
380.33
246.12
483.18
230.06
413.19
'"'07.09
331.45
640.16
529.79
540.72
510.70
752.55
695.62
424.47
380.96
542.97
654.18
394.42
567.65
509.67
622.76
621.92
318.18
722.04
436.07
788.34
662.81
No. of Occupied Residen
tial Houses'
682
30:7
186
382
239
342
211
400
260
286
405
270
521
451
481
543
643
545
430
343
394
515
353
477
492
566
808
314
515
232
1,254
55~
{ 94
URBAN/VILLAGE PRIMARV-
No. of Households
5
682
307
186
382
239
342
211
400
260
286
405
270
521
452
481
543
643
545
430
343
394
515
353
477
492
566
808
315
515
234
1,254
559
Total Population (including Institutional
and Houseless , P'opulation)
r----..A----~--~
Persons Males Females
6
3,610
1,816
1,164
2,079
1,299
1,860
1,259
2,571
1,409
1,762
2,144
1.473
3,030
2,460
2,521
2,918
3.535
2.992
2,319
1,931
2,838
3,114
2,033
2,778
2,820
3,005
4,229
},741
2,974
1,335
7,427
3,174
1,871
934
624
1,108
677
973
649
1,340
738
886
1,102
736
1,578
1.264
1,290
1,515
1,839
1,549
1,235
997
1.463
1,6-32
1.059
1,472
1,423
1,585
2,138
893
1.553
700
4,199
J ,831
1,739
.882
540
971
622
887
610
1,231
671
876
1,042
737
1,452
1,196
1,231
·1.403
1.696
1,443
1,084
934
1,375
),482
974
1,306
1,397
1,420
2,091
848
1,421
635
3,228
1,343
Scheduled Castes
r---"---..,
Scheduled Tribes
r----A----~ M F M F
9
53 297
155
464
122
214
745
64
514
590
604
1,05l
655
703
617
687
767
644
141
285,
752
291
731
477
817
851
333
120
250
1,402
834
11
56 1,603
281 501
141 438
415 243
101 156
122
199 ,31
708 223
59 64
500 . 53
552 17
607 10
936 113
673 60
688 23
.606 80
607 186
669 203
601 324
134 324
230 264
730 587
275 77
647 Ziti
42b 342
714 335
861 100
317 185
100 1,098
210 130
963 150
727 121
12
1,519
461
375
203
138
132
26
165
49
57
12
14
92
43
12
77
176-
206
274
,00
259
51 s' 61
247
317
338
94
163
1,018
122
96
97

-CENSUS ABSTRACT
Literates -r-~
M F
13
_274
288
199
446
199
'258
148
274
141
369
365
256
627
483
373
398
·491
502
368
285
425
449
333
402
302
464
880
331
544
175
14
107
116
39
139
57
100
3S
78
28
189
135
89
253
237
173
151
160
171
120
93
150
137
153
105
102
211
490
163
184
45
Total Mam
Workers (I-IX) ~
M F
15
809
501
305
658
396
538
364
723
412
538
611
410
868
16
"-523
135
15
38
18
26
3
51
61
26
22
27
665 19
710 19
835 79
972 71
875 114
683 90
552 167
810 25
893 30
567 74
847 143
829 7
944 132
1,090 67
510 55
689 397
421 6
:2,626 - 1,228, 2,457 193
887 191 1,215 37
[ 95 1
MAIN WORKERS --A __ """<: _________ --.
Household Industry-
Manufacturing, Processing.
Agricultural Servicing Cultivators I.abourers and Repainng
Other Workers
[III, IV, V(b) &; VI to IX] (I) (II) [V (a)]
,---'-_---. r--....... ~ ,-----"----., ,.-_--A.-.--., M F M F M F M F
17 18 19 20 21
1
115 400
269
473
237
388
281
555
13 77
4 20
16 139
I, 138
2 130
70
9 150
6 2 17 2
7 t .. 15
2
40
238 10 167 51
453 69 /'
381 193 24
257 4 130 13 8
608-· 5 212 21
440 5 159 6" 10
485 2 166 12
543 12 135 33 45
693 12 247 56 3
654 54 169 57
405 13 242 74
386 44 156 116
358 3 375 20
634 5 215 22 3
332 9 194 59
590 37 242 98
626 190 6
625 50 183 68
447 12 259 19
225 IS 130 29
61 1 49 11
367 6 39
13
3
16
2
1
565
583
202 79 60
148 23/
22
18
2
23
808
24
14
44
21
19
13
18
7
16
37
15
48
56
59
112
29
51
36
15
76
41
41
15
13
123
381
139
577
14
2 1,630
484
24
523
7
4
5
10
9
2
5
1
8
5
16
3
3
3
2
2
3
6
8
12
35
11
385
108
14
Marginal Workers Non-Workers
.------"---~ M P M F
2S
26
16
8
11
25
S
5
49
8
S
9
12
6
63
5S
14
3
50
76
200
29
68
9
1
25
38
36
32
2
2
2
33
5
8
27
1,062
407
JO~
442
270
410
280
617
326
348
28
1,213
697
449
733
575
793
598
1,179
585
876
491 1,016
321 677
710 1,425
550 1.141
580 1,212
672 1,292
867 1,62~
674 1,329
552 992
439 770
653 t,317
134 1,447
483. ' 892
17 613 1,146
594 1.390
641 1.288
4 1,042 2,020
383 793
16 SOl 1,008
25 279 6C4
34 1,687 3,004
.602 1.306

( 96 1
URBAN/\'ILLAGE PRIMARY
L01:atioD Area of Code Mouza
Number (Vi1lag~), i. e. in ;, . T.otal Population
J. L.No. Name ~e}1 Hectarr No. of (including Institutional (l~. ,Mou'la ~VA :r and <), Occupied an~ Houseless Scheduled Scheduled
M6if7J1 Town/War (lD absence TOYin/ Residen- No. of Population) Castes Tribes '(Village)/ , ofna~e repeat, IT War,clin " tial House-. ,,.--,-,,,-"--,.----, -"-~ ,----"--_ \\ aid No. (War No.)' Sq. Kms "Houses bolds Persons Males Females M F M F
'1 ~ ~.:'\ !;t
5 3 4 (j r., 8 9 10 1] 12
10 P.S. Falakata-concld.
F'ilakat: (NM) f,r .92 "2,'128 2,2fJ7 I 11,998 6,179 5,819 956 846 47 32 " Iii' 28,292 '28,365 157,013 ' RUral 312.6 82,334 74,679 32,649 29,831 16.684 15,382
urban ~ ~4.9 (2.128 2,207 11,998 '6,179' 5;819 956 846 47 32
Grand T~f') ,
30,572 317.5 30,420 169,011 ' I
88,513 80,498 33,605 30,677 16,731 15,414 ",",' rlt
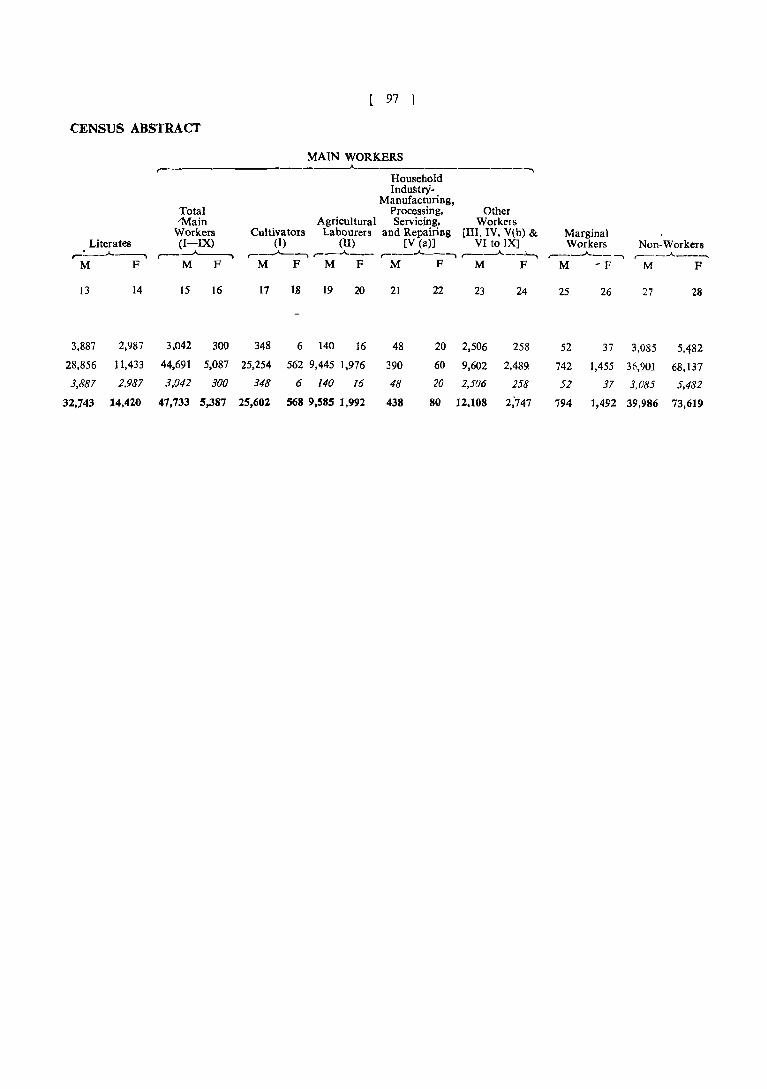
CENSUS ABSTRACT
Total -'Main Workers
Literates (I-IX) r-~~ ,.------A------.
M F M F
13 14 15 16
3,887 2,987 3.042 300
28,856 11,433 44,691 5,087
3,887 2,987 3,042 300
32,743 14,420 47,733 5,387
[ 97 1
MAIN WORKERS
Household InduStrY
Manufacturing, Processing, Other
Agricultural Servicing, Workers Cultivators Labourers and Repairing [Ill. IV, V(b) & Marginal
(J) (II) [V (a)] VI to IX] Workers Non-Workers r---"'-------. ,-.. ---A.___ '----"""'---1 ,-__ A_~ r--_..A.._-~ ,--__ ..A. __ --.
M F M F M F M F M -F M F
17 1.8 19 20 21 22 23 24 25 26 27 28
348 6 140 16 48 20 2,506 258 52 37 3,085 5,482
25,254 562 9,445 1,976 390 60 9,602 2,48'l 742 1,455 36,901 68,137
348 6 140 16 48 20 2,506 258 52 37 3,085 5,482
25,602 568 9,585 1,992 438 80 12.108 2~747 794 1,492 39,986 73,619


[ 99 ]
ALPHABETICAL LIST OF VILLAGES
il P.S. MADARIHAT
"-
Population Population S1. J. L. ,..---A-----... 81, J. L. ,...--...-A----., No. N arne of Villages .No. 1971 1981 No. Name of Villages No. 1971 1981
1 2 3 4 5 2 3 4 5
1 Ballalguri 34 995 1.626 16 Madhya Madarihat 47 1,279 1,260
2 Chapaguri 24 880 ],140 17 Madhya Ranglibazna 23 2,968 3,190
3 Dakshin Kharibari 22 1,0]8 1,365 18 Mujnai Tea Garden 39 3,019 3,151
4 Dakshin Madarihat 49 ],154 1,191 19 Pasehim Kharibari 41 459 1,793
5 Dakshin Ranglibazna 21 1,157 1,540 20 Pasehim Madarihat 48 984 1,084
6 Dakshin Sisubari 20 527 1,191 21 Purbba Khairbari 36 432 1,284
7 Dumehi Forest 25 157 197 22 Purbba Madarihat 50 ],032 1,152
8 Dumehipara Tea Garden 27 3,685 5,037 23 Titi Forest 32 * * 9 Garganda Tea Garden 29 3,101 3,574 24 Totopara 33 1,205 1,497
10 Hantupara Tea Garden 28 4,333 5.161 25 Uttar Chhekamari 45 .1,177 1,208
11 Holapara Forest 35 538 317 26 Uttar Khairbari 37 905 1,020
12 Islamabad 42 1,770 21301 27 Uttar Madarihat 46 3,746 4,973
13 Khairbari Forest 43 144 542 28 Uttar Rangalibazna 40 1,251 1,473
14 Madhya Chhekamari 44 869 1,025 • 29 Uttar Sisubari 19 1,413 1,765
15 Madhya Khairgari 38 2,549 2.139 Total 42,807 53.196
.. Uninhabited

£ 100 j
Location Area of Code Mouza
Number (Village) ~~ ~
J. L. No. Name of Hectares of Mouza (Village)! and of
Mouza Town/Ward (in ab~ence Town/ (Village)! of name repeat Ward in
Ward ~o. Ward No.) Sq. Kms
2
II P. S. Madarihat
19 Uttar Sisubari 261.81
20 Dakshin Sisubari 328.16
21 Dakshin Rangalibaznar 32'I'.Ch
22 Dakshin Khairbari 247.97
23 Madhya Rangalibaznar 523.54
Chapaguri
Dumchi Forest
266.16
1,199.49
24
25
27
28
29
3Z
Dumchipara Tea Garden 1,040.79
Hantupara Tea Garden 1,230.09
Garganda Tea Garden 943.88
Titi Forest 3,122.12
33 Tolopara
34 Ballalguri
35 Holapara Forest
36 Purbba Khairbari
37 Uttar Khairbari
38 Madhya Khairbari
39 Mujnai Tea Garden
40 Uttar R'lngalibaznar
41 Paschim Khairbari
42 Islamabad
43 Khairbari Forest
44 Madhya Ckhekamari
45 Uttar Chhekamari
46 Uttar Madarihat
47 Madhya Madarihat
48 Paschim Madaribat
49 Dakshin Madarihat
50 Purbba Madaribat
80!?06
408.H
1,357.52
246.24
203.12
505.08
743.60
385:84
294.92
351. 77
1,825.95
262.85
388.95
429.41
344.61
332.24
327,93
253.08
No. of Occupied Residen
tial Houses
4
276
189
270-
239
598
218
32
959
971
·761
271
289
60
218
183
438
686
261
370
410
89
176
222
939
225
209
211
217
No. of HOUseholds
5
299
189
270
239
604
218
32
959-
971
761
271
289
60
218
183
438
687
261
370
415
89
176
222
968
225
209
211
217
Total (Entirely Rural)
189.7 9,987 iO,051 Sq.KmS
URBAN/VlLLAGE PRIMARY
Total Populatioll (including Institutional
and Houseless Population)
r-------.A.-----'""\
Schedule'a Castes
r---.A._-,""\
SCheduled Tribes
r---""---'""\ Persons Males Females M F M F
6
1,765
1,191
1,540
1,365
3,190
1,140
197
5,037
5.161
3,574
1,497
1,626
317
1,284
1,020
2,139
3,151
1,473
1,793-
2,301
542
1,025
1,208
4,973
1,260
1.084
1,191
1,152
53,196
7
937
'623
818
721
10,655
828
568
722
644
1,535
9
49
48
20
62
372
632 508 3,
93 104
2,502 2.535 128
2,634 2,527 331
1,770 ,1,,804 515
790
865
169
672
§30
1,117
1.650
733
960
1,228
272
563
641
2,655
646
583
613
582
27,654
Uninhabited
707
761
148
612
490
1,022
1,501
740
833
1,073
270
462
567
2,318
614
501
578
570
25,542
20
25
31
21
104
,97
63
325
709
72
21
201
80
329
30
48
74
83
3,861
10
41
37
20
62
373
11
393
316
273
264
438
4 292
92
123 722
343 1,229
537 477
.18 365
28 583
25 54
9 261
77 200
87 '610
54 1.091
334 276
627 93
58 65
20 186
'193 239
51 383
303 155
32 186
36 256
76 63
79 106
3,652 9,668
12
358
284
~52
22.7
374
230
103·
715
1,191
477
351
500
49
219
190
5~5
978
276
84
68
174
178
343
117
178
819
57
100
9,447

( 101 1
'CENSUS ABSTRACT
MAIN WORKERS ____ -----------.J....-------------......
Literates >r"-~
M F
13
463
142
214
260
574
151
874
1158
347
136
186
22 131
170
238
355
190
-484
468
66
165
137
1,352
i40
132
208
203
14
302
44
71
146
327
63
347
203
124
36
60
91
80
54
155
69
249
219
23
48
48
860
63
40
89
97
Total Main
Workers (I-IX)
r,--A-...:-----.. M F
15 16
461 15
~45' III
450
446 22
911 92
305 4
'53 5
1,076 892
1;437 ,1,269
725 543
405 164
546 468
97
316 11
163 52
499 55
723 422
414 26
621 36
625 22
124 75
329
344 16
1,331- 93
366 9
341 41
325 5
280 15
Household Industry-
-Manufacturing. Pr9cessing.
Agricultural Servicing Cultivators Labourers and Repairing
(I) (II) [V (a)]
Other V, orkers)
[III. 1 V, V(b) & VI t() IX]
Marginal WorKers
,-__ ..A. ___ -, ,-__ -"-__ -, ,-__ -"-__ -, ,---'-__ -, ..-__ -"-------. Non-Workers
...----"---.... M F M F/M F M F M F M F
17 18 19 20
155 3 60
264 100 61
348 99
352 12 57
3
8
9
462 36 231 38
184 82 2
10
7
4
2
6,
21
7
2
7
44
5
5
Uninhabited
317 152 19
512 459 17
79 5
2
150 5 69 2
67 7 46 16
290 12 129 19
6 29 2
311 3 80 12
321 2 221 26
344 7 173 5
34
218
3
99 3
269 5 53 5
252 6 97 7
206 5 61
226 14 94 21
203 2 100 3
205 5 31 10
4
3
3
18
10
12
22,
7
23
239
20
30
174
39
24,
9
3
II
2
43 4
19 1,063 870
2
2
2
5
1,433 1,263
720 542,
69
13
13
50
77
685
23
79
90
87
12
12
970
99
21
22
43
10
7
4
29
22
420
II
8
8
75
I
79
3
6,
,',
25
6
3
56
48
203
4
159
140
126
124
48
58
9
30
26
137
27
476
272
\ 368
272
688
321
40
52, 1,378
1,197
291 842
8
2
1
240
110
H!6
166
381
3f9
72
356
208
478
801
319
339
479
148
234
28
812
457
721
622
1.306
504
99
1.59l
1,25&
970
535
293
145
600
198
857
893
714
797
885
19~
45&
133 249 418
23 1.266 2,202
280 604
2 242 458
6 279 567
272
.,
11,667 3,909 14,058 4,469 5,790 836 1,923 20S 122 38 6,223 3,390 1,014 1,364 12,582 19,70'

51. No.
2
3
d
5
6
7
8
9
10
11
12
1~
14
15
16
17
1.
ly
20
21
22
23
24
25
26
27
28
29
30
31
32
33
34
35
Name of Villages
2
AlipUl Duar
Alipur Duar Junction
Bairiguri
Bakla
Banchukamari
Baniadabri
Baniagaon
Bara Chakirbas
Bhasadabri
BhatIbari
Bhelukdabri
Bholardabri
Bindipara
Bimara
Boragari
Brajerkuthi
Chalnipak
Chandijhar
Chapa tali
Chaprarpar
Chechakhata
Chengpara
Chepani
Chhipra
C~hota Chakirbas
Chiidiguri
Chilurghat
Dakshin Barajbar ,Forest
Dakshin Chakoakheti
Dakshin Dhalkar
Daksbin Kamsinggram
Dakshin Mahakalguri
Dakshin Majberdabri
Dakshin Majidkhana
Daksbin Paitkapara
1. L. No.
3
VO
J 47
126
42
104
103
123
76
68
62
56
70
45
67 133
64
63
43
54
57
53
127
125
124
93
~O
12
20
77
29
122
55
87
33
102
ALPHABETICAL LIST OF VILLAGES
12 P.S. ALIPUR DUARS
Population ,-_ ...A.----., 1971 1981
4
t
t 2,079
1,337
1.569
849
1, 43
1,935
1,052
1,71
1.591
3,842
599
3,598
1.541
1,311
1,744
2,031
2,606
2,336
3,371
1,048
2.166
1,105
851
N.A.
892
1,239
2,531
1.226
1,168
1,422
983
1,876
1,594
5
t
t 2,734
1,532
1,889
1.137
1,492
))80
1,155
1.<39
2,068
5.932
729
5.762
1.985
1 578
2,911
2.!:I4
2.347
1,882
tt Ij4l'1
2,044
1,309
969
30
1.162
2.898
3,439
1.473
1,373
120
1,077
2,224
1,605
51. No. Name or Villages
2
36 Dakshin Panialguri
,7 Dakshin Parokata
38 Dak~hin Sibkata
39 Dakshin Sonapur
40 Damanpur
41 Damsibad
42 Dangi
43 Dhalajhora
44 DhaJajhora Tea Garden
45 Foskadanga
46 Garokhuta
47 Ghaj!ra
41' JaJdapara
49 Jasodanga
50 Jogendranagar
51 Joypur
52 Kadampur
,,3 K 11abaria
54 Karjlpara
55 Karipara
56 Kayakha ta
57 Khatpara
58 Kohinur Refugee Camp
59 Kumarijan
Kumarpara
Loknathpur
62 Madhya Paitkapara
63 Madhya Parokata
64 Madhya Sibkata
65 Mahaka:guri
66 Mathura Tea Garden
67 Mejbil
68 Munsipara
69 Naothcartari
70 Nurpur
J. L. No.
3
60
13"
78
27
51
112
H)9
liS
Ws
40
108
46
10
8~
5
105
100
6
69
71
14
72
120
91
24
117
37
Db
82
121
25
3
8
35
1J3
Population • ...A... __ _
1971 1981
4
2,355
2,296
1 364
1,353
t 1,597
846
',55'
1,65':1
1,970
2,6')2
481
1,825
2,130
352
4',9
1,947
t,608
457
2. ,1)1
426
2,5b9
2, 7)
1,404
1,180
1, III
911
241
918
3,527
2,098
3.344
1,046
1,298
5
2,'710
2,743
1,596
1,501
t 1.827
994
1.579
'2,407
.937
830
3,106
636
4,143
2.2Q9
449
609
2.353
1,927
526
2.L3Z
17
3,427-
L Ld2
I,J31
8,304
1,464
2,036-
254
1,205
7,1"'3
2,636·
4,120
1,222..
1.291

103
ALPHABETICAL LIST OF VILLAGES
12 P. S. 4.LIPUR DUARS-concld.
St. No.
1. L. No.
Popula:101.1 .A .~
1')81 Name of Villages 1971
71 Nhtanpara 11 1,1)( 2
72 Pachkalguri 28 1,()93
73 Paitkapara Tea Garden 39 1,252
74 Pakuritala 32 2,944
75 Panbari 110 644
76 Pararpar 44 2,16'7
77 Parpatlakhawa 2 3,115
78 Paschim Bara Chouki 65 2.253
79 Paschim Chepani 98 1,465
80 Paschim Chikligufl 92, 1,OOS
81 Paschim Jitpur 49 4,'704
82 Paschim Kathalbari 4 '2,876
83 Pascbim Khalisamri 97 1,505
84 Paschim Majherdabri Tea
Garden 48
85 Paschim Salbari 34
-86 Paschim Simlabari 22
87' ~atlakhawa 18
88 Patotala 101
89 Pradhanpara 9
90 Pukhuria 83
91 Purbba Bara Chouki 66
92 Pllrbba Chepani 128
9j Purbba Chikliguri 94
'94 Purbba Jitpur 106
95 Pu?bba Kathalbari 17
96 Purbba Khalisamari 131
97 Pubba Majherdabri Tea
Garden 58
98 Parbba SimJabari 21
99 Putimari 75 '100 Salkumar Forest 15
101
'102
Salkumarhat
Salsa1abari
7
73
t Included in Alipurauars (M)
552
1,853
37
948
1,652
1,331
1.114
1,094
5,053
t '206
3,395
1,298
1,752
590
')94
204
2,491
4,049
l,R65
1.936
3,205
3,301
681
2,507
168
2,592
2,331
1, '36
7,955
3.619
1,571
664
1,127
373
1,605
2,270
1,874
1,460
1,273
3,875
2,929
198
4,046
1.464
1,148
624
1,199 Z77
3,468
4,692
tt Part in Alipurduar Rly. Jnc. part in Chechakhata O. G.
Sl. No, Name of ViUap
103 Sambalpur
104 Samuktala
105 Satkodali
106 Saadpura
107 Sidhabari
108 SilbaIihat
109 Simlabari
110 Sirubari
III Sobaganj
112 Srinathpur Tea Garden
113 Suripara
114 Taleswarguri
115 Tapsikhatll
116
117
Tatpara
Thanupara
118 Torsa Forest
119 Turturi
120 Uttar Bhatibari
121 Uttar Clllkirbas
122 Uttar Chakoakheti
123 Utt~r Chikliguri
124 Uttar Dhalkar
125 Uttar Kamsingram
126 Uttar Majherdabri
127 Uttar Majidkhana
128 Uttar Paitkapara
129 Uttar Panialguri
130 Uttar Parokata
131 Uttar Rampur
132 Uttar Sibkata
133 Uttar Simlabari 134 Uttar Sonapu.!"
Total
1.L. No.
Population ,...---.A. __ "-\
1971 1981
107 374
102 2,873
41 1,550
88 1.268
13 1,990
19 2,665
111 707
16 1.122
52 2,363
81 1,058
14 1.445
99 1,675
31 1,924
85
96
2,453
1,400
1 715
114 1.216
89 1,605
119 5,675
36 887
95 1,378
79 1,240
30 l,toO
61 1,002
86 2,186
38 1.728
59 2t.408
129 2,337
116 618
80 886
23 951 26 3,361
522
3.714
1,680
1,554
2,832
3,026
909
1,479
tt 1,050
1.950
2.210
2,329
2,632
1,633
246
1,404
1,787
55
1.077
1,646
1,496
1,216
1,567
2,325
2,023
2,79't>
3,067
688
2,028
1.125 3,508
217,312 261.692

Location Area of Code Mouza
Number (Village) i. e. in
J. L. No. Name of Hectares of Mouza (Village)/ and of
Mouza Town/Ward (in absence Town! (Village)/ of name repeat Ward in Ward No. Ward !-fo.) ~ Sq. Kms
2
12 P. S. Alipur Duars
Torsa Forest
2 Parpatlakhawa
3 Mejbil I,
4 Paschim Kathalbari
5 Jogendranagar
6 Kalabaria
7 Salkumarhat
8 Munsipara
9 Pradhanpara
Jaldapara
3
2,763.61
31.36
551.78
861.65
547.49
417.99.
555.86
754.60
430.38
448.74 10
.f1
12
!3
t"~
15
16
17
18
19
20
21
22
Nutanpara 577.09
Dakihin Barajhar Forest 9,893.79
2~
24
25
26
27
28
29
30
31
32
Sidhabari
Suripara
Salkumar Forest
Sirubari , Purbba Kathalbari
Patlakhawa
SilbarihaIt
Dakshin Chakroakheti
Purbba Simlabari
Paschim Simlabafi
Uttar Simlabari
Kumarpara--
Mathura Tea Garden
Uttar Sonapur
Dakshin Sonapur
Pachkalguri
Dakshin Kamsinggram
Dakshin Kamsinggram
Tapasikhata
Pukuritala
625.38
392.94
503.03
282.21
695.33
642.95
610.22
653.76
315.41
343.33
290.24
466.35
814.24'
74&.80
361.45
308.67
290.76
355.}5
966.40
756.31
No. of Occupied Residen
tial Houses
4
62
76
495
733
415
421
.632
732
2'33
125
471
517
467
351
38
263
730
286
553
658
122
64
176
248
1,399
632
260
396
256
218
439
591
I 104
Total Population (ifJcluding Institutional
URBAN/VILLAGE PRIMARY
and Houseless Scheduled No. of Population Castes House- .-------"--------, ,---"----.
Scheduled Tribes
,---"---~
holds Persons Males Females M F M fi
5
62
76
497
7!3
415. 421
638
733
234
125
471
517
467
351
38
263
732
286
553
659
122
64
176
248
1,40D
632
260
398
256
218
439
593
6
246
36&
2,636
3,619
2,299
2,353
3,468
4,120
1,874
636
2,865
2,898
2,832
1,950
277
1,479
4.046
1,605
3,02.6
3,439
624
373
1,125
1,531
7,173
3,508
1,504
1.936
1,373
1,216
2,329
3,301
7
131
184
1,374
1,900'
1,182
1,230
1,814
2,109
961
330
1.535
1,536
1.468
1,030
162
749
2,085
841
1,563
1.769
347
179
592
814
3,730
1.817
774
1.036
698
642
1,231
1,740
8
liS
184
1,262
1,719
1,117
1,123
1,654
2,611
913
306
1,330
1.362
1,364
920
US
730
1,961
764
1.463
1,670'
277
176
533
717
3,443
1,691
730
900
675
574
1,098
1.561
9
23
74
830
1,416
779
715
1,393
1,696
566
166
732
38
997
836
584
801
540
990
1,152
~192
35
120
541
222
1,339
676
811
564
481
955
1.270
10
15
73
816
1,296
689
597
1,301
1.599
513
11
44
13
161
227
167
219
247
269
121
165 85
607 296
9 1,396
913 383
765 141
148
589 50
576 286
419 161
737 195
928 ISO
178 103
22 29
97 418
512 253
89 2.907
1,219 M
640
706 23
558 33
424 138
771 50
1.042 179
12
31
13
170
216
148
206
220
265
122
Tf.
261
1,2si .,;
372
117
III
36-
231
131
171
149-
67
26
379
193
2,745
58
26·
23
132
31
162

CENSUS ABSTRACT
Literates ,...---..-'----,
1\1 F
13
60
60
565
684
421
335
778
941
354
111 439
249
639
404
11
241
989
122
578
827
89
55
75
'\
14
18
24
242
224
121
94
311
350
93
27
151
66
266
119
2
80
594
35
217
535
30
25
25
Total Main
Workers (I-IX)
r-----"-----.. M F
15 16
79
105 10
767 134
],049 82
636 38
668
930 ,
1.164
557
185
802
897
770
559
57
431
1,021
470
858
986
198
114
355
31
63
44
12
2
91
343
12S
112
13
10
132
21
72
96
13
1
7
419 147 473 33
],010
963
430
453
257
198
452
877
347 1,595' 581
466
169
149
81
60
197
393
984
428
581
403
378
634
912
66
21
37
11
117
91
58
[ 105 J
MAIN WORKERS .----------------~ Household Industry
Manufacturing, Processing, Otber
Agricultural Servicing, Workers Cultivators Labourers and Repairin8 [Ill, IV, Vlb) &: Marginal
(1) (II) [V (a)J VI to IX] Workers .-----"----, .----'-----, ,--........ ----, r-----"-----. .----"-----.
M F M F M F M PM P
17 18 19 20
66
530 26
791 42
501 22
29 5
171 86
179 15
99 10
468
555
730
397
134
2 143 23
6 193 29
5 27i 18
2 113 5
522 15
232 217
546 79
399 83
47 7
30 2
232 73
548 124
207 28
155 27
3 5
261 155 10
445 29 153 64
37i 2 88 19
485 9 188 48
407 7 323 ~8
125 71 12
104 7
325 S 20 2
21
4
4
2
7
20
31
4
17
3
22
22
11
11
5
23
79
6
62
70
29
56
12 162
16
1
5
·125
43
21
47
117
17
5
7
15
401
4
182
234
2
3
10
24
3
II
14
1
6
16
20
4
2
2
18
2
23
14
46
25
7
4
44
39
54
111
13
27
8
52
7
19
105
8
26
3
61
10
123
199
38
106
87
56
152
5
2
17
7
74
17
Non-Worker! .--_ ........ _-..
M F
28
52 115
n 174
603 1,125
807 1,576
507 1,069
50S 969
773 1,392
932 1,929
377 795
137 "217
681
639
698
464
86
)'183
1;019
1,239
656
97
318 718
959 1,812
370 736
697 1,317
783 1,574
149 247
83 175
237 525
291
142
2 149 27 33 4 1 341 683
2,637
1.598
709
749
664
457
954
3 81 11
617 14
351 13
283 2
301 4
293 68
331 34
557 12
200 32
44 4
151 HI
100 7
75 47
194 50
148 36
31
7
2
9
11
15
2
2
1
3
1,341 667
160
31
138
2
10
97
192
IS
2
17
2
6
7
91
6
5
1
8
18
125 2,044
27
114
53
24
827
345
450
295
263
589
810 1,479

Location Area of Code Mouza
Numebr (Village) ',. i.e. in J. L. No. Name of Hectares
of Mouza (Village! and of Mouza Town/Ward in absence Townl
(VilIage)1 of name repeat Ward :il Ward No. Waret No.) Sq. Kms
2 3
No. of Occupied
Residen- No. of Hal House-
Houses holds
4 5
106 J
Total Population (inclu-ding Institutional
and HOl.ls~l:;:JJ Population)
--:------""'---"'-...._-~ Pers~ns Male~ Females
6 7 8
URRAN/VILLAGE PRIMARY
Scheduled Castes
.r----A.---, M F
9 10
Scheduled Tribes
r----."A_---~
M F
11 12
12 P. S. Alipurduars-contq. .'
33 Dakshin Paitkapara
34 Paschim Salbari
689.41
322.76
35. Naothoartari 566.21
36 Uttar Chabakheti 455;16
37 Madhya Pailkapara 259.97
38 Uttar Paitkapara 515.13
39 Paitkapara Tea Garden 498.37
40 Foskadanga.. 635.02
41 Satkodali 577.94
42 Banchukamari 481.82
43 Chapatali 543.53
44 Pararpar 546.53
45 'Birpara 612.47
46 Ghagra 50 l.OO
47
48
49
Bairiguri
Paschim Majberdabri
Tea Garden
Paschim Jitpur
50 Alipur Guar
51 Damanpur
52 Sobaganj
53 Chengpara
54 Chaprarpar
55 Daksbin Majherdabri
56 Bholardabri
458.92
125.84
632.32
393.20
564.68
264.25
242.01
287
196
202
186
255
345
588
310
286
339
420
463
!,097
589
469
140
1,430
308
324
208
1,045
/
, 287
196
1,605
1,127
207 1,222
186 1,077
256 1.464
345 2,023
591 ],205
312 1,937
286 1,680
339 1.889
420 2,347
463 I 2,507
1,097 5,762
589 3,106
469
140
1.430
2,734
664
7,955
838
594
633
581
777
1,057
1,626
1,027
878
980
1.237
1,295
2,974
1,646
1,426
358
4,218
767
533
589
496
687
966
1,579
910
802
909
1,110
1,212
2,788
1,450
1,308
306
3,739
260
385
300
150
517
678
215
263
127
608
620
830
862
930
733
4
739
[neluded in Alipur Duar (M)
Included in Alipur Duar (M)
Included in Sobaganj (OG)
308
329
208
1,481 763 718 660
1,048
1,882
1,077
5:932
1,040
575
3,079
842
502
2,853
715
415
746
259- 426
354 172
'!. 295 320
144 429
464 136
627 324
I tIl, 181
250 749
236 607 ,
566 11w 560 147
782 106
868 140
835 19
674
9
645
618
591
358
692
181
212
160
8
42
38
42
376 , 142
285
348
110
291
1,194
650
562
77
141
94
120
24
180.
1~2
131
4
39
28
38
:37 Chechakhata Partly included in Alipur Duar Rly. June. and re naining part included in Chechak6ata {OG)
58 Purba Majberdabri
Tea Garden 298.21
59 Uttar Panialguri
60 Dakshin Panialguri
61 Uttar Majberdabri
62 Bhelukdabri
520.72
564.66
369.52
417.24
233
426
491
279
375
233
426
491
279
S75
1,143
2,790
2,7.10
1,567
2,068
603
1,~01
1,410
865
1,102
540 23
1,389 259
1,300 474
702 669
966 • 712
19
239
471
572
515
457
832
130
37
27
398
829
134
21
19

( 107 1
CENSUS ABSTRACT
MAIN WORKERS r-----------------------~-------------------------,
Literates ,...-----J'----.
M F
13
216
265
267
149
256
369
293
336
268
336
333
460
1,615
860
398
76
2.804
335
449
307
1,939
14
65
76
57
47
100
112
92
120
89
151
164
220
1,059
425
164
25
1.888
159
200
177
1,275
Total Main
Workers (I-IX)
,-___ .A._~
M F
15 16
490
292
288
306
402
45
J
11
88
9
553 122
654 461
404 8
460
5.18
23
20
655 72
724 67
1,557 149
796 44
769 134
143
1,819
406
599
318
1.449
76
73
47
58
50
123
Household Industry
Manufacturing. Processing,
Agricultural Servicing C;ultivators Labourers and Repairing
(I) (II) [V (a)]
Other Workers
[III;,IV. V(b) & VI to IX]
,-_.A-._.~ ;:::-_-"-__ --, ,-_ _.A. __ ---, ,-_--A.. __ --,
M F M F M F
17 18 19 20
389 20 61 10
236 48
263 3 15 2
268 70 25 15
262 2 71 3
364 66 128 41
14 8 1
320 3 61 2
361 II 62 11
307 2 176 13
375 43 232 29
351 9 253 52
314 4 317 69
263 184 29
434 123 165 8
., ~ 9 I
21
24
4
15
15
5
t
9
14
2
1
22
15
9
4
6
M F
23
16
8 ,
10
9
54
46
627
22
37
35
48
111
912
347
169
133
24
6
2
4
6
460
3
5
2
70
15
2
181 2 222 16 41 3 1,375
7S
52
151
220
180
251
6
8
12
Included in Alipur Duar (M)
Included in Alipur Duar (M)
Included in Sobaganj (00)
161 26 I ~
lOS 17
98 37
276 ~ 22
2
66 19
93
273
38
856
11
41
5
70
Marginal Workers . Non-Workers
,-_ ......... _--., r----,.,.__~
M F M F
25
7
42
25
80
t64
43
28
19
2
37
40
, 24
7
9
26
161
131
35
2
126
90
127
58
27 .
341
260
344
250
374
504
892
459
375
434
217 563
2 569
48 1,380
42 810
656
28
561
401
578
373
676
844
992
81Z
652
831
821
1,143
2,591
J,374
1,173
215 230
10 2,375 3.654
21
356
441
250
1,621
670
784
452
2,709
Partly include~ in Alipur Duar Rly. June. and remaining part included in Chechakhata (OG)
156
662
811
426
535
38
547
4'41
178
27~
280 146
672 148
529 16
459 IS
528 14
45 2
328 44 269 70
228 4 161 6
249 143 11
282 4 180 9
4
8
.. , 3
235
75
136
59
66
144
34
6
23 '28
162
24
J9
305 366
729 1,222
719 1,283
382 687
573 952

Location Code
Number i. e.
Area of Mouza (Village)
in J. L. No.
of Mouza
(Village)! Ward No.
Name of Hectares Mouza (Village)! and of
Town/Ward (in absence Town/ of name repeat Ward in
Ward No.) Sq. Kms
2 3
12 P. S. Alipur.duars-contd.
63
64
65
66
67
68
69
70
71
72
73
74
75
76
77
78
79
80
81
82
83
84
85
Chandijhar
Chalnipak
Paschim Bara Chouki
Purbba Bara Chouki
B'oragari
Bhatibari
Karjipara
Bindipara
Karipara
Khatpara
Salsalabari
Kayakhata
Putimari
Bhasadabri
Dakshin Dhalkar
Dakshin Sibkata
Uttar Dhalkar
Uttar Sibkhata
Srinathpur Tea Garden
Madhya Slbkata
Pukhuria
Jasodanga
Tatpara.
86 Uttar Majidkhana
87 Dakshin Majidkhana
88 Saudpara
89 Uttar Bhatibari
90-- Chilurghat
91 Kumarijan
92. Paschim Chikliguri
93 Chikliguri
94 Purbba Chikliguri
"\.
555.52
579.79
665.30
308.42
464.23
435.26
521.99
204.48
104.83
151.84
683.25
322.45
305.86
324.35
335.99
421.47
407.75
513.46
329.4 [
67.45
690.43
421.14
540.69
559.14
:m.82
169.77
335.28
133.1 [
518.95
142.30
10.93
429.38
No. of Occupied Residen
tial Houses
4
411
534 .
526
256
364
353
359
143
99
116
838
423
232
189
255
262
241
366
183
49
265
809
493
426
4[6
294
32[
227
4[6
206
S
siI
[ 108 )
No. of Houi!ehoids
5
411
551
526
256
364
353
359
143
99
119
839
423
234
189
255
262
241
366
183
49
265
809
494
426
416
294
321
229
416
206
S
Sll
Tota[ Population (including Institutional
and Houseless Population)
,Persons
6
2,294
2,917
2,592
1,273
1,985
1,839
1,927
729
526
517
·4,692
2,232
1,199
1,155
1,473
1,596
1.496
2,028
1,050
254
1,460
4,143
2,632
2,325
2,224
1,554
1,787
1,162
2.282
1,136
30
2.929
Males Females
J
1.201
1,536
1,323
656
1,007
- 943
999
394
277
263
2.489 .. 1,165
633
616
781
855
788
1,069
550
128
755
2,125
1.366
1,231
1.144
83?
931
620
1,233
595
15
1,48'
8
1,093
1,381
1,269
617
978
896
928
335
249
254
2.203
1.067
566
539
692
741
708
959
500
126
705
2.018
1,266
1,094
1,080
715
856
542
1.049
541
IS
1,441
URBAN/VILLAGE PRIMARY
Scheduled Castes
~--...... M F
9
810
863
648
142
703
794
430
367
50
248
1,180
773
401
157
182
528
13
107
80
62
10
1,179
615
698
400
623
387
31,
648
248
9
716
10
752
769
632
114
695
783
398
313
69
23[
1.053
714
351
131
163
447
13
109
85
59
II
1,085
574
607
372
536
346
252
567
244
.9 '
679
Scheduled Tribes
,-_--A.--. M F
11
14
179
186
10
3
141
32
37
3[
40
115
418
533
300
19
693
27
4
4
3
8
10
12
43
12
9
170
160
12
2
126
30
30
25
36
94
350
464
280
14
654
27
1
6
1
9
4
9

[ 109 1
,CENSUS ABSTRACT
MAIN WORKERS ,--------------~.--------------.-------~
Total
Literates .,,__....______,
Main Workers (I-IX) ~-.....
"M F M F
13
538
<746
411
226
339
428
495
244
108
135
1,420
563
245
322
361
384
:295
201
70
42
.235
<748
573
·627
'665
349
-573
.:289
.552
235
6
'471
14 15 16
249 611 107
306 860 79
137 777 145
50 386 92
103 566 26
173 448 66
214 497 28
89 220 !O
39 166 4
62 123 20
876 1.229 123
260 643 86
103
163
195
155
188
70
23
20
139
334
331
323
427
214
330
193
220
87
1
154
351 III
297 131
413 29
454- 21
369 16
590 42
297 139
67
469 59
1.053 145
699 174
470 17
537 40
405 17
462 49
338 56
600 28
299 9
7
799 1<}
\
Agricultural Cultivators Labourers
(1) (II) r--"""'--_._._ r--.A.-....
M F M F
17 18 19 20
338 41 199 64
523 3 280 72
442 62 283 76
237 31 130 61
340 201 21
258 2 142 63
243 181 25
105 106 10
60 102 4
63 3 34 11
453 29 236 63
277 13 248 49
188 34' 120 7t"
148 89 100 42
223 146 26
296 133 19
234 11 118 5
390 12 164 20
115
57
393
387
271
245
205
191
240
75
365
177
2
460
5 2
6
51 63 7
14 487 77
14 283 111
2 106 10
8 125 13
153 11
27 136 18
2 98 45
7 187 13
89 8
,5
274 12
Houusehold Indstry
Manufacturing. Processing, Other Servicing Workers
and Repairing [III. IV. V(b) " [V (a)] VI to IX]
,-____.A".-----,. ,.------A-----,. M F M F
21
10
2
2
3
5
2
27
22
2
3
3
3
40
17
11
H
3
i ..
2 64
4 S5
50
16
2 20
47
73
9
2
26
4 513
19 96
22
2
2
S
43
47
44
22
17
36
177
10
139
145
JOi 196
61
75
165
45
32
64
24
7
3
I
2
6
27
5
5
2
2
10
131
I
32
47
3
19
4
4
9
7
i
Marginal Workers
r-----"-~ Non-Workers
,-_-A-----" M F M F
2S
I 3
3
17
14
3
19
7
3
(;
3
8
54
20
125
{it
54
20
'26 27 28
587 986
673 1,302
15'1 529 '9n 270 525
441 952
48! 830
501 900
174 325
2 108 243
':'/8 121 156
5 1,253 2,075
9 519 972
64
2
44
f
33
U7
44
38 71)
77
35
U4
ii
282
319
362
398
'H9
478
253
53
286
I~OH~
647
<H6 546
380
449
282
632
296
8
.sa7
455
408
599
718
{i48
916
36l
n 529
1,829
t,{)54
1.007
963
663
693
4il6
940
532
is
l,424

Location Area of Code Mouza
Number (Village) i. e: in
J. L.No. Name of Hectares of Mouza (Village)! and of
Mouza Town/Ward (in absence Town} . (Village)! of name repeat Ward in Ward No. Ward No.) Sq. Kms
1 2 3
12 P. S. AlipuFduars-contd.
95
96
~7
93
99
100 101
102
103
104
105
106
107
108
Ll09
110
111
lI2
!l13
164 115
n16
117
118
119
120
121
122
123
124
1205
lf6
UUar Chikliguri
Thanupar_a
Paschim Kh,alisamari
Paschim Chepani
Thleswarguri
Kadampur
Patotola.
Samuktala
Baniagaon
Baniadabri
Joypur
Purbba Jitpur
Sambalpur
Garokhuta
Dangi
Panbari
Simlabari
Damsibad
~urpur
Turturi
Dhalajhora
Uttar Rampur
Loknathpur
Dhaolajhora Tea Garden \
Uttar Chakirbas
Kohinur Refugee Camp
Mahakalgyri
Dakshim Mahakulguri
Bara Chakirbas
Chhota Chakirbas
Chhipra
Bakla
355.20
396.29
384.00
634.73
302.95
287.64
278.34
362.42
592.92
559.91
148.69
1ll.o1
200.49
346.37
334.15
281.82
420.68
560.9&
'40.71
'517.08
549.4&
.331.00
425.06
615.94
20.63
762.74
232.13
331.87
455.49
239.09
324.42
'349.68
No:-of Occupied Residen
tial Houses
4
321
290
302
433
398
121
433
683
278
225
87
36
100
159
204
115
157
351
245
254
305
115
2,131
495
9
627
205
208
335
192
262
280
[ tiD ]
Total Population (including lnsti tutional
and Houseless Population)
URBAN/VILLAGE PRIMARY
Scheduled Tribes No. of
Housebolds
~-- -"------, Scheduled
Castes ,..-_.A.~ ,..-__ .A.._--.
5
321
290
302
433
398
121
433
693
278
225
87
36
100
159
204
115
157
351
245
254
~05
115
2,131
495
9
627
·205
209
335
192
262
280
Persons Males Females
6
1,646
1,633
1,571,
2,331
2,210
609
2,270
3,714
1,492
1,137
449
198
522
830
994
681
909
1,827
1·,291
1,404
1,579
688
8,30 ~
2,407,
55
3,427
1,205
'1,206
1,980
969
1,389
1,532
7
849
845
811li
1,202
1,149
308
1,152
2,004
752
600
233
104
277
446
494
344
456
950
675
746
823
364
4,195
1,243
30
'1,723
637
615
1,008
.524
722
806
8
797
~8
755
1,129
1,061
301
1,118,
1,710
740
53'J
216
94
245
384
500
337
453
877
616
658
756
324
4,109
1,164
25
1,704
568
591
972
445
667
7i6
M F
9
446
476
348
326
159
152
235
\3
4
203
21"
48
274
163
165
81
4
635
49
8
118
74
218
143
250
178
326
10
415
43'6
315
295
172
128
223
11
2
236
18
51
235
153
151
90
6
620
48
6
138
15
188
127
214
163
312
M F
It
8
7
62
33
211
276
274
397
'736
585
231
104
274
413
220
266
387
571 , 411
492
490
277
397
969
16
1,183
245
153
572
88
'181
26
12
5
i
64
2S
, 183
268
2IW
333
729
523
216 -\"I> 94
243
364
215
262
380
534
363
431
40'[
234,-
334
930
15
1,.135-.
211
179
566
72.
174·
26.

.cENSUS ABSTRACT
Literates ~---"-----,
M F
j 13
410
410
279
548
4J6
148
669
816
115
174
25
23
33
146
95
53
44
·193
48
185
235
99
.807
-157
6
175
317
300
437
147
.264
.389
14
197
160
139
257
237
108
410
440
65
88
\11
10
3
74
28
11
27
87
13
102
132
48
258
77
2
65
148
186
293
54
128
184
Total Main
Workers (I-IX)
,----A------, M F
15 16
451 18
418 25
409 16
600 49
686 180
194 22
593 106
1,102 157
438 103
367 260
158 140
66 4
220 167
292 216
323 113
212 18
246 179
488 184
499 156
448 39
540 199
197 104
1,699 310
7?-' 603
17
634
331
288
50~
309
391
328
22
30
62
13
13
415 15
[ 111 ]
MAIN WORKERS
Household Industry
Manufacturing, Processing.
Agricultural Servicing Cultivators Labourers and Repairing
(J) (II) [V (a)) r---"------, ,--_.A...._-, ..----~
M F M F M P
17 18 19 20
299 102 14
234 7 162 17
266 2 126 12
358 4 182 35
354 110 150 2-+
129 5 57 15
141 5 168 62
2,40 16 207 68
263 8 165 95
266 182 94 75
124 102 32 38
61 5
181 137 37 29
197 147 84 68
212 3 96 110
192 12 18 6
98 28 134 ISO
338 129 127 50
377 116 113 39
273 14 )40 22
382 121 133 76
185 99 9 5
700 69 928 197
16
4
222
164
274
193
26.
270
4
10
7
8
62
60 11
So 6
190 • 29-
73 1
82 4
2 101 11
21
41
3
2
9
22
3
1
22 '28
10 1
75 16
4 2
2
2
7
1 . 1
12
4
1
2
1
7
1
2
4
10
'\ Other
Workers) [ID. IV, V(b) &; Marginal
VI to IX] Workers r---A---,~
M F M P
23
40
19
15 51
160
8
274
580
10
3
2
9
8
2
14
23
.8
24
1
10
18
2
38
57
4
t
4
t
-3
2
25
15
&i 6
<i1
8
18
13
22
S4
2
U
18
2G
'56
33
27
29
109
1
39
96
J.
74
113
21
Non-Workers .-__ .A. __ -,
M II
27
382
366
401
5H
23
723
730
738
1,053
455 S52
96 179
S46' 1,OI(}"
880 1.514
314 -637
179 181
7)
38
5'3
15-1
169
120
[92
462
17.6
298
282
:I6!
7S
90
77
I68
313
205
253
693
460
(519
557
190
34
25
3
59
725
42
W2
<i .2.496 3,793
558
25
564
48
36
44
43
36
44
327
"1
to 19
1l
t
.2
1 501)
ti3
29
33
15
:ti f)
-4
U
t,<>40
284
303
493
213
316
'38~
1,313
511
528
1l3S
410
648
707

112 ]
URBAN/VILLAGE PRIMAR\1'
Location Area of Code Mouza
'Number (Vi~lage) Total Population i. e. m
J. L. No. Name of Hectares No. of . (including Institutional of Moum (VilIage)( and of Occupied and Houseless Scheduled Scheduled
Mouza Town/Ward (in absence Townl Residen- No. of Population Castes Tribes (Village)} of name repeat Ward in tia} House- r-------.A.--------. r----.A.---, r---...A ..... Ward No. Ward No.) Sq. Kms Houses bolds Persons Males Females M F M F ,
1 2 3 4 5 6 7 8 9 10 11 12
12 P. S. Alipurduars-contd.
127 Chepani 551.20' 388 38g 2,044 1,073 971 395 341 32 27
128 Purbba Chepani 625.89 688 688 3,875 2,040 1,835 1,263 1,144 145 115
129 Uttar Parokata 619.03 545 545 3,067 1,621 1,446 805 719 33 21
130' Madhya PafQkata 395.17 359 359 2,036 1,038 998 508 494 24 24;
131 Purbba Khalisamari 380'.76 283 283 1,464 778 686 391 333 8 8
132 Dakshin Parokata , 577.11 516 516 2,743 1,422 1,321 844 755 102 103
133 Brajerkuthi 315.34 272 272 1,578 827 751 459 331 14 22.'

CENSUS ABSTRACT
Lit (es ,-- -"---.
M F
13 14
567 281
824 370
770 383
553 283
263 139
571 232
350 169
Total Main'
Workers (I-IX)
r---~----. M F
15 16
621 37
1,067 64
845 34
~)2 48
410 7
797 70
423 21
( 113 J
MAIN WORK.ER:S .A.-____________ ....,
Household Industry
Manufacturing, Processing, Other
Agricultural Servicing Workers Cultivators Labourers and Repairing (Ill, IV, V(b) & MargInal ~ (I) (II) [V (a)J VI to IX] Workers Non-Workers
r---~----' r--.A.-...... ,.... __ A-_...., ,.... __ .A. __ """,\ ,,-__ ..A. __ -., ..-__ ..A. __ ....,
M F M F M- F M F M F M F
17 18 19 20 21 22 23 24 25 26 27 28
334 3 222 13 17 2Q 48 24 2 428 932
598 3 311 47 16 142 13 13 960 ],771
523 3 159 9 21 6 142 16 9 8 767 1,404
218 164 38 5 5 135 4 12 3 504 947
356 2 32 2 8 3 14 1 367 678'
453 6 295 63 7 42, 2 625 1,249
313 73 19 36 2 404 730

r 1[4
URBAN/VILLAGE PRIMARY
Location Area of Code Mouza
Number (Village) i. e. 'in Total Population
J. L.No. Name of Hectares No. of (including Institutional of Mouza (Villagerr and of Occupied and Houseless Scheduled Scheduled Mouza Town/Ward (in absence Town/ Residen- No. of Population) Castes Tribes (Village)! of name repeat Ward in tial House- ,..--_ _.___ -, -"---,
,.-__ A __ -,
Ward No. (Ward No.) Sq. Kms Houses holds Persons Males Females M F M F
2 3 / 4 5 6 7 8 9 10 11 12
12 P. S. Alipurduars-concld.
'" Alipurduar (UA) 19.53 12,289 12,433 71,573 37,842 33,731 4,465 3,910 513 204 Alipurduar 10.89 8,100 8,244 48,605 25,517 23.088 2,804 2,565 89 \ 68 Alipur Duar (M) 9.36 7,543 7,684 45,324 23,798 21,526 2,527 2,332 88 65
~~
Ward No. 413 421 2,385 1,236 1,\49 61 57 2 1 2 684 689 3,536 1,892 1,644 129 108 25 8 3 460 466 2,744 1.369 1,375 123 111 12 8 4 457 457 2,904 1,471 1,433 76 71 5 .. 5 874 877 5,416 2,&66 2,550 575 483 3 2
., 6 654 665 4,157 2,f41 2,016 150 137
.. 7 523 542 3,132 1,652 1,480 200' 182 5 2
" 8 519 522 3.342 1,729 1,613 116 131 3 6 9 568 578 3,624 1,886 1,738 237 213 2 3
10 556 584 3.508 1,958 1,550 135 110 3 1
" 11 434 451 2,606 1,471 1,135 167 151 II 7 .. 12 708 731 3,950 1,981 1,969 255 309 12 21
" 13 693 701 4,020 2,146 1,874 303 269 5 5
Sobhaganj (00) 1.53 557 560 3,281 1,719 1,562 277 233 3
Alipurduar Rly. JI?c. 8.64 4,189 4,189 22,968 12,325 10,643 1.661 1,345 424 136 Alipurduar Rly. Jnc. (NM) 7.20 3,391 3,391 17.774 9,448 8.326 1,365 1,113 64 58 Chechakhata (00) 1.44 798 798 5,194 2,877 2.317 296 232 360 78
Rural 674.0 48,345 48,419 261,692 136,463 125,229 58,592 52.727 29,790 27,264 Urban 19.5 12.289 12,433 71,57J 37,842 33.,!31 4,465 3,910 513 204 Grand Total 693.5 60,634 60,852 333,265 174,305 158,~60 63,057 56,637 ~O.303 27,468

CENSUS ABSTRACT
Total Main
Workers Literates (I-IX)
r-___"'_~ r------"'----",,\ ~ F M F'
13 14 15 16
27,938 21,059 16,977 1,559
18,376 13,895 11,765 1,143
17,311 13,174 10,922 1,061
1,062
1,457
1,045
1,180
1.999
1,842
1,221
1,441
1,354
.1.294
973
i,'264
1,179
1.065
916
1,117
852
978
1,410
1,519
895
1,116
1,026
932
59.8
1,031
784
721
9,562 7,164
7,334 5,673
2,228 1,491
498
838
56l
577
1,356
41
73
88
38
117
855 75
823 69
650 ,68
861 53
1,099 90
763 84
923 185
1,112 80
843 82
5.212 416
4.205 357
1.007 59
[ 115 J
MAIN WORKERS ._------,
Household Industry
Manufacturing, Processing, Other
Agricultural Servicing, Workers f'? Cultivators Labourers and. Repairing [III. IV, V(b) & Marginal
(I) (II) [V (a)] VI to IX] Workers. Non-Workers r-----A---, ,----"---~ ,--........ ----, ..----A. __ --, ,---........ --, ,---........ _---,
M F M F M F M F M F M F
. 17 18 19 20 21 22 23 24
402
342
255
6
5
25
43
-'6 3
9
16
10
II
15
36
87
60
60
4 329
4 204
4 131
18
37
2 61
9
2
73
125
15
110
13 374 78 15,872 1.464
9 328 77 10,891 1,053
9 296 55 10.240 993
2
7
4
I
3
3 489
26 _ 3 807
49 4 470 I
57 10 440
46 15 1.173
26
4
10
15
8
21
18
13
32
46
26
20
15 825
810
2 61S
2 835
./ 1,079
2 741
2 895
22
1,061
651
4,98l
4.164
817
41
70
81
27
93
60
69
66
51
90
82
183
80
60
411
356
55
25
150
131
130
5
20
42
44
6
3
9
19
19
26 27
..,. 28
86 20,715 32,086
82 13,621 21,863
81 12.746 20,384
738 1,107
6 1,049 1.56S
10 787 1,277
394 1.395
1,51(:) 2.433
3 1,285 1,938
30 787 1,381
15 1,035 1,530
6 1,019 1,679
859 1,460
705 1.051
1,053 1,784
10 1.025 1,784
875 1,479
4 7,094 10.223
3 5,224 7,966
1,870 2,257
53,855 25,927 70,569 10,608 36,258 2,975 18,126 3,867 855
347
308 15,330 3,458 2,277 4,276 63,617 110,345
27,938 21,059 16,977 1,559 402 4 329 13 78 15,872 1,464 150 86 20,7/5 32.086
81,793 46,986 87,546 12,167 36,660 2.979 18,455 3,880 1,229 386 31,202 4,9Z2 2,427 4,362 84,332 142,431


[ 117 J
ALPHABETICAL LIST OF VILLAGES
. 13 P.S. KALCHINI
Population Population -81. J. L. ,-____"_____,
" Sl. J. L. r-~
No. Name of Villages No. 1971 1981 No. Name of Villages No. 1971 1981
1 2 3 4 5 2 3 4 5
Atiabari Tea parden 41 4.216 4.998 24 Madhya SataH 5 1,374 3,385
2 Beech Tea Garden 21 4,~58 5.388 25 Malangi Tea Garden 20 5,791 5.852
3 Bharnobari Tea Garden 22 5,667 6,441 26 Mechiabasti 25 1,538 791
4 Bhatkhawa Tea Garden 40. 4,043 4,886 27 Mechiabasti Tea Garden 35 3,998 4,859
5 Bhatpura Tea Garden 36 5,801 6,476 28 Nilpara Forest 3 953 64
6 Bhutri-Forest 31 t 457 39 Nimti Domohani 12 1,341 1,559
7 Buxa Hill Forest 44 3.028' 2,227 30 Niriltijhora Tea Garden " 11 3,293 3,470
8 Buxa Forest (Panbari 31 Paschim Satali 6 1,390 391
Khanda) 45 791 6,347 32 Parmalangi Z 103 181
9 Buxa Forest (Raja Bhat 33 Purbba Satali 15 1,901 1,869
Khawa) 43 5,452 7,984 34 Radharani Tea Garden' 32 935 922
10 Chaupara 34 ...96 58 35 Rajabhat.l'ea Garden 42 2,689 3.~95
11 Chaupara Tea Garden 33 4,396 4.901 36 Rangamati Tea Ga1'den 30 5,300 {),t40
12 Chhota Joygaon 28 1,636 781 37 SataH Mandalpara 16 J,368 1,218
13 Dakshin Latabari 13 1,389. 1,057 48 Satali Nakadala 8 861 1,263
14 Dakshin Me~bari 10 1.146 1.381 49 SataH Tea Garden 19 5,641 4,401
15 Dakshin Satali 7 1,350 2,879 40 Saudamani Tea Garden 4 2.901 2,918
16 D~rsintpara, Tca Garden 23 8,424 10.663 41 TOTsa Tea Garden 24 2,901 5,465
17 Dima Tea Garden 391 6,880 4.213 42 Uttar Barajhu Forest 1 70 132
18 Gangulia Tea Garden 38J 3,870 43 Uttar Latabari 14 6,280 t
29 Gabur Basra Tea Garden 29 1,501 615 44 Uttar Mendabari) 9 t,366 1,756
20 Gopimohan Tea Garden 26 195 146 45 Uttar Satali 17 127 * 21 Joygaon 27 2,042 ~,468
.22 Kalchini Tea Garden 37 8,108 16.274 Total U~467 151,948
"23 Madhu Tea Gar~en 18 3,011 3,477
~
t Included in Uttar Latabari (NM)
* Uninhn bited

Location Code
JSumber i. e.
Area of Mouza
(Village) in
J. L. No. of
Mouza (ViIlage)/
'Ward No.
Name of Hectares Mouza (Village)! and of
T own/Ward (in absence Towrij of name repeat. Ward in
Ward No.) Sq. Kms
2 3
13 P. S. Kalchini
Uttar Barajhar Forest 8,753.79
2 Parmalangi 270.33
159.45
530.55
552.84
459.69
499.58
523.67
559.69
579.89
475.92
618.37
567.40
660.87
586.39
490.89
471.26
538.58
855.11
651.08
3
4
5
6
7
: 8
'9
10
11
12
13
15
16
17
18
19
20
21
v 2 23
24
25
26
27
28
29
30
31
32
33
NiJpara Forest
Saudamini Tea Garden
Madhya Sa tali.
Paschim Satali
Dakshio Satali
Satali Nakadala
Uttar Menda~ari
Dakshio Mendabari
Nimtijhora Tea Garden
Nimti Domohani
Daksbio La labari
Purbba SataIi
Satali Manclalpara
Uttar Satali
Madhu Tea Garden
Salali Tea Garden
Malangi Tea Garden
Beech Tea Garden
Bharnobari Tea Garden 769.62
Darsrngpara Tea Garden 1,982.20
Torsa Tea Garden 1,347.40
MecJiabasti 198.73
Gopimoban Tea Garden 367.61
Joygaon 168.89
Chhota ]oygaon 40.21
Gaburbasra Forest 4,7~4.08
Rangamari Tea Garden 1,500.47
Bhutri Forest 1,507.46
Radharani Tea Garden 291.05
Chuapara Tea Garden 951.35
[ lIS )
URBAN/VJLLAGE PRIMARY"
No. of Occupied Residen
tial Houses
No. of Households
4
33
43
18
61l
648
77
463
217
299
236
693
308
191
328
199
692
854
1,050
983
1,316
1,840
1,027
155
35
1,211
129
121
1.166
66
205
903
5
33 .
68
18
611
666
77
·463
217
299
236
694
310
191
328
199
692
854
1,052
983
1,316
1.840
1.027
155
35
1,224
129
121
1,166
66
205
903
Total Population (including Institutional
and Houseless Population)
,...------___.._-----..., Persops Males Females
6
132
181
64 ... 2,918
3,385
391
2,879
1,263
1.756
1,381
3,470
1,559
1,057
1.869
1,218
3,477
4,401
5,852
5,388
6,441
10,661
5,465
791
146
6,468
781
615
6,140
4n 922
4,901
7
68
151
38
1,469
1,856
197
1,500
652
919
724
1,849
849
571
985
635
1,788
2.2511
2,994
2,699
3,431
5.546
2.884
418
78
3A7S
417 \
320
3,083
256
497
2,535
8
64
30
26
1,449
1,529
194
1,379
611
837
657
1,621
710
486
884
583
Uninhabited
1,689
2,143
2,858
2,689
3,QIO
5,117
2,581
373
68
2,990
364
295
d,057
201
425
2,366
Scheduled Castes
Scheduled Tribes
• .!---A... __ "-\ ,.....---"--_ M F M F
9
4
4
168
96
17
29
75
161
186
35
16
6
164
176
168
213
86
569
415
32
3
255
24
38
213
6
6
190
10
2
3
146
84
IS
14
76
151
144
28
10
2
13
21
1
1,031
751
167 , 1,233
606
837
563
909
595
484
875
522
lSI 1 .• 241
168 1,547
180 1,535
203 1.439
19b 2,305
559 1.024
405 1,000
29 214
3 28
230 329
28 33
29 236
194 1,362
5 27
9 164
187 1,408
12
13
16
1,058
658
161
1,166
574
755
506
873
520
423
779
486
1,223
1,539>
1,502
1,468
2,2<07 .
982
815
171
26
305
17
229
1,361
23
139
1,366

119 1
-CENSUS ABSTRACT
MAIN WORKERS r----~--------.A.
Total
Literates '"r----'---"""""
Main Workers (I-IX) .-~
M F M F
13
41
·68
30
309
755
35
462
131
350
199
600
280
104
268
221
579
672
587
508
787
:1,318
526
87
14
1,123
71
66
1,184
78
105
718
14 15 16
17 43
5 131 2
17 22
123 667 538
432 1,106 95
15
204
86
158
105
201
99
25
94
113
101
836 J 14
355 15
480 91
471 179
941 670
533 167'
332 9
557 250
328 23
187 670 421
267 1,127 830
242 1,381 924
195
301
342
162
26
6
540
15
16
349
42
26
149
1,405 1,115
1,679 1,170
2,500 1,258
1,257 508
227 16
53 19
1,809
214
192
68
98
3
1.12.7 700
146
231 145
1,038 598
Household Industry-n
Manufacturig, Processing,
Agricultural Servicing Cultivators Labourers and Repairing
(1) (II) [V (a)] .-~----.. ,-__ .A._---.. .-__ .A. __ """""
M F M F M P
17 18 19 20
10 8
311 3 90
92 2
685 99 90 3
248 2- 93 13
350 29 88 45
385 83 170
43 30 2
366 30 71 135
314 9 6
498 223 33 20
257 18 57 5
21
2
2
11
Uninhabited
673 96
477 160
181
33 9
400
214
159
76
4
98
2
55 109
12
3
283 44
/
4
9
8
11
3
18
10
22
1
1
Others Workerb
[Ill, IV, V( ) & VI to IX]
,-_.A.-_""""" M P
23
43
113
22
667
703
7
91
12
42
3
857
96
11
26
14
661
1,127
1,380
24
1
538
92
12
16
7
666
2
7
421
830
923
1.405 1.1lS
1,679 1.170
t.76r 1,053
765 348
43 16
19 10
1,108
29
1,117
61
231
20
700
2 3 1.035
14;
596
Marginal Workers
~----""' M P
25
3
12
68
76
3
59
44
s
5
2
26
68
4
12
87
21 28
25 63
20 28
16 26
'8U2 9 [l
747 J,434
69
664
289
439
253
896
315
239
36b 307
194
1.265
528-
746
474
939
543
477
547
560
150 1,042
1 1,131
1,612
1,294
I,IlS
1.312
1.934
.,574
1,749 1,839
18 2,981 3.841
68 i ,583 _ 2,005
19 [ 357
25 49
4 1,664 -2.918
203 266
122 123 170
1,956
3Q 108
2,357
110
280
1,155
266
U 1;495

[ 120 )
URBAN/VILLAGE PRIMARY-
Location Area of Codee Mouza
NumhoI (Vi.Hage) Total Population In
(iN. Name of Hectares No. of (including Institutional Mouza (Village)! and of Occupied and Houseless SchedUled S'¥:eduled
Mouza Town/Ward (in absence Towr:! Residen- No. of Population) Castes ribes. (Village)! of name repeat Ward Hl tial House-
__ .A. __ ._ .... ,,---...A.-_-, ~..A. __ ---.~
Ward No. Ward No.) Sq. Kms Houses holds Persons Males 'Females M F M F
2 3 4 S 6 g 9 10 11 12
13 P. S. Kalchini-concId.
34 Chuapara 236.07 11 12 5.8 33 25 27 22
3S Mechiabasti Tea Garden 1,016.24 ?07 908 4,859- 2,453 2,406 167' 166 1,130 1,153
36 Bbatpara Tea Garden 1277.63 1,307 1,307 6,416 3,367 3,109 349 343 1,379 1.318
37 Kalchini Tea Garden 2305.85 3,338 ~,358 16.274 8,554 7,720 1.179 1,186 2,474 2.432
38 Gangulia Tea Garden 611.85 784 784 3.8m 1.961 1.909 377 391 746 696
39 Dima Tea Garden 611.86 965 965 4,21~ 2,173 2,050 191 211 1,398 1,320
40 Bhatkbawa Tea Garden 805.99 945 947 4,886 2,511 2,375 268 273 1,453 1.420
41 Atiabari Tea Garden 741.99 998 1,007 4,998 2,525 2.473 311 315 1.287 1,301
42 Rajabhat Tea Garden 422.12 673 677 3.295 1,721 1,574 64 6S 971 910
43 Buxa Forest (Raja
Bhat Khawa) 11,968.42 1,467 1,470 7.984 4.230 3.75~ 232 231 2.405 2,315
44 Buxa.Hill Forest ~ 11,662.98 360 360 2.227 1!140 1,0~7 3 45 492 512
45 Buxa Forest (Panbari
Khanda) 6,111.18 1.484 1,484 6,367 3, \30 3,237 lQ9 253 902 793
Uttat Latabari (NM) 6.68 1,658 1,707 8,667 4,589 4,078 .426 430 546 458
Rural 885.3 29,356 29,457 1~1,948 78,943 73,005 6,605 6.636 37.164 35,553
Urban 6.7 1,658 1,707 8,667 4,589 4,078 426 430 546 458
Grand Total 829.0 31,014 31.164 J60,615 83,532 77,083 7,O~1 7,066 37,710 36,01L

CENSUS ABSTRACT
Total Main
Workers Literates (I-IX)
r--.A..~ ,--.A..--, M F M F
13 14 15 16
8 2 13 3,
655 218 914 414
1,006 266 1,237 439
3,589 1,171 3.58~ '1,441
764 308 I 698 401
757 276 1,065 469
773 226 1,080 706
640 291 988 i5l9
249 108 681 434
1,224 555 2,306 837
275- 78 482 • 54
1,325 1;132 1,307 111
2,687 1,866 1,975 204
23,531 9,190 36,315 15,956
2,687 1,866 1.975 204
26,218 11,056 38,290 16,160
121 1
MAIN WORKERS __
Household Industry
Manufacturing. Processing. Other
Agricultural Servicing, Workers Cultivators Labourers and Repairing [III, IV, V(b) & Marginal
(1) (II) [V (a)] VI to IX] 'Workers' Non-Workers ,-__ A __ --. r----_"._-~ ,-__ ..A. __ ~ r--..A..--",-\ ,-__ ..A. __ --. r--_.A.._--...,
M_ F M F M F M F M F M F
17 18 19 20 21 22 23 24 25 26 27 28
11 2 .. 2 J 20 223 .....
If 2 911 414 1,539 1,991
126 ·42 1,069 437 10 5 2,120 2,665
29, 2 22 3,534 1,439 30 22 4,939 6,257
2 696 401 3 1,263 1,50.5-
3 20 3 3 1,039 464 2 3 1.106 1.578-
8 1,071 706 205 200 1,226 1,469-
2 986 619 227 231 1,310 1,623
681 434 1.039 1,139
885 279 718 273 9 2 694 283 101 285 1,823 2,632
313 33 57 112 20 '61- 22 597 1,01l
481 8 224 49 - 2 600 ~ 5 14 1,818 3,112
330 105 162 20 42 3 1,441 76 3 2,611 3,874
7,594 1,110 2,089 878 109 8 26,523 13.960 930 1;365 41,698 55.684
330 105 j62 20 42 3 1,441 ·76 3 ( .. 2,611 3,874
7,924 1,215 2,251 898 ,151 11 27,964 14,036 933 1,365 44,309 59,558


51. - J.L. No. Name of Villages No.
2 3
1 Amarpur 30
2 Barabisa 49
3 Bara Daldali 44
4 Baruipara 55
5 Bhalka 53
6 Bhalka Forest 47
7 Chengmari 41
8 Chhota Daidali ,22
~ Chuniajhora Tea Garden 3
10 Daksb in Chengmari 42
J I Dakshin Haldi11ari 39
12 Dakshin Kamakhyaguri 17
13 Dakshin Narathali 14
14 Dakshin Rampur 51
15 Dhantali 28
16 Dhumpara Forest 32
17 Gachhimari 21
18 Ghaksapara 45
19 Hernaguri 43
20 Joydebpur 29
21 Jainti Tea Garden 6
22 Jainti Tea Garden II 8
23 Kartika Tea Garden 4
24 Kumargram 37
2S Kumargram Tea Garden 33
26 Lalchandpur 27
27 Laskarpara 52
28 Madhya Haldlbari 38
29 Madbya Kamakhyaguri 16
* Uninhabited
1 123 ]
ALPHABETICAL LIST OF VILLAGES
14 P.S. KUMARGRAM
Population r---"----. SI.
1971 1981 No. Name of Villages
4 5 2
947 1.451 30 Madhya Narathali
2.282 2.661 31 Majherdabri
1.399 1.,685 32 Marakhata
1.216 1,416 33 Narathali
2,017 2.147 34 Newlands Tea Garden
988 * 35 Paglarhat
1,037 1,249 36 Pakriguri
1,950 2,212 37 Paschim Chakchaka
1,707 1,792 38 Paschim Chengmari
2,471 2,693 39 Paschim Narathali
798 1,179 40 Phaskhawa Tea Garden
1,794 2,222 41 Pukharigaon
3.258 4,469 "2 Purbba Chakchaka
1,908 2,350 43 Purbba Narathali
231 401 44 Purbba Salbari
860 .. 45 Radhanagar
1.011 1.191 46 Rahirnabad Tea Garden
1,207 2,154 47 Rydak Forest
243 447 48 Rydak Tea Garden
1,03Z 1,486 49 Sachaphu Forest
3,049 2,465 50 Sankos Tea' Garden
t 851 51 Telipara
2.980 3.148 52 Turturikhanda
2,848 3,309 53 Turturi Tea Garden
3,846 4,557 54 Uttar Haldibari
425 333 55 Uttar Kamakbyaguri
1,751 3,255 56 Uttar Narthail
2,014 2,822
1,928 2,175 Total
Population J.L ,-__ .A __ ~
No. 1971 1981
3 4 5
12 1.232 2,910
56 1.171 1.598
25 1.682 1,872
23 2.731 3.342
31 3,931 4,611
40 426 780
54 935 1,748
19 893 1,304
26 1,710 2,020
13 2,180 2,477
2 812 891
36 1,458 2,263
50 1,368 2,004
20 1,908 2,275
48 1,437 1,808
46 1,148 1,276
5 1,858 2.443
11 584 2,910
10 4.817 5,600
402 * 34 3,980 4,685
18 1.958 2,556
7 1,350 2.646
9 1.320 1,368
35 1,510 1,964
15 6.026 7,767
24 1.187 1.329
97,211 119,657

Location Area of Code Mouza
Number (Village) i. e. in
J. L.No. Name of Hectares of Mouza t Village)1 and of
Mouza Town/Ward (in absence Town/ (Village)/ of name repeat Ward in Ward j:'iIo. Ward No.) Sq. Kms
"2 3
14 P. S. KUrY!argram
Sacbliphu Forest 4,845..72
2 Phaskhawa Tea Garden 532.94
3 Chuniajhora Tea Garden 764.56
Kartika Tea Garden 1,343.97
5 Rahimabad Tea Garden 800.78
6
7
8
9
10
11
12
13
14
15
16
17
18
19
20
21
Jainu' Tea Garden
Turturikhanda
Jainti Tea Garden II
Turturi Tea Garden
Rydak Tea Garden
Rydak Forest
Madhya Narathali
Pascham Narathali
Dakshin Narathali
Uttar Kamakhyaguri
Madhya Kamakhyaguri
Dakshm Kamakhyaguri
Teilpala
Paschim Chakchaka
Purbba Narathali
Gachaimari
22 Chhota Daldali
23 Narathali
24 Uttar Narathali
25 Marakhata
26
• 27
28
ig 30
31
Paschim Chengmari
LalChandpur
Dhantali
Joydebpur
Amarpur
Newlands Tea Garden
32 Dhumpara Forest
·1,222.57
514.96
230.23
617.96
2,779.07
10,128.10
596.65
579.58
461.49
350.80
457.24
460.34
545.24
265.51
464.54
457.58
554.83
634.38
392.10
502.29
570.39
220.96
359.49
506.97
396.37
1,154.69
3,009.66
No. of Occupied Residen
tial H(;>uses
4
182
388
599
421
515
522
157
291
1,112
548
425
755
1,339
416
409
447
248
398 •
213
3§4
612
239
327
321
51
69
267
271
942
( 124 1
No. of Households
5
182
388
599
421
515
528
157
291
1,112
548
425
756
1,345
416
409
447
248
398
213
364
621
239
327
321
51
69
267
271
942
Total Population (including Institutional
and Houseless Population) ,---__ .. __ .A.. ______ ~
Persons Males Females
6
891
1,792
3,148
2,443
2,465
2,646
851
1,368
5,600
2,910
2,477
4,469
7,767
2,175
2,222
~,556
1,304
2,275
1,191
2,212
3,342
1,329
1,872
2,020
333
401
1,486
1,451
4,611
7
Uninhabited
480
924
I,620
1,270
1,253
1;455
446
744
2,870
Uninhabited
1,514
1,315
2,321
3.978
1.108
1,093
1,320
657
1,175
634
1,124
1,709
715
956
1,050
179
211
752
779
2,414
8
411
868
},528
1',173
~,212
1,191
405
624
2,730
1,396
1,162
2,148
3,789
L067
1,129
1,236
647
1,100
557
1,088
1,633
614
916
970
154
190
734
672
2,197
Uninhabited
URBAN/VILLAGE PRIMAR1
Scheduled Castes r-~
Scheduled Tribes
r---.A._-M F M F
9
28
46
11
56
40
78
13
98
81
1,010
904
754
796
603
740
841
446
352
434
514
392
231
]59
106
11
46
J03
91
281
10 11
28 243
37 647
13 1,484
76 437
47
48
17
92
76
969
808
707
725
609
776
SOO
421
,230
395
'719
443
251
347
2,499
293
256
205
38'
173
205
17!3
4
206
104
508 339
365 .... 637 \
207 390 •
158 543
80
'6
37
313
89
303
729
\32
107
278
531
1,348
\2
203
630
1,413
436
703
378
233
; 310
2,427
291
231
161
45
154
208
160
5
195
79
336
671
320
495
688
106
107
239
429
1,253

'CENSPS ABSTRACT
r.iterates ~
M P,
13
'194
155
287
408
387
481
98
80
830
627
606
1.356
.:2,874
440
352
617
114
402
179
356
530
217
·255
329
31
42
195
122 ~35
14
68
38
99
135
108
139,
21
24
285
218
254
'959
2,131
193
118
327
34
129
76
148
211
14
99
156
11
8
55
23
174
Total Main
Workers (I-IX)
r--..A.--~
M F
15 16
223 135
430 280
146 359
517 305
5i8, 404
858 54
220 176
296 155
1,024 576
879
698
1.078
1.838
555
636
654
360
519
325
657
885
413
489
461
103
47
23
62
125
28'
39
28
16 29
56
212
49
37
26
)6
108 5
414 46
429 4
940 654
( 125 1
MAIN WORKERS ..A. ______________________ _
Household Industry
Manufacturing, Processing,
Agricqltural Servicing Cultivators Labourers and Repairing
(I) (II) ~a») ,..-___...,__~ ,..-__ .A.._--, ,..-__ -.A.._--'\
M F M F M F
17 18 19 20 21
Uninhabited
2
28
1
478
21
5
5
9
211
4 60
5 -
7
3
4
10
6
1
9
4
Uninhabi!ed
510 3
429
383 4
281 3
269 1 3
381 5
388 16
179 1
430 4
201 8
499 119
305 41
229 15
191 11
160 10
171 19
188 25
191 ' 5
172 12
103 14
113 46
lSI 88
457 2 317 34
332 16 69 20
337 5 135 20
399 3 54 13
75 28
84 19 5
326 17 52 19
203 177 30 ,1
4
17
140
6
23
4
4
1
20
2
11
Uninhabited
22
1
7
13
2
2
4
Other Workers
[III, IV, V(b) & VI to IX) r-'-~
,M F
23
218
419
5Q7
506
521
319
190
296
1,008
64
36
487
1,257
109
38
75
9
42
7
i)
91
'12 16
8
5
i4
49
893
24
135
277
355
304
402
49
171
155
576
3
8
40
99
6
1
7
3
11
1
13
1
1
10
4
653
Marginal Workers ~on-Workerw _ _..____, -----~
M F M II
2S
52
26
8
56
2
4
464
2
8
"7
1
37
21
7
4
52
36
67
1
28
205 224
468 552
866 1, 169
7q3 ;801 723 .. 807
6' 593 J,131
229
4~9
226
448
700 1,382 J,454
1
9
4
14
2
72
84
4
94
633
60!)'
1,236
2,139
516
1,348
1,130
2,082
3,664
1,025
1,088
l,136
631
981
501
872
, 20
457
645
297
595
l09
460
820
302
461
589
1,490
577
870
620
154
10
1
191
,334
76
'1 93 184
i 337 681
350 668
288 1,28 1,2553

Location Code
Number i. e.
Area of Mouza
(Village) in
1. L.No. of
Mouza (Vi1lage)/
- Ward No.
Name of Hectares Mouza (Village)! and of
Town/Ward (in absence Town/ of name repeat Ward in
Ward No.) Sq.,Kms
2 3
14 P. S. Kumargram-conc1d.
33 Kumargram Tea Garden 868.88
34 Sankos Tea Garden 933.21
35 Uttar Haldibari 488.31
36 Pukharigaon
37 Kumargram
38 • Madhya Haldibari
39 Dakshin Haldibari
~O Paglarhat
41 Chengmari"",
42 Dakshin Chengmari
43
44
45
46
47
48
49
50
.51
52
53
54
Hemaguri
.Bara Daldali
Gbaksapara
Radhanagar
Bhalka Forest
Purbba Salbari
Barabisa
Purba Chakcbaka
Dakshin Rampur
Laskarpara
Bhalka
Pakriguri
55 Baruipara
56 Majher Dabri
308:72
549.69
640.19
303.91
227.78
391.85
633.34
461.54
541.05
461.14
292.88
3,729,60
501.44
720.43
513.22
348.84
362.40
552.07
4Q7.22
295.34
512.67
[ 126 }
URBAN/VILLAGE PRIMARY.
No. of Occupied Residen
tial Houses
4
859
869
, 316
393
630
504
218
136
203
469
76
309
379
227
301
505
378
417
'559
357
330
Total Population (including Institutional
and Houseless No. of Population) Hous~ r-----___.A.----""'
hoids Persons Males Females
5
859
869
316
399
633
504
218
145
203
469
76
309
379
227
301
505
382
417
559
358
330
6
4,557
4,685
1,964
2,263
3,309
2,822
1,179·
780
1,249
2,693
447
1,685
2,154
1,276
7
2,342
2,417
1,017
1,209
1,750
1,520
621
403
635
1,401
237
863
1.120
6~2
968
1,442
1,110
1,209
1,667
1,134
8
2,215
2,268
947
1,054
1,559
1,302
558
377
614
1,292
210
822
1.034
594
Uninhabited
840
1,219
894
1.141
1,588
1.013
248 248
1,808
2,661
2,004
2,350
3,255
2,147
1,748
1,416
1,598
924
752
827
824
664
771 2g.,... 285
Scheduled Castes
.-----'-------. Scheduled
Tribes .----'----,..
M F M F
9
101
151
562
339
783
1,124
410
192
546
522
67
471
615
311
367
893
690
556
724
1.09(}
430
280
144
r
10 11
84 1,380
143 1,641
524 347
296 269
682 235
967 123
388 95
184 162
512 56
486 592
54
457
566
265
345
755
612
508
724
972
364
257
128
79
77
362
202
34\
196
30
66
56
12
1,32($
1,555
310 '
239
220
96
81
156
61
584
85
76
343·
182
313·
J41
18
52
4J..
Total 504.0 21,816 21,861 ]]9,657 62,316 57,341 20,893 19,303 20,075 18;787 (Entirely Rural) Sq. Kms.

[ 127 )
>CENSUS ABSTRACT
MAIN WORKERS r-----------------------A
Literates <,....____..______, M F
13
515
424
257
538
834
387
194
148
.271
·453
60
378
460
274
.121
531
'633
696
897
442
225
299
242
14
147
207
57
244
462
59
60
47
127
159
18
140
220
102
'83
162
327
438
549
131
62
123
52
Total Main
Workers (I-IX) ~-.....
M F
IS 16
1,084 782
1,091 717
472 47
607 42
972 157
751 72
332 19
210 38
299 17
754 59
141 2
451 24
542 37
369 8
566 7
819 59
'37 90
618 46
840 63
557 76
483 33
343 2
478 2
Agricultural Cultivators Labourers
(I) (II) r-.A.---.. ,----"---.
M F M F
17
21
2
261
198
460
518
224
130
17'
52'
17
243
331
220
18 19 2(J
3 4
142
80
10 105
90
61
5 55
46
9 153
117
2 121
28
12
47
29
18
).9
10
44
2
15
3 118 26
2 60 5
Houusehold Indstry·
Manufacturing, Processing, Other Servicing Workers
and Repairing [III. IV, V(b) .I: [V (a)] VI to IX]
,-----'-----..... ~ M P M P
21
4
1
2
21
63
2
4
7
3
22
1
5
1
23
1,055
1,088
67
308
344
141
47 2S
77
68
7
80
93
86
24
718
717
19
25
99
43
4
6
6
6
8
Uninhabited
375 1 148 6
532 17 227 37
233 8 211 76
248 7 75 9
315 2 154 3'
390 18 117 53
273
217
361
120 29
94
2 112
1
10
23
31
49
3
2
2
15
36
50
170
264
322
47
88
30
5
4
6
15
22
4
~
Marginal Workers ~
M P
1S
S4
2
28
31
8
18
5
31
1
32
53
5
1
:z 3
5
25
16
S
39
15
30
2
110
30
46
47
3
42
Non.Workers ,-_.A. __
M F
27
1,258
1,326
491
600
750
738
281
175
331
61fi
95
380
525
313
28
1,432
1,551
864 1,{)12
1,397
1,191
524
30~
595
1,123
208
768
951
jjli
397 sn 622 1,li()
471 757
588 1,092
822 1,525
552 895
791
662
76~
:22,678 10,297 30,759 6,345 13,008 310 5,534 921 497 5<1 11,729 5,059 1,106 1,196 30,351 "S,ltO


APPENDIX

[ 130 I
APPENDIX
URBAN/VILLAGE PRIMARY CENSUS ABSTRACT
Total Scheduled Castes and Scheduled Tribes Population Urban Block-wise
Location Name of Total Scheduled Scheduled Location Name of Total Scheduled Scheduled Code Town/Ward/ Population Castes Tribes Code Town/Ward/ Population Castes Tribes No: Urban Block . No. Urban/Bleck
2 3 4 5 2 3 4 5
Dabgram (NM) I 76,402 18,710 979 Dabgram (NM)
23/02/I/C (1) 418 55 • 83 23/02/I/C (35) 275 247
... (2) 534 77 243 (36) 510 273
(3) 477 128 69 (37) 347 94
(4) 524 258 10 (38) 892 412
(5) 507 183 ,6 (39) I
658 564 2
(6) 475 156 3 (40) 906 693 22
, (7) 288 67 14 (41) 729 306 27
(8) 719 128 5 (42) 694
(9) 657 55 12 (43) 524 208
(10) 773 201 39 (44) 554 227
(11) 780 -35 76 (45) 388 133
(12) 778 113 (46) A81 103
(13) 616 66 (47) 621 ~09
(14) 624 69 (48) 545 2\6
(15) 475 33 (49) 375 112
(16) 637 302 24 (50) 369 93
(17) 461 157 (51) 462 163
(18) 520 435 (52) 433
(19) 512 255 (53) 556
(20) 574 91 (54) 647 , 28 .. ' " (21) 712 95 7 (55) 82q • 138'
(22) 640 112 15 (56) 1,025: ,55
(23) 744 180 4 (57) 921 17
(24) 293 264 1 (58) 766
(25) 484 91 15 (59) 790 48
(26) 497 73 13 (60) 892 7
(27) - 489 480 6 (61) 435 13 5
(28) 791 700 1 (62) 600 7 4
(29) 876 325 (63) {j91 163
(30) 498 314 7 (64) 683 11 (31) 498 92 (65) 369 41
(32) 540 120 (66) 765 36 1
(33) 532 421 (67) 589 20
(34) 541 434 (68) 506 8 S

[ 131 ]
APPENDIX
URBAN/VILLAGE PRIMARY CENSUS ABSTRACT
Total Sebeduleil Castes and Scheduled Tribes Population Urban Block-wise
Location Name of Total Scheduled Scheduled Location Name of Total Seheduled Scheduled Code Town/Ward! Population Castes Tribes Code 'I;own/Ward/ Population Castes Tribes No. Urban Block No. Urban Block
1 2 3 4 5 2 3 4 5
Dabgram (NM) Dabgram (NM)
23/02/I/C (69) 530 96 23/02jI/C (103) 768 2
(70) 635 46 (104) 778 25
(71) 918 792 19 (lOS) 365 20
(7~ 330 112 .,. (106) 544 516
(73) 454 225 .. (107) 546 485
(74) 524 200 132 (108) 442 215
(75) 482 203 (109) 496 50
(76) 464 81 (110) 598 449
(77) 470 104 5 (ll I) 462 432
(78) 361 96 (112) 390 280
(79) 399 107 (113) 434 264 9 .. (80) 527 120 (114) 452 99 17
(81) 528 98 (115) 487 148 1
(82) 472 163 (116) 228 70
(83) 550 108 (117) 392 75 9
(84) 747 34 (118) 478 24
(85) 528 116 (119) 40,8 2 7
(86) 552 78 (120) 195 20
(87) 399 12 (I21) 202 24 5
(88) 438 8 (122) 43 28
(89) 543 77 43 (123) 509 51
(90) 620 68 (124) 385 9 5
(91) 625 67 (125) 502 8
(92) 605 97 (126) 454 32 15
(93) 643 71 (127) 280
(94) 543 221 (128) 54 3
(95) 663 5 (129) 321 24 2
(96) 480 15 (130) 6~ 3
(97) 791 10 (131) 468 68
(98) 671 14 (132) 401 12
(99) 639 11 (133) 140 53
(100) 626 " (l34) 159 9
(101), 785 70 ' (135) 239
(102) 721 (136) 329 14 3

I 132 J APPENDIX
URBAN/VILLAGE P\UMARY CENSUS AQSTRACf
Total Scheduled C~tes and Schedpled Trib~ J?opulation Urban Block-wise
Location Name of Total Scheduled Scheduled' Location Name of Total Scheduled Scheduled Code TownJWard/ Population Castes Tribes Code Town/Ward/ Population Castes Tribes No. Urban Block No, Urban Block
1 2 3 4 5 2 3 4 S
Dabgram(N~ Jalpaiguri (M)
23/02/I/C (137) .. 78 46 23/02/II/2 (3) 615 19 ., (138) 117 32 (4) 835 ·47
(139) 178 9 (5) 348 72
(140) 5 (6) 373 J06 26
(141) 185 10 (7) 358 219 13
(142) 220 107 5
(143) 176 70 11 Ward-3 2,499 573 5
(144) 130 12 23/02/II/3 (1) 459 49
(145) 122 16 (2) 475 39
(146) 157 5 (3) 489 27 5
(147) 113 (4) 455 206
(148) 346 95 (5) 611 252
(149) 287 54
(150) l67 57 15 Ward-4 2.326 259 1
(151) 237 31 8 23/02/Il/4 (I) 659 101 1
(1S2) 360 (2) 601 53
(153) (3) 520 21
(154) 181 4 (4) 546 84 ,"
(ISS) 70 9
(156) 498 Ward-5 5,127 295 6
(157) 198 . 27 23/0'-/II1.5 (1) 48~ 35 1
(2) 541, 16
Jalpaiguri (M) II 61,743 8,440 567 (3) 621
Ward-l 3,275 776 27 (4) 332 20
23/02/II/1 (I) 529 16 24 (5) 539 28 (2) 658 158 3 (6y 544
(3) 624 46 (7) 520 28 "" (4) 456 82 (8) 374 3
(S) 545 88 (9) 376 108
(6) 465 386 (10) 796 56 5
Ward-2 3,749 671 'I) Ward-6 2,885 181
23/02/II/2 (1) 494 143 14 .23/02/II/6 (1) 455
(2) 726 65 46 (2) 477 1 .....

r 133 ]
APPBNDIX
URBAN/VILLAGE PRIMARY CENSUS ABSTRACT
Total Scheduled Castes and Scheduled Tribe!! Population Urban Block-wise
I(.ocatiol) Name of Total Scheduled Scheduled Locatwn Name of Total Scheduled Schedulecl Code Town/Ward/ Population Castes Tribes Code Town/Ward/ PopiIlation Castes Tribes No. Urban Block No. Urban Block
2 3 4 5 2 3 4 s
Jalpaiguri (M) Jalpaiguri (M)
'13/02/11/6 (3) ~89 76 l3/02fl1/10 (5) 539
(4) 456 43 (6) 261 54,
(5) 318 19
(6) 490 42 Ward-ll 2,251 99
23/02/11/11 (I) • 309 36
Ward~7 4,167 - 555 27 (21 318 2
:23/02/11/7 (1) 612 113 (3) 603 20
(2) 687 264 19 (4) 433 14 (3) 546 96 (5) 58S 27
(4) 760 21
(5) 349 17 Ward-12 4,954 779 lS7
(6) 359 9 2. 23/02/11/12 (1) 532 140 5
(7) 379 29 4 (2) 474 204 (;
(8) 475 6 (3) 142 33
(4) 376 19
Ward-8 2,439 101 1 (5) 361 65 101
~23102/II/8 (1) 664 18 (6) 703 172 10
(2) 366 3 (7) 362 115
(3) 561 55 (8) 439 3
(4) 458 17 (9) 325 9 14
(5) 390 .8 (10) 380 28
(11) 392 2
Ward-9 2,313 218 1 (l2) 468 8 2
:23/02/11/9 (1) 393 36
(2) 338 18 Ward-13 1.956 25 3
(3) 466 129 23/02/11/13 (1) 335 6
(4) 543 3 (2) 219 3
(5) 573 32 (3) 633 13
(4) 525
Ward-tO 2,970 96' 1 '(S~ 244 (;
:23/02/11/10 (I) 506 40
(2) 371 2· Ward"":14 ~726 461 T (3) 624 23{02/11/14 (1) 5~6 275 Wi
(4) 669 (~ "399 "77

[ 134 J
APPENDIX -URBANfVILLAGE PRIMARY CENSUS ABSTRACT
Total Scheduled Castes and Scheduled Tribes Population Urban Block-wise
l:ocation Name of Total \ Scheduled Scheduled Location Name of Total Scheduled Schedule~ Code Town/Ward/ Population Castes Tribes Code Town/Ward Population Castes Tribes No. Urban Block No. Urb,an Block -1 2 1 4 5 1 2 3 4 5
Jalpaiguri (M) Jalpaiguri (M)
23/02/11/14 (3). 761 41 23/02/II/18 (3) 679 69 -
(4) 602 39 (4) 394
(5) 378 29 (5) 413 10
(6) 315 28
Ward-IS 3.422 1,094 6 (7) 272
23/03/II/15 (1) 572 159 (8) 765 26
(2) 536 ·44 6
'(3) 355 28 Ward-19 4,898 866 217
(4) 482 23/03/VII/19 (1) 458 106
(5) 383 34 (2) 475 117
(6) 587 564 (3) 344 138 15
(7) 507 265 (4) 770 49 10-
(5) 1,031 163 111
Ward-I6 3.136 799 3 (6) 611 29 19
23/02/11/16 (1) 5.65 85 (7) 340 224 11
(2) 310 15 (8) 287 6
(3) 288 37 (9) 378 26 47
(4) 390 216 (10) 204 8 4 I
(5) 486 143
(!i) 589 90 ;Mal (NM) III 14,991 635' 583·
(7) 508 213 3 23/02)II1/C (I) 338 37 41
(2) 403 17 14
Ward-17 2,'51 388 2 (3) 552 29 2
23/92/11/17 (1) 268 9 (4) 297 1
(2) 428 f5 (5) 79~ 24 1O~
i3) 526 50 (6) 717 24 59
(4) 4'8 19 (7) 732 30 4
(5) 465 241 (8) 827 5
(6) 353 33 2 (9) 898 25·
~7) 413 (10) 654 49
(11) 497 50 ·6 Ward_;18 3.699 204 3 (1'2) 614 T
23/02/II/18 (1) 545 60' (13) 681 22 32.
(2) 316 11' 3 (14) 491 301

[ 135 1
APPENDIX
URBAN/VILLAGE PRIMARY CENSUS ABSTRACT
Total Scheduled Cast~s and Scheduled Tribes Population Urban Block-wise
Location t Name of Total Scheduled Scheduled Location Name of Total Scheduled Scheduled Code Town/Ward! Population Castes Tribes Code Town/Ward! Population Castes Tribe. No. Urbad Block No. Urban Block:
1 2 3 4 5 1 2 3 4 S
Mal (NM) Domohani (NM)
23/02/IV/C (IS) 523 21 14 23/02/V/C \9} 412 258 4
(16) 789 107 34 (10) - 415 42
(17) 1,089 60 227 (11) 386 179
(18) 351 5 (12) "550 149 1
(19) 627 73 4 (13) ~61 194 2)
(20) 650 (14) 757 647
(21) 808 13 23 I
(i5) 726 548
(22) 888 37 1 (16) 595 499'
(23) 708 39 38 (17) 626 620
(24) 62 3 (18) 491 480
(19) 456 454
Odlabari (NM) IV 6,887 777 ' 661
.23 {02{IV/C (1) 454- 34 Mainaguri (NM) VI 19,568 6,145 67
(2) 683 5 123 23/02/VI/C (1) 332 I
(3) 845 20 43 (2) 40~ 81
(4) 649 150 31 (3) 513 81 11
(5) 917 146 139 (4~ 521 27
(6) 403 31 10 (5) '517 '174
(7) 656 236 68 (6) '633 162 .. ~ (8) 651 109 115 (7) 597 41
(9) 473 8 11 ~8) 517 40
(10) 419 'I8 13 (9) . 'y77 199 18
(11) 414 20 94 (10) 489 41
(12) -323 14 ~1l) 570 4{)
(12) 603 86 .J.
Domohani (NM) V 10,339 6,113 98 . (13) 517 128
23/02/V/C ( I) 432 286 5 (14) 393 78
(2) 404 297 60 (15) 598 322 2
(3) 575 276 -(16) 611 599
(4) 67Q 42<) 2 (11) 528 340
(5) 549 61 (18) 531 150
(6) 522 152 {I9) 641 72
(7) 682 255 1 (20) 645 96
..(8) 430 287 ;(21) 584 ,65 <l

I 136 ]
APPENDIX
URBAN/VILLAGE;.- PRIMARY CENSUS ABSTRACT
Total Scheduled Castes and Scheduled Tribes Population Urban Block-wise
Location Name of Total Scheduled Scheduled Location Name of Total Scheduled Scheduled< Code Town/Ward/ Population Castes Tribes Code. Town/Ward I Population Castes Tribes No. Urban Block No. Urban Block
1 2 3 4 5 2 3 4 5
Mainaguri (N~) Dhupguri (NM) VIII 23,098 6,560 20
23/02/VljC (22) 499 71 23/02/VIII/C ([) 731 152 15
(23) 533 9 (~) 824 85
(24) 738. [44 1 (3) 691 234
(25) 424 35 3 (4) 481 [01
(26) 474 157 (5) 454 238
(27) 621 155 24 (6) 531 42
(28) • 719 110 (7) 223 61
(29) 414 53 (8) 744 58'
(30) 4[6 '193 4 (9) 694 242
(31) 704 247 ([0) 565 562
(32) 425 193 (I [) 777 13
(33) 4[9 238 (12) 784 57
(34) 471 366 (13) 643 61
(35) 503 474 (14) 569 431
(36) 588 508 (15) 828 119
(37) 450 309 (16) 545 24
(17) 380 163
Gairkata (NM) VII 5,955 1,366 777 (18) 659 270
23/02/VII/C (1) 291 14 43 (!9) 490 2[8
(2) 368 53 113 (20) 499 44
(3) 441 367 17 (21) 325 3,1'3
(4) 415 38 97 (22) 493 [2
(5) 266 59 3 (23) 471 33
(6) 324 22 14 (24) 732 320
(7) 334 92 (25) 618 16[
(8) 358 53 40 (26) 375 1 [7
(9) 3[6 13 2 (27) 567 103
(10) 273 35 1 (2b) oj
[ 137 )
APPENDIX t
URBAN/VILLAGE PRIMARY CENSUS ABSTRACT
To.tal Scheduled Casles and Scheduled Tribes Population Urban Block-wise
Location Name of Total Scheduled Scheduled Location Name of Total Scheduled Scheduled Code Town/Ward/ Population Castes Tribes Code Town/Ward/ Population Castes Tribes No. Urban Block No. Urban Block
1 2 3 4 5 1 2 3 4 5
Dhupguri (NM) Alipur Duar (M)
23/02JVIlIjC (35) 442 258 23/02/X/I (2) 630
(36) 820 45 (3) 550 17
(37) 630 13~ (4) 382 72
(38) 364 108
(39) 726 179 Ward-2 3,536 237 33
(40) 416 42 23/02/X/2 (1) 555 55 4
(2) 674 19
Falakata (NM) IX. 11,998 1,802 79 (3) 655 27 . 23/02/IX/C (1) 568 127 2 (4) 662 47 25
(2) 848 637 (5) 564 63
(3) 479 325 11 (6) 426 26 4
(4) 498 73 24
(5) 767 81 4 Ward-3 2,744 234 20
(6) 700 24 4 23/02jX/3 (t) 422 48 2
(7) 532 (2) 636 99 15
(8) 441 5 m 643 33 3
(9) 309 (4) 632 45
(10) 458 ]6 (5) 411 9
(11) 632 18 10
(12) 486 12 Ward-4 4,213 722 6
(13) 429 26 23/02/X/4 (1) 873 35 6 (14) 508 58 (2) 754 103
(15) 314. 51 (3) 507
(16) 455 13 (4) 770 9
(17) 618 88 5 (5) 725 150
(18) 551 116 7 (6) 584 425
(19) 529 43
(20) 543 11 Ward-S 4,107 483 5 efl) 631 7 1 23/02jX/5 (I) 653 85 5
(22) 702 71 11 (2) 841 18
(3) 662 120
Alipur Duar (M) X 45,324 4,859 153 (4) 742 59
Ward-l 2,385 118 3 (5) 659
23/02/X/1 (1) 823 29 3 (6) 550 191

[ us ]
APPJlNDIX
URBAN/VILLAGE PRIMARY; CENSUS ABSTRACT . Total Scheduled Castes and Scbeduled/Fribes Population Urban Block-wise
Location Name of Total Scheduled Scheduled' Location Name of Total Scheduled Scheduled Code TownjWardj Population Castes Tribes Code TownlWardj Population Castes Tribes No. Urban Block No. Urban Block
I'
, ,1, 2 3 4 5 1 2 3 4 5
Alipur Duar (M) Alipur Dual' (M)
Ward-6 2,540 143 23/02/XJlO (5) 510 53 3
23/02jX/6 (1) 697 6 (6) 740 ,~1
(2) 664 23
(3) 699 31 Ward-ll 3,341 441 22
(4) 480 83 23j02jXjll (1) 735 1~3 4
(2) 436 70 "-
Ward,7 3,132 382 7 (3) 598 88 12
23'j02jXj7 (1) 424 35 (4) 412 38 6
(2) 784 67 (5) 401, 33
(3)" 285 4 (6) 759 ~9 r
(4)' 342
(5) 872 69 Ward-12 4,832 585 29
(6) 425 207 7 23/()2jXj 12 (1) 729 40 8
(2) 466 85
Ward-S 3,342 247 !} (3) 622 203 7
23/02jXj8 (1) 608 )2 3 (4) 670 98 8
dj 696 40 (i (5) 430 15 (j
(3) 797 135 (6) 645 102
(4) 595 (7) 537 18
(5)- 646 (8) 435 2~
(9) 298
Ward-9 3,624 450 5
23jo2/X/9 (1) 83(:) 231 ~ard-13 4,020 572 10
(2) 787 3 5 23/02jIl/13 (I) 574 4
(3) 488 18 (.2) 536 49 10
(4) 563 11 (3) 5n 252
(5) 612 171 (4) 362 57
(6) 344 16 (5) 497 56
(6) 490 106
Ward-tO 3,508 245 4 (7) 661 48
23j02jX/lO (1) ~5 73 (8) 303
(2~ 490 17
(3~, 432 18 Sobhaganj COG) XIA 3,281 510 4
(4) 641 23 23/Q2jXA/C (1) 1.275

[ 139 ]
APPENDIX
URBAN/VILLAGE PRIMARY CENSUS ABSTRACT
Total Scheduled Castes and Scheduled Tribes Population Urban Block-wise
Location Name of Total Scheduled Scheduled Location Name of Total Scheduled ScI1eduled Code Town/Ward/ Population Castes Tribes Code Town/Ward/ Population Castes Tribes No. Urban Block No. Urban Block
1 2 3 4 5 2 3 4 5
Sobhaganj (OG) Checbakhata (OG) XIA 5,194 528 438
23/02/XA/C (2) 532 50 23/02/XIA/C (1) 848 123 55
(3) 281 172 (2) 798 50 25
(4) 1,193 288 4 (3) 402 13
(4) 765 7
Alipurduar Rly. Junc. (NM) XI 17,774 2,478 122 (5) 368- 27
23/02/XI1C (I) 986 66 (6) 921 180 338
(2) 800 8,4 7 (7) 523 81
(3) 1,005 136 4 (8) 569 67
(4) 651 132 14
(5) 1,249 372 4 Uttar Latabari (NM) XII 8,667 856 1,004
(6) 1,124 127 14 23/02/XII/C (I) 609 31 117
(7) 954 58 (2) 723 56
(8) 1,050 117 6 (3) 710 128 51
(9) 937 116 4 (4) 268 32 60
(10) 920 128 18 (5) 618 56 54
(11) 962 124 (6) 491 6 379
(12) 846 106 5 (7) 694 71 187
(13) 930 96 1 (8) 270 104
(N) 954 100 14 (9) 649 238 39
(15) . 261 80 (10) 566 59 63
(16) 1.142 123 8 (11) 631 19 10
(17) 973 13 13 (12) 680 25 27
(18) 593 81 (13) 519
(19) 796 343 10 (14) 418
(20) 641 76 (15) 821 31 17


DISTRICT PRIMARY CENSUS ABSTRACT {
FOR SCHEDULED CASTES AND
SCHEDULED TRIBES

[ 142 ]
PRIMARY CENSUS ABSTRACT
No. of households
81. Name of District} Total with Total No. Police Stationl Rural Scheduled Scheduled Castes
U. A./City/ Urban Castes Population) Literates Town Members. --A. ,------.A.-_~
P M F P M F
2 3 4 5 6 7 8 9 10
1 J ALP AIGURI DISTRICT T 144,823 766,498 398,945 367,553 176,712 130,993 45,719
R 132,688 706,719 367,396 339,323 157,756 lt8,151 39,605
i U 12,135 59,779 31,549 28,230 1i,956 12,842 6,114"
Sodar Subdivision T 97,916 514,729 267,364 247,365 119,797 90,851 28,946
R 88,001 465,983 241,662 224,321 105,200 80,806 24,394
U 9,915 48,746 25,702 23,044 14,597 10,045 4,552
Rajganj T 14,787 79,317 41,483 37,834 18,934 14,Sl7 4,417
R' 11,161 60,607' 31,603 29,004 14,OIl 10,980 3,031
U 3,626 18,710 9,880 8,830 4,923 3,537 1,386
Dabl!:ram (NM) U 3,626 18,710 9,880 8,830 4,923 3,537 1,386
12 Jalpaiguri T 24,486 ",
127,423 66,389 61,034 31,024 22,612 8,412
R 22,664 118,983 61,982 57,001 27,694 20,474 7,220
U 1,822 8,440 4,407 4,033 3,330 2,138 1,192
Jalpaiguri (M) U 1,822 8,440 4,407 4,033 3,300 2,138 1,192
S Mal T 9,052 44,194 23,~65 20,829 8,781 6,819 1,962
It 8,756 42,782 22,565 20,217 8,225 6,4048 1,777
U 296 1,412 800 61--2 556 371 185
Mal (NM) U 150 635 375 • 260 284 189 95
Odlabari (NM) U 14' 777 425 352 272 182 90
.. Mitiali T 1,494 8,652 4,519 4,133' 1,724 1,32'8 396
R 1,494 8,652 4,519 4,133 1,724 1,328 396-
tl
S Maynaguri T 24,997 135,713 71,39i 64,321 31,658 24,577 7,08t
R 22,491 123,455 ·65,006 58,449 211,300 22,263 6,037
U 2,506 12,258 6,386 5,872 3,358 2,314 1,044
Mainaguri (UA) U 2,506 12,258 6,386 5,872 3,358 2,314 1,044
(a) Domohani (N~) U 1,243 6,113 3,146 2,967 1,245 915 330 . (b) Mainaguri (NM) U 1,263 6,145 3,240 2,905 2,1l3 1,399 714

l 143 1
,FOR SCHEDULED CASTES
MAIN WORKERS _I
Total Main Workers Cultivators Agricultural (I-IX) (I) Labourers (II)
~ ____ ,A_ .__ r- ,..
1\1 "'"" P M F P M P P P 11 12 13 14 15 16 17 18 19
235,104 215,179 19,925 123,008 120,264 2,744 62,307 55,247 7,060
217,739 199,238 18,501 1l9,556 116.846 2,710 ,59,508 • ~2l~83 ~,925 ,
17,365 15,941 1,424 3,452 3,418 34 2,799 2,664 135
156,862 145,278 11.584 84,488 82.903 1,585 40,326 36,575 3,751 142,535 132,091 10,444 81,298 79.739 1.559 37.736 34,102 3,634 14,327 13-.187 1,140 3,190 3.164 26 2,590 2,473 117
I 11,107 10,is8 23,597 22,018 1,579 319 7,124 ',286 83a
18.453 17,113 1.346 10.148 9,836 312 <i,127 S,324 "t~03' 5,144 4,905 239 959 952 7 997 962 35
I .' 5,144 4.905 239 959 952 7 997 962 35
3~,863 36,223 2,640 20,686 20.319 367 '1.0,621 9,529 1.On 36,307 34,147 2,160 20,580 20,214 366 IO.50~ 9,425 1,084, 2,556 2,076 480 106 105 1 112 164 .3
2,556 2,076 480 106 105 tI2 104 :&
'14.161 12,477 1,684 6,624 6,497 127 3.53'} 3,173 36i ·13,787 12.127 1.660 6,592 6,465 127 3,504 3,140_ 364
374 350 24 32 32 .. 35 33 2
180 165 15 4 4 5 5
194 185 9 28 28 30 28 :'2
, " 3,151 2,309 842 ' 606 588 18 437 389 48 3,151 2,309 842. 606 588 18 437 389 ,j 48
., u'
'41,579 39,845 1,734 26,123 25,650 473 10,551 ',938 0613 37,816 36,31/ 1.500 24,779 24,320 459 9,638 9.0~4 :574
3,763 3,529 234 1,344 1,330 14 913 874 39
3,763 3,529 234 1,344 1,336 14 ~13 874 39 1,922 1,806 116 839 826 13 438 404 34 1,841 ~.723 118 505 504 1 475 4~O is

144
PRIMARY CENSUS ABSTRACT
MAIN )VORKERS
Household Industry-Manufacturing, Other
Processing, Workers [III, Name o§ DistricV Servicing & IV. V(b) &
Police tationl Total Repairs [Yea)] . VI to IX] 81. u. A./Cityl Rural --.. No. Town Urban P M F P M F
1 2 3 20 21 22 23 24 25
JALP AIGURI DISTRIC1 T 2,924 2,192 732 46,865 37,476 9,389
'R 2,461 1.805 656 3fi,Z14 28,004 8,210
U 463 387 76 10,651 9,472 1,179
Sadar Subdivisioll T 2,086 1.566 520 29,962 24,234 5,728
R 1,694 1.23~ 458 21,807 17,014 4,793
U 392 330 62 8.155 7.220 935
1 Rajganj T 286 215 53 5.098 4.729 369<
R 161 124 37 ' 2,017 1,829 188
U 107 91 16 3.081 2,900 181
Dabgram (NM) U 101 91 16 3,081 2,900 181'
2 Jalpaigurj T 761 573 188 6,795 5.802 993
R 696 516 180 4,522 3.992 53()
U 65 57 8 2.273 1,810 46:>
J alpaiguri. (M) U 65 57 8 2,273 1,810 463
S Mal T 155 107 48 3.843 2.700 1,14~
R 149 101 48 3.542 2,421 1.121
U 6 6 301 279 22'
Mal,NM) U 170 155 15
Odlabari (NM) U 5 5 131 124 i
4 Mitiali T 30 29 2,078 1,303 775
R 30 29 2,078 1,303 775>
U
5 Maynaguri T 463 316 147 4,442 3,941 501
R 368 246 122 3,031 2,686 345
U 95 70 2S 1,411 1,255 156.
Mainaguri (U A) U 95 70 25 1,411 1,255 156 (a) Domohani (NM) U 64 39 25 581 537 44
(b) Mainagur.i (NM) U 31 31 830 718 112

[ 145 ]
FOR SCHEDULED CASTES
Marginal Workers Non-Workers
r -A----_____ -.
p M F P M F
26 27 28 \I' 29 30 31 . ,
11,415 4,561 6,854 519,979 179,205 340,774
10,951 4,279 6,672 478,029 163,879 314,150
464 282 182 41,950 15,326 26,624
6,724 2,956 3,768 351,l43 119,130 232,013
6,315 2,707 3,608 317,133 106,864- 210,269
409 249 160 34,010' 12,266 2/,744-
1,977 867 1,110 53,743 1'8,598 35,145
1;696 666 1,030 40,458 13,824 26,634
281 201 80 n,285 4,774 8,511
281 201 80 13.285 4,774 8.51 J
976 376 600 87,584 29,790 57,794
953 361 592 81,723 27,474 54,249
23 15 8 5,861 2,316 3,545
23 15 8 5,861 2,316 3,545
760 395 365 29,273 10,493 18,780
749 388 361 28,246 10,050 18,196
11 7 4 1,02i 443 584
3 3 452 207 245
8 4 4 575 236 339
382 195 187 5,\19 2,015 3,104
382 195 187 5,\19 2,015 3,1()4
1,005 476 529 93,129 31.071 62,058
923 457 466 84,716 28,133 56,483 -82 19 63 8,413 2,838 5,575
82 19 63 8,413 2.838 5,575
~6 6 20 4.165 1,334 2,831
56 13 43 4,248 1,504 2,744

[ 146 ]
PRIMAR\' CENSUS ABSTRACT
No. of households
81. Name of District/ Total with Total No. Police Stationj Rural Scheduled Scheduled Castes
U. A.jCity/ Urban Castes Population Literates Town Members r------~-------. r------.A..--------.
p M F P M F
2 3 4 5 6 7 8 9 10
6 Nagrakata T 781 3.637 1,911 1.726 654 507 147~
R 781 3,637 1,911 1,726 654 507 147
U
7 Banarbat T 5,423 28,430 14,792 13,6,38 6,598 4,977 1,621
R 5,142 27,064 14,057 13,007 6,101 4,660 1,441
U 281 1,366 735 631 497 317 180
Gairkata (NM) U 281 1,366 735 631 497 317 ISO
8 Dhubguri T 16,896 87,363 43,513 43,850 20,424 15,514 4,910
R 15,512 80,803 40.019 40,784 18,491 14.146 4,345
U 1,384 6,560 3,494 3,066 1,933 1,368 565
Dhupguri (NM) U 1,384 6,560 3,494 3,066 1.933 J,363 565
'_
Alipurduar Snbdivision T 46)07 251,769 131,581 120,188 56,915 40.142 16,773
R 44,687 240,716 125.734 '115,002 52,556 37,345 15,211
U 2,220 il,033 5,847 5,186 4,359 2,797 1,562
9 Birpara T 1,195 5,987 3.134 2,853 1.176 874 302
R 1,195 5,987 3,134 2,853 1,176 874 302
U
, 10 Falakata T 11,332 64,282 33.605 30,677 6.965 \652 3,314
R 10,951 62,48{) 32.649 29,831 6,450 3,352 3,125
U 381 1.802 - 956 846 516 327 189
Falakata (NM) U 381 1',802 956 846 516 ,327 189
II Madarihat T 1,520 7,513 3,861 3,652 1,860 1,326 534
R 1,520 7,513 3,861 3,652 1,860 1,326 534
U /'
12 Alipurduar T 22,629 119.694 63,057 56,637 34,334 24,891 9.443
R 20,940 111,319 58.592 52,727 30,842 22,642 8,2QO
U 1,689 8.375 4.465 3,910 3,492 2,249 1,243

FOR SCHEDULED CASTES
Total Main Workers (I-IX) r-----........ ---------..,
p
11
1~224
1,224
9,186
8,775
411
411
25,101
23,622
2.079
2.079
78,242
75,204
3,038
1,981
t,981
20.169
19.622
547
547
2,503
2,503
36,687
34.374
2,313
M
12
840
·840
7,485
7,097
388
388
24,081
22,142
1,939
1,939
69,901
67.147
2,754
1,385
1,385
18,922
18,434
488
488
2,012
2.012
33.399 •
31,302
2,097
F
13
384
384
1,701
1,678
23
23
1,020
880
140
140
8,341
8,057
284
596
596
1,247
1,188
59
59
491
491
3.288
3,072
216
P
14
82
82
3,048
~,991
57
57
IG,212
15,520
692
692
38,~20
38,258
262 ,
254
254
12,350
12,192
158
158
846
846
18;306
18,217
89
[ 141 I
MAIN WORKERS
Cultivators (I) ........
M
15
79
79
2,980
2,923
?7
57
16,002
15,314
688
688
37,361
37,107
254
23<1
239
12,153
11,999
154
154
815
815
17,594
17,508
86
F
16
3
3
68
68
210
206
4
4
1.159
1,15/
8
15
15
197
193
4
4
31
31
712
709
3
Agricultural Labourers (II)
r-------..A._-------, .P M F
17
132
132
1,893
1,798
95
95
6,029
5.591
438
438
21,981
21.772
299
35
35~'
5,840
5,780
60
60
478
478
11,724
11.604
120
fe, 10
112
112
1,559
1,468
91
9r
5,589
5,180
409
409
18,672
18,481
191
22
22
5.048
'p';96
52
52
439
439
9.934
9.822
112
19
20
20
334
330
4
4
440
411
29
29
3,309
3,291
18
13
l3
792
784
8
8
39
39
1,790
1.782
8

148 1 PRIMARY CENSUS ABSTRACT
MAIN WORKERS
Household Industry-Manufacturing, Other
Processing, Workers [III, Name of District/ Servicing & IV V(b) &
Poliee Station/ Total Repairs [V (a)] VI to IX] S1. U. A./CitYI Rural r--------"--------"""\ -r- ---"-------"""\ No. Town Urban p- M F P M F
2 3 20 21 22 23 24 25
ti Nagrakata T 16 16 994 633 361
R 16' 16 994 633 361
U
7 Banarhat T 144 125 19 4,101 2,821 l,i80
R 128 111 17 3,858 2,595 1,263
U 16 1~ 2 243 226 17
Gairkata (NM) U 16 14 2 243 226 17
8 Dhubguri T 249 US 64 2,611 2,305 306
R 146- 93 S3 1,765 1,555 , 210
U 103 92 11 846 750 96
Dhupguri (NM) U 103 92 11 846 750 96
Alipurduar SlIbdivision T 838 626 212 16,903 13,242 3,661
R 767 569 198 14,407 10,990 3,417
U 71 57 14 -2,496 2,252 244
9 Birpara T 40 311 1 1,652 1,085 567 R 40 39 1 1,652 1,085 567 U
10 Falakata T 142 111 31 1,837 1,6l(), 227 R J24 96 28 1,526 1,343 185 U 18 1,5 3 311 267 44
Falakata (NM) U 18 15 3 311 267 44
11 Madarihat T 21 16 5 1,158 74~ 416
R 21 "V-
16 5 1,158 742 416
U
12 Alipurduar T 497 344 153 6,160 5.527 633
R 447 303 144 4,106 3,669 437
U 50 41 9 2,054 1,858 196

,FOR SCHEDULED CASTES
P
26
141
141
757
756
726
715
11
11
4,961
4,636
55
109
109
<102
587
15
15
368
368
2,776
2,736
40
Marginal Workers
M
27
t 59
59
311
310
277
271
6
6
1,605
1,572
33
20
20
142
131
10
10 .. 175
175
970
947
23
F
28
82
82
446
446
449
441-
5
5
3,086
~064
22
89
89
460
455
5
5
193
193
1,806
1,789
17
I 149 1
---, ,-P
29
2,272
2,272
18,487
17,533
954
954
61;536
57,066
4,470
4,470
168,836
160,896
7.940
3,897
3,&97
43,511
42,271
1,240
1,240 J
4.642
4,642
80,231
74,209
6,0.22
Non-Workers
M
30
1,012
1,012
'.996
(5,650
346 -I
346
-19.155
17.606
1,549
1.546
60,075
57,015
3,000
1,729
1,729
14,541
14.083
458
458
1,674
1.674
28,688
26.343
2,345
F
31
t,260
1~26~
i1,491
aq.~83f
J08
! \ 308
42.381
39,46()
2,921
2,nl
108,761
103,881
4,880
2,168
.2.168
.28,97D
23,188
1182
782
2.968
2.968
51,543
47.866
1-'77
~

[ 150 ]
PRIMARY CENSUS ABSTRACT
No. of households
Name of DistrictJ with Total Police Station/ Total Scheduled Scheduled Castes
st. U. A./Cityl Ruta} Castes Population Literates No. Town Urban Members
,-___ • ____ ..A.. __ • ____ ., ,.. _______ ..A. ______
P M P P M p-
I 2 . 3 4 5 6 7 8 9 10
Alipurduar (UA) U ],689 8,375 4,465 3,910 3,492 2,249 1,243
(a) Alipurduar U 1,109 5,369 2,804 2,565 2,P9 1,364 765
(i) Alipur Duar (M) U 1,007 4,859 2,527 2,332 2,026 1,293 733
(ii) Sobhaganj (OG) U 102 510 227 233 103 71 32
~) Alipurduar Rly. Jun. U 580 3,006 ],661 ],345 1,363 885 I
478
(i) Alipurduar Rly. Jun.(MN) U 495 2,478 1,365 1,113 1,087 705 382
(ii) Chechakhata (OG) U 85 528 296 232 276 180 96
13 Kalchini T 2,737 14,097 7,03] 7,066 2,791 2,029 762
R 2,587 ]3,241 6;605 6,636 2,440 1,808 632
U 150 856 426 430 351 221 130
Uttar Latabari (NM) U . ]56 856 426 430 351 221 130
I
14 Kumargram T 7,494 40,196 20,893 19,303 .... 9.788 7.370 2;418:
R 7.494 40.196 20,893 19,303 9,788 7.37_D 2,418
u

151 ]
FOR SCHEDULED CASTES
MAIN WORKERS
Total Main Workers Cultivators Agricultural I-IX) (I) Labourers (11)
-r-------.A. --"""\ ----"- ~
P M F P M F P . M F
11 12 13 14 15 16 17 18 19
2,313 2,097 216 89 86 3 120 i12 8
1,502 1,346 156 g2 79 3 91 84 7
1,368 1,219 149 63 60 3 70 i53 7
134 127 7 19 19 2.1 21
811 751 60 7 7 29 28 1
686 637 49 '10 9 1
125 114 11 7 7 119 19
A,556 3,039 1,517 429 380 4' 252 175 9)
4.378 2.870 1,508 414 366 48 22.3 no 91
178 169 9 15 .{ 14 1 29 27 2
178 169 9 15 14 1 29 27 '2
-12.346 11,144 1,202 6,335 6,180 155 3,652 3,072 580
12,346 11.144 1,202 6,335 6,180 155 3,652 .3,072 SilO
•• !J,

I 152 ]
PRIMARY CENSUS ABSTRACT
MAIN WORKERS -"-
Household Industry-Manufacturing, Others
Processing. Workers [III. Name. of District1 Servi,cing & IV, V(b) & Police Station/ Total Repairs [V(a)] VI to IX]
8l u. A./City/ . Rural r--No. Town • Urban P M F p M F 1 2 3 20 21 22 23 24 25
Alipurduar (UA) U 50 41 9 2.054 1.8'58 196
/ (a) Alipurduar U 39 30 9 1,290 1,153 137
(i) Alipur Duar (M) U 30 ~S S 1,205 1,071 134 (ii) Sobhaganj (OG) U 9 '5 4 85 82 3
(b) Alipurduar Rly. Jun. U 11 U 764 705 59 (i) Alipurduar Rly. ]un.(NM) 11 10 10 66Ci 618 48
(ii) Chechakhata (00) U 1 98 87 11
13 Kalchini T 29 23 6 3.846 2,479 1.'36; ,/ It 26 22 1~ 3,715 2.352 1,36}--
U 3 2 131 f21 • 4
Uttar Latabari (NM) U 3 2 131 127 4
14 Kumargram T 109 93 16 2,250 ]'799 451 R 109 93 16 2,250 1.799 451 U ,.

I 153 ]
FO'R SCHEDULED CASTES
Marginal Non-Workers Workers ..A.. _________ --,
r-------------..A..-----------~ p M F P M F
26 27 28 29 30 -31
40 23 17 6.022 2,345 3.677
3S 19 Jfj 3.832 1.439 2.393
34 1'9 15 3.457 1,289 2.168
375 150 225
5 4 2:190· 906 1~284
5 4 1,787 724 1.063
403 182 '221
242 91 151 9,299 3.901 ~?398
242 91 151 8,621 3.644 4.977
678 257 421
678 257 421
594 207 387 27.256 9,542 17,714 ~
594 207 387 27,256 9.542 17,714

154
PRIMARY CENSUS ABSTRACT
No. of households
Sl. Name of Districtl Total with Total No. Police Station! Rural Scheduled Scheduled Tribes
U. A.jCity/ Urban Tribes Population) Literates Towjl' Members r-------A-------~ r--,----.A..·-----_____
p M F P M F 2 3 4 5 6 .-- 7 g 9 10
1 JALPAIGURI DISTRICT T 94,781 491,791 252,842 238,949 59,528 45,636 13,892
R 93,624 486,239 249,660 236,579 57,745 44,337 13,408
U 1,157 5,5'52 3,182 2,370 1,783 1,299 484
Sadar Subdivision T 47,767 242.072 123,989 118.083 25,164 20.145 5.091
R 46,948 238,320 121,913 116,407 24,078 19,397 4,681 . U 819 3,752 2.076 1,676 1,086 748 338
t Rajganj T 1.600 8.240 4.284 3,956 999 801 198
R 1.374 ~.261 3.749 3,512 719 616 103
U 226 979 535 444 280 185 95
Dabgram (NM) U 226 979 535 444 280 185 95
2 J:tlpaiguri T 2,689 13,821 7.174 6.674 1,655 1,274 381
R 2.563 13,254 6.847 6,407 1.324 1,074 250
U 126 567 327 240 331 200 131
Jalpaiguri (M) U 126 567 327 240 331 200 131
3 Mal T 14,692 72.977 36,554- 36,423 7,295 5,883 1,412·
R 14.441 71,733 35,864 35.869 6.912 5,592 1,320
U 251 1,244 690 554 383 291 92
Mal (NM) U 106 583 357 226 291 217 74
OdJabari (NM) ~ U 145 661 333 328 92 74 18
4 Mitiali T 7,545 38,691 20,294 18,397 4,576 3,815 761 ~
R 7,545 38.691 20.294 18.397 4,576 3,815 761
U .. '
S Maynaguri T 661 3,728 1,991 1.737 610 481 129
R 616 3,563 1,890 1,673 573 452 121
U 45 165 101 64 37 29 8
Mainaguri (UA) U 45 165 101 64 37 2~ 8 (a} Domohani (NM) U 24 98 65 33 24 2l. 3 (b) Mainaguri (NM) U 21 67 36 31 13 8 5

155 1
FOR SCHEDULED TRIBES
MAIN WORKERS r-----------------------------------------------------,-Total Maio "-
Workers Cultivators Agricultural (I-IX) (I) La bouTers (II) ,,-______ .A.-______ -,. , _______ A _______ ~
~----~-_-A--------~ P M F P M P P M P
11 12 13 14 IS 16 17 18 19
'" 182,326 120,549 61,777 40,263 36,092 4,171 16,355 12,003 4,3~2
180,667 119,108 61.559 39,785 35.695 4,090 16,086 11,770 4,316
1,659 1,441 218 478 397 81 269 233 36
91,724 57,533 34,191 12,139 11.428 711 4.992 3,771 1,221
90,623 56,534 34,089 /],938 11,232 706 4.821 3,619 1,202
1,101 999 102 201 1% 5 171 152 19
2,724 2,038 686 863 825 38 394 280 114
2,446 1,773 673 777 739 38 364 250 114
278 265 13 86 86 30 30
218 265 13 86 86 30 30
4,829 3,362 1,467 1,004 968 36 476 358 118
4.652 3,206 1,446 ~ 994 958 36 474 356 118
177 156 21 10 10 2 2
177 156 21 10 10 2 2
28,864 17,627 11,237 3,789 3,536 253 1,576 1,235 341 f
28,557~ 17,352 11,205 3,741 3,488 253 1,501 1,170 331
307 275 32 48 48 75 65 10
134 117 17 9 9 13 12 1
173 158 15 39 39 62 53 9
15.729 9,409 6.320 1,501 1,336 195 455 326 129 15,729 9,409 6,320 1,5(:H 1,336 165 455 326 129
1,188 1,087 101 514 -- 498 16 144 126 18 1,12i 1,024 97 508 492 16 129 114 15
67 63 4 6 6 15 12 3
67 63 4 6 6 15 12 3
411 4S 3 6 6 14 11 3
19 18

, 156 I
PRIMARY CENSUS ABSTRACT
MAIN WORKERS
Household Industry-Manufacturing, Other
Processing, Workers [III. Name of District! Servicing & IV, V(b) & Police Stationl Total Repairs [V(a)] VI-to IX]
SI. u. A./City/ Rural ,.--- ,------'- ---'\ No. Town Urban P M F P M F
1 2 3 20 21 22 23 24 25
JALPAIGURI DISTRICT T 324 217 107 '125,384 72,237 53,147
R 309 203 106 124,487 71,440 53,047
b 15 14 1 897 797 100
Soda, Subdivision T 205 142 63 74,388 42,192 32,196
R 196 133 63 73,668 41,550 32,118
U 9 9~ 720 642 78
I Rajganj T 6 6 1,461 927 534
R 1 1 1,304 7~ 521
U 5 5 157 144 13 I
Dabgram (NM) U 5 5 157 144 13
2 Jalpaiguri T 9 7 2 3,340 2.029 1,311
R 9 7 2 3,175 1,885 1,290
U 165 144 21
Jalpaiguri (M) U 165 144 21
3 Mal T 69 44 25 23,430 12.812 10,618
R 68 43 25 23,247 12,651 10,596
U 183 161 22
Mal ~NM) U 111 95 16
Odlabari (NM) U 72 66 6
4 Mitiali T 32 26 6 13,741 7,72! 6,020
R 32 ,26 6 13,741 7,n1 • 6,020
U
5 Mll9naguri T 6 6 524 457 67
R 4 4 480 414 66
U 2 2 44 43
Mainaguri (UA) U 2 2 44 43
(a) Domohani (NM) U 2 2 26 26
(b) Mainaguri (NM) U 18 1-

[ 157 ]
.FOR SCHEDULED TRIBES
Marginal Workers Non-Workers
r- ---. _, P M F P M iF
26 27 28 29 30 31
17,529 6,408 11,121 291,936 125,885 166,051
17,484 6,372 11,112 188,088 124,180 163,908
45 36 9 3,848 1,705 2,143-
9,215 3,658 5,557 141,1331 62,798 78,33';
9,175 3,627 5,548 138,522 61,752 76,77I'J
40 31 9 2,611 1,046 1,565
173 65 108 5,343 2,181 3,162 \
160 53 107 4,655 1;923 2,732
13 12 6S'S 258 43(1
13 12 688 258 431}
447 '158 289 8,545 3,654 4,8'Jt
443 156 287 8,159 3,485 .. ,~ 4 2 2 - '386 16,? :217
4 2 2 386 169 217
2,423 956 i,467 41,690 17,971 23,719
.1,401 940 1,46'1 40,775 17,572 23,20;-'
22 16 6 915 399 51'
6 5 443 .2}S 208
16 11 5 472 16~ .308
2,013 851 1,162 20,949 10,034 mO,911> , 2,013 8S! 1,162 20,949 10,034 110.91:)
3 3 2,537 90<1 11,63)
3 3 2,439 866 t,51.1
98 38 ~6G
98 38 <6{J
50 20 :3Q
48 18 sa

[ 158 ]
PRIMARY CENSUS ABSTRACT
No. of households
51. Name of Districtl Total with Total No. Police Station} Rural Scheduled Scheduled Tribes
U. A./City; Urban Tribes Population Literates Town Members r------~------~ ,.....---~-------...
P M F P M F
2 3 4 5 6 7 8 9 10
6 Nagrakata T 7,764 39,058 20,050 19,008 3,699 2,957 142
R 7,764 39,058 20,050 19,008 3,699 2.,957 742
U
.!J Banarhat T 12,105 61,858 31,555 30,303 5,863 4,552 1,311
R 11,940 61,081, 31,141 29,940 5,814 4,514 1,300
U 165 777 414 363 49 38 11
Gairkata (NM) U 165 777 414 363 49 38 II
8 Dhubguri T 711 3,699 2,087 1,612 467 382 85
R 705 3,679 2,078 1,601 461 377 84
U 6 2Q 9 11 6 5
~hupguri·(NM) U 6 20 9 11 6 5
Alipurduar Snbdivi.sUm T 47,014 249,719 128,853 120,866 34,364 25,491 8,873
R 46,676 247,919 127,747 120,172 33,667 24,940 8,727
U 338 1,800 1,106 694 697 551 146
9 BirPllflll T 5,606 28,105 14.366 13.739 2,908 2,259 649-
R 5,606 28,105 14,366 13,739 2,308 2.259 649
U
10 Falakata: T 5,895 32,145 16.731 15,414 3.332 3,733 599-
R 5,870 32,066 16.684 15,382 3,3 II 2,719 592 , U 25 79 47 32 21 14 1
Falakata (NM) U 25 79 47 32 21 14 7
11 Madaribat T 3,559 19,115 9,668 9.447 2,053 1,$96 451
R • 3,559 19,115 9,668 9,447 2,053 1,596 457
U
12 Alipurduar- T 10.568 57.771 30,303 27,468 9.705 6.789 2.916
R 10,462 57,054 29,790 27,264 9,246 6,400 2,846
U 106 717 .513 204 459 389 7()

FOR SCHEDULED TRIBES
Total Main Workers (I-IX)
.r--------A--------, P M F
11
13.785
13,785
23,213'
.22,948
265
265
1,392
1,385
7
7
'90,602
-90,044
558
10,184
10,184
11,233
11.208
25
25
7,455
7,455
21,546
21.425
121
12
8.846
8,846
13,902
13,669
233
233
1,262
1.2~5 7
7
63,016
62,574
442
6,156
6.156
8,555
8,532
23
23
5,093
5,093
16.134
16,030 '
194
13
4,939
4,939
9,311
9,~79
32
32
130
130
27,586
27,470
116
4,028
4,028
2,678
2,676
2
2
2,362
2.362
5,412
5,395
17
[ 159 ]
MAIN WORKERS
Cultivators (I)
~_------A------_, P M F
14
1,346
1;346
2,139
1,090
49
49
983
981
2
2
28,124
27,847
277
521
521
4,700
4,697
3
3
3,000
3,000
10,668
10,661
7
15
1.295
1,295
2,024
1,980
44
44
946
944
2
2
24,664
24,463
201
463
463
4,425
4,422
3
3
2,429
2,429
8,963
8,956
7
16
51
51
115
110
5
5
37
37
3,460
3,384
76
58
58
275
275
571
571
1.705
1,705
,. P
17
741
741
893
844
4?
49
313
313
11,363
11,265
98
306
306
2,054
2,047
7
7
661
663
5,038
5,021
11
Agricul tural Labourers (II) ____..._
M
18
577
577
642
599
43
43
227
227
8,232
8,151
81
228
228
1.385 . 1,380
5
5
556
SSt)
3.573
3.556
17
'""" F
19
164
164
251
245
6
, Sit
.s.
3,131
3~111f.
(7
18
73
069-
c567
Z
2
107
107

[60 I
PRIMARY CENSUS ABSTRACT I
MAIN WORKERS , Household Industry-
Manufacturing, Other Processing. Workers [ill,
Name of DistrlctJ Servicing & IV V(b) & Poliee Station}. Total Repairs [V (a)] VI to IX]
!I'l U. A./City/ Rural" ,-~
Woo Town Urban P M E P M F " :I 2 3 20 21 22 23 24 25
6- ·Nagrakata T 58 37 21 1l,640 6,937 4,703
R 58 37 21 11,640 6.937 4.703
U
.") Ban arhat T 22 16 6 20,159 11,:pO 8.939
·R 21 15 6 19,993 11,075 8,918
U 166 145 21
<iairkata (NM) p 1, 166 1145 21
I Dhubguri T. 3 3 93 89 4
R 3 3 88 84 4
U j 5
Dhupguri (NM) U 5 5
Alipurduar Subdivision T 119 75 44 50,996 30,045 20,951
R 113 70 43 50,819 29,890 20,929'
U 6 5 1 177 \ 155 22
'9 Birpara T 11 8 3 9,346 5,457 3,889
R 11 8 3 9,346 5,457 • 3,389 U
10 Falaka,ta T 11 10 4,468 2.735 1,733-R 11 10 1 4,453 2,720 1,733-U 15 IS
\ Falakata (NM) U - 15' 15
11 Madaribat T 26 16 10 3.766 2,092 1,674-
R 26. 16 10 3,766 2,092 1,674
U ... "
12 Alipurduar T 42 24 18 5,798 3,574 2.224-
R 42 '24 18 5,701 3,499 2,201
U 9'1- 80 11

FOR SCHEDULED TRIBES
Marginal Workers
,----------"-P
26
1,176
1,176
2,899
2,898
81
81
8,3/4
8,309
5
477
477
I,Cl49
1,046
3
3
989
989
2,241
2,239
2
M
27
498
498
1,109
1,108
21
21
2,750
2,745
5
213
213
322
319
3
3
364
364
592
590
2
F 28
678
678
1,790
1.790
60
60
5,564
5,564
264
264
727
727
625
625
1,649
1,64'
I 161 ]
----( p
29
24,097
24,097
','
35,746
35,235
'511
511
2,226 l
2,213
13
13
150,80J
149,566
1,237
17,444
17,444
19,863
19,812
51
51
10,671
10,671
33,984
33,390
594
Non-Workers -------~------------~
M
30
10,706
10,706
16,544
16,364
180
ISO
804
802
2
2
63,087
62,428
659
7,997
7,997
7,854
7,833
21
21
4,211
4,211
13,577
13,170
407
F
31
13,391
13,391
19202
18,871
331
331
1,422
1,411
II
11
87,716
87,138
578
9,447
9,447
12,009
11,979
30
30
6,460
6,460
20,407
20,220
187

[ 162 1
PRIMARY CENSYS ABSTRAC'F
No. of households
Name of District/ with Total Police Station/ Total Scheduled Scheduled Tribes
SI. U. A.rCity! Rural Tribes Population Literates No. Town Urban Members ,...-~ ~
P M F P M F
1 2 3 .4 S 6 7 8 9 10
Alipurduar (UA) U 106 717 513 204 4~9 389 70
(a) Alipurduar U 45 IS7 - 89 68 56 37 19
(i) Alipur Duar (M) U 44 153 88 65 56 37 19
(ii) liJobhaganj 'tOG) t4 4 3
(b) Alipurduar Rly. Jun. U • 61 560 424 136 403 352 51
0) Alipurduar Rly. Juil. (MN) U 29 122 64 58 71 '42 29
(ii) Chechakhata (OG) U 32 438 360 78 232 310 22
13 Kalchini T 14,179 73,721 37,710 36,011 10,295 7,660 2,635
R 13,972 72,717 37,164 35,553 10,078 7,512' 2,566
U 207 1,004 546 458 217 148 '69
Uttar Latabari (NM) U 207 1,004 546 458 217 148 69
14 Kumargram T 7,207 38,862 2O,Q75 18,787' 6,071 ,4.454 1,611
R 7,207 38.862 20.075 18,787 6,071 4,454 1,617
Y

163 )
FOR SCHEDULED TRIBES
MAIN WORKERS
Total Main Workers Cultivators Agricultural I-IX) (1) Labourers (II)
,_. ,_. .A.--___ ....
P M F P M F P M F
11 12 13 14 15 16 17 18 19 \
121 104 17 7 7 17 17 ""1
55 44 11 2 2 1 1
53 43 10 2 2 .
/2
66 60 6 5 5 16 16
30 28 2
36 32 4 5 S 16 16
,27,968 17.7~o4 9,364 5.591 4,866 725 1,866 1,2721 594
26,656 17,38,9 9,267 5,324 4.675 649 1.792 1,213 579
412 315 97 2...67 191 76 74 59 15
412 315 97 267 191 76", 74 59 15
13.116 9.374 3,742 3.644 3,5,18 126 1,436 1,218 218
13,H6 9.374 3.742 3,644 3,518 126 I 1,436 1,218 213

51. No.
I
Name of DistrictJ Police Station} Total
U. A./CitYI Rural TOJIID Urban
2 3
Alipurduar (UA) V
(a) AUpurduar U
(i) Alipur Duar (M) U
(ji) Sobhagaoj (OG) U
(b) AJipurduar Rly. Jun. U
(i) Alipurduar Rly. Jun.(NM) U
(ii) Checbakhata (OG) U
13 Kalchini T
R
U
Uttar Latabari (NM)
14 Kumargram
u
T
R
U
( 164 ]
PRIMARY CENSUS ABSTRACT
MAIN WORKERS ,..----------------"----- ._--....----""" Household Industry
Manufacturing. Processing, Servicing &
Repairs [Veal] ,..-______ --A ________ ~
P M F
20 21 22
15
9
6
6
14
14
11
6
5
5
6
6
4
3
1
8
8
Others Workers [III,
IV, V(b) & VI to IX] r--------A--------""" P M F
23 24 25
97
52
50
2
4S
30
15
19,596
19,531
65
65
...s,022
8,022
80
41
40
39
28
II
11,555
11,495
60
60
4,632
4,632
17
11
10
6
2
4
8,041
8,036
5
5
3,390
3,390

( 165 )
"FOR SCHEDULED TRIBES
Marginal NoD-Workers Workers
p M F P M F
26 27 28 29 30 31
2 2 594 407 187
, 102 45 57
100 45 55
2 2
2 2 492 562 130
Z 2 90 34 56
402 328 74
1,409 534 875 45,244 19,472 ~5,772
1,409 534 875 44,652 19.241 .25,411
592 231 361
592 231 361
2,149 725 1,424 23.597 9,976 13,621
2,149 725 1.424 23,597 9,97' <13.621


LIST OF SCHEDULED CASTES .. AND
SCHEDULED TRIBES


LIST OF SCHEDULED CASTES: WEST BENGAL
1. BAGDI, DULEY 30. KARENGA,KORANGA
2. BAHKLIA 31. KAUR
3. BAITI 32. KEOT,KEYOT
4. BANTAR 33. KHAIRA
5. BAUJU 34. KHATIK
6. BELDAR 35. K.O~a;
7. BHOGTA 36. ~ON4I
8r BHUIMALI 37. KONWAR
9. BRUIYA 38. KOTAL
10. BIND 39. KURARIAR
11. CHAMAlt, ctIARMAKAll, MOCID, MUcm, 40. LALBEGI
RABUOAS,RUEOAS,BiSEU 41. LOHAR
12. CHA"UPAL 42, MAHAR
13. DABGAR 43. MAL
- -14. llAMAI C~EP ALI} 44. MALLAH
15. DHOBA, DHOBI 45. MUSAHAR
16. DOAI 46. NAMASUDRA
17. DOM, DHANGAD 47. NAT
- 18. DOSADH,DUSADH,DHAlU,OHABED 48. NUNIYA
19. GHASI 49. PALIYA
20. ~ONRHI 50. PAN, SAWASI
21- HALALKHOR 51. PASI
22. HARI, MEBTAR, MEHTOR, BHANG1 52. PATNI
23. JALIA KAIBARTTA 53. POD, POUNDRA
24. JHALO- MALO, MALO 54. RAJBANSHI
25. KADAR 55. RAJWAR
26. KAMI (~EPALI) 56. SARKI-(NEPALI)
27. KANDRA 57. SUNRI (EXCLUDING SARA)
28. KANJAR 58. TIYAR
29. KAORA 59. TURI

LIST OF SCHEDULED TRmES : WEST BENGAL . 1. ASUR 20. KORA
2. BAIGA 21. KORWA
13. BEDIA, BEDIYA 22. LEPeHA
4. BHUMIJ 23. LODHA, KHERIA, KHARIA
5. BHUTIA, SHERPA, TOTO, DUKPA, 24. LOHARA, LOHRA
KAGATAY TIBETAN, YOLMO 25. MAGH
6. BIRHOR 26. MAHALI
7. BIRJIA 27. MAHLI
8. CHAKMA 28. MAL PAHARIVA
9. CHERO 29. MECH
10. CRIK BARAIK 30. MRU
11. GARO 31, MUNDA
12. GOND 32. NAGESIA
13. GORAIT 33. ORAON
14. HAJA~G 34. PARHAIYA
15. HO 35. RABHA
16. KARMALI 36. SANTAL
17. KHARWAR 37. SAURIA PAHARIA
18. KHOND 38. SAVAR
19. KISAN

POLICE STATION MAPS


173
o
1<:)
,_
o
a:
I
< ...
,-
POLICE STATION RAJGANJ DISTRICT JALPAlGURI
o ._
N
t o
...
A Co
...
IOUIIDAR"r, INTtRN~ttOHAt. ••• _._.--.-DISTRICT •• • .....•...... _._ ....... _ POLICE STATION ••••.• .. ... _._._ ...... VIU. ... GE WITH LOtATlOtI COo[ HUNGER .[:::~J~::::J
l1E ... ~TERS: POUCE STATION •••••••.•.•••••• © ro-~~!;:;~~_=~~~~4~~~~,2~ ... O •• • e ~AlEA .. THLOCATIa.COD£ .. U..,!lEIr ••••••• W"'4i~ ICATIONALMIGMWAY/STATE HJGttWAT ••.•.••••• ---U..U.."v'~ lMPOItTAMT MUALI.!D ROAD •..••••••••••.•...••. _____ _
UNMtTALL£a ANlJ 0flI£R ROADS
1AlLWAJ' UKE WITH STAnON,BROAD CAtlGl ••••••••• -=-=-:iSoo:=-_ IUVER MD $TltAH ••••••• ....... " "'''''===~-''''-POST OfFICE ~ •••••• , ••..••••.••••••••.•••••• .0 HlGHEA S£CONOARY SCHOOL •••••• • ••••••••••• ,.
'IUMARY tfEAIl" ctNTAE ......................... _

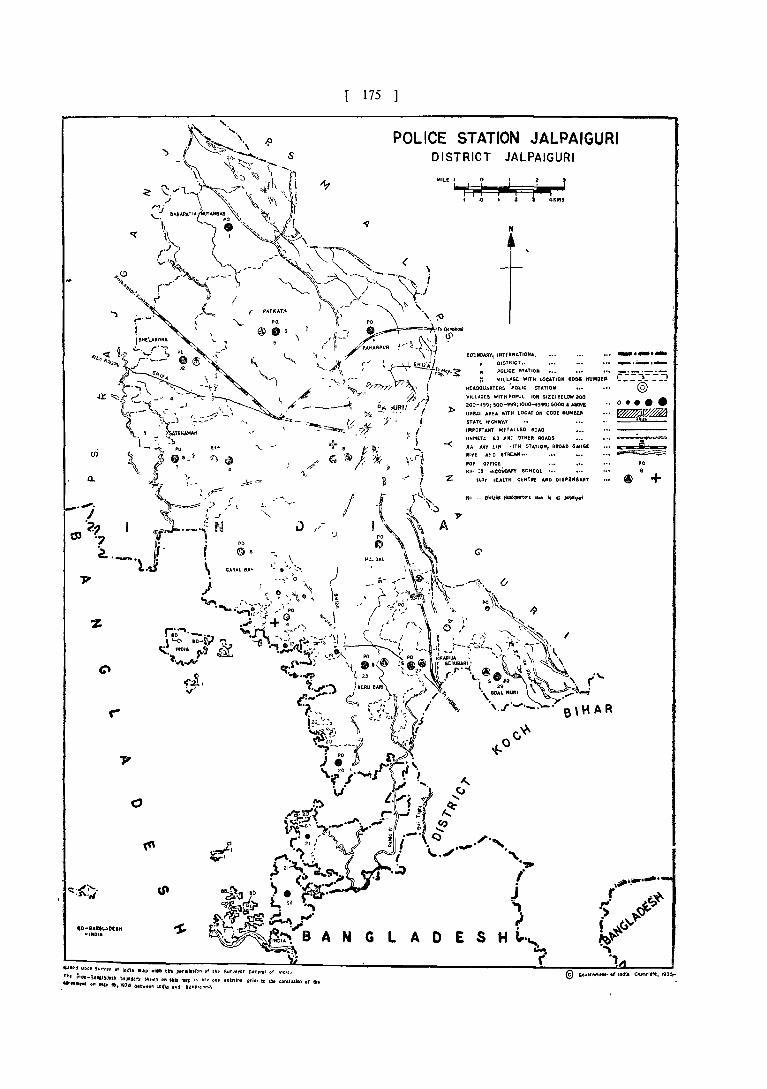
IO-84ftGt.AOtIH "INDIA
o
8a"d u!Jatt '3''''Vn Of India ... " .... ttr. permruion Of til, Surveyor G,h'l'iH or !II"!'
n. tnO .... B.!IfIIIAdt'h hUIIllar)l Yllhlfl Oft. ClItia flep '6 t.he on. ,.inlnt prior to tile conelwllOG of Ch. IIfrftm ... on til" 16.197. O.t .. "n Ul414 ."~ 8"n,'u~~".
175
POLICE STATION JALPAIGURI DISTRICT JALPAIGURI
MILE t 0
-<
""H , 4ltM$
N
SOUNDAAY, fNTERN"TIONAL
DISTRICT ..
POLICt STATION
" VllL~GE WITH LOCATION COO& NUMIC"
HEADQUARTERS POllC STATION
VILLAGES WIT" POPUL ION SIZE: BELOW ZOO
200- ~')gi 500-999; 1000-4999; 5000 & AiCM: UABIJ. AREA WITH lOCATION CODE HUMI!oEl'
STATE HiGHWAY
IJIIPORT.urr MHAL.lEO MAO
UNM£T,l _EO .U~~ OTHER ROADS
.RA /JAY LIN ·ITH STATION, BROAD CAUGE
RIVE MD STI\EAM •• •
POt OFFICE
HI+· :1 i~CO~ SCH(lOL
IA.RY -ItALTH CENTIE AND OI$',"SAII"
~ ...... -_ ...... , ......
•• ~.+


POLlCE STATION MAL OISiRICT JAlPAIGURI
IOUNOARY. OISTI\ICT
POLIC.! STA.TION
VILI,.AGE WITH LOCATIO,. COD£ NUMBER
Mf,AflQuMTEftS POLlcE &TA'ftOft
VtLLAGf;S WfTH POPULATfON SIZE B£1.0W 200 ZOO-499, 5QO..9991 1000-49991 ~OOO & ABOVE
URBAN AREA WJTH lOCATION CODE HUMBER
NATIONAl. HIGHWAY
STATE HIGI:IWAY /IMPORT.ANT MlTAlt.r.D lOAD
UNMtTALlEQ AND OTH£R ROADS
RAILWAY LINE WITN flT,mON, "'ETRE GAUGE
RIVER ANO 6TRU.M
POST OfFtCE
HIGHER SECONDARY SCHOOL
HOSPITAL
PRIMARY HEAL1lI C£HfRE
r
ti'
-~-.-_.--C::-!f_-_-_'J
@)
0 ••••
::':'-_j.!--=--~
~~
bH~1
..!.!!.!L/ __
1111~lltl
~~
PO
~ li ."
"'",*"SW'Y""lIr11O.GtwtUl~"''''f.~",,_ .... ....
177 )
\
...
,..
?
I
"


"
POLICG STATION MITIALI DISTRICT JALPAIGURt
t ~
It' ( . ./ Q
N
'OUHDA~Y, DIST~ICT ••
, 3 ,
POLICE STATION _"_o_._ VILLAGE w,TH LOCATION CODE NUM9ER ~ = ~:::: ~ :::: =::::}
HEAf1UUARTERS: POLICE STATION @.
'VII.LAG£S WITH POFULATlO'N SIZE: 200-4~';;OO-99~I.IOOO·4999;;OOO" AeOVE • • • •
NATIONAL HIGHWAY
STATE HIGHWAY
IMPORTANT METAL LEO ROAO
UHM£Tll.LED AN'O OTHEft ROADS .
ftAllWA'f LINE WITH STATlC~,MfTRE GAUGE.
RIVER AHD STREA,..
POST OF~ICE
HIGHER SECONOARY SCHOOL
HOSPTTA~.PRIMARY HEALTH .CENTRE',. DISPENSARY Ano CHILO WELFARE C£"TRE
NH 31
SH 12
•• 1.
PO
5
[. 179
o
"II
o
r
R J
..,
" \
'I .... /
0
Q,
I I Go
I "'l
~
I ,)..
I '(
~ (
( ~
0
/'
' ........ ~ _, '7 0 < ~ Q.
~--~~--------------------~~~--~~~~~--------------------------------~------------------~~~~G.:Y.;r:nm:";"~~;:~; .. ~~~";r~=.;,~,,\is. But. ~ $urvrr 'f In," lII.p .~ tb. ,ermIN.Oft .f the Sury.,., GIn.ral tf Inil.


18I
+ •
.. 1
<>
' .. \ . ...
'f .~ , , G ,..£.-i ~
U I? ,,-' . .".
00.,," VP"1 S,,~tV ~f Indnl lIIa~ IIIltb tbt tlrmiUlO1I of the $qrYlJor Gt"crll of India"
POLICE STATION MAYNAGURI OISTRtCT JALPAIGURI
• ~ . A . '
I • It ••
BOUNDARY, _Tftel' .... ~_ ........ : ....... h •• _,_ .... ~
II pouce S1A1 .................................. ......
V1t.UGt WITH tQc"noft tOOl SUMBtI~;::(:::J H&AOQUAATtRS. POLICE STAtI09 ................ _.. 0 ~~~~:::,:~~'iI:grl'Co~~9~I::J:~;Q~~~; ..... 0 ••• _ CftINlUBn£D VILLAGtS wn. \OGA~ CODa NVMD£JL:::(~-'::J .. a ... R" WIT. LOCATIaN ~Dl ."Met ••• __ WA2J~ ftATfONAL HIGHWAY ••• __ ._~. __ ~ ... _ .......... 'I. NH3t_
stATE HIGHWAY ••••••• _ ................... ...,_,. .. --. __ -"'§Ho.l' ..... '-_.
~
IMlO~AN1 MEtaLI.ED 80~ ••••• ~ .... _ ... ~._ •• ____ _
ONMfTALL£O AND OTHER ROA05 __ .. ___ ........ -1--"... .. IlA1UVAf ,-tNe t(lTH &TArlQfI, IIOIJt CAlI4£ .....
• aTRI GAUGS ,""lIlt "t RIVEI AHD STReAM ••••••••••••••••••••••• ~ .... ~
'0$1 DffICI/ POST AND TnCUAIM amc& •• _~.,
"IGI118 &GCORDAIIY SCHOO\, •••• " ....... _0 _._
CtRIIIlAIY HEAL-fit cnut AND tlJSP£"~'f''''''''
.o/m
• * +
,._, Q
,
I


....
183
0.:
t Iflll-V~ T .... " .... rre6 'tOIl '.S.Me_1
!!It!J ''''''"' of IIflt II" wII' IIIf ,,, ... ,10 •• f'" $,",,.. II, ..... " 10414.
STATION NAGRAKATA DISTRICT JALPAIGURI
2 , , ,
; i4 N ; 2 I 0 , .I(,",S
'. , . I·
':ale'! STATIO. ftII' __ _ 1'01.1;;" 3TATIOlflQiI _ _
BOUllOAILY. INT£IINATIONAL
OI$TRlCT
.~ _._ ... POLICE STATlOI!
., VILLAGE WITH LOCATION COilE IIUICBER,
HEADQUARTERS POLICE STAOiOH •• •• ••• • ••
VILLAGES Willi .l'O?UlATION SIZE
_._.-r- - - - - - - -, I 12 I
-------~ @)
1100- .99; 500-999. 1000-.999; 5000 6 ABOVE •• , •••••
HA TlOHAt HIGHWAY •• '.. NH "e IMPORTANT I4£TALLEO ROAD ••• •
UNMETALUD ;'110 OTHER lO'-DS •••
RAILWAY llllE WITH STATION. M£T1l 'AUG', ••
RIVER AIID STREAIC... ••• ••• ••• • ..
POST OFfICE /I'0I'l" fJID TElEG8APH OFFICI
~
'1IIIIIaPIIU'"
_. KCDIID";Y SCHOOL • •• •• ••• •
IICI$PITAL.'_ARY HEALTH CtIlTRE,DlIPEIlIAIiY... ~ @) + ® ~ ••• ,...... or I,... ;'"'''''. Itot.


POLICE STATION BANARHAT ~
DISTRICT JALP~!GURI
NIUI ° 2
~~ i ,
° 3 4~NS
N
t '\ .. ~
to
tJ)'
$,
o u'
80IlMDAR't, IlITtRN"t'OHi'~"."".;. .. ", .. " .... :. .. ::" ..... "" ... _._._
t' POLICE. &T4TI0,.. ................................ -;' •••••••• _._._ ,-------., It VILLAGE W'T" LOCATION CODE NUMIIt •• ~ ... L __ !'! __ -' .. FOUST-RE5ERVto WITII HAME ............... ~: )~~.~f:: ::!
"~ADU.iTtR$; POll~t $T"TioH....................... ••• @
VIlJ.AGt& W"14 ,oPULATIIlH.IUZE 'ELOW 100. • ••• _-419; 500,.'99.1000-4999; ,000 .. A80VE ..... • ...... 0 UNIHKA.rttO Vill-AGES WITH LOCATION Coot 1tUM.u.~[::i2.e[_-.J
hM4 .,.. 5wrv,,, If 1"1 1111'"
185
,
8 G
URIIAN oW Wflt,· LOCATIO .. CODE "IIMU.".~ ....... WH4'V1W.&a NATIONAl. tffGHWAY •...•.•...•..••••••• ,' ....................... _..IiHLIlIli.i3tIloC __
fMlOOUHT METALLED .OAO ......................... " ..... __ ~ __
fJAl1,WAY \.IM' 'S11H SlAT ION, Mr.TRl GAuvl"""'-"IIIIIIII¥UU'1I11t
''''1'' ANO ',.iltAM •••..•..• ~ ............................ ~ :::< P05T OffK'.( ................... _~ ......... _ ....... . '0
H"NtIt UCONOARY 'CHOOl._ ......... ~, ..... _. .. ••
HOSPI'rAL.,I'ItMARY I4EALTH ~tIITRt 4KO DfSPtflSARY ~ +
-
o -P. S.-OHuICufI
N-Po S ... HAGRAUT.


,..
~ 187
POLICE STATION OHUBGURI DISTRICT JAlPA-IGURI
2 3
I 0
;La; !
3 4K14S
N
t BOUNDARY, DISTRICT .............................. . IMPORTANT METALLED 1l00D •••••••..•. ,. . . . . .• • . . . •....
POLICE STATION· .. ... • • . • .. •..•....•.•••• .. _. _ • _ UNM~TALLED AND OTH£II'ROAOS .............................. ________ =_ VILLAGE WITH LOCATION C,ODE NUMBER .. ·• ........ [:=~:::=J
HEADQUARTERS: POliCE STATION" • • .. • • ••• • • • •• .•• • . ... ... @
VILLAGES WITH POPULATION SIZE:ZOQ-4", 500-999; 1000-4999 ..................................... . • • UNINHABITED VILLAGES WITH LOCATiON COD!HUM8£R···· .•.• [:::X}:2::1 URBAN AREA WITH LOCATION COOE NUMBER ••••••••.•••..•.••.• WVIU%;0l NATIONAL HIGHWAY' ••.•.•••.•..•....•...•.•••••••••••••••••• HH31
s T A t , o Ii ..... _ . ..;'"\.._f'._.
45 • .)
.. (I! -r ... 'l ____ \
45 •
os RAILWAY LIliE WITH STATION, BIIOAO GAUGE • • • • • ••• • ••• •• ••
RIVER AND STREAM······· ......................... , •••••..
POST OFFICE·· .............................. '" •. •• • •• . •.• PO
KIGIltIl 5E<:.0II_., ~_ •••••.•.•••.•.••....••. " •• • • •• •. •
HOSPITAL, PRIMARY HEII.LTII C£NtllE AND DISPENSARY _... • • • • .• ~ ® +
8 A N
" o
,..
C')
'"
o
.,.
s .,. R c H B H A
............. R o K o
'0 • 0 ,GlUtS
..... .,.. a. ..... r India- m,p '''th tho permi,,!'" of tilt 5urv_ Gfntt.1 of india. @GoYernment .r India CopynSbt,1985 •


189
POLICE STATION BIRPARA N DISTRICT JALPAIGURI
~II I
o
'~ i I 0
\.
I..., ,"
~,
~,
:r:
Q:
/ ~ /
z I 1\
« \
I I I I
I f S I • &.\, : PO I \ I \\ EJ) I '-'
('\ J ~ ~ --
~ '-'\ .1 -4 ::) -'-'-'~j ....... (
l. A K'
BOUNDARY, INTERNATIONAL
" POLlel:: STATION ., ••••.•...••••••••••••••
" VILLAGE WITH LOCATlON ceOE t.'J:·i&ER •••.
HEADQUARTERS' POLlCE STATlOIl •.•...••••.••••••.•..
VILLAGES WITH POPULATION SIZE: BELOW 200, 500-999; 1000-499S; 5000 & ABOVE •• , ...••••••••••
tlATIOIIAl HIGHWAY ••••••••••••••.••••.•.•••. , •••• .
IMPORTANT METALLED ROAD •• • • • • . • . . • • . • •. • .••••••
UflM£TALlEO AND OTHEI!. ROADS , •.•.•••••••• , .•••••••
-$ "" " ....
i 2
"of ~-;.
~ \
.... d "".n. Survey of Indl. map with tho ptrm, .. 'on of tn. Surveyor G.nerQI of India.
i :s
2 I
~ !
4 KMI
A
e;,.
~.
RAI~W~Y LIM:: \'liTH STATION, METIlE GAUGE •.••••
RIVER AND STREAM
POST OFFlcr / POST AND TELEGRAPH OFFICE .•••.•••••
fi~GHER S~CO:'IDAAY SCHOOL
HOSPiTAL .
PRIMARY H£ALTII CENTRE .•• • .... • ............... .
" OISPE~JSARY . . .... ,. .. . . . . . . . • • . • . . . . , •. , CHILD WELFARE CENTRE •.•••••••• , • ... .... ••• • ••• ~


p. s. N
:0
eui)NDAIt't', DISTRICT • " POLICE STATION.. •. • ... ___ o __ _
" VIl.LAGE WITH LOCATION CODE NUMBER C"':: 1S:::::: HtAOQJIART[lS, POLlt1: 5T,,1I0' ••••• @ UILL"GES WITH POFULATlon SIZE:
ZO<f-4"1500-1199; 1000.4999;5000 • ABOVE.· • (I • •
".UH AR'A WITH LO~'T!ON COO, NU"B,R •• m'1~ NATIONAL HIGHWAY ~H3t IMPORTANT MttALLED ROAD
UNM£TALLED AND OTHER ROAOS
JAILWAY LINE WITH STATION, 8ROAD GAUGE
1nyu AND STFIEAM
POST OFF ICE/ TELEGRAPH OFFICE
tllCIlER SECONDARY SCHOOL··· .....
-----~--- ..... ::;:==
'O/TO
HOSPITAL) PRIMARY HEALTH CtNTRE, QISPENSARY lI:!,. IE\ + AHO <:toILD WELFAIIE CtH~ ••• '1:117., ..
191
a Ii P 04 II
POLICE STATION FALAKATA DISTRICT JAL'PAIGURI
JULI, 0 Z I
..,.~ , ! : 0 3 4KMS
s.
.. c
o
c:
I( 0 C' H B f


LLJ o :i o Q.
, . \ . \
..
..
W J
i
N H :> 1
~ .. "
193
N 0 I~ ! .I. It
V )f
.. ~:
D
o I .I. .J. s
I i i
J.
ai
! ::> z .. '" " :E 8 ~
S
e r ' I I
.: : u
.I~: ~ 1)(1 x I I Z
., I I I
OL.J .. ~ :E ::> z
I
!11~ I ._ .,
I f I 1 I
o
: ! ..
u k: .. o f .. .. .. w .. ...
~ g " " ..
W DO ....
+ • t&
Z •
~ : .. "I! ':,z ..... .. " %, ...
t= "'~ 2:'" ;;;)0 .. _;~ " " ~u .. 0 OZ ,.<
I-


4': .... I
(J I f,,-4'<oj
I I
./.",.~ ~ ( r
'" o
t9S
o "
,_
o
1
,_
o
! I 1 I i I
r" ,..., !: " :~ t! @ r I .~ LJ _
....
.. J 8
I 1
~ ~
~~ ____ ~ __________________ ~ ____ ~"~~' __ ~ ________________ ~J


197
z " .-. :I: = 0 0:
. ..J ::> < I!) ~
~ ~ Z ...I
Q « z41 ....,
!;( I- -r u ~ (/) 0:
I- 0
UJ I/)
0 0 ..J 0 i
Q. ~
.:r:
I
a
"e .' ~.". j '. ~:..w

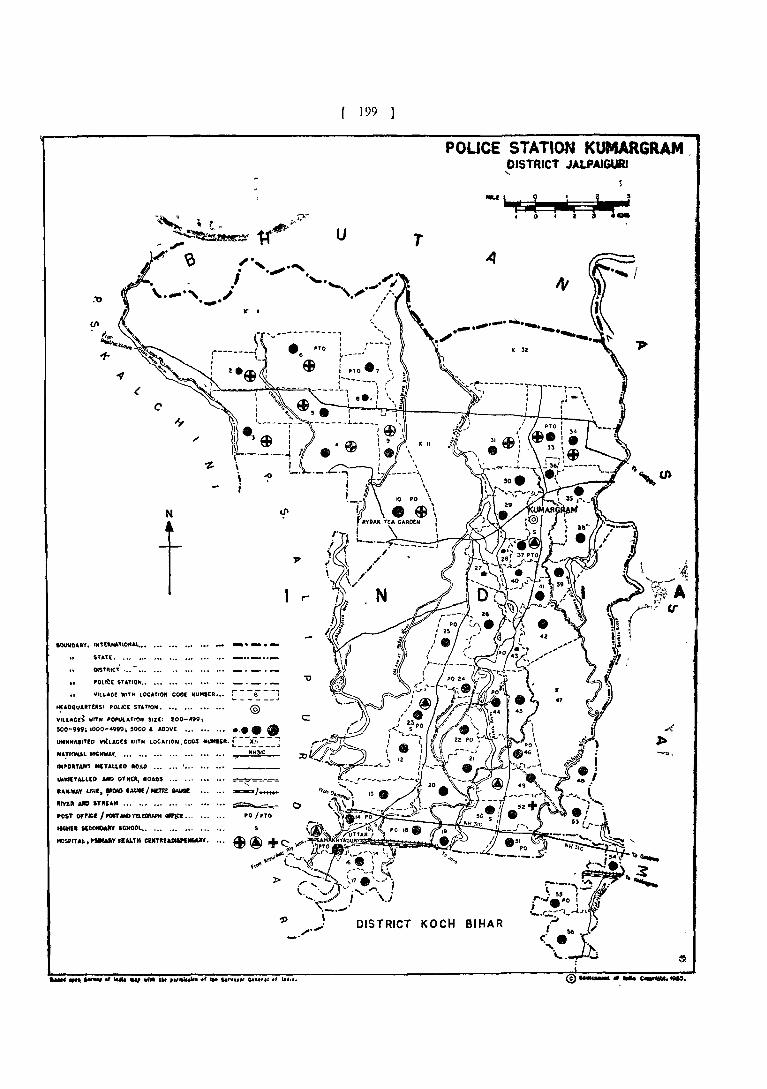
.'tI
(
lOUNOA"". tH'ft"HlTtOtlAI.,. ••
S'U.tE •••••••
QtStRtC1 ' •• - H. 'OUCE STAtiON. ~
VILI,.AG£ WITH LOCATIOH COOE NUMaEA' H [= =: € ==J ~'OQUAItTER5: fOL.ICE ST,UfO". "0 •• , ... @ VIUAGE$ WnH ~OPUlA1'ION SiZE: 200-.99;
SOO-999; .000-'999; '000' '.OVE •• , '" e_ •••
UNINHABITED VlLUGES WITH LOCATIOH.COC! tnIM"ft. [::~:: :_J c
NA7'ONAL HfGNWAY. .., ••• .., NK3IC ;:0
IMPORTANT MITALLeD IlOAO ••• I •••
UNMETAl.UO AfifO OTHtIlj lOADS
R •• LWAY LI"E, ~ IA_I __
"IVIR _ nRUM ••• '" " .......
POST OfFIC1/ __ m_ 0fI'lCW •..
.. II .. U jl\C_ SCHOOl... ... ... • ..
tlCSPlTAL •• _Y H!~TH ClHT ... DIVPWIV.
... ,- -~l
~O
POl"'"
u
199
1
POUCE STATION KUMARGRAM DISTRICT JALPAIGURI "
i i
[
I
•
_",._ .......... _. -. • 32
..... _. \' 1>
u
DISTRICT KOCH BIHAR
@_ .. _-_.