Baseline BMI is a Strong Predictor of Nadir BMI after Adolescent Gastric Bypass
Remote Sensing of Environment 113 (2009) 846–856
Contents lists available at ScienceDirect
Remote Sensing of Environment
j ourna l homepage: www.e lsev ie r.com/ locate / rse
View angle effects on the discrimination of soybean varieties and on the relationshipsbetween vegetation indices and yield using off-nadir Hyperion data
Lênio Soares Galvão a,⁎, Dar A. Roberts b, Antônio Roberto Formaggio a,Izaya Numata c, Fábio Marcelo Breunig a
a Instituto Nacional de Pesquisas Espaciais (INPE), Divisão de Sensoriamento Remoto, Caixa Postal 515, 12245-970, São José dos Campos, SP, Brazilb University of California, Geography Department, Santa Barbara, CA, 93106-4060, USAc South Dakota State University, GIScCE, Brookings, SD, 57007, USA
⁎ Corresponding author.E-mail address: [email protected] (L.S. Galvão).
0034-4257/$ – see front matter © 2008 Elsevier Inc. Aldoi:10.1016/j.rse.2008.12.010
a b s t r a c t
a r t i c l e i n f oArticle history:
Imaging spectrometry has Received 24 June 2008Received in revised form 23 December 2008Accepted 24 December 2008Keywords:Hyperspectral remote sensingHyperionSoybeanYieldMODISView angleVegetation indices
the potential to provide improved discrimination of crop types and betterestimates of crop yield. Here we investigate the potential of Hyperion to discriminate three Brazilian soybeanvarieties and to evaluate the relationship between grain yield and 17 narrow-band vegetation indices.Hyperion analysis focused on two datasets acquired from opposite off-nadir viewing directions but similarsolar geometry: one acquired on 08 February 2005 (forward scattering) and the other on 14 January 2006(back scattering). In 2005, the soybean canopies were observed by Hyperion at later reproductive stages thanin 2006. Additional Hyperion datasets were not available due to cloud cover. To further examine the impactof viewing geometry within the same season, Hyperion data were complemented by 250 m ModerateResolution Imaging Spectroradiometer (MODIS) images (bands 1 and 2) acquired in consecutive days (05–06February 2005) with opposite viewing geometries (−42° and +44°, respectively). MODIS data analysis wasused to keep reproductive stage as a constant factor while isolating the impact of viewing geometry. Fordiscrimination purposes, multiple discriminant analysis (MDA) was applied over each dataset using surfacereflectance values as input variables and a stepwise procedure for band selection. All possible Hyperion bandratios and the 17 narrow-band vegetation indices with soybean grain yield were evaluated across yearsthrough Pearson's correlation coefficients and linear regression. MODIS-derived Normalized DifferenceVegetation Index (NDVI) and Simple Ratio (SR) were evaluated within the same growing season. Resultsshowed that: (1) the three soybean varieties were discriminated with highest accuracy in the back scatteringdirection, as deduced from MDA classification results from Hyperion and MODIS data; (2) the highestcorrelation between Hyperion vegetation indices and soybean yield was observed for the NormalizedDifference Water Index (NDWI) (r=+0.74) in the back scattering direction and this result was consistent withband ratio analysis; (3) higher Hyperion correlation results were observed in the back scattering directionwhen compared to the forward scattering image. For the same reproductive stage, stronger shadowingeffects were observed over the MODIS red band in the forward scattering direction producing lower andlesser variable reflectance for the sensor. As a result, the relationship between MODIS-derived NDVI andsoybean yield improved from the forward (r of +0.21) to the back scattering view (r of +0.60). The same trendwas observed for SR that increased from +0.22 to +0.58.
© 2008 Elsevier Inc. All rights reserved.
1. Introduction
Crop yield prediction can impact economic strategic planning, foodmanagement and pricing.Most often, vegetation indices have been usedto either establish empirical relationships with crop yield at local scales(e.g., Ma et al., 2001; Serrano et al., 2000; Shanahan et al., 2001;Shibayama & Akiyama, 1991; Royo et al., 2003) or to estimate abiophysical attribute, such as LeafArea Index (LAI) for use in cropgrowth
l rights reserved.
and yield models (Bauer et al., 1986; Clevers, 1997; Doraiswamy et al.,2004; Prasad et al., 2006; Rizzi & Rudorff, 2007). Successive measure-ments of vegetation indices during the growing season or betweenmultiple dates have also been proposed as an alternative for yieldprediction (Aparicio et al., 2000; Chang et al., 2003; Li et al., 2007; Liu &Kogan, 2002; Rudorff & Batista, 1990; Wiegand et al., 1991). At localscales, yield is also dependent on crop varieties (Pfeiffer, 1996), whichhave been continuously developed and tested to provide higher yieldsthrough adaptation to local climates and soils, and/or through greatertolerance to herbicides, pests and diseases.
WhileBrazil hasexperiencedan impressive rise in soybeanproductionin the last few decades, few remote sensing studies have focused on
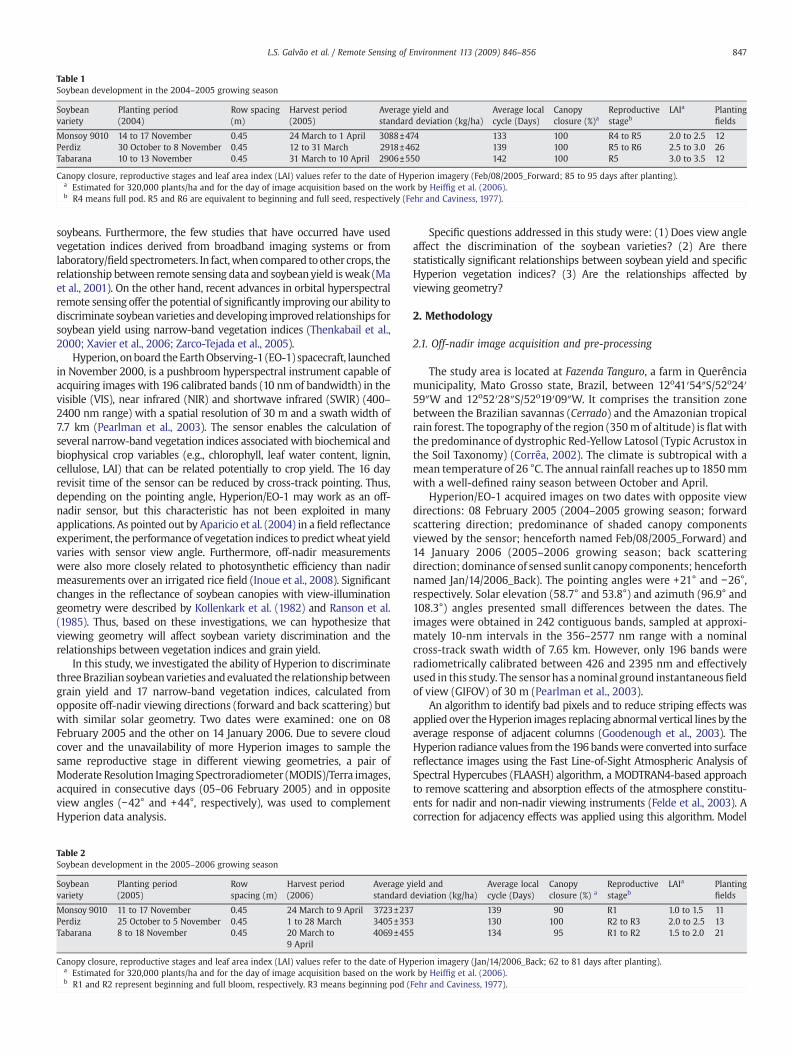
Table 1Soybean development in the 2004–2005 growing season
Soybeanvariety
Planting period(2004)
Row spacing(m)
Harvest period(2005)
Average yield andstandard deviation (kg/ha)
Average localcycle (Days)
Canopyclosure (%)a
Reproductivestageb
LAIa Plantingfields
Monsoy 9010 14 to 17 November 0.45 24 March to 1 April 3088±474 133 100 R4 to R5 2.0 to 2.5 12Perdiz 30 October to 8 November 0.45 12 to 31 March 2918±462 139 100 R5 to R6 2.5 to 3.0 26Tabarana 10 to 13 November 0.45 31 March to 10 April 2906±550 142 100 R5 3.0 to 3.5 12
Canopy closure, reproductive stages and leaf area index (LAI) values refer to the date of Hyperion imagery (Feb/08/2005_Forward; 85 to 95 days after planting).a Estimated for 320,000 plants/ha and for the day of image acquisition based on the work by Heiffig et al. (2006).b R4 means full pod. R5 and R6 are equivalent to beginning and full seed, respectively (Fehr and Caviness, 1977).
847L.S. Galvão et al. / Remote Sensing of Environment 113 (2009) 846–856
soybeans. Furthermore, the few studies that have occurred have usedvegetation indices derived from broadband imaging systems or fromlaboratory/field spectrometers. In fact,when compared toother crops, therelationship between remote sensing data and soybeanyield isweak (Maet al., 2001). On the other hand, recent advances in orbital hyperspectralremote sensing offer the potential of significantly improving our ability todiscriminate soybeanvarieties anddeveloping improved relationships forsoybean yield using narrow-band vegetation indices (Thenkabail et al.,2000; Xavier et al., 2006; Zarco-Tejada et al., 2005).
Hyperion, onboard theEarthObserving-1 (EO-1) spacecraft, launchedin November 2000, is a pushbroom hyperspectral instrument capable ofacquiring images with 196 calibrated bands (10 nm of bandwidth) in thevisible (VIS), near infrared (NIR) and shortwave infrared (SWIR) (400–2400 nm range) with a spatial resolution of 30 m and a swath width of7.7 km (Pearlman et al., 2003). The sensor enables the calculation ofseveral narrow-band vegetation indices associated with biochemical andbiophysical crop variables (e.g., chlorophyll, leaf water content, lignin,cellulose, LAI) that can be related potentially to crop yield. The 16 dayrevisit time of the sensor can be reduced by cross-track pointing. Thus,depending on the pointing angle, Hyperion/EO-1 may work as an off-nadir sensor, but this characteristic has not been exploited in manyapplications. As pointed out by Aparicio et al. (2004) in a field reflectanceexperiment, the performance of vegetation indices to predictwheat yieldvaries with sensor view angle. Furthermore, off-nadir measurementswere also more closely related to photosynthetic efficiency than nadirmeasurements over an irrigated rice field (Inoue et al., 2008). Significantchanges in the reflectance of soybean canopies with view-illuminationgeometry were described by Kollenkark et al. (1982) and Ranson et al.(1985). Thus, based on these investigations, we can hypothesize thatviewing geometry will affect soybean variety discrimination and therelationships between vegetation indices and grain yield.
In this study, we investigated the ability of Hyperion to discriminatethreeBraziliansoybeanvarieties andevaluated the relationshipbetweengrain yield and 17 narrow-band vegetation indices, calculated fromopposite off-nadir viewing directions (forward and back scattering) butwith similar solar geometry. Two dates were examined: one on 08February 2005 and the other on 14 January 2006. Due to severe cloudcover and the unavailability of more Hyperion images to sample thesame reproductive stage in different viewing geometries, a pair ofModerate Resolution Imaging Spectroradiometer (MODIS)/Terra images,acquired in consecutive days (05–06 February 2005) and in oppositeview angles (−42° and +44°, respectively), was used to complementHyperion data analysis.
Table 2Soybean development in the 2005–2006 growing season
Soybeanvariety
Planting period(2005)
Rowspacing (m)
Harvest period(2006)
Average ystandard
Monsoy 9010 11 to 17 November 0.45 24 March to 9 April 3723±237Perdiz 25 October to 5 November 0.45 1 to 28 March 3405±353Tabarana 8 to 18 November 0.45 20 March to
9 April4069±455
Canopy closure, reproductive stages and leaf area index (LAI) values refer to the date of Hypa Estimated for 320,000 plants/ha and for the day of image acquisition based on the worb R1 and R2 represent beginning and full bloom, respectively. R3 means beginning pod (
Specific questions addressed in this study were: (1) Does view angleaffect the discrimination of the soybean varieties? (2) Are therestatistically significant relationships between soybean yield and specificHyperion vegetation indices? (3) Are the relationships affected byviewing geometry?
2. Methodology
2.1. Off-nadir image acquisition and pre-processing
The study area is located at Fazenda Tanguro, a farm in Querênciamunicipality, Mato Grosso state, Brazil, between 12o41′54″S/52o24′59″W and 12o52′28″S/52o19′09″W. It comprises the transition zonebetween the Brazilian savannas (Cerrado) and the Amazonian tropicalrain forest. The topography of the region (350m of altitude) is flat withthe predominance of dystrophic Red-Yellow Latosol (Typic Acrustox inthe Soil Taxonomy) (Corrêa, 2002). The climate is subtropical with amean temperature of 26 °C. The annual rainfall reaches up to 1850mmwith a well-defined rainy season between October and April.
Hyperion/EO-1 acquired images on two dates with opposite viewdirections: 08 February 2005 (2004–2005 growing season; forwardscattering direction; predominance of shaded canopy componentsviewed by the sensor; henceforth named Feb/08/2005_Forward) and14 January 2006 (2005–2006 growing season; back scatteringdirection; dominance of sensed sunlit canopy components; henceforthnamed Jan/14/2006_Back). The pointing angles were +21° and −26°,respectively. Solar elevation (58.7° and 53.8°) and azimuth (96.9° and108.3°) angles presented small differences between the dates. Theimages were obtained in 242 contiguous bands, sampled at approxi-mately 10-nm intervals in the 356–2577 nm range with a nominalcross-track swath width of 7.65 km. However, only 196 bands wereradiometrically calibrated between 426 and 2395 nm and effectivelyused in this study. The sensorhas a nominal ground instantaneousfieldof view (GIFOV) of 30 m (Pearlman et al., 2003).
An algorithm to identify bad pixels and to reduce striping effects wasapplied over theHyperion images replacing abnormal vertical lines by theaverage response of adjacent columns (Goodenough et al., 2003). TheHyperion radiance values from the 196 bandswere converted into surfacereflectance images using the Fast Line-of-Sight Atmospheric Analysis ofSpectral Hypercubes (FLAASH) algorithm, a MODTRAN4-based approachto remove scattering and absorption effects of the atmosphere constitu-ents for nadir and non-nadir viewing instruments (Felde et al., 2003). Acorrection for adjacency effects was applied using this algorithm. Model
ield anddeviation (kg/ha)
Average localcycle (Days)
Canopyclosure (%) a
Reproductivestageb
LAIa Plantingfields
139 90 R1 1.0 to 1.5 11130 100 R2 to R3 2.0 to 2.5 13134 95 R1 to R2 1.5 to 2.0 21
erion imagery (Jan/14/2006_Back; 62 to 81 days after planting).k by Heiffig et al. (2006).Fehr and Caviness, 1977).
Table 3Hyperion-derived vegetation indices used in the study
VegetationIndex
Formulaa Reference
ARVI (ρ864− (2⁎ρ671−ρ467))/(ρ864+(2⁎ρ671−ρ467))
Kaufman and Tanré (1992)
EVI 2.5⁎ ((ρ864−ρ671)/(ρ864+6⁎ρ671−7.5⁎ρ467+1))
Huete et al. (2002)
NDVI (ρ864−ρ671)/(ρ864+ρ671) Rouse et al. (1973)SR ρ864/ρ671 Rouse et al. (1973)MSI ρ1598/ρ823 Hunt and Rock (1989)NDII (ρ823−ρ1649)/(ρ823+ρ1649) Hunt and Rock (1989)NDWI (ρ854−ρ1245)/(ρ854+ρ1245) Gao (1996)WBI ρ905/ρ973 Penuelas et al. (1997)PSRI (ρ681−ρ498)/ρ752 Merzlyak et al. (1999)CRI (1/ρ508)− (1/ρ701) Gitelson, Kaufman, Stark, &
Rundquist (2002)PRI (ρ529−ρ569)/(ρ529+ρ569) Gamon et al. (1997)SIPI (ρ803−ρ467)/(ρ803+ρ681) Penuelas et al. (1995)RENDVI (ρ752−ρ701)/(ρ752+ρ701) Gitelson et al. (1996)REP (ρn+1−ρn)/10 in the 690–750 nm interval Curran et al. (1995)VOG1 ρ742/ρ722 Vogelmann et al. (1993)VARI (ρ559−ρ640)/(ρ559+ρ640−ρ467) Gitelson, Zur, Chivkunova,
& Merzlyak (2002)VIg (ρ559−ρ640)/(ρ559+ρ640) Gitelson, Zur, Chivkunova,
& Merzlyak (2002)
Index abbreviations are defined in the text.a ρ is the reflectance of the closest Hyperion bands (n, centre in nanometers) to the
original wavelength formulations.
848 L.S. Galvão et al. / Remote Sensing of Environment 113 (2009) 846–856
parameters included a tropical atmosphere and a rural aerosol model.Hyperion bands covering the 1140-nm water vapor band were used to
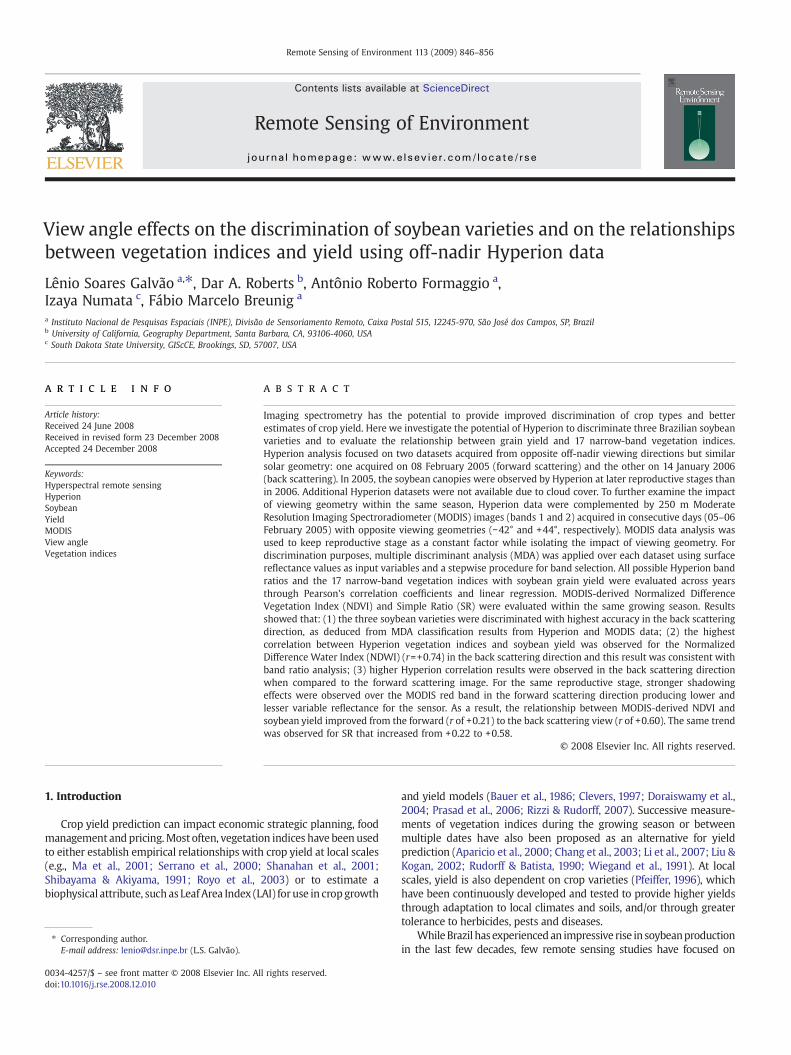
Fig. 1. False color composites with the Hyperion bands at 864 nm (red), 1659 nm (green) and(b) back (Jan/14/2006_Back) scattering directions. (c) Planted soybean variety fields at the T
estimate precipitablewater vapor on a per-pixel basis. To remove artifactsfrom atmospheric correction and to smooth data, inverseminimumnoisefraction (MNF) transformations (Green et al., 1988) were applied to eachFLAASH-derived surface reflectance image at selected spectral intervals.The images were then geo-referenced (nearest-neighbor resampling).
Severe cloud cover precluded the use of additional Hyperion imagesfrom the same reproductive stage in opposite viewing geometries. Tokeep soybean reproductive stage as a constant factor and change viewangle, a pair of off-nadirMODIS images acquired in2005 in a close date asHyperion (05–06 February 2005 for MODIS versus 08 February 2005 forHyperion) was selected. Surface reflectance values (MOD09GQ product)of the red (620–670 nm) and near infrared (841–876 nm) bands with250 m of spatial resolution were acquired in the forward (henceforthnamed MODIS_Feb/06/2005_Forward) and back (MODIS_Feb/05/2005_Back) scattering directions with view angles of +44° and −42°,respectively. The solar azimuth and elevation angles were 98° and 63°,respectively. Use of MODIS data at 500 m of spatial resolution was notpossible due to the comparatively small size of the soybean fields in thefarm and the associated spectral mixture effects on data analysis. TheMODIS Reprojection Tool (MRT) (Dwyer & Schmidt, 2006) was used toconvert the sinusoidal projection into planar coordinates (WGS-84).
2.2. Soybean variety development in the 2004–2005 and 2005–2006growing seasons
Seven soybean varieties were planted (11,000 ha) at the Tangurofarm in the 2004–2005 and 2005–2006 growing seasons. From this
2203 nm (blue) from off-nadir viewing in the (a) forward (Feb/08/2005_Forward) andanguro farm in 2006.
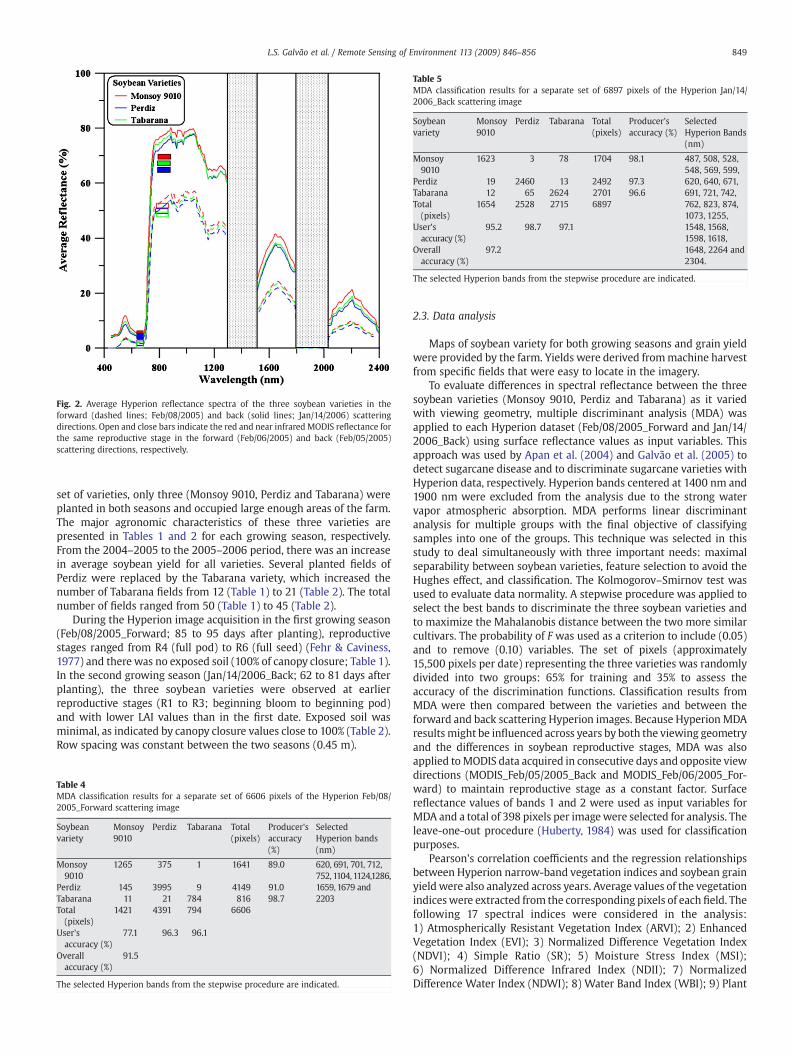
Fig. 2. Average Hyperion reflectance spectra of the three soybean varieties in theforward (dashed lines; Feb/08/2005) and back (solid lines; Jan/14/2006) scatteringdirections. Open and close bars indicate the red and near infrared MODIS reflectance forthe same reproductive stage in the forward (Feb/06/2005) and back (Feb/05/2005)scattering directions, respectively.
Table 5MDA classification results for a separate set of 6897 pixels of the Hyperion Jan/14/2006_Back scattering image
Soybeanvariety
Monsoy9010
Perdiz Tabarana Total(pixels)
Producer'saccuracy (%)
SelectedHyperion Bands(nm)
Monsoy9010
1623 3 78 1704 98.1 487, 508, 528,548, 569, 599,620, 640, 671,691, 721, 742,762, 823, 874,1073, 1255,1548, 1568,1598, 1618,1648, 2264 and2304.
Perdiz 19 2460 13 2492 97.3Tabarana 12 65 2624 2701 96.6Total(pixels)
1654 2528 2715 6897
User'saccuracy (%)
95.2 98.7 97.1
Overallaccuracy (%)
97.2
The selected Hyperion bands from the stepwise procedure are indicated.
849L.S. Galvão et al. / Remote Sensing of Environment 113 (2009) 846–856
set of varieties, only three (Monsoy 9010, Perdiz and Tabarana) wereplanted in both seasons and occupied large enough areas of the farm.The major agronomic characteristics of these three varieties arepresented in Tables 1 and 2 for each growing season, respectively.From the 2004–2005 to the 2005–2006 period, there was an increasein average soybean yield for all varieties. Several planted fields ofPerdiz were replaced by the Tabarana variety, which increased thenumber of Tabarana fields from 12 (Table 1) to 21 (Table 2). The totalnumber of fields ranged from 50 (Table 1) to 45 (Table 2).
During the Hyperion image acquisition in the first growing season(Feb/08/2005_Forward; 85 to 95 days after planting), reproductivestages ranged from R4 (full pod) to R6 (full seed) (Fehr & Caviness,1977) and there was no exposed soil (100% of canopy closure; Table 1).In the second growing season (Jan/14/2006_Back; 62 to 81 days afterplanting), the three soybean varieties were observed at earlierreproductive stages (R1 to R3; beginning bloom to beginning pod)and with lower LAI values than in the first date. Exposed soil wasminimal, as indicated by canopy closure values close to 100% (Table 2).Row spacing was constant between the two seasons (0.45 m).
Table 4MDA classification results for a separate set of 6606 pixels of the Hyperion Feb/08/2005_Forward scattering image
Soybeanvariety
Monsoy9010
Perdiz Tabarana Total(pixels)
Producer'saccuracy(%)
SelectedHyperion bands(nm)
Monsoy9010
1265 375 1 1641 89.0 620, 691, 701, 712,752, 1104,1124,1286,1659, 1679 and2203
Perdiz 145 3995 9 4149 91.0Tabarana 11 21 784 816 98.7Total(pixels)
1421 4391 794 6606
User'saccuracy (%)
77.1 96.3 96.1
Overallaccuracy (%)
91.5
The selected Hyperion bands from the stepwise procedure are indicated.
2.3. Data analysis
Maps of soybean variety for both growing seasons and grain yieldwere provided by the farm. Yields were derived frommachine harvestfrom specific fields that were easy to locate in the imagery.
To evaluate differences in spectral reflectance between the threesoybean varieties (Monsoy 9010, Perdiz and Tabarana) as it variedwith viewing geometry, multiple discriminant analysis (MDA) wasapplied to each Hyperion dataset (Feb/08/2005_Forward and Jan/14/2006_Back) using surface reflectance values as input variables. Thisapproach was used by Apan et al. (2004) and Galvão et al. (2005) todetect sugarcane disease and to discriminate sugarcane varieties withHyperion data, respectively. Hyperion bands centered at 1400 nm and1900 nm were excluded from the analysis due to the strong watervapor atmospheric absorption. MDA performs linear discriminantanalysis for multiple groups with the final objective of classifyingsamples into one of the groups. This technique was selected in thisstudy to deal simultaneously with three important needs: maximalseparability between soybean varieties, feature selection to avoid theHughes effect, and classification. The Kolmogorov–Smirnov test wasused to evaluate data normality. A stepwise procedure was applied toselect the best bands to discriminate the three soybean varieties andto maximize the Mahalanobis distance between the two more similarcultivars. The probability of F was used as a criterion to include (0.05)and to remove (0.10) variables. The set of pixels (approximately15,500 pixels per date) representing the three varieties was randomlydivided into two groups: 65% for training and 35% to assess theaccuracy of the discrimination functions. Classification results fromMDA were then compared between the varieties and between theforward and back scattering Hyperion images. Because Hyperion MDAresults might be influenced across years by both the viewing geometryand the differences in soybean reproductive stages, MDA was alsoapplied toMODIS data acquired in consecutive days and opposite viewdirections (MODIS_Feb/05/2005_Back and MODIS_Feb/06/2005_For-ward) to maintain reproductive stage as a constant factor. Surfacereflectance values of bands 1 and 2 were used as input variables forMDA and a total of 398 pixels per imagewere selected for analysis. Theleave-one-out procedure (Huberty, 1984) was used for classificationpurposes.
Pearson's correlation coefficients and the regression relationshipsbetween Hyperion narrow-band vegetation indices and soybean grainyield were also analyzed across years. Average values of the vegetationindiceswere extracted from the corresponding pixels of each field. Thefollowing 17 spectral indices were considered in the analysis:1) Atmospherically Resistant Vegetation Index (ARVI); 2) EnhancedVegetation Index (EVI); 3) Normalized Difference Vegetation Index(NDVI); 4) Simple Ratio (SR); 5) Moisture Stress Index (MSI);6) Normalized Difference Infrared Index (NDII); 7) NormalizedDifference Water Index (NDWI); 8) Water Band Index (WBI); 9) Plant
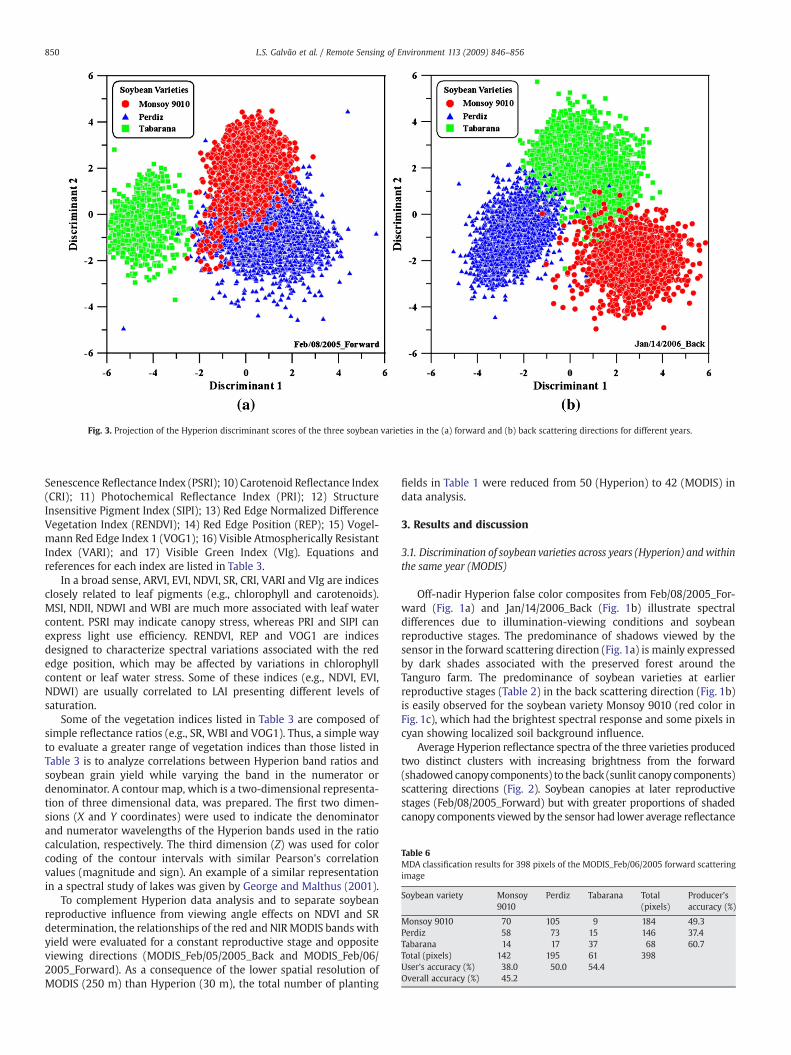
Fig. 3. Projection of the Hyperion discriminant scores of the three soybean varieties in the (a) forward and (b) back scattering directions for different years.
Table 6MDA classification results for 398 pixels of the MODIS_Feb/06/2005 forward scatteringimage
Soybean variety Monsoy9010
Perdiz Tabarana Total(pixels)
Producer'saccuracy (%)
Monsoy 9010 70 105 9 184 49.3Perdiz 58 73 15 146 37.4Tabarana 14 17 37 68 60.7Total (pixels) 142 195 61 398User's accuracy (%) 38.0 50.0 54.4Overall accuracy (%) 45.2
850 L.S. Galvão et al. / Remote Sensing of Environment 113 (2009) 846–856
Senescence Reflectance Index (PSRI); 10) Carotenoid Reflectance Index(CRI); 11) Photochemical Reflectance Index (PRI); 12) StructureInsensitive Pigment Index (SIPI); 13) Red Edge Normalized DifferenceVegetation Index (RENDVI); 14) Red Edge Position (REP); 15) Vogel-mann Red Edge Index 1 (VOG1); 16) Visible Atmospherically ResistantIndex (VARI); and 17) Visible Green Index (VIg). Equations andreferences for each index are listed in Table 3.
In a broad sense, ARVI, EVI, NDVI, SR, CRI, VARI and VIg are indicesclosely related to leaf pigments (e.g., chlorophyll and carotenoids).MSI, NDII, NDWI and WBI are much more associated with leaf watercontent. PSRI may indicate canopy stress, whereas PRI and SIPI canexpress light use efficiency. RENDVI, REP and VOG1 are indicesdesigned to characterize spectral variations associated with the rededge position, which may be affected by variations in chlorophyllcontent or leaf water stress. Some of these indices (e.g., NDVI, EVI,NDWI) are usually correlated to LAI presenting different levels ofsaturation.
Some of the vegetation indices listed in Table 3 are composed ofsimple reflectance ratios (e.g., SR, WBI and VOG1). Thus, a simple wayto evaluate a greater range of vegetation indices than those listed inTable 3 is to analyze correlations between Hyperion band ratios andsoybean grain yield while varying the band in the numerator ordenominator. A contour map, which is a two-dimensional representa-tion of three dimensional data, was prepared. The first two dimen-sions (X and Y coordinates) were used to indicate the denominatorand numerator wavelengths of the Hyperion bands used in the ratiocalculation, respectively. The third dimension (Z) was used for colorcoding of the contour intervals with similar Pearson's correlationvalues (magnitude and sign). An example of a similar representationin a spectral study of lakes was given by George and Malthus (2001).
To complement Hyperion data analysis and to separate soybeanreproductive influence from viewing angle effects on NDVI and SRdetermination, the relationships of the red and NIRMODIS bands withyield were evaluated for a constant reproductive stage and oppositeviewing directions (MODIS_Feb/05/2005_Back and MODIS_Feb/06/2005_Forward). As a consequence of the lower spatial resolution ofMODIS (250 m) than Hyperion (30 m), the total number of planting
fields in Table 1 were reduced from 50 (Hyperion) to 42 (MODIS) indata analysis.
3. Results and discussion
3.1. Discrimination of soybean varieties across years (Hyperion) and withinthe same year (MODIS)
Off-nadir Hyperion false color composites from Feb/08/2005_For-ward (Fig. 1a) and Jan/14/2006_Back (Fig. 1b) illustrate spectraldifferences due to illumination-viewing conditions and soybeanreproductive stages. The predominance of shadows viewed by thesensor in the forward scattering direction (Fig. 1a) is mainly expressedby dark shades associated with the preserved forest around theTanguro farm. The predominance of soybean varieties at earlierreproductive stages (Table 2) in the back scattering direction (Fig. 1b)is easily observed for the soybean variety Monsoy 9010 (red color inFig. 1c), which had the brightest spectral response and some pixels incyan showing localized soil background influence.
Average Hyperion reflectance spectra of the three varieties producedtwo distinct clusters with increasing brightness from the forward(shadowed canopy components) to the back (sunlit canopy components)scattering directions (Fig. 2). Soybean canopies at later reproductivestages (Feb/08/2005_Forward) but with greater proportions of shadedcanopy components viewed by the sensor had lower average reflectance
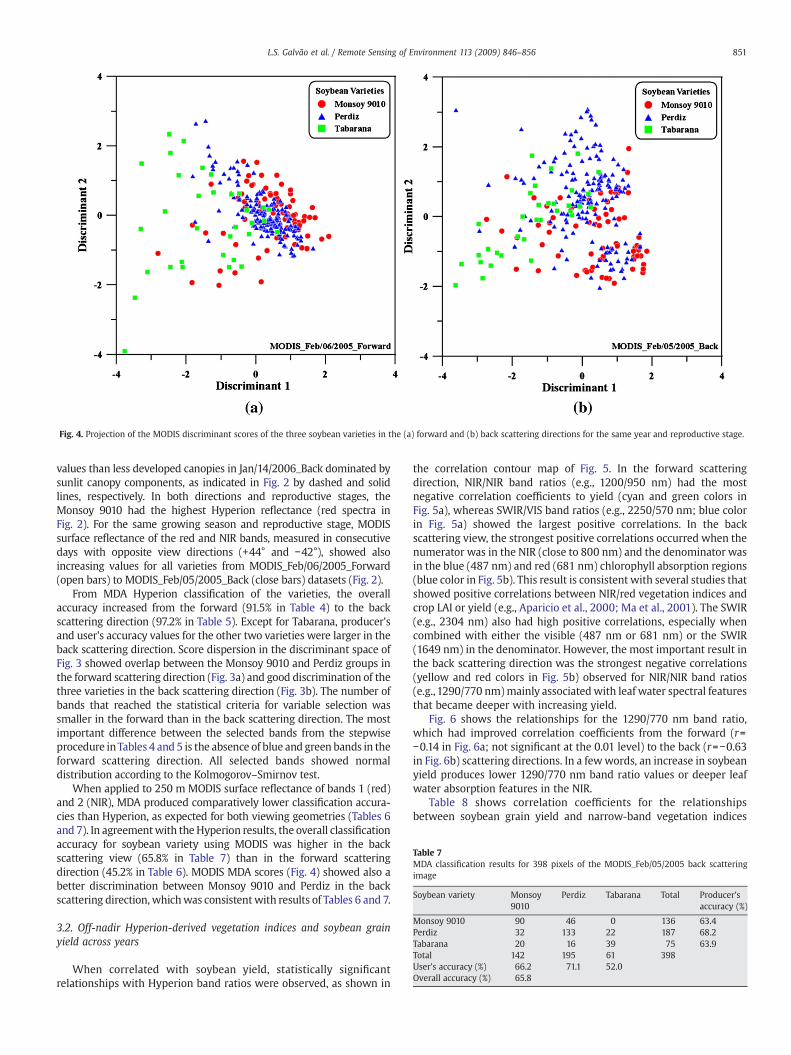
Fig. 4. Projection of the MODIS discriminant scores of the three soybean varieties in the (a) forward and (b) back scattering directions for the same year and reproductive stage.
Table 7MDA classification results for 398 pixels of the MODIS_Feb/05/2005 back scatteringimage
Soybean variety Monsoy9010
Perdiz Tabarana Total Producer'saccuracy (%)
Monsoy 9010 90 46 0 136 63.4Perdiz 32 133 22 187 68.2Tabarana 20 16 39 75 63.9Total 142 195 61 398User's accuracy (%) 66.2 71.1 52.0Overall accuracy (%) 65.8
851L.S. Galvão et al. / Remote Sensing of Environment 113 (2009) 846–856
values than less developed canopies in Jan/14/2006_Back dominated bysunlit canopy components, as indicated in Fig. 2 by dashed and solidlines, respectively. In both directions and reproductive stages, theMonsoy 9010 had the highest Hyperion reflectance (red spectra inFig. 2). For the same growing season and reproductive stage, MODISsurface reflectance of the red and NIR bands, measured in consecutivedays with opposite view directions (+44° and −42°), showed alsoincreasing values for all varieties from MODIS_Feb/06/2005_Forward(open bars) to MODIS_Feb/05/2005_Back (close bars) datasets (Fig. 2).
From MDA Hyperion classification of the varieties, the overallaccuracy increased from the forward (91.5% in Table 4) to the backscattering direction (97.2% in Table 5). Except for Tabarana, producer'sand user's accuracy values for the other two varieties were larger in theback scattering direction. Score dispersion in the discriminant space ofFig. 3 showed overlap between the Monsoy 9010 and Perdiz groups inthe forward scattering direction (Fig. 3a) and good discrimination of thethree varieties in the back scattering direction (Fig. 3b). The number ofbands that reached the statistical criteria for variable selection wassmaller in the forward than in the back scattering direction. The mostimportant difference between the selected bands from the stepwiseprocedure inTables 4 and 5 is the absence of blue and green bands in theforward scattering direction. All selected bands showed normaldistribution according to the Kolmogorov–Smirnov test.
When applied to 250 m MODIS surface reflectance of bands 1 (red)and 2 (NIR), MDA produced comparatively lower classification accura-cies than Hyperion, as expected for both viewing geometries (Tables 6and 7). In agreementwith the Hyperion results, the overall classificationaccuracy for soybean variety using MODIS was higher in the backscattering view (65.8% in Table 7) than in the forward scatteringdirection (45.2% in Table 6). MODIS MDA scores (Fig. 4) showed also abetter discrimination between Monsoy 9010 and Perdiz in the backscattering direction, whichwas consistentwith results of Tables 6 and 7.
3.2. Off-nadir Hyperion-derived vegetation indices and soybean grainyield across years
When correlated with soybean yield, statistically significantrelationships with Hyperion band ratios were observed, as shown in
the correlation contour map of Fig. 5. In the forward scatteringdirection, NIR/NIR band ratios (e.g., 1200/950 nm) had the mostnegative correlation coefficients to yield (cyan and green colors inFig. 5a), whereas SWIR/VIS band ratios (e.g., 2250/570 nm; blue colorin Fig. 5a) showed the largest positive correlations. In the backscattering view, the strongest positive correlations occurred when thenumerator was in the NIR (close to 800 nm) and the denominator wasin the blue (487 nm) and red (681 nm) chlorophyll absorption regions(blue color in Fig. 5b). This result is consistent with several studies thatshowed positive correlations between NIR/red vegetation indices andcrop LAI or yield (e.g., Aparicio et al., 2000; Ma et al., 2001). The SWIR(e.g., 2304 nm) also had high positive correlations, especially whencombined with either the visible (487 nm or 681 nm) or the SWIR(1649 nm) in the denominator. However, the most important result inthe back scattering direction was the strongest negative correlations(yellow and red colors in Fig. 5b) observed for NIR/NIR band ratios(e.g., 1290/770 nm)mainly associated with leaf water spectral featuresthat became deeper with increasing yield.
Fig. 6 shows the relationships for the 1290/770 nm band ratio,which had improved correlation coefficients from the forward (r=−0.14 in Fig. 6a; not significant at the 0.01 level) to the back (r=−0.63in Fig. 6b) scattering directions. In a fewwords, an increase in soybeanyield produces lower 1290/770 nm band ratio values or deeper leafwater absorption features in the NIR.
Table 8 shows correlation coefficients for the relationshipsbetween soybean grain yield and narrow-band vegetation indices
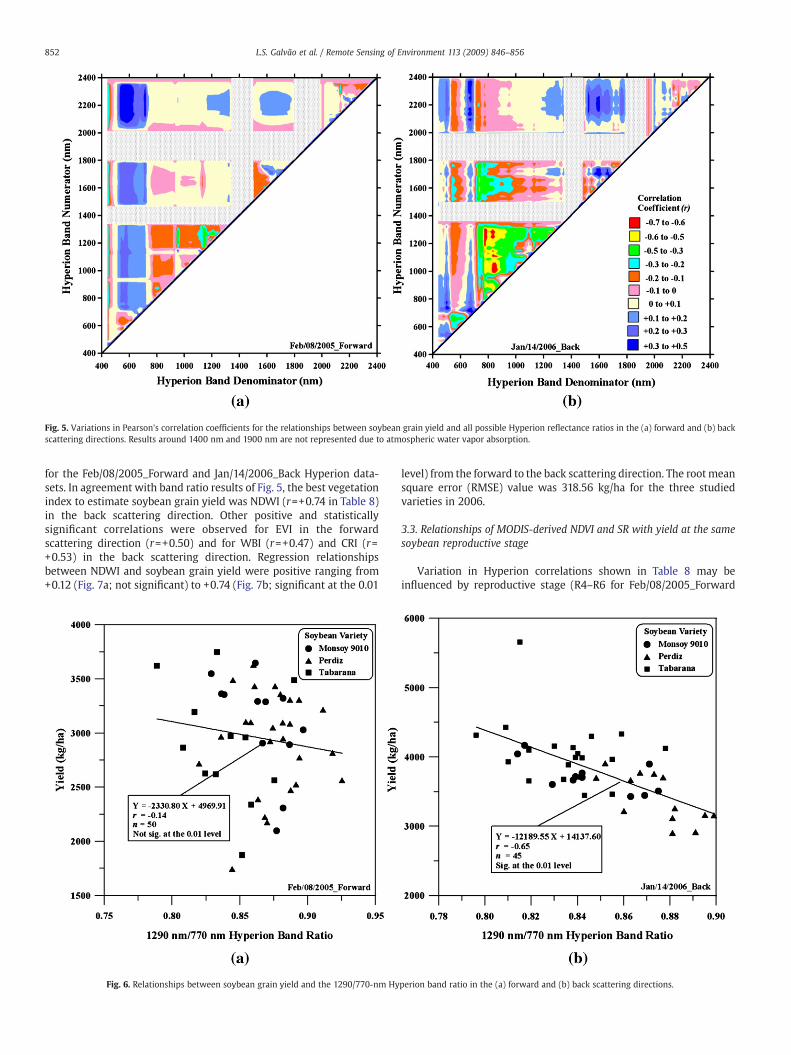
Fig. 5. Variations in Pearson's correlation coefficients for the relationships between soybean grain yield and all possible Hyperion reflectance ratios in the (a) forward and (b) backscattering directions. Results around 1400 nm and 1900 nm are not represented due to atmospheric water vapor absorption.
852 L.S. Galvão et al. / Remote Sensing of Environment 113 (2009) 846–856
for the Feb/08/2005_Forward and Jan/14/2006_Back Hyperion data-sets. In agreement with band ratio results of Fig. 5, the best vegetationindex to estimate soybean grain yield was NDWI (r=+0.74 in Table 8)in the back scattering direction. Other positive and statisticallysignificant correlations were observed for EVI in the forwardscattering direction (r=+0.50) and for WBI (r=+0.47) and CRI (r=+0.53) in the back scattering direction. Regression relationshipsbetween NDWI and soybean grain yield were positive ranging from+0.12 (Fig. 7a; not significant) to +0.74 (Fig. 7b; significant at the 0.01
Fig. 6. Relationships between soybean grain yield and the 1290/770-nm Hy
level) from the forward to the back scattering direction. The rootmeansquare error (RMSE) value was 318.56 kg/ha for the three studiedvarieties in 2006.
3.3. Relationships of MODIS-derived NDVI and SR with yield at the samesoybean reproductive stage
Variation in Hyperion correlations shown in Table 8 may beinfluenced by reproductive stage (R4–R6 for Feb/08/2005_Forward
perion band ratio in the (a) forward and (b) back scattering directions.
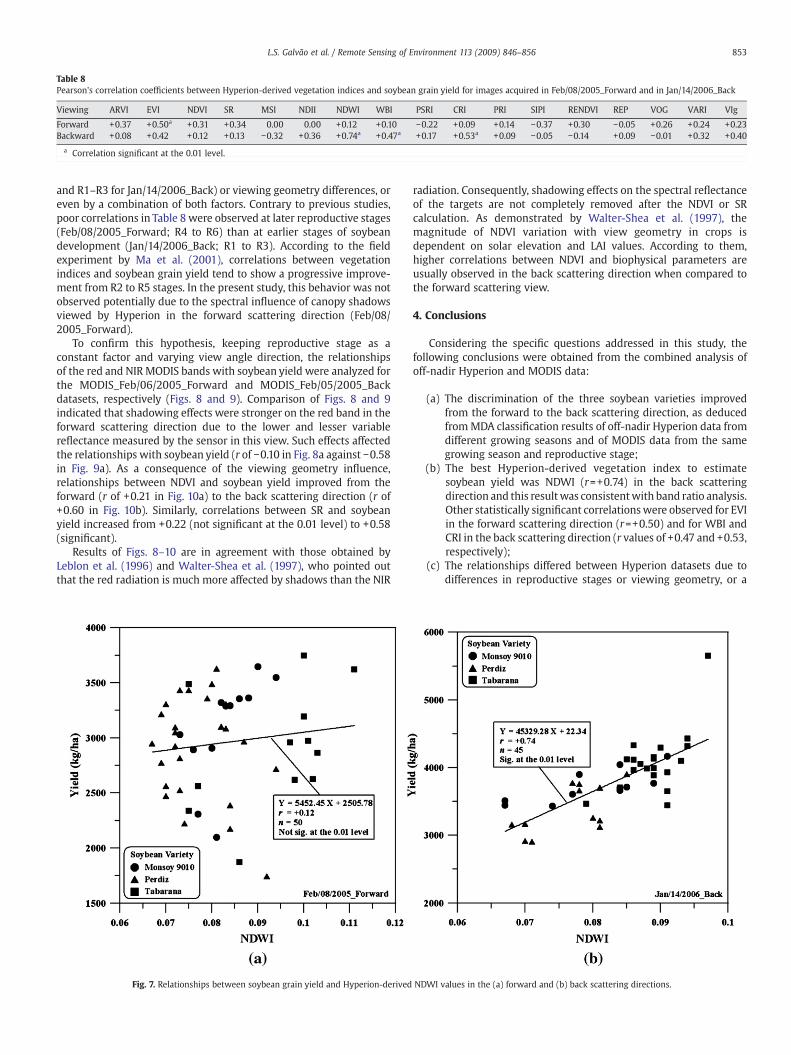
Table 8Pearson's correlation coefficients between Hyperion-derived vegetation indices and soybean grain yield for images acquired in Feb/08/2005_Forward and in Jan/14/2006_Back
Viewing ARVI EVI NDVI SR MSI NDII NDWI WBI PSRI CRI PRI SIPI RENDVI REP VOG VARI VIg
Forward +0.37 +0.50a +0.31 +0.34 0.00 0.00 +0.12 +0.10 −0.22 +0.09 +0.14 −0.37 +0.30 −0.05 +0.26 +0.24 +0.23Backward +0.08 +0.42 +0.12 +0.13 −0.32 +0.36 +0.74a +0.47a +0.17 +0.53a +0.09 −0.05 −0.14 +0.09 −0.01 +0.32 +0.40
a Correlation significant at the 0.01 level.
853L.S. Galvão et al. / Remote Sensing of Environment 113 (2009) 846–856
and R1–R3 for Jan/14/2006_Back) or viewing geometry differences, oreven by a combination of both factors. Contrary to previous studies,poor correlations in Table 8 were observed at later reproductive stages(Feb/08/2005_Forward; R4 to R6) than at earlier stages of soybeandevelopment (Jan/14/2006_Back; R1 to R3). According to the fieldexperiment by Ma et al. (2001), correlations between vegetationindices and soybean grain yield tend to show a progressive improve-ment from R2 to R5 stages. In the present study, this behavior was notobserved potentially due to the spectral influence of canopy shadowsviewed by Hyperion in the forward scattering direction (Feb/08/2005_Forward).
To confirm this hypothesis, keeping reproductive stage as aconstant factor and varying view angle direction, the relationshipsof the red and NIR MODIS bands with soybean yield were analyzed forthe MODIS_Feb/06/2005_Forward and MODIS_Feb/05/2005_Backdatasets, respectively (Figs. 8 and 9). Comparison of Figs. 8 and 9indicated that shadowing effects were stronger on the red band in theforward scattering direction due to the lower and lesser variablereflectance measured by the sensor in this view. Such effects affectedthe relationships with soybean yield (r of −0.10 in Fig. 8a against −0.58in Fig. 9a). As a consequence of the viewing geometry influence,relationships between NDVI and soybean yield improved from theforward (r of +0.21 in Fig. 10a) to the back scattering direction (r of+0.60 in Fig. 10b). Similarly, correlations between SR and soybeanyield increased from +0.22 (not significant at the 0.01 level) to +0.58(significant).
Results of Figs. 8–10 are in agreement with those obtained byLeblon et al. (1996) and Walter-Shea et al. (1997), who pointed outthat the red radiation is much more affected by shadows than the NIR
Fig. 7. Relationships between soybean grain yield and Hyperion-derived
radiation. Consequently, shadowing effects on the spectral reflectanceof the targets are not completely removed after the NDVI or SRcalculation. As demonstrated by Walter-Shea et al. (1997), themagnitude of NDVI variation with view geometry in crops isdependent on solar elevation and LAI values. According to them,higher correlations between NDVI and biophysical parameters areusually observed in the back scattering direction when compared tothe forward scattering view.
4. Conclusions
Considering the specific questions addressed in this study, thefollowing conclusions were obtained from the combined analysis ofoff-nadir Hyperion and MODIS data:
(a) The discrimination of the three soybean varieties improvedfrom the forward to the back scattering direction, as deducedfromMDA classification results of off-nadir Hyperion data fromdifferent growing seasons and of MODIS data from the samegrowing season and reproductive stage;
(b) The best Hyperion-derived vegetation index to estimatesoybean yield was NDWI (r=+0.74) in the back scatteringdirection and this resultwas consistentwith band ratio analysis.Other statistically significant correlationswere observed for EVIin the forward scattering direction (r=+0.50) and for WBI andCRI in the back scattering direction (r values of +0.47 and +0.53,respectively);
(c) The relationships differed between Hyperion datasets due todifferences in reproductive stages or viewing geometry, or a
NDWI values in the (a) forward and (b) back scattering directions.
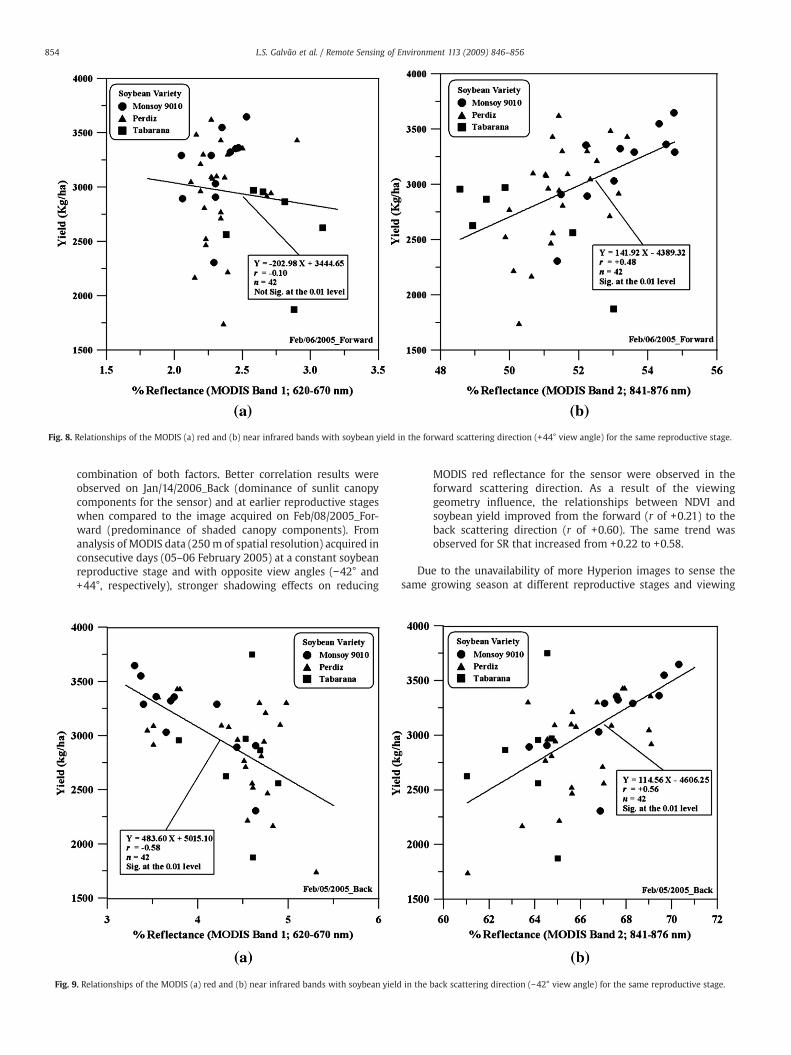
Fig. 8. Relationships of the MODIS (a) red and (b) near infrared bands with soybean yield in the forward scattering direction (+44° view angle) for the same reproductive stage.
854 L.S. Galvão et al. / Remote Sensing of Environment 113 (2009) 846–856
combination of both factors. Better correlation results wereobserved on Jan/14/2006_Back (dominance of sunlit canopycomponents for the sensor) and at earlier reproductive stageswhen compared to the image acquired on Feb/08/2005_For-ward (predominance of shaded canopy components). Fromanalysis of MODIS data (250m of spatial resolution) acquired inconsecutive days (05–06 February 2005) at a constant soybeanreproductive stage and with opposite view angles (−42° and+44°, respectively), stronger shadowing effects on reducing
Fig. 9. Relationships of the MODIS (a) red and (b) near infrared bands with soybean yield
MODIS red reflectance for the sensor were observed in theforward scattering direction. As a result of the viewinggeometry influence, the relationships between NDVI andsoybean yield improved from the forward (r of +0.21) to theback scattering direction (r of +0.60). The same trend wasobserved for SR that increased from +0.22 to +0.58.
Due to the unavailability of more Hyperion images to sense thesame growing season at different reproductive stages and viewing
in the back scattering direction (−42° view angle) for the same reproductive stage.

Fig. 10. Relationships between MODIS-derived NDVI and soybean yield in the (a) forward and (b) back scattering directions for the same reproductive stage.
855L.S. Galvão et al. / Remote Sensing of Environment 113 (2009) 846–856
geometries, further research is still necessary to better evaluate viewangle effects on the relationships between narrow-band vegetationindices and yield, as a function of LAI and nadir data. Furthermore,MODIS data do not allow NDWI calculation with spatial resolutionbetter than 500 m to confirm the potential of this index, calculatedfrom back scattering direction, for earlier soybean yield prediction inthe study area.
Acknowledgements
The authors are very grateful to Grupo Maggi for providing soybeanground information for this research. Thanks are also due to the FAPESP(Fundação de Amparo à Pesquisa do Estado de São Paulo), the CNPq(Conselho Nacional de Desenvolvimento Científico e Tecnológico), andto the anonymous reviewers for the very useful comments.
References
Apan, A., Held, A., Phinn, S., & Markley, J. (2004). Detecting sugarcane ‘orange rust’disease using EO-1 Hyperion hyperspectral imagery. International Journal of RemoteSensing, 25(2), 489−498.
Aparicio, N., Villegas, D., Casadesus, J., Araus, J. L., & Royo, C. (2000). Spectral vegetationindices as nondestructive tools for determining durum wheat yield. AgronomyJournal, 92(1), 83−91.
Aparicio, N., Villegas, D., Royo, C., Casadesus, J., & Araus, J. L. (2004). Effect of sensor viewangle on the assessment of agronomic traits by ground level hyper-spectralreflectance measurements in durum wheat under contrasting Mediterraneanconditions. International Journal of Remote Sensing, 25(6), 1131−1152.
Bauer, M. E., Daughtry, C. S. T., Biehl, L. L., Kanemasu, E. T., & Hall, F. G. (1986). Fieldspectroscopy of agricultural crops. IEEE Transactions on Geoscience and RemoteSensing, 24(1), 65−75.
Chang, J., Clay, D. E., Dalsted, K., Clay, S., & O'Neill, M. (2003). Corn (Zea mays L.) yieldprediction using multispectral and multidate reflectance. Agronomy Journal, 95(6),1550−1559.
Clevers, J. G. P. W. (1997). A simplified approach for yield prediction of sugar beet basedon optical remote sensing data. Remote Sensing of Environment, 61(2), 221−228.
Corrêa, J. C. (2002). Effect of cropping systems on the stability of red-yellow latosolaggregates in Querência, Mato Grosso, Brazil. Pesquisa Agropecuária Brasileira, 37(2), 203−209 (In Portuguese).
Curran, P. J., Windham, W. R., & Gholz, H. L. (1995). Exploring the relationship betweenreflectance red edge and chlorophyll concentration in slash pine leaves. TreePhysiology, 15(3), 203−206.
Doraiswamy, P. C., Hatfield, J. L., Jackson, T. J., Akhmedov, B., Prueger, J., & Stern, A.(2004). Crop condition and yield simulations using Landsat and MODIS. RemoteSensing of Environment, 92(4), 548−559.
Dwyer, J., & Schmidt, G. (2006). The MODIS reprojection tool. In J. J. Qu, W. Gao, M.Kafatos, R. E. Murphy, & V. V. Salomonson (Eds.), Earth science satellite remotesensing (pp. 162−177). Berlin Heidelberg: Springer Berlin Heidelberg.
Fehr, W. R., & Caviness, C. E. (1977). Stages of soybean development. Iowa StateAgriculture and Home Economics Experiment Station and Cooperative ExtensionService Ames, Iowa: Iowa State University of Science and Technology Special Report80. 11 pp.
Felde, G. W., Anderson, G. P., Adler-Golden, S. M., Matthew, N. W., & Berk, A. (2003).Analysis of Hyperion data with the FLAASH atmospheric correction algorithm.Proceedings of the International Geoscience and Remote Sensing Symposium (IGARSS),Toulouse, 21–25 July 2003 (pp. 90−92).
Galvão, L. S., Formaggio, A. R., & Tisot, D. A. (2005). Discrimination of sugarcane varieties inSoutheastern Brazil with EO-1 Hyperion data. Remote Sensing of Environment, 94(4),523−534.
Gamon, J. A., Serrano, L., & Surfus, J. S. (1997). The photochemical reflectance index: Anoptical indicator of photosynthetic radiation use efficiency across species, functionaltypes, and nutrient levels. Oecologia, 112(4), 492−501.
Gao, B. C. (1996). NDWI—A normalized difference water index for remote sensing ofvegetation liquid water from space. Remote Sensing of Environment, 58(3), 257−266.
George, D. G., & Malthus, T. J. (2001). Using a compact airborne spectrographer imagerto monitor phytoplankton biomass in a series of lakes in north Wales. The Science ofthe Total Environment, 268(1–3), 215−226.
Gitelson, A. A., Kaufman, Y. J., Stark, R., & Rundquist, D. (2002). Novel algorithms for remoteestimation of vegetation fraction. Remote Sensing of Environment, 80(1), 76−87.
Gitelson, A. A., Merzlyak, M. N., & Lichtenthaler, H. K. (1996). Detection of red edgeposition and chlorophyll content by reflectance measurements near 700 nm.Journal of Plant Physiology, 148(3–4), 501−508.
Gitelson, A. A., Zur, Y., Chivkunova, O. B., & Merzlyak, M. N. (2002). Assessing carotenoidcontent inplant leaveswith reflectancespectroscopy.PhotochemistryandPhotobiology,75(3), 272−281.
Goodenough, D. G., Dyk, A., Niemann, K. O., Pearlman, J. S., Chen, H., Han, T., et al. (2003).Processing Hyperion and ALI for forest classification. IEEE Transactions onGeoscience and Remote Sensing, 41(6), 1321−1331.
Green, A. A., Berman, M., Switzer, P., & Craig, M. D. (1988). A transformation for orderingmultispectral data in terms of image quality with implications for noise removal.IEEE Transactions on Geoscience and Remote Sensing, 26(1), 65−74.
Heiffig, L. S., Câmara, G. M. S., Marques, L. A., Pedroso, D. B., & Piedade, S. M. S. (2006).Closed canopy and leaf area index of soybean in different space arrangements.Bragantia, 65(2), 285−295 (In Portuguese).
Huberty, C. J. (1984). Issues in the use and interpretation of discriminant analysis.Psychological Bulletin, 95(1), 156−171.
Huete, A. R., Didan, K., Miura, T., Rodriguez, E. P., Gao, X., & Ferreira, L. G. (2002).Overview of the radiometric and biophysical performance of the MODIS vegetationindices. Remote Sensing of Environment, 83(1–2), 195−213.
Hunt, E. R., & Rock, B. N. (1989). Detection of changes in leaf-water content using near-infrared and middle-infrared reflectances. Remote Sensing of Environment, 30(1),43−54.
Inoue, Y., Penuelas, J., Miyata, A., & Mano, M. (2008). Normalized difference spectralindices for estimating photosynthetic efficiency and capacity at a canopy scalederived from hyperspectral and CO2 flux measurements in rice. Remote Sensing ofEnvironment, 112(1), 156−172.

856 L.S. Galvão et al. / Remote Sensing of Environment 113 (2009) 846–856
Kaufman, Y. J., & Tanré, D. (1992). Atmospherically resistant vegetation index (ARVI) forEOS-MODIS. IEEE Transactions on Geoscience and Remote Sensing, 30(2), 261−270.
Kollenkark, J. C. V., Vanderbilt, V. C., Daughtry, C. S. T., & Bauer,M. E. (1982). Influence of solarillumination angle on soybean canopy reflectance. Applied Optics, 21(7), 1179−1184.
Leblon, B., Gallant, L., &Granberg,H. (1996). Effects of shadowing types on ground-measuredvisible and near-infrared shadow reflectances. Remote Sensing of Environment, 58(3),322−328.
Li, A. N., Liang, S. L., Wang, A. S., & Qin, J. (2007). Estimating crop yield from multi-temporal satellite data using multivariate regression and neural network. Photo-grammetric Engineering and Remote Sensing, 73(10), 1149−1157.
Liu,W. T., & Kogan, F. (2002).MonitoringBrazilian soybeanproduction usingNOAA/AVHRRbased vegetation condition indices. International Journal of Remote Sensing, 23(6),1161−1179.
Ma, B. L., Dwyer, L. M., Costa, C., Cober, E. R., & Morrison, M. J. (2001). Early prediction ofsoybean yield from canopy reflectance measurements. Agronomy Journal, 93(6),1227−1234.
Merzlyak,M. N., Gitelson, A. A., Chivkunova, O. B., & Rakitin, V. Y. (1999). Non-destructiveoptical detection of pigment changes during leaf senescence and fruit ripening.Physiologia Plantarum, 106(1), 135−141.
Pearlman, J. S., Barry, P. S., Segal, C. C., Shepanski, J., Beiso, D., & Carman, S. L. (2003).Hyperion, a space-based imaging spectrometer. IEEE Transactions on Geoscience andRemote Sensing, 41(6), 1160−1173.
Penuelas, J., Baret, F., & Filella, I. (1995). Semiempirical indexes to assess carotenoidschlorophyll-a ratio from leaf spectral reflectance. Photosynthetica, 31(2), 221−230.
Penuelas, J., Pinol, J., Ogaya, R., & Filella, I. (1997). Estimation of plant waterconcentration by the reflectance water index WI (R900/R970). International Journalof Remote Sensing, 18(13), 2869−2875.
Pfeiffer, T. W. (1996). Choosing soybean varieties from yield trials: multiple maturitygroups and yield variability. Journal of Production Agriculture, 9(3), 371−376.
Prasad, A. K., Chai, L., Singh, R. P., & Kafatos, M. (2006). Crop yield estimation model forIowa using remote sensing and surface parameters. International Journal of AppliedEarth Observation and Geoinformation, 8(1), 26−33.
Ranson, K. J., Biehl, L. L., & Bauer, M. E. (1985). Variation in spectral response of soybeanswith respect to illumination, view and canopy geometry. International Journal ofRemote Sensing, 6(12), 1827−1842.
Rizzi, R., & Rudorff, B. F. T. (2007). MODIS sensor images associated with an agronomicmodel to estimate soybean grain yield. Pesquisa Agropecuária Brasileira, 42(1),73−80 (In Portuguese).
Rouse, J. W., Haas, R. H., Schell, J. A., & Deering, D. W. (1973). Monitoring vegetationsystems in the Great Plains with ERTS. Proceedings of Third ERTS-1 Symposium,Washington, DC, 10–14 December, NASA, SP-351, vol. 1 (pp. 309−317).
Royo, C., Aparicio, N., Villegas, D., Casadesus, J., Monneveux, P., & Araus, J. L. (2003).Usefulness of spectral reflectance indices as durum wheat yield predictors undercontrasting Mediterranean conditions. International Journal of Remote Sensing, 24(22),4403−4419.
Rudorff, B. F. T., & Batista, G. T. (1990). Spectral response of wheat and its relationship toagronomic variables in the tropical region. Remote Sensing of Environment, 31(1),53−63.
Serrano, L., Filella, I., & Penuelas, J. (2000). Remote sensing of biomass and yield ofwinter wheat under different nitrogen supplies. Crop Science, 40(3), 723−731.
Shanahan, J. F., Schepers, J. S., Francis, D. D., Varvel, G. E., Wilhelm,W.W., Tringe, J. M., et al.(2001). Use of remote-sensing imagery to estimate corn grain yield.Agronomy Journal,93(3), 583−589.
Shibayama,M., &Akiyama, T. (1991). Estimating grainyield ofmaturing rice canopies usinghigh spectral resolution reflectancemeasurements. Remote Sensing of Environment, 36(1), 45−53.
Thenkabail, P. S., Smith, R. B., & Pauw, E. (2000). Hyperspectral vegetation indices andtheir relationships with agricultural crop characteristics. Remote Sensing ofEnvironment, 71(2), 158−182.
Vogelmann, J. E., Rock, B. N., & Moss, D. M. (1993). Red edge spectral measurementsfrom sugar maple leaves. International Journal of Remote Sensing, 14(8), 1563−1575.
Walter-Shea, E. A., Privette, J., Cornell, D., Mesarch, M. A., & Hays, C. J. (1997). Relationsbetween directional spectral vegetation indices and leaf area and absorbedradiation in alfalfa. Remote Sensing of Environment, 61(1), 162−177.
Wiegand, C. L., Richardson, A. J., Escobar, D. E., & Gerbermann, A. H. (1991). Vegetationindexes in crop assessments. Remote Sensing of Environment, 35(2–3), 105−119.
Xavier, A. C., Rudorf, B. F. T., Moreira, M. A., Alvarenga, B. S., Freitas, J. G., & Salomon, M. V.(2006). Hyperspectral field reflectancemeasurements to estimatewheat grain yieldand plant height. Scientia Agricola, 63(2), 130−138.
Zarco-Tejada, P. J., Ustin, S. L., &Whiting, M. L. (2005). Temporal and spatial relationshipsbetween within-field yield variability in cotton and high-spatial hyperspectralremote sensing imagery. Agronomy Journal, 97(3), 641−653.
Copyright © 2022 FDOKUMEN