Vidal & Kruk 2008 PANAMJAS
68
Transcript of Vidal & Kruk 2008 PANAMJAS


PAN-AMERICAN JOURNAL OF AQUATIC SCIENCES - PANAMJAS
Executive Editor: Gonzalo Velasco
Scientific Editors: Alexandre M. Garcia, María Cristina Oddone, Daniel Loebmann, Ronaldo Angelini, Getulio Rincon, and Pablo Muniz.
Honorary members: Jorge P. Castello, Omar Defeo, and Kirk Winemiller.
Advisory committee: Júlio N. Araújo, André S. Barreto, Sylvia Bonilla S., Francisco S. C. Buchmann, Danilo Calliari, Adriana Carvalho, Marta Coll M., César S. B. Costa, Karen Diele, Ruth Durán G., Gisela M. Figueiredo, Sergio R. Floeter, Ricardo M. Geraldi, Denis Hellebrandt, David J. Hoeinghaus, Simone Libralato, Luis O. Lucifora, Paul G. Kinas, Monica G. Mai, Rodrigo S. Martins, Manuel Mendoza C., Aldo Montecinos, Walter A. Norbis, Enir G. Reis, Marcelo B. Tesser, João P. Vieira, and Michael M. Webster.
PanamJAS is a non-profit Journal supported by researchers from several scientific institutions.
PanamJAS is currently indexed in Aquatic Sciences and Fisheries Abstracts (ASFA)
Directory of Open Access Journals Online Access to Research in the Environment
IndexCopernicus International Thomson BiologyBrowser database
Electronic Resources from Smithsonian Institution Libraries Divulgador Científico Ensenadense Sistema de Bibliotecas SISBI-UFU
Cover photo of this issue: A jellyfish (Cnidaria, Scyphozoa) photographed in situ in waters from Rio Grande do Norte State, Brazil. Picture taken by Thelma Dias.
PAN-AMERICAN JOURNAL OF AQUATIC SCIENCES 2006, 1-2 2008, 3 (2) Quarterly Journal ISSN 1809-9009 (On Line Version) CDU 570

Pan-American Journal of Aquatic Sciences (2008) 3 (2): 94-151
Pan-American Journal of Aquatic Sciences Research articles Relative growth of the fiddler crab Uca rapax (Smith) (Crustacea: Decapoda: Ocypodidae) in a tropical lagoon (Itaipu), Southeast Brazil. COSTA, T. & SOARES-GOMES, A..................................................................................................94-100 Notes on the morphology of two species of Gussevia Kohn & Paperna (Monogenea: Dactylogyridae) parasitic on Astronotus ocellatus (Agassiz) (Perciformes: Cichlidae) from Brazil. ABDALLAH, V. D., AZEVEDO, R. K. & LUQUE, J. L...................................................................101-104 Record of native amphibian predation by the alien African catfish in the Brazilian Atlantic Rain Forest. VITULE, J. R. S., UMBRIA, S. C. & ARANHA, J. M. R.................................................................105-107 Acute toxicity of waters from the urban drainage channels of Santos (São Paulo, Brazil). AMBROZEVICIUS, A. P. & ABESSA D. M. DE S……...................................................................108-115 Population structure of Munida microphthalma Leach (Crustacea: Decapoda: Galatheidae) from the north coast of Rio de Janeiro State, Brazil. KASSUGA, A. D., SILVA-FERREIRA, T. C. G., OSTROVSKI, M. C. & COSTA, T. M. M................116-121 Evaluation of the viability of a microscale method for the short-term chronic toxicity test using Lytechinus variegatus embryos. NILIN, J., CASTRO C. B., PIMENTEL, M. F., FRANKLIN JR, W., MATOS, R. F. G. & COSTA-LOTUFO, L. V............................................................................................................122-129 A simple protocol for a low invasive DNA accessing in Stenella longirostris (Cetacea: Delphinidae). FARRO, A. P. C., ROLLO JR., M. M., SILVA JR., J. M. & MARINO, C. L......................................130-134 Functional feeding habits of Chironomidae larvae (Insecta, Diptera) in a lotic system from Midwestern region of São Paulo State, Brazil. SILVA, F. L., RUIZ, S. S., BOCHINI, G. L. & MOREIRA, D. C......................................................135-141 Cylindrospermopsis raciborskii (Cyanobacteria) extends its distribution to Latitude 34°53’S: taxonomical and ecological features in Uruguayan eutrophic lakes. VIDAL, L. & KRUK, C................................................................................................................142-151 Diffusion Material - Do not cite Original scientific photographs Oda, F. H., Oda, T. M. & Felismino, M. F….......................................................................................I Software and Book Review HaviStat© v 1.0 - Aplicación para evaluar uso y preferencia de hábitat. MONTENEGRO, J. & ACOSTA, A......................................................................................................II-VI
Pan-American Journal of Aquatic Sciences (2008) 3(2): 94-100
Relative growth of the fiddler crab Uca rapax (Smith) (Crustacea:
Decapoda: Ocypodidae) in a tropical lagoon (Itaipu), Southeast Brazil
TARSO COSTA1,2 & ABILIO SOARES-GOMES1,3
1Universidade Federal Fluminense, Departamento de Biologia Marinha, 24001-970, P.O. Box 100.644, Niterói, Rio de Janeiro, Brasil. 2 E-mail: [email protected] 3 E-mail: [email protected]
Abstract: The relative growth of the fiddler crab Uca rapax from a population of a tropical lagoon system of southeast Brazil was determined. Carapace height (CH), length (LMC) and height (HMC) of the major cheliped of males and abdomen width of females (AW) were employed as dependent variables and carapace width (CW) as independent variable. A total of 634 crabs, 357 males and 277 females, were sampled. The CW of males and females ranged from 2.61 to 21.94 mm (10.30 + 2.53 SD) and from 2.24 to 18.22mm (9.31 + 2.23 SD), respectively. The relationship between CW and LMC showed positive allometry in juveniles (logLMC = -0.6634 + 1.857logCW) and negative one in adult males (logLMC = 0.4570 + 0.8465logCW). The females showed allometric positive growth for CW x AW in juveniles (logAW = -0.7485 + 1.4410logCW) and adults (logAW = -0.4222 + 1.3127LogCW) with reduction of the allometry level in the adult phase.
Key words: abdome width, allometry, coast lagoon, major cheliped length, morphometry.
Resumo. Crescimento relativo do caranguejo violinista Uca rapax (Smith) (Crustacea: Decapoda: Ocypodidae) em uma laguna tropical (Itaipu), sudeste do Brasil. Uma população do caranguejo violinista Uca rapax, proveniente de uma população localizada em uma laguna tropical no sudeste do Brasil, teve seu crescimento relativo estudado. A largura da carapaça foi utilizada como variável independente enquanto que as medidas da altura da carapaça (CH), do comprimento (LMC) e altura (HMC) do maior quelípodo dos machos e do abdome das fêmeas (AW) foram empregadas como variáveis independentes. Foram amostrados um total de 634 crabs, 357 machos e 277 fêmeas. A largura da carapaça de machos e fêmeas variou de 2,61 a 21,94 mm (10,30 + 2,53 DP) e 2,24 a 18,22mm (9,31 + 2,23 DP) respectivamente. A relação entre CW e LMC nos machos foi alométrica positiva em juvenis (logLMC = -0.6634 + 1.857logCW) e alométrica negativa em adultos (logLMC = 0.4570 + 0.8465logCW). Nas fêmeas foi observado crescimento alométrico positive na relação CW x AW em juveniles (logAW = -0.7485 + 1.4410logCW) e adultos (logAW = -0.4222 + 1.3127LogCW) com redução do nível de alometria na fase adulta. Palavras chave: alometria, comprimento do maior quelípodo, largura do abdome, laguna costeira, morfometria.
Introduction
Crabs of the genus Uca Leach, 1814 occur in intertidal sheltered zones of tropical and subtropical regions, burrowing in the sediment and feeding on sedimentary organic matter. Their digging activity causes bioturbation that influences the nutrient cycling and promotes transfer of energy and nutrients to nearby estuaries
(Colby & Fonseca 1984, Genoni 1991, Castiglioni & Negreiros-Fransozo 2006). Fiddler crabs are important dietary items for a large number of fishes, birds and mammals, being responsible for a significant part of the macrobenthic production in the intertidal zone (Koch et al. 2005, Masunari 2006).

Relative growth of the fiddler crab Uca rapax.
Pan-American Journal of Aquatic Sciences (2008), 3(2): 94-100
95
Uca are dimorphic animals: while males have one cheliped much larger than the other, in females both chelipeds are small. The major cheliped plays an important role in agonistic behavior and in courtship (Crane 1975). The major cheliped develops until the animal becomes sexually mature (Masunari & Ayoub 2003).
Size and form are closed related to feeding, and habitat occupation, among others ecological features, influencing the fitness of an organism, being the result of evolutionary processes (Peres-Neto 1995). Allometric growth occurs when some part of an animal’s body grows at a different rate in relation to a reference dimension, generating changes in body proportions. Some changes are abrupt, marking crucial ontogenetic stages, such as prepuberal or puberal molting (Hartnoll 1978, 1982).
Allometric analysis is a powerful tool for both taxonomists and ecologist interested in intra- and interspecific morphological variation. These kind of analysis have been used to compare intraspecific variations among populations from different locations (e.g. Benneti & Negreiros-Fransozo 2004, Cardoso & Negreiros-Fransozo 2004, Castiglioni & Negrreiros-Fransozo 2004b, García-Dávila et al. 2005, Ibáñez-Aguirre et al. 2006), and to estimate mid-length sexual maturity, observing variations according to environmental conditions (e.g. Seiple & Salmon 1987, López et al. 1997, Pinheiro & Fransozo 1998, Flores & Negreiros-Fransozo 1999, Muiño et al. 1999, Flores et al. 2002, Colpo & Negreiros-Fransozo 2004, Dalabona et al. 2005).
Crustaceans are particularly suited to studies on relative growth due to their hard exoskeleton that facilitates precise body measuring. Also, their type of growth allows unequivocal division of their ontogeny into distinct phases, and exhibits great differences between the growth rates of males and females, and of juveniles and adults (Hartnoll 1978). For brachyuran crustaceans, changes are conspicuous in the male cheliped, female abdomen, and pleopods of both sexes during the transition from the juvenile to the adult stage (Castiglioni & Negreiros-Fransozo 2004b).
Five species of Uca have had their relative growth studied in Brazil: Uca thayeri Rathbun, 1900 (Negreiros-Fransozo et al. 2003); Uca burgersi Holthuis, 1967 (Benetti & Negreiros-Fransozo 2004); Uca rapax (Smith, 1870) (Castiglioni & Negreiros-Fransozo 2004); Uca leptodactyla Rathbun, 1898 (Masunari & Swiech-Ayoub 2003, Cardozo & Negreiros-Fransozo 2004); Uca maracoani (Latreille, 1802-1803) (Masunari et al. 2005) and Uca mordax (Smith, 1870) (Masunari &
Disenha 2005). Uca rapax is one of the most common
species of Uca, occurring in Florida, the Mexican Gulf, the Caribbean, Venezuela, and Brazil (from Pará to Santa Catarina states). U. rapax lives in burrows in muddy and sandy mangrove sediments, along river banks and coastal lagoons (Melo 1996). This work aimed to determine the relative growth of U. rapax from Itaipu Lagoon (Fig. 1), in order to compare it with data from other locations and of congeneric species. Materials and Methods
Crabs were collected monthly in Itaipú lagoon (Fig. 1) from July 2006 to March 2007, by digging the sediment enclosed in five areas of 0.25m2 during low tide. Individuals were sexed according to the presence of the major cheliped or the morphology of the abdomen. Measurements were taken to the nearest 0.01 mm using a digital vernier caliper. The following dimensions related to reproduction (Masunari & Swiech-Ayoub 2003, Benetti & Negreiros-Fransozo 2004, Cardozo & Negreiros-Fransozo 2004, Castiglioni & Negreiros-Fransozo 2004, Masunari & Disenha 2005, Masunari et al. 2005) were measured: carapace width (CW); carapace height (CH); major cheliped length (LMC); height of the major cheliped (HMC); and female abdomen width (AW). The individual wet weight (WW) was also obtained.
Allometric technique was employed to distinct adults from juvenile’s crabs. The Iterative Process for the Determination of the Transition Point routine of the software Regrans (Pezzuto1993) was used to estimate the size at the onset of morphologic sexual maturity. This routine looks for the best fit where data set of the regression line could be divided in two subsets, corresponding to the puberty molting.
Individuals were classified as dextrous or sinistrous depending on the side of occurrence of the major cheliped (Yamaguchi 1977).
Growth ratios for the independent variable (CW) and the other variables (dependent) were determined by using the logarithmic transformation log Y = log a + b log X and the function Y = aXb, where x is the independent variable (CW), Y is the dependent variable, “a” is the value of Y when X = 0, and “b” the slope of the regression line (Hartnoll, 1978, 1982; Lovett & Felder, 1989). The "b" value represents the relative growth constant (b = 1 means isometric growth; b > 1 means positive allometric growth; and b < 1 means negative allometric growth). The statistical significance of "b" was tested by Student’s t-test, adopting a significance

T. COSTA & A. SOARES-GOMES
Pan-American Journal of Aquatic Sciences (2008) 3(2): 94-100
96
level of 5% (Negreiros-Fransozo et al. 2003, Benetti & Negreiros-Fransozo 2004, Castiglioni & Negreiros-Fransozo 2004, Cardozo & Negreiros-Fransozo 2004), and noting the confidence interval of the regression line (Masunari & Swiech-Ayoub 2003, Masunari & Disenha 2005, Masunari et al. 2005).
Figure 1. Location of the study area. Results
A total of 634 crabs, 357 males and 277 females, were sampled. The CW of males ranged from 2.61 to 21.94 mm (10.30 + 2.53 SD), and of females from 2.24 to 18.22 mm (9.31 + 2.23 SD). The length of sinistrous and dextrous major chelipeds did not differ, and ranged from 1.72 to 37.57mm (17.26 + 7.02 SD). The occurrence of sinistrous (48.21%) and dextrous (51.79%) crabs was statistically similar (p < 0.01).
The estimated CW sizes at the onset of sexual maturiry of males and females were 12.07 mm and 6.78 mm, respectively.
The relationship between CW and CH was negative for juveniles of both sexes (Figs. 2 and 3). The equation logCH = -0.1697 + 0.9581 logCW describes that relationship for juvenile males (significance test for slope STS = t[1.645] = -1.80, p < 5%) and logCH = -1.1686 + 0.9433logCW (TSD = t[1.68] = -1.42, p < 5%). For adults this relationship was positive for males and isometric for females. The equations describing that relationship for adults were logCH = -0.4049 + 1.1616logCW (STS = t [1.66] = 3.23 p < 5%) and logCH = -0.2253 + 1.0198logCW (STS = t [1.645] = 0.95, p > 5%), for males and females, respectively.
Concerning the relationship between CW and LMC, positive allometry was observed in juveniles and negative allometry in adult males. The relationship between LMC and CW (Fig. 4) was described by the following equations: logLMC = -0.7864 + 1.9814logCW (STS = t [1.68] = 5.09, p < 5%) for juveniles females, and logLMC =
0.4570 + 0.8465logCW (STS = t[1.66] = -2.19, p < 5%) for adults.
The relationship CW x HMC was allometric positive in juveniles and isometric in adults. The equations logHMC = -0.8481 + 1.5850logCW (STS = t [1.645] = 24.37, p < 5%) and logHMC = -0.2386 + 1.0127CW (STS = t [1.66] = 0.15, p > 5%) describe the relationship between HMC and (Fig. 5) CW for juveniles and adults, respectively.
A positive allometric growth was observed for the relationship between CW and WW, in both sexes and different life stages.
Table I shows the growth relationships between body dimensions for each sex and life history stages of U. rapax.
Figure 2. Relationship between carapace height and carapace width in males of U. rapax from Itaipu lagoon.
Figure 3. Relationship between carapace height (CH) and carapace width (CW) of females of U. rapax from Itaipu lagoon.
Figure 4. Relationship between major cheliped length (LMC) and carapace width (CW) of males of U. rapax from Itaipu lagoon.

Relative growth of the fiddler crab Uca rapax.
Pan-American Journal of Aquatic Sciences (2008), 3(2): 94-100
97
In both juveniles and adults females allometric growth were positive for the relationship between CW and AW (Fig. 6), being described by logAW = -0.7845 +
1.4410logCW (STS = t [1.68] = 4.41, p < 5%), for juveniles, and logAW = -0.4222 + 1.3127LogCW (STS = t [1.645] = 1.75, p < 5%), for adults.
Figure 5. Relationship between major cheliped height (HMC) and carapace width (CW) of males of U. rapax from Itaipu lagoon.
Figure 6. Relationship between abdomen width (AW) and carapace width (CW) of females of U. rapax from Itaipu lagoon.
Table I. Uca rapax. Statistics on the relationship between the independent variable carapace width (CW) and the dependent variables (CH) carapace height, (LMC) major cheliped length, (HMC) major cheliped height, (AW) abdomen width, (WW) wet weight, (JM) juvenile males, (AM) adult males, (JF) juvenile females, (AF) adult females, (n) size sample, (r) correlation coefficient, (R2) determination coefficient, (a) intersection, (b) declivity, (*) significant (H0: b =1; Student’s t-test, α = 5%), (ns) non-significant, (+) positive allometry, (0) isometry, (-) negative allometry.
Variables categories n r R2 a b (I. C. 95%) t (b=1) ALL CW x CH 262 0.9802 0.9607 -0.1697 0.9581 (0.93–0.98) -1.80 * - CW x LMC 258 0.9564 0.9780 -0.7864 1.9824 (1.93–2.03) 37.78 * + CW x HMC 254 0.9708 0.9422 -0.8481 1.5850 (1.54–2.13) 24.37 * + CW x WW
JM
261 0.9815 0.9632 -3.8301 3.4988 (3.41–3.58) 59.49 * + CW x CH 90 0.9250 0.8557 -0.4049 1.1616 (1.06–1.26) 3.23 * - CW x LMC 85 0.769 0.5876 0.4570 0.8465 (0.69–0.99) -2.19 * - CW x HMC 85 0.7864 0.6139 -0.2386 1.0127 (1.83–1.18) 0.15 * 0 CW x WW
AM
87 0.8846 0.7801 -3.3732 3.0941 (2.74–3.44) 12.31 * + CW x CH 41 0.9598 0.9213 -0.1686 0.9433 (0.85–1.03) -1.42 * - CW x AW 40 0.9207 0.8478 -0.7845 1.4410 (1.22–1.65) 4.41 * + CW x WW
JF
40 0.9566 0.9151 -0.4017 3.6054 (3.23–3.97) 14.47 * + CW x CH 238 0.9528 0.9078 -0.2253 1.0198 (0.97–1.06) 0.95 ns 0 CW x AW 237 0.9255 0.8567 -0.4222 1.3127 (1.24–1.38) 1.75* + CW x WW
AF
237 0.9151 0.8375 -3.5273 3.0997 (2.92–3.27) 26.23* +
Discussion Carapace width is the main dimension used
as an independent variable in relative growth analysis of crabs because it represents well the physiological changes that occur over their life history (Castiglioni & Negreiros-Fransozo 2004). The type of growth found in the present work agrees with Hartnoll’s (1978, 1982) predictions for Brachyura.
The major cheliped has an important role in the reproductive behavior of Uca. That appendage is used by fiddler crabs in intra- and interspecific contests for territory defense, agonistic behavior,
displays, and courtship. Bigger major chelipeds lead to an advantage in fights among males and in handling females during copulation (Crane 1975, Hartnoll 1982, Pinheiro & Fransozo 1999).
The allometric growth of the major cheliped of males was negative for juveniles and positive for adults. Negative allometric growth has never been reported in the literature about Uca (Table II).
According to Masunari & Swiech-Ayoub (2003), the reduction of allometry level of the chelipeds may be related to the necessity of

T. COSTA & A. SOARES-GOMES
Pan-American Journal of Aquatic Sciences (2008) 3(2): 94-100
98
males to maintain body balance, and hence the major cheliped reachs a much larger length than the carapace. The reduction of allometric level in the adult phase can prevent cheliped malformation that could impair the execution of displays. Castiglioni & Negreiros-Fransozo (2004), studying populations from São Paulo state coast, found conflicting results in two sites. At one site the level of allometry did not vary significantly, whereas at the other site the allometric level increased from juvenile to the adult phase (Table II). The phenotypic plasticity of the major cheliped are commonly related to environmental and population variables such as food availability, population density, intra and interespecific competition, and sex ratio.
The abdomen shows a marked dimorphism in crabs, being the female’s body part where eggs are incubated during embriogenic periods. Uca rapax from Itaipú lagoon had a positive allometric growth in juveniles (b = 1.44) and adults (b = 1.31). The shift in the level of allometry during the adult phase is probably related to the fact that this organ does not act independently, like the chelipeds. The abdomen works in conjunction with the sternum. After it reaches an effective size in the puberty moult, any disproportionate growth in its length would reduce the efficiency of the walking mechanism, hampering the pereiopod steps. The same growth pattern was also described in U. rapax by Castiglioni & Negreiros-Fransozo (2004) and in U. thayeri by Negreiros-Fransozo et al. (2003), in Ubatuba (São Paulo State) coast.
Table II presents the allometric level for the relationships of CW with LMC and AW calculated for several species of Uca from different
localities. The relationship between carapace
width and height did not follow a well- defined pattern. Juveniles of both sexes and adult males showed a negative allometric growth while adult females showed isometric growth. Juveniles of U. rapax had a higher growth rate in length than in width. In females, after the puberal moult, and with the increase of gonadal volume, the carapace started to show isometric growth between length and width. However, the CW x CH relationship is not suitable in expressing biological changes in the life history of crabs since alterations in carapace shape do not represent the transition from the juvenile to the adult phase. Secondary sexual characters, such as chelipeds and abdomen morphology represent better those changes (Santos et al. 1995).
The relationship between CW and WW showed high levels of allometry in all categories. Since CW is a variable that expresses surface area, and WW expresses volume, it was an expected result. As the crab grows, its volume increases at a rate three times bigger than its surface area. In crabs raised commercially, the CW x WW relationship is commonly used because it supplies essential information for biomass projections in aqua- culture and favors the exploitation and handling of trading important species (Pinheiro & Taddei 2005).
The allometric growth of U. rapax in Itaipú lagoon differed from other Uca populations studied along the southern Brazilian coast, indicating that growth could have been influenced by environmental variables in this section of the coast.
Tabela II: Allometry levels for Uca spp. using carapace width (CW) as independent variable. (1) Cavalo River population, (2) Ubatumirim population, (3) Itamambuca population, (0) isometry, (+) positive allometry.
Males (CW x LMC) Females (CW x AW)Species Authors juvenile adult juvenile adult
Uca burgersi (1) Benetti & Negreiros-Fransozo (2004) 1.66 (0) 2.01 (+) 1.29 (0) 1.64 (+) Uca burgersi (2) Benetti & Negreiros-Fransozo (2004) 1.62 (+) 2.04 (+) 1.40 (+) 1.59 (+) Uca leptodactyla Masunari & Swiech-Ayoub (2003) 2.19 (+) 1.24 (0) 1.30 (+) 1.07 (0) Uca mordax Maunari & Disenha (2005) 1.51 (+) 2.37 (+) 1.22 (+) 1.60 (+) Uca rapax (2) Castiglioni & Negreiros-Fransozo (2004) 1.43 (+) 1.86 (+) 1.45 (+) 1.31 (+) Uca rapax (3) Castiglioni & Negreiros-Fransozo (2004) 1.55 (+) 1.52 (+) 1.67 (+) 1.23 (+) Uca thayeri Negreiros-Fransozo et al. (2003) 1.52 (+) 2.24 (+) 1.32 (+) 1.10 (+) Uca maracoani Masunari et al. (2005) 1.39 (+) 1.95 (+) 1.00 (0) 1.51 (+) Uca rapax This study 1.98 (+) 0.84 (-) 1.44 (+) 1.31 (+)

Relative growth of the fiddler crab Uca rapax.
Pan-American Journal of Aquatic Sciences (2008), 3(2): 94-100
99
Acknowledgements The authors are indebted to M. Tavares from the Museu Paulista de Zoologia for species identification and to CAPES for providing scholarship for the first author during his Master Degree Course. References Benetti, A. S. & Negreiros-Fransozo, M. L. 2004.
Relative growth of Uca burgersi (Crustacea, Ocypodidae) from two mangroves in the southeastern Brazilian coast. Iheringia, 94(1): 67-72.
Cardoso, F. C. R. & Negreiros-Fransozo, M. L. 2004. A comparison of the allometric growth in Uca leptodactyla (Crustacea: Brachyura: Ocypodidae) from two subtropical estuaries. Journal of Marine Biology Association of United Kingdom, 84: 733-735.
Castiglioni, D. da S. & Negreiros-Fransozo, M. L. 2004a. Comparative analysis of the relative growth of Uca rapax (Smith) (Crustacea, Ocypodidae) from two mangroves in São Paulo, Brazil. Revista Brasileira de Zoologia, 21(1): 137-144.
Castiglioni, D. da S. & Negreiros-Fransozo, M. L. 2004b. Somatic growth of the mudflat fiddler crab Uca rapax (Smith, 1870) (Brachyura: Ocypodidae) from two subtropical mangroves in Brazil. Universidad y Ciencia, 20(39): 15-22.
Castiglioni, D. da S. & Negreiros-Fransozo, M. L. 2006. Ciclo reprodutivo do caranguejo Uca rapax (Smith) (Crustacea, Brachyura, Ocypodidae) habitante de um estuário degradado em Paraty, Rio de Janeiro, Brasil. Revista Brasileira de Zoologia, 23(2): 331-339.
Colby, D. R. & Fonseca, M. S. 1984. Population dynamics and somatic growth of the sand fiddler crab Uca pugilator. Marine Ecology Progress Series, 16(3): 269-279.
Colpo, K. D. & Negreiros-Fransozo, M. L. 2004. Comparison of the population structure of the fiddler crab Uca vocator (Herbst, 1804) from three subtropical mangrove forests. Scientia Marina, 68(1): 139-146.
Costa, T. M. & Negreiros-Fransozo, M. L. 2003. Population biology of Uca thayeri Rathbun, 1900 (Brachyura, Ocypodidae) in a subtropical South Americam mangrove area: results from transect and catch-per-unit-effort techniques. Crustaceana, 75: 1201-1218.
Crane, J. 1975. Fiddlers crabs of the world
(Ocypodidade: Genus Uca). Princeton University, Princeton, 736p.
Dalabona, G., Silva, J. L. & Pinheiro, M. A. A. 2005. Size at morphological maturity of Ucides cordatus (Linnaeus, 1763) (Brachyura, Ocypodidae) in the Laranjeiras Bay, Southern Brazil. Brazilian Archives of Biology and Technology, 48(1): 139-145.
Flores, A. & Negreiros-Fransozo, M. L. 1999. Allometry of the secundary sexual characters of the shore crab Pachygrapsus tranversus (Gibbes, 1850) (Brachyura, Grapsidae). Crustaceana, 72(9): 1051-1066.
Garcia-Dávila, C. R., Magalhães, C. & Guerrero, J. C. H. 2005. Morphometric variability in populations of Palaemonetes spp. (Crustacea, Decapoda, Palaemonidae) from the Peruvian and Brazilian Amazon Basin. Iheringia, 95(3): 327-334.
Genoni, G. P. 1991. Increased burrowing by fiddler crabs Uca rapax (Smith) (Decapoda: Ocypodidae) in response to low food supply. Journal of Experimental Marine Biology and Ecology, 147: 267-285.
Hartnoll, R. G. 1978. The determination of relative growth in crustacea. Crustaceana, 34(3): 281-293.
Hartnoll, R. G. 1982. Growth. Pp. 111-185. In: Bliss, D. E. (Ed.). The biology of Crustacea: embryology, morphology and ecology. New York Academic Press, New York, 383p.
Ibañez-Aguirre, A. L., Cabral-Solis, E., Gallardo-Cabelo, M. & Espino-Barr, E. 2006. Comparative morphometrics of two populations of Mugil curema (Pisces: Mugilidae) on the Atlantic and Mexican Pacific coasts. Scientia Marina, 70(1): 139-145.
Knoppers, B., Carmouze, J. P. & Moreira–Turcq, P. F. 1999. Nutrient dinamics, metabolism and eutrophication of lagoons along the East Fluminense Coast, State of Rio de Janeiro, Brazil. Environmental Geochemestry of Coastal Lagoon Systems, 6: 123-154.
Koch, V., Wolff, M. & Diele, K. 2005. Comparative population dynamics of four fiddler crabs (Ocypodidae, genus Uca) from a North Brazilian mangrove ecosystem. Marine Ecology Progress Series, 291: 177-188.
Litulo, C. 2005a. Population structure and reproductive biology of the fiddler crab Uca inversa (Hoffman, 1874) (Brachyura: Ocypodidae). Acta Oecologica, 27: 135-141.
Litulo, C. 2005b. Population structure and

T. COSTA & A. SOARES-GOMES
Pan-American Journal of Aquatic Sciences (2008) 3(2): 94-100
100
reproductive biology of the fiddler crab Uca urvillei (Brachyura: Ocypodidae) in Matupo Bay (South Mozambique). Journal of Natural Science, 39(25): 2307-2318.
Litulo, C. 2006. Populational and reproductive biology of the fiddler crab Uca chlorophtalmus (Brachyura: Ocypodidae) from Inhaca, southern Mozambique. Journal of Marine Biology Association of United Kingdom, 86: 737-742.
López, L. S., Stella, V. S. & Rodríguez, E. M. 1997. Size at onset maturity in Chasmagnathus granulata (Decapoda, Brachyura). Nauplius, 5(2): 65-75.
Lovett, D. L. & Felder, D. L. 1989. Application of regression techniques to studies of relative growth in crustaceans. Journal of Crustacean Biology, 9(4): 529-539.
Masunari, S. & Dissenha, N. 2005. Alometria no crescimento de Uca mordax (Smith) (Crustacea, Decapoda, Ocypodidae) da Baía de Guaratuba, Paraná, Brasil. Revista Brasileira de Zoologia, 22(4): 984-990.
Masunari, S. 2006. Distribuição e abundância dos caranguejos Uca Leach (Crustaceea, Decapoda, Ocypodidae) na Baía de Guaratuba, Paraná, Brasil. Revista Brasileira de Zoologia, 23(4): 901-914.
Masunari, S., Dissenha, N. & Falcão, R. C. 2005. Crescimento relativo e destreza dos quelípodos em Uca maracoani (Crustacea, Decapoda, Ocypodidae) no Baixo Mirím, Baía de Guaratuba, Paraná, Brasil. Revista Brasileira de Zoologia, 22(4): 974-983.
Masunari, S. & Swiech-Ayoub, B. de P. 2003. Crescimento relativo em Uca leptodactyla Rathbun (Crustacea, Decapoda, Ocypodidae). Revista Brasileira de Zoologia, 20(3): 487-491.
Melo, G. A. S. 1996. Manual de identificação dos brachyura (caranguejos e siris) do litoral brasileiro. Plêiade/Fapesp, São Paulo, 604p.
Muiño, R., Fernández, L., González-Gurriarrán, E., Freire, J. & Vilar, A. 1999. Size at maturity of Liocarcinus depurator (Brachyura: Portunidae): a reproductive and morphometrtic study. Journal of Marine Biology Association of United Kingdom, 79:
295-393. Negreiros-Fransozo, M. L., Colpo, K. D. & Costa, T.
M. 2003. Allometric growth in the fiddler crab Uca thayeri (Brachyuyra, Ocypodidae) from a subtropical mangrove. Crustaceana, 23(2): 273-279.
Peres-Neto, P. R. 1995. Introdução às análises morfométricas. Oecologia Brasiliensis, 2: 57-89.
Perrin, P. 1999. Physiography and surface formations of the east fluminense coast, State of Rio de Janeiro, Brazil. Environmental Geochemestry of Coastal Lagoon Systems, 6: 11-23.
Pezzuto, P.R. 1993. Regrans: a Basic program for an extensive analysis of relative growth. Atlântica, 15: 93-105.
Pinheiro, M. A. A. & Fransozo, A. 1998. Sexual maturity of swimming crab Arenaeus cribrarius (Lammarck, 1818) (Decapoda, Brachyura, Portunidae), in the Ubatuba Littoral, São Paulo state, Brazil. Crustaceana, 71(4): 434-452.
Pinheiro, M. A. A. & Fransozo, A. 1998. Reproductive behavior of the swimming crab Arenaeus cribrarius (Lamarck, 1818) (crustaceca, Brachyuyra, Portunidae) in Captivity. Bulletin of Marine Science, 64(2): 243-253.
Pinheiro, M. A. A. & Taddei, F. G. 2005. Relação peso/largura da carapaça e fator de condição em Dilocarcinus pagei Stimpson (Crustacea, Brachyura, Trichodactylidae), em São José do Rio Preto, São Paulo, Brasil. Revista Brasileira de Zoologia, 22(4): 825-829.
Santos, S., Negreiros-Fransozo, M. L. & Fransozo, A. 1995. Morphometric relationships and maturation in Portunus spinimanus Latreille, 1819 (Crustaceca, Brachyura, Portunidae). Revista Brasileira de Zoologia, 55(4): 545-553.
Seiple, W. H. & Salmon, M. 1987. Reproductive, growth and life-history contrasts between two species of grapsid crabs, Sesarma cinereum and S. reticulatum. Marine Biology, 94: 1-6.
Yamaguchi, T. 1977. Studies on the handness of the fiddler crab Uca lactea. Biological Bulletin, 152: 424-436.
Received December 2007 Accepted March 2008
Published online June 2008
Pan-American Journal of Aquatic Sciences (2008) 3(2): 101-104
Notes on the morphology of two species of Gussevia Kohn & Paperna
(Monogenea: Dactylogyridae) parasitic on Astronotus ocellatus (Agassiz) (Perciformes: Cichlidae) from Brazil
VANESSA D. ABDALLAH1, RODNEY K. AZEVEDO1 & JOSÉ L. LUQUE2
1Curso de Pós-Graduação em Ciências Veterinárias, Universidade Federal Rural do Rio de Janeiro, RJ, Brasil. 2Departamento de Parasitologia Animal, Universidade Federal Rural do Rio de Janeiro, Caixa Postal 74.508, CEP 23851-970, Seropédica, RJ, Brasil. E-mail: [email protected]
Abstract: Gussevia asota and G. astronoti (Monogenea) were collected on Astronotus ocellatus (Agassiz, 1831) from southeastern Brazil by the first time. A comparative morphological analysis between present specimens and their types showed variability in the morphology of the haptor.
Key words: fish parasite, taxonomy, freshwater fish, Neotropical region.
Resumo. Notas sobre a morfologia de duas espécies de Gussevia Kohn & Paperna (Monogenea: Dactylogyridae) parasitas de Astronotus ocellatus (Agassiz) (Perciformes: Cichlidae) no Brasil. Gussevia asota e G. astronoti (Monogenea) foram coletados de Astronotus ocellatus no sudeste do Brasil pela primeira vez. A análise morfológica comparativa entre os espécimes estudados e os espécimes-tipo mostrou variabilidade na morfologia geral do haptor. Palavras chave: parasito de peixe, taxonomia, peixe dulcícola, região Neotropical. Gussevia Kohn & Paperna, 1964 is a
Neotropical monogenean genus which includes parasite species of cichlid fishes (Kritsky et al. 1986). Currently, there are 17 valid species in the genus, three of them are parasites on Astronotus ocellatus (Agassiz, 1831) from Amazonas River Basin (Thatcher 2006). During a parasitological survey of fishes from the Guandu River, southeastern Brazil, numerous specimens of Gussevia asota Kritsky, Thatcher & Boeger, 1989 and G. astronoti Kritsky, Thatcher & Boeger, 1989 were collected from the gills of A. ocellatus. A comparative morphological analysis between specimens of these species of Gussevia and their type specimens revealed variability. Herein, notes concerning the general morphology of the haptor of these monogeneans are provided.
Between December 2004 and November 2005, 35 specimens of A. ocellatus (Cichlidae) from the Guandu River (22°48’32”S, 43º37’35”W), State of Rio de Janeiro, Brazil were collected. The fish measured 20.4 (11.5-28.5) cm in standard length. The monogeneans were removed from
the gills of the hosts and placed in vials containing a 1:4.000 solution of formalin. After one hour, the vials were shaken and additional formalin was added to increase the concentration to 5%. The parasites were stained with Gomori’s trichrome and mounted in Canada balsam; some specimens were mounted in Gray and Wess’ medium (Humason 1979) for study of sclerotized structures. Measurements are in micrometers (μm); means are followed by ranges in parentheses. The illustrations were made with the aid of a drawing tube mounted on a Hund Wetzlar H-600 phase contrast microscope. Voucher specimens are deposited in the Helminthological Collection of the Instituto Oswaldo Cruz (CHIOC), Rio de Janeiro, Brazil. Type-specimens of the two species studied and G. rogersi Kritsky, Thatcher & Boeger, 1989 deposited in the Invertebrates Collection of the Instituto Nacional de Pesquisas da Amazônia (INPA) were also examined. The ecological terms follows Bush et al. (1997) and haptoral terminology is according to Kritsky & Mizelle (1968) and related papers.

V. D. ABDALLAH ET AL.
Pan-American Journal of Aquatic Sciences (2008) 3(2): 101-104
102
Gussevia asota Kritsky, Thatcher & Boeger, 1989 (Figs. 1, 3, 4)
Measurements (based on 20 specimens from 40 examined): Body 523 (510-540) long; greatest width 100 (91-105) at level of gonads. Pharynx 22 (20-23) in diameter; haptor 90 (81-105) long, 109 (90-118) wide, well-developed anterior and posterior lobes, posterior lobe larger than anterior bearing bilateral small glandular patches. Ventral anchor 27 (26-29) long, base width 6 (5-7). Dorsal anchor 28 (26-30) long, base 8 (7-9) wide. Ventral bar 31-32 long; dorsal bar 34 (33-35) long. Hooks pairs 1, 2, 3, 4, 6 and 7, 11-12 long; hook pair 5, 13 (12-14) long. Testis, 77-74 long, 17-18 wide. Male copulatory organ 52 (49-54) long, proximal ring diameter 12 (10-13). Accessory piece 33 (32-35) long. Germarium 86-87 long, 21-22 wide.
Host: Astronotus ocellatus (Agassiz, 1831)
(Perciformes: Cichlidae) Site of infection: Gills. Locality: Guandu River, State of Rio de Janeiro,
Brazil (22°48’32”S, 43º37’35”W). Voucher specimens: CHIOC N° 36991a, b; 36993. Other specimens studied: Holotype (INPA N° 170)
and nine paratypes (INPA N° 171a-i). Prevalence: 71.4% (25 of 35 fishes examined). Mean intensity: 17.6 Gussevia astronoti Kritsky, Thatcher & Boeger, 1989 (Figs. 2, 5, 6).
Measurements (based on 20 specimens from 35 examined): Body 465 (443-508) long; greatest width 145 (135-151) at level of gonads. Pharynx 25 (22-27) in diameter; haptor 73 (63-77) long, 111 (102-120) wide, well-developed anterior and posterior lobes, the anterior lobe larger than posterior bearing bilateral small glandular patches. Ventral anchor 39 (38-40) long, base width 7 (6-8). Dorsal anchor 33 (32-34) long, base 10 (9-11) wide. Ventral bar 35 (33-37) long; dorsal bar 45 (43-47) long. Hooks pairs 1, 2, 3, 4, 6 and 7, 10 (8-12) long; hook pair 5, 14 (12-15) long. Testis, 47 (42-52) long, 19 (17-20) wide. Male copulatory organ 71 (69-72) long, proximal ring diameter 13 (12-14). Accessory piece 51 (48-54) long. Germarium 53 (48-58) long, 29 (24-33) wide. Vagina dextral, with internal well sclerotised shield, opening in anterior half of trunk. Host: Astronotus ocellatus (Agassiz, 1831)
(Perciformes: Cichlidae). Site of infection: Gills. Locality: Guandu River, State of Rio de Janeiro,
Brazil (22°48’32”S, 43º37’35”W).
Figures 1-2. Gussevia asota, 1. ventral view. Gussevia astronoti, 2. ventral view. Scales in micrometers.
Figures 3-6. Gussevia asota. 3. Entire specimen, 4. detail of the haptor (stained with Gomori’s trichrome). Gussevia astronoti. 5. Entire specimen, 6. detail of the haptor (stained with Gomori’s trichrome). All scales in micrometers.

Notes on the morphology of two species of Gussevia
Pan-American Journal of Aquatic Sciences (2008), 3(2): 101-104
103
Voucher specimens: CHIOC N° 36990a, b; 36992. Other specimens studied: Holotype (INPA N° 169). Prevalence: 62.8% (22 of 35 fishes examined). Mean intensity: 17.5
Examination of the type-specimens of G. asota and G. astronoti showed that these species were adequately described by Kritsky et al. (1989). Nevertheless, all the specimens collected from Guandu River showed morphological differences in haptor and body shape. First, these specimens presented conspicuous well-developed haptoral lobes with bilateral posterior glandular patches (absent in original descriptions of G. asota and G. astronoti and in the type-specimens). Second, the body of specimens collected in Guandu River showed larger dimensions than the type-specimens. In addition, differences between the vagina illustrated by Kritsky et al. (1989) and the vagina observed in the holotype of G. astronoti were observed; in the holotype an internal well-sclerotized shield is present, but this detail was not illustrated in the original description.
The comparative morphology of the haptoral and copulatory complexes are nearly identical with the original description and observed in type-specimens, with minor differences easily explained by orientation of specimens. Also, differences in soft parts, can be a result of differing fixation technique: the type-specimens are apparently very contracted.
Another species of Gussevia described by Kritsky et al. (1989) parasitic on A. ocellatus, G. rogersi, also showed haptoral lobes. Accor- ding to Kritsky et al. (1989), this species could be differentiated from G. asota and G. astronoti because the morphology of the male copulatory organ, vagina and sclerotised haptoral structures. We confirmed these differences with the observation of the holotype of G. rogersi (INPA N˚318-1).
This is the first record of G. asota and G. astronoti in southeastern Brazil, outside Amazonas River Basin. Possibly, these parasite species were introduced with the host (A. ocellatus) in southeastern Brazil. Astronotus ocellatus is a native fish from Amazonas River Basin and is considered an allochtonous species in southeastern Brazil, where it was initially intro-duced during the 1960’s (Azevedo et al. 2007). Formal quantitative data (intensity or prevalence) about species of Gussevia were not included in Kritsky et al. (1989), but in the remarks of the original description of G. asota, the authors commented the low infestation level of
this species (<10 worms/fish), interestingly, mean intensity of G. asota in the Guandu River (17.6) is much higher than the type-locality (Janauacá Lake, Amazonas, Brazil). Recently, Mendoza-Franco et al. (2007) recorded a single specimen of G. asota on six specimens of A. ocellatus from Central Panama, suggesting that A. ocellatus has lost their original monogenean since its colonization to Panama from South America. Acknowledgements The authors are grateful to Dr. Célio Magalhães (Invertebrates Collection, Instituto Nacional de Pesquisas da Amazônia, INPA, Brazil) for loaned type-specimens. José L. Luque was supported by a Research fellowship from CNPq (Conselho Nacional de Pesquisa e Desenvolvimento Tecnológico, Brazil) and by a grant of FAPERJ (Fundação de Amparo à Pesquisa do Estado do Rio de Janeiro, Brazil). Vanessa D. Abdallah and Rodney K. Azevedo were supported by student fellowships from CNPq and FAPERJ, respectively. References Azevedo, R. K., Abdallah, V. D. & Luque, J. L.
2007. Ecologia da comunidade de metazoários parasitos do apaiarí Astronotus ocellatus (Cope, 1872) (Perciformes: Cichlidae) do rio Guandu, estado do Rio de Janeiro, Brasil. Revista Brasileira de Parasitologia Veterinária, 16: 15-20.
Bush, A. O., Lafferty, K. D., Lotz, J. M. & Shostak, A. W. 1997. Parasitology meets ecology on its own terms: Margolis et al. revisited. Journal of Parasitology, 83: 575-593.
Humason, G. L. 1979. Animal Tissue Techniques. W.H. Freeman Co, San Francisco, 661 p.
Kritsky, D. C., & Mizelle, J. D. 1968. Studies on monogenetic trematodes. 35. Some new and previously described North American species of Gyrodactylus. The American Midland Naturalist, 79: 205-215.
Kritsky, D. C., Thatcher, V. E., & Boeger, W. A. 1986. Neotropical Monogenea. 8. Revision of Urocleidoides (Dactylogyridae, Ancyroce-phalinae). Proceedings of the Helminthological Society of Washington, 53: 1-37.
Kritsky, D. C., Thatcher, V. E. & Boeger, W. A. 1989. Neotropical Monogenea. 15. Dactylogyrids from the gills of Brazilian Cichlidae with proposal of Sciadicleithrum

V. D. ABDALLAH ET AL.
Pan-American Journal of Aquatic Sciences (2008) 3(2): 101-104
104
gen. n. (Dactylogyridae). Proceedings of the Helminthological Society of Washington, 56: 128-140.
Mendoza-Franco, E. F., Aguirre-Macedo, M. L. & Vidal-Martinez, V. M. 2007. New and previously described species of
Dactylogyridae (Monogenoidea) from the gills of Panamanian freshwater fishes (Teleostei). Journal of Parasitology, 93: 761-771.
Thatcher, V. E. 2006. Amazon Fish Parasites. Pensoft Publishers, Sofia, 508p.
Received April 2008 Accepted May 2008
Published online June 2008

Pan-American Journal of Aquatic Sciences (2008) 3(2): 105-107
Record of native amphibian predation by the alien African
catfish in the Brazilian Atlantic Rain Forest
JEAN R. S. VITULE 1,2, SIMONE C. UMBRIA 1 & JOSÉ M. R. ARANHA 1
1 Departamento de Zoologia, Laboratório de Ecologia de Rios (EcoRios), Setor de Ciências Biológicas, Universidade Federal do Paraná, Curitiba, Paraná, CEP 81531-990, Brasil. 2 E-mail: [email protected]
Abstract: We record here the predation of an adult individual of the native frog Leptodactylus ocellatus (Linnaeus, 1758) by the non-native catfish Clarias gariepinus (Burchell, 1822), in a river at the Brazilian Atlantic Rain Forest.
Key words: Clarias gariepinus, feeding, food web, invasive fish, Leptodactylus ocellatus.
Resumo. Registro de predação de um anfíbio nativo pelo bagre-Africano introduzido na Floresta Atlância brasileira. Registramos aqui a predação de um indivíduo adulto da rã nativa Leptodactylus ocellatus (Linnaeus, 1758) pelo bagre introduzido Clarias gariepinus (Burchell, 1822), em um rio da Floresta Atlântica brasileira. Palavras-chave: Alimentação, Clarias gariepinus, Leptodactylus ocellatus, peixe invasor, teia trófica.
Neotropical fauna faces a new and potentially serious threat: the introduction and spread of alien fishes. Fishes are major components of food webs in tropical rivers, and display great variability in trophic behaviour at all levels (Winemiller & Jepsen 1998). The ecological consequences of fish invasions include alterations in community-ecosystem energy flow. On August 3, 2004, during an ecological survey on alien fishes in a river located in the Brazilian Atlantic Rain Forest (Guaraguaçu river basin, 25º45’S and 48º35’W at costal plain, east side of the Serra do Mar, sub-basin of Paranaguá Bay, Paranaguá city, Paraná state, southern Brazil), we retrieved a well-preserved specimen of the native frog Leptodactylus ocellatus (Linnaeus, 1758) (Amphibia, Anura, Leptodactylidae) (female, 85 mm total length, 76.58 g total mass) from the esophagus of an adult specimen of the catfish Clarias gariepinus (Burchell, 1822) (Teleostei, Siluriformes, Clariidae) (female, 600 mm total length, 575 mm standard length, 1.650 kg total mass – (Fig. 1)).
The African catfish C. gariepinus is an alien species in Brazil, and has been reported as a serious ecological problem (Vitule et al. 2006a, b,
Vitule 2008). This species is originally from Africa and parts of Asia (Israel, Syria and south of Turkey); it has a long body, pseudo-lungs, and a high mucous secretory capacity, as adaptations to live in stagnant shallow environments or even out of the water (Donnelly 1973). The capacity for amphibious life-style can provide specific advantages to its feeding ecology, such as access to food sources that are mostly inaccessible to other fish, as shown in other fish species (Kruitwagen et al. 2007). In its natural geographical areas of occurrence, C. gariepinus feeds on plankton, arthropods, mollusks, vegetables, fish, reptiles, and amphibians, showing a very wide and generalist diet (Munro 1967, Willoughby & Tweddle 1978, Bruton 1979, Spataru et al. 1987, Winemiller & Kelso-Winemiller 1996, Yalçin et al. 2001). In Brazil, native fishes and arthropods have been reported in its diet (Mili & Teixeira 2006). This catfish is a top food chain predator, and being a voracious feeder, could deeply modify pre-existing biotic interactions in the community. The impact of this large invasive predator species in a native food web of a community with many endemic species of short size is imminent (Vitule et al. 2006a, Vitule 2008). Maximum adult

J. R. S. VITULE ET AL.
Pan-American Journal of Aquatic Sciences (2008) 3(2): 105-107
106
size is a relevant biological variable for successful invasions in life-history traits of non-native fishes in Iberian watersheds (Ribeiro et al. 2007).
The amphibian prey L. ocellatus occurs widely in South America, east of the Andes. This species is well adapted to habitat modification and disturbance. It is frequently found in ponds, small lakes or flooded areas (sensu IUCN 2006). It occurs in some tropical regions where deforestation
5 cm
5 cm
5 cm
5 cm
5 cm
5 cm
5 cm
5 cm
5 cm
5 cm5 cm
5 cm5 cm
5 cm
Figure 1. Photographs depicting the African catfish Clarias gariepinus with the frog Leptodactylus ocellatus stuck into its throat (top picture), and the withdrawal of the frog.
advances at fast rates, including the Atlantic Rain Forest, one of the most ecological diverse but threatened ecosystems of the planet (Myers et al. 2000). Impacts of alien fishes on amphibian populations have already been reported in temperate regions (Knapp & Matthews 2000, Finlay & Vredenburg 2007). The predation of this resistant native amphibian species by a large alien fish like C. gariepinus may indicate its potential for high impact on an aquatic community and in nearby habitats such as lateral pools and riparian areas. Frogs seem to be a preferred prey for this catfish, as, while using longline for capturing fish in this river basin, frogs were the only baits that allowed us to capture the African catfish (Vitule 2008). We believe such information can contribute to the development of management plans aimed at minimizing probable impacts. Unfortunately, many aquaculture publications (including some FAO technical papers e.g. De Graaf & Janssen (1996)) are referring to the advantages and benefits of its cultivation, due to its robustness and fast growth, attaining a large size, but without considering its highly invasive potential. This stimulates the use of such species in an indiscriminate way in countries with high biodiversity and natural resources, but poor in technology in order to properly explore them in an adequate manner. In this context the disse-mination of these results can help institutions involved in the licensing of growers and the conservation of the environment with the adoption of preventive actions to be adopted as early as possible. Acknowledgements We thank Flávia Francine Gazola da Silva and Simone Dala Rosa for advice during fieldwork, Marcelo Rennó Braga for taking the photographs, Mitzi de Oliveira for the identification of L. ocellatus, and Carolina A. Freire for valuable suggestions and text revision. We also acknowledge the financial support by the Conselho Nacional de Desenvolvimento Científico e Tecnológico (CNPq), Fundação Araucária, and Fundação O Boticário de Proteção à Natureza. References Bruton, M. N. 1979. The food and feeding behaviour
of Clarias gariepinus (Pisces, Clariidae) in Lake Sibaya, South Africa, with its emphasis on its role as a predator of cichlids. Transactions of the Zoological Society, 35: 47-114.
De Graaf, G. & H. Janssen. 1996. Artificial

Record of native amphibian predation by the alien African catfish
Pan-American Journal of Aquatic Sciences (2008), 3(2): 105-107
107
reproduction and pond rearing of the African catfish Clarias gariepinus in sub-Saharan África – A handbook. Nº 362. Rome: FAO Fisheries Technical Paper. 73p.
Donnelly, B. G. 1973. Aspects of behaviour in the catfish Clarias gariepinus (Pisces: Clariidae) during periods of habitat desiccation. Arnoldia, 6: 1-8.
Finlay, J. C. & V. T. Vredenburg. 2007. Introduced trout sever trophic connections in watersheds: consequences for a declining amphibian. Ecology, 88: 2187-2198.
IUCN, Conservation International and Nature Serve. 2006. Global Amphibian Assessment. World Wide Web electronic publication accessible at http://www.globalamphibians.org. (Accessed 12/09/2007).
Knapp, A. R. & R. K. Matthews. 2000. Non-Native Fish Introductions and the Decline of the Mountain Yellow-Legged Frog from within Protected Areas. Conservation Biology, 14: 428-438.
Kruitwagen, G., Nagelkerken, I., Lugendo, B. R., Pratap, H. B. & S. E. Wendelaar Bonga. 2007. Influence of morphology and amphibious life-style on the feeding ecology of the mudskipper Periophthalmus argentilineatus. Journal of Fish Biology, 71: 39-52.
Mili, P. S. M. & R. L. Teixeira. 2006. Notas ecológicas do bagre africano, Clarias gariepinus (Bulchell, 1822) (Teleostei, Clariidae), de um córrego do sudeste do Brasil. Boletim do Museu de Biologia Mello Leitão, 19: 45-51.
Munro, J. L. 1967. The food of a community of East African freshwater fishes. Journal of Zoology, 151: 389-415.
Myers, N., Mittermeier, R. A., Mittermeier, C. G., Fonseca & G. A., Kent, J. 2000. Biodiversity hotspots for conservation priorities. Nature, 403: 853-858.
Ribeiro, F., Elvira, B., Collares-Pereira, M. J. & P. B. Moyle. 2008. Life-history traits of non-native fishes in Iberian watersheds across
several invasion stages: a first approach. Biological Invasions, 10: 89-102.
Spataru, P., Viveen, W. J. A. R. & M. Gophen. 1987. Food composition of Clarias gariepinus (= C. lazera), (Cypriniformes, Clariidae) in Lake Kinneret (Israel). Hydrobiologica, 144: 77-82.
Vitule, J. R. S., Umbria, S. C. & J. M. R. Aranha. 2006a. Introduction of the African catfish Clarias gariepinus (BURCHELL, 1822) into Southern Brazil. Biological Invasions, 8: 677-681.
Vitule, J. R. S., S. C. Umbria & J. M. R. Aranha. 2006b. Introdução de espécies, com ênfase em peixes de ecossistemas continentais. Pp. 217-229. In: Monteiro-Filho, E. L. A. & Aranha, J. M. R. (Eds.). Revisões em Zoologia - I: Volume Comemorativo dos 30 Anos do Curso de Pós-Graduação em Zoologia da Universidade Federal do Paraná. Secretaria Do Meio Ambiente Do Estado Do Paraná, Curitiba, 391 p.
Vitule, J. R. S. 2008. Distribuição, abundância e estrutura populacional de peixes introduzidos no Rio Guaraguaçu, Paranaguá, Paraná, Brasil. Tese de Doutorado. Universidade Federal do Paraná, Curitiba, Paraná, Brasil. 139 p.
Willoughby, N. G. & D. Tweddle. 1978. The ecology of the catfish Clarias gariepinus and Clarias ngamensis in the Shire Valley, Malawi. Journal of Zoology, 186: 507-534.
Winemiller, K. O. & D. B. Jepsen. 1998. Effects of seasonality and fish movement on tropical river food webs. Journal of Fish Biology, 53: 267–296.
Winemiller, K. O. & L. C. Kelso-Winemiller. 1996. Comparative ecology of catfishes of the Upper Zambezi River floodplain. Journal of Fish Biology, 49: 1043-1061.
Yalçin, S., Akyurt, I. & K. Solak. 2001. Stomach contents of the catfish (Clarias gariepinus Burchell, 1822) in the River Asi (Turkey). Turkey Journal of Zoology, 25: 461-468.
Received March 2008 Accepted May 2008
Published online May 2008

Pan-American Journal of Aquatic Sciences (2008) 3(2): 108-115
Acute toxicity of waters from the urban drainage channels
of Santos (São Paulo, Brazil)
ANDRÉA PIMENTA AMBROZEVICIUS1,2,3 & DENIS MOLEDO DE SOUZA ABESSA1
1UNESP – Universidade Estadual Paulista Júlio de Mesquita Filho – Campus do Litoral Paulista, Unidade São Vicente. Pça Infante D. Henrique, s/n°- Parque Bitaru CEP 11330-900 São Vicente – SP – Brasil; 2USP – PROCAM – Programa de Pós-Graduação em Ciências Ambientais. Rua do Anfiteatro, 181, Colméia, Favo 15, CEP 05508-900, Cidade Universitária, São Paulo – SP – Brasil. 3Corresponding author. E-mail address: [email protected]
Abstract: The objective of this study was to evaluate the toxicity of water which flows toward the beaches of Santos, SP, Brazil. Water samples were collected from eight urban drainage channels and a small creek, in March, April and August 2005. For each sample, some physical-chemical parameters were analyzed: pH, dissolved oxygen, temperature, salinity, presence of free chlorine and total ammonia contents. Acute toxicity tests (48h) with Daphnia similis were also performed with the samples. The level of ammonia was relatively high in the majority of the samples (≥ 1.5 mg/L), and free chlorine was measurable in most of them. Acute toxicity was observed in four water samples (stations 3, 4, 5 and 7), at least in one occasion. The toxicity was positively correlated with the ammonia concentrations and salinity. Because acute toxicity was detected, actions aiming to control the pollution sources and improve the water quality are recommended. Keywords: Water quality; water pollution; Daphnia similis; toxicity tests; ecotoxicology.
Resumo. Toxicidade aguda de águas dos canais de drenagem urbana de Santos (São Paulo, Brasil). No presente estudo, foi estudada a contribuição tóxica dos pequenos corpos d’água afluentes às praias de Santos, SP. Foram selecionados oito pontos de coleta, que foram amostrados em março, abril e agosto de 2005. Foram medidos alguns parâmetros físico-químicos (pH, salinidade, oxigênio dissolvido, temperatura, cloro total e nitrogênio amoniacal total) e realizados testes de toxicidade aguda, com duração de 48hs, utilizando o crustáceo Daphnia similis. Os níveis de amônia se apresentaram relativamente altos na maioria das amostras (≥ 1.5 mg/L), nas quais a presença de cloro também foi detectada. Toxicidade aguda foi observada nas amostras de quatro estações (pontos 3, 4, 5 e 7), ao menos em uma campanha de amostragem. A toxicidade apresentou correlação positiva com a concentração de amônia e a salinidade. Como os resultados demonstraram a existência de toxicidade, são recomendadas ações visando o controle das fontes de contaminação e a melhoria da qualidade das praias. Palavras-chave: Qualidade da água; poluição aquática; Daphnia similis; biotestes; ecotoxicologia.
Introduction
The traditional methods to evaluate aquatic systems which receive residual discharges from domestic, industrial and agricultural origins were originally based on measuring the concentration of dissolved oxygen in receiving waters. More recently, attention is being given to the pollutants that may cause damage to the environment, due to their potential to produce toxic effects on the biota (Blum & Speece 1990). The toxicity of complex chemical mixtures is difficult to predict based only on the
single chemical exposure data and, therefore, it may not be feasible to determine possible threats to the environment from chemical analyses alone (Zagatto & Goldstein 1991, Lambolez et al. 1994, Mitchell et al. 2002 and Cooman et al. 2005). Thus, measures of biological effects of contaminants, especially toxicity tests, have been incorporated into environmental monitoring programs (Abessa et al. 2008, CETESB 2006a).
Toxicity tests can be used to evaluate the toxic potential of isolated and/or mixtures of
Acute toxicity of waters from the urban drainage of Santos.
Pan-American Journal of Aquatic Sciences (2008), 3(2): 108-115
109
substances, complex effluents and environmental samples. These tests present the final biological effects produced by the multiple interactions that can occur among contaminants, which can be additive, synergic or antagonistic, to be determined (Bertoletti et al. 1992, Dewhurst et al. 2002, Abessa 2006, Knie & Lopes 2004, Cooman et al. 2005). These bioassays have also been used to assess the potential hazard that a chemical poses to the biota and also to predict maximum permissible concentrations of individual chemicals in the environment (Sverdrup et al. 2002).
The use of toxicity tests in water quality monitoring was recently incorporated into the Brazilian Legislation (Brasil 2005). In the State of São Paulo, such tests are also required by the State environmental agency (São Paulo 2000), in the monitoring of waters and effluents.
Approximately one third of the Brazilian population lives on the coast. Brazilian coastal cities often do not have sufficient infra-structure for basic sanitation. Even when it is present, the existing systems are unreliable and inefficient, especially concerning the collection and treatment of domestic sewage. Thus, in the majority of the Brazilian coastal cities, the domestic sewage, the urban drainage waters, and even the industrial effluents are discharged, with little or not treatment, directly into coastal lagoons, rivers, creeks, estuaries and sea.
The city of Santos, situated on the central coast of the State of São Paulo, shares the same problems described previously for other coastal Brazilian cities. The pollution of marine, estuarine and river waters is well known (CETESB 2006, Braga et al. 2000, Lamparelli et al. 2001, Abessa et al. 2008). The inner portion of the Santos Estuarine System was considered one of the worlds most polluted sites during the 1970s (CETESB 1985). In recent years, this situation has slowly improved due to the implementation of some control programs by the State Environmental Agency and the installation of the Santos Submarine Sewage Outfall System (SSOS), which is responsible for the oceanic disposal of about 98% of Santos and 60% of São Vicente sewage (Abessa et al. 2005, 2008).
However, these new policies were not totally effective, and the contamination of the urban drainage water bodies still persists (Braga et al. 2000, 2003, CETESB 2006). Recently, some palliative actions were adopted, as the automatization of the floodgates in the drainage channels of Santos. These channels were constructed, initially, to drain the runoff from the streets, because the city had very poor sanitary conditions during the 19th century (Azevedo 1965).
The construction of these channels resulted in a significant reduction in disease outbreaks due to the city’s improved sanitation. Subsequently the channels began to receive illegal discharges of urban sewage resulting in the contamination of beaches (Tommasi 1979), and leading the municipal authorities to install automatic mechanisms for the opening and closure of the floodgates in each channel, close to the beach. When the channel floodgates are closed, the channels waters drain towards the sewage Pre-Conditioning Plant and then to the SSOS, which discharges the sewage at 4 km from the coast. However, during storm events or periods of high rainfall, the floodgates are opened and the waters are discharged directly onto the beaches (Braga et al. 2003). Additionally, there are also some natural and artificial channels without floodgates that flow continuously onto the beaches.
Most of the water bodies adjacent to Santos Bay are analyzed periodically by the State environmental agency (CETESB), for the presence of fecal coliforms and other pathogenic bacteria. The most recent results showed that more than 80% of the samples exceeded the maximum limits established for fecal and total coliforms (CETESB 2006). Such results indicate that these water bodies receive large inputs of untreated domestic sewage, although the Brazilian laws do not allow the discharge of untreated sewage into the water bodies (Brazil 2005). Storm water outfalls also flow to these water bodies, carrying a wide variety of contaminants (Braga et al. 2003).
Although it is known that the waters from the drainage channels of Santos are contaminated (Braga et al. 2000, 2003, CETESB 2006), the specific contaminants have not been identified; likewise, their risks and/or effects to the adjacent environments are not well studied. At one time domestic sewage was one of the main sources of contaminants, which included a myriad of organic substances as well as residues of medicines (e.g., antibiotics and hormones). Moreover, the storm water outfalls can contribute to the degradation of these waters bodies with inputs of metals, hydrocarbons, pesticides, etc. washed from the streets. An understanding of the effects produced by the combination of such contaminants is also necessary, in order to allow the risks to the biota to be estimated. For this purpose bioassays may be used to determine if the channels waters are toxic and, therefore, may poise risks to the environment and to the public health, especially when they are discharged directly into the sea. The aim of this study was to evaluate the quality of the water bodies that flow to the Santos beaches using toxicity tests

A. P. AMBROZEVICIUS & D. M. DE S. ABESSA
Pan-American Journal of Aquatic Sciences (2008) 3(2): 108-115
110
with the crustacean Daphnia similis. The hypothesis to be tested in the present work is that the waters of the drainage channels of Santos are toxic due to the presence of contaminants from sewage, storm water and other diffuse sources of contaminations. Materials and Methods
Water samples were collected at eight sampling stations, distributed along the Santos shoreline (Figure 1), in order to include all the water bodies that flow towards the beaches in Santos city.
Figure 1 – Map of the study area, showing the sampling stations in the urban channels (#1-7) and the small creek (#8).
Samples were collected on three occasions
in 2005 (March, April and August). At each sampling station, a single surface water sample was collected using a polyethylene bucket. In the field, the temperature was measured with a mercury thermometer and the samples were stored in 0.5 L polycarbonate bottles. The samples were taken to the laboratory, where the other physical-chemical analyses and the toxicity tests were immediately performed, except after the April sampling when the water samples were kept refrigerated at 4°C for 24h until the toxicity tests were commenced.
The physical-chemical analyses included measures of: temperature, pH, dissolved oxygen, salinity, free chlorine presence and total ammonia concentration. The samples that had salinity higher than 1‰ were diluted with distilled water in order to avoid the effects of the salinity on the organisms.
The acute toxicity tests were conducted according to the CETESB L5.018 protocol (CETESB 1997), using Daphnia similis Claus, 1876 (Cladocera, Crustacea) as the test organism. This micro-crustacean, commonly known as the water flea, is one of the most common organisms used in toxicity tests in the State of São Paulo (CETESB 2006a), due to its sensitivity to contaminants and because tests made with this species are simple, precise, inexpensive and easy to interpret (Zagatto & Goldstein 1991, Bertoletti et al.
1992, Dewhurst et al. 2002). The test organisms were obtained from the
Ecotoxicology Laboratory from the Santa Cecília University (Santos, SP, Brazil). Four replicates were prepared for each sample, in 15-ml glass tubes, and 5 neonates of D. similis (less than 24 h old) were introduced in each one. Additionally, four replicates were prepared for the control (culture water). The test was maintained at constant temperature (20±2 °C) and controlled photoperiod (8:16 - dark:light), by the use of an incubator (experiment III) or a temperature controlled room (experiments I and II). Animals were not fed during the test. Mobile and immobile animals were counted after 48 h.
Firstly, data of each collection were analyzed for normality and homocedasticity, by using the Shapiro-Wilks and the Bartlett tests, respectively (USEPA 1991). Then, the results were statistically analyzed using the Student’s t-test, for comparing the immobility of the animals exposed to the samples as compared with the control. One way analysis of variance (ANOVA), followed by the Tukey’s multiple comparison (Zar 1984), was used to compare the mean immobilities in the different samples. The occurrence of temporal variations in the toxicity at each station was analyzed by comparing the presence/absence of toxicity in each station, for the different collections. Moreover, physical-chemical parameters and toxicity were compared by Pearson’s multiple correlations, using the Microsoft Office Excel software. Results
In the first collection (March), most of the samples had pH values between 7.30 and 7.57, however, the sample from station 8 had a pH of 9.14 (Table 1). The water salinities ranged between 0 and 1‰, but in the sample from station 7, the value was higher than 1‰, thus it was diluted in distilled water – this sample was tested at 20% original concentration. The total ammonia concentrations ranged from 0.5 to >1.5 mg/L, and the highest values were observed in the samples from stations 2, 3, 4 and 7 (Table I). The dissolved oxygen (DO) levels were high in all samples (11 mg/L). Chlorine was detected in all the samples, except from station 8. In this station, the in situ water temperature was the highest among all samples (29°C). The pH negatively correlated with the ammonia contents (r = -0.71; p < 0.05). These results suggest that sewage was present in the samples because organic enrichment tends to decrease the pH and increase the ammonia concentration in the water. In this first sampling period, significant immobility was observed in the animals exposed to the waters from
Acute toxicity of waters from the urban drainage of Santos.
Pan-American Journal of Aquatic Sciences (2008), 3(2): 108-115
111
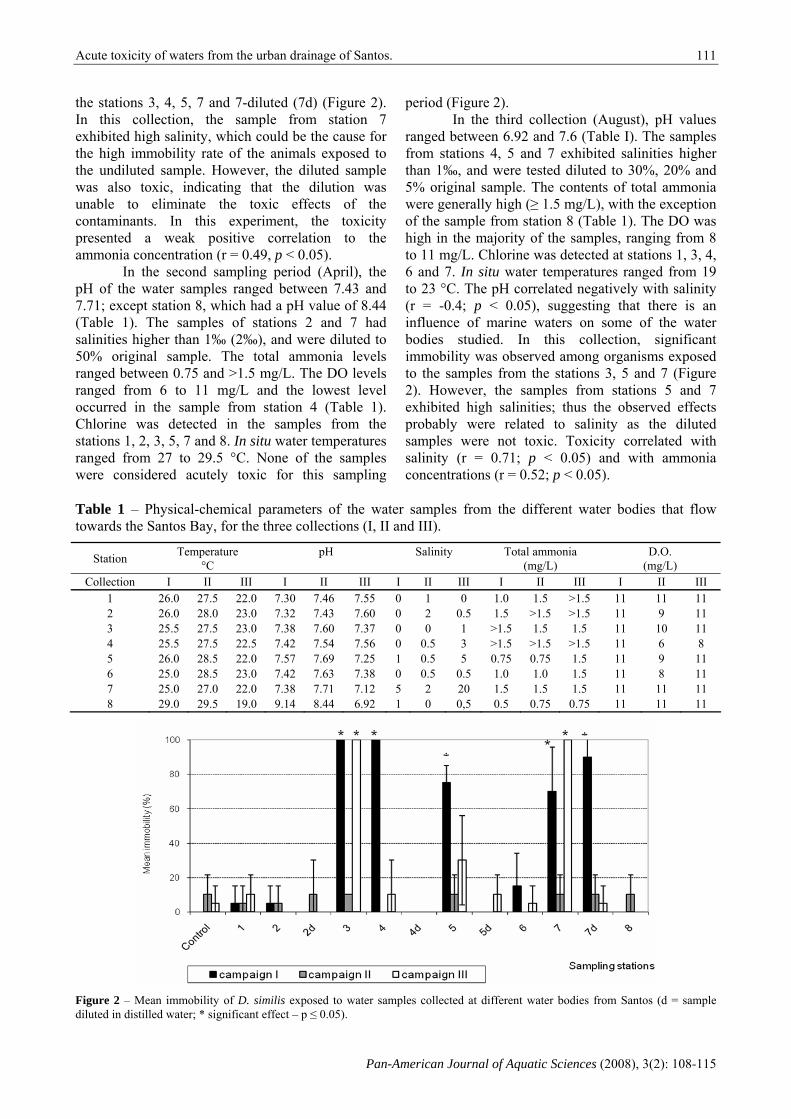
the stations 3, 4, 5, 7 and 7-diluted (7d) (Figure 2). In this collection, the sample from station 7 exhibited high salinity, which could be the cause for the high immobility rate of the animals exposed to the undiluted sample. However, the diluted sample was also toxic, indicating that the dilution was unable to eliminate the toxic effects of the contaminants. In this experiment, the toxicity presented a weak positive correlation to the ammonia concentration (r = 0.49, p < 0.05).
In the second sampling period (April), the pH of the water samples ranged between 7.43 and 7.71; except station 8, which had a pH value of 8.44 (Table 1). The samples of stations 2 and 7 had salinities higher than 1‰ (2‰), and were diluted to 50% original sample. The total ammonia levels ranged between 0.75 and >1.5 mg/L. The DO levels ranged from 6 to 11 mg/L and the lowest level occurred in the sample from station 4 (Table 1). Chlorine was detected in the samples from the stations 1, 2, 3, 5, 7 and 8. In situ water temperatures ranged from 27 to 29.5 °C. None of the samples were considered acutely toxic for this sampling
period (Figure 2). In the third collection (August), pH values
ranged between 6.92 and 7.6 (Table I). The samples from stations 4, 5 and 7 exhibited salinities higher than 1‰, and were tested diluted to 30%, 20% and 5% original sample. The contents of total ammonia were generally high (≥ 1.5 mg/L), with the exception of the sample from station 8 (Table 1). The DO was high in the majority of the samples, ranging from 8 to 11 mg/L. Chlorine was detected at stations 1, 3, 4, 6 and 7. In situ water temperatures ranged from 19 to 23 °C. The pH correlated negatively with salinity (r = -0.4; p < 0.05), suggesting that there is an influence of marine waters on some of the water bodies studied. In this collection, significant immobility was observed among organisms exposed to the samples from the stations 3, 5 and 7 (Figure 2). However, the samples from stations 5 and 7 exhibited high salinities; thus the observed effects probably were related to salinity as the diluted samples were not toxic. Toxicity correlated with salinity (r = 0.71; p < 0.05) and with ammonia concentrations (r = 0.52; p < 0.05).
Table 1 – Physical-chemical parameters of the water samples from the different water bodies that flow towards the Santos Bay, for the three collections (I, II and III).
Station Temperature °C
pH
Salinity
Total ammonia (mg/L)
D.O. (mg/L)
Collection I II III I II III I II III I II III I II III 1 26.0 27.5 22.0 7.30 7.46 7.55 0 1 0 1.0 1.5 >1.5 11 11 11 2 26.0 28.0 23.0 7.32 7.43 7.60 0 2 0.5 1.5 >1.5 >1.5 11 9 11 3 25.5 27.5 23.0 7.38 7.60 7.37 0 0 1 >1.5 1.5 1.5 11 10 11 4 25.5 27.5 22.5 7.42 7.54 7.56 0 0.5 3 >1.5 >1.5 >1.5 11 6 8 5 26.0 28.5 22.0 7.57 7.69 7.25 1 0.5 5 0.75 0.75 1.5 11 9 11 6 25.0 28.5 23.0 7.42 7.63 7.38 0 0.5 0.5 1.0 1.0 1.5 11 8 11 7 25.0 27.0 22.0 7.38 7.71 7.12 5 2 20 1.5 1.5 1.5 11 11 11 8 29.0 29.5 19.0 9.14 8.44 6.92 1 0 0,5 0.5 0.75 0.75 11 11 11
Figure 2 – Mean immobility of D. similis exposed to water samples collected at different water bodies from Santos (d = sample diluted in distilled water; * significant effect – p ≤ 0.05).
A. P. AMBROZEVICIUS & D. M. DE S. ABESSA
Pan-American Journal of Aquatic Sciences (2008) 3(2): 108-115
112
To allow the observation of temporal changes in the water quality for each site, the presence and/or absence of toxicity in each water sample in all samples are displayed in the Table 2. This qualitative classification made possible to establish different degrees of toxicity for each water body. Additionally, when the immobility was influenced by the salinity, the result was considered inconclusive. Based in these criteria, we proposed a specific classification, in
which the water bodies could be classified as 1) always toxic: toxicity in all the three samples; 2) frequently toxic: toxicity in two of three samples (66.6%); 3) periodically toxic: toxicity in one of three samples (33.3%); 4) not toxic – absence of toxicity all samples (0%). Thus, the waters from stations 1, 2, 6 and 8 were considered not toxic, whereas those from the stations 3, 4, 5 and 7 presented a variable degree of acute toxicity (Table II).
Table II – Summary of acute toxicity found in Santos water bodies. Sampling station Collection I Collection II Collection III Temporal classification
1 Not toxic Not toxic Not toxic Not toxic 2 Not toxic Not toxic Not toxic Not toxic 3 Toxic Not toxic Toxic Frequently toxic 4 Toxic Not toxic Not toxic Periodically toxic 5 Toxic Not toxic Inconclusive Periodically or frequently toxic6 Not toxic Not toxic Not toxic Not toxic 7 Toxic Not toxic Inconclusive Periodically or frequently toxic8 Not toxic Not toxic Not toxic Not toxic
Discussion According to Abessa et al. (2008) and
Lamparelli et al. (2001), several contaminant sources are mainly responsible for the environmental degradation of Santos Bay, especially the industrial effluents, the submarine sewage outfall, the Port of Santos, the dredging and disposal activities and the discharge of sewage by intermittent sources, among others. Some studies also mention the contribution of the drainage channels to the decreasing quality of the waters (Braga et al. 2000, 2003, CETESB 2006) due to the existence of high levels of nutrients, fecal and total coliforms in their waters, indicating that they receive discharge of sewage. Braga et al. (2003) also showed that the contamination levels may be influenced by the weather, especially to the occurrence of rainfalls, which suggests that storm water can modify the water quality of the channels.
In this study, some additional evidences for the presence of sewage in the water bodies was obtained, as the presence of chlorine and the high levels of ammonia, confirming the results obtained by other authors. According to Braga et al. (2000), the levels of ammonia in the channels waters are explained by the decomposition of organic substances and the urea hydrolysis. Together with sewage, storm waters may be considered a significant contamination source to the channels. Rainwater washes the streets and sidewalks and carries many different types of contaminants to the channels.
As a result of the combined effects of the contaminants from different sources, some samples
exhibited toxicity, beyond the physical-chemical effects and the microbiological contamination reported by Braga et al. (2000) and CETESB (2006). Considering that the natural streams flow constantly to the sea and that the channel floodgates are frequently opened, due to the high local rainfall rates, the results show that the water bodies (small creeks and channels) contribute significantly to the degradation of the waters of Santos Bay.
Despite the evidences of the sewage influence on the waters which were considered toxic, the presence of chlorine and the high levels of ammonia were also observed among the not toxic samples. This suggests that there are other contaminants contributing to the observed toxicity. Metals, oils and hydrocarbons may be associated with storm water (Bay et al. 1996), whereas detergents are commonly associated with sewage (Abessa et al. 2005, 2008).
The contribution of storm water to the degradation of the waters in the streams and channels was also observed in the second and third sample collections, which were conducted after a dry period. As the inputs of storm water was not significant, due to the absence of rainfall, few or none of the sample exhibited toxicity. Apparently, the dilution caused by the abundance of water during rainy periods is not always enough to attenuate the effects of the contaminants washed into the channels by the storm waters. Braga et al. (2003) demonstrated that the fecal contamination in the Santos drainage channels is higher during the rainy season; however, it likely depends on the

Acute toxicity of waters from the urban drainage of Santos.
Pan-American Journal of Aquatic Sciences (2008), 3(2): 108-115
113
precipitated volumes, the frequency of rainfall episodes and the duration of the precipitation. Nonetheless, this situation is the opposite of what was observed in the Pirajussara River, which is situated in São Paulo (Abessa 2003), where the rains were able to dilute the pollutants.
Regarding the temporal variability of the toxicity, the water conditions in stations 1, 2, 6 and 8 tended to remain similar over time; these samples were not toxic, but exhibited the presence of free chlorine and high levels of ammonia. At station 8, the physical-chemical parameters were variable; however, the samples were not toxic for all the collections. For the other stations, in general the physical-chemical parameters tended to be more constant, but the toxicity was variable. Station 3 exhibited the highest frequency of acute toxicity – two of three sampling periods. The sample from station 4 was acutely toxic once, whereas those from stations 5 and 7 were not toxic in the first collection, toxic in the second one and produced inconclusive results in the third sampling. Such toxicity variability may be due to contaminants from other sources than the sewage, including storm waters and unidentified effluents; this is supported by the fact that physical-chemical parameters did not exhibit such variability. However, further studies are required, using chemistry or toxicity identification evaluation – TIE – in order to verify the causes of toxicity and its variability.
As mentioned previously, the observed toxicity depends on a combination of the different primary sources of contaminants, as sewage, stormwater and others, and their dynamics. Braga et al. (2000) reported that the concentrations of nutrients in the water channels corresponded mainly to the vacation periods and weekends (more tourists) and also with the amount of rain.
The degradation of the water quality may cause conflicts on the use of the Santos beaches. Although the primary use of the channels is for urban drainage, they are also used by tourists for bathing or washing feet, hands and beach tools. Obviously, water bodies which main use is to receive and dilute contaminants may not be used for bathing or recreation. Thus, by the precautionary principle, the most restrictive criteria should be used to classify these waters; and they should be defined as Class 2 by the Brazilian Legislation (Brasil 2005), which permits, among others, the recreational uses of water, for bathing, swimming and aquatic sports. Moreover, the ammonia concentrations in all the tested samples were above the legal limit (0.4 mg/L).
In summary, water from stations 3, 4, 5 and 7 exhibited toxic contributions to the beaches, on at
least one occasion, whereas the samples from stations 1, 2, 6 and 8 were not acutely toxic at any sampling period. However, independent of the toxicity, all the studied water bodies are potential sources of contaminants to the adjacent beaches.
Based on these results, some priority actions are recommended, as investigations on the diffuse sources that contribute to the water contamination, aiming to connect the residences to the collecting system. Improvements and expansion of the sewage plant would be very helpful. This would allow it to receive a larger volume of effluent, and, therefore, the floodgates of the channels could remain permanently closed. Further studies are also necessary to produce additional information on the effects of these waters to the biota, in terms of bioaccumulation, genotoxicity, chronic toxicity, and the identification of the contaminants related to the observed effects. Toxicity tests with samples collected in the sea could also be made to estimate the effect of the dilution, the fate of the contaminants in the marine water and the assimilation of contaminants by the local biota.
Acknowledgements We would like to thank to MSc. C. Pereira and Dr. S. L. Rodrigues da Silva (UNISANTA), for providing D. similis and for their suggestions; FAPESP for the financial support (Process 04/12325-2); M. R. Coelho, W. Ferreira Villano and R. Gonçalves de Oliveira (UNESP) for the technical assistance. We greatly appreciate the constructive technical reviews provided by Dr. R. S. Carr.
References Abessa, D. M. S. 2003. Avaliação ecotoxicológica
da água do rio Pirajussara (SP, Brasil). O Mundo da Saúde, 28: 543-550.
Abessa, D. M. S. 2006. Ecotoxicologia Marinha. p. 19-41. In: Silva-Souza, Ângela Teresa. (Org.) Sanidade de organismos aquáticos no Brasil. Abrapoa, Maringá.
Abessa, D. M. S., Sousa, E. C. P. M., Rachid, B. R. F. & Mastroti, R. R. 1998. Use of the burrowing amphipod Tiburonella viscana as a tool in marine sediments contamination assessment. Brazilian Archives of Biology and Technology, 41: 225-230.
Abessa, D. M. S., Sousa, E. C. P. M., Rachid, B. R. F. & Mastroti, R. R. 2001. Toxicity of sediments from Santos estuary (SP, Brazil): preliminary results. Ecotoxicology and Environmental Restoration, 4: 6-9.
Abessa, D. M. S., Carr, R. S., Rachid, B. R. F., Sousa, E. C. P. M., Hortellani, M. A. &
A. P. AMBROZEVICIUS & D. M. DE S. ABESSA
Pan-American Journal of Aquatic Sciences (2008) 3(2): 108-115
114
Sarkis, J. E. 2005. Influence of a brazilian sewage outfall on the toxicity and contamination of adjacent sediments. Marine Pollution Bulletin, 50: 875-885.
Abessa, D. M. S., Carr, R. S., Sousa, E. C. P. M., Rachid, B. R. F., Zaroni, L. P., Pinto, Y. A., Gasparro, M. R., Bícego, M. C., Hortellani, M. A., Sarkis, J. E. S., Muniz, P. 2008. Integrative Ecotoxicological Assessment of a Complex Tropical Estuarine System. Chapter 4, p.1-36. In: Hoffer, T.N. (ed) Marine Pollution: New Research. Nova Science Publishers Inc., New York.
Azevedo, H. 1965. A Baixada Santista: Aspectos Geográficos. EDUSP, São Paulo, 4 vols.
Bay, S. M., Greenstein, D. J., Lau, S. M., Stenstrom, M. K. & Kelley, C. G. 1996. Toxicity of dry weather flow from the Santa Monica Bay watershead. Bulletin of Southern California Academy of Science, 95(1): 33-45.
Bertoletti, E., Nipper, M. G. & Magalhães, N. P. A. 1992. Precisão de testes de toxicidade com Daphnia. Ambiente, 6: 55-59.
Blum, D. J. W. & Speece, R. E. 1990. Determining chemical toxicity to aquatic species. Environmental Science & Technology, 24: 284-293.
Braga, E. S., Bonetti, C. V. D. H., Burone, L. & Bonetti-Filho, J. 2000. Eutrophication and bacterial pollution caused by industrial and domestic wastes at the Baixada Santista Estuarine System – Brazil. Marine Pollution Bulletin, 40: 165-173.
Braga, E. S., Fonseca, A. L. O., Bosquilha, G. E., Ducatti, G. M. F., Aguiar, V. M. C., Lima, C. A. C. & Arasaki, E. 2003. Eutrophication and bacterial pollution assessment risks on the Santos Bay’s sandy beaches (Brazil): influence of seasonal conditions. Journal of Coastal Research, 35: 516-524.
Brasil. Resolução CONAMA 357, de 17 de março de 2005. Dispõe sobre a classificação dos corpos d’água e diretrizes ambientais para o seu enquadramento, bem como estabelece as condições e padrões de lançamento de efluentes, e dá outras providências. Diário Oficial da União, Brasília, DF, 53, seção 1: 58-63.
CETESB 1985. Baixada Santista – memorial descritivo. Carta do meio ambiente e sua dinâmica. Relatório Técnico CETESB. São Paulo, 33 p.
CETESB 1997. Norma L5.018 - Teste de toxicidade aguda com Daphnia similis
Claus, 1876 (CLADOCERA, CRUSTACEA). Série normas, São Paulo.
CETESB 2006. Relatório de qualidade das águas litorâneas do estado de São Paulo: balneabilidade das praias 2005. Série relatórios, CETESB, Secretaria do Meio Ambiente, São Paulo.
CETESB 2006a. Relatório de qualidade de águas interiores no Estado de São Paulo - 2005. Série relatórios, CETESB, Secretaria do Meio Ambiente, São Paulo.
Cooman, K., Debels, P., Gajardo, M., Urrutia, R. & Barra, R. 2005. Use of Daphnia spp. for the ecotoxicological assessment of water quality in an agricultural watershed in south-central Chile. Archives of Environmental Contamination and Toxicology, 48: 191-200.
Dewhurst, R. E., Wheeler, J. R., Chummun, K. S., Mather, J. D., Callaghan, A. & Crane, M. 2002. The comparison of rapid bioassays for the assessment of urban groundwater quality. Chemosphere, 47: 547-554.
Knie, J. L. W. & Lopes, E. W. B. 2004. Testes Ecotoxicológicos: métodos, técnicas e aplicações. FATMA / GTZ, Florianópolis, 289 p.
Lambolez, L., Vasseur, P., Ferard, J. F. & Gisbert, T. 1994. The environmental risks of industrial waste disposal: an experimental approach including acute and chronic toxicity studies. Ecotoxicology and Environmental Safety, 28: 317-328.
Lamparelli, M. L., Costa, M. P., Prósperi, V. A., Bevilácqua, J. E., Araújo, R. P. A., Eysink, G. G. L. & Pompéia, S. 2001. Sistema Estuarino de Santos e São Vicente. Relatório Técnico CETESB, São Paulo.
Mitchell, J. A. K., Burgess, J. E. & Stuetz, R. M. 2002. Developments in ecotoxicity testing. Environmental Science & Biology and Technology, 1: 169–198.
Moser, G. A. O. 2002. Aspectos da eutrofização no Sistema Estuarino de São Vicente-Santos: distribuição espaço temporal da biomassa e produtividade primária fitoplânctonica e transporte instantâneo de sal, clorofila-a, material em suspensão e nutrientes. Doctorate Thesis. Instituto Oceanográfico, Universidade de São Paulo, São Paulo, Brazil.
Rachid, B. R. F. 2002. Avaliação ecotoxicológica dos efluentes domésticos lançados pelos sistemas de disposição oceânica da Baixada

Acute toxicity of waters from the urban drainage of Santos.
Pan-American Journal of Aquatic Sciences (2008), 3(2): 108-115
115
Santista. Doctorate Thesis. Instituto Oceanográfico, Universidade de São Paulo, São Paulo, Brazil.
São Paulo (Estado). 2000. Resolução SMA 03 de 02/22/2000. Secretaria de Estado de Meio Ambiente, São Paulo, SP. Diário Oficial do Estado (25/02/2000), p. 24.
Sverdrup, L. E., Fürst, C. S., Weideborg, M., Vik, E. A. & Stenersen, J. 2002. Relative sensitivity of one freshwater and two marine acute toxicity tests as determined by testing 30 offshore E & P chemicals. Chemosphere, 46: 311-318.
Tommasi, L. R. 1979. Considerações ecológicas sobre o sistema estuarino de Santos (SP).
Honorary Professor Thesys. Instituto Oceanográfico, Universidade de São Paulo, São Paulo, Brazil. 2 vols.
USEPA. 1991. Short-term methods for estimating the chronic toxicity of effluents and receiving waters to marine and estuarine organisms. Klemm, D.; G. E. Morrison; T. J. Norberg-King; W. H. Peltier & M. A. Heber (Eds.). U.S. Environmental Protect Agency Report EPA/600/4-91/003. Ohio, Cincinnati, 579p.
Zagatto, P. A. & Goldstein, E. G. 1991. Toxicidade em águas do Estado de São Paulo. Ambiente, 5: 13-20.
Zar, J. H. 1984. Biostatistical Analysis. Englewood Cliffs, Prentice-Hall Inc., New Jersey, 718p.
Received January 2008 Accepted May 2008
Published online June 2008

Pan-American Journal of Aquatic Sciences (2008) 3(2): 116-121
Population structure of Munida microphthalma Leach
(Crustacea: Decapoda: Galatheidae) from the northern coast of Rio de Janeiro State, Brazil
ALEXANDRE D. KASSUGA1, TEREZA C. G. SILVA-FERREIRA1, MARIA C. OSTROVSKI1 & TARSO M. M. COSTA2
1Departamento de Zoologia, Instituto de Biologia, Universidade Federal do Rio de Janeiro, Cidade Universitária, 21944-970, Rio de Janeiro, RJ, Brasil; [email protected]; [email protected]; [email protected]. 2 Departamento de Biologia Marinha, Universidade Federal Fluminense, 24001-970, P.O. BOX 100.644, Niterói, RJ, Brasil; [email protected].
Abstract: We analyzed the demographic structure (sex ratio, size-frequency distributions) and morphometry of Munida microphthalma Leach, 1820 from a sample collected in the north coast of Rio de Janeiro, Southeastern Brazil. A total of 174 individuals were obtained (80 males and 94 females); 58.06% of the females were ovigerous. Sex ratio did not depart from the expected 1:1 proportion. Carapace length for males ranged from 9.11 to 20.73 mm, while in females it ranged from 9.78 to 20.72 mm. The allometric equations showed differences on relative growth between males and females. Keywords: Anomura, squat lobster, allometric growth, morphometrics, deep water.
Resumo. Estrutura populacional de Munida microphthalma Leach (Crustacea: Decapoda: Galatheidae) da costa Norte do Estado do Rio de Janeiro, Brasil. Foi analisada a estrutura demográfica (razão sexual, distribuição da freqüência de tamanhos) e a morfometria de uma amostra de Munida microphthalma Leach, 1820 coletada na costa do Rio de Janeiro, Sudeste do Brasil. Um total de 174 indivíduos foi obtido (80 machos e 94 fêmeas); 58,06% das fêmeas se encontravam ovadas. A razão sexual não diferiu da proporção esperada 1:1. O comprimento da carapaça para machos variou de 9,11 a 20,73 mm, enquanto para as fêmeas variou de 9,78 a 20,72 mm. As equações alométricas demonstraram diferenças no crescimento relativo entre machos e fêmeas. Palavras-chave: Anomura, lagostim, crescimento alométrico, morfometria, águas profundas.
Introduction
Galatheidae Samouelle, 1819 is an anomuran crab family particularly abundant at mid latitudes (Tapella et al. 2002). Munida Leach, 1820 is probably the most representative genus (Melo 1999), with around 100 widespread species, presenting a broad bathymetric distribution, ranging from 10 m to more than 2,300 m (Melo-Filho 1992).
After Melo (1999) there are records for 16 species of Munida from Brazil. He also cited five species from Rio de Janeiro state: Munida flinti Benedict, 1902, M. forceps A. Milne-Edwards, 1880, M. irrasa A. Milne-Edwards, 1880, M. pusilla Benedict, 1902, and M. spinifrons Henderson, 1885. M. microphthalma A. Milne-Ewards, 1880 was previously recorded from Espírito Santo and São
Paulo states, in depths from 750 m to 1,700 m. Relative growth studies on Crustacea reveal
several phases of growth. Normally, these phases are correlated with changes on relative growth, so they can reveal the moult that the individuals pass from sexually immature to sexually mature (Hartnoll 1978). The allometric relation between body size and other organs has been used to estimate size at sexual maturity, assuming that the secondary sexual characters change their growth in the transitional phase (Barreto et al. 2006). Recent work on Munida reproduction recognized that the change in cheliped growth rate indicates the transition to morphometric maturity (Tapella et al. 2002). Morphological studies were also used to compare similar species of the genus Munida (Tapella & Lovrich 2006).

Population structure of Munida microphthalma.
Pan-American Journal of Aquatic Sciences (2008), 3(2): 116-121
117
The objective of the present paper is to characterize the relative growth of the galatheid crab Munida microphthalma from Southeastern Brazil and determine possible secondary sexual characters for this species and size at sexual maturity using the morphological data. Also we provide data available on this species population structure that could be extracted from the samples collected. Materials and Methods Data gathering
Two samples were obtained using trawling techniques in the northern coast of Rio de Janeiro State, Southeastern Brazil. The first trawling (21º17’44’’S/40º04’38’’W) was carried out in March 2002 at 1,340 m deep, and the second (22º09’16’S/40º04’38’’W) in May 2002 at 1,192 m deep. Collected specimens were preserved in alcohol 80 %. In the laboratory, crabs were identified, counted and sexed. The sex ratio and the proportion of ovigerous females were calculated. The specimens have been deposited in the Coleção Carcinológica do Departamento de Zoologia Instituto de Biologia/UFRJ, numbers DZUFRJ2758 and DZUFRJ2759.
Statistical analyses
For testing the sex ratio a simple Chi-square test was used. For comparing carapace length and cheliped length between sexes and cheliped symmetry Student´s t-test (p<0, 01) was used.
For the morphometric analysis the following measurements were made with a digital caliper, with a precision of 0.1mm: carapace length (CL), the distance between the ocular orbit and the posterior margin of the carapace; carapace width (CW), the distance between the left and the right fifth lateral spine of the carapace; rostrum length (RL), the distance between the tip of the rostrum and the posterior margin of the ocular orbit; supra-ocular spine length (SOL), the distance between the tip of the supra-ocular spine and the posterior margin of the ocular orbit; cornea diameter (CD); propodus height (PH) measured at the larger dorso-ventral distance of the propodus; cheliped length (CH), maximum length between the tip of the propodus and the proximal margin of the coxa; palm length (PL), distance between the proximal margin of the propodus and the insertion of the dactylus; dactylus length (DL), distance between the tip of the dactylus and its proximal margin. Carapace length was chosen to be the reference for all morphometric analyses. In the study of relative growth of the dactylus in relation to palm, the latter was used as reference.
The morphometric index (MI%) for different dimensions related to the distinct CL class was calculated according to the equation: MI (%) = Measure 1 X 100 /Measure 2 (CL) (Alencar et al. 1998). This index represents the ratio of growth of a dimension in relation to the CL.
For the analysis of relative growth, the allometric equation y = axb was used in its logarithmic form log y = log a + b log x (Hartnoll 1978), where the constant “b” indicates the allometry in the regression graph. In this paper we considered that values higher than 1.1 (b>1.1) indicate positive allometry, values between 0.9 and 1.1 (0.9<b<1.1) indicate isometry and values lower than 0.9 (b<0.9) indicate negative allometry (Moraes-Riodades & Valenti 2002). All the values obtained for “b” in the logari- thmic equations were tested against the isometry value (1) using Student´s t-test at 5% of significance level.
Size at morphometric maturity was the CL of the inflexion point observed on the Major Cheliped (MCL) growth, as the change in the allometry of cheliped growth represents the acquisition of secondary sexual characters (Hartnoll 1978).
Results Population structure
A total of 174 individuals (80 males and 94 females) were analyzed. The sex ratio did not differ statistically from 1:1 (X2 = 0.56; p < 0.05). Ovigerous females made up 58.06 % of total females.
Carapace length for males ranged from 9.11 to 20.73 mm, while in females it ranged from 9.78 to 20.72 mm (Table I); ovigerous females ranged from 10.71 to 20.72 mm. For males, the modal class was the 17-19 mm CL class, whereas that for female was the 13-15 mm CL class (Fig. 1). Males were significantly larger than females (p<0.01). Growth
CL/CW growth is isometric for males and positive for females (Fig. 2). The allometric growth equations demonstrated isometry for CL/RL, CL/SOL, in both sexes. On the other hand, both sexes showed negative allometry for the following regressions: CL/CD and PL/DL for both chelipeds. Males showed positive allometry for all cheliped-related ratios except for PL/DL. The females showed negative allometry for CL/PH for left cheliped; isometry for CL/PH for right cheliped, CL/CH for both chelipeds, CL/PL, CL/DL (Table II).

ALEXANDRE D. KASSUGA ET AL.
Pan-American Journal of Aquatic Sciences (2008) 3(2): 116-121
118
Table I. Munida microphthalma. Statistics for morphometric dimensions of males and females. Min (Minimal values); Max (Maximum values); SD (Standard-deviation); N (sample size).
MALES FEMALES Morphometric Dimensions (mm) N Max Min Mean SD N Max Min Mean SD
CL 76 20.73 9.11 16.03 2.5 90 20.72 9.78 14.36 2.03 CW 71 17.24 7.16 13.17 2.07 83 17.28 7.8 11.76 1.79 RL 76 11.05 4.75 7.56 1.31 87 8.78 4.56 6.6 1.04
SOL 81 3.33 1.39 2.11 0.4 90 2.62 1.03 1.93 0.33 CD 83 2.03 1.06 1.58 0.2 91 1.68 0.88 1.41 0.16
Left CH 69 77.76 24.47 51.51 14.98 83 55.17 24.95 36.2 5.51 Right CH 70 80.64 24.74 52.87 13.98 77 48.99 25.05 36.48 5.47 Left PL 70 17.71 5.07 11.13 3.89 83 11.16 4.52 6.9 1.19
Right PL 70 19.88 4.87 11.62 3.91 77 9.74 4.64 6.89 1.17 Left DL 68 15.86 5.18 10.78 2.97 83 11.63 5.39 7.78 1.25
Right DL 70 17.13 5.2 11.14 2.84 76 10.77 5.31 7.84 1.34 Left PH 69 5.07 1.48 2.97 0.87 83 3.36 1.63 2.29 0.42
Right PH 71 4.85 1.55 3.07 0.78 77 3.32 1.67 2.3 0.41 CL –carapace length; CW – carapace width; RL – rostrum length; SOL – supra-ocular spine length; CD – cornea diameter; CH – cheliped length; PL – palm length; DL – dactylus length; PH – palm height. Table II. Munida microphthalma. Statistics for the allometric equation log y = log a + b log x between independent (X) and dependent (Y) dimensions. n=sample size; a = y-intercept constant; b = allometric constant ;r2 = coefficient of determination; r = coefficient of correlation ; AL= allometry.
Table IIa: MALES PARAMETERS (Log CL X Log Others) REGRESSION
n a b r2 r AL CL/CW 71 -0.1183 1.0227(0.992 – 1.052)* 0.9869 0.9934 =CL/RL 76 -0.2300 0.9218(0.810 – 1.033)* 0.8025 0.8958 =CL/SOL 81 -0.7312 0.8765(0.701 – 1.051)* 0.5811 0.7623 =CL/CD 82 -0.7059 0.751(0.686 – 0.815)* 0.8802 0.9382 -CL/Left CH 69 -0.2027 1.5873(1.416 – 1.757)* 0.8523 0.9232 +CL/Right CH 70 -0.1937 1.5856(1.431 – 1.739)* 0.8718 0.9337 +CL/Left PL 70 -1.1847 1.8441(1.575 – 2.113)* 0.7549 0.8688 +CL/Right PL 70 -1.2371 1.8972(1.663 – 2.130)* 0.8097 0.8998 +CL/Left DL 68 -0.7837 1.508(1.347 – 1.667)* 0.8577 0.9261 +CL/Right DL 70 -0.8213 1.5458(1.403 – 1.687)* 0.8842 0.9403 +CL/Left PH 69 -1.0548 1.2635(0.983 – 1.543)* 0.5755 0.7586 +CL/Right PH 71 -0.9795 1.2109(0.986 – 1.434)* 0.6496 0.8060 +Left PL/ Left DL 68 0.2419 0.7616(0.722 – 0.800)* 0.9621 0.9809 -Right PL/ Right DL 70 0.2342 0.7692(0.730 – 0.807)* 0.9632 0.9814 -CL –carapace length; CW – carapace width; RL – rostrum length; SOL – supra-ocular spine length; CD – cornea diameter; CH – cheliped length; PL – palm length; DL – dactylus length; PH – palm height. * Confidence intervals.
Table IIb: FEMALES PARAMETERS (Log CL X Log Others) REGRESSION
n a b r2 r AL CL/CW 83 -0.1580 1.0634(1.028 – 1.098)* 0.9789 0.9894 +CL/RL 87 -0.2812 0.9499(0.829 – 1.070)* 0.7442 0.8627 =CL/SOL 90 -0.8250 0.9567(0.778 – 1.134)* 0.5672 0.7531 =CL/CD 90 -0.6105 0.6574(0.548 – 0.765)* 0.6217 0.7885 -CL/Left CH 83 0.4076 0.9955(0.914 – 1.076)* 0.8829 0.9396 =CL/Right CH 77 0.4099 0.9926(0.891 – 1.093)* 0.8363 0.9145 =CL/Left PL 83 0.3208 1.0019(0.863 – 1.140)* 0.7225 0.8500 =CL/Right PL 77 -0.3444 1.0178(0.863 – 1.172)* 0.6973 0.8350 =CL/Left DL 83 -0.2906 1.0214(0.913 – 1.129)* 0.8158 0.9032 =CL/Right DL 75 -0.2896 1.0220(0.916 – 1.127)* 0.8365 0.9146 =CL/Left PH 83 -0.5350 0.7666(0.545 – 1.005)* 0.2901 0.5386 -CL/Right PH 77 -0.6502 0.8701(0.649 – 1.090)* 0.4522 0.6725 =Left PL/ Left DL 83 0.1493 0.8840(0.801 – 0.966)* 0.8491 0.9215 -Right PL/ Right DL 75 0.1601 0.8782(0.817 – 0.938)* 0.9192 0.9587 -CL –carapace length; CW – carapace width; RL – rostrum length; SOL – supra-ocular spine length; CD – cornea diameter; CH – cheliped length; PL – palm length; DL – dactylus length; PH – palm height. *Confidence intervals
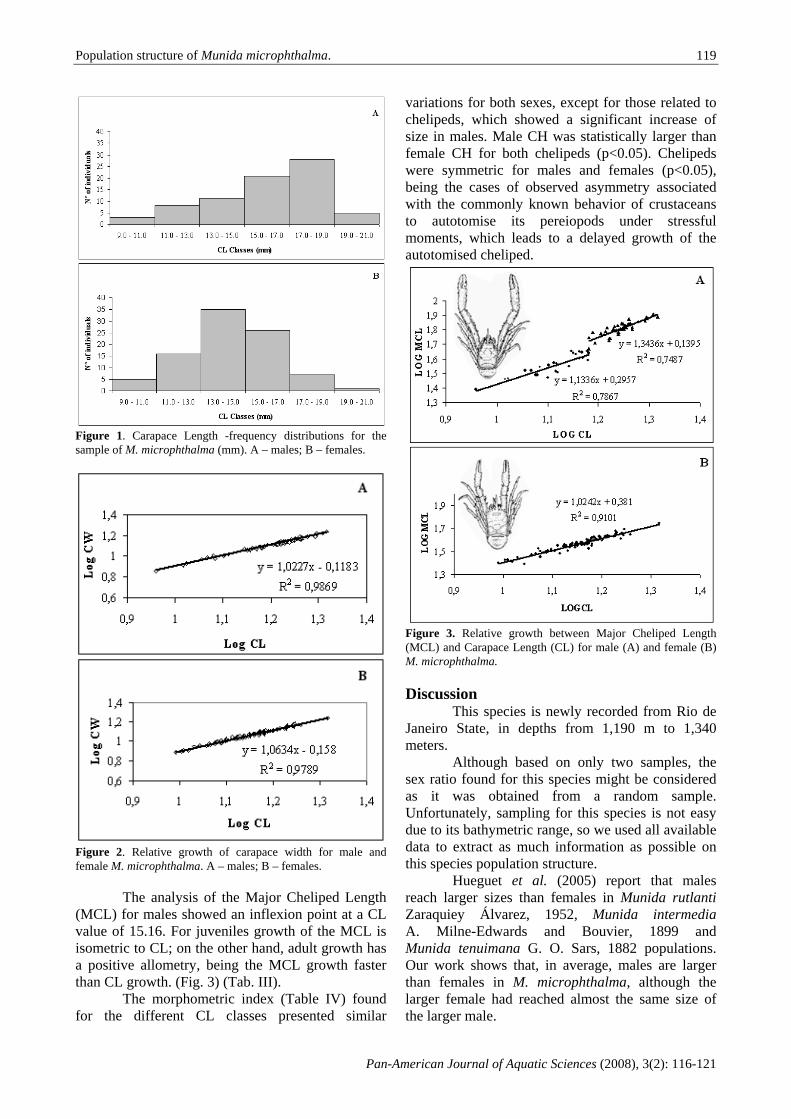
Population structure of Munida microphthalma.
Pan-American Journal of Aquatic Sciences (2008), 3(2): 116-121
119
Figure 1. Carapace Length -frequency distributions for the sample of M. microphthalma (mm). A – males; B – females.
Figure 2. Relative growth of carapace width for male and female M. microphthalma. A – males; B – females.
The analysis of the Major Cheliped Length (MCL) for males showed an inflexion point at a CL value of 15.16. For juveniles growth of the MCL is isometric to CL; on the other hand, adult growth has a positive allometry, being the MCL growth faster than CL growth. (Fig. 3) (Tab. III).
The morphometric index (Table IV) found for the different CL classes presented similar
variations for both sexes, except for those related to chelipeds, which showed a significant increase of size in males. Male CH was statistically larger than female CH for both chelipeds (p<0.05). Chelipeds were symmetric for males and females (p<0.05), being the cases of observed asymmetry associated with the commonly known behavior of crustaceans to autotomise its pereiopods under stressful moments, which leads to a delayed growth of the autotomised cheliped.
Figure 3. Relative growth between Major Cheliped Length (MCL) and Carapace Length (CL) for male (A) and female (B) M. microphthalma. Discussion
This species is newly recorded from Rio de Janeiro State, in depths from 1,190 m to 1,340 meters.
Although based on only two samples, the sex ratio found for this species might be considered as it was obtained from a random sample. Unfortunately, sampling for this species is not easy due to its bathymetric range, so we used all available data to extract as much information as possible on this species population structure.
Hueguet et al. (2005) report that males reach larger sizes than females in Munida rutlanti Zaraquiey Álvarez, 1952, Munida intermedia A. Milne-Edwards and Bouvier, 1899 and Munida tenuimana G. O. Sars, 1882 populations. Our work shows that, in average, males are larger than females in M. microphthalma, although the larger female had reached almost the same size of the larger male.

ALEXANDRE D. KASSUGA ET AL.
Pan-American Journal of Aquatic Sciences (2008) 3(2): 116-121
120
Table III. Munida microphthalma. Statistics for the allometric equation log y = log a + b log x between independent (x) and dependent (y) dimensions. n=sample size; a = y-intercept constant; b = allometric constant; r2 = coefficient of determination; r = coefficient of correlation ; AL= allometry; X=inflexion point.
PARAMETERS (LOG CL X LOG MCL) REGRESSION n r r2 a b AL CL X MCL (X=15,16) (MALE) <X 25 0.8869 0.7867 0.2958 1.1335 (0.879 - 1.388) =
>X 39 0.8654 0.7488 0.1395 1.3436 (1.084 - 1.603) + CL X MCL (FEMALE) 88 0.9541 0.9103 0.3806 1.0245 (0.955 - 1.093) =
CL – capapace length; MCL – major cheliped length.
Table IV. Munida microphthalma. Morphometric Index for males and females. See text for abbreviations of dimensions. MORPHOMETRIC INDEX (MI%)
SEX CL Classes CW RL SOL CD Left
CH Right CH
Left PL
Right PL
Left DL
Right DL
Left PH
Right PH
1 79.66 49.87 14.36 11.47 274.75 275.80 54.74 53.97 59.48 58.39 17.37 17.81 2 69.73 48.71 13.79 10.25 266.31 272.45 51.82 53.54 57.48 58.45 16.89 17.74 3 81.31 47.41 13.44 10.24 274.93 279.16 54.99 55.70 58.70 59.88 17.11 17.74 4 80.61 47.58 12.87 10.04 302.59 337.50 66.50 68.08 63.79 70.78 17.28 17.49 5 81.38 47.02 13.32 9.56 347.68 337.40 77.36 76.34 66.78 70.83 18.15 19.39 6 82.29 47.91 13.65 9.46 370.40 367.09 81.25 86.84 74.84 76.51 19.43 19.65
MA
LES
MEAN 79.16 48.08 13.57 10.17 306.11 311.56 64.44 65.75 63.51 65.81 17.71 18.30 1 79.47 47.47 12.87 10.70 254.66 200.17 50.24 37.52 54.54 43.79 16.99 13.08 2 81.75 46.09 13.52 10.73 238.48 235.96 45.32 44.58 51.18 48.20 15.72 14.97 3 82.53 44.84 13.88 9.84 251.53 250.23 47.44 46.46 53.80 54.00 16.10 16.00 4 82.38 41.98 12.87 9.62 252.59 255.19 48.31 49.11 54.62 55.17 15.68 16.11 5 83.50 45.96 13.66 9.27 252.36 253.83 48.49 48.39 54.52 55.51 14.75 15.51 6 83.40 42.37 12.36 7.82 266.26 219.93 53.86 39.33 56.13 48.02 15.78 11.05
FEM
ALE
S
MEAN 81.93 45.27 13.36 10.03 249.93 239.08 47.96 45.21 53.73 51.34 15.85 15.13 CL –carapace length; CW – carapace width; RL – rostrum length; SOL – supra-ocular spine length; CD – cornea diameter; CH – cheliped length; PL – palm length; DL – dactylus length; PH – palm height.
Previous work on Munida subrugosa
(White, 1847) reproduction (Tapella et al. 2002) stated that male and female physiological sizes at maturity occurred at very similar sizes. This may not be true for M. microphthalma, since the morphological size at maturity observed in our work for males (CL=15.16 mm) is very high when compared to the smallest ovigerous female (CL=10.72 mm). In the same previous work Tapella et al. (2002) showed that only 3% of their male fraction of the population was composed of morphologically mature males, which leads them to believe that it wouldn’t be adaptive to the species to rely on morphometric mature males to ensure mating and offspring production; in our sampling 67.1% of the males were morphologically mature, making possible that these males ensure the next offspring production.
The equation y = axb in its logarithmic form log y = log a + b log x showed varying results. The isometric growth observed in males for CL/CW indicated that there is a proportional carapace growth in both length and width, as both dimensions grow in the same ratio. For females a positive
allometry was observed for CL/CW which indicates that CW grows faster than CL; this may be due to an increase of carapace volume related to an increase of gonad volume in females. The cheliped relations also showed differences between sexes. The positive allometry found for males represents that the chelipeds grow faster than carapace length. For females the cheliped regressions showed that the cheliped grows in the same proportion as carapace length. Only in regressions related to palm height a negative allometry was observed in cheliped, demonstrating that they become thinner with size increase (Table II). For both sexes CL/RL and CL/SOL relations were isometric, indicating that rostrum and supra-ocular spine grows in the same rate as the carapace; a negative allometry was found for CL/CD showing that cornea diameter grows slower than the carapace.
In the allometric relationship PL/DL a negative allometry was found for both sexes, which indicated that the dactylus grew slower than the palm in M. microphthalma. In this way younger individuals have its DL longer than its Palm length, while older ones have the opposite relation, as PL is

Population structure of Munida microphthalma.
Pan-American Journal of Aquatic Sciences (2008), 3(2): 116-121
121
longer than DL. Current taxonomical literature (Melo 1999) indicates the size relationship between dactylus and palm as an important character for this species diagnosis. The results obtained in this paper disagree with that remark, as dactylus/palm ratio change with age.
Morphometric index results clearly indicated a sexual dimorphism related to cheliped size. The MI% for cheliped growth in males displayed a variation of 100 between classes 1 and 6, what means that the chelipeds of larger males added almost one carapace length during growth in relation to smaller ones (Table IV). The importance of the chelipeds on feeding is presented for Munida sarsi (Huus 1935) as an important food selecting and handling tool; works on other groups of Crustacea state the importance of the chelipeds on territory occupation and defense, social structure management, and reproduction behavior (Moraes-Riodades & Valenti 2002; Masunari et al. 2005). The size difference observed in our work may be related to reproductive behavior, such as competition for females and female handling, for M. microphthalma, as the CL differentiation is clearly seen in mature males.
References Alencar, C. A. G., Salles, R., Rocha, C. A. S. &
Ximenes-Carvalho, M. O. 1998. Caracte-rização biométrica do batata, Lopholatilus villarii Ribeiro, 1915 (Teleostei: Malacan-thidae), no Nordeste do Brasil. Arquivos de Ciências do Mar, 31 (1-2): 101-106.
Barreto, A. V., Batista-Leite, L. M. A. & Aguiar, M. C. A. 2006. Maturidade sexual das fêmeas de Callinectes danae (Crustacea, Decapoda, Portunidae) nos estuários dos rios Botafogo e Carrapicho, Itamaracá, PE, Brasil. Iheringia, 96 (2):141-146.
Baudoin, M. 1975. Host castration as a parasitic strategy. Evolution, 29: 335 – 352.
Hartnoll, R. G. 1978. The determination of relative growth in Crustacea. Crustaceana, 34 (3): 281 – 293.
Hartnoll, R. G. 1982. Growth. Pp. 111-196. In: D E Bliss (ED.). The Biology of Crustacea. Vol. 2. Embriology, Morphology and Genetics. Academic Press, New York, 440 p.
Huguet, C., Maynou, F. & Abelló, P. 2005. Small-
scale distribution characteristics of Munida spp. populations (Decapoda: Anomura) off the Catalan coasts (western Mediterranean). Journal of Sea Research, 53: 283 – 296.
Kowalczuk, V. G. L. & Masunari, S. 2000. Crescimento relativo e determinação de idade na fase juvenil de Armases angustipes (Dana) (Decapoda, Brachyura, Grapsidae). Revista Brasileira de Zoologia, 17 (1): 17 – 24.
Masunari, S. & Swiech-Ayoub, B. P. 2003. Cres-cimento relativo em Uca leptodactyla Rath-bun (Crustacea, Decapoda, Ocypodidae). Re-vista Brasileira de Zoologia, 20 (3):487–491.
Masunari, S., Dissenha, N. & Falcão, C. F. 2005. Crescimento relativo e destreza dos quelí-podos de Uca maracoani (Latreille) (Crusta-cea, Decapoda, Ocypodidae) no Baixio Mi-rim, Baía de Guaratuba, Paraná, Brasil. Revis-ta Brasileira de Zoologia, 22(4): 974 – 983.
Melo, G. A. S. 1999. Manual de Identificação dos Crustacea Decapoda do Litoral Brasileiro: Anomura, Thalassinidea, Palinuridea, As-tacidea. Editora Plêiade, São Paulo, 552 pp.
Melo-Filho, G. A. S. 1992. Taxonomia e distribuição do gênero Munida Leach (Crustacea: Decapoda: Galatheidae) na costa brasileira. Master`s Thesis, Instituto de Biociências da Universidade Estadual Paulista, São Paulo, Brasil, 204 pp.
Moraes-Riodades, P. M. C. & Valenti, W. C. 2002. Crescimento relativo do camarão canela Macrobrachium amazonicum (Heller) (Crustacea, Decapoda, Palaemonidae) em viveiros. Revista Brasileira de Zoologia, 19 (4): 1169 – 1176.
Tapella, F. & Lovrich, G. A. 2006. Morphological differences between ‘subrugosa’ and ‘gregaria’ morphs of adult Munida (Decapoda: Anomura: Galatheidae) from the Beagle Channel, southern South America. Journal of the Marine Biological Association of the United Kingdom, 86: 1149 – 1155.
Tapella, F., Lovrich, G. A., Romero, M. C. & Thatje, S. 2002. Reproductive biology of the crab Munida subrugosa (Decapoda: Anomura: Galatheidae) in the Beagle Channel, Argen-tina. Journal of the Marine Biological Asso-ciation of the United Kingdom, 82:589–595.
Received December 2007 Accepted April 2008
Published online June 2008

Pan-American Journal of Aquatic Sciences (2008) 3(2): 122-129
Evaluation of the viability of a microscale method for the short-term
chronic toxicity test using Lytechinus variegatus embryos
JEAMYLLE NILIN, CAROLINE B. DE CASTRO, MARCIONÍLIA F. PIMENTEL, WILSON FRANKLIN JÚNIOR, RICARDO F. G. DE MATOS &
LETÍCIA V. COSTA-LOTUFO*
Laboratório de Ecotoxicologia Marinha, Instituto de Ciências do Mar (Labomar), Universidade Federal do Ceará, Av. Abolição 3207, Fortaleza, Ceará, Brasil, 60125-120, Phone: 55-85-3242-6422, Fax: 55-85-3366-4333, [email protected] * Author for correspondence and reprint requests
Abstract: The aim of the present work was to propose some modifications to the standardized method of toxicity test with embryos of sea urchins, such as: i) use of 24-well tissue culture plates instead of glass tubes; ii) reduction of sample volume in each replicate from 10 mL to 2.5 mL, and iii) increase in number of exposed embryos in each replicate from 300 to 500 The experiments evaluated the effects of widely used reference toxicants - zinc and sodium dodecyl sulfate (SDS), using the standard protocol and the new proposed method. The mean EC50 values for SDS were 3.35 ± 0.78 and 2.89 ± 0.58 mg L-1 for microscale and standard methods, respectively, whereas, for zinc, the EC50 was 0.07 ± 0.02 mg L-1 regardless of the method. The modifications in the toxicity test using Lytechinus variegatus embryos proposed were acceptable, at the least, for the reference substances tested. Such modifications may mean improvements to this method, for it represents costs reduction, reduced water consumption and minimization of contamination due to poor handling of glassware. However, much effort on the validation of the microscale method should be done especially to access its applicability considering hydrophobic chemicals and environmental samples. Keywords: Sea urchin, zinc, sodium dodecyl sulfate, 24-well microplates, embryo density, quality assurance.
Resumo. Avaliação da viabilidade de um método em microescala para o teste de toxicidade crônica de curta duração com embriões de Lytechinus variegatus. O objetivo deste trabalho é propor as seguintes modificações no método padronizado para o bioensaio com embriões de ouriço do mar: i) uso de placas 24-multicavidades ao invés de tubos de vidro; ii) redução do volume do teste em cada réplica de 10 a 2,5 mL e iii) aumento no número de embriões expostos de 300 para 500, em cada réplica. Experimentos foram executados seguindo os procedimentos padronizado e modificado, comparando os efeitos do zinco e do dodecil sulfato de sódio (DSS). Os valores médios de CE50 para o DSS foram 3,35 ± 0,78 e 2,89 ± 0,58 mg L-1, para o método padrão e o micrométodo respectivamente, e 0,07 ± 0,02 mg L-1 para o zinco, indiferentemente do método. As modificações no teste de toxicidade utilizando os embriões de Lytechinus variegatus propostos podem ser consideradas aceitáveis, pelo menos para as substâncias referência testadas. Essas modificações podem ser consideradas melhorias no método padronizado, já que levam à redução nos custos, a um consumo reduzido de água e amostras e minimizam a contaminação pela manipulação inadequada da vidraria. Entretanto, esforços devem ser investidos na validação desse método especialmente para verificar sua aplicabilidade para avaliação de compostos hidrofóbicos e amostras ambientais. Palavras-chave: ouriço do mar, zinco, dodecil sulfato de sódio, placa 24-multicavidades, densidade de embriões, controle de qualidade.
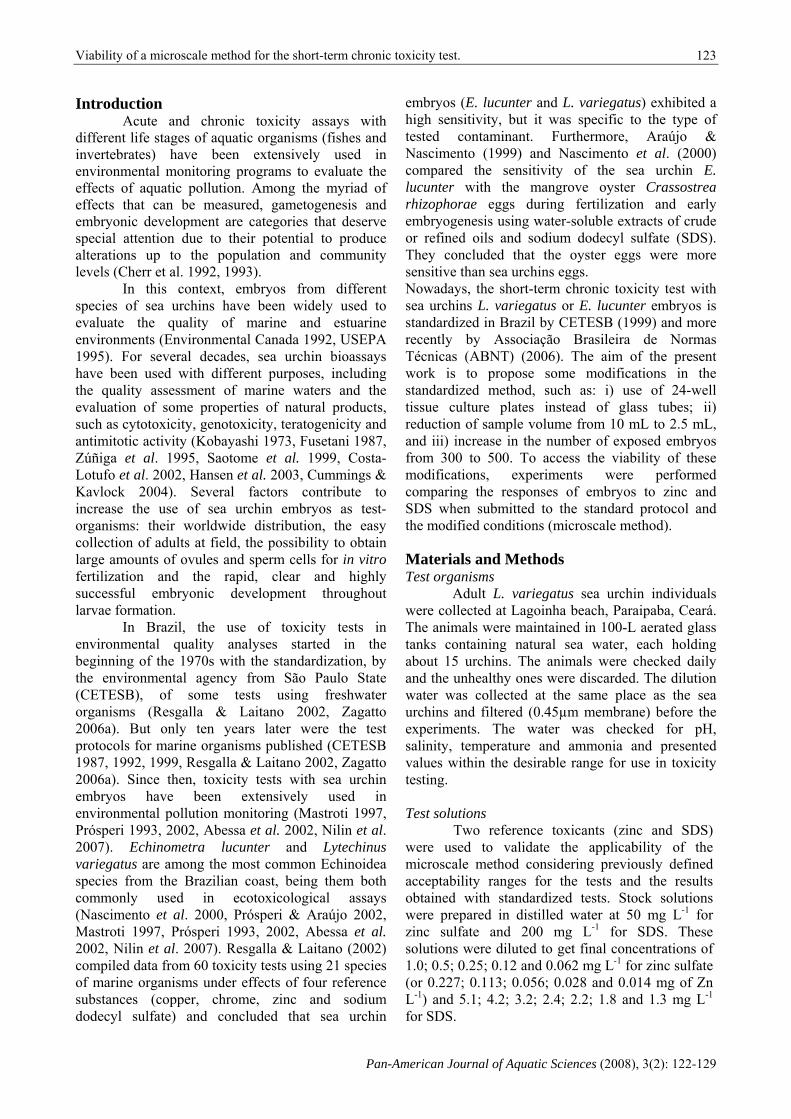
Viability of a microscale method for the short-term chronic toxicity test.
Pan-American Journal of Aquatic Sciences (2008), 3(2): 122-129
123
Introduction Acute and chronic toxicity assays with
different life stages of aquatic organisms (fishes and invertebrates) have been extensively used in environmental monitoring programs to evaluate the effects of aquatic pollution. Among the myriad of effects that can be measured, gametogenesis and embryonic development are categories that deserve special attention due to their potential to produce alterations up to the population and community levels (Cherr et al. 1992, 1993).
In this context, embryos from different species of sea urchins have been widely used to evaluate the quality of marine and estuarine environments (Environmental Canada 1992, USEPA 1995). For several decades, sea urchin bioassays have been used with different purposes, including the quality assessment of marine waters and the evaluation of some properties of natural products, such as cytotoxicity, genotoxicity, teratogenicity and antimitotic activity (Kobayashi 1973, Fusetani 1987, Zúñiga et al. 1995, Saotome et al. 1999, Costa-Lotufo et al. 2002, Hansen et al. 2003, Cummings & Kavlock 2004). Several factors contribute to increase the use of sea urchin embryos as test-organisms: their worldwide distribution, the easy collection of adults at field, the possibility to obtain large amounts of ovules and sperm cells for in vitro fertilization and the rapid, clear and highly successful embryonic development throughout larvae formation.
In Brazil, the use of toxicity tests in environmental quality analyses started in the beginning of the 1970s with the standardization, by the environmental agency from São Paulo State (CETESB), of some tests using freshwater organisms (Resgalla & Laitano 2002, Zagatto 2006a). But only ten years later were the test protocols for marine organisms published (CETESB 1987, 1992, 1999, Resgalla & Laitano 2002, Zagatto 2006a). Since then, toxicity tests with sea urchin embryos have been extensively used in environmental pollution monitoring (Mastroti 1997, Prósperi 1993, 2002, Abessa et al. 2002, Nilin et al. 2007). Echinometra lucunter and Lytechinus variegatus are among the most common Echinoidea species from the Brazilian coast, being them both commonly used in ecotoxicological assays (Nascimento et al. 2000, Prósperi & Araújo 2002, Mastroti 1997, Prósperi 1993, 2002, Abessa et al. 2002, Nilin et al. 2007). Resgalla & Laitano (2002) compiled data from 60 toxicity tests using 21 species of marine organisms under effects of four reference substances (copper, chrome, zinc and sodium dodecyl sulfate) and concluded that sea urchin
embryos (E. lucunter and L. variegatus) exhibited a high sensitivity, but it was specific to the type of tested contaminant. Furthermore, Araújo & Nascimento (1999) and Nascimento et al. (2000) compared the sensitivity of the sea urchin E. lucunter with the mangrove oyster Crassostrea rhizophorae eggs during fertilization and early embryogenesis using water-soluble extracts of crude or refined oils and sodium dodecyl sulfate (SDS). They concluded that the oyster eggs were more sensitive than sea urchins eggs. Nowadays, the short-term chronic toxicity test with sea urchins L. variegatus or E. lucunter embryos is standardized in Brazil by CETESB (1999) and more recently by Associação Brasileira de Normas Técnicas (ABNT) (2006). The aim of the present work is to propose some modifications in the standardized method, such as: i) use of 24-well tissue culture plates instead of glass tubes; ii) reduction of sample volume from 10 mL to 2.5 mL, and iii) increase in the number of exposed embryos from 300 to 500. To access the viability of these modifications, experiments were performed comparing the responses of embryos to zinc and SDS when submitted to the standard protocol and the modified conditions (microscale method). Materials and Methods Test organisms
Adult L. variegatus sea urchin individuals were collected at Lagoinha beach, Paraipaba, Ceará. The animals were maintained in 100-L aerated glass tanks containing natural sea water, each holding about 15 urchins. The animals were checked daily and the unhealthy ones were discarded. The dilution water was collected at the same place as the sea urchins and filtered (0.45µm membrane) before the experiments. The water was checked for pH, salinity, temperature and ammonia and presented values within the desirable range for use in toxicity testing. Test solutions
Two reference toxicants (zinc and SDS) were used to validate the applicability of the microscale method considering previously defined acceptability ranges for the tests and the results obtained with standardized tests. Stock solutions were prepared in distilled water at 50 mg L-1 for zinc sulfate and 200 mg L-1 for SDS. These solutions were diluted to get final concentrations of 1.0; 0.5; 0.25; 0.12 and 0.062 mg L-1 for zinc sulfate (or 0.227; 0.113; 0.056; 0.028 and 0.014 mg of Zn L-1) and 5.1; 4.2; 3.2; 2.4; 2.2; 1.8 and 1.3 mg L-1 for SDS.

J. NILIN ET AL.
Pan-American Journal of Aquatic Sciences (2008) 3(2): 122-129
124
Collection of Gametes and fertilization Gamete elimination was induced by
injecting 3.0 mL of 0.5 M potassium chloride (KCl) solution into the perivisceral cavity of one male and one female for each experiment. Gender recognition was attempted based on the criteria described by Abessa et al. (2001). The ovules were allowed to settle to the bottom of a graduate cylinder filled with filtered sea water. This process was repeated twice to wash off the gelatinous coat from the ovules. Concentrated sperm was collected with a Pasteur pipette. Fertilization was performed by adding 1 mL of a sperm suspension (0.05 mL of concentrated sperm plus 2.45 mL of filtered sea water) to 100 mL of filtered sea water containing the ovules. Fecundation was confirmed by visualizing of the fertilization membrane. The eggs were counted in a chamber using a dissecting microscope at 40X, and the concentration was adjusted to 10000 eggs mL-1.
Test procedures – Microscale method
In the new proposed method, non-treated sterile polystyrene 24-well tissue culture plates with lids (TPP, Switzerland) were used as test chambers. After the fertilization, as described above, 500 eggs (in a maximum volume of 50 μL) were added to each well. The final volume per well of the tested sample was 2.5 mL. The plates were then were kept under a 12:12 h light–dark cycle (lights on at 06:00 h) at 25 ± 2ºC. After 24 hours, a 10 µL aliquot was taken to verify the embryos development. When the control showed at least 80% of well-developed pluteus larvae (26 ± 2 hours), 125 µL of formaldehyde were added to each well for fixation of the embryos. Test procedures – standardized method (CETESB)
In the standardized method, 15 mL glass tubes were used as test chambers carrying 10 mL of each sample. After the fertilization, 300 eggs (in a maximum value of 100 μL) were added. The test tubes were kept under a 12:12 h light–dark cycle (lights on at 06:00 h) at 25 ± 2ºC during 24 hours. After this interval, aliquots were taken to verify the embryos development. When the control showed at least 80% of well-developed pluteus larvae (26 ± 2 hours), the content of each test tube was transferred to a glass tube containing 0.5mL of formaldehyde for fixation of the embryos. Statistical analysis
According to USEPA (2002), three experimental replicates were used for each dilution and for control tests. Seven and six experiments
were executed simultaneously using both methods for zinc and SDS, respectively, in order to use the same pool of gametes.
One hundred eggs or embryos were counted for each concentration of test substance to obtain the percentage of normal larvae. Data were analyzed as means ± standard deviation (SD). The Effective Concentration to affect 50% of tested organisms (EC50) and their confidence intervals were obtained by nonlinear regression using the GRAPHPAD program (Intuitive Software for Science, San Diego, CA). The EC50 values obtained for tested substances in the present study using both methods were compared using Student’s T test with 5% significance level. Further, EC50 values obtained in the present study were compared to those described in the literature for the same species and substances using one-way ANOVA followed by Student Newman Keuls, also with 5% significance level. Results and discussion
In the present study, some modifications in the short-term chronic toxicity test with L. variegatus embryos standardized by Brazilian environmental authorities (CETESB 1999, ABNT 2006) were proposed to accommodate the test in a microscale using non-treated sterile 24-well microplates.
Firstly, the development of normal pluteus larvae using 24-well microplates was compared to that obtained by the standardized method, and the Figure 1 shows control data obtained using both methods. No significant differences were observed between the mean normal embryonic development rates (p > 0.05); the mean value of normal pluteus was 88.5 ± 0.9 % (coefficient of variation = 8.7%, n=75) in the 24-well assays, and 90.3 ± 0.9 % (coefficient of variation = 6.3%, n= 39) in the standardized method. The mean normal development rates of both methods were above 80%, which is one of the acceptability criteria for the sea-urchin embryos test (CETESB 1999, Prósperi & Araújo 2002, ABNT 2006), demonstrating the data reliability. Moreover, the low coefficient of variation indicated a good reproducibility of the 24-well assay.
Dinnel et al. (1987) and Lera et al. (2006) argued that plastic dishes might have a toxic effect due to the leaching of chemicals from newly manufactured plastic on the sea urchin spermatozoa, leading to a low fertilization success. However, further studies conducted by Vaschenko et al. (1999) demonstrated that there was no significant difference in the fertilization rates of experiments running in

Viability of a microscale method for the short-term chronic toxicity test.
Pan-American Journal of Aquatic Sciences (2008), 3(2): 122-129
125
Microscale Standardized0
20
40
60
80
100
120
Figure 1. Development of normal pluteus larvae using the microscale (24-well microplates) and the standardized method (glass tubes) under control conditions.
parallel in both plastic plates and small glass beakers. It is worthwhile mentioning that, in the present study, the fertilization was performed in a glass beaker, and only after confirmed fertilization that the eggs were transferred to the 24-wells microplates.
The sensitivity of exposed embryos was assessed by comparative studies on the toxicity of SDS and zinc using both microscale and standardized methods. The results are presented as the obtained EC50 (mean ± 2SD) in Figure 2. The mean EC50 values for SDS were 3.35 ± 0.78 and 2.89 ± 0.58 mg L-1 using the microscale and
standardized methods, respectively, whereas, for zinc, it was 0.07 ± 0.02 mg L-1 regardless of the method used (Figure 2). It is worthwhile mentioning that there was no difference in the statistical analysis when only the experiments conducted in parallel were considered.
Data obtained in the present study were in good agreement with those obtained from literature using the standardized method with the same species, as shown in Table I. PhD. Denis Abessa (personal communication) compared the sensibility of three L. variegatus populations collected at different beaches, Ubatuba, Santos and São Sebastião, all located on the coast of the state of São Paulo, and demonstrated that the EC50 values ranged from 0.04 to 0.06 mg L-1 for zinc, and 1.35 to 2.50 mg L-1 for SDS. Mastroti (1997) obtained values for SDS toxicity in the range of 1.52 to 2.70 mg L-1, with a mean value of 2.06 ± 0.38 mg L-1. On the other hand, Prósperi (2002) obtained EC50 values for zinc in the range of 0.05 to 0.12 mg L-1, with a mean value of 0.07 ± 0.02 mg L-1. Statistical comparison among EC50 values revealed significant differences within values obtained for SDS using the standardized method, considering these from the present work and those obtained in literature, and
SDS Microscale (a)
1 2 3 4 5 6 7 8 9 10 111.5
2.0
2.5
3.0
3.5
4.0
4.5
5.0
Tests
SDS Standardized (b)
1 2 3 4 5 61.5
2.0
2.5
3.0
3.5
4.0
4.5
5.0
Tests
Zn Microscale (c)
1 2 3 4 5 6 7 8 9 10 11 12 13 140.00
0.05
0.10
0.15
Tests
Zn Standardized (d)
1 2 3 4 5 6 70.00
0.05
0.10
0.15
Tests
Figure 2. Control-charts for two reference substances (SDS and Zn), showing the mean EC50 values and the upper and lower intervals obtained from the short-term chronic toxicity test with Lytechinus variegatus embryos using microscale and standardized methods. Figures 2a and 2c: data for SDS and Zn, obtained from 11 and 14 microscale tests, respectively. Figures 2b and 2d: data for SDS and Zn, from 6 and 7 standardized tests, respectively.
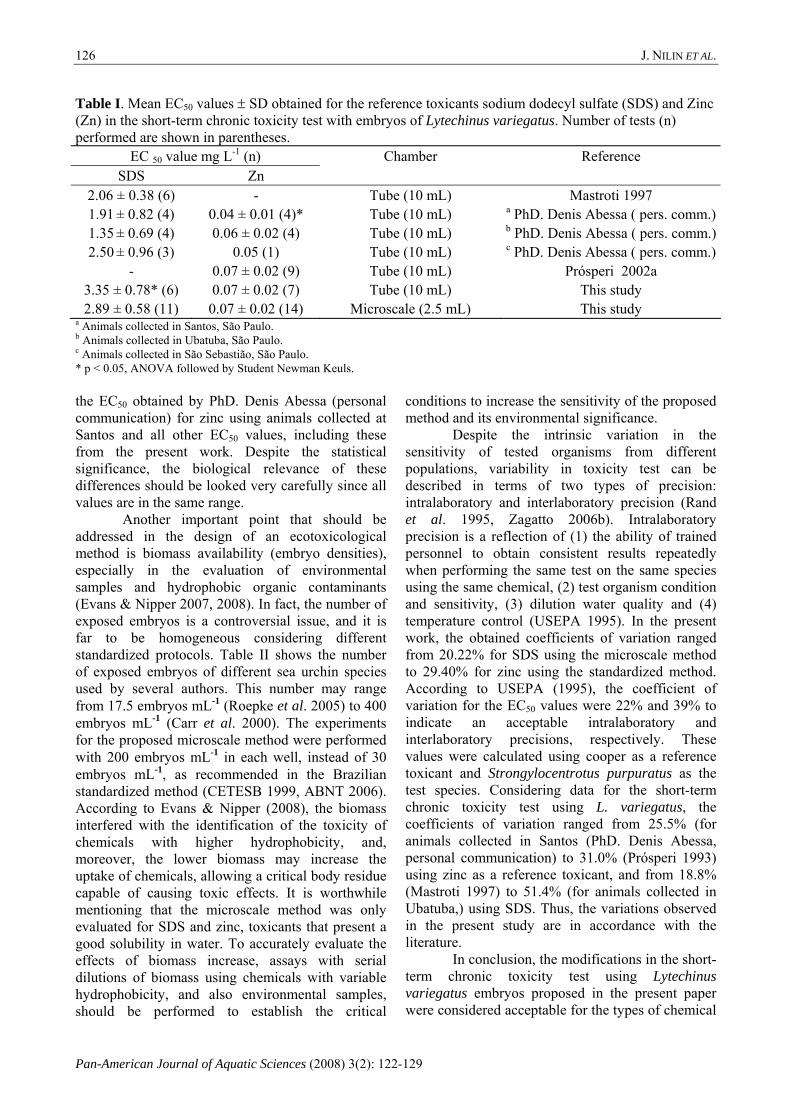
J. NILIN ET AL.
Pan-American Journal of Aquatic Sciences (2008) 3(2): 122-129
126
Table I. Mean EC50 values ± SD obtained for the reference toxicants sodium dodecyl sulfate (SDS) and Zinc (Zn) in the short-term chronic toxicity test with embryos of Lytechinus variegatus. Number of tests (n) performed are shown in parentheses.
EC 50 value mg L-1 (n) Chamber Reference SDS Zn
2.06 ± 0.38 (6) - Tube (10 mL) Mastroti 1997 1.91 ± 0.82 (4) 0.04 ± 0.01 (4)* Tube (10 mL) a PhD. Denis Abessa ( pers. comm.)1.35 ± 0.69 (4) 0.06 ± 0.02 (4) Tube (10 mL) b PhD. Denis Abessa ( pers. comm.)2.50 ± 0.96 (3) 0.05 (1) Tube (10 mL) c PhD. Denis Abessa ( pers. comm.)
- 0.07 ± 0.02 (9) Tube (10 mL) Prósperi 2002a 3.35 ± 0.78* (6) 0.07 ± 0.02 (7) Tube (10 mL) This study 2.89 ± 0.58 (11) 0.07 ± 0.02 (14) Microscale (2.5 mL) This study
a Animals collected in Santos, São Paulo. b Animals collected in Ubatuba, São Paulo. c Animals collected in São Sebastião, São Paulo. * p < 0.05, ANOVA followed by Student Newman Keuls. the EC50 obtained by PhD. Denis Abessa (personal communication) for zinc using animals collected at Santos and all other EC50 values, including these from the present work. Despite the statistical significance, the biological relevance of these differences should be looked very carefully since all values are in the same range.
Another important point that should be addressed in the design of an ecotoxicological method is biomass availability (embryo densities), especially in the evaluation of environmental samples and hydrophobic organic contaminants (Evans & Nipper 2007, 2008). In fact, the number of exposed embryos is a controversial issue, and it is far to be homogeneous considering different standardized protocols. Table II shows the number of exposed embryos of different sea urchin species used by several authors. This number may range from 17.5 embryos mL-1 (Roepke et al. 2005) to 400 embryos mL-1 (Carr et al. 2000). The experiments for the proposed microscale method were performed with 200 embryos mL-1 in each well, instead of 30 embryos mL-1, as recommended in the Brazilian standardized method (CETESB 1999, ABNT 2006). According to Evans & Nipper (2008), the biomass interfered with the identification of the toxicity of chemicals with higher hydrophobicity, and, moreover, the lower biomass may increase the uptake of chemicals, allowing a critical body residue capable of causing toxic effects. It is worthwhile mentioning that the microscale method was only evaluated for SDS and zinc, toxicants that present a good solubility in water. To accurately evaluate the effects of biomass increase, assays with serial dilutions of biomass using chemicals with variable hydrophobicity, and also environmental samples, should be performed to establish the critical
conditions to increase the sensitivity of the proposed method and its environmental significance.
Despite the intrinsic variation in the sensitivity of tested organisms from different populations, variability in toxicity test can be described in terms of two types of precision: intralaboratory and interlaboratory precision (Rand et al. 1995, Zagatto 2006b). Intralaboratory precision is a reflection of (1) the ability of trained personnel to obtain consistent results repeatedly when performing the same test on the same species using the same chemical, (2) test organism condition and sensitivity, (3) dilution water quality and (4) temperature control (USEPA 1995). In the present work, the obtained coefficients of variation ranged from 20.22% for SDS using the microscale method to 29.40% for zinc using the standardized method. According to USEPA (1995), the coefficient of variation for the EC50 values were 22% and 39% to indicate an acceptable intralaboratory and interlaboratory precisions, respectively. These values were calculated using cooper as a reference toxicant and Strongylocentrotus purpuratus as the test species. Considering data for the short-term chronic toxicity test using L. variegatus, the coefficients of variation ranged from 25.5% (for animals collected in Santos (PhD. Denis Abessa, personal communication) to 31.0% (Prósperi 1993) using zinc as a reference toxicant, and from 18.8% (Mastroti 1997) to 51.4% (for animals collected in Ubatuba,) using SDS. Thus, the variations observed in the present study are in accordance with the literature.
In conclusion, the modifications in the short-term chronic toxicity test using Lytechinus variegatus embryos proposed in the present paper were considered acceptable for the types of chemical
Viability of a microscale method for the short-term chronic toxicity test.
Pan-American Journal of Aquatic Sciences (2008), 3(2): 122-129
127
Table II. Number of sea urchin embryos from different species used in the short-term chronic toxicity test. Species Number of embryos mL-1 Reference
30 Bellas et al. 2005 Paracentrotus lividus 300 Lera & Pellegrini 2006 400 Carr et al. 2000 50 Evans and Nipper 2007
Arbacia punctulata
50, 100, 200 and 400 Evans and Nipper 2008 30 CETESB 1999 Lytechinus variegatus
200 This study Strongylocentrotus purpuratus 17.5 Roepke et al. 2005
use in the experiments, since the normal viability of embryos were not altered and the sensitivity for reference toxicants, SDS and zinc, were in agreement with data obtained using the standardized method. We believe that such modifications improved this test, since it has a reduced cost (plastic microplates are generally less expensive than glass tubes), a reduced water consumption and minimization of contamination problems due to poor
handling of glassware. However, much effort on the validation of the microscale method should be done, especially to access its applicability considering hydrophobic chemicals and environmental samples.
Ackownlegments We wish to thank CNPq, Instituto Claude Bernard and FUNCAP for the financial support in the form of grants and fellowship awards.
References Abessa, D. M. S., Rachid, B. R. F., Sousa, E. C. P.
M. 2001. Preliminary results in the sexual dimorphism determination of the sea urchin Lytechinus variegatus variegatus (Lamarck, 1816), Echinoidea, Toxopneustidae. Revista Brasileira de Oceanografia, 49: 133-135.
Abessa, D. M. S. 2002. Avaliação da qualidade de sedimentos do Sistema Estuarino de Santos. PhD. Thesis, Instituto Oceanográfico da Universidade de São Paulo, São Paulo, 290p. ABNT – Associação Brasileira de Normas Técnicas 2006. Ecotoxicologia aquática – Toxicidade crônica de curta duração – Método de ensaio com Lytechinus variegatus (Echinodermata: Echinoidea). Norma NBR15350, Rio de Janeiro.
Araújo, M. M. S. & Nascimento, I. A. 1999. Testes ecotoxicológicos marinhos: análise de sensibilidade. Ecotoxicology and Environ-mental Restoration, 2: 41-47.
Bellas, J., Beiras, R., Mariño-Balsa, J. C., Fernández, N. 2005. Toxicity of organic compounds to marine invertebrate embryos and larvae: a comparison between the sea urchin embryogenesis bioassay and alternative test species. Ecotoxicology, 14: 337-353.
Carr, R. S., Montagna, P. A., Biendenbach, J. M., Kalke, R., Kennicut, M. C., Hooten, R., Cripe, G. 2000. Impact of storm-water outfalls on sediment quality in Copus Christi Bay, Texas, USA. Environmental Toxicology
Chemistry, 19: 561-574. CETESB – Companhia de Tecnologia de
Saneamento Ambiental 1987. Água do mar – Teste de toxicidade com Artemia. Norma Técnica L5.021, São Paulo.
CETESB - Companhia de Tecnologia de Saneamento Ambiental 1992. Água do mar - Teste de toxicidade aguda com Mysidopsis juniae Silva, 1979 (Crustacea: Mysidacea). Norma Técnica L5.251, São Paulo.
CETESB - Companhia de Tecnologia de Saneamento Ambiental. 1999. Água do mar-Teste de toxicidade crônica de curta duração com Lytechinus variegatus, Lamarck, 1816. (Echinodermata, Echinoidea). Norma Técnica L5. 250, São Paulo.
Cherr, G. N., Summers, R. G., Baldwin, J. D., Merrill, J. B. 1992. Preservation and visualization of the sea urchin blastoceolic extracellular matrix. Microbiology Research Technology, 2: 11-22.
Cherr, G. N., Higashil, R. M., Shenker, J. M. 1993. Assessment of Chronic Toxicity of Petroleum and Produced Water Components to Marine Organisms. University of California, Davis-Bodega Marine Laboratory et al. U.S. DOI. Available from NTIS PB94-171642. OCS Study, MMS 94-0035, Davis, California.
Costa-Lotufo, L. V., Cunha, G. M. A., Farias P. A. M., Viana, G. S. B., Cunha, K. M. A., Pessoa,

J. NILIN ET AL.
Pan-American Journal of Aquatic Sciences (2008) 3(2): 122-129
128
C., Moraes, M. O., Silveira, E. R., Gramosa, N. V., Rao, V. S. N. 2002. The cytotoxic and embryotoxic effects of Kaurenoic acid, a diterpene isolated from Copaifera langsdorffi oleo-resin. Toxicon, 40: 1231-1234.
Cummings, A. M. & Kavlock, R. J. 2004. Function of sexual glands and mechanism of sex differentiation. Journal Toxicology Science, 29: 167–178.
Dinnel, P. A., Link, J. M. & Stober, Q. J. 1987. Improved methodology for a sea urchin sperm bioassay for marine waters. Archives of Environmental Contamination and Toxicology, 16: 23-32.
Environmental Canada 1992. Biological Test Method: Fertilization assay using echinoids (sea urchins and sand dollars). Environmental Protection Series-EPS 1/RM/27, Environmental Canada, Ottawa, 99 p.
Evans, A. D. & Nipper, M. 2007. Toxicity of Phenanthrene and Lindane Mixtures to Marine Invertebrates. Environmental Toxicology, 22: 495–501.
Evans, A. D. & Nipper, M. 2008. The influence of Biomass on the toxicity of hydrophobic organic contaminants. Archives of Environmental Contamination and Toxicology, 54: 219-225.
Fusetani, N. 1987. Marine metabolites which inhibit development of echinoderm embryos. Pp. 61–92. In: P.J. Scheur (Ed.) Bioorganic Marine Chemistry, Springer-Verlag, Berlin, Heidelberg, 192 p.
Hansen, E., Eilertsen, H. C., Ernstsen, A., Genevière, A. M. 2003. Anti-mitotic activity towards sea urchin embryos in extracts from the marine haptophycean Phaeocystis pouchetii (Hariot) Lagerheim collected along the coast of northern Norway. Toxicon, 41: 803-12.
Kobayashi, N. 1973. Studies on the effects of some agents on fertilized sea urchin eggs, as a part of bases for marine pollution bioassay. Publications of the Seto Marine Biological Laboratory, 21: 109-114.
Lera, S., Macchia, S., Pellegrini, D. 2006. Standardizing the methodology of sperm cell test with Paracentrotus lividus. Environmental Monitoring and Assessment, 122: 101-109.
Lera, S. & Pellegrini, D. 2006. Evaluation of the fertilization capability of Paracentrotus lividus sea urchin storaged gametes by the
exposure to different aqueous matrices. Environmental Monitoring and Assessment, 119: 1-3.
Mastroti, R. R. 1997. Toxicidade e biodegradabilidade de tensoativos aniônicos em água do mar. Master Theshis, Instituto Oceanográfico da Universidade de São Paulo, São Paulo, 112 p.
Nascimento A., Smith D. H., Pereira, S. A., Sampaio, M. M. A.; Silva M. A., Mariani, A. M. 2000. Integration of varying responses of different organisms to water and sediment quality at sites impacted and not impacted by the petroleum industry. Aquatic Ecosystem and Health & Management, 3: 449-458.
Nilin, J., Castro, C. B., Pimentel, M. P., Franklin Júnior,W., Matos, R. F. G., Lotufo, T. M. C., Costa-Lotufo, L. V. 2007. Water toxicity assessment of the Ceará river estuary (Brazil). Journal of Brazilian Society of Ecotoxicology, 2: 107-113.
Prósperi, V. A. 1993. Aplicação de testes de toxicidade com organismos marinhos para análise de efluentes industriais lançados em áreas estuarinas. Master Theshis, Universidade de São Paulo, Escola de Engenharia de São Carlos, São Paulo,120 p.
Prósperi, V. A. 2002. Comparação de métodos ecotoxicológicos na avaliação de sedimentos marinhos e estuarinos. PhD. Thesis, Escola de Engenharia de São Carlos, São Paulo, 119 p.
Prósperi, V. A. & Araújo, M. M. S. 2002. Teste de toxicidade crônica com Lytechinus variegatus, Lamarck 1816 e Echinometra lucunter, Linnaeus 1758 (ECHINODERMATA: ECHINOIDEA). Pp. 99-110. In: Iracema A. Nascimento, Eduinetty Ceci P.M. Sousa e Marion Nipper (Eds.). Métodos em ecotoxicologia Marinha: Aplicações no Brasil. Artes Gráficas, São Paulo, 262 p.
Rand, G. M., Wells, P. G.& McCarty, L. S. 1995. Introduction to aquatic toxicology. Pp. 3-70. In: Rand, G.M. (ed.) Fundamentals of aquatic toxicology. 2nd Ed., Taylor & Francis, Washington, DC,1125 p.
Resgalla Jr., C. & Laitano, K. S. 2002. Sensibilidade dos organismos marinhos utilizados em testes de toxicidade no Brasil. Notas Técnicas Facimar, 6:153-163.
Roepke,T. A., Snyder, M. J. & Cherr, G. N. 2005. Estradiol and endocrine disrupting compounds adversely affect development of sea urchin embryos at environmentally relevant concentrations. Aquatic Toxicology, 71:

Viability of a microscale method for the short-term chronic toxicity test.
Pan-American Journal of Aquatic Sciences (2008), 3(2): 122-129
129
155–173. Saotome, K., Sofuni, T. & Hayashi, M. 1999. A
micronucleus assay in sea urchin embryos. Mutation Research, 446: 121–127.
USEPA. 1995. Short-term methods for estimating the chronic toxicity of effluents and receiving waters to west coast marine and estuarine organisms. Report EPA/600/R-95-136. U.S. Environmental Protection Agency.Ohio, Cincinati, 661 p.
USEPA. 2002. Short-term methods for measuring the chronic toxicity of effluents and receiving waters to marine and estuarine organisms. 3ed. Report EPA/821/R-02/014. U.S. Environmental Protection Agency Washington, DC, 489 p .
Vaschenko, M. A., Zhang, Z. P. Lam, P. K. S., Wu, R. S. S. 1999. Toxic Effects of Cadmium on Fertilizing Capability of Spermatozoa, Dynamics of the First Cleavage and pluteus Formation in the Sea Urchin Anthocidaris
crassispina (Agassiz). Marine Pollution Bulletin, 38: 1097-1104.
Zagatto, P. A. 2006a. Ecotoxicologia. Pp. 1-14. In: Zagatto, P.A. and Bertoletti, E. (eds.) Ecotoxicologia Aquática. 1st Ed., Rima Editora, São Carlos, São Paulo,464 p.
Zagatto, P. A. 2006b. O uso de substâncias de referência no controle de qualidade de ensaios ecotoxicológicos. Pp. 185-198. In: Zagatto, P.A. and Bertoletti, E. (eds.) Ecotoxicologia Aquática. 1st Ed., Rima Editora, São Carlos, São Paulo, 464 p.
Zúñiga, M., Roa, R., Larrain, A. 1995. Sperm cell bioassay with the sea urchin Arbacia spatuligera on samples from two polluted Chilean coastal sites. Marine Pollution Bulletin, 30: 313-319.
Received June 2007 Accepted July 2008
Published online July 2008

Pan-American Journal of Aquatic Sciences (2008) 3(2): 130-134
A simple protocol for a low invasive DNA accessing in
Stenella longirostris (Cetacea: Delphinidae)
ANA PAULA C. FARRO1, MARIO M. ROLLO JR.2, JOSÉ M. SILVA JR.3& CELSO L. MARINO4
1Universidade Federal do Espírito Santo (UFES), Centro de Ciências Humanas e Naturais, Av Fernando Ferrari, 514, Vitória, ES, 29075-010, Brazil. E-mail: [email protected] 2Campus Experimental do Litoral Paulista, UNESP, Pça Infante D. Henrique, s/n, São Vicente, SP, 11330-205, Brasil. 3Centro Mamíferos Aquáticos - ICMBio, Cx Postal 49, Vila do Boldró, s/n, Fernando de Noronha, PE, Brasil. 4Instituto de Biociências, Departamento de Genética, UNESP, Distrito de Rubião Jr., s/n, Botucatu, SP, 18618-000, Brasil.
Abstract: The most significant studies about the spinner dolphin (Stenella longirostris) in the Southwestern Atlantic Ocean were conducted in Fernando de Noronha Archipelago, off Northeastern Brazil. The continuity of these studies depends upon the development of non-invasive methods. In this work, we present results from the skin swabbing sampling procedure for this species. We tested the performance of this method for nuclear and mitochondrial DNA analysis, unknown for this population. A total of skin 161 samples were collected during two expeditions. After the contacts the most of the dolphins remained close to the boat. Microsatellites markers and cytochrome b region primers were evaluated and the respective fragments were successfully amplified. Thus, skin swabbing may be considered an efficient strategy to obtain tissue samples for spinner dolphin genetic analysis in Fernando de Noronha Archipelago.
Key words: Cytochrome b, Fernando de Noronha Archipelago, microsatellites, spinner dolphin.
Resumo. Um protocolo simples e pouco invasivo para acesso de DNA de Stenella longirostris (Cetacea: Delphinidae). Os principais estudos sobre golfinhos rotadores (Stenella longirostris) no Atlântico Sul têm sido desenvolvidos no Arquipélago de Fernando de Noronha, Brasil. A continuidade desses estudos requer a aplicação de métodos cada vez menos invasivos. Nesse trabalho apresentamos resultados obtidos a partir do procedimento de raspagem de pele para esta espécie. Nós testamos o desempenho deste método de coleta para análises nucleares e mitocondriais, ainda inéditos para essa população. Um total de 161 amostras de pele foi coletado durante duas expedições. A maioria dos golfinhos permaneceu próxima à embarcação após o contato. Marcadores microssatélites e primers da região do citocromo b foram avaliados e os respectivos fragmentos foram amplificados com sucesso. Assim, concluímos que o método de raspagem de pele pode ser considerado uma eficiente estratégia para obtenção de amostras de tecido para análises genéticas de golfinhos rotadores no Arquipélago de Fernando de Noronha. Palavras-chave: Citocromo b, Fernando de Noronha, golfinho-rotador, microssatélites.
Since the onset of molecular studies, a
myriad of different methods have been used to improve the acquisition of biological material in order to perform DNA analysis and protect animals’ health and well being. For large cetaceans, efficient and non-invasive methods include the collection of sloughed skin (Whitehead et al. 1990, Amos et al. 1992, Valsecchi et al. 1998, Gendron & Mesnick
2001). A potentially alternative sampling method that does not require puncturing the skin, used with some species of cetaceans is the skin swabbing (Harlin et al. 1999, Gales et al. 2002). This procedure can be challenging for some species that tend not to approach boats (Bearzi 2001). The spinner dolphin Stenella longirostris lives in deep waters of tropical and subtropical seas

A simple protocol for a low invasive DNA accessing.
Pan-American Journal of Aquatic Sciences (2008), 3(2): 130-134
131
and is commonly observed close to banks or islands (Perrin 2002), approaching boats of different sizes (Norris et al. 1994). A large number of spinner dolphins are found in Fernando de Noronha, an Oceanic Archipelago off Northeastern Brazil. Their typical bow-riding behavior allows easy approximation (Silva Jr. et al. 2005a). However, no previous attempts for a DNA analysis using skin swabbing methods have been reported for the species. One important issue with this method is related to sample adequacy, function of the total skin amount collected. In this work we show the results of nuclear and mitochondrial DNA analysis performed on Stenella longirostris skin samples collected in Fernando de Noronha, Brazil. Considering the conservation status of the area and the lack of knowledge for the species in Brazilian waters, standardization of a less invasive method to spinner dolphin’s genetic analyses is an important task.
Skin samples of 161 spinner dolphins were collected along Fernando de Noronha Archipelago, off Northeastern Brazil (Fig. 1), using a small inflatable boat. Two expeditions were conducted, in August 2004 and February 2006, during ten and six days, respectively. Contrasting meteorological and
oceanographic typical conditions characterize these sampling periods. Trade winds predominate in August, generating high amplitude waves. February is characterized as a dry period with calm waters. A moderately abrasive, 4 X 4-cm synthetic fiber scrub pad, made of synthetic fiber, attached with plastic fasteners to the tip of 130-cm long wooden sticks, was used to collect the skin samples, following the skin-swabbing method described by Harlin et al. (1999). Samples were removed by friction of the scrub pad against the back of an approaching dolphin. Skin samples were transferred to a flask containing 20% dimethylsulfoxide (DMSO) or 70% alcohol solution. Samples were ranked taking the amount of skin collected into account. Care was taken to avoid keeping the same individuals moving along with the boat, by frequently changing both the course and speed of the boat. In the laboratory, the skin adhered in the scrub pad was removed and DNA were extracted using the Chelex resin. The samples were quantified by spectrophotometer (Pharmacia Biotech GeneQuant). DNA ampli-fication was performed using primers of cytochrome b and nuclear DNA through microsatellite markers (Table I).
Figure 1. Map of the study area, the Fernando de Noronha Archipelago, showing the main island that bears the same name, the limits of the Fernando de Noronha National Marine Park and the “Mar de Dentro” portion of the waters surrounding the islands, where all data were collected.

A. P. C. FARRO ET AL.
Pan-American Journal of Aquatic Sciences (2008) 3(2): 130-134
132
Table I. PCR conditions in cytochrome b and microsatellite analysis.
Cytochrome b Microsatellites
Primers GLUDG-L and CB2
(Palumbi 1996).
Slo 1, 2, 3, 4, 9, 11, 13, 14, 15, 16 and Slo17
(Farro 2006).
Reagents 25 ng of DNA, Buffer 10X,
1.5 mM MgCl2 (50 mM),
0.2 mM dNTP (10 mM),
1u of Taq DNApolymerase (Invitrogen)
0.4 μM of each primer (10 μM)
1 μL of DNA, Buffer 10X,
1.25 mM MgCl2 (50 mM),
0.83 mM dNTP (10 mM),
0.75 u of Taq polimerase (Invitrogen)
0.42 μM of each primer (10 μM)
Cycles 95°C for 2 min, followed by 35
cycles of 94°C for 30 sec, 60°C
for 1 min and 72°C for 30 sec; the
extension was at 72°C for 5 minutes.
95°C for 5 min, followed by 32 cycles at 94°C
for 30 sec, annealing (t oC = X) for 20 sec and
72°C for 20 s, the extension was at 72°C for
10 minutes.
Gel 1% agarose 8 % polyacrilamide
In the cytochrome analysis a spinner
dolphin’s liver sample was used for comparison. After the PCR and the fragment’s verification, other PCR reaction was performed with the Big Dye Terminator® Kit (Applied Byosistems). In this procedure 0.5 µL of the amplified product was mixed, 1.8 µL of Big Dye, v.3.01, 1 µL of Save money and 0.5 µL of each primer (GLUDG-L ou CB2, both for 10µM) for a total volume of 10µL. Amplification was realized in the following conditions: 96°C for 2 min and 25 cycles at 96°C for 45 sec, 52°C for 30 sec and at 60°C for 4 minutes. Sequencing was performed in an automatic sequencer ABI 3100 (Applied Byosystems). The obtained sequences were analyzed with the program SequencherTM, v.3.1 version. After that, a consensus sequence was generated and compared with other sequences deposited in GenBank. Besides GenBank comparison, the sequences were submitted to the site DNA Surveillance (http://www.cebl .auckland.ac.nz:9000). This site compares the submitted sequences with those obtained from other cetacean species, and informs the taxon that has the highest homology with them. The microsatellite fragments were visualized using a silver-staining protocol, under white light and the picture was taken with EagleSight. The sizes were determined with the program Kodak Digital Science 1D, 3.0.1 version.
In first season ninety-two contacts were made in 10 days, an average effort of four hours per day, and 87 percent of them were effective. Samples
were ranked according to the amount of skin tissue observed, yielding in the first cruise: 10 samples with no skin fragment (--), 39 samples containing small amounts, and 40 containing larger amounts of skin (++). Laboratorial analysis verified that only (+-) and (++) samples provided enough DNA, thus, only samples ranked as (+-) and (++) samples were stored during the second cruise, resulting in 109 contacts, with 33 (+-) and 49 (++) samples. Amplifications with nuclear and mitochondrial markers were successfully accomplished. The alleles were adequately identi-fied in microsatellite analyses (Fig. 2). With the fragments and the individual genotypes we verified that nine dolphins were probably sampled twice. The doubled samples, discharged after its detection, demonstrated that the exfoliating procedure did not promote a trauma to the animals, since they still performed bowriding behaviour after been sampled.
In cytochrome b test the resulted bands showed the expected sizes, around 460 bp for the next analysis step (Fig. 3). After sequencing and also submitting to the GENBANK and DNA SURVEILLANCE site and it was confirmed that these samples corresponded to Stenella longirostris species, as it was expected. In GenBank, the submitted sequences showed e-values of zero. The samples showed score of 823 to the accession AF084101 (gi = 5870054), the accession number is the identification of a GenBank sequence, and score of 831 to the accession X92524 (gi = 1199854), to liver and skin respectively.

A simple protocol for a low invasive DNA accessing.
Pan-American Journal of Aquatic Sciences (2008), 3(2): 130-134
133
Figure 2. Microsatellite fragments amplified with the Slo15 marker from 13 spinner dolphin’s skin samples collected in 2006. Column 6 = ladder 10bp.
Figure 3. Fragments around 460 bp amplified in a spinner dolphin´s muscle sample (G1) and skin sample (68: extracted by chelex) using cytochrome b primers. Agarose gel 1% stained with bromide ethidium. First and last columns are ladder 100bp. Control (C) = sample without DNA.
Harlin et al. (1999) described a skin swabbing sampling method for Lagenorhynchus obscurus from Kaikoura, New Zealand, and we reproduced here for Stenella longirostris. The spinner dolphins reacted as dusky dolphins (L. obscurus) to the scrub pad contact. They swam faster, jumping or diving after being touched but, in several occasions, they returned to the boat prow. This suggests that the skin swabbing procedure did not cause a trauma for the animals and it can be used to collect tissue samples for different types of genetic analysis. Despite the different oceanographic conditions during both collection periods, a similar sampling success was observed in both. The number of very good samples (++) was higher in the second expedition. We believe that this was due to the changes in the sampling procedure (particularly the increase in dowel size). Our results
confirm the efficiency of the proposed procedure for any time period in Fernando de Noronha area. The cytochrome b analysis showed that the samples had enough DNA for mitochondrial studies, assuring positive results, as reported in Harlin et al. (1999). In addition, we verified if the samples could be used in nuclear analysis. In microsatellite tests, both heterozygote and homozygote individuals were identified adequately. Therefore, the visible samples attached in the scrub were enough to perform nuclear as well as mitochondrial DNA analyses. For this reason, the skin sampling method can be considered a reliable tool in genetic studies with Stenella longirostris. Acknowledgements We gratefully thank the professionals of BIOGEN laboratory for their help, G. A. Braga da Rosa, Instituto Estadual de Meio Ambiente e Recursos Hídricos, and A. M. Ciotti, Universidade Estadual Paulista, for the comments on the manuscript. We also thank the Instituto Chico Mendes de Conservação da Biodivercidade (ICMBio) for the collection and manipulation licenses. CAPES and PETROBRAS provided financial support. References Amos, W., Whitehead, H., Ferrari, M. J., Glockner-
Ferrari, M. D., Payne, R. & Gordon, J. 1992. Restrictable DNA from sloughed cetacean skin – It’s potential for use in population analysis. Marine Mammal Science, 8(3): 275-283.
Bearzi, G. 2001. Biopsy sampling and instrusive research. http://www.tethys.org/biopsy.htm. Last access in 4/17/2007.
Gales, N. J., Dalebout, M. L. & Bannister, J. L. 2002. Genetic identification and biological observation of two free-swimming beaked whales: Hector’s beaked whale (Mesoplodon hectori, Gray, 1871), and Gray’s beaked whale (Mesoplodon grayi) Von Haast, 1876. Marine Mammal Science, 18: 544-551.
Gendron, D. & Mesnick, S. L. 2001. Sloughed skin: a method for the systematic collection of tissue samples from Baja California blue whales. Journal of Cetacean Research and Management, 3(1): 77-79.
Harlin, A. D., Würsig, B., Baker, C. S. & Markowitz, T. M. 1999. Skin swabbing for genetic analysis: application to dusky dolphins (Lagenorhynchus obscurus). Marine Mammal Science, 15: 409-425.

A. P. C. FARRO ET AL.
Pan-American Journal of Aquatic Sciences (2008) 3(2): 130-134
134
Norris, K. S., Würsig, B., Wells, R. S. & Würsig, M. 1994. The Hawaiian Spinner Dolphin. University of California Press, Berkeley and Los Angeles, 408 p.
Perrin, W. F. 2002. Spinner dolphin. Pp. 1174-1178. In: Perrin W. F., Wursig B., Thewissen J. G. M. (Eds). Encyclopedia of Marine Mammals. Academic Press, San Diego.
Silva Jr., J. M., Silva, F. J. L. & Sazima, I. 2005a. Rest, nurture, sex, release, and play: diurnal underwater behaviour of the spinner dolphin
at Fernando de Noronha Archipelago, SW Atlantic. Aqua, 9(4): 161-176.
Valsecchi, E., Glockner-Ferrari, D., Ferrari, M. & Amos, W. 1998. Molecular analysis of the efficiency of sloughed skin sampling in whale population genetics. Molecular Ecology, 17(10): 1419-1422.
Whitehead, H., Gordon, J., Mathews, E. A. & Richard, K. R. 1990. Obtaining skin samples from living sperm whales. Marine Mammal Science, 6(4): 316-326.
Received June 2007 Accepted June 2008
Published online July 2008

Pan-American Journal of Aquatic Sciences (2008) 3(2): 135-141
Functional feeding habits of Chironomidae larvae (Insecta, Diptera) in
a lotic system from Midwestern region of São Paulo State, Brazil
FABIO L. SILVA1,4, SONIA S. RUIZ2, GABRIEL L. BOCHINI3 & DIANA C. MOREIRA3
1Programa de Pós Graduação em Ecologia e Recursos Naturais PPGERN/CCBS - UFSCar. Laboratório de Entomologia Aquática – Departamento de Hidrobiologia - Universidade Federal de São Carlos, São Carlos, SP, Rodovia Washington Luís, km 235. Caixa Postal 676. CEP: 13565-905. 2Universidade Paulista, Rodovia Marechal Rondon, km 335, Bauru, SP. CEP: 17048-290. 3Laboratório de Organismos Aquáticos - Departamento de Ciências Biológicas - Universidade Estadual Paulista, Avenida Luiz Edmundo Carrijo Coube, s/n, Bauru, SP. Caixa Postal 473. CEP: 17018-130. 4E-mail: [email protected]
Abstract. Functional feeding habits of Chironomidae larvae (Insecta, Diptera) in a lotic system from Mid-western region of São Paulo State, Brazil were analyzed. Collectors were the dominant organisms, repre-sented by genera Chironomus, Fissimentum and Cryptochironomus, following by shredders and predators.
Key words: Diet, food habits, functional feeding groups, gut contents.
Resumo. Hábitos alimentares de larvas de Chironomidae (Insecta, Diptera) em um sistema lótico da região centro-oeste do Estado de São Paulo, Brasil. Foram analisados os hábitos alimentares de larvas de Chironomidae (Insecta, Diptera) em um sistema lótico da região centro-oeste do Estado de São Paulo, Brasil. Os coletores foram os organismos dominantes, representados pelos gêneros Chironomus, Fissimentum e Cryptochironomus, seguidos por fragmentadores e predadores. Palavras-chave: Conteúdo estomacal, dieta, grupos funcionais de alimentação, hábitos alimentares.
In recent decades, two general approaches
using invertebrates are being employed worldwide to conduct biological assessments of aquatic systems. One is taxonomic, and the other is functional. The first involve measures, such as species density, specific diversity or richness, while the second is focused in food webs and energy flow (Cummins et al. 2005). According to Cummins & Klug (1979), the use of the functional approach may be more adequate if the goal is to characterize ecosystem condition. Within this context, the concept of guild has become useful, since it can be considered a functional unit in community analysis, making it unnecessary to consider each and every species as a separate entity (Odum 1988).
The family Chironomidae has an important role in aquatic food webs, representing a major link between producers, such as phytoplankton and benthic algae, and secondary consumers (Tokeshi 1995). These organisms can occupy important
positions in the trophic dynamics of aquatic ecosystems, due to their numeric abundance and role in nutrient cycling. The chironomids alter the composition of fine organic matter (< 1mm) and supply important subsidies for predators (Sankarperumal & Pandian 1992). Moreover, due to their long life cycle and low mobility, chironomids integrate various biological processes and may be used as indicators of environmental conditions (Kuhlmann et al. 2001).
In recent years, interest towards the feeding behavior of chironomid larvae has increased, primarily because of (1) improvements in taxonomic keys that allow their identification, (2) attempts to control pestiferous emergences in lentic habitats and (3) recognition of their energetic importance in freshwater ecosystems (Berg 1995).
Despite pioneer attempt of Coffman & Ferrington (1996) to categorize the functional feeding habits of chironomids from Neartic zone and

F. L. SILVA ET AL.
Pan-American Journal of Aquatic Sciences (2008) 3(2): 135-141
136
this work be considered the main treaty on the subject, various studies on the feeding ecology of Chironomidae from Neotropical region indicate a diversity of feeding habits and functions, although most are considered omnivorous (Nessimian & Sanseverino 1998, Nessimian et al. 1999, Henriques-Oliveira et al. 2003). With this in mind, this study aims to analyze the functions and feeding habits of chironomid larvae in a lotic system from Midwestern region of São Paulo State (Brazil). We believe that there are divergences between the feeding strategies of larvae sampled in this study, carried out in lotic system from Neotropical zone, and the information gathered by Coffman & Ferrington (1996) from the North American literature.
This study was carried out in Ribeirão dos Peixes, in the municipality of Dois Córregos (22º 22’S; 48º 22’ W), located in the Midwestern region of São Paulo State, Brazil (figure 1). This water body runs through the municipality and is under a high sedimentation process due to marginal vegetation deforestation, beyond receiving discharges of domestic sewage and industrial effluents in different points along its course (Lucatto & Talamoni 2007).
For sediment collection were made seven samplings (02, 04, 07, 08, 10, 11 e 14/IV/2003), in four points along Ribeirão dos Peixes (figure 2), previously determined (Mazzini 2002): Point 1 (P1) is a spring of lentic character, it show better environmental conditions than the other points; Point 2 (P2), located below a fish culture tank, receives input of organic matter from this activity. This place is a narrow stretch, resulting in higher draught and the formation of depositional areas; Point 3 (P3) is an impounded area with more intense sedimentation; Point 4 (P4), in urban area, exhibits alterations due to human activity. This place received discharges of domestic sewage until the year prior to this study (Silva et al. 2008).
Each sample corresponded to 3 subsamples. By this way a total of 84 subsamples were collected using an Ekman-Birge grab (0,0225m2 area) and immediately fixed in a 10% formalin solution. In the laboratory, the samples were washed using 0.250 mm sieve, sorted and preserved in 70% ethanol. The organisms were mounted on slides in Hoyer's medium after it were examined under an optical microscope and identified using appropriate literature (Epler 1995, Trivinho-Strixino & Strixino 1995), being subsequently counted.
Figure 1. Map of Ribeirão dos Peixes (Dois Córregos, SP, Brazil), illustrating the samplings points.

Functional feeding habits of Chironomidae larvae.
Pan-American Journal of Aquatic Sciences (2008), 3(2): 135-141
137
Figure 2. Sampling points of Ribeirão dos Peixes (Dois Córregos, SP, Brazil): A) Point 1, B) Point 2, C) Point 3, D) Point 4.
For the fauna analysis was considered absolute (N) and relative (ni) abundance, which this work corresponded to sum of three subsamples of all samples taken at each point. Gut content analyses were made according to Mcshaffrey & Olive (1985), based on previously prepared slides of larvae. No attempt was made during collection to prevent regurgitation of food in the gut, however all specimens presented some gut content. Guts were left in the bodies and examined microscopically by transparency through the cuticle, being identified as detritus, plant material, or animal material. Individuals were grouped according to their trophic position as detritivorous, herbivorous, carnivorous and omnivorous; the percentage calculation was based on the total number of individuals sampled at each point. Another analysis categorized genera according to feeding mode: (1) collectors (gatherers and filterers) - ingest decomposition matter; (2) shredders - chew vascular plants, macrophytes and submerged leaves or excavate wood; (3) grazer-scrapers - remove firmly attached algae from exposed surfaces, sediments and submerged organic matter; (4) predators - feed on living animal tissue, attack and ingest their prey whole or in pieces, or bore the prey tissues removing their body fluids (Berg 1995, Coffman & Ferrington 1996). In this classification, functional group designations are closely related to feeding mode than the food
ingested, given that a determined feeding mechanism, such as filtering, can result in the intake all food categories (Cummins 1973).
In this study, 1439 specimens were collected, belonging to 14 Chironomidae genera (table I). In P1, the genus that presented highest relative abundance was Fissimentum (51.7%), this place displayed low draught and arenaceous substrate. Cranston & Nolte (1996) recorded this detritivorous genus in marginal sediments of slowly-flowing, tropical, lowland rivers from South America, Florida and Texas. In Brazil, Fissimentum has been observed in courses with low draught and arenaceous and/or muddy substrate (Strixino & Trivinho-Strixino 1998). Sanseverino & Nessimian (2001) recorded this genus in lotic systems and reservoirs associated to arenaceous substrate. Therefore, we can suppose that the environmental conditions of P1 (lentic character and arenaceous substrate) may have contributed for the abundance of Fissimentum.
P2 presents depositional areas, resulting of a higher draught. In this point Cryptochironomus (72.3%) was the dominant genus (table I). According to Simpson & Bode (1980), this genus is commonly found in various types of habitats and water conditions. Higuti & Takeda (2002) has been observed this genus associated to substrate composed of fine sand. Sanseverino & Nessimian

F. L. SILVA ET AL.
Pan-American Journal of Aquatic Sciences (2008) 3(2): 135-141
138
Table I. Absolute (N) and relative (ni) abundance of larvae Chironomidae collected in the four sampling points along Ribeirão dos Peixes (Dois Córregos, SP, Brazil) in April 2003.
Point 1 Point 2 Point 3 Point 4 Genera N ni N ni N ni N ni Chironominae
Chironomini Chironomus Meigen, 1803 58 0.143 24 0.202 8 0.229 808 0.919 Cladopelma Kieffer, 1921 - - - - - - 2 0.002 Cryptochironomus Kieffer, 1918 28 0.069 86 0.723 7 0.200 42 0.048 Dicrotendipes Kieffer, 1913 2 0.005 - - - - - - Endotribelos Grodhaus, 1987 - - - - 1 0.029 - - Fissimentum Cranston & Nolte, 1996 210 0.517 - - 6 0.171 - - Goeldichironomus Fittkau, 1965 - - - - - - 2 0.002 Harnischia Complex Kieffer, 1921 1 0.002 - - - - - - Polypedilum Kieffer, 1912 33 0.081 7 0.059 12 0.343 24 0.027
Tanytarsini Caladomyia Säwedal, 1981 14 0.034 - - - - - - Tanytarsus Van der Wulp, 1874 2 0.005 - - 1 0.029 - -
Tanypodinae Pentaneurini
Ablabesmyia Johannsen, 1905 45 0.111 2 0.017 - - 1 0.001 Procladiini
Djalmabatista Fittkau, 1968 7 0.017 - - - - - - Procladius Skuse, 1889 6 0,015 - - - - - -
(2001) found Cryptochironomus inhabit areas composed of arenaceous substrate. Such information allows infer that the dominance of this genus occurred due to presence of sandy substrate in P2, a habitat also examined by Higuti et al. (1993).
P3 registered lowest abundance of Chirono-midae specimens, with Polypedilum as the most abundant genus (34.3%) (Table I). It is composed of herbivorous (Coffman & Ferrington 1996) and according to Barton & Smith (1984), belongs to the psammophilic group of Chironomidae, generally associated to arenaceous sediments. Polypedilum inhabit a wide variety of substrate and different environmental conditions (Armitage et al. 1995, Sanseverino & Nessimian 1998). Amorim et al. (2004) found Polypedilum in areas formed by arenaceous substrate. The presence of sedimentation process and formation of deposition zones in P3 may have contributed to the predominance of this genus.
In P4, the dominant genus was Chironomus (91.9%) (Table I). According to Simpson & Bode (1980), this genus is ecologically versatile, with various species living in standing or flowing waters as well as polluted or clean. Chironomus is commonly associated to presence of decomposing organic matter and aquatic macrophytes (Sanseverino & Nessimian 2001). Resende &
Takeda (2007) and Fusari (2006) recorded the genus in areas strongly impacted by anthropic actions. The elevated abundance of Chironomus in P4, possibly is relating to input of a large quantity of organic matter from riparian vegetation and previous stretches of the stream.
The majority of chironomids collected in Ribeirão dos Peixes was classified as detritivorous (table II), followed by herbivorous and omnivorous. There was no record of carnivore organisms. These results agree with Nessimian & Sanseverino (1998), who found detritivorous organisms to be the most abundant chironomids collected in the Paquequer River (Teresópolis, State of Rio de Janeiro, Brazil).
A predominance of collectors was recorded in all sampling stations of this study, followed by shredders in P2, P3 and P4 and by predators in P1 (figure 3).
Collectors were the dominant organisms in all studied habitats, highlighted by the high abundance of Chironomus, Cryptochironomus and Fissimentum. The organisms pertaining to this category feed on fine organic matter (< 1mm) and are thus named because of the reaggregation of small particles resulting from their ingesting activities, being either suspension feeders or gatherers of
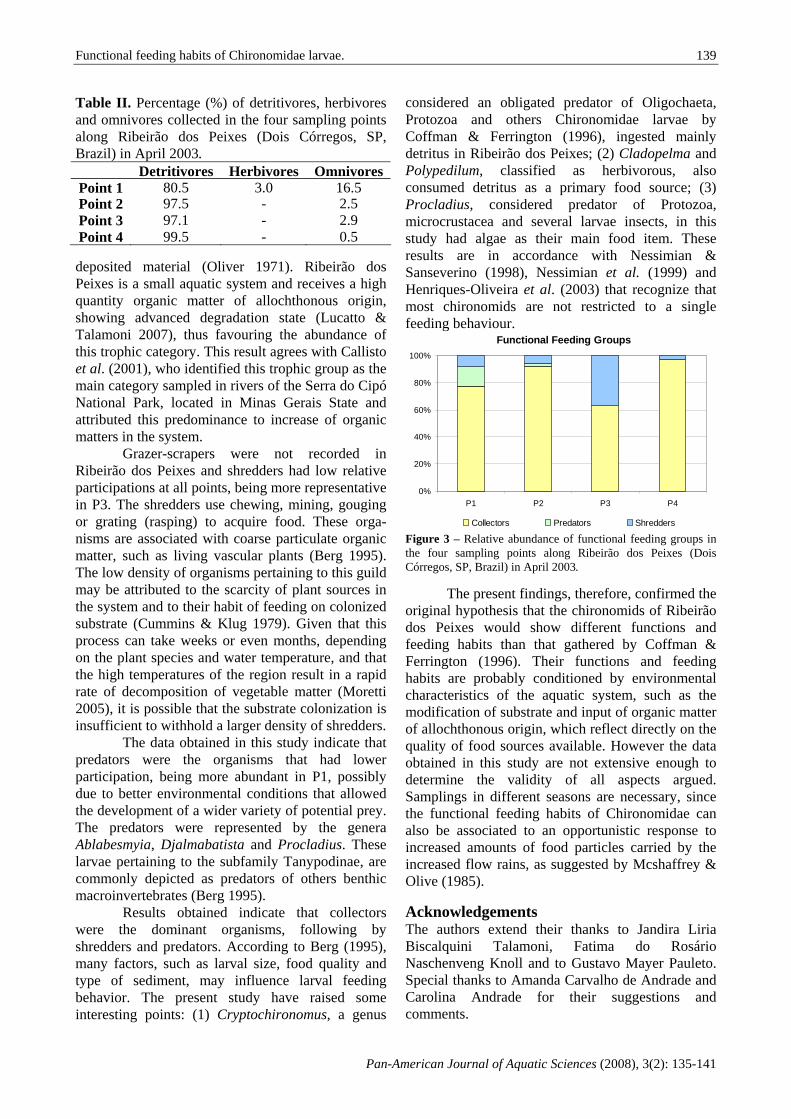
Functional feeding habits of Chironomidae larvae.
Pan-American Journal of Aquatic Sciences (2008), 3(2): 135-141
139
Table II. Percentage (%) of detritivores, herbivores and omnivores collected in the four sampling points along Ribeirão dos Peixes (Dois Córregos, SP, Brazil) in April 2003.
Detritivores Herbivores OmnivoresPoint 1 80.5 3.0 16.5Point 2 97.5 - 2.5Point 3 97.1 - 2.9Point 4 99.5 - 0.5
deposited material (Oliver 1971). Ribeirão dos Peixes is a small aquatic system and receives a high quantity organic matter of allochthonous origin, showing advanced degradation state (Lucatto & Talamoni 2007), thus favouring the abundance of this trophic category. This result agrees with Callisto et al. (2001), who identified this trophic group as the main category sampled in rivers of the Serra do Cipó National Park, located in Minas Gerais State and attributed this predominance to increase of organic matters in the system.
Grazer-scrapers were not recorded in Ribeirão dos Peixes and shredders had low relative participations at all points, being more representative in P3. The shredders use chewing, mining, gouging or grating (rasping) to acquire food. These orga-nisms are associated with coarse particulate organic matter, such as living vascular plants (Berg 1995). The low density of organisms pertaining to this guild may be attributed to the scarcity of plant sources in the system and to their habit of feeding on colonized substrate (Cummins & Klug 1979). Given that this process can take weeks or even months, depending on the plant species and water temperature, and that the high temperatures of the region result in a rapid rate of decomposition of vegetable matter (Moretti 2005), it is possible that the substrate colonization is insufficient to withhold a larger density of shredders.
The data obtained in this study indicate that predators were the organisms that had lower participation, being more abundant in P1, possibly due to better environmental conditions that allowed the development of a wider variety of potential prey. The predators were represented by the genera Ablabesmyia, Djalmabatista and Procladius. These larvae pertaining to the subfamily Tanypodinae, are commonly depicted as predators of others benthic macroinvertebrates (Berg 1995).
Results obtained indicate that collectors were the dominant organisms, following by shredders and predators. According to Berg (1995), many factors, such as larval size, food quality and type of sediment, may influence larval feeding behavior. The present study have raised some interesting points: (1) Cryptochironomus, a genus
considered an obligated predator of Oligochaeta, Protozoa and others Chironomidae larvae by Coffman & Ferrington (1996), ingested mainly detritus in Ribeirão dos Peixes; (2) Cladopelma and Polypedilum, classified as herbivorous, also consumed detritus as a primary food source; (3) Procladius, considered predator of Protozoa, microcrustacea and several larvae insects, in this study had algae as their main food item. These results are in accordance with Nessimian & Sanseverino (1998), Nessimian et al. (1999) and Henriques-Oliveira et al. (2003) that recognize that most chironomids are not restricted to a single feeding behaviour.
Functional Feeding Groups
0%
20%
40%
60%
80%
100%
P1 P2 P3 P4
Collectors Predators Shredders Figure 3 – Relative abundance of functional feeding groups in the four sampling points along Ribeirão dos Peixes (Dois Córregos, SP, Brazil) in April 2003.
The present findings, therefore, confirmed the original hypothesis that the chironomids of Ribeirão dos Peixes would show different functions and feeding habits than that gathered by Coffman & Ferrington (1996). Their functions and feeding habits are probably conditioned by environmental characteristics of the aquatic system, such as the modification of substrate and input of organic matter of allochthonous origin, which reflect directly on the quality of food sources available. However the data obtained in this study are not extensive enough to determine the validity of all aspects argued. Samplings in different seasons are necessary, since the functional feeding habits of Chironomidae can also be associated to an opportunistic response to increased amounts of food particles carried by the increased flow rains, as suggested by Mcshaffrey & Olive (1985).
Acknowledgements The authors extend their thanks to Jandira Liria Biscalquini Talamoni, Fatima do Rosário Naschenveng Knoll and to Gustavo Mayer Pauleto. Special thanks to Amanda Carvalho de Andrade and Carolina Andrade for their suggestions and comments.
F. L. SILVA ET AL.
Pan-American Journal of Aquatic Sciences (2008) 3(2): 135-141
140
References Amorim, R. M., Henriques-Oliveira, A. L. &
Nessimian, J. L. 2004. Distribuição espacial e temporal das larvas de Chironomidae (Insecta: Diptera) na seção ritral do rio Cascatinha, Nova Friburgo, Rio de Janeiro, Brasil. Lundiana, 5 (2): 119-127.
Armitage, P. D., Cranston, P. S. & Pinder, L.C.V. 1995. The Chironomidae: biology and ecology of non-biting midges. Chapman & Hall, London, 572 p.
Barton, D. R. & Smith, S. M. 1984. Insects of extremely small and extremely large aquatic habits. Pp. 457-483. In: RESH, V.H. & ROSENBERG. D.M. (Eds.). The ecology of aquatic insects. Preager, New York, 625 p.
Berg, H. B. 1995. Larval food and feeding behaviour. Pp.136-168. In: Armitage, P. D., Cranston, P. S. & Pinder, L. C. V. (Eds). The Chironomidae: biology and ecology of non-biting midges. Chapman & Hall, London, 571 p.
Callisto, M., Moreno, P. & Barbosa, F. A. R. 2001. Habitat diversity and benthic functional trophic groups at Serra do Cipó, Southeast Brazil. Revista Brasileira de Biologia, 61 (2): 259-266.
Coffman, W. P. & Ferrington, L. C. 1996. Chironomidae. Pp. 635-754. In: Merrit, K. W. & Cummins, R. W. (Eds). An introduction of aquatic insects of North America. Kendall Hunt Publishing, Dubuque, 722 p.
Cranston, P. S. & Nolte, U. 1996. Fissimentum, a new genus of drought tolerant Chironomini (Diptera-Chironomidae) from the Americas and Australia. Entomological News, 107: 1-15.
Cummins, K. W. 1973. Trophic relations of aquatic insects. Annual Review of Entomological, 18: 183-206.
Cummins, K. W. & Klug, M. J. 1979. Feeding eco-logy on stream invertebrates. Annual Review of Ecology and Systematic, 10: 147-172.
Cummins, K. W., Merrit, R. W. & Andrade, C. N. 2005. The use of invertebrate functional groups to characterize ecosystem attributes in selected streams and rivers in south Brazil. Studies on Neotropical Fauna and Environment, 40: 71-90.
Epler, J. H. 1995. Identification Manual for the Larvae Chironomidae (Diptera) of Florida. Department of Environmental Protection. Division of water facilities, Tallahassee, 308 p.
Fusari, L. M. 2006. Estudos das comunidades de
macroinvertebrados bentônicos das Represas do Monjolinho e do Fazzari no campus da UFSCar, município de São Carlos, SP. Dissertação de Mestrado. Universidade Federal de São Carlos, São Carlos, Brasil, 80 p.
Henriques-Oliveira, A. L., Nessimian, J. L. & Dorvillé, L. F. M. 2003. Feeding habits of chironomid larvae (Insecta: Diptera) from a stream in the Floresta da Tijuca, Rio de Janeiro, Brazil. Brazilian Journal of Biology, 63 (2): 269-281.
Higuti, J., Takeda, A. M. & Paggi, A. C. 1993. Distribuição espacial das larvas de Chironomidae (Insecta, Diptera) do rio Baía (MS-Brasil). Revista Unimar, 15: 65-81.
Higuti, J. & Takeda, A. M. 2002. Spatial and temporal variation in densities of Chironomid larvae (Diptera) in two lagoons and two tributaries of the Upper Paraná River Floodplain. Brazilian Journal of Biology, 62 (4): 807-818.
Kuhlmann, M. L., Brandimarte, A. L., Shimizu, G. Y. & Anaya. M. 2001. Invertebrados bentônicos como indicadores de impactos antrópicos sobre ecossistemas aquáticos continentais. Pp. 237-248. In: Maia, N. B., Martos, H. L. & Barrella, W. (Eds). Indicadores ambientais: conceitos e aplicações. EDUC/COMPED/INEP, São Paulo, 285 p.
Lucatto, L. G. & Talamoni, J. L. B. 2007. A construção coletiva interdisciplinar em Educação Ambiental no Ensino Médio: a microbacia hidrográfica do Ribeirão dos Peixes como tema gerador. Ciência & Educação, 13 (3): 389-398.
Mazzini, F. 2002. Caracterização limnológica, com ênfase na comunidade zoobentônica, do Ribeirão dos Peixes, Dois Córregos, SP. Mo-nografia de Conclusão de Curso. Univer-sidade Estadual Paulista, Bauru, Brasil, 135 p.
Mcshaffrey, D. & Olive, J. H. 1985. Ecology and distribution of chironomid larvae from Carroll County, Ohio (Diptera: Chironomidae). Ohio Journal of Science, 85 (4): 190-198.
Moretti, M. S. 2005. Decomposição de detritos foliares e sua colonização por invertebrados aquáticos em dois córregos na Cadeia do Espinhaço (MG). Dissertação de Mestrado. Universidade Federal de Minas Gerais, Belo Horizonte, Brasil, 63 p.
Functional feeding habits of Chironomidae larvae.
Pan-American Journal of Aquatic Sciences (2008), 3(2): 135-141
141
Nessimian, J. L. & Sanseverino, A. M. 1998. Trophic functional categorization of the chironomid larvae (Diptera: Chironomidae) in a first-order stream at the mountain region of Rio de Janeiro State, Brazil. Verhandlungen der Internatioalen Vereinigunf für theoretische und angewandre Limnologie, 26 (4): 2115-2119.
Nessimian, J. L., Sanseverino, A. M. & Oliveira, A. L. H. 1999. Relações tróficas de larvas de Chironomidae (Diptera) e sua importância na rede alimentar em um brejo no litoral do Estado do Rio de Janeiro. Revista Brasileira de Entomologia, 43(1/2): 47-53.
Odum, E. P. 1988. Ecologia. Guanabara, Rio de Janeiro, 434 p.
Oliver, D. R. 1971. Life history of the Chironomidae. Annual Review of Ento-mology, 12: 211-230.
Resende, D. L. M. C. & Takeda, A. M. 2007. Larvas de Chironomidae (Diptera) em três Reser-vatórios do Estado do Paraná, Brasil. Revista Brasileira de Zoociências, 9 (2): 167-176. Sankarperumal, G. & Pandian, T. J. 1992. Larval abundance of Chironomus circumdatus in relation to biotic and abiotic factors. Hydrobiologia, 246: 205-212.
Sanseverino, A. M. & Nessimian, J. L. 1998. Habitat preference of Chironomidae larvae in an upland stream of Atlantic Forest, Rio de Janeiro State, Brazil. Verhandlungen der Interna-tioalen Vereinigunf für theore-tische und angewandre Limnologie, 26: 2141-2144.
Sanseverino, A. M. & Nessimian, J. L. 2001. Hábitats de larvas de Chironomidae (Insecta, Diptera) em riachos de Mata Atlântica no Estado do Rio de Janeiro. Acta Limnologica Brasiliensia, 13 (1): 29-38.
Silva, F. L., Ruiz, S. S., Moreira, D. C. & Bochini, G. L. 2008. Parasitismo por Mermithidae (Nematoda) em larvas do gênero Chironomus gr. decorus (Diptera: Chironomidae) no Rio dos Peixes, Dois Córregos, SP, Brasil. Biota Neotropica, 8(2): 1-4. Acessível em http://www.biotaneotropica.org.br/v8n2/pt/abstract?short-communication+bn00608022008.
Simpson, K. W. & Bode, R. W. 1980. Common larvae of Chironomidae (Diptera) from New York state streams and rivers with particular reference to the fauna of artificial substrates. Bulletin New York State Museum and Science Service, 1:105.
Strixino, G. & Trivinho-Strixino, S. 1998. Povoamentos de Chironomidae (Diptera) em lagos artificiais. Oecologia Brasiliensis, 5: 141-154.
Tokeshi, M. 1995. Production ecology. Pp.269-296. In: Armitage, P. D., Cranston, P. S. & Pinder, L. C. V. (Eds). The Chironomidae: biology and ecology of non-biting midges. Chapman & Hall, London, 571 p.
Trivinho-Strixino, S. & Strixino, G. 1995. Larvas de Chironomidae (Diptera) do Estado de São Paulo: Guia de identificação e diagnose dos gêneros. PPG-ERN-UFSCar, São Carlos, 227p.
Received April 2008 Accepted June 2008
Published online July 2008
Pan-American Journal of Aquatic Sciences (2008) 3(2): 142-151
Cylindrospermopsis raciborskii (Cyanobacteria) extends its
distribution to Latitude 34°53’S: taxonomical and ecological features in Uruguayan eutrophic lakes
LETICIA VIDAL1* & CARLA KRUK1
1Limnology Section, Faculty of Sciences. Universidad de la República. Iguá 4225. Montevideo, CP 11400, Uruguay. *[email protected]
Abstract: Cylindrospermopsis raciborskii, a potentially toxic tropical cyanobacterium, has recently gained scientific attention because of its invasive behaviour. Many hypotheses have been proposed to explain its expansion towards cooler regions. However, its morphological variability and its southern distribution in South America are still not clear. Here we analyse the spatial occurrence and relative frequency of this species over 47 lakes in southern Uruguay (34°48’-53’S). This is the first report of C. raciborskii from Uruguay and the southernmost record in the Americas. We explored the morphological features and described the environmental conditions where the species was detected. Also, we compared our morphotypes with others from temperate and tropical regions. Cylindrospermopsis raciborskii was only observed in four of 47 freshwater lakes. These sites were characterized by high water temperature and nutrient concentrations, low light availability and well-mixed waters. There was a high degree of variation in morphotypes in samples from Uruguay and elsewhere, with no clear association to their geographical origin. We argue that in-lake environmental factors (such as light in the water column) are more important than global factors for the establishment and the development of morphological characteristics of each population of C. raciborskii. We suggest that a more confident taxonomic resolution and the analysis of the ‘Cylindrospermopsis complex’ life cycle, along with genetic studies of the populations are needed to successfully test the causes of the spread of this species. Keywords: Morphotypes, spatial distribution, subtropical lakes, South America.
Resumen. Extensión de la distribución de Cylindrospermopsis raciborskii (Cyanobacteria) hacia la latitud 34°53’S: características taxonómicas y ecológicas en lagos eutróficos de Uruguay. Cylindrospermopsis raciborskii es una cianobacteria tropical potencialmente tóxica. Recientemente, esta especie ha recibido mayor atención científica debido a su comportamiento invasor. Se han desarrollado varias hipótesis que intentan explicar su expansión hacia regiones más frías. Sin embargo, su variabilidad morfológica y su distribución en América del Sur aún no son claras. En este trabajo analizamos su distribución espacial y frecuencia de ocurrencia en 47 lagos del área sur de Uruguay (34°53’S). A su vez se presenta el primer registro de esta especie para Uruguay, así como el más al sur para el continente Americano. Se exploraron las características morfológicas y se describieron las condiciones ambientales donde la especie fue observada. Además, se compararon los morfotipos encontrados con otros de regiones templadas y tropicales. C. raciborskii solo fue observada en 4 sistemas dulceacuícolas, los cuales se caracterizaron por tener una alta temperatura y concentración de nutrientes, conjuntamente con baja disponibilidad de luz en la columna de agua y condiciones de mezcla. Los morfotipos uruguayos y extranjeros variaron en gran medida, sin una clara asociación con su origen geográfico. Nuestro argumento es que para el establecimiento y el desarrollo de las características morfológicas de cada población de C. raciborskii, las características ambientales de cada lago son más importantes que los factores globales. Para poner a prueba en forma exitosa las causas de la dispersión de esta especie sería necesario mejorar la identificación taxonómica e incluir análisis de los cambios durante el ciclo de vida del “complejo Cylindrospermopsis”, conjuntamente con el desarrollo de estudios genéticos. Palabras clave: Morfotipos, distribución espacial, lagos subtropicales, América del Sur.

Cylindrospermopsis raciborskii extends its distribution.
Pan-American Journal of Aquatic Sciences (2008), 3(2): 142-151
143
Introduction The global distribution patterns of
phytoplankton species are still poorly known. However, Cylindrospermopsis raciborskii (Wolos-zynka) Seenaya & Subba Raju (1972) is an exception to this rule. This species has recently gained scientific attention due to its invasive behaviour in diverse continental waters of the world. Cylindrospermopsis raciborskii is a bloom forming cyanobacteria (order Nostocales) with high potential toxicity and remarkable negative consequences for human health.
Cylindrospermopsis raciborskii was first recorded in Java, Indonesia (Woloszynka 1912) and classified as a tropical species optimally growing at 25 °C (Briand et al. 2004). In the last 10 years the frequency of Cylindrospermopsis blooms has increased in the tropics (Branco & Senna 1994, Fabbro & Duivenvoorden 1996). The species has also been recently observed in subtropical (Jones & Sauter 2005) and temperate regions (Tóth & Pádisak 1986, Fastner et al. 2003). Its current distribution reaches as far as northern Europe (Germany, 54º 25’ N; Wiedner et al. 2002), New Zealand (37º 56’S; Ryan et al. 2003), South Africa (33º55’ S; Harding 1996) and North America (45º04’ S; Hill 1970). In South America the species is well known in tropical waters of Brazil (Huszar et al. 2000), but the information about its distribution in southern latitudes is disperse and incomplete (Komárek 2002, Zalocar & Forastier 2005). Prior to this study, the southernmost latitudinal record of bloom forming C. raciborskii in South America was from Brazil (32º07’; Torgan & Garcia 1989), while as a non-dominant species it was reported from subtropical Argentina (34º 14’, De Tezanos-Pinto et al. 2006).
A number of hypotheses have been suggested to explain the successful spread and invasive behaviour of C. raciborskii (Komárek 2002). Some authors have proposed that high physiological tolerance to light and temperature (Padisák 1997) coupled with higher temperatures promoted by climate warming may explain the expansion of this species to new regions (Briand et al. 2004). Others suggested that the spread of C. raciborskii represents a species radiation after the last glaciation (Gugger et al. 2005). Low edibility and allelopathy have also been hypothesized to contribute to increased bloom occurrence and geographic expansion (Branco & Senna 1994, Figueredo et al. 2007).
Taxonomic misidentification has obscured the testing of these hypotheses (Komárek 2002). Cyanobacteria as a group, and especially C.
raciborskii, display large morphological plasticity (Mc Gregor & Fabbro 2000). The variability of the morphological features used for taxonomic identification, caused by genetic or environmental factors (Singh 1962, Hawkins et al. 1997, Neilan et al. 2003) complicates their differentiation from other Nostocales species. For instance, C. raciborskii has been previously misidentified as Anabaenopsis, Raphidiopsis, and Cylindrospermum (Hawkins et al. 1997). Clearly, a better unders-tanding of its range of morphological variability and ecological preferences is urgently required (Komárek, 2002) especially in areas with scarcity of studies.
The aim of this study is to analyse for the first time the spatial distribution and relative frequency of C. raciborskii close to its southernmost distribution. We sampled subtropical lakes along the coast of Uruguay, including systems of different origin, trophic state and anthropogenic impact. In those systems where the species was found, we analysed the morphological diacritical features and the environmental conditions. We further discuss the classification of C. raciborskii into different morphotypes and compare the local morphotypes with others described from temperate and tropical areas. Materials and Methods
The study area is located in the coastal region of Uruguay and it extends from 34º50’-S 53º40’W to 34º53’S-56º15’W, an area that includes ca. 200 aquatic ecosystems. From theses systems we analysed a database of 47 lakes, including natural and man-made, shallow and deeper sites, as well as freshwater and brackish systems with different trophic states (from oligotrophic to hypertrophic). Most of these systems were sampled since 2003, at least once in summer, with the exception of nine that were sampled seasonally. The available information included lake morphology, water physico-chemistry and phytoplankton characteristics. In the present analysis we included only systems where the genus Cylindrospermopsis appeared. Of those lakes that were sampled more than once, the data from the sampling date where the genus was most abundant were included in the analysis.
Specific conductivity, pH, temperature, dissolved oxygen (Horiba sensor) and transparency (Secchi disk) were measured in situ. Temperature and dissolved oxygen profiles were measured every 20 cm in the deepest point of the lakes (Horiba sensor), and used to estimate the water column mixing depth. The euphotic zone depth

L. VIDAL & C. KRUK
Pan-American Journal of Aquatic Sciences (2008) 3(2): 142-151
144
(1% of incident light) was determined from profiles of photosynthetically available radiation (Licor Li-250/2π). Integrated water column samples (Ruttner bottle) for nutrients and phytoplankton analysis were collected simultaneously at mid- day. Total nitrogen and total phosphorus were analysed according to Valderrama (1981). Phytoplankton net tows (25-µm mesh size) were collected to obtain samples for qualitative analysis. Counts of the whole phytoplankton community were made from quantitative samples (Utermöhl 1958), with taxonomic richness being estimated thereafter.
We followed the description of C. raciborskii by Komárek & Komárková (2003) to select the diacritical features. In each sample, we randomly selected at least 50 trichomes and 30 vegetative and differentiated cells for the analysis. We examined the trichomes (length, number of cells, shape, number and location of differentiated cells and presence of constrictions) as well as the shape, length and width of apical cells, vegetative cells, akinetes and heterocytes, under a light microscope with 1000X magnification. We calculated the biovolume according to Hillebrand et al. (1999). To test whether these features were significantly different between lake populations we used non-parametric analyses of variance (Kruskall-Wallis) and non-parametric correlation tests (Spearman) to analyse the relationship between morphological features. Using principal components analysis (PCA) performed with the software CANOCO 4.52 (ter Braak and Smilauer 2003), we analysed the importance of the morphological variables in explaining morphotype variability and compared the mean values of the Uruguayan populations with morphotypes described in temperate and tropical systems (References in Table I). A total of 30 field morphotypes were included. When ranges of values were offered in the literature the mean of each morphological feature was used. Two descriptions of C. raciborskii (Seenayya & Subba Raju 1972, Komárek & Komárková 2003) and descriptions of three other species (C. philipinenesis; Taylor, Komárek 1984, C. cuspis; Komárek & Kling 1991 and C. africana; Komárek & Kling 1991) were also included as references for comparison. The presence of constrictions and the shape of the apical cells were included as nominal (dummy) variables. Trichome shape was incorporated as a fuzzy variable between straight and coiled. When necessary, data were log-transformed.
Results Ecological features
We found Cylindrospermopsis in only four out of the 47 lakes that formed our database. Those systems were: Laguna Blanca (Maldonado), Lago Javier (Canelones), Laguna Chica (Canelones) and Laguna del Sauce (Maldonado). Laguna del Sauce and Laguna Blanca are natural systems used as drinking water sources, while Lago Javier and Lagu-na Chica are man-made lakes used for recreation. Laguna Blanca has been sampled since 2000 and Cylindrospermopsis was found from 2004 until 2007, mainly in summer. Lago Javier and Laguna Chica were sampled in summer 2005 and 2007, and on both occasions Cylindrospermopsis was present. Laguna del Sauce has been sampled from 2002 to 2007, and Cylindrospermopsis occurred only during the summer of 2004 and 2005. All these systems are polymictic, small to large-sized (0.5 - 4550 ha) and shallow to medium depth (2.6 - 9.8 m maximum depth). Specific conductivity varied between 279 and 421 µS cm-1 and water temperature fluctuated around 24 ºC. Secchi depth was low to mean (0.4 - 1.3 m), while the ratio of mixing / euphotic depth varied between 1.27 and 3.06. Total nutrients were generally high (phosphorous = 55.7 – 223.0 μg L-1, nitrogen = 30.0 - 2079 μg L-1), while pH was alkaline (8.9 - 9.1) (Table II). The colour of the water was olive-green in all lakes and surface scum was only observed in Laguna Blanca.
In Laguna Blanca, C. raciborskii became the dominant species with an average abundance of 2.3x10⁶ cells ml-1 (1.0x10⁸ trichomes L-1). In this system, the total phytoplankton abundance was high (2.4x10⁶ cells ml-1) but taxonomic richness was low (8 species). In Lago Javier, C. raciborskii mean abundance was 9.4x10⁵ cells ml-1 (6.3x10⁷ trichomes L-1), representing ca. 50% of the total phytoplankton abundance. Other cyanobacteria were co-dominant (Planktolyngbya spp.) and total richness was 21 species. Laguna Chica had 1.6x10⁵ cells ml-1 C. raciborskii (6.3x10⁶ trichomes L-1), representing 29% of the total phytoplankton density. Richness was 40 species, and co-dominant species included Ceratium hirudinella, chlorophytes and cryptophytes. The lowest abundance of C. raciborskii was found in Laguna del Sauce (4.6 x10³ cells ml-1; 3.2x10⁶ trichomes L-1), where it represented only 9.9% of the total phytoplankton density. Planktolyngbya limnetica and Aphanizomenon issatschenkoi were dominant and total richness was 29 species in this system. C. raciborskii population biovolume varied from 7.9 mm3 L-1 in Laguna del Sauce to 312.7 mm3 L-1 in Laguna Blanca (Fig. 1).

Cylindrosperm
opsis raciborskii extends its distribution. Pan-American Journal of Aquatic Sciences (2008), 3(2): 142-151
145
AC
0
1
0 1
1 1
1
1 0 1 0 1 1
1
1
1
1 1
A W 4.5 4.0 4.0 4.9 4.0 3.7
4.0
3.5 4.4 1.3 3.5 4.0
3.2 3.9 4.0 3.0 3.3 3.6 3.7 3.6 3.0 1.8 2.5 1.0 4.0 3.9 3.9 3.7
4.9
A L 14.5 13.9 14.4 16.5 13.3 12.2
12.5
12.5 15.5 1.8
12.2 11.8
11.1 13.5 4.2 9.5 5.5
14.6 8.4
14.6 12.5 13.3 10.0 11.9 11.8 9.0
11.4 12.2
13.2
H W 4.0
3.5 2.9 2.9 2.9 2.4 1.8
1.8
1.8 6.1 3.3
1.9 1.9 2.0 2.4 2.4 3.2 2.5 3.2 2.4 2.6 2.8 1.2
2.7 2.6
H L 11.5
10.0 10.5 8.7
10.4 6.5 5.0
5.0
2.0 8.1 7.0
7.0 7.4 4.0 7.8 4.0
10.4 8.0
10.4 6.0 7.6 7.5 8.7
5.3 5.8
4.9
VC W 2.5 2.6 3.2 2.9 2.6 2.0 2.0 1.8 2.2 1.9
1.8 3.0 7.0
1.9 2.9 1.9 3.0 2.8 2.6 2.8 2.6 2.4 1.8 2.6 1.0
3.0 2.9
3.1 2.1
VC L 9.0
10.2 10.0 8.5 9.3 7.0 7.8
11.5 5.9
11.0
2.0
7.6 9.4 8.1
12.0 8.1
16.7
4.0
13.3 10.2 11.9
6.0 6.5
4.7
10.8
Tc 0.5 0.5
0 0.5 0.2
0.5 0 0 0 0
0.3 0.5 0 0 0 0
0.5 1 0 1
0.2 0.5 0.5 0 0 1 0 0
0.5 0.5
Tr 0.5 0.5
1 0.5 0.8
0.5 1 1 1 1
0.7 0.5 1 1 1 1
0.5 0 1 0
0.8 0.5 0.5 1 1 0 1 1
0.5 0.5
Species C. raciborskii C.raciborskii C. raciborskii C. raciborskii C. raciborskii C. raciborskii C. raciborskii C. raciborskii C. raciborskii C. raciborskii C. raciborskii C. raciborskii C. raciborskii C. raciborskii C. raciborskii C.cuspis C.cuspis C.cuspis C.cuspis C. raciborskii C. philippinensis C. raciborskii C. philippinensis C. raciborskii C .africana C. raciborskii C. cuspis C. raciborskii C. raciborskii C. raciborskii C. raciborskii C. taverae C. raciborskii
Climatic area Description Description
Temp Temp Temp Temp Temp Temp Temp Temp Temp Temp Temp Subt Subt Subt Subt Subt Subt Trop Trop Trop Trop Trop Trop Trop Trop Trop Trop Trop Trop Trop Trop
Label Desc 72 Desc 03 USA r3 USA r4 Hun r Eslo r Hun r2 Fran r2 Aust r5 Fran r1 Aust r2 Can r USA r Aust r6 Usa r2 Blanca Chica Javier Sauce India r
Phi Cuba Cuba r Afr Ep Bra r2 Afr Ea Afr Er Afr Ec Aust r1 Aust r3 Aust r4 Bra r1 Mex t Ta Ja r
Location Description Description USA Minnesota (Cashaca puddle) USA Minnesota (Starring lake) Slovakia Slovakia (Peri Lagoon) Hungary France Australia France Australia Canada USA Michigan (Mona Lake) Australia USA Indiana Uruguay (Blanca) Uruguay (Chica) Uruguay (Javier) Uruguay (Sauce) India Philipinas. Indonesia and Cuba Cuba East Africa Brazil (Paranoa Reservoir) East Africa (Victoria Lake) East Africa East Africa (Victoria Lake) Australia Australia (Solomon dam) Australia (Solomon dam) Brazil Mexico (Pond central Mexico) Thailand & Japan
Table I. Morphological features of Cylindrospermopsis morphotypes. Morphotypes found in Uruguay and in other regions obtained from literature are included, together with data about authors, location, climatic region, species, type of trichome (straight: Ts and coiled: Tc), length (L) and width (W) of vegetative cells (VC), heterocytes (H), and akynetes (A), and shape of apical cells (AC, attenuated: 1 or not: 0).
Author Seenayya & Subba Raju 1972 Komárek & Komárková 2003 Hill 1970 Hill 1970 Horecká & Komárek 1979 Hindák 1988 Padisák 1990-1991 Couté et al. 1997 McGregor & Fabbro 2000 Briand et al. 2002 Moore et al. 2005 Hamilton et al. 2005 Hong et al. 2006 Baker & Fabbro 1999 Jones & Sauter 2005 This study This study This study This study Singh 1962 Komárek 1984 Komárek 1984 Komárek & Kling 1991 Branco & Senna 1991 Komárek & Kling 1991 Komárek & Kling 1991 Komárek & Kling 1991 Baker 1991 Saker et al. 1999 Saker et al. 1999 Komárková et al. 1999 Komárek & Komárková 2002 Chonudomkul et al. 2004
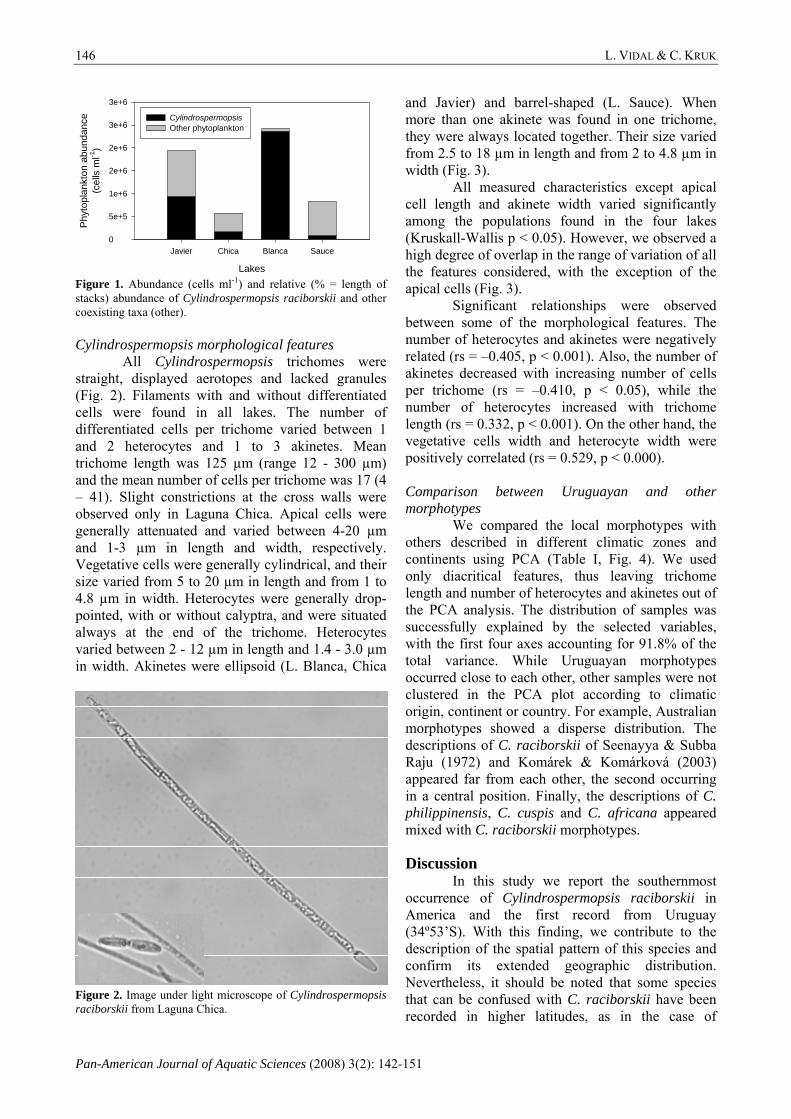
L. VIDAL & C. KRUK
Pan-American Journal of Aquatic Sciences (2008) 3(2): 142-151
146
Lakes
Javier Chica Blanca Sauce
Phy
topl
ankt
on a
bund
ance
(cel
ls m
l-1)
0
5e+5
1e+6
2e+6
2e+6
3e+6
3e+6
Cylindrospermopsis Other phytoplankton
Figure 1. Abundance (cells ml-1) and relative (% = length of stacks) abundance of Cylindrospermopsis raciborskii and other coexisting taxa (other). Cylindrospermopsis morphological features
All Cylindrospermopsis trichomes were straight, displayed aerotopes and lacked granules (Fig. 2). Filaments with and without differentiated cells were found in all lakes. The number of differentiated cells per trichome varied between 1 and 2 heterocytes and 1 to 3 akinetes. Mean trichome length was 125 µm (range 12 - 300 µm) and the mean number of cells per trichome was 17 (4 – 41). Slight constrictions at the cross walls were observed only in Laguna Chica. Apical cells were generally attenuated and varied between 4-20 µm and 1-3 µm in length and width, respectively. Vegetative cells were generally cylindrical, and their size varied from 5 to 20 µm in length and from 1 to 4.8 µm in width. Heterocytes were generally drop-pointed, with or without calyptra, and were situated always at the end of the trichome. Heterocytes varied between 2 - 12 µm in length and 1.4 - 3.0 µm in width. Akinetes were ellipsoid (L. Blanca, Chica
Figure 2. Image under light microscope of Cylindrospermopsis raciborskii from Laguna Chica.
and Javier) and barrel-shaped (L. Sauce). When more than one akinete was found in one trichome, they were always located together. Their size varied from 2.5 to 18 µm in length and from 2 to 4.8 µm in width (Fig. 3).
All measured characteristics except apical cell length and akinete width varied significantly among the populations found in the four lakes (Kruskall-Wallis p < 0.05). However, we observed a high degree of overlap in the range of variation of all the features considered, with the exception of the apical cells (Fig. 3).
Significant relationships were observed between some of the morphological features. The number of heterocytes and akinetes were negatively related (rs = –0.405, p < 0.001). Also, the number of akinetes decreased with increasing number of cells per trichome (rs = –0.410, p < 0.05), while the number of heterocytes increased with trichome length (rs = 0.332, p < 0.001). On the other hand, the vegetative cells width and heterocyte width were positively correlated (rs = 0.529, p < 0.000). Comparison between Uruguayan and other morphotypes
We compared the local morphotypes with others described in different climatic zones and continents using PCA (Table I, Fig. 4). We used only diacritical features, thus leaving trichome length and number of heterocytes and akinetes out of the PCA analysis. The distribution of samples was successfully explained by the selected variables, with the first four axes accounting for 91.8% of the total variance. While Uruguayan morphotypes occurred close to each other, other samples were not clustered in the PCA plot according to climatic origin, continent or country. For example, Australian morphotypes showed a disperse distribution. The descriptions of C. raciborskii of Seenayya & Subba Raju (1972) and Komárek & Komárková (2003) appeared far from each other, the second occurring in a central position. Finally, the descriptions of C. philippinensis, C. cuspis and C. africana appeared mixed with C. raciborskii morphotypes. Discussion
In this study we report the southernmost occurrence of Cylindrospermopsis raciborskii in America and the first record from Uruguay (34º53’S). With this finding, we contribute to the description of the spatial pattern of this species and confirm its extended geographic distribution. Nevertheless, it should be noted that some species that can be confused with C. raciborskii have been recorded in higher latitudes, as in the case of
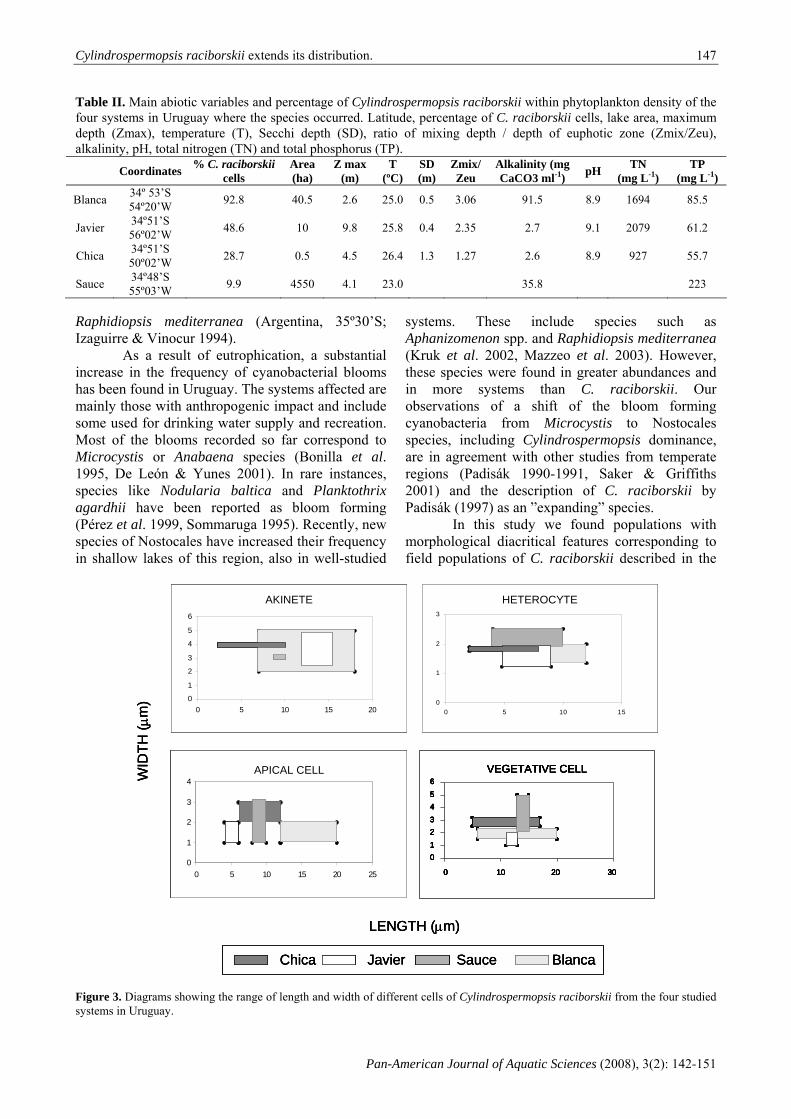
Cylindrospermopsis raciborskii extends its distribution.
Pan-American Journal of Aquatic Sciences (2008), 3(2): 142-151
147
Table II. Main abiotic variables and percentage of Cylindrospermopsis raciborskii within phytoplankton density of the four systems in Uruguay where the species occurred. Latitude, percentage of C. raciborskii cells, lake area, maximum depth (Zmax), temperature (T), Secchi depth (SD), ratio of mixing depth / depth of euphotic zone (Zmix/Zeu), alkalinity, pH, total nitrogen (TN) and total phosphorus (TP).
Coordinates % C. raciborskii cells
Area (ha)
Z max (m)
T (ºC)
SD (m)
Zmix/Zeu
Alkalinity (mg CaCO3 ml-1) pH TN
(mg L-1) TP
(mg L-1)
Blanca 34º 53’S 54º20’W 92.8 40.5 2.6 25.0 0.5 3.06 91.5 8.9 1694 85.5
Javier 34º51’S 56º02’W 48.6 10 9.8 25.8 0.4 2.35 2.7 9.1 2079 61.2
Chica 34º51’S 50º02’W 28.7 0.5 4.5 26.4 1.3 1.27 2.6 8.9 927 55.7
Sauce 34º48’S 55º03’W 9.9 4550 4.1 23.0 35.8 223
Raphidiopsis mediterranea (Argentina, 35º30’S; Izaguirre & Vinocur 1994).
As a result of eutrophication, a substantial increase in the frequency of cyanobacterial blooms has been found in Uruguay. The systems affected are mainly those with anthropogenic impact and include some used for drinking water supply and recreation. Most of the blooms recorded so far correspond to Microcystis or Anabaena species (Bonilla et al. 1995, De León & Yunes 2001). In rare instances, species like Nodularia baltica and Planktothrix agardhii have been reported as bloom forming (Pérez et al. 1999, Sommaruga 1995). Recently, new species of Nostocales have increased their frequency in shallow lakes of this region, also in well-studied
systems. These include species such as Aphanizomenon spp. and Raphidiopsis mediterranea (Kruk et al. 2002, Mazzeo et al. 2003). However, these species were found in greater abundances and in more systems than C. raciborskii. Our observations of a shift of the bloom forming cyanobacteria from Microcystis to Nostocales species, including Cylindrospermopsis dominance, are in agreement with other studies from temperate regions (Padisák 1990-1991, Saker & Griffiths 2001) and the description of C. raciborskii by Padisák (1997) as an ”expanding” species.
In this study we found populations with morphological diacritical features corresponding to field populations of C. raciborskii described in the
Chica Javier Sauce Blanca
0
1
2
3
4
5
6
0 5 10 15 20
AKINETE
0
1
2
3
0 5 10 15
HETEROCYTE
0
1
2
3
4
0 5 10 15 20 25
APICAL CELL
0123456
0 10 20 30
VEGETATIVE CELLWID
TH (μ
m)
LENGTH (μm)
Chica Javier Sauce BlancaChica Javier Sauce Blanca
0
1
2
3
4
5
6
0 5 10 15 20
AKINETE
0
1
2
3
0 5 10 15
HETEROCYTE
0
1
2
3
4
0 5 10 15 20 25
APICAL CELL
0123456
0 10 20 30
VEGETATIVE CELLWID
TH (μ
m)
LENGTH (μm)
0
1
2
3
4
5
6
0 5 10 15 20
AKINETE
0
1
2
3
0 5 10 15
HETEROCYTE
0
1
2
3
4
0 5 10 15 20 25
APICAL CELL
0123456
0 10 20 30
VEGETATIVE CELL
0
1
2
3
4
5
6
0 5 10 15 20
AKINETE
0
1
2
3
4
5
6
0 5 10 15 200
1
2
3
4
5
6
0 5 10 15 20
AKINETE
0
1
2
3
0 5 10 15
HETEROCYTE
0
1
2
3
0 5 10 150
1
2
3
0 5 10 15
HETEROCYTE
0
1
2
3
4
0 5 10 15 20 25
APICAL CELL
0
1
2
3
4
0 5 10 15 20 250
1
2
3
4
0 5 10 15 20 25
APICAL CELL
0123456
0 10 20 30
VEGETATIVE CELL
0123456
0 10 20 30
0123456
0 10 20 30
VEGETATIVE CELLWID
TH (μ
m)
LENGTH (μm)
Figure 3. Diagrams showing the range of length and width of different cells of Cylindrospermopsis raciborskii from the four studied systems in Uruguay.

L. VIDAL & C. KRUK
Pan-American Journal of Aquatic Sciences (2008) 3(2): 142-151
148
-1.0 -0.5 0.0 0.5 1.0
-1.0
-0.5
0.0
0.5
1.0
Tr
Tc
VC L
VC W
H L
H W
A L A W
AC
Const.
Desc Afr Ep
Aust r3
Phi Cuba
Bra r2
Aust r5
Eslo r
Desc Afr EaAfr Er
India r
Desc Afr Ec
Aust r1
Aust r2
Aust r4
Blanca
Bra r1
Can r
Chica
Cuba r
Fran r1
Hun r
Javier
Sauce
USA r
Aust r6
Desc 03
Desc 72
Mex t
Ta Ja r
Hun r2
Fran r2
USA r3
USA r4
Figure 4. Species-samples biplot for the first two PCA axis. Uruguayan morphotypes described here are included along with morphotypes from other climatic regions and taxonomic descriptions of species, labels according to Table I. Abbreviations: L for length and W for width, VC: vegetative cells, AC: apical cells with or without narrow ends, const.: with or without constrictions, H: heterocytes, A: akinetes, trichome shape: straight (Tr) and coiled (Tc). literature. However, we found a high variability in most morphological characteristics within and among lakes. Moreover, it was difficult to clearly separate this species from other Cylindrospermopsis taxa, including C. cuspis and C. africana, due to the high overlap of cell sizes and shapes. Although the identification of these organisms at the species level was not trivial, Uruguayan morphotypes occurred together in the PCA analysis when compared with those of other regions. Based on this exercise, we suggest that more work is needed to clarify the taxonomical aspects as well as their changes during the life cycle of different species of the genera (Komárek 2002).
Morphological variation in C. raciborskii was not associated with latitudinal, continental or even country distribution. Moreover, our results showed that morphotypes belonging to the same country could differ as much as those from different continents. Despite the definition of the species as tropical (Padisák 1997), morphological characters were independent of climatic origin. This suggests that local factors are more relevant determining morphology than factors at a global scale. In nature, C. raciborskii displays a high morphological variability that is not completely explained by genetic distances (Saker et al. 1999). Furthermore, Gugger et al. (2005) showed that morphotypes from different continents might be genetically closer than

Cylindrospermopsis raciborskii extends its distribution.
Pan-American Journal of Aquatic Sciences (2008), 3(2): 142-151
149
those from the same region. These authors also detected higher similarities among different species or even genera from the same continent than between C. raciborskii of different continents. Our results showing the overlap of C. raciborskii with other Cylindrospermopsis species gives further evidence for these conclusions. As morphological and genetic differences are not linked, at least at this level, we expect that local environmental conditions might explain this variation (Reynolds 1984, Neilan et al. 2003). This is the case for the frequency of akinetes, which increases markedly in cooler regions (Padisák 1997).
Cylindrospermopsis raciborskii is common-ly observed over a wide range of ecological conditions (Padisák 1997). Most of what it is known about the environmental preferences of C. racibo-rskii is based upon tropical water bodies. However, its expansion towards temperate climates suggests that different ecological trends are emerging. For example, while C. raciborskii typically occurs in deep (>50 m) stratified tropical lakes, it seems to prefer shallower waters in temperate zones (i.e. <10 m) (Padisák 1997). However, experimental temperate and tropical isolates have similar light and temperature requirements (Briand et al. 2004, Chonodunkul et al. 2004). In this study, Cylindrospermopsis appeared in densities ranging from low abundances up to bloom conditions (maximum observed densities 108 –109 trichomes L-1 according to Padisák 1997) in newly built reservoirs or natural lakes under current anthropogenic impacts. In the analysed database from Uruguayan subtropical lakes, we observed higher occurrence in shallow, well-mixed systems. Most of the environmental conditions found reflect expectations based on the literature (Padisák 1997). A further refinement of this study might involve the analysis of how morphological organism’s attributes change with environmental conditions
The recent appearance and the low frequen-cy of occurrence in southern latitudes of C. raci-borskii might reflect the effects of climate warming or its spreading from tropical areas. As suggested by Padisák (1997), morphological variations during the C. raciborskii life cycle render difficult to clarify the association between morphological and environ-mental changes. Analysis of the changes in morpho-logical characteristics of different population under different local environmental conditions along with genetic studies might help unravel these questions. In this sense, this working group emphasizes the necessity to analyse the morphological variability within the “Cylindrospermopsis complex” during a whole annual cycle.
Acknowledgements We are grateful to S. Bonilla, D. Conde and M. Meerhoff for their kind criticism and suggestions on the manuscript. We are thankful to Dermot Antoniades for the English review. We also thank N. Mazzeo, AGUAS DE LA COSTA S.A and URAGUA for the provision of data. This study was partially funded by AGUAS DE LA COSTA S.A., URAGUA and WOTRO foundation for the advance of tropical research. References Bonilla, S., Pérez M. C. & De León, L. 1995.
Cyanophyceae plactónicas del lago Ton-ton, Canelones, Uruguay. Hoehnea, 22: 183-190.
Branco, C. W. C. & Senna, P. A. C. 1991. The taxonomic elucidation of the Paranoá Lake (Brasilia, Brazil) problem: Cylindrosper-mopsis raciborskii. Bulletin du Jardin Botanique National de Belgique, 61: 85-91.
Branco, C. W. C. & Senna, P. A. C. 1994. Factors influencing the development of Cylindros-permopsis raciborskii and Microcystis aeruginosa in the Paranoá reservoir, Brasília, Brazil. Algological Studies, 75: 85-96.
Briand, J. F., Robillot C., Quiblier-Lloberas, C., Humbert, J.-F., Coute, A. & Bernard, C. 2002. Environmental context of Cylindrospermopsis raciborskii (Cyanobacteria) blooms in a shallow pond in France. Water Research, 36: 3183-92.
Briand, J. F., Leboulanger, C., Humbert, J. F., Bernard, C. & Dufour, P. 2004. Cylindros-permopsis raciborskii (Cyanobac-teria) invasion at mid-latitudes: selection, wide physiological tolerance, or global warming? Journal of Phycology, 40: 231-238.
Chonudomkul, D., Yongmanitchai, W., Theeragool, G., Kawachi, M., Kasai, F., Kaya, K. & Watanabe, M. M. 2004. Morphology, genetic diversity, temperature tolerance and toxicity of Cylindrospermopsis raciborskii (Nosto-cales, Cyanobacteria) strains from Thailand and Japan. FEMS Microbiology Ecology, 48: 345-355.
De León, L. & Yunes, J. S. 2001. Short Communication. First report of a microcystin-containing bloom of the cyanobacterium Microcytis aeruginosa in the La Plata River, South America. Enviromental Toxicology, 16: 110-112.
De Tezanos-Pinto, P., Allende, L. & O’Farrell, I. 2006. Influence of free-floating plants on the structure of a natural phytoplankton assemblage: an experimental approach.
L. VIDAL & C. KRUK
Pan-American Journal of Aquatic Sciences (2008) 3(2): 142-151
150
Journal of Plankton Research, 28: 1-10. Fabbro, L. D. & Duivenvoorden, L. J. 1996. Profile
of a bloom of the cyanobacterium Cylindrospermopsis raciborskii (Woloszyns-ka) Seenaya and Subba Raju in the Fitzroy River in tropical central Queensland. Marine & Freshwater Research, 47: 685-94.
Fastner, J., Heinze, R., Humpage, A. R., Mischke, U., Eaglesham, G. K. & Chorus, I. 2003. Cylindrospermopsin occurrence in two German lakes and preliminary assessment of toxicity and toxin production of Cylindrospermopsis raciborskii (Cyanobac-teria) isolates. Toxicon, 42: 313-21.
Figueredo, C. C., Gianni, A. & Bird, D. F. 2007. Does allelopathy contribute to Cylin-drospermopsis raciborskii (Cyanobacteria) bloom occurrence and geographic expansion? Journal of Phycology, 43: 256-265.
Gugger, M., Molica, R., Le Berre, B., Dufour, P., Bernard, C. & Humbert, J-F. 2005. Genetic Diversity of Cylindrospermopsis Strains (Cyanobacteria) Isolated from Four Conti-nents. Applied Environmental Microbio-logy, 71: 1097-1100.
Harding, W. R. 1996. The phytoplankton ecology of a hypertrophic shallow lake, with particular reference to primary production, periodicity and diversity. PhD Thesis. University of Cape Town, South Africa.
Hawkins, P. R., Chandrasena, N. R., Jones, G. J., Humpage, A. R. & Falconer, I. R. 1997. Isolation and purification of Cylindro-spermopsis raciborskii from an ornamental lake. Toxicon, 35: 341-346.
Hill, H. 1970. Anabaenopsis raciborskii Woloszynska in Minnesota lakes. Journal of Minnesota Academy of Science, 36: 80-82.
Hillebrand, H., Dürselen, C-D., Kirschtel, D., Pollingher, U. & Zohary, T. 1999. Biovolume calculation for pelagic and benthic micro-algae. Journal of Phycology, 35: 403-424.
Huszar, V. L. M., Silva, L. H. S., Marinho, M., Domingos, P. & Anna, C. L. S. 2000. Cyanoprokaryote assemblages in eight productive tropical Brazilian waters. Hidro-biologia, 424: 67-77.
Izaguirre, I. & Vinocur, A. 1994. Typology of shallow lakes of the Salado River basin (Argentina), based on phytoplankton communities. Hydrobiologia, 277: 49-62.
Jones W. W. & Sauter, S. 2005. Office of Water Quality. Indiana Department of Environmental Management. Indianapolis, In: School of Public and Environmental
Affairs. Indiana University, Bloomington, IN. 41pp.
Komárek, J. 1984. Sobre las cianofíceas de Cuba. (3) Especies planctónicas que forman florecimientos de las aguas. Acta Botánica Cubana, 19: 1-30.
Komárek, J. 2002. Proceedings of Freshwater Harmful algal blooms: health risk and control management. Isitituto Superiore di Sanità. Serena Melchiorre, Emanuela Viaggiu and Milena Bruno (Eds). Rapporti ISTISAN 02/9. 103 p.
Komárek, J. & Kling, H. 1991. Variation in six planktonic genera in lake Victoria (East Africa). Algological Studies, 61: 21-45.
Komárek, J. & Komárková, J. 2003. Phenotype diversity of the cyanoprocaryotic genus Cylindrospermopsis (Nostocales); review 2002. Czech Phycology, 3: 1-30.
Kruk, C., Mazzeo, N., Lacerot, G. & Reynolds, C. S. 2002. Classification schemes for phyto-plankton: a local validation of a functional approach to the analysis of species temporal replacement. Journal of Plankton Research, 24: 1191-1216.
Mazzeo, N., Rodríguez-Gallego, L., Kruk, C., Meerhoff, M., Gorga, J., Lacerot, G., Quintans, F., Loureiro, M., Larrea, D. & García-Rodríguez, F. 2003. Effects of Egeria densa Planch. beds on a shallow lake without piscivorous fish. Hydrobiologia, 506-509: 591-602.
McGregor, G. B. & Fabbro, L. D. 2000. Dominance of Cylindrospermopsis raciborskii (Nosto-cales, Cyanoprokaryota) in Queensland tropi-cal and subtropical reservoirs: Implications for monitoring and management. Lakes & Reser-voirs: Research and Management, 5: 195-205.
Neilan, B. A., Saker, M. L., Fastner, J., Törökné, A. & Burns, B. P. 2003. Phylogeography of the invasive cyanobacterium Cylindrospermopsis raciborskii. Molecular Ecology, 12: 133-140.
Padisák, J. 1990-91. Occurrence of Anabaenopsis raciborskii Wolosz. in the pond Tómalom near Sopron, Hungary. Acta Botanica Hungarica, 36: 163-165.
Padisák, J. 1997. Cylindrospermopsis raciborskii (Woloszynska) Seenayya et Subba Raju, an expanding, highly adaptative cyanobacterium: worldwide distribution and review of its ecology. Archiv für Hydrobiologie. Supplementband. Monographic studies, 107: 563-93.
Pérez M. C., Bonilla, S., De León, L., Smarda, J. &
Cylindrospermopsis raciborskii extends its distribution.
Pan-American Journal of Aquatic Sciences (2008), 3(2): 142-151
151
Komárek, J. 1999. A bloom of Nodularia baltica-spumigena group (Cyanobacteria) in a shallow coastal lagoon of Uruguay, South America. Algological Studies, 93: 91-101.
Reynolds, C. S. 1984. The ecology of freshwater phytoplankton. Cambridge University, London.
Ryan, E. F., Hamilton, D. P. & Barnes, G. 2003. Recent occurrence of Cylindrospermopsis raciborskii in Waikato lakes of New Zealand. New Zealand Journal of Marine and Freshwater Research, 37: 829-836.
Saker, M. L., Thomas, A. D. & Norton, J. H. 1999. Cattle mortality attributed to the toxic cy-anobacterium Cylindrospermopsis raciborskii in an outback region of north Queensland. Environmental Toxicology, 14: 179-182.
Saker, M. L. & Griffiths, D. L. 2001. Occurrence of blooms of the cyanobacterium Cylindrosper-mopsis raciborskii (Woloszynska) Seenayya and Subba Raju in a north Queensland domestic water supply. Marine & Freshwater Research, 52: 907-15.
Seenayya, G. & Subba Raju, N. S. S. 1972. On the ecology and systematic position of the alga known as Anabaenopsis raciborskii (Wolosz.) Elenk. and a critical evaluation of the forms described under the genus Anabaenopsis. In: Desikachary, T. V. (Ed.) Taxonomy and Biology of Blue-green Algae. University of Madras, Madras, India, pp. 52-57.
Singh, R. N. 1962. Seasonal variants of Anabaenopsis raciborskii Wolosz. Hidro-biología, 20: 87-91.
Sommaruga, R. 1995. Microbial and classical food webs; visit to a hypertrophic lake. FEMS Microbiology Ecology, 17: 257-270.
ter Braak, C. J. F. & Smilauer, P. 2003. CANOCO for windows version 4.52. Biometrics-Plant Research International, Wageningen, The Netherlands.
Torgan, L. & García, M. 1989. Novas ocorrências (Cyanophytas e Chlorophyta) para a ficoflora planctônica do Rio Grande do Sul, Brasil. Hoehnia, 16: 57-64.
Tóth, L. G. & Padisák, J. 1986. Meteorological factors affecting the bloom of Anabaenopsis raciborskii Wolosz. (Cyanophyta: Hormogo-nales) in the shallow Lake Balaton, Hungary. Journal of Plankton Research, 8: 353–63.
Utermöhl H. 1958. Zur Vervollkommung der quantitativen Phytoplankton- Methodik. Mitteilungen. Internationale Vereinigung fuer theoretische und angewandte Limnologie, 9: 1-38.
Valderrama, J. C. 1981. The simultaneous analysis of total nitrogen and total phosphorus in natural waters. Marine Chemistry, 10: 109-122.
Wiedner, C., Nixdorf, B., Heinze, R., Wirsing, B., Neumann, U. & Weckesser, J. 2002. Regulation of cyanobacteria and microcystin dynamics in polymictic shallow lakes. Archiv fuer Hydrobiologie, 155: 383-400.
Woloszynka, J. 1912. Das Phytoplankton einiger Javanian Seen mit Berücksichtigung des Sawa-Planktons. Bulletin of the International Academy of Science Cracoviae, 6: 649-709.
Zalocar, Y. & Forastier, M. 2005. Biodiversidad de Cyanophyceae (Cyanobacteria) y especies toxigénicas del litoral fluvial argentino. Temas de la Biodiversidad del Litoral fluvial argentino II INSUGEO, Miscelánea, 14: 213-228.
Received June 2007 Accepted July 2008
Published online July 2008

This picture may be used for academic or personal purposes but always accompanied by the author's information (copyright). To obtain permission for commercial use or for any other non-personal, non-academic use, or to inquire about reprints, fees, and licensing, please contact the author via e-mail.
Pan-American Journal of Aquatic Sciences (2008), 3 (2): I
Diffusion material only – Do not cite
Original Scientific Photographs
BY FABRÍCIO HIROIUKI ODA1, THIAGO M. ODA2 & MARIANA FERRARI FELISMINO3
1Universidade Federal de Goiás - UFG, Laboratório de Comportamento Animal, Instituto de Ciências Biológicas, Campus Samambaia. Conjunto Itatiaia, 74000-970. C.P. 131. Goiânia, State of Goiás, Brazil. E-mail: [email protected] 2Universidade Federal da Grande Dourados - UFGD. Caixa Postal 529, CEP 79804-970, Cidade Universitária, Dourados, State of Mato Grosso do Sul, Brazil. E-mail: [email protected] 3Universidade Estadual de Maringá - UEM. Departmento de Biologia Celular e Genética, CEP 87020-900, Maringá, State of Paraná, Brazil. E-mail: [email protected]
The forms by which the preys avoid to be eaten by its predators are as diverse as the hunting’s tactics (Rickfles 2003). In many fish species, behaviour varies adaptively among populations in response to predation risk (Magurran et al. 1993). Rivulus Poey is the most species genus among Neotropical aplocheiloids, comprising about 100 valid species, occurring in the great majority of river basins of Middle and South America (Costa 2003). On June 29th, 2007 at 2130h, in an artificial small tank (1 m2) at the Araçatuba city, State of São Paulo, Brazil, an adult specimen of Rivulus apiamici (Fig. 1) was observed under a leaf of water lettuce (Pistia stratiotes L.). The observation was accomplished during the night period, during 10 min. When the fish was disturbed by our presence, it dove into the water. The antipredator behaviour displayed by R. apiamici could be attributed by the presence of a juvenile Cichla ocellaris Bloch & Schneider (1801) in the tank. Picture’s characteristics: Digital Machine model Sony DSC-R1, 3 megapixels resolution (72 dpi), diaphragm aperture 6.3, time of exposition 1/2000; Speed ISO-160. References Costa, W. J. E. M. 2003. Family Rivulidae (South American annual fishes). Pp 526-548. In: Reis, R. E.; Kullander, S. O. &
Ferraris Jr., C. J. (Eds.). Check list of the freshwater fishes of South and Central America. Porto Alegre, Edipucrs, 729p.
Magurran, A. E.; Seghers, B. H.; Carvalho, G. R. & Shaw, P. W., 1993. Evolution of adaptive variation in antipredator behaviour. In: Huntingford, F. A. & Torricelli, P. (Eds.) Behavioural Ecology of Fishes, 23(1) 1-4.
Rickfles, R. E. 2003. A Economia da Natureza. 5ª Edição. Ed. Guanabara Koogan, Rio de Janeiro, 2003.

Pan-American Journal of Aquatic Sciences (2008) 3(2): II-IV
HaviStat© v 1.0
Aplicación para evaluar uso y preferencia de hábitat
JAVIER MONTENEGRO1 & ALBERTO ACOSTA2
1Pontificia Universidad Javeriana, Colombia, Bogotá, ([email protected]) 2Pontificia Universidad Javeriana, Colombia, Bogotá, ([email protected])
Abstract. The design of new informatics tools is essential to improve the efficiency and reliability on data collection and results analysis. The selection and habitat preference are topics of great importance in ecology, evolution, and natural resource management; however, most of the theory and the evaluation methods are disperse in the literature, and there is a lack of tools that integrate it on a concise and practical way. Considering this, it was created the HaviStat © application, that allows to perform all the mathematical, statistical and graphical procedures required to infer habitat use, selection, and preference (or resources), as well as breadth niche for any species. The application is the result of a wide literature review, where we have selected the most important information to allow users to understand and perform a great variety of mathematical tests. The advantage of HaviStat © with respect to other applications is that it is free of charge, do not requires installation or extensive knowledge in the topic. This application is also clear, specific, practical, written in a user-friendly language, include literature and manuals that properly guide the user, and default functions that will prevent users to carry out critic errors. Key words: habitat, preference, selection, use.
Resumo. El diseño de nuevas herramientas informáticas resulta fundamental, para mejorar la eficiencia y confiabilidad en la obtención de datos y análisis de resultados. La selección y preferencia de hábitat son temáticas de gran importancia en ecología, evolución y manejo de recursos naturales; no obstante, la mayor parte de la teoría y metodología para su evaluación está dispersa en la literatura, y se carece de herramientas que la compilen de manera práctica y concisa. Considerando esto fue creada la aplicación HaviStat©, que permite realizar todos los procedimientos matemáticos, estadísticos y gráficos requeridos para inferir uso, selección, preferencia de hábitat (o recursos), al igual que amplitud de nicho para cualquier especie. Siendo esta aplicación el resultado de una extensa revisión bibliográfica, donde se ha seleccionado lo más importante para permitir a los usuarios entender y realizar una gran variedad de pruebas matemáticas. La ventaja de HaviStat© frente a otras aplicaciones es que esta es de acceso libre, no requiere instalación, ni extensos conocimientos en la temática. Esta aplicación además es clara, concreto, práctico, está escrita en un lenguaje amigable, cuenta con bibliografía y manuales que guían apropiadamente al usuario y posee funciones predeterminadas que evitarán que el usuario cometa errores críticos. Palabras clave: hábitat, preferencia, selección, uso.
Introducción Conocer la preferencia de hábitat de una
especie es un tema de particular interés en múltiples disciplinas como biología, ecología y áreas relacionadas con el manejo y conservación de recursos naturales. Esta información permite inferir las necesidades ecológicas de una especie de interés, es decir las condiciones y recursos bióticos y abióticos que requiere un organismo para sobrevivir,
crecer y reproducirse; al igual que ayuda a explicar su abundancia, distribución espacial (Manly et al. 1993) y estrategias de evolución para su persistencia en el tiempo. No obstante, este tema es controversial y difícil de abordar por investigadores inexpertos, en parte debido a la alta dispersión de información en la literatura y a los múltiples métodos matemáticos que se han generado para tal fin. Hasta el momento no
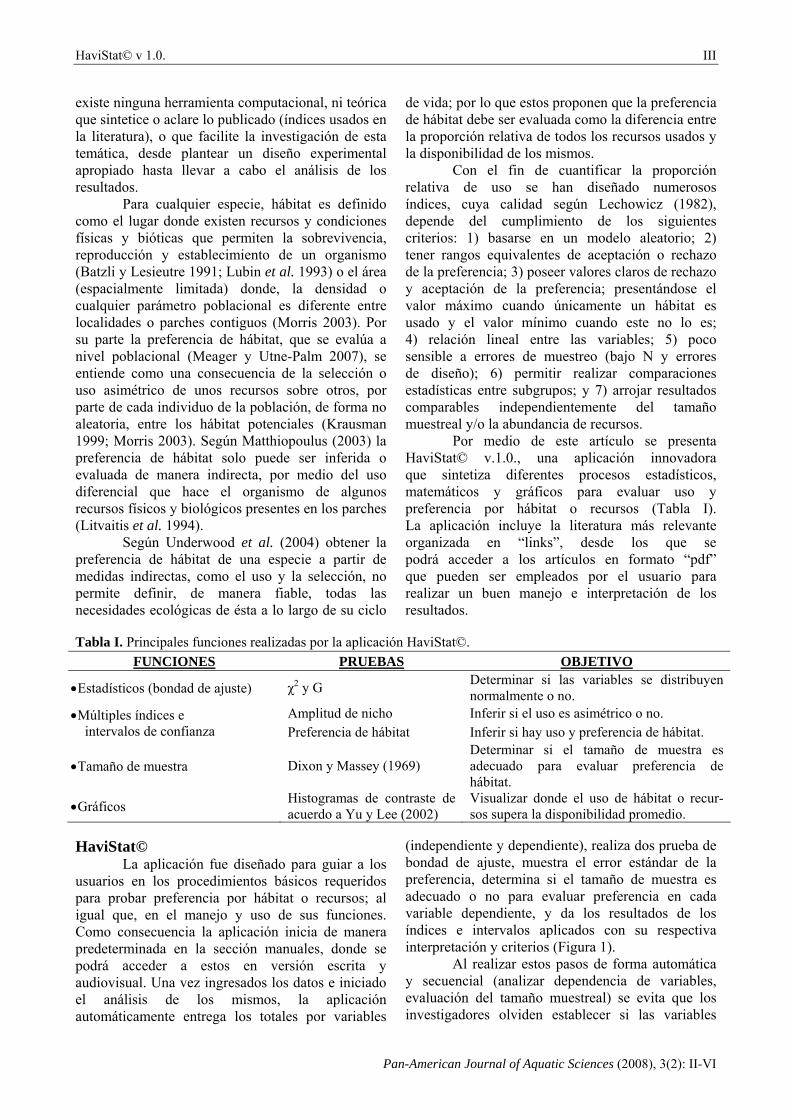
HaviStat© v 1.0.
Pan-American Journal of Aquatic Sciences (2008), 3(2): II-VI
III
existe ninguna herramienta computacional, ni teórica que sintetice o aclare lo publicado (índices usados en la literatura), o que facilite la investigación de esta temática, desde plantear un diseño experimental apropiado hasta llevar a cabo el análisis de los resultados.
Para cualquier especie, hábitat es definido como el lugar donde existen recursos y condiciones físicas y bióticas que permiten la sobrevivencia, reproducción y establecimiento de un organismo (Batzli y Lesieutre 1991; Lubin et al. 1993) o el área (espacialmente limitada) donde, la densidad o cualquier parámetro poblacional es diferente entre localidades o parches contiguos (Morris 2003). Por su parte la preferencia de hábitat, que se evalúa a nivel poblacional (Meager y Utne-Palm 2007), se entiende como una consecuencia de la selección o uso asimétrico de unos recursos sobre otros, por parte de cada individuo de la población, de forma no aleatoria, entre los hábitat potenciales (Krausman 1999; Morris 2003). Según Matthiopoulus (2003) la preferencia de hábitat solo puede ser inferida o evaluada de manera indirecta, por medio del uso diferencial que hace el organismo de algunos recursos físicos y biológicos presentes en los parches (Litvaitis et al. 1994).
Según Underwood et al. (2004) obtener la preferencia de hábitat de una especie a partir de medidas indirectas, como el uso y la selección, no permite definir, de manera fiable, todas las necesidades ecológicas de ésta a lo largo de su ciclo
de vida; por lo que estos proponen que la preferencia de hábitat debe ser evaluada como la diferencia entre la proporción relativa de todos los recursos usados y la disponibilidad de los mismos.
Con el fin de cuantificar la proporción relativa de uso se han diseñado numerosos índices, cuya calidad según Lechowicz (1982), depende del cumplimiento de los siguientes criterios: 1) basarse en un modelo aleatorio; 2) tener rangos equivalentes de aceptación o rechazo de la preferencia; 3) poseer valores claros de rechazo y aceptación de la preferencia; presentándose el valor máximo cuando únicamente un hábitat es usado y el valor mínimo cuando este no lo es; 4) relación lineal entre las variables; 5) poco sensible a errores de muestreo (bajo N y errores de diseño); 6) permitir realizar comparaciones estadísticas entre subgrupos; y 7) arrojar resultados comparables independientemente del tamaño muestreal y/o la abundancia de recursos.
Por medio de este artículo se presenta HaviStat© v.1.0., una aplicación innovadora que sintetiza diferentes procesos estadísticos, matemáticos y gráficos para evaluar uso y preferencia por hábitat o recursos (Tabla I). La aplicación incluye la literatura más relevante organizada en “links”, desde los que se podrá acceder a los artículos en formato “pdf” que pueden ser empleados por el usuario para realizar un buen manejo e interpretación de los resultados.
Tabla I. Principales funciones realizadas por la aplicación HaviStat©.
FUNCIONES PRUEBAS OBJETIVO
• Estadísticos (bondad de ajuste) χ2 y G Determinar si las variables se distribuyen normalmente o no.
Amplitud de nicho Inferir si el uso es asimétrico o no. • Múltiples índices e intervalos de confianza Preferencia de hábitat Inferir si hay uso y preferencia de hábitat.
• Tamaño de muestra Dixon y Massey (1969) Determinar si el tamaño de muestra es adecuado para evaluar preferencia de hábitat.
• Gráficos Histogramas de contraste de acuerdo a Yu y Lee (2002)
Visualizar donde el uso de hábitat o recur-sos supera la disponibilidad promedio.
HaviStat©
La aplicación fue diseñado para guiar a los usuarios en los procedimientos básicos requeridos para probar preferencia por hábitat o recursos; al igual que, en el manejo y uso de sus funciones. Como consecuencia la aplicación inicia de manera predeterminada en la sección manuales, donde se podrá acceder a estos en versión escrita y audiovisual. Una vez ingresados los datos e iniciado el análisis de los mismos, la aplicación automáticamente entrega los totales por variables
(independiente y dependiente), realiza dos prueba de bondad de ajuste, muestra el error estándar de la preferencia, determina si el tamaño de muestra es adecuado o no para evaluar preferencia en cada variable dependiente, y da los resultados de los índices e intervalos aplicados con su respectiva interpretación y criterios (Figura 1).
Al realizar estos pasos de forma automática y secuencial (analizar dependencia de variables, evaluación del tamaño muestreal) se evita que los investigadores olviden establecer si las variables

J. MONTENEGRO & A. ACOSTA
Pan-American Journal of Aquatic Sciences (2008) 3(2): II-VI
IV
poseen distribución aleatoria o no, mediante las pruebas χ2 y G, siendo la G, según Krebs (1989), la más adecuada para estudios de preferencia debido a su solidez y por basarse en la diferencia entre las proporciones de uso y disponibilidad en cada una de las categorías de la variable independiente. Adicionalmente, al ser evaluado el tamaño de
muestra con dos pruebas, el investigador podrá conocer la veracidad de sus resultados, ya que según Cherry (1996) la primera prueba (N*pi) es menos exigente que la segunda (N*(1-pi)) y por tanto, si el tamaño muestreal supera ambas pruebas, los resultados serán confiables para inferir preferencia ya sea por hábitat o recursos.
Figura 1. Interface de la aplicación HaviStat© y algunas de sus funciones predeterminadas para el análisis de la preferencia. Totales por variable, resultado de las pruebas χ2 y G, error estándar de la preferencia y evaluación del tamaño de muestra.
Con el fin de evaluar la preferencia, la aplicación HaviStat© incluye 4 índices de amplitud de nicho que permitirán determinar si las categorías de variable independiente están siendo usadas asimétricamente o no, de no ser así, esto implicaría que la variable dependiente se distribuye aleatoriamente (p>0.05) entre las categorías de la variable independiente y por ende no debería existir preferencia. Para inferir si existe preferencia o no, se pueden emplear los 18 índices y 2 intervalos de confianza que posee la aplicación HaviStat©. Si el investigador lo desea podrá seleccionar los más adecuados para su estudio con ayuda de la literatura complementaria, aunque cabe resaltar que la aplicación ofrece la opción “Los más importantes (*)” con la que automáticamente se aplican los índices más relevantes, según el autor (después de realizar una
exhaustiva revisión bibliográfica de más de 300 artículos en el tema). Los índices e intervalos de confianza fueron seleccionados siguiendo los criterios propuestos por Lechowicz (1982) tales como: no ser muy sensibles a errores muéstrales, tener rangos de aceptación y rechazo de preferencia equivalentes, valores máximos y mínimos estables, y asociar un valor estadístico, como ocurre con intervalos de confianza.
La aplicación no solamente genera los resultados de forma automática sino que también permite realizar gráficos de contraste, al generar histogramas de frecuencia que comparan el uso efectivo con la disponibilidad en cada una de las categorías de la variable independiente; visualizándose así, por cuál de las categorías existe preferencia, es decir, cua do el uso supera la disponibilidad promedio (Figura 2).
Figura 2. Histogramas de frecuencia generado por la aplicación HaviStat© contrastando el uso efectivo con la disponibilidad en cada una de las categorías de la variable independiente. En azul la disponibilidad de hábitat y en rojo los hábitat usados.

HaviStat© v 1.0.
Pan-American Journal of Aquatic Sciences (2008), 3(2): II-VI
V
El ejemplo de la Figura 2 corresponde a un estudio de campo, en el que se cuantificaron y categorizaron de acurdo a la forma, todas las esponjas observadas y la asociación o no del Zoantharia, Parazoanthus sp. con estas. El total de esponjas cuantificadas corresponden al potencial de uso (disponibilidad de hábitat) y la frecuencia de asociación de Parazoanthus sp. a estas, al uso observado (hábitat usados). En el histograma de contraste se observa que la mayor frecuencia de asociación de Parazoanthus sp. a las esponjas se ubican en las categorías de forma incrustante y ramificada, categorías que también presentan la menor frecuencias de esponjas. Esto nos permite inferir que Parazoanthus sp. no está asociándose de forma aleatoria y por tanto, puede existir una preferencia por esponjas de forma incrustante y ramificada, aunque es importante verificar estos resultados con los índices e intervalos de confianza.
HaviStat© frente a otras aplicaciones de su tipo, posee ciertas ventajas: no es comercial, no posee una interfase compleja, ni requiere instalación, al funcionar como un aplicativo para Microsoft Office Excel 2003 o superiores. Las características amigables de la aplicación son otro atractivo, particularmente para usuarios novatos.
A diferencia de otras aplicaciones creados por ingenieros y programadores, HaviStat© es una aplicación diseñada por biólogos y para biólogos, por tanto es el resultado de una exhaustiva revisión bibliográfica sobre el tema, trabaja con los datos de campo en bruto (previa compilación) y finalmente, funciona a partir de variables bien conocidas y fáciles de obtener para los investigadores, como nivel de confianza y numero de variables dependientes e independientes.
Planes Futuros
La aplicación será traducida a varios idiomas como Ingles, Portugués y Japonés. La sección literatura complementaria será actua-lizada regularmente, los algoritmos serán depurados con el fin de hacerlos más eficientes y se imple-mentaran nuevas pruebas y procedimientos. Para solicitar copia gratuita de la aplicación, al igual que para efectuar un “feed-back” efectivo (recibir sugerencias y comentarios), los usuarios podrán escribir al siguiente correo electrónico “[email protected]”.
Conclusiones
La aplicación HaviStat© es una valiosa herramienta en ecología y aéreas afines, que permite a los investigadores inferir, de manera rápida y
efectiva, la preferencia por hábitat o recursos de cualquier organismo. Los investigadores pueden usar la aplicación sin mayores inconvenientes, dada su sencillez y practicidad.
HaviStat© es útil en la obtención de información relevante para estrategias de manejo que pretendan aumentar el tamaño poblacional de una especie en vía de extinción o rara, o por lo contrario, controlar el crecimiento poblacional de una especie invasora o plaga. De igual forma, la “preferencia de hábitat” puede ser usada como indicador de nuevas condiciones, recursos, o adaptaciones como consecuencia del cambio climático global.
Agradecimientos
Se le agradece a la dirección de carrera del departamento de biología de la Pontificia Universidad Javeriana (Bogotá, Colombia) por facilitar los fondos para la producción física de la aplicación y a los profesores-investigadores que participaron en el proceso de evolución y validación de la aplicación. Referencias Batzli, G. O. & Lesieutre, C. 1991. The influence of
high quality food on habitat use by arctic microtine rodents. Oikos, 60(3): 299-306.
Cherry, S. A. 1996. Comparison of Confidence Interval Methods for Habitat Use-Availability Studies. The Journal of Wildlife Management, 60(3): 653-658.
Krausman, R. P. 1999. Some basic principles of habitat use, grazing behavior of livestock and wildlife. Idaho Forest. Wildlife and Range Experiment Station Bulletin, 70: 85-90.
Krebs, C. J. 1989. Ecological methodology. Harper-Collins Publishers, New York, p 456-495.
Lechowicz, M. J. 1982. The sampling characteristics of electivity indices. Oecologia, 52(1): 22–30.
Litvaitis, J. A., Tittus, K. & Anderson, E.M. 1994. Research and Management Techniques for Wildlife and Habitats. Bookhout, Th.A. ed. Bethesda, Maryland, p 254-274.
Lubin, Y., Ellner, S. & Kotzman, M. 1993. Web relocation and habitat selection in a desert widow spider. Ecology, 74(7): 2456-2459.
Manly B., McDonald, L. & Thomas, D. 1993. Resource Selection by Animals, Statistical Design and Analysis for Field Studies. Chapman & Hall, London, p 10.
Matthiopoulus, J. 2003. The use of space by animals as a function of accessibility and preference. Ecological Modeling, 159(2): 239-268.

VI J. MONTENEGRO & A. ACOSTA
Pan-American Journal of Aquatic Sciences (2008) 3(2): II-VI
Meager, J. J. & Utne-Palm, A. C. 2007. Effect of turbidity on habitat preference of juvenile Atlantic cod, Gadus morhua. Environmental Biology of Fishes DOI 10.1007/s10641-007-9183-z.
Morris, D. W. 2003. Toward an ecological synthesis: a case for habitat selection. Oecologia, 136 (1): 1-13.
Underwood, A. J., Chapman, M. G. & Crowe, T. P. 2004. Identifying and understanding ecological preferences for habitat or prey.
Journal of Experimental Marine Biology and Ecology, 300: 161-187.
Yu, S. L. & Lee, T. W. 2002. Habitat preference of the stream fish, Sinogastromyzon puliensis (Homalopteridae). Zoological Studies, 41(2): 183-187.
Received February 2008 Accepted May 2008
Published online June 2008