(PDF) Textile dye wastewater characteristics and constituents ...
Upload
independentCategory
view
0download
0
Vibrational Spectroscopy: A tool for characterization of nucleic acid constituents: Cytosine and Uracil 33
Asian Journal of Physics Vol. 24, No 1 (2015) 33-59
Vibrational Spectroscopy: A tool for characterization of nucleic acid constituents: Cytosine and Uracil
M A Palafox1, S K Rathor2, Rachna Rastogi2, Daisy Bhat3, V Bena Jothy4 and V K Rastogi2,3
1Nofima AS - the Norwegian Institute of Food, Fisheries and Aquaculture Research,Osloveien 1, 1430 Ås, Norway
2Indian Spectroscopy Society, KC-68/1, Old Kavinagar, Ghaziabad-201 002, India3R D Foundation Group of Institutions, NH-58, Kadrabad (Modinagar), Ghaziabad-201 204, India
4Department of Physics and Research Centre, Women’s Christian College, Nagercoil-629 001, IndiaDedicated to Prof G D Baruah
Vibrational spectroscopy is one of the most powerful methods for the characterisation of nucleic acid constituents and their spectroscopic studies may help to throw light on their role in biological systems. The main advantage of vibrational spectroscopy in the characterisation of molecules is its applicability in all physical forms, i .e. solids, liquids and gaseous states. The motivation for predicting theoretically the vibrational spectra is to make vibrational spectroscopy a more practical tool. In the present work, the vibrational spectroscopy with the help of DFT calculations was used for the characterization of the nucleic acid constitutents: cytosine (Cy) and uracil (U). Here, the molecular structure of Cy and U are analyzed from the data available in the bibliography as determined theoretically by quantum chemical methods and experimentally by x-ray diffraction, whereas their IR and Raman spectra were analyzed with the support of ab initio (HF, MP2) and DFT (B3LYP, PBE, B-P, CCSD, etc) calculations using several basis sets. In addition, the 30 ring normal modes of uracil and cytosine molecules were characterized and numbered for their use as notations in the spectra of their derivatives. © Anita Publications. All rights reserved.Keywords: Cytosine,Uracil, Vibrational wavenumbers, DFT, IR and Raman spectra
1 Introduction
Cellisthefirststepinthecreationoflife.Thefundamentalstructuralunitsofacellarethenucleicacids, the proteins and the phosphates. All the evidences indicate that the nucleic acids are the molecules that exert primary control over the basic life processes in all organisms. The nucleic acids consists of two types of nitrogen bases: pyrimidines and purines. Though pyrimidine does not exist in nature but pyrimidines are considered to be important because they are the integral part of the genetic material, viz DNA and RNA as nucleotides and nucleosides. The important pyrimidine bases found in the nucleic acid comprise cytosine, uracil and thymine. Infrared spectroscopy in conjunction with Raman spectroscopy has undergone a renaissance in recent years and moved away from the straight forward technique encountered early in a chemistry course [1]. Today biomolecules are the most fascinating molecules. The largest and most fascinating molecules, found in living organisms today are the nucleic acid molecules. Cytosine (in short Cy, Fig 1a), also named as 4-amino-2(1H)-pyrimidinone or 4-amino-2-hydroxypyrimidine, is a pyrimidine base and a constituent of nucleotides and as such one member of the base pair guanine-cytosine. Uracil (in short U, Fig 1b) also named as 2,4-dihydroxypyrimidine, 2,4(1H,3H)-pyrimidinedione, 2,4-pyrimidinediol, 2,4-dioxopyrimidine, 2,4-pyrimidinedione, is also a pyrimidine base and a constituent of nucleotides and as such one member of the base pair AU. They belong to a group of the most important pyrimidines that play a fundamental role in the structure and function of enzymes and drugs. The importance of Cy and U and their derivatives has been indicated actually by the considerable number of publications appeared in the bibliography. The motivation for predicting theoretically the vibrational spectra is to make vibrational spectroscopy a more practical tool [2]. From a practical point of view, the main disadvantage of vibrational spectroscopy is the lack of a direct spectra-structure relation.Thismakes it imposible or difficult to determinate the
Corresponding author :e-mail: [email protected]; (M Alcolea Palafox); [email protected] (V K Rastogi)
34 M Alcolea Palafox, Rachna Rastogi, S K Rathor, Daisy Bhat, V Bena Jothy and V K Rastogi
structure of a molecule from its vibrational spectrum, however, the vibrational spectroscopy has a number of advantages over other spectroscopies, such as NMR. Most of these relate to the inherently greater sensitivity of vibrational spectroscopy, which makes it possible to detect very small amounts. Further advantages are the wider scope of vibrational spectroscopy, e.g. its applicability to solids, liquids and gases, as well as to adsorbed layers, etc. Instrument cost of IR spectroscopy also generally lower than for other spectroscopies. It is thus clear that main advantages of vibrational spectroscopy could be increased if a method could be found to predict vibrational spectra reliably. Such a method could be used to calculate the expected spectra of proposed structures.Comparisonwith the observed spectrawould confirm the identity of a product,even that of a completely new molecule. DFT methods are the most adequate for this purpose, in special B3LYP.
(a) (b)
Fig 1. Structures of (a) Cytosine and (b) uracil with the label of their atoms.
In general, the computation of the vibrational spectrum of a polyatomic molecule of even modest size is lengthy. The more accurate quatum chemical methods are still too expensive and cumbersome to apply as a routine research. Thus, one may be forced to work at small level, and consequently, one must expect with a large over estimation of the calculated vibrational frequencies. This overestimation can be remarkably reduced with the use of transferable empirical parameters for the calculated frequencies [2]. The scale factor is therefore designed to correct the calculated harmonic frequencies to be compared with the anharmonic frequencies found by experiment. The present manuscript shows the use of this scaling in the vibrational frequencies of Cy and U molecules, which can permit an accurate assignment of them. The parameters collected here are the most accurate calculated today for these compounds.
2 Tautomerism in nucleic acid bases
Nucleic acid bases are constituents of DNA and RNA and play important role in the genetic code transformation. Although for this process they occur as one predominant isomer, other minor tautomeric forms also exist. In the famous 1953 publication [3,55], Watson and Crick stated the importance of tautomeric forms of pyrimidine and purine nucleic acid bases with respect to the three-dimensional stacking in DNA. Further studies [4,56] have shown that the tautomeric equilibrium strongly depends on the chemical environment and might differ from crystalline state, aqueous or other solution and gas phase. Tautomerism in nucleic acid bases is believed to have a role in mutagenesis of DNA [5,57]. The process is intimately connected with the energetics of the chemical bonds. Generally, the keto form of Cyexists as themain form in the double helix.The formationof specificGCWatson-CrickH-bonds is

Vibrational Spectroscopy: A tool for characterization of nucleic acid constituents: Cytosine and Uracil 35
responsible for the maintenance of the genetic code. If Cy is replaced by another type of base, it may lead to the introduction of a wrong genetic code. In fact, it has been known for a long time that Cy may also exist in other noncanonical tautomeric forms. Some of the tautomeric forms may cause the base mispairing, which has been proven to be one of the origins of gene mutation [5-7]. The various tautomeric forms of Cy differ from each other by the position of the proton, which may be bound to either ring nitrogen atoms or oxygen atoms. There are at least 14 tautomers of Cy that have beenidentifiedbyab initio calculations [8,9], most of which have not been experimentally observed. These tautomers are grouped into four main types, namely the amino-keto, amino-enol, imino-keto and imino-enol forms. When the amino group transfers a hydrogen to the neighbouring ring nitrogen the imino tautomer is formed. However, experimental studies are not in complete agreement, some authors indicate the existence of two tautomers [10-12] while others have observed three [4,13]. It is not entirely clear whether these differences arise from the methods used to prepare the samples or if the effects of the local environment (vacuum,matrix, solid, solution, etc.) significantly change the tautomerdistributions.Of all thepossiblecombinations, the six Cy tautomers of Scheme 1 are the most stable, important and studied tautomers.
C1
Scheme 1. Cytosine tautomers with standard numbering and adopted nomenclature: Nonaromatic 2-oxo form (C1), aromatic 2-hydroxy trans form (C2a), aromatic 2-hydroxy cis form (C2b), non-aromatic 4-imino cis form (C3a), non-aromatic 4-imino trans form (C3b), and non-aromatic amino-oxo form (C4).
The uracil molecule has also several tautomeric forms. The most stable ones are collected in Scheme 2. In contrast to the enol form C2b found in Cy, the keto form U1 of uracil is the most stable one, in the isolated state and as well in solution.

36 M Alcolea Palafox, Rachna Rastogi, S K Rathor, Daisy Bhat, V Bena Jothy and V K Rastogi
Scheme 2. Uracil tautomers with standard numbering and adopted nomenclature.
3 Theoretical Methods
The molecular structure of Cy and U are analyzed from the data available in the bibliography determined theoretically by quantum chemical methods and experimentally by x-ray diffraction. The values are collected in the Tables 1-3. Among the quantum chemical methods, Density Functional (DFT) [14] Methods result concretely with those obtained by B3LYP, were selected as more appropriate. DFT methods because they provide a very good overall description of medium-size molecules. Moreover, for the wavenumber calculations [2,15] they appear more accurate than HF and MP2 [16] methods, and at lower computational cost. Among the DFT methods, the Becke’s three-parameter exchange functional (B3) [17] in combination with the correlation functional of Lee, Yang and Parr (LYP) [18], i.e. B3LYP, appears as the best and more used. The results obtained with several basis set differing in size and contraction are shown in the different Tables of the manuscript. The 6-311++G(3df,pd) basis sets represents the most accurate for geometrical parameters, but it is prohibited in computational memory required for wavenumber calculations. The 6-31G** and 6-311+G(2d,p) basis are optimum for this purpose. All the results were determined with the GAUSSIAN 09 [19] program package. In Fig 1 is plotted the molecules of Cy and U with the labeling of their atoms. The optimized bond lengths and angles obtained with HF and MP2 ab initio methods, and different DFT methods are shown in Tables 1-2. Table 1 corresponds to the values of the cytosine ring and Table 2 is related to the bond angles and torsional angles of the NH2 group in Cy. The results with different basis sets, and as well the available experimental values are included. The optimized ring structure of the molecule is planar, in agreement with that determined by X-ray.

Vibrational Spectroscopy: A tool for characterization of nucleic acid constituents: Cytosine and Uracil 37
Table 1. Equilibrium geometries of cytosine, bond lengths in Å and bond angles in degrees. The calculated values are with different ab initio and DFT methods and basis set.
ParametersHF MP2 B3LYP HCTH407 PBE B-P BH-LYP CCSDa
Exp.b6-31+G(2d,p)
6-311++G(2df,2pd)c cc-pVTZd 6-311++G
(3df,pd)6-311++G(2df,2pd)c
6-311++G(2df,2pd)c
6-311++G(2df,2pd)c
6-311++G(2df,2pd)c 6-31G**
Bond lengths
N1-C2C2-N3N3=C4C4-C5C5=C6N1-C6C2=OC4-N9Bond anglesN-C2-NC2-N=C4N3=C4-C5C4-C5=C6N1-C6=C5C2-N1-C6N3-C2=O
1.39741.36041.29491.44301.33871.34491.19381.3480
116.75120.35123.84
123.02124.89
1.4131.3731.313
1.2181.362
1.40831.36841.30791.42591.35031.34611.21471.3556
115.98120.21124.25116.04119.76123.75125.18
1.42261.36641.31421.43571.35281.34951.21391.3562
116.05120.66123.75116.16120.10123.28125.61
1.4261.3621.316
1.2161.353
1.4361.3721.326
1.2251.362
1.4311.3731.324
1.2261.370
1.4041.3561.300
1.2011.342
1.4131.3851.3131.4571.3541.3631.2201.368
116.3119.6124.6115.9119.8123.7124.8
1.3991.3561.3341.4261.3371.3641.2371.334
aFrom ref. [3].bFrom x-ray and neutron diffraction data summarised in a statistical survey of the Cambridge Structural Database [3,4]. cRef. [5].dRef. [6].
Table 2. Equilibrium geometries of the amino group of cytosine, bond angles and torsional angles in degrees.
Parameters HF MP2 B3LYP CCSDa
6-31G* 6-31+G(2d,p) 6-31G** DZP b DZ(2d) b cc-pVTZc 6-311++G
(3df,pd) 6-31G**
N3-C4-N9C4-N9-H12C4-N9-H13H12-N9-H13N3=C4-N9-H12C5-C4-N9-H13C2-N3=C4-N9Inversion Barrier(kcal/mol)b
115.6119.5117.411.7−20.8
−0.15
117.66117.01120.16118.0810.08
178.26
114.4118.4116.213.9−26.1
−0.32
114.2117.4115.615.0−24.9
−0.64
114.2117.6115.515.3−24.7
−0.34
117.10
11.7−18.9176.6
117.13117.69121.25118.896.96−10.91178.71
117.1114.7118.4116.213.7−25.4176.9
aFrom ref. [20]. bRef. [21].cRef. [23].
Table 3 lists the optimised bond lengths and bond angles in uracil molecule (U), for simplicity only at two levels of computation. The crystal structure of uracil belongs to the space group of C2h-P21/a and includes four molecules in a unit-cell [54]. The molecues are arranged in a H-bonded layer, in which one oxygen atom forms two H-bonds with nitrogen atoms in the neighbouring molecules. An schematic representation of the dimer form of this unit-cell is shown in Fig 2.

38 M Alcolea Palafox, Rachna Rastogi, S K Rathor, Daisy Bhat, V Bena Jothy and V K Rastogi
Fig 2. Schematic representation of the dimer found in the crystal structure of uracil as determined in ref. [54].
Table 3. Geometrical parameters optimized, bond lengths in Å and bond angles in degrees optimized in uracil molecule at two levels of computation.
Parameters B3LYP/6-311++G(3df,pd) MP2/6-31G(d,p)Bond lengthsN1-C2C2-N3N3-C4C4-C5C5=C6N1-C6N1-HC2=OC4=OC-XBond anglesN-C2-NC-N3-CN-C4-CC-C5=CC2-N1-H7N3-C2=OC4-N3-H9N3-C4=OC4-C5-XN1-C6=C5C5=C6-X
1.38991.37901.40841.45461.34381.37001.00811.21011.2127
-
113.04127.99113.61119.81115.15124.27116.27120.20118.27122.02122.17
1.38961.38451.40801.45681.35131.37581.00781.22361.2270
-
112.41128.86113.16119.94114.91124.41115.88120.56118.47121.76122.52
5 Vibrational wavenumbers
5.1 Characterisation of the ring modes
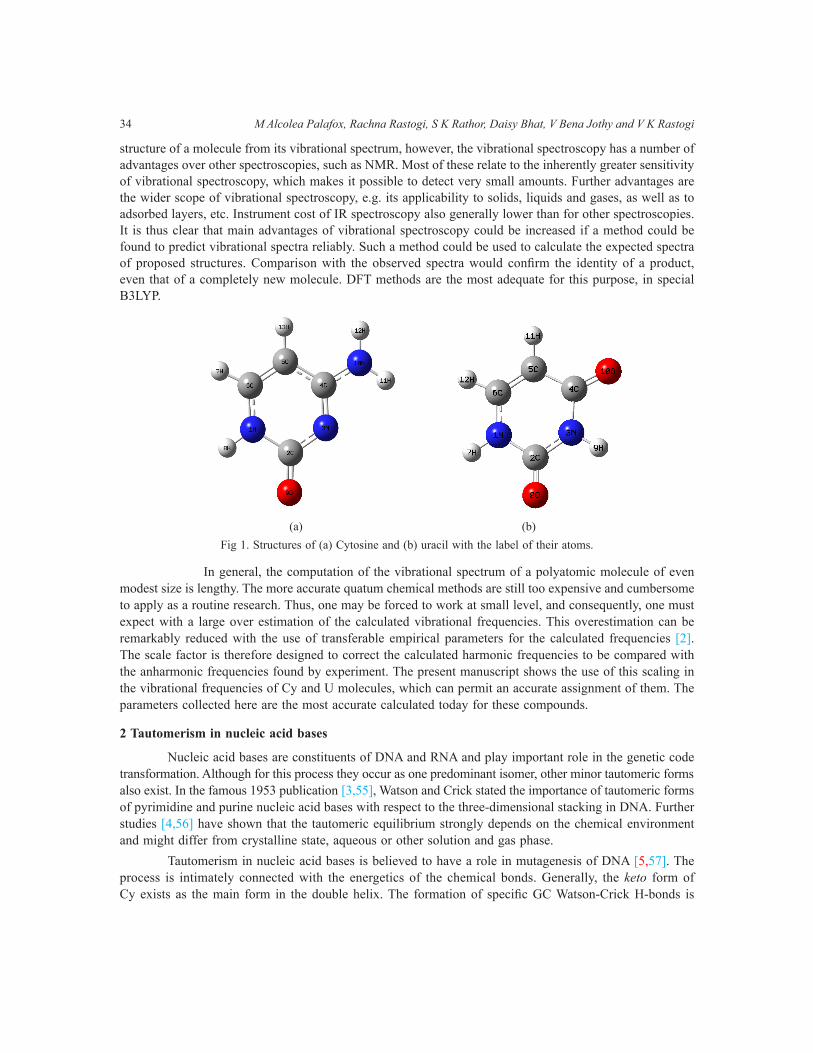
The ring modes characterized at the B3LYP/6-311+G** level in Cy and U molecules, with their calculated wavenumbers, appear plotted in Figs 2 and 3, respectively. The atomic displacements for each computed wavenumber are presented as XYZ coordinates, in the standard orientation, which are plotted to identify each vibration.The normalmodes of uracil structure, numbered from 1 to 30, are brieflyanalyzed.

Vibrational Spectroscopy: A tool for characterization of nucleic acid constituents: Cytosine and Uracil 39
Fig 3. Characterization of the normal modes in cytosine molecule at B3LYP/6-311+G** DFT level with three water molecules (*strongly coupled with water vibrational modes)
It is interesting to observe that a few skeletal ring modes retain a certain resemblance to the pseudo normal modes of a hypothetical C6 ring and the skeletal modes of benzene, although the uracil ring has no symmetry within the molecular plane. A correlation between these modes has been reported [25].
5.2 Wavenumber calculation
Cytosine molecule: as one of the constituents of nucleic acids, it has been studied intensively by IR spectroscopy in the free monomeric state (in the gas phase [26] or in low temperature inert matrices [27-29] ) and in the crystalline phase at room [28,30-31] or at low temperatures [32]. The vibrational spectra show that different aggregate states contain different tautomeric forms [33]: the gas phase contains both the enol and the ketone forms, whereas in the crystalline state and polar solvents only the ketone form has been observed [29,34]. The shifts of the absorption bands observed in the experimental spectra is due to the different tautomeric forms of Cy that appear under particular experimental conditions. Theoretically vibrational spectrum of Cy has been predicted at different levels of approximation [28,29,35]. The simulated IR and Raman spectra at B3LYP/6-31G** level with scaled wavenumbers are shown in Figs 4 to 6, corresponding to the stretching region, the bending region and the far-infrared region (< 500 cm–1), respectively.
40 M Alcolea Palafox, Rachna Rastogi, S K Rathor, Daisy Bhat, V Bena Jothy and V K Rastogi
Fig 4. Characterization of the normal modes in uracil molecule at B3LYP/6-311+G** DFT level.
Fig 5. Simulated IR and Raman spectrum of citosine molecule at B3LYP/6-31G** level in the 3650-3000 cm–1 range.

Vibrational Spectroscopy: A tool for characterization of nucleic acid constituents: Cytosine and Uracil 41
Fig 6. Simulated IR and Raman spectrum of citosine at B3LYP/6-31G** level in the 1750-500 cm–1 range.
Fig. 7. Simulated IR and Raman spectrum of citosine at B3LYP/6-31G** level in the 500-150 cm–1 range.

42 M Alcolea Palafox, Rachna Rastogi, S K Rathor, Daisy Bhat, V Bena Jothy and V K Rastogi
Fig 8. Schematic representation of the crystal structure of cytosine as determined in ref. [36]. The molecules are tilted ∼27.5º from parallel to the plane of the page. Hydrogen bonds are formed by all three available protons and are indicated by dashed lines.
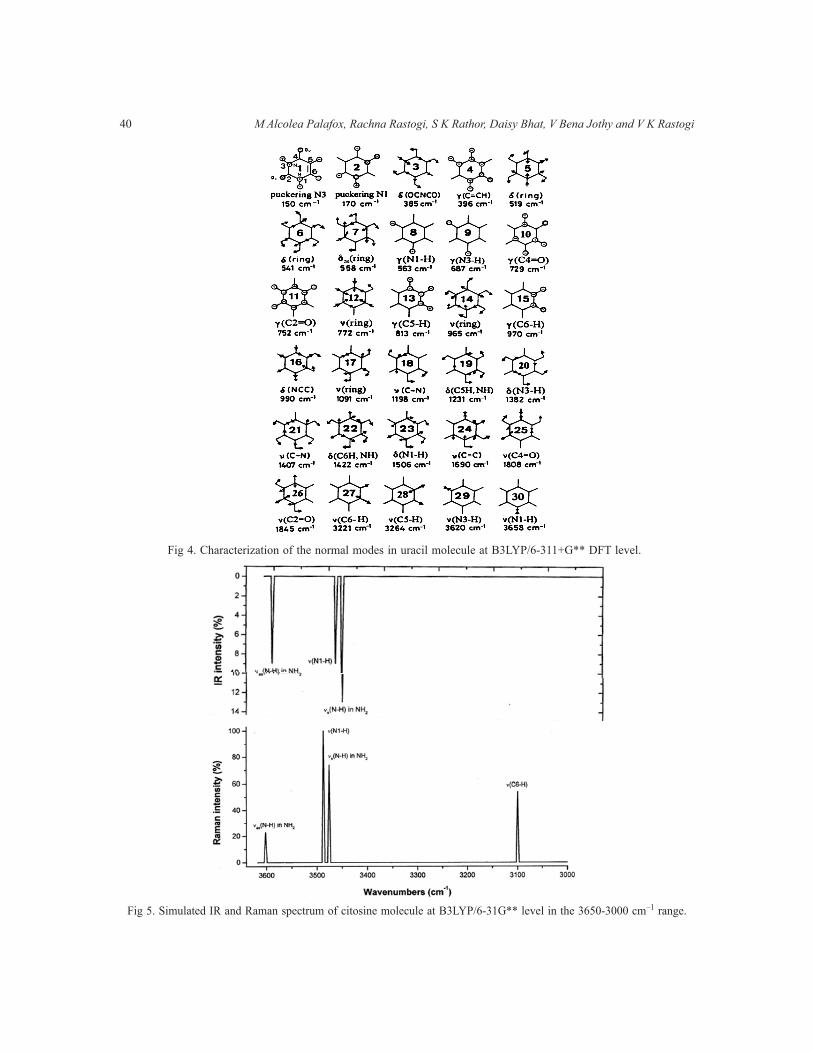
In crystals (Fig 7) with differently bound multiple NH- groups the bands due to the N-H stretching and out-of-plane bending N-H modes are usually broad and extensively overlapped [36]. However, at low temperature, the broadening originated from the interaction of both modes with thermally excited low frequency intermolecular deformational modes (librations) can be suppressed [36].On the other hand,in isotopically doped crystals, the vibrational coupling between neighboring H-bonds in the differently organized H-bonded chains is removed. Thus, in the low temperature spectra of isotopically doped crystals the spectral resolution is in general remarkably improved. Based on this fact, the FTIR spectra of both the pure and isotopically substituted ND polycrystalline Cy have been reported in the range 400-4000 cm–1 as a function of temperature (10-300 K) [36]. The vibrational bands computed with the HF and B3LYP theoretical methods and two different basis set are examined in Table 4.Thefirstcolumnreferstothenumbersassignedtothecalculatedvibrations,which are given in increasing order of wavenumbers. These normal modes of Cy structure, numbered in Fig 2,arebrieflyanalyzedinparagraphsbelow.Thesecondandthethirdcolumnlistthecalculatedwavenumbersat the HF/6-31G** and HF/6-31+G(2d,p) levels, respectively, with their absolute infrared intensities (fourth column)andtheirrelativevalues(fifthcolumn).TherelativeIRintensitieswereobtainedbynormalizingthe computed values to the intensity of the strongest line, no. 28. The calculated HF Raman intensities (sixth-seventh columns), the Raman depolarization ratios (eighth column) were also included. Columns 9th to 14th correspond to B3LYP calculations. Columns 11-13th only show the values with the 6-311+G(2d,p) basis set, due to the small difference with 6-31G**.
Vibrational Spectroscopy: A tool for characterization of nucleic acid constituents: Cytosine and Uracil 43
Tabl
e 4.
Com
paris
on o
f th
e ex
perim
enta
l wav
enum
bers
(ν,
cm
–1)
and
calc
ulat
ed h
arm
onic
val
ues
(ω, c
m–1
) at
the
HF
and
B3L
YP
leve
ls, t
oget
her
with
thei
r ab
solu
te (I
, km
/mol
) and
rela
tive
(A, %
) inf
rare
d in
tens
ities
, abs
olut
e (R
, Å4 /a
mu)
and
rela
tive
(S, %
) Ram
an s
catte
ring
activ
ities
, Ram
an d
epol
ariz
atio
n ra
tios
(D),
Forc
e co
nsta
nts
(f, m
Dyn
e/Å
), an
d ch
arac
teriz
atio
n ob
tain
ed in
the
norm
al ri
ng m
odes
of c
ytos
ine
mol
ecul
e.
No.
HF
B3L
YP
Infr
ared
wIR
Int.
Ram
Int.
Dw
IR In
t.f
Cha
ract
eriz
atio
naN
ebA
rb,c
Ard
6-31
+ G
**6-
31+
G(2
d,p)
IA
RS
6-31
+ G
**6-
311+
G
(2d,
p)I
A
196
152
10
0.3
00.
7513
413
42
00.
06(1
00%
) puc
kerin
g N
1
215
322
113
10
00.
6420
220
2.3
51
0.17
(100
%) p
ucke
ring
N3
321
829
126
729
2.2
20.
6915
625
7.4
231
310.
05(9
5%) γ
(NH
2) w
aggi
ng22
0 (4
7)23
6 (3
0)
439
139
23
00.
30
0.69
358
359.
23
00.
26(4
3%) δ(C=O
)+(42%
)δas
(NH
2) +
(15%
) δ,Γ
(rin
g)34
2 (2
)34
3 (5
)
543
343
031
31.
82
0.75
398
398.
921
30.
25(4
5%) γ
(N1-
C=C
) + (3
0%) γ
(rin
g)+
(25%
) τ(N
H2)
397
(6)
400
(4)
657
956
516
20.
30
0.66
527
520.
316
20.
2(8
0%) τ
(NH
2)51
1 (5
6)50
7 (2
2)50
7 (1
4)
757
958
08
12.
83
0.45
533
533.
52
00.
68(6
0%) δ(C=O
)+(25%
)δ,Γ
(rin
g) +
(15%
) δas
(NH
2)52
5 (3
2)52
0 (5
7)51
9 (3
2)
858
559
02
00.
40
0.27
545
547.
23
00.
8(8
0%) δ
(rin
g) m
ainl
y in
N1,
N3
+ (2
0%) τ
(NH
2)53
1 (1
7)53
5 (1
6)53
5 (5
)
962
562
54
04.
74
0.4
577
580.
73
01.
83(9
5%) δ(ring)mainlyinO8
571
(3)
568
(8)
574
(7)
1066
164
778
80.
20
0.68
624
618.
859
80.
27(7
0%) γ
(N1-
H) +
(25%
) γ(C
4-N
9)61
4 (2
7)61
3 (1
7)61
3 (1
5)
1179
379
538
40.
81
0.68
724
722.
838
50.
45(6
2%) γ
(C5-
H) +
(27%
) γ(r
ing)
+ (1
1%) τ
(NH
2)71
1 (3
)71
0 (3
)70
9 (3
)
1283
082
62
018
.817
0.03
763
765.
56
12.
02(7
5%) δ
,γ(r
ing)
+ (2
5%) δ
s(NH
2)71
7 (8
)71
7 (8
)
1385
685
828
30.
91
0.59
769
770.
47
11.
45(4
3%) γ
(C4-
C5)
+ (3
0%) γ
(C5-
H)+
(27%
) γ, δ
(rin
g)74
9 (5
)74
7 (4
)74
9 (5
)
1487
288
967
70.
40
0.72
773
789.
239
54.
17(6
5%) γ
(C-N
3=C
) mai
nly
in C
2 +
(35%
) γ(r
ing)
767
(3)
767
82)
767
(3)
1510
1210
143
02.
93
0.31
924
923.
54
11.
58(6
5%) ν
(rin
g) +
(35%
) δas
(NH
2)
1610
6910
681
02.
83
0.4
962
963.
81
00.
72(7
5%) γ
(C6-
H) +
(25%
) γ(C
5-H
)
1711
0911
020
03.
13
0.74
988
989.
61
02.
67(8
0%) ν
(rin
g) +
(20%
) δas
(NH
2)94
8 (0
)95
5 (1
)98
0 (3
)
1812
0512
1021
26.
46
0.22
1088
1094
.949
71.
46(5
0%) δ
as(N
H2)
+ (3
5%) δ(C=O
)+(15%
)δ(r
ing)
1085
(10)
1083
(12)
1082
(15)
1912
1712
2130
31.
51
0.73
1128
1126
.62
01.
14(5
0%) δ
(C5-
H)+
(30%
) δ(N
1-H
) +(2
0%) ν
(C=C
-N)
1103
(3)
1091
(6)
1090
(8)
2013
0913
0686
912
.311
0.28
1220
1213
.347
61.
27(5
0%) δ
(HC
6-N
H)+
(35%
) δ(C
5-H
)+(1
5%) ν
(N-C
6)11
98 (3
4)11
96 (2
9)11
93 (3
3)
2113
8813
7615
212
.311
0.1
1264
1251
.527
42.
89(4
8%) ν
(C2-
N3)
+22%
ν(C
-N9)
+17%
δ(N
H2)
+13%
δ(r
ing)
1237
(11)
1244
(5)
1223
(10)

44 M Alcolea Palafox, Rachna Rastogi, S K Rathor, Daisy Bhat, V Bena Jothy and V K Rastogi22
1472
1465
104
1117
.416
0.11
1359
1355
.561
82.
12(3
7%) δ
(C6-
H) +
(34%
) ν(C
4-N
9) +
(22%
) ν(r
ing)
1324
(17)
1320
(16)
1318
(28)
2315
7515
7216
818
4.3
40.
1114
4314
4186
123.
03(4
2%) δ
(N1-
H)+
(30%
) ν(C
-N3-
C) +
(22%
) ν(N
1-C
6)13
82 (9
)13
82 (1
7)13
76 (2
3)
2416
2616
2015
317
8.8
80.
2915
0814
99.9
167
233.
65(4
0%) ν
(C-N
9)+(
25%
) δ(C
6-H
)+(2
0%) δ
(rin
g)+(
15%
) δ(N
H2)
1441
(47)
1439
(51)
1438
(97)
2517
2317
1728
731
23.4
210.
3115
7015
62.2
153
216.
81(5
5%) ν
(C4-
C5)
+ (3
2%) ν
(rin
g) +
(13%
) δ(N
H2)
1540
(18)
1539
(21)
1559
(17)
2617
8617
8895
1010
.810
0.18
1637
1632
.612
917
2.06
(90%
) βs(N
H2)
1569
(18)
1570
(14)
1595
(25)
2718
4118
3374
180
15.6
140.
0916
9216
81.4
470
648.
22(5
0%) ν
(C=C
) + (3
0%) ν
(N3=
C4)
+ (1
2%) ν
(rin
g)16
25
(100
)16
22 (9
1)16
20
(100
)
2819
4319
2892
410
016
.215
0.26
1774
1758
739
100
16(8
0%) ν(C=O
)+(20%
)ν(r
ing)
1725
(58)
1718
(1
00)
1714
(56)
2933
8333
693
067
.461
0.53
3211
3191
.72
06.
55(7
5%) ν
(C6-
H) +
(25%
) ν(C
5-H
)
3034
0633
962
010
0.7
920.
232
3632
16.8
20
6.69
(75%
) ν(C
5-H
) + (2
5%) ν
(C6-
H)
3138
5138
3395
1010
9.6
100
0.11
3610
3590
.680
117.
94(9
8%) ν
s(NH
2)34
74 (3
3)34
71 (1
2)34
68 (7
)
3238
8538
8611
112
83.6
760.
2136
2936
16.1
7310
8.31
(98%
) ν(N
1-H
)35
75 (3
6)35
64 (1
8)
3339
9739
7064
743
390.
7237
5237
19.3
476
8.99
(100
%) ν
as(N
H2)
3618
(50)
3600
(18)
a Abb
revi
atio
ns: ν
, stre
tchi
ng; δ
, in-
plan
e be
ndin
g; γ
, out
-of-
plan
e be
ndin
g.
b Ref
. [34
]. c Ex
perim
enta
l wav
enum
bers
sel
ecte
d as
fund
amen
tal f
or th
e co
mpa
rison
with
the
theo
retic
al v
alue
s. d R
ef, [
27].

Vibrational Spectroscopy: A tool for characterization of nucleic acid constituents: Cytosine and Uracil 45
The characterization established by B3LYP for each calculated wavenumber is very close to that calculated with HF, which was omitted in the Table 4. The % of contribution of the different modes to a computed wavenumber is shown in parentheses. Contributions lower than 10% were not considered. Slight differences in the % of contribution of the different modes appear by HF. The 15-17th columns collect the experimental wavenumbers reported in Neon [29] and Argon [27,29] matrix. Due to our calculated wavenumbers refer to an isolated molecule, they can be compared satisfactory with the experimental Ar matrix data. The most detailed study of the Ar matrix data corresponds to Nowak et al [29]. Thus, their experimental values were selected for comments. In matrix isolation infrared studies, both C1 and C2 tautomers have been detected, with likely a small amount of C3 [28].
Fig 9. IR spectrum of uracil (a) in KBr pellet., (b) in nujol mull.
Because the accuracy in the wavenumber calculation with the B3LYP method is much higher than with HF [2], in the discussion below of the results we had used mainly the B3LYP/6-311+G(2d,p). Although wavenumber calculations on Cy have been reported with other DFT methods [23, 27] the values shown in the columns of Table 4 represent the most accurate today.
(b)
(a)

46 M Alcolea Palafox, Rachna Rastogi, S K Rathor, Daisy Bhat, V Bena Jothy and V K Rastogi
Fig. 10. Simulated IR spectrum of uracil at two DFT levels in the 3550-3350 cm–1 range.
Fig. 11. Simulated IR spectrum of uracil at two DFT levels in the 2000-50 cm–1 range.
Fig. 12. Simulated Raman spectrum of uracil at two DFT levels in the 3550-3050 cm–1 range.

Vibrational Spectroscopy: A tool for characterization of nucleic acid constituents: Cytosine and Uracil 47
Tabl
e 5.
Com
paris
on o
f th
e ex
perim
enta
l wav
enum
bers
(ν,
cm
–1)
and
calc
ulat
ed h
arm
onic
val
ues
(ω, c
m–1
) w
ith th
e 6-
31G
** b
asis
set
, tog
ethe
r w
ith th
eir
rela
tive
(A, %
) inf
rare
d in
tens
ities
, rel
ativ
e R
aman
sca
tterin
g ac
tiviti
es (S
, %),
forc
e co
nsta
nts
(f, m
Dyn
e/Å
), an
d ch
arac
teriz
atio
n ob
tain
ed in
the
norm
al ri
ng
mod
es o
f ura
cil m
olec
ule
with
som
e of
the
met
hods
use
d.
No.
Cha
ract
eriz
atio
naM
P2c
B3P
86B
3PW
91B
3LY
PB
3LY
PeIn
frar
edb
Ram
an
ww
ww
wδ
AF
wS
Arm
atrix
fga
sgga
shso
lidso
lid+H
2Oso
lu-
tione
1pu
cker
ing
N3
139
151
151
150
147
00.
1215
40
2pu
cker
ing
N1
161
171
171
170
165
00.
117
10
185
w18
5 w
3δ)
OC
NC
O(
383
385
385
385
387
41.
0738
41
391
m37
7 m
374
vw
40
1
4γ)
21H
-C=C
(37
939
739
639
639
54
0.26
405
141
1 m
411
m39
5 w
426
426
5δ)
γνir
(51
851
951
851
952
34
1.26
519
251
6.5
m52
7 m
512
w52
6.6
526.
6
6δ+
)γνi
r( δ
)O=C
(54
154
354
254
154
31
1.09
539
453
6.4
m
53
453
453
6
7δ s
a+
)γνi
r( δ
)O=C
(56
056
055
955
854
71
0.2
556
255
9 w
588
w
552.
555
4.3
553
8γ)
H-1
N(
566
571
570
563
560
81.
2458
00
551.
2 m
556
m54
5 w
574.
657
4.6
573
9γ)
H-3
N(
698
693
692
687
677
140.
3169
91
662.
1 s
633
m65
9.5
w
10γ+
)O=4
C( γ
)H-5
C(
782
732
731
729
728
20.
6372
70
718
w
717.
4 vw
11γ)
O=2
C(
722
760
759
752
765
102.
7376
30
76
9 s
756.
5 w
12ν)
γνir
(73
878
177
977
276
90
2.92
769
2375
9.2
sh?
786.
978
6.9
782
13γ+
)H-5
C( γ
)O=4
C(
799
814
814
813
819
100.
9782
10
804
s81
0 s
802
w
14ν+
)C-C
( δ)H
-N(
990
975
970
965
962
11.
4396
23
958.
3 w
946
vw95
2 w
15γ)
H-6
C(
930
971
973
970
972
00.
7297
02
963
w97
4 w
972
sh98
2.3,
98
998
2.3,
993
966
16δ)
CC
N(
999
994
993
990
994
13.
4398
81
982
w99
9 w
?99
0 sh
1005
.110
06.8
1001
17ν+
)γνi
r( δ
)H-5
C(
1113
1098
1097
1091
1086
11.
4210
856
1073
w10
89 s?
1082
m10
97.3
1099
1095
18ν(
+)N
-Cδ)
H1N
,H6C
(12
3612
1012
0911
9811
9114
2.03
1195
011
84 v
s
1172
s
19δ+
)H-5
C( δ
)H-N
(12
7312
4012
3712
3112
271
1.22
1224
1512
17.4
w12
28 m
12
34.4
1232
.712
32
20δ+
)H-3
N( δ
)H-C
(14
1313
8813
8713
8213
823
2.28
1378
1313
59.3
vw
1360
m13
56 sh
1393
.613
93.6

48 M Alcolea Palafox, Rachna Rastogi, S K Rathor, Daisy Bhat, V Bena Jothy and V K Rastogi21
ν+ )N
-C( δ
)H-3
N(
1436
1417
1415
1407
1406
202.
9514
012
1388
.7 v
s13
80 s
1387
s14
16.9
1416
.913
87
22δ+
)H-6
C( δ
)H-N
(14
4914
2814
2614
2214
233
2.08
1411
113
99.6
vs
1396
ms
1400
s14
58.4
1457
.5
23δ+
)H-1
N( ν
)C-1
N(
1536
1520
1518
1506
1498
183.
4114
9710
1472
ms
1480
s14
61 s
1503
1503
24ν)
C=C
(17
1217
0417
0116
9016
7012
8.51
1672
2416
44 m
1632
vs
1641
s16
43.2
1644
.616
31
25ν)
O=4
C(
1826
1830
1826
1808
1757
100
14.6
817
6055
1741
vs
1688
vs
26ν)
O=2
C(
1868
1868
1864
1845
1791
9215
.17
1791
2417
57.5
vs
1734
vs
1756
vs
1712
.317
12.2
1708
27ν)
H-6
C(
3263
3234
3231
3221
3200
16.
5932
1290
30
76 w
30
79.7
3079
.730
79
28ν)
H-5
C(
3304
3281
3278
3264
3242
06.
7832
5110
030
84i
3101
w31
24 m
3095
.730
94.4
3094
29ν)
H-3
N(
3612
3643
3642
3620
3592
118.
1935
8868
3434
.5 s
3427
w34
36 s
30ν)
H-1
N(
3656
3682
3681
3658
3636
178.
436
3289
3484
.3 s
3450
w34
84 s
a Abb
revi
atio
ns: ν
, stre
tchi
ng; δ
, in-
plan
e be
ndin
g; γ
, out
-of-
plan
e be
ndin
g.
b Not
atio
n: s
h, s
houl
der;
vs, v
ery
stro
ng; s
, stro
ng; m
, med
ium
; w, w
eak;
vw,
ver
y w
eak.
c W
ith th
e 6-
31G
* ba
sis
set.
d With
the
6-31
1+G
(2d,
p) b
asis
set
.e W
ith th
e au
g-cc
-pV
DZ
basi
s se
t.f R
efs.
[39-
41].
g Ref
s. [4
0,41
].h R
ef. [
42].
i Ram
an, r
ef. [
40].

Vibrational Spectroscopy: A tool for characterization of nucleic acid constituents: Cytosine and Uracil 49
Uracil molecule: The wavenumbers and intensities of U, calculated at different levels, is examined inTable5.Thefirstcolumnreferstothenumbersassignedtothecalculatedvibrationsplottedinthecentrumof the rings in Fig. 3, and are given in increasing order of wavenumbers [15,38]. For simplicity, in the second column the assignments include only the contributions of predominant modes. The columns with relative intensities were obtained by dividing the computed values by the intensity of the strongest line. The 12-14th columns collect the experimental wavenumbers reported in Argon matrix [39-41] and in gas phase [40,42]. Although wavenumber calculations on uracil have been reported with HF [43], MP2 [44], B3LYP [45], and other DFT methods [46], the values shown in the columns 3rd-12th of Table 3 represents the most accurate today [15,38]. The experimental IR spectrum of uracil in KBr pellets and in Nujol mull is shown in Fig. 8, while simulated IR and Raman spectra at two DFT levels with scaled wavenumbers are shown in Figs. 9 to 12. The infrared spectrum corresponding to the strechingand bending regionare shown in Fig. 9 and 10, respectively, while the simulated Raman spectra are plotted in Figs. 11 and 12, stretching and bending regions, respectively. In general, good accordance is found of our simulated spectra with the experimental ones.
Fig.13. SimulatedRaman spectrum of uracil molecule at two DFT levels in the 2000-50 cm–1 range.
Unfortunately few studies undertake the gas-phase vibrational spectrum of U: the early work in the 70’s by Nowak et al [47], studying the NH and C-H stretching region, and the most complete work today was reported by Colarussoet al [42]. We select this one [42] for comments, since the assignments given there correspond most closely to our own. The comparison of the theoretical values was also performed on the gas phase data [40,41], and in few cases from spectra in argon matrices [39,45,48].
6 Scaling
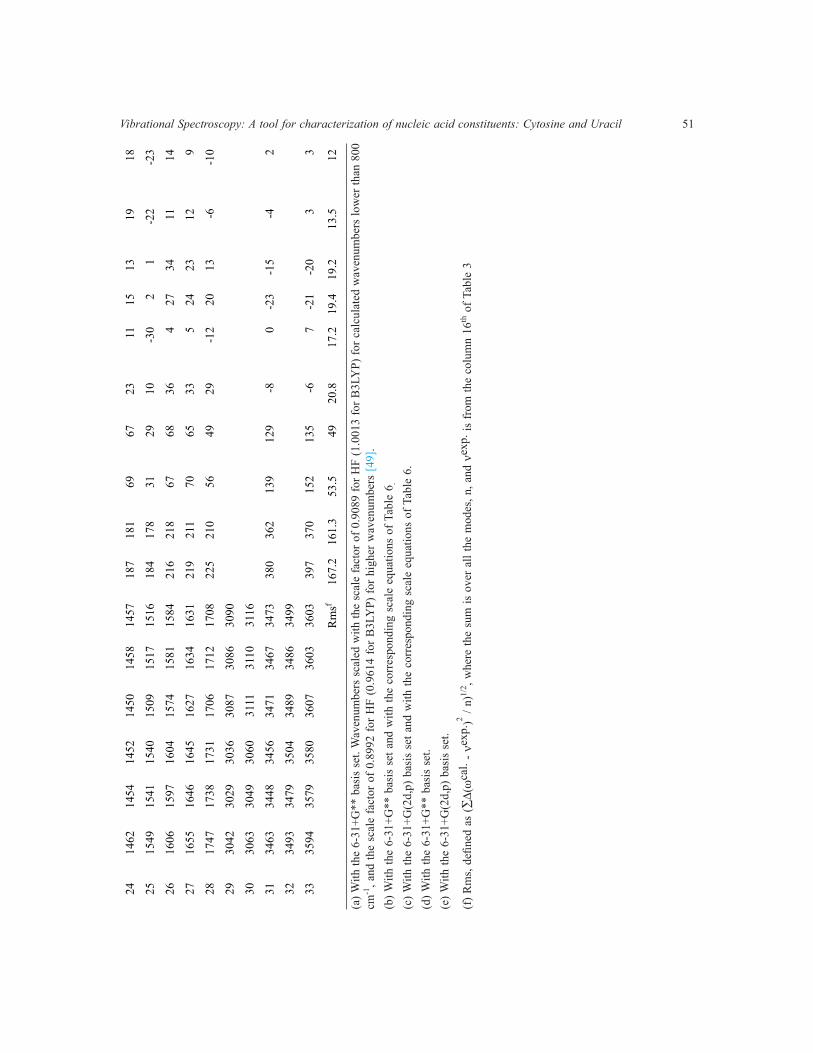
To improve the computed wavenumbers, two procedures of scaling were used [2,15,38]. In Table 6 appears the results obtained in Cy. (a)Thefirstprocedureusesasingleoverallscalefactorforthecalculatedwavenumbers,νexp./ωcalc. It is the easiest and thus it is the procedure generally used in the bibliography to scale the wavenumbers. To correct the overestimation of the calculated wavenumbers, several authors have reported scale factors for different levels. The most complete set of values have been determined by Scott and Radom [49], with the particularity of use two scale factors, one for the high and medium-wavenumber vibrations, and the another for the low-wavenumbers. Thus with these scale factors were obtained in Cy the scaled wavenumbers of the columns (a) of Table 6.

50 M Alcolea Palafox, Rachna Rastogi, S K Rathor, Daisy Bhat, V Bena Jothy and V K RastogiTa
ble
6. S
cale
d w
aven
umbe
rs w
ith d
iffer
ent
proc
edur
es a
nd v
alue
s of
the
abs
olut
e er
ror
(ωca
l. – νe
xp. )
in c
m–1
, obt
aine
d in
the
cal
cula
ted
and
scal
ed
wav
enum
bers
of c
ytos
ine.
No.
Scal
ed w
aven
umbe
rsA
bsol
ute
erro
r
HF
B3L
YP
Cal
cula
ted
wav
enum
ber
Scal
ed w
ith a
n ov
eral
l fac
tor
Scal
ed w
ith a
n eq
uatio
n
(a)
(b)
(c )
(a)
(b)
(c )
HFd
HFe
B3L
YPd
B3L
YPe
HFd
B3L
YPd
HFd
HFe
B3L
YPd
B3L
YPe
187
8212
313
414
413
8
213
913
318
615
616
520
2
319
819
124
920
220
924
5-1
855
-34
12-3
8-3
4-4
513
-27
9
435
534
634
135
835
935
148
4915
1512
153
-216
8
539
438
437
539
939
739
333
30-2
2-6
-1-1
6-2
5-3
-7
652
651
549
752
852
051
072
5820
1619
218
-10
133
752
651
551
153
452
651
959
6013
136
14-5
-96
-1
853
252
052
054
653
753
250
5510
11-3
11-1
5-1
52
-3
956
855
655
257
856
856
457
579
110
10-1
2-1
60
-4
1060
158
857
162
561
360
848
3411
12-1
212
-25
-42
0-5
1171
370
770
569
670
870
883
8514
193
-14
-3-4
-2-2
1274
674
073
473
474
674
611
310
946
5129
1723
1729
29
1377
076
376
373
975
175
310
911
122
2823
-816
164
6
1478
477
879
174
375
576
610
512
26
2217
-24
1124
-12
-1
1591
090
390
488
890
090
0
1696
195
495
392
593
693
3
1799
799
098
395
096
195
815
414
733
3342
-535
286
3
1810
8410
7610
8110
4610
5610
6312
212
75
141
-37
-7-2
-27
-20
1910
9410
8710
9110
8410
9510
9312
613
037
373
-7-4
04
2
2011
7711
6911
6811
7311
8311
8211
311
024
25-1
9-2
3-2
7-2
8-1
3-1
4
2112
4812
4012
3112
1512
2512
2114
413
220
174
-29
-4-1
3-1
9-2
3
2213
2413
1613
1213
0713
1613
1315
214
539
374
-13
-4-8
-4-7
2314
1614
0814
0913
8713
9613
9819
319
061
6334
526
2714
16
Vibrational Spectroscopy: A tool for characterization of nucleic acid constituents: Cytosine and Uracil 51
2414
6214
5414
5214
5014
5814
5718
718
169
6723
1115
1319
18
2515
4915
4115
4015
0915
1715
1618
417
831
2910
-30
21
-22
-23
2616
0615
9716
0415
7415
8115
8421
621
867
6836
427
3411
14
2716
5516
4616
4516
2716
3416
3121
921
170
6533
524
2312
9
2817
4717
3817
3117
0617
1217
0822
521
056
4929
-12
2013
-6-1
0
2930
4230
2930
3630
8730
8630
90
3030
6330
4930
6031
1131
1031
16
3134
6334
4834
5634
7134
6734
7338
036
213
912
9-8
0-2
3-1
5-4
2
3234
9334
7935
0434
8934
8634
99
3335
9435
7935
8036
0736
0336
0339
737
015
213
5-6
7-2
1-2
03
3
Rm
sf16
7.2
161.
353
.549
20.8
17.2
19.4
19.2
13.5
12
(a) W
ith th
e 6-
31+G
** b
asis
set
. Wav
enum
bers
sca
led
with
the
scal
e fa
ctor
of 0
.908
9 fo
r HF
(1.0
013
for B
3LY
P) fo
r cal
cula
ted
wav
enum
bers
low
er th
an 8
00
cm-1
, and
the
scal
e fa
ctor
of 0
.899
2 fo
r HF
(0.9
614
for B
3LY
P) fo
r hig
her w
aven
umbe
rs [4
9].
(b) W
ith th
e 6-
31+G
** b
asis
set
and
with
the
corr
espo
ndin
g sc
ale
equa
tions
of T
able
6.
(c) W
ith th
e 6-
31+G
(2d,
p) b
asis
set
and
with
the
corr
espo
ndin
g sc
ale
equa
tions
of T
able
6.
(d) W
ith th
e 6-
31+G
** b
asis
set
. (e
) With
the
6-31
+G(2
d,p)
bas
is s
et.
(f)R
ms,definedas(∑∆(ω
cal.
- νex
p.)2 /
n)1/
2 , whe
re th
e su
m is
ove
r all
the
mod
es, n
, and
νex
p. is
from
the
colu
mn
16th
of T
able
3

52 M Alcolea Palafox, Rachna Rastogi, S K Rathor, Daisy Bhat, V Bena Jothy and V K Rastogi
(b) A remarkable improvement in the accuracy of the scaled wavenumbers is obtained if a linear relationship is established between the calculated and experimental wavenumbers. This procedure called scaling equation,usesascalingequationtocorrectthecomputedwavenumbersofamoleculeataspecificleveloftheory.This procedure, developed by one of the authors, represents a compromise between accuracy and simplicity, and thus only the results obtained with this procedure are the enough accurate for the stadard today. Table 7 collets the scaling equations obtained in the ring modes of Cy molecule and at different levels of computation. The results obtained are shown in the columns (b) and (c) of Table 6. The scaling equations have good transferability for their Cy derivatives, which permits an accurate assignment of the experimental values.
Table 7. Linear scaling equations νscaled= a + b · ωcalculated obtained in cytosine and uracil molecules.
Methods a b correlationcoeffient,r
Cytosine moleculeHF/6-31+G**HF/6-31+G(2d,p)B3LYP/6-31+G**B3LYP/6-31+G(2d,p)B3LYP/6-311+G(2d,p)
Uracil moleculeHF/6-31G**HF/6-31++G**MP2/6-31G*BP86/6-31G**BLYP/6-31G**B3P86/6-31G**B3LYP/6-31G*B3LYP/6-31G**B3LYP/6-311+G(2d,p)B3LYP/6-311++G(3df,pd)B3LYP/dgdzvpB3PW91/6-31G*B3PW91/6-31G**
–4.1–14.316.36.24.8
5.710.534.546.046.434.130.834.630.831.939.230.134.9
0.89650.90530.95600.96310.9671
0.89280.89380.93720.96780.97180.93890.94680.94470.95380.95120.94720.94210.9393
0.99970.99970.99990.99990.9999
0.99970.99980.99960.99980.99980.99990.99990.99990.99990.99990.99990.99990.9999
Table 8 shows the results obtained in U molecule with the corresponding scaling equations of Table 7. These scaling equations were obtained in the ring modes of uracil molecule [38]. For experimental wavenumbers, the values reported by gas phase were selected as more appropriate In the lack of these data, the values obtained by Ar-matrix, Raman spectroscopy, and Infrared spectroscopy (IR) were used. These scaling equations also show a good transferability for their uracil derivatives.
6.1 Errors obtained with the scaling
For a better comparison of the accuracy of the different scaling procedures and the two theoretical methods used, in Table 6 is shown the absolute error obtained in the wavenumbers of Cy molecule. It also helps in the assignment and analysis of the experimental fundamental modes. To calculate the errors were selected the experimental values of the 16th column of Table 4. In the last row is determined the root-mean square (rms) error of each case. The errors obtained in the predicted wavenumbers were very small with the scaling equation, the mean deviation was 10 cm–1 (1%). The value of these rms errors are very close to other compounds studied by us [50-52].

Vibrational Spectroscopy: A tool for characterization of nucleic acid constituents: Cytosine and Uracil 53
Remarkably differences also appear in Table 6 between the calculated wavenumbers by HF and B3LYP. Due to the results by B3LYP are more in accordance to the experimental data, therefore, they were taken as reference. The large rms error in the calculated wavenumbers is remarkably reduced with the scaling, especially by HF. The large error obtained after scaling by HF, mainly in the vibrations nos. 17, 23 and 26 leads to arms error by HF higher than by B3LYP.
Table 8. Absolute error (ωcal.- νexp) in cm–1 obtained in the calculated wavenumbers, scaled values and the error obtained with them in the molecule of uracil.
No. exp.freq.
error scaled error
HFa MP2b B3P86a B3LYPa B3LYPc B3PW91a B3LYPc,d
123456789
10111213141516171819
20 21222324252627282930
185391395512
536.4559545
659.5
717.4756.5759.2
802952972990
10731172
1217.4
13561387140014611641174117563076312434363484
–635344957504370
8610547
10310113886
102134160
174167157186206254256318305427418
–24–8
–16651
2138
65–35–44–338
–429
406486
574949757185
112187180176172
–14–62771
2633
153
–11223–14
253853
323028596389
112158157207198
–15–6175
–11827
12–5
–101113–20
182644
26202245496789
145140184174
–20–40
117
–121517
118
–13171004
131940
26192337291635
124118156152
–14–61660
2532
142
–3121813
243750
312826576085
108155154206197
171.1188.2400.0407.6529.7548.8552.6565.0676.6
725.2760.5764.3812.0948.4957.9978.9
1066.71166.81201.2
1349.01371.91388.11459.61623.71706.71739.13083.03123.13456.93498.9
–39
131813–62018
845
10–4
–14–11–6–5
–16
–7–15–12–1
–17–34–17
7–12115
rms 184 82 77 66 54 75 70 13.7aWith the 6–31G** basis set. bWith the 6-31G* basis set. cWith the 6-311+G(2d,p) basis set. dWith the scaling eqns. hRms,definedas (∑ (ωcal. - νexp.)2 / n)1/2, where the sum is over all the modes, n, and νexp. is from the second column.
DuetothedeficienciesbyHFinthecalculationofseveralmodesinthismoleculeofCy,theuseofascalingequationdoesnotrepresentasignificantimprovementinthewavenumbersovertheuseofan

54 M Alcolea Palafox, Rachna Rastogi, S K Rathor, Daisy Bhat, V Bena Jothy and V K Rastogi
overall scale factor procedure. However, by B3LYP is obtained a remarkable reduction of the error and thus the risk to a mislay. The best for this purpose is the 6-311+G(2d,p) basis set, together with the use of the scaling equation procedure, last column of Table 6. Larger basis set represents an excessive increase of the computational cost for a very slight improvement. The largest error in the last column corresponds to vibration no. 12, a ring bending. Large errors also appear in the vibrations nos. 21 and 25, corresponding to C-N and C-C stretchings, respectively. Table 8 shows the values of the absolute errors obtained in the calculated wavenumbers of uracil. ThefirstcolumnreferstothenumberofthemodesofFig. 4. The experimental values selected in the second column were those reported in gas phase by Colarussoet al [42], and several in Ar matrix. Remarkable differences are observed between the calculated and experimental wavenumbers, columns 3-8th. The bottom of the Table shows the root-mean square (rms) error obtained for the calculated wavenumbers with several of the methods used. The largest errors are marked in bold type. With DFT methods the wavenumbers are significantlyclosetotheexperimental,althoughtheresultsdonotadequatelyreproducealltheexperimentalpattern of wavenumbers. The use of scale procedures solves this problem. Table 8 collects all the errors otained in the calculated and scaled wavenumbers by the two procedures of scaling. Thus, it can be concluded that the scaling equation procedure leads to very low errors, and even lower thanusing theuniformscalingprocedure.WithB3LYPthewavenumbersaresignificantlyclose tothe experimental and much better than by HF.
Table 9. Errors obtained in the calculated and scaled wavenumbers of the uracil modes by the different procedures and methods.
Method
calculated wavenumbers scaled wavenumberswith an overall factor
scaled wavenumbers with the scaling equations
rmslargest error
rmslargest error
rmslargest error
positive negative positive negative positive negative HF/6-31G** HF/6-31++G** MP2/6-31G* BP86/6-31G**BLYP/6-31G** B3P86/6-31G** B3LYP/6-31G** B3LYP/6-311+G(2d,p)B3PW91/6-31G**
18417782353477665475
427 (29)418 (29)187 (27)86 (29)73 (29)
207 (29)184 (29)156 (29)206 (29)
6 (2)11 (2)
44 (12)44 (11)
49 (11,15)14 (2)15 (2)20 (2)14 (2)
23
3733342421
25
53(25,26)
53 (9)56 (29)54 (29)46 (29)44 (29)
50 (29)
37 (12)
95 (15)50 (11)54 (15)44 (15)40 (12)
41 (15)
22.616.725.418.119.615.013.813.714.9
46 (26)27 (19)50 (10)34 (9)34 (9)
32 (26)24 (9)
21 (29)30 (26)
57 (28)50 (28)66 (15)32 (21)36 (21)26 (15)23 (21)34 (25)26 (22)
7 Assignments for the vibrational modes
Cytosine molecule N1-H modes: The N1-H stretching (mode no. 32) appears clearly characterized as pure mode and with strong intensity, and it was scaled at 3499 cm–1 using the B3LYP/6-311+G(2d,p) level. The N1-H in-plane bending is more complicated. It appears mixed with other modes and in some cases with low IR intensity. Seven calculated vibrations have noticeable contribution of this mode. The highest contribution corresponds to the computed band at 1441 cm–1. The N1-H out-of-plane bend is predicted at 618.8 cm–1 as almost pure mode (70% of contribution), with medium IR intensity and null Raman activity, in agreement with the medium-strong intensity band observed in Ar matrix [29] at 613 cm–1. C-H modes: The stretching modes appear as pure modes and with almost null IR intensity in accordance with its no detection in the experimental spectra. The ν(C5-H) mode is coupled (75% of

Vibrational Spectroscopy: A tool for characterization of nucleic acid constituents: Cytosine and Uracil 55
contribution) with ν(C6-H) and vice verse. C-H in-plane bending modes appear mixed mainly with ν(N-C) modes. The band at 1320 cm-1 in Argon matrix [26] was assigned to δ(C6-H) in accordance to a scaled wavenumber between 1307-1324 cm–1. δ(C5-H) mode appears with very low IR intensity and thus it was assigned to the experimental band at 1091 cm–1 also with low IR intensity, and in good accordance with a scaled value between 1084-1095 cm–1. A high contribution of this mode was also determined in the computed band at 1213.3 cm–1. The C6-H out-of-plane bending mode appears as almost a pure mode (75% of contribution) at 963.8 cm–1, with null IR intensity, and thus it was not detected in the experimental Ar matrix spectra. Mode γ(C5-H) appears spread out in the computed bands at 963.8 (coupled with C6-H), 7704 and mainly at 722.8 cm-1 (62% of contribution). C=O modes: IntheUmoleculethestretchingregionisstronglyinfluencedbyFermiinteractionsand many bands appears in this region [38].InCythecalculatedC2=OstretchisthestrongestIRbandinaccordance with that observed in the Ar matrix spectra [29]. However, Radchenko et al [27] in the Ar matrix spectra pointed as the most intense the IR band at 1620 cm–1 corresponding to the ν(C=C) stretching, while the ν(C=O)bandat1714cm–1 has only strong IR intensity. The Ne matrix spectrum [29] shows similar result in contradiction with our calculations. The scaled wavenumber at ca. 1720 cm–1 is in accordance with the experimental ones at 1718 cm–1. TheC=Oin-planebendingappearsmixedwithδas(NH2) and δ(ring) modes. The main contribution was determined at 533.5 cm–1 and scaled at ca. 520 cm–1 in agreement with the experimental band detected at 520 cm–1. However, a remarkable disagreement appears in the intensity. Thus it was calculated with very weak IR intensity in contrast to the strong band observed experimentally. C=C and ring modes: The stretching C=C vibration appears with very strong IR intensity and strongly coupled with the ν(N3=C4) and ν(ring) modes, in accordance with that observed experimentally. The ring stretching appears spread out in several computed bands at 1758.0, 1681.4, 1562.2 and 1355.5 cm–1, but mainly at 989.6 and 923 cm–1. Ring deformations appear also spread out in several computed bands at 1499.9, 1251.5, 1094.9, 533.5 and 359.2 cm–1, but mainly at 765.5, 580.7 and 547.2 cm–1. These bands were accurately related to the Ar matrix ones. NH2 substituent: The antisymmetric νas and symmetric νs(NH2) stretching vibrations were computed at 3719.3 and 3590.6 cm–1, respectively, and as pure modes. They appear with medium IR intensity, but with a slightly higher value for the symmetric mode than for the antisymmetric ones. However, experimentally the symmetric mode has slightly lower IR intensity than the antisymmetric ones. In the Raman spectra mode νs was computed with the highest intensity of the spectra, while mode νas appears with strong intensity. The in-plane bending βs mode was also computed as a pure mode at 1632.6 cm–1 (scaled at 1584cm–1) and with strong intensity in accordance with the strong experimental band observed at 1570 cm–1. The antysymmetric mode appears strongly coupled with δ(C=O)andδ(ring) modes at 1094.9 cm–1. The torsional motion τ appears as almost pure mode (80% of contribution) at 520.3 cm–1 and with weak IR intensity, although experimentally was observed with strong intensity at 507 cm–1. However, the wagging γ mode was computed with strong intensity (31%) in perfect agreement with the experimental IR band at 236 cm–1 with an intensity of 30%.
Uracil Molecule:
N-H modes: The N-H stretching appear as pure modes and with strong intensity, and thus they were clearly characterized and assigned. The N-H in-plane bending are more complicated due to they appear mixed with other modes. Seven calculated vibrations have noticeable contribution of these modes. In some cases they also appear with very low IR intensity. The description of mode 22 is complex as can be seen in Fig. 4. Mainly, it was characterized as δ(C6-H)+ δ(N-H), with some contribution of ν(C-N), in agreement

56 M Alcolea Palafox, Rachna Rastogi, S K Rathor, Daisy Bhat, V Bena Jothy and V K Rastogi
with the assignment by Harsányiet al [40] and Colarussoet al [42]. Although mode 21 has some small contribution of δ(C6-H) and δ(C5-H) modes, it has been characterized as ν(C-N)+ δ(N3-H) in agreement with Harsányiet al [40], but in contrast to Colarussoet al [42] and Léset al [48]. Mode 20 is characterized as δ(N3-H) with a high contribution of δ(C6-H, C5-H), differing of the assignment reported by Harsányiet al [40] and Császáret al [53] as β(C-H).Significantcontributionofν(N3-C4) is not observed in the mode 19 as indicated by refs. [40,42,54], and it was characterized as δ(C5-H)+ δ(N-H). Due to its weak IR intensity, it has not been detected in gas phase [42], although Harsányiet al [40] reported a band with medium intensity at 1228 cm–1. Mode 18 was calculated with strong IR intensity and scaled at 1166.8 cm–1, column 9th of Table 7, which was related to the strong IR band [42] at 1172 cm–1, differing from the band detected and assigned to this mode at 1089 cm–1 [40]. The N-H out-of-plane bends are predicted as almost pure modes and with strong and medium intensity, N3-H and N1-H respectively, in agreement with the strong and medium bands observed in Ar matrix [39f] at 662.1 and 551.2 cm–1 and to that obtained by other calculations [46,53]. In gas phase the N1-H mode is clearly related to the band at [40] 556 cm–1 or at [42] 545 cm–1, in disagreement with Aamoucheet al [44], who related this band to the two calculated wavenumbers, corresponding to δ(C2=O)and γ(N1-H) modes. The very weak gas phase band [40] at 672 cm–1 or [42] at 692 cm–1 should be changed the assignment and related to the γ(N3-H) mode. C-H modes: The stretching modes appear as pure modes and with weak or almost null IR intensity in accordance with the experimental results. Mode ν(C5-H) was scaled at 3123.1 cm–1, Table 7, and related to the Raman band at 3084 cm–1 and to the IR band in gas phase [42] at 3124 cm–1. Similarly, mode ν(C6-H) is scaled at 3083 cm–1, in accordance with the experimental IR bands observed at 3076 cm–1 and 3080 cm–1 in Ar matrix [40] and KBr pellet [55], respectively. C-H in-plane bending modes appears mixed mainly with δ(N-H) modes. The band at 1228 cm–1 in gas phase [40] was related to the band at 1217.4 cm–1 in Argon matrix, instead [44] of to the band at 1184 cm–1, and it was assigned to δ(C5-H) instead of to ν(C-N). The C6-H out-of-plane bending mode appears as a pure mode with null IR intensity. However, this mode was detected in the gas phase at 974 cm–1, but assigned [40] simultaneously to the ∆(ring) and γ(C6-H) modes, instead of only to γ(C6-H). The assignment appears corrected in Table 4, due to the mode ∆(ring) should be related to the gas phase band at 999 cm–1. Several authors [42,44] also mislay the assignment of several C-H bands. C=O modes: the stretching region is strongly influencedbyFermi interactions, and thusmanybands appears in this region, althoughonly two fundamental bands are expected.The calculatedC2=OandC4=Ostretchesare the strongest IRbands, and theyarepredictedwith similar intensity.The scaledwavenumber of both modes is very close, at 1739.1 and 1706.7 cm–1,modesC2=OandC4=O,respectively,and in accordance with the gas phase results. TheC=Oout-of-planebendingappearsingeneralmixedwithγ(C-H) modes. The description of mode 13 asγ(C5-H)+ γ(C4=O)isinagreementwithColarussoet al [42] and other authors [45a,48,53]. The band reported in gas phase [42] at 717.4 cm–1, and in Argon matrix at 707.4 and 719 cm–1 by Ivanov et al [41] and Szczepaniaket al [45a],respectively,wererelatedtomode10,definedasγ(C4=O)+γ(C5-H). The C=Oin-planebendingsappearmixedinmodes6and7.Thebandcorrespondingtomode6wasobservedonly in Ar matrix at 536.4 cm–1. It has been computed at 527 cm–1 by Peticolas and Rush [43] from ab initio (HF+CI)/6-31G* calculus, and at 529 cm–1 by Estrinet al [46] from LDA (Local Density Aproximation)-DFT/6-31G**. C=C and ring modes: The stretching C=C vibrations appears as an almost pure mode and with medium IR intensity. The null IR intensity predicted for mode 12 is in accordance with the lack of bands in the gas phase IR spectra, although the shoulder in Ar matrix at 759.2 cm–1 has been assigned [41] to this mode in agreement with other authors [39f,48]. The strong Raman activity calculated for this mode is in

Vibrational Spectroscopy: A tool for characterization of nucleic acid constituents: Cytosine and Uracil 57
accordance with the very strong lines detected [44] at 786 and 789 cm–1. The wavenumber predicted for mode 17 corresponds to the IR band [42] at 1082 cm–1, in contrast to the assignment reported in ref. [40]. The characterization of this mode as ν(ring) involves a high contribution of the N1-C6 stretch in accordance to a recent assignment [45a] of the IR band at 1073 cm–1 in Ar matrix. The ring deformation, mode 7, is predicted with weak intensity and was related to the band in Ar matrix [41,48] at 559 cm–1 (588 cm–1 in gas phase [40] ). The out-of-plane bending of the ring, mode 4, has a strong contribution of the C=C-H moiety.
Resume ane Conclusions
(i) The 30 ring normal modes of uracil and cytosine molecules were characterized and numbered for their use as notations in the spectra of their derivatives. (ii) The vibrational spectra of cytosine and uracil nucleo basis were accurately simulated by DFT methods, compared with the experimental IR and Raman spectra, and assigned all their bands. (iii) Two scaling procedures are presented and used in the calculated spectra of cytosine, and uracil. The use of the accurate linear scaling equation procedure remarkably reduces the error in the calculated wavenumbers, and it is the best for this purpsose. Thus, the assignment of most of the fundamentals provided in this work is believed to be unambiguous. (iv) The linear scaling equations obtained for uracil and cytosine molecules at different levels of computation are shown in the present manuscript. They are recommended to be used in the calculated wavenumbers of uracil and cytosine derivatives.
Acknowledgements
The authors are thankful to Prof Shabbir Ahmad, and Dr Mohammad Jane Alam, Department of Physics,AligarhMuslimUniversity,Aligarhfortheirsuggestionsandfinallygoingthroughthemanuscript.Two of the authors (DB and VKR) are thankful to Sri Rakesh Mohan Garg, Chairman R D Foundation Group of Institutions, NH 58, Kadrabad, Modinagar for providing computer facility in the Institute.
References 1. Schmitt M, Popp J, Kiefer W, in Applications of Raman spectroscopy in life sciences and mineralogy, Anita
Publications, Ghaziabad, Delhi, India, 2002. 2. Alcolea Palafox A, Recent Res. Devel. in Physical Chem. Transworld Research Network: Trivandruw, India, 2(1998)
213. 3. Watson J D, Crick FHC, Nature, 171(1953)737. 4. Brown R D, Godfrey P D, McNaughton D, Pierlot A P, J Am Chem Soc, 111(1989)2308. 5. Topal M D, Fresco J R, Nature, 263(1976)285. 6. Holbrook S R, Cheong C, Kim S H, Nature, 353(1991)579. 7. Shi K, Wahl M, Sundaralingam M, Nucleic Acids Res, 27(1999)2196. 8. Estrin D A, Paglieri L, Corongiu G, J Phys Chem, 98(1994)5653. 9. ShishkinOV,GorbL,HobzaP,LeszczynskiJ,Int J Quantum Chem, 80(2000)1116. 10. Szczesniak M, Szczepaniak K, Kwiatkowski J S, Kubulat K, Person W B, J Am Chem Soc, 110(1988)8319. 11. Nowak M J, Lapinski L, Fulara J, Spectrochim Acta, 45A(1989)229. 12. Gould I R, Vincent MA, Hillier IH, Lapinski L, Nowak M, Spectrochim Acta, 48A(1992)811. 13. Dong F, Miller R E, Science, 298(2002)1227. 14. (a) Seminario J M, Politzer P (Eds.), Modern Density Functional Theory: a tool for Chemistry, vol. 2, Elsevier,
Amsterdam, 1995.

58 M Alcolea Palafox, Rachna Rastogi, S K Rathor, Daisy Bhat, V Bena Jothy and V K Rastogi
(b) March N H, Electron Density Theory of atoms and molecules. Acad. Press, London, 1991. (c) Parr R G, Yang W, Density Functional Theory of atoms and molecules,OxfordUniv.Press.,1989. 15. Palafox M Alcolea, Rastogi V K, Spectrochim. Acta, 58A(2002)411. 16. (a) Hehre W J, Radom L, Schleyer PvR, Pople J A, Ab initio Molecular Orbital Theory, Wiley & Sons, New york,
USA, 1986. (b) Lawley K P, Ab initio methods in Quantum Chemistry, Part. 1, John Wiley & Sons, Ltd., Chichester, UK,
1987. 17. Becke A D, J Chem Phys, 97(1992)9173; 98(1993)5648. 18. Lee C, Yang W, Parr R G, Phys Rev, B37(1988)785. 19. Gaussian 09, Revision D.01, Frisch M. J.; Trucks G W, Schlegel H B, Scuseria G E, Robb M A, Cheeseman J R,
Scalmani G, Barone V, Mennucci B, Petersson G A, Nakatsuji H, Caricato M, Li X, Hratchian H P, Izmaylov A F, Bloino J, Zheng G, Sonnenberg J L, Hada M, Ehara M, Toyota K, Fukuda R, Hasegawa J, Ishida M, Nakajima T,HondaY,KitaoO,NakaiH,VrevenT,MontgomeryJA (Jr),Peralta JE,OgliaroF,BearparkM,HeydJ J,Brothers E, Kudin K N, Staroverov V N, Kobayashi R, Normand J, Raghavachari K, Rendell A, Burant J C, Iyengar S S, Tomasi J, Cossi M, Rega N, Millam N J, Klene M, Knox J E, Cross J B, Bakken V, Adamo C, Jaramillo J, GompertsR,StratmannRE,YazyevO,AustinAJ,CammiR,PomelliC,OchterskiJW,MartinRL,MorokumaK, Zakrzewski V G, Voth G A, Salvador P, Dannenberg J J, Dapprich S, Daniels A D, Farkas Ö, Foresman J B, OrtizJV,CioslowskiJ,FoxDJ,Gaussian,Inc.,WallingfordCT,2009.
20. AlparoneA,MillefioriA,MillefioriS,Chem Phys, 312(2005)261. 21. ClowneyL,JainSC,SrinivasanAR,WestbrookJ,OlsonWK,BermanHM,J Am Chem Soc, 118(1996)509. 22. Piacenza M, Grimme S, J Comput Chem, 25(2004)83. 23. Fogarasi G, J Phys Chem A, 106(2002)1381. 24. Šponer J, Hobza P, Int J Quantum Chem, 57(1996)959. 25. Susi H, Ard J S, Spectrochim Acta, 27A(1971)1549. 26. Ferro D, Bencivenni L, Teghil R, Mastromarino R, Thermochim Acta, 42(1980)75. 27. Radchenko E D, Sheina G G, Smorygo N A, Blagoi Y P, J Mol Struct, 116(1984)387. 28. Szczesniak M, Szczepaniak K, Kwiatkowski J S, Kubulat K, Person W B, J Am Chem Soc, 110(1988)8319. 29. Nowak M J, Lapinski L, Fulara J, Spectrochim Acta, 45A(1989)229. 30. Susi H, Ard J S, Purcell J M, Spectrochim Acta, 29A(1973)725. 31. Florian J, Baumruk V, Leszczynski J, J Phys Chem, 100(1996)5578. 32. Aamouche A, Ghomi M, Grajar L, Baron M H, Romain F, Baumruk V, Stepanek J, Coulombeau C, Jobic H,
Berthier G, J Phys Chem A, 101(1997)10063. 33. Ten G N, Baranov V I, Opt & Spectrosc, 97(2004)195. 34. Radchenko E D, Plokhitnichenko A M, Ivanov A Yu, et al, Biofizika, 31(1986)373. 35. Gould I R, Vincent M A, Hillier I H, Lapinski L, Nowak M, Spectrochim Acta, 48A(1992)811. 36. Rozenberg M, Shoham G, Reva I, Fausto R, Spectrochim Acta, 60A(2004)463. 37. Pulay P, Saebo S, Malagoli M, Baker J, J Comput Chem, 26(2005)599. 38. Alcolea Palafox M, Iza N, Gil M, J Molec Struct,(Theochem), 585(2002)69. 39. (a) Szczepaniak K, Szczesniak M, Nowak M, Scott I, Person W B, Int J Quantum Chem; Quant Chem Symp, 18
(1984)547. (b) Szczesniak M, Nowak M J, Rostkowska H, Szczepaniak K, Person W B, Shugar D, J Am Chem Soc, 105
(1983)5969. (c) Chin S, Scott V, Szczepaniak K, Person W B, J Am Chem Soc, 106(1984)3415. (d) Maltese M, Passerini S, Nunziante-Cesaro S, Dobos S, Harsányi L, J Mol Struct, 116(1984)49.
(e) Radchenko E D, Plokhotnichenko A M, Sheina G G, Blagoi Y P, Biofizika, 28(1983)923. (f) Barnes A J, Stuckey M A, Gall L L, Spectrochim Acta, 40A(1984)419. 40. Harsányi L, Császár P, Császár A, Boggs J E, Int J Quantum Chem, 29(1986)799.

Vibrational Spectroscopy: A tool for characterization of nucleic acid constituents: Cytosine and Uracil 59
41. Ivanov A Y, Plokhotnichenko A M, Radchenko E D, Sheina G G, Blagoi Y P, J Mol Struct, 372 (1995)91. 42. Colarusso P, Zhang K, Guo B, Bernath P F, Chem Phys Letts, 269(1997)39. 43. Peticolas W L, Rush III Th, J Comp Chem, 16(1995)1261. 44. Aamouche A, Ghomi M, Coulombeau C, Jobic H, Grajcar L, Baron M H, Baumruk V, Turpin P Y, Henriet C,
Berthier G, J Phys Chem, 100(1996)5224. 45. (a) Szczepaniak K, Person W B, Leszczynski J, Kwiatkowski J S, Polish J Chem, 72(1998)402. (b) Chandra A K, Nguyen M T, Zeegers-Huyskens Th, J Phys Chem A, 102(1998)6010. 46. Estrin D A, Paglieri L, Corongiu G, J Phys Chem, 98(1994)5653. 47. Nowak M J, Szczepaniak K, Barski A, Shugar D, Z Naturforsch, 33C(1978)876. 48. Lés A, Adamowicz L, Nowak M J, Lapinski L, Spectrochim Acta, 48A(1992)1385. 49. Scott A P, Radom L, J Phys Chem, 100(1996)16502. 50. Palafox M Alcolea, J Phys Chem, 103 A(1999)11366. 51. Rastogi V K, Singh C, Jain V, Palafox M Alcolea, J Raman Spectrosc, 31(2000)1005. 52. (a) Rastogi V K, Jain V, Yadav R A, Singh C, Palafox M Alcolea, J Raman Spectrosc, 31(2000)595 (b) Palafox M A, Rastogi V K, Kumar H, Kostova I, Vats J K, Spectrosc Letts, 44(2011)300. (c) Palafox M Alcolea, Int J Quantum Chem, 77(2000)661. (d) Anupma, Vats J K, Palafox M Alcolea, Bhat Daisy, Rastogi V K, Asian Chem Lett,18(2014)115. 53. Császár P, Harsányi L, Boggs J E, Int J Quantum Chem, 33(1988)1. 54. Aamouche A, Berthier G, Coulombeau C, Flament J P, Ghomi M, Henriet C, Jobic H, Turpin P Y, Chem Phys,
204(1996)353. 55. Nishimura Y, Tsuboi M, Kato S, Morokuma K, J Am Chem Soc, 103(1981)1354.
[Received: 25.02.2015; accepted: 6.03.2015]
Copyright © 2022 FDOKUMEN