Impact of water constituents on radiative heat transfer in the ...
Upload
khangminh22Category
view
4download
0
ANALYSIS OF TRACE ELEMENTS AND ORGANIC CONSTITUENTS IN ARJUNA
(TERMINALIA ARJUNA) BARK
A DISSERTATION Submitted in partial fulfillment of the
requirements for the award of the degree of
MASTER OF TECHNOLOGY in
ADVANCED CHEMICAL ANALYSIS
By
PRATIMA T. GAJBHIYE 01, maa,444p
tie
DEPARTMENT OF CHEMISTRY INDIAN INSTITUTE OF TECHNOLOGY ROORKEE
ROORKEE - 247 667 (INDIA)
JUNE, 2006
4:N qivei rzrzl ft-d-zrr Trt09- .4-r I I
M66-ki --T,74-10-cil
4-04: imilisuiTizr tElwisui -utfa- .4-F4 I
, yam!)
314, vq4 facw 7-4-4 444)14)1 .4 4 1 " * %JIM 411
**I 1-1-q , ftM. 4 TEF TAT •8411
ctrMi t Wet UM TT aTtraT Tim ticm, mica uqr aftsT 79. 1 ,i44)41) *
, .er tom -krw ,itizi)4r) gqq 9171%-mict) .101.) wr VET 3TP-Tqf 113 ifitT
~tial 4r4-) **iv 111TR 111-4 10T t I
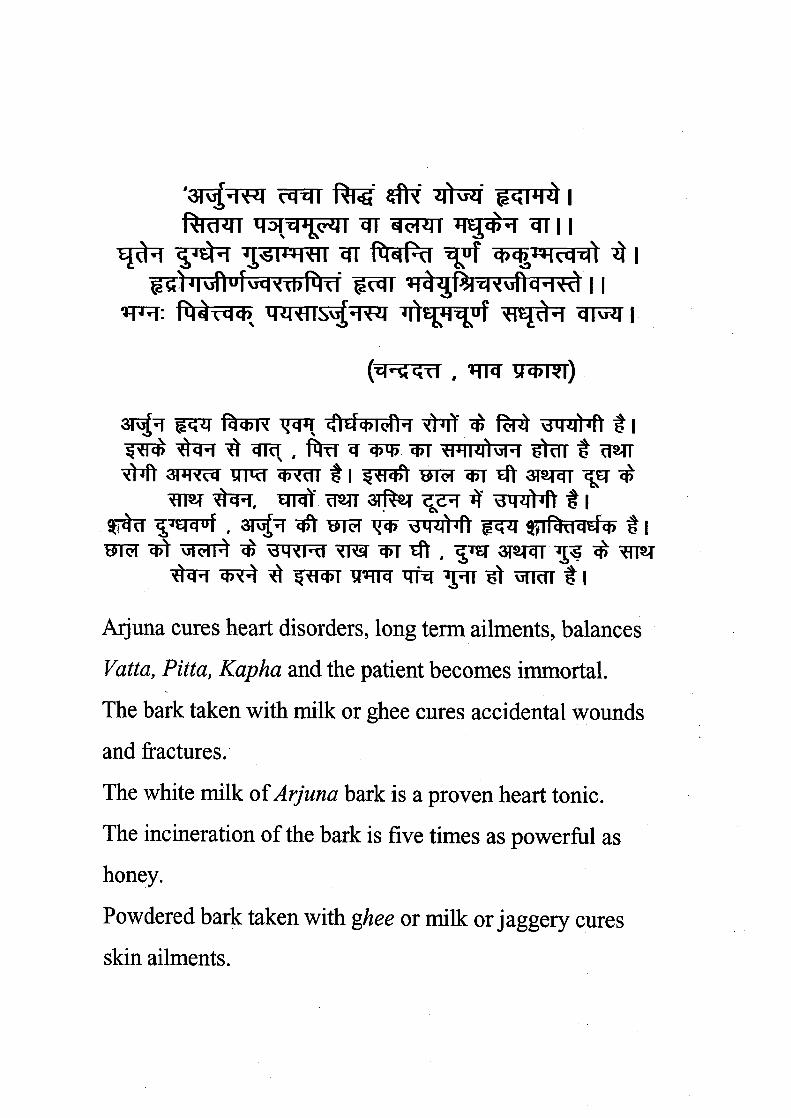
Arjuna cures heart disorders, long term ailments, balances
Vatta, Pitta, Kapha and the patient becomes immortal.
The bark taken with milk or ghee cures accidental wounds
and fractures.
The white milk of Arjuna bark is a proven heart tonic.
The incineration of the bark is five times as powerful as
honey.
Powdered bark taken with ghee or milk or jaggery cures skin ailments.

laores1141
(A. . GARG) Professor in Chemistry
CANDIDATE'S DECLARATION
I hereby certify that the work being presented in the dissertation
entitled Analysis of Trace Elements and Organic Constituents in Arjuna
(Terminalia Arjuna) bark is an authentic record of my own work carried out
by me under the supervision of Prof. A.N. GARG at the Department of
Chemistry, Indian Institute of Technology, Roorkee during July, 2005 to June,
2006. The work forms a part of M.Tech. in Advanced Chemical Analysis
and the matter presented in this dissertation has not been submitted by me
for the award of any other degree of this or any other Institute.
Dated: 30 June 2006 (PRATIMA T. GAJBHIYE) Candidate
Enrolment. no. 0119703 This is to certify that the above statement made by Ms Pratima
Gajbhiye is correct to the best of my knowledge.
'4614 (Ravi Bhushan)
Professor and Head Dept. Of Chemistry I IT Roorkee, Roorkee-247667
(I)

ACKNOWLEDGEMENTS
I take this opportunity of expressing my deep sense of gratitude and
indebtedness to Professor A. N. Garg for his inspiring guidance, generous criticism and
invaluable encouragement, which helped me, exploring new things. Without his good
self and support, it would not have been possible for me to complete the work. I am glad
to mark that it is a great experience for me to learn under his guidance.
It is my privilege to avail this opportunity to pay my sincere thanks to Prof. Ravi
Bhushan, Professor and Head, Department of Chemistry, IIT, Roorkee for providing all
the necessary facilities for the fulfillment of this project. I am also thankful to all the
faculty members for their moral support. I express my gratitude to Prof. K. Chandra and
R. M. Manikawasagam, Institute Instrumentation Centre, Mr. Handa, Mr. Juyal and Mr.
Saini for their cooperation in analyzing the samples using ICP-MS, AAS, TGA. I would
also like to acknowledge my sincere thanks to Mr. Abdul Haq for all the technical
assistance required from time to time in the department.
My sincere sentiments are for my senior colleague Mr. Ratnadeep Paul
Choudhury for his kind, considerate and constant encouragement during the course of
this work. It would have been impossible for me to complete this work without his active
cooperation. He carried out all the experimental work at the Dhruva reactor at the
Bhabha Atomic Research Center, Trombay, Mumbai. Also I would like to thank Drs.
A.V.R.Reddy, and R. N. Acharya for their kind cooperation during irradiation work and
providing all the experimental facilities at BARC. My sincere thanks to lab mates Mrs.
Zareena I. and Ms Indu for their friendly cooperation.
Finally my heartfelt gratitude to my parents for all the sacrifices, constant
encouragement and consistent support.
At last thanks to the God almighty who has given me spiritual support and
courage to carry out this work.
(PRATIMA T. GAJBHIYE)

TABLE OF CONTENTS Candidate's Declaration.. Acknowledgement (ii) Table of contents (iii) List of Tables (iv) List of Figures (v)
Abstract (vi) Ch. I INTRODUCTION 1-28
1.1 General Aspects 1 1.2 Medicinal Importance 4 1.3 Importance of Trace Elements 6 1.4 Organic Constituents 13 1.5 Analytical Techniques 16 1.6 Literature Survey 24 1.7 Aim and Scope of Work 27
Ch. II METHODS AND INSTRUMENTATION 29-42 11.1 Sampling 30 11.2 Packing and Irradiation 31 11.3 Measurement and Activity 31 11.4 Calculation of Concentrations 34 11.5 MS Determination 34 11.6 ICP-MS Determination 38 11.7 Separation of Organic Constituents 39 11.8 Instrumentation 41
Ch. III RESULTS AND DISCUSSION 43-70
111.1 Results 43 111.2 Data Validation 44 111.3 Variation of Elemental contents 45 111.4 Elemental ratios. 49 111.5 Comparison of NAA with MS and ICP-MS 49 111.6 Comparison with Literature Data 50 111.7 Identification of Organic Constituents 51 111.8 Thermogravimetric analysis 55 111.9 Carbonaceous matter 56
CONCLUSION 71 REFERENCES 72 - 80

LIST OF TABLES
Page No. 1.1 Nomenclature of Arjuna (Terminalia Arjuna) 3
1.2 Classification of the elements of biological importance 7
1.3 List of essential elements, their metabolic functions and their deficiency symptoms
11
1.4 Nuclear Reactors available for NM at BARC, Mumbai 20
11.1 Irradiation, delay and counting schedule 32
11.2 Nuclear characteristics of radionuclides identified and determined 33
11.3 Wavelength, Working range and Detection limits of elements analyzed by AAS.
38
111.1 Elemental concentrations in SRMs used for data validation in NAA 58
111.2 Elemental concentrations in Arjuna bark of different brands using NM 59
111.3 Elemental concentrations in Arjuna by MS. 60
111.4 Elemental concentrations in Arjuna bark and RMs by ICP-MS 61
111.5 Comparison of our data with those reported in the literature 62
111.6 Elemental Analysis of Arjuna bark powder 62
(iv)
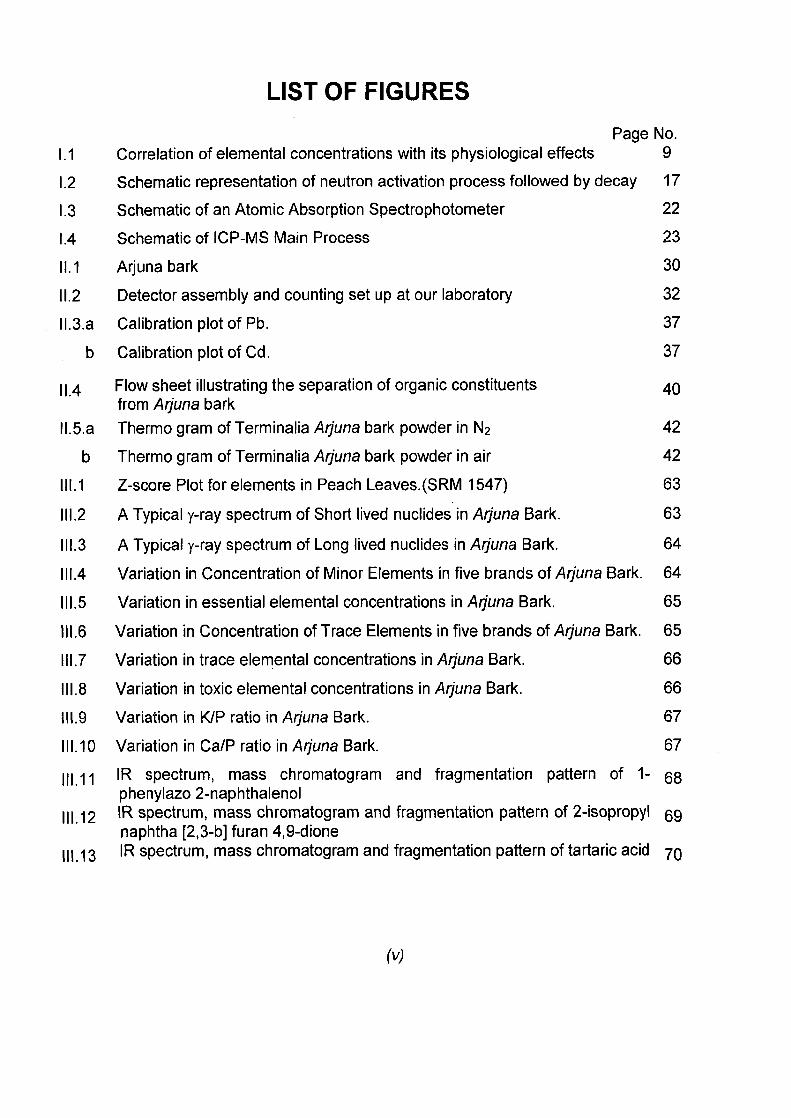
LIST OF FIGURES Page No.
1.1 Correlation of elemental concentrations with its physiological effects 9
1.2 Schematic representation of neutron activation process followed by decay 17
1.3 Schematic of an Atomic Absorption Spectrophotometer 22
1.4 Schematic of ICP-MS Main Process 23
11.1 Arjuna bark 30
11.2 Detector assembly and counting set up at our laboratory 32
II.3.a Calibration plot of Pb. 37
b Calibration plot of Cd. 37
11.4 Flow sheet illustrating the separation of organic constituents 40 from Arjuna bark
II.5.a Thermo gram of Terminalia Arjuna bark powder in N2 42
b Thermo gram of Terminalia Arjuna bark powder in air 42
111.1 Z-score Plot for elements in Peach Leaves.(SRM 1547) 63
111.2 A Typical y-ray spectrum of Short lived nuclides in Arjuna Bark. 63
111.3 A Typical y-ray spectrum of Long lived nuclides in Arjuna Bark. 64
111.4 Variation in Concentration of Minor Elements in five brands of Arjuna Bark. 64
111.5 Variation in essential elemental concentrations in Arjuna Bark. 65
111.6 Variation in Concentration of Trace Elements in five brands of Arjuna Bark. 65
111.7 Variation in trace elemental concentrations in Arjuna Bark. 66
111.8 Variation in toxic elemental concentrations in Arjuna Bark. 66
111.9 Variation in K/P ratio in Arjuna Bark. 67
111.10 Variation in Ca/P ratio in Arjuna Bark. 67
111.11 IR spectrum, mass chromatogram and fragmentation pattern of 1- 68 phenylazo 2-naphthalenol
111.12 IR spectrum, mass chromatogram and fragmentation pattern of 2-isopropyl 69 naphtha [2,3-b] furan 4,9-dione
111.13 IR spectrum, mass chromatogram and fragmentation pattern of tartaric acid 70
(v)

INPIA The Times of India, New Delhi
'EY 14+ina Jeln/TNN
detv.Delbli India seems to have band its answer to the multi-billion. Chinese stress buster, ginseng. The extract of the
of a pee, Terminally arju-r4toinnicinly known as Arju-ria, has been found to be ex-remely helpftd in controlling tress and in early stages of oronary artery disease. Scientists at the Central
)rug Research Institute (CDRI) a Lucknow, after four years of .ainstaking research, have con-irmed that the extract, used in
..erk on animal models. yurvedic pre tione;: does
The Indian Council of.Aled-cal Research (ICMR). ill'how .rrpari it to start cl tnic4 trials
In at least four centres around the country The All India Insti-tute of 'Medical Sciences and the University College of Med-ical Sciences will be among the two cen-tres chosen in Delhi. A senior ICMR sci-entist told TNN, "It seems to work as well as ginseng."
Ginseng is among some of the world's largest saying herbal products. In
,Revital, a multi-vitamin containing gin. sang, has sales ceasing ill mil-lion mutually Ginseng is used to reduce stress, regulate blood and sugar levels and strengthen the cardiovascular system.
Scientists at ICMR said the preliminary results of arjuna showed that It has stress-bust-
: ing properties. It also helps those in the early stages of coronary artery disease and patients of high blood pressure. The Muria tree Is found all over India.
ICMR, in fact, for the first time la ac-tively trying to vali-date traditional ther-apies and ayurvedic
preparations with scientific re-search so as to create a global market for them. It has initiat-ed trials to study a traditional remedy for diarrhoea, a plant extract for treating Illariasis,
Ginseng another extract for treating liv er diseases and a herbal prepa ration for treating prostate problems in men. At Nair hos pitai In Mumbal, trials are go L. on to study the use of dried ginger, curcumin and the ex tract of nutgram in the treat ment of diarrhoea in children The preparation is said to strengthen intestines and thu' check recurrence of diarrhoea.
Nearly 220 patients have been enrolled for the study One group has been put on the oral rehydration solution pre-scribed by the WHO and anoth-er on this preparation. Results so far have been encouraging. says ICMR, which hopes to push these alternative thera-pies into treatment regimens.
juna to be India's reply to

ABSTRACT
Arjuna (Terminalia Arjuna) bark powder is a widely used heart tonic as described
in ancient Sanskrit texts. Five samples including two commercial brands, collected from
different places have been analyzed for elemental contents by neutron activation
analysis (NAA), atomic absorption spectrophotometry (AAS) and inductively coupled
plasma-mass spectrometry (ICP-MS) for 27, 14 and 22 elements respectively. In all 23
elements have been determined by three different techniques and a maximum of 32
elements have been determined in Arjuna bark. All the elements show wide variation
depending on their origin. A comparison for some elemental concentrations by different
techniques suggests good agreement even though AAS and ICP-MS require sample
dissolution. The bark powder is particularly enriched in K (5.87±2.11mg/g), Ca
(34.1±10.5 mg/g), Mg (5.41±1.93 mg/g), Fe (2.99±1.77mg/g), Mn (75.5±24.8 pg/g) and
Zn (11.9±8.9 p.g/g). Further, Mo, Rb, Cs, Sr and V were also found in few p.g/g amounts.
Also Ca/P (105 ± 50) ratio is much higher compared to K/P (16.4 ± 4.6). NAA has the
advantage of being non-destructive compared to MS and ICP-MS where sample
dissolution is required. Thin layer chromatography (TLC) and column chromatography
were used to separate three new organic compounds; 1-phenylazo 2-naphthalenol, 2-
isopropyl naphtho [2, 3, [3], furan 4, 9-dione and tartaric acid with Rf = 0.79, 0.63 and 0.72 respectively from the methanolic extract of Arjuna bark. The compounds were
identified by elemental analysis, infrared and NMR spectra and further confirmed by
GC-MS where fragmentation pattern have been proposed. It is proposed that metal ions
remain complexed with the naturally occurring organic ligands making them
bioavailable. Thermogravimetric studies suggest three stage decomposition followed by
—16% non-volatile matter left at 900 °C
(vi)

Ch I
INTRODUCTION
1.1 GENERAL ASPEtil
The genus Terminalia consists of large hard wooded trees. Over 100
species of this genus are widely distributed in the tropics (Terminalia word
originated from the Latin word Terminus, referring to the leaves being borne on
the tips of the shoots). In India, T. arjuna, T. chebula, T. bellrica and T. ciliata are
major related species. Terminalia arjuna or Arjuna in Hindi belongs to the family
Combretaceae and it is a deciduous tree (60-70 feet or 25 meter in height),
1

Ch I INTRODUCTION
abundantly found throughout the sub-Himalayan tracts, the Deccan region,
Myanmar, Sri Lanka and in the southeastern countries [1]. It has long, cone
shaped round leaves and white bark, which gives out a milky juice when cut. The
tree and especially its bark has been found to be medicinally important, widely
used in the preparation of Ayurvedic formulations for as a heart tonic. Leaves are
sub-opposite, 5-14 x 2-4.5 cm., oblong or elliptic oblong, glabrous, often in
equilateral, margin often crenulate, apex obtuse or sub-acute, base rounded or
sometimes cordate; petioles 0.5-1.2cm. Flowers are small and white but fruit is
2.3-3.5 cm long, fibrous woody, glabrous with 5 hard wings, striated with
numerous curved veins.
Flowering time is normally during spring. It
can be artificially propagated through seeds,
coppicing, pollarding, root-suckers, stumps and
air layering. It is initially slow growing but later
grows fast. It attains 2-3 m height in 3 years.
Arjuna yields up to 45 kg dry bark chips on a
three-year cycle without injury [2].
Nomenclature: It is known by various names in different Indian languages [3] as
listed in Table 1.1. However, it is also known as Arjun Chhal in trade circles. Both
Charaka and Susruta have mentioned this plant in their Samhitas. It was Acharya
Vagbhata who for the first time mentioned about this plant Arjuna [2], for its use
in treating heart diseases. Because of its beneficial properties of strengthening
2

Ch I INTRODUCTION
Table 1.1. Nomenclature of Arjuna (Terminalia Arjuna) [3]
Language Nomenclature English White Marudah Hindi Arjun, Arjuna, Koha, Kahu, Arjan
Gujarati Arjun - Sadada, Sadado Marathi Arjuna, Arjun Sadada, Sadura, Ladada Sanskrit Arjuna, Dhanvi, Indradruma, Kakubha, Karvirak Oriya Arjuna, Sahajo Tamil Vellamatta
Kannada Maddi Telugu Yerra maddi, Tellamaddi Assam Orjun Bengali Arjhan Punjabi Arjuna Chinese ... San guo mu (Taiwan) German Echte Myrobalane Russian Tepmmianmi appKylia, Tepromanms apKylia Nepalese Arjun, Kaahuu
the heart muscles, it has attracted the attention of modern research workers all
over the world. It is widely found in the terrains of Himalaya, Bengal, Bihar and
Madhya Pradesh. Lines of trees can be seen in dry mountain areas, along rivers
and ponds.
Though modern medical sciences have progressed a lot in its fight against
heart ailments, the numbers of heart patients are continuously increasing. Large
number of medications starting from aspirin to sophisticated open-heart surgeries
is now a days common in developed countries. In spite of the ultramodern
technologies and the awareness programs, heart diseases like Angina pectoris
and Myocardial Infraction are creating alarming situation in the society. If we
consider the traditional Indian herbal system of medicine - Ayurveda, we come to
3
Ch I
INTRODUCTION
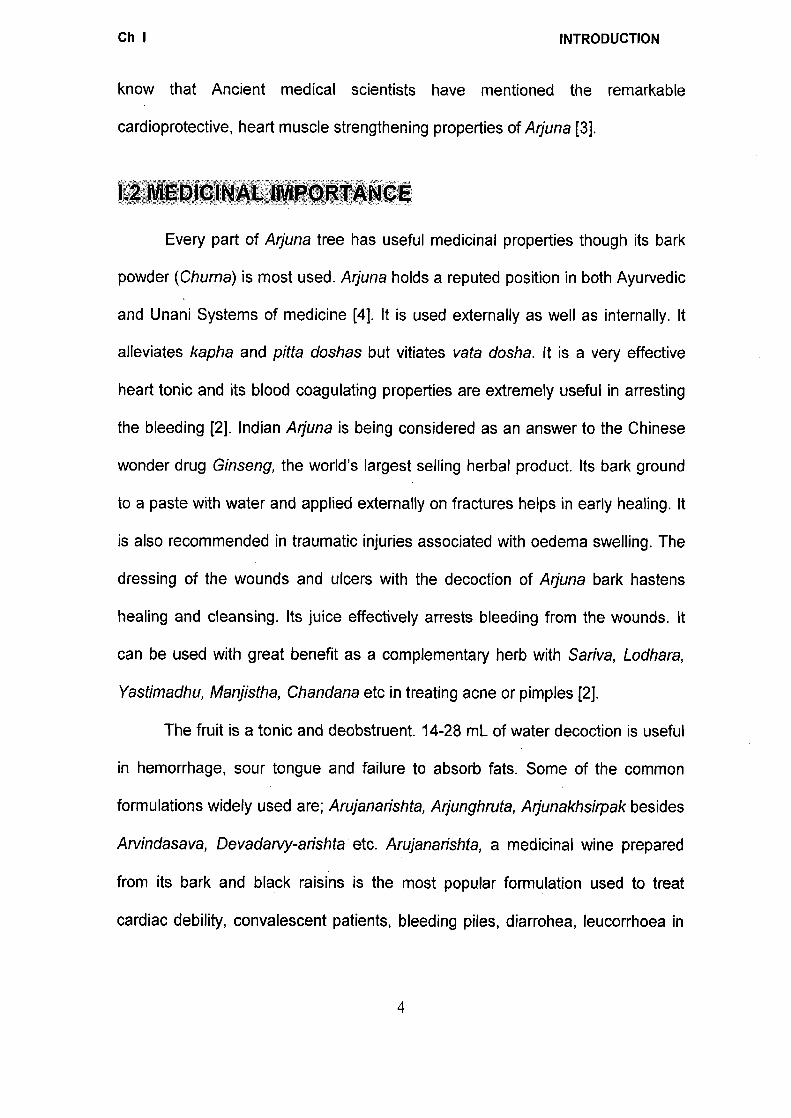
know that Ancient medical scientists have mentioned the remarkable
cardioprotective, heart muscle strengthening properties of Arjuna [3].
Every part of Arjuna tree has useful medicinal properties though its bark
powder (Chuma) is most used. Arjuna holds a reputed position in both Ayurvedic
and Unani Systems of medicine [4]. It is used externally as well as internally. It
alleviates kapha and pitta doshas but vitiates vata dosha. It is a very effective
heart tonic and its blood coagulating properties are extremely useful in arresting
the bleeding [2]. Indian Arjuna is being considered as an answer to the Chinese
wonder drug Ginseng, the world's largest selling herbal product. Its bark ground
to a paste with water and applied externally on fractures helps in early healing. It
is also recommended in traumatic injuries associated with oedema swelling. The
dressing of the wounds and ulcers with the decoction of Arjuna bark hastens
healing and cleansing. Its juice effectively arrests bleeding from the wounds. It
can be used with great benefit as a complementary herb with Sariva, Lodhara,
Yastimadhu, Manjistha, Chandana etc in treating acne or pimples [2].
The fruit is a tonic and deobstruent. 14-28 mL of water decoction is useful
in hemorrhage, sour tongue and failure to absorb fats. Some of the common
formulations widely used are; Arujanarishta, Arjunghruta, Arjunakhsirpak besides
Arvindasava, Devadarvy-arishta etc. Arujanarishta, a medicinal wine prepared
from its bark and black raisins is the most popular formulation used to treat
cardiac debility, convalescent patients, bleeding piles, diarrohea, Ieucorrhoea in
4

Ch I INTRODUCTION
the dosage of 2-4 teaspoons twice a day [3. Some of its beneficial properties are
[5,6]
(i) Healing Power: The bark of Arjuna tree is a cardiac stimulant and has a
cooling effect. It is useful in arresting secretion or bleeding. It helps to relieve
fever. It is also useful in removing calculi or stones formed in the urinary system,
in promoting flow of bile, in wound healing and healing of fractured bones.
(ii) Heart Disorder: The bark and its preparations are known to have a marked
stimulant action on the heart [6]. The practitioners of Indian system of medicine
use it in conditions of cardiac failure and dropsy. As a heart stimulant, either a
decoction of the thick portion of the bark made with milk should be taken every
morning on an empty stomach or its powder in 1 to 2 g doses should be used
with milk and jaggery. In case of heart attack, it cannot act against like
streptokinase or eurokinase. Its regular use just recovers the patient from heart
attack and reduces the chance of further attack to a great extent [7,8]. 2-3 g
powdered bark soaked overnight in a cup of water, decanted next morning and
the water taken in empty stomach helps bring down the blood pressure. Besides,
no toxic or side effects have been found.
(iii) Asthma: In Ayurveda, the bark of Arjuna is considered beneficial in the
treatment of asthma [9]. A fine powder of the bark is made and stored in a well -
corked bottle. Infusion is made in hot water from 1 teaspoon of Arjuna bark
powder and drunk as tea.
(iv) Diarrhoea and dysentery: A decoction of the bark taken in doses of 15 to
30 g may relieve patients of diarrhoea or dysentery [10].
5

Ch I INTRODUCTION
(v) Acne: An ointment made by mixing the bark and honey applied over the
affected area, can treat acne successfully [11].
(vi) Aphrodisiac: The powder of the bark is an effective sex stimulant, if taken
with milk regularly over a period of time.
(vii) Other disorders: The juice of fresh leaves can be used beneficially in
earache. Ash of the bark is also prescribed in scorpion sting. The decoction of
the herb is used as an astringent for cleaning sores, ulcer etc. It is useful as
diuretic, incirrhosis (degeneration of liver), inflammatory conditions and drops
[12,13]
(viii) Radioprotective Effect: Some researchers have found it as radioprotective
with different model systems against y- radiation [14].
(ix) Antioxidant Propertiei: Its antioxidant effects like prevention, radical
scavenging and repair have been studied and mechanism well understood in
terms of its high ability to react with and neutralize the free radicals and related
species of biological importance such as superoxide, hydroxyl radical, singlet
oxygen, thiyl radical and peroxyl radical derived from various sources. [14].
Realization of the importance of trace elements in nutrition began in 19th
century with the chemical analysis of elements in biological systems. It was
demonstrated that certain elements were essential for the growth of
microorganisms and biochemical processes [15]. In addition to the organic
elements C, H, N and 0 there are nine other elements required in relatively large
quantities and are therefore called macronutrients. These are Na, K, Mg, Ca, S,
6
I. Structural Elements
II. Electrolyte Elements
Anions
Ill. Trace Elements
Essential
a. Biologically
C, H, 0, P, N, S, Ca
Ca, CI, K, Mg, Na
HCO3-, S042-, HP042
Co, Cr, Cu, Fe, I, Mn, Mo, Se,
Zn, As, F, Ni, Si, Sn, V
Cr, Cu, Fe, I, Se, Zn
b. Clinically
Toxic
a. Potentially Toxic
b. Environmental contaminants
c. Industrial Hazards
As, Br, Cd, Hg, Pb, TI, Th
Cd, Hg, Pb
As, Be, Cr, Hg, Ni, Mn, Pb, Sb,
Si, Ba, Sr
Ch I INTRODUCTION
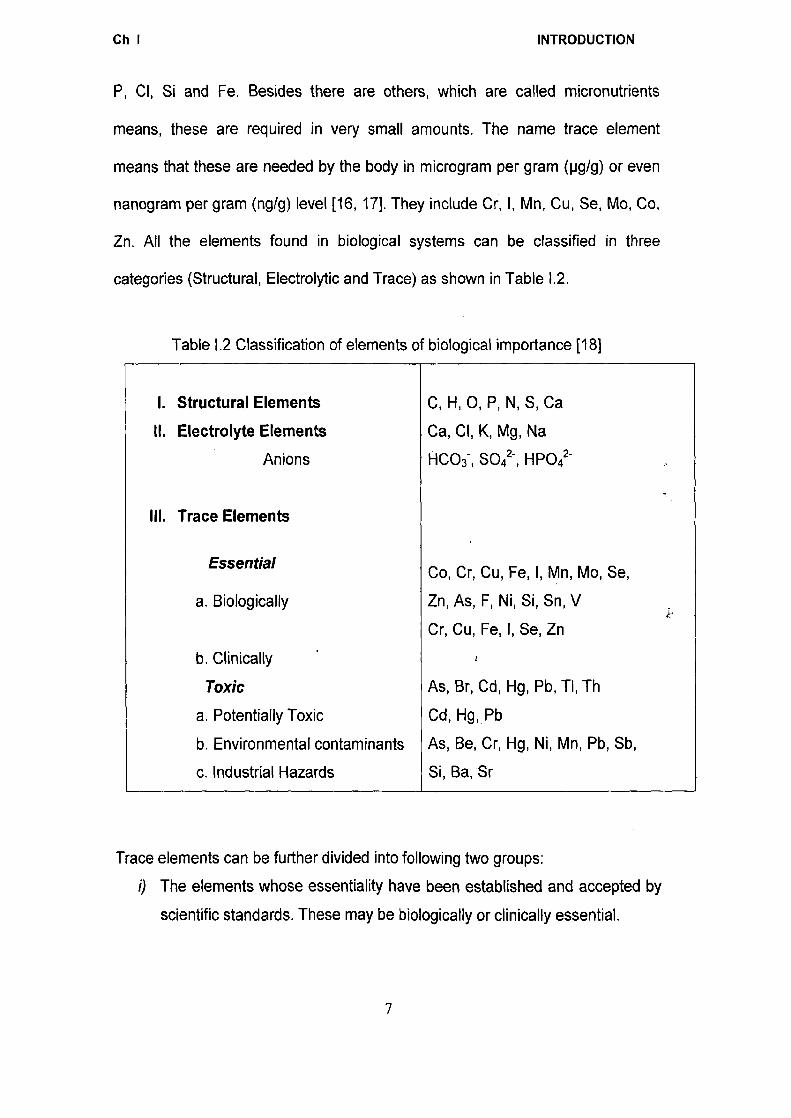
P, CI, Si and Fe. Besides there are others, which are called micronutrients
means, these are required in very small amounts. The name trace element
means that these are needed by the body in microgram per gram (pg/g) or even
nanogram per gram (nglg) level [16, 17]. They include Cr, I, Mn, Cu, Se, Mo, Co,
Zn. All the elements found in biological systems can be classified in three
categories (Structural, Electrolytic and Trace) as shown in Table 1.2.
Table 1.2 Classification of elements of biological importance [18]
Trace elements can be further divided into following two groups:
0 The elements whose essentiality have been established and accepted by
scientific standards. These may be biologically or clinically essential.
7
Ch I INTRODUCTION
ii) Those elements who's proof of essentiality does not exist but on the other
hand their presence is harmful. Hence these are called toxic elements.
An essential element is defined as the one required for maintenance of
life. Its absence results in deleterious effects causing death of the organism.
Elements such as Fe, Mn, Co, Cu, and Zn in trace amounts are active in
biological systems and biochemical processes. Their deficiency causes
disturbances in metabolism and growth of tissue, whereas their excess amounts
may cause harmful effects. Underwood and Mertz (1986) [16] have reviewed the
role of trace elements in nutrition required for the development of purified diets
and methods of animal care that limit exposure to contaminants. The science of
human nutrition is mainly concerned with defining the optimum amounts of the
constituents of food necessary to achieve or maintain health in all groups of the
population. During last few decades, researchers have further added Se, Cr, Ni,
V, Si, I, and As in the list of essential elements suggesting their essentiality at
optimum concentration. These play a vital role in biochemical and enzymatic
processes. Nutritional supply of these elements must be in sufficient quantity to
maintain essential metabolic functions of enzymes and hormones.
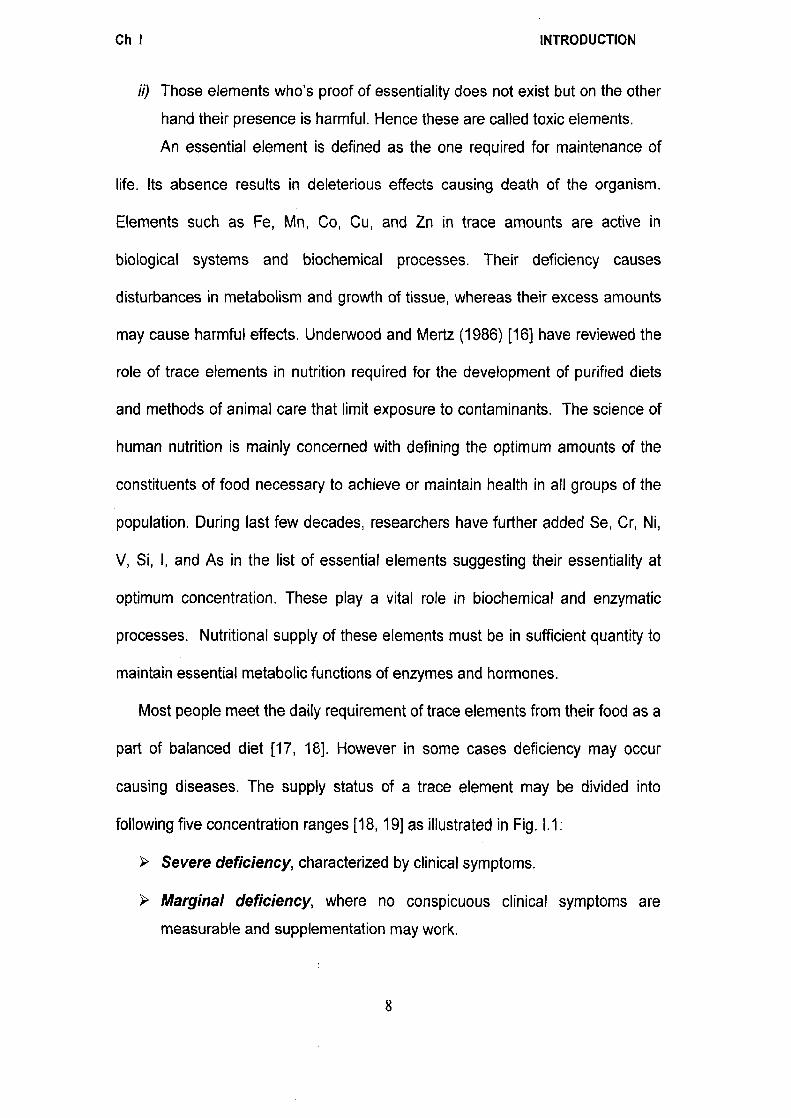
Most people meet the daily requirement of trace elements from their food as a
part of balanced diet [17, 18]. However in some cases deficiency may occur
causing diseases. The supply status of a trace element may be divided into
following five concentration ranges [18, 19] as illustrated in Fig. 1.1:
➢ Severe deficiency, characterized by clinical symptoms.
➢ Marginal deficiency, where no conspicuous clinical symptoms are
measurable and supplementation may work.
8

DISEASED OR DELETERIOUS
F14
Ch I INTRODUCTION
> Optimal concentration leading to metabolic functioning, promoting
normal health and organ performance.
> Sub toxic, where intake is in excess of the optimal supply and is
characterized by biochemical changes with pharmacological aspects
manifested by clinical symptoms.
> Toxic is characterized by clinical symptoms and finally acute toxicity may
cause death.
Fig. 1.1 Correlation of elemental concentrations with its physiological effects
Trace elements are essential in the assimilation and utilization of
vitamins, proteins and other nutrients. They aid in digestion and act as catalyst
for many hormones, enzymes and essential body functions and biochemical
reactions. They also aid in replacing electrolytes lost through heavy perspiration
or extended diarrhea and protect against toxic reactions and heavy metal
poisoning [19]. Excessive levels of non-essential mineral contaminants such as
9
Ch I INTRODUCTION
Al, As, Cd, Pb may affect the adsorption and efficient use of minerals in the body
and can have an imbalancing effect on the body cell [19]. For example Cd an air
pollutant from cigarette smoke and industrial emission is experimentally known to
cause hypertension, cancer and immune disorders. It acts as classical stress
agent and has also been implicated in learning disabilities. Several diseases are
known to be associated with the deficiency or excess amounts of particular
elements in body systems such as:
o Minimata due to Hg.
• Itai-itai due to Cd.
• Keshan due to deficiency of Se.
• Baritosis due to Ba inhaling.
• Goiter due to I deficiency.
o Parkinson's disease due to Cu and
o Alzheimer's supposedly due to Al.
A chronological order of the establishment of essentiality of trace
elements and their normal metabolic functions including deficiency symptoms are
listed in Table I. 3.
Physical illness can raise demands for many trace elements. For example,
the need for Mg increases in heart disease and eating disorders. The demand of
zinc increases under psychological stress. In following lines are described the
importance of some elements whose essentiality or toxic effects have been
proved.
10
Ch I
INTRODUCTION
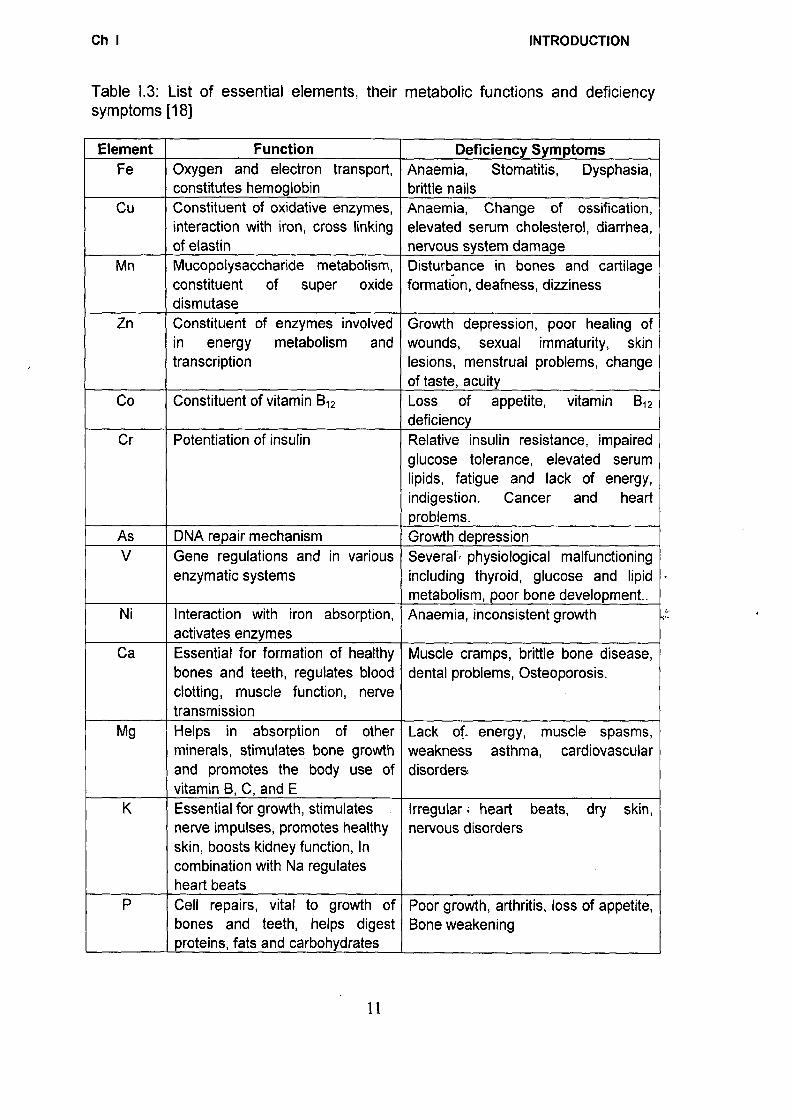
Table 1.3: List of essential elements, their metabolic functions and deficiency symptoms [18]
Element Function Deficiency Symptoms Fe Oxygen and electron transport,
constitutes hemoglobin Anaemia, Stomatitis, Dysphasia, brittle nails
Cu Constituent of oxidative enzymes, interaction with iron, cross linking of elastin
Anaemia, Change of ossification, elevated serum cholesterol, diarrhea, nervous system damage
Mn Mucopolysaccharide metabolism, constituent of super oxide dismutase
Disturbance in bones and cartilage formation, deafness, dizziness
Zn Constituent of enzymes involved in energy metabolism and transcription
Growth depression, poor healing of wounds, sexual immaturity, skin lesions, menstrual problems, change of taste, acuity
Co Constituent of vitamin B12 Loss of appetite, vitamin B12 deficiency
Cr Potentiation of insulin Relative insulin resistance, impaired glucose tolerance, elevated serum lipids, fatigue and lack of energy, indigestion. Cancer and heart problems.
As DNA repair mechanism Growth depression V Gene regulations and in various
enzymatic systems Several., physiological malfunctioning including thyroid, glucose and lipid metabolism, poor bone development..
Ni Interaction with iron absorption, activates enzymes
Anaemia, inconsistent growth
Ca Essential for formation of healthy bones and teeth, regulates blood clotting, muscle function, nerve transmission
Muscle cramps, brittle bone disease, dental problems, Osteoporosis.
Mg Helps in absorption of other minerals, stimulates bone growth and promotes the body use of vitamin B, C, and E
Lack of_ energy, muscle spasms, weakness asthma, cardiovascular disorders.
K Essential for growth, stimulates nerve impulses, promotes healthy skin, boosts kidney function, In combination with Na regulates heart beats
Irregular ‘ heart beats, dry skin, nervous disorders
P Cell repairs, vital to growth of bones and teeth, helps digest proteins, fats and carbohydrates
Poor growth, arthritis, loss of appetite, Bone weakening
11

Ch I INTRODUCTION
Chromium (Cr): It is an essential trace nutrient required for normal sugar and fat
metabolism [22]. It occurs in the body with highest concentrations in the liver,
kidney, spleen and bone and works with insulin in the metabolism of sugar and
stabilizes blood sugar levels, cleans the arteries by reducing cholesterol and
triglyceride levels, helps transport amino acids and control appetite. It has been
shown that persons with low levels of Cr are more susceptible to having cancer
and heart problems and becoming diabetic. Toxic effects are due to industrial
exposure of Cr (VI), whereas Cr (III) is essential [23].
Manganese (Mn): It helps nourish the nerves and brain and aids in the
coordination of nerve impulse and muscular action. It helps eliminate fatigue and
reduces nervous irritability [24]. Manganese is found in citrus fruits, the outer
covering of nuts, grains, green leaves of edible plants, fish and raw egg yolk.
Iron (Fe): It exists chiefly as hemoglobin in the blood and transports oxygen
inhaled into the lungs [25]. It is the master mineral which creates vitality and
stamina, required for the healthy complexion and for building up resistance in the
body. Its chief sources are grapes, raisins, spinach, all green vegetables, whole
grain, cereals, dried beans, dark colored fruits, beets, dates, liver and egg yolk.
Cobalt (Co): It is a compone'nt of vitamin B12, a nutritional factor necessary for
the formation of red blood cells. Recent researches have shown that its pink
colour is attributed to the presence of cobalt. The presence of this mineral in
foods helps the synthesis of hemoglobin and the absorption of food-iron [26].
Copper (Cu): It helps in the conversion of iron into hemoglobin and stimulates
the growth of red blood cell's. It is also an integral part of certain digestive
12

Ch I INTRODUCTION
enzymes. It makes the amino acid tyrosine usable, enabling it to work as the
pigmenting factor for hair and skin. It is also essential for the utilization of vitamin
C [27]. Copper is found in most foods containing iron, especially in almonds,
dried beans, peas, lentils, whole wheat, prunes and egg yolk.
Zinc (Zn): It is needed for healthy skin and hair, proper healing of wounds,
successful pregnancy and male virility. It plays a vital role in guarding against
diseases and infection [28]. It is needed to transport vitamin A to the retina. Large
number of enzymes requires zinc for their functioning.
Selenium (Se): It slows down ageing and hardening of tissues through oxidation.
Males seem to have a greater need for this mineral. It is useful in keeping
youthful elasticity in tissues. It alleviates hot flushes and menopausal distress
and helps in the prevention and treatment of dandruff. Its deficiency can cause
premature loss of stamina and may be a cause for breast cancer [29,30]. In Its
deficiency was first noted in soil from Keshan province of China resulting in the
cause of a disease named after that province.
The phytochemistry of Terminalia arjuna has been extensively worked up
in terms of a large number of organic compounds and reviewed [31,36]. Various
constituents of the dried bark extract include acids such as arjunic acid, gallic
acid, ellagic acid, arjunin [31] and terminic acid, glycosides such as
arjunaphthanoloside [32], the flavone arjunolone, tannins, oligomeric
proanthocyanidins (OPCs), colouring matter, essential oils and minerals such as
13

Ch I INTRODUCTION
Ca, Mg, Zn and Cu. A novel naphthanol glycoside, arjunaphthanoloside, was
isolated and its structure established as 2,3,6,7,8,9-hexahydroxynaphthalene 2-
0-13-L(-)-rhamnoside by spectroscopic methods. Ali et al. [32] showed that
arjunaphthanoloside [32] had potent antioxidant activity and inhibited NO
production in lipopolysaccharide (LPS)-stimulated rat peritoneal macrophages.
OH
OH 011 I
Arjunaphthanoloside (I)
Arjunin (II)
Siddiqui et al. [33] isolated a new phytoconstituent (III) responsible for
hypotensive activity and its structure was elucidated from spectral evidence.
Me Me Me Me
II n
(III) ___A../11\/.J■ Me
00 H
OH OH
O
OH
OH
Crude ethanolic extract of the bark of Terminalia arjuna (Combretaceae)
14

OH I
IV HO L(0
0\
HO OH
OH
0
Ch I INTRODUCTION
and its three compounds arjunic acid, arjungenin and arjunetin were evaluated
for antifeedant, growth inhibitory and oviposition-deterrent activities against a
lepidopterous insect Spilarctia oblique [33]. Two pentacyclic triterpenoid
glycosides from the bark of Terminalia arjuna, have been characterized as olean-
3a, 2213-dio1-12-en-28-oic acid-3-0-0-D-glucOpyranosyl (1-4)- 13 -D-
glucopyranoside and olean-313,4,2213-trio1-12-en-28-oic acid-3-O-13-D-
glucopyranosyl (1-4)- p-D-glucopyranoside [34]. Terminoside A, a oleanane-type
triterpene was isolated from the acetone fraction of the ethanolic extract. The
structure was established as olean-1a,313,2213-trio1-12-en-28-oic acid-313-D-
glucopyranoside. Chang et al. [35] isolated casuarinin [35], a hydrolyzable tannin
from the bark and investigated its antiviral activity on herpes simplex type 2
(HSV-2) in vitro. It possesses anti-herpesvirus activity in inhibiting viral
attachment and penetration, and also disturbing the late event(s) of infection.
Yadav and Rathore [36] isolated a new cardenolide 16,17-dihydroneridienone 3-
0-p-d-glucopyranosyl-(1 6)-0-13-d-galactopyranoside (IV) from its roots.
The main purpose of studying the organic compounds is that these may act as
probable ligands to the metals making them bioavailable.
15

Ch I
INTRODUCTION
The composition of biological systems is so complex that the essential and
trace elements are totally masked by the major constituents of C, H, N, 0 etc.
Hence, their determination requires dissolution followed by sophisticated
analytical methods. The techniques used here for the determination of essential
and trace elements Arjuna bark are as follows-
(i) Neutron Activation Analysis (NAA) is one of the most sensitive, accurate
and precise technique used for qualitative and quantitative elemental analysis of
multiple major, minor, and trace elements in samples from almost every
conceivable field of scientific or technical interest [37-42]. For many elements,
NM offers sensitivities that are superior to those possible by any other
technique. Moreover, the accuracy and precision of the technique is such that it
is still one of the primary analytical methods used by the National Institute of
Standards and Technology (NIST) to certify the elemental concentrations in
Standard Reference Materials (SRMs). For many elements, NM offers
sensitivities that are superior to those attainable by other methods of the order of
ppb or better. In addition, NAA is generally recognized as the "reference method"
of choice when new procedures are developed or when other methods yield
results that do not agree.
George de von Hevesy and Hilde Levi discovered NM in 1936 and found
that samples containing certain rare earth elements became highly radioactive
after exposure to a source of neutrons (222Rn-Be). The sequence of events
16
Tar get Nucleus
o o
Prompt O Beta Gamma ray Particle
Incident Neutron
\ogo6o0.• Radioactiv oo.o *0 o. Nucleus
gos*/
Compound Delayed Nucleus Gamma ray
Product Nucleus
Ch I INTRODUCTION
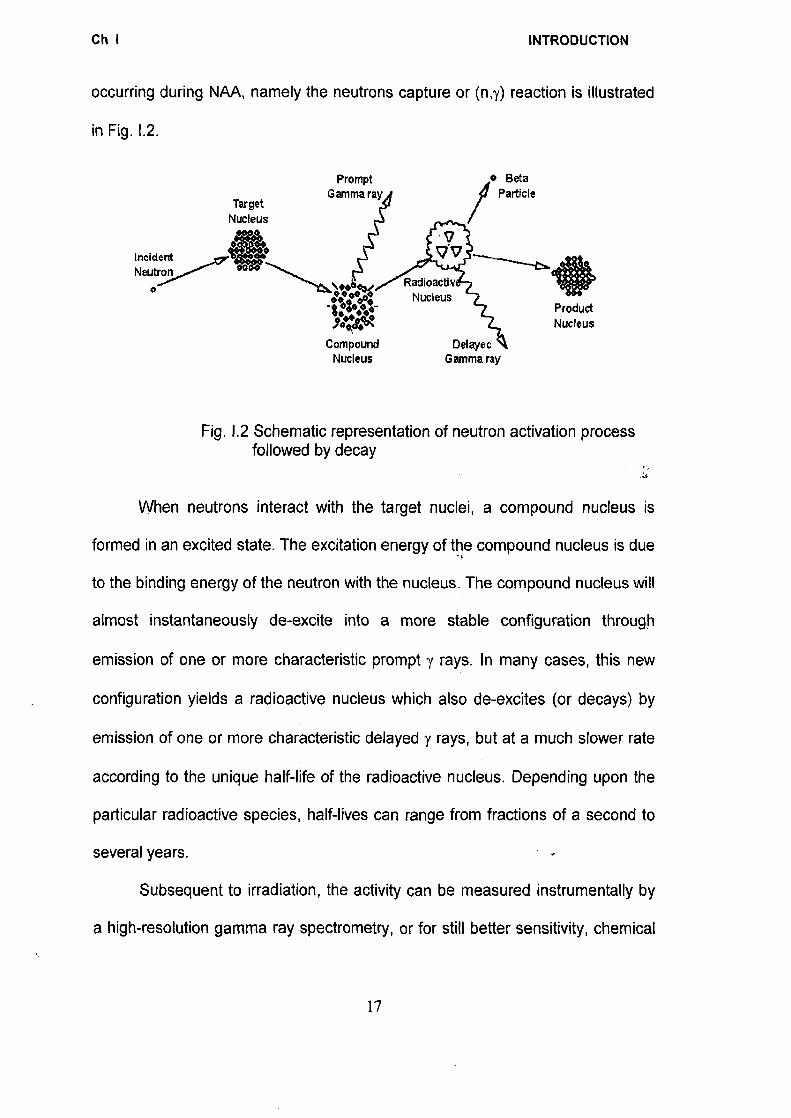
occurring during NAA, namely the neutrons capture or (n,y) reaction is illustrated
in Fig. 1.2.
Fig. 1.2 Schematic representation of neutron activation process followed by decay
When neutrons interact with the target nuclei, a compound nucleus is
formed in an excited state. The excitation energy of the compound nucleus is due
to the binding energy of the neutron with the nucleus. The compound nucleus will
almost instantaneously de-excite into a more stable configuration through
emission of one or more characteristic prompt y rays. In many cases, this new
configuration yields a radioactive nucleus which also de-excites (or decays) by
emission of one or more characteristic delayed y rays, but at a much slower rate
according to the unique half-life of the radioactive nucleus. Depending upon the
particular radioactive species, half-lives can range from fractions of a second to
several years.
Subsequent to irradiation, the activity can be measured instrumentally by
a high-resolution gamma ray spectrometry, or for still better sensitivity, chemical
17

Ch I INTRODUCTION
separations can be applied to reduce interferences. The procedure generally
used to calculate concentration (i.e., ppm of element) in the unknown sample is
to irradiate the unknown sample and a comparator standard containing a known
amount of the element of interest together in the reactor. If the unknown sample
and the comparator standard both are measured on the same detector, then one
needs to correct the difference in decay between the two. One usually corrects
the measured counts (or activity) for both samples back to the end of irradiation
using the half-life of the measured isotope. The eqn. used to calculate the mass
of an element in the unknown sample relative to the comparator standard is
= MUM e-1r ) Sat!
4,30 m se (e—rd /sad
where A = activity of the sample (sam) and standard (std),
m = mass of the element,
X = decay constant for the isotope and
td= decay time.
When performing short irradiations, the irradiation, decay and counting times are
normally fixed the same for all the samples and standards such that the time
dependent factors cancel. Thus the above equation simplifies into
Si 427$2
Cmpn = Si c5
CSAV 27i
where C = concentration of the element in sample and standard and
W= Weight of the sample and standard comparator.
In principle, therefore, with respect to the time of measurement, NAA falls
into two categories:
(1.2)
18

Ch I INTRODUCTION
i. Prompt gamma-ray neutron activation analysis (PGNAA), where measurements take place during irradiation, or
ii. Delayed gamma-ray neutron activation analysis (DGNAA), where the measurements follow radioactive decay.
The latter operational mode is more common. Thus, NM is generally assumed
as the measurement of the delayed gamma rays. About 70% of the elements
have properties suitable for measurement by NM.
Although there are several types of neutron sources (reactors,
accelerators, and radioisotopic neutron emitters) one can use for NAA, nuclear
reactors with their high flux of neutrons from U fission offer the highest available
sensitivities for most elements. Different types of reactors and different positions
within a reactor can vary considerably with regard to their neutron energy
distributions and fluxes due to the materials used to moderate (or reduce the
energies of) the primary fission neutrons.
Owing to the high neutron flux, experimental nuclear reactors operating
in the maximum thermal power region of 100 kW-10 MW with a maximum
thermal neutron flux of -1014 neutrons cm-2 s-1 are the most efficient neutron
sources for high sensitivity activation analysis induced by epithermal and thermal
neutrons. The reason for the high sensitivity of the majority of the elements is
that the neutron absorption cross-section is high in the thermal region. There is a
wide distribution of neutron energy in a reactor . and, therefore, interfering
reactions must be considered. In India, following nuclear reactors located at the
Bhabha Atomic Research Centre (BARC), Mumbai are available for NM
experiments
19

Ch I
INTRODUCTION
Table 1.4 Nuclear Reactors available for NAA at BARC, Mumbai
Reactor Type Flux (0 Power (WO Moderator/Coolant
APSARA
(1956)
Swimming
Pool
-1011 1.0 Light water/ light
water
CIRUS
(1960)
Tank 1012 40 Heavy water/ heavy
water
DHRUVA
(1985)
Tank -10" 100 Heavy water/ heavy
water
Apart from high sensitivity for many elements, NAA has the advantage
that it is purely a nuclear method of analysis and the results are not influenced by
the chemical state of the element under investigation. Moreover, contamination
after irradiation is no longer a threat, a major advantage in trace element
analysis. The modern y measuring systems consist of a gamma detector, usually
a HPGe type and sometimes Nal (TI) scintillation crystals. The detectors are
connected to a computer based multichannel analyzer (MCA) by an appropriate
electronic system (preamlifier, spectroscopy amplifier, etc.).
Recent applications include:
/ Environmental studies to characterize pollutants and determine their
source and methods of reduction.
/ Semiconductor materials analysis to measure ultra trace-element impurities and to determine methods for reducing or eliminating
impurities from final products.
/ Pharmaceutical materials analysis to measure ultra trace-element impurities and to determine methods for reducing or eliminating
impurities from final products.
20

Ch I INTRODUCTION
✓ Forensic studies as a non-destructive method to analyze evidence as
an aid in the investigation and prosecution of criminal cases.
✓ Archaeological studies to fingerprint artifacts and determine the
place of origin as a way to understand the activities of humans in the
past.
✓ Nutritional epidemiological studies to investigate the contribution of
diet, occupation, and lifestyle on chronic diseases.
(ii) Atomic Absorption Spectrometry (AAS) is now a well-established
technique for the determination of trace elements covering a wide range of
analyte types including metals and a few of the nonmetals [43, 44]. In their
elemental form, metals will absorb UV light when they are excited by heat. Each
metal has a characteristic wavelength that will be absorbed. AAS consists ofra
light source, a sample compartment and a detector. In this method, light source
is directed through the sample to a detector. A schematic is shown in Fig. I. 3.
The source of light is Hollow Cathode Lamp (HCL) whose cathode is composed
of the element being determined. The lamp is housed inside the lamp
compartment, which is really the flame since it absorbs radiation from the source.
In the sample compartment an atomic sample vapor is generated in the light
beam from the source. This is usually done by introducing the sample into a
burner system (Flame AAS) or electrically heated furnace or platform, aligned in
the optical path of the spectrophotometer. The sample of interest is aspirated into the
flame. The flame height is controlled by regulating the flow of fuel mixture A
monochromator is required to disperse several wavelengths of light that are
emitted from the light source to isolate a particular line of interest. A detector
21

Monochromator Detector 1 ./
Nebulizer Test Solution Data
Processor
Hollow cathode
lamp Flame
Ch I INTRODUCTION
produces an electrical current that is dependent on the light intensity. . The
instrument measures the change in intensity..
Fig. I. 3 Schematic of an Atomic Absorption Spectrophotometer (AAS)
The electrons of the atoms in the flame can be promoted to higher orbital
for an instant by absorbing energy, which is specific to a particular electron
transition in a particular element. As the quantity of energy put into the flame and
the quantity remaining at the detector can be measured, concentration of the
element may be calculated. A calibration plot is drawn by running standards of
varying concentrations on the AAS and observing the absorbance. The computer
data system draws the curve and samples are tested and measured against this
curve.
(iii) Inductively Coupled Plasma Mass Spectrometry (ICP-MS). This
technique developed in the late 1980's combines the easy sample introduction
and quick analysis of ICP technology with the accurate and low detection limits of
a mass spectrometer [42,451 The resulting instrument is capable of trace
22

Sample Introduction and Aerosol Generation
Ch I
multielemental analysis, often at the part per trillion levels. ICP-MS has been
used widely over the years, finding applications in a number of different fields
including drinking water, wastewater, natural water systems/hydrogeology,
geology and soil science, mining/metallurgy, food sciences and medicine.
This technique is used to measure the concentrations ranging from ng/mL
to mg/mL of inorganic elements from the liquid samples such as water, oil, and
metal ion solutions. It consists of four main processes, including sample
introduction and aerosol generation, ionization by an argon plasma source, mass
discrimination and the detection system as shown schematically in Fig. I. 4.
Mass discriminator and Detector
Fig. I. 4 Schematic of ICP-MS main process
Aqueous samples are introduced by way of a Nebulizer, which aspirates
the sample with high velocity Ar gas forming a fine mist. The aerosol then passes
into a spray chamber where larger droplets are removed via a drain. The liquid
sample is pumped into a Nebulizer at atmospheric pressure where the aerosol
mist is created. The mist droplets are separated by size in a spray chamber and
only the finest particles are carried into the plasma where temperature varies
23

Ch I INTRODUCTION
from 6000 to 10000 K. The aerosol is dried and ions are created which are
extracted from the plasma into the ion lens through sample and skimmer cones
interface by applying differential pressure. The pressure at the interface is — 10-3
torr. The ionized and atomized particles are extracted from the cone interface
into the ion lens and quadrupole mass filter by applying high vacuum of 10-6 torr.
The shadow stop in front of the ion lens removes the photons and the ion lens
removes the atomized particles and allows mainly the ionized particles to the
quadrupole mass filter by applying suitable electrical charge to the lens.
However, all the ionized particles of various elements having different mass try to
enter the mass filter under an electromagnetic field applied to the quadrupole.
Only one mass passes at a time, which goes to the detector and produces
electrons after collision, which is counted electronically. The measurement is
done in pulse and analog mode for increased dynamic range. Therefore the
measurement can be done together for low and high concentration in the same
sample.
Most studies on medicinal plants reported in literature pertain to the
organic contents viz. essential oils, alkaloids and their antioxidant properties,
polyphenols, vitamins etc. A thorough literature survey shows only scanty reports
on essential trace element contents in Aduna bark. Garg and Khanduja [46] were
the first to report the mineral composition in terms of calcium, magnesium and
aluminum oxides in Arjuna leaves growing on an alkaline soil. Singh and Garg
[47] reported 20 elements (ik, Ba, Br, Ca, CI, Co, Cr, Cu, Fe, K, Mn, Mo, Na, P,
24

Ch I INTRODUCTION
Rb, Sb, Sc, Se, Sr and Zn) in Arjuna bark. An essential ingredient of Pragya-
peya, an herbal drink is Arjuna and in our earlier work, we analyzed Arjuna bark
along with 11 other herbal constituents for 7 minor (Al, Ca, CI, Mg, Na, K, P) and
15 trace (Ba, Br, Co, Cr, Cs, Fe, Hg, La, Mn, Rb, Sc, Se, Th, V, Zn) elements
[48]. Naidu and Swamy [49] observed seasonal variation in Ca, Mg, S and Na
contents of Terminalia arjuna.
Comparatively speaking, organic constituents of Arjuna bark have been
widely studied by a large number of workers in India and abroad. Pawar and
Bhutani [50] isolated oleanane triterpenes arjunic acid, arjungenin and their
glucosides, arjunetin and arjunglucoside from the bark. Cheng et al [35] isolated
casuarinin, a hydrolyzable tannin and investigated its antiviral activity. This
compound has been further studied by Kuo et al [51] who found it to inhibit
human non-small cell lung cancer A549 cells. Kaur et al [52] studied the
antimutagenic effect of benzene, chloroform, acetone and methanol extracts as
well as that of ellagic acid isolated from Terminalia Arjuna. Kandil et al [53]
isolated arjunin, four known tannins and two phenolic acids and determined their
structures by spectroscopic analyses. Gupta et al [54] reported antioxidant action
of the bark powder and found it to be comparable to vitamin E. In addition, it also
has a significant hypocholesterolaemic effect. Nagpal et al [55] investigated the
effects of acetone and methanol extracts on the growth of human normal
fibroblasts. Bharani et al. [56] observed improvement in symptoms of heart by
bark. Dwivedi et al. [57] studied the effect of Terminalia Arjuna on angina
pectoris. Singh et.al. [31] evaluated the insect feeding-deterrent and growth
25
Ch I INTRODUCTION
inhibitor activity of Arjunetin from the ethanolic extract. Upadhyay et at [58]
isolated new triterpene glycoside, arjunetoside, together with oleanolic and
arjunic acid in the root by chemical and spectral data. Sivalokanathan [59]
evaluated the antioxidant nature of ethanolic extract of the bark on N-
nitrosodiethylamine (DEN) induced hepatocellular carcinoma in rats. Rane [60]
studied the comparative effect of oral administration and topical application of
alcoholic extract the bark on incision and excision wounds in rats. Patel et at [61]
extracted tannin from the bark of Arjuna tree. Bhuyan et al [62] extracted and
identified the color components from the barks of Terminalia arjuna and also
evaluated their wool dyeing characteristics on wool. Bhatia et at [63] isolated
oxalic acid by digesting the bark with water and 20% H2SO4 at 100°C. Nagar et al
[65] isolated cerasidin, 13-sitosterol, friedelin, methyl oleanolate, gallic acid, ellagic
acid, and arjunic acid from the fruits by successive extraction with light petroleum
and ethanol followed by column chromatography over silica gel. Colabawalla et
at [65] found that the alcoholic extract of the bark contained Ca0 (0.33 %), Mg0
(0.078%), and A1203 (0.076%). The powdered bark was found to contain 38%
CaO. Mummert et at [66] reported the use of aqueous-alcoholic extracts of its
bark for the production of cosmetic or dermatological preparations for the
treatment of ignitable skin conditions and/or to the skin protection with sensitively
determined dry skin. Honda [67] isolated arjungenin, arjunglucoside I, and
arjunglucoside II, a new triterpene and new triterpene glucosides from Terminalia
Arjuna bark.
26

Ch I INTRODUCTION
.11 Alqi AND SCOPE OF THE PRESENT WORK
Plants have been a rich source for therapeutics in all world civilizations.
Ayurveda, the ancient Indian system of medicine fully recognizes and utilizes
medicinal properties of plants. Arjuna (Terminalia Arjuna) is a well-known heart
tonic used extensively in cardiac debility. It is being used since the days of
Charak and Susruta. It has attracted the attention of many research workers
around the world essentially because of its beneficial properties of strengthening
heart muscles. According to newspaper reports (see in front) Arjuna is
considered as a wonder drug in reply to china's Ginseng. This prompted us to
undertake present work to determine essential and trace elements composition
along with organic constituents in the bark of Terminalia Arjuna. Though marry
workers have isolated organic compounds but no studies have been reported on
elemental composition. Arjuna has blood-coagulating properties and can arrest
bleeding and is also used in various problems like diabetes mellitus, diarrhoea,
dysentery, obesity and leucorrhea. Following work has been carried out in the
present dissertation.
D Determination of 7 minor (Na, K, Ca, Mg, CI, P and Fe) and 20 trace
(As, Ba, Br, Co, Cr, Cs, Cu, Eu, Fe, Hg, La, Mn, Rb, Sb, Sc, Sm, Sr,
Th, V, Zn) elements by INAA
• SRMs from INCT Poland and NIST, USA were analyzed for quality
assurance and data validation.
* Determination of 14 elements including Ni, Cd, Pb and Mo by MS.
0 Determination of 22 elements by ICP-MS including Sn, which could not
be determined by other methods.
27

Ch I INTRODUCTION
14 Comparison of some essential trace elemental concentrations by
different techniques of NM, AAS and ICP-MS
14 Geographical variation was studied by analyzing five samples collected
from Mumbai, Nagpur and Roorkee including two commercial brands
(Himalaya Drugs, Bangalore and Vyas Pharmacy, Indore).
►P Three new organic compounds were isolated from the methanolic
extract by TLC and column chromatography.
14 Structures of the compounds were confirmed by elemental analysis,
infrared spectra and GC-MS.
C.1) Fragmentation pattern has been proposed for three compounds.
1+ Thermal decomposition studies were carried out in air and N2
atmosphere and correlate the data with elemental analysis.
An attempt has been made to correlate elemental contents with the therapeutic
properties of Terminalia Arjuna.
28

Ch II
METHODS & INSTRUMENTATION
We have primarily used NAA for elemental analysis of Arjuna bark though
AAS and ICP-MS were also used for data validation. Further, three new organic
compounds were separated from the methanolic extract by thin layer and column
chromatography and identified by elemental analysis, spectral methods and GC-
MS studies. Also thermal decomposition studies were performed. All the details
of various instrumental methods used in this study are included here.
29

Ch II METHODS & INSTRUMENTATION
H. 1 SAMPLING.
All the bark samples for analysis were procured in powder form and
purchased from different chemist shops in cities of Roorkee, Nagpur and
Mumbai. The other two brands were from Vyas
Pharmacy, Indore, and capsules from the
Himalaya Drug Company, Bangalore. For the
analysis of organic constituents bark was
collected from a tree in the campus. It was dried,
and powdered in an agate mortar. Following
three standard reference materials (SRMs) of
biological origin were used as comparator
standards and for quality assurance/data validation.
(i) Mixed Polish Herbs (INCT-MPH-2) from the Intitute of Nuclear
Chemistry & Technology (INCT), Warsaw, Poland [68]
(ii) Peach Leaves (SRM 1547) from the National Institute of Standards
and Technology (NIST), USA [69]
(iii) Pine Needles (SRM 1575a) from NIST USA [70]
(iv) Apple leaves (SRM 1515) from NIST, USA [71]
All the samples along with SRMs were dried in oven for 2 h before packing for
irradiation.
30

Ch II
METHODS & INSTRUMENTATION
11.2 PACKING AND IRRADIATIO About 30 mg each of the powdered samples along with RMs were
accurately weighed and heat-sealed in Alkathene bags. In each batch five
samples including two SRMs were packed for 1 min irradiation using pneumatic
carrier facility (PCF) in DHRUVA reactor at a thermal neutron flux of 5x10¹³ n cm"
2 S-1 at BARC, Mumbai. Activity measurements were carried out at the reactor
site of BARC and later at the Radiochemistry Division of BARC, Mumbai. 40-50
mg each of samples and three RMs were accurately weighed and packed in
aluminum foil to make a second batch of 12 samples. It was irradiated for 3 d in
CIRUS reactor at a thermal flux of -1013 n cm-2 s-1. Afterwards these were
brought to Roorkee for activity measurement. In both cases, irradiated packets
were decontaminated by swiping with tissue paper and cotton soaked in acetone.
11.3 MEASUREMENT OF ACTIN/11N
Activity of short lived radionuclides was measured using HPGe detector
(EG & G, ORTEC) coupled with 8k multichannel analyzer (MCA) at the reactor
site in BARC, Mumbai. My colleague Mr. R. Paul Choudhury carried out all these
measurements at BARC. However, long-lived nuclides were counted at our
laboratories in Roorkee. A coaxial HPGe detector with 8k MCA (Canberra, USA)
and GENIE 2000 software was used as shown in the photograph (Fig. 11.2).
Following are the specifications and performance data of the detection system;
Detector Model GC 2018; Cryostat Model 7600 SL; Serial No. 05017312;
Preamplifier Model 2002 CSL; Resolution: 1.8 keV (FWHM) at 1332 keV of 60Co
and 0.9 keV (FWHM) at 122 keV of 57Co,
31
Ch II METHODS & INSTRUMENTATION
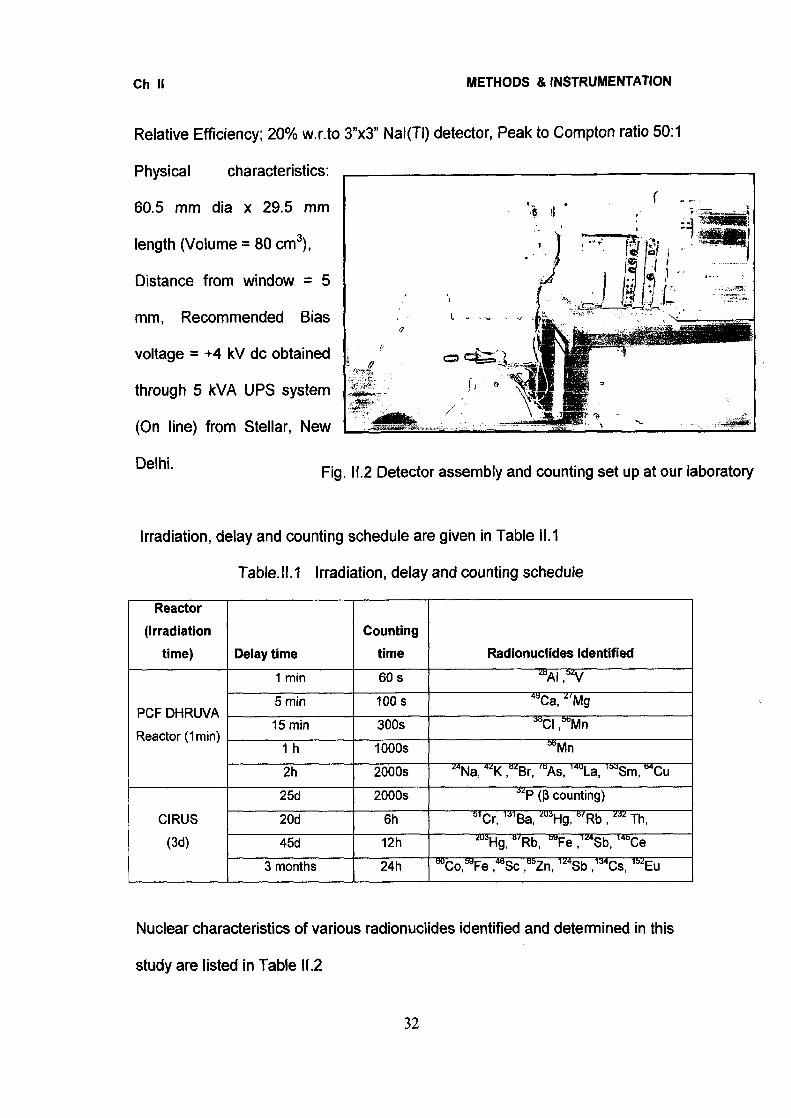
Relative Efficiency; 20% w.r.to 3"x3" Nal(T1) detector, Peak to Compton ratio 50:1
Physical characteristics.
60.5 mm dia x 29.5 mm
length (Volume = 80 cm3),
Distance from window = 5
mm, Recommended Bias
voltage = +4 kV dc obtained
through 5 kVA UPS system
(On line) from Stellar, New
Delhi. Fig. 11.2 Detector assembly and counting set up at our laboratory
Irradiation, delay and counting schedule are given in Table 11.1
Table.11.1 Irradiation, delay and counting schedule
Reactor (Irradiation
time) Delay time Counting
time Radionuclides Identified
PCF DHRUVA
Reactor (1min)
1 min 60 s 26AI ,52V
5 min 100 s "Ca, 2rMg
15 min 300s 3uCI ,Mnub
1 h 1000s 5uMn
2h 2000s 14Na, 41K ,uzBr, mAs, 14uLa, 1"Sm, b4Cu
CIRUS
(3d)
25d 2000s 32P (3 counting)
20d 6h 51Cr, 131E3a, 203Hg, 8fRb , 232 Th,
45d 12h 2°3F1g, u'Rb, b9Fe ,124Sb, 145Ce
3 months 24h uuCo,u9Fe ,"Sc ,buZn, 124Sb ,134Cs, 152Eu
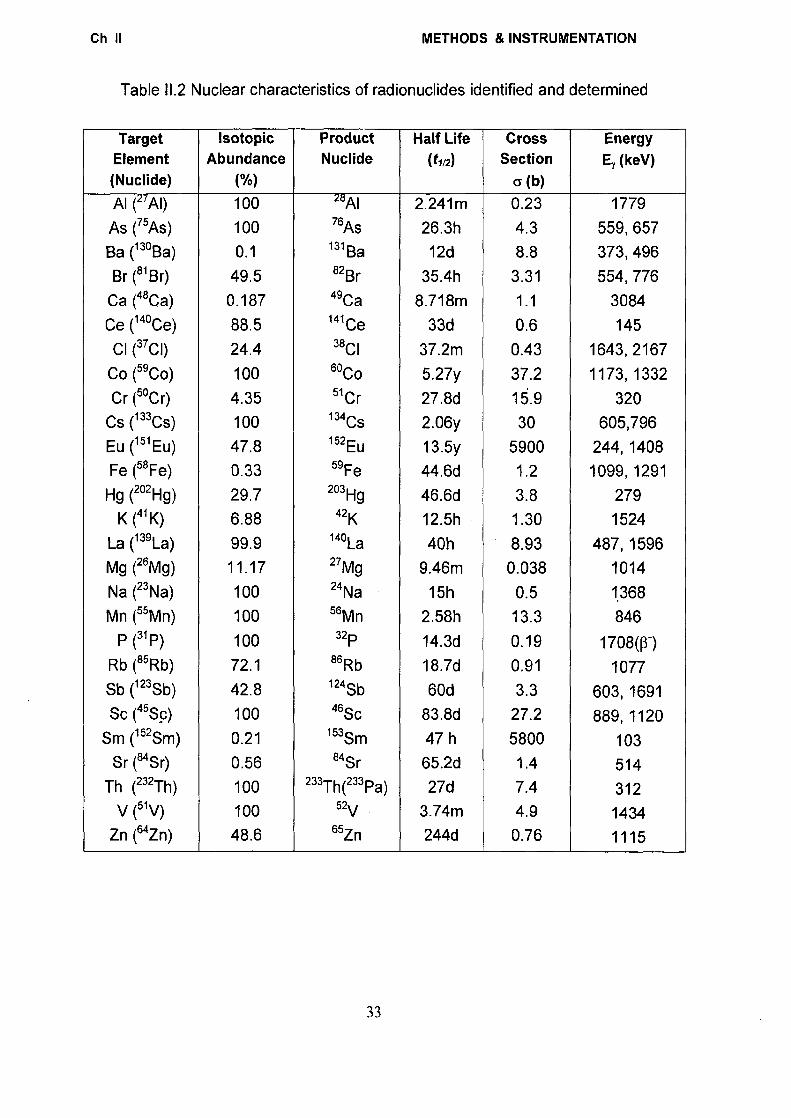
Nuclear characteristics of various radionuclides identified and determined in this
study are listed in Table 11.2
32
Ch II
METHODS & INSTRUMENTATION
Table 11.2 Nuclear characteristics of radionuclides identified and determined
Target Element (Nuclide)
Isotopic Abundance
(%)
Product Nuclide
Half Life (t112 )
Cross Section
0 (b)
Energy Ey (keV)
Al (27A1) 100 28AI 2.241m 0.23 1779 As (78As) 100 76As 26.3h 4.3 559, 657 Ba (130Ba) 0.1 131Ba 12d 8.8 373, 496 Br (81Br) 49.5 82Br 35.4h 3.31 554, 776
Ca (48Ca) 0.187 49Ca 8.718m 1.1 3084 Ce (140Ce) 88.5 141Ce 33d 0.6 145 CI (37CI) 24.4 38CI 37.2m 0.43 1643, 2167
Co (59Co) 100 60Co 5.27y 37.2 1173, 1332 Cr (80Cr) 4.35 "Cr 27.8d 15.9 320
Cs (133Cs) 100 134CS 2.06y 30 605,796 Eu (151Eu) 47.8 152Eu 13.5y 5900 244, 1408 Fe (58Fe) 0.33 59Fe 44.6d 1.2 1099, 1291 Hg (202Hg) 29.7 2o3Hg 46.6d 3.8 279
K (41K) 6.88 42K 12.5h 1.30 1524 La (139La) 99.9 140La 40h 8.93 487, 1596 Mg (26Mg) 11.17 27Mg 9.46m 0.038 1014 Na (23Na) 100 24Na 15h 0.5 1.368 Mn (55Mn) 100 56Mn 2.58h 13.3 846
P (31P) 100 32P 14.3d 0.19 1708((3-) Rb (85Rb) 72.1 'nib 18.7d 0.91 1077 Sb (123Sb) 42.8 124Sb 60d 3.3 603, 1691 Sc (45Sc) 100 46Sc 83.8d 27.2 889, 1120
Sm (152Sm) 0.21 153SM 47 h 5800 103 Sr (84Sr) 0.56 84Sr 65.2d 1.4 514
Th (232Th) 100 233Th(233Pa) 27d 7.4 312 V (51V) 100 52V 3.74m 4.9 1434
Zn (84Zn) 48.6 65Zn 244d 0.76 1115
33

Ch II METHODS & INSTRUMENTATION
Concentrations of elements were calculated by using comparator method
where RM with known and certified concentrations of various elements is
simultaneously irradiated along with the sample under similar experimental
conditions and counted in the same geometry [37]. For short lived nuclides where
half life (t1/2) and delay time (td ) ) are comparable eqn (1.1) mentioned in Ch I was
used. However, if t112 of the radionuclide is long enough compared to delay and
counting time then it can be further simplified to
Concn. of element Concn. of element Sp. Activity in sample in sample (Sa) — in standard (St) X Sp. Activity in standard
Thus all the elemental concentrations were calculated as discussed in Ch III.
The inorganic content of most medicinal herbs is only a minor constituent
and interfered by major constituents. Therefore, first task in inorganic analysis is
to remove the organic matter. Several methods have been reported in the
literature [72, 73]. Organic matter is usually destroyed by dry oxidation i.e.
burning in air and converting to ash. This requires heating at — 500° C where
many volatile elements may be lost. Another method is by wet oxidation by acids,
which has the advantage of being applicable to a wide variety of samples. It is
fairly rapid and less prone to volatilization. Commonly employed acids include
HCI, HNO3 including aquaregia, H202 and HCI04. For the analysis of medicinal
herbs, a combination of above reagents is normally recommended.
34
Ch II METHODS & INSTRUMENTATION
(i) Dissolution of sample; About 2g of powdered sample was weighed
accurately and taken in a 100mL beaker. 10 mL mixture of 5:1, nitric acid,
perchloric acid was added and then heated on a hot plate [74]. After sometime
slurry was formed which was cooled and then 10 mL of acid mixture was added
drop wise. The mixture was continuously stirred till all the fumes vanished. All
these operations were performed in a fume hood. It was further heated till a clear
solution was obtained. On further heating a white gelatinous mass was observed.
10 mL of double distilled water was added. It was then heated to reduce the
solution up to 2 mL. After further reducing it to slurry few drops of the acid
mixture was added and heated. Water was added to see if all the organic matter
has been oxidized. If not then 1 mL of 6 M HCI was added drop wise. Afterwards •
5 mL double distilled water was added and the solution was filtered through
Whatman filter paper no. 42 to remove any turbidity or suspended matter. The
solution was made to 50 mL. All the solutions were stored in tightly capped
polythene bottles. These were directly used for the determination of various '°
elements by AAS and ICP-MS. All the common acids such as HCI, HNO3 and
H2SO4 were of AR grade. Double distilled water was used for preparing all the
solutions..
(ii) Preparation of Standards for AAS and ICP-MS; 100 mL 0.1 M solutions of
various metal ions were prepared by dissolving weighed amounts of their
respective AR/High Purity grade salts with following specifications
1. Molybdenum; 12.359 g ammonium molybdate (NH4)6M07024.4H20,
MW =1235.9, AR 99% Qualigens. Mumbai
35

Ch II METHODS & INSTRUMENTATION
2. Nickel; 3.95 g ammonium nickel (II) sulfate hex hydrate.
(NH4)2SO4.NiSO4.6 H2O MW=394.97.AR 98.5% E. Merck, Mumbai.
3. Arsenic; 1.97 g arsenous oxide As203, Mw = 197.82, A.R 99.8% BDH,
Mumbai
4. Antimony; 2.28 g antimony trichloride SbCI3 MW = 228.11 AR 99%, Sisco
Research Laboratories. Mumbai
5. Barium; 2.44 g barium chloride BaCl2 Mw = 244.28 AR = 99.5% , Merck
Mumbai
6. Calcium; 2.36 g calcium nitrate tetra hydrate Ca(NO3)24H20, MW =
236.15, AR,99%., S.d. fine chemicals Mumbai
7. Cadmium; 3.08 g cadmium nitrate Cd(NO3)24 H20, MW= 308.47, AR,99%
Thomas Baker Mumbai.
8. Cobalt; 2.91 g cobalt nitrate hex hydrate Co(NO3)2.6 H2O MW = 291.04,
AR,99% Thomas Baker Mumbai
9. Cesium; 3.25 g cesium carbonate Cs2CO3, MW = 325.82 AR = 99%,
Merck, Germany.
10. Copper; 1.704 g copper chloride, CuCl2.2 H2O MW= 170.48, AR = 99.5%
Merck Mumbai.
11.Chromium; 4.00 g chromium nitrate, Cr(NO3)3.9H20 MW= 400.15, AR,
99% Merck Mumbai
12./ron; 3.92 g ferrous ammonium sulfate, (NH4)2SO4.FeSO4.6H20 MW =
392.13 AR 99% , Thomas Baker (Chemicals) Mumbai.
13. Mercury; 2.71 g mercury (II) chloride. HgCl2 MW= 271.50, AR 99%, E
Merck, Mumbai
14.Potassium; 0.745 g potassium chloride KCI, MW= 74.55 AR 99.5 % S.d.
Fine Chemicals, Mumbai.
15.Lead; 3.312 g lead nitrate Pb(NO3)2 MW = 331.21,AR,99% Samir Tech.
Chem. Industry
16. Zinc; 2.19 g zinc acetate Extra pure Zn(CH3C00)2.H20 MW = 219.50, AR
99.9% Sisco Research Laboratories Mumbai
36
8 10 12
Concentration of Pb(gg/g)
Fig. II.3(a): Calibration plot of Pb
D0 0.5 1.0 1.5 2.0 2.5 Concentration of Cd(gglg)
Fig. II.3(b): Calibration plot of Cd 37
Ch II METHODS & INSTRUMENTATION
17. Magnesium; 2.46 g magnesium sulfate MgSO4 .7H20 MW= 246.48, AR
99% Merck Mumbai
18. Manganese; 1.97 g manganese (II) chloride MnC12. 6 H2O MW= 197.9,AR
99%, Merck Mumbai
19. Sodium; 0.584 g sodium chloride NaCI MW = 58.44 AR, 99.9 % , Merck
Mumbai.
20. Strontium; 2.66 g strontium chloride hex hydrate, SrC12.6H20, MW =
266.6, AR, 99%, Merck, Mumbai
21. Tin; 2.256 g stannous chloride dihydrate, SnC12.2H20, MW = 225.6, 99%,
Merck, Mumbai
All solutions were prepared in doubly distilled water in standard Borosil
glassware and stored in precleaned polythene bottles. These solutions were
further diluted to desired concentration of ppm range.
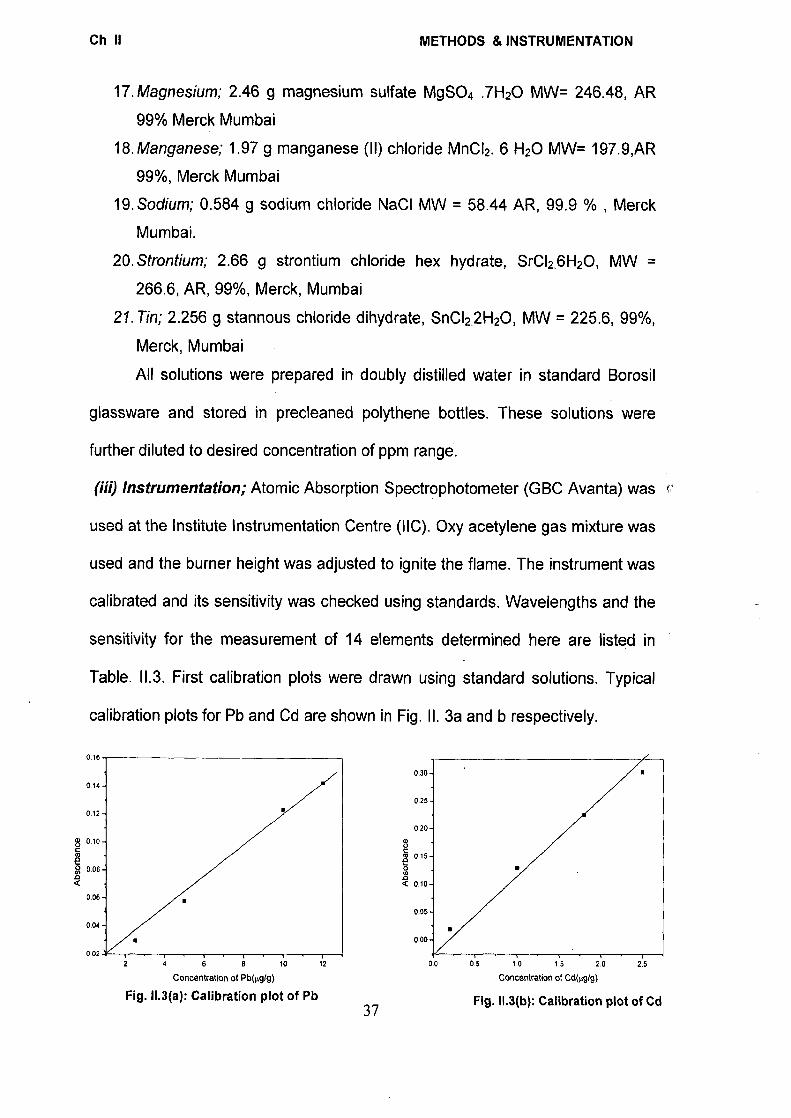
(iii) Instrumentation; Atomic Absorption Spectrophotometer (GBC Avanta) was
used at the Institute Instrumentation Centre (IIC). Oxy acetylene gas mixture was
used and the burner height was adjusted to ignite the flame. The instrument was
calibrated and its sensitivity was checked using standards. Wavelengths and the
sensitivity for the measurement of 14 elements determined here are listed in
Table. 11.3. First calibration plots were drawn using standard solutions. Typical
calibration plots for Pb and Cd are shown in Fig. II. 3a and b respectively.
0.16
0.30-
0.25-
0.20-
C 0.15 -
VI .0 < 0.10 -
0.05 -
0.00-
0.14 -
0.12 -
§ 0.10 -
g 0.08 -.0
0.06 -
0.04 -
0,02
Ch II
METHODS & INSTRUMENTATION
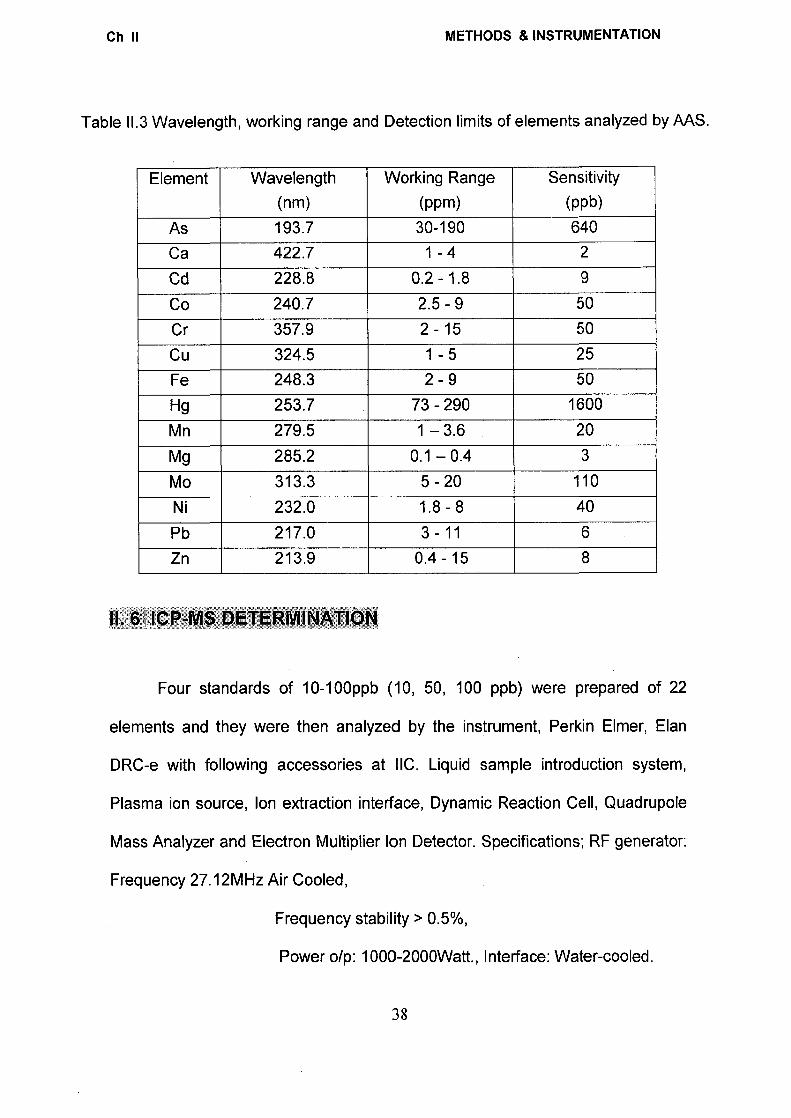
Table 11.3 Wavelength, working range and Detection limits of elements analyzed by AAS.
Element Wavelength (nm)
Working Range (ppm)
Sensitivity (ppb)
As 193.7 30-190 640 Ca 422.7 1 - 4 2 Cd 228.8 0.2 - 1.8 9 Co 240.7 2.5 - 9 50 Cr 357.9 2 - 15 50 Cu 324.5 1 - 5 25 Fe 248.3 2 - 9 50 Hg 253.7 73 - 290 1600 Mn 279.5 1 — 3.6 20 Mg 285.2 0.1 — 0.4 3 Mo 313.3 5 - 20 110 Ni 232.0 1.8 - 8 40 Pb 217.0 3-11 6 Zn 213.9 0.4 - 15 8
Four standards of 10-100ppb (10, 50, 100 ppb) were prepared of 22
elements and they were then analyzed by the instrument, Perkin Elmer, Elan
DRC-e with following accessories at IIC. Liquid sample introduction system,
Plasma ion source, Ion extraction interface, Dynamic Reaction Cell, Quadrupole
Mass Analyzer and Electron Multiplier Ion Detector. Specifications; RF generator:
Frequency 27.12MHz Air Cooled,
Frequency stability > 0.5%,
Power o/p: 1000-2000Watt., Interface: Water-cooled
38

Ch II METHODS & INSTRUMENTATION
Nebulizer; Cross flow, Direct injection,
Spray chamber: Peltier Cooled.
SEPARATION OF ORGANIC CONSTITUENTS
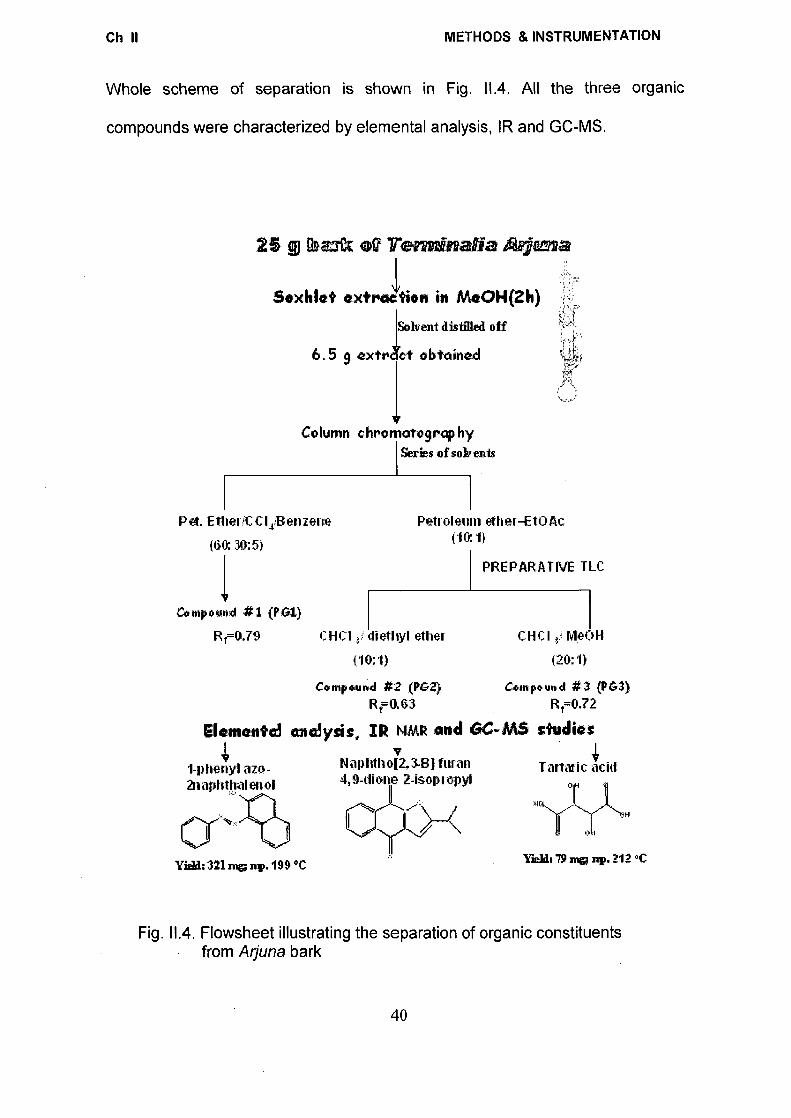
25g Terminalia Arjuna bark powder was extracted repeatedly with
methanol using Soxhlet apparatus for 6 h. The solvent was then distilled off to
obtain 6.5 g materials. 6 g of extract was taken in a 1.5X45 cm 2 glass column
packed with 200g Silica Gel-G (60-120 mesh) from Merck, Mumbai. A series of
solvents were used as eluants in order of their increasing polarity. In all seven
fractions were collected;
Fraction-1 in Petroleum ether/CCI4/benzene (60:30:5) shows a single spot
with Rf=0.79. The solvent was distilled off and a reddish compound (PG I) was
recrystallized in acetone (yield, 321 mg).
Fractions -2 to 7 were impure and mixed together and the solvent was
removed to get —5 mL residue. The mixture was subjected to preparative TLC
(20x20cm2) on 1 mm thick layer Silica Gel (SRL-MUmbai) using CCI4 /CH2Cl2/
Me0H (3:3:1) five times. The bands were allowed to develop in an iodine
chamber. The bands were then scrapped out and dissolved in dichloromethane.
It was then filtered using cotton wad and the solvent was distilled off. Two
compounds with Rf values of 0.63 in CHCI3/ diethyl ether (10:1) and 0.72 in
CHCI3 / Me0H (20:1) were obtained. The first compound was obtained as
yellowish oil (PG II) while second one on recrystallizaion in methanol yielded
sharp white crystals (PG III) with yield of 79 mg. The compounds PG I and PG III
showed m.pt of 199 °C and 212 °C. PGIII also gave acid test in litmus paper.
39
Compound # (PG Compound #3 (P63) Rt= 0.63 111=0.72
eiysisi IR NMR and GC-MS studies V
Nmlitho[2,3-B] furan Tartaric acid 4,9-dione 2-isopropyl
Yield: 79 inv Bp. 212 °C
Ch II METHODS & INSTRUMENTATION
Whole scheme of separation is shown in Fig. 11.4. All the three organic
compounds were characterized by elemental analysis, IR and GC-MS.
2 g bezik allia a
Soxklet extraction in Me0H(2h)
; Solvent distilled off
6.5 g extr ct obtained
I Column chromatography
Series of solvents
en zene Petroleu n ether-Et0Ac (10' 1)
Pet. EtherC C14,
(60: 30:5)
Compound #1 (PG1)
Rt=0.79
Elam nto3
1-phenyl azo- 2naphdralerrol
Yield: 321 n mp. 199 °C
PREPARATIVE TLC
C HC I diethyl ether
(10:1)
CH CI H
(20:1)
Fig. 11.4. Flowsheet illustrating the separation of organic constituents from Arjuna bark
40
Ch II METHODS & INSTRUMENTATION
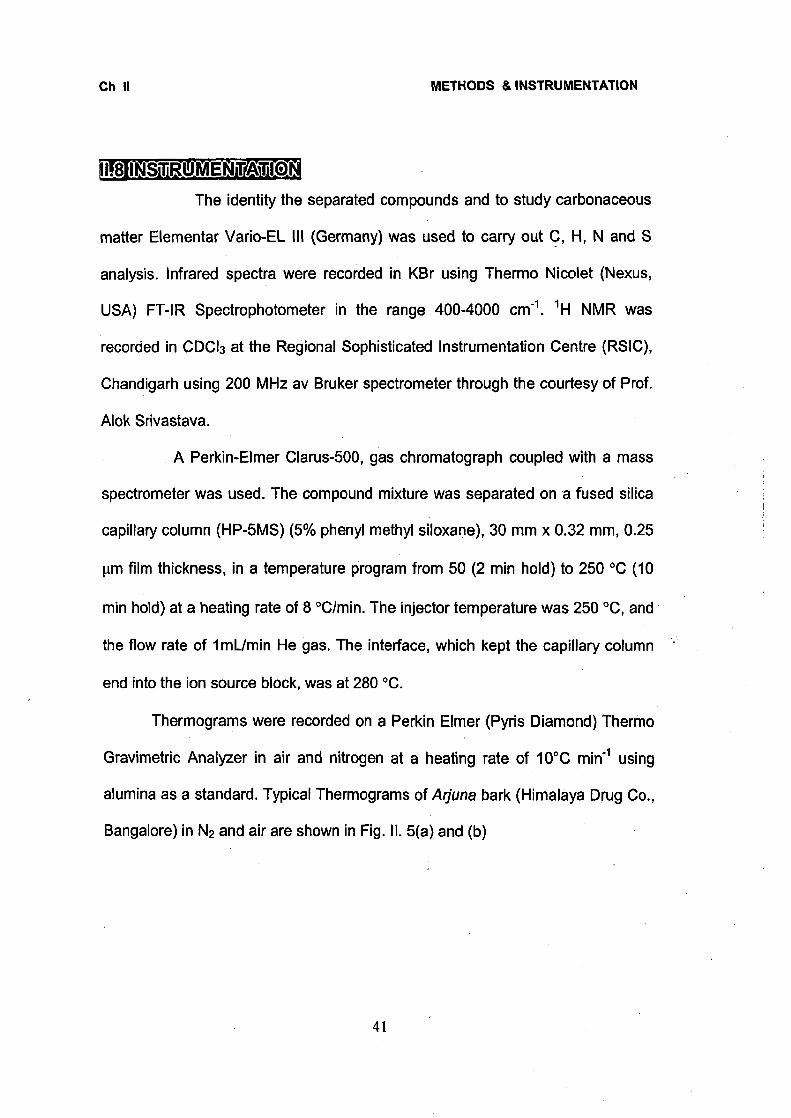
'I IN &STROM E thaili1911 The identity the separated compounds and to study carbonaceous
matter Elementar Vario-EL III (Germany) was used to carry out C, H, N and S
analysis. Infrared spectra were recorded in KBr using Thermo Nicolet (Nexus,
USA) FT-IR Spectrophotometer in the range 400-4000 cm-1. 'H NMR was
recorded in CDCI3 at the Regional Sophisticated Instrumentation Centre (RSIC),
Chandigarh using 200 MHz av Bruker spectrometer through the courtesy of Prof.
Alok Srivastava.
A Perkin-Elmer Clarus-500, gas chromatograph coupled with a mass
spectrometer was used. The compound mixture was separated on a fused silica
capillary column (HP-5MS) (5% phenyl methyl siloxane), 30 mm x 0.32 mm, 0.25
pm film thickness, in a temperature program from 50 (2 min hold) to 250 °C (10
min hold) at a heating rate of 8 °C/min. The injector temperature was 250 °C, and
the flow rate of 1mUmin He gas. The interface, which kept the capillary column
end into the ion source block, was at 280 °C.
Thermograms were recorded on a Perkin Elmer (Pyris Diamond) Thermo
Gravimetric Analyzer in air and nitrogen at a heating rate of 10°C min -1 using
alumina as a standard. Typical Thermograms of Arjuna bark (Himalaya Drug Co.,
Bangalore) in N2 and air are shown in Fig. II. 5(a) and (b)
41

800 1 00
700
50
600 -. 0
500 -50
4 00ti
- -100
300
-150
200
-200
1 00
-250
100.0%
152Cel 99.8%
22ICel 96.2%
150.0
140.0
130.0
120.0
110.0
100.0
90.0
80.0
70.0
80.0
50.0
40.0
0 40
0 20
0 00
.0 20
-0.40
-0 0 0
-0 80
-1 00
-1 20
-1 40
266Cel 306Ce1 0.32m g/m 0.31m g m, in 469 Cel
1 0.26m g/m in 681Ce1 0.21m g/m In
183Cel 0.06m g/m In
117Cel
Heating rate: 10 °C/ min 356Cel 67.1%
479Cel 43 6C el/---',..N/54.0% 60.7%
610Cel 48.7% ' 788C;
37.4% 699Cel _ 38.6%
28 OCeIN 83.3%
1 0 0 0 k
800
7, 6 0 0
0
4 0 0
2 0 0
290Cel 0.57/m in 681Cel
0.1>ng/m in
398Cel 2.3m g/m in
428Cel /0.3m g/m in
414Cel 153 uV
305Cel 31 uV 428C el
26 uV
119Cel 100.0 %
-749 m2/m 9- -1846 ml/mg,,
218Cel 94.7 %
324Cel 64.8 %
386Cel 53.4 %
Heating rate: 10 °C/ min
414Cel 36.0
472Cel 24.6 96 569Cel
24.1 % 696Ce1 999Ce1 16.0 % 16.6 96"
-4 0 .E. e E -6,
0 F (-- : -6 o (.5 1- 0
300
200
100
0
-100
-200
-300
-400
0.0
-2 0
8.0
-10 0
-12.0
14 0
150.0
100.0
50.0
200.0
Ch II
METHODS & INSTRUMENTATION
0
15
30
45
60 T im e (m in )
Fig 111.5 (a) Thermogram of Terminalia Arjuna bark powder in N2.
0
15 30 45
60
75 Tim e (m in)
Fig. 111.5 (b) Thermogram of Terminalia Arjuna bark powder in air
42

Ch III
RESULTS & DISCUSSION
Elemental contents in RMs as calculated on the basis of other RM as
comparator standard are listed in Table 111.1. Also included are certified values
[68-71] for comparison. Since irradiations were carried out in different batches of
short and long durations, at least Peach Leaves (SRM 1547) was common in both
irradiations and for this reason maximum number of 27 elements could be
43

Ch III RESULTS AND DISCUSSION
determined in this case whereas in other cases only a few elements are reported.
Elemental concentrations in five different samples of Arjuna bark powder including
ranges and mean ± SD are listed in Table 111.2. 14 and 22 elements were also
determined by MS and ICP-MS for comparison and data validation. The data
obtained by the two techniques are listed in Tables 111.3 and 4 respectively. In order
to validate data Z-score plot for Peach leaves was drawn and the same is shown in
Fig 111.1. Typical 7-ray spectra for short and long-lived nuclides produced in Arjuna
bark after 1min and 3d irradiation are shown in Figs 111.2 and 3 respectively. Also
shown are the identified photo peaks corresponding to various radionuclides. A
comparison of minor, trace and toxic elemental concentrations in five brands is
shown as bar plots in Figs. 111.4, 6 and 8 respectively. Variation in minor and trace
element concentrations in five brands is shown in Fig 111.5 and 7 respectively.
Comparison of our data with those reported in literature is listed in Table 111.5. Bar
plots of elemental ratios of K/P and Ca/P are shown in Fig. III. 9 and 10 respectively.
Infra red spectra, GC-MS and fragmentation pattern of the three organic compounds
1-phenylazo 2-naphthalenol, 2-isopropyl naphtha [2,3-b] furan 4,9-dione and tartaric
acid are shown in Figs 111.11, 12 and 13 respectively.
A comparison of our data with those of certified values in Table 111.1 shows
that most values are in good agreement within ±10% except in few cases. Though
all the data are not available for all four RMs analyzed in this study because different
sets of SRMs were used in different irradiation batches. Typical 7-ray spectra for
short and long-lived radionuclides are shown in Fig. 111.1 and 2 respectively. The
44
Ch III RESULTS AND DISCUSSION
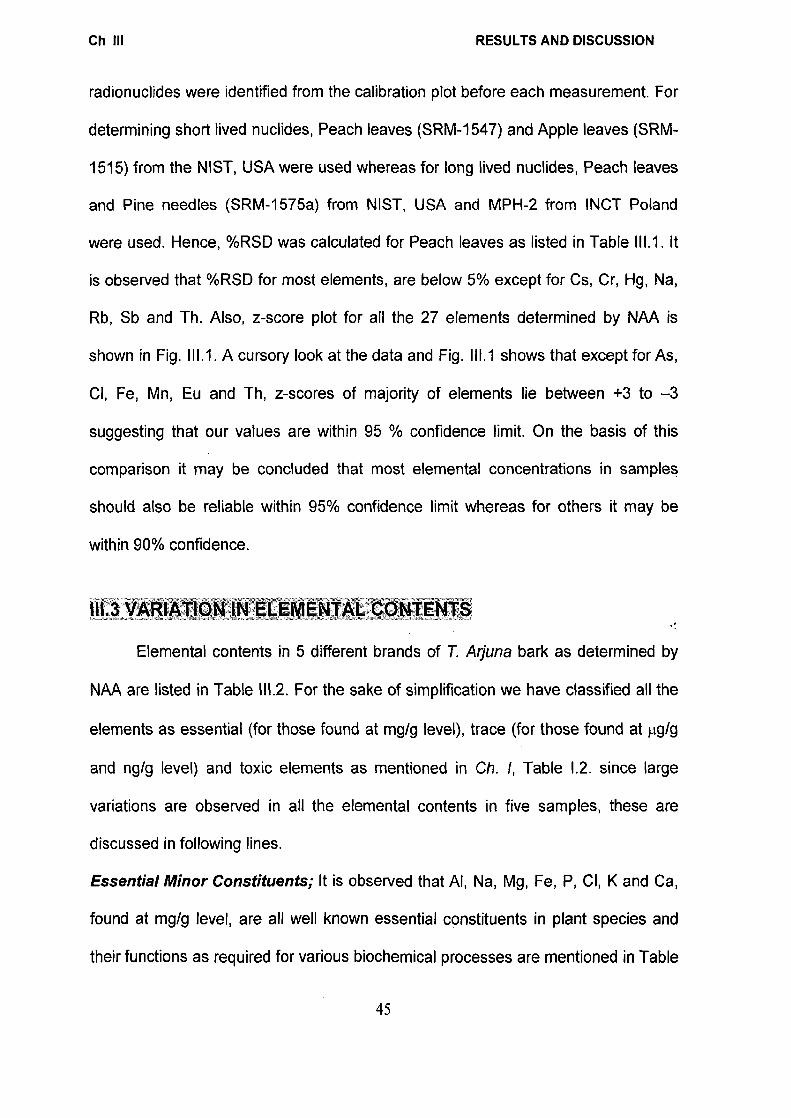
radionuclides were identified from the calibration plot before each measurement. For
determining short lived nuclides, Peach leaves (SRM-1547) and Apple leaves (SRM-
1515) from the NIST, USA were used whereas for long lived nuclides, Peach leaves
and Pine needles (SRM-1575a) from NIST, USA and MPH-2 from INCT Poland
were used. Hence, %RSD was calculated for Peach leaves as listed in Table 111.1. It
is observed that %RSD for most elements, are below 5% except for Cs, Cr, Hg, Na,
Rb, Sb and Th. Also, z-score plot for all the 27 elements determined by NAA is
shown in Fig. 111.1. A cursory look at the data and Fig. 111.1 shows that except for As,
CI, Fe, Mn, Eu and Th, z-scores of majority of elements lie between +3 to —3
suggesting that our values are within 95 % confidence limit. On the basis of this
comparison it may be concluded that most elemental concentrations in samples
should also be reliable within 95% confidence limit whereas for others it may be
within 90% confidence.
Elemental contents in 5 different brands of T. Arjuna bark as determined by
NM are listed in Table 111.2. For the sake of simplification we have classified all the
elements as essential (for those found at mg/g level), trace (for those found at 119/g
and ng/g level) and toxic elements as mentioned in Ch. I, Table 1.2. since large
variations are observed in all the elemental contents in five samples, these are
discussed in following lines.
Essential Minor Constituents; It is observed that Al, Na, Mg, Fe, P, CI, K and Ca,
found at mg/g level, are all well known essential constituents in plant species and
their functions as required for various biochemical processes are mentioned in Table
45

Ch III RESULTS AND DISCUSSION
1.3. Variation in elemental contents amongst individual brands is quite marked as
evident from the SD values mentioned in last column of Table 111.2 and bar plot
shown in Fig 111.4. Not only Ca content is highest in all the brands but also its
variation is within a small range of 18.0-46.6 mg/g, by a factor of 3. Similar is the
case with K which varies in the range of 2.88-8.07 mg/g and Mg (2.46-7.18 mg/g)
and P (0.19-0.62 mg/g) which all vary by a factor 3 to 4. On the other hand Na (0.06-
0.40 mg/g) and CI (1.44-6.29 mg/g) show much larger variations by a factor of 4 to 5.
Incidentally Himalaya brand shows quite high concentrations of Na and CI
suggesting that probably some common salt might have been added to suppress its
bitterness and enhance its shelf life. Fe content (0.14-4.84 mg/g), however, varies by
more than an order of magnitude. It is observed that in powdered samples collected
from Mumbai, Roorkee and Nagpur, Ca, CI, P and K contents are lower compared to
those from Vyas Pharmacy (Indore) and Himalaya Drugs (Bangalore). Incidentally
Vyas Pharmacy sample shows the highest Ca (46.6±1.6 mg/g), K (8.07±0.20 mg/g)
and P (0.62±0.04 mg/g) content. These variations may be attributed to variation in
geographical locations and climatic conditions in places from where the samples
were collected [75-77]. It may be noted that all the five samples were collected from
a large area covering from Roorkee in North to Bangalore in South where soil
conditions are widely varying. In order to further see the variation in elemental
concentrations a plot has been drawn in Fig. 111.5. It is observed that basic elemental
profiles are same for all the samples. Ca and Mg are in higher amounts and their
ratio should have remained same. However, it is found to vary in a wide range of
46

Ch III RESULTS AND DISCUSSION
2.56 to 18.9 with a mean value of 8.1±6.5, lowest for Roorkee sample and highest
for the sample from Vyas Pharmacy (Indore).
Tun and Nguyen [78] observed strong correlation between Ca deficiency and
the pathogenesis of hypertension due to cardiovascular disfunctioning in chicks
during embryonic development. Slotki [79] observed patients with severe cardiac
failure and anemia to benefit from iron supplementation. Thus, high Ca and Fe
contents besides other elements in the Arjuna bark could explain its use in acute
conditions of cardiac failure and dropsy
Essential Trace Elements; As pointed out in Ch 1 trace elements play vital role in
biochemical and enzymatic processes. However, their concentrations also vary in a
wide range depending on geo-environmental factors. Variation in concentrations of
essential trace elements in different brands is bar plotted in Fig. 111.6. It is observed
that Cu (2.27-4.00 µg/g), Mn (38.0-101p,g/g), Rb (5.54-15.4 µg/g) and V (0.18-0.54
µg/g) vary by a factor of 2-3 while Co (0.09-0.86 1.1g/g), Zn (2.48-21.6 .xg/g) and Cr
(0.25-10.5 µg/g) vary by an order of magnitude and more. It is observed that mean
elemental contents of Cu (4.00± 0.10ttg/g), Mn (101±1.0 µg/g) and V (0.54±0.03
µg/g) are very high in sample from Himalaya Drugs while that from the Vyas
Pharmacy has the lowest Co (0.09±0.02 µg/g) and Cr (0.25±0.05 fig/g). Powdered
sample from Mumbai has excessively high Co (0.86±0.19 µg/g), Cr (10.5±2.0 µg/g)
and Zn (20.7±0.2 µg/g) content while Rb content (15.4±3.0 µg/g) is highest in
Roorkee sample. Sample from Nagpur showed lowest Mn (38.0±0.6 µg/g), Rb
(5.54±1.08 µg/g) and Zn (2.48 0.18 µg/g) contents. In order to see the variation in
trace elemental concentrations a plot has been drawn in Fig. 111.7. It is observed that
47
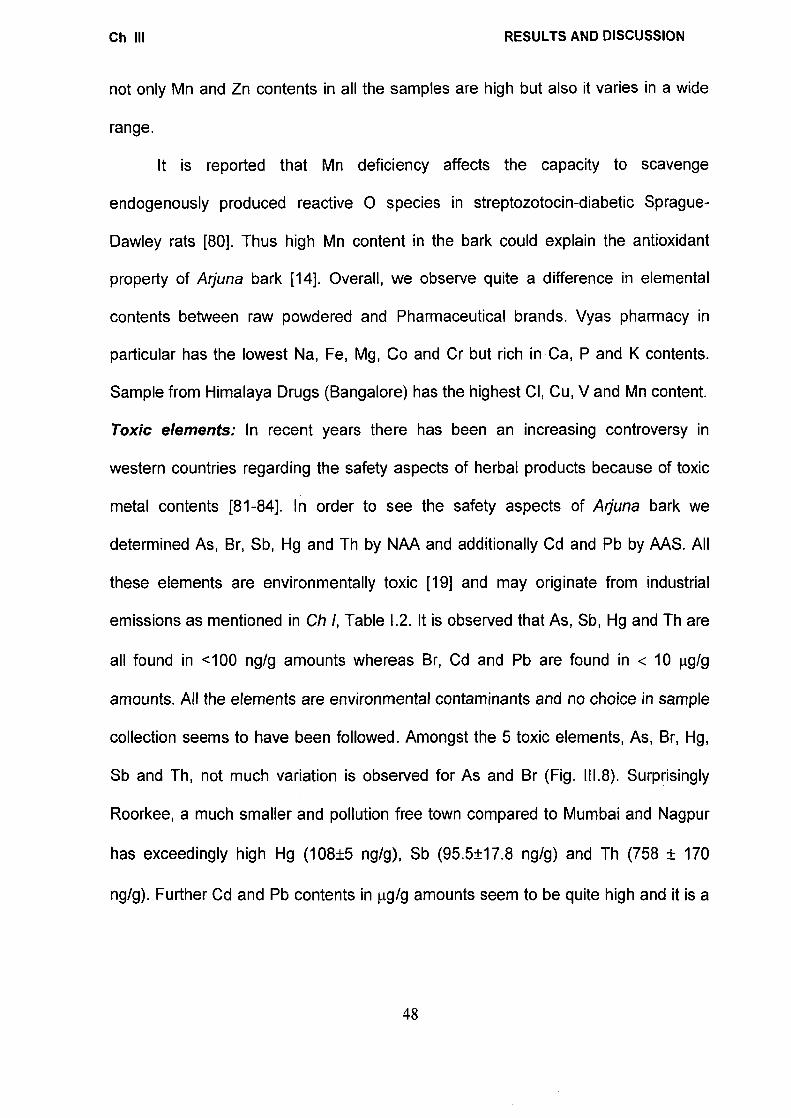
Ch III RESULTS AND DISCUSSION
not only Mn and Zn contents in all the samples are high but also it varies in a wide
range.
It is reported that Mn deficiency affects the capacity to scavenge
endogenously produced reactive 0 species in streptozotocin-diabetic Sprague-
Dawley rats [80]. Thus high Mn content in the bark could explain the antioxidant
property of Arjuna bark [14]. Overall, we observe quite a difference in elemental
contents between raw powdered and Pharmaceutical brands. Vyas pharmacy in
particular has the lowest Na, Fe, Mg, Co and Cr but rich in Ca, P and K contents.
Sample from Himalaya Drugs (Bangalore) has the highest CI, Cu, V and Mn content.
Toxic elements: In recent years there has been an increasing controversy in
western countries regarding the safety aspects of herbal products because of toxic
metal contents [81-84]. In order to see the safety aspects of Arjuna bark we
determined As, Br, Sb, Hg and Th by NM and additionally Cd and Pb by AAS. All
these elements are environmentally toxic [19] and may originate from industrial
emissions as mentioned in Ch I, Table 1.2. It is observed that As, Sb, Hg and Th are
all found in <100 ng/g amounts whereas Br, Cd and Pb are found in < 10 tig/g
amounts. All the elements are environmental contaminants and no choice in sample
collection seems to have been followed. Amongst the 5 toxic elements, As, Br, Hg,
Sb and Th, not much variation is observed for As and Br (Fig. 111.8). Surprisingly
Roorkee, a much smaller and pollution free town compared to Mumbai and Nagpur
has exceedingly high Hg (108±5 ng/g), Sb (95.5±17.8 ng/g) and Th (758 ± 170
ng/g). Further Cd and Pb contents in 1.1g/g amounts seem to be quite high and it is a
48

Ch III RESULTS AND DISCUSSION
matter of concern. This is essentially due to not following good agricultural practice
as advocated by some workers [85]
1114 ELEMENTAL RATIOS
Many a times elemental ratios rather than its contents also play an important
role. Variation in K/P and Ca/P ratio in five brands is shown in Fig. 111.9 and 10
respectively. K/P ratio varies in a small range of 10-23 while Ca/P ratio varies in a
much higher range of 45-180 in five brands. We observed that the sample from
Nagpur has the highest ratio for both. Fe and Zn are physiologically important
elements in our body system [18] and their ratio Fe/Zn also varies in a wide range of
0.03 to 1.6 with a mean value of 0.48±0.66, lowest being for Vyas Pharmacy, Indore
and highest for Nagpur. Thus it is interesting to observe that in Indore sample,
Ca/Mg is highest whereas Fe/Zn is lowest. Therefore, Ca and Fe contents seem to
be inversely correlated. Our studies have clearly shown that in spite of variation in
elemental contents in samples from different geographical locations, elemental
profile remain same and Arjuna bark is enriched in some essential nutrients in
bioavailable form.
111.5 'GC
NOFI
In order to validate our data several elements such as Cu, Fe, Zn, Mn, Cr etc
were determined by AAS and ICP-MS. 14 elements were determined by MS and 22
by ICP-MS. A comparison of our NM data with those of MS and ICP-MS shows
that As, Ca, Co, Cr, Cu and Hg match within -10%. Considering the fact that the
49
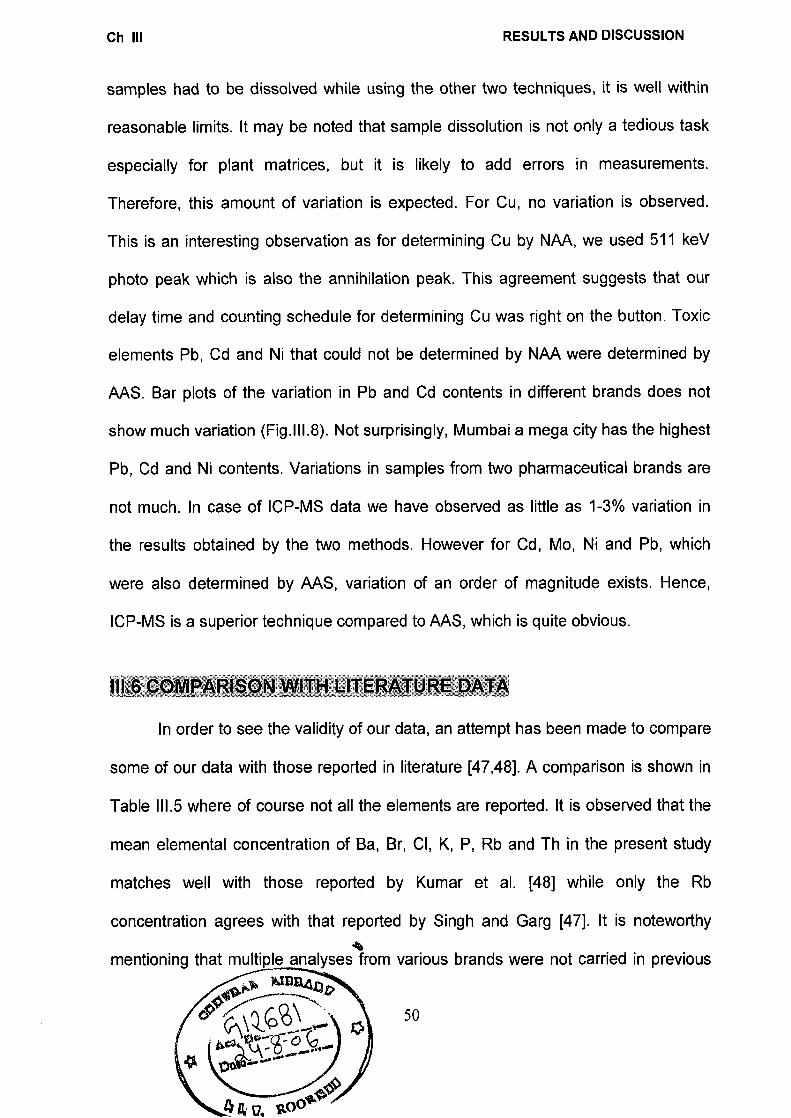
Ch III RESULTS AND DISCUSSION
samples had to be dissolved while using the other two techniques, it is well within
reasonable limits. It may be noted that sample dissolution is not only a tedious task
especially for plant matrices, but it is likely to add errors in measurements.
Therefore, this amount of variation is expected. For Cu, no variation is observed.
This is an interesting observation as for determining Cu by NAA, we used 511 keV
photo peak which is also the annihilation peak. This agreement suggests that our
delay time and counting schedule for determining Cu was right on the button. Toxic
elements Pb, Cd and Ni that could not be determined by NAA were determined by
AAS. Bar plots of the variation in Pb and Cd contents in different brands does not
show much variation (Fig.III.8). Not surprisingly, Mumbai a mega city has the highest
Pb, Cd and Ni contents. Variations in samples from two pharmaceutical brands are
not much. In case of ICP-MS data we have observed as little as 1-3% variation in
the results obtained by the two methods. However for Cd, Mo, Ni and Pb, which
were also determined by AAS, variation of an order of magnitude exists. Hence,
ICP-MS is a superior technique compared to AAS, which is quite obvious.
In order to see the validity of our data, an attempt has been made to compare
some of our data with those reported in literature [47,48]. A comparison is shown in
Table 111.5 where of course not all the elements are reported. It is observed that the
mean elemental concentration of Ba, Br, CI, K, P, Rb and Th in the present study
matches well with those reported by Kumar et al. [48] while only the Rb
concentration agrees with that reported by Singh and Garg [47]. It is noteworthy
mentioning that multiple analyses from various brands were not carried in previous
50

Ch III RESULTS AND DISCUSSION
works. Hence, mean contents of Al, Co, Cr, Cs, Fe, 'Hg, La, Na, Sc and Zn reported
by Kumar et al. [48] is in the range reported by us in Table III. 2. However, a look at
Table 111.5 shows that Mg and Mn content in this study is high while V and Ca
content is much lower.
111..7 IDE=NTIFICATION OF ORGANIC CONSTITUENTS, As already pointed out we have been able to separate and identify three new
organic compounds by elemental analysis, spectral and GC-MS studies. These
details are discussed in following lines.
(i) 1-phenylazo 2-naphthalenol (PG I): It is obtained as a reddish crystalline solid,
yield: 321 mg, m. pt 199 °C, (lit. m.pt. 205 °C), Rf=0.79 in Petroleum
ether/CCI4/benzene (60:30:5), Elemental content (%): C, 77.9 (77.4); H, 5.06 (4.83);
N, 10.98 (11.3). This corresponds to the molecular formula C16H12N20.
(cm-1) in KBr
3469 VO-4-1
2917, 2843 vc_H aromatic
1637
MS at Rt=9.58 min., mIz (rel. int.)
248 [66] C16F-112N20
171 (19) C10H7N2
143 (71) C10+H70
115 (100) +C9H7
105 (9.2) C6H5N2+
77 (59.9) +C6H5
51 (36.2) +C41-13
These assignments match well with that for 1-phenylazo 2-naphthalenol [86, 87]
IR spectrum, mass spectrum of 1-phenylazo 2-naphthalenol and the possible
51

7.63 7.46
Possible binding site 5.0 M----- 0
7.93
7.17
7.82
Ch III RESULTS AND DISCUSSION
fragmentation pattern is shown in Fig. 111.11. The compound is an azo dye and is
commonly known as Sudan Red I, probably because of the interest of the British
Empire in Sudan at the time it was developed in the late 19th century [88]. This
compound is not reported in Terminalia Arjuna. Amenduni et al [89] developed a
rapid and reliable method to determine this dye from red chili using HPLC with
diode array detection. Vanker et al [90] have reported special treatment for
dyeing cotton with T. Arjuna. It all fastness parameters, it showed good results.
Though no efforts were made to identify the dye, the compound isolate here may
be responsible for dyeing characteristics. Further, it has two binding sites, a
coordinate bond through N and a covalent bond through 0 to form a six
membered ring with the transition metal ions [91]. Possible binding site along
with the 1H NMR 6 values are depicted here.
7.46 7.93 7.53 7.21
7.46
7.30
1-phenylazo 2-naphthalenol
52

Ch III RESULTS AND DISCUSSION
(ii) 2-isopropyl naphtha [12,3-01 furan 4,9-dione (PG II): It is obtained as a yellowi
sh oil, Rf=0.63 in CHCI3/ diethyl ether (10:1), Elemental content (%): C, 75.84 (75.0);
H, 5.20 (5.0). This corresponds to the molecular formula C15H1203
IR (cm 1)in KBr
2935 vc_H aromatic
2835 vc_H aliphatic
1626 vc.o
1508 vc.c
1206 vc_o asymmetric
1025 vc.0 symmetric
MS at Ri=9.58 min., m/z (rel. int.)
240 (59.3) C15H1203
225 (100), +C141-1903
197 (16.2), 4.C12H503
77 (24.1), +C6H5
69 (34.6) +C4H50
These assignments match well with that for 2-isopropyl naphtha [2,3-b] furan
4,9-dione [86]. IR spectrum, mass spectrum and the possible fragmentation pattern
is shown in Fig. 111.12.
0 2-isopropyl naphtho [2,3-b] furan 4,9-dione
53

Ch III RESULTS AND DISCUSSION
De Nys et al. [92] observed that furanone derivatives inhibit bacterial
colonization through interference with a key bacterial quorum-sensing pathway
hereby explaining the role of Arjuna bark as an antibacterial agent [93]
(iii) Tartaric acid (PG III): It is obtained as a white crystal, yield: 79 mg, m. pt 212 °C,
(lit. mpt. 205 °), Rf=0.72 in CHCI3 / Me0H (20:1), Elemental content (%): C, 31.68
(32.0); H, 4.20 (4.0). This corresponds to the molecular formula C4H606
IR (cm 1)in KBr
3437 b,vo-H
2604 vc_H aliphatic
1734 vo.0
1129 vc_o asymmetric
1078 vc_o symmetric
MS at Rt=9.58 min., rnIz (rel. int.)
150 (1.71), C4H606
105 (28.3), +C3H504
104 (1.62), C3H404
76 (100), C2H403
59 (47.3), +C2H302
58 (77.6), C2H202
These assignments match well with that for tartaric acid [86,87]. IR spectrum,
mass spectrum of tartaric acid and the possible fragmentation pattern is shown in
Fig. 111.13. Tartaric acid is widely distributed in natural products and acts as a
refrigerant, antiseptic and antiscorbutic agent [94]. Chen et al. [95] developed a
rapid, simple and sensitive HPLC method combined with a novel double cell quartz
54

Ch III RESULTS AND DISCUSSION
crystal (DCQC) detector for the determination of divalent carboxylic acids including
tartaric acid in traditional Chinese herbal and patented medicines. Structure of
tartaric acid along with 1H NMR 8 values are shown here.
2.0 OH 0
11.0H0 4.50
4.50 OH11.0
0 OH 2.0
Tartaric acid
ii18THERMOGRAVIVIETRIC ANKLYSIS In recent years thermal decomposition of medicinal herbs has attracted
attention because of use of DTA for taxonomical investigations. In view of these
literature reports, we had investigated thermal decomposition behavior of all the
samples of Arjuna bark powder in air and in N2 atmosphere. Typical thermo grams of
Himalaya brand in air and N2 atmospheres are shown in Fig.11.5. In order to avoid the
effect of moisture content, the starting temperature was maintained at -120°C.
Earlier we had observed that if starting temperature was 25°C then a weight loss of
-5% had occurred at 120°C. In both cases decomposition occurs in three stages,
though it is much sharp in air atmosphere compared to that in N2 atmosphere.
Another major difference in air is that residual wt obtained at 990°C is -16%,
whereas in N2 atmosphere, it is -37% at 790°C.
In general, decomposition in air is fast compared to that in N2 atmosphere as
evident from large difference in weight loss in two media. Also stage I is the fastest
55

Ch III RESULTS AND DISCUSSION
process whereas stage III is slowest. Temperature ranges of three stages of
decomposition are same though weight losses in stages I and II are different in air
and N2 atmosphere.
Stages Temp. Range Percent wt Loss
(°C) Air N2 Stage I 220-350 -40 - 30
Stage II 350-400 -30 - 15
Stage III 600-700 -12 - 12
Total wt Loss 82 57
The major difference between decomposition occurring in two media is that
in air, residual weight is 16% at -700°C whereas at the same temperature in N2
atmosphere it is -40% in N2.The extra loss clearly indicates oxidation leading to the
formation of volatile oxides in air. DTA plot in air shows two exotherms at -300°C
and 415°C but no such enthalpy change (AH) is observed in N2 atmosphere.
Actually DTA plot in N2 atmosphere is convex in nature. Wesolowski and
Konieczynski [96,97] observed a similar behaviour while studying thermal-
decomposition of several Polish medicinal plants and concluded that the elemental
composition reflected by the results of their thermal decomposition supported its
chemotaxonomy.
In order to check the carbonaceous matter in Arjuna bark powder, elemental
analysis of all the powder samples was performed. The data are given in Table 111.6.
No sulfur content could be detected in any of the samples though no N content was
56

Ch III RESULTS AND DISCUSSION
found in at least Nagpur sample. A perusal of data shows that similar to mineral
elemental contents, C, H, and N contents also vary in a wide range. Mean C, H and
N contents are found to be 34.93±3.27, 4.00±0.51 and 0.11±0.07% respectively.
Thus, total of all C, H, N contents is found to be 39.01±3.76 which means that the
total carbonaceous matter should be -40%. However, it is observed from the
thermogram in N2 atmosphere (Fig. II.5a) that -39% residual wt. remains compared
to -17% in air atmosphere. Assuming that all the carbonaceous matter is oxidized in
air, we observed a residual wt.=15.4±2.7% compared to that of 33.6±3.0 % in N2
atmosphere. It means that even after heating in air at -900° C -16% wt is left which
must non-volatile metal oxides suggesting that Arjuna bark is rich in mineral content.
Large difference in residual wt of Arjuna bark powder in air and N2 atmosphere by
-20% is indicative of the combustible material.
57

Ch III RESULTS AND DISCUSSION
Table 111.1 Elemental concentrations in SRMs used for data validation in NM.
Element Mixed Polish
Herbs (MPH-2)
Peach Leaves (SRM 1547)
Pine Needles
(SRM 1575 a) Apple Leaves (SRM 1515) Certified RSD (%)
265±6 269±6 Al (pg/g) (249±7) 2.3 (286±9) 67.1±0.5 187±2 As (ng/g) (60±18) 0.7 (191±23)
31.6±3.8 107± 1.8 Ba (pg/g) (32.5±2.5) (124±4) 1.7 11.8±0.1 7.18±0.01 Br (pg/g) [11] 0.8 (7.17±0.61) 14.3±0.2 16.6±0.2 Ca (mg/g) (15.6±0.2) 1.4 (15.3±0.15) 0.39±0.01 0.54±0.01 Cl (mg/g) (0.36±0.02) 2.6 (0.58±0.02)
193±3 83±2 Co (ng/g) (210±25) [70] 2.2 1.27 1.33 1.57±0.11 Cr (pg/g) (1.69±0.13) [1] 7.0 (1.33±0.11)
Cs (ng/g) 66.4±14.6 (76±7)
78.4±15.8 (84.2±1.2) 20.2
199±7
3.89±0.09 8.16±0.23 Cu (pg/g) (3.7±0.4) 2.3 (7.77±0.53) 16.7±2.9 163±1 4.28±0.17 Eu (ng/g) (15.7±1.8) [170] 0.6 465±30 200±7 52±6 Fe (pg/g) [460] (218±14) 3.5 (46±20)
15.6±2.0 29.2±2.9 37.3±2.2 Hg (ng/g) (17.6±1.6) (31±7) 9.9 [35.1] 25.4±0.1 18.3±0.1 K (mg/g) (24.3±0.3) 0.4 (19.1±1.2) 7.96±0.33 0.63±0.01 La (pg/g)
[9] 4.1 (0.57±0.05) 4.51±0.12 2.35±0.11 Mg (mg/g) [4.32] 2.7 (2.71±0.08) 95.5±0.5 55.4±0.3 Mn (pg/g) (98±3) 0.5 (54±3) 27.5±2.2 363±31 Na (pg/g) (24±2) 8.0 [350]
2.46±0.218 1.25±0.069 1.19±0.04 P (mg/g) [2.5] (1.37±0.07) 5.5 (1.07±0.08) 12.1±2.9 18.9±2.3 16.1±1.8 Rb (pg/g) (10.7±0.7) (19.7±1.2) 12.2 (16.4±0.4) 59.3±5.6 23.1±4.5 29.2±5.4 Sb (ng/g) (65.5±9.1) [20] 17.2 (33±6) 119±2 41.4±0.9 91.8±1.9 Sc (ng/g) (123±9) [40] 2.2 (101±3)
1065±6 88.8±0.3 Sm (ng/g) [1000] 0.6 (94.4±8.2) 36.1±2.2 56.1±1.6 82.7±12.9 Sr (pg/g) (37.6±2.7) (53±4) 2.8 143± 1 31.6±2.4 169±8 Th (ng/g) (154+13) [50] 7.6 (205±26)
0.33±0.01 0.30±0.01 V (pg/g) (0.37±0.03) 3.0 (0.26±0.03) 30.3±0. 19.7±0.6 41.7±3.6 Zn (pg/g) (33.5±2.1) (17.9±0.4) 3.0 (38±2)
58
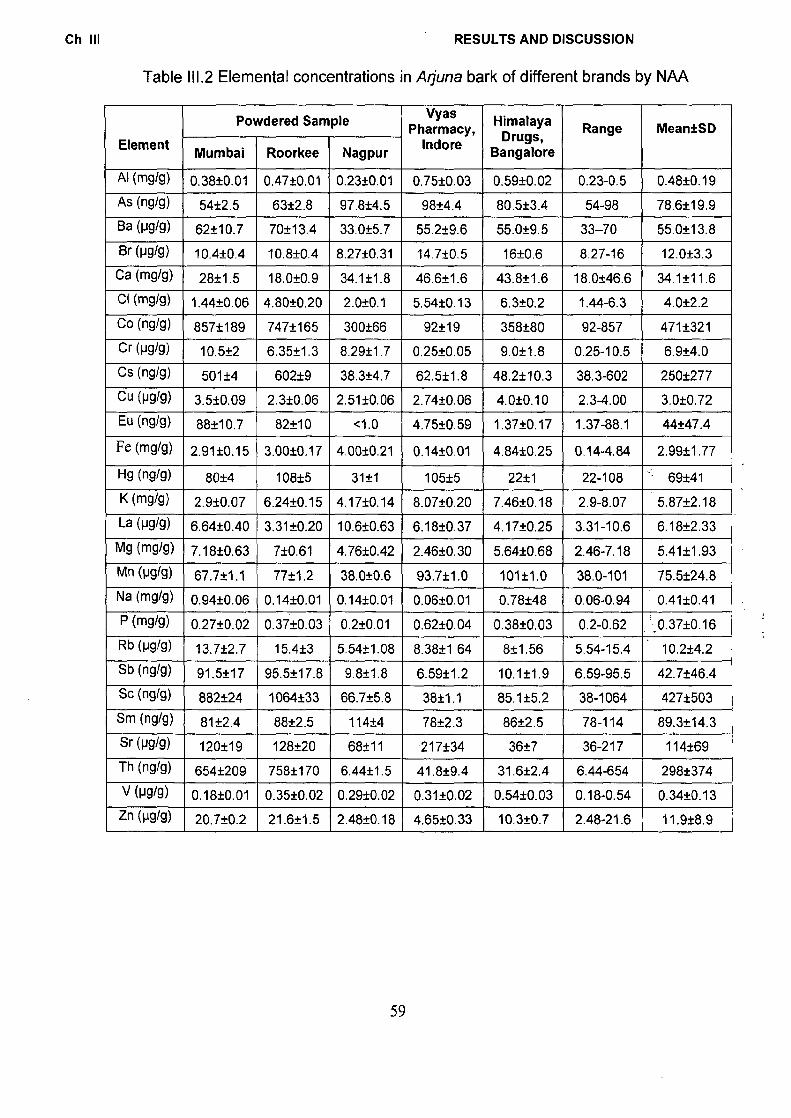
Ch III RESULTS AND DISCUSSION
Table 111.2 Elemental concentrations in Arjuna bark of different brands by NAA
Element
Powdered Sample Vyas Pharmacy,
Indore
Himalaya Drugs, Bangalore
Range Mean±SD
Mumbai Roorkee Nagpur
Al (mg/g) 0.38±0.01 0.47±0.01 0.23±0.01 0.75±0.03 0.59±0.02 0.23-0.5 0.48±0.19 As (ng/g) 54±2.5 63±2.8 97.8±4.5 98±4.4 80.5±3.4 54-98 78.6±19.9 Ba (p9/9) 62±10.7 70±13.4 33.0±5.7 55.2±9.6 55.0±9.5 33-70 55.0±13.8
Br (Pg/g) 10.4±0.4 10.8±0.4 8.27±0.31 14.7±0.5 16±0.6 8.27-16 12.0±3.3 Ca (mg/g) 28±1.5 18.0±0.9 34.1±1.8 46.6±1.6 43.8±1.6 18.0±46.6 34.1±11.6
CI (m9/9) 1.44±0.06 4.80±0.20 2.0±0.1 5.54±0.13 6.3±0.2 1.44-6.3 4.0±2.2 Co (ng/g) 857±189 747±165 300±66 92±19 358±80 92-857 471±321 Cr (pg/g) 10.5±2 6.35±1.3 8.29±1.7 0.25±0.05 9.0±1.8 0.25-10.5 6.9±4.0 Cs (ng/g) 501±4 602±9 38.3±4.7 62.5±1.8 48.2±10.3 38.3-602 250±277 Cu (pg/g) 3.5±0.09 2.3±0.06 2.51±0.06 2.74±0.06 4.0±0.10 2.3-4.00 3.0±0.72 Eu (ng/g) 88+10.7 82±10 <1.0 4.75±0.59 1.37±0.17 1.37-88.1 44±47.4
Fe (mg/g) 2.91±0.15 3.00±0.17 4.00±0.21 0.14±0.01 4.84±0.25 0.14-4.84 2.99±1.77
Hg (ng/g) 80±4 108±5 31±1 105±5 22±1 22-108 69±41
K (mA) 2.9±0.07 6.24±0.15 4.17±0.14 8.07±0.20 7.46±0.18 2.9-8.07 5.87±2.18 La (pg/g) 6.64±0.40 3.31±0.20 10.6±0.63 6.18±0.37 4.17±0.25 3.31-10.6 6.18±2.33
Mg (mg/g) 7.18±0.63 7±0.61 4.76±0.42 2.46±0.30 5.64±0.68 2.46-7.18 5.41±1.93
Mn (Pg/g) 67.7±1.1 77±1.2 38.0±0.6 93.7±1.0 101±1.0 38.0-101 75.5±24.8 Na (mg/g) 0.94±0.06 0.14±0.01 0.14±0.01 0.06±0.01 0.78±48 0.06-0.94 0.41±0.41
P (mg/9) 0.27±0.02 0.37±0.03 0.2±0.01 0.62±0.04 0.38±0.03 0.2-0.62 ' 0.37±0.16 Rb (pg/g) 13. 7±2 .7 15.4±3 5.54±1.08 8. 38±1. 64 8±1.56 5.54-15.4 10.2±4.2 Sb (ng/g) 91.5±17 95.5±17.8 9.8±1.8 6.59±1.2 10. 1±1. 9 6.59-95.5 42.7±46.4 Sc (ng/g) 882±24 1064±33 66.7±5.8 38±1.1 85.1±5.2 38-1064 427±503 Sm (ng/g) 81±2.4 88±2.5 114±4 78±2.3 86±2.5 78-114 89.3±14.3 Sr (pg/g) 120±19 128±20 68±11 217±34 36±7 36-217 114±69 Th (ng/g) 654±209 758±170 6.44±1.5 41.8±9.4 31.6±2.4 6.44-654 298±374
V (P9/g) 0.18±0.01 0.35±0.02 0.29±0.02 0.31±0.02 0.54±0.03 0.18-0.54 0.34±0.13 Zn (pg/g) 20.7±0.2 21.6±1.5 2.48±0.18 4.65±0.33 10.3±0.7 2.48-21.6 11.9±8.9
59

Ch III
RESULTS AND DISCUSSION
Table 111.3 Elemental concentrations in Arjuna by MS.
Element
Powdered Samples Vvas • - Pharmacy
Indore
Himalaya Drugs,
Bangalore
Mean ±SD
SRMs
Mumbai Roorkee Nagpur
Mixed Polish Herbs
MPH-2
Peach Leaves
SRM 1547
As (ng/g) 56 65.7 31.8 102 90.7 69.2±28
Ca (mg/g) 30.4 17.6 35 48 46.11 35.4±12.4
12.2 (10.8±0.7)
15.8 (15.6±0.2)
Cd (pg/g) 21.7 2.5 1.12 1.1 1.4 5.60±9.04
0.22 (0.20±0.02)
1.6 (2.6±0.3)
Co (ng/g) 775 656 271 90.6 356 429±281
Cr (pg/g) 9.70 6.60 8.50 0.30 9.6 6.94±3.91
1.70 (1.69±0.13)
1.60 [1]
Cu (pg/g) 3.3 2.3 2.52 2.7 4.03 2.96±0.69
7.90 (7.77±0.53)
4.25 (3.7±0.7)
Fe (mg/g) 2.7 3.62 4.7 0.15 4.90 3.21±1.92
0.45 [0.460]
0.20 (0.21±0.01
) Hg
(ng/g) 76 105 31.8 102 90.7 81±30 -
Mn (pg/g) 67 76.7 37.8 104 104 78±28
194 (191±12)
94 (98±3)
Mo (ng/g) 5.7 0.85 0.63 1.70 0.90 1.95±2.13
Ni (pg/g) 10 0.90 0.64 2.30 2.28 3.22±3.87
1.33 (1.57±0.16)
1.02 (0.69±0.09
)
Pb (pg/g) 11.2 2.93 3.67 2.93 4.28 5.0±3.5
4.0 (2.16±0.23)
Zn (pg/g) 21.40 21.45 2.30 4.81 10.63 12.1±9.0
32.0 (33.5±2.1)
20.44 (17.9±0.4)
60

Ch III RESULTS AND DISCUSSION
Table 111.4 Elemental concentrations in Arjuna bark and RMs by ICP-MS
Elem. Powdered Sample Vyas
Pharmacy Indore
Himalaya Drugs,
Bangalore Mean±SD
SRMs
Mumbai Roorkee Nagpur
Mixed Polish Herbs MPH-2
Peach Leaves
SRM 1547
Al (pg/g) 388 464 229 751 590 484±198
610 (670±111)
275 (249±7.5)
As (ng/g) 2.1 72.6 96.8 87.0 86.2 80.9±13.6
177 (191±23)
61.5 (60±18)
Ba (pg/g) 63.0 70.5 32.3 52.9 52.2 54.2±14.4
35 (32.5±2.5)
107 (124±4)
Ca (mg/g) 26.0 17.0 35.1 43.6 48.8 34.1±13.0
8.80 (10.8±0.7)
15.4 (15.6±0.2)
Cd (pg/g) 21.4 2.01 1.15 1.17 1.24 5.4±8.9
0.23 (0.20±0.02)
0.16 (2.6±0.3)
Co (ng/g) 856 750 301 91.9 360 472±320
202 (210±25)
78.5 [70]
Cr (pg/g) 10.3 6.2 8.1 0.28 9.0 6.69±3.90
1.75 (1.69±0.13)
1.56 [1]
Cs (ng/g) 503 607 40.4 65.8 9.25 245±286
71.9 (76±7)
71.7 (84.2±1.2)
Cu (pg/g) 3.48 2.28 2.50 2.75 3.99 3.0±0.71
7.77 (7.77±0.53)
4.01 (3.7±0.4)
Fe (mg/g) 2.72 3.14 4.16 0.15 4.48 2.93±1.71
0.44 [0.460]
0.24 (0.20.014)
Hg (nglg) 79.6 104 28.2 103 23.3 67.5±39.6
15.5 (17.6±1.6)
29.1 (31±7)
Mg (mg/g) 6.96 7.18 5.13 2.36 5.85 5.5±1.9
2.81 (-)
3.2 [4.32]
Mn (pg/g) 67.3 77.1 38.1 92.6 101 75.2±24.6
200 (191±12)
97.8 (98±3)
Mo (ng/g) 5.80 0.85 0.75 1.80 0.89 2.0±22
560 (520)
60.3 (60±8)
Na (pg/g) 963 143 141 61.4 792 420±423
327 (350)
25.7 (24±2)
Ni (pg/g) 10.7 0.92 0.61 2.48 2.25 3.4±4.3
1.54 (1.57±0.16)
1.1 (0.69±0.09)
Pb (pg/g) 12.0 3.2 3.73 3.4 4.4 5.4±3.8
2.1 (2.16±0.23)
0.64 (0.87±0.09)
Rb (pg/g) 13.3 15.2 5.40 7.78 9.73 10.3±3.8
12.4 (10.7±0.7)
19.8 (19.7±1.2)
Sr (pg/g) 134 127 71.1 219 42.5 118±68
36.2 (37.6±2.7)
57.2 (53±4)
Sn (pg/g) 251 6.42 3.04 1.95 10.2 54.5±109
4.65 (-)
0.34 [0.2]
V (pg/g) 0.17 0.36 0.25 0.34 0.56 0.34±0.15
0.83 (0.95±0.16)
0.35 (0.37±0.03)
Zn (pg/g) 20 21.4 2.46 4.49 10.3 11.7±8.6
36.3 (33.5±2.1)
16.3 (17.9±0.4)
61
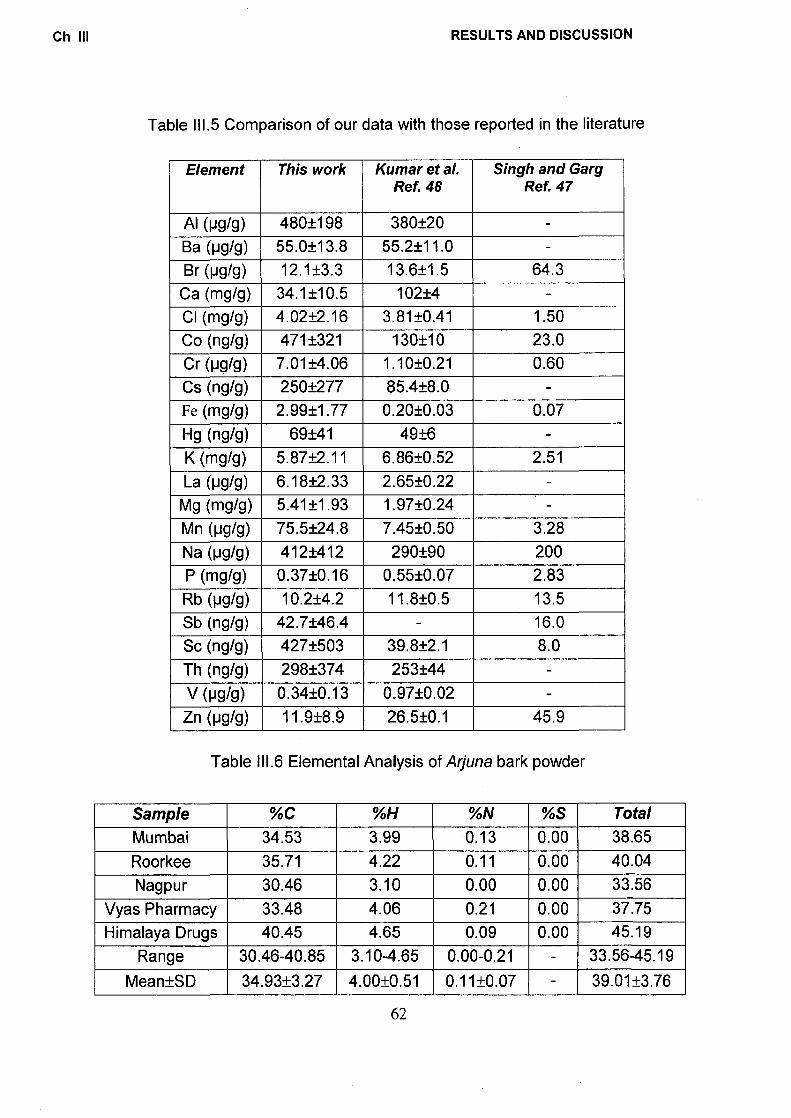
Ch III RESULTS AND DISCUSSION
Table 111.5 Comparison of our data with those reported in the literature
Element This work Kumar et al. Ref. 48
Singh and Garg Ref. 47
Al (pg/g) 480±198 380±20 - Ba (pg/g) 55.0±13.8 55.2±11.0 - Br (pg/g) 12.1±3.3 13.6±1.5 64.3 Ca (mg/g) 34.1±10.5 102±4 - CI (mg/g) 4.02±2.16 3.81±0.41 1.50 Co (ng/g) 471±321 130±10 23.0 Cr (pg/g) 7.01±4.06 1.10±0.21 0.60 Cs (ng/g) 250±277 85.4±8.0 - Fe (mg/g) 2.99±1.77 0.20±0.03 0.07 Hg (ng/g) 69±41 49±6 - K (mg/g) 5.87±2.11 6.86±0.52 2.51 La (pg/g) 6.18±2.33 2.65±0.22 -
Mg (mg/g) 5.41±1.93 1.97±0.24 - Mn (pg/g) 75.5±24.8 7.45±0.50 3.28 Na (pg/g) 412±412 290±90 200 P (mg/g) 0.37±0.16 0.55±0.07 2.83 Rb (pg/g) 10.2±4.2 11.8±0.5 13.5 Sb (ng/g) 42.7±46.4 - 16.0 Sc (ng/g) 427±503 39.8±2.1 8.0 Th (ng/g) 298±374 253±44 - V (pg/g) 0.34±0.13 0.97±0.02 - Zn (pg/g) 11.9±8.9 26.5±0.1 45.9
Table 111.6 Elemental Analysis of Arjuna bark powder
Sample %C %H %N %S Total Mumbai 34.53 3.99 0.13 0.00 38.65 Roorkee 35.71 4.22 0.11 0.00 40.04 Nagpur 30.46 3.10 0.00 0.00 33.56
Vyas Pharmacy 33.48 4.06 0.21 0.00 37.75 Himalaya Drugs 40.45 4.65 0.09 0.00 45.19
Range 30.46-40.85 3.10-4.65 0.00-0.21 - 33.56-45.19 Mean±SD 34.93±3.27 4.00±0.51 0.11±0.07 - 39.01±3.76
62

•
• ■ • •
• • • • • • •
•
• • •
• •
• •
1 1 1 1 1 1 1 1 1 1 1 1 1 1 1 I I 1 1 1 1 1 1 1 1 1
• •
t=1 min td=3 min DHRUVA PCF
r-
100 -
50 -
PO
T
300 -
250 -
200 -
150 -
Ch III RESULTS AND DISCUSSION
12
10
8
6
4
2 0 cf 0 N
-2
-4
-6
-8
Cou
nts/
sec
'NA2940cPck.PckkAANS keko Rit.svw■ocr
Element Fig 111.1 Z-score plot for elements in Peach Leaves (SRM-1547)
500 1000 1500 2000
2500
3000
3500
Energy (keV)
Fig 111.2 A typical 7-ray spectrum of short lived nuclides in Arjuna bark
63
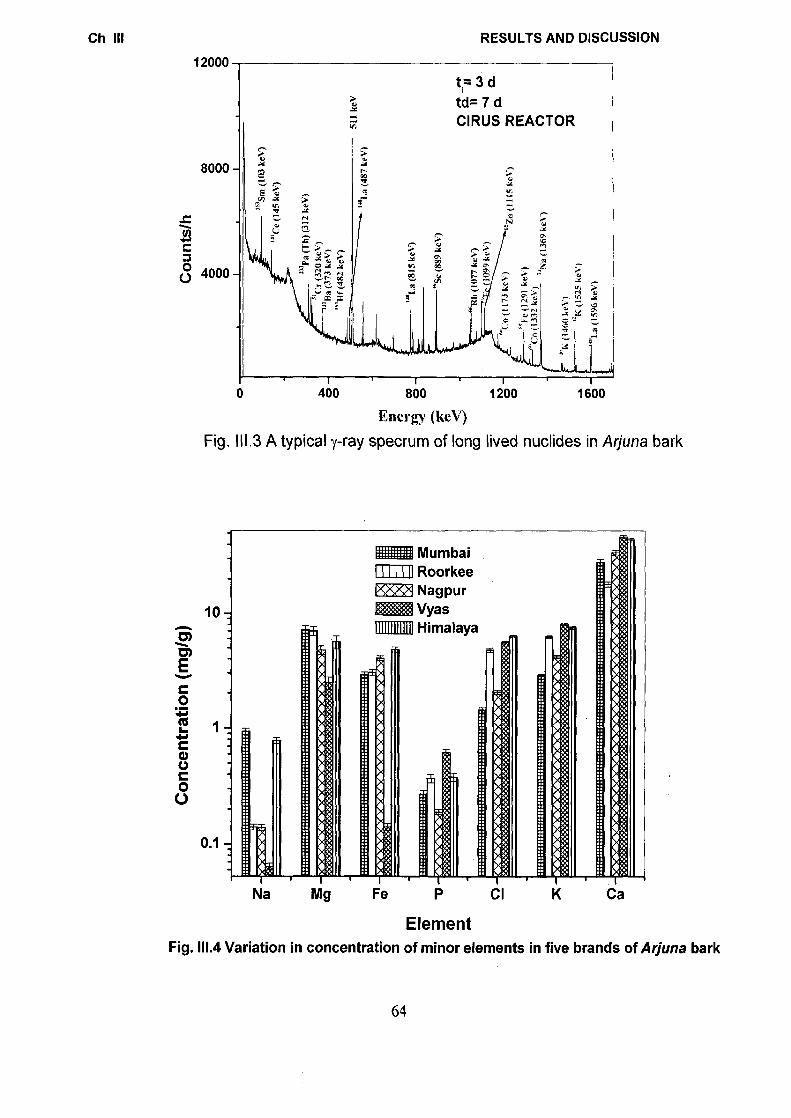
Na Mg Fe P CI K
Mumbai Roorkee Nagpur Vyas Himalaya
10
Con
cent
rati
on (m
g/g
)
0.1
Ch III RESULTS AND DISCUSSION 12000
t= 3 d td= 7 d CIRUS REACTOR
8000 -
0 4000 -
Zn
(111
5 ke
V)
I I I I 400 800 1200 1600
Energy (keV) Fig. 111.3 A typical 7-ray specrum of long lived nuclides in Arjuna bark
Element Fig. 111.4 Variation in concentration of minor elements in five brands of Arjuna bark
64

Mumbai Roorkee Nagpur Vyas
I Himalaya
Mn Co Cu Rb
Ch III RESULTS AND DISCUSSION
- Mumbai —0-- Roorkee
A Nagpur —v— Vyas
O Himalaya
50 -
45 -
40
35 -
•
g 25 -
0 10 -
5 -
0 -
5 I ' I ' I I ' I ' I • I Na Mg Fe P CI K Ca
Element
Fig. 111.5 Variation of Essential elemental Concentrations in Arjuna bark
Element Fig. 111.6 Variation in concentration of trace elements in five brands of Arjuna bark
Co
nce
ntra
tion
(lig
ig)
65

—0--- Mumbai —0-- Roorkee
Nagpur —v-- Vyas
Himalaya
Cr Mn Co Cu Zn Rb
110 -
100 -
90 -
80 -
70 -
60 -
50 -
40 -
30 -
20 -
10-
0-
-10
Pb As Hg Sb
Element Fig. 111.8 Variation in toxic elemental concentrations in Arjuna Bark.
Mumbai Roorkee Nagpur Vyas Himalaya
,V 2t]
Con
cent
ratio
n (n
g/g)
111111111111
Th Cd
Ch III RESULTS AND DISCUSSION
Element Fig. 111.7 Variation in Trace element Concentrations in Arjuna bark
Con
cent
ratio
n (R
g/g)
66

Ch III RESULTS AND DISCUSSION
25
20 -
10-
Bombay Roorkee Nagpur Vyas Himalaya Mean
Brands Fig. 111.9 Variation in K/P ratio in Arjuna bark
200
180
160
140
120
100
80
60
40
20
0
Mumbai Roorkee Nagpur Vyas Himalaya Mean
Brands Fig. III. 10 Variation in Ca/P ratio in Arjuna bark
67

HO
O
m/z=171
m/z=77
-C2H2
m/z=115
Ch III "1 164
RESULTS AND DISCrtiJJSSION
144
10-
6-
21
3500 3003 2500 2000 1500 1000 500 Wavenumber4 (an-1)
115
77
143 248
a000
100
51
11\4
‘1
8385 36 39 89 171
35 50
62 75 101 144
2 7,,11(_78 69 1399 1105, 3 116 128
, , 1k7 in 142 219 247 249
;1 41 491 61 1 5 56 165 172 189191 201 21 K251 24 0
51
f rV 19 3{, "."114, ' CV /V r11.1 "'"VV" TU T If 1 t'''' .1-37'71.17 'rUf T0/ ' 4 1 TV% ' 1U1 41 1 441 131 141
m/z=51
Fig. 111.1 1 IR spectrum, mass chromatogram and fragmentation pattern of 1-phenylazo 2-naphthalenol
68

Ch III
57'r an
rn t ta nc
1.
16
14
12
6 7
RESULTS AND TISCUSSION
er\
10 1Y 0. .3 00
13
9 10
9
16 37 7
4
V 47 .8
1 02
131 2 73412 .9 56
1500 3500 3000 W avenum bars (cm -1)
1000 500'
225
240
69 127
77
78 1 5 123 20 139,141
197 ( no
241 51
36 39 5(1, ,3 83 152..155
0 32 '.., Lep 62. 84 84,759 g.1:71-1 Ps./ 121 0 129
l .1 I 5I,JC v iv 18 168 169181 198207211 21 235 242
7 , 17
, 27
). li3ii, / 4.07) ,(tv54,41.,l3i; /0 7,76s%lsa, Nytili )1,444 1,."141"1 , (14‘y, A.y , t mob , ty sill th t ,,(vt obt4rwl)' tttitiOilk ,),,yr4o mrz 87 97 157 117 127 137 147 157 167 177 187 197 207 217 227 237 247
4500
100—
0 m/z=240
, j• —C H3CHC H3
0
m/z=225
—CH3
m/z=77
m/z=197 O
m/z=69 m/z=128
Fig. 111.12 IR spectrum, mass chromatogram and fragmentation pattern of 2-isopropyl naphtha [2,3-b] furan 4,9-dione
69

50 40
100-
5
45
50-
49 5 0 511' 11 1 11 .01
76
70
105
111 .r ,11100 60 70
80 88
.11 1 1.1 .1 11Trrrrirri 80 90 100
150
110 120 130 140 150 160
RESULTS AND DISCUSSION Ch III
104.
4.
oi
4000 ...,,,....2000
Wayenumbers (om-l) 1500 1000
HO
OH
0
0
OH
OH
OH
m/z=150
0
OH OH
O\ HO
H
m/z=59
-H
OH
0 OH m/z=105
-H
OH
O
0
m/z=104
-CO
° 0
H
m/z=58
OH
HO
0 IM/Z=76
-OH [=> HOy®
0 m/z=59
Fig. 111.13 IR spectrum, mass chromatogram and fragmentation pattern of tartaric acid
70

COWCLVSIOX Five samples of Arjuna bark powders including two commercial brands
were analyzed for 8 minor (Al. K, Na, Ca, Mg, CI, P and Fe), 14 trace (Ba, Ce,
Co, Cr, Cs, Cu, Mn, Rb, Eu, La, Sm, Sr, V, Zn) and 5 toxic (As, Br, Hg, Sb, Th)
elements by instrumental neutron activation analysis (INAA). Also 14 elements
including Ni, Pb, Cd and Mo were determined by AAS. Further, 22 elements were
including Sn were determined by ICP-MS. In each case Standard Reference
Materials (SRMs) were analyzed for quality control and data validation. Most
elemental concentrations vary in a wide range, by a factor of 5 except Fe, Cs,
Na, Sb, Eu, Zn which vary by an order of magnitude. This may be attributed to
local soil characteristics and environmental factors of the region from where the
samples were derived.. Bark powder is enriched in K, Ca, Mn, Fe and Zn which
are all essential and play vital role in biochemical processes. Thin layer and
column chromatography were used to separate three new organic compounds an
azo dye, a furanone and tartaric acid which were further confirmed by infrared
and NMR spectra and GC-MS. Essential elements seem to remain complexed
with organic ligands so as to make them bioavailable in the body system.
Thermogravimetric studies have suggest three stage decomposition with —15%
non-volatile material due to metal oxides.
71
REFERENCES
1. Bhattacharjee, S.K., Handbook of Medicinal Plants, 4th Edn, Pointer Publishers, Jaipur (1996) pp. 490.
2. Paranjpe, P., Indian Medicinal Plants; Forgotten Healers, Chaukhamba Sanskrit Pratisthan, Delhi, (1999), p. 19
3. Sharma, P.V., Dravyaguna Vigyan, Vol. II, Chaukhambha Bharti Academy, Varanasi, (1993), pp. 873
4. Prabhakar Y S, Suresh K. D., The Chemistry of Terminalia arjuna (ROXB), Wight and Amot with reference to its medicinal uses. Plantes Medicinales Phytotherapieii, 22, 30 (1988).
5. Rastogi, R.P. and Mehrotra, B.N., Compendium of Indian Medicinal Plants, Vol. 1-6, Central Drug Research Institute, Lucknow and National Institute of Science Communication, New Delhi, (1998-2002) pp. (516+860+832+930+1060+177).
6. Karthikeyan, K.; Sarala Bai, B. R.; Gauthaman, K.; Sathish, K. S.; Devaraj, S. N., Cardioprotective effect of the alcoholic extract of Terminalia arjuna bark in an in vivo model of myocardial ischemic reperfusion injury, Life Sci., 73, 2727 (2003)
7. Miller A L., Botanical influences on cardiovascular disease, Alt. Med. Rev., 3, 422 (1998)
8. Dwivedi S; Jauhari R., Beneficial effects of Terminalia arjuna in coronary artery disease, Ind. Heart J., 49, 507 (1997)
9. Prasad, M. V. V.; Anbalagan, N.; Patra, A.; Veluchamy, G.; Balakrishna, K, Antiallergic and anti-asthmatic activities of the alcoholic extract of Terminalia arjuna and arjunolic acid, Nat. Prod. Sci., 10, 240, (2004)
10.Yoo, S.H., Methods and compositions using a bile acid and a carbohydrate for reducing neurodegeneration in amyotrophic lateral sclerosis or other neurodegenerative disease, PCT Int. Appl. # WO 2006050165, (2006) pp.64
11. Rani P., Khullar N., Antimicrobial evaluation of some medicinal plants for their anti-enteric potential against multi-drug resistant Salmonella typhi, Phytother. Res., 18, 670 (2004)
72

12.Tejasvi M.V., Mahesh B., Nalini M. S; Prakash H. S; Kini K. R; Subbiah V., Shetty H.S., Fungal endophyte assemblages from ethnopharmaceutically important medicinal trees, Can. J. Microbiol.,52, 427 (2006)
13. Mary N K; Babu B H; Padikkala J., Antiatherogenic effect of Caps HT2, a herbal Ayurvedic medicine formulation, Internl. J. Phytother. Phytopharmacol., 10, 474 (2003)
14. Tilak, J. C.; Devasagayam, T. P. A.; Adhikari, S., Radioprotective and antioxidant properties of Indian medicinal plant, Terminalia Arjuna, BARC Newsletter, 249, 167 (2004)
15. Committee on Diet and Health, Food and Nutrition Board, Diet and Health, National Academy Press, Washington DC, (1989), pp. 518
16. Underwood, E.J. and Mertz, W., Introduction. In: Mertz, W., (Ed.), Trace Elements in Human and Animal Nutrition, Vol. 1, Academic Press, NY, (1986) pp. 1-19.
17. Prasad, A.S., Essential and Toxic Elements in Human Health and Diseases, Wiley-Liss, NY, (1993), pp. 391
18.0'Dell, B and Sunde, R., (Eds.), Handbook of Nutritionally Essential Mineral Elements, Marcel Dekker Inc., NY, (1997), pp. 681.
19. Merian, E. (Ed.), Metals and their compounds in the environment, VCH, Weinham., (1991), pp. 1438.
20.Verma S; Cam M.C; McNeill J.H., Nutritional factors that can favorably influence the glucose/insulin system: vanadium, J. Am. Col/. Nutr.,17, 11 (1998)
21. Mukherjee B., Patra B., Mahapatra S., Banerjee P., Tiwari A., Chatterjee M., Vanadium--an element of atypical biological significance, Toxicol. Letts.,150, 135 (2004)
22. Preuss, H. G.; Gondal, J. A.; Bustos, E.; Bushehri, N.; Lieberman, S.; Bryden, N. A.; Polansky, M. M.; Anderson, R. A. Effects of chromium and guar on sugar-induced hypertension in rats, Clinical Nephrol.,44, 170 (1995)
23.Vincent, J.B., Recent advances in the biochemistry of chromium(III), J. Trace Elem. Exp. Med., 16, 227 (2003)
73
24. Cui, J; Wang, X; Zhang, Y Ma, M; Li, H; Sun, Y; Qiu, G., Effects of manganese on function of thyroid gland and adrenal cortex, Zhongguo Gonggong Weisheng Xuebao , 15, 339 (1996)
25. Lymperis, N. Hemoglobin, iron, and the Universe, Chemika Chronika Genike Ekdose, 67, 21 (2005)
26. Kobayashi, M.; Shimizu, S., Cobalt proteins, Eur. J. Biochem.,261, 1 (1999)
27. Cobalt, S., Richard M., Clinical Nutrition in Health and Disease, Marcel Dekker Inc., USA, (1997) pp. 357
28. Hettiarachchi, M., Liyanage, C., Wickremasinghe, R., Hilmers, D.C., Abrams, S.A., Prevalence and severity of micronutrient deficiency: a cross-sectional study among adolescents in Sri Lanka, Asia Pacific J. Clinical Nutr., 15, 56 (2006)
29. a) Whanger, P. D., Relationship of selenium intake to cancer, Nutrition and Cancer Prevention, CRC Press LLC, Boca Raton, USA, (2006), pp.189 b) Egalou, A., Roussis, A., Spaink, H. P., The Arabidopsis selenium-binding protein confers tolerance to toxic levels of selenium, Functional Plant Biol.,32, 881 (2005)
30.a) Singh, V., Garg, A. N., Trace element correlations in the blood of Indian women with breast cancer, Biol. Trace Elem. Res., 64, 237 (1998) b) Garg, A. N., Singh, V., Weginwar, R. G. and Sagdeo, V. N., An elemental correlation study in cancerous and normal breast tissue with successive clinical stages by neutron activation analysis, Biol. Trace Elem. Res., 46, 185 (1994).
31. Singh, D. V.; Gupta, M. M.; Tripathi, A. K.; Prajapati, V; Kumar, S. Arjunetin from Terminalia arjuna as an insect feeding-deterrent and growth inhibitor. Phytother. Res.,18, 131 (2004)
32.Ali, A.; Kaur, G.; Hayat, K.; Ali, M.; Ather, M. A novel naphthanol glycoside from Terminalia arjuna with antioxidant and nitric oxide inhibitory activities. Pharmazie , 58, 932 (2003)
33. Siddiqui, A. A.; Wani, S.M.; Rajesh, R.; Alagarsamy, V., Isolation of phytoconstituent and hypotensive activity of Terminalia arjuna bark, Ind. J. Het. Chem., 14, 115 (2004)
74

34.Ali, A.; Abdullah, S. Tarique; H., Hinna; Ali, Mohammed; A. M. S., Two new pentacyclic triterpenoid glycosides from the bark of Terminalia arjuna, Ind. J. Het. Chem., 42B, 2905 (2003)
35. Cheng, H.Y. Lin, C. C. Lin, T.C., Antiherpes simplex virus type 2 activity of casuarinin from the bark of Terminalia arjuna Linn, Antiviral Res., 55, 447 (2002)
36. Yadav, R. N.; Rathore, K., A new cardenolide from the roots of Terminalia arjuna, Fitoterapia, 72, 459 (2001)
37. Ehmann, W. D. and Vance, D. E., Radiochemistry and Nuclear Methods of Analysis, John Wiley and Sons, New York, (1991) pp. 531.
38.Alfassi, Z. B. (Ed.) Chemical Analysis by Nuclear Methods. Wiley, Chichester, UK, (1994) pp. 556.
39. Lieser, K. H. Nuclear and Radiochemistry: Fundamentals and Applications. Wiley-VCH, Weinheim, (1997) pp. 300.
40.Amiel, S. (Ed.) Nondestructive Activation Analysis with Nuclear Reactors and Radioactive Neutron Sources, Elsevier, Amsterdam (1981) pp. 369.
41. Witkowska, E., Szczepaniak, K. and Biziuk, M., Some applications of neutron activation analysis: a review, J. Radioanal. Nucl. Chem., 265, 141, (2005).
42.Vandecastelle, C. and Block, C.B., Modern Methods for Trace Element Determination, John Wiley and Sons, NY, (1997), pp. 330
43. Herber R.F.M. and Stoeppler M., (Eds.) Trace Element Analysis in Biological Specimens, Elsevier Science, Amsterdam, (1994), pp. 576
44. Maduro, C.; Vale, G.; Alves, S.; Galesio, M.; Gomes da Silva, M. D. R.; Fernandez, C.; Catarino, S.; Rivas, M. G.; Mota, A. M.; Capelo, J. L. Determination of Cd and Pb in biological reference materials by electrothermal atomic absorption spectrometry: A comparison of three ultrasonic-based sample treatment procedures, Talanta, 68, 1156 (2006)
45. Montaser, A., Inductively Coupled Plasma Mass Spectrometry, Wiley-VCH Inc., Canada, (1998), pp.954
46. Dwivedi S; Jauhari R, Beneficial effects of Terminalia arjuna in coronary artery disease, Ind. Heart J., 49, 507 (1997)
75

47. Singh, V; Garg, A. N. Availability of essential trace elements in Ayurvedic Indian medicinal herbs using instrumental neutron activation analysis, Appl. Radiat. Isot., 48, 97 (1996)
48. Kumar, A.; Nair, A. G. C.; Reddy, A. V. R.; Garg, A. N. Analysis of essential elements in Pragya-peya-a herbal drink and its constituents by neutron activation, J. Pharm. Biomed. Anal.,37, 631 (2005)
49. Naidu, C. V.; Swamy, P. M. Seasonal variation in Ca, Mg, S and Na content of different plant parts in tropical deciduous tree species, Ind. J. Plant Physiol., 1, 1 (1996)
50. Pawar, R. S.; Bhutani, K. K., Effect of oleanane triterpenoids from Terminalia arjuna-a cardioprotective drug on the process of respiratory oxyburst. Phytomed., 12, 391 (2005)
51. Kuo, P. L; Hsu, Y.L.; Lin, T.C.; Chang, J.K., Lin, C.C., Induction of cell cycle arrest and apoptosis in human non-small cell lung cancer A549 cells by casuarinin from the bark of Terminalia arjuna Linn, Anti-Cancer Drugs, 16, 409 (2005)
52. Kaur S; Grover I S; Kumar S., Antimutagenic potential of extracts isolated from Terminalia arjuna, J. Envlron. Pathol. ToxicoL Oncol., 20, 9 (2001)
53. Kandil F E; Nassar M I, A tannin anti-cancer promotor from Terminalia arjuna, Phytochem.,47, 1567 (1998)
54.Gupta R; Singhal S; Goyle A; Sharma V.N., Antioxidant and hypocholesterolaemic effects of Terminalia arjuna tree-bark powder: a randomised placebo-controlled trial, J. Assoc. Physicians Ind., 49, 231 (2001)
55. Nagpal A; Meena L S; Kaur S; Grover I S; Wadhwa R; Kaul S C, Growth suppression of human transformed cells by treatment with bark extracts from a medicinal plant, Terminalia arjuna, In-vitro cellular Develop. Biol. Animal, 36, 544 (2000)
56. Bharani A; Ganguly A; Bhargava K D., Salutary effect of Terminalia Arjuna in patients with severe refractory heart failure, Intl. J. Cardiol., 49, 191 (1995)
57. Dwivedi, S., Jauhari, R., Beneficial effects of Terminalia Arjuna in coronary artery disease, Ind. Heart J., 49, 507 (1997)
76

58. Upadhyay R K; Pandey M B; Jha R N; Singh V P; Pandey V B, Triterpene glycoside from Terminalia arjuna, J. Asian Nat. Products Res., 3, 207 (2001)
59.Sivalokanathan S., Ilayaraja M., Balasubramanian M.P., Antioxidant activity of Terminalia arjuna bark extract on N-nitrosodiethylamine induced hepatocellular carcinoma in rats, MoL Cell. Biochem., 281, 87 (2006)
60. Rane M. M; Mengi S. A Comparative effect of oral administration and topical application of alcoholic extract of Terminalia arjuna bark on incision and excision wounds in rats, Fitoterapia, 74, 553 (2003),
61. Patel, P; Khuntia, A.; Nanda, J. K.; Roy, G. K., Extraction of tannin from the bark of Arjuna tree, Chem. Eng. World , 39, 56 (2004)
62. Bhuyan, R.; Saikia, C. N.; Das, K. K., Extraction and identification of color components from the barks of Mimusops elengi and Terminalia arjuna and evaluation of their dyeing characteristics on wool, Ind. J. Fibre Textile Res., 29, 470 (2004)
63. Bhatia, K., Ayyar, K. S., Barks of Terminalia species - a new source of oxalic acid, Indian Forester, 106, 363 (1980)
64. Nagar, A.; Gujral, V. K.; Gupta, S. R., Arjunone, a new flavanone from Terminalia arjuna, its constitution and synthesis; Planta Medica, 37, 183 (1979)
65. Colabawalla, H. M., An evaluation of the cardiotonic and other properties of Terminalia arjuna, Ind. Heart J., 3, 205 (1951)
66.Mummert, C., Mundt, C., Blatt, T.,; Kolbe, L., Immeyer, J., Schoenrock, U., Rode, T., Staeb, F., Use of aqueous-alcoholic extracts from Terminalia arjuna for the production from cosmetic or dermatological preparations to the prophylaxis and treatment of ignitable skin conditions and/or to the skin protection with sensitively determined dry skin, German Patent # Al 20030306 (2003)
67. Honda, T., Murae, T., Tsuyuki, T., Takahashi, T., The structure of arjungenin. A new sapogenin from Terminalia arjuna, Chem. Pharm. Bull., 24, 178 (1976)
68. Dybczynski, R., Danko, B., Kulisa, K., Malozewska, E., Polkowska-Motrenko, H., Samczynski, Z., Szopa, Z., Preparation and preliminary certification of two new Polish CRMs for inorganic trace analysis. J. Radioanal NucL Chem., 259 (2004) 409.
77
69. Certificate of Analysis, Peach Leaves (SRM-1547), National Institute of Standards and Technology, USA (1993) pp. 5
70. Becker D.A., and Mackey, E.A., Final report: Result of the ASTM lnterlaboratory Comparison Exercise for the determination of the element content of Pine Needles, (SRM-1575 a), National Institute of Standards and Technology, USA (2004)
71. Certificate of Analysis, Apple Leaves (SRM-1515), National Institute of Standards and Technology, USA (1993) pp. 5
72. Middleton, G.; Stuckey, R. E. Preparation of biological material for the determination of trace metals, A critical review of existing procedures. Analyst, 78, 532 (1953)
73. Gorsuch, T. T., Radiochemical investigations on the recovery for analysis of trace elements in organic and biological materials-report to the analytical methods committee by the society's first analytical chemistry research scholar, Analyst, 84, 135 (1959)
74.Zhang, A; Zhang, L., He, Y., FI-HG-AAS determination of selenium in Mongolian medicines, Huaxue Fence, 39, 648 (2003)
75. Zaidi, J.H., Fatima, I., Qureshi I.H., Subhani, M.S., Trace elements evaluation of some medicinal herbs by instrumental neutron activation analysis, Radiochim. Acta, 92, 363 (2004)
76. Naithani, V.; Kakkar, P., Effect of Ecological Variation on Heavy Metal Content of Some Medicinal Plants Used as Herbal Tea Ingredients in India, Bull. Environ. Contamination Toxicol.,76, 285 (2006)
77.Zhang, S; Shan, X.Q., Is the bioavailability index applicable for trace elements in different types of soil? Chem. Speciation Bioavail.,12, 117 (2000)
78. Tun, R. S.; Nguyen, H. Q. Cardiovascular changes in calcium-deficient chick embryos, J. Exp. Med., 165, 1418 (1987)
79. Slotki, I., Intravenous iron supplementation in the anemia of renal and cardiac failure-a double-edged sword? Nephrology, Dialysis, Transplantation, 20, 16 (2005)
80. Thompson, Katherin H.; Lee, Melvin. Effects of manganese and vitamin E deficiencies on antioxidant enzymes in streptozotocin-diabetic rats, J. Nutr. Biochem., 4, 476 (1993)
78
81.Angelova, V., Ivanova, R., Ivanov, K., Accumulation of lead, cadmium and Zinc from contaminated soils to various plants, J. Balkan Ecol., 7, 83 (2004)
82. Haider, S., Naithani, V., Barthwal, J., Kakkar, P., Heavy metal content in some therapeutically important medicinal plants, Bull. Environ. Contamin. Toxicol., 72, 119 (2004)
83.Jawad, I.M., Al-Khafaji, S.H., Ali, A.A., The level of trace metals and other contaminants in some spices and medicinal plants used in Iraq, J. Biol. Sci. Res., 17, 139 (1986)
84. Wang, C.F; Duo, M.J; Chang, E.E.; Yang, J.Y., Essential and toxic trace elements in the Chinese medicine, J. Radioanal. Nucl. Chem., 211, 333 (1996)
85.Chan, J., Some aspects of toxic contaminants in herbal medicines, Chemosphere, 52, 1361, (2003)
86. The Aldrich Library of FT-IR Spectra, 2'd Edn., Vol.2, Sigma Aldrich Co., USA ,(1997), pp.2173.
87. Ponchert CJ, Behnke JD, The Aldrich Library of 13C and 1H NMR spectra, 1st Edn., Vol. 2., Aldrich Chemical Co. Inc. Ltd., (1993) pp.1147.
88. www.food.gov.uk/news/newsarchive/2005/mar/sudanlist
89.Amenduni, C.; Ferrieri, F.; Spinelli, S.; Fiume, F.; Lattarulo, 0. Proposed method for the determination of the Sudan Red 1 synthetic dye in food products containing hot chilli, Bollettino dei Chimici lgienisti , 55, 169 (2004)
90.Vankar, P. S.; Tiwari, V; Shanker, R., Srivastava, J., Special treatments for dyeing cotton with Terminalia arjuna, Asian Dyer, 1, 56 (2004)
91.Toropova, V. F.; Budnikov, G. K.; Maistrenko, V. N. Polarography of complexes of metals with substituted azo compounds. III. Polarographic behavior of chelates of some metals with o-hyroxy azo compounds in dimethylformamide, Zhurnal Obshchei Khimii , 44, 364 (1974)
92.de Nys, R.; Givskov, M.; Kumar, N.; Kjelleberg, S.; Steinberg, P. D. Furanones, Progress MoL Subcell. Biol., 42, 55 (2006)
93. Perumal S. R; Ignacimuthu S; Sen A, Screening of 34 Indian medicinal plants for antibacterial properties, J. Ethnopharmacol.,62, 173 (1998)
79
94. Summary report, Tartaric acid, The European Agency for the Evaluation of Medicinal Products, London, (1997)
95. Chen, P.; Zhang, Y.; Wei, W.; Yao, S.-Z. Determination of divalent carboxylic acids in traditional Chinese herbal and patent medicines using HPLC with double cell quartz crystal detector, J. Pharm. Biomed. Anal., 23, 387 (2000)
96.Wesolowski, M.; Konieczynski, P.; Ulewicz-Magulska, B. Thermal decomposition of medicinal plant raw materials based on principal component analysis, J. Thermal Anal. Calorimetry, 66, 593 (2001)
97. Wesolowski M, Konieczynski P. Thermal decomposition and elemental composition of medicinal plant materials-leaves and flowers Principal component analysis of the result, Thermochim. Acta, 397, 171 (2003)
80
Copyright © 2022 FDOKUMEN