damping characteristics of reinforced and partially prestressed ...
Upload
khangminh22Category
view
0download
0
This electronic thesis or dissertation has beendownloaded from Explore Bristol Research,http://research-information.bristol.ac.uk
Author:Maheri, M. R
Title:Vibration damping in composite/honeycomb sandwich beams.
General rightsAccess to the thesis is subject to the Creative Commons Attribution - NonCommercial-No Derivatives 4.0 International Public License. Acopy of this may be found at https://creativecommons.org/licenses/by-nc-nd/4.0/legalcode This license sets out your rights and therestrictions that apply to your access to the thesis so it is important you read this before proceeding.
Take down policySome pages of this thesis may have been removed for copyright restrictions prior to having it been deposited in Explore Bristol Research.However, if you have discovered material within the thesis that you consider to be unlawful e.g. breaches of copyright (either yours or that ofa third party) or any other law, including but not limited to those relating to patent, trademark, confidentiality, data protection, obscenity,defamation, libel, then please contact [email protected] and include the following information in your message:
•Your contact details•Bibliographic details for the item, including a URL•An outline nature of the complaint
Your claim will be investigated and, where appropriate, the item in question will be removed from public view as soon as possible.

VIBRATION DAMPING
IN
COMPOSITE/HONEYCOMB SANDWICH BEAMS
by
M. R. MAHERI
A dissertation submitted for the Degree of Doctor of Philosophy at the University of Bristol,
Department of Mechanical Engineering
March 1991

Errata
Page 24
The second term in Eqn. (3.1. b) should be
kia2w)
Page 25
The second term in Eqn. (3.5. b) should be
bzs2W
Page 28
The last term in Eqn. (3.18) should be
äC3sin(bßQ
Page 34
Middle of the page, the reference "Mead, 1968" should be changed to "Mead and Markus, 1969"
Page 50
In the last sentence of the first paragraph, the expression "... in the second mode... " should be changed to "... in higher modes... ".
Page 83
In the third sentence of the fourth paragraph, the expression "... with the core thickness (Eqns. (3.23)). " should be changed to "... with the core thickness (Eqn. (3.42)). "
Page 96
The correct form of Eqns. (6.31) and (6.32) are, respectively, as follows
ý'r = 8'' E
nl(nZC1, +m2C12 -mnCie)(Ci1Q*I1 +Ci2Q12 +Ci6Q16)(k' -(k-1)') JIM
`I'mo. =Cg am" E
mn(2mnCi, -2mnCiz - (m2 -n2)Cis)(CiºQ11 +Ci2Q12 +Ci6Q16)(k3 - (k-1)') �In k-,
Page 137
The correct form of Eqns. (B. 13) and (B. 14) are, respectively, as follows
k` = 1(1
_ 192. h E1 tanh(ni w/2h)) 3 %c5 w TI, 3,.. ns
G= 4it'f° J,.
xL k, wh3
The sentence in between Eqns. (B. 13) and (B. 14) should be changed to "Then, Eqns. (B. 1), (B. 4) and (B. 12) give... "
24/91/ AAA-

1
Memorandum
The accompanying dissertation entitled "Vibration damping in composite/honeycomb
sandwich beams" is submitted in support of an application for the degree of Doctor of
Philosophy in Engineering at the University of Bristol.
The dissertation is based on independent work by the candidate - all contributions from
others have been fully acknowledged within the dissertation. The supervisor's contribution
was that normally made at a British University.
None of the work described has been, or is being, submitted for any other degree or diploma
to this or any other University.
I hereby declare that the statements in this memorandum are true.
Mohammad Reza Maheri
March 1991

11
Acknowledgements
I wish to express my sincere gratitude to Prof. R. D. Adams for his invaluable supervision
and assistance throughout the course of this work.
I am also grateful to the other academic and technical staff of the Department of Mechanical
Engineering for their advice and assistance and in particular, to Mr. B. Smith and
Mr. J. Skinner for their considerable effort in developing the test-rigs and preparing the
specimens.
Thanks are also due to Mrs. M. Singh for her interest in the subject and many helpful
discussions, and to Mr. J. Bishopp of Ciba-Geigy for his general assistance and providing
some of the specimens.
I would like to acknowledge the assistance always readily offered by the staff at the
Computer Centre, especially Dr. I. Stewart.
Finally, I wish to acknowledge with gratitude the financial support of the Iranian Ministry
for Higher Education for the duration of this work.

111
Summary
The Timoshenko beam equations have been extended to account for flexural vibration of a
shear-sensitive beam carrying a mass, thus enabling steady-state damping measurements to
be made when the drive and pick-up mechanisms are attached to the beam. These equations
have been subsequently adapted to account for simple bending/shearing of a shear soft
sandwich beam. Experimental verifications, regarding the frequencies and mode shapes,
have been carried out.
A method has been devised for measuring the dynamic properties of honeycomb in shear.
The orthotropic shear properties of a number of aluminium and composite honeycombs have
been investigated.
The basic laminated plate theory and the Adams-Bacon damping criterion, have been
utilised to predict, from constitutive data, the modulus and the specific damping capacity of
unidirectional laminated composite beams with respect to fibre orientation. The necessary
experimental verifications have been carried out.
Using the constitutive data of the laminated skins, and the dynamic data of the core, the
modified Timoshenko beam equations have been utilised to predict the proportions of the
skin/core contribution to the overall damping of a shear soft symmetric sandwich beam with
respect to the skin fibre orientation. The necessary experimental verifications regarding the
overall damping have been carried out.

iv
List of Contents
Memorandum Acknowledgements ii Summary iii List of Contents iv List of Tables vii List of Illustrations viii List of Figures ix Nomenclature xiv
Chapter 1 1 INTRODUCTION 1
1.1 General introduction 1 1.2 Objectives 4
Chapter 2 5 A SURVEY OF LITERATURE 5
2.1 Application of Timoshenko beam equations 5 2.1.1 The shear correction factor 8
2.2 Damping of composite and sandwich structures 13 2.2.1 Undamped analysis 13 2.2.2 Damped analysis 15
2.3 Works of Adams et al 19
Chapter 3 23 FLEXURAL VIBRATION OF A TIMOSHENKO BEAM 23
3.1 Loaded beams 23
3.2 Constitutive equations 24
3.3 Centrally loaded beam 27
3.3.1 Strain energy 29 3.3.1.1 Strain energy of bending 31 3.3.1.2 Strain energy of shearing 32
3.3.2 Bending and shearing stresses 33 3.3.3 Bernoulli-Euler simplification 33 3.3.4 Sandwich beam 34 3.3.5 Computation of the specific damping capacity 37
3.3.6 Computer implementation 40
3.4 Experimental verifications 41 3.4.1 Natural frequencies 43
3A. 2 Mode Shapes 49 3.5 Conclusions 52

V
Chapter 4 54 HONEYCOMB DYNAMIC SHEAR PROPERTIES 54
4.1 Measurement of honeycomb dynamic shear properties 54
4.2 A new method for measurement of dynamic shear properties 57
4.2.1 Analysis of honeycomb dynamic shear properties 63
4.2.1.1 Shear modulus 63
4.2.1.2 Steady-state shear vibration damping 64
4.2.2 Honeycomb shear tests 65 4.2.2.1 Edge effects 67
4.2.2.2 Test results 70
4.23 Conclusions 72
Chapter 5 74 THE STEADY-STATE FLEXURAL DAMPING TEST 74
5.1 The test-method 74
5.2 Extraneous damping 76
5.2.1 Assessment of extraneous damping 78
5.2.1.1 Air damping 79
5.2.1.2 Friction damping 80
53 Damping of aluminium sandwich beams 81 5.4 Conclusions 84
Chapter 6 86 DAMPING OF COMPOSITE/HONEYCOMB SANDWICH BEAMS 86
6.1 Constitutive equations of unidirectional composites 86
6.2 Flexure of a thin laminate 90
63 Effective Young's modulus of laminated beams in flexure 92
6.4 Damping prediction of laminated beams 93
6.5 Computer implementation 96
6.6 Experimental procedure 97 6.6.1 Preparation of the sandwich skins 97
6.6.1.1 Pre-preg and moulding specifications 99
6.6.2 Preparation of the sandwich beams 100
6.7 Test procedure and results 101
6.7.1 Sandwich skins 102
6.7.1.1 Modulus 103
6.7.1.2 The specific damping capacity 106
6.7.2 Sandwich beams 112
6.7.2.1 The factor k 112 6.7.2.2 The specific damping capacity 116
6.8 Conclusions 123

vi
Chapter 7 125 GENERAL CONCLUSIONS 125
Suggestions for further work 127
Appendix (A) 128 ANALYSIS OF THE FLEXURAL TEST-RIG 128
A. 1 Determination of the specific damping capacity 128 A. 2 Calibration of the drive and pick-up coil/magnet sets 130
Appendix (B) 131 THE LONGITUDINAL SHEAR TESTS 131
B. 1 Analysis of the circular section test piece 134 B. 1.1 Shear modulus 134 B. 1.2 Steady-state vibration damping 135
B. 2 Analysis of the rectangular section test piece 136
B. 2.1 Shear modulus 136
B. 2.2 Steady-state vibration damping 137 B. 2.3 Experimental verification 138
Appendix (C) 141 ANALYSIS OF A SYMMETRICALLY END-LOADED TIMOSHENKO BEAM 141
C. 1 Timoshenko's uncoupled equations 141
C. 2 End loaded beam 143 C. 2. a Symmetric modes 144
C. 2. b Anti-symmetric modes 145
C. 2.1 Strain energy 145 C. 2.2 Bending and shearing stresses 148 C. 23 Bernoulli-Euler simplification 148
Appendix (D) 149 AN EXAMPLE OF THE COMPUTATION OF THE RESULTS AND
ESTIMATION OF EXPERIMENTAL ERROR 149
D. 1 Sandwich skin 149 D. 1.1 Prediction of modulus and the SDC of the sandwich skin 149
D. 1.2 Measurement of modulus and the SDC of the sandwich skin 152 D. 2 Sandwich core 155
D. 3 Sandwich beam 156
References 160

vii
List of Tables
Table (3.1) Solid beams specifications
Table (3.2) Elastic properties of solid beams
Table (3.3) Aluminium sandwich beams specifications
Table (3.4) Elastic properties of sandwich beams
Table (6.1) Constitutive data of sandwich skins
Table (6.2) Composite sandwich beams and core specifications
41
42
42
43
103
112

viii
List of Illustrations
Fig. 2.1 Schematic shear distribution 10
Fig. 3.1 Centrally loaded beam 27
Fig. 3.2 Beam co-ordinate system 29
Fig. 3.3 Transient measurement of natural frequencies 44
Fig. 3.4 End loaded beam 47
Fig. 4.1 Keer-Lazan honeycomb shear test-rig 54
Fig. 4.2 Original honeycomb shear test-rig 57
Fig. 4.3 Honeycomb shear test piece 60
Fig. 4.4 Rearrangement of honeycomb shear test 61
Fig. 4.5 Honeycomb shear test-rig 62
Fig. 4.6 Schematic representation of honeycomb shear test piece 63
Fig. 4.7 Honeycomb edge effect 68
Fig. 5.1 Flexural test-rig 75-6
Fig. 6.1 Co-ordinate system of unidirectional lamina 87
Fig. B. 1 Longitudinal shear test-rig 133
Fig. C. 1 Elementary flexure of a Timoshenko beam 141
Fig. C. 2 Symmetrically end loaded beam 143

ix
List of Figures
Fig. 3.5 Frequency Vs Mode No. (Test piece : AL1, square section Duralumin)
Fig. 3.6 Frequency Vs Mode No. (Test piece : AL2, rectangular section Duralumin)
Fig. 3.7 Frequency Vs Mode No. (Test piece : MS 1, square section mild steel)
Fig. 3.8 Frequency Vs Mode No. (Test piece : MS2, rectangular section mild steel)
Fig. 3.9 Fundamental natural frequency Vs Thickness/length (Test piece : AU)
Fig. 3.10 Fundamental natural frequency Vs Thickness/length (Test piece : AL2)
Fig. 3.11 Fundamental natural frequency Vs Thickness/length (Test piece : MS 1)
Fig. 3.12 Fundamental natural frequency Vs Thickness/length (Test piece : MS2)
Fig. 3.13(a) Frequency Vs Symmetric mode No. (Test piece : Centrally-loaded AL2)
Fig. 3.13(b) Frequency Vs Anti-symmetric mode No. (Test piece : Centrally-loaded AL2)
Fig. 3.14 Frequency Vs Mode No. (Test piece : End-loaded AL2)
Fig. 3.15 Frequency Vs Mode No. (Test piece : 2SB1-X, 0.5 in. thick M-Board)
Fig. 3.16 Frequency Vs Mode No. (Test piece : Centrally-loaded 2SB 1-X)
Fig. 3.17 Frequency Vs Mode No. (Test piece : 2SB2-X, I in. thick M-Board)
Fig. 3.18 Frequency Vs Mode No. (Test piece : 2SB3-X, 1.33 in. thick M-Board)
Fig. 3.19 Frequency Vs Mode No. (Test piece : 2SB4-X, 2 in. thick M-Board)
Fig. 3.20 Optimum shear factor Vs Skin/core thickness

Fig. 3.21 Mode shape of 2SB1-X (free-free, unloaded, 400 mm)
Fig. 3.22 Mode shape of 2SB I -X (free-free, unloaded, 300 mm)
Fig. 3.23 Mode shape of 2SB1-X (free-free, centrally-loaded, 400 mm)
Fig. 3.24 Mode shape of 2SB1-X (free-free, end-loaded, 400 mm)
Fig. 3.25 Mode shape of 2SB I -X (free-free, centrally-loaded, 300 mm)
Fig. 3.26 Mode shape of 2SB I -X (free-free, centrally-loaded, 200 mm)
Fig. 4.8 Honeycomb edge effects
Fig. 4.9 Honeycomb shear: SDC Vs Stress amplitude (Test piece : Aw 2.3,3/8,15)
Fig. 4.10 Honeycomb shear : SDC Vs Stress amplitude (Test piece : Aw 3.4,1/4,15)
Fig. 4.11 Honeycomb shear : SDC Vs Stress amplitude (Test piece : Aw 5.2,1/4,25)
Fig. 4.12 Honeycomb shear: SDC Vs Stress amplitude (Test piece : Aw A1,29,3)
Fig. 4.13 Honeycomb shear : SDC Vs Stress amplitude (Test piece : Aw A1,48,3)
Fig. 4.14 Honeycomb shear: SDC Vs Stress amplitude (Test piece : Aw A1,50,6)
Fig. 4.15 Honeycomb shear: SDC Vs Stress amplitude (Test piece : Aw A1,64)
Fig. 4.16 Honeycomb shear: SDC Vs Stress amplitude (Test piece : Aw A1,96,3)
Fig. 4.17 Honeycomb shear properties Vs Density
Fig. 5.2 SDC Vs Displacement amplitude (Test piece : Duralumin)
Fig. 5.3 SDC Vs Displacement amplitude (Air damping)

xi
Fig. 5.4 SDC Vs Displacement amplitude (Friction damping)
Fig. 5.5 SDC Vs Skin stress amplitude (Test piece : 2SB1)
Fig. 5.6 SDC Vs Skin stress amplitude (Test piece : 2SB2)
Fig. 5.7 SDC Vs Skin stress amplitude (Test piece : 2SB4)
Fig. 5.8 SDC Vs Core thickness (Test piece : 2SB 1,2,4)
Fig. 5.9 Strain energy Vs Displacement amplitude (Test piece : 2SB 1-X)
Fig. 6.2 Modulus Vs Fibre orientation (Test piece : Off-axis DLS)
Fig. 6.3 Modulus Vs Fibre orientation (Test piece : Angle-ply 913C)
Fig. 6.4 Modulus Vs Fibre orientation (Test piece : Off-axis 913C)
Fig. 6.5 Modulus Vs Fibre orientation (Test piece : Angle-ply 913G)
Fig. 6.6 Modulus Vs Fibre orientation (Test piece : Off-axis 913G)
Fig. 6.7 SDC Vs Stress amplitude (Test piece : Off-axis DLS)
Fig. 6.8 SDC Vs Stress amplitude (Test piece : Angle-ply 913C)
Fig. 6.9 SDC Vs Stress amplitude (Test piece : Off-axis 913C)
Fig. 6.10 SDC Vs Stress amplitude (Test piece : Angle-ply 913G)
Fig. 6.11 SDC Vs Stress amplitude (Test piece : Off-axis 913G)
Fig. 6.12 SDC Vs Fibre orientation (Test piece : Off-axis DLS)
Fig. 6.13 SDC Vs Fibre orientation (Test piece : Angle-ply 913C)

X11
Fig. 6.14 SDC Vs Fibre orientation (Test piece : Off-axis 913C)
Fig. 6.15 SDC Vs Fibre orientation (Test piece : Angle-ply 913G)
Fig. 6.16 SDC Vs Fibre orientation (Test piece : Angle-ply 913G)
Fig. 6.17 Frequency Vs Mode No. (Test piece : 0° 913C/Alum. )
Fig. 6.18 Frequency Vs Mode No. (Test piece : 0° 913C/Nomex)
Fig. 6.19 Theoretical SDC Vs Fibre orientation (Test piece : Angle-ply 913C/Nomex)
Fig. 6.20 Modulus Vs Fibre orientation (Test piece : Off-axis DLS/Nomex)
Fig. 6.21 Modulus Vs Fibre orientation (Test piece : Angle-ply 913C/Alum. )
Fig. 6.22 Modulus Vs Fibre orientation (Test piece : Angle-ply 913C/Nomex)
Fig. 6.23 Modulus Vs Fibre orientation (Test piece : Off-axis 913C/Nomex)
Fig. 6.24 Modulus Vs Fibre orientation (Test piece : Angle-ply 913G/Nomex)
Fig. 6.25 SDC Vs Skin stress amplitude (Test piece : Off-axis DLS/Nomex)
Fig. 6.26 SDC Vs Skin stress amplitude (Test piece : Angle-ply 913C/Alum. )
Fig. 6.27 SDC Vs Skin stress amplitude (Test piece : Angle-ply 913C/Nomex)
Fig. 6.28 SDC Vs Skin stress amplitude (Test piece : Off-axis 913C/Nomex)
Fig. 6.29 SDC Vs Skin stress amplitude (Test piece : Angle-ply 913G/Nomex)
Fig. 6.30 SDC Vs Core stress amplitude (Test piece : Angle-ply 913C/Alum. )
Fig. 6.31 SDC Vs Fibre orientation (Test piece : Off-axis DLS/Nomex)
X111
Fig. 632 SDC Vs Fibre orientation (Test piece : Angle-ply 913C/Alum. )
Fig. 6.33 SDC Vs Fibre orientation (Test piece : Angle-ply 913C/Nomex)
Fig. 6.34 SDC Vs Fibre orientation (Test piece : Off-axis 913C/Nomex)
Fig. 6.35 SDC Vs Fibre orientation (Test piece : Angle-ply 913G/Nomex)
Fig. 636 Theoretical SDC Vs Mode No.
Fig. 6.37 Theoretical SDC Vs Core depth/length
Fig. A.! Calibration of the pick-up unit
Fig. A. 2 Calibration of the drive unit
Fig. A. 3 Drive unit sensitivity Vs Field current
Fig. B. 2 Longitudinal shear : SDC Vs Stress amplitude (Test piece : 913C, 913G)
Fig. B. 3 Longitudinal shear: SDC Vs Stress amplitude (Test piece : DLS)

XIV
Nomenclature
N. B. - Most symbols have been defined in the text where they first appear. Otherwise, the following definitions apply.
A Cross sectional area of solid beam
Cross sectional area of sandwich beam core
b Frequency number
c Thickness of sandwich core
E Dynamic Young's modulus
j. Natural frequency
G Dynamic shear modulus
h Total depth of beam or plate
I Moment of inertia
,l Polar moment of inertia
K Stiffness
k Dynamic shear shape factor
L Beam length
M Bending moment Total mass attached to each end of shear test piece
M, Total central mass attached to beam
M, Total end mass attached to beam
m Beam mass
Q Shearing force
r Rotary inertia parameter
s Shear flexibility parameter
t Thickness of sandwich skin Time
U Maximum strain energy
w Total lateral deflection
w Width of beam
Time dependent total lateral deflection
of Volume fraction of fibre in pre-preg
x Distance along the beam

xv
AU Energy dissipation per cycle
E Normal strain
r Coil sensitivity
y Shear rotation Shear stress Bending slope Time dependent bending slope
e Angle w. r. t. lay of fibre
p Mass density
a Normal stress
v Poisson's ratio Angular velocity
Specific damping capacity (SDC)

i
Chapter I
INTRODUCTION
1.1 General introduction
Earlier sandwich structures were often made from non-metallic skins with corrugated or
foam cores; the work on these was mainly focused on the static loading characteristics, and
specially on the core stability under lateral load. More modem sandwich structures, made
mostly from aluminium and incorporating a honeycomb core, proved to be adequately stiff
in that respect but posed problems in dynamic loading, namely, vibration, noise and fatigue.
These problems, of particular concern in aerospace applications, are frequently realised only
subsequent to some in-service period, and the necessary modifications are usually costly,
difficult to implement and often unsatisfactory. Tremendous interest has, therefore, been
shown in different aspects of sandwich damping as a means of minimising the resonant
vibrations. In aerospace applications particularly, an important consideration has been in the
efficient incorporation of damping into the sandwich such that an acceptable
weight/stiffness ratio is realised. This task has been made easier with the, advent of
polymer-based fibrous composites, which provide the designer with a greater degree of
flexibility in material selection and even the material design, the so called "tailoring" of
properties.
Work on the mechanisms of vibration damping' in a sandwich, in so far as the proportion of
the contribution of the constituent parts to the overall damping is concerned, has been
usually confined to the one-dimensional case, i. e. a 'beam'. Initial work on sandwich
damping was carried out around 1960 in the U. S. A. The earlier works seem to have suffered
By the term 'damping', the specific damping capacity, defined as the ratio of energy dissipation per cycle to maximum strain energy, is
meant. Any reference to the 'damping energy'. or alternatively the'energy dissipation', will be made specifically in those terms.

-Ch I- 2
from the lack of a systematic analytical tool. It is, therefore, not surprising to see that, for
example, some investigations on the sandwich beam took into consideration one or both of
the second order parameters, namely rotary inertia and shear flexibility, but simply assumed
an elementary (Bernoulli-Euler) type of mode shape. From the pioneering works of Keer
and Lazan [1961] to the work by Bert eta! [1967] continuous refinements were made to, or
utilised in, the theory.
In this last work [Bert et al, 1967], the Timoshenko beam equations, uncoupled into the
bending slope and total deflection through Huang's procedure [1961], were adapted for a
sandwich configuration. Characteristically, the Timoshenko equations stem from an attempt
to refine the classical (Love-Kirchhoff) bending theory by adding the deflection due to
transverse shear when it no longer can be ignored. Of course, 'exact' analyses have been
introduced which, by definition, have their basis not so much in refinements or corrections
of simple existing theories, but in a wholesome application of the elasticity theory
following, more or less strictly, the patterns developed by the stresses, strains and
displacements. As such, these analyses can be expected to offer correct, or more correct,
predictions as well as providing an insight into the actual deformations. Inevitably, however,
they are also very complex and generally difficult, if not impossible, to apply to other than
simple idealised situations. Moreover, these difficulties are not usually matched by the
improvements they afford on the 'corrected' theories.
Measurement of damping is a somewhat involved procedure, demanding a great deal of
time, care and patience. Repeatability has seldom been the virtue of damping tests,
particularly when different test-methods, mathematical models, units etc. have been used.
Indeed, the ad hoc approach to sandwich damping is a characteristic of the early works.
Quoting figures for 'facing damping coefficient', having units (in 3/lb-cycle), or 'core
damping coefficient', here of units (in? /Ib-cycle), are not uncommon. For that reason,

-ChI -3
throughout this work the specific damping capacity, a non-dimensional measure of damping,
is used.
Furthermore, in the early works the method for damping measurement was almost
exclusively by the free-decay of the resonant amplitude. Although this method is a quick
and convenient way of assessing the vibration damping, but compared to the steady-state
damping measurement, the free-decay suffers several drawbacks [Adams, 1967]. The chief
limitation is the fact that, similar to the bandwidth method, the damping is measured over a
varying stress amplitude, making it difficult to quote measurements at a particular stress
level for a material with stress dependent damping. The problem becomes more acute for
high damping materials where the decay rate is relatively short, and the material
non-linearity is large. A further problem may arise in testing composites which show some
degree of anisotropy in flexure, where the free vibration is more prone to coupled modes.
Damping measurement in steady-state vibration, on the other hand, can be expected to offer
a higher degree of repeatability. Moreover, it can provide a convenient means to measure
damping at different stress amplitudes, thereby providing an insight into the material
behaviour with respect to stress variation. Indeed, it has been used as a means of
non-destructive testing of structural integrity of the material [Adams and Cawley, 1985].
The method's shortcomings include the fact that the shape of the cyclic deformation needs to
be explicitly determined, and that forced vibration could, and often does, introduce
additional extraneous damping due to the excitation system.

-Ch1-
1.2 Objectives
4
The basic objective of this work was to investigate the mechanisms by which the constituent
parts of a symmetric composite-honeycomb-composite sandwich beam contribute to the
overall damping in flexural vibration and, by a wider implication, the possibility of
predicting the damping properties of such a beam at a given skin fibre orientation from the
constituent data based on elasticity and damping properties of the unidirectional composite,
and those of the honeycomb. A second, concurrent, objective of the work was to measure
the damping of the sandwich in steady-state vibration. These general objectives involved the
following
a) extending the modified Timoshenko-Huang beam equations to account for flexural
vibration of a loaded shear-soft beam, thus enabling the assessment of the bending/shearing
proportion in the beam when the latter is required to be loaded with the drive and pick-up
mechanisms,
b) devising a method for measuring the dynamic properties of honeycomb in shear, and
c) verification of the Adams-Bacon damping criterion in predicting the damping properties
of a multilayer unidirectional fibrous composite with respect to fibre orientation from the
orthotropic elastic data and the damping data of the composite.
5
Chapter 2
A SURVEY OF LITERATURE
Scope - Given the great volume and the diversity of the work on the dynamics of sandwich
structures, one cannot afford but to be very selective regarding the past work. In this
chapter, an outline of the work reported on those aspects of the dynamics of sandwich beams
which are deemed to be of relevance to the present work, is considered.
2.1 Application of Timoshenko beam equations
Timoshenko [1921] proposed to add the shear effect in the transverse vibrations of prismatic
bars. In so doing, he derived the well known and often used equation incorporating both the
rotary inertia, which had been introduced earlier by Lord Rayleigh, and the shear effects.
Beam analyses which include both these so called 'secondary effects', are generally referred
to as Timoshenko beams.
It was not, however, until the lapse of another thirty years or so that the Timoshenko beam
analyses were gradually utilised to their best effect. Much of the earlier work on vibration of
the Timoshenko beams seems to have suffered complexity or inaccuracy of analysis. The
Uflyand analysis, for example, of a semi-infinite Timoshenko beam subjected to a
concentrated load has incorrect boundary conditions [Dengler and Goland, 1951], although
Miklowitz [1953] shows that Uflyand's solutions are meaningful subject to 'proper
interpretation'.
Kruszowski in 1949 was reported to be the first to have applied the correct boundary
conditions for use with Timoshenko beam equations [Bert et al, 1967] although the
correctness of his boundary conditions are not universally acknowledged [Nordby et al,

-Ch2- 6
1965]1. There is, however, agreement [Miklowitz, 1953; Nordby et al, 1965; Bert et al, 1967]
on the validity of another form of the boundary conditions derived by Dengler and Goland
[1951]. In analysing the problem of the instantaneous stresses produced in transverse impact
of long beams, Dengler and Goland used the Timoshenko beam equations using time
dependent boundary conditions. They point out, however, the limitations of the Timoshenko
theory ('and in this way achieves its simplicity') inasmuch as, unlike the solutions obtained
by the elasticity theory, they do not account for the presence of the higher modes at each
wavelength, which are of significance in impact.
Forced vibration of the Timoshenko beams is discussed by Herrmann [1955], who utilised
the method first used by Mindlin and Goodman in 1950 in dealing with time dependent
boundary conditions.
The first explicit use of Timoshenko's original coupled equations and the associated
boundary conditions was probably due to Anderson [1953]. As stated by Anderson and
reiterated by Miklowitz [19531, the coupled equations approach results in simplified
associated expressions and well defined boundary conditions. Using the classical mode
superposition method, Anderson proceeds to solve the Timoshenko beam equations in a
series form, in the same way as the solutions of the elementary (Bernoulli-Euler) equations
are usually presented. In this, he shows the convenience for routine numerical calculations.
Although this view is shared by such as Dengler [1954], Anderson's series solutions have
also been subject to criticism as 'cumbersome' [Nordby et al, 1965] and somewhat
superficial compared to the exact solution [Dengler, 1954].
In his paper, Huang [1961] mentions the complexity and limitations of the analysis by
Kruszowski. The latter obtains the frequency equations for clamped-free and free-free
beams by solving a complete differential equation in lateral deflection with prescribed
1 Nordby et al [1965] state that these incorrect boundary conditions will be discussed in a later section, but no further reference to this
point is made.

-Ch2- 7
boundary conditions. Huang, however, proceeds in obtaining two complete differential
equations in bending slope and total deflection from the original coupled equations due to
Timoshenko [1955 -a slightly modified version of Timoshenko, 1921]. Two solutions are
therefore obtained with the constants in the solutions being related through the original
coupled equations. The 'novel' features of his approach include homogeneous prescribed
boundary conditions. Frequency equations and normal mode functions are obtained for all
combinations of fixed, free and simply supported end conditions.
Kobayashi's analysis in 1954 of the vibration of a sandwich beam was reportedly the first of
its kind [Nordby et a!, 1965] but his analysis was based on the elementary equations. Kimel
et a! in 1959 used an energy approach and included both shear and rotary inertia effects but
again based their mode shapes on the elementary theory. Raville et al [1961] also used an
energy approach and included both shear and rotary inertia effects. They derived the
frequency equation for a fixed-fixed beam in the form of a series which would converge to a
'good accuracy' with the number of terms used only slightly higher than the number of
frequencies required. They attributed the consistently lower experimental values to the
difficulty in achieving complete fixity at the ends. Clary and Leadbetter in 1963 were
reportedly the first to apply the Timoshenko beam theory to a sandwich beam [Nordby et a!,
1965] but used the same boundary conditions as Kruszowski.
Nordby et al [1965] were apparently the first to apply correctly the Timoshenko-Huang2
beam equations to a sandwich beam. To this end, they assumed the direct stresses and shear
strains were limited to the skins and the core respectively. Their use of the equations so
obtained was, however, limited to predicting the natural frequencies and mode shapes of a
free-free sandwich beam. Their prediction of the fundamental frequency and the nodal
locations of various samples is fairly good with almost all the values within a difference of
+I% to +6% from the experimental values.
2 Although not specifically using Huang's method, they arrived at the same equations using the Lagrangian method.

-Ch2- 8
Similar use of the Timoshenko-Huang equations together with what is said to be the
Dengler-Goland boundary conditions was made later by Bert et al [1967]. Their prediction
of the fundamental frequencies and the nodal locations of aluminium and GFRP sandwich
beams, with free-free boundary conditions, are generally good with a difference from
experimental values of mostly below 5% in frequencies and -2% to +5% in nodal locations3.
2.1.1 The shear correction factor
From the onset of the derivation of Timoshenko's beam equations, controversy has existed
about the characteristic nature of what is usually known as the shear correction (or shape)
factor. The shear correction factor, usually represented by k, is defined as the ratio of the
mean shear stress over the beam cross section to the maximum shear stress occurring at the
neutral axis, and stems from the assumption of uniformity of shear stress distribution over
the cross section in deriving the Timoshenko beam equations. In the static analysis of the
deflection of a solid and uniformly loaded beam with rectangular cross section it is readily
shown that the parabolic nature of the shear distribution will require that k be 2/3 4. Initially,
it was simply assumed that this value also applied to the dynamic problems [Timoshenko,
1921], only to be modified later to an empirical value of 8/9 [Timoshenko, 1922]. The
inadequacy of the static value of k for dynamic problems has been mentioned in several
works [Mindlin, 1951; Goodman and Sutherland, 1951; Mindlin and Deresiewicz, 1953;
Dengler and Goodman, 1954; Cowper, 1966; Whitney, 1973 etc. ] where it is generally
pointed out a more complicated nature of shear distribution, especially at higher frequencies,
due to the presence of inertia forces. There is, however, less unanimity in an alternative
definition for the shear correction factor. Roughly speaking, there seem to be two general
approaches in tackling the factor k. Expressions have been derived which find k either
3A persistent misrepresentation of the expressions for a and ß has been noticed in the paper by Bert et al, as well as in Wilkins [19651
which is believed to be the original source for this paper. In both cases the term (r24) in the expressions appears with the first power while this term should be of the second power.
4 Even this definition of the static value of k has been subject to criticism. See [Cowper, 1966].

-Ch2- 9
through equating the shear dominant frequencies of vibration [Mindlin, 1951] or relate k to
the Poisson's ratio through the application of the elasticity theory [Mindlin, 1951; Goodman,
1951; Cowper, 1966].
Mindlin's approach to the problem seems to have been the most popular of all, and many
workers who subsequently used the Timoshenko beam equations followed this approach in
one way or another. In a paper [1951) concerning the two dimensional analysis of plate
vibration, analogous to the one dimensional Timoshenko beam analysis, he postulated to
find the factor k in such a way that the first pure thickness-shear frequency predicted by the
Timoshenko beam (or in his case plate) equations equals the frequency of the first pure
shear mode of vibration according to the exact three-dimensional theory of elasticity. For a
beam with rectangular cross section, these frequencies are, respectively, given as
(0, I = kAG/pI
w, 2 = (n/h)2 (G/p)
where A, o, p, I and h are the cross sectional area, shear modulus, density, second moment of
area and depth of the beam respectively. The first frequency is readily obtained by setting to
zero the lateral displacement amplitude, w(x, ) , in the Timoshenko beam equations (Appendix
(C)), while the second frequency follows from the equations of the waves of distortion in an
elastic medium [Timoshenko and Goodier, 1951]. Equating these frequencies will result in
k=n2/12 (=0.822), which is also the value obtained by Mindlin for a simply supported plate.
Mindlin's reasoning for this procedure was based on the fact that at the frequencies of the
first thickness-shear mode, there is a strong coupling between the flexural and
thickness-shear modes [Mindlin and Deresiewicz, 1955]. In the same paper [1951], using
classical plate theory, he derives an expression relating the k factor to Poisson's ratio in
which the former ranges from 0.76 to 0.91 for a range of the latter from 0 to 0.5. Mindlin
restates Rayleigh's observation that the classical plate theory gives better results for long

-Ch2- 10
waves and that its departure from the three-dimensional theory of elasticity at shorter
wavelengths is almost entirely due to the transverse shear deformation.
In a somewhat similar way to Mindlin's first method, Goodman [1951] derived a cubic
equation for the case of a simply supported beam in which k is found in terms of Poisson's
ratio. For a Poisson's ratio of 0.33, this equation yields k=0.869.
As noted by Goodman [1954] and Mindlin [1955], at lower frequencies the shear stress
distribution is not much different from the parabola of statics but, as the frequency
increases, owing to inertia forces a "skin effect" dominates in such a way that the shear
distribution tends to revert, maximising near the surface and diminishing towards the
mid-depth (Fig. 2.1).
j
(a) (b)
Fig. 2.1 Schematic shear distribution in solid beams a) static, b) high frequency dynamic
In a three-dimensional elasticity analysis of beams, Cowper [1966] derived expressions in
terms of Poisson's ratio for various cross-sections which were 'most satisfactory for static
and... low-frequency' situations. Cowper's value for k for a rectangular section beam with a
Poisson's ratio of 0.33 is 0.851, which is somewhat lower than the corresponding figure
obtained by Goodman. The expressions used for shear stress and displacement are said to be
applicable to both uniformly loaded beams as well as to end loaded cantilever beams, since
in both cases the shear stress distribution is exactly the same. Based on this, Cowper

-Ch2- 11
concludes that the k values would be valid approximations for general loading, including
dynamic loading.
It will be noted that whichever method is used regarding the determination of k, the latter
will be frequency dependent owing to the inertia effects and therefore, as advocated by most
writers and in particular by Mindlin [1951], a choice should be made or compromised
depending on the 'relative importance of the two modes of motion' (i. e. flexural and
thickness-shear).
There seem to be only a few investigators who have undertaken to find the shear correction
factor for a skin/core sandwich configuration [Yu, 1959-a, b; Nordby et al, 1965; Bert et al,
1967], although the shear factor for thick solid laminated beams and plates has been the
subject of several investigations [Whitney and Pagano, 1970; Chow, 1971; Kulkarni and
Pagano, 1972; Whitney, 1972,1973; Sun and Whitney, 1973 etc. ]. In an elaborate analysis
in which no otherwise customary assumptions were made, Yu [1959-a] developed
stress-strain and displacement equations of motion for the flexure of a symmetric sandwich
plate. His method was, in fact, an extension of Mindlin's earlier work on plate theory and
reduces to Mindlin's results for a continuum plate as a special case. Similarly, the
one-dimensional case is reducible to that of a Timoshenko beam. In much the same way as
Mindlin's method, Yu [1959-b] then proceeds to find the thickness-shear frequency equation
and equates the frequencies to those obtained from the exact theory of elasticity. His
expression for the factor k so obtained involves the skin/core ratios of thickness and density.
In the limiting case of very thin skins, k becomes unity, thereby removing the need for a
shear correction factor.
Nordby et at [1965] applied Mindlin's method in its entirety to a sandwich beam, that is, they
adapted the expression for pure shear frequency given by the three-dimensional theory of
elasticity for a solid beam by replacing the density with the effective density of a sandwich.
Through this procedure, they arrive at an expression for k in terms of the mass, the mass

-Ch2- 12
moment of inertia of the beam, and depth of the core. For a typical sandwich beam, their
expression gives a value for k of the order 2. This method was subsequently used by Wilkins
[1965].
Bert et a! [1967], while acknowledging the 'very simplified' nature of the earlier analysis by
Nordby et al, proceed to replace the expression for the pure shear frequency in that work by
the one they obtain through treating the core and the skins as a two degree of freedom
system consisting of a shear-type spring bounded between two longitudinally vibrating
masses. Their expression for k is a function of mass moment of inertia and width of the
beam, density of the skin and depth of the core. They report k values in the range of 1 to 1.4
for typical sandwich constructions. They further propose a second method, based on
elasticity analysis, in which the core is treated as a continuous medium. From symmetry, the
half depth of the core and one skin are considered as a "shear cantilever" subjected to the
lateral vibration of the end mass. The expression for the factor k involves the mass moment
of inertia and width of the beam, the depth of the core and the densities of the skin and the
core. No typical value for k is reported.

-Ch2- 13
2.2 Damping of composite and sandwich structures
2.2.1 Undamped analysis
Although a considerable amount of work has been carried out on damping of composites,
relatively fewer works have been produced specifically on the damping of honeycomb
sandwich structures. The earliest reported investigation on the damping properties of these
structures was due to Keer and Lazan in 1961 [Bert et al, 1967]. They used the elementary
theory for their analysis and for this reason the apparently close agreement between the
theoretical predictions and experimental results has been subject to scepticism [Nordby et al,
1965; Wilkins, 1965].
In a sizeable work on the damping of aluminium honeycomb sandwich beams, James [1962]
undertook to demonstrate the feasibility of predicting the damping of the compound beam
from that of the constituent partss. He used an energy method to find the frequency and in
this he included both rotary inertia and shear effects. Nonetheless, he used a mode shape
based on the elementary theory. Basically, his method for predicting the specific damping
capacity (SDC) of the compound beam may be written as
(AU /U) = (AUS /U) + (AUS IU) ,
where AU and U are the damping energy per cycle and the maximum strain energy
respectively, and the suffixes s and c refer to the skin and the core. Assuming the damping
energy to be proportional to the square of the stress amplitude (the 'linear damping'
mechanism), then all the terms in this equation will have the square of the displacement
amplitude of vibrations as a factor and this is cancelled out. The SDC will then be a function
of the beam geometries, Young's modulus of the skin, the shear modulus of the core, and the
damping properties of the skin and of the core. An assumed logarithmic decrement, that of
5 As acknowledged by lames 119621, the method is originally due to C. W. Norris of the Forest Products Laboratory, U. S. A.

-Ch2- 14
soft aluminium (0.00052, equivalent to a SDC of 0.1%) was used throughout. The damping
of the compound beam was then found experimentally by the free-decay method
James' predictions of the fundamental frequency are only fair (within -0.8% to +12% of the
experimental values) but the damping predictions are generally poor (mostly with a
difference of between 30 to 70%, and as high as +134%, from the experimental values).
James attributes the poor damping predictions to the 'simple theory' used.
Nordby et al [1965] used the free-decay method to measure the damping of honeycomb
sandwich beams. All their samples had GFRP skins. The honeycomb cores were either
GFRP or aluminium. They present their damping results as a function of stress amplitude in
the skins which they measured using strain gauges.
Bert et al [1967] used the same basic method as James [1962] in order to predict the
damping of a honeycomb sandwich beam. However, they followed the method of Nordby et
al [1965] (as outlined in 2.1), to derive the frequency equation and mode shape of a free-free
beam. They further used the mode shape equation to derive expressions for maximum strain
energy as well as the damping energy per cycle for the skins and the core, and thus
proceeded in predicting the damping of the beam from those of the constituent parts. All
their samples consisted of GFRP skins and either GFRP or aluminium honeycomb core.
They used reported values for the damping coefficients of the skin and the core, although
they measured the skin modulus at compatible frequencies. They found a difference of
mostly above 20% and as high as -37% between the predicted and the measured damping of
the compound beam. Nonetheless, in comparison, their predictions are an improvement on
James' results.

-Ch2-
2.2.2 Damped analysis
15
The flexural vibration of another sandwich configuration, that of a beam consisting of
alternate layers of elastic and viscoelastic material, was analysed by DiTaranto [1965]. As
such, DiTaranto's analysis involved the concept of complex notation where the elastic and
viscous behaviour of a linearly viscoelastic material are modelled as separable quantities
and are treated as real and imaginary components of a complex set. DiTaranto derived a
sixth-order linear homogeneous differential equation of motion in terms of the longitudinal
displacements. Expressions were subsequently obtained for the natural frequencies and loss
factor of a freely vibrating beam. These expressions implied that the variation of the loss
factor with natural frequency was independent of the end conditions and mode shapes but
dependent on the cross-sectional geometry and material properties of the elastic and
viscoelastic materials.
It is noted that in DiTaranto's analysis, all the damping is attributed to the viscous shearing
of the viscoelastic layer. Furthermore, unlike the 'undamped' analyses in which the equations
of motion are derived for materials assumed to be Hookean elastic, in analyses such as
DiTaranto's the viscoelastic nature of the modulus will lead to equations of motion for a
damped material, and consequently to damping dependent frequencies.
In a later work [DiTaranto and Blasingame, 1967], the results of the earlier analysis
[DiTaranto, 1965] were used to obtain generalised plots, presenting loss factors and various
eigenvalues as functions of a parameter in terms of the average mass density of the
composite beam, the Young's modulus of the elastic layer, the elastic component of the
viscoelastic shear modulus, the thickness of the elastic layer, and the reduced natural
frequency.
Agbasiere and Grootenhuis [1968] question the notion of a complex shear modulus since it
'presupposes' a definite stress-strain law. Their own analysis of a damped sandwich beam
concerns a general stress-strain relation applicable to both linear and non-linear materials.

-Ch2- 16
This approach, however, resulted in a complex set of four simultaneous equations of the
twelfth order which were cumbersome to solve in a closed form and therefore they resolved
to a numerical method (Finite Differences). Nonetheless, their expressed confidence in the
analysis is backed by some experimental results which they obtained from tests on a three
and a five layer beam. These results indicate fairly accurate predictions of resonance curves
and mode shapes especially for the three layer and the lower modes of the five layer beam.
Mead and Markus [1969] derived a sixth order differential equation of flexural motion,
analogous to that of DiTaranto's, in terms of the transverse displacements (the DTMM,
DiTaranto-Mead-Markus equation as it was subsequently called by Mead [1982]). The
equation in terms of the transverse displacements, they argue, will allow a better physical
understanding of the problem, especially in the presence of transverse loading. Furthermore,
they challenge DiTaranto's use of the complex stiffness notation for free vibration and state
that DiTaranto's resonant frequencies and modes can, in fact, be attributed to a special class
of forced vibration. All the other conclusions of DiTaranto, and in particular his assertion
that the curve of the loss factor versus frequency is independent of the end conditions, are
reiterated in this work; although one particular result in a later work [Mead and Markus,
1970] seemed to imply otherwise. In their analysis, Mead and Markus [1969] make the usual
simplifying assumptions which include no through thickness straining and negligible normal
stresses in the core and shear strains in the skin compared to the same quantities in the skin
and in the core respectively. In these analyses, the rotary inertia effects are also ignored. In
fact, for a sandwich beam with a shear stiff core, the DTMM equation will reduce to the
elementary Bernoulli-Euler equation [Mead, 1982]. The DTMM equation is refined in a
later work [Mead, 1982] by including the shear and longitudinal inertia effects in the skins.
The rotary inertia effects were still ignored.
In an analytical work much reminiscent of the earlier one [1961], Huang and Huang [1971]
incorporated viscoelastic damping in the Timoshenko beam equations. The viscoelastic

-Ch2- 17
response was based on the standard viscoelastic model. Here, too, the frequency equations
and mode functions for different combinations of end conditions were obtained.
Mead [1972] undertook a theoretical study of the effect of imposing elastic boundary
conditions, such as stiffeners and rivets, on the damping of a three layer damped sandwich
plate. A constant loss factor (0.3), representing a highly damped viscoelastic layer, is
assumed throughout but a wide range of the shear moduli' are considered. Computed results
are mostly presented as plots of the loss factor of the plates with different boundary
conditions versus the shear parameter, the latter being a non-dimensionalised function of the
complex shear modulus, Young's modulus of the elastic layer, the plate geometry and
Poisson's ratio. Among the conclusions made from these results one is that in the absence of
torsional edge constraints, preventing local shearing through riveting would substantially
reduce the damping but the latter would increase when torsional constraints are also
imposed. Furthermore, torsional constraints on their own would reduce the damping of a
soft core sandwich, but would increase that for a stiff core.
A similar analytical study, but this time concerning the effect of boundary conditions on
eigensolutions of a sandwich beam, was carried out by Markus and Valaskova [1972].
Frequency equations are obtained for the case of the unrestrained and that of the riveted free
end of a cantilever beam. Results showed that, for a relatively soft core sandwich beam,
certain nodal shifts relative to Bernoulli-Euler beam occurred in both cases. As expected, no
such shifts resulted for a beam with a very rigid core. Analogous effects were deduced from
eigenvalues.
Soovere [1973] investigated the dynamic response and sonic fatigue resistance of
honeycomb sandwich panels with graphite fibre skins. In all cases, Nomex cores were used.
A coil attached to the panel and a magnet provided the means of excitation, while strain
I The expression for the complex shear modulus on the second page should read G* (1+43). according to the definitions in the appendix.

-Ch2- 18
gauges attached to the panel were used to measure the response. Results showed that the
damping in the fundamental mode of the graphite sandwich panel was of about the same
order as that in an aluminium sandwich panel or in a graphite fibre solid beam. Increased
damping in other modes was attributed to the acoustic radiation. Free-free tests on PRD-49
(Kevlar) panels showed a five fold increase in damping of these panels compared to the
graphite panels. Apart from the possibility of higher material damping, it was concluded that
the increase in damping was possibly due to different fibre orientations (woven and
unidirectional respectively) and the methods of fabrication (hand-lay-up and pre-cured
sheets).
Similar conclusions were reported in a later work [Soovere, 1984]. It was found that
acoustic radiation was the major contributor to damping in stiffened honeycomb panels. The
material damping was found to be very low in CFRP sandwich honeycomb panels. On the
other hand, damping in Kevlar sandwich honeycomb panels was found to be quite
significant and it was shown to be resin dominated. The damping due to fasteners was
shown to be small.

-Ch2-
2.3 Works of Adams et at
19
Much of the present work has been based, directly or otherwise, on the earlier works by
Adams and co-workers. In this section, the relevant works are outlined.
Adams and Bacon [1973-a] described an apparatus suitable for measurement of material
damping in steady-state flexural vibration. The apparatus, it is reported, can be used to
measure accurately specific damping capacities as low as 0.1% over a frequency range of e
100 to 800 Hz and a temperature range of -50 to +200 C. A pair of coils attached to opposite
surfaces in the mid-span of a free-free beam and placed in magnetic fields provide the
means for excitation and measurement of displacement. The Bernoulli-Euler beam equations
with the appropriate boundary conditions are used to derive expressions for the frequency
equation, mode shape function, and maximum strain energy. These equations, together with
a knowledge of the displacement amplitude and the excitation energy per cycle were then
used to compute the SDC, maximum surface stress and the dynamic Young's modulus of the
beam. Tests were carried out in air and in a vacuum, and over a range of temperatures. The
results showed that air damping was of significance for low damping high modulus
materials such as Duralumin and CFRP along the fibre direction, and that it increased
linearly with displacement amplitude. The mode shapes were accurately predicted.
Guild and Adams [1981] developed a new technique for the measurement of the SDC of
beams in flexure. This technique was basically a rearrangement of the earlier method of
Adams and Bacon [1973-a] in that here the two coils were attached to the beam ends. Unlike
the centrally driven arrangement in which only symmetric modes can be attained, this
technique can produce both symmetric as well as anti-symmetric modes. The relevant
expressions, based on Bernoulli-Euler beam equations, are derived for the new boundary
conditions. Good agreement was obtained between theoretical and experimental mode
shapes for the fundamental mode and it was shown that the rotary inertia of the end coils did
not have any significant effect on the mode shapes. However, compared to the results

-Ch2- 20
obtained by Adams and Bacon [1973-a], their results of tests on Duralumin seems to
indicate a relatively significant increase in extraneous damping (from 0.1% to 0.5%). This
result is somewhat unexpected since, as will be shown in the present work (Chapter 5), the
end driven arrangement should lead to reduced extraneous damping.
Theoretical predictions and experimental results of the variation of dynamic properties in
flexure as well as torsion of unidirectional composites with respect to fibre volume fraction
are presented by Adams and Bacon [1973-b]. They adopt Hashins's expression for the
complex moduli as a function of fibre volume fraction for their prediction of axial and
longitudinal shear damping. The damping is assumed to be stress independent and due to the
matrix only. A torsion pendulum apparatus was used to find the longitudinal shear damping
of the matrix. Their prediction of the flexural damping involves first finding the damping
due to interlaminar shear from a knowledge of the longitudinal shear damping of the matrix
and the Bernoulli-Euler mode shape. Their flexural damping is then given by the sum of the
axial and interlaminar shear damping. Attempts were made to compare their predictions of
damping in longitudinal shear with those of Hashin and the results, normalised with respect
to the matrix damping and presented as functions of fibre volume fraction, show that
although both theories overestimate the damping, the predictions of Adams and Bacon are
closer to the experimental points. Flexural damping results are presented as functions of
aspect ratio of the beam. As expected, predictions based on the law of mixtures alone do not
account for the variation of damping with aspect ratio and also they underestimate the
damping by a large margin. However, predictions which do take into account the
interlaminar shearing closely follow the trend of the experimental results but still generally
underestimate them by a significant margin.
The effect of fibre orientation and laminate geometry on the dynamic properties of free-free
composite beams are discussed by Adams and Bacon [1973-c]. They postulate a criterion for
damping in which the damping energy in an elastically deformed element of the material is a

-Ch2- 21
function of three independent components of energy dissipation in the x, y and xy
directions. Hence, with respect to the fibre direction, x, of a unidirectional layer of
composite, the total damping would be a function of longitudinal, transverse and
longitudinal shear damping. Using the constitutive equations of flexure of a laminated plate,
they derived expressions for the effective Young's modulus and flexural damping of a
free-free laminated beam. For simplicity of solution, stress independent damping across the
beam thickness was assumed. The bending-twisting coupling was ignored and tests on the
off-axis unidirectional CFRP beams showed that the induced torsion due to the above
mentioned coupling was relatively small. The Young's modulus and flexural damping
results are presented as functions of fibre orientation. The predictions of modulus and
damping in the case of unidirectional beams are reasonably good, but for the angle plied
laminates they generally overestimate the damping, increasingly so towards the 45°
orientation. It was shown that neither the modulus nor the damping was significantly
affected by the width of the beam.
In a similar but more refined work, Ni and Adams [1984] obtained expressions for
predicting the dynamic Young's modulus and specific damping capacity of laminated
fibrous beams in flexure. Using the Adams-Bacon apparatus, tests were carried out on both
CFRP and GFRP free-free beams in the fundamental mode. Beam samples were either cut at
different orientations from a unidirectional laminate ('off-axis' beams), or cut at different
orientations from cross and angle ply laminates ('general ply' beams). Experimental results
were closely predicted. Comparing their damping results with those of Adams and Bacon
[1973-c], Ni and Adams attribute their improved predictions to the fact that, unlike the
former work, they did take into account the bending-twisting coupling.
Based on Adams-Bacon [1973-c] damping criterion, Lin et al [1984] included the 'damped
element' in a Finite Element program originally due to Cawley [1978]. The analysis is
basically the plate equivalence of that of Ni and Adams [1984] for beams, although the

- Ch 2- 22
Adams-Bacon damping criterion was extended to five terms including the two transverse
shears (the xz and yz shears, x and y being the in-plane co-ordinates). Parabolic variation of
transverse shear over the thickness was assumed. Flexural frequencies, mode shapes and
damping of various free-free angle plied symmetric composite plates were both measured
and computed. Damping measurements were obtained from the frequency domain transient
response using a dynamic analyser capable of 'zooming' on a resonance peak, a method
developed earlier by Lin and Adams [1984]. Both GFRP and CFRP plates were tested for up
to the sixth flexural mode. An examination of their results show that the frequencies were
predicted to within a range of -14% to +20% of experimental values but mostly less than
6%. The damping results were predicted to within a range of -34% to +18%, but again
mostly much lower. They further produced plots for prediction of frequencies and damping
from the geometry of the plate.
The work of Ni et a! [1984] concerns the prediction of dynamic properties of hybrid layered
composite beams and plates. They adapted the earlier analysis [Ni and Adams, 1984] for the
damping prediction of beams, and used the damped element Finite Element program of Lin
et al [1984] for prediction of the plate modal damping. In both cases the test pieces were
made up of symmetrically oriented layers of GFRP sandwiched between CFRP. The
predictions of the effective Young's modulus and the SDC of the beams are in most cases in
good correlation with the experimental results. They attribute the few deviations to the lack
of perfect fibre alignment. The predictions of the first six flexural frequencies of the plates
are mostly within 5% of experimental values, while the damping results fall within an error
range of -45% to +9%.

23
Chapter 3
FLEXURAL VIBRATION OF A TIMOSHENKO BEAM
Scope - In this chapter, equations are developed for flexural vibration of a centrally loaded
free-free beam using Timoshenko beam equations. The developed equations are then
adapted for prediction and measurement of damping in a free-free sandwich beam.
Theoretical and experimental results, regarding frequencies and mode shapes of both solid
and sandwich beams, will be presented. The case of a symmetrically end loaded beam will
also be considered. Application of these equations with regard to damping of sandwich
beams is considered in later chapters.
3.1 Loaded beamsl
The flexural vibration of both centrally loaded and end loaded beams is of particular interest
in steady-state measurement of damping, since in forced vibration of the beam, it may be
required that the latter is point-loaded in the centre, or loaded symmetrically at both ends, by
the drive and/or pick-up mechanisms [Adams and Bacon, 1973-a; Guild and Adams, 1981 ].
Depending on the load, this would change the frequency and mode shape of the beam,
which should be taken into account when computing the kinetic or strain energies.
Moreover, whereas for a monolithic beam within the limits of linear damping, the damping
is theoretically independent of any load carried by the beam (also verified experimentally by
Wren and Kinra [1989-a]), for a hybrid structure such as a shear-soft sandwich beam the
load will have an influence on the proportion of the skin/core contribution to the overall
damping of the beam.
1 The terms 'load' and loaded' are somewhat loosely used in this work; but they are used for conciseness and are meant to merely refer to a
mass attached to a point on the beam.

-Ch3- 24
The case of the centrally loaded Timoshenko beam applies to the present work and its
analyses will be considered here in some detail. The analyses of a symmetrically end loaded
Timoshenko beam are given in Appendix (C).
Explicit representations of the developed equations will be extremely lengthy and therefore
unwarranted; substitutions will have to be used.
3.2 Constitutive equations
The coupled equations for the total deflection, w, and the bending slope, 0, of a uniform
beam in harmonic flexural vibration are given as [Timoshenko, 1955]
a24 aw a24 El -+ k( -- ¢) AG - p1 -=0 (3.1. a) aX2 aX an
pA -- k( -- aý)
AG =0 (3.1. b) at= a2X ax
where
w= We1o
0= eýý
and w and 0 are normal functions of x.
(3.2)
(3.3)
Eliminating, in turn, 0 and w from Eqns. (3.1), the following two uncoupled differential
equations of flexure are obtained [Huang, 1961] 2
a+w a2W Ep1 dew p21 &w EI -+ pA -- (p1 +-)+--=0 (3.4. a)
ax+ a12 kG ax2at2 kG at4
aýý a20 Ep' a'4 p21 a04 EI -+ pA -- (p1 +L PI
+--=0 (3.4. b) ax4 atz kG axlat2 kG at'
2 See Appendix (C) for a complete derivation.

-Ch3- 25
Substituting for 0 and w in Eqns. (3.1) and (3.4), the latter are respectively reduce to a20 1 aw
sI a- (1 - bz r2 s2) 4+L0 (35. a)
s
a2W a(D a+
b2 s2 f2 -[ aý =0 (3.5. b) z
aaw a2w -+ b2( r2 + s2) -- b2 (I - b2r2s2 )W=0 (3.6. a)
a+(D a=(b -+ h2( r2+$2) - -b2(1 -b2r2s2)C1 =0 (3.6. b) aC4 aC2
where
x ý=L (3.7)
PAL40 2 b2 = (3k)
EI
I r2 =- (3.9)
ALz
E/ S2 =
kAGIJ (3.10)
The solutions to the uncoupled Eqns. (3.6) are given as
W=C, cosh(ba4) + C2 sinh(baý) + C3 cos(b(3C) + C4 sin(bßc) (3.11. a)
0=C,, sinh(bac) + C2' cosh(baý) + C,,, sin(bI )+ C4' cos(b(3C) (3.11. b)
where
1, i2 �I
a, f= ý2 -, + (r2+s2) + (r'-s2)2 +4J (3.12)
Only one half of the coefficients C; , C; - (s . 1.4) are independent since w and c are coupled by
Eqns. (3.1). The dependent coefficients are found by substituting Eqns. (3.11) in either one of
the coupled Eqns. (3.5) and equating the coefficients of individual hyperbolic and
trigonometric terms. The following are found from Eqn. (3.5. b)

-Ch3- 26
b a2+s2 b a2+s2 Cl, =L(a)C, C2' =L(a) C2
b P2 P -S2 b 1-s2 C3' =--() C3 C, ' =L() C4
(3.13)
Equations (3.11) and their first derivatives may now be written as
W=C, cosh(baý) + C2 sinh(baý) + C, cos(bßý) + C4 sin(b3C) (3.14. a)
aw b ax L
(C, a sinh(baý) + C2 a cosh(bat) - C3ß sin(b(3C) + C4 0 cos(bf i)J (3.14. b
b a2+s2 =-I (C, sinh(bac) + C2 cosh(bcc, ))
La
- W-S2
(C3 sin(bRC) - C, cos(bRC)) ] (3.14. c)
b
ax = (L )2 I (a2+s2)( C, cosh(baý) + C2 sinh(baý))
- (R2-s2)( C3 cos(b(3ý) + C4 sin(bP3 ))] (3.14. d)

-Ch3-
3.3 Centrally loaded beam
27
A free-free Timoshenko beam with a point load at the mid-span (Fig. 3.1) vibrating in a
symmetric normal mode is subjected to the following conditions
Mc
fL
Fig. 3.1 Centrally loaded beam
- i) at x=0, EI =0 (zero bending moment) ax
aý so, -=0 (3.15. a) ax
ii) at x=0, kAGy =0 (zero shearing force)
aw so, ( -4D)=0 (3.15. b) ax
L at x= , 0=0 (zero bending slope) (3.15. c) 2
` iv) at X= -,
cý W=0 kAGy -ý (shear force induced due to Mc)
aw so, - 4)) - LAG ( - WW=o
ax 2
M W ` or wW=0 MG ( )- (3.15. d) a 2 x
In Eqns. (3.15), the local effects due to the point load [Timoshenko and Goodier, 1951] have
been neglected.

-Ch3- 28
Equations (3.15) will respectively give the following four equations
C, (a2+s2) - C3 (p2-S2) =0 (3.16. a)
- C2 s2 + C4 a s2 =0 (3.16. b)
P (a1+sz)(C, sinh(H) + C2 cosh(H)) -a (ß2-s2)((C3 sin(T) + C4 cos(T))= 0 (3.16. c)
mL b
bis (C, a sinh(H) + C2 a cosh(H) - C3ß sin(T) + C4 P cos(T)]
zL
MC - (C, cosh(H) + C2 sinh(H) + C3 cos(T) + C4 sin(T)l =0 (3.16. d)
2
where
H= baJ2 ;T= b012
Equations (3.16) may be written in the form
JAI (CJ =0,. - 1.4)
For a non-trivial solution, the determinant of the matrix of coefficients (Al is set to zero.
This will give the following frequency equation for the centrally loaded free-free
Timoshenko beam
a2+ m ( p) cosh(H) sin(T) -
(p2-. a2) sinh(H) sin(T)
MC +
32 (ßI-s2) b aß2 2
(a2+(32) m (a2+s2)2+(p-s2)2 MC Mý - sinh(H) cos(T) + cosh(H) cos(T) -+=0
aß (a2+s2) b I3(a2+s1)(ß2-s2) 2
(3.17)
From Eqns. (3.16), three of the constants C. may be found in terms of the fourth one, for
example C,, giving, from Eqn. (3.14. a), the total deflection, W, as z
W= _s C3 cosh(baý) + C3 sinh(baý) + C,, cos(b(3C) + C,, sin(bßC) (3.18) a2+s2
where
(f -s2)(a sin(T) -ß sinh(H)) P= (3.19)
(02-sz) cos(T) + (a2+s2) cosh(H)

-Ch3- 29
Now, if W is known at some positive x, then C. can be found from Eqn. (3.18). Consequently,
the constants C� C2, C, will be known, and the quantities w, Max, 4) and ac/ax can be found
explicitly for any x.
3.3.1 Strain energy
The total strain energy stored in flexure of a Timoshenko beam is assumed to consist of two
separable strain energies, one due to bending about the y axis (Fig. 3.2), and the other due to
shearing between the xy planes.
z
y j-x
Fig. 3.2 Beam co-ordinate system
Thus
(ýL EI ao fi kAC aw U= Ub + Us =Jo2 (-ax )22 dr +Ja2 (-ax - 4D) _ dx (3.20)
f
To avoid complex algebra in the above integration, it will be convenient to rewrite
Eqns. (3.14) in the same general form, viz
W=A cosh(baC) +B sinh(baý) +C cos(bßý) +D sin(bpC) (3.21. a)
aw_ b ax L
(A cosh(ba5) +B sinh(ba; ) +C cos(bßý) +D sin(bß; ) I (3.21. b)
b _-IA cosh(baC) +B sinh(baC) +C cos(bpC) +D sin(bf 3ý) J (3.21. c)
L
ýD b
ax -(LlA cosh(baý) +B sinh(ba) +C cos(b f g) +D sin(bpC) J (3.21. d)

-Ch3- 30
where the coefficients A, B, C and D are only locally defined within each individual equation.
In terms of C, , these coefficients are found as follows
In Eqn. (3.21. a) L2-S-
-s2 1
A= C3 ; B=RPC, a2+s2
1 C= C3 ;D=aP C3
(3.22. a)
in Eqn. (3.21. b)
A-aPC3 B_a -s2 C3 R a2+s2
CaP C3 D-R C3 (3.22. b)
in Eqn. (3.21. c) I P2-S2
A=- (a2+s2) P C3 ;B=C, aß a
% p2 -S2
C= aß (P2 -S2) P C, ;D=-ß C3 (3.22. c)
and in Eqn. (3.21. d)
I A= ((32-s2) C3 ;B=R (a2+s2) P C,
1 C=- (f-s2) C, D
a (2-s2) P C,
(3.22. d)

-Ch3-
3.3.1.1 Strain energy of bending
Strain energy of bending of a Timoshenko beam is given by
EI D (D b= 2
02 (ax)
Substituting for Wax from (3.21. d) and integrating will give
Ub= EI ( b)3
Sb (A'-B2+C'2+D2) L4
A2+B2 C2-D2 + sinh(2H) + sin(2T)
4a 4ß
AB CD +- cosh(2H) -- cos(2T)
2a 2ß
2 +( (a AC - (i BD) sinh(H) cos(T)
a2+ß2
+ (a BD + (3 AC) cosh(H) sin(T)
+ (a AD +ß BC) sinh(H) sin(T)
+ (a BC - (3 AD) cosh(H) cos(T) J
AB CD 2 --+-- (aBC-ßAD)
2a 2ß a2+ß2
31
(3.23)
(3.24)
where A, B, C and D are given by Eqns. (3.22. d).

-Ch3-
3.3.1.2 Strain energy of shearing
Strain energy of shearing of a Timoshenko beam is given by
L kAc aw US =- (- -c)2dx
fo
2 ax
Substituting for awiax and 0 from Eqns. (3.21. b) and (3.21. c), and integrating will give bb2222
Us = kAG (L)4 (Als - B, 2 + C, 2 + D12)
22 A, 2+B, 2
+ sinh(2H) 4a
+ A12B, 2
cosh(2H) 2a
2
22 C,
2 -D! 2 +R sin(2T)
4
C, 2D12 - cos(2T)
2a
(a A12Clz - (3 B, 2D12) sinh(H) cos(T) a2+ß2
+ (a B! 2D, 2 +ß Al2C12) cosh(H) sin(T)
+ (a A12D, 2 +ß B12C12) sinh(H) sin(T)
+ (a B1, C, 2 - (3 A12DJ2) cosh(H) cos(T) ]
A, 2B12 C, 2D, 2 2 - 2a
+ 2p -
aZ+02 (a B12C12 -ß Ai2Diz)
where
A, 2 , B, 2 , C, 2 , D, 2 = A, - A2 , B, - B2 9 C, - C2 , D, - D2
and
A,, B1, Cl, D, =A, B, C, D
as given by Eqns. (3.22. b); and
A2, B2, C2, D2=A, B, C, D
as given by Eqns. (3.22. c).
32
(3.25)
(3.26)

-Ch3-
3.3.2 Bending and shearing stresses
33
For the first mode of vibration, the maximum bending moment of a free-free Timoshenko
beam is given by
ao M,,.. EI (ax ) (x=u2) (3.27)
where a4/ax is given by Eqn. (3.21. d), in which the constants A, B, C and D are given by
Eqns. (3.22. d).
The maximum bending stress is then given by
-h (3.28) 12
The shearing stress is given by
aw T= kG (-- 4)) (3.29)
ax
where awiax is given by Eqn. (3.21. b), in which the constants A, B, C and D are given by
Eqns. (3.22. b); and 0 is given by Eqn. (3.21. c), in which the constants A, B, C and D are given by
Eqns. (3.22. c).
3.3.3 Bernoulli-Euler simplification
The Timoshenko beam equations are readily simplified to the elementary Bernoulli-Euler
beam equations by setting the rotary inertia and the shear parameters to zero. Thus
r=3=0
and Eqn. (3.12) will now give
a=ß= 1/ib
The following relationship is then established between the quantity b in this work and ? in
[Bacon, 1973]
-Jb = A. (330)

-Ch3- 34
Once relevant substitutions are made, Eqns. (3.17) and (3.18) will be identical to Eqns. (18) and
(19) in [Bacon, 1973]. The total strain energy in Eqn. (3.20) will now reduce to the strain
energy due to bending, Ub , and the latter will reduce to the corresponding Eqn. (21) in
[Bacon, 1973].
3.3.4 Sandwich beam
By making certain simplifying assumptions, it is possible to adapt the Timoshenko beam
equations for a symmetric skin-core-skin sandwich beam [Bert et a!, 1967]. To that end the
following usual assumptions are made
1- the in-plane modulus of the core is negligible compared to that of the skin
2- transverse shearing of the skin is negligible compared to that of the core
Both assumptions have been almost universally accepted as justified and have been utilised
in sandwich analyses [James, 1962; DiTaranto, 1965; Mead, 1968; Donnell, 1976 etc. ] By
virtue of the assumption 1, the bending stiffness El in Eqns. (3.8) and (3.10) will be that of the
skins only. In accordance with the Timoshenko beam equations, this implies the skins bend
about the sandwich neutral axis and, therefore, undergo uniaxial tension or compression.
Also implicit within this assumption is that the mass of the beam is concentrated in the
skins, which is a justifiable assumption since the skins are usually several times heavier than
the core. From assumption 2, the area A will be the cross sectional area of the core only. The
rotary inertia parameter, r, is now expressed in terms of 1, c, the effective moment of inertia
of the whole beam cross section. Based on these assumptions, Eqns. (3.8) to (3.10) can be
written as follows
12 = nO
(3.31) (Ei)s
_ IS c r (3.32)
Ac
(EJ)s s2 =
(kAG)c V (3.33)

-Ch3- 35
where suffixes s and c indicate skin and core respectively, and',, is given by
Isc = IS + PC
- Ic (3,34) PS
In the above formulae, the contribution from the adhesive layer3 to the overall stiffness has
been considered negligible. Furthermore, as Mindlin [1951] showed, the rotary inertia is
almost entirely negligible 'over the whole wave-length spectrum'. For a typical sandwich
beam, the shear parameter, s, is of the order of ten times or more of the rotary inertia
parameter, r. In view of this and the fact that, unlike the skin and the core, the geometry of
the adhesive layer is not well defined, the rotary inertia due to the adhesive layer has also
been ignored.
The question arises as to the value of the factor k (Eqn. (333)), following the above
procedure. Unfortunately, the equations so developed for a sandwich configuration throw
little light on the actual shear distribution over the beam cross section, even more so than
their original counterparts intended for a solid beam. The first of the above assumptions
implies that the shear distribution over the core cross section is uniform [Mead and Markus,
1969], which in turn leads to a shear correction factor of unity. However, the notion of unity
of the factor k which follows the assumed uniformity of shear distribution over the core
cross section would be somewhat misleading, for it ignores the shearing stresses which must
exist in the skins if the implication of shear discontinuity at the interface is to be avoided
[Chow, 1971]. On the other hand, if it is assumed that the shear stress over the whole
sandwich cross section is uniform, then this implies that the shear stress in the skin is of the
same order as that in the core, regardless of the core shear rigidity. As pointed out by Mead
[1981], this cannot be the case when the core is soft, in which case the skins tend to bend
independently of the core and about their own neutral axis. Moreover, as was already
pointed out, when the beam is subjected to dynamic loading, the inertia effects could
3 In this work, the 'adhesive layer' refers specifically to the adhesive used in the skin/core interface.

-Ch3- 36
become the determining factors in the shear distribution, although this is expected to occur
only at high frequencies.
An assumption which is implicit within the Timoshenko beam equations is that no through
thickness straining in the beam occurs, such that the outmost planes, for example, remain
plane and at the same fixed distance regardless of the state of the stress. This assumption,
however, is not exclusive to the Timoshenko equations and follows from the classical theory
of bending; it is another 'almost universal' assumption in sandwich analyses. Even in solid
beams there is a variation in this distance due to the Poisson's effect alone [Donnell, 1976;
Whitney, 1987]. For a sandwich configuration in particular, where the core is of relatively
small elastic modulus, this assumption imposes a constraint on the deformation, in that it
allows no localised bending of the skins which can be expected to occur because of such as
point loads. By the same token, the state of stress within the skins is assumed to be
unaffected by any compressive stresses which may develop in the core [Benjamin, 1969].
When the beam is point loaded in the mid span, the situation becomes somewhat more
complicated. From symmetry, there cannot be shearing in the mid span while, immediately
beyond this point, an abrupt change in the shear stress should take place. Timoshenko and
Goodier [1951] elaborate on local effects at the point of loading and show that the shear
deflection for a length along the beam approximately equal to half of the depth of the beam
is slightly less than when assuming a uniform stress distribution.
It is apparent from the foregoing that an analytical determination of the shear correction
factor for a sandwich configuration becomes extremely difficult and subject to the particular
circumstances. Subsequently, the determination of the factor k in the present work was
approached from a different view point, i. e. , that its value be such that the experimentally
determined natural frequencies are accurately predicted. It is suggested that this procedure is
justifiable as far as the damping of a shear soft sandwich is concerned since, in effect, the

-Ch3- 37
factor k is manipulated so that the correct ratio of the bending/shearing stiffness, as indicated
by the sandwich natural frequency, is achieved.
However, in so doing, the physical meaning of the factor k will be somewhat removed from
its original definition. A more appropriate definition for k would now be 'a correction factor'
taking into account mainly the assumption of the uniformity of the shear distribution, but
also the extent of the validity of the assumptions made for the particular test piece, as well
as the extent of the idealisation of the test piece, that is, such factors as the accuracy of the
skin and core moduli, the structural integrity of the sandwich, the degree of the contribution
of the adhesive layer to the overall stiffness and, as correctly pointed out by James [1962],
the uniformity of the adhesive distribution since, depending on the particular mode shape
and nodal locations, a non-uniform distribution would lead to overrating or underrating the
experimental natural frequency.
3.3.5 Computation of the specific damping capacity
By definition of the SDC, the damping energy in the skins undergoing uniaxial
tension/compression is given by
AU, =J aZ e. yr(a. )d(v, ) (3.35) v,
where v, is the skin volume and y(a) indicates the stress dependency of damping, T. For a
uniform beam in flexure, the integration over the width is trivial. However, the stress varies
over both depth as well as length in the beam. Hence, in order to take the stress dependency
of SDC into account, it will be necessary to establish the relationship between the SDC and
as for the particular material under test. Adams and Bacon [1973-a] outlined a method in
which this relationship may be established through the use of a polynomial of a suitable
degree fitting the experimentally determined SDC versus stress points, the coefficients of
which are determined experimentally. Such a procedure would subsequently involve
numerical integration of the integral in Eqn. (3.35). White and Abdin [1985] postulated a

-Ch3- 38
similar approach. However, most workers in the past have assumed a damping mechanism
in which the damping energy is proportional to the square of the stress amplitude [Keer and
Lazan, 1961; Bert et al, 1967; Adams and Bacon, 1973-a, b, c; Ni and Adams, 1984 etc. ]. In
this case, the SDC will be independent of the stress amplitude and the so called 'linear'
damping mechanism applies. Keer and Lazan [1961] reported that stress independency of
the SDC was recorded in all their tests on aluminium honeycomb sandwich beams. This
assumption can be justified only for the lower regions of stress amplitude where many
materials show a constant damping with the variation of stress. Lazan [1968] showed that
for metals, the linear damping existed for amplitudes of cyclic stresses up to 80% of the
fatigue limit, at which point the material showed both nonlinear and
stress-history-dependent damping.
For most engineering purposes, a low stress amplitude and, therefore, linear damping may
be assumed. In this case, Eqn. (3.35) may be written as
AU, = yr, f a, e, d(v, ) v,
(3.36)
where W, is the flexural damping of the skin as determined experimentally from a uniform
beam of the same material. The integral has already been evaluated as Eqn. (3.24), in which
for a sandwich beam, Eqns. (331) to (3.34) apply.
Similarly, the energy dissipation in the core is given by
AU, =JG. E. yt(a 1) d(vd (337) vc
As mentioned earlier, the assumption of negligible direct stresses in the core will lead to the
assumption of uniform shear distribution over the core cross section. Therefore, the
integration over both width and depth of the core becomes trivial, and the stress dependency
of the SDC is integrated over the length only. The experiments of Keer and Lazan [1961],

-Ch3- 39
however, showed that the linear damping mechanism was also present in the core. With this
assumption, Eqn. (3.37) may be written as
DUB = Wý 1 VC
ßn c d(vd (3.38)
where yr, is the core shear damping. The integral has already been evaluated as Eqn. (3.26)
where, for a sandwich beam, the quantity kAG will be that of the core.
The SDC of the beam is, therefore, given by
_ W, Ub+Wcu,
(3.39) Ub + U,
where Ub and U, are given by Eqns. (3.24) and (3.26) respectively. It is noted that both Ub and U,
have the square of the displacement amplitude as a factor and, therefore, V will be
independent of the amplitude of vibration.
For measuring the SDC in steady-state flexural vibration, Eqn. (3.39) may be re-written as
AU
U+U (3.40)
b U.
In Appendix (A), a method is described for measuring the energy dissipation per cycle oU ,
as well as the displacement amplitude of vibration at mid-span, thereby obtaining the values
of Ub , U, and the maximum bending stress, a�, (Eqn. (3.28)), for a given mid-span
displacement amplitude.
For a slender solid beam of the Bernoulli-Euler type, Eqn. (3.40) is reduced to
Au y! = Ub (3.41)
where ub is found following the arguments given in section 33.3. This equation may be used
for measuring the SDC of the thin skins bending on their own.

-Ch3- 40
For predicting the individual contributions of the skin and of the core to the total SDC of the
sandwich beam, Eqn. (3.39) may be rearranged as
Ws Ub Yc 11U. +
Ub + U, Ub + U, (3.42)
where the first term is the contribution to damping of the skins in bending, and the second
term is the contribution to damping of the core in shearing. In Chapter 4, a method for
measuring the core shear damping, jr, , will be described.
3.3.6 Computer implementation
The above analyses were put into computer code using FORTRAN 77. One program,
BEAM4. FOR, was written for the computation of the SDC using either the Adams-Bacon or
the Adams-Guild test rigs. Both solid as well as sandwich beam options have been
implemented. A second program, BEAM6. FOR, was written specifically for the eigen solution
of either beam.
The roots are found successively, and are first roughly located by a simple scanning of the
frequency equations ((3.17), (C. 11) (Appendix (C)) and (C. 15)), detecting the change of sign. A
sufficiently small sampling interval, found by experience, is used. In the case of the end
loaded beam, the frequency equation is discontinuous and the roots are situated at alternate
occurrence of the change of sign. Subsequent pin-point location of the root is carried out
using the secant iterative method.
On request, both programs can provide the user with a file containing a detailed description
of a data file, thereby avoiding the need for a separate 'user-guide'. A desk-top computer can
be conveniently used to run either one of the programs.

-Ch3-
3.4 Experimental verifications
41
Few explicit experimental investigations of the Timoshenko beam analysis have been
reported in the literature. Huang [1961] presented a graph of the ratio of the Timoshenko to
Bernoulli-Euler frequencies as a function of the rotary inertia for the first five modes of a
clamped-free beam. He noted that the eigen solution of a Timoshenko beam was 'highly
transcendental'. Such a frequency chart would, therefore, allow corrections to be made to the
frequencies obtained by the elementary analysis. Bert et al [1967] carried out a series of
theoretical investigations on the effect of the beam length on the fundamental frequency and
nodal locations of different sandwich beams.
Here, the Timoshenko beam equations were subjected to a series of experimental
investigations. Frequency and mode shape tests were carried out on solid as well as on
honeycomb sandwich beams. Only free-free end conditions, which are the only end
conditions applicable to this work, were considered. Both loaded as well as unloaded beams
were tested. Solid beams of two different cross sections and materials were investigated.
The specifications of the solid beams are tabulated in Table (3.1).
Table (3.1) Solid beams specifications
Material Designation m (g)
L (mm)
w (mm)
h (mm)
Duralumin ALI 257.2 600.0 12.65 12.65
Duralumin AL2 292.1 600.5 19.00 9.50
Mild steel MS 1 748.4 600.0 12.65 12.65
Mild steel MS2 858.6 600.0 19.10 9.60
where m, [., w and h are mass, length, width and thickness of the beams respectively.
The Young's modulus of the solid beams was found dynamically. First, the fundamental
frequency in flexure was found for a slender beam sample. Using the Bernoulli-Euler option

-Ch3- 42
in the program BEAM4. FOR, and hence avoiding the need for a shear correction factor at this
stage, the dynamic Young's modulus was computed according to Eqn. (3.8). It will be noted
that, for a sufficiently slender beam, the elementary and improved analysis give almost
identical results for the first frequency. The Poisson's ration, v, for aluminium and for mild
steel was assumed to be 0.35 and 0.28 respectively. The shear modulus, G, was calculated
from E=2G (1 + v). The elastic properties of the solid beams are tabulated in Table (3.2).
Table (3.2) Elastic properties of solid beams
Designation E (GPa) G (GPa)
AL1 67.34 24.94 0.35
AL2 69.88 25.88 0.35
MS 1 207.36 81.00 0.28
MS2 207.08 80.89 0.28
The sandwich beams were pre-fabricated symmetric all-aluminium beams using identical
skin, core and adhesive (Ciba-Geigy's 'Aerolam M-Board'). The specifications of the
sandwich beams are tabulated in Table (3.3).
Table (3.3) Aluminium sandwich beams specifications
Designation m (g)
L (mm)
w (mm)
c (mm)
r (mm)
cell size (mm)
2SB1-X 72.2 400.0 40.0 12.5 0.57 6.25
2SB2-X 87.2 400.0 40.0 25.0 0.57 6.25
2SB3-X 67.4 270.0 39.5 33.5 0.57 6.25
2SB4-X 120.9 400.0 40.0 50.0 0.57 6.25
where c and i are the thicknesses of the honeycomb core and the skin respectively, and cell
size refers to the diameter of the inscribed circle of the hexagonal honeycomb cell.

-Ch3- 43
No raw material was available for the skin of the sandwich beam and the manufacturer's
figure for the Young's modulus had to be used. The shear modulus of the core (Ciba-Geigy's
Aeroweb 5.2,1/4,25-3003) was found using the honeycomb shear test-rig (Chapter 4). The
shear modulus was found along the ribbon, or x, direction since this was the orientation of
the core in the sandwich beam tested. The elastic properties of the sandwich beams are
tabulated in Table (3.4).
Table (3.4) Elastic properties of sandwich beams
Designation E, (GPa) G, (GPa)
2SB1,2,3,4-X 69.0 0.285
3.4.1 Natural frequencies
The roots of the frequency Eqns. (3.17), (C. 11) (Appendix (C)) and (C. 1S) will give the
frequencies of the centrally and end loaded Timoshenko beam. The frequencies of the
unloaded beam are obtained by simply setting Mc, Me =0 in these equations.
The frequency tests were carried out to within the sensitivity of the equipments available. As
far as it was possible, the steady-state technique was used for greater accuracy. An
electrodynamic shaker was used for excitation and the amplified signal from a microphone
was fed to a voltmeter and an oscilloscope. The resonance frequency was then noted at the
maximum reading of the voltmeter. Beyond the limit of the shaker (about 5 kHz), the
transient technique was used, taking particular care to tap the sample on the centre so that
not to excite any torsional frequencies. The test set-up for the latter method is shown in
Fig. 3.3.

-Ch3-
Sig coruhtiona (B aK 2107)
signal
analyser (Saenufic-Adula
SD3$O)
microphone upping
beam
e-e
Ucn Orts
Fig. 3.3 Transient measurement of natural frequencies
44
The test procedure for the transient tests was as follows. The first 25 frequencies were
initially computed for the particular beam under test using the Timoshenko' option on the
BEAM6. FOR program, at this stage ignoring the shear correction factor (i. e. k=1). The lower
frequencies were determined without any filtration. At higher frequencies, the 'Freq.
Analysis' option on the signal conditioner was used to filter out the noise at the expected
frequency, thus giving a cleaner signal. For some range beyond the range of the signal
conditioner (20 kHz), still a reasonable signal could be gained using the 'Auto. ' option.
The frequency results are presented in Figs. 3.5 to 3.19. For the solid beams, the predicted
frequencies were obtained for a shear correction factor of 0.82. For the sandwich beams, the
frequencies were obtained for a correction factor which would predict the highest test
frequency within ±0.5% (see below). Comparison is also made with the predictions
according to the elementary theory. With negligible rotary inertia effects, this theory may be
conceived as that for a Timoshenko beam with a shear factor tending to infinity. For both
the solid as well as the sandwich beams, the frequency results with unit correction factor are
also included. These results, F(k=1) , have also been used as basis for normalising the
frequencies, F, according to the following criterion
F- F(k=1) (3.43)
F(k_1)

-Ch3- 45
As such, this quantity represents the percentage error with respect to the frequencies F(k_1).
The choice of a theoretical rather than the test frequency as the normalising basis was made
to keep any scatter in the test results within the latter. The specific choice of F(ks1) was made
on the basis of its significance as the case for 'no shear correction'. All the frequencies are
presented as functions of the mode number, the latter being the only common factor as far as
the elementary and the improved theories are concerned.
Referring to the results, generally with or without a correction factor, excellent frequency
predictions are made by the improved theory. Moreover, it can be seen that the accuracy of
predictions are maintained over the whole frequency range. Comparing the results obtained
through the two theories, the mainly shear effects which are accounted for in the improved
theory are clearly manifested at higher frequencies and in the shorter beams.
As can be seen (Figs. 3S to 3.12), in the case of the solid unloaded beams, the difference
between the predicted frequencies and the test results for either value of k is of any
significance only at the top range of frequency. However, there does not seem to be any
particular trend in the predictions regarding the two values of the shear factor. For the
square section Duralumin beam (Fig. 3.5), the k=0.82 tends to underestimate the predictions
while k=1 seems to overestimate the predictions. This trend is seen to be repeated for the
rectangular section mild steel beam (Fig. 3.8). On the other hand, for the rectangular section
Duralumin beam (Fig. 3.6) and the square section mild steel beam (Fig. 3.7), the k=1 and
k=0.82 frequencies are, respectively, seen to give very accurate predictions, although, as is
best shown in the normalised frequencies of Fig. 3.7, within each set of these two results, a
constant fluctuation between the theoretical and test frequencies occurs, a possible
indication of slight frequency dependence of the shear distribution. As expected, for the
same mode, the elementary theory leads to a higher percentage of error for the thicker,
square section beams, as these experience more shearing (cf. elementary results of Figs. 3.5
and 3.6, and of Figs. 3.7 and 3.8).

-Ch3- 46
In comparing the test results with those obtained with the two values of the shear factor, the
impression should be avoided that any one value of k is necessarily a 'better' representation
of the shear distribution. Certain assumptions have been made regarding the elastic
properties. A value for the Poisson's ratio, for example, has been assumed, and the shear
modulus has been found accordingly. Furthermore, it has been assumed that the moduli
remain independent of the frequency. A more rigourous investigation, if warranted, would
require that both moduli are found at each test frequency, and the theoretical frequencies are
found accordingly, a procedure which would bring about further complexities. Clearly then,
a limit emerges as to the capacity of the test results in accurate determination of the shear
distribution at any particular frequency.
Theoretically, the influence of the decrease in the wavelength on the second order effects
should be the same regardless of how the decrease is realised. Then, when increasing the
frequencies by progressively shortening the beam, the same trend in the predicted
frequencies should be observed regarding different values of k. However, unlike the results
of the frequency as a function of mode number, the scatter of the test results observed
regarding the frequency as a function of the beam depth/length (Figs. 3.9 to 3.12) makes the
emergence of any particular trend difficult; although in one particular case (square section
mild steel beam, Fig. 3.11), a value of unity for the shear factor gives more accurate
predictions at high frequencies. However, since the difference between the two results is
only marginal and within the range of the experimental errors, again, no firm conclusions
can be drawn.
As expected, compared to the results for the unloaded beams, there are some discrepancies
in the frequency results of the loaded solid beams (Figs. 3.13 and 3.14), more so in the case of
the end loaded beam. The discrepancies are believed to be almost entirely due to the
extraneous inertia effects. The central load on the Duralumin beam was in the shape of a
cylinder with a mass ratio to that of the beam of 0.38. This was bonded along its length

-Ch3- 47
across the width of the beam so that point-loading condition could be achieved. As can be
seen from the last few results (Fig. 3.13), the theoretical predictions generally overestimate
the frequency. However, while the overestimate is consistently larger for the symmetric
modes (Fig. 3.13(a)), it is relatively small for the anti-symmetric modes (Fig. 3.13(b)). The
reason for this seems to be due to the fact that in the latter case, the mid-span is laterally
stationary. Hence, the extraneous inertia effects brought about by any off-set between the
centre of the mass and the mid-span will be smaller for the anti-symmetric modes. It will be
noted that, neglecting the in-plane rotary inertia effects of the centre mass, the
anti-symmetric frequencies of the centrally loaded and those of the unloaded beam will be
the same since in either case the mid-span is laterally stationary. This can be verified by
comparing the anti-symmetric frequency results in Figs. 3.6 and 3.13(b). Up to the onset of the
discrepancies (mode 12, Fig. 3.13(b)), the two frequencies are found to be almost identical.
In the case of the end loaded beam, two identical cubic masses having a total mass ratio to
the beam of 0.26 were bonded to the beam at either ends with the edge of the beam
positioned half way on the cube surface (Fig. 3.4).
Fig. 3.4 End loaded beam
The results (Fig. 3.14) indicate much larger discrepancies, and are somewhat inconsistent.
There is a fluctuation of test results across the frequency spectrum, initially falling below the
predictions, before overtaking the predictions for the higher modes. Dynamically, the end
loaded beam is less stable than the centrally loaded beam because of the presence of two
loads which makes the achievement of perfect symmetry that much more difficult. To this
OF Cc STOt.
ET: GIYSEEWNýi

-Ch3- 48
must be added the difficulty in achieving point-loading at the beam end and, similarly, in
determining the effective length of the beam. At one stage it was noted that a slight
misalignment of one end load dropped the third frequency by 8% (from 594 to 545 Hz).
As is evident from Figs. 3.13 and 3.14, unlike the unloaded beams, with the loaded beams the
fundamental frequency is generally underestimated by both values of k=1 and 0.82, a likely
indication of a major difference in shear distribution, at least in the fundamental mode,
between the loaded and unloaded beams.
The shear effect is much more profound on the frequencies of the sandwich beams, as can
be seen by comparing the frequencies obtained by the elementary and the improved theories
in Figs. 3.15 to 3.19. This is, of course, due to the relative shear softness of the sandwich core.
Comparing a typical aluminium honeycomb sandwich with a solid aluminium beam, such as
2SB1-X and AL1 beams specified in section 3.4, the shear modulus of the former is some 93
times less than the latter. For the same reason, the frequencies are much more sensitive to
the shear factor, k. For example, at the highest frequency which could be attained for the
unloaded 2SB1-X beam (mode 9, Fig. 3.15), a change of k from 1.77 to 1.0 decreases the
frequency by some 25% while, in a solid beam and at a comparable frequency number, a
change of the same order in the value of k bears almost no consequence on the frequency.
As mentioned earlier, k was selected to predict the highest test frequency which could be
attained within ±0.5%. The reason for setting this criterion was based on the argument that
the higher modes are more representative of the dynamic shear distribution in the beam
since, as advocated by Goodman [1954] and Mindlin [1955], the nature of the shear
distribution is different for lower and higher frequencies owing to the inertia effects (section
2.1.1). Nonetheless, the results here indicate a remarkable accuracy of the predictions over
the entire frequency range, especially for thicker beams (Figs. 3.17 to 3.19). The persistently
close predictions may be due to the lower inertia effects of the sandwich, since these are

-Ch3- 49
primarily due to the skins, and therefore a more stable shear distribution with respect to the
frequency.
The frequencies of the centrally loaded beam (Fig. 3.16) are also accurately predicted,
although slightly more scatter of results is observed here (cf. Figs. 3.15 and 3.16).
From these results, it is clear that the assumption of unity of k due to the assumed uniformity
of transverse shear distribution over the core cross section of the sandwich cannot account
for the sandwich frequencies. The test results for the four sandwich beams varying only in
thickness of the core (Figs. 3.15 to 3.19) suggest that the value of k is sensitive to the core
thickness. In Fig. 3.20, the optimum value of k, obtained from earlier results, has been
considered as a function of the skin/core thickness ratio. These results suggest that a linear
variation of k with the ratio of skin/core thickness exists. It is of interest to note (Fig. 3.20)
that a value of 1.0 for k occurs only at infinitely small skin/core thickness ratio.
3.4.2 Mode Shapes
The stored energy in a vibrating structure at any instant depends on the shape of the
deformation of the structure at that instant. By definition, therefore, the accuracy of the
prediction, or steady-state measurement, of the SDC is directly related to the accuracy of the
function defining the mode shape.
A series of tests was conducted on the 2SB1-X sandwich beam. All the tests were carried
out in the first mode and on different lengths of the free-free beam which was supported on
cotton threads at the nodal points. The latter were detected by sensing the vibration through
a thin rod lightly held on the beam. Both unloaded and loaded beams were tested. In the
latter case, the beam was either loaded at the mid-point with the drive and pick-up coil
assembly (of 134 g mass) or loaded at the ends with the drive and pick-up magnets
(each of 40 g mass). In the case of the unloaded beams, an electrodynamic shaker was used
to excite the beam at one end, and a microphone held over the mid-point was used to detect

-Ch3- 50
and tune the resonance frequency as well as to check and maintain a constant displacement
amplitude. In the case of the loaded beams, the drive coils were used for excitation. For each
test, the beam was marked at equal intervals (10 mm) along its length and on the edge of the
upper skin. An image-shearing optical device (WISE) was used to measure the displacement
amplitude at the marked points. With the forced vibration arrangement (centrally or end
driven), steady-state vibration was maintained throughout the test duration. However, using
the shaker as a means of excitation proved to be troublesome and the current to the shaker
had to be constantly readjusted to maintain a constant amplitude of vibration. Furthermore,
only the longer beams could be tested in the unloaded or end loaded set ups. This was
because, unlike the centrally driven arrangement, in these cases the displacement amplitude
was too small to be measured with certainty. Attempts were also made to carry out tests in
the second mode, but for the same reason these proved to be futile even with the centrally
driven arrangement.
The theoretical predictions were obtained following the arguments given at the end of
section 3.3, which have been implemented in the program BEAM4. FOR. In the centrally and
end driven cases, the voltage induced in the pick-up coil was used to measure the local
displacement amplitude while, with the unloaded cases, the central displacement amplitude
was measured using the WISE. In this procedure of predicting the mode shape, it is
important to measure the single displacement amplitude accurately since, depending on the
particular mode shape, its value will to a lesser or greater extent influence the predictions.
This concept will be explained in more detail below with reference to some illustrative
examples.
The flexural mode shape (lateral displacement amplitude) results are shown in Figs. 3Z1 to
3.26. As Fig. 3.21 indicates, with the 400 mm unloaded beam no appreciable difference exists
between the predictions of the two analyses and the test results, although a slight
overestimation of the Bernoulli-Euler predictions towards the beam ends is noticeable. As is

-Ch3- 51
indicated by Fig. 3.22, the deviation of displacement amplitude according to the elementary
theory from the actual displacement amplitude is-more pronounced as the beam becomes
shorter. For the beams carrying a central load (Figs. 3.23,3.25 and 3.26), this effect is
increased even further, since the elementary (Bernoulli-Euler) analysis does not account for
the shearing of the core which increases with the shorter beams and with the beams which
carry a load. The nature of the actual deformation is illustrated even more positively in Fig.
316, where the extent of the shearing in the centrally loaded shorter beam is such that the
beam curves in, a process which is in sharp contrast to the prediction of the elementary
theory where, as expected, a convex curve is resulted through the assumption of pure
bending of the beam. The Timoshenko beam analysis on the other hand closely predicts the
mode shape. The slight deviation of the Timoshenko predictions from the actual results in
Fig. 3.26 could be either due to the underrating of the core shear modulus or the onset of a
discrepancy between the theoretical predictions and the experimental results. However,
since there is no apparent reason to question the accuracy of the measurement of the core
shear modulus it seems therefore that the latter case is true. Referring to the same figures
3.23,3.25 and 3.26, it can be seen that as the nodal lines move towards the mid-point, the
central displacement amplitude and its ratio to the end displacement amplitude decreases. In
the case of the centrally driven 200 mm beam, for example (Fig. 3.26), this ratio is of the order
of nearly 1: 10 for the experimental results. Hence, any error occurring in the measurement
of the central displacement amplitude will be magnified by 10 times when computing the
end displacement amplitude. For this reason and in the absence of the means for accurate
measurement of the central displacement amplitude for the prediction of the mode shape, it
may be advantageous to use a curve fitting procedure whereby the mode shape is computed
from a displacement amplitude which would bring the theoretical and experimental results
as close together as possible. This procedure was used by Ritchie [1973].
The mode shape results for the end loaded 400 mm beam are shown in Fig. 3.24. No
appreciable difference exists between the predictions of the elementary and the improved

-Ch3- 52
theories. The shift between the predicted and actual displacement amplitudes in the middle
portion of the beam is believed to be due to the overrating of the end displacement
amplitude from which the mode shapes were predicted. As mentioned previously, the end
loaded beams are less stable than the centrally loaded beams due to the difficulties in
achieving perfect alignment of the two end masses. The scatter of the test results in this
figure, compared to the results of the centrally driven beams, seems to have been caused by
the instability of the vibrating system.
3.5 Conclusions
On the basis of the Timoshenko beam equations, the theoretical frequencies and mode
shapes of both solid as well as sandwich beams were computed, and these were shown to
follow closely the experimental results for both loaded and unloaded free-free beams.
Certain assumptions were made in adapting the Timoshenko equations for a shear soft
sandwich beam. On the basis of the high correlation between the results, these assumptions,
within the context of the shear correction factor, seem to be justified. The particular
relevance of these equations to the shear flexible sandwich beams was clearly shown.
In the case of the solid beams, two special values for k, n2112 and 1.0, were considered. The
difference in results was found to be marginal and well within the limitations of an
experimental verification; no trend could be detected as to the superiority of one value or the
other in prediction of frequencies. With the loaded beams, both values were found to
underrate the fundamental frequency.
It was further concluded that, at least in the case of aluminium honeycomb sandwich, the
shear factor was a linear function of the relative thickness of the skin and of the core, and
that in practical situations its value was more than unity. Moreover, it was shown that for
both solid beams and aluminium sandwich beams, any deviation from the experimental
results could be attributed solely to the value chosen for the shear correction factor, k, such

-Ch3- 53
that for a 'correct' factor, the accuracy of frequency predictions was maintained over the
entire frequency range.
Owing to unnecessary complexities involved in an analytical approach to the determination
of the factor k in a sandwich beam, specially when, as in the damping tests in the present
work, the beam is to be subjected to mid-span forced vibration, an empirical approach to its
determination was suggested.
Generally, owing to shear, there is a shift of the nodal lines towards the centre of the beam
and a partial translation of the total lateral displacement amplitude into the shear rotation, a
process which was found to be closely followed by the Timoshenko theory.

54
Chapter 4
HONEYCOMB DYNAMIC SHEAR PROPERTIES
Scope - In this chapter, a device is described for measuring the dynamic shear properties,
namely dynamic modulus and the SDC, of honeycomb. Results of shear tests are then
presented and these are compared with those reported in the literature. Some of these results
will be used in a subsequent chapter.
4.1 Measurement of honeycomb dynamic shear properties
Very few works have been reported on the measurement of the honeycomb dynamic
properties in shear. The first attempt in this field seems to have been due to James and
Norris in 1958 [James, 1962]. Their work was followed by the work of Keer and Lazan
[1961]. Except for a schematic diagram, reproduced here in Fig. 4.1, no details are given of
the apparatus used in this latter work.
A
A- Accelenxnroier
C- Sandwich cam
S- Shaken movins coil
V- Velocity pickup
M1 222 M2
Fig. 4.1 Keer-Lazan honeycomb shear test-rig (After Keer and Lazan (19611)

-Ch4- 55
Evidently, the test-rig constitutes a two DOF vibrating system due to lateral anti-phase
vibration of the masses M1 and M2 (indicated by hatchings in the diagram). From their
assumption that the core damping energy was proportional to the square of the transverse
shear stress amplitude, Keer and Lazan sought to find the constant of proportionality, the so
called'core damping coefficient', . 1,, in
O, =J, T2
where
Dý=2ttWo/A,
in which wa is strain energy which, for small damping, may be assumed as equal to kinetic
energy, and therefore
WO =0S(M, x12+M2 x22),
and A, is the amplification factor at resonance, which is obtained from the frequency
band-width, ow, at 42 of the resonance amplitude according to the relationship
Al=t Ii of
where 4 is the natural frequency. Having obtained the shear modulus of the core from
G=w�z MI M2 C
- Mj+M2A
in which c and A are thickness of the core and the total area under shear respectively, they
proceed to find the total displacement amplitude of vibration by adding the deflections x,
and x2 as measured by the accelerometer and the velocity pick-up. The shear strain, and
subsequently the shear stress are found from the total deflection.
The results are presented as values of �, for a number of honeycomb core materials including
aluminium and fibreglass. Contrary to their assertion, no explicit results are presented in this
work in support of the assumption of proportionality of damping energy to the square of the
stress amplitude. In a later work, however, James [1962] presented results showing that

-Ch4- 56
linear damping mechanism existed in the case of aluminium honeycomb for a stress
amplitude up to about 140 kPa. At higher stresses, the power of the stress proportionality
increased, reaching a value of 4.5 at about 700 kPa.
The honeycomb damping results reported by these experimenters are dimensionalised with
respect to the particular samples. However, from the definition of the SDC as eu
SDC =- U
where
AU=D, and U=0S T2/G,
then the following relationship may be established between the SDC and the core damping
coefficient SDC =2 JJ G (4.1)
Nordby et a! [1965] proposed to utilise the modified Timoshenko-Huang beam equations in
order to compute the dynamic shear modulus of the core, as well as the dynamic Young's
modulus of the skin, from the fundamental natural frequency and nodal locations determined
by a single test on a sandwich specimen. To this end, they showed that the natural frequency
depends on both E and E/G, and that nodal locations depend on E/G only. Since there is
only one unique set of values of E and G which satisfy a unique value of E and the ratio
E/G, then they can both be explicitly determined. Their tests in the fundamental mode
showed that for both fibreglass skin and aluminium core, the dynamic moduli were 'the
same as' then static values.

- Ch4-
4.2 A new method for measurement of dynamic shear properties
57
In this work, a new method was used to measure the dynamic properties of the sandwich
honeycomb core in shear. The basic requirement was for an arrangement whereby the
honeycomb could be put into shear vibration with the least extraneous damping. The shear
modulus could then be computed from the natural frequency, and the SDC could be
obtained by the free-decay method or, in a steady-state test, computed from the
measurement of maximum strain energy and the damping energy per cycle, in much the
same way as in the flexural tests. The latter method offers the possibility of measuring
damping as a function of stress amplitude. The double-lap joint arrangement, described
below, proved to be adequate for this purpose.
Initially, two identical aluminium sandwich beams were bonded together on the skin and a
slot was cut through the middle section, leaving the single skin on each side (Fig. 4.2). A
length of the single skin and the honeycomb was then removed at both ends on each face,
leaving the double skin protruding out at the ends.
Fig. 4.2 Original honeycomb shear test-rig

-Ch4- 58
This arrangement is basically a double-lap joint which allows for the application of an axial
force at the ends to be--translated into mainly shearing of the honeycomb. The test piece is
symmetric about the mid-plane as well as the mid-section.
Two equal masses were clamped at either ends with a permanent U magnet attached to each
mass. Using cotton threads, the test piece was then suspended horizontally, from the end
masses, inside an aluminium frame and two coils, attached to the frame, were positioned
inside the magnets' poles. The instrumentation used was the same as that used for the
flexural test-rig (fully described in Chapter 5), with one coil driving the end mass, and the
other sensing the displacement amplitude of vibration.
Initial difficulties, not dissimilar to those reported by Bacon [1973], were experienced
concerning the pick-up signal. In developing the flexural test-rig, Bacon reported an
interference of the drive magnetic field with the pick-up signal when the drive and pick-up
coils were positioned in the same plane. The voltage across the pick-up coil is expected to
rise linearly as the frequency approaches resonance. However, Bacon observed a sharp
non-linear fall of the pick-up signal as the beam approached resonance. He attributed the
cause to the cutting of the drive magnetic flux by the pick-up coil. Since at resonance the
drive current falls to a minimum, so does the intensity of the drive coil magnetic field and
therefore any induced voltage across the pick-up coil due to the drive system. The nature of
the problem in the honeycomb shear test was somewhat different from that experienced by
Bacon in that the pick-up signal was not responsive to resonance to any appreciable extent.
The distance between the drive and pick-up points was about 15 in., some five times that in
the flexural test-rig. Moreover, the flux intensity of the permanent magnet used here was
much lower than the flux intensity of the electromagnet used in the flexural rig. These may
explain the fact that pick-up was not responsive to the changes in the drive magnetic flux.
The remedy, however, was found to be the same as that reported by Bacon. At resonance,
the pick-up coil/magnet set were rotated through 90° so that the plane of the pick-up coil

-Ch4- 59
was perpendicular to the plane of the drive coil. As the coil was rotated, the pick-up signal
intensified, reaching a maximum at 900. The most likely explanation seems to be the
sensitivity of the pick-up coil to the electromagnetic radiation from the drive coil. When the
two coils are positioned at right angles, the drive/pick-up interaction reaches a minimum
allowing the voltage induced in the pick-up by cutting the magnetic flux to prevail.
In the double-lap joint arrangement, because of the eccentricity of the forces in the
mid-plane and the outer faces, bending moments are induced which tend to distort the outer
skins specially in the middle. As a result, the skins undergo a complex cyclic deformation.
These deformations have an adverse affect in two ways. First, they are expected to increase
extraneous damping and secondly a number of frequencies are excited which make the
detection of the shear frequency that much more difficult. Clearly, a more rigid test piece
was needed. To that end, two thick Duralumin plates were stuck to the outer skins using a
thermoset adhesive. This reduced the non-shear frequencies but at the same time seemed to
have slightly increased damping, most likely due to deformation of the additional adhesive
layer.

-Ch4- 60
At this point, it was decided to fabricate the test piece from the constituent parts, replacing
the skins with thick plates. A schematic diagram of the new test piece is shown in Fig. 4.3.
200 1
iuniin
Ha
+C +
+ý
Fig. 4.3 Honeycomb shear test piece
Four honeycomb slices of equal size were cut from stock and, using a hot-press, were
adhered to Duralumin plates following the manufacturer's moulding instructions and
specifications. The same adhesive film used in the beams, was used for this purpose. Using
the sandwich beams is a simple and convenient way to fabricate the shear test piece. Also, it
has the merit that tests can be carried out on the manufacturer's end product. However, tests
on the new test piece showed that the former method was inadequate for honeycomb shear
assessment. For the same honeycomb, the SDC as measured by the second arrangement was
reduced by almost a half (from 2.1% to 1.1%). The non-shear frequencies were not totally
eliminated but compared to the shear frequency, these were of negligible amplitude. The
vibration in the poles supporting the coils was still a cause for concern. The possibility of
reducing these was explored by first placing the test piece horizontally on a solid platform
Bom
ý, ý H7 I--

-Ch4- 61
with the coils fixed to two brackets which were rigidly secured in position (Fig 4.4). With
this arrangement, the damping due to-the suspension, which at the time could not have been
assessed, would be avoided. The vibration in the coils was almost entirely eliminated but the
damping increased slightly (1.1% to 1.3%). Clearly the new source of extraneous damping
was due to the contact between the test piece and the platform. The fact that the two
overhung end masses were now imposing a bending moment of their own on the structure
could also have been a contributory factor.
Fig. 4.4 Rearrangement of the honeycomb shear test
An alternative method which would avoid the problem of overhung end masses as well as
the damping due to the vibration of the suspension was to suspend the test piece vertically
from the outer plates (Fig 4.5). A new frame was build for this purpose with particular
emphasis put on the rigidity of the coil supports. Tests on the same honeycomb sample
showed that this arrangement was a good improvement on the horizontal suspension,
reducing the SDC from 1.1% to 0.7%. All subsequent honeycomb shear tests were carried
out using this test-rig.

-Ch4-
4x adjustable suspension points
adjustable bar
pick-up
M
cotton suspension
r,
M Duralumin drive frame
I 300
Fig. 4.5 Honeycomb shear test-rig
62
The vibration system is basically a two DOF system which with a symmetrical test piece
will give two symmetric frequencies. Then, the only non-rigid-body motion is when the end
masses vibrate in opposite directions. The relative motion of the end masses was verified
experimentally by attaching an accelerometer, in turn, to the outer end of each mass and
comparing the two signals.
Some extraneous damping due to the vibration of the outer Duralumin plates is inevitable,
although this is expected to be insignificant. Generally, the outer plates are subjected to a
complex system of forces, but provided the plates are sufficiently rigid the resulting
vibrations and therefore any air-damping will be of negligible magnitude. The plates used in
the shear test piece were 1/2 in. thick Duralumin plates and as expected, it was found that the

-Ch4- 63
largest displacement amplitude was due to the flexure at the mid-section where the plate is
subjected to the maximum bending moment. However, compared to the shear displacement
amplitude this was of insignificant value (less than one tenth).
4.2.1 Analysis of honeycomb dynamic shear properties
4.2.1.1 Shear modulus
From symmetry, the mid-section is axially stationary and only one half of the test piece need
be considered, as shown in Fig 4.6. The undamped spring-mass mathematical model is shown
in the same figure, in which the two parallel springs, each of stiffness K, are subjected to
longitudinal vibration of the mass m, where M is the total mass attached at either end of the
shear test piece, including mass of the central plate.
a
c
M 126
(a) (b)
K
Fig. 4.6 Schematic representation of honeycomb shear test piece
For harmonic vibration of M, the frequency is given by
f� _, 4 (2K/M) (4.2) Zit
However, the total stiffness of the springs subjected to a force F is given as

- Ch4- 64
F 2K =- (43)
S
and the shear modulus is given by
Fc G= -- 2A 8
(4A)
where A and c are, respectively, the shear area and thickness of each honeycomb slice. Then,
the dynamic shear modulus of the honeycomb may be found from Eqns. (4.2) to (4.4) as 2n2f�2MC
(4.5) A
4.2.1.2 Steady-state shear vibration damping
The specific damping capacity of the vibrating system is given as
Au v= - (4.6)
u
where the damping energy per cycle, AU, is found from the measurement of the drive current
and the pick-up voltage, as described in Appendix (A). For small damping, the total maximum
strain energy, u, may be assumed as equal to the total maximum kinetic energy. The latter is
given as s
K. E. =M (w� S) (4.7)
where w� is the angular frequency and 6 is the peak displacement amplitude at either end,
which is obtained from the frequency of vibration and the induced voltage in the pick-up
coil (Eqn (A. 6), Appendix (A)). In Eqn. (4.7), compared to the total end masses (2xM = 2.28 kg),
the mass of the honeycomb has been neglected.
The SDC may be plotted as a function of the maximum shear stress in the honeycomb, and
the latter may be obtained from the maximum shear strain as
T,,,,, =G (S / c) (4.8)

-Ch4-
421 Honeycomb shear tests
65
A series of shear tests was carried out on aluminium (Aeroweb Type 3003) and the polymeric
based Nomex (Aeroweb Type Al) honeycomb samples with different specifications. The latter
honeycomb is described by the manufacturer (Ciba-Geigy Information sheet No. ATA 55k)
as 'high temperature resistant fibrous aramid' coated with phenolic resin. The tests were
carried out in air and at room temperature.
The basic method of manufacture of the honeycomb involves rolling glue lines onto
alternate flat sheets which are subsequently stacked, bonded to each other and then
expanded to form the honeycomb panels. The cell size is controlled by the distance between
the glue lines. Alternatively, the sheets are corrugated to form a series of half-cells, the
adhesive is applied at nodes and the sheets are stacked and bonded on the nodes. Due to the
geometry of the cells as well as the fact that the glue lines are locations of bonded
double-web junctions (also called node or ribbon) which are aligned along one direction of
the panel, a degree of orthotropy exists in the honeycomb panel.
The honeycomb density refers to the bulk density of the expanded cells and therefore
depends on both the cell size and the degree of expansion. In this work, only the
honeycombs which have been nominally expanded to regular hexagonal cells have been
considered. As such, the honeycomb density would depend on the cell size only, the latter
being defined as the diameter of the inscribed circle of the regular hexagonal cell. For the
same cell size, the variation in bulk density indicates a variation in one of, or both, thickness
and density of the honeycomb web.
The same designation system used by the manufacturer for the honeycombs is used here.
This designation is best described through the use of the following example. The
designation: Aeroweb 23,3/8,15 - 3003 refers to, respectively, a particular Aeroweb hexagonal
honeycomb of 2.3 Ibf/ft3 bulk density, 3/8 in. cell size, and made from a foil having a
thickness of 15x0.0001 in. and being an aluminium alloy of the 3003 type.

-Ch4- 66
The same basic designation system is also used for Nomex honeycombs, although metric
units are used here. The Nomex honeycombs are distinguishable from the aluminium ones
by the presence of the characters Al in their designation as in Aeroweb A1,50,6 which refers to
an Aeroweb Al type honeycomb (Nomex) with hexagonal cells having a bulk density of 50
kg/m3 and a cell size of 6 mm. It is also noted that, unlike aluminium honeycomb, the
thickness of the web is absent from the designation of the Nomex honeycombs, although
these are quoted in the manufacturer's brochures.
Preparation of each shear test piece involved cutting four small slices of honeycomb and
eight pieces of adhesive film (Redux 609) of the same size. These were then assembled onto
the Duralumin plates, which had already been degreased with acetone, to form the shear test
piece (Fig. 43). The test piece was placed in the pre-heated press and cured at 120° C
temperature and under about 5 kN force for one hour.
To avoid distorting the honeycomb geometry and specially crushing the cells, all the
honeycomb samples were cut cell by cell using a pair of scissors. As far as possible,
symmetry in each slice was maintained by cutting along the same row of cells. This was
easily achievable with the well regulated and more resilient Nomex cells but not always
possible with aluminium honeycombs which are very malleable.
Altogether, nine different types of aluminium and Nomex honeycombs were subjected to
steady-state shear vibration tests, and the shear modulus and the SDC were computed. In
some cases, the degree of orthotropy in the honeycomb was determined by measuring the
shear properties across as well as along the ribbon direction. In one case, different
thicknesses of the same specimen were subjected to shear tests. The specimens tested were
as follows

- Ch4-
1- Aeroweb 2.3,3/8,15 - 3003 2- Aeroweb 3.4,1/4,15 - 3003 3- Aeroweb 5.2,1/4,25 - 3003 4- Aeroweb A1,29,3 5- Aeroweb A1,48,3 6- Aeroweb A 1,50,6 7- Aeroweb A1,64,3 8- Aeroweb A1,64,5 9- Aeroweb A1,96,3
67
The tests were carried out in air, and at room temperature. The frequencies for the
aluminium honeycombs fell in the range 1000 to 2500 Hz, and for the Nomex honeycomb in
the range 700 to 1500 Hz.
For each test, the shear frequency was verified using an accelerometer as described earlier.
The test was carried out by noting the pick-up voltage at a number of drive currents, as the
latter was increased.
4.21.1 Edge effects
So far, the assumption has been made that the honeycomb in the double-lap test piece is
subject to shear stresses only. This, however, is not entirely true. As mentioned previously,
because of the eccentricity of forces applied to the honeycomb, bending moments will be
induced which, because of the symmetry of the test piece, will have zero global effect, but
nonetheless tend to distort the honeycomb locally in a non-shear manner. The edge near the
central loading point (Fig. 4.7(a)) is subjected to tensile stresses, while the edge further from
this point is subjected to compressive stresses [Adams and Wake, 1984].

-Ch4-
LW L'Qb
compression s shear
1 5:: ýj
j
L-i L-i tension vv
C M its
(a) (b)
Fig. 4.7 Schematic honeycomb edge effects a) Bending moments and, transverse and shear stress distribution, b) Extreme case
of edge effects
68
Similarly, the magnitude of the stresses developed at the edges will be different from those
in the honeycomb slices. In their extensive treatment of the lap joint employed in adhesive
testing, Adams and Wake [1984] present results from finite element stress analysis, based on
which they conclude that stress concentration at the edge is 'at least 10 times the applied
shear stress on the joint'.
Because honeycomb is basically a structure, the stress distribution in honeycomb cells is
less uniform than in an otherwise solid material, and the stress concentration is expected to
be more severe at and near the edge. Furthermore, the geometry of the cells and whether or
not these are complete structures at the edge, will play a significant role in the extent of
stress concentrations. These stress concentrations in the honeycomb will generally cause the
damping to become increasingly non-linear [Keer and Lazan, 1961].

-Ch4- 69
In an attempt to assess the significance of these 'edge effects' in the double-lap honeycomb
shear test piece, a series of tests was carried out on aluminium honeycomb with a cell size of
3/8 in., this being the largest cell size used in a sandwich configuration in the present work.
The honeycomb, in the shape of the double-lap joint, was progressively sliced through
symmetrically at both ends and along the length of the test piece. For each reduced shear
area so obtained, the test piece was subjected to the shear test. The shear modulus and SDC
were then calculated and plotted against the normalised shear area (Fig. 4.8).
As the figure indicates, with the present total shear area in the double-lap test piece
(4x(9lmmx62mm)), the edge effects are small in the computation of modulus. For a reduction
of up to 60% or so in the shear area, the computed modulus remains independent of the
variation in the area, while from about 60% to 80% the increase in the computed shear
modulus is relatively slight. This tends to suggest a fairly uniform shear stress distribution
over the length, as has been suggested in Fig. 4.7(a). The sudden upsurge of the computed
shear modulus for the lowest 'shear' area (about 93% reduction in the original shear area)
seems to be due to a sharp increase in the relative stiffness owing to, it is suggested, a
change of mode from a predominantly shear deformation for a sufficiently large number of
honeycomb cells (Fig. 4.7(a)), to a deformation comparable to that caused by the lateral
deflection of a fixed-fixed beam (Fig. 4.7(b)).
The SDC results, however, indicate that eliminating the non-linear damping is somewhat
more difficult. The relatively low rate at which the damping approaches linearity (Fig. 4.8)
may be explained by the fact that, there will always be stress concentrations in the outer
honeycomb webs at the edges regardless of the shear area, especially if these are not parts of
a complete cell structure. Nonetheless, the trend of the damping results seems to suggest
that, for this particular cell size, the present total shear area of the test piece is the minimum
area required in order to make any non-linear damping due to edge effects insignificant. As
the largest cell size, together with the highest modulus, present the worst case for edge

-Ch4- 70
effects, it may therefore be safely assumed that the latter is effectively eliminated on both
counts of modulus and the SDC in aluminium and Nomex honeycombs with smaller cells.
4.2.2.2 Test results
Results of tests on aluminium and Nomex honeycombs are presented in Figs. 4.9 to 4.11, and
4.12 to 4.16 respectively.
The aluminium honeycomb Aeroweb 2.3,3/8,15-3003 (Fig. 4.9) is almost exactly the same
sample as one tested by James [1962, Table 3, second sample], save for the lower foil
thickness of the former (0.0015 and 0.002 in. ). His figures for the SDC, after the necessary
conversion through Eqn. (4.1), are 1.8% along and 5.6% across the ribbon direction.
Compared to 0.7% in both cases as found in the present work, James' figures are
considerably higher, especially in the cross-ribbon direction where the above figure for
aluminium honeycomb is unrealistic. However, unlike the expanded samples used here, his
honeycomb sample was corrugated and this may, at least partially, account for the difference
between the two sets of results. James could not find a convincing explanation for the
unexpectedly high damping result in the cross-ribbon direction, including possible increased
extraneous damping in the apparatus owing to 'more compliant' orientation, and the cause
remained 'obscure'.
Tests by Keer and Lazan [1961] on the other hand, showed slightly higher damping along
than across the ribbon direction (1.88% and 1.60% SDC respectively). Generally, the
aluminium cross-ribbon damping results are somewhat erratic and unpredictable. Both Fig.
4.9 and particularly Fig. 4.10 indicate non-linear damping in this direction, possibly due to
one or both friction damping caused by imperfect bonding in the nodes and stress
concentration owing to misalignment of a number of honeycomb cells. However, as is
evident from Figs. 4.9 and 4.11 there is no or very little difference in the low stress damping
when stressing the honeycomb along and across the ribbon direction. All other factors being

-Ch4- 71
the same, it is believed that the significant difference observed in Fig. 4.10, and possibly also
the difference in the James' results, could well be due to an unsound specimen.
The ribbon-direction modulus of the above named honeycomb is some 30% lower than the
figure reported by James (141 and 206 MPa), although this difference should be considered
against a 25% lower density. The cross-ribbon modulus is only slightly lower (98 and 103
MPa).
A similar honeycomb to Aw 5.2,1/4,25 (Fig. 4.11) was tested by Nordby et al [1965, Table 1]
through the above mentioned procedure (section 4.1), and the shear modulus, measured
along the ribbon, agrees well with the value found here (281 and 285 MPa respectively),
although the latter value is some 35% lower than the manufacturer's quoted figure (440 MPa,
Ciba-Geigy Publication No. LGC 35c). This is a considerable difference and cannot be
readily accounted for by such factors as, for example, misalignment of the honeycomb cells.
It should, however, be pointed out that the manufacturer's figure is the result obtained by a
different test-method, namely, the three-point bending test (a full description of this test is
given by Teti and Caprino [1989]).
The damping results for different Nomex samples (Figs. 4.12 to 4.16) indicate a low amplitude
sensitivity of the SDC. In the case of the A 1,48,3 Nomex (Fig. 4.13) for example, a rise of the
SDC of the order of 3% is observed before the latter becomes constant with the amplitude.
Whether this low amplitude non-linearity is indeed the damping characteristic of the
honeycomb Nomex material, or whether it has been caused by such external factors as the
low sensitivity of the pick-up voltmeter at lower frequencies, is difficult to determine with
certainty. However, as will be seen later (Chapter 6), the practical level of the shear stress in
the sandwich honeycomb is well above the limit of non-linearity observed here. For that
reason, in using the damping data of the Nomex honeycombs in subsequent computations,
the apparent non-linear lower regions of these graphs have been ignored.

-Ch4- 72
The damping results for the Nomex honeycombs (Figs. 4.12 to 4.17) further indicate that,
similar to aluminium, the orthotropy of the honeycomb structure does not affect damping to
any appreciable extent. Moreover, referring to the same results, and in particular to Figs. 4.15
and 4.17, it may be concluded that neither the honeycomb density nor the cell size is a
determining factor in the damping of the Nomex honeycomb. In short, whatever the
specifications, Nomex honeycombs posses a high damping level (about 10% to 12% SDC)
and any variation in the damping between different specimens, or due to the orthotropy of
the honeycomb, will be relatively marginal.
In Fig. 4.17 the variation of shear properties with density for the same cell size are shown.
The manufacturer's quoted results are also included (Ciba-Geigy Information Sheet No.
ATA 55k; the cell size is not specified for the "Typical' results). As can be seen, evaluation
of moduli of the Nomex honeycombs agrees reasonably well with the manufacturer's figures
for most parts, the major difference being in the modulus of the 96 kg/m' Nomex honeycomb
which is seen to be some 30% lower (70 and 100 MPa). However, too few experimental
results and the scatter observed make it difficult to find with certainty any particular trend
from the present results, although it would be safe to assume that, at least initially, the
modulus increases linearly with density. More tests are needed for a conclusive verification.
Benjamin [1969] quotes static shear modulus versus density test results for glass cloth
honeycomb, showing that the modulus could vary by about 20% from an expected linear
mean 'depending upon the resin used, the dimensions of the honeycomb, etc'.
4.2.3 Conclusions
The double-lap shear test piece is an effective arrangement for measuring the dynamic
properties of honeycomb in shear. Compared to flexural tests, fewer sources of extraneous
damping are present in this configuration. Main sources of energy loss are friction at the
points of attachment of the end masses to the test piece, and the energy transmission from

-Ch4- 73
the drive unit to the frame. However, these sources of extraneous damping would be of any
significance only when testing low damping materials such as aluminium honeycomb.
Preparation of the test piece is a somewhat lengthy and laborious procedure, but the method
should ensure minimum extraneous damping. This is testified by measuring a SDC of 0.7%
for aluminium honeycomb in shear, by far the lowest figure reported for a comparable
sample in the literature.
There is still some room for modification of the test-rig from its present state. In particular, a
frame rigid enough to evade the expected frequencies of the honeycomb is warranted.
Otherwise, due care should be taken in interpreting the system response to excitation.
The test results clearly show that a sound honeycomb sample experiences linear damping at
low stress amplitudes. Furthermore, the orthotropy of both aluminium and Nomex
honeycombs is manifested only in the considerable difference in the shear moduli; there is
little difference, if any, between the low stress damping of the shear vibration along the two
principal directions. Results not conforming to these trends, should be treated as the
characteristics of the particular sample under test.

74
Chapter 5
THE STEADY-STATE FLEXURAL DAMPING TEST
Scope - In this chapter, the centrally driven test-rig, suitable for measuring the SDC of beams
in steady-state flexural vibration, is described. Test results are presented showing that in
most cases, the extraneous energy losses are well within the tolerances of the results for the
materials tested in this work.
Both in-air and in-vacuo damping of all-aluminium sandwich beams will also be considered.
5.1 The test-method
The test-method used here is originally due to Adams el al [1969]. Later improvements of
the apparatus were carried out by Bacon [1973] who gives a full description of the
development of the test-rig. However, Bacon's test-rig was inadequate for this work. Having
been designed for testing slender composite beams, it was too small and ineffectual for the
relatively larger and stiffer sandwich beams. Consequently, based on the original design, a
larger apparatus, incorporating a more powerful drive system, had to be utilised.
The basic principles of the test are given below. The theory behind the test is given in
Appendix (A). The computation of the SDC for the slender beams tested here is based on
Eqn. (3.41).
Basically, the test involves suspending a uniform beam horizontally at its nodal points so
that free-free boundary conditions are achieved at the beam ends. Then, the beam is excited
at one of its flexural natural frequencies (usually the fundamental frequency) and the input
energy per cycle and the lateral displacement amplitude of the steady-state vibration
measured.

-Ch5- 75
The means of excitation and displacement measurement are by two flat coils of wire, the
planes of which are mutually perpendicular (Fig. 5.1(a)). The coil assembly incorporates a
clamping arrangement and is secured at the mid-span of the beam with the coils positioned
on opposite faces. Each coil can move freely in the gap of a U-magnet cutting the magnetic
flux at right angles. The gaps are deliberately narrowed in order to intensify the flux and to
keep the lines of flux straight, while the mutually perpendicular arrangement of the two coils
is intended to minimise, if not quite eliminate,. the interference of the drive magnetic flux
with the pick-up coil (the pick-up flux from a relatively small permanent U-magnet, is too
weak to have had any detectable effect on the drive coil).
In constructing the coil assembly, consideration should be given to the lightness and to the
choice of material which should be ferrous-free. Aluminium adequately satisfies both
requirements and was, therefore, used for the coil assembly. Excess material was removed
by drilling holes in the clamping beams and the coil yoke, while maintaining symmetry
(Fig. 5.1(a)).
In the test set-up used (Fig. 5.1(b)), the initial steady-state sine-wave is supplied by a signal
generator which also provides the means to adjust and read, digitally, the frequency to
within one millionth of a Hertz. The signal is amplified to the required level and is fed to the
drive coil which interacts with the magnetic flux of the drive magnet to induce a magnetic
force proportional to the drive current. This causes the beam to vibrate at the frequency of
the initial signal. At the same time, the cutting by the pick-up coil of the magnetic flux of
the pick-up magnet will induce a voltage across this coil which is proportional to the
velocity of vibration. A digital ammeter in the drive circuit is used to read the current
supplied to the drive coil and a digital voltmeter is used to read the voltage across the
pick-up coil. Both drive and pick-up signals are monitored on the oscilloscope, the latter
signal after being conditioned through the signal conditioner.

pick-up
B~ pick-up coil permanent magnet
Cotton
suspension
beam
nodal line J
OOOÖÖ drive electromagnets
""..............:
drive coil
drive magnet (not shown) (a)
signal generator & digital frequency read-out power
amplifier digital ammeter (HP 3325A) ý (B &K 2706) (Solarfron 7045) 40.
A NMI
I
signal
conditioner
(BJkK2107) two-channel
oscilloscope (Teiequipmere D1 6a) 1digital voltmeter
(Soloman 7045) yýý B
C 12 volts
stepped down 12 volt DC supply car ammeter
battery rheostat (MEGGER)
(b)
Fig. 5.1 Flexural test-rig
a) centrally-loaded coil, b) drive, pick-up & electromagnet circuitary

-Ch5- 76
An electromagnet, capable of taking a current of up to 8 A, was used in the drive system. A
3A current, however, was found to be adequate which, with a maximum allowable rms
drive current of 1.5 A, provides a cyclic force of about 0.9 N amplitude (see Appendix (A)).
The D. C. current supplied to the electromagnet had to be kept constant during the test
period, and this was achieved by connecting a car battery across the stepped-down D. C.
supply, with the battery in effect acting as an electric buffer for any fluctuation in the
current. A rheostat in series with an ammeter were used to adjust and monitor the current.
The drive and pick-up coil/magnet pair had to be calibrated and re-calibrated from time to
time. The details of the calibration method are given in Appendix (A).
Measuring the current input to the drive coil will provide the means to compute the energy
needed to maintain the vibration at a steady-state and will, therefore, give a measure of the
energy dissipation. At the same time, by measuring the induced voltage across the pick-up
coil, the displacement amplitude of vibration at the centre of the beam may be computed.
When the displacement amplitude is known, the strain energy of the beam or the kinetic
energy of the vibrating system can then be computed.
5.2 Extraneous damping
Provided it can be shown that the energy dissipation mentioned above is limited to the
specimen, then this energy would represent the damping energy of the specimen, or in a
more general term, the 'material damping'. Otherwise, the experimenter should verify that
the extraneous damping energies are sufficiently small not to impair the measurement of the
overall damping of the specimen.
In practice, losses occur due to interaction between the material under test and its
environment. Generalisations of the chief sources of extraneous damping have been made
[I, azan, 1960] as structural (interfaces with the vibrating system), hydro-mechanical (e. g. air
damping) and electro-mechanical (eddy currents and magnetic hysteresis).

-Ch5- 77
All the flexural tests in this work were carried out using the free-free resonant test method.
With the free-free end conditions, the extraneous damping introduced due to an otherwise
clamped specimen will be avoided.
Air damping is caused by the cyclic flow of air particles due to lateral pressure difference
induced by the vibrating system. As such, air damping would be expected to be a function of
the dimensions of the vibrating system, frequency and amplitude of vibration as well as the
viscosity and density of the air. Bacon [1973] distinguished the lower, amplitude
independent, and upper regions of the SDC versus Amplitude graph as 'viscous' and 'inertia'
effects respectively, associated with lower and higher Reynolds numbers. His attempts,
however, for predicting the air damping proved futile, leading him to the conclusion that'the
only satisfactory way' would be to test in-vacuo.
At low displacement amplitudes, air damping remains constant with amplitude.
Furthermore, air damping is known to be more amplitude dependent in the clamped-free
than free-free vibrations [Soovere and Drake, 1985]. Hence, strictly speaking, if it is
intended to measure the damping as, for example, a means of material assessment, then the
material should be tested in a vacuum. Otherwise, the beam should be tested in the free-free
condition and only the test-results at the lower amplitudes should be considered. No such
general statements, however, may be made as regards to the frequency of vibration and the
relative dimensions of the specimen since, all other factors being the same, these only vary
in inverse proportion to one another.
Another source of energy loss is the friction caused between the specimen and the points of
attachment of the coil assembly to the beam. The beam is secured between two thin silver
steel rods cemented in V-grooves which are cut on the surfaces of the clamping beams, the
latter forming an integral part of the coil retaining yoke (Fig. 5.1(a)). At first, it would seem
best to secure the coil assembly on two points across the beam and on the neutral axis where
no straining occurs. However, any gain in so doing should be weighed against the practical

-Ch5- 78
difficulties in maintaining the stability of the coil assembly during the vibration and on the
method of point-attachment if a new source of friction damping is to be avoided. The
clamping arrangement was consequently used.
The suspension mechanism brings about another source of energy loss which is more
difficult to resolve. The beam rests on its lower face at two nodal points on two pieces of
cotton string which are attached to the supporting structure. Here, the energy losses are
caused in mainly two ways, one friction between the beam and the supporting string in
much the same way as the clamping arrangement mentioned above, and the other by
vibration transmission via the suspension to the supporting structure. Again, an effective
remedy to reduce losses in the suspension mechanism would seem to be to position the
supports on the neutral axis of the beam, but, as mentioned previously, this method would
impose practical difficulties. The vibration of the suspension strings, however, cannot be
eliminated regardless of where the supports are located, because the nodal cross-sections
have a longitudinal vibration.
5.2.1 Assessment of extraneous damping
Before carrying out the flexural tests, it was necessary to ensure that the contribution of
extraneous damping to the overall damping was insignificant. To this end, tests were carried
out on slender Duralumin beams. Aluminium is known to have a very low damping level;
figures as low as 0.002% for the in-vacuo SDC of Duralumin in torsion have been reported
[Cottell et al, 1948]. Duralumin has been frequently used as a reference material in the
assessment of background damping [Adams et al, 1969; Bacon, 1973; Adams and Bacon,
1973-a; Guild and Adams, 1981 etc. ], where the material damping of the beam, as compared
to the background damping, has been assumed to be negligible. In the ensuing discussions,
this assumption has been maintained. The frequencies of tests on Duralumin beams fell in
the range 70 to 80 Hz.

-Ch5-
5.2.1.1 Air damping
79
Air damping may be accounted for by testing in a partial vacuum. A specially designed
vacuum chamber, originally due to Bacon [1973], was available for this purpose. The
in-vacuo tests were carried out under the minimum air pressure which could be achieved, and
this was recorded to be about 1 kPa or 1% of the atmospheric pressure. This is believed to
be a good enough vacuum for effectively removing air damping.
In Fig. 5.2, the results of the in-air and in-vacuo tests on the same Duralumin beam are shown.
From this figure it is noted that the in-vacuo damping remains almost constant at about
0.15%, a figure which agrees with previous results [Bacon, 1973, Fig. 8]. The in-air results
indicate the initial invariability of the SDC with amplitude, and the increase of the SDC at
higher amplitudes, attributed to air damping, is seen to be linear. Extrapolation of the two
curves to zero displacement amplitude suggests a difference of about 0.04% SDC between
the Duralumin beam in-air and in-vacuo . This is believed to be partly due to aerodynamic
losses but mainly due to the damping caused on the beam surface under hydrostatic stresses.
For this particular test, therefore, this figure represents low amplitude air damping.
Generalisation to other materials, however, is not possible since the low amplitude air
damping would depend on the material under test.
Air damping is proportional to the size of the vibrating system. The new and larger coil
assembly was compared with Bacon's coil as regards to air damping. The results of the tests
on the same Duralumin beam are presented in Fig. 5.3. From the in-air results in this figure, it
is noted that using a larger coil would indicate a larger SDC than a smaller coil, significantly
more so at higher amplitudes. At lower amplitudes, however, the difference is within 0.02%
SDC, a portion of which (about 0.01%) is believed to be due to a higher friction damping
inherent in the larger coil, as indicated by the in-vacuo results.
-Ch5-
5.2.1.2 Friction damping
80
Compared with the quoted figure of 0.002%-0.02% for Duralumin [Cottell et al, 1948], a
SDC of 0.15%, as indicated by the in-vacuo results of Fig. 5.2, suggests that the major
proportion of the in-air damping at low amplitude is due to the friction caused at the
clamping lines and to the suspension mechanism. Induction of eddy currents in the coil
assembly owing to radiation from the coils is possibly another contributory factor [Bacon,
1973], although compared to the two former sources, these are believed to be of little effect.
For stability reasons, the coil assembly originally incorporated a 3-line clamping
arrangement whereby the beam could be clamped between two silver steel rods on the upper
surface and one rod, positioned between the two upper rods, on the lower surface. This was
modified to a 2-line clamping with one upper and one lower rod positioned immediately
opposite each other. Careful and even tightening of the coil assembly to the beam proved
that the stability was not compromised in the latter arrangement. In Fig. 5.4 the in-air and
in-vacuo results of the two arrangements are compared. This figure clearly shows the
increase in the SDC due to the friction caused at the extra clamping line. The results indicate
that, at lower amplitudes, the difference in damping of the 2 and 3-line clamping is almost
the same (a SDC of about 0.02%) for the in-air and in-vacuo tests, although at about a
displacement amplitude of 0.35 mm an increase in both cases occurs, but remains constant
for higher amplitudes. The constant difference in damping due to the extra clamping line is
in support of the proposition that friction damping is independent of sliding velocity and
depends only on the number of friction points [Soovere and Drake, 1985].
The losses due to the clamping of the coil to the specimen may be accounted for by using
the Guild and Adams [1981] test-method. In this arrangement, two small U-magnets are
bonded to the beam at either end and are positioned in suspension on top of two small coils
which act as the drive and the pick-up coils. Hence, the friction damping which is otherwise
encountered in the clamping of the coil to the beam will be avoided, although some energy

-Ch5- 81
losses may occur at the points of attachment of the magnets to the beam due to the straining
of the adhesive layer. However, being located at the beam ends, strains are minimal, and
energy losses can be reduced further by using the least amount of adhesive necessary.
Using the end driven technique, the in-vacuo SDC of the Duralumin beam was found by the
free-decay method. Free-decay tests were also carried out on the centrally driven beam
in-vacuo. In each case, the test was repeated three times and, using the error criterion
analogous to Eqn. (3.43), it was found that within a tolerance of ±0.01% a good consistency
existed in each set of results. The SDC of the centrally driven beam was found to be 0.135%
(cf. 0.15% found in steady-state) while for the end driven beam it was recorded as 0.053%.
A major proportion of the latter figure should, therefore, represent a measure of the damping
due to the suspension as well as any energy losses at the points of adhesion of the end
magnets to the beam. This figure agrees with a value of 0.05% suggested by Adams et al
[1969] although they used foam knife edges for supporting the beam, a method which, when
compared to cotton suspension, is known to impart more damping on the system [James,
1962; Bacon, 1973]. The difference between the results obtained using the centrally and end
driven methods, amounting to a SDC of about 0.08%, is believed to indicate the order of the
friction damping at the clamping lines using the centrally driven method.
53 Damping of aluminium sandwich beams
At this point, it is appropriate to consider the damping of all-aluminium sandwich beams
which exhibit a low level of damping. In so doing, the application of Timoshenko's modified
equations for steady-state damping measurement will also be considered.
Three thicknesses of pre-fabricated all-aluminium sandwich beams (Ciba-Geigy's Aerolam
M-board) were subjected to both in-air and in-vacuo steady-state damping tests, using the
centrally driven arrangement. The damping of the sandwich with respect to the orthotropic

-Ch5- 82
properties of the core were also considered. The results are presented in Figs. 5.5 to 5.7. The
frequencies of tests on sandwich beams fell in the range 400 to 1200 Hz.
Also included in these figures are the free-decay (FD) results, obtained from the decay of
the lowest displacement amplitude of the steady-state tests. The free-decay results are the
average of results of three tests, although 'for the most part they were noted to be fairly
consistent.
The beams, 2SB1,2,4, were all of dimensions 400 mm length x 40 mm width, and 0.57 mm
skin thickness, as previously tabulated in Table (3.3); the core was Aeroweb 5.2,1/4,25-3003,
the dynamic shear properties of which were already presented in Fig. 4.11.
Computation of the SDC in steady-state flexural vibration was based on Eqn. (3.41), and the
computation of the maximum stress in the skins was based on Eqn. (3.28). As mentioned
previously (section 3.4), no raw material was available for the skins and no prediction of the
sandwich damping could be made from the damping properties of the constituent parts.
In Fig. 5.5, the damping results of the 1/2 in. beam are shown. The shear correction factor, k,
was found so that the test frequency was accurately predicted (within ±0.5%), as advocated
previously (3.3.4). Also included in this figure are the results for a unit factor, as well as for a
factor tending to infinity (Bernoulli-Euler beam).
The in-air results (Fig. 5.5) generally show the trend observed earlier for the Duralumin
beam, i. e., a constant initial damping with respect to the stress amplitude, followed by an
increase in damping. However, unlike the Duralumin beam (Fig. 5.2), the in-vacuo damping
results show an increase with stress amplitude, which can be seen to happen even at
comparable stress levels (cf. Figs. 51,5.6 and 5.7). For the thicker beams (Figs. 5.6 and 5.7), an
unexpected rapid change is noticed in the SDC of the low stress region of the in-vacuo tests.
This apparent upsurge of the SDC cannot be explained, although it is also noted that the

-Ch5- 83
free-decay results are generally higher than is indicated by steady-state results at these low
stress regions.
The in-vacuo results in Fig. 5.5 indicate a low stress damping of aluminium sandwich of
0.25%. Assuming the extraneous dampings are of about 0.15%, the in-vacuo SDC of the
aluminium sandwich will be roughly of the order of 0.1%.
The SDC was read off at 1 MPa skin maximum stress from Figs. 5.5 to 5.7, and was plotted
against the core thickness in Fig. 5.8. From this latter figure, it is clear that at low level stress,
both in-air and in-vacuo SDC of the beam increases with the core thickness. The similarity of
the trends in the in-air and in-vacuo results tends to rule out the influence of aerodynamic
damping, which is only to be expected since these are negligible at low amplitudes.
Moreover, since at the same skin stress, the core shear stress subsides with the increase in
the core thickness, the possibility of the influence of any non-linear damping in the core on
the observed increase in the SDC also seems to be an unlikely cause.
In fact, the increase in the SDC with the core thickness follows the mechanism by which the
sandwich constituent parts contribute to the overall damping. Both the bending and shearing
energies increase with the sandwich thickness. However, as is shown in Fig. 5.8, the rate of
increase of the shearing energy (U) is more than that of the bending energy (Ub), which
means that the skin contribution to damping falls and that of the core rises with the core
thickness (Eqns. (3.23)). Since the strain energy in bending is the dominant of the two, this in
turn implies that the rise in the core contribution to the overall damping is proportionally
more than the fall in the skin contribution, resulting in a net gain in overall damping. This
process will be considered again in the next chapter (section 6.7.2.2), with reference to actual
skin and core damping contribution.
In measuring the damping of the sandwich by the forced resonance method described above,
the main result of not allowing for shearing of the core (Bernoulli-Euler beam) is to not

-Ch5- 84
account for strain energy in shearing of the core. Moreover, the computed strain energy in
bending of the skin is also overestimated. In Fig. 5.9, the bending and shearing energies of
the X-oriented 1/2 in. thick sandwich beam have been plotted against the central
displacement amplitude. The bending energy of the beam obtained by the elementary
(Bemoulli-Euller) analysis is also included in this figure. When shear is ignored, the
elementary theory attributes all the central deflection to the direct strain in the skin and
therefore, a rise in the strain energy of bending compared to the same energy in the
sandwich will result. As the figure shows, this theory increasingly overrates the total energy
of the beam with amplitude and therefore, as is indicated in Fig. 5.5, underrates the damping.
However, provided the core strain energy is substantially lower than that of the skin, the
difference in measured damping at low amplitudes will be relatively small. For the same
reason, any correction for shear, will also have marginal effect on the measured damping
(Fig. 5.5).
Generally, good agreement is seen to exist between the free-decay damping results and
those measured in the steady-state, the only exceptions being the in-vacuo results of the 1
and 2 in. thick beams (Figs. 5.6 and 5.7), as mentioned previously.
The cross-ribbon (Y) damping results also follow the trend shown by the results in the
ribbon (X) direction, although as observed in the double-lap shear tests, they are generally
slightly higher (Fig. 5.8).
5.4 Conclusions
The centrally driven system described above offers an adequate method for determining the
SDC in free-free steady-state vibration. Compared to the end driven method, the system is
more stable, the loading points are better defined, and the rotary inertia is limited to the
specimen, making the steady-state damping analysis and tests that much more reliable. One

-ChS- 85
drawback, inevitably, is the fact that it involves more extraneous damping, roughly by a
factor of 3 to 1.
At low amplitudes, friction-damping is the major contributor to the overall extraneous
damping, surpassing the air damping by a factor of about 4 to 1. Nonetheless, the overall
extraneous damping of the centrally driven system used in this work, is within a SDC of
0.2%, a figure which should be taken into account when measuring the properties of lightly
damped materials, such as unidirectional composites or aluminium sandwich beams, but is
low enough to be discarded for most other cases.
In the absence of air damping, the extraneous damping in the centrally driven system
amounts to a maximum SDC of about 0.15%. Roughly 2/3 of this figure results from the
friction at the clamping points where the coil assembly is secured to the mid-span of the
beam. The remaining 1/3 may be attributed to friction and the vibration transmission in the
suspension arrangement.
Testing all-aluminium sandwich beams, the steady-state damping results were found to be in
good agreement with those obtained by the free-decay of the resonant amplitude. Depending
on the sandwich thickness, the in-vacuo damping of all-aluminium sandwich beams was
found to be in the range of 0.25% to 0.55% SDC, including the extraneous damping. Due to
the fact that strain energy in bending of the sandwich skin was the dominant contributor to
the total strain energy of the beam, no appreciable difference in damping measurement
resulted from considering a shear correction factor, especially at low amplitudes of
vibration.
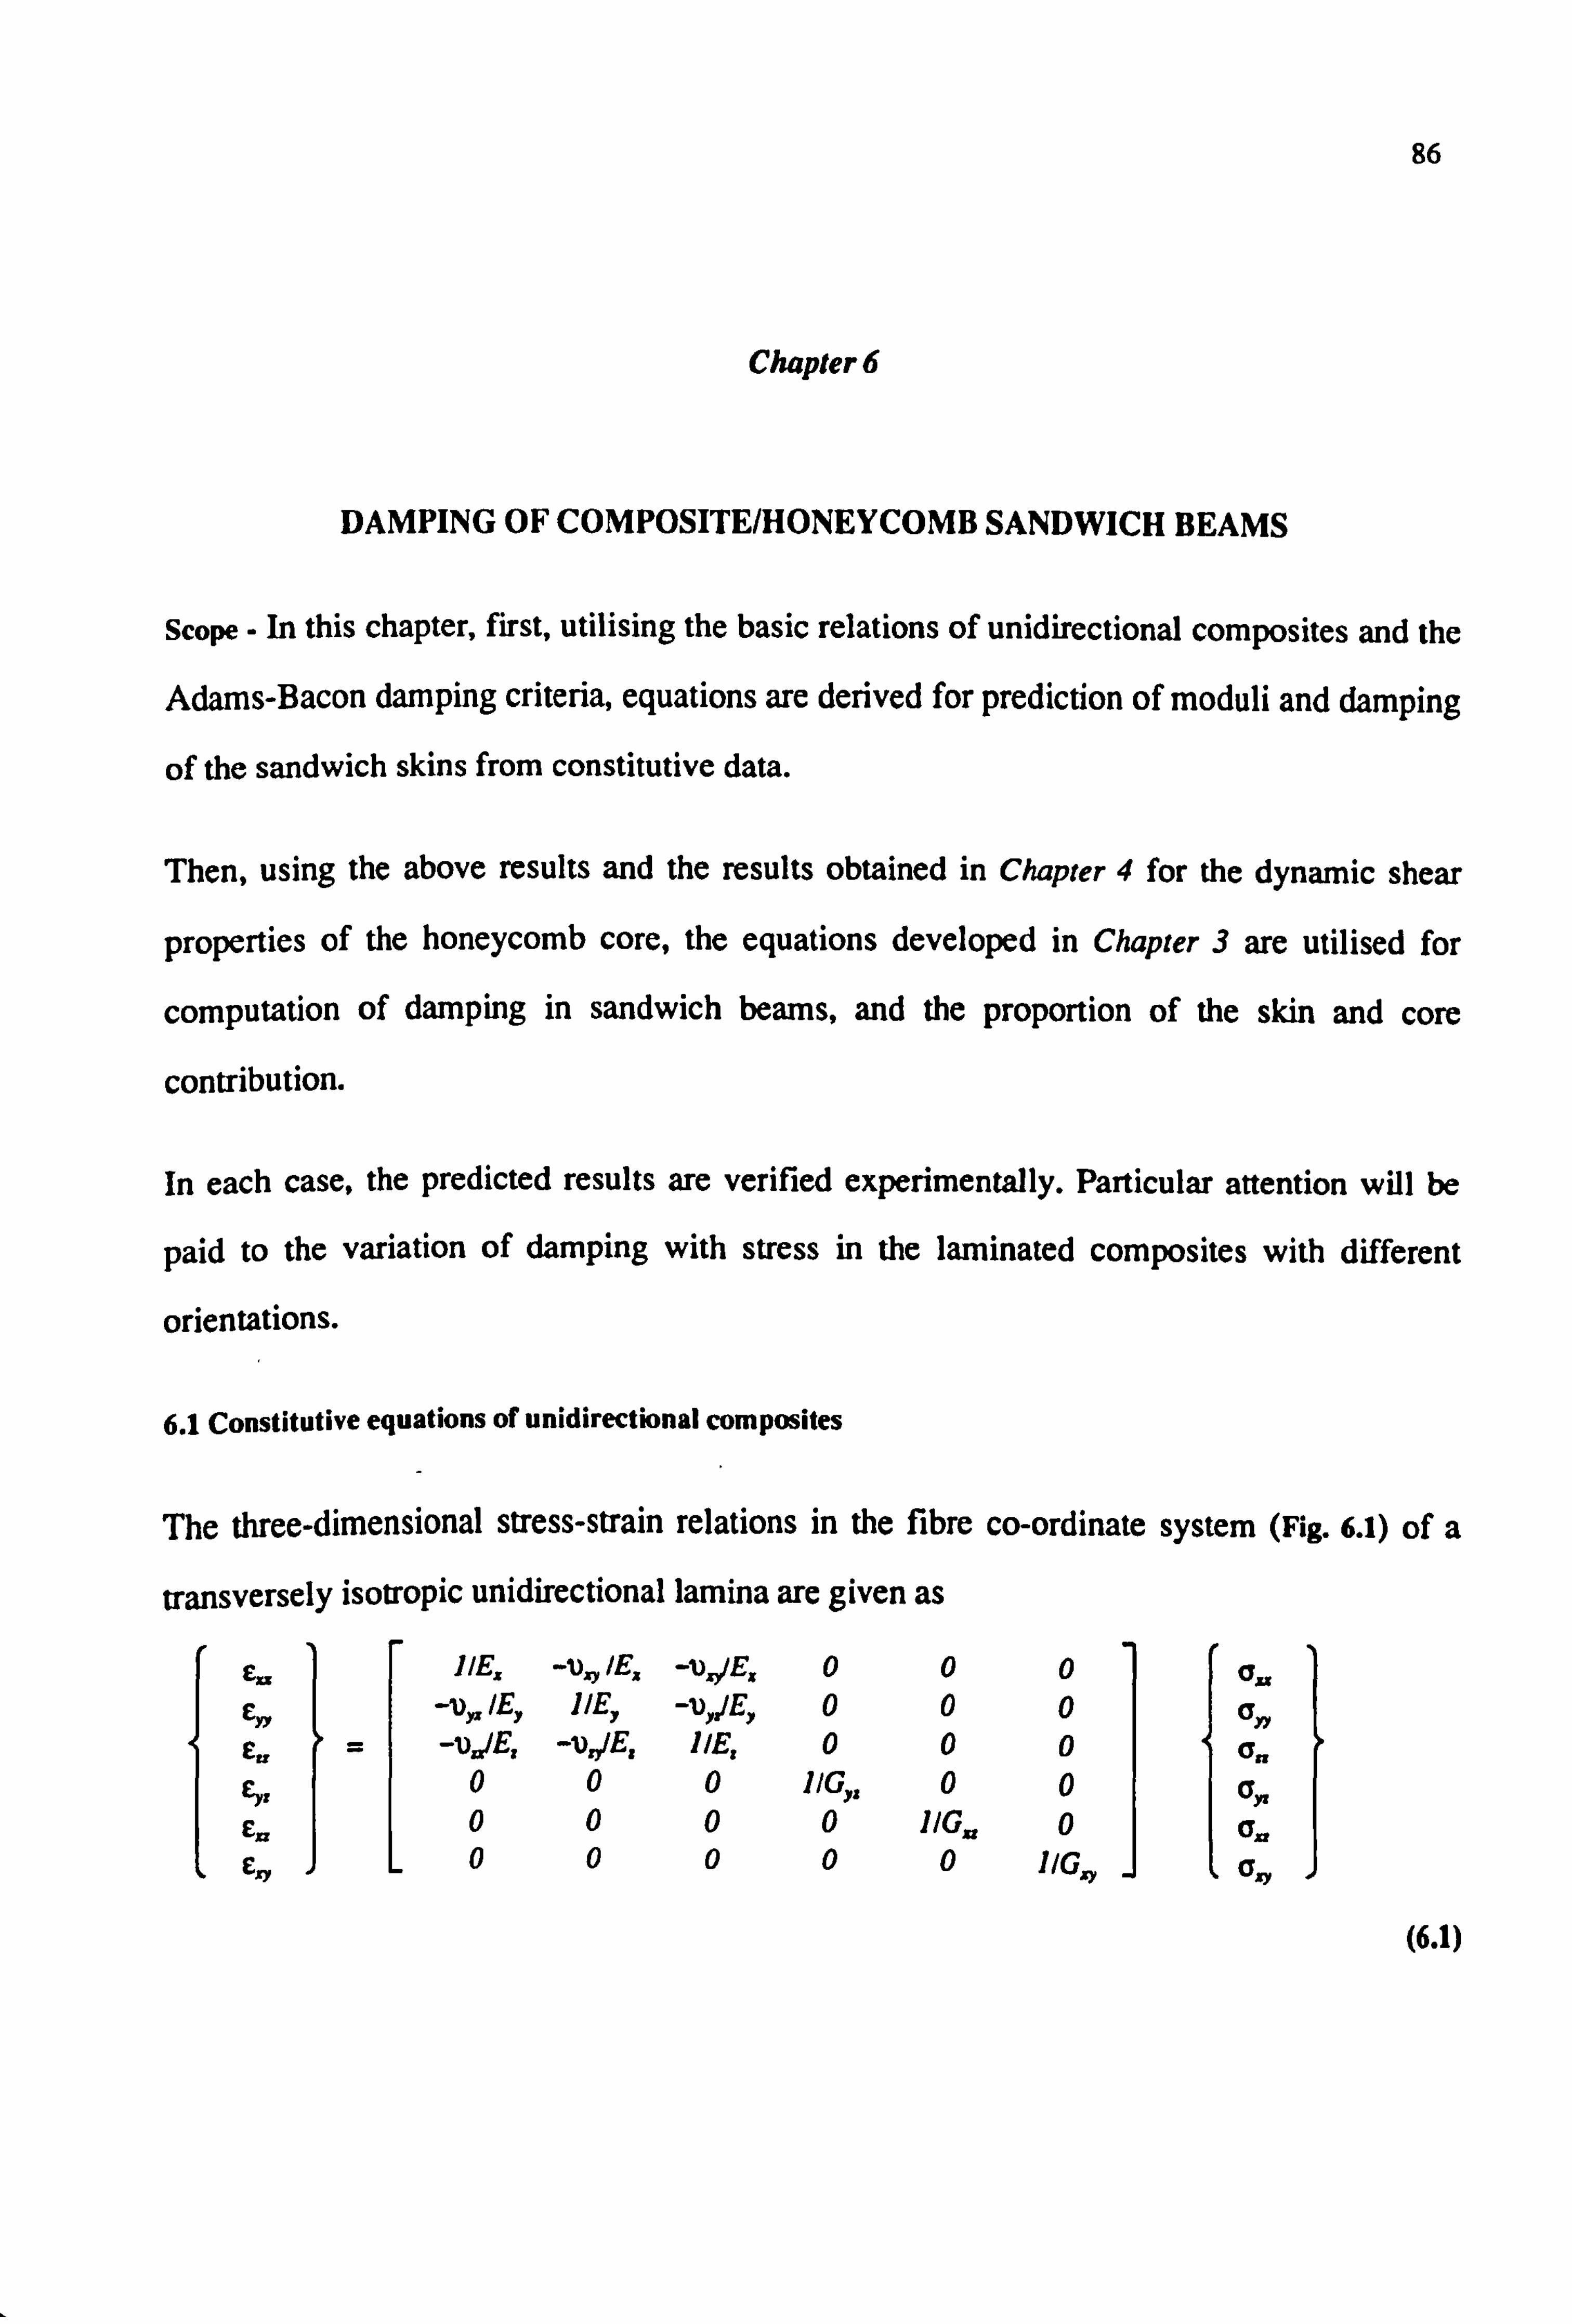
86
Chapter 6
DAMPING OF COMPOSITE/HONEYCOMB SANDWICH BEAMS
Scope - In this chapter, first, utilising the basic relations of unidirectional composites and the
Adams-Bacon damping criteria, equations are derived for prediction of moduli and damping
of the sandwich skins from constitutive data.
Then, using the above results and the results obtained in Chapter 4 for the dynamic shear
properties of the honeycomb core, the equations developed in Chapter 3 are utilised for
computation of damping in sandwich beams, and the proportion of the skin and core
contribution.
In each case, the predicted results are verified experimentally. Particular attention will be
paid to the variation of damping with stress in the laminated composites with different
orientations.
6.1 Constitutive equations of unidirectional composites
The three-dimensional stress-strain relations in the fibre co-ordinate system (Fig. 6.1) of a
transversely isotropic unidirectional lamina are given as
C. DE, -v,,, IE, -v,, /E, 000 axx CY, -v,, IE, RE, -v, )E, 000 ay Eu -va/E, -v/E, 11E, 000 a. c, =
000 11G,, 00 ßn £XX 0000 11G. 0 On £X), 000001 /GO (Ti,
(6.1)

-Ch6-
I
Fig. 6.1 Coordinate system of unidirectional lamina
where from the material symmetry
E,, =E, , vyj lE,, = vom, /E,, = vu /E1, vn /E,, = ), /E,
87
The elastic properties in Eqn. (6.1) refer to those obtained by uniaxial tests on a typical
unidirectional laminate, viz
EE=E,, E, =E,, G, =Gk, v, =vu
where suffixes t and t refer to the directions along and transverse to the fibre respectively, Gfr
is the longitudinal shear modulus, v� is the major Poisson's ratio and G, and G. are
interlaminar shear moduli.
In practical applications, laminae are sufficiently thin to assume that a state of plane stress
within the lamina prevails. In this case a. = vn = att = cr, = c.. = 0. Strict application of the
plane stress criterion, however, cannot account for significant interlaminar shearing which
does occur in flexure of thick laminates. For that reason, formulations have been developed
in which the transverse shears, c,,, and E. , are retained in Eqn. (6.1) to account for
interlaminar shears, while keeping with the assumption that the state of stress within the
lamina remains that of plane stress [Pagano, 1970; Whitney and Pagano, 1970; Chow, 1971;
Kulkarni and Pagano, 1972; Whitney, 1972,73,87 etc. ]. These formulations, generally
referred to as the 'shear deformation theory', are an extension of Mindlin's theory for
homogeneous plates and as such are based on the assumption of a state of plane strain for
12_ Y.

-Ch6- 88
the laminate. However, as pointed out by Whitney [1987], the state of the plane stress within
a lamina leads to the implication of the stress discontinuity at the ply interface, warranting
further modifications for a more reasonable shear distribution. Similar formulations have
been used, with reasonable success, as the basis for finite element analysis of modal
vibration of thick isotropic plates [Cawley and Adams, 1978,79] and laminated composites
[Lin et al, 1984]. Whitney [1987] shows that for a symmetric laminated beam, the shear
deformation theory leads to the Timoshenko beam equations. His application of the theory
to a soft core sandwich beam, however, involves no shear correction factor.
The approach in this work was to treat the skins as thin and homogeneous materials
undergoing uniaxial tension/compression about the sandwich mid-plane. Timoshenko beam
equations, adopted through the usual simplifying assumptions could then be used to
determine the bending/shearing energy ratio and damping in a sandwich, as advocated
previously (Chapter 3). Both assumptions of thin as well as homogeneous skins are
justifiable for relatively high ratios of skin/core thickness [Whitney, 1987]. The minimum
skin/core thickness ratio used in this work was of the order 1: 6; for the majority of the
beams, however, this ratio was of the order 1: 12.
For the sandwich skins, therefore, a state of plane stress is assumed. In this case, Eqn. (6.1)
reduces to
E. 11E, -ui,, /Es 0 as Eyy _ -u,; IEs 1 /Ey 0 ari (6.2) E. y
001 /G,, v,,
or
(£:., )=lC:., 1fQ=., ) (6.3)
The suffix xy here is intended to indicate reference to the fibre coordinates system. In this
equation, e,,, and a.,, are on-axis strain and stress, and C,,, is the on-axis compliance matrix.
Equation (6.2) is applicable to an orthotropic lamina under plane stress conditions, and as can

-Ch6- 89
be seen, to completely characterise such a lamina four independent elastic properties are
required.
Equation (6.3) may be written as
{aj,, } =IQ., 1(c, )
where
(6.4)
Q. Q, 0 lQ., 1=lC:, r1r= Q, Q» 0 (6S)
00Q.
and
El. E, E, 1), E= Ey Q
ry = Q., ry (6.6) Q. =
E. -v2X, E, '" E, -very E, 'Q Ej-Wry E, =C
Transformation of stress from the fibre to the lamina coordinate system is carried out
through the transformation matrix [Tja
(CF) = (Tyla (a:. r) i, i-1,2,6 (6.7)
Similarly (E) = IT. ). (E., ) i, i -1,2,6 (6.8)
where i=I. 2.4,5,6 in the laminate coordinate system are analogous to xx, yy, yz, xz, xy in the
fibre coordinate system. Equations (6.4), (6.7) and (6.8) will give
(Cri) = [%aa (Q,,, J I TO, (c) i , 1.1,2,6
or
(a, )=IM(ei) 1, i-1,2,6 (6.9)
where ./
(Qd - IT do (Q,, rl MI. r, f-1,2.6 (6.10)

-Ch6- 90
and
m2 nz -2mal (T], = n2 m2 2mn (6.11)
mit -mn m2-n2
where m=cosO, n=sinO.
In general IT], * IT), due to the use of engineering rather than tensorial shear strains. The
matrix [T]E is given by IT],, when the elements 13 and 23 in the latter are divided by two and
the elements 31 and 32 multiplied by two.
The components of IQ;, ] are given as
I Q11 Q12 Q16
l Qq1 = Q12 Q22 Q26 (6.12)
Q16 Q26 Q66
where from Eqn. (6.10)
Q1, =m4Qu+n4Q, +2m2n2(Q, +2Q�)
Q12 =m2 n2(Q. +Q,,, -4 Q�)+(m4+n4)Q2,,
Q1e =mn (m2 QLr - n2 Qn, - (m2 - n2)(Q, +2 Q�)1
Q22=n+Q=+mrQ, +2mmn2(Q, +2Q,, )
Q26 =mn (n2 Q., -mzQn, +(m2 -nz)(Q,, +2 Q�)]
Q6= m2 n2 (Q. +Qn, -2QX, )+(m2-n2)2Q�
(6.13)
In Eqn. (6.9), [QJ for i, j=1,2,6 is referred to as the off-axis reduced plane-stress stiffness
matrix of the lamina.
6.2 Flexure of a thin laminate
From the usual assumption of plane stress conditions for a thin composite plate, it follows
that the normals to the undeformed planes in the plate would remain normal and
undeformed in the deformed planes with the implication that the in-plane strains in the plate

-Ch6- 91
are linear functions of thickness. Then, the following strain-displacement relations apply to
the composite plate e, a2W/ax, = z x, z F-2 = a2W/ay, 2 z= X2 Z (6.14)
C6 2a2W/aX, ay, z X6 Z
where W is the lateral displacement and X, 9 X2 and X6 are curvatures.
The constitutive equations for general loading of a laminated plate are given in terms of
stress and moment resultants per unit length, Nt and M, , at the mid-plane
1Ni A; BO c°;
Mi By Dq x; i. J 1.2.6
where e0; are mid-plane strains, and
W (A,;. B. D�) = Q4;; (1, z. z2)dz i, 1-1,2,6 (6.16)
in which Q4, refers to the reduced stiffness matrix of the Oh layer and h is the thickness of
the plate. The matrices A;; , B;; and Dv are referred to as the in-plane modulus,
bending-stretching coupling modulus and the flexural modulus respectively.
In the absence of in-plane forces, Eqn. (6.15) is reduced to
M; = B;; e°; + DV X1 id -1.2.6 (6.17)
For symmetric laminates, the bending-stretching coupling effect, which mutually induces
in-plane stresses and moments, is removed and Eqn. (6.17) is reduced to
Mý = Dy X; 4.1-1.2.6 (6.18)
The k'rh layer stiffness matrix, Qky , is a function of both material properties and ply
orientation. The flexural damping of special cases where either material properties or
orientation remain constant across the section, and therefore may be factored out of the
integral in Eqn. (6.16), are discussed in [Ni et al, 1984] and [Ni and Adams, 1984]
respectively.

-Ch6- 92
The flexural modulus, Dy , is given by Eqn. (6.16). In this equation, the reduced stiffness
matrix, Q;; , is independent of thickness within the k'th lamina. The equation, therefore, may
be written as (w2)
D;, =J Qka z= dz -(w2)
NC/2 /ý =2L Qk4i Z2 dz
k=1
ýha-n
2 N2 =- 7 Q*y ijj . 1.2.6
3 k=1
where N is the total number of layers and h(k) , h(k_1) are the upper and lower coordinates of
the k'th layer. For the case where the layers are of the same thickness, ho , this equation may
be written as
2hß N12 D,; E QAy (k3 -(k-1)J) t. f-1.2.6
3 k=1
W8 N/2 D;; _--I Qk (k3-(k-1)3) i. 1-1.2.6 (6.19)
12 N3 k=1
Normalised flexural modulus is defined as
* Dy Du
D° (h3 / 12) h"`
8 N/2 -1 Q';, (k3-(k-1)') 1,1.1,2,6 (6.20) N3 k-i
And, therefore, the normalised flexural compliance is given as
C*y = D* = Cy-h* i. l-x. 2,6 (611)
63 Effective Young's modulus of laminated beams in flexure
The curvatures are given by Eqn. (6.18) as
(y . j) =1 Dj1'1 [M1) =1 Cyl [M1) (6.22)

-Ch6- 93
If a beam is subjected to the bending moment M, only, the deformation is referred to as 'free
flexure'. In this case, if the assumption is made that application of the bending moment m,
involves only one curvature along the '1' direction, x, , then, Eqn. (6.22) is reduced to
Xi = c� M, (6.23)
The analogous curvature for a homogeneous isotropic beam is given by
M, Xr - EI
(6.24)
where in accordance with the definitions in Eqn. (6.15), M, and I are moment and moment of
inertia per unit width of the beam. Then, the effective Young's modulus in free flexure, E. ,
is defined as that of a laminated beam equivalent to a homogeneous isotropic beam; and is
obtained by equating Eqns. (6.23) and (6.24)
II Eff E
C� h* C*� (6.25)
In 'pure flexure', any twisting curvature, X6 , resulting from the application of the moment m,
is constrained to zero by the application of the twisting moment M6 . In this case, Eqn. (6.22)
gives - Cl6
M6 = CM, C66
and, therefore, the effective Young's modulus in pure flexure, Ew, is given by c* 66 EEI=
C*uC*66 - C*_ ra (6.26)
The case of free flexure is applicable to the free-free flexural vibration tests in this work and
will be used for the prediction of the effective Young's modulus.
6.4 Damping prediction of laminated beams
Experiments of Adams and Bacon [1973-c], Ni and Adams [19841, Ni et al [1984], Lin et al
[1984] and Wren and Kinra [1989-b] have shown that damping properties of unidirectional
fibrous composites can be predicted with a good degree of accuracy using the Adams-Bacon
damping criteria. Adams and Bacon [1973-c] postulated that the energy dissipation in a thin

-Ch6- 94
unidirectional lamina is the sum of separable energy dissipations due to az , ay and a,,, l. Then,
the specific damping capacity of a laminated composite may simply be written as
eu= euy nur W= W(x. y, xy) =++U (6.27)
By definition, the energy dissipation due to a, is given by
DU, =2 ryrýeýajdv
Substituting for aj and e, from (6.7) and (6.8) gives
1 -1 DU: =2rW, ýITr; It (£; ) } (m2 (a1)) dv i-t. i-1, z. 6
noting that for free flexure of the beam, a, = a6 = 0. Substitution for a, from (6.9) gives
1 't k AUS _ Wi l (T;
1lc (e1)ß ßm2 [Qy ] [c1)) dv i-1.1-1,2.6
2
Substituting for i, from (6.14) gives 1 -1 k
DUB =2W, ( ! TTýIt (X/)z) (m2(Qy ] (z)Z) dv i-I, 1-1,2,6
Substituting for x; from (6.22) gives
1 -, . AU. =2r ITO It I CO1 M, (Q# 1I Cy)M, m=z2 dv
Then, for a beam of unit width, the energy dissipation becomes f 1.2 A/2 -1 1
AU, ý =2 M1' dx Vi (To 1c1 Cy I (Qq II CO 1 m2 z2 dz i"1.1-1,2.6 0J0
Strain energy stored in the beam under the bending moment resultant, M, , is given by
U2 U=M, x, dx Ja
(6.28)
1 Analogous suggestions have been postulated with reasonable success, for example, regarding the strain energy of natural rubber as a separable function of the extension ratios (author's M. Sc. thesis).

-Ch6- 95
Substituting for x, from (6.23) gives
U=C,, M, 2 dz (6.29) fo 2
The specific damping capacity due to a, is, therefore, given by
2 wz -I W: IT# JE ICI IQ,, 1 IC ij I m2 z2 dz i -I j- 1,2,6 Cu 0
Assuming that the linear damping mechanism holds, that is that the amplitude of vibration is
sufficiently low to make the specific damping capacity independent of the stress amplitude,
then this equation may be written as
2y, w2 -' k Wý - IT# hI Cyl IQy / IC 41 M2z2dz i"1, /. 1.2.6
Cii 0
The orientations m, n and the stiffness matrix Qy are independent of thickness within the Oh
lamina. Then following the same arguments in deriving Eqn. (6.20), the above equation
reduces to h3 841, N12 '1 R
W, -E [Tu 1. IC, I IQvI IC#1m2 (k'-(k-1)') I-1.1-1.2,6 12 Cl, N3 k-I
Using the normalised flexural compliance, as defined in Eqn. (6.21), this equation is
simplified further to 1 8y! º N12 -1 R
W: -C*11 N' 2I [Ty 1, l C*ql IQÜ II C*; ý1 m2(k3 -(k-1)3) l-i, l-1,2, e
or
*41º E2 m2 (m2 C*11 + n2 Cn + mit C*16) (C*Jr Qk,, + C*, 2 Qkli + C*, 6 Qk, 6) (k' -(k-])])
C 1, N3 k-I
(6.30)

-Ch6
Similarly, it can be shown that
-= *XVr 72 n2 (n2 C+ m2 C12 + mit C*16) (C*Jl Qku + C*12 012 + C*16 Q4,2) (k3 - (k-1)3)
C �N3 k=1
and that
N12 Wry = *11
7, mit (2mn Cm,, - 2mn C*12 - (m2 - n2) C*16) (C*u Qk1 + C*n Q'n + C*1e Q&, 2) x �N3 k=1
(k3 - (k-1)3 )
6.5 Computer implementation
96
(6.31)
(6.32)
The above analyses were put into computer code using FORTRAN77. The necessary data for
running this program includes the modulus and SDC of the 0° and 90° orientations in
flexural mode, modulus and SDC of the longitudinal shear mode and the major Poisson's
ratio. Once these data are supplied, the program can compute the effective Young's modulus
and SDC in flexure of a beam having mid-plane symmetry of orientation. Although the need
did not arise in this work, the program can be easily modified to account for beams having
material symmetry across the section so that it can be run for beams consisting of different
composites.
Similar to the computer programs mentioned previously (section 3.3.6), this program,
PREDAMP. FOR, can provide the user with a file containing a detailed description of a data
file, again avoiding the need for a separate user-guide. A desk-top computer can be
conveniently used to run the program.

-Ch6-
6.6 Experimental procedure
97
Combinations of three different unidirectional composites and three different honeycombs
were used for the fabrication of the sandwich beams. In all cases, both skins consisted of
eight plies of the same unidirectional composite material. The skins were of identical
orientations and the sandwich was of mid-plane symmetry. In addition to the orthotropic
0°/90° skins (0° along the beam), for which D*, 6 =0, two systems of anisotropic skins
(D*16 *o), namely the 'off-axis' (all layers at 0) and the symmetric 'angle-ply' (layers at -9,0, -
e, e, e, -e, e, -e), were considered. For either system and each particular skin/core material
combination, a series of sandwich beams was fabricated for increments of 15° of fibre
orientation covering the 00 to 90° range. Experimental and theoretical results were obtained
for both the beams (sandwich skins) and the sandwich beams regarding the variation of
modulus and the SDC with respect to orientation.
In all cases, the sandwich cores were aligned along the ribbon direction.
6.6.1 Preparation of the sandwich skins
All the sandwich skins were moulded from the pre-preg sheets using a hot press. To make
sure of accurate orientation, the pre-preg sheet was pinned down on a board and the plates
were marked on the pre-preg prior to cutting out the ply with a sharp scalpel. The plies, cut
slightly over the size of the mould, were then stacked and trimmed along the edges to the
same size as the mould. This step was necessary since in stacking the plies it is not always
possible to make the edges coincide, and once the plies are in contact it is difficult to
separate them without disturbing the fibres. The backing sheets at the outer surfaces were
not removed until the moulding stage for protection.
In compression moulding of composites, flushing of some resin through the mould openings
is not only inevitable but also desirable since this helps the flow of the resin through the
fibres thereby filling voids and expelling air and gases from the moulding. Excess flushing,

-Ch6- 98
on the other hand, might lead to areas of 'resin starvation' and possible debonding of fibres.
With this in mind, it was decided to set the height of the mould cavity to the nominal
thickness of the laminate. Shims, inserted between the top mould surface and its backing
plate, were used for this purpose. The amount of flushing varied for different mouldings. In
some cases, these were carefully removed from the mould and the moulding and weighed.
The weight of the excess resin was found to be generally below 1% of the weight of the
moulding.
Prior to each moulding operation, the mould was cleaned and degreased with acetone. It was
then heated to 60' C and the release agent (Frekote 700-NC) was sprayed onto the surfaces
of the pre-heated mould. The mould was re-heated, this time to 1200 C, and the laminate was
carefully placed on the bottom surface and the top plate was lowered into the mould. The
mould walls were then tightened up and the mould was placed in the hot press. In closing
the press platens onto the mould, it is important to apply the pressure as gently as possible in
order to minimise fibre misalignment caused by otherwise too violent a resin flow around
the fibres. The press used lacked the facility for setting the closing rate, but this could be
controlled manually by throttling the flow valve.
The manufacturer's curing specifications were used in moulding of the plates, and these are
listed in section 6.6.1.1.
For the off-axis beams, unidirectional square plates (300 mm x 300 mm) were first moulded
and the beams with the different orientations marked on the plates. Two plates were then
stacked together and cut through giving pairs of beams with identical size and orientation.
Smaller, rectangular plates (300 mm x 70 mm) were moulded for angle-ply orientations. Each
plate was subsequently cut into halves along its length for the two sandwich skins. A milling
machine with a diamond-wheel cutter was used for cutting the beams. Using this cutter
results in very smooth edges. To avoid any edge-effects, a width of about 2 mm of all the
edges of the moulding were also removed.

-Ch6-
6.6.1.1 Pre-preg and moulding specifications
Three different unidirectional composites were used. These were
1- DLS-280 2- Fibredux 913G-E-5-30 3- Fibredux 913C-TS-5-40
99
The first two are glass fibre reinforced plastic (GFRP) composites and the third is carbon
fibre reinforced plastic (CFRP) composite. The Fibredux 913 refers to the resin used in the
pre-preg and is specified by the manufacturer (Ciba-Geigy Information Sheet No. FTA. 46e)
as a modified epoxy resin for use at a working temperature in the range -55 to +130° C. The
designation G-E-5-30 in the second composite refers to, respectively, the fibre type as Glass
fibre of type E, with a cured pre-preg thickness of 5x0.001 in. and, finally, the resin content
of the pre-preg as 30% by weight (equivalent to 54% of fibre by volume - personal
communication with the manufacturer). Similarly, the designation C-TS-5-40 in the third
composite refers to Carbon fibre of 'high tensile strength, with a cured pre-preg thickness of
5x0.001 in. and a resin weight fraction of 40% (equivalent to 54% of fibre by volume).
The following moulding specifications, recommended by the manufacturer (personal
communication), were used.
DLS-280 cured at 90° C for 1/2 hr. and at 120° C for 1 hr. Fibredux 913G-E-5-30 cured at 120° C for 1 hr. Fibredux 913C-TS-5-40 cured at 120° C for 1 hr.
All the plates were moulded under a nominal pressure of 600 kPa on the mould backing
plate. At the end of the curing cycle, the mould was removed from the press and allowed to
cool at room temperature. Close inspection of the mouldings revealed that, in most cases,
these were of reasonably good finish, although a few visible surface imperfections proved to
be unavoidable.

-Ch6-
6.6.2 Preparation of the sandwich beams
100
Three different honeycombs were used for the fabrication of the sandwich beams (Table
(6.2)). The honeycomb was cut from stock using the same method described previously
(section 4.2.2).
The adhesive film used for the fabrication of the sandwich beams was Redux 609, specified
by the manufacturer (Ciba-Geigy Instruction Sheet No. RTC. 101d) as a high strength epoxy
adhesive incorporating a cotton scrim for easy handling. The adhesive film is said to possess
a good filleting property to be particularly suitable for honeycomb sandwich construction.
Having degreased the composite skins, the adhesive film, previously cut to size, was peeled
off the backing sheets and placed on the skin. The skins were then carefully assembled onto
the honeycomb core, applying a slight pressure to make the sandwich hold together. The
beams were then placed side by side between two aluminium plates for uniform pressure
and for protection of the outer surfaces. The assembly was then placed in the heated press.
The manufacturers curing specifications for Redux 609 were followed, namely at 120° C for
one hour. A nominal pressure of 100 kPa on the sandwich skins was used. At the end of the
cure cycle, the beams were removed from the press and let to cool at room temperature.
Excess adhesive on the edges was carefully scraped off using a sharp scalpel.

-Ch6-
6.7 Test procedure and results
101
The tests were carried out in two stages. First, having prepared the sandwich skins, dynamic
flexural tests were carried out on one of each pair of the skins. Having obtained the
necessary data for the skins, the latter were subsequently used to construct the sandwich
beams. Dynamic flexural tests were then carried out on the sandwich beams.
The tests basically involved determination of modulus and the SDC in the first flexural
mode. All the tests were carried out in the steady-state vibration using the centrally mounted
coils, in air and at room temperature (19° to 22° C). For each test piece, the SDC results were
obtained for increments of the maximum bending stress of the composite (skins).
Computation of the effective dynamic Young's modulus of the skins bending about their
own neutral axis was based on Eqn. (3.8) after reduction to the elementary theory (section
33.3), while the computation of the effective dynamic Young's modulus of the skins of the
fabricated sandwich bending about the sandwich mid-plane was based on Eqn. (3.31). The
two moduli are referred to as the 'skin modulus' and the 'sandwich modulus' respectively.
Computation of the SDC of the skins in steady-state flexural vibration was based on
Eqn. (3.41), and that for the sandwich on Eqn. (3.40).
Computation of the maximum stress in the skin on its own and in the sandwich was based
on Eqn. (3.28), in the first case after reduction to the elementary theory. Computation of the
shearing stress in the core was based on Eqn. (3.29).
Regarding the sandwich skins, prediction of the modulus and the SDC at different
orientations was based on Eqns. (6.25) and (6.27) respectively, utilising the constituent data
obtained from tests on narrow beams (Table (6.1)). Prediction of the sandwich beam damping
was based on Eqn. (3.39), utilising the predicted properties of the skins, and the honeycomb
shear results obtained in Chapter 4 (Table (6.2)).

-Ch6- 102
A detailed account of these computations, together with estimation of experimental error, is
presented in Appendix (D) with reference to a typical result.
6.7.1 Sandwich skins
Before fabricating the sandwich beams, steady-state flexural tests were carried out on the
composite beams subsequently used as the sandwich skins. However, in the case of the
off-axis beams, owing to the relatively large mass of the central coils, achieving resonance,
specially for orientations higher than 45°, proved to be difficult. In the off-axis case,
therefore, tests had to be carried out on smaller beams (nominally 200x12x1 (mm)), using the
small central coils.
The skin dimensions were nominally 250x35x1 (mm). The beams used in the flexural tests
were, therefore, of a sufficiently high length/thickness aspect ratio (at least 200) for the
application of the elementary theory with good accuracy. This was verified in the case of
one beam (0° 913C, 252x36x1.1 (mm) at 103 Hz) which was treated as a Timoshenko type,
with an assumed shear correction factor of 0.82. The shear modulus in flexure of a
laminated Timoshenko beam is given by GR [Ritchie et at, 1975] and this was measured from
a torsion test (Appendix (B)) on the 900 beam. The improved theory showed an increase of
0.12% in modulus (113.86 and 113.72 GPa) and a reduction of 0.06% in the SDC (0.8488%
and 0.8493%). Subsequently, the beams were treated as Bernoulli-Euler type, and the
experimental values of the modulus and the SDC were obtained for all orientations.
For each composite type, longitudinal shear tests were also carried out and the modulus and
the SDC in this mode were obtained. The longitudinal shear tests are discussed in Appendix
(B).
In Table (6.1), the flexural and longitudinal shear data needed for the prediction of the
modulus and the SDC of the composite sandwich skins tested in this work are listed. The
flexural data represent results of tests on the beams of nominal dimensions 200x12x1 (mm).

-Ch6-
Table (6.1) Constitutive data of sandwich skins
103
composite V1 El Et yri wt Gh Wit vet
(%) (GPa) (GPa) (%) (%) (GPa) (%)
DLS-280 52 47.4 10.7 1.17 7.8 5.9 7.80 0.290
Fibredux 913C 54 112.5 8.4 0.74 7.3 4.8 6.60 0.301
Fibredux 913G 54 41.5 12.5 1.61 6.7 5.0 7.30 0.286
The SDC values yr, , yes and yrit were measured at the lowest stress amplitude attainable,
where a stress independent SDC was assumed. This point will be discussed later (6.7.1.2)
with reference to experimental results.
The major Poisson's ratio, -oll , was measured using strain gauges (TML, type : FLA-3-1 1). A
strip of material of 0° fibre orientation, 1 mm thick, 15 mm wide and of about 180 mm gauge
length was used as the test piece. To avoid damaging the test piece in the grips, and also for
a more uniform distribution of load, each end of the test piece was bonded between two
rectangular metal pieces. Gauges were used on both faces of the test piece to account for any
possible bending effects. Two strain gauges, connected in series and forming one arm of the
bridge, were bonded on opposite faces of the test piece in the longitudinal direction. A
second pair of gauges, connected in series and forming the second arm of the bridge, were
similarly bonded in the transverse direction. The test piece was then subjected to a number
of tensile loads, in the range 0 to 10 kN, and the longitudinal and transverse displacements
were recorded.
6.7.1.1 Modulus
Prediction of the moduli follows from the application of the basic laminated plate theory
reduced to the one dimensional case (Eqn. (6.25)). The experimental points and the
predictions are presented in Figs. 6.2 to 6.6. As mentioned previously (6.7.1), because of

-Ch6- 104
practical difficulties, narrow beams had to be used for tests on the off-axis series, and the
predictions for these beams are based on results obtained from tests on narrow beams
(nominal dimensions 200xl2xl (mm)). The predictions for the angle-ply beams are based on
results obtained from tests on actual sandwich skins (nominal dimensions 250x35xl (mm)).
Results generally show excellent prediction of the experimental moduli for the off-axis
beams, while in the case of the angle-ply beams discrepancies exist. Subsequently, tests
were also carried out on a series of angle-ply narrow beams (nominal dimensions
200x12x1 (mm)) and, as can be seen (Figs. 6.3 and 6.5), the results of the tests on the narrow
beams fall close to the predicted points.
Clearly then, the source of the discrepancy should be sought in the dimensions of the
sandwich skins. These were nominally 250x35xl (mm), where the length was limited to the
mould size and the minimum width was limited to a size which could accommodate a
reasonable number of honeycomb cells in order to avoid edge effects. On the other hand, it
was felt that tests should be carried out on the actual skins in order to have as few variables
as possible.
Adams and Bacon [1973-c] investigated the variation of the flexural modulus of orthotropic
angle-ply beams with respect to orientation. Their angle-ply beams consisted of a total of 5
to ply pairs which were repeated through the thickness. With no mid-plane symmetry, this
type of laminate is referred to as the antisymmetric (or quasi-symmetric) angle-ply laminate.
Their tests on both narrow (0.5 in. ) and wide (I in. ) beams, all of 10 in. length, showed 'no
significant effect' in the SDC or the modulus due to the beam width. Experiments of Wren
and Kinra [1989-b] on symmetric graphite/aluminium angle-ply beams also showed close
prediction of the experimental results. Their beams had length/width aspect ratios ranging
from 10 to 20.

-Ch6- 105
The basic difference between the anisotropic and orthotropic laminates lies in the presence
or otherwise of the shear and normal couplings. For an antisymmetric angle-ply laminate,
the bending-twisting couplings (D, 6 and D26) are eliminated but the bending-stretching
couplings (B, 6 and B26) are mutually induced. A complete reversal of this process occurs for
the symmetric laminates (this, in fact, can be shown to follow from Eqn. (6.16) where for a
symmetric laminate Qky (z) = Qk,; (-z) while for an antisymmetric laminate Q4,; (z) =- Qk;; (-z);
and it can further be shown that both these effects tend to diminish as the number of plies is
increased resulting in a'quasi-homogeneous' material).
Hence, for the 0° and 90° beams, from the data of which the predictions are made, and for
the antisymmetric angle-ply beams, any deviation from the definition of a beam will be
confined to the curvature X2 , due to the Poisson's coupling D, z (Eqn. (6.22)), while for the
symmetric angle-plies the curvature Xo , due to the shear coupling D, 6 , also comes into
effect. The Poisson's coupling, however, tends to diminish rapidly with decreasing aspect
ratio, while the shear coupling becomes negligible only for high aspect ratios [Whitney and
Dauksys, 1970; Whitney, 1987]. This process, on the one hand, explains the close
predictions of Adams and Bacon [1973-c] for both widths of the beam, and on the other, the
close predictions of the narrow beams results in the present work as well those of Wren and
Kinra [1989-b]. It further explains the more pronounced deviations observed for the low
angle wide beams (15° to 45°, Figs. 63 and 6.5) where the shear effect is more severe. The
Poisson's effect is noticed in the 0° and 90° beam results on Fig. 6.3, and more clearly on Fig.
6.5, where the moduli of the narrow beams fall below the apparent moduli of the wider
sandwich skins. Even closer predictions of the results of the angle-ply narrow beams are
obtained if the predictions are derived from the 0° and 90° data of the narrow beams (these
predictions are not included on the figures).
The effect of the shear coupling D, 6 on the off-axis beams is even larger than the angle-ply
beams. Close inspection of the off-axis results reveals some deviation in the shear sensitive

-Ch6- 106
regions even for the narrow beams (Figs. 6.4 and 6.6). Compared with the angle-ply beams,
the sharp fall of the modulus of the off-axis beams with increasing 0 is due to the lack of
constraints which adjacent layers impose on one another, allowing the plies to deform
independently.
6.7.1.2 The specific damping capacity
In supporting the beams on the cotton strings, one rule was followed, and that was
supporting the beam where the least amount of vibration was transmitted to the supporting
structure. At the same time, it was verified that this position also coincided with the peak
displacement amplitude, as indicated by the pick-up voltage. In all cases of the angle-ply
beams, the nodal lines were lateral to the beam, and the optimum locations for supports
coincided with the nodal lines; the latter being determined by sensing the vibration (the
customary use of sand or powder for nodal location was not always possible owing to
relatively low frequencies). In the case of the off-axis beams, the nodal lines were at an
angle to the transverse direction of the beam, being at a maximum of about 50° for the 15°
beam and gradually tending to 00 for the 90° beam. However, supporting the beam on the
nodal lines did not necessarily lead to the least amount of vibration transmission, possibly
due to a more complex nature of behaviour of the nodal lines than conceived. In fact, in a
few cases where the nodal lines were at a large angle to the lateral direction (15° and 30°
beams), it was found that maintaining the nodal supports lateral to the beam led to less
damping (higher pick-up voltage) than otherwise supporting the beam on the nodal lines.
Both the symmetric angle-ply and the off-axis beams are subject to the bending-twisting
effect. Using a stroboscope, the motion of the centrally driven 300 off-axis as well as that of
the 450 angle-ply wide beams was studied. In each case, the stroboscope was tuned to a
small frequency difference thus showing the beam movement in slow motion. The beam end
was then viewed against a horizontal datum line. Up to a maximum peak-to-peak
displacement amplitude of approximately 10 mm at the end of the beam, no twisting could

-Ch6- 107
be detected in either case.. Given that the damping test displacement amplitudes are well
below this figure (3 mm at most), and that the Young's moduli are well above the shear
modulus, the effect on the strain energy due to any twisting of the beam is believed to be
negligible. Pagano and Halpin [1968] showed that the twisting of the beam end had little
effect on the normal strain field.
The SDC results for various stress amplitudes are presented in Figs. 6.7 to 6.11. Comparisons
of the experimental SDC results at the lowest stress amplitude and the predicted results are
presented in Figs. 6.12 to 6.16.
Ideally, the SDC values used for the predictions should be measured at the same stress level
and, similarly, comparison should be made with those experimental points which are at the
same stress level. However, because of the low sensitivity of the voltmeter at low pick-up
voltages, there was a limit to the lowest displacement amplitude which could be attained.
Consequently, depending on the modulus of each beam, the initial SDC results fell at
different stress levels (Figs. 6.7 to 6.11). Nonetheless, referring to the results, it can be seen
that in most cases the lowest amplitude falls within a stress level not more than I MPa and,
since those results which do not fall into this range (0° and 15°) are the ones which show
most stress independence, it may therefore be safely said that the SDC results represent
damping at a stress amplitude not more than 1 MPa. Moreover, in most cases the assumption
of stress independence at low stress amplitude seems to hold, although in some cases closer
examination of the SDC at low stress amplitudes is needed. For example, an initial apparent
sensitivity of the SDC is observed in a number of the higher angle beams (75° and 90°
beams in the DLS series (Fig. 6.7), 75° in the off-axis 913C series (Fig. 6.9), 45° to 90° in the
angle-ply 913G series (Fig. 6.10)), but as can be seen, this effect is not universal. Similar low
stress sensitivity of the damping values was also observed in some of the damping tests on
the honeycomb cores (Figs. 4.13 to 4.16).

- Ch 6- 108
Several trends can be seen in the results. In all cases, the low level damping, which is
observed in the low-angle beams (0° and 15°), is seen to be relatively stress independent
over the whole stress range. In these cases, the fibre properties are dominant and the
composite approaches a Hookean elastic material. The low angle beams show the closest
resemblance to linear damping where the hysteresis loop is elliptical and the energy
dissipation is proportional to the square of the stress amplitude. For the higher angle beams,
the stress sensitivity of the SDC seems to be a function of fibre/resin interaction. For
example, in the case of the angle-ply 913C series (Fig. 6.8), the onset of non-linear damping
for the high-angle beams (30° to 90°) can be seen to be about 1 MPa, while a change of fibre
from carbon to glass (Fig. 6.10) results in a substantially reduced non-linearity of the SDC for
up to the test range of 4 MPa. A similar low sensitive SDC is noticed in the second glass
fibre composite (DLS, Fig. 6.7). Bacon [1973] reports non-linearity in the SDC of the
HM-S/DX209 (CFRP) angle-ply beams, although no results are given indicating the extent
or the onset of non-linear damping. He associates the phenomenon with 'a more complex
state of stress than predicted by plate theory'.
Non-linear damping is generally attributed to a plastic-type deformation which most
materials experience beyond certain critical stress limits [Lazar, 1960,68]. With fibre
reinforced composites having a polymeric matrix, the non-linear behaviour becomes even
more significant, particularly in the transverse direction and in shear where the resin
undergoes a considerable amount of straining.
Poor material integrity also causes non-linear damping. Defects in the micro structure, such
as voids, crazing, impurities and 'frozen-in' stresses in the resin, and imperfect resin/fibre
bonding or delamination in the composite are locations of stress concentration and/or
friction, both of which tend to increase the damping energy in a proportion exceeding the
second power of the stress amplitude. Hence, Bacon [1973, p. 39] would be correct in
suggesting that linear damping indicates a modulus which is invariant of amplitude, but his

-Ch6- 109
assertion that, similar to certain cast irons, non-linear damping in composites is necessarily
indicative of a decreasing modulus is not entirely true. Damping is more sensitive to the
composite material integrity than is the modulus.
Rate-dependent damping as a contributory factor to non-linear damping cannot be ruled out,
given that increasing the displacement amplitude increases the strain rate even at a constant
frequency. The rate-dependent damping mechanism is manifestly observed in viscoelastic
materials where the material shows a time/temperature dependent response to the applied
load due to the inertia of the molecular chains in coiling/uncoiling and the intermolecular
movements. The viscoelastic damping is known to peak at the 'glass transition temperature',
marking a transition from the 'rubbery' (higher temperatures/lower frequencies) response to
the applied load to a 'glassy' (lower temperatures/higher frequencies) response. The
viscoelastic phenomenon is not strong in thermosets, and the degree of the viscoelastic
response depends on such factors as the degree of cross-linking and on the fibre contribution
in load bearing in the fibrous composites. Increasing the frequency by a combination of
shortening the beam length in the first flexural mode as well as testing in the second mode,
Bacon [19731 found 'some' frequency dependence in the steady-state damping of the
F/MNA epoxy resin even at room temperature (an increase in the SDC from 3% at 250 Hz to
5.7% at 2200 Hz). In interpreting these results, it should be borne in mind that he used the
elementary (Bernoulli-Euler) theory which tends to give lower modulus/higher SDC with
increase in frequency. Soovere [1985], however, recorded a 'constant' variation of damping
with frequency in the (1,1) mode for both composite as well as aluminium honeycomb
panels.
Generally, good correlation exists over the whole range of 0 between the experimental and
the predicted damping results (Figs. 6.13 to 6.16); an exception is the results of the off-axis
DLS beams (Fig. 6.12) which will be discussed later.

-Ch6- 110
The results generally show that the longitudinal component of the SDC is the sole
contributor in the 00 beams, and the major contributor in the 15° angle-ply beams. Its
contribution at higher angle beams becomes insignificant, although it falls more gradually in
the angle-plies than the off-axis beams.
The shear component of the SDC peaks at 30° in the off-axis beams (Figs. 6.12,6.14 and 6.16)
and at 45° in the angle-plies (Figs. 6.13 and 6.15). Peaking of the shear component at 45° is
analogous to the shear distribution in an isotropic material, indicating the more uniform
nature of the shear constraint with respect to the angle of ply in the angle-ply laminates. In
the off-axis beams, the shear component is the dominant contributor in the 150 to 45° range,
while with the angle-plies it is the major contributor only in the 30° and 45° beams.
The transverse component of the SDC rises with the angle of orientation, but more gradually
so in the angle-ply beams. It becomes the major contributor in the 60° and 750 beams and
the sole contributor in the 90° beams.
As expected, comparison of the overall damping results in the off-axis and angle-ply beams
shows a reversal of the process observed with the moduli. Here, a rapid increase in the SDC
of the off-axis beams occurs with increasing angle of orientation, and a more gradual rise is
seen in the angle-ply beams.
Naturally, the degree of the contribution of each component to the overall damping at any
angle would depend on the proportion of the longitudinal, transverse and longitudinal shear
damping of the particular composite. Hence, the peaks in the overall damping reported, for
example, by Adams and Bacon [1973-c] (at 30° for the off-axis, and at 45 0 for the angle-ply
beams of the HM-S/DX209 (CFRP) composite), are absent in the present results, since they
used a longitudinal-shear SDC of some 10%, compared to a value of 6.6% found for the
CFRP tested in this work.

-Ch6- 111
The test results for the SDC of the angle-ply narrow beams (200x12x1 (mm)) are also
included on Figs. 6.13 and 6.15. Generally, the beam width does not seem to have affected the
damping results to any appreciable extent. With the 913G narrow beams (Fig. 6.15), the
computed SDC is of a lower value than that of the wider sandwich skins for the 00 and 15°
orientations, and slightly higher for higher orientations. The same trend is observed for the
913C beams (Fig. 6.13) for the 0° and 15° orientations, although even less deviation exists
here, and for the higher orientations the results are more scattered than the 913G, but still no
significant difference exists between the two results. It is unlikely that the increase in the
SDC of the 0° and 15° wide beams is due to the increase in the air damping at higher
frequencies since, comparing the 913C and the 913G results (Figs. 6.13 and 6.15), higher
frequencies of the latter have not led to lower deviations.
In contrast to the 913 composites, large deviations exist between the experimental and the
predicted SDC of the DLS composite (Fig. 6.12). This is almost certainly due to the problems
experienced in moulding this pre-preg. Being dry, and possibly out of shelf life, it was found
necessary to wet the surface of the layer (with acetone) when stacking the plies. As a
consequence of wetting the layers, if not because of an already degraded resin, the
mouldings were found to contain voids, as indicated by opacity. The moduli, however, do
not seem to have suffered (Fig. 6.2), indicating that there was no serious delamination.
Furthermore, and somewhat unexpectedly, no undue non-linearity is observed in the SDC
results (Fig. 6.7). Comparison of the experimental and the predicted results (Fig. 6.12) seems
to suggest overestimation of the longitudinal shear and, possibly also, the transverse
damping used for the predictions. Only a limited amount of this pre-preg was available, and
no attempt could be made to produce improved mouldings. The material, nonetheless, was
used for fabrication of some of the sandwich beams and the results are included here.

-Ch6-
6.7.2 Sandwich beams
112
Similar to the sandwich skins, steady-state flexural tests were carried out on the fabricated
sandwich beams. The SDC of the sandwich beams were computed for increments of the
maximum direct stress in the skins.
In Table (6.2), the sandwich beams tested in this work, together with the core dynamic shear
properties, are listed (The skin properties were listed previously in Table (6.1)).
Table (6.2) Composite sandwich beams and core specifications
skin core
material orientation material c G yr
(MM) (MPa) (%)
DLS-280 off-axis A1,50,6 (Nmx) 12.75 48.0 10.4
Fibredux 913C off-axis A1,50,6 (Nmx) 12.75 48.0 10.4
Fibredux 913C angle-ply A1,50,6 (Nmx) 12.75 48.0 10.4
Fibredux 913C angle-ply 5.2,1/4,25 (Alum) 12.70 284.0 0.75
Fibredux 913G angle-ply A1,64,5 (Nmx) 6.90 56.9 10.6
6.7.2.1 The factor k
From the works on the shear correction factor for solid laminated beams and plates (section
2.1.1), the work by Chow [1971] on the subject seems to have drawn particular attention.
Using a strain energy method and treating the case of static flexural loading of symmetric
laminated beams, he derived expressions showing that the value of k'depends heavily on the
material constants' and ply orientations. For homogeneous anisotropic materials, his results
reduced to the earlier results of Reissner [1945] for homogeneous isotropic materials and a
value of 516 for k. Suggestions were also made to the effect that, for low frequency dynamic
loading of the beam, k could be ignored (i. e. k=1), and that for high frequencies, k was

-Ch6- 113
'usually of order unity'. Kulkarni and Pagano [1972] suggested the values of 213 and 516,
depending on the mode of vibration. They too, confirmed that k was a function of fibre
orientation, though apparently not dependent on the number of layers.
Bert et al [1967] found that for a sandwich beam with a sufficiently stiff core, such as
aluminium, the damping was relatively insensitive to the value of the factor k, while for a
more flexible core, such as fibre-glass honeycomb, the experimental results for frequency,
nodal location and damping did not 'clearly distinguish' any one value of k- obtained
according to four different theories and in the range of 0.706 to 1.94 - as being superior.
As mentioned previously (3.3A), an empirical approach to the determination of the factor k
has been made in the present work, i. e., that its value be such that the test frequency is
accurately predicted. The three basic conclusions made regarding the shear factor of
all-aluminium sandwich beams, are reiterated here. These were that a) it is a linear function
of the relative thickness of the skin and of the core, b) its value is more than unity and c) it is
basically frequency independent.
Through similar frequency tests, the feasibility of establishing any relationship which might
exist between the factor k and laminated sandwich parameters were examined. A plot such
as in Fig. 3.20, for example, would change the status of the factor k from a purely empirical to
a semi-empirical quantity, such that for the given parameters, its value could be estimated.
Initially, frequency tests were conducted on two 0° composite sandwich beams used for the
damping tests, and the results are presented in Figs. 6.17 and 6.18 (for more clarity of the
improved predictions, the full extent of the elementary predictions is not shown). As before,
the theoretical results are based on ak factor which would accurately predict the last
frequency attainable (within ±0.5%). Figure 6.17 shows frequency test results for the 0' beam
with the same aluminium honeycomb specifications used in the 2SB1-X (Aerolam
M-Board) sample (Fig. 3.15). Compared to the latter, what is immediately apparent here is
the relatively large increase in the overestimations of the elementary theory, even for the

-Ch6- 114
fundamental frequency, which is basically due to some 60% increase in the skin modulus
(70 and 113 GPa) although, as before, the accuracy of the predictions of the improved theory
are maintained over the whole frequency range. When the aluminium honeycomb of the 0°
beam is replaced by Nomex (Fig. 6.18), a reduction of some 490% in the core modulus (285
and 48 GPa) brings about an even sharper increase in the overrating of the elementary theory
and, more to the point, a distinct deviation in the improved theory results. This deviation
(also visible on a reduced scale in the 913C/aluminium beam, Fig. 6.17), seems to be
primarily due to a frequency dependence of the Nomex honeycomb modulus, and can be
attributed to a viscoelastic characteristic of the material where the measured properties are
not constant but functions of the test conditions, namely frequency and temperature.
Clearly then, no single value of k could be expected to fit the experimental points over the
whole frequency range, unless the frequency dependence of the moduli is taken into
account.
On the other hand, shear correction for all orientations in a series of beams is not always
possible. The sensitivity of the sandwich frequencies to the factor k much depends on the
relative stiffness of the skin and the core. Increasing the factor k, for example, is tantamount
to increasing the core stiffness and therefore to sustaining a higher portion of a given lateral
deflection to direct strains in the skins. As a consequence, the extent of the sensitivity of the
frequency to the factor k would depend on the skin stiffness. The stiffer the skin, the more
sensitive the frequencies become to k. This is the case with the lower angle beams (0° to 30)
where only a small adjustment of the shear factor is needed to arrive at the exact test
frequency. Conversely, the change in the factor k is of little consequence to the frequencies
of the 90° beam. In this case, larger changes of k are needed to predict the exact frequency.
Further complications arise from the fact that the moduli of the higher angle beams tend to
become more frequency dependent with the result that the test frequencies are generally

-Ch6- 115
higher than the predicted frequencies, thus impeding shear correction for higher angle beams.
Subsequently, for each series of the beams, the factor k was chosen such that the damping
test frequency of the 00 beam was predicted, and this value was maintained for the rest of
the beams in the series.
The effect of a shear correction on the damping mechanisms is considered in Fig. 6.19. As
can be seen, the influence of a shear correction is more pronounced in the bending/shearing
damping ratio than in overall damping, specially for the skins of lower moduli. The figure
can also be interpreted as showing the result of stiffening the core, which tends to have little
effect on a sandwich of highly stiff skin but, as expected, for skins of lower stiffness, it
would lead to a higher skin/core damping ratio.
In Figs. 6.20 to 6.24, the results of the sandwich moduli are presented. In these figures, the
'skin modulus' refers to the sandwich skin modulus as obtained from the frequencies of the
narrow beams, while the 'sandwich modulus' refers to the apparent modulus of the sandwich
skin computed from the sandwich frequency. The considerable discrepancy which could
result from the assumption of unit correction factor is clearly evident from these results. In
Fig. 6.20, for example, for the unidirectional skin (0) of the DLS series, a 28% overrating of
the sandwich modulus results by not allowing for shear correction, and a similar order of
discrepancy is maintained over the whole orientation range to the 90° beam where a 27%
overrating occurs. For the latter beam, the shear correction reduces the deviation of the
sandwich modulus from the skin modulus to +11%, although, as mentioned previously, the
fact that the two moduli have been measured at different frequencies (510 and 38 Hz
respectively) is a possible contributory cause of the deviation. The second GFRP series
(913G, Fig. 6.24) also shows a similar order of overrating of the sandwich modulus (25% for
the 00 beam). In Figs. 6.21 and 6.22, the results of the same angle-ply sandwich beams but
with different cores are presented. For the beams with aluminium core, larger deviations are

-Ch6- 116
noticed between the skin modulus and the sandwich modulus (cf. the 300 and 45° beams on
the figures), most likely due to a stiffening effect arising from the flexure of an anisotropic
skin constrained by a higher modulus core (aluminium). The discrepancies between the skin
and the sandwich modulus result in corresponding discrepancies in the measured and
predicted damping results, as will be discussed later.
However, testing on all-aluminium sandwich beams, James [1962] found overrating of the
experimental frequencies (underrating of modulus) by the predictions of the order of 17%.
He attributed the discrepancy partly to an overrating of the honeycomb shear modulus,
owing to the use of 'heavy adhesive layer' in his shear test on the honeycomb. It is more
likely that, the overestimates were due to his use of a theory which was basically of the
Bernoulli-Euler type.
6.7.2.2 The specific damping capacity
Steady-state damping tests on the sandwich beams were carried out twice, with an interval
of eight weeks in between. In all cases, the earlier results were reproduced, although slightly
lower values were obtained in the second series of tests, almost certainly due to a drop in the
temperature.
The free-decay tests were also carried out, and the results are included. It should be pointed
out that in some cases, the free-decay results were rather erratic. Tests on the same sample
gave results which could be different by as much as 1.5% in the SDC between two tests, or
the SDC at two different amplitudes for the same specimen. The signal was found to
degenerate for the lower amplitudes of the sandwich beam, mainly due to coupled modes.
The free-decay results reported here are those obtained from the decay of the highest
displacement amplitude of the steady-state tests. All the free-decay results were obtained
from the average of the results of three tests.

-Ch6- 117
The SDC results for increments of the skin stress amplitude are given in Figs. 6.25 to 6.29.
Comparisons of the steady-state SDC results at the lowest stress amplitude and the predicted
results, as functions of the sandwich skin fibre orientation, are presented in Figs. 6.31 to 6.35.
The maximum skin stress which could be achieved depended on the stiffness of the
particular sandwich, and was limited to the maximum current which could be safely fed to
the drive coil (not more than 2 A). Hence, as can be seen, the stress in the sandwich skins
falls well below the corresponding stress obtained when testing the skins on their own, and
in almost all cases is within the limit of linear damping observed for the skins.
For the 913C/Nomex samples, non-linear damping is observed in the shear sensitive skins
for both off-axis and angle-ply orientations (15° to 60° beams, Figs. 6.27 and 6.28). However,
no such trend is observed when the Nomex core is replaced by aluminium (cf. Figs. 6.26 and
6.27). This is almost certainly due to the bending-twisting effect imposed by the skins on the
core, which causes non-linear damping in the Nomex core, but has little effect on the
aluminium core owing to the low damping properties of aluminium. The same trend, but on
a reduced scale, is observed in the DLS/Nomex (Fig. 6.25) beams. The reason for the reduced
non-linear damping in this case should be sought in the skin properties. For the same core
thickness, and at the same lateral displacement amplitude, the bending-twisting deformation
is larger in the 913C skins than in the DLS, because of the substantially higher moduli of the
913C skins. The shear coupling, D, 6 , becomes more severe in the sandwich [Lantz, 1969;
Whitney and Dauksys, 1970], because of the weighting factor introduced by the core (cf.
Eqn. (6.20)). Hence, only slight non-linear damping is observed in the 913G/Nomex samples
(Fig. 6.29) compared to the DLS/Nomex (Fig. 6.25), because of the (slightly) lower skin
moduli and the thinner core of the former.
It is noted that, apart from the anisotropic cases mentioned above, the SDC results for the
sandwich do not violate the results obtained earlier for the constituent parts. Linear damping
in the sandwich is maintained within the limits of linear damping of the skins. For the

-Ch6- 118
angle-ply 913C/aluminium series, the results of the SDC versus core shear stress amplitude
are also included (Fig. 630). Although core shear stresses were found to exceed the
maximum shear stress when testing the cores on their own (e. g. compare Figs. 6.30 and 4.11),
the indications are that the shear stresses in the cores are within the linear damping range.
The variation of damping with stress in the 0° DLS beam (Fig. 6.25) seems to be an
exception. The results show an unexpected non-linear damping, compared to, say, the 15°
beam. Although the cause is difficult to pin-point, partial debonding of the skin due to the
lack of adhesive was possible, given that the adhesive layer was not uniform and there were
locations of thinning of the adhesive. The moduli results (Fig. 6.20) do not seem to contradict
the postulation. If there is a partial debonding of the 0° sandwich skin, a drop in the
measured modulus of the sandwich, and consequently a higher value of k, should result,
hence underestimating the sandwich modulus of the immediately higher angle beam, i. e. the
15° beam, which is seen to be the case.
The SDC results as functions of the skin orientation are given in Figs. 6.31 to 6.35. Although,
as expected, the results are more scattered and somewhat less consistent than those obtained
for the sandwich skins, closer examination will show that for most parts, the predicted
results faithfully follow the earlier results concerning the damping and modulus of the skin.
For example, a general overestimate of the predicted SDC results in the DLS series is seen
to be confined to this series. In almost all other cases, the theoretical results underestimate
the experimental ones. Since the moduli results in the DLS series (Fig. 6.20) are fairly close,
the overrating of the damping by the predictions seem to be mainly due to the overrating of
the constituent damping data used for the predictions; as suggested previously (section
6.7.1.2).
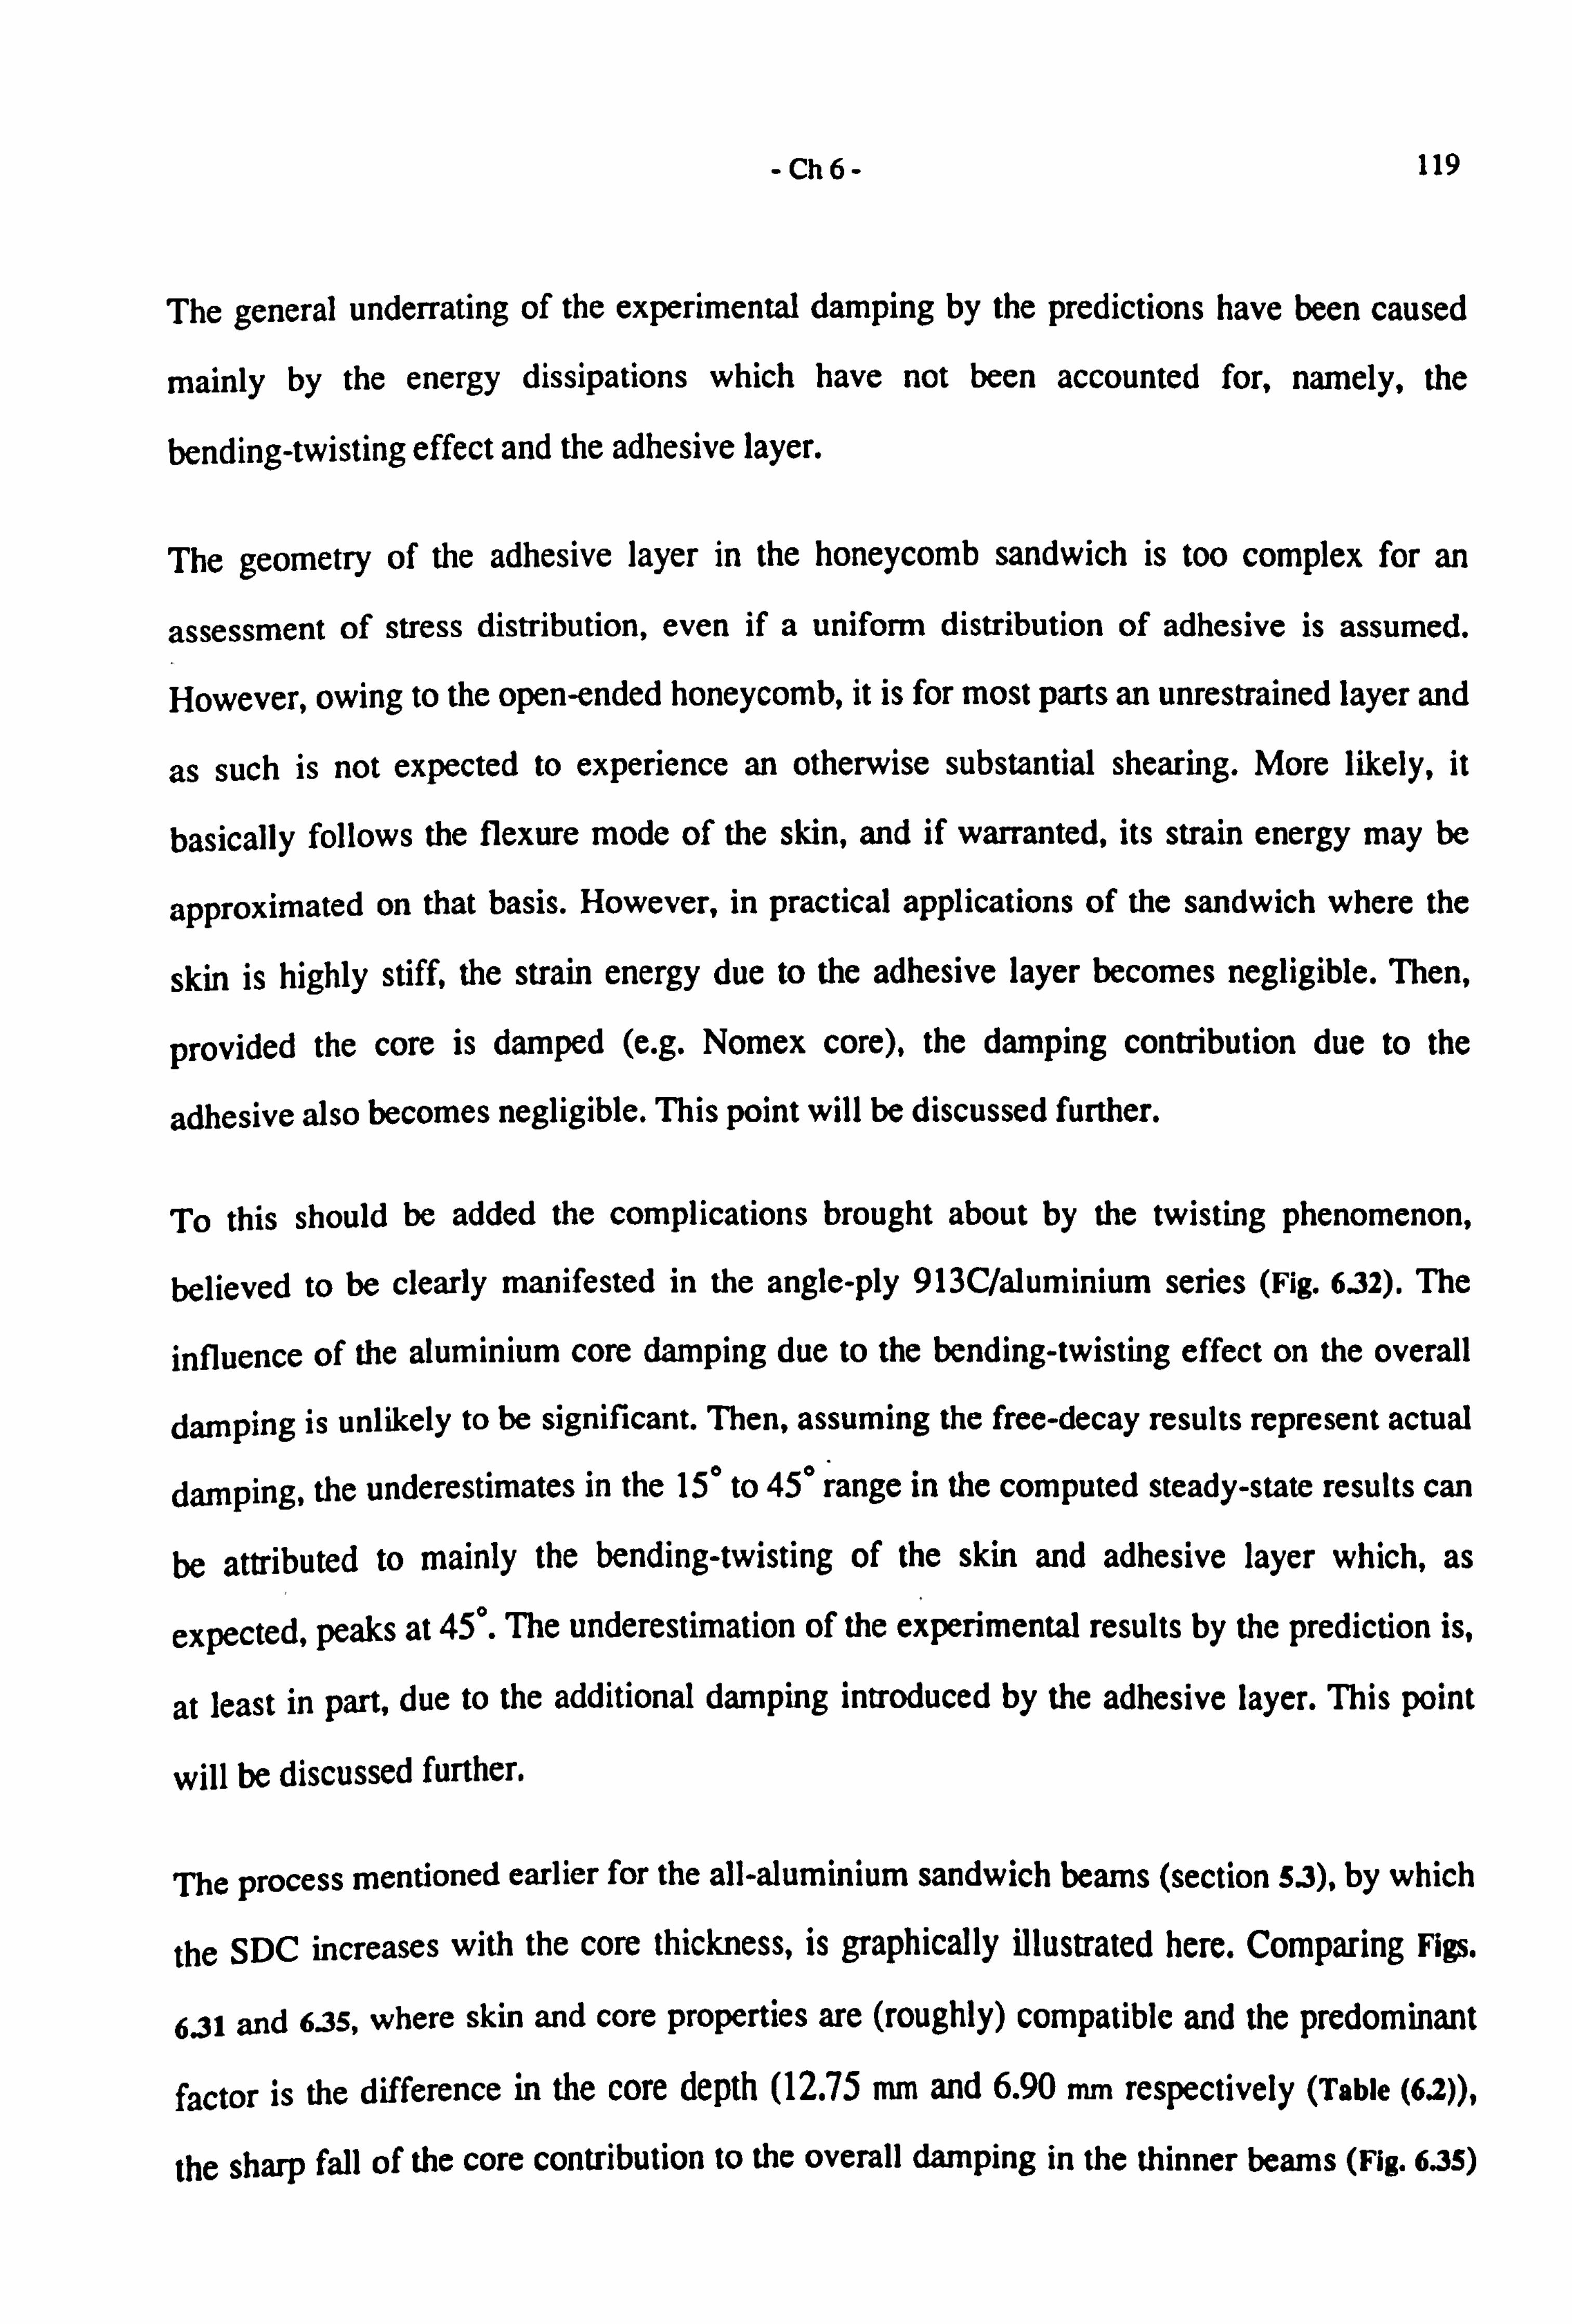
-Ch6- 119
The general underrating of the experimental damping by the predictions have been caused
mainly by the energy dissipations which have not been accounted for, namely, the
bending-twisting effect and the adhesive layer.
The geometry of the adhesive layer in the honeycomb sandwich is too complex for an
assessment of stress distribution, even if a uniform distribution of adhesive is assumed.
However, owing to the open-ended honeycomb, it is for most parts an unrestrained layer and
as such is not expected to experience an otherwise substantial shearing. More likely, it
basically follows the flexure mode of the skin, and if warranted, its strain energy may be
approximated on that basis. However, in practical applications of the sandwich where the
skin is highly stiff, the strain energy due to the adhesive layer becomes negligible. Then,
provided the core is damped (e. g. Nomex core), the damping contribution due to the
adhesive also becomes negligible. This point will be discussed further.
To this should be added the complications brought about by the twisting phenomenon,
believed to be clearly manifested in the angle-ply 913C/aluminium series (Fig. 6.32). The
influence of the aluminium core damping due to the bending-twisting effect on the overall
damping is unlikely to be significant. Then, assuming the free-decay results represent actual
damping, the underestimates in the 15° to 45° range in the computed steady-state results can
be attributed to mainly the bending-twisting of the skin and adhesive layer which, as
expected, peaks at 45°. The underestimation of the experimental results by the prediction is,
at least in part, due to the additional damping introduced by the adhesive layer. This point
will be discussed further.
The process mentioned earlier for the all-aluminium sandwich beams (section 5.3), by which
the SDC increases with the core thickness, is graphically illustrated here. Comparing Figs.
6.31 and 6.35, where skin and core properties are (roughly) compatible and the predominant
factor is the difference in the core depth (12.75 mm and 6.90 mm respectively (Table (6.2)),
the sharp fall of the core contribution to the overall damping in the thinner beams (Fig. 635)

-Ch6- 120
is seen to be accompanied by only a modest increase in the skin contribution. As a result, a
similar sharp fall of the overall damping is noticed in the lower region (low angle beams)
where core damping dominates, while the increase in the overall damping in the
skin-dominant region is relatively slight. Moreover, it is seen that as the core depth is
increased (Figs. 6.35 and 6.31 respectively), the point where the core contribution
predominates extends further such that, for a sufficiently deep core, the latter could become
the principal contributor to the overall damping for any skin orientation or modulus.
The influence of the adhesive layer on the overall damping is well illustrated in the shallow
beam results (Fig. 6.35). Here, since the skin becomes the principal contributor in the higher
angle beams, and also any discrepancies due to the shear coupling are greatly reduced, the
relatively large underestimating of the tests results by the predictions at higher angle beams
can be more assuredly attributed to, mainly, the damping due to flexure of the adhesive
layer. It is notable that, for the same reason, the computed SDC results (steady-state)
generally overestimate the results obtained by free-decay since, in the former, the increase in
the strain energy due to the flexure of the adhesive layer is not accounted for. It will be
appreciated that, as the angle of fibre orientation is increased, the beam modulus approaches
that of the adhesive layer; for the 90° beam, the two are roughly compatible. Furthermore, it
is noted that since in the lower angle beams the core damping dominates, the discrepancies
due to the flexural damping of the adhesive layer are minimised and, consequently, all the
results can be seen to fall very close together.
In fact, referring to the results, the above arguments are seen to hold for all the samples.
That is, where the discrepancies due to the anisotropy of the skin are absent, and the
adhesive damping is marginal, the steady-state, free-decay and the predicted results fall very
close together. This can be observed from the 0° and 90° beam results in Figs. 631 and 633,
the 90' result in Fig. 632, and the 0° results in Fig. 6.35. It could similarly be argued that, with
orthotropic skins, the discrepancies are most likely due to the adhesive layer. This can be

-Ch6- 121
seen to be the case in the 0° 913C/aluminium beam (Fig. 6.32) and the 90° 913G/Nomex (Fig.
6.35), where the experimental results are underestimated by the predictions. In the first case,
the discrepancy is due to low damping of the aluminium core, making the skin damping
dominant at all orientations. As a result, the energy dissipation in the 0° beam will be mainly
due to the flexure of the adhesive layer, and possibly also some air-damping. In the second
case, the discrepancy was already mentioned to have been caused by the relative
shallowness of the sandwich, making the damping due to the adhesive layer more
pronounced at higher orientations.
Comparing the angle-ply and the off-axis results (Figs. 6.33 and 6.34), as expected, the trend
observed earlier in the variation of damping with orientation is seen to recur, that is, a sharp
rise in the damping due to the skin with fibre orientation in the off-axis series, followed by
an almost constant damping with orientation, as opposed to a more gradual rise with the
angle-plies. The fact that the fall in the core damping with fibre orientation follows the same
pattern as the rise in the skin damping arises from Eqn. (3A2), where the strain energy due to
bending of the skin, Ub , is the dominant contributor to the total strain energy.

-Ch6- 122
Comparing the sandwich beam results with those obtained earlier for the sandwich skins, the
relatively larger discrepancies are not entirely unexpected, bearing in mind, in addition to
the discrepancies caused by the above mentioned factors, also the following
a) here, a compound structure is involved, with more variables, analysis and
simplifying assumptions;
b) within the laboratory environment, the consistency of material (adhesive
layer, honeycomb core) for all the samples cannot be ensured;
c) the method of manufacture is entirely different; the sandwich beams are
individually assembled by hand and any off-set of the skins or misalignment of the
core etc. is not always obvious;
d) some additional assumptions have been implied; for example it has been
assumed that both modulus and damping are independent of frequency (and
temperature) within the test range, and that no post curing of the sandwich skin, or
core, has occurred.
In most cases, the steady-state and the free-decay results are seen to be reasonably close.
The maximum error, with reference to the free-decay results, was found to be -20%, in the
15° 913C/aluminium beam results (Fig. 632). Given the factors mentioned above, and in
particular the complexities brought about by the shear coupling effect and the adhesive
layer, these results seem to verify the adequacy of the Timoshenko beam equations in
measuring the steady-state damping, and justify the simplifying assumptions made in
adopting these equations for a sandwich beam.
It will be noted that, unlike the simple beams, sandwich damping properties will be
necessarily a function of beam length, end conditions or any load supported by the beam,
since such factors have an influence on the relative bending/shearing the beam undergoes.
The point is illustrated in the theoretical variation of the SDC with the mode number, and
the core depth/length ratio presented in Figs. 6.36 and 6.37 respectively. As expected, the

_Ch 6_ 123
graphs follow a similar trend which covers a range between two extremes. On one extreme,
a sufficiently long sandwich beam would experience little shearing and the energy
dissipation is almost entirely through bending of the skins. The beam would be in effect a
Bernoulli-Euler type. On the other extreme, the beam experiences a thickness-shear type
mode of deformation. Theoretically, depending on the beam length, the damping of the
sandwich could be almost entirely due to either the core or the skin. This concept is of great
significance in the overall damping of the sandwich if unlike, for example, all-aluminium
sandwich, the two constituent dampings are not compatible.
The effect of a load on damping contribution of the constituent parts is shown in Fig. 6.37.
Evidently, for the free-free beam, the contribution of the skin to the total damping drops
when the beam is loaded in the mid-span, although the mutual increase in the core damping
would more than compensate for the decrease. This follows from consideration of the mode
shape, together with Eqn. (3A2). The load on the beam moves the nodal lines closer to the
mid-span. This has the effect of increasing the strain energy of shearing in the core and a
mutual, proportionately higher, reduction in the strain energy of bending of the skins.
6. S Conclusions
The tests showed that, using basic plane-stress relations for laminated composites and the
Adams-Bacon damping criterion, the moduli and the SDC of both symmetric angle-ply and
off-axis beams at any orientation can be predicted with fairly good accuracy. However, the
bending-twisting could result in serious overestimates of the measured effective Young's
moduli in flexure, although its effect on the measured SDC was found to be not as severe.
The absence of bending-stretching coupling has made the symmetric angle-ply laminated
plates of particular interest on two accounts. First, these are less prone to warping caused by
thermal contraction, and second they are more amenable to closed form mathematical
analysis. However, anisotropy could cause serious discrepancies between the measured and
predicted effective flexural moduli of the beams, unless these are of sufficiently large aspect

-Ch6- 124
ratios to make the deformations not accounted for in the simple bending of beams
insignificant.
A variety of composites, orientations and honeycombs was used in the construction of the
sandwich beams, to allow a broader assessment of the damping mechanisms in the
sandwich. Generally, the results showed a high degree of inter-dependence between the skin
and the core in either one's capacity in contributing to the overall damping of the sandwich.
It was shown that the Timoshenko beam equations were adequately capable of accounting
for energy mechanisms of simple bending/shearing in a shear soft beam. These equations
were used for the steady-state measurement of the SDC in a sandwich beam, and for
determining the bending/shearing proportion to the overall damping. It was suggested that
the shear factor be found empirically for the particular damping test, and it was concluded
that the shear correction is of more significance to the bending/shearing damping ratio than
to the overall damping.
The theoretical results were found to follow the free-decay results with reasonable accuracy.
In most cases where discrepancies occurred, these were found to correlate with the energy
dissipations not accounted for in the theory, namely, 1) the bending-twisting inherent in the
anisotropic composite skin, which is more severe than when testing the skins on their own
owing to the weighting factor introduced by the sandwich core, and 2) the adhesive layer.
The latter, however, would be of little significance in most practical constructions of the
polymer based honeycomb sandwich, where the skin stiffness is sufficiently high to allow
the core damping to predominate.

125
Chapter 7
GENERAL CONCLUSIONS
Relevant conclusions have been drawn at the end of each chapter. Here, general conclusions
which can be made collectively from different aspects of the work will be outlined.
The modified Timoshenko beam equations may be used with confidence for measuring the
flexural damping of shear-flexible symmetric, honeycomb sandwich beams in steady-state
vibration. Excellent repeatability of the damping results can be expected. The same
equations can be utilised for predicting the skin/core contribution to the overall damping.
However, discrepancies will inevitably arise if the beam vibration is not exclusive to the
simple bending/shearing of the skin/core components.
In adapting these equations for a sandwich configuration, certain assumptions are made
which cannot be fully verified. The problem becomes more complicated with the presence
of the as-yet ill-defined shear correction factor, k, associated with these equations.
Nonetheless, it was shown in the case of solid beams, with or without a shear correction,
that these equations are well capable of predicting the frequencies with good accuracy even
in the high frequency domain; also, for the all-aluminium sandwich beams, a linear
relationship exists between the optimum value of k and the skin/core thickness ratio. For the
all-composite sandwich, a frequency-dependent modulus was noticed with the result that no
single value of k could be expected to fit all the experimental values. The shear correction
was found to be of less influence on the overall damping of the sandwich than it was on the
skin/core contribution to damping. An empirical approach for the determination of the factor
k was suggested.

-Ch7- 126
It was further shown that it is possible to predict, with a good degree of accuracy, the
modulus and the specific damping capacity of laminated composite beams having an
anisotropic flexural modulus. The effective flexural modulus was found to be more sensitive
to the plan aspect ratio than the orthotropic modulus as reported in the literature. The
discrepancies in the damping results due to anisotropy were found to be only noticeable
when the beams were used as skins in a sandwich configuration.
The sandwich damping results were generally found to follow the expected trend, and a
correlation was found to exist between the degree of the discrepancies and the skin
anisotropy and/or the energy dissipation in the adhesive layer.
Regarding the skin orientation, two sandwich beams of the same dimensions and fabricated
from the same composite skin and damped honeycomb core materials, might show the same
order of vibration damping, yet the mechanism of damping in each, could be entirely
different. In a beam with 0° skins, for example, the core is the principal contributor to
damping while, in a 90° beam the skin becomes the principal contributor. The end
conditions, any loads supported by the beam, and the beam dimensions would all influence
the proportion of the contribution of the skin and of the core, and hence, the overall damping
of the beam.
A test method was developed for measuring the modulus, as well as the specific damping
capacity of honeycomb in steady-state shear vibration. Though somewhat laborious to
produce, the double-lap test piece was found to give by far the lowest relevant SDC reported
in the literature.

-Ch7-
Suggestions for further work
Some aspects of the present work are believed to merit further investigation. These are
127
1) The establishment of any possible relationship between the shear factor
and the relevant parameters (core thickness, fibre orientation etc. ) of the
composite/honeycomb beam
2) Only the first mode of vibration was considered in this work. Of particular
relevance to the present work is the prediction and measurement of sandwich
damping in higher modes of vibration, where the specimen is subjected to intensified
shear deformation. In both of the above cases, any frequency dependence of modulus
should be accounted for
3) Only free-free end conditions were considered. Similar investigation of
sandwich damping with respect to other end conditions (clamped-clamped,
clamped-free) is also warranted
4) In the range between the orthotropic 0° and 90° orientations, only
anisotropic orientations (symmetric angle-ply) were considered. It would be of
interest to see if, as expected, using orthotropic orientations (e. g. anti-symmetric
angle-ply laminate) reduces the discrepancies in the damping of the sandwich.
Closed form analyses have been used in this work. The disadvantage here is the limitation of
a closed form analysis to model accurately the actual deformation. More accurate modelling
should be possible using such numerical methods as the Finite Elements Analysis. Indeed,
some work was carried out to modify an existing Finite Element program (GINYOR, Lin et a!
[1984]) for a composite/honeycomb sandwich configuration using the shear deformation
theory [Whitney, 1987]. Although implemented, the program (PLATE. FOR) remains to be
tested on its own ('debugged'), and to be verified experimentally.

128
Appendix (A)
ANALYSIS OF THE FLEXURAL TEST-RIG
A. 1 Determination of the specific damping capacity
The specific damping capacity, SDC, is defined as Au
W= (A. 1)
where AU is the energy dissipated per cycle, and U is the maximum strain energy.
With an applied cyclic force, F, maintaining the vibration in a steady-state, the energy
dissipation per cycle is given by
AU= fF
dw
where
F F. cos(wt)
For relatively low damping, at resonance the response lags the applied force by n/2 to a close
approximation. Then
W=W. sin(tot)
and AU = it F. Wm (A. 2)
where F., and W. are maximum force and the corresponding displacement amplitude
respectively.
The quantities F. and W. are found by measuring the current flowing through the drive coil
and the voltage induced across the pick-up coil respectively, as follows

- Appx (A) - 129
The maximum induced force on a total length, L, , of the drive coil subjected at right angles
to the lines of flux of intensity Bd of the drive magnet is given by
F. IP. ak
Ld Bd
where t,, is the peak current in the drive coil. Provided 1 remains the only variable in a
damping test, then this equation may be written as
F. = 1,. * Td
where the constant rd is termed the 'drive sensitivity'.
(A3)
Similarly, the maximum induced voltage across a total length, L. , of the pick-up coil cutting
at right angles the lines of flux of intensity B, of the pick-up magnet is given by
V, = v, 1LLBo
which may be written in terms of the 'pick-up sensitivity', r, , as
V,, = V. rp (A. a)
where v. is the maximum velocity of the pick-up coil and is given by
v. =wW. (A3)
1 Then W.
V,, (A. 6)
ro W.
Equations (A. 1), (A. 2), (A3) and (A. 6) will now give
% r, %. V. W=rf1 (A. 7) v
The computation of the maximum strain energy, U, of a free-free beam carrying a central
mass, M, , in the first mode of flexural vibration of lateral displacement amplitude W,, has
been covered previously (Chapter 3).

- Appx (A) -
Al Calibration of the drive and pick-up coil/magnet sets
130
One way of finding the sensitivities r, and r, is to treat both the drive and pick-up sets as
pick-up. This may be conveniently achieved by using the flexural test set-up itself. In this
case, the coil assembly, mounted on the mid-span of a low damping beam (e. g. Duralumin),
is tuned to an appropriate frequency and a number of v_ Vs W. points are measured for
each coil/magnet set while employing the second coil/magnet set as the drive unit. The
displacement amplitude, W. , may be measured by an optical image shearing device, as was
done in this work using 'WISE', or any other appropriate method. Then, in each case, the
quantity r, may be found according to Eqn. (A. 4). The unit of r, so found will be V. s/m which
is applicable to the pick-up set. For the drive set, however, the sensitivity rd is of the unit
N/A according to Eqn. (A3). It is easily verified that since
Watt = Newton. meter / second = Volt. Amp
Then 1 (V. s/m) =1 (N/A)
The sensitivities might change over a period of time and it would be sensible to check these
regularly. The changes in the sensitivities may be due to any change in the gap size of the
drive electromagnet, possible short circuit of one or more loops in the coils, room
temperature etc. In most cases, however, it was found that the variation in the sensitivities
was small (less than M.
Calibration graphs are presented in Figs. A. 1 to A. 3. The solid lines join the first and last
points in the range. Figures A. 1 and A. 2 indicate the sensitivities of both drive and pick-up
units remain constant over the whole range of displacement amplitude. Figure A. 3 shows the
calibration of the drive sensitivity over a range of the electromagnet current. As can be seen,
up to a current of 5A the sensitivity is linear and, if need be, may be read off directly from
this graph with reasonable accuracy.

131
Appendix (B)
THE LONGITUDINAL SHEAR TESTS
Fox [1972] and Flitcroft [1976] used test rigs which were based on the torsion pendulum
arrangement for measuring the dynamic properties in torsion. Both apparatuses used two
sets of coil/magnet for the drive and pick-up systems.
Investigating the dynamic properties of cast iron for up to and beyond fatigue endurance
limit, Fox developed an apparatus capable of producing relatively large torques. As such,
this apparatus consisted of a heavy metal frame on which large drive and pick-up magnets
were fixed, while the drive and pick-up coils were fixed at either ends of a symmetrical
inertia bar. The specimen was clamped at one end to the frame and at the other to the inertia
bar. A Duralumin 'dummy specimen' was similarly clamped to the inertia bar at one end and
to the frame at the other end, thereby establishing clamped-clamped end conditions. The
dummy specimen had been incorporated in the system in order to constrain
flexural/torsional coupling, and also to have a degree of control over the resonance
frequency by using dummies with different dimensions.
Flitcroft, investigating the dynamic torsional properties of fibrous composites, found Fox's
apparatus to be inadequate for this purpose. This was because the dummy specimen
dominated the stiffness of the system and hence the calculation of the stiffness of the test
specimen would involve small differences between large numbers. Removing the dummy
specimen, however, would bring about adverse affects on two accounts. First, flexure of the
specimen tended to occur due to the imbalance of the inertia bar, although he found that
dynamic balancing of the inertia bar 'eliminated' this problem; and second, the system was
of too large an inertia for testing of composites at an appropriate frequency. He developed a
similar apparatus with the necessary modifications which included removing the dummy

- Appx (B) - 132
specimen and replacing the inertia bar with a cylindrical coil arrangement incorporating the
drive and pick-up coils thereby reducing inertia as well as enhancing dynamic balance.
Both these rigs were available for the present work, but were found to be of too high an
inertia for the stiffness of the test piece. They are also rather tedious to set up due to the lack
of adequate access and the hindrance caused by the presence of various fly wires.
Consequently, a new and simple rearrangement was utilised. The test-rig used is basically a
scaled down version of Fox's rig but in a clamped-free formation, that is, without a dummy
specimen. With a relatively small inertia bar, higher frequencies, more compatible with the
tests in this work, can be attained. It has the added advantage that, unlike the previous rigs,
no fly wires are involved, although any gain in reducing extraneous damping would be of
significance only for low damping materials. Moreover, as pointed out by Willway and
White [1988], with the clamped-clamped formation direct strains are induced which cannot
be neglected for higher amplitudes.
The rig was originally intended for testing the less stiff flat specimens at adequate
frequencies (not below 30 Hz), but it also proved to be suitable for testing standard circular
section specimens, although a heavier inertia bar had to be used in this case.
The test-rig consists of a relatively small symmetric inertia bar which carries two pairs of
small permanent magnets (Fig. B. 1(a)). The inertia bar is fixed to one end of the specimen,
and the latter is firmly clamped at the other end to a concrete block. Two corresponding
pairs of coils, each pair in series and each pair positioned diagonally on an aluminium frame
(Fig. B. 1(b)), provide the drive and pick-up coils. 1

Appx (B) -
inertia ö
bar L_--
D drive magnets beam
p pick-up magnets sample
(coils not shown) fixed
--JAI. end _..: ý- -- - -- - --- x I-r
Ro R, ýý-r ý-
- P F--] F-I I "ý [E DýI-*I
D ýLJ PL
(a) (b)
Fig. B. 1 Longitudinal shear test-rig
i i_ý
The instrumentation and the test procedure are similar to those in the flexural tests. With a
current flowing through the drive coils forces are induced which can be made of opposite
directions by ensuring that the position of one drive magnet poles relative to the current flow
is opposite to that of the poles of the second drive magnet. Then, provided the inertia bar is
dynamically balanced and that the two drive coils are of the same sensitivity, a pure couple
should result.
In the case of the Fibredux 913C and 913G composites, circular section samples were
machined from the square section mouldings prepared by stacking strips of the
unidirectional pre-preg. In the case of DLS-280, the same moulded material which was used
for flexural tests was also used for longitudinal shear test t. Hence, in this latter case, the
I This was due to the lack of material for this particular composite.

- Appx (B) -
specimen was in the shape of rectangular flat strip which was cut from the moulded
unidirectional plate.
The circular section test pieces were of standard dimensions (nominally 10 mm diameter and
140 mm gauge length) with square ends. For these test pieces, a heavier inertia bar,
incorporating two V-clamps (Fig. B. 1(b)), was used.
The arrangement, therefore, imposes a single DOF system of torsional vibration on the test
piece, the frequency of which is given by
f=1 2n
where K is the torsional stiffness of the specimen and J, is the mass moment of inertia of
the inertia bar about the x axis (Fig. B. 1(a)).
The moment of inertia of the inertia bar was obtained by comparing its period of oscillation
with that of a uniform disc whose moment of inertia, j, , could be readily calculated. The
inertia bar and the disc were in turn suspended from the same length of wire and, following
a small initial twist, the period of oscillation in each case was measured. Applying Eqn. (B. 1)
to each case and equating the stiffness yields
�ew =( )2 �ax (B. 2) T di.
B. 1 Analysis of the circular section test piece
B. 1.1 Shear modulus
The angle of twist resulting from the application of torque T over a uniform length L of the
134
specimen is given by
e= TL
(B. 3) GJ
where G is the shear modulus and J is the polar second moment of area of the specimen.

- Appx (B) - 135
By definition, the torsional stiffness is given as
T K=- (B. 4)
Then, Eqns. (B. 1), (B. 3) and (BA) will give the shear modulus as 1281rf. 2 J6,, L
G= (BS) d4
where d is the diameter of the specimen.
B. 1.2 Steady-state vibration damping
By analogous arguments in deriving Eqn. (A. 2) in Appendix (A), the energy dissipation per
cycle of the longitudinal shear vibration is shown to be given by
AU =nT. e,. (B. 6)
where T. and 0. are the peak values of the torque and the corresponding angle of twist
respectively. These are given by
T, ý _ 42 I,,., r. R. (B. 7)
J2 V, ý� on, _ (B. 8) 21r rrRof1,
where l,,,,, and V,,, � are the current through the drive coil and voltage across the pick-up coil,
R, and R. are the mean radii of the drive and pick-up coils from the axis of rotation (Fig. B. 1),
and r, and r, are the total sensitivities of the drive and pick-up coil pair respectively. It will
be noted that in order to avoid imposing any flexural deformation on the specimen a pure
couple should be applied, and ideally this is achieved by ensuring that the two drive
coil/magnet pairs have the same sensitivity. However, manipulating the sensitivities of the
ready made coils is not without difficulty, and a compromise should be made as regards to
the closeness of the sensitivities. The drive units used here were of sensitivities 0.070 and
0.074 N/A, believed to be sufficiently close to make any flexural deformation negligible.

- Appx (B) - 136
Assuming a uniform distribution of stress in the material, the maximum strain energy in
torsion is given by
1 U=-G ?2v
4
where y, n is the maximum shear strain and v is the volume of the working length of the
material.
Since
d 0.
2L
therefore
nGd49. = U= (B. 9)
64L
Then, by the definition of the SDC as yr = DUIU, the latter is given by Eqns. (BS) to (B. 9) as
1�., r, r, R, Ro T
Jb., V. fn (B"ýO)
Also, the maximum shear stress is found as 42 GdV,,,,,
ýý _ (B. 11) 4nL1', RPf�
B. 2 Analysis of the rectangular section test piece
B. 2.1 Shear modulus
Exact solutions are obtained in torsion of circular shafts by assuming, to a good
approximation, that the plane cross sections remain plane. This assumption, however, does
not hold for prismatic bars [Timoshenko and Goodier, 1951]. The usual solution to this
problem has been through the membrane analogy in which the outline of the cross section is
treated as a membrane subjected to tension and lateral pressure.

- Appx (B) - 137
Utilising the membrane analogy, the torque on a rectangular section uniform beam can be
shown to be given by [Timoshenko and Goodier, 1951 ]
0 T =k, G - wh3 L
(B. 12)
where w and h are the width and depth of the bar respectively, and k, is a numerical factor the
value of which will depend on the ratio weh. The factor k, is given as 1 192 h °° I
k, _- (1 ---I- tanh(nitb/2d)) (B. 13) 3 7C3 W n_1.3.3... ns
Then, Eqns. (B. 1), (B. 3) and (B. 12) give the longitudinal shear modulus as
4 n2f 2Jam, G= (B. 14)
k, wh3
The maximum shear stress is given by
tom= kGL. h (B. 15)
where similar to k� k is a numerical factor depending on the ratio w/h. The factor k is given as
8 k= (I -- (B. 16)
n= n=1,3. s.... n2 cosh(nnb/2d)
Substituting for e,. from (B. 8) in (B. 15) will give 42 kGV,,.,
ýý _ (B. 17) 2nLr, Rof�
B. 2.2 Steady-state vibration damping
The maximum strain energy in torsion of a narrow rectangular bar of width w and depth h is
given by [Timoshenko and Goodier, 19511
U=1k, G-w hi (B. 18) 2L

- Appx (B) - 138
Then, Eqns. (B. 6), (B. 7), (B. 8), (B. 14) and (B. 18) will now give the SDC as i, rd r Rd Ro
Jbar Vmufe (B. 19)
As expected, this expression is seen to be identical with the one obtained for a circular
section sample.
B. 23 Experimental verification
Walton [1973] found that for both round and rectangular section beams, a decrease in the
cross sectional area resulted in a small but detectable decrease in the measured shear
modulus, and the decrease was, therefore, accompanied with an increase in the measured
SDC of the material.
The theoretical values for longitudinal shear modulus and damping, as given by Eqns. (B. 14)
and (B. 19), were verified experimentally. For shear modulus, a torsion test was carried out on
a rectangular section aluminium beam and the shear modulus was computed using
Eqns. (B. 14). The modulus so found was then compared with the expected shear modulus of
aluminium.
The following data for the shear modulus test was recorded
= 107 mm
w = 12.74 mm h = 3.38 mm
ib� = 3.22 x 10⁻³ kg m2 f, = 60.8 Hz
A digital computer can be conveniently programmed to compute the factors k, and k
according to Eqns. (B. 13) and (B. 16). The series converge fast and these factors can be found
very accurately for any given value of w/h. For the aluminium test piece, weh = 3.77 for

- Appx (B) - 139
which it was found that k, = 0.2776. Equation (B. 14) will now give
G= 25.8 GPa
The Young's modulus was measured dynamically, and was found to be
E= 69.52 GPa
Taking the Poisson's ratio, v, for the aluminium sample as 0.35, then the static value of G is
given as E
G== 25.75 GPa 2 (1 +v)
This value is almost identical with the value computed using Eqn (B. 14).
The SDC as given by Eqn. (B. 16) was checked by simply comparing the result with the one
obtained by free-decay method. The following data were recorded for the longitudinal shear
damping test on the GFRP (DLS-280) specimen at the lowest displacement amplitude.
w = 13.7 mm h = 1.60 nun
1. = 21 mA V. = 1.79 mV
rd = 0.144 N/A
0.081 mV. s/mm Rd = R,, =25.5 mm fA = 35.2 Hz
The coil sensitivities had been found individually for each coil using the same procedure as
described for flexural test-rig (Appendix (A)).
For the ratio wih = 8.562, k, = 0.3088 and k=1.0. Equations (B. 17) and (B. 19) will now give
at T. = 0.81 MPa
W=7.85%

- Appx (B) - 140
The average of three free-decay test results (7.45,7.57 and 7.52%) for this sample was
found to be
yr=7.51%
The computed result is 4.5% higher than the free-decay value of the SDC. This is a fair
agreement between the two results.
The results of the steady-state tests on the three sample are presented in Figs. B. 2 and B. 3.
These results indicate that, within the range tested, the stress dependency of the SDC is only
marginal.
Adams et al [1969] found that the longitudinal shear damping of the CFRP was both stress
and (slightly) stress-history dependent, but for GFRP it was found to be generally stress
independent. Experiments of Willway and White [1988] also showed stress dependent
damping in resin and CFRP rods, under both clamped-clamped and clamped-free conditions.

141
Appendix (C)
ANALYSIS OF A SYMMETRICALLY END-LOADED TIMOSHENKO BEAM
Scope - In this appendix, the uncoupled Timoshenko beam equations are first derived, and are
subsequently applied to a symmetrically end loaded beam.
C. 1 Timoshenko's uncoupled equations
Applying Newton's second law of motion to an element of a uniform beam (Fig. C. 1)
subjected to lateral vibration will give [Timoshenko, 1955]
aQ a2w
ax _ (PA dx) n
(C. 1) `r
am a2
-- dx +Q dx = (pl dx) äý= (C. 2)
L
Ix iHdx
/1Q MI +. ý \
dx
M+(a M/ a x)dx
Q+(a Q/ a x)dx
Fig. C. 1 Elementaryf exure of Timoshenko beam
where 0 is the bending slope and w is the total lateral deflection.

- Appx (C) - 142
Now,
M= -EI axe (C3)
and kAGy
aw =kAG (ax 0) (C. 4)
Then, substituting for m and Q in Eqns. (C. 1) and (C. 2) will give j)2 aw
EI axe
+ k( ax
0) AG - pI at =0 (C. 5)
iw pA - k(
w- a-ý) AG =0 (C. 6)
zs
Solving Eqn. (C. 6) for 0 gives
0; 12w p a2w
J( ax; kG at2
aw p a2w = dr + Const.
ax kG atz
Substituting for 0 in Eqn. (C. 5) gives ajw p a°w p a2w
EI( -- ý7G
)+ kAG dx aX3 aX2 at2 kG at2
a3w p c; > w p' ax at kG ate
dr) + Const. =0 z
Differentiating w. r. t. x gives a+w a2w Epl a'w p2/ a4w
EI -+ pA -- (PI +-)+0 (C. 7) ax, a12 kG ax2aý2 kG C) t4
Similarly, from Eqn. (CS)
EI a2¢ Pl a2 dx w- kAG axe +
kAG ate )

- Appx (C) - 143
Substituting for w in Eqn. (C. 6) gives
f a=- -
EI p
a+0 pl a=e LJ
aýý - AJ ät= kAG 7X2 ate kA ät2 ' d; r - 'mac + axe
EI a40 pl a+w ao +) dz --+ Const. =0
roc ax' sac axe ate ax
Differentiating w. r. t. x gives
El 0+
pA a2o
- (pl + EPI
) ýo
+1 CP40
=0 (C. 8) ax' ate kG ax2at2 kG at+
Equations (C. 7) and (C. 8) are Timoshenko's uncoupled differential equations of lateral
vibration corresponding to Eqns. (3.4. a) and (3.4. b).
C. 2 End loaded beam
Consider a Timoshenko beam symmetrically loaded with equal symmetric masses at either
ends (Fig. C. 2) and vibrating in a normal mode.
M`/2
ý_ L
Fig. C. 2 Symmetrically end loaded beam
Provided the end masses do not hinder rotation of the beam end, then the beam may be
considered as being free-free and will be subjected to the following conditions &0 aw
i) at x=0, E! -+J W- =0 (C. 9. a) ax ax (bending moment due to rotary inertia, i, of end mass)
ii) at x=0 , MG ( aw
ax -4))+ Me 2 OW=0 (C. 91)
(shear force due to acceleration of end mass)

- Appx (C) - 144
For symmetric modes, the following conditions apply
L iii) at x=2, c=0 (zero bending slope) (C. 9. c)
L aw (zero shearing force) iv) at x= 2-, MG ( ax -(D)=o
aw SO, -=0 (C. 9. d)
ax
For anti-symmetric modes, the following conditions apply
at x= -, W=O (zero lateral displacement) (C. 9. e) L 2
L4 iv) at X= -, -=O (zero bending slope) (C. 9. f)
2 ax
C. 2. a Symmetric modes
Equations (C. 9. a, b, c, d) will respectively lead to the following equations
(C, (a2+s2) - C3 (ß2-s2)) mL2 + (C2 a+ C4 P) Jb= 0 (C. 10. a)
-2m(CZß-C4 a)+Meb(C, +C, )aß=0 (C. 10. b)
j3 (a2+s2)(C, sinh(H) + C2 cosh(H)) -a (ß2-s2)(C,, sin(T) - C, cos(T)) =0 (C. 10. c)
C, a sinh(H) + C2 a cosh(H) - Cj ß sin(T) + C4 (3 cos(T) =0 (C. 10. d)
where H=ba/2 T=bß/2
By setting the determinant of the matrix of coefficients to zero, the following frequency
equation for the symmetric modes of the end loaded Timoshenko beam is obtained
(fp -s2) nd 2-ß tan(T) Jb aß Me b+ tam tan(T) +=0 (C. 11)
(a2+s2) mL) -a tanh(H) A aß Me b+ 2ßm tanh(H)
From Eqns. (C. 1O), the constants C, , C2 , C, may be found in terms of C, , giving the total
lateral deflection, W, as
W=P Cj cosh(bac) -P C3 tanh(H) sinh(baý) + Cj cos(b(3C) + C3 tan(T) sin(b3C) (C. 12)

- Appx (C) -
where
P= aP Me b+ 2m tan(T)
-- pa Me b+ 2m tanh(H)
C. 2. b Anti-symmetric modes
Equations (C. 9. e, f) will respectively lead to the following equations
C, cosh(H) + Cz sinh(H) + C3 cos(T) + C4 sin(T) =0
(a2+s2)( C, cosh(baý) + C2 sinh(baC)) - (2-s2)( Cj cos(bf t) + C4 sin(b(3ý)) =0
145
(C. 13)
(C. 14. a)
(C. 14. b)
By setting to zero the determinant of the matrix of coefficients in Eqns. (C. 9. a, b) and (C. 14),
the following frequency equation for the anti-symmetric modes of the end loaded
Timoshenko beam is obtained (ß2-s2) mV +ß cot(T) Jb 0 M, b- tam cot(T)
(a2+s2) ml) -a coth(H) Jb + =0 aß M. b+ 2ßm coth(H) (C. 15)
The constants C,, C2, C, are found in terms of C, using Eqns. (C. 9. a, b) and (C. 14). The total
deflection, W, is then given as
W= Cj P cosh(b4) - Cj P coth(H) sinh(baC) + C3 cos(bßt) - Cj cot(T) sin(bJ3 )
where a Me b- 2m cot(T)
P= -- PaM. b+ 2m coth(H)
C. 2.1 Strain energy
(C. 16)
(C. 17)
Strain energy of an end loaded Timoshenko beam is given by Eqn. (3.20), for which, similar
to the centrally loaded case (Chapter 3), it will be convenient to rewrite Eqns. (3.14) in the
form of Eqns. (3.21).

- Appx (C) - 146
The coefficients of Eqns. (3.21) for symmetric modes of an end loaded Timoshenko beam are
found as follows
In Eqn. (3.21. a)
A=P C3 ;B=- tanh(H) P Cj
C= C3 ;D= tan(T) C3 (C. 18. a)
in Eqn. (3.21. b)
A= -atanh(H)PC3 ; B= aPC3
C=ß tan(T) C. ;D= -ßC3 (C. 18. b)
in Eqn. (3.21. c)
a2+s2 a2+s2 A=- tanh(H) P C3 ;B=P Cj aa
s2 _s2 C=R tan(T) C3 ;D=--C, (C. 18. c)
and in Eqn. (3.21. d)
A= (a2+s2) P C3 B=- (ct2+s') tanh(H) P CJ
C=- (2_s2) C3 ;D=- (f -s2) tan(T) Cj (C. 18. d)
The coefficients of Eqns. (3.21) for anti-symmetric modes of an end loaded Timoshenko
beam are found as follows
In Eqn. (3.21. a)
A=P C3 ;B=- coth(hf) P C3
C= C3 ;D=- cot(T) C3 (C. 19. a)

- Appx (C) - 147
in Eqn. (3.21. b)
A=-a coth(H) P C3
C= -ßcot(T)C3
B=aPC3
D= -ßC, (C. 19. b)
in Eqn. (3.21. c)
a2+s2 A=- coth(H) P C3
a
s2
C=- cot(T) C3
a2+s2 B= PC3
a
D= --s. C3 ß
(C. 19. c)
and in Eqn. (3.21. d)
A= (a2+s2) P C3
C=- ((32-s2) C3
B=- (ac=+s2) coth(H) P Cj
D= (p2-s2) cot(T) C,, (C. 19. d)
Strain energy of bending is now given by Eqn. (3.24) in which A, B, C and D are given by
Eqns. (C. 18. d)/(C. 19. d) for symmetric/anti-symmetric modes of an end loaded Timoshenko
beam.
Similarly, strain energy of shearing of an end loaded Timoshenko beam is given by
Eqn. (3.26), in which
A12, B129 C12, D12 =A, -A2, B, -B29 Cj -C2, D, -Di
where A,, B,, Cl, D, =A, B, C, D
as given by Eqns. (C. 18. b)/(C. 19. b) for symmetric/anti-symmetric modes; and
A2, B2, C2, D2-A, B, C, D
as given by Eqns. (C. 18. c)/(C. 19. c) for symmetric/anti-symmetric modes.

- Appx (C) -
C. 2.2 Bending and shearing stresses
148
For the first mode of flexural vibration of an end loaded beam, the maximum bending stress
is obtained from Eqns. (3.27) and (3.28), where a/ax is given by Eqn. (3.21. d) in which the
constants A, B, C and D are given by Eqns. (C. 18. d).
Similarly, the shearing stress is given by Eqn. (3.29), where DWiax is given by Eqn. (3.21. b), in
which the constants A, B, C and D are given by Eqns. (C. 18. b); and D is given by Eqn. (3.21. c),
in which the constants A, B, C and D are given by Eqns. (C. 18. c).
C. 2.3 Bernoulli-Euler simplification
Simplification of the end loaded Timoshenko equations to the Bernoulli-Euler equations
(section 33.3) will establish the following relationship between the quantity b in the present
work and 4) in [Guild and Adams, 1980]
Jb = 4D (C. 20)
Once relevant substitutions are made, Eqns. (C. 11) and (C. 12) will be identical to Eqns. (10) and
(11) in [Guild and Adams, 1980]. The total strain energy in Eqn. (3.20) will now reduce to the
strain energy due to bending, U, , and the latter will reduce to the corresponding Eqn. (14) in
[Guild and Adams, 1980].

149
Appendix (D)
AN EXAMPLE OF THE COMPUTATION OF THE RESULTS
AND
ESTIMATION OF EXPERIMENTAL ERROR
Scope - In this appendix, a detailed account of different stages of computations involved in
the determination of both theoretical and experimental results for a typical sandwich beam is
presented. The results under consideration are the modulus and the SDC of the angle-ply
913C/Nomex sandwich beam at 15° orientation (Fig. 6.33). All the predictions regarding the
sandwich skins are based on the constituent data obtained from tests on narrow beams.
Also included in this appendix is an estimation of the experimental error for this particular
beam.
D. 1 Sandwich skin
D. 1.1 Prediction of modulus and the SDC of the sandwich skin
In order to predict the modulus and SDC of the above sandwich skin, the longitudinal,
transverse and longitudinal shear properties (modulus and SDC) of the unidirectional
composite will be needed. The first two sets of data are obtained from flexural tests on the
0° and 900 beams using the centrally driven flexural test-rig, while the longitudinal shear
properties are obtained from the longitudinal shear test.
The following data were recorded for the flexural test on the 0° beam

- Appx (D) -
Test piece specifications
m=3.8 g G= 200 mm w= 12.8 mm h=1.00 mm
Test parameters (small coils)
M, = 45.2 g rd = 0.514 N/A ro = 0.784 V. s/m
Test readings in the first flexural mode at the lowest amplitude
f� = 144.1 Hz 10 mA
V,,,,, = 3.82 my
Using the above data in the program BEAM4. FOR gives the following results
modulus = 112.5 GPa
maximum bending stress = 4.93 MPa SDC = 0.74%
The following data were recorded for the flexural test on the 90° beam
Test piece specifications
m=4.2 g L= 202 mm
w= 12.5 mm h=1.12 mm
Test parameters
same as for 00
150
(D. 1)
(D. 2)
Test readings in the first flexural mode at the lowest amplitude

- Appx (D) - 151
f� = 43.3 Hz 20 mA
V". = 2.82 mV
Using the above data in the program BEAM4. FOR gives the following results
modulus = 8.4 GPa (D. 3)
maximum bending stress = 0.9 MPa SDC = 7.3% (D. 4)
The following data were recorded for the longitudinal shear test on a unidirectional
cylindrical sample of the 913C composite.
Test piece specifications
G= 141.5 mm d=9.94 mm
Test parameters
, 1,,, = 5.52x10⁻⁵ kg m2 R, = 26.0 mm Ro = 26.0 nun rd = 0.144 N/A rp = 0.081 V. s/m
Test readings at the lowest angular amplitude
fn = 122.2 Hz 40 mA
V. = 0.81 mV
Using the above data, first the shear modulus was obtained from Eqn. (B. 5) (Appendix (B)).
Then, the SDC and the corresponding maximum shear stress were computed from Eqns.
(B. 10) and (B. 11) respectively. The following results were obtained
shear modulus = 4.8 GPa (D. 5)
maximum shear stress = 0.104 MPa
SDC = 6.6% (D. 6)

- Appx (D) - 152
The data given by (D. 1) to (D. 6) constitute the necessary data for the prediction of the
modulus and the SDC of the 15° angle-ply laminate. These data, together with the major
Poisson's ratio found for the material, are summarised below
yr, = 0.74%
yr, = 7.3% vu = 6.6% E, = 112.5 GPa E, = 8.4 GPa
G� = 4.8 GPa
v� = 0.30 laminate (-15 ,
15 ,- 15
, 15 ),
Using these data in the program PREDAMP. FOR gives the following predictions for the 15°
angle-ply laminate
modulus = 86.3 GPa
W= 0.62%
W= 0.05%
Wý = 1.04%
SDC = 1.71%
D. 1.2 Measurement of modulus and the SDC of the sandwich skin
The following data were recorded for the flexural test on the 15° beam
Test piece specifications
Measured to within Error
m=3.8 g 0.01 g ± 0.26% L 200 mm 0.5 mm ± 0.25%
12.0 mm 0.05 mm ± 0.42%
h=1.05 mm 0.005 mm ± 0.48%
(D. 7)
(D. 8)

- Appx D-
Test parameters (same as for 00)
Measured to within Error
M, = 45.2 g 0.05 g ±0.11% r, = 0.514 N/A -± 2% (estimated) r, = 0.784 V. s/m -± 2% (estimated)
Test readings in the first flexural mode at the lowest amplitude
132.8 Hz 0.1 Hz ± 0.08% 10 mA 0.1 mA ± 1.00%
V. = 1.81 mV 0.05 mV ± 2.76%
Using the above data in the program BEAM4. FOR gives the following results
modulus = 88.0 GPa
maximum bending stress = 2.1 HiPa
overall SDC = 1.70%
153
(D. 9)
(D. 10)
The theoretical and experimental values of the modulus, given by (D. 7) and (D. 9)
respectively, are compared on Fig. 6.3 (for the 15° orientation). The SDC versus stress
amplitude can be found in Fig. 6.8, while the theoretical and experimental values of the SDC,
given by (D. 8) and (D. 1o), as well as the theoretical damping components yr, , W, and Wr , are
given in Fig. 6.13, although as mentioned in the text (section 6.7.1.1), the predictions on these
figures are based on the data of the wide beams which give slightly different values of 87.3
GPa for modulus and 1.80% for the overall SDC.
stion of experimental error Emati
The modulus is found from Eqn. (3.8) in which b is found iteratively to within 10-9 from the
frequency equation (3.17). After reduction to the elementary theory, this latter equation will
be a function of Malm. Then, neglecting the error in computations, b is found to within
±[(m%)-'+ (M, %)21I12 = ±1(026Y + (0.11)21112 =± 028%

- Appx (D) -
The modulus is, therefore, accurate to within
± [22(b%)2 + (m%)2 + 32(L%)2+ 22((%)2 + (w%)2 + 32(h%)2Jvv2 =
± [22(0.28)2 + (0.26)2 + 32(025)2 + 22(0.08)2 + (0.42)2 +
32(0.48)211/2 =±1.79%
154
The maximum bending stress is found from Eqns. (3.27) and (3.28). The quantity ao/ax is given
by Eqn. (3.21. d) which after reduction to the elementary theory will be a function of b, L2, and
WM . The displacement amplitude, W. , is given by Eqn. (A. 6) and is, therefore accurate to
within
± [(V,,,,, %)2 + (r %)z + (f%n)2 J112 =± ((2.76)2 + (2)2+(0.08)211,2
=±3.41%
Then, a4/ax is accurate to within
± ((b%)2 + 22(L%)2 + (WM%)2]112 =± ((028)2 + 22(0.25)= + (3.41)2]112
=±3.46%
The maximum bending stress is, therefore, accurate to within
± ((E%)2 + (aOlax%)-+ (w%)2 + 22(h%)2)112 =± ((1.79)2 + (3.46)2
+ (0.42)2 + 22(0.48)1112 =±4.03%
The SDC is found from Eqn. (3.41) in which U. is given by Eqn. (3.24). After reduction to the
elementary theory, this latter equation will be a function of E, i, b2ILs and W. 2. From Eqn.
(A. 2), AU is a function of F. and W.. The SDC is, therefore, accurate to within
± [(E%)2 + (w%P + 32(h%)2 + 22(b%)z + 32(L%)2 + (r, %)2 + (1,,, �%)2 + (W%)23112=
± %(1.79)2 + (0.42)2 + 32(0.48)= + 22(o. 28)2+32(025)2 + (2)2 +
(1.00)2 + (3.41)211/2 =±4.79%

- Appx (D) -
D. 2 Sandwich core
155
The following data were recorded for the shear test on the honeycomb core used for the 15°
angle-ply sandwich beam (Aeroweb A 1,50,6; Fig. 4.14) along the ribbon direction
Test piece specifications
Measured to within Error
A= 63mm x97mm 1x1.5 mm ±(1.6%x1.5%)
c= 12.75 mm 0.1 mm ±0.78%
Test parameters
Measured to within Error
M= 1142 g1g ±0.08% rd = 1.185 N/A -± 2% (estimated) ro = 1.352 v. s/m -± 2% (estimated)
Test readings at the lowest amplitude
1010 Hz 0.5 ±0.05% 51 mA 0.1 ±0.20%
V,,,,, = 0.34 my 0.02 ±5.88%
Using the above data, first the shear modulus was obtained from Eqn. (4.5), and then the
maximum shear stress and SDC were computed using Eqns. (4.6) to (4.8), in which DU and 8
were found using Eqns. (A. 2), (A3) and (A. 6). These were found to be
shear modulus = 48.0 AN (D. 11)
maximum shear stress = 211 Pa
SDC = 10.4% (D. 12)
as indicated on Fig. 4.14.

- Appx (D) -
Estimation of experimental error
The core modulus is given by Eqn. (4.5) and is, therefore, accurate to within
± (22(f %)2 + (M%)2 + (C%)2 + (A%)2j: 12 =
± 122(0.05)2 + (0.08)2 + (0.78)2 + (1.60)2 + (150)2]1/2 =±2.33%
156
The maximum shear stress is given by Eqns. (4.8) and (A. 6), and is, therefore, accurate to
within
±[(G%)2 + (V,,. %)-' + (rr%)' + (fVlo)2 + (c%)112 = ± [(2.33)2 + (5.88)2 + (2)2 + (0.05)2 + (0.78)2)i12 =±6.68%
The SDC is given by Eqns. (4.6), (4.7) and (A. 2), and is, therefore, accurate to within
t [(%%)2 + (V, %O)2 + (rd%U)2 + (r, %)2 + (M%)2 + 0)2J1/2 _
t [(020)2 + (5.88)2 + (2)2 + (2)2 + (0.08)2 + (0.05)2)1/2 =t 6i3%
D3 Sandwich beam
First, the empirical value of the shear correction factor, k, corresponding to the prediction of
the exact frequency of the centrally driven 0° sandwich beam, was obtained. For the
frequency test on this beam the following data were recorded
Test piece specifications
Measured to within Error
m = 48.3 g 0.2 g ±0.41% L = 248.0 mm 0.5 mm ± 0.20%
w = 41.3 mm 0.1 mm ± 0.24% t = 1.15 mm 0.005 mm ±0.43%
c = 12.75 mm 0.1 mm ± 0.78%
EI = 112.5 GPa (from DI) G, = 48.0 MPa (from Dli)

- Appx (D) -
Test parameters (large coils)
M, _ 132.5 g
157
Using these data, the value of k which would predict the first natural frequency of 838 Hz
was found to be 1.24.
The following data were recorded for the flexural damping test on the 15° sandwich beam
Test piece specifications
Measured to within Error
in = 42.0 g 0.2 g ± 0.48% L = 251.0 mm 0.5 mm ±0.20%
w = 36.3 mm 0.1 mm ± 0.28%
t = 1.12 mm 0.005 mm ± 0.45%
c = 12.75 mm 0.1 mm ± 0.78%
E, = 88.0 GPa (from (D. 9)) G, = 48.0 MPa (from (D. 12))
k=1.24
Test parameters (large coils)
Measured to within Error
MM = 132.5 g 0.5 g ±0.38% rd = 0.585 N/A -± 2% (estimated) ro = 0.685 v. s/m -± 2% (estimated)
Test readings at the lowest amplitude
Measured to within Error
f� = 833 Hz 0.5 Hz ± 0.06% 101 mA 0.5 mA ± 0.50%
V. = 0.8 mV 0.02 mV ± 2.50%

- Appx (D) - 158
Using the above data in the program BEAM4. FOR gives the following results
sandwich skin modulus = 93.4 GPa (D. 13) maximum bending stress in the skin = 91 kPa
shearing stress in the core = 0.26 kPa sandwich SDC = 8.44% (D. 14)
The skin modulus and the sandwich skin modulus, given by (D. 9) and (D. 13) respectively, are
compared on Fig. 6.22 for the 15° orientation.
The following data are needed to predict the SDC of the sandwich beam
VºJ = 1.7% ý{ºý = 10.4%
(from (D. 8)) (from (D. 12))
These data, together with the test piece specifications (above) in which the experimental
value of E, is replaced by the predicted value (86.3 GPa, from (D. 7)), constitute the necessary
data for prediction of the SDC of the 15° sandwich beam. The program BEAM4. FOR gives the
following results
SDC due to skin = 0.3% (D. 15) SDC due to core = 7.7% (D. 16) total sandwich SDC = 8.0% (D. 17)
The experimental and theoretical values of the SDC of the sandwich, given by (D. 14) and
(D. 17) respectively, as well as the proportion of the contribution of the skin and the core to
the overall SDC, given by (D. 15) and (D. 16), are presented in Fig. 6.33 for the 15° orientation.

- Appx (D) -
Estimation of experimental error
159
The sandwich modulus (for k=1) is found from the sandwich frequency according to Eqn.
(3.8). The frequency number, b, in this equation is found iteratively from the frequency
equation (3.17). This latter equation is a function of a2 , ß2 , s2, m and M, . Ignoring the rotary
inertia parameter r, a and ß are given by Eqn. (3.12) as functions of s. From Eqns. (3.8) and
(3.10), s2 is found to within
± ((m%)2 + (W%)2 + (t%)2 + (L%)2 + 22 (J%)2 + (G%)2)112 =
± ((0.48)2 + (0.28)2 + (0.45)2 + (02)2 + 22(o. 06)2+(2.33)2]1,2= ± 2.45%
Therefore, b is found to within
± ((a%)2 + (m%)2 + (Mc%)2]112 =
± ((2.45)2 + (0.48)2 + (0.38)2)1'2 =±2.52%
The modulus is, therefore, found approximately to within
±122(b%)2 + (m%)2 + (w%)2 + 32(t%)2+ 42(L%)2 + 22f%) 2+ 32(c%)1112 =
± [22(2.52)2 + (0.48)2 + (028)2 + 32(0.45)2 + 42(020)2 + 22(0.06)2 +
32(0.78)2)12 = ±5i3%
The SDC is found from Eqn. (3.40), in which AU is given by Eqn. (Al) and, U. and U, are
given by Eqns. (3.24) and (3.26) respectively. Ignoring the rotary inertia parameter, the SDC is
found approximately to within
± ((E%)2 + (1, %)2 + 42(b%)2 + 32(L%)2 + 22(S%)2 + (G%)2 + (V,,,,, %) +
(rP%C)= + (J,,, %)2 + (r %)2 + (jgf)2»/2 =
± [(1.79)2+(0.28)2+32(o. 45)2 + 32(0.78)2 + 42(2J2)2+32(020)2+
22(2.45)2 + (2.33)2 + (2.50)2 + (2)2+ (050)2 + (2)2 + (0.06)2 =± 12.51%

160
References
N. B. - The references are listed in the alphabetical order of authors' names. Works by the same author(s), are listed according to the year of publication; for the same author(s) and year of publication, the works are referenced as -a, -b etc. which appear with the year of publication.
ADAMS R. D., The Damping Characteristics of Certain Steels. Cast Irons and Other Metals, Ph. D. Thesis,
Cambridge University. (1967)
ADAMS R. D., BACON D. G. C., Measurement of the Flexural Damping and Young's Modulus of Metals
and Reinforced Plastics, J. Physics, D: Applied Physics, 6,27-41, (1973-a)
ADAMS R. D., BACON D. G. C., The Dynamic Properties of Unidirectional Fibre Reinforced Composites in
Flexure and Torsion, J. Composite Materials, 2,53-67, (1973-b)
ADAMS R. D., BACON D. G. C., Effect of Fibre Orientation and Laminate Geometry on the Dynamic
Properties of CFRP. J. Composite Materials, 2,402-428, (1973-c)
ADAMS R. D., CAWLEY P., Vibration Techniques in Nondestructive Testing, Nondestructive Testing, $,
303-360, (1985)
ADAMS R. D., FOX M. A. O., FLOOD RJ. L., FRIEND RJ., HEWITT R. L., The Dynamic Properties of Unidirectional Carbon and Glass Fibre Reinforced Plastics in Torsion and Flexure, I. Composite Materials,. J,
594-603, (1969)
ADAMS R. D., WAKE W. C., Structural Adhesive Joints in Engineering, Elsevier Applied Science
Publishers, London, (1984)
AGBASIERE J. A., GROOTENHUIS P., Flexural Vibration of Symmetrical Multi-Layer Beams With
Viscoelastic Damping, J. Mechanical Engineering Science, IL (3), (1968)
ANDERSON R. A., Flexural Vibration in Uniform Beams According to the Timoshenko Theory, J. Applied
Mechanics, Trans. ASME, 25,504-510, (1953)
BACON D. G. C., The Dynamic Properties of Carbon and Glass Fibre Reinforced Plastic, Ph. D. Thesis,
Dept. Mech. Eng., University of Bristol, (1973)
BENJAMIN B. S., Structural Design with Plastics, Polymer Science and Engineering Series, Van Nostrand
Company, London, (1969)

- Refs - 161
BERT C. W., WILKINS D. J., CRISMAN W. C., Damping in Sandwich Beams With Shear Flexible Cores, J. Engineering for Industry, Trans. ASME, 89B (4), 662-670, (1967)
CAWLEY P., ADAMS R. D., The Predicted and Experimental Natural Modes of Free-Free CFRP Plates, J. Composite Materials, 12,336-347, (1978)
CAWLEY P., ADAMS R. D., The Location of Defects in Structures from Measurements of Natural Frequencies, J. Strain Analysis, 14 (2), 49-57, (1979)
CHOW T. S., On the Propagation of Flexural Waves in an Orthotropic Laminated Plate and Its Response to an Impulsive Load, J. Composite Materials, 5,306-319, (1971)
COTTELL G. A., ENTWISTLE K. M., THOMPSON F. C., The Measurement of Damping Capacity of Metals in Torsional Vibration, J. Inst. of Metals, Z, 373-424, (1948)
COWPER G. W., The Shear Coefficient in Timoshenko's Beam Theory, J. Applied Mechanics, Trans. ASME, 22 (E), 335-340, (1966)
DENGLER M. A., GOLAND M., Transverse Impact of Long Beams, including Rotatory Inertia and Shear Effects, Proc. 1st U. S. Natl. Cong. on App1d. Mechs., ASME, 179-186, (1951)
DiTARANTO R. A., Theory of Vibratory Bending for Elastic and Viscoelastic Layered Finite-Length Beams,
J. Applied Mechanics, Trans. ASME, $Z (E), 881-886, (1965)
DiTARANTO R. A., BLASINGAME W., Composite Damping of Vibrating Sandwich Beams, J. Engineering
for Industry, Trans. ASME, $Q (B), 633-638, (1967)
DONNELL L. H., Beams, Plates, and Shells. McGraw-Hill Book Company, London, (1976)
DREW R. C., WHITE R. G., An Experimental Investigation into Damage Propagation and its Effects Upon
Dynamic Properties in CFRP Composite Material, Composite Structures 4,2, Elsevier Applied Science
London, 2.45-2.56. (1987)
FLITCROFT J. E., The Non-Destructive Testing of Glass and Carbon Fibre Reinforced Plastics, Ph. D.
Thesis, Dept. Mech. Eng., University of Bristol, (1976)
FOX M. A. 0., The Damping and Dynamic Elastic Properties of Cast Iron, Ph. D. Thesis, Dept. Mech. Eng.,
University of Bristol, (1972)
GOODMAN L. E., Discussion of paper (ANDERSON R. A., 19531, J. Applied Mechanics, Trans. ASME, 2¢,
202-204, (1954)
GOODMAN L. E., SUTHERLAND J. G., Discussion of paper 1AYRE R. S., JACOBSEN L. S., 1950], J. Applied Mechanics, Trans. ASME, fl, 217.218, (1951)

- Refs - 162
GUILD F. J., ADAMS R. D., A New Technique for the Measurement of the Specific Damping Capacity of Beams in Flexure, J. of Physics, E: Scientific Instruments, J4,355-363, (1981)
HERRMANN G., Forced Motions of Timoshenko Beams, J. Applied Mechanics, Trans. ASME, Z¢,
221-224, (1955)
HUANG T. C., The Effect of Rotatory Inertia and of Shear Deformation on the Frequency and Normal Mode
Equations of Uniform Beams With Simple End Conditions, J. Applied Mechanics (vol 28), Trans. ASME, B, }
(E), 571-584, (1961)
HUANG T. C., HUANG C. C., Free Vibration of Viscoelastic Timoshenko Beams, J. Applied Mechanics,
Trans. ASME, 2$, 515-521, (1971)
JAMES W. L., Calculation of Vibration Damping in Sandwich Construction from Damping Properties of the
Cores and the Facings, Report No. 1888, Forest Products Laboratory, Madison, Wisconsin, (1962)
KEER L., LAZAN B. J., Damping and Fatigue Properties of Sandwich Configurations in Flexure, ASD
Technical Report 61-646, U. S. Air Force, Wright-Patterson Air Force Base, Ohio, (1961)
KULKARNI S. V., PAGANO N. J., Dynamic Characteristics of Composite Laminates, J. Sound and
Vibration, 21 (1), 127-143, (1972)
LANTZ R. B., Boron Epoxy Laminate Test Methods, J. Composite Materials, . 1,642-650, (1969)
LAZAN BJ., Energy Dissipation Mechanisms in Structures, with Particular Reference to Material Damping,
Structural Damping, Ed. RUZICKA J. E., Pergamon Press, London, (1960)
LAZAN BJ., Damping of Materials and Members in Structural Mechanics. Pergamon Press, London, (1968)
LIN D. X., NI R. G., ADAMS R. D., Prediction and Measurement of the Vibrational Damping Parameters of
Carbon and Glass Fibre-Reinforced Plastics Plates, J. Composite Materials, j$, 132-152, (1984)
LIN D. X., ADAMS R. D., Determination of Dynamic Characteristics of Structures by Transient Testing
Using Zoom-FFT, J. de Physique, 44 C9: 363-369, (1984)
MARKUS S., VALASKOVA 0., On Eigenvalue Boundary Problems of Transversely Vibrating Sandwich
Beams, J. Sound and Vibration, 22(4), 423-432, (1972)
MEAD D. J., The Damping Properties of Elastically Supported Sandwich Plates, J. Sound and Vibration, 2A
(3), 275-295, (1972)
MEAD D.. 1., A Comparison of Some Equations for the Flexural Vibration of Damped Sandwich Beams, J.
Sound and Vibration, $ (3), 363-377, (1982)

- Refs - 163
MEAD D. J., MARKUS S., The Forced Vibration of a Three-Layer, Damped Sandwich Beam With Arbitrary
Boundary Conditions, J. Sound and Vibration, ]Q (2), 163-175, (1969)
MEAD D. J., MARKUS S., Loss Factors and Resonant Frequencies of Encastre Damped Sandwich Beams, J.
Sound and Vibration, 12 (1), 99-112, (1970)
MIKLOWITZ J., Flexural Wave Solution of Coupled Equations Representing the More Exact Theory of
Bending, J. Applied Mechanics, Trans. ASME, 25,5111-514, (1953)
MINDLIN R. D., Influence of Rotatory Inertia and Shear on Flexural Motions of Isotropic, Elastic Plates, J.
Applied Mechanics, la, 31-38, (1951)
MINDLIN R. D., DERESIEWICZ H., Timoshenko's Shear Coefficient for Flexural Vibrations of Beams,
Proc. 2nd U. S. Natl. Cong. Aplid. Mechs., 171-178, (1955)
NI R. G., ADAMS R. D., The Damping and Dynamic Moduli of Symmetric Laminated Composite Beams - Theoretical and Experimental Results, J. Composite Materials, l$, 104-121, (1984)
NI R. G., LIN D. X., ADAMS R. D., The Dynamic Properties of Carbon-Glass Fibre Sandwich Laminated
Composites: Theoretical, Experimental and Economic Considerations, Composites, 11 (4), 297-304, (1984)
NG C. F., WHITE R. G., The Dynamic Behaviour of Postbuckled Composite Plates under Acoustic Excitation,
Composites Structures, 2,19-35, (1988)
NORDBY G. M., CRISMAN W. C., BERT C. W., Dynamic, Elastic, Damping, and Fatigue Characteristics
of Fiberglass-Reinforced Sandwich Structure, USAAVLABS Technical Report 65-60, Contract DA
44-177-AMC-164(T), University of Oklahoma Research Institute, (1965)
PAGANO N. J., Exact Solutions for Rectangular Bidirectional Composites and Sandwich Plates, J.
Composite Materials, 4,20-34, (1970)
PAGANO NJ, HALPIN C. J., Influence of End Constraint in the Testing of Anisotropic Bodies, ].
Composite Materials, 2,18-31, (1968)
RAVILLE M. E., UENG E. S., LEI M. M., Natural Frequencies of Vibration of Fixed-Fixed Sandwich
Beams, J. Applied Mechanics, Trans. ASME, ß (E), 376-381, (1961)
REISSNER E., The effect of Transverse Shear Deformation on the Bending of Elastic Plates , J. Applied
Mechanics, 12 (2), Trans. ASME, U, A-69-77, (1945)
RITCHIE I. G., Improved Resonant Bar Techniques for the Measurement of Dynamic Elastic Moduli and a
Test of the Timoshenko Beam Theory, J. Sound and Vibration, 11 (4), 453-468, (1973)

- Refs - 164
RITCHIE I. G., ROSINGER H. E., SHILLINGLAW A. J., FLEURY W. H., The Dynamic Elastic Behaviour of Fibre-Reinforced Composite Sheet: 1. The Precise Experimental Determination of the Principal Elastic Moduli, J. Physics, D: Applied Physics, $, 1733-1749, (1975)
SOOVERE J., Dynamic Properties of Graphite Fibre Honeycomb Panels, AIAA Paper No. 73-326, (1973)
SOOVERE J., Dynamic Response of Acoustically Excited Stiffened Composite Honeycomb Panels, Ph. D. Thesis, l. S. V. R., University of Southampton, (1984)
SOOVERE J., DRAKE M. L., Aerospace Structures Technology Damping Design Guide,
AFWAL-TR-84-3089 Volume 1, (1985)
SUN C. T., WHITNEY J. M., Theories for the Dynamic Response of Laminated Plates, AIAA J., 1], 178-183, (1973)
TETI R., CAPRINO G., Mechanical Behaviour of Structural Sandwiches, Proc. Ist. Int. Conf. on Sandwich Constructions, Stockholm, Eng. Materials Advisory Services Ltd., U. K., (1989)
TIMOSHENKO S. P., On the Correction for Shear of the Differential Equation for Transverse Vibrations of Prismatic Bars, Philosophical Magazine, 41,744-746, (1921)
TIMOSHENKO S. P., On the Transverse Vibrations of Bars of Uniform Cross-Sections, Philosophical
Magazine, 42,125-131, (1922)
TIMOSHENKO S., Vibration Problems in Engineering (3rd Ed. ), Macmillan & Company, Ltd., London, (1955)
TIMOSHENKO S., GOODIER J. N., Theory of Elasticity (2nd Ed. ), McGraw-Hill Book Company, London,
(1951)
WALTON D., Torsion of Prismatic Bars of Orthotropic Materials, Internal Report, Dept. Mech. Eng.,
University of Bristol, (1973)
WHITE R. G., ABDIN E. M. Y., Dynamic Properties of Aligned Short Carbon Fibre-Reinforced Plastics in
Flexure and Torsion, Composites, Jf (4), 293-306, (1985)
WHITE R. G., MOUSLEY R. F., Dynamic Response of CFRP Plates under Action of Random Acoustic
Loading, Composite Structures 4,. 1, Elsevier Applied Science , London, 1.519-1.535, (1987)
WHITNEY J. M., Stress analysis of Thick Laminated Composite and Sandwich Plates, J. Composite
Materials, ¢, 426-440, (1972)
WHITNEY J. M., Shear Correction Factors for Orthotropic Laminates Under Static Load, J. Applied
Mechanics, Trans. ASME, 42 (E), 302-304, (1973)

- Refs - 165
WHITNEY J. M., Structural Analysis of Laminated Anisotropic Plates, Technomic Publishing Co. Inc., (1987)
WHITNEY J. M., DAUKSYS RJ., Flexure Experiments on Of Axis Composites, J. Composite Materials, 4, 135-137, (1970)
WHITNEY J. M., PAGANO N. J., Shear Deformation in Heterogeneous Anisotropic Plates, J. Applied Mechanics, Trans. ASME, 2 (4), 1031-1036, (1970)
WILKINS D. J., Analysis of Material Damping in Sandwich Beams, M. Sc. Thesis, University of Oklahoma,
(1965)
WILLWAY T. A., WHITE R. G., The Effects of Induced Axial Strains on the Damping of Clamped-Clamped
Unidirectional CFRP and Resin Rods in Torsion, Composites Structures, Q, 89-100, (1988)
WREN G. G., KINRA V. K., On the Effect of an End-Mass on Beam Damping, To appear in Experimental Mechanics' (See following ref. ) (1989-a)
WREN G. G., KINRA V. K., An Experimental Study of the Complex Dynamic Modulus, Proc. Damping'89, WRDC-TR-89-3116 Vol Il, (1989-b)
YU Y: Y., A New Theory of Elastic Sandwich Plates - One Dimensional Case, J. Applied Mechanics, Trans. ASME, ß1. (E), 415-421, (1959-a)
YU Y: Y., Simple Thickness-Shear Modes of Vibration of Infinite Sandwich Plates , J. Applied Mechanics,
Trans. ASME, 26,679-681, (1959-b)

60
50
40
* Timoshenko (k=1.0)
O Timoshenko (kß. 82) +
+ Bernoulli-Euler +
D Test +
+ +g
+ +
+r
+oS + +
+
Ü 30 C
I
LL
20
10 E
b "ý o o a
A o ý
V ý y 4
ö. 4U
35
Ü 30
25 - t R
20
?a v(ý
II is ri
Li.
10
S
0
.5
8 12 16 20 24 28
Mode No.
+ +
+ +
+ +
+ +
+ +
+ +
+ +
+ +
+ +
++ ++
----rvv we 70 `8' `ý Ö uu QOQOOOOO '-'
048 12 16 20 24 28
Mode No.

60
50
40
A Timoshenko (k=1.0)
O Timoshenko (k=0.82)
+ Bernoulli-Euter
O Test +
+ 88 +e
+ + + 15
+ 15 + 15
N
. 14
30
20
10
-o 048 12 16 20 24
Mode No.
O "Ü
fi
Q. oo r __ 30
28
elf 26
24
22 ý d) 20 ý1 a
18
Fam., C
16 ý ýe 14
12
10 ý`. 8
6
4
2
0
-2
-4
28
+ +
+ +
+ +
+ +
+ +
+ +
+ +
+ +
+ +
++
--woOOOOOOOOO 000000
048 12 16 20 24 28
Mode No.
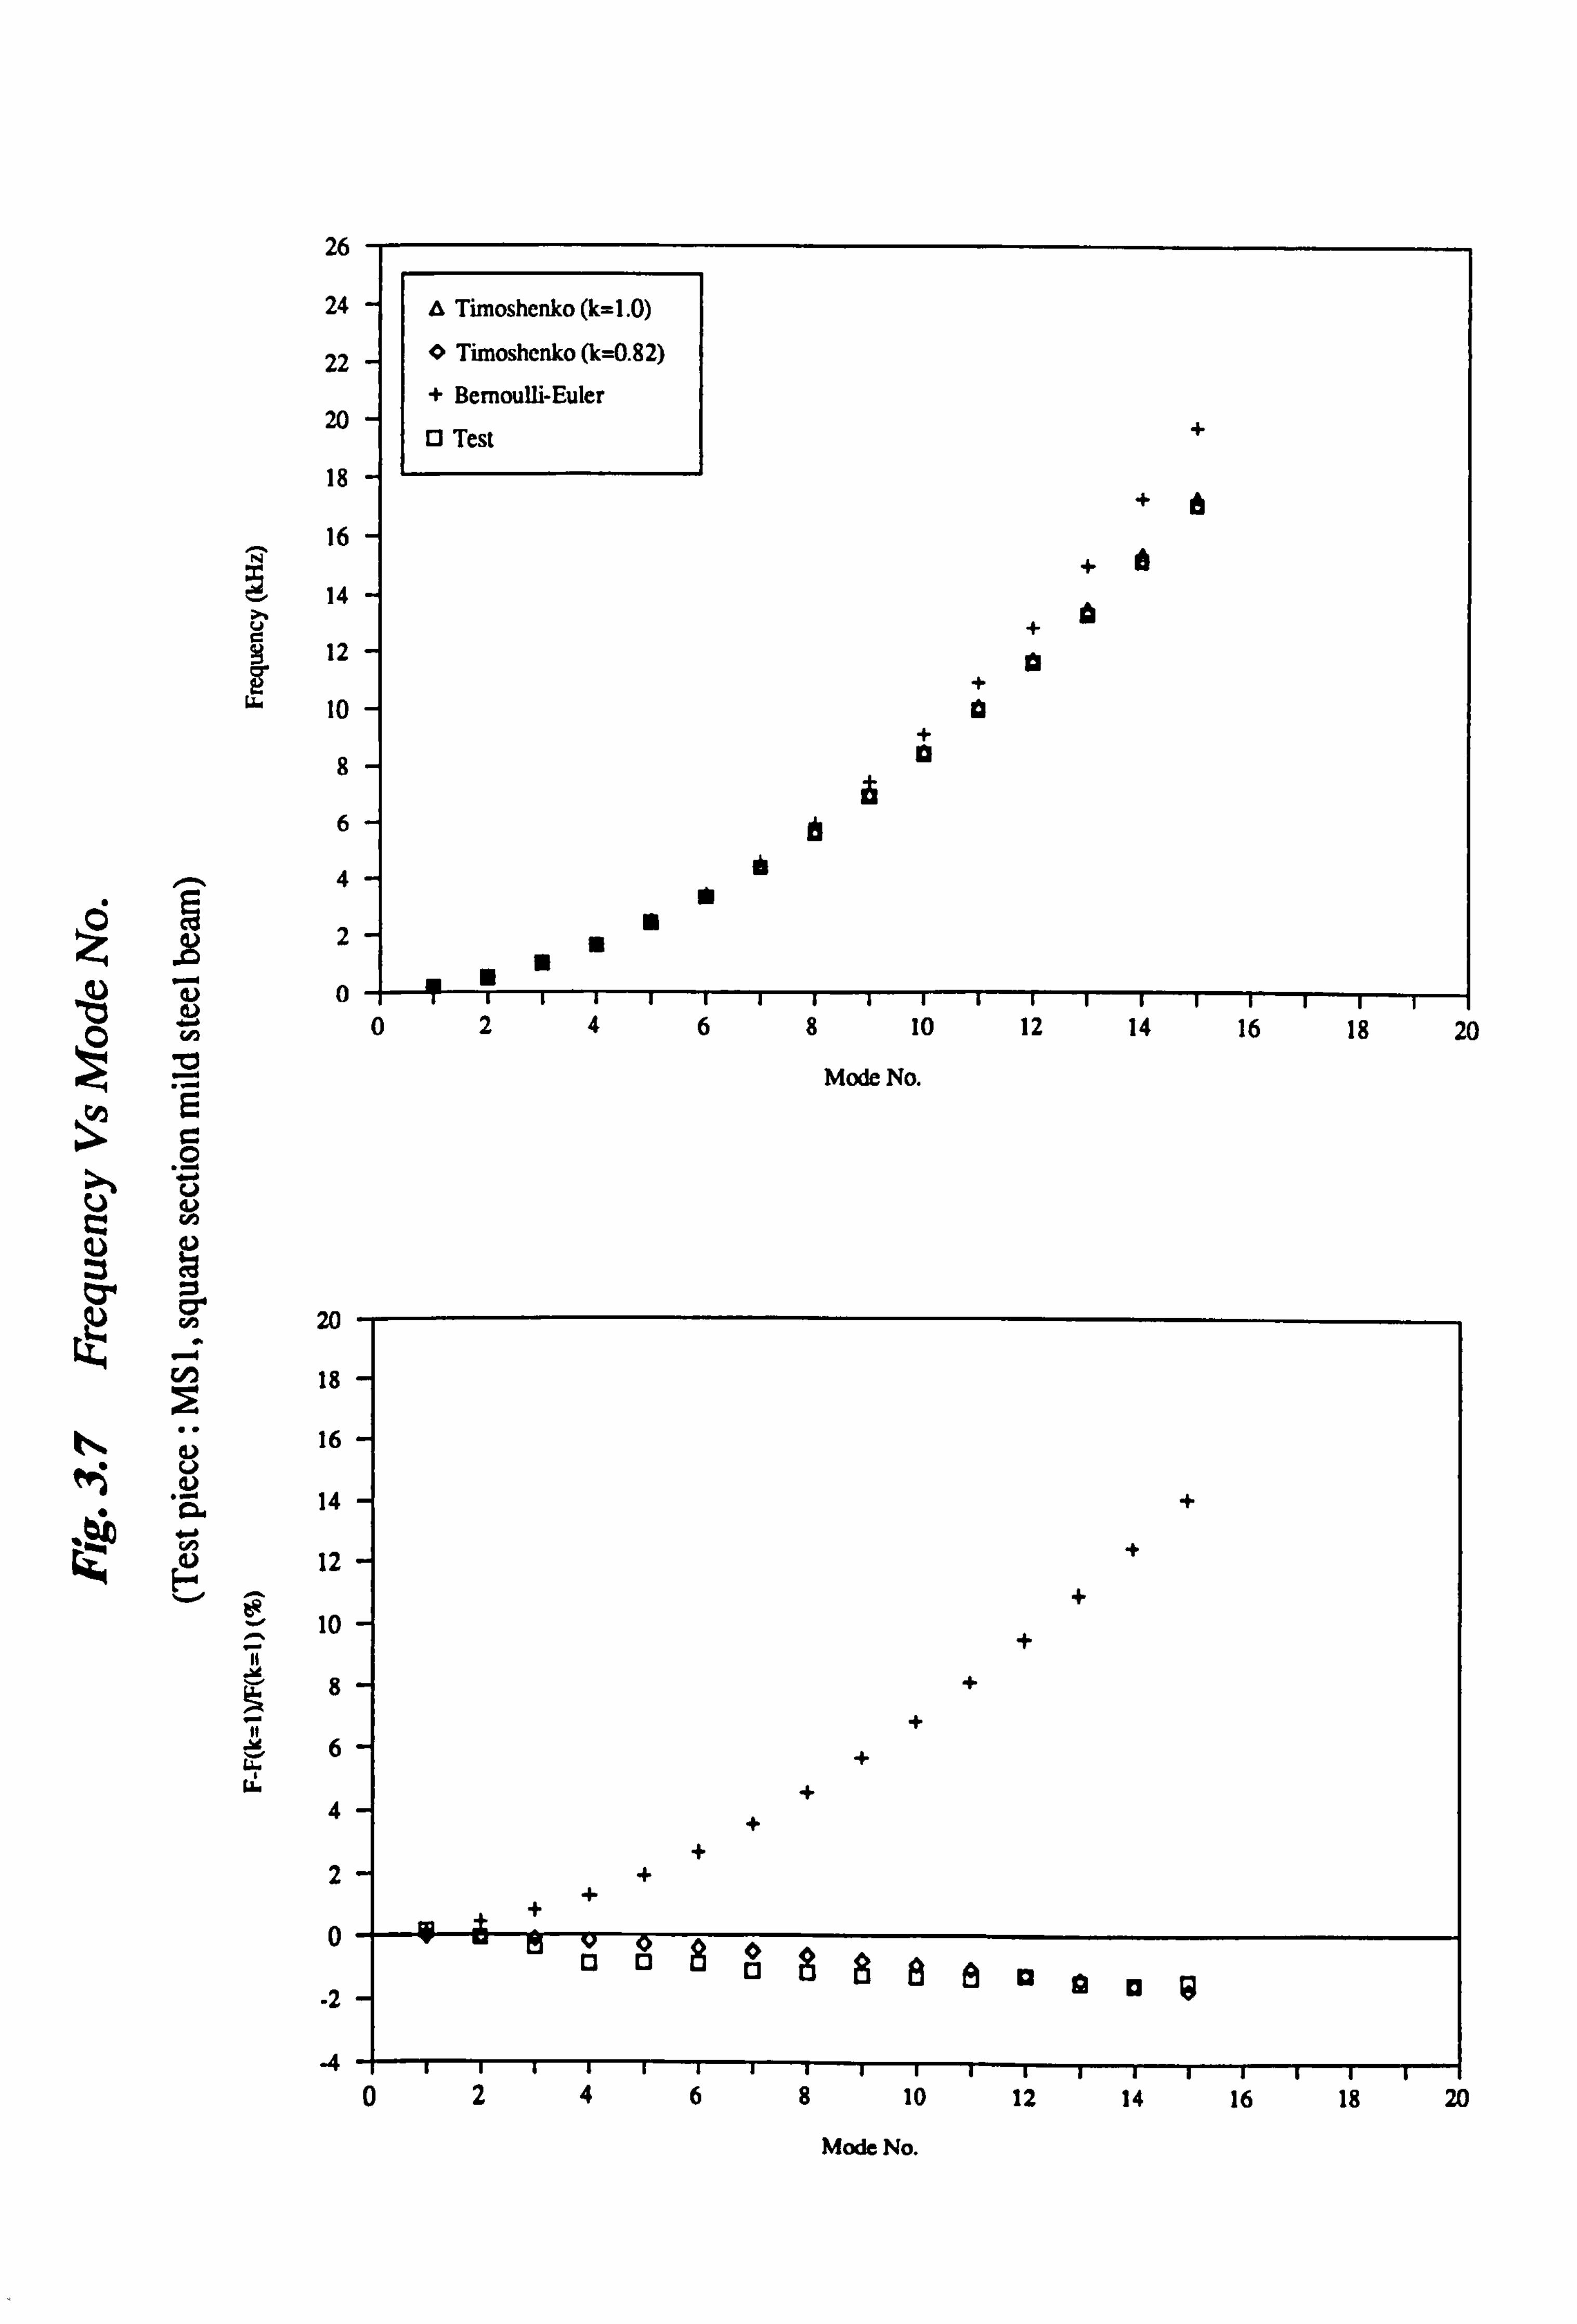
26
24
22
20
18
16
14 u
12
10
8 6
ý-. 4
2
A 0
A Timoshenko (k=1.0)
O Timoshenko (k=0.82)
+ Bernoulli-Euler
0 Test +
+e +
+ a +
+ a
0
C O
Ü "v
aý
20
N 18
16 ý! U
'ä 14
(Z 0 12
ý .. 10
8
6 v. w
4
2
0
.2
-4 0
2468 10 12 14 16 18 20
Mode No.
2468 10 12 14 16 18 20
Mode No.

40
35
30
25
20 C d I.
15
10
f. Cd
5
t Timoshenko (k=1.0)
0 Timoshenko (kß. 82) +
+ Bemouui-t uler + 0 Test +S
+S "
+0 +0
+p +O
+0
a
0 "W 048 12 16 ýC+ F- Mode No.
Ö
"Ü
H
bO
20
18 + N y +
16 + Qc + M v 14
12 + 0
- + 10 +
+ +
6 + +
4 +
2 +
++ 12 -a Ei 00a ®8 8 g 12 ö0oa o000 °°° o000
-2
-4 048 12 16 20 24
Mode No.
zu L4

50
40
30
.C ° bA
w 20
10 U ^
C 0 ,, -
a Timoshenko (k=1.0)
O Timoshenko (k=0.82)
+ Bernoulli-Euler
13 Test
+0
A
+ 0
+
b b
" T-r
>IPI E 0 ; -
C a .ý
GO2
le Q 30 .
28
26
C 24 Ü
ý 22
cu 20 Ici r. (a 18
;i 14
12
10
S
6
4
2
0
-2 -4
0
0.04 0.08 0.12 0.16 0.2 0.24 0.28 0.32
h/L
0.04 0.08 0.12 0.16 0.2 0.24 0.28 0.32
h/L

35
30
25
hý C
tt
20
C O
15
10 U
5
Timoshenko (k=1.0)
O Timoshenko (kß. 82)
+ Bernoulli-Euler
D Test
+
+
+
6 I
I
T-r-
+
Ü 0 0 0 A
O ý .
H ýy
V ~
ý 'V
ý+ Ü
ºý- 18
L 16
b aý 14
12
10
8
w '`V 4
2
0
.2
-4
0.04 0.08 0.12 0.16 0.2 0.24 0.28
h/L
+
+
+
0 O p
O O 0 O O
o 0.04 0.08 0.12 0.16 0.2 0.24 0.28
h/L

3U
45
40
35
.. 30
25
aQ Q ,
20
rA V1 15
^Q 10
5
0
A Timoshenko (k=1.0)
* Timoshenko (kß. 82)
+ Bernoulli-Euler
13 Test
+
+ + 10
15 + 5
+ a
an
Ü 0 0.1
C t
25 O
L __
1F% =1 3U r
vý r 28
03 26 24 22
a 20
H 18
16
L'e 14
^I 12
10
6
4
2
0
.2
0.2 0.3
h/L
0
++ E3 a E3 D
0op00
0.1 0.2 0.3
h/L

Q
35
30
25
b4 ý 20
15
_"� 10
5
0
a Timoshenko (k=1.0)
* Timoshenko (kß. 82)
+ Bernoulli-Euler
13 Test
+
v + S
+ d
o i
"
-ter
+
0
>, U y b o
t -i
Q, o
95
24
22
20
R3 W 18 0
a 16 ý ^ 4 1
12
10
u. 8 ý
6 ý
4
2
0
.2
-4
0.04 0.08 0.12 0.16 0.2 0.24 0.28
h/L
+
+
t
+ +
+
p 8
0 0.04 0.08 0.12 0.16 0.2 0.24 0.28
h/L

30
28
26
24
22
20
18 16
14 1
12 L 10
8 C ý 6
O I 4
2 v A 0
a Timoshenko (k=1.0)
O Timoshenko (kß. 82)
+ Bernoulli-Euler
0 Test +
ö
+ 8 +
6
I
048 12 16 20
Mode No.
CN -- 20 'CJ 18
16
14
12
10
8 M U
6
" a ý
'ý1 äi y 4
2 i.
0
-2
-4
-6
-g
-10
+ o
A * * 0 o 13
0 13
048 12 16 20
Mode No.

30
28
26
24
22
20
,, 18 N
16 T U ü 14 7
12 z 10
z
2 8 6
U 4
C A r 0
A Timoshenko (k=1.0)
0 Timoshenko (kß. 82) + + Bernoulli-Euler
Q Test
+
8
+ e
6 6
v048 12 16
GOD Mode No. I?
U 20
Q 'O 18 Ö
16
14
12
V 10 ^ v 8
U $ 6
4 ý 4
't D V
2
0
.2
-4
-6
-8
-10
20
+
+
+
+ +
+ 13 0 0 8 0 D 0
0
0
048 12 16
Mode No.
20

30
28
26
24
22
20
18
16 U
14
12
10
Cl 8
6 E
4 2
'C A 0
a Timoshenko (k=1.0)
o Timoshenko (k=0.82)
+ Bernoulli-Euler
13 Test +
0 + 0 0
i
10e r
Ö048 12
Mode No.
20
Ia$ 15
+
10 lo +
+
++ " .ý
.. V 5 + ++ + +0 00
++ o 0
+++ O O 0 0 00 0000 000
OO
u, -5 O
O
. 10 O
-15
O
. 2p p 48 12 16 20
Mode No.
IV W

30
28
26
24
22
20
N 18
16 V
14
12
10
8
6
4 O s 2
-d c o
A Timoshenko (k=1.0)
O Timoshenko (k=1.77)
+ Bernoulli-Euler
13 Test
+
+
+
O
+ o
+ O O da O + 0
N o :Z -E ý o
U ýC U t Q" C
y ,ý 1n 16U
150
140
it) 0 130 N 120
110 a 100
N - v
M
80
%0 i7 ` 0
U/ ii.
50
40
30
20
10
0
2468 10
Mode No.
4
+
+
+
+
+
+ 8
+
e
e 0
02468 10
Mode No.

15
14
13
12
11
10
9
g U
7
6
5 v 4
"d 3 C
2
'b W 0
A Timoshenko (k=1)
0 Timoshenko (k=1.77)
+ Bernoulli-Euler
12 Test +
n
QA O
ig
0246
Nd Mode No.
U WI)
ý" X
100
N 'O 90 (L)
80
M " 70
60
50 a n j w
40
30
20
10
0
+
+
+
8 v C
o O
+
0246
Mode No.

26
24
22
20
18
16
14
12
10
8
6
4
Z Ü
... 2
b 'ý 0
e Timoshenko (k=1.0)
o Timoshenko (k=1.42)
+ Bernoulli-Eulen
13 Test
+° °e
+°
0 N o
GO2
C U
Qý all
p 150
140
N 130
120 M
v ý
110
" ' 100
90 1 80
70 dC
w 60 ri.
50
40
30
20
10
0
246
Mode No.
+
+
+
+
+
+ 0 o o ý a
0 246
Mode No.

JU
40
30
u
20
E I 10
O v Z 3 'b O
"d § 0
* Timoshenko (k=1.0)
O Timoshenko (k=1.25)
+ Bernoulli-Euler
13 Test
+
+ g
+
2
+
Q 0
o ý
U
Gý
o
v ý
r4+ M zw
240
220
M N 200
180 Z " a 160
H v
ci ^ 140
120
100
80
60
40
20
0
ia Mode No.
6
+
+
+
C a 0
0 24
Mode No.
6

su 28
26
24
22
20
18
16
i
14
r 12
10
8
6
4 Z 2 3
'C b o
* Timoshenko (k=1.0)
O Timoshenko (k=1.20)
+ Bernoulli-Euler
O Test +
+
+ Q 0
g g +
e I -I I
o
C)
N 190 180
N ""
170 160 150 140
"ýy y
130 120
= 110 100
90 80
w 70 60 50 40
30 20
10 0
-10
24
Mode No.
6
+
+
+
+
0 0 0 ý
0246
Mode No.

G)
. ýC U
t0, O
O U
w
Cl U
0 N M
bÄ iz
U
b CA X Itt go N O
N
H .ý
13
ö Ö
C
Ö Ö
0 cV Q. 00 tý ýO ýt M N Oý 00
13
U

4-4 E OE
ii
iz
8
8 M
8
8
E E
s Vwr` ýJ
.ý
(ww) M `opn2ridwd
CÖ Ct QQQ

0 vi M
N ÖE
ý .d
'ti ö
M
bÄ
0 tf) N
E E
O
c
.ý
0
0 V
(ww) M `opni11dwy
. -9 O 2; NM9 kn r- pp Ö 0. ppOOOOOO0OO
000ööOOo c2 c cý cj Q

N
O ýt Vb cat ö
bä
Ü
N °i
8 tn
8 M
8
8
E
y bq C
(ww) M `opnliidwd
CD -i NM et Vi
cqqCQ4

X
NE
Og
o OC
a)
a)
izi
8 in
8 M
8
8
E E
C
(ww) M `apnU! ldwd
8 VI ööc °' öööö 0öo0ooý? 4444

0 M
N
Ög
10 8. U ft3
O
-U le ob Ü
0
oE E
.ý
0 tn
C
(ww) M `opnl! ldwd
N0O 25 O 00 -N qt ýo 00 NNNN
O0NN
(=5 C) QQQQ, QQQQQQQ

8 N
ON
Mb 1
C N
0 00
O
r.
SE v
00 c .ý
O N
O N
"(
(ww) M 'apn2! 1dwd
öööööös 00 0 00QýQ44

Apparent modulus (MPa)
0 g)gö
cýS
r4 "rz
O
Ü
G. )
.. r
E
vl "" M
A c. i "'
00
M
fV
C. º Q
ý. r
Ü
v 'ä
Ö
140 Iq A
GL
N I -ý
ýd
00 Ö
«s aý eä
aý H
0
it . G.
Qý
d Ln
N O
0
N Q> 00 [- ýc %A `ý MN-! - O> 00 t- e %A emN-O
--ý ý-+ ÖOOÖÖOOO
(°! v) Dus
X I'
U 10 E 0 C14
Q+ E
cl aý 9
Q+ .c . ter
. .r
0 C b + .
F
Q+
Q+
Q+
Q+

13
13
13
13
+Q
+Q
+Q
+Q
b
Ü
y 'r
u2 ýc
U Qä
Mp
c. i In 00
-0 ei ON
Q
Öý
H
Z
00 1 I
«e- I II
0 (D
Q+
N r.
0
00
e;
Na
10
Q)
. i.
vi
1t
N
.. + ON oo N ýO Vý et MNO 60ÖooÖÖo
(%) Das

HcL
NX
II II üü
Q+
13
O
Ei 1-N U
E to
g
M
:r aM
. iZ
(D en
CL) i Oc
.r H
"
0
11
0
0
13
+
+
+
+
+
+
E3
0
+
+
+
+
0
13
%Q " Cl C4 00 .qN r-+ oo 'q et Cl O cri cq -' r-+ OÖ00
Co
ýc
ett
b
E cl
Q) . l:
N
0
(%) Das

U M
Ag
WO kn
C ß'
ý+4
0 a
ao
0 a
ao
0 a
0 a
0 a
Qo
ao
13
13
1: 1
13
13
E3
13
13
13
13
X
"-
cl Cl 91,
"t ö
00 00 N 00 ý V (7 I
0 Q Q
ýt
N 1-4
O ..
ao
Cil
a 00
b
r.. a E cu
lt
N
CD . -. Oý 00 \D tt MNO
OÖoÖOÖÖÖO
(%) Dos

9)
m
c
C) A
.c 0
e
. -
A >C ae U_
O r: CL) E O
Z M ON N . -i
U U
_F
t-
IýM C14
Q ý- C7
MN -4 O O' 00 N \O V-b 't MN --ý O
N
... 4
00 Ö
ö
Ö
N Ö
0
e;
aý
Ici .r
ea H
b H
CQ
(%) Das

+
u
E RY
U0 Az
M
Qý ~
Q r Oý
H
di
M V-4
b4
0
0
0 0 +
0 13
+
0
a + 0
O
Cco
. "--
N
. -q
eý
00 Oy
Ici w_ C. L
ca
c
Q) . är. u2
et Ö
N Ö
0 1/y dMN 00 IS ýO N 14t MN-O ý. , ý.., ,.. i 14 . --i ý.. i
eý cl «S a a a o ýo I
et Iü'
N i0i
X ý X
U U U
.C ., C .ý .r wr a+
C C C
Q + O
(%) Das

u
tý.
ctt
Vj «r
., ö 'z
.) `° C
Z I
öQ
aý 'ä y
t
V
"
11
+0
0
0
13
13
1: 3
13
+°
+°
+0
ý---
ä ä
O 06 T `
M M
ý
Cý Cý C
o + H
ý:
N
1-4
el
00 ý_
H
b H
0 4)
ýt 0
N O
M cý NO Oý 00 N \O hVMN-O
(%) Dus

N
r-i
u 110
«s E
AN ii
aý Q
0,4
W-4
00 C5
ev
b
C)
N Ö
0 MN-C CN 00 N ýO V tt MN -+ O
C13 ä
O1% N
%6 -4 V) %C
+E
+EE Q v'I M
ýI II
NN
.r "r Hh
UU Q+
13
13
Q+
(°! o) das

13
a) b "
*tA
".
a) z Vj M
%iD wo
Q
aý ÖU U
13
11
O
13
13
11
el
M Oý ýD
N ij, MN "-ý 0 ON 00 t- %O to It MNO - . -M 0-1 r, rl rl
N . -+
00 C5
\o ö
ýt Ö
N Ö
0
. ýe
b
(°! v) Dus

Modulus (MPa)
00990090
C
ýJ
oz
v
ai 8 C cn
% 4)
+4J
Z
00000
Q
O
QO
"" 'äS
1-1 ow QO ýC
üü bÖ
Äööö
04, o
O C% 00 -z
in --MN
--ý O ON 00 t- ýO tn ýt MNO
8
CD 00
. ý.
ýö ý
. ýe .ý ý`
.y
C
1a
0 N
0
(%) Das

Cl
P-4
O
CO)
x U N
00
E
V
'o E
a) E
Iv b
o[ Ü
N Ö
0 M vi N v'i O
MNO OpO0O0O c5
+ . >
Q -+' +
13
13
13
13
+ Q
13
Q
(°! 0) Das

13
13 oa
Q
Q a
oQ
oQ
o+ Q
N "Cl
,ý oe
M -r ý F;
O a+
13
O a+
O 13
O d+
O
oQ
O °+
v
N
-I
E E a0 10
00 a ö ý=
8 \o
b
et
N Ö
M 0
ö N
O
ö
O
Ö ö
0
O
. - ý .
«f > cýi >
- - - . . . . - o Ü Ü Ü
ý () p jp p ,q
ct3 cts
0 4 Q +
C°! o) DOS

Q
ä E
ý.. ý 72 aý A Ü r=
.ýx
CA rV
U
en As
V/ E
2
E E
a + C C > > 5 5 5 5 13 . . . C C C C
+ 'l 'ä "ä "ä
0 Q Ü u u u
C C C .c
d to N M N
Q d + Q O
Q
a+
0 Q
0 13
a +
Q a
Q o
N
.4
.-
00
Iv
a) c3
b
N Ö
O
V) M vý N l O 0 0 0
(%) DQS

"----
E «i
U
b 9
0
ctt ý- 0 C,
E
r
Uö AU
E uE V"N
"N
C) C) C)
C)
x
x
a 0
13
+a 0
13
13 +ö
+a x°
x+a
+Q
X
+° x x+ ýo 0
Q0
C' 00 t- ýo h ý7; M OO00OOO
C)
O
N
ý ý
O
A A Q
rý Q
cý Q
rý Q
V GG Q
13 + o a x
N . --.
0
00
.ý ed
... CA
E E 'ý
a
a
a
a
It
N
0
N "-ý O ÖÖ
(°! o) Das

E a)
U
GOD
ý pq
äE
dö I
ýG E
ý�
U Ao r^
U SE
r. +
E
v1 ý
N
Eý .. ý
N
0
09 ýq Vi It MN "i O CÖÖOÖÖÖ
O 13
O
0
0
0
0 0
Q+
13
13
13
13
0
13
0
X
ý--
+
H H m
H
G
'fie
+
+
+
+
+
's s s 00 , NR ° ö
, ö
I - - Q Q ý
Q + O
\o
It
, - «t
(°%o) Dus

C) .o U
b
o
Qo . SE
.. C
hE
i
aý Ev
M
N
CA
E E ed
ý.
0 c} MN- Oý 00 NZ V) tfi MNO V-4 . -. .... . -+ 0ÖÖÖÖÖ6 ÖÖ
SM
W) ö '0
00 >+ö°ö
I
+xX yam'. Q+o
0 Q+
0
13
oQ+
oQ
o+
o+ Q+ Q+
o 13
oQ
(%) Das

Us/Ub
- C' 00 lý ýO tt MN . -. Q OÖýÖOÖÖÖO
s
. -. rA E
U
3
l) as y
"ý as
Ä
CiL N
E=
0 N
0
cy -- ON 00 r- \O vi lt N ý-4 O .,...
ööOOOOÖÖÖ
(%) DOS
CA
E E
OQ+
r. +
y
fti
Q+ 0
X
OQ
d d>
Q+O
E E H N
U
. ýC
4.. O U

4)
M4
a) E cý3
aX
N
Ci °d
1ýr r. +
L
"
ýp Np
8CO
oQ+
oQ+
oQ+
OQ+
OQ +
00
Q+O
sgö
(wN) AS. iauo UflU
Ö
M O Ö
E
ö
U cd
b
RS
0
0 0

O
.C0
t/i ..
bi
; &4
Co) ZA
aC .. r
EI3 V ,V
Q+
13
+Q
-E]
Q+
0 (D CD CD \o V) le en 000 C14 9-t
91
O N
O
Cm
G
V C
2 .0 {Z
C M
0
0 ,..
(edo) sninpoj

lo-I E
y3 iU. O y
b 2
o o + H
O
ctt
O
12 Ü
.D> ö
aq
V "d b
bÄ
13 M
0 OI-
13 o-
s>
ED
ID-
9
0 S
0 m h d
O "vS
WI
O
LL O
0
EW
4D c0+ß
008a 000
080O0000 en C4
0 ..,
(edo) sninpoW

O
cis
O U . -r
iz
w °' . 52
W-W
C) ö "-
0 CA . - L Ü
Q +
a
C$
$OOOOOOO 0MNO
"-1 00 en
F
0 N
0 Om h C
O
C N
'C O
.c ýL
O M
0 r.
0
(edo) sninpoJ, ij

. -. H
E
Cl) " yap.
wÖ U
/1 y
Q O +
ES 0
®0
O
00
r
WO 8
b
ý1
Qe
Q 40
13 0+
13 OF-
a
0 00
0 N
s
0 Om
O
G. `
"rý"I
M
C) N
0 .ý
®o
00 In "T
0000 MN
(edo) sninpoN
0

O
cis
O
.C Z
0 ýz
, - V M
I
C
U
E= ...
yH
C
tý "Ü
10
E2 c Q+
Q+
Q+
O0 N
0000 MNý
C) C7%
0 S
0 O vi C
O
a O
.a
O M
0 r,
0
iedo) SnjnPoNj

lit . -4
N . -.
0 a) 2
a a)
CA ý�
Ü
H
VII "/ýýýI
00 eSc'
9 :E
, It
N
0 O Oý 00 N-O
Q+ OaXDO
0
13
+Q
13
Da O 0
XO Da
4O+ X0
x0 aO
XODd
(%) ous

I'
W 1 .=
M
CA GA
-
bU
Q C) C/1 ä
bA OMW G4
0
Q + O 4 X D O
+
00
1: 1 N .r
+ 13 CD 1-9
H
0
E
0
O
O
X
xaO OD Xd+
O 0pxODO
X 0
'ý
Itt
N
0 O Oý 00 MN --O
r (%)
. 7QS

(/1 M
COD
O
r1 U f+a ý Vý 'ä
m O p
ý +
M
O ei' 4
8
X
ý
D O
+
+
Oa
to> xa X O+
DQ X
10 0a+ ex
O+
Ne nt en N-
(%) DUS
\O
Q N
O
D . -, cl a
00 H H LU
r. + H
E E
ýo ý
1: 1
It
N
-1- o 0

r'n rA
QÜ
.. r LS.
"
mO-M dý ýO Oý
Q+ O4XDO
+Q
O
0
> OX 0+
OX 0Q
OX
>O x+
Xd0
%ý d
N
0
00
ct7
H
E E 'ý
ýt
N
0 CK 00 l*- kO In 'r MN-0
(°! o) Dus

4) j -ci
E cý C
^ M
Q) O\
Q U
H
Iý
1 1-4
Q+ O4XDO
13
13
+Q
0XO
O4+ XpQ
DOX+
DO Q X0
DO a0+ X0
D0 4
N .ý
0
00
111*1 «f
NG H H
4ýr
E E 'ý
ýt
N
0 p' 00 tý ýC Vý dMN-O
1 e (%%D) DQS

O
C11
"Ö I
^Ä yy
U A
w
13
Q
Q1 "
\1
\Q C
"" 1 y "a+
LL,
0% 00 tý ýO try I ft MN-O
9
0 00
C N
8
0 Om
C 0
C O
.0 Lrý
O M
0 N
0 r.
(%)x is

O
cd
I) "ý Ü OM
V
eo% C ýý
^ýI
m r"T
.
I ý
i+ "
/"
+Q 1; 1;
+Q\
ý Vý .
Y
W C
1 \i ýý
ýý
1 ý `:
C
O 0% 00 tý ýD N et MN-O 1-4
91
0 00
O N
8
O CD
tf)
C
G Ihr
.a
C
0 N
0
0
(°! v) Dus

O
cri
a) M
C' r^ y
U C
oio
Q
>T v
F-
Q
p ON 00 tý ýD ýn et MN-O 1.4
9
C) 00
0 N
8
0 Om
O
cu
O .Ö
.a
0 M
0 N
0
0
(%) Dus

O
cri
a) .Ö
C7
r" .p
CD-4
bD Gz+
/ /
' +;
13
0 rA cl
to) (A
1
O oý oo N \O N et MN-0
F
C) 00
0 F-
s
0 Om
C O
"O
M
0 N
0
0
(%) Dus

O . r, cri
G. i M
w "; r
{ýi Ü
'ä IV)
(L) --c t
bÄ *mag Lw
/
Q
a /
Q \r
CA 'd x >. * r
rn ý I
0 0: 00 r- 10 i, et mN-O
0 ON
00
O n
8
0 Om
O
eV
"Ö
M
0 N
0
0
(°! °) Das

4U
35
30
25
20
15
10
b n
U en
5
0
* Timoshenko (k=1.0)
O Timoshenko (k=1.68)
+ Bernoulli-Euler
13 Test
+
i 1
12 A A
o A
+ p A
e
öý o
c o a)
5 IOU C 0 90
" v 80
" cy 70
tR r
60 .
50 II
LPL 40 Li.
30
20
10
0
246g
Mode No.
+
4
B
'T
8 a8 10 a
e
0 246
Mode No.
8

1J
14
13
12
11
10
9
8 d 7
w 6
4
3
2 Z ö
o e
A Timoshenko (k=1.0)
O Timoshenko (k=1.50)
+ Bernoulli-Euler
O Test
O
Q A
BA
ÖA 7i
pý 02468
Mode No.
OA Uy
C)
r2
w b Iiu 140
pip 130
120
110 . -
(S, r 100
F 90
80 70
60
50
40
30
20
10
0
0 0 o S D p 0 ° ° o 13
02468
Mode No.

a
O
C)
O
t/1
Up
C öO
O N
0 m
Oý 'r"l O
-4 «S C O
O O
.G
C
. 1C O tý cý'I
0
0
O O1% 00 tý ýO ýt en N --ý O 9-4
N S O + II II
y U)
r.. i Q
o +
o +
Q + o
`" cu > ö '' O U c iý
Q +
(%) ous

oý g
II II
y H
b b
0 0
ö E 3 3 r b _
u2 u2
Q + 0
O II
Cß/1 A
`"
E
N
bA *um W
o
o 0+
9
0
0
O
w, O
.a
C Je
O Vn M
0 r.
o+13
0 -El
0+ 13
4C3ý
O
r. , o C o o 0 0 0 0
C
(edJ) sninpoW

O . r.
O
. CD
cn
W-I N
*mm W
I g n n <EI e
Ici <EI 32 E 3 3 r_ b
Q + O
AQ
O+- Q
+
+Q
E
U
O'
to
t)
a)
OO
elf) P-4 NO89ýOOOOOOO
---- . --I
0 ON
CD rl-
0 CD
O
eS .r U
tom,
J4
M
0 ..,
0
(edo) sninpoW

N
II II
H y
y :3
b
C E
b O
C b b E
+ o H
O
G) .Öe
ö
Ü
C 0'
C vý a
O aý
op" t o--ý +Q
0 ý 0
0 n
0 m
Oö
. I. 4. O
w. 2
.0
CD vn M
0
10
o +Q
*U
48
c
c
0
00N08R0 OO 00OOOOO
(edo) snjnpoW

O
cý
a)
O
C/1
M N
bE
Pýo
N S
II II
10 Ici
8 3 3 r_ b b
(A C cn Q + O
E 0
U . -r ON
tA
O V U V
i-
CD e CD CD
MN-Sg 00 t3OOONO0 P--i . -y Pd . "- P. W . -i
a
0
0 CD
O . -S ed .r
O 2
in lam,
0
0 ...
(Edo) sninpoW

O
.M
.. bid ON Gn >%
N °n
CD. 05 H
N
bD
8 o+Q
Gn CA
b " . 0 +Q E 3 3 r_ b b
C Q + O
o+Q
o +Q
o +Q
o +Q
0
0 00 ýM
0 Ch
O n
0
OC
cd a+
1. O
1ý.
0
0
000 N ý--ý
(edo) snlnpoW

iW
' 3 C/? . 9
Q Ü
_ "a
E v
bÄ *mm W
mO.. -4 M dý r-
Q+O4XO
XD4
O
xD
OQ Oa
X
O 13
OQ
XD
00
N
+
0 Q + o a X p
O
Q + 0 a x D
xpý 04 O
0xp 13 Oi
00 h [ý N
(%)z is
+
+
^' ä
H yy
G
H °O E
C E
ýo ö
ö
N Ö
-f- o
4i

'Itt
r-. I
cý E
Gn Ü
.r a'
Gn 6 C ä,
*mm Gzr
12 CL
E
N .E
0 Cý 00 IN ýo In qt en N "-+ 0
1m -° 8Nö 11
Q+O4X>O+
+
13
OQ
+
O
O 13
dO x'
4
Xý aO
xg +Q X0 O
xýo ao
XcD do
xQ ao
(%) Das

Q + O i X D O
D
«3 ý E o
U JM
ä
U aý
.
.
0 w
O0 13
x
40
+Qx
0G 0
+QX
OdD 0
+Qx
Q4 0D
+QX
0 +Qx
0 40 D +Qx
0
+QX
%0
N
.4
Cl*
E E
öý
ýt Ö
N Ö
CD \O '-1: N 01 00 \o eN 00 00 %0 eN r- (> O> O' 00 00 00 OÖ iz [z (z N
(%) Das

mo m° vý ýö
O+OdxO
a +O
x 0
+
x O<
O +
xQ4
+Q
xO
+Q ®C
+O Oc
OD
+o px 0
O+ 1Dx
1 ý
r-.
ý ý U
M _ 01
n Ü
.r aý
N v
CÄ W
a
a
a
c
%0
.i
ýt
N
I"
CIO
00 vý 0y
H
E E
Ö
, I: Ö
N Ö
0 p 00 \O -t O, 00 ýG TN 00 00 "" 0ý Oý O, O, Co 06 00 06 NNN
(°! v) Dus

CJ
2 z ý
c o
w en
2 . {
v N
bÄ
00
m-rvör Qö +O4XDO
Q+
O
O
>43 D0 O
ýQ O
0'*4 O
Dýa A] O
Dox< ,J rOxa °
0
ItT
ca a
H H
a.. l H
E E eý
N
0
v
(%) Dus

8
0 00
4. ) "C)
2
. r.
CJ
G
F.. ý1 Ü
Ci. y
0
ä'ßi
*mm
s
Co
Co
4)
0 N
0
C' 00 tN ýc in IRt MN "-+ 0
mp C) W) en C* 8 Irr-I
Q+0X O
13
13
+
13 O
+ 13
O
0
O +Q Cý
X d
$a o x
öa +Q
x O
x9
a o +Q
d
o .b O
xcc> 4 p
(°! o) Dus

13F
O
G)
O ö
-0 9-
.ýA Cl) g Gn
U N
Q
_U U! "EL
r. +
ll
.
bD
O+
_EI
l.
rr2-
" : ý, .c
VVV
1 'Ci C2 S4 0
CA rA
1I
' N, t
ýi II it + I'
t, I, ý I
+Q / `.
/ '.
I
0 CA 00 N ýD v if en N-O
a
0 00
0 N
9 0 CD
O
c
O0
C "r
O v7 M
0 N
0
0
NO) Das

Q+ 1
Q+
-EI I
+Q
, . + Q'
\
aý. + \I A . 12 >,. Ö 00 +Q %
äu ö ýtý C\ c S. ÜÜÜ
O
NH ' "I Q+i
NO ON 00 N ýC ýn dMN -+ O -- 14
F
0 00
O S
8 0
O0 ýO
a)
OO ti' y
.D
M
M N
0 ..,
0
(%) 3QS

11
O
(ö
(ý U
ä
Mt
000 W
+
B
+Q
+Q
i i i
o+
-U .ao
c c#
E2 E2 '
', Q+H
/%
/ / `.
/ ý,
0 O\ 00 tý ýC ý/ MN "--ý O
a 0 00
0 N
9 0
OC O
eis
OC 2 w,
.D
O cn
0 N
0
0
(%) Dus

Eg
O . r. .. r cd
ÖW
4) ö
;zÜ M
cD
V
GO2
bÄ *mm W
13F
Gý Ö
[ý] .-_
1 Q V
1 yyýýV
ý+ a+
E"" ýI I
Q i- ,1
+QI'
,j
+Q
Q+ /
Q+
/`
0 ON 00 M fV -O
0 o.
O 00
O N
0 'o
0
OC O
cd .r V
OO
.0
O cri m
0 N
0
CD
(%) DQS

O . r.
a) < Öö
I 9-
.r
a
U^ F. ý1
Ü
H
M
bA .. r W
Q+I`Q+
I
I Q+ 1 1 1'
1'
1I Q+`%
/ /
/
9 rA U +r / ý"C
JD 0
Ö 15 / 11
v'ÜÜ0/ 11
(A coi
CA gt ý 11 1
/J tý B
O O: 00 t- v in et ei N-0
F
0 00
0 N
9 0
Oö
cd W
C 0w`
1ý1
14 Ov/
M
O N
O r.
0
(%) Das

ö z ö"
r V
U
O
E"'
, *D M 1O
bA W
cd ö C
0 U
"d b 0
E
cn
öö
. Yi
0
M 11 y
. -r
b
0 E
11
U A
0
O Oý 00 l- e vi qt MN9O
O 2
00
1o
Itt
N
O
ö z
(%) Das

a) aý w 41
liz
bA
C)
00
Ga) II
Ov
ö 7 en M
V b
co
OU
0
MN
bÄ op" P64
I I I \'
tI
1
\
1\
> \\
ö U O\\
` \\ \ 55%
\ \
\ \
\/ \/
\/
ýý
i i 1 1
/ /
/ /
g / v /
/ /
/ /
/ /
00 N O
Mt N O
N Ö
Ö
N .ý O
00 O Ö
8 Ö
CD
o C> CO tN ýo vlý lt mN-O
(%) DQS

Ö
N Ö
\o Ö
llý
NE
4
00 O Ö
Ö
O
(A) 3PdA
N C: oo l- e vl lt MN ^" ^" O cl00 r, - OOÖÖÖOOO
CD
CC0CCCCÖÖÖÖÖÖÖÖOOO

N
x
n U
. r. U O
a)
45 taA aý
-ö
o
NV
OD
(S+
1~ 00 ÖqÖÖÖ --O, O
ÖÖÖ0 -iÖ
696OOO0OOOO
ýt N Ö
N Ö
Io Ö
. -. y
cV e
Ö
00
0
0
I (A) I dA

U
U 'd U
. r. w
U)
M 4
bA OOM P&d
. -. ... ... c aý
..
0
Ict
N
. -. OOOOO
(d/H) AM! APPiSU S anuQ
d
.r cW C v b u LZ

ý,.. ý
i
" Cd
cqs
Ca
I
aA 0
N
b- *ON W
ä IO CIO +
co
n Q v n
C7 + V Ü
M M Fl, O,
+ Q Q
0 +
+
0
Q +
Q +
+ Q
+ Q
00 Ö
14D
CO 0)
'At 0
N Ö
CD O O' 00 N MD vli Wt en N P--4 O'
(°! o) ous

v Cl
n 1)
a E
UÄ Aö
. - "" 0
1! W
ýJ " rý^l
M
b! J
OOM W
13
11
1: 1
0
0
El
13
13
C3
19t
N
0
N . -y O oý oo t \G ýn dMN-O
(%) NIS t NrVERSlY OF Cfl1STOL
USAARY
OWMERNO
0-1
cl D..
rA H
Copyright © 2022 FDOKUMEN