Verified-Cross-Complaint-conformed.pdf - Tyler & Bursch LLP
433
1 2 3 4 5 6 7 8 9 10 11 12 13 14 15 16 17 18 19 20 21 22 23 24 25 26 27 28 1 VERIFIED CROSS-COMPLAINT TYLER & BURSCH, LLP Jennifer L. Bursch, State Bar No. 245512 [email protected] 25026 Las Brisas Road Murrieta, California 92562 Telephone: (951) 600-2733 Facsimile: (951) 600-4996 Attorneys for Cross-Complainants Immanuel Schools, Ryan Wood, Matt Zulim, and Greg Jackson SUPERIOR COURT OF THE STATE OF CALIFORNIA FOR THE COUNTY OF FRESNO COUNTY OF FRESNO through JEAN M, ROUSSEAU, in his official capacity as Emergency Services Director and County Administrative Officer Plaintiff, v. IMMANUEL SCHOOLS., a California non- profit corporation; RYAN WOOD, Chief Executive Officer of Immanuel Schools and DOES 1 through 50, inclusive, Defendants. Case No.: 20CECG02447 VERIFIED CROSS-COMPLAINT FOR A VIOLATION OF THE EQUAL PROTECTION CLAUSE OF THE CALIFORNIA CONSTITUTION; FOR A VIOLATION OF THE CONTRACTS CLAUSE OF THE CALIFORNIA CONSTITUTION; FOR A VIOLATION OF THE FOURTEENTH AMENDMENT OF THE U.S. CONSTITUTION; AND DECLARATORYAND INJUNCTIVE RELIEF IMMANUEL SCHOOLS, a California non- profit Corporation; RYAN WOOD, Chief Executive Officer of Immanuel Schools; MATT ZULIM, an individual; and GREG JACKSON, an individual Cross-Complainants, v. COUNTY OF FRESNO, through JEAN M. ROUSSEAU in his official capacity; JEAN M. ROUSSEAU in his official capacity as the Emergency Services Director and County Administrative Officer; RAIS VOHRA, in his official capacity as the Interim Health Officer of Fresno County; GAVIN NEWSOM, in his official capacity as the Governor of California; SANDRA SHEWRY, in her official capacity E-FILED 9/11/2020 8:02 AM Superior Court of California County of Fresno By: J. Nelson, Deputy
-
Upload
khangminh22 -
Category
Documents
-
view
2 -
download
0
Transcript of Verified-Cross-Complaint-conformed.pdf - Tyler & Bursch LLP

1
2
3
4
5
6
7
8
9
10
11
12
13
14
15
16
17
18
19
20
21
22
23
24
25
26
27
28 1
VERIFIED CROSS-COMPLAINT
TYLER & BURSCH, LLP Jennifer L. Bursch, State Bar No. 245512 [email protected] 25026 Las Brisas Road Murrieta, California 92562 Telephone: (951) 600-2733 Facsimile: (951) 600-4996
Attorneys for Cross-Complainants Immanuel Schools, Ryan Wood, Matt Zulim, and Greg Jackson
SUPERIOR COURT OF THE STATE OF CALIFORNIA
FOR THE COUNTY OF FRESNO
COUNTY OF FRESNO through JEAN M, ROUSSEAU, in his official capacity as Emergency Services Director and County Administrative Officer
Plaintiff,
v.
IMMANUEL SCHOOLS., a California non-profit corporation; RYAN WOOD, Chief Executive Officer of Immanuel Schools and DOES 1 through 50, inclusive,
Defendants.
Case No.: 20CECG02447
VERIFIED CROSS-COMPLAINT FOR A VIOLATION OF THE EQUAL PROTECTION CLAUSE OF THE CALIFORNIA CONSTITUTION; FOR A VIOLATION OF THE CONTRACTS CLAUSE OF THE CALIFORNIA CONSTITUTION; FOR A VIOLATION OF THE FOURTEENTH AMENDMENT OF THE U.S. CONSTITUTION; AND DECLARATORYAND INJUNCTIVE RELIEF
IMMANUEL SCHOOLS, a California non-profit Corporation; RYAN WOOD, Chief Executive Officer of Immanuel Schools; MATT ZULIM, an individual; and GREG JACKSON, an individual
Cross-Complainants,
v.
COUNTY OF FRESNO, through JEAN M. ROUSSEAU in his official capacity; JEAN M. ROUSSEAU in his official capacity as the Emergency Services Director and County Administrative Officer; RAIS VOHRA, in his official capacity as the Interim Health Officer of Fresno County; GAVIN NEWSOM, in his official capacity as the Governor of California; SANDRA SHEWRY, in her official capacity
E-FILED9/11/2020 8:02 AMSuperior Court of CaliforniaCounty of FresnoBy: J. Nelson, Deputy

1
2
3
4
5
6
7
8
9
10
11
12
13
14
15
16
17
18
19
20
21
22
23
24
25
26
27
28 2
VERIFIED CROSS-COMPLAINT
as the State Public Health Officer and Department of Public Health Director; and ROES 1 through 50, inclusive
Cross-Defendants.
TO EACH PARTY AND ITS ATTORNEY OF RECORD: Cross-Complainants
Immanuel Schools, Ryan Wood, Matt Zulim and Greg Jackson bring this cross-complaint and allege
and show the Court as follows:
PARTIES
1. Immanuel Schools (“Immanuel”) is a non-profit California corporation operating a
K-12 private school located at 1128 S. Reed Avenue, Reedley CA 93654 in the County of Fresno.
Approximately 605 students attend Immanuel.
2. Ryan Wood is the Chief Executive Officer and Superintendent of Immanuel Schools.
(Immanuel Schools and Ryan Wood are hereinafter collectively referred to as “Immanuel” or
“Cross-Complainants”).
3. Matt Zulim is an individual and parent of a student at Immanuel Schools. Matt Zulim
resides in the County of Fresno, State of California.
4. Greg Jackson is an individual and parent of 1st, 3rd, and 6th grade students at
Immanuel Schools. Greg Jackson resides in the County of Fresno, State of California.
5. Cross-Defendant Jean M. Rousseau (“Rousseau”) is the duly appointed Emergency
Services Director and County Administrative Officer of the County of Fresno. As Emergency
Services Director and County Administrative Officer, Rousseau is empowered by Fresno Ordinance
Code § 2.44.060 and the Charter of the County of Fresno to sue in the name of the County to enforce
County ordinances, orders or regulations.
6. Cross-Defendant Dr. Rais Vohra (“Dr. Vohra”) is the duly appointed Interim Health
Officer of the County of Fresno, and a physician licensed to practice in the State of California.
7. Cross-Defendant Gavin Newsom (“Governor Newsom”) is made a party to this
Action in his official capacity as the Governor of California. The California Constitution vests the

1
2
3
4
5
6
7
8
9
10
11
12
13
14
15
16
17
18
19
20
21
22
23
24
25
26
27
28
3 VERIFIED CROSS-COMPLAINT
“supreme executive power of the State” in the Governor, who “shall see that the law is faithfully
executed.” Cal. Const. Art. V, § 1. See, e.g., Ex Parte Young, 209 U.S. 123 (1908).
8. Cross-Defendant Xavier Becerra (“Becerra”) is made a party to this Action in his
official capacity as the Attorney General of California. Under California law, Becerra is the chief
law enforcement officer in the State. Cal. Const. Art. V, § 13.
9. Cross-Defendant Sandra Shewry (“Shewry”) is made a party to this Action in her
official capacity as State Public Health Officer and Acting Director of the California Department of
Public Health (“CDPH”).
10. Cross-Defendants DOES 1 through 100, inclusive, are sued herein under fictitious
names. Their true names and capacities are unknown to Cross-Complainants. When their true
names and capacities are ascertained, Cross-Complainants Complaint by inserting their true names
and capacities herein.
11. Cross-Complainants are informed and believe and thereon allege, that each of the
fictitiously named defendants is responsible in some manner for the occurrences herein alleged, and
that Cross-Complainant’s damages as herein alleged were proximately caused by those cross-
defendants.
12. Cross-Complainants are informed and believe and thereon allege that at all times
herein mentioned, defendants DOES 1 through 100 were agents, servants, and employees of their
codefendants, and in doing the things hereinafter alleged were acting in the scope of their authority
as agents, servants, and employees, and with the permission and consent of their codefendants.
JURISDICTION AND VENUE
13. This is a civil action for violation of the constitutional right to education, violation
of the contracts clause of the California Constitution, and an overbreadth claim is brought under the
laws of the State of California, which this court has subject matter jurisdiction over pursuant to
California Code of Civil Procedure section 410.10.
14. Personal jurisdiction is proper in this court because all Cross-Defendants have
engaged in business in the State of California as employees or elected officials of the State of
California. Cross-Complaints are informed, believe, and thereupon allege that all Cross-Defendants

1
2
3
4
5
6
7
8
9
10
11
12
13
14
15
16
17
18
19
20
21
22
23
24
25
26
27
28
4 VERIFIED CROSS-COMPLAINT
reside in the State of California. This action arises out of business conducted in California by all
defendants and relates to the operation of a school in the County of Fresno, California.
15. Jurisdiction and venue are proper in the Superior Court, State of California, County
of Fresno, because this judicial district is where the school at issue is located.
STATEMENT OF FACTS
16. On or about March 4, 2020 Governor Newsom declared a State of Emergency
throughout the State of California due to the coronavirus pandemic.
17. On or about March 15, 2020, Mr. Rousseau, the emergency Services director for the
County of Fresno, issued a declaration of local emergency for the County of Fresno. (Exhibit 39.)
18. On or about March 17, 2020, the Fresno County Board of Supervisors ratified the
declarations of the County Health Officer and Emergency Services Director and declared a public
and health emergency in the County. (Exhibit 40.)
19. On or about March 19, 2020, Governor Newsom issued Executive Order N-33-20
ordering “all residents are directed to immediately heed the current State public health directives.”
(Exhibit 1.)
20. On or about May 4, 2020, Governor Newsom issued Executive Order N-60-20 in
which he ordered “All residents are directed to continue to obey State public health directives.” But,
Governor Newsom did not specifically mention schools as he vested power in the CDPH to make
determinations about the re-openings of “businesses and spaces” (Exhibit 2.)
21. On or about July 17, 2020, Governor Newsom announced a framework to reopen
schools. (Exhibit 3.) Under this plan, “Schools and school districts may reopen for in-person
instruction at any time if they are located in a local health jurisdiction (LHJ) that has not been on
the county monitoring list within the prior 14 days.” (Exhibit 4.)
22. On or about August 13, 2020 the Interim Health Officer, Dr. Vohra, issued an order
instructing Immanuel Schools to immediately cease all in-person classroom instruction operations
until the County was off of the State’s monitoring list for fourteen (14) days. (Exhibit 41.)
23. On or about August 14, 2020, Immanuel, pursuant to their well-founded belief of
herd immunity through the testing of Dr. Atmajian and the unconstitutionality of the Cross-

1
2
3
4
5
6
7
8
9
10
11
12
13
14
15
16
17
18
19
20
21
22
23
24
25
26
27
28
5 VERIFIED CROSS-COMPLAINT
Defendants’ orders, opened for in-person instruction. Cross-Complainants are informed, believe,
and thereupon allege that as of the time of filing, no students at Immanuel have contracted COVID-
19.
24. On or about August 25, 2020 CDPH’s acting director Sandra Shewry announced
statewide guidance which allows “small groups of students (cohorts) to receive in-person
supervision, specialized and targeted services, and other support in settings that include schools that
are otherwise not permitted to reopen under the Framework.” Under the subsequently amended
guidance, cohorts are defined as, “a stable group of no more than 14 children or youth and no more
than two supervising adults.” (Exhibit 42.)
25. On or about August 28, 2020 Governor Newsom announced a new four-tier
framework to reopen schools (the “Framework”). (Exhibit 43.) Under this new, “more stringent”
Order, schools within a county considered “Tier 1” cannot open for any in-person instruction, with
an exception for waivers granted by local health departments for TK-6 grades. (Ibid.) Otherwise, to
become eligible for limited in-person instruction, a county must advance to the less restrictive “Tier
2.” To advance, “a county must remain in a tier for a minimum of three weeks before being able to
advance to a less restrictive tier.” (Ibid.) To then reopen schools, the county must maintain Tier 2
status for another 14 days. (Ibid.) However, if at any time a county’s adjusted case rate reverts back
to Tier 1 thresholds for two weeks, the county reverts back to Tier 1 and schools must close once
again to in-person meetings. (Ibid.)
26. On or about August 28, 2020 the Interim Health Officer, Dr. Vohra, issued an order
instructing Immanuel Schools to screen any person who enters the campus, to exclude those
reporting any illness in the previous ten days, and to report to the Fresno County Department of
Public Health within 24 hours any person who enters the campus who shows symptoms of any
symptoms of COVID-19. (Exhibit 44.)
27. As of September 9, 2020, the County of Fresno was considered Tier 1. (Exhibit 5.)
28. As of September 10, 2020, The County of Fresno was still listed as “widespread”
and unable to open for in-person instruction. (Exhibit 5.)

1
2
3
4
5
6
7
8
9
10
11
12
13
14
15
16
17
18
19
20
21
22
23
24
25
26
27
28
6 VERIFIED CROSS-COMPLAINT
29. On or about September 10, 2020 school age children (0-17 years) only made up 10%
of the cases in Fresno County. (Exhibit 45.) Cross-Complainants are informed and believe that the
2020 mortality of school age children (0-17 years) represent 0% of all COVID-19 mortalities in
Fresno County. (Ibid.) Whereas, 74% of the reported COVID-19 mortalities were patients 65 years
of age or older. (Ibid.)
30. Cross-Complainants are further informed and believe that in anticipation of the
distance learning framework, the California Legislature and Governor Newsom enacted a budget
that provided an additional $5.3 billion (consisting of $4.8 billion in federal funds) in funding for
public schools which were necessary to remediate recognized deficiencies in the distance learning
model and to help facilitate distanced learning. (Exhibit 6.) These funds were not made available
to Immanuel Schools and, as a result, Immanuel was left at a disadvantage to provide equal
interaction and support which would be equivalent to in-person learning. Immanuel was forced to
either implement a distance learning model without equivalent funding to the public-school system
or to re-open in a safe manner.
31. Immanuel took tremendous measures to evaluate if its community could reopen
safely by contracting with a board certified clinical pathologist, Paul Atmajian, M.D., who
conducted an antibody test on 198 individuals at the Immanuel Schools school site to assess the herd
immunity within the local community. (Decl. of Wood ¶ 19; Decl. of Atmanjian ¶ 7.)
32. Dr. Atmajian’s testing was designed to evaluate whether individuals had COVID-19,
defeated COVID-19, or were immune to COVID-19. Through the antibody tests, Dr. Atmajian
determined that at least 59% of petitioner Immanuel School had developed antibodies for COVID-
19. (Decl. of Atmajian ¶ 7.)
33. To further increase the reliability of testing, Dr. Atmajian implemented additional
controls, including but not limited to performing tests for SARS-CoV2 proteins at 37 degrees
Celsius, use of blocking agents, use of high binding microtiter plates, and the use of three antigenic
targets resulting in a lower positivity rate. (Decl. of Atmajian ¶ 9.)
34. Cross-Complainants are informed, believe, and thereupon allege that under the less
reliable test which is frequently used for commercial testing, the same testing would have reported

1
2
3
4
5
6
7
8
9
10
11
12
13
14
15
16
17
18
19
20
21
22
23
24
25
26
27
28
7 VERIFIED CROSS-COMPLAINT
approximately 80% of Immanuel Schools possessing the requisite antibodies for COVID-19. (Decl.
of Atmajian ¶¶ 12, 14.)
35. On information and belief, Dr. Atmajian’s testing demonstrates that Immanuel has
obtained herd immunity within their student body. (Decl. of Atmajian ¶¶ 12, 14.)
36. Cross-Complainants are further informed, believe, and on such information and
belief allege that the student body and the Immanuel community would be irreparably and
unnecessarily damaged due to the mandatory adoption of a distance learning model. (Decl. of Wood
¶ 21.)
37. The County of Fresno refuses to acknowledge the existence of the antibody testing
and evidence of herd immunity in assessing the scope of its orders.
38. Teachers and schools are issuing staggering reports of decreased student involvement
after implementing the distance learning school model, which reflect both the harm to Immanuel
and the impact on the fundamental right of education. (Exhibit 8.) Studies indicate that some
students are unable to obtain technology, creating a “digital divide” which impacts student learning.
(Ibid.)
39. This “digital divide” was acknowledged by Governor Newsom’s recent issuance of
Executive Order N-73-20 which ordered state agencies to pursue a minimum broadband speed goal
of 100 megabits per second to facilitate distance learning. (Exhibit 16.) By implication, the
Governor’s office concedes that broadband speeds are insufficient to meet the strains of distance
learning.
40. This impact is further magnified in the private school system as these schools and
students do not have access to the same funding available in the public education system. Teachers
and staff from Immanuel report that students have difficulties with distance learning and
acknowledge that the distance learning system is a failure to students. (Decl. of Reimer ¶ 5; Decl.
of Wood ¶¶ 13, 15, 24; Decl. of James ¶ 11.)
41. The third grade teacher at Immanuel Schools noted that “[t]he quality of the Zoom
lessons was negatively impacted by technology glitches, families with more than one child learning
in the household, and students’ inability to focus on a computer for hours at a time.” (Decl. of James

1
2
3
4
5
6
7
8
9
10
11
12
13
14
15
16
17
18
19
20
21
22
23
24
25
26
27
28
8 VERIFIED CROSS-COMPLAINT
¶ 6.) This substantial absence from in-person instruction may have long-term psychological and
mental health impacts on children as distance learning makes “it difficult for schools to
identify…important learning deficits as well as… physical or sexual abuse, substance use,
depression, and suicidal ideation.” (Exhibit 12.)
42. Similarly, Linda Reimer, the Director of Counseling for Immanuel Schools, stated
that students “reported to me that it was a struggle to find the self-motivation to attend lessons or
office hours via Zoom and/or complete their assignments…[and reported] … feelings of anxiety,
depression, and anger as compared to when Immanuel offered traditional in-person instruction.”
(Decl. of Reimer ¶ 5; See also Decl. of Wood ¶ 24.)
43. Experts conclude that closure of in-person learning for children is largely detrimental
to the health and welfare of children. (Exhibit 12.) For example the American Academy of Pediatrics
(“AAP”) opined that many health benefits received from in-person instruction will be lost including,
“child . . . development,” “social and emotional skills,” “reliable nutrition,” physical/speech and
mental health therapy,” and “opportunities for physical activity,” if in-person instruction is not
permitted. (Exhibit 12; See also Decl. of Victory ¶ 14.) This results in health issues in students.
(Decl. of Melson ¶ 18.)
44. Immanuel also reports a decline in students’ social, emotional, and spiritual
development under the distance learning model. (Decl. of Reimer ¶¶ 5-7; Decl. of Wood ¶¶ 15, 18.)
Students are struggling in the online environment as they lack the home support they need to thrive
in a distance learning model. (Decl. of Wood ¶ 15; Decl. of James ¶ 9.)
45. The CDC stated that COVID-19 posed a low risk to students and encourages States
to resume in-person instruction. (Exhibit 13.) In a study conducted by the CDC, South Korea
reported that less than 2% of COVID-19 transmissions occurred between individuals from the ages
0-20 with less than 1% of transmissions below the age of 10. (Exhibit 14; Decl. of Bhattacharya ¶
22; Decl. of Melson ¶ 12.) Similarly, Kelly Victory, M.D., opined that “children are essentially at
zero risk of contracting COVID-19 or becoming ill from the virus if school were to reopen.” (Decl.
of Victory ¶12.) There is “no evidence that children are the primary drivers of the infection” (Decl.
of Mu ¶ 3)

1
2
3
4
5
6
7
8
9
10
11
12
13
14
15
16
17
18
19
20
21
22
23
24
25
26
27
28
9 VERIFIED CROSS-COMPLAINT
46. Despite the CDC recommendation, expert recommendations, and the day-to-day
reports from school districts, the County of Fresno, in cooperation with Governor Newsom and the
CDPH crafted orders which mandated distance learning for private schools resulting in irreparable
injury to students. The County’s actions completely disregard recommendations of health entities
which provide guidelines to minimize the spread of COVID-19 for in-person instruction even if
counties return to the monitoring list. (Exhibit 9.)
Violation of the California Equal Protection Clause
Against All Cross-Defendants
47. Cross-Complainants incorporate herein by reference each and every allegation
contained in the preceding paragraphs of this Cross-Complaint as though fully set forth herein.
48. Cross-Complainants are informed, believe, and thereupon allege that Cross-
Defendants’ collectively and individually targeted private schools and their students as an
identifiable class of individuals who are treated differently than other private schools in the State of
California based on their county of residence. Cross-Complainants are informed, believe, and
thereupon allege that similarly situated private schools in California are permitted to open for in
person instruction under less restrictive guidelines.
49. Cross-Complainants are informed, believe, and thereupon allege that Cross-
Defendants orders violate the equal protection clause of the California Constitution as they
arbitrarily treat similarly situated private schools differently solely based on their county of
residence. Similarly, the Cross-Complaining parents have a fundamental liberty interests to send
their children to private schools and Cross-Defendants’ orders violate that fundamental liberty
interest without so much as a rational basis explaining the differential treatment of similarly situated
parents and students across the state.
50. The right to education is so deeply rooted in the history and tradition of the United
States, that the California Supreme Court previously ruled that it is a fundamental right guaranteed
under the California Constitution. “all California children should have equal access to a public
education system that will teach them the skills they need to succeed as productive members of

1
2
3
4
5
6
7
8
9
10
11
12
13
14
15
16
17
18
19
20
21
22
23
24
25
26
27
28
10 VERIFIED CROSS-COMPLAINT
modern society.” (Serrano v. Priest (1971) 5 Cal.3d 584, 605 [“Serrano I”, stating that education
is “the lifeline of both the individual and society.”]; Serrano v. Priest (1976) 18 Cal.3d 728, 767-
768 [“Serrano II”, stating that education “lie[s] at the core of our free and representative form of
government.”]; see also Cal. Const. Art. I, § 7; id. Art. IV, § 16; Id. Art. IX, §§ 1 & 5.)
51. While the state does not fund private schools, the Cross-Complaining parents have a
fundamental liberty interest in the upbringing of their children through the private education system.
52. The Framework facially, and as-applied, arbitrarily treats Cross-Complainants as
schools, parents, and their children differently from those in other counties, even though all such
children and their families are all similarly situated.
53. Under Equal Protection claims, when the government enacts law which burdens a
fundamental right, courts apply strict scrutiny and analyze whether the law is narrowly tailored to
serve a compelling government interest. (Serrano v. Priest (1976) 18 Cal.3d 728, 767-768.) Cross-
Complainants are informed, believe, and thereupon allege that the Framework cannot survive even
rationale basis review. No rational basis exists for differentiating between similarly situated schools
based on countywide health metrics, because children are highly unlikely to be sickened by,
transmit, or succumb to COVID-19. “[V]ague, undifferentiated fears” do not provide a rational basis
for “what would otherwise be an equal protection violation.” (City of Cleburne v. Cleburne Living
Ctr. (1985) 473 U.S. 432, 449.)
54. Despite the purported risk posed by in person gatherings of children in school, the
State allows small groups of students (cohorts) to receive in-person supervision, specialized and
targeted services, and other support in settings that include schools that are otherwise not permitted
to reopen under the Framework. (Exhibit 42.) Likewise, the State allows children to congregate by
the thousands in daycare facilities and camps across California, even in Tier 1 counties. The Cross-
Defendants have articulated no reasonable basis for believing daycare centers and camps are safe
but private school campuses like Immanuel’s are not.
55. Cross-Complainants are informed, believe, and thereupon allege that the State
effectively prohibits it from operating while similarly situated schools in other counties can open
pursuant to the CDPH’s guidelines as Cross-Defendants’ orders are not equally applied to similarly

1
2
3
4
5
6
7
8
9
10
11
12
13
14
15
16
17
18
19
20
21
22
23
24
25
26
27
28
11 VERIFIED CROSS-COMPLAINT
situated individuals. While public schools are also barred from providing in-person instruction in
Fresno County, these are not impacted as severely as private schools like Immanuel because public
schools do not lose funding, indeed they have gained funding, with distance learning.
56. The Framework facially, and as-applied, arbitrarily results in the disparate treatment
of students at Immanuel because it fails to make even a rational basis assessment of whether there
is actually a heightened risk of COVID-19 transmission at Immanuel compared to private schools
in non-Tier 1 counties.
57. Cross-Complainants, on information and belief, allege that the Framework relies on
an overbroad classification which presumes Immanuel, other private schools, and the 346 public
schools within the 6,011 square mile Fresno County have the same transmission risk. Cross-
Complainants further allege that the Cross-Defendants, individually and collectively, cannot meet
any level of scrutiny as the Cross-Defendants’ orders willfully ignoring medical evidence of actual
transmission risk data in favor of overbroad countywide classifications is not rationally related to
the interest of protecting public health nor narrowly tailored to such interests.
58. Cross-Complainants have no adequate remedy at law, have suffered, and will
continue to suffer serious and irreparable harm to their constitutional rights unless Cross-Defendants
are enjoined from implementing and enforcing the Framework and associated guidance documents
which restrict the reopening of schools in a manner that violates Immanuel’s right to equal protection
under the law.
Violation of the Contracts Clause of the California Constitution
Against all Cross-Defendants
59. Cross-Complainants incorporate herein by reference each and every allegation
contained in the preceding paragraphs of this Cross-Complaint as though fully set forth herein.
60. The California Constitution provides that "a…law impairing the obligations of
contracts may not be passed." (California Constitution Art. 1, Sect. 9). In similar fashion the United
States Constitution provides "No State shall . . . pass any Bill of Attainder, ex post facto law, or law
impairing the Obligation of Contracts . . ." (U.S. Constitution Art. 1, Sect. 10.) Legislation running

1
2
3
4
5
6
7
8
9
10
11
12
13
14
15
16
17
18
19
20
21
22
23
24
25
26
27
28
12 VERIFIED CROSS-COMPLAINT
afoul of these constitutional protections can be stricken. These constitutional provisions are
intended prevent the legislative branch from enacting bills that prevented the performance of
existing contractual obligations.
61. Courts have applied the Contracts Clause of the California constitution to private
contracts and hold that the “state cannot impair private contractual…rights.” (San Bernardino Public
Employees Ass’n v. City of Fontana (1998) 67 Cal.App.4th 1215, 1222.) The State contract clause
echoes the rights provided by the Federal Constitution which prohibits the government from
impairing contractual obligations between private individuals. (Green v. Biddle (1823) 21 U.S. 1,
92.)
62. Cross-Complainants’ contracts, as attached hereto, are substantially impaired by
Cross-Defendants as parents are refusing to comply with the contracts based on the inability to
legally provide in-person instruction. Cross-Complainants attached and specifically incorporate
herein Exhibit 46 as if set forth in full.
63. Cross-Complainants’ contracts are conditioned on in-person instruction and
Immanuel may be subject to contractual liability for a failure to perform the essential terms of the
agreement.
64. Immanuel is in a position of serious financial jeopardy due to the failure to comply
with their contractual obligations, loss of students, and the assumption of contractual liability
stemming from hundreds of potential breach of contract allegations from parents. The result is that
Immanuel may be unable to continue operations or will be unable to offer similar services to future
students.
65. The Framework’s substantial interference with Immanuel’s contractual rights is not
justified by the government’s purported significant and legitimate public purpose of slowing the
transmission of COVID-19 in Tier 1 counties like Fresno as Cross-Complainants are informed,
believe and thereupon allege that herd immunity was obtained.

1
2
3
4
5
6
7
8
9
10
11
12
13
14
15
16
17
18
19
20
21
22
23
24
25
26
27
28
13 VERIFIED CROSS-COMPLAINT
66. Cross-Complainants have no adequate remedy at law, have suffered, and will
continue to suffer serious and irreparable harm to their constitutional rights unless Cross-Defendants
are enjoined from implementing and enforcing the Framework and associated guidance documents
which restrict the reopening of schools in a manner that violates the Contract Clauses of both the
California Constitution.
Arbitrary and Capricious Deprivation of Substantive Due Process of Law
Against All Defendants
67. Cross-Complainants incorporate herein by reference each and every allegation
contained in the preceding paragraphs of this Cross-Complaint as though fully set forth herein.
68. The Due Process Clause of the Fourteenth Amendment to the U.S. Constitution
provides that no state shall “deprive any person of life, liberty, or property, without due process of
law.” (U.S. Const. amend XIV.) The Cross-Complaining parents have a liberty interest in their
right to equal access to basic minimum education for their students and in their rights secured by
the California Constitution and state law, which includes the right to instruct the upbringing of their
children by contracting with private schools for education.
69. Cross-Defendants deprive the Cross-Complainants of their rights and liberties
without due process of law, in violation of the Fourteenth Amendment to the U.S. Constitution, by
(1) mandating distanced-learning in most circumstances, which effectively provides no or unequal
access to education; by (2) substantially impairing Immanuel’s ability to meet contractually
obligated in-person instruction of their students; and by (3) creating an arbitrary Framework which
arbitrarily treats similarly situated private schools differently and ignores medical evidence strongly
indicating it is safe for Immanuel to re-open for in-person instruction.
70. The Framework and Cross-Defendants’ enforcement thereof further violate
Immanuel’s substantive due process rights as follows: (1) the California Constitution entitles the
Cross-Complaining parents to equal access to a basic minimum education for their children through
the private education system; (2) the California Constitution entitles to the Immanuel community be
free of substantial impairment from the state of their ability to obligate educational institutions to

1
2
3
4
5
6
7
8
9
10
11
12
13
14
15
16
17
18
19
20
21
22
23
24
25
26
27
28
14 VERIFIED CROSS-COMPLAINT
instruct their children by operation of contract law; (3) Cross-Defendants lack any legitimate,
rational, or compelling interest for depriving Immanuel’s students of their right to an education; (4)
even if such a legitimate interest existed, the Framework and associated guidance is neither
rationally related nor narrowly tailored to further any such interest.
71. To further implement arbitrary and capricious regulations on Cross-Complainants,
the County of Fresno specifically targeted Cross-Defendants with unique and independent orders,
which Cross-Complainants, on information and belief, allege were not issued to any other business
within the County. These new arbitrary orders instructed Immanuel to exclude those reporting any
to report to the Fresno County Department of Public Health within 24 hours any person who enters
the campus who shows symptoms of any symptoms of COVID-19. (Exhibit 44.)
72. Cross-Complainants have no adequate remedy at law, have suffered, and will
continue to suffer serious and irreparable harm to their constitutional rights unless Cross-Defendants
are enjoined from implementing and enforcing the Framework and associated guidance documents
which restrict the reopening of schools in a manner that violates Cross-Complainants Substantive
Due Process rights.
PRAYER FOR RELIEF
WHEREFORE, Cross-Complainants pray for relief against Cross-Defendants and DOES 1
– 100 as follows:
1. An order and judgment declaring that the Framework and associated CDPH
guidance, facially and as-applied to Cross-Complainants, violates the Cross-Complainants’ Equal
Protection, Due Process, and Contract rights guaranteed under the California Constitution and that
Immanuel should be allowed to continue in-person instruction without delay;
2. An order temporarily, preliminarily, and permanently injunction enjoining and
prohibiting Cross-Defendants, and all persons acting under, in concert with or for them, from
enforcing the Framework and associated guidance or otherwise interfering with Cross-
Complainants’ constitutional and statutory guarantees;
3. Compensatory and actual damages in an amount to be proven at the time of trial;
4. Costs of suit incurred herein;

1
2
3
4
5
6
7
8
9
10
11
12
13
14
15
16
17
18
19
20
21
22
23
24
25
26
27
28 15
VERIFIED CROSS-COMPLAINT
5. Attorneys’ fees; and
6. For such other and further relief that the Court may deem just and proper.
DATED: September 10, 2020 TYLER & BURSCH, LLP
By: Jennifer L. Bursch, Esq. Attorneys for Complainants, Immanuel Schools, Ryan Wood, Greg Jackson, and Matt Zulim


1
2
3
4
5
6
7
8
9
10
11
12
13
14
15
16
17
18
19
20
21
22
23
24
25
26
27
28
VERIFICATION
I have read the foregoing VERIFIED CROSS-COMPLAINT and know its contents.
I am a party to this action. The matters stated in the foregoing document are true of my ownknowledge except as to those matters which are stated on information and belief, and as to thosematters I believe them to be true.
I declare under penalty of perjury under the laws of the State of California that the foregoingis true and correct.
^ Sepl0,2020 , Kingsburg „ , .Executed on , at 5 Cahtomia.
f W-Matt Zlilim (Sep 10,2020 21:44 PDT)
Matt Zulim, an individual
18
VERIFIED CROSS-COMPLAINT

2
3
4
5
6
7
8
9
10
11
12
13
14
15
16
17
18
19
20
21
22
23
24
25
26
27
28
VERIFICATION
I have read the foregoing VERIFIED CROSS-COMPLAINT and know its contents.
I am a party to this action. The matters stated in the foregoing document are true of my ownknowledge except as to those matters which are stated on information and belief, and as to thosematters I believe them to be true.
I declare under penalty of perjury under the laws of the State of California that the foregoingis true and correct.
Ex.cu.ed on 10. 2020 KiUgSburg
^Grog (Sop 10.2020 21:36 POT)
Gree Jackson, an individual
19
VERIFIED CROSS-COMPLAINT

EXHIBIT "1"


EXHIBIT "2"

EXECUTIVE ORDER N-60-20
WHEREAS on March 4, 2020, I proclaimed a State of Emergency to exist in
California as a result of the threat of COVID-19; and
WHEREAS on March 19, 2020, I issued Executive Order N-33-20, which
directed all California residents to immediately heed current State public health
directives; and
WHEREAS State public health directives, available at
https://covid19.ca.gov/stay-home-except-for-essential-needs/, have ordered all
California residents stay home except for essential needs, as defined in State
public health directives; and
WHEREAS COVID-19 continues to menace public health throughout
California; and
WHEREAS the extent to which COVID-19 menaces public health
throughout California is expected to continue to evolve, and may vary from
place to place within the State; and
WHEREAS California law promotes the preservation of public health by
providing for local health officers—appointed by county boards of supervisors
and other local authorities—in addition to providing for statewide authority by a
State Public Health Officer; and
WHEREAS these local health officers, working in consultation with county
boards of supervisors and other local authorities, are well positioned to
understand the local needs of their communities; and
WHEREAS local governments are encouraged to coordinate with federally
recognized California tribes located within or immediately adjacent to the
external geographical boundaries of such local government jurisdiction; and
WHEREAS the global COVID-19 pandemic threatens the entire State, and
coordination between state and local public health officials is therefore, and will
continue to be, necessary to curb the spread of COVID-19 throughout the State;
and
WHEREAS State public health officials have worked, and will continue to
work, in consultation with their federal, state, and tribal government partners;
and
WHEREAS the State Public Health Officer has articulated a four-stage
framework—which includes provisions for the reopening of lower-risk businesses
and spaces (“Stage Two”), to be followed by the reopening of higher-risk
businesses and spaces (“Stage Three”)—to allow Californians to gradually
resume various activities while continuing to preserve public health in the face
of COVID-19; and

WHEREAS the threat posed by COVID-19 is dynamic and ever-changing,
and the State’s response to COVID-19 (including implementation of the four-
stage framework) should likewise retain the ability to be dynamic and flexible;
and
WHEREAS to preserve this flexibility, and under the provisions of
Government Code section 8571, I find that strict compliance with the
Administrative Procedure Act, Government Code section 11340 et seq., would
prevent, hinder, or delay appropriate actions to prevent and mitigate the
effects of the COVID-19 pandemic.
NOW, THEREFORE, I, GAVIN NEWSOM, Governor of the State of California,
in accordance with the authority vested in me by the State Constitution and
statutes of the State of California, and in particular, Government Code sections
8567, 8571, 8627, and 8665; and also in accordance with the authority vested in
the State Public Health Officer by the laws of the State of California, including
but not limited to Health and Safety Code sections 120125, 120130, 120135,
120140, 120145, 120150, 120175, and 131080; do hereby issue the following Order
to become effective immediately:
IT IS HEREBY ORDERED THAT:
1) All residents are directed to continue to obey State public health
directives, as made available at https://covid19.ca.gov/stay-home-
except-for-essential-needs/ and elsewhere as the State Public Health
Officer may provide.
2) As the State moves to allow reopening of lower-risk businesses and
spaces (“Stage Two”), and then to allow reopening of higher-risk
businesses and spaces (“Stage Three”), the State Public Health Officer
is directed to establish criteria and procedures—as set forth in this
Paragraph 2—to determine whether and how particular local
jurisdictions may implement public health measures that depart from
the statewide directives of the State Public Health Officer.
In particular, the State Public Health Officer is directed to establish
criteria to determine whether and how, in light of the extent to which
the public health is menaced by COVID-19 from place to place within
the State, local health officers may (during the relevant stages of
reopening) issue directives to establish and implement public health
measures less restrictive than any public health measures implemented
on a statewide basis pursuant to the statewide directives of the State
Public Health Officer.
The State Public Health Officer is further directed to establish
procedures through which local health officers may (during the
relevant stages of reopening) certify that, if their respective jurisdictions
are subject to proposed public health measures (which they shall
specify to the extent such specification may be required by the State
Public Health Officer) that are less restrictive than public health
measures implemented on a statewide basis pursuant to the statewide
directives of the State Public Health Officer, the public health will not
be menaced. The State Public Health Officer shall additionally establish
procedures to permit, in a manner consistent with public health and

safety, local health officers who submit such certifications to establish
and implement such less restrictive public health measures within their
respective jurisdictions.
The State Public Health Officer may, from time to time and as she
deems necessary to respond to the dynamic threat posed by COVID-
19, revise the criteria and procedures set forth in this Paragraph 2.
Nothing related to the establishment or implementation of such criteria
or procedures, or any other aspect of this Order, shall be subject to the
Administrative Procedure Act, Government Code section 11340 et seq.
Nothing in this Paragraph 2 shall limit the authority of the State Public
Health Officer to take any action she deems necessary to protect
public health in the face of the threat posed by COVID-19, including
(but not limited to) any necessary revision to the four-stage framework
previously articulated by the State Public Health Officer.
3) Nothing in this Order shall be construed to limit the existing authority of
local health officers to establish and implement public health measures
within their respective jurisdictions that are more restrictive than, or that
otherwise exist in addition to, the public health measures imposed on a
statewide basis pursuant to the statewide directives of the State Public
Health Officer.
IT IS FURTHER ORDERED that as soon as hereafter possible, this Order be
filed in the Office of the Secretary of State and that widespread publicity and
notice be given of this Order.
This Order is not intended to, and does not, create any rights or benefits,
substantive or procedural, enforceable at law or in equity, against the State of
California, its agencies, departments, entities, officers, employees, or any other
person.
IN WITNESS WHEREOF I have hereunto set
my hand and caused the Great Seal of the
State of California to be affixed this 4th day
of May 2020.
_____________________________
GAVIN NEWSOM
Governor of California
ATTEST:
_____________________________
ALEX PADILLA
Secretary of State

EXHIBIT "3"

8/21/2020 Governor Gavin Newsom Lays Out Pandemic Plan for Learning and Safe Schools | California Governor
https://www.gov.ca.gov/2020/07/17/governor-gavin-newsom-lays-out-pandemic-plan-for-learning-and-safe-schools/ 1/2
Governor Gavin Newsom Lays Out PandemicPlan for Learning and Safe Schools
Published: Jul 17, 2020
Plan centers on rigorous instruction for students even when schools are physically closed
Decisions to open in-person will be determined by local data that the public can track on a daily basis
Schools open for in-person instruction will implement precautions, including a requirement that students in 3rd grade and above wear masks
Newsom: “In California, health data will determine when a school can be physically open – and when it must close – but learning should never stop”
SACRAMENTO – Governor Gavin Newsom today announced his plan for learning and safe schools ahead of the 2020–2021 school year, as the CaliforniaDepartment of Public Health issued a framework for when and how schools should reopen for in-person instruction.
“Learning is non-negotiable,” said Governor Newsom. “The virus will be with us for a year or more, and school districts must provide meaningfulinstruction in the midst of this pandemic. In California, health data will determine when a school can be physically open – and when it must close – butlearning should never stop. Students, sta�, and parents all prefer in-classroom instruction, but only if it can be done safely.”
The Governor’s plan centers on five key areas:
1) Safe in-person school based on local health data
The California Department of Public Health today issued updated schools guidance that includes using existing epidemiological metrics to determine ifschool districts can start in-person instruction. CDPH currently uses six indicators to track the level of COVID-19 infection in each California county as wellas the preparedness of the county health care system – data that includes the number of new infections per 100,000 residents, the test positivity rate, andthe change in hospitalization rate, among others. Any county that does not meet the state’s benchmarks is put on the County Monitoring List.
Schools located in counties that are on the Monitoring List must not physically open for in-person instruction until their county has come o� theMonitoring List for 14 consecutive days. Schools in counties that have not been on the Monitoring List for the prior 14 days may begin in-personinstruction, following public health guidelines. School community members – including parents, teachers, sta� and students – can track daily data onwhether and why their county is on the Monitoring List at https://covid19.ca.gov/roadmap-counties/#track-data.
There is a single exception. Local health o�icers may grant a waiver to allow elementary schools to reopen in-person instruction if the waiver is requestedby the district superintendent, in consultation with labor, parents and community-based organizations. When considering a waiver request, the localhealth o�icer must consider local data and consult with the California Department of Public Health.
The Department also issued updated guidance for when schools must physically close and revert to distance learning because of COVID-19 infections.Following a confirmed case of a student who was at school during his or her infectious period, other exposed students and sta� should be quarantinedfor 14 days. The school should revert to distance learning when multiple cohorts have cases or 5 percent of students and sta� test positive within a 14-day period. The district should revert to distance learning when 25 percent or more of its schools have been physically closed due to COVID-19 within 14days. Closure decisions should be made in consultation with local health o�icers. A�er 14 days, school districts may return to in-person instruction withthe approval of the local public health o�icer.
2) Strong mask requirements for anyone in the school
In the updated guidance, all sta� and students in 3rd grade and above will be required to wear a mask or face covering. Students in 2nd grade and beloware strongly encouraged to wear a face covering. Students should be provided a face covering if they do not have one. The state has delivered over 18million face coverings to schools to support them to reopen and ensure all students can participate in learning.
3) Physical distancing requirements & other adaptations
In the updated guidance, CDPH requires that all adults stay 6 feet from one another and 6 feet away from children, while students should maintain 6 feetof distance from one another as practicable. Anyone entering the school must do a health screen, and any student or sta� exhibiting a fever or othersymptoms will be immediately sent home. The guidance also provides that if anyone in a student or sta� member’s household is sick, they too shouldstay home.
4) Regular testing and dedicated contact tracing for outbreaks at schools
The public health guidance recommends sta� in every California school be tested for COVID-19 periodically based on local disease trends and as testingcapacity allows. The Governor also announced today that the state will provide resources and technical assistance for COVID-19 investigations in schoolsettings.
5) Rigorous distance learning
Over the course of the pandemic, most schools will likely face physical closure at some point due to COVID-19. The Legislature and Governor Newsomenacted a budget that provided $5.3 billion in additional funding to support learning, and set requirements to ensure schools provide rigorous andgrade-appropriate instruction. Under newly enacted state law, school districts are required to provide:
Devices and connectivity so that every child can participate in distance learning.
Daily live interaction for every child with teachers and other students.

8/21/2020 Governor Gavin Newsom Lays Out Pandemic Plan for Learning and Safe Schools | California Governor
https://www.gov.ca.gov/2020/07/17/governor-gavin-newsom-lays-out-pandemic-plan-for-learning-and-safe-schools/ 2/2
Class assignments that are challenging and equivalent to in-person instruction.
Targeted supports and interventions for English learners and special education students.
The full guidance from the California Department of Public Health can be found here: https://files.covid19.ca.gov/pdf/guidance-schools.pdf
###

EXHIBIT "4"

State of California—Health and Human Services Agency
California Department of Public Health
SONIA Y. ANGELL, MD, MPH GAVIN NEWSOM State Public Health Officer & Director Governor
CDPH, MS 0500 ● P.O. Box 997377 ● Sacramento, CA 95899-7377
(www.cdph.ca.gov)
COVID-19 and Reopening In-Person Learning
Framework for K-12 Schools in California, 2020-2021 School Year
July 17, 2020
Overview
California schools have been closed for in-person instruction since mid-March
2020 due to the COVID-19 pandemic. School closures to in-person instruction
were part of a broader set of recommendations intended to reduce
transmission of SARS-CoV-2, the virus that causes COVID-19. CDPH developed
the following framework to support school communities as they decide when
and how to implement in-person instruction for the 2020-2021 school year. New
evidence and data about COVID-19 transmission, including variations by age,
and the effectiveness of disease control and mitigation strategies continues to
emerge regularly. Recommendations regarding in-person school reopening and
closure should be based on the available evidence as well state and local
disease trends.
The CA School Sector Specific Guidelines, and the Centers for Disease Control
and Prevention CDC have published additional guidance on school re-entry.
In-Person Re-Opening Criteria
Schools and school districts may reopen for in-person instruction at any time if
they are located in a local health jurisdiction (LHJ) that has not been on the
county1 monitoring list within the prior 14 days.
If the LHJ has been on the monitoring list within the last 14 days, the school must
conduct distance learning only, until their LHJ has been off the monitoring list for
at least 14 days.2
1 School districts in LHJs that are cities are considered to be included as part of the
county if the county is on the monitoring list.
2 A waiver of this criteria may be granted by the local health officer for elementary
schools to open for in-person instruction. A waiver may only be granted if one is
requested by the superintendent (or equivalent for charter or private schools), in
consultation with labor, parent and community organizations. Local health officers
must review local community epidemiological data, consider other public health
interventions, and consult with CDPH when considering a waiver request.

State of California—Health and Human Services Agency
California Department of Public Health
SONIA Y. ANGELL, MD, MPH GAVIN NEWSOM State Public Health Officer & Director Governor
CDPH, MS 0500 ● P.O. Box 997377 ● Sacramento, CA 95899-7377
(www.cdph.ca.gov)
Guidance Once Re-Opened to In-Person Instruction
How should schools think about testing?
Once schools are re-opened to at least some in-person instruction, it is
recommended that surveillance testing be implemented based on the local
disease trends. If epidemiological data indicates concern for increasing
community transmission, schools should increase testing of staff to detect
potential cases as lab testing capacity allows.
Who should be tested and how often?
School staff are essential workers, and staff includes teachers, para-
professionals, cafeteria workers, janitors, bus drivers, or any other school
employee that may have contact with students or other staff. School districts
and schools shall test staff periodically, as testing capacity permits and as
practicable. Examples of recommended frequency include testing all staff over
2 months, where 25% of staff are tested every 2 weeks, or 50% every month to
rotate testing of all staff over time.
What if a school or school district reopens to in-person instruction, but the county
is later placed on the county monitoring list?
Schools should begin testing staff, or increase frequency of staff testing but are
not required to close.

State of California—Health and Human Services Agency
California Department of Public Health
SONIA Y. ANGELL, MD, MPH GAVIN NEWSOM State Public Health Officer & Director Governor
CDPH, MS 0500 ● P.O. Box 997377 ● Sacramento, CA 95899-7377
(www.cdph.ca.gov)
What measures should be taken when a student, teacher or staff member has
symptoms, is a contact of someone infected, or is diagnosed with COVID-19?
Student or Staff with: Action Communication
1. COVID-19 Symptoms
(e.g., fever, cough,
loss of taste or smell,
difficulty breathing)
Symptom Screening:
Per CA School Sector
Specific Guidelines
Send home
Recommend testing (If positive, see #3, if
negative, see #4)
School/classroom remain open
No Action
needed
2. Close contact (†) with
a confirmed COVID-
19 case
Send home
Quarantine for 14 days from last exposure
Recommend testing (but will not shorten 14-
day quarantine)
School/classroom remain open
Consider school
community
notification of a
known contact
3. Confirmed COVID-19
case infection
Notify the local public health department
Isolate case and exclude from school for 10
days from symptom onset or test date
Identify contacts (†), quarantine & exclude
exposed contacts (likely entire cohort (††)) for
14 days after the last date the case was
present at school while infectious
Recommend testing of contacts, prioritize
symptomatic contacts (but will not shorten 14-
day quarantine)
Disinfection and cleaning of classroom and
primary spaces where case spent significant
time
School remains open
School
community
notification of a
known case
4. Tests negative after
symptoms
May return to school 3 days after symptoms
resolve
School/classroom remain open
Consider school
community
notification if prior
awareness of
testing

State of California—Health and Human Services Agency
California Department of Public Health
SONIA Y. ANGELL, MD, MPH GAVIN NEWSOM State Public Health Officer & Director Governor
CDPH, MS 0500 ● P.O. Box 997377 ● Sacramento, CA 95899-7377
(www.cdph.ca.gov)
(†) A contact is defined as a person who is <6 feet from a case for >15 minutes.
In some school situations, it may be difficult to determine whether individuals
have met this criterion and an entire cohort, classroom, or other group may
need to be considered exposed, particularly if people have spent time together
indoors.
(††) A cohort is a stable group with fixed membership that stays together for all
courses and activities (e.g., lunch, recess, etc.) and avoids contact with other
persons or cohorts.
Guidance on School Closure
What are the criteria for closing a school?
Individual school closure is recommended based on the number of cases, the
percentage of the teacher/students/staff that are positive for COVID-19, and
following consultation with the Local Health Officer. Individual school closure
may be appropriate when there are multiple cases in multiple cohorts at a
school or when at least 5 percent of the total number of teachers/student/staff
are cases within a 14-day period, depending on the size and physical layout of
the school.
The Local Health Officer may also determine school closure is warranted for
other reasons, including results from public health investigation or other local
epidemiological data.
If a school is closed for in-person learning, when may it reopen?
Schools may typically reopen after 14 days and the following have occurred:
Cleaning and disinfection
Public health investigation
Consultation with the local public health department
What are the criteria for closing a school district?

State of California—Health and Human Services Agency
California Department of Public Health
SONIA Y. ANGELL, MD, MPH GAVIN NEWSOM State Public Health Officer & Director Governor
CDPH, MS 0500 ● P.O. Box 997377 ● Sacramento, CA 95899-7377
(www.cdph.ca.gov)
A superintendent should close a school district if 25% or more of schools in a
district have closed due to COVID-19 within 14 days, and in consultation with the
local public health department.
If a school district is closed, when may it reopen?
Districts may typically reopen after 14 days, in consultation with the local public
health department.
State Resources for Case, Contact & Outbreak Investigations
California is committed to supporting local health departments with resources
and other technical assistance regarding school case, contact, and outbreak
investigations.

EXHIBIT "5"


EXHIBIT "6"

CALIFORNIA STATE BUDGET

This page intentionally blank to facilitate double-sided printing.

TABLE OF CONTENTS
Introduction . . . . . . . . . . . . . . . . . . . . . . . . . . . . . . . . . . . . . . . . . . . . . . . . . 1
Summary Charts . . . . . . . . . . . . . . . . . . . . . . . . . . . . . . . . . . . . . . . . . . . . . . . 9
Saving Lives and Emergency Response . . . . . . . . . . . . . . . . . . . . . . . . . . . . . . . . . . 13
Encouraging Recovery . . . . . . . . . . . . . . . . . . . . . . . . . . . . . . . . . . . . . . . . . . . 21
K-12 Education . . . . . . . . . . . . . . . . . . . . . . . . . . . . . . . . . . . . . . . . . . . . . . . 31
Higher Education . . . . . . . . . . . . . . . . . . . . . . . . . . . . . . . . . . . . . . . . . . . . . . 43
Health and Human Services . . . . . . . . . . . . . . . . . . . . . . . . . . . . . . . . . . . . . . . . 53
Homelessness and Local Government . . . . . . . . . . . . . . . . . . . . . . . . . . . . . . . . . . 65
Labor and Workforce Development . . . . . . . . . . . . . . . . . . . . . . . . . . . . . . . . . . . 71
Judicial Branch . . . . . . . . . . . . . . . . . . . . . . . . . . . . . . . . . . . . . . . . . . . . . . . 75
Public Safety . . . . . . . . . . . . . . . . . . . . . . . . . . . . . . . . . . . . . . . . . . . . . . . . . 79
Natural Resources . . . . . . . . . . . . . . . . . . . . . . . . . . . . . . . . . . . . . . . . . . . . . . 93
Environmental Protection . . . . . . . . . . . . . . . . . . . . . . . . . . . . . . . . . . . . . . . . . . 99
Statewide Issues and Various Departments . . . . . . . . . . . . . . . . . . . . . . . . . . . . . . . 101
Veto Message . . . . . . . . . . . . . . . . . . . . . . . . . . . . . . . . . . . . . . . . . . . . . . . 117
Staff Assignments . . . . . . . . . . . . . . . . . . . . . . . . . . . . . . . . . . . . . . . . . . . . . 119

This page intentionally blank to facilitate double-sided printing.

INTRODUCTION
T he Budget closes a $54.3 billion gap in 2020-21 and significantly reduces the state’s
ongoing structural deficit. Despite the global economic crisis caused by the
COVID-19 pandemic, the state’s prudent fiscal management, including its structurally
balanced budgets and record reserves, puts it in a much better position to contend
with these challenges.
The COVID-19 pandemic has impacted every sector of the state's economy and has
caused record high unemployment—almost 1 in 5 Californians who were employed in
February were out of work in May—and further action from the federal government is
needed given the magnitude of the crisis. The Governor continues his efforts to secure
$1 trillion in flexible federal aid to state and local governments across the country. This
additional support is critical to mitigate the worst effects of the public health crisis,
encourage recovery, and support Californians in need.
The Budget makes critical investments to save lives and promote economic recovery
by continuing critical purchases of personal protective equipment and other
safeguards necessary to safely reopen the economy during the COVID-19 pandemic. It
protects public education and supports Californians facing the greatest hardships. This
is important since the pandemic is having a disproportionate impact on lower-wage
workers and is further exacerbating income inequality. Finally, the Budget supports job
creation, economic recovery and opportunity by recognizing and supporting the role
small businesses play in job creation in the state.
VersionnumberjA1s8RKnoP5m INTRODUCTION
CALIFORNIA STATE BUDGET — 2020-21 1

BUDGET POSITIONS THE STATE FOR THE FUTURE
At the Governor's Budget in January, the state was projecting a surplus of $5.6 billion. At
the May Revision, the state confronted a budget deficit of $54.3 billion—a four-month
swing of $60 billion caused by the COVID-19 Recession. The Budget closes this gap and
brings the state’s resources and spending into balance while preserving reserves for
future years.
The Budget significantly reduces the structural deficit over the next several years, but
there is still more work to do to eliminate it. To reduce the structural deficit in the coming
years, the Budget sustains the January 1, 2022 suspension of several ongoing
programmatic expansions that were made in the 2019 Budget Act. In addition, the
Budget accelerates the suspension of most Proposition 56 rate increases to July 1, 2021.
Despite these measures, the Administration forecasts an operating deficit of $8.7 billion
in 2021-22, after accounting for reserves.
BALANCED APPROACH TO CLOSING THE BUDGET GAP
The Budget takes a balanced approach to closing the $54.3 billion budget deficit and
sets aside $2.6 billion in the Special Fund for Economic Uncertainties, including
$716 million for the state to respond quickly to the changing conditions of the COVID-19
pandemic. The Budget is balanced as follows:
• Reserves—The Budget draws down $8.8 billion in reserves from the Rainy Day Fund
($7.8 billion), the Safety Net Reserve ($450 million), and all of the funds in the Public
School System Stabilization Account.
• Triggers—The Budget includes $11.1 billion in reductions and deferrals that will be
restored if at least $14 billion in federal funds are received by October 15, 2020. If
the state receives a lesser amount between $2 billion and $14 billion, the reductions
and deferrals will be partially restored. The trigger includes $6.6 billion in deferred
spending on schools, approximately $970 million in funding for the University of
California and the California State University, $2.8 billion for state employee
compensation, $150 million for courts, and funding for child support administration,
teacher training, moderate-income housing, and infrastructure to support infill
housing. The trigger would also fund an additional $250 million for county programs
to backfill revenue losses.
• Federal Funds—The Budget relies on $10.1 billion in federal funds that provide
General Fund relief, including $8.1 billion already received. This includes the
INTRODUCTION VersionnumberjA1s8RKnoP5m
2 CALIFORNIA STATE BUDGET — 2020-21

enhanced Federal Medical Assistance Percentage (FMAP), a portion of the state's
Coronavirus Relief Fund allocation and funds provided for childcare programs.
• Revenues—The Budget temporarily suspends the use of net operating losses for
medium and large businesses and temporarily limits to $5 million the amount of
business incentive credits a taxpayer can use in any given tax year. These short-term
limitations will generate $4.4 billion in new revenues in the 2020-21 fiscal year.
• Borrowing/Transfers/Deferrals—The Budget relies on $9.3 billion in special fund
borrowing and transfers, as well as other deferrals for K-14 schools. (Approximately
$900 million in additional special fund borrowing is associated with the reductions to
employee compensation and is contained in the trigger.)
• Cancelled Expansions, Updated Assumptions and Other Solutions—The remaining
$10.6 billion of solutions includes:
◦ Cancelling multiple program expansions and anticipating increased government
efficiencies.
◦ Higher ongoing revenues above the May Revision forecast.
◦ Lower health and human services caseload costs than the May Revision
estimate.
STRENGTHENING EMERGENCY RESPONSE AND PROTECTING PUBLIC HEALTH
The Budget reflects estimated spending of $5.7 billion to respond directly to the
COVID-19 pandemic. Expenditures include the necessary personal protective
equipment to reopen the economy, hospital surge preparation, and other expenditures
to support populations at greater risk of contracting COVID-19. Under federal law, at
least 75 percent of these expenditures will be reimbursed by the federal government.
The Budget also includes a $716 million reserve within the Special Fund for Economic
VersionnumberjA1s8RKnoP5m INTRODUCTION
CALIFORNIA STATE BUDGET — 2020-21 3

Uncertainties so the state can respond to the changing conditions of the COVID-19
pandemic.
The Budget also strengthens the state’s emergency preparedness in other areas. It
makes new investments in wildfire prevention and mitigation, including $85.6 million to
CAL FIRE for firefighting resources and surge capacity and $50 million for community
power resiliency. The Budget also supports the new state Earthquake Early Warning
Program, integrates the Seismic Safety Commission into the California Office of
Emergency Services, and significantly expands efforts to address cybersecurity
threats.
The Budget also includes support for counties that are on the front lines of addressing
the public health impacts of the pandemic. Of the $9.5 billion in Coronavirus Relief Fund
received by the state, $4.5 billion is allocated to local school districts, $1.3 billion is
allocated to counties, and $500 million to cities. The Budget also includes $750 million
General Fund to provide support for counties experiencing revenue losses due to the
pandemic. Funds are available for all local governments in compliance with federal
guidance and state health requirements on COVID-19 response. If sufficient federal
funds are made available by October 15, 2020, the Budget provides an additional $250
million in support to counties in protecting programs serving vulnerable populations.
PROTECTING PUBLIC EDUCATION
Due to declining revenue, the constitutional Proposition 98 guarantee level of
$70.9 billion is more than $10 billion below the minimum guarantee at the 2019
Budget Act. However, the Budget offsets this loss in several ways and defers $12.9 billion
in payments into the next fiscal year to preserve programs and give K-12 schools and
California Community Colleges the resources needed to safely reopen. The state has
also committed to purchasing personal protective equipment and other supplies
needed to reopen schools safely.
Furthermore, the Budget allocates $5.3 billion ($4.8 billion federal funds) to mitigate
learning loss and support the immediate needs of students and schools, with a focus on
students disproportionately impacted by the pandemic. The Budget also redirects
$2.3 billion designated for long-term unfunded pension liabilities to reduce school
(district and community college district) employer contribution rates in the next two
years. Finally, the Budget commits to making supplemental appropriations above the
Proposition 98 guarantee for several years starting in 2021-22, which will accelerate
General Fund support for schools over the multi-year forecast period.
INTRODUCTION VersionnumberjA1s8RKnoP5m
4 CALIFORNIA STATE BUDGET — 2020-21

In addition to these funding changes, the Budget also increases support for students in
special education programs by raising per-pupil base rates, and initiates a process to
inform future changes in school policing.
SUPPORTING CALIFORNIANS FACING THE GREATEST HARDSHIPS
The Budget takes several steps to support Californians who are facing the greatest
hardships. It maintains eligibility for the Medi-Cal program, including the expanded
senior eligibility enacted in the 2019 Budget Act, and preserves optional benefits
and Proposition 56 provider rate increases in the budget year. The Budget also
maintains In-Home Supportive Services (IHSS) service hours and developmental services
rates at current levels for the budget year. It includes an increase in the overall
maximum Supplemental Security Income/State Supplemental Payment grant by
passing the federal cost-of-living adjustment onto recipients. In CalWORKs, the Budget
maintains eligibility and grant levels and extends the time limit for aid to adult recipients
from 48 months to 60 months, the maximum under federal law. These steps will reduce
childhood poverty and provide vital support for families in need during the current
economic crisis.
The Budget also protects programs for working families and students. It preserves last
year’s expansion of the state Earned Income Tax Credit, including the Young Child Tax
Credit, and expands eligibility to include undocumented filers with a child age five and
under. It also preserves the Covered California health insurance subsidies for
middle-income households enacted in the 2019 Budget Act, and it protects Cal Grants
at current levels of eligibility, including the recently established supplemental Cal Grant
access award for students with dependent children. These steps will enable more
workers and families to cope with the impact of the pandemic.
The Budget also prioritizes funds to mitigate homelessness and takes a new approach
by allocating $600 million to the Department of Housing and Community Development
for HomeKey to acquire permanent housing through the purchase and renovation of
motel properties throughout the state. The Budget also includes $300 million General
Fund to cities, counties, and continuums of care to support efforts to reduce
homelessness.
ENHANCING GOVERNMENT EFFICIENCY
Historically, state government has been slow to adopt modernizations in the workplace.
But the COVID-19 pandemic has forced a massive experiment in telework and allowed
VersionnumberjA1s8RKnoP5m INTRODUCTION
CALIFORNIA STATE BUDGET — 2020-21 5

state managers, led by the Government Operations Agency, to rethink business
processes.
This transformation will allow for expanded long-term telework strategies, increased
modernization and delivery of government services online, reconfigured office space,
reduced leased space, and when possible, flexible work schedules for employees.
Nearly all state operations will be reduced by approximately 5 percent over the next
two years. Nonessential contracts, purchases, and travel are suspended and
departments have been directed to fill only the most essential vacant positions.
PROMOTING ECONOMIC RECOVERY
Small businesses will play a critical role in California’s economic recovery. For this
reason, the Budget provides an additional $75 million for loan loss mitigation and
reducing the cost of capital for small businesses to address gaps in available federal
assistance. These funds will be administered by the California Infrastructure and
Economic Development Bank. The Budget also expands the $800 Minimum Franchise
Tax exemption for first-year corporations to all businesses, removing a barrier to small
business creation for all types of small businesses.
A strong recovery must lift people and small businesses up in all parts of the state. For
this reason, the Budget includes funding for additional staff at the Governor’s Office of
Business & Economic Development to connect businesses with opportunities to create
jobs in regions of the state that have historically experienced less economic growth. The
Budget also includes funding to expand University of California medical training in
Fresno and Riverside and supports an economic development effort in the Fresno
region.
The Administration is committed to creating the necessary conditions for a more
equitable recovery; to this end, the Budget reflects an increase of the statewide
minimum wage to $15 per hour by 2022. The increases over the next few years will
affect roughly 60 percent of Californians who earn the minimum wage. The Budget
also maintains last year's historic expansion of the Earned Income Tax Credit,
providing a tax credit to households making up to $30,000 annually (full-time at
minimum wage), and provides a credit of $1,000 for every family that otherwise qualifies
for a credit and has at least one child age 5 and under.
The Governor has convened a Task Force on Business and Jobs Recovery—a diverse
group of leaders from business, government, labor, and the non-profit sector—to
INTRODUCTION VersionnumberjA1s8RKnoP5m
6 CALIFORNIA STATE BUDGET — 2020-21

develop actionable recommendations and advise the state on how economic
recovery can be expedited and address the effects of wage disparity exacerbated by
COVID-19. The Administration will work with the Legislature as well as the Task Force, the
Governor's Council of Economic Advisors, and other stakeholders to develop
further actions that support a safe, swift, and equitable economic recovery.
DEFINING THE PATH FORWARD
California's history has been marked by periods of great challenge—brought on by
global conflict and change, natural disasters, and economic crises. California's history
has also been one of innovation, ingenuity, resiliency and resurgence. The COVID-19
pandemic and the recession that has accompanied it pose a new challenge for the
state. The Budget takes steps to reduce spending commitments and address long-term
structural deficits, but deficits remain and further actions will be needed especially if
the federal government does not act.
California will overcome this challenge as it has overcome challenges in the past. The
state, its businesses and its families will recover and will emerge stronger and more
resilient. However, the size and scale of this crisis has not been seen in recent times and
the federal government must do more to prevent exacerbating income inequality that
existed before the pandemic.
VersionnumberjA1s8RKnoP5m INTRODUCTION
CALIFORNIA STATE BUDGET — 2020-21 7

This page intentionally blank to facilitate double-sided printing.

SUMMARY CHARTS
This section provides various statewide budget charts and tables.
VersionnumberjA1s8RKnoP5m SUMMARY CHARTS
CALIFORNIA STATE BUDGET — 2020-21 9

SUMMARY CHARTS VersionnumberjA1s8RKnoP5m
10 CALIFORNIA STATE BUDGET — 2020-21

VersionnumberjA1s8RKnoP5m SUMMARY CHARTS
CALIFORNIA STATE BUDGET — 2020-21 11

SUMMARY CHARTS VersionnumberjA1s8RKnoP5m
12 CALIFORNIA STATE BUDGET — 2020-21

SAVING LIVES AND EMERGENCY RESPONSE
A s of late June, COVID-19 resulted in over 125,000 deaths in the United States, and
more than 5,900 in California. Since the initial outbreak, the Administration has
taken action to reduce the spread of the virus, becoming the first in the nation
to implement a statewide stay-at-home requirement to mitigate the spread of
COVID-19.
RESPONDING TO COVID-19
In early March, the Governor proclaimed a state of emergency for the novel
coronavirus outbreak. Within two weeks, the Administration issued the statewide
stay-at-home order. Even prior to these actions, the State Operations Center had been
activated, informed by the state’s public health officers, to prepare for an expected
surge of patients infected with the virus. Based on data from medical models,
projections indicated that hospitals would be inundated with patients, outstripping
medical resources both in terms of available beds as well as the staffing and supplies
needed to care for them. Necessary actions to address the immediate needs for
various vulnerable populations and healthcare workers were identified and taken, and
local governments were provided state assistance to stop the spread of COVID-19 and
mitigate the impacts. In addition, food banks were supported and staffed as the
demand for these services began to increase.
Moving forward, the state continues to take action to safely reopen the state’s
economy based on six specific indicators informed by science and public health
VersionnumberjA1s8RKnoP5m SAVING LIVES AND EMERGENCY RESPONSE
CALIFORNIA STATE BUDGET — 2020-21 13

guidance. This approach necessitates the continuation of the state’s proactive
measures to mitigate potential outbreaks and surges in positive cases and
hospitalizations. The state is now better prepared for a potential resurgence of positive
cases and increased pressure on the state’s health care system. The state has procured
personal protective equipment, issued public health guidance, is expanding
contract tracing programs, and made other preparations to strengthen hospital
capacity and protect vulnerable populations.
The state has also developed a data portal for the public—https://covid19.ca.gov/
roadmap-counties/ —which reflects information by county to better understand local
COVID-19 statistics. With a focus on health equity, the state continues to monitor data
and make adjustments to both guidance and support to respond to the changing
conditions of the COVID-19 pandemic.
Pursuant to a Presidential Disaster declaration, funds from the Federal Emergency
Management Agency (FEMA) became available to help pay for the state’s response
efforts. The Budget reflects $5.7 billion in estimated planned expenditures for the state’s
direct emergency response efforts for the COVID-19 pandemic. We expect that the
federal government will reimburse the majority of these expenditures. Also, to prepare
for needs that may occur in the coming months, the Budget sets aside $716 million
General Fund within the Special Fund for Economic Uncertainties.
COVID-19 FEDERAL ASSISTANCE
The federal government has provided temporary federal funding to support the state’s
response to the COVID-19 pandemic. This funding was made available through four
federal bills to help pay for emergency response, testing and contact tracing, health
care, and financial relief to individuals, families, and businesses as well as state and
local governments, including schools and higher education institutions. The following
summarizes the four bills passed by Congress since March 2020:
• Coronavirus Preparedness and Response Supplemental Appropriations Act (HR 6074)—Provided emergency funding for public health and health care.
• Families First Coronavirus Response Act (HR 6201)—Provided some early assistance
to families and temporarily increased the federal match for some state programs
including Medi-Cal and In-Home Supportive Services. Federal funding was also
extended for testing and testing-related services for uninsured individuals.
SAVING LIVES AND EMERGENCY RESPONSE VersionnumberjA1s8RKnoP5m
14 CALIFORNIA STATE BUDGET — 2020-21

• Coronavirus Aid, Relief, and Economic Security (CARES) Act (HR 748)—Broadened
the assistance available to include funding for states, local governments,
education, child care, individuals and families. Funding was also expanded,
extended, and supplemented for unemployment insurance benefits. Finally, this
measure provided assistance to businesses, including the health care sector, small
businesses, farmers, airports, and transit agencies.
• Paycheck Protection Program and Health Care Enhancement Act (HR 266)—Expanded funding for small businesses, hospitals, community and rural
health centers, and substantially expanded funding for testing and contact tracing
to support reopening businesses and the economy.
As of late June, California expects to receive over $72 billion in assistance to state
programs. Unemployment insurance represents about $52 billion of this total. In
addition, over $142 billion in direct assistance is expected to be provided to individuals
and families, small businesses, hospitals and providers, including rural and community
clinics, higher education institutions and college students, local housing authorities,
airports, farmers, and local government. Funds identified to date are detailed in the
chart below:
CORONAVIRUS RELIEF FUND
The CARES Act allocated Coronavirus Relief Funds (CRF) to state and local
governments for expenditures incurred between March 1, 2020 and December 30, 2020
in response to COVID-19, not previously accounted for in the most recent state and
local budgets.
Based on the state’s population, California received a total of $15.3 billion with
$9.5 billion paid to the state. Cities and counties with populations over 500,000
(15 counties, city and county of San Francisco, and 5 cities) received $5.8 billion directly
from the U.S. Treasury. The funding allocated to five large cities was deducted from the
county share.
VersionnumberjA1s8RKnoP5m SAVING LIVES AND EMERGENCY RESPONSE
CALIFORNIA STATE BUDGET — 2020-21 15

The $9.5 billion in state CRF allocations are summarized in the following chart:
DEPARTMENT OF PUBLIC HEALTH
The Department of Public Health has continued to be at the forefront of the state’s
response to the COVID-19 pandemic—extensively planning for, preparing for, and
responding to the pandemic since mid-January.
The Budget maintains and increases the Department’s ongoing disease surveillance
and identification workforce. Specifically, the Budget includes $5.9 million General Fund
for 2020-21 and $4.8 million General Fund ongoing, to support state laboratory staff and
to purchase equipment and laboratory supplies. In addition, the Budget includes
ongoing funding for infectious disease prevention and control that had previously been
scheduled for suspension on January 1, 2022.
In early April, the Governor announced the COVID-19 Testing Task Force, a
public-private collaborative charged with boosting California’s testing capacity. The
task force efforts have led to significant increases in testing, improvements to the supply
chain for testing supplies, and the establishment of specimen collection sites across the
state, including mobile labs. In addition, the State has built up significant testing
capacity in partnership with private and public laboratories, including high throughput
capacity to improve the turnaround time for test results.
California is now completing more than 80,000 COVID-19 tests per day, but more work is
necessary to reduce the cost of testing, create more equitable access to testing, and
improve disease surveillance. Control Section 11.95 will allow for the allocation of more
than $600 million in federal funds to support testing and contact tracing.
SAVING LIVES AND EMERGENCY RESPONSE VersionnumberjA1s8RKnoP5m
16 CALIFORNIA STATE BUDGET — 2020-21

In the ongoing effort to mitigate the spread of COVID-19, the Administration launched
California Connected, the state’s effort to greatly expand county contact tracing
programs, which redirects state employees to begin contact tracing efforts. This effort
includes contracts with the University of California, San Francisco and University of
California, Los Angeles to launch an online training academy to develop a culturally
competent and skilled contact tracing workforce.
ENHANCING EMERGENCY RESPONSES AND PREPAREDNESS
In response to the global COVID-19 pandemic, the state has had to implement an
unprecedented emergency response effort necessary to protect the health of
Californians. However, the state remains at risk from other types of emergencies. The
Budget continues the Administration's prioritization of enhancing emergency response
and preparedness.
OFFICE OF EMERGENCY SERVICES
The Budget reflects $117.6 million for the Office of Emergency Services (Cal OES) to
enhance the state’s emergency preparedness and response capabilities.
• Community Power Resiliency—$50 million one‑time General Fund to support
additional preparedness measures that bolster community resiliency. Building on this
year’s investments, these measures will support critical services still vulnerable to
power outage events, including schools, county election offices, and food storage
reserves.
• California Disaster Assistance Act (CDAA)—$38.2 million one-time General Fund to
increase the amount of funding available through the CDAA, which is used to
repair, restore, or replace public real property damaged or destroyed by a disaster
or to reimburse local governments for eligible costs associated with emergency
activities undertaken in response to a state of emergency proclaimed by the
Governor. This augmentation increases total CDAA funding available in the Budget
to $100.8 million.
• California Earthquake Early Warning Program—$17.3 million, supported by a
one-time loan of the same amount from the School Land Bank Fund, to operate this
new, innovative program that uses science, monitoring, and technology to alert
people, businesses, and transit agencies via devices before the anticipated
strongest seismic activity arrives.
VersionnumberjA1s8RKnoP5m SAVING LIVES AND EMERGENCY RESPONSE
CALIFORNIA STATE BUDGET — 2020-21 17

• California Cybersecurity Integration Center—$11.1 million General Fund in 2020‑21
for various departments (including $7.6 million General Fund in 2020-21 for Cal OES),
to enhance the state’s critical cybersecurity infrastructure. This investment will
provide a full-time Joint Incident Response Team to bolster the state’s capabilities in
preventing, mitigating, and responding to cyberattacks.
• Seismic Safety Commission Transfer—$2.5 million ($503,000 General Fund) to transfer
the Seismic Safety Commission to Cal OES. These resources will be critical to
supporting the effective integration of the Seismic Safety Commission into Cal OES,
resulting in increased coordination with other components of the state’s
multi-hazard strategy, earthquake preparedness, and broader distribution of seismic
safety policies and recommendations.
• Wildfire Forecast and Threat Intelligence Integration Center—$2 million General Fund
ongoing to enhance the state’s emergency response capabilities through improved
forecasts for tracking and predicting critical fire weather systems, which improves
situational awareness of fire threat conditions in real-time, consistent with
Chapter 405, Statutes of 2019 (SB 209).
DEPARTMENT OF FORESTRY AND FIRE PROTECTION
Over the past several years, the state has experienced unprecedented increases in
wildfire activity driven by climate change. Furthermore, 2020 is likely to be an active fire
year, as evidenced by year-to-date fire activity, given lower than average
precipitation, snowpack, and fuel moisture levels.
The Budget reflects $90 million General Fund ($93.2 million General Fund ongoing) to
further enhance CAL FIRE’s fire protection capabilities.
• CAL FIRE Relief Staffing and Additional Surge Capacity—$85.6 million General Fund
ongoing for additional firefighting resources to provide CAL FIRE with operational
flexibility throughout the peak fire season and beyond as fire conditions dictate.
These resources will be leveraged to provide relief for frontline firefighting staff,
which will directly benefit employee health and wellness. Additionally, these
resources will serve as an immediate resource pool to be deployed strategically,
based on fire risk, to build CAL FIRE’s surge capacity by staffing additional engines
during the late fall, winter, and early spring, and adding a fourth firefighter on a
portion of engines.
SAVING LIVES AND EMERGENCY RESPONSE VersionnumberjA1s8RKnoP5m
18 CALIFORNIA STATE BUDGET — 2020-21

• Innovation Procurement Sprint—$4.4 million General Fund ($7.6 million ongoing) to
enable CAL FIRE to implement the new, pioneering wildfire prediction and modeling
technology that was procured through the Innovation Procurement Sprint process
initiated through Executive Order N-04-19. The recently-executed contract will
enable CAL FIRE to access a wildfire predictive software program that can perform
hundreds of millions of simulations daily, over large geographic areas, and generate
predictions and wildfire forecasts based on simulated or reported ignition points
throughout the state. The data from this software program will be used to inform fire
pre-positioning and suppression tactical operations, with the intent to more readily
control and contain wildfires, and to protect people and assets at risk.
VersionnumberjA1s8RKnoP5m SAVING LIVES AND EMERGENCY RESPONSE
CALIFORNIA STATE BUDGET — 2020-21 19

This page intentionally blank to facilitate double-sided printing.

ENCOURAGING RECOVERY
U ntil February, California enjoyed an historic economic expansion that reduced
unemployment from a peak of 12.3 percent to 3.9 percent, and lowered the
poverty rate from a peak of over 16 percent to under 12 percent. Real per capita
personal income had increased by almost 25 percent between 2007 and 2018. This
strong economic growth enabled billions of dollars in investments to improve schools
and roads, to increase access to and affordability of higher education, to create a
robust state earned income tax credit program, and to steadily increase the state’s
minimum wage. But even during this period of expansion, growth was uneven and
unequal, and too many people continued to struggle to make ends meet.
The COVID-19 Recession ended the longest recovery period in the state’s history. The
ensuing recession has caused massive job losses, precipitous drops in family and
business income, and has exacerbated inequality. The May Revision forecast included
a peak unemployment rate of 24.5 percent in the second quarter of this year and a
decline in personal income of nearly 9 percent in 2020. The official unemployment rate
exceeded 16 percent in April and May.
Since February, more than 1 million Californians have left the labor force, meaning they
are no longer employed nor actively searching for work. Including those individuals, as
well as reclassifying employees who had been furloughed without pay, would increase
the unemployment rate to close to the May Revision forecast. Although there are signs
of improvement as businesses reopen, there were were fewer than 15.5 million
employed Californians in May, the lowest level since April 1999.
VersionnumberjA1s8RKnoP5m ENCOURAGING RECOVERY
CALIFORNIA STATE BUDGET — 2020-21 21

The Budget enacts policies and investments to encourage recovery for all Californians.
With additional funding and policy changes at the federal level, there are greater
opportunities for state and local government to shape a safe, swift recovery that will
promote greater resilience and sustainability.
REVENUE SOLUTIONS
The Budget maintains three tax measures included in the Governor's Budget:
• Extending the sales tax exemption for diapers and menstrual products through the
end of 2022-23.
• Extending the carryover period for film credits from 6 years to 9 years.
• Extending the current exemption from the minimum tax for first year corporations to
first year Limited Liability Corporations, partnerships, and Limited Liability Partnerships.
In addition, the Earned Income Tax Credit (EITC) has been expanded to taxpayers that
use an Individual Taxpayer Identification Number (ITIN) rather than a Social Security
number for taxpayers with at least one child age 5 or younger.
As part of a balanced approach to managing the budget deficit, the Budget
also includes two significant temporary changes to tax law, as well as a measure to
reduce the sales tax gap. These measures are intended to raise revenue, stimulate
economic growth, and help those in need. They are:
• Suspending Net Operating Losses for 2020, 2021, and 2022 for medium and large
businesses.
• Limiting business incentive tax credits from offsetting more than $5 million of tax
liability for 2020, 2021, and 2022.
• Requiring used car dealers to remit sales tax to the Department of Motor Vehicles
with the registration fees.
These revenue measures net $4.3 billion in 2020-21, $3.1 billion in 2021-22 and $1.3 billion
in 2022-23.
While the Budget does not include a new tax on e-cigarettes based on nicotine
content, the Administration remains committed to working with the Legislature to enact
this measure.
ENCOURAGING RECOVERY VersionnumberjA1s8RKnoP5m
22 CALIFORNIA STATE BUDGET — 2020-21

SUPPORTING THE RECOVERY OF SMALL BUSINESS
Small businesses are the core of California’s economy—nearly 4 million businesses
employ approximately half of the private workforce.
Small businesses have suffered massive losses as a result of the COVID-19 Recession
and they are facing increased costs to modify their operations in order to reduce the
transmission of COVID-19. Given their critical role in California’s economy, the Budget
increases funding to support the recovery of this sector in the near- and long-term.
MINIMUM FRANCHISE TAX
To support new business creation and innovation, the Budget waives the $800 minimum
franchise tax—often a costly barrier for start-up businesses—for the first year of
operation.
SMALL BUSINESS LOAN GUARANTEES
The California Infrastructure and Economic Development Bank's (IBank) Small Business
Finance Center manages California’s small business loan guarantees, disaster loan
guarantees, and direct lending programs. The Budget includes $50 million additional
VersionnumberjA1s8RKnoP5m ENCOURAGING RECOVERY
CALIFORNIA STATE BUDGET — 2020-21 23

General Fund to provide a total of $100 million General Fund for the Small Business
Finance Center to address gaps in available federal assistance and grow California’s
program. This increase will be leveraged to access existing private lending capacity
and philanthropic funding to increase the funds available to provide necessary capital
to restart California small businesses.
Further, the Budget includes $25 million General Fund for IBank to provide capital to
Community Development Financial Institutions (CDFIs) and other mission based lenders
to enable the origination of more loans in underbanked communities. IBank works with
the CDFI network to serve economically disadvantaged small businesses, including the
underbanked and unbanked. This funding will increase liquidity and available capital in
these areas.
As part of the federal Payroll Protection Program, over 750,000 California small
businesses have received a combination of grants and loans totaling over $85 billion
primarily to support continued payment of employees and to help overcome the
temporary loss of revenue they are experiencing. While these amounts are significant,
the awards to date benefit less than 20 percent of California’s 4 million small businesses.
The recently enacted Paycheck Protection Flexibility Act of 2020 (HR 7010) extends the
time to spend funds from 8 to 24 weeks, reduces the percentage of funds required to
be spent on payroll from 75 percent to 60 percent, and provides more time to return to
pre-COVID-19 staffing levels.
SMALL BUSINESS AND ECONOMIC DEVELOPMENT
To further support the needs of underserved communities and direct small businesses to
capital options, California helps fund a network of federally contracted centers to
consult and train California small business owners. The Governor’s Office of Business and
Economic Development administers a grant program that funds business technical
assistance centers to expand services to underserved small businesses, and the Capital
Infusion Program to help small businesses access capital.
The Budget includes an investment of $758,000 ongoing General Fund for four positions
to bring business and economic development to Inland and Northern California.
SUPPORTING JOB CREATION
This Budget includes measures to support job creation including: assistance to help spur
the recovery of small businesses and the jobs they create, support for increased housing
ENCOURAGING RECOVERY VersionnumberjA1s8RKnoP5m
24 CALIFORNIA STATE BUDGET — 2020-21

affordability and availability, and investments in human and physical infrastructure. The
investments and actions will focus on equity, shared prosperity and long-term growth.
The Governor has also convened a Task Force on Business and Jobs Recovery—a
diverse group of leaders from business, labor, and the non-profit sector—to develop
actionable recommendations and advise the state on how economic recovery can be
expedited and address the effects of wage disparity that are being made even worse
by the COVID-19 Recession. The Administration is committed to additional actions,
informed by the Legislature, the Governor's Council of Economic Advisers, the Task
Force, and other stakeholders to support a safe, swift and equitable economic
recovery.
TRANSPORTATION INVESTMENTS
In the immediate term, the Department of Transportation (Caltrans) will accelerate
projects to achieve cost savings, support the creation of new jobs in the transportation
sector, and improve roads. The Federal Highway Administration estimates that
approximately 13,000 jobs are created for every billion dollars spent on highway
infrastructure. While fuel tax revenues used to fund transportation projects are expected
to decline by a total of $1.8 billion through 2024-25, the Budget maintains current
planning and engineering staffing levels to continue developing and designing
previously programmed projects. Not only does Caltrans plan to award all of the
projects it currently has programmed for construction in the coming year, but the
continued project development work will support preparedness for when additional
stimulus funding becomes available.
HOUSING
The COVID-19 pandemic and resulting recession has impacted vulnerable communities
and made the housing shortage crisis more acute. In response, the Budget prioritizes
expanded state tax credits and maximizing federal funds to focus on housing.
This builds upon the Governor’s series of actions earlier this year to temporarily halt
evictions statewide and financial institutions’ foreclosure proceedings. Additionally, the
federal government has prohibited federally backed mortgage lenders from initiating
foreclosure proceedings for 60 days and provided certain homeowners a right of
forbearance for 180 days due to COVID-19-related financial hardships.
VersionnumberjA1s8RKnoP5m ENCOURAGING RECOVERY
CALIFORNIA STATE BUDGET — 2020-21 25

LOW-INCOME HOUSING TAX CREDITS
The 2019 Budget Act provided expanded state tax credits for low-income housing that
pair with a federal 4-percent tax credit. With continued increased demand for these
tax credits, the Budget allocates up to $500 million in additional tax credits in 2021,
provided the committees involved in the tax credit allocation process, the California
Debt Limit Allocation Committee and the California Tax Credit Allocation Committee,
adopt regulations that further align their programs to continue to increase production,
contain costs, and take into consideration maximizing the efficient use of public
subsidies and benefits that would be created. New data collection and reporting
requirements are also included.
Other Significant Adjustments
• Mixed-Income Program—The 2019 Budget Act included a one-time $500 million
General Fund investment to the California Housing Finance Agency (CalHFA) over
four years for mixed-income development loans (between 30 and 120 percent of
the Area Median Income) at a lower subsidy level than traditional state programs.
This investment served to help a target population that had not been assisted by
other state housing programs. The Budget reverts $45 million planned for
expenditure in 2020-21, that will be restored, should federal funds become available
by October 15, 2020. In addition, there also remains a dedicated annual revenue
provided by real estate transaction fees (estimated at $40 million in 2020-21) and up
to $200 million in state low-income housing tax credits to help develop moderate
income housing.
• Infill Infrastructure Grants—The 2019 Budget Act also provided $500 million General
Fund in grants for necessary infill infrastructure improvements that will stimulate and
facilitate residential or mixed-use development. The Budget reverts $203 million of
this one-time investment. To the extent the federal government provides sufficient
federal funds by October 15, 2020, this funding will be restored. The Department of
Housing and Community Development also has $300 million in Proposition 1 bond
funds for infill infrastructure grants.
NATIONAL MORTGAGE SETTLEMENT RELIEF
As California homeowners and renters struggle to make payments during this time, the
Budget provides $331 million in National Mortgage Settlement funds to help prevent
avoidable foreclosures and evictions. Of this amount, $300 million will be available for
ENCOURAGING RECOVERY VersionnumberjA1s8RKnoP5m
26 CALIFORNIA STATE BUDGET — 2020-21

housing counseling as well as mortgage assistance through CalHFA. Specifically,
CalHFA will partner with U.S. Department of Housing and Urban Development certified
counselors to help homeowners, former homeowners, and renters take advantage of
rights and resources available to them. Additionally, CalHFA will provide mortgage
assistance to help qualified residential mortgage borrowers avoid defaults on their
payments and maintain ownership of their homes and buildings. The remaining
$31 million will provide legal assistance and counseling for renters and homeowners
through Judicial Branch grants to local legal service organizations throughout the state.
Housing production and affordability remains a priority for the Administration. With
strategic funding to maintain fiscal sustainability while making impactful long-term
investments, the 2020 Budget includes $8.3 billion across multiple departments and
programs to address housing throughout the state.
VersionnumberjA1s8RKnoP5m ENCOURAGING RECOVERY
CALIFORNIA STATE BUDGET — 2020-21 27

ENCOURAGING RECOVERY VersionnumberjA1s8RKnoP5m
28 CALIFORNIA STATE BUDGET — 2020-21

SUPPORTING THE RECOVERY
The CARES Act provides temporary program enhancements and expanded
unemployment insurance benefits to millions of workers no longer employed due to the
COVID-19 Recession. Most notably, the CARES Act included a federally funded
temporary emergency benefit increase of $600 per week through July 31, 2020 and a
federally funded Pandemic Unemployment Assistance program to provide up to 39
weeks of unemployment insurance benefits to individuals who do not qualify for
traditional unemployment compensation, including business owners, the self-employed,
independent contractors, individuals with limited work history, and other individuals not
usually eligible for regular state unemployment insurance benefits who are unemployed
as a direct result of the COVID-19 Recession. From March until mid-June, over $37 billion
has been paid out through these expanded unemployment insurance programs.
The Short-Term Compensation program included in the CARES Act is another benefit
that helps employers retain workers at reduced time and wages—ready to restart
operations once stay-at-home orders are eased. Unlike regular unemployment
insurance, these benefits are fully funded for up to 26 weeks by the federal government
through the end of 2020. It is intended to support businesses in retaining their workers as
the economy reopens and customers come back. The Administration is working to
address the cumbersome process that has delayed enrollment to increase the number
of businesses participating in this program.
Finally, $27.9 billion in direct economic impact payments from the U.S. Treasury has
been allocated to nearly 16.9 million California families who have filed a federal tax
return in 2018 or 2019, as well as individuals who receive Social Security retirement, SSDI,
Railroad Retirement benefits, SSI and Veterans Affairs beneficiaries who have not filed a
tax return in the last two years.
A STRONGER, MORE INCLUSIVE ECONOMY
While average per capita income had increased almost 25 percent in real terms from
2007 to 2018, median household income was flat over the same period. Most of the jobs
added since the Great Recession were in lower-wage sectors. Job growth was also
uneven across regions. Income inequality persisted, and prosperity was not shared by
all regions of the state.
The COVID-19 Recession is disproportionately impacting low-wage workers and
communities of color, and worsening inequality and opportunity. Informed by the
Future of Work Commission, and advised by the Task Force on Business and Jobs
VersionnumberjA1s8RKnoP5m ENCOURAGING RECOVERY
CALIFORNIA STATE BUDGET — 2020-21 29

Recovery and the Governor's Council of Economic Advisers, the Administration will
continue to work on actions to protect those facing the greatest hardships from the
COVID-19 Recession. It will also work on tangible actions to broaden opportunity, better
prepare the state's workforce, and modernize worker safety net protections.
The California state minimum wage increased by $1 per hour on January 1, 2020 to
reach $12 per hour for businesses with 25 or fewer employees, and $13 per hour for
businesses with 26 or more employees. These increases will affect roughly 60 percent of
Californians. Annual increases of $1 per hour are scheduled to continue until the
statewide minimum wage reaches $15 per hour for everyone, with indexing for inflation
after that. The Budget maintains these scheduled increases.
The 2019 Budget Act significantly expanded the EITC beginning in tax year 2019, by
more than doubling the existing credit from $400 million to $1 billion. The expanded
program extends credits to 1 million additional households, raising the number of
households receiving the credit to 3 million. The expanded credit includes a
$1,000 credit for every family that otherwise qualifies for the credit and has at least one
child age 5 and under. The Budget continues the EITC at this expanded level and
extends the EITC to more Californian taxpayers including those who file using ITIN and
have at least one child age 5 or younger. This expansion allows more families with
young children to receive additional help to address the costs of food, rent, and other
basic necessities.
The Budget also maintains increased resources to protect employees and address the
misclassification of employees.
ENCOURAGING RECOVERY VersionnumberjA1s8RKnoP5m
30 CALIFORNIA STATE BUDGET — 2020-21

K-12 EDUCATION
C alifornia provides instruction and support services to roughly six million students in
grades kindergarten through twelve in more than 10,000 schools throughout the
state. A system of 58 county offices of education, 1,000 local school districts, and more
than 1,200 charter schools provides students with instruction in English, mathematics,
history, science, and other core competencies to enable them to develop the skills they
will need upon graduation for either entry into the workforce or higher education.
The Budget includes total funding of $98.8 billion ($48.1 billion General Fund and
$50.7 billion other funds) for all K-12 education programs.
PROPOSITION 98
Proposition 98 is a voter-approved constitutional amendment that guarantees minimum
funding levels for K-12 schools and community colleges. The Guarantee, which went
into effect in the 1988-89 fiscal year, determines funding levels according to multiple
factors including the level of funding in 1986-87, General Fund revenues, per capita
personal income, and school attendance growth or decline. The Local Control Funding
Formula is the primary mechanism for distributing these funds to support all students
attending K-12 public schools in California.
The COVID-19 Recession has heavily impacted the economy and the state's General
Fund revenues, creating a parallel negative impact on the state's K-14 Proposition 98
Guarantee. The Budget estimates Proposition 98 levels of $78.5 billion, $77.7 billion, and
VersionnumberjA1s8RKnoP5m K-12 EDUCATION
CALIFORNIA STATE BUDGET — 2020-21 31

$70.9 billion in 2018-19, 2019-20, and 2020-21. For K-12 schools, this results in Proposition
98 per pupil spending of $10,654 in 2020-21—a $1,339 decrease over the 2019-20 per
pupil spending levels. Additionally, in the same period, per pupil spending from all state,
federal, and local sources decreased by approximately $542 per pupil to $16,881.
ADDRESSING IMMEDIATE NEEDS AND AVOIDING PERMANENT DECLINE
To help mitigate the negative impacts of the state's revenue decline on funding for K-12
schools and California Community Colleges, the Budget includes the following:
DEFERRALS
The COVID-19 Recession requires $1.9 billion of Local Control Funding Formula (LCFF)
apportionment deferrals in 2019-20, growing to $11 billion LCFF apportionment deferrals
in 2020-21. These deferrals will allow LCFF funding to remain at 2019-20 levels in both
fiscal years; the Budget suspends the statutory LCFF cost-of-living adjustment in 2020-21.
Of the total deferrals, $5.8 billion will be triggered off in 2020-21 if the federal
government provides sufficient funding that can be used for this purpose.
LEARNING LOSS MITIGATION
The Budget includes a one-time investment of $5.3 billion ($4.4 billion federal
Coronavirus Relief Fund, $539.9 million Proposition 98 General Fund, and $355.2 million
federal Governor’s Emergency Education Relief Fund) to local educational agencies to
address learning loss related to COVID-19 school closures, especially for students most
heavily impacted by those closures.
Funds will be allocated to local educational agencies on an equity basis, with an
emphasis on ensuring the greatest resources are available to local educational
agencies serving students with the greatest needs. The funds are intended to track and
mitigate the inequitable impact that the COVID-19 pandemic has had on different
student populations, including low-income students and students with disabilities.
Specifically, funds will be allocated in the following manner:
• $2.9 billion based on the LCFF supplemental and concentration grant allocation.
• $1.5 billion based on number of students with exceptional needs.
K-12 EDUCATION VersionnumberjA1s8RKnoP5m
32 CALIFORNIA STATE BUDGET — 2020-21

• $979.8 million based on total LCFF allocation.
Funds may be used for:
• Learning supports that begin prior to the start of the school year, and the continuing
intensive instruction and supports into the school year.
• Extending the instructional school year, including an earlier start date, by increasing
the number of instructional minutes or days.
• Providing additional academic services for pupils, including diagnostic assessments
of student learning needs, intensive instruction for addressing gaps in core
academic skills, additional instructional materials or supports, or devices and
connectivity for the provision of in-classroom and distance learning.
• Providing integrated student supports to address other barriers to learning, such as
the provision of health, counseling or mental health services; professional
development opportunities to help teachers and parents support pupils in
distance-learning contexts; access to school breakfast and lunch programs; or
programs to address student trauma and social-emotional learning.
SUPPLEMENTAL APPROPRIATIONS
In 2019-20 and 2020-21, the Proposition 98 funding level drops below the target funding
level (Test 2), by a total of approximately $12.4 billion. To accelerate the recovery from
this funding reduction, the Budget provides supplemental appropriations above the
constitutionally-required Proposition 98 funding level, beginning in 2021-22, and in each
of the next several fiscal years, in an amount equal to 1.5 percent of General Fund
revenues per year, up to a cumulative total of $12.4 billion. This appropriation will
accelerate growth in the Guarantee, which the Administration proposes to increase as
a share of the General Fund. Currently, Proposition 98 guarantees that K-14 schools
receive approximately 38 percent of the General Fund in Test 1 years. The Budget
increases this share of funding to 40 percent by 2023-24.
REVISED CALPERS AND CALSTRS CONTRIBUTIONS
To provide local educational agencies with increased fiscal relief, the Budget redirects
$2.3 billion appropriated in the 2019 Budget Act to CalSTRS and CalPERS for long-term
unfunded liabilities to reduce employer contribution rates in 2020-21 and 2021-22. This
reallocation will further reduce the CalSTRS employer rate from 18.41 percent to
VersionnumberjA1s8RKnoP5m K-12 EDUCATION
CALIFORNIA STATE BUDGET — 2020-21 33

approximately 16.15 percent in 2020-21 and from 17.9 percent to 16.02 percent in
2021-22. The CalPERS Schools Pool employer contribution rate will be further reduced
from 22.67 percent to 20.7 percent in 2020-21 and from 24.6 percent to 22.84 percent in
2021-22.
FEDERAL FUNDS
In addition to the federal Coronavirus Relief Fund and Governor’s Emergency
Education Relief Fund allocated to K-12 education above, the Budget appropriates
$1.6 billion in federal Elementary and Secondary School Emergency Relief funds that
California was recently awarded. Of this amount, 90 percent ($1.5 billion) will be
allocated to local educational agencies in proportion to the amount of Title I-A funding
they receive to be used for COVID-19 related costs. The remaining 10 percent
($164.7 million) is available for COVID-19 related state-level activities, as follows:
• $112.2 million to provide up to $0.75 per meal for local educational agencies
participating in the National School Lunch Program, School Breakfast Program,
Seamless Summer Option, or Summer Food Service Program and serving meals
between March 2020 and August 2020 due to physical school closures caused by
the COVID-19 pandemic. These funds will enable local educational agencies to
address food insecurity in their communities, especially for students and families who
rely on school meals.
• $45 million for grants to local educational agencies, including county offices of
education, to coordinate or expand community schools to increase access to
health, mental health, and social service supports for high-needs students. These
funds will enable improved delivery of mental health and social-emotionally
supportive services for students experiencing the stress, anxiety, and trauma caused
by the COVID-19 pandemic.
• $6 million for the University of California Subject Matter Projects to provide educator
professional development for providing high-quality distance learning and
addressing learning loss in mathematics, science, and English language arts due to
the COVID-19 pandemic.
• $1.5 million for the Department of Education for state operations costs associated
with the COVID-19 pandemic.
K-12 EDUCATION VersionnumberjA1s8RKnoP5m
34 CALIFORNIA STATE BUDGET — 2020-21

TEMPORARY REVENUE INCREASES
The Budget proposes the temporary three-year suspension of net operating losses and
limitation on business incentive tax credits to offset no more than $5 million of tax liability
per year. This, along with other tax changes, generates a net $4.3 billion in General
Fund revenues and approximately $1.6 billion in benefit to the Proposition 98
Guarantee.
SPECIAL EDUCATION
The Budget increases special education resources and creates new mechanisms to
improve special education financing, programs, and student outcomes. Specifically,
the Budget increases special education base rates to $625 per pupil pursuant to a new
funding formula, apportioned using the existing hold harmless methodology, and
provides $100 million to increase funding for students with low-incidence disabilities.
The Budget also includes: (1) $15 million federal Individuals with Disabilities Education
Act (IDEA) funds for the Golden State Teacher Scholarship Program to increase the
special education teacher pipeline, (2) $8.6 million federal IDEA funds to assist local
educational agencies with developing regional alternative dispute resolution services
and statewide mediation services, and (3) $1.1 million federal IDEA funds for a study of
the current special education governance and accountability structure, as well as
three workgroups to create a statewide Individualized Education Program template,
provide recommendations on alternative pathways to a diploma for students with
disabilities, and study the costs of out-of-home care.
AVERAGE DAILY ATTENDANCE
Since the beginning of the COVID-19 pandemic in early March, local educational
agencies across the state closed for classroom instruction, transitioning students and
teachers to distance learning models. The loss of classroom-based instruction has had
unprecedented impacts on students and families, especially the most vulnerable
students.
To help minimize additional learning loss related to COVID-19, the budget presumes
that local educational agencies should transition back to providing in-classroom
instruction in the 2020-21 school year. However, if local or state public health official
orders necessitate a school closure, local educational agencies will need flexibility to
VersionnumberjA1s8RKnoP5m K-12 EDUCATION
CALIFORNIA STATE BUDGET — 2020-21 35

provide distance learning. To ensure funding stability regardless of the instructional
model, the Budget includes a hold harmless for the average daily attendance used to
calculate school funding for all local educational agencies. Additionally, the Budget
includes requirements for distance learning to ensure that, when in-person instruction is
not possible, students continue to receive access to a quality education via distance
learning.
Specifically, the Budget includes:
• A hold-harmless for the purpose of calculating apportionment in the 2020-21 fiscal
year; average daily attendance shall be based on the 2019-20 year, except for new
charter schools commencing instruction in 2020-21.
• An exemption for local educational agencies from the annual minimum
instructional minutes requirement. The minimum daily instructional minutes and
minimum instructional day requirements are maintained, but may be met through a
combination of in-person and distance learning instruction.
• Requirements for distance learning services, including the provision of devices and
connectivity and supports for students with exceptional needs, English language
learner students, youth in foster care, and youth experiencing homelessness, as well
as students in need of mental health supports. Daily interaction with students in
distance learning is required and local educational agencies are required to
provide access to nutrition programs.
• Distance learning attendance requirements, including documentation of daily
student participation, weekly engagement records, and attendance reporting for
purposes of chronic absenteeism tracking. The Budget also requires local
educational agencies offering distance learning to develop tiered re-engagement
strategies for students who do not participate and to regularly engage with parents
or guardians regarding academic progress.
• Fiscal penalties for local educational agencies offering distance learning that do
not meet instructional day requirements or the attendance-related requirements.
• A material revision exemption for site-based charter schools offering distance
learning.
Additionally, the Budget provides $750,000 one-time Proposition 98 General Fund for the
Sacramento County Office of Education to develop distance learning curriculum and
instructional guidance for mathematics, English language arts, and English language
development, for adoption by the State Board of Education by May 31, 2021.
K-12 EDUCATION VersionnumberjA1s8RKnoP5m
36 CALIFORNIA STATE BUDGET — 2020-21

2020-21 LEARNING CONTINUITY AND ATTENDANCE PLAN
In April, the Governor issued Executive Order N-56-20, which allowed local educational
agencies to submit local control and accountability plans, normally due July 1, 2020, by
December 15, 2020, in recognition of the challenges that local educational agencies
would have faced in completing the plans during the COVID-19 pandemic this spring.
Federal funds provided to schools for COVID-19 must be expended by local
educational agencies on an accelerated timeline. In order to ensure transparency
around the expenditures of these new federal funds, and in alignment with new
flexibilities related to distance learning, the Budget replaces the December local
control and accountability plan with a Learning Continuity and Attendance Plan, to be
completed by September 30, 2020.
The Budget requires the Superintendent of Public Instruction, in consultation with the
executive director of the State Board of Education, to develop the template for the
Learning Continuity and Attendance Plan by August 1, 2020, and requires the template
to include all of the following:
• A description of how the local educational agency will provide continuity of
learning during the COVID-19 pandemic and address all of the following:
◦ Distance learning
◦ Learning loss
◦ Mental health and social-emotional well-being
◦ Professional development
◦ Pupil engagement and outreach
◦ School nutrition
• Local educational agency expenditures related to addressing the impacts of the
COVID-19 pandemic.
• How local educational agencies are increasing or improving services in proportion
to funds generated on the basis of the number and concentration of English
learners, youth in foster care, and low-income students pursuant to the local control
funding formula.
VersionnumberjA1s8RKnoP5m K-12 EDUCATION
CALIFORNIA STATE BUDGET — 2020-21 37

In adopting the Learning Continuity and Attendance Plan, local educational agencies
must consult with stakeholders, solicit stakeholder input, and hold public hearings on the
plan.
SCHOOL POLICING
Schools serve a foundational role in the social development of students. This
development can be advanced or hindered by the presence of police officers on
school campuses. To better promote student mental health, restorative justice, and
social-emotional well-being, state and local leaders must evaluate opportunities for
improvement in school safety infrastructure.
To this end, the Budget includes $200,000 one-time non-Proposition 98 General Fund for
the creation of a Young People’s Task Force, whose members can speak to the lived
reality of school policing and will inform changes in policy, contingent on the
enactment of future legislation. The Budget also includes intent language for the
Legislature to evaluate the presence of law enforcement on school campuses and
consider reforms informed by local needs to improve student safety.
EMPLOYEE PROTECTIONS
To ensure the continuity of employment for essential school staff during the COVID-19
pandemic, the Budget includes the following:
• Suspension of the August 15, 2020, layoff window for teachers and other
non-administrative certificated staff.
• Suspension of layoffs for classified staff working in transportation, nutrition, and
custodial services from July 1, 2020 through June 30, 2021.
The Budget also includes the intent of the Legislature that school districts, community
college districts, joint powers authorities, and county offices of education retain all
classified employees in the 2020-21 fiscal year.
Other Significant Adjustments
• Classified School Employees Summer Assistance Program—An increase of
$60 million Proposition 98 General Fund to provide a match of state funds for
participating classified employees to be paid during the summer recess period.
K-12 EDUCATION VersionnumberjA1s8RKnoP5m
38 CALIFORNIA STATE BUDGET — 2020-21

• Department of Education State Operations—A total increase of $436,000
non-Proposition 98 General Fund for the following:
◦ $336,000 ongoing non-Proposition 98 General Fund for the School Fiscal Services
Division for workload associated with deferrals and average daily attendance
changes.
◦ $100,000 one-time non-Proposition 98 General Fund for the Department of
Education to develop a template for the Learning Continuity and Attendance
Plan in consultation with the executive director of the State Board of Education.
EARLY LEARNING AND CARE PROGRAMS
Investing in early learning and care supports the success of children and families of
color, the majority of people served by these programs. The Budget preserves funding
for early learning and care programs to the greatest extent possible, given the
constraints of the COVID-19 Recession. Access, reimbursement rate levels, and quality
investments are all maintained or grown, with a specific focus on serving the children of
income-eligible workers essential to the fight against COVID-19.
PROTECTING ESSENTIAL SERVICES
To support access for families and provide stable funding for early learning and care
programs and providers, the Budget:
• Maintains early learning and care provider reimbursement rates at 2019-20 levels.
• Eliminates the application of negative statutory growth adjustments for early
learning and care programs.
• Provides a hold harmless provision in 2020-21 for providers that contract directly with
the Department of Education.
• In 2020-21, provides reimbursement at a child’s maximum certified level of need for
all providers accepting vouchers.
VersionnumberjA1s8RKnoP5m K-12 EDUCATION
CALIFORNIA STATE BUDGET — 2020-21 39

CARES ACT FUNDING FOR CHILD CARE
California received $350.3 million through the federal CARES Act for COVID-19 related
child care activities. To maximize the benefits of these funds to providers and families,
the Budget includes the following expenditure plan:
• $144.3 million for state costs associated with SB 89 expenditures, family fee waivers,
and provider payment protection.
• $125 million for voucher provider hold harmless and stipends.
◦ Up to $62.5 million to fund providers accepting vouchers at the maximum
certified level of need.
◦ At least $62.5 million for one-time stipends for providers accepting vouchers that
offer care during the COVID-19 pandemic.
• $73 million to continue care for at-risk children and essential workers.
• $8 million to extend family fee waivers until June 30, 2020.
FUTURE FEDERAL COVID-19 FUNDS FOR CHILD CARE
To allow for the quick deployment of potential future federal COVID-19 funds for child
care, the Budget includes language allowing up to $300 million of such funds to be
allocated by the following schedule:
• $150 million to extend access for families being served through limited-term subsidies
and expand access for unserved, eligible families.
• $125 million to provide limited-term stipends for state-subsidized child care providers
offering care during the COVID-19 pandemic.
• $25 million to assist licensed child care providers with costs to re-open child care
facilities closed due to the COVID-19 pandemic, and to supplement unfunded costs
caused by low attendance or temporary closures due to the COVID-19 pandemic.
SHIFT OF CHILD CARE PROGRAMS TO THE DEPARTMENT OF SOCIAL SERVICES
To promote a high-quality, affordable, and unified early childhood system, the Budget
includes $2.3 million General Fund in 2020-21 to transition the existing child care and
child development programs from the Department of Education to the Department of
K-12 EDUCATION VersionnumberjA1s8RKnoP5m
40 CALIFORNIA STATE BUDGET — 2020-21

Social Services. This will align all child care programs within a single department in state
government and will ease the administration of collective bargaining commencing
later this year.
Other Significant Adjustments
• $9.3 million one-time federal funds to develop and implement an early learning and
care data system.
• A decrease in new federal Child Care and Development Block Grant funding
available for child care vouchers of $6 million, bringing the total allocation for
increased access in the Alternative Payment Program from $53.3 million to
$47.2 million. Additionally, the Budget specifies that first priority for these funds will be
to extend subsidized care for income-eligible essential worker families and at-risk
children from a limited-term to an ongoing basis.
VersionnumberjA1s8RKnoP5m K-12 EDUCATION
CALIFORNIA STATE BUDGET — 2020-21 41

This page intentionally blank to facilitate double-sided printing.

HIGHER EDUCATION
T he Budget makes adjustments that reduce the overall level of support for the state's
public higher education segments—the University of California (UC), the California
State University (CSU), and the California Community Colleges (CCC). However, the
Budget will increase state support for those systems if sufficient federal funds are
received.
The Budget includes total funding of $19.4 billion General Fund and local property tax
for all higher education entities in 2020-21.
UNIVERSITY OF CALIFORNIA
In addition to supporting undergraduate instruction, the UC is the state’s primary
institution for awarding doctoral degrees and professional degrees. The UC’s ten
campuses provide education to approximately 280,000 undergraduate and graduate
students, and UC’s university extension programs reach an additional 400,000 students.
In 2018-19, the UC awarded 77,000 degrees.
The Budget reflects a net General Fund decrease of $258.4 million, which is the result of
investments totaling $44 million, a base increase of approximately $169.2 million,
and contingent reductions totaling $471.6 million. As a result of the COVID-19 Recession
and absent the receipt of additional federal funds to assist the state with the fiscal crisis,
reductions are necessary to balance the state budget. To the extent the federal
government provides sufficient federal funds by October 15, 2020, which are eligible for
VersionnumberjA1s8RKnoP5m HIGHER EDUCATION
CALIFORNIA STATE BUDGET — 2020-21 43

purposes identified below, funds will be appropriated for the 2020-21 fiscal year,
pursuant to Control Section 8.28.
The federal CARES Act provided UC with approximately $260 million. The Act requires
50 percent be allocated to emergency financial aid. The remaining funds should be
used to help the UC maintain their programs in the 2020-21 fiscal year.
The Budget is based on the expectation that UC will uphold the Administration’s equity
principles, minimize the potential impact of these reductions on disadvantaged
students, and implement the budget adjustments associated with these reductions in
ways that do not disproportionately impact disadvantaged students. The UC is also
expected use their unrestricted reserves to mitigate the impact of these reductions from
one fiscal year to the next.
Other Significant Adjustments
• General Fund Adjustments—An increase of $213.2 million General Fund, of which
$678,000 is one-time, consisting of:
◦ $169.2 million for a base adjustment to mitigate the impact of contingent
General Fund reductions.
◦ $25 million for UC Riverside School of Medicine operational costs.
◦ $15 million for the UC Merced-UCSF Fresno Partnership for a Branch Medical
School Campus.
◦ $3.7 million ($3.1 million of which is ongoing) to offset declining Proposition 56
revenue supporting a statewide grant program to increase the number of
available graduate medical residency slots.
◦ $345,000 for a baseline immigrant legal services adjustment.
• Contingent General Fund Reductions—As a result of the COVID-19 Recession and
absent the receipt of additional federal funds to assist the state with the fiscal crisis,
reductions are necessary to balance the state budget. To the extent the federal
government provides sufficient federal funds by October 15, 2020, which are eligible
for purposes identified below, funds will be appropriated for the 2020-21 fiscal year
as follows:
◦ $428.4 million for UC operational costs.
◦ $43.2 million for UC Office of the President (UCOP), UC PATH, and the UC Division
of Agriculture and Natural Resources.
HIGHER EDUCATION VersionnumberjA1s8RKnoP5m
44 CALIFORNIA STATE BUDGET — 2020-21

• Animal Shelter Grants—If sufficient philanthropic support does not materialize by
April 1, 2021, the Budget authorizes the Director of Finance to provide up to
$5 million one-time General Fund to support a one-time animal shelter
demonstration grant program through the UC Davis Koret Shelter Medicine
Program.
• UC Subject Matter Project—The Budget provides $6 million in one-time federal funds
to support the mitigation of learning loss in mathematics, science, and English and
language arts through existing UC Subject Matter Projects.
• UC PATH—The Budget increases UCOP’s authority to assess campuses in support of
UC PATH from $15.3 million to $46.8 million, while also requiring UCOP to collaborate
with campuses to maximize their use of non-core funds to support the assessment.
• Deferred Maintenance—The Budget authorizes UC to redirect up to $21.6 million in
deferred maintenance funding from the 2019 Budget Act to support for
undergraduate instruction, undergraduate resident enrollment, student support
services, and other core academic operations.
CALIFORNIA STATE UNIVERSITY
The CSU is the state’s broadest platform for providing four-year education, with a focus
on undergraduate and master’s-level graduate instruction. The CSU educates
approximately 475,000 students on 23 campuses, including many based in underserved
regions, while also providing additional opportunities through professional and
continuing education programs. In 2018-19 the CSU awarded 127,400 degrees.
The Budget reflects a net General Fund decrease of approximately $299.1 million, which
is the result of a base increase of approximately $199 million, and contingent reductions
totaling approximately $498.1 million. As a result of the COVID-19 Recession and absent
the receipt of additional federal funds to assist the state with the fiscal crisis, reductions
are necessary to balance the state budget. To the extent the federal government
provides sufficient federal funds by October 15, 2020, which are eligible for purposes
identified below, funds will be appropriated for the 2020-21 fiscal year, pursuant to
Control Section 8.28.
The federal CARES Act provided CSU with approximately $525 million. The Act requires
50 percent be allocated to emergency financial aid. The remaining funds should be
used to help CSU maintain programs in the 2020-21 fiscal year.
VersionnumberjA1s8RKnoP5m HIGHER EDUCATION
CALIFORNIA STATE BUDGET — 2020-21 45

The Budget is based on the expectation that CSU will uphold the Administration’s equity
principles, will minimize the potential impact of these reductions on disadvantaged
students, and implement the budget adjustments associated with these reductions in
ways that do not disproportionately impact disadvantaged students. The CSU is also
expected use their unrestricted reserves to mitigate the impact of these reductions from
one fiscal year to the next.
Other Significant Adjustments
• Ongoing General Fund Adjustment—An increase of approximately $199 million for a
base adjustment to mitigate the impact of contingent General Fund reductions.
• Contingent General Fund Reductions—As a result of the COVID-19 Recession and
absent the receipt of additional federal funds to assist the state with the fiscal crisis,
reductions are necessary to balance the state budget. To the extent the federal
government provides sufficient federal funds by October 15, 2020, which are eligible
for purposes identified below, funds will be appropriated for the 2020-21 fiscal year
as follows:
◦ Approximately $498.1 million for CSU operational costs.
• Deferred Maintenance—The Budget authorizes CSU to redirect up to $146 million in
deferred maintenance funding from the 2019 Budget Act to support for
undergraduate instruction, undergraduate resident enrollment, student support
services, and other core academic operations.
CALIFORNIA COMMUNITY COLLEGES
The CCCs serve as the foundation of the state’s higher education system by providing
Californians with open access to early-stage undergraduate instruction, basic skills,
career education, and transfer opportunities. The CCCs support 2.1 million students
across 73 districts, 115 colleges, and 78 educational centers. In 2018-19, the community
colleges awarded more than 101,000 certificates and 187,000 degrees.
HIGHER EDUCATION VersionnumberjA1s8RKnoP5m
46 CALIFORNIA STATE BUDGET — 2020-21

COMMUNITY COLLEGE FLEXIBILITIES
To assist CCCs in their recovery from the impacts of the COVID-19 Recession and
provide additional near-term certainty, the Budget enacts statutory changes to:
• Exempt direct COVID-19-related expenses incurred by districts from the 50 Percent
Law. This excludes revenue declines.
• Provide a hardship exemption for districts unable to meet their financial obligations
due to the deferrals enacted in the Budget.
• Extend the Student-Centered Funding Formula hold harmless provisions for an
additional two years, and authorize the use of past-year data sources that have not
been impacted by the COVID-19 pandemic for the calculation of the
Student-Centered Funding Formula for 2020-21.
• Encourage and expedite the development of short-term career technical
education courses to address the impacts of the COVID-19 pandemic.
Other Significant Adjustments
• Staff for Working Group on Community College Athlete Compensation—An increase
of $700,000 one-time non-Proposition 98 General Fund for the CCC Chancellor’s
Office to contract with an external organization to staff a working group on a
community college athlete’s use of the athlete’s name, image, and likeness for
compensation, pursuant to Chapter 383, Statutes of 2019 (SB 206).
• 2019-20 Deferrals—A deferral of approximately $330.1 million Proposition 98 General
Fund of community college apportionments from 2019-20 to 2020-21.
• 2020-21 Deferrals—A deferral of approximately $662.1 million Proposition 98 General
Fund of community college apportionments from 2020-21 to 2021-22.
VersionnumberjA1s8RKnoP5m HIGHER EDUCATION
CALIFORNIA STATE BUDGET — 2020-21 47

• 2020-21 Deferrals Subject to Control Section 8.28–As a result of the COVID-19
Recession and absent the receipt of additional federal funds to assist the state with
the fiscal crisis, reductions are necessary to balance the state budget. To the extent
the federal government provides sufficient federal funds by October 15, 2020, which
are eligible for purposes identified below, funds will be appropriated for the 2020-21
fiscal year as follows:
◦ A deferral of approximately $791.1 million Proposition 98 General Fund of
community college apportionments from 2020-21 to 2021‑22.
• COVID-19 Response Block Grant for CCCs—A one-time increase of approximately
$120.2 million, which is comprised of approximately $54 million from the Coronavirus
Relief Fund (CARES Act) and approximately $66.3 million Proposition 98 General
Fund, for a COVID-19 Response Block Grant for the community colleges to support
student learning and mitigate learning loss related to the COVID-19 pandemic.
• Dreamer Resource Liaisons—An increase of $5.8 million Proposition 98 General Fund
to fund Dreamer Resource Liaisons and student support services, for immigrant
students including undocumented students in community colleges, pursuant to
Chapter 788, Statutes of 2019 (AB 1645). These services provide an opportunity to
address disparities and advance economic justice by supporting educational
attainment, career pathways and economic mobility for students who may face
barriers related to their immigration status.
• Legal Services—An increase of $10 million ongoing Proposition 98 General Fund to
provide legal services to immigrant students, faculty, and staff on community
college campuses.
• Calbright College—A decrease of $5 million ongoing Proposition 98 General Fund
for Calbright College, and a decrease of $40 million one-time Proposition 98
General Fund provided to Calbright College that is redirected to offset
apportionments costs for 2020-21.
• Revised CalPERS/CalSTRS Contributions—As referenced in the K-12 Education
Chapter, to provide local educational agencies and community college
districts with increased fiscal relief, the Budget redirects $2.3 billion appropriated in
the 2019 Budget Act to CalSTRS and CalPERS for long-term unfunded liabilities to
further reduce employer contribution rates in 2020-21 and 2021-22.
HIGHER EDUCATION VersionnumberjA1s8RKnoP5m
48 CALIFORNIA STATE BUDGET — 2020-21

• CCC Facilities—An increase of general obligation bond funding of $223.1 million,
including $28.4 million to start 25 new capital outlay projects and $194.7 million for
the construction phase of 15 projects anticipated to complete design by spring
2021. This allocation represents the next installment of the $2 billion available to
CCCs under Proposition 51.
• Local Property Tax Adjustment—A decrease of $60.9 million Proposition 98 General
Fund as a result of increased offsetting local property tax revenues.
• Food Pantries—The Budget enacts statutory changes to support food pantries within
available Student Equity and Achievement Program funding.
• CCC State Operations—An ongoing increase of $116,000 non-Proposition 98 General
Fund for a new position to support the Chancellor’s Office accounting operations.
CALIFORNIA STUDENT AID COMMISSION
The California Student Aid Commission, which administers the state’s financial aid
programs, the largest of which is the Cal Grant, supports over 410,000 financial aid
awards to students accessing higher education. The Budget reflects a sustained
commitment to financial aid programs as a cornerstone of our dedication to providing
the least resourced students access to higher education.
Other Significant Adjustments
• Cal Grant Program Adjustment—A decrease of approximately $149 million in 2019-20
and approximately $63.3 million in 2020-21 to reflect revised estimates of the number
of new and renewal Cal Grant awardees in 2019-20 and 2020-21.
• Temporary Assistance for Needy Families (TANF) Adjustment—A decrease of
$600 million in federal TANF reimbursements in 2019-20 which increases General Fund
support for the Cal Grant program by an equal amount.
• Golden State Teacher Grant Program—As referenced in the K-12 Education
Chapter, an increase of $15 million one-time federal funds to support grants to
students enrolled in special education teacher preparation program at a high-need
school site.
VersionnumberjA1s8RKnoP5m HIGHER EDUCATION
CALIFORNIA STATE BUDGET — 2020-21 49

• Grant Delivery System—An increase of $5.3 million one-time General Fund to fund
the third year and final year of project development costs for the Grant Delivery
System Modernization Project.
• Student Loan Debt Service Work Group—An increase of $250,000 one-time General
Fund to convene a work group to analyze student loan borrowing patterns and
develop more affordable loan repayment alternatives.
• Cal Grant B Service Incentive Grant—A reappropriation of $7.5 million one-time
General Fund from the 2019 Budget Act and a redirection of the Program's
$7.5 million funding in 2020-21 to support the Disaster Relief Emergency Student
Financial Aid Program, which will provide emergency financial aid to students at the
University of California, California State University, and California Community
Colleges.
• Child Savings Account Grant Program—A decrease of $15 million one-time General
Fund to the Child Savings Account program, established in the 2019 Budget Act.
• Contingent General Fund Reduction—As a result of the COVID-19 Recession and
absent the receipt of additional federal funds to assist the state with the fiscal crisis,
reductions are necessary to balance the state budget. To the extent the federal
government provides sufficient federal funds by October 15, 2020, which are eligible
for purposes identified below, funds will be appropriated for the 2020-21 fiscal year
as follows:
◦ A decrease of $88.4 million one-time General Fund for the Golden State Teacher
Grant program, established in the 2019 Budget Act.
UC HASTINGS COLLEGE OF THE LAW
Affiliated with the UC system, but governed by its own board, the Hastings College of
the Law is one of the state’s important legal institutions. Hastings primarily serves
students seeking a Juris Doctor degree, but also offers programs leading to Master of
Laws and Master of Studies in Law degrees. In 2018-19, UC Hastings enrolled 964 full-time
equivalent students.
Other Significant Adjustments
• Base Adjustment—An ongoing increase of approximately $1.4 million General Fund
to mitigate the impact of contingent General Fund reductions.
HIGHER EDUCATION VersionnumberjA1s8RKnoP5m
50 CALIFORNIA STATE BUDGET — 2020-21

• Contingent General Fund Reduction—As a result of the COVID-19 Recession and
absent the receipt of additional federal funds to assist the state with the fiscal crisis,
reductions are necessary to balance the state budget. To the extent the federal
government provides sufficient federal funds by October 15, 2020, which are eligible
for purposes identified below, funds will be appropriated for the 2020-21 fiscal year
as follows:
◦ Approximately $1.9 million General Fund for operating costs.
CALIFORNIA STATE LIBRARY
The California State Library offers a wide range of services, including timely information
for the Governor and Legislature, archival access for researchers, and technical
assistance for libraries across California. The State Library also administers state- and
federally-funded programs to support local libraries.
Other Significant Adjustments
• Braille Institute of America in Los Angeles—An increase of $500,000 ongoing General
Fund to support services provided by the Braille Institute of America in Los Angeles.
• Statewide Library Broadband Services Augmentation—An increase of $170,000
ongoing General Fund for continued participation in the Corporation for Education
Network Initiatives in California.
• Library Services Act—A decrease of $1.75 million ongoing General Fund.
FRESNO DRIVE
The Budget includes $2 million one-time General Fund to support the Fresno Developing
the Region’s Inclusive and Vibrant Economy (DRIVE) initiative’s Fresno-Merced Food
Innovation Corridor concept. This funding will support planning, community
engagement, and financial planning needed to secure the private and philanthropic
resources to launch and scale the Fresno-Merced Future of Food (F3) Innovation
Initiative over the next ten years.
VersionnumberjA1s8RKnoP5m HIGHER EDUCATION
CALIFORNIA STATE BUDGET — 2020-21 51

This page intentionally blank to facilitate double-sided printing.

HEALTH AND HUMAN SERVICES
T he Health and Human Services Agency oversees departments and other state
entities that provide health and social services to California's vulnerable and at-risk
residents.
The Budget includes $179.6 billion ($44.8 billion General Fund and $134.8 billion other
funds) for all health and human services programs.
The Budget utilizes $450 million of the Safety Net Reserve in 2020-21 to prevent
reductions that otherwise would occur in California Work Opportunity and Responsibility
to Kids (CalWORKs) and Medi-Cal services and benefits.
DEPARTMENT OF HEALTH CARE SERVICES
Medi-Cal, California’s Medicaid program, is administered by the Department of Health
Care Services. Medi-Cal is a public health care program that provides comprehensive
health care services at no or low cost for low-income individuals. The federal
government mandates basic services be included in the program, including: physician
services; family nurse practitioner services; hospital inpatient and outpatient services;
laboratory and radiology services; family planning; and early and periodic screening,
diagnosis, and treatment services for children. In addition to these mandatory services
the state provides optional benefits, such as outpatient drugs, dental, home and
community-based services, and medical equipment. The Department also operates
the California Children’s Services and the Primary and Rural Health programs, and
VersionnumberjA1s8RKnoP5m HEALTH AND HUMAN SERVICES
CALIFORNIA STATE BUDGET — 2020-21 53
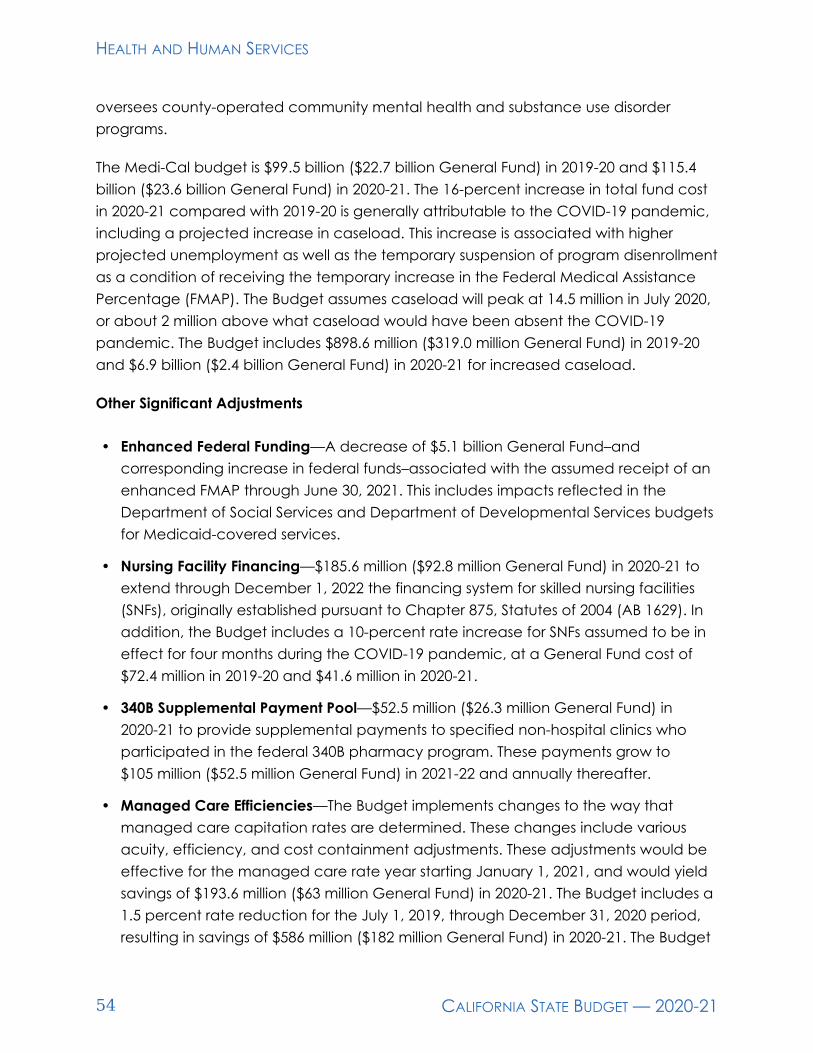
oversees county-operated community mental health and substance use disorder
programs.
The Medi-Cal budget is $99.5 billion ($22.7 billion General Fund) in 2019-20 and $115.4
billion ($23.6 billion General Fund) in 2020-21. The 16-percent increase in total fund cost
in 2020-21 compared with 2019-20 is generally attributable to the COVID-19 pandemic,
including a projected increase in caseload. This increase is associated with higher
projected unemployment as well as the temporary suspension of program disenrollment
as a condition of receiving the temporary increase in the Federal Medical Assistance
Percentage (FMAP). The Budget assumes caseload will peak at 14.5 million in July 2020,
or about 2 million above what caseload would have been absent the COVID-19
pandemic. The Budget includes $898.6 million ($319.0 million General Fund) in 2019-20
and $6.9 billion ($2.4 billion General Fund) in 2020-21 for increased caseload.
Other Significant Adjustments
• Enhanced Federal Funding—A decrease of $5.1 billion General Fund–and
corresponding increase in federal funds–associated with the assumed receipt of an
enhanced FMAP through June 30, 2021. This includes impacts reflected in the
Department of Social Services and Department of Developmental Services budgets
for Medicaid-covered services.
• Nursing Facility Financing—$185.6 million ($92.8 million General Fund) in 2020-21 to
extend through December 1, 2022 the financing system for skilled nursing facilities
(SNFs), originally established pursuant to Chapter 875, Statutes of 2004 (AB 1629). In
addition, the Budget includes a 10-percent rate increase for SNFs assumed to be in
effect for four months during the COVID-19 pandemic, at a General Fund cost of
$72.4 million in 2019-20 and $41.6 million in 2020-21.
• 340B Supplemental Payment Pool—$52.5 million ($26.3 million General Fund) in
2020-21 to provide supplemental payments to specified non-hospital clinics who
participated in the federal 340B pharmacy program. These payments grow to
$105 million ($52.5 million General Fund) in 2021-22 and annually thereafter.
• Managed Care Efficiencies—The Budget implements changes to the way that
managed care capitation rates are determined. These changes include various
acuity, efficiency, and cost containment adjustments. These adjustments would be
effective for the managed care rate year starting January 1, 2021, and would yield
savings of $193.6 million ($63 million General Fund) in 2020-21. The Budget includes a
1.5 percent rate reduction for the July 1, 2019, through December 31, 2020 period,
resulting in savings of $586 million ($182 million General Fund) in 2020-21. The Budget
HEALTH AND HUMAN SERVICES VersionnumberjA1s8RKnoP5m
54 CALIFORNIA STATE BUDGET — 2020-21

also includes a risk corridor for the period of July 1, 2019 to December 31, 2020. The
Budget does not implement a maximum fee schedule for inpatient services in the
managed care program.
• Hearing Aids—$352,000 General Fund in 2020-21 to administer and establish a
program to assist with the cost of hearing aids and related services for children
without health insurance coverage in households with incomes up to 600 percent of
the federal poverty level, no sooner than July 1, 2021. The Budget assumes ongoing
costs of approximately $15 million General Fund to provide and administer this
benefit.
• Proposition 56 Medi-Cal Investments—$1.1 billion Proposition 56 funding for
supplemental payments, rate increases, and value-based payments. The Budget
also maintains funding for the Physicians’ and Dentists’ Loan Repayment Program
allocated in the 2018 and 2019 Budget Acts. All Proposition 56 programs other than
women’s health, family planning, and the Loan Repayment Program are subject to
suspension on July 1, 2021. The suspension will be lifted if the Administration
determines through the 2021 Budget Act process that there is sufficient General
Fund revenue to support all suspended programs in the subsequent two fiscal years.
• Optional Benefits—The Budget maintains funding for the Community Based Adult
Services (CBAS) and Multipurpose Senior Services Program (MSSP). Additionally, the
Budget continues ongoing funding for full adult dental services, acupuncture,
optometry, nurse anesthetists services, occupational and physical therapy,
pharmacist services, and the Diabetes Prevention program.
• Suspended Programs—The Budget maintains the suspension framework in the 2019
Budget Act for audiology and speech therapy, incontinence creams and washes,
optician and optical lab services, podiatry, screening, brief intervention and referral
to treatments for opioids and other illicit drugs in Medi-Cal. The funding will be
suspended on December 31, 2021. The suspension will be lifted if the Administration
determines through the 2021 Budget process that there is sufficient General Fund
revenue to support all suspended programs in the subsequent two fiscal years.
• Medi-Cal Aged, Blind, and Disabled—$135.5 million ($67.7 million General Fund) to
expand Medi-Cal to aged, blind, and disabled individuals with incomes between
123 percent and 138 percent of the federal poverty level and the Medi-Cal Aged,
Blind, and Disabled Medicare Part B disregard.
• Postpartum Mental Health Expansion—$34.3 million General Fund to implement the
2019 Budget Act expansion of Medi-Cal to post-partum individuals who are
receiving health care coverage and who are diagnosed with a maternal mental
VersionnumberjA1s8RKnoP5m HEALTH AND HUMAN SERVICES
CALIFORNIA STATE BUDGET — 2020-21 55

health condition. The increased funding for postpartum care will be suspended on
December 31, 2021. The suspension will be lifted if the Administration determines
through the 2021 Budget Act process that there is sufficient General Fund revenue
to support all suspended programs in the subsequent two fiscal years.
• County Administration—An increase of $67.7 million ($23.7 General Fund) in 2020-21
relative to the 2019 Budget Act for county eligibility determination activities based
on growth in the California Consumer Price Index. The Budget also reflects an
increase of $12.7 General Fund in 2019-20 and matching federal funds approved
through the Control Section 36.00 process.
• Behavioral Health Counselors in Emergency Departments—The Budget maintains
one-time $20 million General Fund to hire behavioral health providers and peer
navigators in emergency departments to screen patients and offer intervention and
referral to mental health or substance use disorder programs.
• Medical Interpreters Pilot Project—The Budget maintains one-time $5 million General
Fund for the Medi-Cal Interpreters Pilot Project.
• Medi-Cal Enrollment Navigators—The Budget maintains one-time $15 million
General Fund for the Medi-Cal Health Enrollment Navigators program.
• Caregiver Resource Centers—The Budget maintains $10 million General Fund in both
2020-21 and 2021-22 for caregiver resource center information technology
improvements.
• Martin Luther King, Jr. Hospital—The Budget maintains $8.2 million General Fund for a
supplemental payment to this hospital.
• Dental Managed Care—The Budget maintains dental managed care in Los Angeles
and Sacramento Counties for calendar year 2021.
DEPARTMENT OF SOCIAL SERVICES
The Department of Social Services (DSS) serves, aids, and protects needy and
vulnerable children and adults in ways that strengthen and preserve families,
encourage personal responsibility, and foster independence. The Department’s major
programs include CalWORKS, CalFresh, In-Home Supportive Services (IHSS),
Supplemental Security Income/State Supplementary Payment, Child Welfare Services,
Community Care Licensing, and Disability Determination. The Budget includes
$37.1 billion ($11.6 billion General Fund) in 2020-21 for the Department.
HEALTH AND HUMAN SERVICES VersionnumberjA1s8RKnoP5m
56 CALIFORNIA STATE BUDGET — 2020-21

Other Significant Adjustments
• CalWORKs Time Clocks—Statutory changes to establish a single 60-month
CalWORKs time limit and allow clients to participate in a greater array of
welfare-to-work activities for the entire 60 months, effective May 1, 2022 or when
automation is possible. The Budget includes $2.6 million General Fund/Temporary
Assistance for Needy Families (TANF) block grant funding in 2020-21, growing to
$66.2 million General Fund in 2023-24.
• CalWORKs Single Allocation—$2.4 billion General Fund/TANF for counties’ CalWORKs
Single Allocation which funds employment services, county administration, Stage
One child care, and Cal-Learn.
• CalWORKs Expanded Subsidized Employment—The Budget maintains $134.1 million
General Fund/TANF for CalWORKs Expanded Subsidized Employment.
• CalWORKs Outcomes and Accountability Review (Cal-OAR)—Statutory changes
making components of Cal-OAR optional for counties in 2020-21, resulting in a
one-time reduction of $21 million General Fund/TANF.
• CalWORKs Home Visiting Program—The Budget includes a one-time reduction of
$30 million General Fund/TANF and continues to serve clients already enrolled in the
CalWORKs Home Visiting program.
• CalFresh Simplifications—The Budget includes statutory changes that: (1) require
state CalFresh verification rules be no more restrictive than federal rules, (2) clarify
counties must use the most up-to-date information to determine eligibility,
(3) require counties to contact clients electronically and telephonically to collect
information for reporting changes, (4) require counties to implement flexible
interview scheduling techniques, (5) require DSS create a workgroup to consider
reporting structure and submit recommendations to the Legislature, (6) require
counties to maximize integrated application for Medi-Cal and CalFresh, including
the development and automation of a pre-populated CalFresh application for
Medi-Cal recipients, and (7) require the development and automation of a
pre-populated semi-annual reporting form. The Budget includes $27.5 million
General Fund in 2020-21 and $8.4 million annually thereafter for these purposes.
• IHSS Hours Restoration—The Budget includes $410 million General Fund in 2020-21 to
avoid 7-percent across-the-board reduction to IHSS service hours. The increased
funding for IHSS service hours will be suspended on December 31, 2021. The
suspension will not occur if the Administration determines through the 2021
VersionnumberjA1s8RKnoP5m HEALTH AND HUMAN SERVICES
CALIFORNIA STATE BUDGET — 2020-21 57

Budget process that there is sufficient General Fund revenue to support all
suspended programs.
• Conform IHSS Residual Program to Timing of Medi-Cal Coverage—Savings of
$72.6 million General Fund ongoing by conforming use of the IHSS Residual Program
to the timing of Medi-Cal coverage.
• IHSS County Administration—The Budget includes ongoing savings of $12.2 million
ongoing to freeze IHSS county administration funding at the 2019-20 level.
• Extended Foster Care—$32 million one-time General Fund in 2020-21 to temporarily
extend foster care support for youth who turn 21 while in the extended foster care
program, thus allowing them to continue to remain in the program and receive
assistance.
• Emergency Assistance for Pending Resource Families—$13.4 million one-time
General Fund in 2020-21 to provide caregivers with up to four months of emergency
assistance payments pending resource family approval and up to twelve months for
cases that meet good cause criteria. Beginning in 2021-22 and annually thereafter,
the state will fund up to three months of emergency assistance payments for
caregivers pending approval, as local child welfare agencies and probation
departments are anticipated to complete the resource family approval process on
a timelier basis.
• Transitional Housing Supplement for Older Foster Youth—$4 million ongoing General
Fund ongoing to provide transitional housing supplement for foster youth over
18 years of age.
• Continuum of Care Reform Reconciliation for Fiscal Years 2016‑17 and 2017‑18—$2.6 million one-time General Fund in 2020-21 to reflect Continuum of
Care Reform true-up related to county Child and Family Teams actual expenditures
for fiscal years 2016-17 and 2017-18 and $80 million one-time General Fund in
2020-21 to support county child welfare departments.
• California Newcomer Education and Well-Being Project—$15 million one-time
Proposition 98 General Fund for the California Newcomer Education and Well-Being
Project to assist school districts in supporting refugee and unaccompanied
undocumented minor students’ well-being and academic performance. The
funding, which is available over three years, also will provide school-based supports
to immigrant families for access to safety net and wellness programs including
through guidance about federal immigration policies like the public charge, that
contribute to a chilling effect on government assistance and deeper inequities.
HEALTH AND HUMAN SERVICES VersionnumberjA1s8RKnoP5m
58 CALIFORNIA STATE BUDGET — 2020-21

• Food Banks—A one-time increase of $50 million General Fund for existing
Emergency Food Assistance Program providers, food banks, tribes, and tribal
organizations to mitigate increases in food needs among low-income and
food-insecure populations.
• Transition of Child Care Programs—$2.3 million General Fund in 2020-21 to transition
existing early learning and child care programs from the Department of Education
to the Department of Social Services, effective July 1, 2021. This transition
will promote a high-quality, affordable, and unified early childhood system; and
maximize the integration of early learning and care programs with other social
safety net programs that support children and families.
DEPARTMENT OF AGING
The California Department of Aging administers programs that serve older adults, adults
with disabilities, family caregivers, and residents in long-term care facilities throughout
the state to increase choices, equity, and well‑being for all Californians as we age. The
Budget includes $406.5 million ($84.3 million General Fund) in 2019-20 and $258.9 million
($68.0 million General Fund) in 2020-21 for the Department.
Other Significant investments
• Community-Based Adult Services—The Budget maintains the CBAS program and
includes $3.2 million General Fund in 2020-21 and $2.7 million ongoing. These figures
reflect impacts to CBAS state operations; CBAS local assistance is in the DHCS
budget.
• Multipurpose Senior Services Program—The Budget maintains MSSP and includes
$22.2 million General Fund in 2020-21 and $21.8 million ongoing
DEPARTMENT OF DEVELOPMENTAL SERVICES
The Department of Developmental Services (DDS) provides individuals with
developmental disabilities a variety of services that allow them to live and work
independently or in supported environments. California provides services to indiviuals
with developmental disabilities as an entitlement. The Budget includes $8.5 billion
($5 billion General Fund) in 2019-20 and $9.8 billion ($5.9 billion General Fund) in 2020-21
for the Department.
VersionnumberjA1s8RKnoP5m HEALTH AND HUMAN SERVICES
CALIFORNIA STATE BUDGET — 2020-21 59

Other Significant Adjustments
• Supplemental Rate Increases for Additional Service Codes—$18 million ($10.8 million
General Fund) in 2020-21 and 2021-22 to provide supplemental rate increases for
Early Start Specialized Therapeutic Services, Infant Development and Independent
Living Services. This approach is consistent with the supplemental rate increases
included in the 2019 Budget Act. The increased funding for the three services will be
suspended on December 31, 2021. The suspension will be lifted if the Administration
determines through the 2021 Budget process that there is sufficient General Fund
revenue to support all suspended programs.
• Uniform Holiday Schedule—$31.3 million General Fund in 2020-21 to suspend
implementation of the Uniform Holiday Schedule. The funding will be suspended on
December 31, 2021. The suspension will be lifted if the Administration determines
through the 2021 Budget process that there is sufficient General Fund revenue to
support all suspended programs.
• COVID-19 Impacts—$336.7 million ($237.5 million General Fund) in 2020-21 to reflect
impacts of the COVID-19 pandemic on the developmental services system. These
changes reflect increased costs associated with increased utilization in purchase of
services specific to residential settings, respite, and personal attendants. These costs
also reflect surge development at the developmental centers and in the
community.
• Incompetent to Stand Trial (IST) Capacity—$16.4 million General Fund in 2020-21 to
activate a 20-bed unit at Porterville Developmental Center (PDC) and develop five
enhanced behavioral support homes to increase capacity for IST placements and
secure community resources for individuals at PDC. The increased capacity at PDC
will sunset on June 30, 2023.
• Fairview Developmental Center Warm-Shutdown—$11.9 million General Fund to
extend the warm-shutdown period at Fairview Developmental Center through
2020-21 until a site assessment is completed to inform the disposition of the property.
DEPARTMENT OF PUBLIC HEALTH
The Department of Public Health is charged with protecting and promoting the health
and well-being of the people of California. The Budget includes $3.2 billion
($214.1 million General Fund) in 2020-21 for the Department.
HEALTH AND HUMAN SERVICES VersionnumberjA1s8RKnoP5m
60 CALIFORNIA STATE BUDGET — 2020-21

The Department of Public Health is at the forefront of the state’s response to the
COVID-19 pandemic—extensively planning, preparing, and responding to the
pandemic since mid-January. The Department’s efforts have included issuing a
stay-at-home order to save lives, increasing testing capacity, increasing hospital surge
capacity, issuing statewide public health guidance, and providing guidance to local
governments as the state works to reopen.
Other Significant Adjustments
• COVID-19 Testing and Resources—$5.9 million General Fund ($4.8 million ongoing) to
support laboratory staff to increase the state laboratories’ testing capacity, and to
purchase equipment and laboratory supplies used specifically for COVID-19 testing.
Additionally, resources will support emergency coordination, communication, and
response, and provide ongoing support for public health laboratory capacity and
disease surveillance.
• Licensing and Certification—$3.1 million State Licensing and Certification Program
Fund and 75 positions to increase staff capacity to support health facility
evaluations, provider technical support services, and healthcare-associated
infection monitoring workload needs. The Department's budget and position
authority will increase over the following two fiscal years in order to perform
100 percent of estimated workload in 2020, depending on the future fiscal outlook
of the state.
• Ongoing Infectious Disease Prevention—$5 million ongoing General Fund each for
STD, human immunodeficiency virus (HIV), and hepatitis C virus prevention and
control that otherwise would have been suspended on January 1, 2022.
• Cannabis Surveillance and Education—$20.8 million ($20.3 million Cannabis Control
Fund and $527,000 in reimbursements) in 2020-21 and $20.6 million ($20 million
Cannabis Control Fund and $527,000 in reimbursements) in 2021-22 and ongoing to
support 87 existing permanent positions and mandated activities of the Medicinal
and Adult-Use Cannabis Regulation and Safety Act and to continue the Medical
Marijuana Identification Card Program.
• Other Public Health Programs—The Budget maintains funding for the Black Infant
Health Program, the Safe Cosmetics Program, mental health disparities reduction
grants, a farmworker health study, and sickle cell anemia monitoring activities.
VersionnumberjA1s8RKnoP5m HEALTH AND HUMAN SERVICES
CALIFORNIA STATE BUDGET — 2020-21 61

DEPARTMENT OF STATE HOSPITALS
The Department of State Hospitals administers the state mental health hospital system,
the Forensic Conditional Release Program, the Sex Offender Commitment Program,
and the evaluation and treatment of judicially and civilly committed patients. The
Budget includes $2.1 billion ($1.9 billion General Fund) in 2020-21 for the Department.
Other Significant Adjustments
• Mission-Based Review—$5 million General Fund and 12.5 positions in 2020-21 and
$10 million General Fund and 30 positions in 2021-22 and ongoing to support critical
needs identified as part of the treatment team and protective services staffing
studies.
• State Hospital System Infrastructure—$26.7 million General Fund in 2020-21 for three
critical roof repair and replacement projects at three state hospitals. The Budget
also includes $5.3 million General Fund in 2020-21 to mitigate ligature risks at four
hospitals. This funding is for the first year of a seven-year project totaling $73.6 million
General Fund.
Other Health and Human Services Adjustments
• Behavioral Health Focused Investigations—$2.8 million in 2020‑21 and $4.7 million in
2020-21 and annually thereafter from the Managed Care Fund to further enforce full
service commercial health plan’s compliance with laws requiring parity of the
behavioral health service delivery system with that of the medical and surgical
service delivery system.
• Child Support Disregard—The Budget increases the child support disregard and
pass-through up to the federal share limit, $100 for a family with one child and $200
for a family with two or more children.
• CBAS and MSSP—$3.2 million General Fund in 2020-21 and $2.7 million ongoing for
CBAS and $22.2 million General Fund in 2020-21 and $21.8 million ongoing for MSSP.
These programs are also discussed in detail under the Department of Health Care
Services section. The figures in this section only reflect impacts to the Department of
Aging budget.
• Health Care Workforce Investment—$33.3 million ongoing General Fund to support
the Song-Brown Healthcare Workforce Training Program at the Office of Statewide
HEALTH AND HUMAN SERVICES VersionnumberjA1s8RKnoP5m
62 CALIFORNIA STATE BUDGET — 2020-21

Health Planning and Development. This funding will primarily pay for new and
existing residency slots for primary care physicians.
• Independent Living Centers—The Budget maintains funding for the Independent
Living Centers funded by the Department of Rehabilitation
• Realignment Backfill for Counties—$750 million to provide support for counties
experiencing revenue losses for realigned programs, and to the extent the federal
government provides sufficient eligible funding by October 15, 2020, an additional
$250 million may be provided. For additional information, see the Homelessness and
Local Government chapter.
VersionnumberjA1s8RKnoP5m HEALTH AND HUMAN SERVICES
CALIFORNIA STATE BUDGET — 2020-21 63

This page intentionally blank to facilitate double-sided printing.

HOMELESSNESS AND LOCAL GOVERNMENT
HOMELESSNESS AND LOCAL GOVERNMENT
The Budget continues California’s commitment to resolve the state’s homelessness crisis.
California has experienced significant increases in the number of unsheltered
individuals in recent years, a problem inextricably linked to the state’s underproduction
of affordable housing. The state’s approach has been to simultaneously focus on
preservation and new affordable housing production while also investing in
comprehensive solutions to address homelessness.
The unprecedented COVID-19 pandemic has significantly impacted state finances, but
the state’s broad goals to reduce homelessness remain unchanged—moving
individuals and families experiencing homelessness into stable housing and providing
support to help stabilize and prevent homelessness. However, the strategy to achieve
these goals has evolved given the state’s fiscal constraints and immediate needs.
PROJECT ROOMKEY AND HOMEKEY
At the outset of the COVID-19 pandemic, the state acted quickly to prioritize vulnerable
populations by initiating Project Roomkey, a multi-agency state effort to provide safe
isolation hotel and motel rooms for vulnerable individuals experiencing homelessness.
Chapter 2, Statutes of 2020 (SB 89), provides emergency expenditure authority of up to
$1 billion for COVID-19 relief. In March, the Administration issued $150 million for
VersionnumberjA1s8RKnoP5m HOMELESSNESS AND LOCAL GOVERNMENT
CALIFORNIA STATE BUDGET — 2020-21 65

COVID-19-related emergency assistance, including $100 million for local governments
and Continuums of Care to help protect Californians experiencing homelessness,
administered through the Homeless Coordinating and Financing Council within the
Business, Consumer Services and Housing Agency (BCSH) using the existing Homeless
Housing Assistance Prevention (HHAP) allocation formulas. It also included $50 million to
the Department of Social Services to secure hotel and motel rooms and acquire trailers
to safely house the most at-risk homeless populations.
As of late June, Project Roomkey and its county partners had secured over 15,700 hotel
and motel units, of which more than 10,600 are occupied, providing safe shelter for an
estimated 13,000 individuals in total. In addition, the state purchased and distributed
over 1,300 trailers to local governments for the same purposes.
This housing provides short-term emergency shelter for homeless individuals to mitigate
the spread of COVID-19 among this vulnerable population and were intended to keep
hospitals and emergency rooms available for a surge in treating critically ill COVID-19
patients. The opportunity now is to acquire as many of these hotels and motels as
possible, together with other appropriate residential settings, and convert them into
permanent and affordable housing opportunities for Californians experiencing
homelessness.
Building off the success of the state’s short-term emergency solution, Project Roomkey,
the Budget includes $550 million of the state's direct allocation of federal Coronavirus
Relief Fund (CRF) for Homekey—a statewide effort to acquire hotels, motels, residential
care facilities, and other housing that can be converted and rehabilitated to provide
permanent housing for persons experiencing homelessness, and who are also at risk of
COVID-19. Through the Department of Housing and Community Development (HCD),
the state will provide grants to local jurisdictions to acquire these facilities, which will be
owned and operated at the local level. This funding must be expended by December
30, 2020, per federal requirements. The Budget also includes an additional $50 million
General Fund for the acquisition of and to provide initial operating subsidies for
Homekey sites. These funds will provide a critical supplement to allow cities and
counties to support interim needs of these facilities and their residents.
HCD will accept applications from cities and counties that choose to participate in
Homekey, and will distribute resources in a way that considers the needs of areas
throughout the state, including the number of unsheltered persons, the incidence of
COVID-19 infection rates, and the ability of applicants to support projects on an
ongoing basis. The state will also provide significant technical assistance to local
jurisdictions seeking to purchase and operate former Project Roomkey hotels and
HOMELESSNESS AND LOCAL GOVERNMENT VersionnumberjA1s8RKnoP5m
66 CALIFORNIA STATE BUDGET — 2020-21

motels to address homelessness in their localities. In addition to CRF funds, the state will
use future eligible federal stimulus funds and existing state housing/homeless program
funds to further encourage local jurisdictions to invest their dollars toward the same
goal—acquiring properties to house people experiencing homelessness.
The Budget also provides exemptions to the California Environmental Quality Act and
local zoning restrictions to expedite the acquisition of these units prior to the
December 30, 2020 deadline to expend CRF funds.
In light of COVID-19, the Budget also allows certain hotel and motel unit conversions
and the preservation of certain mobile homes to count toward local agencies'
Regional Housing Needs Allocation and help keep Californians in their homes.
Additionally, to build upon Executive Order N-06-19 on developing innovative
affordable housing projects on excess state lands, the Budget allows the Department of
General Services to conduct land swaps with local governments. This will allow the state
to further bolster affordable housing development, as well as permanent supportive or
transitional housing and emergency shelters.
HOMELESS HOUSING, ASSISTANCE, AND PREVENTION PROGRAM
Cities, counties, and Continuums of Care are key to solving the homelessness challenge
by coordinating to provide homeless individuals and families with the necessary housing
and services. The Budget builds onto the framework of supporting local action on
homelessness that began with the $500 million provided in 2018-19 for the Homeless
Emergency Aid Program (HEAP) and the $650 million provided in 2019-20 for the HHAP.
The Budget provides $300 million General Fund for additional HHAP grants to be
distributed based on the 2019 homelessness point-in-time counts, of which $130 million is
for cities with populations of 300,000 or more, $90 million is for Continuums of Care, and
$80 million is for counties. These funds will build on the regional collaboration that began
with HEAP and with Round 1 of HHAP to develop unified regional responses to
homelessness. To receive funds, eligible entities will apply to the Homeless Coordinating
and Financing Council (HCFC) demonstrating how they have coordinated, and will
continue to coordinate, with other local agencies in resolving homelessness on a
regional level. The $300 million may be used for operating costs for Homekey facilities
and for evidence-based solutions that include rapid rehousing; rental subsidies;
subsidies for new and existing housing and emergency shelters; services such as
workforce, education, and training programs to support housing stability; and
increasing permanent housing through efforts that include hotel and motel conversions.
VersionnumberjA1s8RKnoP5m HOMELESSNESS AND LOCAL GOVERNMENT
CALIFORNIA STATE BUDGET — 2020-21 67

With strategic funding to maintain fiscal sustainability while continuing to make
investments, the Budget includes $1.2 billion across multiple departments and programs
to aid local governments addressing homelessness:
LOCAL GOVERNMENT
DIRECT CORONAVIRUS AID, RELIEF, AND ECONOMIC SECURITY ACT (CARES ACT) ALLOCATIONS FOR CITIES AND COUNTIES
The Budget provides a portion of the state’s CARES Act funding to local
governments—$500 million to cities and $1.3 billion to counties—to combat the
COVID-19 pandemic.
• Cities—The Budget provides $225 million to cities with populations greater
than 300,000 that did not receive a direct CARES Act allocation from the federal
government, with the funds distributed according to their relative populations.
Another $275 million is provided to cities with populations less than 300,000, with the
funds distributed according to their relative populations, with each city guaranteed
HOMELESSNESS AND LOCAL GOVERNMENT VersionnumberjA1s8RKnoP5m
68 CALIFORNIA STATE BUDGET — 2020-21
a minimum of $50,000. Recipients must use the funds according to federal law, and
are encouraged to prioritize these funds to support efforts by counties and
Continuums of Care to address the impact of the COVID-19 pandemic on people
experiencing homelessness.
• Counties—The Budget provides $1.3 billion to counties, with the funds distributed
according to their relative populations. Recipients must use the funds according to
federal law, and are encouraged to prioritize these funds to address the public
heath, behavioral health, and other health and human services needs that have
arisen as a result of the COVID-19 pandemic.
Funding is contingent on adherence to federal guidance, the state’s stay-at-home and
other health requirements as directed in executive orders, statutes, and all State
Department of Public Health orders, directives, and guidance issued in response to the
COVID-19 pandemic. To receive funds, cities and counties must submit an application
to the Department of Finance certifying their agreement to comply with these
requirements. This certification form can be found on Finance’s website and must be
submitted by July 10.
REALIGNMENT BACKFILL FOR COUNTIES
The Budget includes $750 million General Fund to provide support for counties
experiencing revenue losses for realigned programs. Counties will prioritize support for
health and human services, entitlement programs, and programs that serve vulnerable
populations. In using these funds, counties will adhere to federal guidance and state
health requirements related to the COVID-19 pandemic. To the extent the federal
government provides sufficient eligible funding by October 15, 2020, an additional
$250 million may be provided to counties for the aforementioned purposes.
Other Significant Adjustments
• Homeless Coordinating and Financing Council Administrative Resources—The
Budget includes $1.5 million General Fund ongoing and 10 permanent positions to
effectively carry out statutory mandates and strengthen its strategic coordination of
the state’s efforts to address homelessness.
• Homeless Data Integration System—The Budget includes statutory changes to allow
the HCFC to establish a statewide Homeless Data Integration System. The system will
consolidate existing homelessness data from the individual Continuums of Care
VersionnumberjA1s8RKnoP5m HOMELESSNESS AND LOCAL GOVERNMENT
CALIFORNIA STATE BUDGET — 2020-21 69

throughout the state and allow the state to understand the demographics and
shared characteristics of the homeless population.
HOMELESSNESS AND LOCAL GOVERNMENT VersionnumberjA1s8RKnoP5m
70 CALIFORNIA STATE BUDGET — 2020-21

LABOR AND WORKFORCE DEVELOPMENT
T he Labor and Workforce Development Agency addresses issues relating to
California workers and their employers and helps businesses and workers thrive in
California. In light of the unprecedented increase in unemployment due to the
COVID-19 Recession, the Budget includes vital investments as California begins to
recover.
ENFORCEMENT OF LABOR LAWS
Chapter 296, Statutes of 2019 (AB 5) established a new statutory employment test to
determine whether a worker may be classified as an independent contractor instead of
an employee for certain purposes. Under AB 5, all workers are classified as employees
unless the employer can demonstrate a worker meets specified conditions, known as
the ABC test. The Budget provides resources to implement AB 5, including $17.5 million
for the Department of Industrial Relations, $3.4 million for the Employment Development
Department (EDD), and $780,000 for the Department of Justice. These resources will
allow these state entities to train employees on the employment determination test and
to conduct more hearings, investigations, and litigation related to AB 5.
PAID FAMILY LEAVE
Throughout the year, the Administration convened several Task Force meetings
comprised of experts representing workers, early education, legislative staff, and
employers to develop recommendations to expand the Paid Family Leave (PFL)
VersionnumberjA1s8RKnoP5m LABOR AND WORKFORCE DEVELOPMENT
CALIFORNIA STATE BUDGET — 2020-21 71

program. The Task Force developed a long-term, step-by-step plan so that policy
changes could be phased in over time. As a first step, the Task Force focused on
expanding job protections.
The Administration is committed to expanding job protections this year, and the Budget
includes $1 million General Fund to support the training needs of small businesses with
employees utilizing the PFL program.
UNEMPLOYMENT INSURANCE
Demand for unemployment insurance (UI) benefits in California continues to grow as a
result of the impact of the COVID-19 Recession. Since mid-March, the EDD has received
approximately 6 million UI claims, including 5 million regular UI claims and 1 million
Pandemic Unemployment Assistance (PUA) claims, and provided $37 billion in UI claim
benefits.
The Budget includes an increase of $38 billion to reflect the projected increase in UI
benefit payments. The Budget also includes $126.3 million and 777 positions to reflect
additional federal funding and the projected workload increase to process UI benefit
claims. Much of these resources are federally funded as a result of recently enacted
federal legislation in response to the COVID-19 pandemic. This includes the Federal
Pandemic Unemployment Compensation program that provides a temporary
emergency increase of $600 per week in addition to the regular UI weekly benefit
through July 31, 2020. It also includes the PUA program to provide up to 39 weeks of UI
benefits to individuals who do not qualify for traditional unemployment compensation,
including business owners, the self-employed, independent contractors, and other
individuals not usually eligible for regular state UI benefits who are unemployed as a
direct result of the COVID-19 pandemic. The PUA program runs through
December 26, 2020.
Under federal law, states that exhaust their UI trust fund may borrow from the federal UI
trust fund to continue UI benefit payments. Pursuant to the Families First Coronavirus
Response Act enacted in March, interest on federal loans are waived through
December 31, 2020. The federal government has also authorized California to borrow as
needed to continue paying benefits to eligible UI benefit claimants. Like other states,
California has already begun borrowing.
The Budget also includes statutory changes through January 1, 2021 that conform the
state’s UI program to federal guidelines in order to receive additional federal UI
administration funds. States must ease eligibility requirements and access to
LABOR AND WORKFORCE DEVELOPMENT VersionnumberjA1s8RKnoP5m
72 CALIFORNIA STATE BUDGET — 2020-21

unemployment compensation for claimants and relieve employers of benefit charges
related to the COVID-19 pandemic. California qualifies for approximately $120 million in
federal unemployment administration funds.
Other Significant Adjustments
• The Budget also includes $46 million to continue implementation of the Benefit
Systems Modernization project. This project will modernize and consolidate the EDD's
UI, Disability Insurance, and PFL benefit systems. The state of EDD’s information
technology system and the need to replace it has come into sharp focus during the
COVID-19 pandemic as millions of Californians have accessed the system to apply
for UI benefits.
• Finally, the Budget provides a $10 million General Fund investment for the Social
Entrepreneurs for Economic Development initiative, providing entrepreneurial
training for individuals, including those who are undocumented. The purpose of this
initiative is to support economically disadvantaged communities facing significant
barriers to employment by advancing economic mobility through entrepreneurial
opportunities and spurring economic and racial justice alongside economic
contributions to the state.
VersionnumberjA1s8RKnoP5m LABOR AND WORKFORCE DEVELOPMENT
CALIFORNIA STATE BUDGET — 2020-21 73

This page intentionally blank to facilitate double-sided printing.

JUDICIAL BRANCH
T he Judicial Branch consists of the Supreme Court, Courts of Appeal, trial courts, and
the Judicial Council. The trial courts are funded with a combination of General
Fund, county maintenance-of-effort requirements, fines, fees, and other charges. Other
levels of the Judicial Branch receive most of their funding from the General Fund.
The Budget includes total funding of $4.0 billion ($2.1 billion General Fund and
$1.9 billion other funds) in 2020-21 for the Judicial Branch, including $1.5 billion General
Fund and $1.2 billion other funds to support the trial courts. The Budget also includes
$190 million General Fund and $147 million other funds to support programs offered by
trial courts such as Court Appointed Dependency Counsel, California Collaborative
and Drug Court Projects, and the Equal Access Fund, among others. For the State Level
Judiciary, which is comprised of the Supreme Court, Courts of Appeal, the Judicial
Council, and the Habeas Corpus Resource Center, the Budget includes $491.3 million
General Fund and $497.2 million other funds.
MAINTAINING ACCESS TO JUSTICE
OPERATIONAL CHANGES IN RESPONSE TO COVID-19
The Judicial Branch has had to radically change its operations to protect the public
from the spread of COVID-19 while also maintaining access to justice. Actions taken by
the Judicial Council include extending court deadlines, suspending jury trials, using
VersionnumberjA1s8RKnoP5m JUDICIAL BRANCH
CALIFORNIA STATE BUDGET — 2020-21 75

technology to conduct proceedings remotely, and suspending evictions and
foreclosures. Trial courts have also taken actions to protect the public by closing
courthouses and courtrooms, limiting operations to only essential court functions, and
suspending collection activities, among others.
These actions have resulted in delays in court operations and a backlog of cases that
will take time for the courts to process as they continue to practice physical distancing.
In an effort to help the trial courts address the backlog and resume normal operations,
the Budget includes $50 million one-time General Fund in 2020-21.
The COVID-19 pandemic has required the Judicial Branch to reevaluate processes and
like the rest of state government, the Judicial Branch should use this opportunity
to improve court operations. The Budget includes $25 million General Fund in 2020-21
and 2021-22 for modernizing court operations with the goal of achieving efficiencies
and increasing access to court services online. For example, the Judicial Council may
allocate this funding for projects such as enabling electronic case filing, digitizing court
documents, resolving disputes online, and utilizing video technology to facilitate remote
participation in hearings. These efficiency efforts are even more important now
to maintain access to justice.
As a result of the COVID-19 Recession and absent the receipt of additional federal
funds to assist the state with the fiscal crisis, reductions are necessary to balance the
state budget. To the extent the federal government provides sufficient federal funds by
October 15, 2020, which are eligible for purposes identified below, funds will be
appropriated for the 2020-21 fiscal year as follows:
• Trial Courts—A base reduction of $176.9 million General Fund in 2020-21 and
ongoing. If the federal government provides sufficient funding, $126.9 million will be
triggered off in 2020-21. The amount that would be restored in 2020-21 is lower
because the Budget includes a $50 million one-time augmentation for the trial court
caseload backlog.
• State Level Judiciary—A decrease of $23.1 million General Fund in 2020-21 and
ongoing, all of which will be triggered off if the federal government provides
sufficient funding.
JUDICIAL BRANCH VersionnumberjA1s8RKnoP5m
76 CALIFORNIA STATE BUDGET — 2020-21

Other Significant Adjustments
• Fine and Fee Revenues—The Budget includes an additional $238.5 million one-time
General Fund in 2020-21 to backfill declining fine and fee revenues: $90.9 million in
2019-20 and $147.6 million for 2020-21.
• Trial Court Employee Benefits—$30 million ongoing General Fund for trial court
employee health benefit and retirement costs.
• Language Access—$9.9 million General Fund in 2020-21 and $9.6 million General
Fund annually thereafter for increased costs for court interpreters and to purchase
equipment for the newly established Video Remote Interpreting Program.
• County Law Libraries—$7 million one-time General Fund to backfill the County Law
Libraries for lost revenue due to the reduction in civil case filings from the COVID-19
pandemic.
VersionnumberjA1s8RKnoP5m JUDICIAL BRANCH
CALIFORNIA STATE BUDGET — 2020-21 77

This page intentionally blank to facilitate double-sided printing.

PUBLIC SAFETY
T his Chapter describes items in the Budget related to California's correctional system
and public safety programs.
DEPARTMENT OF CORRECTIONS AND REHABILITATION
The California Department of Corrections and Rehabilitation (CDCR) incarcerates
people convicted of the most violent felonies, supervises those released to parole, and
provides rehabilitation programs to help them reintegrate into the community. The
Department strives to facilitate the successful reintegration of the individuals in its care
back to their communities equipped with the tools to be drug-free, healthy, and
employable members of society by providing education, treatment, and rehabilitative
and restorative justice programs.
The Budget sustains prior investments that support the Administration’s long-term goals
of further improving rehabilitation, reentry and restorative justice programs. It also
reflects the Administration's commitment to limit the expansion of new programs due to
the drastic budget impacts of the COVID-19 Recession, reduce costs through
efficiencies, and implement long-term prison reform strategies.
The Budget includes total funding of $13.4 billion ($13.1 billion General Fund and
$311 million other funds) in 2020-21 for the Department.
VersionnumberjA1s8RKnoP5m PUBLIC SAFETY
CALIFORNIA STATE BUDGET — 2020-21 79

PRISON CAPACITY
The adult prison population has declined steadily over many years, presenting
opportunities for CDCR to reduce its reliance on contract prison capacity. After more
than a decade, CDCR terminated its final remaining contract to house inmates
out-of-state in June 2019. In addition, CDCR terminated its final remaining contract with
a private in-state facility for male inmates in May 2020. Based on current population
trends, the Administration plans to close the remaining three male, public in-state
contract correctional facilities in 2020-21.
In addition, the Budget plans to close one state-owned correctional facility beginning in
2021-22 and a second facility beginning in 2022-23. While statutory authority is not
necessary to implement the prison closure plan, the Budget agreement included
statutory changes that would have specified a reporting timeline and considerations to
be made in determining which prisons should be prioritized for closure. These closures
will be achieved through various actions that will further reduce the prison population
through rehabilitation, which are described below.
COVID-19 RESPONSE
CDCR took a series of proactive measures to reduce the presence and spread of
COVID-19 in its institutions. Among other things, CDCR restricted inmate movement,
activated gyms and dayrooms to create physical distancing, modified the parole
suitability hearing process to take place by video and telephone conference, restricted
family visitation and provided inmates with free telephone calls, initiated a staff
screening process upon entering facilities, suspended large-scale construction projects
within the secure perimeter of CDCR facilities, and suspended in-person rehabilitative
programs and education classes. CDCR also delayed the Basic Correctional Officer
Academy and modified the training to provide for social distancing, and employed the
California Prison Industry Authority to produce cloth face masks and hand sanitizer for
inmates and staff.
Before an incarcerated person is released from any institution, they are offered testing
for COVID-19 within seven days of their anticipated release. For those who test positive,
CDCR works with state and local public health and law enforcement officials to find
housing where the incarcerated person can be safely isolated and monitored.
Individuals are also released with reusable cloth barrier masks provided by the
Department with appropriate precautionary measures taken during transportation.
PUBLIC SAFETY VersionnumberjA1s8RKnoP5m
80 CALIFORNIA STATE BUDGET — 2020-21

Beginning in June 2020, CDCR also began expanded employee testing for COVID-19 at
skilled nursing facilities consistent with guidance from the California Department of
Public Health. This guidance includes baseline testing of all employees by the end of
June, and separate protocols for continued testing, the frequency of which is
dependent on whether an institution has active outbreaks. Beginning in July 2020,
CDCR expects to expand employee testing protocols to the remaining institutions
without skilled nursing facilities.
On March 24, 2020, the Governor issued Executive Order N-36-20, to mitigate the
spread of COVID-19 in the state's adult institutions by stopping intake for 30 days, which
was subsequently extended to 60 days. While intake resumed on May 29, 2020, CDCR is
proceeding with an abundance of caution. For example, the Department is offering
testing to all inmates upon intake and has instituted a mandatory 14-day quarantine
period in its reception centers. CDCR estimates that approximately 8,200 inmates will be
held in county jails as a result of the suspension of intake for 60 days and anticipates
transferring all those inmates to CDCR in the coming months.
In addition, CDCR initiated the release of inmates who were within 60 days of release at
the beginning of April 2020, and who were not serving a current term for domestic
violence, a violent felony, or required to register as a sex offender. These actions have
contributed to a significant decline in the prison population. As of June 17, 2020, the
adult inmate population was 114,643, compared to 122,941 as of March 25, 2020, a
reduction of 8,387 inmates.
At the time of this publication, court orders and changing conditions are requiring
additional actions to mitigate the spread of COVID-19 and protect staff and inmates.
EARNING RELEASE THROUGH REHABILITATION
The Budget sustains academic, vocational and rehabilitative program investments
made in recent years to continue the progress made to support inmates in preparing
for release. These investments in rehabilitation, as well as additional actions highlighted
below, will allow the Department to safely reduce the prison population and achieve
the prison closures described above.
• Reducing Reception Center Process to 30 days—The suspension of intake provided
CDCR the opportunity to move the majority of inmates from reception centers to
mainline institutions, thereby creating space in the reception centers to facilitate
safely reopening intake. CDCR plans to reduce the reception center process to as
VersionnumberjA1s8RKnoP5m PUBLIC SAFETY
CALIFORNIA STATE BUDGET — 2020-21 81

few as 30 days instead of 90 to 120 days. This will allow inmates to begin
participating in academic and rehabilitative programs sooner and will likely enable
CDCR to convert some existing Reception Center housing to General Population
housing in 2020-21. This change is expected to save $3.7 million General Fund in
2020-21, and significantly more in future years with the exact amount depending on
the timing and details of future prison closures.
• Changes to Good Conduct Credits—CDCR will pursue changes to good conduct
credits that will be applied prospectively. These changes will provide greater
incentives for individuals to engage in good conduct such as by participating in
work and program assignments. While the changes are still being developed, the
preliminary estimate is that these changes will save $2.7 million General Fund in
2020-21.
TEMPORARY MODIFIED WORK ASSIGNMENTS
The Budget includes $16.7 million General Fund annually for two years to provide
modified work assignment posts for staff with medical conditions that result in restrictions
or limitations, such as pregnancy, to provide them opportunities to continue working or
return to work earlier than would otherwise be possible. This proposal advances the
Administration’s commitment to the health and wellness of its correctional staff and
promotes the recruitment and retention of a diverse workforce. The Department will use
the period covered by the limited term funding to determine the appropriate level of
ongoing resources for this program.
The Budget also includes the following General Fund investments:
• Mental Health Psychiatry Registry—$13.3 million for contract psychiatry services to
meet the federal court order to fill at least 90 percent of the state prison system’s
psychiatry positions.
• Intake Cell Retrofits for Suicide Prevention—$3.8 million one-time to retrofit 64 intake
cells across the state to provide a safer environment for inmates entering
segregated housing.
• Expansion of Statewide Telepsychiatry Program—$5.9 million to support expansion of
telepsychiatry, which uses secure videoconferencing to increase inmate access to
mental health care services.
PUBLIC SAFETY VersionnumberjA1s8RKnoP5m
82 CALIFORNIA STATE BUDGET — 2020-21

• Legionella Remediation at California Health Care Facility—$9.7 million in 2019-20 and
$4.3 million ongoing to establish new water system protocols to control Legionella
bacteria and minimize the risk of illness at the California Health Care Facility.
• Information Technology Security Staffing and Tools—$2.9 million for additional
resources to strengthen security and cybersecurity infrastructure to protect patient
health records.
• Medical Imaging Equipment—$1 million to replace and maintain CDCR’s medical
imaging equipment.
• Secure Electronic Data Share Unit for Patient Health Records—$377,000 to support an
electronic health care data exchange process to transfer health records to counties
for inmates who are transitioning to county custody or the community.
VALLEY STATE PRISON YOUTH OFFENDER REHABILITATIVE COMMUNITY
The Budget includes $1.3 million General Fund in 2020-21, and $2 million ongoing, to
establish a Youth Offender Rehabilitative Community at Valley State Prison in
Chowchilla. The program will house individuals under the age of 26 together in a
campus-style environment conducive to positive behavioral programming and will
deliver educational programs targeted to their unique needs.
OTHER SIGNIFICANT ADJUSTMENTS
• Consolidate Fire Camps—The Budget includes the closure of eight camps, currently
not at capacity, that will be selected in coordination with the California Department
of Forestry and Fire Protection. The locations selected will take into consideration
proximity to other fire camps in an effort to minimize impacts to communities that
rely on the services provided by inmate fire crews. CDCR’s savings are estimated to
be $7.4 million General Fund in 2020-21 and $14.7 million ongoing.
• Draw Down Federal Funds for Health Care for Community Reentry Programs—Under
federal policy, individuals who are considered prison inmates are ineligible for
Medicaid benefits. However, this exclusion does not apply to individuals residing in
supervised residential treatment facilities, such as reentry facilities designed to
transition individuals from prison to the community. The Centers for Medicare and
Medicaid Services (CMS), which sets these policies, recently issued guidance
outlining how it distinguishes between prisons and supervised residential treatment
facilities. Specifically, CMS has stated that in order to qualify for Medicaid eligibility
residents must generally have freedom to seek employment in the community and
VersionnumberjA1s8RKnoP5m PUBLIC SAFETY
CALIFORNIA STATE BUDGET — 2020-21 83

access resources available to the general public, such as education, libraries, and
healthcare facilities. CDCR is implementing operational changes at its reentry
facilities to adhere to these guidelines in a manner that ensures public safety,
thereby allowing the state to draw down federal funding for residents’ health care
and saving $4.2 million General Fund in 2020-21 and $8.5 million ongoing.
• Eliminate the Integrated Services for Mentally Ill Parolee Program—The Integrated
Services for Mentally Ill Parolee Program provides wraparound services, including
some transitional housing, for approximately 1,500 of 18,000 mentally ill parolees. As
this program is costly at $10,000 per parolee annually and has shown limited
effectiveness at reducing recidivism, the Budget eliminates the program. The
Department will adjust policies to connect these individuals with community
resources, which ultimately provide better continuity of care long-term. Elimination
of this program is expected to result in savings of $8.1 million General Fund in 2020-21
and $16.3 million ongoing General Fund. Although the Budget reduces funding for
the program, statutory changes are necessary to eliminate the program.
• Remote Court Appearance—CDCR will pursue efforts to increase video capabilities
to enable remote court appearances by inmates and staff. This will result in
efficiencies associated with transportation of inmates from their assigned prison to a
prison closer to the court, and daily transportation of inmates to court. This will also
reduce inmate absences from rehabilitation and work assignments. Statutory
changes are needed to implement this proposal.
• Suspension of the Transition-Aged Youth Pilot in the Division of Juvenile Justice—The
Budget suspends the seven-year pilot program operated by the Division of Juvenile
Justice to divert transition-aged youth from adult prison to a juvenile facility. The pilot
had limited participation and its suspension will result in estimated savings of
$3.1 million General Fund in 2020-21 and ongoing. Although the Budget reduces
funding for this program, statutory changes are necessary to suspend the pilot.
• Integrated Substance Use Disorder Treatment Program Reduction—The Budget
implements a one-time reduction of $30 million to the Integrated Substance Use
Disorder Treatment Program reflecting expected challenges in full program
implementation due to the COVID-19 pandemic.
PUBLIC SAFETY VersionnumberjA1s8RKnoP5m
84 CALIFORNIA STATE BUDGET — 2020-21
PAROLE
CAP PAROLE TERMS
In an effort to align community supervision terms with evidence that most recidivism
occurs earlier in the supervision period, create incentives for positive behavior change,
and more effectively use limited state resources, the Budget will cap supervision for
certain parolees at 24 months and establish earned discharge for non-Penal Code
section 290 registrants at 12 months. The estimated savings are expected to be
$23.2 million General Fund in 2020-21, increasing to $64.6 million ongoing General Fund
in 2023-24. The Budget includes a reduction of funding associated with this proposal.
However, statutory changes are necessary to implement the proposal and realize these
projected savings.
EXPANDING THE ELDERLY PAROLE PROGRAM AND COMPASSIONATE RELEASE
The Budget agreement includes additional opportunities for elderly and terminally ill
inmates to be released from custody. Statutory changes are necessary to modify the
existing Elderly Parole Program to lower the criteria for eligibility for an elderly parole
suitability hearing from inmates aged 60 or older who have served 25 continuous years
of a sentence to inmates aged 50 or older who have served 20 continuous years.
The Budget agreement also expands the compassionate release process whereby the
Secretary of the CDCR can request the court resentence an inmate diagnosed with an
incurable condition that will result in death within twelve months. Statutory changes are
necessary to implement this proposal.
These changes are anticipated to result in General Fund cost savings in future years
while simultaneously providing consideration for release to inmates at high-risk for
COVID-19 and who are not likely to recidivate.
INMATE MEDICAL CARE AND MENTAL HEALTH SERVICES
The Budget continues the state’s significant financial commitment to improve the
Department’s delivery of health care services to inmates. The Budget dedicates
$3.6 billion General Fund for health care services programs, which provide access to
mental health, medical, and dental care that is consistent with the standards and
scope of services appropriate within a custodial environment.
VersionnumberjA1s8RKnoP5m PUBLIC SAFETY
CALIFORNIA STATE BUDGET — 2020-21 85

OTHER SIGNIFICANT ADJUSTMENTS
The Budget also removes $20.6 million from CDCR’s baseline budget to eliminate the
Tattoo Removal Program ($2.1 million) and by reducing ongoing prison maintenance
funding ($18.5 million).
Although the state is not in a fiscal position to expand many programs given the drastic
budget impacts of the COVID-19 Recession, the Budget provides $943,000 to promote
objectivity and fairness in the investigation of equal opportunity complaints and
$37.6 million for necessary roof replacements at California State Prison, Sacramento.
REALIGN DIVISION OF JUVENILE JUSTICE
The Division of Juvenile Justice currently houses approximately 800 youth. The
Governor’s Budget proposed to transfer the Division of Juvenile Justice to a newly
created independent department within the Health and Human Services Agency. That
approach was intended to align the rehabilitative mission of the state’s juvenile justice
system with trauma-informed and developmentally appropriate services supported by
programs overseen by the state’s Health and Human Services Agency. The May
Revision proposed instead to transfer the responsibility for managing all youth to local
jurisdictions and direct a portion of the state savings to county probation departments.
The Administration continues to support the shift of this population to local jurisdictions
and will continue to work with the Legislature and relevant stakeholders over the
coming weeks to develop a plan for implementing a successful realignment.
CONFORMING STATUTE TO REALIGNMENT
The Budget agreement includes changes to existing law to clarify that an individual’s
underlying offense determines whether their sentence is served in a county jail or state
prison. Currently, if an enhancement qualifies for state prison, the entire sentence is
served in state prison—even though the underlying offense would otherwise be served
in a county jail. CDCR estimates these changes will affect several dozen individuals
annually and reduce the prison population by around 150 inmates on an ongoing basis.
Statutory changes are necessary to implement this proposal.
PUBLIC SAFETY VersionnumberjA1s8RKnoP5m
86 CALIFORNIA STATE BUDGET — 2020-21

LOCAL PUBLIC SAFETY
Proposition 47 Savings—In November 2014, voters passed Proposition 47 which requires
misdemeanor rather than felony sentencing for certain property and drug crimes and
permits inmates previously sentenced for these reclassified crimes to petition for
resentencing. The Department of Finance currently estimates net savings of
$102.9 million General Fund for Proposition 47 when comparing 2019‑20 to 2013‑14.
These funds will be allocated according to the formula outlined in the initiative.
Post Release Community Supervision—The Budget includes $12.9 million General Fund
for county probation departments to supervise the temporary increase in the average
daily population of individuals on Post Release Community Supervision as a result of the
implementation of Proposition 57.
COMMISSION ON PEACE OFFICER STANDARDS AND TRAINING
To meet the short-term needs of local law enforcement training due to the COVID-19
pandemic and the potential long-term impact of reduced state and local budgets, the
Commission on Peace Officer Standards and Training (POST) will leverage existing
funding provided in the 2018 Budget Act to provide for the strategic development and
implementation of a framework to support distance learning opportunities for all
California law enforcement agencies.
Specifically, the Budget reappropriates $10 million General Fund to: (1) create a
Distance Learning Grant Program, (2) increase the functionality of POST’s Learning
Portal, and (3) upgrade previously produced and developed distance learning courses
and videos.
The Budget establishes a Distance Learning Grant Program to allocate $5 million to
governmental entities and non-profit law enforcement educational institutions to
develop and deliver training through innovative, distance learning modalities with a
focus on use of force and de-escalation, implicit bias and racial profiling, community
policing, cultural diversity, and organizational wellness.
The POST Learning Portal is a secure website available for California peace officers,
dispatchers, and law enforcement instructors to access self-paced training courses and
applications to support law enforcement training in California. Access to the Learning
Portal is free to California law enforcement in the POST program. POST will explore
replacing, enhancing, and/or modernizing the functionality of the Learning Portal by
VersionnumberjA1s8RKnoP5m PUBLIC SAFETY
CALIFORNIA STATE BUDGET — 2020-21 87

adding and incorporating additional modules that would provide law enforcement
agencies the ability to develop their own agency-specific courses to develop and
deliver their own instructor-led distance training.
Finally, POST will identify and upgrade existing distance learning courses and videos that
are in legacy software formats no longer supported. By converting these materials,
POST can ensure that relevant training materials continue to be accessible to local law
enforcement agencies. POST also anticipates continued creation of high-quality, online
in-service and specialized training videos that enable law enforcement to meet
Continuous Professional Training mandates through distance learning options.
To reduce costs, the Budget also reverts $16.5 million General Fund appropriated in prior
budgets provided to POST for training reimbursements and grants that are unlikely to be
expended given the restrictions associated with the COVID-19 pandemic.
VICTIM SERVICES
Crime victims and their families bear significant physical, emotional, and financial
burdens. The Budget reflects the Administration’s continuing commitment to both assist
crime victims and their families in recovering from such traumas, and to proactively
make strategic investments to protect those who face a high risk of victimization by
including the following proposals:
• Restitution Fund Backfill—$23.5 million one-time General Fund to backfill declining
fine and fee revenues in the Restitution Fund, allowing the Victim Compensation
Board to continue operating at its current resource level.
• California Violence Intervention and Prevention (CalVIP) Grant Program—$9 million
ongoing for the Board of State and Community Corrections to continue funding the
CalVIP program, which provides competitive grants to cities and community-based
organizations to support services such as community education, diversion programs,
outreach to at-risk transitional age youth, and violence reduction models.
IMPROVING INDIGENT DEFENSE
Currently, the Office of the State Public Defender’s mission is focused on assisting
individuals sentenced to death with post-conviction appeals. The Budget includes
$4 million General Fund in 2020-21 and $3.5 million annually thereafter to expand the
Office’s mission to include improving the quality of indigent defense services provided
PUBLIC SAFETY VersionnumberjA1s8RKnoP5m
88 CALIFORNIA STATE BUDGET — 2020-21

by counties. Specifically, these resources are intended to provide training and
technical assistance for attorneys providing indigent defense, with the goal of
promoting more effective representation statewide. While there is funding in
the Budget, statutory changes are needed to expand the Office's mission to allow for
these activities.
In addition, the Budget includes $10 million one-time General Fund for the Board of
State and Community Corrections to administer a pilot program, in consultation with
the Office of the State Public Defender, to supplement local funding for indigent
criminal defense. This funding will also support the completion of an evaluation to
determine the effectiveness of the grants in improving indigent defense services.
DEPARTMENT OF JUSTICE
As chief law officer of the state, the Attorney General has the responsibility to see that
the laws of California are uniformly and adequately enforced. This responsibility is
fulfilled through the diverse programs of the Department of Justice (DOJ). The
Department provides legal services on behalf of the people of California; serves as
legal counsel to state agencies; provides oversight, enforcement, education, and
regulation of California's firearms laws; provides evaluation and analysis of physical
evidence; and supports data needs of California’s criminal justice community. The
Budget includes total funding of approximately $1.1 billion, including $369.2 million
General Fund in 2020-21, to support DOJ.
BUREAU OF FIREARMS
The Bureau of Firearms regulates and enforces the manufacture, sale, ownership, safety
training, and transfer of firearms. In recent years, several laws have been enacted that
affect the purchase and ownership of a firearm in California, thereby increasing the
Bureau’s workload. The Budget continues the Administration’s commitment to
strengthen gun violence protections by including the following significant investments:
• Firearm Precursor Parts (AB 879)—$5.9 million General Fund in 2020-21 and
$8.3 million in 2021-22 to regulate and track the sale of firearm precursor parts.
AB 879 requires the sale of firearm precursor parts to be conducted by or processed
through a licensed firearm precursor part vendor beginning July 1, 2024. Precursor
parts can be used to manufacture “ghost guns” that are untraceable due to a lack
of serial numbers or identifying markers. Given the risk that such guns present to
VersionnumberjA1s8RKnoP5m PUBLIC SAFETY
CALIFORNIA STATE BUDGET — 2020-21 89

public safety, the Budget includes resources to accelerate the implementation of
these requirements to July 1, 2022. However, statutory changes are needed to
facilitate this acceleration.
• Firearms Information Technology Modernization—$2.4 million Dealers’ Record of Sale
(DROS) Special Account to begin the planning and analysis phase of combining
and modernizing the existing firearms tracking systems. DOJ currently tracks firearms
using 11 information technology systems that are antiquated, costly to update, and
inefficient at data collection. New firearms policies and reporting requirements are
difficult to implement given the disconnected structure of these systems.
Modernizing these systems will enable DOJ to respond to changing business needs
and legislative mandates efficiently and in a cost-effective manner.
• Semiautomatic Rifle Sales (SB 61)—$2.1 million DROS Special Account in 2020-21,
$1 million in 2021-22, and $379,000 annually thereafter to implement and enforce
the provisions of SB 61 that prohibit the sale of semiautomatic centerfire rifles to any
person under 21 years of age, except a law enforcement officer or active duty
member of the Armed Forces, and prohibit a person from making an application to
purchase more than one semiautomatic centerfire rifle in any 30-day period.
• Tracking Firearms Sales (SB 376)—$981,000 DROS Special Account in 2020-21,
$306,000 in 2021-22, and $232,000 annually thereafter to track and report annual
firearms sales, loans, and transfers to enforce the provision under SB 376 that
reduces the threshold for which a manufacturer’s license is required from
100 firearms manufactured annually to 50.
• “Other” Firearm Registration—$128,000 DROS Special Account in 2020-21, $862,000 in
2021-22, and $14,000 annually thereafter to close regulatory loopholes for assault
weapons that are not currently defined as a rifle, pistol, or shotgun. This proposal
enables DOJ to appropriately define and regulate such weapons. While this funding
is included in the Budget, statutory changes are needed to close this loophole and
allow DOJ to regulate these firearms.
LEGAL SERVICES
HEALTHCARE RIGHTS AND ACCESS SECTION
In recent years, there has been an increase in healthcare litigation due to issues such as
the opioid crisis, drug price-fixing, antitrust cases, and defenses of the Affordable Care
Act. Currently, healthcare-related litigation is handled by separate units throughout
DOJ. The Budget includes $6.9 million in 2020-21 ($3.7 million Attorney General Antitrust
PUBLIC SAFETY VersionnumberjA1s8RKnoP5m
90 CALIFORNIA STATE BUDGET — 2020-21

Account and $3.2 million Unfair Competition Law Fund) and $6.7 million annually
thereafter ($3.6 million Attorney General Antitrust Account and $3.1 million Unfair
Competition Law fund) to establish the Healthcare Rights and Access Section to
consolidate and centralize healthcare litigation within DOJ. This approach allows DOJ
to handle the increase in healthcare litigation and develop expertise and specialization
in this area of law.
Other Significant Adjustments
• Bureau of Forensic Services—$35.8 million one-time ($25.8 million General Fund and
$10 million Fingerprint Fees Account) to backfill the continued decline in fine and
fee revenues in the DNA Identification Fund. This funding will enable DOJ to
continue processing forensic evidence for client counties.
• Criminal Records: Automatic Relief (Chapter 578, Statutes of 2019 (AB 1076))—$3.7 million Fingerprint Fees Account in 2020-21, $4 million in 2021-22,
and $1.9 million annually thereafter to review records in statewide criminal justice
databases to identify persons eligible to have their arrest or criminal conviction
records withheld from disclosure and modify existing systems to grant such relief
automatically. Statutory changes are needed to delay the implementation of AB
1076 until July 1, 2022. This will provide DOJ sufficient time to make the necessary
information technology improvements to implement this bill.
• California Law Enforcement Telecommunications System: Immigration (Chapter 789, Statutes of 2019 (AB 1747))—$2.8 million General Fund in 2020-21, $2.9 million in
2021-22, and $2.5 million annually thereafter to conduct investigations and audits to
monitor compliance with AB 1747, which limits the use of the California Law
Enforcement Telecommunications System for immigration enforcement purposes.
• Replacement of License 2000 System—$724,000 one-time Gambling Control
Fines and Penalties Account for the initial planning and analysis phase of replacing
the License 2000 System, which is used by the Bureau of Gambling Control and
Gambling Control Commission to manage cardroom licensing, registration, and
auditing functions.
• Sex Offender Registration (Chapter 541, Statutes of 2017 (SB 384)) Funding Alignment—A net change of zero by moving $4.8 million General Fund expenditures
from 2020-21 and 2021-22 to 2022-23 and 2023-24, to align the funding to implement
SB 384 with an updated implementation timeline. Statutory changes are needed to
implement modifications to SB 384 that will ease the workload burden for DOJ, the
courts, and local law enforcement agencies.
VersionnumberjA1s8RKnoP5m PUBLIC SAFETY
CALIFORNIA STATE BUDGET — 2020-21 91

ELIMINATION OF CERTAIN CRIMINAL ADMINISTRATIVE FEES
State law authorizes state and local governments to charge administrative fees to
individuals in the criminal justice system to recover costs for various activities, including
probation supervision, representation by counsel, and diversion programs, among
others. These fees can have a significant impact on low-income individuals and people
of color who are disproportionately represented in the state’s criminal justice system.
Specifically, these fees often place an undue burden on those who cannot afford to
pay and can create financial hardship for individuals seeking to get their lives back on
track following a criminal conviction. Therefore, the Administration is committed to
working with the Legislature to provide economic relief to this population by eliminating
certain criminal administrative fees.
PUBLIC SAFETY VersionnumberjA1s8RKnoP5m
92 CALIFORNIA STATE BUDGET — 2020-21

NATURAL RESOURCES
T he Natural Resources Agency consists of 26 departments, boards, commissions and
conservancies responsible for administering programs to conserve, restore, and
enhance the natural, historical, and cultural resources of California. The Budget
includes $6.6 billion ($3.6 billion General Fund, $1.6 billion special funds, and $1.4 billion
bond funds) for programs included in this Agency.
DEPARTMENT OF WATER RESOURCES
The Department of Water Resources (DWR) protects, conserves, develops, and
manages California's water. The Department also works to prevent and minimize flood
damage, oversee the safety of dams, and educate the public about the importance
of water and its efficient use.
SUSTAINABLE GROUNDWATER MANAGEMENT ACT
The Sustainable Groundwater Management Act (SGMA) was signed into law in
September 2014. SGMA assigns the primary responsibility for ongoing groundwater
management to local entities. Local agencies are required to form Groundwater
Sustainability Agencies (GSAs) to then develop and implement Groundwater
Sustainability Plans (GSPs) that identify actions and implementation measures to halt
overdraft and bring groundwater basins into balanced levels of pumping and recharge
within 20 years of adoption. DWR is charged with two key responsibilities under SGMA:
VersionnumberjA1s8RKnoP5m NATURAL RESOURCES
CALIFORNIA STATE BUDGET — 2020-21 93

(1) establishing the regulations for how a GSP must be prepared and assessing the
GSP’s likelihood of achieving sustainability, and (2) assisting the locals in preparing and
implementing their GSPs through technical, planning, and other support.
The Budget includes $9.6 million and 37 positions to further develop DWR’s Sustainable
Groundwater Management Program and provide critical assistance to GSAs. The
resources included in the Budget are critical to advancing SGMA while assisting local
communities with implementation of strong GSPs that can achieve groundwater
sustainability and helping communities plan for major changes in groundwater
management that could affect economic activity.
The state remains committed to supporting local communities' transition to sustainable
groundwater use, and DWR will allocate $26 million of existing Proposition 68 bond funds
to local agencies in critically overdrafted basins to help defray the cost of
implementation projects. In addition, a state interagency team will be created to work
with stakeholders to identify tools and strategies to address the economic,
environmental, and social effects of changing land use and agricultural production.
Other Significant Adjustments
• American River Common Features Flood Control Project—$46 million one-time
General Fund for the 2020-21 cost associated with a Sacramento region flood
control project that leverages $1.5 billion in federal funding.
• New River Improvement Project—$18 million one-time General Fund and $10 million
Proposition 68 bond funds to support the New River Improvement Project, which will
address solid waste and pollution exposure challenges in the City of Calexico, and
support health, recreation, and economic benefits in the area.
• Salton Sea Management Plan—$19.3 million Proposition 68 bond funds to address
the air quality and habitat restoration objectives at the Salton Sea through
implementation of the North Lake Pilot Project.
DEPARTMENT OF FISH AND WILDLIFE
The Department of Fish and Wildlife, which serves as a trustee for California’s natural
resources, has worked with stakeholders on a statutorily mandated service-based
budget analysis. Preliminary results have identified gaps in specified levels of service.
The Budget continues to support the Department in addressing service-based budget
NATURAL RESOURCES VersionnumberjA1s8RKnoP5m
94 CALIFORNIA STATE BUDGET — 2020-21

gaps by making permanent approximately $23.4 million General Fund that expires in
2020-21, and funding new mandates associated with recently chaptered legislation.
STATE PARKS
Many Californians lack access to parks, open spaces, and natural and cultural
amenities. The Budget includes the following initiatives to expand access to state parks
and open spaces and invest in cultural resources to share their value with the public
and protect them for future generations:
• Improving Access for Underserved Populations—$20 million General Fund to
establish the Outdoor Equity Grants Program under Chapter 675, Statutes of 2019
(AB 209) to enable underserved and at-risk populations to participate in outdoor
environmental education experiences at state parks.
• Eliminate Cost as Barriers for Low-Income Individuals—To increase participation in a
program that provides free day-use entry, the Department will partner with state
and county social and public health programs to increase use of the low-income
pass program.
• Establishing a New State Park—$5 million General Fund to create a new state park
that is inclusive and supports equitable access for all Californians. The Department
will work with various philanthropic, conservation, and park interest groups to secure
a property and design the vision and operations for the new park.
• Acquiring Lands to Expand Parks—$4.6 million bond funds to acquire inholding
properties that expand existing state parks and provide other co-benefits such as
protecting biodiversity.
• Improving Facilities in Urban Areas—$6.1 million Proposition 68 bond funds to
expand access to state parks in urban areas and make other improvements to
parks that serve disadvantaged communities.
• Enhancing Access Programming—$8.8 million Proposition 68 bond funds to expand
both technological and physical access to parks, as well as culturally inclusive
enhancements to park programming and interpretive exhibits.
The Budget includes the following fund shifts:
• Indian Heritage Center—$95 million from the General Fund to lease revenue
bonds. State Parks is in the process of completing the preliminary plans for the
VersionnumberjA1s8RKnoP5m NATURAL RESOURCES
CALIFORNIA STATE BUDGET — 2020-21 95

project. Once the plans are finalized, the state can explore the option of financing
the project from lease revenue bonds.
• Deferred Maintenance—$44 million from the General Fund to Proposition 68 bond
funds for deferred maintenance projects in the state parks system.
DEPARTMENT OF CONSERVATION
California is the nation’s leader in reducing reliance on fossil fuels, limiting greenhouse
gas emissions, and transitioning to a low-carbon economy. This transition includes
strengthening oversight of oil and gas extraction to better protect people and the
environment in a manner that facilitates a thoughtful economic transition.
The mission of California Geologic Energy Management Division (CalGEM) is to protect
human health, safeguard the environment, and advance the state’s climate and
energy goals. The economic downturn resulting from the COVID‑19 pandemic has
increased the need to focus on the environmental and health and safety risks resulting
from idle and deserted wells.
The Budget includes $7.2 million Oil, Gas, and Geothermal Administrative Fund and
25 new positions for activities related to private oil companies operating in California
having adequate financial coverage for idle and orphaned wells, and to improve
public transparency related to natural gas and oil leaks and CalGEM’s regulatory
actions.
STRENGTHENING PARTNERSHIPS WITH TRIBES AND COMMUNITIES
Tribal communities have protected and preserved California’s natural resources since
before the state’s inception. The Budget includes the following significant investments
to strengthen collaboration with California Native American tribes directly affected by
natural resource management decisions:
• Truth and Healing Council—$100,000 annually through 2024-25 from the
Environmental License Plate Fund to the Native American Heritage Commission to
support the establishment of the Truth and Healing Council as identified in the
Governor’s Executive Order N-15-19.
• Environmental Justice—$360,000 ongoing from the Environmental License Plate Fund
to the Agency to establish the positions of Assistant Secretary for Environmental
NATURAL RESOURCES VersionnumberjA1s8RKnoP5m
96 CALIFORNIA STATE BUDGET — 2020-21

Justice and Assistant Secretary for Tribal Affairs to support and expand the Agency’s
effort to institutionalize environmental justice and tribal consultation practices into its
program planning, development and implementation.
VersionnumberjA1s8RKnoP5m NATURAL RESOURCES
CALIFORNIA STATE BUDGET — 2020-21 97

This page intentionally blank to facilitate double-sided printing.

ENVIRONMENTAL PROTECTION
T he California Environmental Protection Agency's programs promote the state’s
economic vitality in a sustainable manner by reducing greenhouse gas emissions,
enhancing environmental quality, and protecting public health. The Secretary
coordinates the state's regulatory programs and provides fair and consistent
enforcement of environmental law. The Budget includes $3.3 billion ($126.6 million
General Fund, $3.2 billion special funds, and $18.3 million bond funds) for programs
included in this Agency.
PROTECTING VULNERABLE COMMUNITIES
The impacts of climate change and environmental pollution continue to be an urgent
threat to the environment and vulnerable populations. The Budget continues to
prioritize the protection of these vulnerable populations.
AIR QUALITY IN DISADVANTAGED COMMUNITIES
The Budget provides $50 million Air Pollution Control Fund to support local air districts’
implementation of Chapter 136, Statutes of 2017 (AB 617). This one-time funding
supports local programs addressing the air quality disparities suffered by California’s
most disadvantaged communities. This funding will support local efforts to deploy
community-scale air pollution monitoring, as well as to develop and execute
community-driven pollution-reduction strategies.
VersionnumberjA1s8RKnoP5m ENVIRONMENTAL PROTECTION
CALIFORNIA STATE BUDGET — 2020-21 99

CAP AND TRADE EXPENDITURE PLAN
The Cap and Trade Program is one of the key policies included in the 2017 Scoping Plan
to achieve the 2030 emission-reduction target specified in Chapter 249, Statutes of 2016
(SB 32). The 2022 Scoping Plan Update will evaluate the state’s progress towards
achieving the SB 32 target and provide a path for achieving carbon neutrality by
mid-century.
As part of the 2022 Scoping Plan Update, the Air Resources Board will evaluate and
identify if any policies, including the Cap and Trade Program, should be adjusted
through a subsequent rulemaking to keep the state on track to achieve the 2030 target
and support further emission reductions to achieve carbon neutrality by mid-century.
While the enacted Budget does not include funding, the Administration will work with
the Legislature in the coming months to enact a Cap and Trade Expenditure Plan for
the 2020-21 fiscal year. Programs that are most protective of vulnerable communities,
such as the Safe and Affordable Drinking Water program and the Community Air
Protection program, should be prioritized.
DEPARTMENT OF TOXIC SUBSTANCES CONTROL
Over the past year, the Administration has developed a vision for the future of the
Department through stakeholder engagement, input from members and committees of
the Legislature, and three public workshops conducted in Sacramento, Bakersfield and
Los Angeles.
The Budget provides $27.3 million General Fund to maintain current levels of funding at
the Department.
Consistent with its commitment to protecting the state’s most vulnerable communities
from toxic pollutants, the Administration will work with the Legislature to secure
long-term sustainable governance and fiscal reforms before the end of the legislative
session.
ENVIRONMENTAL PROTECTION VersionnumberjA1s8RKnoP5m
100 CALIFORNIA STATE BUDGET — 2020-21

STATEWIDE ISSUES AND VARIOUS DEPARTMENTS
T his Chapter describes items in the Budget that are statewide issues or related to
various departments.
TRANSFORMING STATE GOVERNMENT
The COVID-19 pandemic has disrupted state government operations, forcing the state
to find creative ways to adapt and deliver core functions. It has also created an
opportunity to rethink the way the state delivers services to its nearly 40 million residents.
Investments in technology have already advanced the ability of government to deliver
services during the current pandemic, and the state is committed to building on this
progress to make California an example of what government should look like in the
21st century.
Transforming state government will include lessons learned from the state’s real-time
experiment with a statewide telework program. The state’s response has shown that
teleworking on a large scale is possible, and the ability to optimize a telework approach
can reduce the state’s carbon footprint and leased office space, while increasing the
state’s digital presence for the benefit of both California’s employees and the people
they serve.
VersionnumberjA1s8RKnoP5m STATEWIDE ISSUES AND VARIOUS DEPARTMENTS
CALIFORNIA STATE BUDGET — 2020-21 101

GOVERNMENT EFFICIENCY
Led by the Government Operations Agency, the Administration will work with agencies
and departments to examine their workforce to determine classifications and/or
positions that can telework without disruption to serving the citizens of California.
Increased telework can reduce statewide absenteeism, increase employee retention,
promote inclusion, and move the state toward being an “employer of choice.”
Telework is also environmentally favorable, as it reduces vehicle miles traveled and
improves air quality.
The COVID-19 pandemic has challenged the state to reexamine in-person processes to
protect state employees and the public. For example, the Department of Motor
Vehicles (DMV) temporarily closed its field offices, but encouraged the public to use its
alternative service channels such as online, mail, kiosks, and a new Service Advisor on
DMV’s website. Additionally, DMV launched its Virtual Field Office to create new digital
options for transactions with DMV staff that previously required an in-person office visit.
As a result, a substantial majority of all DMV transactions can now be processed without
a field office visit. The state will build on DMV’s successful pilot program and look to
implement similar digital-based services in other agencies or departments that provide
a direct service to the public.
In an effort to transform the way the state conducts business and serves Californians,
the Administration will use the Office of Digital Innovation to assist agencies and
departments to rethink how to meet the public’s needs, including by delivering more
government services online. The state will build on the lessons learned through
establishing the— https://COVID-19.ca.gov —website to build a new CA.gov website.
The new site will be user-centered to allow Californians simple, easily understood
transactions and to access all state information at a single portal.
WORKSPACE INNOVATIONS
With an increased remote workforce, the Administration, led by the Department of
General Services (DGS), will evaluate the state’s real estate portfolio to determine
which agencies and departments may be able to reduce lease space. Agencies and
departments may be able to reconfigure their workspace to include additional
meeting rooms and hoteling space, thereby reducing their lease footprint. Reducing
space will decrease not only lease costs, but also energy costs. Additionally, DGS will
look for possible restacking opportunities in state-owned buildings.
STATEWIDE ISSUES AND VARIOUS DEPARTMENTS VersionnumberjA1s8RKnoP5m
102 CALIFORNIA STATE BUDGET — 2020-21

ADDITIONAL EFFICIENCY AND COST SAVINGS MEASURES
In addition to the efficiencies described above, the Budget includes a 5-percent
reduction to nearly all state department budgets beginning in 2021-22.
• Reduce Travel
◦ Reduce statewide travel costs by using video conferencing for meetings or
trainings, where possible.
◦ Reduce state fuel and insurance costs by assessing use of telematics (a mini GPS
device that tracks distance, time, location, and speed) in state vehicles.
• Improve State Processes
◦ Improve processes and quality of services from the customer’s point of view by
encouraging agencies and departments to attend the Department of Human
Resources’ Lean Academy.
◦ Establish performance-based oversight of regulatory programs to better measure,
track, and allocate limited resources based on predetermined program
performance measures.
EMPLOYEE COMPENSATION
As a result of the COVID-19 Recession, and absent the receipt of additional federal
funds, reductions in state employee compensation costs are necessary to balance the
Budget. To the extent the federal government provides sufficient federal funds by
October 15, 2020, which are eligible for purposes identified below, funds will be
appropriated for the 2020-21 fiscal year.
The Budget includes a provision providing flexibility for the state and bargaining units to
negotiate savings totaling roughly $2.8 billion ($1.4 billion General Fund), which is an
approximate 10-percent reduction in employee compensation. As of June 26, 2020, the
State has reached agreements with 16 of the 21 bargaining units, including the State
Employees’ International Union, Local 1000; California Association of Highway
Patrolmen; California Correctional Peace Officers’ Association; California Statewide
Law Enforcement Association; Professional Engineers in California Government;
California Association of Professional Scientists; International Union of Operating
Engineers (bargaining unit 12); and American Federation of State, County, and
Municipal Employees. The Administration continues to negotiate with the remaining
VersionnumberjA1s8RKnoP5m STATEWIDE ISSUES AND VARIOUS DEPARTMENTS
CALIFORNIA STATE BUDGET — 2020-21 103

bargaining units. To achieve the necessary employee compensation savings,
bargaining units that do not have ratified agreements prior to July 1, 2020, will be
subject to furloughs.
The Budget authorizes the suspension of various employee compensation increases
scheduled for Fiscal Year 2020-21; however, priority is given to targeted salary increases
for the state's lowest paid workers. The Budget also authorizes funding for increases in
health care premiums and enrollment for active state employees, and retiree health
care prefunding for active employees.
STATE RETIREMENT CONTRIBUTIONS
The state makes all required pension payments for 2020-21. The Budget reflects the
following actions:
• California Public Employee’s Retirement System (CalPERS) State Annual Pension Contribution Payment Offset—Chapter 33, Statutes of 2019 (SB 90) authorized a
$3 billion General Fund supplemental pension payment toward the CalPERS state
plans’ unfunded liabilities with the goal of maximizing the state’s savings over the
next three decades. Of the $3 billion, $2.5 billion was paid to CalPERS in 2019.
CalPERS applied approximately $100 million of the $2.5 billion to produce savings in
the 2019-20 employer contributions. The Budget redirects the remaining $2.4 billion
over the next two years to pay the state's obligations that will produce more
immediate savings to the state and results in a reduction in the state’s retirement
contribution in fiscal years 2020-21 and 2021-22.
• Elimination of $500 Million General Fund Supplemental Pension Payment to CalPERS—The Budget eliminates the remaining $500 million General Fund
supplemental pension payment towards the CalPERS state plans’ unfunded liabilities
as authorized under SB 90. SB 90 was subsequently amended by Chapter 859,
Statutes of 2019 (AB 118) to specify that of the $500 million payment to CalPERS,
$243 million will be applied to the California Highway Patrol (CHP) retirement plan.
The Budget instead authorizes the use of Proposition 2 debt repayment funding to
make the $243 million payment to the CHP retirement plan.
• Suspension of the 2020-21 California State Teachers’ Retirement Systems (CalSTRS) Defined Benefit Annual Rate Increase—The Budget suspends the annual rate
increases authorized by the Teachers’ Retirement Board at the 2019-20 level in
2020-21.
STATEWIDE ISSUES AND VARIOUS DEPARTMENTS VersionnumberjA1s8RKnoP5m
104 CALIFORNIA STATE BUDGET — 2020-21

Other Significant Adjustments
• Surplus Money Investment Fund Loan—The Budget includes $221 million within the
2020-21 Proposition 2 debt payment requirement to pay down the General Fund’s
share of the internal cash loan authorized by Chapter 50, Statutes of 2017 (SB 84) to
make a $6 billion supplemental pension payment to the CalPERS state plans in 2017.
• State Employees’ Retirement Contributions—The Budget includes $7.0 billion
($4.0 billion General Fund) for state contributions to CalPERS for state pension costs.
This includes $733 million General Fund for California State University pension costs.
• Teachers’ Retirement Contributions—The Budget includes $3.4 billion General Fund
for state contributions to CalSTRS. The Budget also makes a $297 million
supplemental payment from the Proposition 2 required debt repayment funds.
The State Retirement and Health Care Contributions figure provides an historical
overview of contributions to CalPERS, CalSTRS, the Judges’ Retirement System (JRS), JRS
II, and the Legislators’ Retirement System for pension and health care benefits.
VersionnumberjA1s8RKnoP5m STATEWIDE ISSUES AND VARIOUS DEPARTMENTS
CALIFORNIA STATE BUDGET — 2020-21 105

CALIFORNIA DEPARTMENT OF FOOD AND AGRICULTURE
FAIRGROUNDS
The 77 fairgrounds throughout California that make up the Network of California Fairs
have historically supported operations through revenue-generating activities with
limited supplemental state support. A total of 53 of the 77 fairgrounds are state-affiliated
STATEWIDE ISSUES AND VARIOUS DEPARTMENTS VersionnumberjA1s8RKnoP5m
106 CALIFORNIA STATE BUDGET — 2020-21

fairs and have state civil service employees. As a result of the COVID-19 pandemic, fairs
are canceling revenue-generating activities and are projected to lose approximately
$98 million in revenue between March and June 2020, with revenue losses expected to
continue.
Many fairs have little to no reserves and must initiate the layoff process immediately as
they may become insolvent. The Budget includes $40.3 million General Fund in 2019-20
to support state-affiliated fairs that are projected to have insufficient reserves to pay
legally mandated costs that may be incurred during the state civil service layoff
process, including staff salaries, payout of leave balances, and unemployment
insurance.
The Administration will work with fairs, local governments, and partners toward
alternative options given limited General Fund resources. The Administration plans to
engage the Legislature and stakeholders over the course of the next year to develop a
thoughtful approach to transition the state’s relationship with fairs, while acknowledging
the need to continue supporting properties that may be necessary for emergency
operations.
FARM TO SCHOOL PROGRAM
Farm to School Programs are a vital way to improve the health and well-being of
California schoolchildren through integrated nutrition education and healthy food
access. Hundreds of millions of meals are served each year in California schools, and
expanding opportunities for local food procurement that is tied to nutrition education is
essential for establishing healthy eating habits that children can carry into adulthood.
Procurement of more California Grown food also supports connecting California’s
agriculture to California consumers.
The Budget includes $10 million one-time General Fund in 2020-21 and $1.5 million
annually thereafter for the California Department of Food and Agriculture to establish a
Farm to School Grant Program. This program will help support California farmers and
expand healthy food access in schools by providing grants to schools to establish
programs that coordinate local and California Grown food procurement and utilization
in school meals. It will also support food and agriculture education in classrooms and
cafeterias through experiential learning opportunities in school gardens, on farms and
through other culinary agricultural pathways. This funding will also support the Farm to
School Working Group to advance farm to school implementation and explore how to
create a more resilient and climate-smart food supply in California.
VersionnumberjA1s8RKnoP5m STATEWIDE ISSUES AND VARIOUS DEPARTMENTS
CALIFORNIA STATE BUDGET — 2020-21 107

PROPOSITION 12
In November 2018, California voters approved Proposition 12, which expanded current
animal housing requirements and established new, more stringent minimum space
standards on housing for calves raised for veal, breeding pigs and egg-laying hens. The
measure also makes it illegal for businesses in California to knowingly sell eggs or
uncooked pork or veal that came from animals housed in a manner that does not
meet the new confinement requirements, including products from animals raised and
maintained at facilities located in California and out-of-state. The Department is
finalizing statutorily mandated regulations to establish comprehensive program
requirements.
The Budget includes $1.4 million and 6 positions in 2020-21, and $2.8 million and
15 positions ongoing to support full implementation of Proposition 12, and also includes
statutory changes to establish new fee authority that will support associated program
costs. This will be funded for two years by a short-term loan from the Food and
Agriculture Fund until this new fee revenue can support all program costs.
Other Significant Adjustments
• Given the unprecedented budget impacts of the COVID-19 Recession, the Budget
includes a baseline decrease of $3.9 million General Fund ongoing beginning in
2020-21 associated with the reduction of funding for the California Biodiversity
Initiative, which was provided in the 2019 Budget Act.
CALIFORNIA PUBLIC UTILITIES COMMISSION
BROADBAND EXPANSION
The COVID-19 pandemic has required significant numbers of Californians to telework,
learn via distance education, and receive healthcare through telehealth. The
movement toward these technology platforms highlights the state's inequities in access
to computing devices, technology tools, and connectivity. In response, the California
Public Utilities Commission (Commission) took action in April to help bridge this digital
divide by making $25 million available from the California Teleconnect Fund for
hotspots and Internet service for student households, prioritizing rural, small, and
medium-sized school districts. The Commission also made $5 million available from the
California Advanced Services Fund Adoption Account to help cover the cost of
STATEWIDE ISSUES AND VARIOUS DEPARTMENTS VersionnumberjA1s8RKnoP5m
108 CALIFORNIA STATE BUDGET — 2020-21

computing and hotspot devices. The Commission coordinated with the California
Department of Education and this funding is being prioritized toward low-income
communities and communities with high percentages of residents with limited English
proficiency.
To identify which areas of the state lack sufficient access to broadband, the Budget
includes $2.8 million and 3 positions from the Public Utilities Commission Utilities
Reimbursement Account for the Commission to enhance its broadband mapping
activities. This additional information will better inform the state’s broadband
infrastructure grant program, improve safety by providing broadband speed data at
emergency response locations such as fairgrounds, and enhance the state’s ability to
compete for federal broadband funding.
The Budget also includes statutory changes intended to increase the ability of the state
to compete for federal funding to improve access to broadband Internet in California.
WILDFIRE MITIGATION EFFORTS
Chapter 81, Statutes of 2019 (AB 111) added $50.1 million in 2019-20 for the Commission
to review and enforce utility wildfire mitigation plans and implement Chapter 79,
Statutes of 2019 (AB 1054). These bills were enacted to facilitate consumer access to
safe, reliable, and affordable power by providing a durable solution to the problems
arising from utility-caused wildfires. The bills established a new Wildfire Safety Division,
created procedures and standards applicable to catastrophic wildfire proceedings,
and established a Wildfire Fund and mechanisms to capitalize the fund to protect
ratepayers. The Budget provides 106 new positions and $30 million for the Commission
to address issues related to utility-caused wildfires.
PACIFIC GAS AND ELECTRIC BANKRUPTCY
In May, the Commission approved Pacific Gas and Electric’s (PG&E) bankruptcy plan.
As part of its approval of PG&E’s plan, the Commission imposed a number of terms and
conditions on PG&E, such as an enhanced oversight and enforcement process.
Pursuant to the bankruptcy settlement, PG&E has until September 30, 2020, to
successfully emerge from bankruptcy.
The Budget includes $5 million for an observer to monitor PG&E’s progress in wildfire
preparation and public safety power shutoffs; conduct field visits, interviews, and
VersionnumberjA1s8RKnoP5m STATEWIDE ISSUES AND VARIOUS DEPARTMENTS
CALIFORNIA STATE BUDGET — 2020-21 109

inspections. The state will seek reimbursement for these costs from PG&E through the
bankruptcy process.
The Budget also provides for a loan of up to $50 million to Golden State Energy (GSE), a
nonprofit utility which will be established to take over PG&E should it fail to meet the
deadline for its bankruptcy plan to become effective or to perform as a transformed
utility in the future. These funds would be used for initial startup costs until GSE is able to
secure revenues or financing.
DEPARTMENT OF MOTOR VEHICLES
In response to the COVID-19 pandemic, DMV temporarily closed its field offices to
protect both its employees and the public.
DMV took several immediate actions to accommodate the needs of the public. All
driver licenses that expire between March 1 and July 31, 2020, have been extended,
and temporary paper extensions have been made available for seniors. The validity of
expiring commercial driver licenses, endorsements, and certificates has been extended
through September 30, 2020. In-person renewals have also been waived for eligible
driver license and identification cardholders through July 28, 2020.
During its temporary closure, DMV began procuring personal protective equipment for
its staff and developing plans to promote appropriate physical distancing within its
offices for an eventual public reopening. DMV began a limited reopening of 25 field
offices and 10 industry business centers on May 8 to honor existing appointments and
serve customers whose unique transactions cannot be completed through one of
DMV’s multiple alternative service channels. All offices reopened to the public for
appointments and limited services on June 11. Behind-the-wheel drive tests halted in
mid-March and resumed on June 26 with additional safety protocols.
During the closures, DMV continued to encourage the public to utilize its alternative
service channels such as online, mail, and kiosks. Customers can also use the Service
Advisor on DMV’s website to learn about service options. Additionally, DMV also quickly
launched its DMV Virtual Field Office to create new digital options for transactions with
DMV staff that previously required an in-person office visit. As a result, a substantial
majority of all DMV transactions can now be processed without a field office visit.
The federal enforcement date by which a federally compliant driver license or
identification will be required to board domestic flights or enter secure federal facilities
has been extended until October 2021. DMV continues to be funded to provide REAL
STATEWIDE ISSUES AND VARIOUS DEPARTMENTS VersionnumberjA1s8RKnoP5m
110 CALIFORNIA STATE BUDGET — 2020-21

IDs by this deadline. Now that offices have reopened, DMV is again able to address
these and other transactional needs in field offices.
CANNABIS
The Governor’s Budget included an announcement of the Administration’s intention to
consolidate the cannabis-regulatory functions in the Departments of Consumer Affairs,
Food and Agriculture, and Public Health into a single Department of Cannabis Control,
and stated more details would be submitted to the Legislature in the spring.
The Administration was in the process of developing a more detailed plan, including
establishing workgroups tasked with building a foundation and infrastructure for the
transition. However, this process was interrupted by the COVID-19 pandemic, requiring
the Administration to evaluate its ability to implement the consolidation on July 1, 2020
as planned. Consequently, the consolidation and creation of the new department is on
hold and will be pursued through the 2021 Budget process.
In light of the delayed cannabis consolidation effort, the Budget includes special fund
proposals from each of the licensing entities to address expiring limited-term funding
and positions. These proposals include $68.2 million for the Department of Consumer
Affairs, Bureau of Cannabis Control, $20.3 million for the Department of Public Health,
and $42.4 million for the Department of Food and Agriculture to continue cannabis
licensing and enforcement activities, as well as make improvements to enforcement
including, but not limited to, proposed statutory changes to shift sworn investigators
from the Department of Consumer Affairs’ Division of Investigations to its Bureau of
Cannabis Control.
2020-21 ALLOCATION OF THE CANNABIS TAX FUND
Proposition 64 specified the allocation of resources in the Cannabis Tax Fund, which are
continuously appropriated. Pursuant to Proposition 64, expenditures are prioritized for
regulatory and administrative workload necessary to implement, administer, and
enforce the Cannabis Act, followed by research and activities related to the
legalization of cannabis and the past effects of its criminalization. Once these priorities
have been met, the remaining funds are allocated to youth education, prevention,
early intervention, and treatment; environmental protection; and public safety-related
activities. The Budget estimates $296.9 million will be available for these purposes in
2020‑21, and the structure of these allocations is unchanged from 2019‑20:
VersionnumberjA1s8RKnoP5m STATEWIDE ISSUES AND VARIOUS DEPARTMENTS
CALIFORNIA STATE BUDGET — 2020-21 111

• Education, prevention, and treatment of youth substance use disorders and school
retention—60 percent ($178.1 million).
• Clean-up, remediation, and enforcement of environmental impacts created by
illegal cannabis cultivation—20 percent ($59.4 million).
• Public safety-related activities—20 percent ($59.4 million).
These figures reflect an increase of $86.1 million compared to the 2019-20 allocations.
DEPARTMENT OF CONSUMER AFFAIRS – VARIOUS FEE INCREASES
The Department of Consumer Affairs proposed fee increases at May Revision for
four boards and one bureau via statutory changes with an effective date of
January 1, 2021. Although fee increases for Boards and Bureaus have recently been
handled by the policy committees of the Legislature, given the effects of the COVID-19
pandemic on legislative processes and the uncertainty of when these issues could be
addressed, it was necessary to propose these fee increases in the May Revision to allow
timely implementation of the fees.
The programs included in this proposal are: the Board of Behavioral Sciences, the Board
of Podiatric Medicine, the Bureau for Private Postsecondary Education, the California
Acupuncture Board, and the Medical Board of California. The fund balances for these
programs have been in decline; however, the need for fee augmentations has
accelerated with recent increases in the costs of government, most of which are
outside of the individual programs’ control. These programs are all at or near their
current statutory fee limits and require a legislative change to amend their existing fees.
Each program has completed, or is in the process of completing, a contracted fee
study to support their respective fee augmentation requests.
The Legislature has deferred action on these fee increases to allow more discussion to
take place over the coming weeks. Without a statutory fee change effective
January 1, 2021, these programs will risk financial insolvency.
The Legislature also deferred proposed fee increases that are needed to support
various legislative requirements enacted in 2018 and 2019 related to the Controlled
Substance Utilization Review and Evaluation System, also known as CURES. Absent a fee
increase, statutory relief from requirements of the recent CURES legislation will be
necessary, which may endanger public health and safety, particularly as it relates to
the opioid crisis. The Administration will continue to pursue this necessary fee increase.
STATEWIDE ISSUES AND VARIOUS DEPARTMENTS VersionnumberjA1s8RKnoP5m
112 CALIFORNIA STATE BUDGET — 2020-21

CALIFORNIA CONSUMER FINANCIAL PROTECTION
The Department of Business Oversight (DBO) regulates financial services and
state‑licensed financial institutions, including banks, credit unions, money transmitters,
securities brokers and dealers, investment advisers, payday lenders, mortgage lenders,
escrow agents, student loan servicers, and other commercial and consumer lenders.
The California Consumer Financial Protection Law proposal seeks to cement California’s
consumer protection leadership amidst a growing financial crisis and the
consumer‑protection retreat by federal agencies, including the Consumer Financial
Protection Bureau. The fragmented oversight of financial services has left consumers
vulnerable to abuse.
These problems are further exacerbated in times of crisis, including the COVID-19
pandemic and related economic fallout. Financially distressed consumers—especially
communities of color, immigrant communities, and the elderly—will be targets of
predatory financial products and practices. Those practices will emerge and evolve to
avoid existing regulatory frameworks, requiring alert oversight and agile enforcement.
This law would expand DBO’s ability to provide greater consumer protection and
memorialize that intent by renaming the DBO as the Department of Financial Protection
and Innovation. Additionally, this proposal:
• Creates a new Division of Consumer Financial Protection, and a related California
Consumer Financial Protection Law, to expand oversight over current and emerging
abusive acts and practices that cause consumers financial harm, and promote
consumer-focused research and outreach.
• Establishes an Office of Financial Technology Innovation to study emerging
technologies in financial services, including virtual currencies, and to engage with
California companies developing new financial products and services.
The Budget includes $10.2 million in 2020-21, growing to $19.3 million ongoing in 2022-23,
in a set‑aside item for these purposes. However, expenditure of these funds is
contingent upon enactment of statutory changes that authorize the California
Consumer Financial Protection Law program. The Administration and Legislature will
work together over the next several weeks to finalize the statutory framework needed
to implement the program and other changes that aim to improve consumer
protection for all Californians.
VersionnumberjA1s8RKnoP5m STATEWIDE ISSUES AND VARIOUS DEPARTMENTS
CALIFORNIA STATE BUDGET — 2020-21 113

CALIFORNIA VOLUNTEERS
As the State Service Commission for California, California Volunteers manages programs
and initiatives aimed at increasing the number of Californians engaged in service and
volunteering. This includes a lead role in coordinating volunteer and donation
management during the COVID-19 pandemic response and recovery. The state’s
response to the COVID-19 pandemic has highlighted the need to build up and support
these activities.
The Budget provides $2.9 million ongoing General Fund for administrative and strategic
planning staff, including emergency volunteer coordinators that will be located in the
three most populated regions of the state. This infrastructure will build the state’s
capacity to respond to the COVID-19 pandemic, as well as future emergencies, by
increasing opportunities for Californians to serve their communities in a time of need.
The Budget also provides $10.1 million ongoing General Fund to sustain nearly
500 AmeriCorps volunteer positions that were established with funding from the 2019
Budget Act. AmeriCorps volunteers serve statewide in programs that address critical
community needs in education, public safety, health and human services, and the
environment. Many of these programs provide services to underserved communities,
such as low-income Californians, people of color and those transitioning out of foster
care. AmeriCorps members also are participating in COVID-19 response and recovery
by volunteering in food banks, assisting with meal deliveries to seniors, and meeting a
variety of other COVID-19 related community needs as they arise.
SECRETARY OF STATE
Executive Order N-64-20, issued May 2020, required each county elections official to
send vote-by-mail ballots for the November 3, 2020 General Election to all registered
voters so that Californians can exercise their right to vote in a safe and accessible
manner. Chapter 4, Statutes of 2020 (AB 860) codified the provisions of Executive Order
N-64-20 and related election requirements for the November 3, 2020 statewide general
election. In addition, Executive Order N-67-20, issued June 2020, authorizes certain
counties to provide three days of early voting starting the Saturday before election day,
and provides for earlier availability of ballot drop-box locations while also allowing
certain counties to consolidate voting locations.
Recognizing that the COVID-19 pandemic will impact the ability of California to carry
out the November 2020 General Election, the Budget includes a total of $111.6 million
STATEWIDE ISSUES AND VARIOUS DEPARTMENTS VersionnumberjA1s8RKnoP5m
114 CALIFORNIA STATE BUDGET — 2020-21

($46.1 million General Fund and $65.5 million Federal Funds) to prevent, prepare for,
and respond to the impacts of COVID-19 on the election and provide associated voter
education and outreach. This funding includes $35 million in new General Fund,
$11.1 million in unspent General Fund provided for state voting system replacement in
the 2018 and 2019 Budget Acts, and Help America Vote Act (HAVA) funds included in
the CARES Act ($36.5 million) and the Consolidated Appropriations Act of 2020
($29 million). Counties will not be required to provide a match to use the remaining
funding from the state’s voting system allocations provided in the 2018 and 2019 Budget
Acts if used for COVID-19 related costs while carrying out the November 2020 General
Election.
CALIFORNIA DEPARTMENT OF VETERANS AFFAIRS
The California Department of Veterans Affairs (CalVet) works to serve the nearly
1.6 million veterans and their families living in California. CalVet strives to ensure that
veterans of every era and their families receive state and federal benefits and services
they have earned as a result of honorable military service. CalVet operates eight
homes throughout the state that provide residential and medical care services to aged
or disabled California veterans who served on active duty.
ELECTRONIC HEALTHCARE RECORD SYSTEM
The Budget includes one-time funding of $1.2 million General Fund to begin
implementation of a new information technology project for a single electronic
healthcare record system to replace multiple legacy systems. The system will streamline
data entry and will provide a centralized repository for the health records to modernize
CalVet’s medical record keeping.
MASTER PLAN
In January 2020, CalVet released its statutorily required Master Plan for the overall
operation of the veterans homes. The Master Plan examines veteran population trends
in California, the potential location of future facilities and alternate service delivery
models, and includes several recommendations, some of which are reflected in the
Budget as follows:
• Realigning Levels of Care—The Budget includes a plan to begin realigning levels of
care by adjusting domiciliary populations at Chula Vista and Yountville and
VersionnumberjA1s8RKnoP5m STATEWIDE ISSUES AND VARIOUS DEPARTMENTS
CALIFORNIA STATE BUDGET — 2020-21 115

converting current Intermediate Care Facilities to Residential Care Facilities at
Yountville. For example, CalVet maintains a waitlist with nearly 85 percent of
applicants seeking skilled nursing or memory care, while independent living and
intermediate care units are underutilized. Residents needing intermediate care will
be placed in either Residential Care or Skilled Nursing Facilities based on the severity
of their treatment needs. This will provide a continuum of care for residents of the
veterans homes. Current residents will not be displaced and realigning levels of care
will be achieved over time.
• Mental Health Services for Veterans—The Budget includes $1.1 million General Fund
in 2020-21 and $2.1 million ongoing to improve behavioral health services at the
veterans homes by standardizing mental health support staffing.
OTHER SIGNIFICANT ADJUSTMENTS
• Department of General Services, Capitol Annex Projects—A transfer of $694.2 million
from the State Project Infrastructure Fund (SPIF) to the General Fund. These funds
were previously earmarked for the design and construction of a series of projects
necessary for the renovation or reconstruction of the Capitol Annex. Funding in the
amount of $60 million SPIF remains available for pre-construction activities for the
projects, and for modifications of the west wing in order to facilitate a fully
functioning State Capitol. The remaining costs associated with the design and
construction phases of the Annex Projects will be shifted to lease-revenue bond
financing.
STATEWIDE ISSUES AND VARIOUS DEPARTMENTS VersionnumberjA1s8RKnoP5m
116 CALIFORNIA STATE BUDGET — 2020-21

VETO MESSAGE
VersionnumberjA1s8RKnoP5m VETO MESSAGE
CALIFORNIA STATE BUDGET — 2020-21 117

This page intentionally blank to facilitate double-sided printing.

Gavin Newsom June 29, 2020 Governor
State of California Governor’s Office
I object to the following appropriation contained in Senate Bill 74. Item 6440-495—Reversion, University of California. I delete this item. I am deleting this item to conform to the Legislature’s intent. With the above deletion, I hereby approve Senate Bill 74.
GAVIN NEWSOM

This page intentionally blank to facilitate double-sided printing.

STAFF ASSIGNMENTS
VersionnumberjA1s8RKnoP5m STAFF ASSIGNMENTS
CALIFORNIA STATE BUDGET — 2020-21 119

This page intentionally blank to facilitate double-sided printing.

STF01_1698
STAFF ASSIGNMENTS VersionnumberjA1s8RKnoP5m
120 CALIFORNIA STATE BUDGET — 2020-21
ExEcutivE OfficE
Keely Martin Bosler Director of Finance
(916) 445-4141
Vivek Viswanathan Gayle Miller Chief Deputy Director, Budget Chief Deputy Director, Policy
(916) 445-9862 (916) 445-8582
Richard Gillihan Kari Krogseng Chief Operating Officer Chief Counsel
(916) 445-4923 (916) 322-0971
H.D. Palmer Jolie Onodera Deputy Director, External Affairs Legislative Director
(916) 323-0648 (916) 445-8610
BudgEt PrOgram arEas PrOgram BudgEt managErs
Budget Planning and Preparation, Thomas Todd .................... (916) 445-5332 Cash Management, FI$Cal Project Support, Statewide Budget Issues, and Statewide Accounting Policies and Training
Corrections and Rehabilitation, Amy Jarvis ........................ (916) 445-8913 Justice, and General Government
Education Jeff Bell.............................. (916) 445-0328
Employee Compensation and Jennifer Whitaker ............ (916) 445-3274 State Pension, Audits and Evaluations, Departmental Administration and Information Services, and Information Technology and Consulting
Energy, Housing and Homelessness, Erika Li ............................... (916) 445-3274 Labor, Local Government, Tax Agencies, and Transportation
Health and Human Services Adam Dorsey ................... (916) 445-6423
Natural Resources, Environment, Matt Almy ......................... (916) 324-0043 and Capital Outlay
Revenue Forecasting, Irena Asmundson ........... (916) 322-2263Economic Projections, and Chief Economist and PBM Demographic Data

EXHIBIT "7"

8/21/2020 In-Person-Elementary-Waiver-Process
https://www.cdph.ca.gov/Programs/CID/DCDC/Pages/COVID-19/In-Person-Elementary-Waiver-Process.aspx 1/3
August 3, 2020
TO:
SUBJECT:
SONIA Y. ANGELL, MD, MPHState Public Health O�icer & Director
GAVIN NEWSOMGovernor
State of California—Health and HumanServices Agency
California Department ofPublic Health
All Californians
COVID-19 and Reopening In-Person Learning Elementary Education Waiver Process
OverviewCalifornia schools have been closed for in-person instruction since mid-March 2020 due to the COVID-19 pandemic.
School closures to in-person instruction were part of a broader set of recommendations intended to reduce
transmission of SARS-CoV-2, the virus that causes COVID-19. The California Department of Public Health (CDPH)
developed the COVID-19 and Reopening In-Person Learning Framework (PDF) to support school communities as they
decide when and how to implement in-person instruction for the 2020-21 school year.
This framework permitted schools and school districts to reopen for in-person instruction at any time if they are
located in a local health jurisdiction (LHJ) that has not been on the county monitoring list within the prior 14 days. If
the LHJ has been on the monitoring list within the last 14 days, the school must conduct distance learning only,
until their LHJ has been o� the monitoring list for at least 14 days.
The framework authorized local health o�icers (LHO) to grant a waiver of this criteria, in order for elementary
schools to open for in-person instruction under specified conditions. Applicants must satisfy all waiver
requirements in order to be granted a waiver. Waivers should be granted or denied pursuant to the process outlined
below.
Waiver ProcessCDPH recommends that schools within jurisdictions with 14-day case rates more than two times thethreshold to be on the County Monitoring List (>200 cases/100,000 population) should not beconsidered for a waiver to re-open in-person instruction.Closed elementary schools in counties on the monitoring list within the prior 14 days may not open for in-person instruction until they have received approval of a waiver submitted to the LHO.This elementary school waiver is applicable only for grades TK-6, even if the grade configuration at the schoolincludes additional grades.A district superintendent, private school principal/head of school, or executive director of a charter school(hereina�er applicant) can apply for a waiver from the LHO to open an elementary school for in-personinstruction.Applications and all supporting documents must be submitted to the LHO at least 14 days prior to the desiredreopening date.Prior to applying for the waiver, the applicant (or his/her sta�) must (1) consult with labor, parent, andcommunity organizations, and (2) publish elementary school reopening plans on the website of the local

8/21/2020 In-Person-Elementary-Waiver-Process
https://www.cdph.ca.gov/Programs/CID/DCDC/Pages/COVID-19/In-Person-Elementary-Waiver-Process.aspx 2/3
educational agency (or equivalent). Examples of community organizations include school-based non-profitorganizations and local organizations that support student enrichment, recreation, a�er-school programs,health services, early childhood services or provide family support.As described in the CDPH/CalOSHA Guidance for Schools and School-Based Programs (PDF), elementaryschool reopening plans must address several topics related to health and safety, in a manner consistent withguidance from CDPH and the local health department. Those topics include:
Cleaning and disinfectionSmall, stable, cohortingEntrance, egress, and movement within the schoolFace coverings and other essential protective gearHealth screenings for students and sta�Healthy hygiene practicesIdentification and tracing of contactsPhysical distancingSta� training and family educationTesting of students and sta�Triggers for switching to distance learningCommunication plans
When applying for the waiver, the applicant must submit to the LHO a waiver application form, to beprovided by the LHO. The application must include evidence of (1) consultation with labor, parent, andcommunity organizations and (2) publication of the elementary school reopening plans on the website of thelocal educational agency (or equivalent).
The applicant must sign an attestation confirming the names and dates that the organizations wereconsulted. If school sta� are not represented by a labor organization, then the applicant must describethe process by which it consulted with school sta�.The applicant must confirm publication of the elementary school reopening plans on the website ofthe local educational agency (or equivalent).
If applying on behalf of a school district, the applicant should submit a consolidated application and publisha plan for elementary schools in the district that are seeking to reopen for in-person instruction. If applyingfor an independent, private, faith-based, or charter school, the applicant should submit an application andpublish a plan for each school.Upon receipt of a waiver application, the LHO will review and consider the application, supporting materials,and the following:
Available scientific evidence regarding COVID-related risks in schools serving elementary-age students,along with the health-related risks for children who are not provided in-person instruction.State law directing public schools to "o�er in-person instruction to the greatest extent possible." (Ed.Code § 43504).Whether elementary in-person instruction can be provided in small, stable cohorts.Local health guidance, safety plans, availability of appropriate PPE, and availability of public healthand school resources for COVID-19 investigation and response.Current new case rate, testing % positivity trends, and the number and degree of indicators abovethresholds to be on the County Monitoring List.Local hospitalization trends and hospital capacity.Any other local conditions or data contributing to inclusion on the County Monitoring List.Availability of testing resources within the community and via employee health plans.The extent to which the applicant has consulted with sta�, labor organizations, community, and parentorganizations.
Following review, the LHO will consult with CDPH regarding the determination whether to grant or deny thewaiver application. Consultation with CDPH is accomplished by submitting a notice pursuant to CDPHinstructions.
CDPH will acknowledge receipt of the notice and follow up if there are any questions or concerns.CDPH will provide technical assistance as requested.

8/21/2020 In-Person-Elementary-Waiver-Process
https://www.cdph.ca.gov/Programs/CID/DCDC/Pages/COVID-19/In-Person-Elementary-Waiver-Process.aspx 3/3
Page Last Updated : August 4, 2020
If the LHO has not received a further response within three business days of submission, the waiverapplication may be approved or denied consistent with CDPH instructions.
LHOs may conditionally grant an application with limits on the number of elementary schools allowed to re-open or allow re-opening in phases to monitor for any impact on the community.Closed elementary schools in counties on the monitoring list within the prior 14 days may not open for in-person instruction until they have received approval of a waiver submitted to the LHO.
California Department of Public HealthPO Box, 997377, MS 0500, Sacramento, CA 95899-7377
Department Website (cdph.ca.gov)

EXHIBIT "8"

8/21/2020 Coronavirus: Report reveals disparities among Black, Latino LAUSD students in online learning amid COVID-19 pandemic - ABC7 Los A…
https://abc7.com/lausd-los-angeles-unified-school-district-race-disparity-racial-divide/6321930/
EDUCATION
Report reveals disparities among Black, LatinoLAUSD students in online learning amidCOVID-19 pandemicA new LAUSD report shows more than 50,000 of its Black and Latinomiddle and high school students didn't regularly participate in onlineinstruction after campuses closed in March.
Friday, July 17, 2020SHARE TWEET EMAIL
EMBED <> MORE VIDEOS
A new LAUSD report shows more than 50,000 of its Black and Latino middle and high school students didn'tregularly participate in online instruction after campuses closed in March.
LOS ANGELES (KABC) -- More than 50,000 Black and Latino middle and high schoolstudents in Los Angeles did not regularly participate in the school system's main platform forvirtual classrooms after campuses closed in March, reflecting the disparities faced by
00:15
00:00 00:40

8/21/2020 Coronavirus: Report reveals disparities among Black, Latino LAUSD students in online learning amid COVID-19 pandemic - ABC7 Los A…
https://abc7.com/lausd-los-angeles-unified-school-district-race-disparity-racial-divide/6321930/
students of color amid the COVID-19 pandemic and the difficulties ahead as the LAUSDprepares for continued online learning, according to a new report.
The numbers, reflected in a first-of-its-kind report by Los Angeles Unified School Districtanalysts examining student engagement during campus closures, paint a stark picture ofstudents in the nation's second largest school district struggling under the new pressures ofonline learning, the Los Angeles Times reported.
Nearly every category of students -- sorted by race, income and learning needs -- includedlarge numbers who did not regularly participate in distance learning. But low-incomestudents and Black and Latino students showed participation rates between 10 and 20percentage points lower than white and Asian peers, according to study cited by The Times.
RELATED: California State Superintendent Tony Thurmond seeks $500 millionhelp to close digital divide
English learners, students with disabilities, homeless students and those in the foster-caresystem had lower rates of online participation, according to The Times.
The engagement report dated July 7, was completed before Superintendent Austin Beutnerannounced Monday that campuses would remain closed when the new school year begins onAug. 18. In making the decision, he acknowledged that online learning would be nosubstitute for the classroom.
The report measured engagement without explaining why certain groups of students wereless likely to participate. But previous surveys have shown that many families of color andlow-income families at first lacked computers and internet access. L.A. Unified moved tominimize those issues by providing computers and internet hot spots.
At the same time, the coronavirus crisis has taken a uniquely devastating toll on Black andLatino families, whose members disproportionately work as essential front-line workers,frequently in low-paying jobs that have exposed family members to health risks andprevented them from overseeing their children's schoolwork at home.
The achievement gap among Black and Latino students has persisted for decades.
RELATED: Gov. Gavin Newsom announces which California school districts can

8/21/2020 Coronavirus: Report reveals disparities among Black, Latino LAUSD students in online learning amid COVID-19 pandemic - ABC7 Los A…
https://abc7.com/lausd-los-angeles-unified-school-district-race-disparity-racial-divide/6321930/
reopen in the fall
The LAUSD study examined the period between March 16, the Monday after schools closed,and May 22. It described how students engaged at various levels online. For example, somestudents simply logged in and did little else. Others only viewed their work. Those whom thereport described as "participating'' were students who submitted work, took tests, posted ona discussion board or created a message.
Using that measure, the report found that on an average day only about 36% of middle andhigh school students participated online. About 25% logged on or viewed work only. Andabout 40% were absent, The Times reported.
Among Latinos, who make up three-quarters of the district's 206,000 middle and highschool students, the peak weekly participation rate was 67 percent for middle school studentsand 73 percent for high school students. For Black students, it was 67 percent and 71 percent.
By comparison, weekly participation among the district's 19,300 white secondary studentspeaked at 88 percent for middle school students and 85 percent for high school students.
Among Asians, who had the highest participation rates, it was 89 percent and 91 percent.They account for 8,241 students in the analysis.
RELATED: Most CA schools 'shouldn't reopen' if COVID-19 trends continue,state superintendent says
Low-income students, meanwhile, lagged between 10 and 20 percentage points behind theirpeers from more affluent families. And among English learners, students with disabilitiesand those who are homeless or in foster care, peak weekly participation was 57 percent orlower.
"These are deeply disturbing, yet not surprising data,'' UCLA education professor TyroneHoward, who also directs the Black Male Institute, told The Times. "Unfortunately, whatthese data remind us is that race, socioeconomic status, disabilities and disadvantage stillmatters.''
City News Service contributed to this report.

EXHIBIT "9"

COVID-19
INDUSTRY
GUIDANCE:
Schools and School-
Based Programs
Updated: August 3, 2020
All guidance should be implemented
only with local health officer approval
following their review of local
epidemiological data including cases
per 100,000 population, rate of test
positivity, and local preparedness to
support a health care surge, vulnerable
populations, contact tracing, and
testing.

OVERVIEW
Communities across the state are preparing for the forthcoming school year. To assist
with that planning process, the following guidelines and considerations are intended
to help school and community leaders plan and prepare to resume in-person
instruction.
This guidance is interim and subject to updates. These guidelines and considerations
are based on the best available public health data at this time, international best
practices currently employed, and the practical realities of managing school
operations; as new data and practices emerge. Additionally, the guidelines and
considerations do not reflect the full scope of issues that school communities will need
to address, which range from day-to-day site-based logistics to the social and
emotional well-being of students and staff.
California public schools (traditional and charter), private schools (including nonpublic
nonsectarian schools), school districts, and county offices of education, herein referred
to as schools, will determine the most appropriate instructional model, taking into
account the needs of their students and staff, and their available infrastructure. This
guidance is not intended to prevent a school from adopting a distance learning,
hybrid, or mixed-delivery instructional model to ensure safety. Schools are not required
to seek out or receive approval from a state or local public health officer prior to
adopting a distance-learning model.
Implementation of this guidance will depend on local public health conditions,
including those listed here. Communities meeting those criteria, such as lower
incidence of COVID-19 and adequate preparedness, may implement the guidance
described below as part of a phased reopening. All decisions about following this
guidance should be made in collaboration with local health officials and other
authorities.
Implementation of this guidance should be tailored for each setting, including
adequate consideration of instructional programs operating at each school site and
the needs of students and families. School leaders should engage relevant
stakeholders—including families, staff and labor partners in the school community—to
formulate and implement plans that consider the following:
Student, Family and Staff Population: Who are the student, family and staff
populations who will be impacted by or can serve as partners in implementing
any of the following measures?
Ability to Implement or Adhere to Measures: Do staff, students and families have
the tools, information, resources and ability to successfully adhere to or
implement the new measures?
Negative or Unintended Consequences: Are there any negative or unintended
consequences to staff, students or families of implementing the measures and
how can those consequences be mitigated?

This guidance is not intended to revoke or repeal any worker rights, either statutory,
regulatory or collectively bargained, and is not exhaustive, as it does not include
county health orders, nor is it a substitute for any existing safety and health-related
regulatory requirements such as those of Cal/OSHA. Stay current on changes to public
health guidance and state/local orders, as the COVID-19 situation continues.

1. General Measures
Establish and continue communication with local and State authorities
to determine current disease levels and control measures in your
community. For example:
o Review and refer to, if applicable, the relevant county variance
documentation. Documentation can be found here.
o Consult with your county health officer, or designated staff, who are
best positioned to monitor and provide advice on local conditions. A
directory can be found here.
o Collaborate with other schools and school partners in your region,
including the county office of education.
o Regularly review updated guidance from state agencies, including
the California Department of Public Health and California
Department of Education.
Establish a written, worksite-specific COVID-19 prevention plan at every
facility, perform a comprehensive risk assessment of all work areas and
work tasks, and designate a person at each school to implement the
plan.
o Identify contact information for the local health department where
the school is located for communicating information about COVID-
19 outbreaks among students or staff.
o Incorporate the CDPH Guidance for the Use of Face Coverings, into
the School Site Specific Plan that includes a policy for handling
exemptions.
o Train and communicate with workers and worker representatives on
the plan. Make the written plan available and accessible to workers
and worker representatives.
o Regularly evaluate the workplace for compliance with the plan and
document and correct deficiencies identified.
o Investigate any COVID-19 illness and determine if any work-related
factors could have contributed to risk of infection. Update the plan
as needed to prevent further cases.
o Implement the necessary processes and protocols when a
workplace has an outbreak, in accordance with CDPH guidelines.
o Identify individuals who have been in close contact (within six feet for
15 minutes or more) of an infected person and take steps to isolate

COVID-19 positive person(s) and close contacts. See Section 10 for
more detail.
o Adhere to these guidelines. Failure to do so could result in workplace
illnesses that may cause classrooms or the entire school to be
temporarily closed or limited.
Evaluate whether and to what extent external community organizations
can safely utilize the site and campus resources. Ensure external
community organizations that use the facilities also follow this guidance.
Develop a plan for the possibility of repeated closures of classes, groups
or entire facilities when persons associated with the facility or in the
community become ill with COVID-19. See Section 10 below.
Develop a plan to further support students with access and functional
needs who may be at increased risk of becoming infected or having
unrecognized illness due to COVID-19. For example, review existing
student health plans to identify students who may need additional
accommodations, develop a process for engaging families for
potentially unknown concerns that may need to be accommodated or
identify additional preparations for classroom and non-classroom
environments as needed. Groups who might be at increased risk of
becoming infected or having unrecognized illness include the following:
o Individuals who have limited mobility or require prolonged and close
contact with others, such as direct support providers and family
members;
o Individuals who have trouble understanding information or practicing
preventive measures, such as hand washing and physical distancing;
and
o Individuals who may not be able to communicate symptoms of
illness.
Schools should review the CDPH Guidance for the Use of Face Coverings
and any applicable local health department guidance and incorporate
face-covering use for students and workers into their COVID-19
prevention plan. Some flexibility may be needed for younger children
consistent with child development recommendations. See Section 3 for
more information.

2. Promote Healthy Hygiene Practices
Teach and reinforce washing hands, avoiding contact with one's eyes,
nose, and mouth, and covering coughs and sneezes among students
and staff.
o Teach students and remind staff to use tissue to wipe their nose and
to cough/sneeze inside a tissue or their elbow.
o Students and staff should wash their hands frequently throughout the
day, including before and after eating; after coughing or sneezing;
after classes where they handle shared items, such as outside
recreation, art, or shop; and before and after using the restroom.
o Students and staff should wash their hands for 20 seconds with soap,
rubbing thoroughly after application. Soap products marketed as
“antimicrobial” are not necessary or recommended.
o Staff should model and practice handwashing. For example, for
lower grade levels, use bathroom time as an opportunity to reinforce
healthy habits and monitor proper handwashing.
o Students and staff should use fragrance-free hand sanitizer when
handwashing is not practicable. Sanitizer must be rubbed into hands
until completely dry. Note: frequent handwashing is more effective
than the use of hand sanitizers.
o Ethyl alcohol-based hand sanitizers are preferred and should be used
when there is the potential of unsupervised use by children.
Isopropyl hand sanitizers are more toxic when ingested or
absorbed in skin.
Do not use hand sanitizers that may contain methanol which can
be hazardous when ingested or absorbed.
o Children under age 9 should only use hand sanitizer under adult
supervision. Call Poison Control if consumed: 1-800-222-1222.
Consider portable handwashing stations throughout a site and near
classrooms to minimize movement and congregations in bathrooms to
the extent practicable.
Develop routines enabling students and staff to regularly wash their
hands at staggered intervals.
Ensure adequate supplies to support healthy hygiene behaviors,
including soap, tissues, no-touch trashcans, face coverings, and hand
sanitizers with at least 60 percent ethyl alcohol for staff and children who
can safely use hand sanitizer.

Information contained in the CDPH Guidance for the Use of Face
Coverings should be provided to staff and families, which discusses the
circumstances in which face coverings must be worn and the
exemptions, as well as any policies, work rules, and practices the
employer has adopted to ensure the use of face coverings.
Employers must provide and ensure staff use face coverings in
accordance with CDPH guidelines and all required protective
equipment.
The California Governor’s Office of Emergency Services (CalOES) and
the Department of Public Health (CDPH) are and will be working to
support procurement and distribution of face coverings and personal
protective equipment. Additional information can be found here.
Strongly recommend that all students and staff be immunized each
autumn against influenza unless contraindicated by personal medical
conditions, to help:
o Protect the school community
o Reduce demands on health care facilities
o Decrease illnesses that cannot be readily distinguished from COVID-
19 and would therefore trigger extensive measures from the school
and public health authorities.
Nothing in this guidance should be interpreted as restricting access to
appropriate educational services.
3. Face Coverings
Face coverings must be used in accordance with CDPH guidelines unless a
person is exempt as explained in the guidelines, particularly in indoor
environments, on school buses, and areas where physical distancing alone is
not sufficient to prevent disease transmission.
Teach and reinforce use of face coverings, or in limited instances, face
shields.
Students and staff should be frequently reminded not to touch the face
covering and to wash their hands frequently.
Information should be provided to all staff and families in the school
community on proper use, removal, and washing of cloth face
coverings.
Training should also include policies on how people who are exempted
from wearing a face covering will be addressed.

STUDENTS
Age Face Covering Requirement
Under 2 years old No
2 years old – 2nd grade Strongly encouraged**
3rd grade – High School Yes, unless exempt
**Face coverings are strongly encouraged for young children between two years old
and second grade, if they can be worn properly. A face shield is an acceptable
alternative for children in this cohort who cannot wear them properly.
Persons younger than two years old, anyone who has trouble breathing,
anyone who is unconscious or incapacitated, and anyone who is
otherwise unable to remove the face covering without assistance are
exempt from wearing a face covering.
A cloth face covering or face shield should be removed for meals,
snacks, naptime, or outdoor recreation, or when it needs to be
replaced. When a cloth face covering is temporarily removed, it should
be placed in a clean paper bag (marked with the student’s name and
date) until it needs to be put on again.
In order to comply with this guidance, schools must exclude students
from campus if they are not exempt from wearing a face covering
under CDPH guidelines and refuse to wear one provided by the school.
Schools should develop protocols to provide a face covering to students
who inadvertently fail to bring a face covering to school to prevent
unnecessary exclusions. Schools should offer alternative educational
opportunities for students who are excluded from campus.
STAFF
All staff must use face coverings in accordance with CDPH guidelines
unless Cal/OSHA standards require respiratory protection.
In limited situations where a face coverings cannot be used for
pedagogical or developmental reasons, (i.e. communicating or assisting
young children or those with special needs) a face shield can be used
instead of a cloth face covering while in the classroom as long as the
wearer maintains physical distance from others, to the extent
practicable. Staff must return to wearing a face covering outside of the
classroom.

Workers or other persons handling or serving food must use gloves in
addition to face coverings. Employers should consider where disposable
glove use may be helpful to supplement frequent handwashing or use of
hand sanitizer; examples are for workers who are screening others for
symptoms or handling commonly touched items.
4. Ensure Teacher and Staff Safety
Ensuring staff maintain physical distancing from each other is critical to
reducing transmission between adults.
Ensure that all staff use face coverings in accordance with CDPH
guidelines and Cal/OSHA standards.
Support staff who are at higher risk for severe illness or who cannot safely
distance from household contacts at higher risk, by providing options
such as telework, where appropriate, or teaching in a virtual learning or
independent study context.
Conduct all staff meetings, professional development training and
education, and other activities involving staff with physical distancing
measures in place, or virtually, where physical distancing is a challenge.
Minimize the use of and congregation of adults in staff rooms, break
rooms, and other settings.
Implement procedures for daily symptom monitoring for staff.
5. Intensify Cleaning, Disinfection, and
Ventilation
Consider suspending or modifying use of site resources that necessitate
sharing or touching items. For example, consider suspending use of
drinking fountains and instead encourage the use of reusable water
bottles.
Staff should clean and disinfect frequently-touched surfaces at school
and on school buses at least daily and, as practicable, these surfaces
should be cleaned and disinfected frequently throughout the day by
trained custodial staff.
Buses should be thoroughly cleaned and disinfected daily and after
transporting any individual who is exhibiting symptoms of COVID-19.
Drivers should be provided disinfectant wipes and disposable gloves to
support disinfection of frequently touched surfaces during the day.

Frequently touched surfaces in the school include, but are not limited to:
o Door handles
o Light switches
o Sink handles
o Bathroom surfaces
o Tables
o Student Desks
o Chairs
Limit use and sharing of objects and equipment, such as toys, games, art
supplies and playground equipment to the extent practicable. When
shared use is allowed, clean and disinfect between uses.
When choosing disinfecting products, use those approved for use
against COVID-19 on the Environmental Protection Agency (EPA)-
approved list “N” and follow product instructions.
o To reduce the risk of asthma and other health effects related to
disinfecting, programs should select disinfectant products on list N
with asthma-safer ingredients (hydrogen peroxide, citric acid or
lactic acid) as recommended by the US EPA Design for Environment
program.
o Avoid products that contain peroxyacetic (peracetic) acid, sodium
hypochlorite (bleach) or quaternary ammonium compounds, which
can cause asthma.
o Follow label directions for appropriate dilution rates and contact
times. Provide workers training on the chemical hazards,
manufacturer’s directions, Cal/OSHA requirements for safe use, and
as applicable and as required by the Healthy Schools Act.
o Custodial staff and any other workers who clean and disinfect the
school site must be equipped with proper protective equipment,
including gloves, eye protection, respiratory protection, and other
appropriate protective equipment as required by the product
instructions. All products must be kept out of children’s reach and
stored in a space with restricted access.
o Establish a cleaning and disinfecting schedule in order to avoid both
under- and over-use of cleaning products.
Ensure safe and correct application of disinfectant and keep products
away from students.

Ensure proper ventilation during cleaning and disinfecting. Introduce
fresh outdoor air as much as possible, for example, by opening windows
where practicable. When cleaning, air out the space before children
arrive; plan to do thorough cleaning when children are not present. If
using air conditioning, use the setting that brings in outside air. Replace
and check air filters and filtration systems to ensure optimal air quality.
o If opening windows poses a safety or health risk (e.g., by allowing
pollen in or exacerbating asthma symptoms) to persons using the
facility, consider alternatives. For example, maximize central air
filtration for HVAC systems (targeted filter rating of at least MERV 13).
Consider installing portable high-efficiency air cleaners, upgrading the
building’s air filters to the highest efficiency possible, and making other
modifications to increase the quantity of outside air and ventilation in
classrooms, offices and other spaces.
Take steps to ensure that all water systems and features (for example,
drinking fountains and decorative fountains) are safe to use after a
prolonged facility shutdown to minimize the risk of Legionnaires’ disease
and other diseases associated with water.
6. Implementing Distancing Inside and
Outside the Classroom
Arrival and Departure
Maximize space between students and between students and the driver
on school buses and open windows to the greatest extent practicable.
Minimize contact at school between students, staff, families and the
community at the beginning and end of the school day. Prioritize
minimizing contact between adults at all times.
Stagger arrival and drop off-times and locations as consistently as
practicable as to minimize scheduling challenges for families.
Designate routes for entry and exit, using as many entrances as feasible.
Put in place other protocols to limit direct contact with others as much
as practicable.
Implement health screenings of students and staff upon arrival at school
(see Section 9).
Ensure each bus is equipped with extra unused face coverings on school
buses for students who may have inadvertently failed to bring one.

Classroom Space
To reduce possibilities for infection, students must remain in the same
space and in cohorts as small and consistent as practicable, including
for recess and lunch. Keep the same students and teacher or staff with
each group, to the greatest extent practicable.
Prioritize the use and maximization of outdoor space for activities where
practicable.
Minimize movement of students and teachers or staff as much as
practicable. For example, consider ways to keep teachers with one
group of students for the whole day. In secondary schools or in situations
where students have individualized schedules, plan for ways to reduce
mixing among cohorts and to minimize contact.
Maximize space between seating and desks. Distance teacher and
other staff desks at least six feet away from student desks. Consider ways
to establish separation of students through other means if practicable,
such as, six feet between desks, where practicable, partitions between
desks, markings on classroom floors to promote distancing or arranging
desks in a way that minimizes face-to-face contact.
Consider redesigning activities for smaller groups and rearranging
furniture and play spaces to maintain separation.
Staff should develop instructions for maximizing spacing and ways to
minimize movement in both indoor and outdoor spaces that are easy for
students to understand and are developmentally appropriate.
Activities where there is increased likelihood for transmission from
contaminated exhaled droplets such as band and choir practice and
performances are not permitted.
Activities that involve singing must only take place outdoors.
Implement procedures for turning in assignments to minimize contact.
Consider using privacy boards or clear screens to increase and enforce
separation between staff and students.

Non-Classroom Spaces
Limit nonessential visitors, volunteers and activities involving other groups
at the same time.
Limit communal activities where practicable. Alternatively, stagger use,
properly space occupants and disinfect in between uses.
Consider use of non-classroom space for instruction, including regular
use of outdoor space, weather permitting. For example, consider part-
day instruction outside.
Minimize congregate movement through hallways as much as
practicable. For example, establish more ways to enter and exit a
campus, create staggered passing times when necessary or when
students cannot stay in one room and create guidelines on the floor that
students can follow to enable physical distancing while passing. In
addition, schools can consider eliminating the use of lockers and moving
to block scheduling, which supports the creation of cohort groups and
reduces changes of classrooms.
Serve meals outdoors or in classrooms instead of cafeterias or group
dining rooms where practicable. Where cafeterias or group dining
rooms must be used, keep students together in their cohort groups,
ensure physical distancing, and consider assigned seating. Serve
individually plated or bagged meals. Avoid sharing of foods and utensils
and buffet or family-style meals.
Consider holding recess activities in separated areas designated by
class.
Sports and Extra Curricular Activities
(Updated August 3, 2020)
Outdoor and indoor sporting events, assemblies, dances, rallies, field
trips, and other activities that require close contact or that would
promote congregating are not permitted at this time. For example,
tournaments, events, or competitions, regardless of whether teams are
from the same school or from different schools, counties, or states are
not permitted at this time.
Youth sports and physical education are permitted only when the following
can be maintained: (1) physical distancing of at least six feet; and (2) a
stable cohort, such as a class, that limits the risks of transmission (see CDC
Guidance on Schools and Cohorting). Activities should take place outside
to the maximum extent practicable.

For sports that cannot be conducted with sufficient distancing or cohorting,
only physical conditioning and training is permitted and ONLY where
physical distancing can be maintained. Conditioning and training should
focus on individual skill building (e.g., running drills and body weight
resistance training) and should take place outside, where practicable.
Indoor physical conditioning and training is allowed only in counties where
gyms and fitness centers are allowed to operate indoors.
Avoid equipment sharing, and if unavoidable, clean and disinfect shared
equipment between use by different people to reduce the risk of COVID-19
spread.
Consistent with guidance for gyms and fitness facilities, cloth face coverings
must be worn during indoor physical conditioning and training or physical
education classes (except when showering). Activities that require heavy
exertion should be conducted outside in a physically distanced manner
without face coverings. Activities conducted inside should be those that do
not require heavy exertion and can be done with a face covering. Players
should take a break from exercise if any difficulty in breathing is noted and
should change their mask or face covering if it becomes wet and sticks to
the player’s face and obstructs breathing. Masks that restrict airflow under
heavy exertion (such as N-95 masks) are not advised for exercise.
Youth sports programs and schools should provide information to
parents or guardians regarding this and related guidance, along with
the safety measures that will be in place in these settings with which
parents or guardians must comply.
Activities where there is increased likelihood for transmission from
contaminated exhaled droplets such as band and choir practice and
performances are not permitted.
7. Limit Sharing
Keep each child’s belongings separated and in individually labeled
storage containers, cubbies or areas. Ensure belongings are taken home
each day to be cleaned.
Ensure adequate supplies to minimize sharing of high-touch materials (art
supplies, equipment, etc.) to the extent practicable or limit use of
supplies and equipment to one group of children at a time and clean
and disinfect between uses.
Avoid sharing electronic devices, clothing, toys, books and other games
or learning aids as much as practicable. Where sharing occurs, clean
and disinfect between uses.

8. Train All Staff and Educate Families
Train all staff and provide educational materials to families in the
following safety actions:
o Enhanced sanitation practices
o Physical distancing guidelines and their importance
o Proper use, removal, and washing of face coverings
o Screening practices
o How COVID-19 is spread
o COVID-19 specific symptom identification
o Preventing the spread of COVID-19 if you are sick, including the
importance of not coming to work if staff members have symptoms,
or if they or someone they live with has been diagnosed with COVID-
19.
o For workers, COVID-19 specific symptom identification and when to
seek medical attention
o The employer’s plan and procedures to follow when children or
adults become sick at school.
o The employer’s plan and procedures to protect workers from COVID-
19 illness.
Consider conducting the training and education virtually, or, if in-person,
ensure a minimum of six-foot distancing is maintained.
9. Check for Signs and Symptoms
Prevent discrimination against students who (or whose families) were or
are diagnosed with COVID-19 or who are perceived to be a COVID-19
risk.
Actively encourage staff and students who are sick or who have
recently had close contact with a person with COVID-19 to stay home.
Develop policies that encourage sick staff and students to stay at home
without fear of reprisal, and ensure staff, students and students’ families
are aware of these policies.
Implement screening and other procedures for all staff and students
entering the facility.

Conduct visual wellness checks of all students or establish procedures for
parents to monitor at home. If checking temperatures, use a no-touch
thermometer.
Ask all individuals if they or anyone in their home is exhibiting COVID-19
symptoms.
Make available and encourage use of hand-washing stations or hand
sanitizer.
Document/track incidents of possible exposure and notify local health
officials, staff and families immediately of any exposure to a positive
case of COVID-19 at school while maintaining confidentiality, as required
under FERPA and state law related to privacy of educational records.
Additional guidance can be found here. As noted in Section 11 below,
the staff liaison can serve a coordinating role to ensure prompt and
responsible notification.
If a student is exhibiting symptoms of COVID-19, staff should
communicate with the parent/caregiver and refer to the student’s
health history form and/or emergency card.
Monitor staff and students throughout the day for signs of illness; send
home students and staff with a fever of 100.4 degrees or higher, cough
or other COVID-19 symptoms.
Policies should not penalize students and families for missing class.
10. Plan for When a Staff Member, Child or
Visitor Becomes Sick
Work with school administrators, nurses and other healthcare providers to
identify an isolation room or area to separate anyone who exhibits
symptoms of COVID-19.
Any students or staff exhibiting symptoms should immediately be
required to wear a face covering and be required to wait in an isolation
area until they can be transported home or to a healthcare facility, as
soon as practicable.
Establish procedures to arrange for safe transport home or to a
healthcare facility, as appropriate, when an individual is exhibiting
COVID-19 symptoms:
o Fever
o Cough
o Shortness of breath or difficulty breathing

o Chills
o Repeated shaking with chills
o Fatigue
o Muscle pain
o Headache
o Sore throat
o Congestion or runny nose
o Nausea or vomiting
o Diarrhea
o New loss of taste or smell
For serious injury or illness, call 9-1-1 without delay. Seek medical
attention if COVID-19 symptoms become severe, including persistent
pain or pressure in the chest, confusion, or bluish lips or face. Updates
and further details are available on CDC’s webpage.
Notify local health officials immediately of any positive case of COVID-
19, and exposed staff and families as relevant while maintaining
confidentiality as required by state and federal laws. Additional
guidance can be found here.
Close off areas used by any individual suspected of being infected with
the virus that causes COVID-19 and do not use before cleaning and
disinfection. To reduce risk of exposure, wait 24 hours before you clean
and disinfect. If it is not possible to wait 24 hours, wait as long as
practicable. Ensure a safe and correct application of disinfectants using
personal protective equipment and ventilation recommended for
cleaning. Keep disinfectant products away from students.
Advise sick staff members and students not to return until they have met
CDC criteria to discontinue home isolation, including at least 3 days with
no fever, symptoms have improved and at least 10 days since symptoms
first appeared.
Ensure that students, including students with disabilities, have access to
instruction when out of class, as required by federal and state law.
Schools should offer distance learning based on the unique
circumstances of each student who would be put at-risk by an in-person
instructional model. For example, students with a health condition,
students with family members with a health condition, students who
cohabitate or regularly interact with high-risk individuals, or are otherwise
identified as “at-risk” by the parents or guardian, are students whose
circumstances merit coffering distances learning.

Implement the necessary processes and protocols when a school has an
outbreak, in accordance with CDPH guidelines.
Investigate the COVID-19 illness and exposures and determine if any
work-related factors could have contributed to risk of infection. Update
protocols as needed to prevent further cases.
Update protocols as needed to prevent further cases. See the CDPH
guidelines, Responding to COVID-19 in the Workplace, which are
incorporated into this guidance and contain detailed recommendations
for establishing a plan to identify cases, communicating with workers
and other exposed persons, and conducting and assisting with contact
tracing.
11. Maintain Healthy Operations
Monitor staff absenteeism and have a roster of trained back-up staff
where available.
Monitor the types of illnesses and symptoms among your students and
staff to help isolate them promptly as needed.
Designate a staff liaison or liaisons to be responsible for responding to
COVID-19 concerns. Workers should know who they are and how to
contact them. The liaison should be trained to coordinate the
documentation and tracking of possible exposure, in order to notify local
health officials, staff and families in a prompt and responsible manner.
Maintain communication systems that allow staff and families to self-
report symptoms and receive prompt notifications of exposures and
closures, while maintaining confidentiality, as required by FERPA and state
law related to privacy of educational records. Additional guidance can
be found here.
Consult with local health departments if routine testing is being
considered by a local educational agency. The role of providing routine
systematic testing of staff or students for COVID-19 (e.g., PCR swab testing
for acute infection, or presence of antibodies in serum after infection) is
currently unclear.
Support students who are at higher risk for severe illness or who cannot
safely distance from household contacts at higher risk, by providing
options such as virtual learning or independent study.

12. Considerations for Reopening and Partial or
Total Closures
California schools have been closed for in-person instruction since mid-March
2020 due to the COVID-19 pandemic. School closures to in-person instruction
were part of a broader set of recommendations intended to reduce
transmission of SARS-CoV-2, the virus that causes COVID-19. For more detailed
direction on measures to be taken when a student, teacher, or staff member
has symptoms or is diagnosed with COVID-19, please see the COVID-19 and
Reopening Framework for K-12 Schools in California.
Check State and local orders and health department notices daily
about transmission in the area or closures and adjust operations
accordingly.
When a student, teacher or staff member tests positive for COVID-19
and had exposed others at the school, refer to the CDPH Framework for
K-12 Schools, and implement the following steps:
o In consultation with the local public health department, the
appropriate school official should ensure cleaning and quarantine of
exposed persons and whether any additional intervention is
warranted, including the length of time necessary, based on the risk
level within the specific community as determined by the local
public health officer.
o Close off the classroom or office where the patient was based and
do not use these areas until after cleaning and disinfection. Wait at
least 24 hours before cleaning and disinfecting. If 24 hours is not
feasible, wait for at least two hours and as long as possible.
o Additional areas of the school visited by the COVID-19 positive
individual may also need to be cleaned and disinfected.
o Implement communication plans for exposure at school and
potential school closures to include outreach to students,
parents, teachers, staff and the community.
o Include information for staff regarding labor laws, information
regarding Disability Insurance, Paid Family Leave and
Unemployment Insurance, as applicable to schools. See additional
information on government programs supporting sick leave and
worker’s compensation for COVID-19, including worker’s sick leave
rights under the Families First Coronavirus Response Act and
employee’s rights to workers’ compensation benefits and
presumption of the work-relatedness of COVID-19 pursuant to the
Governor’s Executive Order N-62-20, while that Order is in effect.
o Provide guidance to parents, teachers and staff reminding them of

the importance of community physical distancing measures while
a school is closed, including discouraging students or staff from
gathering elsewhere.
o Develop a plan for continuity of education. Consider in that plan how
to also continue nutrition and other services provided in the regular
school setting to establish alternate mechanisms for these services to
continue.
o Maintain regular communications with the local public
health department.

EXHIBIT "10"

Projecting the potential impacts of COVID-19 school closures on academic achievement
With 55 million students in the United States out of school due to the COVID-19 pandemic, education systems are scrambling to meet the needs of schools and families, including planning how best to approach instruction in the fall given students may be farther behind than in a typical year. Yet, education leaders have little data on how much learning has been impacted by school closures. While the COVID-19 learning interruptions are unprecedented in modern times, existing research on the impacts of missing school (due to absenteeism, regular summer breaks, and school closures) on learning can nonetheless inform projections of potential learning loss due to the pandemic. In this study, we produce a series of projections of COVID-19-related learning loss and its potential effect on test scores in the 2020-21 school year based on (a) estimates from prior literature and (b) analyses of typical summer learning patterns of five million students. Under these projections, students are likely to return in fall 2020 with approximately 63-68% of the learning gains in reading relative to a typical school year and with 37-50% of the learning gains in math. However, we estimate that losing ground during the COVID-19 school closures would not be universal, with the top third of students potentially making gains in reading. Thus, in preparing for fall 2020, educators will likely need to consider ways to support students who are academically behind and further differentiate instruction.
Suggested citation: Kuhfeld, Megan, James Soland, Beth Tarasawa, Angela Johnson, Erik Ruzek, and Jing Liu. (2020). Projecting the potential impacts of COVID-19 school closures on academic achievement. (EdWorkingPaper: 20-226). Retrieved from Annenberg Institute at Brown University: https://doi.org/10.26300/cdrv-yw05
Megan KuhfeldNWEA
James SolandUniversity of Virginia
Beth TarasawaNWEA
Angela JohnsonNWEA
Erik RuzekUniversity of Virginia
Jing LiuBrown University
VERSION: May 2020
EdWorkingPaper No. 20-226

1
Projecting the potential impacts of COVID-19 school closures on academic achievement
Megan Kuhfeld Research Scientist, NWEA
James Soland
Assistant Professor, Curry School of Education University of Virginia
Beth Tarasawa Executive Vice President of Research, NWEA
Angela Johnson Research Scientist, NWEA
Erik Ruzek Research Assistant Professor, Curry School of Education University of Virginia
Jing Liu Postdoctoral Research Associate, Annenberg Institute, Brown University

2
Projecting the potential impact of COVID-19 school closures on academic achievement
Abstract
With 55 million students in the United States out of school due to the COVID-19 pandemic,
education systems are scrambling to meet the needs of schools and families, including planning
how best to approach instruction in the fall given students may be farther behind than in a typical
year. Yet, education leaders have little data on how much learning has been impacted by school
closures. While the COVID-19 learning interruptions are unprecedented in modern times,
existing research on the impacts of missing school (due to absenteeism, regular summer breaks,
and school closures) on learning can nonetheless inform projections of potential learning loss
due to the pandemic. In this study, we produce a series of projections of COVID-19-related
learning loss and its potential effect on test scores in the 2020-21 school year based on (a)
estimates from prior literature and (b) analyses of typical summer learning patterns of five
million students. Under these projections, students are likely to return in fall 2020 with
approximately 63-68% of the learning gains in reading relative to a typical school year and with
37-50% of the learning gains in math. However, we estimate that losing ground during the
COVID-19 school closures would not be universal, with the top third of students potentially
making gains in reading. Thus, in preparing for fall 2020, educators will likely need to consider
ways to support students who are academically behind and further differentiate instruction.

3
Introduction
Virtually all K-12 students in the United States had face-to-face instruction interrupted
during the 2019-20 school year due to the SARS-CoV-2 (COVID-19) pandemic. The majority of
school districts are providing some virtual instruction during the last months of the school year
(Lake & Dusseault, 2020a). But it remains unclear how effective virtual learning will be, given
that most K-12 students and teachers have little experience with online instruction and that large
gaps in technology access exist in many parts of the country. Additionally, during the extended
school closure, many working parents struggle to educate and care for their children. These
unique educational challenges are accompanied by broader shocks to society, including a major
economic downturn, job losses, and the tangible health threat that is COVID-19. In short,
extended time out of school will almost certainly affect student achievement (likely in a negative
way for many), and that impact is hard to estimate given all the unique aspects of COVID-19 on
schooling and society.
While many aspects of the pandemic make anticipating its impact on achievement
difficult, there are parallels between the current situation and other planned and unplanned
reasons for which students miss school that can help us quantify the potential scale of the
COVID-19 impact. Specifically, existing research on the effects on learning of (a) summer
vacation, (b) weather-related school closures (e.g., Hurricane Katrina in New Orleans), and (c)
out-of-school time due to absenteeism can provide a rough sense of how additional time out of
school due to COVID-19 will affect achievement in the coming fall and longer term. The intent
of our study is to better understand and project how COVID-19-based school closures might
affect achievement and growth during the current school year (2019-20) and the next (2020-21).
Given that our projections, while based on existing literature, are unable to account for the

4
impact of virtual instruction, access to supplemental curriculum, or the availability of additional
educational resources, among other important factors, we present these results as preliminary
estimates of the potential negative impacts expected due to extended school closures.
Prior research on time students spend out of school is useful given the importance of
forecasting the impact of COVID-19 on short- and long-term achievement. Teachers and schools
can benefit from knowing not only how much lower achievement might be but also how much
more variable it could be in the fall. If students begin school in the fall of 2020 (or whenever
regular schooling resumes) with bigger gaps in content knowledge between low- and high-
performing students, then strategies like expanding instructional differentiation may be
warranted. Further, projections of how potential learning loss due to out-of-school time might
affect growth in the coming school year may also help educators identify students who are not on
track academically when school resumes and give them needed supports.
In this study,1 we made projections about the effects of COVID-19 on student
achievement trends from the spring of 2020, when schools were first shut down across the
United States (U.S.), through to the start of the 2020-21 school year. To provide preliminary
estimates of the potential impacts of the extended pause on face-to-face academic instruction
during the pandemic, we used a national sample of five million students in Grades 3-8 who took
MAP® Growth™ assessments in the 2017-18 and 2018-19 school years (e.g., about 22% of the
approximately 22 million U.S. public school students in Grades 3-8 according to NCES [2018]).
Specifically, we compared typical growth trajectories across a standard-length school year to
1 This paper has its origins in a NWEA brief (Kuhfeld & Tarasawa, 2020), which presents some preliminary learning projections. The current paper is distinct from the brief in terms of the volume of analyses and theoretical grounding.

5
learning projections that assume students are out of school for the last three months of the 2019-
20 school year. In so doing, we investigated three research questions:
(1) What are possible scenarios (based on prior literature and recent MAP Growth data)
for student learning patterns during the 2019-20 school year as a result of the school
closures?
(2) How much variability do we expect in (a) students’ learning rates during the extended
school closure period and (b) students’ fall 2020 scores assuming a normal 2019-20
school year versus one disrupted by COVID-19?
(3) What is the association between out-of-school time due to COVID-19 and projected
subsequent learning rates over the course of the 2020-21 school year?
Background
While the COVID-19 school closures are unprecedented in the U.S., there are multiple
bodies of research on which we can draw to anticipate the impacts2 of extended closures on
student learning. These include (a) seasonal learning studies that compare learning that occurs
during the school year to learning that occurs during summer breaks, (b) studies on weather-
related school closures, and (c) studies on student absenteeism. Table 1 provides a summary of
the effect sizes (reported in standard deviation [SD] units for each day out of school) from key
studies in each body of literature that are discussed below (further details on the studies are
provided in Appendix A of the supplemental materials). We then discuss the degrees to which
2 Studies from these three lines of research provide descriptive as well as credibly causal evidence. For the purpose of this study, we consider the research evidence collectively without distinguishing causal estimates from associations and refer to all estimated relations between out-of-school time and achievement as effects or impacts.

6
each of these bodies of work is likely to reflect the conditions observed during the COVID-19
school closures.
Seasonal Learning Studies
Seasonal learning research (including studies to understand the effects of summer
learning loss) makes comparisons of student learning patterns when school is in versus out of
session. Thus, one way to think about COVID-19 school closures is to consider them extensions
of summer break for most students. Research has consistently shown that achievement typically
slows or declines over the summer months (on average) and that the declines tend to be steeper
for math than for reading (Quinn & Polikoff, 2017). However, there is much debate about the
magnitude of summer loss and the degree to which summer vacation contributes to
socioeconomic achievement gaps (von Hippel, 2019).
Prominent early work on summer learning loss found that students lost about a month of
learning over the summer, with lower-income students falling behind middle- and high-income
students in reading (Cooper, Nye, Charlton, Lindsay, & Greathouse, 1996; Alexander, Entwisle,
& Olson 2001). Recent summer loss research using the Early Childhood Longitudinal Study,
Kindergarten Cohort (ECLS-K) has indicated minimal loss on average during the summer, while
studies using NWEA’s MAP Growth assessment showed fairly sizable drops (Atteberry &
McEachin; 2020; Kuhfeld, Condron, & Downey, 2019). This variability in estimates can be seen
in Table 1, where summer drop estimates range from 0.001 to 0.010 SDs per day of school
missed across grades/subjects. However, research using both recent data sources agree that
summer does not appear to be a time in which socioeconomic and racial/ethnic inequalities
widen (e.g., von Hippel & Hamrock, 2019; Kuhfeld, 2019; von Hippel, 2019).
School Closures due to Inclement Weather and Natural Disasters

7
The literature on school closures also provides some insight into the potential effect of
COVID-19 school closures, especially given such closures occur unexpectedly and disrupt
scheduled instruction. Although they occur over a shorter duration, school closures resulting
from inclement weather or natural disasters provide an analog to school closures due to COVID-
19. Absent the weather event or natural disaster, schools would be in session and learning for
most students would occur as normal. Hansen (2011) found that each day of school cancellation
due to snow in Colorado reduced 8th grade math achievement by magnitudes ranging from 0.013
to 0.039 SDs, and the impact effects of snow days in Maryland ranged from 0.013 to 0.016 SDs.
Goodman (2014) studied snow day closures in Massachusetts and found that each day of school
closure had null effects on math and reading achievement overall, but that students attending
poor schools experienced a decline of 0.014 SDs in math and 0.016 SDs in reading for every day
of school closure. A related line of research found that the displacement effect of Hurricane
Katrina led to drops in achievement at a magnitude of approximately 0.10 SDs in the year after,
though these studies did not investigate effect heterogeneity by student demographics or school
poverty (e.g., Sacerdote, 2012). However, these estimates are not comparable to those provided
by the snow day literature due to differences in research design and recorded units of time.
Absenteeism
In contrast to the seasonal learning and school closure studies discussed above, an
emerging literature on school absenteeism focuses on the impact of instructional time loss due to
absences while schools are in session. Unlike the school closure due to the COVID-19 that forces
every student to be out of school, not all students are absent during a normal school year. There
are numerous reasons for which a student might miss school, including lack of access to reliable
transportation and need to care for family members. Minority and low-income students tend to

8
have more absences and are more likely to be chronically absent (i.e., missing at least 10% of
school days), compared with their more affluent peers (Whitney & Liu, 2016).
Research consistently found that absences had negative effects on end-of-year test scores.
Several studies that used a value-added model found similar effect sizes in both elementary and
secondary schools. Specifically, missing ten school days can decrease student math test scores by
0.06 to 0.08 SDs; the effect sizes for ELA scores were slightly smaller (Aucejo & Romano,
2016; Gershenson, Jacknowitz, & Brannegan, 2017; Liu, Lee, & Gershenson, 2019). Studies that
used either flu or snow days as an instrumental variable for absences tended to yield much larger
estimates (Aucejo & Romano, 2016; Goodman, 2014) largely due to the specific variation used
in estimating the impact of absences. For example, Goodman (2014) found that one moderate
snow day-induced absence reduced student math scores by 0.05 SDs. Another takeaway from the
absenteeism literature is that the negative effects of absences were linear, meaning that each
additional absence caused similar learning loss no matter how many absences a student had
already accrued (Gershenson et al., 2017; Liu et al., 2019).
Similarities/Differences Between Out-of-School Time Studies and COVID-19 School
Closures
The literatures on summer vacation, school closures due to weather and natural disasters,
and absenteeism indicate that student learning is likely to be negatively impacted by being out of
school. While there is a fair amount of variability in the effect size estimates by grade and study
(Table 1), some clear trends emerge. Students showed bigger losses in math than reading while
out of school. Being absent from school is generally associated with larger impacts on learning
than being out of school due to summer vacation, particularly in middle school. Finally, our
review suggests that studies on summer loss and absenteeism may provide better (if imperfect)

9
models for the impact of COVID-19 than the literature on weather-related school closures, which
was sparse (only two studies with effect size estimates), generated inconsistent findings, and
tended to rely on small sample sizes from specific geographical settings. Accordingly, we draw
on the absenteeism effect sizes reported in Table 1, as well as new summer loss analyses, to
produce the projections reported in this study.
Before describing our approach, we consider how current and past school closures and
their impact on achievement may differ. First, relying on past precedent may overstate the effect
of COVID-19 school closures. Specifically, the biggest difference between school closures
examined by previous studies and those of COVID-19 is that most school districts are now
providing online instruction. Many districts have offered remote learning plans, which may
include formal curriculum, assignments, and/or progress-monitoring as well as access to general
educational resources. By April 3rd - 4th, 83 percent of parents in a Gallup poll indicated their
child was involved in an online learning program from their school (Brenan, 2020). Further, one
could imagine that parents of high socioeconomic status (SES) might leverage their cultural
capital such that their children actually make larger academic gains than in typical school days,
and these gains could further contribute to educational disparities.
Second, there is also evidence suggesting that measures taken by schools may not be as
effective as hoped. There are concerning signs that many teachers have had no contact at all with
a significant portion of students (Lieberman, 2020). According to national survey of teachers
conducted by EdWeek (Kurtz, 2020), as of April 8th only 39% of teachers reported interacting
with their students at least once a day, and most teacher-student communication occurred over
email. There is also evidence that, even when teachers are making themselves and their
instructional materials available virtually, many students lack the means to access online

10
materials from home. Nearly 50% of low-income families and 42% of families of color lack
sufficient devices at home to access distance learning, according to an Education Trust (2020b)
poll. Moreover, few school systems provide plans to support students who need accommodations
or other special populations (Lake & Dusseault, 2020b). Thus, despite many administrative
leaders’ and educators’ best efforts, students and their families may bear the brunt of the
responsibility for ensuring learning continues during the closures.
There is also uncertainty about whether virtual instruction, even when well-implemented,
is likely to be as effective as traditional face-to-face instruction. Prior comparisons of online and
traditional public schools show that students in online schools lose between 0.1 and 0.4 SDs on
standardized tests compared to students in traditional schools (Gill et al. 2015; CREDO, 2015;
Ahn & McEachin, 2017). The COVID-19 virtual instruction is somewhat different because
students already know their teachers and are potentially doing review rather than being taught
new material. However, many public teachers have not been trained on how to provide effective
virtual instruction.
Finally, past precedent on out-of-school time may understate the impact of COVID-19 on
student learning, especially compared to summer break, which is a wholly anticipated event. The
same Education Trust (2020b) poll of California and New York parents found that elevated stress
levels for families (parents and children) continue due to economic uncertainty and job loss,
fears about catching a life-threatening virus, and the psychological impact of social isolation and
disruptions to everyday life. The (almost certainly adverse) effect of these economic and
psychological factors on the learning occurring in homes is difficult to anticipate. However,
extended school closures due to natural disasters such as Hurricane Katrina and the Christchurch,
New Zealand earthquakes may provide some clues. Research suggests the impact of school

11
disruptions following natural disasters on student development was long lasting, with some
students continuing to show psychological distress and trouble concentrating for several years
afterwards (Picou & Marshall, 2007; Duncan, 2016).
Given unique elements of the current situation, we are not positioned in this study to
speculate about whether current research and historical trends in achievement will likely
understate or overstate the effects of COVID-19 school closures on achievement. However,
given the scale of our data and what we know from past research, we can make forecasts about
potential impacts of COVID-19 based on multiple scenarios and assumptions about how learning
might have changed this past school year (2019-20) and will change over the next (2020-21).
Even if forecasts can only provide a range of potential impacts based on different assumptions
made about the current situation, forecasts are nonetheless invaluable in helping educators and
policymakers understand what to expect when students return in the fall, including how learning
might progress differently over the course of the 2020-21 school year.
To that end, our study includes several analyses that can prepare educators and
policymakers for what they may face next year. First, we produce two sets of possible scenarios
for COVID-19 learning loss while students would have otherwise been in school in 2019-20.
One set of projections is based on empirical analyses examining summer loss using MAP
Growth data. We then compare those projections to a second set of projections for learning loss
based on the absenteeism literature, obtained by multiplying the daily learning loss rate from that
literature by the days of school missed during the pandemic. Second, we provide estimates of (a)
predicted variability in learning rates and (b) predicted variability in student scores at the
beginning of the 2020-21 school year that account for the extended time out of school. Third, we
go beyond prior school closure research to look not only at the potential effect of school closure

12
on current achievement, but also the relationship between out-of-school time achievement
declines and growth during the following year (i.e., how strongly associated is the magnitude of
learning loss with the gains made in the next year?).
Methods
Analytic Sample
The data for this study are from NWEA’s anonymized longitudinal student achievement
database. School districts use NWEA’s MAP Growth assessments to monitor elementary and
secondary students’ reading and math growth throughout the school year, with assessments
typically administered in the fall, winter, and spring. We use the test scores of approximately five
million third- to seventh-grade students3 in 18,958 schools across the United States. In this study,
we follow students across two school years (2017-18 and 2018-19) and one summer break
(summer of 2018). The NWEA data also include demographic information, including student
race/ethnicity, gender, and age at assessment, though student-level SES is not available. Table 2
provides descriptive statistics for the sample by subject and grade. Overall, the sample is 51%
male, 47% White, 17% Black, 4% Asian, and 18% Hispanic. School-level free or reduced priced
lunch (FRPL) eligibility was obtained from the 2017-18 Common Core of Data (CCD) file from
the National Center of Education Statistics (NCES). The average student in our sample attends a
school that is 51% FRPL-eligible. A comparison of the 18,972 schools in our sample relative to
U.S. population of public elementary and middle schools (72,075 schools serving Grades 3-8) is
provided in Appendix B of the supplemental materials. Overall, the sample closely aligns to the
3 Due to limited MAP Growth testing in high schools, we did not follow the cohort of 8th graders in 2017-18 into 9th grade in 2018-19.

13
characteristics of U.S. public schools, with a slight overrepresentation of Black students and
underrepresentation of Hispanic students.
Measures of Achievement
Student test scores from NWEA’s MAP Growth reading and math assessments are used
in this study. MAP Growth is a computer adaptive test that precisely measures achievement even
for students above or below grade level and is vertically scaled to allow for the estimation of
gains across time. The MAP Growth assessments are typically administered three times a year
(fall, winter, and spring) and are aligned to state content standards. Test scores are reported on
the RIT (Rasch unIT) scale, which is a linear transformation of the logit scale units from the
Rasch item response theory model.
Projecting COVID-19 School Closure Impacts on Learning Trajectories
In this study, we present two sets of estimates of the potential impacts of COVID-19
school closures on student learning: (a) empirical estimates calculated using MAP Growth data
based on summer loss patterns during the summer of 2018, and (b) estimates calculated based on
prior absenteeism literature. We begin by describing our empirical approach to estimating
students’ academic growth during the school year and learning loss during summer break under
normal (pre-COVID-19) conditions. Subsequently, we discuss how we use the absenteeism and
summer loss estimates to produce COVID-19 projections.
We first estimated typical growth rates across two school years (2017-18 and 2018-19)
and the summer break in between using a series of multilevel growth models (longitudinal test
scores nested within students within schools). Following other seasonal learning research studies
(e.g., von Hippel et al., 2018; Kuhfeld et al., 2019), we estimated student learning rates as a
function of the months that elapsed during the two school years and the summer between. Given

14
that prior research using MAP Growth data found evidence of non-linearity in students’ within-
school growth trajectories (Kuhfeld & Soland, 2020), particularly in reading, we modeled
student learning rates across the school year using a quadratic function (though a set of models
assuming linear growth are also reported in Appendix Tables C3 and C4). Under this model, the
test score 𝑦𝑦𝑡𝑡𝑖𝑖𝑖𝑖 for student i in school j at timepoint t was modeled as a quadratic function of the
months that a student had been exposed to the 2017-18 school year (MonY1𝑖𝑖𝑖𝑖), the summer of
2018 (Sum𝑖𝑖𝑖𝑖), and the 2018-19 school year (MonY2𝑖𝑖𝑖𝑖). At level 1, the growth model can be
expressed as:
𝑦𝑦𝑡𝑡𝑖𝑖𝑖𝑖 = 𝜋𝜋0𝑖𝑖𝑖𝑖 + 𝜋𝜋1𝑖𝑖𝑖𝑖MonY1𝑡𝑡𝑖𝑖𝑖𝑖 + 𝜋𝜋2𝑖𝑖𝑖𝑖MonY1𝑡𝑡𝑖𝑖𝑖𝑖2 + 𝜋𝜋3𝑖𝑖𝑖𝑖Sum𝑡𝑡𝑖𝑖𝑖𝑖 (1)
+𝜋𝜋4𝑖𝑖𝑖𝑖MonY2𝑡𝑡𝑖𝑖𝑖𝑖 + 𝜋𝜋5𝑖𝑖𝑖𝑖MonY2𝑡𝑡𝑖𝑖𝑖𝑖2 + 𝑒𝑒𝑡𝑡𝑖𝑖𝑖𝑖 .
The intercept (𝜋𝜋0𝑖𝑖𝑖𝑖) is the predicted score for student i in school j tested on the first day of the
2017-18 school year, 𝜋𝜋1𝑖𝑖𝑖𝑖 is the average instantaneous rate of change at the start of the 2017-18
school year, and 𝜋𝜋2𝑖𝑖𝑖𝑖 is the average rate of change of the linear growth term in 2017-18 for a
one-month change in time (e.g., the acceleration or deceleration in growth), 𝜋𝜋3𝑖𝑖𝑖𝑖 is the monthly
summer linear loss rate, and 𝜋𝜋4𝑖𝑖𝑖𝑖 and 𝜋𝜋5𝑖𝑖𝑖𝑖 are the linear and quadratic terms in the 2018-19
school year, respectively. At level 2 and 3 of the model, the intercept and growth parameters
were allowed to vary among students within schools and between schools:
Level-2 Model (student (i) within school (j)): (2)
𝜋𝜋0𝑖𝑖𝑖𝑖 = 𝛽𝛽00𝑖𝑖 + 𝑟𝑟0𝑖𝑖𝑖𝑖
𝜋𝜋1𝑖𝑖𝑖𝑖 = 𝛽𝛽10𝑖𝑖 + 𝑟𝑟1𝑖𝑖𝑖𝑖
𝜋𝜋2𝑖𝑖𝑖𝑖 = 𝛽𝛽20𝑖𝑖
𝜋𝜋3𝑖𝑖𝑖𝑖 = 𝛽𝛽30𝑖𝑖 + 𝑟𝑟3𝑖𝑖𝑖𝑖
𝜋𝜋4𝑖𝑖𝑖𝑖 = 𝛽𝛽40𝑖𝑖 + 𝑟𝑟4𝑖𝑖𝑖𝑖
𝜋𝜋5𝑖𝑖𝑖𝑖 = 𝛽𝛽50𝑖𝑖

15
Level-3 Model (school (j)):
𝛽𝛽00𝑖𝑖 = 𝛾𝛾000 + 𝑢𝑢00𝑖𝑖
𝛽𝛽10𝑖𝑖 = 𝛾𝛾100 + 𝑢𝑢10𝑖𝑖
𝛽𝛽20𝑖𝑖 = 𝛾𝛾200
𝛽𝛽30𝑖𝑖 = 𝛾𝛾300 + 𝑢𝑢30𝑖𝑖
𝛽𝛽40𝑖𝑖 = 𝛾𝛾400 + 𝑢𝑢40𝑖𝑖
𝛽𝛽50𝑖𝑖 = 𝛾𝛾500
Variance component specification:
𝑒𝑒𝑡𝑡𝑖𝑖𝑡𝑡 ~ N(0,𝜎𝜎𝑡𝑡𝑖𝑖𝑡𝑡2 ), 𝒓𝒓𝒊𝒊𝒊𝒊~MVN(𝟎𝟎,𝑻𝑻𝑆𝑆𝑡𝑡), 𝒖𝒖𝒊𝒊~MVN(𝟎𝟎,𝑻𝑻𝑆𝑆𝑆𝑆ℎ).
This model was estimated separately by subject (math and reading) and grade (3-7) using HLM
Version 7 (Raudenbush, Bryk, & Congdon, 2013). Estimated parameters from these models are
reported in Appendix Tables C1 and C2.
We began by calculating “typical” growth rates across a standard 9.5-month school year
(assuming students start school on September 1st and end on June 15th). To estimate typical
growth, we used the estimated parameter estimates from the 2017-18 school year for each grade
g and subject separately:
RIT� 𝑡𝑡𝑡𝑡 = 𝛾𝛾�000 + (𝛾𝛾�100) ∗ Mont + (𝛾𝛾�200) ∗ Mont2, (3)
where Mont takes values from 0 to 9.5. We then calculated “typical” summer loss across a 2.5-
month summer:
SumLoss� 𝑡𝑡𝑡𝑡 = (𝛾𝛾�300) ∗ SumMont, (4)
where SumMont takes values from 0 to 2.5 months. Under the standard-length school year,
students end the year at their 9.5-month achievement level (RIT� 9.5𝑡𝑡) and then were assumed to

16
lose ground linearly across a 2.5-month summer. We provided the “typical” school year growth
rates and summer loss as a reference for the COVID-19 projections described below.
The first scenario, which we refer to as “COVID Loss Summer Slide”, assumes that
assumes that typical summer loss patterns would extend through the prolonged school closure.
Linear projections were made based on the same SumLoss� 𝑡𝑡𝑡𝑡 calculation described above, but
starting from the projected achievement level at 6.5 months (RIT� 6.5𝑡𝑡) and extending to the
presumed start of the next school year (12 months, September 1st). During the “normal” summer
period (9.5 to 12 months), the typical summer loss and COVID Loss Summer Slide rates were
the same, and so these lines were parallel during the summer months (June 15th to September
1st).
The second scenario for our COVID-19 projections, which we refer to as “COVID Loss
Absenteeism”, draws on existing absenteeism literature. We first calculated an average effect
size (in SD units) for each day missed of school by subject based on the effect sizes reported in
Table 1 (e.g., an average -0.007 SDs per day in math and -0.004 SDs per day in reading). Next
we converted these estimates into monthly losses on the RIT scale using NWEA’s subject- and
grade-specific achievement norms (Thum & Kuhfeld, 2020), assuming there are approximately
20 potential instructional days in a typical month and that students are absent during the entire
school closure period. Given the majority of schools in the U.S. shut down around the week of
March 15th (6.5 months into the school year), we used students’ projected achievement level at
6.5 months (RIT� 6.5𝑡𝑡) as the starting point for the projection and then assumed students lose
ground from that point at that monthly rate calculated for each subject/grade. Given that students
can only be absent while schools are still in session, we produced absenteeism projections only
to the end of the school year (9.5 months).

17
RQ1. Possible Scenarios for Learning Gains during the 2019-20 School Year
To display the possible scenarios for learning as a result of the school closures during the
2019-20 school year, we produced a set of plots to compare these empirical- and literature-based
projections to typical learning rates. The plots display students’ estimated learning rates across
the 2019-20 school year and summer of 2020 based on the absenteeism and summer loss
projections. In addition to the plots, we also reported the impact of school closures as a
percentage of learning gains that students were expected to make relative to a typical school
year. These percentages were calculated by estimating the total gains during the school year
(subtracting the initial score on September 1st, 2019 from the projected score on June 15th, 2020)
under the two different COVID Loss assumptions and dividing those estimates by the total gains
expected under typical growth.
RQ2. Quantifying Variability in COVID-19 Impacts
We do not expect that all students will be impacted by COVID-19 school closures
equally. Prior summer learning loss research indicated that there is a considerable variability in
students’ learning patterns over the summer (e.g., Atteberry & McEachin, 2019; Kuhfeld et al.,
2019), most of which cannot be explained by observed student and family characteristics (von
Hippel et al., 2019; Kuhfeld, 2019; Borman, Benson, Overman, 2005). In addition to producing
average estimates of learning rates during time out of school, we estimated variation in these
learning rates across students. Specifically, we used the variance term of the within-school
summer loss random effect (𝑟𝑟3𝑖𝑖𝑖𝑖) to examine the potential variability in COVID-19 impacts
based on learning patterns during the summer of 2018. Based on the average monthly summer
loss rate (𝛾𝛾�300) and the standard deviation of the learning loss across students within the same
school (𝑇𝑇𝑆𝑆𝑡𝑡(3,3)), we calculated the monthly learning rates for students at the 25th, 50th, and 75th

18
percentiles of the summer learning distribution. These estimates were then plotted to allow for an
examination of the potential spread in fall 2020 RIT scores by grade/subject assuming students
maintained the same rate of growth from school closure (March 15th) to the start of the 2020-21
school year.
There are two potential limitations to this approach. First, while this approach allowed us
to quantify variability in potential growth rates while students are out of school, it did not
provide a direct estimate of the possible variability in test scores when students return to school
following the COVID-19 school closures. Second, it ignored the correlation between gains made
while in school and losses that occur out of school. Prior research has indicated school-year and
summer learning are negatively correlated, with students who made the largest gains during the
school year showing the biggest drops in the summer (e.g., Kuhfeld, 2019; von Hippel et al.,
2018).
Therefore, we also used the empirical Bayes (EB) estimates of students’ learning rates
from our models to project students’ achievement in fall 2020 under two scenarios. Under the
first scenario, we used the EB estimates from the 2017-18 school year and the summer of 2018 to
produce projected scores at the start of the 2018-19 school year. These projected fall scores were
treated as what would be expected in fall 2020 under “business as usual”, had students completed
the full 2019-20 school year and a typical summer break. The fall RIT scores are predicted using
the following equation, in which 𝛾𝛾� are parameter estimates from the model and �̂�𝑟 are EB
estimates of the random intercepts and slopes:
RIT� 𝑇𝑇𝑇𝑇𝑇𝑇𝑖𝑖𝑆𝑆𝑇𝑇𝑙𝑙𝐹𝐹𝐹𝐹𝐹𝐹𝐹𝐹,𝑡𝑡𝑖𝑖𝑖𝑖 = 𝛾𝛾�000 + �̂�𝑟0𝑖𝑖𝑖𝑖 + �𝛾𝛾�100 + �̂�𝑟1𝑖𝑖𝑖𝑖� ∗ 9.5 + (𝛾𝛾�200) ∗ 9.52 (5)
+ �𝛾𝛾�300 + �̂�𝑟3𝑖𝑖𝑖𝑖� ∗ 2.5.

19
In the second scenario, we assumed that COVID-19 increased the effects of summer loss
by extending out of school time. In this case, projected fall scores were calculated for each
student assuming a 6.5-month school year followed by a 5.5-month summer break, using the
following equation:
RIT� 𝐶𝐶𝐶𝐶𝐶𝐶𝐶𝐶𝐷𝐷𝐹𝐹𝐹𝐹𝐹𝐹𝐹𝐹,𝑡𝑡𝑖𝑖𝑖𝑖 = 𝛾𝛾�000 + �̂�𝑟0𝑖𝑖𝑖𝑖 + �𝛾𝛾�100 + �̂�𝑟1𝑖𝑖𝑖𝑖� ∗ 6.5 + (𝛾𝛾�200) ∗ 6.52 (6)
+ �𝛾𝛾�300 + �̂�𝑟3𝑖𝑖𝑖𝑖� ∗ 5.5
Further details on the calculation of the projected scores under each scenario are provided
in Appendix D. We then compared the distribution of scores under each condition to understand
how much more variable the fall scores were under the COVID-19 Summer Slide assumption
relative to a normal fall.
RQ3. Estimating the Relationship Between Summer Loss and Next School Year’s Growth
To guide planning to support student learning during this pandemic and school closures,
it is important to understand not only the possible impact of school closures on student learning,
but also whether students with large losses recover at similar or different rates than other
students. To investigate this question, we examined the correlation among the learning rates
during the summer of 2018 and in the 2018-19 school year. Specifically, we examined the level-
2 random effect correlation matrix to understand the association between out of school learning
rates and growth in the following school year. Though the empirical data are from a typical
school year and summer, the results from this analysis can inform decision-making by serving as
a proxy for student learning recovery post-COVID-19.
Results
RQ1. Possible Scenarios for Learning Gains during the 2019-20 School Year

20
Projected COVID-19 impacts on average academic growth trajectories are presented in
Figure 1 for mathematics (Panel A) and reading (Panel B). In a typical year (shown as solid
lines), average academic growth is not constant across the academic year (shown as the curved
lines seen in some grades) and generally declines from the last day of school through the
summer, with steeper declines in mathematics than in reading. The dashed line shows projected
trajectories based on prior absenteeism literature (from COVID-19 school closure to the end of
the 2019-20 school year), and dotted lines show projected trajectories under summer learning
loss patterns (from COVID-19 school closure to start of the 2020-21 school year). Since the
absenteeism estimates pertain to missing school while schools are still open, we did not extend
the COVID Loss Absenteeism projections past June 15th.
Under both sets of projections, students’ learning gains are projected to be substantially
lower at the end of the school year than under typical conditions. The COVID Loss Absenteeism
projections for losses in learning are more dire than the COVID Loss Summer Slide projections,
implying steeper drops while students are out of school across all grades and subjects. We also
calculated the percentage of learning gains that students would be expected to have made relative
to a normal year under each condition. Our results suggest that under the COVID Loss Summer
Slide projections, students end the abbreviated 2019-20 school year with roughly 63-68% of the
learning gains in reading relative to a typical school year (see Table D1 in the supplemental
materials). However, in mathematics, students are likely to show much smaller gains, ending the
school year with 37-50% of the average gains in a normal school year. For students moving from
fifth to sixth grade, we expect under COVID Loss Summer Slide projections that students end
the school year with only 19% of total mathematics gains. Under the COVID Loss Absenteeism
projections, the story is even more dire, with students in sixth and seventh grade projected to end
the school year with less than 30% of their typical learning gains in both math and reading.

21
RQ2. Quantifying Variability in COVID-19 Impacts
Beyond average achievement, educators may be equally concerned about whether
COVID-19 will result in greater variability in the academic skills that students bring with them
when school resumes. In Figure 2, we display the variability in learning expected under the
COVID Loss Summer Slide model from March 15th (when schools shut down) to September 1st
(when schools are expected to reopen). These estimates are based on variability seen during a
typical summer, but with the duration of that summer extended. For parsimony, we only display
Grades 4 and 6, but the model-based variability estimates for all grades/subjects are presented in
Table D3 of the supplemental materials. The shaded areas display the spread in potential
outcomes between students who were in the 25th percentile of summer learning loss (who
showed steep declines) and those in the 75th percentile (who showed flat scores or even small
gains during the summer). In mathematics, we see a fair amount of variability in learning rates,
though the majority of students show losses over the extended closure and summer period.
However, in reading, there is an even wider spread of potential outcomes, with students who are
in the 75th percentile and above showing sizable learning gains during the summer. As seen in
Table D3, approximately the upper half of the distribution (39-46% of students) are projected to
show monthly gains in reading during the summer. Altogether, these plots show that extended
time out of school may lead to more variability in achievement when students return in the fall.
One limitation of the plots in Figure 2 is that they do not provide concrete evidence on
the variability in fall achievement under COVID-19 relative to variability under a typical school
year. Thus, in Figure 3 we display the spread of the projected fall 2020 test scores under
“typical” conditions as well as the COVID Loss Summer Slide projections. The box plot shows
the interquartile range (e.g., the 25th, 50th, and 75th percentiles) and the vertical lines extending

22
above and below the box stretch one and half times the interquartile range, with scores outside
that range displayed as outliers (circles in the figure). The estimated means, SDs, and percentiles
scores for each condition and grade/subject are reported in Table D3 in the supplemental
materials. Across the board, students are projected to return in the fall with lower scores and
more variability relative to a typical fall. In reading, the SDs of expected scores are expected to
be up to 1.2 times the SDs expected in a typical fall. Thus, students will likely return not only
with lower achievement (on average), but with a wider range of academic skills that may require
teachers to further differentiate instruction.
RQ3. Estimating the Relationship Between Summer Loss and Next School Year’s Growth
Finally, to project whether larger COVID-19 learning losses would be associated with
faster growth rates during the 2020-21 school year, we examined whether students who lost more
ground during a typical summer showed slower rates of recovery during the subsequent typical
school year. Correlations between students’ summer loss and linear growth during the 2018-19
school year are presented in Tables C1 and C2 in the supplemental materials. In mathematics,
student-level correlations ranged from -0.41 to -0.43, and in reading the correlations ranged from
-0.45 to -0.46. These correlations imply that students who lost more ground during the summer
of 2018 showed steeper growth during the following school year (2018-19) than students with
less summer loss. Accordingly, this suggests that a student who lost ground during the summer
does not necessarily continue to lose ground during the next school year; rather, they are likely to
gain ground.
Discussion
Educators, policymakers, families, and students find themselves in uncharted territory
during the COVID-19 crisis. School districts in particular are on the front lines to help ensure all

23
students have access to academic materials, instruction, and digital resources, among other basic
needs such as food for students from low income backgrounds and support for students with
disabilities, English learners, and students in temporary housing (Education Trust, 2020a).
Despite these efforts, a majority of parents with children in K-12 schools are concerned that their
children will fall behind academically due to the disruptions of COVID-19 school closures
(Horowitz, 2020). In this study, we produced a set of possible scenarios for learning loss rates
during the extended period when schools are physically closed and students are not receiving
normal face-to-face instruction. These projections can help prepare educators and parents for the
degree of variability in student achievement to expect when school resumes, including over the
course of the upcoming school year.
First, we show that students will likely (a) not have grown as much during the truncated
2019-2020 academic year and (b) will likely lose more of those gains due to extended time out of
school. Based on our projections, students will return in fall 2020 with approximately 63-68% of
the learning gains in reading relative to a typical school year and with 37-50% of the learning
gains in math. In some grades, students may come back close to a full year behind in math.
While such projections may reinforce the worst fears of educators and parents, we should note
that they do not factor in the home schooling and online instruction that students may currently
be receiving. Therefore, they should be viewed as a likely upper bound for the potential negative
effects on students’ learning.
Second, we also examined variability in possible learning outcomes during the school
closures and in the fall of 2020. We found that losing ground over the summer was not universal,
with the top third of students in reading making gains during a typical summer. As a result of this
variability, we project that the range of students’ academic achievement will be more spread out

24
in the fall of 2020 relative to a normal fall term, particularly in reading. In presenting these
projections, we assume that the variability in typical summer loss can act as a proxy for the large
variability in learning that is expected due to the widely differing home and school district
conditions impacti learning during the school closure period. In all likelihood, differential access
to parent and teacher supports for learning during the school closure months will produce
variation larger than what typical summer break variability would imply.
Finally, we show that, although our projections are dire, our models also suggest that
students who lose the most while out of school tend to gain the most the following year (at least
under typical summer loss conditions). Thus, there is hope that students most impacted by the
additional average achievement losses under COVID-19 may also be the ones who rebound the
most by the end of the 2020-21 academic school year. At the same time, one cannot be sure how
financial uncertainty, health issues related to the virus, and psychological stresses may affect the
association between summer loss and subsequent academic growth.
Limitations of Our Projections
While we provide two sets of projections in this study—one based on growth rates
calculated from MAP Growth data and the other based on prior literature on student
absenteeism—we acknowledge that it is impossible to accurately weigh the complex range of
supports and challenges that students are facing during this period. The school closures caused
by COVID-19 have additional aspects of trauma to students, loss of resources, and loss of
opportunity to learn that go well beyond a traditional summer break for many families. In other
words, families with financial resources, stable employment, and flexible work-from-home and
childcare arrangements will likely weather this storm more easily than families who are renting
their housing, working in low-paying fields that are hardest hit by the economic impacts, and

25
experiencing higher rates of food insecurity, family instability, and other shocks from this
disruption.
Given the uncertain impact of COVID-19, we have chosen not to make projections
specific to inequalities by race/ethnicity, biological sex, and SES. Recent analyses of both ECLS-
K and MAP Growth data have found little evidence that achievement gaps by race/ethnicity and
SES widen during summer months (von Hippel & Hamrock, 2019; Kuhfeld, 2019). This is likely
due to the fact that families of all income levels typically treat summer break as a vacation from
math and reading, a time when “kids can be kids” (von Hippel, 2020). Were we to base estimates
of COVID-19 impacts on racial/ethnic disparities in achievement and growth on these historical
summer learning loss patterns, we would likely conclude that the COVID-19 pandemic is going
to minimally impact long-standing inequalities in this country.
However, there are many reasons to believe the COVID-19 impacts might be larger for
children in poverty and children of color. There are higher rates of COVID-19 infections and
deaths in the African American community (Bouie, 2020), and the economic downturn has been
particularly damaging for African American and Hispanic parents, who are less likely to be able
to work from home during the pandemic (Krogstad, Gonzalez-Barrera, & Noe-Bustamente 2020;
Cerullo, 2020). Furthermore, the so-called “digital divide” in technology and internet access by
race/ethnicity and socioeconomic status (Musu, 2018) likely contributes to greater inequalities
during the COVID-19 pandemic than a typical summer. Given this evidence that the impacts of
the COVID-19 school closures will have disproportionate impacts on our country’s most
underserved communities in ways that historic summer data fails to capture, we chose not to
produce projections based on pre-COVID-19 MAP Growth summer learning data for individual

26
subgroups. However, we believe it will be of great importance to study how existing inequalities
have widened or been reshaped once schools have reopened.
Furthermore, in calculating the projected impact of out-of-school time on learning in this
study, we assumed that it is appropriate to linearly extrapolate learning loss from research on
absenteeism and summer loss across the three months of school closure. Liu and colleagues
(2019) found that additional absences had an approximately linear impact on student learning,
though the number of absences assumed in this study (approximately 60 school days) far exceeds
the average number of absences observed in their study. Furthermore, we have very little data
about whether the summer months have a linear impact on students’ reading and mathematics
skills. Campbell and Frey (1970) hypothesize that forgetting learned material may occur non-
linearly, with rapid initial deceleration of knowledge followed by slower drop offs as time
passes. However, we are unaware of any studies that have examined this phenomenon in the
context of summer break. If the true effect of being out of school accelerates the longer students
are out of school, we could be underestimating the impact on learning. But if summer loss simply
reflects a process of forgetting and re-remembering that is not directly linked to the amount of
time out of school, we could be greatly over-estimating the potential impacts on learning.
Where Do We Go From Here?
While we are not well-positioned to make recommendations for ways to remedy the
learning loss that is likely occurring due to COVID-19, our results do provide takeaways that can
inform how educators and leaders can prepare to support students upon return. First, we show
that students may be substantially behind, especially in mathematics. Thus, teachers of different
grade levels may wish to coordinate in order to determine where to start instruction. Educators

27
will also need to find ways to assess students early, either formally or informally, to understand
exactly where students are academically.
Second, students are likely to enter school with more variability in their academic skills
than under normal circumstances. Prior research suggests greater heterogeneity in student
achievement affects a classroom teacher’s ability to adapt instruction to meet the instructional
needs of all students (Connor, Piasta, Fishman, Glasney, Schatschneider, Crowe, & Morrison,
2009; Evertson, Sanford, & Emmer, 1981).Therefore, educators may need to consider ways to
further differentiate instruction or provide opportunities for individualized learning. For a
summary of related literature, one could turn to Peters, Rambo-Hernandez, Makel, Matthews,
and Plucker (2017).
Third, under typical schooling conditions, the students who lose the most during the
summer tend to gain the most when back in school. Nonetheless, the ground that students have to
make up during the 2020-21 academic year will probably be greater due to COVID-19.
Therefore, educators may want to work with students to determine growth rates needed to catch
up and set learning goals for the year that are ambitious but obtainable. These strategies might
include establishing out-of-school learning supports during the 2020-21 school year for the
students most affected by school closures.
Finally, the effects of COVID-19 to which our study cannot speak may be ones most
worthy of addressing. Districts are rushing to support educators who are attempting to teach
academic content remotely while also caring for their students’ social emotional well-being.
Prior research on students displaced by Hurricane Katrina indicated that students had difficulty
concentrating and often manifested symptoms of depression in the months following the
hurricane (Picou & Marshall, 2007). Understanding these impacts and how to best support

28
students’ social and emotional needs after this huge disruption of COVID-19 will be essential.
Many students may face greater food insecurity, loss of family income, loss of family members
to the coronavirus, and fear of catching the virus themselves (NAACP, 2020). While the scale of
the COVID-19 school closures is novel, the inequalities in our school systems are unfortunately
anything but new. Our models cannot account for the reality that the crisis is having an unequal
impact on our most underserved communities. Nonetheless, we hope these analyses, which
synthesize what we know from existing bodies of research, will inform tomorrow’s decision
making.
Conclusions
These preliminary forecasts parallel many education leaders’ fears: missing school for a
prolonged period will likely have major impacts on student achievement. Further, students will
likely return in the fall of 2020 with greater variability in their academic skills. While we are
unable to account for students’ exposure to virtual instruction while schools are closed, our
learning loss projections imply that educators and policymakers will need to prepare for many
students to be substantially behind academically when they return.
Similar to the research that found students took nearly two full years to make up lost
ground for the loss in instructional time due to Hurricane Katrina (Harris & Larsen, 2019), our
COVID Loss projections provide new evidence on the scope of the long-term educational
recovery efforts that will be required. We believe this study is one in a growing body of
important work that leverages prior research to empower school leaders, policy makers, and
researchers to make urgent evidence-informed post-COVID-19 recovery decisions.

29
References
Ahn, J. & McEachin, A. (2017). student enrollment patterns and achievement in Ohio’s online
charter schools. Educational Researcher, 46(1), 44–57.
Alexander, K.L., Entwisle, D.R., & Olson, L.S. (2007). Lasting consequences of the summer
learning gap. American Sociological Review, 72 (2), 167-180.
Atteberry, A. & McEachin, A. (2020). School's out: The role of summers in understanding
achievement disparities. (EdWorkingPaper: 20-82). Retrieved from Annenberg Institute
at Brown University: https://doi.org/10.26300/2mam-bp02.
Aucejo, E. M. & Romano, T. F. (2016) Assessing the effect of school days and absences on test
score performance. Economics of Education Review, 55, 70-87.
Bouie, J. (2020). Why Coronavirus is killing African-Americans more than others. New York
Times. Retrieved from https://www.nytimes.com/2020/04/14/opinion/coronavirus-
racism-african-americans.html.
Brenan, M. (2020, April 8). Over 8 in 10 parents now say child is learning remotely. Gallup.
Retrieved from https://news.gallup.com/poll/307754/parents-say-child-learning-remotely.aspx.
Campbell, D. T., & Frey, P. W. The implications of learning theory for the fade-out of gains
from compensatory education. In J. Hellmuth (Ed.), Compensatory education: A national
debate, disadvantaged child, vol.3. New York: Brunner/Mazel, 1970.
Cerullo, M. (2020, March 23). Black and Hispanic workers less able to work from home. CBS
News. Retrieved from https://www.cbsnews.com/news/work-from-home-black-hispanic-workers/.
Connor, C. M., Piasta, S. B., Fishman, B., Glasney, S., Schatschneider, C., Crowe, E., ... &
Morrison, F. J. (2009). Individualizing student instruction precisely: Effects of child by

30
instruction interactions on first graders’ literacy development. Child Development, 80(1),
77.
Cooper, H., Nye, B., Charlton, K., Lindsay, J., & Greathouse, S. (1996). The effects of summer
vacation on achievement test scores: A narrative and meta-analytic review. Review of
Educational Research, 66 (3), 227-268.
CREDO. (2015). Online charter school study. Stanford, CA: Center for Research on Education
Outcomes, Stanford University.
Duncan, J. (2016). CPPA Inquiry into the Ministry of Education’s post-earthquake response for
education in Christchurch. Christchurch, New Zealand: Canterbury Primary Principals
Association.
Education Trust. (2020a). COVID-19: Impact on education equity: Resources and responses.
Retrieved April 18, 2020 from https://edtrust.org/covid-19-impact-on-education-equity-
resources-responding/.
Education Trust. (2020b). CA & NY parents overwhelmingly concerned their children are falling
behind during school closures. Retrieved April 18, 2020 from https://edtrust.org/ca-ny-
parents-overwhelmingly-concerned-their-children-are-falling-behind-during-school-
closures/.
Education Week (2020). Map: Coronavirus and school closures. Retrieved from
https://www.edweek.org/ew/section/multimedia/map-coronavirus-and-school-
closures.html.
Evertson, C. M., Sanford, J. P., & Emmer, E. T. (1981). Effects of class heterogeneity in junior
high school. American Education Research Journal, 18, 219-232.

31
Gershenson, S., Jacknowitz, A., & Brannegan, A. (2017). Are student absences worth the worry
in US primary schools? Education Finance and Policy, 12 (2), 137-165.
Gill, B., Walsh, L., Wulsin, C. S., Matulewicz, H., Grau, E., Lee, A., Kerwin, T., (2015). Inside
online charter schools. Cambridge, MA: Mathematic Policy Research.
Goodman, J. (2014). Flaking out: Student absences and snow days as disruptions of instructional
time. NBER Working paper 20221.
Hansen, B. (2011). School Year Length and Student Performance: Quasi -Experimental
Evidence. Social Science Research Networking Paper.
Harris, D. and Larsen, M. (2019). The effects of the New Orleans post-Katrina market-based
school reforms on medium-term student outcomes. Education Research Alliance for New
Orleans. Retrieved from
https://educationresearchalliancenola.org/files/publications/Harris-Larsen-Reform-
Effects-2019-08-01.pdf.
Horowitz, J. M. (2020, April 15). Lower-income parents most concerned about their children
falling behind amid COVID-19 school closures. Retrieved from
https://www.pewresearch.org/fact-tank/2020/04/15/lower-income-parents-most-concerned-about-their-
children-falling-behind-amid-covid-19-school-closures/
Kuhfeld, M., Condron, D., & Downey, D. (2019). When does inequality grow? A seasonal
analysis of racial/ethnic disparities in learning in kindergarten through eighth grade. (The
Collaborative for Student Growth at NWEA Working Paper).
https://www.nwea.org/resource-library/research/when-does-inequality-grow-3.
Kuhfeld, M. (2019). Surprising new evidence on summer learning loss. Phi Delta Kappan, 101
(1), 25-29.

32
Kuhfeld, M. & Tarasawa, B. (2020). The COVID-19 slide: What summer learning loss can tell
us about the potential impact of school closures on student academic achievement.
NWEA.
Kuhfeld, M., & Soland, J. (2020). The learning curve: Revisiting the assumption of linear growth
across the school year. (EdWorkingPaper: 20-214). Retrieved from Annenberg Institute
at Brown University: https://doi.org/10.26300/bvg0-8g17.
Krogstad, J.M., Gonzalez-Barrera, A. & Noe-Bustamente, L. (2020, April 3). U.S. Latinos
among hardest hit by pay cuts, job losses due to Coronavirus. Pew Research Center.
Retrieved from https://www.pewresearch.org/fact-tank/2020/04/03/u-s-latinos-among-
hardest-hit-by-pay-cuts-job-losses-due-to-coronavirus/.
Kurtz, H. (2020, April 10). National survey tracks impact of coronavirus on schools: 10 key
findings. Education Week. Retrieved from
https://www.edweek.org/ew/articles/2020/04/10/national-survey-tracks-impact-of-
coronavirus-on.html
Lake, R. & Dusseault, B. (2020a). Remote classes are in session for more school districts, but
attendance plans are still absent. Center for Reinventing Public Education. Retrieved
April 29, 2020, from https://www.crpe.org/thelens/remote-classes-are-session-more-
school-districts-attendance-plans-are-still-absent.
Lake, R. & Dusseault, B. (2020b). School systems make a slow transition from the classroom to
the cloud. Center for Reinventing Public Education. Retrieved April 18, 2020, from
https://www.crpe.org/thelens/school-systems-make-slow-transition-classroom-cloud.

33
Lieberman, M. (2020, April 17). Taking attendance during coronavirus closures: Is it even
worth it? Retrieved from https://www.edweek.org/ew/articles/2020/04/17/taking-attendance-is-tricky-
during-coronavirus-closures.html
Liu, J., Lee, M., & Gershenson, S. (2020). The Short- and Long-Run Impacts of Secondary School
Absences. (EdWorkingPaper: 20-125). Retrieved from Annenberg Institute at Brown
University: https://doi.org/10.26300/xg6s-z169Q
Musu, L. (2018, October). The Digital Divide: Differences in Home Internet Access. Retrieved from
https://nces.ed.gov/blogs/nces/post/the-digital-divide-differences-in-home-internet-access
NAACP. (2020, March). Ten equity implications of the Coronavirus COVID-19 outbreak in the
United States. Retrieved from https://naacp.org/wp-content/uploads/2020/03/Ten-Equity-
Considerations-of-the-Coronavirus-COVID-19-Outbreak-in-the-United-States_Version-2.pdf.
National Center for Educational Statistics (2018). Digest of Education Statistics: 2018. Retrieved
from https://nces.ed.gov/programs/digest/d18/tables/dt18_203.10.asp.
Peters, S. J., Rambo-Hernandez, K., Makel, M. C., Matthews, M. S., & Plucker, J. A. (2017). Should
millions of students take a gap year? Large numbers of students start the school year above
grade level. Gifted Child Quarterly, 61(3), 229-238.
Picou, J. S., & Marshall, B. K. (2007). Social impacts of Hurricane Katrina on displaced K-12
students and educational institutions in coastal Alabama counties: Some preliminary
observations. Sociological Spectrum, 27, 767-780.
Quinn, D., & Polikoff, M. (2017). Summer learning loss: What is it, and what can we do about
it. Washington, DC: Brookings Institution. Retrieved from
https://www.brookings.edu/research/summer-learning-loss-what-is-it-and-what-can-we-do-
about-it/.

34
Sacerdote, B. (2012). When the saints go marching out: Long-term outcomes for student evacuees
from Hurricanes Katrina and Rita. American Economic Journal: Applied Economics, 4(1),
109-135.
von Hippel, P. T., & Hamrock, C. (2019). Do test score gaps grow before, during, or between the
school years? Measurement artifacts and what we can know in spite of them. Sociological
Science, 6, 43–80.
von Hippel, P. T. (2019). Is summer learning loss real? Education Next. Retrieved from
https://www.educationnext.org/is-summer-learning-loss-real-how-i-lost-faith-education-
research-results/
von Hippel, P. T., Workman, J., & Downey, D. B. (2018). Inequality in reading and math skills
forms mainly before kindergarten: A replication, and partial correction, of “Are schools
the great equalizer?” Sociology of Education, 91(4), 323-357.
von Hippel, P.T (2020). How will the coronavirus crisis affect children’s learning? Unequally.
Retrieved from https://www.educationnext.org/how-will-coronavirus-crisis-affect-childrens-learning-
unequally-covid-19/.

35
Table 1 Estimates of the Impact of Out-of-School Days on Standardized Test Scores Across Summer Loss, School Closure, and Absenteeism Literature
Citation Location Grade level Math Effect ELA Effect Summer Loss
Atteberry & McEachin (2019) National (NWEA) 1st grade -0.009 -0.010 2nd grade -0.006 -0.006 3rd grade -0.006 -0.005 4th grade -0.005 -0.003 5th grade -0.005 -0.003 6th grade -0.003 -0.002 7th grade -0.002 -0.001
von Hippel, Workman, & Downey (2018)
National (ECLS-K:2011)
Kindergarten 0.002 -0.001 1st grade -0.001 -0.001
Kuhfeld, Condron, & Downey (2019)
National (NWEA) Kindergarten -0.005 -0.004 1st grade -0.007 -0.004 3rd grade -0.006 -0.004 4th grade -0.005 -0.003 6th grade -0.004 -0.002 7th grade -0.002 -0.001
Absenteeism Liu, Lee, & Gershenson (2020) large urban CA school
district 6th-8th grade -0.008 -0.006
Gershenson, Jacknowitz, & Brannegan (2017)
ECLS-K + NC K-1st grade −0.002 −0.002 NC public schools 3rd-5th grade -0.007 -0.004
Aucejo & Romano (2016) NC public schools 3rd-5th grade -0.006 -0.003 School Closures due to Inclement Weather
Hansen (2011) CO and MD public schools
8th grade (CO) -0.013 to -0.039 N/A 3rd grade (MD) -0.003 to -0.011
(NS) 5th grade (MD) -0.015 to -0.016 8th grade (MD) -0.009 to -0.013
Goodman (2014) MA public schools 3rd-8th + 10th grade
-0.000 (NS) 0.003 (NS)
Note. ECLS-K=Early Childhood Longitudinal Study, Kindergarten Cohort, CA=California, NC=North Carolina, CO=Colorado, MD=Maryland, MA=Massachusetts, NS=Not significant. All coefficients are reported as drops in standard deviation units on math and reading/English Language Arts assessments for each day of school missed. More details on each study are presented in Appendix Table A1.

36
Table 2
Descriptive Statistics for the Sample
Race/ethnicity
Male % FRPL Grade N. Schools N. Students White Black Asian Hispanic Other race
Mathematics
3 12,816 986,862 0.45 0.18 0.04 0.18 0.14
0.51 0.51 4 13,071 999,788 0.46 0.17 0.04 0.18 0.14
0.51 0.50
5 14,146 1,029,363 0.47 0.17 0.05 0.18 0.13
0.51 0.50 6 8,952 976,105 0.47 0.17 0.04 0.18 0.14
0.51 0.50
7 7,040 937,054 0.47 0.16 0.04 0.18 0.13
0.51 0.50
Full Sample 18,972 4,929,172 0.47 0.17 0.04 0.18 0.14 0.51 0.50
Reading
3 12,874 988,644 0.45 0.18 0.04 0.18 0.14
0.51 0.51 4 13,066 997,088 0.47 0.18 0.04 0.18 0.14
0.51 0.51
5 14,129 1,026,057 0.47 0.17 0.04 0.18 0.13
0.51 0.50 6 8,943 970,524 0.47 0.17 0.04 0.18 0.14
0.51 0.50
7 6,995 934,960 0.48 0.17 0.04 0.18 0.13
0.51 0.50
Full Sample 18,958 4,917,273 0.47 0.17 0.04 0.18 0.14 0.51 0.50
Note. N=Number, %FRPL=percentage of free or reduced priced lunch. Grade is the grade level students were in during the 2017-18 school year.

37
(A) Mathematics Projections
(B) Reading Projections
Figure 1. Mathematics and reading forecasts based on summer loss estimates and absenteeism literature.

38
(A) Mathematics Projections
(B) Reading Projections
Figure 2. Mathematics and reading forecasts for the 2019-20 school year accounting for the variability observed in typical summer loss patterns.

39
Figure 3. Projected fall 2020 score distributions under a typical fall (fall 2018) and COVID Loss Summer Slide conditions

1
Appendix A. Literature Review on Out-of-School Time Impacts
In Tables A1-A3, we describe the studies included and excluded from our effect size table (Table 1 in the main paper) as well as the approach taken to convert the reported estimates into a single metric (SD loss per day of school missed). These articles were identified through a combination of database searches (e.g., Google Scholar), review of cited literature within recent studies, and inquiries of experts in each area. While we tried to capture key studies in each area, this review should not be considered a full representation of the work on each topic. In selecting studies for inclusion in Table 1, we prioritized recent studies where (a) the outcome was a math or reading test score and (b) the paper had estimates that could be converted into standard deviation (SD) units. For all studies that were included in Table 1, we present both the reported estimate (in the unit of the original reported coefficient) as well as the “Calculated” estimate (units of SD loss per day of school missed), which is consistent across all included studies.

2
Table A1
Review of Key Summer Learning Loss Studies
Citation Location Research Design Grade Level
Calc. Math Effect
Calc. ELA Effect
Reported Math Effect
Report ELA Effect Description of Units
Included in Literature Review Table 1 Atteberry & McEachin (2020)
National (NWEA - 1st to 8th grade)
Seasonal growth model
Summer after 1st -0.009 -0.010 -0.19 -0.19 Scale of original estimate: total RIT point drop across entire summer (reported in Tables 2 and 3) Conversion: Divided estimate by 2020 spring SDs (by grade/subject) and then converted into instructional days (assuming approx. 50 weekdays during the summer)
Summer after 2nd -0.006 -0.006 -0.14 -0.10 Summer after 3rd -0.006 -0.005 -0.13 -0.08 Summer after 4th -0.005 -0.003 -0.11 -0.06 Summer after 5th -0.005 -0.003 -0.10 -0.06 Summer after 6th -0.003 -0.002 -0.06 -0.04 Summer after 7th -0.002 -0.001 -0.04 -0.02
von Hippel, Workman & Downey (2018)
National (ECLS-K:2011)
Seasonal growth model
Summer after K 0.002 -0.001 0.03 -0.01 Scale of original estimate: Monthly SD units (reported in Table 4) Conversion: Divided by 20 weekdays per month to get SD per day
Summer after 1st -0.001 -0.001 -0.02 -0.02
Kuhfeld, Condron, & Downey (2019)
National (NWEA, K-8)
Seasonal growth model
Summer after K -0.005 -0.004 -1.19 -1.00 Scale of original estimate: RIT point drop per summer month (reported in Table 2) Conversion: Divided estimate by 2020 spring SDs (by grade/subject) and then divided by 20 weekdays per month to get SD per day
Summer after 1st -0.007 -0.004 -1.89 -1.06 Summer after 3rd -0.006 -0.004 -1.72 -1.14 Summer after 4th -0.005 -0.003 -1.58 -0.88 Summer after 6th -0.004 -0.002 -1.44 -0.75 Summer after 7th -0.002 -0.001 -0.85 -0.41
Excluded from Literature Review Table 1 Cooper, Nye, Charlton, Lindsay, & Greathouse (1996)
13 different studies
Meta-analysis
1st-9th N/A N/A -0.14 -0.05 Reported estimates are in SD units across the whole summer (pg. 253). This study was excluded due to measurement issues (described by von Hippel & Hamrock, 2019) in the studies reviewed.
Quinn, Cooc, McIntyre, & Gomez, (2016)
National (ECLS-K:2011)
Seasonal growth model
K-2nd N/A N/A N/A N/A This study only compares race/SES differences in summer loss and does not provide overall summer drop estimates, so we did not include the results from this study in Table 1.
Kuhfeld (2019) National (NWEA)
Projected test scores
K-7th N/A N/A 70-78% lost ground
62% to 73%
This paper reports the percentage of students who lost ground during the summer, which can not be translated into SD units.
von Hippel & Hamrock (2019)
National (ECLS-K:2011 + NWEA) and Baltimore schools
Seasonal growth model
K-8th N/A N/A N/A N/A This study only compares race/SES differences in summer loss and does not provide overall summer drop estimates, so we did not include the results from this study in Table 1.

3
Table A2
Review of Key School Closures Studies
Citation Location Research Design Grade Level
Calc. Math Effect
Calc. ELA Effect Reported Math
Effect Reported ELA Effect Notes
Included in Literature Review Table 1 Hansen (2011)
CO; MD Two-sample least squares
8th grade (CO)
-0.013 to -0.039
N/A .013-.039 (NS) N/A Scale of original estimate: SD units for every absence (reported in Table 6 on pg 36) Conversion: None necessary
3rd grade (MD)
-0.003 to -0.011 (NS)
.003-.011 (NS)
5th grade (MD)
-0.015 to -0.016
.015-.016
8th grade (MD)
-0.009 to -0.013
.009- .013
Goodman (2014)
MA Instrumental variables
3rd-8th + 10th grade
-0.000 (NS) 0.003 (NS) -0.000 (NS) 0.003 (NS) Scale of original estimate: SD units for every day closed (reported as maximum plausible effect size), Column (IV) Table 6 on pg 35 Conversion: None necessary
Excluded from Literature Review Table 1 Sacerdote (2012)
LA/TX Difference-in-Difference
students impacted by Hurricane Katrina
N/A N/A initial decline of 0.1 SD, but gained back within 3 years
initial decline of 0.1 SD, then gained back
The comparison reported in this study is by "evacuee" status. The reported estimate is drop one year later on standardized test scores, which we could not convert into the SD/day metric of the other studies so it was excluded from Table 1.
students impacted by Hurricane Rita
N/A N/A Initial decline of 0.08 SD, then gained slightly
initial decline of 0.06 SD, and not gained back by 2009
The comparison reported in this study is by "evacuee" status. The reported estimate is drop one year later on standardized test scores, which we could not convert into the SD/day metric of the other studies so it was excluded from Table 1.
Ward, Shelley, Kaase, & Pane (2008)
MS Means of scale scores
3rd to 8th grade
N/A N/A 5-7 points 4-7 points The comparison reported in this study was students who were and were not "displaced" by Hurricane Katrina. We are unable to covert the mean scale score differences into SD units so it was excluded from Table 1.

4
Marcotte (2007)
MD Regression 3rd grade N/A N/A -1.20% -0.78% The reported metric was change in % of students getting 'satisfactory' per SD increase in snow accumulation. We are unable to covert the mean scale score differences into SD units so it was excluded from Table 1. 5th grade N/A N/A -0.93% not sig
8th grade N/A N/A -0.94% not sig Marcotte & Hemelt (2007)
MD Regression 3rd grade N/A N/A -0.53% -0.51% The reported metric was change in % of students getting 'satisfactory' per day lost. We are unable to covert the mean scale score differences into SD units so it was excluded from Table 1.
5th grade N/A N/A smaller than 3rd grade
smaller than 3rd grade
8th grade N/A N/A smaller than 3rd grade
half 3rd grade

5
Table A3
Review of Key Absenteeism Studies
Citation Location Research Design
Grade Level
Calc. Math Effect
Calc. ELA Effect
Reported Math Effect
Report ELA Effect Notes
Included in Literature Review Table Liu, Lee, & Gershenson (2020)
large urban CA school district
Lagged-score VAM and between-subject differences
middle school
-0.008 -0.006 -0.077 -0.057 Scale of original estimate: SD units for every 10 spring absences. Math results are taken from column (5) of Table 4 and ELA results are results are taken from column (5) of Table A2. Conversion: Divided by 10 to get SD units per day
high school
-0.009 -0.008 -0.085 -0.075
Gershenson, Jacknowitz, & Brannegan (2017)
ECLS-K Value-added models
K-1st −0.002 −0.002 −0.002 −0.002 Scale of original estimate: SD units for every absence. Results are taken from Table 4. Conversion: None necessary
NC public schools
3rd-5th -0.007 -0.004 -0.007 -0.004
Aucejo & Romano (2016)
NC public schools
Student/School fixed effects model + Instrumental variables
3rd – 5th -0.006 -0.003 -0.0055 -0.0029 Scale of original estimate: SD units for every absence. Results taken from columns (5) from Table 3. Conversion: None necessary.
Excluded from Lit Review Table Gottfried & Kirskey (2017)
small urban CA district
School and classroom fixed effects.
3rd-5th N/A N/A -0.07 -0.03 The reported metric is change in SD for one spring absence (pg. 124).
Gottfried (2011)
Philadelphia school district
Family-FE estimates
2nd-4th grade
N/A N/A -0.10 -0.08 We are reporting the effect sizes from pg. 172 from the family fixed effects models. These results are from comparing siblings in the same family.
Gottfried (2009)
Philadelphia school district
Lagged test score VAM
2nd-4th grade
N/A N/A -0.099 -0.054 We are reporting the VAM estimates (Column 8) from Table 4 and 7.

6
References (in order of appearance of the table)
Summer Loss
Atteberry, A. & McEachin, A. (2020). School's Out: The Role of Summers in Understanding Achievement Disparities. (EdWorkingPaper: 20-82). Retrieved from Annenberg Institute at Brown University: https://doi.org/10.26300/2mam-bp02
von Hippel, P. T., Workman, J., & Downey, D. B. (2018). Inequality in reading and math skills forms mainly before kindergarten: A replication, and partial correction, of “Are Schools the Great Equalizer?” Sociology of Education, 91, 323–357.
Kuhfeld, M., Condron, D., & Downey, D. (2019). When Does Inequality Grow? A Seasonal Analysis of Racial/Ethnic Disparities in Learning in Kindergarten through Eighth Grade. (The Collaborative for Student Growth at NWEA Working Paper).
Cooper, H., Nye, B., Charlton, K., Lindsay, J., & Greathouse, S. (1996). The effects of summer vacation on achievement test scores: A narrative and meta-analytic review. Review of Educational Research, 66(3), 227.
Quinn, D. M., Cooc, N., McIntyre, J., & Gomez, C. J. (2016). Seasonal dynamics of academic achievement inequality by socioeconomic status and race/ethnicity: Updating and extending past research with new national data. Educational Researcher, 45, 443–453.
Kuhfeld, M. (2019). Surprising new evidence on summer learning loss. Phi Delta Kappan, 101 (1), 25-29.
von Hippel, P. T., & Hamrock, C. (2019). Do test score gaps grow before, during, or between the school years? Measurement artifacts and what we can know in spite of them. Sociological Science, 6, 43–80.
School Closures
Hansen, B. (2011). School year length and student performance: Quasi -experimental evidence. Social Science Research Networking Paper.
Goodman, J. (2014). Flaking out: Student absences and snow days as disruptions of instructional time. NBER Working paper 20221.
Sacerdote, B. (2012). When the saints go marching out: Long-term outcomes for student evacuees from Hurricanes Katrina and Rita. American Economic Journal: Applied Economics, 4(1), 109-135.
Ward, M.E., Shelley, K., Kaase, K., & Pane, J. (2008). Hurricane Katrina: A Longitudinal Study of the Achievement and Behavior of Displaced Students, Journal of Education for Students Placed at Risk, 13:2-3, 297-317
Marcotte, D. E. (2007). Schooling and test scores: A mother-natural experiment. Economics of Education Review, 26, 629-640.
Marcotte, D. E. & Hemelt, S. W. (2007). Unscheduled school closings and student performance. IZA Discussion Papers, No. 2923., Institute for the Study of Labor (IAZ), Bonn.

7
Absenteeism Liu, J., Lee, M., & Gershenson, S. (2020). The short- and long-run impacts of
secondary school absences. (EdWorkingPaper: 20-125). Retrieved from Annenberg Institute at Brown University: https://doi.org/10.26300/xg6s-z169
Gershenson, S., Jacknowitz, A., & Brannegan, A. (2017). Are student absences worth the worry in US primary schools? Education Finance and Policy, 12 (2), 137-165.
Aucejo, E. M. & Romano, T. F. (2016) Assessing the effect of school days and absences on test score performance. Economics of Education Review, 55, 70-87.
Gottfried, M. & Kirskey, J.J. (2017). “When” students miss school: The role of timing of absenteeism on students’ test performance. Educational Researcher, 46(3), 119–130.
Gottfried, MA. (2011). The detrimental effects of missing school: evidence from urban siblings. American Journal of Education, 117(2), 147-182.
Gottfried, M. (2009). Excused versus unexcused: How student absences in elementary school affect academic achievement. Educational Evaluation and Policy Analysis, 31, No. 4, 392-415.

8
Appendix B. Comparison of NWEA and US Public Schools
NWEA schools. We defined a NWEA school as one that tests at least 10 students in Grades 3-8 in math or reading in either 2017-18 or 2018-19. The final sample included 18,958 NWEA schools.
Population of Public Schools. We downloaded the 2017-18 Public Elementary/Secondary School Universe Survey data file from https://nces.ed.gov/ccd/pubschuniv.asp. We define the population of interest as the set of US operational (e.g., school status variable SY_STATUS does not indicate the school is closed or yet to be opened) public schools in the 50 states and District of Columbia serving students in grades 3-8 (based on the minimum (GSLO) and maximum (GSHI) grades offered at the school). In 2017-18, the population of interest consists of 72,075 schools. The NCES school characteristics included in our comparison include enrollment by grade, percentage of students receiving free or reduced-price lunch (TOTFRL divided by school enrollment), and percentages of the students in the school who were Hispanic, Black, and White, and Asian (HI, BL, WH and AS) divided by total enrollment, and urbanicity (NCES’ LOCALE codes, collapsed into City, Suburb, Town, and Rural). Comparison of Sample and Population. Table B1 presents the comparison between the NWEA schools and population of US public schools serving students in Grades 3-8 based on 2017-18 CCD information. The NWEA and population of schools match closely on Percent FRPL and urbanicity, but there were small differences in the percentage of students enrolled of different racial/ethnic groups. Specifically, the NWEA sample of schools has a slightly higher percentage of Black students on average (17% vs. 15% overall) and lower percentage of Hispanic students (20% vs. 24% overall). Table B1 Characteristics of the NWEA Sample of Schools Relative to the US Population of Public Schools
NWEA Sample of Schools Population of US Public
Schools Serving Grades 3-8 N M SD N M SD 3rd grade 13,699 71.51 42.55 53,430 70.87 44.72 4th grade 13,621 73.03 45.54 53,180 72.54 47.21 5th grade 13,220 75.83 54.75 51,881 74.69 55.75 6th grade 9,006 104.08 107.37 37,688 101.47 110.08 7th grade 7,452 123.14 122.29 31,995 117.88 129.00 8th grade 7,344 124.27 124.38 31,770 118.47 130.32 Percent FRPL 18,479 0.50 0.30 72,062 0.51 0.31 Percent Hispanic 18,480 0.20 0.24 72,063 0.24 0.27 Percent Black 18,480 0.17 0.25 72,063 0.15 0.23 Percent White 18,480 0.53 0.33 72,063 0.51 0.33 Percent Asian 18,480 0.04 0.07 72,063 0.04 0.09 City 18,483 0.29 0.45 72,075 0.28 0.45 Suburb 18,483 0.33 0.47 72,075 0.33 0.47 Town 18,483 0.11 0.32 72,075 0.11 0.32 Rural 18,483 0.26 0.44 72,075 0.28 0.45

9
Appendix C. Parameter Estimates from Multilevel Growth Models
Tables C1 and C2 display the random and fixed effects from the quadratic growth models for mathematics and reading, respectively. The right half of the tables show the school- and student-level correlations among the random effects. Tables C3 and C4 display the random and fixed effects from the linear growth models for mathematics and reading, respectively. These models were estimated to confirm the findings that were observed with the quadratic growth models.

10
Table C1
Multilevel Quadratic Growth Model Parameter Estimates for Mathematics
School SD Student SD ICC Int. Lin. - Y1 Sum. Lin. - Y2 Int. Lin. - Y1 Sum. Lin. - Y2Math 3 Intercept 186.24 (0.06)*** 6.24 12.01 0.21 1.00 1.00Math 3 Linear Growth - Year 1 2.23 (0.01)*** 0.33 0.78 0.15 0.00 1.00 -0.20 1.00Math 3 Quadratic Growth - Year 1 -0.06 (0.00)***Math 3 Summer Drop -1.35 (0.01)*** 0.90 1.98 0.17 0.08 -0.71 1.00 0.11 -0.57 1.00Math 3 Linear Growth - Year 2 1.49 (0.01)*** 0.32 0.76 0.15 0.17 0.26 -0.31 1.00 0.08 0.06 -0.42 1.00Math 3 Quadratic Growth - Year 2 -0.01 (0.00)***Math 4 Intercept 198.45 (0.06)*** 6.72 12.40 0.23 1.00 1.00Math 4 Linear Growth - Year 1 1.47 (0.01)*** 0.34 0.77 0.16 0.20 1.00 -0.06 1.00Math 4 Quadratic Growth - Year 1 0.00 (0.00)***Math 4 Summer Drop -1.45 (0.01)*** 0.90 2.01 0.17 -0.01 -0.68 1.00 0.07 -0.57 1.00Math 4 Linear Growth - Year 2 1.28 (0.01)*** 0.34 0.79 0.16 0.23 0.32 -0.35 1.00 0.14 0.08 -0.41 1.00Math 4 Quadratic Growth - Year 2 -0.01 (0.00)***Math 5 Intercept 207.66 (0.07)*** 7.66 13.62 0.24 1.00 1.00Math 5 Linear Growth - Year 1 1.34 (0.01)*** 0.36 0.81 0.17 0.25 1.00 0.00 1.00Math 5 Quadratic Growth - Year 1 -0.01 (0.00)***Math 5 Summer Drop -2.51 (0.01)*** 1.12 2.30 0.19 -0.26 -0.72 1.00 -0.19 -0.65 1.00Math 5 Linear Growth - Year 2 1.11 (0.01)*** 0.32 0.76 0.15 0.19 0.22 -0.29 1.00 0.15 0.08 -0.41 1.00Math 5 Quadratic Growth - Year 2 -0.01 (0.00)***Math 6 Intercept 211.97 (0.09)*** 8.20 14.07 0.25 1.00 1.00Math 6 Linear Growth - Year 1 1.20 (0.01)*** 0.36 0.80 0.17 0.17 1.00 -0.02 1.00Math 6 Quadratic Growth - Year 1 -0.02 (0.00)***Math 6 Summer Drop -1.04 (0.01)*** 0.91 2.17 0.15 -0.05 -0.77 1.00 0.02 -0.58 1.00Math 6 Linear Growth - Year 2 0.87 (0.01)*** 0.31 0.80 0.13 0.18 0.34 -0.36 1.00 0.11 0.07 -0.42 1.00Math 6 Quadratic Growth - Year 2 -0.01 (0.00)***Math 7 Intercept 218.30 (0.11)*** 8.97 15.64 0.25 1.00 1.00Math 7 Linear Growth - Year 1 0.96 (0.01)*** 0.35 0.83 0.15 0.13 1.00 -0.06 1.00Math 7 Quadratic Growth - Year 1 -0.01 (0.00)***Math 7 Summer Drop -0.79 (0.02)*** 0.97 2.29 0.15 -0.04 -0.75 1.00 0.00 -0.60 1.00Math 7 Linear Growth - Year 2 0.90 (0.01)*** 0.34 0.85 0.14 0.14 0.47 -0.55 1.00 0.13 0.07 -0.43 1.00Math 7 Quadratic Growth - Year 2 -0.02 (0.00)***
Student-level CorrelationGrade Fixed EffectGrowth TermSubject
Random Effects School-level Correlation

11
Table C2
Multilevel Quadratic Growth Model Parameter Estimates for Reading
School SD Student SD ICC Int. Lin. - Y1 Sum. Lin. - Y2 Int. Lin. - Y1 Sum. Lin. - Y2Reading 3 Intercept 184.80 (0.07)*** 7.33 15.56 0.18 1.00 1.00Reading 3 Linear Growth - Year 1 2.33 (0.01)*** 0.32 1.03 0.09 -0.21 1.00 -0.39 1.00Reading 3 Quadratic Growth - Year 1 -0.10 (0.00)***Reading 3 Summer Drop -0.75 (0.01)*** 0.92 2.72 0.10 0.08 -0.73 1.00 0.15 -0.58 1.00Reading 3 Linear Growth - Year 2 1.71 (0.01)*** 0.28 0.95 0.08 -0.19 0.25 -0.38 1.00 -0.17 0.05 -0.45 1.00Reading 3 Quadratic Growth - Year 2 -0.08 (0.00)***Reading 4 Intercept 195.28 (0.07)*** 7.35 15.18 0.19 1.00 1.00Reading 4 Linear Growth - Year 1 1.77 (0.01)*** 0.29 0.96 0.08 -0.23 1.00 -0.38 1.00Reading 4 Quadratic Growth - Year 1 -0.08 (0.00)***Reading 4 Summer Drop -0.58 (0.01)*** 0.85 2.61 0.10 0.05 -0.71 1.00 0.15 -0.59 1.00Reading 4 Linear Growth - Year 2 1.44 (0.01)*** 0.27 0.90 0.08 -0.21 0.27 -0.40 1.00 -0.15 0.04 -0.46 1.00Reading 4 Quadratic Growth - Year 2 -0.07 (0.00)***Reading 5 Intercept 202.58 (0.07)*** 7.44 14.87 0.20 1.00 1.00Reading 5 Linear Growth - Year 1 1.51 (0.01)*** 0.27 0.93 0.08 -0.27 1.00 -0.37 1.00Reading 5 Quadratic Growth - Year 1 -0.08 (0.00)***Reading 5 Summer Drop -0.53 (0.01)*** 0.87 2.63 0.10 0.07 -0.67 1.00 0.14 -0.57 1.00Reading 5 Linear Growth - Year 2 1.02 (0.01)*** 0.27 0.93 0.08 -0.18 0.20 -0.31 1.00 -0.11 0.02 -0.46 1.00Reading 5 Quadratic Growth - Year 2 -0.05 (0.00)***Reading 6 Intercept 207.89 (0.09)*** 7.66 14.90 0.21 1.00 1.00Reading 6 Linear Growth - Year 1 1.11 (0.01)*** 0.30 0.96 0.09 -0.22 1.00 -0.34 1.00Reading 6 Quadratic Growth - Year 1 -0.05 (0.00)***Reading 6 Summer Drop -0.44 (0.01)*** 0.88 2.71 0.10 0.06 -0.73 1.00 0.12 -0.58 1.00Reading 6 Linear Growth - Year 2 0.83 (0.01)*** 0.27 0.95 0.08 -0.15 0.30 -0.41 1.00 -0.08 0.02 -0.46 1.00Reading 6 Quadratic Growth - Year 2 -0.04 (0.00)***Reading 7 Intercept 212.20 (0.10)*** 7.67 15.04 0.21 1.00 1.00Reading 7 Linear Growth - Year 1 0.90 (0.01)*** 0.31 0.99 0.09 -0.22 1.00 -0.32 1.00Reading 7 Quadratic Growth - Year 1 -0.04 (0.00)***Reading 7 Summer Drop -0.27 (0.02)*** 0.93 2.78 0.10 0.03 -0.73 1.00 0.09 -0.59 1.00Reading 7 Linear Growth - Year 2 0.86 (0.01)*** 0.29 0.97 0.08 -0.14 0.38 -0.54 1.00 -0.07 0.01 -0.46 1.00Reading 7 Quadratic Growth - Year 2 -0.05 (0.00)***
School-level Correlation Student-level CorrelationSubject Grade Growth Term Fixed Effect
Random Effects

12
Table C3
Multilevel Linear Growth Model Parameter Estimates for Mathematics
School SD
Student SD ICC Int. Lin. - Y1Sum. Lin. - Y2 Int. Lin. - Y1 Sum. Lin. - Y2
Math 3 Intercept 186.91 (0.06)*** 6.21 12.01 0.21 1.00 1.00Math 3 Linear Growth - Year 1 1.69 (0.00)*** 0.33 0.78 0.15 0.02 1.00 -0.20 1.00Math 3 Summer Drop -1.62 (0.01)*** 0.93 1.99 0.18 0.07 -0.68 1.00 0.11 -0.57 1.00Math 3 Linear Growth - Year 2 1.42 (0.00)*** 0.32 0.76 0.15 0.18 0.26 -0.30 1.00 0.08 0.06 -0.42 1.00Math 4 Intercept 198.50 (0.06)*** 6.71 12.40 0.23 1.00 1.00Math 4 Linear Growth - Year 1 1.42 (0.00)*** 0.34 0.77 0.16 0.20 1.00 -0.06 1.00Math 4 Summer Drop -1.45 (0.01)*** 0.90 2.01 0.17 -0.01 -0.67 1.00 0.07 -0.57 1.00Math 4 Linear Growth - Year 2 1.23 (0.00)*** 0.34 0.79 0.16 0.23 0.32 -0.35 1.00 0.14 0.08 -0.41 1.00Math 5 Intercept 207.75 (0.07)*** 7.66 13.62 0.24 1.00 1.00Math 5 Linear Growth - Year 1 1.26 (0.00)*** 0.36 0.81 0.17 0.25 1.00 0.00 1.00Math 5 Summer Drop -2.51 (0.01)*** 1.12 2.30 0.19 -0.27 -0.72 1.00 -0.19 -0.65 1.00Math 5 Linear Growth - Year 2 0.99 (0.00)*** 0.32 0.76 0.15 0.20 0.22 -0.29 1.00 0.15 0.08 -0.41 1.00Math 6 Intercept 212.16 (0.09)*** 8.19 14.07 0.25 1.00 1.00Math 6 Linear Growth - Year 1 1.04 (0.00)*** 0.36 0.80 0.17 0.18 1.00 -0.02 1.00Math 6 Summer Drop -1.10 (0.01)*** 0.91 2.17 0.15 -0.06 -0.76 1.00 0.02 -0.58 1.00Math 6 Linear Growth - Year 2 0.79 (0.00)*** 0.31 0.80 0.13 0.18 0.34 -0.35 1.00 0.11 0.07 -0.42 1.00Math 7 Intercept 218.46 (0.11)*** 8.97 15.64 0.25 1.00 1.00Math 7 Linear Growth - Year 1 0.84 (0.00)*** 0.34 0.83 0.15 0.13 1.00 -0.06 1.00Math 7 Summer Drop -0.77 (0.01)*** 0.95 2.29 0.15 -0.05 -0.74 1.00 0.00 -0.60 1.00Math 7 Linear Growth - Year 2 0.69 (0.00)*** 0.34 0.85 0.14 0.14 0.45 -0.54 1.00 0.13 0.07 -0.43 1.00
Student-level Correlation
Subject Grade Growth Term Fixed Effect
Random Effects School-level Correlation

13
Table C4
Multilevel Linear Growth Model Parameter Estimates for Reading
School SD
Student SD ICC Int.
Lin. - Y1 Sum.
Lin. - Y2 Int. Lin. - Y1 Sum.
Lin. - Y2
Reading 3 Intercept 185.95 (0.07)*** 7.31 15.55 0.18 1.00 1.00Reading 3 Linear Growth - Year 1 1.39 (0.00)*** 0.35 1.03 0.10 -0.19 1.00 -0.39 1.00Reading 3 Summer Drop -0.99 (0.01)*** 1.00 2.72 0.12 0.06 -0.73 1.00 0.15 -0.58 1.00Reading 3 Linear Growth - Year 2 0.99 (0.00)*** 0.29 0.95 0.09 -0.16 0.28 -0.41 1.00 -0.16 0.05 -0.45 1.00Reading 4 Intercept 196.18 (0.07)*** 7.34 15.17 0.19 1.00 1.00Reading 4 Linear Growth - Year 1 1.02 (0.00)*** 0.31 0.97 0.09 -0.22 1.00 -0.38 1.00Reading 4 Summer Drop -0.74 (0.01)*** 0.91 2.61 0.11 0.05 -0.72 1.00 0.15 -0.59 1.00Reading 4 Linear Growth - Year 2 0.79 (0.00)*** 0.28 0.91 0.09 -0.18 0.30 -0.42 1.00 -0.15 0.04 -0.46 1.00Reading 5 Intercept 203.39 (0.07)*** 7.43 14.86 0.20 1.00 1.00Reading 5 Linear Growth - Year 1 0.83 (0.00)*** 0.29 0.93 0.09 -0.26 1.00 -0.37 1.00Reading 5 Summer Drop -0.76 (0.01)*** 0.93 2.63 0.11 0.06 -0.69 1.00 0.14 -0.57 1.00Reading 5 Linear Growth - Year 2 0.59 (0.00)*** 0.28 0.93 0.08 -0.16 0.20 -0.33 1.00 -0.11 0.02 -0.46 1.00Reading 6 Intercept 208.44 (0.09)*** 7.64 14.90 0.21 1.00 1.00Reading 6 Linear Growth - Year 1 0.65 (0.00)*** 0.31 0.96 0.10 -0.22 1.00 -0.34 1.00Reading 6 Summer Drop -0.56 (0.01)*** 0.91 2.71 0.10 0.05 -0.73 1.00 0.12 -0.58 1.00Reading 6 Linear Growth - Year 2 0.48 (0.00)*** 0.27 0.95 0.08 -0.13 0.28 -0.40 1.00 -0.08 0.02 -0.46 1.00Reading 7 Intercept 212.66 (0.10)*** 7.66 15.03 0.21 1.00 1.00Reading 7 Linear Growth - Year 1 0.53 (0.00)*** 0.31 0.99 0.09 -0.22 1.00 -0.31 1.00Reading 7 Summer Drop -0.30 (0.01)*** 0.94 2.78 0.10 0.02 -0.72 1.00 0.09 -0.59 1.00Reading 7 Linear Growth - Year 2 0.41 (0.00)*** 0.29 0.97 0.08 -0.12 0.36 -0.53 1.00 -0.06 0.01 -0.46 1.00
School-level Correlation Student-level Correlation
Subject Grade Growth Term Fixed Effect
Random Effects

14
Appendix D. Supplemental Results
Table D1 contains (a) the predicted monthly drop in RIT scores from the absenteeism literature, (b) estimates of typical fall-spring growth across 9.5 months (based on the linear 𝛾𝛾�100 and quadratic 𝛾𝛾�200growth parameters) and summer loss (𝛾𝛾�300) based on parameters from quadratic growth model, (c) projected gains by the end of the school year under COVID Loss Absenteeism and COVID Loss Summer Slide (assuming students were in school for 6.5 months followed by three months of out of school time), and (d) percentage of learning gains made relative to a typical school year under the two projections. The COVID Loss Absenteeism rate was calculated by averaging the effect size estimates from the absenteeism studies in Table 1 of the paper (separately for mathematics and Reading/ELA) and converting those SD drops into RIT units using the spring RIT SDs per/grade subject in NWEA’s 2020 Norms (see Thum & Kuhfeld, 2020). With the exception of 5th grade mathematics, the COVID Loss Absenteeism estimates implied larger RIT drops per month than the COVID Loss Summer Slide projections.
Projected gains by the end of the school year under typical growth, COVID Loss Absenteeism, and COVID Loss Summer Slide assumptions were calculated as follows. Assuming that students were learning at a typical rate 6.5 months out of a standard 9.5-month followed by three months of learning lost at each projected rate, the estimate gain would be
Gaın�𝑇𝑇𝑇𝑇𝑇𝑇𝑖𝑖𝑆𝑆𝑇𝑇𝑙𝑙,𝑡𝑡 = (𝛾𝛾�100) ∗ 9.5 + (𝛾𝛾�200) ∗ 9.52
Gaın�𝐴𝐴𝐴𝐴𝑡𝑡𝑡𝑡𝐴𝐴𝐴𝐴𝑡𝑡,𝑡𝑡 = (𝛾𝛾�100) ∗ 6.5 + (𝛾𝛾�200) ∗ 6.52 + (𝐴𝐴𝐴𝐴𝐴𝐴𝑒𝑒𝐴𝐴𝐴𝐴) ∗ 3
Gaın�𝑆𝑆𝑆𝑆𝑆𝑆𝑆𝑆𝐴𝐴𝑆𝑆,𝑡𝑡 = (𝛾𝛾�100) ∗ 6.5 + (𝛾𝛾�200) ∗ 6.52 + (𝛾𝛾�300) ∗ 3,
where the 𝐴𝐴𝐴𝐴𝐴𝐴𝑒𝑒𝐴𝐴𝐴𝐴 is the monthly absenteeism rate reported in Table D1 and the parameters estimates are presented in Tables C1 and C2. The percentage of learning gains made relative to a typical year is calculated by dividing the projected gains under each scenario (Gaın�𝐴𝐴𝐴𝐴𝑡𝑡𝑡𝑡𝐴𝐴𝐴𝐴𝑡𝑡,𝑡𝑡 and Gaın�𝑆𝑆𝑆𝑆𝑆𝑆𝑆𝑆𝐴𝐴𝑆𝑆,𝑡𝑡) by the typical gains (Gaın�𝑇𝑇𝑇𝑇𝑇𝑇𝑖𝑖𝑆𝑆𝑇𝑇𝑙𝑙,𝑡𝑡) estimated in each grade/subject. The percentages of learning gains made under the two scenarios (final columns of Table D1) reveal that students may be expected to show large losses, particularly in math, due to the COVID school closures.
Table D2 presents the summer loss parameter estimates (e.g., the parameter estimate 𝛾𝛾�300 and random effect SD �𝑇𝑇𝑆𝑆𝑡𝑡(3,3)) from the multilevel growth models as well as the monthly learning rates for students at the 25th, 50th, and 75th percentiles of the summer learning distribution across grades/subjects. Additionally, we report the percentile in the summer learning distribution at which students show monthly gains rather than losses. In both mathematics and reading, there is a large amount of variability in summer learning rates. In mathematics, students in the top 20-30% of the distribution (depending on the grade) actually show monthly gains rather than losses. In reading, approximately the upper half of the distribution (39-46% of students) show gains during the summer. Based on these findings, it is clear that summer loss is

15
common but far from universal, and provide some evidence that we could expect that the COVID-19 extended school closures may not be associated with academic loss for all students.
As a second part of Research Question 2, we compared projected fall scores under two different scenarios based on the empirical Bayes (EB) estimates from the models fit to the 2017-18 and 2018-19 MAP Growth data. The first scenario assumes “typical” fall scores assuming student i in grade g within school j completed the prior school year and had a standard summer break:
RIT� 𝑇𝑇𝑇𝑇𝑇𝑇𝑖𝑖𝑆𝑆𝑇𝑇𝑙𝑙_𝐹𝐹𝑇𝑇𝑙𝑙𝑙𝑙,𝑡𝑡𝑖𝑖𝑖𝑖 = 𝛾𝛾�000 + �̂�𝑟0𝑖𝑖𝑖𝑖 + �𝛾𝛾�100 + �̂�𝑟1𝑖𝑖𝑖𝑖� ∗ 9.5 + (𝛾𝛾�200) ∗ 9.52 + �𝛾𝛾�300 + �̂�𝑟3𝑖𝑖𝑖𝑖� ∗ 2.5.
In the second scenario, we produce COVID-19 projected fall assuming students were out of school during the last three months of the 2019-20 school year:
RIT� 𝐶𝐶𝐶𝐶𝐶𝐶𝐶𝐶𝐷𝐷_𝐹𝐹𝑇𝑇𝑙𝑙𝑙𝑙,𝑡𝑡𝑖𝑖𝑖𝑖 = 𝛾𝛾�000 + �̂�𝑟0𝑖𝑖𝑖𝑖 + �𝛾𝛾�100 + �̂�𝑟1𝑖𝑖𝑖𝑖� ∗ 6.5 + (𝛾𝛾�200) ∗ 6.52 + �𝛾𝛾�300 + �̂�𝑟3𝑖𝑖𝑖𝑖� ∗ 5.5.
For each grade/subject, we calculated projected fall scores under each scenario for all of the students in the analysis. Table D3 displays the predicted means, SDs, and percentile scores (based on NWEA’s 2020 Norms) under two scenarios. We observed that the test scores under the COVID-19 projections are more variable, with SDs that are slightly larger in mathematics and close to 16-20% larger in reading as compared with SDs in a typical fall. Also, while under normal conditions this sample of students’ projected scores is close to the national norms on average (e.g., near 50th percentile in their fall scores), under the COVID-19 Summer Slide projections these students would be considered well-below average in the fall based on NWEA’s grade/subject-specific norms.

16
Table D1 Projected Gains Retained at the End of the 2019-20 School Year
Grade Subject
Absenteeism Drops per
Month
2017-18 Results (based on Quadratic Growth Model)
Projected Gains by the End of School Year
Percentage of Learning Gains Made Relative to a Typical
School Year
Fall Score
Fall-Spring Growth
Summer Drop Per Month
COVID Loss Absenteeism
COVID Loss Summer Slide
COVID Loss Absenteeism
COVID Loss Summer Slide
3 Mathematics -1.62 186.24 15.77 -1.35 7.09 7.91 45% 50% 4 Mathematics -1.79 198.45 13.97 -1.45 4.19 5.21 30% 37% 5 Mathematics -1.92 207.66 11.83 -2.01 2.53 2.26 21% 19% 6 Mathematics -2.01 211.97 9.60 -1.04 0.93 3.84 10% 40% 7 Mathematics -2.14 218.30 8.22 -0.79 0.12 3.45 1% 42% 3 Reading -1.14 184.80 13.11 -0.75 7.50 8.67 57% 66% 4 Reading -1.14 195.28 9.60 -0.58 4.70 6.39 49% 67% 5 Reading -1.12 202.58 7.13 -0.53 3.08 4.85 43% 68% 6 Reading -1.12 207.89 6.03 -0.44 1.74 3.78 29% 63% 7 Reading -1.15 212.20 4.94 -0.27 0.72 3.35 15% 68%
Note. The absenteeism rate (reported in RIT points per month) is a transformation of the SD results seen in existing literature whereas the 2017-18 results presented are model-based estimates based on the quadratic model results displayed in Tables C1 and C2.

17
Table D2 Variability in Summer Learning Loss Estimates During Summer of 2018
Grade Subject
Summer Drop Fixed Effect
Summer Drop SD
Perc. at Which Students Show Gains
Monthly Learning Loss at Different Points in the
Distribution
25th Perc.
50th Perc.
75th Perc.
3 Mathematics -1.35 1.98 75% -2.68 -1.35 -0.01 4 Mathematics -1.45 2.01 76% -2.81 -1.45 -0.09 5 Mathematics -2.01 2.30 81% -3.55 -2.01 -0.45 6 Mathematics -1.04 2.17 68% -2.51 -1.04 0.42 7 Mathematics -0.79 2.29 64% -2.33 -0.79 0.75 3 Reading -0.75 2.72 61% -2.58 -0.75 1.09 4 Reading -0.58 2.61 59% -2.34 -0.58 1.18 5 Reading -0.53 2.63 58% -2.30 -0.53 1.24 6 Reading -0.44 2.71 56% -2.26 -0.44 1.39 7 Reading -0.27 2.78 54% -2.15 -0.27 1.60
Note. Perc=Percentile. Reported estimates are monthly gains/losses in RIT points during the summer months. The reported percentile is the estimated percentile in which students are showing positive monthly growth rates in either reading or mathematics during the summer. Table D3 Fall 2020 Score Projections Under “Typical” and COVID-19 Conditions
"Typical" Fall Scores COVID-19 (Summer Slide)
Projected Fall Scores Grade Subject M SD Perc. M SD Perc. 4 Mathematics 199.20 13.90 0.49 191.32 15.24 0.28 5 Mathematics 209.12 15.30 0.50 200.53 16.08 0.29 6 Mathematics 214.41 15.59 0.49 203.04 15.40 0.23 7 Mathematics 220.69 17.27 0.51 215.10 17.65 0.38 8 Mathematics 226.21 18.46 0.50 221.76 18.89 0.43 4 Reading 196.13 15.98 0.49 191.98 19.06 0.39 5 Reading 203.81 15.63 0.49 200.82 18.52 0.41 6 Reading 209.70 15.41 0.49 207.29 18.37 0.43 7 Reading 213.82 15.58 0.49 211.96 18.36 0.45 8 Reading 217.64 15.68 0.49 216.40 18.27 0.46
Note. M=Mean, SD=Standard deviation, and Perc. = Percentile score under NWEA’s 2020 Norms (Thum & Kuhfeld, 2020). Scores are reported for Grades 4-8 because we are tracking cohorts of students who are in Grades 3-7 in 2017-18 into the fall of 2018, so results are only reported for the subsequent grade levels (e.g., Grades 4-8).

EXHIBIT "11"

8/21/2020 Achievement gap and coronavirus | McKinsey
https://www.mckinsey.com/industries/public-and-social-sector/our-insights/covid-19-and-student-learning-in-the-united-states-the-hurt-could-last-a-life… 1/15
Public & Social Sector
New evidence shows that the shutdowns caused by COVID�19 couldexacerbate existing achievement gaps.
T he US education system was not built to deal with extended shutdowns like thoseimposed by the COVID�19 pandemic. Teachers, administrators, and parents have
worked hard to keep learning alive; nevertheless, these e�orts are not likely to provide thequality of education that’s delivered in the classroom.
Even more troubling is the context: the persistent achievement disparities across incomelevels and between white students and students of black and Hispanic heritage. Schoolshutdowns could not only cause disproportionate learning losses for these students—compounding existing gaps—but also lead more of them to drop out. This could have long-term e�ects on these children’s long-term economic well-being and on the US economyas a whole.
DOWNLOADS
Article (PDF�605KB)
COVID-19 and student learning in theCOVID-19 and student learning in the
United States: The hurt could last aUnited States: The hurt could last a
lifetimelifetimeJune 1, 2020June 1, 2020 | Article| Article
By Emma Dorn, Bryan Hancock , Jimmy Sarakatsannis , and Ellen Viruleg

8/21/2020 Achievement gap and coronavirus | McKinsey
https://www.mckinsey.com/industries/public-and-social-sector/our-insights/covid-19-and-student-learning-in-the-united-states-the-hurt-could-last-a-life… 2/15
Despite the enormous attention devoted to the achievement gap, it has remained astubborn feature of the US education system. In 2009, we estimated that the gapbetween white students and black and Hispanic ones deprived the US economy of $310billion to $525 billion a year in productivity, equivalent to 2 to 4 percent of GDP. Theachievement gap between high- and low-income students was even larger, at $400 billionto $670 billion, 3 to 5 percent of GDP. Although we calculate these two gaps separately,we recognize that black and Hispanic students are also more likely to live in poverty. Yetpoverty alone cannot account for the gaps in educational performance . Together, theywere the equivalent of a permanent economic recession.
Unfortunately, the past decade has seen little progress in narrowing these disparities. Theaverage black or Hispanic student remains roughly two years behind the average whiteone, and low-income students continue to be underrepresented among top performers.
We estimate that if the black and Hispanic student-achievement gap had been closed in2009, today’s US GDP would have been $426 billion to $705 billion higher. If theincome-achievement gap had been closed, we estimate that US GDP would have been$332 billion to $550 billion higher (Exhibit 1).
[ 1 ]
[ 2 ]
[ 3 ]

8/21/2020 Achievement gap and coronavirus | McKinsey
https://www.mckinsey.com/industries/public-and-social-sector/our-insights/covid-19-and-student-learning-in-the-united-states-the-hurt-could-last-a-life… 3/15
These estimates were made before schools closed and the transition to remote learningbegan, sometimes chaotically. In this article, we explore the possible long-term damage ofCOVID�19–related school closures on low-income, black, and Hispanic Americans, and onthe US economy.
Learning loss and school closures
To that end, we created statistical models to estimate the potential impact of schoolclosures on learning. The models were based on academic studies of the e�ectiveness ofremote learning relative to traditional classroom instruction for three di�erent kinds ofstudents. We then evaluated this information in the context of three di�erentepidemiological scenarios .
Exhibit 1

8/21/2020 Achievement gap and coronavirus | McKinsey
https://www.mckinsey.com/industries/public-and-social-sector/our-insights/covid-19-and-student-learning-in-the-united-states-the-hurt-could-last-a-life… 4/15
How much learning students lose during school closures varies signi�cantly by access toremote learning, the quality of remote instruction, home support, and the degree ofengagement. For simplicity’s sake, we have grouped high-school students into threearchetypes. First, there are students who experience average-quality remote learning; thisgroup continues to progress, but at a slower pace than if they had remained in school.Second, some students are getting lower-quality remote learning; they are generallystagnating at their current grade levels. Then there are students who are not getting anyinstruction at all; they are probably losing signi�cant ground. Finally, some students dropout of high school altogether.
We also modeled three epidemiological scenarios. In the �rst—“virus contained”—in-classinstruction resumes in fall 2020. In the second—“virus resurgence”— school closures andpart-time schedules continue intermittently through the 2020�21 school year, and in-school instruction does not fully resume before January 2021. In the third scenario—“pandemic escalation”—the virus is not controlled until vaccines are available, andschools operate remotely for the entire 2020�21 school year.
In our second scenario (in-class instruction does not resume until January 2021), weestimate that students who remain enrolled could lose three to four months of learning ifthey receive average remote instruction, seven to 11 months with lower-quality remoteinstruction, and 12 to 14 months if they do not receive any instruction at all (Exhibit 2).
[ 4 ]
[ 5 ]

8/21/2020 Achievement gap and coronavirus | McKinsey
https://www.mckinsey.com/industries/public-and-social-sector/our-insights/covid-19-and-student-learning-in-the-united-states-the-hurt-could-last-a-life… 5/15
Exhibit 2

8/21/2020 Achievement gap and coronavirus | McKinsey
https://www.mckinsey.com/industries/public-and-social-sector/our-insights/covid-19-and-student-learning-in-the-united-states-the-hurt-could-last-a-life… 6/15
Although students at the best full-time virtual schools can do as well as or better thanthose at traditional ones, most studies have found that full-time online learning doesnot deliver the academic results of in-class instruction. Moreover, in 28 states, witharound 48 percent of K�12 students, distance learning has not been mandated. As aresult, many students may not receive any instruction until schools reopen. Even in placeswhere distance learning is compulsory, signi�cant numbers of students appear to beunaccounted for. In short, the hastily assembled online education currently available islikely to be both less e�ective, in general, than traditional schooling and to reach fewerstudents as well.
Likely effects on low-income, black, andHispanic students
Learning loss will probably be greatest among low-income, black, and Hispanic students.Lower-income students are less likely to have access to high-quality remote learning or toa conducive learning environment, such as a quiet space with minimal distractions, devicesthey do not need to share, high-speed internet, and parental academic supervision.Data from Curriculum Associates, creators of the i-Ready digital-instruction and -assessment software, suggest that only 60 percent of low-income students are regularlylogging into online instruction; 90 percent of high-income students do. Engagement ratesare also lagging behind in schools serving predominantly black and Hispanic students; just60 to 70 percent are logging in regularly (Exhibit 3).
[ 6 ]
[ 7 ] [ 8 ]
[ 9 ]
[ 10 ]
[ 11 ]
[ 12 ]

8/21/2020 Achievement gap and coronavirus | McKinsey
https://www.mckinsey.com/industries/public-and-social-sector/our-insights/covid-19-and-student-learning-in-the-united-states-the-hurt-could-last-a-life… 7/15
These variations translate directly into greater learning loss. The average loss in ourmiddle epidemiological scenario is seven months. But black students may fall behindby 10.3 months, Hispanic students by 9.2 months, and low-income students by more thana year. We estimate that this would exacerbate existing achievement gaps by 15 to 20percent.
Exhibit 3
[ 13 ]

8/21/2020 Achievement gap and coronavirus | McKinsey
https://www.mckinsey.com/industries/public-and-social-sector/our-insights/covid-19-and-student-learning-in-the-united-states-the-hurt-could-last-a-life… 8/15
In addition to learning loss, COVID�19 closures will probably increase high-school drop-outrates (currently 6.5 percent for Hispanic, 5.5 percent for black, and 3.9 percent for whitestudents, respectively). The virus is disrupting many of the supports that can helpvulnerable kids stay in school: academic engagement and achievement, strongrelationships with caring adults, and supportive home environments. In normalcircumstances, students who miss more than ten days of school are 36 percent more likelyto drop out. In the wake of school closures following natural disasters, such asHurricane Katrina (2005) and Hurricane Maria (2017), 14 to 20 percent of students neverreturned to school. We estimate that an additional 2 to 9 percent of high-schoolstudents could drop out as a result of the coronavirus and associated school closures—232,000 ninth-to-11th graders (in the mildest scenario) to 1.1 million (in the worst one).
In addition to the negative e�ects of learning loss and drop-out rates, other, harder toquantify factors could exacerbate the situation: for example, the crisis is likely to causesocial and emotional disruption by increasing social isolation and creating anxiety over thepossibility that parents may lose jobs and loved ones could fall ill. Milestones such asgraduation ceremonies have been canceled, along with sports and other extracurricularevents. These challenges can reduce academic motivation and hurt academicperformance and general levels of engagement.
The loss of learning may also extend beyond the pandemic. Given the economic damage,state budgets are already stressed. Cuts to K�12 education are likely to hit low-incomeand racial- and ethnic-minority students disproportionately, and that could further widenthe achievement gap.
The economic impact of learning loss anddropping out
These e�ects—learning loss and higher dropout rates—are not likely to be temporaryshocks easily erased in the next academic year. On the contrary, we believe that they maytranslate into long-term harm for individuals and society.
[ 14 ]
[ 15 ]
[ 16 ]
[ 17 ]
[ 18 ]

8/21/2020 Achievement gap and coronavirus | McKinsey
https://www.mckinsey.com/industries/public-and-social-sector/our-insights/covid-19-and-student-learning-in-the-united-states-the-hurt-could-last-a-life… 9/15
Using the middle (virus resurgence) epidemiological scenario, in which large-scale in-classinstruction does not resume until January 2021, we estimated the economic impact of thelearning disruption. (The results would, of course, be worse in the third scenario and betterin the �rst.) All told, we estimate that the average K�12 student in the United States couldlose $61,000 to $82,000 in lifetime earnings (in constant 2020 dollars), or the equivalentof a year of full-time work, solely as a result of COVID�19–related learning losses. Thesecosts are signi�cant—and worse for black and Hispanic Americans. While we estimate thatwhite students would earn $1,348 a year less (a 1.6 percent reduction) over a 40-yearworking life, the �gure is $2,186 a year (a 3.3 percent reduction) for black students and$1,809 (3.0 percent) for Hispanic ones.
This translates into an estimated impact of $110 billion annual earnings across the entirecurrent K�12 cohort (Exhibit 4). Of that sum, $98.8 billion would be associated withloss of learning and the rest ($11.2 billion) with the increase in the number of high-schooldropouts. This is not just an economic issue. Multiple studies have linked greatereducational attainment to improved health, reduced crime and incarceration levels, andincreased political participation.
[ 19 ]

8/21/2020 Achievement gap and coronavirus | McKinsey
https://www.mckinsey.com/industries/public-and-social-sector/our-insights/covid-19-and-student-learning-in-the-united-states-the-hurt-could-last-a-lif… 10/15
The damage to individuals is consequential, but the consequences could go deeper: theUnited States as a whole could su�er measurable harm. With lower levels of learning andhigher numbers of drop-outs, students a�ected by COVID�19 will probably be less skilledand therefore less productive than students from generations that did not experience asimilar gap in learning. Furthermore, if other countries mitigate the impact of lostlearning and the United States does not, this will harm US competitiveness. By 2040, mostof the current K�12 cohort will be in the workforce. We estimate a GDP loss of $173 billionto $271 billion a year—a 0.8 to 1.3 percent hit (Exhibit 5).
Exhibit 4
[ 20 ]
[ 21 ]

8/21/2020 Achievement gap and coronavirus | McKinsey
https://www.mckinsey.com/industries/public-and-social-sector/our-insights/covid-19-and-student-learning-in-the-united-states-the-hurt-could-last-a-lif… 11/15
A call to action
These numbers are sobering—but they are not inevitable. If the United States acts quicklyand e�ectively, it may avoid the worst possible outcomes. But if there is a delay or a lack ofcommitment, COVID�19 could end up worsening existing inequities.
It is therefore urgent to intervene immediately to support vulnerable students. Manystudents will continue to take advantage of free learning resources, but school systemsmust also think creatively about how to encourage ongoing learning over the summer.Initiatives might include expanding existing summer-school programs, working withagencies that run summer camps and youth programs so that they add academics to theiractivities, and enlisting corporations to identify and train volunteer tutors. Tennessee, forexample, is recruiting 1,000 college students to tutor kids falling behind. New York will beconducting remote summer school for 177,700 students (compared with 44,000 in 2019).Some districts are making digital summer learning available (though optional) to allstudents.
Exhibit 5

8/21/2020 Achievement gap and coronavirus | McKinsey
https://www.mckinsey.com/industries/public-and-social-sector/our-insights/covid-19-and-student-learning-in-the-united-states-the-hurt-could-last-a-lif… 12/15
1. For both 2009 and 2019, we use $25,000 in annual income (in 2009 constant dollars) as the cuto�between low and high income.
The necessity of continued remote learning cannot be an excuse for inaction orindi�erence. There are examples of high-quality online education, and reaching this levelshould be the general expectation. While no one knows exactly what level of in-classlearning will be possible for the 2020�21 school year, many students will probably need tostay home for at least part of it. Educators need to use the summer to learn how to makeinstruction more e�ective, whatever the scenario.
Achieving this goal will make it necessary to provide teachers with resources that showthem how they can make virtual engagement and instruction e�ective and to train them inremote-learning best practices. It will also be necessary to work with parents to helpcreate a good learning environment at home, to call upon social and mental-healthservices so that students can cope with the pandemic’s stresses, and to ensure that allstudents have the infrastructure (such as laptops, tablets, and good broadband) neededfor remote learning.
As a blend of remote and in-classroom learning becomes possible, more �exible sta�ngmodels will be required, along with a clear understanding of which activities to prioritize forin-classroom instruction, identi�cation of the students who most need it, and the �exibilityto switch between di�erent teaching methods. And all this must be done while schoolsystems keep the most vulnerable students top of mind. That may require investment—something that cannot be taken for granted if state and local government budgets are cut.
The US academic-achievement gap was �rst identi�ed in 1966. Its persistence is troubling.The possibility that COVID�19 could make it worse deserves focused attention. Theachievement gap costs the United States hundreds of billions of dollars—and also exacts along-term cost in social cohesion. This is a moment—and a challenge—that calls forurgency and energy.

8/21/2020 Achievement gap and coronavirus | McKinsey
https://www.mckinsey.com/industries/public-and-social-sector/our-insights/covid-19-and-student-learning-in-the-united-states-the-hurt-could-last-a-lif… 13/15
2. Erik Hanushek, Paul E. Peterson, Laura M. Talpey, and Ludger Woessmann. Long-run Trends in theU.S. SES�Achievement Gap, NBER Working Paper No. 26764, National Bureau of EconomicResearch, February 2020; S. F. Reardon, “The widening academic achievement gap between the richand the poor: New evidence and possible explanations,” in Greg Duncan and Richard Murnane (Eds.),Whither Opportunity? Rising Inequality and the Uncertain Life Chances of Low-Income Children, NewYork: Russell Sage Foundation, 2011.3. The learning gap has remained almost the same between 2007 (the year of the latest data whenwe published our 2009 report) and 2019. Black students scored, on average, 31 points lower thanwhite students did on eighth-grade National Assessment of Education Progress (NAEP) mathassessments in 2007; in 2019 they scored 32 points lower. Hispanic students scored, on average, 26points lower than white students did on eighth-grade NAEP math assessments in 2007; in 2019 theyscored 24 points lower. The increase in dollar values is the result of an increase in proportion of blackand Hispanic people in the workforce and higher GDP base value in 2019.4. High-quality remote-learning programs are typically the result careful planning and deliberateapproaches—which were not typical of the COVID�19 transition.5. For simplicity’s sake, we have equated this with schools restarting as normal in January 2021, eventhough the reality is more likely to be a patchwork of di�erent actions.6. There is evidence from online-learning providers’ internal, peer-reviewed research that somevirtual-learning experiences can achieve parity with brick-and-mortar experiences for students,especially those who were struggling academically.7. See, for example the 2015 Online Charter School Study of the Center for Research on EducationOutcomes (CREDO), credo.stanford.edu.8. Alaska, Arkansas, Colorado, Connecticut, Georgia, Hawaii, Illinois, Iowa, Kansas, Kentucky,Louisiana, Maine, Maryland, Massachusetts, Missouri, Montana, New Jersey, New York, NorthCarolina, Ohio, Rhode Island, South Carolina, South Dakota, Tennessee, Utah, Virginia, West Virginia,and Wisconsin.9. Politics K�12, “Coronavirus and learnings: What’s happening in each state,” blog entry by EducationWeek sta�, April 3, 2020, blogs.edweek.org.10. The Curriculum Associates analysis of anonymized data on usage from March to May 2020 of i-Ready software (a personalized learning system typically used as supplemental instruction byclassroom teachers), curriculumassociates.com.11. Many parents continue to work full-time outside their homes, so their children may not have anadult at home to supervise their learning; Brooke Auxier and Monica Anderson, “As schools close dueto the coronavirus, some U.S. students face a digital ‘homework gap,’” Fact Tank, March 16, 2020,pewreasearch.org. Many white-collar workers, however, are able to work remotely and thus provide atleast some supervision. Dana Goldstein, Adam Popescu, and Nikole Hannah-Jones, ”As school movesonline, many students stay logged out, New York Times, April 6, 2020, nytimes.com. Also, one in tenpublic school students in New York City lives in shelter housing, which can mean several childrensharing a single room; Anna North, “The shift to online learning could worsen educational inequality,”Vox, April 9, 2020, vox.com.12. The Curriculum Associates analysis of anonymized data on usage from March to May 2020 of i-Ready software (a personalized learning system typically used as supplemental instruction byclassroom teachers), percentage of log-ins as a portion of pre-closure rates on a weekly basis,curriculumassociates.com.13. To gauge the proportion of students that may fall into our three learning archetypes by race orethnicity and by income level, we integrated multiple sources of information, including nationalsurveys of teachers and data on student log-in patterns by race or ethnicity and income estimates to

8/21/2020 Achievement gap and coronavirus | McKinsey
https://www.mckinsey.com/industries/public-and-social-sector/our-insights/covid-19-and-student-learning-in-the-united-states-the-hurt-could-last-a-lif… 14/15
generate the plausibility of the type of instruction that students may receive given the incomequintiles of their families. Speci�cally, “No instruction” estimates based on Curriculum Associates dataand press reporting, including Mark Lieberman, “Taking attendance during Coronavirus closures: Is iteven worth it?”, Education Week, May 27, 2020, edweek.org; and Howard Blume and Sonali Kohli,“15,000 LA high-school students are AWOL online, 40,000 fail to check in daily amid coronavirusclosures,” Los Angeles Times, March 30, 2020, latimes.com. High- and low-quality instructionestimates are based on US Census income quintiles (Income Data Tables, US Census Bureau, 2019,census.gov), with the assumption that top two income quintiles receive higher-quality instruction.14. Research brief: Chronic absenteeism, Utah Education Policy Center, University of Utah, 2012,uepc.utah.edu.15. “Declining Enrollment, Shuttered Schools,” Education Week, September 19, 2018, edweek.org;“Legacy of Katrina: The Impact of a Flawed Recovery on Vulnerable Children of the Gulf Coast,”National Center for Disaster Preparedness, Children’s Health Fund, 2010.16. To create these estimates, we compared data on the e�ects on drop-out rates resulting fromextended school absences, online-only instruction (which can disrupt engagement and student–teacher relationships), and natural disasters. We focus on grades 9 to 11, as many school districts haverelaxed testing and other graduation requirements for current 12th-grade students.17. Leah Lessard and Hannah Schacter, “Why the coronavirus crisis hits teenagers particularly hard:Developmental scientists explain,” Education Week, April 15, 2020, edweek.org.18. During the 2008 recession, annual academic gains in US counties that su�ered the largest shocksto employment fell 25 percent from prerecession levels. These districts disproportionately servedpoor and black Americans. K. Shores, K and M. P. Steinberg, Schooling During the Great Recession:Patterns of School Spending and Student Achievement Using Population Data, 2019.19. Using projected learning loss onto the National Assessment of Education Progress and itsrelationship with the country’s GDP and earnings. In addition, in all calculations below, we haveaccounted for the e�ects of an economic recession on academic outcomes.20. Similar e�ects have been noted for other generations that experienced major learning disruptions.For example, several studies have shown long-term earnings implications for students whose learningwas disrupted during World War II.21. Using Hanushek and Woessman 2008 methodology to map national per capita growth associatedwith decrease in academic achievement, then adding additional impact of COVID drop-outs on GDP.
ABOUT THE AUTHOR(S)
Emma Dorn is the global Education Practice manager in McKinsey’s SiliconValley o�ce. Bryan Hancock and Jimmy Sarakatsannis are partners in theW hi t DC � d Ell Vi l i i d i b d i

8/21/2020 Achievement gap and coronavirus | McKinsey
https://www.mckinsey.com/industries/public-and-social-sector/our-insights/covid-19-and-student-learning-in-the-united-states-the-hurt-could-last-a-lif… 15/15
Washington, DC, o�ce, and Ellen Viruleg is a senior adviser based in
Providence, Rhode Island.
The authors wish to thank Priyanka Agrawal, Justice Tention-Palmer, and JoshWilliams for their contributions to this article.
This article was edited by Cait Murphy, a senior editor in the New York o�ce.

EXHIBIT "12"

/
The purpose of this guidance revision is to continue to support communities, local leadership ineducation and public health, and pediatricians collaborating with schools in creating policies forschool re-entry during the coronavirus disease 2019 (COVID-19) pandemic that foster the overallhealth of children, adolescents, educators, sta�f, and communities and are based on availableevidence. Along with our colleagues in the �eld of education, the American Academy ofPediatrics (AAP) strongly advocates for additional federal assistance to schools throughoutthe United States, with no restrictions regarding their plans for in-person versus virtual learning.Regardless, in places in the United States with high levels of community transmission of severeacute respiratory syndrome-coronavirus 2 (SARS-CoV-2), the virus that causes COVID-19, wherein-person learning is not possible, these schools will also need more assistance, not less, tosupport the additional sta��ng needs, alternative learning sites, hybrid educational models, andchild care.
Schools and school-supported programs are fundamental to child and adolescent developmentand well-being and provide our children and adolescents with academic instruction, either inperson or virtually; social and emotional skills; safety; reliablenutrition; physical/speech therapy and mental health services; and opportunities for physicalactivity, among other bene�ts. Schools also serve as critical centers in communities bysupporting adult-focused activities (such as job training, neighborhood meetings, and parentingclasses) as well as ensuring safe places for children and adolescents to be while parents orguardians are working, which in turn supports the local economy.
Beyond supporting the educational development of children and adolescents, schools play acritical role in addressing racial and social inequity. As such, it is critical to re�lect on thedi�ferential impact the COVID-19 pandemic and the associated school closures have had ondi�ferent racial and ethnic groups and vulnerable populations. The AAP condemns the persistentracial and social inequities that exist within the US educational system. The disparities in schoolfunding, quality of school facilities, educational sta��ng, and resources for enriching curriculumbetween schools have been exacerbated by the pandemic. Families rely on schools toprovide child care; a safe, stimulating space for children to learn; opportunities forsocialization; and access to school-based mental, physical, and nutritional health services.Without adequate support for families to access these services, disparities will likely worsen,especially for children who are English language learners, children with disabilities, children

/
living in poverty, and children of African American/Black, Latinx/Hispanic, and NativeAmerican/Alaska Native origin.i,ii
For children and adolescents in virtual learning models, educational disparities may widenfurther. According to the Pew Research Center, 1 in 5 teenagers are not able to completeschoolwork at home because of lack of a computer or internet connection.iii This technological“homework gap” disproportionately a�fects Black, Hispanic, and low-income families.3
The AAP strongly recommends that school districts promote racial/ethnic and social justice bypromoting the well-being of all children in any school-reopening plan, particularly childrenliving in marginalized communities. To address these disparities, federal, state, andlocal governments should allocate resources to provide equitable access to educationalsupports. These recommendations are provided, acknowledging that our understanding ofthe COVID-19 pandemic is changing rapidly.
Any school re-entry policies should consider the following key principles:
To be able to open schools safely, it is vitally important that communities take allnecessary measures to limit the spread of the SARS-CoV-2.
School policies must be �lexible and nimble in responding to new information, andadministrators must be willing to re�ne approaches when speci�c policies are notworking.
Schools must take a multi-pronged, layered approach to protect students, teachers, andsta�f. By using di�ferent approaches, these layers of protection will make in-personlearning safe and possible.
It is critically important to develop strategies that can be revised and adapted dependingon the level of viral transmission and test positivity rate throughout the community andin the schools, recognizing the di�ferences between school districts, including urban,suburban, and rural districts.
School districts must be in close communication and coordinate with state and/or localpublic health authorities, school nurses, local pediatric practitioners, and other medicalexperts.
School re-entry policies should be practical, feasible, and appropriate for child andadolescent's developmental stage and address teacher and sta�f safety.
Special considerations and accommodations to account for the diversity of youth shouldbe made, especially for vulnerable populations, including those who are medicallyfragile or complex, live in poverty, have developmental challenges, or have

/
disabilities, with the goal of safe return to school. These youth and their families shouldwork closely with their pediatrician using a shared decision-making approach regardingreturn to school.
Pediatricians, families, and schools should partner together to collaboratively identifyand develop accommodations when needed for any child or adolescent with uniquemedical needs.
Children and adolescents who need customizedconsiderations should not be automatically excluded from school unlessrequired in order to adhere to local public healthmandates or because their unique medical needs would put them at increasedrisk for contracting COVID-19 during current conditions in their community.
School policies should be guided by supporting the overall health and well-being of allchildren, adolescents, their families, and their communities but should also look tocreate safe working environments for educators and school sta�f. This focus on overallhealth and well-being includes addressing the behavioral/mental health needs ofstudents and sta�f.
These policies should be consistently communicated in languages other than English, ifneeded, based on the languages spoken in the community, to avoid marginalization ofparents/guardians who are of limited English pro�ciency or do not speak English at all.
Federal, state, and local funding should be provided for all schools so they can provide allthe safety measures required for students and sta�f. Funding to support virtual learningand provide needed resources must be available for communities, schools, andchildren facing limitations implementing these learning modalities in their home(eg, socioeconomic disadvantages) or in the event of school re-closure becauseof resurgence of SARS-CoV-2 in the community or a school outbreak.
With the above principles in mind, the AAP strongly advocates that all policy considerations forthe coming school year should start with a goal of having students physically present inschool. Unfortunately, in many parts of the United States, there is currently uncontrolled spread of SARS-CoV-2. Although the AAP strongly advocates for in-person learning for the coming school year, the currentwidespread circulation of the virus will not permit in-person learning to be safely accomplished in manyjurisdictions. The importance of in-person learning is well-documented, and there is alreadyevidence of the negative impacts on children because of school closures in the spring of 2020.

/
Lengthy time away from school and associated interruption of supportive services o�ten results insocial isolation, making it di��cult for schools to identify and address important learning de�citsas well as child and adolescent physical or sexual abuse, substance use, depression, and suicidalideation. This, in turn, places children and adolescents at considerable risk of morbidity and, insome cases, mortality. Beyond the educational impact and social impact of school closures, therehas been substantial impact on food security and physical activity for children and families. Thedisproportionate impact this has had on Black, Latinx, and Native American/AlaskanNative children and adolescents must also be recognized.
Policy makers and school administrators must also consider the mounting evidence regardingCOVID-19 in children and adolescents, including the role they may play in transmission of theinfection. SARS-CoV-2 appears to behave di�ferently in children and adolescents than othercommon respiratory viruses, such as in�luenza, on which much of the current guidance regardingschool closures is based. Although children and adolescents play a major role in amplifyingin�luenza outbreaks, to date, this does not appear to be the case with SARS-CoV-2. Althoughmany questions remain, the preponderance of evidence indicates that children andadolescents can become infected and are less likely to be symptomatic and less likely to havesevere disease resulting from SARS-CoV-2 infection.iv We continue to learn more about the rolechildren play in transmission of SARS-CoV-2. At present, it appears that children younger than 10years may be less likely to become infected and less likely to spread infection to others, althoughfurther studies are needed.v More recent data suggest children older than 10 years may spreadSARS-CoV-2 as e��ciently as adults, and this information should be part of the considerationstaken in determining how to safely and e�fectively open schools. Additional in-depth studies areneeded to truly understand the infectivity and transmissibility of this virus in anyone youngerthan 18 years, including children and adolescents with disabilities andmedical complexities. Policies to mitigate the spread of COVID-19 within schools must bebalanced with the previously noted known harms to children, adolescents, families, and thecommunity that come with keeping children at home.
Finally, policy makers and school administrators should acknowledge that COVID-19 policies areintended to mitigate, not eliminate, risk. No single action or set of actions will completelyeliminate the risk of SARS-CoV-2 transmission, but implementation of several coordinatedinterventions can greatly reduce that risk. For example, where physical distance cannot bemaintained, students (older than 2 years) and sta�f should wear cloth face coverings (unlessmedical or developmental conditions prohibit use). In the following sections, some generalprinciples are reviewed that policy makers and school administrators should consider as theysafely plan for the coming school year. For all of these, engagement of the entire school

/
community, including teachers and sta�f, regarding these measures should begin early, ideally atleast several weeks before the start of the school year.
Since this guidance was �rst released, there have been several other documents released bythe Centers for Disease Control and Prevention (CDC), National Association of School Nurses,and the National Academy of Sciences, Engineering, and Medicine. All these documents areconsistent regarding the importance of considering the degree to which SARS-CoV-2 iscirculating in a community in making school re-opening policies. In many places in the UnitedStates at the present time, opening schools to in-person learning for all students is likely notfeasible because of widespread community transmission and high levels of positivity in testing.Even in these communities, though, in-person learning should still be the goal and may befeasible as the epidemiology improves. Countries that have been able to successfully openschools have had low rates of community SARS-CoV-2 circulation. This guideline is intended toaugment, not replace, guidance from the CDC and others and should be used in concert withother guidance. Ultimately, the decision to re-open schools to in-person learning should bebased on the guidance of local and state public health authorities and school administrators.
Physical Distancing Measures Physical distancing, sometimes referred to as social distancing, is simply the act of keepingpeople separated with the goal of limiting spread of contagion between individuals. It isfundamental to lowering the risk of spread of SARS-CoV-2, as the primary mode of transmissionis through respiratory droplets by persons in close proximity. There is a con�lict between optimalacademic and social/emotional learning in schools and strict adherence to current physicaldistancing guidelines. For example, the CDC recommends that schools "space seating/desks atleast 6 feet apart when feasible." In many school settings, 6 feet between students is not feasiblewithout drastically limiting the number of students. Some countries have been able tosuccessfully reopen schools a�ter �rst controlling community-wide spread of SARS-CoV-2 while using 3 feet of distance between students without increases in communityspread.vi Physical distance between desks should follow current public health guidance. In theabsence of speci�c guidance, desks should be placed at least 3 feet apart, and ideally 6 feet apart.If desks are spaced less than 6 feet apart, face coverings should be strongly encouraged andadhere to public health guidance. In many jurisdictions, face coverings are mandatory forchildren in public settings, including schools. Schools should weigh the bene�ts of strictadherence to a 6-feet spacing rule between students with the potential downside if remotelearning is the only alternative. Further, while these guidelines support the conceptof cohorting, strict adherence to a speci�c size of student groups (eg, 10 per classroom, 15 per

/
classroom, etc) should be discouraged, because the size of cohorts will vary depending on manyfactors specific to individual schools and even individual classrooms.
Given what is known about SARS-CoV-2 transmission dynamics, adults within schools shouldmaintain a distance of 6 feet from other people as much as possible, particularly around otheradult sta�f. For all of the below settings, physical distancing by and among adults is stronglyrecommended, and meetings and curriculum planning should take place virtually or outside ifpossible. In addition, other strategies to increase adult-adult physical distance in time and spaceshould be implemented, such as staggered drop-o�fs and pickups, and drop-o�fs and pickupsoutside when weather allows. Parents should, in general, be discouraged from entering theschool building. Physical barriers, such as plexiglass, should be considered in reception areas andemployee workspaces where the environment does not accommodate physicaldistancing. Congregating in shared spaces, such as sta�f lounge areas, should not beallowed given the increasing evidence that these types of spaces have increased rates oftransmission because of close proximity and lax adherence to masking recommendations.
The recommendations in each of the age groups below are not instructional strategies butare guidance to optimize the return of students to schools in the context of physical distancingguidelines and the developmentally appropriate implementation of the strategies. Educationalexperts may have preference for one or another of the guidelines based on the instructionalneeds of the classes or schools in which they work.
Pre-Kindergarten (Pre-K) In Pre-K, the relative impact of physical distancing among children is likely small based oncurrent evidence, and it is certainly di��cult to implement. Therefore, Pre-K programplanning should focus on more e�fective risk mitigation strategies for this population.These strategies include hand and cough hygiene, infection prevention education for sta�f andfamilies, adult physical distancing from one another, adults and children wearing facecoverings, cohorting, and spending time outdoors.
Higher-priority strategies:
Cohort classes to minimize crossover among children and adults within the school; theexact size of the cohort may vary, o�ten dependent on local or state health departmentguidance.
Utilize outdoor spaces when possible.
Limit unnecessary visitors into the building.

/
Lower-priority strategies:
Cloth face coverings for children in the Pre-K setting Encourage families to practice wearing cloth face coverings with children whileat home. Support modeling by teachers and parents.
Reducing classmate interactions/play in Pre-K–aged children may not providesubstantial COVID-19 risk reduction.
Elementary Schools Higher-priority strategies:
Children should wear cloth face coverings Practice by children and good modeling by adults will help children be moresuccessful at wearing cloth face coverings at younger ages.
Desks should be placed at least 3 feet apart, and ideally 6 feet apart when feasible. If this reduces the amount of time children are present in school, harm mayoutweigh potential bene�ts.
Cohort classes to minimize crossover among children and adults within the school.
Utilize outdoor spaces when possible.
Lower-priority strategies:
The risk reduction of reducing class sizes in elementary school-aged children may beoutweighed by the challenge of doing so.
Similarly, reducing classmate interactions/play in elementary school-aged children maynot provide enough COVID-19 risk reduction to justify potential harms.
Secondary Schools There is likely a greater impact of physical distancing on risk reduction of COVID-19 in secondaryschools than early childhood or elementary education. There are also di�ferent barriers tosuccessful implementation of many of these measures in older age groups, as the structure of

/
school is usually based on students changing classrooms. Suggestions for physical distancing riskmitigation strategies when feasible:
Universal face coverings in middle and high schools, particularly when not able tomaintain a 6-foot distance (students and adults).
Planned avoidance of close physical proximity in cases of increased exhalation (singing,exercise, band); these activities are safest outdoors and spread out.
Desks should be placed at least 3 feet apart, and ideally 6 feet apart when feasible.
Cohort classes if possible, limit cross-over of students and teachers to the extentpossible.
Ideas that may assist with cohorting: Block schedules (with fewer classes in a given day and electivestruncated to shortened time periods).
Eliminate use of lockers or assign them by cohort to reduceneed for hallway use across multiple areas of the building.
This strategy would need to be implemented in conjunctionwith planning to ensure that students are not carrying home anunreasonable number of books on a daily basis and may varydepending on other cohorting and instructional decisionsschools are making.
Have teachers rotate into di�ferent classrooms instead of students whenfeasible.
Utilize outdoor spaces when possible.
Teachers and other adult sta�f should maintain a distance of 6 feet fromstudents when possible and if not disruptive to educational process.
Restructure elective o�ferings to allow small groups within oneclassroom. This may not be possible in a small classroom.
Special Education Every child and adolescent with a disability is entitled to a free and appropriate education and isentitled to special education services based on their individualized education program (IEP).Students receiving special education services may be more negatively a�fected by distance-

/
learning and may be disproportionately impacted by interruptions in regular education. It maynot be feasible, depending on the needs of the individual child and adolescent, to adhere both todistancing guidelines and the criteria outlined in a speci�c IEP. Attempts to meet physicaldistancing guidelines should meet the needs of the individual child and may require creativesolutions, o�ten on a case-by-case basis. Additional safety measures for teachers and sta�fworking with students with disabilities may need to be in place to ensure optimal safety for all.
Adult Staff and Educators Universal cloth face coverings at all times.
Particular avoidance of close physical proximity to other adults and children.
Desks should be placed 6 feet away from students if feasible.
Cohort teachers with classes if possible, limit cross-over of students and teachers to theextent possible.
Recognizing certain teachers must cross-over to multiple classes, such asspecials teachers, special educators, and secondary school teachers.
Use plexiglass in front and around desks particularly if unable to be 6 feet away fromstudents.
Physical Distancing in Specific Enclosed Spaces Buses
Encourage alternative modes of transportation for students who have other safe options,including walking or biking.
Ideally, for students riding the bus, symptom screening would be performed priorto them being dropped o�f at the bus stop.
Having bus drivers or monitors perform these screenings is problematic, as theymay face a situation in which a student screens positive yet the parent has le�t,and the driver would be faced with leaving the student alone or allowing thestudent on the bus.

/
Assigned seating; if possible, assign seats by cohort (same students sit together eachday).
Tape marks showing students where to sit.
Face coverings should be worn at all times, particularly if 6 feet distance cannot bemaintained.
Driver should be a minimum of 6 feet from students; driver must wear face covering;consider physical barrier for driver (eg, plexiglass).
Minimize number of people on the bus at one time within reason. Consider altering start and end times at di�ferent grades to allow fewer studentson the bus at a time.
Adults who do not need to be on the bus should not be on the bus.
Have windows open if weather allows.
Ensure adequate cleaning of buses between uses.
Hallways Consider creating one-way hallways to reduce close contact.
Place physical guides, such as tape, on �loors or sidewalks to create one-way routes.
Where feasible, keep students in the classroom and rotate teachers instead.
Stagger class periods by cohorts for movement between classrooms if students mustmove between classrooms to limit the number of students in the hallway whenchanging classrooms.
Assign lockers by cohort or eliminate lockers altogether.
Playgrounds Enforcing physical distancing in an outside playground is di��cult and may not be the moste�fective method of risk mitigation. Emphasis should be placed on maintaining classroomcohorts of students and limiting the size of groups participating in playground time (eg, mixingof cohorts). Outdoor transmission of virus is known to be much lower than indoor transmission. Ifplayground equipment is being used, it should be part of cleaning plans implemented byschools.

/
Meals/Cafeteria School meals play an important part in addressing food security for children and adolescentsand, as was observed in the early stages of the pandemic, were crucial sources of food andnutrition to children, adolescents, and their families. Regardless of whether children areparticipating in in-person or distance learning, school districts must continue to provide foodsecurity to all students. This may require enacting strong policies and procedures to ensureaccess to all students. Decisions about how to serve meals must take into account the fact that inmany communities there may be more students eligible for free and reduced meals than prior tothe pandemic.
Consider having students cohorted, potentially in their classrooms, especially if studentsremain in their classroom throughout the day.
Create separate lunch periods to minimize the number of students in the cafeteria at onetime.
Use unused or underutilized spaces for lunch/break times.
Use outdoor spaces when possible.
Create an environment that is as safe as possible from exposure to food allergens.
Encourage children and adults to wash their hands or use hand sanitizer before and a�tereating.
Face Coverings and Personal ProtectiveEquipment (PPE) Cloth face coverings protect others if the wearer is infected with SARS-CoV-2 and is not aware.Cloth face coverings may o�fer some level of protection for the wearer. Evidence continues tomount on the importance of universal face coverings in interrupting the spread of SARS-CoV-2.vii,viii,ix Universal face covering use in schools for children older than 2 years isrecommended. It is important to note many children, even those with medical conditions, areable to safely and e�fectively wear face coverings with adequate practice and support as well asmodeling from adults. School sta�f and older students (those who attend middle or high school)should be able to wear cloth face coverings safely and consistently and should be encouraged todo so. Children younger than 2 years and anyone who has trouble breathing or is unconscious,

/
incapacitated, or otherwise unable to remove a face covering without assistance should not wearcloth face coverings.
For certain populations, the use of cloth face coverings by teachers may impede the educationprocess. These include students who are deaf or hard of hearing, students receivingspeech/language services, young students in early education programs, and English languagelearners. Although there are products (eg, face coverings with clear panels in the front) tofacilitate their use among these populations, these products may not be available in all settings.
Students and families should be taught how to properly wear (cover nose and mouth) a clothface covering, to maintain hand hygiene when removing for meals and physical activity, and toreplace and maintain (wash daily) a cloth face covering.
School health sta�f should be provided with appropriate medical PPE to use in health suites. ThisPPE should include universal N95 masks, surgical masks, gloves, disposable gowns, and faceshields or other eye protection. School health sta�f should be aware of the CDC guidance oninfection control measures. Asthma treatments using inhalers with spacers should beused rather than nebulizer treatments whenever possible, because nebulizer treatments areaerosol-generating procedures, which increase risks to others. The CDCrecommends that nebulizer treatments at school should be reserved for children who cannotuse or do not have access to an inhaler (with spacer or spacer with mask) for a respiratoryemergency. Schools should work with families and health care providers to assist with obtainingan inhaler and spacer for students with limited access. In addition, schools should work todevelop and implement asthma action plans, which may include directly observed controllermedication administration in schools to promote optimal asthma control. In those rare cases inwhich a student can only use a nebulizer, school health sta�f should wear gloves, an N95facemask (when available), gown, and eye protection. Sta�f should be trained on proper donningand do��ng procedures and follow the CDC guidance regarding precautions whenperforming this aerosol-generating procedure. Nebulizer treatments should be performed in aspace that limits exposure to others and with minimal sta�f present. Rooms should be well-ventilated, or treatments should be performed outside. A�ter the use of the nebulizer, the roomshould undergo routine cleaning and disinfection.
School sta�f working with students who are unable to wear a cloth face covering or who areunable to manage secretions and who must be in close proximity to these students should wear asurgical mask in combination with a face shield.
Cleaning and Disinfection

/
The main mode of COVID-19 spread is from person to person, primarily via droplet transmission.For this reason, strategies for infection prevention should center around this form of spread,including physical distancing, face coverings, and hand hygiene. Given the challenges that mayexist in children and adolescents e�fectively adhering to recommendations, it iscritical that sta�f consistently set a good example for students by modeling behaviors aroundphysical distancing, face coverings, and hand hygiene. Infection via fomites is less likely.However, because the virus may survive on certain surfaces for some time, it is possible to getinfected a�ter touching a virus contaminated surface and then touching the mouth, eyes, ornose. Frequent handwashing as a modality of containment is vital.
The additional cleaning requirements because of the COVID-19 pandemic will require additionalresources for schools both in supplies and potential in sta��ng. Cleaning should be performedper established protocols followed by disinfection when appropriate. Normal cleaning with soapand water decreases the viral load and optimizes the e��cacy of disinfectants. When usingdisinfectants, the manufacturers’ instructions must be followed, including duration of dwelltime, use of PPE if indicated, and proper ventilation. The useof the Environmental Protection Agency (EPA)-approved disinfectants against COVID-19 isrecommended (EPA List N). When possible, only products labeled as safe for humans and theenvironment (eg, Safer or Designed for the Environment), containing active ingredients such ashydrogen peroxide, ethanol, citric acid, should be selected from this list, because they are lesstoxic, are not strong respiratory irritants or asthma triggers, and have no known carcinogenic,reproductive, or developmental e�fects.
When EPA-approved disinfectants are not available, alternative disinfectants such as dilutedbleach or 70% alcohol solutions can be used. Children should not be present when disinfectantsare in use and should not participate in disinfecting activities. Most of these products are not safefor use by children, whose “hand-to-mouth” behaviors and frequent touching of their face andeyes put them at higher risk for toxic exposures. If disinfection is needed while children are in theclassroom, adequate ventilation should be in place and nonirritating products should be used.Disinfectants such as bleach and those containing quaternary ammonium compounds or “Quats”should not be used when children and adolescents are present, because these are knownrespiratory irritants.
In general, elimination of high-touch surfaces is preferable to frequent cleaning. For example,classroom doors can be le�t open rather than having students open the door when entering andleaving the classroom, or the door can be closed once all students have entered followed by handsanitizing. As part of increasing social distance between students and surfaces requiring regularcleaning, schools could also consider eliminating the use of lockers, particularly if

/
they are located in shared spaces or hallways, making physical distancing more challenging. Ifschools decide to use this strategy, it should be done within the context of ensuring that studentsare not forced to transport unreasonable numbers of books back and forth from school on aregular basis.
When elimination of use of high-touch surfaces is not possible, surfaces that are used frequently,such a drinking fountains, door handles, sinks and faucet handles, etc, should be cleaned anddisinfected at least daily and as o�ten as possible. Bathrooms, in particular, should receivefrequent cleaning and disinfection. Shared equipment including computer equipment,keyboards, art supplies, and play or gym equipment should also be disinfected frequently. Handwashing should be promoted before and a�ter touching shared equipment. Computer keyboardcovers can be used to facilitate cleaning between users. Routine cleaning practices should beused for indoor areas that have not been used for 7 or more days or outdoor equipment. Surfacesthat are not high-touch, such as bookcases, cabinets, wall boards, or drapes should be cleanedfollowing standard protocol. The same applies to �loors or carpeted areas.
Outdoor playgrounds/natural play areas only need routine maintenance, and hand hygieneshould be emphasized before and a�ter use of these spaces. Outdoor play equipment with high-touch surfaces, such as railings, handles, etc, should be cleaned and disinfected regularly if usedcontinuously.
Alternative Disinfection Methods The e��cacy of alternative disinfection methods, such as ultrasonic waves, high-intensity UVradiation, and LED blue light against COVID-19 virus is not known. The EPA does not routinelyreview the safety or e��cacy of pesticidal devices, such as UV lights, LED lights, or ultrasonicdevices. Therefore, the EPA cannot con�rm whether, or under what circumstances, such productsmight be e�fective against the spread of SARS-CoV-2.x
Testing and Screening Virologic testing is an important part of the overall public health strategy to limit the spread ofCOVID-19. Virologic testing detects the viral RNA from a respiratory (usually nasal) swabspecimen. The CDC does not recommend universal testing of students and sta�f. Testing allstudents for acute SARS-CoV-2 infection prior to the start of school is not feasible in mostsettings at this time. Even in places where this is possible, it is not clear that such testing wouldreduce the likelihood of spread within schools. It is important to recognize that virologic testingonly shows whether a person is infected at that speci�c moment in time. It is also possible that

/
the nasal swab virologic test result can be negative during the early incubation period of theinfection. So, although a negative virologic test result is reassuring, it does not mean that thestudent or school sta�f member is not going to subsequently develop COVID-19. Stated anotherway, a student who is negative for COVID-19 on the �rst day of school may not remain negativethroughout the school year.
A student or school sta�f member who has had a known exposure to COVID-19 (eg, closecontact –within 6 feet for at least 15 minutes – with an individual with laboratory-con�rmedSARS-CoV-2 infection or illness consistent with COVID-19), according to CDC guidelines, shouldself-quarantine for 14 days from the last exposure. In every case, local health o��cials shouldmake the determination on quarantine and contact tracing. However, depending on currentcommunity viral case rates, local health authorities may make di�fering recommendationsregarding contact tracing and/ or school exclusion or school closure.
Another type of testing is serologic blood testing for antibodies to SARS-CoV-2. At the currenttime, serologic testing should not be used for individual decision-making and has no place inconsiderations for entrance to or exclusion from school. CDC guidance regarding antibodytesting for COVID-19 is that serologic test results should not be used to make decisions aboutgrouping people residing in or being admitted to congregate settings, such as schools,dormitories, or correctional facilities. Additionally, serologic test results should not be used tomake decisions about returning people to the workplace. The CDC states that serologic testingshould not be used to determine immune status in individuals until the presence, durability, andduration of immunity is established. The AAP recommends this guidance be applied to schoolsettings as well.
Schools should have a policy regarding symptom screening for teachers and sta�f and what to doif a student or school sta�f member becomes sick with symptoms. Temperature checks andsymptom screening are a frequent part of many reopening processes to identify symptomaticpersons to exclude them from entering buildings and business establishments. The listof symptoms of COVID-19 infection has grown since the start of the pandemic and themanifestations of COVID-19 infection in children, although similar, is o�ten not the same as thatfor adults. First and foremost, parents should be instructed to keep their child at home if theyare ill, and sta�f members should stay home if they are ill. Any student or sta�f member with afever of 100.4 degrees or greater or symptoms of possible COVID-19 virus infection should not bepresent in school. School policies regarding temperature screening and temperature checksmust balance the practicality of performing these screening procedures for large numbers ofstudents and sta�f with the information known about how children manifest andtransmit COVID-19 infection, the risk of transmission in schools, and the possible lost

/
instructional time to conduct the screenings. At this time, the CDC currently doesnot recommend universally screening students at school, because screening may fail to identify astudent who has a SARS-CoV-2 infection and may overidentify students with di�ferent commonchildhood illnesses. Schools should develop plans for rapid response to a student or sta�fmember with fever who is in the school regardless of the implementation of temperature checksor symptom screening prior to entering the school building.
In lieu of temperature checks and symptom screening being performed a�ter arrival toschool, methods to allow parent performing and reporting of symptoms and temperaturechecks performed at home may be considered. Resources and time may necessitate thisstrategy at most schools. The epidemiology of disease in children along with evidence of theutility of temperature screenings in health systems may further justify this approach. Proceduresusing texting apps, phone systems, or online reporting rely on parent report and may be mostpractical but possibly unreliable, depending on individual family's ability to use thesecommunication processes, especially if not made available in their primary language or lack ofelectronic forms of communication. School nurses or nurse aides should be equipped to measuretemperatures for any student or sta�f member who may become ill during the school day andshould have an identi�ed area to separate or isolate students who may have COVID-19 symptoms.
COVID-19 manifests similarly to other respiratory illness in children. Although children manifestmany of the same symptoms of COVID-19 infection as adults, some di�ferences arenoteworthy. According to the CDC, children may be less likely to have fever, may be less likely topresent with fever as an initial symptom, and may have only gastrointestinal tract symptoms. Astudent or sta�f member excluded because of symptoms of COVID-19 should contact their healthcare provider to discuss testing and medical care. In the absence of testing, students or sta�fshould follow local health department guidance for exclusion.
Ventilation The primary mode of transmission of SARS-CoV-2 appears to be by droplet transmissionby people in close proximity. There are emerging studies on the possible role of airbornetransmission. Although it is possible that there may be this type of transmission in some settings,the preponderance of evidence at this time suggests that this is not a primary mode oftransmission. For example, the reproductive number of SARS-CoV-2 is in the range of otherviruses known to be transmitted primarily by respiratory droplets, such as in�luenza. Further,simple face masks appear to be quite e�fective for decreasing the likelihood of transmission of

/
SARS-CoV-2, in contrast with known airborne pathogens such as measles. With this in mind,mitigation e�forts should focus on prevention of droplet transmission. Proper ventilation,however, does have a role in preventing the spread of any respiratory pathogen. Heating, airconditioning, and ventilation (HVAC) systems should be inspected for optimal functioning,�lters should be within their service life, and MERV-13 (minimum e��ciency reporting value)e��ciency �ltration should be used, if the equipment allows.xi,xii Demand-controlled ventilation(DVC) should be disabled when possible, and the system should run continuously to improve airexchanges in the school building.
Other Considerations On-site School-Based Health Services On-site school health services, including school-based health centers, should be supported ifavailable, to complement the pediatric medical home and to provide pediatricacute, chronic, and preventive care. Collaboration with school nurses will be essential, and schooldistricts should involve school health services sta�f early in the planning phase for reopening andconsider collaborative strategies that address and prioritize immunizations and other neededhealth services for students, including behavioral health, vision screening, hearing, andreproductive health services.
Vision Screening Vision screening practices should continue in school whenever possible. Vision screening servesto identify children who may otherwise have no outward symptoms of blurred vision or subtleocular abnormalities that, if untreated, may lead to permanent vision loss or impaired academicperformance in school. Personal prevention practices and environmental cleaning anddisinfection are important principles to follow during vision screening, along with anyadditional guidelines from local health authorities.
Hearing Screening Safe hearing screening practices should continue in schools whenever possible. School screeningprograms for hearing are critical in identifying children who have hearing loss as soon as possibleso that reversible causes can be treated and hearing restored. Children with permanent orprogressive hearing loss will be habilitated with hearing aids to prevent impaired academicperformance in the future. Personal prevention practices and environmental cleaning and

/
disinfection are important principles to follow during hearing screening, along with anyadditional guidelines from local health authorities.
Education The impacts of lost instructional time and social emotional development on children andadolescents should be anticipated, and schools will need to be prepared to adjust curricula andinstructional practices accordingly without the expectation that all lost academic progress can becaught up. Plans to make up for lost academic progress because of school closures and distressassociated with lost academic progress and the pandemic in general should be balanced by arecognition of the likely continued distress of educators and students that will persist whenschools reopen. If the academic expectations are unrealistic, school will likely become a source offurther distress for students (and educators) at a time when they need additional support. It isalso critical to maintain a balanced curriculum with continued physical education and otherlearning experiences rather than an exclusive emphasis on core subject areas. In addition,continued improvement of remote learning practices should be encouraged, and further fundingshould be provided by federal and local governments to provide further support(eg, universal free broadband internet).
Students with Disabilities The impact of loss of instructional time and related services, including mental health services aswell as occupational, physical, and speech/language therapy during the period of school closuresis signi�cant for students with disabilities. All students, but especially those withdisabilities, may have more di��culty with the social and emotional aspects of transitioning outof and back into the school setting. As schools prepare for reopening, school personnel shoulddevelop a plan to ensure a review of each child and adolescent with an IEP to determine theneeds for compensatory education to adjust for lost instructional time as well as other relatedservices. In addition, schools can expect a backlog in evaluations; therefore, plans to prioritizethose for new referrals as opposed to re-evaluations will be important. Many school districtsrequire adequate instructional e�fort before determining eligibility for special educationservices. However, virtual instruction or lack of instruction should not be reasons to avoidstarting services such as response-to-intervention (RTI) services, even if a �nal eligibilitydetermination is postponed.
Behavioral Health/Emotional Support for Children andAdolescents

/
Schools should anticipate and be prepared to address a wide range of mental health needs ofchildren and sta�f when schools reopen. Preparation for infection control is vital and admittedlycomplex during an evolving pandemic. But the emotional impact of the pandemic, grief becauseof loss, �nancial/employment concerns, social isolation, and growing concerns about systemicracial inequity — coupled with prolonged limited access to critical school-based mental healthservices and the support and assistance of school professionals — demands careful attention andplanning as well. Schools should be prepared to adopt an approach for mental healthsupport, and just like other areas, supporting mental health will require additional funding toensure adequate sta��ng and the training of those sta�f to address the needs of the students andsta�f in the schools.
Schools should consider providing training to classroom teachers and other educators on how totalk to and support children during and a�ter the COVID-19 pandemic. Students requiring mentalhealth support should be referred to school mental health professionals.
Suicide is the second leading cause of death among adolescents or youth 10 to 24 years of age inthe United States. In the event distance learning is needed, schools should develop mechanismsto evaluate youth remotely if concerns are voiced by educators or family members and should beestablishing policies, including referral mechanisms for students believed to be in need of in-person evaluation, even before schools reopen.
School mental health professionals should be involved in shaping messages to students andfamilies about the response to the pandemic. Fear-based messages widely used to encouragestrict physical distancing may cause problems when schools reopen, because the risk of exposureto COVID-19 may be mitigated but not eliminated. Communicating e�fectively is especiallycritical, given potential adaptations in plans for in-person or distance learning that need to occurduring the school year because of changes in community transmission of SARS-CoV-2.
When schools do reopen, plans should already be in place for outreachto families whose students do not return for various reasons. This outreach is especially critical,given the high likelihood of separation anxiety and agoraphobia in students. Studentsmay have di��culty with the social and emotional aspects of transitioning back into the schoolsetting, especially given the unfamiliarity with the changed school environment andexperience. Special considerations are warranted for students with pre-existing anxiety,depression, and other mental health conditions; children with a prior history of trauma or loss;and students in early education who may be particularly sensitive to disruptions in routine andcaregivers. Students facing other challenges, such as poverty, food

/
insecurity, and homelessness, and those subjected to ongoing racial inequities may bene�t fromadditional support and assistance.
Schools need to incorporate academic accommodations and supports for all students who maystill be having di��culty concentrating or learning new information because of stress or familysituations that are compounded by the pandemic. It is important that school personnel do notanticipate or attempt to catch up for lost academic time through accelerating curriculum deliveryat a time when students and educators may �nd it di��cult to even return to baseline rates. Theseexpectations should be communicated to educators, students, and family members so thatschool does not become a source of further distress.
Mental Health of Staff The personal impact on educators and other school sta�f should be recognized. In the same waythat students are going to need support to e�fectively return to school and to be prepared to beready to process the information they are being taught, teachers cannot be expectedto be successful at teaching children without having their mental health needs supported. Thestrain on teachers this year as they have been asked to teach di�ferently while they support theirown needs and those of their families has been signi�cant, and they will be bringingthat stress back to school as schools reopen. Resources such as Employee Assistance Programsand other means to provide support and mental health services should be established prior toreopening. The individual needs and concerns of school professionals should be addressed withaccommodations made as needed (eg, for a classroom educator who is pregnant, has a medicalcondition that confers a higher risk of serious illness with COVID-19, resides with a familymember who is at higher risk, or has a mental health condition that compromises the ability tocope with the additional stress).
Although schools should be prepared to be agile to meet evolving needs and respond toincreasing knowledge related to the pandemic and may need to institute partial or completeclosures when the public health need requires, school leaders should recognize that sta�f,students, and families will bene�t from su��cient time to understand and adjust to changes inroutine and practices. During a crisis, people bene�t from clear and regular communication froma trusted source of information and the opportunity to dialogue about concerns and needs andfeel they are able to contribute in some way to the decision-making process. Change is moredi��cult in the context of crisis and when predictability is already severely compromised.
Food Insecurity

/
In 2018, 11.8 million children and adolescents (1 in 7) in the United States lived in a food-insecurehousehold.xiii The coronavirus pandemic has led to increased unemployment and poverty forAmerica’s families, which will likely increase even further the number of families who experiencefood insecurity.xiv School re-entry planning must consider the many children and adolescentswho experience food insecurity already (especially at-risk and low-income populations) and whowill have limited access to routine meals through the school district if schools remain closed. Theshort- and long-term e�fects of food insecurity in children and adolescents are profound.xv In theearly months of the pandemic, many families were not able to pick up the food provided throughschools despite the school’s attempt to reach all families. Given low participation in pick-up foodprograms this spring in some school districts, school districts should coordinate meal delivery inaccessible locations and consider providing multiple days’ worth of meals to reduce the burdenon families. Plans should be made prior to the start of the school year for how studentsparticipating in free- and reduced- meal programs will receive food in the event of a schoolclosure or if they are excluded from school because of illness or SARS-CoV-2 infection.
Immunizations Existing school immunization requirements should be maintained and not deferred because ofthe current pandemic. In addition, although in�luenza vaccination is generally not required forschool attendance, in the coming academic year, it should be highly encouraged for allstudents and sta�f. The symptoms of in�luenza and SARS-CoV-2 infection are similar and takingsteps to prevent in�luenza will decrease the incidence of disease in schools, and the related losteducational time and resources needed to handle such situations by school personnel andfamilies. School districts should consider requiring in�luenza vaccination for all sta�f members.
Pediatricians should work with schools and local public health authorities to promote childhoodvaccination messaging well before the start of the school year. It is vital that all children receiverecommend vaccinations on time and get caught up if they are behind as a result of thepandemic. The capacity of the health care system to support increased demand for vaccinationsshould be addressed through a multifaceted collaborative and coordinated approach among allchild-serving agencies including schools.
Organized Activities It is likely that sporting events, practices, and conditioning sessions as well as otherextracurricular activities will be limited in many locations. The AAP Interim Guidance on Returnto Sports helps pediatricians inform families on how best to ensure safety when considering a

/
return to sports participation. Preparticipation evaluations should be conducted in alignmentwith the AAP Preparticipation Physical Evaluation Monograph, 5th ed, and state and localguidance.
Resources Coalition to Support Grieving Students
Using Social Stories to Support People with I/DD During the COVID-19 Emergency
Social Stories for Young and Old on COVID-19
Additional Information AAP Guidance Related to Childcare During COVID-19
AAP Guidance on Providing Pediatric Well-Care During COVID-19
AAP Guidance on Cloth Face Coverings
AAP Guidance on Testing
AAP Guidance on Use of Personal Protective Equipment (PPE)
COVID-19 Interim Guidance: Return to Sports
Information for Parents on HealthyChildren.org: Returning to School During COVID-19
List of latest AAP News articles on COVID-19
Pediatrics COVID-19 Collection
AAP COVID-19 Advocacy Resources (Login required)
Centers for Disease Control and Prevention: Considerations for Schools
Centers for Disease Control and Prevention: School Decision Tree
Centers for Disease Control and Prevention: Parent Decision Making Tool
Centers for Disease Control and Prevention: Activities and Initiatives Supporting theCOVID Response
Centers for Disease Control Schools and Childcare - Plan, Prepare, & Respond
Centers for Disease Control and Prevention: Information for PediatricHealthcare Providers

/
References
Levinson M, Cevik M, Lipsitch M. Reopening primary schools during the pandemic. N Engl JMed. July 29, 2020. Available at: https://www.nejm.org/doi/full/10.1056/NEJMms2024920?query=TOC.
National Academies of Sciences, Engineering, and Medicine 2020. Reopening K-12
Schools During the COVID-19 Pandemic: Prioritizing Health, Equity, and Communities. Washington,DC: The National Academies Press; 2020. Available at: https://doi.org/10.17226/25858.
Pew Research Center. As schools close due to the coronavirus, some U.S. students face a digital‘homework gap’. March 16, 2020. Available at: https://www.pewresearch.org/fact-tank/2020/03/16/as-schools-close-due-to-the-coronavirus-some-u-s-students-face-a-digital-homework-gap/
Kaiser Family Foundation. What Do We Know About Children and Coronavirus Transmission?July 29, 2020. Available at: https://www.k�f.org/coronavirus-covid-19/issue-brief/what-do-we-know-about-children-and-coronavirus-transmission/
Park YJ, Choe YJ, Park O, et al. Contact tracing during coronavirus disease outbreak, SouthKorea, 2020. Emerg Infect Dis. 2020;26(10). Available at: https://doi.org/10.3201/eid2610.201315
Melnick H, Darling-Hammond L, Leung M, et al. Reopening schools in the context of COVID-19: Health and safety guidelines from other countries (policy brief). Palo Alto, CA: Learning PolicyInstitute; 2020. Available at: https://learningpolicyinstitute.org/product/reopening-schools-covid-19-brief
Rodriguez-Palacios A, Cominelli F, Basson AR, Pizarro TT, Ilic S. Textile masks and surfacecovers-a spray simulation method and a "universal droplet reduction model" against respiratorypandemics. Published 2020 May 27. Front Med (Lausanne). 2020;7:260. Available at:doi:10.3389/fmed.2020.00260
World Health Organization. Advice on the use of masks in the context of COVID-19. June 2020.Available at: https://apps.who.int/iris/bitstream/handle/10665/332293/WHO-2019-nCov-IPC_Masks-2020.4-eng.pdf?sequence=1&isAllowed=y
Centers for Disease Control and Prevention. Use of Masks to Help Slow the Spread of COVID-19. Available at: https://www.cdc.gov/coronavirus/2019-ncov/prevent-getting-sick/diy-cloth-face-coverings.html
Centers for Disease Control and Prevention. Cleaning and Disinfecting Your Facility. Availableat: https://www.cdc.gov/coronavirus/2019-ncov/community/disinfecting-building-facility.html
[1]
[2]
[3]
[4]
[5]
[6]
[7]
[8]
[9]
[10]

/
American Academy of Pediatrics, Council on School Health. Schools. In: Etzel RA, Balk SJ, eds.Pediatric Environmental Health. 4 ed: Itasca, IL: American Academy of Pediatrics; 2019: 163-187
US Environmental Protection Agency. Supports Healthy Indoor Environments in SchoolsDuring COVID-19 Pandemic. Available at: https://www.epa.gov/iaq-schools/epa-supports-healthy-indoor-environments-schools-during-covid-19-pandemic
Coleman-Jensen A, Rabbit MP, Gregory CA,Singh A. Household Food Security in the UnitedStates in 2018. Economic Research Report No. (ERR-270). Washington, DC: US Department ofAgriculture Economic Research Service; September 2019. Available at:https://www.ers.usda.gov/publications/pub-details/?pubid=94848
Dunn CG, Kenney E, Fleischhacker SE, Bleich SN. Feeding low-income children during theCovid-19 pandemic. N Engl J Med. 2020;382:e40. Available at:https://www.nejm.org/doi/full/10.1056/NEJMp2005638
American Academy of Pediatrics, Council on Community Pediatrics and Committee onNutrition. Promoting food security for all children. Pediatrics. 2015;136(5):e1431-e1438. Availableat: https://doi.org/10.1542/peds.2015-3301.
Interim Guidance Disclaimer: The COVID-19 clinical interim guidance provided here has beenupdated based on current evidence and information available at the time of publishing.Guidance will be regularly reviewed with regards to the evolving nature of the pandemic andemerging evidence. All interim guidance will be presumed to expire in December 2020 unlessotherwise speci�ed.
Last Updated 08/19/2020
Source American Academy of Pediatrics
[11]
th
[12]
[13]
[14]
[15]

EXHIBIT "13"

8/21/2020 The Importance of Reopening America’s Schools this Fall | CDC
https://www.cdc.gov/coronavirus/2019-ncov/community/schools-childcare/reopening-schools.html#fn20 1/6
The Importance of Reopening America’s Schools this FallImportance of Reopening SchoolsUpdated July 23, 2020 Print
As families and policymakers make decisions about their children returning to school, it is important to consider the fullspectrum of bene�ts and risks of both in-person and virtual learning options. Parents are understandably concerned aboutthe safety of their children at school in the wake of COVID-19. The best available evidence indicates if children becomeinfected, they are far less likely to su�er severe symptoms. Death rates among school-aged children are much lowerthan among adults. At the same time, the harms attributed to closed schools on the social, emotional, and behavioral health,economic well-being, and academic achievement of children, in both the short- and long-term, are well-known andsigni�cant. Further, the lack of in-person educational options disproportionately harms low-income and minority childrenand those living with disabilities. These students are far less likely to have access to private instruction and care and far morelikely to rely on key school-supported resources like food programs, special education services, counseling, and after-schoolprograms to meet basic developmental needs.
Aside from a child’s home, no other setting has more in�uence on a child’s health and well-being than their school. The in-person school environment does the following:
provides educational instruction;
supports the development of social and emotional skills;
creates a safe environment for learning;
addresses nutritional needs; and
facilitates physical activity.
This paper discusses each of these critical functions, following a brief summary of current studies regarding COVID-19 andchildren.
COVID-19 and ChildrenThe best available evidence indicates that COVID-19 poses relatively low risks to school-aged children. Children appear to beat lower risk for contracting COVID-19 compared to adults. To put this in perspective, according to the Centers for DiseaseControl and Prevention (CDC), as of July 17, 2020, the United States reported that children and adolescents under 18 years oldaccount for under 7 percent of COVID-19 cases and less than 0.1 percent of COVID-19-related deaths. Although relativelyrare, �u-related deaths in children occur every year. From 2004-2005 to 2018-2019, �u-related deaths in children reported toCDC during regular �u seasons ranged from 37 to 187 deaths. During the H1N1pandemic (April 15, 2009 to October 2, 2010),358 pediatric deaths were reported to CDC. So far in this pandemic, deaths of children are less than in each of the last �ve �useasons, with only 64. Additionally, some children with certain underlying medical conditions, however, are at increased riskof severe illness from COVID-19.*
Scienti�c studies suggest that COVID-19 transmission among children in schools may be low. International studies that haveassessed how readily COVID-19 spreads in schools also reveal low rates of transmission when community transmission islow. Based on current data, the rate of infection among younger school children, and from students to teachers, has beenlow, especially if proper precautions are followed. There have also been few reports of children being the primary source ofCOVID-19 transmission among family members. This is consistent with data from both virus and antibody testing,suggesting that children are not the primary drivers of COVID-19 spread in schools or in the community. No studiesare conclusive, but the available evidence provides reason to believe that in-person schooling is in the best interest ofstudents, particularly in the context of appropriate mitigation measures similar to those implemented at essential workplaces.
[1],[2],[3]
[4]
[5]
†
[6],[7],[8]
[9],[10],[11]
MENUCoronavirus Disease 2019 (COVID-19)

8/21/2020 The Importance of Reopening America’s Schools this Fall | CDC
https://www.cdc.gov/coronavirus/2019-ncov/community/schools-childcare/reopening-schools.html#fn20 2/6
Educational InstructionExtended school closure is harmful to children. It can lead to severe learning loss, and the need for in-person instruction isparticularly important for students with heightened behavioral needs. Following the wave of school closures in March2020 due to COVID-19, academic learning slowed for most children and stopped for some. A survey of 477 school districts bythe University of Washington’s Center on Reinventing Public Education found that, “far too many schools are leaving learningto chance.” Just one in three school districts expected teachers to provide instruction, track student engagement, ormonitor academic progress for all students, and wealthy school districts were twice as likely to have such expectationscompared to low-income districts.
We also know that, for many students, long breaks from in-person education are harmful to student learning. For example,the e�ects of summer breaks from in-person schooling on academic progress, known as “summer slide,” are also well-documented in the literature. According to the Northwest Evaluation Association, in the summer following third grade,students lose nearly 20 percent of their school-year gains in reading and 27 percent of their school-year gains in math. Bythe summer after seventh grade, students lose on average 39 percent of their school-year gains in reading and 50 percent oftheir school-year gains in math. This indicates that learning losses are large and become even more severe as a studentprogresses through school. The prospect of losing several months of schooling, compared to the few weeks of summervacation, due to school closure likely only makes the learning loss even more severe.
Disparities in educational outcomes caused by school closures are a particular concern for low-income and minority studentsand students with disabilities. Many low-income families do not have the capacity to facilitate distance learning (e.g. limitedor no computer access, limited or no internet access), and may have to rely on school-based services that support their child’sacademic success. A study by researchers at Brown and Harvard Universities assessed how 800,000 students used Zearn, anonline math program, both before and after schools closed in March 2020. Data showed that through late April, studentprogress in math decreased by about half, with the negative impact more pronounced in low-income zip codes. Persistentachievement gaps that already existed before COVID-19, such as disparities across income levels and races, can worsen andcause serious, hard-to-repair damage to children’s education outcomes. Finally, remote learning makes absorbinginformation more di�cult for students with disabilities, developmental delays, or other cognitive disabilities. In particular,students who are deaf, hard of hearing, have low vision, are blind, or have other learning disorders (e.g., attention de�cithyperactivity disorder (ADHD)) and other physical and mental disabilities have had signi�cant di�culties with remote learning.
Social and Emotional Skill DevelopmentSchools play a critical role in supporting the whole child, not just their academic achievement. In addition to a structure forlearning, schools provide a stable and secure environment for developing social skills and peer relationships. Socialinteraction at school among children in grades PK-12 is particularly important for the development of language,communication, social, emotional, and interpersonal skills.
Extended school closures are harmful to children’s development of social and emotional skills. Important social interactionsthat facilitate the development of critical social and emotional skills are greatly curtailed or limited when students are notphysically in school. In an in-person school environment, children more easily learn how to develop and maintain friendships,how to behave in groups, and how to interact and form relationships with people outside of their family. In school, studentsare also able to access support systems needed to recognize and manage emotions, set and achieve positive goals,appreciate others’ perspectives, and make responsible decisions. This helps reinforce children’s feelings of schoolconnectedness, or their belief that teachers and other adults at school care about them and their well-being. Such routine in-person contacts provide opportunities to facilitate social-emotional development that are di�cult, if not impossible, toreplicate through distance learning.
Additionally, extended closures can be harmful to children’s mental health and can increase the likelihood that childrenengage in unhealthy behaviors. An environment where students feel safe and connected, such as a school, is associated withlower levels of depression, thoughts about suicide, social anxiety, and sexual activity, as well as higher levels of self-esteemand more adaptive use of free time A longitudinal study of 476 adolescents over 3 years starting in the 6th grade foundschool connectedness to be especially protective for those who had lower connectedness in other areas of their lives, such ashome, and to reduce their likelihood of substance use.
[12],[13]
[13]
[13]
[14]
[14]
[15]
[15]
[15],[16]
[17]
[18]
[18],[19],[20]
[19],[20]
[20]

8/21/2020 The Importance of Reopening America’s Schools this Fall | CDC
https://www.cdc.gov/coronavirus/2019-ncov/community/schools-childcare/reopening-schools.html#fn20 3/6
Further, a review of studies conducted on pandemics found a strong association between length of quarantine and PostTraumatic Stress Disorder symptoms, avoidance behavior, and anger. Another review published this year found that post-traumatic stress scores of children and parents in quarantine were four times higher than those not quarantined.
In-person schooling provides children with access to a variety of mental health and social services, including speech languagetherapy, and physical or occupational therapy to help the physical, psychological, and academic well-being of the child.
Further, school counselors are trained in the mental health needs of children and youth and can recognize signs oftrauma that primary caregivers are less able to see because they themselves are experiencing the same family stresses. School counselors can then coordinate with teachers to implement interventions to o�er children a reassuring environmentfor regaining the sense of order, security, and normalcy.
Without in-person schooling, many children can lose access to these important services. For example, we know that, evenoutside the context of school closures, children often do not receive the mental health treatment they need. Among childrenages 9-17, it is estimated that 21 percent, or more than 14 million children, experience some type of mental health condition.
Yet only 16 percent of those with a condition receive any treatment. Of those, 70-80 percent received such care in aschool setting. School closures can be particularly damaging for the 7.4 million American children su�ering from a seriousemotional disturbance. For those individuals who have a diagnosable mental, behavioral or emotional condition thatsubstantially interferes with or limits their social functioning, schools play an integral role in linking them to care andnecessary support services.
For children with intellectual or physical disabilities, nearly all therapies and services are received through schools. These vitalservices are di�cult to provide through distance learning models. As a result, more children with disabilities have receivedfew to no services while schools have been closed.
SafetyExtended school closures deprive children who live in unsafe homes and neighborhoods of an important layer of protectionfrom neglect as well as physical, sexual, and emotional maltreatment and abuse. A 2018 Department of Health and HumanServices report found that teachers and other educational sta� were responsible for more than one-�fth of all reported childabuse cases—more than any other category of reporter. During the COVID-19 school closures, however, there has been asharp decline in reports of suspected maltreatment, but tragically a notable increase in evidence of abuse when children areseen for services. For example, the Washington, D.C. Child and Family Services Agency recorded a 62 percent decrease inchild abuse reporting calls between mid-March and April 2020 compared to the same time period in 2019, but saw moresevere presentation of child abuse cases in emergency rooms. Children who live in a home or neighborhood whereneglect, violence, or abuse occur, but who are not physically in school, are deprived of access to trained school professionalswho can readily identify the signs of trauma and provide needed support and guidance.
NutritionExtended school closures can be harmful to the nutritional health of children. Schools are essential to meeting the nutritionalneeds of children with many consuming up to half their daily calories at school. Nationwide more than 30 million childrenparticipate in the National School Lunch Program and nearly 15 million participate in the School Breakfast Program. Forchildren from low-income families, school meals are an especially critical source of a�ordable, healthy foods. While schoolshave implemented strategies to continue meal services throughout periods of school closures, it is di�cult to maintain thistype of school nutrition program over the long-term. This is a particularly severe problem for the estimated 11 million food-insecure children, living in the United States.
Physical ActivityWhen schools are closed, children lose access to important opportunities for physical activity. Many children may not besu�ciently physically active outside of the context of in-school physical education (PE) and other school-based activities. Beyond PE, with schools closed, children may not have su�cient opportunities to participate in organized and safe physicalactivity. They also lose access to other school-based physical activities, including recess, classroom engagements, and afterschool programs.
The loss of opportunities for physical activity from school closures, especially when coupled with potentially diminishednutrition, can be particularly harmful to children. Physical inactivity and poor nutrition among children are major risk factorsf hildh d b it d th h i h lth diti O 75 t f hild d d l t i th U it d St t
[21],[22]
[23], [24],
[25],[26]
[27] [23]
[23]
[28]
[29]
[30],[31],[32],[33],[34]
[35],[36]

8/21/2020 The Importance of Reopening America’s Schools this Fall | CDC
https://www.cdc.gov/coronavirus/2019-ncov/community/schools-childcare/reopening-schools.html#fn20 4/6
for childhood obesity and other chronic health conditions. Over 75 percent of children and adolescents in the United Statesdo not meet the daily physical activity level recommendations (60 minutes or more), and nearly half exceed 2 hours per day insedentary behavior. Current models estimate that childhood obesity rate may increase by 2.4 percent if school closurescontinue to December 2020.
ConclusionSchools are an important part of the infrastructure of our communities, as they provide safe, supportive learningenvironments for students, employ teachers and other sta�, and enable parents, guardians, and caregivers to work. Schoolsalso provide critical services that help meet the needs of children and families, especially those who are disadvantaged,through supporting the development of social and emotional skills, creating a safe environment for learning, identifying andaddressing neglect and abuse, ful�lling nutritional needs, and facilitating physical activity. School closure disrupts the deliveryof in-person instruction and critical services to children and families, which has negative individual and societal rami�cations. The best available evidence from countries that have opened schools indicates that COVID-19 poses low risks to school-agedchildren, at least in areas with low community transmission, and suggests that children are unlikely to be major drivers of thespread of the virus. Reopening schools creates opportunity to invest in the education, well-being, and future of one ofAmerica’s greatest assets—our children—while taking every precaution to protect students, teachers, sta� and all theirfamilies.
*Some children have developed multisystem in�ammatory syndrome (MIS-C) after exposure to SARS-CoV-2 (the virus that causes COVID-19).(https://www.cdc.gov/mis-c/cases/index.html) In one targeted surveillance study for MIS-C associated with SARS-CoV-2, however, the majorityof children who were hospitalized with COVID-related MIS-C (70 percent) had recovered by the end date of the study period. (Feldstein LR et al..Multisystem In�ammatory Syndrome in US Children and Adolescents. N Engl J Med. 2020;10.1056/NEJMoa2021680)
CDC COVID Data Tracker. Available at https://www.cdc.gov/covid-data-tracker/. Accessed on July 21, 2020.
References
1. Zhen-Dong Y, Gao-Jun Z, Run-Ming J, et al. Clinical and transmission dynamics characteristics of 406 children withcoronavirus disease 2019 in China: A review [published online ahead of print, 2020 Apr 28]. J Infect. 2020;S0163-4453(20)30241-3. doi:10.1016/j.jinf.2020.04.030
2. Choi S-H, Kim HW, Kang J-M, et al. Epidemiology and clinical features of coronavirus disease 2019 in children. Clinical andexperimental pediatrics 2020;63(4):125-32. doi: https://dx.doi.org/10.3345/cep.2020.00535
3. Coronavirus Disease 2019 in Children — United States, February 12–April 2, 2020. Morb Mortal Wkly Rep. 2020;69:422–426.
4. Armitage R, Nellums LB. Considering inequalities in the school closure response to COVID-19. Lancet Glob Health.2020;8(5):e644. doi:10.1016/S2214-109X(20)30116-9
5. CDC COVID Data Tracker. Available at https://www.cdc.gov/covid-data-tracker/. Accessed on July 23, 2020.
6. National-Centre-for-immunization-research-and-surveillance. COVID-19 in schools–the experience in NSW, April 26, 2020.Accessed 07/08/2020. Available at: http://ncirs.org.au/sites/default/�les/2020-04/NCIRS%20NSW%20Schools%20COVID_Summary_FINAL%20public_26%20April%202020.pdf
7. Ludvigsson JF. Children are unlikely to be the main drivers of the COVID-19 pandemic – A systematic review [publishedonline ahead of print, 2020 May 19]. Acta Paediatr. 2020;10.1111/apa.15371. doi:10.1111/apa.15371
8. Danis K, Epaulard O, Benet T, et al. Cluster of coronavirus disease 2019 (Covid-19) in the French Alps, 2020. Clinicalinfectious diseases : an o�cial publication of the Infectious Diseases Society of America 2020 doi:https://dx.doi.org/10.1093/cid/ciaa424
9. World Health Organization (WHO). Report of the WHO-China Joint Mission on Coronavirus Disease 2019 (COVID-19). 16-24 February 2020. Accessed 07/10/2020. Available at: https://www.who.int/docs/default-source/coronaviruse/who-china-joint-mission-on-covid-19-�nal-report.pdf
10. Children and COVID-19. National Institute for Public Health and the Environment, Ministry of Health, Welfare and Sport,The Netherlands. Accessed 07/08/2020. Available at: https://www.rivm.nl/en/novel-coronavirus-covid-19/children-and-covid-19
11. Gudbjartsson DF, Helgason A, Jonsson H, et al. Spread of SARS-CoV-2 in the Icelandic Population. N Engl J Med.2020;382(24):2302-2315. doi:10.1056/NEJMoa2006100
12. Dorn E, Hancock B, Sarakatsannis J, Viruleg E. COVID-19 and student learning in the United States: the hurt could last alifetime. Retrieved July 4, 2020, from https://www.mckinsey.com/industries/public-sector/our-insights/covid-19-and-
[37],[38],[39]
†

8/21/2020 The Importance of Reopening America’s Schools this Fall | CDC
https://www.cdc.gov/coronavirus/2019-ncov/community/schools-childcare/reopening-schools.html#fn20 5/6
student-learning-in-the-united-states-the-hurt-could-last-a-lifetime.
13. Gross, Bethany (2020) Center for Reinventing Public Education. Too Many Schools leave Learning to Chance During thePandemic. https://www.crpe.org/publications/too-many-schools-leave-learning-chance-during-pandemic Assessed onJuly 8, 2020.
14. https://www.nwea.org/blog/2018/summer-learning-loss-what-we-know-what-were-learning/
15. Chetty, Friedman, Hendren, Stepner, and the Oportunity Insights Team. How Did COVID-19 and Stabilization PoliciesA↵ect Spending and Employment? A New Real-Time Economic Tracker Based on Private Sector Data. OpportunityInsights. June 17, 2020. https://opportunityinsights.org/wp-content/uploads/2020/05/tracker_paper.pdf
16. Dorn E, Hancock B, Sarakatsannis J, Viruleg E. COVID-19 and student learning in the United States: the hurt could last alifetime. Retrieved July 4, 2020, from https://www.mckinsey.com/industries/public-sector/our-insights/covid-19-and-student-learning-in-the-united-states-the-hurt-could-last-a-lifetime.
17. S. Department of Education, O�ce of Elementary and Secondary Education, Consolidated State Performance Report,2017–18. See Digest of Education Statistics 2019.
18. Collaborative for Academic, Social, and Emotional Learning (CASEL). What is SEL? Website. https://casel.org/what-is-sel/.
19. Foster, C. E., Horwitz, A., Thomas, A., Opperman, K., Gipson, P., Burnside, A., Stone, D. M., & King, C. A. (2017).Connectedness to family, school, peers, and community in socially vulnerable adolescents. Children and youth servicesreview, 81, 321–331. https://doi.org/10.1016/j.childyouth.2017.08.011
20. Loukas A, Roalson LA, & Herrera DE (2010). School connectedness bu�ers the e�ects of negative family relations andpoor e�ortful control on early adolescent conduct problems. Journal of Research on Adolescence, 20(1), 13–22
21. Fegert JM, Vitiello B, Plener PL, and Clemens V. Challenges and Burden of the Coronavirus 2019 (COVID-19) Pandemic forChild and Adolescent Mental Health: A Narrative Review to Highlight Clinical and Research Needs in the Acute Phase andthe Long Return to Normality. Child Adolesc Psychiatry Ment Health. 2020 May 12;14:20.
22. Brooks SK, Webster RK, Smith LE, Woodland L, Wessely S, Greenberg N, et al. The psychological impact of quarantine andhow to reduce it: rapid review of the evidence. 2020;395(10227):912–920. doi: 10.1016/S0140-6736(20)30460-8.
23. Burns BJ, Costello EJ, Angold A, Tweed D et al. Children’s Mental Health Service Use Across Service Sectors, Health A�airs,Vol. 14, No. 3, 1995: 149-159.
24. Return to School During COVID-19, American Academy of Pediatrics, Healthy Children website:https://www.healthychildren.org/English/health-issues/conditions/COVID-19/Pages/Return-to-School-During-COVID-19.aspx, Last updated 7/8/2020.
25. Constantino J, Sahin M, Piven J, Rodgers R, and Tschida J. The Impact of COVID-19 on Individuals with Intellectual andDevelopmental Disabilities: Clinical and Scienti�c Priorities. Am J Psychiatry, submitted.
26. Turk MA, Landes SD, Formica MK, and Goss KD: Intellectual and developmental disability and COVID-19 case-fatalitytrends: TriNetX analysis. Disability and Health Journal. 2020 May 22; [e-pub ahead of print]doi.org/10.1016/j.dhjo.2020.100942.
27. US DHHS. Mental Health: A Report of the Surgeon General, Executive Summary. Rockville, MD: U.S. Department of Healthand Human Services, Substance Abuse and Mental Health Services Administration, Center for Mental Health Services,NIH, NIMH, 1999.
28. Department of Health and Human Services (2018) Child Maltreatment 2018https://www.acf.hhs.gov/sites/default/�les/cb/cm2018.pdf
29. WUSA (2020) Child abuse is likely going to underreported during the coronavirus pandemic. Here’s what you can do tohelp. https://www.wusa9.com/article/news/health/coronavirus/child-abuse-going-underreported-due-to-coronavirus-schools-being-out-maryland-dc-virginia/65-a04a5ecb-b91f-4f11-9421-56cf46972a89 Assessed on July 8, 2020.
30. Baron, E. Jason and Goldstein, Ezra G. and Wallace, Cullen, Su�ering in Silence: How COVID-19 School Closures Inhibit theReporting of Child Maltreatment (May 14, 2020). Available at SSRN: https://ssrn.com/abstract=3601399 orhttp://dx.doi.org/10.2139/ssrn.3601399
31. Child Welfare Information Gateway. (2019.) Child maltreatment 2017: Summary of key �ndings. Washington, DC: U.S.Department of Health and Human Services, Administration for Children and Families, Children’s Bureau.
32. Campbell, A. (2020). An increasing risk of family violence during the Covid-19 pandemic: Strengthening communitycollaborations to save lives. Forensic Science International: Reports, 2020 Apr 12. doi: 10.1016/j.fsir.2020.100089
33. https://pediatrics.aappublications.org/content/pediatrics/125/5/1094.full.pdf
34. https://www.acf.hhs.gov/sites/default/�les/cb/cm2017.pdf
35. https://www.ers.usda.gov/topics/food-nutrition-assistance/child-nutrition-programs/national-school-lunch-program/

8/21/2020 The Importance of Reopening America’s Schools this Fall | CDC
https://www.cdc.gov/coronavirus/2019-ncov/community/schools-childcare/reopening-schools.html#fn20 6/6
35. https://www.ers.usda.gov/topics/food nutrition assistance/child nutrition programs/national school lunch program/
36. https://www.ers.usda.gov/topics/food-nutrition-assistance/child-nutrition-programs/school-breakfast-program/
37. Terry-McElrath, Y. M., O’Malley, P. M., & Johnston, L. D. (2015). Foods and beverages o�ered in US public secondaryschools through the National School Lunch Program from 2011 – 2013: early evidence of improved nutrition andreduced disparities. Preventive Medicine, 78, 52-58.
38. Johnson, D. B., Podrabsky, M., Rocha, A., & Otten, J. J. (2016). E�ect of the Healthy Hunger-Free Kids Act on the nutritionalquality of meals selected by students and school lunch participation rates. JAMA Pediatrics, 170(1), e15391.
39. An, R. “Projecting the impact of the coronavirus disease-19 pandemic on childhood obesity in the United States: Amicrosimulation model. Science. 2020
Last Updated July 23, 2020

EXHIBIT "14"

8/21/2020 Early Release - Contact Tracing during Coronavirus Disease Outbreak, South Korea, 2020 - Volume 26, Number 10—October 2020 - Emerging Infectious Diseases journal - CDC
https://wwwnc.cdc.gov/eid/article/26/10/20-1315_article 1/5
ISSN: 1080-6059
Disclaimer: Early release articles are not considered as �nal versions. Any changes will be re�ected in the online version in the month the article is o�cially released.
Volume 26, Number 10—October 2020
Dispatch
Contact Tracing during Coronavirus Disease Outbreak, South Korea, 2020
Young Joon Park , Young June Choe , Ok Park, Shin Young Park, Young-Man Kim, Jieun Kim, Sanghui Kweon, Yeonhee Woo, JinGwack, Seong Sun Kim, Jin Lee, Junghee Hyun, Boyeong Ryu, Yoon Suk Jang, Hwami Kim, Seung Hwan Shin, Seonju Yi, SangeunLee, Hee Kyoung Kim, Hyeyoung Lee, Yeowon Jin, Eunmi Park, Seung Woo Choi, Miyoung Kim, Jeongsuk Song, Si Won Choi,Dongwook Kim, Byoung-Hak Jeon, Hyosoon Yoo, Eun Kyeong Jeong , on behalf of the COVID-19 National EmergencyResponse Center, Epidemiology and Case Management TeamAuthor a�liations: Korea Centers for Disease Control and Prevention, Cheongju, South Korea (Y.J. Park, O. Park, S.Y. Park, Y.-M. Kim, J. Kim, S. Kweon, Y. Woo, J. Gwack, S.S. Kim, J. Lee, J. Hyun, B. Ryu, Y.S. Jang, H. Kim, S.H. Shin, S. Yi, S. Lee, H.K. Kim, H.Lee, Y. Jin, E. Park, S.W. Choi, M. Kim, J. Song, S.W. Choi, D. Kim, B.-H. Jeon, H. Yoo, E.K. Jeong); Hallym University College ofMedicine, Chuncheon, South Korea (Y.J. Choe)Suggested citation for this article
On This Page
The Study
Conclusions
Suggested Citation
Tables
Table 1
Table 2
Downloads
RIS [TXT - 2 KB]
Altmetric
Metric Details
Related Articles
Di�erential Tropism of SARS-CoVs in Bat Cells
SARS-CoV-2 Natural Transmission from Human to Cat, Belgium, March 2020
Exposure of African Green Monkeys to MERS-CoV
More articles on Coronavirus, COVID-19
1 1
AbstractWe analyzed reports for 59,073 contacts of 5,706 coronavirus disease (COVID-19) index patients reported in South Koreaduring January 20–March 27, 2020. Of 10,592 household contacts, 11.8% had COVID-19. Of 48,481 nonhouseholdcontacts, 1.9% had COVID-19. Use of personal protective measures and social distancing reduces the likelihood of

8/21/2020 Early Release - Contact Tracing during Coronavirus Disease Outbreak, South Korea, 2020 - Volume 26, Number 10—October 2020 - Emerging Infectious Diseases journal - CDC
https://wwwnc.cdc.gov/eid/article/26/10/20-1315_article 2/5
E�ective contact tracing is critical to controlling the spread of coronavirus disease (COVID-19) (1). South Korea adopted arigorous contact-tracing program comprising traditional shoe-leather epidemiology and new methods to track contacts bylinking large databases (global positioning system, credit card transactions, and closed-circuit television). We describe anationwide COVID-19 contact tracing program in South Korea to guide evidence-based policy to mitigate the pandemic (2).
The StudySouth Korea’s public health system comprises a national-level governance (Korea Centers for Disease Control andPrevention), 17 regional governments, and 254 local public health centers. The �rst case of COVID-19 was identi�ed onJanuary 20, 2020; by May 13, a total of 10,962 cases had been reported. All reported COVID-19 patients were tested usingreverse transcription PCR, and case information was sent to Korea Centers for Disease Control and Prevention.
We de�ned an index case as the �rst identi�ed laboratory-con�rmed case or the �rst documented case in an epidemiologicinvestigation within a cluster. Contacts in high-risk groups (household contacts of COVID-19 patients, healthcare personnel)were routinely tested; in non–high-risk groups, only symptomatic persons were tested. Non–high-risk asymptomatic contactshad to self-quarantine for 14 days and were placed under twice-daily active surveillance by public health workers. We de�neda household contact as a person who lived in the household of a COVID-19 patient and a nonhousehold contact as a personwho did not reside in the same household as a con�rmed COVID-19 patient. All index patients were eligible for inclusion inthis analysis if we identi�ed >1 contact. We de�ned a detected case as a contact with symptom onset after that of a con�rmedCOVID-19 index patient.
We grouped index patients by age: 0–9, 10–19, 20–29, 30–39, 40–49, 50–59, 60–69, 70–79, and >80 years. Because we couldnot determine direction of transmission, we calculated the proportion of detected cases by the equation [number of detectedcases/number of contacts traced] × 100, excluding the index patient; we also calculated 95% CIs. We compared the di�erencein detected cases between household and nonhousehold contacts across the strati�ed age groups.
We conducted statistical analyses using RStudio (https://rstudio.com ). We conducted this study as a legally mandated publichealth investigation under the authority of the Korean Infectious Diseases Control and Prevention Act (nos. 12444 and 13392).
We monitored 59,073 contacts of 5,706 COVID-19 index patients for an average of 9.9 (range 8.2–12.5) days after severe acuterespiratory syndrome coronavirus 2 (SARS-CoV-2) infection was detected (Table 1). Of 10,592 household contacts, indexpatients of 3,417 (32.3%) were 20–29 years of age, followed by those 50–59 (19.3%) and 40–49 (16.5%) years of age (Table 2). Atotal of 11.8% (95% CI 11.2%–12.4%) household contacts of index patients had COVID-19; in households with an index patient10–19 years of age, 18.6% (95% CI 14.0%–24.0%) of contacts had COVID-19. For 48,481 nonhousehold contacts, the detectionrate was 1.9% (95% CI 1.8%–2.0%) (Table 2). With index patients 30–39 years of age as reference, detection of COVID-19contacts was signi�cantly higher for index patients >40 years of age in nonhousehold settings. For most age groups, COVID-19was detected in signi�cantly more household than nonhousehold contacts (Table 2).
Top
ConclusionsWe detected COVID-19 in 11.8% of household contacts; rates were higher for contacts of children than adults. These riskslargely re�ected transmission in the middle of mitigation and therefore might characterize transmission dynamics duringschool closure (3). Higher household than nonhousehold detection might partly re�ect transmission during social distancing,when family members largely stayed home except to perform essential tasks, possibly creating spread within the household.Clarifying the dynamics of SARS-CoV-2 transmission will help in determining control strategies at the individual andpopulation levels. Studies have increasingly examined transmission within households. Earlier studies on the infection rate forsymptomatic household contacts in the United States reported 10.5% (95% CI 2.9%–31.4%), signi�cantly higher than fornonhousehold contacts (4). Recent reports on COVID-19 transmission have estimated higher secondary attack rates amonghousehold than nonhousehold contacts. Compiled reports from China, France, and Hong Kong estimated the secondaryattack rates for close contacts to be 35% (95% CI 27%–44%) (5). The di�erence in attack rates for household contacts indi�erent parts of the world may re�ect variation in households and country-speci�c strategies on COVID-19 containment andmitigation. Given the high infection rate within families, personal protective measures should be used at home to reduce therisk for transmission (6). If feasible, cohort isolation outside of hospitals, such as in a Community Treatment Center, might bea viable option for managing household transmission (7).
, p p g
transmission.

8/21/2020 Early Release - Contact Tracing during Coronavirus Disease Outbreak, South Korea, 2020 - Volume 26, Number 10—October 2020 - Emerging Infectious Diseases journal - CDC
https://wwwnc.cdc.gov/eid/article/26/10/20-1315_article 3/5
We also found the highest COVID-19 rate (18.6% [95% CI 14.0%–24.0%]) for household contacts of school-aged children andthe lowest (5.3% [95% CI 1.3%–13.7%]) for household contacts of children 0–9 years in the middle of school closure. Despiteclosure of their schools, these children might have interacted with each other, although we do not have data to support thathypothesis. A contact survey in Wuhan and Shanghai, China, showed that school closure and social distancing signi�cantlyreduced the rate of COVID-19 among contacts of school-aged children (8). In the case of seasonal in�uenza epidemics, thehighest secondary attack rate occurs among young children (9). Children who attend day care or school also are at high riskfor transmitting respiratory viruses to household members (10). The low detection rate for household contacts of preschool-aged children in South Korea might be attributable to social distancing during these periods. Yet, a recent report fromShenzhen, China, showed that the proportion of infected children increased during the outbreak from 2% to 13%, suggestingthe importance of school closure (11). Further evidence, including serologic studies, is needed to evaluate the public healthbene�t of school closure as part of mitigation strategies.
Our observation has several limitations. First, the number of cases might have been underestimated because allasymptomatic patients might not have been identi�ed. In addition, detected cases could have resulted from exposure outsidethe household. Second, given the di�erent thresholds for testing policy between households and nonhousehold contacts, wecannot assess the true di�erence in transmissibility between households and nonhouseholds. Comparing symptomaticCOVID-19 patients of both groups would be more accurate. Despite these limitations, the sample size was large andrepresentative of most COVID-19 patients early during the outbreak in South Korea. Our large-scale investigation showed thatpattern of transmission was similar to those of other respiratory viruses (12). Although the detection rate for contacts ofpreschool-aged children was lower, young children may show higher attack rates when the school closure ends, contributingto community transmission of COVID-19.
The role of household transmission of SARS-CoV-2 amid reopening of schools and loosening of social distancing underscoresthe need for a time-sensitive epidemiologic study to guide public health policy. Contact tracing is especially important in lightof upcoming future SARS-CoV-2 waves, for which social distancing and personal hygiene will remain the most viable optionsfor prevention. Understanding the role of hygiene and infection control measures is critical to reducing household spread,and the role of masking within the home, especially if any family members are at high risk, needs to be studied.
We showed that household transmission of SARS-CoV-2 was high if the index patient was 10–19 years of age. In the currentmitigation strategy that includes physical distancing, optimizing the likelihood of reducing individual, family, and communitydisease is important. Implementation of public health recommendations, including hand and respiratory hygiene, should beencouraged to reduce transmission of SARS-CoV-2 within a�ected households.
TopDr. Young Joon Park is the preventive medicine physician leading the Epidemiology and Case Management Team for theCOVID-19 National Emergency Response Center, Korea Centers for Disease Control and Prevention. His primary researchinterests include epidemiologic investigation of infectious disease outbreaks. Dr. Choe is an assistant professor at HallymUniversity College of Medicine. Her research focuses on infectious diseases epidemiology.
Top
AcknowledgmentWe thank the Ministry of Interior and Safety, Si/Do and Si/Gun/Gu, medical sta� in health centers, and medical facilities fortheir e�orts in responding to COVID-19 outbreak.
Top
References1. World Health Organization. Contact tracing in the context of COVID-19 [cited 2020 May 15].
https://www.who.int/publications/i/item/contact-tracing-in-the-context-of-covid-19
2. COVID-19 National Emergency Response Center. Epidemiology & Case Management Team, Korea Centers for DiseaseControl & Prevention. Contact transmission of COVID-19 in South Korea: novel investigation techniques for tracingcontacts. Osong Public Health Res Perspect. 2020;11:60–3. DOI
3. Choe YJ, Choi EH. Are we ready for coronavirus disease 2019 arriving at schools? J Korean Med Sci. 2020;35:e127. DOIPubMed
4. Burke RM, Midgley CM, Dratch A, Fenstersheib M, Haupt T, Holshue M, et al. Active monitoring of persons exposed topatients with con�rmed COVID-19—United States, January–February 2020. MMWR Morb Mortal Wkly Rep. 2020;69:245–6 DOI PubMed

8/21/2020 Early Release - Contact Tracing during Coronavirus Disease Outbreak, South Korea, 2020 - Volume 26, Number 10—October 2020 - Emerging Infectious Diseases journal - CDC
https://wwwnc.cdc.gov/eid/article/26/10/20-1315_article 4/5
6. DOI PubMed
5. Liu Y, Eggo RM, Kucharski AJ. Secondary attack rate and superspreading events for SARS-CoV-2. Lancet. 2020;395:e47. DOI PubMed
6. Je�erson T, Del Mar C, Dooley L, Ferroni E, Al-Ansary LA, Bawazeer GA, et al. Physical interventions to interrupt orreduce the spread of respiratory viruses: systematic review. BMJ. 2009;339(sep21 1):b3675.
7. Park PG, Kim CH, Heo Y, Kim TS, Park CW, Kim CH. Out-of-hospital cohort treatment of coronavirus disease 2019patients with mild symptoms in Korea: an experience from a single community treatment center. J Korean Med Sci.2020;35:e140. DOI PubMed
8. Zhang J, Litvinova M, Liang Y, Wang Y, Wang W, Zhao S, et al. Changes in contact patterns shape the dynamics of theCOVID-19 outbreak in China. Science. 2020;368:1481–6. DOI PubMed
9. Principi N, Esposito S, Marchisio P, Gasparini R, Crovari P. Socioeconomic impact of in�uenza on healthy children andtheir families. Pediatr Infect Dis J. 2003;22(Suppl):S207–10. DOI PubMed
10. Ferguson NM, Cummings DA, Fraser C, Cajka JC, Cooley PC, Burke DS. Strategies for mitigating an in�uenza pandemic.Nature. 2006;442:448–52. DOI PubMed
11. Liu J, Liao X, Qian S, Yuan J, Wang F, Liu Y, et al. Community transmission of severe acute respiratory syndromecoronavirus 2, Shenzhen, China, 2020. Emerg Infect Dis. 2020;26:1320–3. DOI PubMed
12. Choe YJ, Smit MA, Mermel LA. Comparison of common respiratory virus peak incidence among varying age groups inRhode Island, 2012–2016. JAMA Netw Open. 2020;3:e207041. DOI PubMed
Top
Tables
Table 1. Contacts traced by age group of index coronavirus disease patients, South Korea, January 20–March 27, 2020
Table 2. Rates of coronavirus disease among household and nonhousehold contacts, South Korea, January 20–March 27, 2020
Top
Suggested citation for this article: Park YJ, Choe YJ, Park O, Park SY, Kim YM, Kim J, et al. Contact tracing during coronavirusdisease outbreak, South Korea, 2020. Emerg Infect Dis. 2020 Oct [date cited]. https://doi.org/10.3201/eid2610.201315
DOI: 10.3201/eid2610.201315
Original Publication Date: July 16, 2020
These authors contributed equally to this article.Table of Contents – Volume 26, Number 10—October 2020
1
Comments
Please use the form below to submit correspondence to the authors or contact them at the following address:
Eun Kyeong Jeong, Korea Centers for Disease Control and Prevention, Osong Health Technology Administration Complex, 187, Osongsaengmyeong 2-ro,Osong-eup, Heungdeok-gu, Cheongju, Chungcheongbuk-do, South Korea,
Return Address
Send To
Comments
Authors Editors

8/21/2020 Early Release - Contact Tracing during Coronavirus Disease Outbreak, South Korea, 2020 - Volume 26, Number 10—October 2020 - Emerging Infectious Diseases journal - CDC
https://wwwnc.cdc.gov/eid/article/26/10/20-1315_article 5/5
Top
The conclusions, �ndings, and opinions expressed by authors contributing to this journal do not necessarily re�ect the o�cial position of the U.S. Department of Health andHuman Services, the Public Health Service, the Centers for Disease Control and Prevention, or the authors' a�liated institutions. Use of trade names is for identi�cation only anddoes not imply endorsement by any of the groups named above.
10000 character(s) remaining.
Send
Page created: June 30, 2020Page updated: July 16, 2020
Page reviewed: July 16, 2020

EXHIBIT "15"

JUNE 2020
Betheny Gross Alice Opalka
We knew the sudden shift to remote learning would be hard. For the last two months CRPE followed a group of large, mostly urban school systems as they clarified their expectations for teaching students, tracking attendance, and monitoring learning. These districts are prominent in the national debate and serve nearly one of every six public school students in the country. But we knew they might not represent the experience of all school systems in the U.S.
Now, for the first time, we are releasing results from a new, nationally representative sample of 477 school systems. This new analysis includes the 81 U.S. school districts in the original database, but adds 396 districts. We apply statistical weights to provide a nationally representative sample of U.S. school districts. For the first time, then, we are able to compare remote education in districts in different types of communities and with different student characteristics.
The original cohort of districts we followed showed increasing clarity and expectations for instruction, tracking student engagement, and progress monitoring. The nationally representative sample reveals a more sobering story.
We found just one in three districts expect teachers to provide instruction, track student engagement, or monitor academic progress for all students—fewer districts than our initial study suggested. Far too many districts are leaving learning to chance during the coronavirus closures.
Figure 1. Districts That Expect Teachers to Provide Remote Instruction
Perc
ent
of d
istr
icts
exp
ecte
d to
pro
vide
inst
ruct
ion
to A
LL s
tude
nts
Too Many Schools Leave Learning to Chance During the Pandemic

2 MAY 2020
We also found significant gaps between rural districts and their urban and suburban counterparts. And school districts in affluent communities are twice as likely as their peers in more economically disadvantaged communities to expect teachers to deliver real-time lessons to groups of students.
These results are likely a function of uncertainty about technology access, but the net result is that many students in these communities were unlikely to receive consistent instruction in spring 2020.
Two-Thirds of Districts Set Low Expectations for Sustaining InstructionNationally, nearly all districts—85 percent—made sure their students received some form of grade- and subject-specific curriculum in packets; assignments posted in Google Classroom, Canvas, or some other platform; or guidance to complete segments of online learning software. Educators, however, understand that the instructional core is defined by the interaction between teachers, students, and content. The teachers’ role in this interaction involves more than delivering assignments to students.
Remote instruction can take many forms: live video lessons, recorded lectures, one-on-one support over the phone, or feedback delivered through an online platform. Yet we found that only one-third of districts expect all of their teachers to continue to engage and interact with all of their students around the curriculum content.
We know that some teachers are going beyond their district’s expectations to continue instruction. But lacking clear expectations to provide instruction, districts open themselves up to wide variation in what remote learning looks like from teacher to teacher, subject to subject, class to class.
Experience tells us that low expectations for instruction bode poorly for the students who faced the greatest challenges: those in low-income households, those with disabilities, those who speak a language other than English at home.
Only Half of the Districts Track Students’ Engagement in LearningOnly half of districts nationally expect teachers to track their students’ engagement in learning through either attendance tracking or one-on-one check-ins. Our review finds 27 percent of school districts require schools to track their students’ attendance—which could include monitoring logins to online platforms or other metrics for participation used as a proxy for attendance. This data is one way for districts to monitor which students they are reaching during the pandemic, and to report this information to policymakers and the general public.
Where technology access is limited and students don’t have a consistent method for demonstrating their attendance, tracking regular attendance may not be meaningful. But teachers can still be expected to make regular contact with their students by phone or text to assess engagement and problem-solve for students’ varied experiences at home. We found that a slightly higher proportion (37 percent) of districts require teachers to check in one-on-one with their students on a regular basis. Looking across both approaches to monitor students’ engagement, we found that just under half of districts set clear expectations for monitoring engagement.
JUNE 2020

3 MAY 2020
Figure 2. Expectations for Tracking Student Engagement
Again, many teachers are keeping in touch with their students—and we know that some are doing so even in districts that don’t require them to do so. But lacking a clear expectation to sustain contact with each student, it isn’t hard to imagine that teachers will stay in touch with students who are easy to contact, while students who are less connected are at greater risk of falling through the cracks.
More Than Four Districts in Ten Do Not Require Teachers to Monitor Students’ Academic ProgressTracking student progress by collecting work for review, assessing students’ progress toward academic benchmarks, or grading their work is the best way to gauge if students are continuing to learn in their remote settings. It may also be our only way to get a sense of gaps in students’ learning that may emerge before the fall, when districts may be able to assess where students stand.
Again, we found worrisome trends in the expectations districts set. Just 42 percent expect teachers to collect student work, grade it, and include it in final course grades for at least some students (typically those in middle and upper grades).
JUNE 2020
Attendance taken Check-ins expected Attendance OR check-ins expected

4 MAY 2020
Figure 3. Expectations for Progress Monitoring and Grading
More districts (about 58 percent) expect their teachers to monitor progress or provide feedback (if not grades) for at least some of their students—typically older students. Even still, this means two out of five districts make no firm expectation for students to complete assignments and leave families on their own to keep track of learning. Lacking any progress monitoring this spring, teachers may reconvene with their students this fall with little information on what students accomplished during nearly three months of closures—or what learning gaps emerged, for which students, during months of lost learning time.
About Our AnalysisThe COVID-19 response database tracks how a nationally representative group of school districts responded to the COVID-19 school closures in spring 2020. The goal of this effort is to create a national portrait of the expectations school districts set for the continuation of learning and support to students during the spring closure period. Our sample includes 477 school districts, sampled and weighed to reflect a representative cross-section of school districts across the U.S. We collected and coded publicly available information, merging the coded data with descriptive information on each district, such as percent of students receiving free or reduced-price lunch, racial demographics, and locale description from the National Center on Education Statistics Common Core of Data.
JUNE 2020
Progress monitoring expected for ALL or SOMEGrading expected for ALL or SOME

5 MAY 2020
This project is a collaboration with RAND Corporation, and stems from the ongoing American School District Panel project, a project intended to build a nationally representative panel of American school districts. The project also builds on CRPE’s prior COVID-19 response database, which tracked the progress of 82 school districts in rolling out remote learning plans through the COVID crisis in real time. We have included 81 of these original districts (Toronto is excluded), which were generally large and urban, in this new representative sample, but they are weighed appropriately.
Because districts’ responses have changed as the closures continued, we plan to update these data this month. In a subsequent round of coding, we will re-code the original indicators on instruction during spring 2020. We will also add new codes reflecting districts plans for summer programming and contingency planning for fall 2020.
More details on coding and methodology are provided in Appendix B and C of our research brief.
The Largest Divide in Access to Instruction and Progress Monitoring May Be Between Urban and Rural School DistrictsRural districts, where internet infrastructure lags well behind urban and suburban areas, were bound to face more challenges in providing remote learning. Our analysis indeed shows gaps between the expectations for instruction, staying in touch with students, and progress monitoring. Only 27 percent of rural and small-town school districts expect teachers to provide instruction, compared with over half of urban school districts. There are similar gaps for expectations to monitor engagement: 43 percent of rural school districts expect teachers to take attendance or check-in with their students on a regular basis, compared with 65 percent of urban districts. And there is more than a 25 percentage point gap in the proportion of rural districts that require progress monitoring and a 17 percentage point gap in the proportion of rural districts that provide formal grades of some kind, compared with urban districts.
Figure 4. Gaps in Expectations for Instruction and Monitoring Progress by Region
JUNE 2020

6 MAY 2020
This rural-urban divide in expectations is stark—far more so than the gap in instruction between districts with high concentrations of students who qualify for free or reduced-price lunch. When we divide the sample into quartiles based on the district’s concentration of economically disadvantaged students, we do not see a clear divide between the districts with the highest and lowest quartiles in terms of expectations for instruction, tracking student engagement, or progress monitoring.
Figure 5. Expectations for Instruction and Monitoring by High and Low Free and Reduced-Price Lunch Districts
Affluent Districts Are Twice as Likely as High-Poverty Districts to Require Live InstructionMore affluent school districts are more likely to require live video instruction from teachers. While expectations around synchronous, or real-time, teaching are uncommon across the board (expected in 21.8 percent of districts), only 14.5 percent of school districts with the highest concentration of students receiving free or reduced-price lunch expect teachers to provide live instruction. The most affluent 25 percent of districts in our sample are twice as likely to expect real-time teaching.
JUNE 2020
Attendance OR check-ins expectedInstruction expected for ALL students Progress monitoring expected for all or some

7 MAY 2020
Figure 6. Districts Expect Teachers to Provide Synchronous Instruction to At Least Some Students
This gap is most likely due to concerns about students’ access to technology in high-poverty districts but does show how concerns about access can shape the learning opportunities districts expect their teachers to provide—with the net result that higher-poverty districts are setting somewhat lower expectations that students receive live interaction with teachers and classmates.
Looking Ahead to Summer and FallRolling out quality remote learning plans is something that would ordinarily take districts months, if not years, of planning. The COVID-19 crisis forced districts to accomplish this in a matter of weeks, while balancing equity and connectivity needs and providing access to basic resources. It was unlikely to be perfect.
This spring, it seems far too many school districts let perfect be the enemy of good. In the challenge to connect all students, they left the level of instruction and progress monitoring up to the discretion of schools and teachers, thus creating highly varied learning experiences for their students. Without clear expectations across the board, and therefore pressure to meet the needs of each student, many districts likely left at risk the learning experiences of students who face the greatest challenges.
This need to pick up the slack was felt by parents who, in surveys, reported worry that their child is missing instruction and felt unsure about their ability to support their child’s learning at home. In one survey only 33 percent of parents reported regular access to their child’s teachers. And teachers felt these low expectations, too: in another survey, over half of responding teachers were worried that their students would fall behind academically. Most report less time spent on instruction than usual, and lower engagement from their students.
Districts have an opportunity to do better by students, teachers, and parents this fall. Official guidance advises schools to prepare for continued uncertainty and some level of remote learning for fall 2020. School districts now have several months to plan ahead to align the resources, create teacher professional development, and assess community priorities to design plans for the fall that have high expectations for each student’s learning and are responsive to each student’s needs. CRPE will support this hard work by continuing to track districts’ plans for summer and fall learning, sharing innovative strategies, and pushing for ways funders and policymakers can alleviate the burden. Despite the challenge of the COVID-19 crisis, we cannot continue to leave learning to chance for any student.
JUNE 2020

8M
AY 2020
JUNE 20208
Appendix A. Full Data Tables
Page 1 of 2
Sample includes 477 school districts weighted to provide nationally representative sample. Results are reported as % of group and reflect weighted frequency.
AllQuartile 1
(0-34% FRL)
Quartile 2 Quartile 3(53-70% FRL)
Quartile 4 (71+% FRL)
High FRL:FRL �����
(15��%)
Low FRL:FRL����
Medium����:�������������
��������
City12.7%
Rural65.2 %
Suburb22.1%
Content and teaching No curriculum resources provided 1.5 1.1 1.4 0.9 2.9 4.0 2.3 0.9 0.0 1.6 2.1General learning resources provided 10.1 10.8 6.9 14.5 8.4 6.2 10.1 10.8 7.4 9.6 12.8Grade and subject specific resources provided 84.7 81.8 87.3 82.8 86.0 86.2 78.0 85.3 92.0 83.5 84.1No closure information found (see note 1) 3.7 6.3 4.4 1.8 2.6 3.6 9.6 3 0.6 5.3 1.0
District expects ALL teachers to engage with students around content via synchronous or asynchronous means 33.5 37.4 26.3 37.5 35.8 38.0 52.9 30.1 51.5 27.2 42.0District expects SOME teachers to engage with students around content via synchronous or asynchronous means 13.2 17.8 18.4 7.0 8.6 9.4 9.6 14.5 10.3 14.7 10.5District does not make an explicit expectations around teaching 49.5 38.5 50.9 53.7 53.0 49.1 27.9 52.4 37.5 52.8 46.5No closure information found (see note 1) 3.7 6.3 4.4 1.8 2.6 3.6 9.6 3 0.6 5.3 1.0
Synchronous teaching expected for ALL teachers 7.9 9.4 8.2 4.4 8.4 8.5 14.6 6.3 5.7 7.4 8.8Synchronous teaching expected for SOME teachers 13.9 19.4 17.4 11.7 6.1 7.3 16 15.1 9.7 14.8 14.1No expectations around synchronous teaching 74.8 64.9 70 82.1 82.8 80.6 59.8 75.6 83.9 72.6 76No closure information found (see note 1) 3.7 6.3 4.4 1.8 2.6 3.6 9.6 3 0.6 5.3 1.0
Monitoring engagement and progress Attendance is taken 27.4 34.6 26.4 24.1 26.1 27.4 40.6 25.7 25.6 24.2 38.0
No expectations about attendance 68.9 59.1 69.2 74.2 71.3 69.0 49.8 71.3 73.8 70.5 61.0No closure information found (see note 1) 3.7 6.3 4.4 1.8 2.6 3.6 9.6 3 0.6 5.3 1.0
Checkins are expected 36.9 25.2 37.1 41.9 42.1 43.7 25.0 37.1 59.6 34.8 30.1No expectations about checkins 59.3 68.5 58.5 56.3 55.2 52.7 65.4 59.9 39.7 59.9 68.8No closure information found (see note 1) 3.7 6.3 4.4 1.8 2.6 3.6 9.6 3 0.6 5.3 1.0
Attendance OR checkins expected 48.0 46.8 48.9 46.1 50.3 51.8 52.4 46.7 65.5 43.1 52.4No expectations about attendance or check-ins 48.3 46.9 46.6 52.1 47.1 44.6 38.0 50.3 33.9 51.6 46.6No closure information found (see note 2) 3.7 6.3 4.4 1.8 2.6 3.6 9.6 3 0.6 5.3 1.0
Progress monitoring for ALL students 48.0 38.8 52.3 53.7 43.5 42.1 45.7 49.6 65.2 43.2 52.4Progress monitoring for SOME students 9.9 14.7 6.3 9.2 11.4 9.6 5.3 10.5 14.4 9.4 8.6No progress monitoring expected 38.3 40.2 36.9 35.4 42.4 44.7 39.5 36.9 19.7 42.1 38.0No closure information found (see note 2) 3.7 6.3 4.4 1.8 2.6 3.6 9.6 3 0.6 5.3 1.0
Grading is done for ALL students 29.0 19.6 32.5 32.0 29.2 30.5 22.5 29.6 29.5 29.6 27.1Grading is done for SOME students 13.1 14.9 11.8 15.9 9.6 9.9 10.9 14.0 27.7 10.2 13.4No grading expected 54.4 59.1 51.2 50.4 58.5 56.0 57.0 53.4 42.2 55.0 58.5No closure information found (see note 2) 3.7 6.3 4.4 1.8 2.6 3.6 9.6 3.0 0.6 5.3 1.0
Technology Hotspots (community or home based) 30.4 25.7 33.6 30.2 30.6 34.8 20.5 30.9 48.5 28.6 25.4No mention of hotspots provided 65.9 68 62 68 66.8 61.6 69.9 66.1 50.8 66.1 73.6No closure information found (see note 2) 3.7 6.3 4.4 1.8 2.6 3.6 9.6 3 0.6 5.3 1
Devices provided to all or some students ("some" typically means upper grades only or means based) 52.0 53.4 47.8 62.1 44.2 47.9 52.0 52.8 84.6 43.2 59.1No mention of devices provided 44.3 40.3 47.8 36.1 53.2 48.5 38.4 44.2 14.8 51.5 39.9No closure information found (see note 2) 3.7 6.3 4.4 1.8 2.6 3.6 9.6 3.0 0.6 5.3 1.0
By free and reduced-price federal lunch (FRL) quartile (see note 1) Comparing extremes By locale (see note 3)
(35-52% FRL)�
Weighted�Percentage
��������������(���%)
Weighted Percentage Weighted Percentage
Appendix A. Full Data Tables(see note 2)
(see note 3)
(see note 3)
(see note 3)
(see note 3)
(see note 3)
(see note 3)
(see note 3)
(see note 3)
(see note 3)
(see note 3)

9 MAY 2020
Appendix A. Full Data Tables (cont.)Note 1.
Quartile 1: the 25 percent of districts with the lowest concentration of low-income students, as measured by the percentage of students who qualify for FRL, and includes districts with between zero and 34 percent of such students.
Quartile 2: the 25 percent of districts with the second-lowest concentration of low-income students, as measured by the percentage of students who qualify for FRL, and includes districts with between 35 and 52 percent of such students.
Quartile 3: the 25 percent of districts with the third-lowest concentration of low-income students, as measured by the percentage of students who qualify for FRL, and includes districts between 53 and 70 percent of such students.
Quartile 4: the 25 percent of districts with the fourth-lowest concentration of low-income students, as measured by the percentage of students who qualify for FRL, and includes districts with 71 and above percent of such students.
Note 2. City, Rural, Suburban configuration:
All NCES codes for City (11 - Large, 12 - Midsize, and 13 - Small) are collapsed to “city.”
All NCES codes for Suburban (21 - Large, 22 - Midsize, 23 - Small) are collapsed to “suburb.”
All NCES codes for “Town” and “Rural” (31 - Town, Fringe; 32 - Town, Distant; 33 - Town, Remote; and 41 - Rural, Fringe; 42 - Rural, Distant; and 43 - Rural, Remote) are collapsed to “rural.”
Note 3. “No closure information found”:
We report a district as “no closure information found” when we fail to find any web-based public information on the district or any reference to COVID-19 or coronavirus school closures on the district’s website, Facebook oage, or Twitter account. We chose to include “no information” districts in all of our analyses because we feel the lack of easy-to-access public information is a salient concern amid the closures.

10 MAY 2020
Category Indicator Measure Definition Examples
Curriculum
Resources provided by district
NoneGeneralSpecific
None = District provides no resources or expectations about curriculum, lessons, or activities.
General = District provides a menu of learning resources (not sequential lessons). This could be a general list of resources or it could be a list organized by grade-level. This is essentially the most passive option.
Specific = District provides (or expects schools to provide) curated/directive curriculum, placing each student in a specific position in a resource and prescribing their pacing through that resource, lessons/activities/units that are associated with a grade-level and a subject area (at least ELA and mathematics), or daily or weekly physical or downloadable packets that are distinct from the previous day or week's packet. These may be created by the district, schools, teachers, or a 3rd party.
Ratings are rounded up. So if any specific resources are available, the district gets a "specific" rating. The next content indicator, "Resource coverage" provides an opportunity to indicate whether the "Resources provided by the district" rating was based on providing resources to all grades (All) or if it was rounded up from only some grades (Partial).
None = District website says schools are on break or closed until XYZ date with no information about learning expectations.
General = District provides a list of homepage links to Khan Academy, the local library system, kidsreads.com, etc. Or district provides paper or digital packet of optional activities (things to do) that are not part of a curriculum or sequence of learning.
Specific = District communications/plans explain that teachers are expected to provide students with assignments during the week or district makes work packets by grade level and subject available.
For a district that delegates decision-making to its schools or teachers, it would receive a "specific" rating if it communicates expectations for teachers or schools to provide specifc curriculum.
Resource coverage
None All Partial
None = No grades covered.
All = Resources for all grades (at least K-12).
Partial = Resources for some grades (must explain what partial arrangement is in "coverage note" column).
Partial = If partial, explain in the "Explanation of partial coverage column". For example, you might write "For high school only."
Instruction
Instruction from teachers
None All Partial
None = No instruction.
All = Instruction for all grades (at least K-12).
Partial = Instruction for some grade bands (must explain what partial arrangement is in "Partial Explanation of Instruction" column).
District expects teachers to engage with students to help them access and understand content. There may be different approaches taken, but there must be strategies in place to help students understand content and assignments. Students are not expected to rely primarily on themselves or parents to understand content or assignments. This could happen via live instruction, pre-recorded video, online platforms, one on one conversations that are tied to content, or other strategies that ensure that students receive structured guidance on concepts.
For a district to be marked as a “yes” on instruction, there has to be an expectation communicated that teachers will be providing instruction or instructional resources, not just uploaded assignments or work packets on a learning management platform.
For a district that delegates decision-making to its schools or teachers, it would receive an "all" rating if it communicates expectations for teachers or schools provide instruction. Partial = If partial, explain in the Coverage Notes column. For example, you might write "For high school only."
District communications/plans explain that teachers will post video lessons or provide other instructional resources on Google Classroom or other platforms along with assignments -- beyond just uploading assignments and offering office hours.
District communications/plans explain that teachers will provide "real-time" instruction for students over video conference at scheduled times.
District communications/plans explain that teachers will assign virtual instruction via online instructional platforms like Edgenuity, iReady, or Khan Academy. These assignments must be directed by teachers and tied to classwork or assignments, not offered as general resources.
Students receive daily calls from a teacher to talk through their understanding of work assigned in packets.
Partial: Middle and highschool students receive synchronous instruction or are directed to instruction on a platform while elementary students receive work packets only.
Do not count districts where some teachers choose to provide instruction, but it is not an expectation for all as "partial."
None = Teacher office hours or real-time video chat that isn't attached to a lesson.
Teacher uploading weekly curricular assignments without accompanying instruction.
Code “none” if there is not enough evidence that instruction is happening, or if it seems up to teacher discretion.
Code “none” if it is an optional, student selected instructional resource, like public TV programming that is not directed by teachers or connected to curriculum.
Synchronous teaching flag
None All Partial
None = No synchronous teaching.
All = Synchronous teaching for all grades.
Partial = Synchronous teaching for some grades (must explain what partial arrangement is in "coverage note" column).
District expects some synchronous ("real time") teaching. Offering office hours does not count as synchronous teaching.
Partial = If partial, explain in the Coverage Notes column. Fort example, you might write "For high school only."
District communications/plans explain that teachers will provide "real-time" instruction for students over video conference.
For a district that delegates decision-making to its schools or teachers, even if some teachers are providing synchronous instruction it would not receive an "all" or "partial" rating unless all teachers in the district/grade level are asked to provide it.
Appendix B. Code Definitions

11 MAY 2020
Instruction
Synchronous student engagement flag
None All Partial
None = No synchronous student engagement.
All = Synchronous student engagement for all grades.
Partial = Synchronous student engagement for some grades (must explain what partial arrangement is in "coverage note" column).
District expects teacher to facilitate some student-to-student synchronous engagement.
None = Office hours would count as teacher check-in, but not synchronous student engagement.
Partial = If partial, explain in the Coverage Notes column. For example, you might write "For high school only."
District communications/plans explain that teachers will faciliate whole-group sessions among students in their class (e.g., video conference).
District communications/plans explain that teachers will faciliate virtual advisory class.
District communications/plans explain that teachers are expected to assign collaborative group projects that require students to work together virtually with or without the teacher present.
For a district that delegates decision-making to its schools or teachers, even if some students are experiencing synchronous engagement it would not receive an "all" or "partial" rating unless all students in the district/grade level are expected to receive it.
Students with disabilities
YesNo
Yes = District webpage specifically mentions how schools and/or the district will support students with disabilities.
No = District webpage does not provide information mentioning how schools and/or the district will support students with disabilities.
This indicator captures a range of possibilities. The lowest bar: a district communicates that IEP meetings will be virtual or that specialists will be reaching out directly to families to talk about supports for student learning; others might have more elaborate resources or plans.
Progress monitoring
Feedback on student work
None All Partial
None = no feedback
All = feedback for all grades (K-12)
Partial = feedback expected for some grades (must explain what partial arrangement is in "coverage note" column).
District expects teachers to provide feedback on student work, monitor the academic progress of students, or issue grades. This measure captures multiple points on this continuum. The next indicator (formal grading flag) identifies the subset of districts that require some student work completed during the shutdowns to contribute to their final course grade.
Partial = If partial, explain in the Coverage Notes column. For example, you might write "For high school only."
District communications/plans explain that teachers should request that students submit work, provide students with feedback on their work, monitor student progress, and/or grade students work for contribution to the student's grade.
Note that the lowest bar for an affirmative answer (All or Partial) is students are asked to submit some of their work to their teachers.
For a district that delegates decision-making to its schools or teachers, even if some teachers are providing feedback on student work it would not receive an "all" or "partial" rating unless all teachers in the district/grade level are asked to provide it.
Formal grading flag
None All Partial
None = No grading of student work.
All = Grading of student work for all grades (e.g., ELM, MS, HS).
Partial = Grading of student work expected for some grades (must explain what partial arrangement is in "coverage note" column).
The formal grading flag identifies the subset of districts that require some student work completed during the shutdowns to contribute to their final course grade.
Partial = If partial, explain in the Coverage Notes column. For example, you might write "For high school only."
District communications/plans explain that teachers will be recording grades on student work. Pass/Fail and Extra Credit only count as a formal grade.
None = District communications/plans mentions that teachers may be grading or scoring assignments but that these scores won't contribute to the final course grade.
Teacher Check In YesNo
Yes = District communicates an expectation that teachers will check in with students, via phone call, email or virtual platform.
No = No expectations communicated for teachers to check in with students.
This indicator captures whether teachers are maintaining contact and connection with students outside of instruction and regular class settings.
District communicates that teachers will be calling students 1:1 to check in.
District communicates that teachers will hold office hours if students or families have questions.
Advisors hold advisory class. Teachers hold morning meetings or weekly wellness meetings.
Learning Time
Attendance tracking
YesNo
Yes = District communicates a process for tracking student attendance.
No = District does not communicate a process for tracking student attendance.
District communicates some process for capturing student attendance. Examples could be students are asked to log in each day to a virtual platform, students are asked to download instruction or assignments each day via an app like Canvas, students are asked to submit a response to a "question of the day", teachers record attendance via phone calls home.
Instructional minutes
YesNo
Yes = District recommends or requires a certain amount of instructional minutes each day or week.
No = District does not recommend or require minimum instructional minutes.
Technology
Device distributionNone All Partial
None: No devices provided, or district hasn't started providing devices yet.
All: Devices provided for all students.
Partial: Devices provided for some grades, or one per family, etc. (must explain what partial arrangement is in "coverage note" column).
District provides technology devices (laptops, tablets) to students.
Partial: If partial, explain in the Coverage Notes column. For example, you might write "For high school only" or "One per family, not each student." Partial also applies if the district is in process of providing devices, but they have not been provided to all grade levels yet.
Hotspot acccessCommunityHomeBoth
Community-based: Hotspots provided to students at school or community-based sites.
Home-based: Mobile or personalized hotspots provided for some grades or student groups. Both: Both provided.
Community-based: District has established amplified wifi outside school parking lots, or is stationing buses equipped with wifi in communities.
Home-based: District provides phones equipped with wifi or pays for parents to establish mobile hotpots on their personal phones.
Appendix B. Code Definitions (cont.)

12 MAY 2020
Appendix C. Methodology1. Description of the Project
The COVID-19 response database tracks how a nationally representative group of school districts responded to the COVID-19 school closures in spring 2020. The goal of this effort is to capture a national portrait of the expectations districts set for the continuation of learning and support to students during the spring closure period. Our sample includes 477 school districts, sampled and weighed to reflect a representative cross-section of school districts across the U.S. We collected and coded publicly available information that captured the level of curricular resources and instruction, feedback, and tracking of student work, and basic resources like devices and meals provided to students during school closures. We merged the coded data with descriptive information on each district, such as percent of students receiving free or reduced-price lunch, racial demographics, and locale description from the National Center on Education Statistics Common Core of Data.
Because districts’ responses have changed as the closures continued, we plan to update these data at the end of May 2020. In a subsequent round of coding, we will re-code the original indicators on instruction during spring 2020. We will also add new codes reflecting districts’ plans for summer programming and contingency planning for fall 2020.
This project is a collaboration with RAND Corporation, and stems from the ongoing American School District Panel project, a project intended to build a nationally representative panel of American School Districts.
2. Sources Accessed for Information
For each school district, we coded the indicators based on publicly available information. Primary sources were the school district website and social media (district Facebook pages or Twitter, YouTube). When needed, analysts would check individual school websites or, if publicly accessible, teachers’ online learning platform pages (such as Google Classroom).
In total we found no references to school closures on the district’s website or social media feeds for 14 of the sampled districts. We coded these districts as “no information on closure.” Some districts offered very limited information on their websites or other social media, and it was clear that these districts (or district representatives) directly communicated information on closure procedures and plans with parents via email or some other parent communication platform. As such, these accounts should be considered a conservative take on districts’ responses.
We gathered descriptive information from the school districts (enrollment, racial demographics, percent of students receiving free or reduced-price lunch, locale code) from the National Center for Education Statistics. For the majority of school districts, this was based on 2016 data. A small subset of school districts were missing free or reduced-price lunch data for 2016, so we included 2015 data in the analysis.
3. Coder Training
Coders participated in several training and norming activities, including: (1) all coders reviewed a codebook outlining definitions for codes in the various fields of interest, (2) all coders reviewed information from districts, then coded a common sample of four districts, then met to discuss alignment and misalignment, (3) all inexperienced coders were paired with an experienced coder to who would check their codes against the correct coding for the four districts, and discuss any discrepancies, (4) all coders participated in multiple alignment sessions in which they discussed coding questions and further aligned on code definitions.
During the next round of coding, we will add four new coders to the team, and we will go through a similar process of test-coding four districts. We will discuss the responses and any misalignment as a team to make sure that the team is fully aligned on the new codes for summer and fall learning.
4. Data Collection Time Frame and Planned Updates
Coders collected data for the initial round of coding between April 6 and May 1, 2020. Analysts quality-checked the data and made updates for missing data during the week of May 4, 2020.

13 MAY 2020
Our team plans to re-code the districts with the additional summer and fall codes, and quality-check the codes between May 25 and June 12, 2020.
5. Definition of Codes
Attachment A is the codebook for the first round of coding. For all indicators, codes were based only on publicly available information, and when there was no information available, were coded “no” or “negative.”
Codes for summer and fall learning, which will be used in the re-code of the database, were still in development through the week of May 18. There will also likely be some changes to the original codebook on the attendance codes and the “district delegation” codes.
6. Explanation of the Sample and Sample Calibration
The Sample
The national sample includes two groups of districts.
Group 1 includes 399 districts and is a stratified random sample from a sample of 1,200 school districts. The 1,200 school districts represent the recruitment sample for the RAND-led American School District Panel project, a project intended to build a nationally representative panel of American School Districts. The sample of 399 districts is stratified by school location and includes 200 small-town and rural districts and 199 suburban and urban districts.
Group 2 includes the 82 urban districts CRPE began collecting district response data in March 2020. CRPE updated data on these districts weekly from March 28, 2020, through the period of time when CRPE completed data collection on the national sample.
Because 3 of the 82 large urban districts also appear among the 399 districts, and one is in Canada, the total national sample includes 477 U.S. school districts.
Calibration and Sample Weights
Excluding the duplicates, we combined the Group 1 and Group 2 districts and then calibrated to reflect the national population of school districts along 10 factors:
• Total enrollment in the district split into 3 groups: Small [0-800], medium [800-3000] and Large [3000+]
• Total number of schools in the district split into 3 groups: 1, [2-5], and [6+]
• Per-pupil expenditure on instructional materials
• Current expenditure dollar range code represents per-student current expenditures within ranges and are maintained on district (except Supervisory Union) and public school records
• Percentage of minority students in the district split into four groups [0-15%], [15-25%], [25-50%], and [50%+]
• Percentage of poverty level students in the district split into four groups [0-10%], [10-15%], [15-25%], and [25%+]
• Percentage of free / reduced-price lunch students in the district split into four groups [0-25%], [25-50%], [50-75%], and [75%+]
• The specific level of instruction in the school district, Elementary, Secondary or Unified
• The percentage of special education students in the district split into [0-12%], [12-17%], and [17%+]
• Bilingual Education Indicator that indicates if Bilingual Education is offered [Yes/No]
Appendix C. Code Methodology (cont.)

EXHIBIT "16"

EXECUTIVE ORDER N-73-20
WHEREAS deploying affordable and reliable broadband networks throughout California will accelerate continuous improvements in economic and workforce development, infrastructure, public safety, education, economy, and an engaged citizenry; and
WHEREAS broadband access, adoption, and training are essential components of digital equity for California’s diverse populations; and
WHEREAS over 2,000,000 Californians do not have access to high-speed broadband service at benchmark speeds of 100 megabits per second download, including 50 percent of rural housing units; and
WHEREAS as of December 2018, 23 percent of California housing units, housing 8.4 million residents, do not have broadband subscriptions; and
WHEREAS despite the increasing importance of broadband for employment, health, public safety information and community connections, 34 percent of adults 60 and over do not currently use the Internet; and
WHEREAS the COVID-19 pandemic has amplified the extent to which broadband is essential for public safety, public health, and economic resilience; and
WHEREAS the COVID-19 pandemic has caused schools to shift to distance learning; and
WHEREAS telehealth greatly expands the ability of Californians to access medical, behavioral and oral health services, and has been prioritized across health systems during the COVID-19 pandemic, yet not all Californians have access to sufficient broadband to allow live video connections; and
WHEREAS effective emergency services require using broadband infrastructure to integrate data in real time from all available sources so decision makers at the local, regional, and statewide level have access to the information necessary for the protection of lives and property; and
WHEREAS local and tribal governments play a critical role in understanding the broadband needs of their communities and in infrastructure planning and permitting.
NOW, THEREFORE, I, GAVIN NEWSOM, Governor of the State of California, in accordance with the power and authority vested in me by the Constitution and statutes of the State of California, do hereby issue this Order to become effective immediately.

IT IS HEREBY ORDERED THAT:
1. California state agencies subject to my authority are directed to pursue a minimum broadband speed goal of 100 megabits per second download speed to guide infrastructure investments and program implementation to benefit all Californians.
2. The California Broadband Council is requested to create a new State Broadband Action Plan by December 31, 2020, and to review the plan annually thereafter. The California Department of Technology’s Office of Broadband and Digital Literacy is directed to support and monitor implementation of the Plan and this Executive Order. The Plan shall incorporate the 100 megabits per second goal, and include the following elements:
a. A roadmap to accelerate the deployment and adoption of broadband by state agencies and to support such deployment and adoption by local governments.
b. Publicly accessible information on all federal and state funding opportunities and eligibility requirements.
c. Provisions to maximize the inclusion of tribal lands in all broadband
access and adoption opportunities developed in consultation with tribal governments.
MAPPING AND DATA
3. The California Public Utilities Commission (CPUC) is requested to lead data aggregation and mapping efforts in collaboration with the California State Transportation Agency (CalSTA) and other relevant state agencies, local and tribal governments, and regional consortia. These efforts should address:
a. Locations without broadband access;
b. Information on public and private broadband network infrastructure;
c. State-owned infrastructure and rights of way;
d. The costs of deploying various middle and last-mile network
components; and
e. Information to support the development of local broadband infrastructure deployment and digital equity plans.
4. The California Department of Technology (CDT), in collaboration with the
Governor’s Office of Business and Economic Development (GO-Biz) and the Department of General Services (DGS), is directed to regularly convene private-sector companies in an effort to understand and predict current and future demand for broadband, for the purpose of enabling the State to more effectively allocate resources and manage policies and

programs supporting broadband goals and continuing the State’s leadership in broadband innovation.
FUNDING
5. GO-Biz is directed to identify funding opportunities for broadband deployment and adoption by:
a. Collaborating with all cabinet-level agencies, independent departments, and independent constitutional officers to create a list of funding sources to support broadband, equipment, and digital literacy; and
b. Coordinating efforts of state agencies to maximize federal broadband funding for California.
6. CDT, in collaboration with DGS, is directed to seek opportunities to leverage the State’s contract authorities as resources to further statewide broadband access and adoption.
DEPLOYMENT
7. CalSTA and California Department of Transportation (Caltrans) are directed to work with the California Transportation Commission (CTC) to identify and incorporate the installation of conduit and/or fiber into all appropriate and feasible transportation projects along strategic corridors.
8. CPUC, in collaboration with CDT and other relevant agencies, is requested to seek opportunities to use programs under its jurisdiction to accelerate broadband deployment and to leverage utility infrastructure to increase access to existing fiber and cost-effectively deploy new fiber.
9. DGS is directed to provide an inventory of state property for possible use for broadband infrastructure based on such criteria as may be provided by the CPUC, Caltrans, and other relevant agencies, to accelerate broadband deployment.
10. The Governor’s Office of Emergency Services (CalOES) is directed to coordinate with jurisdictions implementing Next-Generation 9-1-1 to expand broadband infrastructure to enhance public safety and disaster preparedness, response, recovery, and mitigation capabilities.
11. The California Department of Food and Agriculture (CDFA) is directed to identify and facilitate new broadband projects that support precision agriculture and food systems in rural communities. CDFA is also directed to work with CalOES to inventory the status of existing broadband connectivity at all fairgrounds.
12. The California Department of Housing and Community Development and the California Housing Finance Agency are directed to provide recommendations to the CPUC to increase free or low-cost broadband connectivity at all publicly subsidized housing communities for residential units.

ADOPTION 13. GO-Biz is directed to coordinate the outreach efforts of existing statewide
programs and institutions to inform residents of affordable Internet service offerings, including:
a. The CPUC is requested to develop tools for low-income individuals and social service organizations to easily identify and subscribe to affordable broadband plans;
b. The California Emerging Technologies Fund is directed to continue promoting affordable home Internet service offers to recipients of the National School Lunch Program; and
c. The California State Library, in consultation with local libraries, is
directed to promote affordable home Internet services within their communities.
14. The California Department of Education is requested to continue leading statewide efforts to ensure that students have the computing devices and connectivity necessary for distance learning and online instruction.
15. The California Department of Aging, in partnership with CDT and CPUC, is directed to analyze the needs of people ages 60 and older for access to affordable, reliable, high-speed broadband, and to identify program and partnership opportunities to close the digital divide among older Californians.
IT IS FURTHER ORDERED that, as soon as hereafter possible, this Order be filed in the Office of the Secretary of State and that widespread publicity and notice be given to this Order.
This Order is not intended to, and does not, create any rights or benefits,
substantive or procedural, enforceable at law or in equity, against the State of California, its agencies, departments, entities, officers, employees, or any other person.
IN WITNESS WHEREOF I have hereunto set my hand and caused the Great Seal of the State of California to be affixed this 14th day of August 2020.
_____________________________ GAVIN NEWSOM Governor of California ATTEST: _____________________________

ALEX PADILLA Secretary of State

EXHIBIT “27”

1
2
3
4
5
6
7
8
9
10
11
12
13
14
15
16
17
18
19
20
21
22
23
24
25
26
27
28 1
DECLARATION OF ALBERT C. MU, D.O. IN SUPPORT OF OPPOSITION TO TEMPORARY RESTRAINING ORDER
TYLER & BURSCH, LLP Jennifer L. Bursch, State Bar No. 245512 [email protected] Cody J. Bellmeyer, State Bar No. 326530 [email protected] 25026 Las Brisas Road Murrieta, California 92562 Telephone: (951) 600-2733 Facsimile: (951) 600-4996
Attorneys for Defendants Immanuel Schools and Ryan Wood
SUPERIOR COURT OF THE STATE OF CALIFORNIA
FOR THE COUNTY OF FRESNO
COUNTY OF FRESNO through JEAN M, ROUSSEAU, in his official capacity as Emergency Services Director and County Administrative Officer
Plaintiff,
v.
IMMANUEL SCHOOLS., a California non-profit corporation; RYAN WOOD, Chief Executive Officer of Immanuel Schools and DOES 1 through 50, inclusive,
Defendants.
Case No.: 20CECG02447
DECLARATION OF ALBERT C. MU, D.O. IN SUPPORT OF OPPOSITION TOTEMPORARY RESTRAINING ORDER
Ex Parte Date: August 25, 2020 Time: 3:29 p.m. Dept. 501
I, ALBERT C. MU, the undersigned, declare as follows:
1. I am over the age of 18 years and I am not a party to this action. I make this
declaration based on my own personal knowledge, my professional experience and professional
writings from sources known to be reliable and reputable sources in my field of expertise. If called
as a witness, I could and would testify competently to the matters set forth herein.
2. I submit this declaration in support of the Opposition to Temporary Restraining
Order.

1
2
3
4
5
6
7
8
9
10
11
12
13
14
15
16
17
18
19
20
21
22
23
24
25
26
27
28 2
DECLARATION OF ALBERT C. MU, D.O. IN SUPPORT OF OPPOSITION TO TEMPORARY RESTRAINING ORDER
3. I obtained my D.O. from the College of Osteopathic Medicine of the Pacific and
performed my residency at Loma Linda University. I am a board-certified family physician. I
believe that Immanuel schools in Reedley, California should specifically be allowed fair
consideration by the County Department of Public Health and State of California for an exemption
to remain open for in-person classroom instruction. Attached hereto as Exhibit “28” is a true and
accurate copy of a letter I sent to the Board of Supervisors for Fresno County. The letter contains a
brief summation of my professional opinion based on the data available at the time it was written.
I declare under penalty of perjury under the laws of the State of California that the foregoing
is true and accurate.

EXHIBIT “28” 8/20/2020 1:32:58 PM3

August 16, 2020 To the Board Chair of the Fresno County Board of Supervisors, Honorable Mr. Buddy Mendes,
I write to petition your thoughtful consideration to allow on campus education for Immanuel Schools. The SARS-CoV2 pandemic has created exceptional fear, confusion and uncertainty. With cases rising in Fresno County I understand the position of Fresno County Public Health Department, as well as the State of California to threaten shut down of the school, but I must disagree with their decision, given the data that is available to me as of the time this is written. I appreciate you taking the time to read my thoughts on why, as a Board-certified Family Physician, I am compelled to send my children to school.
To my knowledge, the state of California and Fresno County have no plan as to when this will end – only fluctuating mitigation strategies – which add to the panic and fear. Everything is uncertain: when to reopen all businesses, when masks will no longer be required, whether society will ever go back to normal, and in our case, when to reopen schools. Certainly these are difficult decisions. But what are these decisions to be based on? I propose that they be driven by the facts available to us. As briefly as I can, I want to discuss why true mortality rates (which are driving mass fear amongst adults) are misrepresented, and why children should be allowed on campus again for school.
As of 8/15/2020, the County of Fresno Public Health Department website has reported 19,900 PCR confirmed cases of SARS-CoV2 with 203 deaths. This is a mortality rate of 1%, or 1 in 100. Statistics such as these have greatly increased anxiety and fear levels within our local population. Medically, however, it is irrational to assume that only the PCR positive tests represent the true number of infected persons. The available numbers do not fairly depict the true risk level. The COVID-19 mortality rate is significantly lower. To get a better understanding we need information provided via antibody testing.
Neither the State of California nor Fresno County Department of Public
Health, to my knowledge, have done or proposed any studies to answer the true infection rate via antibody testing, though our neighbors to the north and south have done so. Being that we are in between two of the largest population densities in the country, the SF Bay Area and Los Angeles, we are naturally affected by their COVID statuses. And their results corroborate each other very closely. A study conducted by USC/LA County using antibody testing in April/May 2020 and published in the Journal of the American Medical Association (JAMA) showed that based on positive antibodies to COVID-19 in healthy volunteers, the infection rate was approximately 40-50 times higher than PCR testing alone indicated.
Corroborating USC’s data, Stanford University researchers determined the
antibody prevalence in Santa Clara County to be 50-85 times higher than what PCR
8/20/2020 1:32:58 PM4

testing alone could detect. The following is a quote from the research paper published by Dr. Jay Bhattacharya and colleagues: “After weighing for population demographics of Santa Clara County, the prevalence [of antibodies to SARS-COV2] was 2.8%. These prevalence point estimates imply that 54,000 people were infected in Santa Clara County by early April, many more than the approximately 1,000 [PCR-only] confirmed cases at the time of the survey. Conclusion: The estimated population prevalence of SARS-CoV2 antibodies in Santa Clara County implies that the infection may be much more widespread than indicated by the number of [PCR only] confirmed cases.”
This is consistent with other large counties in the U.S. Among the 10,000
employees of the Major League Baseball Study who were tested for COVID-19 antibodies, numbers of positive antibody results were lower, but notably 70% of those who tested positive were asymptomatic and healthy.
One can debate all day about study limitations and critiques, but there is no
such thing as a study ever done that is above criticism, especially in medicine. Furthermore, I do not know of any government plan to answer these questions that are essential for moving our society forward. The point is, if we factor in these two studies from USC and Stanford performed by outstanding, reputable institutions, and apply it, conservatively, to the mortality rate here in Fresno County, it brings the actual mortality rate in our county far lower than that earlier 1% calculated on PCR testing alone. I am left to logically conclude the rate of mortality from COVID-19 is very likely pushed much lower down, likely closer to that of influenza: ~1 in 1000, or 0.1%.
To further corroborate my thinking, the CDC estimated, early on in the
pandemic that the actual number of infections in most places was more than 10 times the reported testing numbers, which would also place the local mortality rate at 1 in 1000, on par with seasonal influenza. To my knowledge, the State of California, nor any County Public Health Department has never shut down the school system, business and societal function on account of seasonal influenza, not even when the unknown, but underreported, H1N1 struck in 2009. That public health emergency resulted in 60 million cases in the US by CDC estimates and a significant 358 pediatric deaths ensued, two-three times higher than usual. Children were not kept out of schools. To date we have 5.4 million cases of COVID-19 in the US, but we have prevented our children from attending school in person.
The data available to us demonstrate that the benefits outweigh the risks of sending our children back to school. Children comprise 22% of the US population yet make up 7% of all COVID cases. Our current data also conclude that severity in pediatric patients is extremely low. Children make up only 3% of COVID-19 hospitalizations, and death is rare (ranging from 0 to 0.5% depending on the state). This is a very conservative estimate as no large-scale antibody studies have been conducted on children, which likely means as I argued earlier, that the pediatric death rate is much lower. From data obtained from COVID-NET, a collaborative
8/20/2020 1:32:58 PM5

database studying pediatric hospitalizations throughout multiple states, pediatric hospitalization rates are 8 in 100,000. That means 99,992 children in 100,000 would recover. As I write this letter, more children have died from seasonal influenza in each of the past five seasons (3 month time periods) than this year’s 5+ month COVID season, and again, schools have never shut down in our lifetime on account of influenza. The majority of children who had to be hospitalized had underlying medical conditions and 1 in 3 who are hospitalized are admitted to the ICU (the same as adults) so I advocate children with such pre-existing conditions should consider distance learning online. This is precisely what Immanuel Schools has offered to all enrolled families. In Fresno County I lament that one precious child has succumbed to the disease, but we do know this child had severe predisposing medical conditions. As a physician but also as a father, I ask that you will not keep all our children out of school due to fear, when the numbers tell us that the death rate is so low.
From a community standpoint, the most updated data show children may
have similar nasopharyngeal viral loads and are able to spread the virus (no surprise) but we have no evidence that children are the primary drivers of infection as with other common viruses. This data came as a great surprise to myself and many others, and is being widely discussed amongst the medical and scientific community, but that is why we must study such things and base decisions accordingly.
In medicine, as in public policy, what do we base our decisions on? I cannot know everything but I try my hardest to practice evidence-based medicine. It is my obligation to the public and my patients. I must do my best to stay afloat with changing knowledge and the use of statistics, aware of their limitations, as tools to help guide me in discussions with patients so they have the best evidence to make decisions on their health. Likewise, should not the decision on keeping Immanuel Schools open be based on evidence-based information as well? Many academic and governing institutions, including the CDC, have made the argument that schools should reopen, especially for the subgroup under 18 years old. Why, then is Immanuel being threatened to shut down? With the data presented above, I see no evidence-based reason why the government should take action against my children’s school.
My request is based on data from: the Centers for Disease Control, the Johns Hopkins University of Medicine Coronavirus Tracker, the American Academy of Pediatrics, the Infectious Diseases Society of America, the Journal of the American Medical Association, and the Fresno County Department of Health. These statistics are available publicly. Thank you for your valuable time and thoughtful consideration. Regards, Albert C. Mu, D.O.
8/20/2020 1:32:58 PM6

EXHIBIT “29”

1
2
3
4
5
6
7
8
9
10
11
12
13
14
15
16
17
18
19
20
21
22
23
24
25
26
27
28 1
DECLARATION OF PAUL ATMAJIAN IN SUPPORT OF OPPOSITION TO TEMPORARY RESTRAINING ORDER
TYLER & BURSCH, LLP Jennifer L. Bursch, State Bar No. 245512 [email protected] Cody J. Bellmeyer, State Bar No. 326530 [email protected] 25026 Las Brisas Road Murrieta, California 92562 Telephone: (951) 600-2733 Facsimile: (951) 600-4996
Attorneys for Defendants Immanuel Schools and Ryan Wood
SUPERIOR COURT OF THE STATE OF CALIFORNIA
FOR THE COUNTY OF FRESNO
COUNTY OF FRESNO through JEAN M, ROUSSEAU, in his official capacity as Emergency Services Director and County Administrative Officer
Plaintiff,
v.
IMMANUEL SCHOOLS., a California non-profit corporation; RYAN WOOD, Chief Executive Officer of Immanuel Schools and DOES 1 through 50, inclusive,
Defendants.
Case No.: 20CECG02447
DECLARATION OF PAUL ATMAJIAN IN SUPPORT OF OPPOSITION TO TEMPORARY RESTRAINING ORDER
Ex Parte Date: August 25, 2020 Time: 3:29 p.m. Dept. 501
I, PAUL ATMAJIAN, the undersigned, declare as follows:
1. I am over the age of eighteen years and I am not a party to this action. I am a licensed
M.D. I make this declaration based on my own personal knowledge and if called to testify as a
witness I could and would testify competently thereto.
2. I make this declaration in support of the Opposition to the Temporary Restraining
Order.
3. I have been licensed to practice medicine in the State of California since October 1,
1991. I obtained my bachelor’s degree in physics from California State University, Fresno. I

1
2
3
4
5
6
7
8
9
10
11
12
13
14
15
16
17
18
19
20
21
22
23
24
25
26
27
28 2
DECLARATION OF PAUL ATMAJIAN IN SUPPORT OF OPPOSITION TO TEMPORARY RESTRAINING ORDER
obtained my M.D. degree from UCLA. My internship was in pediatrics. During my medical
training I took one year off to be a medical volunteer in Armenia.
4. After volunteering in Armenia, I completed a residency in clinical pathology at Yale
New Haven Hospital. Clinical pathology relates to blood diseases, diagnostic chemistry, diagnostic
immunology, blood banking, and molecular diagnostics, among other topics. In order to complete
the residency program, I had to develop at least one test that could be used in the Yale New Haven
Hospital lab.
5. After completing my residency at Yale New Haven Hospital, I completed a
fellowship in hematopathology at UC Davis. Hematopathology is the study of blood, clotting,
lymph nodes, spleen, and related illnesses. During my fellowship, I developed a Western Blot
method for the identification of translocations common to Burkitt’s lymphoma. After completing
my fellowship at UC Davis, I stayed an additional two years and trained in surgical pathology,
which, at a practical level, primarily involves the microscopic interpretation of biopsies.
6. After completing the education and training described above, I worked as a general
pathologist for approximately 20 years. I was also the laboratory director for the Reedley Hospital
lab, the Selma Hospital lab, and the Fresno Surgical Hospital for several years. In short, I have
dedicated the majority of my medical career to blood tests and interpretation of biopsies for purposes
of diagnosing and combatting diseases including infectious diseases.
7. I conducted testing for antibodies directed to SARS-CoV-2, commonly referred to
as Covid-19 or the novel coronavirus (“Covid-19”) using blood samples obtained at petitioner
Immanuel School’s campus. Meaning, I was testing for individuals that had either already
contracted and defeated Covid-19 or were immune to Covid-19. I conducted the testing between
August 4, 2020 and August 13, 2020 by enzyme linked immunosorbent assay (ELISA).
8. The ELISA method I use for my testing is not unique. The basic method is well-
known and accepted within the medical and research communities. The ELISA is considered by
many to be the gold standard, although very time consuming and relatively expensive. The detailed
method upon which I based my test was published by researchers and medical professionals

1
2
3
4
5
6
7
8
9
10
11
12
13
14
15
16
17
18
19
20
21
22
23
24
25
26
27
28 DECLARATION OF PAUL ATMAJIAN IN SUPPORT OF OPPOSITION TO TEMPORARY RESTRAINING
ORDER
screening populations in Germany and New York City. I have attached a true and accurate copy of
the published screening protocol as Exhibit “30” to my declaration.
9. I modified the test and implemented steps to increase the sensitivity and specificity
of the test. I conduct my testing to RBD and S1 proteins at 37 degrees Celsius, which is body
temperature. I found by experimentation that conducting Covid-19 testing to detect IgG antibody
directed to RBD and S1 proteins at body temperature gave the best results. I am uncomfortable using
a test looking for IgG to those protein targets which is not conducted at normal body temperature.
10. I also found from my own observations that every person’s immune system may
respond differently in regard to antibody production upon infection with Covid-19. Each person
who is exposed to Covid-19 and overcomes the illness may develop antibodies to one or more of
the multiple antigenic targets on the virus. I am unable to predict the pattern. I know of cases in
which a whole family was infected, and a parent tested PCR+. The whole family was sick at the
same time, to varying degree, and all eventually recovered, usually children first, then parents. But
one month later, when everyone should have antibodies according to common wisdom, I could find
antibodies to one or more common antigenic targets in a parent’s blood, but not in a child’s blood.
I believe that not all the possible antigenic targets are known or understood yet. I believe that how
children respond to infection with Covid-19 is not fully known or understood yet. Therefore, it is
important to use more antigens in testing. I used three antigens in the research for Immanuel schools.
11. I don’t produce my own recombinant proteins. I purchase recombinant proteins, S1,
RBD, and N, from Raybiotech Inc., which is a highly specialized reputable company within the
medical research industry to ensure consistency of the proteins from lot to lot. I also purchase
antibody conjugates from them.
12. I don’t use dry milk as blocking agent although it is cheap; I found that 1.5%
Hammarsten Grade Casein works best, and that 5% ultrapasteurized lactose free fat free milk is
second best, with less nonspecific background. When I tested random patient samples against the
blocking agent alone, I found some persons had a reaction to something in the dry milk which might
lead to poor results. I also do not rely completely on the automatic plate washer. I found that
striking off after each wash gave cleaner results than only striking off after a cycle of 3 or 4 washes. 3

1
2
3
4
5
6
7
8
9
10
11
12
13
14
15
16
17
18
19
20
21
22
23
24
25
26
27
28 4
DECLARATION OF PAUL ATMAJIAN IN SUPPORT OF OPPOSITION TO TEMPORARY RESTRAINING ORDER
Some details of my modified test are included on page 2 of a letter I drafted and sent to Immanuel
School on or about August 13, 2020. A true and accurate copy of this letter is attached to this
declaration as Exhibit “31”.
13. To be clear, the changes I made to the protocol published by Stadlebaeur and others
only serve to improve it.
14. My test reporting methodology is a more stringent version of the aforementioned
published protocol. To test positive for Covid-19 antibodies with my test, I looked for either a
positive antibody result to two of the three antigens (114/198), or a positive antibody result to a
single antigen that is just simply too high to be ignored (2/198). With two exceptions, if a person
had antibody to only one antigen, I did not count that positive in my final reporting. This is because
so much is still unknown about Covid-19 that I wish to be very strict in final result reporting.
15. Furthermore, in testing the school population, I saw nothing to be gained by
sacrificing specificity for more sensitivity. If Covid-19 went through the school at a time when
there were no precautions in January or February 2020, we must expect a dramatically high number
of people to still have some detectable antibodies. The published figures for general populations
(not cruise ships or nursing homes) have typically been between 1 and 10 percent. It is common
laboratory practice to set test cutoff values to achieve a desired sensitivity and specificity. However,
a population exposure is not a matter of a few percent one way or another; it is a very dramatic
event. Therefore, for the intended purpose and for this project, I believe I was justified in being
very strict in the final reporting.
16. During my test development, a local Blood Center gave me samples from
previously PCR+ convalescent plasma donors and others; in return, I performed a titer for each one
of those samples. Titers showed previously minimally symptomatic plasma donors recovered from
Covid-19, could produce more antibodies than previously hospitalized patients. Subjective or
objective degree of illness does not appear to be correlated with the amount of antibody produced
or persisting after some months. It is not at all unusual that persons who did not feel sick, or were
not sick enough to be hospitalized, produce antibodies detectable months after exposure.

1
2
3
4
5
6
7
8
9
10
11
12
13
14
15
16
17
18
19
20
21
22
23
24
25
26
27
28 DECLARATION OF PAUL ATMAJIAN IN SUPPORT OF OPPOSITION TO TEMPORARY RESTRAINING
ORDER
17. My modified version of the test is easily re-creatable and can be conducted by a
fully trained medical or research laboratory professional in a properly equipped high level
laboratory. The reporting methodology may be adapted to suit the intended purpose.
18. I would expect that any research grade ELISA test, or a traditional FDA approved
test, proven over time (in contrast to most of the emergency use approved tests which were failures
and/or had their emergency use approvals withdrawn), will still be able to detect antibodies to all
three of the antigens I used, several months after a primary infection, when the test is properly
performed by skilled laboratory professionals. Given the highly disappointing experience of the
nation with antibody tests given only Emergency Use Authorization, I would not expect any useful
result from those kinds of tests.
19. Immanuel School administration and parents reported symptoms of Covid-19
infection around February 2020. I tested 198 individuals who had their blood drawn at Immanuel
School on August 4, 2020. My test showed a 59% positive rate for Covid-19 antibodies after 5
months. Because of the nature of Covid-19, I believe with reasonable medical certainty that if
anyone in a household tested positive, with no precautions having been taken (as was the case in
February 2020), the others in the household were likely exposed; this factor would raise the
exposure rate to higher than 59% of all individuals. Attached hereto as Exhibit “32” is a true and
accurate copy of a spreadsheet I created documenting the results of the 198 samples I took from
Immanuel School. The results in the spreadsheet accurately reflect the lab findings from the samples
from the Immanuel School testing project.
20. After I finished my work on the morning of August 13 and sent my final reports to
Mr. Wood, I made a reasonable attempt to share my findings with the CDC, the Department of
Public Health lab, and a presumed State of California lab. I was unable to reach the CDC after 4
attempts; their published phone number was always busy. I telephoned the Fresno County
department of Health and asked to speak to the laboratory director. According to the Department of
Public Health’s representative who answered the phone, the lab was destroyed by flooding. I was
not connected to any lab staff. I asked if important or special cases were sent to a state lab or directly
to the CDC. I was provided with a telephone number for the State lab reportedly located in 5


EXHIBIT “30” 8/20/2020 1:40:39 PM9

1
A detailed protocol for a serological assay to detect SARS-CoV-2 1 seroconversion in humans: antigen production and test setup 2
Daniel Stadlbauer1#, Fatima Amanat1,2#, Veronika Chromikova1, Kaijun Jiang1, Shirin 3 Strohmeier1,3, Guha Asthagiri Arunkumar1,2, Jessica Tan1,2, Disha Bhavsar1, Christina 4 Capuano1, Ericka Kirkpatrick1,2, Philip Meade1,2, Nichalle Britto1, Catherine Teo1, Meagan 5 McMahon1, Viviana Simon1,4,5, Florian Krammer1* 6
7 8
1Department of Microbiology, Icahn School of Medicine at Mount Sinai, New York, NY, USA 9 2Graduate School of Biomedical Sciences, Icahn School of Medicine at Mount Sinai, New York, 10 NY, USA 11 3Department of Biotechnology, University of Natural Resources and Life Sciences, Vienna, 12 Austria 13 4Global Health Emerging Pathogens Institute, Icahn School of Medicine at Mount Sinai, NY, 14 USA 15 5Division of Infectious Diseases, Department of Medicine, Icahn School of Medicine at Mount 16 Sinai, New York, NY, USA 17
18 *To whom correspondence should be addressed: [email protected] #contributed equally 20
21 22 23 24 25 26 27 28
Abstract 29 In late 2019, cases of atypical pneumonia were detected in China. The etiological agent was 30 quickly identified as betacoronavirus (named SARS-CoV-2) which has since caused a pandemic. 31 Several methods allowing for the specific detection of viral nucleic acids have been established 32 but only allow detection of the virus during a short period of time, generally during acute infection. 33 Serological assays are urgently needed to conduct serosurveys, to understand the antibody 34 responses mounted in response to the virus and last but not least for identifying individuals who 35 are potentially immune re-infection. Here we describe a detailed protocol for expression of 36 antigens derived from the spike protein of SARS-CoV-2 that can serve as substrate for 37 immunological assays as well as a two-step serological enzyme-linked immunosorbent assay 38 (ELISA). These assays can be used for research studies as well as for testing in clinical 39 laboratories. 40
41 42 43 44 45 46
8/20/2020 1:40:39 PM10

2
47 48
Introduction 49 50
Severe acute respiratory syndrome coronavirus 2 (SARS-CoV-2), the virus that causes 51 COronaVIrus Disease 2019 (COVID19), emerged in late 2019 in Wuhan, China1,2. The virus 52 rapidly spread globally causing a pandemic. Currently, no drugs or antivirals are available and 53 countermeasures are limited to non-pharmaceutical interventions (NPIs). Nucleic acid-based 54 tests for detection of the virus during acute disease are in use worldwide3,4. 55 However, the development of serological assays has been lagging behind due to lack of suitable 56 reagents. Serological assays are needed to perform serosurveys aimed at determining the real 57 infection rate and infection fatality rate in a given population. Furthermore, they are useful to 58 characterize the immune response to the virus in a detailed qualitative and quantitative manner. 59 In addition, serological assays are also of immediate practical use. They can be used to identity 60 individuals who were infected (including severe, mild and asymptomatic cases) and who are now 61 potentially immune. A recent study in non-human primates showed that reinfection, at least in the 62 small number of animals used in this study, does not occur5 once antibody responses have been 63 mounted. Infection with coronaviruses circulating in human populations such as HKU, NL63 etc. 64 also leads to immunity that protects from re-infection for months to years6. Therefore, individuals 65
Figure 1: Protocol overview.
8/20/2020 1:40:39 PM11

3
who have mounted an immune response to SARS-CoV-2 are likely immune, which means that 66 they are unlikely to transmit the virus to others. As an example, health care workers who are 67 immune can take care of COVID19 patients with minimal risk to themselves, their colleagues and 68 other patients. In addition, the use of convalescent serum may serve as valuable treatment option 69 for patients with severe COVID19, especially in the absence of other options. A serological assay 70 is critical for identifying potential blood donors. 71 The surface glycoprotein of the virus, termed spike (S) protein, mediates attachment of the virus 72 to human cells via its receptor binding domain (RBD)7 and mediates fusion of viral and cellular 73 membranes. Antibodies that bind to the spike protein, and especially to the RBD domain, can 74 neutralize coronaviruses. We used, therefore, different recombinant spike protein preparations as 75 antigen for our ELISA. We reported in our in earlier work that individuals not exposed to SARS-76 CoV-2 are completely naïve for the spike protein and show no reactivity in an ELISA8. It is, 77 therefore, easy to distinguish between exposed/immune and naïve people. 78 In this report, we provide detailed protocols for expressing the needed antigen(s) (Part I) as well 79 as for setting up the ELISA that we have developed (Part II) (Figure 1). We believe that this 80 protocol will be useful not only for research laboratories around the globe but also for testing in 81 diagnostic/clinical laboratories. The described protocol setup works well for us but it can easily be 82 modified, adapted to local needs and improved by the research community in the future. 83 Mammalian expression plasmids for the generation of the recombinant proteins are available from 84 the corresponding author. 85 86 Part I: Mammalian cell transfection and protein purification protocol 87 88 This protocol can be used for both expression vectors for the secreted RBD as well as a soluble 89 trimeric version of the SARS-CoV-2 spike protein. Expression levels of the RBD are very high in 90 our hands (>20 mg/l culture) while expression levels for the full length spike are lower 91 (approximately 1 mg/ml). Therefore, we use the recombinant RBD for initial screening ELISAs 92 and the full length spike for confirmatory ELISAs (as described in Part II). Preparation of plasmids 93 for mammalian cell expression is not described here. The plasmids all carry a betalactamase 94 (amp) resistance gene. They are grown in E. coli at 37°C (or 30°C) in shaker flasks over night. 95 High quality plasmid DNA can be obtained using commercially available maxiprep kits (ideally 96 with an endotoxin removal step). Importantly, other cell lines (293T, CHO etc.), other media, 97 transfection reagents and more sophisticated protein purification methods might be used as 98 alternatives. Of note, cells can also be transfected in regular flasks in regular incubators without 99 shaking. 100 101 MATERIALS 102
● Expi293 Expression Medium (Gibco #A1435102) 103 ● Opti-MEM™ I Reduced Serum Medium (Gibco #31985088) 104 ● ExpiFectamine™ 293 Transfection Kit (GIbco #A14524) 105 ● PBS (1X) (Gibco #10010-023 or equivalent) 106 ● Ni-NTA Agarose (Qiagen #30230 or equivalent) 107 ● SDS-PAGE gels (Bio-Rad #4561094 or equivalent) 108 ● SDS-PAGE cell and power supply 109 ● Sodium phosphate monobasic monohydrate NaH2PO4. H2O (Sigma Aldrich #S3522 or 110
equivalent) 111 ● Sodium Chloride NaCl (Sigma-Aldrich #S3014 or equivalent) 112 ● Imidazole (Sigma-Aldrich #I5513 or equivalent) 113
8/20/2020 1:40:39 PM12

4
● Disposable Polycarbonate Erlenmeyer Flasks (Corning #431147) 114 ● Trypan blue solution, 0.4 % (Gibco #15250-06 or equivalent)115 ● Cell counting slides (Invitrogen #C10312 or equivalent)116 ● 5mL Polypropylene columns (Qiagen #34964 or equivalent)117 ● Amicon™ Ultra Centrifugal Filter Units 10 kDa (MilliporeSigma #UFC901024 or118
equivalent)119 ● Amicon™ Ultra Centrifugal Filter Units 50 kDa (MilliporeSigma #UFC905024 or120
equivalent)121 ● Polypropylene sterile conical tubes122
○ 15 mL (Denville Scientific #C1018P or equivalent)123 ○ 50 mL (Fisher Denville Scientific #C1060P or equivalent)124
● Sterile, serological pipettes125 ○ 5mL (Falcon #356543 or equivalent)126 ○ 10mL (Falcon #357551 or equivalent)127 ○ 25 mL (Falcon #357535 or equivalent)128 ○ 50 mL (Falcon #356550 or equivalent)129
● Micropipette tips130 ○ 20 µL barrier tips (Denville Scientific #P1121 or equivalent)131 ○ 200 µL barrier tips (Denville Scientific #P1122 or equivalent)132 ○ 200 µL tips (USA Scientific #1111-1700 or equivalent)133 ○ 1000 µL barrier tips (Denville Scientific #P1126 or equivalent)134
● 1.5 mL Eppendorf tubes (Denville #C2170 or equivalent)135 ● Stericup Quick Release-GP Sterile Vacuum Filtration System (MilliporeSigma136
S2GPU05RE or equivalent)137 ● Pipet-Aid138 ● Micropipettes139 ● Class II biological safety cabinet140 ● Timer141 ● Countess II cell counter or equivalent142 ● CO2 incubator with built in shaker (Eppendorf New Brunswick S41i or Equivalent)143 ● Benchtop shaker (Benchmark #BT3000 or equivalent)144 ● Cooling Centrifuge (Eppendorf 5810R or equivalent)145 ● Refrigerator at 4°C (+/- 1°C)146 ● Ultra-Low Freezer (-80°C)147
148 DEFINITIONS 149
150 ● RBD = Receptor Binding Domain of SARS-CoV-2 (NR-52306)151 ● PBS = Phosphate-Buffered Saline152 ● RT = Room Temperature (18-25°C)153 ● MEM = Minimum Essential Medium154 ● DNA = Deoxyribonucleic Acid155 ● Ni-NTA = Nickel-Nitrilotriacetic acid156
157 PROCEDURE: 158
159 Transfection in mammalian cells: 160
8/20/2020 1:40:39 PM13

5
HEK 293F cells are counted using an automated cell counter (or a regular counting chamber) and 161 seeded at a density of 600,000 cells/ml in Expi293 expression medium. The viability of the cells 162 must be greater than 90% at all times. Cells are passaged every 3-4 days and incubated in an 163 orbital shaking incubator at 37°C and 125 RPM with 8% CO2. A maximum cell density of 4-5 x 164 106 cells/ml is recommended and at this point, cells should be immediately passaged. 165
Transfections are performed according to manufacturer’s instructions. 600 x 106 cells are 166 suspended in 200 ml of Expi293 expression media in a 1 L shaker flask. Twelve ml of Opti-MEM 167 is added to two 50 ml falcon tubes: one tube receives 200 ug (1 ug/ul) of respective plasmid DNA 168 (for RBD or full-length spike) while the other tube receives 640 ul of ExpiFectamine transfection 169 reagent. The contents of both the 50 ml Falcon tubes are mixed together and incubated at RT for 170 10 minutes after which the transfection mixture is added dropwise to the cells. Cells are then 171 returned to the shaking incubator. Sixteen hours post transfection, 1.2 ml of Expifectamine 293 172 Transfection Enhancer 1 and 12.1 ml of Expifectamine 293 Transfection Enhancer 2 is added to 173 the culture and subsequently, the culture is returned to the shaking incubator. 174
Three days post-transfection, the cells are harvested and spun at 4,000g for 20 minutes at 4°C. 175 The supernatant is filtered using a 0.22 um stericup filter, the cell pellet can be discarded. 176 Alternately, cells can be spun at 200g for 10 minutes, supernatant can be collected, and the same 177 cells can be resuspended in 200 mls of fresh Expi293 expression medium and returned to the 178 shaking incubator for another 3 days. This alternate strategy works well with the RBD but is less 179 suitable for the full-length spike (we have detected protein degradation in that case). 180
Ideally is the supernatant containing the protein is further processed immediately. Alternatively, if 181 it is stored, it must be kept at 4°C (and for no longer than overnight/16h) in order to prevent 182 denaturation of the protein at room temperature. 183
184
Protein purification via gravity flow: 185
Note: This step can be substituted with more advanced purification methodology if e.g. an Aekta 186 purifier is available. The methods described below work, even in labs not geared towards protein 187 purification. 188
Prior to use, Ni-NTA resin (6 ml per 200 ml culture) is washed with fresh PBS, then spun at 2000g 189 for 10 min in a centrifuge. Once the centrifugation is complete, PBS is discarded, and resin is 190 resuspended with the supernatant from cells and inverted about two or three times. The resin is 191 then incubated with the supernatant for 2 hours on a shaker at RT. 192
193 Two clean polypropylene columns are loaded with the supernatant-resin mixture and then washed 194 with Wash Buffer four times. Columns are then eluted using the Elution Buffer. Which contains a 195 high concentration of imidazole Four fractions are collected from each column by incubating the 196 resin in the column with 3 ml of Elution Buffer for each fraction. Eluate is collected directly in a 50 197 ml falcon tube placed on ice. The total volume of eluate should be 24 ml from the two columns. 198 More columns can be used to speed up the purification time depending on the volume of the 199 culture. 200
201 Eluate is spun through 10 kDa Amicon Centrifugal Filter Units (for RBD) or 50 kDa Amicon 202 Centrifugal Filter Units (for full-length spike) at 4000g for 30 minutes (or longer if eluate takes 203 longer to pass through the membrane) at 4°C until only 200-300 ul remain in the unit. The 204
8/20/2020 1:40:39 PM14

6
Centrifugal Filter Unit is then washed with PBS twice by centrifugation at 4000g for 30 minutes at 205 4°C (washing means filling up with PBS and centrifugation until the volume in the unit is down to 206 200-300ul again). Finally, the protein is collected from the Amicon centrifugal unit, concentration207 is measured (e.g. using Bradford reagent or similar methods), and a denaturing SDS-page is run 208 to check integrity of the purified protein. 209
210 After the elution step, protein is always kept on ice. For storage longer than 24h it should be frozen 211 to -80°C to avoid degradation. 212
213
Wash buffer (4L): 214
NaH2PO4. H2O 31.74 g 215 NaCl 70.16 g 216 Imidazole 5.44 g (final concentration is 20 mM) 217 Distilled water* 4L 218
219 220
Elution buffer (4L): 221 NaH2PO4. H2O 31.74 g 222 NaCl 70.16 g 223 Imidazole 64.0 g (final concentration is 235 mM) 224 Distilled water* 4L 225
226 *Use Distilled water filtered using a 0.22um stericup vacuum filtration system.227
228 229
Part II: A two-step ELISA protocol for high throughput screening of human serum 230 samples for antibodies binding to the spike protein of SARS-CoV-2 231
232 The purpose of this part of the protocol is to describe the procedure for measuring human antibody 233 responses to the recombinant receptor binding domain (RBD) of the spike protein or full-length 234 spike protein of SARS-CoV-2 and to ensure the reproducibility and consistency of the obtained 235 results. 236 We developed this as a two-step ELISA in which the first step (A) includes relatively high 237 throughput screening of samples in a single serum dilution against the RBD (which expresses 238 very well and therefore there is typically more protein available). This is followed by a second step 239 (B) in which positive samples from the first step undergo a confirmatory ELISA against the full240 length spike protein (which is harder to purify, therefore there is usually less available). For the 241 second step a dilution curve is performed. Typically, if only one operator is available, screening 242 ELISAs can be run in the morning (760 samples/10 plates per run) and confirmatory ELISAs can 243 be run in the afternoon (140 samples/10 plates per run). Of note, we describe the assay here as 244 set up in our laboratory. We use a plate washer and a plate reader but no automated system. The 245 protocol can be adapted to an automated liquid handler as well. In addition, one of the difficulties 246 to set up the assay is the availability of appropriate negative and positive controls. Negative 247 controls are easier to come by and can be serum pools of serum taken before 2020. Positive 248 controls can be convalescent samples from COVID19 patients or monoclonal antibodies (mAbs) 249 like CR30229,10. If no human sera or mAbs are available, mouse mAbs, mouse sera against 250 SARS-CoV-2, order animal sera against SARS-CoVo2 or anti-his tag antibodies (the proteins are 251 his-tagged) can be used. However, in this case a different secondary antibody for the species 252 from which the primary antibody is derived is needed for the positive control. Also, we recommend 253
8/20/2020 1:40:39 PM15

7
generating large batches of positive controls, which can be used for many runs. The positive 254 control should be selected to exceed an OD490 of the negative control plus 3 standard deviations 255 of the negative controls up to, at least, a 1:150 dilution. ELISAs can be run with both serum and 256 plasma. 257
258 Of note: RBD or full length spike might be used for both ELISA steps if only one antigen is 259 available. In addition, only step A (not recommended) or only step B might be performed if fewer 260 resources are available. 261
262 ● MATERIALS263
○ Recombinant RBD protein264 ○ Recombinant full-length spike protein265 ○ Flat-Bottom Immuno Nonsterile 96-Well Plates 4 HBX (Thermo Scientific #3855,266
or equivalent)267 ○ Flat Bottom Cell Culture Plates (Corning #3599 or equivalent)268 ○ Milk Powder (AmericanBio #AB10109-01000, or equivalent)269 ○ PBS (1X) (Gibco #10010-023 or equivalent)270 ○ Water For Injection (WFI) for Cell Culture (Gibco #A1287301 or equivalent)271 ○ Tween 20 (Fisher Bioreagents #BP337-500, or equivalent)272 ○ Phosphate Buffered Saline (10X) (Corning™ 46013CM or equivalent)273 ○ Polypropylene sterile conical tubes274
■ 15 mL (Denville Scientific #C1018P or equivalent)275 ■ 50 mL (Fisher Denville Scientific #C1060P or equivalent)276
○ Sterile, serological pipettes277 ■ 5mL (Falcon #356543 or equivalent)278 ■ 10mL (Falcon #357551 or equivalent)279 ■ 25 mL (Falcon #357535 or equivalent)280 ■ 50 mL (Falcon #356550 or equivalent)281
○ Micropipette tips282 ■ 20 µL barrier tips (Denville Scientific #P1121 or equivalent)283 ■ 200 µL barrier tips (Denville Scientific #P1122 or equivalent)284 ■ 200 µL tips (USA Scientific #1111-1700 or equivalent)285 ■ 1000 µL barrier tips (Denville Scientific #P1126 or equivalent)286
○ Sterile reservoirs (Fisher Scientific #07-200-127 or equivalent)287 ○ Anti-Human IgG (Fab specific)-Peroxidase antibody produced in goat (Sigma288
#A0293)289 ○ Hydrochloric Acid 3.0M (Fisher Scientific #S25856, or equivalent)290 ○ SIGMAFAST™ OPD (Sigma-Aldrich #P9187 or equivalent)291 ○ Kimberly-Clark Kimwipes (Kimberly-Clark Professional #34721 or equivalent)292 ○ Pipet-Aid293 ○ Micropipettes294 ○ Class II biological safety cabinet295 ○ Ultra-Low Freezer (-80°C)296 ○ Refrigerator at 4°C (+/- 1°C)297 ○ Multichannel pipette(s) capable of pipetting 50-250 µL298 ○ 1.5 mL Eppendorf tubes (Denville #C2170 or equivalent)299 ○ Timer300 ○ Aquamax 2000 Plate Washer (Molecular Devices #AQUAMAX 2000 or equivalent)301 ○ Biotek SynergyH1 Microplate Reader or equivalent302
303 ● DEFINITIONS304
8/20/2020 1:40:39 PM16

8
305 ○ RBD = Receptor Binding Domain306 ○ ELISA = Enzyme-Linked Immunosorbent Assay307 ○ PBS = Phosphate-Buffered Saline308 ○ PBS-T = Phosphate-Buffered Saline with 0.1% Tween 20309 ○ RT = Room Temperature (18-25°C)310 ○ HRP = Horseradish Peroxidase311 ○ HCl = Hydrochloric Acid312 ○ OPD = o-phenylenediamine dihydrochloride313
314 315
● A - RBD Screening ELISA316 317
1. Coating ELISA plates (day 1)318 ● Thaw the required number of vials of antigen (SARS-CoV-2 RBD protein) to coat 96-319
well microtiter ELISA plates at a concentration of 2 µg/ml. Once thawed, mix by gently320 vortexing vial before diluting in 1X PBS.321
● Prepare approximately 5 mL for each plate to be coated.322 ● Coat plates with 50 µl of diluted protein per well using a multichannel pipette and a323
reservoir. Lightly tap plates against surface to ensure protein is evenly coating the324 bottom of every well.325
● Incubate at 4°C overnight. Plates can be stored at 4°C for up to 1 week.326 ● Always keep a cover plate on top of coated plates during all steps of the protocol!327
328 2. Heat inactivation of samples (day 1, this is a safety precaution)329
● Set the water bath to 56°C. Once temperature is reached, place the serum/plasma330 samples in and start the timer for 1h immediately.331
● Remove samples when the timer goes off. Do not leave samples at 56°C for longer332 than 1h. Store at 4°C overnight or until use.333
334 3. Block ELISA plate (day 2)335
● Calculate to prepare at least 30 ml of blocking solution per plate.336 ● Blocking solution consists of PBS-T + 3% milk powder (weight/volume).337 ● Using an automated plate washer, wash coated ELISA plates 3x with PBS-T.338 ● Add 200 µl blocking solution to all wells of the plates, starting the timer for 1h (do not339
exceed 4h) after completing the first plate. Place plates in a 20°C (RT) incubator.340 Note: This step (and wherever a plate washer is needed below) can also be performed341 by washing plates with a multichannel pipette by hand if no plate washer is available.342
343 4. Pre-diluting samples (day 2)344
● In a biological safety cabinet, set up sterile Eppendorf tubes to pre-dilute serum345 samples 1:5.346
● Add 40 µl of sterile 1X PBS to all tubes.347 ● Gently vortex serum sample to mix and add 10 µl to the Eppendorf tube, vortexing348
once more. Do this for all remaining samples including the positive and negative349 controls. Volume not needed in this part A will be stored and used for part B.350
351 5. Dilution plate set-up (day 2)352
● Calculate and prepare at least 30 ml of PBS-T + 1% milk powder (weight/volume).353
8/20/2020 1:40:39 PM17

9
● Prepare 1 dilution plate (separate flat bottomed cell culture plate) per antigen coated 354 plate prepared.355
● Add 180 µl of PBS-T containing 1% milk to all wells of the dilution plate (including blank356 wells)357
● Leaving Columns 1 and 12 as blanks, add 20 µl of sample (or control) into the358 designated well. This results in a final serum dilution of 1:50.359
● Continue until all samples and controls have been added to designated wells. See360 reference plate layout below.361
362 363
364 365 366
6. Transfer serum dilution (day 2)367 ● After blocking incubation, remove plates from the room temperature incubator and368
throw off the blocking solution. Tap the plates dry on a kimwipe.369 ● Using a multichannel pipette, pipette up and down 4-6 times in the first row of dilution370
plate to mix.371 ● Transfer 100 µl to the corresponding rows in the ELISA plate. Change tips and372
continue to transfer second row to the ELISA plate.373 ● Start the timer for 2h as soon as all the rows have been transferred to the first ELISA374
plate. (Do not exceed 4h)375 ● Place plates in a 20°C (RT) incubator.376
377 7. Secondary Antibody (day 2)378
● After 2h, wash the plates 3x with PBS-T using the automated plate washer.379 ● Dilute anti-human IgG (Fab specific) HRP labeled secondary antibody 1:3000 in PBS-380
T containing 1% milk. Prepare at least 5 ml per plate.381
8/20/2020 1:40:39 PM18

10
● Add 50 µl to all wells of the plate using a multichannel pipette. Be sure to avoid382 touching the tips of the pipette to the walls of the well to avoid carry over and high383 background signals.384
● Start the timer for 1h (stay in a range of 50min to 65min) as soon as the secondary385 antibody has been added to the first plate. Place plates in a 20°C (RT) incubator.386
387 8. Plate development and reading (day 2)388
● After 1h, wash plates 3x with PBS-T using an automated plate washer.389 ● Prepare SigmaFast OPD solution and calculate amount needed. One set of tablets (1390
gold + 1 silver tablet) dissolved in 20 ml WFI can be used for 2 plates.391 ● Fully dissolve one gold tablet in 20 mL WFI. Do not add silver tablet to solution until392
ready to start adding to the plates (needs to be prepared fresh right before use).393 ● Add 100 µl to all wells of the plate. Begin timer for 10 minutes as soon as OPD has394
been added to the first row on the first plate. Do not exceed 10 minutes of developing395 before stopping the reaction.396
● To stop the reaction after exactly 10 minutes, add 50 µl of 3M HCl to all wells.397 ● Read ELISA plates in plate reader at an absorbance of 490 nm (immediately after398
adding HCl) and record data.399 ● Samples that exceed certain OD490 cutoff value (proposed cutoff: OD490 = 0.15-0.2 or400
mean of negative controls plus 3 times the standard deviation of the negative controls)401 are assigned presumptive positive and will be tested in confirmatory ELISA using full-402 length spike protein.403
● OD490 cutoff has to be experimentally determined and depends on assay background404 and noise.405
406 407
● B - Spike confirmatory ELISA408 409
1. Coating ELISA plates (day 1)410 ● Thaw the required number of vials of antigen (SARS-CoV-2 Spike protein) to coat 96-411
well microtiter ELISA plates at a concentration of 2 µg/ml. Once thawed, mix by gently412 vortexing vial before diluting in 1X PBS.413
● Prepare approximately 5 mL for each plate to be coated.414 ● Coat plates with 50 µl of diluted protein per well using a multichannel pipette and a415
reservoir. Lightly tap plates against surface to ensure protein is evenly coating the416 bottom of every well.417
● Incubate at 4°C overnight. Plates can likely be stored in 4°C for up to 1 week but this418 needs to be validate locally to ascertain that it does not change rhe results.419
420 421
2. Block ELISA plate (day 2)422 ● Calculate to prepare at least 30 ml of blocking solution per plate.423 ● Blocking solution consists of PBS-T + 3% milk powder (weight/volume).424 ● Using an automated plate washer, wash coated ELISA plates 3x with PBS-T.425 ● Add 200 µl blocking solution to all wells of the plates, starting the timer for 1 h (do not426
exceed 4h) after completing the first plate. Place plates in a 20°C (RT) incubator.427 428
3. Pre-diluting samples (day 2)429 ● Retrieve 1:5 pre-diluted samples from Part A to be tested and confirmed (samples that430
are above certain threshold in RBD screening ELISA based on a set OD490 value –431 see end of A).432
8/20/2020 1:40:39 PM19

11
433 434
4. Serial dilution (day 2) 435 ● Calculate and prepare at least 20 ml of PBS-T + 1% milk powder (weight/volume) per 436
plate. 437 ● After blocking incubation, remove plates from the room temperature incubator and 438
throw off the blocking solution. Tap the plates dry on a kimwipe. 439 ● Using a multichannel pipette, add 120 µl of PBS-T containing 1% milk to all wells of 440
the plate. 441 ● Leaving Columns 1 and 12 as BLANKS, add an extra 51 µl only to Columns 2 and 7 442
(=sample wells). 443 ● Add 9 µl of 1:5 pre-diluted sample (final dilution 1:100 on the plate) to the first well in 444
Column 2 and continue to add samples to all 8 wells. In Column 7, add samples to 445 wells 1 through 6. Transfer positive and negative control into wells 7 and 8, 446 respectively. See reference plate layout below. 447
● With the multichannel pipette, pipette up and down 4-6 times in Column 2 to mix. 448 Discard these tips. With new tips, transfer 60 µl (3-fold dilution) from Column 2 to 449 Column 3 and pipette up and down once 4-6 times to mix. Repeat this until Column 6; 450 discard 60 µl before Column 7. 451
● Taking fresh tips mix Column 7 by pipetting. Repeat the same process of transferring, 452 mixing, and discarding tips from Columns 7-11. Once Column 11 is reached, discard 453 60 µl. 454
● Start timer for 2h (do not exceed 4h) once the first ELISA plate has been serially 455 diluted. 456
● Place plates in a 20°C (RT) incubator. 457 458
459
8/20/2020 1:40:39 PM20

12
460 461
5. Secondary Antibody (day 2)462 ● After 2h, wash the plates 3x with PBS-T using the automated plate washer.463 ● Dilute anti-human IgG (Fab specific) HRP labeled secondary antibody 1:3000 in PBS-464
T containing 1% milk. Prepare at least 5 ml per plate.465 ● Add 50 µl to all wells of the plate using a multichannel pipette. Be sure to avoid466
touching the tips of the pipette to the walls of the well.467 ● Start the timer for 1 h (50 – 65 min) as soon as the secondary antibody has been468
added to the first plate. Place plates in a 20°C (RT) incubator.469 470
6. Plate development and reading (day 2)471 ● After 1h, wash plates 3x with PBS-T using an automated plate washer.472 ● Prepare SigmaFast OPD solution and calculate amount needed. One set of tablets (1473
gold + 1 silver tablet) dissolved in 20 mL WFI can be used for 2 plates.474 ● Fully dissolve one gold tablet in 20 mL WFI. Do not add silver tablet to solution until475
ready to start adding to the plates.476 ● Add 100 µl to all wells of the plate. Begin timer for 10 minutes as soon as OPD has477
been added to the first row of the first plate. Do not exceed 10 minutes of developing478 before stopping the reaction.479
● To stop the reaction after exactly 10 minutes, add 50 µl of 3M HCl to all wells.480 ● Read ELISA plates in plate reader at an absorbance of 490 nm (immediately after481
adding HCl) and record data.482 ● True positive samples will have a signal higher than the negative control plus 3483
standard deviations of the negative controls in at least two consecutive dilutions.484 485 486
Acknowledgements 487 488
We thank Dr. Raffael Nachbagauer (Icahn School for Medicine at Mount Sinai) and Dr. Aubree 489 Gordon (University of Michigan) for critical reading and constructive comments. Development of 490 this protocol was partially supported by the NIAID Centers of Excellence for Influenza Research 491 and Surveillance (CEIRS) contract HHSN272201400008C. 492 Philanthropic donations in support of our work are much appreciated since the reagents are 493 shared free of charge with the scientific community. Please contact Vanes Saric 494 ([email protected]) for further information. 495
496 References 497
498 1. Zhu, N., et al. A Novel Coronavirus from Patients with Pneumonia in China, 2019. N Engl 499
J Med 382, 727-733 (2020). 500 2. Wu, F., et al. A new coronavirus associated with human respiratory disease in China. 501
Nature (2020). 502 3. Corman, V.M., et al. Detection of 2019 novel coronavirus (2019-nCoV) by real-time RT-503
PCR. Euro Surveill 25(2020). 504 4. Chu, D.K.W., et al. Molecular Diagnosis of a Novel Coronavirus (2019-nCoV) Causing an 505
Outbreak of Pneumonia. Clin Chem (2020). 506 5. Bao, L., et al. Reinfection could not occur in SARS-CoV-2 infected rhesus macaques. 507
bioRxiv, 2020.2003.2013.990226 (2020). 508
8/20/2020 1:40:39 PM21

13
6. Callow, K.A., Parry, H.F., Sergeant, M. & Tyrrell, D.A. The time course of the immune509 response to experimental coronavirus infection of man. Epidemiol Infect 105, 435-446510 (1990).511
7. Wrapp, D., et al. Cryo-EM structure of the 2019-nCoV spike in the prefusion conformation.512 Science (2020).513
8. Amanat, F., et al. A serological assay to detect SARS-CoV-2 seroconversion in humans.514 medRxiv, 2020.2003.2017.20037713 (2020).515
9. Tian, X., et al. Potent binding of 2019 novel coronavirus spike protein by a SARS516 coronavirus-specific human monoclonal antibody. Emerg Microbes Infect 9, 382-385517 (2020).518
10. ter Meulen, J., et al. Human monoclonal antibody combination against SARS coronavirus:519 synergy and coverage of escape mutants. PLoS Med 3, e237 (2006). 520
521
8/20/2020 1:40:39 PM22

EXHIBIT “31” 8/20/2020 1:40:39 PM23

Paul Atmajian, M.D. EIV Diagnostics 1477 E. Shaw #170 Fresno, CA 93710 (559) 777-7117 August 13, 2020 Dear Mr. Wood Thank you for the opportunity to work together. I hope to have our results published, without mentioning the name of the school, when I get time to write it up.
The final tally is in Excel format. We assigned a number to each volunteer’s sample, and, in keeping with HIPAA privacy rules, have disclosed detailed results only to the individuals in paper format. The following is a summary of the work we performed: We adapted an ELISA (Enzyme Linked Immunosorbent Assay) protocol published by Stadlbaeur et al: (A serological assay to detect SARS-CoV-2 seroconversion in humans, Nature Medicine, 26 (1033-1136) (2020). This was used widely in Germany and New York. I am attaching the article for your convenience. The basic principle is illustrated in the following image(biosciencenotes.com):
8/20/2020 1:40:39 PM24

We made changes to the published protocol which optimized results. These included:
1. Purchase of SARS-Cov2 recombinant proteins (S1, RBD, N) from Raybiotech (Peachtree Corners, GA).
2. Purchase of antibody conjugate (HRP-Anti-human Fc) from Raybiotech (Peachtree Corners, GA)
3. Use of high binding microtiter plates from Nunc (Denmark). 4. Use of Hammarsten Casein (Bioworld, Dublin Ohio); 1.25- 1.5% mixed in 1
X PBS pH 7.2-7.4 as blocking agent. 5. We checked samples of patient plasma to assure they did not significantly
react directly with the blocking agent. 6. Use of 1 ug/ml antigen coating in pH 9.6 bicarbonate buffer. 7. Striking off the microtiter plates after every wash by hand. 8. Performance of tests for S1 and RBD at 37 degrees. 9. No use of the edges of the plates at 37 degrees. 10. We performed most confirmation work at 1:160 or 1:200, so that results
would be accurate and reproducible within one dilution (1:80- 1:320).
We used positive and negative samples from previously PCR positive or negative convalescent patients (Central California Blood Center) for evaluation of the basic procedure.
We strived to produce results which could be interpreted visually, but resorted to the spectrophotometer for resolution of difficult interpretations. For example, the following photo is a microtiter plate used for confirmation. Note that the edges are not used. Each well represents a volunteer sample at 1:160 dilution. The reaction has been stopped with acid after 6 minutes incubation with the substrate. All of the bright yellow wells are interpreted as positive. The weaker or absent color is interpreted as negative. We know what sample is in which well because we create a map of the plate.
8/20/2020 1:40:39 PM25

The following photo illustrates dilutions. We recommend dilutions at 37 degrees Celsius to determine titers, and to avoid cutting corners. The edges of the plate, including the first and last column are not used. In the second column, samples 1-6 (top to bottom, row B-G) are added to the coated and blocked well at a 1:40 dilution. Then the sample is diluted to 1:80 into column 3, 1:160 into column 4 and 1:320 into column 5. Column 6 shows the 1:40 dilutions for samples 7-12; these are diluted out as previously described in columns 7,8, and 9. Columns 10 and 11 contain negative controls (ROWS B, C, D) and the highest positive control I have (ROWS E,F,G). In this example samples 2,3,5,and 12 are interpreted as negative. The spectrophotometer shows 7 is weaker than the other positives, although stronger than the obvious negatives at a wavelength of 450 nm.
The test is extremely sensitive and will not detect antibody except to the target antigens. Just as in samples from the Central California Blood Center, we found a dramatic range in individual antibody responses. Each individual appears to respond in a different way to exposure to the virus. Every person who is exposed and recovers does NOT produce antibody to RBD, or S1, or N protein. There must also be an antigenic target or targets to which some people respond of which the scientific community is
8/20/2020 1:40:39 PM26

simply not yet aware. Some people who were in the same household as PCR+ persons, and were ill do not necessarily have detectable antibody to the common antigens in use, yet some had minimal symptoms and recovered in a few days.
We tested each sample for antibody to S1 Subunit of the Spike protein, RBD antigen alone, and Nucleocapsid (N) protein. To call a final result positive, we required two positive results, or a single result so high that it simply could not be ignored.
The literature mentions use of what we consider artificial cut-offs and appears highly biased to detect very high antibody levels. A primary response tends to produce a lower antibody level. Extremely high levels are achieved only with an anamnestic response. Furthermore, as antibody levels drop off over time, an individual result which may have been positive 1 month after symptoms started, may drop to undetectable after 3 months. The antigens used are so specific, that we consider ANY result at a working titer of 1:160 or higher dilution as significant.
If you believe the health department is interested in science and facts, rather than something else, I would advise offering the volunteer samples to them immediately before significant deterioration can occur. They have been kept refrigerated, but will not survive indefinitely; we can freeze the plasma, but freezing and thawing is not beneficial to antibodies either. I would be willing to share a detailed protocol which would allow the state laboratory or any legitimate laboratory to reproduce our results.
As usual, if you have any questions, please call me on my cell phone at (559) 970-4803 as I generally do not function well with texts and emails, and do much better by telephone or face to face.
Best Regards,
Paul Atmajian, M.D.
8/20/2020 1:40:39 PM27

EXHIBIT “32” 8/20/2020 1:40:39 PM28

;g
'<?)a.
iSoa>•0
LIJI-Oz
</>
oCM
fO
Oi
ir
(0<0OO<0OW«0(0<0t0C0OC0(/>a)C/5C0C0C0C/>OWOC0OC0OC0«0C)V>W05Wa)OC/>OOOC'5W5C0C0C0CDOC0C0OOW00C0WOWOOWWOWW
uJOuJUJOlUOOOOOOuJOOOOOOOOuJOuJOuJOiuOOuJOOOOOujOujiiJiuOOOOOiUUJOOiiiiuOOOOuJOuJiuOOiuOO
Q:Q.ZZQ.ZQ.OLCLCL.Q.a.ZQ.Q.Q.Q.Q.Q.Q.Q.ZQ.ZCLZCLZQ.CLZQLO.O.Q.Q.ZQ.ZZZQ.Q.Q.Q.Q.ZZQ.CLZZQ.CLQ.Q.ZQ.ZZQ.Q.ZaQ.
c^WOOOOOTWOTOOTOTOWOTOTOTWOTWtOOWOWOWOTWWOWOTOWOWOTOOt^OOTWMWOWWtOOTCOOTWWOTOWCDOtOOTWWM
'VOuJUJUJiilOOOliJOOuJOOOOOOOOuJOuJOiiJOOOOUJOOtiJOuJOOlilliJOuJOOOOuJOOOOOOOOOuJOuJUJOOOOO
zazzzza.a.a.za.Q.ZQ.a.Q.Q.a.aQ.CLZQ.zoLzaa.a.Q.ZQ.a.ZD.zcLa.zZQ.zaQ.Q.D.ZQ.a.a.Q.a.Q.Q.a.o.za.zZQ.CLQ.aa.
QWOOWOWOTWOWWOOTWWWWrotOWOWOWWOOCDOTOOTOWWWOWOCaOWWWtOWOOWWOOWOOTWOWCOOOTCDWWW
coOiiJUJOiiJOOOUJOOuJOOOOOOOOiiJOuJOOiiJiiiuJOliiOuJOOOuJOliJliJtiJOOOOOiutuOOiiJliJOiilOOliJOOliJOliJOOO
Q:Q,zzcLza.Q.a.ZQ.aza.a.Q.a.CLCLacLZQ.za.Q.zzZQ.za.ZQ.a.a.ZQ.zzzcLQLCLa.a.zza.Q.zzQ.Z(LD.ZQ.a.ZQ.za.Q.a.
(OOOWCDOTfSwWOTWOWWmOOOWWCSWCDOTOWOWtOOWOWWWOWOOOWWWOWCaOfjjwOOtOOTWCOOOTOWWOJOOW
,-OiuiuoiiiOyjOOOOuiOOOuJUJtuOOuJOiiiOiiiOiiiOOiiJOiuOOOuJOiiiiuujOOOiuOuJiutfouJUJOOOOiiiOujOOOuiujO
ua.zZQ.za.sa.Q.Q.QLZaaa.zzza.a.zQ.ZQ.ZQ.za.Q.ZQ.za.Q.azazzza.a.a.zQ.zzsa.zzQ.Q.Q.azQ.ZQ.a.azzaL
c^-
Oz-jouji3o[3ooooooi3ooooooooi3o[3ooooooi2oooooooijjujooooooiuooooooooo3oooooooo
<Z>>Z>-ZZZZZZ>-ZZZZZZZZ>-Z>-ZZZZZZ>ZZZZZZZ>>-ZZZZZZ>-ZZZZZZZZZ>-ZZZZZZZZ
q:
UJmI-z3_1
O>
fMco^*n<or^coo>o^cMco^iotor^<oo>OT-c>jco^tf><Dh^<3OO>o^fMrt^»rt<or^coo>o^eM<o^tf)*Df^cooo*-<Mcov*n<Of^co0>o^cMrt^
^^^^t-T-i-^i-i-CMCM<M(N<MCMfM(MCM<MCOCO«OncOCOr)COcOcO^^^^'^M''M'M'Tr-^inU>miOU>U^iniOmtr>tOID<DtD«D
8/20/2020 1:40:39 PM29

8/20/2020 1:40:39 PM30

8/20/2020 1:40:39 PM31

8/20/2020 1:40:39 PM32

EXHIBIT “33”

1
2
3
4
5
6
7
8
9
10
11
12
13
14
15
16
17
18
19
20
21
22
23
24
25
26
27
28
1 DECLARATION OF RYAN WOOD IN SUPPORT OF OPPOSITION TO TEMPORARY RESTRAINING
ORDER
TYLER & BURSCH, LLP Jennifer L. Bursch, State Bar No. 245512 [email protected] Cody J. Bellmeyer, State Bar No. 326530 [email protected] 25026 Las Brisas Road Murrieta, California 92562 Telephone: (951) 600-2733 Facsimile: (951) 600-4996 Attorneys for Defendants Immanuel Schools and Ryan Wood
SUPERIOR COURT OF THE STATE OF CALIFORNIA
FOR THE COUNTY OF FRESNO
COUNTY OF FRESNO through JEAN M, ROUSSEAU, in his official capacity as Emergency Services Director and County Administrative Officer
Plaintiff,
v. IMMANUEL SCHOOLS., a California non-profit corporation; RYAN WOOD, Chief Executive Officer of Immanuel Schools and DOES 1 through 50, inclusive,
Defendants.
Case No.: 20CECG02447 DECLARATION OF RYAN WOOD IN SUPPORT OF OPPOSITION TO TEMPORARY RESTRAINING ORDER Ex Parte Date: August 25, 2020 Time: 3:29 p.m. Dept. 501
I, RYAN WOOD, declare as follows:
1. I am over the age of eighteen years and I am the Superintendent of Petitioner
Immanuel Schools (“Immanuel”). I make this declaration based on my own personal knowledge
and if called to testify as a witness I could and would testify competently thereto.
2. I make this declaration in support of the Opposition to the Temporary Restraining
Order.
3. I have a Bachelor of Arts in Communicative Disorders and a Master’s Degree in
Educational Leadership. I have worked at Immanuel for over 25 years as both a teacher and

1
2
3
4
5
6
7
8
9
10
11
12
13
14
15
16
17
18
19
20
21
22
23
24
25
26
27
28
2 DECLARATION OF RYAN WOOD IN SUPPORT OF OPPOSITION TO TEMPORARY RESTRAINING
ORDER
administrator. As the Superintendent of Immanuel I oversee all aspects of its operations, including,
but not limited to, academics, admissions, finances, athletics, and spiritual development of our
students.
4. In March 2020, Immanuel complied with Governor Newsom’s orders to conduct
school via distance learning. We anticipated the students would remain at home for 15 days and
then return to complete the school year. The students did not return to school for in-person
instruction to complete the 2019-2020 school year.
5. During the in-person closure, Immanuel created an excellent support system for its
students. We received compliments from many parents regarding our efforts to avoid disrupting
their student’s education. However, many of those same parents have informed us that they are
unwilling to pay tuition if school is online only again.
6. Nearly all of Immanuel’s revenue is generated from tuition, fees, and fundraising.
Immanuel has received State Title 2 funds in the past for professional development for our teachers,
but declined any state funding for the 2020-2021 school year.
7. Prior to the pandemic, Immanuel was already in a tight financial situation due to a
recent initiative to build a new elementary campus. If Immanuel is not permitted to hold in-person
instruction, I anticipate we will have several families withdraw their students. In turn, I anticipate
Immanuel will have to lay off teachers and staff because of the reduced tuition. By laying off
employees it will affect the quality of education and experience for students and will make it more
difficult to retain students in the future.
8. At the start of the summer, I worked closely with my administration team, which
includes the Chief Administrative Officer, High School Principal, Junior High Principal, Elementary
Principal, Athletic Director, and the Business Director, to develop a reopening plan for the 2020-
2021 school year. We took the local, state, and federal guidelines and began creating a plan to safely
reopen the school.
9. In addition to working with the administration, we worked with parents of our
students to develop a reopening plan. We conducted a survey of our parents and documented their

1
2
3
4
5
6
7
8
9
10
11
12
13
14
15
16
17
18
19
20
21
22
23
24
25
26
27
28
3 DECLARATION OF RYAN WOOD IN SUPPORT OF OPPOSITION TO TEMPORARY RESTRAINING
ORDER
responses in a spreadsheet that we used to help develop the reopening guidelines. Attached as
Exhibit “34” to this declaration is a true and accurate copy of the documented survey responses we
created. We also conducted a live Zoom call with the parents to address their questions and
concerns.
10. After a thorough evaluation of the parents’ concerns, the various county guidelines,
and Immanuel’s traditional operations, we created the reopening plan for 2020-2021. A true and
accurate copy of the reopening plan is attached hereto as Exhibit “35”. It took us weeks to develop
this plan and we sent it out to all parents for their review and consideration prior to committing their
student to attending Immanuel for the 2020-2021 school year.
11. The reopening plan calls for Immanuel to provide PPE for each classroom, office
space, and common areas. Immanuel hired a school nurse to help monitor the student population,
manage Covid-19 requirements, and take the lead on contact tracing.
12. In order for a student to enroll for in-person instruction at Immanuel for the 2020-
2021 school year, we require the parents of the student to review the reopening plan and sign off
that they are satisfied with the safety precautions Immanuel has developed.
13. I must commend my teachers for their efforts in providing a suitable online teaching
experience to our students during Spring 2020. However, teachers, parents, and students have all
echoed the same message. Online learning is not the same. This was repeated to me countless times
during the school year and the same message has followed me during the summer.
14. Our teachers choose to teach at Immanuel because they love the Lord, love their
students, and love teaching. Their love is best expressed in person.
15. For most of our students, it is clear that online education is not a substitute for in-
person instruction. A child’s education is not just about academics. An education involves aiding
a child’s physical, emotional, and spiritual development. Undoubtedly the “non-academic”
development for our students suffered significantly as they were cut off from their teachers and
classmates and were stuck at home in front of a screen. Moreover, we saw significant decreases in
with a lot of our students’ academic performance once we switched to distance learning.

1
2
3
4
5
6
7
8
9
10
11
12
13
14
15
16
17
18
19
20
21
22
23
24
25
26
27
28
4 DECLARATION OF RYAN WOOD IN SUPPORT OF OPPOSITION TO TEMPORARY RESTRAINING
ORDER
16. Immanuel’s curriculum includes hands-on classes, such as shop class, culinary arts,
architecture, choir, drama, and athletics. It is impossible to adequately teach these classes to our
students via distance learning. There are many students that learn significantly better when using
their hands as opposed to just readying and memorizing facts, theories, formulas, or rules. These
students are suffering the most during this closure.
17. Immanuel is also a place where our students learn to get along with others, serve one
another, listen to authority figures, deal with disappointment, handle success, failure, and conflict.
The personal interaction that leads to this variety of situations does not exist in the online learning
environment. Immanuel’s students are missing a crucial aspect of their education when they are
stuck at home in front of a screen.
18. It is clear to me the prohibitions against providing in-person instruction is creating
serious problems for our children that will have negative long-term effects as they are unable to
fully develop while stuck at home in front of a screen.
19. It is my belief that Covid-19 spread through Immanuel prior to the March closures.
As detailed in Dr. Amtajian’s declaration, Immanuel students were tested for antibodies. In January
and February 2020, we had a significant surge in absences as compared to the same months in
previous years. For January 2020, 8 of our 13 grades had at least 40% of students record an absence
in the month, including 5 of the grades which had a 50% absent rate. In February 2020, 8 of our 13
grades had at least 50% of the students record an absence in the month. In total we had 1,129
recorded absences in January and February 2020, which is a significant uptick from the 831, 857,
and 819 we saw in January and February 2017, 2018, and 2019 despite similar enrollment numbers
across all years. Attached hereto as Exhibit “36” is a true and accurate copy of a spreadsheet I
created documenting absences for the 2015-2016 school year through the 2019-2020 season.
20. Immanuel Schools has contracts with the parents of each enrolled student to provide
a Christian based education. Immanuel Schools’ ability to complete its contractual obligations and
continue existing may be in jeopardy if Immanuel Schools is unable to provide in-person learning
to its students.

1
2
3
4
5
6
7
8
9
10
11
12
13
14
15
16
17
18
19
20
21
22
23
24
25
26
27
28
5 DECLARATION OF RYAN WOOD IN SUPPORT OF OPPOSITION TO TEMPORARY RESTRAINING
ORDER
21. The Board of Immanuel Schools engaged in numerous conversations regarding the
disparate impact on students of not reopening for in-person instruction. I understand the risks of
COVID but believe, based on the California Department of Public Health and CDC guidelines, that
our Return to School plan properly provided accommodations for student and family safety. Upon
weighing our options, the Board decided, in conjunction with the independent antibodies studies
conducted on our school grounds, that the disparate impact on students learning far outweighed the
risks on opening with on-campus instruction.
22. I have discussed with parents who told me and school staff that home education
became burdensome, forcing families to choose between their child’s education and financial
stability. I believe this should be a choice for families to make, not a mandate forced upon families
through government officials.
23. I noticed a strain and tension on the student population as parents struggled to help
with Zoom conferences, homework, and technological issues.
24. Parents from Immanuel Schools report that their students are sad, disconnected,
depressed, and worried during the distance learning model. Since returning, those same parents
report that their children are smiling, happier, and more motivated. The social and relational aspect
is a much needed component of education and to eliminate that was a detriment to the students
emotional and spiritual development, not to mention the academic struggles created by being online.
25. I believe the implementation of distance learning for the 2020-2021 school year may
place Immanuel Schools in a position where they may not recover financially and could not meet
the contractual obligations to provide education to the parents.
26. As we talked with families during the end of last school year and this summer, it
became apparent that the majority of our families did not want to engage in distance learning for the
2020-21 school year. I understood the importance of providing an on-campus education for our
families because it was unlikely that a lot of our families would be willing to pay tuition for an
online education when they could get that for free. Immanuel Schools projects a loss of 10% of our
student population if we started the year with online education only and would need to offer a 20%
reduction in tuition costs for those who remained. This would immediately institute the laying off


EXHIBIT “34” 8/20/2020 5:35:11 PM7

Faci
al masKs are currently
mandated for all students in
lire
slate of Cal
ifor
nia.
If
that
mandate is not lif
ted,
will th
is
affect you
r de
cisi
on to send
your chi
ld to school?
No
Unsure
Yes
Would like in classroom or
distance learning op
tion
until
vaccines are available
Yes
. ̂
...
Chapel is an essential par
t of the Immanuel
mask^da^SewlT"
experi
ence.
Are y
ou con
cerned
a.»ut
your
child'
smask ai
l day
. please e
xpiam wny.
participation i
n Cha
pel s
ervices?
as long as there is so
cial
distancing
My chi
ld has asthma and can be difficult to wear mask
and breathing can be a pos
sibl
e is
sue,
but
would hope Can some social distances be im place?
tfra
t my can get
by wit
h a mask on.
I don't l)e
liev
e it is healthy for a number of educated
reas
ons why, I f
eel like the psy
chol
ogic
al emo
tion
aleffects will not t>e
known until Much later (mental
health issue, lack of contact, dep
ress
ion,
separation)
Chapel is a necessity
and we believe physical he
alth
comes with a number
of thi
ngs including exposure to bacteria/virus/infections
and building antibodies.
Flow
will they social di
stan
ce in chapel?
I am not
com
fort
able
wit
h my chi
ld wea
ring
a mask all
day A mask doesn't tak
e the pl
ace of good hygiene.
Ido
n't want my child feeling suf
foca
ted
all day long We
do not
feel th
at wearing a mask is good psychologically Chapel,
for our children.
I tie
liev
e chapel is an essential part of goi
ng to a
Christian school. Yes, they should be inv
olve
d in
If in two months when school
starts the majority of
hea
lth
expe
rts say it
is tieneficial to
wear masks while attending
school I don't have any
problem wi
th the kids wearing
masks.
No
Yes I would homeschool until
the state says It
's not
mandatory, we love Immanuel
and wil
l send them back as
soon as masks are not
required.
If you are not
com
fort
able
uri
th you
r child
participating in
Chapel, ple
ase ex
plai
n why.
We are currently planning
on taking st
uden
t and
visitor temperatures as
they
get on a bus or
amve on campus each
morning. How
comfortable are you with
this pra
ctic
e?Very com
fort
able
Very comfortable
Very comfortable
Would they be abl
e to soc
ial distance?
I can't answer that question without knowing the
steps IHS wil
l t>
e taking dunng chapel to enhance
the safety of ou
r ch
ildr
en.
II is also har
d to answer
that question two months bef
ore sc
hool
starts
because we don't know Iti
call
y how the virus wlil be
affe
ctin
g Re
edle
y, the County, et
c., i
n 2 months
I hope it
continues whi
le fol
lowi
ng sta
te gui
deli
nes
(if st
ate required, then; outdoors, or smaller groups,
or distancing, etc
.). If not possible, then on
line
again?
Nuetral
Very com
fort
able
My com
fort
level will depend on what steps
IHS is ta
king
to help pre
vent
the spr
ead of
Covid-ig, once I know what the plan is
for
IHS reg
ardi
ng enhanced safety measures,
etc.
I co
uld then answer tha
t question more
conf
iden
tly.
A lot
of how comfortable (or
not ,,
. ̂ w
comfortable) I w
ill fe
el in
a co
uple mo
nths
comfortable
will depend on how the City of
Ree
dley
,Fresno County, th
e State, et
c., ar
e de
alin
gwith the Covid num
t>er
s in
Aug
ust.
So, it
depends on iHS
's plan/process and the
current state of virus when schooi resumes
I would not feel comfortable wi
th Chapel
happ
enin
g if
it goes against stale
guidelines.
According to CDC chi
ldre
n under t2 don't have to
wear them, in
fo is ou
t that says masks cause
resp
irat
ory is
sues
. We have not
made them wear them
up to th
is poi
nt There is too much con
flic
ting
info Out
there.
I want Chapel to happen and am not worried about
them get
ting
sic
k, we go to church and big
friends.
Very com
fort
able
Very
com
fort
able
8/20/2020 5:35:11 PM8

8/20/2020 5:35:11 PM9

8/20/2020 5:35:11 PM10

8/20/2020 5:35:11 PM11

8/20/2020 5:35:11 PM12

8/20/2020 5:35:11 PM13

8/20/2020 5:35:11 PM14

8/20/2020 5:35:11 PM15

8/20/2020 5:35:11 PM16

8/20/2020 5:35:11 PM17

8/20/2020 5:35:11 PM18

8/20/2020 5:35:11 PM19

8/20/2020 5:35:11 PM20

8/20/2020 5:35:11 PM21

8/20/2020 5:35:11 PM22

8/20/2020 5:35:11 PM23

EXHIBIT “35”

Return to School Plan
Face Masks / PPE
● Hand Sanitizers, Disinfecting wipes and PPE’s (Masks/Gloves)
available in all classrooms and indoor locations around campus.
● Masks and gloves optional
Staff/Nurse
● All staff will complete a self-certification form each morning which
includes a temperature check
○ Nurse
■ 7:30am - 3:00pm M-F (students on campus)
■ All communication & data related to cv-19 (cv-19 point
person)
■ Responder to student health, illness, injury issues
■ Maintain immunization records
■ Health Office - upstairs in old athletics office
● Nurse’s office
● Quarantine room
● Supplies/equipment storage
Classrooms/Academics
● All students must have temperature taken by staff before entering the
campus.
● Assigned seating (1st-12); and no prolonged group work
○ Wear a mask for junior high and high school when necessary for
prolonged group works; example science experiments/Culinary
Arts
● Rows in classrooms that have traditional desks (1st-12th)
● Personal Space/ Physical Distancing: vast majority classrooms meet
the six foot requirement, but when unable to meet the six feet, desks
1

will be spaced apart to the extent possible as determined by the size of
the classroom. Frequent reminders throughout the day to wash
hands and cough/sneeze into tissue.
● IES - assign Chromebooks and wiped/sanitized between use
● IES - no “pod/group” supply sharing. Students will have individual
supplies.
● IES - no classroom visitors/volunteers (student TA/Tutor exception)
● IJHS/IHS - no classroom visitors or guest speakers
● PE clothes - no dress out for regular 6th - 8th grade PE Class; PE
clothes changing for 6th - 8th grades sports athletes only. PE
students will be outside as much as possible and work in pods of 10 or
smaller. Any equipment used will be disinfected and sanitized daily.
● HS Weights class will dress out in PE clothes and use the locker room
as per usual.
● Culinary Arts - wear masks and gloves
Chapel/Events
● K-12 Assigned seating (every other seat) and staggered by row (365
student capacity)
● K-12 Live Stream chapel service accommodation for a student whose
parent isn’t comfortable with the “audience” setting (gym)
● Chapel Speakers - temperature checks upon arrival & will complete a
symptoms questionnaire
● No Visitors at the start of the year
● No Communion at the start of the year
● IES - class chapels held off until Spring (hopefully to allow visitors to
attend by then)
Recess/Lunch
● IES is adding a 3rd lunch period
● IES will sit per classroom group - assigned table
● IJHS will limit number of students to 6 per table, 4 per booth
(indoor)
● IHS will limit number of students to 6 per table, 4 per booth (indoor)
● IJHS/IHS will have outdoor seating at tables
● Kitchen staff to wear gloves & mask
2

● Individually packaged food
● Compliance with health code inspection requirements
Transportation
● Temperatures will be taken before students get on the bus by the bus
driver. Parent’s must remain at the bus stop in case a student is
turned away for a temperature higher than 100.
● We will keep a log of students who had their temperature taken. The
nurse will be notified of individuals that were turned away because of
the 100 degree temperature.
● Masks will be available (student/parent choice), but will not be
required.
● Number of students per seat:
○ 2 per (if not siblings)
○ 3 per (if siblings)
● Students will be assigned seating on the bus based on family units.
Facilities
● Disinfecting/sanitizing:
○ All classrooms/offices at the end of each day
○ Eating locations between lunch periods
○ Kitchen at the end of each day
○ Playground & Outdoor equipment at end of each day
○ All buses at the end of each day
○ Locker Rooms at the end of each day
○ All other locations at the end of each day
● Drinking Fountains - NO USE
● All walk-in gates will be locked during school hours.
● Visitors and/or Late Arriving Students:
○ Must have temperature checked at the gate (Riverview)
○ Must have temperature checked before entering the office
Weight room/Locker rooms
● Student-Athletes clean equipment in the weight room immediately
following use which will be monitored by the teacher.
3

● No internal or external use of the weight room after the nightly
custodial team is done until the next morning’s class.
● Locker room - school use as needed for PE classes/sports practices,
limit the amount of students using at one time.
Sports
● Season & practice compliance with CIF directives.
● Sporting events - use as per usual for home team; no locker rooms for
visiting team.
Online Learning Options
● Students/Family can choose our online option if not comfortable with
on campus learning.
● Online will be offered when a student is out ill or quarantined which
will help them keep up with their education.
4

EXHIBIT “36” 8/20/2020 5:35:11 PM29

#of
Absences
# of students
with Absences
#of students
enrolled
% of students
with absences
#of
Absences
# of students
with Absences
#of students
enrolled
% of students
with absences
#of
Absences
# of students
with Absences
#of students
enrolled
% of students
with absences
#of
Absences
# of students
with Absences
#of students
enrolled
% of students
with absences
#of
Absences
# of students
with Absences
#of students
enrolled
% of students
with absences
August K 3 2 24 8.3% 7 2 30 6.7% 9 7 31 22.6% 6 6 34 17.6% 10 8 35 22.9%1st 7 4 34 11.8% 3 2 26 7.7% 14 5 32 15.6% 15 7 38 18.4% 17 10 34 29.4%2nd 6 6 20 30.0% 4 4 33 12.1% 2 1 29 3.4% 13 4 35 11.4% 8 6 38 15.8%3rd 8 7 22 31.8% 4 3 21 14.3% 2 1 40 2.5% 3 2 31 6.5% 12 7 39 17.9%4th 13 7 26 26.9% 2 2 27 7.4% 6 3 22 13.6% 5 4 41 9.8% 17 13 36 36.1%5th 5 4 18 22.2% 3 1 28 3.6% 3 3 29 10.3% 6 4 26 15.4% 31 14 45 31.1%6th 5 3 40 7.5% 6 5 27 18.5% 1 1 40 2.5% 10 7 34 20.6% 5 5 29 17.2%7th 7 7 52 13.5% 4 2 45 4.4% 2 2 37 5.4% 8 4 52 7.7% 18 11 46 23.9%8th 14 9 45 20.0% 1 1 54 1.9% 9 7 49 14.3% 11 7 35 20.0% 34 20 57 35.1%9th 10 7 73 9.6% 14 8 69 11.6% 21 13 78 16.7% 11 10 61 16.4% 8 6 49 12.2%10th 18 13 67 19.4% 9 8 79 10.1% 10 7 61 11.5% 13 9 71 12.7% 19 11 61 18.0%11th 17 11 70 15.7% 11 7 70 10.0% 13 10 64 15.6% 25 15 57 26.3% 17 9 67 13.4%12th 27 16 56 28.6% 11 7 68 10.3% 15 13 66 19.7% 14 9 66 13.6% 30 17 60 28.3%
September K 19 10 24 41.7% 20 13 30 43.3% 17 13 31 41.9% 26 11 34 32.4% 32 16 35 45.7%1st 32 15 34 44.1% 34 12 26 46.2% 24 11 32 34.4% 15 12 38 31.6% 38 17 34 50.0%2nd 10 6 20 30.0% 31 18 33 54.5% 5 4 29 13.8% 16 10 35 28.6% 28 13 38 34.2%3rd 14 9 22 40.9% 15 6 21 28.6% 31 15 40 37.5% 9 7 31 22.6% 31 16 39 41.0%4th 13 9 26 34.6% 13 8 27 29.6% 12 10 22 45.5% 19 11 41 26.8% 21 12 36 33.3%5th 13 7 18 38.9% 28 13 28 46.4% 12 7 29 24.1% 17 9 26 34.6% 30 15 45 33.3%6th 28 12 40 30.0% 15 9 27 33.3% 8 3 40 7.5% 16 9 34 26.5% 18 12 29 41.4%7th 24 19 52 36.5% 28 17 45 37.8% 17 10 37 27.0% 25 14 52 26.9% 18 10 46 21.7%8th 41 27 45 60.0% 24 16 54 29.6% 22 16 49 32.7% 17 10 35 28.6% 19 14 57 24.6%9th 34 23 73 31.5% 37 27 69 39.1% 31 23 78 29.5% 30 21 61 34.4% 21 14 49 28.6%10th 37 21 67 31.3% 35 29 79 36.7% 34 28 61 45.9% 29 20 71 28.2% 19 13 61 21.3%11th 46 24 70 34.3% 34 23 70 32.9% 29 22 64 34.4% 35 17 57 29.8% 36 16 67 23.9%12th 44 26 56 46.4% 56 37 68 54.4% 48 25 66 37.9% 54 34 66 51.5% 24 19 60 31.7%
October K 25 16 24 66.7% 27 14 30 46.7% 25 16 31 51.6% 34 16 34 47.1% 31 13 35 37.1%1st 21 14 34 41.2% 13 9 26 34.6% 35 13 32 40.6% 31 16 38 42.1% 33 14 34 41.2%2nd 9 5 20 25.0% 21 13 33 39.4% 5 3 29 10.3% 31 14 35 40.0% 40 20 38 52.6%3rd 9 6 22 27.3% 15 7 21 33.3% 38 20 40 50.0% 25 14 31 45.2% 26 14 39 35.9%4th 13 11 26 42.3% 20 13 27 48.1% 12 7 22 31.8% 40 15 41 36.6% 37 15 36 41.7%5th 10 7 18 38.9% 9 8 28 28.6% 17 10 29 34.5% 16 10 26 38.5% 37 19 45 42.2%6th 21 10 40 25.0% 12 7 27 25.9% 25 14 40 35.0% 16 10 34 29.4% 31 15 29 51.7%7th 13 9 52 17.3% 23 11 45 24.4% 10 9 37 24.3% 19 15 52 28.8% 20 12 46 26.1%8th 32 22 45 48.9% 37 18 54 33.3% 18 11 49 22.4% 17 10 35 28.6% 60 28 57 49.1%9th 37 20 73 27.4% 46 27 69 39.1% 39 26 78 33.3% 23 15 61 24.6% 39 16 49 32.7%10th 40 20 67 29.9% 31 23 79 29.1% 58 30 61 49.2% 56 23 71 32.4% 44 25 61 41.0%11th 50 28 70 40.0% 29 21 70 30.0% 35 21 64 32.8% 42 24 57 42.1% 34 22 67 32.8%12th 48 24 56 42.9% 32 27 68 39.7% 41 29 66 43.9% 41 24 66 36.4% 44 27 60 45.0%
November K 42 19 24 79.2% 32 13 30 43.3% 31 15 31 48.4% 33 13 34 38.2% 34 17 35 48.6%1st 52 23 34 67.6% 22 12 26 46.2% 39 19 32 59.4% 37 14 38 36.8% 48 18 34 52.9%2nd 17 7 20 35.0% 28 15 33 45.5% 6 3 29 10.3% 58 17 35 48.6% 39 19 38 50.0%3rd 27 12 22 54.5% 13 9 21 42.9% 19 10 40 25.0% 32 11 31 35.5% 42 22 39 56.4%4th 13 9 26 34.6% 31 11 27 40.7% 31 16 22 72.7% 46 17 41 41.5% 34 16 36 44.4%5th 23 7 18 38.9% 26 15 28 53.6% 24 13 29 44.8% 28 12 26 46.2% 40 18 45 40.0%6th 13 15 40 37.5% 23 12 27 44.4% 35 17 40 42.5% 34 14 34 41.2% 20 7 29 24.1%7th 33 25 52 48.1% 28 14 45 31.1% 15 12 37 32.4% 31 19 52 36.5% 27 14 46 30.4%8th 28 17 45 37.8% 33 19 54 35.2% 19 15 49 30.6% 36 16 35 45.7% 35 19 57 33.3%9th 43 24 73 32.9% 48 31 69 44.9% 37 28 78 35.9% 36 22 61 36.1% 35 20 49 40.8%10th 50 27 67 40.3% 47 31 79 39.2% 43 23 61 37.7% 40 25 71 35.2% 18 15 61 24.6%11th 44 24 70 34.3% 32 23 70 32.9% 48 33 64 51.6% 36 23 57 40.4% 17 14 67 20.9%12th 42 21 56 37.5% 55 37 68 54.4% 45 30 66 45.5% 67 30 66 45.5% 22 15 60 25.0%
December K 16 7 24 29.2% 21 13 30 43.3% 28 13 31 41.9% 35 20 34 58.8% 28 15 35 42.9%1st 26 16 34 47.1% 29 9 26 34.6% 32 13 32 40.6% 23 14 38 36.8% 44 22 34 64.7%2nd 11 5 20 25.0% 34 18 33 54.5% 7 6 29 20.7% 22 13 35 37.1% 27 10 38 26.3%3rd 12 6 22 27.3% 11 10 21 47.6% 32 15 40 37.5% 31 15 31 48.4% 54 22 39 56.4%4th 21 6 26 23.1% 14 10 27 37.0% 19 7 22 31.8% 31 17 41 41.5% 35 18 36 50.0%5th 6 4 18 22.2% 20 7 28 25.0% 22 9 29 31.0% 15 9 26 34.6% 25 15 45 33.3%6th 18 13 40 32.5% 11 7 27 25.9% 22 13 40 32.5% 26 14 34 41.2% 11 5 29 17.2%7th 9 6 52 11.5% 16 8 45 17.8% 6 5 37 13.5% 22 15 52 28.8% 17 12 46 26.1%8th 9 8 45 17.8% 16 12 54 22.2% 8 8 49 16.3% 17 11 35 31.4% 29 16 57 28.1%9th 27 12 73 16.4% 23 18 69 26.1% 13 12 78 15.4% 11 9 61 14.8% 11 9 49 18.4%10th 14 11 67 16.4% 21 14 79 17.7% 32 29 61 47.5% 15 13 71 18.3% 12 11 61 18.0%11th 25 15 70 21.4% 19 13 70 18.6% 25 17 64 26.6% 16 12 57 21.1% 8 7 67 10.4%12th 16 10 56 17.9% 34 22 68 32.4% 38 27 66 40.9% 21 13 66 19.7% 15 11 60 18.3%
January K 52 21 24 87.5% 23 11 30 36.7% 37 12 31 38.7% 39 16 34 47.1% 40 15 35 42.9%1st 37 19 34 55.9% 24 15 26 57.7% 37 15 32 46.9% 29 16 38 42.1% 64 25 34 73.5%2nd 21 8 20 40.0% 17 10 33 30.3% 19 9 29 31.0% 37 13 35 37.1% 55 21 38 55.3%3rd 11 5 22 22.7% 14 9 21 42.9% 28 17 40 42.5% 49 19 31 61.3% 59 21 39 53.8%4th 31 13 26 50.0% 14 7 27 25.9% 17 10 22 45.5% 38 17 41 41.5% 28 19 36 52.8%5th 12 7 18 38.9% 21 11 28 39.3% 25 14 29 48.3% 22 10 26 38.5% 46 18 45 40.0%6th 26 14 40 35.0% 12 9 27 33.3% 30 14 40 35.0% 26 12 34 35.3% 11 10 29 34.5%
15/16 16/17 17/18 18/19 19/20
8/20/2020 5:35:11 PM30

7th 18 11 52 21.2% 23 12 45 26.7% 24 14 37 37.8% 16 11 52 21.2% 29 17 46 37.0%8th 24 13 45 28.9% 20 12 54 22.2% 19 12 49 24.5% 11 8 35 22.9% 44 23 57 40.4%9th 37 22 73 30.1% 68 35 69 50.7% 42 29 78 37.2% 41 22 61 36.1% 39 18 49 36.7%10th 43 26 67 38.8% 48 29 79 36.7% 40 24 61 39.3% 44 23 71 32.4% 48 26 61 42.6%11th 42 22 70 31.4% 27 23 70 32.9% 34 24 64 37.5% 24 15 57 26.3% 36 21 67 31.3%12th 62 25 56 44.6% 43 21 68 30.9% 61 36 66 54.5% 29 21 66 31.8% 42 23 60 38.3%
February K 48 20 24 83.3% 32 16 30 53.3% 28 17 31 54.8% 24 14 34 41.2% 43 18 35 51.4%1st 67 20 34 58.8% 20 12 26 46.2% 27 16 32 50.0% 36 20 38 52.6% 59 22 34 64.7%2nd 20 13 20 65.0% 34 20 33 60.6% 17 8 29 27.6% 29 16 35 45.7% 42 21 38 55.3%3rd 30 14 22 63.6% 4 3 21 14.3% 32 12 40 30.0% 23 18 31 58.1% 55 21 39 53.8%4th 19 11 26 42.3% 16 11 27 40.7% 16 9 22 40.9% 39 18 41 43.9% 57 21 36 58.3%5th 28 11 18 61.1% 24 10 28 35.7% 13 9 29 31.0% 23 15 26 57.7% 48 20 45 44.4%6th 38 19 40 47.5% 28 11 27 40.7% 24 12 40 30.0% 18 12 34 35.3% 36 15 29 51.7%7th 41 25 52 48.1% 34 19 45 42.2% 22 15 37 40.5% 20 12 52 23.1% 41 21 46 45.7%8th 58 33 45 73.3% 32 23 54 42.6% 31 21 49 42.9% 27 16 35 45.7% 58 29 57 50.9%9th 36 29 73 39.7% 72 41 69 59.4% 65 45 78 57.7% 28 19 61 31.1% 38 20 49 40.8%10th 63 34 67 50.7% 66 41 79 51.9% 39 29 61 47.5% 37 26 71 36.6% 54 30 61 49.2%11th 66 38 70 54.3% 61 31 70 44.3% 59 41 64 64.1% 44 28 57 49.1% 41 26 67 38.8%12th 84 39 56 69.6% 54 34 68 50.0% 71 44 66 66.7% 66 35 66 53.0% 56 31 60 51.7%
8/20/2020 5:35:11 PM31

15/16 16/17 15/16 to 16/17 17/18 16/17 to 17/18 18/19 17/18 to 18/19 19/20 18/19 to 19/20
#of Absences #of Absences % +/- #of Absences % +/- #of Absences % +/- #of Absences % +/-
August K 3 7 133.3% 9 28.6% 6 -33.3% 10 66.7%1st 7 3 -57.1% 14 366.7% 15 7.1% 17 13.3%2nd 6 4 -33.3% 2 -50.0% 13 550.0% 8 -38.5%3rd 8 4 -50.0% 2 -50.0% 3 50.0% 12 300.0%4th 13 2 -84.6% 6 200.0% 5 -16.7% 17 240.0%5th 5 3 -40.0% 3 0.0% 6 100.0% 31 416.7%6th 5 6 20.0% 1 -83.3% 10 900.0% 5 -50.0%7th 7 4 -42.9% 2 -50.0% 8 300.0% 18 125.0%8th 14 1 -92.9% 9 800.0% 11 22.2% 34 209.1%9th 10 14 40.0% 21 50.0% 11 -47.6% 8 -27.3%10th 18 9 -50.0% 10 11.1% 13 30.0% 19 46.2%11th 17 11 -35.3% 13 18.2% 25 92.3% 17 -32.0%12th 27 11 -59.3% 15 36.4% 14 -6.7% 30 114.3%
September K 19 20 5.3% 17 -15.0% 26 52.9% 32 23.1%1st 32 34 6.3% 24 -29.4% 15 -37.5% 38 153.3%2nd 10 31 210.0% 5 -83.9% 16 220.0% 28 75.0%3rd 14 15 7.1% 31 106.7% 9 -71.0% 31 244.4%4th 13 13 0.0% 12 -7.7% 19 58.3% 21 10.5%5th 13 28 115.4% 12 -57.1% 17 41.7% 30 76.5%6th 28 15 -46.4% 8 -46.7% 16 100.0% 18 12.5%7th 24 28 16.7% 17 -39.3% 25 47.1% 18 -28.0%8th 41 24 -41.5% 22 -8.3% 17 -22.7% 19 11.8%9th 34 37 8.8% 31 -16.2% 30 -3.2% 21 -30.0%10th 37 35 -5.4% 34 -2.9% 29 -14.7% 19 -34.5%11th 46 34 -26.1% 29 -14.7% 35 20.7% 36 2.9%12th 44 56 27.3% 48 -14.3% 54 12.5% 24 -55.6%
October K 25 27 8.0% 25 -7.4% 34 36.0% 31 -8.8%1st 21 13 -38.1% 35 169.2% 31 -11.4% 33 6.5%2nd 9 21 133.3% 5 -76.2% 31 520.0% 40 29.0%3rd 9 15 66.7% 38 153.3% 25 -34.2% 26 4.0%4th 13 20 53.8% 12 -40.0% 40 233.3% 37 -7.5%5th 10 9 -10.0% 17 88.9% 16 -5.9% 37 131.3%6th 21 12 -42.9% 25 108.3% 16 -36.0% 31 93.8%7th 13 23 76.9% 10 -56.5% 19 90.0% 20 5.3%8th 32 37 15.6% 18 -51.4% 17 -5.6% 60 252.9%
8/20/2020 5:35:11 PM32

9th 37 46 24.3% 39 -15.2% 23 -41.0% 39 69.6%10th 40 31 -22.5% 58 87.1% 56 -3.4% 44 -21.4%11th 50 29 -42.0% 35 20.7% 42 20.0% 34 -19.0%12th 48 32 -33.3% 41 28.1% 41 0.0% 44 7.3%
November K 42 32 -23.8% 31 -3.1% 33 6.5% 34 3.0%1st 52 22 -57.7% 39 77.3% 37 -5.1% 48 29.7%2nd 17 28 64.7% 6 -78.6% 58 866.7% 39 -32.8%3rd 27 13 -51.9% 19 46.2% 32 68.4% 42 31.3%4th 13 31 138.5% 31 0.0% 46 48.4% 34 -26.1%5th 23 26 13.0% 24 -7.7% 28 16.7% 40 42.9%6th 13 23 76.9% 35 52.2% 34 -2.9% 20 -41.2%7th 33 28 -15.2% 15 -46.4% 31 106.7% 27 -12.9%8th 28 33 17.9% 19 -42.4% 36 89.5% 35 -2.8%9th 43 48 11.6% 37 -22.9% 36 -2.7% 35 -2.8%10th 50 47 -6.0% 43 -8.5% 40 -7.0% 18 -55.0%11th 44 32 -27.3% 48 50.0% 36 -25.0% 17 -52.8%12th 42 55 31.0% 45 -18.2% 67 48.9% 22 -67.2%
December K 16 21 31.3% 28 33.3% 35 25.0% 28 -20.0%1st 26 29 11.5% 32 10.3% 23 -28.1% 44 91.3%2nd 11 34 209.1% 7 -79.4% 22 214.3% 27 22.7%3rd 12 11 -8.3% 32 190.9% 31 -3.1% 54 74.2%4th 21 14 -33.3% 19 35.7% 31 63.2% 35 12.9%5th 6 20 233.3% 22 10.0% 15 -31.8% 25 66.7%6th 18 11 -38.9% 22 100.0% 26 18.2% 11 -57.7%7th 9 16 77.8% 6 -62.5% 22 266.7% 17 -22.7%8th 9 16 77.8% 8 -50.0% 17 112.5% 29 70.6%9th 27 23 -14.8% 13 -43.5% 11 -15.4% 11 0.0%10th 14 21 50.0% 32 52.4% 15 -53.1% 12 -20.0%11th 25 19 -24.0% 25 31.6% 16 -36.0% 8 -50.0%12th 16 34 112.5% 38 11.8% 21 -44.7% 15 -28.6%
January K 52 23 -55.8% 37 60.9% 39 5.4% 40 2.6%1st 37 24 -35.1% 37 54.2% 29 -21.6% 64 120.7%2nd 21 17 -19.0% 19 11.8% 37 94.7% 55 48.6%3rd 11 14 27.3% 28 100.0% 49 75.0% 59 20.4%4th 31 14 -54.8% 17 21.4% 38 123.5% 28 -26.3%5th 12 21 75.0% 25 19.0% 22 -12.0% 46 109.1%6th 26 12 -53.8% 30 150.0% 26 -13.3% 11 -57.7%
8/20/2020 5:35:11 PM33

7th 18 23 27.8% 24 4.3% 16 -33.3% 29 81.3%8th 24 20 -16.7% 19 -5.0% 11 -42.1% 44 300.0%9th 37 68 83.8% 42 -38.2% 41 -2.4% 39 -4.9%10th 43 48 11.6% 40 -16.7% 44 10.0% 48 9.1%11th 42 27 -35.7% 34 25.9% 24 -29.4% 36 50.0%12th 62 43 -30.6% 61 41.9% 29 -52.5% 42 44.8%
February K 48 32 -33.3% 28 -12.5% 24 -14.3% 43 79.2%1st 67 20 -70.1% 27 35.0% 36 33.3% 59 63.9%2nd 20 34 70.0% 17 -50.0% 29 70.6% 42 44.8%3rd 30 4 -86.7% 32 700.0% 23 -28.1% 55 139.1%4th 19 16 -15.8% 16 0.0% 39 143.8% 57 46.2%5th 28 24 -14.3% 13 -45.8% 23 76.9% 48 108.7%6th 38 28 -26.3% 24 -14.3% 18 -25.0% 36 100.0%7th 41 34 -17.1% 22 -35.3% 20 -9.1% 41 105.0%8th 58 32 -44.8% 31 -3.1% 27 -12.9% 58 114.8%9th 36 72 100.0% 65 -9.7% 28 -56.9% 38 35.7%10th 63 66 4.8% 39 -40.9% 37 -5.1% 54 45.9%11th 66 61 -7.6% 59 -3.3% 44 -25.4% 41 -6.8%12th 84 54 -35.7% 71 31.5% 66 -7.0% 56 -15.2%
8/20/2020 5:35:11 PM34

EXHIBIT “37”

1
2
3
4
5
6
7
8
9
10
11
12
13
14
15
16
17
18
19
20
21
22
23
24
25
26
27
28
1 DECLARATION OF LINDA REIMER IN SUPPORT OF OPPOSITION TO TEMPORARY RESTRAINING
ORDER
TYLER & BURSCH, LLP Jennifer L. Bursch, State Bar No. 245512 [email protected] Cody J. Bellmeyer, State Bar No. 326530 [email protected] 25026 Las Brisas Road Murrieta, California 92562 Telephone: (951) 600-2733 Facsimile: (951) 600-4996 Attorneys for Defendants Immanuel Schools and Ryan Wood
SUPERIOR COURT OF THE STATE OF CALIFORNIA
FOR THE COUNTY OF FRESNO
COUNTY OF FRESNO through JEAN M, ROUSSEAU, in his official capacity as Emergency Services Director and County Administrative Officer
Plaintiff,
v. IMMANUEL SCHOOLS., a California non-profit corporation; RYAN WOOD, Chief Executive Officer of Immanuel Schools and DOES 1 through 50, inclusive,
Defendants.
Case No.: 20CECG02447 DECLARATION OF LINDA REIMER IN SUPPORT OF OPPOSITION TO TEMPORARY RESTRAINING ORDER Ex Parte Date: August 25, 2020 Time: 3:29 p.m. Dept. 501
I, LINDA REIMER, declare as follows:
1. I am over the age of eighteen years and I am the Director of Counseling for petitioner
Immanuel Schools (“Immanuel”). I make this declaration based on my own personal knowledge
and if called to testify as a witness I could and would testify competently thereto.
2. I make this declaration in support of the Opposition to the Temporary Restraining
Order.
3. I have a Bachelor of Arts in English, Master’s Degree in English Literature, Master’s
Degree in Education: Counseling and Student Services, and a Doctorate in Psychology (PsyD).

1
2
3
4
5
6
7
8
9
10
11
12
13
14
15
16
17
18
19
20
21
22
23
24
25
26
27
28
2 DECLARATION OF LINDA REIMER IN SUPPORT OF OPPOSITION TO TEMPORARY RESTRAINING
ORDER
4. In March 2020, Immanuel complied with Governor Newsom’s orders to conduct
school via distance learning. The students did not return to school for in-person instruction to
complete the 2019-2020 school year.
5. During the in-person closure, Immanuel created an excellent support system for its
students. However, the distance learning was a substantial adjustment for the staff, the students,
and their parents. A diverse group of students and/or their parents reported to me that it was a
struggle to find the self-motivation to attend lessons or office hours via Zoom and/or complete their
assignments. In addition, I dealt with a substantially higher number of students battling feelings of
anxiety, depression, and anger as compared to when Immanuel offered traditional in-person
instruction.
6. I spoke with many parents who revealed their children were placed on medication
for anxiety and/or depression, due, at least in part, to the loss of structure offered by in-person
instruction and were receiving online counseling. I had other parents discuss their child’s new or
increased struggles with anger management due to being stuck at home and the stress associated
with distance learning. The consistent theme in the conversations was these students and parents
missed the traditional setting and the interaction with teachers and classmates.
7. There was also a significant decrease in academic achievement amongst a diverse
group of Immanuel’s students. The group of students that demonstrated the most substantial drop
in achievement were those students who tend to finish in the middle grade range during traditional
instruction (i.e. “C”, “C+”, “B-”, and “B” level students). Many of those students failed to perform
their work and Immanuel had to intervene and provide extreme options for the students to make up
work over the summer to avoid having to repeat courses. Immanuel also noticed several higher
performing students, who are working towards admittance to competitive colleges after graduation,
struggling during the transition to online instruction.
///
///
///
///


EXHIBIT “38”

1
2
3
4
5
6
7
8
9
10
11
12
13
14
15
16
17
18
19
20
21
22
23
24
25
26
27
28
1 DECLARATION OF PAMELA JAMES IN SUPPORT OF OPPOSITION TO TEMPORARY RESTRAINING
ORDER
TYLER & BURSCH, LLP Jennifer L. Bursch, State Bar No. 245512 [email protected] Cody J. Bellmeyer, State Bar No. 326530 [email protected] 25026 Las Brisas Road Murrieta, California 92562 Telephone: (951) 600-2733 Facsimile: (951) 600-4996 Attorneys for Defendants Immanuel Schools and Ryan Wood
SUPERIOR COURT OF THE STATE OF CALIFORNIA
FOR THE COUNTY OF FRESNO
COUNTY OF FRESNO through JEAN M, ROUSSEAU, in his official capacity as Emergency Services Director and County Administrative Officer
Plaintiff,
v. IMMANUEL SCHOOLS., a California non-profit corporation; RYAN WOOD, Chief Executive Officer of Immanuel Schools and DOES 1 through 50, inclusive,
Defendants.
Case No.: 20CECG02447 DECLARATION OF PAMELA JAMES IN SUPPORT OF OPPOSITION TO TEMPORARY RESTRAINING ORDER Ex Parte Date: August 25, 2020 Time: 3:29 p.m. Dept. 501
I, PAMELA JAMES, the undersigned, declare as follows:
1. I am over the age of eighteen years and I am a third grade teacher at petitioner
Immanuel Schools (“Immanuel”) I make this declaration based on my own personal knowledge
and if called to testify as a witness I could and would testify competently thereto.
2. I make this declaration in support of the Opposition to the Temporary Restraining
Order.
3. I have a Bachelor of Science in Elementary Education and a Master’s Degree in
Education. I have been teaching for over 30 years.

1
2
3
4
5
6
7
8
9
10
11
12
13
14
15
16
17
18
19
20
21
22
23
24
25
26
27
28
2 DECLARATION OF PAMELA JAMES IN SUPPORT OF OPPOSITION TO TEMPORARY RESTRAINING
ORDER
4. In March 2020, Immanuel complied with Governor Newsom’s orders to conduct
school via distance learning. The students did not return to school for in-person instruction to
complete the 2019-2020 school year.
5. During the in-person closure, Immanuel set a standard schedule for how they wanted
the elementary school teachers to schedule our days to assist our students. We met with students
five days per week via the Zoom video conference application for approximately 1.5 hours to go
over the lessons for the day. I was then available for two scheduled hours to meet with students
and/or parents on an individual basis to go over work with them. Lastly, I also personally added a
reading time at the end of the day so I could read to the students.
6. On my end, distance learning brought on many challenges. The quality of the Zoom
lessons was negatively impacted by technology glitches, families with more than one child learning
in the household, and students’ inability to focus on a computer for hours at a time. In addition, I
could observe that students were easily distracted by siblings, pets, and/or toys.
7. I also experienced significant issues collecting students’ work. When conducting
traditional in-person instruction, handing out and receiving assignments is not a problem. However,
once we switched to distance learning it became an arduous process. Many families experienced
issues downloading or uploading assignments. I had parents texting me pictures of completed
assignments, emailing me assignments, or even mailing me weekly packets. It made tracking
assignments very difficult.
8. In addition, meeting with students with special academic needs was particularly
difficult. Many times, students would miss their assigned time to meet with me. These same
students had missing work which affected their grades.
9. The distance learning required parents to partner with teachers to ensure the students
were properly educated. Unfortunately, not all parents had the ability to give their undivided
attention to the student to help their learning. Many parents had to split their attention between their
own jobs and/or other children in the household. The distance learning was overwhelming for many
parents.


EXHIBIT "39"

Fresno County Newsroom
News, Notes and Stories from Our Community
Fresno County Officials Declare Local Public Health Emergency inResponse to New COVID-19 Activity
ON MARCH 15, 2020 / BY FRESNOCOUNTYNEWSROOM
Today, March 15, 2020, the Fresno County Board of Supervisors and the Fresno County Department of Public Health (FCDPH) declared a localand public health emergency in response to the second confirmed case of coronavirus disease 2019 (COVID-19) and the potential for increasedspread in the U.S. and Fresno County.
“Ensuring the health and safety of Fresno County residents is our top priority and that meansmaking sure we have access to adequate resources and equipment to be�er protect our communityshould the threat of COVID-19 increase in Fresno County,” says Dr. Rais Vohra, Fresno CountyInterim Health Officer.
“Fresno County will continue to mobilize resources, continue with emergency planning, andcoordinate with partners and agencies to ensure our community has the information and resourcesnecessary to prepare and help protect against further COVID-19 spread in the community,” saysJean M. Rousseau, County Administrative Officer.
Dr. Vorha; CAO Rousseau; Director of Fresno County Dept. of Public Health, David Pomaville;and Director of Fresno County Dept. of Behavioral Health, Dawan Utecht; addressed local media alongside Fresno County Supervisors, BrianPacheco (Distrist 1), Steve Brandau (Dist. 2), Sal Quintero (Dist 3), Buddy Mendes (Dist 4), Nathan Magsig (Dist 5); Fresno County Sheriff,Margaret Mims; and Fresno Mayor, Lee Brand.
FCDPH is prepared to manage and investigate suspected and confirmed cases of COVID-19 within the County. FCDPH continues to workclosely with the Centers for Disease Control and Prevention (CDC), the California Department of Public Health (CDPH), and local partners inorder to provide Fresno County residents accurate information about how to reduce the spread of COVID-19 and other viruses such asInfluenza.
Steps to take to prevent the spread of COVID-19 and other respiratory infections are:
Stay home if you are sickCall your doctor before going into the healthcare facility or clinicIf you do not have a doctor, call the FCDPH before going inWash your hands with soap and water for at least 20 seconds after using the bathroom, before eating, and after blowing your nose,coughing, or sneezingCover your cough or sneeze with a tissue, then throw the tissue in the trashGet your flu vaccine to protect yourself and others. (Flu vaccine does not protect against COVID-19 but can prevent being infected withinfluenza and COVID-19 at the same time which can further weaken an individual’s immune system).
Although individual risk for becoming infected with COVID-19 remains low for most residents in Fresno County, residents should still preparefor the possibility of further significant social distancing, should there become increased community spread.
Preparation measures should include:
Having a reasonable supply of essentials at home (including water, food, hygiene products, medications, and pet food) in case the need tostay home arisesPlanning for the possibility of business disruptions, school closures, and modifications/cancellations of certain public eventsPracticing simple social distancing strategies that limit your exposure to others who may be sick (verbal greetings instead of handshakes andhugs, no sharing of utensils, cups, personal items and linens, staying 6 feet away from others in public se�ings).
Fresno County officials are asking businesses, schools, and community-based organizations to prepare plans that allow people to stay home ifthey are sick without the risk of being academically or financially penalized. Please make arrangements for sick employees or students to workor complete assignments from home.
FCDPH is requesting organizations to do the following to reduce the spread of COVID-19 and other viruses:
Implement a cleaning and disinfecting schedule for frequently touched surfacesEnsure that your continuity of operations plans (COOP) are up to date, so their essential functions can continueDo not require a doctor’s note for staff returning to work after being sick, when possible. This will reduce the strain on the healthcaresystem.
FCDPH will be taking measures to implement the following:
Ensure that individuals who have tested positive for COVID-19 and their identified close contacts are being closely monitored andsupported while they are in self-isolationFrequent updates and guidance for childcare facilities, schools, colleges/universities, employers, hotels, first responders, shelters, congregateliving facilities and parents on how to prepare to reduce the spread of COVID-19Weekly teleconferences with elected officials, city managers, schools, healthcare facilities, first responders, and partnersConstant communication and preparation with first responders and health care workers. Ensuring there is adequate supply of PPE.
For more information about COVID-19, visit these resources:
Fresno County Department of Public Health: www.fcdph.org/covid19 (h�p://www.fcdph.org/covid19)Centers for Disease Control and Prevention: www.cdc.gov/covid19 (h�ps://www.cdc.gov/coronavirus/2019-ncov/)

EXHIBIT "40"

Return to full list >>
ANNOUNCEMENTS
Fresno County Adopts Local Emergency ProclamationPost Date: 03/17/2020 2:03 PM
Fresno County adopts Local Emergency proclamation, activates Emergency Operations Center in response to COVID-19 pandemic
FRESNO, CA, Tuesday, March 17, 2020 – The Fresno County Board of Supervisors has formally adopted a Local Emergency resolution and Fresno County has activated its Emergency Operations Center (EOC) to coordinate
the County’s ongoing response to the evolving COVID-19 pandemic.
“Our experts with the County Department of Public Health have been working diligently to manage Fresno County’s ongoing response efforts and keep our communities safe,” says Fresno County Administrative Officer, Jean
Rousseau. “As this pandemic continues to evolve, activation of the EOC is a necessary step to lend more personnel, resources and capacity for the County to effectively support our communities during this uncertain time.”
Fresno County also announced steps being taken to help minimize risks of potential exposure for employees and the public by minimizing staffing levels, encouraging remote work, providing alternative means for the public to
access services remotely, postponing services, closing facilities as needed, and encouraging those who conduct in-person business with the County to utilize alternate means.
“We recognize the concerns shared by our entire community,” says Rousseau. “Many people in Fresno County rely on County services and it is our intent to provide options and minimize disruptions wherever possible. However,
protecting public health and safety is always our top priority and we encourage residents to adhere to CDC and State guidance and take appropriate measures to prepare for additional impacts as the situation develops.”
FCDPH continues to investigate suspected cases of COVID-19 within the County and continues to work closely with the Centers for Disease Control and Prevention (CDC), the California Department of Public Health (CDPH), and
local partners in order to provide Fresno County residents accurate information about current risk and how to help reduce the spread of COVID-19 and other viruses such as Influenza.
To date, Fresno County has confirmed two positive cases of travel-related COVID-19. While the risk to our region remains low, the County encourages the public to adhere to CDC and State recommendations regarding hygiene,
travel, social distancing, public gatherings and otherwise to help prevent the further spread of this virus in our community and beyond.
For more information about COVID-19, including the local status, actions being taken, and guidance visit these resources:
Fresno County Department of Public Health: www.fcdph.org/covid19
Centers for Disease Control and Prevention: www.cdc.gov/covid19
California Department of Public Health: www.cdph.ca.gov/covid19
Photo – David Pomaville, Director of Fresno County Department of Public Health, addresses the Fresno County Board of Supervisors regarding the Local Emergency declaration and current efforts to respond in Fresno County.

EXHIBIT "41"

County of Fresno DEPARTMENT OF PUBLIC HEALTH
Promotion, preservation and protection of the community’s health 1221 Fulton Street /P. O. Box 11867, Fresno, CA 93775
(559) 600-3200 FAX (559) 600-7687 The County of Fresno is an Equal Employment Opportunity Employer
www.co.fresno.ca.us www.fcdph.org
HEALTH OFFICER ORDER FOR COUNTY OF FRESNO
TO CLOSE ALL IMMANUEL SCHOOLS
Please read this Order carefully. Violations of or failure to comply with this Order is a crime punishable by fine, imprisonment, or both. Violators are also subject to civil enforcements actions including civil penalties of up to $1,000 per violation per day, injunctive relief, and attorneys’ fees and costs. (Health and Safety Code Section 120275; Penal Code Section 19; Government Code Sections 25132 and 8665; County Ordinance 2.44.100
Under the authority of California Health and Safety Code Sections 101040, 101085,120175, and 120275; Title 17 California Code of Regulations Section 2501; Article XI of the California Constitution; California Government Code Sections 8610, 8630, 8634, and 8665; and Fresno County Code Section 2.44.100, The Health Officer of the County of Fresno (“Health Officer”) Orders:
1. All Immanuel Schools, headquartered at 1128 South Reed Avenue, Reedley, CA 93654, regardless of grade level taught or building location, shall close for in-person instruction until Fresno County has come off the State’s Monitoring List for fourteen (14) consecutive days. School community members – including parents, teachers, staff and students – can track daily data on whether and why their county is on the Monitoring List at https://covid19.ca.gov/roadmap-counties/#track-data.
2. All Immanuel Schools, regardless of grade level taught, shall follow the State of California’s School
and School Based Program Guidance (PDF). 3. Any elementary school wishing to receive a State waiver to open in-person instruction (PDF) shall
only be granted the waiver at the discretion of the Fresno County Health Officer. 4. Violation of this order will subject Immanuel Schools to civil enforcement actions including civil
penalties of up to $1,000 per violation per day, injunctive relief, and attorneys’ fees and costs. 5. This Order is issued as a result of the worldwide pandemic of COVID-19 disease, also known as
“novel coronavirus” which has infected over ten million individuals worldwide in over 200 countries and is implicated in over 700,000 worldwide deaths, including over 16,000 cases and 150 deaths in Fresno County. These numbers increase significantly every day.
6. This Order is issued based on evidence of increasing transmission of COVID-19 both within the County of Fresno and worldwide, scientific evidence regarding the most effective approach to slow transmission of communicable diseases generally and COVID-19 specifically as well as best practices as currently known and available to protect the public from the risk of spread or of exposure to COVID-19.
Ordered Closure

7. This Order is intended to address the strain upon the health care system from the effects of the COVID-19 virus. Similarly, this Order is intended to reduce the likelihood of exposure to COVID-19, thereby slowing the spread of COVID-19 in communities worldwide.
8. This Order is issued in accordance with, and incorporates by reference, the: March 4, 2020
Proclamation of a State of Emergency issued by Governor Gavin Newsom; the March 13, 2020 Declaration of a National Emergency issued by President Donald Trump; the March 15, 2020 Declaration of Local Health Emergency based on an imminent and proximate threat to public health from the introduction of novel COVID-19 in Fresno County; the March 15, 2020 Declaration of Local Emergency; the March 17, 2020 Resolutions of the Board of Supervisors of the County of Fresno ratifying the Local Emergency and Local Health Emergency; the guidance issued on March 11, 2020 by the California Department of Public Health regarding large gatherings of 250 people or more; Governor Gavin Newsom’s Executive order N-25-20 of March 12, 2020 preparing the State to commandeer hotels and other places or temporary residence, medical facilities, and other facilities that are suitable as places of temporary residence or medical facilities as necessary for quarantining, isolating, or treating individuals who test positive or COVID-19 or who have had a high-risk exposure and are thought to be in the incubation period; the guidance issued on March 15, 2020 by the centers for Disease Control and Prevention, the California Department of Public Health, and other public health officials through the United States and around the world recommending the cancellation of gatherings involving more than fifty (50) or more persons in a single space at the same time; Governor Newsom’s Executive Order N-33-20 giving the state the ability to increase the health care capacity in clinics, mobile health care units and adult day health care facilities and allowing local governments more flexibility to utilize the skills of retired employees in order to meet the COVID-19 surge; Governor Newsom’s Executive Order N-39-20 indented to expand the health care workforce and recruit health care professionals to address the COVID-19 surge; the California Public Health Officer’s Order issued July 17, 2020; the California Department of Public Health’s July 17, 2020 guidelines on reopening schools; and the California Department of Public Health’s Industry Guidance for Schools and School Based Programs updated on August 3, 2020 . The Governor and the County Public Health Officer continue to issue COVID-19-related orders to mitigate the public health crisis.
9. This order is made in accordance with all applicable State and Federal laws, including but not limited to: Health and Safety Code Sections 101030, et seq.: Health and Safety Code Sections 120100, et. Seq.; and Title 17 of the California Code of Regulations Section 2501.
10. To the extent necessary, pursuant to Government Code Sections 26602 and 41601 and Health and
Safety Code Section 101029, the Health Officer requests that the Sheriff and all Chiefs of Police in the County ensure compliance with and enforcement of this Order. Violators are also subject to civil enforcement actions including civil penalties of up to $1,000 per violation per day, injunctive relief, and attorneys’ fees and costs.
11. Copies of this Order shall promptly be (1) made available at the County of Fresno Department of
Public Health office located at 1221 Fulton Mall, Fresno, CA 93721; and (2) provided to any member of the public requesting a copy of this Order.
August 13, 2020
(Signature of Health Officer or Deputy Health Officer) (Date of Issuance of Order)

NOTICE OF RIGHTS
1. If you object to this order, you have a right to arrange for your own legal representative.
2. You have a right to also file for judicial relief to seek release from the order. 3. All requests to contact the County Health Officer will be through FCDPH at (559) 600-3332
during normal business hours. After hours, weekends, and holidays notify FCDPH On-Call staff at (559) 352-7067. If no response, contact County Sheriff Dispatch at (559) 600-3111.
August 13, 2020 (Signature of Health Officer or Deputy Health Officer) (Date of Issuance of Order)

EXHIBIT "42"

September 4, 2020
TO:
SUBJECT:
Sandra ShewryActing Director
GAVIN NEWSOMGovernor
State of California—Health and Human Services AgencyCalifornia Department of Public Health
All Californians
Guidance Related to Cohorts - UPDATED September 4, 2020
This guidance applies to groups of children and youth in controlled, supervised, and indoor environments operated by local educational agencies, non profits, or other authorized providers, including, but not
limited to, public and private schools; licensed and license-exempt child care settings; organized and supervised care environments, i.e., "distance learning hubs"; recreation programs; before and a�er school
programs; youth groups; and day camps. Guidance and directives related to schools, child care, day camps, youth sports, and institutions of higher education are not superseded by this document andstill apply to those specified settings.
Purpose: To provide guidance for necessary in-person child supervision and limited instruction, targeted support services, and facilitation of distance learning in small group environments for a specified subset of
children and youth, and for those programs to understand the required health and safety practices needed to prevent the spread of COVID-19 in their settings.
Definitions:Cohort: a cohort is a stable group of no more than 14 children or youth and no more than two supervising adults (or a configuration of no more than 16 individuals total in the cohort) in a supervised environment
in which supervising adults and children stay together for all activities (e.g., meals, recreation, etc.), and avoid contact with people outside of their group in the setting.
Supervising adult: an adult assigned to one cohort of children or youth, who does not physically interact with any other cohorts. This includes child care sta�, certificated or classified school sta�, volunteers,
participating parent or caregiver, or other designated supervising adult(s).
Supervised care environment: an environment where multiple children or youth, from multiple families or households, are being supervised simultaneously by an adult. This includes, but is not limited to, licensed
child care facilities, licensed exempt child care programs, supervised programs on a school site while a school is not in session or is providing curriculum in a distance-learning format, or where some educational
services are being o�ered to a subgroup of students as identified by a local educational agency on a school campus.
Considerations for CohortsUtilizing cohorts minimizes the number of people exposed if a COVID-19 case is identified in a child or youth attendee, provider, other instructional support provider, or sta� member of a particular cohort.
Children or youth, attendees and adults in supervised care environments during the COVID-19 pandemic must be in groups as small as possible. This practice decreases opportunities for exposure to or
transmission of the virus; facilitates more e�icient contact tracing in the event of a positive case; and allows for targeted testing, quarantine, and isolation of a single cohort instead of an entire population of
children or youth and supervising adults in the event of a positive case or cluster of cases.
While present at the supervised care environment, children or youth and supervising adults in one cohort must not physically interact with children or youth and supervising adults in other cohorts, other child
facility sta�, or parents of children or youth in other cohorts.
Cohort Size
Cohorts must be limited to no more than 14 children and youth and no more than two supervising adults, or a configuration of no more than 16 individuals total (children and youth or adults) in the cohort.Requirements for adult to child ratios continue to apply for licensed child care programs.Cohorts can be divided, as needed, into subgroups of children and youth from the same cohort, as long as the 14-to-2 ratio is not exceeded.The maximum cohort size applies to all children and youth in the cohort, even when all children are not participating at the same time. For example:
A cohort may not include 6 children or youth who attend full‐time, 6 children on Mon/Wed/Fri, and 6 children on Tue/Thu (total of 18). A cohort may not include 8 children or youth who attend for the entire day, 4 who attend mornings only, and 4 who attend a�ernoons only (total of 16).
Cohort Mixing
Prevent interactions between cohorts, including interactions between sta� assigned to di�erent cohorts. Assign children and youth who live together or carpool together to the same cohort, if possible.Avoid moving children and youth from one cohort to another, unless needed for a child's overall safety and wellness.Cohorts must be kept separate from one another for special activities such as art, music, and exercise. Stagger playground time and other activities so that no two cohorts are in the same place at thesame time.
The requirement to prevent interaction between cohorts can be met either by having each cohort in a separate room or space created by partitions.One-to-one specialized services can be provided to a child or youth by a support service provider that is not part of the child or youth's cohort.Specialized service includes but not limited to occupational therapy services, speech and language services, and other medical, behavioral services, or educational support services as part of a targetedintervention strategy.Services must be provided consistent with the industry guidance for Limited Services (PDF).
Considerations for Sta�Supervising adults should be assigned to one cohort and must work solely with that cohort, unless serving children five years of age and younger in which case an adult may be assigned to no more than 2 cohorts.
Avoid changing sta� assignments to the extent practicable. Substitute providers who are covering for short‐term sta� absences are allowed but must only work with one cohort of children per day.
Meetings among the sta� from di�erent cohorts must be conducted remotely, outdoors, or in a large room in which all providers wear cloth face coverings and maintain at least 6 feet distance from other providers.
Outdoor meetings and meetings in large rooms with the windows open are preferred over meetings in small rooms with windows closed.
Precautions and ConsiderationsPhysical distancing, in combination with the use of face coverings, decreases the risk of COVID‐19 from respiratory droplets. Physical distancing between adults must be maintained as much as possible, and adults
and students must use face coverings at all times, pursuant to the CDPH Schools Guidance regarding face coverings. Physical distancing between young children in the same cohort should be balanced with
developmental and socio‐emotional needs of this age group. Supervised care settings should follow applicable industry guidance on appropriate use of face coverings by children and youth.
See the CDPH Guidance on Schools and School Based Programs (PDF) and on Child Care (PDF) for additional considerations regarding, face masks, meals, cleaning, drop o� and pick up and health screening.
California Department of Public HealthPO Box, 997377, MS 0500, Sacramento, CA 95899-7377
Department Website (cdph.ca.gov)

Page Last Updated : September 5, 2020

EXHIBIT "43"

COVID-19
Blueprint for a Safer Economy Last updated 9/8/20
California has a new blueprint for reducing COVID-19 in the state with revised criteria for loosening and tightening restrictions on activities. Every county in California is assigned to a
tier based on its test positivity and adjusted case rate for tier assignment including metrics from the last three weeks. The detailed plan is below.
Additional information about the Blueprint:
Find the status of activities in your county
Understand which activities and businesses are open in the four tiers (PDF)
Explore the complete data by county - California Blueprint Data Chart (Excel)
Plan for Reducing COVID-19 and Adjusting Permitted Sector Activities to Keep Californians Healthy and Safe
Updates as of 9/8/2020:
Addition of a California Blueprint Data Chart (Excel) displaying: county tier status, date of tier assignment, health equity measure (pending), number of consecutive weeks
meeting the next tier's criteria, case rates, adjusted case rate for tier assignment, testing positivity, and test rates. Data displayed is for the weeks ending August 22 and August
29.
Clarification of the initial adjustment scale to case rate, including the addition of a table with case rate adjustment factors for tier assignment.
Clarification of how counties will be assigned their status if tiers di�er between reporting periods.
Updated and consistent language throughout the Blueprint to distinguish between case rate and adjusted case rate for tier assignment.
Addition of an appendix titled: Appendix 1: Calculation of metrics.
This guidance outlines an updated framework for a safe progression of opening more businesses and activities in light of the pandemic. The framework for this guidance is informed by
increased knowledge of disease transmission vulnerabilities and risk factors and is driven by the following goals:
1) To progress in phases based on risk levels with appropriate time between each phase in each county so impacts of any given change can be fully evaluated.
2) To aggressively reduce case transmission to as low a rate as possible across the state so the potential burden of flu and COVID-19 in the late fall and winter does not challenge our
healthcare delivery system's ability to surge with space, supplies and sta�. Also, with winter weather pushing more activities indoors, low levels of transmission in the community will
make large outbreaks in these riskier settings less likely.
3) To simplify the framework and lay out clear disease transmission goals for counties to work towards.
Tier FrameworkThis framework lays out the measures that each county must meet, based on indicators that capture disease burden, testing, and health equity. A county may be more restrictive than
this framework. This framework also notes signals of concern, including impacted healthcare capacity that may lead towards a dimming intervention. This framework replaces the
current County Data Monitoring metrics. As the COVID-19 pandemic continues to be an evolving situation and new evidence and understanding emerges, the California Department of
Public Health (CDPH), in collaboration with other State o�icials, will continue to reassess metrics and thresholds.
See chart below for the framework metrics as set according to tiers based on risk of community disease transmission. Calculation of metrics is described in Appendix 1.
^Excludes state and federal inmates
*Population denominators from the Department of Finance: State Population Projections - Total Population by County- Table P-1
**Case rate will be determined using cases confirmed by PCR
*** Counties are assigned a tier based on two metrics: test positivity and case rate. The case rate is adjusted based on testing volume per 100,000 population as described below. Due
to variability in data, this adjustment does not apply to small counties (defined as those with a population less than ~100,000 residents)
For counties with testing volume above the state average, the factor is less than 1, decreasing in a linear manner from 1.0 to 0.6 as testing volume increases from the stateaverage to 2x the state average. The factor remains at 0.6 if the testing volume is greater than 2x the state average.For counties with testing volume below the state average, the factor is greater than 1, increasing in a linear manner from 1.0 to 1.4 as testing volume decreases from the stateaverage to zero. However, this adjustment for low testing volume will not be applied to counties with a test positivity < 3.5%.
California COVID-19 Case Rate Adjustment Factor

Testing Volume Case Rate Adjustment Factor*
0 1.4
0.25*Average 1.3
0.50*Average 1.2
0.75*Average 1.1
Average 1
1.25*Average 0.9
1.5*Average 0.8
1.75*Average 0.7
2.0*Average and above 0.6
Counties with fewer than ~100,000 individuals will be exempted from case rate adjustments, and counties with test positivity <3.5% will be exempted from adjustment for testingrates lower than the state average.
If the two metrics are not the same tier, the county's tier assignment will be determined by the more restrictive of the two. For example, if a county's test positivity corresponds to tier 3(orange, moderate), but the case rate corresponds to tier 1 (purple, widespread), the county will be assigned as tier 1.
Moving through the Tiers
Rules of the framework:
1. A�er the initial assignments e�ective 8/31 , CDPH will assess indicators weekly and the next assignments were released on September 8, 2020.
2. A county must remain in a tier for a minimum of three weeks before being able to advance to a less restrictive tier.
3. A county can only move forward one tier at a time, even if metrics qualify for a more advanced tier.
4. If a county's adjusted case rate for tier assignment and test positivity measure fall into two di�erent tiers, the county will be assigned to the more restrictive tier.
5. City local health jurisdiction (LHJ) data will be included in overall metrics, and city LHJs will be assigned the same tier as the surrounding county
6. An LHJ may continue to implement or maintain more restrictive public health measures if the local health o�icer determines that health conditions in that jurisdiction warrant
such measures.
Initial step applied on August 28, 2020:
1. Each county was assigned to a tier based on an adjusted case rate and test positivity from the weeks of 8/11 and 8/18 . If a county's adjustedcase rate and test positivity measures fell into two di�erent tiers, the county was assigned the more restrictive tier. Similarly, if either adjusted caserate or testing positivity tiers di�er between the two reporting periods, the county will be assigned the more restrictive tier.
2. This tier status will be e�ective on Monday, August 31, 2020.
3. If a county is initially assigned to Purple Tier 1 and has met the criteria for a less restrictive tier the prior week, the county only needs to meet the criteria for a less restrictive tier
for one more week to move to the Red Tier 2. (For the September 8, 2020 assignment, a county does not need to remain in the Purple Tier 1 for three weeks. For all subsequent
assessments, a county must remain in a tier for three weeks and meet the criteria to advance as described below.)
To advance:
1. A county must have been in the current tier for a minimum of three weeks, except as described in the "Initial step applied on August 28, 2020" section above.2. A county must meet criteria for the next tier for both measures for the prior two consecutive weeks in order to progress to the next tier. 3. In addition, the state will establish health equity measures on activities such as data collection, testing access, contact tracing, supportive isolation, and outreach that
demonstrate a county's ability to address the most impacted communities within a county. Additional measures addressing health outcomes such as case rates, hospitalizationsand deaths, will also be developed and tracked for improvement.
To move back:
1. During the weekly assessment, if a county's adjusted case rate and/or test positivity has been within a more restrictive tier for two consecutive weekly periods, the county mustrevert to the more restrictive tier.
2. At any time, state and county public health o�icials may work together to determine targeted interventions or county wide modifications necessary to address impacted hospitalcapacity and drivers of disease transmission, as needed.
3. Counties will have three days to implement any sector changes or closures unless extreme circumstances merit immediate action.
Risk CriteriaActivities and sectors will begin to open at a specific tier based on risk-based criteria (PDF), as outlined below. Lower risk activities or sectors are permitted sooner and higher risk
activities or sectors are not permitted until later phases. Many activities or sectors may increase the level of operations and capacity as a county reduces its level of transmission.
Criteria used to determine low/medium/high risk sectors
Ability to accommodate face covering wearing at all times (e.g. eating and drinking would require removal of face covering)Ability to physically distance between individuals from di�erent householdsAbility to limit the number of people per square footAbility to limit duration of exposureAbility to limit amount of mixing of people from di�ering households and communitiesAbility to limit amount of physical interactions of visitors/patronsAbility to optimize ventilation (e.g. indoor vs outdoor, air exchange and filtration)Ability to limit activities that are known to cause increased spread (e.g. singing, shouting, heavy breathing; loud environs will cause people to raise voice)
SchoolsSchools may reopen for in-person instruction based on equivalent criteria to the July 17 School Re-opening Framework (PDF) previously announced. That framework remains in
e�ect except that Tier 1 is substituted for the previous County Data Monitoring List (which has equivalent case criteria to Tier 1). Schools in counties within Tier 1 are not permitted to
reopen for in-person instruction, with an exception for waivers granted by local health departments for TK-6 grades. Schools that are not authorized to reopen, including TK-6 schools
that have not received a waiver, may provide structured, in-person supervision and services to students under the Guidance for Small Cohorts/Groups of Children and Youth.
st
th th
th

Page Last Updated : September 8, 2020
Schools are eligible for reopening fully for in-person instruction following California School Sector Specific Guidelines once the county is out of Tier 1 (and thus in Tier 2) for at least 14
days, which is similar to being o� the County Data Monitoring List for at least 14 days. As noted above, an LHJ may continue to implement or maintain more restrictive public health
measures if the local health o�icer determines that health conditions in that jurisdiction warrant such measures.
As stated in the July 17 School Re-opening Framework (PDF), schools are not required to close if a county moves back to Tier 1, but should consider surveillance testing of sta�.
County Data Adjudication ProcessIf a county finds that there is discrepancy between the county's and state's calculated data for the above defined measures, the county shall notify the CDPH Local Coordinator. The
county may request a meeting to discuss with local and state epidemiology leads to compare data. In addition, CDPH will work with California Conference of Local Health O�icers and
County Health Executives Association of California to develop other methodologies to assess qualitative and contextual information impacting these metrics and the most appropriate
interventions.
Once a discrepancy is adjudicated by CDPH, any updated tier status will be determined by CDPH and the tier status will be reflected on the public website within 48 hours, as
appropriate.
APPENDIX 1: Calculation of metrics
Metric Definition
Case Rate (rate per 100,000 excluding prisoncases,7-day average with 7-day lag)
Calculated as the average (mean) daily number of COVID-19+ cases, excluding cases among persons incarcerated at state orfederal prisons (identified as cases with an ordering facility name or address associated with prison locations), over 7 days(based on episode date), divided by the number of people living in the county/region/state. This number is then multiplied by100,000. Due to reporting delays, there is a 7 day lag built into this calculation. For example, for data updated through 8/22/20,the case rate will be dated as 8/15/20 and will include the average case rate from 8/9/20 - 8/15/20.
Adjusted Case Rate for TierAssignment (rate per 100,000 excluding prisoncases,7-day average with 7-day lag)
Calculated as the Case Rate per 100,000 multiplied by the Case Rate Adjustment Factor that is based on the county's testing rateper 100,000.
Testing Positivity (excluding prison cases, 7-day average with 7-day lag)
Calculated as the total number of positive polymerase chain reaction (PCR) tests for COVID-19 over a 7-day period (basedon specimen collected date) divided by the total number of PCR tests conducted (excludes tests for persons out of state or withunknown county of residence), excluding tests for persons incarcerated at state or federal prisons (identified as cases with anordering facility name or address associated with prison locations). This number is then multiplied by 100 to get a percentage.Due to reporting delay (which may be di�erent between positive and negative tests), there is a 7-day lag. Example: Forcumulative lab data received on 8/22/20, reported test positivity is dated as 8/15/20 and is calculated based on tests withspecimen collection dates from 8/9/20 - 8/15/20.
Test Rate (tests per 100,000 excluding prisoncases, 7-day average with 7-day lag)
Calculated as average (mean) number of polymerase chain reaction (PCR) tests per day over a 7-day period (based on specimencollection date), excluding tests for persons incarcerated at state or federal prisons (identified as cases with an ordering facilityname or address associated with prison locations), and divided by the number of people living in the county/region/state. Thisnumber is then multiplied by 100,000. Due to reporting delay, there is a 7-day lag included in the calculation. Example: Forcumulative lab data received through 8/22/20, the reported 7-day average number of tests will be dated as 8/15/20 and willinclude PCR tests with specimen collection dates from 8/9/20 - 8/15/20.
Helpful LinksFind the status of activities in your county
Understand which activities and businesses are open in the four tiers (PDF)
Explore the complete data by county (Excel)
School Re-opening Framework (PDF)
Guidance for Small Cohorts/Groups of Children and Youth
www.covid19.ca.gov
th

EXHIBIT "44"

County of Fresno DEPARTMENT OF PUBLIC HEALTH
Promotion, preservation and protection of the community’s health 1221 Fulton Street /P. O. Box 11867, Fresno, CA 93775
(559) 600-3200 FAX (559) 600-7687 The County of Fresno is an Equal Employment Opportunity Employer
www.co.fresno.ca.us www.fcdph.org
County of Fresno
Department of Public Health
ORDER OF THE HEALTH OFFICER
August 28, 2020
Pursuant to California Health and Safety Code Sections 101040, 120175, and 120175.5(b) the Health
Officer of the County of Fresno orders as follows:
1. This order is issued as a result of the direct violation of the Closure Order issued on August 13, 2020,
and continued violations through August 28, 2020.
2. Effective August 28, 2020, the following will be in effect:
A. All Immanuel Schools shall:
i. On a daily basis, screen any person who enters the campus for any purpose, for febrile
respiratory illness; and
ii. Exclude from campus all employees, students, faculty, or administrators that report
symptoms of febrile respiratory illness for ten days from the day that they are identified as
having symptoms and until 24 hours after improvement of symptoms or fever without the
use of fever-reducing medications; and
iii. Within 24 hours, report to the Fresno County Department of Public Health any person who
enters the campus for any purpose, whether students, faculty, administrators, parents, or
anyone else allowed on campus, who is showing signs of a febrile respiratory illness or
showing symptoms of COVID-19; and
iv. For the purpose of this order, a febrile respiratory illness is defined as “a new or worsening
episode of either cough or shortness of breath, presenting with fever (temperature 38
degrees C or 100.4 degrees F or higher) or chills in the previous 24 hours;” and
v. Symptoms of COVID-19 include any of the following:
(1) fever or chills
(2) cough
(3) Shortness of breath or difficulty breathing
(4) Congestion or runny nose
(5) Repeated shaking/ tremors

2
(6) Muscle pains or body aches
(7) Headache
(8) Sore throat
(9) New loss of taste or smell
(10) Nausea, vomiting or diarrhea
B. All Immanuel Schools shall comply with Department of Public Health Investigation and Guidance
Requests in a timely manner when individuals who enter the Immanuel Schools campus(es) are
confirmed with a COVID infection.
C. If for any reason COVID-19 related testing is done on campus or sponsored by Immanuel Schools,
they shall provide testing results for individuals who are tested at their premises as soon as these
are available
D. Department of Public Health, and/or the Public Health Officer may modify this guidance based on
other factors.
3. For the purpose of this order:
A. Close contact is defined as someone who has spent 15 minutes or more time within 6 feet or less
of the index person while unmasked;
B. Social distancing is defined as “maintain a six-foot separation from all persons except for family
members;”
4. The California Department of Public Health (CDPH) and the Centers for Disease Control and Prevention
(CDC) may recommend further guidance.
I, as Interim Health Officer for the County of Fresno, encourage voluntary compliance with this Health Officer’s Order. However, violation
of this order is subject to fine, imprisonments or both (California Health and Safety Code Section 120295.)
Violation of or failure to comply with this Order is punishable by fine, imprisonment or both under various criminal statutes:
Cal. Penal Code section 148 makes it a misdemeanor to resist, delay, or obstruct a public officer, in the discharge of his or her duty. Sheriff
deputies and city police officers are authorized to enforce health orders in the discharge of his or her duty.
Cal. Penal Code section 69 may be charged as a felony for the attempt, by means of any threat or violence, to deter or prevent an
executive officer from performing any duty imposed by law, or to knowingly resist, by the use of force or violence, the officer, in the
performance of the officer's duty. Sheriff deputies and city police officers are authorized to enforce health orders in the discharge of his
or her duty.
Cal. Penal Code section 409.5 allows the health officer to close an area where a calamity has created an immediate menace to public
health.
California Health and Safety Code sections 120275 and 120295 makes it a misdemeanor to violate certain sections of the Health and
Safety Code, including those requiring individuals to comply with health orders to facilitate isolation or quarantine.
________________________________________ 8/28/2020_____________ Rais Vohra MD Date Health Officer

EXHIBIT "45"

COVID-19:Cases
Note:Numbersdonotrepresenttrueday-over-daychangeastheseresultsincludecasespriortoyesterday.
LosAngeles 249,876Riverside 54,320Orange 49,394SanBernardino 49,264SanDiego 41,326Kern 29,925Fresno 26,724Sacramento 19,474Alameda 19,399SanJoaquin 18,799SantaClara 18,759Stanislaus 15,469ContraCosta 14,816Tulare 14,787Ventura 11,497Imperial 10,233SanFrancisco 9,996SantaBarbara 8,528Monterey 8,527SanMateo 8,478Merced 8,441Kings 6,721Sonoma 6,397Marin 6,321Solano 5,680Madera 3,926Placer 3,222SanLuisObispo 3,131Yolo 2,604
PositiveCasesbyCounty
FresnoCASES |=CaliforniaPopulation%
26,7241DayΔ+84+0.3%
7DayΔ+939+3.6%
14DayΔ+2,653+11.0%
7DayAvg.134
14DayAvg.190
Weekly%Change-45.2%
USTotalCases:6,310,6634/1 4/23 5/15 6/6 6/28 7/20 8/11 9/2
843
Day-Over-DayNewCases
Female 51%
Male 49%
Unknown 1%
Gender
0-17 10%
18-49 60%
50-64 19%
65+ 11%
Missing 0%
Age
AIAN 0%
Asian 6%
Black 4%
Latino 61%
NHPI 1%
White 17%
Multi-Race 1%
Other 11%
Race/Ethnicity
CALIFORNIATESTINGRESULTS
12,389,991 1DayΔ+46,194+0.4%
14DayΔ+1,471,576+13.5%
Positivity:7Day:3.5%14Day:4.0%
4/1 4/23 5/15 6/6 6/28 7/20 8/11 9/2
12,389,991 CumulativeTestsReportedbyAllLabs
FresnoDEATHS |=CaliforniaPopulation%
Female 42%
Male 57%
Unknown 0%
Gender
0-17 0%
18-49 7%
50-64 19%
65+ 74%
Missing 0%
Age
AIAN 0%
Asian 12%
Black 8%
Latino 49%
NHPI 0%
White 30%
Multi-Race 1%
Other 1%
Race/Ethnicity3261DayΔ+0+0%
7DayΔ+36+12.4%
14DayΔ+87+36.4%
7DayAvg.5
14DayAvg.6
Weekly%Change-29.4%
USTotalDeaths:189,1474/1 4/23 5/15 6/6 6/28 7/20 8/11 9/2
00
Day-Over-DayNewDeaths
Note:Anyinstanceofanegativenumberofcasesordeathsreflectsacorrectiontopreviousreporting.
Note:Demographicpercentagesmaynotaddupto100%duetorounding.Breakdownofdeathsisasubsetoftotaldeathsasreportedbylawenforcement.
LastUpdatedon9/9/2020
SortbyPositiveCases

EXHIBIT "46"


Immanuel Schools
Upcoming Payments
View Full Schedule
Expand All I Collapse AU
A Due Date: 15 Sep 2020
Tenn: 2020-2021 School Year
ACCOUNT
- K-6 Activity
Fee
- K-6 Tuition
- K-6 Activity
Fee
-K-6 Tuition
- K-6 Activity
Fee
- K-6 Tuition
f.lly.ll:ll:!ll.£!,mu115 079 94�) Amwn1 Oue:$20,565.00
CHARGES PAYMENTS AMOUNT DUE
$150.00 $0.00 $150.00
$6,705.00 $0.00 $6,705.00
$150.00 $0.00 $150.00
$6,705.00 $0.00 $6,705.00
$150.00 $0.00 $150.00
$6,705.00 $0.00 $6,705.00
1/1

1
2
3
4
5
6
7
8
9
10
11
12
13
14
15
16
17
18
19
20
21
22
23
24
25
26
27
28 1
VERIFIED CROSS-COMPLAINT
PROOF OF SERVICE
County of Fresno v. Immanuel Schools, et al. Fresno Superior Court Case No. 20CECG02447
I am an employee in the County of Riverside. I am over the age of 18 years and not a party to the within entitled action; my business address is 25026 Las Brisas Road, Murrieta, California 92562.
On September 11, 2020, I served a copy of the following document(s) described as VERIFIED CROSS-COMPLAINT FOR A VIOLATION OF THE EQUAL PROTECTION CLAUSE OF THE CALIFORNIA CONSTITUTION; FOR A VIOLATION OF THE CONTRACTS CLAUSE OF THE CALIFORNIA CONSTITUTION; FOR A VIOLATION OF THE FOURTEENTH AMENDMENT OF THE U.S. CONSTITUTION; AND DECLARATORYAND INJUNCTIVE RELIEF on the interested party(ies) in this action as follows:
SEE ATTACHED SERVICE LIST
BY E-MAIL OR ELECTRONIC TRANSMISSION. Based on a court order or an agreement of the parties to accept service by e-mail or electronic transmission, I transmitted copies of the above-referenced document(s) on the interested parties in this action by electronic transmission. Said electronic transmission reported as complete and without error.
BY FACSIMILE TRANSMISSION. Pursuant to agreement and written confirmation of the parties to accept service by facsimile transmission, I transmitted copies of the above-referenced document(s) on the interested parties in this action by facsimile transmission from (951) 600-4996. A transmission report issued as complete and without error.
BY UNITED STATES POSTAL SERVICE. I am readily familiar with the practice for collection and processing of correspondence for mailing and deposit on the same day in the ordinary course of business with the United States Postal Service. Pursuant to that practice, I sealed in an envelope, with postage prepaid and deposited in the ordinary course of business with the United States Postal Service in Murrieta, California, the above-referenced document(s).
BY OVERNIGHT DELIVERY. I enclosed the above-referenced document(s) in an envelope or package provided by an overnight delivery carrier and addressed as above. I placed the envelope or package for collection and overnight delivery at an office or a regularly utilized drop box of the overnight delivery carrier.
BY PERSONAL SERVICE. I caused copies of the above-referenced documents to the addressee(s) noted above served by process server.
I declare under penalty of perjury under the laws of the United States of America that the foregoing is true and correct and that I am an employee in the office of a member of the bar of this Court who directed this service.
Shelly Padilla

1
2
3
4
5
6
7
8
9
10
11
12
13
14
15
16
17
18
19
20
21
22
23
24
25
26
27
28 2
VERIFIED CROSS-COMPLAINT
SERVICE LIST
County of Fresno v. Immanuel Schools, et al. Fresno Superior Court Case No. 20CECG02447
Daniel C. Cederborg, Esq. Katwyn T. Delarosa, Esq. FRESNO COUNTY COUNSEL 2220 Tulare Street, Ste. 500 Fresno, CA 93721 Tele: (559) 600-3479 Fax: (559) 600-3480 [email protected] [email protected] [email protected]
Attorneys for Plaintiff, COUNTY OF FRESNO, through JEAN M. ROUSSEAU, Emergency Services Director and County Administrative Officer


![[FINAL] Prime Trust Complaint - Stretto](https://static.fdokumen.com/doc/165x107/633c6f7020c0e317e400ecfe/final-prime-trust-complaint-stretto.jpg)