Vehicle occupant protection: Four-wheel-drives, utilities and ...
119
Department of Transport and Regional Deyelopment The Federal Office of Road Safety Vehicle Occupant Protection: Four-Wheel-Drives? Utilities and Vans Brian Fildes, Sally Kent, John Lane, Jim Lenard, Peter Vulcan Monash University Accident Research Centre
-
Upload
khangminh22 -
Category
Documents
-
view
0 -
download
0
Transcript of Vehicle occupant protection: Four-wheel-drives, utilities and ...

Department of Transport and Regional Deyelopment The Federal Office of Road Safety
Vehicle Occupant Protection: Four-Wheel-Drives? Utilities and Vans
Brian Fildes, Sally Kent, John Lane, Jim Lenard, Peter Vulcan
Monash University Accident Research Centre

0 Commonwealth of Australia 1996
ISBN 0 642 51229 9
This work is copyright. Apart from any use as permitted under the CopyrightAct 1968, no part may he reproduced by any process without prior written permission from the Australian Government Publishing Service. Requests and inquiries concerning reproduction and rights should be addressed to the Manager, Commonwealth Information Services, Australian Government Publishing Service, GPO Box 84, Canberra ACT 2601.
Produced by ihe Australian Government Publishing Service
11 FOUR-WHEEL-DRIVES. UTILITIES & VANS ..
DEPARTMENT OF TRANSPORT AND REGIONAL DEVELOPMENT
FEDERAL OFFICE OF ROAD SAFETY
LOCUMENT RETRIEVAL 1NFORMATION
-
Report No. Date Pages ISBN ISSN
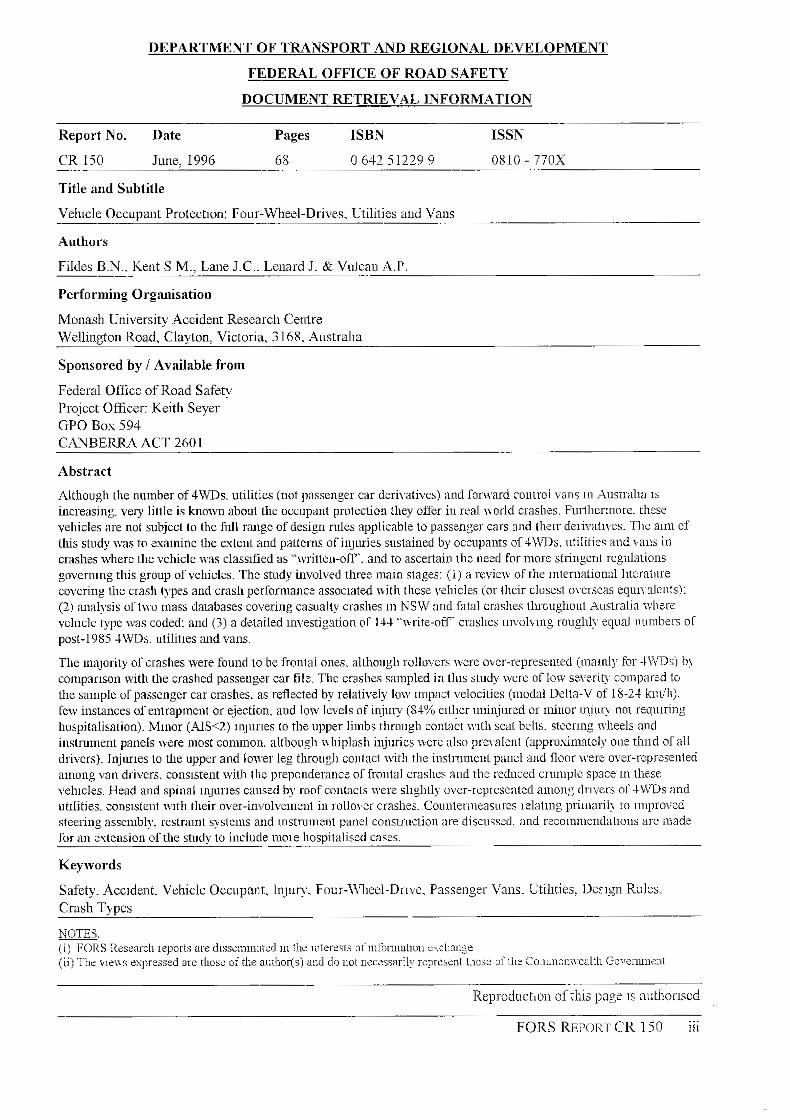
CR 150 June, 1996 68 0 6 4 2 5 1 2 2 9 9 0810 - 770X
Title and Subtitle
Vehlcle Occupant Protect~on: Four-Wheel-Drives. Utilities and Vans
Authors
Fildes B.N.. Kent S M., Lane J.C.. Lenard J. 82 Vulcan A.P.
Performing Organisation
Mollash University Accident Research Centre Wellin$on Road, Claytonl Victoria, 3 168. Australla
Sponsored by /Available from
Federal Officc of Road Safety PI-ojcct Offker: Keith Seyer GPO Box 594 CANBERRA ACT 2601
Abstract
Althouglr the nlunber of4WDs. utilities (not passenger car derivatives) and Conwd conrroi wms 111 Australla IS
vehicles are not subject to the fidl range of design d e s applicable to passenger cars and t h e ~ r delivatlves. The a1111 of increasing. v e q little is known about the occupant protection they oifer in real norld crashes. Fullhermore. these
[his stndy was to esaminc the extent and patterns of i~~quries sustained by occupants o€.I\liDs. utilities and vans in crashes w l m e the vehicle was classlfied as “writte11-on“. and to ascertain the need for more slringent reKulations govenung this group ofvehicles. The study involved three main stages: (1) a revien of the inleanational 1Itcralllre covering the crash Iypes and crash peslbrnlance assoclated with tl~cse vehicles (or thcir closest o~erscas eqni\~alcnts):
velucle txx was coded: and (3) a detailed Investigation or 144 “write-off crashes Involmng roughly equal numbers o l (2) analysis of two mass databases covering casualty crashes 111 NSW and mal crashes throughoul Ansualia where
post-1985 4U’Ds. ntililles m d y a m
The maqorily olcrasl~es were found lo be €rental ones. although rollovers were over-rzpresented jmalnl!; for 4WDsi b! con~par~son with the crashed passenger car file. Tlrc crashes sampled i n [Ills study were oilow severih cornpared to the sample of passcngcr car crashes. as reflected by relatively low mpact velocities (modal Delta-\’ of 18-24 kldll). few instances o€ entrapmcnl or ejection, and low lcvels of i n j q (S1% elther uninjured or minor rrt-iu? 1101 requlsing hospitalisation). Mmor (.2IS<2) q u r l e s to tbe upper limbs through contact \ut11 seat belts. stccrlng wheels and i~lstnnnent panels were most conmon. al1hoog11 nhiplash injuries were also premlcnt (appro.<matcl!; one thnd oCa1i drivers). Injor~es to the upper and lover leg through contact with the inst~ument panel and floor were over-rcpi-sentecl
veblcles. Head and spinal ~ n j u r ~ e s caused b!; roof contacts were slightly o\:er-representcd among drwess oC4WDs and alnong van drivcrs. CnnsLstent with the preponderance oTlrontal crashes and the reduced cnnuplc space III these
utilities. conslslent 1v1t11 their o\,er-involvemel~t in rollover crashes. Connterrneasurcs ~ e l a t ~ n g primaril! to mpro\;cd steering asscmbl!;. restramt systems and ~nstnment 1xnel construction are discussed. and I-ecoluiucIldatlolls are made for an cvtcnsion orthe study to i~lclude mole hospilalised cases.
Keywords
Safety. Acc~dent. Vehiclc Occupant. lnjun. Four-Mlleei-Drwc. Passenger \‘am. Utilities. D ~ g n Rules. Crash Tvpes
N O T E S . ( i ) FORS Rescnrcli leports zre drsse,m~n;~ied i n tile lateresls 3i!11ijmla1~11 e \ c i n i l ~ e ( i i ) T k we\\s expressed m u rhost oftlie aoihorjsj aod do nor nec-ssaril? rqxc imt t.mse 3111~e Conunx~vcnl:h C-a~reilu?le:ll
RepIoduct,on ofrliis pass 1s authorlscd
FORS Rj!rowr CR 150 i i i

iV FOUR-WHEEL-DRIVES, UTILlTIES & VANS

Contents Preface . . . . . . . . . . . . . . . . . . . . . . . . . . . . . . . . . . . . . . . . . . . . . . . . . . . . . . . . . . . . . . . . . . . . . . . . . . . . . . . . . . . . . . . . . . . . . . . . . . . . . . . . . . . . . . . . . . . . . . . . . . . . . . . . . . . . . . ix Acknowledgements .................................................................................................................. xi Executive Summary . . . . . . . . . . . . . . . . . . . . . . . . . . . . . . . . . . . . . . . . . . . . . . . . . . . . . . . . . . . . . . . . . . . . . . . . . . . . . . . . . . . . . . . . . . . . . . . . . . . . . . . . . . . . . . . . xm
...
1 .
2 .
3 .
4 .
5 .
Introduction . . . . . . . . . . . . . . . . . . . . . . . . . . . . . . . . . . . . . . . . . . . . . . . . . . . . . . . . . . . . . . . . . . . . . . . . . . . . . . . . . . . . . . . . . . . . . . . . . . . . . . . . . . . . . . . . . . . . . 1 1.1 Study ObJectives 1 1.2 Study Design . . . . . . . . . . . . . . . . . . . . . . . . . . . . . . . . . . . . . . . . . . . . . . . . . . . . . . . . . . . . . . . . . . . . . . . . . . . . . . . . . . . . . . . . . . . . . . . . . . . . . . . . . . 1
Literature Review . . . . . . . . . . . . . . . . . . . . . . . . . . . . . . . . . . . . . . . . . . . . . . . . . . . . . . . . . . . . . . . . . . . . . . . . . . . . . . . . . . . . . . . . . . . . . . . . . . . . . . . . . . . . 3 2.1 Definltlons 3 2.2 Special Purpose Vehicles in the Australian Fleet .................................................. 3 2.3 Crash Performance ofVehicle Types .................................................................... 5 2.4 Rollovers ... . . . . . . . . . . . . . . . . . . . . . . . . . . . . . . . . . . . . . . . . . . . . . . . . . . . . . . . . . . . . . . . . . . . . . . . . . . . . . . . . . . . . . . . . . . . . . . . . . . . . . . . . . . . . . 7 2.5 Specific Injury Types . . . . . . . . . . . . . . . . . . . . . . . . . . . . . . . . . . . . . . . . . . . . . . . . . . . . . . . . . . . . . . . . . . . . . . . . . . . . . . . . . . . . . . . . . . . . . 8 2.6 Conclusions ......................................................................................................... 12
Mass Database Analysis . . . . . . . . . . . . . . . . . . . . . . . . . . . . . . . . . . . . . . . . . . . . . . . . . . . . . . . . . . . . . . . . . . . . . . . . . . . . . . . . . . . . . . . . . . . . . . . . 13 3.1 Databases . . . . . . . . . . . . . . . . . . . . . . . . . . . . . . . . . . . . . . . . . . . . . . . . . . . . . . . . . . . . . . . . . . . . . . . . . . . . . . . . . . . . . . . . . . . . . . . . . . . . . . . . . . . . . 13 3.2 N.S.W. Casualty Data .......................................................................................... 13
3.4 Conclusions . . . . . . . . . . . . . . . . . . . . . . . . . . . . . . . . . . . . . . . . . . . . . . . . . . . . . . . . . . . . . . . . . . . . . . . . . . . . . . . . . . . . . . . . . . . . . . . . . . . . . . . . . 29
Crashed Vehicle Study . . . . . . . . . . . . . . . . . . . . . . . . . . . . . . . . . . . . . . . . . . . . . . . . . . . . . . . . . . . . . . . . . . . . . . . . . . . . . . . . . . . . . . . . . . . . . . . . . . 31 4.1 Method . . . . . . . . . . . . . . . . . . . . . . . . . . . . . . . . . . . . . . . . . . . . . . . . . . . . . . . . . . . . . . . . . . . . . . . . . . . . . . . . . . . . . . . . . . . . . . . . . . . . . . . . . . . . . . . . . 31 4.2 Variables & Data Analyses .................................................................................. 34 4.3 Overall Results 33
4.4 InJunes 41
. . . . . . . . . . . . . . . . . . . . . . . . . . . . . . . . . . . . . . . . . . . . . . . . . . . . . . . . . . . . . . . . . . . . . . . . . . . . . . . . . . . . . . . . . . . . . . . . . . . . . .
. . . . . . . . . . . . . . . . . . . . . . . . . . . . . . . . . . . . . . . . . . . . . . . . . . . . . . . . . . . . . . . . . . . . . . . . . . . . . . . . . . . . . . . . . . . . . . . . . . . . . . . . . . . . . . .
3.3 FORS Fatality File ............................................................................................... 21
1 -
. . . . . . . . . . . . . . . . . . . . . . . . . . . . . . . . . . . . . . . . . . . . . . . . . . . . . . . . . . . . . . . . . . . . . . . . . . . . . . . . . . . . . . . . . . . . . . . . . . . . . . . . . . . . . . . . . . . . . . . . . . . . . . . . . . . . . . . . . . . . . . . . . . . . . . . . . . . . . . . . . . . . . . . . . . . . . . . . . . . . . . . . . . . . . . . . . . . . . . . . . . . . . . . . . . . . . . .
4.5 InjuryKontact Source Analyses .......................................................................... 47
Discussion and Recommendations ................................................................................ 57 5.1 Characteristics of the Sample .............................................................................. 57 5.2 Vehicle Integrity . . . . . . . . . . . . . . . . . . . . . . . . . . . . . . . . . . . . . . . . . . . . . . . . . . . . . . . . . . . . . . . . . . . . . . . . . . . . . . . . . . . . . . . . . . . . . . . . . . 59 5.3 InJunes . . . . . . . . . . . . . . . . . . . . . . . . . . . . . . . . . . . . . . . . . . . . . . . . . . . . . . . . . . . . . . . . . . . . . . . . . . . . . . . . . . . . . . . . . . . . . . . . . . . . . . . . . . . . . . . . . 59 5.4 Countermeasures . . . . . . . . . . . . . . . . . . . . . . . . . . . . . . . . . . . . . . . . . . . . . . . . . . . . . . . . . . . . . . . . . . . . . . . . . . . . . . . . . . . . . . . . . . . . . . . . . . 62 5.5 Vehicle Regulations . . . . . . . . . . . . . . . . . . . . . . . . . . . . . . . . . . . . . . . . . . . . . . . . . . . . . . . . . . . . . . . . . . . . . . . . . . . . . . . . . . . . . . . . . . . . . 64
. .
5.6 Further Research and Development ..................................................................... 64
References . . . . . . . . . . . . . . . . . . . . . . . . . . . . . . . . . . . . . . . . . . . . . . . . . . . . . . . . . . . . . . . . . . . . . . . . . . . . . . . . . . . . . . . . . . . . . . . . . . . . . . . . . . . . . . . . . . . . . . . . . . . . . . 67
Attachment 1 Details of Inspection Procedure
Attachment 2 Consent Forms and Occupant Injury Form
Attachment 3 The (NASS) Vehicle Inspection Forms
FORS REPORT CR 150 v
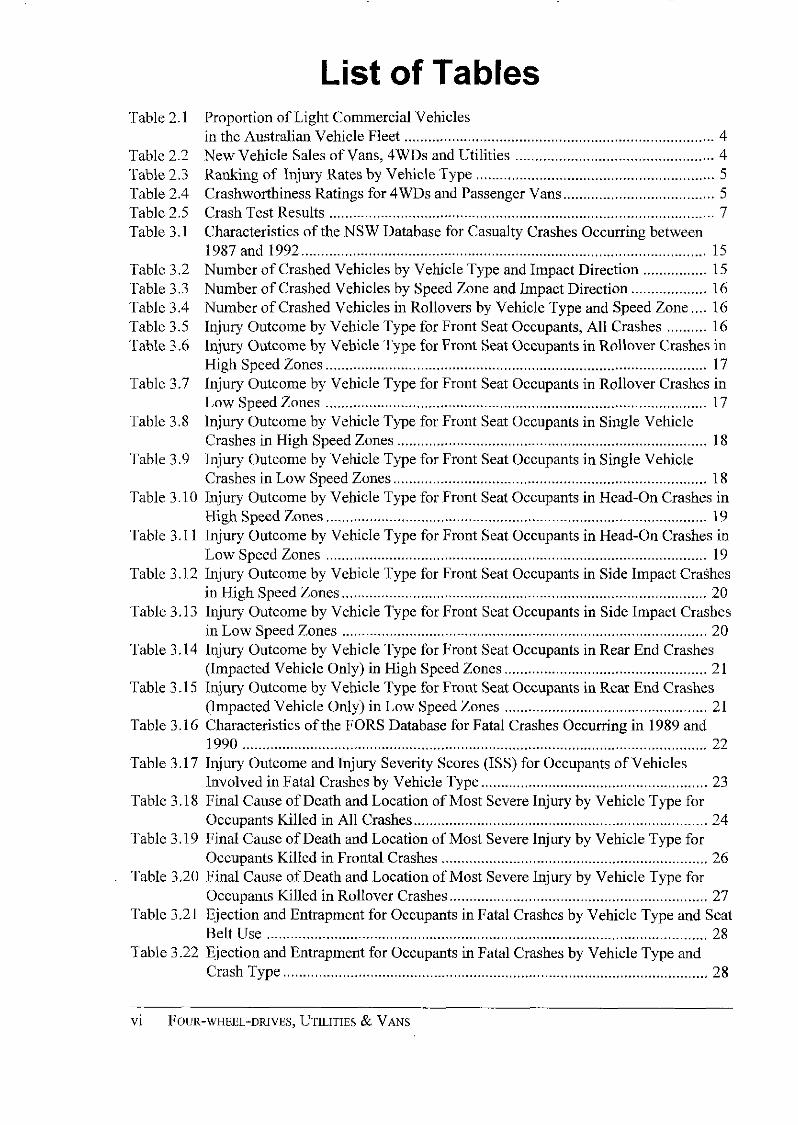
List of Tables Table 2.1
Table 2.2 Table 2.3 Table 2.4 Table 2.5 Table 3.1
Table 3.2 Table 3.3 Table 3.4 Table 3.5 Table 3.6
Table 3.7
Table 3.8
Table 3.9
Proportion oELight Commercial Vehicles in the Australian Vehicle Fleet . . . . . . . . . . . . . . . . . . . . . . . . . . . . . . . . . . . . . . . . . . . . . . . . . . . . . . . . . . . . . . . . . . . . . . . . . . . . . . 4 New Vehicle Sales of Vans, 4WDs and Utilities .................................................. 4 Ranking of Injury Rates by Vehicle Type ............................................................ 5 Crashworthiness Ratings for 4WDs and Passenger Vans ...................................... 5 Crash Test Results . . . . . . . . . . . . . . . . . . . . . . . . . . . . . . . . . . . . . . . . . . . . . . . . . . . . . . . . . . . . . . . . . . . . . . . . . . . . . . . . . . . . . . . . . . . . . . . . . 7 Characteristics of the NSW Database for Casualty Crashes Occurring between 1987 and 1992 ...................................................................................................... 15 Number of Crashed Vehicles by Vehicle Type and Impact Direction ................ 15 Number of Crashed Vehicles by Speed Zone and Impact Direction ................... 16 Number of Crashed Vehicles in Rollovers by Vehicle Type and Speed Zone .... 16 Injury Outcome by Vehicle Type for Front Seat Occupants, All Crashes .......... 16 Injury Outcome by Vehicle Type for Front Seat Occupants in Rollover Crashes in High Speed Zones ................................................................................................ 17 Injury Outcome by Vehicle Type for Front Seat Occupants in Rollover Crashes in Low Speed Zones ... . . . . . . . . . . . . . . . . . . . . . . . . . . . . . . . . . . . . . . . . . . . . . . . . . . . . . . . . . . . . . . . . . . . . . . . . . . . . . . . . . . . . . . . . . . . . . 17 Injury Outcome by Vehicle Type for Front Seat Occupants in Single Vehicle Crashes in High Speed Zones . . . . . . . . . . . . . . . . . . . . . . . . . . . . . . . . . . . . . . . . . . . . . . . . . . . . . . . . . . . . . . . . . . . . . . . . . . . . . . 18 Injury Outcome by Vehicle Type for Front Seat Occupants in Single Vehicle Crashes in Low Speed Zones ............................................................................... 18
Table 3.10 Injury Outcome by Vehicle Type for Front Seal Occupants in Head-on Crashes in High Speed Zones . . . . . . . . . . . . . . . . . . . . . . . . . . . . . . . . . . . . . . . . . . . . . . . . . . . . . . . . . . . . . . . . . . . . . . . . . . . . . . . . . . . . . . . . . . . . . . . . 19
Table 3.11 Injury Outcome by Vehicle Type for Front Seat Occupants in Head-on Crashes in Low Speed Zones . . . . . . . . . . . . . . . . . . . . . . . . . . . . . . . . . . . . . . . . . . . . . . . . . . . . . . . . . . . . . . . . . . . . . . . . . . . . . . . . . . . . . . . . . . . . . . . . 19
Table 3.12 Injury Outcome by Vehicle Type for Front Seat Occupants in Side Impact Crashes in High Speed Zones . . . . . . . . . . . . . . . . . . . . . . . . . . . . . . . . . . . . . . . . . . . . . . . . . . . . . . . . . . . . . . . . . . . . . . . . . . . . . . . . . . . . . . . . . . . . 20
Table 3.13 Injury Outcome by Vehicle Type for Front Seat Occupants in Side Impact Crashes in Low Speed Zones . . . . . . . . . . . . . . . . . . . . . . . . . . . . . . . . . . . . . . . . . . . . . . . . . . . . . . . . . . . . . . . . . . . . . . . . . . . . . . . . . . . . . . . . . . . . 20
Table 3.14 Injury Outcome by Vehicle Type for Front Seat Occupants in Rear End Crashes (Impacted Vehicle Only) in High Speed Zones ................................................... 21
Table 3.15 Injury Outcome by Vehicle Type for Front Seat Occupants in Rear End Crashes (Impacted Vehicle Only) in Low Speed Zones ................................................... 21
Table 3.16 Characteristics of the FORS Database for Fatal Crashes Occurring in 1989 and 1990 ..................................................................................................................... 22
Table 3.17 Injury Outcome and Injury Severity Scores (ISS) for Occupants of Vehicles Involved in Fatal Crashes by Vehicle Type ......................................................... 23
Table 3.18 Final Cause of Death and Location of Most Severe Injury by Vehicle Type for Occupants Killed in All Crashes .......................................................................... 24
Table 3.19 Final Cause of Death and Location of Most Severe Injury by Vehicle Type for
Table 3.20 Final Cause of Death and Location of Most Severe Injury by Vehicle Type for Occupants Killed in Frontal Crashes 26
Occupants Killed in Rollover Crashes ................................................................. 27 Table 3.21 Ejection and Entrapment for Occupants in Fatal Crashes by Vehicle Type and Seat
Table 3.22 Ejection and Entrapment for Occupants in Fatal Crashes by Vehicle Type and Belt Use 28
Crash Type ........................................................................................................... 28
...................................................................
...............................................................................................................
__ "
vi FOLR-WHEEL-DRIVES, ~JTILITIES & VANS

Table 4.1
Table 4.2 Table 4.3
Table 4.4 Table 4.5 Table 4.6 Table 4.7 Table 4.8 Table 4.9
Population Characteristics of the Crashed 4WD. Van. Ute File Compared with the Crashed Passenger Vehicle File ........................................................................... 36
Rank Ordering of Vehicle Damage Intrusions for Crashes by Front and Rear Seating Posltlons .................................................................................................. 38 Front Seat Intrusions for Crashes by Vehicle Type ............................................. 39
List of the Type of Vehicles in the Crashed Vehicle File (n=144) ...................... 37
. .
Rear Seat Intrusions for Crashes by Vehicle Type .............................................. 39 Entrapment Analysis for Belted and Unbelted Occupants .................................. 41 Ejection Analysis for Belted and Unbelted Occuuants ........................................ 41 Body Region Injured by Seating Position for All Collisions .............................. 44 Seating Position by Level and Probability of a Serious Injury ............................ 44
Table 4.10 Body Region Injured for Drivers by Vehicle Type ............................................. 45 Table 4.1 1 Vehicle Type by Level and Probability of a Serious Injury ................................ 45 Table 4.12 Points of ConfAct for Injured Occupants for All Collisions ................................ 46 Table 4.13 Points of Contact for Injured Drivers by Vehicle Type ....................................... 47 Table 4.14 Body Region by Contact Source Analysis for ALL Injuries and Severe Injuries
(AIS>2) for the 116 Drivers involved in ALL Collisions ................................... 48 Table 4.15 Body Region by Contact Source Analysis for ALL Injuries and Severe Injuries
(AIS>2) for the 27 Front-Left Passengers involved in ALL Collisions .............. 49 Table 4.16 Body Region by Contact Source Analysis for ALL Injuries and Severe Injuries
Table 4.17 Body Region by Contact Source Analysis for ALL Injuries and Severe Injuries
Table 4.18 Body Region by Contact Source Analysis for ALL Injuries and Severe Injuries (AIS2) for the 35 - Utility Drivers involved in ALL Collisions ........................ 53
Table 4.19 Body Region by Contact Source Analysis for ALL Injuries and Severe Injuries (AIS>2) for the 39 - Van Drivers involved in ALL Collisions ........................... 54
Table 5.1 Summary of Injuries to Drivers by Vehicle type ................................................. 60
(AIS>2) for the 12 Rear Passengers involved in ALL Collisions ....................... 50
(AIS>2) for the 42 - 4WD Drivers involved in ALL Collisions ......................... 52
List of Figures Figure 2.1 Motor vehicles involved in serious injury casualty crashes in N.S.W. ................ 4 Figure 2.2 Relative rollover fatality rate per million registered vehicles .............................. 8 Figure 2.3 Overall .4 bbreviated Injury Scale (OAIS) for unrestrained
and restrained front occupants injured in pickup crashes in Canada by estimated impact speed .................................................................................. 10
tests 11 Figure 2.4 Outline of a good performing forward control van in the series of barrier crash
Figure 2.5 Outline of a poor performing forward control van in the series of barrier crash
Figure 2.6 Medical costs for front seat occupants offorward control vans and passenger
Figure 4.1 National Accident Sampling System proforma used for coding vehicle impact
Figure 4.2 Distribution of delta-V and Equivalent Barrier Speed (EBS) values for the
Figure 4.3 Injury outcome for all occupants in all collisions .............................................. 42
... . . . . . . . . . . . . . . . . . . . . . . . . . . . . . . . . . . . . . . . . . . . . . . . . . . . . . . . . . . . . . . . . . . . . . . . . . . . . . . . . . . . . . . . . . . . . . . . . . . . . . . . . . . . . . . . . . .
. . . . . . . . . . . . . . . . . . . . . . . . . . . . . . . . . . . . . . . . . . . . . . . . . . . . . . . . . . . . . . . . . . . . . . . . . . . . . . . . . . . . . . . . . . . . . . . . . . . . . . . . . . . . . . . . . . . . . . tests 11
................................................................................................... cars, all crashes 12
location and direction (courtesy ofNHTS.4). ..................................................... 33
sample of 42 and 88 4WD, Vans and Utility vehicles respectively ................... 40
Figure 4.4 Injury outcome for occupants in all collisions by vehicle type .......................... 42
FORS REPORT CR 150 vii

viii FOUR-WHEEL-DRIVES, UTILITIES & V.4~s

Preface
The Federal Office of Road Safety commenced a review^ ofthe level of occupant protection provided by off-road passenger vehicles and light commnercial vehicles in 1992.
As part ofthis review, a study was commissioned by FORS with the Monash University Accident Research Centre to examine the occurrence of injuries to ocwpants of these vehicle catesories This report details the outcomes of that study.
In parallel. a review group was set up with industry to explore ways to improve the level of occupant protection provided by these vehicles. This included development of an agreed timeframe within which to introduce changes to the Australian Design Rules.
FORS Report OR 17 - “Review of Occupant Protection in Light Commercial. Off-Road and Forward Control Passenger Vehicles” draws together the 1-esearch conducted as part ofthis review and should be read in conjunction with this report OR 17 also details the changes to the Australian Design Rules which bring the level of occupant protection of these vehicles u p to that provided by passenger cars. Four-wheel-drives sold in ustralia already cornply with the only rollover standard available, US Federal Motor Vehicle Safety Standard 21 6.
FORS REPORT CR 150 ix

x FOUR-WHEEL-DRIVES, UTILITIES & VANS

Acknowledgements
The authors are indebted to the Federal Office of Road Safety, Commonwealth Department of Transport and Regional Development, Australia, for their sponsorship, interest and assistance with this project.
A study of this magnitude could not have been undertaken without the help and co-operation of a large number ofpeople. In particular, the valuable assistance ofother Accident Research Centre staff Srs. Nicole O’Mearaand Barbara Fox in collecting the injury data and M r . Tri Minh Le, Ms Sandra Gantzer and Mr. David Dyte in conducting the analyses was greatly appreciated.
The study team acknowledge the generous assistance of the eleven study hospitals, their co- ordinators, and their staff in providing access to patients and medical records? namely the Alfred, Austin, Ballarat Base, Box Hill, Dandenong & District, Geelong, LaTrobe Regional, Monash Medical Centre, Royal Melbourne, PANCH, and WesternHospitals. We are grateful, too, to the many vehicle occupants who kindly agreed to participate in the study during their time oftrauma.
To Fowles Auction Group, and in particular Mr. David Grey, for providing us access to their vehicles and allowing us to work in their yard, we are especially grateful. To the insurance companies RACVLimited, GI0 Insurance and AAMI: who willingly providedus details on these crashed vehicles, we are eternally thankful. The Victorian Police were always ready to assist either inlocating thevehicles, providing details on the crash: or providing access to vehicles stored in their yards and we are extremely grateful to the many members of the police force who assisted with the study.
We would also like to thank the NSW Roads & Traffic Authority for allowing us access to their data on relevant casualty crashes and to the Federal Office of Road Safety for undertaking a number of analyses on the fatal file. UJe are also grateful to Intstat Statistical Data Analysts: especially Robin Attew-ell, for undertaking these analyses on behalf of FORS.
FORS REPORT CR 150 xi

Executive Summary Four-Wheel-Drives, Cab-Chassis Utilities, and to a lesser extent. Vans, are becoming an increasing proportion of the vehicle fleet as many people choose to drive these vehicles as an alternativetopassengercars. In1992, forinstance,salesof4WDsandUtilitiesrepresented18.1% of all new vehicle sales, compared with 16.7% in 1991.
While a number of current Australian Design Rules apply to these vehicles (such as ADR 1010 1 for steering column intrusions), these vehicles are not classified as “passenger cars or deriva- tives”, and hence are not subject to the full range of design rules that currently apply to passenger cars in this country.
AIMS & STUDY TASKS
The objectives of this study were to examine the extent and patterns of injuries occurring to occupants of these vehicles and the need for more stringent regulations for this growing fleet of alternative passenger vehicles.
Three tasks were undertaken to meet these aims. First. a review of mainstream occupant protection literature was conducted to highlight previous published findings in this area.
Second, an analysis of six years ofNew South Wales tow-away casualty data and two years fatality dataonthenationalfatalfilewasthenca~iedouttoillustratetheextentoftheproblemandpattems ofinjuries sustained by seriously injured occupants ofpassenger cars, four-wheel-drives (4WDs), vans and light truckshtilities.
Finally, a thorough examination of 140 vehicles (4WDs: Vans & Utilities) which had been written-off as a result of a road crash with another vehicle or a fixed object was undertaken to provide a more detailed picture of the extent of damage, the injuries sustained by the occupants and the sources of these injuries from within or outside the vehicle.
MASS DATA ANALYSIS
The main findings from the mass data analysis of casualty and fatal crash data were as follows:
Four-wheel-drives, utilities and vans involved in casualty crashes in NSW over the years 1987-1992 accounted for roughly 10% ofroad trauma to vehicle occupants.
- Four-Wheel-Drives, compared with other vehicle types, were over-involved in casualty and fatal crashes occurring in high speed zones (>75km,h): but were particularly over-involved in rollover crash configurations in both high and low speed zones.
* Rollover crash configurations were 12 times more likely to occur in high than low speed zones, and high speed zone rollovers accounted for 80% of injuries sustained in rollover crashes.
- While there were no consistent differences in overall injury severity between the vehicle types, 4WD occupants were marginally more likely to die in a high or low speed rollover crash than car or van occupants in equivalent crashes.
FORS REPoKr CR 150 xiii

Drivers of4WDs involved in casualty or fatal crashes were more likely to be male and aged between 26 and 55 years; additionally, occupants of 4WDs were more likely than other vehicle occupants to be unrestrained and hence ejected.
Passenger vans were over-involved in fatal outcomes in head-on crashes in low speed zones (i 75kmih) and their occupants were more likely to be trapped in the vehicle in these crashes. This is probably because of the more limited crumple space available in passenger vans.
Head and chest injuries were the predominant cause of death in fatal crashes.
Occupants of 4WDs killed in rollover crashes were slightly more likely to sustain a severe spinal injury but less likely to sustain a severe chest injury by comparison with passenger car occupants in equivalent crashes.
CRASHED VEHICLE STUDY
The pattern of crash types in the crash vehicle file mirrored those from the mass databases with 4WDs being over-involvedinrollovers -nearly halfofthe 4WD crashes were rollovers. The mean delta-V value for 4WD crashes (35.5 km/h) was lower thanthat observed in the crashedpassenger car study (45.4 km/h) suggesting that these crashes were of relatively low severity, probably due to the vehicle-based entrance criteria. Observed belt-wearing rates were extremely high among this sample of relatively minor crashes (98%) and no occupants were ejected.
The vehicle-based entrance criteria and the relatively small number of cases (144) probably also contributed to sparse injury data and the low levels of injury severity observed (84% minor or no injuries). Further, the high number of “driver-only’’ vans and utilities in the sample resulted in very small numbers o f occupants in other seating positions. The lack of major injuries and the small number of front-left and rear passengers in particular were problematic for this study. Nevertheless, some interesting trends were apparent in the data for drivers, and these are presented below.
Upper limb injuries were the most common injury among drivers of 4WDs, vans and utilities alike, but were relatively minor (only 2% or less with AIS > 2). These injuries were most often causedby contactwith seatbelts, the steering wheel andthe instrument panel. Injuries to the thigh, knee and lower leg were also quite common, particularly among van drivers, and usually the result of instrument panel or floor contacts
Non-severe neck injures, mainly whiplash, were anotable feature ofthe injury pattern, with about one quarter o f the drivers in each vehicle category sustaining one of these injuries. Whiplash injuries were typically from crash forces or were seat belt induced. Most of the head and chest injuries observed here were relatively minor, caused by contact with the steering wheel, side glazing, door panel or the roof.
Serious injuries, although arare occurrence, were more prevalent among van drivers, particularly by comparison with 4WD drivers, only one of whom sustained a serious injury(A1S > 2).
Extremely small numbers prevented an analysis of injuries and injury sources for unrestrained, ejected, or trapped occupants.
POTENTIAL COUNTERMEASURES
While the findings were not particularly robust, there were some suggestions of suitable countermeasures to reduce the injuries observed in the crashed vehicle study. Many of these
xiv FOUR-WHEEL-DRIVES, UTILITIES & VANS

measures have already been suggested from a previous study (CR95) for passenger cars.
STEERZNGASSEMBLY: The steering wheel and assembly has been shown to inflict injury to drivers ofthese special purpose cars. This is in spite of the fact that 98% of the occupants whose belt wearing status could be determined were properly restrained. Steering wheel related countermeasures worthy of consideration include supplementary air bags, belt tighteners and webbing clamps, padded steering wheels, or no steering wheel at all.
IMPROVEDRESTRAZNTSYSTEMS: Theneed forimprovements to existing seat belt systems was noted in CR95 for passenger cars and is again highlighted in the injury and contact source findings for this study since upper limb injuries caused by seat belts were the most common. Possible improvements to existing seat belt systems are better seat belt geometry, belt tighteners and webbing clamps, improved front seat designn, better positioning of seat belt stalks, seat belt interlocks, as well as other incidental belt improvements.
THEINSTRUMENTPANEL: The instrument panel assembly was awe11 documentedproblem area for front seat occupants of current generation passenger cars and was also a cause of significant lower limb injury in this study. There are several possible countermeasures currently available to minimise or alleviate these injuries, such as the use of knee bolsters. improved padding, reduced protrusions, and the use of less injurious instrument panel materials that are more energy absorbing and less likely to shatter.
THE NEED FOR VEHICLE REGULATIONS
Special purpose vehicles such as 4WDs, vans and utilities are not currently subject to the full set of Australian Design Rules that apply to passenger cars and their derivatives. In particular, the only frontal crash requirement is for these vehicles to comply with ADR10/01 which specifies maximum steering column intrusion levels. Moreover, there is no current rollover requirement such as a roof strength test for any passenger vehicle (other than buses) sold in Australia.
Given the increasing use of 4WDs vans and utilities for private use as alternatives to passenger cars, it could be argued that they should also be expected to provide similar levels of occupant protection as passenger cars. Thus, a strong case could be mounted for all these special purpose vehicle types to be similarly regulated.
In particular, they should at least be required to meet the new dynamic frontal crash performance requirement ADR69 as well as side impact regulations, either current or proposed for the future.
Given the preponderance of rollovers among 4WD vehicles, it would seem desirable for these vehicles in particularto have to meet aroof strengthrequirement as well, although the form ofthis standard may require further consideration.
FURTHER RESEARCH AND DEVELOPMENT
This study highlighted a number ofareas requiring further research. Most notably, these findings would be more robust ifmore data was available on those seriously injured in crashes involving these vehicles. In addition, the cost-effectiveness of many of these measures needs to be established for these vehicles. It had been hoped to gain some appreciation ofthe injurious nature of bull-bars in this study but this proved not to be possible. There would be considerable merit in mounting such a study in hture.
FORS REPORT CR I50 xv

1. INTRODUCTION Four-Wheel-Drives, Cab-Chassis Utilities and, to a lesser extent, Vans, are becoming an increasing proportion of the vehicle fleet as many people choose to drive these vehicles as an alternative to passenger cars. In 1992, sales of 4WDs and Utilities represented 18.1% of all new vehicle sales, an increase of 1.4% over the previous year (see Table 2.2).
While a number of current Australian Design Rules apply to these vehicles (such as ADR 10/01 on steering column intrusions), these vehicles are not classified as normal passenger cars or derivatives and hence are not subject to the full range of design rules that apply to passenger cars in this country.
In 1993, the Monash University Accident Research Centre was commissioned by the Federal Office of Road Safety to undertake research into vehicle occupant protection, focussing on Four-Wheel-Drive (4WD) vehicles, Vans (both passenger and light commercial) and Utilities (non-passenger car derivatives).
1.1 STUDY OBJECTIVES
The objectives of this study were to examine the extent and patterns of injuries occurring to occupants of these vehicles (including sources of injury inside and outside the vehicle) and to suggest countermeasures to reduce the frequency and severity of injury. Of particular interest was the need for more stringent safety regulations for this growing fleet of alternative passenger vehicles.
To the degree possible, the study was also to examine the consequence of having bull-bars fitted to these vehicles in terms of injuries to the vehicle occupants as well as to the occupants of vehicles struck by 4WDs, Vans and Utilities.
1.2 STUDY DESIGN
The study comprised a number of tasks as outlined below.
1.2.1 Literature Review
The first task was to undertake a review of traditional vehicle safety literature to illustrate past research and findings in this area. As the widespread use of these vehicles for the transportation of passengers is a relatively recent phenomenon, a large source of publications on the safety of these vehicles was not expected .
Literature was collected from main-stream occupant protection sources. These included inter- national vehicle safety conference proceedings such as the International Council on the Bioki- netics of Impacts (IRCOBI); The Association for the Advancement of Automotive Medicine ( A M ) , the STAPP Car Conference: Enhanced Safety Vehicles (ESV), etc. Technical papers fromthe Society of Automotive Engineers ( S A E ) . Transportation Research Laboratories (TRL) and the Transport Research Board (TRB) were also examined. Furthermore, literature search- ers over several years were also undertaken of a number of periodicals such as Injury, the Journal of Trauma: and Accident Analysis and Prevention.
FORS REPORT CR 150 1

1.2.2 Mass Data Analysis
The second stage of the research program was to undertake an analysis of existing mass databases available to provide initial incidence data on injuries to occupants of 4WDs, Vans and Utilities which could then be compared with passenger car figures. The two databases which were used for this analysis were police tow-away crash records over the period January 1987 to December 1992 held by the Traffic Authority of NSW, and records of Australian fatal road crashes for the years 1988 and 1990 held by the Federal Office of Road Safety (FORS Fatal File).
1.2.3 Crashed Vehicle File
To provide more detailed information on injuries and sources of injury to occupants, inspec- tions of crashed 4WDs, Vans and Utilities were carried out during 1993 and 1994 using the NASS format developed and refined in earlier crashed vehicle inspection programs (see FORS reports CR95 and CR134).
Given their larger mass and size, it was expected that crashes involving these vehicles (espe- cially 4WDs) were less likely to result in hospitalisation to their occupants than passenger car crashes. Thus, revised entry criteria (fromperson-busedto vehicle-bused) were adopted for this study.
As 4WDs and Vans really started to become popular as passenger cars around 1985, a later entry criterion date (vehicles first registered 1st January 1985 or later) was also adopted. A total of 140 cases was inspected during the 1992/93 and 1993194 financial years using these entrance criteria.
1.2.4 Project Reporting
A Project Advisory Committee, comprising members of the MTB and Research Departments of FORS as well as the Principal Investigators of the study at MUARC reviewed progress of the study during the course of the research.
This report outlines the findings of the study and makes recommendations on possible counter- measures and the need for further research.
A one-page summary of each ofthe crashed vehicles and occupants is found in a supplementary volume to this report.
2 FOUR-WHEEL-DRIVES, UTILITIES & VANS

2. LITERATURE REVIEW
2.1 DEFINITIONS
For the purpose of mass data analysis, the vehicles of interest often cannot be identified in official statistics. For example, four wheel drive vehicles (4WDs) do not appear as a separate class in the various census publications or the Australian Design Rules (4DRs). The nearest category in the ADRs is “oi-f-road passenger vehicles”, coded as MCI and MC2. These are usually four wheel drive, but other passenger vehicles such as passenger cars may also have four wheel drive transmissions.
In the U.S. literature, four wheel drive vehicles are not identified as such. Typically, vehicles are classed as small, medium and large cars: small and standard vans, small (also conlpact) and standard ‘pickups’ and multipurpose vehicles. It is assumed that standard pickups (4500 lb (2045 kg) or more) can be regarded as similar to light goods vehicles, NA1 and NA2, in the Australian fleet. However, they are not strictly equivalent to the category of utilities which are derivatives of the 4WD class in the Australian fleet (e.g., Holden Rodeo, Toyota Hiluxj as these are generally much lighter (about 1200-1600 kg). A parallelism between ‘pickups’ and multipurpose vehicles (sometimes multipurpose passenger vehicles) is also assumed, but this class is not homogenous.
Thus, it should be noted that the term ‘pickup’ is American usage and is retained throughout this literature review for lack of an Australian equivalent.
Not all the U.S. vehicles referred to have four wheel drive, though most of the multipurpose vehicles do. The percentages of vehicles with four wheel drive are: standard pickup 24%; standard van 0%; compact (ie, small) pickup 19%; minivan 0%; multipurpose vehicle 85% (Data Link, 1988).
“Forward control vans” in the literature are those in which the engine compartment and front axle are underneath (as opposed to in front oQ the front passenger compartment and may be for passenger (eg, Toyota Tarago) or light commercial (e.g., Toyota Liteace) applications.
2.2 SPECIAL PURPOSE VEHICLES IN THE AUSTRALIAN FLEET
There seems no suitable category in the Australian xhicle census to which off-road-passenger vehicles can be attached, but if the light goods vehicles of the ADRs can be approximated as the light commercial vehicles of the census, their proportion of the vehicle fleet may be similar to that shown in Table 2.1,
Recent sales data for 4WDs, cab chassis utilities and vans (Table 2.2) indicate that 4WDs in particular, and utilities to a lesser extent, represent a substantial and increasing proportion of new vehicles.
FORS REPORT CR 150 3

Table 2.1 Proportion of Light Commercial Vehicles in the Australian Vehicle Fleet
LCV (000s) All Vehicles (000s) 1976
1003 1982
7375 879 1979
6621 75 8
9418 1183 1988
8960 1140 1985
8218
1991 10099 1480
Yo LCV 11.4
11.9
12.2
12.7
12.6
14.7
Source: ABS (1974-1991)
Table 2.2 New Vehicle Sales of Vans, 4WDs and Utilities I
1991 %difference 1992 Vans
7.3% 34,973 32,597 Utes (cab.chas.)*
21.3% 35,403 29,184 4 m s -5.4% 14,588 15,458
All Vehicles** 369,464 389,330 5.4% YO 4WDs & Utes 1.4% 18.1% 16.7%
*Cab Chassis utilities can be suppliedas either 2 WD or 4 WD. **Cars, Vans 4 WD & c/c Utes, from Pmus (1992).
This increase in the sales of 4WDs is also reflected in the large increase (126%) in the numbers of these vehicles involved in serious casualty crashes, over an approximate five year period, as shown in Figure 2.1. Notably, crashes involving cars and motorcycles decreased by 26% and 37% respectively over the same period.
9,000,
~ ~~~
1.L993 1988-90 Average
PaUVm &-ud m T d Pdpd T& C U I T m k
Vehicle Type Figure 2.1 Motor vehicles involved in serious injury
casualty crashes in N.S. W. (Source: Graham and Taylor, 1994)
4 FOUR-WHEEL-DRIVES, UTILITIES & VANS

2.3 CRASH PERFORMANCE OF VEHICLE TYPES
Regarding overall performance, Partyka, Sikora, Surti and Van Dyne (1987) examined fatality and injury rates (per 10,000 vehicles) from the 1984 and 1985 FARS and North Carolina files, disaggregated by collision type. A combined ranking of the various vehicle types is shown in Table 2.3. Standard pickups and both small and large vans are in the middle of the range, having lower (ie, better) rankings than small and medium cars. Small pickups andmultipurpose vehicles show higher rankings than the average light duty vehicle.
Table 2.3 Ranking of Injury Rates by Vehicle Type
Vehicle Type
8 6 6 Small car
All Crashes Towaway Crashes (K+A)*
Medium car
Large car
5
7 Small pickup
1.5 Stand'd van
1.5 Small van
4 Stand'd pickup Multi-p vehicle 8
1 3
5
3
1
2
7 4.5
8
Yo @+A)* I NORTH CAROLINA
Killed All Injuries
FARS
8
7
6
7 4
4 2
8 5
- 7 3
3 1
1 6
5
c
Source: Partyka el a1 (1987). The rank are standardised by vehicles on the register. * K= killed; A= incapacilating injury.
Table 2.4 Crashworthiness Ratings for 4WDs and Passenger Vans
Nissan Ford Mitsubishi Tayota Toyota Daihstsu Suzuki
PATROL MAVERICK P A J E R O
4 R U N N E R I H I L U X LANDCRUISER
ROCKY F70/75 SIERRA
82-92 86-92 83-92 8 2 ~ 3 2 82-32 87-92 82-92
2 . 2 4 1.94
2.47 2.59 3 5 3 3.87
16
37 27
40 70 76
1 .15 1 .22 1 .a4 2.13
2.62 1 . @ X
2.73 3.27 3.10 3 .04 5 .99 5 . 1 2
1 sa 2.05
0.31 1.27
4.91 2 .50
o a 2 0.91 0.51 0.35
0.65 1.39
Toyata TARAGO 83-90 3 .59 72 Milsubishi PASSENGER V A N S 82-32 2.89 52 2.12 3.67 1.55 0.53
2.86 4.31 ., .45 0.40
Source: Cameron, Finch & L e (1994)
FORS REPORT CR 150 5

2.3.1 Crashworthiness Results
Crashworthiness ratings for 1982-92 models of 4WDs and passenger vans have been developed based on crash data from NSW and Victoria over the period 1987-92 (Cameron, Finch & Lee, 1994). The crashworthiness ratings, defined as the product of severity and risk of injury, for a number of popular vehicles in Australia are shown in Table 2.4. There is some variability within the 4WD class, but their overall rating (2.65) is about the same as the all make/model average (2.66) and lower (ie, better) than that of passenger vans (3.41). It is noteworthy that the two 4WD models with high (unfavourable) ratings are vehicles of relatively low mass. Similar, but rather older rating on US vehicles (Highway Loss Data Institute, 1988) indicate that “among vans, pickups and utility vehicles, large and small utility vehicles and small pickups are the worst. Injury claim figures were closely related to vehicle size, with the larger vehicles having lower claim frequencies.” Within each class, there was considerable variability (4WDs, though, did not differ appreciably from 2WD vehicles).
2.3.2 Crash Test Results
Full frontal tests conducted on vehicles on the Australian market under the New Car Assess- ment Program (NCAP, 1994) include five 4WDs and four passenger vans. These tests are carried out at an impact velocity of 56 km/h. A further test series of six 4WDs, conducted by the same testing organisation but at 48 km/h, have been reported by Higgins and Seyer (1995). The main results of the two series are shown in Table 2.5.
In the two series, the chest compression and femur loads are within the limits prescribed by Australian Design Rule 60100. The chest acceleration exceeded the limit in two vehicles of the NCAP series and in one of these, for the driver, in the 48 km/h series. Three vehicle models are common to both test series. The measured values are not systematically different despite the difference in impact velocities.
In the 48 kmih series, the HICs were all within the limit except for the driver in one model and the passenger in another, the latter being due to the dummy’s head striking the thigh. All the driver HICs and two passenger HICs exceeded 1000 in the NCAP series.
In the NCAP passenger van full frontal tests, all chest compressions and all femur loads but one were within the ADR limits. Four of eight chest accelerations exceeded 60g and all HICs exceeded the limit value.
6 FOUR-WHEEL-DRIVES, UTILITIES & VANS

Table 2.5 Crash Test Results
Impact velociq
driver
driver passenger
driver
driver passenger
driver
I driver
driver
driver passenger
T NCAF' Tests 56 kmih chest
1530.01 46 I 54
1880.0 41 49 790.0 43 49
1240.0 52 84 1810.0 40 72
1140.0 47 48 700.0 37 40
1750.0 44 67 1840.0 41 59
1000 76.2 60
- femur L R - "
1.9 3.: 3.0 1.i "
2.8 1.( 0.9 0.; "
7.1 6.; 1.1 1.1 "
7.5 2.f 1.4 3.; "
2.8 2.( 1.3 3.: "
"
"
- 10
T FORS Tests 48 kmih
1167.1 628.3 - 945.1 1379.0
773.8 573.2 -
-
708.9 612.8
791 .4 471.4 -
881.1 589.0 1000 -
76.2 I 60.0 I 10 I Sources: NCAP 1994, Higgins R. Sever, 199L (FORS)
Chest = chest compression. mm; accelerarion. g; femur = compressive load. k& AN vehicles manufacrwed between January andMq, 1994
2.4 ROLLOVERS
Rollovers are worthy of special mention because of their generally more injurious outcomes than other crash modes. The rollover experience of various vehicle types in the USA is illustrated in Figure 2.2. Because o f the high centre of gravity relative to wheel base, pickups and 4WDs would be expected to have an increased propensity to rollover (eg, Mengert, Salvatore, DiSario & Walter, 1989). Increased propensity to rollover has been shown to characterise small '?eep-like" utility vehicles (Reinfurt, Stutts & Hamilton, 1984). Rollover propensity is likely to exist in 4WD vehicles in the .4ustralian fleet which do not have the configuration of passenger cars. Vans in general do not appear to share this propensity to rollover, although Rattenbury and Gloyns (1990) reported an increased propensity for fonvard control vans to be involved in rollover crashes.
FORS REPORT CR I50 7

- I I ' Small PU '
T i I I
t 1 I S td. PU 1
Utility I
1 I 4 0 20 40 60 80 100 120 140
MILLION REGISTERED VEHICLES
Figure 2.2 Relative rollover fatality rate per million registered vehicles (Source. Hinch. Shadle & Klein (1992). based on US data, 1985-89)
What appears to be the h a 1 word on the propensity of individual vehicle types to overturn is provided by Klein (1994) who repeated the type of analysis used by Mengert, but made use of logistic regression. The data came from the (US) National Accident Sampling System (NASS) for five states over several years in the late 1980's.
Tilt ratio was found to be the best predictor of rollover propensity. The vehicle classes, Sport Utility, Van, and Pickup. were significantly more likely to rollover than passenger cas , the reference class. Front wheel drive vehicles were more significantly likely to rollover than rear wheel drive vehicles. These results arc independent of variables such as driver age, type of road and alcohol use.
2.5 SPECIFIC INJURY TYPES
2.5.1 'Pickup Trucks'
Occupant injuries in pickup trucks have been analysed from records of nearly 1400 collisions collected by multi-disciplinary teams in Canada between 1981 and 1984 (Cunningham & Wilson, 1989). Drivers had a higher incidence of serious or fatal injury than front scat passengers, attributed to the steering wheel and foot controls. These results are not that dissimilar to those of passen, w r cars.
8 FOUR-WHEEL-DRIVES. Umrrms & VANS

Restrained front occupants had fewer and less severe injuries than those unrestrained in the same seating positions in frontal collisions, side impacts (including those with compartment intrusion) and rollovers. Events resulting in intrusion, ejection and rollover exposed front occupants to greater risk of severe and multiple injury than the generality of accidents. The relation of injury level to impact speed is illustrated in Figure 2.4 for unrestrained and restrained front occupants respectively.
In rear end collisions, according to Cunningham and Wilson (1989), the occupants of pick-up trucks benefited from increased energy absorption capability provided by the cargo space, but integral head restraints were advocated. Other improvements suggested were strengthening of the vehicle’s upper body structure components. A particular feature of pickup accidents is the susceptibility of these vehicles to injury of occupants riding in the rear “tray“, “bed” or cargo space (Hamar, King, Bolton & Fine, 1991; Bucklew, Osler, Eidson, Clavenger, Olson & Demarest, 1992; Nelson & Struebert, 1991). Children appear to be especially at risk (Agran, Winn & Castillo, 1990; Tong & Teaford, 1989; Woodward & Bolte, 1990).
2.5.2 Forward Control Vans
Forward control vans, which do not have a bonnet, fail to provide protection to front seat passengers equivalent to that provided in passenger cars. Davis (1986) found, inNSW, that the rate of injury accidents among forward control vans was 27% higher than that of cars. In a crashed vehicle study, injuries to front seat passengers were caused by the dashboard, steering wheel, and, most commonly, were to the legs. The steering wheel displacement permitted by ADR 10B was considered to be too large to prevent driver injury in these vehicles.
Barrier tests were carried out on representative forward control vans manufactured between 1981 and 1985 (Federal Office of Road Safety, 1986). Gross vehicle mass ranged from 1350 to 2395 kg. The main observations from these tests were the substantial rearward movement of the steering wheel and reduction of footroom in most of the tests. Representative illustrations of good and poor performers are shown in Figures 2.5 and 2.6.
Application of rules such as ADRlOB or ECE Regulation 33 would have a significant improve- ment in the “survival space” of these vehicles, though neither rule in existing form was entirely suitable for the forward control configuration.
Forward control van crash performance was investigated by Paix, Gibson and McLean (1985) using data from the Victorian Motor Accidents Board and from a sample of towaway crashes in Adelaide. The MAB data showed that front seat occupants of forward control vans not only had a different pattern of injuries than occupants of passenger cars but also that the overall severity of injuries was greater in terms oftreatment costs (see Figure 2.6). In frontal impacts forward control van occupants had proportionately more leg injuries and fewer head and chest injuries than car occupants.
The towaway crash series confirmed the excess of leg injuries in forward control vans and showed a high incidence of’ intrusion in vehicles with front end damage. Intrusion involved components mounted in the dashboard area: such as brake master cylinders and booster, air- conditioner and heater assemblies.
FORS REPORT CR 150 9

0.8
0.7 - Restrained Occupants
0.5 -
0.5 - 0 D n c Y
O A I E = 0
- Y 0 4 - - li
aaxs = 1 - 2
0.3 -
02 -
0.1 -
Figure 2.3 Overall Abbreviated Injury Scale (OAIS) for unrestrained and restrained front occupants injured in pick-up crashes in Canada
by estimated impact speed (Source: Cunningham & Wilson (1989).
10 FOUR-WHEEL-DRIVES, UTILITIES & VANS

----- o r i g i n a l c o n € i p r a t i o n
Figure 2.4 Outline o f a goodperforming forward control van in the series o f barrier crash tests
(Source; Federal Ofice of Road Safety 1986)
----- Original configuration
- Post-crash coa=i?i;ration
Figure 2.5 Outline o f a poor performing forward control van in the series o f barrier crash tests
(Source: Federal Ofice ofRoadSafety 1986j
FORS REPORT CR 150 11

1 0 0 1 7 L Figure 2.6 Medical costs for front seat occupants o f forward control vans
and passenger cars, all crashes. (Source: Paix et al, 1985)
2.6 CONCLUSIONS
The literature on 4WDs, Vans and ‘pickup trucks’ is scanty and not easy to interpret in terms of its relevance to the vehicle types in the Australian vehicle fleet which are the focus of the current study.
Mass data results in the US indicate that the classes “sports utility, van and pick-up’’ were more likely to rollover than were passenger cars.
Australian data suggested that 4WD vehicles have a crash performance as good as that of passenger cars generally, but not necessarily superior. While direct evidence is lacking, the small 4WD utility vehicles are likely to have an increased tendency to overturn.
Forward control vans, on the other hand, show evidence of more severe injury to front seat occupants compared with front seat occupants in conventional passenger cars. Leg injuries are a feature of crashes to forward control vans.
On oversea evidence, ‘pickup trucks’ appear to provide less protection than the generality of vehicles although this is somewhat dependent on the type of crash. Occupants of the rear tray or cargo space in pickups are particularly at risk of injury and severe injury.
12 FOUR-WHEEL-DRIVES, UTILITIES & VANS

3. MASS DATABASE ANALYSIS
3.1 DATABASES
Two databases were sourced for the mass data analysis. The Roads and Traffic Authority of N.S.W. maintain the database of police-reported crashes in that state while the Federal Office of Road Safety (FORS) hold the national fatal file for all fatal road crashes in Australia. Both these databases contain codes on special purpose vehicles such as 4WD, vans and utilities of interest in this study. The Transport Accident Commission injury compensation database and the VicRoads database on police-reported casualty crashes in the state of Victoria did not contain the specific codes for vehicle types needed for this mass data analysis.
The N.S.W. database contains six years of data (1987-1992) of police-reported crashes in the state of N.S.W. Entrance into this database is dependent on at least one person involved in the crash being injured or at least one of the vehicles being towed away from the crash scene. Variables of interest from this database were vehicle type, impact direction, speed zone and injury outcome.
The FORS Fatal File is compiled biannually and contains details on all fatal road accidents occurring throughout Australia. The 1988 and 1990 files were sourced for this analysis, and in most cases the results are based on the combined data for both years (although for some variables, only 1990 data were available).
3.1.1 Variables and Analyses The major independent variable for the analyses was vehicle type, focussing on the three special purpose categories relevant to this study (4WDs, Vans and Utilities) and a fourth category of passenger cars. Other independent variables of interest included crash type (or primary impact direction). speed zone, seating position and occupant characteristics such as age and sex. The existence of a bull-bar (although of potential interest) could not be included as an independent variable because this information was not consistently coded in either of the databases.
The major dependent variables were indices of injury outcome such as casualty level (fatal, hospitalised or medically treated) (N.S.W. and FORS files), injury severity (ISS) and body regions injured (location of most severe injury and final cause of death) (FORS fatal file only). Other dependent variables investigated from the FORS fatal file were ejection and entrapment.
Each of the databases was analysed using the Statistical Package for the Social Sciences (SPSS).
3.2 N.S.W. CASUALTY DATA
All analyses of the NSW database were based on the subset of casualty crashes (ie, where at least one occupant was injured). Injury outcome results are presented for front seat occupants only as the number of rear occupants was very small. The category of ‘nose-tail’ crashes included in the crash type by vehicle type analysis was modified for the analysis of injury outcomes by crash types to include the impacted vehicle only; this enabled an examination of the effects of being impacted from the rear on i n j q outcome.
FORS REPORT CR 150 13

3.2.1 Overview of Data
Table 3.1 shows the frequency distributions of several relevant crash, vehicle and occupant variables. Four wheel drive vehicles were over-involved in casualty crashes occurring in speed zones of 75 W h or more (usually rural roads) compared with passenger cars, vans and utilities. To some degree, this probably reflects differences in exposure of these vehicle types in different road environments, as passenger cars would be expected to predominate in urban areas with lower speed limits, and 4WDs to be more prevalent in rural areas with higher speed limits.
By comparison with passenger cars, injured drivers of 4WDs, vans and utilities were more likely to be male and aged 26-55 years, probably reflecting exposure differences.
3.2.2 Crash Types
The type of impact in casualty crashes for the vehicle types of interest in the NS W data is shown in Table 3.2. By comparison with the other vehicle types, 4WDs were considerably over- involved in rollover casualty crashes, consistent with their over-use in rural areas, although vans and utilities had a higher involvement in rollovers than did passenger cars.
Although the literature does not contain much evidence on 4WDs of the type investigated in this study, it did suggest that vehicles with a high centre of gravity (eg, American “pick-ups” and “jeep-like” utilities) had an increased propensity to rollover (eg; Mengert et al, 1989).
An analysis of impact type by speed zone (see Table 3.3) for all tow-away crashes (ix., casualty and non-casualty) shows that rollover crashes are 12 times more likely in high speed zones by comparison with low speed zones. Over-involvement in high speed zones, albeit to a much lesser degree, was also apparent for head-ons (3:l) and single-vehicle crashes (approx. 4:l). In rollover crashes (Table 3.4), it is noteworthy that 4WD vehicles are two times more likely than passenger cars and one and a half times more likely than utilities to be involved in high-speed- zone rollovers. Notably, 4WDs also have an increased likelihood ofrollover in low speed mnes by comparison with the other vehicle types. This suggests that the propensity of 4WDs to rollover in low speed zone crashes is greater than for other vehicle types in equivalent crashes.
3.2.3 Injury Outcome
The NSW database does not code for type of injury or injury severity, so only injury outcome could be compared across the different vehicle types. Injury outcome is defined as whether the occupant(s) were killed, hospitalised, received medical treatment or were uninjured.
Table 3.5. shows that front-seat occupants of 4WDs have a considerably greater chance of being killed and a somewhat greater chance of being hospitalised, than occupants of other vehicle types. While this is probably influenced to some degree by the higher involvement of 4WDs in rural crashes and rollovers, it does suggest, however, that these vehicles may not be as safe as is generally considered among the population at large.
In general, serious injury outcomes (killed or hospitalised) were more frequent in head-on, single vehicle and rollover crashes (in that order) and at high (275 kmh) rather than low (<75 kmh) speeds.
Further analyses of injury outcome by vehicle type was conducted, controlling for crash type and speed zone (Tables 3.6 to 3.15).
14 FOUR-WHEEL-DRIVES, UTILITES & VANS

Table 3.1 Characteristics of the NSW Database for Casualty Crashes Occurring between 1987 and 1992
Passenger Car
Freq (%) I Freq (%) I Freq ( O h ) I Freq (Yo)
Light TrucWUtility Four Wheel Drive Passenger Van
Speed Zone:
Less than 75 k d h
3212 (26) 552 (38) 1033 (25) 32739 (20) 75 km/h or more 9258 (74j 904 (62) 3115 (75) 132822 (80)
Age of Driver:
Less than 25 years
1013 (8) 122 (8) 389 (9) 22025 (14) 56 years or more 73 13 (62) 859 (61) 2769 (69) 82648 (51) 25-55 years
3503 (30) 43 1 (31) 881 (22) 56132 (35)
Sex ofDriver:
Male
1389 ( 12) 336 (24) IO51 (26) 58919 (36) Female 10567 188) 1092 (76) 3025 (74) 103333 (64)
BAC of Drher:
0.05 or less
242 (2) 33 (3) 58 (2) 283 1 (2) Morc than 0.05 5444 (52) 609 (49) 1569 (46) 66469 (47)
Source: NSW Crash Database 1987-1992
Table 3.2 Number of Crashed Vehicles by Vehicle Type and Impact Direction
I Imoact Direction 1
Source: NSW Crash Database 1987.1992
FORS REPORT CR 150 15

Table 3.3 Number of Crashed Vehicles by Speed Zone and Impact Direction
I Irnuact Direction I I
Head On Other Single Vehicle Nose-tail Side Impact Rollover Speed Zone
Low (e75 km/h) 19885
0.5 4 1 0.3 12 3 Rafio HigWLow (16) (26) (26) ( 8 ) (12) (13) (n=36533)
13737 22335 22073 641 1 9912 11267 High (>JS krn/h)
(34) (7) (26) (27) (1 ) (5) (n=142984))
151699 31524 1 I6848 118172 4119
Source: NSW Crash Database 1987-1992
(”/) (%I (”/) (”/) ( O h ) (“4
Table 3.4 Number of Crashed Vehicles in Rollovers by Vehicle Type and Speed Zone
Vehicle Type Passenger Car
( O h )
4WD Light Truck Speed Zone
Law (c?5 krn/h) 3688
8 8 11 Ratio Hi!?h/Low (16) (23) ( 1 1 ) (n=36533)
1078 234 8600 High (375 krn/h)
(2) (3) (1) (n=142984))
378 73 (”/.I ( W
Source: NSW Crash Database 1987-1992
Table 3.5 Injury Outcome by Vehicle Type for Front Seat Occupants, All Crashes
~~~
Injury Outcome
Vehicle Type (”/)
159 1769 597 62 Passenger Van (7) (71) (20) (2) (n=101972)
7023 72 143 2063 1 2175 Passenger Car ( O h ) ( O h )
Fatality (“h)
Hospitalised Nontreated Injury MedicallyTreated
(n=883) Light TruckRltility I 191 I 1506 I 4084 I 44 I
(10) (57) (27) (6)
(n=6222) 7714 78498 22970 2482 Total (7) (66) (24) (3)
(n=l11664)
Source: NSW Crash Database 1987-1992 (7) (70) (21) (2)
ROLLOVERS Tables 3.6 and 3.7 show the Injury Outcome for occupants of all vehicle types in rollover crashes. In rollover crashes in both high and low speed zones, occupants of 4WDs were more likely to be killed by comparison with occupants of vans or passenger cars. Moreover, in low spsed zones, they were more likely to be hospitalised as well.
16 FOUR-WHEEL-DRIVES. UTILITIES & VANS

This finding is noteworthy given that 4WDs appear to have a propensity to rollover and that rollover crash configurations are generally associated with more severe injuries than other crash modes (Fildes, Lane, Lenard & Vulcan, 1991; Rechnitzer & Lane, 1994).
Occupants of utilities also had a relatively high incidence of injuries requiring hospitalisation in high speed rollover crashes but a relatively low incidence of such injuries in low speed rollover crashes. Overall, the number of front-seat casualties in rollover crashes was four times higher at speeds greater than 75km/h than at speeds less than 75 kmih (5962 cf. 1460). Thus, while & speed rollovers represent 70% of all tow-away rollover crashes (from Table 3.3), they account for 80% of rollover injuries.
SINGLE VEHICLE CRASHES: Four-wheel-drive occupants were over-involved in a fatal outcome in high speed zone crashes, as shown in Table 3.8. Moreover, those in 4WDs and utilities were also slightly over-involved in a hospitalised outcome in these high speed zone crashes by comparison with the other vehicle types. This probably reflects greater usage of these vehicles in rural areas where speed limits are generally higher.
Vehicle type, however, seemed to have had very little influence on the injury outcome for occupants of single vehicle crashes in low speed zones (Table 3.9).
Table 3.6 Injury Outcome by Vehicle Type for Front Seat Occupants in Rollover Crashes in High Speed Zones
I Iniurv Outcomc I
(n=180)
(6) (54) (37) (3) (Il=718)
(9) (54) (28) (9)
LightTrucWUtilit). 43 385 268 22
Total (7) (60) (30) (3 (n=596?)
381 3612 1791 168
Source: NSW Crush Database 1987-1992
Table 3.7 Injury Outcome by Vehicle Type for Front Seat Occupants in Rollover Crashes in Low Speed Zones
Source: NSW Crash Database 1987-1992
FORS REPORT CR 150 17

Table 3.8 Injury Outcome by Vehicle Type for Front Seat Occupants in Single Vehicle Crashes in High Speed Zones
Source: NSW Crash Database 1987-1992
Table 3.9 Injury Outcome by Vehicle Type for Front Seat Occupants in Single Vehicle Crashes in Low Speed Zones
Injury Outcome
Vchicle Type
Passenger Car
(4) (65) (28) (3) (n=11700)
502 7643 3261 294
Passcnger Van 5 70 150 10
Fatality Nontreated Injury MedicallyTreated Hospitslised (”/I ( W (“A) (”/)
(n=12649) (3) (28)
Source: NSW Crash Database 1987-1992
HEAD-ON CRASHES In high speed zone head-on crashes (ix. , 75 !unh or greater) there were more fatalities and hospitalisations than for head-on crashes in low speed zones, but there were no real difhences in injury outcome across the vehicle types (Table 3.10).
For low speed zone head-on crashes (i.e., less than 75 !unh), vans appeared to be slightly over- represented in numbers of fatalities, but there were no other apparent differences in injury outcome across the vehicle types (Table 3.1 1).
SIDE IMPACT CRASHES: Four-wheel-drives, and to a lesser extent, vans and utilities, are under-represented in injury outcomes from side impact crashes in high speed zones by contrast with passenger cars, making comparisons between the vehicle types meaningless (Table 3.12). Injury outcomes from side impact crashes in low speed zones showed no obvious differences between the four vehicle types (Table 3.13).
18 FOUR-WHEEL-DRIVES, UTILITIES & VANS

REAR END CRASHES: The relative safety for occupants involved i n rear-end crashes by comparison with other crash types is evidenced by an increase in the number of those uninjured or only requiring medical treatment, compared to other crash types and the fewer number of fatalities (Tables 3.14 & 3.15). The increase in safety of rear-end crashes has been alluded to earlier in other mass data analyses (Fildes et al, 1991).
Table 3.10 Injury Outcome by Vehicle Type for Front Seat Occupants in Head- On Crashes in High Speed Zones
Source: NSWCrash Database 1987-1992
Table 3.11 Injury Outcome by Vehicle Type for Front Seat Occupants in Head- On Crashes in Low Speed Zones
Source: ATSW Crash Database 1987-1992
FORS REPORT CR 150 19

Table 3.12 Injury Outcome by Vehicle Type for Front Seat Occupants in Side Impact Crashes in High Speed Zones
Source: NSW Crash Database 1987-1992
Table 3.13 Injury Outcome by Vehicle Type for Front Seat Occupants in Side Impact Crashes in Low Speed Zones
Source: NSW Crash Database 1987-1992
20 FOUR-WEEL-DRIVES, UTILITIES & VANS

Table 3.14 Injury Outcome by Vehicle Type for Front Seat Occupants in Rear Endcrashes (Impacted Vehicle Only) in High Speed Zones
Source: NSW Crash Database 1987-1992
Table 3.15 Injury Outcome by Vehicle Type for Front Seat Occupants in Rear Endcrashes (Impacted Vehicle Only) in Low Speed Zones
Source: IVSW Crash Database 1987-1992
3.3 FORS FATALITY FILE
While the FORS fatal file includes a category known as ‘Light Commercial’, this did not equate to the category of ‘Utilities’ used in the crashed vehicle file in the current study, as it also contains vans other than passenger vans and rigid trucks of not more than 3.5 tonnes. In addition, while the ‘Van’ category in the crashed vehicle file contained both passenger and light commercial vans, the FORS fatal file only distinguishes ‘Passenger Vans’ as a separate class. Thus, comparisons between vehicle types in the FORS fatal file were confined to 4WDs, Passenger Vans and Passenger Cars.
FORS REPORT CR 150 21

3.3.1 Overview of Data
Table 3.16 shows the frequency distributions of several relevant crash and occupant variables for three vehicle categories of interest. By comparison with passenger cars and vans, 4WDs were over-represented in fatal crashes that occurred on unsealed roads, in high speed zones (275 km/h), and in rollover crashes. Of special interest, the majority of 4WD fatal crashes have rollover as their primary impact (54%) and in a further 11% of cases, the vehicle subsequently rolled over after the primary impact.
These figures were considerably higher than for either passenger cars or vans and confirm the findings from the previous analysis that occupants of 4WD vehicles experience severe injury outcomes, probably because of higher impact speeds from rural crashes and the inherent instability of the vehicle. The majority of drivers of 4WDs involved in fatal crashes also tended to be in the 26-55 year age group, whereas drivers of passenger cars killed tended to be younger (<26 years). Apart from a slight preponderance of male van drivers, there was no marked differences in the sex distribution of drivers in fatal crashes across the three vehicle types. Drivers of 4WDs involved in fatal crashes were slightly more likely to have an illegal BAC (>.05) than other drivers.
Table 3.16 Characteristics of the FORS Database for Fatal Crashes Occurring in 1989 and 1990
Road Surface: Sealed
Unsealed Speed Zone:
Less than 75 k m h 75 kmih or more
Primary Impact: Frontal Side Rollover Other
kge of Driver: Less than 25 years 26-55 years
Sex of Driver: 56 years or more
Male
BAC of Driver: Female
0.05 or less More than 0.05 Not tested
r Passenger Car Freq
2405 158
782 1745
1094 817 499 96
989 1050 493
1896 65 1
1137 684 50 1
Source: 1988 & 1990 FORS Fatali@ Files
Passenger Van Four Wheel Drive
22 FOUR-WHEEL-DRIVES, UTILITIES & VANS

Table 3.17 Injury Outcome and Injury Severity Scores (ISS) for Occupants of Vehicles Involved in Fatal Crashes by Vehicle Type
I Passenger Car I Passenger Van I Fourwheel Drive -
Freq I (“/I Freq 1 (“A) Freq I (%) Degree of Casualty
Not Injured
Inj, No Med Trtmt
Inj: Med Trtmt
Hospitalised
Mean (s.d.) Mean (s.d.) Mean ( s d ) ISS:
All Occupants
(20) 37 (17) 33 (21 ) 41 Drivers (22) 37 (18) 35 (21) 40
Source: 1988 & 1990 FORS Fatality Files
3.3.2 Injury Outcome
The overall injury outcome for occupants of vehicles involved in fatal crashes is shown in Table 3.17 by vehicle type. Occupants of passenger cars appeared to suffer the worst outcome, with 36% of them dying as a result of a fatal crash (cf, 25% and 24% for 4WDs and vans respectively). For drivers only, there was little difference in injury outcome across vehicle types - roughly 60-70% of drivers died in fatal crashes and a further 190/0 were hospitalised.
3.3.3 Injury Severity Score (ISS)
The Fatal File has the capacity for scoring up to 10 injuries per injured occupant. All injuries are scored in terms of the Abbreviated Injury Scale (AIS 85) including their severity in terms of the likelihood of death. The Injury Severity Score (ISS) is the sum of the squares ofthe three highest AIS scores and is a generally accepted measure of total injury severity.
Table 3.17 shows that there was considerable variation in the mean ISS scores for occupants of the three vehicle types, with occupants of passenger cars recording the highest ISS scores in fatal crashes. However, the high standard deviations for all vehicle types indicate substantial variation in ISS scores across vehicle category which suggests these results need to be inter- preted with considerable caution.
FORS REPORT CR 150 23

Table 3.18 Final Cause of Death and Location of Most Severe Injury by Vehicle Type for Occupants Killed in All Crashes
r Cause of Death Direct head only Direct head chest Direct head chest abdom Direct head + other severe Direct chest only Direct other severe Direct no severe Total Sub-iotal head Sub-iotal chest
Location of Most Severe Injury
Head Chest Head chest Abdomen Chest abdomen Spine Ext Head chest abdomen Other Total Sub-iotal head Sub-tutal chest
~~
Passen Freq
480 43 1
101 138 480 329 234 2193 1150 1012
730 675 253 118 77 107 30 25
178
2193 I008 1030
Passen
F V
18 13 4
2 14 13 13 77
41 28
29
19 9 4
0
3 8
0
5
77
40
30
Four Wheel Drive
F v
20 12 4
5
12 15 15
83 37 31
29 16 9 3 3
5
4 2
12
83 38
28
1
Source: 1988 and 1990 FORS Fatali@ Files
3.3.4 Body Regions Injured
The cause of death and location of the most severe injury for occupants killed in fatal crashes are shown in Table 3.18, fatalities where the cause of death could not be attributed directly to the crash (eg, heart attack or complications arising in hospital), or where no specific injury detail was recorded, were excluded from this analysis. The 'cause of death' variable is a coding of the most severe injuries (AIS 2 4,5,6) by body regions, such that a fatality coded as 'Direct head chest' would have suffered one or more injuries of AIS 2 4, 5 or 6 to the head and chest. The 'location of the most severe injury' variable indicates the body region where the injury with the highest AIS value was sustained.
Summing the number of fatalities where a severe head injury was sustained (either on its own or in conjunction with a severe injury to another body region) indicated little difference in the incidence of fatal head injuries across vehicle types (52% passenger cars cf. 49% 4WDs, 48% vans,). A similar calculation for chest injuries revealed a slight preponderance of fatal chest injuries in passenger cars (46%) compared with 4WDs (34%), and to a lesser extent. vans (40%). 24 FOUR-WHEEL-DRIVES, UTILITIES & VANS

Additionally, chest injuries seem to have been over-represented as the 'most severe injury' among passenger car fatalities and under-represented among 4WD fatalities (47% cf. 36%).
There was a slight over-representation of severe external injuries (ie, lacerations or burns) among van occupants who died.
3.3.5 Injuries by Crash Type
The injury analysis was also broken down by crash type and the results for frontal crashes and rollovers are reported in Tables 3.19 and 3.20 respectively. Once again fatalities with indirect cause and unspecified injury detail have been excluded from the totals.
Front&: Table 3.19 shows that in frontal crashes, severe chest and head injuries were the major cause of fatality among vehicle occupants with no marked differences across the vehicle types. Notably, occupants of 4WDs were comparatively more likely to have an external injury as the most severe one than occupants of passenger cars or passenger vans were (1 8% cf. 1% and 2% respectively).
Rollovers: The number of vans involved in rollover crashes was relatively small (see Table 3.20): so comparisons are confined to passenger cars and 4hDs . Severe head injuries were the predominant cause of death in fatal rollovers, but were higher among passenger car occupants than among 4WD occupants (58% cf. 41%). Fatal chest injuries, while less common, were slightly more prevalent among passenger car occupants than among 4WD occupants (38% cf. 30%). There was a slight suggestion that 4WD occupants killed in a rollover crash were more likely to sustain a severe spinal injury than passenger car occupants in equivalent crashes. A rollover crash study conducted by MUARC (Rechnitzer & Lane, 1994) found that poor roof integrity in 4WD vehicles resulted in significant vertical and lateral roof crush which in turn was a significant factor contributing to severe spinal injuries.
3.3.5 Ejection and Entrapment
The analysis of ejection and entrapment in fatal crashes for the three vehicle types is broken down by restraint use and crash type as these can have a major influence on outcome severity. As shown in Table 3.21, there was no difference in the incidence of ejection across the three vehicle types for restrained occupants, however unrestrained occupants of 4WDs were slightly over-represented in ejections by comparison with equivalent passenger car occupants (48% cf. 39%), which may be due in part to the over-involvement of 4WDs in fatal rollovers (54% cf. 20% passenger cars).
Table 3.21 also suggests that occupants of 4WDs have lower seat belt wearing rates than occupants of passenger cars (approximately 49% cf. 70%) which may explain the higher incidence of ejection of 4WD occupants than passenger car occupants in rollover crashes (43% cf. 34%, see Table 3.22).
Occupants of 4WDs (restrained or unrestrained) have marginally less likelihood of being trapped in the vehicle following a fatal crash than equivalent occupants of passenger cars or vans (Table 3.21); and are also less likely to be trapped in the vehicle following fatal frontal collisions than passenger car and van occupants(25% cf. 32% and 38%, see Table 3.22).
FORS REPORT CR 150 25

Table 3.19 Final Cause of Death and Location of Most Severe Injury by Vehicle Type for Occupants Killed in Frontal Crashes
Cause of Death:
Direct head only
Direct head chest
Direct head chest abdom
Direct head + other severe
Direct chest only
Direct other severe
Direct no severe
Total
Sub-total head
Sub-total chest
Location of Most Severe Injury:
Head Chest
Head chest
Abdomen
Chest abdomen
Spine
Ext
Head chest abdomen
Other
Total
Sub-total head
Freq
174
164 48
52
235 145
117
935 438
447 - 268
319
94
57
45
42
13 1 1
86 935
3 73
469
Passenger Car - "
"
"
"
"
"
"
- I ,
(50)
Source: 1988 and 1990 FORS Fatality Files
i . Passer
. . Freq
9 8
3
1
13
4 1 1
49 10
9
15
15
8
2
0
3 I
n 5
49 9
9
. ,
r Four Wheel Drive
Freq
2
6
1
1 2
6 4
22 21
24
5 4
4
1
1
0
4 0
3 22
23
23
(49)
26 FOUR-WHEEL-DRIVES, UTILITIES & VANS

Table 3.20 Final Cause of Death and Location of Most Severe Injury by Vehicle Type for Occupants Killed in RolloverCrashes
F I Passen Four Wheel Drive
t Freq Freq
117
66
6
12
60
43
44
348 201
Freq
3
3 1
0
0
5
2
14
18
13
6
2
1
1
0
0
4
0
0
14
22
16
12
3
1
3
9
7
9
44
Direct head only
Direct head chest Direct head chest abdom
Direct head + other severe
Direct chest only
Direct other severe
Direct no severe 1Tnt.l
7 kuh-total head
ISuh-total chest 4
18
10
3
1
2
4
0
I 5
44
132
151
74
56
I 1 3
17
9
I 26
348 208
ILocation o f Most Severe Injury . Head Chest
Head chest Abdomen
Chest abdomen
Spine
Ext
Head chest abdomen
Other
Total
Sub-total head 8
134 3
Source: I988 and 1990 FORS Fatality Files
FORS REPORT CR 150 27

Table 3.21 Ejection and Entrapment for Occupants in Fatal Crashes by Vehicle Type and Seat Belt Use
Passenger Car Passenger Van I Four WheelDrive 1 Freq ("/.I Freq
Restrained:
Ejected 87 (3) 4 Not Ejected 2797 (97) 135
Unrestrained:
Ejected 473 (39) 29 Not Ejected 736 (61) 42
Restrained:
Trapped 833 (30) 40 Not Trapped 1903 (70) 91
Unrestrained:
Trapped 215 (1 8) 11
Not Trapped 950 (82) 60
Source: 1988 and 1990 FORS Fatality Files
Table 3.22 Ejection and Entrapment for Occupants in Fatal Crashes by Vehicle Type and Crash Type
Source: 1988 and 1990 FORS Fatality Files
28 FOUR-WHEEL-DRIVES, UTILITIES & VANS

3.4 CONCLUSIONS
Overall, the findings suggested that the pattern of crash type and injury outcomes for 4WD vehicle occupants was different in many respects from that for occupants of passenger cars and passenger vans. The findings for occupants of utilitiedlight trucks generally fell somewhere in between but were closer to those for 4WDs than to those for passenger cars or passenger vans.
The main trends evident in these data were as follows:
Four-wheel-drive occupants were over-involved in crashes (both casualty and fatal) occurring on roads where the speed limit was 75 km/h or greater. This result is probably a function of greater exposure of 4WD vehicles on rural roads with higher speed zones.
Four-wheel-drives were over-involved in rollover crashes (in both high and low speed zones), and their occupants sustained more serious injury outcomes. The latter finding may have been because 4WD occupants were more likely to be unrestrained and ejected during the crash, than occupants of passenger cars or vans. Ejection has been found to be a significant factor in rollover fatalities and is related to a significant lack of roof integrity in 4WD vehicles by comparison with other vehicle types (see Rechnitzer & Lane, 1994).
Rollover crash configurations were 12 times more likely to occur in high than low speed zones, and high speed zone rollovers accounted for 80% of injuries sustained in rollover crashes.
Drivers of 4WDs involved in casualty or fatal crashes tended to be male and aged between 26-55 years. The proportion of younger (< 26 years) drivers involved in these crashes was slightly higher for passenger cars than for the other vehicle types.
Passenger vans were over-involved in fatal outcomes in head-on crashes in low speed zones (< 75 kmih) and their occupants were more likely to be trapped in the vehicle in these crashes. This is probably due to the more limited crumple space available in passenger vans.
Head, and to a lesser extent, chest injuries were the most common causes of death in fatal crashes. Severe chest injuries were slightly under-represented among 4WD fatalities by comparison with passenger car fatalities.
In fatal frontals, severe chest injuries were again under-represented among 4WD occu- pants, particularly as the most severe injury, by comparison with passenger car occupants.
In fatal rollovers, chest and to a lesser extent, head injuries were under-represented as the cause of death and most severe injury for 4WD occupants by comparison with passenger car occupants; however, killed 4WD occupants were more likely to have sustained a severe spinal injury than occupants killed in fatal rollovers in other vehicle types.
Occupants of 4WDs involved in fatal crashes were more likely to be unrestrained and ejected, and less likely to be entrapped than occupants of passenger cars and passenger vans.
FORS REPORT CR 150 29

4. CRASHED VEHICLE STUDY Detailed and reliable information on impact direction, vehicle damage and personal injury to establish causal relationships of occupant injuries is generally not available inmass crash injury data in this country. Thus, it was necessary to undertake a detailed retrospective examination of a representative sample of crashed vehicles to provide definitive information on the sources of injury to vehicle occupants in typical on-road crashes. This enabled details on improvements in vehicle design and construction to be identified so that reductions in the frequency and/or severity of these injuries could be achieved. The information included details on the type, severity and location of all injuries sustained by the vehicle occupants for each seating position and type of vehicle.
4.1 METHOD
The method developed from previous passenger car studies was adopted here. This involved the detailed assessment of the extent of occupant injuries and the vehicle damage for a sample of crashes involving post-1985 Four-Wheel-Drives (4WDs), light commercial vans andutilities (especially those capable of a 4WD transmission). However, in contrast to previous passenger car studies the criterion for inclusion in this study was ”vehicle-based“ rather than ”person- based’ (see “Selection Criteria” below). As the study was primarily concerned with secondary safety (i.e., aspects of a vehicle’s crashworthiness performance), in-depth analysis at-the-scene was not attempted. Most of the crashes occurred in Victoria and 45% of the crashes occurred in rural areas.
4.1.1 Selection Criteria
Vehicle SuitabiIity: The criterion for the selection of vehicles was that they had to have sustained over $5,000 damage as a result of a crash. However, vehicles fitting this criterion which were repairable proved difficult to locate, and the final sample of crashed vehicles comprised those which were mainly “write-offs”. Most of these were located at a salvage auction yard in Melbourne.
Occupant Suitability: Ethical considerations required that all occupants (injured or not) had to agree to participate in this study. While occupants are required by law to be belted in their vehicles, a number of them nevertheless do not wear seat belts. It was necessary to include patients in the crashed vehicle sample who were both belted and unbelted so as not to bias the study and overlook another set of problems for a subgroup of vehicle occupants most at risk.
Crash Suitability: Because of the difficulty in interpreting the effects of multiple collisions in terms of which crash caused which injury, only cases where the impacted vehicle sustained most damage from a single impact were included. The impacted object could have been either another car, a truck: or a movable or immovable object, including rollovers.
4.1.2 Occupant Assessment The assessment and classification of injuries sustained by road trauma patients (including injury severity judgements) requires specialised medical training and research skills. Two State Registered Nurses (SRNs) with additional research qualifications were employed by MUARC during the course of this study to undertake these duties and were extensively trained in the collection of injury data for research purposes including making Abbreviated Injury Score (AIS) assessments of injury severity. A proforma was developed to provide a standardised
FORS REPORT CR 150 3 1

format for the collection of patients’ medical, vehicle, and crash information (see Attachment 1) . This was trialed and modified prior to commencement of its use in the project. As many of the occupants were either uninjured or only slightly injured, most of the assessments were conducted using telephone interview procedures, although these accounts were checked against hospital records where this was possible.
4.1.3 Hospital Participation
Approval to approach and interview patients in hospital, where necessary, or to access their medical records was obtained from the ethics committees of eleven major public hospitals in Victoria. These included the Alfred Hospital (and Trauma Centre), Austin Hospital (Spinal Unit), Ballarat Base Hospital, Box Hill Hospital, Dandenong and District Hospital, Geelong Hospital, La-Trobe Regional Hospital (Moe & Traralgon campuses), Monash Medical Centre, Royal Melbourne Hospital, Preston and Northcote Community Hospital and Western Hospital. This approval was subject to obtaining the patient’s agreement to participate, as well as ensuring confidentiality of the information.
4.1.4 Vehicle Assessment
The detailed assessment of the crashed vehicles was a critical task in accurately specifying vehicle involvement in patient injuries and has been previously undertaken in two earlier MUARC studies (Fildes, Lane, Lenard & Vulcan, 1991; 1994). A mechanical engineer trained in undertaking these inspections and in making judgments of injury and vehicle component interactions was employed for this task (see Attachment 1 for a full description of the inspection process). The National Highway Traffic & Safety Administration (NHTSA) in Washington D.C. kindly provided the National Accident Sampling System’s (NASS) crash inspection proforma (including training and coding manuals) as well as the computer software CRASH3 for computing Delta-V (see Attachment 3). Figure 4.1 shows the NASS vehicle proforma for coding impact direction and vehicle region.
4.1.5 Calculation of Impact Velocity
Impact velocity is defined as the change in velocity from the moment of impact until the study vehicle separated from its impacting source (delta-V). This value was calculated using the CRASH 3 program made available by the National Highway Traffic Safety Administration. It should be noted that the delta-V values computed are best estimates of impact velocity and can be subject to error from the assumptions made in the program and vehicle stiffness values used in making these calculations. In this study, American stiffness values had to be used in the calculations of delta-V for vehicles of the same sizes as the Australian vehicles as local figures were not readily available. These errors could be reduced to some degree if appropriate stiffness values for Australian vehicles were to be provided by the local manufacturers.
Calculation of the delta-V values is dependent upon having mass, stiffness, and crush profile data on the ‘B’ vehicle involved in the impact with the target vehicle. Because of the large number of single-vehicle impacts (mainly rollovers) in the crashed vehicle file, and the diffi- culty of obtaining details of the ‘B’ vehicle prior to repairs being undertaken (due mainly to the vehicle based selection method), delta-V values could only be calculated for 42 of the 144 cases (29%). Equivalent Barrier Speed (EBS) estimates were calculated for 88 cases (61%), where EBS is defined as the speed which would cause equivalent damage to the target vehicle if it was driven into a rigid barrier. This allowed a test of ‘goodness of fit’ ofthe obtained distribution of delta-Vs against the distribution of EBSs. As with delta-Vs, EBS values could not be calculated for rollovers, which accounted for 39 (27%) of the crash cases in this sample.
32 FOUR-WHEEL-DRIVES, UTILITIES & VANS

I t I
2 I
3 f
1 d
11 )r
* #
IO 4 8 9
Figure 4.1 National Accident Sampling System proforma used for coding vehicle impacf location and direction (courfesy of NHTSA).
FORS REPORT CR 150 3.3

4.1.6 Procedure Once a target crashed vehicle was located, contact was made with the driver and/or registered owner ofthe vehicle to explain the study objectives and to seek the signed written consent of the occupants to participate in the study. Only 5 cases were rejected because the occupant or owner failed to give their consent to participate. Once consent was received, these occupants were interviewed by the nurse to obtain injury and crash details (see Attachment 2 for consent and occupant injury forms). Interviews were conducted mainly over the telephone using standard interviewing procedures, although some hospital and home face-to-face interviews were con- ducted. Occupants’ injury reports were verified against any hospital or medical records where these existed.
These injury details were passed on to the engineer who then conducted a detailed inspection of the vehicle to determine the extent of damage and the interactions between injuries and vehicle components (see Attachment 3 for vehicle inspection forms). Where a second vehicle was involved and could be located, it was briefly examined to complete the details required to explain the damage and to calculate the impact velocity (details of injuries to occupants in the second vehicle were not collected). Each case was fully documented and coded into a computer database for subsequent analysis. A subsequent volume to this report provides a one-page summary of each occupant’s injuries and is available on request from FORS.
4.1.7 Coding Injuries & Contacts Injuries: The National Accident Sampling System (NASS) for classifying and coding occu- pant injuries includes 20 separate body region injury codes. To simplify presentation of the results (especially given the small patient numbers) these were subsequently grouped into nine discrete body region categories, namely the head, face, chest, abdomen, pelvis, upper limb (i,e., arm and shoulder), thigh and knee, lower leg, and spine (including the neck).
Injury Contact Sources: The NASS classification further allows for coding injury source using 82 vehicle components as points of contact. Again, to simplify presentation of the results for this limited number of cases, these were grouped into sixteen vehicle regions, including the windscreen and header, steering wheel, steering column, instrument panel, console, pillars, side glazing (window and door frame), door panel (and rail), roof surface, seats, seat belts, other occupants, floor, exterior contacts, non-contacts, and others or unknown.
4.2 VARIABLES & DATA ANALYSES
A number of independent variables were of particular interest in the crashed vehicle study. These included patient characteristics, injuries sustained (including AIS severity), vehicle damage and extent of deformation, direction of principal force, severity of impact (delta-V), component and equipment failures, cabin distortion and intrusions, use of restraints, and an assessment of the source of all injuries. The inspection method used in this study has been shown to be the only objective and accurate means of making assessments of seat-belt wearing behaviour (Cromark, Schneider & Blaisdell, 1990).
The dependent variables comprised crash and injury involvement rates per 100 vehicles or occupants relative to the population of crashes investigated in the follow-up study of crashed vehicles. Sources of injury inside and outside the vehicle were especially important in this study. Presentation of the results was confined to reporting percentage differences in involvement and rank ordering of involvement rates for injuries per body region and vehicle components,
34 FOUR-WHEEL-DRIVES, UTILITIES & VANS

4.3 OVERALL RESULTS
The final database comprised details on 144 vehicles and 197 occupants, The crashed vehicle database contains information on 572 variables for each crash investigated. The population characteristics of the sample are shown in Table 4.1, with comparisons from the crashed vehicle study of passenger cars (CR 95, Fildes, Lane, Lenard & Vulcan, 1991) where appropriate. One feature of the database which should be borne in mind when interpreting the analyses is that the number of front-left (27) and rear-seat (12) occupants is much too small to make meaningful comparisons across seating positions or to draw reliable conclusions.
4.3.1 Crash Type Frontal crashes predominated the sample accounting for just over half of all crashed vehicles inspected. Side impacts were well under-represented by comparison with the sample of crashed passenger cars (16% cf. 35%) and rollovers were over-represented (27?,6 cf. 5%).
4.3.2 Type of Vehicle
Roughly one third of vehicles fell into each of the three body types - 4WDs: Vans & Utes. Table 4.2 lists the various makes and models of vehicles in the crashed vehicle fleet. The fleet contains a representative spread of manufacturers of these vehicles and covers the majority of models available in this country. Unfortunately, there are no accurate figures available on the proportions of vehicle models in the current vehicle population in Victoria nor their relative exposure, making it difficult to gauge relative involvement rates. A large majority (82%) of the vehicles had manual transmissions while the rest were automatics. There were no front-wheel- drive only vehicles in this sample. Over half (57%) of the vehicles had rear-wheel drive transmissions and the remaining 43% of the total sample were four-wheel drives. Most of the utes (67%) and all vans (100%) had rear wheel drive transmissions.
4.3.3 Occupant Characteristics Seventy-three percent of occupants were drivers, 18% were front-left seat passengers, while 9% were rear seat passengers. The slightly higher proportion of drivers compared with the passen- ger car file (73% cf. 62%) probably reflects higher exposure rates of driver-only vehicles in the “van” and “ute”categories (a high proportion of these were commercial vehicles with no rear seat, rather than ‘>people carriers”). There was a strong over-representation of males in the sample, compared with population figures. The majority of occupants (54%) were aged between 26-55 years, and a further 27% 17-25 years old. It is noteworthy that those aged over 55 were under-represented in crashes involving 4WDs, vans or utes, compared with passenger car crashes (8% cf. 18%) and that males were strongly over-represented (72% cf. 49%).
4.3.4 Seat belt Wearing Of the 172 occupants whose belt-wearing status could be determined, 169 (98%) ofthem were belted at the time of the collision. This is slightly higher than population wearing rates (95%) and markedly higher than the rate observed among the sample of hospitalised occupants in the passenger car study (82%). The 98% wearing rate may be a slight over-estimation since it does not take into account the 1 1% of drivers whose belt wearing status could not be determined with certainty. However, it may also be: in part, a function of the lower injury severity levels for these special purpose vehicles, brought about by the change to a vehicle-based entrance criterion in this study. While the numbers were small; there was no difference apparent in seatbelt wearing rates across seating positions (for occupants whose belt wearing could be .determined).

Table 4.1 Population Characteristics of the Crashed 4WD, Van, Ute File Compared with the Crashed Passenger Vehicle File
CHARACTERISTIC
1. IMPACT VELOCITY Delta-V Mean Standard Deviation Range EBS: Mean Standard Deviation Range
Frontal Side impact Rear end Rollover Other
2. CRASH TYPES
3. VEHICLE TYPES 4WD Vans Utes
4. SEATING POSITION Driver Front-Left Rear
5. OCCUPANT’S SEX Males Females
6. OCCUPANT’S AGE < 17 years 17 - 25 yrs 26 - 55 yrs 56 - 75 yrs > 75 years
CRASHED VEHICLE 4WD, VANS & UTES
(n=144)
35.5 k m h 16.7 kmh
15-100 kmih
21.6 kmh 16.6 kmh
5-100 km/h
55% 16% 1%
27% 1%
3 2% 35% 33%
73% 18% 9%
12% 2 8%
11% 21% 54% 7% 1 Yo
CRASHED VEHICLE PASSENGER CAR
(n=227)
45.4 km/h 23.3 kmh
3-111 kmh
60% 35% 0% 5 Yo
62% 25% 13%
49% 51%
8% 27% 47% 15% 3%
Note: Delta-V values are based on 42 cases and EBS values are based on 88 cases.
36 FOUR-WHEEL-DRIVES, UTILITIES & VANS

Table 4.2 List of the Type of Vehicles in the Crashed Vehicle File (n=144)
PERCENTAGE OF I\.IASS VEHICLE MAKEMODEL NUMBER TOTAL SAMPLE ( ~ ~ ~ G E )
(K=144) Utes Holden Rodeo 11 7.60% 1310-1j90kg
Toyota Hilux 12 8.30% 1155-1470 kg Ford Courier 5 3.50% 1290-1555kg Nissan NWUa 9 6.309.0 1260-1660 kg
Mitsubishi Triton 4 2.80% 1230-1570kg Mazda 82200 2 1.40% l465-1480kg Mazda Bravo 1 0.7046 1470-1510kg Nissan 4x4 1 0.70% 1260-1620 kg
4s Vans Mitsublshi Ford Toyota
Tayota
Tayata Ford Nissan Holden
Holden Mitsubishi Nissan Nissan Suzuki TOYOta
Mazda
9 7
6 5 6 2 2
2
1 2 2 1 I 1
2
6.30% 1.90% 4.20% 3.50% 4.20% 1.40% 1 .40% 1.40% 0.70% 140% 1.40% 0.70%
0.70%
0.70% 1.40%
1250-1296 kg 1230-1404 kg
1445-1510 kg 1430-1745 kg 1070-1160 kg
I250 kg 1350-1450 kg
750 kg
1440 kg
1291-1391 kg
1530-1650 kg
1200-1280 kg
755-815 kg 1190-1200 kg
1230 kg
Mazda E2200 2 1.40% 1355.1445 kg
51 4WD Toyota Land Cruiser 8 5.60% 1940-2145 kg Nissan Patrol 5 3 .5 0% 1906-2028 kg
Rover Range Rover 6 4.20% 1780-2017 kg
Rover Land Rover 2 80% 1810-1920kg
T0y0tV 4-Runner 4 2.80% 1490-1590 kg
Suzuki Vitara 7 4.90% 920-1152 kg
Ford Maverick 2 I ,40% 1932-2130 kg
Mitsubishi Pajero 5 3.5096 1590-1660 kg
Lads Niva 1 0.70% I I70 kg Suruki Siena 2 I .JOY6 920-940 kg Holden DrO\W 2 1.40% 960-990 kg Daihatsu 1 0.704/0 1125 kg
Holden Jackarm I 0 70% 1810 kg 48
NB: A summary of each of these cases is mailable in the supplemenfan; volume to this report (FORS Report No. CR 15Uaj.
FORS REPORT CR 150 37

4.3.5 Intrusions and Deformations
Table 4.3 lists the rank ordering of intrusions in the front and rear seat occupant areas where intrusion was defined in relation to the space inside the vehicle likely to be occupied by passengers. It should be noted that while front-seat intrusions were based on the total sample of vehicles, rear seat intrusions were based on a subset of these vehicles which had a rear seat occupant area, thereby excluding two-door utilities or vans with no rear-seats fitted. Given that the sample comprised several vehicles without rear seating positions, it is not surprising that the number of front seat intrusions far exceeded the number of rear seat intrusions.
Table 4.3 Rank Ordering of Vehicle Damage Intrusions for Crashes by Front and Rear Seating Positions
FRONT SEAT INTRUSION
(n=84)* (n=144)
REAR SEAT INTRUSION
ITEM FREQ (”/)
Side panel 4 ( 5 ) Roof side rail 31 (22) C-pillar 5 (6 ) A-pillar 35 (24)
Door panel 7 (8) Instrument panel 42 (29)
Roof side rail 11 (13) Toe pan 49 (34)
Roof 13 (16) Steering Assembly 50 (35) ITEM mQ (“/.I
Roof 30 (21) A-pillar 1 (1) Door panel 29 (20) B-pillar 25 (1 7) Wscreedheader 20 (14)
Side panel 1 ( 1 ) Other 5 (4) Totals 317 41
* Rear Seat Inhusion analysis is bused on only those vehicles with rear seaisfiited. Steering assembly inirusions in the top part of Table 4.3 refer to cases where there was movement in either a longitudinal, lateral, or vertical plane (movemenis in more than one plane were only scored us u single movement). The breaMown of intrusions into the total numbers of individualplane movements for all crashes is detailed below.
~ ~ ~~ ~~ ~ ~~~~~
Steering Assembly Movements by Direction of Displacement
Longitudinal 34 (24) Vertical 23 (16)
The most common front seat intrusions were the steering assembly, toe pan, instrument panel and A-pillar. These structural components were also among the top five front seat intrusions for passenger cars (Fildes et al., 1991). The most common intrusions into the rear seating area were the roof surface and side rail which were also the most common rear seat intrusions for passenger cars (Fildes et al., 1991). Notably, front and rear intrusions from the door panel ranked only 7th and 3rd respectively, compared with 2nd and 1st for passenger car crashes. The
38 FOUR-WHEEL-DRIVES, UTILITIES & VANS

lower part of Table 4.3 shows that for steering assembly intrusions displacement direction was more often longitudinal or lateral (24% ea.), rather than vertical (16%).
Tables 4.4 and 4.5 show the breakdown of front and rear seat intrusions by vehicle type. Overall, vans and 4WDs have more front seat intrusions than utilities. Further, there are some noteworthy differences in the pattern of common front seat intrusions across the three vehicle types. Vans have a preponderance of toe pan and instrument panel intrusions (59Y0 & 55%), whereas utility intrusions were mainly to the roof surface, side rail, B pillar and door panel (22% each). Four-wheel-drives showed a somewhat similar pattern to Utes with front intrusions mainly to the roof surface, side rail and the A-pillar. The intrusion pattern for 4WDs can partly be explained by the over-representation of these vehicles in rollover crashes.
Table 4.4 Front Seat Intrusions for Crashes by Vehicle Type
FRONT SEAT IA'TRUSIOY
COMPONENT
Toe pan
Instrument panel
Door panel
Roof
Roof side rail
A-pillar
B-pillar
Wlscreeniheader
R'screeniheader
Windscreen
Rear Conlpartment
Outer Object
Side panel
Totals
VANS (n=51) 4WD (n=48)
(%)
(591 (23)
102 I 97
Table 4.5 Rear Seat Intrusions for Crashes by Vehicle Type
REAR SEAT INTRUSION*
COMPONENT Door panel Roof
Roof side rail A-pillar C-pillar Side panel
Totals ! FORS REPORT CR 150 39

Roughly 50% of the 4WDs and utes with rear seats fitted had intrusions into this area and the proportion was slightly less for vans (38%). There was no clear pattern of differences between the vehicles in rear seat intrusions, although the numbers of vehicles eligible for this analysis was probably too small to show strong trends. The pattern of rear seat intrusions for 4WDs was again consistent with their over-invlovement in rollovers.
4.3.6 Impact Velocity
Figure 4.1 shows the delta-V and/or the Equivalent Barrier Speed (EBS) distributions of impact velocity observed in the various subsets of the sample of crashes. The modal value of the delta- Vdistribution was 18-24 km/h, with a range of impact speeds from 15 to 100 km/h. Seventy percent of all delta-V values were equal to or less than 42 km/h. The modal value of the EBS distribution was 12-24 km/h, with a range of impact speeds between 5 and 100 h / h . The 70th percentile value for EBS was 36 h i h .
The curves of the delta-V and the EBS distributions are roughly similar although the EBS values on the whole tend to be slightly lower. Notably, both the delta-V and EBS values observed in this sample of crashes were lower than those for passenger car crashes, a result which could be partially attributable to the 'hospitalised' selection criterion for the passenger car study.
96-102 90-96 "
84-90 78-84 72-78 ~
66-72 T
-
-
I DeltaV 0 EBS I 48-54 -" I . - ~ - l
-kTi ~
(kmlh) 42-48 I 36-42
"-
30-36 24-30 18-24 .~
12-18 :-
~~ ..
- .--I - .~ , . " I
."~. 1~" - ". .-
6-12 - ""mF""T- 0-6
~
"~
..
0 2 4 6 8 10 12 14 16 18
Figure 4.2 Distribution of delta-V and Equivalent Barrier Speed (EBS) values for the sample o f 42 and 88 4WD, Vans and Utility vehicles respectively.
4.3.7 Entrapments and Ejections Table 4.6 shows that there were only seven entrapments (3 full, 4 partial) in the sample, all among belted occupants. Table 4.7 reveals there were no ejections of occupants whose belt- wearing status was known or could be determined, however, there was one ejection of an occupant of unknown belt-wearing status. Note that cases where part of the occupant may have been transiently out of the vehicle during the crash but subsequently came to rest inside the vehicle were treated as non-ejected in this analysis.
40 FOUR-WHEEL-DRIVES, UTILITIES & VANS

Table 4.6 Entrapment Analysis for Belted and Unbelted Occupants
ENTRAPMENTS BELTED UNBELTED
FREQ (“A) FREQ (“10) No entrapment 155 (96%) 3 (: 100%) Full entrapment 3 (2%) 0 Partial entrapment 4 (2%) 0 Total 162 (100%) 3 (100%)
The total number of cases of entrapment and no entrapment is less than the total number of occupants (162 cf 197) due to the diyiculhj in ass~gnmgentrapment status retrospecriveli.
Table 4.7 Ejection Analysis for Belted and Unbelted Occupants.
EJECTIONS BELTED UNBELTED FREQ (“A) FREQ ( X . )
No ejection 169 (98%) 3 (2%)
Full ejection 0 (0%) 0 (0%)
Partial ejection 0 (0%) 0 (0%)
Total 169 (98%) 3 (2 Y o )
The total number of cases ofejection and non-ejection is less than the total numher of occupants (169 cf 197) due lo the d?ificulhj in assigning ‘partial ejectron” retrospectively.
4.4 INJURIES
The study was especially interested in the types of injuries and their sources inside the vehicle. Analysing the injury and contact source combinations provides a means of identifying particu- lar components inside the vehicle that are major causes of injury to occupants in these crashes and thus require intervention effort. All injury analyses are based on the ‘injured’ subset of the total occupant sample. Injury analyses broken down by vehicle type (4WDs, Vans, and Utes) are reported for drivers only to avoid confounding vehicle-type effects with seating position effects. A further limitation was the small number of occupants in other seating positions. The small number of rear occupants is not surprising given the seating configurations of the vehicles under investigation.
It should also be noted that in this crashed vehicle study assumptions about comparable accident severity across the 3 vehicle types cannot be made because (I), cases were not selected according to an ‘occupant hospitalisation‘ criterion; (2), vans have a lower market value and hence a higher scrappage rate than utilities or 4WDs; and (3), 4WDs are over-represented in rollovers by comparison with vans or utilities. Similarly, comparisons between injury out- comes for this sample of vehicles and those for the crashed passenger car sample do not accurately reflect the relative crashworthiness of the various vehicle types.
FORS REPORT CR 150 41

60%
v) 50% v) W
a
10%
0% i + UNINJURED MEDICAL HOSPITAL FATAL
INJURY OUTCOME OF THE OCCUPANT
Figure 4.3 Injury outcome for all occupants in all collisions
70%
60%
10%
0% -t t
1.4WD ~
UTILITIES
VANS
-I UNINJURED MEDICAL HOSPITAL FATAL
INJURY OUTCOME OF THE OCCUPANT
Figure 4.4 Injury outcome for occupants in all collisions by vehicle type
42 FOUR-WHEEL-DRIVES, UTTLITIES & VANS

4.4.1 Extent of Injury
Figure 4.2 shows that the majority of occupants (63%) in this study received only minor injuries requiring medical treatment. Furthermore, the proportion of occupants who were uninjured was greater than the proportion who were hospitalised (21% cf. 15%). The fact that this sample of vehicle occupants was relatively uninjured by comparison with occupants in the passenger vehicle study (97% of whom were either hospitalised or killed) is most likely due to the fact that cases were selected according to a vehicle rather than a person-based criterion (Le.> being 'written-off). Injury outcomes for the different vehicle types (Figure 4.3) suggest that occu- pants of 4WDs are marginally more likely to sustain injuries requiring medical treatment or hospitalisation than occupants of utes or vans.
4.4.2 Body Regions Injured Table 4.8 shows that drivers sustained marginally more injuries on average than other occu- pants (2.8 cf. 2.5 for fiont left passengers and 1.7 for rear). The most frequent body region injured among drivers was upper limbs, followed by kneeithigh, spineheck and chest. For front-left passengers the most frequent body region injured :vas also upper limbs, followed by head, face, chest and kneehigh. Body regions injured for rear passengers were mainly upper limbs, spineheck and face, although this is not an accurate indication of regions likely to be injured by these occupants given their small number in this study
Table 4.9 highlights the minor nature of injuries to occupants in this study. For the crashes sampled the probability of any vehicle occupant sustaining a severe injury (AIS>2) was roughly 2 in 10 (cf. 6 in 10 for the passenger car study), and the average Injury Severity Score was only 5.2 (cf. 17.8 for the passenger car study). However, comparisons between the current study and the earlier passenger car study are difficult due to the different selection criteria used. This difference alone could account for the large differences in injury outcomes found between the two studies. Further, as previously mentioned, the small number of front-left and rear-seat occupants makes comparisons of probability of serious injury across seating positions very difficult.
Table 4.10 shows that drivers of vans had fewer injuries to the upper limbs and chest, but more injuries to the lower leg and foot by comparison with drivers of utilities or 4WDs. While the average number of body regions injured was the same across vehicle types (2.8 ea.), the injuries sustained by drivers of vans were more severe (see Table 4.1 1). The probability of serious injury indices and the average injury severity scores for drivers of vans were markedly higher than those for drivers of utes or 4WDs.
FORS REPORT CR 150 43

Table 4.8 Body Region Injured by Seating Position for All Collisions
BODY REGION INJURED DRIVERS FRONT LEFT REAR
(n=76) (n=18) (n=4)
ALL (AIS>Z) ALL (AIS2) ALL (AW-2)
% W ) % (4w % (%I Head 27 (3) 33 (4) 17 0
Face
Chest
Abdomen
Pelvis 15 (1) 11 0 8 0 Upper limb 61 (2) 56 n 42 0
Knee &thigh 38 (2) 30 0 8 (8)
Lower leg & foot 30 (3) 22 0 0 0
Spine & neck 35 0 26 0 33 0 Other 1 0 0 0 1 0
Average/Occupant 2.8 (0.2) 2.5 (0.2) 1.7 (0.2)
particular body region (of any level of severity). Figures inparenthesis show thepercentages for serious injuries Figures for ALL injuries refers to the percentage of injured occupants who had at least I injury in that
serious (AIS>2) injuries. only (AIS>Z). Averagehecupant = mean number of body regions injuredper occupant for all injuries and
Table 4.9 Seating Position by Level and Probability of a Serious Injury
SEATING POSITION OCCUPANTS INJURED A". ISS* PROBABILITY OF SERIOUS INJURY
AW-2 ISS>15 ISS>25
Driver 116 5.5 0.21 0.05 0.03
Front-lefl 27 4.1 0.11 0.07 0 Rear 12 3.9 0.25 0.08 0.08
Total (Averages) 155 (5.2) (0.19) (0.06) (0.03)
* Injury Severity Score (ISS) is a generally accepted measure of overall severity of injury from road trauma
recordedfor each of 3 body regions injured. (Baker et al., 1980). It is calculated by adding the square of the 3 highest Abbreviated Injury Scores (AIS)
44 FOUR-WHEEL-DRIVES, UTILITIES & VANS

Table 4.10 Body Region Injured for Drivers by Vehicle Type
BODY REGION INJURED
UTILITES VANS 4WD
(n=35) (n=39) (n=42) ALL (AIS>2) ALL (AISz2) ALL (AIS2)
% (“A) % (“/.I % (“/.I Head 29 (3) 26 (8) 26 0
Face 29 0 21 ( 3 ) 29 0
Chest 40 (6) 23 (5) 36 0
Abdomen 14 0 15 (5) 14 0
Pelvis 20 (3) 13 0 12 0
Upper limb 60 0 54 (5) 69 0
Knee &thigh 29 0 49 (5) 36 0 Lower leg & foot 20 0 49 (8) 21 (2) Spine & neck 31 0 33 0 33 0
Other 3 0 0 0 0 0
Averape/Occuoant 2.8 0 2.8 (0.4) 2.8 (0.02)
Frgures for ALL injuries refers lo thepercentage of injured occupants who had at least I injur); in that parricular bo& region (of any level ofseveriryi. Figures in parenthesis show thepercentages for serious Lljuries only (AIS>2). Averages/occupant =mean number o f b o 4 regions injuredper occupant for all injuries and serious (A/S>2) injuries.
Table 4.11 Vehicle Type by Level and Probability of a Serious Injury
VEHICLE TYPE DRIVERS INJURED AV. ISS* PROBABILITY OF SERIOUS INJURY
AIS22 ISS>15 ISS>25
Utilities 35 5.9 0.14 0.06 0.03
Vans 39 7.1 0.46 0.1 0.08
4wD 42 3.6 0.02 0 0
Total (Averages) 116 (5.5) (0.20) (0.05) (0.03)
* Injup Severily Score (ISS) is a generallv accepted measure of overall severify of injuwfrom road trauma (Baker et al., 1980j. It is calculated by adding the square of the 3 highest AbbreviatedInJur); Scores (AIS) recordedfor each o f 3 body regions injured.
4.4.3 Sources of Injury
Table 4.12 shows that the most prominent sources of injury for drivers were non-contacts (i.e., injuries such as whiplash where no contact was made with any vehicle component), seat-belts and the instrument panel, but of those, only the instrument panel was a source of severe injury (4% of injured drivers). Notably, the steering wheel was the fourth most frequent source of injury to drivers (26%) in contrast to the passenger car study where it was the most frequent source (53%).
FORS REPORT CR 150 45

Table 4.12 Points of Contact for Injured Occupants for All Collisions
POINTS OF CONTACTS
DRIVERS FRONT LEFT REAR
(n=ll6) (n=27) (n= 12) ALL (AIS>2) ALL (AIS>2) ALL (AIS>2)
% W ) Yo (%I % (“/.I Windscreenheader 9 0 7 0 0 0
Steering wheel 26 0 0 0 0 0
Steering column 7 0 0 0 0 0
Instrument panel 35 (4) 33 0 0 0
Console 3 0 0 0 0 0
Pillar 3 (1) 7 0 0 0
Sideglaze 10 (1) 15 0 17 0
Door panel 14 (1) I 1 0 0 0
Roof surface 7 0 22 0 0 0
Seats 2 0 4 0 8 (8) Seat belts 36 0 30 0 so (8) Other occupants 3 0 4 0 0 0 Floor & toe pan 13 (2) 0 0 0 0
Exterior contacts 9 (3) 11 (4) 0 0
Non-contact 41 0 41 0 33 0
Other 4 0.0 7 (4) 0 0
Average/Occupant 2.2 (0.1) 2.1 10.1) 1.1 (0.2) . ,
Figures for ALL contacts refer to thepercentage of injured occupants who made contact with thatparticular
source resulted in a severe inju9 (AIS-2). vehicle component. Figures in parenthesis show thepercentage of injured occupants for whom contact with that
Front-left passengers had a similar pattern of injury sources to drivers, but with a marked increase in roof-surface contacts (22%). None of these contact sources caused serious injury to front-left passengers, the main source of severe injury being exterior contacts (4%). Rear-seat occupants recorded contacts with only seat belts (50%) and the sideglazing (17%), although 33% of them sustained non-contact injuries such as whiplash.
Table 4.13 shows the major differences in contact points for drivers of the three vehicle types were the instrument panel (over-representation of vans & 4wDs), the steering wheel (over- representation of 4WDs), the door panel (over-representation of utilities), seat belts (under- representation of vans), floodtoe pan (over-representation of vans), and non-contact sources (over-representation of utilities). Further, the contacts made by van drivers resulted in more severe injuries (particularly contacts with the instrument panel, exterior objects and the floor/ toe pan) by comparison with driver contacts in the other two vehicle types.
46 FOUR- EL-DRIVES, UTILITIES & VANS

Table 4.13 Points of Contact for Injured Drivers by Vehicle Type
POINTS OF CONTACTS UTILITES V.4NS 4WD
(n=35) (n=3 9) (n=42) ALL (AIS22) ALL (AIS>Z) ALL (MS>2)
% W ) Yo (“/I % Windscreedheader 11 0 5 0 10 0
Steering wheel Steering column
Instrument panel Console
Pillar Sideglaze Door panel
Roof surface
Seats Seat belts
Other occupants
Floor &toe pan
Exterior contacts
Non-contact
Other
23
9
17
6
9
11
20
9
3
37
0
I 1 9
49
6
36 0
2 0
33 ( 2 )
0 0
0 0
10 0
10 0
12 0
0 0
41 0
0 0
2 0
10 0
36 0
2 0
AveragelOccupant 2.3 (0.1) 2.3 (0.3) 2 (0.02)
Figures for ALL contacts refer lo the percentage qfrnjured occupnnts nha made contact with thatparticular vehicle component, Figures inparenthesis show the percentage of injured occupantsfor whom contaci with that saurce resulted in a severe i n j q (4fS>2).
4.5 INJURYKONTACT SOURCE ANALYSES
In scoring injuries and points of contact, where there were multiple injury/source combinations for each occupant (e.g., two head injuries from the steering wheel), only the most severe injury/ contact source was scored. However, multiple scoring of injuries and points of contact for each occupant was allowed, providing they were unique injury-source combinations (e.g., two head injuries, one from the steering wheel and another from the instrument panel).
Injuryicontact-source analyses are presented for the three main seating positions, namely drivers, front-left passengers, and rear seat passengers (Tables 4.14 - 4.16) and for drivers in the three vehicle types, namely utilities, vans and 4WDs (Tables 4.17 - 4.19). No analyses were attempted by seat belt wearing status because of the small number of unrestrained occupants observed in this study. For each of these tables non-contact injuries to the spine are typically whiplash injuries caused by crash forces: and non-contact injuries to the upper limbs are lacerations caused by flying glass.
FORS REPORT CR 150 47

Table 4.14 Body Region by Contact Source Analysis for ALL Injuries and Severe Injuries (AIS>2) for the 116 Drivers involved in ALL Collisions
48 FOUR-WHEEL-DRIVES, UTILITIES & VANS

Table 4.15 Body Region by Contact Source Analysis for ALL Injuries and Severe Injuries (AIS>2) for the 27 Front-Left Passengers involved in ALL Collisions
REGION H a d Face Chut Abdomm P&k Uppar ThighL Low, Spln TOTAL Limb Knw Leg
Windscreen h header
7
Floor
4 4 16
FORS REPORT CR 150 49

Table 4.16 Body Region by Contact Source Analysis for ALL Injuries and Severe Injuries (AIS>2) for the 12 Rear Passengers involved in ALL Collisions
Instrument " I ' , ' , '
I (0) 0
50 FOUR-WHEEL-DRIVES, UTILITIES & VANS

4.5.1 Seating Position
Drivers. Table 4.14 shows that the three most common injuryicontact-source combinations for drivers were:
thigh /knee with instrument panel (24%),
* chest with seat belts (20%),
- lower leg with instrument panel (17%),
Non-contact injuries to the spine were also significant (24%). For severe injuries (AIS>2), the notable injury/contact-source combinations for drivers were: - head with exterior (3%), - abdomen, thigWknee and lower leg with instrument panel (2?/, ea.), - lower leg with floor (2%).
The relatively low number of cases for front-left and rear seating positions was somewhat problematic in this study. However, these results are included for completeness. It should be stressed however that these findings are based on very small sample sizes (27 &: 12 occupants respectively) and therefore likely to be somewhat unreliable.
Front-LeftPussengers: Table 4.15 shows that the most common injurykontact-source conlbi- nations for front-left passengers were:
chest with seat belts (26%),
thigh /knee with instrument panel (19%),
* head with the roof surface (1 5%) and
* upper limbs with seat belts (15%).
Non-contact injuries to the spine for front-left passengers were also significant (15%). The only notable severe (AIS2) injurykontact-source combination for front-left passengers was the head with an exterior source (4%)
Rear Passengers: Table 4.16 shows that the most common injuryicontact source combinations for rear passengers were the face, chest and upper limbs with seat belt, head with side glazing and non-contact injuries to the spine and upper limbs (all 170/0 ea.). The only combinations resulting in severe injuries were thigNknee with seats and chest with seat belts (8% ea).
FORS REPORT CR 150 5 1

Table 4.17 Body Region by Contact Source Analysis for ALL Injuries and Severe Injuries (AIS>2) for the 42 - 4WD Drivers involved in ALL Collisions
TOP mw npUm In ach d l mx the injury/ramrca mntad rated per 100 injured occupants f a all Injuries. Those in PARENTHESIS n the mntsd rdm pa 100 ocwpanntt for s m in]urlea (AIS>2). Multiple injuries are indudd where sepuate injury swrces were I n w h d .
52 FOUR-WHEEL-DRIVES, UTILITIES & VANS

Table 4.18 Body Region by Contact Source Analysis for ALL Injuries and Severe Injuries (AIS>2) for the 35 - Utility Drivers involved in ALL Collisions
CONTAC SOURCE
REGION H u d Face C h d Abdomen pllv* U p p r Wh.L Lower 5- O t h e r TOTAL Limb Ki*. Leg l n l v
Wlndncmn a header
3 6 16 (0)
Steulng 3 11 3 6 6 3 W h n l (0)
9 (0)
32
Steerlng 9 column
FORS REPORT CR 150 53

Table 4.19 Body Region by Contact Source Analysis for ALL Injuries and Severe Injuries (AISS) for the 39 - Van Drivers involved in ALL Collisions
54 FOUR-WHEEL-DRIVES. UTILITIES & VANS

4.5.2 Vehicle Type
The injury/source analyses by vehicle type were confined to drivers only so that these results were directly comparable.
4WDS: Table 4.17 shows that the most common injuryicontact source combinations for drivers of 4WDs were:
thigh and knee with instrument panel (24%),
chest with seat belts (24%), and
* face with steering wheel (17%).
Drivers of 4WDs sustained a similar level of non-contact injuries (24%) as drivers of utes and vans (26% and 23%). There was only one serious injury recorded for drivers of 4\VDs, that being a lower leg injury caused by contact with the instrument panel.
Utilities: Table 4.18 shows that the most common injuryicontact-source combinations for drivers of utilities were:
- chest with seat belts (23%j,
* upper limb with seat belts (17%), and - thighknee with instrument panel (14%)
Non-contact injuries to the spine were significant for drivers of utilities (26%). Severe injury/ contact-source combinations for drivers of utilities were:
* head with exterior YO),
chest with pillars (3%0),
- chest with door panel (?YO), and
* pelvis with instrument panel (3%).
Vans: Table 4.19 shows that most common injuqdcontacr source combinations for drivers of vans were:
- thigwknee with instrument panel (31%),
lower leg with instrument panel (3 l%)> and - lower leg with floor (26%).
Non-contact injuries were also notable for drivers of vans (23Yoj. Severe injuryicontact source combinations for drivers of vans included:
- thighknee with instrument panel (5%).
- lower leg with floor (5?h]+md
abdomen with instrument panel (5%).
FORS REPORT CR 150 55

5. DISCUSSION AND RECOMMENDATIONS This chapter attempts to bring together the findings from the literature review: the mass data analysis and the crashed vehicle study to provide a broad overview of the occupant protection issues for current generation 4WDs, utilities and vans in the Australian vehicle fleet.
5.1 CHARACTERISTICS OF THE SAMPLE
5.1.1 Seating Position Drivers were highly over-represented amongst the occupants of these crashed vehicles, com- pared with findings for crashed passenger cars, which is probably due to the large proportion of 'driver-only' vans and utilities used for commercial pulposes. Of special interest, the propor- tions of occupants in other seating positions in 4WDs (40%) approximated that for passenger cars (38%). It is likely that the findings ofthe Crashed Vehicle Study for seating positions other than the driver are not totally reliable, given the relatively small numbers of people observed in these seating positions.
5.1.2 Age and Sex of Driver
The majority of the drivers of crashed 4WDs, utilities and vans in this sample (and in the mass data bases) was aged 26-55 years. This probably reflects higher exposure of this age group as drivers of these vehicles.
Males, too, were over-represented as drivers of these vehicles, compared to passenger cars. Results from both the crashed vehicle file and the mass data analysis revealed about 75-85% of injured occupants of 4WDs. utilities and vans were males compared with about 60% for passenger cars (CR 95) and 68% for the Victorian population generally (Rogerson & Keall, 1990). Again, it is likely that these findings reflect exposure differences, rather than differences in predisposition to injury.
5.1.3 Crash Types
Frontal impacts comprised the majority (55%) of crash types in this sample similar to earlier fmdings for passenger car occupants (60% frontal). Frontal impacts appeared to be under- represented in the NSW casualty crash database, but this is because only head-on frontals are coded separately in the impact direction variable.
There were, however, subtle differences in crash type by vehicle type illustrated in both the mass data analyses and the crashed vehicle file. Rollovers were strongly over-represented in the crashed vehicle file by comparison with passenger car crashes, where 44% of 4WD crashes and a further 27% of utility crashes involved rollovers. The propensity for 4WDs to rollover was further supported in the analysis of casualty and fatal crashes on the mass databases where 54% of fatal 4WD crashes and 12% of casualty 4WD crashes involved rollovers (cf. 20% fatal and 3% casualty for passenger cars). These findings support the suggestion from available literature that 4WDs. and to a lesser extent utilities, are more likely to be involved in rollover crashes because of their high centre of gravity relative to wheel base. The rollover propensity might also be accentuated by the greater use of these vehicles in rural areas at higher speeds and on unsealed roads
Vans, by comparison, were primarily involved in frontal crashes (70%) probably reflecting more urban use of these vehicles. Although forward control vans have been found previously to
FORS REPORT CR 150 57

have a propensity to rollover (Rattenbury & Gloyns, 1990), this was not supported in the current sample of crashes among passenger and light commercial vans, nor in the samples of casualty and fatal crashes in the mass databases. Anecdotally, many of the vans inspected in the Crashed Vehicle File seemed to be relatively less damaged than the other vehicle types, suggesting that there might be a tendency to write these vehicles off at lower levels of damage in the event of a collision.
5.1.4 Restraint Use
Levels of restraint use, which primarily reflected driver usage, since the proportions of occu- pants in other seating positions was so small, were consistent with population wearing rates for drivers of around 95% as assessed by exposure surveys (Rogerson & K e d , 1990). The wearing rate of 98% reported for this sample may be a slight overestimation, since it does not take into account the 11% of drivers whose belt wearing status could not be determined with any certainty.
The previous passenger car study (Fildes et al., 1991) showed that unrestrained occupants were roughly THREE times over-represented in hospital admissions or fatalities, compared with population figures. The fact that this was not repeated in this study is probably partly a function of differences in entrance criteria (from person-based to vehicle-based) and the higher propor- tion of uninjured or minor injured occupants observed here as a consequence. It might also be in part because of the relatively small numbers of cases observed in this study.
5.1.5 Ejection and Entrapment
It is therefore difficult to draw definitive conclusions about the influenceof seat-belt wearing or impact type or vehicle type on ejection and entrapment from this sample of vehicles because there were so few instances of unrestrained occupants. The low incidence of ejections could be explained by the high rates of seat-belt wearing observed in this sample, and the low incidence of entrapments by the fact that the sampling method selected low severity crashes with consequently less intrusions.
The mass data findings on entrapments indicated that in fatal crashes occupants of 4WDs were less likely to be trapped than occupants of vans and passenger cars. This trend was especially more marked in frontal crashes. These results could he partly explained by the stronger sub- structures of 4WD vehicles offering more resistance to intrusions and therefore entrapment in head-on crashes. However, in rollover crashes occupants of 4WDs were more likely to be ejected than passenger car or van occupants. This result may be partly due to lower belt- wearing rates reported among 4WD occupants, but also to a lack of roof strength in 4WD vehicles resulting in vertical or lateral roof intrusion or the roof sheeting being dislodged from the roof structure, both of which increase the likelihood of partial or full ejection (Rechnitzer & Lane, 1994).
The issue of entrapment and ejection is worthy of further investigation, particularly with regard to rollover crash configurations where 4WDs are particularly vulnerable. Unfortunately, the number of cases inspected in the crashed vehicle file was too small to draw any definitive conclusions on this issue.
5.1.6 Impact Velocity
The delta-V values for this sample of vehicles were lower than those observed in the crashed passenger car sample, again indicating relatively lower crash severity in the current sample.
58 FOUR-WHEEL-DRIVES, UTILITIES & VANS

Again, there were insufficient cases to compare those who were hospitalised or killed in these special purpose vehicles with the passenger car findings. Of particular note, however, 86% of delta-V and EBS values were equal to or below 48 k d h , the value specified in ADR69, the new dynamic standard for passenger cars. It should be remembered that almost all of these vehicles were involved in a crash where the vehicle was written-off. which cannot be considered a minor impact, although most were below the threshold resulting in injuries requiring hospitalisation.
5.2 VEHICLE INTEGRITY
lntrusions in the front seating area were mainly from the steering assembly, toe pan and instrument panel. This is consistent with the predominance of frontal crashes in the sample. It is difficult to make definitive statements about the pattern of rear seat intrusions as the number of vehicles with rear seats fitted was a much smaller subset of the total sample of vehicles. Nevertheless, the most common rear seat intrusions (Le,: roof and roof side rail) reveal apattern consistent with the substantial number of rollovers in this sample. Similar patterns of front and rear intrusions were found in the sample of passenger car crashes, although these had more door panel intrusions as a result of more side impact configurations.
Four-wheel-drives had a greater incidence of intrusions to the roof. roof side rail, A-pillar and windscreen & header, consistent with their greater involvement in rollover crashes. Vans had substantially more intrusions of the toe pan and instrument panel confirming findings by Paix and others (1985) and FORS (1987) that earlier versions of these vehicles did not offer sufficient lower leg protection because of a lack of frontal crash structural components.
5.3 INJURIES
5.3.1 Degree of Casualty
Although the vehicles in the crashed vehicle file were mainly write-offs, the occupants of these vehicles were relatively uninjured in these crashes. Eighty-four percent of occupants received either no injuries or only minor injuries requiring medical attention. While this was not desirable in terms of examining patterns of injuries to occupants of these vehicles, it was necessary to ensure sufficient cases for the study, given the relatively smaller proportions of these special purpose vehicles on the road. Nevertheless, the findings do provide some valuable insights into patterns of injuries likely to be sustained in crashes and show that there is scope for occupant protection improvement in these vehicles.
In the relatively low severity crashes sampled in the current study, occupants of 4WDs and utilities were more likely than van occupants to sustain injuries requiring medical attention (65% cf. 58%). Given that 4WDs and utes were over-involved inrollover c.rashes (35% cf. 10% of vans) the injury difference provides limited support for the convention that these crash types are typically associated with more injurious outcomes (Fildes et al., 1991: Rechnitzer & Lane, 1994). This contention was further supported by the mass data analysis of serious rollover crashes (casualty and fatal) where occupants of 4WDs were more likely to be killed or hospitalised than occupants of passenger vans.
FORS REPORT CR 150 59

5.3.2 Body Regions Injured
A summary of the injury findings from the crashed vehicle file is presented in Table 5.1 below. Injuries to the upper limbs were the most frequent injury sustained by drivers of 4WDs, utes and vans alike. They were predominantly minor (3% or less had an AIS>2) and equally common among all seating positions and across the three vehicle types.
Severe head and chest injuries predominated above all others as principal cause of death for occupants of these vehicles in the FORS fatal file. Given the fact that a small sample of crash tests involving 4WDs and vans in the Australian New Car Assessment Program (1994) showed relatively high head and chest injury values, there is a suggestion that the current generation of these vehicles do not offer adequate protection, especially for the driver.
Head and chest injuries in the crashed vehicle file were relatively less frequent by comparison with the passenger car study (26-29% cf. 61%), no doubt influenced by the less severe entrance criteria. Nan-severe spineheck injuries (predominantly whiplash) were relatively common in these crashes, occurring to roughly one third of all injured drivers. However, severe spinal injuries were a notable feature of the injury pattern for occupants of 4WDs killed in rollover crashes in the FORS fatal file. This latter finding warrants further investigation.
The relatively high proportion of lower limb injuries (knee, thigh, lower leg and foot) among drivers of vans and the increased likelihood of severe injury to these regions was highlighted in this study. Davis (1986) reported a 27% higher rate of injury crashes among forward control passenger vans by comparison with passenger cars. Davis ( 1 986) and Paix and others (1985) also found an increased propensity for lower limb injuries. Paix and others (1985) claimed that van crashes were more costly in terms of treatment costs and argued that existing standards were insufficient to ensure optimum protection; the findings from the current study confrm this.
Table 5.1 Summary of Injuries to Drivers by Vehicle type
UTILITIES VANS (N=35)
4 w s (N=39) (N=42)
Uninjured Degree of casualt$:
Medically lrealed Hospitalised Killed
22% 62%
24%
16% 59% 14% 3%
13% 73% 14%
Average Injury Severity score (Iss): I 5 9
7.1 3 6
Most fnquent body nglon (SW (60%) Injured (All AIS):
Upper Limb Upper llmb
~ for Injuries (All AIS): Most frequent contact source Non-contad (ie., whiplash) Instrument panel
(51%) (49%)
Mostfrequent InJurylcontact ThigMvree - Instrumen1 pane (23%) source cornblnstlon (All AIS):
Chest - seat belt (31%)
Upper Llmb (69%)
Seat belt (41%) I
ThghJknee - lnstrumenl panel Chest - Seat bell
(24% ea )
60 FOUR-WHEEL-DRIVES, UTILITIES & VANS

5.3.3 Injury Severity The overall level of injury severity for this sample of crashes was quite low. The average number of serious injuries (AIS>2) per occupant was less than 1, the probability of sustaining a serious injury was only 20% (compared with 60% for the passenger car study and the average Injury Severity Score (based on the three highest AIS scores) was 5.2 (cf. 17.8 in the passenger car study). Collectively, the observed pattern of injured body regions and the various indices of injury severity, further highlight the relatively less severe nature of the crashes in this sample.
One exception, though, was van drivers who had, on average, higher injury severity scores and higher probability of sustaining a severe injury compared to both 4WD and Utility drivers.
The results suggest that even in crashes of.only moderate severity, occupants of vans are still susceptible to serious (albeit, non-life threatening) injuries. The question of whether 4WDs and utes by comparison offer better or worse protection to occupants in crashes or greater severity cannot be argued on the basis of these findings.
5.3.4 Contact Sources It is not surprising that the majority of contacts in the crashed vehicle file were with the instrument panel, seat belts and steering wheel, given that the majority of crashes were frontal. These components were also the most common contact sources reported for frontal crashes among passenger cars.
One unusual finding was the relatively high proportion of drivers who sustained injuries not directly attributable to any specific structural components (non-contacts accounted for 41% in this study, compared with only 25% in the passenger car study). It is possible that given the relatively minor nature of injuries sustained by occupants in these crashes, non-contact injuries such as whiplash were more discernible, whereas in the passenger car study such injuries were most likely masked by more serious injuries requiring hospitalisation. While these injuries are relatively minor (in terms of AIS), they are, nevertheless, painful injuries and costly to treat.
Contact sources for the three vehicle types were directly correlated with intrusions, with van drivers being strongly over-involved in contacts with the instrument panel and floorhoe pan and drivers of 4WDs and utilities being slightly over-involved in contacts with the roof surface.
5.3.5 InjuryKontact Source Combinations This study was especially useful in being able to assign contact sources to each injury sustained by the occupants. For drivers generally, the most common injury/source combinations were thigh, knee and lower leg injuries (a small number of them severe) caused by contact with the instrument panel . This can be explained by the high proportion of frontal crashes and suggests that the floor and lower structures are not optimal for occupants of these vehicles.
In addition, there were a number of chest injuries (albeit not usually severe) caused by the seat belt itself. This pattern is consistenr with the passenger car study where a relatively high proportion of seat belt induced injuries were found. While such injuries are likely to be less severe than those for unrestrained occupants, these results indicate the scope for additional improvement in seat belt systems as well as improvements in seat design in these special purpose vehicles.
Head contacts with the steering wheel were much less prevalent among drivers in these crashes than in the sample of passenger car crashes (3% cf. 19%). However, this is also likely to be a
FORS REPORT CR 150 61

function of the lower crash severity in this study. Drivers of 4WDs and utes had more face injuries from the steering wheel and chest injuries from the seat belts, while van drivers had comparatively more thighknee and lower leg injuries from the instrument panel and floor. In particular, the proportions of lower leg injuries caused by contacting the instrument panel and floor among van drivers were more than double those for drivers of 4WDs and utes. Non- contacts were equally significant across the three vehicle types.
There was a slight indication of head and spine injuries (although not severe) from the roof surface for drivers of 4WDs and utes. This finding was interesting in the light of evidence suggesting that in more severe rollover crashes, roof crush is directly related to spinal chord injuries caused by the head ‘locking-in’ under the roof framing (Rechnitzer & Lane, 1994).
It was not possible to draw any reliable conclusions regarding injury contact combinations for front and rear passengers as the numbers in these seating positions were too small.
5.4 COUNTERMEASURES
A number of countermeasures seem to be suggested from these findings, many of which have already been suggested from the previous passenger car study, and these are discussed below.
5.4.1 Steering Assembly The steering assembly has been shown to inflict a considerable number of minor (AIS < 2) injuries to drivers of these special purpose cars. This is in spite of the fact that most drivers (up to 98%) were properly restrained. There are a number of steering assembly countermeasures worthy of consideration. As these have been fully discussed in the passenger car study, they are only listed here for completeness.
PADDED STEERING WHEELS - Heavily padded wheels and hubs to soften the impact force of a head, chest or abdomen contacting the rigid metal structure of the wheel would be a useful countermeasure for drivers involved in frontal crashes.
BELT TIGHTENERS - Belt tighteners to reduce forward movement by the occupant and the risk of impact with the steering wheel are another potential countermeasure against these injuries.
SUPPLEMENTARY AIRBAGS - A supplementary airbag to the existing 3-point seat belt restraint system to cushion or prevent impact between the front seat occupant and the steering wheel or instrument panel is another important potential countermeasure for front seat occupants in frontal crashes. While these are fast becoming a common feature on new model passenger cars in Australia, there is little evidence yet of their wide-spread use on 4WDs, vans and utilities.
5.4.2 Improved Restraint Systems
The need for improvements lo existing seat belt systems was noted in CR 95 for passenger cars and again highlighted in the injury and contact source findings here. Possible improvements to existing seat belt systems are listed below.
BETTER SEAT BELT GEOMETRY -Improved front seat belt geometry is necessary to ensure that belt alignment is optimal and to minimise submarining and belt related injuries. As noted previously, this could be achieved by attaching the lower anchor points
62 FOUR-WHEEL-DRIVES, UTILITIES & VANS

of the belts on the seat, rather than on the floor and providing an adjustable D-ring on the B-pillar.
BELT TIGHTENERS - Mechanical and electronic belt tightening devices have recently started to appear on some current generation passenger cars in this country and are an effective means of preventing occupant contact with the steering wheel and instrument panel. The wide-spread use of these devices beyond passenger cars is to be encouraged.
WEBBING CLAMPS - Seat belt webbing clamps have also been developed to reduce the amount of webbing reel-out from the retractor after it has locked. Although these are not as effective as belt tighteners because they do not remove all webbing slack in the system, they are considerably simpler and cheaper than belt tighteners and may be able to be installed with less lead time than belt tighteners.
FRONT SEAT DESIGN - Evidence from the Crashed Vehicle File showed that the design of the front seat in 4WJls, vans and utilities is not optimal for occupant protection. A number of seat design improvements discussed for passenger cars in CR 95 such as integral seat belts, a more inclined seat cushion angle, a solid, appropriately sloped seat pan (to reduce submarining), close fitting head restraints: and stronger structure, are still desirable features.
SEAT BELT STALKS - Positioning seat belt anchor stalks on the side of the front seat can lead to a marked reduction in abdominal injuries from contacts with the seat belt buckle. While the stalk arrangement is clearly still preferred, it is possible to position these fittings away from occupant areas to reduce the risk of abdominal injury.
SEAT BELT INTERLOCKS - The seat belt has repeatedly been shown to be very effective in preventing serious injuries to vehicle occupants. In spite of this, 6% of front seat and approximately 30 to 40% of rear seat occupants still do not wear seat belts in Australian cars. While the numbers of unrestrained were relatively low in this study, the need for a seat belt interlock should be examined to help reduce severe i n j q amongst these occupants.
OTHER BELT IMPROVEMENTS - The width of the seat belt and the webbing stiffness are aspects of the belt itself which can have a bearing on the injuries sustained by occupants. While there are limitations in how much these features can be varied, there may be substantial improvements that could be made by further research in this area. There may also be scope to introduce load limiting devices, although the trade-off of greater forward movement would need to be carefully considered.
5.4.3 The Instrument Panel The instrument panel assembly was a problem area for front seat occupants of all vehicle types in the current study. There are several possible countermeasures currently available to mini- mise or alleviate these injuries.
BETTER MATERIALS - The use of better safety materials in the construction of instrument panels is one obvious injury countermeasure. The current trend is to use moulded plastics in instrument panel and console construction (and the covers surround- ing the steering column and other lower leg regions) Lvhich are often brittle and disinte- grate leaving sharp edges to contact. Sheet metal covers could offer better energy absorbing properties with less propensity to shatter.
FORS REPORT CR 150 63

IMPROVED PADDING - As noted for passenger cars in CR 95, the need for improved padding or energy absorbing construction was noted for the door surfaces, A- and B- pillars, header rails, and some parts of the instrument panel to soften occupant contact in the event of a collision.
REDUCED PROTRUSIONS - Protrusions of the lower or underneath regions of the instrument panel were not uncommon. Furthermore, there were a number of instances of intrusions of the fire wall and floor pan in many of these vehicles, especially forward control vans. These need to be reduced by improved structure, greater crumple space, etc.
KNEE BOLSTERS - Knee bolsters as fitted to many American models as part of their airbag systems have been suggested previously as an effective means of reducing lower limb injuries and would also be worthwhile for these special purpose vehicles.
5.5 VEHICLE REGULATIONS
Special purpose vehicles such as 4WDs, vans and utilities are not currently subject to the full set of Australian Design Rules that apply to passenger cars and their derivatives. In particular, the only frontal crash requirement is for these vehicles to comply with ADR10/01 which specifies maximum steering column intrusion levels. Furthermore, there is no rollover requirement either for these vehicles or for passenger cars.
Given the increasing use of these vehicles for private use as an alternative to passenger cars, it could be argued that they should also be expected to provide similar levels of occupant protection as passenger cars. Thus, a strong case could be mounted for all these special purpose vehicle types (4WDs, utilities, and vans) to be similarly regulated. In particular, they should at least be required to meet the new dynamic frontal crash performance requirement ADR69 as well as side impact regulations, either current or proposed for the future. Given the preponder- ance of roll-overs among 4WD vehicles, it would seem worthwhile for these vehicles in particular to have to meet a roof strength requirement as well, although the form of this standard may require further consideration.
5.6 FURTHER RESEARCH AND DEVELOPMENT
5.6.1 Additional Cases
Data shortages and additional research topics were highlighted on a number of occasions during this research program. The inability of the data to provide reliable robust fmdings for other than fiont seat occupants was noted, and with the vehicle-based entrance requirements, there was a general lack of seriously injured occupants. Indeed, many of these injury data were often hampered by having only a few relevant cases on which to draw meaningful conclusions. The high rate of seat belt wearing compared to other injury based studies could simply be a function of the vehicle based entrance criterion and minimal number of cases examined.
The most urgent need, therefore, is for the continuation of the crashed vehicle inspection program for these special purpose vehicles to ensure sufficient cases for a robust analysis of the injury consequences for their occupants. The best way to achieve this would be with a structured sample with minimum quotas of hospitalised and fatal cases.
64 FOUR-WHEEL-DRIVES, UTILITIES & VANS

5.6.2 Cost-Effectiveness of Countermeasures
The cost-effectiveness and therefore priority ranking of countermeasures was outside the scope of this study. While it is possible to rank safety improvements in terms of the frequency of injury contact, this disregards the costs and likely effectiveness of many of these measures in reducing the incidence and severity of occupant injuries. Further research would be required to provide the information necessary to effectively allocate scarce resources.
5.6.3 Effects of Bull Bars It had been hoped to collect details on the injurious effects of bull bars, commonly found on the front of many ofthese special purpose vehicles. Unfortunately, this proved to be too difficult to undertake at this time. A study of the injurious effects of bull bars could certainly be undertaken if sufficient resources were available. As most mass databases do not code whether or not bull bars were fitted on crashed vehicles, a follow-up case study, similar to the Crashed Vehicle File, would be required. It would be likely that these units would have their most injurious effect on a vehicle impacted in the side when the striking vehicle was fitted with a bull bar.
FORS REPORT CR 150 65

REFERENCES Australian Bureau of Statistics (1976-1991) Motor vehicle census, Australia. Catalogue No. 9309. Canberra, Australia: ABS.
Agran, P.F, Castillo, D. & Winn, D.G. (1990) 'Childhood motor vehicle occupant injuries', Amer JDis Child, 144553462,
Bucklew, P.A., Osler, T.M., Eidson, J.S., Clavenger, F.W., Olson, S.E. & Demaresk, G.B. (1992) 'Falls and ejection from pickup trucks', Journal ofTrauma 32: 468-478.
Cameron, C., Finch, C. & Le, T. (1994) Vehicle crashworthiness ratings: Victoria and NSW crashes during 1987-92. Summary report, Report No. 55, Monash University Accident Research Centre.
Cromark, S.R., Schneider, D., & Blaisdell, D. (1990). 'Occupant kinematics and belt markings in crash tests with unrestrained and partially restrained test dummies'. Proceedings of the 34fh annual conference of the Association for the Advancement ofAutomotive Medicine, pp 203- 225.
Cunningham, S.W. & Wilson, F.R. (1989) 'Injury patterns for occupants of small trucks', Accident Analysis & Prevention, 2I(2), pp 105-113.
Data Link Inc. (1988) Light truck and van occupant exposure severity. Unpublished h'HTSA Technical Memorandum.
Davis, C.J. (1986) Forward control van crashes involving?ontal impact. RN 4/86, Traffic Authority of NSW, Sydney, NSW.
Federal Office of Road Safety (1986), Frontal impact on forward control vehicles, Report OR 8, Federal Office of Road Safety, Department of Transport, Canberra.
Fildes, B.F.. Lane, S.C.: Lenard, S . & Vulcan, A.P. (1991). Passenger cars and occupant injury, Report CR 95, Monash University Accident Research Centre, Federal Office of Road Safety, Canberra.
Fildes, B.F., Lane, S.C., Lenard, J. & Vulcan, A.P (1994) Passenger cars and occupant injury: Side impact crashes, Report no CR 134, Monash University Accident Research Centre, Federal Office of Road Safety, Canberra.
Graham, A. & Taylor, R. (1994) Measuring fhe success of Road Safely 2000: trends and targets, Road Safety Review Conference: Roads & Traffic Authority, Sydney.
Hamar, B., King, W., Bolton, A. &Fine, P.R. (1991) 'Fatal incidents involving pickup trucks in Alabama', Southern Medical Journal, 84: pp. 349-354.
Higgins, R.K. & Seyer? K.A. (1995) Review of occupantprotection in light commercial. off- road and,forward controlpassenger vehicles. Department ofTransport. Federal Office of Road Safety, Canberra, Report OR 17.
Hinch, S . : Shadle, S. & Klein. T.M. (1992) &'HTS.4 rollover rule-makingprogram. In Vehicle dynamics androlloverpropensity research, S A E SP-909, ppl17-130.
FORS REPORT CR 150 67

Klein, T.M. (1994) ‘Statistical analysis of vehicle rollover propensity and vehicle stability’, Auto & TrafJic Saf ty , 1(2), pp 2-10.
Mengert, P., Salvatore, S., DiSario, R. & Walter, R. (1989) Statistical estimation ofrollover risk. NHTSA, Report DOT-HS-807-446.
NCAP (1994), Crash test report technical summa?y, New Car Assessment Program, Sydney, Vol 1, No. 3.
Nelson, D.C. & Struebert, J.V. (1991) ‘Effect of open backed vehicles on casualty rates: The case of PapuaNew Guinea’, Accident Analysis & Prevention, 23, pp. 109-1 17.
Paix, B.R., Gibson, T.J. & McLean, A.J. (1985) The safety of forward control passenger vehicles, University of Adelaide, NH&MRC Road Accident Research Unit.
Partyka, S., Sikora, J., Surti, J. & Van Dyke, J. (1987) Relative risk to car and light truck occupants, SAE Paper 871093.
Rattenbury, S.J. & Gloyns, P.F. (1990) Fatal accidents involving forward control vans, mini- buses and motor caravans in 1986. TRRL Contract Report No 1350.
Rechnitzer, G. & Lane, J. (1994) Rollover crash study - vehicle design and occupant injuries, Report no. 65, Monash University Accident Research Centre, Melbourne.
Reinfurt, D.W., Stutts, J.C. &Hamilton, E.G. (1984) ilfurther lookat utility vehicle rollovers. University of North Carolina Highway Safety Research Center.
Rogerson, P. & Keall, M. (1990) Melbourne on-roadexposuresurves: 1984,1985, 1986, 1988. Report GW90-5, VicRoads Research and Investigations, Australia.
Tong, T. & Teaford, P.A. (1989) ‘Falls from pickup trucks during childhood’, h e r JDis Child 143, pp. 997-998
Woodward, G.A. & Bolte, R.G. (1990) ‘Childrenriding in the backof pickup trucks’, Pediatrics, 86, pp. 683-691.
68 FOUR-WHEEL-DRIVES. UTILITIES & VANS

Attachment 1
Details of Inspection Procedure

U T
The inspecr;onprocedure~orcrashedvehiciesdivides n a t u r a l l y i n r o s l r j - ~ g . e s : ( l ) ~ ~ i l : ; l d e n t - ~ ~ ~ 0 speci&np the damaged vehicle, ( 2 : describing rhe exterior body damage. ( 3 ) c e s c n h g :he :xerior (passenger companmenr) damage, (4) reconstxcr ing the injL:I m e c h m s m . 13: c c x p i k r g a photo- graphic record, and(6) es+abl ishing acomputerdatabase fooranalyxs.
- I
The vehicle type 1s specL5ed (a ) by reierence t o its external badzes, cumberplaies, com?iiazce plate. manu-acturer's piate. emission controi label. chassis wJmber and regszratian label and ib) by direct o n s e n a n o n o f t h e car body, engine, undercarnage andinterior.
9
Obsenat ions on ;he s u t e o f t h e Coors acd-w;.ndows are gener3iiyroxtice. n .e two zalr-tges ~ o f ~ i a s s
The settingoiajmkenside--daw ar ~ m p a c : ( o p e n o r c l o s e d ) ~ s m c ; c ~ t e c b y q i ~ s s ~ a ~ e n ~ l e ~ a r o ~ d ( l d n a t e d and toughened) shatter diTeren:Iy rhe facture F a i s = therebv enabiicg;denTu5caicn.
:he wndow frame and b y t h e locaclon a i rhe wuder mechznism w t h n :he door. i a ~ ~ ~ l o a z s d &s noma!i;y reveais by irs fracture pactern whecherltwas broken byde:bmaiionofi:s F r a n e o r b y p o ~ t contact (eg. a hesd 01 hand); io rhe case of toughened giass it 1s someuxes xecessar? to sea-ch icr hair or skin fragments around :he window frane. o r ocher forensic endence, t o heip assign the c a s e ofdamage. m e m ~ n a ~ m s o f t h e r e m a i n i n ~ e ~ e r n a l d a m a g e o b s e n ~ a n o n s arerorecord(aJ thedi recr icna3darea oiappiicationof-helmpaccforce ad (b) thechange:njhape i'c-sh': of the crashed oehicie. especlai;? as - o d d be seen fromoverhead. The region oidirecccoctact, such as meta!-to-memi conracrhetween two cars. is usuaiiy:nGca:ed5? the exrext o f c r ~ s h , by sharp changes a i shape oime:al!ic coa?onen:s. by the re iaavei : i 5ne-g-hed texture of surface damage (eg. ta sheet me521 paneisj. ancs i~" i Ia rcocs ider l t1ons . The di-echon of the force appiled to rhe vehic!e during i a p a c t is oiien retiec:ed in the r e s i c i d deiornation of st;-Jcturalcomponent.s m r b h the regionoidi-eczconract. h t h e czse o f= oeser % n d .
directlyback, o r (b )bacKana in to -heen~neconpar ;men i ,o r fc! backanc t o t h e o c t s i d e o f t ~ e o ~ ~ ~ for example. the fronr corner mai&g merd-to-metal conrac: with the ocher c z r xay be c x s h e d (a)
body line. Similarly, in rhe case a i a side collision centredon the passenger cor=pz-=ent, t L e 3 - p d k may be pushed direct!y across the c a r , o r across the car with a component o f deiomaiion:o &her :he front o r the back. This type of obserranon provides a physicd basis fo r t h e a s s i p n e a t ofthe mpacc force directmn to the cioc'kface (ie. t o che nearest 30 deg.:. Scratchlines, the a v e r d shape o i ' cadycush and various other discernible features may also be useful. however this assessment alweys requxef! an element of judgment and an awareness oinumerous compiexlnes. The change in shape from original ofthe crashed vehlcle is sketched and measured. T?e sketches are made over diagrams of a :ener?c sedan mewed from its bur sides and overhead. These sketches routineiyinciude the vehcle'spost-crash shape. the area of direct conract ami olrecrlon of force, sheet nera! buckling, secondary 1mpact.s. c a r body b o w n g , p z r s o f the vehicle mt . damaged o r removed =fe r t he crash. scratch lines. a n d nates reievanr t o the crash sequence o r t o the :nter;rreranon ofthe ?hatographicrecord. T h e crash damage measuremencs a r e Intended in 2"ri t o pronde input t o the cF-Gii3 p r o g r a m for c a l c d a n n g DELTA-V - thevehicle's change o i v e l o c : t y d ~ n g ~ p a c t ( ~ ? ; , T C . ~ 19,561. Fbinf iuences t h e m e a s u r e m e n ~ p ~ c e d ~ l r e a n d i o ~ a r ~ w h i ~ . r ~ e d a ~ i s r e c o r d e d . ~ ~ t ~ i c a l ~ e m i g ~ ~ r u r a s f o ~ o w s : - T h e c a r h ~ s u f i e r e d ~ n t a l ~ ~ a g e . A h o r ~ o n r a ! 2 m p o l e s u p p o ~ e d o n t w o u p ~ g h t s i s ~ ~ e d w i t h t ~ e undamaged rear Sumper t o s e v e as a zero reference line. A 5 , z e a s - n n g rape is !aid on the ground a ~ o n g s l d e t h e c a r e x : e n ~ g f r o ~ t t e r e a r b u " p e r l i ~ e r ~ ~ ~ e y o n d ; t e ~ r i o n t b ~ m p e r . ? , e a ~ g s a r e t h e n t a k e r . o f t h e r e a r a r l e - i i n e , ~ o n r ~ e - ! i n e a r , C t ~ . e ~ r o ~ t ~ u ~ ; l e r s a r , e r . ~ e o r i ~ ~ ~ p o s i ~ o n o f t t e i r o o t b u n p e r is also marked o i ion the ~ o u n d a: tiis s;a:e. :hi3 specizcation l ~ z e ha-.<ngbee~de?ernined ~romre~erencerexr .sc~?.edonsl te . S a c e therl~a;..isEever.,readic~7F arealso t&enoi:heA.Banc C pillars, rhe dashboard comer azd the sreexzcwkee! b - ~ h in d e r :a hei? subseouen: estimazes o i interior d a a a g e a n c ~ j u g i ~ e c : l a n l s m s . . ~ I tLe"eastuezenrs os each side are takenmTrhour: z o m n g i h e r a y e , ~ a k i n g l t a o l l e - p e r s o r , o ~ e r a ~ ,on-..- = ? A " - , . , ; n l z l r g " e a s ~ e ~ e c i u l c e ~ - , u r : ; . l ' h e t h r e e - p i e c e f r a m e ~ s - ~ e n m o v e d ~ ~ ~ . t h e r e ~ o o f t : ~ e c a r t c t h e o ~ ~ n z : ~ o ~ t ' ~ ~ ~ ~ e r p o s i ~ o ~ . t c s e ~ e n o w a s a z e r o r e i e r e n c e i i n e f a r ~ o n t - f n d c r ~ s h T ? l e c ~ ~ s h ~ r o n ~ e ~ s r e c o r C e d b y s _ u - , e a s ~ - e n e n i ~ r ~ e n a t e q u a i d i s t a n c e s i l e F - , t o n g n c : ~ c n g ~ n e d e f o ~ e d ~ ~ ~ 2 c ~ o i ~ h ~ c ~ - ~ i . ~ . ~ ~ ~ ~ h i s - . e ~ - ~ ~ d 2 t s ~ ~ ~ c ~ ~ r s
. ..
~
3-
. .
_.

aiongthecar thatwereequdlyspacedbeforerheaccident) .Thecrushproi l le iscomPletedbyrecordi~g theuldthoftheoveralldamage~eldandafthedirectcontactsub-field,andbylocatingthese~eldswithin
l en~hs .Forexample , i f t he i ron t - endhasbeenreduced to80~of i t so r i~a lwid thandwhol~ydamaged t~edamagedside-mthiscasethe~ntendoithecar.??lesemeasuresagarnreieru,pre-crashororiginal
as aresul t ofmapping around apole , the damage tieid is recorded as the origmal width. Sametmes this means that reference has to be made t o simdarundamaged cars, to an undamaged sect ionafthe same car, o r t o o n g i n d speciiicabons. Finally, the damageis coded accordingto the Collision Deformation CIassiiication(SAE 3224?L%R90). The procedure for aside collision vmes slightly from the frontal case. ‘The zero reference line for the measurement ofcmsh is generaliydirectlymarkedoifby s t n n g o r a 2m pole placed across the field ofdamage and aligned at its ends to undamaged sections oithe c a r surface. For example, a damaged vehicle that h a d taken impact t o its left doors might have its crush profile taken relative to a string at tached or a l i m e d to the left side A and C pillars. This method large!y avoids the incorpcratian o f the body structure %owin$ Into the crush profile. The case ofarolloverorofother non-two-dimensland impactcannotbewdysedbytheCXIZSH3model. so measurements are made as the case dictates, w th the aim of having as accurate passenger compartment intnmonirCoruat ion as posslble. - A main a m of the internal damage observations is to record the change ofshape and intrusions into the passenger cornparcment. Sketches are drawn over pnnced diagrams of various views o f a genenc paasengercompar;ment.Thesesketchesroutrnely Include ii) outlines ofthe vehicle’sinternal shape ac mid, lower and upper secrions, (ii) identlilcation afintrudingcomponents and the magnitude and
direcrion of the exrenc of intrusion. (iii) steenng wheel movement, iiv) components cut, damaged o r removed after impact, and (VI notes onitems o i spend in te res t o r impor tance . In t rus ion magxtudes (and ocher movements) areusually e s t i i a t ed on site,usinga tape measure, by eitherjudgkg ang ina l
same car. positionsorbycomparingmeasurements m t h asimilarundamagedcaroranundamagedsecrlonoithe
Specidattentionisgiven duringthe internaldamage inspection tu the steeringassembly, seats andseat belts. Beyonda roucine desmption of these components [tilt column, bucket seats, retracrable belts etc.) the seats and seat bei ts are checked iormechmcal o r performance failure, and both the movement of the steering columnrelative to ita mount at thedashiioard and the deformationofthesteenngwheel rim are measured. One imponanc task is to ascertain whether the seatbelts in the car were in use during the accldeni. A belt system that has been loaded can leave a variety oisigns:
- The sur iaces of the tongue (latchplate) touching the webbing often appear to he scratched or abradedina mannernever occurr ing bynomal wear and tear This sign varies kom beingbareiy discernible undermagm5cat1on t o being grossly vrsible at a cursory glance.
- Similar damage may be observed on the D-nng typically mounted on the upper E-pillar. - The webbingwhichinuseliesmthevlcinityofthe D-ringor tongue may be marked by scummy
teningor abrasion, o r by fibre damage as ifby the generation ofsurface heat. deposits, by discoiouration, by a change in surface texture and reflectivity due t o fibre flat-
- The Interior trim down the B-pillar may be fractured o r dislodged by the t ightening and
- Other components may be damaged by loading ofthe seat belt. system, including the latch and straighteningofthe webbingdirectedfrom theD-ring to the retractor.
S ~ o U n d i n g p a r t s . and thewebbing andsurroundingpartsintheviclnityofthe ioweroutboard
- Blood and glass fragments o r similar may be present over the full length ofthe webbing(orover
Occasionaliy Useful circumstantial evidenceis available, forexample, the webbingmay have beencut during rescue, indicating that the rescue team found it. :n use. Sometimes the crash forces on a belt system are not sufficient to leave any discernible signs. in practice this means tha t i t is generally easler to prove (by Inspection) that a beit was w o r n than to prove t h a t i twasno t .
anchor.
o d y t h a t ? = t of the webbing rhat i s exposed while fully retracted).
The final part ofthe vehicle inspection mvolves reconstructinghow the occupant’s injuries occurred.

Normal practlce is t oob ta in t he i c j cy ie rds be fo reconduc t ing the mspecuon . Th i s g v e s iocus to t i e examinatlon. enahlingma_rlmum coniidence in therecons tnc t ion tn be buiit c p i n n i n i m c n %=le. Tt.es1gns ofoccupant contact can be extrerneiysubtle and the mechanlsms ofinjury can be rlusi.;e o r coapiex - i the lps toknowwhethercne~ssearch~ngior thee~planar ;on c f a b r c k e n n o s e o r c i a h r o a e n d e ! .A! an init ial workmg assumption, the dlretrion o i the occupani's inertial movement relative t o the vehicle during the accident sequence may be assumed t o be oppcs1:e to the direczlon of the a?plied impactforce. Given thecccupanr's seatingposition andlikeliinood o i seat belt 'xe, ~ i i s su---tswhere to look for signs oicootacr; in the case o i a ierl side impact. :or examFIe, one searches inl:lal!y 50 the left of the injured occupanc. A simple aid to gaicing some feel for rhe i i iuat ion Is 70 si: :n :he s a z e posicion as the pat lent- if possibie +.th the seat be!t tensioned by the body t o its cas1non a: Fd! load. S i ~ a i o c c l l p a n t c o n t a c t v a ~ ~ ~ e a t i y : c l o t ~ r . g r ? b r . s , s ~ r a n d s o f ~ h i r a n c flakes 'ofsi<xczn 5e f o u d on t i e c o n t a c t e d c o m p o n e n t s ; m o v e n e n t , d ~ a ~ e o r c e f o r a a n o n o i c o m ? o ~ e n t s a r c ~ ~ . c t h e c a r i n u f i o r may be plainly due to Forces o ~ g l n a t i n g fr3m;ulthin the c a r a n a acung ncpcsiteiy X the direction a i the impact force; intrusion may be so s e a t as to nake con tac t l=evi:ab:s: camponenc scz-aces may be smeared, brushed. discoloured o r abraded h y the contact. N a t e s c n : h e s i ~ s o f o c c u p a n t c o n t a c r a r e r e c o r c e a o v e r C i a ~ a n s ~ ~ f a ~~ner.c:.e.llc!ein:e.-.or;~.t:..:,ie emphasis heavily o n inlurycausir.g contacts. . ~ j u d , ~ e n r . s f c o ~ ~ c e n - e level 1s a150 ass igxd to each sugzesteacontacrpoint. in the absence ofspecific ewdence. a d e g e e o f inierence ca? be mvolvec in t:le assi-mxent o f mjcr-1- cau41ng contacx polna . Far exampie, ax unbe?ted dnver night t e .r?own :a i a x hit his zesd 3n :he windscreenandhis knees on ;he lower dash: his bilateral r ib f r a c t x 5 s &-e :hen p l a u s ~ o ~ : ~ a r tnbaredto steerinc wheel contact, even thoughno i o r e n s l c e v l d e n c e o r ~ = d e i c ~ a ~ c n 1s apparent. 9 : s r-ipe o f judgment. t o a g e a t e r o r l e s s e r d e g e e , m s t b r x q h the recms:xc-.icr. cr r.ow s o n e mj--es c c x r .
O n e s i t u a t i o n o f p a r t i c u i a r d i ~ c u l ~ ~ / d ~ e q u e c ~ ? i s t h e c a s r o i a b e l t e C ^ L - ~ e r j u r : ~ ~ n g s t e ~ - ~ c r r i b h c r u r e s . I t 1s not always easy tc disrinyuish seac beir JressL-e i x m ~r 'e~ . r .g . i~hee l ccn tac t as :he inju?ngforce.Routine procedure intbiis case. iipossibie. is to I icecp the beitwecblngmtoits posirion o f f d l loadiasdescribedabove)andtomeasurethedistanceinr=t~e ster?.~-tts:hes:eer.rga-heelhub.
a p o m ~ o i k n o w n c o n t a c t ~ v e s s o m e i m p r e s s i o n o ~ t h e ~ e l i h o o d o i s t e e r ~ g r h e e i c ~ n ~ c r , a i r a y s b e ~ If appropriate. placingone's h e e s in to a sha t t e red l ower dash ioa rd a~~dsz re t ch~~goxe ' s head t oward
inmind ~ .epmbab lemleofwebb ings r re t ch , e l a s t i c r eboundof thes t een~gasse~b~~~ o c c u p ~ t ' s h e i g h t
common situations, to a h 5 b u r e t h e i n j u r y to a combmation o f Eo... and weight, and v a n o w other considerations. I t may be most plausible, in this ana severai other
"es. m e r e are normdymoreinjur'.es that injury-causing contactpoints. it saves t i n e atinsFernoninhave alreaaypuped themjuries accordingto their i ikelycommcn czuse.Tne brokennose;cnt i q , chipped ioorh and f ractured jaw, f o r example, probably arose in the s a n e way. These mjury s o u p s a re transcriDed fmm the h o s ~ ~ c d . reparc onto apage beariigseveral mews o i the h m a n body; e.FiuatooIy notes on the o n g i n and applicazion of forces on - the body likely to have generated these injuries are then made as part oftheinspection process.
1"-
. .
, . . .
, .
.~
.. - .
LpROTOC-
After the field notes are completed, around hventy to thir ty photographs are taken of :he crashed vehicle. An unexceptional case has a rough baiance between I n i e E o r and e s t eea r sho t s -unusual o r interestingfeaturesnaturally draw special attention. - Much of theinformation gatheredirom the pacient :aterr;ew.injury descqtion and vehicie inspection is convened to (most ly) numefi t code. generating about 650-1000 characters on computer f o r each occupant (dependingon the numberoiinjux+esi. Information such as name, address andregs t ra t ion number a r e s p ~ c d y n o t i n c l u d e d t o p r o ~ c t c o ~ d e n t ~ a l i t ~ ~ . ' ~ ~ e c o d e ~ s ~ c s t ! y d e ~ v e d F r o n t ~ e ~ - ~ ~ f o m a t (NHTSA 1989). The C R G H 3 pmgram isusedto comFufe impacce!ca,ty fromresi&Jd crushme~juremencs.Stat; .sri~ analysis 1s undertaken on SPSS soit-are.

Attachment 2
Consent Forms and Occupant Injury Form

I M O N A S H U N I V E R S I T Y
A U S T R A L I A
Dear
Thank you for talking to us recently and agreein2 to help us in our ve.iic!e safety research. The Accident Research Centre at Monash University is currently engazed in a study of how vehicles perform in accidents. This work is aimed at m a k q our Cehicles and roads sder for ail Australians
This work requires us to examine vehicles involved in road crashes :o determice how various parts o f the vehicie behave in real accidents and cornpxe these findinzs with the sorts C ~ I ~ J U ~ ~ S
people like yourself have suffered as a result ofthe crash.
To do this, we need your co-operation. We would like to talk to you abcut rhe crash you were recently involved in and any injuries you may have sustained from the crash LVe would also :ilk to see if you can recall which parts of the vehicle caused your injunes.
If you were treated in a hospital after the crash, we would also like to look at yow rnedical record fde at this hospital.
The information we collen is for research purposes only and will be treated in stricrest confidence. We do not intend discussing any aspect of our findinzs wirh either the policel your insurance company or-any other party to the crash. We may need to inspect any other vehicle involved in the collision as well but only for the purpose ofexamining the damage sustained in the- crash. We will not seek to participate in any legal action over the crash
At the end of Qur invesrigations, we *ill condense all the indibidual cases of information into anon,&ous sets of data withour names and addresses. Hence, your coni5denriaiity is fUt,:?er safeguarded. At the end ofour research, our repon will hizdight aspeds of car desisn that require hrther safety improvements.
We have enclosed a consent form for you to s i g , ageeing to participate in this important study and, where appropriate, authorising us to obtain details about your injuries from the hospital, or other medical practitioner where you were treated. Please sign and date the attached form indicating that you are willing to participate in the study. Our nurse, Sister Kate Edwards- Coghill will contact you shortly to talk to you.
I hope you have made a swift recovery from your injuries and that you have fully recovered from the effects of the accident.
Yours sincerely,
Professor Peter Vuican,
Director.
.
Shouldyou have any complainf concerning ;he manner m which thu research projec? is conducied, piecse do no!
Research on Humans, Lhdversir). Secrete.~at. .Lfonash Cnwersin; hesrtate to mnJorm the researchers in person or;,ou mayprejer io con;acI !he Stcnb’~ng Commiitee on Eihics in
CLAYTON, V I C T O R I I . 3165 AUSTRALIA F A X :61! 1 3 ; iios 1 j 6 a n L i P F l 1 0 ~ ~ . p37; 30s 1j7i IDD -61 j 905 4371
FORS RE.?oKT CR 1 SO 77

D m
CONSENT TO BE INTER #ED
I have read through and understand this letter and I HEREBY COhrSENT to officers of the
collision I was recently involved in and consulting my hospital records if appropriate. Monash University Accident Research Centre interviewing me about the circumstances of the
~
Signature
Please print full name
Dated this day of 19
Treating Hospital
Treating Doctor
(Doctor's Address)
Telephone
Would you please sign this form and return it to the Monash University Accident Research Centre as soon as possible. Thank you for your co-operation with this importmt research.
Shouldyou h e any complaint concerning the manner in which this researchproject is conducted. please do not hesitate to infirm the researchers in person oryou mayprefer to wnlact the Standing Committee on Ethics in Research on Humans. University Secretanat, Monash Universiv.
78 F~~R-WI-EEL-DRIVES, UTILITES & VANS

OCCUPANT PROTECTION PROJECT
MEDICAL REPORT FORM
Reg. No. Casc No.
l ~ a r e of incervlew I
Dare a i birrh
I 0CCUP.INT DET.4IE I Name
Address
CRASH DETAILS
Locallon
Dare Tirnc
Ambulancc Type Casc Na. -
OTHER VEHICLE
MakeiModel
OwncrIDrlver
Addrcss
Tciephone Reg. No. - Passenger name
Telephone number
Trcaring hospital or GP I

MEDICAL REPORT FORM
ACCJDENT CIRCUMSTANCES
Vchicle M a k z M o d c l
ScavPasilion Scalbcll usc
Dcscrlprlon
Evasive Acrlon (neering, braking)'
Vchiclc-A Spccd (prc-impact. Irnpacl)
Vchiclc-a Spccd Drlving Expcrtence
Weather
Heavy luggoge/cargo Trallcr
Ltghl
Fue! Level Fuel Spiiinge
Fire Windows Open
Trappcd
Ejccrcd
Exi:,from Vehicle
80 Fo~R-WIGEL-DRIVES. UTILITIES & VANS

Manash ~nii.e:siry i.ccldenr Research C e n t r e
MEDICAL REPORT FOWf
INJURY DESCRIPTION
Injury Socrcc
I
Fracrcrcs
i
Loss oiconsclousncss 1 i ,
I Rclcvanr Pnar Injuries I
- Trcatrncnt Lcvci Durarior. oiTrcarmen!

Monash Unlversity Accidcm Resscarch Ccnlrc
MEDICAL REPORT FORM
~ ~~ ~
OCCUPANT DETAILS
I Hclght 1 Wcighr
I OTHER OCCUPANTS I

Mooash ~ n i v e r s l l y Accidcnt Rcscarch Ccnirc
MEDICAL REPORT FORIM
AIS Code
I
FIiVAL LYJURY CODING
NASS Code I Desscripllan
I


FOR
S Rl3'0R
T CR
150 S5


Monash University Accident Research C e n t r e
OCCUPANT INJURY FORM
Record beiow the actual injuries sustained bv this occupant :hat were identified f r i m the offic:al and urofflcial data sources. Remember not to double count a n injury Jus t becacse it was identlfied ircrn two different sources. If greater than twenty injurles have been documentec. encode the balance o n tne Occupar,t Injury Supc ' emen t .
0 i.C.-A.I.S. Injur.1 Source
of I n j u r y Body s,,,,, Direct:
S y s e m A,! 5. I r lurv Data Region Aspect ies lon Organ SsveriQ Source
e i n i i d e n c e lnd,:2ct a c x c a n t Ar?a Le.;2l I k : u r v 1ntms:on U G .
FORS R ~ I Y K : CR ! S O 87

NOUV3UISStW AHnrNI lNVdfl330

Attachment 3
The (NASS) Vehicle Inspection Forms

1. Prlnar,f Sampllng Unit Number "
2. Case Number-Stratum ""
3. Vehlcle Number "
4. Vehicle Model Year . "
(99) Unknown Code the last two digits of the model year
5. Vehicle Make (specify!: "
Applicable codes are found in your NASS COS Data Collection, Coding, and Editing Manual. i99i Unknown
6. Vehicle Model (specify):
Applicable codes are found in your
Editing Manual. NASS CDS Data Collection, Coding, and
(999) Unknown
7. Body Type "
the back of this page. Note: Applicable codes are found on
8. Vehicle tde%tihcatio&Number ~ ~~ .
Laft justify; Slash zeros and letter Z !0 and 21 No VIN-Code all zeros Unknown-Code all nlne's
FORM NATIONAL ACCIDENT SAMPLING SYSTEM CRASHWOETHINESS DA-A SYSTEM
11. Police Reported Alcohol or Drug Presence - (0) Neither alcohol nor drugs ,aresent jl! Yes !alcohol present! 12) Yes (drugs present;) 13) ?es (alcohol and drcgs nrssent) 14) Yes ialcohol or drugs ,?resent-specifics
unkr,own! (71 Not reported (8) l o driver 7reser-t (91 drknown
12. Alcohol Test Result for Driver "
itrst Sigit-O.xx! Code actual vaiue [dec~mal mnliec before
195i -?SI refused (961 None given i97! AC test periorned, -esill:s unknown !Sa! No drlver present 1991 Unknown
Source
13. Speed Limit iO0) No statu?oT;i ih.mit Code posled s r s:atutory speec I ; r n l f
(99) Unknown
"
~~
14. Attempted AvoidanceManeuver ~:~-::~ : -- r _ . . ~ ~ ~ " r?
$0) No Impact ( C l I No avoidance actions
iC3! 6raning jlockap! ( C Z ) 6r3k1ng ico lockup)
(124) Braking Ilockup unknown1 (05) Releasing brakes (061 Steering left (071 Steering right (08) Braking and steer;ng left (09) Brakirg and steering rlght ( i o ! Accelerating ( 1 :! .Accelerating and steerlng left ( ? Z ! ccelerat~ng and s teer ing right (98) Other action !speci%i-
(991 Unknowi .~ ~~ ~ , ~ . .;- -ii.il. .~.~.
,. ,- . .~ .. " ' . - = ~ ~ ~ . - ~ : :*Y:~< <:?: 15. &*ent ~:~ ~-~ . ~ _ ~ I . ~ .;.I *L$?E' ,: .~. Applicable codes may~be fcund on the back of page ~ N O of this fleld f 3 m io01 Nc impact Code the number oi the diagram that best cescrlbes the accident circumstance 198) Other accident type ispeci~!:
. . . . ~ "".-
(991 Unknown
HS 1/88
***I STOP H E R E IF GV07 DOES NOT EQUAL 01-49 ****
~ Form 435
FORS RLI~oKTCR 150 91

Yational Accident Samoling System-Crashworthiness t
( 1 ) Driver present (9) Unknown
' ' (00-96) Co'de actu.al number of occupants
for this vehicle (97) 97 or more (991 Unknown
~ 18. Number of Occupant ForrnsSubmitted ,:--
. , , , , . . ., . , "~ , , . , . .
. . , , . , . . , . I
. . t9. Vehicle Curb Weight . , , . "- ,. . .
0.0 -Code weight to nearest
100 pounds, . ,, , ' , ,
(000) Less than 50 pounds (135) 13,500 Ibs or more (999) Unknown
Source:
. . ,
20. Vehicle Cargo Weight,, i, , - , . ., --a 0 " -Code weighttcxnearest I .: ' "
,. . .,,... 100,pounds. L-:.L;..- :.,- a . , j i . .~, . .k. , ij:~i . .~ __._;
, , , , ' . , . , ,
. , , ' . . ,.
, . , . , . , .
, . . : . .. . , .
, . , , -
(00) Less than 50 pounds (97) 9,650 Ibs or more (99) Unknown
( 1 ) Yes-towed trailing unit (9) Unknown
. -
22.Documentation of Tta&tory Data .~ , . , , . - ' : , ; . ,
. , , , , , . . , , , . , ..
for This Vehicle, . , , . . . ' - (0)"No (1) Yes
, . -. . , . . , .
. ,
23. Post Collision Condition otTree or Pole , '
. . (for Highest Delta V), . . - 1 . . ' , ,
(0) Not collision (for highest delta V) with tree or pole
(1) Not damaged ( 2 ) Crackedisheared ( 3 ) Tilted <45 degrees (4) Tilted 245 degrees ( 5 ) Uprooted tree' ( 6 ) Separated pole from base (7) Pole replaced (8) Other (specifi4):
~- . .._ .~ ". . , . - .
(9) Unknown
. . , . -.
..
:24. Rollover - ,:': . , ~ ~ . ~ , ~ ~ ~ ~ ~ ~ ~ ' ~ : ~ , ~ ~ ~ : ~ : ~ ~ ~ ~ ~ ~ ~ ~ ~ ~ ~ ~ ~ ~ . ~ , - . . : . , , . , ~ ~ ~ . . , ~ ~ . ~ . ~ ~ ~ .;~,,~ J.7 ,~.. ,~
, . ' 1. " .? .,...,. : ., , . . . . .~
i..- ~ .. , . . ~ ~ .. i . ... . . . .
(0) No rollover (no overturning)
( 1 ) Rollover, 1 quarter turn only Rollover (primarily about the longitudinal axis)
(2) Rollover, 2 quarter turns (3) Rollover, 3 quarter t u r n s (4) Rollover, 4 or more quarter turns (specify):
(5) Rollover-end-over-end (i.e., primarily
(9) Rollover (overturn), details unknown about the lateral axis)
, . , ~ . ~ . , . 25.' Front Override/Underride~(this.vehiclel, ..'';: .': L
.,26..Rear O&rride/Underride (thiswehiclej. . 2: ,,,,. -
.,+e**;,<: ; , . - .
. . . ,
. - ,
, . .., .. ,: , . . , , . . .. ~ , ,
,,) ,. ~. . . ' . ~ . ' . ' , ; ~ , ' . . ~ . ~ . ~ . . 2 ' '. .. .
(0) No overridelunderride, or not an end-to-end impact
Override (see specific CDC) (1) 1st CDC izj 2nd CDC
~~
(3) Other not automated CDC (specify):
Underride (see specific CDC) (4) 1st CDC (5) 2nd CDC (6) Other not automated CDC (specify):
(7) Mediurnlheavy truck override (9) Unknown
Values: (000)-(359) Code actual value (997) Noncollision (998) Impact with object (999) Unknown
92 FOLJR-WHEEL-DRIVES, UIILITIFS & VANS

Stional Accident Sampling System-Crashworthiness Data System: General Vehicle Form Page 3
19. Basis for Total Delta V (Highest) - Delta V Calculated ( 1 ) CRASH program-damage only routine (2) CRASH program-damage a n d trajectory
(31 Missing vehicle algorlthm
Delta V Not Calculated (4) At least one vehlcle (which may be t h i s vehicle
tion program, regardless of colIIsicn conditlons is beyopd the scope of an acceptable reconstrlic
( 5 ) All vehicles within scope (CDC applicable) 0' CRASH program but one of the collision con. ditions is beyond the scope of the CRASH pro. gram o r other acceptable reconstruction tech. niques, regardless of adequacy of damage data
(6) All vehicle and collision conditions are withir scope of one of the acceptable reconstruc?ior programs, but there is insufficient data available
routine
Secondary Highes ,- -j._ . ~
0.5 mphi (NOTE: 00 means less than
(99) Unknown (971 96.5 m p h and above
(NOTE. -00 means greater than -0.5 and less than +0.5 mph) ( ~ 9 7 ) 296.5 mph and above (- 99) Unknown
Secondary Highesl
32. Lateral Component of Delta V - - _"
-Nearest mph
(NOTE. -00 means greater than -0.5 and less than - 0 . 5 mph! 1x97) ~ 9 6 . 5 r n p h a E d above (- 99) Unknown
33. Energy Absorption ""0 0
-Nearest 100 foot-lbs
(NOTE: 00CO means less than 50 Foot-Lbsi
(9999) Unknown (9997) 999.650 foot-lbs cr more
34. Confidence in Reconstruction Program- ~ ::: ~ - Results (for Highest Delta V) (0) No reconstruction (1) Collision fits model-results appear
(2) Collision fits model-results appear high
(4) Borderline recanstruction-results (3) Collision fits model-results appear low
~ ~~ ,
. .
reasonable
appear reasonable ~ . .~
. .~ I , , ~ 2.-x'Y :35..Typ&~'dbehicl& Inspection ~ . I . - ~ _ :: ~ ~ ~.-.>%~-
. ~1 ~- ~ .&:~ - .
(0) No Inspection ( l j Complete inspection (21 Partial inspection (specify):
*** STOP HERE IF THE CDS APPLICABLE *** VEHICLE WAS NOT INSPECTED

USDepo~nleft ~ficnfporfat!cn EXTERIOR VEHICLE FORM National Highway Trafiic Safety Adrnlnirtmtlon
NATIONAL ACCIDENT SAMPLING SYSTEI CRASHWORTHINESS DATA SYSTEI
1. Primary Sampling U n i t N u m b e r __ 3. Vehicle Number "
V I N _ _ _ _ _ _ _ _ _ - - M o d e l Year
Vehicle Make isnecifvl: Vehicle Model (speclfv):
Locate the end of the damage with respect to the vehicle longitudinal center line or bumper corner for end impacts or an undamaged axle for side imoac?s. Specific lmoact NO. I Locatlon of Dlrect Damage Location of Field L
I I
NOTES: Identify t h e plane at which the C-measurements are taken (e.g., at bumper, above bumper, at ~ 1 1 1 , above sill, etc.) and label adjustments (e.g., free space).
Measure and document on the vehicle diagram the location of maximum crush.
impacts. Measure C1 to C6 from driver to passenger side in f ront or rear impacts and rear to f ront in side
the individual C locations. T h i s may include the following: bumper lead, bumper taper, side protrusion, Free space value is defined as the distance between the bagline and the original body contour taken at
side taper, etc. Record the value for each C-measurement and maximum crush.
HS Form 435A 1/88
94 FOIJI-WFEEL-DRIVES, UTILITIES & VANS

a t iona l Accident Samol ina Svs tem-Crashwor th iness Data System: Exter ior Vehicle Form 2
TIRE-WHEEL DAMAGE 3 . Rotation physically b. Tire
~~~~~
restricted deflated
RF - R F - LF - L F - R R - R R - LR - LR - (1) Yes (2) No ( 8 ) NA (9) Unk.
TYPE OF TRANSMISSION
'7 Manual n Automatic
ORIGINAL SPECIFICATIONS
Whee lbase
Overall Length
Maximum Width
Curb Weight
Average Track
Front Overhang
Rear Overhang
Engine Size: cyl./ displ.
Undeformed End Width
- WHEEL STEER ANGLES
iFor locked front wheels o displaced rear ax!es only)
RF x LF I _--
R R = "-.-' L R r --a
Withln = 5 d e g r e e s
DRIVE WHEELS 0 F W D RWD 3 4WD
Approximate Cargo Weight
r-CRASH I t Bumper corner II " Bumper corner
Stringline 1 " Srrlngline
h " r , _ r , -
Bumper corner " Bumper cornel
Strlngline ' Strlngline
FORS Rtro~r CR 150 95

National Accident Samdinq Svstem-Crashworthiness Data System: Exterior Vehicle Form Page 3
CODES FOR OBJECT CONTACTED
01-30-Vehicle Number Noncollision
(31) Overturn-rollover
(33) Jackknife (32) Fire or explosion
(34) Other intraunit damage (specify):
(35) Noncollision injury (38) Other noncollision (specify):
(39) Noncollision-details unknown Collision with Fixed Object
(41) Tree ( 5 4 inches in diameter) (42) Tree (>4 inches in diameter) (43) Shrubbery or bush ( 4 4 ) Embankment
(45)'Breakaway pole or post (any diameter) Nonbreakaway Pole or Post
(50) Pole or post ( 5 4 inches in diameter) (51) Pole or post ( > 4 but 512 inches in
(52) Pole or post (>12 inches in diameter) (53) Pole or post (diameter unknown)
(54) Concrete traffic barrier (55) Impact attenuator (56) Other traffic barrier (specify):
diameter)
(58) Wall (57) Fence
(59) Building 160) Ditch or Culvert 161) Ground (62) Fire hydrant (63) Curb (64) Bridge (68) Other fixed object (specify):
169) Unknown fixed object Collision With Nonfixed Object
(71) Motor vehicle not in transport (72) Pedestrian (73) Cyclist or cycle (74) Other nonmotorist or conveyance (speciiy):
(75) Vehicle occupant (76) Animal (77) Train (78) Trailer, disconnected in transport (88) Other nonfixed object (specify):
(89) Unknown nonfixed object
(98) Other event (specify):
(99) Unknown event or object
DEFORMATION CLASSIFICATION BY EVENT N U M B E R
Accident Event
- 1.1) ( 2 )
14) 15) Specific Specific 16)
Direction Incremental 13) Lansitudinal Vertical or TvDe of - Sequence Object of Force Value of Deformation or Lateral Number Contacted Idegrees)
Lateral Shih
Damage Deformation Location Location Location Distrlbutlon Extent
. .
" " -" " - - - - "

HIGHEST DELTA "V"
Accident Specific Event (1 1 (21 (31
Specific
Sequence Object Direction Deformation or Lateral or Lateral Longitudinal Vertical
Number Contacted of Force Location Location Location
141 151
Second Highest Delta "V"
12." 13." 14." 15. - 16. - 17. -
(61 Type of
Distribution Damage
10. -
i7) Deformation
Extent
11."
19."
(The crush profile for the damage described in the CDCisi above should be documented in the appropriate space below. ALL MEASUREMENTS ARE IN INCHES.)
HIGHEST DELTA "V"
20. L
21. 22. - c1 c2 c3 c 4 c 5 C6 - D
i
"_ " " " " " " ""
Second Highest Delta "V"
23. L
24. c1 c2 c3 c 4 c 5 C6 - D
25. - -
) Not towed due vehicle damage
vehicle damage ( 1 ) Towed due to (9999) Unknown
(9) Unknown
***STOP HERE IF THE CDS APPLICABLE*** VEHICLE WAS NOT TOWED (LE., GV09 = 0 OR 9)


L
TOP Longitudinal VIEW
. . , . . . . ... .~ .
4 3 Longliudinal
VIEW LEFT SIDE Vertical e
VIEW RIGHTSIDE Vertical
4p+ Vertical
LOCATION DOMINANT INTRUDED OF CRUSH COMPARISON - iNTRUCED = lNTRLjSION
COMPONENT INTRUSION DIRECTION VALUE VALVE - -

Note: If no intrusions, leave variables IV 47-IV 86 blank.
LOCATION OF~INTRUSION
Front Seat
(12) Middle !l 1 ) Left
(13) Right Second Seat
(21) Left
(23) Right 122) Middle
Third Sea t (31) Left (32) Middle (33) Right
Fourth Sea t (41 j Left (42) Middle (43) Right
(98) Other enclosed area (specify):
(99) Unknown
Interior Components (01) Steering assembly ( 0 2 ) Instrument panel left (03) Instrument panel center (04) Instrument panel right (05) Toe pan (06) A-pillar (07) 6-pillar (08) C-pillar (09) D-pillar (10) Door panel (1 1) Side panel/kickpanel (12) Roof (or convertible top) (13) Roof side rall (14) Windshield (15) Windshield header (16) Window frame 117) Floor pan (18) Backlight header (19) Front seat back (20) Second seat back 127) Third seat back (22) Fourth seat back (23) Fifth seat back (24) Seat cushion ( 2 5 ) Back panel or door surface 126) Other interior component-(specify):
Exterior Components (30) Hood (31) Outside surface of vehicle (specify):
(32) Other exterior object in the enviionment
(33) Unknown exterior object
1981 Intrusion of unlisted compo.nent(s) (specify):
(99) Unknown
(specify):
MAGNITUDE OF INTRUSION - .
(1) 2 1 inch b u t < 3 inches:.:.: (2) 2 3 inches but,,( 6 inches ~~~ .- (3) 2 6 inches but < 12~inches .~ - .- t
(4) 2 12 inches but < 18 inches . ,
( 5 ) 2 18 inches but < 24 inches ( 6 ) 2 24 inches ~.
(9) Unknown
. .
. .
DOMINANT CRUSH DIRECTION
(2) Longitudinal (1) Vertical
(3) Lateral (9) Unknown

Sreering Column Shear Module Movement
Rishr - Direcrion and Magnitude of Steenng Column .Llovement
V = - I .
Vertical Movement Lateral Movemmr Longimdinal Movement
Insrnment Panel
COMPARISON VALUE - DAMAGED VALUE = MOVEMENT
VERTICAL - - -
LONGITUDINAL - - -
STEERING RIMJSPOKE DEFORMATION
COMPARISON VALUE - DAMAGED VALUE - DEFORMATION -
- - -
- - - !
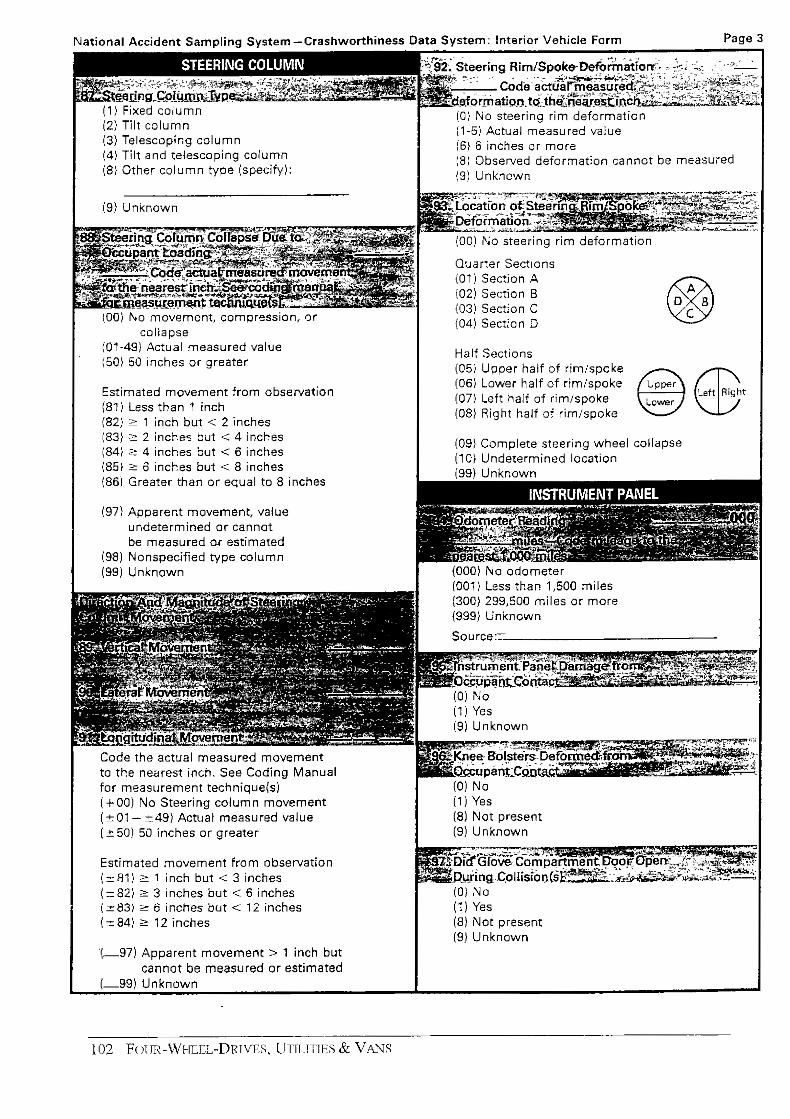
ational Accident Sampling System-Crashworthiness Data System: Interior Vehicle Form Page
(2) Tilt column (3) Telescoping column (4) Tilt and telescoping column (81 Other column type (specify):
(61 6 inches or more
(9) Unknown (81 Obseried deformation cannot be measured
(9) Unknown 1 I (00) No steering rim deformation
Quarter Sectlons (011 Section A (02) Section B (03) Section C (04) Section D 100) No movement, compression, or
collapse (01-49) Actual measured value (50) 50 inches or greater
Estimated movement from observation
(821 2 1 inch but < 2 inches ( 8 1 ) Less than 1 inch
I Half Sections (05 ) Upper half of rimispoke - - ( 0 6 ) Lower half of r imkpoke (07) Left half of rimispoke (08) Right half of r imkpoke
(831 2 2 inches but < 4 inches (84) 2 4 inches but < 6 inches (85) 5 6 inches but < 8 inches (86) Greater than or equal to 8 inches
(97) Apparent movement, value undetermined or cannot
1981 Nonsoecified Woe column be measured ar estimated
(09) Complete steering wheel collapse (10) Undetermined location
199) Unknown . . 1~ (000) No odometer
1 (001) Less than 1,500 miles
(999) Unknown (300) 299,500 miles or more
Source:-
for measurement technique(s1 (0) No ( f 0 0 ) No Steering column movement (1 ) Yes ( k 0 1 - 249) Actual measured value (8) Not present i +50) 50 inches or greater (9) Unknown - Estimated movement from observation ( ~ 8 1 ) 2 1 inch but < 3 inches ( ~ 8 2 ) 2 3 inches but < 6 inches ( ~ 8 3 ) z 6 inches but < 12 inches (=a41 2 12 inches
'(-97) Apparent movement > 1 inch but cannot be measured or es t imated
( 0 ) No (1) Yes ( 8 ) Not present (91 Unknown
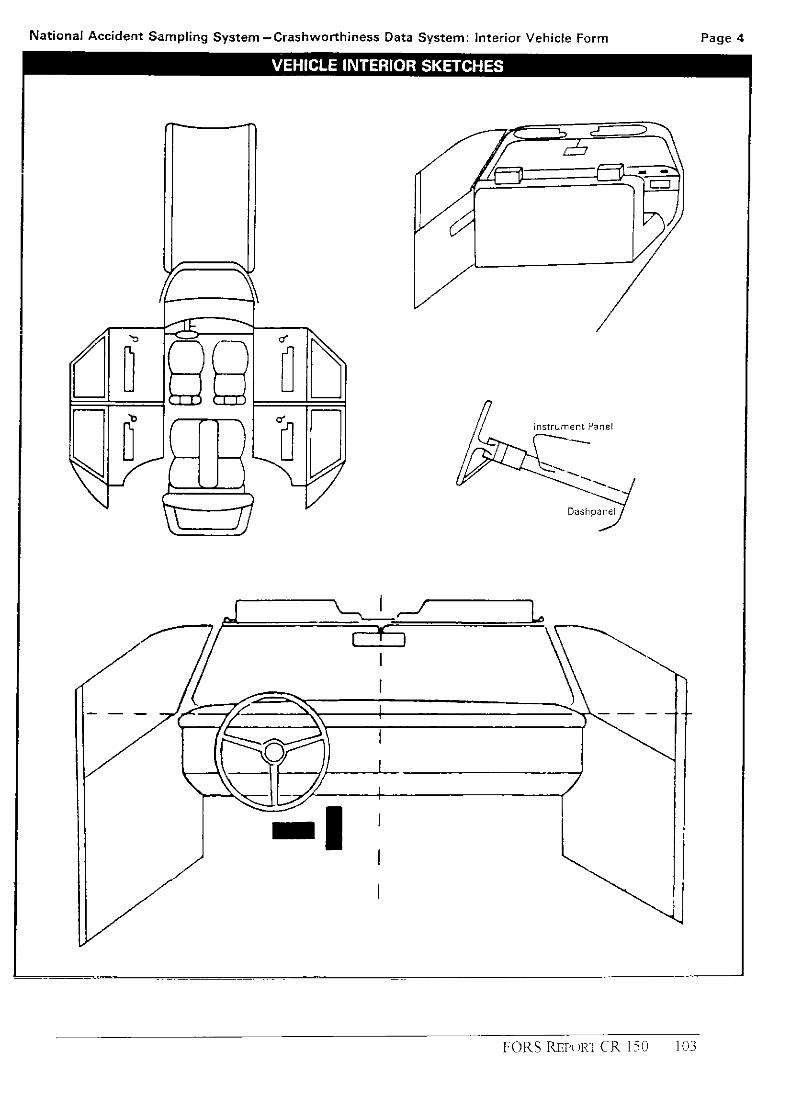
National Accident Sampling System-Crashworthiness Data System: interior Vehicle Form Page 4

N
:RONT (01) Windshield (02) Mirror (03) Sunvisor (04) Steermg wheei rim (05) Steering wheel hubispoke 106) Steering wheei (combination of
(07) Steering column, transmission
( O B ) Add on equipment ie.g.. CB, tape
109) Left instrument panel and beiow
i l l ) Right instrument panel and beiow (10) CenteTinstrument panel and below
(12) Glove compartment door (13) Knee bolster (14) Windshleld including one or more
ofthe following: front header, A- plllar, instrument panel, mirrorm steering assembly idrlver side only)
(15) Windshieid including one or more of the following: front header, A- pillar, instrument panei, or mirror (passenger side only)
1161 Other front abject (specify):
codes 04 and 05)
seiectot lever, other attachment
deck, a i r conditioner)
E F T SIDE (20) Left'side interior surface, exciuding
(21) Left side hardware or armrest (22) Left A pillar
(24) Other left pillar (specify): 123) Ldt B pillar
hardware or armrests
(25) Left side window glass or frame
CODES FOR INTERIOR COMPONENTS
(26) Left side window glass Including one or more of the loilowmg: frame, window 5111, A-piilar, E-pillar, o r roof side rall
(27) Other left slde object (specify):
RIGHT S l O E (30) Right side interior surface,
(31) Right side hardware or armrest excluding hardware or armrests
(32) Right A pillar (331 Right B pillar 1341 Other right pillar (specify):
(35) Right side window glass or frame (36) Right slde window glass mcluding
one or more of the following: frame, window sill, A-pillar, 8-piilar, or roof side rail
(37) Other right side object Ispecifyl:
INTERIOR ( 4 0 ) Seat. back support (411 Belt restraint webbinglbuckle 1421 Belt restraint 6-pillar anachmeni
( 4 3 1 Other restraint srjtem component
( 4 4 ) Head restraint system (45) Air cushion (48) Other occupants (specify):
point
[specify):
(47) Interior loose objects
(48) Child safety seat (specify):
1491 Other interior object (specify):
ROOF 1501 Front header , . 151) Rear header (52) Roo1 left side rail (531 Roof right side rall (54) Roof or convertible top
FLOOR (561 Floor including toe p a n (571 Floor or console mounted
transmission lever, including console
(58) Parking brake handle (59) Foot controis including parking
brake
REAR (60) Backlight (rear window) (61) Backlight storage rack, door. etc. (62) Other rear object (specify):
i CONFIDENCE LEVEL SF CONTACT POINT
(1) Certain (2) Probabie (3) Possible (4) Unknown

NOTES: Encode the data for each applicable front seat position. The attributes for :he variables may be founc
Asssssrnent Form. below. Restraint systems should be assessed during the vehicle inspection then coded o n the Occupanl
4utomatic (Passive) Restraint System Availability Automatic (Passive) Restraint Function
( 0 ) Not equipped/not available (01 Not equipped:not available ( 1 ) Airbag 12) Airbag disconnected (specify): Automatic Bel?
l l i Automatlc belt in use !2) Automatic belt not i n c se
(4) 2 point automatic belts 13) Airbag not reinstalled 13) Automatic belt use unknown
i5i 2 point automaiic belts 16) Automatic belts destroyed or rendered
19) Unknown
Air E a 9 (43 Airbag deployed during accident !5) Airbag deployed Inadvertently j u s t
(61 Deployed, accident sequence undeterminec 17) Nondeployed
(9) Unknown i8! Unknown if deployed
inoperative prior to accident
Did Automatic (Passive] Restraint Fail ( 0 ) Not equippedinot available (1) No 12) Yes (specify): 19) Unknown
FORS REPORT CR I50 105

JOTES: Encode the applicable data for each seat position in the vehicle. The attributes for the variables may bl found below, Restraint systems should be assessed during the vehlcle inspection then coded on tht Occupant Assessment Form.
If a child safety seat is present, encode the data on the back of th i s page,
If the vehicle has automatic restraints available, encode the appropriate data on the back of t h e previou: w e .
Left Center Right F I
Availability
R S
Use
T Failure Modes - 3
C 0 Use N D Failure Modes
H I
R Use
0 T
Availability
H Use E R Failure Modes
E Availability
T Availability
D Failure Modes
Manual (Active) Belt System Availability
(0) Not available (1) Belt removedidestroyed (2) Shoulder belt (3) Lap belt (4) Lap and shoulder belt (5) Belt available - type unknown (8) Other belt (specify):
(9) Unknown
Manual (Active) Belt System Use
(00) None used, not available, or belt rernoved/destroyed
(01) Inoperative (specify):
(02) Shoulder belt (03) Lap belt (04) Lap and shoulder beit ( 0 5 ) Belt used - type unknown
(08) Other belt used (specify):
(12) Shoulder belt used with chlld safety seat (13) Lap belt used with child safety seat (14) Lap and shoulder belt used with child safety seat (15) Belt used with child safety seat - type unknown (18) Othe r belt used with chlld safety seat (specify!:
(99) Unknown if belt used
Manual (Active) Belt Failure Modes During Accident (0) No manual belt used or not available (1) No manual belt failure(s) (2) Manual belt failure(s) (encode all that apply above) [A] Torn webbing (stretched webbing not included) [E] Broken buckle or latchplate [C] Upper anchorage separated [Dl Other achorage separated (specify):
[E] Broken retractor [F] Other manual belt failure (specify):
(9) Unknown
106 FO~IK-WI~IEEI.-DKIVES, UTILITIES & VANS

When a child safety seat is present enter the occupant's number in the first row and complete The column below the occupant's number using the codes listed below. Complete a column for each child safety seat present.
Occupant Number
1. Type of Child Safety Seat
2. Child Safety Seat Orientation
3. Child Safety Seat I
Harness Usage I I
Shield Usage 1 i 4. Child Safety Seat
5. Child Safety Seat Tether Usage
6. Child Safet\/ Sea: Makelblodel Specify Below for Each Child Saiery Seat
1. Type of Child Safety Seat
(0) No child safety seat (1 1 Infant seat (21 Toddler seat (3) Convertible seat (41 Booster seat (7) Other type child safety seat (specify):
18) Unknown child safety seat type (9) Unknown if chi~ld safety seat used
2. Child Safety Seat Orientation
(00) No child safery s e a
Designed for Rear Facing for This AgelWeight (01) Rcar facing (02 ) FGward facing (03) Other orientation (specify]:
(04) Unknown orientation
Designed for Forward Facing for This Agel'Neight
(12) Forward facinc (11) Rear facing
(16) Other orientation (specify]:
(1 9) Unknown orientation
Welght, or Unknown Age/Weight Unknown Design or Orientation for This Age/
(21) Rear iacing (22) Forward facing (28) Other orientation (specify):
(29J'Unknown orientation
G i iinknown if child safety seat used
3. Child Safety Seat Harness Usage
4. Child Safety Seat Shield Usage
5. Child Safety Seat Tether Usage
Note: Options Below Are Used for Variables 3-5.
(00) No child safety seat
Not Designed with HarnessiShieidiTether (01) After market harnessisnieldltether
(02) After market harnessishieidltether used (03) Child safety seat used, b u t no after market
(09) Unknown if harne%s/snield/tether harnessishieldltether added
added O F used Designed with HarnesslSh~eldlTether (11) Harnessishielditether not used (12) Harnessishieldltether used (19) Unknown if harnessishielditether used
Unknown if Designed with HarnessiShield/Tether (21) Harnessishielditether not used (22) Harness/shield/tether used (291 Unknown if harnessishielditether used
(99) Unknown if child safety seat used
added, not used
6. Child Safety Seat MakeiModel (Specify rnake/model and occupant number)
"_

I NOTES: Encode the applicable data for each seat position in the vehicle. The attributes for these variables rn: be found at the bottom of the page. Head restraint typddarnage and seat typeiperformance should t assessed during the vehicle inspection then coded on the Occupant Assessment Form.
Left Center Right F Head Restraint Type/Damage
R I
Seat Type S T Seat Performance S
C E Head Restraint TypejDamage
0 Seat Type N D Seat Performance
H T Heaa Restraint Type/Damage
I Seat Type R D Seat Performance 0 T
Head Restraint TypelDamage
H E
Seat Type
R Seat Performance
Head Restraint TypeIDamage by Occupant at Thin Occupant Position
ill Integral - no damage 10) No head restraints
12) Integral - damaged during accident 13) Adjustable - no damage 14) Adjustable - damaged during accident
(61 Add-on - damaged during accident 15) Add-an - no damage
(81 Other Ispecifyj: 19) Unknown
Seat Type (This Occupant Position)
100) Occupant not seated or no seat 101) Bucket 102) Bucket with foiding back 1031 Bench 104) Bench wlth separate back cushions
106) Split bench with separate back cushions 105) Bench with foiding backls)
(07) Split bench wlth folding back(s1 108) Pedestal 1i.e.. van type)
Seat Performance (This Occupant Position)
IO) Occupant not seated or no seat 11) No seat performance fallureis)
121 Seat performance iailure(s) (Encode all that appiy)
[A] Seat adjusters faded
[Cl Seat tracks facled [B] Seat back folding locks fafled
[Dl Seat anchars fatled [E] Deformed by impact of passenger fram rear [F] Deformed by impact of passenger from front
[HI Deformed by passenger comparirnent intrusion [GI Deformed by own inertla1 forces
Ispecity):
[I] Other (spec~fyl:
I 199) Unknown 1091 Other seat Wpe Ispecity):
I91 Unknown
DESCRIBE ANY INDICATION OF ABNORMAL OCCUPANT POSTURE (LE. UNUSUAL OCCUPANT CONTACT PATTEfiN)

Completethe following i f the researcher has any indications that an occupant was either ejected from or entrappet ?he vehicle. Code the appropriate data on the Occupant Assessment Form.
Describe indications of ejection and body parts invc!ved in partial ejection(s):
I I I I I
I Occupant Number I
i Ejection Area i , I ! l I i ) t I I I I I I
Medium~Status I .. qection
121 Partial ejection ( 1 ) Complete ejection
(3 ) Ejection, unknown degree (9) Unknown
Ejection Area (1) Windshield 12) Left front
(4) Left rear (3) Right front
(5) Right rear IS) Rear
(7) Roof (8) Other a rea l e .g . , back of
pickup, etc.) (specify!:
(9) Unknown
Ejection Medium 11) Door/hatch/tailgate (2) Nonfixed roof structure ( 3 ) Fixed glazing I41 Nonfixed glazing (specify):
(5) Integral structure ( 8 ) Other medium (specifyl:
(91 Unknown
Medium Status (Immediately Priol t o Impact)
11) Open (2) Closed (3 ) Integral structure (9) Unknown
:ompgnent!si:
Vote in vehicle interior diagram]
FORS REPORT CR 150 109

NATIONAL ACCIDENT SAMPLING SYSTE
"l H4-r Trnl(* 5- . i - r l nen l31Tmn~wmm
CRASHPC PROGRAM SUMMARY m S H W O R T H I N E S S D A T A SYSTE l d m m l l t m n m
Identifying Title
- " ""
Prlmary "
z-sz hln -Stratum Acctdent Event Sampling Uni t Sequence No.
"""
Date i m m dd ??I
CRASHPC Vehicle Identification
Vehicle 1
Vehicle 2 Year Make Model NASS
Veh. No.
VEHICLE 1 VEiilCLE 2 Size - Size Weight +", - "" - Weight f - f - ""
- - - - -
Curb Occupantlsi Cargo Curb Occupant(s1 Cargo
CDC CDC PDOF _" PDOF
Stiffness -
Rest Position Rest Position X "-.- X _"._ Y PSI
Impact Position X Y PSI
-".- Y "-.- PSI
Impact Position "-.- X "-.- Y _"._ PSI
"-.- "-.- "-.-
Slin Anole Slip Anale "-
HS Form 435D 1 /a8
1 10 FoI!K-WHE~~~.-DRIV~S, UTILITIES & VANS
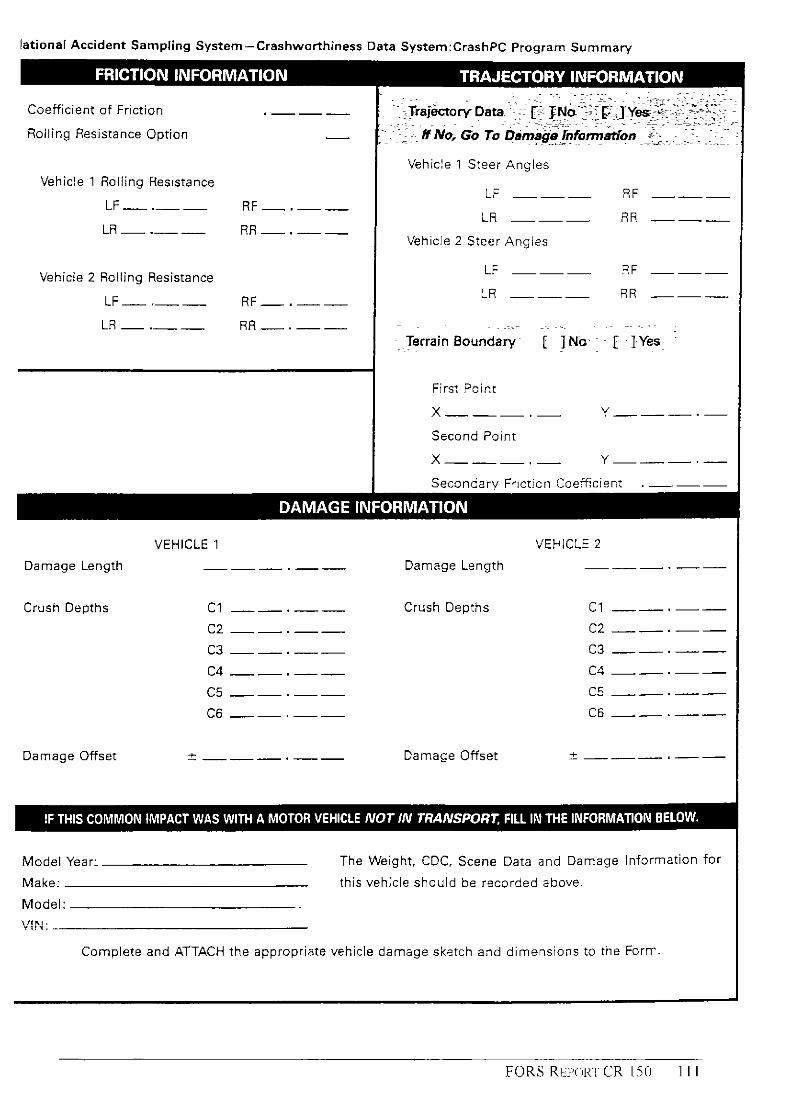
lational Accident Sampling System-Crashworthiness Data System:CrashPC Program Summary
Coefficient of Friction ,"_
Rolling Resistance Option -
Vehicle 1 Rolling Resistance
LF-." RF-."
LR_." RR-."
Vehicle 2 Rolling Resistance
LF-." RF-."
LR - RR-."
Vehic!e 1 Steer Angles
LF _-_ RF ___ LR ___ R R ___
Vehicle 2 Steer Angles
LF ___ 3 F ---
LR ___ R R _-_
First Point
X"_._
Second Point
X"_._
Secondarv Frlctjcn coefficient . ---
VEHICLE 1
Damage Length _"." VEHICLE 2
Damage Length
Crush Depths c1 "." CZ"." C3"." C4"." c5
Damage Offset f-"."
Crush Depths Cl"." CZ"." c3 "." c 4 ".-- c5 "." Cfi"."
Damage Offset ?"-."
Model Year: The Weight, CDC, Scene Data and Damage Information for Make: th is vehicle should be recorded above. Model: .~
\'I p4 :
Complete and ATTACH the appropriate vehicle damsge sketch and dimensions to the Forrr

1 . Basis for Total Delta V (Highest) -
Delta V Calculated ( 1 ) CRASH program-damage only routine (2) CRASH program-damage and trajectory
( 3 ) Missing vehicle algorithm
Delta V Not Calculated (4) At least one vehicle (which may be th is vehicle)
is beyond the scope of a n acceptable reconstruc- tion program, regardless oicollision conditlons.
(5) All vehlcles within scope (CDC applicable) of CRASH program but one of the collision con- ditions is beyond the scope of the CRASH pro- gram or other acceptable reconstruction tech- nlques, regardless oi adequacy of damage data.
(6) All vehicle and collision conditions are withln scope of one of the acceptable reconstruction programs, but there is insufficient data available.
routine
Secondary Highest
'0. Total Delta V "
__Nearest mph
(NOTE: 00 means less than 0.5 mph) (97) 96.5 mph and above (99) Unknown
31. Longitudinal Component of + Delta V _" -Nearest rnph
(NOTE: -00 means greater than
( 2 9 7 ) ~ 9 6 . 5 mph and above -0.5 and less than +0.5 m p h )
(- 99) Unknown
Secondary Highest
32. Lateral Component of Delta V _" +
-Nearest mph -
(NOTE: -00 means greater than
( 2 9 7 ) 296 .5 mph and above -0.5 and less than + O S rnphl
(- 99) Unknown
33. Energy Absorption _",- 0 0
__Nearest 100 foot-lbs __ (NOTE: 0000 means less than 50 Foot-Lbs) (9997) 999,650 foot-lbs or more (9999) Unknown
3 4 . Confidence in Reconstruction Program Results (for Highest Delta V) ( 0 ) No reconstruction ( 1 ) Collision fits model-results appear
(3) Collision fits model-results appear low (2) Collision fits model-results appear high
(4) Borderline recanstruction-results
reasonable
appear reasonable
35. Type of Vehicle Inspection ( 0 ) No Inspection
(2) Partial inspection (specih): (1) Complete inspection
*** STOP H E R E IF THE CDS APPLICABLE *** VEHICLE WAS NOT INSPECTED