VATIN G., BIANCHI N., 2014, SIG des Merveilles: Analysing Rock Art Distribution with a Web...
11
190 Archeologia e Calcolatori Supplemento 5, 2014, 190-200 SIG DES MERVEILLES: ANALYSING ROCK ART DISTRIBUTION WITH A WEB CARTOGRAPHIC PLATFORM 1. Introduction Cartographic analysis tools such as Geographic Information Systems (GIS), whether they are desktop applications or web platforms, are used to improve the knowledge about a geographic area. This kind of tools enables a very accurate analysis and complete display of spatial objects and layers. In the past few years, GIS became more and more popular in sciences such as archaeology or geology. For instance, in archaeology, spatial analysis allows discovering meaning in spatial distribution of static archaeological objects: this use of topographic and archaeological data was studied on engraved rocks in the Vallée des Merveilles (French name for Valley of Marvels) and led to the development of a specific GIS. Since archaeologists started studying this area, they have been try- ing to understand how the engraved rocks were distributed in space and if rules could be extracted between engraving types and rocks location. Spatial analysis can be applied to study distribution of carved rocks, so that it could find new meaning. But using GIS generally requires knowledge in computer science and training for specific software, which may be too generic for a specific research. We developed a GIS that is specific to the needs of archaeologists in study- ing rock art in the Valley of Marvels. This system provides basic tools for spatial analysis that fulfil specified needs, and do not ask for a long training course. The methodology for surveying, modelling and developing the GIS is illustrated is this paper. We first introduce the context and the studied valley. Then, data ac- quisition is explained in Section 3 with both archaeological and topographic survey. In Section 4, the data model and its integration for web-use are pre- sented. Developed tools are described in Section 5, and Section 6 gives an overall view of the web application. Finally, we conclude the paper and give an overview of the future work. 2. Context: the Valley of Marvels and Mount Bego The archaeological site of Mount Bego (Tende, Alpes-Maritimes) is located between 2000 and 2900 m high, in the valleys which are part of one sector of the Mercantour National Park. The current landscape of the region of mount Bego is the result of the protrusion of the quaternary glaciers and
-
Upload
anglais-upvd -
Category
Documents
-
view
6 -
download
0
Transcript of VATIN G., BIANCHI N., 2014, SIG des Merveilles: Analysing Rock Art Distribution with a Web...

190
Archeologia e CalcolatoriSupplemento 5, 2014, 190-200
SIG DES MERVEILLES: ANALYSING ROCK ART DISTRIBUTION WITH A WEB CARTOGRAPHIC PLATFORM
1. Introduction
Cartographic analysis tools such as Geographic Information Systems (GIS), whether they are desktop applications or web platforms, are used to improve the knowledge about a geographic area. This kind of tools enables a very accurate analysis and complete display of spatial objects and layers. In the past few years, GIS became more and more popular in sciences such as archaeology or geology. For instance, in archaeology, spatial analysis allows discovering meaning in spatial distribution of static archaeological objects: this use of topographic and archaeological data was studied on engraved rocks in the Vallée des Merveilles (French name for Valley of Marvels) and led to the development of a specific GIS.
Since archaeologists started studying this area, they have been try-ing to understand how the engraved rocks were distributed in space and if rules could be extracted between engraving types and rocks location. Spatial analysis can be applied to study distribution of carved rocks, so that it could find new meaning.
But using GIS generally requires knowledge in computer science and training for specific software, which may be too generic for a specific research. We developed a GIS that is specific to the needs of archaeologists in study-ing rock art in the Valley of Marvels. This system provides basic tools for spatial analysis that fulfil specified needs, and do not ask for a long training course. The methodology for surveying, modelling and developing the GIS is illustrated is this paper.
We first introduce the context and the studied valley. Then, data ac-quisition is explained in Section 3 with both archaeological and topographic survey. In Section 4, the data model and its integration for web-use are pre-sented. Developed tools are described in Section 5, and Section 6 gives an overall view of the web application. Finally, we conclude the paper and give an overview of the future work.
2. Context: the Valley of Marvels and Mount Bego
The archaeological site of Mount Bego (Tende, Alpes-Maritimes) is located between 2000 and 2900 m high, in the valleys which are part of one sector of the Mercantour National Park. The current landscape of the region of mount Bego is the result of the protrusion of the quaternary glaciers and

SIG des Merveilles: analysing rock art distribution with a web cartographic platform
191
most of the shapes of mountain relief are due to the glacial morphology: today’s valleys are ancient glacial valleys, in a U shape, with steep flanks and a more or less flat bottom. When they melted, the glaciers left glacial rock bars and frontal moraines which retain plenty of stepped lakes: that is why the region is so rich of water. Glacier’s action on the rocks of the site – schist and sandstone of colour purple, orange, red and green – gave birth to very tender and smooth surfaces which were consequently very easy to carve for prehistoric men.
Field researches have been led for more than forty years: we refer here to the current field works of Henry de Lumley’s team, in charge of research on the site since 1967. The first attempt at a complete tracing of all the carved rocks of the site was managed at the beginning of the last century by Clarence Bicknell (Bicknell 1972); his work was resumed by Carlo Conti (Conti 1972), of whom H. de Lumley is the scientific successor.
These studies permitted to list 4111 engraved rocks, on which have been inscribed, at prehistoric period, more than 35000 signs made using the technique of pecking. All these pecked engravings have been inventoried and geolocated in the GIS. However carving activities lasted until 1989, when the site was classified as historical monument, with direct consequence the ban on carving on the rocks: pecked protohistoric engravings coexist with great panoply of patterns and inscriptions made by shepherds, soldiers and visitors who came in the valley from Roman period until nowadays.
Carved rocks of mount Bego region are scattered over 1400 ha, subdi-vided in seven main sectors, in which the most remarkable are the Marvels and Fontanalba because of the great number of carvings they contains. This subdivision in zones and groups was made between 1927 and 1942 by Carlo Conti in charge of listing systematically all engraved rocks of the region, by Piero Barocelli Superintendant of Antiquities of Liguria, Piemonte and Val d’Aosta. Professor Henry de Lumley kept this subdivision in 1967, when he resumed the inventory campaigns.
Engraved signs that were found on mount Bego rocks are not very varied and can be classified in five well distinct categories: horned figures, ploughed bulls, weapons, geometric figures and anthropomorphs. Horned figures are the main engraved signs from far: with about 12000 figurations, in mount Bego region, nearly one pattern out of three is a horned figure.
However it is the weapon category – dagger, halberd and axe – which has a fundamental role in the dating of the prehistoric period of the engravings. To obtain a relative dating for rupestrian carving, we proceed in a typologi-cal comparison between weapons figurations and real weapons found in an archaeological context, during digs in the nearby area and in farther regions. This comparison is based on the matching in morphological characters of the two weapons to be confronted, carved and real. These characters are

G. Vatin, N. Bianchi
192
mainly constituted by the form and length of the blade, its base and edges morphology, and the shape of the pommel and handle concerning daggers; by the form and length of the blade, its base and edges morphology, and the fitting type concerning halberds; and by the fitting type and the cutting edge of the blade for axes.
This approach allows situating engraving realisation of mount Bego between the beginning of Copper age or Final Neolithic in French (from about 3400 years B.C.) and Early Bronze age I (until about 1800 B.C.).
Actually, the most represented daggers seem to be local Final Neolithic ones. The carved daggers can be compared to knapping stone or metal types: stone daggers usually have convex blade edges; on the contrary, copper blades from Chalcolithic 1 and 2 are triangular, often with an axial rib; lastly, daggers from Bell-Beaker culture (Chalcolithic 3) have a triangular blade, trapezoidal at the base. This chronological sequence is also confirmed by halberds. Figures of pecked daggers and halberds dating from the Early Bronze age could ex-ist. The typical dagger blade from Early Bronze age (from 1900 B.C.) has an elongated and rounded base and, as a new character, a hilt. On rock carvings, in some cases, we have revealed the desire to underline the presence of the hilt, by making it protuding; we can find the same desire on the representation of halberds. The dating of pecked weapons seems to cease at Early Bronze age: spatula axes, lances and swords are totally absent.
Compared to the chronological scale given by the study of engraved weapons, archaeological excavations conducted in shelters revealed a pre-historic frequentation of the site wider and much older than Final Neolithic. Indeed, revision of archaeological material found (Binder, Lepère, Huet 2009; Bianchi, Huet, Sandrone 2011) allowed to attest a human pres-ence on the site from the Early Neolithic (5400 B.C.), period represented by few shards of pottery attributed to the Cardial culture; Middle Neolithic and the Chasséenne culture are also recognisable due to the presence of shards of pottery and flint. Even today it is still difficult to say exactly if some engravings could date from these older phases and this is due to the absence of dating elements (such as weapons), and a very weak presence of superimpositions between carved figures (when they exist, superimpositions give a true stratigraphy of patterns, as it is known in the rupestrian site of Valcamonica - BS).
3. Data acquisition
The data that are integrated into the GIS are divided into two types, which are currently gathered in two specific databases: the archaeological data and the topographic data. Each type of data has its own kind of recording, but both are done simultaneously during the summer survey period.

SIG des Merveilles: analysing rock art distribution with a web cartographic platform
193
3.1 Archaeological data
Because of the snow, high valleys around the mount Bego are reach-able only during summer. Carving study should imperatively start with a methodical exploration of the zone, to locate each prehistoric carved rock. This prospecting is done by archaeologists with the help of trainee students who participate in the site for one month at least. Every wall, slab, isolated rock is observed at different times of the day to benefit from a varied solar lighting (with the help of metallic light reflectors). This allows highlighting new engravings on rocks already examined and/or checking the detail of carvings with studies under way.
Carved rocks are then traced full size, transferred from rock to cello-phane paper, with the help of a felt pen with a slender point. At the same time, a scheme of each rock is done a scale of 1/10th on graph paper. The outline and details of the rock (uncouplings, cracks, natural holes, glacial streaks, gutters and desquamated parts) are reported. Each engraving is drawn and receives an ID number.
The numbering used is based on previous Carlo Conti’s work: as far as it was possible, the classification system elaborated by Conti was respected, each figure defined by numbers, zone (Z), group (G), rock (R) and its ID number (e.g., the anthropomorph, on the Chef de Tribu (Tribe Chief) stele is coded by: zone VII, group I, rock 8, number 1 or ZVII.GI.R8, n°1). All rocks previously numbered by Carlo Conti conserved their numbers; new rocks have been numbered considering their proximity with other located rocks, and their numbers are followed by a Greek letter (e.g., ZI.GI.RIα). Digital pictures of the whole rock and each carving are also taken.
Finally, a form is filled for each engraving. It is used, on the one hand to describe the technique of realisation of the observed figure and to assign it a style, and on the other hand to note the characteristics of the rock on which it lays: coordinates, dimensions, nature, colour, dip (inclination) orientation, state of conservation, number of carvings.
At the laboratory, all the documents gathered on the field (tracings on cellophane, scheme plans at 1/10th scale, forms of carvings and pictures) pass through a reclassification to allow their exploitation.
The tracing on cellophane and the scheme plans at 1/10th scale on graph paper are digitized and assembled during a computer graphics process aiming to harmonize their scale. This process gives the opportunity to have a most reliable reconstitution plan of the rocks and its engravings at the 1/5th scale and to have an individual plan of each carving at full size. All of these graphic documents and the pictures taken during the summer study campaign, supply the bank of images of the computer database “Matériel paléontologique et préhistorique: gravures rupestres de la région du mont Bego”.
G. Vatin, N. Bianchi
194
The archaeological database is finally used to enter information con-cerning the carved rocks, its different faces and each carving: a computer form of individual data exists for each listed engraved rock, each of its faces and each traced carving.
3.2 Topographic data
The French IGN (Institut national de l’information géographique et forestière) and its engineering school ENSG (Ecole Nationale des Sciences Géographiques) take part in the topographic survey with professional land surveyors and students. As many rocks have to be recorded in this wide area, we chose to use the RTK technique for practical problems.
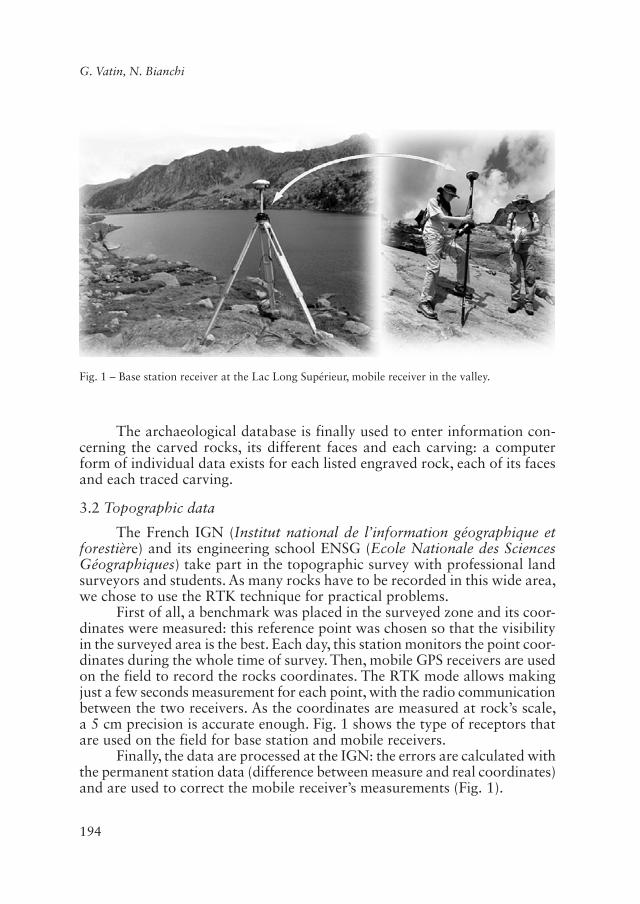
First of all, a benchmark was placed in the surveyed zone and its coor-dinates were measured: this reference point was chosen so that the visibility in the surveyed area is the best. Each day, this station monitors the point coor-dinates during the whole time of survey. Then, mobile GPS receivers are used on the field to record the rocks coordinates. The RTK mode allows making just a few seconds measurement for each point, with the radio communication between the two receivers. As the coordinates are measured at rock’s scale, a 5 cm precision is accurate enough. Fig. 1 shows the type of receptors that are used on the field for base station and mobile receivers.
Finally, the data are processed at the IGN: the errors are calculated with the permanent station data (difference between measure and real coordinates) and are used to correct the mobile receiver’s measurements (Fig. 1).
Fig. 1 – Base station receiver at the Lac Long Supérieur, mobile receiver in the valley.

SIG des Merveilles: analysing rock art distribution with a web cartographic platform
195
4. Data integration
The archaeological database contains the descriptions of the engrav-ings, the rocks and their context. These data are captured from the field files, which archaeologists fill when a new engraving is found. Pictures and vector files of the carvings are stored on a server. A web administration page for the database management has been developed by the researchers.
In order to manage the GPS data that are processed by the IGN, a relational database has been developed based on the OGC standards for geographic information storage, with the Simple feature access (OGC 2012). This database is currently distinct from the archaeological database for a structural question: the first database does not use a relational model. The geographical database was developed with PostgreSQL (PostgreSQL 2012) and PostGIS (PostGIS 2012) extension. Four types of objects are used in this database, based on the archaeological data structure: zones, groups, rocks and figures (carvings). A carving has a unique identifier in the archaeologi-cal database, which can be found in the relational structure: number of zone – number of group – name of rock – number of figure.
With the GIS, only the zones and the rocks can be mapped and visualized. The geometries of the zones (polygons) have been vectorized with the help of topographic maps and the known limits of zones. The rocks geometries (points) are the result of GPS surveying. The groups cannot be mapped because of the fuzzy limits that define them and that are evolving each year. Finally, the carving cannot be mapped because of the mode of GPS surveying, which is at rock scale.
In order to encode the figure description for storage, both databases use a glossary: the general type of engraving is encoded by the first letter of a character string. Then, other characters stand for an accurate description of it, using a hierarchical code. Table 1 gives an example of code for daggers.
Engraving description (French name) CodeDagger (Poignard) PDagger with long blade, concave edges, round end Pbt2Dagger with short triangular blade, straight edges, sharp end Par1Dagger with short triangular blade, straight edges, sharp end, straight base; short and narrow hilt; rounded pommel; 2 rivets
Par1r2ca2gX2
Tab. 1 – Example of encoding from the glossary (Laboratoire Départemental de Préhistoire du Lazaret).
5. Developed tools
5.1 Navigation and filtering
The Valley of Marvels comprises more than 4000 engraved rocks: visualizing all of these data at the same time could prevent understanding

G. Vatin, N. Bianchi
196
the distribution of engravings. The first tools were developed according to Shneiderman’s mantra for information seeking: «Overview first, zoom and filter, then details-on-demand» (Shneiderman 1996). Filters were developed to reduce the amount of displayed data by specifying the type of engraving and the zone of interest.
Overview (a general view of the zone and situation of current view) and zooms are the basic controls for web-mapping platforms. History of zooms and map’s movements is stored, so that the user can go back and forward in map navigation.
Two filters are available; both can be combined to be more accurate: a text field is used to specify the code of carvings to look for, and the zone number can be selected from a list. In order to query a specific type of engrav-ing, or a general code, the “*” symbol can be used to mean “any character string”. For instance, searching all the daggers locations is encoded by a “p*” query (poignard in French). The request can be more specific with a longer character string.
Using a single filter, all the rocks for a given engraving type, or in a given zone, can be requested. Using both filters, we can achieve such queries as “All daggers with a large handle and in zone VII”.
Exporting the displayed rocks is enabled with the use of KML format: KML is the Google language for geographic features, which can be used within any web-, desktop GIS, smartphones or tablets. This allows saving the features in a local file, which can be read with Google Earth; a 3D view of the area is provided with this software. This export does not keep a real connection to the database, but store all the metadata of rocks in the local KML file: this way, the created file can be read by any computer.
5.2 Spatial analysis
Before using this information system, there was not any real geographi-cal knowledge of the spatial distribution of engraved rocks in the valley. That is why such a tool was required to understand the distribution of rocks and carvings. The first objective of this web platform was to manage on-the-fly spatial analysis with easy tools and effective results.
We chose to develop functionalities to analyse the amount of objects among the Valley of Marvels. The objects that could be studied were both the rocks and the figures. Therefore the scale of the analysis could be both the zones and the rocks – the groups are not represented, so they cannot be taken into account. Finally, three kinds of spatial analysis can be highlighted in this study: (1) amount of figure per rock, (2) amount of figure per zone and (3) amount of rock per zone. As an optional criterion for these analyses, the type of figure can be used the same way we described in the above section, with a code field in the form.

SIG des Merveilles: analysing rock art distribution with a web cartographic platform
197
The result of this type of analysis is a map of quantitative data (amount of rocks/engravings): according to the visual variables of Bertin (Bertin 1967), the cartographic representation uses proportional circles standing for the amount of objects.
Fig. 2 presents the three main control panels for displaying, filtering and analysing the data. The Navigation tab contains the different information layers, display options and export tools. The Filtre tab is the form for filter-ing the displayed rocks. Finally, the Carto tab is the spatial analysis form for rocks and engravings study (Fig. 2).
6. Web application
A specific geographic server is used for disseminating these specific data: MapServer (MapServer 2012) was chosen in order to create dynamic Web Feature Services (WFS), which would be specific to user’s request. This request needs to join different tables from the database, according to what has to be analysed. A temporary table (SQL view) would result from this request, and MapScript language allows creating a temporary WFS pointing to this table. It is finally displayed on the client interface.
On the client side, the GIS was developed with the use of open source web libraries for interactive web applications (ExtJS) and web-mapping (OpenLayers, GeoExt). The French Géoportail API of IGN (IGN 2012) was used for the base maps, including topographic maps and orthophotos of the area.
Fig. 3 describes the architecture of the web GIS and the web services for data querying. Only the geographic database is used by the GIS, gather-ing geometries of zones and rocks, coordinates and basic information about rocks and engravings. In the near future, both archaeological and geographic database should be merged to have the most accurate description of the objects in the GIS (Fig. 3). The figure highlights the exchanges of data between the web client (web browser using the GIS) and the Lazaret server (containing the data and the cartographic server). Client displays the platform, requests are encoded into SQL to create a view, and WFS feeds the cartographic portal.
The proportional circles used in the spatial analysis representation re-quire on-the-fly legend: this one is created on the client side, with a Canvas object (graphic web library). This legend object contains three circles: mini-mum, maximum and mean values, which are sent by the database.
The final system is installed on an Intranet server so that it is available only to personnel of the Lazaret laboratory. Indeed, the data are confidential so that hikers cannot access the protected engravings. Fig. 4 presents two types of visualizations: description of filtered rocks (only Zone VII) with pie chart (carving types) and table (carving descriptions), and the result of a

G. Vatin, N. Bianchi
198
Fig. 2 – Control panels: layers, filter and spatial analysis tools.
Fig. 3 – Architecture of the web services and GIS.
Fig. 4 – Two views of the GIS of Marvels: description of a rock and spatial analysis.

SIG des Merveilles: analysing rock art distribution with a web cartographic platform
199
spatial distribution analysis on the whole area (amount of general carvings per rock).
7. Conclusion and future work
This web cartographic platform called SIG des Merveilles (GIS of Mar-vels) is the first cartographic engine that was used in the Lazaret laboratory to study the whole Valley of Marvels. The tests led with archaeologists of the Lazaret laboratory were successful: the geographic information system is simple to use and provides quick and clear results.
New tools would be developed for more accurate analysis: complex filters on other types of attributes (with AND operators) and filters composi-tion. This would allow better analysis for specific areas or objects. Studying the environment of the rocks based of topographic description (e.g., summits, lakes, slope, etc.) could also bring more information about the rocks and engravings distribution.
Moreover, a mobile version of this GIS could be considered: a smart-phone or a tablet could be used on the field to find rocks and engravings, with the user’s situation on the map. This could be a mean to make rocks search easier.
Finally, we intend to include new data from other area around the Vallée des Merveilles: Fontanalba, Gordolasque, etc. The same data acquisition and integration process can now be applied to these other areas of the Mercantour national Park in the next few years.
Gabriel VatinMINES ParisTech - CRC
Nicoletta BianchiLaboratoire Départemental de Préhistoire du Lazaret
Acknowledgments
We would like to express our gratitude to Prof. Henry de Lumley, director of the French Institute of Human Paleontology, for letting us study the Valley of Marvels area and funding this work. We thank ENSG teachers of DIAS and DPTS who supported this work and still do, especially Laure Chandelier and Philippe Nicolon. We would also like to give special thanks to all of the volunteers without whom this work would not have been possible.
BIBLIOGRAPHIE
Bertin J. 1967, Sémiologie graphique, Paris, Mouton/Gauthier-Villars.Bianchi N., Huet T., Sandrone S. 2011, Inventaire du matériel archéologique du gias du Ciari (Tende,
Alpes-Maritimes, France), Soprintendenza per i Beni Archeologici del Piemonte e del Museo delle Antichità Egizie, Museo Civico di Cuneo.

G. Vatin, N. Bianchi
200
Bicknell C. 1972, Guide des gravures rupestres préhistoriques dans les Alpes-Maritimes, traduction française de l’édition originale anglaise de 1913, Bordighera, Institut International d’Etudes Ligures.
Binder D., Lepère C., Huet T. 2009, Compte rendu de mission au Musée des Merveilles – Tende, in Binder D. (ed.), ETICALP, Matières premières, productions et usages du Paléolithique supérieur à l’âge du Bronze ancien, PCR 2009-2011, Rapport 2009,.
Conti C. 1972, Corpus delle incisioni rupestri di Monte Bego, fascicolo I. Zona I. Regione dei Laghi Lunghi, Bordighera, Istituto Internazionale di Studi Liguri.
IGN 2012, API Géoportail (http://api.ign.fr/accueil).MapServer 2012, MapServer 6.0.3 documentation (http://mapserver.org/).OGC 2012, OGC® Standards and Supporting Documents (http://www.opengeospatial.org/standards).PostGIS 2012, PostGIS: Home (http://postgis.refractions.net/).PostgreSQL 2012, PostgreSQL: The world’s most advanced open source database (http://www.postgresql.
org/).Shneiderman B. 1996, The Eyes Have It: A Task by Data Type Taxonomy for Information Visualiza-
tions, in Visual Languages, Proceedings, IEEE Symposium 1996, Boulder, IEE Computer Society, 336-343.
ABSTRACT
The Vallée des Merveilles (Valley of Marvels), in the Mercantour National Park (France), is a major place for studying the late Neolithic Age until the beginning of the Bronze Age: since the early 20th
century, more than 4000 engraved rocks have been listed, representing 40,000 carvings. The Laboratoire Départemental du Lazaret has been studying these engravings for more than forty years: a large database describes the whole rocks and figures and is still filled with new findings. But such a large amount of data from a vast archaeological site needs efficient tools for its study, such as mapping the location of the rocks. Many improvements regarding the study of the carvings and their spatial distribution were made possible by the development of a web GIS: consulting the data is made easier and clearer with a web-mapping platform and specific tools. Filtering for choosing the data to display and automatically generated maps allow an overall view of the spatial distribution of the Marvels’ engravings. Using both the IGN’s Geoportal data and cartographic web libraries produced an efficient and complete web service for consulting and analyzing the engraved rocks of the Valley of Marvels. This one can be used for any area in the Mercantour Park, as long as new data are added to the databases.