Making Sense of Time: Observational and Theoretical Calendars
Upload
khangminh22Category
view
0download
0
data
Article
VARTTA: A Visual Analytics System for MakingSense of Real-Time Twitter Data
Amir Haghighati and Kamran Sedig *
Insight Lab, Middlesex College, Western University, London, ON N6A 3K7, Canada; [email protected]* Correspondence: [email protected]
Received: 28 December 2019; Accepted: 14 February 2020; Published: 19 February 2020�����������������
Abstract: Through social media platforms, massive amounts of data are being produced.As a microblogging social media platform, Twitter enables its users to post short updates as“tweets” on an unprecedented scale. Once analyzed using machine learning (ML) techniques and inaggregate, Twitter data can be an invaluable resource for gaining insight into different domains ofdiscussion and public opinion. However, when applied to real-time data streams, due to covariateshifts in the data (i.e., changes in the distributions of the inputs of ML algorithms), existing MLapproaches result in different types of biases and provide uncertain outputs. In this paper, we describeVARTTA (Visual Analytics for Real-Time Twitter datA), a visual analytics system that combines datavisualizations, human-data interaction, and ML algorithms to help users monitor, analyze, and makesense of the streams of tweets in a real-time manner. As a case study, we demonstrate the use ofVARTTA in political discussions. VARTTA not only provides users with powerful analytical tools,but also enables them to diagnose and to heuristically suggest fixes for the errors in the outcome,resulting in a more detailed understanding of the tweets. Finally, we outline several issues to beconsidered while designing other similar visual analytics systems.
Keywords: visual analytics; stream processing; dataset shift; real-time analytics; twitter data;human-data interaction; data visualization
1. Introduction
Social media platforms allow their users to simultaneously be active consumers (readers) aswell as producers (authors or editors) of data. Individuals, businesses, news agencies, academics,and governments (i.e., tweeters) use social media platforms to express their viewpoints on differenttopics. Microblogging, provided by a variety of such platforms (e.g., Facebook, GNU social, Micro.blog,Tumblr, and Twitter), refers to the activity in which tweeters broadcast brief updates about variouson-going events, discussions, and topics [1]. Microblogging platforms are being used for a widerange of social purposes, e.g., education, product/service review, typical communications, and newsbroadcasting [2,3]. Pendry et al. [4] argue that social platforms have benefits at both individual andsocietal levels, and that due to the richness of their content, they are of greater applied importance thanhas been realized. Depending on their features, user-produced content on microblogging platformsmay include various combinations of data types (e.g., text, videos, images, and hyperlinks). As a newmode of communication, microblogging has shown unprecedented levels of uptake and growth andhas quickly gained widespread popularity [5].
In recent years, proliferation of smartphones has further pushed people to use mobile applicationsand, hence, social media platforms. However, it seems that due to manifold types of platform hosts,overlaps in the discussed topics, numerous varieties of rules and regulations, and multiplicity in formsand data structures of the content, in order to analyze, understand, gain insight into, and make senseof the online discussions in forums, one has to traverse through heterogeneous webs of platforms and
Data 2020, 5, 20; doi:10.3390/data5010020 www.mdpi.com/journal/data

Data 2020, 5, 20 2 of 25
online discussions [6]. Meanwhile, comments may quickly become outdated or unrelated as well assuffer from source credibility. As a result, having a comprehensive understanding of the overarchingpicture of discussions and identifying the main players in discussions can be a very challenging andtime-consuming task.
Launched in 2006, Twitter is a microblogging website which enables users to post messages(named “tweets”) of up to 280 characters in length [5]. In the first quarter of 2018, the number ofmonthly active worldwide users on Twitter broke the 330 million threshold, and the number of tweetspublished per day reached 500 million [7,8]. These characteristics turn Twitter into an importantmicroblogging platform that provides instant access to public opinions on almost any topic of intereston a global scale. Twitter is an open platform; therefore, by default, tweets are public and can bediscovered through searching. In a recent research article, Tolmie et al. [9] indicate that, althoughthere are some similarities between discussions on Twitter and those on existing traditional onlineforums, discussions on Twitter are “a wholly distinct social phenomenon requiring an independentanalysis that treats them as unique phenomena in their own right, rather than as another species ofconversation that can be handled within the framework of existing conversation analysis.” Given thedifferences between Twitter and other social media platforms, it seems that for a valid analysis of thecontent shared on Twitter, both the big volume of data originating from the Twitter API (i.e., applicationprogramming interface), as well as the ever-changing and summarized aspects of its content mustbe considered.
Being a publicly accessible microblogging platform, people can use Twitter for various ends.Accordingly, the vast space of Twitter data, which is being updated by many tweeters (i.e., users,authors, or contributors to Twitter) at an unprecedented scale, if analyzed properly, can help withgaining insights into “what is happening in the world” [7]. Research has shown that Twitter isa reliable source for tracking public opinion about various topics, ranging from political issues andjournalism [10–14] to crises and emergencies [15], and from public and personal health issues [16,17]to brand sentiments [3,18]. Social scientists, for example, can observe discussions on a given issue andconstruct a lens through which they can better understand the public’s perception of the issue. Brandsand businesses can measure their customers’ satisfaction based on the on-going discussions. Politicianscan observe urgent needs of the people they represent and use this insight in their policy-makingprocesses. It should be noted that the sheer number of tweets, the vague line between formal andinformal discussions, and distortions in meaning and misunderstandings due to the brevity of tweetspresent challenges for the analysts as they seek to use Twitter to construct and update their mentalmodels of various discussions.
Thus, the publicly available Twitter data is an invaluable resource for mining interesting andactionable insights. Computational tools, such as machine learning (ML) techniques and algorithms,can be used to help users (i.e., either those who analyze Twitter data to make sense of it or users ofVARTTA—Visual Analytics for Real-Time Twitter datA) analyze and interpret Twitter data, not onlywith seeing an overview of the data in its aggregate form, but also with formation of high-level mentalmodels of its underlying communications [19]. However, for Twitter data not to lose its viability andsuitability when analyzing real-time situations, it cannot be stored and then processed as batcheddatasets. It must be processed in real-time. The existing Twitter analysis tools mostly focus on particularanalytical questions; there seems to be a need for a tool which provides analytical capabilities in bothaggregate and particular forms. To monitor and analyze Twitter data, therefore, it is important to keepa number of issues in mind.
The quality of Twitter data can have various effects on results of any analysis. Throughoutthe literature, noise has been regarded as a negative contributor to data quality: spam, unrelated,and/or meaningless tweets. Moreover, the dynamic nature of Twitter discussions provides a particularchallenge with regards to accuracy, consistency, and reproducibility [20]. Most of free APIs, includingthat of Twitter, do not provide noiseless or quasi-high-quality data. Twitter streaming API deliversa non-representative sample of tweets [21]. The consequences of this skewed sample for research on

Data 2020, 5, 20 3 of 25
the uses of Twitter in different discussions have not yet been examined thoroughly [15]. Nevertheless,although it is possible to obtain high-quality data by purchasing from commercial data vendors, the useof freely available Twitter API seems more suitable for research purposes [22]. In addition to dataquality challenges, using different ML algorithms and techniques to analyze tweets in bulk results invarious degrees of accuracy [23].
Bifet and Frank [24] suggest that Twitter data can be best modeled as a data stream. In this streamform, tweets arrive at high speeds and in large volumes. Data processing approaches must be able toprocess, predict, and/or analyze incoming tweets in a real-time manner and under strict constraintsof computational resources. They suggest that processed properly, these streams, both at micro andmacro levels, can provide great benefits. In a stream processing application, due to the ever-changingcharacteristics of data, variations in the distributions of the data are inevitable [25]. Therefore, datasetshift poses a problem when analyzing such streams. In a machine learning configuration, datasetshift occurs when the testing data (unseen) experience a phenomenon that leads to a change in thedistribution of a single feature, a combination of features, or the class boundaries (i.e., the distributionof output labels). In summary, the common assumption that training and testing data follow the samedistributions is often violated in real-world applications and scenarios. When applied to real-time datastreams, due to changes in the distribution of the incoming data, some ML models may predict totallyobsolete results after some time [26,27]. This makes it even harder for real-time analytics. The followingsection provides the research questions that this paper aims to address.
Research Questions
Visual analytics systems (VASes) are computational tools that combine ML techniques,data visualizations, and human-data interaction [28–31]. VASes can be used to help with theinterpretation and analysis of complex data, such as Twitter data. They allow their users to interactivelycontrol ML techniques and data visualizations to change how data is analyzed and presented to them.This paper examines the design of a VAS, VARTTA, intended to support making sense of real-timeTwitter data. The research questions that this paper examines are as follows:
1. Is it feasible to develop a VAS that supports making sense of Twitter data by integrating machinelearning (ML) and natural language processing (NLP) techniques, stream processing approaches,data visualizations, and human-data interactions, all in real-time?
2. Can such a VAS be flexible and scalable—that is, allow the plugging in of different ML andcomputational techniques?
3. Can such a VAS help with surveillance and sense-making of online Twitter discussions withoutconfining them to pre-defined static topics?
4. What are some of the issues that need to be taken into consideration when designing anddeveloping such a VAS?
The rest of this paper is organized as follows. Section 2 provides the conceptual background forour research. Section 3 describes the design and development of VARTTA intended to address theresearch questions above. Section 4 presents an in-depth case-study of VARTTA. Finally, Section 5summarizes this paper and provides some conclusions.
2. Background
In Twitter analysis, both, quantitative (e.g., influence ratio of a tweeter) as well as qualitative(e.g., positivity or negativity of the expressed sentiments) approaches to modeling are important [32].Assessing validity of arguments, discerning most and least significant contributors, understandingsequence and network of communications, identifying themes and intentions of tweets, and reviewingidentities and backgrounds of contributors are examples where one or both of these approaches canbe used to enhance the outcome. The outcome of these approaches can also be regarded as input forfurther advanced analyses [33–35].

Data 2020, 5, 20 4 of 25
Reviewing literature [11,12,15,16,33,35] and abstracting existing approaches for Twitter analysissuggest that an analyst is ultimately trying to address the following questions:
• “Who” is discussing a topic?• “What” is being discussed?• “How” does a comment get expressed?• “Why” does a comment get expressed?
First, affiliation with an organization, social class, community, or generally a group can determinethe credibility of expressions in each discussion. Also, the background of tweeters in terms of previoustweets can be used as an indication of their significance. Moreover, the role of tweeters in any givengroup can further expose hidden aspects of expressions made by them which directly relates to “why”a comment has been expressed.
Second, as a sample breakdown, topics can consist of subtopics, each of which can include threadsof arguments. Initial filtering can be performed on incoming tweets to discern and identify theirunderlying topics. This helps the analyst to differentiate the topics and distinguish tweets and activetweeters under each topic while keeping in mind the general, more abstract theme of the overarchingdiscussion. These topics and subtopics can be extracted or derived by (1) using keywords, hashtags,and search terms, easily available in a tweet’s textual content, or (2) using computational techniques(e.g., ML and NLP) to analyze a tweet’s textual and multimedia content.
Third, tweeters can express a comment in response to another (i.e., a retweet with a quote ora reply) or they can open up the floor for a new idea (i.e., a new tweet). Tweets can include references toother tweeters (mentions or replies) to invite them to participate or to be considered (e.g., as an answerto a previous tweet). Emoticons, images, videos, and hyperlinks can be used in conjunction to expressconnotations (emotions, metadata, etc.). Tweets, retweets, and replies can be expressed with large ortiny time gaps, highlighting the popularity of their topic.
Fourth, Twitter allows tweeters to participate in any discussion at a global level. On sucha scale, different backgrounds of participants will result in diverse viewpoints and, therefore, differentinterpretations. A tweet posted by a news agency can be interpreted as educational content meant toincrease awareness, or, oppositely, as biased information meant to mislead.
To come to a conclusion regarding each of the above questions, different strategies can result invarious scenarios. Systematic reviews of the existing Twitter analysis studies [12,15–17] show thatexisting approaches are mostly focused on only particular aspects of one of the questions of who, what,how, and why. Although these questions are seemingly different, answering and designing strategiesto assess each can result in overlapping scenarios. Also, one can use immediate data available in thetweet and/or use derived information obtained from various data processing or ML techniques toassess these questions. The rest of this section provides a conceptual background required for efficientassessment of the questions.
2.1. Stream Processing
In computer science literature, stream processing is generically used to refer to the study ofapproaches for processing data flows [36]. Viewed from a systems perspective, stream processingcan be regarded as the study of subsystems and their interconnections for processing data flows (i.e.,data streams). Each subsystem is designed to communicate and work in parallel with other parts.Stream-processing systems are often visualized as directed graphs.
As a guideline for real-time stream-processing systems, Stonebraker et al. [37] suggest eightcharacteristics “that a system must exhibit to excel at a variety of real-time stream processingapplications”. These characteristics can be regarded as general requirements or rules-of-thumb fordesigning real-time stream-processing systems. They are summarized in the following rules: (1)keep the data moving, (2) query using SQL on streams, (3) handle stream imperfections, (4) generatepredictable outcomes, (5) integrate stored and streaming data, (6) guarantee data safety and availability,

Data 2020, 5, 20 5 of 25
(7) partition and scale applications automatically, and (8) process and respond instantaneously.Depending on characteristics of an input stream, various stream-processing systems have beendeveloped, each focusing on a subset of the aforementioned rules (e.g., Apache Spark [38], Apama [39],and Google Dataflow [40]).
We use the term ‘stream processing’ here in a general sense to avoid specificity of computationaltechniques and to provide an abstract view of these tools. Nevertheless, given the current state oftechnology, the use of ML techniques, specifically supervised learning techniques, and particularlyclassification, seems to be inevitable in Twitter analysis. Twitter streaming API [21] requires developersto establish and keep open an uninterrupted HTTP connection to access the most recent tweets. Tweetsmust be obtained by filtering. Keywords can be used as search criteria to filter tweets. Free accountsare supported to filter by up to 400 keywords on one connection; adjusting keywords requires the clientprogram to restart and re-establish its connection to Twitter. The online, ever-changing characteristicsof Twitter data streams, therefore, impose limitations with regards to using such computational tools.Dataset shift is an apparent challenge in stream processing, causing invalid results in a deployedclassifier. The following section briefly discusses this phenomenon.
Covariate Shift
Moreno-Torres et al. [26] define the dataset shift problem as cases in which the joint distributionsof input features (covariates) and label class in test data are different from those in training data. In suchcases, the accuracy of the trained model fluctuates. Different cases of this problem can occur, details ofwhich are beyond the scope of this paper. However, in a Twitter streaming setup, one special caseof the dataset shift problem is the following: the distribution and the variety of input tweets withregards to their content, authors, and topics are unknown and can change anytime. These arbitraryand unpredictable changes in the distribution of input data signify a particular type of the datasetshift problem for Twitter streams: Covariate Shift. This shift invalidates the output of classifiers and,consequently, poses challenges with regards to output of analytical models.
In order to make sense of “who” is discussing “what”, and “how” or “why” they are discussingan issue, these streams must be processed (i.e., verified, normalized, categorized, summarized,and expressed) in real-time. Identifying such stages and decomposing them to more concrete tasks(e.g., using a support vector machine as a classifier) is necessary when designing subsystems ofa stream-processing system. Alongside these subsystems, interactive visualizations can be used tofurther enrich the analytical capabilities of the system. Having all such capabilities under one umbrellais a characteristic of visual analytics systems.
2.2. Visual Analytics
Visual analytics (VA) has been defined as “the science of analytical reasoning facilitated byinteractive visual interfaces” [41]. VA helps analysts obtain insights from complex data via a seamlessintegration of computational tools with human expertise. Visual analytics systems (VASes) cansupport, scaffold, and mitigate execution and performance of complex cognitive activities, such asinterpretation and analysis, decision-making, sense-making, and knowledge discovery, all involvinglarge, heterogeneous datasets [42,43]. A complex cognitive activity is usually open-ended, ill-defined,non-linear, and data-driven; it comprises a network of interdependent visual, interactive, and analytictasks; it is evidence-based and domain-knowledge intensive [44,45].
In the context of visual analytics for social media, Wu et al. [46] have conducted a survey thatfocuses solely on multimedia analysis techniques. They have classified state-of-the-art visual analyticsstudies and systems into (1) retrieving and triaging information and (2) understanding user behaviors.Chen et al. [47] suggest a wider taxonomy that not only includes multimedia analysis but also takesinto account visual analytics approaches. In this taxonomy:
a. Goals of the visual analytics studies and systems are: (1) visual monitoring, (2) features extraction,(3) event detection, (4) anomaly detection, (5) predictive analysis, and (6) situation awareness.

Data 2020, 5, 20 6 of 25
b. Social media entities for which data visualizations were developed are: (1) networks,(2) geo-spatial information, and (3) content.
c. Application domains and disciplines on which these systems shed light are: (1) social sciences,(2) journalism, (3) disaster management, (4) crisis and emergency management, (5) politics,(6) finance, (7) sports and entertainment, (8) tourism and urban planning.
Combination of these goals with entities in different application domains can bring aboutinteresting scenarios for analyzing social media. Depending on the requirements of each scenario,various approaches for processing each social media entity can be taken into account.
By combining visualizations, interaction mechanisms, ML techniques, and analytical models,VASes are capable of providing both computational and cognitive possibilities [6,48,49]. Not onlythrough these possibilities is the analyst equipped with more robust analytical tools, but also a cognitivecoupling of the system and the human analyst is created [28–30,42,45]. In the context of a distributedcognitive system, through possibilities afforded by interaction, human cognitive abilities are leveraged,and the performance of complex cognitive activities is supported. In summary, a VAS can be said toincorporate the following components: ML techniques, data visualizations, and human-data interactionmechanisms. Building a VAS requires detailed descriptions for each of these components.
Since ML techniques help in mitigating and reducing the cognitive load of analysts’ data-intensivetasks, their use in VASes is strongly advocated [30,48,50–52]. Theoretically, in a VAS, the combinationof these techniques with data processing techniques, as a whole, can be regarded as the analyticsengine. This component is technology-independent and can include the use of simple or complexalgorithms, external APIs, and/or any processing technique that fits best the needs of an applicationdomain. As mentioned previously, classification and sentiment analysis techniques are the two typesrequired for a thorough analysis of Twitter discussions and must be incorporated in such a VAS.
Data visualizations in a VAS are visual representations of the data as well as the processedand derived data from the analytics engine. These visualizations further leverage the capabilities ofindividuals to complete tasks by allowing them to analyze information in ways that would be difficultor impossible to do otherwise [31,50,53].
When it comes to conducting complex analytical tasks, static and non-interactive visualrepresentations are of little value. As mentioned, visualizations and interaction mechanisms can becombined in a VAS. This combination can enable analysts with new analytical possibilities. In a VAS,these possibilities can be utilized in an iterative manner. One can regard these iterations as discourses(i.e., back-and-forth communication processes between the analyst and the VAS). As a result, the humananalyst and the system form a joint cognitive system. Thus, the cognitive activity emerges as a result andfrom this human-data interaction process [28–31]. Accordingly, the quality of interaction mechanismsis critical in determining the quality of the cognitive coupling and the VAS itself [31,53]. Given theseissues, technical decisions are critical in determining the overall quality of VASes. The next sectiondiscusses technical issues and existing approaches for such requirements.
2.3. Progressive Web Applications
Handling data streams requires a given system to react to the incoming data in a short time period.Traditional tools are designed for static datasets, where change either happens off-line (i.e., in theabsence of a user and/or by swapping datasets) or is not an option. On the contrary, the proliferationof mobile devices and the need to instantly consume data streams have led to the introduction ofProgressive Web Apps (PWAs). PWAs promise to combine web technologies’ ease of developmentwith the adaptability of native applications [54,55]. These applications can incorporate WebSockets tooffer seamless interface updates [56]. This results in a decrease in application size and source codevolume and, at the same time, an increase in performance efficiency and reactivity [57]. PWAs can beregarded as unifying technologies for cross-platform application development and approaches thatovercome the idiosyncrasies of such developments [54].

Data 2020, 5, 20 7 of 25
Vue.js [58,59] is a programming framework developed in JavaScript that helps to build moreapproachable, versatile, performant, maintainable, and testable web applications. Socket.io [60] isa JavaScript library that offers connectivity through WebSockets in an application. Using these librariesand frameworks PWAs can be implemented more easily and most of the challenges related to real-timedata handling on interfaces could be addressed.
A meta-framework is a framework that “has a highly extensible backbone for integratingcomponents and services” [61]. Nuxt.js [62] is a meta-framework built on top of Vue.js.This meta-framework adds a great deal to modularity of the source code. As an application advancesand grows in size, by providing an efficient package structure, Nuxt.js makes it possible to easilymanage the application’s code. Conditional component rendering, data watchers, detailed input deviceevents, data bindings, universal state management, reusable components, and custom routers arefeatures that can elevate the capabilities of interfaces. The aforementioned frameworks make it easierto build these features into VASes.
3. Design of VARTTA
VARTTA is intended to enable users to perform the following, all in real-time: (1) analyze andview tweet topics, tweeter groups, and content themes in aggregate form, (2) employ various MLalgorithms to analyze incoming streams of tweets, (3) compare results of different ML algorithms,and (4) suggest customized corrections to fix errors (due to biases and covariate shifts in MLmodels). These characteristics of VARTTA are intended to empower analysts to have instant access toactionable insights.
Translating Twitter data into actionable insights requires big data analytics. As such, tweetsas well as their metadata (i.e., data that describes a tweet’s content and author), can be used foraggregations and categorizations. Such categorizations can be described by processing two specificTwitter entities: tweeters and content. Identifying the most and least influential tweeters relates to thefollower/followee network and the expressed sentiments, as was discussed in the Background section.Also, intentions and themes of a tweet must be taken into account. Terms, keywords, and extractedtopics can be used by NLP methods for advanced analyses of textual content, again as was discussedbefore [47,63,64]. Sentiments can be determined through a tweet’s metadata directly or analytically.The latter sometimes requires mixing metadata with additional data derived from sources other thanthe tweet itself (e.g., knowing a tweeter’s organizational affiliation may require analyzing the list oftweeters whom the author follows). Although this may result in more detailed analyses, it can increasecomputational costs. Based on the aggregation methods used to summarize the above features, it isfeasible to build different analytical approaches.
In designing VARTTA our goal is not to concentrate on any specific ML models; rather, our objectiveis to offer a generic stream-processing system that incorporates different ML models and computationalmechanisms for comprehensive analyses of tweets.
In Section 3.1, we describe VARTTA’s pipeline architecture for processing data streams fromTwitter. In Section 3.2, we present VARTTA’s functionalities. Finally, we demonstrate VARTTA’sefficacy in dealing with real-time Twitter data using a case study.
3.1. Data Flow Design: Pipeline Architecture
As discussed in the Background section, stream-processing systems are often described andunderstood as graph-like structures where components are concatenated, each with responsibility fora specific task. Similar to other stream-processing systems, VARTTA breaks down computational tasks,concatenates processing stages, and publishes the output as a data stream. Consequently, VARTTA’suser interface, being subscribed to this stream, receives processed data in real-time.
Design-wise we want each processing component (i.e., stage) in VARTTA’s pipeline to providea variety of processing methods. Meanwhile, in order to maintain functionality and prevent overflows,each component must process its input within a time constraint. Therefore, each component must

Data 2020, 5, 20 8 of 25
consist of subcomponents responsible for processing methods. For achieving non-blocking functionality,these subcomponents must act in parallel and be usable in a plug-and-play manner. Having suchan architecture makes it easier to incorporate multiple data processing methods independently andwithout violating time constraints. Accordingly, a diagram of VARTTA’s abstract pipeline architectureis depicted in Figure 1. This pipeline satisfies the aforementioned requirements by concatenatingcomponents as processing stages. Also, it enables real-time user interactions with ML methods anddata processing components.
Figure 1. Pipeline design for processing a stream from a source (Twitter) to VARTTA’s interface.This pipeline can be regarded as a subscriber to Twitter streams. It has three main components:Pre-Processor, Sentiment Analyzer, and Label Predictor. While the pipelines processes data in stages,each component can include subcomponents (processing methods) that process input data in paralleland in a non-blocking manner. Interacting with the interface, users provide suggestions. By recordingthe suggestions in a database (through an intermediary component between pipeline’s componentsand the actual database (i.e., a database agent), Label Predictor is able to fix/improve the results ofmachine learning (ML) methods incorporated as subcomponents.
3.1.1. Pre-Processor
Tweet analysis methods may require different types of pre-processing and different preliminaryfilters to be performed on their input. Depending on the pre-requisites of inputs of proceedingcomponents, the Pre-Processor component of VARTTA can edit and shape the content of tweets invarious forms. For instance, some sentiment analysis methods can analyze a tweet’s image. In thatcase, a subcomponent in Pre-Processor must be implemented to check that the corresponding field forimage in a tweet’s data is present and is not null. For the sake of simplicity, we only focus on textualanalysis of tweets in VARTTA. Textual content often includes undesirable words (e.g., stop words)that are repeated frequently and are not necessarily useful in processing. Examples of such words are“the”, “and”, and “of”. Other types of undesirable words (e.g., dates or numbers) can be identified,removed, or edited depending on the domain of interest. The incoming tweet stream is already filteredby keywords. Therefore, only the non-uniform textual content must be handled prior to processing.For this aim, requirements of NLP methods that are used in the proceeding components of VARTTA’spipeline must be considered. Some of these methods handle stop words internally while some requirethe input text to be free of such words. Considering these requirements, only one subcomponent issufficient in Pre-Processor and the rules for it to remove stop words are described in Table 1.

Data 2020, 5, 20 9 of 25
Table 1. Implemented rules for the only subcomponent of the Pre-Processor component of VARTTA.
# Rule Description
1 Uniform Resource Locators(URLs)
Regular expression:“/((www\.[\S]+)|(http[\S]*))/g”Removes every substring
with “www.*\T1\textquotedblright; or “http://*”
2 Special Characters Regular expression: “/[-’"?!,.():;]/g”Removespunctuation characters
3 Twitter Handles, Hashtags,and Retweets
Regular expression: “/[@#](\S)+/gi” and“/\brt\b/g”Removes ‘@’, ‘#’, ‘RT’ signs
4 Ellipsis Regular Expression: “/\.{2,}/g”Removes signs related totext ellipsis (i.e., ‘ . . . ’)
5 White Spaces and Leading/TrailingSpaces
Regular Expression: “/\s\s*/g” and “/ˆ\s+|\s+$/g”Replacesextra white space characters with only one
3.1.2. Sentiment Analyzer
Various state-of-the-art sentiment analysis methods exist in the literature; depending on need,different methods can be used. Since one of the research questions of this paper is to examine howflexible and scalable it is to make use of various ML techniques and methods, we implemented fivesentiment analysis methods as subcomponents in VARTTA’s pipeline. The list and description of eachmethod can be seen in Table 2. Each subcomponent processes the data independently, and access type,accuracy, and analytical approach for each of these methods are different. Some of these methodshave their own advanced pre-processing mechanisms. The pre-processed text resulting from thePre-Processor component is the input to all subcomponents of the Sentiment Analyzer component (i.e.,the sentiment analysis methods).
Table 2. Implemented sentiment analysis methods as subcomponents of the Sentiment Analyzercomponent of VARTTA’s pipeline.
# Sentiment Analysis Method Description
1 NaturalJS Library(AFINN-165 Vocab.)
Also called NaturalNode [65].AFINN is a list of English words rated for valence [66].
2 NaturalJS Library(SENTICON Vocab.)
Ibid.The analysis is done using a different approach mentioned in [67].
3 NaturalJS Library (Pattern Vocab.)Ibid.
The Pattern vocabularies are from Pattern project of CLiPS ResearchCenter [68].
4 SentimentJS Library Different library for an AFINN-based sentiment analysis for Node.js [69]
5 IBM Natural LanguageUnderstanding (NLU) API
Formerly known as AlchemyAPI, is an external API that providesvarious types of advanced analyses, including sentiment analysis [70].
3.1.3. Label Predictor (Classifier)
As discussed in the Background section, a comprehensive analysis should consider three featuresof a tweet: (a) the topic of the discussion, (b) the group to which author of the tweet belongs, and (c)the theme of the tweet (i.e., summarized intentions). The topic of discussion can be determined bythe search keyword(s) that acquired a tweet. It can also be determined by using more advanced NLPtechniques to derive granular topics from textual content. For the sake of simplicity, we considersearch keywords as topics. Group and theme are label classes that classifiers can predict for tweetsbased on their content. Depending on the context, ‘tweeter group’ can take on values such as media,general public, and governmental agencies. Likewise, ‘content theme’ can be educational, personal,and unrelated, among others.

Data 2020, 5, 20 10 of 25
Similar to previous components, the Label Predictor component of VARTTA also supportsa plug-and-play mechanism by implementing different analytical methods as its subcomponents.Accordingly, six popular classifying methods in the ML literature are implemented as subcomponentsof the Label Predictor component:
• Long Short-Term Memory Model (LSTM)• Convolutional Neural Network (CNN)• Support Vector Machine (SVM)• K-Nearest Neighbors (KNN)• Random Forests (RF)• Multilayer Perceptron (MLP)
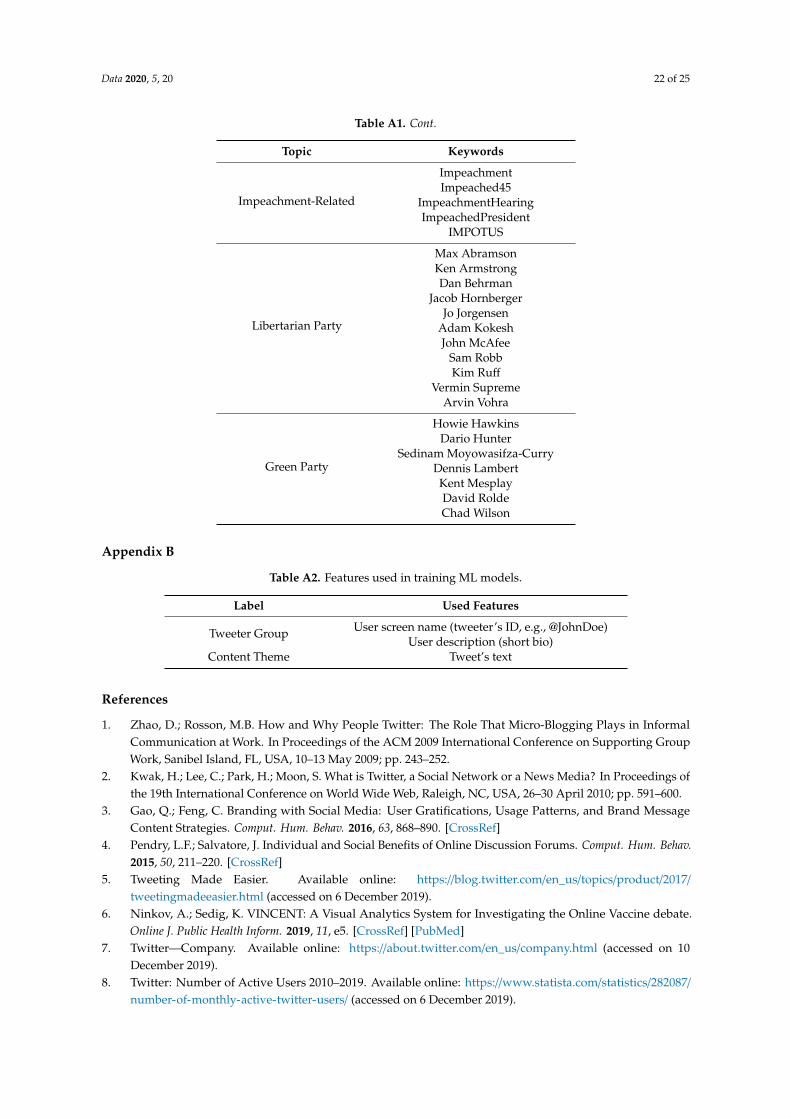
A list of the features used to train these models can be found in Appendix B. Another classifyingmethod, named ‘customized’, is also implemented to attach labels to tweets (content themes) and theirauthors (tweeter groups) based on their similarity to previous suggestions made by analysts usingVARTTA. These suggestions get stored in an internal database with a database manager (agent) asdepicted in Figure 1. Using this classifying method, heuristic suggestions provided by analysts will betaken into account.
The aforementioned methods are implemented using Scikit-learn [71] and Tensorflow [72] librariesin Python. Technically, they are implemented as external APIs and are not part of VARTTA’s server.However, communication with these subcomponents is made through HTTP endpoints; hence,conceptually, it seems as if they are running as VARTTA’s subcomponents. Each subcomponent listenson a specific endpoint and, by emitting the tweet to that endpoint, predicts and returns the class labels.This allows developers to offload computational requirements to and make use of a more powerfulserver and a distributed architecture.
3.2. Interface Design
Using the proposed pipeline, VARTTA’s interface component is always connected to the processeddata stream and, therefore, is always being updated. Accordingly, the interface’s elements (e.g.,data visualizations) must be reactive to incoming data and get updated dynamically. Visual monitoring,anomaly detection, and predictive analyses are the main analytics goals of VARTTA. Accordingly,interactions with visual elements must take into account the ability to communicate with the streampublisher (i.e., the server). VARTTA’s interface is comprised of three main screens (i.e., subcomponents):Analytics, Compare, and Shuffler. Analysts can go back and forth between these screens. In order toincrease quality of the interactions, VARTTA must preserve the current state of each screen. This isintended to reduce the cognitive load resulting from visual discontinuity of the back-and-forthmovement between screens. Details of VARTTA’s interface, a Progressive Web App, implementedusing Vue.js and Nuxt.js libraries, are discussed in the following sections.
3.2.1. Analytics Screen
Figures 2 and 3 show the Analytics screen of VARTTA. This screen includes two menus and fourvisual components. Using dropdown menus, users can select from among the provided analyticsmethods. This selection affects the visual representations of this screen (i.e., Sankey Diagram, Heat Map,Scatter Plot, and Tweet Collection). Sankey Diagram represents the proportion of tweeter categoriesand content themes involved in each topic. It helps users to visually monitor Twitter’s informationspace and gain an understanding of the underlying volume of users and their intentions under eachsubtopic. This screen makes the performance of this task possible without forcing analysts to gothrough all of the tweets posted under each topic. To help with better identification, tweeter groups,topics, and content themes are color-coded.

Data 2020, 5, 20 11 of 25
Figure 2. The top portion of the Analytics screen includes a Sankey Diagram and Heat Map.
Figure 3. The bottom portion of the Analytics screen includes a Scatter Plot and Tweet Collection.
Selecting a text classification method along with a sentiment analysis method fills Heat Map,next to Sankey Diagram. Each cell in Heat Map encodes average sentiment of the tweets of a tweetergroup or a content theme (listed along the vertical axis) against its related subtopic (listed along thehorizontal axis). The goal of this visualization is to enable analysts to perform hybrid analyses (seeFigure 4).

Data 2020, 5, 20 12 of 25
Figure 4. A hybrid analysis using the groups and themes involved in ‘democratic party’ discussions.In this configuration of Heat Map, the chosen topic and the selected sentiment analysis techniquesare ‘democratic party’ and ‘IBM NLU’, respectively. As an example, in this configuration, personaltweets related to ‘amy klobuchar’ have strong positive sentiments; no tweets from ‘media’ has beendetected relating ‘joe biden’; tweets about ‘bloomberg’ have negative sentiments, are mainly from‘public’, and are tweeted for ‘personal’ intentions.
It should be noted that, in some tweeter groups or content themes, there might be no tweets froma subtopic, resulting in a blank cell in the Heat Map.
Selecting the sentiment analysis method results in changes in Scatter Plot. Each item on thisplot represents a tweeter (i.e., a tweet author). The vertical and horizontal axes represent averagesentiment and tweeter influence values, respectively. Tweeter influence, i, is determined using thefollowing formula:
i =# o f f ollowers
# o f f ollowing + 1(1)
Selecting a tweeter icon displays a collection of the tweeters’ recent tweets (collections on theright-hand side of Scatter Plot). This way, VARTTA’s users can drill down on authors to acquirebackground knowledge about them and/or identify major influencers of discussions. This canfamiliarize VARTTA’s users with tweeters and help in a predictive analysis in conjunction with theShuffler screen.
3.2.2. Compare Screen
Figures 5 and 6 shows the Compare screen of VARTTA. This interface component enables analyststo compare and contrast results of different analytics methods. The number of methods to comparecan be set using an adjustable control on top of the screen (see Figure 5). Afterwards, the methodsto compare can be selected. This results in the side-by-side display of instances of Sankey Diagramand Heat Map (see Figure 6). The juxtaposition of results of different methods can provide analystswith a richer mental model of analytical methods. Furthermore, it can and help analysts in detectinganomalies and observing differences among various analytical methods. This screen can also helpusers in verifying analytical models resulting from these methods in real-time scenarios and in different

Data 2020, 5, 20 13 of 25
contexts. As can be deduced, real-time updates of visualizations in this screen can facilitate moreeffective analysis by VARTTA’s users. This feature is one of the core contributions of this research.
Figure 5. The Compare screen is built using visualization components from the Analytics screen.The top section holds a slider to choose the number of comparisons.
Figure 6. Full view of the Compare screen for three comparisons. The selected tweet labeling andsentiment analysis methods, from left to right, are user-customized labeling and NaturalJS-AFINN165,K-Nearest Neighbors (KNN) and IBM NLU, and Support Vector Machine (SVM) and NaturalJS-Senticon.Also, aggregate results related to ‘democratic party’ are filtered for hybrid comparisons on the instancesof Heat Map.
3.2.3. Shuffler Screen
Figure 7 shows the Shuffler screen of VARTTA. This screen consists of two sections: a Topics menuand a tweet collections area. The Topics menu is represented using a hierarchical structure. Topicsare made of subtopics which are actual search keywords used to acquire a tweet. When groupedtogether, multiple subtopics form a topic. This portion of the screen provides users with interactionmechanisms to filter tweets. Analysts can filter tweets by toggling topics/subtopics. On this screen,a tweet collection for each topic is represented and these collections are put side by side.

Data 2020, 5, 20 14 of 25
Figure 7. A sample configuration of the Shuffler screen. The subtopics (i.e., keywords) are groupedunder a Topics menu and a hierarchical structure is used for representation. Adjusting the selectedtopics through this menu results in changes in tweet collections represented in the middle of the screen.These collections are being updated in real-time as new tweets come into VARTTA. Users can short-listsome tweets for a more-detailed exploration. In such cases, the icon of the tweet appears on the bottomof the related collection to that tweet.
Figure 7 shows a sample configuration of this screen where some tweets share subtopics (i.e.,keywords) across multiple topics. In this example, only ‘democratic’ and ‘impeachment’ are among theselected topics, and ‘republican’ is not selected. However, since there are tweets that have keywordsrelated to ‘republican party’, a collection signifying ‘republican’ is also apparent on the screen, and thetweet is repeated under each related collection. This feature of VARTTA helps analysts appreciate thecomplexity of discussions and further facilitates the exploration of tweets.
Drilling down on a tweet is possible by toggling the hamburger menu icon on the top-right-handside of each tweet. As a result, labels given to the tweet by the Sentiment Analyzer and Label Predictorcomponents would be visible to users (see Figure 8).
Tweet collections are sorted alphabetically according to their topic. The visual discontinuitybetween these track-like structures makes it hard for analysts to compare and contrast the latentinformation for tweets from collections on each side of the screen. Also, due to scrolling, the visualdiscontinuity among tweets from one collection further blocks efficient tweet exploration.
In order to overcome these issues, another filtering mechanism is also implemented. By togglingthe selection button on a tweet (i.e., the plus/minus button located next to the time label of each tweet),analysts can add tweets to or remove them from another list located at the bottom of the screen asshown in Figure 7. If short-listed, an icon of the author’s profile picture along with a badge wouldbe shown at the bottom of each collection, representing the selected tweet. The badge can be usedto remove the tweet from this list. By selecting each of the tweet icons, the collection scrolls to thetweet, making it easier to access the actual tweet. This enables analysts to go back and forth betweenselections and enrich their mental models of the information space.
Short-listing the tweets helps analysts to pick and choose the tweets that seem to require a moredetailed exploration. Furthermore, this mechanism puts users in control of the amount of content theyexplore. Accordingly, each short-listed tweet is added as an icon to a context map, shown at the bottomof the Shuffler screen. Regardless of topic selections, this map lists all of the topics in the same orderthat they are presented in the Topics menu and enables users to overcome the visual discontinuitiesfaced in collections. As such, analysts can maintain an overview picture of the information spacewhile having a focused view on a subset of tweets. By selecting each icon shown on this map, analystsadd/remove the respective tweet to the bottom section of the screen. This enables them to compare and

Data 2020, 5, 20 15 of 25
contrast tweets in a focused manner. In order to prevent distractions, the maximum number of tweetsthat are allowed to be added to this section is strictly limited to four. Accordingly, selected tweets havered borders around their icons to represent their selection status. This mechanism is shown in Figure 9.
Figure 8. Drilling down on tweets is possible using the hamburger button. Two results of the analysisstage are visible in two sections: (a) the sentiment analysis using various methods and (b) tweetergroups and content themes produced by each ML technique for the tweet. To help with identification,the results are coded using colors and icons.
Figure 9. Detailed exploration using a context map. Of the short-listed tweets, a few are chosen (havingred borders around their icons) for detailed exploration and are added to the bottom section. By togglingthe icon of a tweet on the map, the tweet can be added to or removed from the bottom section.
This detailed exploration can help analysts identify mislabeled tweets. In fluctuating contexts,mislabeling and lack of accuracy is common in ML techniques. Consequently, users may want tosuggest a new category for ‘tweeter group’ or ‘content theme’ feature of a tweet. By choosing theedit button on the top section of each tweet, represented as a red pen icon, analysts are providedwith a form to enter two values as custom labels. Selecting the save button on this form submitsthe form and sends the inputted data to VARTTA’s server (see Figure 10). The server then saves the

Data 2020, 5, 20 16 of 25
suggestion in its internal database. In parallel, the server queries the database to find similar tweetsand assigns the suggested labels to them. Also, hereafter, the server tries to assign ‘custom’ labels tosimilar incoming tweets—a function performed by a subcomponent of the Label Predictor componentin VARTTA’s pipeline.
Figure 10. Editing/Suggestion menu for a tweet.
This subcomponent acts as yet another classifier assigning ‘custom’ labels to similar tweets,according to previous user suggestions. To define similarity, labels given to tweets by other classifiersare summarized and tagged with each method’s name. Likewise, previous suggestions of users arealso summarized in the same way. Then the difference of the two summaries is calculated for eachtweet. Finally, a threshold is used to decide on the similarity value. VARTTA uses eight as its similaritythreshold; given that the incoming tweet has at least eight labels in common with one of the previoussuggestions, it should be given the same label as the suggestion found in the database. This heuristic isintended to fix the errors of ML techniques. The threshold can be adjusted for addressing differentneeds. Also, by selecting the ‘user-customized labeling’ method in the Compare screen and Analyticsscreen, analysts are able to view the state of previous suggestions. As new data comes into the system,using reactive components and frameworks enables VARTTA to seamlessly and dynamically updateits visualizations in real-time.
4. Case Study: Election Debates
To showcase the capabilities of VARTTA, we present a case study in the context of the U.S. 2020presidential election debates. For this case study, we considered the following tasks:
• search for a list of terms,• analyze results,• identify errors and suggest corrections, and• analyze the corrected results.
Combining some of the hot topics of the time with names of the candidates from each politicalparty, 49 keywords were used as search terms (see Appendix A). Next, we tried to answer the followingquestions:
(Q1) What are the identified tweeter groups and content themes?(Q2) Which of the given topics get coverage by media and news agencies?(Q3) Which topic contains most of the content posted for awareness and educational purposes?(Q4) Which types of tweeters participate in ‘impeachment’ discussions? What is their intent?(Q5) In general, how does the media react to minor parties? What is the general sentiment
towards them?(Q6) How are the tweets, intended as personal tweets, expressed? What is the general sentiment?
Data 2020, 5, 20 17 of 25
(Q7) Currently, which tweeter is the most influential? What is their average sentiment? What aretheir recent tweets?
(Q8) What difference does the usage of different classifiers (e.g., CNN with NaturalJS library,RF with IBM Natural Language Understanding API, and MLP and SentimentJS library) make inidentifying tweeter groups? What about content themes? Are there any groups or themes thathave not been identified using any of the above?
(Q9) Q1 to Q7 with regards to each of the analysis techniques mentioned above.(Q10) How can we add more context to the analysis of individual tweets? How can we verify the
content of a tweet and identify fake news?(Q11) What is exactly the result of each analysis technique for a given tweet?(Q12) How can one drill down into the analytics from different subtopics and compare and contrast
them without having to memorize or write down the results?(Q13) How can we fix a tweet if it is misclassified?
After feeding the keywords to VARTTA, the interface is provided with a data stream, and, throughthe control menus at the top of the Analytics screen, the result of analytical models can be filtered.The rest of this section is dedicated to answering the above questions.
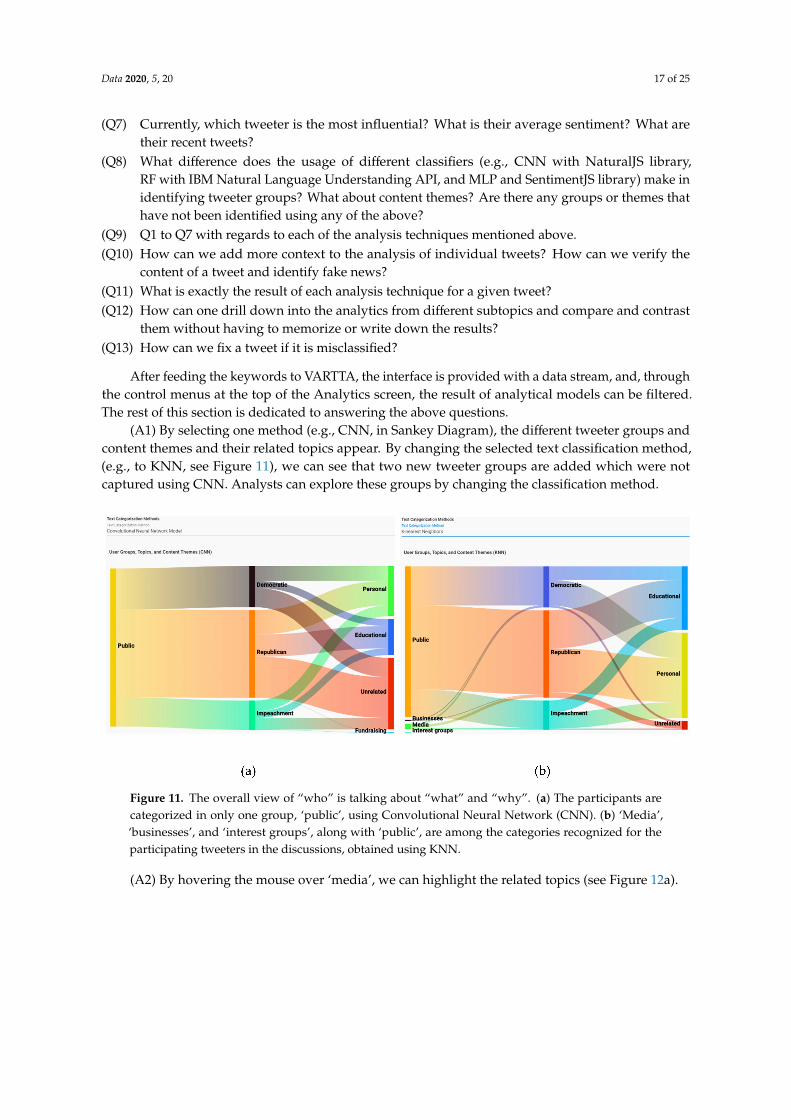
(A1) By selecting one method (e.g., CNN, in Sankey Diagram), the different tweeter groups andcontent themes and their related topics appear. By changing the selected text classification method,(e.g., to KNN, see Figure 11), we can see that two new tweeter groups are added which were notcaptured using CNN. Analysts can explore these groups by changing the classification method.
Figure 11. The overall view of “who” is talking about “what” and “why”. (a) The participants arecategorized in only one group, ‘public’, using Convolutional Neural Network (CNN). (b) ‘Media’,‘businesses’, and ‘interest groups’, along with ‘public’, are among the categories recognized for theparticipating tweeters in the discussions, obtained using KNN.
(A2) By hovering the mouse over ‘media’, we can highlight the related topics (see Figure 12a).

Data 2020, 5, 20 18 of 25
Figure 12. Hovering the mouse over a part of Sankey Diagram highlights the parts related to it anddims others. (a) Highlighting one tweeter group results in fading out unrelated entities. (b) Similarly,highlighting a content theme results in capturing its related entities, while fading out others to keepthe context.
(A3) Similarly, by hovering the mouse over ‘educational’ content theme, we can highlight thetopics involved in that content theme (see Figure 12b).
(A4) Accordingly, hovering the mouse over ‘impeachment’ topic highlights the related users andcontent themes and dims the rest (see Figure 13).
Figure 13. Hovering the mouse over a topic highlights content themes and tweeter groups that areinvolved in that topic.
(A5) and (A6) Having selected KNN as our classifier, ‘personal’ and ‘educational’ are amongcontent themes, and ‘public’, ‘media’, and ‘interest groups’ are among the tweeter groups that arerelated to ‘green’ and ‘libertarian’ topics. By selecting a sentiment analysis technique (e.g., IBM NLU)and choosing ‘democratic’ from Sankey Diagram, Heat Map gets updated to represent the averagesentiment for each tweeter group/content theme. As shown in Figure 4, it can be noted that somethemes/groups have no tweets under some of the subtopics. Similar to personal tweets, the hybridanalysis makes it possible to analyze each category in more depth.
(A7) By zooming in and out on Scatter Plot, we are able to find the farthest tweeter along thehorizontal axis who represents an influential tweet author. Also, the location on vertical axis shows theaverage sentiment for that tweeter. This average value is calculated by only taking into account the

Data 2020, 5, 20 19 of 25
tweets that are already in the system. Selecting a tweeter results in the appearance of a collection ofthat tweeter’s recent tweets (timeline) on the pane at the right-hand side, as demonstrated in Figure 14.
Figure 14. Scatter Plot for representing tweeters participating in the discussions and a Tweet Collectioncontrolled by the selection of the icon of each tweeter.
(A8) and (A9) In the Compare screen, we can choose to have three panes for comparing. Since thesecomponents are similar to the ones on the Analytics screen, they also get updated in real-time, react tointeraction mechanisms in the same way, and provide the same functionality. Therefore, as depicted inFigure 6, this screen enables tweeters to juxtapose different analysis methods while allowing them toperform the previous analytical tasks.
(A10) VARTTA uses a track-like structure for each topic and puts topics side-by-side to reducevisual discontinuity and updates the topics simultaneously. As depicted in Figure 7, this design helpsusers see ‘what’ events are happening in the discussions related to all of the listed parties. Verificationand anomaly detection here become relatively easy tasks since one can follow the threads of tweets tobetter understand the underlying context of the discussions.
(A11) Using the hamburger button on the top-right corner of each tweet, we are able to drill downa tweet to see more details about it (see Figure 8).
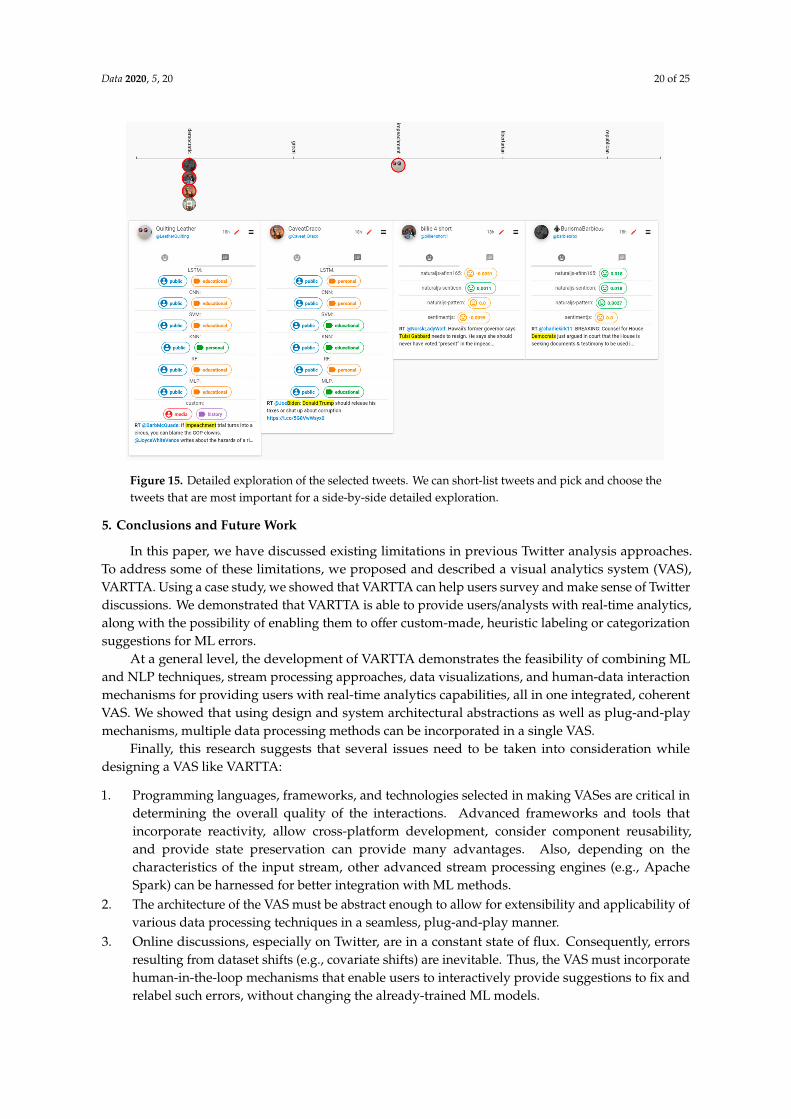
(A12) Using the context map at the bottom of the screen, we can short-list up to four tweets fromeach collection and view them in the context map. The purpose of using such a mechanism (seeFigure 15) is to further mitigate the problem of visual discontinuity of tweet collections or the verticalposition of tweets inside a collection.
(A13) Using the edit icon at the top of each tweet, we are able to edit the labeling for each tweetand/or add our own custom labels. This way, by going back to the Analytics screen or Compare screen,we can see the effects of our custom labeling suggestion. This mechanism is demonstrated in Figure 10and the result of such suggestions is shown in Figure 6.
Data 2020, 5, 20 20 of 25
Figure 15. Detailed exploration of the selected tweets. We can short-list tweets and pick and choose thetweets that are most important for a side-by-side detailed exploration.
5. Conclusions and Future Work
In this paper, we have discussed existing limitations in previous Twitter analysis approaches.To address some of these limitations, we proposed and described a visual analytics system (VAS),VARTTA. Using a case study, we showed that VARTTA can help users survey and make sense of Twitterdiscussions. We demonstrated that VARTTA is able to provide users/analysts with real-time analytics,along with the possibility of enabling them to offer custom-made, heuristic labeling or categorizationsuggestions for ML errors.
At a general level, the development of VARTTA demonstrates the feasibility of combining MLand NLP techniques, stream processing approaches, data visualizations, and human-data interactionmechanisms for providing users with real-time analytics capabilities, all in one integrated, coherentVAS. We showed that using design and system architectural abstractions as well as plug-and-playmechanisms, multiple data processing methods can be incorporated in a single VAS.
Finally, this research suggests that several issues need to be taken into consideration whiledesigning a VAS like VARTTA:
1. Programming languages, frameworks, and technologies selected in making VASes are critical indetermining the overall quality of the interactions. Advanced frameworks and tools thatincorporate reactivity, allow cross-platform development, consider component reusability,and provide state preservation can provide many advantages. Also, depending on thecharacteristics of the input stream, other advanced stream processing engines (e.g., ApacheSpark) can be harnessed for better integration with ML methods.
2. The architecture of the VAS must be abstract enough to allow for extensibility and applicability ofvarious data processing techniques in a seamless, plug-and-play manner.
3. Online discussions, especially on Twitter, are in a constant state of flux. Consequently, errorsresulting from dataset shifts (e.g., covariate shifts) are inevitable. Thus, the VAS must incorporatehuman-in-the-loop mechanisms that enable users to interactively provide suggestions to fix andrelabel such errors, without changing the already-trained ML models.

Data 2020, 5, 20 21 of 25
4. The quality of component-to-component interactions within the VAS (e.g., architectural andtechnical implementations), as well as human-VAS interactions (e.g., human-ML and human-datainteractions), are critical in determining the overall efficacy of the joint cognitive system forcarrying out complex analytical tasks. The importance of such interactions is apparent in real-timeanalytics scenarios. Therefore, both types of interaction must be examined carefully.
Future Work
VARTTA’s development has two major limitations. The first limitation is the quality of the datastream. For free accounts, Twitter only provides a small portion of the actual tweets. In future work,streams with higher data qualities can be used and the resulting analytics can be compared. The secondlimitation is the use of multiple data domains. Supervised ML models only produce labels accordingto the data with which they are trained. As a result, it can be inefficient to use one model for multiplediscussions. A possible fix for that is to provide users with the option of loading custom models.
Author Contributions: Conceptualization, K.S. and A.H.; data curation, A.H.; formal analysis, K.S. and A.H.;funding acquisition, K.S.; investigation, A.H. and K.S.; methodology, A.H.; project administration, K.S.; resources,K.S.; software, A.H.; supervision, K.S.; validation, K.S. and A.H.; visualization, A.H. and K.S.; writing—originaldraft, A.H.; writing—reviewing and editing, K.S. All authors have read and agreed to the published version ofthe manuscript.
Funding: This research was funded by Natural Sciences and Engineering Research Council of Canada (NSERC).
Conflicts of Interest: The authors declare no conflict of interest.
Appendix A
Table A1. List of keywords used in case study.
Topic Keywords
Democratic Party
democratsdems
Michael BennetBennet
Joe BidenBiden
Michael BloombergBloomberg
Cory BookerBooker
Pete ButtigiegJulián CastroJohn DelaneyTulsi Gabbard
Amy KlobucharDeval Patrick
Bernie SandersTom Steyer
Elizabeth WarrenMarianne Williamson
Andrew Yang
Republican Party
Donald Trumptrump
Joe WalshBill Weld
Mark Sanford
Data 2020, 5, 20 22 of 25
Table A1. Cont.
Topic Keywords
Impeachment-Related
ImpeachmentImpeached45
ImpeachmentHearingImpeachedPresident
IMPOTUS
Libertarian Party
Max AbramsonKen ArmstrongDan Behrman
Jacob HornbergerJo Jorgensen
Adam KokeshJohn McAfee
Sam RobbKim Ruff
Vermin SupremeArvin Vohra
Green Party
Howie HawkinsDario Hunter
Sedinam Moyowasifza-CurryDennis LambertKent MesplayDavid RoldeChad Wilson
Appendix B
Table A2. Features used in training ML models.
Label Used Features
Tweeter Group User screen name (tweeter’s ID, e.g., @JohnDoe)User description (short bio)
Content Theme Tweet’s text
References
1. Zhao, D.; Rosson, M.B. How and Why People Twitter: The Role That Micro-Blogging Plays in InformalCommunication at Work. In Proceedings of the ACM 2009 International Conference on Supporting GroupWork, Sanibel Island, FL, USA, 10–13 May 2009; pp. 243–252.
2. Kwak, H.; Lee, C.; Park, H.; Moon, S. What is Twitter, a Social Network or a News Media? In Proceedings ofthe 19th International Conference on World Wide Web, Raleigh, NC, USA, 26–30 April 2010; pp. 591–600.
3. Gao, Q.; Feng, C. Branding with Social Media: User Gratifications, Usage Patterns, and Brand MessageContent Strategies. Comput. Hum. Behav. 2016, 63, 868–890. [CrossRef]
4. Pendry, L.F.; Salvatore, J. Individual and Social Benefits of Online Discussion Forums. Comput. Hum. Behav.2015, 50, 211–220. [CrossRef]
5. Tweeting Made Easier. Available online: https://blog.twitter.com/en_us/topics/product/2017/
tweetingmadeeasier.html (accessed on 6 December 2019).6. Ninkov, A.; Sedig, K. VINCENT: A Visual Analytics System for Investigating the Online Vaccine debate.
Online J. Public Health Inform. 2019, 11, e5. [CrossRef] [PubMed]7. Twitter—Company. Available online: https://about.twitter.com/en_us/company.html (accessed on 10
December 2019).8. Twitter: Number of Active Users 2010–2019. Available online: https://www.statista.com/statistics/282087/
number-of-monthly-active-twitter-users/ (accessed on 6 December 2019).

Data 2020, 5, 20 23 of 25
9. Tolmie, P.; Procter, R.; Rouncefield, M.; Liakata, M.; Zubiaga, A. Microblog Analysis as a Program of Work.Trans. Soc. Comput. 2018, 1, 2. [CrossRef]
10. Molyneux, L. What Journalists Retweet: Opinion, Humor, and Brand Development on Twitter. Journalism2015, 16, 920–935. [CrossRef]
11. Neuberger, C.; vom Hofe, H.J.; Nuernbergk, C. The Use of Twitter by Professional Journalists: Results ofa Newsroom Survey in Germany. In Twitter and Society; Peter Lang: New York, NY, USA, 2014; pp. 345–357.
12. Jungherr, A. Twitter Use in Election Campaigns: A Systematic Literature Review. J. Inf. Technol. Polit. 2016,13, 72–91. [CrossRef]
13. Maireder, A.; Ausserhofer, J. Political Discourses on Twitter: Networking Topics, Objects, and People.In Twitter and Society; Peter Lang: New York, NY, USA, 2014; pp. 305–318.
14. Yaqub, U.; Chun, S.A.; Atluri, V.; Vaidya, J. Analysis of Political Discourse on Twitter in the Context of the2016 Us Presidential Elections. Gov. Inf. Q. 2017, 34, 613–626. [CrossRef]
15. Martínez-Rojas, M.; del Carmen Pardo-Ferreira, M.C.; Rubio-Romero, J.C. Twitter as a Tool for theManagement and Analysis of Emergency Situations: A Systematic Literature Review. Int. J. Inf. Manag.2018, 43, 196–208. [CrossRef]
16. Sinnenberg, L.; Buttenheim, A.M.; Padrez, K.; Mancheno, C.; Ungar, L.; Merchant, R.M. Twitter as a Tool forHealth Research: A Systematic Review. Am. J. Public Health 2017, 107, e1–e8. [CrossRef]
17. Charles-Smith, L.E.; Reynolds, T.L.; Cameron, M.A.; Conway, M.; Lau, E.H.Y.; Olsen, J.M.; Pavlin, J.A.;Shigematsu, M.; Streichert, L.C.; Suda, K.J.; et al. Using Social Media for Actionable Disease Surveillance andOutbreak Management: A Systematic Literature Review. PLoS ONE 2015, 10, e0139701. [CrossRef]
18. Nitins, T.; Burgess, J. Twitter, Brands, and User Engagement. In Twitter and Society; Peter Lang: New York,NY, USA, 2014; Volume 89, pp. 293–304.
19. Weller, K.; Bruns, A.; Burgess, J.; Mahrt, M.; Puschmann, C. (Eds.) Twitter and Society, 1st ed.; Peter Lang:New York, NY, USA, 2013; ISBN 978-1-4331-2169-2.
20. Haustein, S. Grand Challenges in Altmetrics: Heterogeneity, Data Quality and Dependencies. Scientometrics2016, 108, 413–423. [CrossRef]
21. Overview (Twitter API Documents). Available online: https://developer.twitter.com/en/docs/tweets/filter-realtime/overview (accessed on 18 December 2019).
22. Chou, W.S.; Hunt, Y.M.; Beckjord, E.B.; Moser, R.P.; Hesse, B.W. Social Media Use in The United States:Implications for Health Communication. J. Med. Internet Res. 2009, 11, e48. [CrossRef] [PubMed]
23. Stumpf, S.; Rajaram, V.; Li, L.; Burnett, M.; Dietterich, T.; Sullivan, E.; Drummond, R.; Herlocker, J. TowardHarnessing User Feedback for Machine Learning. In Proceedings of the 12th International Conference onIntelligent User Interfaces, Honolulu, HI, USA, 28–31 January 2007; pp. 82–91.
24. Bifet, A.; Frank, E. Sentiment Knowledge Discovery in Twitter Streaming Data. In Discovery Science;Pfahringer, B., Holmes, G., Hoffmann, A., Eds.; Springer: Berlin/Heidelberg, Germany, 2010; pp. 1–15.
25. Colditz, J.B.; Chu, K.-H.; Emery, S.L.; Larkin, C.R.; James, A.E.; Welling, J.; Primack, B.A. Toward Real-TimeInfoveillance of Twitter Health Messages. Am. J. Public Health 2018, 108, 1009–1014. [CrossRef] [PubMed]
26. Moreno-Torres, J.G.; Raeder, T.; Alaiz-Rodríguez, R.; Chawla, N.V.; Herrera, F. A Unifying View on DatasetShift in Classification. Pattern Recognit. 2012, 45, 521–530. [CrossRef]
27. Gama, J.; Žliobait, I.; Bifet, A.; Pechenizkiy, M.; Bouchachia, A. A Survey on Concept Drift Adaptation. ACMComput. Surv. 2014, 46, 44. [CrossRef]
28. Sedig, K.; Parsons, P.; Babanski, A. Towards a Characterization of Interactivity in Visual Analytics. JMPT2012, 3, 12–28.
29. Parsons, P.; Sedig, K.; Didandeh, A.; Khosravi, A. Interactivity in Visual Analytics: Use of ConceptualFrameworks to Support Human-Centered Design of a Decision-Support Tool. In Proceedings of the 201548th Hawaii International Conference on System Sciences, Kauai, HI, USA, 5–8 January 2015; pp. 1138–1147.
30. Didandeh, A.; Sedig, K. Externalization of Data Analytics Models: Human Interface and the Management ofInformation: Information, Design and Interaction; Yamamoto, S., Ed.; Springer: Cham, Switzerland, 2016;pp. 103–114.
31. Sedig, K.; Parsons, P. Design of Visualizations for Human-Information Interaction: A Pattern-BasedFramework. Synth. Lect. Vis. 2016, 4, 1–185. [CrossRef]
32. Laylavi, F.; Rajabifard, A.; Kalantari, M. A Multi-Element Approach to Location Inference of Twitter: A Casefor Emergency Response. ISPRS Int. J. Geo-Inf. 2016, 5, 56. [CrossRef]

Data 2020, 5, 20 24 of 25
33. Riquelme, F.; González-Cantergiani, P. Measuring User Influence on Twitter: A Survey. Inf. Process. Manag.2016, 52, 949–975. [CrossRef]
34. Bild, D.R.; Liu, Y.; Dick, R.P.; Mao, Z.M.; Wallach, D.S. Aggregate Characterization of User Behavior inTwitter and Analysis of the Retweet Graph. ACM Trans. Internet Technol. 2015, 15, 4:1–4:24. [CrossRef]
35. Desai, M.; Mehta, M.A. Techniques for Sentiment Analysis of Twitter Data: A Comprehensive Survey.In Proceedings of the 2016 International Conference on Computing, Communication and Automation(ICCCA), Greater Noida, India, 29–30 April 2016; pp. 149–154.
36. Stephens, R. A Survey of Stream Processing. Acta Inform. 1997, 34, 491–541. [CrossRef]37. Stonebraker, M.; Çetintemel, U.; Zdonik, S. The 8 Requirements of Real-Time Stream Processing. SIGMOD
Rec. 2005, 34, 42–47. [CrossRef]38. Spark Streaming|Apache Spark. Available online: https://spark.apache.org/streaming/ (accessed on 17
December 2019).39. Apama Community Edition. Available online: http://www.apamacommunity.com/ (accessed on 26 January
2020).40. Dataflow: Stream & Batch Processing. Available online: https://cloud.google.com/dataflow (accessed on 26
January 2020).41. Thomas, J.J.; Cook, K.A. (Eds.) Illuminating the Path: The Research and Development Agenda for Visual Analytics;
National Visualization and Analytics Ctr.: Los Alamitos, CA, USA, 2005; ISBN 978-0-7695-2323-1.42. Endert, A.; Hossain, M.S.; Ramakrishnan, N.; North, C.; Fiaux, P.; Andrews, C. The Human Is the Loop:
New Directions for Visual Analytics. J. Intell. Inf. Syst. 2014, 43, 411–435. [CrossRef]43. Parsons, P.; Sedig, K.; Mercer, R.E.; Khordad, M.; Knoll, J.; Rogan, P. Visual Analytics for Supporting
Evidence-based Interpretation of Molecular Cytogenomic Findings. In Proceedings of the 2015 Workshop onVisual Analytics in Healthcare, Chicago, IL, USA, 25 October 2015; p. 2.
44. Mayr, E.; Smuc, M.; Risku, H. Many Roads Lead to Rome: Mapping Users’ Problem-Solving Strategies. Inf.Vis. 2011, 10, 232–247. [CrossRef]
45. Parsons, P.; Sedig, K. Distribution of Information Processing While Performing Complex Cognitive Activitieswith Visualization Tools. In Handbook of Human Centric Visualization; Huang, W., Ed.; Springer: New York,NY, USA, 2014; pp. 693–715. ISBN 978-1-4614-7485-2.
46. Wu, Y.; Cao, N.; Gotz, D.; Tan, Y.-P.; Keim, D.A. A Survey on Visual Analytics of Social Media Data. IEEETrans. Multimed. 2016, 18, 2135–2148. [CrossRef]
47. Chen, S.; Lin, L.; Yuan, X. Social Media Visual Analytics. Comput. Graph. Forum 2017, 36, 563–587. [CrossRef]48. Zhao, K.; Ward, M.; Rundensteiner, E.; Higgins, H. MaVis: Machine Learning Aided Multi-Model Framework
for Time Series Visual Analytics. Available online: https://www.ingentaconnect.com/content/ist/ei/2016/
00002016/00000001/art00018 (accessed on 19 December 2019).49. Angulo, D.A.; Schneider, C.; Oliver, J.H.; Charpak, N.; Hernandez, J.T. A Multi-Facetted Visual Analytics Tool
for Exploratory Analysis of Human Brain and Function Datasets. Front. Neuroinform. 2016, 10, 36. [CrossRef]50. Keim, D.A.; Munzner, T.; Rossi, F.; Verleysen, M. Bridging Information Visualization with Machine Learning
(Dagstuhl Seminar 15101). Dagstuhl Rep. 2015, 5, 1–27.51. Ola, O.; Sedig, K. The Challenge of Big Data in Public Health: An Opportunity for Visual Analytics. Online J.
Public Health Inform. 2014, 5, 223.52. Yu, Y.; Long, J.; Liu, F.; Cai, Z. Machine Learning Combining with Visualization for Intrusion Detection:
A Survey. In Modeling Decisions for Artificial Intelligence; Torra, V., Narukawa, Y., Navarro-Arribas, G.,Yañez, C., Eds.; Springer: Cham, Switzerland, 2016; pp. 239–249.
53. Frénay, B.; Dumas, B. Information Visualisation and Machine Learning: Characteristics, Convergence andPerspective. In Proceedings of the European Symposium on Artificial Neural Networks, ComputationalIntelligence and Machine Learning (ESANN 2016), Bruges, Belgium, 27–29 April 2016.
54. Majchrzak, T.A.; Biørn-Hansen, A.; Grønli, T.-M. Progressive Web Apps: The Definite Approach toCross-Platform Development? In Proceedings of the 51st Hawaii International Conference on SystemSciences (HICSS 2018), Hilton Waikoloa Village, Hi, USA, 2–6 January 2018; 2.
55. Progressive Web Apps|Web|Google Developers. Available online: https://developers.google.com/web/
progressive-web-apps/ (accessed on 26 July 2018).56. Pimentel, V.; Nickerson, B.G. Communicating and Displaying Real-Time Data with WebSocket. IEEE Internet
Comput. 2012, 16, 45–53. [CrossRef]

Data 2020, 5, 20 25 of 25
57. Malavolta, I.; Procaccianti, G.; Noorland, P.; Vukmirovic, P. Assessing the Impact of Service Workers onthe Energy Efficiency of Progressive Web Apps. In Proceedings of the 2017 IEEE/ACM 4th InternationalConference on Mobile Software Engineering and Systems (MOBILESoft), Buenos Aires, Argentina, 22–23 May2017; pp. 35–45.
58. Hanchett, E.; Listwon, B. Vue.Js in Action, 1st ed.; Manning Publications Co.: Greenwich, CT, USA, 2018;ISBN 978-1-61729-462-4.
59. The Progressive JavaScript Framework. Available online: https://vuejs.org/ (accessed on 17 December 2019).60. socketio/socket.io. Available online: https://github.com/socketio/socket.io (accessed on 20 December 2019).61. What is Meta Framework|IGI Global. Available online: https://www.igi-global.com/dictionary/java-web-
application-frameworks/18372 (accessed on 9 January 2020).62. The Progressive Vue.js Framework. Available online: https://nuxtjs.org (accessed on 17 December 2019).63. Liu, S.; Yin, J.; Wang, X.; Cui, W.; Cao, K.; Pei, J. Online Visual Analytics of Text Streams. IEEE Trans. Vis.
Comput. Graph. 2016, 22, 2451–2466. [CrossRef]64. Kucher, K.; Kerren, A. Text visualization techniques: Taxonomy, visual survey, and community insights.
In Proceedings of the 2015 IEEE Pacific Visualization Symposium (PacificVis), Hangzhou, China, 14–17 April2015; pp. 117–121.
65. NaturalNode/natural. Available online: https://github.com/NaturalNode/natural (accessed on 17 December2019).
66. Nielsen, F.Å. A New ANEW: Evaluation of a Word List for Sentiment Analysis in Microblogs. arXiv 2011,arXiv:1103.2903.
67. Cruz, F.L.; Troyano, J.A.; Pontes, B.; Ortega, F.J. Building Layered, Multilingual Sentiment Lexicons at Synsetand Lemma Levels. Expert Syst. Appl. 2014, 41, 5984–5994. [CrossRef]
68. Clips/Pattern. Available online: https://github.com/clips/pattern (accessed on 17 December 2019).69. Sliwinski, A. Thisandagain/Sentiment. Available online: https://github.com/thisandagain/sentiment (accessed
on 17 December 2019).70. Watson Natural Language Understanding—Overview. Available online: https://www.ibm.com/cloud/
watson-natural-language-understanding (accessed on 17 December 2019).71. Scikit-Learn: Machine Learning in Python—Scikit-Learn 0.22 Documentation. Available online: https:
//scikit-learn.org/stable/ (accessed on 20 December 2019).72. TensorFlow. Available online: https://www.tensorflow.org/ (accessed on 20 December 2019).
© 2020 by the authors. Licensee MDPI, Basel, Switzerland. This article is an open accessarticle distributed under the terms and conditions of the Creative Commons Attribution(CC BY) license (http://creativecommons.org/licenses/by/4.0/).
Copyright © 2022 FDOKUMEN