Variations in Cost Inefficiencies of Smallholder Broiler Producers in Ghana: What Factors Explains...
10
The Empirical Economics Letters, 13(9): (September 2014) ISSN 1681 8997 Variations in Cost Inefficiencies of Smallholder Broiler Producers in Ghana: What Factors Explains It? Raymond K. Dziwornu Department of Banking and Finance University of Professional StudiesAccra, Ghana Email: [email protected] W. Seini, Daniel. B. Sarpong, G. T-M. Kwadzo, John K. M. Kuwornu Department of Agricultural Economics & Agribusiness University of Ghana Legon, Ghana Abstract: This paper analyzed the factors explaining variations in cost inefficiency of smallholder broiler producers in Ghana, by simultaneously estimating a stochastic Cobb-Douglas cost frontier and firm-specific inefficiency models, using maximum likelihood estimation approach. The empirical results revealed that smallholder broiler producers are operating about 10 percent above the cost frontier, and that extension service contact, market age of broilers, market access, capacity utilization and credit access are the main factors that significantly explain variations in cost inefficiency of broiler producers. Policy measures directed at these factors as well as proper farm management practices will significantly reduce cost inefficiencies of broiler producers. Keywords: Cost Inefficiency, Smallholder Commercial Broiler Producers, Stochastic Cost Frontier Model, Ghana 1. Introduction The poultry sector plays an important role in the agricultural growth and daily diets of the average household in Ghana. The sector contributes about 5.0 percent to Ghana’s agricultural Gross Domestic Product (MOFA, 2010) and 40 percent of the national animal protein supply (FAO report, 2010). Up until the 1990s, the broiler sector supplied about 95 percent of the total domestic poultry meat requirement in Ghana. However, since 1995 the share of domestic broiler production in total market demand has declined, now satisfying only about 11 percent (Randan and Ashitey, 2011). This decline is attributed to the importation of cheap poultry imports, removal of government support for drug costs and discontinuation of government importation and support for feed mill ingredients (Nkansala, 2004). These factors have raised the cost of broiler production by over 60 percent, resulting in many large poultry enterprises folding up. At the same time, poultry
Transcript of Variations in Cost Inefficiencies of Smallholder Broiler Producers in Ghana: What Factors Explains...

The Empirical Economics Letters, 13(9): (September 2014) ISSN 1681 8997
Variations in Cost Inefficiencies of Smallholder Broiler
Producers in Ghana: What Factors Explains It?
Raymond K. Dziwornu
Department of Banking and Finance
University of Professional StudiesAccra, Ghana
Email: [email protected]
W. Seini, Daniel. B. Sarpong, G. T-M. Kwadzo, John K. M. Kuwornu
Department of Agricultural Economics & Agribusiness
University of Ghana Legon, Ghana
Abstract: This paper analyzed the factors explaining variations in cost inefficiency
of smallholder broiler producers in Ghana, by simultaneously estimating a stochastic
Cobb-Douglas cost frontier and firm-specific inefficiency models, using maximum
likelihood estimation approach. The empirical results revealed that smallholder
broiler producers are operating about 10 percent above the cost frontier, and that
extension service contact, market age of broilers, market access, capacity utilization
and credit access are the main factors that significantly explain variations in cost
inefficiency of broiler producers. Policy measures directed at these factors as well as
proper farm management practices will significantly reduce cost inefficiencies of
broiler producers.
Keywords: Cost Inefficiency, Smallholder Commercial Broiler Producers,
Stochastic Cost Frontier Model, Ghana
1. Introduction
The poultry sector plays an important role in the agricultural growth and daily diets of the
average household in Ghana. The sector contributes about 5.0 percent to Ghana’s
agricultural Gross Domestic Product (MOFA, 2010) and 40 percent of the national animal
protein supply (FAO report, 2010). Up until the 1990s, the broiler sector supplied about 95
percent of the total domestic poultry meat requirement in Ghana. However, since 1995 the
share of domestic broiler production in total market demand has declined, now satisfying
only about 11 percent (Randan and Ashitey, 2011). This decline is attributed to the
importation of cheap poultry imports, removal of government support for drug costs and
discontinuation of government importation and support for feed mill ingredients
(Nkansala, 2004). These factors have raised the cost of broiler production by over 60
percent, resulting in many large poultry enterprises folding up. At the same time, poultry
The Empirical Economics Letters, 13(9): (September 2014) 950
meat imports have more than quadruple from 9,160 Mt in 2000 to 89,889 Mt in 2008
(MOFA, 2010).
Recognizing the need to revive the broiler sector, government facilitated the capitalization
and marketing of broiler birds through a joint Government and Agricultural Development
Bank broiler out grower scheme in 2003 and imported and sold 20,000 Mt of yellow
maize to poultry farmers in 2005 to boost local production. In spite of these efforts to
support the sector, growth in broiler production in Ghana still remains low. For instance,
between 2000 and 2009, domestic broiler production grew by only 9.51 percent and could
not meet demand (MOFA, 2010). Ghana needs to produce over 100,000 Mt of poultry
meat annually to meet increasing domestic demand. Besides, in the midst of increasing
cost of poultry inputs which producers have little or no control over due to the competitive
nature of the input market, concerns have been expressed about the efficiency with which
broiler producers are using their available resources. There is the need for broiler
producers to utilize their available resources more efficiently to reduce cost and be
positioned strategically in the increasingly competitive poultry market. Therefore, the
objective of this study is to examine the factors that explain variations in cost inefficiency
of smallholder broiler producers in Ghana. This study will provide insight into the design
of polices to reduce cost inefficiency to make the broiler sector competitive.
2. Methodology
2.1. Study Area
This study used farm level data from smallholder commercial broiler producers who are
members of the Poultry Farmers Association (GNPFA) in the Greater Accra, Ashanti and
Brong Ahafo Regions of Ghana, where considerable broiler production is undertaken. The
Greater Accra Region is located in the coastal belt of Ghana and lies between longitudes
1o 8’E – 0
o 30W and latitude 5
o 70’ – 6
o 8’ N of the equator and has a total land size of
3.24 thousand square kilometers. The Ashanti Region has a total land area of 24.39
thousand kilometers and is located in the middle belt of Ghana, between longitudes 0o 15’
W – 2o 15’ and latitude 6
o N – 7
o 30’ N of the equator. The Brong Ahafo Region lies in the
forest zone and covers an area of 39,557 square kilometers. These three regions have a
high concentration of commercial activities, infrastructural facilities and climate that
favour the production and marketing of poultry meat products.
2.2. Population, Sample Size and Technique
A Multi-stage sampling technique was used to select 441 smallholder broiler producers
using the deep litter system to raise 50 to 5000 birds in a batch. Three regions and five
districts from each region were first selected purposively. Two communities from each of

The Empirical Economics Letters, 13(9): (September 2014) 951
the five districts were then selected to obtain a total of 30. Since the respondents were not
evenly distributed in the communities selected, simple random sampling was finally used
to select and interview 462 broiler producers in a ratio proportional to their population.
However, 441 questionnaires which contained needed information were used for the
analysis.
2.3. Sources and Method of Data Collection
Data on input and output quantities as well as prices for the 2010 production cycle were
collected with the aid of structured questionnaire. The questionnaire which was pre-texted
consisted of both open-ended and close ended questions as well as yes and no questions.
2.4. Analytical Framework
The analytical framework used for this study was based on Battese and Coelli (1995) and
Battese et al. (1996) models which incorporate inefficiency effects and estimates all
parameters simultaneously. Efficiency is the act of achieving a given result such as output
with minimal waste. Theoretical measurement of efficiency was first developed by Farrell
(1957) when he identified three types of efficiency: technical, allocative and economic.
According to Farrell (1957), technical efficiency is the ability of a firm to produce a given
level of output with a minimum quantity of inputs, given technology, while allocative
efficiency is the ability of a firm to choose optimal input levels for a given factor prices.
Economic efficiency, which is the product of technical and allocative efficiencies, is the
ability of a firm to produce a predetermined quantity of output at minimum cost, given
technology. Farrell’s methodology has been widely used in many studies across the world,
while undergoing improvements. This led to the development of the stochastic frontier
model that enables firm level efficiency to be measured using maximum likelihood
estimate. The stochastic production frontier model which was first independently proposed
by Aigner et al. (1977) and Meeusen and Van den Broeck (1977) incorporates a composed
error structure with a one sided component that captures inefficiency and two sided
component that captures random effects like measurement error and other noise outside
the producer’s control.
Since its developments, many modifications have been made to the stochastic frontier
model and applied in many studies, specifying either a production or cost function
technologies (Ogundari and Ojo, 2007). The cost function represents a dual approach in
the technology and is seen as a constant towards the optimizing behavior of a firm
(Chambers, 1983). Any error of optimization is translated into higher cost to the producer.
However, the stochastic nature of the production frontier still implies that the theoretical
minimum cost frontier would be stochastic. The cost function can be used to
simultaneously predict both technical and allocative efficiency of a firm (Coelli, 1995a). It

The Empirical Economics Letters, 13(9): (September 2014) 952
also reveals all economically relevant information about firm level technology (Chambers,
1983).
2.5. Specification of Empirical Model
Following Battese and Coelli (1995) framework, a modified stochastic Cobb Douglas cost
frontier model with inefficiency component was used for the study. This is specified as:
ln 𝐶𝑖 = 𝛽𝑜 + 𝛽1𝐷𝐻𝐿1 + 𝛽2𝐷𝐹𝐿2 + 𝛽𝑖9𝑖=3 ln 𝑃𝑖 + 𝛽10 ln 𝑌 + 휀𝑖 , 휀 = 𝑉𝑖 + 𝑈𝑖 (1)
Where ln is natural logarithm, Ci is average variable cost of the ith
farm for producing
broiler at market age, P3 is per unit cost of day-old chick, P4 is cost per kilogram of feed
per bird, P5 is wage rate of hired labour per bird, P6 is imputed-wage rate of family labour
per bird, P7 is cost of medications and vaccines per bird, P8 is cost of other inputs per bird,
P9 is cost of capital input per bird, measured as the depreciation value of farm structure and
equipment. Y represents the number of survived day-old chicks that are ready for sale by
the end of the production cycle. βi are parameters to be estimated and are expected to have
a positive sign. i is a composed error term that consists of a two sided random variable
Vi, that are normally distributed with a mean of zero and variance of σv2
and a one sided
non-negative random variable Ui, that account for cost inefficiency, such that Ui are
independently distributed with a mean μ and variance σu2. Ui = 0 is for farm whose costs
lie on the frontier, Ui > 0 and Ui < 0 are for farms whose costs are above and below the
frontier respectively. The two error terms are preceded by positive signs because
inefficiencies are always assumed to increase cost. To solve the problem of zero
observations of wage rate of hired and family labour encountered in the data for
estimation, the log-value of the zero-observations of these two sources of labour were set
to zero with dummy variables to explicitly examine their effect on cost. This ensures that
efficient estimators are obtained using the full data set without introducing any bias. DHL1
and DFL2 are therefore dummy variables equal to one if there is wage rate for hired and
family labours and zero otherwise. They both capture intercept change effect of wage rate
of hired and family labours. The estimator for cost responsiveness to changes in their wage
rates would be bias without the inclusion of DHL and DFL (Battese, 1997).
Given the available technology, cost efficiency of an individual broiler farm for the study
is defined as the ratio of observed cost (Cobs
) to the corresponding minimum cost (Cmin
).
Thus,
𝐶𝑜𝑠𝑡 𝐸𝑓𝑓𝑖𝑐𝑖𝑒𝑛𝑐𝑦 𝐶𝐸𝐸 = 𝐶𝑜𝑏𝑠
𝐶𝑚𝑖𝑛 =𝑓 𝑃𝑖 ,𝑌𝑖 ,𝛽 + 𝑉𝑖+ 𝑈𝑖
𝑓 𝑃𝑖 ,𝑌𝑖 ,𝛽 + 𝑉𝑖= 𝑒𝑥𝑝 𝑈𝑖 (2)
where the observed cost (Cobs
) represents the actual total production cost, while the
minimum cost (Cmin
) represents the frontier average or least variable cost level. Cmin
takes

The Empirical Economics Letters, 13(9): (September 2014) 953
value of 1 or higher with 1 defining cost efficient farm. The cost inefficiency model is also
specified as:
𝑈𝑖 = 𝛿0 + 𝛿1𝐸𝑋𝑇𝐶𝑂𝑁𝑖 + 𝛿2𝑀𝐾𝑇𝐴𝐺𝐸𝑖 + 𝛿3𝑀𝐾𝑇𝐴𝐶𝐶𝑖 + 𝛿4𝐶𝐴𝑃𝑈𝑇𝑖 + 𝛿5𝐶𝑅𝐷𝐴𝐶𝐶𝑖 + 𝑒𝑖 (3)
Where Ui is cost inefficiency effect, EXTCON is number of extension service contact
received in a batch, MKTAGE is market age of broilers measured as deviation from the
standard 56 days broiler are ready for market, MKTACC is a dummy variable indicating 1
if farmer had access to market and 0 otherwise, CAPUT is proportion of installed capacity
of broiler farm utilized by a farmer and CRDACC is a dummy variable representing 1 if
farmer had access to credit and 0 otherwise. Market age variable was hypothesized to have
a positive sign and other explanatory variables were hypothesized to have a negative sign.
The δs are parameters to be estimated. The variances of the random error, σv2, the cost
inefficiency effects σu2 and overall variance of the model σ
2 are related as: γ = σu
2/ σv
2 +
σu2. The gamma (γ) measures the total variation of average variable cost of production
from the frontier cost attributed to cost inefficiency. The parameter estimates of the
stochastic cost frontier function and inefficiency model were simultaneously obtained
through a single-stage maximum likelihood estimation method using the computer
software frontier version 4.1(Coelli, 1996b)
The test for the presence of cost inefficiency using generalized likelihood-ratio statistics λ
is defined by: λ = -2 In (Ho/Ha). Where: Ho is the value of the likelihood function for the
frontier model in which parameters restriction specified by the null hypothesis, Ho are
imposed; and Ha is the value of the likelihood function for general frontier model. If the
null hypothesis is true then λ has approximately a mixed chi-square distribution with
degree of freedom equal to the number of parameters excluded in the unrestricted model.
The critical value for the hypothesis involving γ is obtained from Kodde and Palm (1986).
3. Results and Discussion
3.1. Descriptive statistics of Smallholder Broiler Producers
Table 1 presents the descriptive statistics of the variables included in the stochastic cost
frontier model. The mean average variable cost of broiler production in the study area was
GH¢8.48, of which feed and day-old chick costs together constitute 72 percent, indicating
the importance of these two inputs in broiler production in the study area. The average
extension service contact was 1.38 visits per batch, suggesting that the average
smallholder producer gets less than two contacts in a batch. They also produce
approximately two batches of broiler in a year, less than the potential five batches per year
(Atibudhi, 2004). The average market age at which birds are ready for market was 57.29
The Empirical Economics Letters, 13(9): (September 2014) 954
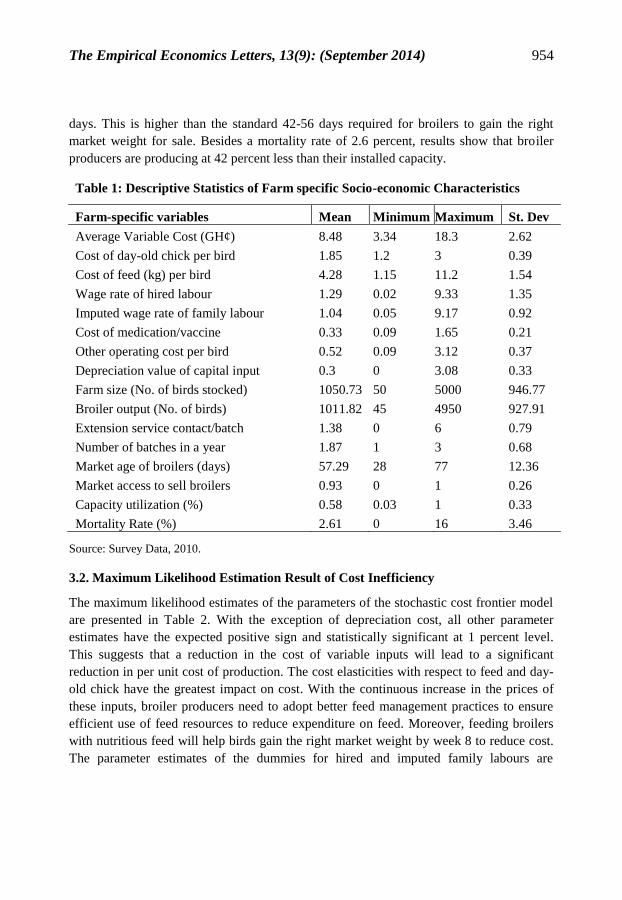
days. This is higher than the standard 42-56 days required for broilers to gain the right
market weight for sale. Besides a mortality rate of 2.6 percent, results show that broiler
producers are producing at 42 percent less than their installed capacity.
Table 1: Descriptive Statistics of Farm specific Socio-economic Characteristics
Farm-specific variables Mean Minimum Maximum St. Dev
Average Variable Cost (GH¢) 8.48 3.34 18.3 2.62
Cost of day-old chick per bird 1.85 1.2 3 0.39
Cost of feed (kg) per bird 4.28 1.15 11.2 1.54
Wage rate of hired labour 1.29 0.02 9.33 1.35
Imputed wage rate of family labour 1.04 0.05 9.17 0.92
Cost of medication/vaccine 0.33 0.09 1.65 0.21
Other operating cost per bird 0.52 0.09 3.12 0.37
Depreciation value of capital input 0.3 0 3.08 0.33
Farm size (No. of birds stocked) 1050.73 50 5000 946.77
Broiler output (No. of birds) 1011.82 45 4950 927.91
Extension service contact/batch 1.38 0 6 0.79
Number of batches in a year 1.87 1 3 0.68
Market age of broilers (days) 57.29 28 77 12.36
Market access to sell broilers 0.93 0 1 0.26
Capacity utilization (%) 0.58 0.03 1 0.33
Mortality Rate (%) 2.61 0 16 3.46
Source: Survey Data, 2010.
3.2. Maximum Likelihood Estimation Result of Cost Inefficiency
The maximum likelihood estimates of the parameters of the stochastic cost frontier model
are presented in Table 2. With the exception of depreciation cost, all other parameter
estimates have the expected positive sign and statistically significant at 1 percent level.
This suggests that a reduction in the cost of variable inputs will lead to a significant
reduction in per unit cost of production. The cost elasticities with respect to feed and day-
old chick have the greatest impact on cost. With the continuous increase in the prices of
these inputs, broiler producers need to adopt better feed management practices to ensure
efficient use of feed resources to reduce expenditure on feed. Moreover, feeding broilers
with nutritious feed will help birds gain the right market weight by week 8 to reduce cost.
The parameter estimates of the dummies for hired and imputed family labours are

The Empirical Economics Letters, 13(9): (September 2014) 955
significant at 1 percent, suggesting that their exclusion from the model would have
produced biased estimates.
Table 2: Maximum Likelihood Estimates of Parameters of Cost Frontier
Variables Parameter Coefficients Standard error
Cost Frontier model
Constant term β0 - 0.163*** 0.006
DHLab β1 0.124*** 0.005
DFLab β2 0.122*** 0.005
Cost of day-old chick β3 0.263*** 0.008
Cost of feed β4 0.543*** 0.007
Wage rate of hired Labour β5 0.081*** 0.004
Imputed wage of Family Labour β6 0.078*** 0.005
Cost of Medication/vaccine β7 0.056*** 0.004
Other operating cost β8 0.050*** 0.005
Cost of fixed input β9 -0.002 0.001
Output β10 0.004 0.004
Inefficiency Model
Constant δ0 -0.154 0.107
Extension Service Contact δ1 - 0.126*** 0.032
Market Age δ2 0.009*** 0.002
Market Access δ3 -0.260*** 0.054
Capacity utilization δ4 -1.562*** 0.342
Credit Access δ5 -0.010*** 0.032
Diagnostic Statistics
Total Variance σ2 0.076***
Variance ratio (Gamma) γ 0.999***
Log-likelihood function 657.478
Source: Survey Data, 2010. *** indicates 1 percent significance level.
The diagnostic statistics shows that the total variance (σ2) of 0.076 is statistically
significant at 1 percent level, indicating the goodness of fit and correctness of the specified
distributional assumption of the composite error term. The estimated variance ratio (γ) of
0.999 indicates that 99.9 percent of the variation in the average variable cost of production

The Empirical Economics Letters, 13(9): (September 2014) 956
of the respondents is due to differences in cost inefficiency. The null hypothesis test for
the absence of cost inefficiency effects (Ho: γ = δ0 = δ1 = … δ5 = 0) and that inefficiency
effects are not stochastic (Ho: γ = 0) are all rejected at 1 percent level of significance
(Table 3). This indicates that the traditional average (OLS) function is not an adequate
representation and also cost inefficiencies exist in smallholder broiler production and are
indeed stochastic.
Table 3: Log-Likelihood Ratio Test of Null Hypotheses
Null Hypothesis Test Statistics (λ) Critical value (0.001) Decision
Ho: γ = δ0 = δ1 = … δ5 = 0 188.05 23.55 Reject Ho
Ho: γ = 0 333.07 9.50 Reject Ho
Source: Survey Data, 2010. Critical values are significant at 0.001 level. The critical value for γ are
obtained from table 1 of Kodde and Palm (1986, p.1246).
The mean cost efficiency scores of respondents presented in Table 4 is 1.10, meaning the
average broiler producer has cost of about 10 percent above the minimum cost frontier.
Ten percent of broiler producers’ costs are wasted relative to the farms producing the same
output and facing the same technology. Majority (73 percent) of the respondents are
producing a given level of output relative to the cost frontier, reflecting their ability to
minimize resource cost wastage in production.
Table 4: Distribution of Cost Efficiency Scores of Smallholder Broiler Producers
Cost Inefficiency Scores Frequency Percentage (%)
Less than 1.10 318 72.56
1.10 – 1.19 66 14.29
1.20 – 1.29 28 6.58
1.30 – 1.39 13 2.95
1.40 – 1.49 4 0.91
1.50 And above 12 2.72
Total 441
Mean 1.1
Minimum 1
Maximum 1.9
Standard Deviation 0.13
Source: Survey Data, 2010.

The Empirical Economics Letters, 13(9): (September 2014) 957
The result of the cost inefficiency effect model in Table 2 shows that extension service
contact, market age, market access, capacity utilization and credit access are the main
factors that significantly explain variations in cost inefficiency of smallholder broiler
producers. Smallholder broiler producers who have access to more extension service
contacts, market, and credit to finance their operation as well as increase their capacity
utilization are less cost inefficient. Besides, broiler producers who deviate more from the
standard 42 - 56 days required for birds to be ready for market are more cost inefficient.
This is because they spend extra money to keep their birds to gain the right market weight.
4. Conclusion and Recommendations
The empirical results revealed that feed and day-old chick costs have the greatest impact
on production cost. Extension service contact, market age, market and credit access and
capacity utilization are the main factors that explain variation in cost inefficiency of
broiler producers. Policy measures directed at increasing market and credit access and
encouraging broiler producers to increase their capacity utilization should be encouraged.
Similarly, providing extension service to build the capacity of farmers is imperative.
Finally, broiler producers should be supported through appropriate policy options to raise
their birds to gain the right weight for the market by week eight.
References
Aigner, D.J., C.A.K. Lovell and P. Schmidt, 1977, Formulation and Estimation of
Stochastic Frontier Production Function Models, Journal of Econometrics, 6, 21-37.
Atibudhi, H.N., 2004, Production and marketing of broiler in the environs of Bhubaneswar
City in Orissa, Indian Journal of Agricultural Marketing, 18(3), 200-01.
Battese, G.E., 1997, A note on the estimation of Cobb-Douglas Production Functions
when some explanatory variables have zero values, Journal of Agricultural Economics, 48,
250 - 252.
Battese, G.E. and T. J. Coelli, 1995, A Model for Technical Inefficiency effect in
Stochastic Frontier Production function for Panel Data, Empirical Economics, 20, 325-
332.
Battese, G.E., S.J. Malik and M.A. Gill, 1996, An Investigation of Technical Inefficiencies
of Production of Wheat Farmers in Four Districts of Pakistan, Journal of Agricultural
Economics, 47 (1), 37-49.
Chambers, R.G., 1983, Applied Production Analysis: A Dual Approach. Cambridge:
Cambridge University Press.

The Empirical Economics Letters, 13(9): (September 2014) 958
Coelli, T.J., 1995a, Recent Development in Frontier Modeling and Efficiency
Measurement. Australian Journal of Agricultural Economics, 39, 215-245.
Coelli, T., 1996a, Specification and Estimation of Stochastic Frontier Production
Functions. Unpublished Ph.D. Dissertation, University of New England, Australia.
Coelli, T., 1996b, Frontier Version 4.1: A Computer Program for Stochastic Frontier
Production and Cost Function Estimation, Working Paper 96/7, Center for Efficiency and
Productivity Analysis, Department of Econometrics, University of New England,
Armidale, Australia.
Farell, M.J., 1957, The measurement of Productive Efficiency, Journal of the Royal
Statistical Society A. General, 120(3), 253 – 281.
FAO Report 2010, Food and Agricultural Organization Report 2010.
Kodde, D. and F. Palm, 1986, Wald Criteria for Jointly Testing Inequality Restrictions,
Econometrica, 54,1243 – 1248.
Meeusen, W, and Van Den Broeck, 1977, Efficiency Estimation from Cobb Douglas
Production Functions with composed Error, International Economic Review, 18(2),
435 – 44.
MOFA, 2010, Fact Sheet, Statistics, Research and Information Directorate (SRID), 2010.
Nkansala, K.O. 2004, Chapter on Ghana, in Ghana Agricultural Workers Union (QAWA).
Ogundari, K. and S.O. Ojo, 2007, Economic Efficiency of Small Scale Food Crop
Production in Nigeria: A Stochastic Frontier Approach. Journal of Social Science 14(2),
123-130.
Randon, M. E. and E. Ashitey, 2011, Poultry and Products Brief Annual, Global
Agricultural Information Network Report, USDA Foreign Agricultural Services.