Variation of F-region critical frequency (foF2) over equatorial and low-latitude region of the...
14
Variation of F-region critical frequency (foF2) over equatorial and low-latitude region of the Indian zone during 19th and 20th solar cycle Sneha Yadav a,⇑ , R.S. Dabas a , Rupesh M. Das a , A.K. Upadhayaya a , S.K. Sarkar a , A.K. Gwal b a Radio and Atmospheric Sciences Division, National Physical Laboratory, Council of Scientific and Industrial Research, Dr. K.S. Krishnan Marg, New Delhi 110012, India b Department of Physics, Barkatullah University, Bhopal 462026, India Received 2 March 2010; received in revised form 31 August 2010; accepted 3 September 2010 Abstract The effect of solar cycle and seasons on the daytime and nighttime F-layer ionization has been investigated over the equatorial and low-latitude region during 19th (1954–1964) and 20th (1965–1976) solar cycle. The F-layer critical frequency (foF2) data observed from the three Indian Ionosonde stations has been used for the present study. The dependence of foF2 on solar cycle has been examined by performing regression analysis between the foF2 values and R 12 (twelve month running average sunspot number). The result shows that the magnitude of the cycle, seasons and the location of station has considerable effects on foF2. There is a significant nonlinear relation- ship between the foF2 values and R 12 during 19th solar cycle as compared to 20th solar cycle. Further, the nighttime saturation effect is prominently seen during the 19th solar cycle and summer season. It is also observed that the most profound saturation effect appears at the equatorial ionization anomaly crest region. Seasonally, it is seen that all the stations exhibits semiannual anomaly. The phenomenon of winter anomaly decays as we move higher along the latitude and is prominently seen during the intense solar activity. Ó 2010 COSPAR. Published by Elsevier Ltd. All rights reserved. Keywords: Equatorial ionosphere; Solar cycle; Equatorial electrojet 1. Introduction It is well known that lonospheric electron densities are produced mainly by solar extreme ultra violet (EUV) and X-ray radiations. Solar EUV radiations are mainly respon- sible for ionization in the F-region of the ionosphere. Since, these radiations show definitive solar cycle variations, con- sequently, electron concentrations and thus, the critical fre- quency of the F2-region (foF2) is also expected to reflect these variations. The 24 h global appearance of ionospheric F-region makes it a most effective layer for long-distance high frequency (HF) radio communication. This attracts scientists to monitor and acquire the knowledge of the dif- ferent dynamics of this layer in terms of its dependence on solar activity, seasons, location and time. For ionospheric long-term predictions, the key parameter used is sunspot numbers (Dabas et al., 2008). The sunspot number is con- venient for use because of its long series of observations and its characteristics of reliability and predictability. It has been observed that foF2 shows a good linear relation- ship for low and moderate values of the sunspot numbers, but foF2 seems to show a saturation effect at high sunspot numbers (Kane, 1992; Lakshmi et al., 1988). Jones and Obitts (1970) fit a parabolic law to the solar cycle variation of foF2 and find more saturation at the higher solar epochs. For considering saturation effects, a second-degree relationship between foF2 and solar activity indices is used frequently (Pancheva and Mukhtarov, 1998; Xenos et al., 1996; Sizun, 1992 and Dabas et al., 2008). Liu et al. (2004) claimed that for low-latitudes, a second-degree rela- tionship made much improvement over linear fitting. Balan 0273-1177/$36.00 Ó 2010 COSPAR. Published by Elsevier Ltd. All rights reserved. doi:10.1016/j.asr.2010.09.003 ⇑ Corresponding author. Tel.: +91 11 45608299. E-mail address: [email protected] (S. Yadav). www.elsevier.com/locate/asr Available online at www.sciencedirect.com Advances in Space Research 47 (2011) 124–137
-
Upload
independent -
Category
Documents
-
view
3 -
download
0
Transcript of Variation of F-region critical frequency (foF2) over equatorial and low-latitude region of the...

Available online at www.sciencedirect.com
www.elsevier.com/locate/asr
Advances in Space Research 47 (2011) 124–137
Variation of F-region critical frequency (foF2) over equatorial andlow-latitude region of the Indian zone during 19th and 20th solar cycle
Sneha Yadav a,⇑, R.S. Dabas a, Rupesh M. Das a, A.K. Upadhayaya a, S.K. Sarkar a,A.K. Gwal b
a Radio and Atmospheric Sciences Division, National Physical Laboratory, Council of Scientific and Industrial Research, Dr. K.S. Krishnan Marg,
New Delhi 110012, Indiab Department of Physics, Barkatullah University, Bhopal 462026, India
Received 2 March 2010; received in revised form 31 August 2010; accepted 3 September 2010
Abstract
The effect of solar cycle and seasons on the daytime and nighttime F-layer ionization has been investigated over the equatorial andlow-latitude region during 19th (1954–1964) and 20th (1965–1976) solar cycle. The F-layer critical frequency (foF2) data observed fromthe three Indian Ionosonde stations has been used for the present study. The dependence of foF2 on solar cycle has been examined byperforming regression analysis between the foF2 values and R12 (twelve month running average sunspot number). The result shows thatthe magnitude of the cycle, seasons and the location of station has considerable effects on foF2. There is a significant nonlinear relation-ship between the foF2 values and R12 during 19th solar cycle as compared to 20th solar cycle. Further, the nighttime saturation effect isprominently seen during the 19th solar cycle and summer season. It is also observed that the most profound saturation effect appears atthe equatorial ionization anomaly crest region. Seasonally, it is seen that all the stations exhibits semiannual anomaly. The phenomenonof winter anomaly decays as we move higher along the latitude and is prominently seen during the intense solar activity.� 2010 COSPAR. Published by Elsevier Ltd. All rights reserved.
Keywords: Equatorial ionosphere; Solar cycle; Equatorial electrojet
1. Introduction
It is well known that lonospheric electron densities areproduced mainly by solar extreme ultra violet (EUV) andX-ray radiations. Solar EUV radiations are mainly respon-sible for ionization in the F-region of the ionosphere. Since,these radiations show definitive solar cycle variations, con-sequently, electron concentrations and thus, the critical fre-quency of the F2-region (foF2) is also expected to reflectthese variations. The 24 h global appearance of ionosphericF-region makes it a most effective layer for long-distancehigh frequency (HF) radio communication. This attractsscientists to monitor and acquire the knowledge of the dif-ferent dynamics of this layer in terms of its dependence on
0273-1177/$36.00 � 2010 COSPAR. Published by Elsevier Ltd. All rights rese
doi:10.1016/j.asr.2010.09.003
⇑ Corresponding author. Tel.: +91 11 45608299.E-mail address: [email protected] (S. Yadav).
solar activity, seasons, location and time. For ionosphericlong-term predictions, the key parameter used is sunspotnumbers (Dabas et al., 2008). The sunspot number is con-venient for use because of its long series of observationsand its characteristics of reliability and predictability. Ithas been observed that foF2 shows a good linear relation-ship for low and moderate values of the sunspot numbers,but foF2 seems to show a saturation effect at high sunspotnumbers (Kane, 1992; Lakshmi et al., 1988). Jones andObitts (1970) fit a parabolic law to the solar cycle variationof foF2 and find more saturation at the higher solarepochs. For considering saturation effects, a second-degreerelationship between foF2 and solar activity indices is usedfrequently (Pancheva and Mukhtarov, 1998; Xenos et al.,1996; Sizun, 1992 and Dabas et al., 2008). Liu et al.(2004) claimed that for low-latitudes, a second-degree rela-tionship made much improvement over linear fitting. Balan
rved.
S. Yadav et al. / Advances in Space Research 47 (2011) 124–137 125
et al. (1993, 1994a,b, 1996) analyzed the relationshipbetween ionospheric ionization, solar radio noise(10.7 cm) flux F10.7, and solar EUV during intense solarcycles. They found a nonlinear relationship between thesolar EUV and F10.7 and concluded that the saturationof ionization was due to the nonlinear increase of the solarEUV fluxes.
A good prediction model of foF2 usually gives an aver-age value of foF2 taking into consideration the effect oftime of the day, seasons, solar cycle and the location coor-dinate of the station. In this paper, therefore, an attempt ismade to examine the effects of different solar cycles, sea-sons, time period and location on the variability of foF2.The knowledge about such variability will be helpful inenhancing the modeling capabilities. For this purpose,foF2 data obtained during the 19th and 20th solar cyclefrom the three Indian ionospheric monitoring stations cov-ering equatorial and low-latitude regions has been used forthe present study.
2. Data and methods
The location of the monitoring stations is shown in Fig. 1.Kodaikanal (10.2 N, 77.29 E, dip 3.5� N) is situated near themagnetic equator whereas Ahmedabad (23.01� N, 72.36� E,dip 34� N) is around the equatorial ionization anomaly(EIA) crest region and Delhi (28.38� N, 77.13� E, dip42.44� N) is a low-mid latitude station. In this paper,monthly median hourly foF2 values during the interval1954–1976 (solar cycle 19th and 20th) have been used. Valuesof foF2 during daytime, 1500 east mean time (1500 EMT)and for nighttime, 0000 east mean time (0000 EMT) wereanalyzed. For the seasonal study, the whole data of 19thand 20th solar cycle has been grouped into three seasons
Fig. 1. The location and geograph
i.e. summer (May, June, July and August), winter (Novem-ber, December, January and February) and equinox (March,April, September and October). R12 (twelve month runningaverage sunspot number) is taken as a solar activity indexand is obtained from world data centre (http://www.ngdc.noaa.gov/wdc/wdcmain.shtml). In order to determine thedependence of F-layer ionization on the solar activity, aregression analysis has been performed between the foF2values and R12. To see the linear relationship, a linear fittinghas been performed which describes the relationship as
foF2 ¼ a0 þ a1 � R12; ð1Þ
where, a0 and a1 are regression coefficients.A second degree fitting is tried where the linear one
failed due to the saturation effect. This then leads to therelationship:
foF2 ¼ b0 þ b1 � R12 þ b2 � ðR12Þ2; ð2Þ
where, b0, b1 and b2 are the second degree regression coef-ficients. The term b2 is significant for considering satura-tion effect as b2 < 0 indicates that when sunspot numberis high enough, the monthly median foF2 decreases withincreasing solar activity whereas b2 > 0 indicates thatfoF2 increases with increasing solar activity (Xu et al.,2008). Linear or second degree fitting has been performedin order to see which of them gives a better fit. A betterfit is taken as the one which has a higher correlation coef-ficient and with less standard error.
Here, the terminology magnitude of solar cycle refers tothe number of sunspot numbers in the cycle. The effect ofmagnitude of solar cycle on monthly median foF2 valueshas been examined simply in terms of parameter DfoF2max.
Parameter DfoF2max is determined by subtracting themaximum values of foF2 obtained for the two solar cyclesi.e. by applying the formula:
ic coordinates of the stations.
Table 1aThe correlation coefficient between foF2 and R12 for both the linear and second degree fits at Kodaikanal during the nighttime period.
19th Solar cycle 00 EMT 20th Solar cycle 00 EMT
Season First degree Second degree First degree Second degree
CC Standard error CC Standard error CC Standard error CC Standard error
Winter 0.94 0.86 0.96 0.78 0.87 0.94 0.88 0.96Summer 0.82 1.90 0.86 1.83 0.94 0.90 0.95 0.94Equinox 0.87 1.20 0.95 0.80 0.94 0.71 0.95 0.69
Table 1bThe correlation coefficient between foF2 and R12 for both the linear and second degree fits at Kodaikanal during the daytime period.
19th Solar cycle 15 EMT 20th Solar cycle 15 EMT
Season First degree Second degree First degree Second degree
CC Standard error CC Standard error CC Standard error CC Standard error
Winter 0.90 0.93 0.92 0.84 0.97 0.37 0.97 0.39Summer 0.96 0.54 0.98 0.41 0.93 0.38 0.94 0.36Equinox 0.94 0.62 0.96 0.50 0.97 0.25 0.97 0.26
Table 2aThe correlation coefficient between foF2 and R12 for both the linear and second degree fits at Ahmedabad during the nighttime period.
19th Solar cycle 00 EMT 20th Solar cycle 00 EMT
Season First degree Second degree First degree Second degree
CC Standard error CC Standard error CC Standard error CC Standard error
Winter 0.99 0.45 0.99 0.48 0.95 0.67 0.95 0.71Summer 0.98 0.50 0.99 0.48 0.97 0.44 0.97 0.41Equinox 0.97 1.17 0.98 1.03 0.97 0.77 0.98 0.73
Table 2bThe correlation coefficient between foF2 and R12 for both the linear and second degree fits at Ahmedabad during the daytime period.
19th Solar cycle 1500 EMT 20th Solar cycle 1500 EMT
Season First degree Second degree First degree Second degree
CC Standard error CC Standard error CC Standard error CC Standard error
Winter 0.93 1.08 0.98 0.57 0.96 0.65 0.98 0.52Summer 0.94 0.80 0.97 0.56 0.97 0.40 0.98 0.36Equinox 0.93 0.60 0.96 0.50 0.93 0.67 0.96 0.54
Table 3aThe correlation coefficient between foF2 and R12 for both the linear and second degree fits at Delhi during the nighttime period.
19th Solar cycle 00 EMT 20th Solar cycle 00 EMT
Season First degree Second degree First degree Second degree
CC Standard error CC Standard error CC Standard error CC Standard error
Winter 0.99 0.33 0.99 0.26 0.88 0.22 0.91 0.21Summer 0.96 0.60 0.98 0.44 0.95 0.46 0.95 0.49Equinox 0.98 0.60 0.98 0.56 0.92 0.51 0.97 0.34
Table 3bThe correlation coefficient between foF2 and R12 for both the linear and second degree fits at Delhi during the daytime period.
19th Solar cycle 1500 EMT 20th Solar cycle 1500 EMT
Season First degree Second degree First degree Second degree
CC Standard error CC Standard error CC Standard error CC Standard error
Winter 0.97 0.85 0.99 0.39 0.87 0.97 0.88 0.98Summer 0.96 0.65 0.98 0.44 0.95 0.48 0.96 0.44Equinox 0.92 1.06 0.98 0.51 0.88 0.75 0.93 0.61
126 S. Yadav et al. / Advances in Space Research 47 (2011) 124–137
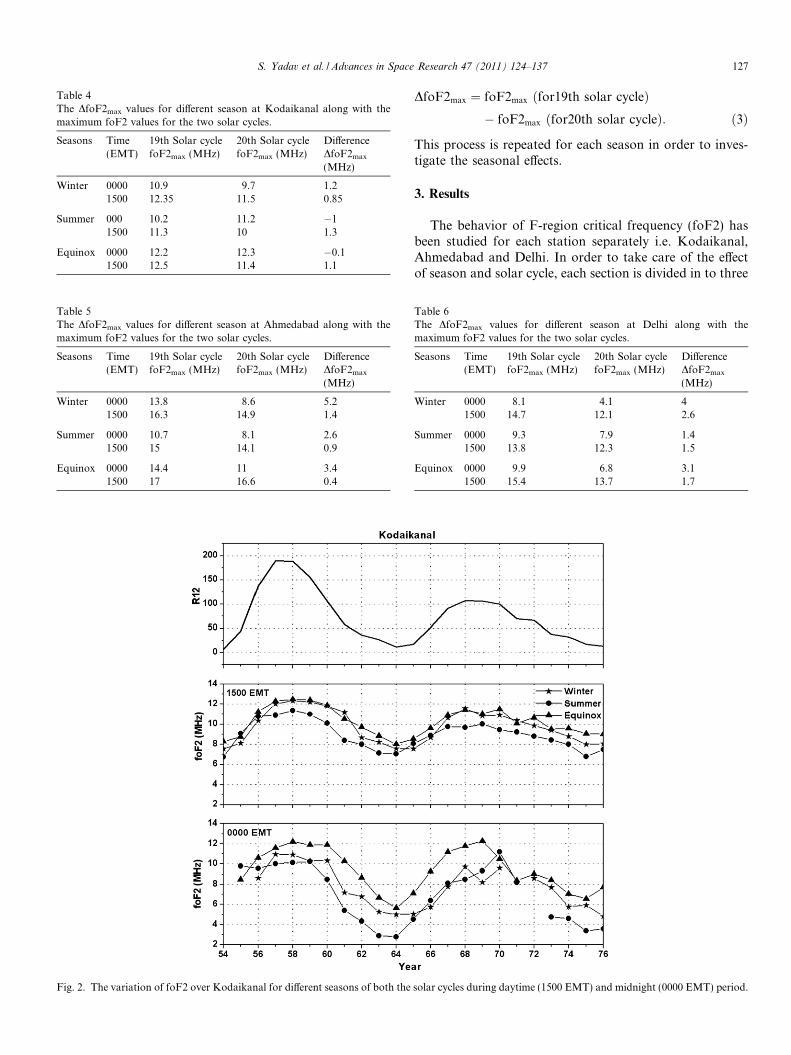
Table 4The DfoF2max values for different season at Kodaikanal along with themaximum foF2 values for the two solar cycles.
Seasons Time(EMT)
19th Solar cyclefoF2max (MHz)
20th Solar cyclefoF2max (MHz)
DifferenceDfoF2max
(MHz)
Winter 0000 10.9 9.7 1.21500 12.35 11.5 0.85
Summer 000 10.2 11.2 �11500 11.3 10 1.3
Equinox 0000 12.2 12.3 �0.11500 12.5 11.4 1.1
Table 5The DfoF2max values for different season at Ahmedabad along with themaximum foF2 values for the two solar cycles.
Seasons Time(EMT)
19th Solar cyclefoF2max (MHz)
20th Solar cyclefoF2max (MHz)
DifferenceDfoF2max
(MHz)
Winter 0000 13.8 8.6 5.21500 16.3 14.9 1.4
Summer 0000 10.7 8.1 2.61500 15 14.1 0.9
Equinox 0000 14.4 11 3.41500 17 16.6 0.4
Fig. 2. The variation of foF2 over Kodaikanal for different seasons of both the
S. Yadav et al. / Advances in Space Research 47 (2011) 124–137 127
DfoF2max ¼ foF2max ðfor19th solar cycleÞ� foF2max ðfor20th solar cycleÞ: ð3Þ
This process is repeated for each season in order to inves-tigate the seasonal effects.
3. Results
The behavior of F-region critical frequency (foF2) hasbeen studied for each station separately i.e. Kodaikanal,Ahmedabad and Delhi. In order to take care of the effectof season and solar cycle, each section is divided in to three
Table 6The DfoF2max values for different season at Delhi along with themaximum foF2 values for the two solar cycles.
Seasons Time(EMT)
19th Solar cyclefoF2max (MHz)
20th Solar cyclefoF2max (MHz)
DifferenceDfoF2max
(MHz)
Winter 0000 8.1 4.1 41500 14.7 12.1 2.6
Summer 0000 9.3 7.9 1.41500 13.8 12.3 1.5
Equinox 0000 9.9 6.8 3.11500 15.4 13.7 1.7
solar cycles during daytime (1500 EMT) and midnight (0000 EMT) period.
128 S. Yadav et al. / Advances in Space Research 47 (2011) 124–137
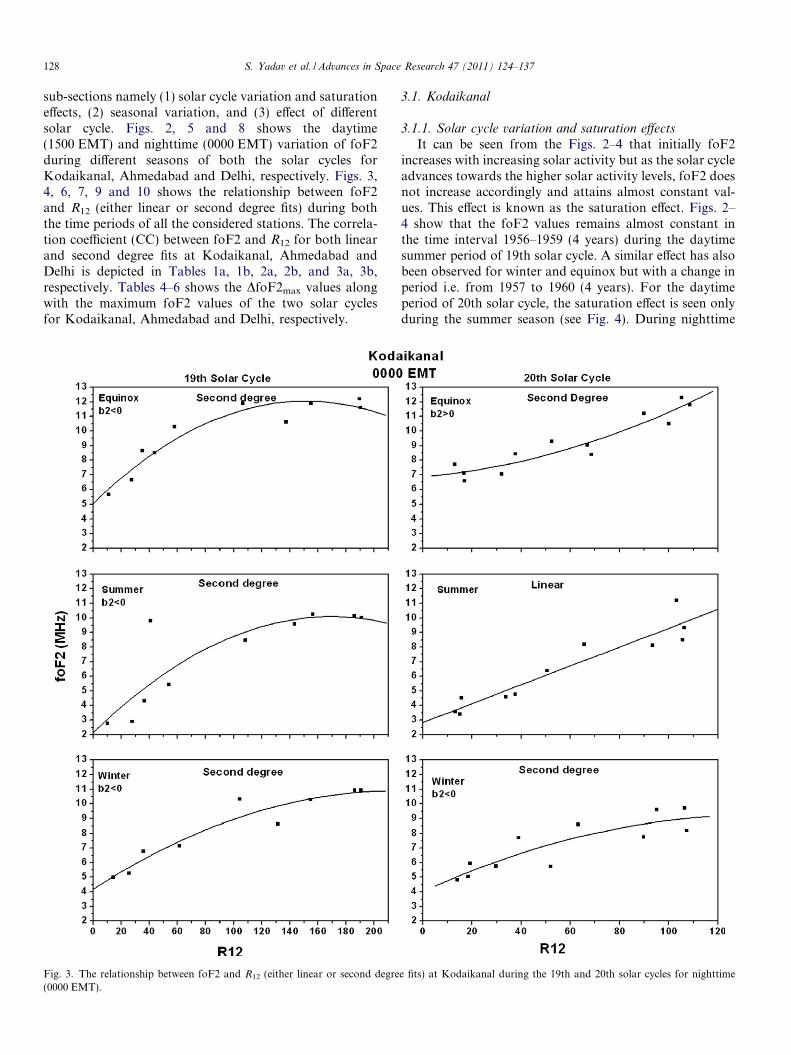
sub-sections namely (1) solar cycle variation and saturationeffects, (2) seasonal variation, and (3) effect of differentsolar cycle. Figs. 2, 5 and 8 shows the daytime(1500 EMT) and nighttime (0000 EMT) variation of foF2during different seasons of both the solar cycles forKodaikanal, Ahmedabad and Delhi, respectively. Figs. 3,4, 6, 7, 9 and 10 shows the relationship between foF2and R12 (either linear or second degree fits) during boththe time periods of all the considered stations. The correla-tion coefficient (CC) between foF2 and R12 for both linearand second degree fits at Kodaikanal, Ahmedabad andDelhi is depicted in Tables 1a, 1b, 2a, 2b, and 3a, 3b,respectively. Tables 4–6 shows the DfoF2max values alongwith the maximum foF2 values of the two solar cyclesfor Kodaikanal, Ahmedabad and Delhi, respectively.
Fig. 3. The relationship between foF2 and R12 (either linear or second degre(0000 EMT).
3.1. Kodaikanal
3.1.1. Solar cycle variation and saturation effects
It can be seen from the Figs. 2–4 that initially foF2increases with increasing solar activity but as the solar cycleadvances towards the higher solar activity levels, foF2 doesnot increase accordingly and attains almost constant val-ues. This effect is known as the saturation effect. Figs. 2–4 show that the foF2 values remains almost constant inthe time interval 1956–1959 (4 years) during the daytimesummer period of 19th solar cycle. A similar effect has alsobeen observed for winter and equinox but with a change inperiod i.e. from 1957 to 1960 (4 years). For the daytimeperiod of 20th solar cycle, the saturation effect is seen onlyduring the summer season (see Fig. 4). During nighttime
e fits) at Kodaikanal during the 19th and 20th solar cycles for nighttime

S. Yadav et al. / Advances in Space Research 47 (2011) 124–137 129
(0000 EMT) period of 19th solar cycle, it is seen that thesummer foF2 values remains almost constant from 1955–1959 (5 years) whereas during winter and equinox, thesame behavior is observed from 1957 to 1960 (4 years). Itcan be seen from the Figs. 3 and 4 that during the two peri-ods, the foF2 values are nonlinearly dependent on solaractivity for all the seasons of 19th solar cycle. For 20thsolar cycle, such behavior is seen only for the daytime per-iod of summer season and nighttime period of winterseason.
3.1.2. Seasonal variation
It can be seen from Fig. 2 that for Kodaikanal, the equi-noctial foF2 values remain slightly higher or roughly equal
Fig. 4. The relationship between foF2 and R12 (either linear or second degr(1500 EMT) period.
to winter foF2 values during the daytime period of both thesolar cycles. However, during nighttime, the equinoctialfoF2 values remain higher than the winter values foralmost all the levels of solar activity. The winter anomalyis also seen during the study. It is observed that duringthe daytime, the winter foF2 values remains greater thanthe summer one in the time interval 1957–1964 and 1967–1976. This phenomenon is also noted during the nighttimeperiod but the appearance of such effect is confined only tothe period 1957–1958, 1960–1964 and 1973–1976.
3.1.3. Effect of different solar cycle
It can be seen from the Table 4 that the magnitude of thesolar cycle does not make much difference in the foF2
ee fits) at Kodaikanal during the 19th and 20th solar cycles for daytime
130 S. Yadav et al. / Advances in Space Research 47 (2011) 124–137
values over the equatorial station like Kodaikanal. Thehighest daytime value of foF2 is around 11–12 MHz duringthe 19th solar cycle whereas it is around 10–11 MHz duringthe 20th solar cycle. For nighttime, it is seen that the foF2values is around 10–12 MHz for 19th solar cycle and 9–12 MHz for 20th solar cycle. It can also be seen from thetable that the DfoF2max over Kodaikanal, remains alwayslesser than 1.5 MHz. One of the interesting features whichcan be noted from the table is the higher values of foF2during nighttime as compared to daytime for the summerand equinoctial season.
3.2. Ahmedabad
3.2.1. Solar cycle variation and saturation effects
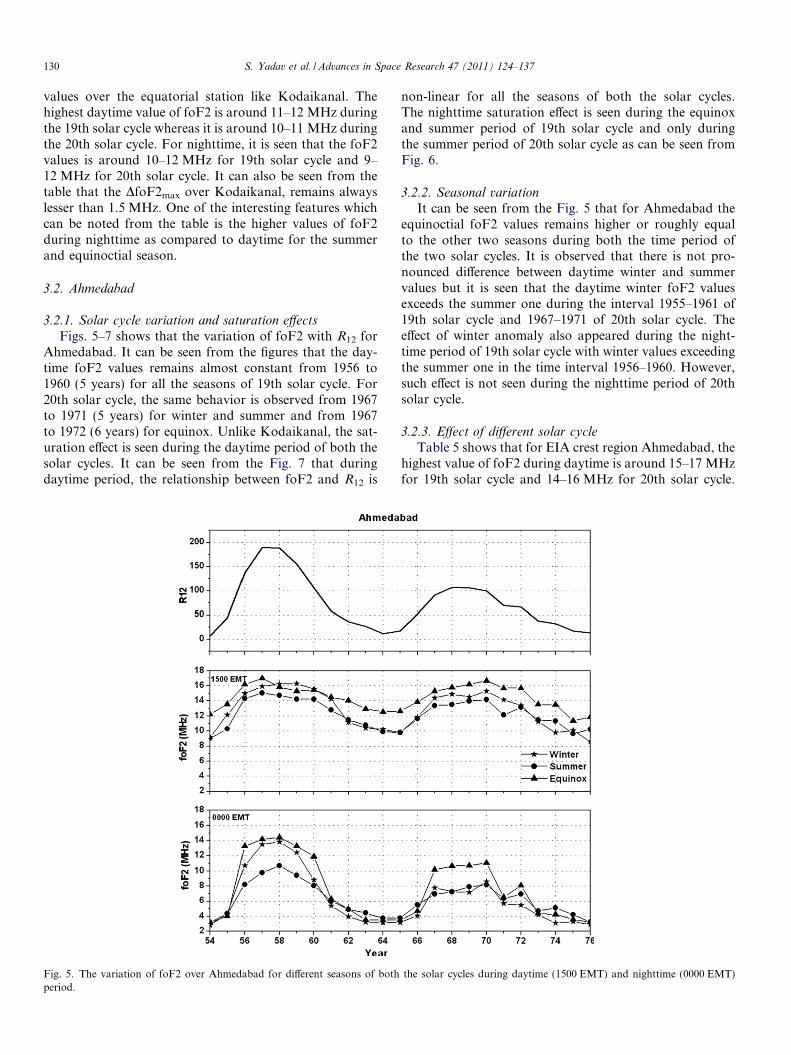
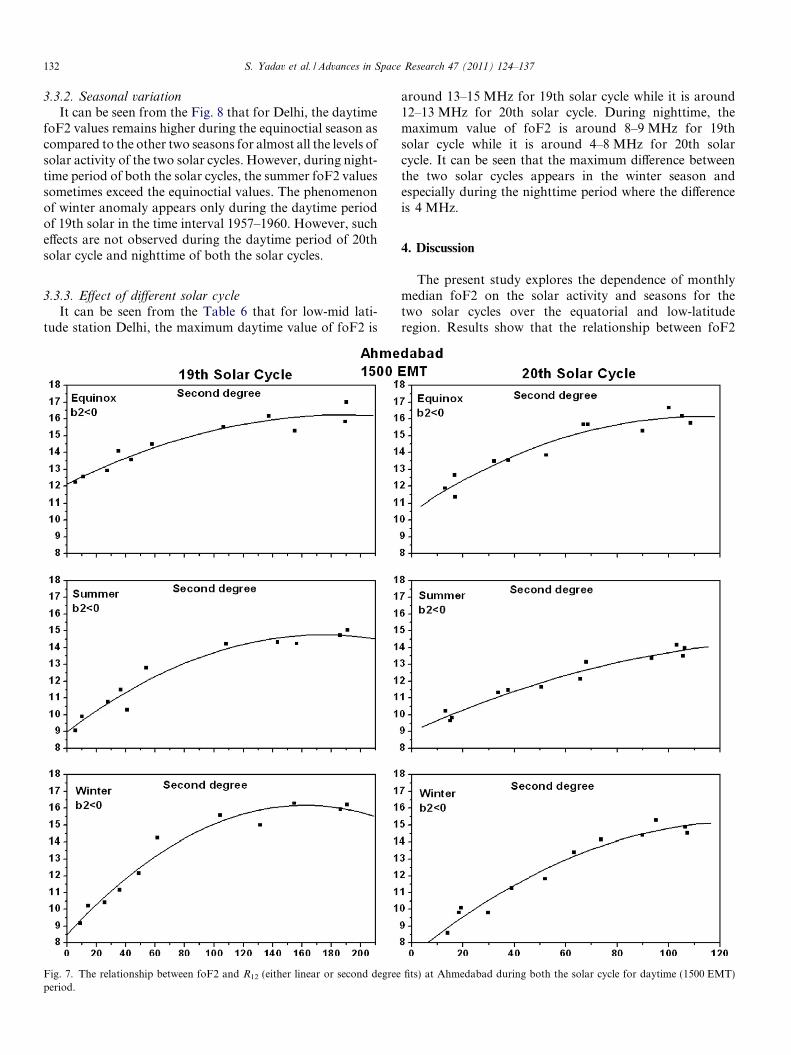
Figs. 5–7 shows that the variation of foF2 with R12 forAhmedabad. It can be seen from the figures that the day-time foF2 values remains almost constant from 1956 to1960 (5 years) for all the seasons of 19th solar cycle. For20th solar cycle, the same behavior is observed from 1967to 1971 (5 years) for winter and summer and from 1967to 1972 (6 years) for equinox. Unlike Kodaikanal, the sat-uration effect is seen during the daytime period of both thesolar cycles. It can be seen from the Fig. 7 that duringdaytime period, the relationship between foF2 and R12 is
Fig. 5. The variation of foF2 over Ahmedabad for different seasons of bothperiod.
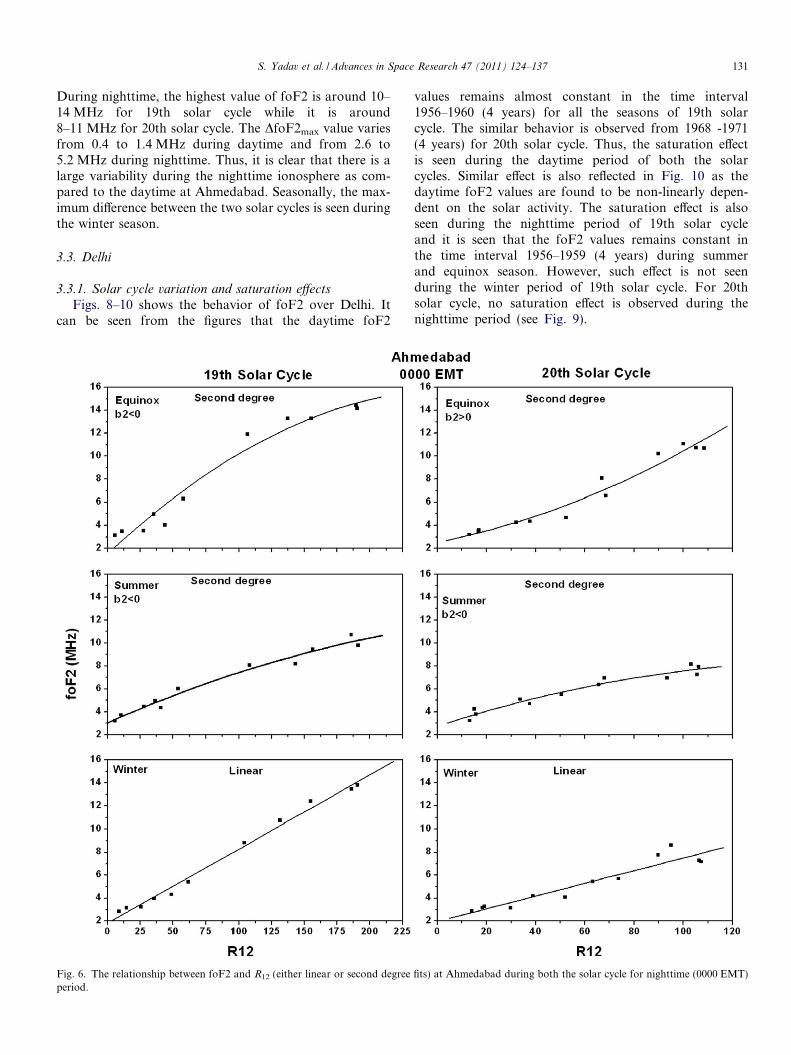
non-linear for all the seasons of both the solar cycles.The nighttime saturation effect is seen during the equinoxand summer period of 19th solar cycle and only duringthe summer period of 20th solar cycle as can be seen fromFig. 6.
3.2.2. Seasonal variation
It can be seen from the Fig. 5 that for Ahmedabad theequinoctial foF2 values remains higher or roughly equalto the other two seasons during both the time period ofthe two solar cycles. It is observed that there is not pro-nounced difference between daytime winter and summervalues but it is seen that the daytime winter foF2 valuesexceeds the summer one during the interval 1955–1961 of19th solar cycle and 1967–1971 of 20th solar cycle. Theeffect of winter anomaly also appeared during the night-time period of 19th solar cycle with winter values exceedingthe summer one in the time interval 1956–1960. However,such effect is not seen during the nighttime period of 20thsolar cycle.
3.2.3. Effect of different solar cycle
Table 5 shows that for EIA crest region Ahmedabad, thehighest value of foF2 during daytime is around 15–17 MHzfor 19th solar cycle and 14–16 MHz for 20th solar cycle.
the solar cycles during daytime (1500 EMT) and nighttime (0000 EMT)
S. Yadav et al. / Advances in Space Research 47 (2011) 124–137 131
During nighttime, the highest value of foF2 is around 10–14 MHz for 19th solar cycle while it is around8–11 MHz for 20th solar cycle. The DfoF2max value variesfrom 0.4 to 1.4 MHz during daytime and from 2.6 to5.2 MHz during nighttime. Thus, it is clear that there is alarge variability during the nighttime ionosphere as com-pared to the daytime at Ahmedabad. Seasonally, the max-imum difference between the two solar cycles is seen duringthe winter season.
3.3. Delhi
3.3.1. Solar cycle variation and saturation effects
Figs. 8–10 shows the behavior of foF2 over Delhi. Itcan be seen from the figures that the daytime foF2
Fig. 6. The relationship between foF2 and R12 (either linear or second degreeperiod.
values remains almost constant in the time interval1956–1960 (4 years) for all the seasons of 19th solarcycle. The similar behavior is observed from 1968 -1971(4 years) for 20th solar cycle. Thus, the saturation effectis seen during the daytime period of both the solarcycles. Similar effect is also reflected in Fig. 10 as thedaytime foF2 values are found to be non-linearly depen-dent on the solar activity. The saturation effect is alsoseen during the nighttime period of 19th solar cycleand it is seen that the foF2 values remains constant inthe time interval 1956–1959 (4 years) during summerand equinox season. However, such effect is not seenduring the winter period of 19th solar cycle. For 20thsolar cycle, no saturation effect is observed during thenighttime period (see Fig. 9).
fits) at Ahmedabad during both the solar cycle for nighttime (0000 EMT)
132 S. Yadav et al. / Advances in Space Research 47 (2011) 124–137
3.3.2. Seasonal variation
It can be seen from the Fig. 8 that for Delhi, the daytimefoF2 values remains higher during the equinoctial season ascompared to the other two seasons for almost all the levels ofsolar activity of the two solar cycles. However, during night-time period of both the solar cycles, the summer foF2 valuessometimes exceed the equinoctial values. The phenomenonof winter anomaly appears only during the daytime periodof 19th solar in the time interval 1957–1960. However, sucheffects are not observed during the daytime period of 20thsolar cycle and nighttime of both the solar cycles.
3.3.3. Effect of different solar cycle
It can be seen from the Table 6 that for low-mid lati-tude station Delhi, the maximum daytime value of foF2 is
Fig. 7. The relationship between foF2 and R12 (either linear or second degreeperiod.
around 13–15 MHz for 19th solar cycle while it is around12–13 MHz for 20th solar cycle. During nighttime, themaximum value of foF2 is around 8–9 MHz for 19thsolar cycle while it is around 4–8 MHz for 20th solarcycle. It can be seen that the maximum difference betweenthe two solar cycles appears in the winter season andespecially during the nighttime period where the differenceis 4 MHz.
4. Discussion
The present study explores the dependence of monthlymedian foF2 on the solar activity and seasons for thetwo solar cycles over the equatorial and low-latituderegion. Results show that the relationship between foF2
fits) at Ahmedabad during both the solar cycle for daytime (1500 EMT)
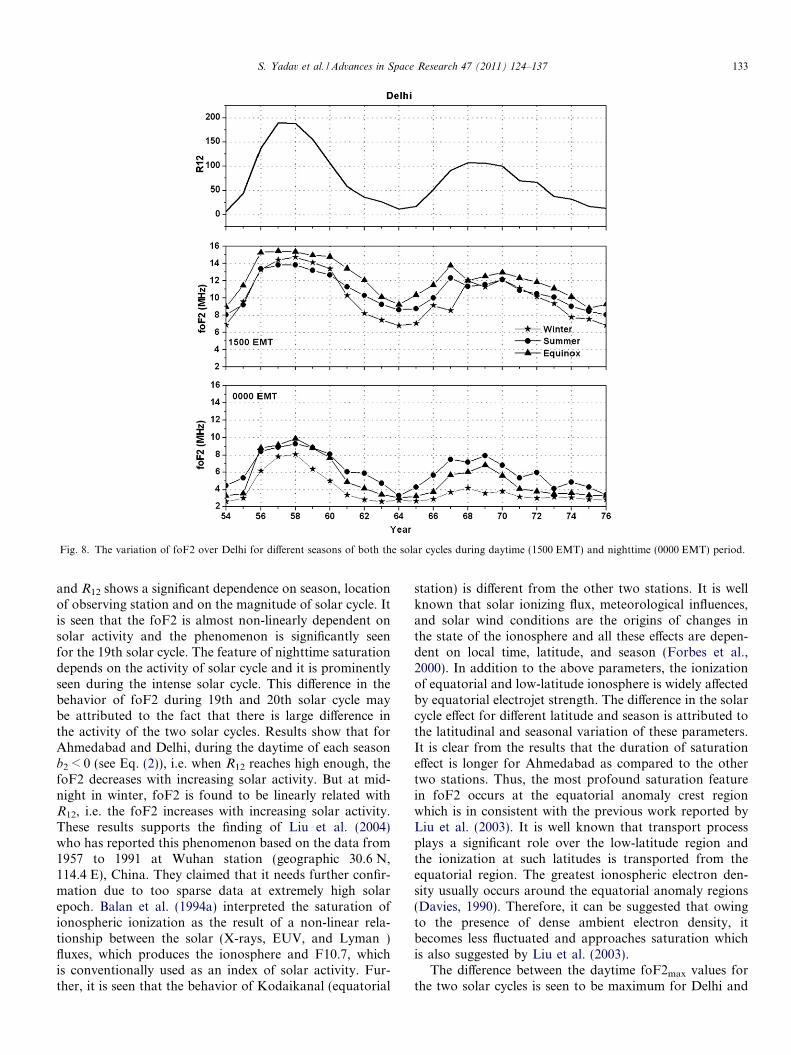
Fig. 8. The variation of foF2 over Delhi for different seasons of both the solar cycles during daytime (1500 EMT) and nighttime (0000 EMT) period.
S. Yadav et al. / Advances in Space Research 47 (2011) 124–137 133
and R12 shows a significant dependence on season, locationof observing station and on the magnitude of solar cycle. Itis seen that the foF2 is almost non-linearly dependent onsolar activity and the phenomenon is significantly seenfor the 19th solar cycle. The feature of nighttime saturationdepends on the activity of solar cycle and it is prominentlyseen during the intense solar cycle. This difference in thebehavior of foF2 during 19th and 20th solar cycle maybe attributed to the fact that there is large difference inthe activity of the two solar cycles. Results show that forAhmedabad and Delhi, during the daytime of each seasonb2 < 0 (see Eq. (2)), i.e. when R12 reaches high enough, thefoF2 decreases with increasing solar activity. But at mid-night in winter, foF2 is found to be linearly related withR12, i.e. the foF2 increases with increasing solar activity.These results supports the finding of Liu et al. (2004)who has reported this phenomenon based on the data from1957 to 1991 at Wuhan station (geographic 30.6 N,114.4 E), China. They claimed that it needs further confir-mation due to too sparse data at extremely high solarepoch. Balan et al. (1994a) interpreted the saturation ofionospheric ionization as the result of a non-linear rela-tionship between the solar (X-rays, EUV, and Lyman )fluxes, which produces the ionosphere and F10.7, whichis conventionally used as an index of solar activity. Fur-ther, it is seen that the behavior of Kodaikanal (equatorial
station) is different from the other two stations. It is wellknown that solar ionizing flux, meteorological influences,and solar wind conditions are the origins of changes inthe state of the ionosphere and all these effects are depen-dent on local time, latitude, and season (Forbes et al.,2000). In addition to the above parameters, the ionizationof equatorial and low-latitude ionosphere is widely affectedby equatorial electrojet strength. The difference in the solarcycle effect for different latitude and season is attributed tothe latitudinal and seasonal variation of these parameters.It is clear from the results that the duration of saturationeffect is longer for Ahmedabad as compared to the othertwo stations. Thus, the most profound saturation featurein foF2 occurs at the equatorial anomaly crest regionwhich is in consistent with the previous work reported byLiu et al. (2003). It is well known that transport processplays a significant role over the low-latitude region andthe ionization at such latitudes is transported from theequatorial region. The greatest ionospheric electron den-sity usually occurs around the equatorial anomaly regions(Davies, 1990). Therefore, it can be suggested that owingto the presence of dense ambient electron density, itbecomes less fluctuated and approaches saturation whichis also suggested by Liu et al. (2003).
The difference between the daytime foF2max values forthe two solar cycles is seen to be maximum for Delhi and
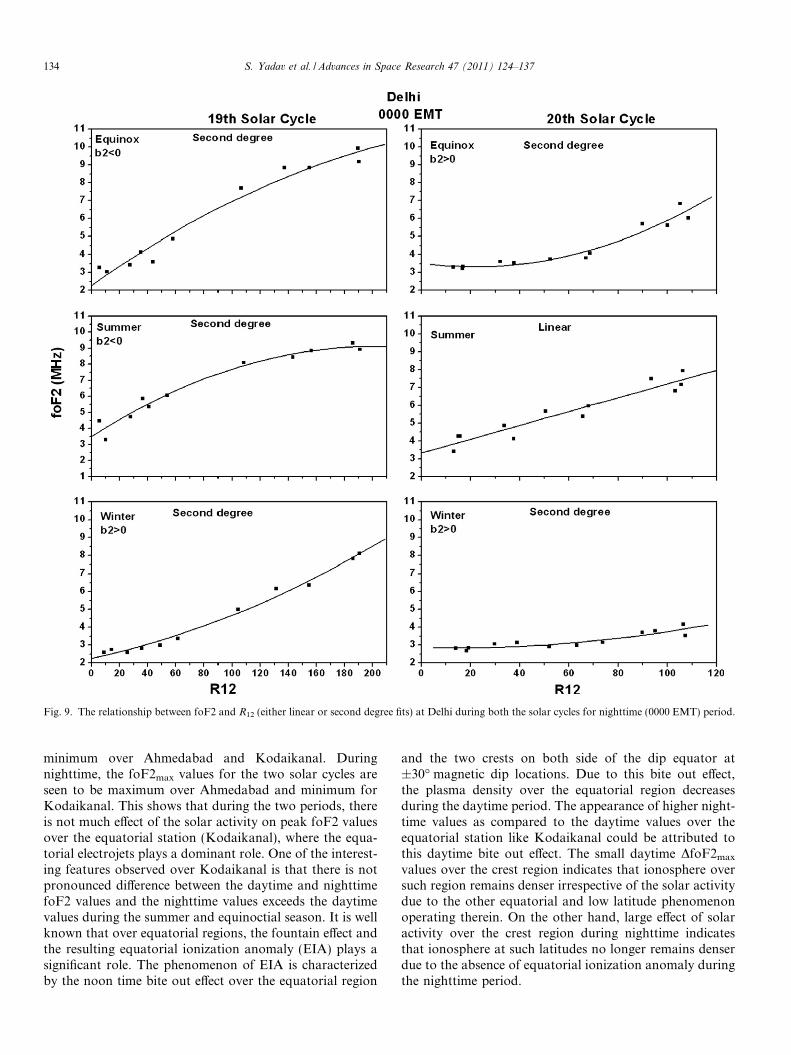
Fig. 9. The relationship between foF2 and R12 (either linear or second degree fits) at Delhi during both the solar cycles for nighttime (0000 EMT) period.
134 S. Yadav et al. / Advances in Space Research 47 (2011) 124–137
minimum over Ahmedabad and Kodaikanal. Duringnighttime, the foF2max values for the two solar cycles areseen to be maximum over Ahmedabad and minimum forKodaikanal. This shows that during the two periods, thereis not much effect of the solar activity on peak foF2 valuesover the equatorial station (Kodaikanal), where the equa-torial electrojets plays a dominant role. One of the interest-ing features observed over Kodaikanal is that there is notpronounced difference between the daytime and nighttimefoF2 values and the nighttime values exceeds the daytimevalues during the summer and equinoctial season. It is wellknown that over equatorial regions, the fountain effect andthe resulting equatorial ionization anomaly (EIA) plays asignificant role. The phenomenon of EIA is characterizedby the noon time bite out effect over the equatorial region
and the two crests on both side of the dip equator at±30� magnetic dip locations. Due to this bite out effect,the plasma density over the equatorial region decreasesduring the daytime period. The appearance of higher night-time values as compared to the daytime values over theequatorial station like Kodaikanal could be attributed tothis daytime bite out effect. The small daytime DfoF2max
values over the crest region indicates that ionosphere oversuch region remains denser irrespective of the solar activitydue to the other equatorial and low latitude phenomenonoperating therein. On the other hand, large effect of solaractivity over the crest region during nighttime indicatesthat ionosphere at such latitudes no longer remains denserdue to the absence of equatorial ionization anomaly duringthe nighttime period.
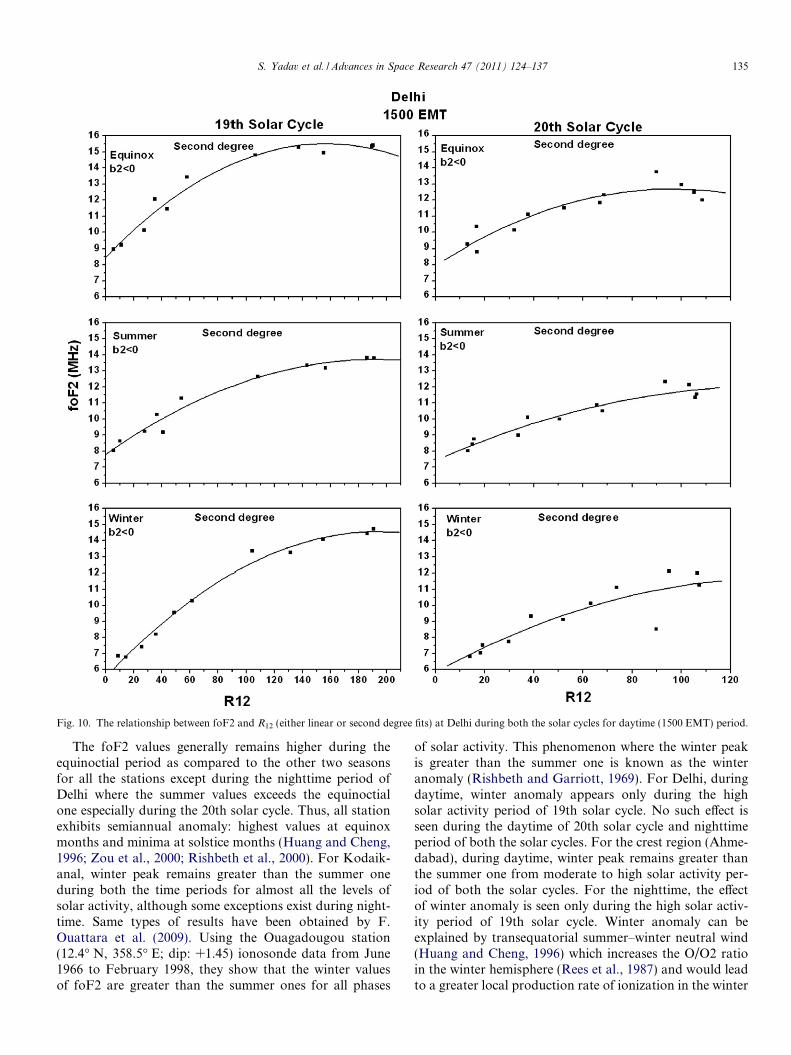
Fig. 10. The relationship between foF2 and R12 (either linear or second degree fits) at Delhi during both the solar cycles for daytime (1500 EMT) period.
S. Yadav et al. / Advances in Space Research 47 (2011) 124–137 135
The foF2 values generally remains higher during theequinoctial period as compared to the other two seasonsfor all the stations except during the nighttime period ofDelhi where the summer values exceeds the equinoctialone especially during the 20th solar cycle. Thus, all stationexhibits semiannual anomaly: highest values at equinoxmonths and minima at solstice months (Huang and Cheng,1996; Zou et al., 2000; Rishbeth et al., 2000). For Kodaik-anal, winter peak remains greater than the summer oneduring both the time periods for almost all the levels ofsolar activity, although some exceptions exist during night-time. Same types of results have been obtained by F.Ouattara et al. (2009). Using the Ouagadougou station(12.4� N, 358.5� E; dip: +1.45) ionosonde data from June1966 to February 1998, they show that the winter valuesof foF2 are greater than the summer ones for all phases
of solar activity. This phenomenon where the winter peakis greater than the summer one is known as the winteranomaly (Rishbeth and Garriott, 1969). For Delhi, duringdaytime, winter anomaly appears only during the highsolar activity period of 19th solar cycle. No such effect isseen during the daytime of 20th solar cycle and nighttimeperiod of both the solar cycles. For the crest region (Ahme-dabad), during daytime, winter peak remains greater thanthe summer one from moderate to high solar activity per-iod of both the solar cycles. For the nighttime, the effectof winter anomaly is seen only during the high solar activ-ity period of 19th solar cycle. Winter anomaly can beexplained by transequatorial summer–winter neutral wind(Huang and Cheng, 1996) which increases the O/O2 ratioin the winter hemisphere (Rees et al., 1987) and would leadto a greater local production rate of ionization in the winter
136 S. Yadav et al. / Advances in Space Research 47 (2011) 124–137
hemisphere (Huang and Cheng, 1996). Seasonal anomaly isalso attributed to inter-hemispheric transport of ionization(Rothwell, 1963), changes in the Sun–Earth distance(Yonezawa, 1959) and seasonal change of O/N2 concentra-tion (Rishbeth and Setty, 1961; Wright, 1963; Rishbethet al., 2000; Zhang et al., 2005). The occurrence of night-time winter peak greater than the summer one at equatorialcrest region could be attributed to the transequatorial flowfrom summer to winter hemisphere even during nighttimeas predicted by Hedin et al. (1991).
5. Conclusions
The investigation of solar cycle variation of foF2 duringdifferent seasons over the Indian region (i.e. equatorial andlow latitude ionosphere) by using the long term database of19th and 20th solar cycle shows some interesting results.The major results of this study are as follows:
(1) The phenomenon of saturation effect depends on sea-sons, local time, latitude, and on the magnitude ofsolar activity. The saturation effect is significant forintense cycle and over the equatorial ionizationanomaly crest regions. At low-latitude stations, thesaturation effect is not seen during the nighttime per-iod of winter season for both the solar cycles. Thelarge effect of solar activity is seen during nighttimeas compared to the daytime ionosphere.
(2) The magnitude of the solar cycle does not make muchdifference in the foF2 values over the equatorialregion and during the daytime period of equatorialionization anomaly crest region.
(3) For the equatorial station, winter peak remainsgreater than the summer one during both the timeperiods of almost all the levels of solar activity withfew unexplainable exceptions. At the equatorialanomaly crest region, the winter anomaly is seenfrom moderate to high solar activity period of bothsolar cycles. At low-mid latitude station, the phenom-enon is seen only during the high solar activity periodof 19th solar cycle. Thus it can be concluded that win-ter anomaly decays with increasing latitudes.
It is well known that solar ionizing flux, meteorologicalinfluences, and solar wind conditions are the origins ofchanges in the state of the ionosphere. In addition to theseparameters, the ionization over equatorial and low latitudeionosphere is widely affected by the equatorial electrojetstrength and equatorial ionization anomaly. Therefore,there is a need to investigate these parameters properlyfor better understanding the variability of the equatorialand low-latitude ionosphere.
Acknowledgment
One of the authors (Sneha Yadav) acknowledges Coun-cil of Scientific and Industrial Research (CSIR), India and
Space Physics Laboratory, Vikram Sarabhai Space Centre,ISRO for providing the financial support under CRABEXproject.
References
Balan, N., Bailey, G.J., Jayachandran, B. Ionospheric evidence for anonlinear relationship between the solar e. u. v. and 10.7 cm fluxesduring an intense solar cycle. Planet. Space Sci. 41, 141–145, 1993.
Balan, N., Bailey, G.J., Jenkins, B., Rao, P.B., Moffet, R.J. Variations ofionospheric ionization and related solar fluxes during an intense solarcycle. J. Geophys. Res. 99, 2243–2253, 1994a.
Balan, N., Bailey, G.J., Moffett, R.J. Modeling studies of ionosphericvariations during an intense solar cycle. J. Geophys. Res. 99, 17467–17475, 1994b.
Balan, N., Bailey, G.J., Su, Y.Z. Variations of the ionosphere and relatedsolar fluxes during solar cycles 21 and 22. Adv. Space Res. 18, (3)11–(3)14, 1996.
Dabas, R.S., Sharma, K., Das, R.M., Sethi, N.K., Pillai, K.G.M., Mishra,A.K. Ionospheric modeling for short- and long-term predictions of Fregion parameters over Indian zone. J. Geophys. Res. 113 (A3), 3306,doi:10.1029/2007JA012539, 2008.
Davies, K. Ionospheric Radio. Peter Peregrinus, London, pp. 580, 1990.Forbes, J.M., Palo, S.E., Zhang, X. Variability of the ionosphere. J.
Atmos. Terr. Phys. 62, 685–693, 2000.Hedin, A.E., Biondi, M.A., Burnside, R.G., Hernandez, G., Johnson,
R.M., Killeen, T.L., Mazaudier, C., Meriwether, J.W., Salah, J.E., Sica,R.J., Smith, R.W., Spencer, N.W., Wickwar, V.B., Virdi, T.S. Revisedglobal model of thermospheric winds using satellite winds using satelliteand ground-based observations. J. Geophys. Res. 96, 7657–7688, 1991.
Huang, Y.N., Cheng, K. Solar cycle variations of the equatorialionospheric anomaly in total electron content in the Asians region.J. Geophys. Res. 101 (A11), 24513–24520, 1996.
Jones, W.B., Obitts, D.L. Global representation of annual and solar cyclevariation of foF2 monthly median 1954–1958. Office of Telecommu-nications ITS Research Report 3, US Government Printing Office,Washington, DC., 1970.
Kane, R.P. Solar cycle variation of f0F2. J. Atmos. Terr. Phys. 54, 1201–1205, 1992.
Lakshmi, D.R., Reddy, B.M., Dabas, R.S. On the possible use of recentEUV data for ionospheric predictions. J. Atmos. Terr. Phys. 50, 207–213, 1988.
Liu, J.Y., Chen, Y.I., Lin, J.S. Statistical investigation of the saturationeffect in the ionospheric foF2 versus sunspot, solar radio noise, andsolar EUV radiation. J. Geophys. Res. 108 (A2), 1067–1073,doi:10.1029/2001JA007543, 2003.
Liu, L.B., Wan, W.X., Ning, B.Q. Statistical modeling of ionospheric foF2over Wuhan. Radio Sci. 39, 2013, doi:10.1029/2003RS003005, 2004.
Ouattara, F., Amory-Mazaudier, C., Fleury, R., Lassudrie Duchesne, P.,Vila, P., Petitdidier, M. West African equatorial ionospheric param-eters climatology based on Ouagadougou ionosonde station data fromJune 1966 to February 1998. Ann. Geophys. 27, 2503–2514, 2009.
Pancheva, D., Mukhtarov, P. A single-station spectral model of themonthly median foF2 and M(3000) F2. Stud. Geophys. Geod. 42, 183–196, 1998.
Rees, D., Fuller-Rowell, T.J., Quegans, S., Moffett, R.J., Bailey, G.J.Thermospheric dynamics: understanding the unusual disturbances bymeans of simulations with a fully-coupled global thermospheric/highlatitude ionospheric model. Ann. Geophys. 5A, 303–328, 1987.
Rishbeth, H., Setty, C.S.G.K. The F-layer at sunrise. J. Atmos. Terr.Phys. 20, 263–276, 1961.
Rishbeth, H., Garriott, O.K. Introduction to Ionospheric Physics.Academic Press, New York, 1969.
Rishbeth, H., Muller-Wodarg, I.C.F., Zou, L., Fuller-Rowell, T.J.,Millward, G.H., Moffett, R.J., Idenden, D.W., Aylward, A.D. Annualand semiannual variations in the ionospheric F2-layer: II. Physicaldiscussion. Ann. Geophys. 18, 945–956, 2000.
S. Yadav et al. / Advances in Space Research 47 (2011) 124–137 137
Rothwell, P. Diffusion of ions between F layers at magnetic conjugatepoints, in: Proceedings of the International Conference on theIonosphere. Institute of Physics and Physical Society, London, pp.217–221, 1963.
Sizun, H. F2-layer critical frequency modelization as a function of upwardand downward phase of solar activity cycle, in: Proceedings ofPRIME/URSI Workshop, Roquetes, Memoria, vol. 16, pp. 205–217,1992.
Wright, J.W. The F-region seasonal anomaly. J. Geophys. Res. 68, 4379–4381, 1963.
Xenos, Th.D., Kouris, S.S., Zolesi, B. Assessment of the solar-cycledependence of foF2. Ann. Geophys. 6, 1157–1166, 1996.
Xu, Tong., Wu, Zhen-Sen., Wu, Jian., Wu, Jun. Solar cycle variation ofthe monthly median foF2 at Chongqing station. China Adv. SpaceRes. 42, 213–218, 2008.
Yonezawa, T. On the seasonal and non-seasonal annual variations andthe semiannual variation in the noon and midnight densities of theF2 layer in middle latitudes II. J. Radio Res. Lab. Jpn. 6, 651–668,1959.
Zhang, S.R., Holt, J.M., Anthony, P., Eyken, V., McCready, M., Amory-Mazaudier, C., Fukao, S., Sulzer, M. Ionospheric local model andclimatology from long-term databases of multiple incoherent scatterradars. Geophys. Res. Lett. 32, L20102, doi:10.1029/2005GL023603,2005.
Zou, L., Rishbeth, H., Muller-Wodarg, I.C.F., Aylward, A.D., Millward,G.H., Fuller-Rowell, T.J., Idenden, D.W., Moffett, R.J. Annual andsemiannual variations in the ionospheric F2-layer. I. Modelling. Ann.Geophys. 18, 927–944, 2000.