Energy performance: A comparison of four different multi-residential building designs and forms in...
45
Transcript of Energy performance: A comparison of four different multi-residential building designs and forms in...

Volume 2 (2012), Number 1

Published by UM Power Energy Dedicated Advanced Centre (UMPEDAC) , University of Malaya, Malaysia
International Journal of Renewable Energy Resources (e-ISSN: 2289-1846)
Editor-In-Chief
Prof. Dr. Nasrudin Abd Rahim
Associate Editor-In-Chief
Assoc. Prof. Dr. Saidur Rahmain
Dr. Md. Hasanuzzaman
Editorial Board
Prof. Dr. Muhamad Rasat Muhammad, UM, Malaysia
Prof. Dr. Mohd Azlan Hussain , UM, Malaysia
Prof. Dr. Masjuki Hj Hassan, UM, Malaysia
Prof. Dr. Zainal Salam, UTM, Malaysia
Assoc. Prof. Dr. Nowshad Amin, UKM, Malaysia
Dr. Ab Halim Bin Abu Bakar, UM, Malaysia
Dr. Jeyraj Selvaraj, UM, Malaysia
International Advisory Board
Prof. Dr. Bilal Akash, Jordan
Prof. Dr. Arif Hepbasli, Canada
Prof. Dr. Rashid Sarkar, Bangladesh
Prof. Michael Negnevitsky, Australia
Prof. Mohsen M. Aboulnaga, Dubai
Prof. Walter Leal Filho, Germany
Prof. Youssef Ahmad Youssef, Brazil
Prof. Roger A Falconer, UK
Prof. Dr. M. A. Rahman, Canada
Submission and Enquiries
Manuscripts submission and enquiries should be addressed to:
Dr. Md. Hasanuzzaman, Associate Editor-In-Chief
International Journal of Renewable Energy Resources
UM Power Energy Dedicated Advanced Centre (UMPEDAC)
Level 4, Wisma R&D, University of Malaya
Jalan Pantai Baharu, 59990 Kuala Lumpur, Malaysia
Email: [email protected]; [email protected]
Published by UM Power Energy Dedicated Advanced Centre (UMPEDAC) , University of Malaya, Malaysia
INTERNATIONAL JOURNAL OF RENEWABLE ENERGY RESOURCES
Vol. 2, No. 1 (JUNE) 2012
CONTENTS PAGE
POTENTIAL USE OF SOLAR PHOTOVOLTAIC IN PENINSULAR
MALAYSIA
A. Johari, S.H. Samseh, M. Ramli and H. Hashim
1
ENERGY ACCESS IN NIGERIA: AN ASSESSMENT OF SOLAR
UTILIZATION IN IBADAN
A. Soneye and A. Daramola
6
ENERGY PERFORMANCE: A COMPARISON OF FOUR DIFFERENT
MULTI-RESIDENTIAL BUILDING DESIGNS AND FORMS IN THE
EQUATORIAL REGION
A.A. Jamaludin, N. Inangda, A.R.M. Ariffin and H. Hussein
13
COMBUSTION STUDIES OF FLUFF REFUSED-DERIVED FUEL
(RDF) IN FLUIDIZED BED (FB) SYSTEM
A. Abdul, M. Rozainee, A. Johari, and R.S.W. Alwi
23
DEADBEAT-BASED PI CONTROLLER FOR STAND-ALONE SINGLE-
PHASE VOLTAGE SOURCE INVERTER USING BATTERY CELL AS
PRIMARY SOURCES
T.L. Tiang and D. Ishak
27
MAXIMUM POWER POINT TRACKING ALGORITHMS FOR WIND
ENERGY SYSTEM: A REVIEW
M.A. Abdullah, A.H.M. Yatim and C.W. Tan
33

1
International Journal of Renewable Energy Resources 2 (2012) 1-5
POTENTIAL USE OF SOLAR PHOTOVOLTAIC IN PENINSULAR MALAYSIA
A. Johari, S.H. Samseh, M. Ramli and H. Hashim
Department of Chemical Engineering,Faculty of Chemical Engineering
Universiti Teknologi Malaysia, 81310 Skudai, Johor, Malaysia
Email: [email protected]
ABSTRACT
Energy is important in all aspects of development to
support population growth, urbanization,
industrialization as well as tourism industry. Energy
consumption is also increasing and several alternative
green energy sources are seriously taken into
consideration to fulfill Malaysia’s energy demand. The
Malaysian government has looked into the renewable
energy (RE) sources such as solar energy to be one of
the alternatives to face problems related with the
increase in energy demand. However, the heavily
subsidized non renewable sources in the country have
made the RE sources as an uneconomical option. The
aim of this paper is to briefly review the incentives and
the RE Act adopted by the Malaysian government to
ensure long term reliability and security of energy
supply. The feed-in-tariff system, solar radiation
intensity in Peninsular Malaysia and the role of
renewable energy sources in the Five-Fuel
Diversification Strategy energy mix are also
highlighted in this paper.
Keywords: Electricity, Renewable energy,
Photovoltaic, Feed-in-tariff, solar radiation.
1. INTRODUCTION
The consumption of energy in Malaysia rises rapidly,
increasing at an average rate of 5% in the 1980s and
12% in 2009 (Loganathan et al. 2010). The maximum
electricity demand in Peninsular Malaysia has
increased by 1.7%, from 14,007 MW in 2008 to 14,245
MW in the year 2009. In Sabah, the maximum
electricity demand has increased by 6.8%, from 673
MW in 2008 to 719 MW in 2009 whilst in Sarawak the
maximum electricity demand has increased from 860
MW in 2008 to 996 MW in 2009 (Energy Commission,
2009). In 2009, the total electricity sales was 92,753
GWh, of which the industrial sector remained the
largest user of electricity at 43.4% of the total energy
sold in 2009 and followed by commercial sector at
33.9%. The residential sector was the third largest user
of electricity in Malaysia at 21.1% and only 0.3% of
the total electricity sold was consumed by the
agriculture sector as shown in Table 1. The growth in
electricity demand is heavily influenced by strong
demand from the industrial sector, which increases at
5.4% annually (Martunus et al. 2008). Mostly,
Malaysia’s energy sources for electricity which are
based on a “four-fuel mix” strategy come from gas, oil,
hydro and coal. By 2010, it was estimated that gas and
coal would contribute 92% of the sources of electricity
generation whilst hydro and oil would contribute 7%
and 1%, respectively (International Energy Agency,
2010). The consumption of fossil fuel in electricity
generation contributes to the emission of greenhouse
gases especially CO2. The emission of greenhouse
gases causes global warming and climate change.
Table 1 Energy usage by sector in 2009
(Loganathan et al. 2010)
Sector Sales of Electricity
(GWh)
Percentage
(%)
Industrial 40,233 43.4
Commercial 31,435 33.9
Residential 19,584 21.1
Agriculture 243 0.3
Public
Lighting
1,208 1.3
Total 92,753 100
The increase in fossil fuel prices today and the
country’s commitment to reduce the carbon emission
has supported the interests in expanding the use of
renewable energy for energy generation. Under the 8th
Malaysia Plan (2001–2005), the government of
Malaysia had changed the Four Fuel Policy to the Five
Fuel Policy energy mix with the addition of renewable
energy as the fifth source of fuel in the year 2000. The
government of Malaysia has formulated numerous
energy related policies in order to ensure long-term
reliability and security of energy supply for sustainable
socio-economic development in the country. Various
efforts are currently undertaken by the government to
encourage the utilization of renewable energy
resources such as biomass, biogas, solar, mini-hydro
and municipal waste for energy generation. The
Ministry of Energy, Water and Communications
(MECW) has stated solar energy as one of the most
important renewable energy sources in Malaysia. The
climatic conditions are favorable for the development
of solar energy due to the abundant sunshine. The aim
of this paper is to review the renewable energy
utilization in Peninsular Malaysia by focusing on the
potential of solar energy particularly towards
photovoltaic (PV) usage in Malaysia. In addition, the
paper is intended to highlight the renewable energy
capacity, policies adopted by Malaysia government to
encourage the utilization of solar PV, feed-in-tariff of
solar PV and solar radiation intensity.

2
2. RENEWABLE ENERGY
In the 8th Malaysia Plan, the Malaysian government
includes renewable energy as the fifth energy source
with the aim to generate 5% of the country’s electricity
from renewable sources. It is estimated that by utilizing
only 5% of renewable energy in the energy mix, the
country could save RM 5 billion over a period of 5
years (Abdul and Lee, 2004). Efforts in promoting the
utilization of renewable energy resources are actively
being made by Malaysian government due to a number
of benefits. One of the benefits in the utilization of
renewable energy resources is the sustainability of
energy supply in a long term. Other benefit of
promoting the utilization of renewable energy is the
reduction of the greenhouse gases emission that has
negative impacts on the environment from the
consumption of fossil fuels. In Malaysia, coal
consumption for electricity generation grows at the rate
of 9.7% per year since 2002. The increase in coal
utilization usually tallies fairly well with the increase in
CO2 emission. Figure 1 shows the consumption of coal
from 2005 to 2020 which increases from 12.4 to 36
million tons.
Figure 1 Coal consumption for electricity generation in
Malaysia, million tons (Martunus et al. 2008)
Figure 2 CO2 Emissions from Coal Fired Plant in
Malaysia, million tons (Martunus et al. 2008)
The increase in coal consumption has contributed to
the changes in CO2 emissions pattern in Malaysia.
Martunus et al. (2008) estimated that CO2 emissions
from coal fired power plants in Malaysia will grow
4.1% per year to reach 98 million tons by 2020 as
shown in Figure 2. The emission is continuously
increasing with the construction of new coal fired
power plants and the increase on the capacity of
existing coal fired power plants. It is estimated that the
country could avoid 42 million tons of CO2 in 2020
and 145 million tons of CO2 in 2030 if the cumulative
renewable energy is to be increased from 2,080 MW to
4,000 MW respectively. Table 2 shows the projection
of cumulative renewable energy capacity for Malaysia.
Solar energy is considered as one of the promising
sources of renewable energy as Malaysia receives
abundant sunlight throughout the year. In addition to
that, it is also considered as a clean energy source that
does not emit CO2 in the process of electricity
generation. Malaysian government realizes that the
solar energy has the ability to ensure energy security
and mitigate climate change. The government has
currently carried out various efforts to develop and
promote the utilization of solar energy resources by
formulating policies and programs on solar energy.
Table 2 Projection of cumulative renewable energy
capacity for Malaysia, Megawatt (Weinee, 2010)
Year Biomass Biogas Mini-
Hydro
Solar
PV
Solid
Waste
Total
2020 800 240 490 190 360 2,080
2030 1,340 410 490 1,370 390 4,000
2050 1,340 410 490 18,700 430 21,370
3. POLICY AND INCENTIVES TO ENHANCE
SOLAR ENERGY IMPLEMENTATION IN
MALAYSIA
The abundance of sunlight makes solar photovoltaic
(PV) a very viable form in generating electricity. In the
9th Malaysian Plan, under the Renewable Energy (RE)
Policy, Malaysian government announced the Malaysia
Building Integrated Photovoltaic (MBIPV) Project
which aimed at promoting the use of solar electricity in
electricity generation. The Building Integrated
Photovoltaic (BIPV) Project was officially launched on
July 2005 with the cost of RM 25 million. The project
was completed in 2010.
The project was initiated by the Malaysian government
with the support from the United Nations for
Development Programme (UNDP) and Global
Environment Facility (GEF). Under this project, the PV
system is connected to the utility’s local grid in which
the excess electricity produced during the day is
exported to Tenaga Nasional Berhad (TNB). The
electricity is imported from TNB if additional
consumption is needed. This concept is known as net
metering. On the other hand, under the MBIPV project,
several financial incentives were offered to the public
to install the PV system into their premises. The
category and purposes of MBIPV incentive schemes
are listed in Table 3.
3
Table 3 MBIPV incentives schemes (Haris, 2010)
MBIPV Category Purpose of BIPV Category MBIPV Incentives
BIPV Showcase
- Target: 100 kWp
To create BIPV success stories and
quality example for public or industry
references
100% technical and financial
incentives (limited to BIPV system),
and promotional support
BIPV Demostration
- Target: 200 kWp
To stimulate the local building industry
(private and government sectors)
100% technical support and limited
financial support for BIPV system (1st
100kWp: 28%, 2nd
100kWp: 25%),
and promotional support.
Suria 1000
- Target: 1,200 kWp
To catalyse BIPV market by targeting
general public to install BIPV at their
premises (homes or building) and
property developers
Financial incentives from 75% (1st
call) reducing to 40% (8th
call) over a
four-year period, based on a bidding
concept and maximum 35% for
property developers.
In 2010, all the MBIPV incentives had been taken and
are no longer available. Effective 13th January 2010,
the MBIPV project reports directly to the Ministry of
Energy, Green Technology and Water (KeTTHA). As
such, MBIPV Project is no longer associated with
Pusat Tenaga Malaysia (PTM), which is now known as
GreenTech Malaysia. On 4 April 2011, the parliament
had passed the Renewable Energy (RE) Act 2010 bill
which aimed at developing renewable energy in a more
aggressive manner. When tabling the bill in December
2010, the Malaysian government aimed to have 2,080
MW of renewable energy capacity by 2020 (Bernama,
2011). The Act allows individuals to sell electricity
produced from renewable sources like solar PV at a
higher rate than traditional power producers to TNB.
This incentive is expected to boost renewable energy
industries and its current electricity generation share in
the country from under 1% to 11% by 2020 (Ling,
2011). Under the RE Act 2010, a small-scale solar
photovoltaic producer, meaning a household, can
potentially earn up to RM1.75 per kWh of electricity
produced by selling the power to TNB (Yee, 2011).
Under the bill, the Malaysia government also proposed
to implement the feed-in tariff system for the country,
covering technologies including solar photovoltaics.
4. FEED-IN-TARIFF (FIT) On 28th April 2011, the Malaysian parliament had
passed the legislation to create a system of feed-in
tariff for the nation. Malaysia is the fourth Asian nation
to implement a feed-in tariff system, following Japan,
Taiwan and Thailand. The program was scheduled to
be implemented by the third quarter of 2011, and
contains targets for specific technologies by year,
including PV projects that are smaller than 1 MW in
size (Malaysia Building Integrated Photovoltaic, 2011).
Tariff levels are set between RM1.23 cents per kWh
for PV plants smaller than 4 kW to RM0.85 cents per
kWh for system 10-30 MW in size. Bonuses are
included for rooftop PV, BIPV, locally produced
modules and inverters. Annual targets for solar
photovoltaics start at 29 MW in 2011 and reach 580
MW in 2030. All solar PV producers are guaranteed an
income for up to 21 years from the date of signing the
agreement. Table 4 lists the feed-in-tariffs rates for
solar PV.
Table 4 The feed-in-tariff rates for solar PV (Haris, 2010)
Capacity of Renewable
Energy Installation
Feed-In-Tariff Rate
(RM-sen/kWh)
Effective Period Initial Annual
Degression Rate
< 4 kW 1.23 21 years 8%
> 4 kW < 24 kW 1.20 21 years 8%
> 24 kW < 72 kW 1.18 21 years 8%
> 72 kW < 1,000 MW 1.14 21 years 8%
> 1 MW < 10 MW 0.95 21 years 8%
> 10 MW < 30 MW 0.85 21 years 8%
Bonus for rooftop +0.26 21 years 8%
Bonus for BIPV +0.25 21 years 8%
Bonus for local modules +0.03 21 years 8%
Bonus for local inverters +0.01 21 years 8%
+ Additional in FIT rate
5. SOLAR RADIATION
In Malaysia, the climatic conditions are favourable for
the development of solar energy as Malaysia lies
directly on the equatorial zone. The average daily solar
radiation in Malaysia of 4,500 kWh/m2
and the
sunshine duration of about 12 hours per day indicate
the potential use of solar energy to generate electricity.
In Peninsular Malaysia, the Klang Valley (Kuala
Lumpur, Petaling Jaya) has the lowest solar radiation
value, whereas areas around Penang (Georgetown,

4
north-west coast) have the highest values measured. An
installation of solar PV in Malaysia would produce
energy of about 900 to 1400 kWh/kWp per year
depending on the locations (United Nations
Development Programme, 2005). The areas located at
the northern and middle part of the Peninsula would
yield higher performance. An installation in Kuala
Lumpur would yield around 1000 - 1500 kWh/kWp per
year (Ismail, 2010). Figure 3 shows the solar radiation
value in Peninsular Malaysia.
Figure 3 Solar radiation values in Peninsular Malaysia
(United Nations Development Programme, 2005)
6. CONCLUSION
The Malaysian energy sector is still heavily dependent
on non-renewable fuels such as fossil fuels and natural
gas as a source of energy. With uncertainties in prices,
depletion and environmental issues surrounding the
non renewable energy resources, the RE approach
through solar energy plays a meaningful role as a
country’s fifth fuel. The Malaysian government has
taken various efforts to encourage individuals and
companies to invest in solar PV project by adopting the
Renewable Energy Act. Under the RE Act, the
government has created a feed-in-tariff system as one
of the most cost effective mechanisms to promote RE
applications. In Malaysia, the favourable climatic
condition makes solar photovoltaics to be in a very
viable form to generate electricity and the applications
are also very versatile. In Malaysia, the reason why RE
approach is important in the future is due to its abilities
in ensuring energy security and sustainability.
7. ACKNOWLEDGEMENT
The authors wish to acknowledge the Universiti
Teknologi Malaysia.
REFERENCES
Abdul, R.M. and Lee, K.T. 2004. Energy policy for
sustainable development in Malaysia, In: The
Joint International Conference on Sustainable
Energy and Environment (SEE), Hua Hin,
Thailand, 1-3 December.
Ahmed, A.Z. 2008. Integrating sustainable energy in
buildings: a case study in Malaysia, In: FAU
Conference, Copenhagen, Denmark, 14-15 May.
Bernama, Renewable energy bill passed, MBIPV
project,
http://www.mbipv.net.my/news1/2011/April/Ren
ewable%20Energy%20Bill%20Passed%204th%2
0April%202011.pdf, 01/05/2011.
Energy Commission. 2009. Electricity Supply
Industry in Malaysia, Performance and Statistical
Information 2009. Putrajaya: Malaysia.
Haris, A. H. Ir. 2010. Renewable energy and feed-in-
tariff, RE/MBIPV, In: National Project Team.
International Energy Agency. 2010. Energy Balances
in Non-OECD Countries, In: Global Commodities
Forum, Paris.
Ismail. 2010. An overview of the renewable energy
and energy efficiency blueprint for Iskandar
Malaysia, In: Minggu Sains dan ICT Negeri
Johor at Iskandar Regional Development
Authority, 21-27 June.
KeTTHA. 2011. (Ministry of Energy, Green
Technology and Water, Malaysia), MBIPV
project, http://www.mbipv.net.my/default.asp
23/02/2011.
Ling, G.P. 2011. Going solar and renewable, MBIPV
project,
http://www.mbipv.net.my/news1/2011/April/Goi
ng%20solar%20and%20renewable%2018th%20
April%202011.pdf, 01/05/2011.
Lim C.H., Elias S. and Philip J. 2006. Renewable
Energy Policy and Initiatives in Malaysia, Alam
Cipta International Journal on Sustainable
Tropical Design Research and Practice I (I): 33-
40.
Loganathan, N. and Thirunaukarasu, S. 2010. Dynamic
Cointegration Link between Energy Consumption
and Economic Performance: Empirical
Evidence from Malaysia, International Journal
of Trade, Economics and Finance I (III): 261-267.
Malaysia Building Integrated Photovoltaic. 2011.
Malaysian parliament approves feed-in-tariffs,
MBIPVproject,
http://www.mbipv.net.my/news1/2011/April/Mal
aysian%20Parliament%20Approves%20FeedIn%
20Tariffs%2029th
%20April%202011.pdf,01/05/2
011.
Martunus, Othman, M.R., Zakaria, R. and Fernando,
W.J.N. 2008. CO2 Emission and Carbon Capture
for Coal Fired Power Plants in Malaysia and
Indonesia, In: International Conference on
Environment 2008.
MMD (Malaysian Meteorological Department).
2010. Petaling Jaya: Selangor.
Muis, Z.A, Hashim, H., Manan, Z.A., Taha, F.M. and
Douglas, P.L. 2010. Optimal Planning of
Renewable Energy-Integrated Electricity
Generation Schemes with CO2 Reduction Target,
Renewable Energy.
http://www.mbipv.net.my/news1/2011/April/Renewable%20Energy%20Bill%20Passed%204th%20April%202011.pdf
http://www.mbipv.net.my/news1/2011/April/Renewable%20Energy%20Bill%20Passed%204th%20April%202011.pdf

5
Saidur, R., Hasanuzzaman, M., Sattar, M.A.,
Masjuki, H.H., Irfan A.M. and Mohiuddin,
A.K.M. 2007. An Analysis of Energy Use,
Energy Intensity and Emissions at the Industrial
Sector of Malaysia, International Journal of
Mechanical and Materials Engineering 2: 84-92.
United Nations Development Programme. 2005.
Overview of policy instruments for the promotion
of renewable energy and energy efficiency in
Malaysia, In: Background Report.
Weinee, C. 2010. Solar photovoltaic: plug into the
sun, MBIPV project, In: Malaysia Energy Guide.
Yee, L. H., Higher income for home solar energy,
MBIPV project,
http://www.mbipv.net.my/news1/2011/April/Hig
her%20income%20for%20home%20solar%20en
ergy%209th%20April%202011.pdf, 01/05/2011.
6
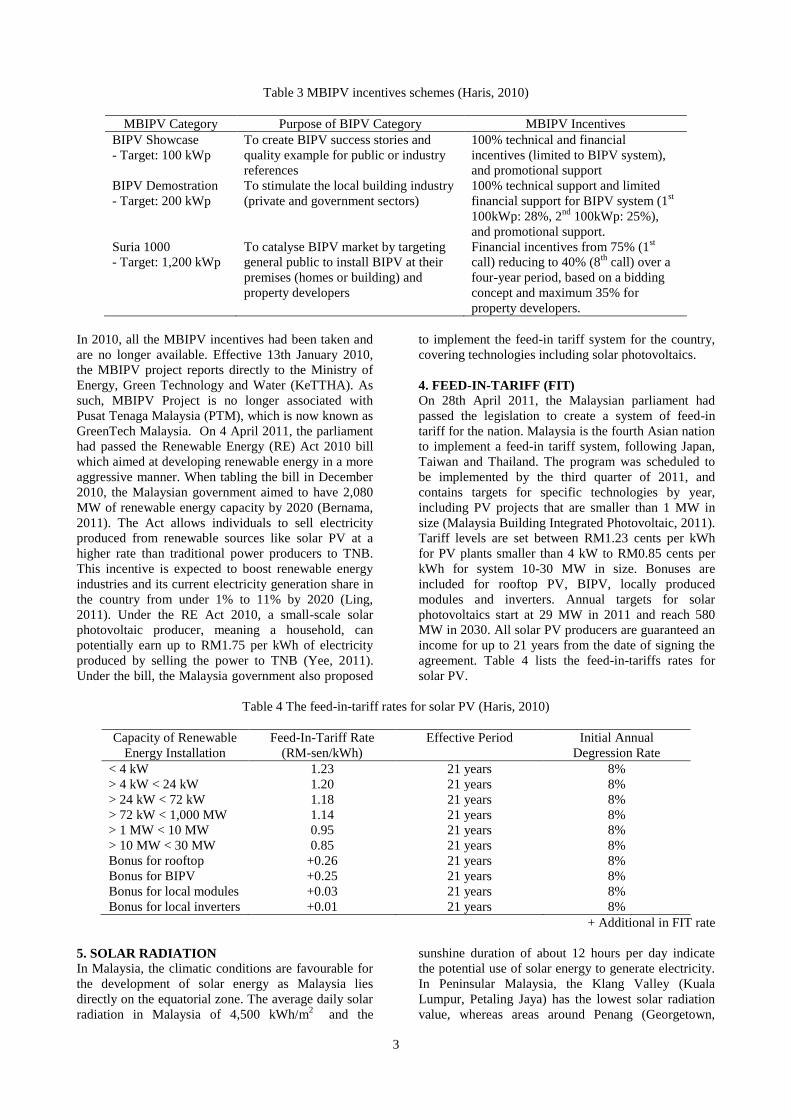
International Journal of Renewable Energy Resources 2 (2012) 6-12
ENERGY ACCESS IN NIGERIA: AN ASSESSMENT OF SOLAR UTILIZATION IN IBADAN
A. Soneye and A. Daramola University of Lagos, Akoka-Yaba, Lagos, Nigeria
Email: [email protected]
ABSTRACT Electricity is a major driving force of an economy.
Mostly, its generation in developing countries is from
hydro sources, oil and gas as well as firewood/charcoal.
As a maritime and an oil and gas economy, Nigeria
generates its energy from hydro, oil and gas. Concerns
about depletion, environment and effectiveness of
distributing produced energy are shifting research
direction to other natural sources especially solar energy.
The paper evaluates the consumption pattern and attitude
of Nigerians towards solar energy utilization. The
findings reveal that about 60% of the residents in the
region receive less than 4hrs of electricity energy supply
daily from the regulatory Power Holding Company of
Nigeria (PHCN) in the country; which is absurd to the
residents; fuelwood consumption is the main alternative;
the level of solar energy awareness is high, and, its
utilization is only limited to traffic lights on 3 main
roads, ATM machines and few water pumps in 2 new
residential estates. The challenges towards enhanced
adoption of the source of energy and the implication for
development are discussed.
Keywords: Energy, Efficiency, Sustainability, Solar,
Nigeria.
1. INTRODUCTION
Energy is an essential stimulant for social and economic
growth. It exists in chemical, mechanical, electrical, heat
and light forms. The final end-products are electricity
and fuel. Ensuring regular generation and supply for
respective needs has always been important to every
nation and newer sources and technologies are designed
from time to time always. The earliest sources of energy
are from biomass as fuelwood, animal and crop residues.
Over time, interests shifted towards fossil hydrocarbon
deposits such as coal, crude oil, natural gas and tar sands
(Kupchella, 1993; Botkin and Keller, 1998). These
sources deplete fast and upset natural balance of
important atmospheric gases depending on the rate of
exploitation thereby being unfriendly environmentally
and unsustainable in meeting the needs of increasing
human population. They contribute to the phenomenon of
global warming (Lohman et al., 2007). Electricity supply
in Nigeria is traced to 1896 when the first power station
was built in Lagos. As documented by NEPA (1998), it
spread to Port Harcourt (1928), Kaduna (1929) and
Enugu (1934). Numerous changes had since been
witnessed since then. In particular, the initial unit of the
Public Works Department providing supply up till
around 1946 was changed to Nigeria Government
Electricity Undertaking (1946 – 1951), Electricity
Corporation of Nigeria (1951 – 1974), National
Electricity Power Authority (1974 – 2002) and Power
Holding Company Nigeria (2002 till date). The sector is
accorded paramount significance in Nigeria national
development plans, policies and budgets as well as the
strive by the country to be one of the first 20 largest
world economies by the year 2020 (Energy Commission
of Nigeria, 2008).
Power Holding Company of Nigeria (PHCN) is
responsible for electricity generation, transmission,
marketing and distribution in Nigeria solely. The few
exemptions are around the tin mining and the oil
producing areas of Jos Plateau and Bonny Islands where
National Electric Supply Company and Shell Petroleum
Development Company are in charge. Supply over the
past 3 decades has been from oil and gas. Some 79% of
the supply between 2002 and 2007 were from petroleum
products, 16% from hydro, 5% from natural gas and
0.04% from coal (Fig. 1). Demand for electricity has
always exceeded supply. As shown in Fig. 2, access is far
below the world value and that of the African continent.
The value of about 136 kWh/capita is less than 3% of
that of the Republic of South Africa about half of that of
Ghana. Further analysis of the figures assumes a strong
correlation between the energy access and the per capita
income of the countries. PHCN is always undergoing a
reform or the other. It is owned by the government fully
but with some private sector involvement in recent times,
all with a view to improve performance (National
Electricity Power Authority, 1997).
As argued in Sambo (2005), electricity generation is
barely understood and achieved while access is rather
deplorable. The oil and gas sources are unfriendly
environmentally. The technology for distribution is
intensive and prone to disaster and safety intricacies
which are worsened by recent socio-political crisis in the
producing Niger Delta area. Hydro sources suffer from
water level fluctuations in dams while coal deposits are
depleting and becoming obsolete. Akarakiri (2002) and
Adesiji (2007) identified the specific challenges to

7
energy access in the country to include (i) scarcity of
manpower and capital for facility maintenance; (ii)
obsolete transmission equipments and distribution grids
which break down frequently; (iii) poor monitoring of
distribution networks with a view to reduce losses to
uncontrolled system expansion and (iv) low awareness
on alternative and renewable sources. Many households
depend on traditional fuel wood consumption still.
Fig. 1 Energy Consumption by Type in Nigeria (2002 – 2007)
Fig. 2 Comparative Access to Electricity in selected African countries (kWh/capita)
The consequences on the development and the need to
drive up supply are reviewed in Subair and Oke (2008)
viz.: (i) demand exceeding supply increasingly; (ii) costs
of producing goods and services rising astronomically
(iii) manufacturing industries and small scale enterprises
(SMEs) folding up; (iv) substandard goods and services
being produced and inefficiently; (v) foreign products
proliferating into the country (vii) employment and other
social vices rising against the GDP (vii) undue stress
being witnessed within the socio-political landscape and
environment; and (viii) socio-economic development
being retarded. The strong nexus identified between
electricity and socio-economic development of the
country led to a National Energy Policy (NEP) being
0.03
0.03
0.03
0.03
0.05
0.05
0.04
11.9
14.2
17.4
12.0
17.0
23.9
16.1
2.8
1.9
4.5
5.5
7.5
8.7
5.278.7
82.4
75.4
67.3
83.9
78.0
85.2
0 10 20 30 40 50 60 70 80 90
2002
2003
2004
2005
2006
2007
Mean
Petroleum Products
Natural Gas
Hydro
Coal
2,596
564
136
144
152
271
932
1,226
3,336
4,848
0 1,000 2,000 3,000 4,000 5,000 6,000
World
Africa
Nigeria
Kenya
Senegal
Ghana
Gabon
Egypt
Libya
South Africa

8
formulated in 2003 to propel access to the resource
(Sambo, 2005). The objectives are:
(i) To ensure the development of the diverse electricity
resources, with option for enhanced achievement of
national energy security.
(ii) To guarantee adequate, reliable and sustainable
supply of the energy at appropriate costs and in
environmentally friendly manner.
(iii) To guarantee efficient and cost effective
consumption pattern of the resources.
(iv) To accelerate the process of acquisition and
diffusion of technology and managerial expertise in
the relevant sectors of the economy.
(v) To promote increased private sector investments and
development of the energy sector industries.
(vi) To ensure comprehensive, coherent and coordinated
plans and programmes of the sector, and;
(vii) To foster international cooperation in the energy
resource trade and projects development in Africa
and the world at large.
Solar energy is one of the eleven sources identified
including wind, wave, solar, geothermal and nuclear. The
policy sought to integrate it in a mix that could ensure
optimum exploitation, conversion, distribution and
consumption. It is planned to be pursued “aggressively”
in order to be integrated into the national power grid. A
summary of the solar energy potential in Nigeria is
provided by Sambo (2008). He argued that the country
receives about 5.08 x 10¹²
kWh of energy per day from
the sun; that if solar energy appliances with just 5%
efficiency are used to cover only 1% of the country’s
surface area, then 2.54 x 10⁶mWh of electrical energy
could be obtained. This, he estimated as being
equivalent to 4.66 million barrels of oil per day. He
supported his argument with the achievement of the solar
photovoltaic pilot research project plants that were
installed for some villages in the early 1990s by the
United States in the semi-arid north-western Sokoto State
of the country on stand-alone basis. They reveal that
solar systems are most viable, economical and
sustainable of all the sources.
Aggressive pursuant of solar energy for the country is
imperative based on the forgoing. Its utilization over time
and space deserves being examined comparatively
relative to other sources. This study attempts an
assessment of the status of electricity supply in the
Ibadan Nigeria currently; the level of satisfaction with
supply, and the alternatives in use including solar energy.
Awareness and adoption of solar energy as well as the
existing solar powered facilities in the area are evaluated.
Also examined are the challenges towards a more rapid
adoption.
2. THE AREA OF STUDY
Ibadan Metropolis (Latitude 7o25’N, Longitude 4
o00’E)
is the capital of present Oyo State in southwestern
Nigeria since 1991 (Fig. 3). It was the administrative
capital of the whole of Southern Nigeria (1946-1960); the
Western region (1960-1962); Old Oyo state (1976-1991).
Eleven (11) of the 33 Local Government Areas (LGAs)
of the state are within Ibadan region. Five of these are
within the Ibadan Metropolis and the remaining six in
predominantly rural hinterlands. The Metropolitan area is
about 3,123.30km2 and the traditional city core about
463.33km2 (Agboola, 1995). In view of its latitudinal
location, the state enjoys a tropical equatorial climate
with high insolation all the year round. Mean length of
day light varies between about 11.5 hrs in dry season to
12.7hrs in the wet season. Mean daily full sunshine hour
is about 7.3hrs of the possible sunshine and is highest
around the peak of the dry season in March. The study
area, Ibadan, was the largest African City up till the
1960s and has a population of about 750,000 presently.
Two of its five Local Government Areas of
administration are studied which are Ibadan North and
Ibadan North East (Fig. 3). The combined population is
about 639,563 (Federal Government of Nigeria, 2006).
This is about 48% of the population of the city. Its
physical development reflects mixed traditional and
modern African layout. Farming is the main occupation
in the rural axis. Manufacturing, dominated by SMEs,
white-collar jobs and informal services dominate the
urban areas. In particular, the local industries include
brewing, canning, publishing, tobacco processing, and
manufacture of furniture. Traditional handcrafts such as
blacksmithing and ceramics, as well as weaving,
spinning and dyeing retain important roles in the
economy of the city. They all depend a lot on electricity
supply.
3. METHODOLOGY
Using a questionnaire, a total of 240 households were
sampled with respect to (i) the status of electricity supply
in the area presently; (ii) the level of satisfaction with
supply, (iii) the alternatives in use (iv) the level of solar
energy awareness and adoption (iv) the existing solar
powered facilities, and; (iv) the challenges towards
adopting the more sustainable solar option. Data for the
study were collected through a set of multiple sources. A
detailed reconnaissance of the LGAs was embarked upon
in October 2009 with a view to determine the sampling
protocol and procedure. This was supported by a set of
township maps and field assessment, administrative
records interviews and social survey. Some field
assessments, interviews and measurements were
accomplished during the period. A set of social surveys
was designed for the research. In parts, the questionnaire
instrument covers the aspects of current electricity supply
and demand in the area, the attitude and behavior of
respondents on the current situation, the alternatives in
use and their perception of renewable energy systems.
Knowledge of the relative significance of solar power
system and hindrances against adopting it were covered.
9
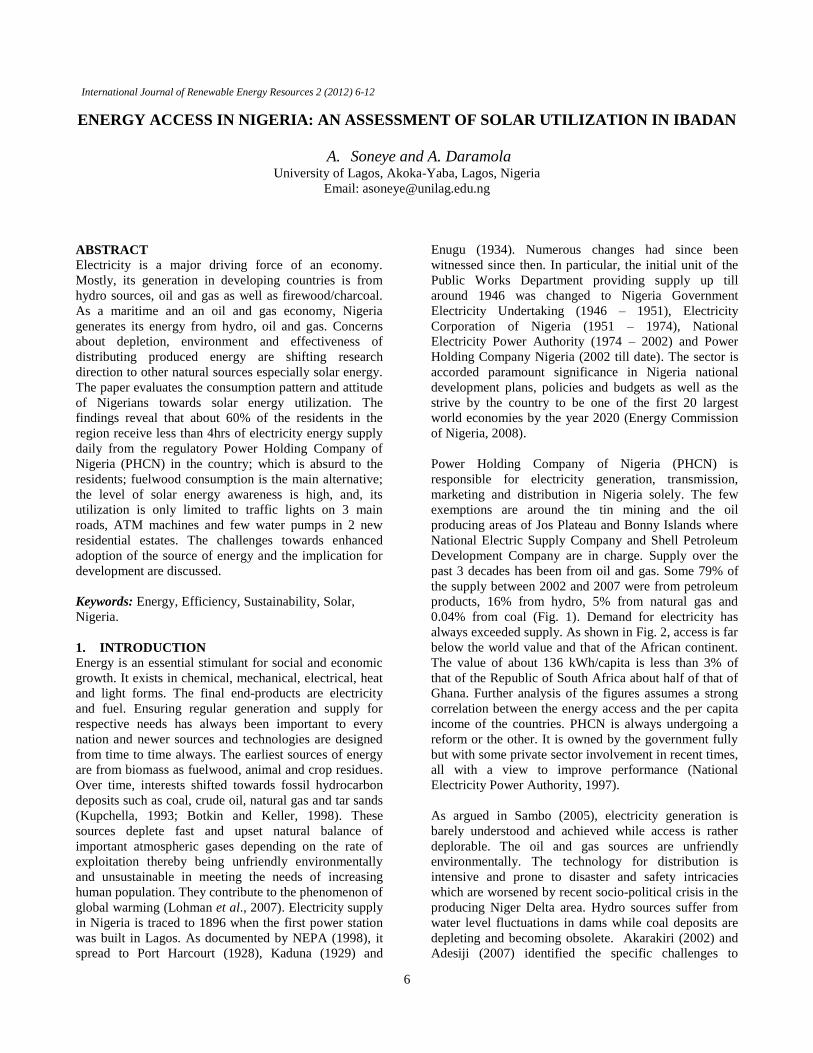
A total of 120 of the questionnaires were administered at
household (HH) levels in each of the 2 LGA on a
stratified random protocol. A total of 113 were recovered
duly completed in Ibadan North and 104 in Ibadan North
East, representing 94% and 87% respectively. The
analysis was done using interactive SPSS (ver. 16.0) and
GIS packages.
Fig. 3: The Study Area
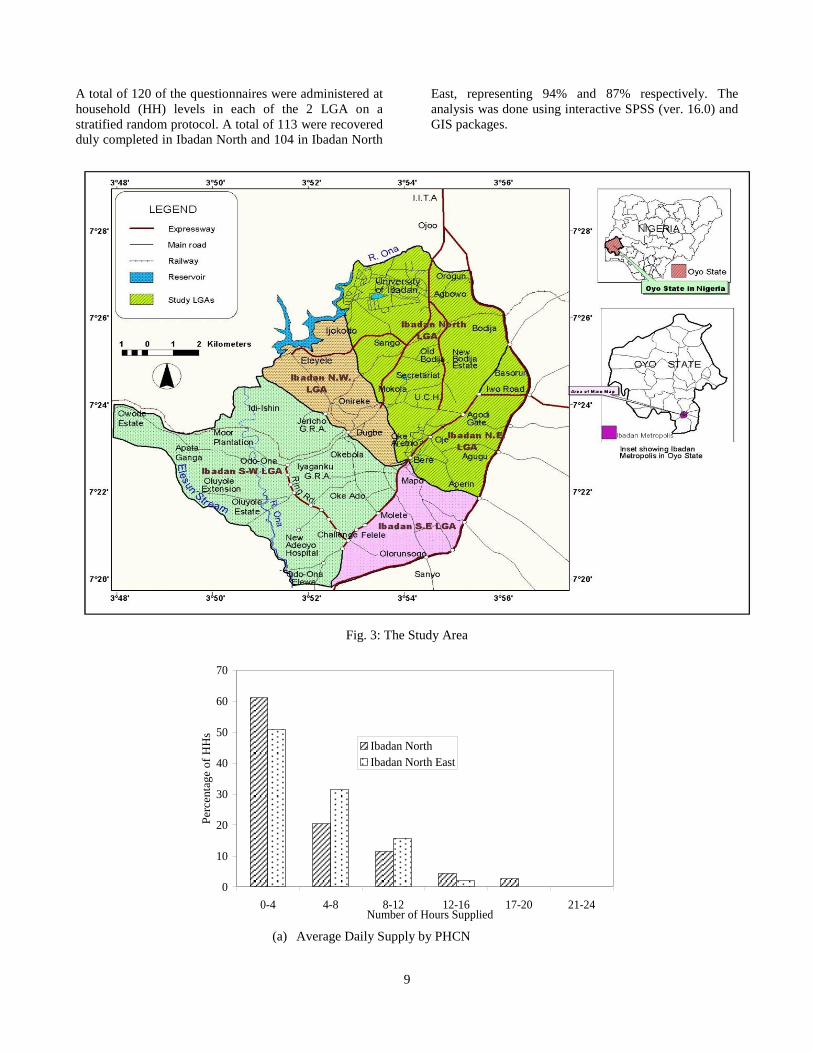
(a) Average Daily Supply by PHCN
0
10
20
30
40
50
60
70
0-4 4-8 8-12 12-16 17-20 21-24Number of Hours Supplied
Perc
en
tage o
f H
Hs
Ibadan North
Ibadan North East

10
(b) Average Monthly Bills paid to PHCN
Fig. 4: Status of Electricity Supply in the Study Area
4. RESULTS AND DISCUSSION
Electricity Supply in the City
No single HH informant in the area ever received
uninterrupted supply for a whole day (i.e. of up to 21 hrs
– 24 hrs) since about the past one year in either LGAs.
As shown in Fig. 4, only 2.6% of the HH have been
receiving between 17 hrs - 20 hrs in Ibadan North while
a larger proportion of 61% and 51% in Ibadan North and
Ibadan North East receive less than 4 hrs. The epileptic
supply situation is berated by almost all the interviewed.
Some 48.6% and 47.0% of the HHs are paying between
N1,000 – N2,000 to the supplier PHCN as monthly bills
in Ibadan and North East LGAs respectively. About 1.8%
and 0.9% pay the highest of N3,000– N4000 monthly.
Only 1% of the interviewed HHs Ibadan North East LGA
adjudged the supply status as good. Some 65% view it as
bad in both LGAs and 34% as fair. The billing system is
regarded unfair by all the HHs because everyone is
charged almost the same amount monthly, whether there
is any supply or not.
HH generators of different models and capacities are
used extensively as alternatives. Use of inverter is close
to nil. Those who can not afford the facility depend on
fuelwoods and kerosene stoves extensively for cooking,
in that order. They use torch lights, candles and lanterns
for lighting. About 75% in Ibadan North LGA and 77%
in Ibadan North East have at least a generator each. But
for a few affluent who could afford higher capacity
generators, more than 60% of the generators in use are of
less than 1kVA, referred to locally as ‘I better pass my
neighbour’. They can only power a few bulbs and fans at
a point in time. The alternatives are unsuitable to the
respondents. While kerosene- stoves and lanterns are
unsafe in view of common recent incidences of
explosions in different parts of the country, generators
produce noise and emissions in high proportions. Some
families are reported to have died from inhaling such
emissions while sleeping overnight.
Level of awareness on solar powered electricity
All the HH informants are aware of solar energy. This is
through the mass media and adverts by various
stakeholders in the country. Only about 66% noted that
they had observed the technology working on a few
street and traffic lights, 25% had seen it being used for
lighting in houses and 9% for pumping borehole water.
Some 87% of the informants are willing to adopt solar
source of energy in their residences as the main
alternative to the epileptic supply from PHCN in their
neighborhoods. But they all claimed they have no
confidence in the technology yet because they doubt its
sustainability based on the level of development in the
country presently.
The Solar Powered Facilities in the Area
The existing solar powered facilities in the LGAs are
shown in Table 2. Those in Ibadan North LGA are street
and traffic lights on 3 main roads, some Automated
Teller Machines (ATM) on the campus of the University
of Ibadan and lighting in a few residences in the New
Bodija Housing Estate. Some borehole water pumps are
being powered by solar energy in Agugu and Bere
neighborhoods of Ibadan North East LGA. The locations
are mapped as presented in Fig. 5. Street and traffic lights
are community development projects of the state
government. Respective banks own the ATM machines
while are HH lighting and borehole pumps are by
individual HHs.
30.6
48.6
18.9
1.8
0
29.4
47
0.9
0
22.5
0 10 20 30 40 50 60
0-10
0010
00-2
000
2000
-300
030
00-4
000
>40
00
Ave
rage
Mon
thly
Pay
men
ts to
PH
CN
(in
Nai
ra)
Percentage of HH
Ibadan North East
Ibadan North

11
Fig 5: Solar Powered Facilities in the study area
Some solar energy service providers in the city berated
the low level of adapting the technology in view of the
failure by PHCN, and that almost all those using it are for
demonstration exercises. They noted that some others are
producing locally-made reading lamps, flashlights,
CCTV cameras, billboards and portable mobile fans
using the technology but that many of the facilities are
highly substandard.
Table 2: Solar Facilities in the area
LG Facility Location Provider
Ibad
an N
ort
h
Street and
Traffic Light
Parliament Road
Govt. Ikolaba Estate (50 Units on a
2.13km length)
Sabo
ATMs University of Ibadan Banks
HH Lighting New Bodija Estate
HHs
Ibad
an
N/E
ast
Water Pump
Agugu
Bere
Challenges against Solar Energy Use in the area
Lack of trust in new technology is the main challenge
identified by informants against the low acceptance of
solar technology in the area. Some 73% claimed that the
present reports from those who had accepted it are not
encouraging enough, and that they would rather tarry a
while and get be more convinced before deciding. Next
to this is affordability. Some 82% of those who are
willing to adopt the energy source reported the present
prohibitive costs of the facility acquisition, installation
and maintenance. They argued that on the long run, the
cost of solar energy to an average HH is about thrice that
of generators, kerosene and fuelwood at the current rates.
They complained about low voltage from the solar panels
available in the country which is below what is required
for HH needs. A few others exhibited fear over common
fake products and spare parts. All the service providers
identified the limitation of the government to support the
industry and service providers through fiscal and
economic policies. None of them claimed knowledge of
any operational public programme on solar energy
support, implementation or enforcement, other than
occasional patronage of vendors on street lighting and
rural water borehole. There are no tax holidays for the
technology manufacturers or importers. Yet the local
currency has continued to depreciate in the global market
and with stiff competition from the growing lucrative
business of HH generator importation into the country.
These do not support genuine solar energy equipment,
cells and accessories which those using the technology
complained about.
Implications for Sustenability
The implication from the forgoing is that the monopoly
being enjoyed in Nigeria energy industry by PHCN can
hardly guarantee more than 4 hours of supply in the study
area daily as at present. It was only able to generate about
40% of the installed 6,000MW of electricity in its nine
electricity generating stations in 2008 [12]. This has been

12
exerting pressure on human activities including
manufacturing and social well-being of dwellers.
Efficient energy sources and access are essential drivers
for promoting economic development, job creation and
poverty alleviation. Sourcing from hydro, oil and gas
resources is highly mechanical, capital intensive and
unsustainable environmentally. The alternatives in use
encourage biomass depletion. Dependency on generators
cannot support employment generation, economic
development and growth locally. Their attendant safety,
health and environmental challenges pose more
challenges. In particular, increasing efforts at mitigating
climate change and emission of GHGs focus specific
attention on the aspects of electricity supply and energy
security.
The inference is that access to viable, economical and
cleaner energy such as solar and wind energy can hardly
be compromised. They have less negative effects on the
environment. As the major providers in the third world,
interest in the technologies by respective government
organs cannot be overemphasized. It is essential that
every feasible sustainable source for generation and
distribution be explored. This will not only afford
manufacturing companies the opportunities to survive but
to also compete favourably in regional and global
markets. Respective ones would attract commensurate
improvement in production of better energy saving
materials. Indeed, it is established that poor accessibility
to electricity in the area is a main reason for general lack
of confidence in government and its development
activities.
5. CONCLUSION
It is established that the current supply is a far outcry
from demand. Hence, the need for practical solution
through low cost renewable sources like solar energy
systems. They are non - depletable and have less negative
effects on the environment. Nonetheless, current solar
market in developing countries are neither affordable,
accessible nor sustainable. Local content input will
enhance acceptance, make the facilities more accessible
and cheaper and more acceptable. It will serve as an
alternative to the ever increasing cost of petroleum
products, protect the ecosystem and also support climate
change.
It calls for research and development in relevant areas and
formulation of achievable policies. It requires
decentralization and localization of generation,
transmission and distribution. It needs to be more private
sector driven, integrate local knowledge system and with
aggressive creation of awareness on energy efficiency and
conservation. Adequate policies and subsidies would
encourage greater participation and lead to competition
that will lower the prices of essential components.
Environmental concerns through encouraged deployment
of other low-carbon technologies and reduced air pollution
sources such as wind and wave energy also qualify as
alternatives.
REFERENCES
Kupchella, C.E. 1993. Environmental Science: Living
within the system of nature, 3rd
ed. Prentice-Hall,
New Jersey. 135 - 137.
Botkin D.B. and Keller A.K. 1998. Environmental
Science: Earth as a living planet, 2nd
ed., John Wiley
and Sons, London. 315 - 361.
Lohman D.J., Bickford D. and Sodhi, N.S. 2007.
Environment: The Burning Issue. Science 324: 481-
484
Energy Commission of Nigeria. 2008. Assessment of
energy options and strategies for Nigeria: Energy
demand, supply and environmental analysis for
sustainable energy development (2000-2030), Report
No. ECN/EPA/2008/01, Abuja.
International Energy Agency. 2010. Key World Energy,
National Electricity Power Authority (NEPA),
(1998). Kainji Power Station. NEPA Review, NEPA
Headquarters, Abuja. p. 3
Sambo, A.S. 2005. Renewable energy for rural
development: The Nigerian perspective. ISESCO
Science and Technology Vision Journal 1: 12-22.
Adesiji, R. 2007. The cost of electricity in Nigeria:
Developing and delivering affordable energy in the
21st century. Proceedings of the 27th USAEE/IAEE
North American Conference. Houston, September.
Akarakiri, J.B. 2002. Rural energy in Nigeria: The
electricity alternative. Proceedings of the Domestic
use of Energy Conference, Cape Town.
Subair, K.and Oke, D.M. 2008. Privatization and trends
of aggregate consumption of electricity in Nigeria:
An empirical analysis. African Journal of
Accounting, Economics, Finance and Banking
Research 3(3): 18-22.
Sambo A.S. 2008. Renewable energy policy and
regulation in Nigeria. Paper Presented at the
International Renewable Energy Conference, Abuja,
October.
Agboola O.D. 1995. Profile of the Ibadan metropolitan
Area. Sustainable Ibadan Project, Ibadan, 1-35.
Federal Government of Nigeria. 2007. Final results of the
2006 national census. National Population
Commission. Abuja.

13
International Journal of Renewable Energy Resources 2 (2012) 13-22
ENERGY PERFORMANCE: A COMPARISON OF FOUR DIFFERENT MULTI-
RESIDENTIAL BUILDING DESIGNS AND FORMS IN THE EQUATORIAL REGION
A.A. Jamaludin1, N. Inangda
2, A.R.M. Ariffin
2 and H. Hussein
2
1Institute of Biological Sciences, Faculty of Science, University of Malaya, 50603 Kuala Lumpur, Malaysia
2Department of Architecture, Faculty of Built Environment, University of Malaya, 50603 Kuala Lumpur, Malaysia
Email address: [email protected]
ABSTRACT
Building sector has been identified as a major energy
consumer with nearly half of the world’s energy used is
associated with providing environmental conditioning in
buildings. Approximately, two third of this is for heating,
cooling and mechanical ventilation. Therefore, there is a
need to optimize building design to be more responsive to
surrounding environment which reduces energy utilisation.
Energy consumption evaluation and audits for buildings is
vital process that can contribute to energy conservation. As
preliminary studies to this research, four low-rise residential
college buildings with specific layout were selected in
finding the relationship between passive building strategies
and energy performance. The study initial approach was to
critically analyse the design of the selected buildings through
scaled drawings and site visits. Comparison of the two were
carefully made to obtain current and post renovation
conditions and surroundings as most of the drawings were
drawn 30 to 40 years back. The elements of bioclimatic
design were implemented as matrixes or criteria, particularly
on natural ventilation and day lighting. Then, the energy
performance was crucially audited to find out Building
Energy Performance (BEP) acknowledged as energy use per
unit floor area, and Energy Efficiency Index (EEI) to
elaborate the kWh/m2/year of each residential college for
five years duration. As initial findings, the implementations
of appropriate bioclimatic design strategies are able to
provide positive impacts to the overall energy performance
of the residential colleges.
Keywords: Bioclimatic design strategies, Building Energy
Performance (BEP), energy audit, Energy Efficiency Index
(EEI).
1. INTRODUCTION
The Malaysian National Energy Efficiency Master Plan
2010 outlined productive use of energy consumption to
promote energy efficiency in built environment. This has
also been highlighted in Tenth Malaysia Plan with a target
to achieve cumulative energy saving of 4,000 kilo tons of oil
equivalent (ktoe) by 2015 (Economic Planning Unit, 2010).
This includes residential and building sector as being the
third largest energy consumer in Malaysia (Economic
Planning Unit, 2006). As reported in 2009, the commercial
and residential sector accounts for about 13% of total energy
consumption in addition to 48% of electricity consumption
in Malaysia (Al-Mofleh et al., 2009). Thus, with this
alarming fact, the building sector is a critical area to be
studied for its energy performance (Levine et al., 2007),
whilst improving thermal and visual comfort as well as
enhances energy efficiency.
Bioclimatic design strategies, which shares its’ design
principles and objectives as ‘green building’, ‘eco design’,
‘low impact design’, ‘energy efficient building’; all are
derived from the key principle ‘sustainable building design’
building. Add that, well designed building can promise
better performance. These building design approaches can
significantly reduce negative environmental impacts and
improve existing non-sustainable design, construction and
operation practices (Tiyok, 2009). This can be achieved with
more effectively with the use of natural resources, especially
energy and water, and using renewable energy in the
operational stage of the buildings.
Energy efficiency in buildings can be achieved in many
ways, but fundamentally, the basics of the passive building
designs should not be ignored. Passive building design is
one of the main factors determining the building’s energy
performance, besides building services design and
appliances and occupant behaviours (Al-Mofleh et al.,
2009); the latter factors are difficult to control and maintain.
In the tropics, as much as 60-70 % of the total energy in
non-industrial buildings is consumed by air-conditioning,
lighting and mechanical ventilation (Omer, 2008). Thus,
natural ventilation and daylighting are two well-known
strategies used to reduce a building’s energy consumption
specifically for cooling and lighting. The peak-cooling load
(which determines the maximum demand of energy) and the
annual electricity consumption can be reduced substantially
by 10 % and 13 %, respectively, through the application of
day lighting (Li et al., 2002; Zain-Ahmed et al., 2002).
Approximately 43 % of energy reduction can be achieved
by using combinations of well-established technologies such
as glazing, shading, insulation, and natural ventilation if the
building itself is designed taking into account the climate of
the site (Omer, 2008). Natural ventilation combined with
solar protection is the most efficient building design strategy

14
to achieve thermal comfort without resorting to mechanical
cooling (Candido et al., 2010). This strengthens the fact that,
sufficient provision for air movements and day lighting are
key considerations in building design in the tropical regions.
Nevertheless, thermal comfort in the building should not be
compromised whilst implementing passive and low energy
systems to meet sustainability requirements.
The effectiveness of bioclimatic building practices in a
building can be verified through energy audit, which
includes the evaluation of consumption patterns and
followed by the identification of specific energy saving
measures. These two steps are the most major ingredient of
the energy management activity (Haji-Sapar and Lee, 2005).
Regarding on the different levels of sophistication, energy
audit can be divided into two types which are walkthrough
audit; simple study of some major equipment/systems and
detailed audit; thorough study of practically all
equipment/systems (EMSD, 2007). The American Society
of Heating, Refrigerating and Air-Conditioning Engineers
(ASHRAE) (ASHRAE, 2004) stated three different level of
analysis for energy audit as listed below:
1. Preliminary energy use analysis: The building’s energy
consumption is evaluated by developing Energy Use
Intensity (EUI) resulted from existing annual utility
billing.
2. Level I - Walkthrough analysis: A visual inspection of
building’s mechanical and electrical systems through
interview of building operating personnel and evaluation
of non-energy related capital investments.
3. Level II - Energy survey and analysis: More detailed
building survey and expands on the walk-through
analysis by conducting field measurements while energy
saving and cost analysis are also completed.
4. Level III - Detailed analysis of capital-intensive
modifications: Built up the dynamic energy model of
existing systems by using software to understand the
return on investment of each option which also known as
investment grade audit.
According to Ministry of Higher Education (2010), there are
20 public universities, 525 private universities which
includes branch campus of overseas’ universities, college,
and university college, 27 polytechnics and 59 community
colleges which offer various programmes from certificate to
higher degree level in Malaysia. As recorded by Planning
and Research Unit (2008) in Malaysia Higher Education
Statistic for 2008, there were 369,169 students intake with
921,548 of students’ enrolment in all higher education
institution. These figures showed the increment from year to
year when six years back, in 2003 there were only stated
approximately 262,626 of student intake. Up to date as
reported in 10th
Malaysia Plan, the enrolment in higher
education institutions for 2010 is estimated 1,103,963
students while as nation embarks on an important mission
towards a progressive and high income mission, particularly
on developing and retaining a first-world talent base,
1,276,667 and 1,610,408 of student’s enrolment were
targeted for year 2012 and 2015 (Economic Planning Unit,
2010). Therefore, it directly shows the numbers of
accommodation facilities that should be provided by the
institutional to the students.
The multi-storey residential college is the best way in
providing accommodation facilities to the huge numbers of
students when the land spaces are limited. The multi-storey
residential building typically plays a role as student halls of
residence, key worker accommodation, care homes and
sheltered house, containing catering facilities, lounges,
dining rooms, health and leisure areas, offices, meeting
rooms and other support areas such as laundry facilities
(BREEAM, 2010). The lamp and fan are two basic
appliances to ensure the optimum comfort level in the living
units occupied by students. This supported by Omer (2008)
who stated in the equatorial region, three main elements
related to building services are conditioning for thermal
comfort, lighting for visual comfort, and ventilation for
indoor air quality to provide clean air to a space in purpose
to meet the metabolic requirements of occupants and to
dilute and remove pollutants emitted within a space.
Unfortunately, lacks of building design could leads to the
increment of electricity for lighting and cooling load in
sustaining the visual and thermal comfort in residential
college buildings. Thus, directly promotes the wastage of
energy when the lights need to switch on although there
have abundance of day lights at the outside. The same things
also happened to the fans when need to switch on
continuously although the natural ventilation can provide
optimum thermal comfort in the living units. Furthermore,
the air conditions probably need to be fixed with lower
temperature to replace fans in purpose to enhance the indoor
air quality. Therefore, with the huge numbers of students in
higher education institutional showed how much the energy
are wasted for sustain the visual and thermal comfort at the
residential college buildings.
Presently, majority of the university students are from the
Millennial Generation, also acknowledge New Boomers
Generation, who are born from 1980 onwards, they are
brought up using digital technologies, electrical gadgets and
automobiles (millennial generation, 2011). They can be
considered as the larger consumers of energy per person as
compared to earlier generations, Baby Boomers (who born
from 1946 to 1964) and Y (who born from 1965 to 1980)
(Meriac et al., 2010).
The aim of this study is to analyse the energy performance
of four residential colleges which are low-rise multi-
residential building, regarding the implementation of

15
bioclimatic design strategies particularly on day lighting and
natural ventilation. Thus, the effects of the recent adoption
of bioclimatic design strategies in influencing the total
energy consumption at residential colleges will be revealed
by evaluating the electricity consumption patterns.
Indirectly, this study will also demonstrate the electricity
consumption patterns of the Millennial Generation living in
residential colleges in Malaysia. It is hope that this study
will be able to fill in the current knowledge gap on passive
energy design in residential college buildings as most of the
studies reported in the literature had strictly focused on
residential houses, such as single storey, double storey, flat
houses and apartments (Wong et al., 2003; Ghisi and
Massignani, 2007; Indraganti, 2010; Mohit et al., 2010),
rather than residential college buildings, which may have
different layouts, services, users and living patterns.
2. RESEARCH DESIGN AND APPROACHES
Building Description
Four residential colleges with different designs, forms,
layouts and capacities were chosen in this study in finding
the relationship between different passive building strategies
implemented and performance of electric consumption.
There were, K1: linear arrangement with fixed opening at
the both end of corridor at each level (705 residents), K2:
linear arrangement with fixed opening at the end and middle
of corridor at each level (1,001 residents), K3: internal
courtyard (885 residents), and K4: internal courtyard with
balcony at each residential unit (897 residents). All of the
case studies are located in the University of Malaya Kuala
Lumpur campus situated at 3°7’1”N and 101°39’12”E. The
salient climate for Kuala Lumpur is consistently hot and
humid all year with annual average temperature between 23
to 32°C and average precipitation reaching up to 190mm.
Kuala Lumpur is affected by the weaker south-east monsoon
from April to September (Ahmad, 2008) though afternoon
rain accompanied by thunderstorms are common.
In each case study, the residential units are limited to two
occupants per room and are occupied by local and
international students. K1 is the oldest residential college,
established in 1963 while K4 is the newest, established in
1997. Each residential college comprises one administrative
block and four to six residential blocks. All administrative
blocks are equipped with air-conditioning, mainly using
split unit systems. The residential units/rooms at the
residential blocks are non-conditioned but are provided at
least with one ceiling fan, two fluorescent tube lamps in
each unit.
Building Design Studies
The blue prints, which included a site plan, architectural
drawings and structure drawings, were the main source of
data for the building design studies. Site visits to each
residential college were also carried out in order to gauge
actual conditions, since most of the drawings were drawn 30
to 40 years ago, and since then, numerous renovations and
add-ons have been carried out to increase the residences’
capacities. The elements of bioclimatic design (passive
mode) introduced by Yeang (2008) were adapted as
matrixes for assessing the building’s design in adapting
green building concepts, with particular focus on the
application of natural ventilation and day lighting.
Performance of Electric Use
The efficiency of electricity use in each residential college
was evaluated by adapting a method from Saidur (2009)
who estimated energy intensity, EI in kWh/m2 by using
following equation:
EI = AEC / TFA
where, AEC is annual energy consumption (kWh) and TFA
is total floor area (m2). Principally, Kamaruzzaman and
Edwards (2006) stated that the energy use per unit floor area
can be described as ‘Normalised Performance Indicators’
(NPI), which is also known as the energy use index or
Building Energy Performance (BEP) (EMSD, 2007).
Consequently, the term BEP will be used in this study to
indicate the performance of electric consumption at the
residential colleges, while Energy Efficiency Index (EEI)
will be used to represent kWh/m2/year (Ibrahim, 2008;
Chou, 2004). Referring to Iwaro and Mwasha (2010),
energy use in residential buildings is usually 10 to 20 times
lower compared to office buildings. Thus, the electricity
usage in residential buildings in Malaysia amounts to
approximately 10 to 25 kWh/m2/year if the electricity use in
office buildings in Malaysia is in the range of 200 to 250
kWh/m2/year (Aun, 2009).
The energy consumption data were collected and analysed
out of a five year period, beginning from 2005 until 2009,
while total floor area was calculated from the building plans.
On-site measurements were also carried out for the purpose
of obtaining accurate facts, since errors arose from the same
sources as mentioned earlier, such as outdated drawings and
recent renovations. Further statistical analysis was carried
out using SPSS 15.0 (Standard version) computer software
package. Descriptive statistical analysis was performed to
analyse mean, median, mode, standard deviation, variance
and range for comparison purposes.
3. RESULTS AND DISSCUSSION
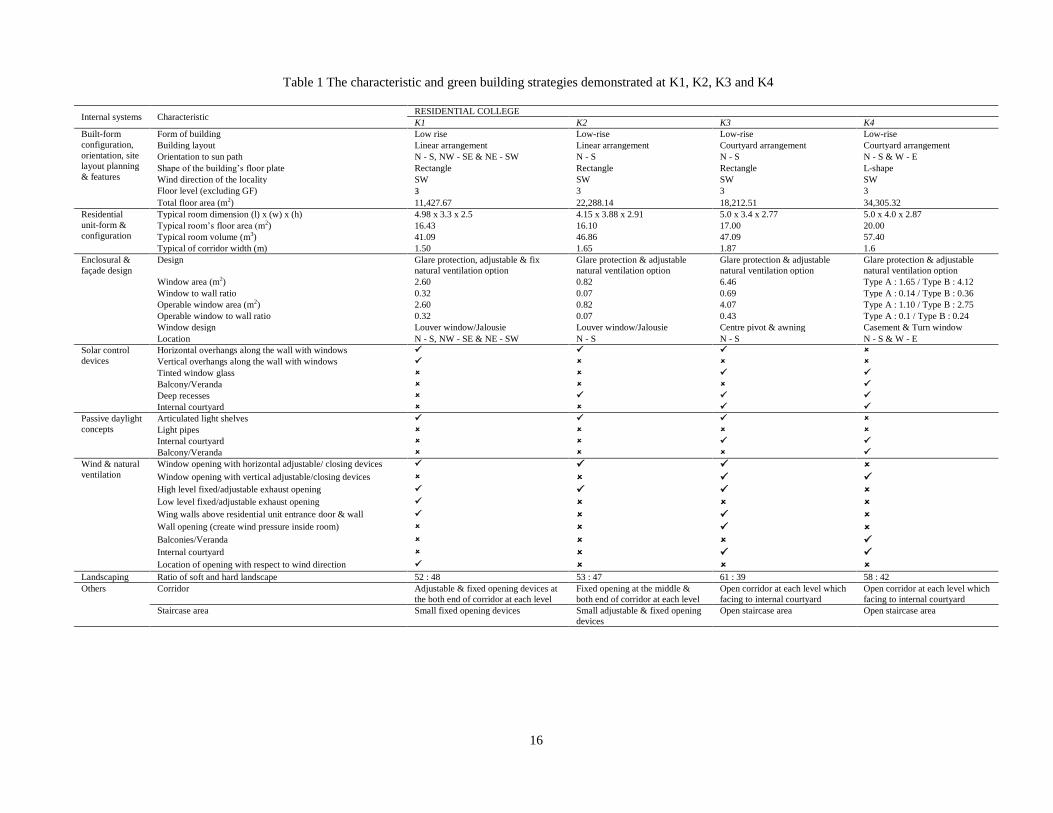
The characteristic and green building strategies
demonstrated by the four residential colleges K1, K2, K3
and K4, particularly regarding natural ventilation and day
lighting, are presented in Table 1.
Roughly, the buildings’ characteristics of K1 and K2 are
quite similar when both of these residential colleges were
built with a linear arrangement and large open ended
corridor. Unfortunately, there is more bioclimatic design
strategies pertaining wind and natural ventilation were
implemented at K1 as compared to K2. There are adjustable
16
Table 1 The characteristic and green building strategies demonstrated at K1, K2, K3 and K4
Internal systems Characteristic RESIDENTIAL COLLEGE
K1 K2 K3 K4
Built-form
configuration,
orientation, site
layout planning
& features
Form of building Low rise Low-rise Low-rise Low-rise
Building layout Linear arrangement Linear arrangement Courtyard arrangement Courtyard arrangement
Orientation to sun path N - S, NW - SE & NE - SW N - S N - S N - S & W - E
Shape of the building’s floor plate Rectangle Rectangle Rectangle L-shape
Wind direction of the locality SW SW SW SW
Floor level (excluding GF) 3 3 3 3
Total floor area (m2) 11,427.67 22,288.14 18,212.51 34,305.32
Residential
unit-form &
configuration
Typical room dimension (l) x (w) x (h) 4.98 x 3.3 x 2.5 4.15 x 3.88 x 2.91 5.0 x 3.4 x 2.77 5.0 x 4.0 x 2.87
Typical room’s floor area (m2) 16.43 16.10 17.00 20.00
Typical room volume (m3) 41.09 46.86 47.09 57.40
Typical of corridor width (m) 1.50 1.65 1.87 1.6
Enclosural &
façade design
Design Glare protection, adjustable & fix
natural ventilation option
Glare protection & adjustable
natural ventilation option
Glare protection & adjustable
natural ventilation option
Glare protection & adjustable
natural ventilation option
Window area (m2) 2.60 0.82 6.46 Type A : 1.65 / Type B : 4.12
Window to wall ratio 0.32 0.07 0.69 Type A : 0.14 / Type B : 0.36
Operable window area (m2) 2.60 0.82 4.07 Type A : 1.10 / Type B : 2.75
Operable window to wall ratio 0.32 0.07 0.43 Type A : 0.1 / Type B : 0.24
Window design Louver window/Jalousie Louver window/Jalousie Centre pivot & awning Casement & Turn window
Location N - S, NW - SE & NE - SW N - S N - S N - S & W - E
Solar control
devices
Horizontal overhangs along the wall with windows
Vertical overhangs along the wall with windows
Tinted window glass
Balcony/Veranda
Deep recesses
Internal courtyard
Passive daylight
concepts
Articulated light shelves
Light pipes
Internal courtyard
Balcony/Veranda
Wind & natural
ventilation
Window opening with horizontal adjustable/ closing devices Window opening with vertical adjustable/closing devices High level fixed/adjustable exhaust opening Low level fixed/adjustable exhaust opening Wing walls above residential unit entrance door & wall Wall opening (create wind pressure inside room) Balconies/Veranda Internal courtyard Location of opening with respect to wind direction
Landscaping Ratio of soft and hard landscape 52 : 48 53 : 47 61 : 39 58 : 42
Others Corridor Adjustable & fixed opening devices at
the both end of corridor at each level
Fixed opening at the middle &
both end of corridor at each level
Open corridor at each level which
facing to internal courtyard
Open corridor at each level which
facing to internal courtyard
Staircase area Small fixed opening devices Small adjustable & fixed opening
devices
Open staircase area Open staircase area

17
openings at K1 with louver windows at both ends of the
common corridor. Vice versa at K2, features large fixed
openings with wide horizontal awning as part of solar
control devices and open corridors at each floors in the
middle of the building to increase the effects of natural
ventilation and day lighting (Figure 1). Due to these passive
design strategies, the lamps in the common corridor need
not be continuously switched on during most part of the day
as compared to K1. Solar control devices, in forms of
horizontal overhangs and awnings are also available at both
residential units with vertical overhangs at window openings
at some of residential building at K1 (Figure 2).
The building massing of K1 and K2 are not orientated to the
sun path, which directly eliminates thermal gain into the
buildings. In addition to K1, there were low exhausted
opening as a part of façade design and transom/fix opening
above the entrance door and wall of each residential
unit/room (Figure 3 & 4), which became an advantageous in
encourage natural ventilation and daylight inside the
residential unit/room compared to K2. Nevertheless, with
regards to the design aim of glare protection, small window
areas of residential units/rooms were instated at K2,
resulting in the smallest window to wall ratio among the
four residential colleges (Figure 5). The same approach can
also be seen in the staircase area, where small adjustable
opening devices were set up, capable of providing adequate
day light and air circulation within these two areas (Figure
5). It was quite different with K1 where there are fixed
opening devices in larger scale which creates wind pressure
effects (Figure 6). Regarding on landscape, K1 stated the
smallest percentage of soft landscape among other
residential colleges which was 52%, followed by K2 with
53%. With the open gable roof design, there is no potential
for a rooftop garden at both residential colleges.
K3 is the leading residential college due to the design of its
residential unit that allows for the best utilisation of natural
ventilation and day lighting. The college’s courtyard, the
transom/fix opening on the top of entrance door and wall,
functions in promoting air circulation and allowing day light
inside the residential unit/room (Figure 7 & 8). As a result,
sufficient day lighting is obtained throughout the corridor
which limits the usage of artificial lighting most part of the
day. In addition, the building’s north-south orientation
heavily reduces the thermal gain into the residential
units/rooms, only the services areas, such as the toilets,
bathrooms, stores, staircases and balconies, are located at a
west-east orientation. The high penetration of sunlight into
the toilets and bathrooms lowers the humidity levels thus
eliminating any risk of mould growth in these areas, which
can be a major contributor to unhealthy buildings and poor
indoor air quality.
Regarding the enclosure and facade design, K3 was
designed with special features such as glare protection and
adjustable natural ventilation options. The two types of
windows namely, centre pivot and awning, which are glass
tinted (Figure 9), offered the occupants the possibility to
channel the outside air/breeze, although the orientation of
the windows and the building orientation are not in
accordance with the wind flow direction; southwest.
Moreover, the amounts of daylight penetration can be
controlled even though each residential unit stated the
biggest window to wall ratio. The awning windows that are
located above the centre pivot directly plays a role as high
level exhaust opening and articulate light shelves. On the
landscape perspective, K3 has the largest soft landscape area
exceeding 60% while flat roof design offers a big potential
for the creation of a rooftop garden in the future, which
would directly help to decrease the heat penetration through
the roof (Figure 10).
Similar to K3, K4 also has a layout with a courtyard but not
placed centre of the residential unit (Figure 11). The
residential buildings are orientated towards north-south and
west-east resulted from L-shape of the building’s floor plate.
There are four residential units/rooms, with their entrance
doors facing each other, creating a cubicle (Figure 12). It is
observed that the corridor lamps are not continuously
switched on during day time as each cubicle is connected by
an open corridor that faces the internal courtyard. The
presence of wall openings creates wind pressure in the
cubicle, which provides air circulation indirectly into the
residential unit. The residential unit included the largest
floor area and volume, 20.0m2 and 57.40m
3, of the four
residential colleges. The residents have full control of the
daylight distribution and air circulation into the residential
unit/room via the balcony at each residential unit/room and
tinted window glass (Figure 13). Moreover, the casement
and turn window aid the air flows even though the position
of the windows and the building orientation are not in
accordance with the wind flow direction, southwest.
Although K4 is a newest residential college, the soft
landscape area was 58% which is higher than K1 and K2.
Whilst, with ‘dutch gable roof' design, roof top garden was
not appropriate to be implemented in the future due to
maintenance problems, leakage and subjected to high winds
and heavy rains; that may lose significant numbers of plants
and seedlings (Figure 14).
The ranking of green building strategies implementation on
in these four residential colleges was found to be in the
following order, K3>K4>K1>K2. This study found that out
of the four colleges there are more natural ventilation design
strategies being implemented as compared to passive
daylight strategies. The electricity use and the total floor
area (TFA) at the four residential colleges are presented in
Table 2. As described, K4 had the largest TFA,
34,305.32m2, followed by K2 with 22,288.14m
2, and K3
with 18,212.51m2. K1 as the oldest residential college was
the smallest building / capacity among these four with
11,427.67m2 of TFA.

18
Figure 1 Large fix opening with wide horizontal awning and
open corridors (small picture in the box) at each floor in the
middle of the building at K2
Figure 2 Vertical overhangs at window openings of
residential building at K1
Figure 3 Low exhausted opening as a part of façade design
at K1
Figure 4 Transom/fix opening above the entrance door and
wall of each residential unit/room at K1
Figure 5 Small window areas at residential unit/room and
staircase area of K2
Figure 6 Fixed opening devices in larger scale at the
staircase area of K1.

19
Figure 7 Internal courtyards at residential block of K3
Figure 8 Transom/fix opening above the entrance door and
wall of each residential unit/room at K3
Figure 9 Two types of windows namely, centre pivot and
awning which are glass tinted with biggest window area at
K3
Figure 10 Flat roof designs at residential building of K3
Figure 11 The courtyard at K4
Figure 12 Four residential units/rooms with entrance doors
facing each other, creating cubicle

20
Figure 13 The balcony and turn window with tinted window
glass at each residential unit/room at K4
Figure 14 The ‘dutch gable roof’ design at K4
Statistically, K4 achieved the best result on electricity usage
as it attained the lowest mean of Energy Efficiency Index
(EEI), 24.235 kWh/m2/year, compared to the other three
case studies: K1 (64.377 kWh/m2/year), K2 (42.697
kWh/m2/year) and K3 (34.523 kWh/m
2/year).
Unfortunately, the value of median is more suitable for
making comparisons among these four case studies due to
the extreme usage of electricity stated at K1 and K3, when
the range value exceeded 98,898 kWh and 152,408 kWh,
which are noticeably higher than usual. As a consequence,
the mean score of electric use is far off from the normal
score or normal usage of electricity and not really
representative of the performance of electric use in an
appropriate manner. By using the median score, K3 stated
the lowest EEI, which was 23.909 kWh/m2/year, followed
by K4 (25.273 kWh/m2/year), K2 (42.904 kWh/m
2/year)
and K1 (54.006 kWh/m2/year). Consequently, only K3 and
K4 were in the range of average electricity usage value in
Malaysia which is 10 to 25 kWh/m2/year.
Tab
le 2
Th
e el
ectr
icit
y c
on
sum
pti
on
and
To
tal
Flo
or
Are
a (T
FA
) at
K1
, K
2,
K3
an
d K
4
T
he
per
form
ance
of
elec
tric
ity c
on
sum
pti
on
- M
on
thly
& A
nnu
al (
kW
h),
BE
P a
nd
EE
I at
res
iden
tial
co
lleg
es
K4
TF
A :
34
,305
.32 m
2
EE
I
24.2
35
25.2
73
3.3
03
10.9
13
7.6
87
No
te:
TF
A :
Tota
l F
loo
r A
rea
(m2)
BE
P :
Buil
din
g E
ner
gy P
erfo
rman
ce (
kW
h/m
2)
EE
I :
Ener
gy
Eff
icie
ncy
Index
(k
Wh
/m2/y
ear)
BE
P
2.0
20
2.0
00
0.4
76
0.2
26
2.0
91
An
nu
al
831,3
78
867,0
12
113,3
25.6
5
1.2
84E
+10
263,7
19
Mon
thly
69,2
82
68,6
18
16,3
21.8
2
2.6
6E
+08
71,7
36
K3
TF
A :
18
,212
.51 m
2
EE
I
34.5
23
23.9
09
17.1
35
293.6
18
33.0
75
BE
P
2.8
77
2.2
68
2.4
35
8.3
68
An
nu
al
62
8,7
52
43
5,4
43
31
2,0
76
.74
9.7
39
E+
10
60
2,3
77
Mo
nth
ly
52
,39
6
41
,29
7
28
,41
8.2
2
8.0
8E
+0
8
15
2,4
08
K2
TF
A :
22
,288
.14 m
2
EE
I
42
.69
7
42
.90
4
3.1
41
9.8
66
7.8
56
BE
P
3.5
58
3.6
34
0.8
29
0.6
87
4.2
11
An
nu
al
95
1,6
43
95
6,2
52
70
,00
7.8
1
4.9
01
E+
09
17
5,1
05
Mo
nth
ly
79
,30
4
80
,98
5
18
,46
9.6
8
3.4
1E
+0
8
93
,85
8
K1
TF
A :
11
,427
.67 m
2
EE
I
64.3
77
54.0
06
20.1
63
406.5
50
44.9
52
BE
P
5.3
65
4.5
72
2.2
07
4.8
71
8.6
54
An
nu
al
735,6
79
617,1
60
230,4
17.2
0
5.3
09E
+10
513,6
96
Mo
nth
ly
61,3
07
52,2
53
25
,222.1
6
6.3
6E
+08
98,8
98
Sta
tist
ical
an
aly
sis
Mea
n
Med
ian
Std
. D
ev.
Var
ian
ce
Ran
ge

21
Regarding the Building Energy Performance (BEP), K4
stated the lowest kWh per unit of floor area, 2.000 kWh/m2,
followed by K3 (2.268 kWh/m2), K2 (3.634 kWh/m
2) and
K1 (4.572 kWh/m2), which means that K1 still remains the
highest user of electricity in five years duration.
4. CONCLUSION
It is found that a significant influence on the energy
performance of residential colleges by means of bioclimatic
design strategies. The adoption of bioclimatic design
strategies, a combination of enclosure and facade design,
solar control devices, optimisation of natural daylight, wind
and natural ventilation and landscaping, as employed in K3,
clearly helped to reduce the electricity consumption per
annum. The combination of internal courtyard and balconies
integrated in the building design assisted in reducing
electricity consumption per unit of floor area as shown in
K4. Open corridors at the middle of the building layout with
the linear arrangement seem not really practical for
optimising day lighting and natural ventilation for lowering
energy consumption in residential college buildings. This is
evidential in K2 which consumed double the amount of
electricity than the average residential buildings in
Malaysia, 10 to 25 kWh/m2/year. Unfortunately, by making
comparison solely between K2 and K1, which more
bioclimatic design strategies were implemented principally
on natural ventilation, the performance of electricity
consumption of K2 is much better. Hence, this directly
showed the effectiveness of open corridor at the middle of
building layout in optimising day lighting and natural
ventilation, even though it was not achievable at the same
level of K3 and K4 which implemented internal courtyard of
building layout.
Internal courtyards and balconies should be seriously
considered as part of multi-storey residential building
designs due to its enormous potential for lowering energy
consumptions used for mechanical cooling the internal
spaces. Balconies and landscaping are able to act as buffers
to protect the units from harsh solar radiation. In addition,
the long daylight hours, available at a consistent rate all year
long in the tropical regions should be optimised as part of
the bioclimatic design principles.
Generally, the electricity consumption of the Millennial
Generation living in residential college in Malaysia is in the
range of 23 to 55 kwh/m2/year.
ACKNOWLEDGMENT
The authors would like to thank JPPHB, UMCARES and all
residential colleges on the University of Malaya campus for
their permission of the auditing process including full
support in supplying data to be used in this study. This work
was conducted as part of the fulfillment of the requirement
for the degree of Doctor of Philosophy and financially
supported by the IPPP, UM under PPP (PV063/2011A).
REFERENCES
Ahmad, S.A. 2008. Kuala Lumpur: A hot humid climate, In:
Hyde, R. (eds) Bioclimatic housing: Innovative designs
for warm climates. Earthscan, UK. 269-293.
Al-Mofleh, A., Taib, S., Mujeebu, M.A. and Salah, W. 2009.
Analysis of sectoral energy conservation in Malaysia,
Energy 34 (6): 733-739.
American Society of Heating, Refrigerating and Air-
Conditioning Engineers-ASHRAE. 2004. Procedures of
commercial building energy audits. ASHRAE, Atlanta.
Aun, C.S. 2009. Green Building Index - MS1525: Applying
MS1525:2007 Code for Practice on energy efficiency
and use of renewable energy for non-residential
buildings. Paper presented at Continuing Professional
Development-CPD Seminar, Kuala Lumpur.
Building Research Establishment Environment Assessment
Method-BREEAM. 2010. BREEAM Multi-residential,
http://www.breeam.org/ page.jsp?id=2
Candido, C., de Dear, R.J., Lamberts, R. and Bittencourt, L.
2010. Air movement acceptability and thermal comfort in
Brazil’s hot humid climate zone, Building and
Environment 45 (1): 222-229.
Chou, S.K. 2004. Performance-based standards for energy
efficiency building. Paper presented at Seminar on
Building Control (Amendment), Singapore.
Economic Planning Unit, Prime Minister’s Department.
2006. Ninth Malaysia Plan 2006-2010. Prime Minister’s
Department, Putrajaya.
Economic Planning Unit, Prime Minister’s Department.
2010. Tenth Malaysia Plan 2011-2015. Prime Minister’s
Department, Putrajaya.
Electrical and Mechanical Services Department-EMSD.
2007. Guidelines on Energy Audit. The Government of
the Hong Kong Special Administrative Region, Hong
Kong.
Ghisi, E. and Massignani, R.F. 2007. Thermal performance
of bedrooms in multi-storey residential building in
southern Brazil, Building and Environment 42 (2): 730-
742.
Haji-Sapar, M. and Lee S.E. 2005. Establishment of energy
management tools for facilities managers in the tropical
region, Facilities 23 (9/10): 416-425.
Ibrahim, H. 2008. Best practices and innovation of buildings
in Malaysia. Paper presented at Seminar on The
Promotion on Energy Efficiency and Conservation for
Building in Southeast Asia, Singapore.
Indraganti, M. 2010. Adaptive use of natural ventilation for
thermal comfort in Indian apartments, Building and
Environment 45 (6): 1490-1507.
Iwaro, J. and Mwasha, A. 2010. A review of building energy
regulation and policy for energy conservation in
developing countries, Energy Policy 38 (12): 7744-7755.
Kamaruzzaman, S.N. and Edwards, R.E. 2006. Evaluating
performance characteristics of electricity use of British
historic building in Malaysia, Facilities 24 (3/4): 141-152
Levine, M., Ürge-Vorsatz, D., Blok, K., Geng, L., Harvey,
D., Lang, S., Levermore, G., Mongameli Mehlwana, A.,

22
Mirasgedis, S., Novikova, A., Rilling, J., and Yoshino,
H. Residential and commercial buildings. In, Metz, B.
Davidson, O.R., Bosch, P.R., Dave, R., Meyer, L.A.
(Eds.), Climate Change 2007: Mitigation. Contribution of
Working Group III to the Fourth Assessment Report of
the Intergovernmental Panel on Climate Change,
Cambridge University Press, USA, 2007, pp. 387-446.
Li, D.H.W., Lam, J.C., and Wong, S.L. Wong. (2002).
Daylighting and its implication to overall thermal
transfer value (OTTV) determinations, Energy, 27 (11):
991-1008.
Meriac, J.P., Woehr, D.J., and Banister, C. 2010.
Generational differences in work ethic: An examination
of measurement equivalence across three cohorts, Journal
of Business Psychology 25(2): 315-324.
millennial generation, Dictionary.com's 21st Century
Lexicon,http://dictionary.reference.com/browse/millenni
al generation
Ministry of Higher Education. 2010. General Information,
http://www.portal.mohe.gov.my/portal/page/portal/
ExtPortal/IPT/ GENERAL_IPT
Mohit, A.M., Ibrahim, M. and Rashid, Y.R. 2010.
Assessment of residential satisfaction in newly designed
public low-cost housing in Kuala Lumpur, Malaysia,
Habitat International 34 (1): 18-27.
Omer, A.M. 2008. Renewable building energy systems and
passive human comfort solutions, Renewable and
Sustainable Energy Reviews 12 (6): 1562-1587.
Planning and Research Unit, Ministry of Higher Education.
2008. Perangkaan pengajian tinggi Malaysia Tahun 2008.
Ministry of Higher Education, Putrajaya
Saidur, R. 2009. Energy consumption, energy saving, and
emission analysis in Malaysian office buildings, Energy
Policy 37 (10): 4104-4113.
Tiyok, P. 2009. Towards Indonesia’s Sustainable future:
Green building council Indonesia, FuturArc 14: 116-119.
Wong, N.H., Cheong, D.K.W., Yan, H. Soh, J., Ong, C.L.
and Sia, A. 2003. The effects of rooftop garden on
energy consumption of a commercial building in
Singapore, Energy and Building 35(4): 353-364.
Yeang, K. 2008. Ecodesign: A manual for ecological design.
John Wiley & Son Ltd, London.
Zain-Ahmed, A., Sopian, K., Othman, M.Y.H., Sayigh,
A.M.M., and Surendran, P.N. 2002. Daylighting as a
passive solar design in tropical buildings: a case study of
Malaysia, Energy Conversion and Management 43 (13):
1725-1736.

23
International Journal of Renewable Energy Resources 2 (2012) 23-26
COMBUSTION STUDIES OF FLUFF REFUSED-DERIVED FUEL (RDF) IN FLUIDIZED BED (FB) SYSTEM
A. Abdul, M. Rozainee, A. Johari, and R.S.W. Alwi Department of Chemical Engineering, Faculty of Chemical and Natural Resources Engineering,
UniversitiTeknologi Malaysia, 81310 Skudai, Johor DarulTahzim, Malaysia
Email address: [email protected]
ABSTRACT
Among most conventional incineration systems, the
fluidized bed combustor (FBC) had been described as one of
the most advantageous by providing simple operation with
ability to accommodate low quality fuel as biomass, sludge
and MSW with high moisture; reduced auxiliary fuel use;
reduced operating and maintenance costs. This could only be
achieved if optimal operating parameters are determined.
This paper presents the methods and part of the findings of
an on-going research aimed at optimizing the operating
parameters that gives lowest emissions in the combustion of
a fluff refused-derived fuel (f-RDF) in pilot scale fluidized
bed combustor. The method adopt includes – cold
fluidization studies in rectangular model column to
determine the fluidizing velocity of the inert bed material
(silica sand), and the effects of increasing fluidizing numbers
on the mixing behavior of bed and fuel. This is closely
followed by combustion study in the pilot scale FBC.
Experimental findings from the cold fluidization studies
indicates that a sand with particle size range (300 – 600 μm)
gave a fluidizing velocity of 0.1 m/s at bed height 1W of
column. Similarly, fluidizing numbers of 4Umf and above
gave better mixing of inert bed material with fuel. Although,
the combustion study is at its preliminary stage, the results
from the cold fluidization shows that the fluidization is better
at bubbling fluidization regime against circulating
fluidization regime which requires much higher fluidizing
velocities and higher turbulence.
Keywords: Incineration Systems; Auxiliary Fuel;
Fluidization; Fluidizing Number; Fluidization Regime
1. INTRODUCTION
Urbanization results in increased solid waste generation
such that the current per capita solid waste generation of
Malaysia as a result of urbanization is between 0.45 – 1.44
kg per day, (Consumer association of Penang report, 2001)
and had increased recently to 1.7 kg/person/day in major
towns (Kathiravale, 2003; Hassan et al., 2000). It is
expected that the amount of MSW generation will reach
31,000 tons by the year 2020 (Latifa, 2009). It has become
an essential environmental and public health concern in the
urban areas in Malaysia (Latifa, 2009). Landfill as the
predominant waste management option in Malaysia
(Sharifah, 2008); Kathiravale, 2003), are usually open
dumping area that produce serious environmental and social
hazards (6). Hence solid waste incineration had been
identified as the primary treatment method for volume
reduction; risk-free and energy recovery (Yan, 2006;
Kathiravale, 2003, and Xiadong et al., 2002). However,
conventional thermal treatment process for MSW is usually
by mass burning incineration processes (Sabbas et al.,
2003). This is met by stiff legislative emission standard;
high financial start-up and operational capital requirements
(Rand et al., 2000; Sabbas et al., 2003; Oh, 2010). But
because of the undesirable and hazardous effects of landfill
such as odour due to decomposition, carbon dioxide and
methane which leads to greenhouse gas emissions etc., the
disposal of solid waste is gradually being shifted from
landfill to incineration. The fluidized bed system is one of
the most efficient (Wan et al., 2008 and Hernandez, 2007)
that could proffer such advantages as- simple operation, the
ability to contain low quality fuels with high moisture
content, the reduced use of supplementary fuel as well as the
reduction in operating and maintenance costs with lower
emissions.
Refused derived fuel (RDF) is an option for extracting
energy from combustible material in a waste; mostly a waste
pre-processing technique for boiler usage.
Therefore, the objective of this study is to establish the
optimal operating conditions for the combustion of (RDF) in
pilot scale fluidized bed system with the aim of achieving
the highest combustion efficiency with minimal gas
emission.
2. METHODOLOGY/ANALYSIS/EXPERIMENTAL
SET-UP
Figure 1.shows the schematic diagram of 0.5m internal
diameter (I.D) Pilot-scale fluidized bed combustor. The
experimental set-up consist of a pilot-scale bubbling
fluidized bed, a cyclone and exit gas into a stack as shown
in Figure 1. The fluidized bed has a cross sectional-area of
0.5 x 0.5 m2 and height of 5m. The bed height was 0.5 times
the combustor diameter 0.5Dc, which is equivalent to a
static bed height of 250mm from the standpipe gas
distribution plate. Inert silica sand with particle diameter,
(dp=300 – 600μm and minimum fluidizing number, Umf =
0.10 ms-1
at room temperature) was fluidized. Fluidizing air
which serves both fluidization and combustion was initiated

24
using five standpipe gas distribution tubes each having 48
holes of 3mm diameter spaced 1mm apart. The flow rate to
the tubes was made possible by the use of a wind box so as
to ensure equal distribution of air to the bed. Secondary air
inlet port was positioned at 2000mm from the bed wall.
Bed preheating was carried out using diesel soaked palm
kernel shell to achieve the desired operating temperature of
about 800oC – 850
oC. Type-k thermocouples attached to a
continuous data acquisition system were placed at varying
heights so as to measure the bed, freeboard and exit flue gas
temperatures above the distributor plates. The fluff
packaged RDF was fed manually through the loading
chamber of the combustor at a predetermined timing. Gas
sampling was carried out just before the exit to the cyclone
to measure the flue gas emission which was achieved by the
use of continuous German made on-line gas analyzer with
model MRU SWG 300-1
for CO, CO2, NOx, NO, SOx and
SO2 concentrations.
2.1 Analytical Tests
The analytical tests include - proximate and ultimate
analysis; the lower heating value (LHV in KJ/Kg) and the
higher heating value (HHV in KJ/Kg) of the solid waste
were determined.
i. Proximate Analysis (ASTM D3172)
Proximate analysis involves the determination of moisture
content; volatile combustible matter; fixed carbon and ash in
a fuel sample. Experimental procedures carried out
involving the proximate analysis of the samples were done
in accordance with the American Standards for Testing and
Materials (ASTM). The first step in the analytical process
requires that samples be grinded into powder having grain
size of up to 250 μm.
ii. Ultimate Analysis (ASTM D3176)
Ultimate analysis provides the major elemental composition
of a solid fuel, usually on a dry ash-free basis. This involves
the use of Elemental Analyzer EA 1108 to determine the
carbon, nitrogen, oxygen, sulfur, chlorine and hydrogen.
The oxygen content was obtained by the difference of all the
chemical elements that make up the solid waste composition
as shown by Equation (1), while sulfur and chlorine were
omitted from the composition for ease of calculation.
% Oxygen = 100 – (carbon content + hydrogen content +
ash) (1)
2.2 Hydrodynamic Studies on Rectangular Column Unit
i. Determination of Minimum Fluidization Velocity of Sand
Size (300 - 600μm)
Air was supplied through the lower base of the standpipe
distributor into a column using dresser roots trinado 108
blower system at ambient temperature and minimum
fluidizing velocity was observed by the first bubble
appearance with increasing air supply. Volumetric flow rate
of air supply was controlled using rotameter downstream of
the blower. The minimum fluidization velocity was then
calculated based on the ratio of the air flow rate to the cross-
sectional area of the column.
ii. Determination of Effect of Fluidization Number on
Mixing of Sand with Fuel
At fluidization numbers in the range (1Umf - 6Umf) which
gives a bubbling regime (Miller, 2008), and at bed height of
300mm approximately equal to 1Width of the rectangular
column; the mixing and fluidization pattern of bed with fuel
at increasing fluidization velocity was determined and were
graded accordingly. According to (Kaewklum and
Kuprianov, 2008), both fluidization pattern and
hydrodynamic characteristics of fluidization affects bed
geometry significantly.
The optimal fluidizing number ranges from 3Umf and above
which gives enhanced mixing of bed with fuel were
therefore chosen for the combustion study in the cylindrical
pilot-scale fluidized bed combustor.
3. RESULTS AND DISSCUSSION
The analytical tests include - proximate and ultimate
analysis; the lower heating value (LHV in KJ/Kg) and the
higher heating value (HHV in KJ/Kg) of the solid waste
were.
Table 1 RDF analysis
Parameters (Wt. %)
Proximate
Moisture content 25
Volatile Matter 90
Fixed Carbon 1.15
Ash 10
Ultimate
Carbon 60
Hydrogen 1.5
Oxygen 30
Nitrogen 4
Sulfur 0.1
Other Parameter
Net Calorific Value
(kcal/kg)
4200
The experimental results for the trial burning are shown in
Table 2 and Figs. 2 – 3. Generally, from Table two, the bed
temperatures from fluidizing numbers of 3; 4 and 5 under
study indicates a promising temperatures for autogenous
combustion of refused-derived fuel (RDF) in fluid bed
system but the temperature profiles which gives the online
operational temperature capture figures 2 and 3 shows
otherwise at increasing fluidizing numbers. At 3Umf
combustion commence at temperature of 800oC and steadily
increases autogenously for the burning period of 30 min.
giving off carbon dioxide of about 1052 ppm. Similarly, at

25
4Umf even though combustion was initiated at elevated
temperature of about 880oC the bed temperature steadily
decreases with increasing time of combustion with higher
carbon monoxide given off. This is true since higher carbon
monoxide is indicative of incomplete combustion.
Table 2 Mass flow of fuels and experimental results for the
trial burning for combustion at AF=1.0 at varying fluidizing
numbers
Fluidizing
numbers (Umf)
3 4 5 6 7
Fuel feed rate
(g/min)
195 260 325 390 455
Temperature
(oC)
Bed 800 880 799 n/a n/a
Freeboard 634 642 570 n/a n/a
Stack 496 528 542 n/a n/a
Gas in stack
O2 (%) 18.7 18.7 18.7 n/a n/a
CO (ppm) 1052 1103 1083 n/a n/a
CO2 (ppm) 1.11 0.99 0.95 n/a n/a
NOx 217 253 291 n/a n/a
CO (mg/m3) 1321 1582 1234 n/a n/a
SO2 (ppm) -195 -164 -192 n/a n/a
n/a – not attempted
Figure 1 Temperature profile at 3 Umf and primary air factor,
PAF = 1
Freeboard temperatures obtained at the prevailing fluidizing
numbers when compared to the bed temperature indicates
that the combustion takes place in the bed, while these
freeboard temperatures are sufficient to burn any released
volatiles to the diffuse regions. As a trial run so many
factors could be attributed to the discrepancies in obtained
results which could include – variances in feed rate as well
as temperature at which combustion was initiated, which
also varies due to the bed pre-heating media and technique
used in this case palm oil kernel shell. The experiment had
to be stopped at 5Umf due to the irregular burning trends at
rising fluidizing velocities.
Figure 2 Temperature profile at 4 Umf and primary air factor,
PAF = 1
It could also be observed that there was a minimal CO2
emission with an average NOx given off. However,
concentration of emission had not been compared with
allowable threshold limits yet because further variation of
air ratio at excess air levels is been considered at established
optimal fluidizing number. Constant oxygen level was
observed in all cases. Finally, the results of the trial runs,
indicates there maybe the need for emission control system
or the by the injection of appropriate catalysts. By then an
ideal comparison of flue gas emission will be made with
acceptable regulated values. This could only be achieved if
there is a sustainable combustion.
4. CONCLUSION
A trial burn in the combustion studies of RDF in pilot-scale
fluidized bed combustor was carried out with the aim of
determining the optimal combustion conditions that gives
higher efficiency with minimal gaseous emissions. The
following conclusions can be inferred.
I. Combustion at 3Umf at stoichiometric air ratio gives
enhanced fuel burning at bed with good temperature
profiles.
II. Increased fluidization velocities lead to drop in
combustor temperatures with unusual non-sustainable
temperature profiles.
III. Combustion at stoichiometric air ratio which is the
theoretical air required for combustion gives high gaseous
emissions.
IV. Stoichiometric air ratio may not be the optimal desirable
air ratio for combustion to give minimal flue gas emissions.
REFERENCES
Consumer’s association of Penang Malaysia, Country report
waste not Asia 2001, Taipei, Taiwan.
Hassan, M.N., Chong, T.L., Rahman, M.M., Salleh, M.N.,
Zakariah, Z., Yunus, M.M.N. 2000. Solid Waste
Management – What’s the Malaysian position. Seminar
waste-to-energy. Malaysia. UPM.

26
Hernandez-Atonal, F.R. 2007. Combustion of refuse-derived
fuel in a fluidized bed. Chemical Engineering Science
62: 627-635.
Kaewklum, R. and Kuprianov, V.I. 2008. Theoretical and
experimental study on hydrodynamic characteristics of
fluidization in air-sand conical beds. Chemical
Engineering Science 63: 1471-1479.
Kathiravale, S.Y. 2003. Energy potential from municipal
solid waste in Malaysia. Renewable Energy 29: 559-567.
Latifa, A.S. 2009. Municipal solid waste management in
Malaysia: Practices and Challenges. Waste Management
29: 2902-2906.
MacGill, I., Outhred, H. and Nolles, K., 2003a. Market-
based environmental regulation in the restructured
Australian electricity industry, In: Proceedings of the
26th International IAEE Conference, Prague.
Miller, B.A. 2008.Combustion Engineering Issues - for solid
fuel systems. UK: Elsevier Inc.
Oh, T.P. 2010. Energy policy and alternative energy in
Malaysia: Issues and Challenges for sustainable growth.
Renewable and Sustainable Energy Reviews 14: 1242-
1252.
PEC. 2009. Pacific Energy Center Factsheet: High-
Efficiency Industrial Compressed Air Systems,
http://www.pge.com/pec, 18/08/2009
Rand, T., Haukohl, J and Marxen, U. 2000. Municipal Solid
Waste Incineration. A decision Maker’s
Guide.Washington, D.C: The International bank for
reconstruction and development, World Bank.
Sabbas, T., Polettini, A., Pomi, R., Astrup, T., Hjelmar, O.,
Mostbauer, P., Cappai, G., Magel, G., Salhofer, S.,
Speiser, C., Heuss-Assbichler, S., Klein, R., Lechner, P.
2003. Management of municipal solid waste incineration
residues. Waste Management 23: 61-88.
Sharifah, A.A. 2008. Combustion characteristics of
Malaysian municipal solid waste and predictions of air
flow in a rotary kiln incinerator. J Mater Cycles Waste
Manag. 10: 116-123.
Strunk J.W. and White, E.B. 1979. The Elements of Style,
third ed. Macmillan, New York.
Wan, H-P., Chang, Y-H., Chen, W-C., Lee, H-T., Huang,
C.C. 2008. Emissions during co-firing of RDF-5 with
bituminous coal, paper sludge and waste tires in a
commercial circulating fluidized bed cogeneration
Boiler, Fuel 87: 761-767.
Xiaodong, L., Chi Yong, Y.J., Mingjiang, N., Kefa, C. 2002.
Development of municipal solid waste incineration
technologies.BAQ, Hong Kong, 18: 18-6
Yan, J.C. 2006. Evaluation of PCCD/Fs emission from
fluidized bed incinerators co-firing MSW with coal in
China. Journal of Hazardous Materials A135: 47-51.
Yunus M.N.M and Kadir, K. 2003. The development of
solid waste treatment technology based on refused
derived fuel and biogasification integration. In:
International symposium on renewable energy. Kuala
Lumpur , 14-17.

27
International Journal of Renewable Energy Resources 2 (2012) 27-32
DEADBEAT-BASED PI CONTROLLER FOR STAND-ALONE SINGLE-PHASE
VOLTAGE SOURCE INVERTER USING BATTERY CELL AS PRIMARY SOURCES
T.L. Tiang and D. Ishak School of Electrical and Electronic Engineering, Universiti Sains Malaysia
Nibong Tebal, Malaysia
Email: [email protected]
ABSTRACT
This paper presents a deadbeat-based proportional-
integral (PI) controller for stand-alone single-phase
voltage source inverter using battery cell as primary
energy sources. The system consists of the lead acid
battery, third order Butterworth low pass DC filter and
AC filter, H-bridge inverter, step-up transformer, and
also a variety of loads as well as its sinusoidal pulse-
width-modulation (SPWM) deadbeat-based PI controller.
In this paper, two simulation case studies have been
carried out which are the abrupt load changes from 400W
resistive load to 500W resistive load and also from 400W
resistive load to inductive load of 500W 0.85 power
factor lagging. From the simulation results for both cases,
the state-of-charge (SOC) battery is decreasing to supply
power to the different type of loads, yet the battery
voltage remains constant at about 36V and also the
battery current exhibits smooth ripple despite current
spikes produced by the H-bridge inverter so as to prolong
the lifespan of the battery. It shows that the DC filter
performs satisfactorily to isolate the current spikes
generated by the SPWM controller and H-bridge inverter.
Besides that, even though the load varies for both cases,
the sinusoidal inverter output voltage can be tracked and
maintained at 230Vrms with 50Hz frequency within few
cycles from the instant the load changes as well as low
THDv content of 1.53% and 2.78% respectively. This
indicates that the controller proves its robustness and
stiffness characteristic in maintaining the output load
voltage at desired value to supply the power for variety
of loads with minimum THDv.
Keywords: Stand-alone; single-phase inverter; deadbeat;
battery cell; low pass filter; sinusoidal pulse-width-
modulation.
1. INTRODUCTION
In last few decades, the traditional power generation
methods of burning the primary fossil fuels such as coal,
oil and natural gas affect the environment which causes
an increase in greenhouse gas emissions that leads to
global warming. Consequently, it becomes the driving
force for the growing interest in alternative energy (Itoh
& Hayashi, 2010; Lee, Song, Park, Moon, & Lee, 2008;
Sangmin, Youngsang, Sewan, & Hyosung, 2007;
Yaosuo, Liuchen, Sren Baekhj, Bordonau, & Shimizu,
2004). In order to reduce the environmental pollutions,
sustainable energy electricity generation systems are
gaining popularity and the development of distributed
power generation (DG) systems as well as the stationary
power generation stand-alone applications systems
become more significant (Delshad & Farzanehfard, 2010;
Haimin, Duarte, & Hendrix, 2008; Yaosuo, et al., 2004).
DG systems can be defined as the implementation of
various power-generating resources that are usually small
modular devices close to electricity users, including wind
turbines, solar energy systems, fuel cells, micro gas
turbines and small hydro systems, as well as the relevant
controlling/managing and energy storage systems
(Sakhare, Davari, & Feliachi, 2004; Yaosuo, et al.,
2004). These systems commonly constitute DC-AC
converters or inverters as interface with the single-phase
loads or sources (Yaosuo, et al., 2004).
The single-phase inverters can be used in power
conversion from wide output variation of DC voltage into
fixed AC voltage for stand-alone applications or injecting
a sinusoidal AC current output following the grid voltage
and frequency for grid-connected applications (Lee, et
al., 2008; Yaosuo, et al., 2004). Besides that, the
inverters also being used in output power quality
assurance that demanding low total harmonic distortion
(THDv), pure sinusoidal voltage at the specific
magnitude, low frequency deviation and voltage/current
flickering as well as fast dynamic response under large
variation in loads (Abdel-Rahim & Quaicoe, 1996; Deng,
Oruganti, & Srinivasan, 2003; Kawamura, Haneyoshi, &
Hoft, 1988; Keliang, et al., 2006; Sangmin, et al., 2007;
Selvajyothi & Janakiraman, 2010; Xu, Zhao, Kang, &
Xiong, 2008; Yaosuo, et al., 2004).
The battery inverter system is more preferable and more
flexible to operate in stand-alone mode applications
(Haimin, et al., 2008). The single-phase inverters in
stationary battery cell power generation systems have
been installed worldwide for the purpose in case of utility
power failures, and are widely used in delivering backup
power to the critical loads such as computers and life
support systems in hospitals, hotels, office building,
schools, utility power plants and even airport terminals as
well as the communication systems (Abdel-Rahim &
Quaicoe, 1996; Deng, et al., 2003; Kawamura, et al.,
1988; Sakhare, et al., 2004; Selvajyothi & Janakiraman,
2010; Xu, et al., 2008).
In general, there are many methods in producing a low
distortion output voltage. One of those methods is the
optimum fixed LC compensators designed to minimize
the expected value of the total THDv , while it is desired
to maintain a specific value of the power factor (Zobaa,
2006). Alternatively, series and shunt compensation or
hybrid series active power filters (APF) can be employed
for the elimination of harmonic when non-linear loads
are connected to an inverter (Itoh & Hayashi, 2010;
Varschavsky, Dixon, Rotella, & Moran, 2010; Zeng,
Tan, Wang, & Ji, 2010). However, appropriate use of

28
reactive shunt compensators and filters may increase the
harmonic current contents as well as the voltage
distortion in the feeders of the systems (Pomilio &
Deckmann, 2007). Besides that, the use of pure
capacitive compensator combined with source harmonics
would degrade power factor and overload the equipment
(Zobaa, 2006). In (Dixon & Moran, 2002), it is shown
that series active filters in two-level PWM based
inverters have disadvantages of high-order harmonic
noise and additional switching losses due to high-
frequency commutation.
In previous research works, there are many control
techniques for producing pure sinusoidal output voltage
with low THDv and fast dynamic response. First, the
conventional PI or PID controllers for the single-phase
inverter are presented in (Delshad & Farzanehfard, 2010;
Sangmin, et al., 2007). Many discrete-time methods
developed by low cost microcontrollers have been
discovered, such as repetitive-based control (Keliang, et
al., 2006), sliding mode control (Wenguang, Jiangang,
Utkin, & Longya, 2008) and deadbeat-based control
(Kawamura, et al., 1988; Mattavelli, 2005) to enhance
the characteristic of the inverter systems. Besides that,
variety control approaches for inverter systems have been
reported for instance, the internal-model control (IMC)
(Xu, et al., 2008), multiple feedback loop control (Abdel-
Rahim & Quaicoe, 1996), composite observers control
(Haimin, et al., 2008; Selvajyothi & Janakiraman, 2010),
neural network based control (Deng, et al., 2003) and
fuzzy logic based control (Sakhare, et al., 2004). In fact,
deadbeat control is one of the most attractive techniques
for discrete-time control since it is able to reduce the
state variable errors to zero in a finite number of
sampling steps and to provide the fastest dynamic
response for digital implementation which can be seen in
(Kawamura, et al., 1988; Mattavelli, 2005).
In previous research work, most of the inverters are used
in the DG system for grid-connected applications, but,
the investigation of the stand-alone application is lacking.
In this paper, a stand-alone voltage source inverter
system using the battery cell as primary energy sources
has been proposed by using a deadbeat-based PI
controller to produce quality sinusoidal output voltage.
This proposed inverter system illustrates a simple
structure with only an output voltage sensor at the load
side and demonstrates an excellent performance. The
proposed single-phase inverter is suitable for residential
power generation especially for stand-alone applications.
The control technique also has strong robustness,
excellent dynamic and static characteristics. In order to
prolong the lifespan of the battery, the CLC DC filter
should be used to mitigate the ripple currents in the
stand-alone power generation systems instead of using
DC active filter in (Itoh & Hayashi, 2010).
2. STAND-ALONE SINGLE-PHASE INVERTER
SYSTEM
2.1 System Configuration In this paper, a low voltage harmonics single-phase voltage source inverter system using lead acid battery as
the primary sources and being controlled by deadbeat-based PI controller is proposed as shown in Figure 1. It shows the schematic circuit and the block diagram of the stand-alone single-phase inverter system that includes a lead acid battery which is the primary source, third order Butterworth low pass DC filter, H-bridge inverter power MOSFET, step-up transformer, third order Butterworth low pass AC filter and the loads. This inverter system will be simulated in Matlab/SIMULINK and most of the components used can be obtained in Matlab/SimPowerSystem simulation software. In general, the power delivered from the lead acid battery to the loads passes through few stages. First, the battery injects the power to the CLC DC filter instead of H-bridge inverter in order to isolate the high peak ripple current created by the switching of the inverter. Then, the DC input voltage will be converted to AC output voltage using SPWM switching scheme for H-bridge inverter and the output voltage is then boosted up via step-up transformer with its transformer ratio of 1:9.5833. The secondary AC voltage contains many harmonics due to the switching frequency of the inverter and it should be filtered out by using CLC AC low pass filter to produce 230 Vrms pure sinusoidal output voltage for loads in the stand-alone application systems. The magnitude and the frequency of the output voltage are controlled by using the deadbeat-based PI SPWM controller in the system with the feedback signal of the fundamental rms value of the output voltage.
Figure 1 The schematic circuit and block diagram of the
stand-alone single-phase inverter system
2.2 Lead Acid Battery Model In this paper, the 36V, 120Ah lead acid rechargeable battery will be used as the primary energy source in the stand-alone single-phase inverter system. The initial state-of-charge (SOC) of the battery is considered to be 50%. The circuit diagram in Figure 1 shows the connection of lead acid battery in inverter system.
2.3 Third Order Butterworth Low Pass DC
Filter Model As reported in (Itoh & Hayashi, 2010), the input current ripples will shorten the lifespan of electrolytic capacitors, batteries and fuel cells that act as the primary sources. Therefore, the lead acid battery needs to be connected to a third order Butterworth low pass DC filter in order to protect the battery from getting damage. The DC filter components constitute two capacitors and an inductor. These components have a transfer function that can be

29
realized using Cauer 1-form. The kth elements of the filter components can be expressed as (Timar & Rencz, 2007):
oddkn
kC
K
),2
12sin(2' (1)
evenkn
kL
K
),2
12sin(2'
(2)
where n is the number of passive components, Ck
’ is the
kth capacitance value for the prototype and k is in odd number, meanwhile, Lk
’ is the kth inductance value for
the prototype and k is in even number. Then, the DC capacitance and inductance value, Cdc1, Ldc2, and Cdc3, as indicated in Figure 1 can be calculated with the aid of frequency and impedance scaling technique as expressed below (Kaufman, 1982):
P
VZ
2
(3)
'
1K
c
k CZ
C
(4)
'
K
c
K LZ
L
(5)
where Z is the terminating impedance in Ω and ωc is the cut-off radian frequency with ωc = 2πfc and fc is the cut-off frequency. In the simulation model, the capacitance and inductance values for the DC filter for Cdc1 and Cdc3 are 872 μF and Ldc2 is 5.8mH.
2.4 Single Phase Inverter Model In (Yaosuo et al., 2004), an overview of single-phase inverters topologies developed for small distributed power generators were discussed. There are many types of the inverter topologies. However, the traditional buck inverter and line frequency transformer shows a simple circuit topology and low components counts, leading to low cost and high efficiency. Such a system also demonstrates robust performance and high reliability shown in (Yaosuo, et al., 2004) that is totally agreed in (Sangmin, et al., 2007) as depicted in Figure 1. It indicates the simple H-bridge voltage source inverter that can be used for conversion from DC to AC voltage, supplying the power to the loads. It is used to produce and regulate the sinusoidal output voltage at rms value of 230 Vrms with 50 Hz frequency to a various type of loads in stand-alone power generation system.
2.5 Deadbeat-based PI controller with SPWM
Switching Control Scheme In order to maintain and regulate the output voltage at 230 Vrms for different type of loads with 50 Hz constant frequency, a deadbeat-based PI controller with SPWM switching control scheme is proposed and employed in the single-phase inverter in stand-alone power generation system as shown in Figure 1. The fundamental rms value of output voltage at 50 Hz at the terminal load, Vrms_01, will be fed back to the controller and compared with the reference signal of 230 Vrms. The difference between two signals is then input to a PI controller to get the corresponding and appropriate modulation index which is accumulated from time to time after a time delay. Next, the product of the previous
modulation index with two sinusoidal signal references which are 180° out of phase from each other will be compared with the triangular signal waveforms in order to produce SPWM switching waveforms used to trigger the four power MOSFETs, S1, S2, S3 and S4 of the H-bridge inverter. The sinusoidal signal waveforms that have been used as reference having constant 50 Hz, meanwhile; the switching frequency of the triangular signal is 5 kHz. Hence, using this simple controller triggering the MOSFETs as shown in Figure 1, the smooth sinusoidal output voltage of 50 Hz can be regulated and maintained.
Figure 1 The block diagram of deadbeat-based PI
controller with SPWM switching technique
2.6 Step Up Transformer Model As depicted in Figure 1, a step-up transformer is connected after the H-bridge inverter to increase the primary voltage in order to maintain the output voltage at 230 Vrms. The transformer turn ratio in this simulation is 1:9.5833. This approach of using transformer is preferable because it can act as isolation transformer to prevent the inverter system from the surge as well as noise mitigation.
2.7 Third order Butterworth Low Pass AC Filter After boosting the primary voltage using step-up transformer, the secondary output voltage consists of many distortion as well as harmonics. Therefore, a third order Butterworth low pass CLC AC filter should be connected before sending power to the loads so as to filter out the unwanted. The calculation for Cac1, Lac2 and Cac3 as indicated in Figure 1 are based on the expressions from (2) to Error! Reference source not found.. In the simulation, the capacitance and inductance values for the AC filter that have been used for Cac1 and Cac3 are 31 μF and Lac2 is 0.334 H.
3. SIMULATION RESULTS AND DISCUSSIONS This deadbeat-based PI controller proposed to produce low voltage harmonic with constant frequency of 50 Hz and to maintain constant rms output voltage of 230 Vrms in pure sinusoidal waveform at the terminal load for various type of loads is simulated in Matlab/Simulink software. In the simulation, the sampling time used is 2 μs for the robustness and stiffness of the simulation. Figure 3 and Figure 4 are showing the SPWM gate signals of S1 and S4 as well as SPWM gate signals for S2 and S3 that have been produced by comparing the 50 Hz reference sinusoidal waveforms and 5 kHz triangular waveform respectively whereby one of the sinusoidal waveform is 180
0 out of phase from the other one,
assuming that the modulation index is 1.00. In fact, the

30
modulation index of the inverter system keeps changing due to the existence of deadbeat-based PI controller. In the simulation, there are two types of load change have taken place. First, Figure 5 to Figure 8 show the simulation results for the case when the resistive load is changing from 400W to 500W. Figures 5, 6 and 7 Figure 4show the SOC, battery voltage and battery current when the load changes respectively. During the simulation time, the SOC of the battery is decreasing, so, the battery is discharging from the beginning of the simulation linearly. Meanwhile, the battery voltage is almost constant at 35.7 V with significant ripples and on the other hand, the battery current is in the range for 18 A to 26 A. It shows smooth ripples instead of spiking current produced by the H-bridge inverter MOSFETs due to the components of the DC low pass filter as shown in Figure 1. This can protect the battery from malfunction in a short time. Besides that, Figure 8 shows the output voltage and output current at the load terminal when the load changes respectively. During the step response of the load changes, the output voltage which initially stays at 230 Vrms experiences sudden decrease in magnitude and slowly ramps up to 230 Vrms within four cycles. In addition, it shows a very good sinusoidal output voltage even though the sudden change in loads whereby the THDv of the last two cycles of the inverter output voltage is also only 1.53 %. This indicates that the AC filter exhibits good performance in filtering out the unwanted frequency components. The phase of the output voltage is the same as the phase of the output current since the step change occur within purely resistive load. Hence, the deadbeat-based PI controller is operating satisfactorily to maintain the inverter output voltage magnitude at 230 Vrms with low voltage harmonics. Secondly, Figures 9-11 indicate the simulation results for the case when the connected load is changed from resistive load of 400W to inductive load of 500W with 0.85 power factor lagging. Figures 9-11 demonstrate the SOC, battery voltage and battery current during the load change respectively. It can clearly be seen that the battery is in discharging mode in order to deliver power to the load by observing the SOC is decreasing linearly which is almost the same as in Figure 5. In the meantime, the battery voltage is kept constant at about 35.7 V with negligible ripples and it is similar in Figure 6. Before the step load change is taking place, the ripple waveforms are similar in Figure 6 and Figure 10 , however, after the load changes in both cases, the ripple waveforms are different due to the connected inductive load. As can be observed, the terminal current of the battery exhibits smooth ripples instead of the spiking currents which prove excellent performance of the low pass DC filter. Besides that, the output voltage and output current at the load during the occurrence of abrupt load changes can be seen in Figure 12. Initially, the output voltage is 230 Vrms and during this transient, the magnitude of the output voltage decreases but it ramps up back to 230 Vrms again within four cycles. Similarly, the inverter output current shows same transient pattern as that of output voltage during this load change. Also, the magnitude of the inverter output current has increased due to higher load and lower power factor. Furthermore, smooth sinusoidal inverter output voltage can be seen although the inverter
system is subjected to a sudden load changes. From the simulation, the THDv of the last two cycles of the inverter output voltage is about 2.78 %, indicating high quality of filter components. With resistive load, the voltage and current waveforms should be in phase as shown in Figure 8, whereas the current should be slightly lagging the voltage as shown in Figure 12 when the load is partially inductive. From these results, the proposed deadbeat-based PI controller shows evidence of its robust characteristic to maintain the inverter output voltage magnitude at 230Vrms with low voltage harmonics even during the load is inductive at 0.85PF.
Figure 2 SPWM gate signals S1 and S4 produced by
comparison of sinusoidal and triangular waveforms
Figure 3 SPWM gate signals S2 and S3 produced by
comparison of sinusoidal and triangular waveforms

31
Figure 4 SOC of battery when the resistive load changing
from 400W to 500W
Figure 5 Terminal voltage of battery when the resistive
load changing from 400W to 500W
Figure 6 Terminal current of battery when the resistive
load changing from 400W to 500W
Figure 7 Output voltage and output current when the
resistive load changing from 400W to 500W (Voltage: 65
V/div, Current: 1.0 A/div)
Figure 8 SOC of battery when the load changing from
resistive load of 400W to inductive load of 500W with
0.85 power lagging
Figure 9 Terminal voltage of battery when the load
changing from resistive load of 400W to inductive load
of 500W with 0.85 power lagging
Figure 10 Terminal current of battery when the load
changing from resistive load of 400W to inductive load
of 500W with 0.85 power lagging
Figure 11 Output voltage and output current when the
load changing from resistive load of 400W to inductive
load of 500W with 0.85 power lagging (Voltage: 65
V/div, Current: 1.0 A/div)
4. CONCLUSION A stand-alone single-phase voltage source inverter using battery cell as primary energy sources and being controlled by a simple deadbeat-based PI controller has been simulated in Matlab/Simulink software. It consists of the lead acid battery, third order Butterworth low pass DC filter, H-bridge inverter, step-up transformer, third order Butterworth low pass AC filter and also variety of loads as well as its deadbeat-based PI controller. From the simulation results, it shows a proper SPWM control switching scheme associated with the deadbeat-based PI controller has been generated to control the H-bridge inverter MOSFETs where its modulation index can be

32
changed according to the feedback signal of the fundamental output voltage. Besides that, in the simulation of the load changes within purely resistive load, the battery is discharging to supply the power while the battery voltage is kept constant as well as the battery current has negligible spikes due to the well performing DC filter so as to extend battery lifespan. The output voltage also shows a good sinusoidal waveform of 230 Vrms with only 1.53% THDv after the load changes and proves the controller exhibits fast dynamic performance as well as effective filter components. The output currents are in phase with the output voltage due to purely resistive load. Furthermore, in the case of load changes from resistive load to inductive load, the inverter is still able to produce sinusoidal waveforms with 2.78% THDv, and the voltage is maintained at 230 Vrms within few cycles after being subjected to abrupt load changes. Hence, it proves that the deadbeat-based PI controller demonstrates a very good performance and acquires robust characteristic in tracking the output voltage at the desired value.
REFERENCES
Abdel-Rahim, N. M., Quaicoe, J. E. 1996. Analysis and
design of a multiple feedback loop control strategy
for single-phase voltage-source UPS inverters. Power
Electronics, IEEE Transactions on, 11(4): 532-541.
Delshad, M., Farzanehfard, H. 2010. A new soft switched
push pull current fed converter for fuel cell
applications. Energy Conversion and Management,
52(2): 917-923.
Deng, H., Oruganti, R., Srinivasan, D. 2003. A neural
network-based adaptive controller of single-phase
inverters for critical applications. Paper presented at
the Power Electronics and Drive Systems, 2003.
PEDS 2003. The Fifth International Conference on.
Dixon, J., Moran, L. 2002. Multilevel inverter, based on
multi-stage connection of three-level converters
scaled in power of three. Paper presented at the
IECON 02, Industrial Electronics Society, IEEE 2002
28th Annual Conference of the.
Haimin, T., Duarte, J.L., Hendrix, M.A.M. 2008. Line-
Interactive UPS Using a Fuel Cell as the Primary
Source. Industrial Electronics, IEEE Transactions on,
55(8): 3012-3021.
Itoh, J.I., Hayashi, F. 2010. Ripple Current Reduction of
a Fuel Cell for a Single-Phase Isolated Converter
Using a DC Active Filter With a Center Tap. Power
Electronics, IEEE Transactions on, 25(3): 550-556.
Kaufman, M. 1982. Schaum's outline of theory and
problems of electronics technology McGraw-Hill.
Kawamura, A., Haneyoshi, T., Hoft, R. G. 1988.
Deadbeat controlled PWM inverter with parameter
estimation using only voltage sensor. Power
Electronics, IEEE Transactions on, 3(2): 118-125.
Keliang, Z., Kay, S.L., Wang, D., Fang, L.L., Bin, Z.,
Yigang, W. 2006. Zero-phase odd-harmonic
repetitive controller for a single-phase PWM inverter.
Power Electronics, IEEE Transactions on, 21(1): 193-
201.
Lee, S.-H., Song, S.-G., Park, S.-J., Moon, C.-J., & Lee,
M.-H. 2008. Grid-connected photovoltaic system
using current-source inverter. Solar Energy, 82(5):
411-419.
Mattavelli, P. 2005. An improved deadbeat control for
UPS using disturbance observers. Industrial
Electronics, IEEE Transactions on, 52(1): 206-212.
Pomilio, J.A., Deckmann, S.M. 2007. Characterization
and Compensation of Harmonics and Reactive Power
of Residential and Commercial Loads. Power
Delivery, IEEE Transactions on, 22(2): 1049-1055.
Sakhare, A., Davari, A., & Feliachi, A. 2004. Fuzzy logic
control of fuel cell for stand-alone and grid
connection. Journal of Power Sources, 135(1-2): 165-
176.
Sangmin, J., Youngsang, B., Sewan, C., Hyosung, K.
2007. A Low Cost Utility Interactive Inverter for
Residential Fuel Cell Generation. Power Electronics,
IEEE Transactions on, 22(6): 2293-2298.
Selvajyothi, K., Janakiraman, P.A. 2010. Reduction of
Voltage Harmonics in Single Phase Inverters Using
Composite Observers. Power Delivery, IEEE
Transactions on, 25(2):1045-1057.
Timar, A., Rencz, M. 2007. Design issues of a low
frequency low-pass filter for medical applications
using CMOS technology. Paper presented at the
Design and Diagnostics of Electronic Circuits and
Systems, 2007. DDECS '07. IEEE.
Varschavsky, A., Dixon, J., Rotella, M., Moran, L. 2010.
Cascaded Nine-Level Inverter for Hybrid-Series
Active Power Filter, Using Industrial Controller.
Industrial Electronics, IEEE Transactions on, 57(8):
2761-2767.
Wenguang, Y., Jiangang, H., Utkin, V., Longya, X. 2008.
Sliding Mode Pulsewidth Modulation. Power
Electronics, IEEE Transactions on, 23(2): 619-626.
Xu, Y., Zhao, Y., Kang, Y., Xiong, R.. 2008. Study on
IMC-PID control for single-phase voltage-source
UPS inverters. Paper presented at the Industrial
Electronics and Applications, 2008. ICIEA 2008. 3rd
IEEE Conference on.
Yaosuo, X., Liuchen, C., Sren Baekhj, K., Bordonau, J.,
Shimizu, T. 2004. Topologies of single-phase
inverters for small distributed power generators: an
overview. Power Electronics, IEEE Transactions on,
19(5): 1305-1314.
Zeng, F. P., Tan, G. H., Wang, J. Z., Ji, Y. C. (2010).
Novel single-phase five-level voltage-source inverter
for the shunt active power filter. Power Electronics,
IET, 3(4): 480-489.
Zobaa, A.F. 2006. Voltage harmonic reduction for
randomly time-varying source characteristics and
voltage harmonics. Power Delivery, IEEE
Transactions on, 21(2): 816-822.

33
International Journal of Renewable Energy Resources 2 (2012) 33-39
MAXIMUM POWER POINT TRACKING ALGORITHMS FOR WIND ENERGY SYSTEM:
A REVIEW
M.A. Abdullah, A.H.M. Yatim and C.W. Tan Department of Energy Conversion, Faculty of Electrical Engineering, Universiti Teknologi Malaysia (UTM)
Email address: [email protected]
ABSTRACT
This paper reviews and studies the state of the art available
maximum power point tracking (MPPT) algorithms. Due
to the nature of wind which is instantaneously changing,
there is only one optimal generator speed desirable at any
one time that ensures maximum energy is harvested from
the available wind. Therefore, including a controller that is
able to track the maximum peak regardless of any wind
speed is essential. The available maximum power point
tracking (MPPT) algorithms can be classified according to
the control variable, namely with and without sensor, and
also the technique used to locate the maximum peak. A
comparison has been made on the performance of the
selected MPPT algorithms based on various speed
responses and the ability to achieve the maximum energy
yield. The tracking performance is performed by
simulating wind energy system using the
MATLAB/Simulink simulation package. Besides that, a
brief and critical discussion is made on the differences of
available MPPT algorithms for wind energy system,
followed by a conclusion.
Keywords: MPPT; Wind energy system; PMSG; Boost
converter
1. INTRODUCTION
Wind energy systems as one of the renewable energy
sources have gained popular demand over the past decade
due to many factors such as the possibility of depletion of
conventional energy sources, its high costs, as well as
having negative effects on the environment. Wind energy
is preferred because it is clean, pollution-free,
inexhaustible and secure. Therefore, a wind energy
generation system could be one of the significant
candidates as an alternative energy source for the future.
The amount of mechanical energy that can be extracted
from the wind is not solely dependent on the wind speed,
but also governed by the ratio of the rotational speed to
wind speed. There is a specific optimal ratio for each wind
turbine, which is called the optimal tip speed ratio (TSR)
or opt , at which the extracted power is maximum. As the
wind speed is instantaneously varying, it is essential for
the rotational speed to be variable to maintain the equality
of the TSR to the optimal one at all times. In the operation
of variable speed condition, a power electronic converter
is essential to convert the variable-voltage-variable-
frequency of the voltage-fixed-frequency that is suitable
for the grid. References (Baroudi et al., 2007; Zhe et al.,
2009) have discussed the different possible configurations
of power electronic converters and electrical generators for
variable speed wind turbine systems.
Among the electric generators, permanent magnet
synchronous generator (PMSG) is preferred due to its high
efficiency, reliability, power density; gearless
construction, light weight, and self-excitation features (Li
et al., 2010; Molina et al., 2010; Muyeen et al., 2010;
Mena 2007). Controlling the PMSG to achieve the
maximum power point (MPP) can be done by varying its
load. In this regard, a boost converter is one of the possible
solutions, where, by controlling the duty cycle of the
converter the apparent load seen by the generator will be
adjusted and thus, its output voltage and shaft speed. In
addition to that, operating the boost converter in
discontinuous conduction mode (DCM) and applying a
power factor correction (PFC) technique contributes in
total harmonic distortion (THD) reduction and increases
the power factor (PF) of the wind power generator
(Kawale and Dutt 2009; Carranza et al., 2010).
In order to determine the optimal operating point of the
wind turbine, a maximum power point tracking (MPPT)
algorithm is essential to be included in the system. Several
MPPT algorithms have been proposed in the literature.
Reference (Raza et al., 2010) has reviewed and criticized
many published MPPT algorithms and concluded that the
two methods described in (Hui and Bakhshai 2008) and
(Kazmi et al., 2011) are the best solutions due to their
adaptive tracking and self-tuning capability. References
(Mirecki et al., 2004; Brahmi et al., 2009; AJ Mahdi et al.,
2010) have compared some of the available MPPT for
PMSG-based wind energy conversion system. This paper
reviews the fundamentals of the available MPPT
algorithms for wind energy system. In addition, a
comparison of simulation results is made on the three
selected MPPT techniques. Finally, a critical discussion is
made, and a conclusion is drawn.
2. SYSTEM OVERVIEW
Figure 1 illustrates the schematic diagram of the proposed
wind turbine system. The system supplies a resistive load
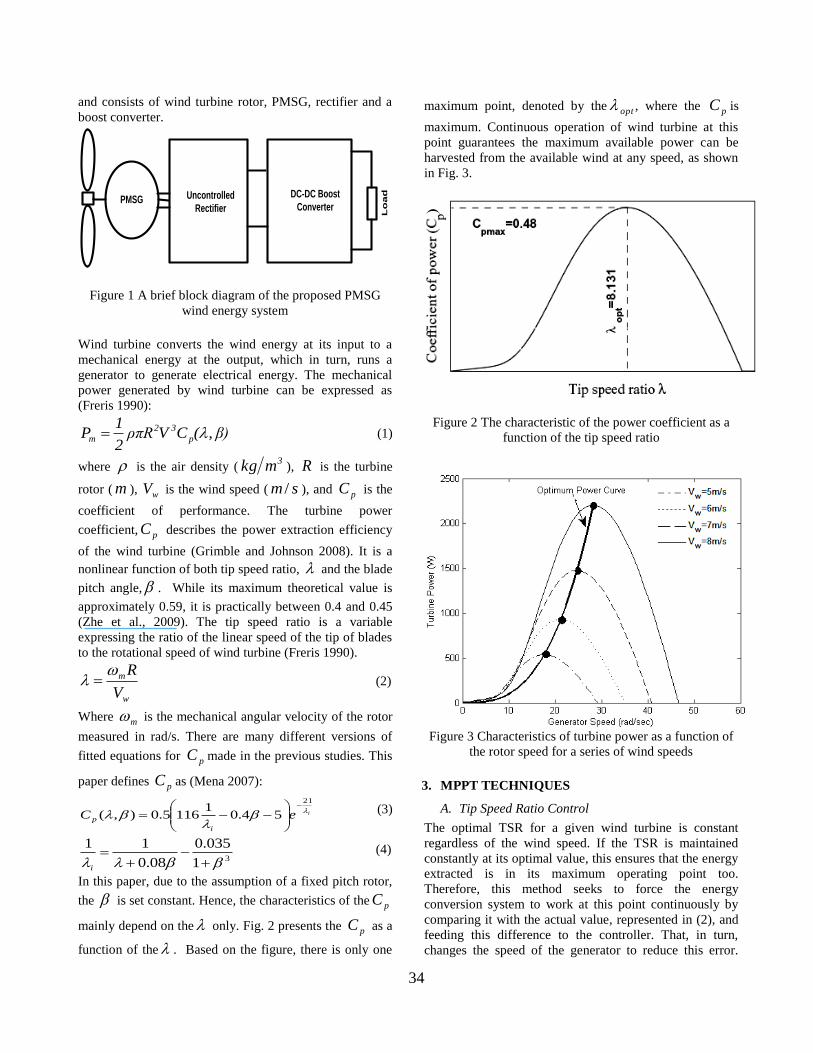
34
and consists of wind turbine rotor, PMSG, rectifier and a
boost converter.
PMSG Uncontrolled
Rectifier
DC-DC Boost
Converter
Lo
ad
Figure 1 A brief block diagram of the proposed PMSG
wind energy system
Wind turbine converts the wind energy at its input to a
mechanical energy at the output, which in turn, runs a
generator to generate electrical energy. The mechanical
power generated by wind turbine can be expressed as
(Freris 1990):
β)(CVρπR2
1P p
32
m , (1)
where is the air density (3mkg ), R is the turbine
rotor ( m ), wV is the wind speed ( sm / ), and pC is the
coefficient of performance. The turbine power
coefficient, pC describes the power extraction efficiency
of the wind turbine (Grimble and Johnson 2008). It is a
nonlinear function of both tip speed ratio, and the blade
pitch angle, . While its maximum theoretical value is
approximately 0.59, it is practically between 0.4 and 0.45
(Zhe et al., 2009). The tip speed ratio is a variable
expressing the ratio of the linear speed of the tip of blades
to the rotational speed of wind turbine (Freris 1990).
w
m
V
R (2)
Where m is the mechanical angular velocity of the rotor
measured in rad/s. There are many different versions of
fitted equations for pC made in the previous studies. This
paper defines pC as (Mena 2007):
ieCi
p
21
54.01
1165.0),(
(3)
31
035.0
08.0
11
i
(4)
In this paper, due to the assumption of a fixed pitch rotor,
the is set constant. Hence, the characteristics of the pC
mainly depend on the only. Fig. 2 presents the pC as a
function of the . Based on the figure, there is only one
maximum point, denoted by the opt , where the pC is
maximum. Continuous operation of wind turbine at this
point guarantees the maximum available power can be
harvested from the available wind at any speed, as shown
in Fig. 3.
Figure 2 The characteristic of the power coefficient as a
function of the tip speed ratio
Figure 3 Characteristics of turbine power as a function of
the rotor speed for a series of wind speeds
3. MPPT TECHNIQUES
A. Tip Speed Ratio Control
The optimal TSR for a given wind turbine is constant
regardless of the wind speed. If the TSR is maintained
constantly at its optimal value, this ensures that the energy
extracted is in its maximum operating point too.
Therefore, this method seeks to force the energy
conversion system to work at this point continuously by
comparing it with the actual value, represented in (2), and
feeding this difference to the controller. That, in turn,
changes the speed of the generator to reduce this error.

35
The optimal point of the TSR can be determined
experimentally or theoretically and stored as a reference.
This method is simple; however, it requires the
measurement of wind speed consistently and accurately,
which complicates its use in reality, as well as increases
the system cost (Patel 1999; Barakati 2008; Wang, 2003).
B. Optimal Torque Control
As mentioned earlier, maintaining the operation of the
wind turbine system at the opt ensures that the
maximum exploitation of the available wind energy be
converted into mechanical energy. For the turbine power
to be determined as a function of the and m ,
equation (2) is re-written as the following equation in
order to obtain the wind speed (Nakamura et al., 2002;
Morimoto et al., 2005; Shirazi et al., 2009; Pucci and
Cirrincione, 2011).
RV m
w (5)
By substituting (5) into (1), the expression yields
pm CR3
35
m2
1P
(6)
If the rotor is running at the opt , it will also run at
the maxpC . Thus, by replacing opt and
maxpp CC into (6), yields the following expression:
33
3
max5
opt-m2
1P moptpm
opt
P KC
R
(7)
Considering that mmm TP , the mT can be plotted as in
Fig. 4 and re-arranged as follows:
22
3
max5
opt-m2
1T moptm
opt
P KC
R
(8)
In general, this method is simple, very fast and efficient.
However, the efficiency is lower as compared to the TSR
control, since it does not measure the wind speed directly,
which wind changes are not reflected instantaneously and
significantly on the reference signal (Raza et al., 2010).
C. Power Signal Feedback Control
The block diagram of a wind energy system with power
signal feedback (PSF) control is shown in Fig. 5. Unlike
the OT control, in this method the reference maximum
power curves of the wind turbine, Fig. 3, should be
obtained first from the experimental results. Then, the data
points for maximum output power and the corresponding
wind turbine speed must be recorded in a lookup table
(Tan and Islam 2004; Barakati 2008; Barakati et al.,
2009). Instead of using the wind turbine maximum power
versus shaft speed curve in obtaining the lookup table as
(Barakati 2008), the maximum DC output power and the
DC-link voltage were taken as input and output of the
lookup table in (Quincy and Liuchen 2004). According to
(Raza et al., 2010), there is no difference between the PSF
and the OT method in terms of the performance and the
complexity of implementation.
Figure 4 The torque-speed characteristic curve for a series
of wind speeds
Controller Wind Energy System
i……..a
ii……..b
. .
. .
. .
x…….z
Turbine Power
Lookup Table
Optimal
Power
Generator
Speed
Figure 5 The block diagram of a wind energy with the
power signal feedback control technique
D. Perturbation and Observation Control
The perturbation and observation (P&O) or hill-climb
searching (HCS) method is a mathematical optimization
technique used to search for the local maxima points of a
given function. It is widely used in wind energy systems to
get the optimal operating point that maximizes the
extracted energy. This method is based on perturbing a
control parameter in small step-size and observing the
resulting changes in the target function, until the slope
becomes zero. As shown in Fig. 6, if the operating point is
to the left of the peak point, the controller must move the

36
operating point to the right to be closer for the MPP, and
vice versa if the operating point is on the other side. In
literature, some authors perturb the rotational speed and
observe the mechanical power. There are also others who
monitor the electrical output power of the generator and
perturb the inverter input voltage (Quincy and Liuchen
2004), or one of the variables of the converter; namely
duty cycle, d (Koutroulis and Kalaitzakis 2006; Patsios et
al., 2009; Hua and Cheng 2010), input current, inI
(Neammanee et al., 2006), or input voltage, inV (Kesraoui
et al., 2010). In methods that used electrical power
measurement, the mechanical sensors are not required, and
thus, they are more reliable and cost less.
Since the P&O method does not need a prior knowledge of
the wind turbine characteristic curve, it is independent,
simple and flexible. However, it fails to reach the
maximum power points under rapid wind variations if it is
used for large and medium inertia wind turbines.
Moreover, the problem of choosing an appropriate step-
size is not an easy task; where larger step-size means
faster response and less efficiency, on the other hand,
smaller step-size improves the efficiency but slows the
convergence speed (Ching-Tsai and Yu-Ling 2010; Hong
and Lee 2010; Kazmi et al. 2011).
Figure 6 Wind turbine output power and torque
characteristics with MPP tracking process (Neammanee et
al., 2006)
E. Other methods
Many of the problems associated with the aforementioned
methods have been solved by means of artificial
intelligence control and hybrid methods. According to
(Simoes et al., 1997), fuzzy logic control methods have the
advantages of fast convergence, parameter insensitivity,
and accepting noisy and inaccurate signals. They can also
be used to obtain an optimal step size for conventional
HCS method, as in (Trinh and Lee 2010). Wind speed
measurement and its associated drawbacks have been
solved by using neural network technique to estimate the
wind speed depending on actual machine torque and speed
(Lee et al. 2009; Pucci and Cirrincione 2011). The
proposed control structure, Wilcoxon radial basis function
network (WRBFN)-based with HCS MPPT strategy and
modified particle swarm optimization (MPSO) algorithm,
in (Lin and Hong 2010) diminish the effect of the wind
turbine inertia on HCS method performance.
Hybrid method is the combination of two methods from
the aforementioned ones; to exploit the advantages of one
technique to overcome the disadvantage of the other. An
example of this method is that in (Kazmi et al. 2011)
where OTC method is merged with HCS to solve the two
problems associated with the conventional HCS, the
speed-efficiency trade-off and the wrong directionality
under rapid wind change. Another example is combining
PSF control and HCS in (Quincy and Liuchen 2004) to
develop a sensor less and flexible method which is also
applicable to all wind turbine levels.
4. SIMULATION RESULTS AND DISCUSSIONS
The performance of three MPPT control methods has been
simulated and compared using the MATLAB/Simulink
simulation package. The studied MPPT methods are:
OTC, P&O of the duty cycle of the boost converter, and
P&O of the input voltage of the boost converter. All the
simulations were carried out with system parameters as
(Mena, 2007). The load resistance, R is 20 Ω for all
simulations. The step-sizes in P&O of the duty cycle and
the input voltage were fixed at 3100.5 and 0.001,
respectively. The obtained performance with the different
methods is shown in Fig. 8 and the results are also
summarized in Table 1. According to the plot and result’s
analysis, the OTC controller is the fastest in achieving the
steady-state and also in the recovery time upon wind speed
change. In addition, the OTC method can reach the highest
value of pC and maintained the same value after the wind
speed change. It is followed by the P&O in input voltage
method, which took approximately double the time to
reach the steady-state, with the pC average of 0.4607. The
slowest and less efficient one is the P&O in duty-cycle
method, where the response time is eight times the first
method, 0.02142. After being 0.46 before the wind speed
step change, maxpC decreased to 0.42 when the step
change occurred. Since the used perturbation and
observation methods are the conventional ones, with a
fixed step-size, the ripples of pC changed under wind
speed variations. In Fig. 9, the generator’s output power
for each method is depicted. While the generator’s output
power for the first two methods stabilized at the same
time, 0.025 sec., it needed 0.175 sec more time for the
third one. Taking the maximum mechanical input energy
of the generator as a reference and measuring the electrical

37
energy output of the generator under the selected methods,
the efficiencies can be calculated, as listed in Table 1.
Table 1 Simulated Results: Power Coefficient Average
Values, Response Times, Recovery Times; Energy and
Efficiency
Method
Median
Respo
nse
time (sec.)
Recov
ery time
(sec.)
Energy (W)
Efficiency
(%)
Max.
theoretical
value (reference)
0.48 -- -- 734.5 --
OTC 0.4789 0.0248
8 0.0006 665.9 90.66
P&O of input voltage
0.4607 0.053 0.0014 645.9 87.94
P&O of duty-cycle
0.3956 0.2142 0.022 597.4 81.33
Figure 7 The wind speed
(a)
(b)
(c)
Figure 8 The power coefficient with: (a) OTC method
(b) P&O of input voltage (c) P&O of duty cycle
(a)

38
(b)
(c)
Figure 9 The output power response produced by the
PMSG generator with : (a) OTC method (b) P&O of input
voltage (c) P&O of duty cycle
5. CONCLUSION
This paper discusses and reviews the available MPPT
algorithms. In addition, simulation and comparison of
selected three control methods in terms of the efficiency
and speed of response were made. Simulation results
demonstrate superiority of OTC method; where it obtained
the maximum average value of pC and held it at its
maximum even with wind speed change. Nevertheless, its
dependency on the wind turbine characteristics makes it
inflexible. On the other hand, P&O method is flexible and
simple in implementation, but it is less efficient and has a
difficulty in determining the optimum step-size.
Comparing the perturbation in duty cycle, perturbation of
the input voltage to get a reference voltage is better, as
there is a controller to force the input voltage to track the
reference. Finding out an adaptive step-size algorithm and
combining two or more of the available methods will
improve the performance and overcome some of the
obstacles of the current methods.
REFERENCES
Mahdi, A.J., Tang, W.H. et al. 2010. A Comparative
study on variable-speed operations of a wind
generation system using vector control.
International Conference On Renewable Energies
And Power Quality, The 10th International
Conference On Renewable Energies And Power
Quality,University of Granada.Granada, Spain.
Barakati, S.M. 2008. Modeling and Controller Design
of a Wind Energy Conversion System Including
Matrix Converter. Electrical and Computer
Engineering. Waterloo, Ontario, Canada, University
of Waterloo: 265.
Barakati, S.M., Kazerani, M. et al. 2009. Maximum
Power Tracking Control for a Wind Turbine System
Including a Matrix Converter, IEEE Transactions
on Energy Conversion 24(3): 705-713.
Baroudi, J.A., Dinavahi, V., et al. 2007. A review of
power converter topologies for wind generators.
Renewable Energy 32(14): 2369-2385.
Brahmi, J., Krichen, L., et al. 2009. A comparative
study between three sensorless control strategies for
PMSG in wind energy conversion system, Applied
Energy 86(9): 1565-1573.
Carranza, O., Garcerá, G., et al. 2010. Peak current
mode control of three-phase boost rectifiers in
discontinuous conduction mode for small wind
power generators, Applied Energy 87(8): 2728-
2736.
Ching-Tsai, P. and Yu-Ling, J. 2010. A Novel
Sensorless MPPT Controller for a High-Efficiency
Microscale Wind Power Generation System, IEEE
Transactions on Energy Conversion 25(1): 207-216.
Freris, L.L. 1990. Wind Energy Conversion System.
London, U.K., Prentice Hall.
Grimble, M.J. and Johnson, M.A. 2008. Optimal
Control of Wind Energy Systems.
Hong, M.K. and Lee, H.H. 2010. Adaptive maximum
power point tracking algorithm for variable speed
wind power systems, Proceedings of the 2010
international conference on Life system modeling
and and intelligent computing, and 2010
international conference on Intelligent computing
for sustainable energy and environment: Part I.
Wuxi, China, Springer-Verlag: 380-388.
Hua, A.C.C. and Cheng, B.C.H. 2010. Design and
implementation of power converters for wind
energy conversion system, Power Electronics
Conference (IPEC), 2010 International.
Hui, J. and Bakhshai, A. 2008. A new adaptive control
algorithm for maximum power point tracking for
wind energy conversion systems, Power Electronics
Specialists Conference, 2008. PESC 2008. IEEE.
Kawale, Y.M. and Dutt, S. 2009. Comparative Study of
Converter Topologies Used for PMSG Based Wind
Power Generation, Computer and Electrical

39
Engineering, 2009, ICCEE '09. Second
International Conference on.
Kazmi, S.M.R., Goto, H. et al. 2011. A Novel
Algorithm for Fast and Efficient Speed-Sensorless
Maximum Power Point Tracking in Wind Energy
Conversion Systems, Industrial Electronics, IEEE
Transactions on 58(1): 29-36.
Kesraoui, M., Korichi, N., et al. 2010. Maximum power
point tracker of wind energy conversion system,
Renewable Energy 2010.
Koutroulis, E. and Kalaitzakis, K.. 2006. Design of a
maximum power tracking system for wind-energy-
conversion applications, IEEE Transactions on
Industrial Electronics 53(2): 486-494.
Lee, C.Y., Shen, Y.X., et al. 2009. Neural Networks
and Particle Swarm Optimization Based MPPT for
Small Wind Power Generator, World Academy of
Science, Engineering and Technology 60 2009: 17-
23.
Li, S., Haskew, T. A., et al. 2010. Conventional and
novel control designs for direct driven PMSG wind
turbines, Electric Power Systems Research 80(3):
328-338.
Lin, W.M. and Hong, C.M. 2010. Intelligent approach
to maximum power point tracking control strategy
for variable-speed wind turbine generation system,
Energy 35(6): 2440-2447.
Mena, L. H. E. 2007. Maximum power tracking control
scheme for wind generator systems, Texas A&M
University.
Mirecki, A., Roboam, X., et al. 2004. Comparative
study of maximum power strategy in wind turbines,
IEEE International Symposium on Industrial
Electronics.
Molina, M.G., Santos, E.C., et al. 2010. Advanced
power conditioning system for grid integration of
direct-driven PMSG wind turbines, Energy
Conversion Congress and Exposition (ECCE), 2010
IEEE.
Morimoto, S., Nakayama, H., et al. 2005. Sensorless
output maximization control for variable-speed
wind generation system using IPMSG, IEEE
Transactions on Industry Applications 41(1): 60-67.
Muyeen, S.M., Takahashi, R., et al. 2010. A Variable
Speed Wind Turbine Control Strategy to Meet
Wind Farm Grid Code Requirements, IEEE
Transactions on Power Systems 25(1): 331-340.
Nakamura, T., Morimoto, S., et al. (2002). Optimum
control of IPMSG for wind generation system.
Power Conversion Conference, 2002. PCC Osaka
2002. Proceedings of the.
Neammanee, B., Sirisumranukul, S., et al. 2006.
Control Performance Analysis of Feedforward and
Maximum Peak Power Tracking for Small-and
Medium-Sized Fixed Pitch Wind Turbines, Control,
Automation, Robotics and Vision, 2006, ICARCV
'06, 9th International Conference on.
Patel, M.R. 1999. Wind and Solar Power Systems,
CRC Press.
Patsios, C., Chaniotis, A., et al. 2009. A comparison of
maximum-power-point tracking control techniques
for low-power variable-speed wind generators. 8th
International Symposium on Advanced
Electromechanical Motion Systems & Electric
Drives Joint Symposium.
Pucci, M. and Cirrincione, M. 2011. Neural MPPT
Control of Wind Generators With Induction
Machines Without Speed Sensors, IEEE
Transactions on Industrial Electronics 58(1): 37-47.
Quincy, W. and Liuchen, C. 2004. An intelligent
maximum power extraction algorithm for inverter-
based variable speed wind turbine systems, IEEE
Transactions on Power Electronics 19(5): 1242-
1249.
Raza K..S.M., Goto, H., et al. 2010. Review and critical
analysis of the research papers published till date on
maximum power point tracking in wind energy
conversion system, Energy Conversion Congress
and Exposition (ECCE), 2010 IEEE.
Shirazi, M., Viki, A.H., et al. 2009. A comparative
study of maximum power extraction strategies in
PMSG wind turbine system, Electrical Power &
Energy Conference (EPEC), 2009 IEEE.
Simoes, M.G., Bose, B.K., et al. 1997. Design and
performance evaluation of a fuzzy-logic-based
variable-speed wind generation system, IEEE
Transactions on Industry Applications 33(4): 956-
965.
Tan, K. and Islam, S. 2004. Optimum control strategies
in energy conversion of PMSG wind turbine system
without mechanical sensors, IEEE Transactions on
Energy Conversion 19(2): 392-399.
Trinh, Q.N. and Lee, H.H. 2010. Fuzzy Logic
Controller for Maximum Power Tracking in PMSG-
Based Wind Power Systems. Advanced Intelligent
Computing Theories and Applications. With
Aspects of Artificial Intelligence. D.-S. Huang, X.
Zhang, C. Reyes García and L. Zhang, Springer
Berlin / Heidelberg. 6216: 543-553.
Wang, Q. 2003. Maximum wind energy extraction
strategies using power electronic converters.
Canada, University of New Brunswick.
Zhe, C., Guerrero, J.M., et al. 2009. A Review of the
State of the Art of Power Electronics for Wind
Turbines, Power Electronics, IEEE Transactions on
24(8): 1859-1875.

Published by UM Power Energy Dedicated Advanced Centre (UMPEDAC), University of Malaya, Malaysia
INFORMATION FOR CONTRIBUTORS
AIMS AND SCOPE
The journal seeks to promote and disseminate knowledge of the various topics and technologies of
renewable energy and therefore aimed at assisting researchers, economists, manufactures, world
agencies and societies to keep abreast of new developments in their specialist fields and to unite in
finding alternative energy solutions to current issues as the greenhouse effect and the depletion of
the ozone layer.
The scope of the journal encompasses the following: Photovoltaic Technology Conversion, Solar
Thermal Application, Biomass Conversion, Wind Energy Technology, Materials Science
Technology, Solar and Low Energy Architecture, Energy Conservation in Buildings, Climatology
(Geothermal, Wave and Tide, Ocean Thermal Energy, Mini Hydro Power and Hydrogen Production
Technology), Socio-economic, Energy Management, Solar Cells, Photo thermal Devices, Photo
electrochemical, Photochemical Devices, Bio and hydrogen energy.
IJRER accepts original research papers or any other original contribution in the form of reviews and
report on new concepts. It promotes innovation, papers of a tutorial nature and a general exchange
of news, views and new books on the above subjects.
TYPES OF CONTRIBUTIONS
The journal will accept following types of contribution:
Literature Review
Theoretical Work
Experimental Work
Technical Notes
ORIGINALITY
Original paper, technical notes/letters published in all fields of renewable energy. Case studies and
papers that describe original work applicable to engineering practice are particularly encouraged.
Submissions must be previously unpublished and may not be under consideration elsewhere.
LANGUAGE
Papers will be published in English and written in third person
REFEREEING
All papers submitted for possible publication will be reviewed by referees chosen because of their
knowledge in the field concerned, experience in producing a balanced review, and ability to make a
firm fair recommendation.
PRESENTATION
The manuscripts should be preceded by a separate cover sheet containing the title, names,
affiliations and e-mail addresses of all authors, an abstract of the paper and maximum five key
words. The abstract should not exceed 150 words and should be a summary of the entire paper.
Manuscripts should be typed doubled-spaced and double column with wide (2.5cm) margins, on
one side of the paper only. The body of the manuscript should be preceded by the title of the paper,
which should be brief. The paper should be subdivided into appropriate sections and, if necessary,
subsections. Mathematical and other symbols must be typewritten in word processing format.

Published by UM Power Energy Dedicated Advanced Centre (UMPEDAC), University of Malaya, Malaysia
Author(s) must use the International System of Units for describing dimensional results in the text,
figures and tables.
PHOTOGRAPHS AND ILLUSTRATIONS
Submitting your illustrations, pictures, tables and other artwork (such as Multimedia- and
Supplementary files) in an electronic format helps us to produce your work to the best possible
standards, ensuring accuracy, clarity and a high level of detail. Photographs and illustrations
submitted in electronic format should be at least 350dpi.
REFERENCES
References to published literature should be listed in alphabetical order at the end of the paper in the
following format:
Reference to a journal publication: Al-Asady, N.A., Abdullah, S., Ariffin, A.K., Beden, S.M.,
and Rahman, M.M. 2009. FEA Based Durability Using Strain-Life Models For Different Medium
Carbon Steel As Fabrication Materials For An Automotive Component, International Journal of
Mechanical and Materials Engineering 4 (2): 141-146.
Reference to a book: Strunk Jr., W., White, E.B. 1979. The Elements of Style, third ed.
Macmillan, New York.
Reference to a conference paper: MacGill, I., Outhred, H., Nolles, K. 2003. Market-based
environmental regulation in the restructured Australian electricity industry, In: Proceedings of the
26th International IAEE Conference, Prague, June.
References to online resources should also be quoted with the organization’s name, authors' name,
title and URL.
COPYRIGHT
Copyright in published papers will be vested in the publisher. It is the authors' responsibility to
obtain and submit all written permissions required, including permission to quote material which
has appeared in another publication. Authors are required to sign and submit the completed
"Copyright Transfer Form" upon acceptance of publication of the paper.
AUTHORS
Correspondence and proofs for correction will be sent to the first-named author who will be the
corresponding author of the paper, unless otherwise indicated. Corrected page proofs must be
returned direct to the editor within three days. Corrections shall be limited to typographical errors;
no new material may be inserted. Corresponding author is responsible for updating affiliations and
contacts of all of the authors.
LENGTH/PAGE
Papers may be up to 30 A4 pages long (double spacing with 12pt font size), including cover sheet,
abstract, text, all images, figures and tables (no more than 2 images, figures and tables in one page),
and all references.
SUBMISSION AND ENQUIRIES
Manuscripts submission and enquiries should be addressed to:
Dr. Md. Hasanuzzaman, Associate Editor-In-Chief
International Journal of Renewable Energy Resources
UM Power Energy Dedicated Advanced Centre (UMPEDAC)
Level 4, Wisma R&D, University of Malaya, Jalan Pantai Baharu, 59990 Kuala Lumpur, Malaysia
Email: [email protected]; [email protected]