Sensitivity of the Australian summer monsoon to tilt and precession forcing
Variation in Serripes groenlandicus (Bivalvia) growth in a Norwegian high-Arctic fjord: Evidence for local- and
large-scale climatic forcing
William G. Ambrose, Jr.*†, Michael L. Carroll†, Michael Greenacre‡, Simon R. Thorrold §, Kelton W. McMahon*§
* Bates College, Department of Biology, Lewiston, Maine 04240, USA †Akvaplan-niva, Polar Environmental Centre, N9296 Tromsø, Norway ‡ Pompeu Fabra University, 08005 Barcelona, Spain § Woods Hole Oceanographic Institution, Biology Department MS 50, Woods Hole, Massachusetts 02543, USA * Corresponding Author: W.G. Ambrose, Jr. Bates College Department of Biology Lewiston, Maine 04240, USA Tel: +1 207 786 6114 Fax: +1 207 786 8334 Email: [email protected] Key Words: Arctic Climate Regime Index, Serripes groenlandicus, bivalve growth, Arctic, Svalbard, benthic community, benthos, climate forcing Running Title: Bivalve growth and Arctic climate
Received:

Ambrose et al., Bivalve growth and Arctic climate Page Page 2 of of 39
Abstract
We examined the growth rate of the circumpolar Greenland Cockle (Serripes
groenlandicus) over a period of 20 years (1983-2002) from Rijpfjord, a high-Arctic fjord
in northeast Svalbard (80º 10´ N, 22° 15´ E ). This period encompassed different phases of
large-scale climatic oscillations with accompanying variations in local physical variables
(temperature, atmospheric pressure, precipitation, sea ice cover), allowing us to analyze the
linkage between growth rate, climatic oscillations, and their local physical and biological
manifestations. Standard Growth Index (SGI), an ontogenetically-adjusted measure of
annual growth, ranged from a low of 0.27 in 2002 up to 2.46 in 1996. Interannual
variation in growth corresponded to the Arctic Climate Regime Index (ACRI), with high
growth rates during the positive ACRI phase characterized by cyclonic ocean circulation
and a warmer and wetter climate. Growth rates were influenced by local manifestations of
the ACRI: positively correlated with precipitation and to a lesser extent negatively
correlated with atmospheric pressure. A multiple regression model explains 65% of the
variability in growth rate by the ACRI and precipitation at the nearest meteorological
station. There were, however, complexities in the relationship between growth and
physical variables, including an apparent 1-year lag between physical forcing changes and
biological response. Also, when the last 4 years of poor growth are excluded, there is a
very strong negative correlation with ice cover on a pan-arctic scale. Our results suggest
that bivalves, as sentinels of climate change on multi-decadal scales, are sensitive to
environmental variations associated with large-scale changes in climate, but that the effects
will be determined by changes in environmental parameters regulating marine production
and food availability on a local scale.
Ambrose et al., Bivalve growth and Arctic climate Page Page 3 of of 39
Introduction
The Arctic climate has changed dramatically in the last several decades (Maxwell,
1997; Overpeck et al., 1997, Johannessen et al., 2003, 2004; AICA 2004). The average
annual air temperature has increased by 1º to 4º C in the last half century (AICA 2004),
and this has been accompanied by changes in terrestrial and marine ecosystems (Oechel &
Vorulitis, 1997; Serreze et al., 2000; Morison et al., 2000). Effects of persistent climate
change on Arctic marine ecosystems are largely undetermined, but changes that occur in
response to decadal-scale climate oscillations may provide insight into longer term effects
of more persistent climate change.
Several large-scale climate oscillations have been shown to influence marine systems
(see Allan et al., 1996; Ottersen et al., 2001; Walther et al., 2002; Stenseth et al., 2003 for
reviews). Linkages between the two climate oscillations with nodes centered in the Arctic,
the Arctic Oscillation (AO) and the Arctic Climate Regime Index (ACRI), and the marine
ecosystem, however, have not been demonstrated. Both indices reflect differences in wind-
driven motion in the central Arctic alternating between two phases, an anticyclonic
circulation regime (ACCR) and a cyclonic circulation regime (CCR). The climate regimes
manifest as physical variables in the Arctic; ACCR is characterized by a cold and dry high-
Arctic atmosphere and a colder and saltier polar ocean (low AO and negative ACRI),
whereas the cyclonic regime is characterized by a warm and wet atmosphere and a warm
and fresh polar ocean (high AO, positive ACRI). Climatic conditions associated with both
the AO and ACRI may affect marine ecosystems as has been demonstrated for the North
Atlantic Oscillation (Ottersen et al. 2001).
Ambrose et al., Bivalve growth and Arctic climate Page Page 4 of of 39
Seafloor communities may be the best location to examine the impact of Arctic
climate oscillations, and by extension the potential effects of climate change on the Arctic
ecosystem. There is often a close relationship between water column and benthic
processes (Grebmeier et al., 1988; Ambrose & Renaud, 1995; Piepenburg et al., 1997;
Wollenburg & Kuhnt, 2000; Dunton et al. 2005), and therefore long lived, sessile benthic
organisms, may be more appropriate monitors of climate change (e.g. Kröncke et al., 1998,
2001; Dunton et al. 2005) than the more transient pelagic system. Additionally, benthic
communities are key components in the carbon cycle on Arctic shelves (Grebmeier et al.,
1989, Stein & Macdonald, 2004; Grant et al., 2002; Clough et al., 2005) and food for
higher trophic levels (e.g. bottom feeding fish, mammals, and birds (Dayton, 1990)).
Consequently, changes to the benthos may have profound effects on carbon cycling,
trophic structure, and food web dynamics on Arctic shelves.
Bivalves comprise a significant proportion of the benthic biomass of Arctic shelves
(Zenkevitch, 1963; McDonald et al., 1981; Feder et al., 1994; Gulliksen et al., 1985;
Grebmeier et al., 1988; Dayton, 1990). The shells of most bivalves exhibit periodic
banding, or growth lines (Rhodes & Penella, 1970; Clark, 1974; Rhoads & Lutz, 1980),
that have proved valuable in developing a history of environmental change in marine
systems (Andrews, 1972; Hudson et al., 1976; Jones, 1981; Jones et al., 1989; Witbaard,
1996; Witbaard et al., 1997, 1999; Tallqvist & Sundet, 2000; Schöne 2003; Müeller-Lupp
& Bauch 2005). Temperature and food are the two main factors influencing bivalve growth
(Buekema et al., 1985; Beukema & Cadée, 1991; Jones et al., 1989; Lewis & Cerrato,
1997; Dekker & Beukema, 1999; Witbaard et al., 1997, 1999; Schöne et al., 2005), and
both are likely to be influenced by climate change in Arctic marine systems (Carroll &

Ambrose et al., Bivalve growth and Arctic climate Page Page 5 of of 39
Carroll, 2003). Furthermore, many deep water and high latitude bivalves have life spans of
decades (Tallqvist & Sundet, 2000; Müeller-Lupp et al., 2003; Sejr & Christensen, 2006)
to well over 100 years (Turekian et al., 1975; Thomson et al., 1980; Zolotarev, 1980, Peck
& Bullough, 1993; Witbaard et al., 1999, Sejr et al., 2004). Bivalves can thus serve as
bioproxies by providing uninterrupted records of environmental conditions over decades to
centuries, which is critical in the Arctic given the paucity of long term data on community
structure and dynamics.
We examined interannual variation in growth of the circumpolar Greenland Cockle
(Serripes groenlandicus) from 1983-2002 in a high-Arctic fjord in northeast Svalbard
(Norwegian Arctic) to explore the relationship between benthic communities and
environmental variations associated with decadal climate oscillations in the Arctic.
Variation in bivalve growth associated with changes in environmental conditions that
occur over the course of a decadal-scale oscillation cycle provides insight into the response
of a dominant member of the Arctic benthos to predicted long-term climate change.
Materials and Methods
Study Site
Rijpfjord (80° 10´ N, 22° 15´ E) is located on the north-central shore of
Nordaustlandet (Fig. 1), north and east of Spitsbergen in the Svalbard Archipelago.
Rijpfjord is oriented south-north and opens to a broad shallow shelf of approximately
200m depth extending to the shelf-break of the Polar Basin at roughly 81° N. The bottom
depth averages 200-250m, but an irregular sill crosses the width of the fjord midway
through its length. Shallower depths are dominated by bedrock and stones covered with a
thin layer of mud, while soft sediments predominate deeper sections.

Ambrose et al., Bivalve growth and Arctic climate Page Page 6 of of 39
Rijpfjord is a true polar fjord. It is predominately ice-covered for at least 9 months
a year (October-June), with breakup occurring between mid-July and mid-August. Even
during the summer period, winds often force drifting pack ice into the fjord. The shallow
outlet of the Rijpfjord shelf to the Polar Ocean results in little warm Atlantic subsurface
water entering the fjord from the north (Sundfjord, unpub. data). The upper 10 m is a
mixed layer with surface water of lower salinity and higher temperature associated with
sea ice melt and in situ radiative warming; below which is a water mass with a temperature
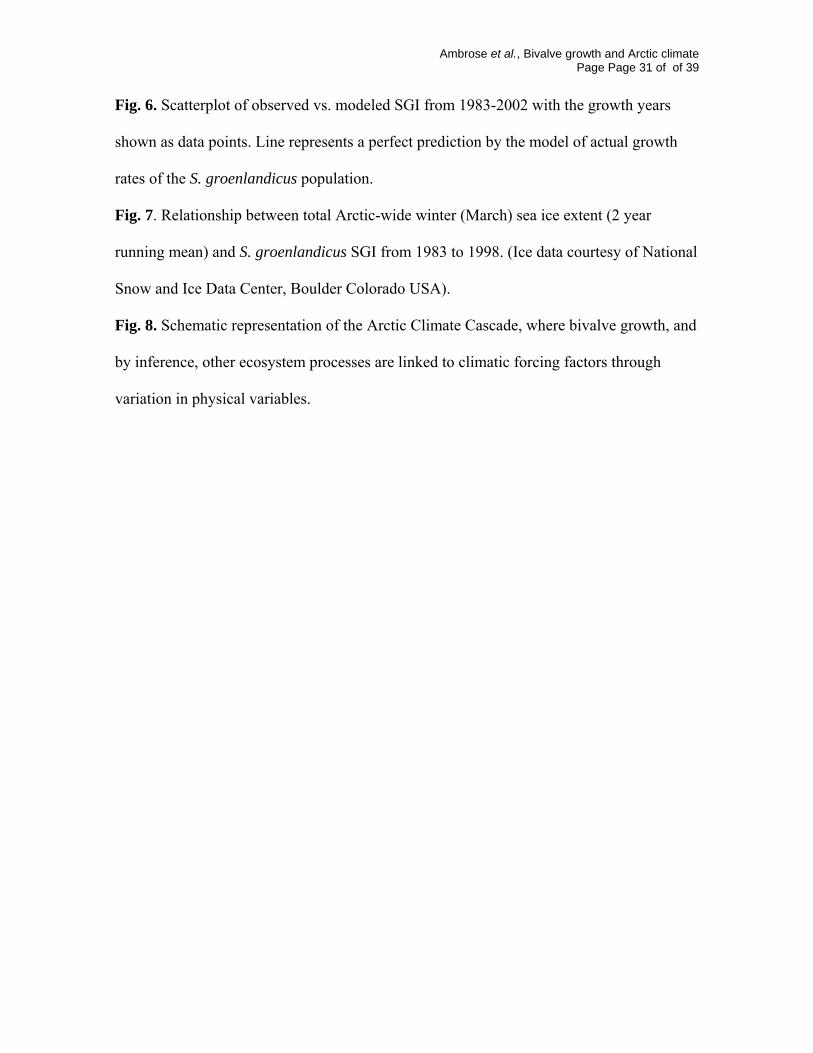
consistently < -1°C and a salinity > 33 ‰ (Fig. 2).
Bivalve Collection
Divers collected four Serripes groenlandicus individuals from 17 m depth on 28
August 2003. Individuals were identified by their pale, white siphon, and were dug from
the sediment where they were buried to a depth of 5 cm. All animals were alive at the time
of collection. Soft tissues were immediately separated from the shells, and the shells air
dried.
Strontium/Calcium Ratios
S. groenlandicus deposit distinctive lines during growth which appear as alternating
thin dark and thicker light bands on the external shell surface. We used changes in the ratio
of Strontium to Calcium in different areas of the shell to identify whether external lines
were deposited annually. The Sr/Ca ratio in carbonate varies with the water temperature at
the time of deposition (Zacherl et al., 2003; Bath et al., 2004), so systematic changes
between presumptive growth lines, reflecting seasonal changes in water temperature,
would suggest the lines are deposited annually. We measured Sr/Ca ratios along the
growth axis within the prismatic layer of two S. groenlandicus shells (N1 and N3) using a
Ambrose et al., Bivalve growth and Arctic climate Page Page 7 of of 39
New Wave Research UP213 laser ablation system coupled to a Thermo Finnigan Element2
single collector sector field ICP-MS. The valves were mounted in resin and a 10mm cross
section was cut along the axis of maximum growth using a low-speed saw equipped with a
diamond blade. The section was mounted on a petrographic slide with cyanoacrylic glue,
polished using 30μm and 3 μm Al2O3 lapping film, and then decontaminated in a clean
room. Each valve was scrubbed with a nylon brush, triple rinsing with 2% HNO3,
sonicated for 5 minutes in ultra pure H2O, triple-rinsed in water, and then dried for at least
24 hrs under a laminar flow clean bench.
Instrument set-up was similar to that outlined by Günther & Heinrich (1999) as
modified by Thorrold et al. (2001). Linear spatial resolution was 100 μm along the growth
axis which corresponded to weekly resolution during early years of life, declining to
monthly resolution as shell growth rates decreased at older ages. Quantification of Sr/Ca
ratios followed the approach outlined by Rosenthal et al. (1999) for precise element/Ca
ratios using sector field ICP-MS. Average external precision (RSD) of Sr/Ca ratios in the
laboratory standard was 0.2%.
Growth Rates
The external growth lines on S. groenlandicus are annual growth checks (Kim et al.
2003; this study - see Sr/Ca ratio results), and thus can be used to determine growth rates.
Since we collected all clams live, each growth increment can be assigned to a specific
calendar year. The distance between the ventral edges of successive growth lines along the
line of maximum growth (shell height) was measured with a digital caliper to the nearest
0.01 cm. We do not include growth beyond the last growth line in our analyses because we
do not know what portion of the present year this growth represents.
Ambrose et al., Bivalve growth and Arctic climate Page Page 8 of of 39
Shell growth of S. groenlandicus was modeled by fitting the von Bertalanffy growth
function to age and shell height data for each clam using Minitab (Ver. 14.10, 1993).
Bivalve growth declines with age, so growth increments within an individual and among
individuals of different ages must be standardized before growth among years can be
compared. We use the methods of Jones et al. (1989), employing the first derivative of the
von Bertalanffy function with respect to time, to derive an ontogenetically-adjusted
measure of annual growth:
ktekdtd t−
∞= SH/SH
where SHt = shell height at age t, = modeled yearly change in shell height, t =
age in years, = maximum, asymptotic shell height, k = growth constant.
dtd t /SH
∞SH
After determining the average yearly changes in shell height based on growth data
from all clams, we calculated the expected yearly increase in shell height for each clam for
each year. We then divided the measured or observed shell growth for each year by the
expected growth for that year to generate a standardized growth index (SGI). This
removes the ontogenetic changes in growth and equalizes the variance for the entire series
(Fritts, 1976). Once annual changes in shell growth were standardized, we calculated the
mean SGI for each calendar year (because growth lines are deposited in winter, growth
year is virtually synonymous with calendar year). The result is a record of year-by-year
growth for the S. groenlandicus individual, with an SGI greater than one indicating a better
than average year for growth, while a value less than one reflects a worse than average
growth year.

Ambrose et al., Bivalve growth and Arctic climate Page Page 9 of of 39
Climatic and Meteorological Data
We examined relationships between clam growth and climate indices with potential
influence on the region: the Arctic Climate Regime Index (ACRI), North Atlantic
Oscillation (NAO) and Arctic Oscillation (AO). The AO is the first principal component of
the sea level pressure field at latitudes > 20º N (Thompson and Wallace 1998, Stenseth et
al. 2003), while the ACRI measures variations in Arctic Ocean and ice circulation based on
the sea level height anomaly at the North Pole (Proshutinsky & Johnson, 1997; Johnson et
al., 1999; Proshutinsky, pers com. for updated index). The sea surface height anomaly at
the North Pole is indicative of the predominant high-Arctic wind pattern. Data for the
NAO, using the sea level pressure difference between Gibraltar and Southwest Iceland
(Jones et al., 1997; Osborn et al., 1999), were obtained from
(http://www.cru.uea.ac.uk/cru/data/nao.htm) and for the AO from
(http://www.cpc.ncep.noaa.gov/products/precip/CWlink/daily_ao_index/ao_index.html).
The Barents Sea temperature data (PINRO, Murmansk) is a time series of
integrated ocean temperature from 0-200 m depth along the Kola transect, which runs from
the Kola Peninsula northward to the ice edge along the 33° 30´ E meridian (Bochkov,
1982; Tereshchenko, 1997). We have used yearly means of Barents Sea temperature in our
analysis.
Meteorological data were obtained from the four official weather stations around
Svalbard (Longyearbyen, Ny Ålesund, Bear Island, and Hopen; Fig. 1) maintained by the
Norwegian Meteorological Institute (http://eklima.met.no). Daily data of precipitation,
pressure, and temperature were used to calculate seasonal and yearly averages.

Ambrose et al., Bivalve growth and Arctic climate Page Page 10 of of 39
Local ice conditions were estimated from imagery by the Nimbus-7 SMMR and
DMSP SSM/I passive microwave satellite (Cavalieri et al. 1997). The spatial resolution of
the satellite imagery is 25x25 km, and the cell used for the ice analysis is immediately
northward of Rijpfjord proper. The temporal resolution is daily from 1988 to 2003 and
every second day from 1978 to 1988. We calculated the ice free days per year as the
number of days with ice cover <25% from 1 July to 30 October of a given year (the
estimated period of active growth of S. groenlandicus). This measure relates closely
(>90%) to ice free days in a calendar year and average yearly ice concentration. Data on
total Arctic-wide spatial extent (km2) of pack ice were obtained from the U.S. National
Snow and Ice Data Center (http://www.nsidc.com/data/seaice_index/) (Fetterer& Knowles,
2002).
Statistical Analyses
We calculated Pearson correlation coefficients in order to determine basic pair-wise
relationships between SGI and the environmental and physical variables. We compared
annual means and also investigated the time-dependence between data in consecutive
years, leading us to incorporate two data transformations: 2 year-running means were used
to reduce the magnitude of interannual variability of both growth rate and environmental
data, and a 1-year lag was used to account for the time for physical processes to be
reflected in shell growth.
We used a general linear model to investigate the data at an individual clam level,
firstly to identify predictors of S. groenlandicus growth, and secondly to test whether there
were significant differences between the clams, included in the model as a random effect.
To further justify pooling the growth rates of the sample of clams, we computed the

Ambrose et al., Bivalve growth and Arctic climate Page Page 11 of of 39
Cronbach α measure of reliability (e.g., Bland & Altman, 1997), for the available growth
data on a common set of years available for all clams (1992-2002) to examine the
homogeneity of the four clam growth rates. Once we established that the clams were a
homogenous sample, we combined the clam data into an annual mean value as a more
reliable indicator of annual clam growth rate. This mean was then used as a response
variable in a multiple linear regression model, investigating relationships with all available
annual predictor variables. In all analyses, we checked for serial correlation in the
residuals, which should be absent to satisfy the assumptions of the regression model.
Statistical analyses were done using Statistica (ver. 6) or SPSS (ver. 11.5.1).
Results
The clams collected were 20, 19, 18, and 11 years old, representing 68 years of
growth data. We assayed Sr/Ca ratios from 440 samples spanning 16 growth increments,
and 350 samples spanning 12 increments, in the 20 year-old (N1) and 19 year-old (N3)
shells, respectively. The two Sr/Ca profiles were similar, with maximum values of
between 3.5 and 4.5 mmol mol-1 in aragonite deposited during early life, and a minimum
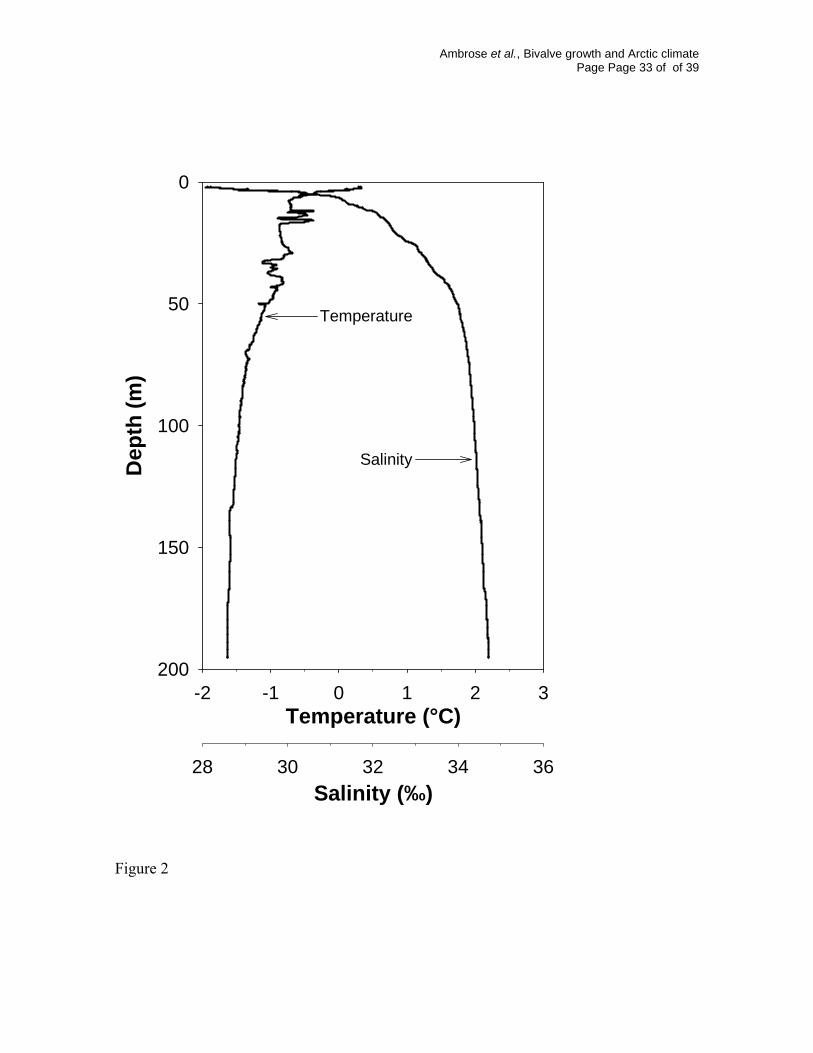
value of approximately 1.5 mmol mol-1 recorded as the individuals grew older (Fig. 3).
There was clear periodicity in Sr/Ca ratios that corresponded to growth increments visible
in the shells. The amplitude of Sr/Ca variation within an increment ranged from 2-2.5
mmol.mol-1 in wide increments during the first 2-3 years of life to 1-1.5 mmol mol-1 as
growth lines narrowed with age. Sharp declines in Sr/Ca ratios were invariably associated
with the presence of a dark growth line, confirming the growth lines are winter growth
checks.
Ambrose et al., Bivalve growth and Arctic climate Page Page 12 of of 39
The von Bertalanffy growth equation ( had an R)1(8.112SH )( 032.0 0ttet−−−= 2 of
0.956 (P≈0), indicating that it was an excellent descriptor of these clams’ growth. This
allowed us to correct for changes in growth with age and confidently generate the expected
growth for each calendar year (Standardized Growth Index = SGI).
SGI varied considerably over the 20 years of the data set (Fig. 4), with a range for
individual clams between 0.27 in the poorest growth year (N1 in 2002) to 2.46 in the best
growth year (N2 in 1996). The total population SGI ranged from 0.45 (2002) to 1.64
(1995). The differences in SGI’s among years are clearly not random, but appear to follow
a cyclic pattern with better growth in the mid-1990s bracketed by two poorer growth
periods in the late-1980s and the early part of this century. Growth has declined steadily
for the last 4 years of the series, with the worst growth in the last two years (2001, 2002).
To justify combining the growth rates for the individual clams into an average
Cronbach’s reliability coefficient was calculated for the years 1992 until 2002, for which
we had data from all four clams. The value α=0.663 indicates a reasonably high level of
reliability. Unless mentioned otherwise, the following results are for the average annual
SGI values.
SGI is most highly correlated with precipitation on Hopen and the ACRI (Table 1).
These positive correlations generally improve when running means are used instead of
annual means for the environmental parameter and when the environmental data are lagged
one year with respect to growth, growth corresponding better to the previous year’s
environmental data than the current year’s. The ACRI was the only large-scale climate
index related to clam growth (Fig. 5) and this correlation was very significant with a one-
year lag and using the running mean (r = 0.671, P<0.001). Atmospheric pressure at Hopen
Ambrose et al., Bivalve growth and Arctic climate Page Page 13 of of 39
and Longyearbyen are also significantly correlated, in these cases negatively, with the SGI
when a one year lag and the running mean of the environmental data are applied. Removal
of the variability explained by the ACRI and a correlation analysis between the residuals
and the SGI revealed significant negative correlations between the SGI and the Kola Sea
temperature, precipitation at Ny Ålesund and air temperature in Longyearbyen.
Considering all explanatory variables and their lags as well as their running means
as possible predictors, the best subset of predictor variables for the SGI which we
identified are the ACRI averaged over the two years prior to SGI measurement (running
mean with a 1 year lag) and the running mean (present and previous year) of precipitation
at Ny Ålesund. The model is:
Average SGI = 1.715 + 0.319 × ACRI – 0.00183 × Ny Ålesund Precipitation (2yr mean, (2yr mean) 1yr lag) (P<0.00001) (P<0.007)
This model explains nearly 65% of the variability in the mean SGI (R2 = 0.649). Although
the individual variables are serially correlated, the residuals in the model are not
autocorrelated (Durbin-Watson test statistic = 1.67), thus satisfying the assumption of the
regression model. Fig. 6 shows the observed mean SGI plotted against the value predicted
by our model, where the 45 degree line indicates perfect prediction. This shows that the
model-generated SGI’s closely track the measured values. The only significant residual is
for the year 1991, which is over-predicted because of a 1-year drop in average SGI in an
otherwise multi-year uptrend in SGI (Fig. 5). In other words, the serial autocorrelation
breaks down in 1991.
Ambrose et al., Bivalve growth and Arctic climate Page Page 14 of of 39
Discussion
Growth of S. groenlandicus from northeast Svalbard is clearly related to the Arctic
Climate Regime Index, a large scale arctic climate oscillation dependent on high-Arctic
atmospheric circulation patterns (Proshutinsky & Johnson, 1997; Johnson et al., 1999;
Polyakov et al., 1999), through local environmental conditions. Fortunately, the S.
groenlandicus growth we examined spanned large changes in the ACRI (from positive to
negative phase and vice versa), offering us the opportunity to examine the response of this
important member of the benthic community to large changes in climate. The response of
S. groenlandicus to the ACRI and local conditions, however, was complex, including an
apparent 1-year lag between physical forcing changes and biological response.
The use of bivalves as bioproxies for climate changes hinges on the ability to
recognize annual markers in their shell. While it is generally assumed that lines visible on
the external shell or internally in cross section are deposited annually, particularly at high
latitudes, this assumption is not always tested (Andrews, 1972; Tallqvist & Sundet, 2000).
When the periodicity of increments has been examined using changes in oxygen and
carbon isotopes between presumptive annual lines (Witbaard et al., 1994; Heilmayer et al.,
2003; Khim et al., 2003), or more rarely in polar environments, mark and recapture studies
(Sejr et al., 2002), they have proved to be annual and are associated with a winter cessation
of growth. In S. groenlandicus from the Chukchi Sea, δ18O values vary systematically
between growth lines with the highest values, reflecting the coldest temperatures,
coincident with the dark lines on the shell, strongly suggesting the lines are deposited
annually during winter (Khim et al., 2003).
Ambrose et al., Bivalve growth and Arctic climate Page Page 15 of of 39
We found that Sr/Ca profiles also varied systematically between individual growth
lines, with minimum values always associated with dark growth bands. Recent culturing
studies have found that the Sr/Ca ratio is positively correlated with temperature in low-Sr
aragonite from mollusk shells and fish otoliths (Zacherl et al., 2003; Bath et al., 2004),
meaning that growth lines in S. groenlandicus from Rijpfjord are likely deposited during
the winter. The within-year amplitudes of Sr/Ca variations we found are on the order of
50-100%, and are of a similar magnitude to those reported by Stecher et al. (1996) for the
bivalve Mercenaria mercenaria. Thus, the results are clearly consistent with an annual
deposition rate of growth lines in S. groenlandicus shells and justify use of external lines
on the shells as annual markers.
Considerable effort has recently been directed towards understanding the
relationships between climate variation and ecosystem structure and function. Climate
oscillations and the associated changes in physical parameters such as temperature, water
circulation, and ice cover have been shown to measurably influence marine ecosystems in
the North Pacific, North Atlantic, and Southern Ocean by regulating the abundances of
organisms at the base and upper levels of food webs (Fomentin & Planque, 1996; Stabeno
& Overland, 2001; Hunt & Stabeno, 2002). S. groenlandicus growth is not strongly related
to the North Atlantic Oscillation (NAO), the Arctic Oscillation (AO), which is itself related
to the NAO (Deser, 2000; Hurrell et al., 2003), or the Barents Sea temperature (until after
the effects of the ACRI are removed) (Table 1), which is influenced by incursions of the
North Atlantic Current into the Barents Sea (Loeng, 1991), and only correlated with one of
the environmental variables from locations outside the polar front (e.g. all locations except
Hopen), atmospheric pressure at Longyearbyen. This pattern of relationships indicates that
Ambrose et al., Bivalve growth and Arctic climate Page Page 16 of of 39
we are measuring the response of the marine ecosystem to an exclusively Arctic
phenomenon, rather than a temperate interaction with Arctic climate. Once the variability
in the SGI attributed to the ACRI is removed, either in the multiple regression model or in
the correlation analysis, precipitation at Ny Ålesund is related to the SGI.
The polar-scale effect of climate on S. groenlandicus growth, however, is not
immediate or direct because variation in S. groenlandicus growth is best explained by the
climate index one year earlier than the current years’ growth (Table 1, regression model).
Lagged response to climate oscillations are common in marine systems and can typically
span many trophic levels (Post 2004) from benthic infauna (Tunberg & Nelson, 1998),
including the bivalve Arctica islandica (Witbaard et al., 2003), to zooplankton (Pershing et
al., 2004), fish (Ottersen et al., 2004) and birds (Thomson & Ollason, 2001). In the case of
S. groenlandicus, the lag is probably because the local manifestations of the climate
oscillation (i.e. precipitation) take a period of time to develop. Furthermore, there is likely
an additional time lag associated with the biophysical coupling via physical constraints on
food production, biological processes of consumption and assimilation as tissue and shell
growth, and storage of energy as tissue from previous years.
Surprisingly, given the importance of ice in mediating environmental conditions in
the Arctic, no measure of ice condition (summer ice free days, total arctic ice pack extent)
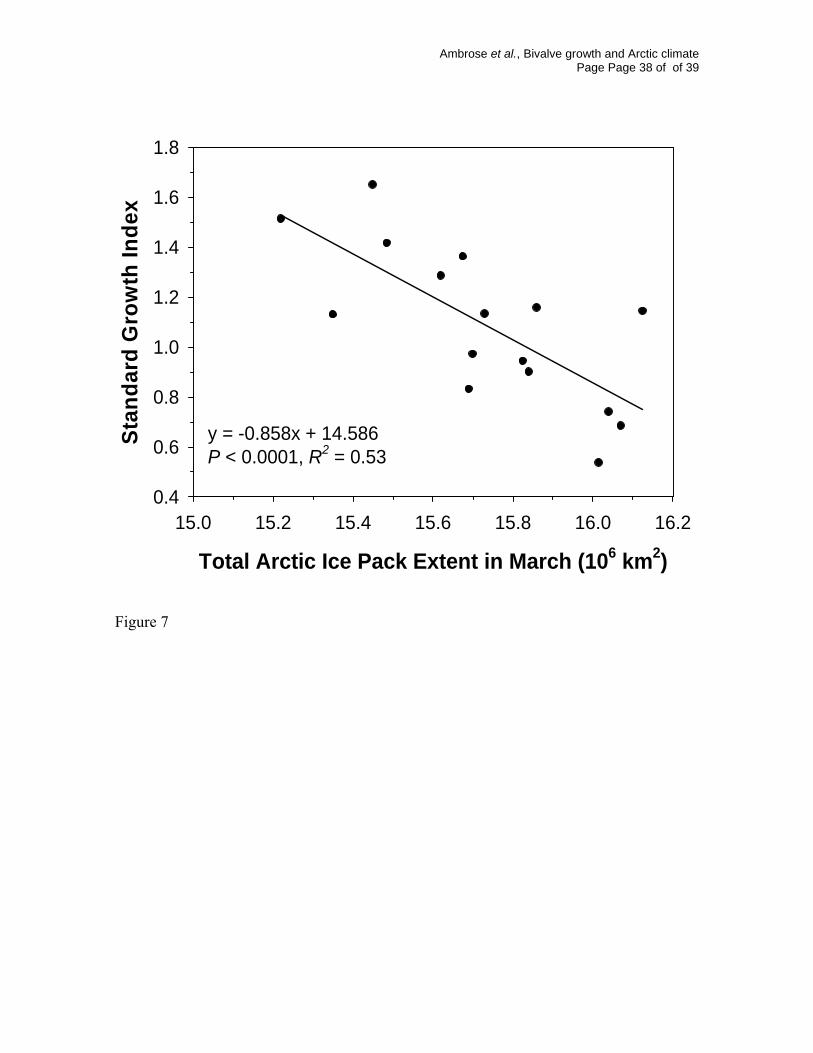
was related to S. groenlandicus growth (Table 1). When the last 4 years of poor growth are
removed from the analysis, however, there is a very strong, significant negative
relationship between SGI and Arctic-wide extent of the pack ice (Fig. 7). It is remarkable
that such a large scale measure of ice conditions as the extent of total pack ice across the
Arctic explains over 50% of the interannual variability in the growth of S. groenlandicus.
Ambrose et al., Bivalve growth and Arctic climate Page Page 17 of of 39
This relationship disappears when the last 4 years are included in the analysis, suggesting a
decoupling of the previously strong relationship between growth and ice conditions in the
last 4 years.
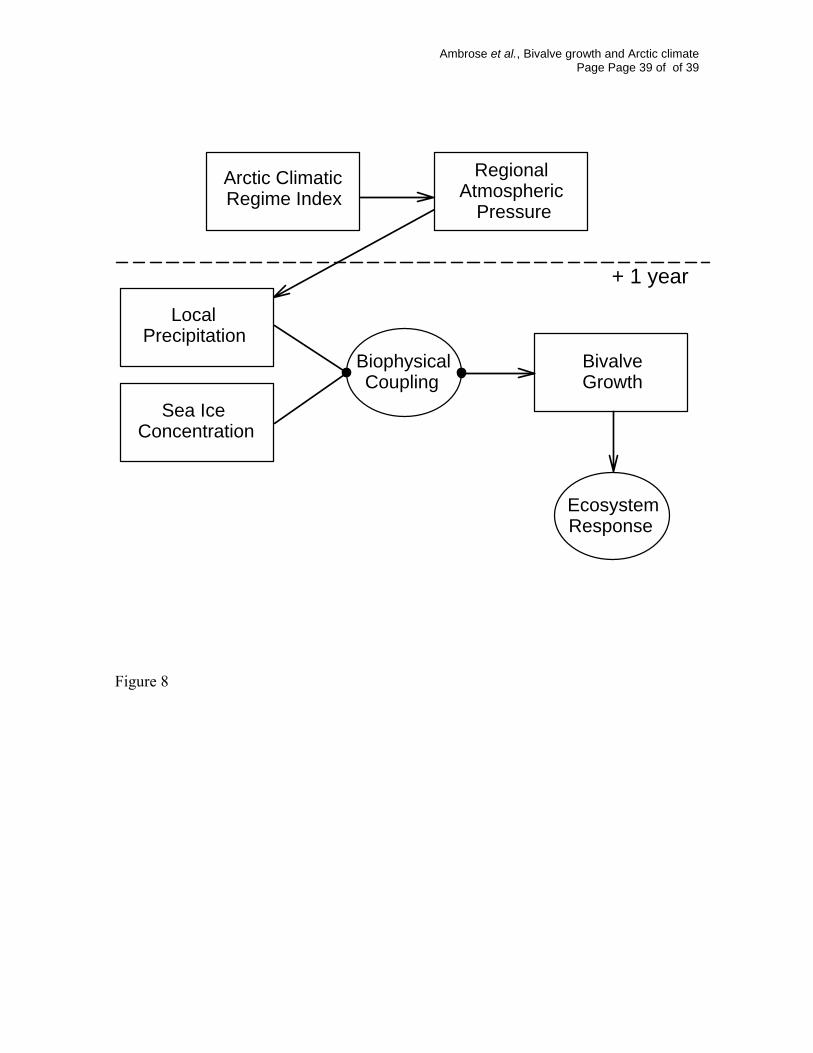
The growth of S. groenlandicus is linked to the ACRI though the impact of the
climate oscillation on the local physical conditions of precipitation and ice cover (Fig. 8).
The integration of water column processes by long-lived Arctic benthos means that the
effect of climate on S. groenlandicus growth may be direct or indirect, and the specific
mechanisms of coupling between physical conditions and bivalve growth in Rijpfjord (Fig.
8) are not well understood. Variation in bivalve growth is typically best explained by
variation in temperature and food (Buekema et al., 1985; Beukema & Cadée, 1991; Jones
et al., 1989, Lewis & Cerrato, 1997; Dekker & Beukema, 1999; Witbaard et al., 1997,
1999). Some of the best documented effects of climate oscillations on individuals,
populations and benthic community structure are mediated through temperature (Kröncke
et al., 1998; Ottersen et al., 2001; Hagberg et al. 2004). In late August when the clams in
Rijpfjord were collected, the thermocline roughly coincided with collection depth (Fig. 2),
indicting that the clams lived deep enough to experience relatively small differences in
temperature over the year, meaning the temperature effects on growth will be limited and
likely minor compared to other factors controlling food availability.
The growth of many polar benthic organisms appears to be food limited
(Brockington & Clarke, 2001) and differences in growth among sites have been related to
differences in food supply (Brey et al., 1995; Norkko et al., 2005). If the S. groenlandicus
population in Rijpfjord is also food- rather than temperature-limited, processes regulating
the quantity and quality of food reaching the bottom of the fjord will have a strong effect
Ambrose et al., Bivalve growth and Arctic climate Page Page 18 of of 39
on S. groenlandicus growth. In the absence of a strong temperature signal, variation in
food quantity, and possibly quality, is the most probable explanation for interannual
differences in S. groenlandicus growth in Rijpfjord. This is the same conclusion reached
by Witbaard et al. (2003) for interannual variations in growth of Arctica islandica in the
North Sea, and Sejr et al. (2004) for Hiatella arctica in east Greenland.
Precipitation is the only environmental variable that enters the multiple linear
regression model as a negative relationship between SGI and precipitation at Ny Ålesund,
and precipitation at Hopen is positively correlated with growth in current and previous
years (Table 1) (precipitation at Ny Ålesund and Hopen are negatively correlated, though
not significantly, hence their opposite relationships with the SGI). The effect of
precipitation on S. groenlandicus growth could be due to direct or indirect effects and we
have little data from Rijpfjord to help us interpret these relationships. The land around
Rijpfjord is heavily glaciated and the un-glaciated areas are sparsely vegetated with
nutrient poor soil, so spring runoff is unlikely to be laden with nutrients necessary to
stimulate a phytoplankton bloom. Precipitation might also stabilize the water column,
which has been shown to initiate a spring bloom in the Bering Sea (Stabeno & Overland,
2001) and west Greenland (Nielsen & Hansen, 1995), but is not necessary for a spring
bloom to develop in the Rijpfjord system (Hegseth et al., 1995). Precipitation could affect
the salinity of surface water and the abundance of herbivorous zooplankton, which are
capable in Arctic fjords of consuming over 80% of annual primary production (Nielsen &
Hansen, 1995) and indirectly influencing bivalve growth (Witbaard et al., 2003); a top-
down rather than a bottom-up effect. It is also possible that precipitation is a reflection of
storms, which may cause resuspension of settled phytodetritus, and in shallow enough
Ambrose et al., Bivalve growth and Arctic climate Page Page 19 of of 39
water, benthic microalgae, both of which could be consumed by S. groenlandicus, a
positive relationship, or excessive wind might suspend bottom sediment clogging the gills
of S. groenlandicus and resulting in lowered growth, a negative relationship. Without
more information on environmental conditions in Rijpfjord and how they affect primary
productivity and delivery of food to the benthos, we can do no more than speculate on the
relationships between growth of S. groenlandicus and precipitation.
Perhaps the most intriguing aspect of the relationships between S. groenlandicus
growth and environmental conditions is the decoupling which occurred during the last 4
years between ice cover and growth. Annual phytoplankton production in the Arctic is
directly proportional to the length of open water (Rysgaard et al., 1999) and benthic
biomass on Arctic shelves is, inversely related to ice cover (Ambrose & Renaud, 1995). In
Rijpfjord, however, 3 weeks after the break-up of ice in 2003 during the period when the
“spring” bloom would be expected, there was a very shallow mixed-layer depth (Fig. 2)
and little suspended chlorophyll biomass in the water column (maximum 1 μg L-1, E.N.
Hegseth, unpub. data). Locally produced phytoplankton alone would appear to be
insufficient to sustain the rich benthic communities observed in Rijpfjord, with infaunal
benthic biomass of 130 g WW m-2 (M.L. Carroll, unpub. data) at 200 m depth adjacent to
the bivalve collection site. Thus, we assume a significant amount of food must reach the
bottom of Rijpfjord from non-local sources, with ice algae from ice flows episodically
driven into the fjord by wind and advected phytoplankton being the most likely
explanation (Carroll et al. in prep.). To the extent that the benthos in Rijpfjord is dependent
on the advection of ice and associated ice algae for food, the recent reduction in summer
ice north of Svalbard (Serreze et al., 2003;

Ambrose et al., Bivalve growth and Arctic climate Page Page 20 of of 39
http://nsidc.org/news/press/20050928_trendscontinue.html) or any change in wind or
current patterns resulting in less ice entering the fjord would cause a reduction in this food
source. Ice algae is a potentially important food source for the Arctic benthos (Ambrose et
al., 2001 and references therein) including S. groenlandicus (McMahon et al., 2006).
There may well be a balance between enough ice for ice algae-laden flows to be advected
into Rijpfjord and too much ice reducing phytoplankton production in surrounding waters
(the source for any advected phytoplankton) and limiting the movement of ice flows. There
are as yet insufficient data to determine if there has been a fundamental shift in the
biophysical coupling in Rijpfjord, but it is possible that the quality or quantity of food
reaching the benthos has recently changed. This change could be a reflection of long term
climate change in the Arctic that is now exerting an overriding effect on the benthos
compared to local climatic conditions.
Bivalves have been used to reconstruct environmental conditions in ancient and
modern environments for many decades. The long life of polar bivalves and the tight
coupling between pelagic and benthic processes make them ideal candidates for
monitoring climate change and for predicting the impact of global warming on Arctic
marine ecosystems. Our results confirm the importance of S. groenlandicus as a biological
proxy of climatic forcing on the marine ecosystem and are the first evidence of an Arctic-
centered climate oscillation influencing marine benthic processes. Our results, however, do
not reveal the proximate causes of variability in bivalve growth. To fully understand the
response of S. groenlandicus and other bottom dwelling organisms to climate fluctuations,
we need to better understand variation in the quality and quantity of food reaching the sea
floor.

Ambrose et al., Bivalve growth and Arctic climate Page Page 21 of of 39
Acknowledgements
This research was supported in part by the Norwegian Research Council, NORDKLIMA
Program (150356-S30 and 151815-S30 to MLC), the U.S. National Science Foundation
Offices of Polar Programs (OPP-0138596, OPP-0222423 to WGA) and Ocean Sciences
(OCE-0215905 to SRT), the BBVA Foundation in Madrid (to MG), and with funds from
the Howard Hughes Medical Institute through Bates College. We thank the captain and
crew of the R/V Lance. Divers H. Hop and S. Nordang collected the bivalve samples and J.
Edgerly measured growth lines. Sea ice data were provided by the National Snow and Ice
Data Center (USA), and meteorological data were provided by the Norwegian
Meteorological Institute. O. Pavlova collated the satellite data of ice concentration.
Discussions with E. Nøst-Hegseth clarified our interpretations. J. Carroll, L. Clough, B.
Johnson, M. Retelle, and P. Renaud and 2 anonymous reviewers provided valuable
comments on earlier versions of the manuscript.
Ambrose et al., Bivalve growth and Arctic climate Page Page 22 of of 39
References
AICA (2004) Impacts of a Warming Arctic: Artic Climate Impact and Assessment. Cambridge University Press, Cambridge. 144 pp.
Allen R, Lindesay J, Parker D (1996) El Niño Southern Oscillation and climate variability. CSIRO, Collingswood, Australia.
Ambrose, WG, Jr, Clough LM, Tilney PR, Beer L (2001) Role of echinoderms in benthic remineralization in the Chukchi Sea. Marine Biology, 139, 937-949.
Ambrose WG Jr., Renaud PE (1995) Benthic response to water column productivity: evidence for benthic-pelagic coupling in the Northeast Water Polynya. Journal of Geophysical Research 100 (C3), 4411-4421.
Andrews JT (1972) Recent and fossil growth rates of marine bivalves, Canadian Arctic, and Late –Quaternary arctic Marine environments. Paleogeography, Paleoclimatology, Paleoecology, 11, 157-176.
Belgrano A, Lima M, Stenseth N Chr, Lindahl O (2004) Responses of phytoplankton communities to climate variability. In: Marine Ecosystems and Climate Variation, The North Atlantic A Comparative Perspective (eds. Stenseth, N Chr, Ottersen G), pp. 109-114. Oxford University Press, Oxford.
Beukema JJ, Knoll E, Cadée GC (1985) Effects of temperature on the length of the annual growing season of the Tellinid bivalve Macoma balthica (L.) living on tidal flats in the Dutch Wadden Sea. Journal of Experimental Marine Biology and Ecology, 90, 129-144.
Beukema JJ, Cadée GC (1991) Growth of the bivalve Macoma balthica in the Wadden Sea during a period of eutrophication: relationships with concentrations of pelagic diatoms and flagellates. Marine Ecology Progress Series, 68, 249-256.
Bland JM, Altman DG (1997) Statistics notes: Cronbach´s alpha. British Medical Journal, 314, 572.
Bochkov, YA (1982) Water temperature in the 0-200m layer in the Kola Meridian Section in the Barents Sea, 1900-1981 (in Russian), Sb. Nauchn. Trud., Polar Research Institute of Marine Fisheries and Oceanography (PINRO), Murmansk 46, 113-122.
Brey T, Pearse J, Basch L, McClintock J, Slattery M (1995) Growth and production of Sterechinus neumayeri (Echinoida: Echinodermata) in McMurdo Sound, Antarctica. Marine Biology, 124, 279-292.
Brockington S, Clarke A (2001) The relative influence of temperature and food on the metabolism of a marine invertebrate. Journal of Experimental Marine Biology and Ecology, 258, 87-99.
Cavalieri D, Parkinson C, Gloerson P, Zwally HJ (1997, updated 2004) Sea ice concentrations from Nimbus-7 SMMR and DMSP SSM/I passive microwave data, January 1979 to December 2003. National Snow and Ice Data Center, Boulder, Colorado, USA. Digital media and CD-ROM (http://nsidc.org/data/nsidc-0051.html).
Carroll ML, Carroll J (2003) The Arctic seas. In: Biogeochemistry of Marine Systems (eds. Black KD, Shimmield GB)Blackwell, Oxford.
Ambrose et al., Bivalve growth and Arctic climate Page Page 23 of of 39
Clark GR (1974) Growth lines in invertebrate skeletons. Annual Review of Earth and Planetary Science, 2, 77-99.
Clough LM, Renaud PE, Ambrose WG Jr. (2005) Sediment oxygen demand, infaunal biomass, and sediment pigment concentration in the western Arctic Ocean. Canadian Journal of Fisheries and Aquatic Science, 62, 1756-1765.
Dayton PK (1990) Polar benthos. In: Polar Oceanography, Part B Chemistry, Biology, and Geology (ed Smith WO) pp. 631-685. Academic Press, San Diego.
Dekker R, Beukema J (1999). Relations of summer and winter temperatures with dynamics and growth of two bivalves, Tellina tenuis and Abra tenuis, on the northern edge of their intertidal distribution. Journal of Sea Research, 42, 207-220.
Deser C (2000) On the teleconnectivity of the ‘Arctic Oscillation’. Geophysical Research Letters 27, 779-782.
Dunton KW, Goodall JL, Schonberg SV, Grembeier JM, Maidment DR (2005) Multi-decadal synthesis of benthic-pelagic coupling in the western arctic: Role of cross-shelf advective processes. Deep-Sea Research II 52, 3462-3477.
Feder HM, Naidu AS, Jewett SW, Hameedi JM, Johnson WR, Whitledge TE (1994) The northeastern Chukchi Sea: benthos-environmental interactions. Marine Ecology Progress Series, 111, 171-190.
Fetterer F, Knowles K (2002, updated 2004). Sea ice index. National Snow and Ice Data Center, Boulder, Colorado, USA. Digital media.
Fomentin JM, Planque B (1996) Calanus and environment in the eastern North Atlantic. II Influence of the North Atlantic Oscillation on C. finmarchicus and C. helgolandicus. Marine Ecology Progress Series, 134, 111-118.
Fritts HC (1976) Tree Rings and Climate. Academic Press, New York, 567 pp.
Grant J, Hargrave G, MacPherson P (2002) Seasonal and spatial patterns in mass and organic matter sedimentation in the North Water. Deep-Sea Research II, 49, 5227-5244.
Grebmeier JM, Feder HM, McRoy CP (1989). Pelagic-benthic coupling on the shelf of the northern Bering and Chukchi Seas II: Benthic community structure. Marine Ecology Progress Series, 51, 253-268.
Grebmeier JM, McRoy CP, Feder HM (1988) Pelagic-benthic coupling on the shelf of the northern Bering and Chukchi Seas I: Food supply and carbon cycling . Marine Ecology Progress Series, 48, 57-67.
Gulliksen B, Holte B, Jakola K-J (1985) The soft bottom fauna in Van Mijenfjord and Raudfjord, Svalbard. In: Marine Biology of Polar Regions and Effects of Stress on Marine Organisms. Proceedings XVIII European Marine Biology Symposium,th (eds Gray, JS, Christiansen ME), pp. 199-215, J. Wiley & Sons, New York.
Günther D, Heinrich CA (1999) Enhanced sensitivity in laser ablation-ICP mass spectrometry using helium-argon mixtures as aerosol carrier. Journal of Analytical Atomic Spectrometry, 14, 1363-1368.
Ambrose et al., Bivalve growth and Arctic climate Page Page 24 of of 39
Hagberg J, Tunberg G, Wicking G, Kröncke I, Belgrano A (2004) Effects of climate variability on benthic communities. In: Marine Ecosystems and Climate Variation, The North Atlantic A Comparative Perspective (eds Stenseth, N Chr., Ottersen G), pp. 115-121. Oxford University Press, Oxford.
Hegseth EN, Svendsen H, von Quillfeldt CH (1995) Phytoplankton in fjords and coastal waters of northern Norway: environmental conditions and dynamics of the spring bloom. In: Ecology of Fjords and Coastal Waters (eds Skjoldal HR, Hopkins C, Erikstad KE, Leinaas HP), pp. 45-72, Elsevier Science B.V. Amsterdam.
Heilmayer O, Brey T, Chanter M, Cattaneo-Vietti R, Arntz WE (2003) Age and productivity of the Antarctic scallop, Adamussium colbecki, in Terra Nova Bay (Ross Sea, Antarctica). Journal of Experimental Marine Biology and Ecology, 288, 239-256.
Hudson I, Shinn E, Halley R, Lidz B (1976) Sclerchronology: a new tool for interpreting past environments. Geology, 4, 361-364.
Hunt GL Jr., Stabeno PJ (2002) Climate change and the control of energy flow in the southeastern Bering Sea. Progress in Oceanography, 55, 5-22.
Hurrell JW, Kushnir Y, Ottersee G, Visbeck M (2003) The North Atlantic Oscillation: climate significance and environmental impact. Geophysical Monograph Series. American Geophysical Union, Washington DC.
Johannessen OM, Miles MW, Bengtsson L, Bobylev, LP, Kuzmina SI (2003) Arctic climate change. In: Arctic Environment Variability in the Context of Global Change (eds Bobylerv, PK, Kondratyev KY, Johannessen OM) pp. 1-15.
Johannessen OM, Bengtsson L, Miles MW et al. (2004) Arctic climate change: observed and modeled temperature and sea-ice variability. Tellus, 4, 328-341.
Johnson MA, Proshutinsky AY, Polyakov IV (1999) Atmospheric patterns forcing two regimes of Arctic circulation: A return to anticyclonic conditions? Geophysical Research Letters 26:1621-1624.
Jones DS (1981) Annual growth increments in shells of Spisula solidissima recorded marine temperature variability. Science, 211,165-165.
Jones DS, Arthus MA, Allard DJ (1989) Sclerochronological records of temperature and growth from shells of Mercenaria mercenaria from Narragansett Bay, Rhode Island. Marine Biology, 102, 225-234.
Jones PD, Jonsson T, Wheeler D (1997) Extension to the North Atlantic Oscillation using early instrumental pressure observations from Gibraltar and South-West Iceland. International Journal Climatology 17, 1433-1450.
Khim B-K, Kranz DE, Cooper LW, Grebmeier JM (2003) Seasonal discharge to the western Chukchi Sea shelf identified in stable isotope profiles of mollusk shells. Journal of Geophysical Research, 108 (C9), 3300, doi:10.1029/2003JC001816.
Kröncke I, Dippner JW, Heyen H, Zeiss B (1998) Long-term changes in macrofaunal communities off Norderney (East Frisia, Germany) in relation to climate variability. Marine Ecology Progress Series, 167, 25-36.
Ambrose et al., Bivalve growth and Arctic climate Page Page 25 of of 39
Kröncke I, Zeiss B, Rensing C (2001) Long-term variability in macrofauna species composition off the Island of Norderney (East Frisia, Germany) in relation to changes in climate and environmental conditions. Senckenbergiana Maritima, 31, 65-82.
Lewis DE, Cerrato RM (1997) Growth uncoupling and the relationship between shell growth and metabolism in the soft shell clam Mya arenaria. Marine Ecology Progress Series, 158, 177-189.
Loeng H (1991) Features of the physical oceanographic conditions of the Barents Sea. Polar Research 10: 5-18.
Maxwell B (1997) Recent climate patterns in the Arctic. In: Global Change and Arctic Terrestrial Ecosystems (eds Oechel WC, Callaghan T, Gilmarov T, Holten JI, Maxwell B, Molau U, Sveinbjörnsson B ), pp. 21-46, Springer Verlag, New York.
McDonald J, Feder HM, Hoberg M (1981) Bivalve mollusks of the Southeastern Bering Sea. In: The Eastern Bering Sea Shelf: Oceanography and Resources (eds Hood DW, Calder JA), University of Washington Press, Seattle.
McMahon KW, Ambrose WG Jr., Johnson BJ, Sun M-Y, Lopez GR, Clough LM, Carroll ML (2006) Benthic community response to ice algae and phytoplankton in Ny Ålesund, Svalbard. Marine Ecology Progress Series In Press
Morison J, Aagaard K, Steele M (2000) Recent environmental changes in the Arctic: A review. Arctic, 53, 359-371.
Müller-Lupp T, Erlenkeuser H, Bauch HA (2003) Seasonal and interannual variability of Siberian river discharge in the Laptev Sea inferred from stable isotopes in modern bivalves. Boreas, 32, 292-303.
Müller-Lupp T, Bauch HA (2005) Linkage of Artic shelf atmospheric circulation and Siberian shelf hydrography: a proxy validation using δδ18O records of bivalve shells. Global Planetary Change 48,175-186.
Nielsen TG, Hansen B (1995) Plankton community structure and carbon cycling on the western coast of Greenland during and after the sedimentation of a diatom bloom. Marine Ecology Progress Series 125, 239-257.
Norkko J, Norkko A, Thursh SF, Cummings VJ (2005) Detecting growth under environmental extremes: spatial and temporal patterns in nucleic acid rations in two Antarctic bivalves. Journal of Experimental Marine Biology and Ecology, 326, 144-156.
O’Donnell TH, Macko SA, Chou J, Davis-Hartten KL, Wehmiller JF (2003) Analysis of δ13C, δ15N, and δ23S in organic matter from the biominerals of modern and fossil Mercenaria spp. Organic Geochemistry, 34, 165-183.
Oechel WC, Vourlitis GL (1997) Climate change in northern latitudes: Alterations in ecosystem structure and function and effects on carbon sequestration In: Global Change and Arctic Terrestrial Ecosystems (eds Oechel WC, Callaghan T, Gilmarov T, Holten JI, Maxwell B, Molau U, Sveinbjörnsson B ), pp. 381-401.
Osborn TJ, Briffa KR, Tett SFB, Jones PD, Trigo RM (1999) Evaluation of the North Atlantic Oscillation as simulated by a coupled climate model. Climate Dynamics, 15, 685-702.
Ambrose et al., Bivalve growth and Arctic climate Page Page 26 of of 39
Ottersen G, Planque B, Belgrano A, Post E, Reid PC, Stenseth NC (2001) Ecological effects of the North Atlantic Oscillation. Oecologia, 128, 1-14.
Ottersen G, Alheit A, Drinkwater K, Friedland K, Hagen E, Stenseth NC (2004) In: Marine Ecosystems and Climate Variation The North Atlantic A Comparative Perspective (eds Stenseth NC, Ottersen G) pp. 73-94, Oxford University Press, Oxford.
Overpeck JK, Hughen K, Hardy D, et al. (1997) Arctic environmental change of the last four centuries. Science, 278, 1251-1256.
Peck LS, Bullough LW (1993) Growth and population structure in the infaunal bivalve Yoldia eightsi in relation to iceberg activity at Signy Island, Antarctica. Marine Biology, 117, 235-241.
Pershing AJ, Greene CH, Planque B, Fromentin J-M (2004) The influence of climate variability on North Atlantic zooplankton populations. In: Marine Ecosystems and Climate Variation The North Atlantic A Comparative Perspective (eds Stenseth NC & Ottersen G) pp. 59-94, Oxford University Press, Oxford.
Piepenburg D, Ambrose WG Jr., Brandt A, Renaud, PE, Ahrens, MJ, Jensen P (1997) Benthic community patterns reflect water column processes in the Northeast Water Polynya (Greenland). Journal of Marine Systems, 10, 476-482.
Polyakov IV, Proshutinsky AY, Johnson MA (1999) Seasonal cycles in two regimes of Arctic climate. Journal of Geophysical Research, 104, 25761-25788.
Post E (2004) Time lags in terrestrial and marine environments. In: Marine Ecosystems and Climate Variation The North Atlantic A Comparative Perspective (eds Stenseth NC & Ottersen G) pp. 165-167, Oxford University Press, Oxford.
Proshutinsky A, Johnson, M (1997) Two circulation regimes of the wind-driven Arctic Ocean. Journal of Geophysical Research 102, 12493-12512.
Rhoads DC, Panella G (1970) The use of molluscan shell growth patterns in ecology and paleoecology. Lethaia, 3, 143-161.
Rhoads DC, Lutz RA (eds) (1980) Skeletal Growth of Aquatic Organisms: Biological Records of Environmental Change. Plenum Press, New York 750 pp.
Rosenthal Y, Field MP, Sherrell RM (1999) Precise determination of element/calcium ratios in calcareous samples using sector field inductively coupled plasma mass spectrometry Analytical Chemistry, 71, 3248-3253.
Rothrock DA, Yu Y, Maykut GA (1999) Thinning of the Arctic sea-ice cover. Geophysical Research Letters, 26, 1-5.
Rysgaard S, Nielsen T, Hansen BW (1999) Seasonal variation in nutrients, pelaic primary production and grazing in a high-Arctic marine ecosystem, Young Sound, Northeast Greenland. Marine Ecology Progress Series,179, 13-25
Schöne BR, Oschmann W, Rössler J, et al. (2003) North Atlantic Oscillation dynamics recorded in shells of a long-lived bivalve mollusk. Geology, 31, 1037-1042.
Ambrose et al., Bivalve growth and Arctic climate Page Page 27 of of 39
Schöne BR, Houk SD, Freyre Castro AD, Fiebig J, Oschmann W, Kröncke I, Dreyer, Gosselck F (2005) Daily growth rates in shells of Arctica islandica: assessing sub-seasonal environmental controls on a long-lived bivalve mollusk. Palaios, 20, 78-92.
Sejr M, Jensen KT, Rysgaard S (2002) Annual growth bands in the bivalve Hiatella arctica validated by a mark-recapture study in NE Greenland. Polar Biology, 25, 794-796.
Sejr M, Petersen JK, Jensen TK, Rysgaard S (2004) Effects of food concentration on clearance rate and energy budget of the Arctic bivalve Hiatella arctica (L) at subzero temperature. Journal of Experimental Marine Biology and Ecology, 311, 171-183. Sejr MK, Christensen PB (2006) Growth, production and carbon demand of macrofauna in Young Sound, with special emphasis on the bivalves Hiatella arctica and Mya truncate. In: Carbon Cycling in Arctic Marine Ecosystems: Case Study Young Sound. (eds Rysgaard S, Glud RN) Meddr Greenland, Bioscience Special Issue. In Press
Serreze MC, Walsh JE, Chapin FS III, et al. (2000) Observational evidence of recent change in the northern high-latitude environment. Climate Change, 46, 159-207.
Serreze MC, Maslanik, JA, Scambos TA et al. (2003) A record minimum arctic sea ice extent and area in 2002. Geophysical Research Letters, 30(3), 1110, doi:10.1029/2002GL016406.
Stabeno PJ, Overland, JE (2001) Bering Sea shifts toward an earlier spring transition. EOS, 82, 317-321.
Stein R, Macdonald RW (eds) (2004) The Organic Carbon Cycle in the Arctic Ocean. Springer, Berlin. 363 pp.
Stecher HA III, Krantz DE, Lord CJ III, Luther GW III, Bock KW (1996) Profiles of strontium and barium in Mercenaria mercenaria and Spisula solidissima shells. Geochimica et Cosmochimica Acta, 60, 3445-3456
Stenseth NC, Ottersen G, Hurrell, JW, et al.(2003) Studying climate effects on ecology through the use of climate indices: the North Atlantic Oscillation, El Niño Southern Oscillation and beyond. Proceedings of the Royal Society of London, 270, 2087-2096.
Tallqvist MI, Sundet JH (2000) Annual growth of the cockle Clinocardium ciliatum in the Norwegian Arctic (Svalbard area). Hydrobiologia, 440, 331-338.
Tereshchenko VV (1997) Seasonal and interannual temperature and salinity variations of main flows at the Kola section of the Barents Sea. Polar Research Institute of Marine Fisheries and Oceanography (PINRO), Murmansk, 71pp. (with updates).
Thompson D, Wallace J (1998) The Arctic Oscillation signature in the wintertime geopotential height and temperature fields. Geophysical Research Letters, 25, 1297-1300.
Thompson PM, Ollason J (2001) Lagged effects of ocean climate change on fulmar population dynamics. Nature, 413, 417-420.
Thompson I., Jones DS, Dreibelbis D (1980) Annual internal growth banding and life history of the ocean quahog Arctica islandica (Mollusca: Bivalvia). Marine Biology, 57, 25-34.
Ambrose et al., Bivalve growth and Arctic climate Page Page 28 of of 39
Thorrold SR, Latkoczy C, Swart PK, Jones CM (2001) Natal homing in a marine fish. Science, 291, 297-299.
Tunberg BG, Nelson WG (1998) Do climate oscillations influence cyclic patterns of soft bottom macrobenthic communities on the Swedish west coast? Marine Ecology Progress Series, 170, 85-94.
Turekian KK, Cochran JK, Kharkar D et al. (1975) Slow growth rate of a deep-sea clam determined by 228 Ra chronology. Proceedings of the National Academy of Science USA, 72, 2829-2832.
Vinnikov KY, Robock, A, Stouffer RJ, et al. (1999) Global warming and northern hemisphere sea ice extent. Nature, 286, 1934-1937.
Walther GR, Post E, Convery P, et al. (2002) Ecological responses to recent climate change. Nature, 414, 389-395.
Witbaard R, Jenness MI, Van der Brog K, Ganssen G (1994) Verification of annual growth increments in Arctica islandica L. from the North Sea by means of oxygen and carbon isotopes. Netherlands Journal of Sea Research, 333, 91-101.
Witbaard R (1996) Growth variations in Arctica islandica L. (Mollusca): a reflection of hydrography-related food supply. ICES Journal of Marine Science, 53, 981-987.
Witbaard R, Franken R, Visser B (1997) Growth of juvenile Arctica islandica under experimental conditions. Helgolander Meeresuntersuchungen, 51, 417-431.
Witbaard R, Duineveld GCA, de Wilde PAWJ (1999) Geographical differences in growth rates of Arctica islandica (Mollusca: Bivalvia) from the North Sea and adjacent waters. Journal of the Marine Biological Association of the United Kingdom, 79, 907-915.
Witbaard R, E Jansma, U Sass Klaassen (2003) Copepods link quahog growth to climate. Journal of Sea Research, 50, 77-83.
Wollenburg JE, Kuhnt W (2000) The response of benthic foraminifera to carbon flux and primary production in the Arctic Ocean. Marine Micropaleontology, 40, 189-231.
Zacherl DC, Paradis G, Lea DW (2003) Barium and strontium uptake into larval protoconchs and statoliths of the marine neogastropod Kelletia kelletii. Geochimica et Cosmochimica Acta, 21, 4091-4099.
Zenkevich L, (1963) Biology of the Seas of the USSR. George Allen & Unwin, London.
Zolotarev VN (1980) The life span of bivalves from the Sea of Japan and Sea of Okhotsk. Soviet Journal of Marine Biology, 6, 301-308.

Ambrose et al., Bivalve growth and Arctic climate Page Page 29 of of 39
Table 1: Pearson Correlations relating S. groenlandicus SGI to various environmental variables, 1983 - 2002. The first sets of two columns of coefficients are from annual data (temperature and pressure data used are annual means, precipitation is annual total sum) and 2-year running means of the annual data. The second set is from the environmental data being set back (lagged) by 1 year with respect to the growth data. The third set contains the correlations (1 year lag only) after the effects of the Arctic Climate Regime Index (2 year running mean, 1 year lag) have been removed. Significant correlations are shown in bold. The levels of the significant correlations are: * P<0.05, ** P<0.01, *** P<0.001.
Correlations with Average SGI Correlations with Residuals
Present Year 1 year lag 1 year lag Environmental Variable Annual Running
Mean Annual Running
Mean Annual Running
Mean Kola Transect Sea Temperature
-0.032 0.008 0.045 0.033 -0.345 -0.462*
Summer Ice Free Days in Rijpfjord
0.166 0.107 0.005 -0.050 -0.132 -0.145
Pack Ice extent March -0.315 -0.232 -0.319 -0.137 -0.416 -0.422 Ny Ålesund Air Temperature
-0.020 -0.141 -0.204 -0.263 -0.409 -0.318
Ny Ålesund Pressure -0.169 -0.349 -0.381 -0.428 0.044 0.202 Ny Ålesund Precipitation -0.212 -0.257 -0.158 0.134 -0.509* -0.250 Longyearbyen Air Temperature
-0.002 -0.112 -0.181 -0.112 -0.434* -0.341
Longyearbyen Pressure -0.198 -0.383 -0.408 -0.455* 0.023 0.177 Longyearbyen Precipitation
0.047 0.181 0.199 0.389 -0.095 0.047
Hopen Air Temperature -0.015 -0.114 -0.175 -0.199 -0.427 -0.362 Hopen Pressure -0.216 -0.417 -0.432 -0.451* -0.055 0.150 Hopen Precipitation 0.476* 0.592** 0.592** 0.515* 0.341 0.244 Bear Island Air Temperature
-0.124 -0.167 -0.152 -0.196 -0.386 -0.354
Bear Island Pressure -0.221 -0.374 -0.366 -0.364 -0.038 -0.175 Bear Island Precipitation 0.323 0.408 0.319 0.213 0.255 0.037 NAO Index (Annual) 0.025 0.106 0.140 0.209 -0.162 -0.148 NAO Index (Winter) 0.178 0.297 0.241 0.219 -0.081 -0.229 AO Index (Annual) -0.021 0.129 0.233 0.332 -0.175 -0.219 AO Index (Winter) 0.242 0.358 0.322 0.368 -0.124 -0.223 Arctic Climate Regime Index
0.297 0.522* 0.492* 0.671*** -0.018 0.000
Ambrose et al., Bivalve growth and Arctic climate Page Page 30 of of 39
Figure Legends
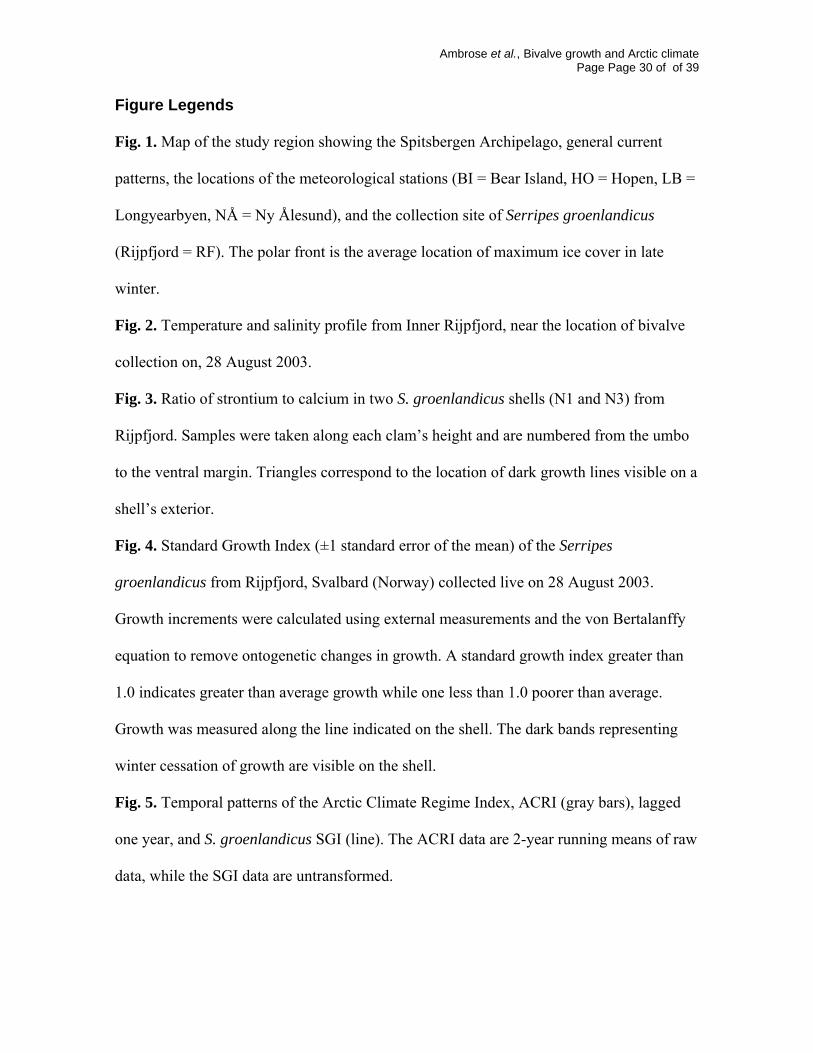
Fig. 1. Map of the study region showing the Spitsbergen Archipelago, general current
patterns, the locations of the meteorological stations (BI = Bear Island, HO = Hopen, LB =
Longyearbyen, NÅ = Ny Ålesund), and the collection site of Serripes groenlandicus
(Rijpfjord = RF). The polar front is the average location of maximum ice cover in late
winter.
Fig. 2. Temperature and salinity profile from Inner Rijpfjord, near the location of bivalve
collection on, 28 August 2003.
Fig. 3. Ratio of strontium to calcium in two S. groenlandicus shells (N1 and N3) from
Rijpfjord. Samples were taken along each clam’s height and are numbered from the umbo
to the ventral margin. Triangles correspond to the location of dark growth lines visible on a
shell’s exterior.
Fig. 4. Standard Growth Index (±1 standard error of the mean) of the Serripes
groenlandicus from Rijpfjord, Svalbard (Norway) collected live on 28 August 2003.
Growth increments were calculated using external measurements and the von Bertalanffy
equation to remove ontogenetic changes in growth. A standard growth index greater than
1.0 indicates greater than average growth while one less than 1.0 poorer than average.
Growth was measured along the line indicated on the shell. The dark bands representing
winter cessation of growth are visible on the shell.
Fig. 5. Temporal patterns of the Arctic Climate Regime Index, ACRI (gray bars), lagged
one year, and S. groenlandicus SGI (line). The ACRI data are 2-year running means of raw
data, while the SGI data are untransformed.
Ambrose et al., Bivalve growth and Arctic climate Page Page 31 of of 39
Fig. 6. Scatterplot of observed vs. modeled SGI from 1983-2002 with the growth years
shown as data points. Line represents a perfect prediction by the model of actual growth
rates of the S. groenlandicus population.
Fig. 7. Relationship between total Arctic-wide winter (March) sea ice extent (2 year
running mean) and S. groenlandicus SGI from 1983 to 1998. (Ice data courtesy of National
Snow and Ice Data Center, Boulder Colorado USA).
Fig. 8. Schematic representation of the Arctic Climate Cascade, where bivalve growth, and
by inference, other ecosystem processes are linked to climatic forcing factors through
variation in physical variables.
Ambrose et al., Bivalve growth and Arctic climate Page Page 32 of of 39
Figure 1
Ambrose et al., Bivalve growth and Arctic climate Page Page 33 of of 39
Temperature (°C)-2 -1 0 1 2 3
Dep
th (m
)
0
50
100
150
200
Salinity (‰)28 30 32 34 36
Salinity
Temperature
Figure 2

Ambrose et al., Bivalve growth and Arctic climate Page Page 34 of of 39
Clam N3
Sample Number (consecutive from umbo toward shell margin)0 100 200 300 400
Sr/C
a(m
mol
/mol
)
1
2
3
4
Clam N1
2
3
4
5
Figure 3

Ambrose et al., Bivalve growth and Arctic climate Page Page 35 of of 39
Year1985 1990 1995 2000
Stan
dard
Gro
wth
Inde
x
0.20.40.60.81.01.21.41.61.82.02.2
n=4
23
4
5
23
4
5
Year1985 1990 1995 2000
Stan
dard
Gro
wth
Inde
x
0.20.40.60.81.01.21.41.61.82.02.2
n=4
Year1985 1990 1995 2000
Stan
dard
Gro
wth
Inde
x
0.20.40.60.81.01.21.41.61.82.02.2
n=4
23
4
5
23
4
5
Figure 4

Ambrose et al., Bivalve growth and Arctic climate Page Page 36 of of 39
Year1980 1985 1990 1995 2000
Clim
ate
Reg
ime
Inde
x (2
yea
r run
ning
mea
n)
-2
-1
0
1
2
Stan
dard
Gro
wth
Inde
x
0.4
0.6
0.8
1.0
1.2
1.4
1.6
Figure 5

Ambrose et al., Bivalve growth and Arctic climate Page Page 37 of of 39
SGI (Modelled)0.0 0.5 1.0 1.5 2.0
SGI (
Obs
erve
d)
0.0
0.5
1.0
1.5
2.0
8384
85
86
87
88
89 90
91
9293
94
95
96
97
98
9900
0102
Figure 6
Ambrose et al., Bivalve growth and Arctic climate Page Page 38 of of 39
Total Arctic Ice Pack Extent in March (106 km2)
15.0 15.2 15.4 15.6 15.8 16.0 16.2
Stan
dard
Gro
wth
Inde
x
0.4
0.6
0.8
1.0
1.2
1.4
1.6
1.8
y = -0.858x + 14.586P < 0.0001, R2 = 0.53
Figure 7
Ambrose et al., Bivalve growth and Arctic climate Page Page 39 of of 39
Arctic Climatic Regime Index
Regional Atmospheric
Pressure
Local Precipitation
BivalveGrowth
BiophysicalCoupling
EcosystemResponse
+ 1 year
Sea Ice Concentration
Figure 8
Copyright © 2022 FDOKUMEN