Variables & Patterns Problem 1.2 - Graphing Data - Lake ...
15
Variables & Patterns Problem 1.2 - Graphing Data Definitions: variable - something that changes and can be measured independent variable - (cause) determines the value of the other variable dependent variable - (effect) value depends on the other variable scale - interval used to label each axis Steps For Graphing: 1.) select two variables 2.) determine which is the independent/dependent variable label the x-axis with the independent variable and the y-axis with the dependent variable 3.) select a scale for each axis 4.) plot the coordinates EXAMPLE for jumping jack data- independent variable - time dependent variable - # of jumping jacks x-scale 10 y-scale 20 time (seconds) 0 10 20 30 40 50 60 70 80 # jumping jacks 0 15 28 38 46 54 61 70 76 coordinates are (0,0) (10,15) (20, 28) (30,38) and so on... 140 120 100 80 60 40 20 0 10 20 30 40 50 60 70 80 90 # of jumping jacks time (seconds)
-
Upload
khangminh22 -
Category
Documents
-
view
1 -
download
0
Transcript of Variables & Patterns Problem 1.2 - Graphing Data - Lake ...

Variables & Patterns
Problem 1.2 - Graphing Data Definitions: variable - something that changes and can be measured independent variable - (cause) determines the value of the other variable dependent variable - (effect) value depends on the other variable scale - interval used to label each axis Steps For Graphing: 1.) select two variables 2.) determine which is the independent/dependent variable label the x-axis with the independent variable and the y-axis with the dependent variable 3.) select a scale for each axis 4.) plot the coordinates EXAMPLE for jumping jack data- independent variable - time dependent variable - # of jumping jacks
x-scale 10 y-scale 20 time (seconds) 0 10 20 30 40 50 60 70 80 # jumping jacks 0 15 28 38 46 54 61 70 76 coordinates are (0,0) (10,15) (20, 28) (30,38) and so on...
140
120
100
80
60
40
20
0 10 20 30 40 50 60 70 80 90
# of jumping jacks
time (seconds)
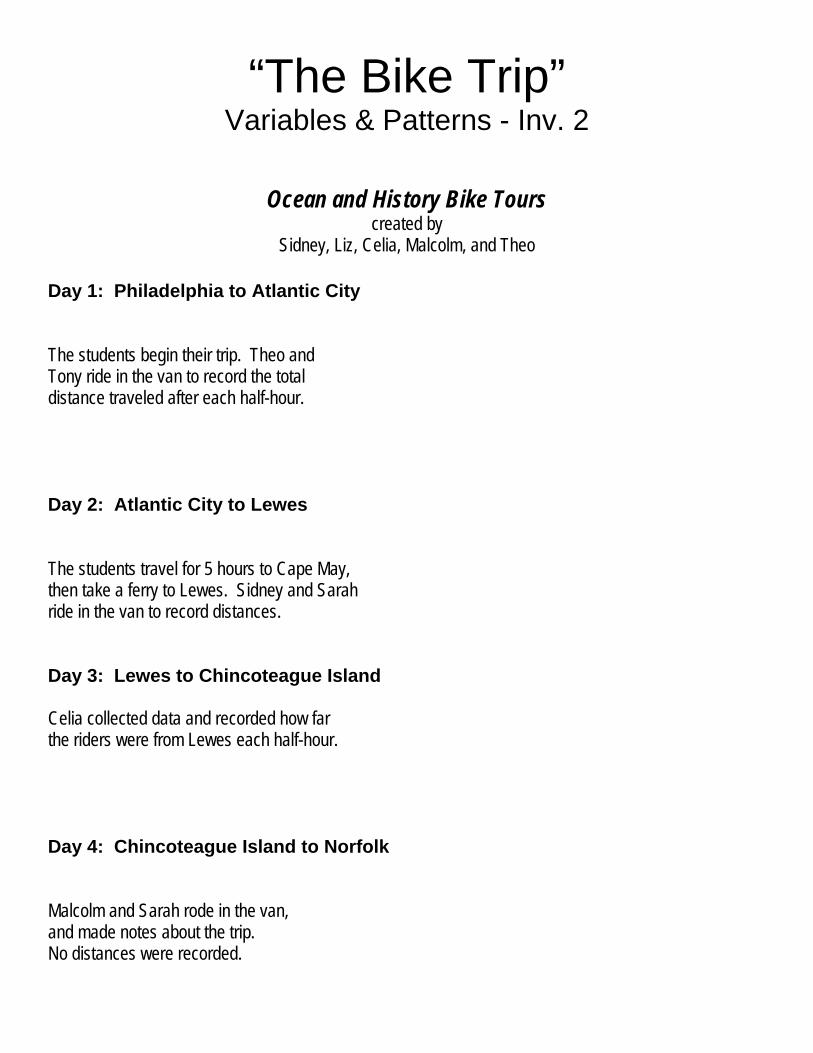
“The Bike Trip” Variables & Patterns - Inv. 2
Ocean and History Bike Tours created by
Sidney, Liz, Celia, Malcolm, and Theo Day 1: Philadelphia to Atlantic City The students begin their trip. Theo and Tony ride in the van to record the total distance traveled after each half-hour. Day 2: Atlantic City to Lewes The students travel for 5 hours to Cape May, then take a ferry to Lewes. Sidney and Sarah ride in the van to record distances. Day 3: Lewes to Chincoteague Island Celia collected data and recorded how far the riders were from Lewes each half-hour. Day 4: Chincoteague Island to Norfolk Malcolm and Sarah rode in the van, and made notes about the trip. No distances were recorded.
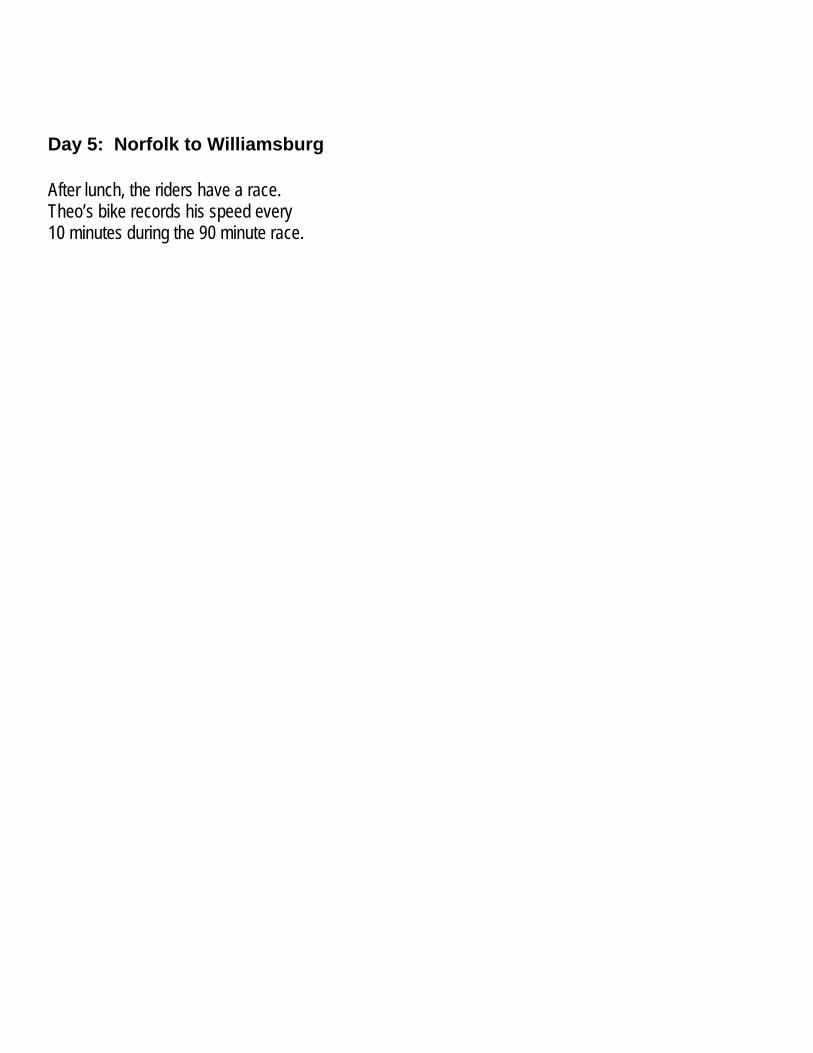
Day 5: Norfolk to Williamsburg After lunch, the riders have a race. Theo’s bike records his speed every 10 minutes during the 90 minute race.
Variables & Patterns
Problem 2.1 - Bike Trip: Day 1
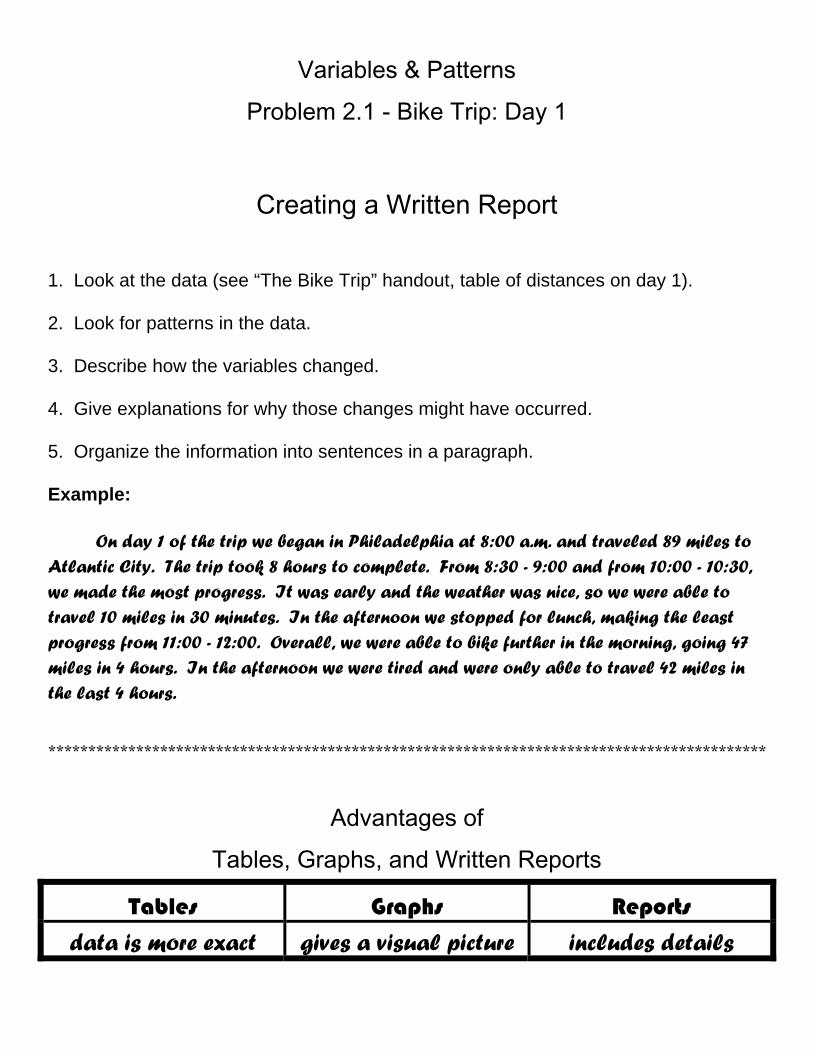
Creating a Written Report 1. Look at the data (see “The Bike Trip” handout, table of distances on day 1). 2. Look for patterns in the data. 3. Describe how the variables changed. 4. Give explanations for why those changes might have occurred. 5. Organize the information into sentences in a paragraph. Example: On day 1 of the trip we began in Philadelphia at 8:00 a.m. and traveled 89 miles to Atlantic City. The trip took 8 hours to complete. From 8:30 - 9:00 and from 10:00 - 10:30, we made the most progress. It was early and the weather was nice, so we were able to travel 10 miles in 30 minutes. In the afternoon we stopped for lunch, making the least progress from 11:00 - 12:00. Overall, we were able to bike further in the morning, going 47 miles in 4 hours. In the afternoon we were tired and were only able to travel 42 miles in the last 4 hours. ******************************************************************************************
Advantages of
Tables, Graphs, and Written Reports
Tables Graphs Reports
data is more exact gives a visual picture includes details

Variables & Patterns
Problem 2.2 - Bike Trip: Day 2 Definitions: coordinate pair - set of x and y values used to locate points on a graph continuous - when the independent variable can be broken down into smaller, measurable units A. Make a coordinate graph of the (time, distance) data given in the Day 2 table.
45 40 35 30 25 20 15 10 5 00.5 11.5 22.5 33.5 44.5 5
B. How far did the group travel in one day? 45 miles How much time did it take them? 5 hours During which intervals did they make the most progress? 0.5 - 1.0 and 2.5 - 3.0 During which intervals did they make the least progress? 3.5 - 4.5 Did they go further in the morning or afternoon? traveled furthest in the first 2.5 hrs C. How do you find the intervals in which they made the least or most progress...
i) on a graph? look at how far apart the coordinates are vertically - the bigger gap is when the most progress is made
ii) in a table? subtract each entry from the entry below it - the larger the difference, the more progress they made in that interval
D. Which do you prefer when reading data, a table or a graph? Why?
Distance (miles)
Time (hours)

Variables & Patterns
Problem 2.3 - Bike Trip: Day 3 A. Would it make sense to connect the points on this graph?
It would probably make sense to connect the points since time (our independent variable) is continuous.
B. Using the graph from “The Bike Trip” handout, Day 2, make a table of miles traveled after each half-hour. Time (hours)
0 .5 1 1.5 2 2.5 3 3.5 4 4.5 5 5.5 6 6.5 7 7.5
distance (miles)
0 7 13 22 22 30 22 31 36 48 48 56 63 72 74 81
C. What do you think happened between hours 2 and 4? Between hours 1.5 and 2? D. Which helps you see changes better, a table or a graph? Why?
Variables & Patterns
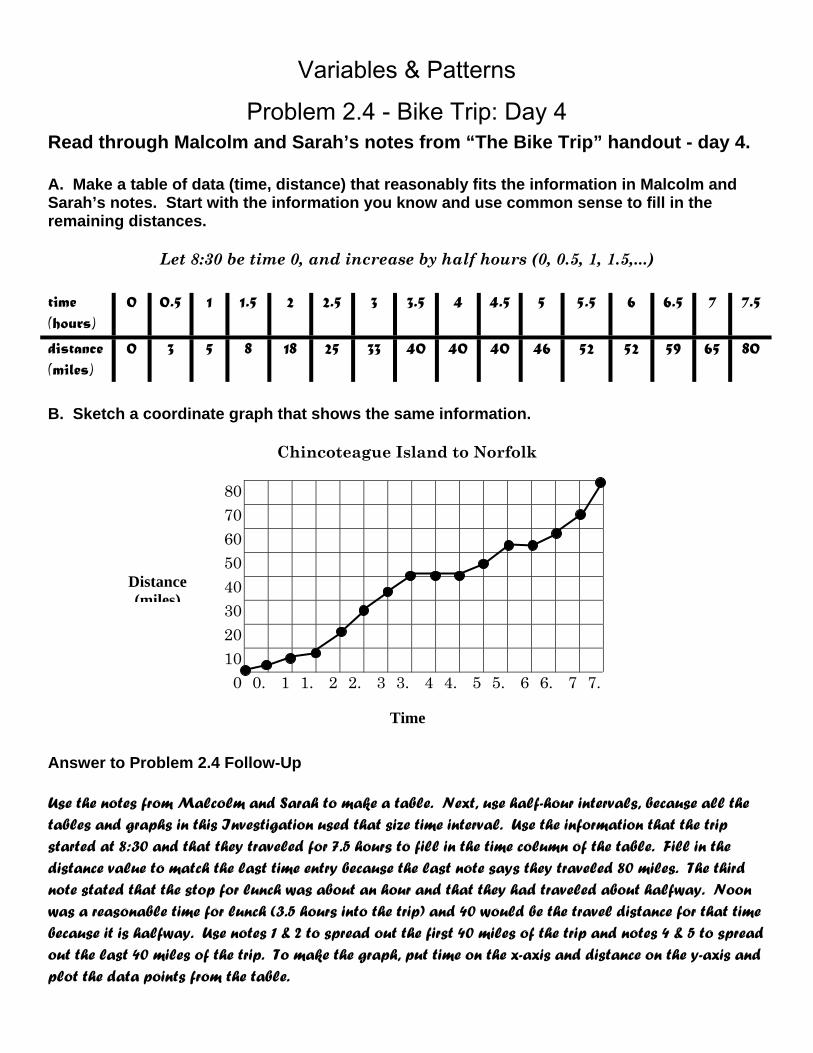
Problem 2.4 - Bike Trip: Day 4 Read through Malcolm and Sarah’s notes from “The Bike Trip” handout - day 4. A. Make a table of data (time, distance) that reasonably fits the information in Malcolm and Sarah’s notes. Start with the information you know and use common sense to fill in the remaining distances.
Let 8:30 be time 0, and increase by half hours (0, 0.5, 1, 1.5,...)
time (hours)
0 0.5 1 1.5 2 2.5 3 3.5 4 4.5 5 5.5 6 6.5 7 7.5
distance (miles)
0 3 5 8 18 25 33 40 40 40 46 52 52 59 65 80
B. Sketch a coordinate graph that shows the same information.
Chincoteague Island to Norfolk
80 70 60 50 40 30 20 10 0 0. 1 1. 2 2. 3 3. 4 4. 5 5. 6 6. 7 7.
Answer to Problem 2.4 Follow-Up Use the notes from Malcolm and Sarah to make a table. Next, use half-hour intervals, because all the tables and graphs in this Investigation used that size time interval. Use the information that the trip started at 8:30 and that they traveled for 7.5 hours to fill in the time column of the table. Fill in the distance value to match the last time entry because the last note says they traveled 80 miles. The third note stated that the stop for lunch was about an hour and that they had traveled about halfway. Noon was a reasonable time for lunch (3.5 hours into the trip) and 40 would be the travel distance for that time because it is halfway. Use notes 1 & 2 to spread out the first 40 miles of the trip and notes 4 & 5 to spread out the last 40 miles of the trip. To make the graph, put time on the x-axis and distance on the y-axis and plot the data points from the table.
Time
Distance (miles)

Variables &Patterns
Problem 3.1 - Renting Bicycles Ocean and History Bike Tours decided to rent their bikes rather that supply their own. They received estimates from two companies. Rocky’s Cycle Center sent a table of weekly rental fees for various numbers of bikes.
# of bikes 5 10 15 20 25 30 35 40 45 50 rental fee $400 535 655 770 875 975 1070 1140 1180 1200
Adrian's Bike Shop sent a graph of their weekly rental fees.
2000
1600
1200
800
400 0 10 20 30 40 50
A. Which bike shop has the better deal? For 35 bikes or fewer, the best value is at Adrian’s Bike Shop. For more than 35 bikes, the best deal is at Rocky’s Cycle Center.
B. How did you use the information in the table and graph to make your decision? You could either graph both sets of data and find the point where the graphs cross. If you put both sets of data into a table, you can located the point at which both stores sell a certain number of bikes for the same price.
Follow - Up
• We would NOT connect the coordinates because # of bikes cannot be broken into smaller parts. • At Adrian’s since 20 bikes is about $600, then each bike is around 600 ÷ 20 = $30 each. • At Rocky’s if 5 bikes cost $400, then each bike is around 400 ÷ 5 = $80 each, but the cost per bike goes
down the more bikes you rent. There is probably an initial fee if you are only renting a few bikes.
Rental Fee
Number of
Variables & Patterns
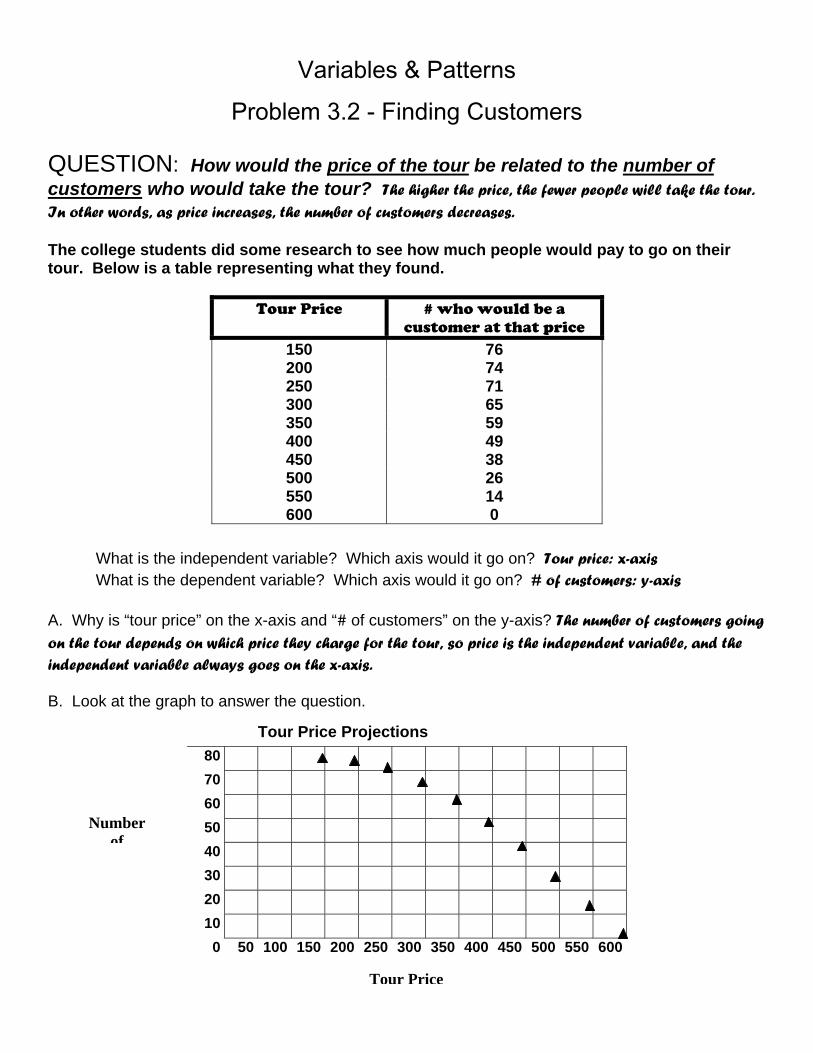
Problem 3.2 - Finding Customers QUESTION: How would the price of the tour be related to the number of customers who would take the tour? The higher the price, the fewer people will take the tour. In other words, as price increases, the number of customers decreases. The college students did some research to see how much people would pay to go on their tour. Below is a table representing what they found.
Tour Price # who would be a customer at that price
150 76 200 74 250 71 300 65 350 59 400 49 450 38 500 26 550 14 600 0
What is the independent variable? Which axis would it go on? Tour price: x-axis What is the dependent variable? Which axis would it go on? # of customers: y-axis
A. Why is “tour price” on the x-axis and “# of customers” on the y-axis? The number of customers going on the tour depends on which price they charge for the tour, so price is the independent variable, and the independent variable always goes on the x-axis. B. Look at the graph to answer the question.
Tour Price Projections 80 70 60 50 40 30 20 10
0 50 100 150 200 250 300 350 400 450 500 550 600 Tour Price
Number of
Based on the data, what price should they charge for the tour? The number of customers starts to drop off after $250, so we should probably charge around $225 or $250.
Follow-Up 1. How does the number of potential customers change as the price increase? As the tour price increases, the number of customers willing to take the tour begins to decrease. This is not a steady decrease, since the graph begins to curve down. 2. How do you see the change when looking at the table? In the table the change in # of customers is shown by calculating the difference between intervals in the “# of customers” column. 3. How do you see the change when looking at the graph? On the graph, the change is shown by how steep the lines are between the coordinates.
Variables & Patterns
Problem 3.3 - Predicting Profit Definitions:
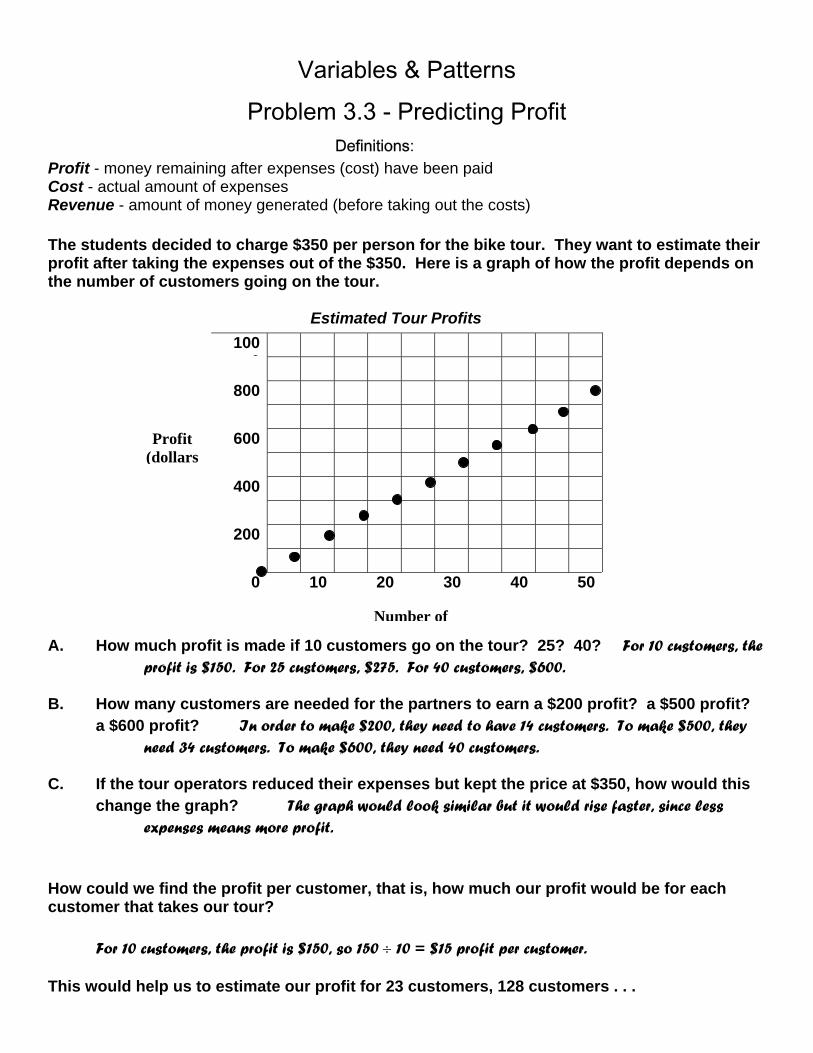
Profit - money remaining after expenses (cost) have been paid Cost - actual amount of expenses Revenue - amount of money generated (before taking out the costs) The students decided to charge $350 per person for the bike tour. They want to estimate their profit after taking the expenses out of the $350. Here is a graph of how the profit depends on the number of customers going on the tour.
Estimated Tour Profits 100
0
800
600
400
200
0 10 20 30 40 50
A. How much profit is made if 10 customers go on the tour? 25? 40? For 10 customers, the
profit is $150. For 25 customers, $275. For 40 customers, $600. B. How many customers are needed for the partners to earn a $200 profit? a $500 profit?
a $600 profit? In order to make $200, they need to have 14 customers. To make $500, they need 34 customers. To make $600, they need 40 customers.
C. If the tour operators reduced their expenses but kept the price at $350, how would this
change the graph? The graph would look similar but it would rise faster, since less expenses means more profit.
How could we find the profit per customer, that is, how much our profit would be for each customer that takes our tour?
For 10 customers, the profit is $150, so 150 ÷ 10 = $15 profit per customer. This would help us to estimate our profit for 23 customers, 128 customers . . .
Number of
Profit (dollars

Variables & Patterns
Problem 3.4 - Counting Cost and Profit Ocean and History Bike Tours decided to look carefully at the company's costs and figure the profit they would make. They considered:
• the trip will bring in about $350 from each rider • bike rental will cost $30 per rider • food and camping will cost $125 per rider • there will be a $700 one-time fee for the van rental per tour group
# of customer
s
Income Bike rental fee
Food and camp costs
Van rental
Total Cost
Profit
1 2 3 4 5 6 7 8 9 10
$350 700
1050 1400 1750 2100 2450 2800 3150 3500
$306090
120150180210240270300
$125250375500625750875
100011251250
$700700700700700700700700700700
$855 1010 1165 1320 1475 1630 1785 1940 2095 2250
$-505-310-115
80275470665860
10501250
Important things to look at: • The income increased $350 for each customer. To find the income for any number of
customers, multiply the number of riders times 350. • The TOTAL cost increased by $155 with each new person added. To find total cost,
multiply the number of riders times 155 then add $700 for the van. • The profit increased more rapidly than the total cost. • The least number of customers needed in order to make a profit is 4 customers.

Variables & Patterns
Problem 4.1- Patterns and Rules Definitions: rule - a description of the relationship between two variables equation - a rule that is expressed with mathematical numbers and symbols formula - an equation that tells you how to find the value of a certain variable
Examples The tour operator charges $350 per customer.
RULE: income = 350 x number of customers
equation/formula: I = 350 n
The circumference of a circle is pi times the diameter. RULE: circumference = π x diameter
equation/formula: C = πd
If the students travel in the van at 55mph, a table and graph can show the relationship between their time and distance traveling at that speed, using:
RULE: distance = 55 x time equation/formula: d = 55t
500 Time (hours)
Distance (miles)
0 0 400 1 55 2 110 300 3 165 4 220 200 5 275 6 330 100 7 385 8 440
0 1 2 3 4 5 6 7 8 9 10
How can you find the distance traveled after 3.25 hours by looking at the table? look between 3 and 4 hours, and add one quarter of the difference to the distance for 3 hours How can you find the distance traveled after 3.25 hours by looking at the graph? on the graph, find the point on the line at 3.25 hours and go over to the y-axis to find the distance How can you find the distance traveled after 3.25 hours by using the equation? multiply 3.25 times 55
Time
distance(miles)
Variables & Patterns
Problem 4.2 - Changing Speeds
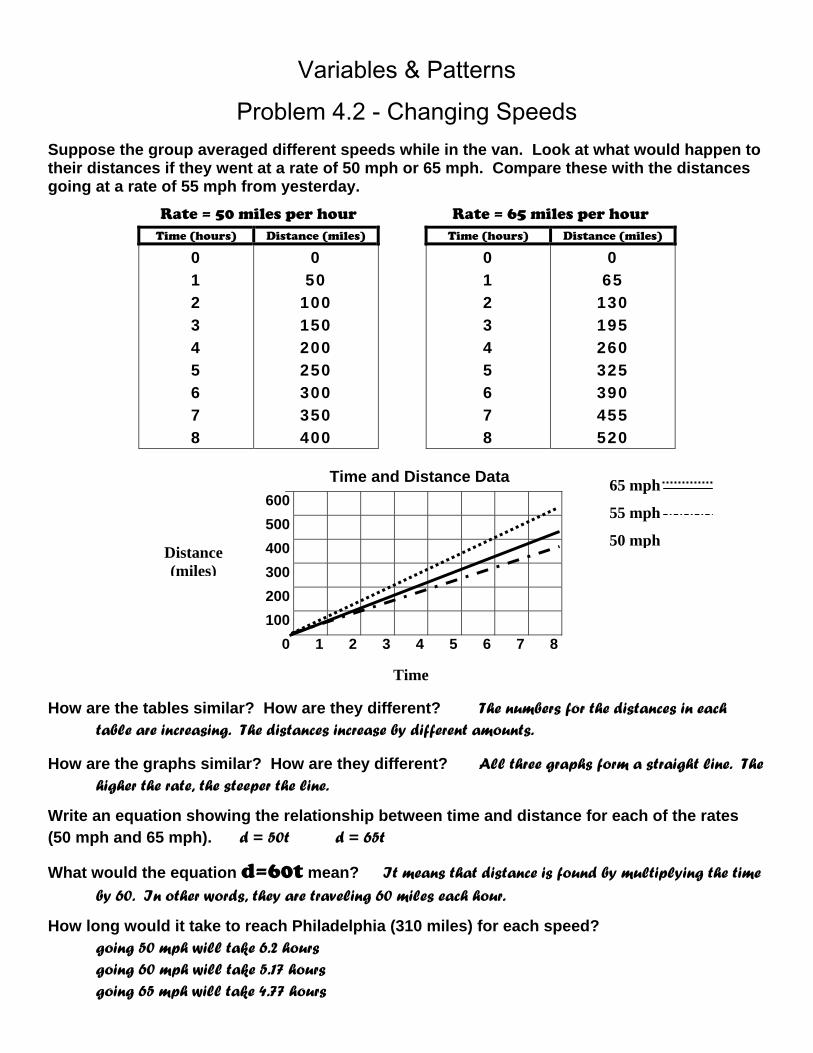
Suppose the group averaged different speeds while in the van. Look at what would happen to their distances if they went at a rate of 50 mph or 65 mph. Compare these with the distances going at a rate of 55 mph from yesterday.
Rate = 50 miles per hour Rate = 65 miles per hour Time (hours) Distance (miles) Time (hours) Distance (miles)
0 1 2 3 4 5 6 7 8
0 50
100 150 200 250 300 350 400
0 1 2 3 4 5 6 7 8
0 65
130 195 260 325 390 455 520
Time and Distance Data 600 500 400 300 200 100
0 1 2 3 4 5 6 7 8 How are the tables similar? How are they different? The numbers for the distances in each
table are increasing. The distances increase by different amounts.
How are the graphs similar? How are they different? All three graphs form a straight line. The higher the rate, the steeper the line.
Write an equation showing the relationship between time and distance for each of the rates (50 mph and 65 mph). d = 50t d = 65t
What would the equation d=60t mean? It means that distance is found by multiplying the time by 60. In other words, they are traveling 60 miles each hour.
How long would it take to reach Philadelphia (310 miles) for each speed? going 50 mph will take 6.2 hours going 60 mph will take 5.17 hours going 65 mph will take 4.77 hours
Time
Distance (miles)
65 mph
55 mph
50 mph

Variables & Patterns
Problem 4.3 - Equations
Look back at the table you created from problem 4.3. A.) Write an equation for the rule to calculate each of the following the costs for any
number of customers. Use n to stand for the number of customers. 1. bike rental 2. food and camp costs 3. van rental C = 30n C = 125n C = 700 B.) Write an equation for the total cost for any number of customers. C = 30n + 125n + 700 or C = 155n + 700 C.) Write an equation for the profit for any number of customers.
P = 350n - 30n - 125n - 700 or P = 195n - 700
Follow-Up 1. Theo's father has a van he will let the students use at no charge. Which equation would represent the total cost of they used his van instead of renting one? a. C=125 + 30 b. C=125n + 30n c. C=155 d. C=155 + n
Answer b is the correct answer. It's every cost except the $700 van.
2. If the partners require customers to supply their own bikes, which of these equations would represent the total cost (assuming they are still renting the van)? a. C=125n + 700 b. C=125 + 700 + n c. C= 825n d. C= 350n + 125N + 700
Answer a is the correct answer. It's every cost except the $30 per bike.
3. If customers must supply their own bikes, which equation will represent Profit? a. C= 350 - (125 + 700 + n) b. C= 350n - 125n + 700 c. C= 350n - (125n + 700) d. C= 350n - 125n - 700
Answers c and d are the correct answers. 350n is their income, and we must subtract all
of their costs from that amount.
![Pathway examples [version 2021] 1.2](https://static.fdokumen.com/doc/165x107/63223a7a117b4414ec0bce38/pathway-examples-version-2021-12.jpg)