1.2 Elasticity - IB economics@yELLOWSUBMARINER
25
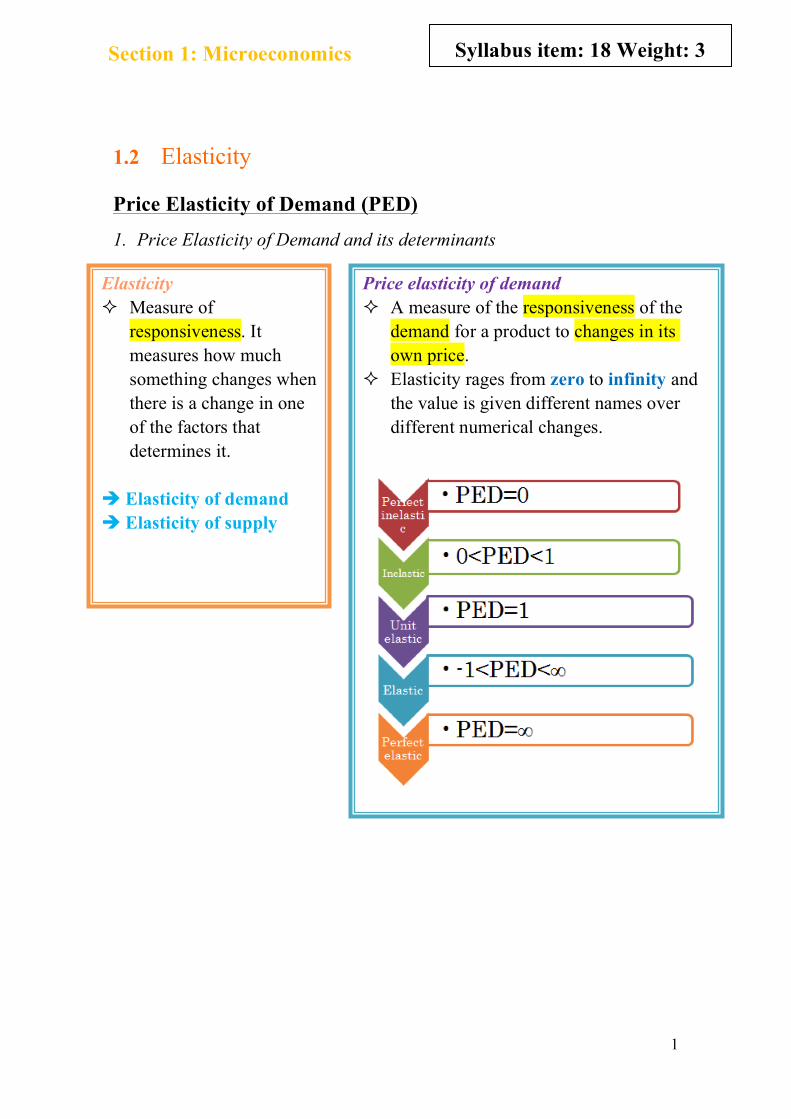
1 1.2 Elasticity Price Elasticity of Demand (PED) 1. Price Elasticity of Demand and its determinants Section 1: Microeconomics Syllabus item: 18 Weight: 3 Elasticity ² Measure of responsiveness. It measures how much something changes when there is a change in one of the factors that determines it. è Elasticity of demand è Elasticity of supply Price elasticity of demand ² A measure of the responsiveness of the demand for a product to changes in its own price. ² Elasticity rages from zero to infinity and the value is given different names over different numerical changes.
-
Upload
khangminh22 -
Category
Documents
-
view
2 -
download
0
Transcript of 1.2 Elasticity - IB economics@yELLOWSUBMARINER
1
1.2 Elasticity
Price Elasticity of Demand (PED) 1. Price Elasticity of Demand and its determinants
Section 1: Microeconomics Syllabus item: 18 Weight: 3
Elasticity ² Measure of
responsiveness. It measures how much something changes when there is a change in one of the factors that determines it.
è Elasticity of demand è Elasticity of supply
Price elasticity of demand ² A measure of the responsiveness of the
demand for a product to changes in its own price.
² Elasticity rages from zero to infinity and the value is given different names over different numerical changes.

2
Formula
PED= Example A publishing firm decreases its magazine price:
P ($) Qd
5 200000
4.5 230000
Calculation 1. % change in price
-50 (cent) /500 (cent) × 100 = -10 % 2. % change in quantity
30000/200000 × 100 = 15 %
3. PED= 15%/-10% = -1.5
The negative value indicates that there is an inverse relationship between P. and Qd. HOWEVER… Economists usually ignore the negative value that comes from the equation and simply give the answer as a positive figure:
Answer: 1.5
% change in Qd of the product % change in price of the product
IB Question • Explain the concept of price elasticity
of demand, understanding that it
involves responsiveness of quantity
demanded to a change in price, along a
given demand curve.
• Calculate PED using the following
equation.
PED= percentage change in quantity
demanded divided by percentage
change in price
• State that the PED value is treated as if
it were positive although its
mathematical value is usually negative.
-50 cent +200000

3
1. Perfectly inelastic demand
2. Inelastic demand
3. Unit elastic demand
è PED = 0 è Meaning that price has no effect on
demand at all. è A change in price will mean that
demand remains exactly the same (Vertical demand curve)
è 0 <PED <1 è Meaning % change in price is
larger than the % change in demand
è Any change in price will result in a relatively smaller change in quantity demanded (Relatively steep demand curve)
è PED = 1 è Meaning % change in price is
identical to the % change in quantity demanded. (proportional)
è Any change in price will result in the same change in quantity demanded (Rectangular hyperbola demand curve)

4
4. Elastic demand
5. Perfectly elastic demand curve
è -1< PED <∞ è Meaning % change in price is less
than the % change in demand è A change in any price will result in
a larger change in quantity demanded (Relatively flat demand curve)
è Goods with elastic demand are more responsive to price changes
è PED = ∞ è Meaning an infinite amount is
demanded at one price but nothing at all at a slightly higher price
è There is an infinite demand at one price level, but any other price levels, nothing will be demanded (Horizontal demand curve)
IB Question • Explain, using diagrams and PED values,
the concepts of price elastic demand, price
inelastic demand, unit elastic demand,
perfectly elastic demand and perfectly
inelastic demand.
5
Determinants of PED ! The value of price elasticity of demand for a good depends on a number
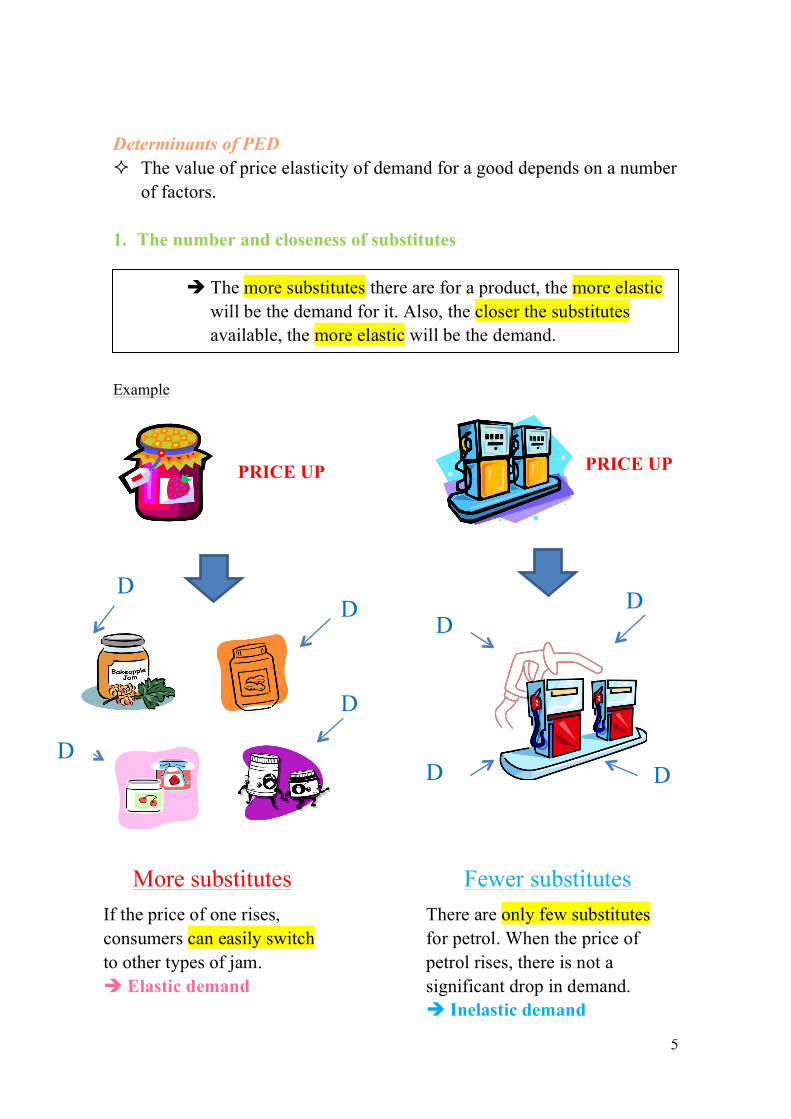
of factors. 1. The number and closeness of substitutes
Example
PRICE UP
D
D
D
D
PRICE UP
D
D
D
D
More substitutes If the price of one rises, consumers can easily switch to other types of jam. è Elastic demand
Fewer substitutes There are only few substitutes for petrol. When the price of petrol rises, there is not a significant drop in demand. è Inelastic demand
è The more substitutes there are for a product, the more elastic will be the demand for it. Also, the closer the substitutes available, the more elastic will be the demand.

6
2. The degree of necessity
Etc.
*For many goods necessity will change from consumer to consumer, since different people have different tastes and necessity is often a subjective view
3. Time period
Example
Elastic
Cars
holidays
Brand goods
Inelastic
Food
Fuel
Shelter
Short term à price rise in heating oil à Demand relatively inelastic Long term à still high price of heating oil à Demand elastic
People do not have many alternatives to switch to
Consumers have time to change their heat systems to ones that uses gas, coal or wood.
è Goods considered ‘essential’ by consumers will have inelastic demand
è In the short run, goods have inelastic demand whereas in the long term, demand is more elastic.
Non-essential Essential

7
4. Proportion of income spent on goods
Elastic Inelastic
è Cheap items likely to have an inelastic demand and for larger items of expenditure, the consumer will be more inclined to weigh up the purchase more carefully, so it is elastic demand.
IB Question • Explain the determinants of PED,
including the number and closeness of
substitutes, the degree of necessity, time
and the proportion of income spent on
the good.
Key word: • Expenditure è 1. the total amount of money
that a government, organization, or person spends during a particular period of time
è 2. the action of spending or using time, money, energy etc:

8
- Calculating PED between 2 designated points on a demand curve using PED equation
Calculation Point A to B l Price $20 à$18
PED = 10/3 ÷ 10 = 3.3 Point C to D l Price $10 à $8
PED = 25/2 ÷ 20 = 0.625
² The PED value is NOT the same at any point on the curve.
² The value of PED falls as we move down the demand curve.
² The graph suggests that low-priced products have a more inelastic demand than high-priced product
Why? è Because consumers are less concerned when the price of an inexpensive
products rises than they are when the price of an expensive product rises.
IB Question • Calculate PED between two designated
points on a demand curve using the PED
equation above.
• Explain why PED varies along a straight line demand curve and is not represented
by the slope of the demand curve.

9
19. Applications of price elasticity of demand Price elasticity and firms " It would be useful for the firm to know what effect a particular price
change might have on total revenue. Example
Price ($) Qd TR (total revenue: $)
10 100 10 × 100 = 1000
8 110 8 × 110 = 880
Price ($) Qd TR (total revenue: $)
10 100 10 × 100 = 1000
8 110 8 × 150 = 1200
Product A (inelastic) Product B (elastic)
² Firms now know that when demand curve is elastic, a price cut will result in an increase in total revenue.
IB Question • Examine the role of PED for firms in
making decisions regarding price changes
and their effect on total revenue.
Key term: • Total Revenue (TR)
TR = p × q The total amount of money that a firm receives from selling a certain amount of a good or service in a given time period.
Syllabus item: 19 Weight: 4
Da = inelastic
Db = elastic

10
! The PED for primary commodities is relatively low (inelastic) whereas manufactured products have a relatively high PED (elastic)
We can see the reason why this is from the table below: Example Determinants Wheat (p.c.) Laptop (m.p.)
Availability of close substitutes
Relatively few substitutes – effectively a necessity
Reasonable number of substitutes depending on precise task (e.g. games consoles etc.)
Luxury or necessity? Necessity Luxury Proportion of income spent Depends on nature of
economy, but generally relatively low
Depends on nature of economy, but generally relatively high - a one-off purchase
Addictive N/A N/A Time period Used over a short period -
consumed immediately Used over a long period
Number of uses Single use –food Multiple uses A table showing the comparison of two products - wheat (a primary commodity) and laptops (a
manufactured good) against each of the determinants of the PED value
IB Question • Explain why the PED for many
primary commodities is relatively low
and the PED for manufactured
products is relatively high.
Key terms: • Primary commodity Material in a raw or unprocessed state. • Manufactured products Products that have been made from a raw material, especially as a large-scale operation using machinery.

11
! PED hold a lot of significance for government while deciding indirect taxes (VAT and excise duties) on goods and services. It is important for governments to select products which have inelastic demand. This is because consumers will avoid heavily taxed products if demand for them is elastic.(e.g. cars).
IB Question • Examine the significance of
PED for government in
relation to indirect taxes.
Key terms • Indirect taxes
Taxation on expenditure. Therefore, an addition to the price imposed on the sale of goods and services by the government. e.g.) VAT and taxes on alcohol, tobacco and petrol

12
20. Cross price elasticity of demand and its determinants Cross elasticity of demand (XED) ! A measure of how much a demand for a product changes when there is
a change in the price of another product.
Formula
XED = Example
% change in Qd for product X % change in price for product Y
Calculation
1. % change in Qd in price of burger -20/200 × 100 = -10 % 2. % change in Qd for pizza -20/400 × 100 = -5 % 3. Put the two values above into the equation for XED.
-5 %/-10 % = 0.5
IB Question • Outline the concept of cross price elasticity of demand, understanding that it involves
responsiveness of demand for one good (and hence a shifting demand curve) to a
change in the price of another good
• Calculate XED using the following equation.
XED= percentage change in quantity demanded of good x divided by percentage
change in price of good y
Decrease in Quantity demanded (Pizza stand is forced to cut their Qd)
Increase in demand
Hamburger stand [price of burger: $2 à$1.8] Pizza stand [Quantity of pizza: 400 à 380]

13
Distinction between positive and negative value of XED ! The numerical value of the XED will depend on the relationship between the goods
in question. If two goods are….
Substitutes Complements
When the price of one good rises, the quantity demanded for another good increases. (e.g. beef and lamb, gas and heating oil, petrol and diesel fuel)
If the two goods are complements, when the price of one good rises, the quantity demanded of another good decreases. (e.g. steak and chips, rice and curry, cars and petrol, torches and batteries)
Positive value of
XED
Negative value of
XED
IB Question • Show that substitute goods have a positive value of XED and
complementary goods have a negative value of XED.

14
! Absolute value of XED depends on the closeness of relationship between two goods
IB Question • Explain that the (absolute)
value of XED depends on the
closeness of the relationship
between two goods.
Example - substitutes Two types of margarine may be very close substitutes in the view of consumers and so a rise in the price of one will lead to a significant fall in the demand for it and a large increase in the demand for the competitor’s margarine. Thus, there would be a high positive value for XED.
Example - complements A computer gaming machine and the games that are played on it may be very close complements for consumers. A rise in the price of the gaming machine may lead to a significant fall in the quantity demanded of it and so a large fall in the demand for the games. Thus, there would be a strong negative value for XED.

15
21. Applications of cross price elasticity of demand ! If prices of substitutes from firm B increases/decreases, firm A should
increase/decrease the number of products they produce. ! If prices of complements from firm B increases/decreases, firm A
should decrease/increase the number of products they produce.
IB Question • Examine the implications of XED
for businesses if prices of substitutes
or complements changec.
Syllabus item: 21 Weight: 3

16
22. Income Elasticity of demand and its determinants Income Elasticity of demand (YED) ! Measure of how much the demand for a product changes when there is a
change in the consumer’s income.
Formula
YED= Example
% change in Qd of the product % change in income of the consumer
Calculation
1. % change in income +6000/60000 × 100 = +10 % 2. % change in Qd 500/2500 × 100 = +20 % 3. Put the two values above into the equation for YED.
+20 %/+10 % = +2
IB Question • Outline the concept of income elasticity of demand, understanding that it involves
responsiveness of demand (and hence a shifting demand curve) to a change in income.
• Calculate YED using the following equation.
YED = percentage change in quantity demanded divided by percentage change in income
Syllabus item: 22 Weight: 3
A person’s annual income [$60,000 à $66,000] Spendings on holiday [$2,500 à $3,000]

17
Normal goods
Positive YED value
The demand increases as
income increases
Inferior goods
Negative YED value
The demand decreases as
income decreases
Necessity goods
% increase in Qd < % increase in
income
Income-inelastic demand
(0≦YED≦1)
Supeior goods (Luxury goods)
% increase in Qd > % increase in
income
Income-elastic demand 1<YED
² Normal goods Increase in income causes an increase in demand
² Inferior goods An increase in income causes a decrease in demand
² Necessity goods For a given percentage rise in real incomes, the demand for these goods tends to rise, but only a smaller percentage. e.g.) Bread
² Luxury goods The demand for these goods tend to rise at a faster pace if income increases. e.g.) Fast cars and holidays
IB Question

18
23. Applications of income elasticity of demand ! Typically, as economic growth occurs and real incomes and living
standards rise over time, the primary sector tends to become relatively less important, while the secondary and tertiary sectors tend to become relatively more important.
Secondary + tertiary sector• High YED
Primary sector• Low YED
HOWEVER, This would not be true for oil and other extracted minerals such as copper, iron and, also, diamonds and other precious and semi-precious stones, for example. Economies rich in primary resources will find that such products would have a relatively higher YED than basic agricultural products. Minerals, oil and gas, and gems for example, will have a derived demand as much as they will be demanded for their use in the manufacturing sector.
As we become better off, there tends to be a more than proportionate increase in demand for electrical equipment, furniture, banking, travel and tourism etc. Hence the secondary and tertiary sectors grow much more rapidly than the primary sector as living standards rise.
Syllabus item: 23 Weight: 3

19
Key words • Primary sector è Includes the production of raw material and basic foods è E.g.) Agriculture, mining, forestry, farming, grazing, hunting etc. • Secondary sector è All manufacturing, processing, and construction lies within the secondary
sector è E.g.) metal working, smelting, automobile production, textile production,
chemical and engineering industries, aerospace manufacturing, energy utilities, engineering
• Tertiary sector è Provides services to the general population and to businesses è E.g.) Retail, wholesale sales, transportation and distribution, entertainment
(movies, television, radio, music, theater, etc.), restaurants, clerical services, media, tourism,
IB Question •

20
24. Price elasticity of supply and its determinants Price elasticity of supply (PES) ! Measures the responsiveness of supply of a product to a change in price.
Formula
PED= Example A publishing firm:
% change in Qs of the product % change in price of the product
Monthly magazine price [$5.00 à $5.50] Supply of magazine [200000 à 230000]
Calculation
1. % change in price 50.5000× 100 = 10 % 2. % change in Qs 30000/200000 × 100 = 15 % 3. Put the two values above into the equation for YED.
15 %/10 % = 1.5
² The value of PES will almost always be positive
IB Question •

21
1. Perfectly inelastic supply
2. Inelastic supply
3. Unit elastic supply
è PES = 0 è Meaning that price has no effect on
supply at all. è A change in price will mean that
supply remains exactly the same (Vertical supply curve)
è 0 <PES <1 è Meaning % change in price is
larger than the % change in supply
è Any change in price will result in a relatively smaller change in quantity supplied (Relatively steep supply curve)
è PES = 1 è Meaning % change in price is
identical to the % change in quantity supplied. (proportional)
è Any straight line supply curve that passes through the origin will have a PES value of 1. (Straight line supply curve)
² Different from Unit elasticity demand curve

22
4. Elastic supply
5. Perfectly elastic supply
è 1< PES <∞ è Meaning % change in price is less
than the % change in supply è Any change in price will result in a
larger change in quantity supplied (Relatively flat supply curve)
è Very responsive to price change
è PES = ∞ è Meaning an infinite amount is
supplied at one price but nothing at all at a slightly higher price
è There is an infinite demand at one price level, but any other price levels, nothing will be supplied (Horizontal supply curve)
IB Question

23
Determinants of PES ! The value of price elasticity of supply for a good depends on a number
of factors. 1. Time period considered
• In the immediate time period firms cannot immediately increase the
number of factors of production that they employ • In the short run, firms may be able to increase the quantity of some of
the factors that they employ but may not able to increase all of the factors.
• In the long run firms may be able to increase the quantity of all the
factors that they employ 2. Mobility of factors of production If the factors of production are mobile or flexible, PES will be relatively elastic. e.g.) It is easy to shift production from manufacturing one liter plastic bottle to manufacturing two liter plastic bottles because they are made from similar materials requiring similar production process.
Perfectly inelastic
More elastic
Much more elastic
24
3. Unused capacity
4. Ability to store stocks If a firm is able to store high levels of stock (inventories) of their product, then they will be able to react to price increases with swift supply increases and so the PES for the product will be relatively elastic. However, where it is impossible or expensive to hold stocks, supply will be inelastic. Some perishable goods will be inelastic because they cannot be stored for a long time.
If a firm has a lot of unused capacity (spare capacity), then it will be able to increase output easily and without great cost increases. è High elasticity of supply If a firm is producing at capacity (running at full capacity supply) then it is difficult to increase supply without a significant increase in productive resources which will be expensive. It is therefore unlikely that the firm will increase supply. è Relatively Inelastic supply
Unused capacity? Output? An amount manufactured or produced during a certain time.

25
25. Applications of price elasticity of supply ! Primary commodities have relatively low PES values (inelastic), while
manufactured goods will tend to have higher values (more elastic). We can see the reason from the table below: Determinants Wheat (p.c.) Laptop (m.g.) The time period Relatively little
opportunity to change supply - once planted, supply is effectively determined for a year
Supply is quite flexible - increased globalization means increased production capacity can be brought on relatively quickly
Substitutability Very difficult to substitute factors of production
Factors of production relatively easy to substitute
Capacity factors Once fields have been planted for a season, capacity is effectively fixed. Only in the long-run can it be changed significantly.
New capacity can be brought in relatively easily - particularly ina ore global economy
Stocks Relatively perishable and so difficult to hold stocks for any significant period of time
Stocks can be held, though these may date as specifications improve
A table showing a comparison of two products - wheat and laptops - against each of
these determinants