Variability in Long Bone Growth Patterns and Limb Proportions Within and Amongst Mesolithic and...
26
8 Variability in Long Bone Growth Patterns and Limb Proportions Within and Amongst Mesolithic and Neolithic Populations From Southeast Europe Ron Pinhasi 1 , S. Stefanovi c 2 , Anastasia Papathanasiou 3 and Jay T. Stock 4 1 Department of Archaeology, University College Cork, Cork, Ireland 2 Faculty of Philosophy, Department of Archaeology, Cika Ljubina 18-20. 11000 Belgrade, Serbia 3 Ephorate of Paleoanthropology and Speleology, Greek Ministry of Culture, Athens, Greece 4 Leverhulme Centre for Human Evolutionary Studies, Department of Biological Anthropology, University of Cambridge, Cambridge, UK 8.1 INTRODUCTION The scientific study of human growth trajectories began more than 200 years ago with the longitudinal growth study by Montbeillard (1759–1777), who periodically recorded the stature of his son. In the early part of the nineteenth century new growth studies appeared, with a focus on the development of epidemiological growth standards that can be used in the assessment of healthy vs. unhealthy growth patterns in individuals and populations, known as auxological epidemiology (Tanner, 1998). During the last 50 years, worldwide variations in growth have been reported by various international programmes and data are assessed against published growth standards, such as those used by the World Health Organization (WHO) (http://www. who.int/childgrowth/en/). Many physical anthropologists are interested in different aspects of growth, such as: Human Bioarchaeology of the Transition to Agriculture Edited by Ron Pinhasi and Jay T. Stock Ó 2011 John Wiley & Sons, Ltd.
Transcript of Variability in Long Bone Growth Patterns and Limb Proportions Within and Amongst Mesolithic and...

8
Variability in Long Bone GrowthPatterns and Limb ProportionsWithin and Amongst Mesolithicand Neolithic Populations FromSoutheast Europe
Ron Pinhasi1, S. Stefanovi�c2, Anastasia Papathanasiou3 and Jay T. Stock4
1 Department of Archaeology, University College Cork, Cork, Ireland2 Faculty of Philosophy, Department of Archaeology, �Cika Ljubina 18-20.11000 Belgrade, Serbia
3 Ephorate of Paleoanthropology and Speleology, Greek Ministry of Culture,Athens, Greece
4 Leverhulme Centre for Human Evolutionary Studies, Departmentof Biological Anthropology, University of Cambridge,Cambridge, UK
8.1 INTRODUCTION
The scientific study of human growth trajectories began more than 200 years ago with the
longitudinal growth study byMontbeillard (1759–1777), who periodically recorded the stature
of his son. In the early part of the nineteenth century new growth studies appeared, with a focus
on the development of epidemiological growth standards that can be used in the assessment of
healthy vs. unhealthy growth patterns in individuals and populations, known as auxological
epidemiology (Tanner, 1998). During the last 50 years, worldwide variations in growth have
been reported by various international programmes and data are assessed against published
growth standards, such as those used by the World Health Organization (WHO) (http://www.
who.int/childgrowth/en/).
Many physical anthropologists are interested in different aspects of growth, such as:
Human Bioarchaeology of the Transition to Agriculture Edited by Ron Pinhasi and Jay T. Stock� 2011 John Wiley & Sons, Ltd.

1. the evolution of human growth and development, and its contextualisation in the broader
fields of human and mammalian life history (Bogin, 1999; Bogin and Smith, 1996); and
2. changes in growth velocity at different ages, differences between sexes in growth trajec-
tories, and variations within and between populations in growth curves.
The latter approaches are mainly propelled by the interest into whether variations in human
growth can be attributed to genetic differences or environmental factors.
The anthropological interest in growth patterns in archaeological samples began with
Johnston’s study of the Indian Knoll Native American population (Johnston, 1962) and
continued with a series of studies during the late 1960s to 1980s on Native American,
European and Nubian samples (Hummert and Van Gerven, 1983; Jantz and Owsley, 1984;
Mensforth, 1985;Merchant andUbelaker, 1977; Stloukal andH�anakov�a, 1978; Sundick, 1978;and see review of additional studies in Saunders, 2000). Most of these studies focused on inter-
population comparisons of growth trajectories of long bones amongst archaeological
‘populations’, and in some cases, in comparison to growth curves from modern studies
(mainly the Denver Study, see below). Less attention has been placed on the study of temporal
and within-site variations in growth (Saunders, 2000).
Various growth studieswere carried out during the 1990s to 2000s,manyofwhich focused on
European medieval and post-medieval archaeological samples. The availability of relatively
large samples, from proximate geographical regions and from short time periods (i.e. measured
in 100s rather than 1000s of years), allowed researchers to investigate the social, economic,
cultural and nutritional factors that may have played a role in the observed variations in
the growth trajectories. One major factor that was only addressed in a few publications is
the effect of variability in health (as indicated from the study of palaeopathological indicators),
sanitation, weaning and socioeconomic status on the growth patterns of archaeological
populations (Lewis, 2002a, 2002b, 2007; Mays, Brickley and Ives, 2008; Mays, Ives and
Brickley, 2009b;Mays, 1999; Ribot andRoberts, 1996).More recently, a few studies examined
the specific role of vitaminDdeficiency and rickets on growth (Mays,Brickley and Ives, 2009a;
Pinhasi et al., 2006). These studies highlight the potential of bioarchaeological investigations
that combine palaeopathological, osteological, physiological and isotopic methods with the
study of anthropometric variations during growth.
Despite these trends, there are several major limitations that affect the majority of
archaeological growth studies:
1. While the actual mortality ratio of subadults-to-adults is often as high as 50:50, the actual
number of subadults in a sample is often considerably smaller due to taphonomic factors
(Humphrey, 2000, 2003; Saunders, 1992, 2000). Subadult bones are often more poorly
preserved due to their relative fragility, but different mortuary treatment of subadults may
also be a factor affecting preservation (as individuals may have been cremated, incorporated
into refuse pits, buried in a separate location, etc.) (Pinhasi and Bourbou, 2008).
2. In most archaeological subadult samples from a given cemetery, the majority of individuals
are newborns and infants and there is a severe under-representation of children and
adolescents. Consequently, most growth studies cannot provide equal representation of
all subadult age groups.
3. All archaeological samples are cross-sectional and therefore their analysis cannot
reveal variations in the individual’s growth rates as in the case of longitudinal studies.
178 Human Bioarchaeology of the Transition to Agriculture

Any variation in the slope of growth curves of such samples may not necessarily reflect
actual variation in the rate of growth of the analysed bone dimension, due to the smoothing
out of growth events that are imperfectly synchronized between individuals
(Humphrey, 2003).
4. It is often desirable to assess the possible synergy between growth patterns, disease and
nutritional status, since it has been well-documented in both archaeological and living
populations that poor health, poor nutrition and high disease load have major impact on the
observed growth patterns (Berti, Leonard and Berti, 1998; Cook, 1984; Larsen, 1997;
Leonard et al., 2000; Lewis, 2002a, 2002b; Ribot and Roberts, 1996). However, the
interpretation of the health profile of skeletal populations is not straightforward due to the
effects of selective mortality and hidden intra-population variability in the susceptibility to
illness (Wood et al., 1992; Wright and Yoder, 2003). As a result, the mortality pattern of the
sample may not reflect the parameters of the living population. These complicating factors
have been described as the ‘osteological paradox’, a further complication of which is that
skeletons with palaeopathological lesions may have been in overall good health, after
surviving periods of episodic stress. However, several studies onmorbidity and demography
(Bennike et al., 2005; Saunders and Hoppa, 1993) suggest that the majority of specimens
with such lesions are those that are more likely the non-survivors. Hence, high prevalence of
palaeopathological lesions of stress is an indicator of the overall poor health of the studied
population.
5. A final major concern is the accuracy, reliability and replicability of skeletal and dental age
estimation methods (as further discussed below).
Relatively few anthropological studies have investigated intra-sample variation in growth
amongst past populations, and male-female differences in growth trajectories provide insights
regarding complex patterns of ontogenetic allometric and isometric variability in growth
proportions and dimensions (c.f. Ruff, 2003). As pointed out by Maresh (1955, p. 732):
When assessing the growth of the major long bones, perhaps we should be willing to allow
greater variability in the pattern by which these bones increase in length than we have
heretofore considered desirable of “healthy”. If one accepts these hypotheses, the growth
curves of the long bones in infancy becomemore reasonable than if one continues to expect
the growth of all segments to be affected equally by growth stimuli-inheritance of body built,
nutritional building materials, hormone-enzyme systems, or whatever the factors may be.
Indeed, themajority of anthropological studies have focused on inter-populationvariation in
growth, and examined differences in average bone dimension-per-age. Less attention has been
placed on intra-sample variability which, when studied in conjunction with archaeological
evidence, can provide important clues about within-sample and sex-specific differences in
nutrition, disease load, living conditions and so on.
Bioarchaeological growth studies have focused on the analysis of skeletal samples from the
relatively recent past and the great majority of studies have focused on Native American
populations. This temporal and geographical bias is mainly due to the paucity of subadult
samples from European and Asian Palaeolithic, Mesolithic and Neolithic periods. Yet, the
assessment of growth in prehistoric populations from these periods is of particular importance
as it can provide insight into whether:
Variability in Long Bone Growth Patterns and Limb Proportions 179

. pre-agricultural hunter-gatherers had growth trajectories similar to those of later prehistoric
and historical (agricultural) samples;
. there are notable differences in growth patterns of pre-agriculturalists and agriculturalists,
and if so, whether this can be attributed to genetic differences, environmental factors, or both.
In this context it is interesting to chart the differences in subadult size and then attempt to
correlate these with a growing body of literature on physiological differences in skeletal
robusticity, activity patterns, behaviour, mobility, sexual dimorphism and so on (see various
contributions in this volume).
In her review of the literature on archaeological growth studies, Saunders (2000) questions
whether the trend amongst most past populations to have shorter limb dimensions-per-age
when compared to most modern populations, reflects genetic differences, or harsher environ-
mental conditions that were more common in the past. This question is particularly relevant
when we consider the Mesolithic-Neolithic transition in various world regions. In regions
where we can assume population continuity, such as in the Danube Gorges, and for which we
have both Mesolithic and Neolithic subadult skeletal samples, it is possible to examine the
effect of the agricultural transition on growth patterns. The underlying expectation is that in
regions where the archaeological record suggests in situ transition, any differences between
Mesolithic (hunter-gatherers) and Neolithic (farmers) should be attributed to changes in
environmental and culturally mediated factors. These include variations in disease load,
mortality,morbidity, population density and temperature, aswell as changes in age ofweaning,
type of weaning foods, quality and quantity of diet, housing, activity and access to resources.
In this chapter we investigate the following:
1. Whether there are any differences in long bone dimensions between Mesolithic and
Neolithic newborns from the Danube Gorges region;
2. The growth profiles of Mesolithic and Neolithic Danube Gorges populations from the sites
of Vlasac and Lepenski Vir, Serbia, in comparison to those of Neolithic subadults from
Greece, medieval and post-medieval populations from Austria and Britain and the modern
population of Denver, Colorado;
3. Changes of lower and upper limb proportions during growth and development of subadults
from birth to 14 years of age; and
4. The degree of inter-bone variability in growth, by examining differences in percentiles of
dimensions-per-age based on the corrected Denver reference sample (see below).
Trends observed in these comparisons are interpreted in the context of studies on inter-
population variation in growth.
8.2 MATERIALS
8.2.1 Danube Gorges Samples
The site of Lepenski Vir is located in the middle of the Upper Gorge of the right bank of the
Danube, Serbia on a semicircular terrace. The sitewas first discovered during a survey in 1960,
and excavation began in 1965 under the direction of Dragosalv Srejovi�c. In subsequent years,
180 Human Bioarchaeology of the Transition to Agriculture

an area of 2500m2 was excavated to reveal architecture, monumental sculpture and graves of
Lepenski Vir culture (8200–5500 calBC, cf. Bori�c, 2002).Human remains for the site as a whole amount to 190 individuals. Skeletal representation
ranges from small fragments to complete skeletons. Of them, 101 individuals were buried in
single graves, 58 in double or triple graves, and 4, 5, 6 and 7 individuals were buried in one
instance each. The total number of adults and subadults are almost identical (83 compared to
84); however, age could not be assigned to 23 individuals (Roksandi�c, 1999). In this study, weanalyse the dimensions of 45 subadult skeletal remains: 39 of these individuals are newborn
babies (35–50 gestational weeks), 3 are children 1 to 5 years of age and 3 are young adolescents
12 to 14 years of age (Table 8.1).
The site of Vlasac is located 3 km downstream from Lepenski Vir and it was submerged by
the Danube owing to the creation of the accumulation lake of the Djerdap Hydro-plant during
the 1960s. It was first discovered in 1970 and was partially excavated in 1970/1971 (Srejovi�cand Letica, 1978). During these two seasons of excavations, 43 dwelling structures, 87 graves
andmore than 35 000mobile objects were unearthed and dated to the period between 9800 and
6900 calBC; (cf. Bori�c and Stefanovi�c, 2004). Themonograph of the sitewas published in 1978
and it is the most comprehensive publication on archaeological, environmental and anthro-
pological data on any individual site of the Lepenski Vir culture (Srejovi�c, 1981;
Tringham, 2000). New excavations at the site started in 2006, and have confirmed that certain
portions of the site are still preserved and accessible for research (Bori�c, 2007).Human skeletal remains fromVlasac comprise 164 individuals from the 87 reported graves.
Adults represent the majority of the sample: 108 individuals or 66%. Forty-seven
Table 8.1 Frequencies of individuals per dental age cohort for the four studied sites
Agea DG Mesolithic DG Neolithic Greek Neolithic
Totals 28 49 14
Sites Vlasac Vlasac, Lepenski Vir Xirolimni, Alepotrypa,
Mavropigi, Franchthi
Location Danube Gorges,
Serbia
Danube Gorges, Serbia cf. Figure 6.1 in
Chapter 6, this volume
birth�1 22 41 8
1–2 1 1 0
2–3 0 1 2
3–4 0 1 1
4–5 0 2 0
5–6 0 0 0
6–7 0 0 1
7–8 2 0 0
8–9 1 0 0
9–10 1 0 2
10–11 0 0 0
11–12 1 0 0
12–13 0 2 0
13–14 0 1 0
aEach number marks the latest age for a given cohort.
Variability in Long Bone Growth Patterns and Limb Proportions 181
individuals are determined as subadults and nine individuals are of undetermined age. In this
study we analyse the dimensions of 31 subadult skeletal remains: 28 from the Mesolithic
phases and 3 from the Neolithic phases. Of these individuals, the majority – 22Mesolithic and
3 Neolithic individuals – are newborn babies, 5 are children (1–10 years of age) and 1 is an
adolescent (11–14 years of age) (Table 8.1).
8.2.2 Greek Neolithic Samples
Mavropigi and Xirolimni are two of the earliest agricultural communities in Greece and
Europe. Mavropigi (Karamitrou-Mendesidi, 2005) is dated around 6600 calBC and covers
about one hectare. It consists of 4 occupation levels with irregular rectangular dwellings of 50
to 90m2 similar to theNeaNikomedeia houses. The site yielded 18 in situ burials, mostly plain,
coarse pottery, and over 2000 objects including stone and bone tools, loom weights, pendants,
beads, six seals and 132 female and animal figurines. The specimens analysed in this study
include one newborn and three children.
Xirolimni (Karamitrou-Mendesidi, 1998) is an Early Neolithic (6500–5700 calBC) settle-
ment with a high concentration of 90% plain, coarse, distinct ceramic ware and 14 pit burials.
Data from stable isotope analyses point to a swift and complete transition to agricultural
practices, even in the very early Neolithic, and a diet based mainly on cereals and significantly
higher consumption ofmeat compared to later Neolithic sites. One child (2.5 years of age) from
this site is included in this study.
The site of Franchthi consists of a large, 150m long cave and an open settlement at the
surrounding area, located at the coast of the southern tip of the Argolid peninsula in eastern
Peloponnese (Jacobsen, 1969; 1973a,b). The well-documented stratigraphic sequence has
revealed evidence of human occupation, starting from 22 000 to 3000 calBC. Apart from the
habitation debris, the site has yielded mortuary evidence and fairly well preserved human
osteological material, dating from 9000 to 3000 calBC, and consisting of formal burials and
extensive human bone scatter. The specimens analysed in this study include four newborns, two
infants and one child.
Alepotrypa Cave is one of a group of three caves located around the rocky, limestone Diros
Bay on the western coast of the Tainaron Peninsula of southern Greece. The cave is situated
about 50m above present-day sea level, in a rocky limestone environment. It is about 300m
long, extending along an east-west axis, and contains a large freshwater lake, and several
smaller lakes that attracted the Neolithic inhabitants (Papathanasiou, 2001). Based on ceramic
typological data, the cave was occupied from approximately 5000 to 3200 calBC, correspond-
ing to the Late and Final Neolithic Periods. More than 50 activity areas have been identified,
with cultural deposits ranging between 50 cm and 5.5m in thickness, including both habitation
areas and mortuary loci (Papathanasiou, 1996, 2001). The specimens analysed in this study
include one newborn and one child.
8.2.3 Comparative Samples
Archaeological samples from Lower Austria and Great Britain were used for comparison. The
Austrian samples include those from the tenth century AD Slavic sites of Gars-Thunau and
Zwentendorf and the Avar Period site (7th–9th centuries AD) of Zw€olfaxing in Lower Austria(Pinhasi et al., 2005) (Table 8.2). The British samples consist of subadults from four medieval
English sites: the Anglo-Saxon site at Raunds Furnells (Boddington and Cadman, 1981); the
182 Human Bioarchaeology of the Transition to Agriculture

late medieval cemetery of St Helen-on-the-Walls from York (Dawes and Magilton, 1980);
the post-medieval cemetery of Broadgate, Central London (Schofield and Maloney, 1998)
(Table 8.2); and the post-medieval cemetery of Christ Church Spitalfields, Central London
(Molleson and Cox, 1993) (Table 8.2). The Broadgate and Christ Church Spitalfields
cemeteries are only about 500m apart, but they differ greatly in the socioeconomic status
of their respective populations. The Broadgate cemetery, located at the inner eastern flank of
the LondonWall, was founded in 1569 by the City to relieve the congestion occurring in parish
burial grounds and contained many primary uncoffined burials at a high density of 8 perm3
(Schofield andMaloney, 1998). The Christ Church Spitalfields cemetery is located at the outer
eastern flank of theLondonWall and contained coffined crypt burials of individuals ofmedium-
high socioeconomic status (Molleson and Cox, 1993).
Data on the diaphyseal length of limb bones for age amongst modern (twentieth century)
subadults was obtained from publications on the Denver Growth Study, which was carried out
between 1927 and 1967 (Maresh, 1943, 1955, 1970). All subjects were of European ancestry, in
good health and of middle-class socioeconomic status (Ruff, 2003). They were examined,
measured and radiographed from two months of age at two-month intervals to six months,
semi-annually from six months to early adolescence, and annually thereafter until late
adolescence (Ruff, 2003).
8.3 METHODS
8.3.1 Bone Measurements
The metric data utilized in this study include diaphyseal length dimensions (excluding
epiphyses) of the femur, tibia, humerus, ulna and radius. In additional,maximumandminimum
midshaft diameters of these long bones and distalmetaphyseal breadth dimensions of the femur
Table 8.2 Description of the comparative samples
Sample N Location Period Reference
Libben 12a Ohio, USA Late Woodland
800–1100 AD
(Lovejoy, Russell and
Harrison, 1990)
Slavonic Mikulcice 17a Bohemia, Czech
Republic
7–9 centuries AD (Stloukal and
H�anakov�a, 1978)Zwentendorf 19 Lower Austria tenth century AD (Pinhasi et al., 2005)
Gars-Thunau 11 Lower Austria tenth century AD (Pinhasi et al., 2005)
C.C. Spitalfields 42 East London, England 1729–1859 AD (Lewis, 2002a, 2002b;
Pinhasi et al., 2006)
Broadgate 42 East London, England 1569–1720 AD (Lewis, 2002a, 2002b;
Pinhasi et al., 2006)
Raunds 25 Northamptonshire,
England
850–1100 AD (Lewis, 2002a, 2002b;
Pinhasi et al., 2006)
St Helen-on-the-Walls 9 950–1550 AD (Lewis, 2002a, 2002b)
twentieth century
Caucasians
24 Denver, Colorado, USA Modern (Maresh, 1943, 1955)
aMean values by age cohort.
Variability in Long Bone Growth Patterns and Limb Proportions 183

and humerus were recorded for the Danube Gorges samples, in order to carry out the
comparison between the growth dimensions of these two samples during the period of
birth-infancy (see below). Measurements were taken according to the procedures described
by Buikstra and Ubelaker (1994).
8.3.2 Dental age
Chronological agewas estimated on the basis of the examination of postnatal dental formation.
The most commonly applied method is based on comparing each cheek tooth to a series of 14
formation stages, using published plots (Moorrees, Fanning and Hunt, 1963a, 1963b). This
system was reworked by Smith (1991) to account for the cross-sectional rather than longi-
tudinal nature of archaeological samples. Ages for a given growth stage were based on the
average age of subjects at a given stage rather than the actual age when that stage was first
attained. Consequently, in longitudinal studies in which subjects are examined at specific
interval lengths, observation of a growth stage usually postdates the actual onset of attainment
by several months or even years. Smith devised new charts for males and females, in which
a given age for a specific formation stage can be interpreted as the actual average age of
attainment of a growth stage. The male and female values can then be averaged to obtain
estimates for the age of subadult individuals from archaeological samples.
A prevailing assumption amongst anthropologists who study growth patterns in past skeletal
populations is that the ontogenetic process of dental root and crown formation is genetically
controlled and is thus much less affected by environmental factors (Saunders, 2000;
Smith, 1991). However, this assumption has been questioned by researchers who examined
clinical samples of modern American children (Garn, Lewis and Polacheck, 1959) and inmore
recent comparative studies on past skeletal populations (Saunders, 2000; Tompkins, 1996) that
yielded varied results (cf. Pinhasi et al., 2005).
8.3.3 Analytical Methods
Analysis of Variance (ANOVA) was applied to study inter-population variations in limb
dimensions. Gompertz curves were calculated following the methods described by Pinhasi
(Pinhasi et al., 2005, 2006). Nonlinear interpolations were carried out in the SPSS statistical
package. In the case of each long bone dimension, the initial value of the point of inflection (m)
was set to zero, the value of the slope (b) was set to 0.2, and the initial value of each long bone
diaphyseal length dimension was calculated from the average value amongst Lepenski Vir
adults.
The radiographic data of the subadults from Denver Colorado (Maresh, 1943, 1955, 1970)
were corrected for parallax (magnification) following Ruff (2007; p. 700):
. . .for femoral, humeral, and tibial lengths 217mm or greater, adjusted length¼ 0.949�original lengthþ 5.63. For smaller bones (except the radius), adjusted length¼ 0.975� orig-
inal length. For the radius, adjusted length¼ 0.98� original length. Femoral distal metaphy-
seal and head breadth magnification factors were the same (2.5%) for bones with lengths
under 217mm, and the same slope (0.949) was used for larger specimens, with intercepts
determined by average size differences between dimensions: for distal metaphyseal breadth,
adjusted¼ 0.949� originalþ 0.965; for head breadth: adjusted¼ 0.949� originalþ 0.555’.
184 Human Bioarchaeology of the Transition to Agriculture

A comparison between the corrected and uncorrected curves indicates that the latter’s
interpolated dimension-per-age values are on average between 2 and 4% larger than the
corrected values (Maresh, 1943, 1955, 1970; Ruff, 2007).
Bone lengths were used to investigate limb proportions by calculating the following indices,
which reflect distal-proximal lower and upper limb proportions, respectively:
1. The Tibio-femoral index¼ 100� (femoral bicondylar length [or shaft length if epiphyses
are not fused]/total length of tibia); and,
2. The Radio-humeral index¼ 100� (greatest length of radius/greatest length of humerus).
These intralimb indices were analysed for the Danube Gorges Mesolithic, Neolithic and
Greek Neolithic samples. Newborns and infants (0–1 years of age) of these skeletal samples
were compared to newborns and infants from the post-medieval sites of Broadgate and
Christ Church Spitalfields, East London, the medieval sites of Raunds in Northamptonshire
and St Helen-on-the-Walls, in York (Lewis, 2002a, 2002b), the Slavic sites of Zwentendorf
and Gars-Thunau (Pinhasi et al., 2006), and mean proportions per age cohort calculated for
subadults from the Slavic site of Mikulcice (Stloukal and H�anakov�a, 1978), and the Native
American site of Libben (Lovejoy, Russell and Harrison, 1990; Mensforth, 1985)
(Table 8.2).
8.4 RESULTS
Statistical comparisons ofMesolithic vs. Neolithic neonates and infants (aged between 0 and 1)
for each variablewere carried out using theMann-Whitneynonparametric test. Results indicate
that the two groups differ only for the following dimensions for which the Danube Gorges
Mesolithic had greater dimensions per age: Tibial maximum (anterior-posterior (a–p)) width
(pG 0.001) and minimum (medio-lateral (m-l)) width (pG 0.003) at midshaft and tibio-
femoral ratio (PG 0.01).
8.4.1 Femur Length
Gompertz curves were calculated for the Danube Gorges Mesolithic, Greek Neolithic and
Broadgate archaeological samples. In addition, corrected�2 standard deviations (SD), averageand þ2 SD curves were plotted for the modern Denver sample. Due to the small number of
individuals in the Danube Gorges Neolithic sample, these were plotted as single individual
cases without interpolation. The attained femoral length of Danube Gorges and the Greek
Neolithic newborns and infants fall below the�2SD value for the Denver reference sample
(Figure 8.1). In the case of theDanubeGorgesMesolithic group, the curve intersects the lowest
Denver (�2SD) curve only around the age of 8 to 9 years, which coincides with the same trend
found amongst the Broadgate sample. Each of the Danube Gorges Neolithic subadults falls
below the�2SD Denver reference curve. This pattern contrasts with the femoral growth curve
of the Greek Neolithic sample that intersects the lower Denver range at around the age of
2 years and attains dimensions close to those of theDenver average by the age of 5. If we accept
any values below the lowest�2SD line of Denver to represent low growth attainment per
age, then it is clear that in the case of the femur, the two Danube Gorges samples resemble
the pattern observed at Broadgate, which is known to be a stressed population
Variability in Long Bone Growth Patterns and Limb Proportions 185

(cf. Pinhasi et al., 2006). This pattern contrasts with the Greek Neolithic curvewhich, after the
age of two, falls within the Denver reference�2SD-average range.
8.4.2 Humerus Length
Inter-population growth patterns of the humerus diaphyseal dimensions are different from the
pattern observed for the femur. In general, all populations show less marked deviations from
each other and from the Denver reference curve (Figure 8.2). However, as in the case of the
femur, the archaeological samples have low humerus length-per-age values for newborns
and infants. Of the four Danube Gorges Neolithic cases aged between 1 and 12 years, two fall
within the Denver 2SD range and two below it. In contrast, the Danube Gorges Mesolithic
curve intersects the lower Denver curve at around the age of 7 and remains within the lower
�2SD –average range of the Denver sample. The Greek Neolithic curve intersects the lower
Denver curve around the age of 10. Both the Greek Neolithic and the Danube Gorges
Mesolithic curves are relatively close to the dimensions-per-age values of the Broadgate curve.
8.4.3 Tibia Length
Less data points were available for the study of inter-population variation in tibial diaphyseal
length dimensions. The Greek Neolithic curve falls within the lower range of the Denver
dimensions-per-age (Figure 8.3). The Broadgate curve falls below this range till the age of 7.
The one DanubeMesolithic child, aged 7, falls on the�2SDDenver curve, as does a 2-year-old
Neolithic child from the Danube. The one Danube Neolithic adolescent falls below the�2SDcurve and closest to the Broadgate sample.
Figure 8.1 Growth patterns of the femoral diaphysis of the Danube Gorges (Mesolithic and Neolithic
samples), GreekNeolithic andBroadgate in relation to the curve of themodern (Denver) reference sample
186 Human Bioarchaeology of the Transition to Agriculture

Figure 8.2 Growth patterns of the humeral diaphysis of the Danube Gorges (Mesolithic and Neolithic
samples), GreekNeolithic andBroadgate in relation to the curve of themodern (Denver) reference sample
Figure 8.3 Growth patterns of the tibial diaphysis of the Danube Gorges (Mesolithic and Neolithic
samples), GreekNeolithic andBroadgate in relation to the curve of themodern (Denver) reference sample
Variability in Long Bone Growth Patterns and Limb Proportions 187

8.4.4 Ulna Length
The ulnar diaphyseal dimensions of the Greek Neolithic sample between the age of 1 and 5 fall
below the Denver �2SD-average range (Figure 8.4). However, Greek Neolithic children
and adolescents older than 5 attainvalueswithin this range. The fewDanubeGorgesMesolithic
and Neolithic cases fall within the Denver range and some attain dimensions that are very close
or even larger than the Denver average. As in the case of the tibia, the Broadgate curve is very
close to the lower Denver range.
8.4.5 Radius Length
The Greek Neolithic curve is positioned below the Denver�2SD curve until the age of 7; after
which it attains valueswithin the�2SD-averageDenver range (Figure 8.5). TheDanubeGorgesMesolithic and Neolithic cases have lower radius length-per-age than the Denver range at birth
and infancy. However, the two Danube Gorges Neolithic children attain lengths-per-age that
are close to the Denver average values. In contrast, the two Danube GorgesMesolithic children
attain dimensions-per-age that are close to the lower (�2SD)Denver curve,while the adolescentcase attains dimensions that are close to the Denver average dimensions-per-age curve. The
Broadgate curve is positioned below the lower Denver curve but intersects it at the dental
age of 12.
In sum, there are some clear inter-population and intra-skeletal variations between diaphy-
seal growth curves. If we take the Denver�2SD-average-þ 2SD range as the modern reference
standard and the Broadgate curve as the comparative example of values attained by a stressed
Figure 8.4 Growth patterns of the ulnar diaphysis of the Danube Gorges (Mesolithic and Neolithic
samples), GreekNeolithic andBroadgate in relation to the curve of themodern (Denver) reference sample
188 Human Bioarchaeology of the Transition to Agriculture

population, it is apparent that the two Danube Gorges and the Greek Neolithic samples attain
dimensions-per-age that are intermediate between the two. In general, the Mesolithic and
Neolithic samples intersect the lower Denver curve during childhood. This pattern may
indicate that individuals from stressed populations manage to compensate for lower
dimensions-per-age during childhood or early adolescence, and attain dimensions close to
those of the Denver reference sample following amelioration in nutrition and/or improved
health. While catch-up growth usually occurs before the age of 2 (Tanner, 1986) a study of
more than 2000 children from the Philippines demonstrated that while 63% of children were
stunted at 2 years of age, about 30% were no longer stunted at 8.5 years, and 32.5% were no
longer stunted at 12 years (Adair, 1999). However, it is important to note that all interpolated
curves of archaeological populations are of cross-sectional data and hence cannot capture
actual ‘catch-up’ growth or changes in growth velocity. While catch-up growth may explain
the observed trends, it is also possible that apparent ‘catch up’ amongst archaeological
samples during older childhood is due to different causes of death that may affect older
children or adolescents. In contrast to small newborns and infants, where malnourishment
and infectious disease may be primary causes of mortality, the human immune system
functions much more efficiently during childhood (Sinclair and Dangerfield, 1998), suggest-
ing that death during childhood or adolescence is rare, and more often occurs in response to
severe and aggressive illnesses rather than chronic conditions or malnutrition that would
affect growth.
It is clear that greater variations between samples are noted in femoral than humeral
dimensions. In the case of the Greek Neolithic sample, tibial and femoral long bone
dimensions-per-age are close to those of the Denver average values, while those of the ulna
Figure 8.5 Growth patterns of the radial diaphysis of the Danube Gorges (Mesolithic and Neolithic
samples), GreekNeolithic andBroadgate in relation to the curve of themodern (Denver) reference sample
Variability in Long Bone Growth Patterns and Limb Proportions 189
and radius fall closer to the Denver lower (�2SD) curve. This pattern contrasts with the
Danube Gorges where the majority of subadults have dimensions-per-age, which are
closer to the Denver average for the distal upper limb bones (radius, ulna) but not for the
tibia. The Broadgate curve does not differ in its general position in relation to the Denver
curves for any of the three distal limb bones, as it is always close to or just below the lower
Denver curve.
8.4.6 Limb Proportions
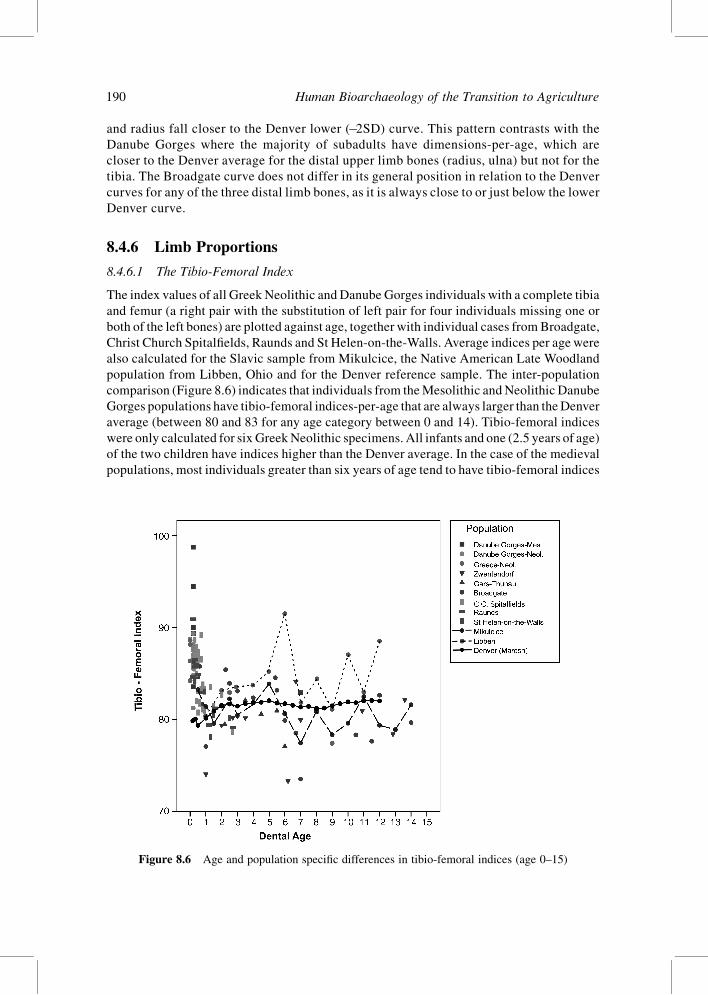
8.4.6.1 The Tibio-Femoral Index
The index values of all Greek Neolithic and Danube Gorges individuals with a complete tibia
and femur (a right pair with the substitution of left pair for four individuals missing one or
both of the left bones) are plotted against age, together with individual cases fromBroadgate,
Christ Church Spitalfields, Raunds and St Helen-on-the-Walls. Average indices per age were
also calculated for the Slavic sample from Mikulcice, the Native American Late Woodland
population from Libben, Ohio and for the Denver reference sample. The inter-population
comparison (Figure 8.6) indicates that individuals from theMesolithic andNeolithic Danube
Gorges populations have tibio-femoral indices-per-age that are always larger than theDenver
average (between 80 and 83 for any age category between 0 and 14). Tibio-femoral indices
were only calculated for six GreekNeolithic specimens. All infants and one (2.5 years of age)
of the two children have indices higher than the Denver average. In the case of the medieval
populations, most individuals greater than six years of age tend to have tibio-femoral indices
Figure 8.6 Age and population specific differences in tibio-femoral indices (age 0–15)
190 Human Bioarchaeology of the Transition to Agriculture

that are smaller than the Denver average. Another interesting observation is the comparison
between the indices-per-age of the Native American population from Libben and the one for
the Slavonic Mikulcice population. The Libben population have on average indices that are
greater than the values recorded for the Denver population, while the Mikulcice population
tend to have on average indices that are smaller than the Denver average. However, both lines
share a similar peak and troughs pattern, which contrasts with the limited fluctuations
observed in the case of the Denver line. An examination of the same graph with a focus on the
birth-infancy age interval (Figure 8.7) indicates that all individuals, with the exception of
a single case from Broadgate, London, have tibio-femoral indices that are greater than the
Denver average for this age interval. Amongst the Mesolithic and Neolithic populations, the
Greek sample display less variation than the Danube Gorges Neolithic and Mesolithic
populations.Moreover, the Danube GorgesMesolithic population has the greatest variability
in tibio-femoral dimensions at birth and during infancy, with two individuals having indices
that are greater than 90. The Danube Gorges Neolithic population displays a similar range of
variation.
The pattern of inter-population variation for the radio-humeral index (Figure 8.8) is different
from the one observed for the lower limbs. The Denver reference sample shows a decrease in
index values from around 82 at birth to around 75 after the age of 2. At the age interval between
2 and 12, the ratio of the Denver population is relatively stable at a value of approximately 75.
For the most part, the graphs of both the Libben and Mikulcice indicate higher index-per-age
values than in the case of Denver. Broadgate and Christ Church Spitalfields, on the other hand,
have lower than average indices in general (in comparison to Denver). An examination of the
same graph with a focus on the age interval of birth to 1 (Figure 8.9) indicates that the
Figure 8.7 Age and population specific differences in tibio-femoral indices (age 0–1)
Variability in Long Bone Growth Patterns and Limb Proportions 191

Figure 8.8 Age and population specific differences in radio-humeral indices (age 0–15)
Figure 8.9 Age and population specific differences in radio-humeral indices (age 0–1)
192 Human Bioarchaeology of the Transition to Agriculture

individuals from the Danube Gorges Mesolithic and Neolithic and the Greek Neolithic
population have indices that are within the range of the Denver reference curve and those
of other archaeological populations.
Femoral/humeral length proportions for all individuals in this study with complete
(paired) bones are plotted together with the Denver average proportions and individual
proportions for the Broadgate subadults following the methods of Ruff (Ruff, 2003)
(Figure 8.10). The main observation is the difference in the proportions of the two
individuals from the Danube Gorges Mesolithic sample and those of the Neolithic, which
contrast with the less pronounced variability amongst the Greek Neolithic infants
(although only three cases). In addition, proportions of Mesolithic and Neolithic speci-
mens aged between 2 and 12 years are all lower than the Denver averages. Similarity, while
the Broadgate sample displays a considerable variability in proportions for a given
age cohort, the great majority of individuals have proportions that are lower than the
Denver average.
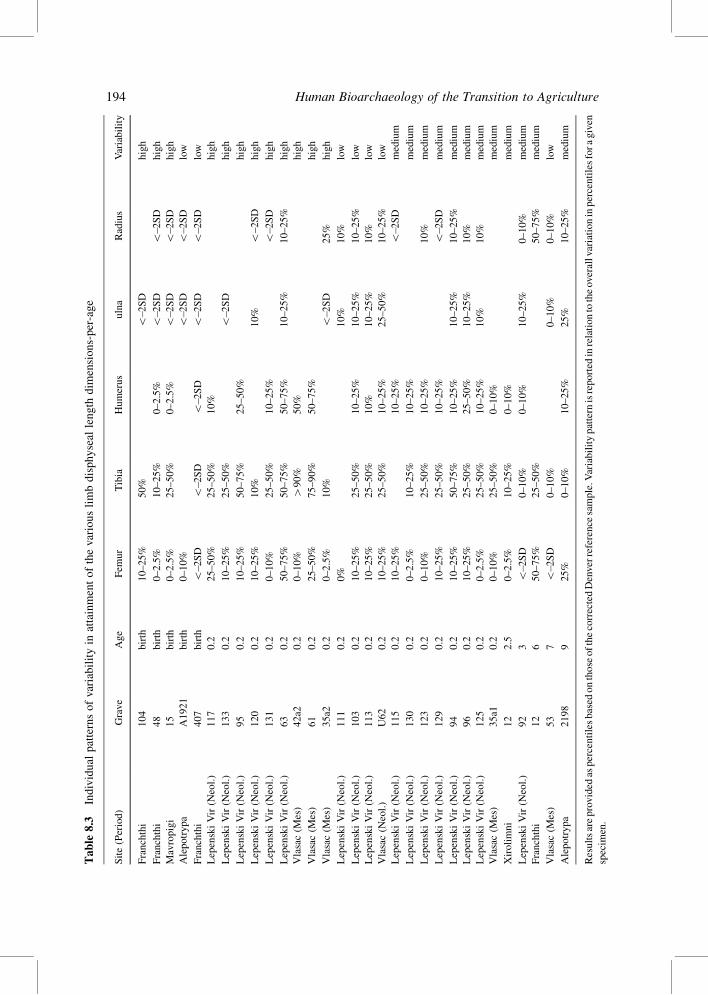
Intra-individual variations in attainment of diaphyseal long bone dimensions-per-age in
comparison of the Denver percentiles are provided in Table 8.3. The results indicate
a significant degree of intra-limb variation and hence reaffirm Maresh’s (1955) observation
from his study of the Denver sample. These variations may reflect intra-population
differences in health, nutrition and other environmental factors, but they may also reflect
biological differences between individuals in terms of growth velocities and response to
stress.
Figure 8.10 Femoral/humeral length proportions for all Mesolithic and Neolithic individuals aged
between 0 and 14with complete (paired) bones in comparison to proportions of theBroadgate and average
proportions of the Denver reference sample
Variability in Long Bone Growth Patterns and Limb Proportions 193
Table
8.3
Individual
patternsofvariabilityin
attainmentofthevariouslimbdisphyseal
length
dim
ensions-per-age
Site(Period)
Grave
Age
Fem
ur
Tibia
Humerus
ulna
Radius
Variability
Franchthi
104
birth
10–25%
50%
G�2
SD
high
Franchthi
48
birth
0–2.5%
10–25%
0–2.5%
G�2
SD
G�2
SD
high
Mavropigi
15
birth
0–2.5%
25–50%
0–2.5%
G�2
SD
G�2
SD
high
Alepotrypa
A1921
birth
0–10%
G�2
SD
G�2
SD
low
Franchthi
407
birth
G�2
SD
G�2
SD
G�2
SD
G�2
SD
G�2
SD
low
LepenskiVir(N
eol.)
117
0.2
25–50%
25–50%
10%
high
LepenskiVir(N
eol.)
133
0.2
10–25%
25–50%
G�2
SD
high
LepenskiVir(N
eol.)
95
0.2
10–25%
50–75%
25–50%
high
LepenskiVir(N
eol.)
120
0.2
10–25%
10%
10%
G–2SD
high
LepenskiVir(N
eol.)
131
0.2
0–10%
25–50%
10–25%
G�2
SD
high
LepenskiVir(N
eol.)
63
0.2
50–75%
50–75%
50–75%
10–25%
10–25%
high
Vlasac(M
es)
42a2
0.2
0–10%
H90%
50%
high
Vlasac(M
es)
61
0.2
25–50%
75–90%
50–75%
high
Vlasac(M
es)
35a2
0.2
0–2.5%
10%
G�2
SD
25%
high
LepenskiVir(N
eol.)
111
0.2
0%
10%
10%
low
LepenskiVir(N
eol.)
103
0.2
10–25%
25–50%
10–25%
10–25%
10–25%
low
LepenskiVir(N
eol.)
113
0.2
10–25%
25–50%
10%
10–25%
10%
low
Vlasac(N
eol.)
U62
0.2
10–25%
25–50%
10–25%
25–50%
10–25%
low
LepenskiVir(N
eol.)
115
0.2
10–25%
10–25%
G�2
SD
medium
LepenskiVir(N
eol.)
130
0.2
0–2.5%
10–25%
10–25%
medium
LepenskiVir(N
eol.)
123
0.2
0–10%
25–50%
10–25%
10%
medium
LepenskiVir(N
eol.)
129
0.2
10–25%
25–50%
10–25%
G�2
SD
medium
LepenskiVir(N
eol.)
94
0.2
10–25%
50–75%
10–25%
10–25%
10–25%
medium
LepenskiVir(N
eol.)
96
0.2
10–25%
25–50%
25–50%
10–25%
10%
medium
LepenskiVir(N
eol.)
125
0.2
0–2.5%
25–50%
10–25%
10%
10%
medium
Vlasac(M
es)
35a1
0.2
0–10%
25–50%
0–10%
medium
Xirolimni
12
2.5
0–2.5%
10–25%
0–10%
medium
LepenskiVir(N
eol.)
92
3G�2
SD
0–10%
0–10%
10–25%
0–10%
medium
Franchthi
12
650–75%
25–50%
50–75%
medium
Vlasac(M
es)
53
7G�2
SD
0–10%
0–10%
0–10%
low
Alepotrypa
2198
925%
0–10%
10–25%
25%
10–25%
medium
Resultsareprovided
aspercentilesbased
onthose
ofthecorrectedDenverreference
sample.V
ariabilitypattern
isreported
inrelationtotheoverallvariationinpercentilesforagiven
specim
en.
194 Human Bioarchaeology of the Transition to Agriculture

8.5 DISCUSSION
The Mann-Whitney nonparametric analysis of Danube Gorges Mesolithic and Neolithic
neonates and infants indicated that there are no significant differences in limb dimensions
between these populations, with the exception of differences in tibial width dimensions and the
tibio-femoral ratio. When comparing the growth profiles of diaphyseal long bone dimensions
of Mesolithic and Neolithic Danube Gorges populations and Greek Neolithic subadults to the
Broadgate and Denver samples, it became apparent that amongst the Danube Gorges samples,
growth attainment is below the�2SD Denver curve until the age of 7 to 9, when attained
dimensions fall within the 5 to 50 (lower) range of the Denver percentiles. The Greek Neolithic
growth curves intersect the�2SD Denver curve at an earlier stage, between the age of 2 and 4.
The Greek sample also attains dimensions-per-age that are close to the Denver average during
childhood in the case of the femur, tibia and radius, but attain lower dimensions-per-age in the
case of the humerus and ulna. Hence it appears that the growth pattern of the Greek sample
differs from the Danube Gorges samples in two distinct ways:
1. the attainment of dimensions-per-age which fall within the Denver�2SD-average range
during early childhood; and
2. the attainment of dimensions-per-age which correspond to higher percentiles of the Denver
reference sample (10–50%) for the lower limb bones and the radius.
While these curves should be interpreted with caution, due to the small sample sizes of the
Mesolithic and Neolithic groups and the unequal presentation of some age cohorts, it does
appear that theGreekNeolithic sample showsmore inter-limb differences in growth attainment
than the Danube Gorges samples. This may reflect inter-site variations in diet, disease load or
other environmental factors that were not tested in this study. This pattern also contrasts with
the Broadgate curves, which overall show higher attainment of dimensions-per-age (although
still just above the Denver�2SD curve) for the proximal limbs than for the distal limbs. Since
the same measuring methods and dental age values have been applied to all archaeological
samples, and these are plotted against the Denver data, it appears that these inter-limb
differences are not likely to be the outcome of methodological biases, and may therefore
reflect inter-population variations in growth patterns.
Previous cross-sectional studies of diaphyseal limb bone growth amongst archaeological
populations (see reviews by Saunders, 2000; Humphrey, 2003) confirm a general trend, in
which attainment of dimensions-per-age of all long bones are well below those of the Denver
modern reference sample (Humphrey, 2003; Johnston, 1962;Miles and Bulman, 1994; Pinhasi
et al., 2005). Humphrey (2003) examined fluctuations in femoral growth trajectories amongst
archaeological samples from various periods and regions of theworld, dated between 3000 BC
to nineteenth century AD, relative to the Denver sample (c.f. Humphrey, 2003, Table 6.1). Her
results indicate marked fluctuations in growth trajectories of the femur, which are most
pronounced during the first three years of life. She reports a notable similarity between the
growth trajectories of the three Native American populations, which was not found amongst
other samples: an increase in percentage of adult size attained relative to the Denver sample in
the first three years of life. This trend reflects a more rapid rate of femoral growth in the Native
American samples during infancy and early childhood than amongst the other samples and
therefore there may be a genetic component to this pattern (Humphrey, 2003). However, this
Variability in Long Bone Growth Patterns and Limb Proportions 195

pattern may be also attributed to other factors, such as a systematic underestimation of age of
infants due to delays in dental development formation stages, and variations in weaning and
dietary patterns.
Pinhasi and colleagues (2005) examined inter-population variability in long bone and
pelvic bone growth (ilium, ischium and pubis) during the Early Medieval period by
comparing the growth trajectories of four archaeological populations: two Slavonic
(Gars–Thunau, Zwentendorf, Austria, tenth-century AD), one Avar (Zw€olfaxing, Austria,eighth-century AD), and one Anglo-Saxon (Raunds, England, tenth-century AD). In this
comparison, it was expected that:
1. the greatest differences in growth patterns would be found between theAnglo-Saxon and the
Austrian samples due to their distinct genetic and biocultural background; and
2. minimal differences would be detected between the two Slavonic populations, as these
were approximately contemporaneous, recovered from geographically close locations, and
shared relatively similar archaeological contexts.
The results showed significant differences in long bone growth between populations in the
growth patterns of distal diaphyseal dimensions of the femur and humerus and the dimen-
sions of the ilium. Inter-population variability in growth curves for femoral and humeral
dimensions were most pronounced during infancy (0–2 years). The most consistent differ-
ences in bone growth and related dimensions were those between Zw€olfaxing and the other
samples and these may be attributed to inter-population differences in weaning practices,
overall health and other environmental factors (Pinhasi et al., 2005). No significant
differences in growth were detected between the Anglo-Saxon and the Austrian populations,
despite the fact that these were less likely to share genetic attributes than the Central
European samples. The results therefore suggest that varying growth patterns are associated
with inter-population differences in absolute dimensions relative to age, but that these
differences are not uniform for all bones. Thismay reflect differences in growth velocities at a
given age interval for different bones, and perhaps also differences in the extent to which the
growth of a given bone dimension is affected by fluctuations in environmental conditions
such as diet and disease, and variation in the timing of susceptibility of growth to
environmental perturbations during development.
In another study, Pinhasi and colleagues (2006) assessed the effects of vitamin D
deficiency related rickets on long bone growth in post-medieval skeletal populations from
East London (Broadgate and Christ Church Spitalfields). The study revealed that rickets had
no effect on the growth curves for any of the long bones studied but a pronounced variation in
growth between the populations was noted to occur during infancy and early childhood (from
birth to 4 years of age), which was followed by ‘catch-up’ growth in which growth trajectories
paralleled those attained by the children from theDenver reference sample. These similar trends
were observed in the East London samples, despite differences in socioeconomic status.
The analysis of changes of lower and upper limb proportions during growth and development
from birth to 14 years of age illustrates a contrast between the tibio-femoral index (Figures 8.6
and 8.7) and the radio-humeral index (Figures 8.8 and 8.9). The Mesolithic and Neolithic
samples have higher tibio-femoral indices than the Denver sample, while their radio-humeral
indices fluctuate both above and below the Denver reference line. However, the Denver index
for the age of 2 months is 0.799, while the forensic assessment of 138 modern Hungarian
196 Human Bioarchaeology of the Transition to Agriculture

foetuses (Fazekas andKosa, 1978) gave average indices of 0.877, 0.870 and 0.876 for foetal age
of 9, 9.5 and 10 lunar months, respectively. The Hungarian values are therefore closer in value
to those of the Neolithic newborns (both the Danube Gorges and Greek samples) but are still
lower than those of some of the Mesolithic newborns. It is possible that the high tibio-femoral
indices for the Mesolithic newborns reflect different relative growth velocities of the femur
and tibia than the average values reported for modern reference samples. The relatively low
tibio-femoral values of the Denver sample, which was comprised of children from above-
average socioeconomic status and good health (Maresh, 1943, 1955), may be due to the effects
of reduced oxygen intake, thermal variations and other high-elevation conditions on the
children from Denver county (�1600m above sea level), as has been reported in the case of
Highland Ecuadorian infants (Leonard et al., 2000).
The assessment of intra-individual variation in the attainment of dimension-per-age
(Table 8.3) does not indicate any clear pattern of inter-sample differences but suggests that
there is a high degree of variability between individuals within a population that perhaps
exceeds inter-population variability (although not tested here). Smith and Buschang (2004)
examined the Denver mixed longitudinal data for boys and girls between 3 and 10 years of age
and found that inter-bone differences in growth velocity parallel inter-bone differences in size.
Hence, greater velocities and sizes are recorded for proximal limb bones (femur, humerus) in
comparison to distal limb bones (tibia, radius, ulna). They also report an overall uniformpattern
of childhood growth for this age interval. On average, the size of one bone explains 71% of the
variation in the size of the other bones as well as a close coordination of inter-bone (diaphyseal)
growth velocities. They state that:
despite the aforementioned growth gradients and the allometric difference between limbs,
the growth changes of all long bones are closely associated. For example, growth of the girls’
tibia explains 79% of variation in the growth of the girls’ radius. This suggests that the
same control mechanisms, hormonal or otherwise, regulate childhood long bone growth in
a parsimonious fashion (Smith and Buschang, 2004: p. 654).
The results of the comparison of archaeological samples in this study suggest somewhat
different results. Indeed, the overall homogeneity of growth patterns of the various limb bones
of the Denver (Maresh) samples is evident in Figures 8.6 to 8.9, whereas theDenver sample has
nearly a constant tibio-femur index for all ages, and a decelerating (age 0–2) and then relatively
constant (age 2–12) radio-humeral index. But the assessment of individual inter-limb dimen-
sions-per-age from the Greek Neolithic and Danube Gorges Mesolithic and Neolithic sites
indicates a medium-to-high degree of variability. In the case of the tibio-femoral index, all the
studied individuals have index values that exceed those of the Denver sample. To some extent,
variation in this trend may be driven by the fact that tibial lengths appear to be more variable
than femoral lengths in response to environmental stress and individual variation (Holliday and
Ruff, 2001), but they may also be the result of sampling bias due to small sample sizes.
In his assessment of variability in femoral/humeral limb proportions by age in the Denver
Study sample, Ruff (2003) reports a relatively constant log-linear increase in proportions
from the age of 6 months to the age of 5, followed by a more moderate increase from the age
of 5 to 12.5 years. His study also indicates that growth trajectories of length, strength and
proportions of proximal limb bones are largely independent. Femoral strength patterns are
related to biomechanical demands that do not seem to affect length proportions. In fact, Ruff
states that:
Variability in Long Bone Growth Patterns and Limb Proportions 197

. . .the characteristically longer human femur begins to develop even prior to birth and
femoral/humeral proportions are already not far from adult proportions (within 10%) in
infancy. Thus, it seems likely that long bone length proportions are highly heritable,
although partially environmentally modifiable (Ruff, 2003: 338).
Hence, the observed variability in femoral/humeral proportions amongst the Danube Gorges
individuals may reflect intra-population variations in heritability of the genotypic complex
traits that control and modify diaphyseal limb length growth, although we cannot rule out the
possibility of environmental influences.
8.6 CONCLUSIONS
This study focused on the analysis of inter-population variability in the growth trajectories of
limb bones, and intra-population and intra-individual variations in growth proportions and the
attainment of dimensions-per-age amongst Danube Gorges and Greek Neolithic populations.
The aim was not only to compare and contrast pre-agricultural vs. agricultural growth
trajectories (in the case of the Danube Gorges region) but also Neolithic subadults from two
regions in southeast Europe–Greece and Serbia. The main limitation of this study is the small
sample sizes utilized and the paucity of children and early adolescents. Consequently, much
emphasis has been placed on the visual interpretation of interpolated growth curves and
dimensions-per-age of individual cases. In the case of the Danube Gorges region, the
relatively large samples of newborns and infants from the Mesolithic and Neolithic contexts
facilitated a comparison of pre-agricultural vs. agricultural variations in long bone dimen-
sions that revealed no significant differences in most dimensions with the exception of tibial
midshaft minimal and maximal breadth dimensions. However, it is important to note that in
the Danube Gorges, the Mesolithic-early Neolithic period (i.e. samples included in this study)
reflects a continuum of Mesolithic economic and cultural patterns, while the Neolithic pottery
of the Star�cevo-K€or€os-Cris only appears in the later stages of the Neolithic, reflecting the
gradual nature of cultural change in this region (Bori�c et al., 2004). In contrast, the Greek
Neolithic samples are all from fully agricultural communities and hence the subadult burials
are associated with fully Neolithic subsistence (see Papathanasiou, this volume). It is
therefore interesting to note that the Gompertz growth curves of diaphyseal dimension-
per-age revealed differences between the Danube Gorges Mesolithic, Greek Neolithic, and
those of the Broadgate, the Denver samples and the individual Danube Gorges Neolithic
cases. The Greek Neolithic subadults show a contrast between tibial and femoral dimensions-
per-age, which are altogether close to those of the average Denver curve, while those of the
ulna and radius fall closer to the Denver’s�2SD curve. In the case of the femur, attained
dimensions close to those of the Denver average dimensions-per-age occur in the Greek
Neolithic sample at the age of 2 to 4, while they occur in the Danube Gorges Mesolithic
sample at around the age of 8 to 10.
8.6.1 The Analysis of the Tibio-Femoral and Radio-Humeral Indices
Individuals from the Mesolithic and Neolithic Danube Gorges populations have indices-per-
age that are always larger than the Denver average. The Greek samples display less variation
than the Danube Gorges Neolithic and Mesolithic populations, while the Danube Gorges
198 Human Bioarchaeology of the Transition to Agriculture

Mesolithic population has the greatest variability in tibio-femoral dimensions at birth or during
infancy. In contrast, the individuals from the Danube Gorges Mesolithic and Neolithic and the
Greek Neolithic population have radio-humeral indices that are within the range of the Denver
reference curve and those of other archaeological populations. The analysis of femoral/
humeral length proportions for all individuals in this study highlights the difference in the
proportions of the two individuals from the Danube GorgesMesolithic sample and those of the
Neolithic, which in turn contrasts with the less pronounced variability amongst the Greek
Neolithic infants (although only three cases).
Finally, intra-individual variation in attainment of diaphyseal long bone dimensions-per-age
show a significant degree of intra-limb variation and hence reaffirms Maresh’s (1955)
observation that even amongst healthy individuals, there is a significant degree of inter-bone
differences in attainment of dimensions-per-age. Since the Denver Study, only included
healthy infants and children from middle-class Caucasian American families, it remains
unclear whether these variations can be attributed to genetic variability that affects ontogenetic
and growth processes, differences in other biological aspects such asmetabolism, immunity, or
perhaps some environmental differences in diet and other conditions between the subadults
from the different households.
The observations made in this study must be considered as preliminary due to the small
sample size. Nonetheless, the comparison of inter-bone variation in growth of archaeological
cases to ‘standard’ eferences (Denver Study) point out the potential of archaeological growth
studies that go beyond the interpretation of average trends and seek the more complex patterns
of variation in growth between individuals and population variation inherent to the growth
process. Further research, which combines growth analysis with health status (paleopatho-
logical markers) and diet (stable isotope analysis), of these Mesolithic and Neolithic popula-
tions, may reveal important information about whether the transition to agriculture in southeast
Europe has caused some alternations in the growth trajectories and, if so, chart the specific
nature of these changes.
REFERENCES
Adair, S. (1999) Filipino children exhibit catch-up growth from age 2 to 12 years. J. Nutr., 129,
1140–1148.
Bennike, P., Lewis, M.E., Schutkowski, H. and Valentin, F. (2005) Comparison of child morbidity in two
contrasting medieval cemeteries from Denmark. Am. J. Phys. Anthropol., 128 (4), 734–746.
Berti, P.R., Leonard, W.R. and Berti, W.J. (1998) Stunting in an Andean community: prevalence and
etiology. Am. J. Hum. Biol., 10, 229–240.
Boddington, A. andCadman, G. (1981) Raunds Furnells: An interim report on excavations 1977–1980, in
Anglo-Saxon Studies in Archaeology and History Cambridge (eds J. Campbell and S.C. Hawkes),
British Archaeological Reports, British Series, Oxford, pp. 103–122.
Bogin, B. (1999) Evolutionary perspective on human growth. Annu. Rev. Anthropol., 28(1), 109–153.
Bogin, B. and Smith, B.H. (1996) Evolution of the human lifecycle. Am. J. Hum. Biol., 8, 703–716.
Bori�c,D. (2002) TheLepenski Vir conundrum: reinterpretation of theMesolithic andNeolithic sequences
in the Danube Gorges. Antiquity, 76, 1026–1039.
Bori�c, D. and Stefanovi�c, S. (2004) Birth and death: infant burials from Vlasac and Lepenski Vir.
Antiquity, 78, 526–546.
Bori�c, D., Grupe, G., Peters, J. and Miki�c, �Z. (2004) Is the Mesolithic-Neolithic subsistence dichotomy
real? New stable isotope evidence from the Danube Gorges. Eur. J. Archaeol., 7(3), 221–248.
Variability in Long Bone Growth Patterns and Limb Proportions 199

Bori�c, D. (2007) Mesolithic-Neolithic Interactions in the Danube Gorges, in Mesolithic-Neolithic
Interactions in the Danube Basin (eds J.K. Kozlowski and M. Nowak), British Archaeological
Reports, International Series, Oxford, pp. 31–45.
Buikstra, J.E. and Ubelaker, D.H. (1994) Standards for Data Collection from Human Skeletal Remains.
Fayetteville: Arkansas Archeological Survey.
Cook, D.C. (1984) Subsistence and health in the Lower Illinois Valley: osteological evidence, in
Paleopathology at the Origins of Agriculture (eds M.N. Cohen and G.J. Armelagos), Academic
Press, Orlando, FL, pp. 237–270.
Dawes, J.D. andMagilton, J.R. (1980) TheCemetery of St Helen-on-the-Walls, The archaeology ofYork.
The Medieval cemeteries 12/1 Tork: Council for British Archaeology for York Archaeological Trust,
Aldwark.
Fazekas, I.G.y. and Kosa, F. (1978) Forensic Fetal Osteology, Akad�emiai Kiado, Budapest.
Garn, S.M., Lewis, A.B. and Polacheck, D.L. (1959) Variability of tooth formation. J. Dent. Res., 28,
135–148.
Holliday, T.W. and Ruff, C.B. (2001) Relative variation in human proximal and distal limb segment
lengths. Am. J. Phys. Anthropol., 116, 26–33.
Hummert, J.R. and Van Gerven, D.P. (1983) Skeletal growth in a medieval population from Sudanese
Nubia. Am. J. Phys. Anthropol., 60, 471–478.
Humphrey, L.T. (2000) Growth studies of past populations: an overview and an example, in Human
Osteology in Archaeology andForensic Science (eds S.Mays andM.Cox), GreenwichMedicalMedia,
London, pp. 25–38.
Humphrey, L.T. (2003) Linear growth variation in the archaeological record, in Patterns of Growth and
Development in the Genus Homo (eds J.L. Thmpson, G.E. Krovitz and A.J. Nelson), Cambridge
University Press, Cambridge, pp. 144–169.
Jacobsen, T.W. (1969) Excavations at Porto Cheli and vicinity, preliminary report, II: the Franchthi Cave,
1967–1968. Hesperia, 38, 343–381.
Jacobsen, T.W. (1973a) Excavation in the Franchthi Cave, 1969–1971, part I. Hesperia, 42, 45–88.
Jacobsen, T.W. (1973b) Excavation in the Franchthi Cave, 1969–1971, part II. Hesperia, 42,
253–283.
Jantz, R.L. andOwsley, D.W. (1984) Long bone growth amongArikara skeletal populations.Am. J. Phys.
Anthropol., 63(1), 13–20.
Johnston, F.E. (1962) Growth of long bones of infants and young children at Indian Knoll. Am. J. Phys.
Anthropol., 20, 249–254.
Karamitrou-Mendesidi, G. (1998) Xirolimni Kozanhs 1998. To Archaiologiko Ergo sth Makedonia kai
sti Thraki, 12, 472–474.
Karamitrou-Mendesidi, G. (2005) Mavropigi 2005: Lignitorycheia kai Archaiothtes. To Archaiologiko
Ergo sth Makedonia kai sti Thraki, 19, 511–539.
Larsen, C.S. (1997) Bioarchaeology, Cambridge University Press, Cambridge.
Leonard, W.R., Dewalt, K.M., Stansbury, J.P. andMcCaston, M.K. (2000) Influence of dietary quality on
the growth of highland and coastal Ecuadorian children. Am. J. Hum. Biol., 12, 825–837.
Lewis, M.E. (2002a) The impact of industrialisation: Comparative study of child health in four sites from
medieval and post-medieval England (850–1859). Am. J. Phys. Anthropol., 119, 211–223.
Lewis, M.E. (2002b) Urbanisation and Child Health in Medieval and Post-Medieval England, BAR,
Oxford.
Lewis, M.E.P.D. (2007) The Bioarchaeology of Children: Perspectives from Biological and Forensic
Anthropology (ed. Mary E. Lewis), Cambridge University Press, Cambridge, p. 255.
Lovejoy, C.O., Russell, K.F. and Harrison, M.L. (1990) Long bone growth velocity in the Libben
population. Am. J. Hum. Biol., 2, 533–542.
Maresh,M.M. (1943)Growth of themajor long bones in healthy children.Am. J.Dis. Child., 66, 227–257.
200 Human Bioarchaeology of the Transition to Agriculture

Maresh, M.M. (1955) Linear growth of long bones of extremities from infancy through adolescence. Am.
J. Dis. Child., 89, 725–742.
Maresh, M.M. (1970) Measurements from roentgenograms, inHuman Growth and Development (ed. R.
W. McCammon), Charles C. Thyomas, Springfield, pp. 157–200.
Mays, S., Brickley, M. and Ives, R. (2008) Growth in an English population from the Industrial
Revolution. Am. J. Phys. Anthropol., 136(1), 85–92.
Mays, S., Brickley, M. and Ives, R. (2009a) Growth and vitamin D deficiency in a population from 19th
century Birmingham. England. Int. J. Osteoarchaeol., 19(3), 406–415.
Mays, S., Ives, R. and Brickley, M. (2009b) The effects of socioeconomic status on endochondral and
appositional bone growth, and acquisition of cortical bone in children from 19th century Birmingham,
England. Am. J. Phys. Anthropol., 140(3), 410–416.
Mays, S.A. (1999) Linear and appositional long bone growth in earlier human popultaions: a case study
frommedieval England, inHumanGrowth in the Past: Studies fromBones and Teeth (eds R.D.Hoppa
and C. Fitzgerald), Cambridge University Press, Cambridge, pp. 290–312.
Mensforth, R.P. (1985) Relative tibia long bone growth in the Libben and Bt-5 prehistoric skeletal
populations. Am. J. Phys. Anthropol., 68(2), 247–262.
Merchant, V.L. and Ubelaker, D.H. (1977) Skeletal growth in the protohistoric Arikara. Am. J. Phys.
Anthropol., 46, 61–72.
Miles, A.E.W. and Bulman, J.S. (1994) Growth curves of immature bones from a Scottish island
population of 16th tomid-19th century: limb-bone diaphyses and some bones of the hand and foot. Int.
J. Osteoarchaeol., 4, 121–136.
Molleson, T. and Cox, M. (1993) The Spitalfields Project, Volume 2: The Anthropology, Council for
British Archaeology, York, CBA Research Report.
Moorrees, C.F.A., Fanning, E.A. and Hunt, E.E. (1963a) Age variation of formation stages for ten
permanent teeth. J. Dent. Res., 42, 1490–1502.
Moorrees, C.F.A., Fanning, E.A. and Hunt, E.E. (1963b) Formation and resorption of three deciduous
teeth in children. Am. J. Phys. Anthropol., 21, 205–213.
Papathanasiou, A. (ed.) (1996)Neolithic Civilization inGreece, Goulandris Foundation, Athens, Greece.
Papathanasiou, A. (2001) A Bioarchaeological Analysis of Neolithic Alepotrypa Cave, Greece,
International Series 961, BAR, Oxford.
Pinhasi, R. and Bourbou, C. (2008) How representative are human skeletal assemblages for population
analysis? in Advances in Human Palaeopathology (eds R. Pinhasi and S. Mays), Wiley-Liss,
Chichester, UK, pp. 31–44.
Pinhasi, R., Teschler-Nicola, M., Knaus, A. and Shaw, P. (2005) Cross-population analysis of the growth
of long bones and the os coxae of three early medieval Austrian populations. Am. J. Hum. Biol., 17,
470–488.
Pinhasi, R., Shaw, R., White, B. and Ogden, D. (2006) Morbidity, rickets, and long bone growth in post-
medieval Britain – a cross-population analysis. Ann. Hum. Biol., 33, 372–389.
Ribot, I. and Roberts, C. (1996) A study of non-specific stress indicators and skeletal growth in two
medieval subadult populations. J. Anthropol. Sci., 23, 67–79.
Roksandi�c, M. (1999) Transition from Mesolithic to Neolithic in the Iron Gates Gorge: Physical
Anthropology Perspective, Simon Fraser Universit, Burnaby.
Ruff, C. (2003) Ontogenetic adaptation to bipedalism: age changes in femoral to humeral length
and strength proportions in humans, with a comparison to baboons. J. Hum. Evol., 45(4),
317–349.
Ruff, C. (2007) Body size prediction from juvenile skeletal remains. Am. J. Phys. Anthropol., 133(1),
698–716.
Saunders, S.R. (1992) Subadult skeletons and growth related studies, in Skeletal Biology of Past Peoples:
Rtesearch Methods (eds S.R. Saunders and M.A. Katzenberg), Wiley-Liss, New York, pp. 1–19.
Variability in Long Bone Growth Patterns and Limb Proportions 201
Saunders, S.R. (2000) Subadult skeletons and growth-related studies, in Biological Anthropology of the
Human Skeleton (eds M.A. Katzenberg and S.R. Saunders), Wiley-Liss, New York, pp. 135–161.
Saunders, S.R. and Hoppa, R.D. (1993) Growth deficit in survivors and non-survivors: biological
correlates of mortality bias in subadult skeletal samples. Yearb. Phys. Anthropol., 36, 127–151.
Schofield, J. and Maloney, C. (eds) (1998) Archaeology in the City of London, 1907–1991: A Guide to
Records of Excavations by theMuseum of London and its Predecessors, Museum of London, London.
Sinclair, D. and Dangerfield, P. (1998) Human Growth After Birth, 6th edn, Oxford University Press,
Oxford.
Smith, B.H. (1991) Standards of human tooth formation and dental age assessment, inAdvances in Dental
Anthropology (eds M.A. Kelley and C.S. Larsen), Wiley-Liss, New York, pp. 143–168.
Smith, S.L. and Buschang, P.H. (2004) Variation in longitudinal diaphyseal long bone growth in children
three to ten years of age. Am. J. Hum. Biol., 16, 648–657.
Srejovi�c, D. (1981) Lepenski Vir: Menschenbilder Einerfr€uhen Europ€aischen Kultur, Verlag Philipp vonZabern, Mainz am Rhein.
Srejovi�c, D. and Letica, Z. (1978)Vlasac: AMesolithic settlement in the IronGates, SerbianAcademy of
Sciences and Arts, Belgrade.
Stloukal, M. and H�anakov�a, H. (1978) The Length of long bones in ancient Slavonic populations with
particular consideration to the questions of growth. Homo, 29, 53–69.
Sundick, R.I. (1978) Human skeletal growth and age determination. Homo, 29, 228–248.
Tanner, J.M. (1986) Growth as a target-seeking function; Catch-up and catch-down growth in man, in
HumanGrowth: AComprehensive Treatise, Vol. 3, 2nd edn (eds F. Falkner and J.M. Tanner), Plenum,
New York, pp. 167–179.
Tanner, J.M. (1998) A brief history of the study of human growth, in The Cambridge Encyclopedia of
Human Growth and Development (eds S. Ulijaszek, F.E. Johnston and M.A. Preece), Cambridge
University Press, Cambridge, pp. 2–7.
Tompkins, R.L. (1996) Human population variability relative to dental development. Am. J. Phys.
Anthropol., 99, 79–102.
Tringham, R. (2000) Southeastern Europe in the transition to agriculture in Europe: bridge, buffer or
mosaic, inEurope’s first Farmers (ed. T.D. Price), CambridgeUniversity Press, Cambridge, pp. 19–56.
Wood, J.W.,Milner, G.R., Harpending, H.C. andWeiss, K.M. (1992) The osteological paradox. Problems
of inferring prehistoric health from skeletal samples. Curr. Anthropol., 33, 343–370.
World Health Organization growth standards http://www.who.int/childgrowth/en/.
Wright, L.E. and Yoder, C.J. (2003) Recent progress in bioarchaeology: approaches to the osteological
paradox. J. Archaeol. Res., 11, 43–70.
202 Human Bioarchaeology of the Transition to Agriculture


![Palaeolithic and Mesolithic research in the central Balkans [2014]](https://static.fdokumen.com/doc/165x107/63333a85ce61be0ae50e8b63/palaeolithic-and-mesolithic-research-in-the-central-balkans-2014.jpg)