Variability and the Severity of the “Little Dry Season” in ...
11
Variability and the Severity of the “Little Dry Season” in Southwestern Nigeria JAMES O. ADEJUWON AND THEOPHILUS O. ODEKUNLE Department of Geography, Obafemi Awolowo University, Ile-Ife, Nigeria (Manuscript received 30 August 2004, in final form 18 August 2005) ABSTRACT The Little Dry Season (LDS) of West Africa is manifested as a decline in both the frequency and amount of daily rainfall for a number of weeks halfway through the rainy season. The mean or climatological LDS is derived from the slope of the cumulative percentage graph of 5-day mean rainfall (daily rainfall data between 1961 and 2000). LDS variability analysis was carried out using the concept of relative variability. The results obtained showed that LDS is observed from mid-July to mid-September along the coast. Northward and eastward the period of occurrence decreases. In general, the phenomenon is not observed north of the eastward-flowing or east of the southward-flowing River Niger. The results also show consid- erable interannual variability. Variability was highest along the southwestern coast and declined inland northward and eastward. Variability was highest with respect to total rainfall, followed by length and number of rain days. There are indications that for most years the LDS was only relatively dry while in certain years it represented a period of drought. The occurrence of the LDS in space and time is explained by the movements of the intertropical discontinuity and its associated zone of rainfall. Interannual vari- ability in occurrence and severity are determined by the Walker Circulation phenomenon. Variability in the severity of the LDS has mixed implications for agricultural practices. 1. Introduction The Little Dry Season (LDS) is a climatological phe- nomenon, which manifests itself as a decline in both the frequency and amount of daily rainfall for a number of weeks halfway through the rainy season (Hamilton and Archibold 1945;;Ilesanmi 1972, 1981). The phenom- enon appears in the annual rainfall curve in the form of a decline in the July–August rainfall. The reduction in rainfall becomes noticeable in the last week of July, intensifies through August, and dissipates thereafter (Ilesanmi 1981). Adefolalu (1972), Adekoya (1979), Omotosho, (1988) show that the phenomenon is pecu- liar to the part of West Africa lying between 4° and 9°N and 7°E and 12°W . This means that the area of occur- rence of this phenomenon in Nigeria is limited and pe- culiar to the southwestern part between 4°–9°N and 3°–7°E (Fig. 1). Studies have indicated the beneficial effects of the phenomenon. It is put to good use in the agricultural calendar in three main ways: (i) it is seen as a period of the growing season during which conditions are favor- able for weeding; (ii) it is also a period when conditions are favorable for the spraying of some crops with in- secticides and pesticides, and (iii) LDS is seen as a phe- nomenon that favors good yield of yam (Osunade 1994). When it occurs with normal intensity it favors good yield of early crops, which are ready for harvest- ing at the times of its occurrence (indigenous knowl- edge). However, when the LDS comes up too early during the growing season it could spell disaster for early crops. In other years, when the LDS persists too late into the second half of the growing season, the length of the growing season is reduced, resulting in widespread crop failure. The foregoing clearly shows the LDS as a phenomenon of some economic signifi- cance especially for crop production. Therefore, knowl- edge of variability and intensity of this phenomenon could be put to good use while laying down the plans for an upcoming growing season. In general, earlier studies of the LDS concentrated mainly on the causes and the spatial variation of the phenomenon, neglecting its temporal variability and se- Corresponding author address: Dr. James O. Adejuwon, De- partment of Geography, Obafemi Awolowo University, Ile-Ife, Nigeria. E-mail: [email protected] 1FEBRUARY 2006 NOTES AND CORRESPONDENCE 483 © 2006 American Meteorological Society Unauthenticated | Downloaded 01/10/22 05:54 PM UTC
-
Upload
khangminh22 -
Category
Documents
-
view
0 -
download
0
Transcript of Variability and the Severity of the “Little Dry Season” in ...

Variability and the Severity of the “Little Dry Season” in Southwestern Nigeria
JAMES O. ADEJUWON AND THEOPHILUS O. ODEKUNLE
Department of Geography, Obafemi Awolowo University, Ile-Ife, Nigeria
(Manuscript received 30 August 2004, in final form 18 August 2005)
ABSTRACT
The Little Dry Season (LDS) of West Africa is manifested as a decline in both the frequency and amountof daily rainfall for a number of weeks halfway through the rainy season. The mean or climatological LDSis derived from the slope of the cumulative percentage graph of 5-day mean rainfall (daily rainfall databetween 1961 and 2000). LDS variability analysis was carried out using the concept of relative variability.The results obtained showed that LDS is observed from mid-July to mid-September along the coast.Northward and eastward the period of occurrence decreases. In general, the phenomenon is not observednorth of the eastward-flowing or east of the southward-flowing River Niger. The results also show consid-erable interannual variability. Variability was highest along the southwestern coast and declined inlandnorthward and eastward. Variability was highest with respect to total rainfall, followed by length andnumber of rain days. There are indications that for most years the LDS was only relatively dry while incertain years it represented a period of drought. The occurrence of the LDS in space and time is explainedby the movements of the intertropical discontinuity and its associated zone of rainfall. Interannual vari-ability in occurrence and severity are determined by the Walker Circulation phenomenon. Variability in theseverity of the LDS has mixed implications for agricultural practices.
1. Introduction
The Little Dry Season (LDS) is a climatological phe-nomenon, which manifests itself as a decline in both thefrequency and amount of daily rainfall for a number ofweeks halfway through the rainy season (Hamilton andArchibold 1945;;Ilesanmi 1972, 1981). The phenom-enon appears in the annual rainfall curve in the form ofa decline in the July–August rainfall. The reduction inrainfall becomes noticeable in the last week of July,intensifies through August, and dissipates thereafter(Ilesanmi 1981). Adefolalu (1972), Adekoya (1979),Omotosho, (1988) show that the phenomenon is pecu-liar to the part of West Africa lying between 4° and 9°Nand 7°E and 12°W. This means that the area of occur-rence of this phenomenon in Nigeria is limited and pe-culiar to the southwestern part between 4°–9°N and3°–7°E (Fig. 1).
Studies have indicated the beneficial effects of the
phenomenon. It is put to good use in the agriculturalcalendar in three main ways: (i) it is seen as a period ofthe growing season during which conditions are favor-able for weeding; (ii) it is also a period when conditionsare favorable for the spraying of some crops with in-secticides and pesticides, and (iii) LDS is seen as a phe-nomenon that favors good yield of yam (Osunade1994). When it occurs with normal intensity it favorsgood yield of early crops, which are ready for harvest-ing at the times of its occurrence (indigenous knowl-edge). However, when the LDS comes up too earlyduring the growing season it could spell disaster forearly crops. In other years, when the LDS persists toolate into the second half of the growing season, thelength of the growing season is reduced, resulting inwidespread crop failure. The foregoing clearly showsthe LDS as a phenomenon of some economic signifi-cance especially for crop production. Therefore, knowl-edge of variability and intensity of this phenomenoncould be put to good use while laying down the plansfor an upcoming growing season.
In general, earlier studies of the LDS concentratedmainly on the causes and the spatial variation of thephenomenon, neglecting its temporal variability and se-
Corresponding author address: Dr. James O. Adejuwon, De-partment of Geography, Obafemi Awolowo University, Ile-Ife,Nigeria.E-mail: [email protected]
1 FEBRUARY 2006 N O T E S A N D C O R R E S P O N D E N C E 483
© 2006 American Meteorological Society
JCLI3642
Unauthenticated | Downloaded 01/10/22 05:54 PM UTC

verity (e.g., Ireland 1962; Ilesanmi 1972). Therefore themain objectives of this study are to
1) determine the mean period of the occurrence ofLDS in southwestern Nigeria;
2) assess the variability in the duration, the total rain-fall, the number of rain days, and the intensity of theLDS; and
3) assess the severity of the LDS in the area defined forthe study.
2. Study area
The study reported here should be regarded as a casestudy as it does not cover all the areas of occurrence ofthe LDS, which includes Liberia, the Ivory Coast,Ghana, Togo, and the Benin Republic in addition tosouthwestern Nigeria. The study area lies to the southand to the west of the River Niger in Nigeria as shownin Fig. 1. As in the other parts of West Africa, theclimate of the area is determined by the interplay ofthree major airstreams: the tropical maritime (Tm) airmass, the tropical continental (Tc) air mass, and theequatorial easterlies (Ojo 1977; Iloeje 1981). The Tmair mass originates from the St. Helena anticyclone lo-cated off the coast of Namibia and in its trajectory,picks up moisture form over the South Atlantic Ocean,crosses the equator, and enters southwestern Nigeria.
The Tc air mass originates from the Libyan anticyclonenorth of the tropic of Cancer. It picks up little moisturealong its path and is thus dry. The two air masses (Tmand Tc) meet along a slanting surface called intertropi-cal discontinuity (ITD). The equatorial easterlies rep-resent a rather erratic cool air mass, which comes fromthe east and flows in the upper atmosphere along theclimatic equator. Occasionally the air mass dives, andundercuts the Tm or Tc air mass and gives rise to linesqualls or dust devils (Iloeje 1981).
The study area experiences marked wet and dry sea-sons associated with, moist Tm and dry (Tc) currents,respectively. In most parts of southwestern Nigeria, thewet season extends from April to October (Hamiltonand Archibold 1945; Ireland 1962). Since the rainfall isbimodal, the growing season has been divided into“early” and “late,” separated by the LDS. Over thestudy area, the mean annual rainfall varies from about1200 mm along the northern boundary of the area ofstudy to over 3000 mm along the coast.
The mean annual maximum temperature is about35°C in Ilorin, Nigeria, in the north, and 30°C in Lagos,Nigeria, in the south, while the mean minimum tem-perature is about 24°C in Lagos and 21°C in Ilorin. Theintra-annual temperature range, as in other tropicalcountries, is low, with an average value of 6°C. In factin some southern stations, it may be as low as 3°C (Il-oeje 1981). The mean relative humidity decreases from
FIG. 1. Southwestern Nigeria.
484 J O U R N A L O F C L I M A T E VOLUME 19
Unauthenticated | Downloaded 01/10/22 05:54 PM UTC

the south to the north, with the maximum of 88% oc-curring around Lagos (Adejuwon and Jeje 1976).
3. Methodology
a. Data source
The climatic data used in this study were the dailyrainfall total. The data were sourced from the archivesof the Nigerian Meteorological Agency, Oshodi, Lagos.The data were collected for the selected rainfall stations(shown in Fig. 1.) for the period from 1961 to 2000 (40yr).
b. Data analysis
The LDS can be characterized in terms of length indays, total rainfall in millimeters, number of rain days,and seasonal intensity of rainfall. The latter is definedas the amount of seasonal rainfall in millimeters dividedby the number of days covered by the season as awhole. The mean or climatological LDS is derived fromthe slope of the cumulative percentage graph of 5-daymean rainfall (Ilesanmi 1972). The basic steps for com-piling data for the graph for each station involved thefollowing:
• The computation of the mean total rainfall for each5-day period from 1 January to 31 December usingthe daily rainfall data for the period from 1961 to2000.
• Also, the computation of the mean annual total rain-fall for the period from 1961 to 2000 for each meteo-rological station.
• The computation of the percentage of the mean an-nual rainfall that the mean of each 5-day period isresponsible for producing.
• The calculation of the cumulative percentage of themean annual rainfall from 1 January up to the end ofeach 5-day period.
• Drawing the graphs of the mean cumulative percent-age of the 5-day mean rainfall from January to De-cember.
The results for each of the four meteorological sta-tions used in this exercise are depicted in Figs. 2, 3, 4,and 5. The onset or beginning of the LDS is the firstpoint of maximum negative curvature, while the cessa-tion or end is the second point of maximum positivecurvature on the graph. (The first point of maximumpositive curvature is used to define the onset of therainy season as a whole.) These points can be easilyidentified by visual observation of the respective
FIG. 2. LDS onset and retreat dates in Ikeja (1961–2000).
1 FEBRUARY 2006 N O T E S A N D C O R R E S P O N D E N C E 485
Unauthenticated | Downloaded 01/10/22 05:54 PM UTC

FIG. 3. Same as in Fig. 2, but for Benin (1961–2000).
FIG. 4. Same as in Fig. 2, but for Ibadan (1961–2000).
486 J O U R N A L O F C L I M A T E VOLUME 19
Unauthenticated | Downloaded 01/10/22 05:54 PM UTC

graphs. The mean length of the LDS is the period ex-tending from the date of the onset to the date of ces-sation given in number of days. Also, the mean rainfalland the mean number of rain days of the LDS are themeans of the observations within the mean period ofoccurrence of the LDS. There is a mean cumulativepercentage of the total annual rainfall, which corre-sponds to the onset, and another, which corresponds tothe end of the LDS. The length, the rainfall, the numberof rain days, and the seasonal rainfall intensity of theLDS are respectively defined by the periods betweenthe dates when these two cumulative percentage pointsare attained each year.
As observed by Nieuwolt (1982), the definition ofwhat constitutes a rain day is far from uniform. Forinstance, most countries of the British Commonwealthuse a lower limit of 0.25 mm, but other countries havefixed it at 1, 2, or 5 mm. In many tropical countries, thelower limit of only 0.25 mm is employed. In Nigeria, arain day is one with at least 0.3 mm of rainfall. But aspointed out by Nieuwolt (1982), in warm climates likesouthwestern Nigeria, total rainfall of less than about 2mm is of little significance for agriculture or water sup-ply usage since most of the small amounts will evapo-
rate before infiltrating the soils. Therefore, in thisstudy, a day is counted as rainy, when it has 2 mm ormore of rainfall.
Relative to the mean characteristics, the LDS variesfrom one year to the other with respect to the length,the total rainfall, number of rain days, and the seasonalintensity of rainfall. The concept of variability has beenadopted in the current analysis, to capture the essenceof the interannual changes in the LDS characteristicsand severity. In fact changes in any of the characteris-tics connote changes in severity. There are many mea-sures of variability, but the two most widely used arerelative variability and coefficient of variation (Ayoade1988). As observed by Ayoade (1988), the coefficient ofvariation is only statistically valid when the data underconsideration is normally distributed. In a situationwhere the data under consideration are not normallydistributed, the relative variability index becomes morerelevant. Although, generally, the annual precipitationtotals are normally distributed except in situationswhere the mean annual rainfall is less than 751 mm, themonthly and seasonal totals are not normally distrib-uted (Ayoade 1988; Jackson 1989). Therefore, sincethis study is concerned with rainfall characteristics sum-
FIG. 5. Same as in Fig. 2, but for Ilorin (1961–2000).
1 FEBRUARY 2006 N O T E S A N D C O R R E S P O N D E N C E 487
Unauthenticated | Downloaded 01/10/22 05:54 PM UTC

marized for periods covering 1–2 months, much lessthan a season, (which may not be normally distributed),we have chosen to adopt the relative variability mea-sure. Relative variability is computed as the averagevariability divided by the mean multiplied by 100%.
The rainfall data used in this study were collectedusing the British Standard rain gauge and Dines’s tiltingsiphon rainfall recorder (Dines 1922). Data collectedusing these instruments are samples in space, and so aresubject to errors relating to data homogeneity. Theproblem of data homogeneity usually arises from gaugesite relocation. Therefore, data consistency was as-sessed and the homogeneity confirmed for all the rain-fall stations under investigation.
4. Results
a. Length of the LDS
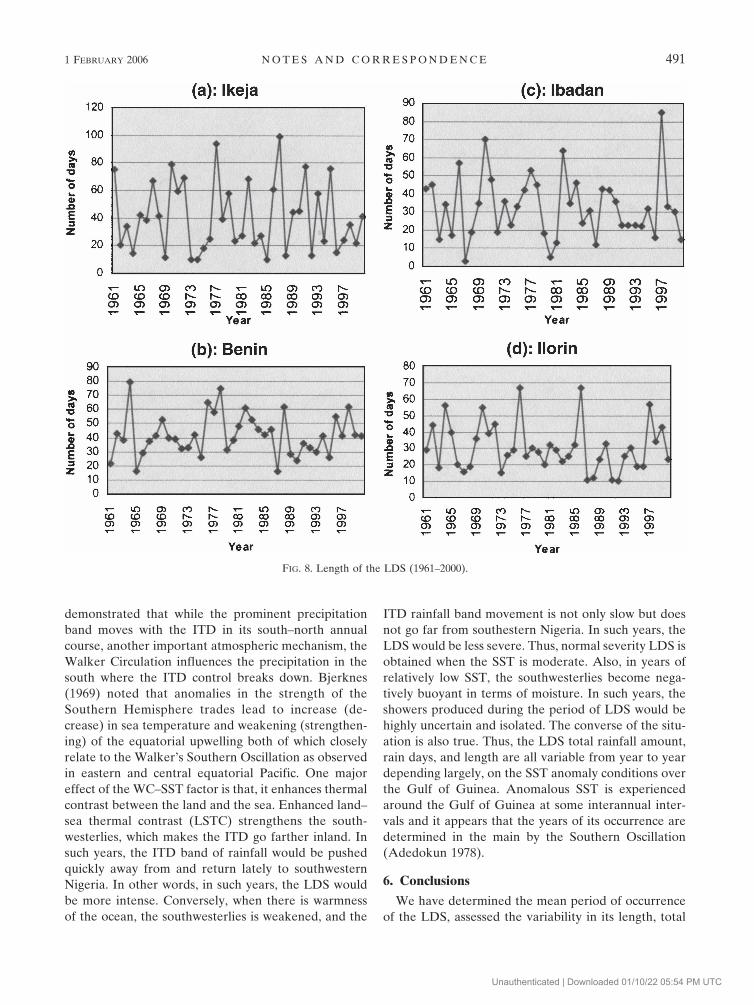
Figures 2, 3, 4, and 5 show the graphs of the meancumulative percentages of 5-day rainfall totals fromJanuary to December, respectively, in Ikeja, Benin,Ibadan, and Ilorin, Nigeria, computed for the period1961–2000. The first point of maximum negative curva-ture on the graph of Ikeja, which corresponds to theonset of the LDS, occurred on 15 July. The cumulativepercentage rainfall at this point had a value of 60.4%.The corresponding points for Benin, Ibadan, and Ilorinoccurred on 20, 20, and 25 July, respectively, with cu-mulative percentage rainfall values of 47.6%, 53.7%,and 53.7%, respectively. The second point of maximumpositive curvature on the cumulative percentagegraphs, which corresponds to the end of the of LDSoccurred on 8 September, 3 September, 29 August, and29 August for Ikeja, Benin, Ibadan and Ilorin, respec-tively. Their respective cumulative percentage rainfallvalues were 74.7%, 68.8%, 67.6%, and 66.9%. Thus themean lengths of the LDS in the various stations were 55days for Ikeja, 46 days for Benin, 40 days for Ibadan,and 35 days for Ilorin. As can be seen in Figs. 2–5, Ikeja,around the coast, had the longest LDS, while Ilorin,farthest into the hinterlands, had the shortest.
b. LDS variability
Four rainfall components or characteristics were ana-lyzed for the LDS variability: rainfall amount, numberof rain days, length of the LDS, and LDS rainfall in-tensity. Separately and collectively, these parametersrepresent measures of the severity of the LDS. Thelonger the season, the smaller seasonal rainfall, thefewer the seasonal number of rain days and the lowerthe seasonal intensity of rainfall, the higher the severityof the LDS. Table 1 shows the averages and the ex-
tremes of the various LDS characteristics with the yearsof their occurrence. The general variation from year toyear in the various LDS characteristics in the respectivestations is depicted in Figs. 6–9.
The results of the relative variability analysis, de-picted in Table 2, clearly show that (although at vari-ant) all of the LDS characteristics exhibit considerablevariability between 1961 and 2000. The table shows thatLDS rainfall intensity was the most variable, while thenumber of rain days was the least variable. When theLDS characteristics were considered together at all sta-tions, they indicated the highest degree of variability atIbadan and the lowest at Benin. However, in general,there appeared to be a tendency for variability to behighest in the southwest corner of the area of study
TABLE 1. LDS extremes in southwestern Nigeria (1961–2000).
(a) Length of the LDS (days)
Station
Length of the LDS (days)
Min Max
MeanDays Yr Days Yr
Ikeja 10 1974 99 1987 55Benin 16 1987 79 1964 46Ibadan 3 1967 85 1997 40Ilorin 10 1992 67 1986 35
(b) LDS intensity (rainfall in mm day�1)
Station
LDS intensity (rainfall in mm day�1)
Min Max
MeanRainfall day�1 Yr Rainfall day�1 Yr
Ikeja 0.13 1982 40.6 1973 7.88Benin 2.05 1982 56.63 1965 14.19Ibadan 0.52 1982 125.6 1980 10.76Ilorin 0.41 1964 30.55 1987 7.16
(c) Rainfall amount in (mm)
Station
Rainfall amount in (mm)
Min Max
MeanRainfall Yr Rainfall Yr
Ikeja 9 1982 622 1987 195Benin 125 1982 906 1965 461Ibadan 29 1981 628 1980 189Ilorin 23 1964 401 1998 159
(d) Rain days (days)
Station
Rain days (days)
Min Max
MeanDays Yr Days Yr
Ikeja 2 1982 26 1963 12Benin 12 1961 38 1965 24Ibadan 3 1983 23 1980 12Ilorin 2 1964 20 1963 10
488 J O U R N A L O F C L I M A T E VOLUME 19
Unauthenticated | Downloaded 01/10/22 05:54 PM UTC

from where there was a decline in variability northwardand eastward. Thus, the latitudinal order of the rainfallstations did not reflect in the relative variability resultsobtained.
c. LDS severity
Riehl (1954) is of the view that effective daily rainfallin the Tropics must be at least 5 mm. Daily potentialevapotranspiration (PE) at Ibadan averages 3–4 mm atthe height of the rainy season and 5–6 mm during thedrier parts of the year (Garnier 1961). The interpreta-tion of this is that rain-fed crop plants require at least 3mm of rain on a daily basis at the peak of the rainyseason and up to 5 mm at the beginning and toward theend of the season. (Water need for crop plants includednot just the consumptive use, but also the evaporationfrom all the surfaces in the crop’s micro-environment,including the surfaces of soils and the aerial parts of theplants.). A good measure of the severity of the LDS,
therefore, is the probability that the average daily rain-fall, over the period of its occurrence, is less than 3 mm.This has been computed for each of the stations overthe 40-yr period (see Table 2). One could observe thatthe probability of 3% for Benin indicates that the LDSat that station is not a dry season at all. It is only rela-tively dry. The relatively low amount of rainfall duringeach of the 40 yr was sufficient to balance potentialevapotranspiration. In other words, crops could nothave suffered because of inadequate rainfall.
Over most of the years at the other three meteoro-logical stations the LDS was only relatively dry. Therainfall was still enough to wet the fields and to meetthe water needs of the various crops. However, duringcertain years, rainfall was inadequate, and the LDS rep-resented a period of drought. Such LDS came with afrequency of 1 in 4 at Ikeja, 1 in 3 at Ilorin, and 2 in 5at Ibadan. During such years, crops could have sufferedand yields could have been depressed. Whether in fact
FIG. 6. LDS rainfall amount (1961–2000).
1 FEBRUARY 2006 N O T E S A N D C O R R E S P O N D E N C E 489
Unauthenticated | Downloaded 01/10/22 05:54 PM UTC

there was a crop failure would have depended on thetype of crop, the development phase affected, and thenumber and distribution of the rain days. In otherwords, with good distribution, enough rain could havebeen delivered during some of such years to ensurenormal crop yield. For example, as noted by Olaniranand Babatolu (1987), consumptive use of water by sor-ghum is higher during vegetative growth and grain-filling phases than during the flowering or tassellingphases of development. In other words, crops could betolerant of some water deficit during specific phases ofdevelopment.
In general, LDS severity appears to be highest atIbadan, followed by Ilorin, Ikeja, and Benin. The lowseverity of the LDS at Benin is quite understandablebecause of the location of the station at 5.5°E which isclose to the eastern limit of the area of occurrence ofthe phenomenon in Nigeria (7°E). Even though theperiod of occurrence is highest at Ikeja, severity at thiscoastal location is lower than that of the inland loca-tions because of its nearness to the main source of mois-
ture, that is, the Atlantic Ocean. With its low seasonalrainfall and mostly interior location, one would haveexpected the severity of the LDS to be highest at Ilorin.The lower severity, compared with Ibadan, seems tohave been occasioned by the shorter period of occur-rence. North of Ilorin, where the LDS is absent, theparticular months of July and August constitute theperiod of peak rainfall (Ilesanmi 1972)
5. Discussion
The space and intra-annual time dynamics of theLDS have been the subject of earlier research. Threemajor factors appear to dominate the engendering rain-fall processes in the general area: the ITD, coastal fac-tors (Ilesanmi 1972), and the Walker Circulation–seasurface temperature anomaly (WC–SSTA; Adedokun1978). However, the variability observed in the amountand frequencies of rainfall interannually appears to bedictated by the Walker Circulation through its effect onsea surface temperature anomalies. Adedokun (1978)
FIG. 7. LDS number of rain days (1961–2000).
490 J O U R N A L O F C L I M A T E VOLUME 19
Unauthenticated | Downloaded 01/10/22 05:54 PM UTC
demonstrated that while the prominent precipitationband moves with the ITD in its south–north annualcourse, another important atmospheric mechanism, theWalker Circulation influences the precipitation in thesouth where the ITD control breaks down. Bjerknes(1969) noted that anomalies in the strength of theSouthern Hemisphere trades lead to increase (de-crease) in sea temperature and weakening (strengthen-ing) of the equatorial upwelling both of which closelyrelate to the Walker’s Southern Oscillation as observedin eastern and central equatorial Pacific. One majoreffect of the WC–SST factor is that, it enhances thermalcontrast between the land and the sea. Enhanced land–sea thermal contrast (LSTC) strengthens the south-westerlies, which makes the ITD go farther inland. Insuch years, the ITD band of rainfall would be pushedquickly away from and return lately to southwesternNigeria. In other words, in such years, the LDS wouldbe more intense. Conversely, when there is warmnessof the ocean, the southwesterlies is weakened, and the
ITD rainfall band movement is not only slow but doesnot go far from southestern Nigeria. In such years, theLDS would be less severe. Thus, normal severity LDS isobtained when the SST is moderate. Also, in years ofrelatively low SST, the southwesterlies become nega-tively buoyant in terms of moisture. In such years, theshowers produced during the period of LDS would behighly uncertain and isolated. The converse of the situ-ation is also true. Thus, the LDS total rainfall amount,rain days, and length are all variable from year to yeardepending largely, on the SST anomaly conditions overthe Gulf of Guinea. Anomalous SST is experiencedaround the Gulf of Guinea at some interannual inter-vals and it appears that the years of its occurrence aredetermined in the main by the Southern Oscillation(Adedokun 1978).
6. Conclusions
We have determined the mean period of occurrenceof the LDS, assessed the variability in its length, total
FIG. 8. Length of the LDS (1961–2000).
1 FEBRUARY 2006 N O T E S A N D C O R R E S P O N D E N C E 491
Unauthenticated | Downloaded 01/10/22 05:54 PM UTC

rainfall amount, and number of rain days between 1961and 2000 and also assessed its severity. The results showthat LDS occurrences in Ikeja, Benin, Ibadan, andIlorin are, on the average, between 15 July and 8 Sep-tember, 20 July and 3 September, 20 July and 29 Au-gust, and 25 July and 29 August, respectively. The rela-tive variability values obtained for the total rainfallamounts of the respective stations are 54%, 38%, 60%,
and 51%. The respective relative variability values forthe total rain days are 40%, 22%, 42%, and 34%. Cor-responding values for the length of the season are 52%,26%, 41%, and 38%, respectively, while those for rainfallintensity were 71.5, 60.5, 96.1, and 71.2, respectively.The LDS is not always a physiologically dry period. Ingeneral it is a period of relatively low rainfall separatingthe early from the late growing season. In places near
TABLE 2. LDS variability and severity in southwestern Nigeria (1961–2000).
Rainfall stations
Variability values
Severity valuesRainfall amount Rain days Length of the LDS LDS intensity
Ikeja 53.34% 39.79% 51.53% 71.50% 23%Benin 38.18% 21.67% 26.90% 60.51% 3%Ibadan 60.11% 41.88% 41.06% 96.08% 38%Ilorin 50.94% 34.00% 38.33% 71.20% 33%
FIG. 9. LDS intensity (1961–2000).
492 J O U R N A L O F C L I M A T E VOLUME 19
Unauthenticated | Downloaded 01/10/22 05:54 PM UTC

the eastern boundary of its area of occurrence, it neverconstituted a period of drought when crop plants suf-fered. Even in the areas of its highest severity, it was awet rather than a dry period for 25 out of the 40 yrbetween 1961 and 2000. However, it is realized that theepicenter of the LDS lies outside Nigeria in the coastalzone between Accra in Ghana and Lome in Togowhere it is probably the main cause of the prevailingaridity.
Acknowledgments. This paper was written as part ofthe output of a research project funded and supportedby three organizations: the System for Analysis, Re-search and Training (START), the National Oceanicand Atmospheric Organization (NOAA), and the As-sessment if Impacts of and Adaptations to ClimateChange (AIACC). The supporting organizations forAIACC are START, the Third World Academy of Sci-ences (TWAS), and the United Nations EnvironmentProgramme (UNEP).
REFERENCES
Adedokun, J. A., 1978: West African precipitation and dominantatmospheric mechanisms. Arch. Meteor. Geophys. Biokl. Ser.A, 27, 289–310.
Adefolalu, D. O., 1972: On the equivalent potential temperatureof the tropical atmosphere and the “Little Dry Season” ofWest Africa. Niger. Meteor. Mag., 2, 15–40.
Adejuwon, J. O., and L. K. Jeje, 1976: Land element of the envi-ronment system of Ife area. Department of Geography, Uni-versity of Ife, Publication 2, Ile-Ife, Nigeria, 106 pp.
Adekoya, J. O., 1979: Little Dry Season in West Africa. M.S.
thesis, Dept. of Meteorology, The Florida State University,158 pp.
Ayoade, J. O., 1988: Introduction to Climatology for the Tropics.Abiprint & Pak Ltd., 258 pp.
Bjerknes, J., 1969: Atmospheric teleconections from the equato-rial Pacific. Mon. Wea. Rev., 97, 163–172.
Dines, J. S., 1922: Note on the effect of a coastline on precipita-tion. Quart. J. Roy. Meteor. Soc., 48, 115–138.
Garnier, B. J., 1961: Delimitation of the humid Tropics. Geogr.Rev., 57, 339–347.
Hamilton, R. A., and J. M. Archibold, 1945: Meteorology of Ni-geria and adjacent territory. Quart. J. Roy. Meteor. Soc., 71,231–265.
Ilesanmi, O. O., 1972: Aspects of the precipitation climatology ofthe July–August rainfall minimum of Southern Nigeria. J.Trop. Geogr., 35, 51–59.
——, 1981: Aspect of the precipitation climatology of the July–August rainfall minimum of Southern Nigeria. Preprints,N.G.A. Regional Planning Committee Seminar on Urban andRegional Problems in Nigeria, Ile-Ife, Nigeria, University ofIfe, 12 pp.
Iloeje, N. P., 1981: A New Geography of Nigeria. Rev. ed. Long-man, 201 pp.
Ireland, A. W., 1962: The Little Dry Season of Southern Nigeria.Nigerian Geogr. J., 5, 7–20.
Jackson, I. J., 1989: Climate, Water and Agriculture in the Tropics.Longman, 377 pp.
Nieuwolt, S., 1982: Tropical Climatology: An Introduction to theClimates of the Low Latitudes. John Wiley and Sons, 207 pp.
Ojo, O., 1977: The Climates of West Africa. Heinemann, 219 pp.Olaniran, O. J., and J. S. Babatolu, 1987: Climate and the growth
of Sorghum at Kabba, Nigeria. J. Agric. Meteor., 42, 301–308.Omotosho, J. B., 1988: Spatial variation of rainfall in Nigeria dur-
ing the Little Dry Season. Atmos. Res., 2, 137–147.Osunade, M. A. A., 1994: Indigenous climate knowledge and ag-
ricultural practice in Southwestern Nigeria. Malaysian J.Trop. Geogr., 25, 21–28.
Riehl, H., 1954: Tropical Meteorology. McGraw Hill, 392 pp.
1 FEBRUARY 2006 N O T E S A N D C O R R E S P O N D E N C E 493
Unauthenticated | Downloaded 01/10/22 05:54 PM UTC