Value of Low-Density Lipoprotein Particle Number and Size as Predictors of Coronary Artery Disease...
7
Atherosclerosis Value of Low-Density Lipoprotein Particle Number and Size as Predictors of Coronary Artery Disease in Apparently Healthy Men and Women The EPIC-Norfolk Prospective Population Study Karim El Harchaoui, MD,* Wim A. van der Steeg, MD,* Erik S. G. Stroes, MD, PHD,* Jan Albert Kuivenhoven, PHD,* James D. Otvos, PHD, Nicholas J. Wareham, MBBS, PHD,‡ Barbara A. Hutten, PHD,† John J. P. Kastelein, MD, PHD,* Kay-Tee Khaw, MBBCHIR,§ S. Matthijs Boekholdt, MD, PHD* Amsterdam, the Netherlands; Cambridge, United Kingdom; and Raleigh, North Carolina Objectives We assessed relations of low-density lipoprotein (LDL) particle number (LDL-P) and LDL particle size as mea- sured by nuclear magnetic resonance spectroscopy with LDL cholesterol (LDL-C) and the risk of future coronary artery disease (CAD). Background Whereas LDL-C is an established risk factor for CAD, its discriminative power is limited. Measuring LDL-P and size may have stronger associations with CAD than LDL-C. Methods A nested case-control study was performed in the prospective EPIC (European Prospective Investigation into Cancer and Nutrition)-Norfolk study, which comprises 25,663 subjects. Cases (n 1,003) were individuals who developed CAD during 6 year follow-up. Control subjects (n 1,885) were matched for age, gender, and enroll- ment time. Odds ratios (ORs) for future CAD were calculated, and we also evaluated whether LDL-P could im- prove the Framingham risk score (FRS) to predict CAD. Results In univariate analyses, LDL-P (OR 2.00, 95% confidence interval [CI] 1.58 to 2.59) and non-high-density lipoprotein cholesterol (non–HDL-C) (OR 2.14, 95% CI 1.69 to 2.69) were more closely associated with CAD than LDL-C (OR 1.73, 95% CI 1.37 to 2.18). The additional value of LDL-P was lost after adjustment for HDL-C and triglyceride levels. Whereas LDL size was inversely related to CAD (OR 0.60, 95% CI 0.47 to 0.76), this relation was abolished upon ad- justment for LDL-P. In a model adjusted for the FRS, LDL-P retained its association with CAD (p for trend 0.02). Conclusions In this large study of individuals with moderately elevated LDL-C, LDL-P was related to CAD on top of FRS as well as after adjusting for LDL-C. The additional value of LDL-P was comparable to non–HDL-C, and it was abolished after adjusting for triglycerides and HDL-C. (J Am Coll Cardiol 2007;49:547–53) © 2007 by the American College of Cardiology Foundation The causal role of low-density lipoprotein (LDL) particles in the pathogenesis of coronary artery disease (CAD) is well established, as is the clinical benefit of lowering LDL in high-risk patients. Hence, low-density lipoprotein- cholesterol (LDL-C) lowering is the principal target in cardiovascular preventive strategies (1). Low-density li- poprotein cholesterol content is used as a parameter to estimate LDL-associated CAD risk. More recently, assess- ment of the number of LDL particles has been put forward as a more reliable method reflecting atherogenicity of the LDL fraction (2). Since the cholesterol content per LDL particle exhibits large inter-individual variation due to differences in particle size as well as relative content of cholesterol ester and triglycerides in the particle core, the information provided by LDL-C and low-density lipoprotein-particle number (LDL-P) is not equivalent (3). From the Departments of *Vascular Medicine and †Clinical Epidemiology and Biostatistics, Academic Medical Centre, University of Amsterdam, Amsterdam, the Netherlands; ‡Medical Research Council Epidemiology Unit, Cambridge, United Kingdom; §Department of Public Health and Primary Care, Institute of Public Health, University of Cambridge, Cambridge, United Kingdom; and LipoScience Inc., Raleigh, North Carolina. Dr. Otvos is an employee of LipoScience, Inc. The EPIC-Norfolk study is supported by programmed grants from the Medical Research Council UK and Cancer Research UK, with additional support from the European Union, Stroke Association, British Heart Foundation, Department of Health, Food Standards Agency, and the Welcome Trust. Manuscript received August 4, 2006; revised manuscript received September 22, 2006, accepted September 28, 2006. Journal of the American College of Cardiology Vol. 49, No. 5, 2007 © 2007 by the American College of Cardiology Foundation ISSN 0735-1097/07/$32.00 Published by Elsevier Inc. doi:10.1016/j.jacc.2006.09.043
Transcript of Value of Low-Density Lipoprotein Particle Number and Size as Predictors of Coronary Artery Disease...

Tiehccpe
FBNKHI
Journal of the American College of Cardiology Vol. 49, No. 5, 2007© 2007 by the American College of Cardiology Foundation ISSN 0735-1097/07/$32.00P
Atherosclerosis
Value of Low-Density Lipoprotein ParticleNumber and Size as Predictors of CoronaryArtery Disease in Apparently Healthy Men and WomenThe EPIC-Norfolk Prospective Population Study
Karim El Harchaoui, MD,* Wim A. van der Steeg, MD,* Erik S. G. Stroes, MD, PHD,*Jan Albert Kuivenhoven, PHD,* James D. Otvos, PHD,� Nicholas J. Wareham, MBBS, PHD,‡Barbara A. Hutten, PHD,† John J. P. Kastelein, MD, PHD,* Kay-Tee Khaw, MBBCHIR,§S. Matthijs Boekholdt, MD, PHD*
Amsterdam, the Netherlands; Cambridge, United Kingdom; and Raleigh, North Carolina
Objectives We assessed relations of low-density lipoprotein (LDL) particle number (LDL-P) and LDL particle size as mea-sured by nuclear magnetic resonance spectroscopy with LDL cholesterol (LDL-C) and the risk of future coronaryartery disease (CAD).
Background Whereas LDL-C is an established risk factor for CAD, its discriminative power is limited. Measuring LDL-P andsize may have stronger associations with CAD than LDL-C.
Methods A nested case-control study was performed in the prospective EPIC (European Prospective Investigation intoCancer and Nutrition)-Norfolk study, which comprises 25,663 subjects. Cases (n � 1,003) were individuals whodeveloped CAD during 6 year follow-up. Control subjects (n � 1,885) were matched for age, gender, and enroll-ment time. Odds ratios (ORs) for future CAD were calculated, and we also evaluated whether LDL-P could im-prove the Framingham risk score (FRS) to predict CAD.
Results In univariate analyses, LDL-P (OR 2.00, 95% confidence interval [CI] 1.58 to 2.59) and non-high-density lipoproteincholesterol (non–HDL-C) (OR 2.14, 95% CI 1.69 to 2.69) were more closely associated with CAD than LDL-C (OR 1.73,95% CI 1.37 to 2.18). The additional value of LDL-P was lost after adjustment for HDL-C and triglyceride levels.Whereas LDL size was inversely related to CAD (OR 0.60, 95% CI 0.47 to 0.76), this relation was abolished upon ad-justment for LDL-P. In a model adjusted for the FRS, LDL-P retained its association with CAD (p for trend 0.02).
Conclusions In this large study of individuals with moderately elevated LDL-C, LDL-P was related to CAD on top of FRSas well as after adjusting for LDL-C. The additional value of LDL-P was comparable to non–HDL-C, and itwas abolished after adjusting for triglycerides and HDL-C. (J Am Coll Cardiol 2007;49:547–53) © 2007 bythe American College of Cardiology Foundation
ublished by Elsevier Inc. doi:10.1016/j.jacc.2006.09.043
maLpdcil
TREH
he causal role of low-density lipoprotein (LDL) particlesn the pathogenesis of coronary artery disease (CAD) is wellstablished, as is the clinical benefit of lowering LDL inigh-risk patients. Hence, low-density lipoprotein-holesterol (LDL-C) lowering is the principal target inardiovascular preventive strategies (1). Low-density li-oprotein cholesterol content is used as a parameter tostimate LDL-associated CAD risk. More recently, assess-
rom the Departments of *Vascular Medicine and †Clinical Epidemiology andiostatistics, Academic Medical Centre, University of Amsterdam, Amsterdam, theetherlands; ‡Medical Research Council Epidemiology Unit, Cambridge, Unitedingdom; §Department of Public Health and Primary Care, Institute of Public
ealth, University of Cambridge, Cambridge, United Kingdom; and �LipoSciencenc., Raleigh, North Carolina. Dr. Otvos is an employee of LipoScience, Inc. 2
ent of the number of LDL particles has been put forwards a more reliable method reflecting atherogenicity of theDL fraction (2). Since the cholesterol content per LDLarticle exhibits large inter-individual variation due toifferences in particle size as well as relative content ofholesterol ester and triglycerides in the particle core, thenformation provided by LDL-C and low-densityipoprotein-particle number (LDL-P) is not equivalent (3).
he EPIC-Norfolk study is supported by programmed grants from the Medicalesearch Council UK and Cancer Research UK, with additional support from theuropean Union, Stroke Association, British Heart Foundation, Department ofealth, Food Standards Agency, and the Welcome Trust.
Manuscript received August 4, 2006; revised manuscript received September 22,006, accepted September 28, 2006.

brptpcfaSlmtpa
M
WpClaccr1dwa
ibpt
ifUuKaaNEotPfCuwEfPhNmnsorNtpNcosTdtlupppsridptttBH1afp
548 El Harchaoui et al. JACC Vol. 49, No. 5, 2007LDL-P and LDL Size in the EPIC-Norfolk Study February 6, 2007:547–53
Individuals with the same level ofLDL-C may have higher orlower numbers of LDL particlesand, as a result, may differ interms of absolute CAD risk.Prospective studies, in whichLDL particle concentration wasestimated by apolipoprotein B(apoB) levels, have underscoredstronger associations betweenLDL-P and CAD risk comparedwith LDL-C, particularly in sub-jects with normal LDL-C con-centration (4,5). In addition, thesize of LDL particles may alsocontribute to the atherogenicityof LDL-C (6,7). Thus, at a givenlevel of LDL-C, individuals withsmall LDL particles have greateratherosclerotic risk than thosewith large-size LDL (8,9).
Lipoprotein particle analysisy nuclear magnetic resonance (NMR) spectroscopy is aelatively new method by which both LDL-P and LDLarticle size can be efficiently measured (10). We evaluatedhe associations between LDL-P and LDL size, in com-arison with LDL-C and non–high-density lipoproteinholesterol (non–HDL-C) as traditional markers, and risk ofuture CAD in apparently healthy men and women enrolled inlarge prospective cohort with moderately elevated LDL-C.ince LDL-P and LDL size are closely related to traditional
ipid factors such as HDL-C and triglycerides, we performedultivariable analyses to assess independency of the correla-
ions. We also assessed clinical usefulness of these novelarameters by determining their effect on the discriminativeccuracy of the Framingham risk score (FRS).
ethods
e performed a nested case-control study among partici-ants of the EPIC (European Prospective Investigation intoancer and Nutrition)-Norfolk study, a prospective popu-
ation study of 25,663 men and women aged between 45nd 79 years, resident in Norfolk, United Kingdom, whoompleted a baseline questionnaire survey and attended alinic visit (11). Participants were recruited from age-genderegisters of general practices in Norfolk as part of the0-country collaborative EPIC study designed to investigateietary and other determinants of cancer. Additional dataere obtained in the EPIC-Norfolk study to enable the
ssessment of determinants of other diseases.The design and methods of the study have been described
n detail (11). In short, eligible participants were recruitedy mail. At the baseline survey between 1993 and 1997,articipants completed a detailed health and lifestyle ques-
Abbreviationsand Acronyms
apoB � apolipoprotein B
BMI � body mass index
CAD � coronary arterydisease
CI � confidence interval
FRS � Framingham riskscore
HDL-C � high-densitylipoprotein cholesterol
LDL � low-densitylipoprotein
LDL-C � low-densitylipoprotein cholesterol
LDL-P � low-densitylipoprotein-particle number
NMR � nuclear magneticresonance
OR � odds ratio
ionnaire. Non-fasting blood was taken by vein puncture r
nto plain and citrate bottles. Blood samples were processedor assay at the Department of Clinical Biochemistry,niversity of Cambridge, or stored at �80°C. All individ-als were flagged for death certification at the Unitedingdom Office of National Statistics, with vital status
scertained for the entire cohort. In addition, participantsdmitted to hospital were identified using their uniqueational Health Service number by data linkage withNCORE (East Norfolk Health Authority) database. Cor-nary artery disease was defined as codes 410-414 accordingo the International Classification of Diseases-9th revision.articipants were identified as having CAD during
ollow-up if they had a hospital admission and/or died withAD as underlying cause. We report results with follow-upp to January 2003, an average of about 6 years. The studyas approved by the Norwich District Health Authoritythics Committee, and all participants gave signed in-
ormed consent.articipants. We excluded all individuals who reported aistory of heart attack or stroke at the baseline clinic visit.one of the cases or control subjects was on statin treat-ent. Cases were individuals who developed a fatal or
on-fatal CAD during follow-up. For each case, 2 controlubjects matched for gender, age (within 5 years), and timef enrollment (within 3 months) were identified who hademained free of CAD during follow-up.
MR spectroscopy. Lipoprotein subclass particle concen-rations and average size of LDL particles were measured byroton NMR spectroscopy (LipoScience, Inc., Raleigh,orth Carolina) as previously described (10). Particle con-
entrations of lipoprotein subclasses of different size werebtained directly from the measured amplitudes of theirpectroscopically distinct lipid methyl group NMR signals.he following LDL subclasses were defined: intermediate-ensity lipoprotein (IDL) (23 to 27 nm), large LDL (21.2o 23 nm), and small LDL (18 to 21.2 nm). Low-densityipoprotein subclass particle concentrations are given innits of nmol/l. Summation of the LDL subclass levelsrovides total LDL (including intermediate-density li-oprotein) particle concentrations. Weighted-average LDLarticle sizes (in nm diameter units) are computed as theum of the diameter of each subclass multiplied by itselative mass percentage as estimated from the amplitude ofts methyl NMR signal. Low-density lipoprotein subclassistributions determined by NMR and gradient gel electro-horesis are highly correlated (12). Low-density lipopro-ein subclass diameters, which are consistent with elec-ron microscopy data (13), are uniformly �5 nm smallerhan those estimated by gradient gel electrophoresis.iochemical analyses. Serum levels of total cholesterol,DL-C, and triglycerides were measured with the RA
000 (Bayer Diagnostics, Basingstoke, United Kingdom),nd LDL-C levels were calculated with the Friedewaldormula (14). Nuclear magnetic resonance analysis waserformed on stored serum samples that were analyzed in
andom order to avoid systemic bias. Researchers and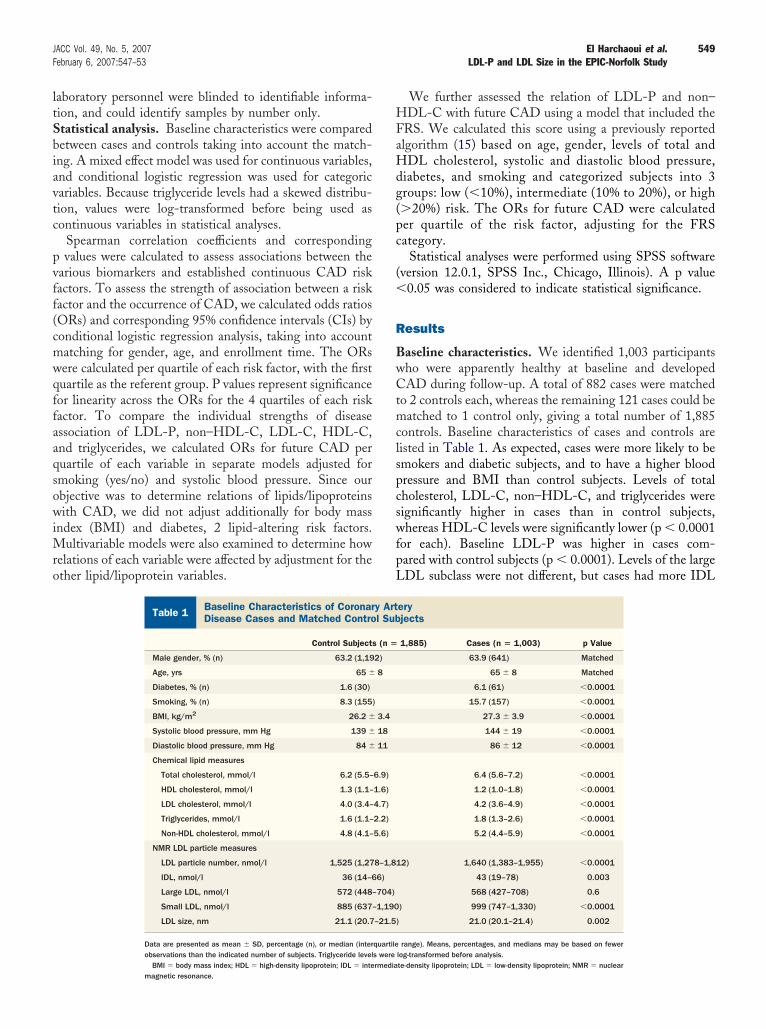
ltSbiavtc
pvff(cmwqffaaqsowiMro
HFaHdg(pc
(�
R
BwCtmclspcswfpL
549JACC Vol. 49, No. 5, 2007 El Harchaoui et al.February 6, 2007:547–53 LDL-P and LDL Size in the EPIC-Norfolk Study
aboratory personnel were blinded to identifiable informa-ion, and could identify samples by number only.tatistical analysis. Baseline characteristics were comparedetween cases and controls taking into account the match-ng. A mixed effect model was used for continuous variables,nd conditional logistic regression was used for categoricariables. Because triglyceride levels had a skewed distribu-ion, values were log-transformed before being used asontinuous variables in statistical analyses.
Spearman correlation coefficients and correspondingvalues were calculated to assess associations between the
arious biomarkers and established continuous CAD riskactors. To assess the strength of association between a riskactor and the occurrence of CAD, we calculated odds ratiosORs) and corresponding 95% confidence intervals (CIs) byonditional logistic regression analysis, taking into accountatching for gender, age, and enrollment time. The ORsere calculated per quartile of each risk factor, with the firstuartile as the referent group. P values represent significanceor linearity across the ORs for the 4 quartiles of each riskactor. To compare the individual strengths of diseasessociation of LDL-P, non–HDL-C, LDL-C, HDL-C,nd triglycerides, we calculated ORs for future CAD peruartile of each variable in separate models adjusted formoking (yes/no) and systolic blood pressure. Since ourbjective was to determine relations of lipids/lipoproteinsith CAD, we did not adjust additionally for body mass
ndex (BMI) and diabetes, 2 lipid-altering risk factors.ultivariable models were also examined to determine how
elations of each variable were affected by adjustment for thether lipid/lipoprotein variables.
Baseline Characteristics of Coronary ArteryDisease Cases and Matched Control Subjects
Table 1 Baseline Characteristics of CoronarDisease Cases and Matched Contro
Control Subjects
Male gender, % (n) 63.2 (1,19
Age, yrs 65 �
Diabetes, % (n) 1.6 (30)
Smoking, % (n) 8.3 (155)
BMI, kg/m2 26.2 �
Systolic blood pressure, mm Hg 139 �
Diastolic blood pressure, mm Hg 84 �
Chemical lipid measures
Total cholesterol, mmol/l 6.2 (5.5–
HDL cholesterol, mmol/l 1.3 (1.1–
LDL cholesterol, mmol/l 4.0 (3.4–
Triglycerides, mmol/l 1.6 (1.1–
Non-HDL cholesterol, mmol/l 4.8 (4.1–
NMR LDL particle measures
LDL particle number, nmol/l 1,525 (1,27
IDL, nmol/l 36 (14–6
Large LDL, nmol/l 572 (448–
Small LDL, nmol/l 885 (637–
LDL size, nm 21.1 (20.7
Data are presented as mean � SD, percentage (n), or median (interobservations than the indicated number of subjects. Triglyceride level
BMI � body mass index; HDL � high-density lipoprotein; IDL � intermediamagnetic resonance.
We further assessed the relation of LDL-P and non–DL-C with future CAD using a model that included the
RS. We calculated this score using a previously reportedlgorithm (15) based on age, gender, levels of total andDL cholesterol, systolic and diastolic blood pressure,
iabetes, and smoking and categorized subjects into 3roups: low (�10%), intermediate (10% to 20%), or high�20%) risk. The ORs for future CAD were calculateder quartile of the risk factor, adjusting for the FRSategory.
Statistical analyses were performed using SPSS softwareversion 12.0.1, SPSS Inc., Chicago, Illinois). A p value0.05 was considered to indicate statistical significance.
esults
aseline characteristics. We identified 1,003 participantsho were apparently healthy at baseline and developedAD during follow-up. A total of 882 cases were matched
o 2 controls each, whereas the remaining 121 cases could beatched to 1 control only, giving a total number of 1,885
ontrols. Baseline characteristics of cases and controls areisted in Table 1. As expected, cases were more likely to bemokers and diabetic subjects, and to have a higher bloodressure and BMI than control subjects. Levels of totalholesterol, LDL-C, non–HDL-C, and triglycerides wereignificantly higher in cases than in control subjects,hereas HDL-C levels were significantly lower (p � 0.0001
or each). Baseline LDL-P was higher in cases com-ared with control subjects (p � 0.0001). Levels of the largeDL subclass were not different, but cases had more IDL
eryjects
1,885) Cases (n � 1,003) p Value
63.9 (641) Matched
65 � 8 Matched
6.1 (61) �0.0001
15.7 (157) �0.0001
27.3 � 3.9 �0.0001
144 � 19 �0.0001
86 � 12 �0.0001
6.4 (5.6–7.2) �0.0001
1.2 (1.0–1.8) �0.0001
4.2 (3.6–4.9) �0.0001
1.8 (1.3–2.6) �0.0001
5.2 (4.4–5.9) �0.0001
2) 1,640 (1,383–1,955) �0.0001
43 (19–78) 0.003
568 (427–708) 0.6
) 999 (747–1,330) �0.0001
21.0 (20.1–21.4) 0.002
range). Means, percentages, and medians may be based on fewerlog-transformed before analysis.
y Artl Sub
(n �
2)
8
3.4
18
11
6.9)
1.6)
4.7)
2.2)
5.6)
8–1,81
6)
704)
1,190
–21.5)
quartiles were
te-density lipoprotein; LDL � low-density lipoprotein; NMR � nuclear

acLtAfc(s�B0totc0
(c�LCuqtcdlLLfCt
vadoaaLLHbCIp
SC
*
550 El Harchaoui et al. JACC Vol. 49, No. 5, 2007LDL-P and LDL Size in the EPIC-Norfolk Study February 6, 2007:547–53
nd small LDL particles. Thus, the increased LDL-C inases is attributable mainly to increased cholesterol in smallDL. The average LDL particle size was smaller in cases
han control subjects.ssociations of LDL measures with other CAD risk
actors. As shown in Table 2, LDL size was inverselyorrelated with LDL-P (r � �0.58), but not with LDL-Cr � 0.01). We identified a strong inverse relation of LDLize with triglyceride levels (r � �0.53) and BMI (r �0.19) and a positive correlation with HDL-C (r � 0.54).oth LDL-C and LDL-P were strongly interrelated (r �.63), but both parameters had markedly different associa-ions with HDL-C and triglycerides. Whereas LDL-C wasnly weakly associated with HDL-C (r � �0.03) andriglyceride levels (r � 0.18), LDL-P was more stronglyorrelated with HDL-C (r � �0.29) and triglycerides (r �.55). Non–HDL-C was strongly correlated with LDL-P
pearman Correlationoefficients Between Measured Variables*
Table 2 Spearman CorrelationCoefficients Between Measured Variables*
Non-HDLCholesterol
LDLCholesterol
LDL ParticleNumber LDL Size
LDL cholesterol 0.94
LDL particle number 0.76 0.63
LDL size �0.18 0.01† �0.58
Total cholesterol 0.94 0.93 0.65
HDL cholesterol �0.16 �0.03‡ �0.29 0.54
Triglycerides 0.47 0.18 0.55 �0.53
BMI 0.11 0.02§ 0.14 �0.19
p � 0.0001 for comparison unless otherwise indicated; †p � 0.6; ‡p � 0.09; §p � 0.2.BMI � body mass index; HDL � high-density lipoprotein; LDL � low-density lipoprotein.
Odds Ratios for Future Coronary Artery DiseaseLipid/Lipoprotein Variable in Univariable and Mu
Table 3 Odds Ratios for Future Coronary ArtLipid/Lipoprotein Variable in Univar
1 2
Univariable models
LDL cholesterol 1.00 1.37 (1.09–1.73)
LDL particle number 1.00 1.23 (0.97–1.56)
HDL cholesterol 1.00 0.76 (0.60–0.95)
Triglycerides 1.00 1.27 (1.00–1.62)
Non-HDL cholesterol 1.00 1.31 (1.04–1.66)
Multivariable models
LDL cholesterol 1.00 1.26 (0.99–1.60)
HDL cholesterol 1.00 0.83 (0.66–1.04)
Triglycerides 1.00 1.12 (0.88–1.43)
LDL particle number 1.00 1.13 (0.89–1.44)
HDL cholesterol 1.00 0.86 (0.68–1.09)
Triglycerides 1.00 1.11 (0.87–1.42)
Non-HDL cholesterol 1.00 1.13 (0.88–1.44)
HDL cholesterol 1.00 0.83 (0.66–1.05)
Triglycerides 1.00 1.08 (0.85–1.39)
*Odds ratios (95% confidence intervals) were calculated by conditioenrollment time and adjusted additionally for smoking and systolic bloa separate model. Multivariable models examined each variable in
variables. †p for linear trend.Abbreviations as in Table 2.
r � 0.76) and triglycerides (r � 0.47), and inverselyorrelated with HDL-C (r � �0.16) and LDL size (r �0.18).DL-P, traditional lipid risk factors, and risk for futureAD. Shown in the upper panel of Table 3 are thenivariate ORs for future CAD associated with increasinguartiles of non–HDL-C, LDL-C, LDL-P, HDL-C, andriglycerides. The 5 lipid/lipoprotein measures exhibitedomparable strengths of association with CAD, with ORsiffering approximately 2-fold comparing the highest and
owest quartiles. The magnitude of the predictive value ofDL-P and non–HDL-C were greater than that ofDL-C. Comparing the highest to lowest quartile, the OR
or LDL-P was 2.00 (95% CI 1.58 to 2.59) and 2.14 (95%I 1.69 to 2.69) for non–HDL-C versus 1.73 (95% CI 1.37
o 2.18) for LDL-C.The lower panels of Table 3 show the results of multi-
ariate analyses in which each lipid/lipoprotein variable wasdjusted for the other 2 parameters to assess the indepen-ence of their mutual relations with CAD. The associationsf both LDL-C and LDL-P with CAD were attenuatedfter adjustment for HDL-C and triglycerides, whereasttenuation was more pronounced for LDL-P than forDL-C (4th quartile ORs reduced from 2.00 to 1.37 forDL-P vs. 1.73 to 1.55 for LDL-C). Similarly, relations ofDL-C and triglycerides with CAD were attenuated more
y adjustment for LDL-P than LDL-C.oncordance/discordance between LDL-C and LDL-P.
n a conditional logistic regression model that included botharameters and corrected for smoking and systolic blood
uartile ofriable Models*
isease by Quartile ofand Multivariable Models*
uartiles
p Value†3 4
1.38 (1.09–1.74) 1.73 (1.37–2.18) �0.0001
1.48 (1.17–1.87) 2.00 (1.58–2.59) �0.0001
0.60 (0.48–0.75) 0.50 (0.39–0.64) �0.0001
1.50 (1.20–1.88) 2.01 (1.61–2.51) �0.0001
1.57 (1.25–1.97) 2.14 (1.69–2.69) �0.0001
1.27 (1.00–1.61) 1.55 (1.22–1.96) 0.001
0.71 (0.56–0.89) 0.66 (0.50–0.87) 0.001
1.22 (0.96–1.54) 1.52 (1.19–1.95) 0.001
1.21 (0.94–1.54) 1.37 (1.04–1.83) 0.02
0.74 (0.59–0.94) 0.70 (0.53–0.92) 0.005
1.19 (0.93–1.51) 1.36 (1.04–1.79) 0.03
1.26 (0.99–1.62) 1.63 (1.26–2.11) �0.0001
0.71 (0.56–0.90) 0.66 (0.50–0.87) 0.001
1.13 (0.88–1.43) 1.30 (0.99–1.70) 0.06
istic regression, taking into account matching for gender, age, andssure. Univariable models examined each lipid/lipoprotein variable inl adjusted for the other 2 lipid/lipoprotein variables as continuous
by Qltiva
ery Diable
Q
nal logod prea mode

paet2LOLwcWrituCLLf1
D
MtdfrcwCacra
isLsLolcuifltfLpibpcssmpwjiiwe
Lse
oprotei
551JACC Vol. 49, No. 5, 2007 El Harchaoui et al.February 6, 2007:547–53 LDL-P and LDL Size in the EPIC-Norfolk Study
ressure, LDL-C was no longer statistically significantlyssociated with future CAD (Table 4). The LDL-P, how-ver, remained a significant risk factor, such that subjects inhe highest quartile had an OR of 1.78 (95% CI, 1.34 to.37; p � 0.0001 for linearity) (Table 4).DL size and risk for future CAD. Table 5 shows theRs for future CAD associated with increasing quartiles ofDL size adjusted for smoking and systolic blood pressure,ith and without additional adjustment for the potentially
onfounding inverse correlation of LDL size with LDL-P.ithout adjustment for LDL-P, there was a significant
elation of smaller LDL size with CAD, with an OR forndividuals in the highest quartile compared with those inhe lowest quartile of 0.60 (95% CI 0.47 to 0.76). However,pon adjustment for LDL-P, the relation of LDL size withAD was greatly attenuated and was no longer significant.DL-P and the FRS. The results in Table 6 indicate thatDL-P and non–HDL-C retain a similar association with
uture CAD after accounting for the FRS (OR of 1.34 and.38, respectively, in the highest vs. lowest quartile).
iscussion
easurements of LDL-P and LDL size have the potentialo improve coronary disease risk assessment as well asecisions about LDL treatment intensity, since they accountor aspects of lipid atherogenicity that are incompletelyeflected by values of LDL-C. In this large prospectivease-control study, we show that LDL-P and non–HDL-Cere more closely associated with the occurrence of futureAD than levels of LDL-C. Upon adjusting for HDL-C
nd triglyceride levels, the predictive capacity of LDL-P wasomparable to that of LDL-C. Whereas LDL size waselated to CAD risk, this relationship was abolished afterdjusting for LDL-P. Both LDL-P and non–HDL-C had
Odds Ratios for Future Coronary Artery Diseaseby Quartile of LDL-C and LDL-P, Both Entered In
Table 4 Odds Ratios for Future Coronary Artby Quartile of LDL-C and LDL-P, Bot
LDL Siz
1 2
LDL-C 1.00 1.23 (0.97–1.57)
LDL-P 1.00 1.18 (0.93–1.51)
*Odds ratios (95% confidence intervals) were calculated by conditionalinear trend.
LDL-C � low-density lipoprotein cholesterol; LDL-P � low-density lip
Odds Ratios for Future Coronary Artery DiseaseQuartile of LDL Size, With and Without Adjustme
Table 5 Odds Ratios for Future Coronary ArtQuartile of LDL Size, With and With
1 2
Range (nm) <20.6 20.7–
Unadjusted for LDL particle number 1.00 0.77 (0.6
Adjusted for LDL particle number 1.00 0.92 (0.7
*Odds ratios (95% confidence intervals) were calculated by conditional logisticwithout additional adjustment for low-density lipoprotein (LDL) particle numb
ncremental value on top of the FRS in multivariate analy-es. Overall, these findings do not support routine use ofDL-P for CAD risk assessment in primary prevention
etting.DL-P and risk for future CAD. The cholesterol contentf LDL particles, which can create discordance betweenevels of LDL-C and LDL-P, is mainly influenced byholesterol ester transfer protein activity, which is enhancednder circumstances of hypertriglyceridemia (8). This has 2mportant consequences. First, transfer of cholesteryl esterrom HDL particles to apoB-containing lipoproteins causesow HDL-C levels. Second, cholesterol depletion andriglyceride enrichment of LDL particles facilitates theormation of small dense LDL particles (3,8). As a result,DL-C levels generally underestimate the number of LDLarticles in individuals with elevated triglycerides, as clearlyllustrated in the Framingham Study (2,3). Discordanceetween LDL-C and LDL-P is also a feature of diabeticatients (2,16) and the number of metabolic syndromeomponents (2,17). Our data in the EPIC-Norfolk studyhowing that triglyceride and HDL-C levels are much moretrongly correlated with LDL-P than LDL-C are in agree-ent with these findings. Accordingly, it was not unex-
ected that the relation of LDL-P with CAD risk was to beeakened more than that of LDL-C by multivariate ad-
ustment for triglycerides and HDL-C. Conversely, adjust-ng for LDL-P weakened relations of CAD with triglycer-des and HDL-C, suggesting that some of the risk associatedith these non-LDL risk factors may actually stem from
levations of LDL-P not reflected by levels of LDL-C.We found a moderate degree of discordance between
DL-C and LDL-P in our study population. While theource of this excess risk may not be due entirely to thelevated LDL-P, since those with discordantly high LDL-P
e Model*
iseaseered Into One Model*
tile
p Value†3 4
.88–1.45) 1.22 (0.92–1.61) 0.3
.08–1.79) 1.78 (1.34–2.37) �0.0001
c regression adjusted for smoking and systolic blood pressure; †p for
n particle number.
r LDL Particle Number*
isease bydjustment for LDL Particle Number*
LDL Size Quartile
p Value†
3 4
21.1–21.4 >21.4
7) 0.76 (0.60–0.95) 0.60 (0.47–0.76) �0.0001
6) 0.99 (0.77–1.28) 0.86 (0.65–1.15) 0.5
to On
ery Dh Ent
e Quar
1.13 (0
1.39 (1
l logisti
bynt fo
ery Dout A
21.0
2–0.9
2–1.1
regression adjusted for smoking and systolic blood pressure, with ander; †p for linear trend.

oiCsprbqi
pdHaftpltphLsgtLtLaHsLsaesficpNfiCfpt
saclmdcLHLoafiambSsgClohlalshatwmta
aaCLfiaetw
552 El Harchaoui et al. JACC Vol. 49, No. 5, 2007LDL-P and LDL Size in the EPIC-Norfolk Study February 6, 2007:547–53
ften have increased triglycerides and decreased HDL-C, its biologically plausible that LDL-P makes a contribution.urrent understanding of the pathophysiology of athero-
clerotic vascular disease is that LDL particles are activearticipants from the time they enter the artery wall, areetained in the intima by binding to extracellular matrix,ecome chemically modified by oxidation, and are subse-uently ingested by macrophages to create foam cells andncreased plaque burden (2,4).
Despite the finding that LDL-P predicted CAD inde-endently of the FRS, our results, showing a loss ofiscriminative power of LDL-P over LDL-C whenDL-C and triglyceride levels are accounted for, do not
rgue for the routine implementation of LDL-P assessmentor CAD risk assessment. Low-density lipoprotein choles-erol particle number may, however, play a useful role inatient management by helping judge the adequacy of LDL
owering therapy, particularly among those with elevatedriglycerides and reduced HDL-C. Such a role has beenroposed for apoB (4,5), and both non–HDL-C and apoBave been put forward as secondary treatment targets afterDL-C goals have been achieved (1,4). In fact, data
upporting LDL-P as an alternative treatment target hasained support from clinical intervention studies showinghat on-treatment levels of apoB or NMR-measuredDL-P were more reliable indicators of residual CAD risk
han on-treatment LDL-C (2,4,5,18,19).DL size and risk for future CAD. Small LDL size isnother factor associated with high triglycerides, lowDL-C, obesity, insulin resistance, diabetes, and metabolic
yndrome (6–9). Our finding of a relation between smallerDL size and greater CAD risk is consistent with previous
tudies reporting that small LDL particles have highertherogenic potential than large LDL particles (8,9). How-ver, upon adjustment for LDL-P, the relationship of LDLize with CAD was abolished. This result is consistent withndings in the Multi-Ethnic Study of Atherosclerosis indi-ating that NMR-measured numbers of small and large LDLarticles are related similarly to carotid atherosclerosis (20).on–HDL-C and risk for future CAD. The present
ndings confirm that non–HDL-C is a better predictor ofAD than LDL-C (21,22). Previous studies have also
ound that the number of most atherogenic lipoproteinarticles, as measured by apoB, were more strongly related
Odds Ratios for Future Coronary Artery DiseaseAfter Taking Into Account the Framingham Risk
Table 6 Odds Ratios for Future Coronary ArtAfter Taking Into Account the Fram
1 2
LDL cholesterol 1.00 1.17 (0.93–1.48)
LDL particle number 1.00 1.10 (0.86–1.39)
Non-HDL cholesterol 1.00 0.98 (0.73–1.32)
*Odds ratios were calculated by conditional logistic regression, with adjtrend.
Abbreviations as in Table 2.
o CAD risk than was non–HDL-C (21,22). In the present r
tudy, we show that the association of LDL-P with CAD islmost equal to that of non–HDL-C. The fact that apoBaptures all atherogenic apoB particles (including veryow-density lipoprotein and LDL), whereas LDL-P only
easures LDL particles, may have contributed to thisistinction. There has been an intense debate concerninglinical relevance of measuring particle numbers (apoB/DL-P) and/or cholesterol content of the particles (non–DL-C). In the present study, we observed that bothDL-P as well as non–HDL-C conferred predictive valuen top of the FRS. Since the association between LDL-Pnd CAD was equal to that of non–HDL-C, the presentndings do not advocate routine use of LDL-P in CAD riskssessment. The potential value of LDL-P measurement foronitoring patients on lipid-lowering medication needs to
e addressed in separate intervention trials.tudy limitations. Our study has several limitations. Thetudy population was relatively elderly, which may limit theeneralizability of our results. Case-control differences inAD among older populations are more weakly related to
ipoprotein levels than in younger populations because manyf the control subjects have extensive subclinical disease, yetave not experienced a coronary event (23). Low-density
ipoprotein cholesterol levels in the study population werelso considerably higher than in the general U.S. popu-ation, with a mean LDL-C value in the EPIC-Norfolktudy corresponding to the 80th percentile of Framing-am subjects of similar age and gender (24). Coronaryrtery disease events in our study were ascertainedhrough death certification and hospital admission data,hich may lead both to under ascertainment and toisclassification of cases. Previous validation studies in
his cohort, however, indicate high specificity of such casescertainment (25).
In conclusion, in this large cohort of apparently healthy mennd women, LDL-P and non–HDL-C were more closelyssociated than LDL cholesterol with the occurrence of futureAD. After adjustment for HDL-C and triglycerides,DL-P was no longer more predictive than LDL-C. Thesendings do not support routine use of LDL-P in CAD riskssessment strategies in primary prevention strategies. How-ver, recognition that patients with low HDL-C and/or highriglycerides often have elevated numbers of LDL particlesithout having elevated LDL-C may enable their LDL-
e*
iseasem Risk Score*
artiles
p Value†3 4
.09 (0.86–1.39) 1.24 (0.97–1.58) 0.15
.22 (0.96–1.54) 1.34 (1.03–1.73) 0.02
.03 (0.76–1.38) 1.38 (1.01–1.90) 0.04
t for risk categories based on the Framingham risk score; †p for linear
Scor
ery Dingha
Qu
1
1
1
ustmen
elated CAD risk to be managed more effectively.

ATpLN
RFCE
R
1
1
1
1
1
1
1
1
1
1
2
2
2
2
2
2
553JACC Vol. 49, No. 5, 2007 El Harchaoui et al.February 6, 2007:547–53 LDL-P and LDL Size in the EPIC-Norfolk Study
cknowledgmentshe authors would like to thank the participants, generalractitioners, and staff in the EPIC-Norfolk study and atipoScience Inc. (Jim Otvos) for kindly performing allMR spectroscopy measurements in the cohort.
eprint requests and correspondence: Dr. John J. P. Kastelein,4.159-2, Department of Vascular Medicine, Academic Medicalentre, Meibergdreef 9, 1105 AZ Amsterdam, the Netherlands.-mail: [email protected].
EFERENCES
1. Third Report of the National Cholesterol Education Program(NCEP) Expert Panel on Detection, Evaluation, and Treatment ofHigh Blood Cholesterol in Adults (Adult Treatment Panel III) finalreport. Circulation 2002;106:3143–421.
2. Cromwell WC, Otvos JD. Low-density lipoprotein particle numberand risk for cardiovascular disease. Curr Atheroscler Rep 2004;6:381–7.
3. Otvos JD, Jeyarajah EJ, Cromwell WC. Measurement issues related tolipoprotein heterogeneity. Am J Cardiol 2002;90:22i–9i.
4. Barter PJ, Ballantyne CM, Carmena R, et al. Apo B versus cholesterolin estimating cardiovascular risk and in guiding therapy: report of thethirty-person/ten-country panel. J Intern Med 2006;259:247–58.
5. Sniderman AD, Furberg CD, Keech A, et al. Apolipoproteins versuslipids as indices of coronary risk and as targets for statin treatment.Lancet 2003;361:777–80.
6. Gardner CD, Fortmann SP, Krauss RM. Association of small low-density lipoprotein particles with the incidence of coronary arterydisease in men and women. JAMA 1996;276:875–81.
7. Lamarche B, Tchernof A, Moorjani S, et al. Small, dense low-densitylipoprotein particles as a predictor of the risk of ischemic heart diseasein men: prospective results from the Quebec Cardiovascular Study.Circulation 1997;95:69–75.
8. Berneis KK, Krauss RM. Metabolic origins and clinical significance ofLDL heterogeneity. J Lipid Res 2002;43:1363–79.
9. Sacks FM, Campos H. Clinical review 163: cardiovascular endocri-nology: low-density lipoprotein size and cardiovascular disease: areappraisal. J Clin Endocrinol Metab 2003;88:4525–32.
0. Otvos JD. Measurement of lipoprotein subclass profiles by nuclearmagnetic resonance spectroscopy. Clin Lab 2002;48:171–80.
1. Day N, Oakes S, Luben R, et al. EPIC-Norfolk: study design andcharacteristics of the cohort. European Prospective Investigation ofCancer. Br J Cancer 1999;80 Suppl 1:95–103.
2. Blake GJ, Otvos JD, Rifai N, Ridker PM. Low-density lipoprotein
particle concentration and size as determined by nuclear magneticresonance spectroscopy as predictors of cardiovascular disease inwomen. Circulation 2002;106:1930–7.
3. Rumsey SC, Galeano NF, Arad Y, Deckelbaum RJ. Cryopreservationwith sucrose maintains normal physical and biological properties ofhuman plasma low density lipoproteins. J Lipid Res 1992;33:1551–61.
4. Friedewald WT, Levy RI, Fredrickson DS. Estimation of the concen-tration of low-density lipoprotein cholesterol in plasma, without use ofthe preparative ultracentrifuge. Clin Chem 1972;18:499–502.
5. Wilson PWF, D’Agostino RB, Levy D, Belanger AM, Silbershatz H,Kannel WB. Prediction of coronary heart disease using risk factorcategories. Circulation 1998;97:1837–47.
6. Garvey WT, Kwon S, Zheng D, et al. Effects of insulin resistance andtype 2 diabetes on lipoprotein subclass particle size and concentrationdetermined by nuclear magnetic resonance. Diabetes 2003;52:453–62.
7. Kathiresan S, Otvos JD, Sullivan LM, et al. Increased small low-density lipoprotein particle number: a prominent feature of themetabolic syndrome in the Framingham Heart Study. Circulation2006;113:20–9.
8. Otvos JD, Collins D, Freedman DS, et al. Low-density lipoproteinand high-density lipoprotein particle subclasses predict coronary eventsand are favorably changed by gemfibrozil therapy in the VeteransAffairs High-Density Lipoprotein Intervention Trial. Circulation2006;113:1556–63.
9. Rosenson RS, Otvos JD, Freedman DS. Relations of lipoproteinsubclass levels and low-density lipoprotein size to progression ofcoronary artery disease in the Pravastatin Limitation of Atherosclerosisin the Coronary Arteries (PLAC-I) trial. Am J Cardiol 2002;90:89–94.
0. Mora S, Szklo M, Otvos JD, et al. LDL particle subclasses, LDLparticle size, and carotid atherosclerosis in the Multi-Ethnic Study ofAtherosclerosis (MESA). Atherosclerosis 2006 Jun 9; [Epub ahead ofprint].
1. Pischon T, Girman CJ, Sacks FM, Rifai N, Stampfer MJ, Rimm EB.Non-high-density lipoprotein cholesterol and apolipoprotein B in theprediction of coronary heart disease in men. Circulation 2005;112:3375–83.
2. Cui Y, Blumenthal RS, Flaws JA, et al. Non-high-density lipoproteincholesterol level as a predictor of cardiovascular disease mortality. ArchIntern Med 2001;161:1413–9.
3. Kuller L, Arnold A, Tracy R, et al. Nuclear magnetic resonancespectroscopy of lipoproteins and risk of coronary heart disease in thecardiovascular health study. Arterioscler Thromb Vasc Biol 2002;22:1175–80.
4. Freedman DS, Otvos JD, Jeyarajah EJ, et al. Sex and age differencesin lipoprotein subclasses measured by nuclear magnetic resonancespectroscopy: the Framingham Study. Clin Chem 2004;50:1189 –200.
5. Boekholdt SM, Peters RJ, Day NE, et al. Macrophage migrationinhibitory factor and the risk of myocardial infarction or death due tocoronary artery disease in adults without prior myocardial infarction orstroke: the EPIC-Norfolk Prospective Population Study. Am J Med
2004;117:390–7.